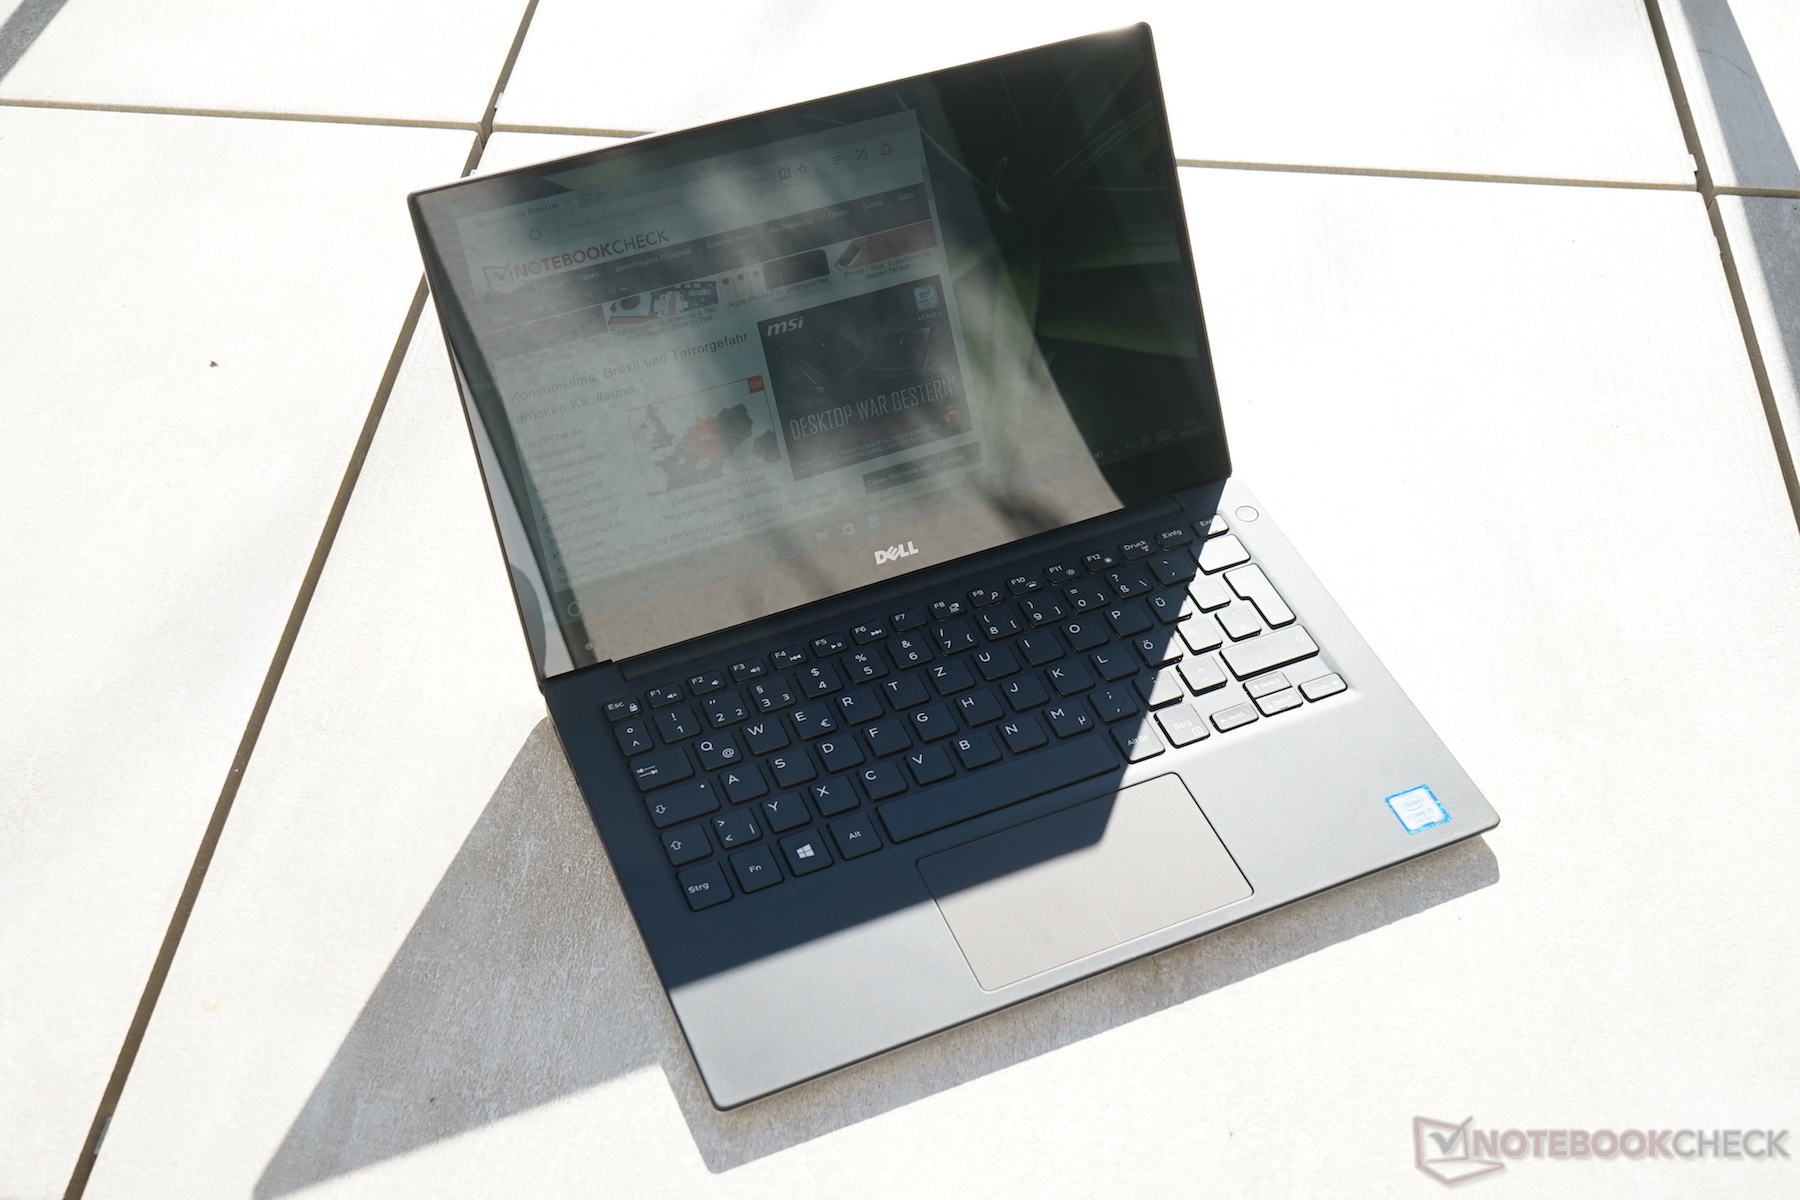
Dell XPS 13 9360R (i5-8250U, QHD) Laptop Review
 pixels")
For the original German review, please check here.
After our recent review of the XPS 13 with the new Intel Core i7-8550U, we are now taking a look at the more affordable model with i5-8250U. "More affordable" is relative of course, since our review notebook with a resolution of 3200 x 1800 pixels and touch display sells for a rather steep 1500 Euro (~$1790). The entry level Kaby Lake Refresh model with FHD non-touch display costs 1255 Euro (~$1500). That raises the question: is the Core i5 sufficient? Given that the thermal properties of the design affect the maximum performance, it's conceivable that the same SoC in different implementations ends up with different scores depending on the efficiency of the cooling system - especially when it comes to long-term performance.
Our review of the XPS 13 9360 (i7-8550U) revealed that the system never reaches its Turbo-maximum of 4.0 GHz and that the performance drops by 9 % when subjected to continuous loads (Cinebench R15 Multi - compared to performance after a cold start).
For our review update, we'll examine the performance of the Intel Core i5-8250U more thoroughly, while skipping certain sections like the ones dealing with the chassis, the connectivity, or the loudspeaker characteristics. For more details, please take a look at our review of the XPS 13 9360 (i7-8550U, QHD) as well.
Note: in the US, the new XPS 13 appears to only be available with the i7 CPU at the time of writing. A model with Core i7-8550U processor, 8 GB of RAM, 256 GB SSD and Full HD display costs $1200 from Dell directly; a version equipped with the same CPU, but 16 GB of RAM and QHD+ display sells for $1550.
| SD Card Reader | |
| average JPG Copy Test (av. of 3 runs) | |
| Dell XPS 13 i5-8250U (Toshiba Exceria Pro SDXC 64 GB UHS-II) | |
| HP Envy 13-ad006ng (Toshiba Exceria Pro SDXC 64 GB UHS-II) | |
| maximum AS SSD Seq Read Test (1GB) | |
| Dell XPS 13 i5-8250U (Toshiba Exceria Pro SDXC 64 GB UHS-II) | |
| HP Envy 13-ad006ng (Toshiba Exceria Pro SDXC 64 GB UHS-II) | |
Webcam
The webcam at the bottom edge takes pictures from a predominantly "nasal" perspective, which isn't exactly flattering during a video chat. Performance isn't any better than what any run-of-the-mill webcam can produce: even during daylight, there's a visible amount of noise, the colors are washed out, and the outlines and surfaces appear jagged.


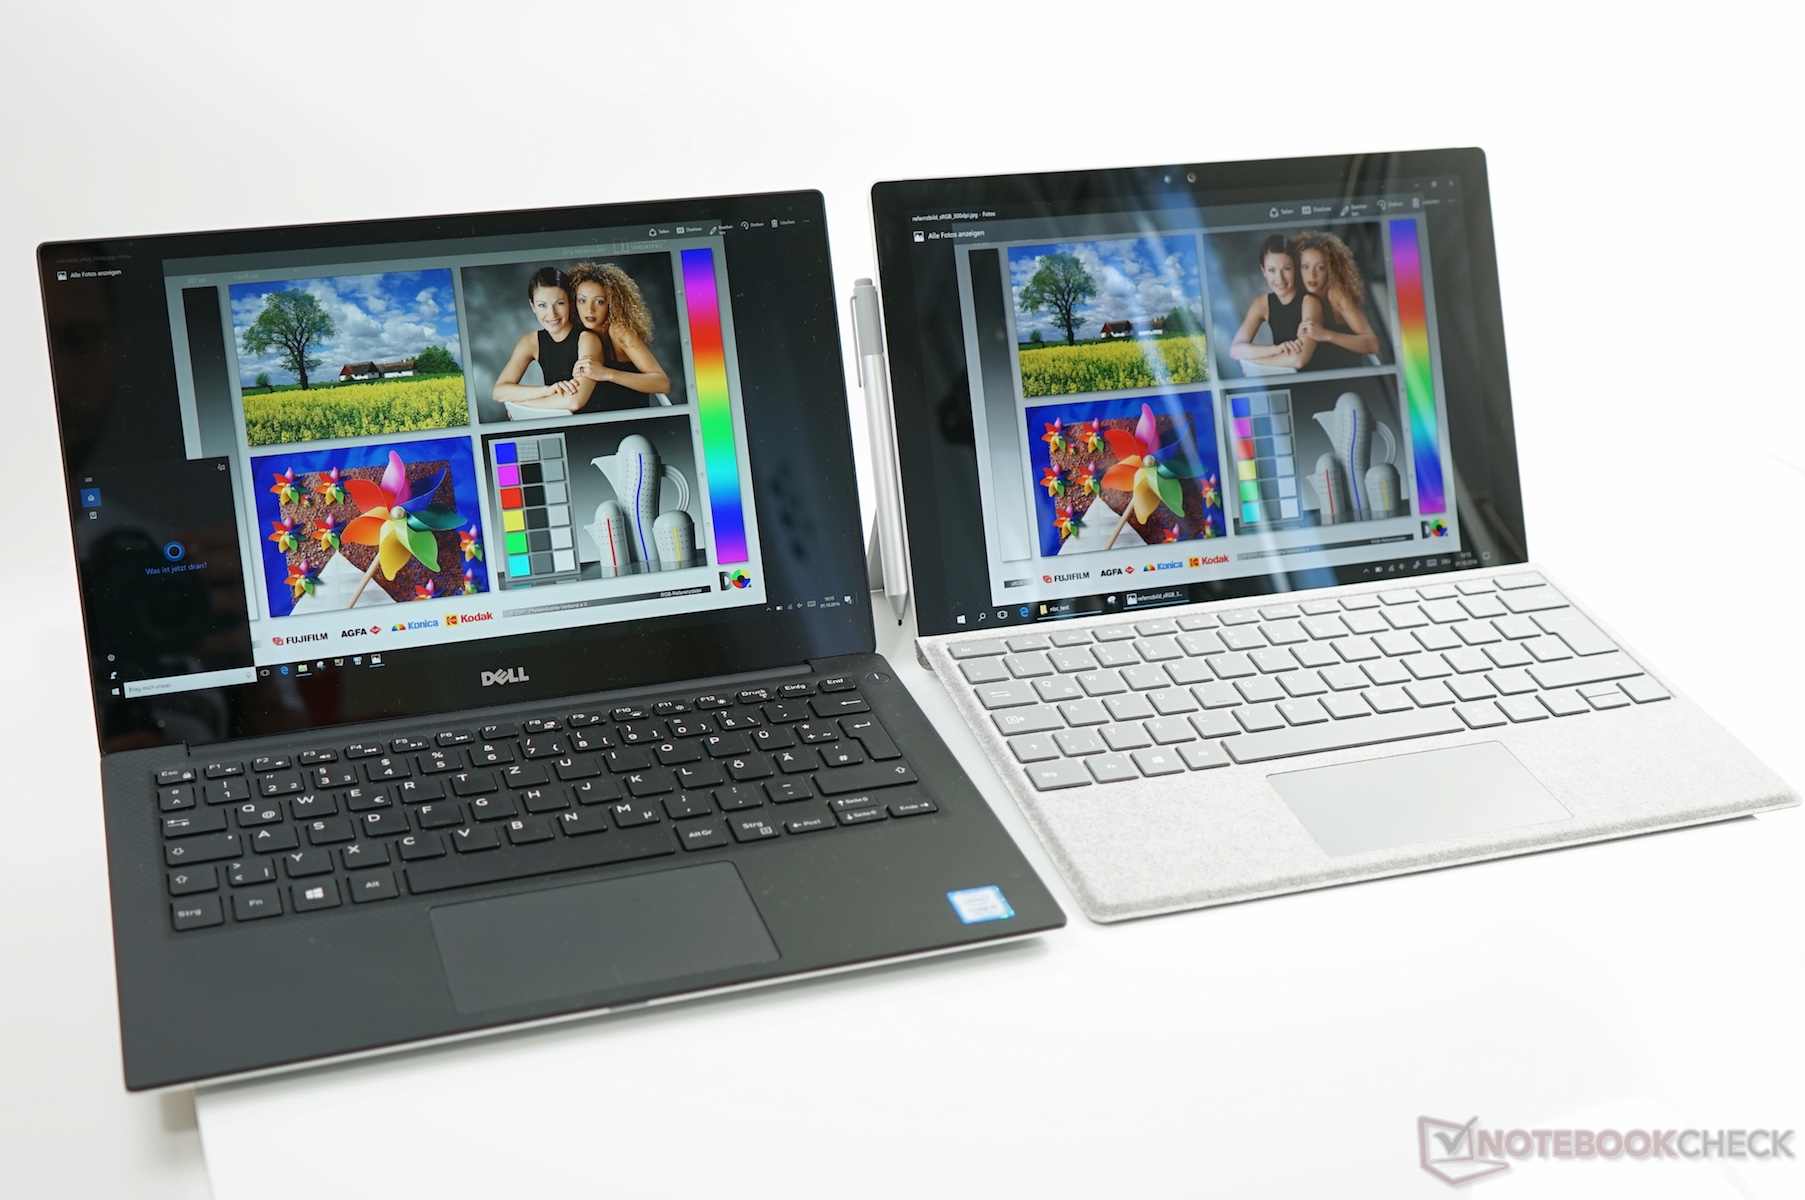
Display

The display is once again the IGZO touchscreen panel sourced from Sharp (type SHP144A). Visually, the display looks very similar to that of the sibling with i7 QHD+ panel, but we decided to repeat our measurements regardless. The result: the coverage of the professional color spaces as well as the gamma and the response times are very similar.
The brightness results are a little different, however, as we recorded about 25 cd/m² less in the middle quadrant. We could certainly attribute this to panel variation, although Dell's CABC (Content Adaptive Brightness Control) might be at fault as well. This technology reduces the brightness of the LEDs in the darker/black areas to save energy. Most users won't notice this behavior at all, but a photospectrometer certainly does.
Be it as it may: the display certainly manages to hold its own when compared to current competitors like the MateBook X or the ZenBook Flip S. Dell uses PWM for all brightness levels (including maximum), although the frequency of 19690 Hz is certainly high enough to not be an issue. Dell confirmed that his is a design feature and not a problem with our review unit.
Subjectively, text and pictures are razor-sharp thanks to the rather unusual 1800p resolution. The panel doesn't look grainy at all and backlight bleeding also isn't much of an issue.
| |||||||||||||||||||||||||
Brightness Distribution: 72 %
Center on Battery: 342 cd/m²
Contrast: 1094:1 (Black: 0.33 cd/m²)
ΔE ColorChecker Calman: 5.26 | ∀{0.5-29.43 Ø4.72}
ΔE Greyscale Calman: 5.69 | ∀{0.09-98 Ø4.97}
92% sRGB (Argyll 1.6.3 3D)
59% AdobeRGB 1998 (Argyll 1.6.3 3D)
65.7% AdobeRGB 1998 (Argyll 3D)
91.7% sRGB (Argyll 3D)
63.9% Display P3 (Argyll 3D)
Gamma: 1.63
CCT: 6499 K
| Dell XPS 13 i5-8250U ID: Sharp SHP144A, Name: LQ133Z1, , 3200x1800, 13.3" | Dell XPS 13 i7-8550U ID: Sharp SHP144A, Name: LQ133Z1, , 3200x1800, 13.3" | HP Spectre 13-v131ng CMN1374, , 1920x1080, 13.3" | Apple MacBook Pro 13 2017 APPA033, , 2560x1600, 13.3" | Huawei MateBook X Chi Mei CMN8201 / P130ZDZ-EF1, , 2160x1440, 13.3" | HP Envy 13-ad006ng BOE070E, , 1920x1080, 13.3" | Apple MacBook 12 (Early 2016) 1.1 GHz APPA027, , 2304x1440, 12" | Dell XPS 13 9360 FHD i7 Iris SHP1449, , 1920x1080, 13.3" | |
|---|---|---|---|---|---|---|---|---|
| Display | 0% | -1% | 32% | 3% | -2% | 4% | -18% | |
| Display P3 Coverage (%) | 63.9 | 63.6 0% | 64.6 1% | 99.2 55% | 65.8 3% | 66.8 5% | 66.8 5% | 51.6 -19% |
| sRGB Coverage (%) | 91.7 | 93 1% | 88.8 -3% | 99.9 9% | 96.2 5% | 86.3 -6% | 95.4 4% | 77.4 -16% |
| AdobeRGB 1998 Coverage (%) | 65.7 | 65.4 0% | 64.8 -1% | 87.1 33% | 66.8 2% | 63.1 -4% | 68 4% | 53.3 -19% |
| Response Times | -7% | -35% | -22% | 3% | -37% | -22% | -21% | |
| Response Time Grey 50% / Grey 80% * (ms) | 29 ? | 35.6 ? -23% | 46 ? -59% | 42.8 ? -48% | 33 ? -14% | 48 ? -66% | 41.2 ? -42% | 41.2 ? -42% |
| Response Time Black / White * (ms) | 30 ? | 27.2 ? 9% | 33 ? -10% | 28.8 ? 4% | 24 ? 20% | 32 ? -7% | 30.4 ? -1% | 30 ? -0% |
| PWM Frequency (Hz) | 19500 ? | 19690 ? | 1000 ? | 19530 ? | ||||
| Screen | 7% | 2% | 39% | 23% | -1% | 17% | 15% | |
| Brightness middle (cd/m²) | 361 | 386.1 7% | 404 12% | 588 63% | 408 13% | 281 -22% | 387 7% | 461 28% |
| Brightness (cd/m²) | 303 | 357 18% | 382 26% | 561 85% | 395 30% | 264 -13% | 358 18% | 418 38% |
| Brightness Distribution (%) | 72 | 83 15% | 91 26% | 92 28% | 88 22% | 83 15% | 88 22% | 85 18% |
| Black Level * (cd/m²) | 0.33 | 0.33 -0% | 0.35 -6% | 0.45 -36% | 0.45 -36% | 0.23 30% | 0.47 -42% | 0.2 39% |
| Contrast (:1) | 1094 | 1170 7% | 1154 5% | 1307 19% | 907 -17% | 1222 12% | 823 -25% | 2305 111% |
| Colorchecker dE 2000 * | 5.26 | 4.2 20% | 5.37 -2% | 1.7 68% | 1.55 71% | 4.83 8% | 1.6 70% | 5.4 -3% |
| Colorchecker dE 2000 max. * | 7.79 | 7.6 2% | 9.46 -21% | 3.5 55% | 2.19 72% | 8.89 -14% | 4 49% | 12.2 -57% |
| Greyscale dE 2000 * | 5.69 | 5.7 -0% | 6.44 -13% | 1.9 67% | 1.91 66% | 6.63 -17% | 1 82% | 5.4 5% |
| Gamma | 1.63 135% | 2.28 96% | 2.52 87% | 2.33 94% | 2.34 94% | 1.85 119% | 2.26 97% | 2.15 102% |
| CCT | 6499 100% | 7336 89% | 6738 96% | 6738 96% | 6491 100% | 6794 96% | 6680 97% | 7258 90% |
| Color Space (Percent of AdobeRGB 1998) (%) | 59 | 59 0% | 58 -2% | 77.92 32% | 61 3% | 56 -5% | 61.6 4% | 48.6 -18% |
| Color Space (Percent of sRGB) (%) | 92 | 92.2 0% | 89 -3% | 99.94 9% | 96 4% | 86 -7% | 82.2 -11% | 76.9 -16% |
| Total Average (Program / Settings) | 0% /
4% | -11% /
-3% | 16% /
30% | 10% /
16% | -13% /
-6% | -0% /
10% | -8% /
3% |
* ... smaller is better
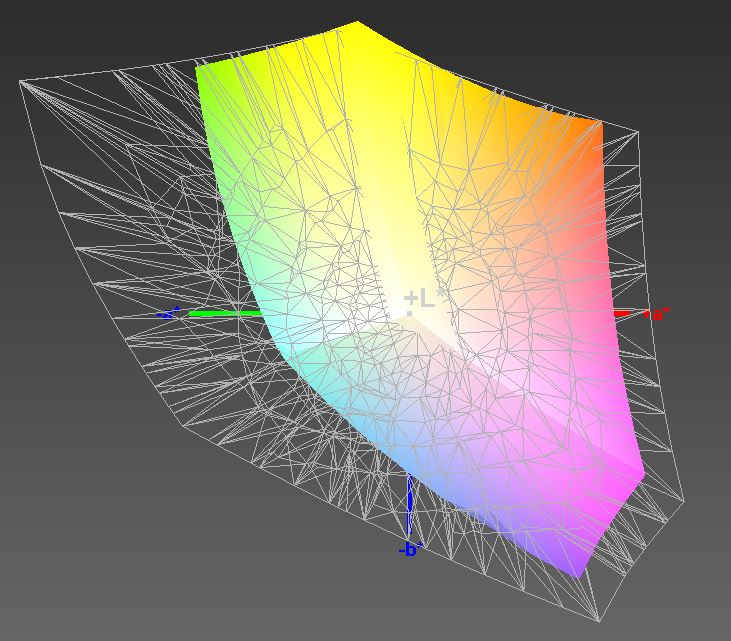
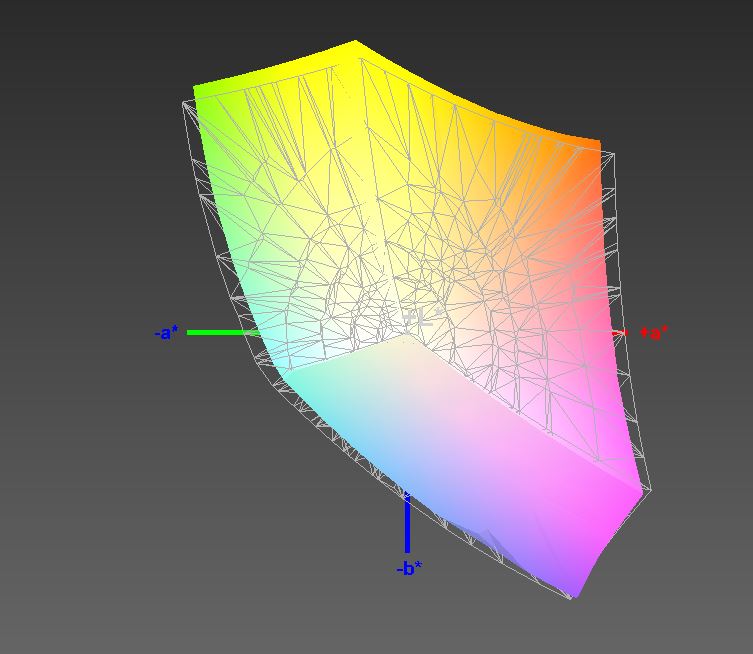
Color space coverage is right around 92 % and 59 % for sRGB and AdobeRGB, respectively. The 4K IGZO panel of the XPS 15 offers even better color reproduction, so users desiring full sRGB coverage might want to consider the larger sibling instead.
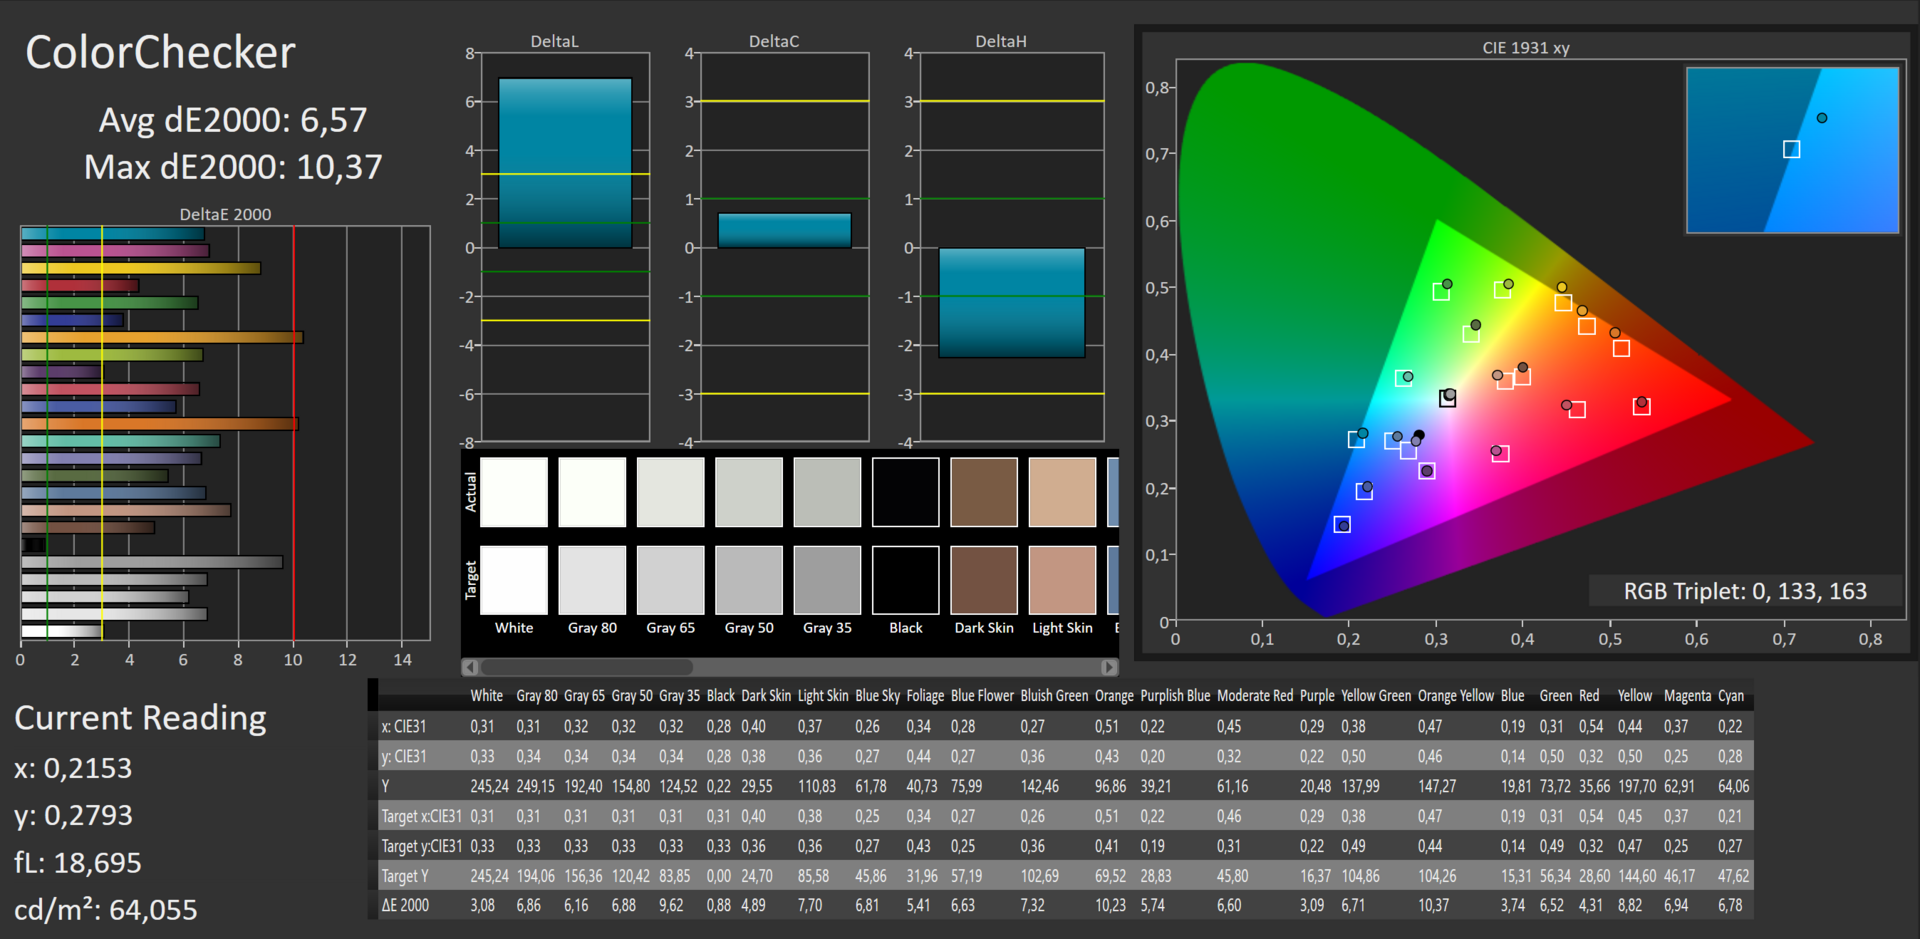
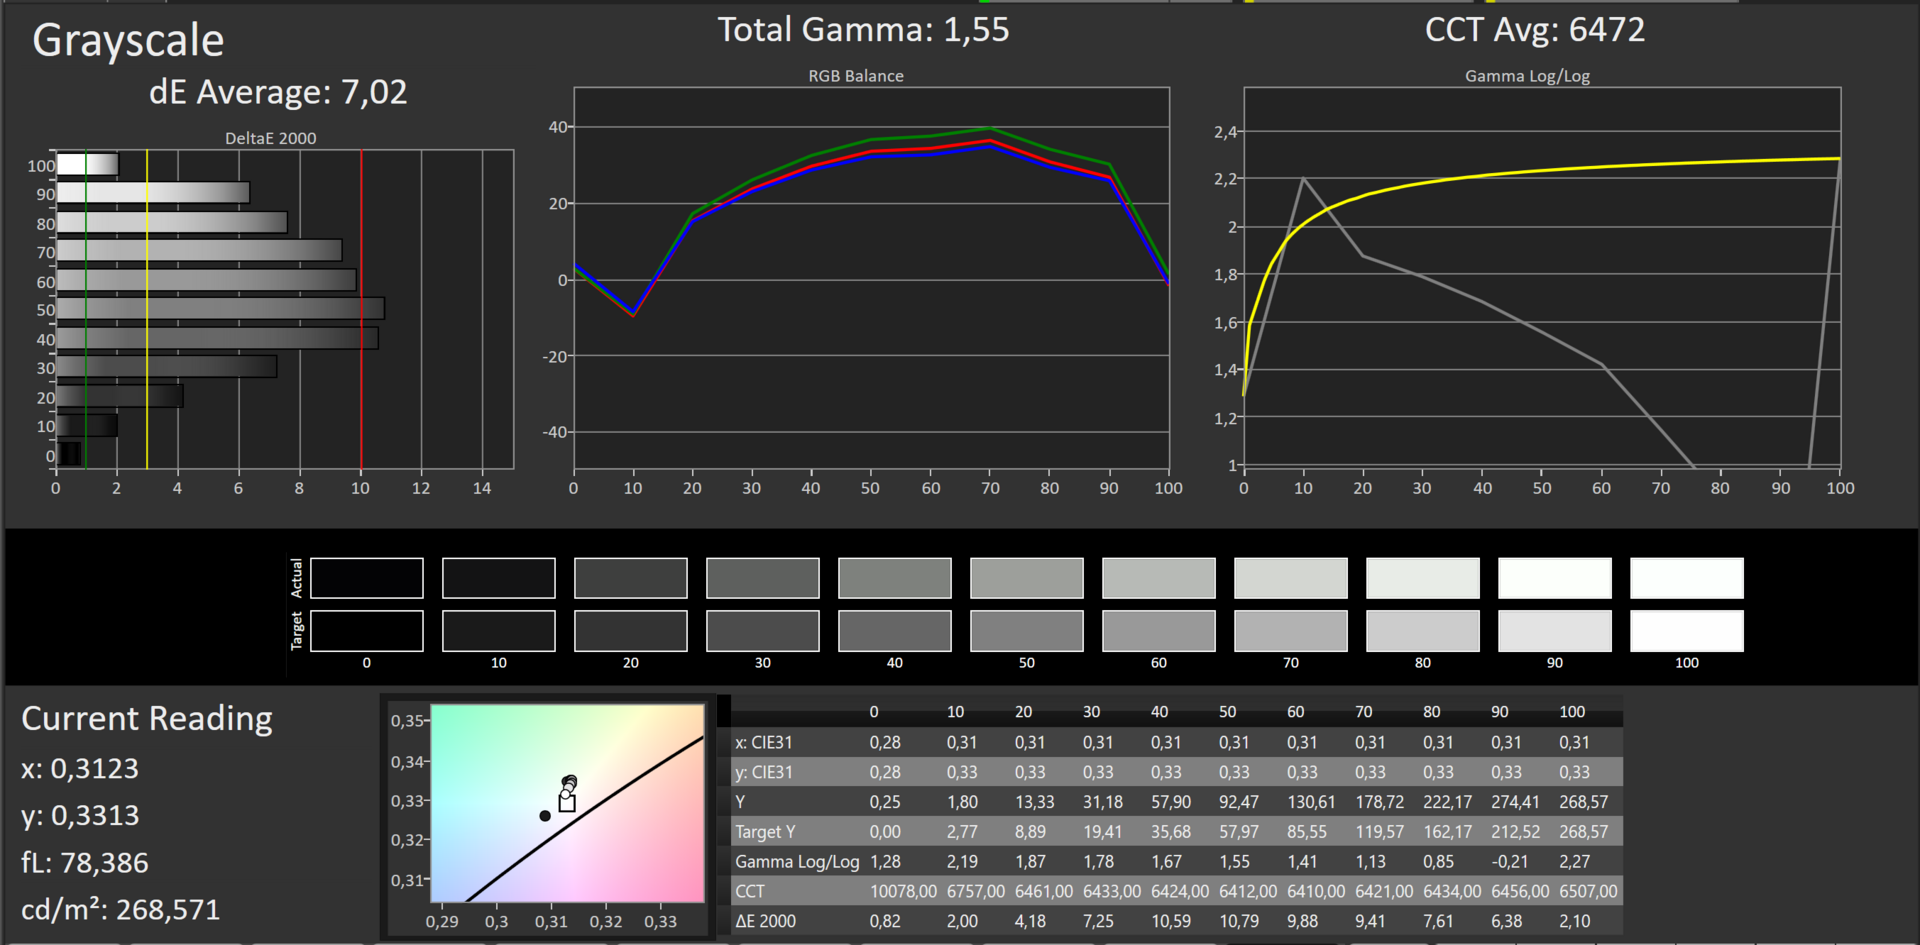

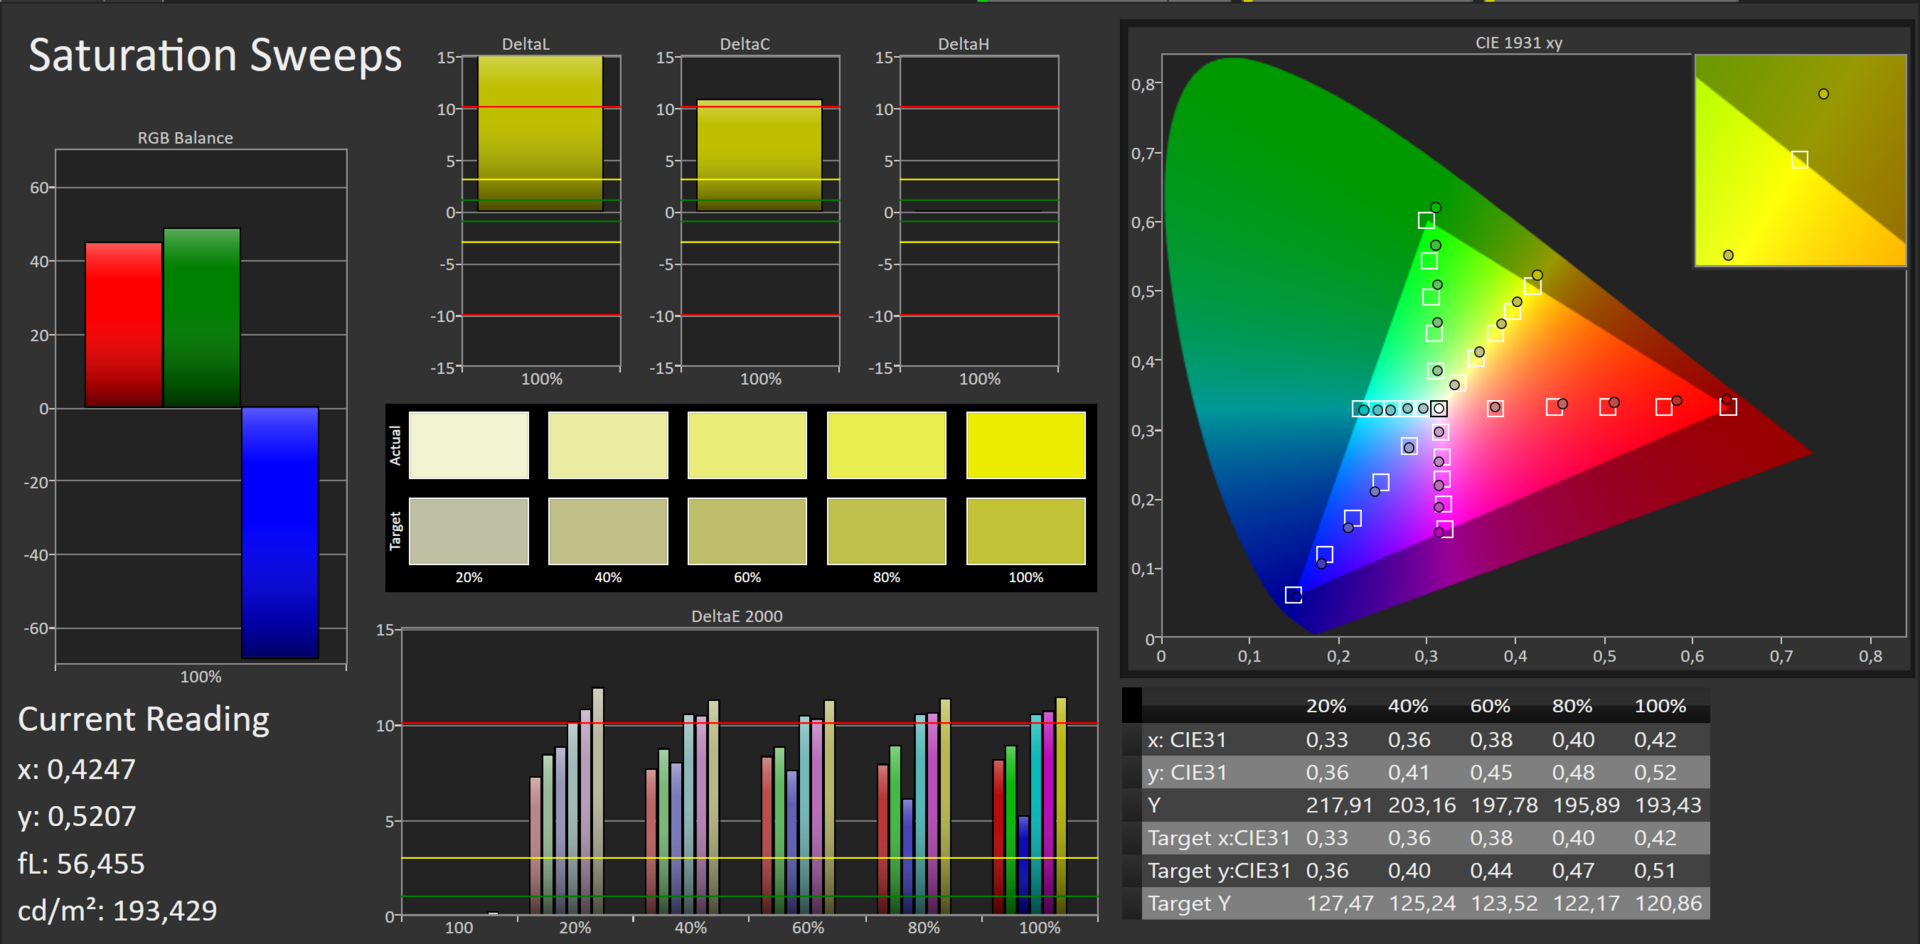
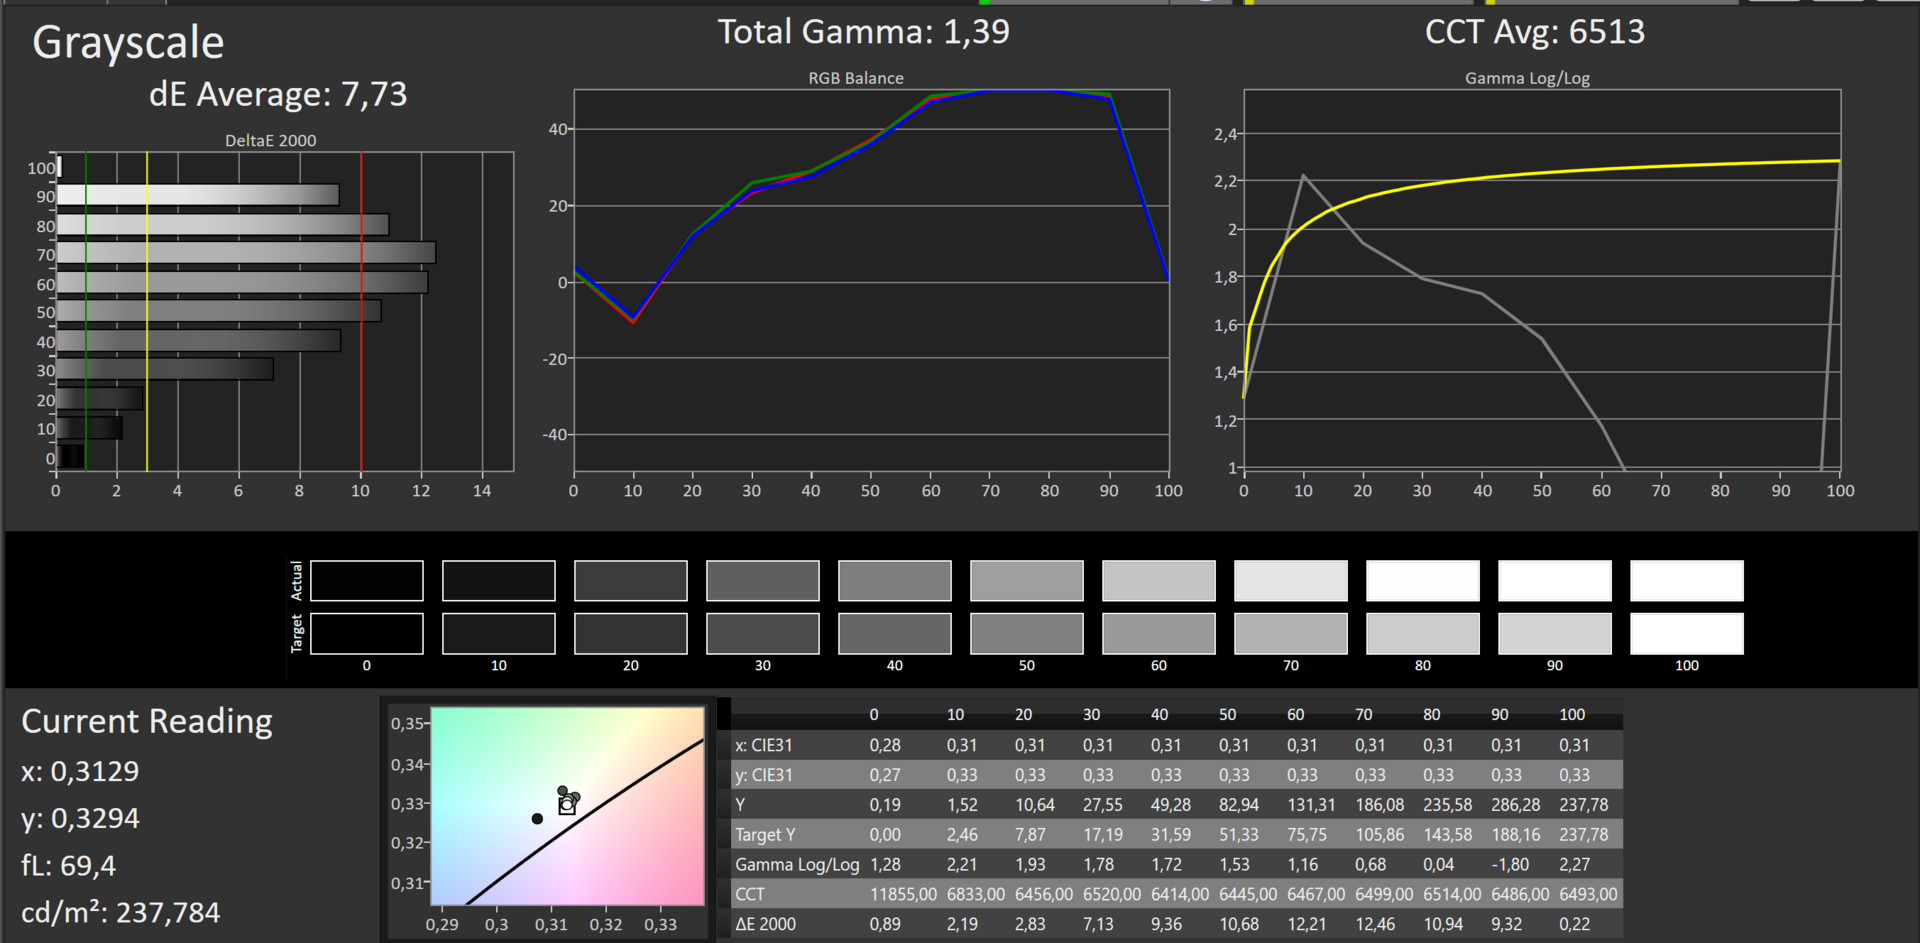
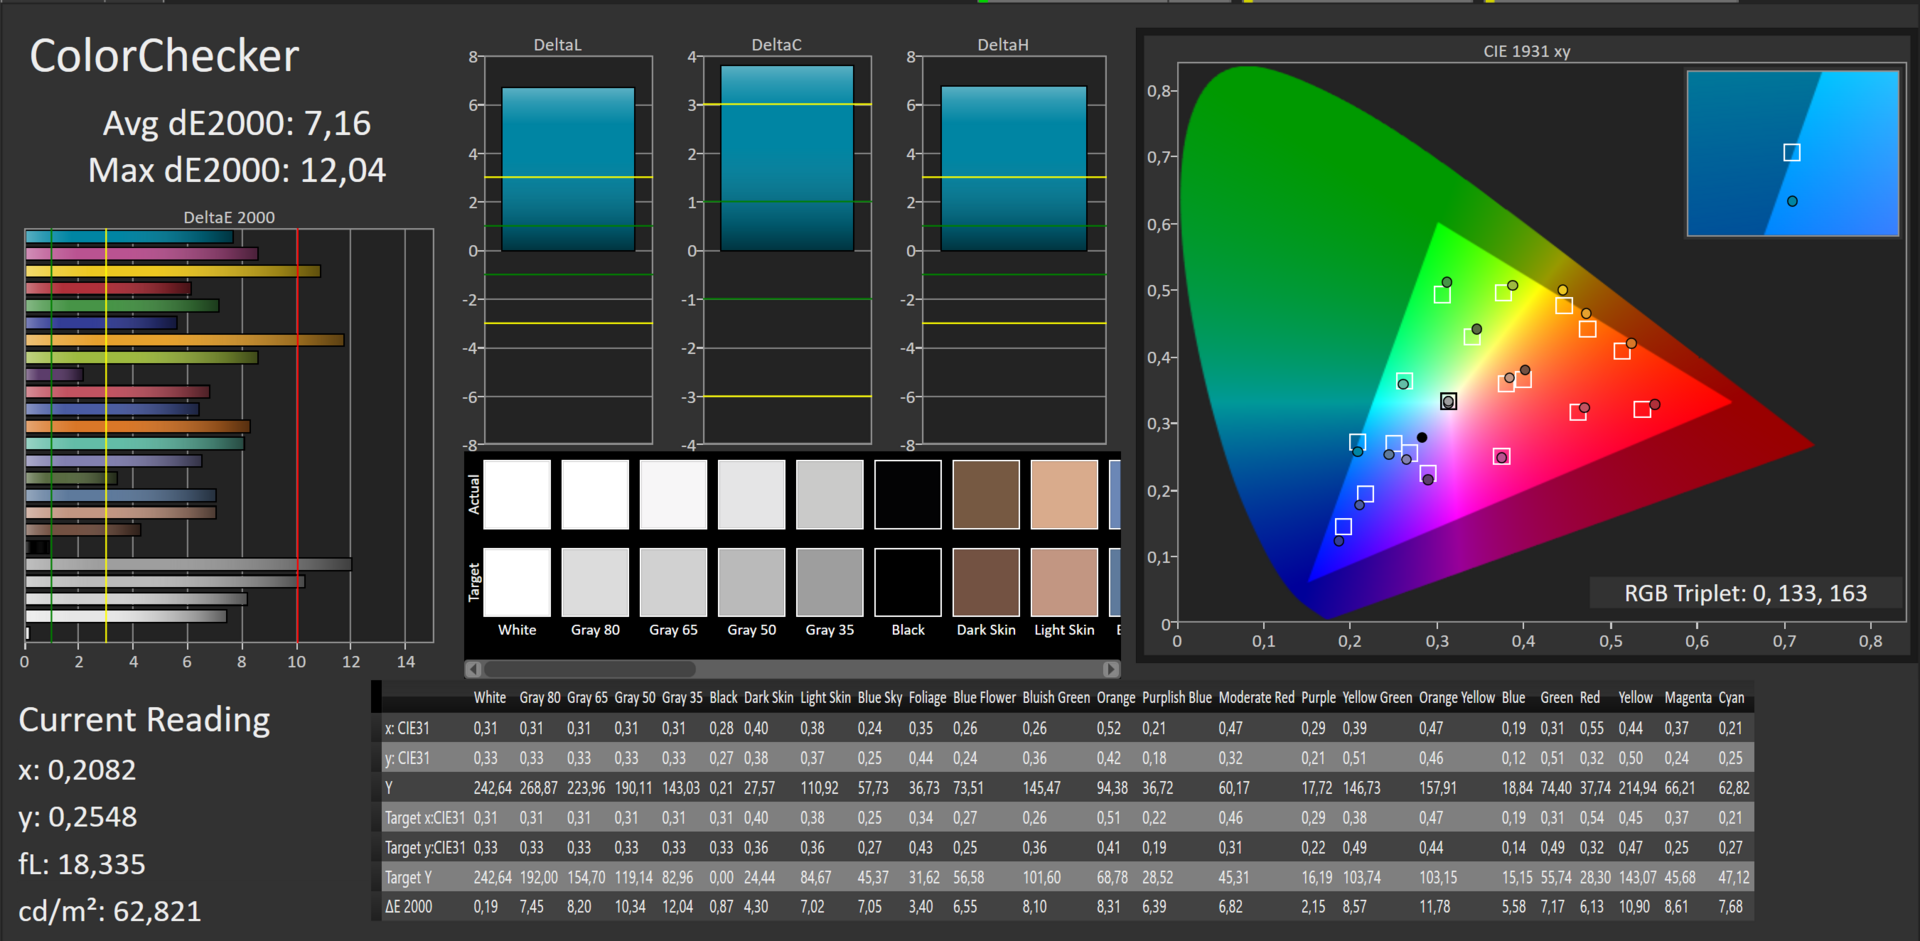
Even after a calibration, our review notebook still suffers from comparatively high DeltaE-deviations for both grayscale and color, while the i7 QHD+ version of the XPS 13 with the same panel improved considerably. It's bewildering: not only does a calibration nothing to improve the accuracy, but the DeltaE values are actually slightly worse afterward. A pre-installed color profile can't be the culprit, since Dell doesn't supply one.
Display Response Times
| ↔ Response Time Black to White | ||
|---|---|---|
| 30 ms ... rise ↗ and fall ↘ combined | ↗ 18 ms rise | 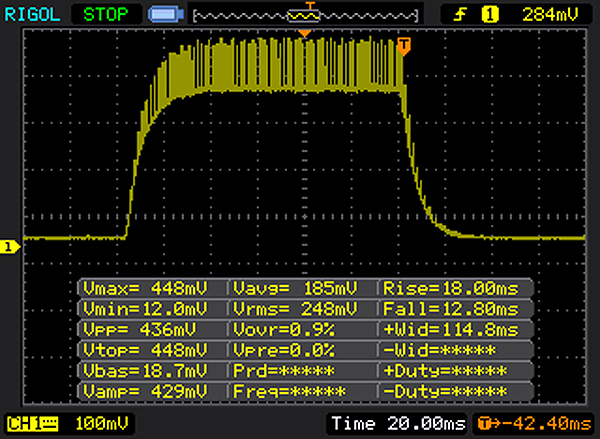 |
| ↘ 12 ms fall | ||
| The screen shows slow response rates in our tests and will be unsatisfactory for gamers. In comparison, all tested devices range from 0.1 (minimum) to 240 (maximum) ms. » 80 % of all devices are better. This means that the measured response time is worse than the average of all tested devices (19.8 ms). | ||
| ↔ Response Time 50% Grey to 80% Grey | ||
| 29 ms ... rise ↗ and fall ↘ combined | ↗ 19 ms rise | 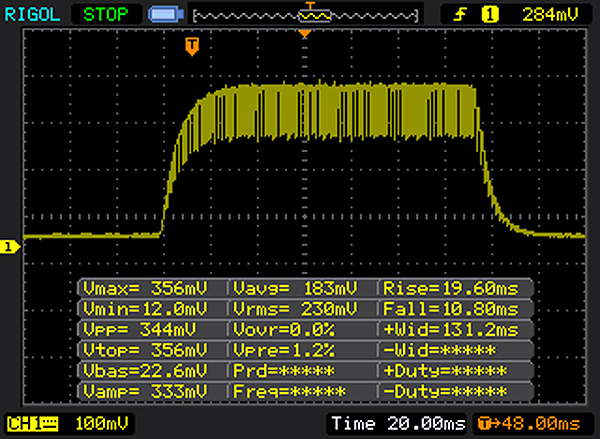 |
| ↘ 10 ms fall | ||
| The screen shows relatively slow response rates in our tests and may be too slow for gamers. In comparison, all tested devices range from 0.165 (minimum) to 636 (maximum) ms. » 39 % of all devices are better. This means that the measured response time is similar to the average of all tested devices (31 ms). | ||
Screen Flickering / PWM (Pulse-Width Modulation)
| Screen flickering / PWM detected | 19500 Hz | ≤ 100 % brightness setting | 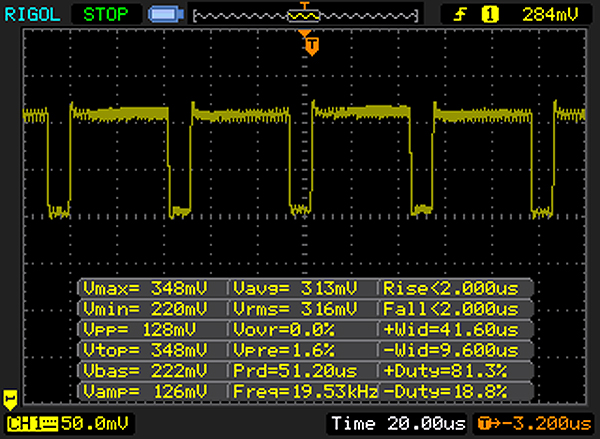 |
The display backlight flickers at 19500 Hz (worst case, e.g., utilizing PWM) Flickering detected at a brightness setting of 100 % and below. There should be no flickering or PWM above this brightness setting. The frequency of 19500 Hz is quite high, so most users sensitive to PWM should not notice any flickering. In comparison: 52 % of all tested devices do not use PWM to dim the display. If PWM was detected, an average of 7747 (minimum: 5 - maximum: 343500) Hz was measured. | |||
Performance
In the near future, the brand-new Core i5-8250U (1.6 – 3.4 GHz) SoC likely will be one of the most frequently-used Windows laptop processors. The price-to-value ratio is excellent and in our opinion it's not worth spending 80 Euro (~$95) more for the i7 CPU.
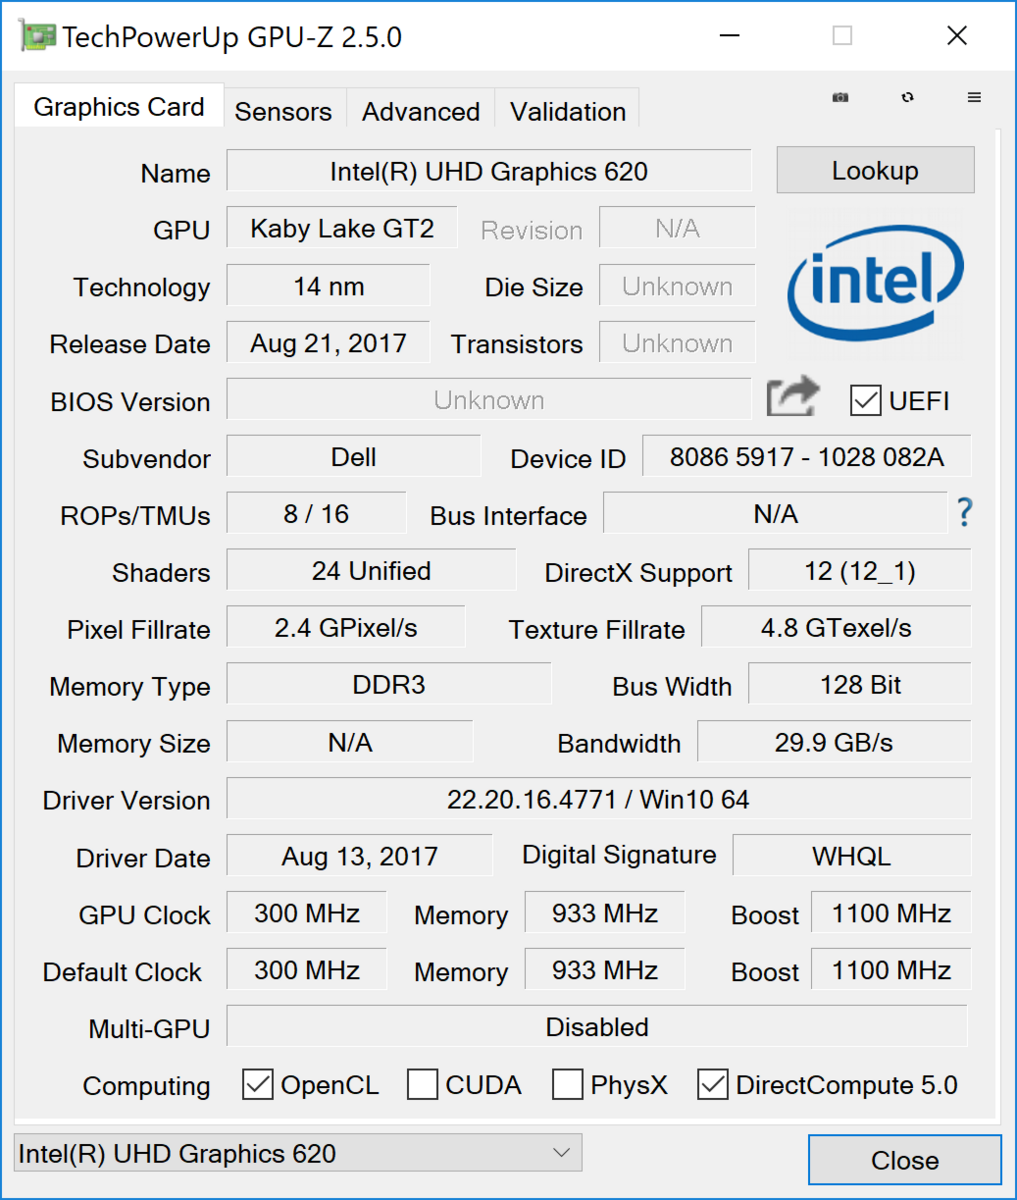
Although the 8250U is the weakest U-series processor, it still offers four real CPU cores and heavily parallelized software should be able to take advantage of the eight total threads. The predecessor 7200U, which also had a TPU of 15 W, only had two cores and four threads. According to Intel, the Intel UHD Graphics 620 is identical to the Intel HD Graphics 620 integrated in the i5-7200U.
The SoC has a TDP rating of 15 W, but the notebook manufacturer can elect to vary the power draw from between 7.5 to 25 W depending on the capabilities of the cooling system.


Processor
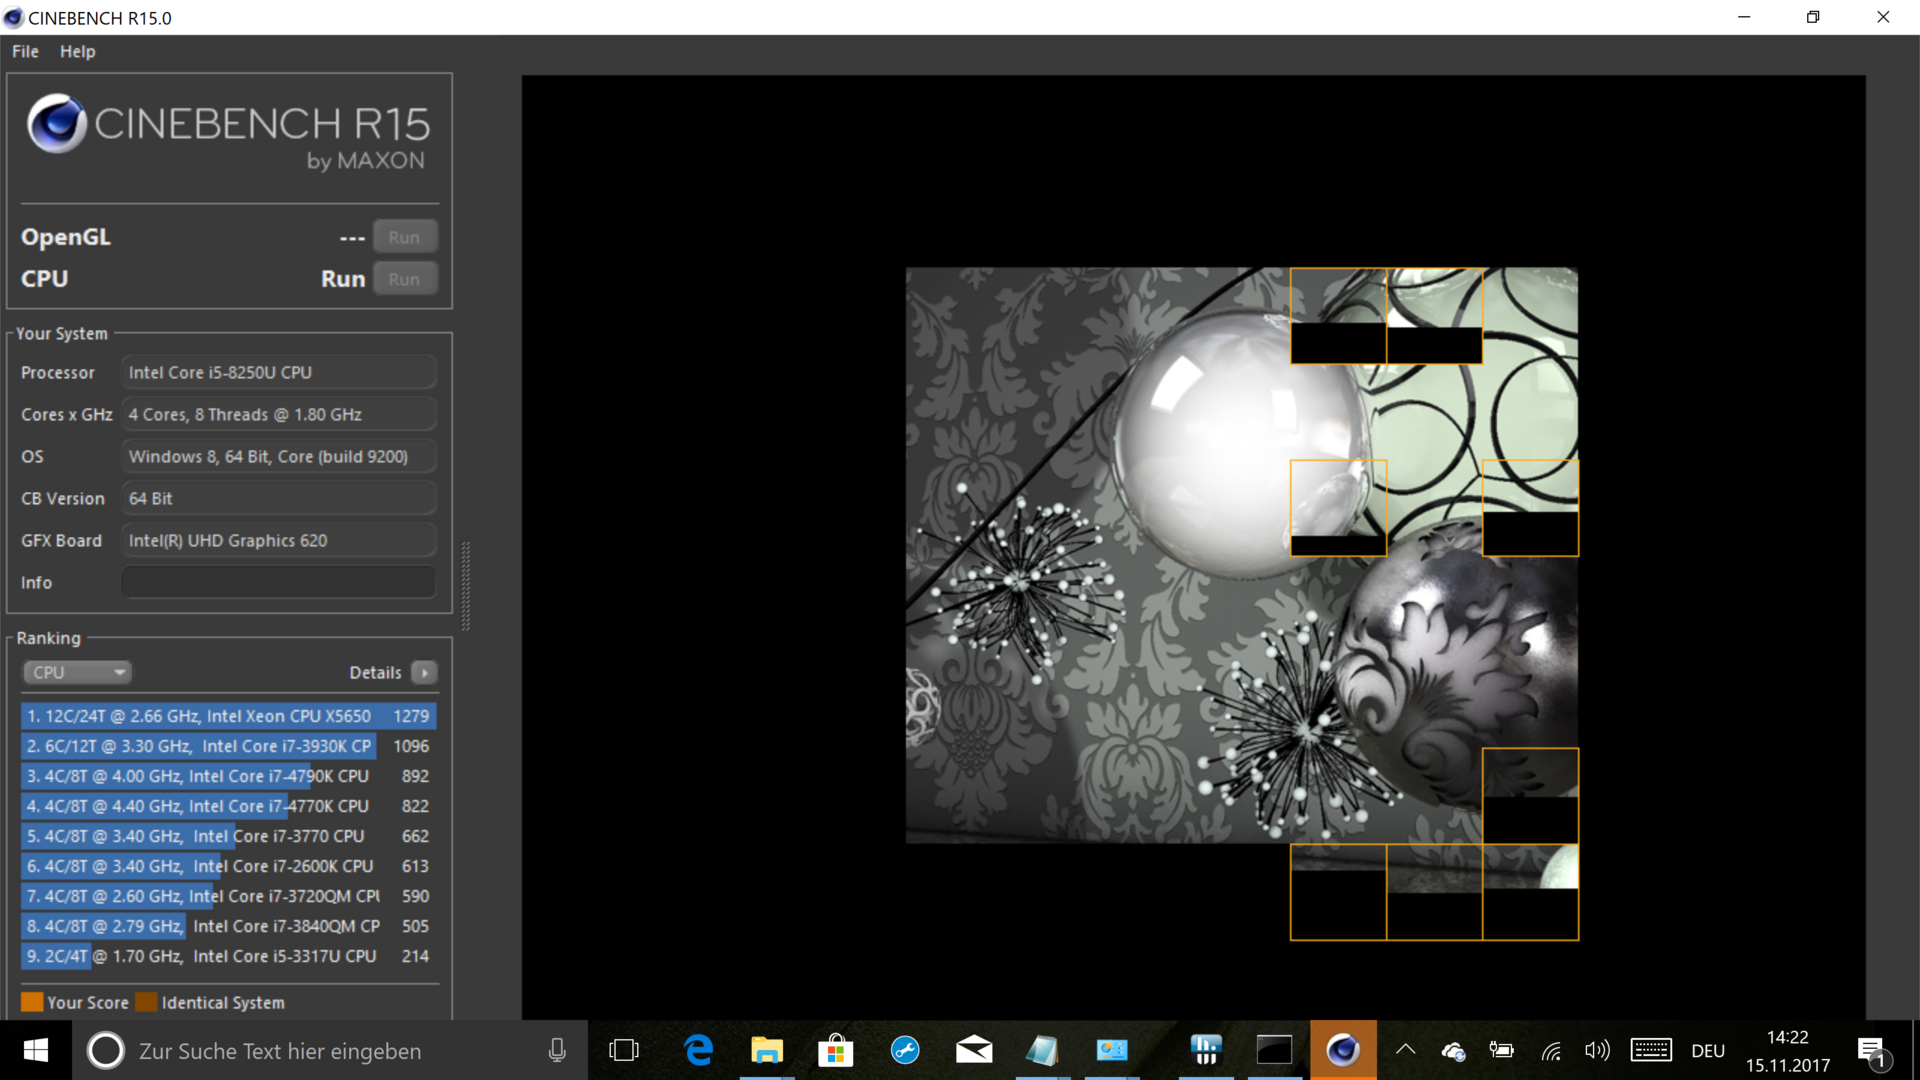
We use the Cinebench R15 loop test to simulate constant load. After a cold start and an initial score of 564 points, the system drops to 503 points (-11 %) after the 3rd loop. The score averages over time is about 520 points (-8 %).
The reason: the SoC core frequency drops to 2.6 GHz in order to keep the temperature below 90 °C. The i7 version has a performance plus of about 9 %.
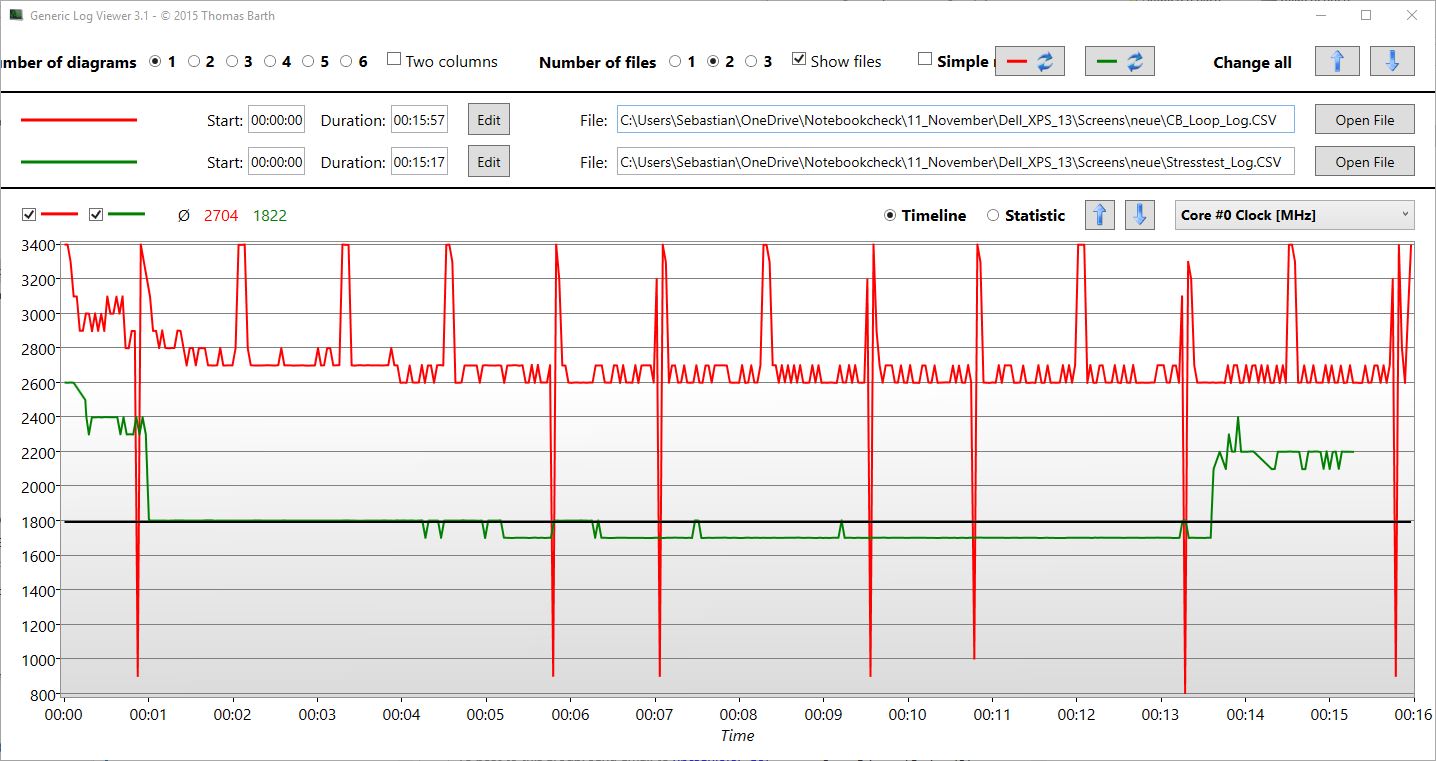
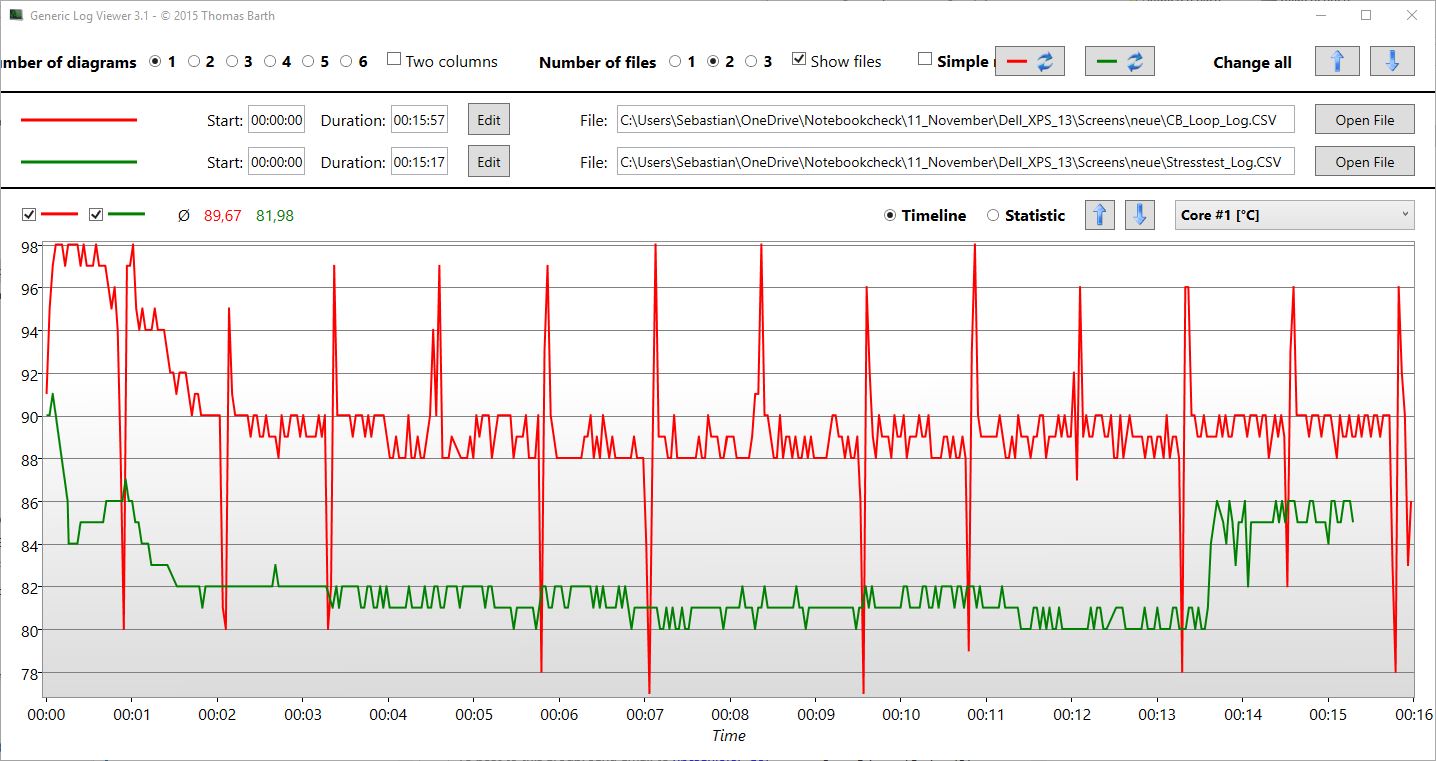
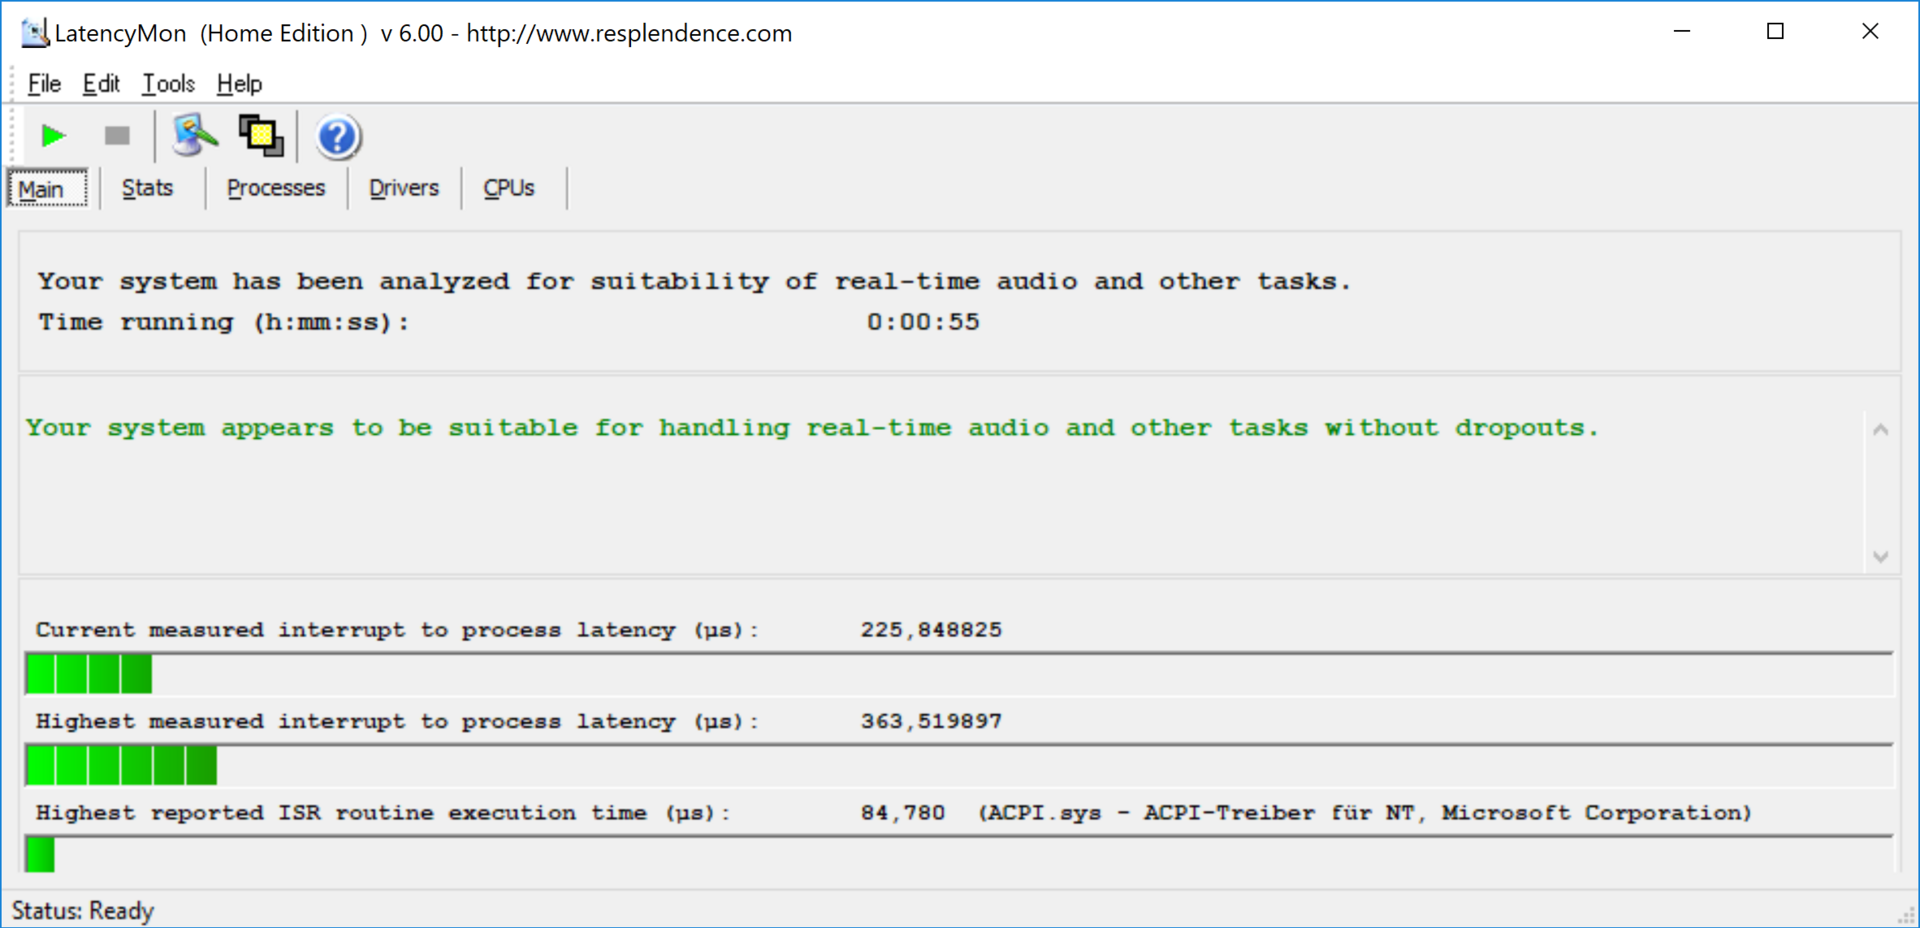
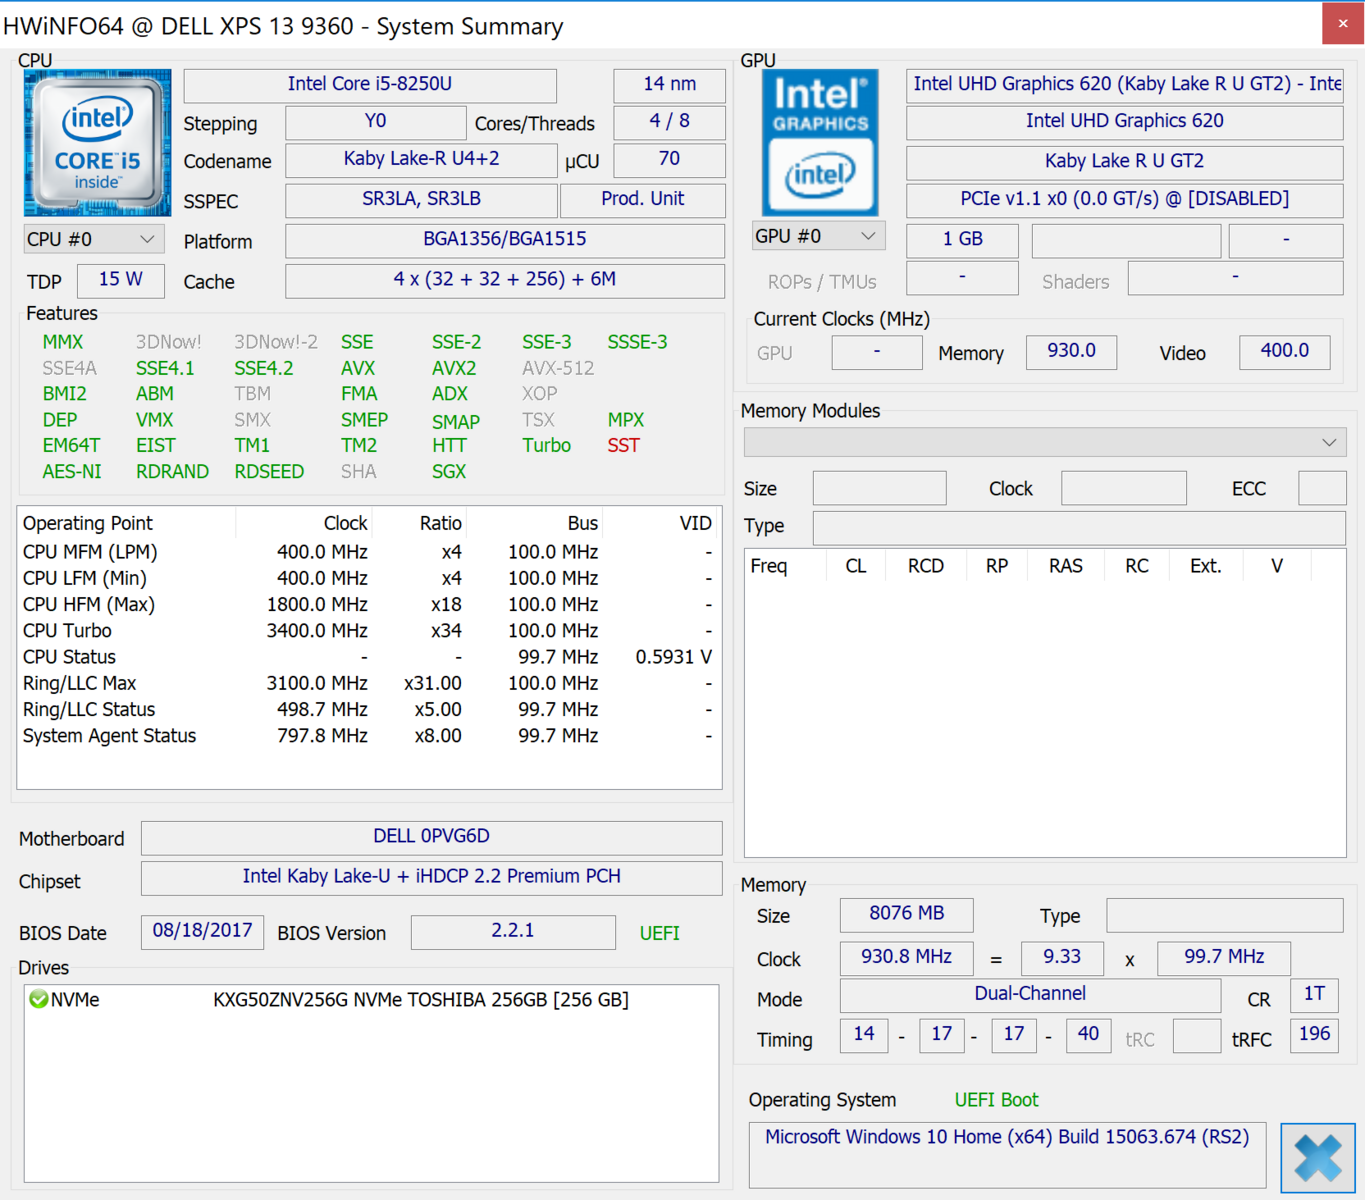
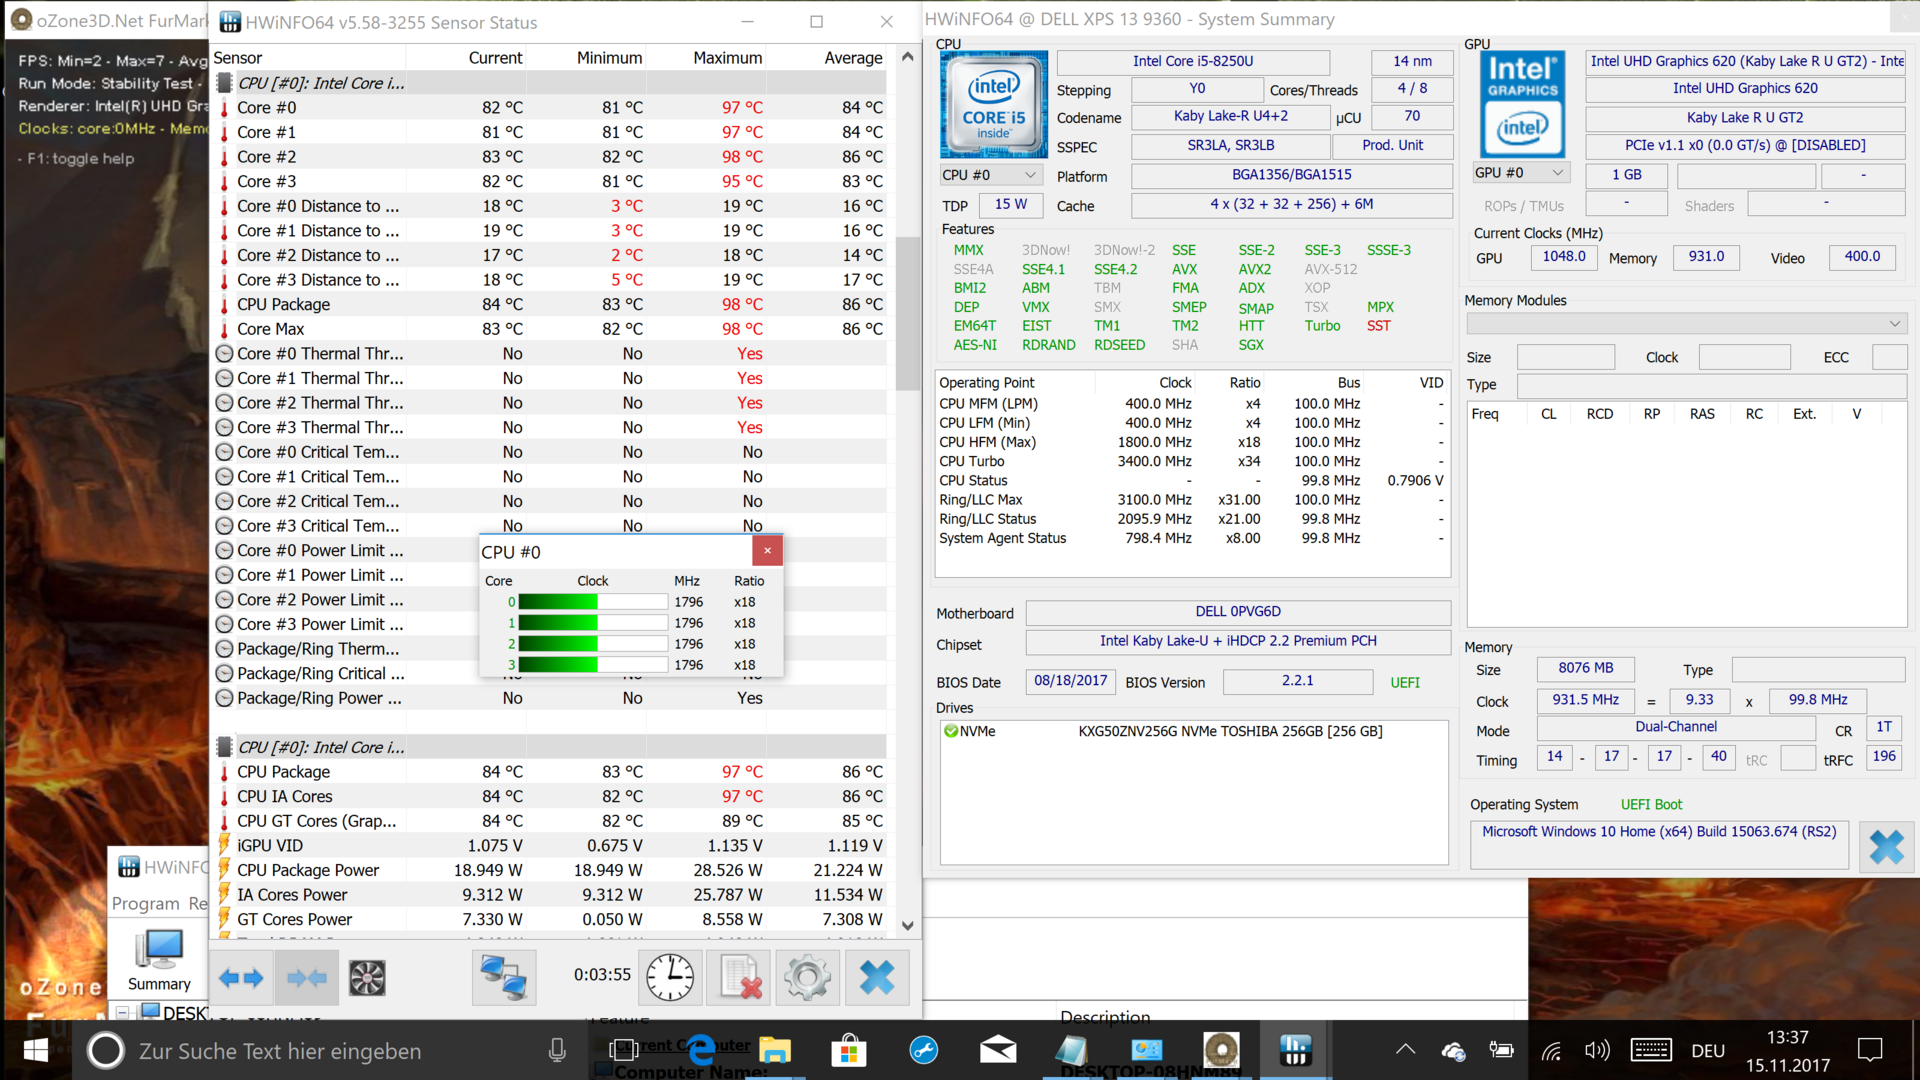
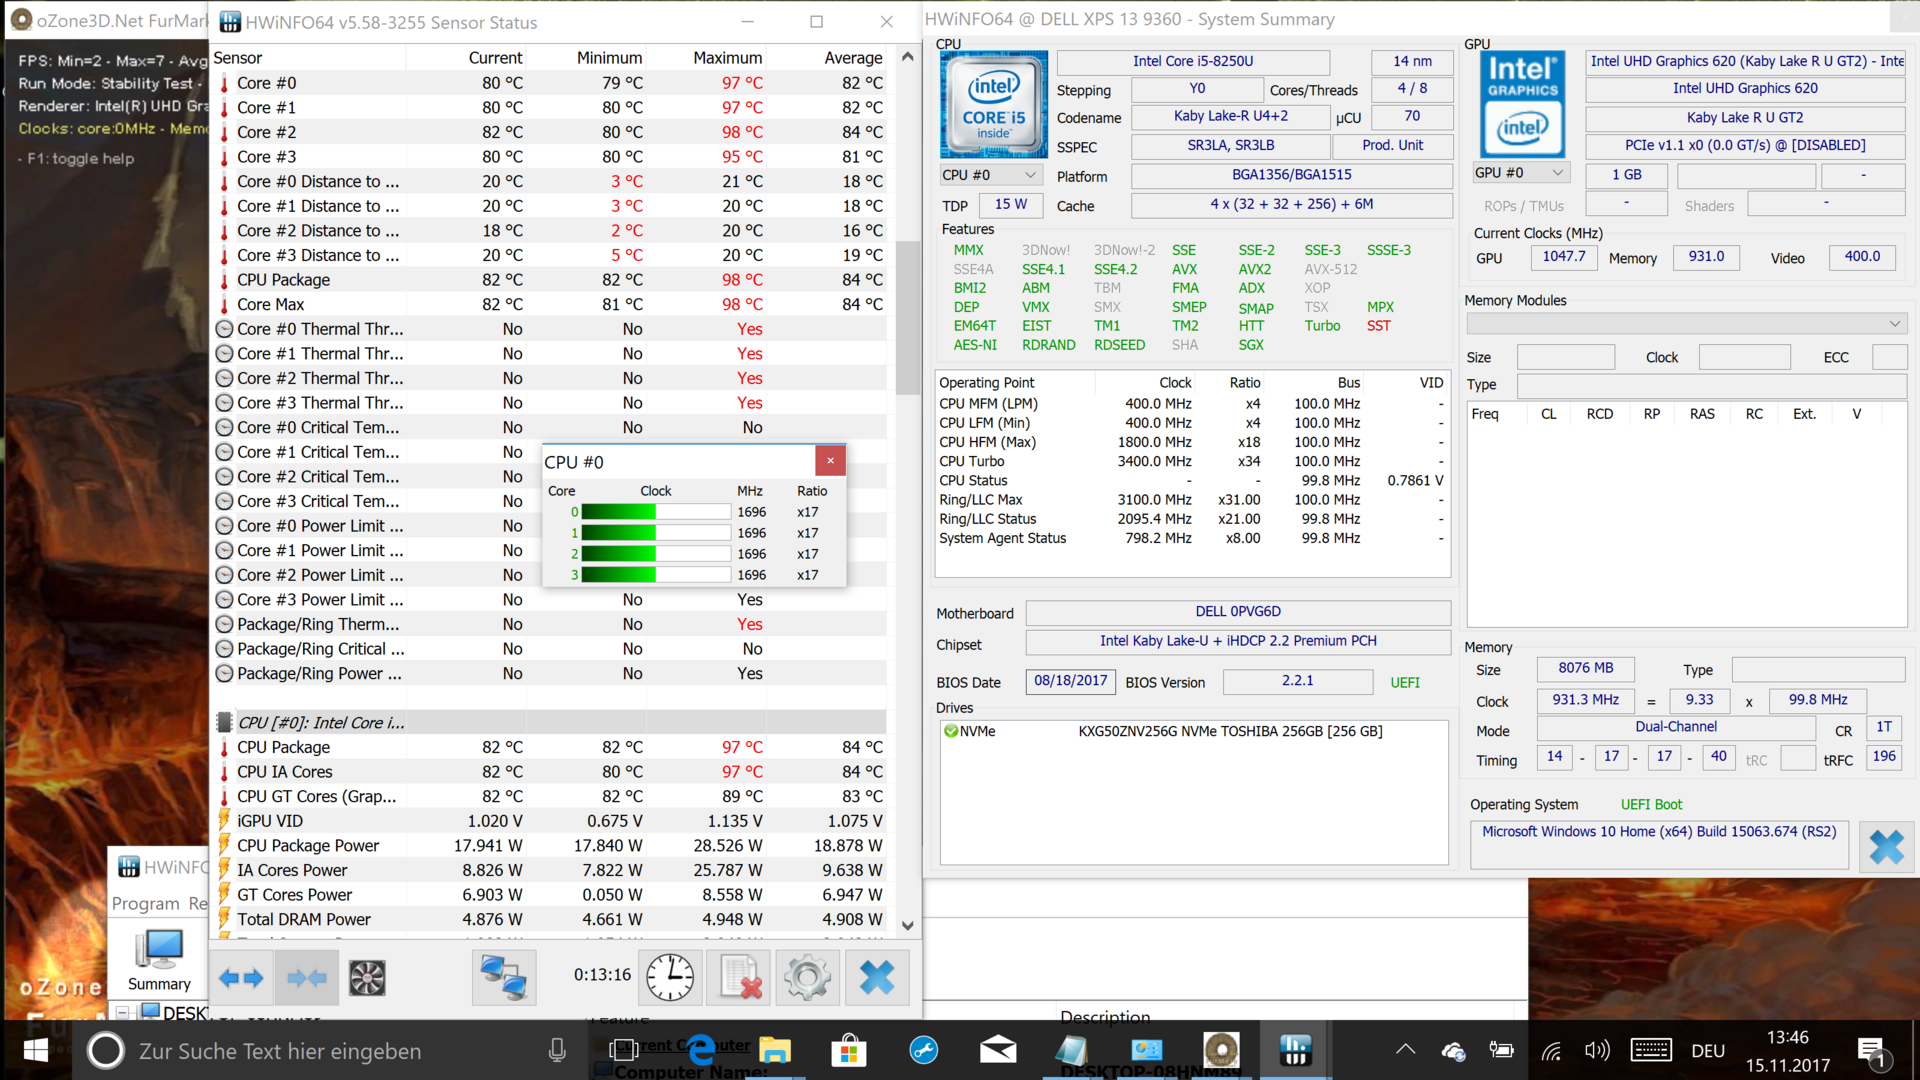
During the stress test, which uses Prime95 and Furmark to utilize both the CPU as well as the GPU to their full potential, the frequency drops even more to 1.7 GHz at a constant SoC temperature of 82 °C. The maximum temperature briefly reaches 97 °C before the clock speeds are reduced rather significantly. Please take a look at the above screenshots for additional details.
At no time does real throttling occur, since the frequency never falls below the base clock speed of 1.6 GHz (R15 Loop 2.6 GHz; stress test 1.7 GHz). After a cold start, the benchmark scores improve and the Core i5-8250U now trails the 8550U (XPS i7) by only -6 %. The i7 XPS is also roughly 19 % faster during the single-threaded portion of the benchmark test.
System Performance
The single-core results of the i7 seem to impact the PCMark scores heavily, as our i5 review notebook trails the i7 model by about 7 to 8 %. Both notebooks are otherwise equipped identically and feature Toshiba NVMe SSDs as well as 8 GB of LPDDR3 dual-channel RAM.
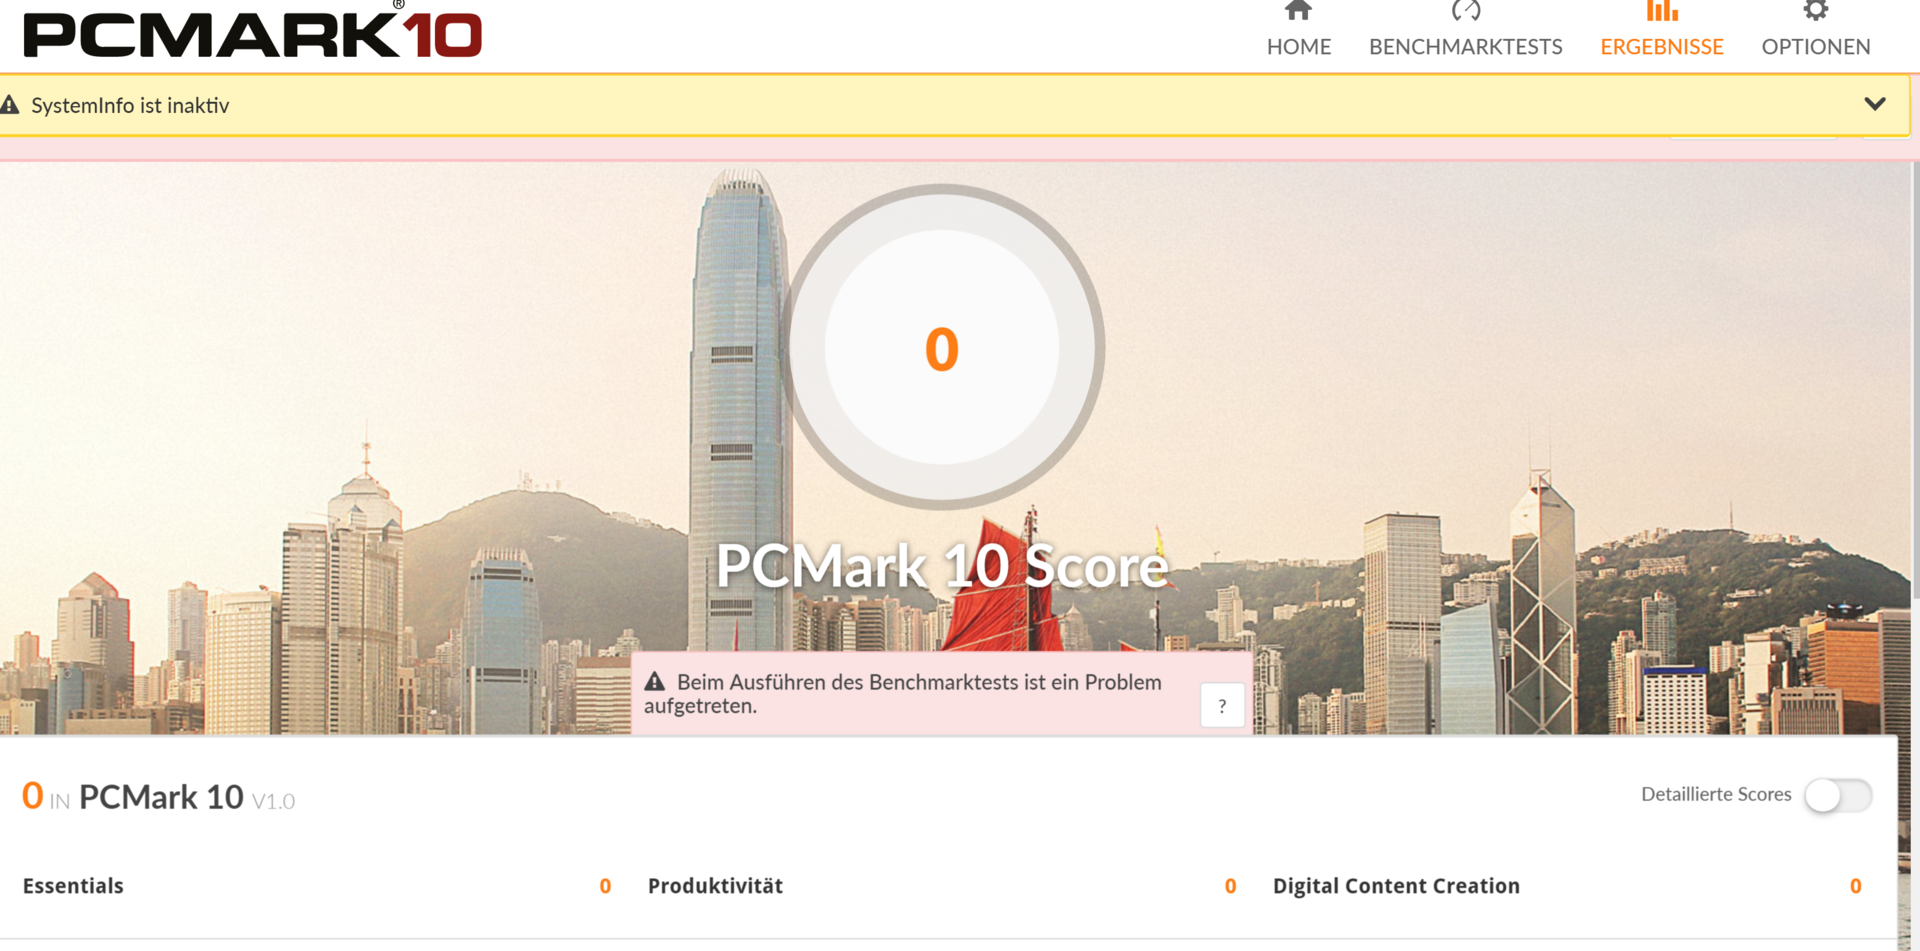
In similar fashion to the i7 version, the PCMark 10 benchmark test crashed multiple times and never completed successfully.
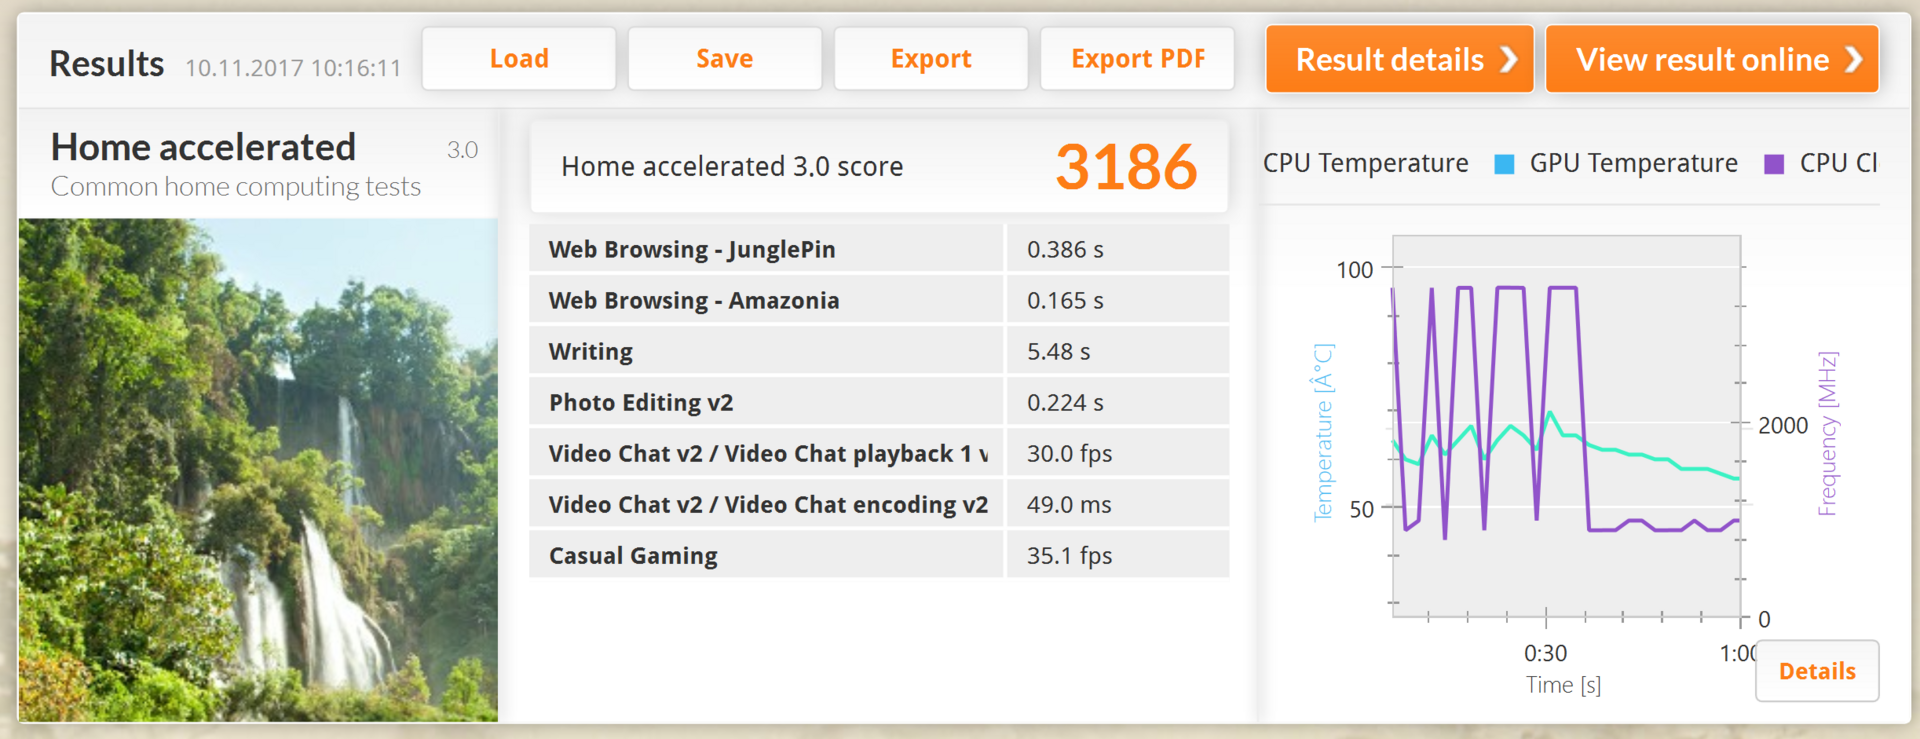
| PCMark 8 Home Score Accelerated v2 | 3186 points | |
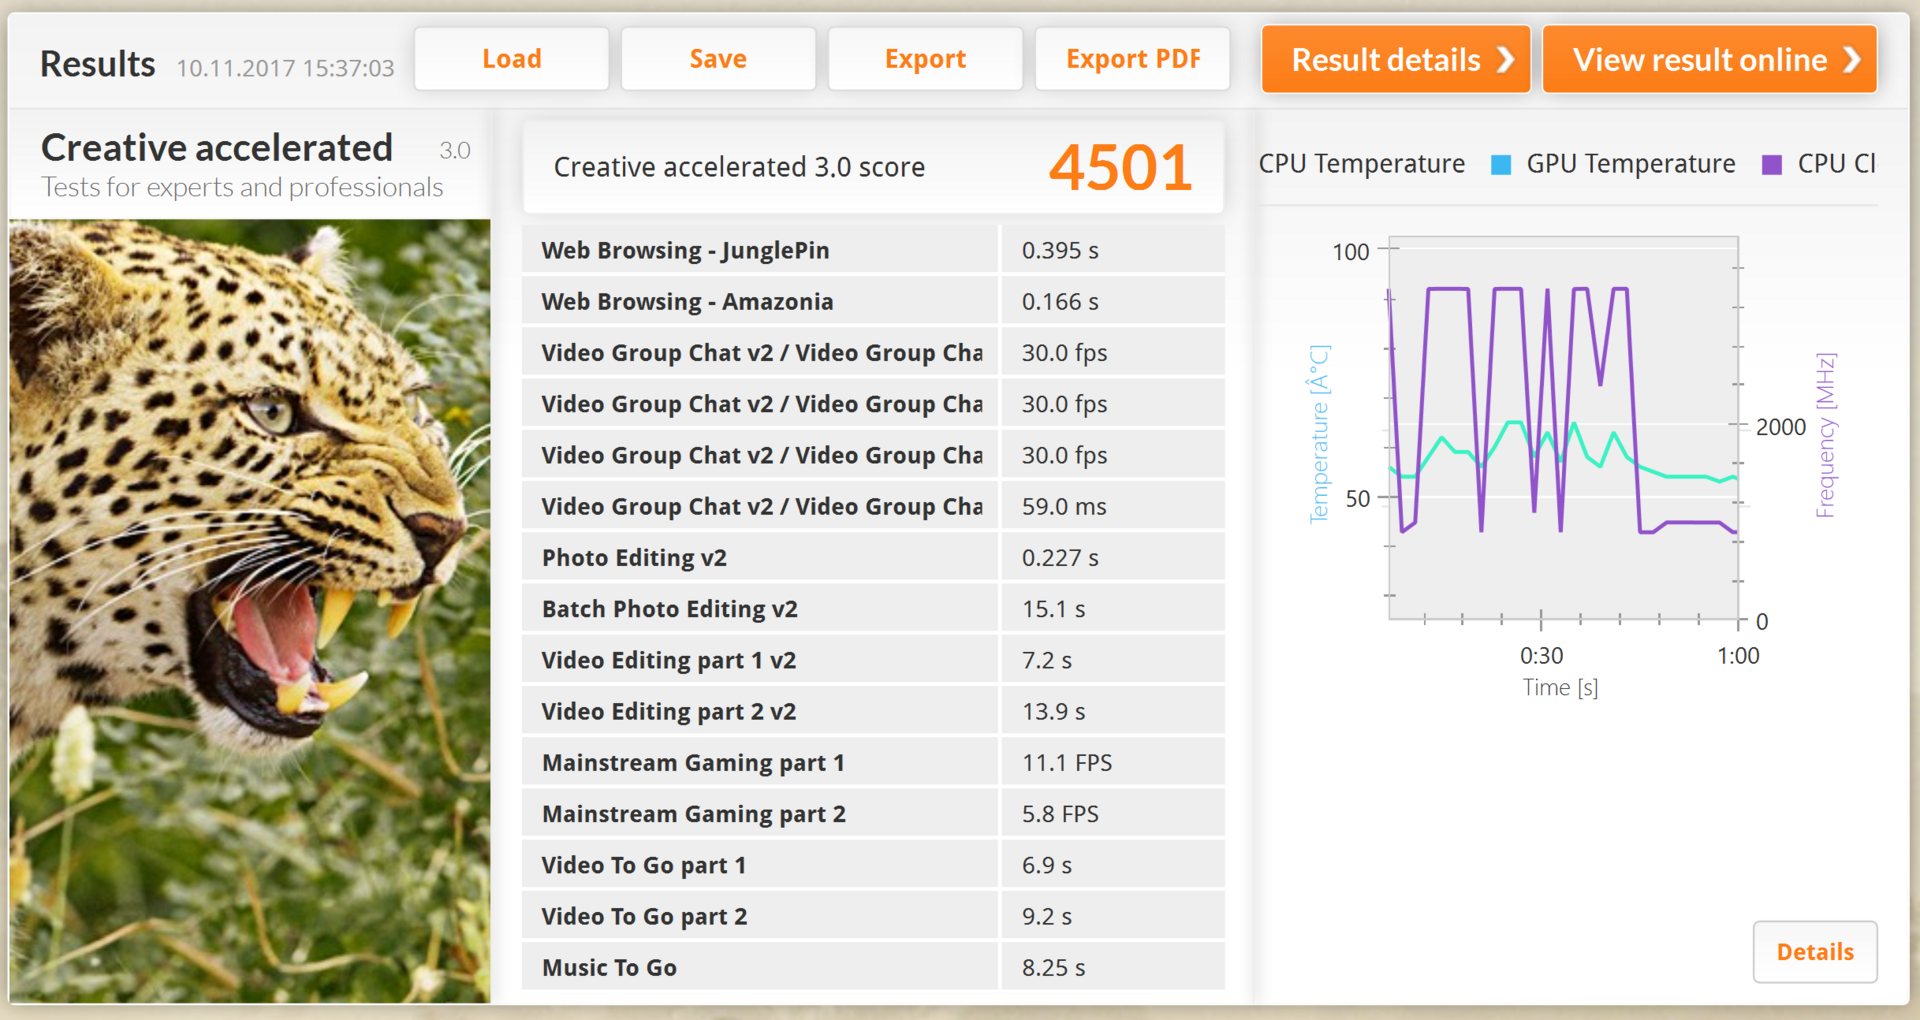
| PCMark 8 Creative Score Accelerated v2 | 4501 points | |
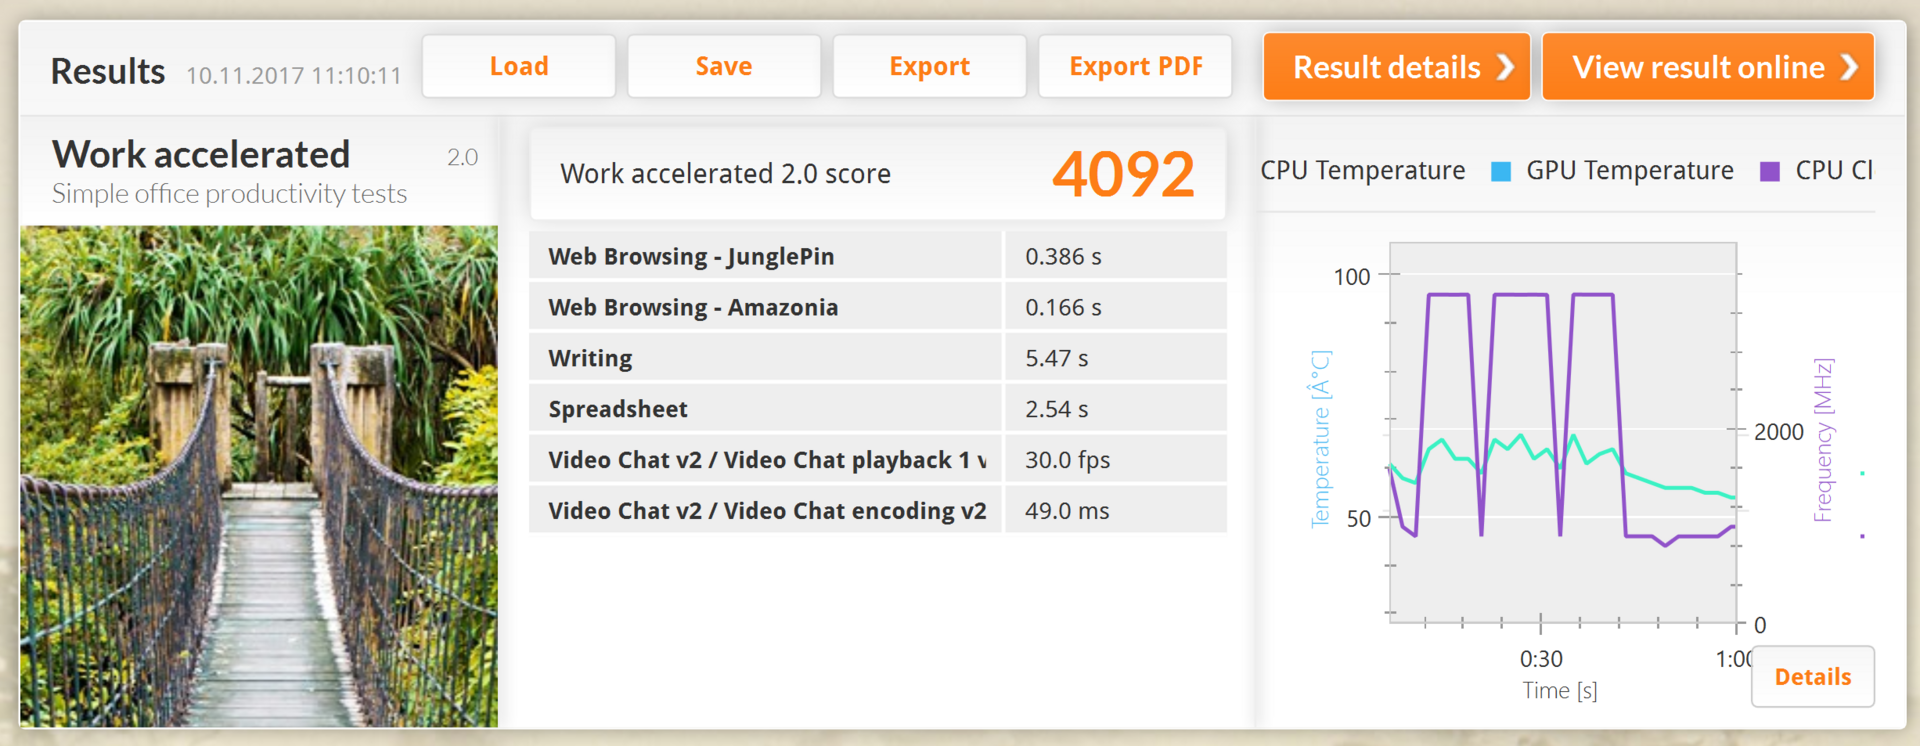
| PCMark 8 Work Score Accelerated v2 | 4092 points | |
Help | ||
| Dell XPS 13 i5-8250U Toshiba XG5 KXG50ZNV256G | Huawei MateBook X LITEON CB1-SD256 | HP Spectre 13-v131ng Samsung PM961 NVMe MZVLW512HMJP | HP Envy 13-ad006ng Toshiba NVMe THNSN5256GPUK | Dell XPS 13 9360 FHD i7 Iris Toshiba XG4 NVMe (THNSN5512GPUK) | Dell XPS 13-9350 Samsung PM951 NVMe MZ-VLV256D | Dell XPS 13 9360 QHD+ i5 Toshiba NVMe THNSN5256GPUK | Dell XPS 13 9343 Core i7 Samsung SSD PM851 M.2 2280 256GB | Dell XPS 13-9343 Lite-On IT L8T-256L9G | |
|---|---|---|---|---|---|---|---|---|---|
| CrystalDiskMark 3.0 | 2% | 92% | -1% | 54% | 2% | 29% | -17% | -1% | |
| Read Seq (MB/s) | 1046 | 741 -29% | 1090 4% | 1019 -3% | 1314 26% | 1097 5% | 1168 12% | 527 -50% | 489.6 -53% |
| Write Seq (MB/s) | 337.4 | 461.2 37% | 1088 222% | 195.4 -42% | 617 83% | 307.7 -9% | 329 -2% | 237.2 -30% | 424.2 26% |
| Read 512 (MB/s) | 443.9 | 504 14% | 753 70% | 735 66% | 1058 138% | 684 54% | 1015 129% | 420.5 -5% | 371.9 -16% |
| Write 512 (MB/s) | 265.7 | 310.3 17% | 911 243% | 172.3 -35% | 502 89% | 308.6 16% | 307 16% | 241.6 -9% | 395.5 49% |
| Read 4k (MB/s) | 26.67 | 29.48 11% | 57.5 116% | 34.5 29% | 37.31 40% | 38.52 44% | 33 24% | 28.29 6% | 34.76 30% |
| Write 4k (MB/s) | 115.6 | 68.1 -41% | 140.2 21% | 109.4 -5% | 133.6 16% | 113 -2% | 132 14% | 103.7 -10% | 79.3 -31% |
| Read 4k QD32 (MB/s) | 365.5 | 498.9 36% | 497.1 36% | 494.6 35% | 425.1 16% | 244.7 -33% | 525 44% | 352.4 -4% | 354 -3% |
| Write 4k QD32 (MB/s) | 345.8 | 257.5 -26% | 416 20% | 161.3 -53% | 431.3 25% | 151.5 -56% | 325 -6% | 239 -31% | 326.3 -6% |

GPU Performance & Gaming
The Intel UHD Graphics 620 is marginally faster than the identical HD Graphics 620. The performance advantage of 5 - 8 % is negligibly, although actual gaming performance of the Kaby Lake R SoC is about 15 to 25 % higher. The fps increase is a bit more pronounced and can - at least for some games - make the difference between barely playable and not playable at all. The overall frame rates are still quite low though and thus shouldn't be a determining factor for a purchase decision.
For more information and benchmarks, please take a look at our dedicated page for the UHD Graphics 620.
| 3DMark 11 Performance | 1856 points | |
| 3DMark Cloud Gate Standard Score | 8773 points | |
Help | ||
| Rise of the Tomb Raider - 1024x768 Lowest Preset | |
| HP Envy 13-ad006ng | |
| Apple MacBook Pro 13 2017 | |
| Dell XPS 13 i5-8250U | |
| Acer Spin 5 SP513-52N-566U | |
| Dell XPS 13 9360 QHD+ i5 | |
| HP Spectre 13-v131ng | |
| Farming Simulator 17 - 1280x720 Low Preset | |
| Acer Spin 5 SP513-52N-566U | |
| Huawei MateBook X | |
| Dell XPS 13 i5-8250U | |
| low | med. | high | ultra | |
|---|---|---|---|---|
| BioShock Infinite (2013) | 71 | 35 | 31 | 9 |
| Rise of the Tomb Raider (2016) | 23.4 | 14 | 6.8 | |
| Farming Simulator 17 (2016) | 19 | 8 |
Emissions
System Noise
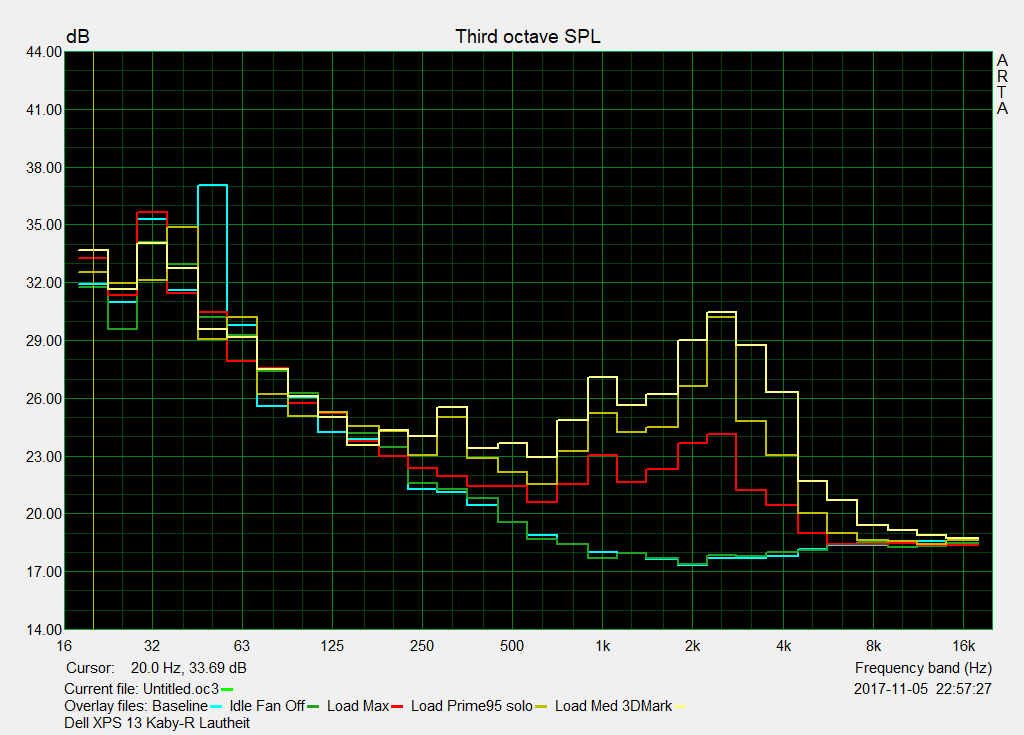
As far as noise and fan characteristics are concerned, our previous XPS 13 i7 review notebook certainly wasn't a very noisy system. The i5 XPS is no different in this aspect: the fan doesn't spin up frequently in the first place and not at all during idle. When the fan is active, the noise increases to a maximum of 38 dB.
Because of the pronounced thermally-induced performance reduction, the average noise of 38.3 dB under load (we use 3DMark06) is actually louder than the maximum of 33.6 dB. During the Prime95 CPU stress test, the fan reaches a maximum of 36.6 dB.
While the i7 sibling produced noticeable coil whine, our review notebook is not affected at all. For all our performance tests we used the default settings (profile "optimized") of the Dell Power Manager.
Noise level
| Idle |
| 30.4 / 30.4 / 30.4 dB(A) |
| Load |
| 38.3 / 33.6 dB(A) |
 | ||
30 dB silent 40 dB(A) audible 50 dB(A) loud |
||
min: | ||
| Dell XPS 13 i5-8250U UHD Graphics 620, i5-8250U, Toshiba XG5 KXG50ZNV256G | Dell XPS 13 9360 FHD i7 Iris Iris Plus Graphics 640, i7-7560U, Toshiba XG4 NVMe (THNSN5512GPUK) | Dell XPS 13 9360 QHD+ i5 HD Graphics 620, i5-7200U, Toshiba NVMe THNSN5256GPUK | Dell XPS 13-9343 HD Graphics 5500, 5200U, Lite-On IT L8T-256L9G | Apple MacBook Pro 13 2017 Iris Plus Graphics 640, i5-7360U, Apple SSD AP0128 | HP Spectre 13-v131ng HD Graphics 620, i7-7500U, Samsung PM961 NVMe MZVLW512HMJP | |
|---|---|---|---|---|---|---|
| Emissions | ||||||
| Fan Noise (dB(A)) | 38.3 | 34.9 -9% | 38.5 1% | 39.3 3% | 40 4% | |
| Noise | 2% | -1% | -6% | 0% | -4% | |
| off / environment * (dB) | 30.4 | 29.9 2% | 30.3 -0% | 30.2 1% | 30.4 -0% | |
| Idle Minimum * (dB) | 30.4 | 29.9 2% | 30.6 -1% | 30.2 1% | 30.2 1% | 30.4 -0% |
| Idle Average * (dB) | 30.4 | 29.9 2% | 30.6 -1% | 30.3 -0% | 30.2 1% | 30.4 -0% |
| Idle Maximum * (dB) | 30.4 | 30.3 -0% | 32.2 -6% | 30.4 -0% | 30.2 1% | 30.4 -0% |
| Load Average * (dB) | 38.3 | 33.9 11% | 32.2 16% | 34.4 10% | 32.9 14% | 40 -4% |
| Load Maximum * (dB) | 33.6 | 34.9 -4% | 38.5 -15% | 48 -43% | 39.3 -17% | 40 -19% |
| Total Average (Program / Settings) | -4% /
1% | 0% /
-1% | -6% /
-6% | 2% /
1% | 0% /
-3% |
* ... smaller is better
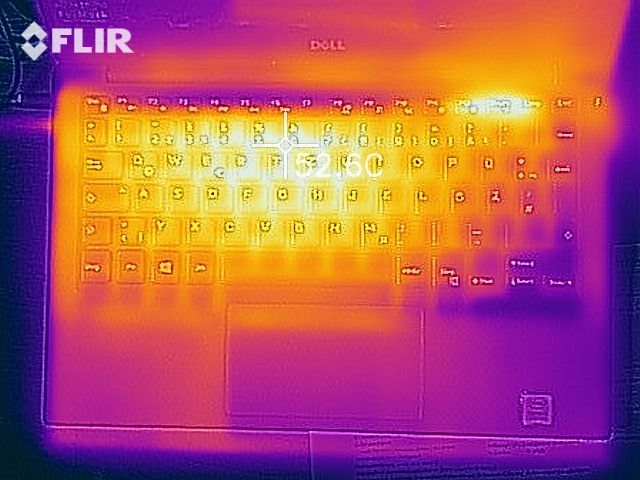
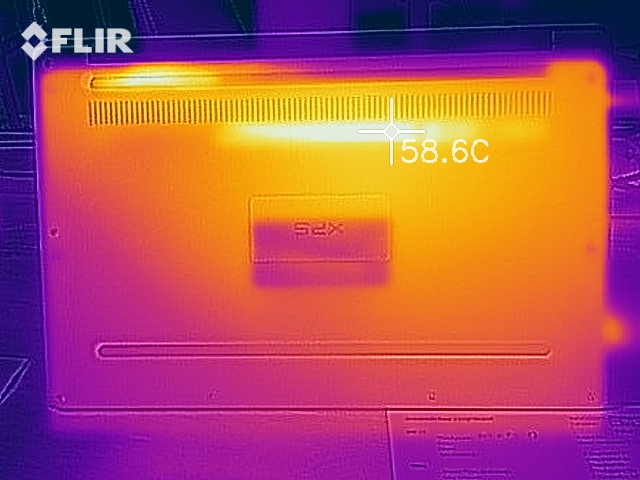
Temperature
The notebook doesn't really get any warmer than the competitors and all surface temperatures are kept in check at all times. Both the XPS 13 9360 FHD i7 Iris (46 C) and the HP Spectre 13-v131ng (54 C) run substantially hotter.
The i5 XPS 13 loses a lot of performance during the stress test. The SoC runs at 1.7 GHz; the UHD Graphics remains at 1097 MHz for a long period of time before dropping slightly to 1047 MHz.
At 82 C during the stress test, the temperatures always remain tolerable, however. When running Prime95 on its own, the SoC runs at 2.2 GHz at a temperature of 86 C.
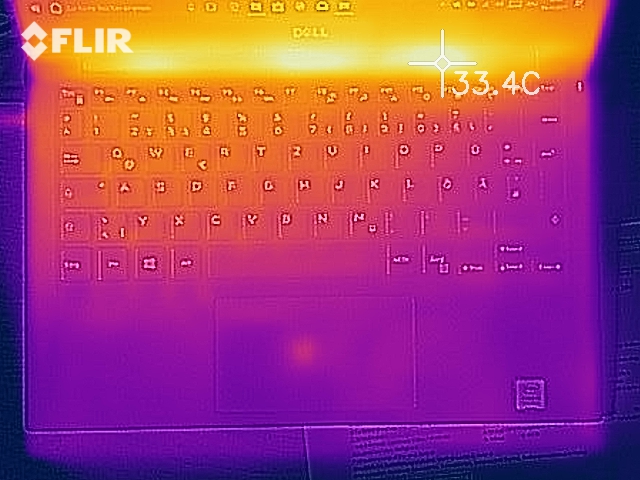
(±) The maximum temperature on the upper side is 41.3 °C / 106 F, compared to the average of 35.9 °C / 97 F, ranging from 21.4 to 59 °C for the class Subnotebook.
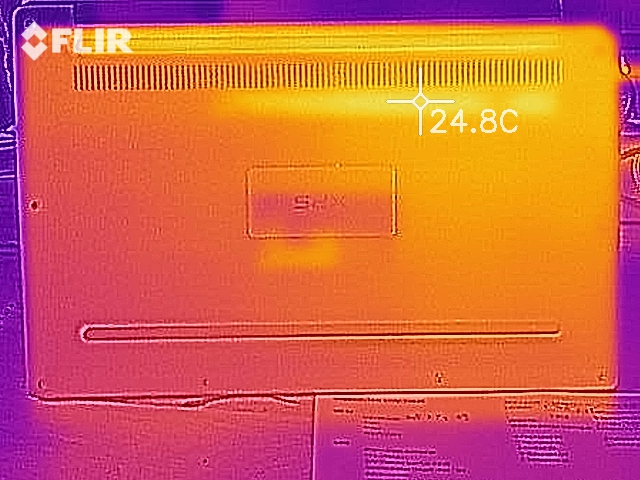
(-) The bottom heats up to a maximum of 46.5 °C / 116 F, compared to the average of 39.2 °C / 103 F
(+) In idle usage, the average temperature for the upper side is 22.9 °C / 73 F, compared to the device average of 30.8 °C / 87 F.
(+) The palmrests and touchpad are cooler than skin temperature with a maximum of 30.2 °C / 86.4 F and are therefore cool to the touch.
(±) The average temperature of the palmrest area of similar devices was 28.2 °C / 82.8 F (-2 °C / -3.6 F).
| Dell XPS 13 i5-8250U UHD Graphics 620, i5-8250U, Toshiba XG5 KXG50ZNV256G | Dell XPS 13 9360 FHD i7 Iris Iris Plus Graphics 640, i7-7560U, Toshiba XG4 NVMe (THNSN5512GPUK) | Dell XPS 13-9343 HD Graphics 5500, 5200U, Lite-On IT L8T-256L9G | Dell XPS 13 9360 QHD+ i5 HD Graphics 620, i5-7200U, Toshiba NVMe THNSN5256GPUK | Apple MacBook Pro 13 2017 Iris Plus Graphics 640, i5-7360U, Apple SSD AP0128 | HP Spectre 13-v131ng HD Graphics 620, i7-7500U, Samsung PM961 NVMe MZVLW512HMJP | |
|---|---|---|---|---|---|---|
| Emissions | ||||||
| Fan Noise (dB(A)) | 38.3 | 34.9 -9% | 38.5 1% | 39.3 3% | 40 4% | |
| Heat | -15% | -11% | -8% | -3% | -12% | |
| Maximum Upper Side * (°C) | 41.3 | 46.2 -12% | 40.6 2% | 40 3% | 43.5 -5% | 54.2 -31% |
| Maximum Bottom * (°C) | 46.5 | 48.8 -5% | 41.2 11% | 42 10% | 40.6 13% | 37.7 19% |
| Idle Upper Side * (°C) | 24.1 | 28.3 -17% | 31.2 -29% | 28 -16% | 27 -12% | 29 -20% |
| Idle Bottom * (°C) | 23.9 | 29.7 -24% | 30.6 -28% | 31 -30% | 26.1 -9% | 27.6 -15% |
| Total Average (Program / Settings) | -12% /
-13% | -11% /
-11% | -4% /
-6% | 0% /
-2% | -4% /
-9% |
* ... smaller is better
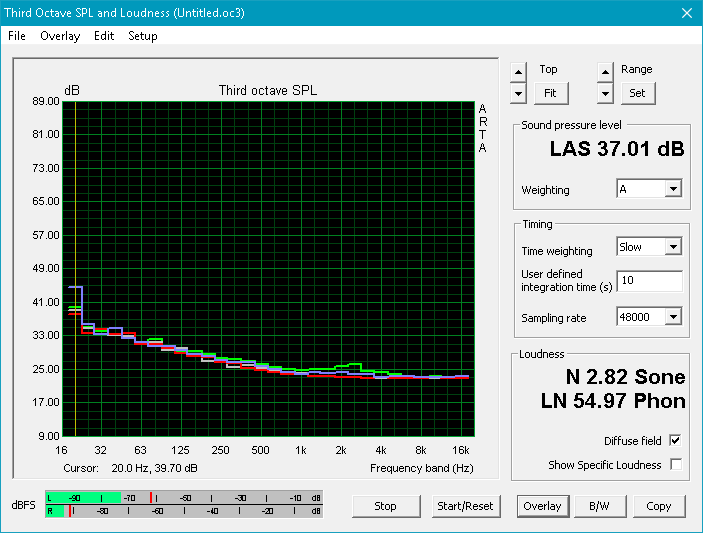
Dell XPS 13 i5-8250U audio analysis
(±) | speaker loudness is average but good (72.2 dB)
Bass 100 - 315 Hz
(-) | nearly no bass - on average 16.9% lower than median
(±) | linearity of bass is average (12% delta to prev. frequency)
Mids 400 - 2000 Hz
(±) | higher mids - on average 5.5% higher than median
(+) | mids are linear (5.9% delta to prev. frequency)
Highs 2 - 16 kHz
(+) | balanced highs - only 4.2% away from median
(+) | highs are linear (6.9% delta to prev. frequency)
Overall 100 - 16.000 Hz
(±) | linearity of overall sound is average (20.4% difference to median)
Compared to same class
» 65% of all tested devices in this class were better, 8% similar, 26% worse
» The best had a delta of 5%, average was 18%, worst was 53%
Compared to all devices tested
» 54% of all tested devices were better, 8% similar, 38% worse
» The best had a delta of 4%, average was 23%, worst was 134%
HP Spectre 13-v131ng audio analysis
(-) | not very loud speakers (68 dB)
Bass 100 - 315 Hz
(-) | nearly no bass - on average 23.7% lower than median
(±) | linearity of bass is average (9.6% delta to prev. frequency)
Mids 400 - 2000 Hz
(±) | reduced mids - on average 5.1% lower than median
(±) | linearity of mids is average (7.6% delta to prev. frequency)
Highs 2 - 16 kHz
(±) | higher highs - on average 7.7% higher than median
(+) | highs are linear (3.1% delta to prev. frequency)
Overall 100 - 16.000 Hz
(±) | linearity of overall sound is average (28.6% difference to median)
Compared to same class
» 90% of all tested devices in this class were better, 2% similar, 7% worse
» The best had a delta of 5%, average was 18%, worst was 53%
Compared to all devices tested
» 86% of all tested devices were better, 3% similar, 11% worse
» The best had a delta of 4%, average was 23%, worst was 134%
Frequency comparison (Checkboxes selectable!)
Energy Management
Power Consumption
The power consumption of the review notebook slightly exceeds that of its i7 sibling. CABC helps to at least partially explain the rather large difference for the idle maximums. The load values aren't really different: a few minutes into the stress test we measure 43 W (initially, the XPS 13 draws 49 W); at this point, performance throttling is already occurring. The very low idle minimum power draw results in a very long idle run time of 18 hours and 12 minutes.
| Off / Standby | |
| Idle | |
| Load |
|
Key:
min: | |
| Dell XPS 13 i5-8250U i5-8250U, UHD Graphics 620, Toshiba XG5 KXG50ZNV256G, IGZO IPS, 3200x1800, 13.3" | Dell XPS 13 i7-8550U i5-8550U, UHD Graphics 620, Toshiba XG5 KXG50ZNV256G, IGZO IPS, 3200x1800, 13.3" | Dell XPS 13 9360 FHD i7 Iris i7-7560U, Iris Plus Graphics 640, Toshiba XG4 NVMe (THNSN5512GPUK), IPS, 1920x1080, 13.3" | Acer Spin 5 SP513-52N-566U i5-8250U, UHD Graphics 620, Micron 1100 MTFDDAV256TBN, , 1920x1080, 13.3" | Razer Blade Stealth QHD i7-8550U i5-8550U, UHD Graphics 620, Samsung PM961 NVMe MZVLW512HMJP, , 3200x1800, 13.3" | Huawei MateBook X i5-7200U, HD Graphics 620, LITEON CB1-SD256, , 2160x1440, 13.3" | Apple MacBook Pro 13 2017 i5-7360U, Iris Plus Graphics 640, Apple SSD AP0128, IPS, 2560x1600, 13.3" | HP Spectre 13-v131ng i7-7500U, HD Graphics 620, Samsung PM961 NVMe MZVLW512HMJP, IPS UWVA, 1920x1080, 13.3" | |
|---|---|---|---|---|---|---|---|---|
| Power Consumption | 9% | 17% | 4% | -2% | -16% | 6% | 10% | |
| Idle Minimum * (Watt) | 3.6 | 4.1 -14% | 3.32 8% | 3.6 -0% | 5.6 -56% | 4.6 -28% | 3.7 -3% | 3.6 -0% |
| Idle Average * (Watt) | 7.9 | 5.8 27% | 5.27 33% | 9.5 -20% | 7.5 5% | 11 -39% | 5.2 34% | 6.4 19% |
| Idle Maximum * (Watt) | 8.5 | 6 29% | 6.32 26% | 9.5 -12% | 8.4 1% | 12 -41% | 7.6 11% | 9.2 -8% |
| Load Average * (Watt) | 43 | 42.5 1% | 32 26% | 32.9 23% | 33.7 22% | 39.5 8% | 41.6 3% | 34 21% |
| Load Maximum * (Watt) | 43 | 41.4 4% | 45.9 -7% | 31.4 27% | 34.6 20% | 34.6 20% | 50.5 -17% | 34.4 20% |
| Witcher 3 ultra * (Watt) | 30 | 31 |
* ... smaller is better
Battery Life
Our WLAN browsing test attempts to more accurately simulates real-world use. For this test, we set the brightness to level 5 - which corresponds to abut 150 cd/m² - and let a script open various websites with different content. The battery drains after a total of 11 hours and 29 in this scenario.
The i7 Kaby Lake R sibling delivers run times that are about 15 % shorter. The reason isn't the i7 processor, but the rather peculiar fact that the system shut down with 20 % battery capacity remaining - and it did so repeatedly. Both notebooks contain the same 60 Wh battery and the idle and load run times aren't different at all.
Compared to the XPS 13 2015 (9343), run times have improved by about 1.5 hours, although we need to point out that we used a different WLAN test back then, so the results can't be compared directly.
The table below shows that long run times aren't exclusive to Dell only: the Apple MacBook Pro 13 2017 lasts almost exactly as long during the WLAN test. The thin HP Spectre can't keep up since it is only equipped with a 38 Wh battery.
| Dell XPS 13 i5-8250U i5-8250U, UHD Graphics 620, 60 Wh | Dell XPS 13 i7-8550U i5-8550U, UHD Graphics 620, 60 Wh | Dell XPS 13 9360 FHD i7 Iris i7-7560U, Iris Plus Graphics 640, 60 Wh | Dell XPS 13-9343 5200U, HD Graphics 5500, 52 Wh | Apple MacBook Pro 13 2017 i5-7360U, Iris Plus Graphics 640, 54.5 Wh | HP Spectre 13-v131ng i7-7500U, HD Graphics 620, 38 Wh | |
|---|---|---|---|---|---|---|
| Battery runtime | -4% | 14% | -10% | -24% | -41% | |
| Reader / Idle (h) | 18.2 | 18.5 2% | 25.4 40% | 15.2 -16% | 12 -34% | |
| WiFi v1.3 (h) | 11.5 | 9.8 -15% | 10.9 -5% | 11.4 -1% | 6.6 -43% | |
| Load (h) | 2.4 | 2.4 0% | 2.6 8% | 2.3 -4% | 1.3 -46% | 1.3 -46% |
| H.264 (h) | 15 | 11.4 | 6.1 | |||
| WiFi (h) | 9.7 |
Verdict
Pros
Cons
The Dell XPS 13 is still an excellent subnotebook and as such it definitely deserves the repeat appearances in our Top 10 list. A run time of 11.5 hours, a display with 90 % sRGB coverage and decent brightness, sturdy aluminum chassis, quiet fan system, decent sound given the size, lots of ports and ease of maintenance - all these attributes make for a very desirable 13-inch notebook.
The main question we asked ourselves at the beginning of this review: is the Kaby Lake R i5 CPU adequate or is the upgrade to the i7 worth the money?
In our opinion, the lower-end SoC is more than sufficient for most users - unless the intent is to mainly run parallelized applications. Both the i5 and the i7 processors throttle their speed when subjected to prolonged loads and performance drops by 8 and 9 %, respectively. At no time did during our tests did the cores reach their respective theoretical maximum Turbo speeds of 3.4 and 4.0 GHz. The CPU performance difference between the i5 and i7 versions of the XPS 13 is very small indeed and ranges from +19 % at its best to +7 % at its worst (single vs. multi-threaded tests). The i7 pulls ahead slightly when it comes to system performance (+ 8 %).
Both XPS 13 versions outperform other subnotebooks like the HP Envy 13-ad006ng or Apple MacBook Pro 13 2017 on the strength of their CPUs - Kaby Lake R with 8 threads - alone. The i7, for example, has a performance plus of 70 % (R15 Multi, Kaby i7 vs Kaby R i7). The new quad-core i5 is up to 75 % faster than the older dual-core 7200U (R15 Multi).
Dell XPS 13 i5-8250U
- 11/16/2017 v6 (old)
Sebastian Jentsch
Price comparison