Face Off: Dell XPS 13 9350 vs XPS 13 9343 vs. XPS 13 9333
The XPS 13 SKUs make up some of our most popular pages and are consistently ranked on our Top 10 lists of Ultrabooks and subnotebooks. For this Face off, we'll list the hardware and performance differences of the latest three generations to help decide if the newest iteration is worth the cost or if the older models offer enough for most to get by.
We encourage users to check out our dedicated review pages below for more data and detailed analyses of each of the three models. This comparison is by no means a replacement, but a condensed aid for those on the fence.
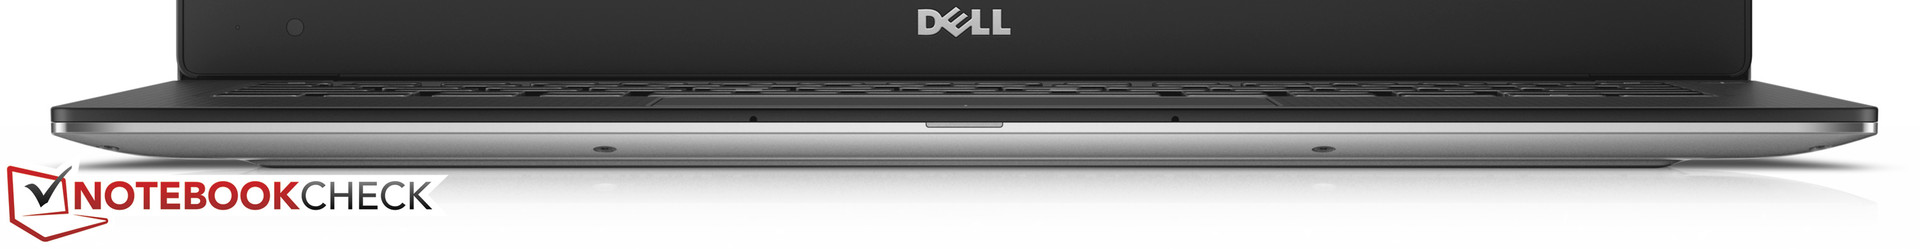
Case
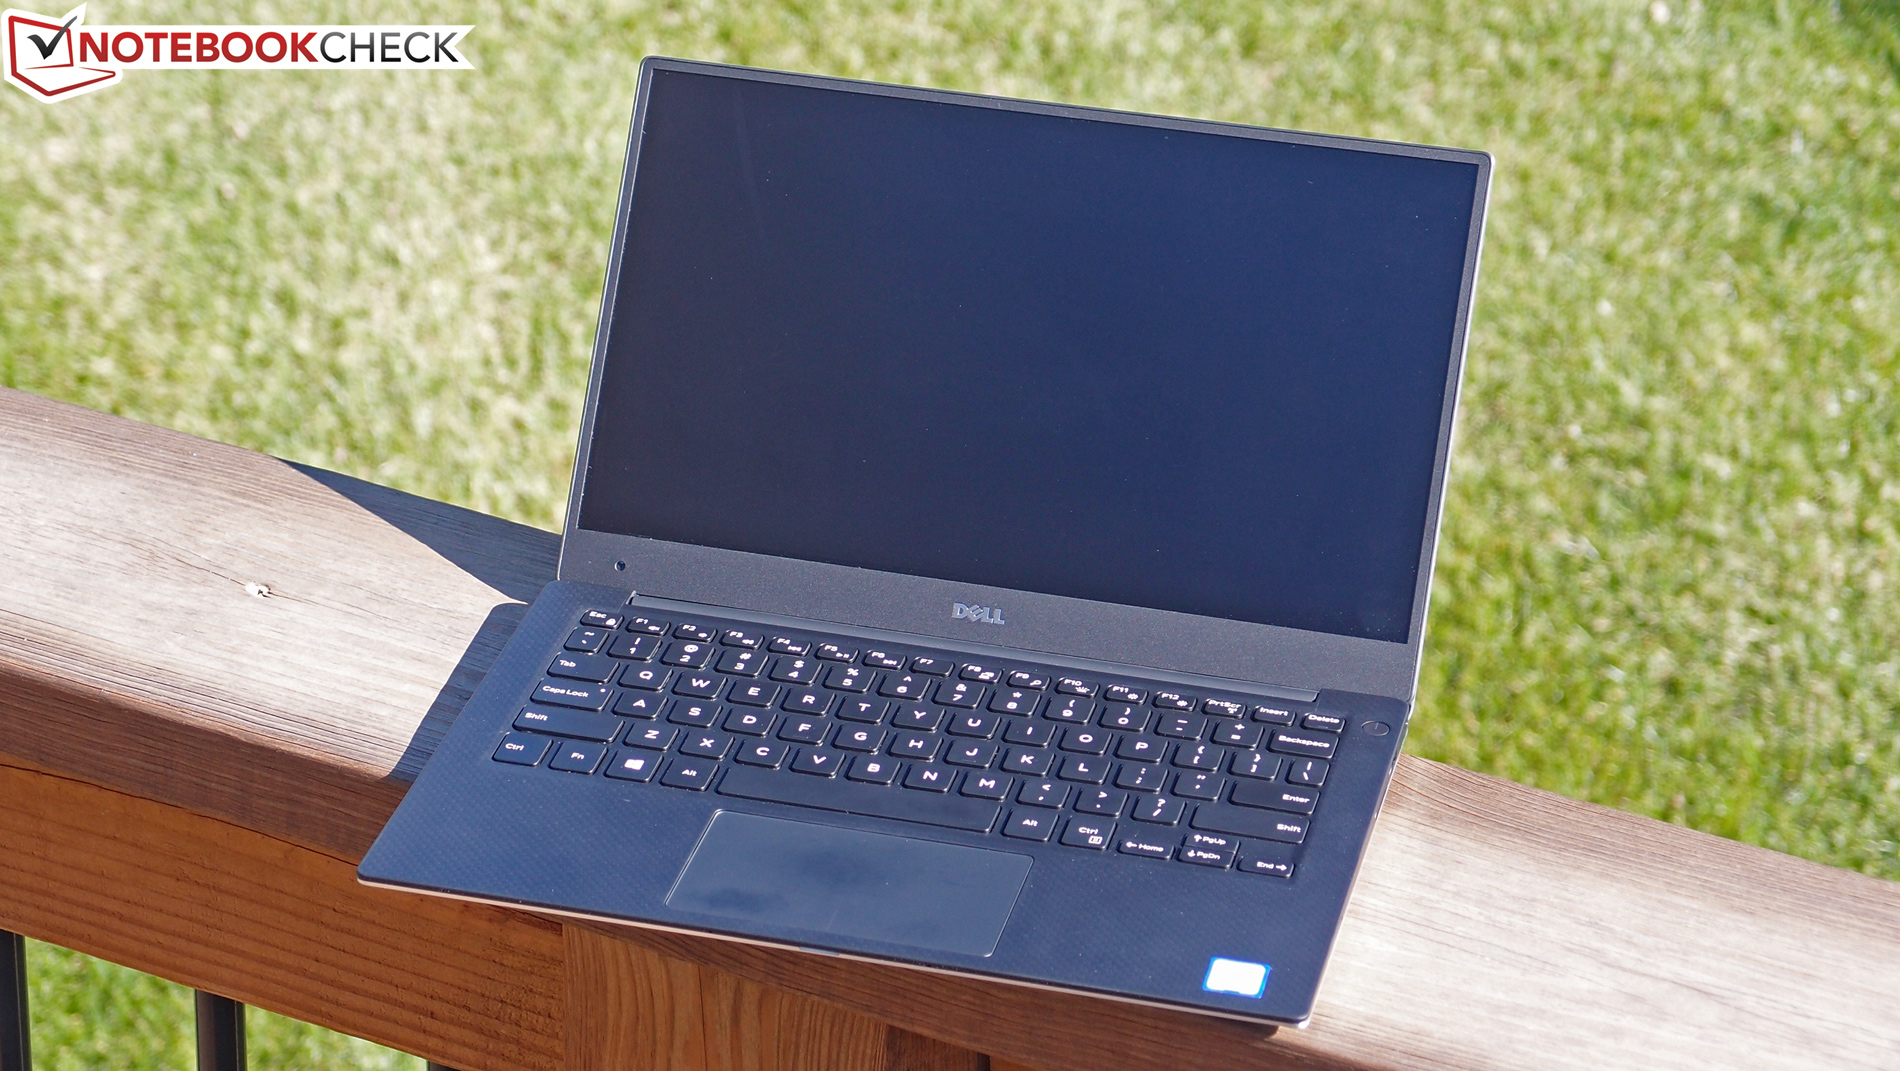
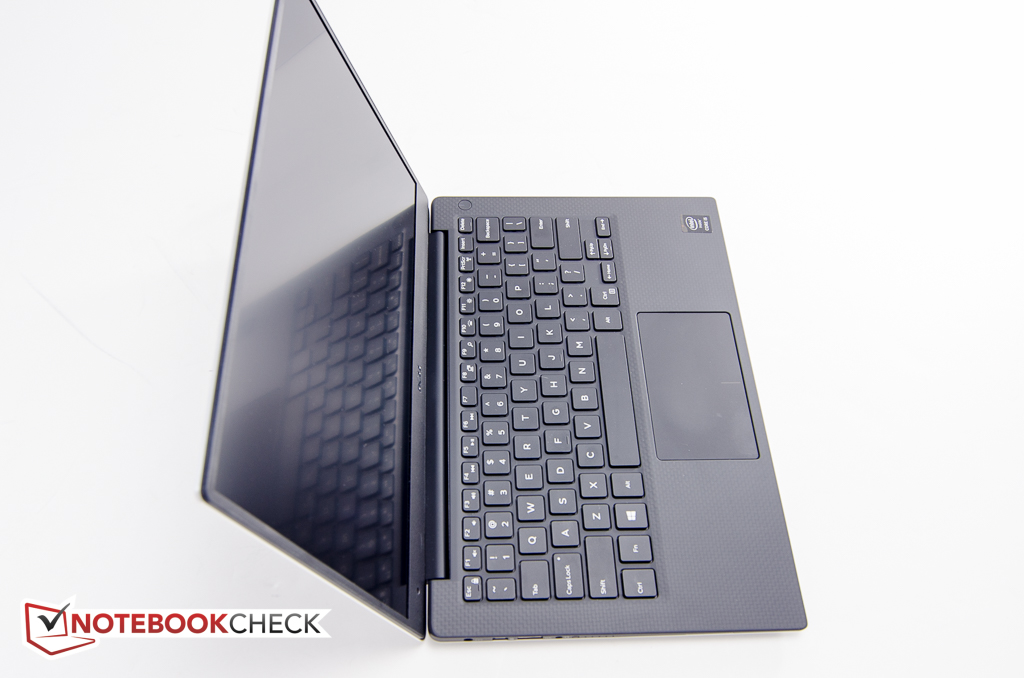
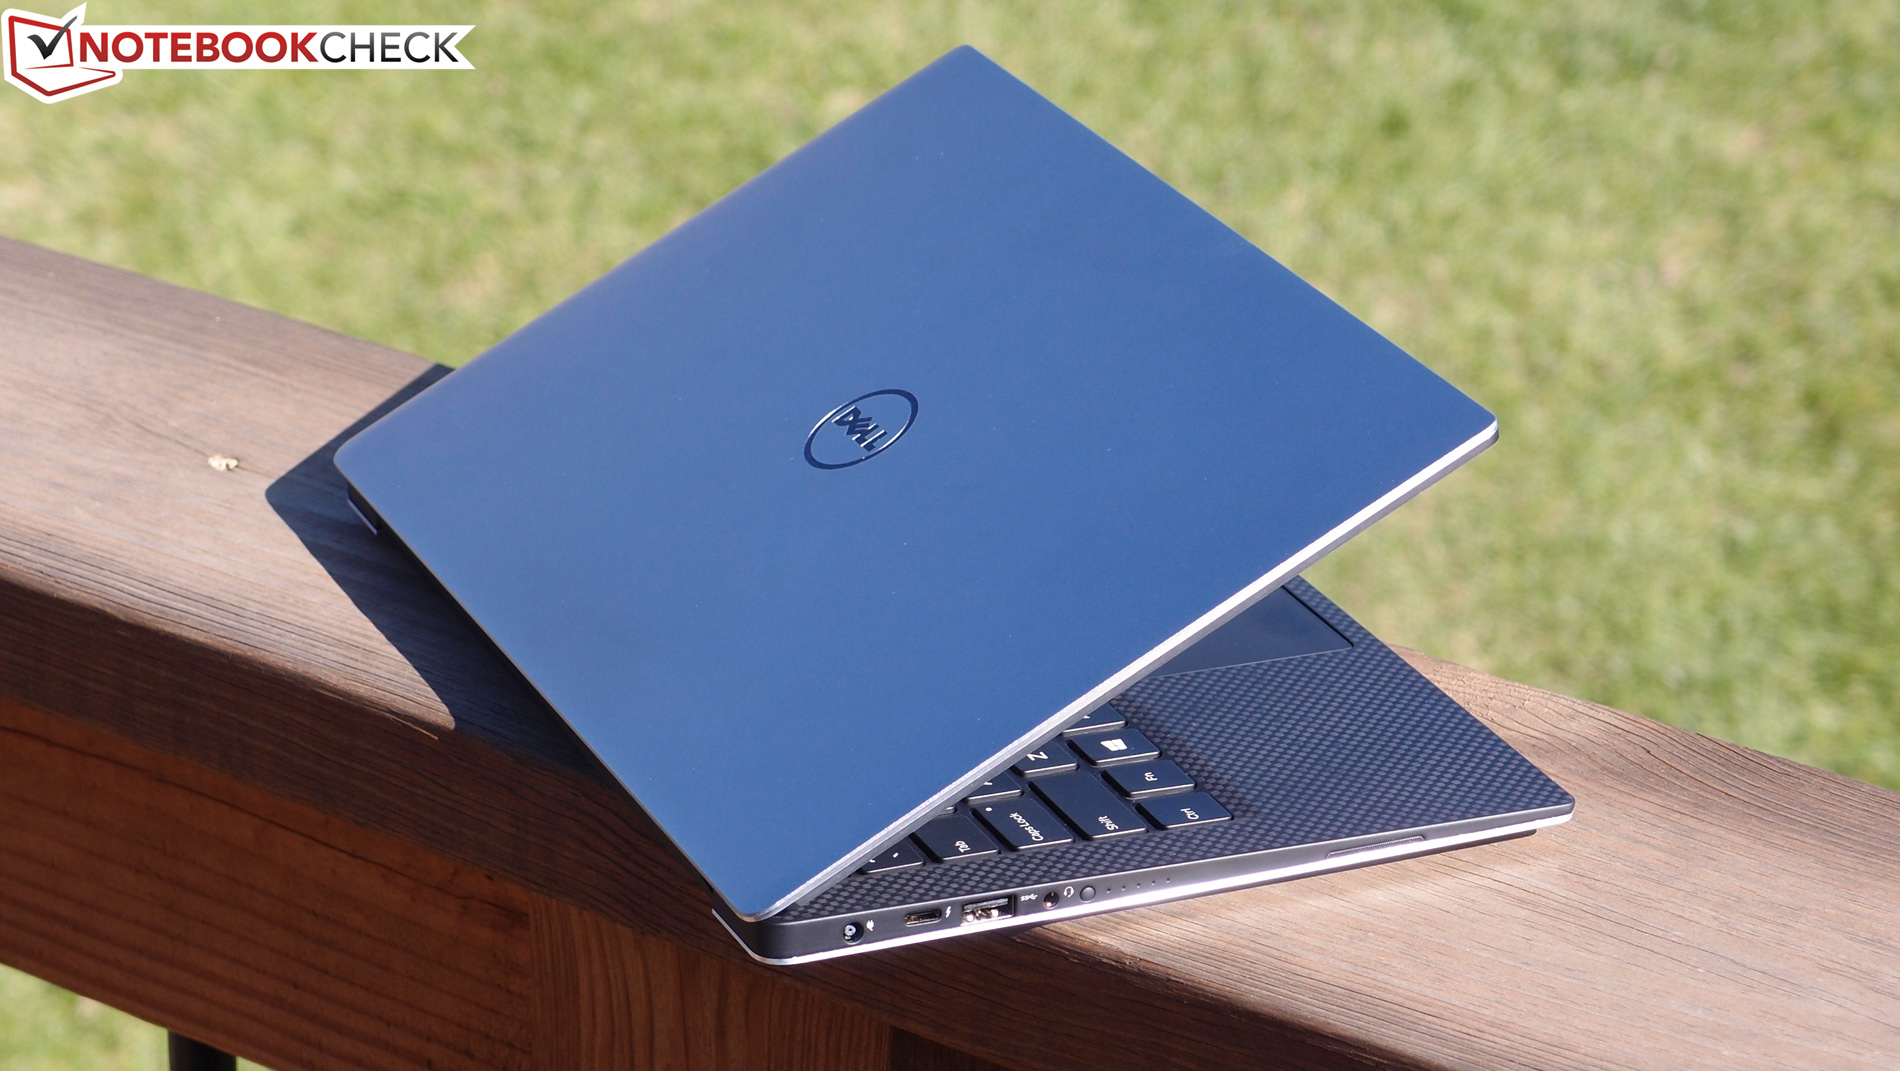
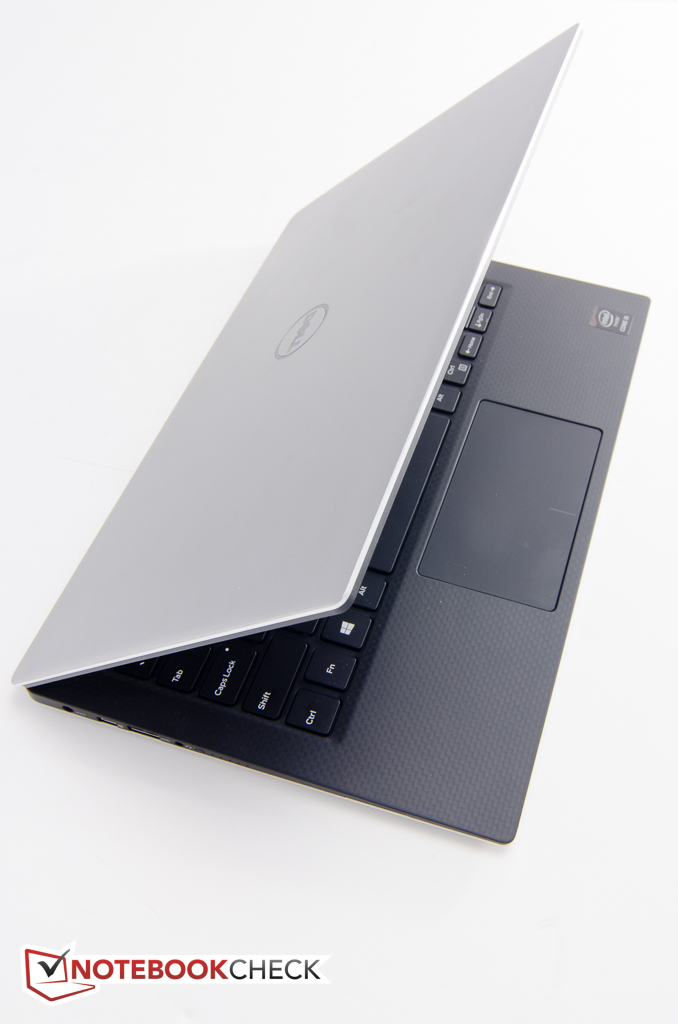
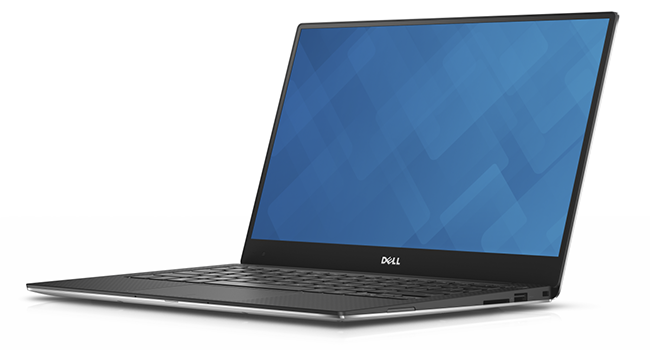
Between the XPS 13 9350, 9343, and 9333, the 9350 and 9343 both carry identical chassis. The signature InfinityEdge design allows the latest two iterations to have extremely narrow bezels measuring about 7 mm from the edge of the screen to the edge of the outer lid. This essentially gives the 13.3-inch notebook the footprint of an 11.6-inch notebook without sacrificing case rigidity and quality.
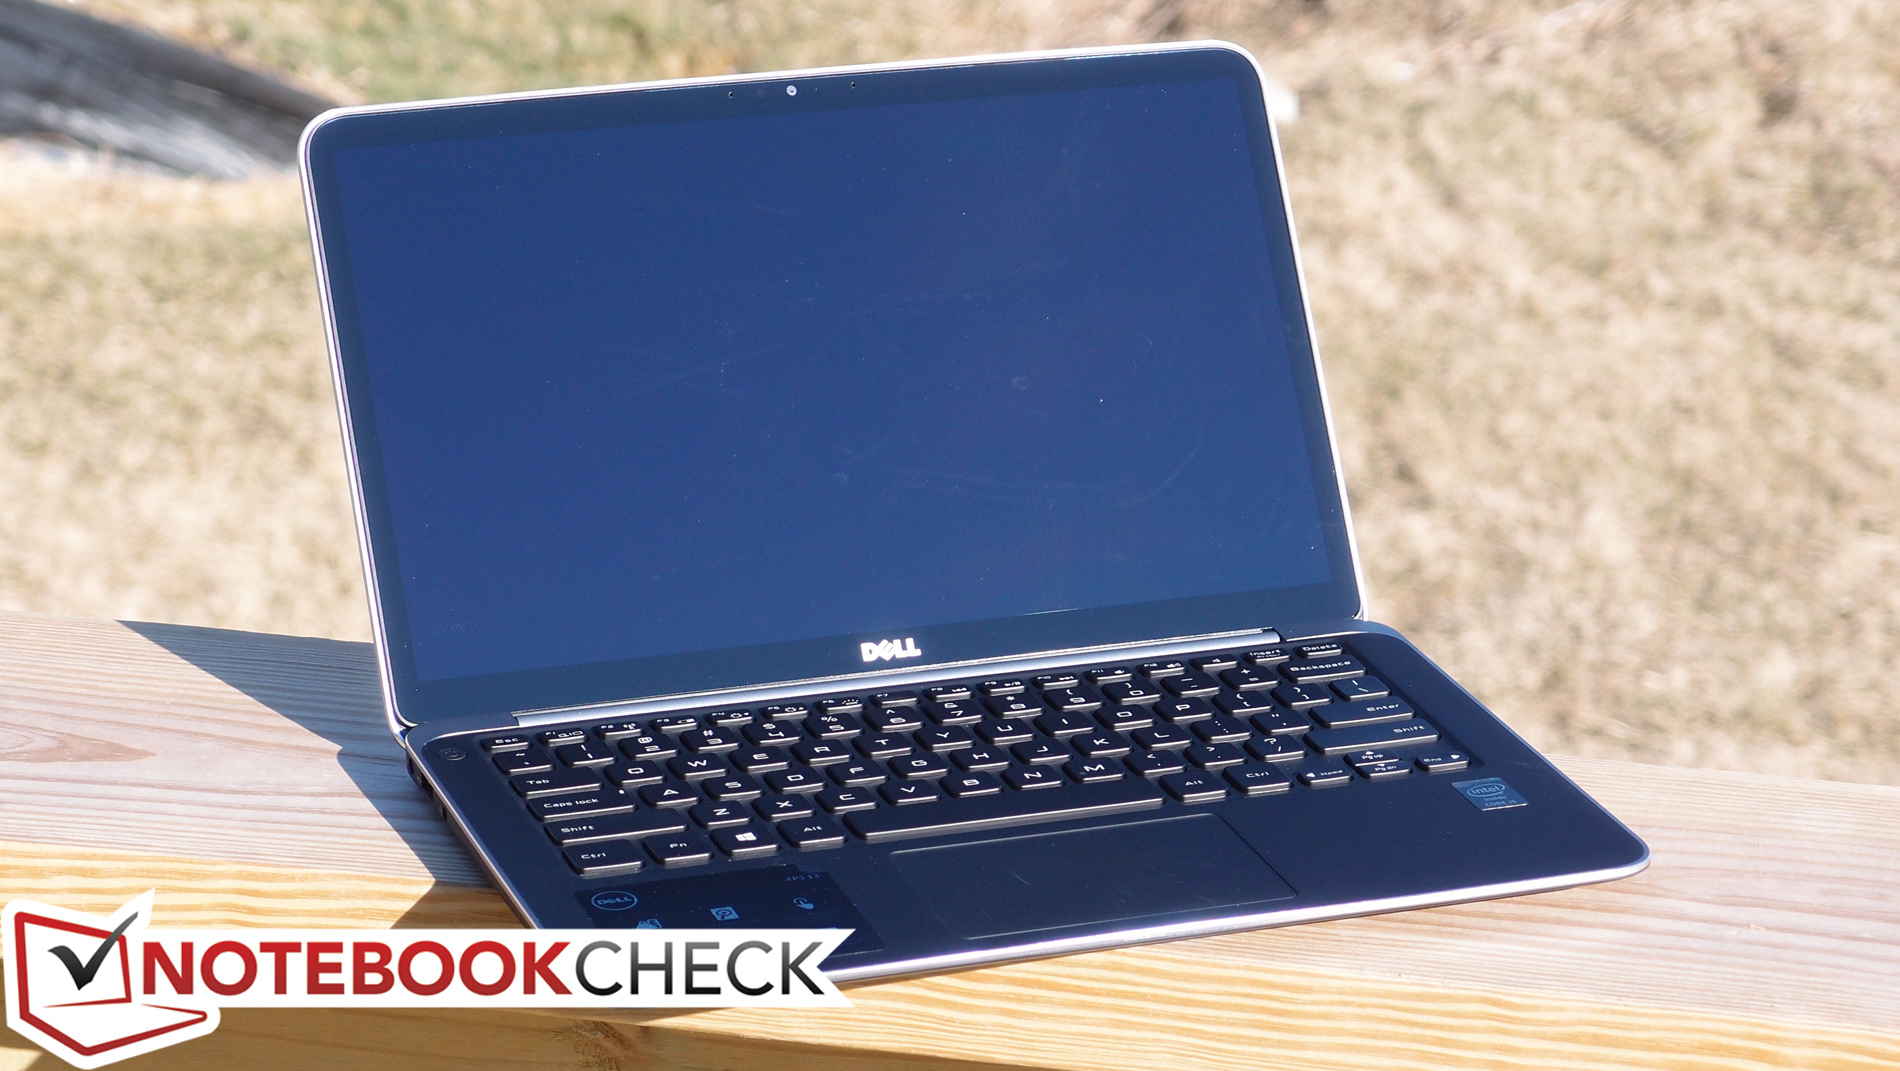
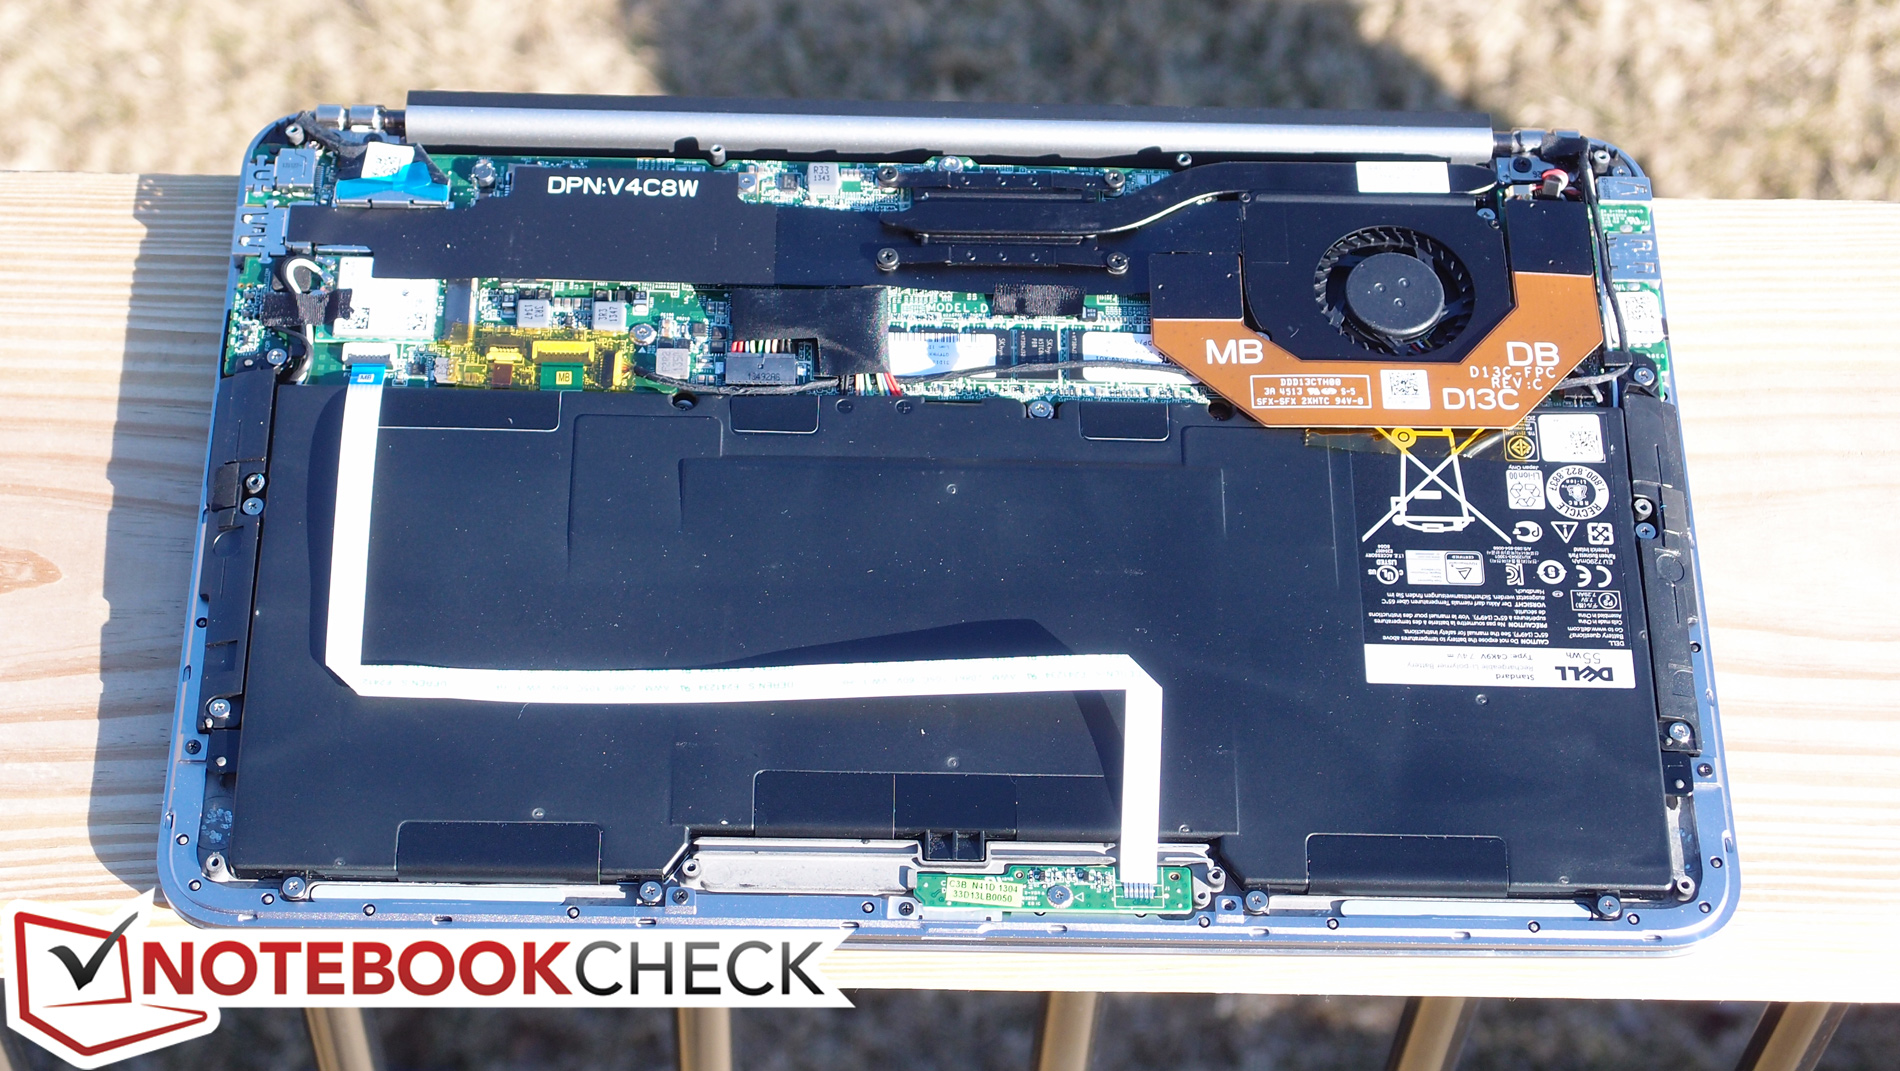
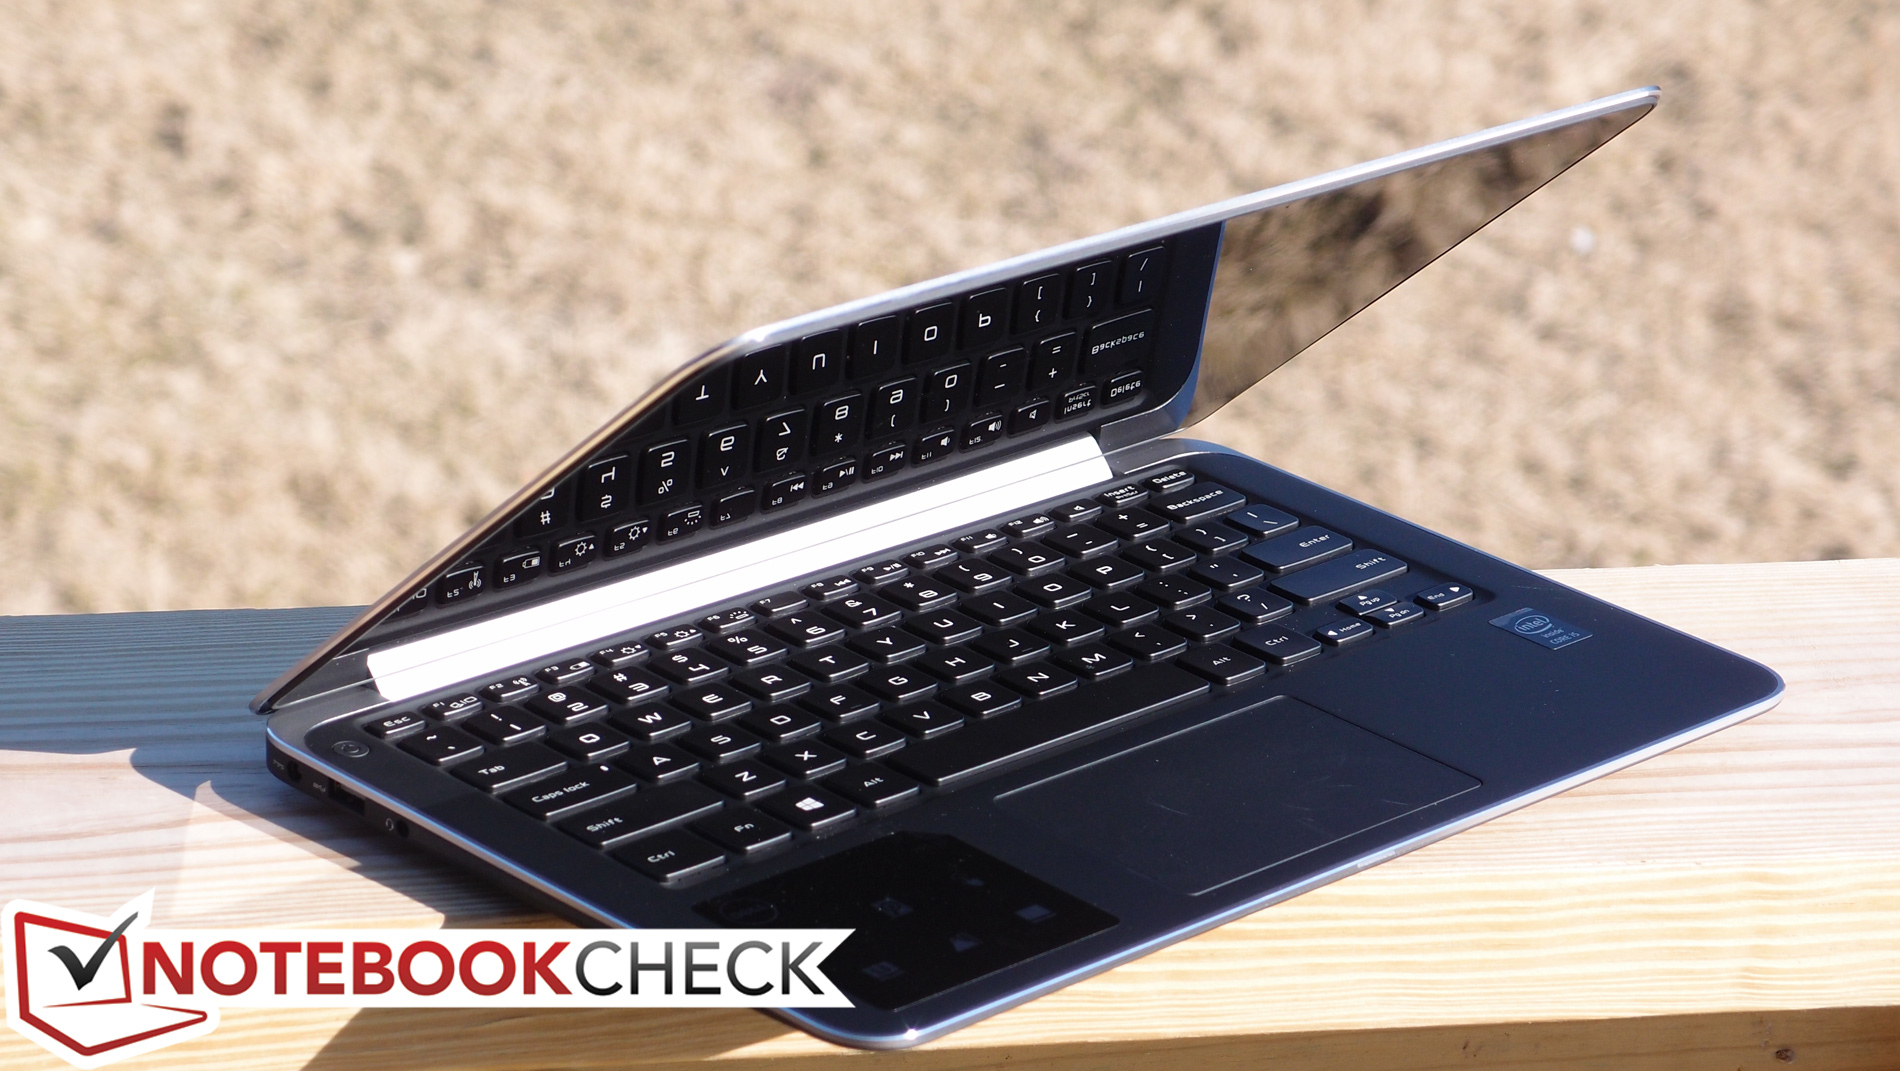
The older XPS 13 9333 SKU is slightly larger in all dimensions and utilizes a similar combination of carbon fiber and aluminum surfaces on all sides and corners. Its design is noticeably rounder, less minimalist, and slightly thicker as well. We did not notice a drastic increase or decrease in workmanship or quality between the immediate generations despite the jump in design from the 9333 to the 9343. Thus, choosing one generation over the other is less about quality and more about the size and weight advantages of the newer generation.
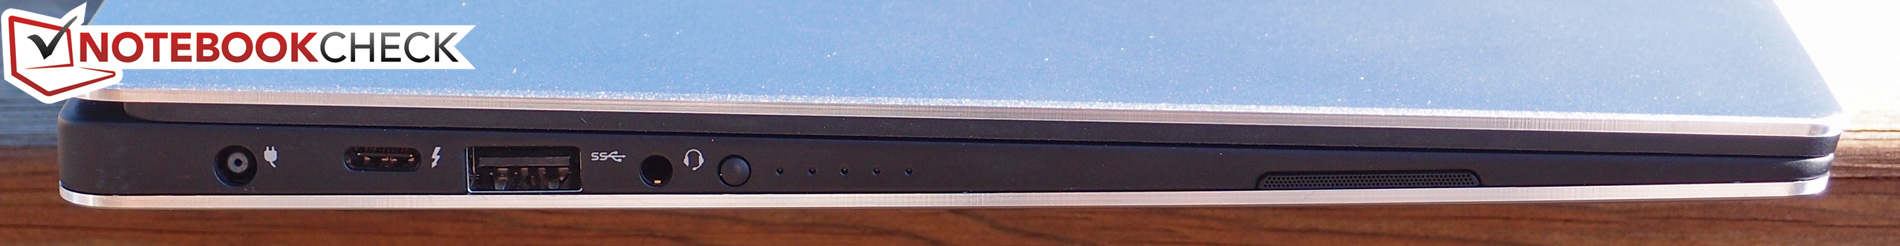
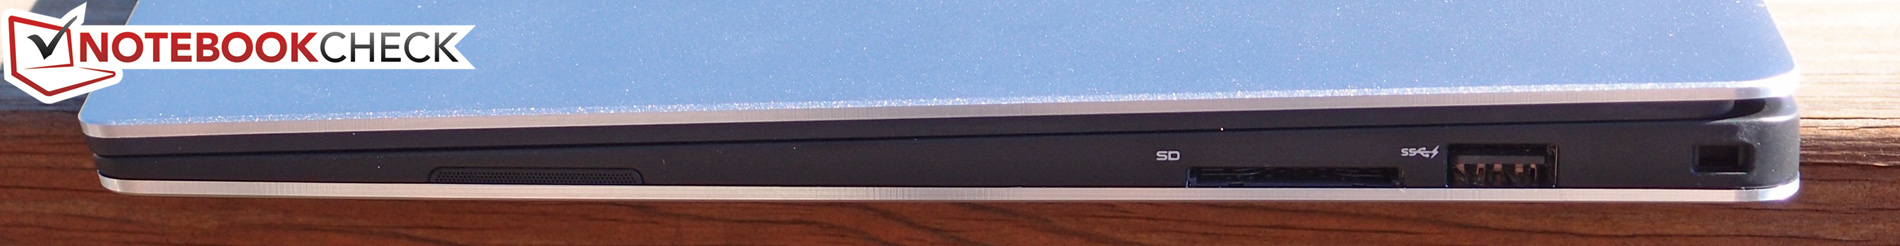
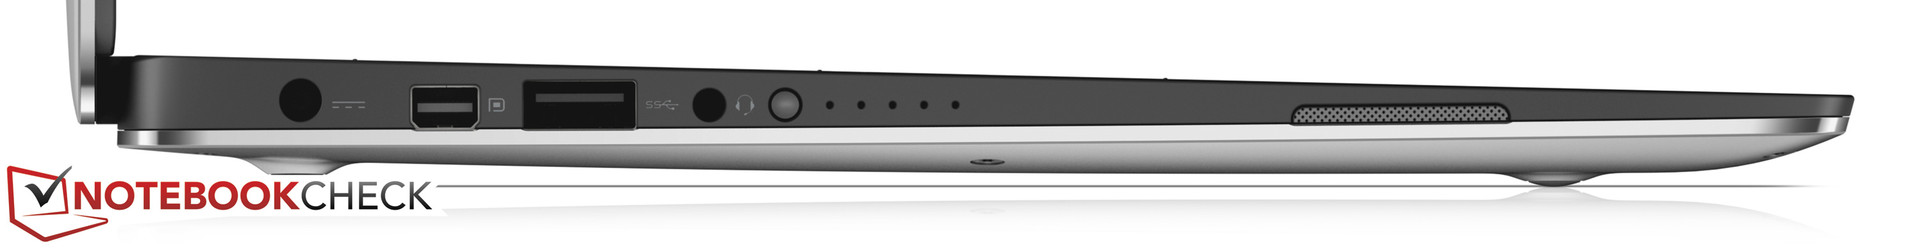
Ports in Comparison
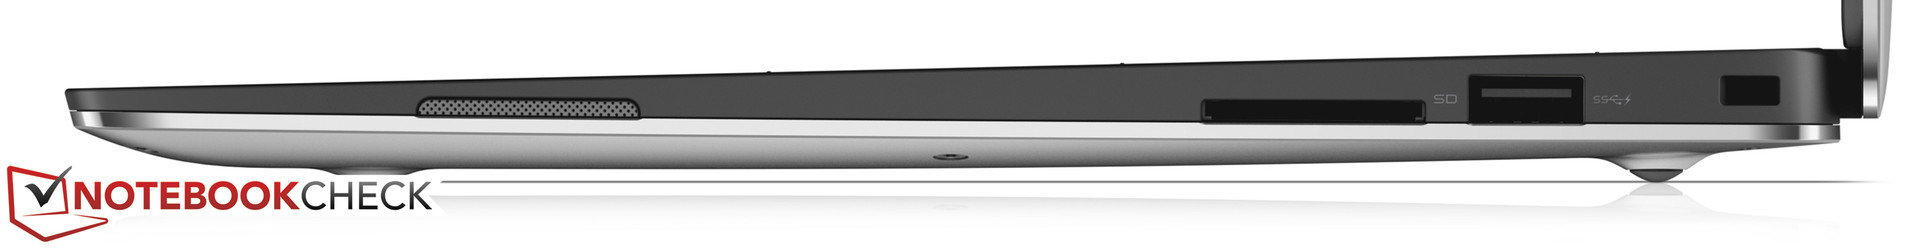
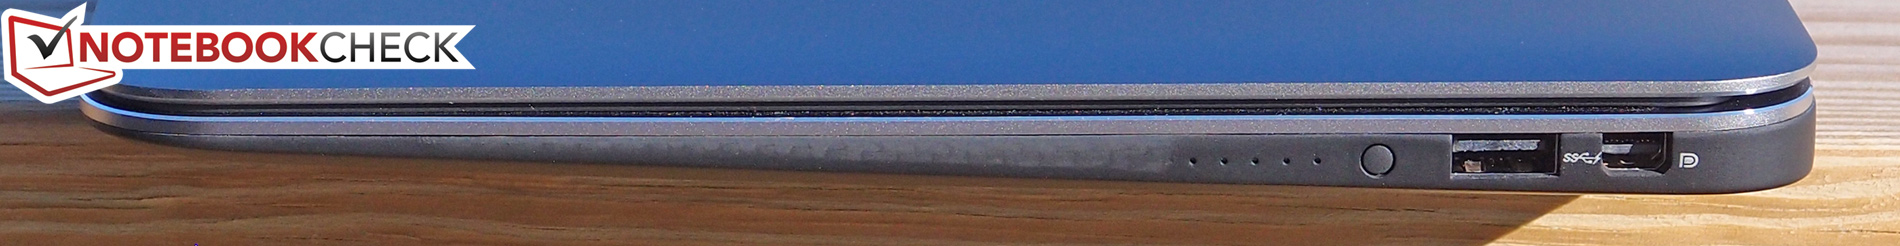
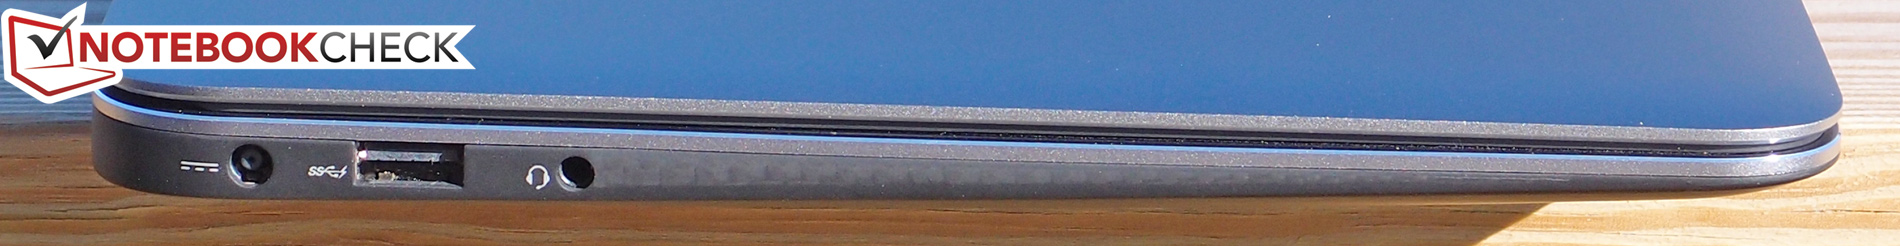
Connectivity
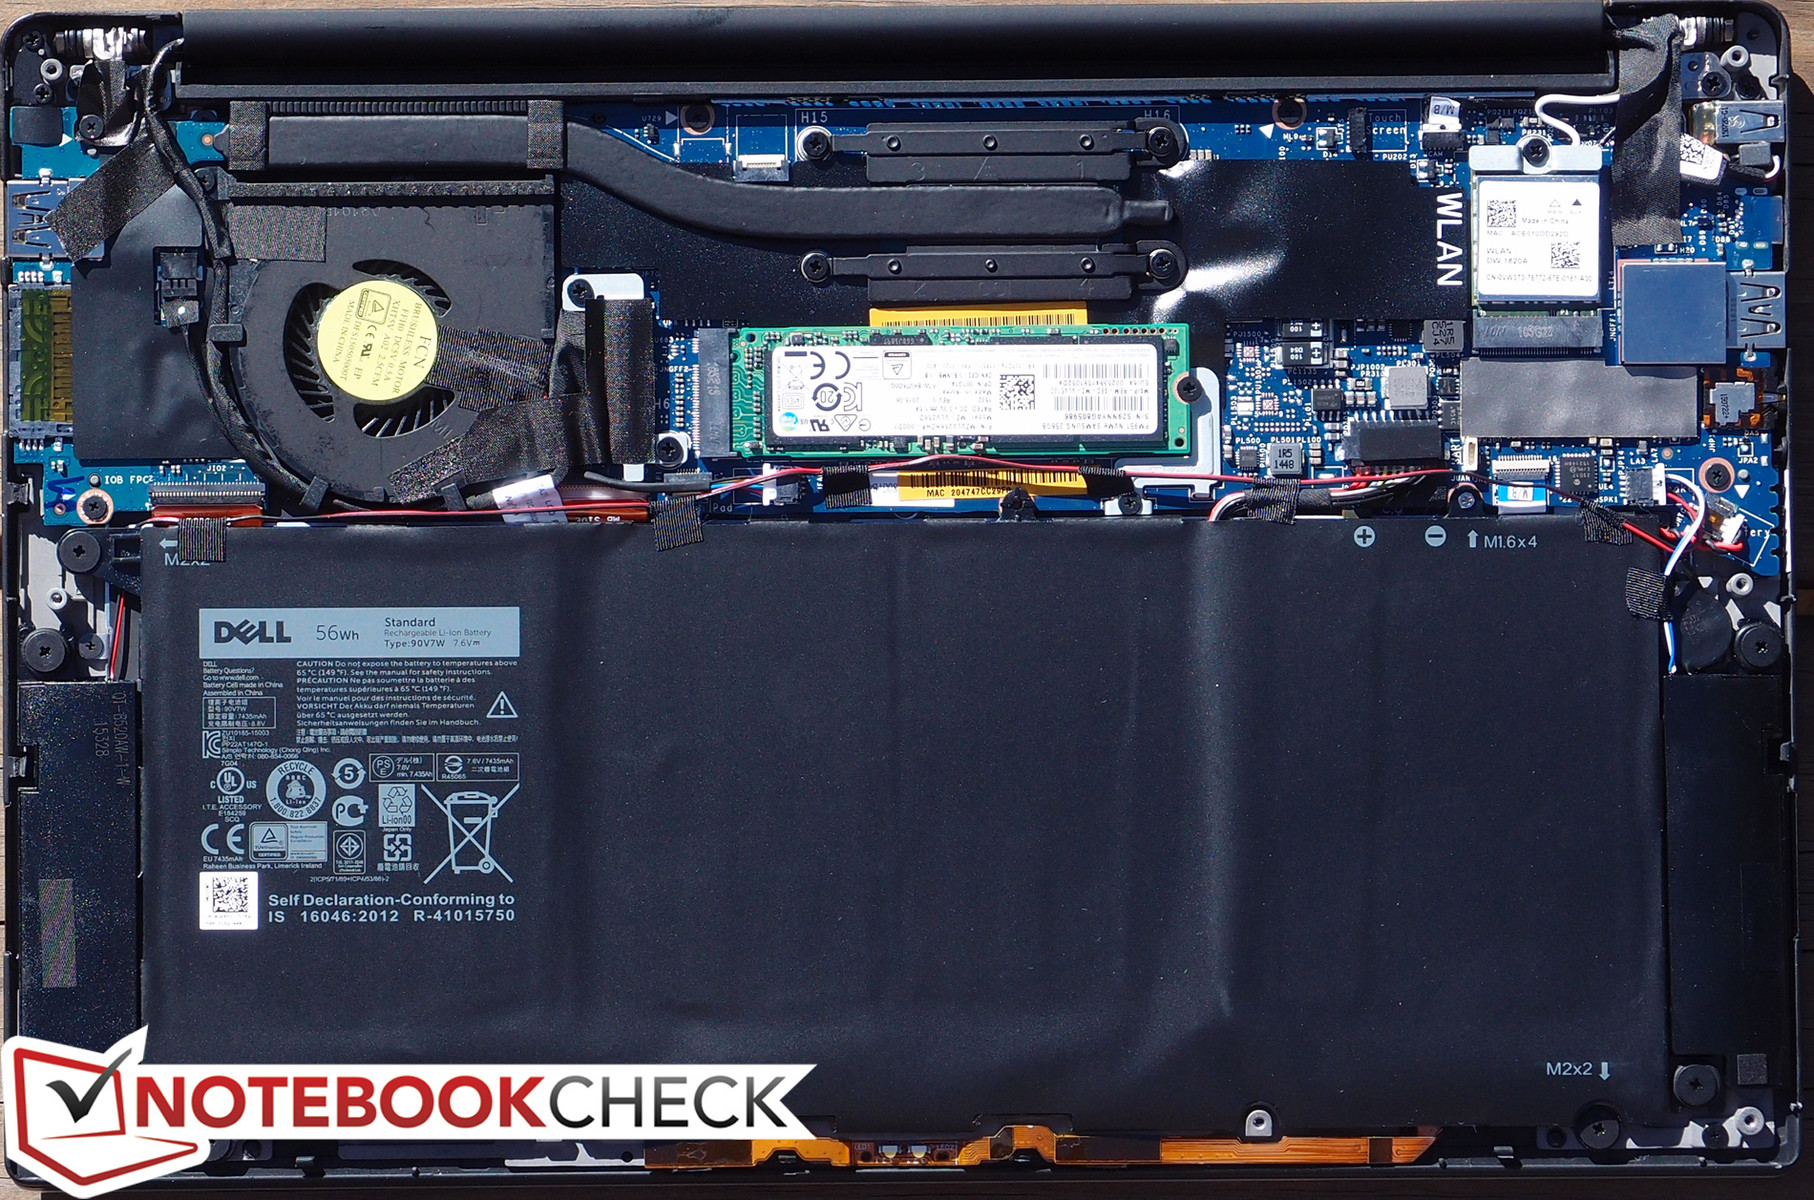
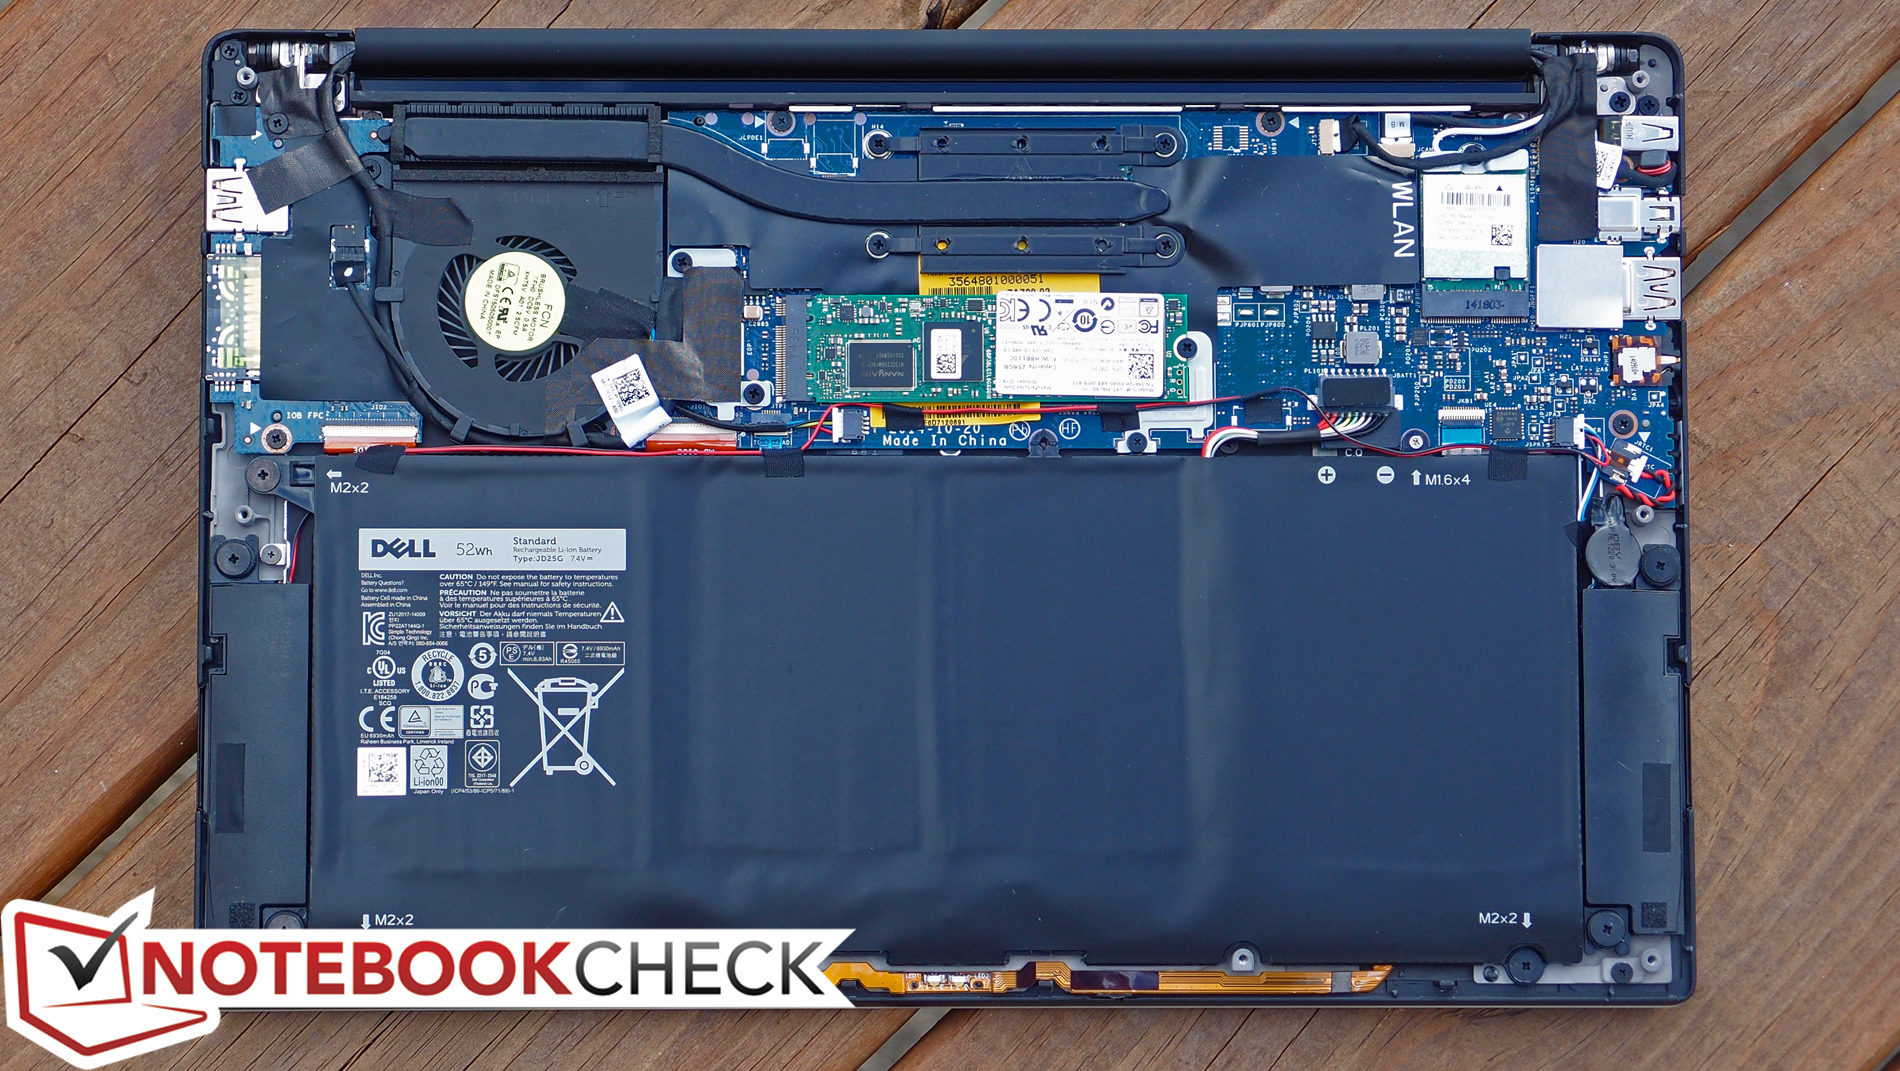
Differences in port selection are minor but noteworthy between the generations. The 9350 has dropped the mini-DisplayPort option altogether in favor of the newer and more versatile USB 3.1 Type-C Gen. 2 port. It also includes NVMe compatibility not found on the 9343 or 9333 models. Notebooks with mSATA slots for storage are becoming increasingly uncommon in favor of the M.2 standard.
| XPS 13 9350 | XPS 13 9343 | XPS 13 9333 | |
| USB | 2x USB 3.0, 1x USB 3.1 Type-C Gen. 2 | 2x USB 3.0 | 2x USB 3.0 |
| Video-out | 1x USB Type-C Gen. 2 | 1x mDP | 1x mDP |
| Other | SD reader, 1x 3.5 mm audio, Kensington Lock | SD reader, 1x 3.5 mm audio, Kensington Lock | SD reader, 1x 3.5 mm audio, Kensington Lock |
| Storage Bays | 1x M.2 | 1x M.2 | 1x mSATA |
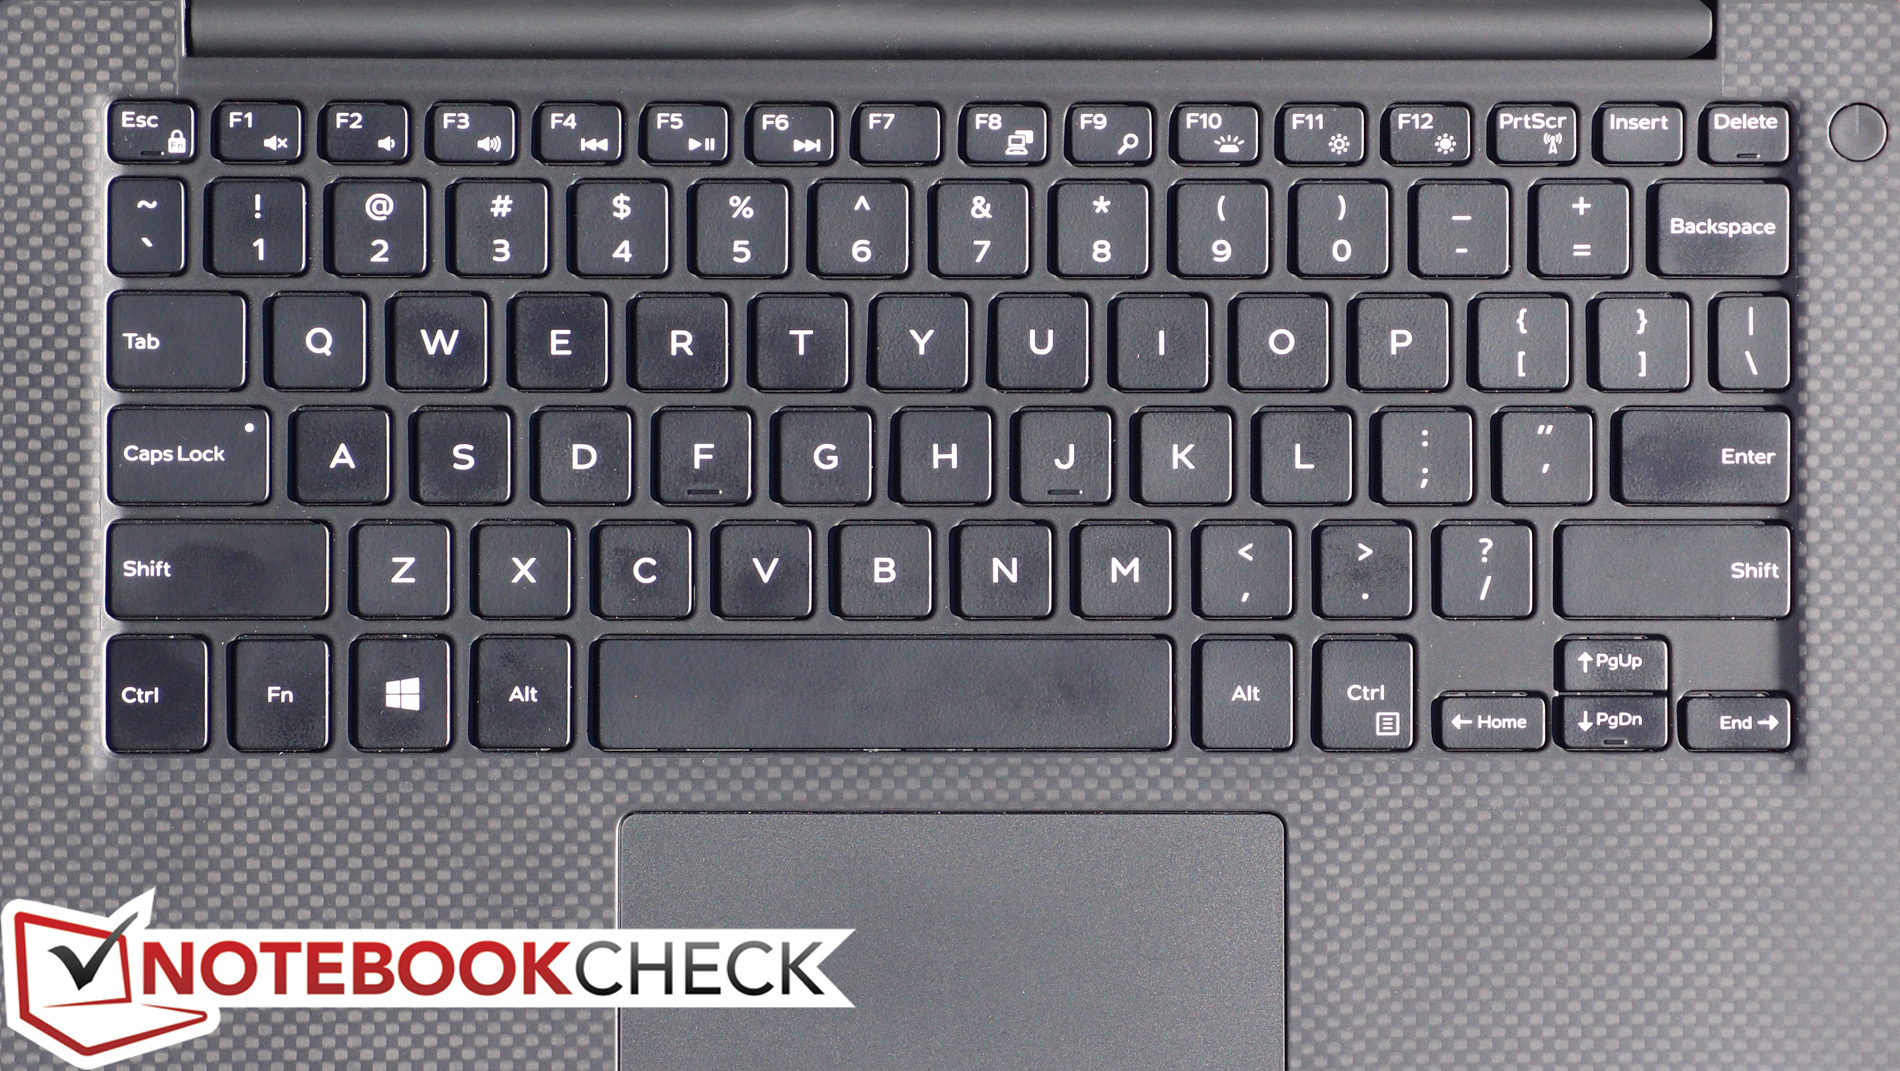
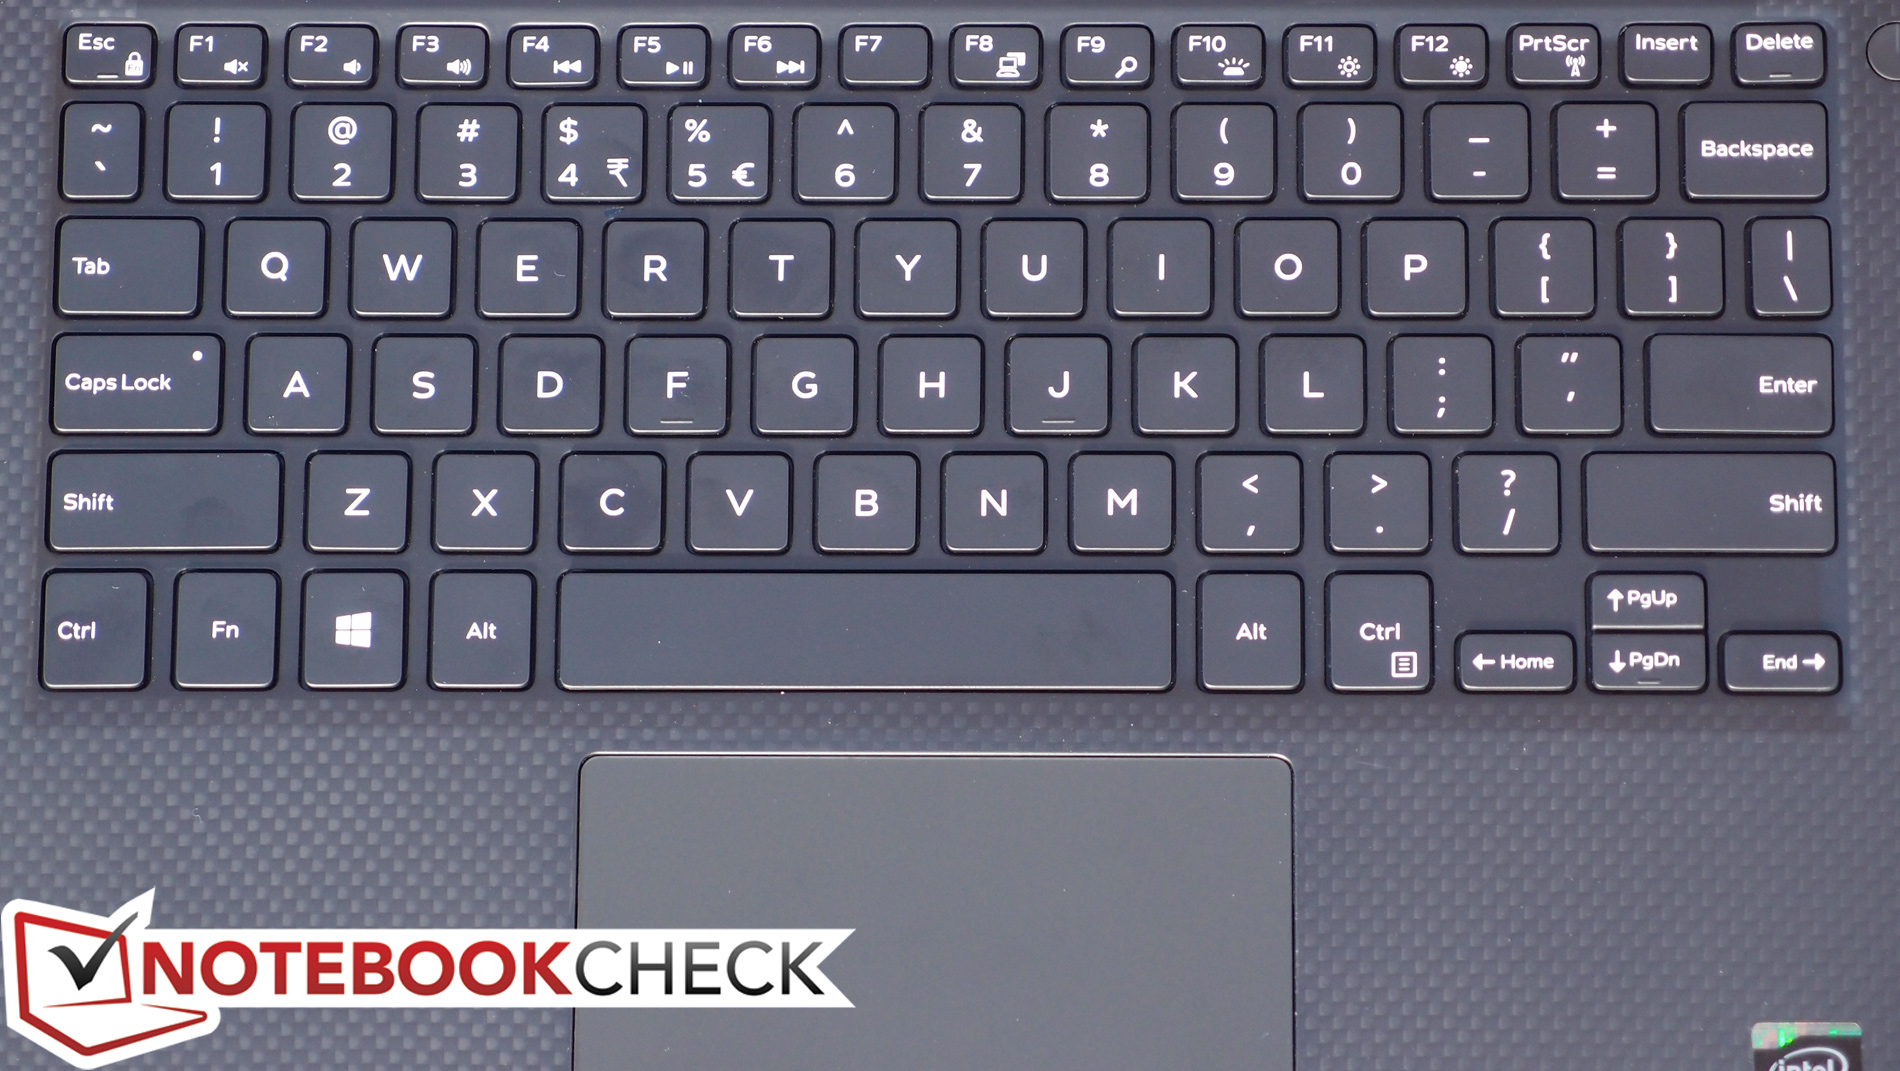
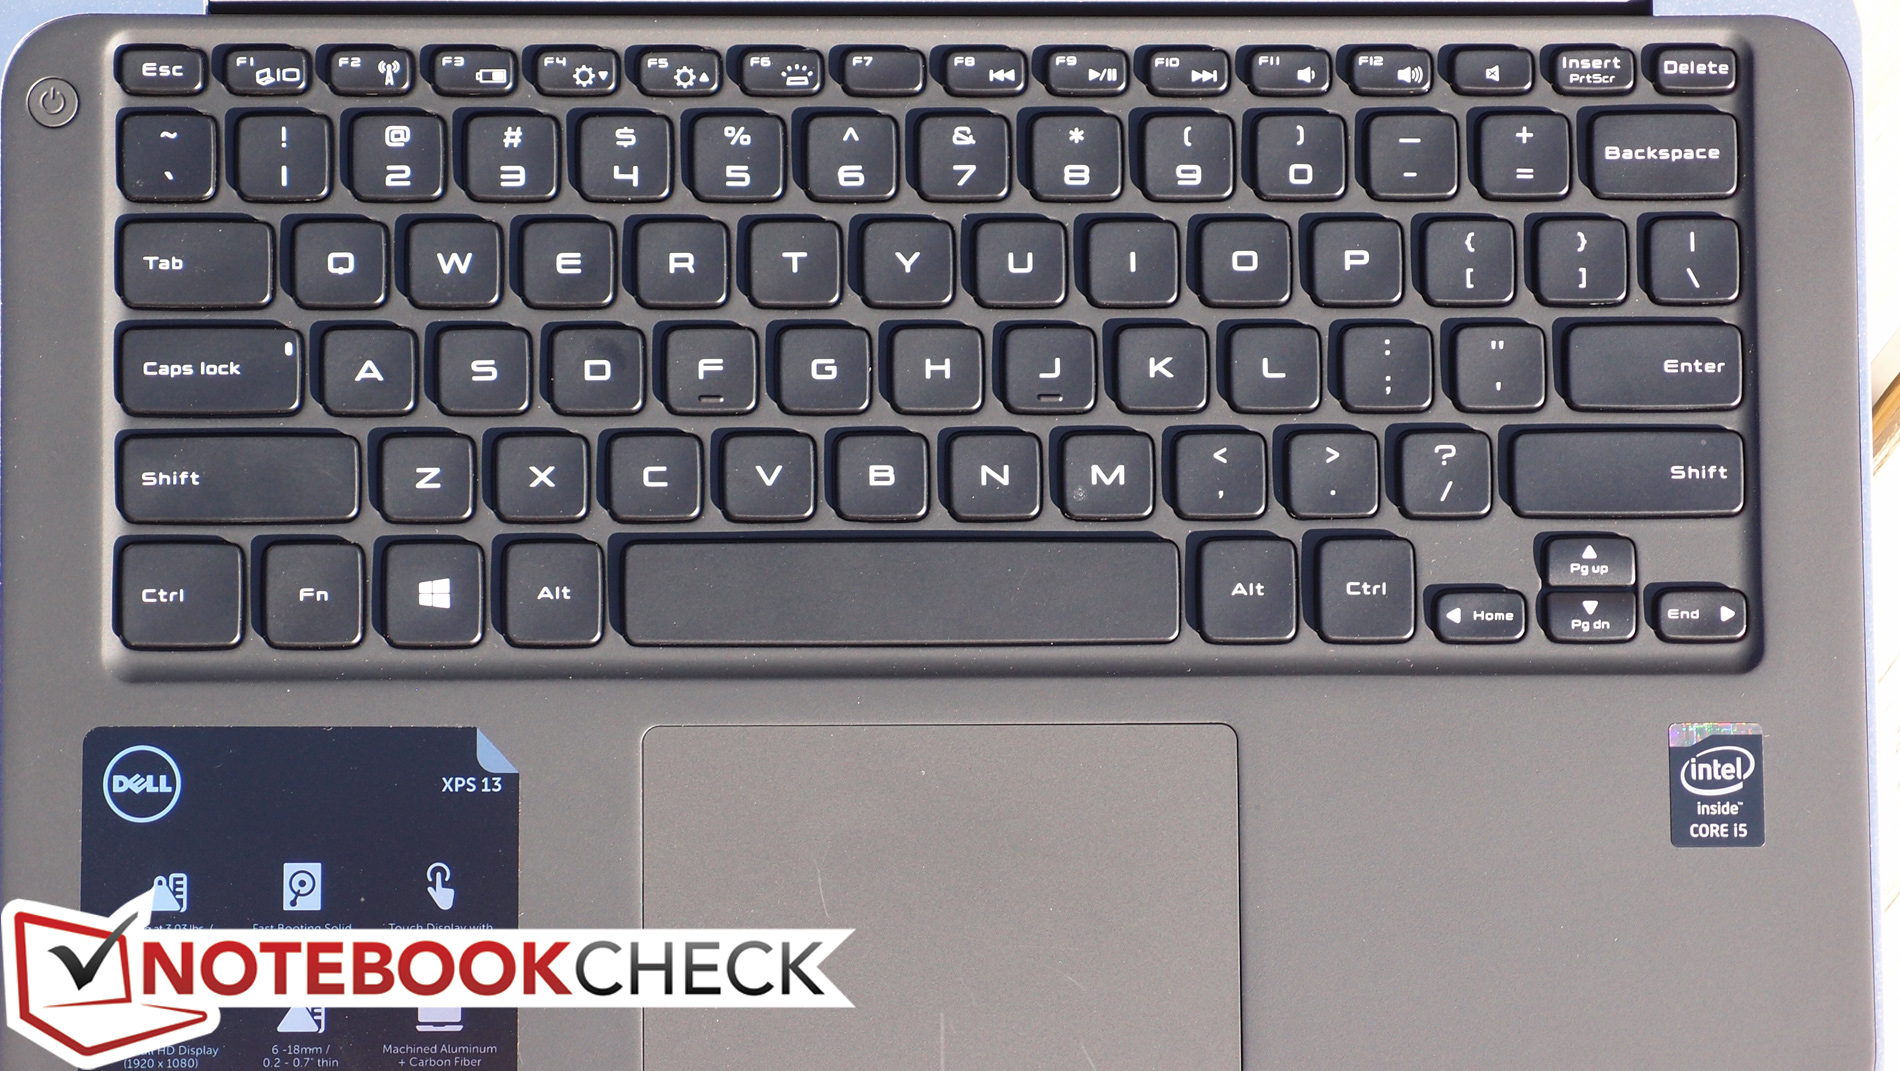
Input Devices
Feedback and travel are similar across the three generations with almost no changes to the overall size or feel of the keyboard. The individual keys are sharper around the corners to better reflect the jump in design from the 9333 to the 9343. In particular, the top row of Function keys are physically larger and with larger font labels compared to the same keys on the outgoing design. Touchpad size has also increased in length ever so slightly.
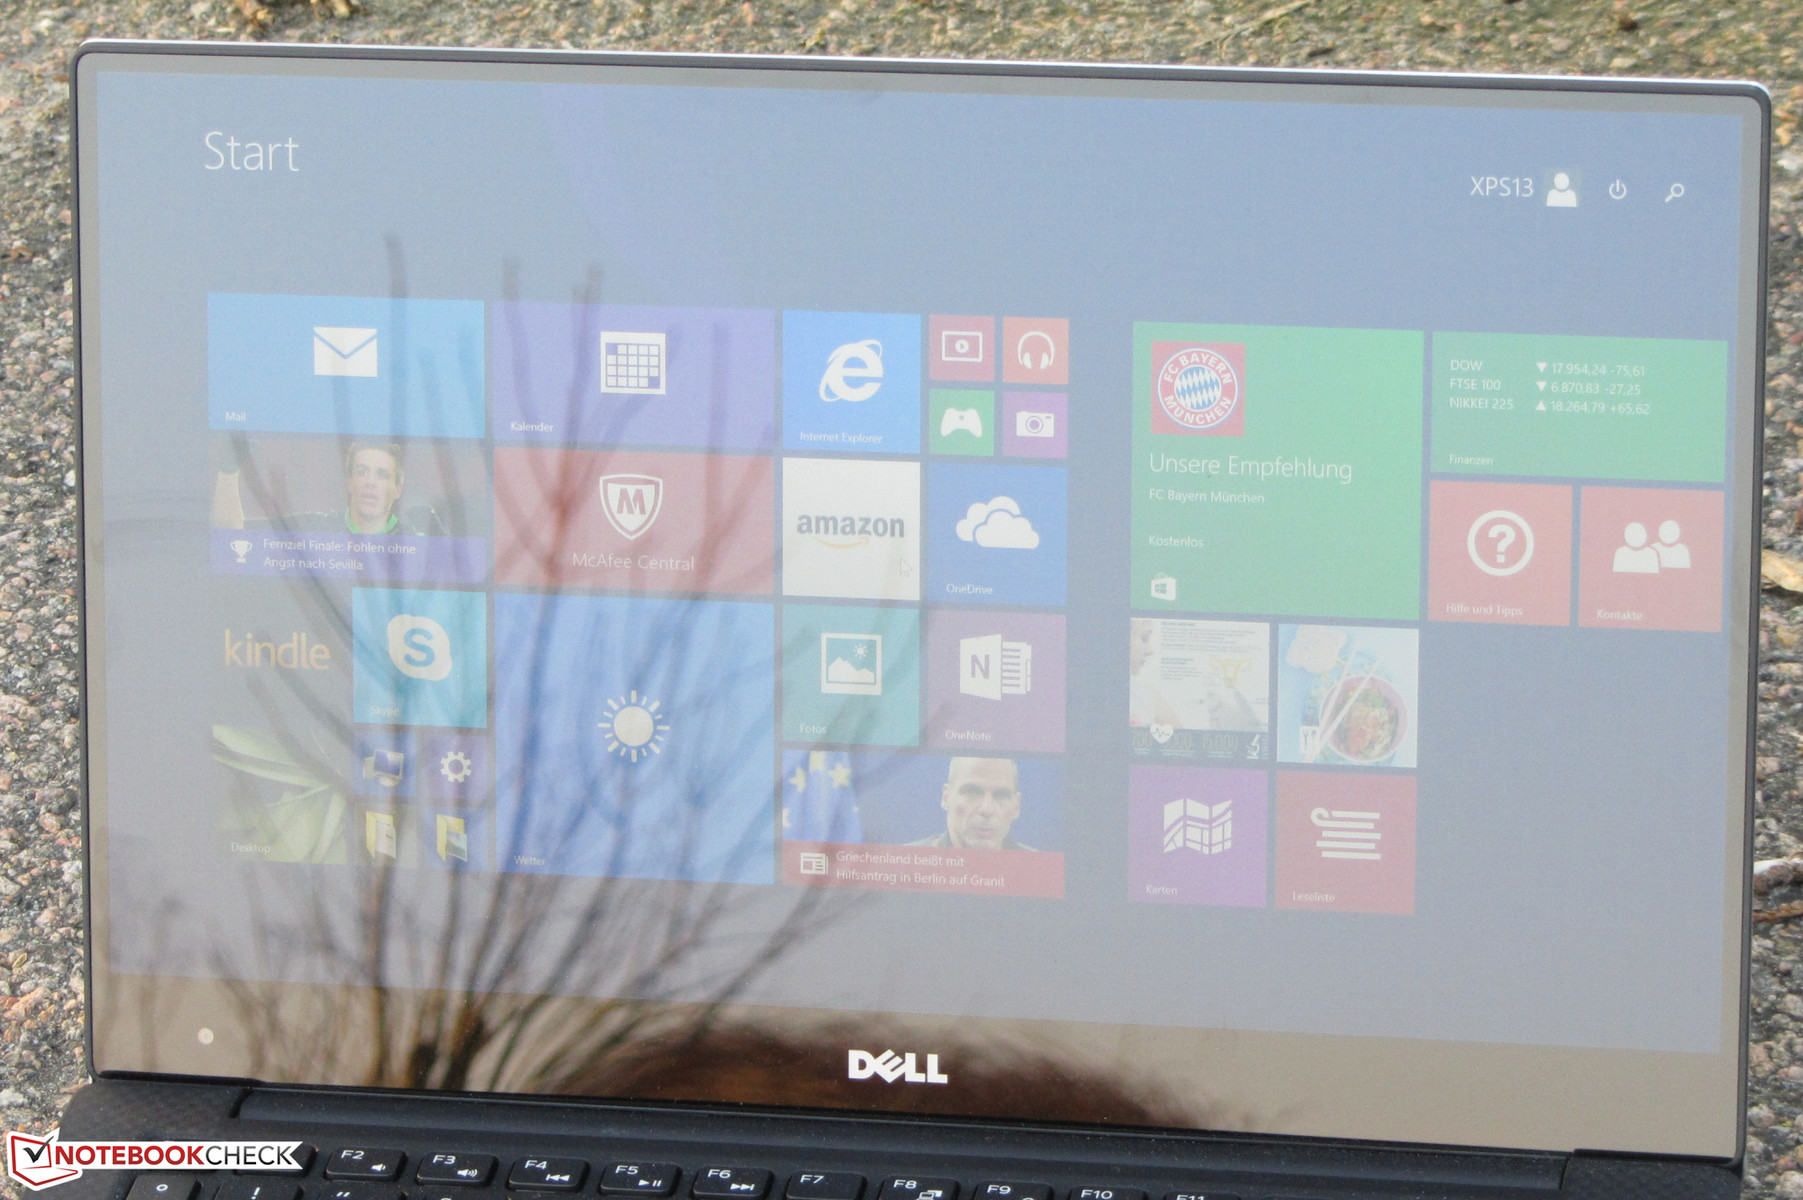
Display
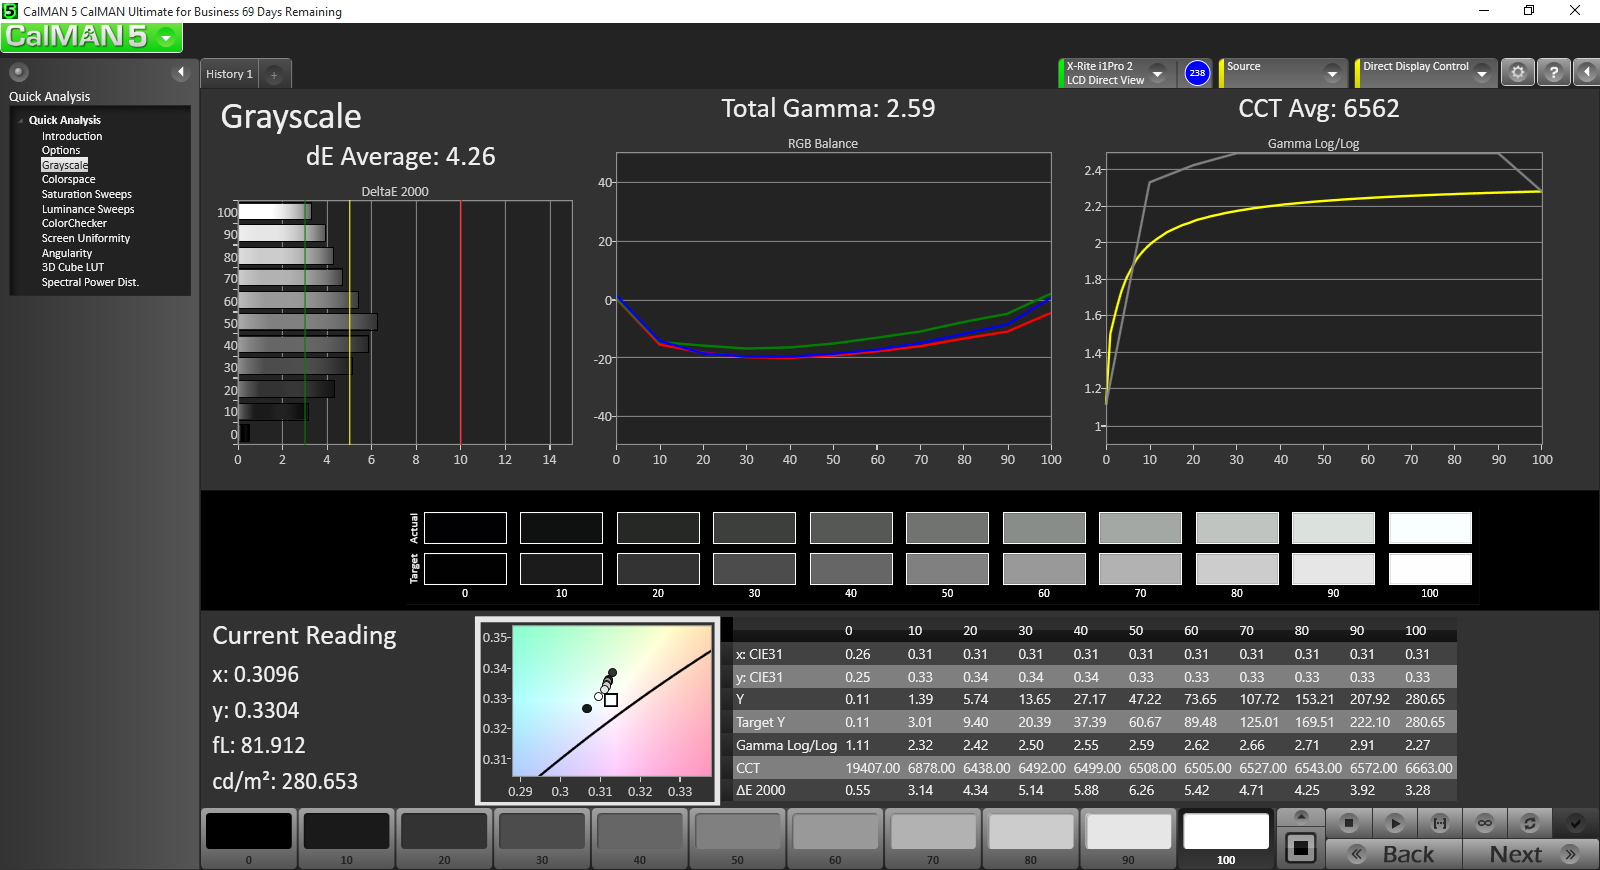
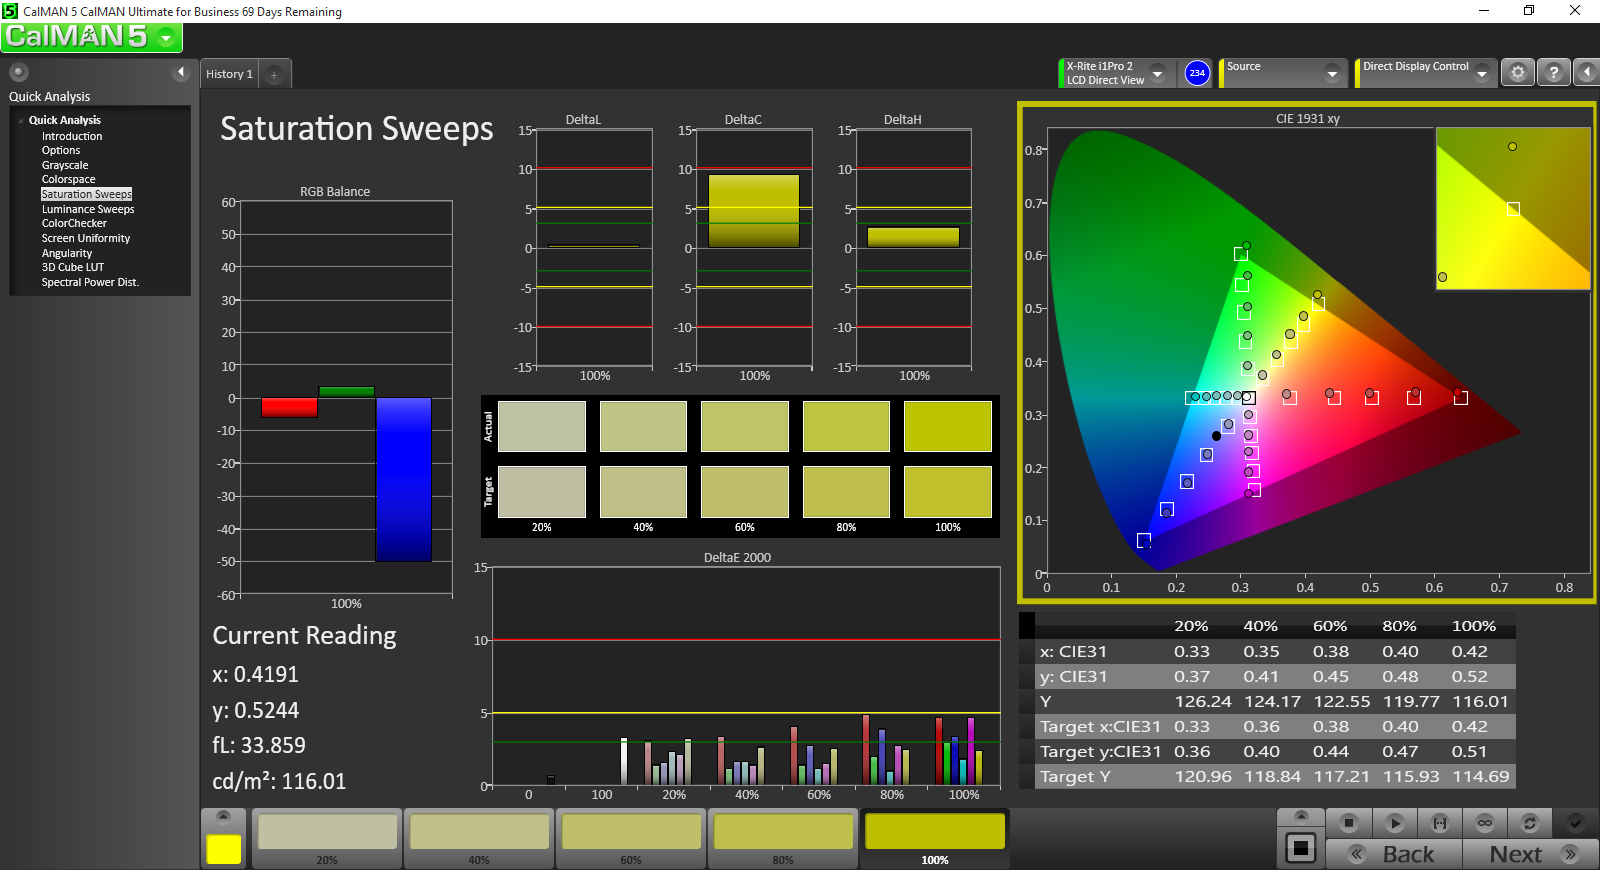
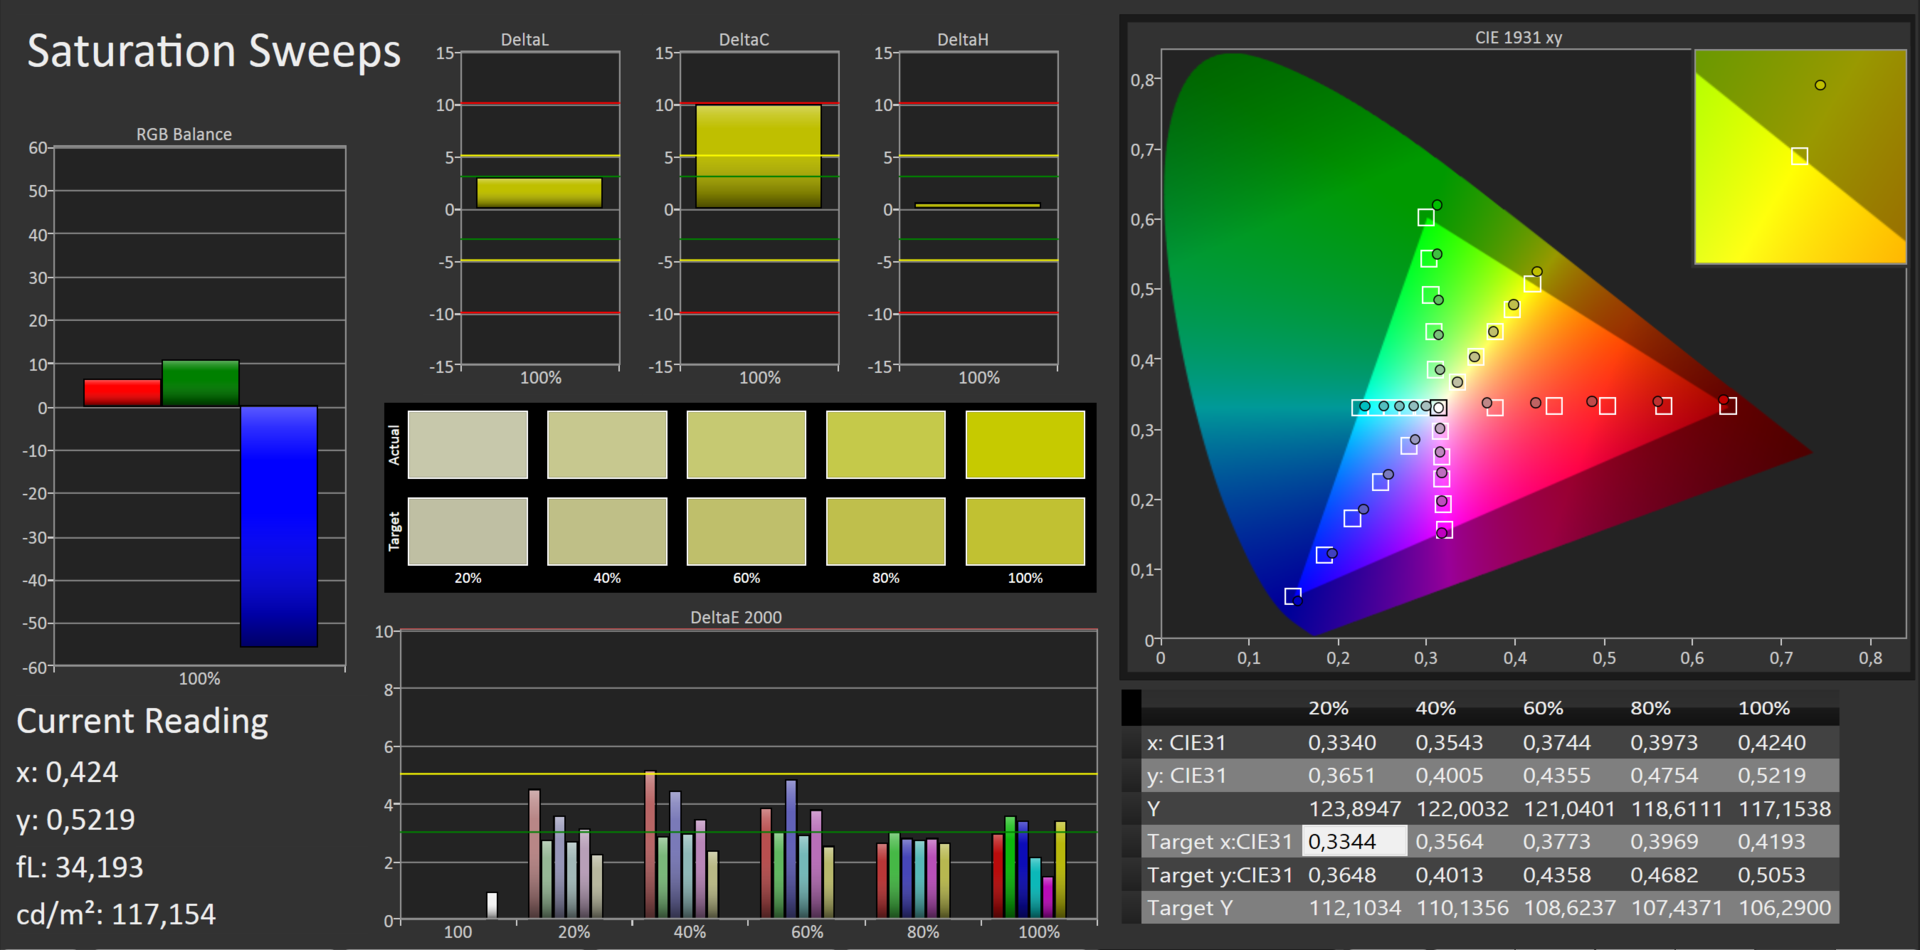
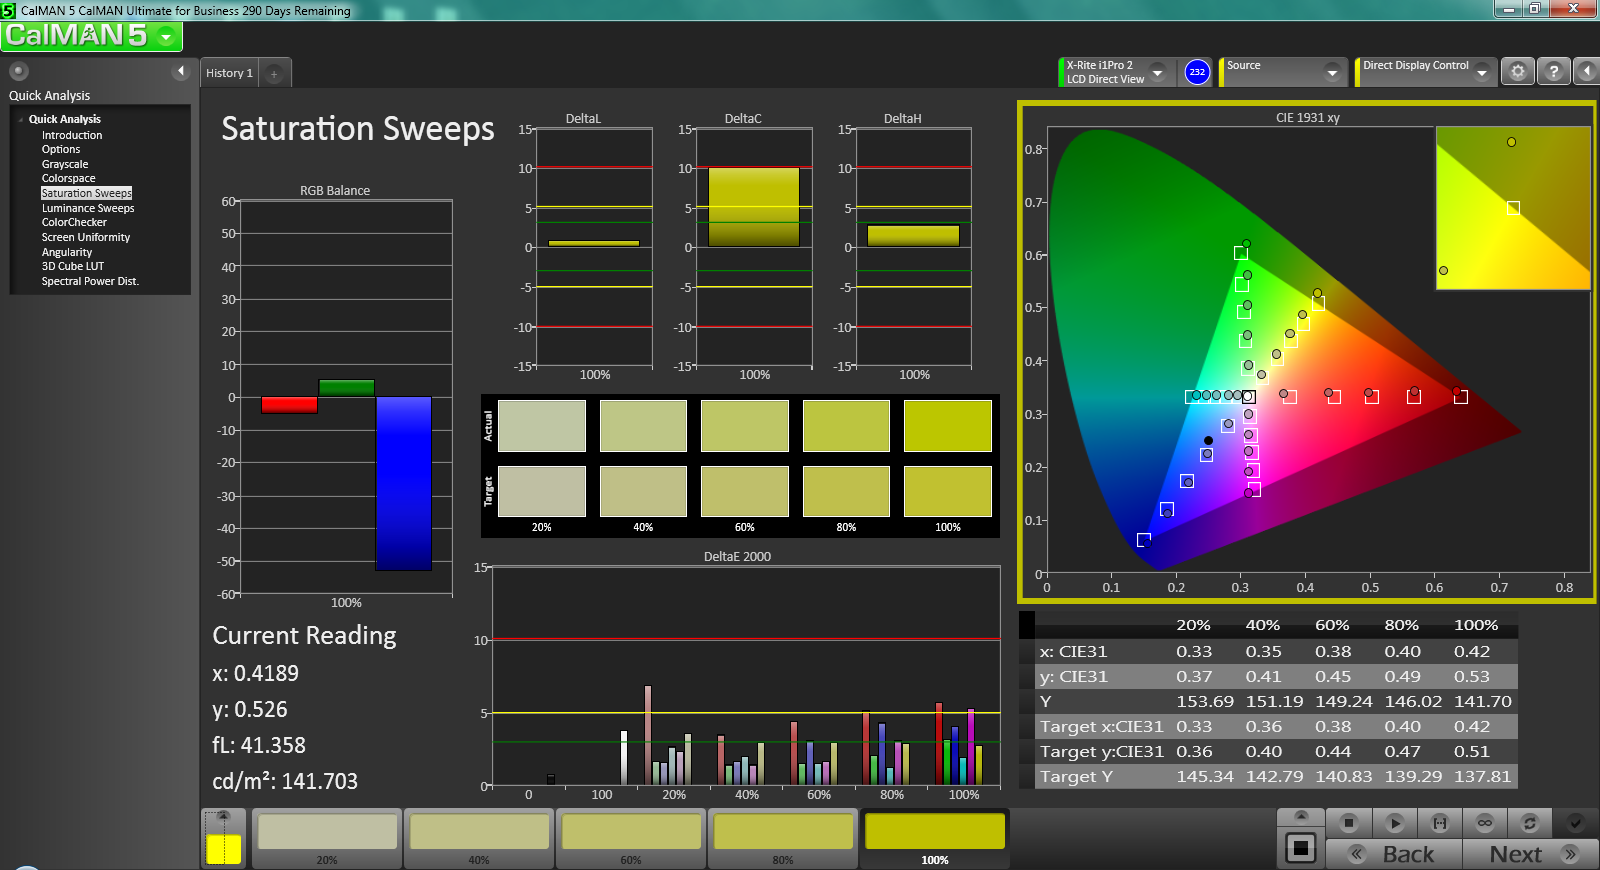
The newer XPS 13 SKUs can be equipped with 1080p FHD and 1800p QHD+ options in either matte (non-touchscreen) or glossy (touchscreen). We were able to measure steadily increasing contrast levels from the older generation to the newest from ~700:1 in the 9333 series to ~1000:1 in the 9343 series and finally ~1500:1 in the 9350.
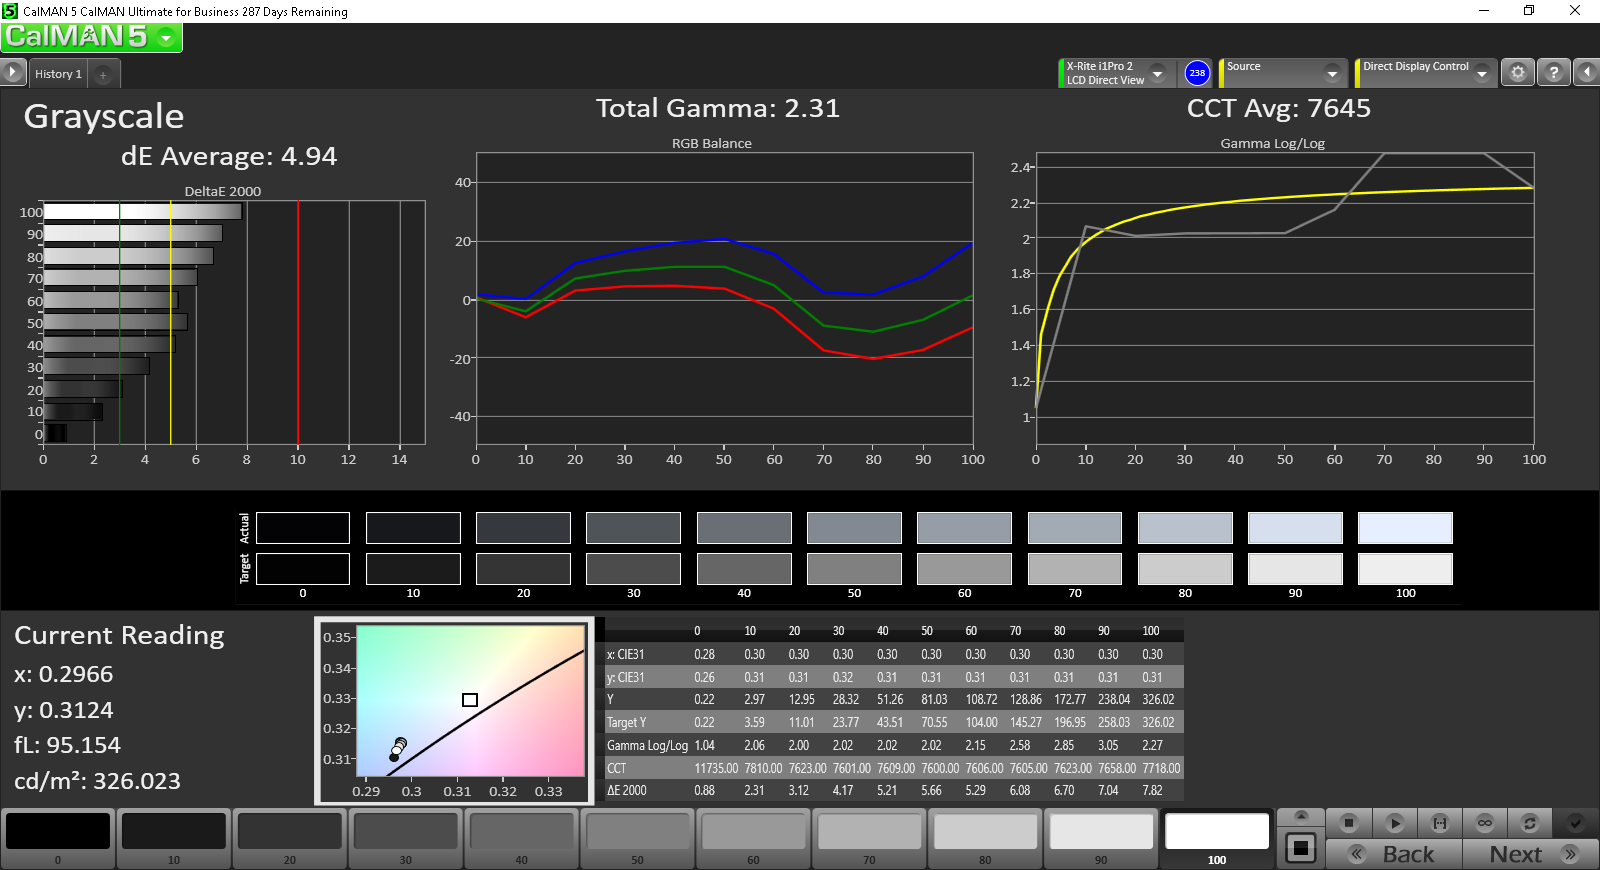
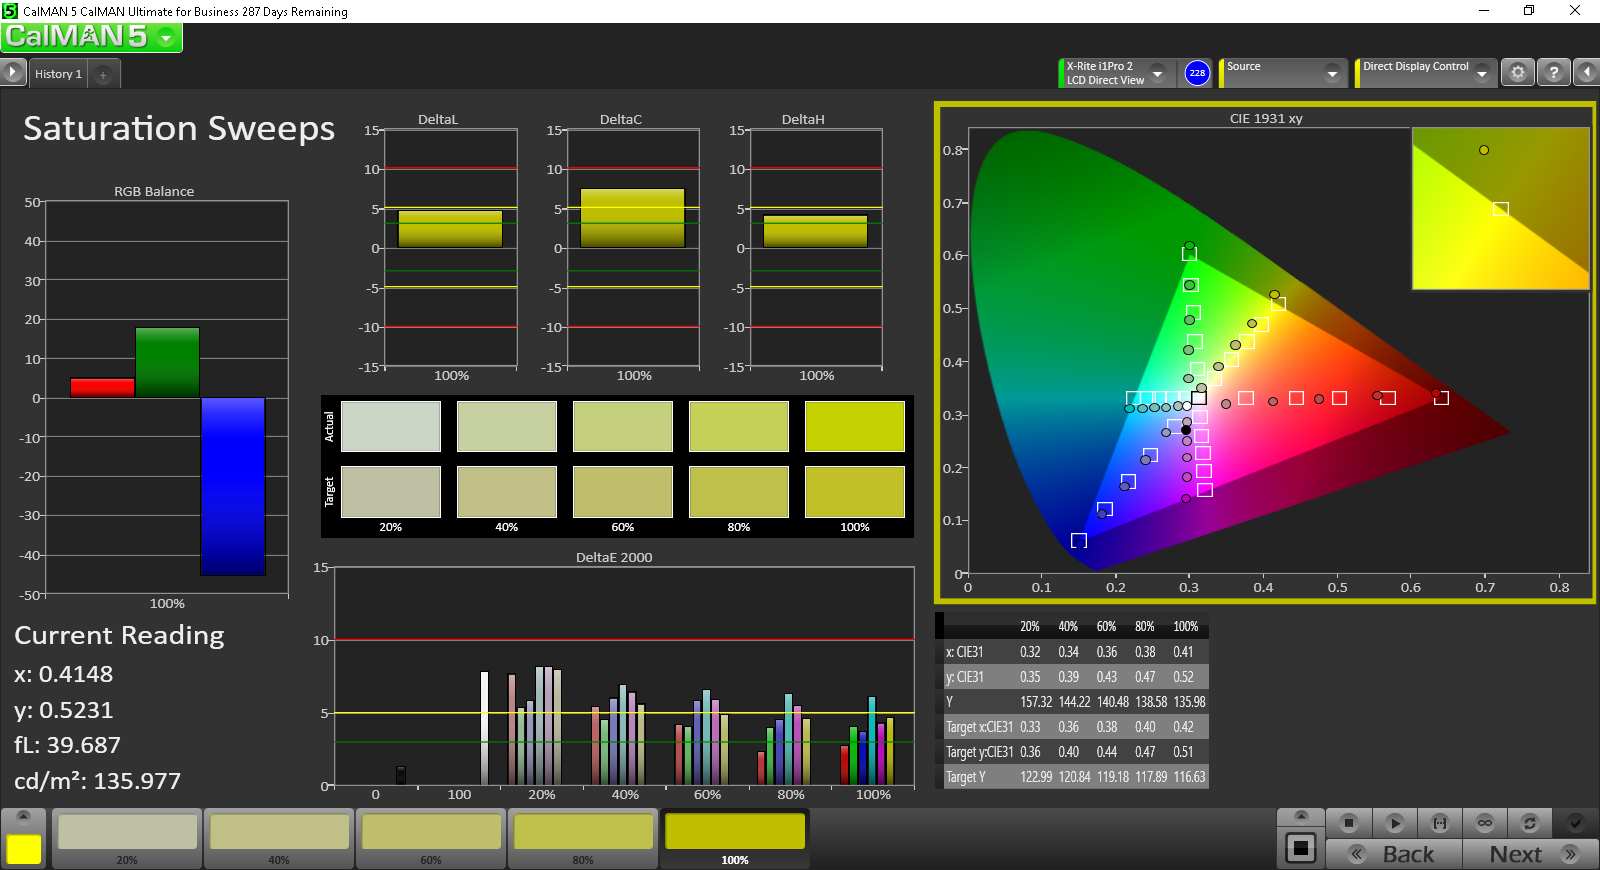
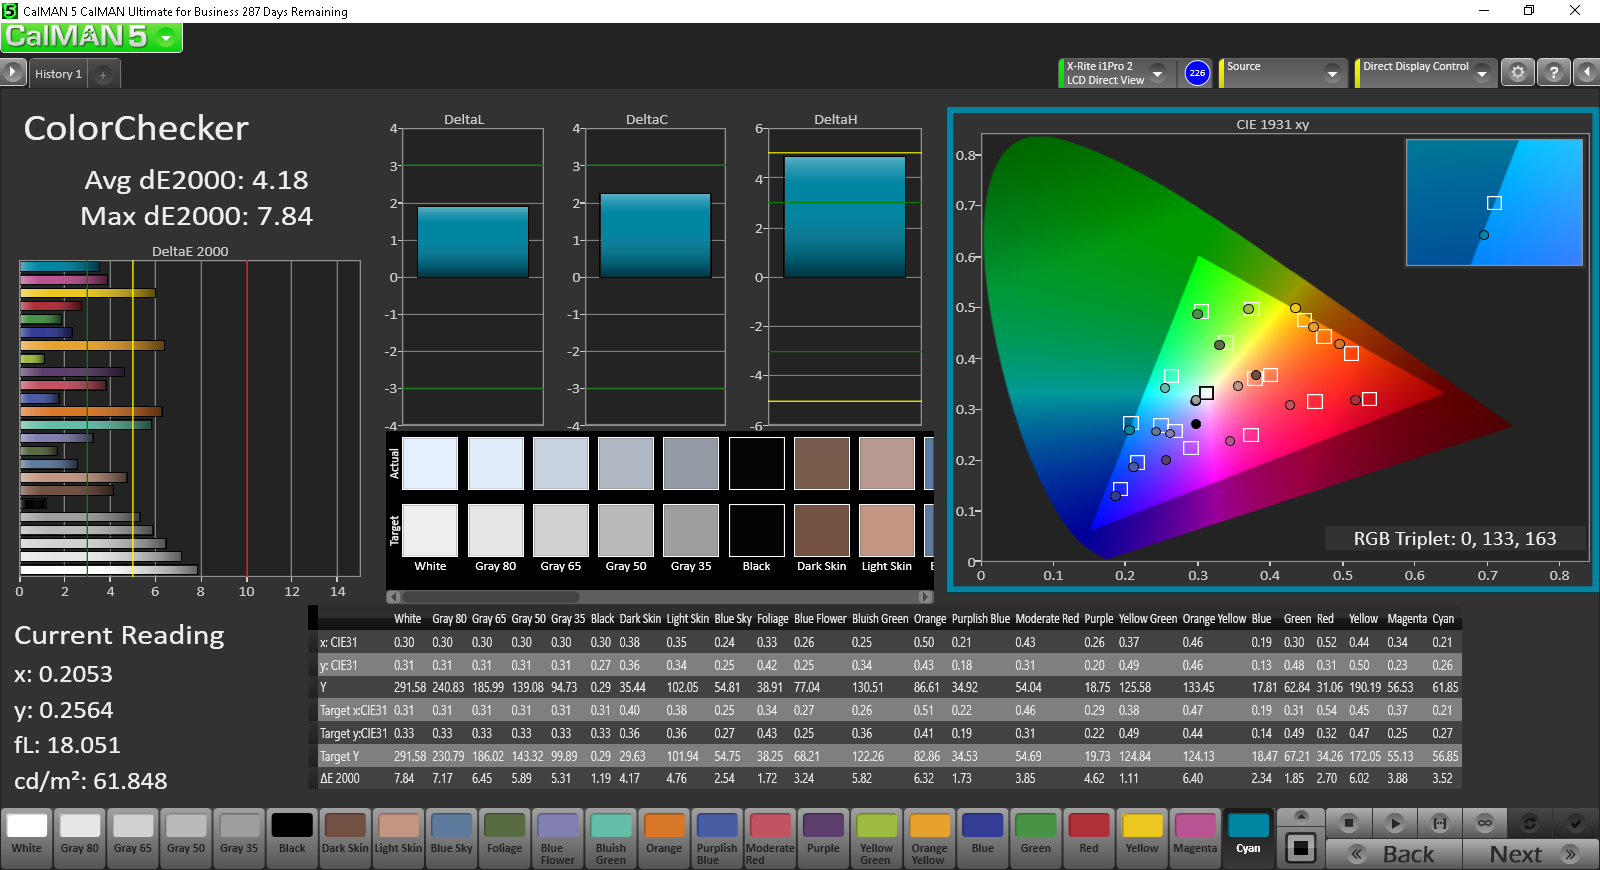
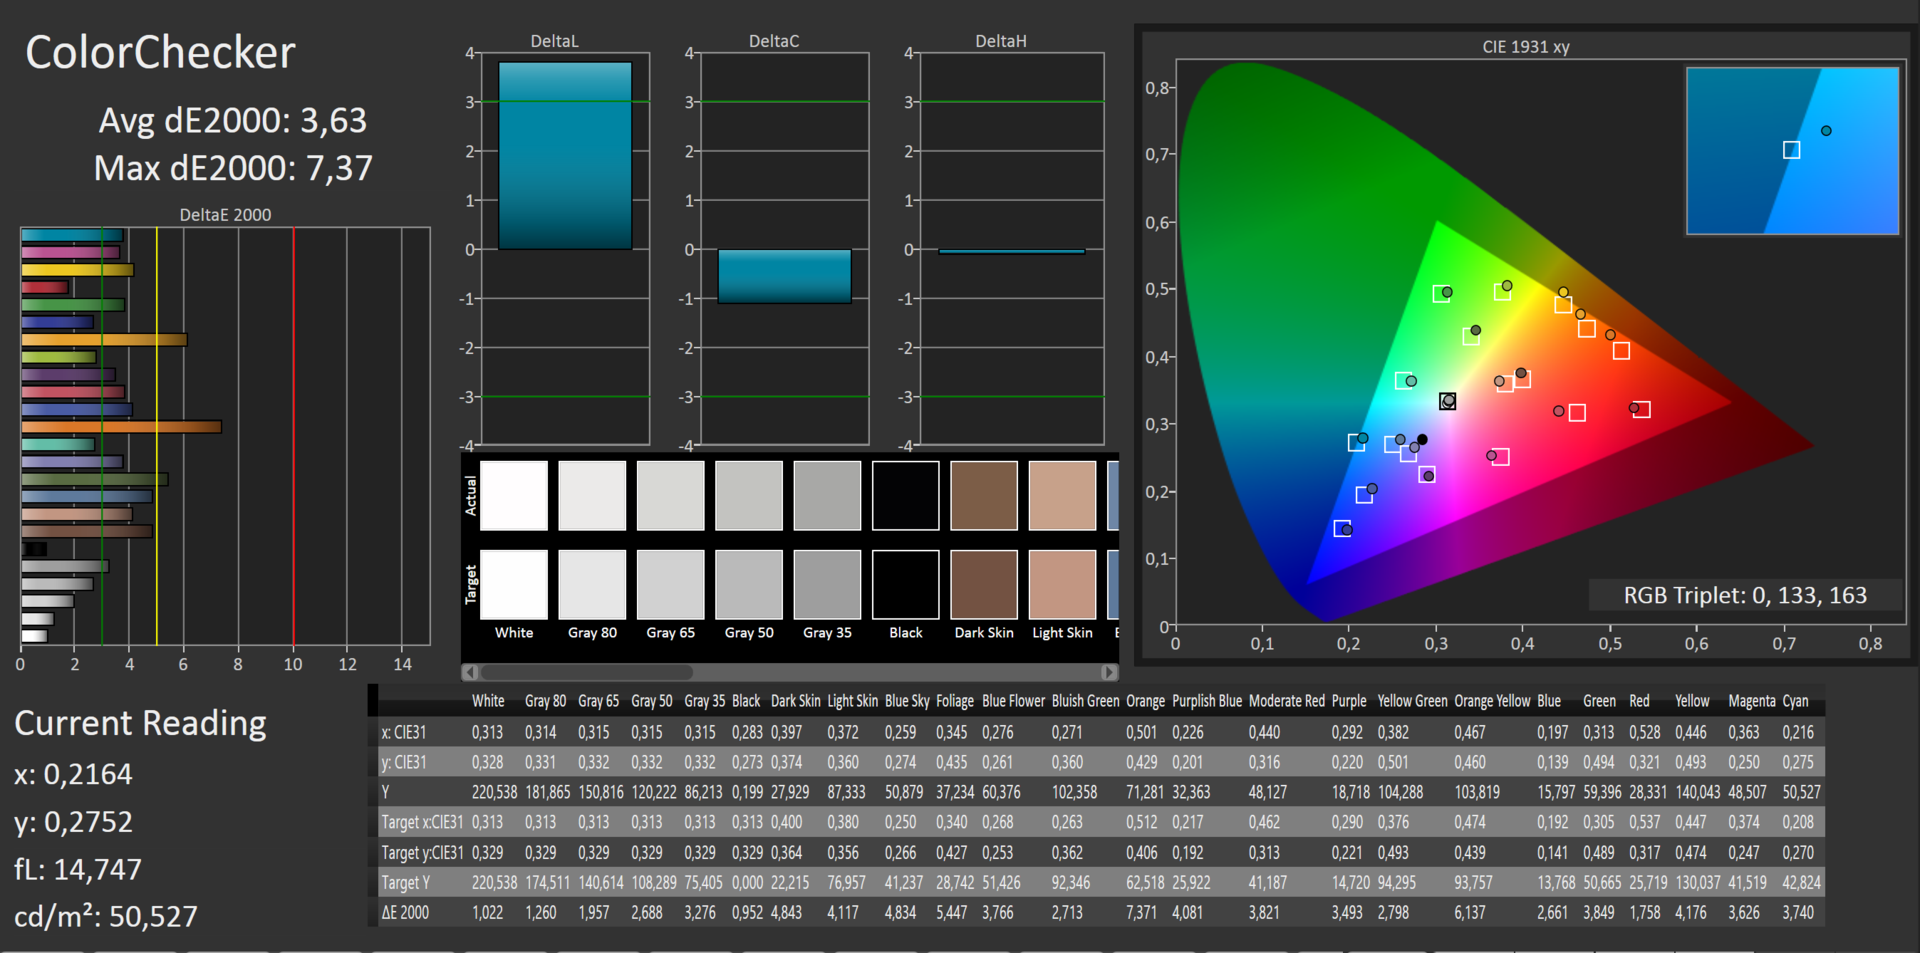
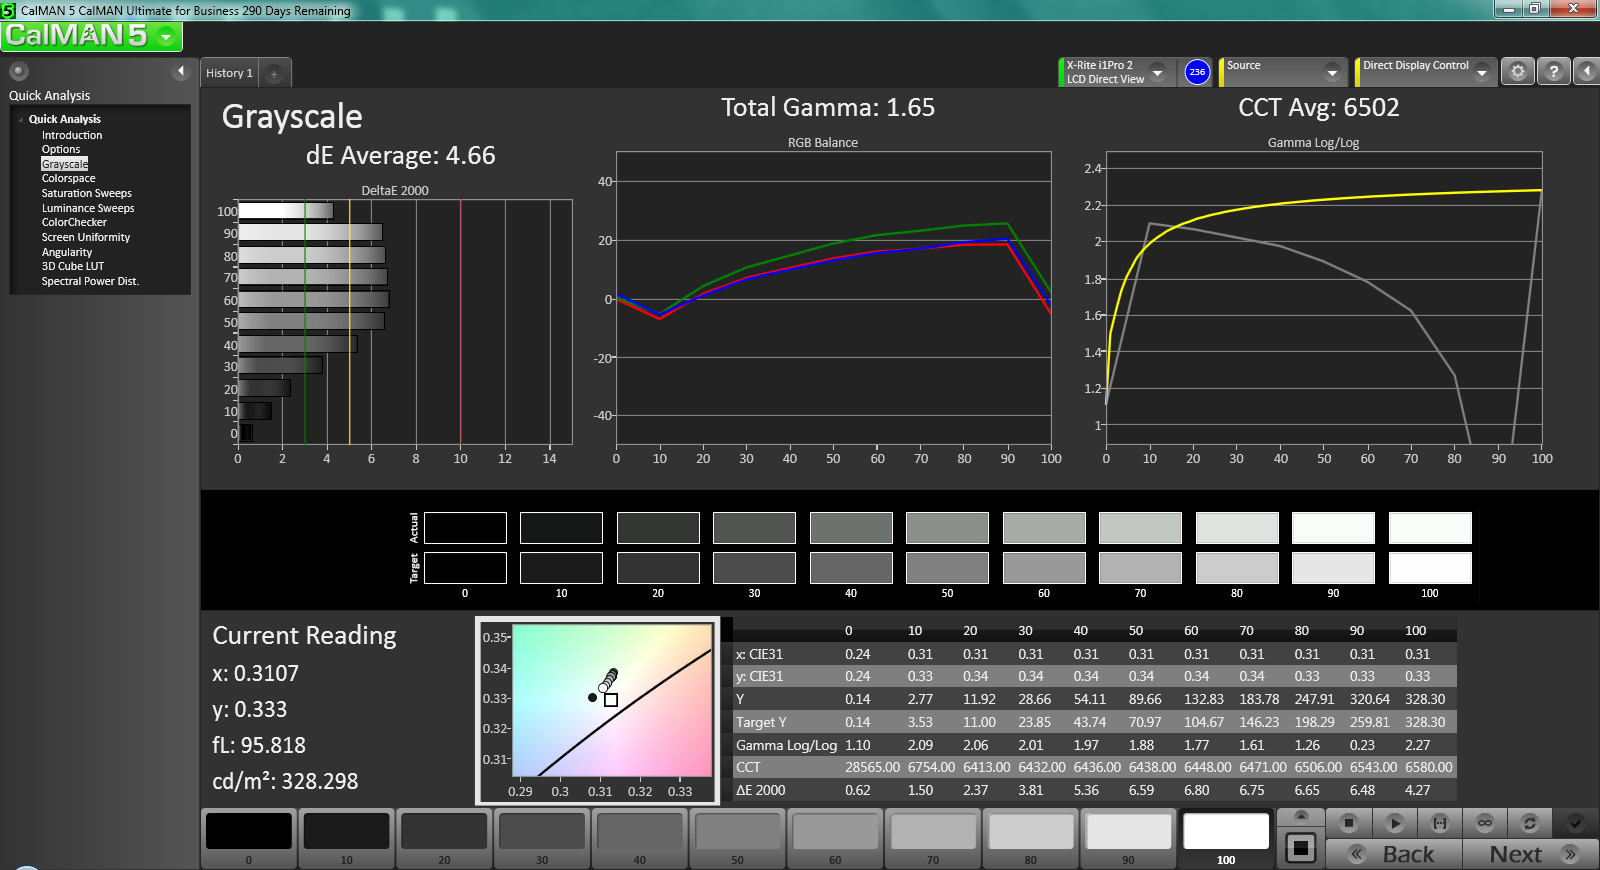
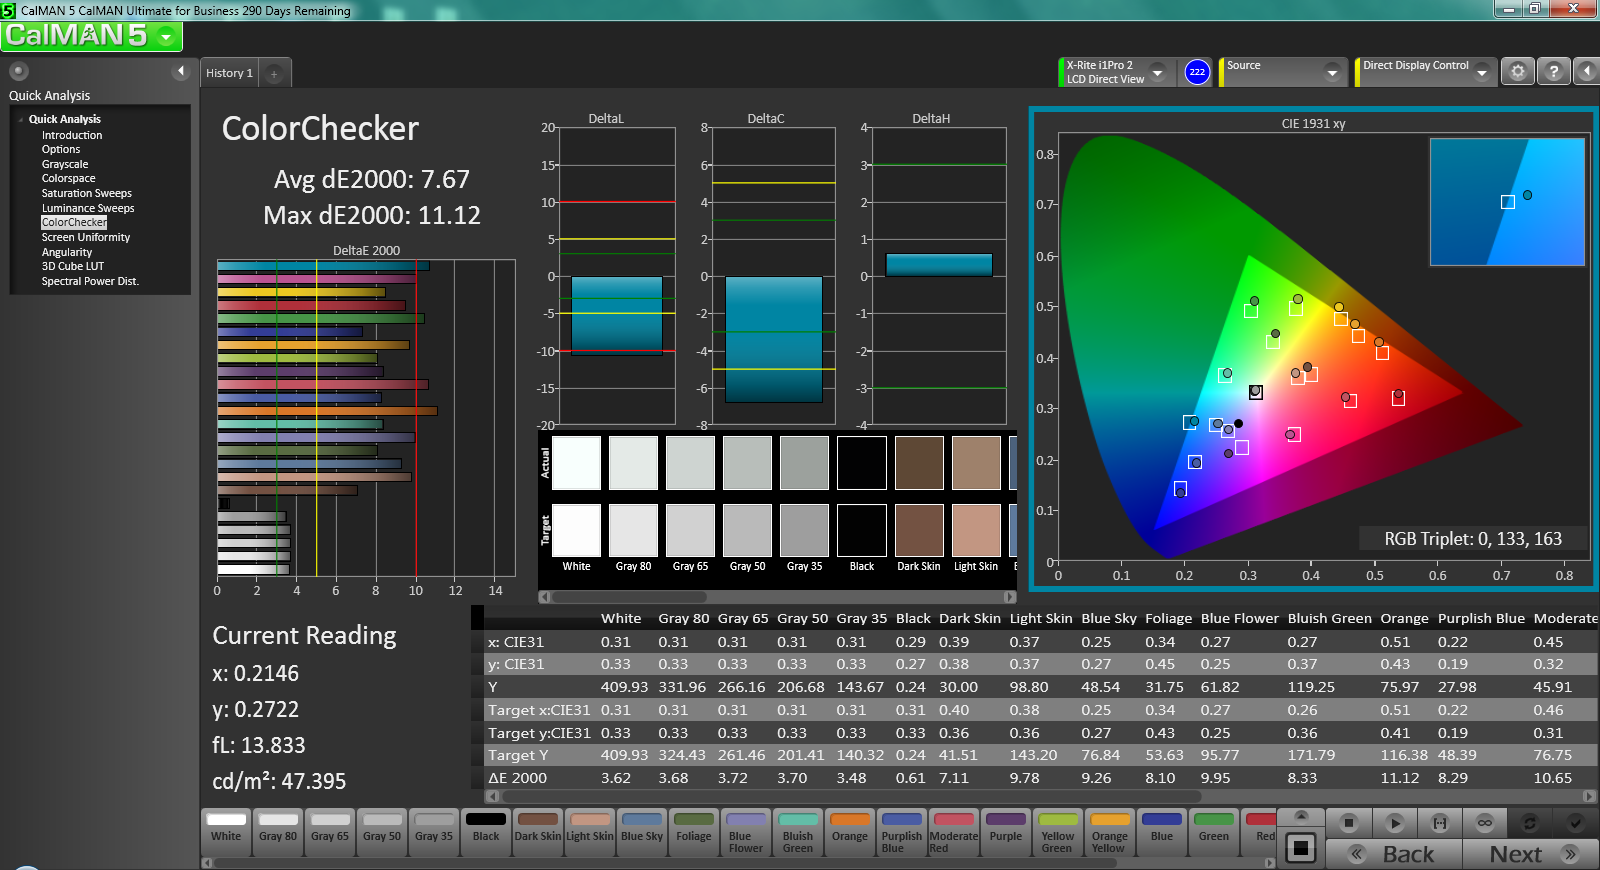
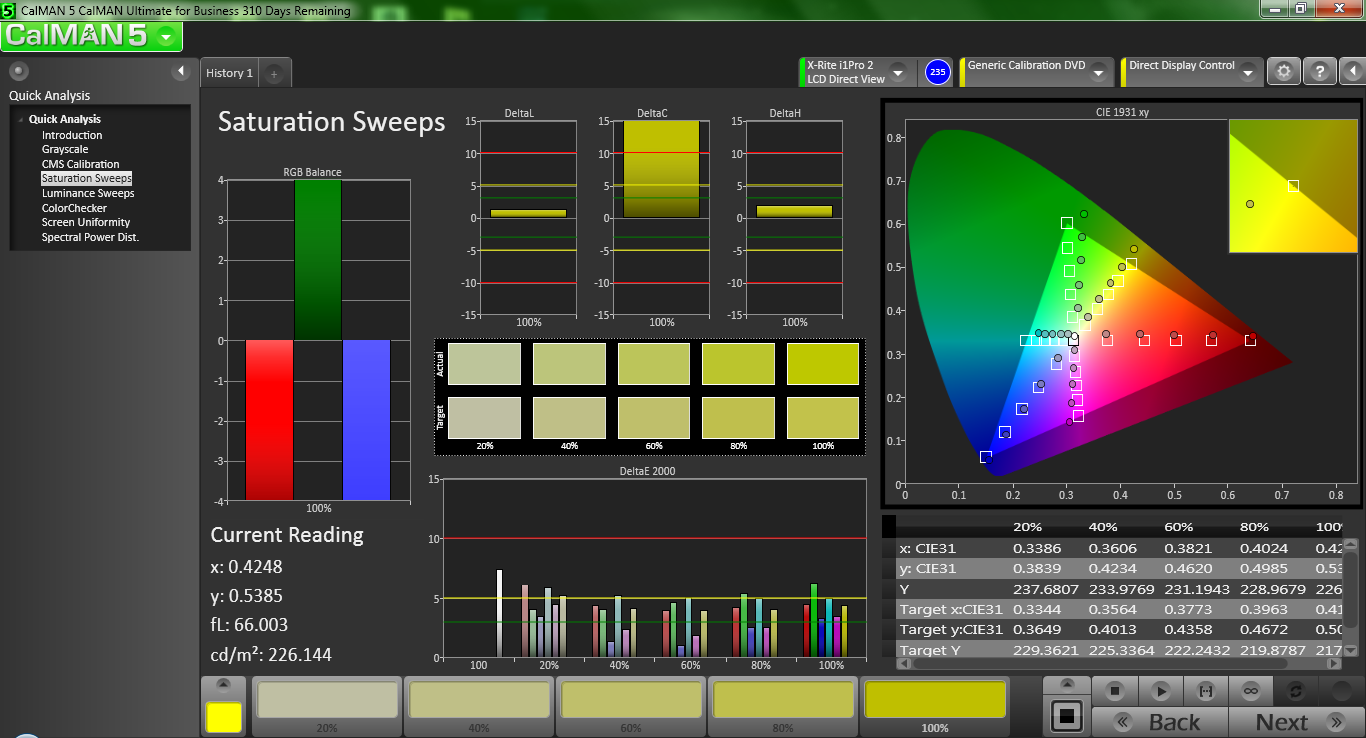
Unfortunately, maximum brightness levels do not follow the same trend. Some SKUs are much brighter than others due to the resolution choice or even software locks imposed by Dell. The recent XPS 15 9550 series also suffered from some hardware hitches at launch, most of which were fixed via BIOS updates. Meanwhile, color accuracy and gamuts are both generally flat between our tested models with no reliable trend in losses or gains.


| XPS 13 9350 FHD | XPS 13 9350 QHD+ | XPS 13 9343 FHD | XPS 13 9343 QHD+ | XPS 13 9333 FHD | XPS 13 2012 | |
| Native Resolution | 1920 x 1080 | 3200 x 1800 | 1920 x 1080 | 3200 x 1800 | 1920 x 1080 | 1920 x 1080 |
| Pixel Density | 166 PPI | 276 PPI | 166 PPI | 276 PPI | 166 PPI | 118 PPI |
| Panel ID | Sharp SHP1420 | Sharp SHP144A | Sharp SHP1420 | Sharp LQ133Z1 | Chi Mei CMN1345 | Dell 133BGE |
| Panel | Matte | Glossy | Matte | Glossy | Glossy | Glossy |
| Dell XPS 13-9350 HD Graphics 520, 6200U, Samsung PM951 NVMe MZ-VLV256D | Dell XPS 13 9350 WQXGA Iris Graphics 540, 6560U, Samsung PM951 NVMe 512 GB | Dell XPS 13-9343 Non-Touch HD Graphics 5500, 5200U, Samsung SSD PM851 M.2 2280 128GB | Dell XPS 13 9343 Core i7 HD Graphics 5500, 5500U, Samsung SSD PM851 M.2 2280 256GB | Dell XPS 13-9333 HD Graphics 4400, 4200U, Liteonit LMT-128M6M | Dell XPS 13 HD Graphics 3000, 2637M, Samsung SSD 830 Series MZMPC256HBGJ-00000 | |
|---|---|---|---|---|---|---|
| Display | ||||||
| Display P3 Coverage (%) | 44.53 | 63.6 | 65.9 | 62.6 | 65.1 | 43.6 |
| sRGB Coverage (%) | 66.8 | 92.3 | 89.6 | 89.8 | 84.7 | 64.2 |
| AdobeRGB 1998 Coverage (%) | 45.97 | 65.4 | 66.2 | 64.2 | 61.5 | 45.16 |
| Response Times | ||||||
| Response Time Grey 50% / Grey 80% * (ms) | 50.8 ? | |||||
| Response Time Black / White * (ms) | 29.6 ? | |||||
| PWM Frequency (Hz) | ||||||
| Screen | ||||||
| Brightness middle (cd/m²) | 277.5 | 307.5 | 409.7 | 232 | 450.1 | 284 |
| Brightness (cd/m²) | 276 | 297 | 405 | 231 | 441 | 277 |
| Brightness Distribution (%) | 88 | 92 | 93 | 82 | 92 | 91 |
| Black Level * (cd/m²) | 0.191 | 0.207 | 0.366 | 0.25 | 0.655 | 1.75 |
| Contrast (:1) | 1453 | 1486 | 1119 | 928 | 687 | 162 |
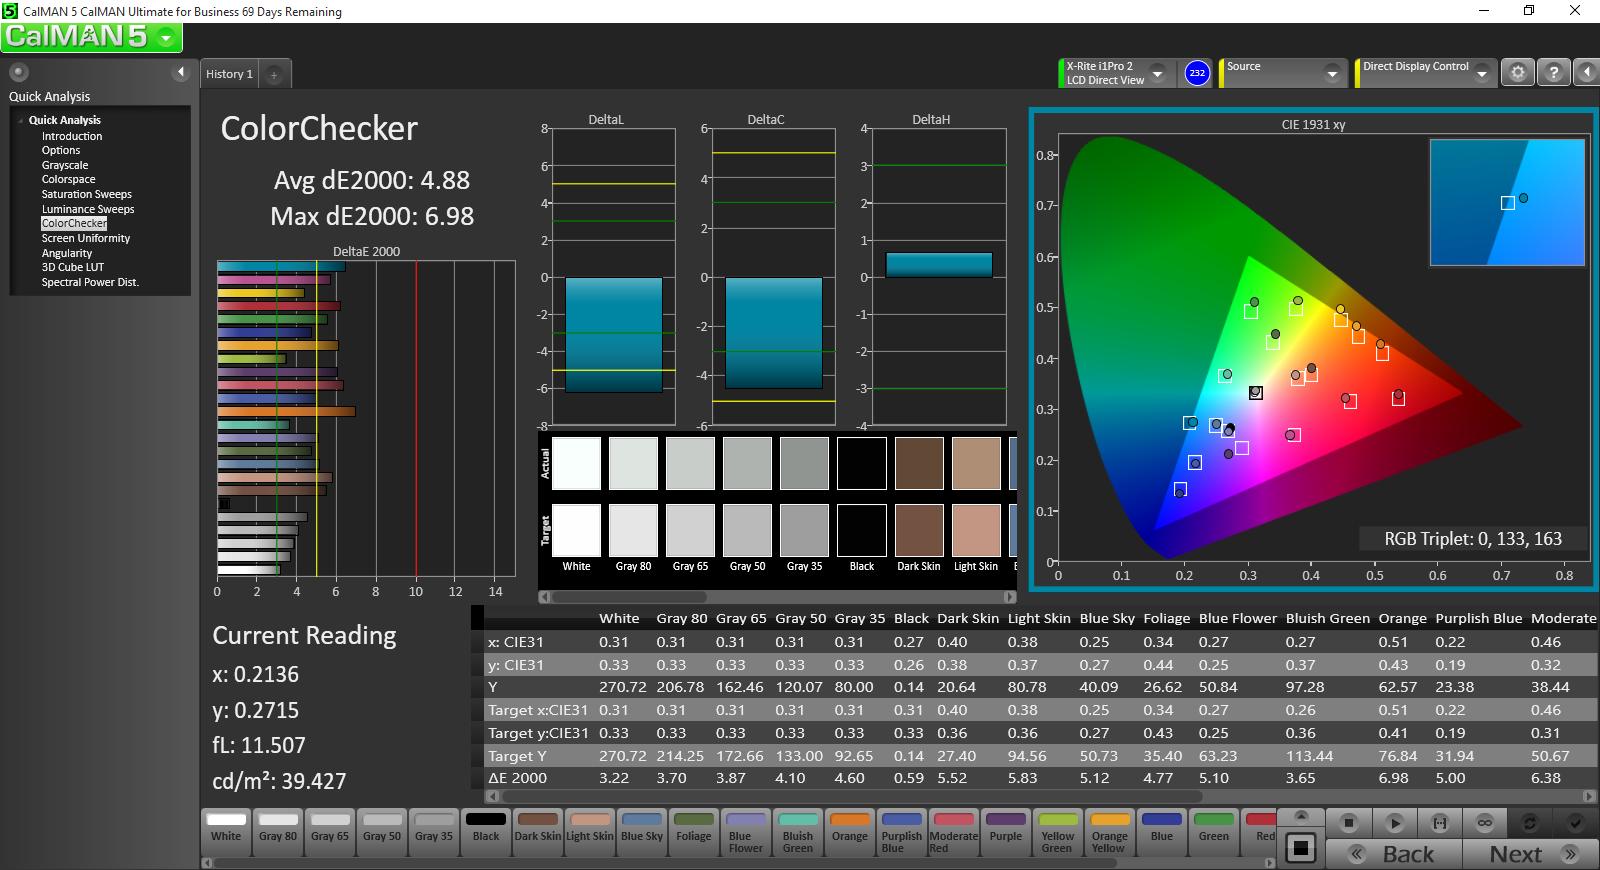
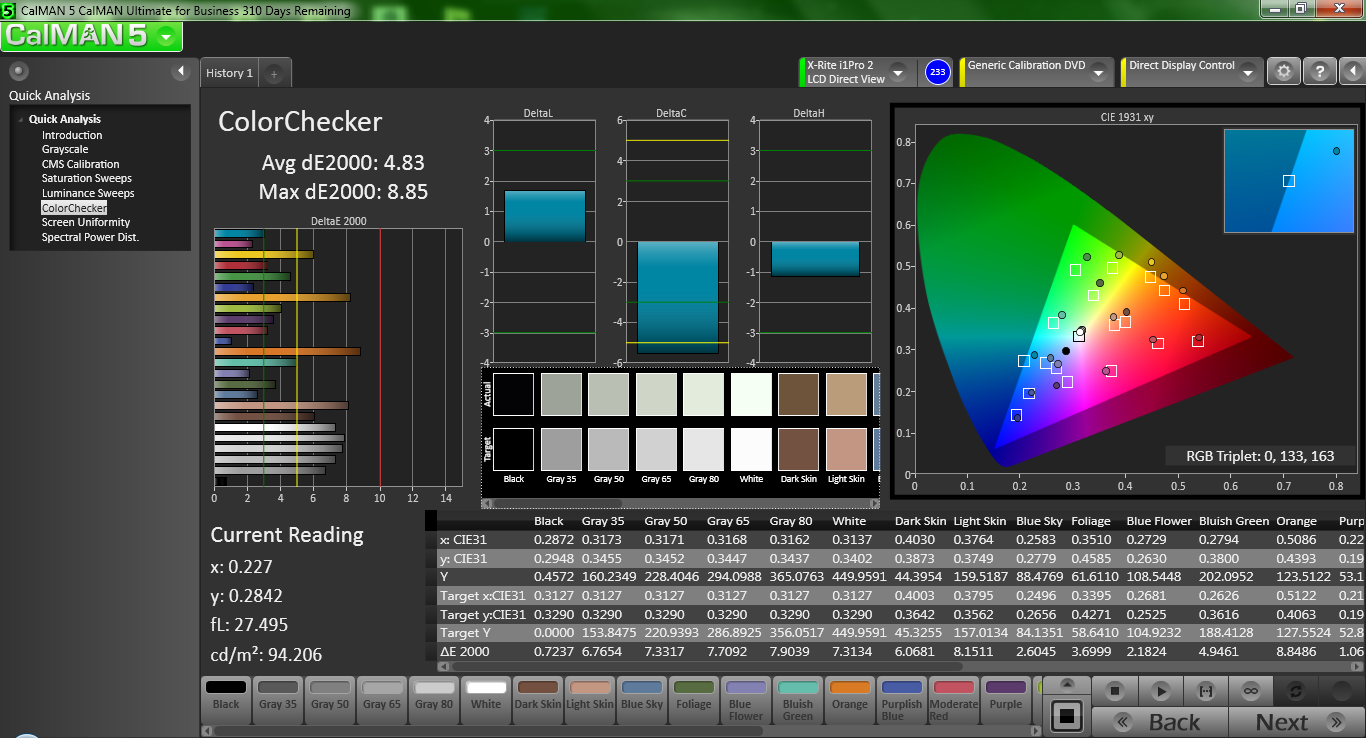
| Colorchecker dE 2000 * | 4.88 | 4.18 | 7.67 | 3.63 | 4.53 | |
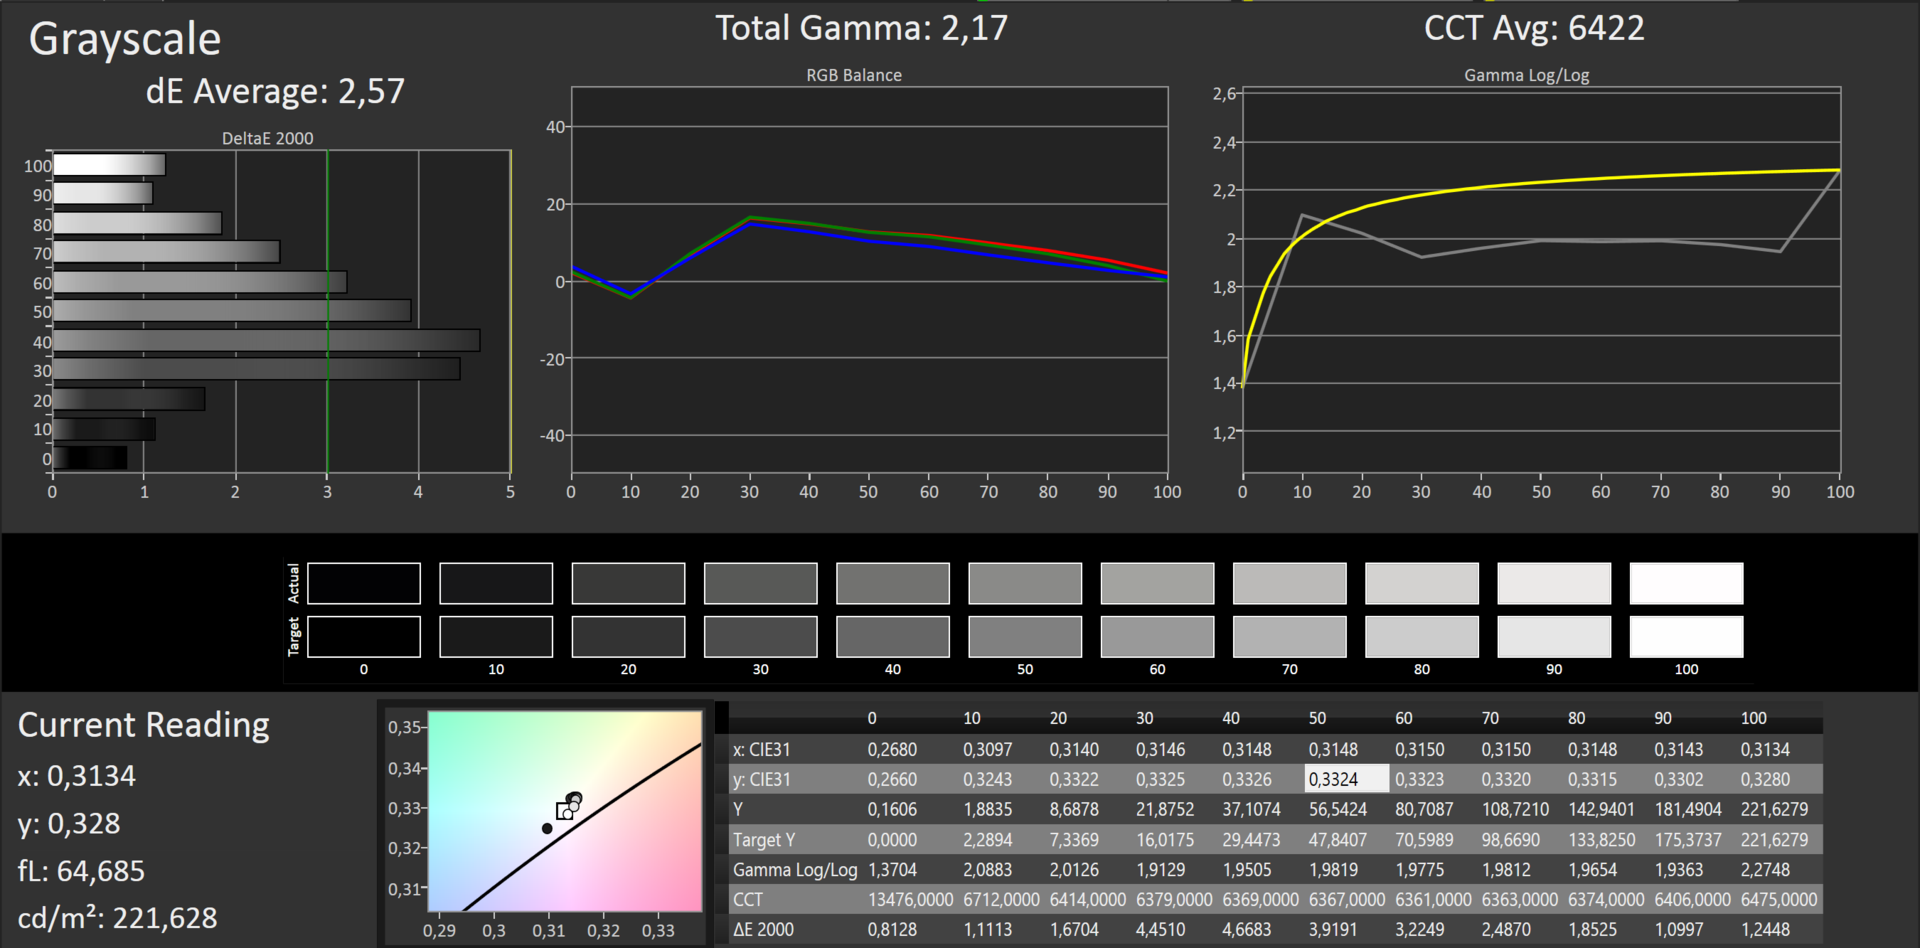
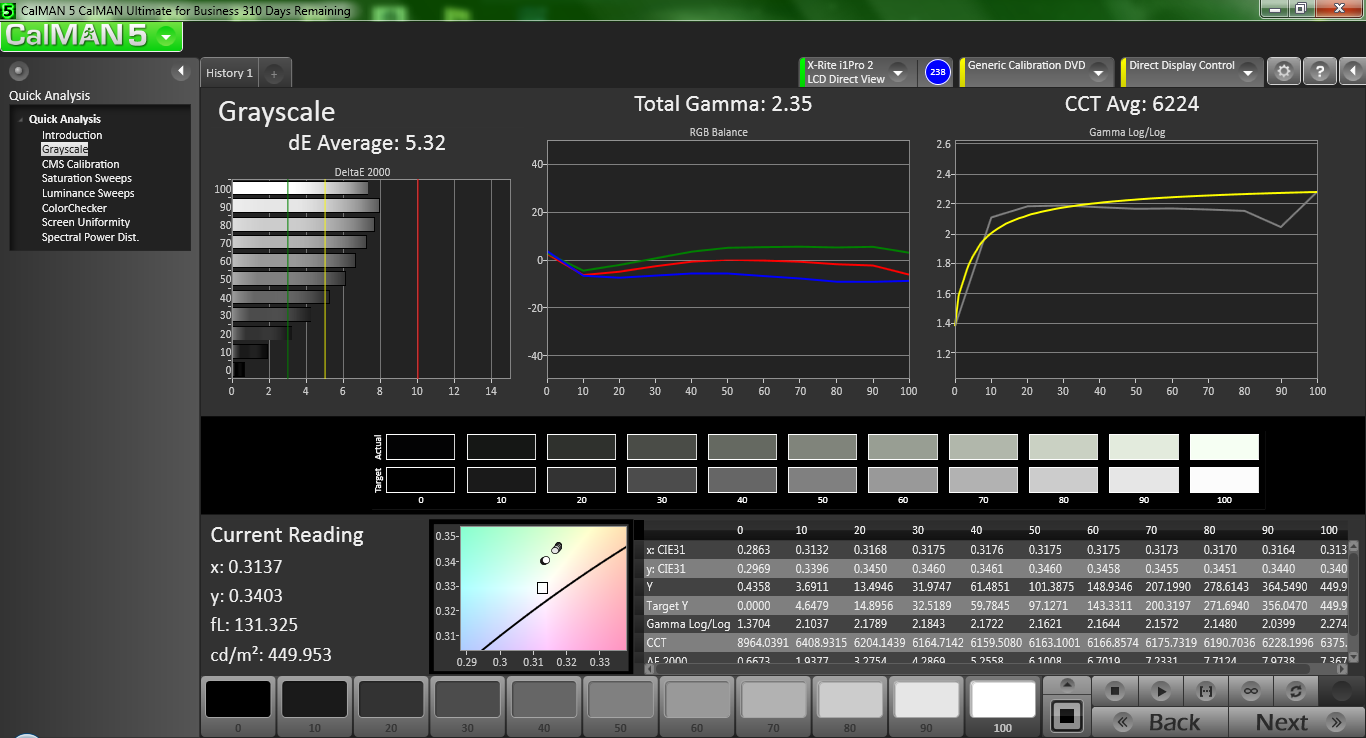
| Greyscale dE 2000 * | 4.26 | 4.94 | 4.66 | 2.57 | 5.32 | |
| Gamma | 2.59 85% | 2.31 95% | 1.65 133% | 2.17 101% | 2.35 94% | |
| CCT | 6562 99% | 7645 85% | 6502 100% | 6422 101% | 6224 104% | |
| Color Space (Percent of AdobeRGB 1998) (%) | 41.6 | 59 | 59.65 | 58 | 55.66 | |
| Color Space (Percent of sRGB) (%) | 65.79 | 92 | ||||
| Colorchecker dE 2000 max. * | 7.84 | |||||
| Total Average (Program / Settings) |
* ... smaller is better
Performance
CPU Performance
We included the XPS 13 model ranging all the way back from 2012 for a more encompassing performance comparison. Our latest XPS 13 with the Core i7-6560U Skylake CPU is just over 50 percent faster in both raw multi-threaded and single-threaded processes compared to the Core i7-2637M Sandy Bridge CPU found on our oldest XPS 13 test unit. When comparing between consecutive generations, however, CPU performance differences are largely in the single digit percentages.
We recommend checking out our dedicated CPU pages on the Core i7-6200U, i5-5200U, and i5-4200U for more benchmarks and comparisons.
| XPS 13 9350 | XPS 13 9343 | XPS 13 9333 | |
| CPU | 2.3 GHz Core i5-6200U | 2.2 GHz Core i5-5200U | 1.6 GHz Core i5-4200U |
| TDP | 15 W | 15 W | 15 W |
| RAM | 8 GB LPDDR3 1867 MHz, Dual-channel, Soldered | 4 GB DDR3L-RS 1600 Dual-channel, Soldered | 8 GB DDR3 1600 MHz, Dual-channel, Soldered |
| GPU | Intel HD Graphics 520 | Intel HD Graphics 5500 | Intel HD Graphics 4400 |
| Cinebench R10 | |
| Rendering Single CPUs 64Bit (sort by value) | |
| Dell XPS 13-9350 | |
| Dell XPS 13-9343 Non-Touch | |
| Dell XPS 13 | |
| Dell XPS 13-9333 | |
| Dell XPS 13-9343 | |
| Dell XPS 13 | |
| Rendering Multiple CPUs 64Bit (sort by value) | |
| Dell XPS 13-9350 | |
| Dell XPS 13-9343 Non-Touch | |
| Dell XPS 13 | |
| Dell XPS 13-9333 | |
| Dell XPS 13-9343 | |
| Dell XPS 13 | |
| Super Pi Mod 1.5 XS 32M - 32M (sort by value) | |
| Dell XPS 13 9350 WQXGA | |
| Dell XPS 13-9350 | |
| Dell XPS 13-9343 Non-Touch | |
| Dell XPS 13 | |
| Dell XPS 13-9333 | |
| Dell XPS 13-9343 | |
| Dell XPS 13 | |
| 3DMark | |
| 1280x720 offscreen Ice Storm Unlimited Physics (sort by value) | |
| Dell XPS 13 9350 WQXGA | |
| 1920x1080 Ice Storm Extreme Physics (sort by value) | |
| Dell XPS 13 9350 WQXGA | |
| 1280x720 Cloud Gate Standard Physics (sort by value) | |
| Dell XPS 13 9350 WQXGA | |
| Dell XPS 13-9350 | |
| Dell XPS 13 9343 Core i7 | |
| Dell XPS 13-9343 Non-Touch | |
| 1920x1080 Fire Strike Physics (sort by value) | |
| Dell XPS 13 9350 WQXGA | |
| Dell XPS 13-9350 | |
| Dell XPS 13 9343 Core i7 | |
| Dell XPS 13-9343 Non-Touch | |
| Fire Strike Extreme Physics (sort by value) | |
| Dell XPS 13 9350 WQXGA | |
| PCMark 8 | |
| Storage Score (sort by value) | |
| Dell XPS 13-9350 | |
| Dell XPS 13-9343 Non-Touch | |
| Dell XPS 13-9343 | |
| Work Score Accelerated v2 (sort by value) | |
| Dell XPS 13 9350 WQXGA | |
| Dell XPS 13-9350 | |
| Dell XPS 13 9343 Core i7 | |
| Dell XPS 13-9343 Non-Touch | |
| Dell XPS 13-9343 | |
| Creative Score Accelerated v2 (sort by value) | |
| Dell XPS 13 9350 WQXGA | |
| Dell XPS 13-9350 | |
| Dell XPS 13 9343 Core i7 | |
| Dell XPS 13-9343 Non-Touch | |
| Dell XPS 13-9343 | |
| Home Score Accelerated v2 (sort by value) | |
| Dell XPS 13 9350 WQXGA | |
| Dell XPS 13-9350 | |
| Dell XPS 13 9343 Core i7 | |
| Dell XPS 13-9343 Non-Touch | |
| Dell XPS 13-9343 | |
* ... smaller is better
GPU Performance
As expected, performance differences in graphics power are much wider between consecutive XPS 13 generations due to Intel's stronger focus on improving its integrated GPU series. 3DMark 11 shows a 145 percent rise in GPU performance from the older HD Graphics 4000 to the newer HD Graphics 520. The Iris Graphics 540 in the higher-end 9350 SKUs are even more powerful across the board.
See our dedicated GPU pages on the HD Graphics 520, HD 5500, and HD 4400 for more benchmarks and comparisons.
| 3DMark 11 - 1280x720 Performance GPU (sort by value) | |
| Dell XPS 13 9350 WQXGA | |
| Dell XPS 13-9350 | |
| Dell XPS 13 9343 Core i7 | |
| Dell XPS 13-9343 Non-Touch | |
| Dell XPS 13-9333 | |
| Dell XPS 13 L322X | |
| 3DMark | |
| 1280x720 offscreen Ice Storm Unlimited Graphics Score (sort by value) | |
| Dell XPS 13 9350 WQXGA | |
| 1920x1080 Ice Storm Extreme Graphics (sort by value) | |
| Dell XPS 13 9350 WQXGA | |
| 1280x720 Cloud Gate Standard Graphics (sort by value) | |
| Dell XPS 13 9350 WQXGA | |
| Dell XPS 13-9350 | |
| Dell XPS 13 9343 Core i7 | |
| Dell XPS 13-9343 Non-Touch | |
| Dell XPS 13 L322X | |
| 1920x1080 Fire Strike Graphics (sort by value) | |
| Dell XPS 13 9350 WQXGA | |
| Dell XPS 13-9350 | |
| Dell XPS 13 9343 Core i7 | |
| Dell XPS 13-9343 Non-Touch | |
| Dell XPS 13 L322X | |
| Fire Strike Extreme Graphics (sort by value) | |
| Dell XPS 13 9350 WQXGA | |
| Dell XPS 13 L322X | |
| Cinebench R11.5 - OpenGL 64Bit (sort by value) | |
| Dell XPS 13 9350 WQXGA | |
| Dell XPS 13-9350 | |
| Dell XPS 13 9343 Core i7 | |
| Dell XPS 13-9343 Non-Touch | |
| Dell XPS 13-9343 | |
| Dell XPS 13-9333 | |
| Dell XPS 13 L322X | |
| Cinebench R15 - OpenGL 64Bit (sort by value) | |
| Dell XPS 13 9350 WQXGA | |
| Dell XPS 13-9350 | |
| Dell XPS 13 9343 Core i7 | |
| Dell XPS 13-9343 Non-Touch | |
| Dell XPS 13-9343 | |
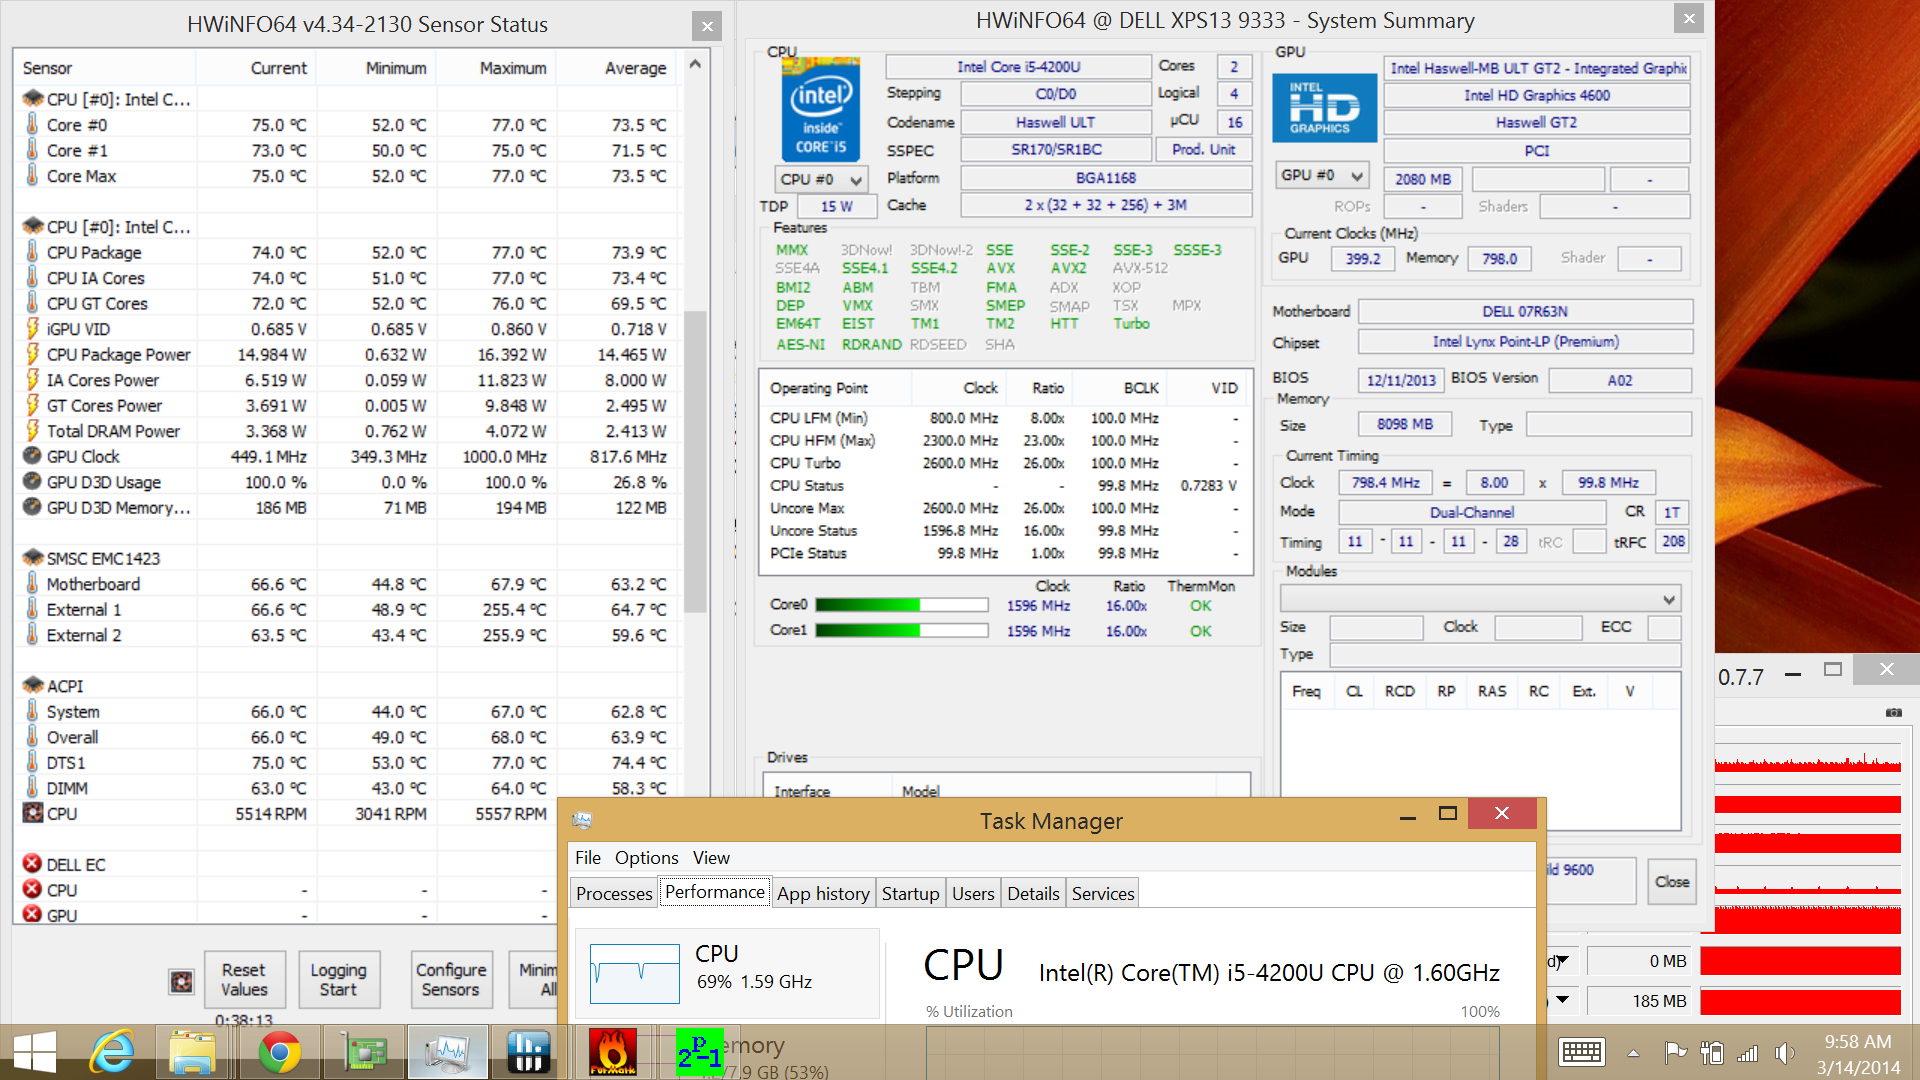
Stress Test
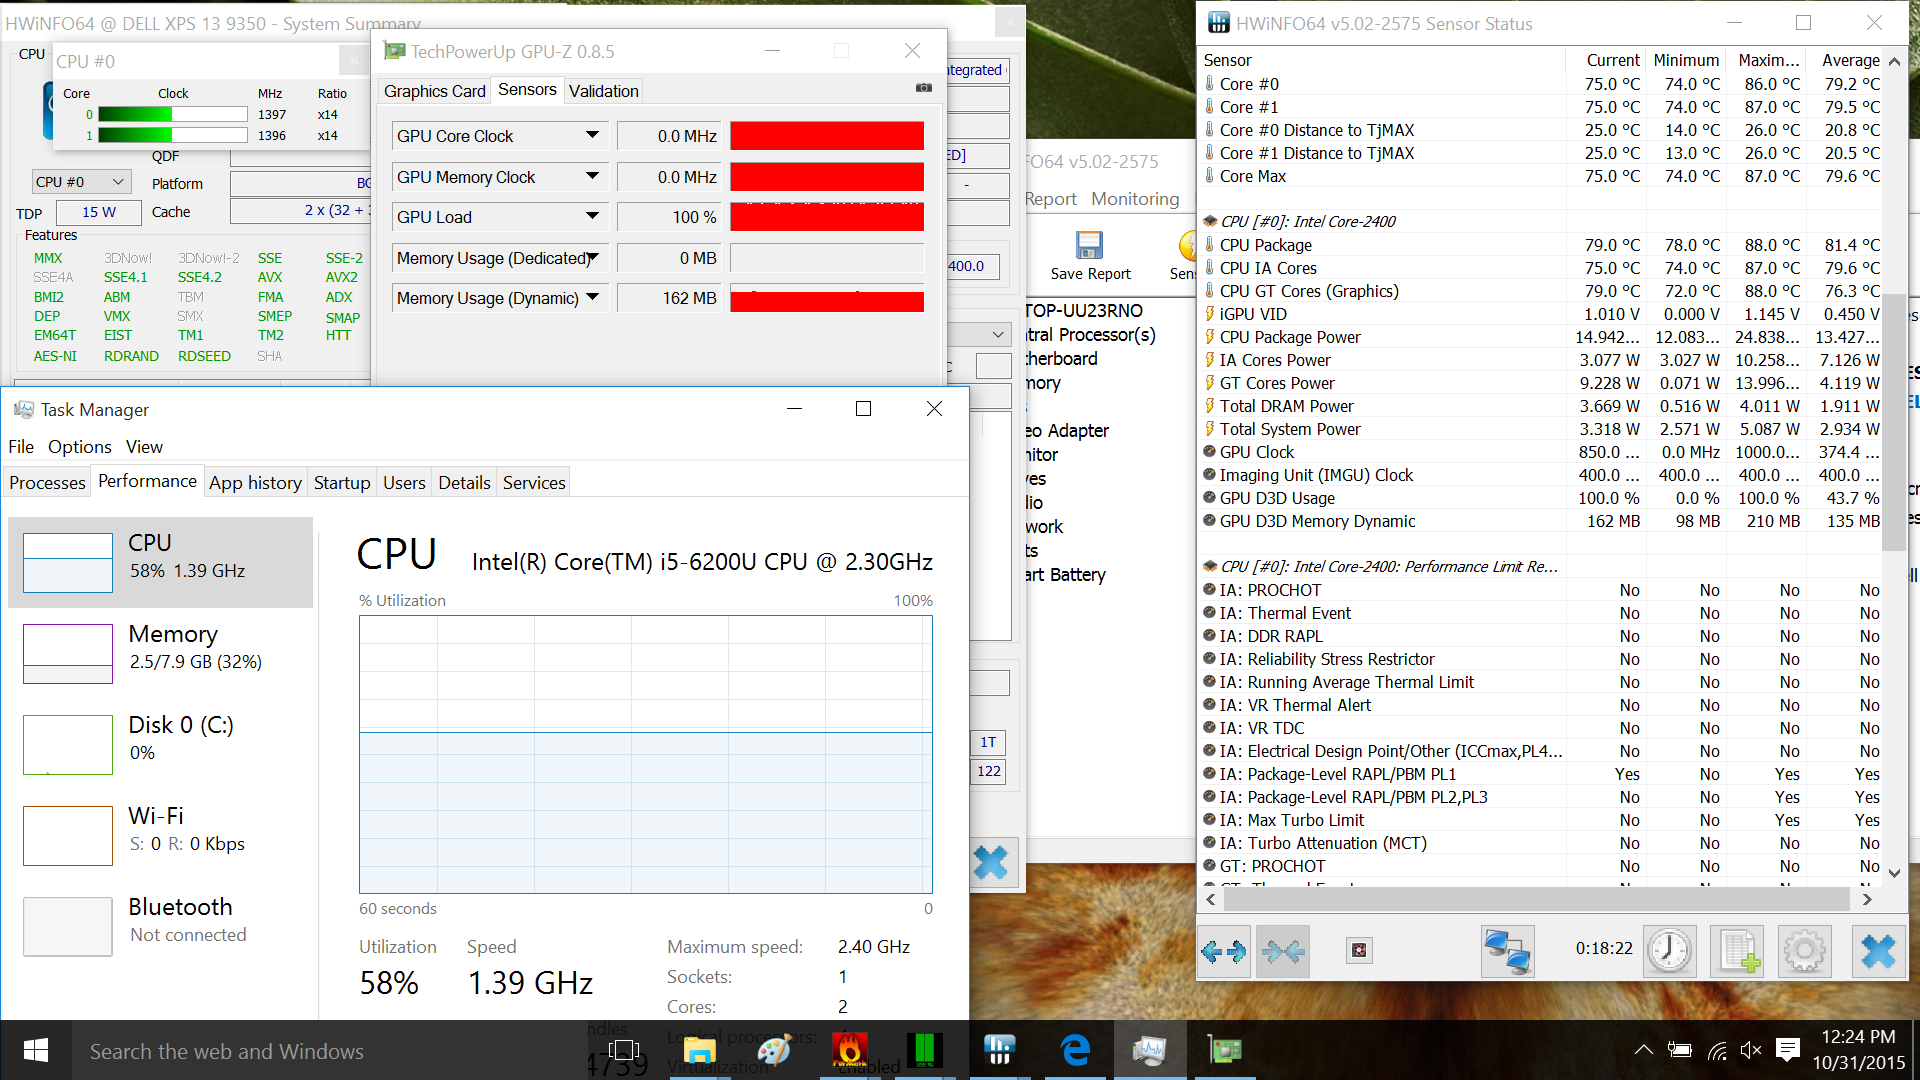
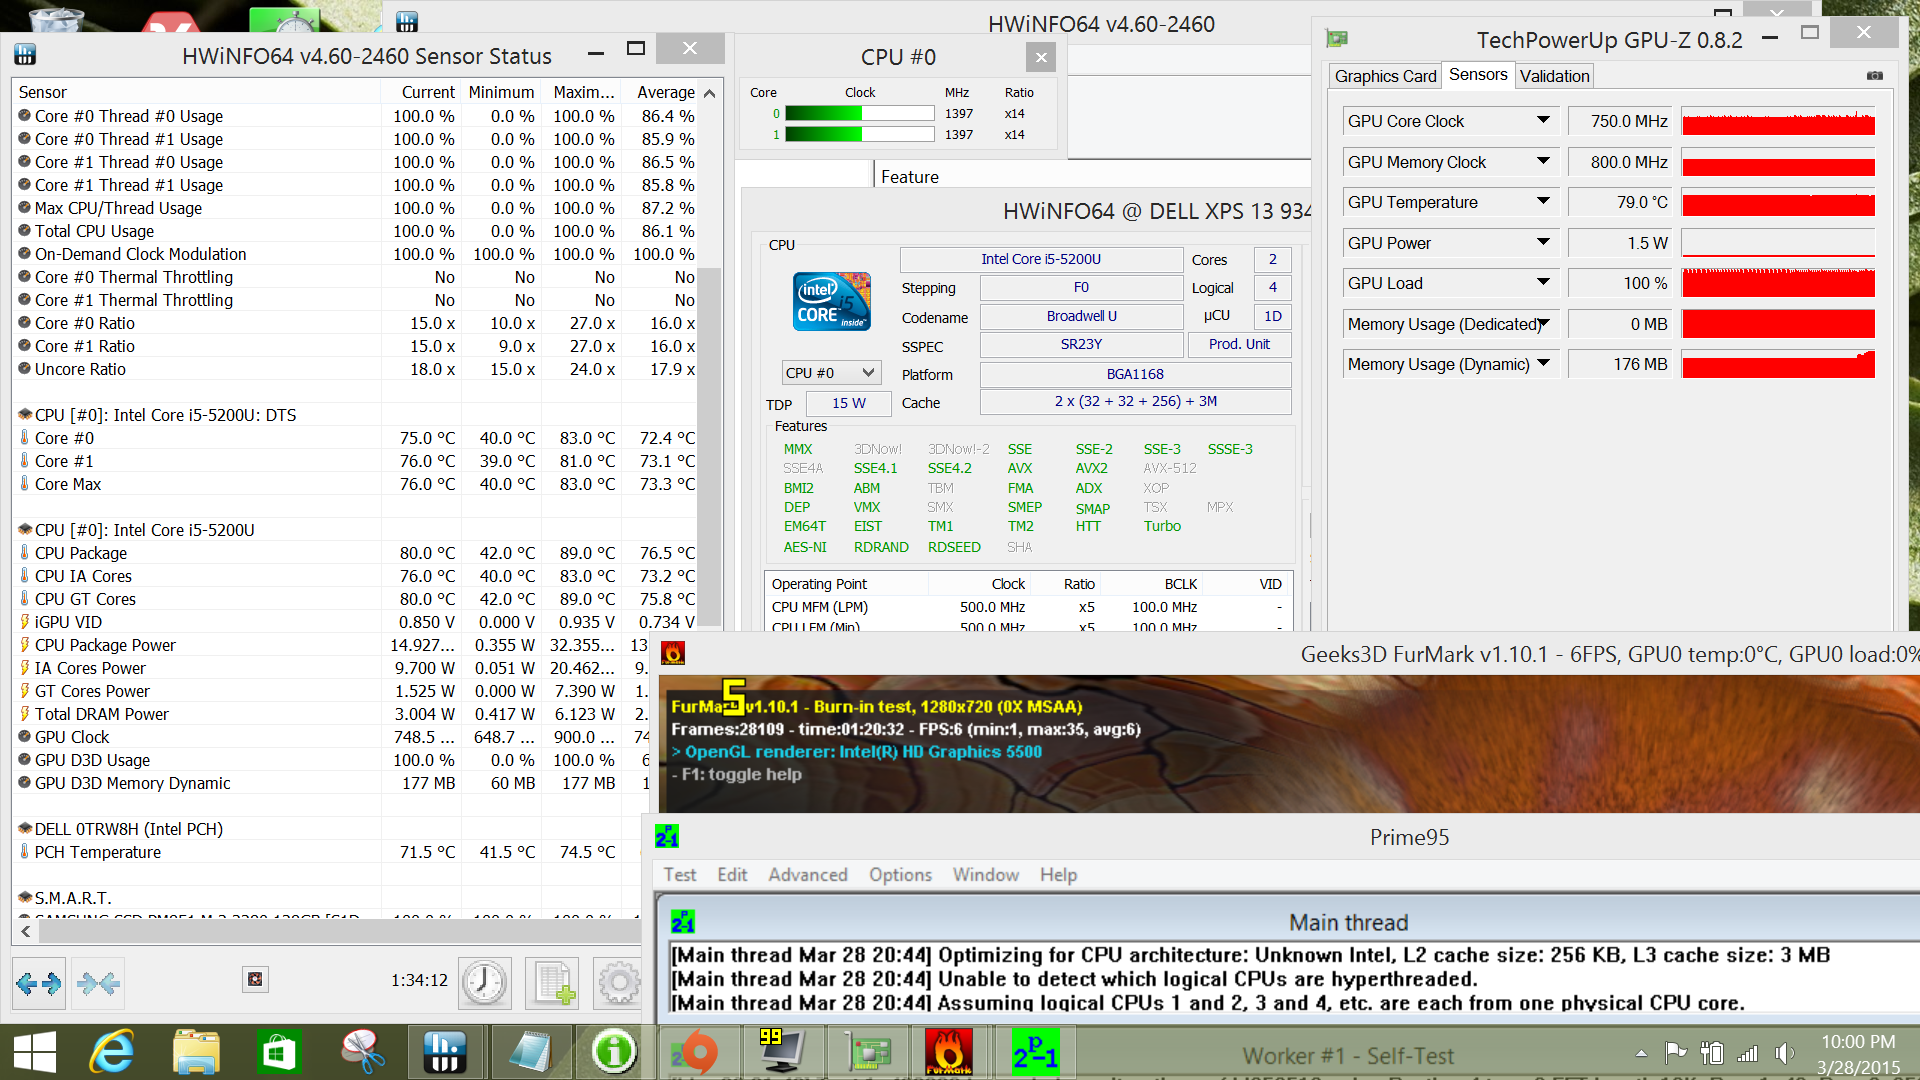
To test system stability, we run both Prime95 and FurMark to simulate maximum stress. These unrealistic conditions do not represent daily workloads, but are instead meant to put both the CPU and GPU at 100 percent capacity.
The ceiling core temperature is almost identical between the XPS 13 9350, 9343, and 9333 generations for our i5-6200U, i5-5200U, and i5-4200U configurations at about 75 C to 80 C. The CPU and GPU of each model will throttle accordingly when under extreme stress in order to maintain a steady core temperature. Processing power appears to be taking a backseat to graphics power as the CPU will throttle much more heavily than the GPU in the newer SKUs.
| XPS 13 9350 | XPS 13 9343 | XPS 13 9333 | |
| Rated GPU Core Clock (MHz) | 300 | 300 | 200 |
| Stable GPU Core Clock on FurMark (MHz) | 850 | 750 | 450 |
| Rated CPU Core Clock (GHz) | 2.3 | 2.2 | 1.6 |
| Stable CPU Core Clock on Prime95 (GHz) | 1.4 | 1.4 | 1.6 |
| Average CPU temperature | 79 C | 80 C | 74 C |
Emissions
System Noise & Temperature
Fan behavior and surface temperatures are very similar between the 9350, 9343, and 9333 series despite the chassis redesign from the 9333 to the 9343. On the 9333, however, fan noise can be as high as 44.6 dB(A) when under extreme loads compared to the low 30 dB(A) range on the 9343 and 9350. In comparison, the system fan in the much older Sandy Bridge-based XPS 13 2012 SKU tends to pulsate occasionally even during low loads and is generally louder when under higher loads. Average surface temperature is otherwise a flat trend.
| XPS 13 9350 | XPS 13 9343 | XPS 13 9333 | XPS 13 2012 | |
| Fan Noise when idling | 28.2 dB(A) | 29.1 dB(A) | 29.2 dB(A) | 29.6 - 33.9 dB(A) |
| Fan Noise under high loads | 30.2 dB(A) | 31.1 dB(A) | 31.6 - 44.6 dB(A) | 40.9 - 45.5 dB(A) |
| Average surface temperature when idling | 27.3 C | 27.3 C | 28.4 C | 28.4 |
| Average surface temperature under high loads | 34.3 C | 33.9 C | 33.0 C | 35.2 C |
| Ambient temperature | 20.5 C | 23.0 C | 21.6 C | 19.7 C |
Battery Life
Battery capacity has grown about 17 percent from the XPS 13 2012 model (47 Wh) to the latest XPS 13 9350 (56 Wh). Panel resolution and CPU, however, will have measurable impacts on runtimes based on our 9350 FHD and 9350 WQXGA (QHD+) test units. Our updated WiFi v1.3 test is also more demanding than our original WiFi v1.0 test, so the WiFi numbers below are not directly comparable.
| Dell XPS 13 9350 WQXGA 56 Wh | Dell XPS 13-9350 56 Wh | Dell XPS 13-9343 Non-Touch 54 Wh | Dell XPS 13 9343 Core i7 52 Wh | Dell XPS 13-9343 52 Wh | Dell XPS 13-9333 55 Wh | Dell XPS 13 47 Wh | |
|---|---|---|---|---|---|---|---|
| Battery runtime | |||||||
| Reader / Idle (h) | 10.1 | 13 | 21.6 | 15.2 | 16.5 | 9.4 | |
| WiFi v1.3 (h) | 5.2 | 7.5 | 10 | ||||
| Load (h) | 2.1 | 2.5 | 2.4 | 2.3 | 3.6 | 1.6 | |
| WiFi (h) | 7 | 9.7 | 7.8 | 5.2 |
Verdict
There are significant improvements between each iteration in terms of contrast level and GPU performance. Other factors such as battery life and display brightness for the later SKUs, however, are much more dependent on the choice of resolution and processor rather than the year of the model.
The jump from the 9333 to the 9343 is the largest due to the chassis update while jumping from the 9343 to the 9350 will see smaller improvements. The 9350 series is more future-proof due to its USB Type-C port that doubles as Thunderbolt 3 for video-out and docking options. It also carries NVMe for even faster SSD transfer rates compared to SATA III-based systems.
Beyond these changes, the 9333 up to the 9350 are very similar in terms of build quality, usability, temperatures, and fan noise. If the USB Type-C port is of no importance, then the 9343 offers the same experience as the 9350 on nearly all accounts.
XPS 13 9350
Price comparison
XPS 13 9343
Price comparison
XPS 13 9333
Price comparison
