Dell XPS 13 Ultrabook Review

For the original German review, see here.
We reviewed Dell's slim and light Ultrabook XPS 13 just a couple of days ago and came away impressed, which is reflected in the notebook's "very good" (88 percent) rating. This time around, we take a look at the more powerful version of the XPS 13 with Core i7 processor. If the new model does as well as its sibling is the subject of our review.
The range of small and compact notebooks is more extensive than one might think at first. The XPS 13 faces quite a few competitors, among them the Asus ZenBook UX305, the Apple MacBook Air 13 MD761D/B and HP EliteBook Folio 1040 G1.
Since the construction of the two XPS 13 models is identical, we will omit the sections on the chassis, connectivity, input devices, and speakers. Please check the review of the Core i5-version of the XPS 13 for details.
Display
The XPS 13 is equipped with a glossy 13.3-inch display, which features a native resolution of 3200 x 1800 pixels. Interestingly enough, the display of the review candidate is substantially less bright at 231,1 cd/m²; the version of the Ultrabook with Core i5 CPU reached 371.9 cd/m². The contrast ratio of 9281:1 is decent, but still trails the Core i5 version significantly (2063:1).
| |||||||||||||||||||||||||
Brightness Distribution: 82 %
Center on Battery: 232 cd/m²
Contrast: 928:1 (Black: 0.25 cd/m²)
ΔE ColorChecker Calman: 3.63 | ∀{0.5-29.43 Ø4.72}
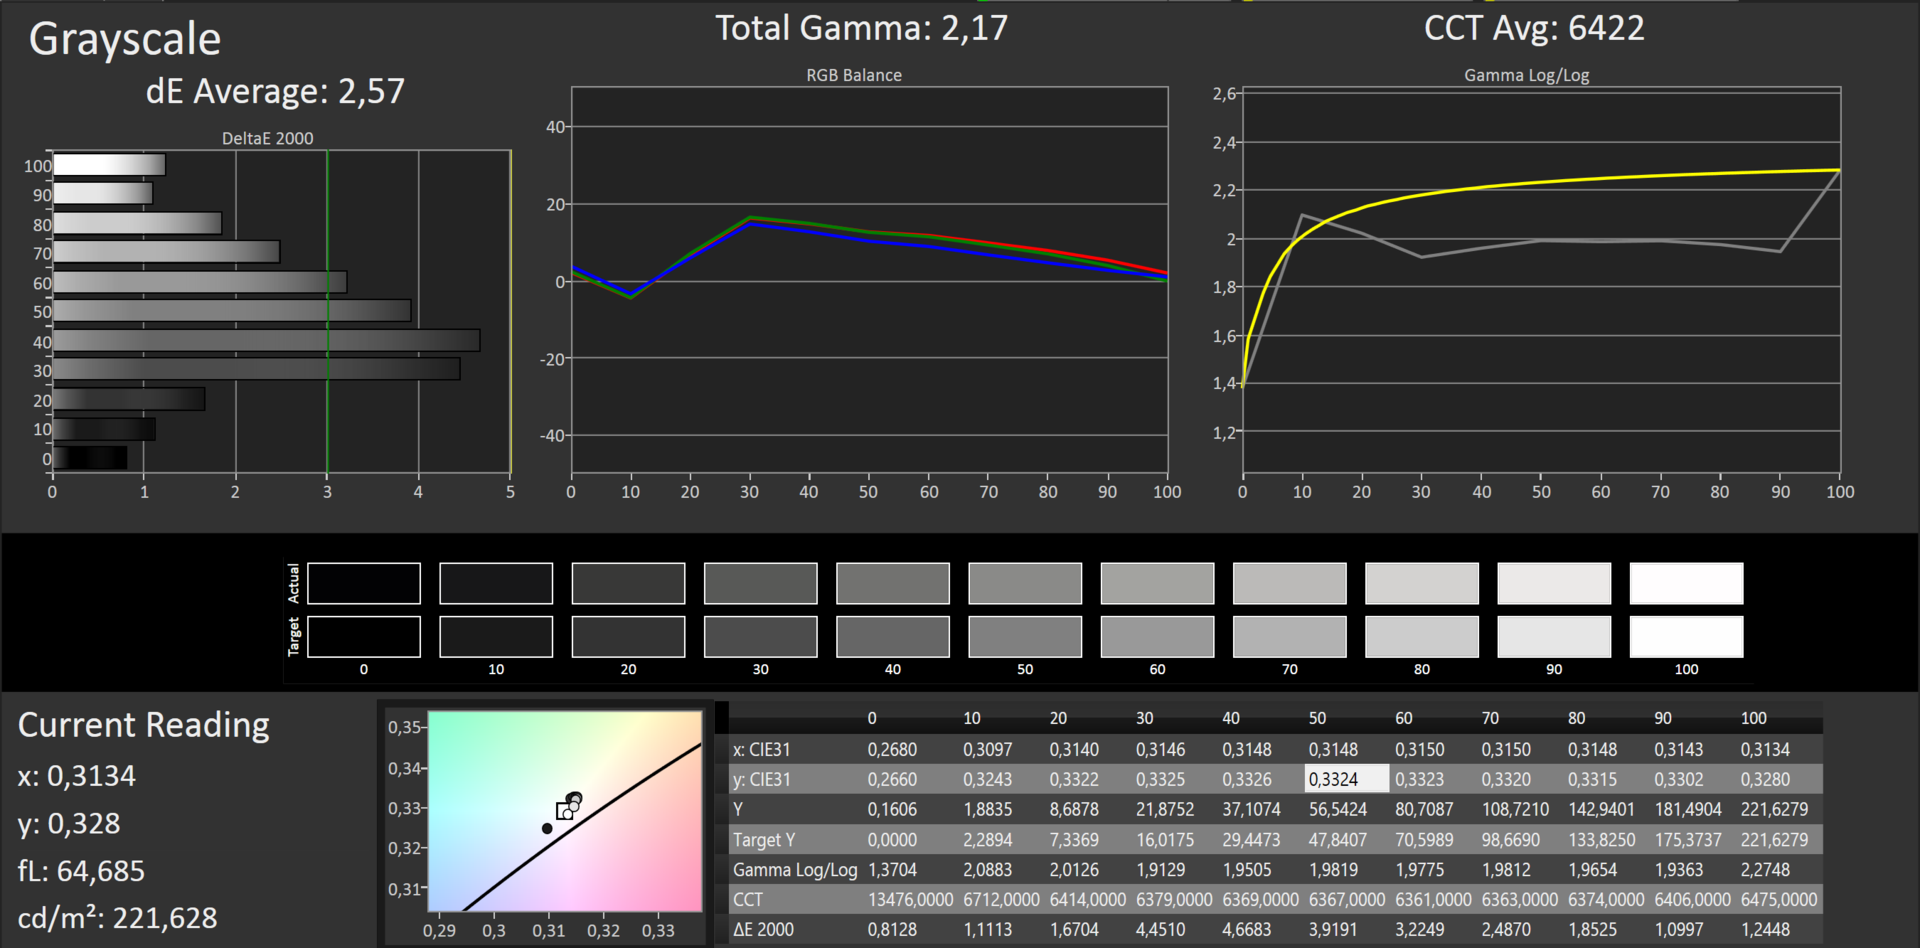
ΔE Greyscale Calman: 2.57 | ∀{0.09-98 Ø4.97}
58% AdobeRGB 1998 (Argyll 1.6.3 3D)
64.2% AdobeRGB 1998 (Argyll 3D)
89.8% sRGB (Argyll 3D)
62.6% Display P3 (Argyll 3D)
Gamma: 2.17
CCT: 6422 K
| Dell XPS 13 9343 Core i7 IPS 3200x1800 | Dell XPS 13-9343 IPS 3200x1800 | Dell XPS 13-9333 IPS 1920x1080 | Asus ZenBook UX305FA-FB003H IPS 3200x1800 | Apple MacBook Air 13 MD761D/B 2014-06 TN 1440x900 | Lenovo ThinkPad X250-20CLS06D00 IPS 1920x1080 | Asus Zenbook UX303LN-R4141H IPS 1920x1080 | HP EliteBook Folio 1040 G1 (H5F62ET) TN 1600x900 | |
|---|---|---|---|---|---|---|---|---|
| Display | 11% | -2% | -7% | -28% | 12% | -34% | ||
| Display P3 Coverage (%) | 62.6 | 72 15% | 65.1 4% | 58.2 -7% | 44.14 -29% | 72.7 16% | 40.89 -35% | |
| sRGB Coverage (%) | 89.8 | 96 7% | 84.7 -6% | 83.3 -7% | 65.8 -27% | 97.5 9% | 60.4 -33% | |
| AdobeRGB 1998 Coverage (%) | 64.2 | 71.6 12% | 61.5 -4% | 60.1 -6% | 45.71 -29% | 71.4 11% | 41.91 -35% | |
| Screen | 16% | -16% | -16% | 10% | -2% | -21% | -116% | |
| Brightness middle (cd/m²) | 232 | 367.3 58% | 450.1 94% | 310 34% | 280 21% | 397 71% | 344 48% | 282 22% |
| Brightness (cd/m²) | 231 | 372 61% | 441 91% | 309 34% | 263 14% | 357 55% | 339 47% | 259 12% |
| Brightness Distribution (%) | 82 | 77 -6% | 92 12% | 90 10% | 84 2% | 81 -1% | 88 7% | 86 5% |
| Black Level * (cd/m²) | 0.25 | 0.178 29% | 0.655 -162% | 0.75 -200% | 0.32 -28% | 0.44 -76% | 0.55 -120% | 0.65 -160% |
| Contrast (:1) | 928 | 2063 122% | 687 -26% | 413 -55% | 875 -6% | 902 -3% | 625 -33% | 434 -53% |
| Colorchecker dE 2000 * | 3.63 | 5.92 -63% | 4.53 -25% | 2.49 31% | 1.91 47% | 4.2 -16% | 5.45 -50% | 13.08 -260% |
| Greyscale dE 2000 * | 2.57 | 4.79 -86% | 5.32 -107% | 1.89 26% | 2 22% | 3.1 -21% | 4.53 -76% | 14.4 -460% |
| Gamma | 2.17 101% | 2.42 91% | 2.35 94% | 2.36 93% | 2.26 97% | 2.6 85% | 2.27 97% | 2.2 100% |
| CCT | 6422 101% | 7013 93% | 6224 104% | 6573 99% | 6724 97% | 6246 104% | 7458 87% | 19526 33% |
| Color Space (Percent of AdobeRGB 1998) (%) | 58 | 63 9% | 55.66 -4% | 54 -7% | 42 -28% | 64 10% | 39.13 -33% | |
| Color Space (Percent of sRGB) (%) | 96.4 | 83.1 | 65.5 | 97.4 | ||||
| Total Average (Program / Settings) | 14% /
14% | -9% /
-12% | -12% /
-13% | 10% /
10% | -15% /
-9% | -5% /
-12% | -75% /
-94% |
* ... smaller is better
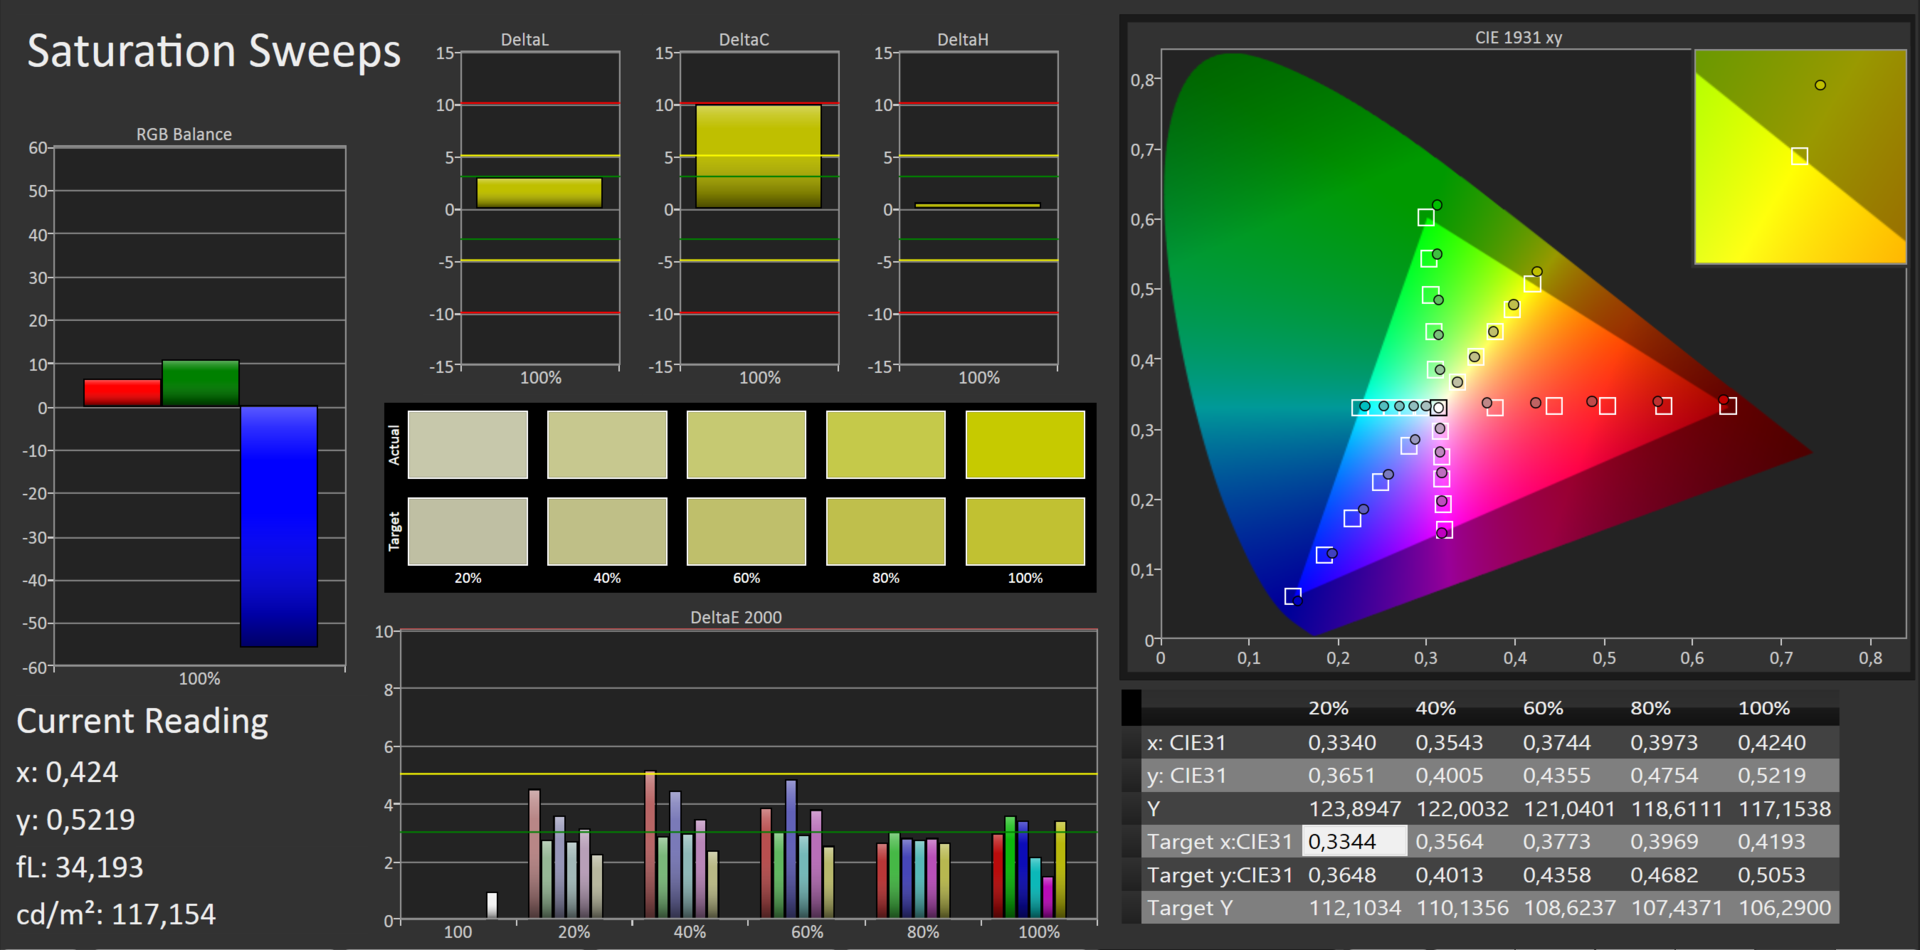
The notebook holds its own as far as the color reproduction is concerned. As shipped, the average DeltaE deviation is 3.63 and thus only slightly misses the ideal value of less than 3. The display is free of any bluish tint or hue.
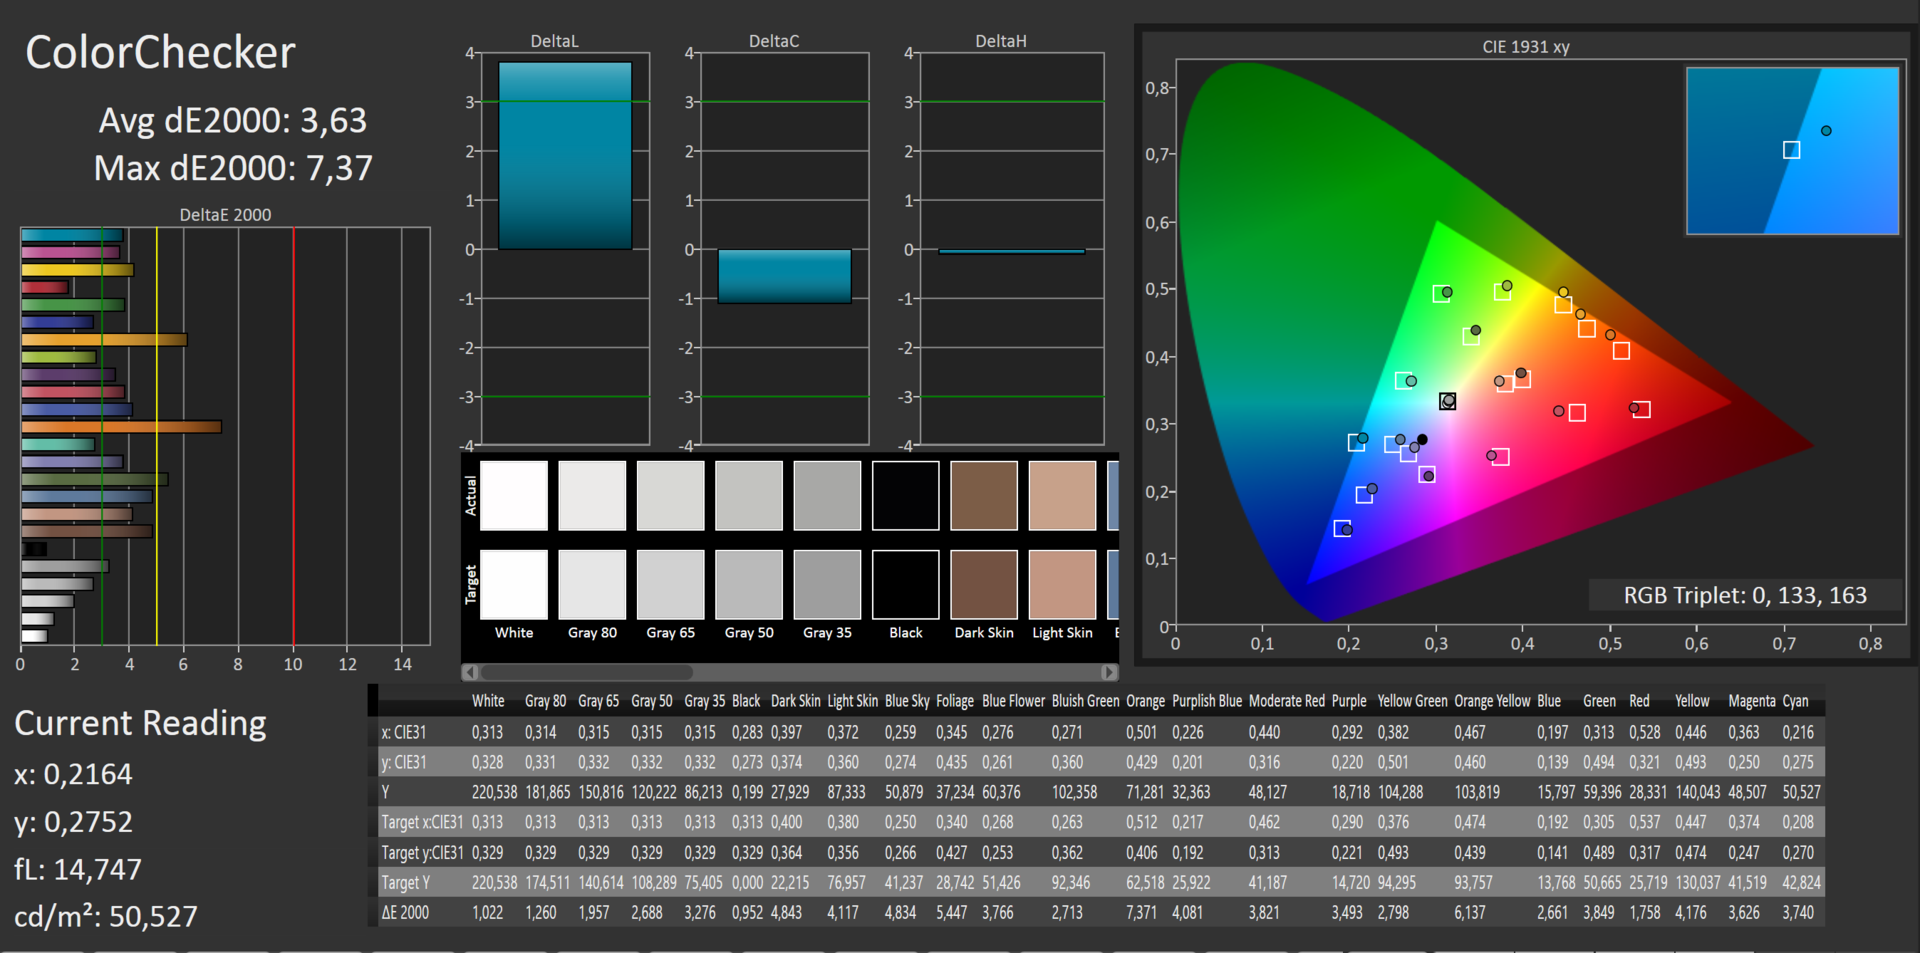
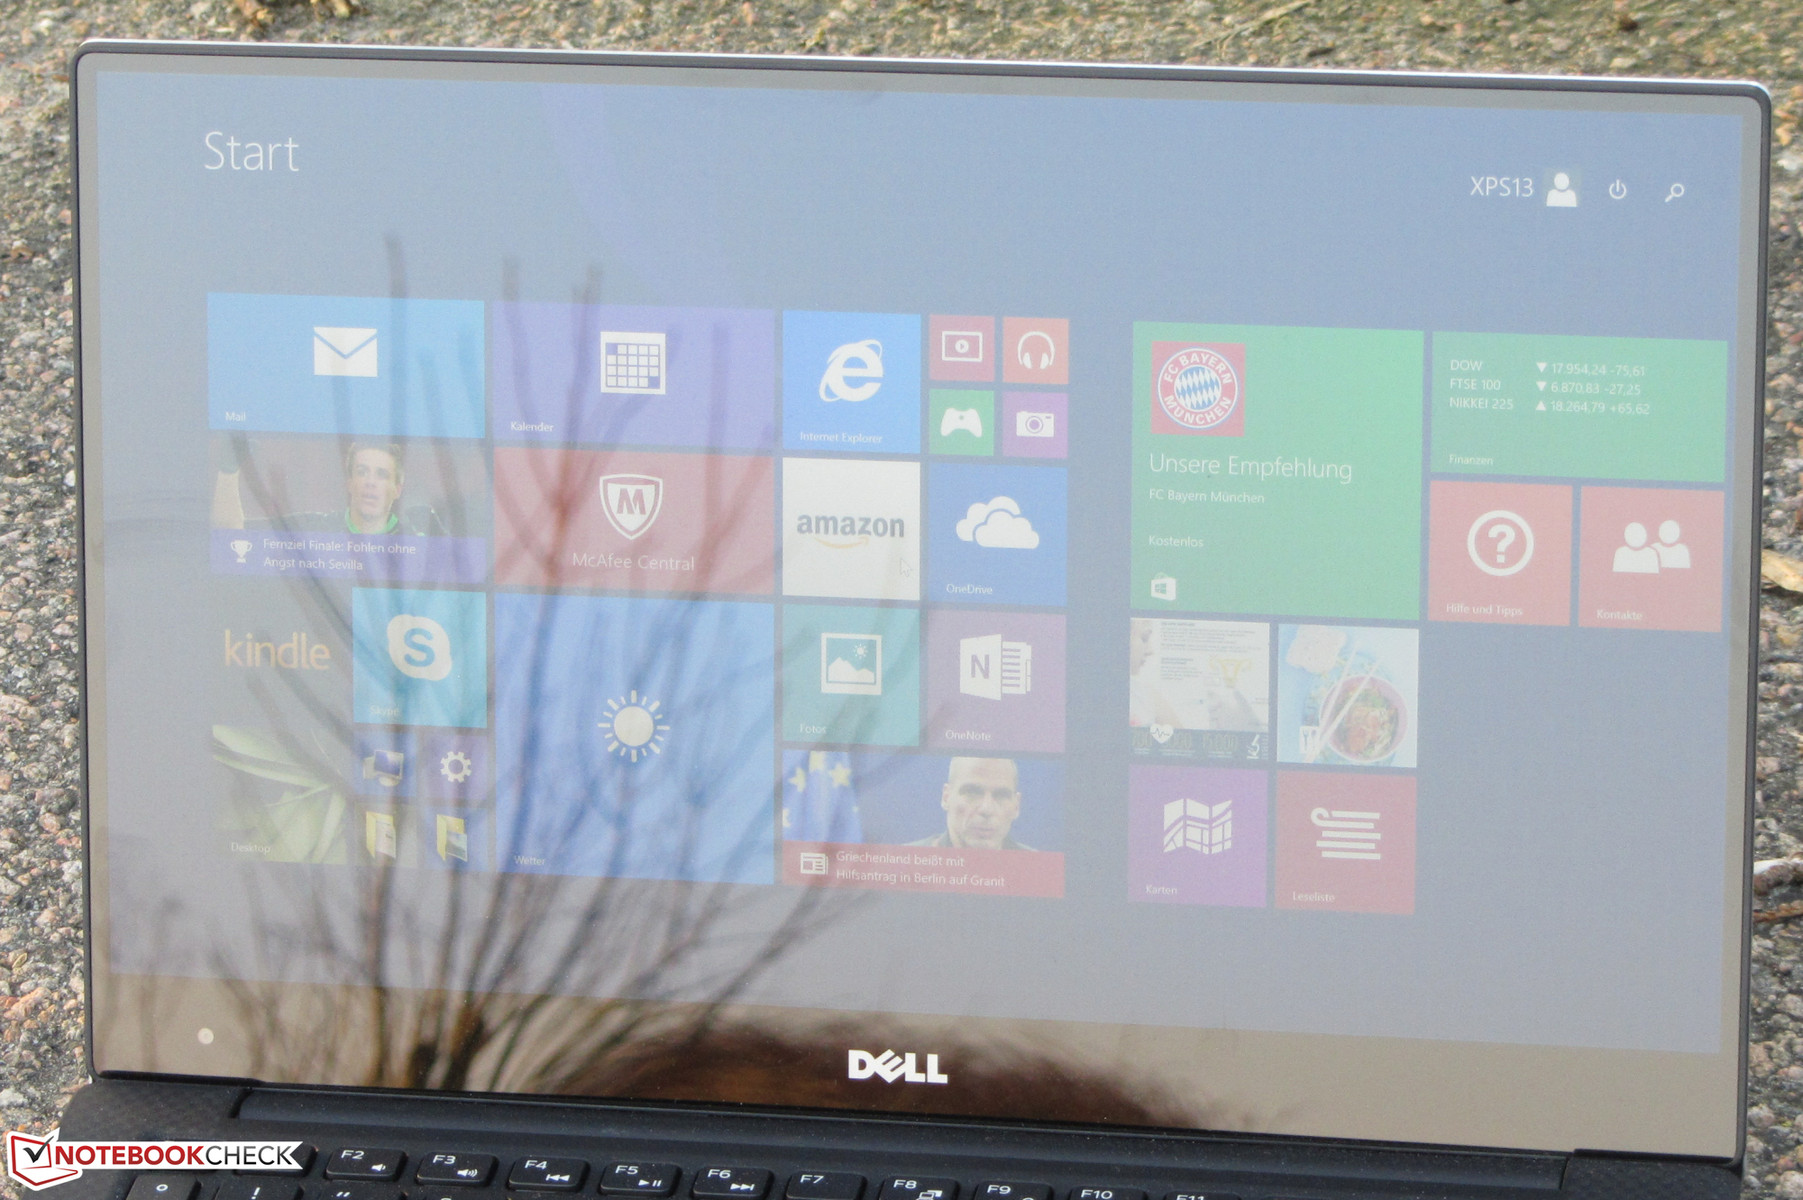
The display panel features IPS technology and is therefore easy to read regardless of the angle, but the low maximum brightness and the reflective display surface make it almost impossible to use the Ultrabook outside.
Performance
Dell's XPS 13 is a compact and mobile 13.3-inch Ultrabook. The performance is more than sufficient to handle commonly encountered daily tasks. Our review model is listed for 1399 Euro (~$1590); the version with Core i5-5200U processor is available for 1349 Euro (~$1540).
Processor
The XPS 13 is equipped with an Intel Core i7-5500U dual-core CPU (Broadwell). The processor features a core speed of 2.4 GHz but the Turbo can overclock both cores to 2.9 GHz or a single core to 3 GHz. The Cinebench CPU benchmark tests show processor speeds of 2.7 - 2.8 GHz (multi-thread) and 2.9 - 3.0 GHz (single-thread) regardless of whether the notebook is plugged in or running on battery, so the Turbo is always active.
| Geekbench 3 | |
| 32 Bit Single-Core Score (sort by value) | |
| Dell XPS 13 9343 Core i7 | |
| Lenovo ThinkPad X250-20CLS06D00 | |
| 32 Bit Multi-Core Score (sort by value) | |
| Dell XPS 13 9343 Core i7 | |
| Lenovo ThinkPad X250-20CLS06D00 | |
| Sunspider - 1.0 Total Score (sort by value) | |
| Dell XPS 13 9343 Core i7 | |
| Asus ZenBook UX305FA-FB003H | |
| Lenovo ThinkPad X250-20CLS06D00 | |
| Asus Zenbook UX303LN-R4141H | |
| Dell XPS 13-9343 | |
| Mozilla Kraken 1.1 - Total (sort by value) | |
| Dell XPS 13 9343 Core i7 | |
| Asus ZenBook UX305FA-FB003H | |
| Lenovo ThinkPad X250-20CLS06D00 | |
| Asus Zenbook UX303LN-R4141H | |
| Dell XPS 13-9343 | |
| Octane V2 - Total Score (sort by value) | |
| Dell XPS 13 9343 Core i7 | |
| Asus ZenBook UX305FA-FB003H | |
| Lenovo ThinkPad X250-20CLS06D00 | |
| Asus Zenbook UX303LN-R4141H | |
| Peacekeeper - --- (sort by value) | |
| Dell XPS 13 9343 Core i7 | |
| Lenovo ThinkPad X250-20CLS06D00 | |
* ... smaller is better
System Performance
Thanks to a speedy Solid State Disk and the powerful processor, the XPS 13 works quickly and smoothly. Windows boots very fast and the system does well in the PC Mark Benchmark tests. As expected, the Core i7-version outperforms the model with Core i5-5200U CPU. A glance at our comparison table reveals that the Lenovo Thinkpad X250 outperforms the Dell significantly despite having a CPU which is only marginally faster. The reason is the higher pixel count of the display: when we lowered the resolution to Full-HD, the PC Mark 8 benchmark results were much closer together. The Zenbook UX305 trails the XPS 13 by a substantial margin, since Asus uses a Core M CPU with a maximum speed of 2 GHz. In addition, the Dell Ultrabook features a more powerful graphics card as well.
| PCMark 8 Home Score Accelerated v2 | 2719 points | |
| PCMark 8 Creative Score Accelerated v2 | 3537 points | |
| PCMark 8 Work Score Accelerated v2 | 3412 points | |
Help | ||
| PCMark 8 - Home Score Accelerated v2 (sort by value) | |
| Dell XPS 13 9343 Core i7 | |
| Asus ZenBook UX305FA-FB003H | |
| Dell XPS 13-9343 | |
| Asus Zenbook UX303LN-R4141H | |
| Lenovo ThinkPad X250-20CLS06D00 | |
Storage Devices
The XPS 13 comes equipped with a Samsung Solid State Disk. This particular model uses the M.2 format, so swapping out the drive should be possible. The raw capacity is 256 GB with 200 GB available to the user. The transfer rates are generally right around where we would expect them to be, although the write rates are trailing the competition a little.

| Dell XPS 13 9343 Core i7 Samsung SSD PM851 | Dell XPS 13-9343 Lite-On IT L8T-256L9G | Dell XPS 13-9333 Liteonit LMT-128M6M | Asus ZenBook UX305FA-FB003H SanDisk SD7SN3Q256G1002 | Apple MacBook Air 13 MD761D/B 2014-06 Apple SSD SD0256F | Lenovo ThinkPad X250-20CLS06D00 Intel SSD Pro 2500 | Asus Zenbook UX303LN-R4141H SanDisk SD6SB1M256G1002 | HP EliteBook Folio 1040 G1 (H5F62ET) Intel SSD Pro 1500 | |
|---|---|---|---|---|---|---|---|---|
| AS SSD | 11% | -2% | 2% | -51% | -111% | 9% | -63% | |
| Seq Read (MB/s) | 515 | 484.7 -6% | 492.7 -4% | 454.5 -12% | 642 25% | 457.9 -11% | 437 -15% | 450.4 -13% |
| Seq Write (MB/s) | 233.4 | 416.8 79% | 302.2 29% | 371.6 59% | 516 121% | 258.3 11% | 427.7 83% | 222.6 -5% |
| 4K Read (MB/s) | 26.28 | 30.89 18% | 29.32 12% | 28.11 7% | 14.34 -45% | 23.41 -11% | 29.76 13% | 21.23 -19% |
| 4K Write (MB/s) | 91.7 | 58.8 -36% | 57.6 -37% | 59.4 -35% | 19.25 -79% | 14.05 -85% | 83.2 -9% | 96.3 5% |
| 4K-64 Read (MB/s) | 359 | 345.5 -4% | 294.2 -18% | 337.3 -6% | 463.6 29% | 197.3 -45% | 330 -8% | 186.5 -48% |
| 4K-64 Write (MB/s) | 181 | 268.3 48% | 249.5 38% | 204.9 13% | 201.4 11% | 82.1 -55% | 167.6 -7% | 215.2 19% |
| Access Time Read * (ms) | 0.14 | 0.069 51% | 0.078 44% | 0.084 40% | 0.237 -69% | 0.075 46% | 0.086 39% | 0.101 28% |
| Access Time Write * (ms) | 0.037 | 0.059 -59% | 0.065 -76% | 0.055 -49% | 0.184 -397% | 0.309 -735% | 0.045 -22% | 0.212 -473% |
* ... smaller is better
GPU Performance
The graphics unit HD Graphics 5500 is courtesy of Intel. The GPU supports DirectX 11.2 and reaches speeds of up to 950 MHz. The HD Graphics 5500 has access to RAM operating in dual-channel mode, so the results of the 3D benchmark tests are better than those of other notebooks equipped with the same GPU. Our review notebook also outperforms the Core i5 version, even though that model is equipped with the same graphics card. The reason: the GPU in the Core i7 XPS 13 operates at a higher speed (950 MHz vs. 900 MHz).
| 3DMark 11 Performance | 1252 points | |
| 3DMark Ice Storm Standard Score | 50151 points | |
| 3DMark Cloud Gate Standard Score | 5370 points | |
| 3DMark Fire Strike Score | 781 points | |
Help | ||
Gaming Performance
The hardware makes it possible to play some games at a lower resolution and low to medium graphics settings without any lags or stutters. The fact that the RAM operates in dual-channel mode has a positive impact, as the XPS 13 is capable of higher frame rates (+ 20 %) than notebooks with the HD Graphics 5500 and single-channel RAM.
| low | med. | high | ultra | |
|---|---|---|---|---|
| Tomb Raider (2013) | 58.2 | 30.7 | 20.4 | 9.9 |
Emissions & Energy
System Noise
Just like the Core i5 model, the i7 version is nearly inaudible during idle, as the fan usually isn't spinning at all. Under load, the fan spools up rapidly, however. During the stress test (Prime95 and Furmark are running in parallel for at least one hour), we measured a constant 43.2 dB; with Prime95 was running on its own, we initially recorded 45 dB. Within a few seconds, the noise level dropped down to 36 dB, however.
Noise level
| Idle |
| 29.6 / 29.6 / 33.2 dB(A) |
| Load |
| 43.2 / 43.2 dB(A) |
 | ||
30 dB silent 40 dB(A) audible 50 dB(A) loud |
||
min: | ||
Temperature
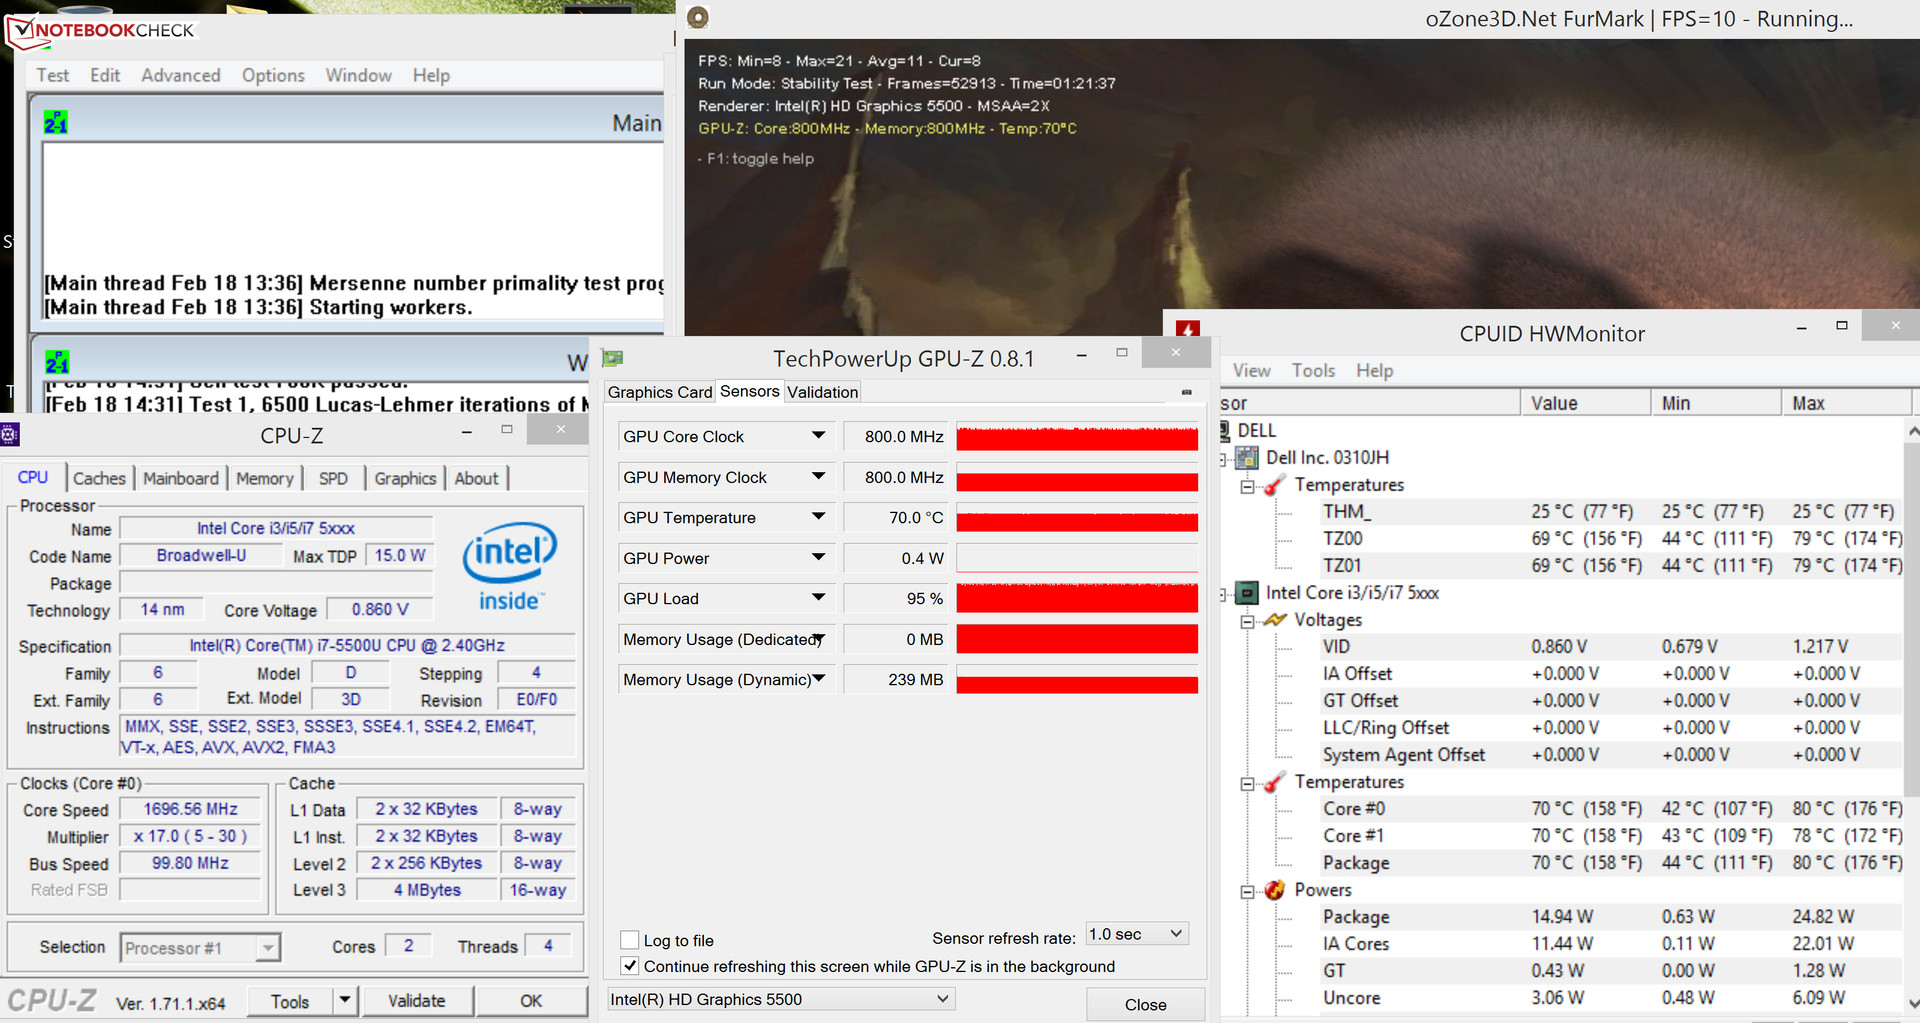
The XPS 13 handles the stress test (Prime95 and Furmark are running in parallel for at least one hour) in identical fashion no matter if its plugged in or running on battery. During the first five minutes, the processor cores fluctuate between 2.7 and 2.8 GHz and the GPU runs at full speed (950 Mhz). After that, the CPU cores drop to 1.6 to 1.7 GHz and the GPU to between 800 and 850 MHz. Heat is not a problem: during the stress test, only one area of the chassis near the fan exceeded 40 degrees C.
(±) The maximum temperature on the upper side is 43.4 °C / 110 F, compared to the average of 35.9 °C / 97 F, ranging from 21.4 to 59 °C for the class Subnotebook.
(+) The bottom heats up to a maximum of 37 °C / 99 F, compared to the average of 39.2 °C / 103 F
(+) In idle usage, the average temperature for the upper side is 24.1 °C / 75 F, compared to the device average of 30.8 °C / 87 F.
(+) The palmrests and touchpad are cooler than skin temperature with a maximum of 29.2 °C / 84.6 F and are therefore cool to the touch.
(±) The average temperature of the palmrest area of similar devices was 28.2 °C / 82.8 F (-1 °C / -1.8 F).
Power Consumption
The power consumption during idle is comparatively high at 6.6 to 11 watts. The Asus Zenbook UX303LN-R4141H, which is equipped with a previous-generation Haswell Core i7 processor, is proof that a lower power consumption is possible. Under full load (stress test, Prime95 and Furmark running), the XPS 13 is only marginally more power-hungry than under medium load levels (3DMark 06 running), since both the CPU and the GPU are throttled.
| Off / Standby | |
| Idle | |
| Load |
|
Key:
min: | |
Battery Life
During the practically relevant WLAN test we use a script that loads a different website every 40 seconds. The power saver profile is active, and the display brightness is reduced to about 150 cd/m². Under these conditions, the XPS 13 shut down after 7 hours and 1 minute. While this is not a bad result, the Core i5 model we tested lasted 9 hours and 40 minutes - so significantly longer. We re-ran the test with power saver profile, the Dell profile and used Google Chrome as well, but the results did not change at all. Users who require longer run times on battery are better off with the Core i5 version of the notebook.
Verdict
With the XPS 13, Dell introduced a very compelling mobile 13.3-inch Ultrabook - but of course at a price. The input devices are very good and the notebook with its fast SSD is capable of very good overall performance. In addition, the temperatures are well controlled and the XPS 13 is barely audible under normal circumstances. The high-end chassis made out of aluminum and carbon is also worth mentioning. Our review notebook is equipped with a Core i7 processor and therefore offers better performance than the Core i5 version we took a look at recently. The performance gain comes with a penalty, however: the battery life is not nearly as good. Users who don't need the additional processing power should probably stick with the Core i5 XPS 13. The display is disappointing, since the QHD+ panel is neither as bright nor offers the same contrast as the panel in the Core i5 model.