Dell XPS 13 9345 Snapdragon X Elite review: Undercutting the Intel Core Ultra 7

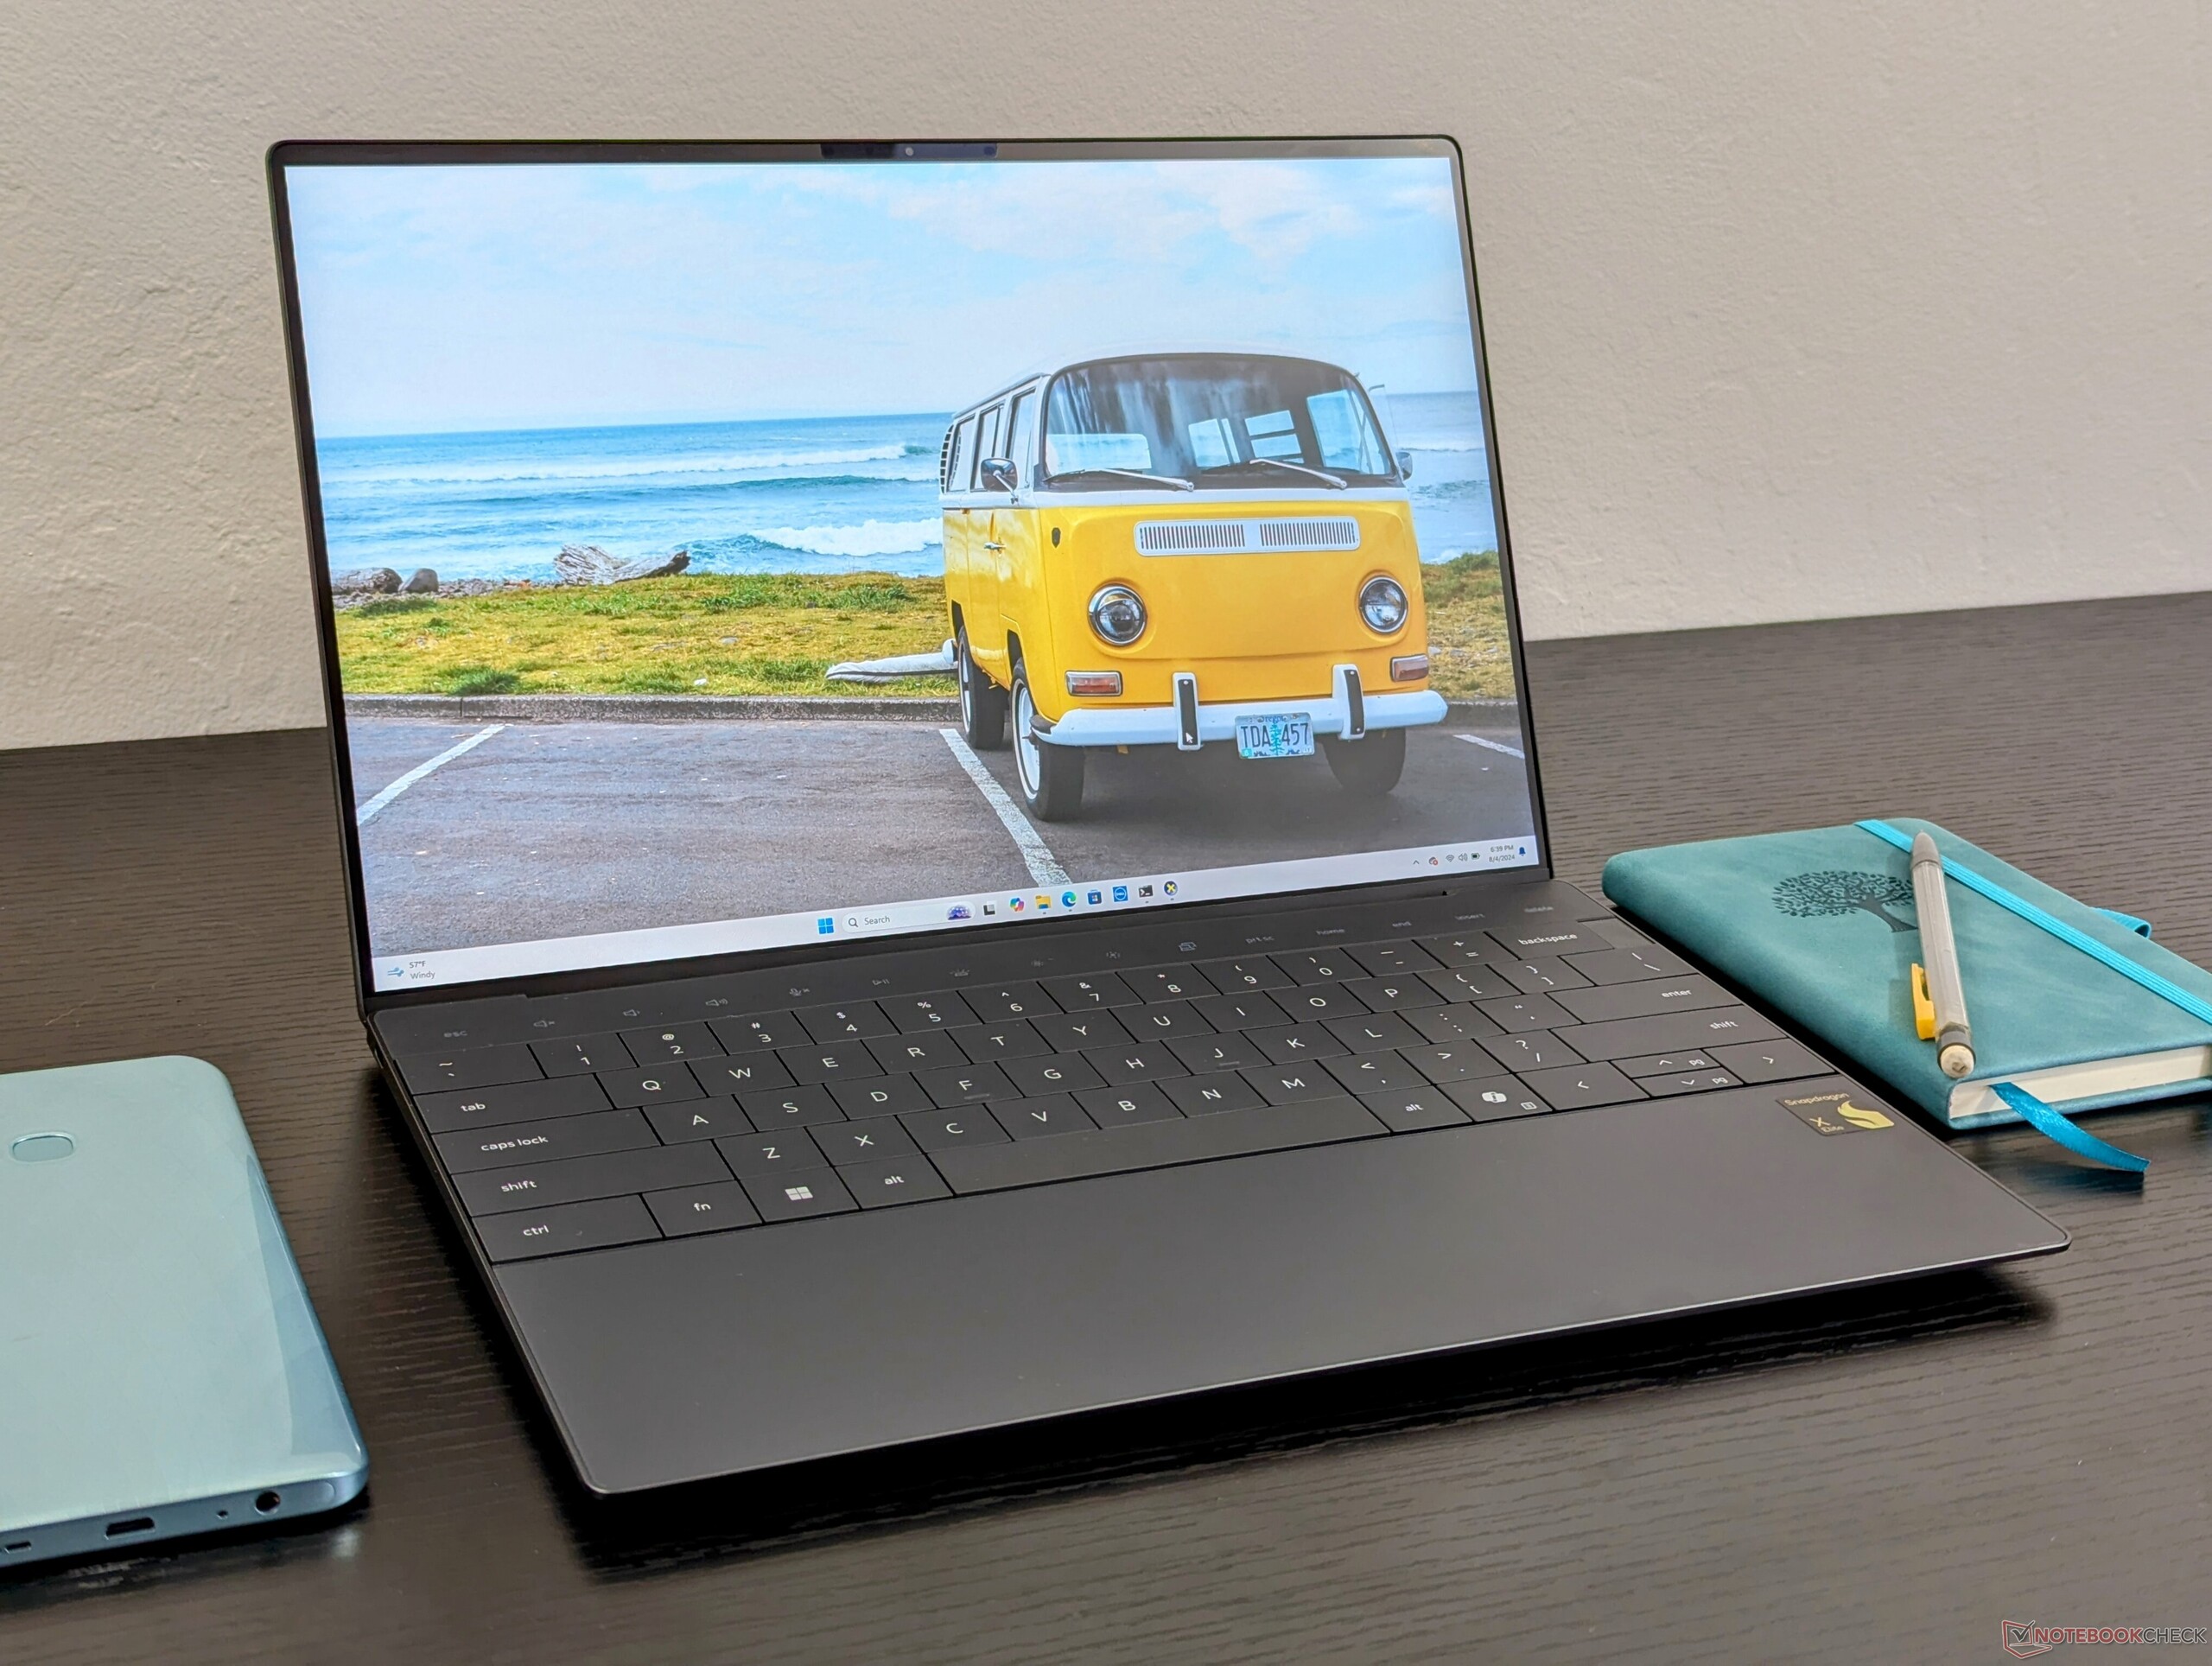
What better way to show off your processor than to debut it on one of Dell's most popular consumer laptops? The XPS 13 Plus 9320/9340 chassis has been repurposed with the latest Snapdragon X Elite CPU to be amongst the small handful of Qualcomm-powered Windows laptops releasing this year. Called the XPS 13 9345, the Snapdragon model is otherwise visually identical to the existing XPS 13 Plus 9320 or 9340 with traditional Intel CPUs.
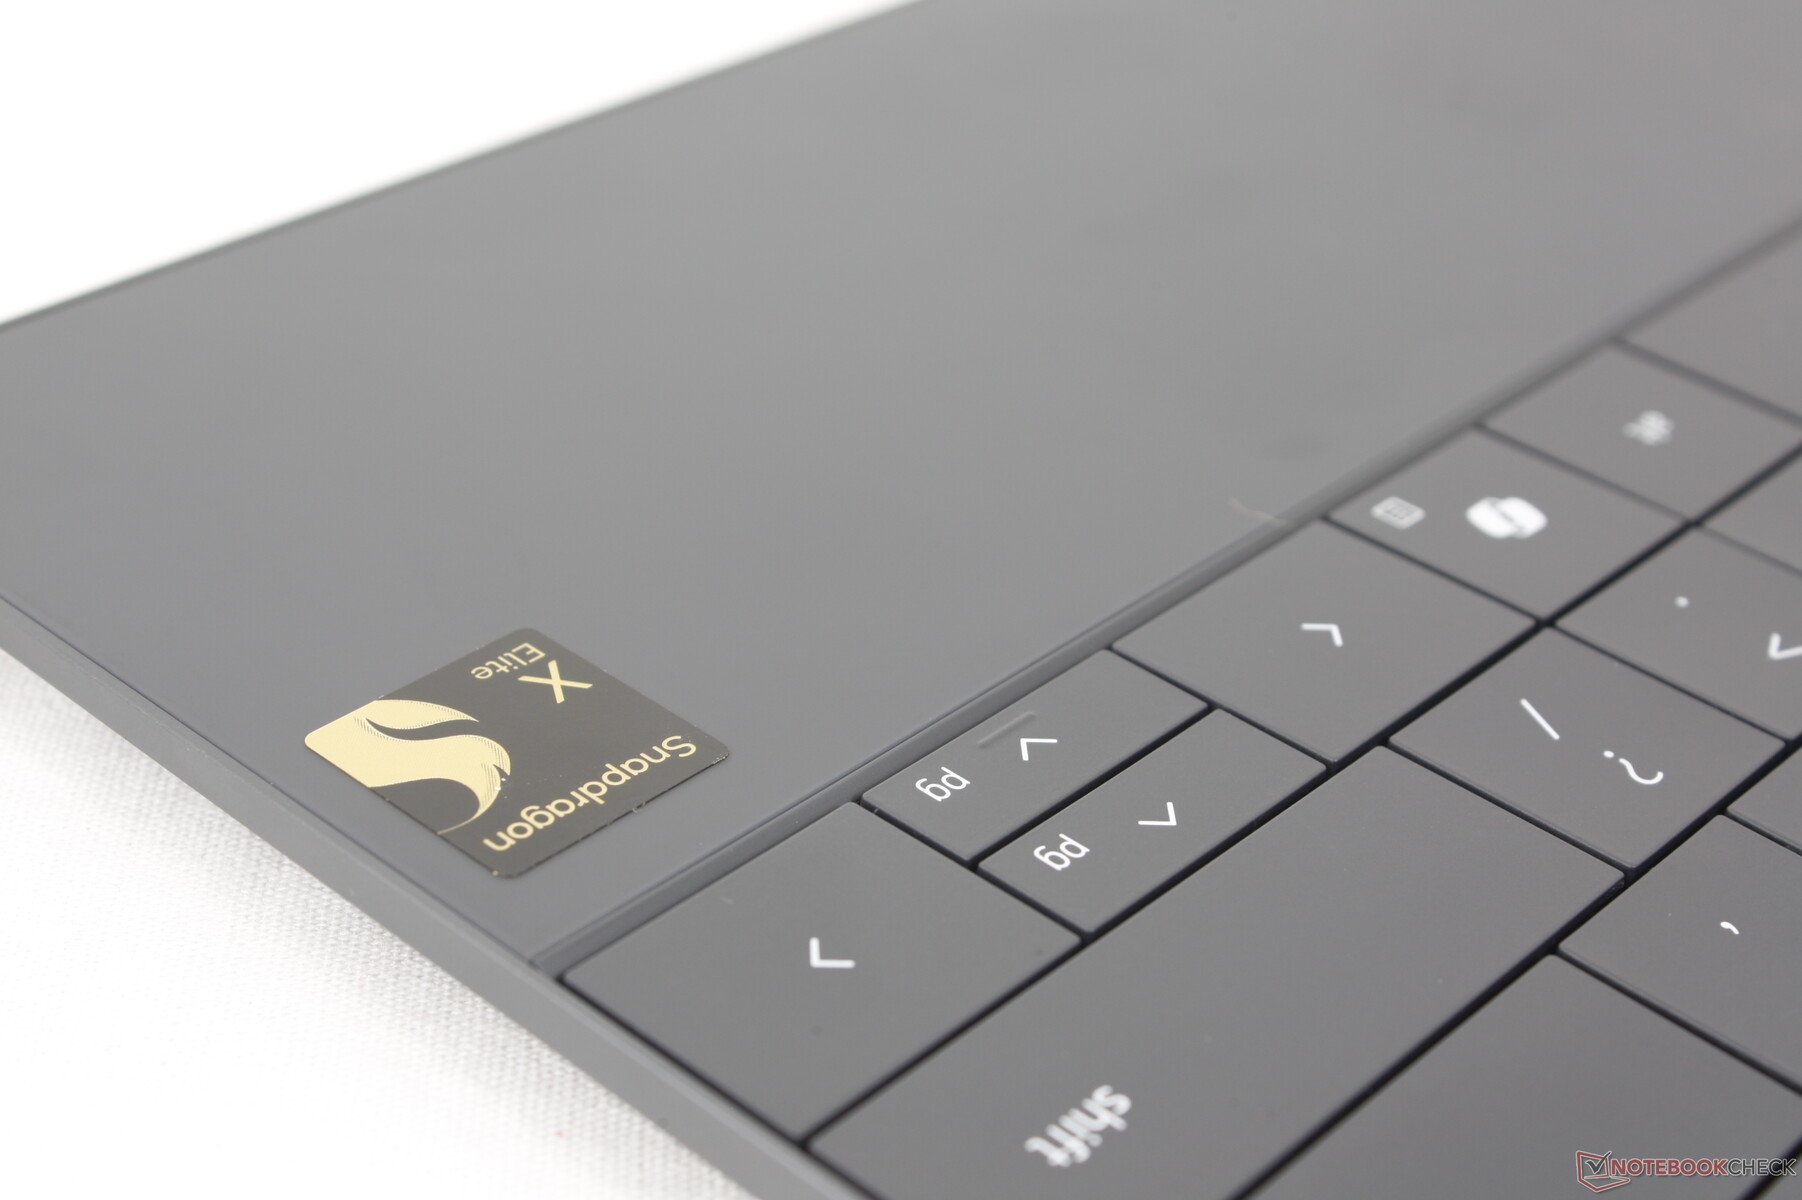
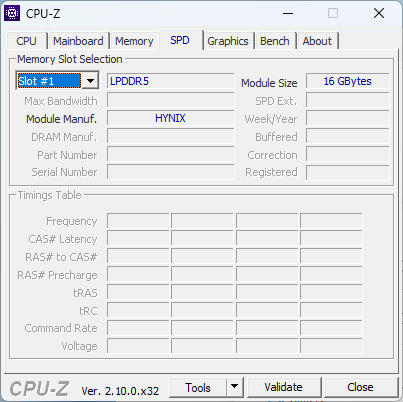
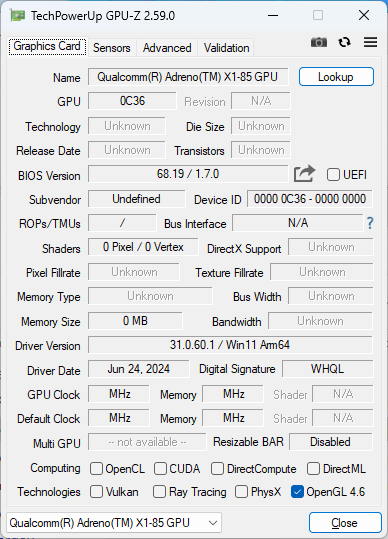
Our review configuration comes equipped with the Snapdragon X1 Elite X1E-80-100, 16 GB LPDDR5X-8448 RAM, and 1200p 120 Hz IPS display for approximately $1300 USD. Higher-end OLED panels are available and some regions may include a second Snapdragon X1 Plus X1P processor option, but the integrated GPU remains the same across the board.
Alternatives to the XPS 13 9345 include the Microsoft Surface Pro or Samsung Galaxy Book4 Edge 16 both powered by the same Snapdragon X1 Elite X1E-80-100 processor. Of course, it also directly competes with more conventional 13-inch and 14-inch office subnotebooks like the Lenovo ThinkBook 13x G4, Asus ZenBook S13, or Dell's own XPS 13 9340.
More Dell reviews:
Potential Competitors in Comparison
Rating | Version | Date | Model | Weight | Height | Size | Resolution | Price |
|---|---|---|---|---|---|---|---|---|
| 84.5 % | v8 | 08 / 2024 | Dell XPS 13 9345 SD X Elite X1E-80-100, Adreno X1-85 3.8 TFLOPS | 1.2 kg | 15.3 mm | 13.40" | 1920x1200 | |
| 86.5 % v7 (old) | v7 (old) | 05 / 2024 | Dell XPS 13 9340 Core Ultra 7 Ultra 7 155H, Arc 8-Core | 1.2 kg | 15.3 mm | 13.40" | 1920x1200 | |
| 86.2 % | v8 | 07 / 2024 | Microsoft Surface Laptop 7 13.8 Copilot+ SD X Elite X1E-80-100, Adreno X1-85 3.8 TFLOPS | 1.3 kg | 17.5 mm | 13.80" | 2304x1536 | |
| 90.1 % v7 (old) | v7 (old) | 05 / 2024 | Lenovo ThinkBook 13x G4 21KR0008GE Ultra 5 125H, Arc 7-Core | 1.2 kg | 12.9 mm | 13.50" | 2880x1920 | |
| 82.3 % | v8 | 07 / 2024 | HP EliteBook Ultra G1q 14 SD X Elite X1E-78-100, Adreno X1-85 3.8 TFLOPS | 1.3 kg | 11.2 mm | 14.00" | 2240x1400 | |
| 85.4 % v7 (old) | v7 (old) | 05 / 2023 | Asus ZenBook S13 OLED UX5304 i7-1355U, Iris Xe G7 96EUs | 1 kg | 11.8 mm | 13.30" | 2880x1800 |
Hinweis: Wir haben unser Rating-System kürzlich aktualisiert und die Ergebnisse von Version 8 sind nicht mit den Ergebnissen von Version 7 vergleichbar. Weitere Informationen dazu sind hier verfügbar.
Note: We have recently updated our rating system and the results of version 8 are not comparable with the results of version 7. More information is available here .
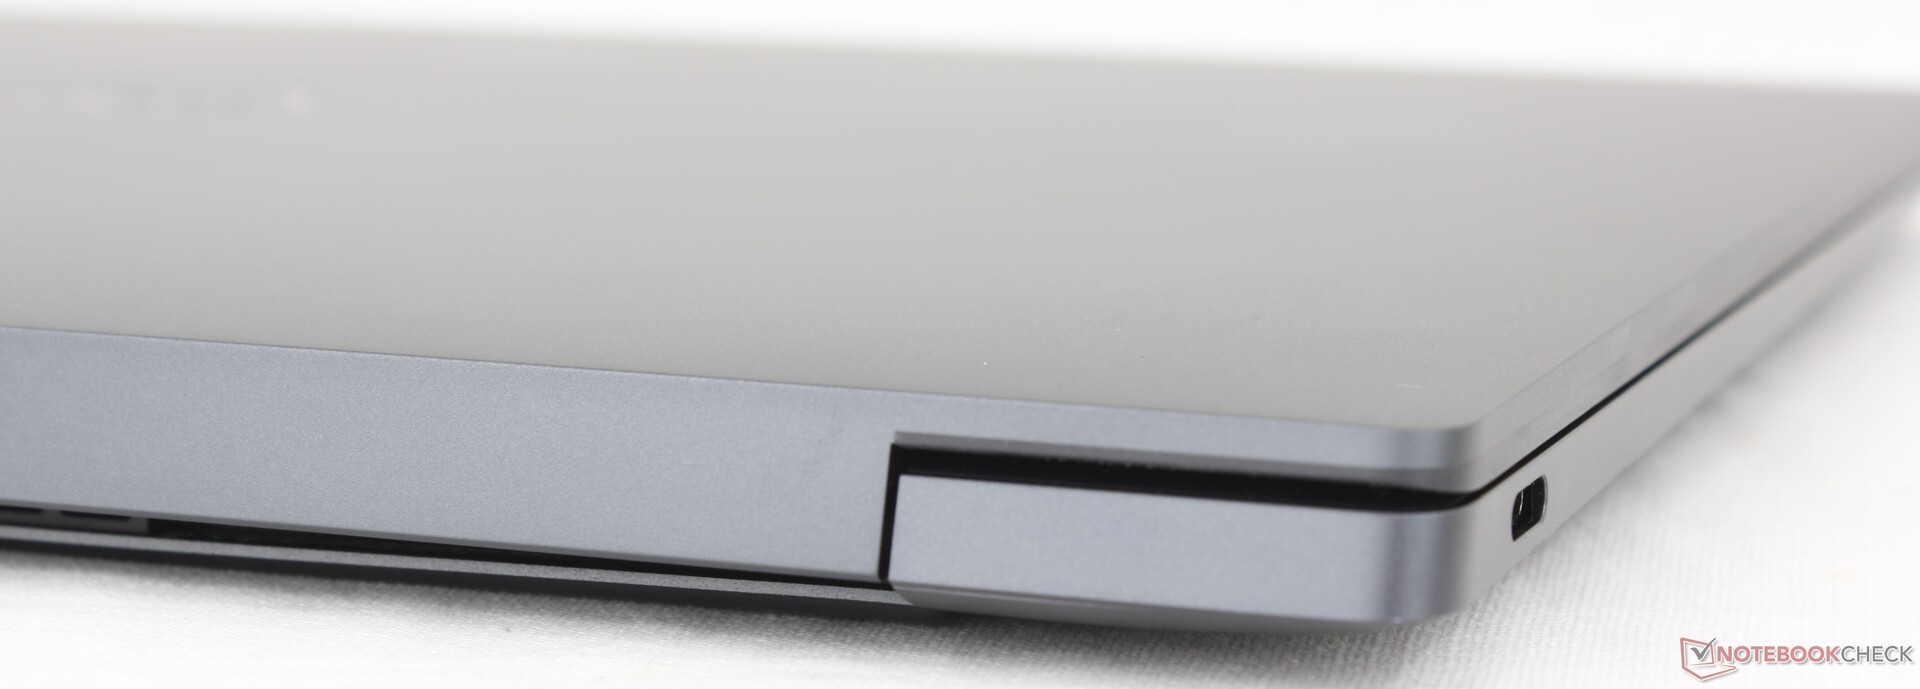
Case — Familiar Look And Feel
There are no external differences separating the Qualcomm model from the Intel model and so our comments about the Intel model apply here as well. Some new color options would have been nice, but the the same Platinum and Graphite options apply. We slightly favor the Platinum option as its bright white color obscures fingerprints better than the darker Graphite option of our Qualcomm test unit especially along the palm rests and outer lid.
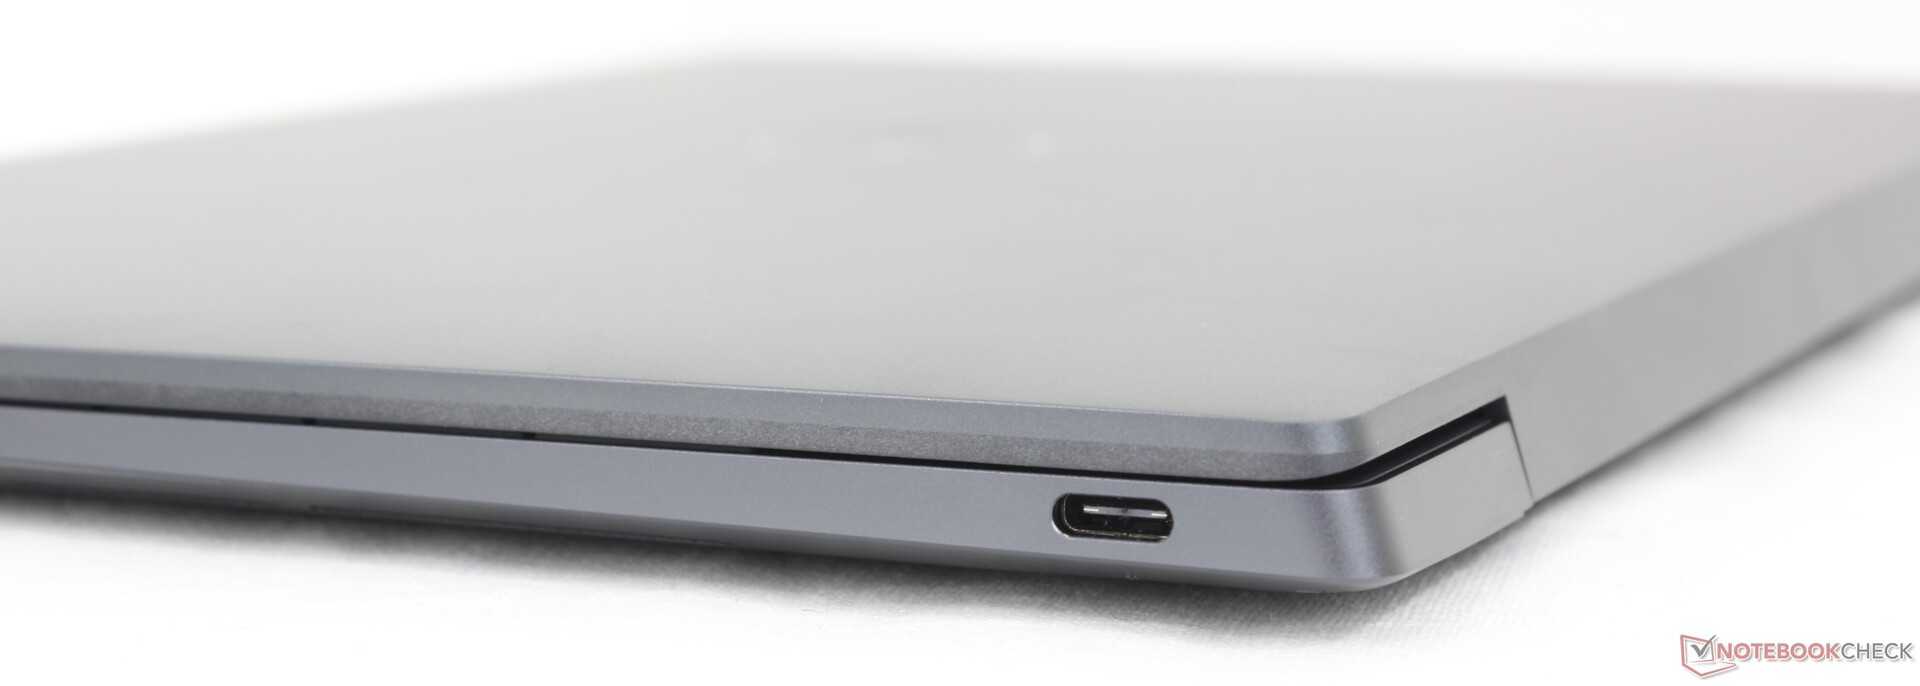
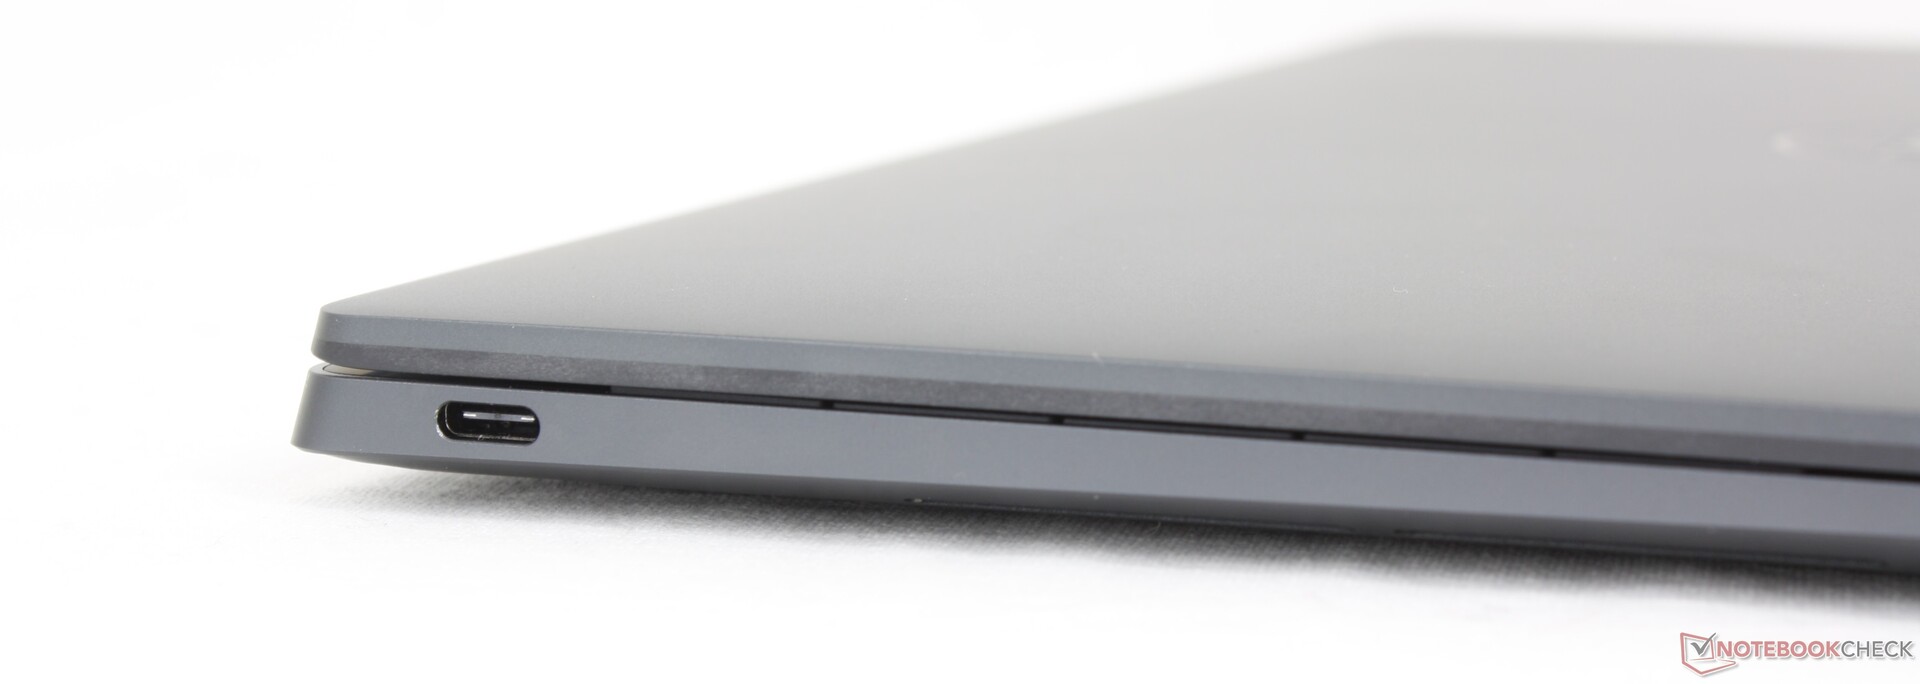
Connectivity
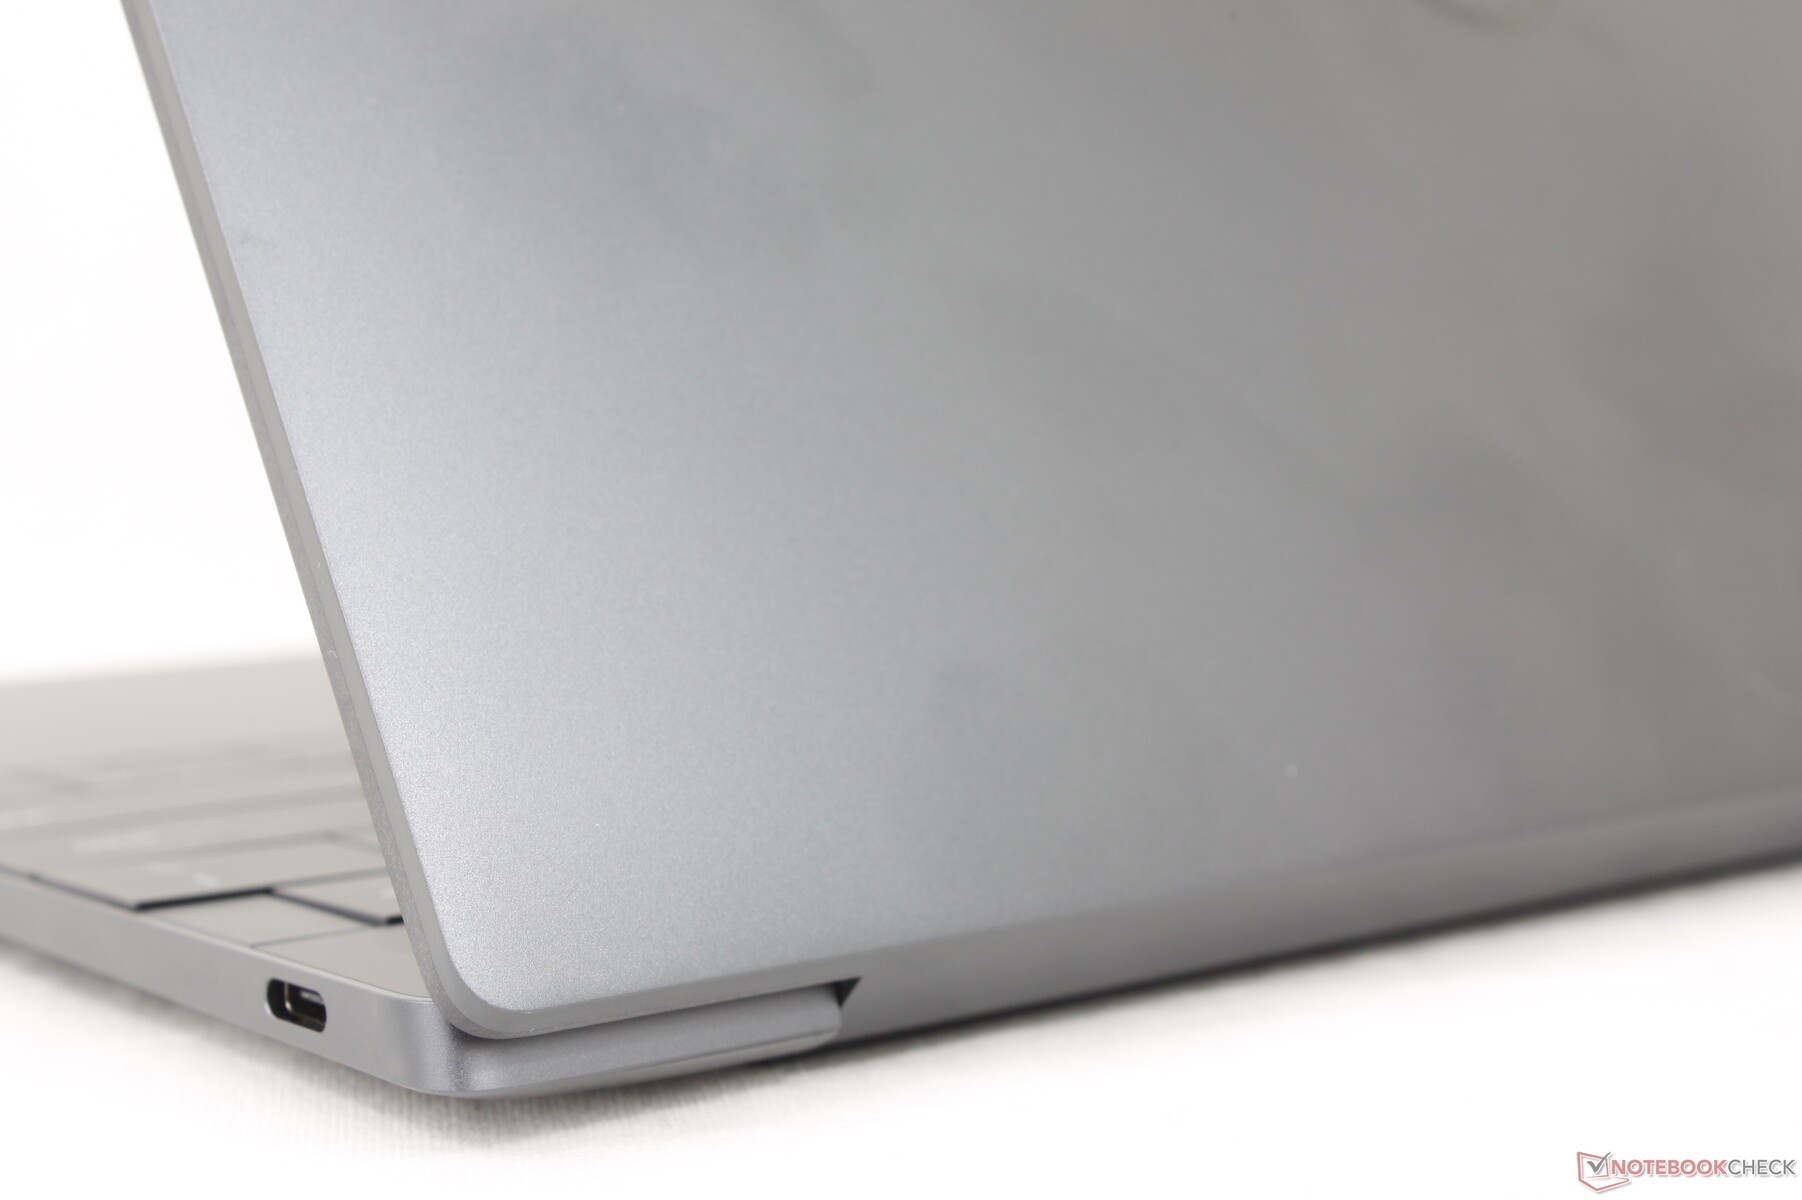
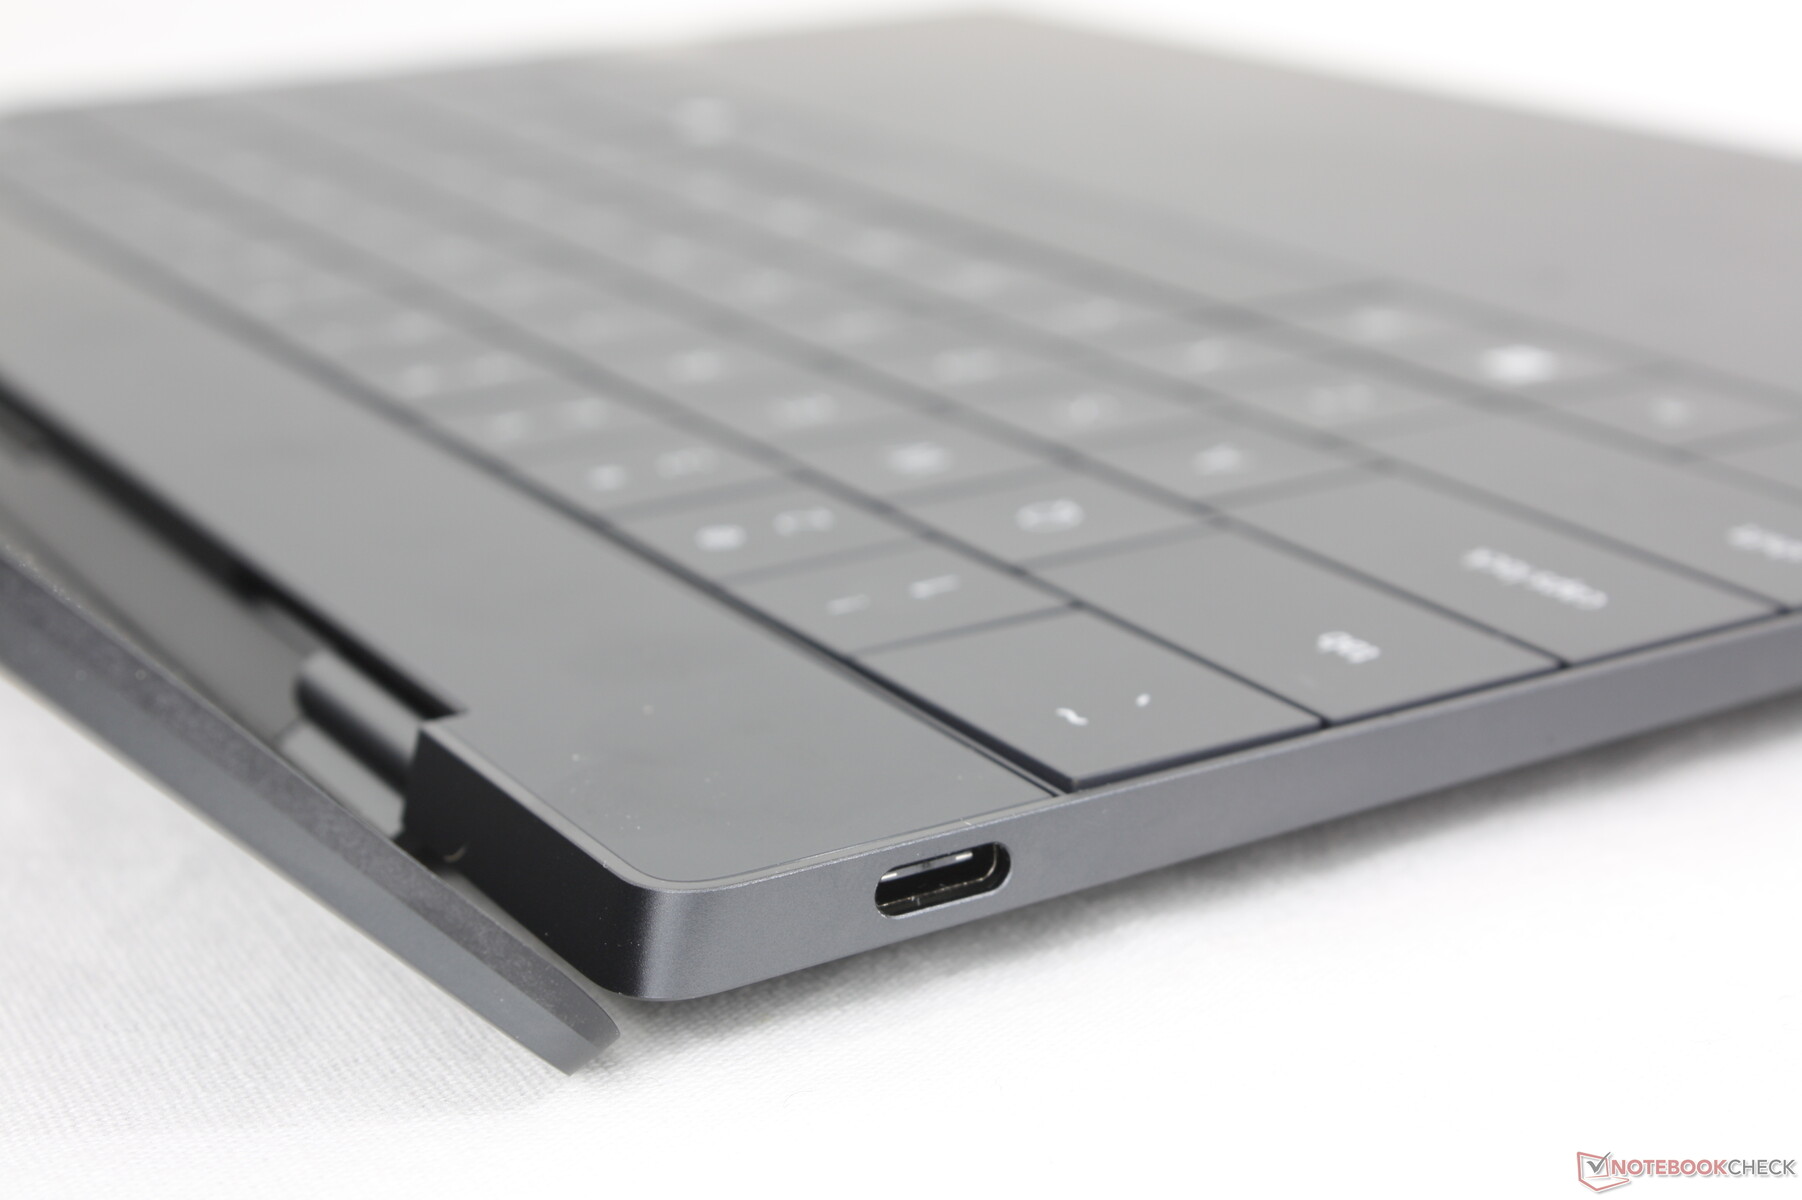
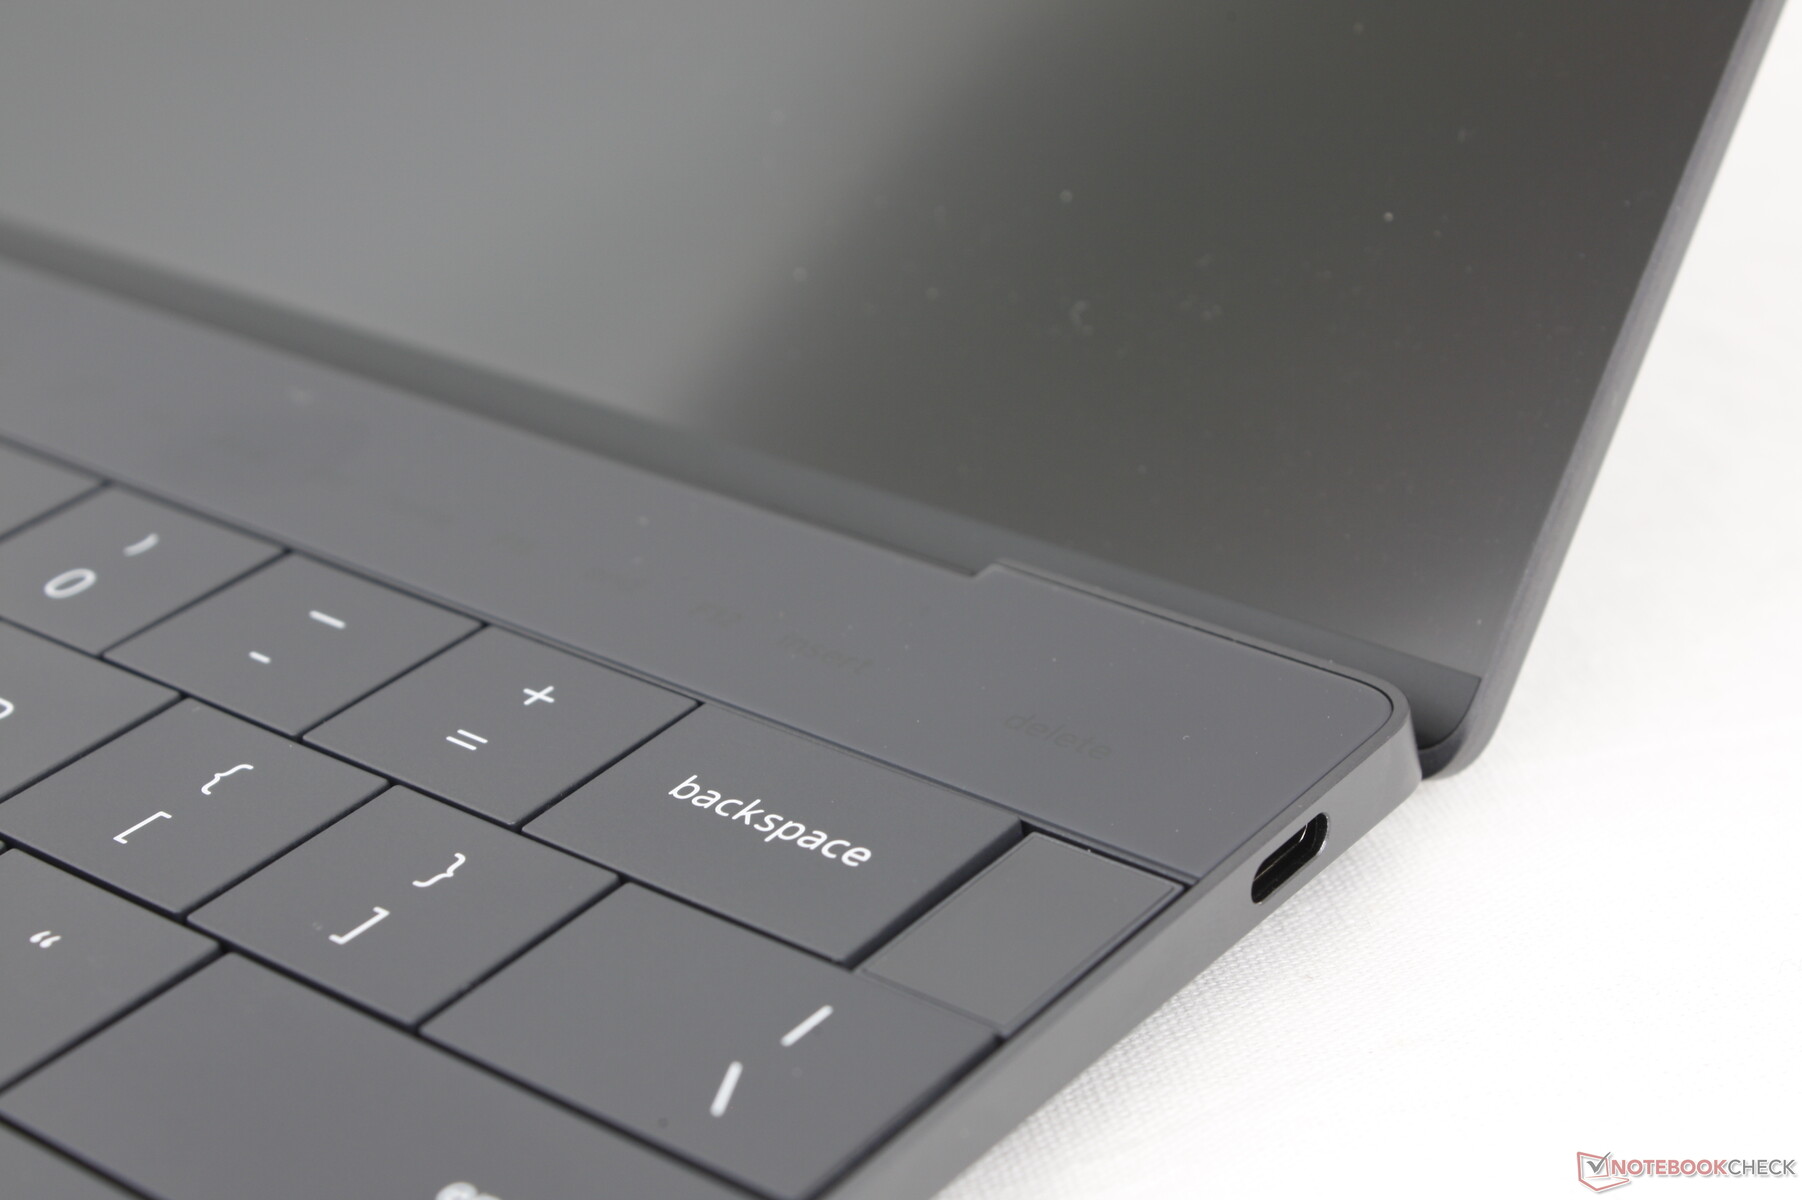
There are two USB-C 4.0 ports just like on the Intel version of the XPS 13. However, the ports here lack Thunderbolt support and so eGPU compatibility is not guaranteed. When attempting to connect our Aorus RTX 2080 Ti Gaming Box, for example, the Qualcomm laptop would be unable to recognize the eGPU whereas a Thunderbolt-enabled PC would recognize it automatically through Device Manager. Qualcomm has said that any support and applicable drivers would be up to the individual eGPU makers which is not promising for existing eGPU owners.
Communication
Dell has swapped out the BE200 from the Intel XPS 13 for the FastConnect 7800 on the Qualcomm XPS 13. The module supports Wi-Fi 7 connectivity which is still uncommon in most households. Performance is nonetheless stable when paired to our Wi-Fi 6E AXE11000 test router.
Webcam
The model comes standard with the same 2 MP webcam as found on the XPS 13 9340 instead of the 1 MP webcam on the original XPS 13 9320. IR is built-in as well to support Windows Hello facial recognition. However, there is still no camera cover or kill switch to speak of.


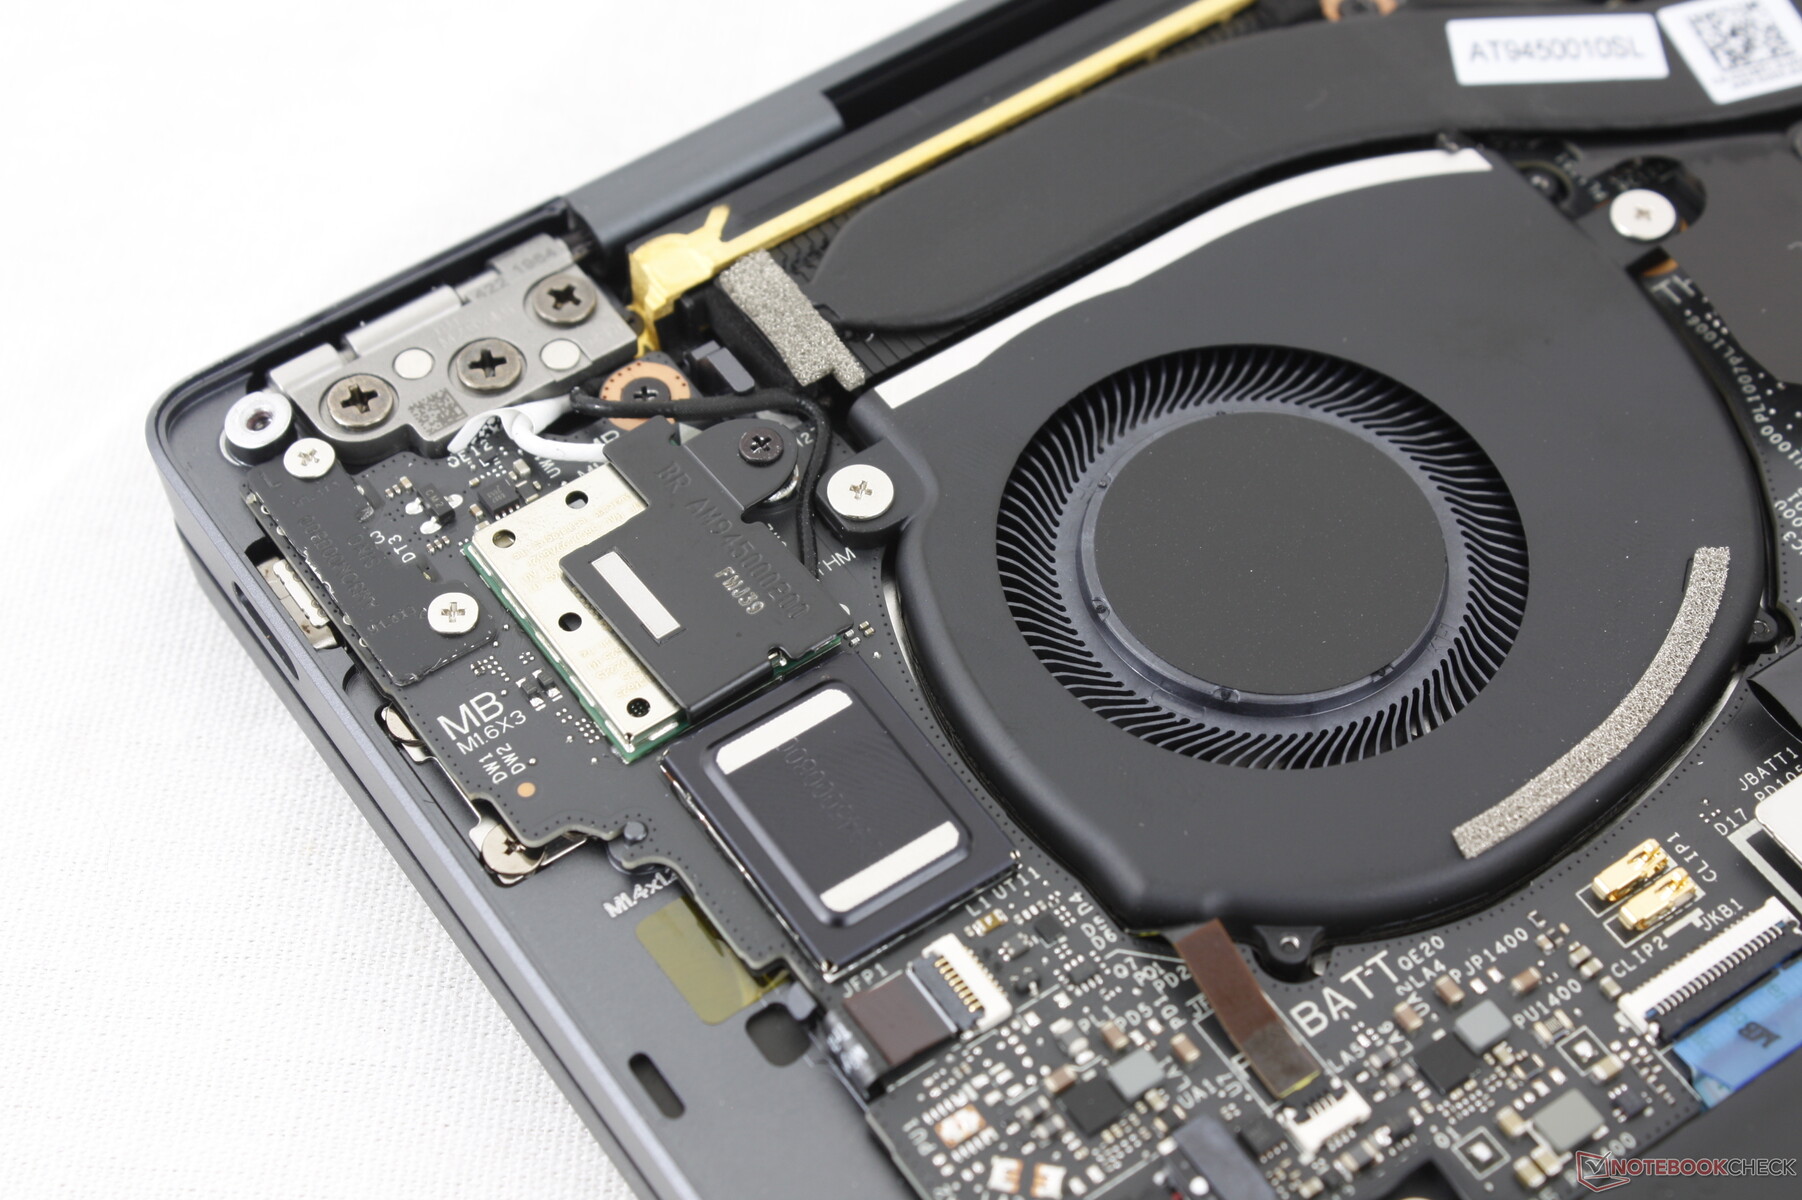
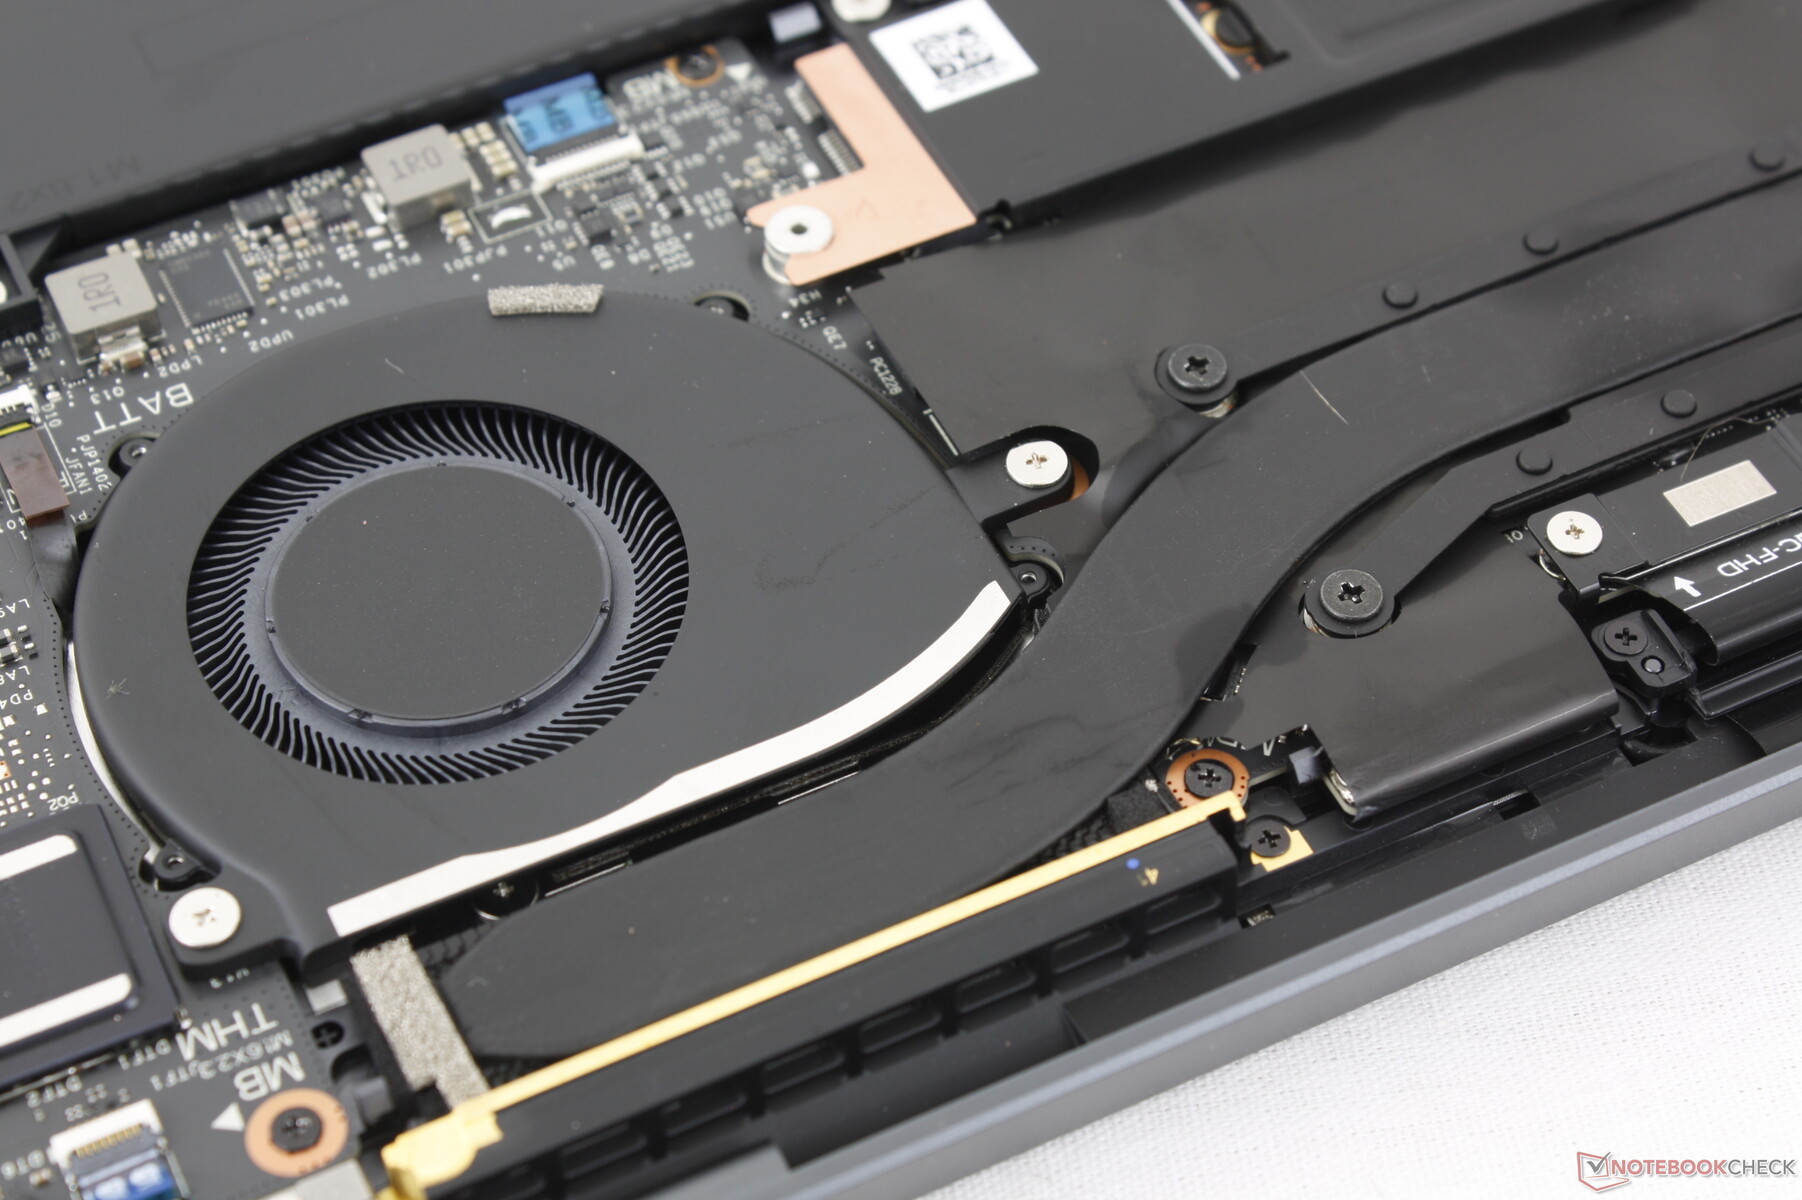
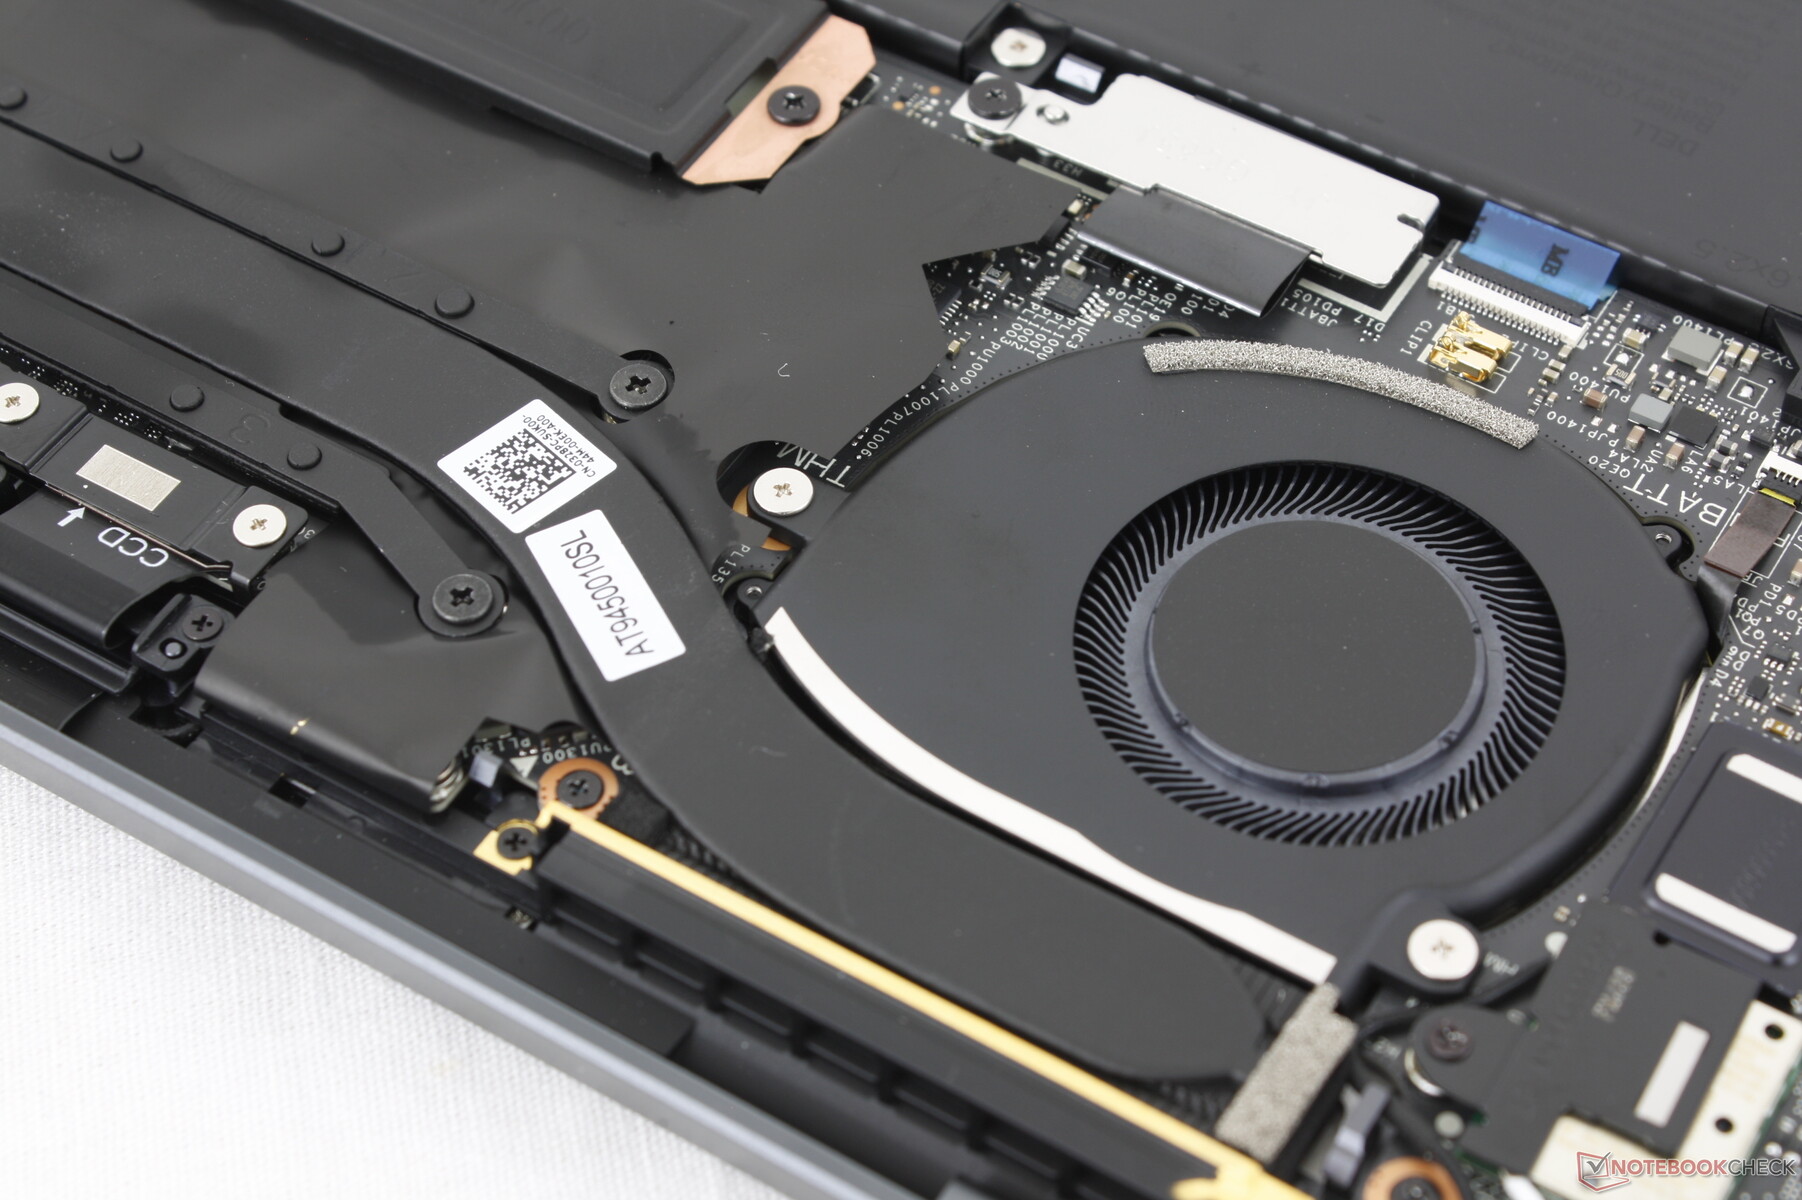
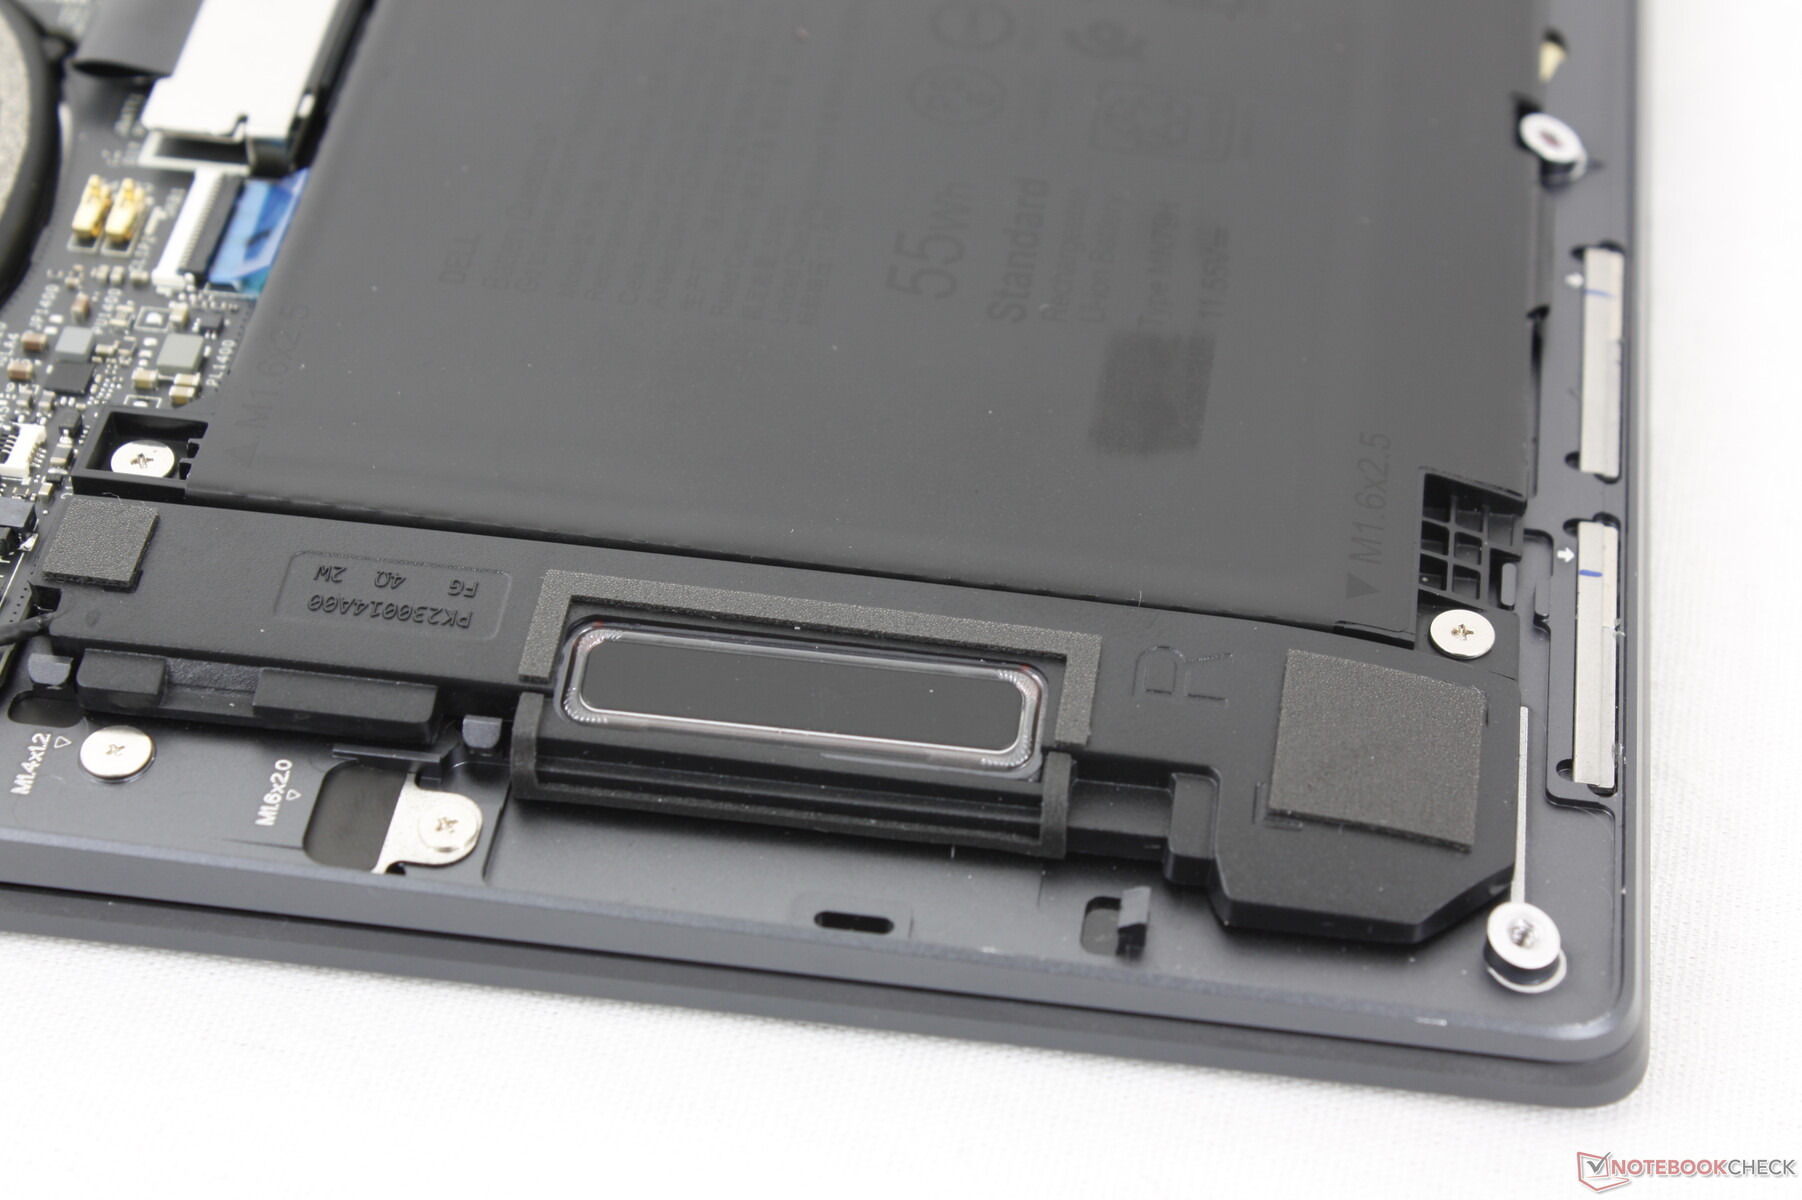
Maintenance
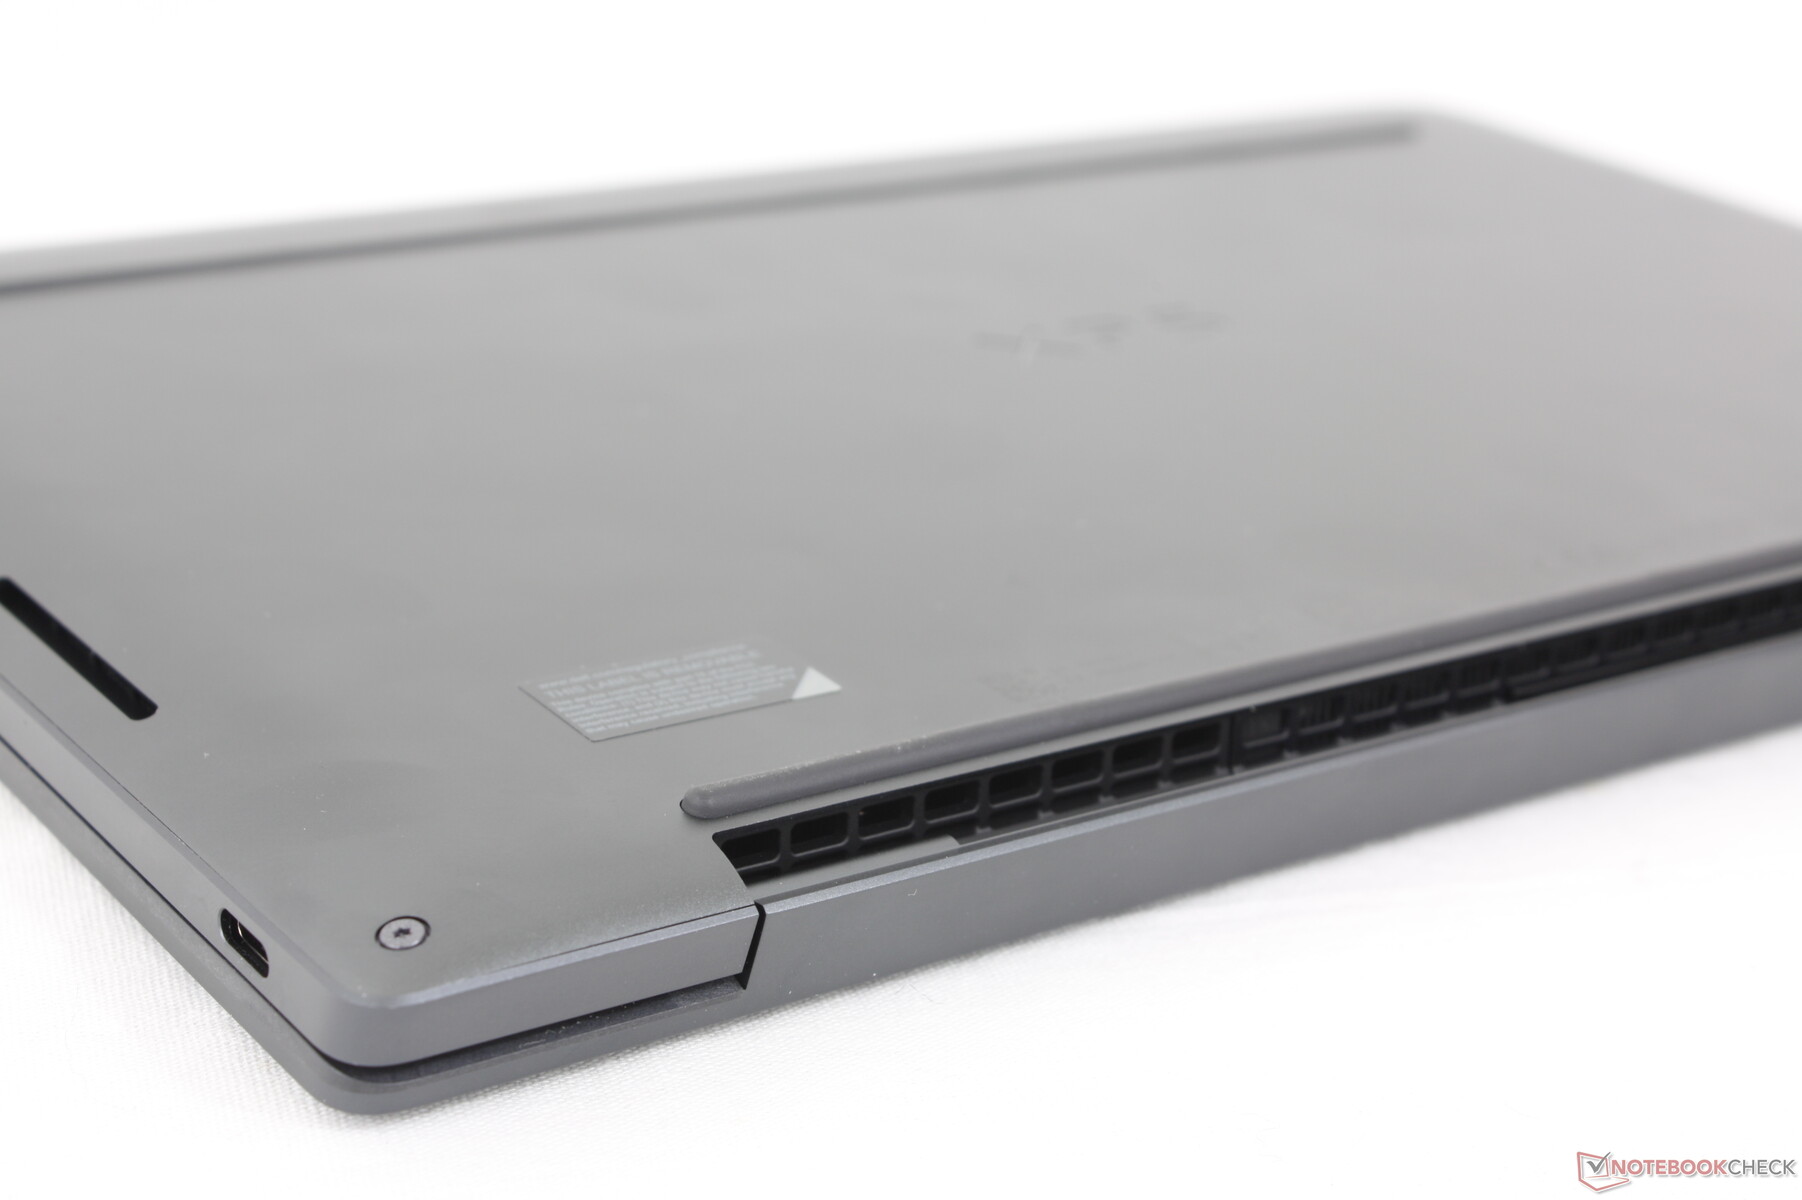
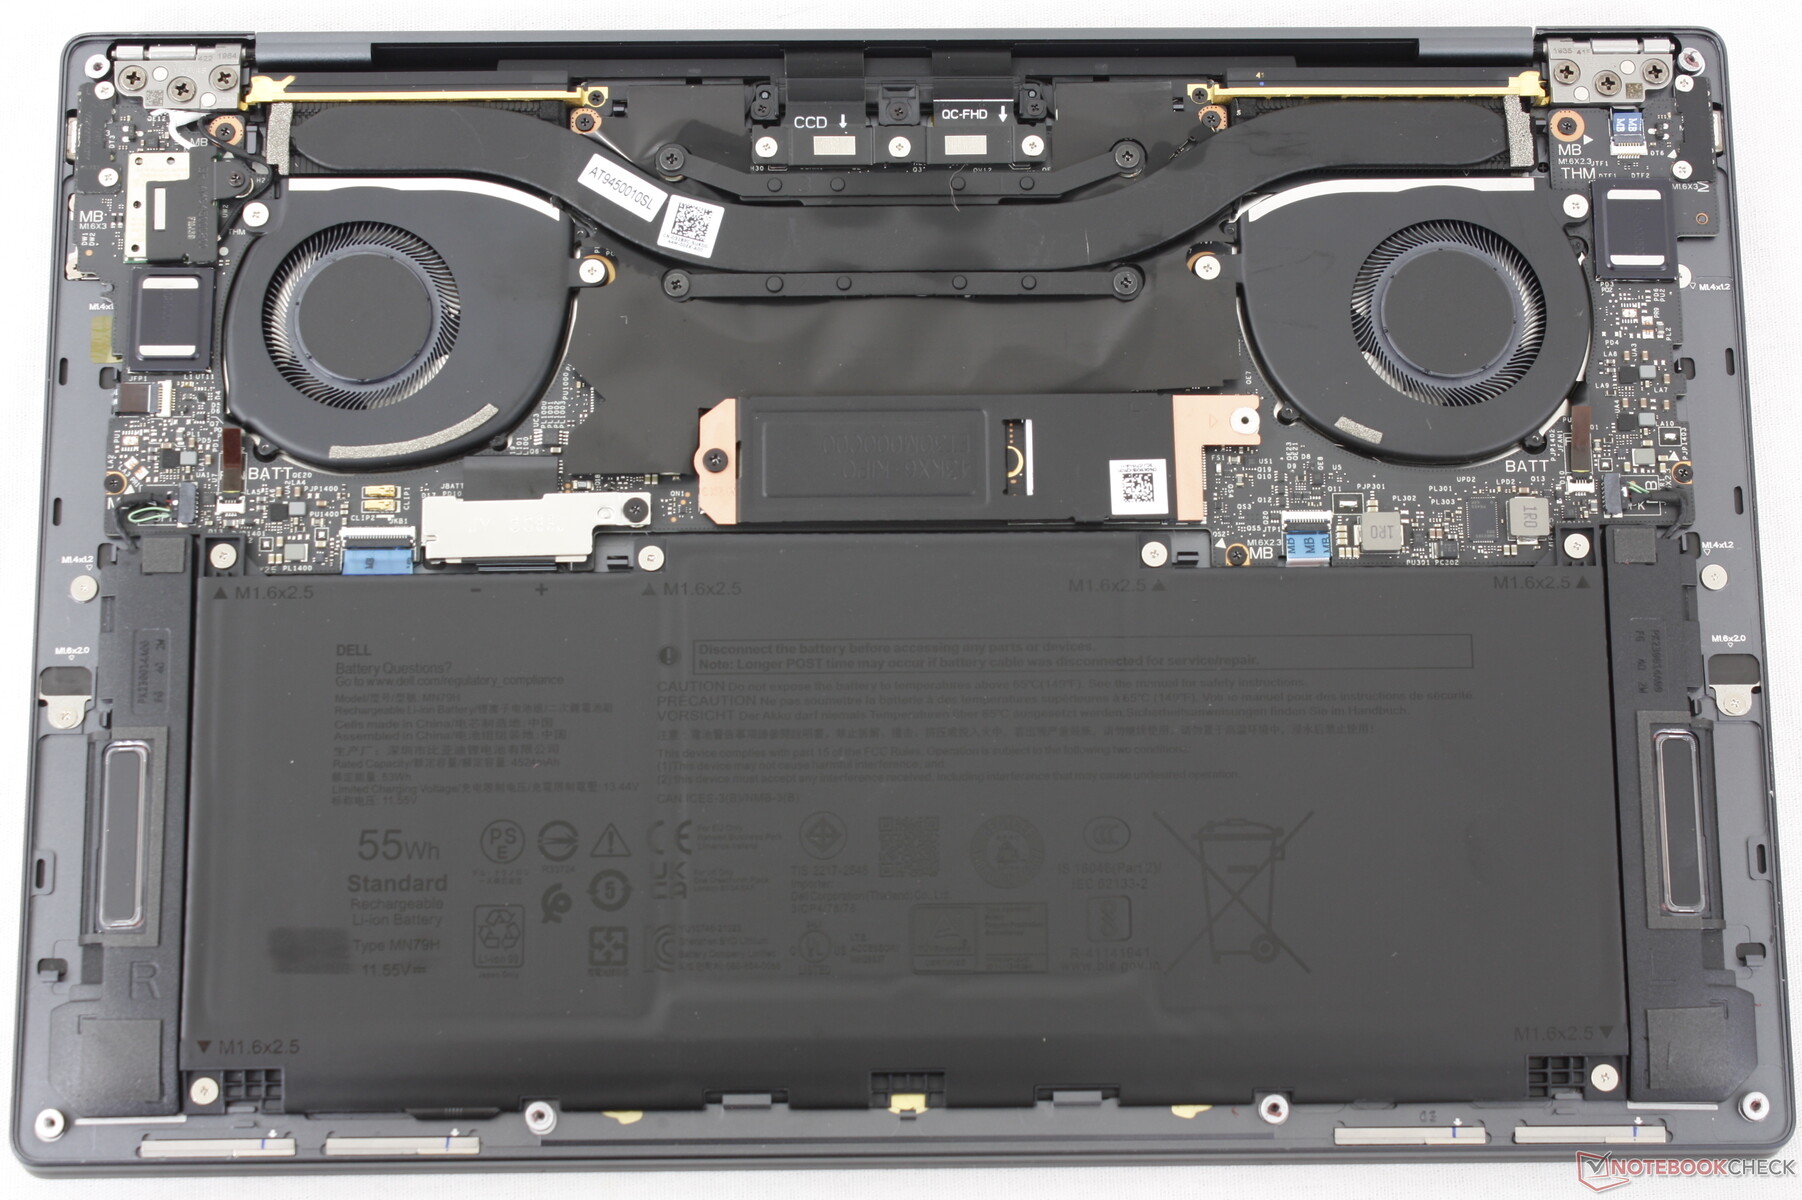
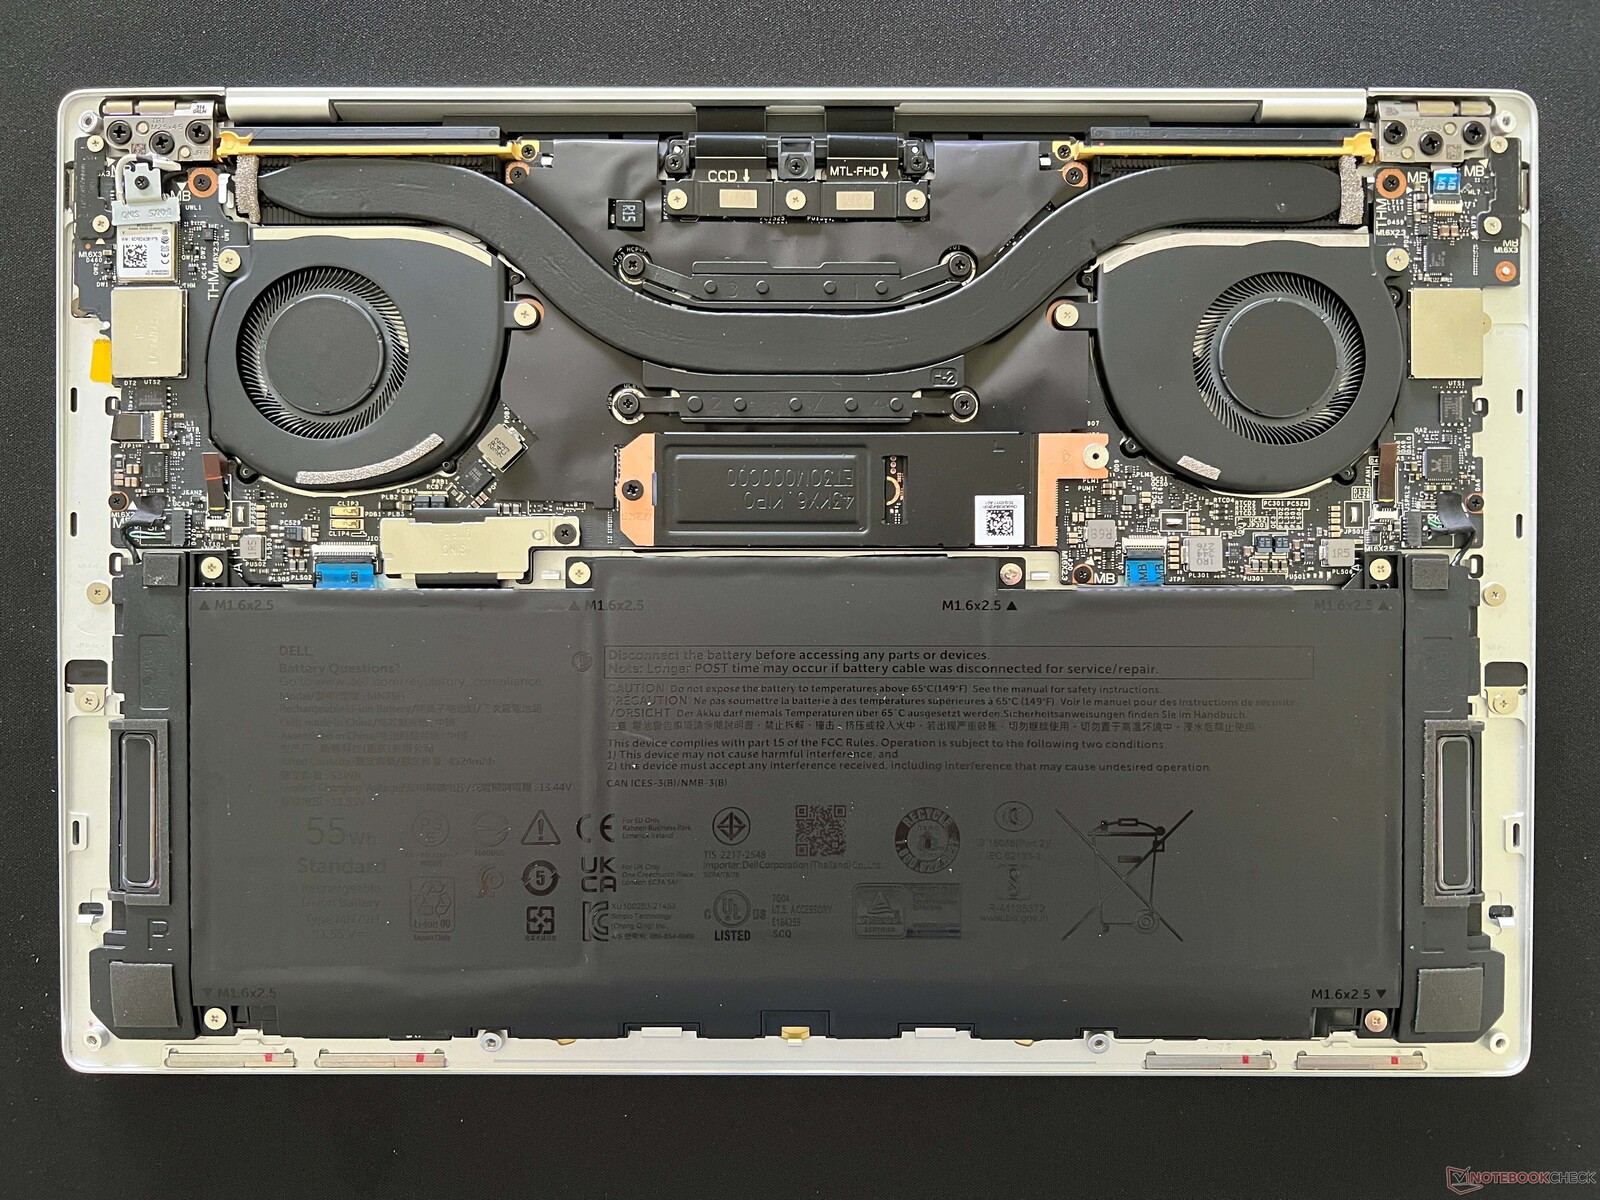
The bottom panel requires only a Torx screwdriver to remove. There is otherwise nothing to upgrade beyond the single M.2 SSD as both RAM and WLAN are soldered.
Sustainability
The packaging consists of 75 percent recycled material and 25 percent renewable material to be fully recyclable. Meanwhile, the laptop itself was manufactured with at least 20 percent recycled aluminum and glass.
Accessories And Warranty
There are no extras in the box other than the AC adapter and paperwork whereas the Intel-based XPS models would often include a USB-C to USB-A adapter for free.
The usual one-year limited manufacturer warranty applies if purchased in the US.
Input Devices — Cleaner Looks At The Expense Of Usability
Keyboard
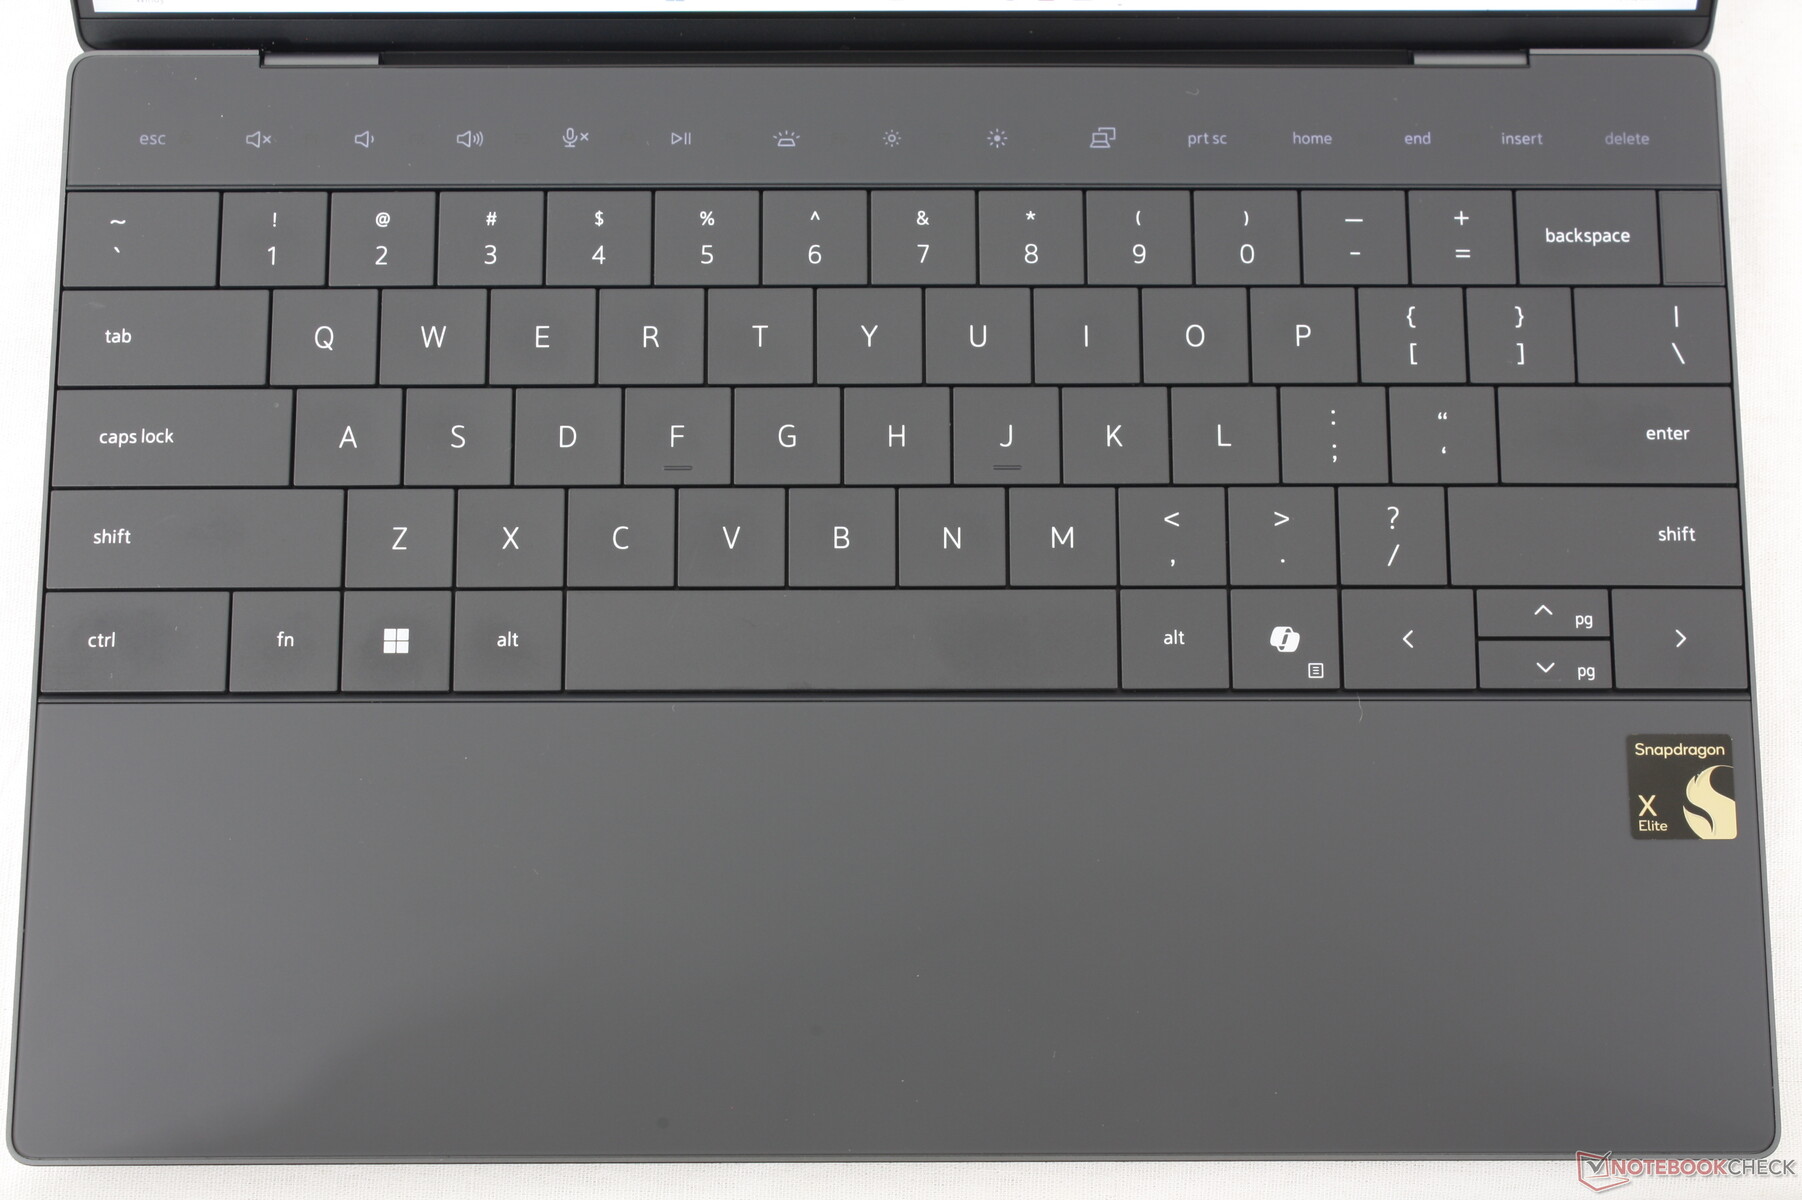
The zero-lattice keyboard takes some getting used to when compared to the traditional keyboards on most other subnotebooks. Key travel is even shallower than usual at just 1.0 mm and feedback is relatively soft for a spongier typing experience. The difference is night and day when jumping between the XPS 13 9345 and the firmer keys on the HP Spectre x360 14.
The touch-enabled function keys are also a mixed bag. Lenovo implemented something very similar on its ThinkPad series several years ago before promptly dropping it and so it's a bit surprising to see them reappear on a competing manufacturer. The main issue is that the keys are sensitive to even the slightest of touches which can lead to accidental inputs.
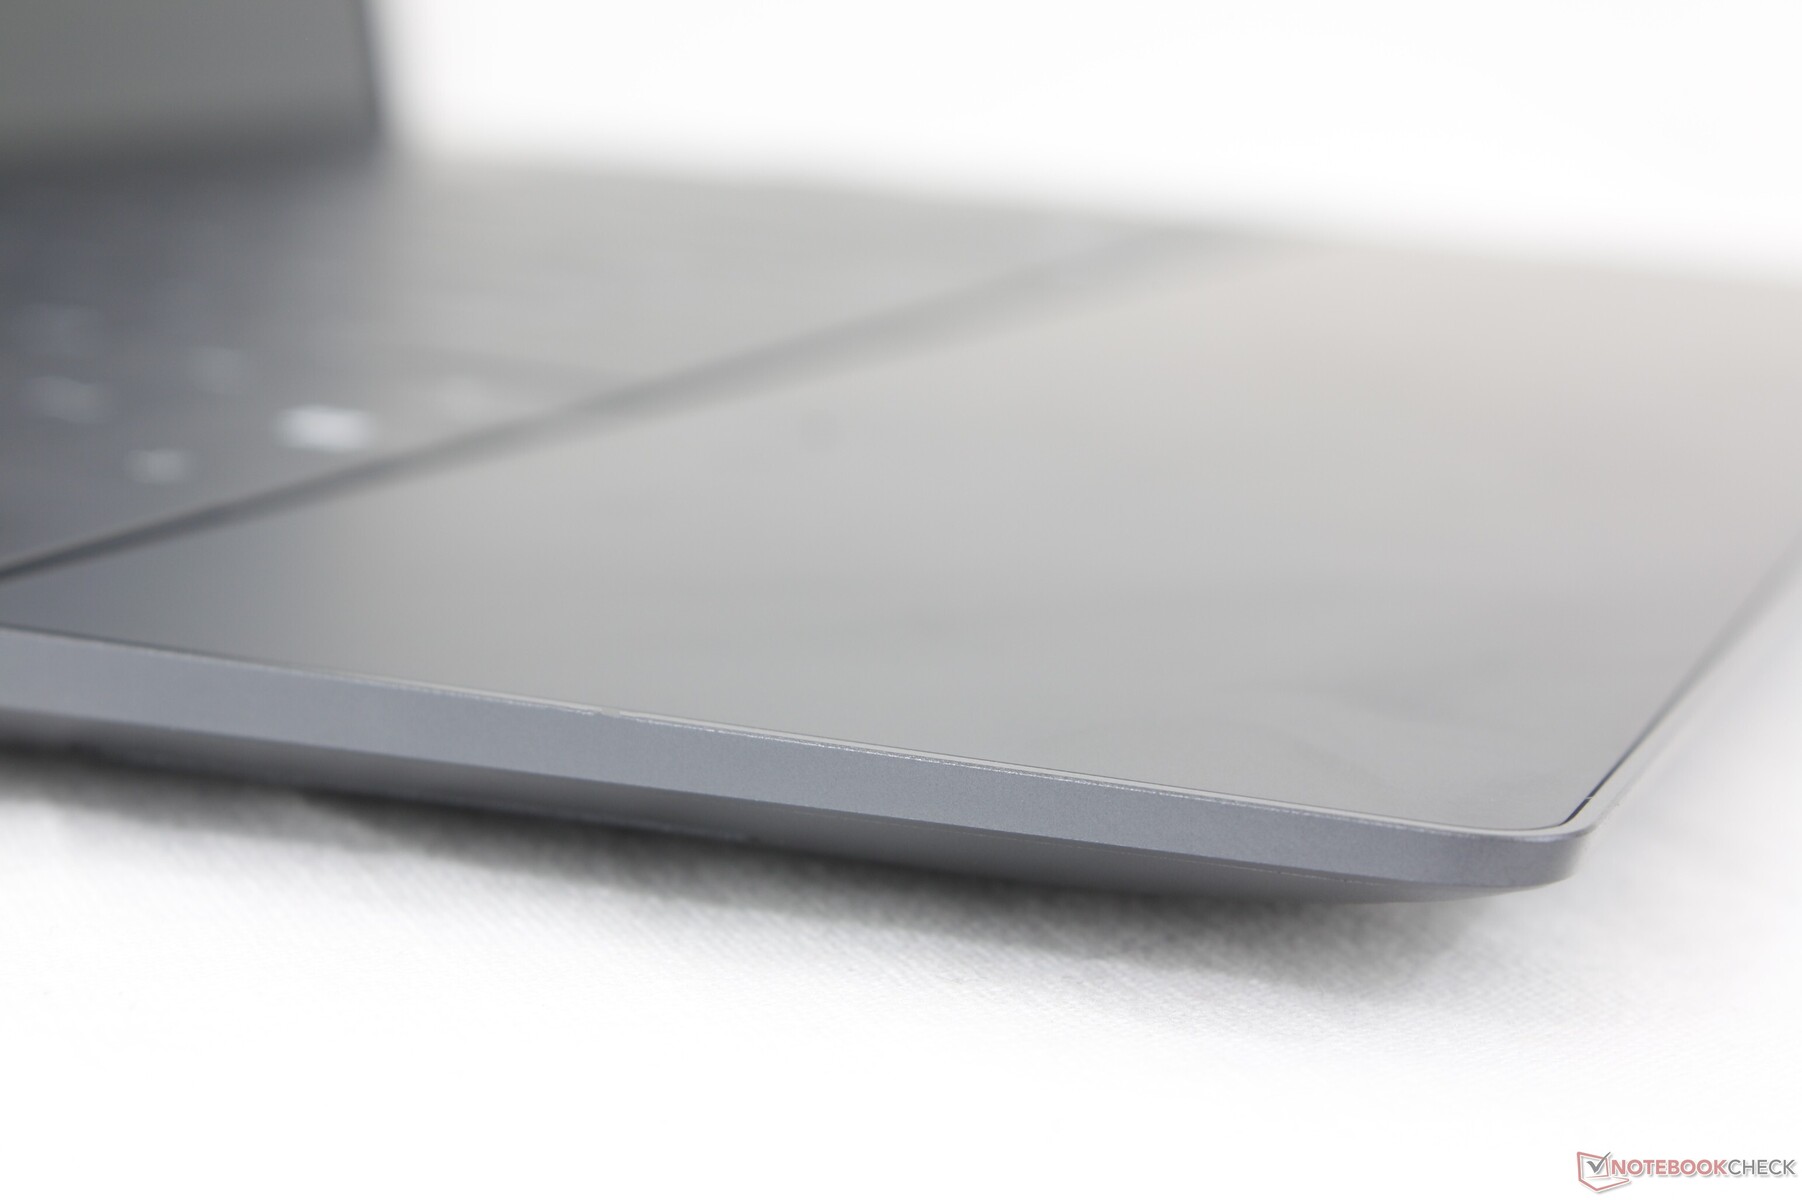
Touchpad
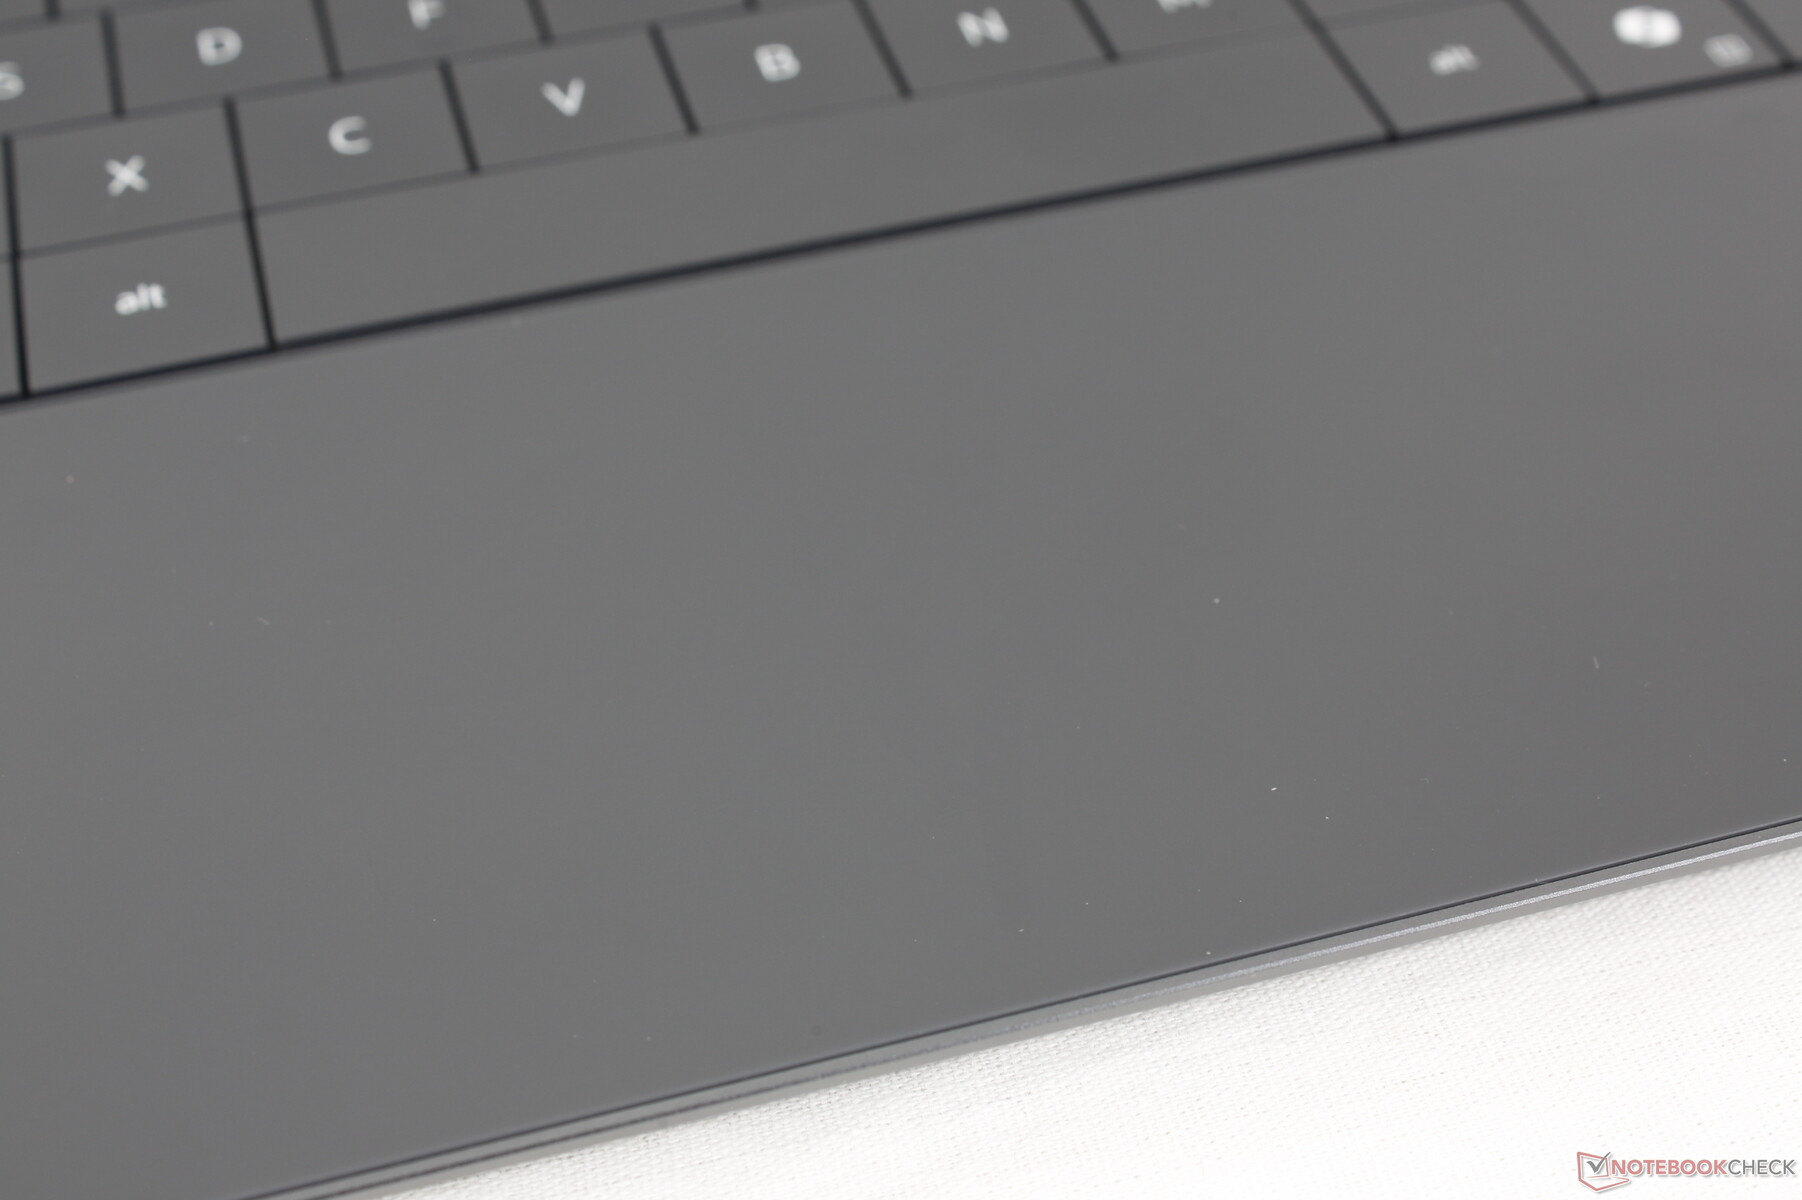
The invisible XPS clickpad has become infamous for its user-unfriendliness and the trend continues on the Snapdragon model. While the usable surface area is quite spacious for a 13-inch form factor at approximately 11.5 x 7.5 cm, clicking is unsatisfying due to the weak feedback. Worse, the force required to input a click is much lower than on most other laptops leading to many accidental clicks and drags when you're simple trying to move the cursor. We were hoping for some improvements in this regard after two years with this design, but that is unfortunately not the case.

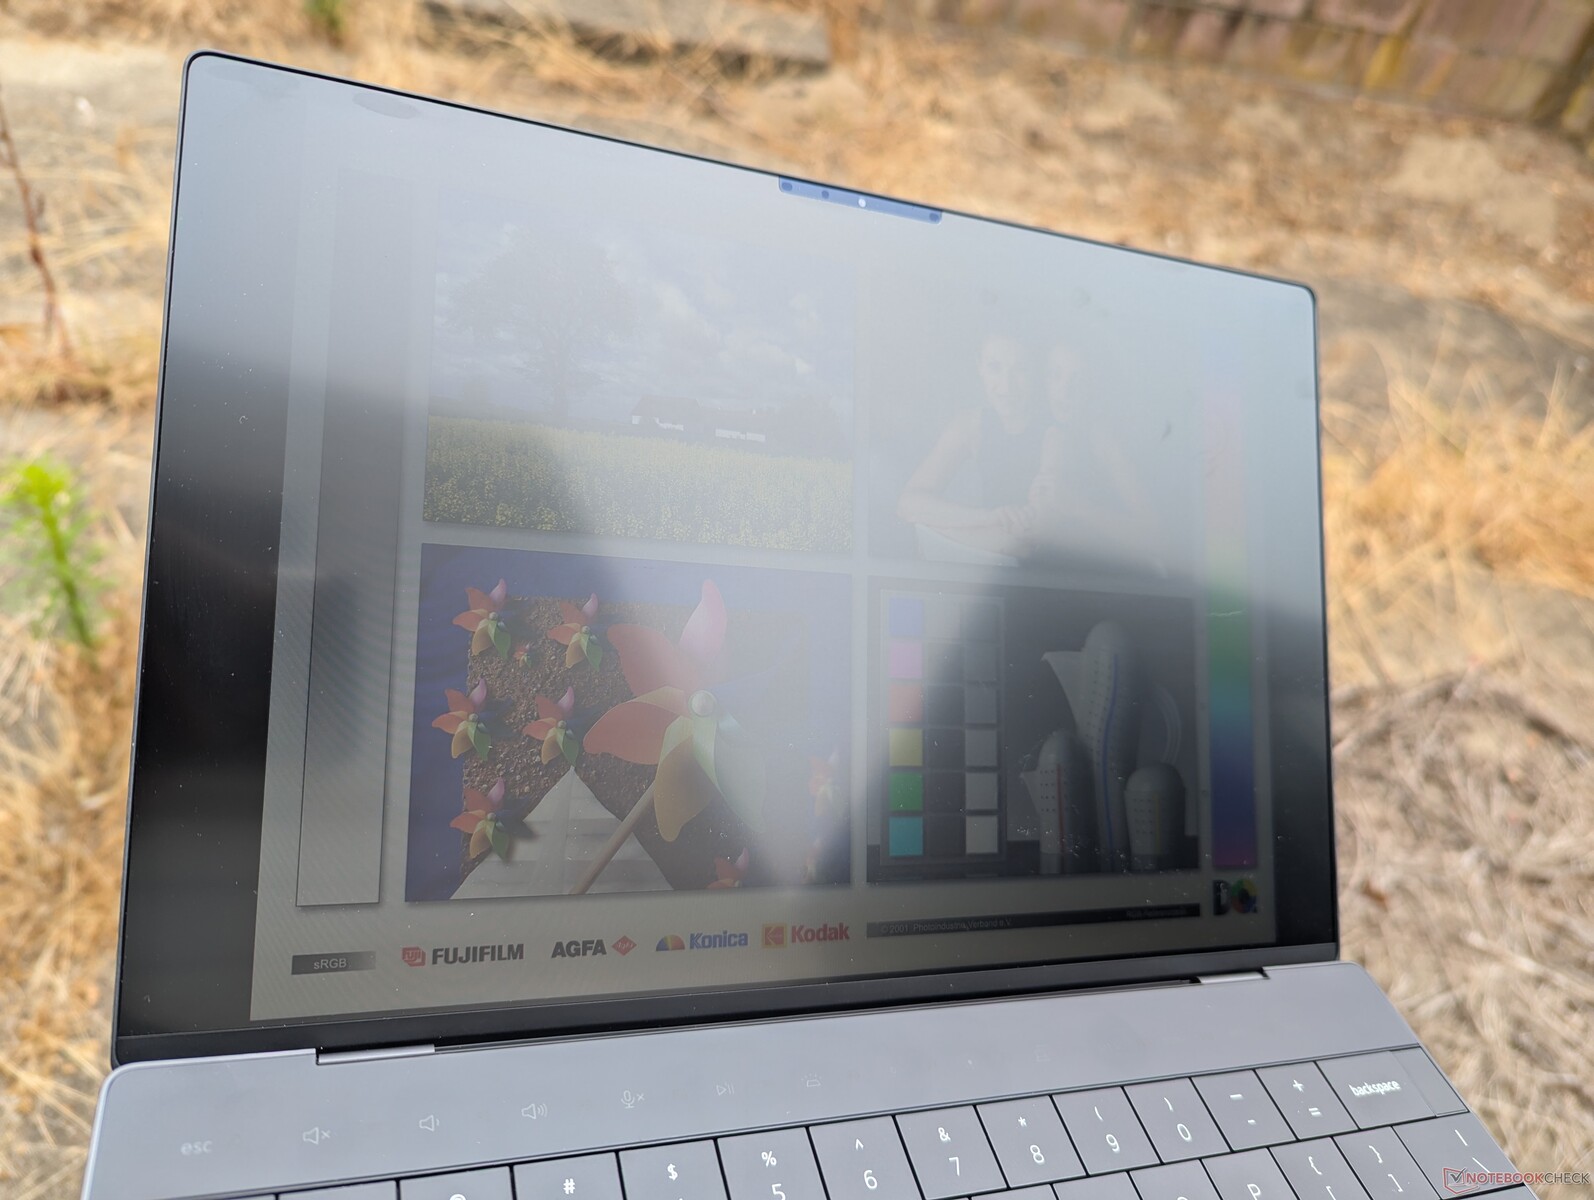
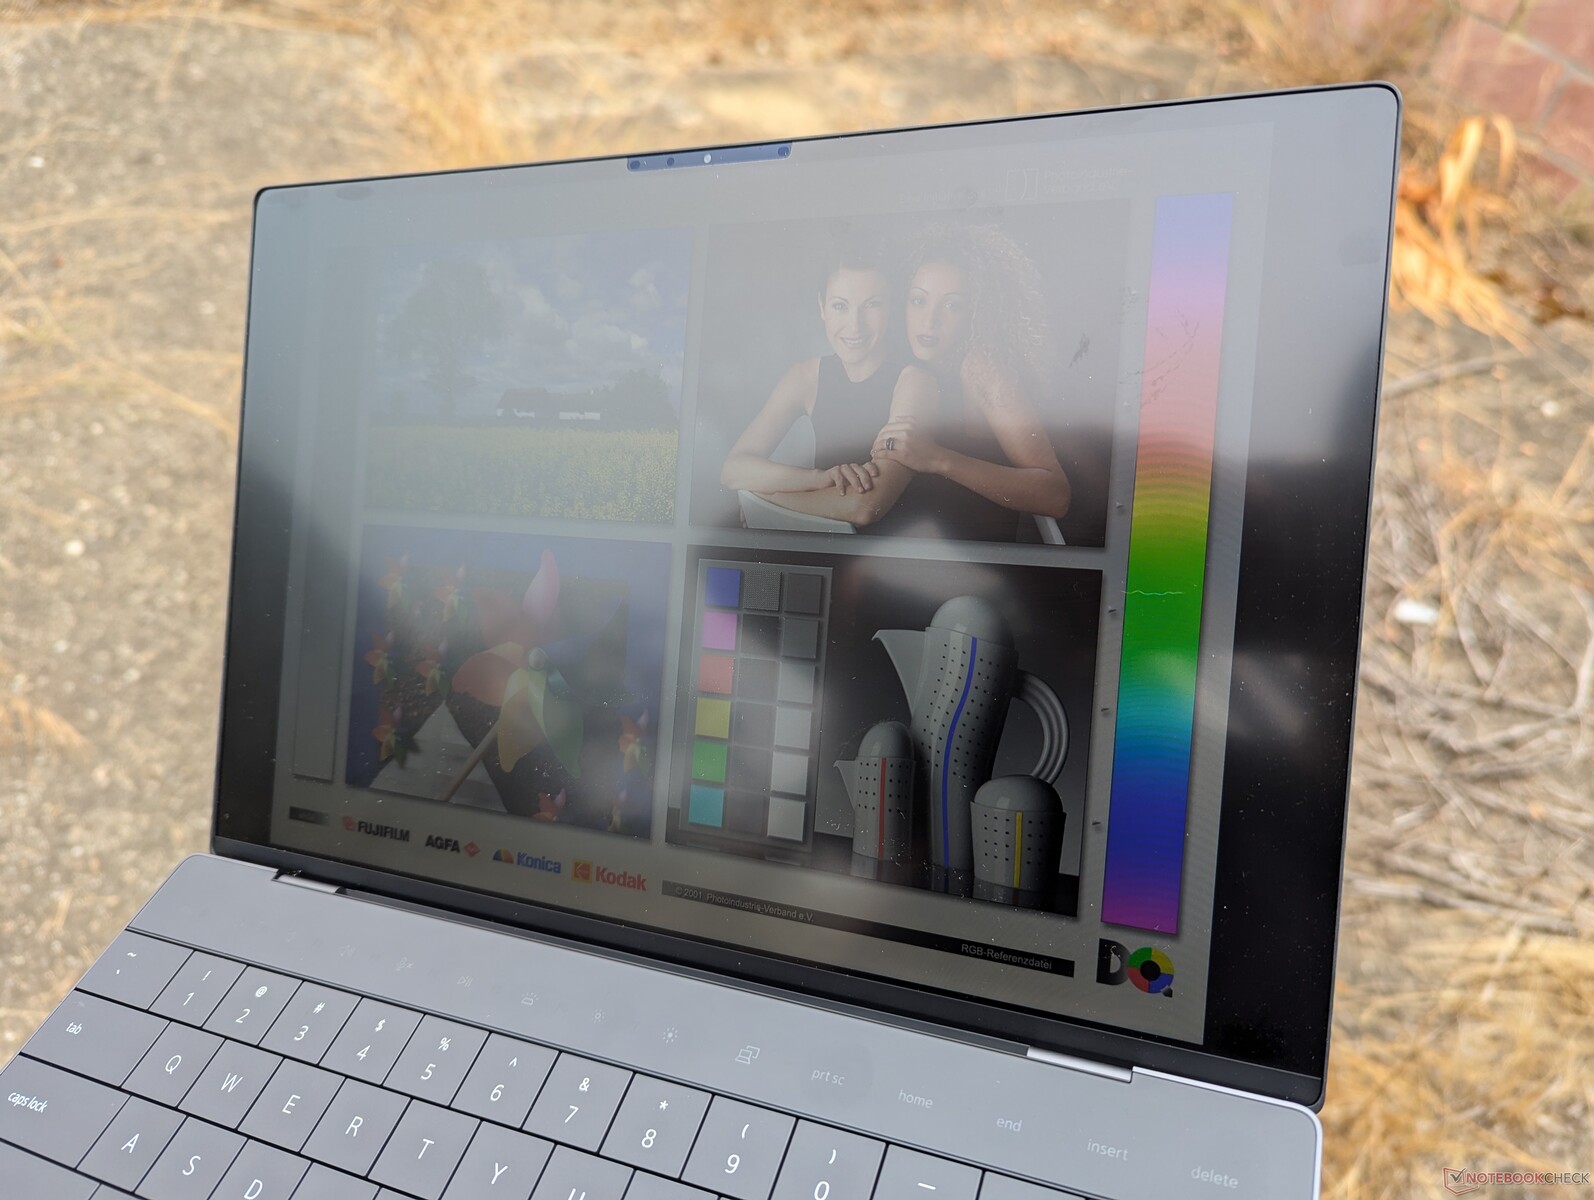
Display
Three display options are available as follows. Our review configuration comes with the bolded option.
- 1920 x 1200, IPS, 120 Hz, non-touch, matte
- 2560 x 1600, IPS, 120 Hz, touch, glossy
- 2880 x 1800, OLED, 60 Hz, touch, glossy
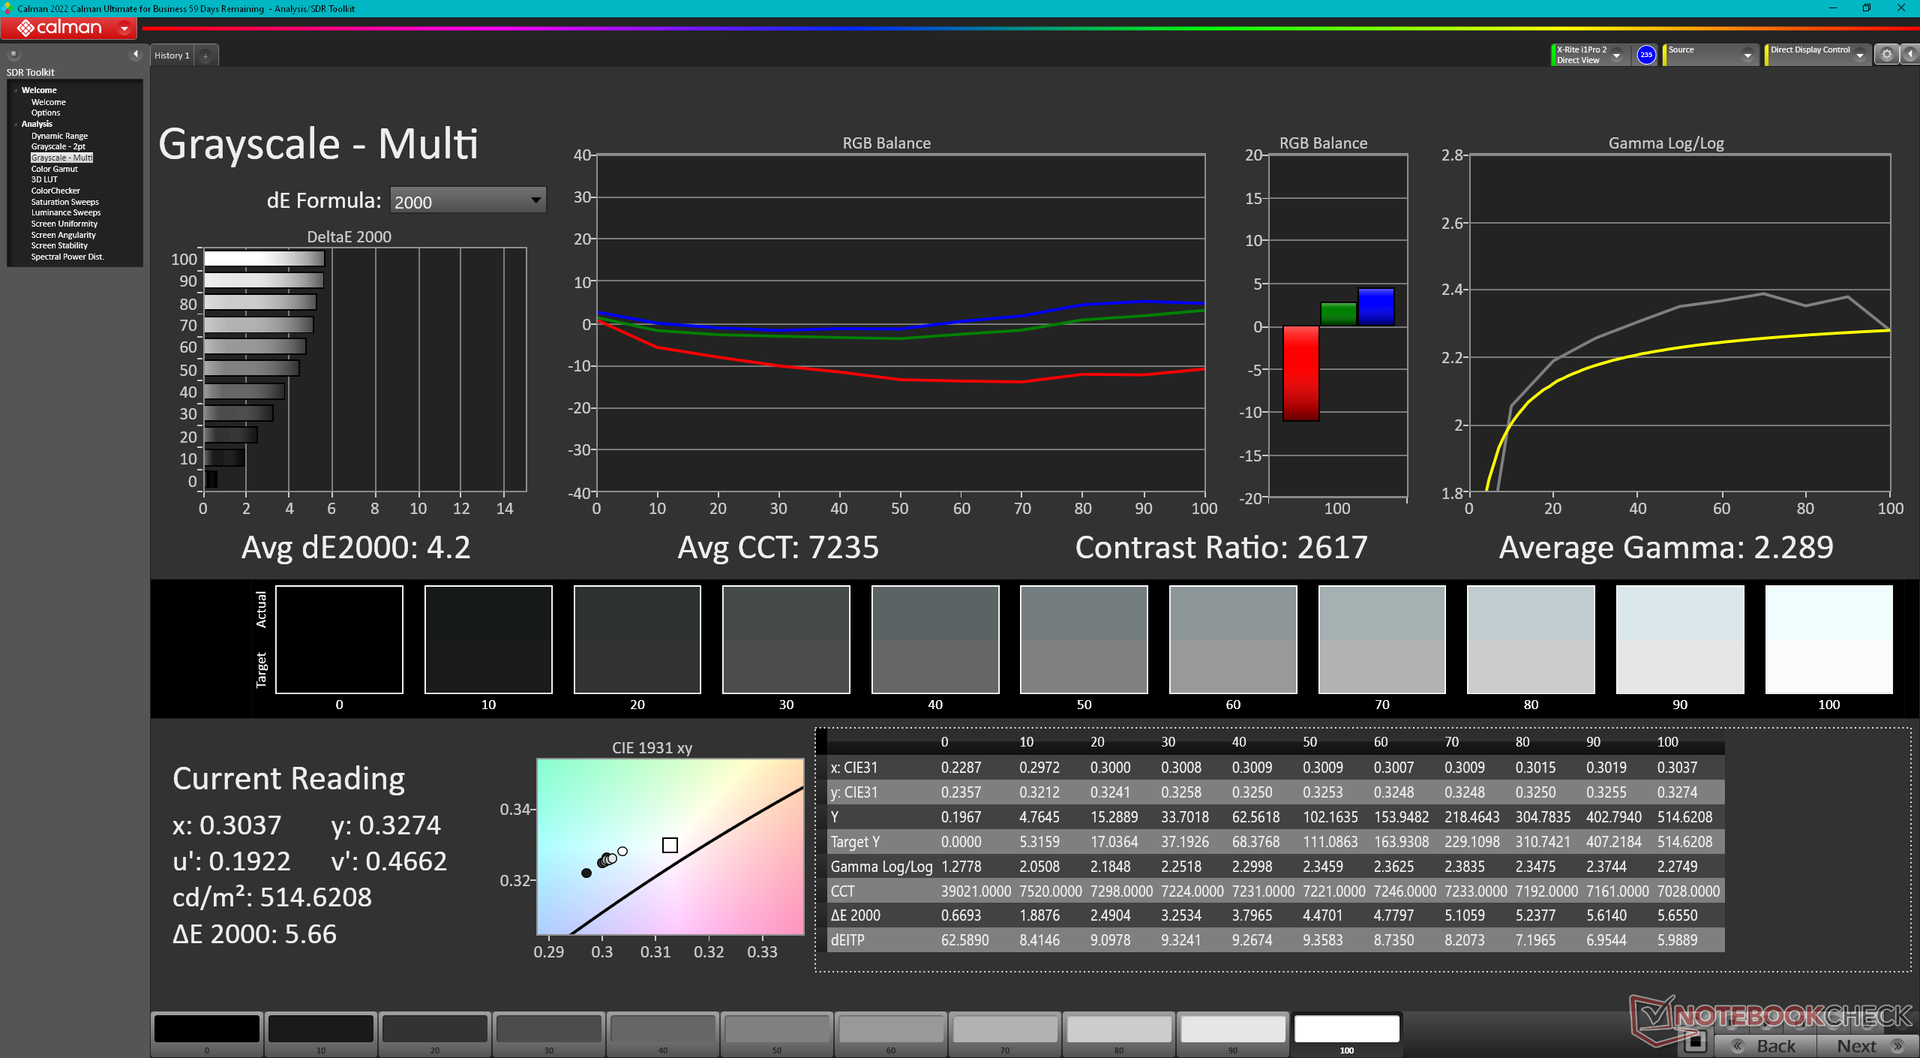
All indications point to our 120 Hz panel being the exact same panel used for the Intel-based XPS 13. Everything from VRR support down to 30 Hz, the adequate response times, and 500-nit maximum brightness are similar features found on our recent Core Ultra 7 XPS 13 test unit. Most notable is the high contrast ratio of almost 2000:1 compared to 1000:1 on most IPS panels found on other laptops. The displays on XPS models have always been some of the best in class and so even the cheapest IPS option still looks fantastic.
Color coverage is limited to >95% sRGB if configured with the base option while DCI-P3 colors are reserved for the pricier 1600p IPS and 1800p OLED panels. Users may want to disable Adaptive Color to prevent any minute color changes when photo editing.
Something worth mentioning about this panel is its relatively high minimum brightness level of 49 nits which is something we noticed on our Core i7 model as well. In comparison, the displays on most other laptops would typically reach 15 nits or dimmer when on the minimum brightness setting. The higher brightness floor of the Dell may be more likely to cause eyestrain if viewing in dark environments. This potential issue is not present on the OLED configuration which can reach much dimmer brightness levels.
| |||||||||||||||||||||||||
Brightness Distribution: 86 %
Center on Battery: 518.3 cd/m²
Contrast: 1993:1 (Black: 0.26 cd/m²)
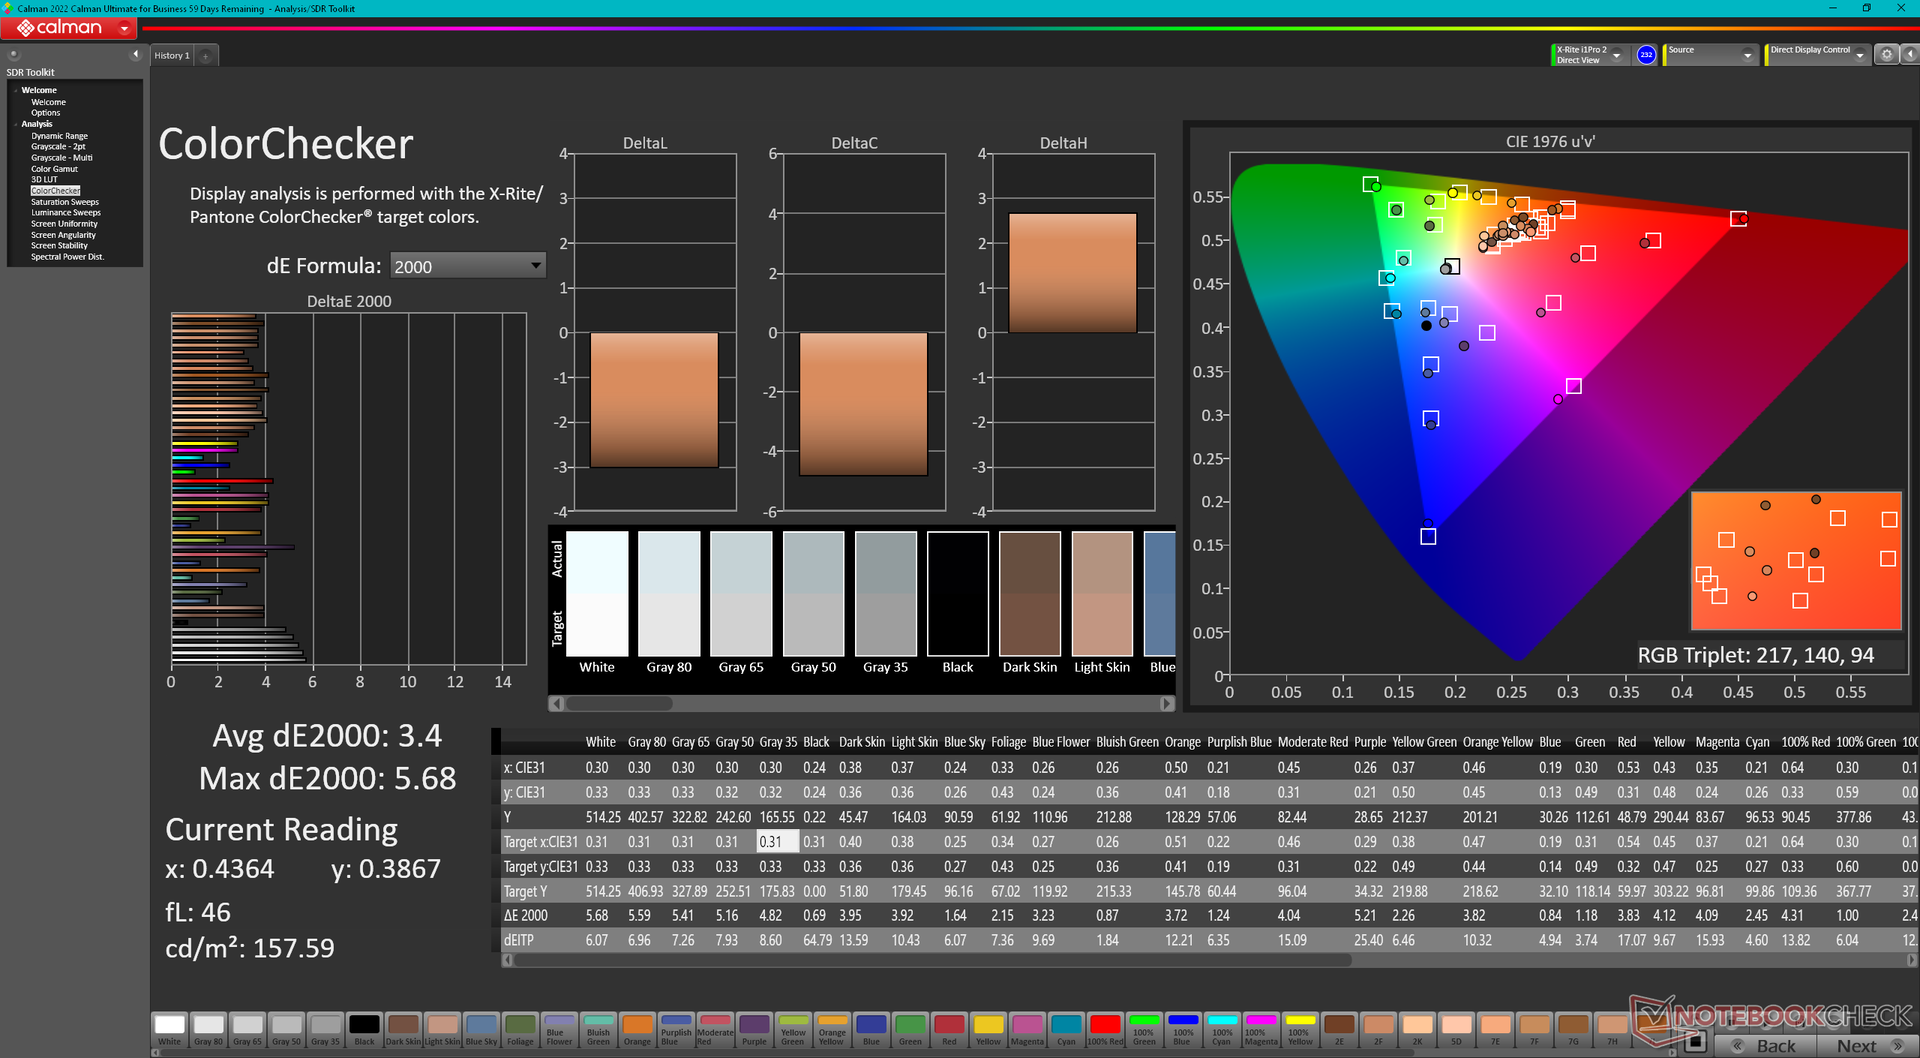
ΔE ColorChecker Calman: 3.4 | ∀{0.5-29.43 Ø4.73}
ΔE Greyscale Calman: 4.2 | ∀{0.09-98 Ø4.97}
71.7% AdobeRGB 1998 (Argyll 3D)
97.8% sRGB (Argyll 3D)
69.4% Display P3 (Argyll 3D)
Gamma: 2.29
CCT: 7235 K
| Dell XPS 13 9345 IPS, 1920x1200, 13.4", 120 Hz | Dell XPS 13 9340 Core Ultra 7 SHP1593, IPS, 1920x1200, 13.4", 120 Hz | Microsoft Surface Laptop 7 13.8 Copilot+ LQ138P1JX61, IPS, 2304x1536, 13.8", 120 Hz | Lenovo ThinkBook 13x G4 21KR0008GE LEN135WQ+, IPS, 2880x1920, 13.5", 120 Hz | HP EliteBook Ultra G1q 14 IPS, 2240x1400, 14", 60 Hz | Asus ZenBook S13 OLED UX5304 SDC417B, OLED, 2880x1800, 13.3", 60 Hz | |
|---|---|---|---|---|---|---|
| Display | 0% | 21% | -4% | 27% | ||
| Display P3 Coverage (%) | 69.4 | 69.4 0% | 97.8 41% | 65.5 -6% | 99.7 44% | |
| sRGB Coverage (%) | 97.8 | 97.8 0% | 98.2 0% | 97.3 -1% | 100 2% | |
| AdobeRGB 1998 Coverage (%) | 71.7 | 71.7 0% | 87.3 22% | 67.7 -6% | 96.9 35% | |
| Response Times | -25% | 5% | 32% | 27% | 94% | |
| Response Time Grey 50% / Grey 80% * (ms) | 35.2 ? | 43.2 ? -23% | 38.9 ? -11% | 27.3 ? 22% | 22.8 ? 35% | 2 ? 94% |
| Response Time Black / White * (ms) | 21.8 ? | 27.6 ? -27% | 17.4 ? 20% | 12.8 ? 41% | 17.9 ? 18% | 1.6 ? 93% |
| PWM Frequency (Hz) | 240 ? | |||||
| Screen | -6% | 16% | 10% | -58% | 27% | |
| Brightness middle (cd/m²) | 518.3 | 429 -17% | 606 17% | 539 4% | 341.4 -34% | 361 -30% |
| Brightness (cd/m²) | 487 | 407 -16% | 592 22% | 513 5% | 315 -35% | 365 -25% |
| Brightness Distribution (%) | 86 | 90 5% | 94 9% | 89 3% | 87 1% | 98 14% |
| Black Level * (cd/m²) | 0.26 | 0.28 -8% | 0.43 -65% | 0.38 -46% | 0.39 -50% | |
| Contrast (:1) | 1993 | 1532 -23% | 1409 -29% | 1418 -29% | 875 -56% | |
| Colorchecker dE 2000 * | 3.4 | 2.6 24% | 1.3 62% | 1.4 59% | 5.63 -66% | 1.2 65% |
| Colorchecker dE 2000 max. * | 5.68 | 6.6 -16% | 2.1 63% | 3.5 38% | 11.94 -110% | 1.9 67% |
| Greyscale dE 2000 * | 4.2 | 4 5% | 2.1 50% | 2.2 48% | 8.8 -110% | 1.2 71% |
| Gamma | 2.29 96% | 2.23 99% | 2.16 102% | 2.19 100% | 2.14 103% | 2.27 97% |
| CCT | 7235 90% | 7332 89% | 6842 95% | 6710 97% | 6034 108% | 6486 100% |
| Colorchecker dE 2000 calibrated * | 1.4 | 0.7 | ||||
| Total Average (Program / Settings) | -10% /
-7% | 14% /
15% | 13% /
10% | -16% /
-41% | 49% /
39% |
* ... smaller is better
Our X-Rite colorimeter shows the display targeting sRGB with decent average grayscale and color deltaE values of 4.2 and 3.4, respectively. Color temperature, however, is slightly too cool at 7235 which throws off color accuracy at lower saturation levels. It's a shame that Dell doesn't calibrate the panel at factory since most calibration software are not yet compatible with ARM including i1Profiler.

Display Response Times
| ↔ Response Time Black to White | ||
|---|---|---|
| 21.8 ms ... rise ↗ and fall ↘ combined | ↗ 10.5 ms rise |  |
| ↘ 11.3 ms fall | ||
| The screen shows good response rates in our tests, but may be too slow for competitive gamers. In comparison, all tested devices range from 0.1 (minimum) to 240 (maximum) ms. » 48 % of all devices are better. This means that the measured response time is similar to the average of all tested devices (19.9 ms). | ||
| ↔ Response Time 50% Grey to 80% Grey | ||
| 35.2 ms ... rise ↗ and fall ↘ combined | ↗ 15.2 ms rise | 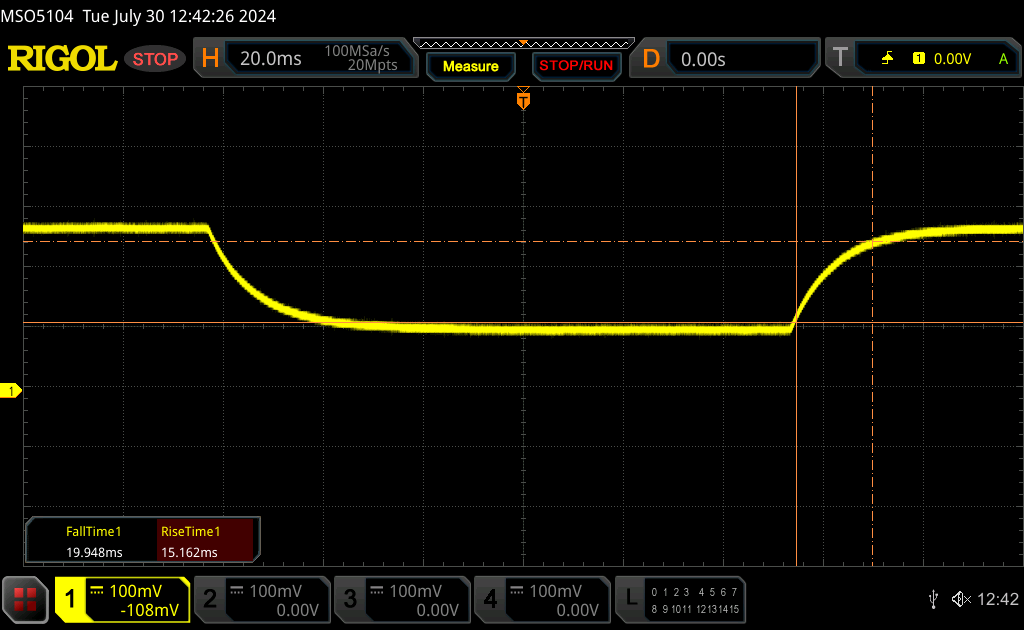 |
| ↘ 20 ms fall | ||
| The screen shows slow response rates in our tests and will be unsatisfactory for gamers. In comparison, all tested devices range from 0.165 (minimum) to 636 (maximum) ms. » 49 % of all devices are better. This means that the measured response time is worse than the average of all tested devices (31.1 ms). | ||
Screen Flickering / PWM (Pulse-Width Modulation)
| Screen flickering / PWM not detected |  | ||
In comparison: 52 % of all tested devices do not use PWM to dim the display. If PWM was detected, an average of 7791 (minimum: 5 - maximum: 343500) Hz was measured. | |||


Performance
Testing Conditions
We set Windows and MyDell to Performance mode prior to running the benchmarks below. MyDell has been redesigned on the Snapdragon model to be simpler to use when compared to the same software on the Intel-based XPS 13. Certain features previously found on the software, such as Presence Detection, have been moved to the Windows Power and Battery menu instead.
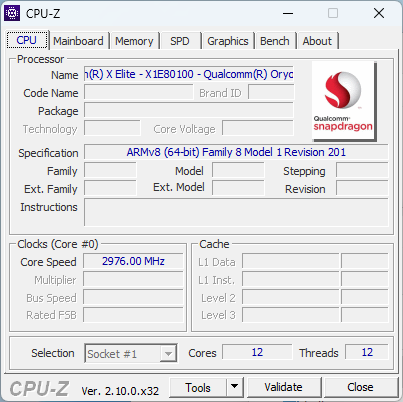
Processor
Performance depends quite heavily on whether or not the application is native or emulated. For example, the processor excels in CineBench 2024 and GeekBench 6 as both have been optimized for an ARM environment. Our Snapdragon X Elite X1E-80-100 would outperform the Core Ultra 7 155H in both multi-thread and single-thread operations when under such conditions. Otherwise, emulated benchmarks pull back our Snapdragon CPU to performance levels that are more on par with the older Core i5-1240P or Core i7-1260P. In other words, the Qualcomm CPU can be competitive against the Core Ultra 7 155H as the manufacturer likes to claim, but conditions and applications have to be just right for those benefits to unfold.
Performance consistency can also be difficult to measure between Snapdragon CPUs. For our example, our Snapdragon X Elite X1E-80-100 would comfortably outperform the Snapdragon X Elite X1E-78-100 in the EliteBook Ultra G1q 14 in CineBench 2024, but the opposite is true in CineBench R23 and R15.
Cinebench R15 Multi Loop
Cinebench 2024: CPU Multi Core | CPU Single Core
Cinebench R23: Multi Core | Single Core
Cinebench R20: CPU (Multi Core) | CPU (Single Core)
Cinebench R15: CPU Multi 64Bit | CPU Single 64Bit
Blender: v2.79 BMW27 CPU
7-Zip 18.03: 7z b 4 | 7z b 4 -mmt1
Geekbench 6.7: Multi-Core | Single-Core
HWBOT x265 Benchmark v2.2: 4k Preset
LibreOffice : 20 Documents To PDF
R Benchmark 2.5: Overall mean
| Cinebench 2024 / CPU Multi Core | |
| Dell XPS 13 9345 | |
| Microsoft Surface Laptop 7 13.8 Copilot+ | |
| Average Qualcomm Snapdragon X Elite X1E-80-100 (621 - 927, n=7) | |
| Medion SPRCHRGD 14 S1 Elite | |
| HP EliteBook Ultra G1q 14 | |
| Lenovo ThinkPad T14s Gen 6 21N10007GE | |
| Dell XPS 13 9340 Core Ultra 7 | |
| Dell XPS 14 2024 OLED | |
| Cinebench 2024 / CPU Single Core | |
| Microsoft Surface Laptop 7 13.8 Copilot+ | |
| Average Qualcomm Snapdragon X Elite X1E-80-100 (122 - 123, n=7) | |
| Dell XPS 13 9345 | |
| Lenovo ThinkPad T14s Gen 6 21N10007GE | |
| Medion SPRCHRGD 14 S1 Elite | |
| HP EliteBook Ultra G1q 14 | |
| Dell XPS 14 2024 OLED | |
| Dell XPS 13 9340 Core Ultra 7 | |
| Geekbench 6.7 / Multi-Core | |
| Lenovo ThinkPad T14s Gen 6 21N10007GE | |
| Dell XPS 13 9345 | |
| Medion SPRCHRGD 14 S1 Elite | |
| Microsoft Surface Laptop 7 13.8 Copilot+ | |
| Dell XPS 14 2024 OLED | |
| HP EliteBook Ultra G1q 14 | |
| Average Qualcomm Snapdragon X Elite X1E-80-100 (7596 - 14998, n=9) | |
| Dell XPS 13 9340 Core Ultra 7 | |
| Geekbench 6.7 / Single-Core | |
| Dell XPS 13 9345 | |
| Microsoft Surface Laptop 7 13.8 Copilot+ | |
| Average Qualcomm Snapdragon X Elite X1E-80-100 (1896 - 2845, n=9) | |
| Lenovo ThinkPad T14s Gen 6 21N10007GE | |
| Medion SPRCHRGD 14 S1 Elite | |
| Dell XPS 14 2024 OLED | |
| Dell XPS 13 9340 Core Ultra 7 | |
| HP EliteBook Ultra G1q 14 | |
Cinebench 2024: CPU Multi Core | CPU Single Core
Cinebench R23: Multi Core | Single Core
Cinebench R20: CPU (Multi Core) | CPU (Single Core)
Cinebench R15: CPU Multi 64Bit | CPU Single 64Bit
Blender: v2.79 BMW27 CPU
7-Zip 18.03: 7z b 4 | 7z b 4 -mmt1
Geekbench 6.7: Multi-Core | Single-Core
HWBOT x265 Benchmark v2.2: 4k Preset
LibreOffice : 20 Documents To PDF
R Benchmark 2.5: Overall mean
* ... smaller is better
AIDA64: FP32 Ray-Trace | FPU Julia | CPU SHA3 | CPU Queen | FPU SinJulia | FPU Mandel | CPU AES | CPU ZLib | FP64 Ray-Trace | CPU PhotoWorxx
| Performance rating | |
| Dell XPS 13 9340 Core Ultra 7 | |
| Lenovo ThinkBook 13x G4 21KR0008GE | |
| Microsoft Surface Laptop 7 13.8 Copilot+ | |
| Dell XPS 13 9345 | |
| HP EliteBook Ultra G1q 14 | |
| Average Qualcomm Snapdragon X Elite X1E-80-100 | |
| Asus ZenBook S13 OLED UX5304 | |
| AIDA64 / FP32 Ray-Trace | |
| Dell XPS 13 9340 Core Ultra 7 | |
| Lenovo ThinkBook 13x G4 21KR0008GE | |
| HP EliteBook Ultra G1q 14 | |
| Microsoft Surface Laptop 7 13.8 Copilot+ | |
| Dell XPS 13 9345 | |
| Average Qualcomm Snapdragon X Elite X1E-80-100 (2184 - 7469, n=7) | |
| Asus ZenBook S13 OLED UX5304 | |
| AIDA64 / FPU Julia | |
| Dell XPS 13 9340 Core Ultra 7 | |
| Lenovo ThinkBook 13x G4 21KR0008GE | |
| Asus ZenBook S13 OLED UX5304 | |
| Microsoft Surface Laptop 7 13.8 Copilot+ | |
| Dell XPS 13 9345 | |
| HP EliteBook Ultra G1q 14 | |
| Average Qualcomm Snapdragon X Elite X1E-80-100 (5687 - 26391, n=7) | |
| AIDA64 / CPU SHA3 | |
| HP EliteBook Ultra G1q 14 | |
| Microsoft Surface Laptop 7 13.8 Copilot+ | |
| Dell XPS 13 9340 Core Ultra 7 | |
| Dell XPS 13 9345 | |
| Average Qualcomm Snapdragon X Elite X1E-80-100 (2607 - 3122, n=7) | |
| Lenovo ThinkBook 13x G4 21KR0008GE | |
| Asus ZenBook S13 OLED UX5304 | |
| AIDA64 / CPU Queen | |
| Lenovo ThinkBook 13x G4 21KR0008GE | |
| Dell XPS 13 9340 Core Ultra 7 | |
| Microsoft Surface Laptop 7 13.8 Copilot+ | |
| Average Qualcomm Snapdragon X Elite X1E-80-100 (67219 - 69762, n=7) | |
| Dell XPS 13 9345 | |
| HP EliteBook Ultra G1q 14 | |
| Asus ZenBook S13 OLED UX5304 | |
| AIDA64 / FPU SinJulia | |
| Dell XPS 13 9340 Core Ultra 7 | |
| Lenovo ThinkBook 13x G4 21KR0008GE | |
| Asus ZenBook S13 OLED UX5304 | |
| Microsoft Surface Laptop 7 13.8 Copilot+ | |
| Dell XPS 13 9345 | |
| Average Qualcomm Snapdragon X Elite X1E-80-100 (1521 - 2357, n=7) | |
| HP EliteBook Ultra G1q 14 | |
| AIDA64 / FPU Mandel | |
| Dell XPS 13 9340 Core Ultra 7 | |
| Lenovo ThinkBook 13x G4 21KR0008GE | |
| Asus ZenBook S13 OLED UX5304 | |
| HP EliteBook Ultra G1q 14 | |
| Microsoft Surface Laptop 7 13.8 Copilot+ | |
| Average Qualcomm Snapdragon X Elite X1E-80-100 (10117 - 15669, n=7) | |
| Dell XPS 13 9345 | |
| AIDA64 / CPU AES | |
| HP EliteBook Ultra G1q 14 | |
| Dell XPS 13 9340 Core Ultra 7 | |
| Microsoft Surface Laptop 7 13.8 Copilot+ | |
| Average Qualcomm Snapdragon X Elite X1E-80-100 (39956 - 71089, n=7) | |
| Dell XPS 13 9345 | |
| Lenovo ThinkBook 13x G4 21KR0008GE | |
| Asus ZenBook S13 OLED UX5304 | |
| AIDA64 / CPU ZLib | |
| Dell XPS 13 9340 Core Ultra 7 | |
| HP EliteBook Ultra G1q 14 | |
| Microsoft Surface Laptop 7 13.8 Copilot+ | |
| Dell XPS 13 9345 | |
| Average Qualcomm Snapdragon X Elite X1E-80-100 (398 - 802, n=7) | |
| Lenovo ThinkBook 13x G4 21KR0008GE | |
| Asus ZenBook S13 OLED UX5304 | |
| AIDA64 / FP64 Ray-Trace | |
| Dell XPS 13 9340 Core Ultra 7 | |
| Lenovo ThinkBook 13x G4 21KR0008GE | |
| Microsoft Surface Laptop 7 13.8 Copilot+ | |
| Dell XPS 13 9345 | |
| Average Qualcomm Snapdragon X Elite X1E-80-100 (2581 - 4044, n=7) | |
| Asus ZenBook S13 OLED UX5304 | |
| HP EliteBook Ultra G1q 14 | |
| AIDA64 / CPU PhotoWorxx | |
| Dell XPS 13 9340 Core Ultra 7 | |
| Lenovo ThinkBook 13x G4 21KR0008GE | |
| Asus ZenBook S13 OLED UX5304 | |
| Microsoft Surface Laptop 7 13.8 Copilot+ | |
| Dell XPS 13 9345 | |
| Average Qualcomm Snapdragon X Elite X1E-80-100 (28474 - 38707, n=7) | |
| HP EliteBook Ultra G1q 14 | |
System Performance
WebXPRT and Kraken, which run natively on the Edge browser optimized for ARM, both rank our Qualcomm XPS ahead of the Intel XPS by decent margins.
WebXPRT 3: Overall
WebXPRT 4: Overall
Mozilla Kraken 1.1: Total
| CrossMark / Overall | |
| Dell XPS 13 9340 Core Ultra 7 | |
| Asus ZenBook S13 OLED UX5304 | |
| Lenovo ThinkBook 13x G4 21KR0008GE | |
| Microsoft Surface Laptop 7 13.8 Copilot+ | |
| Average Qualcomm Snapdragon X Elite X1E-80-100, Qualcomm SD X Adreno X1-85 3.8 TFLOPS (1356 - 1443, n=7) | |
| Dell XPS 13 9345 | |
| HP EliteBook Ultra G1q 14 | |
| CrossMark / Productivity | |
| Dell XPS 13 9340 Core Ultra 7 | |
| Asus ZenBook S13 OLED UX5304 | |
| Lenovo ThinkBook 13x G4 21KR0008GE | |
| Microsoft Surface Laptop 7 13.8 Copilot+ | |
| Average Qualcomm Snapdragon X Elite X1E-80-100, Qualcomm SD X Adreno X1-85 3.8 TFLOPS (1271 - 1375, n=7) | |
| Dell XPS 13 9345 | |
| HP EliteBook Ultra G1q 14 | |
| CrossMark / Creativity | |
| Dell XPS 13 9340 Core Ultra 7 | |
| Lenovo ThinkBook 13x G4 21KR0008GE | |
| Asus ZenBook S13 OLED UX5304 | |
| Microsoft Surface Laptop 7 13.8 Copilot+ | |
| Average Qualcomm Snapdragon X Elite X1E-80-100, Qualcomm SD X Adreno X1-85 3.8 TFLOPS (1402 - 1537, n=7) | |
| Dell XPS 13 9345 | |
| HP EliteBook Ultra G1q 14 | |
| CrossMark / Responsiveness | |
| Dell XPS 13 9340 Core Ultra 7 | |
| Asus ZenBook S13 OLED UX5304 | |
| Microsoft Surface Laptop 7 13.8 Copilot+ | |
| Average Qualcomm Snapdragon X Elite X1E-80-100, Qualcomm SD X Adreno X1-85 3.8 TFLOPS (1237 - 1401, n=7) | |
| Lenovo ThinkBook 13x G4 21KR0008GE | |
| Dell XPS 13 9345 | |
| HP EliteBook Ultra G1q 14 | |
| WebXPRT 3 / Overall | |
| Average Qualcomm Snapdragon X Elite X1E-80-100, Qualcomm SD X Adreno X1-85 3.8 TFLOPS (430 - 455, n=7) | |
| Microsoft Surface Laptop 7 13.8 Copilot+ | |
| Dell XPS 13 9345 | |
| HP EliteBook Ultra G1q 14 | |
| Asus ZenBook S13 OLED UX5304 | |
| Dell XPS 13 9340 Core Ultra 7 | |
| Lenovo ThinkBook 13x G4 21KR0008GE | |
| WebXPRT 4 / Overall | |
| Dell XPS 13 9345 | |
| Average Qualcomm Snapdragon X Elite X1E-80-100, Qualcomm SD X Adreno X1-85 3.8 TFLOPS (295 - 324, n=7) | |
| Microsoft Surface Laptop 7 13.8 Copilot+ | |
| HP EliteBook Ultra G1q 14 | |
| Dell XPS 13 9340 Core Ultra 7 | |
| Asus ZenBook S13 OLED UX5304 | |
| Lenovo ThinkBook 13x G4 21KR0008GE | |
| Mozilla Kraken 1.1 / Total | |
| Lenovo ThinkBook 13x G4 21KR0008GE | |
| Dell XPS 13 9340 Core Ultra 7 | |
| Asus ZenBook S13 OLED UX5304 | |
| HP EliteBook Ultra G1q 14 | |
| Dell XPS 13 9345 | |
| Average Qualcomm Snapdragon X Elite X1E-80-100, Qualcomm SD X Adreno X1-85 3.8 TFLOPS (391 - 422, n=7) | |
| Microsoft Surface Laptop 7 13.8 Copilot+ | |
* ... smaller is better
| AIDA64 / Memory Copy | |
| Dell XPS 13 9340 Core Ultra 7 | |
| Lenovo ThinkBook 13x G4 21KR0008GE | |
| Dell XPS 13 9345 | |
| Microsoft Surface Laptop 7 13.8 Copilot+ | |
| Asus ZenBook S13 OLED UX5304 | |
| Average Qualcomm Snapdragon X Elite X1E-80-100 (44795 - 63495, n=7) | |
| HP EliteBook Ultra G1q 14 | |
| AIDA64 / Memory Read | |
| Dell XPS 13 9345 | |
| Microsoft Surface Laptop 7 13.8 Copilot+ | |
| Average Qualcomm Snapdragon X Elite X1E-80-100 (58855 - 125604, n=7) | |
| Dell XPS 13 9340 Core Ultra 7 | |
| Lenovo ThinkBook 13x G4 21KR0008GE | |
| HP EliteBook Ultra G1q 14 | |
| Asus ZenBook S13 OLED UX5304 | |
| AIDA64 / Memory Write | |
| Dell XPS 13 9340 Core Ultra 7 | |
| Asus ZenBook S13 OLED UX5304 | |
| Lenovo ThinkBook 13x G4 21KR0008GE | |
| Dell XPS 13 9345 | |
| Microsoft Surface Laptop 7 13.8 Copilot+ | |
| Average Qualcomm Snapdragon X Elite X1E-80-100 (37270 - 45265, n=7) | |
| HP EliteBook Ultra G1q 14 | |
| AIDA64 / Memory Latency | |
| Lenovo ThinkBook 13x G4 21KR0008GE | |
| Dell XPS 13 9340 Core Ultra 7 | |
| Asus ZenBook S13 OLED UX5304 | |
| Average Qualcomm Snapdragon X Elite X1E-80-100 (7.4 - 8.8, n=5) | |
| HP EliteBook Ultra G1q 14 | |
| Dell XPS 13 9345 | |
| Microsoft Surface Laptop 7 13.8 Copilot+ | |
* ... smaller is better
Storage Devices
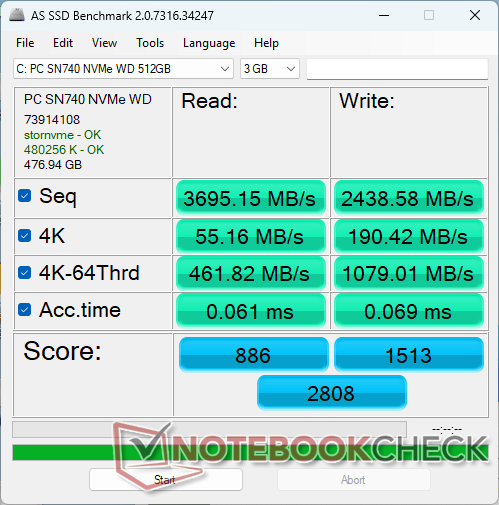
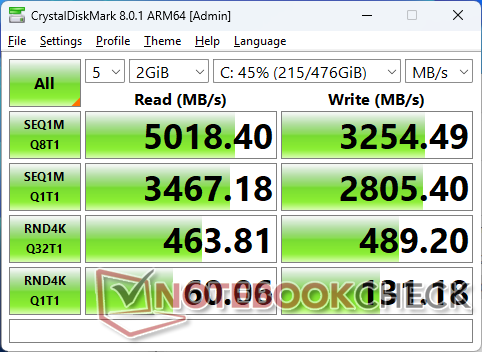
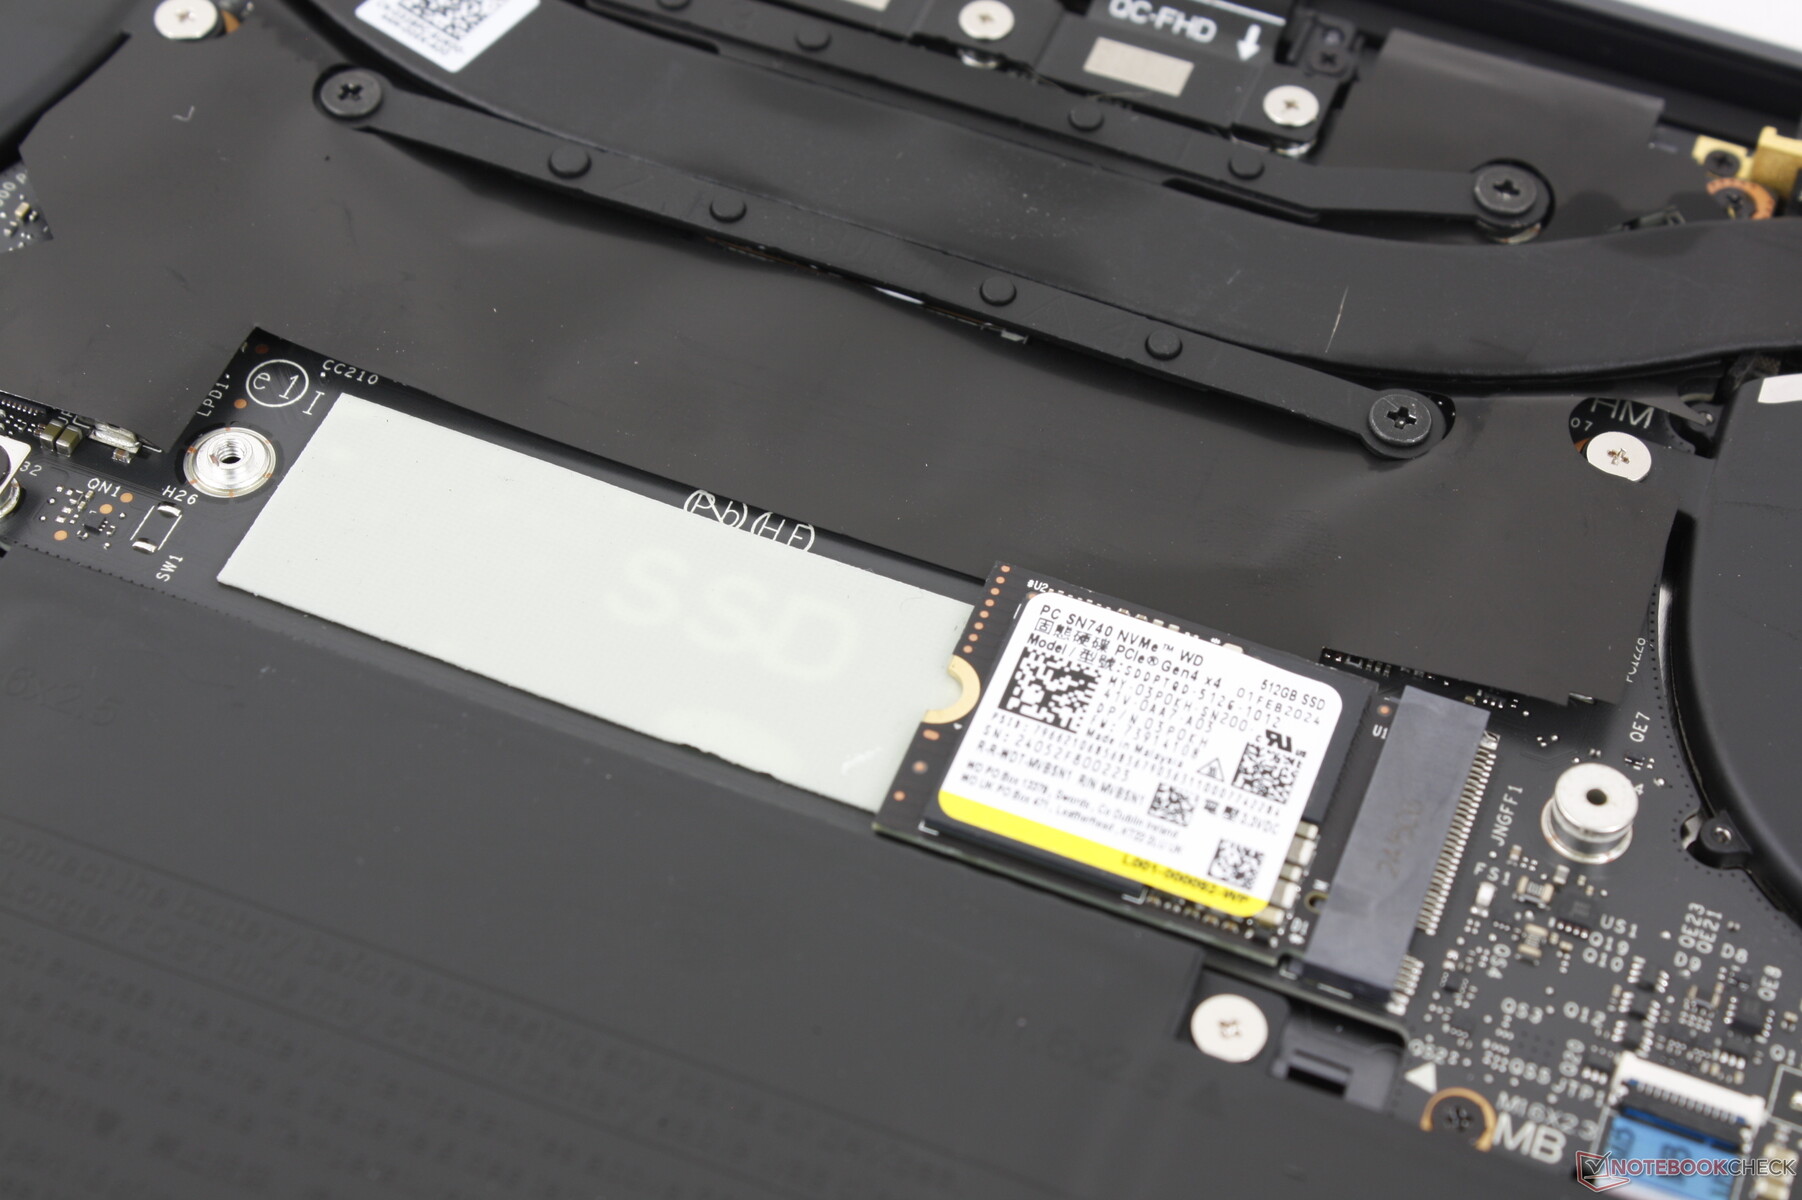
Dell sources its SSDs from a wide variety of manufacturers and so it's difficult to know what drive you're getting prior to purchasing. For example, we've had drives from Micron, Samsung, WD, Toshiba, and SK Hynix across 10+ different in-house XPS 13 units. Our specific Qualcomm unit ships with the mid-range WD SN740 offering stable transfer rates of up to 5000 MB/s. We can observe no throttling behavior despite the small 42 mm length likely due in part to the included SSD heat spreader.

* ... smaller is better
Disk Throttling: DiskSpd Read Loop, Queue Depth 8
GPU Performance
Graphics performance according to emulated 3DMark is on par with the Iris Xe 96 EUs but well behind the Arc 8 or Radeon 680M/780M series by up to 20 to 40 percent. However, results are consistently better than the HP EliteBook Ultra G1q 14 even if the deltas are minor on average.
| Power Profile | Graphics Score | Physics Score | Combined Score |
| Performance mode | 6283 | 17318 | 2611 |
| Balanced mode | 6209 | 18348 | 2643 |
| Battery power | 6287 | 18156 | 2687 |
There is no significant dip in performance when switching between Performance, Balanced, or battery power modes as exemplified by our Fire Strike results table above.
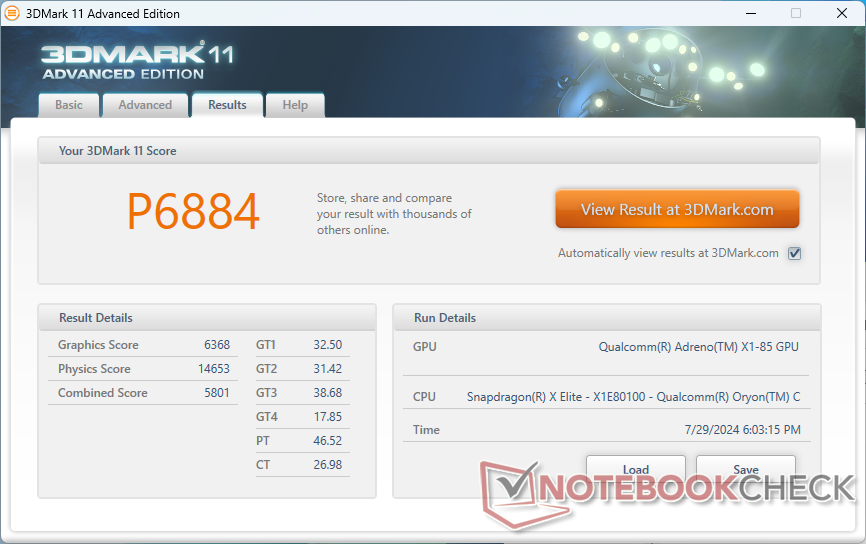
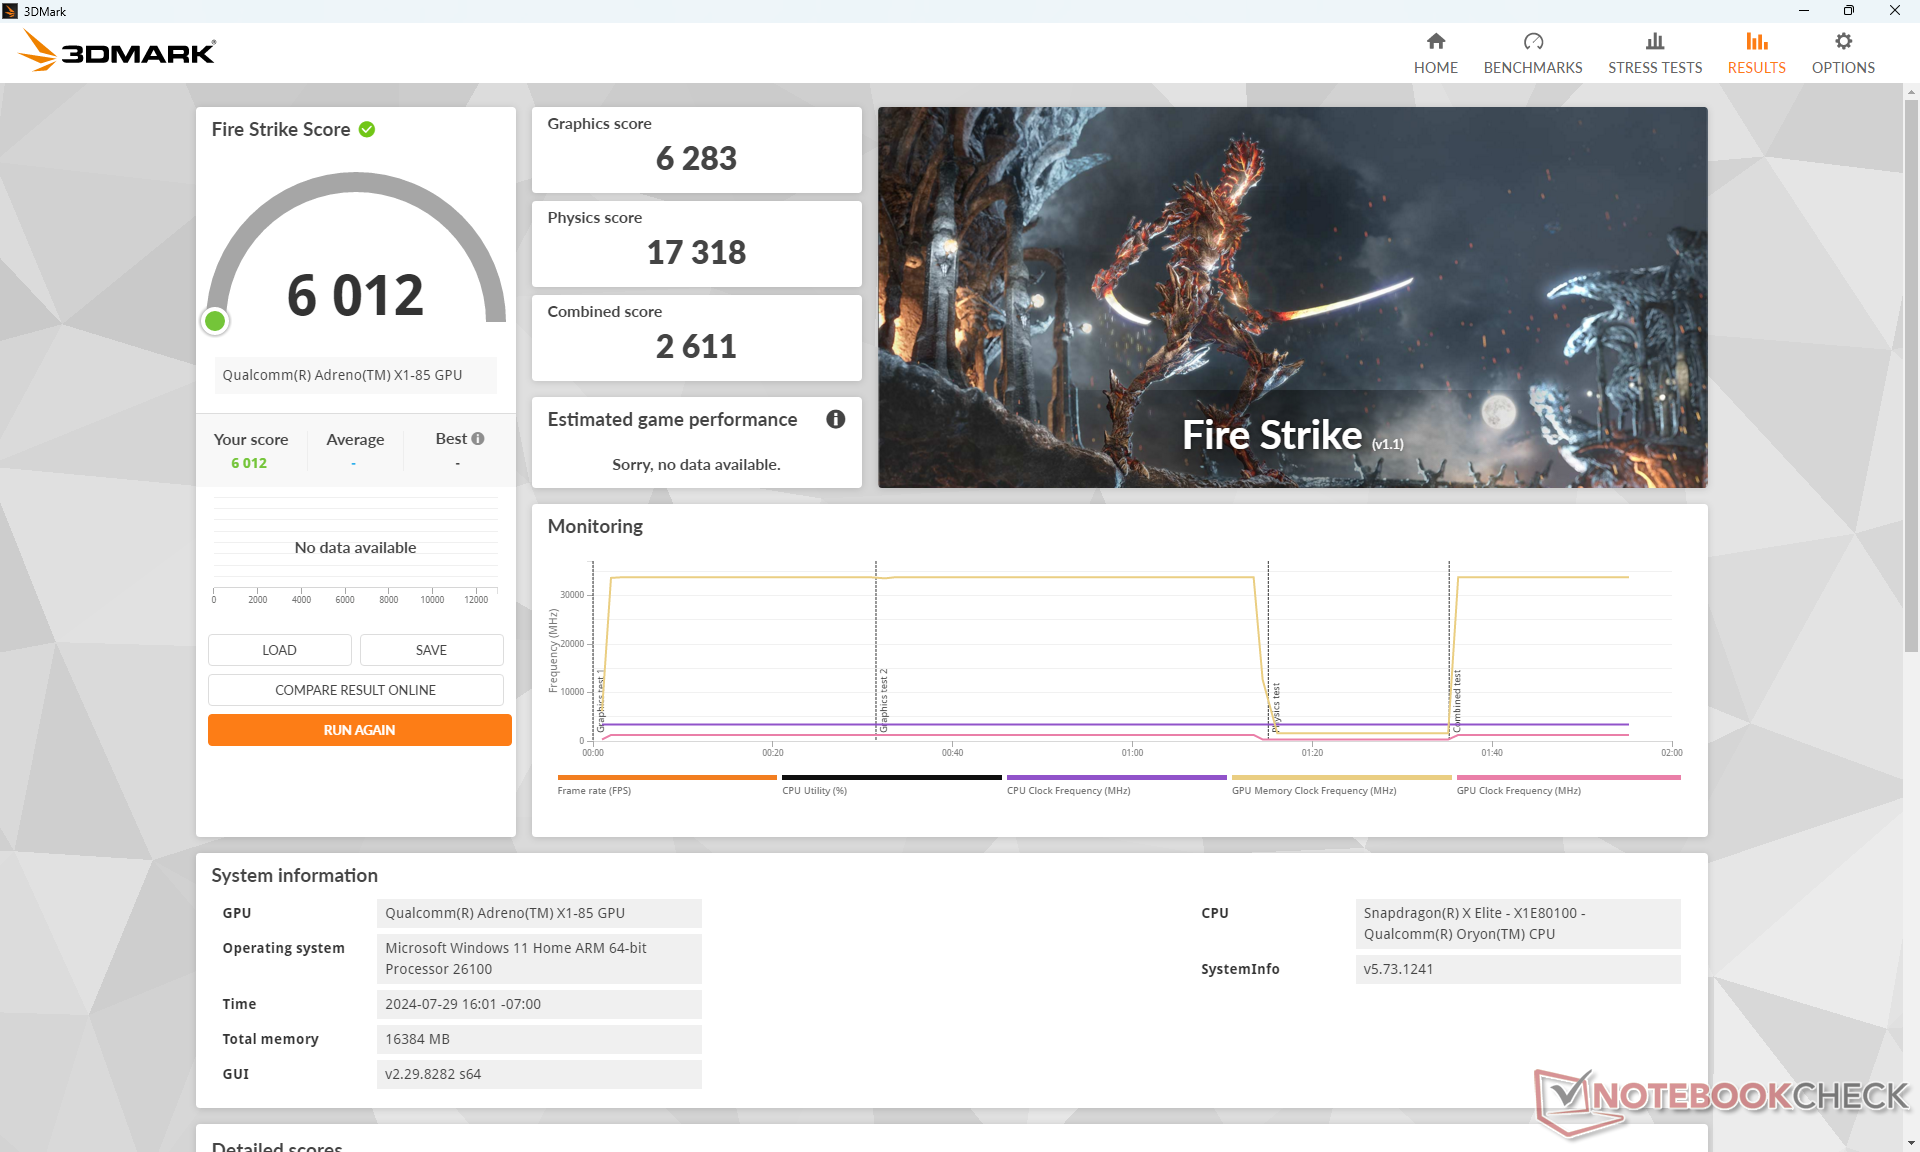
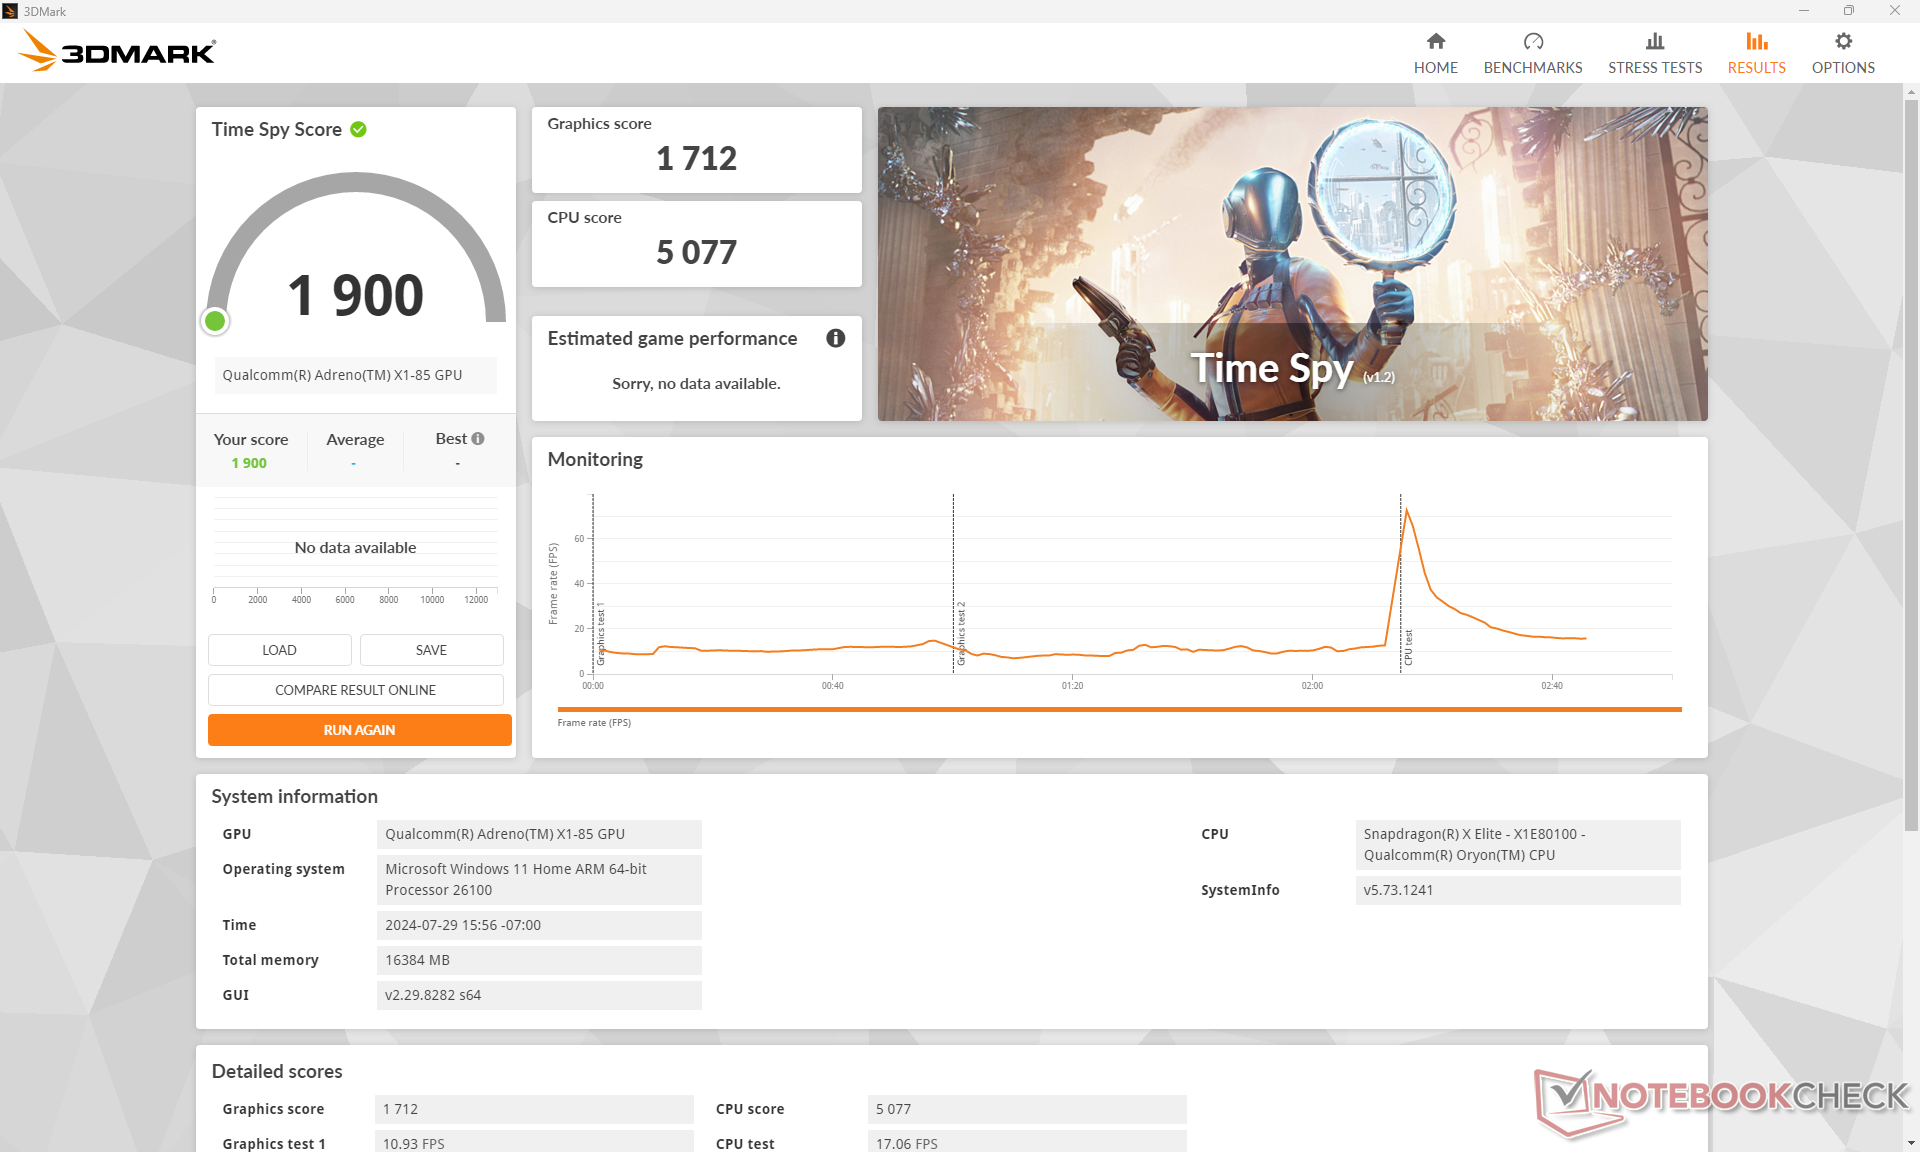
| 3DMark 11 Performance | 6884 points | |
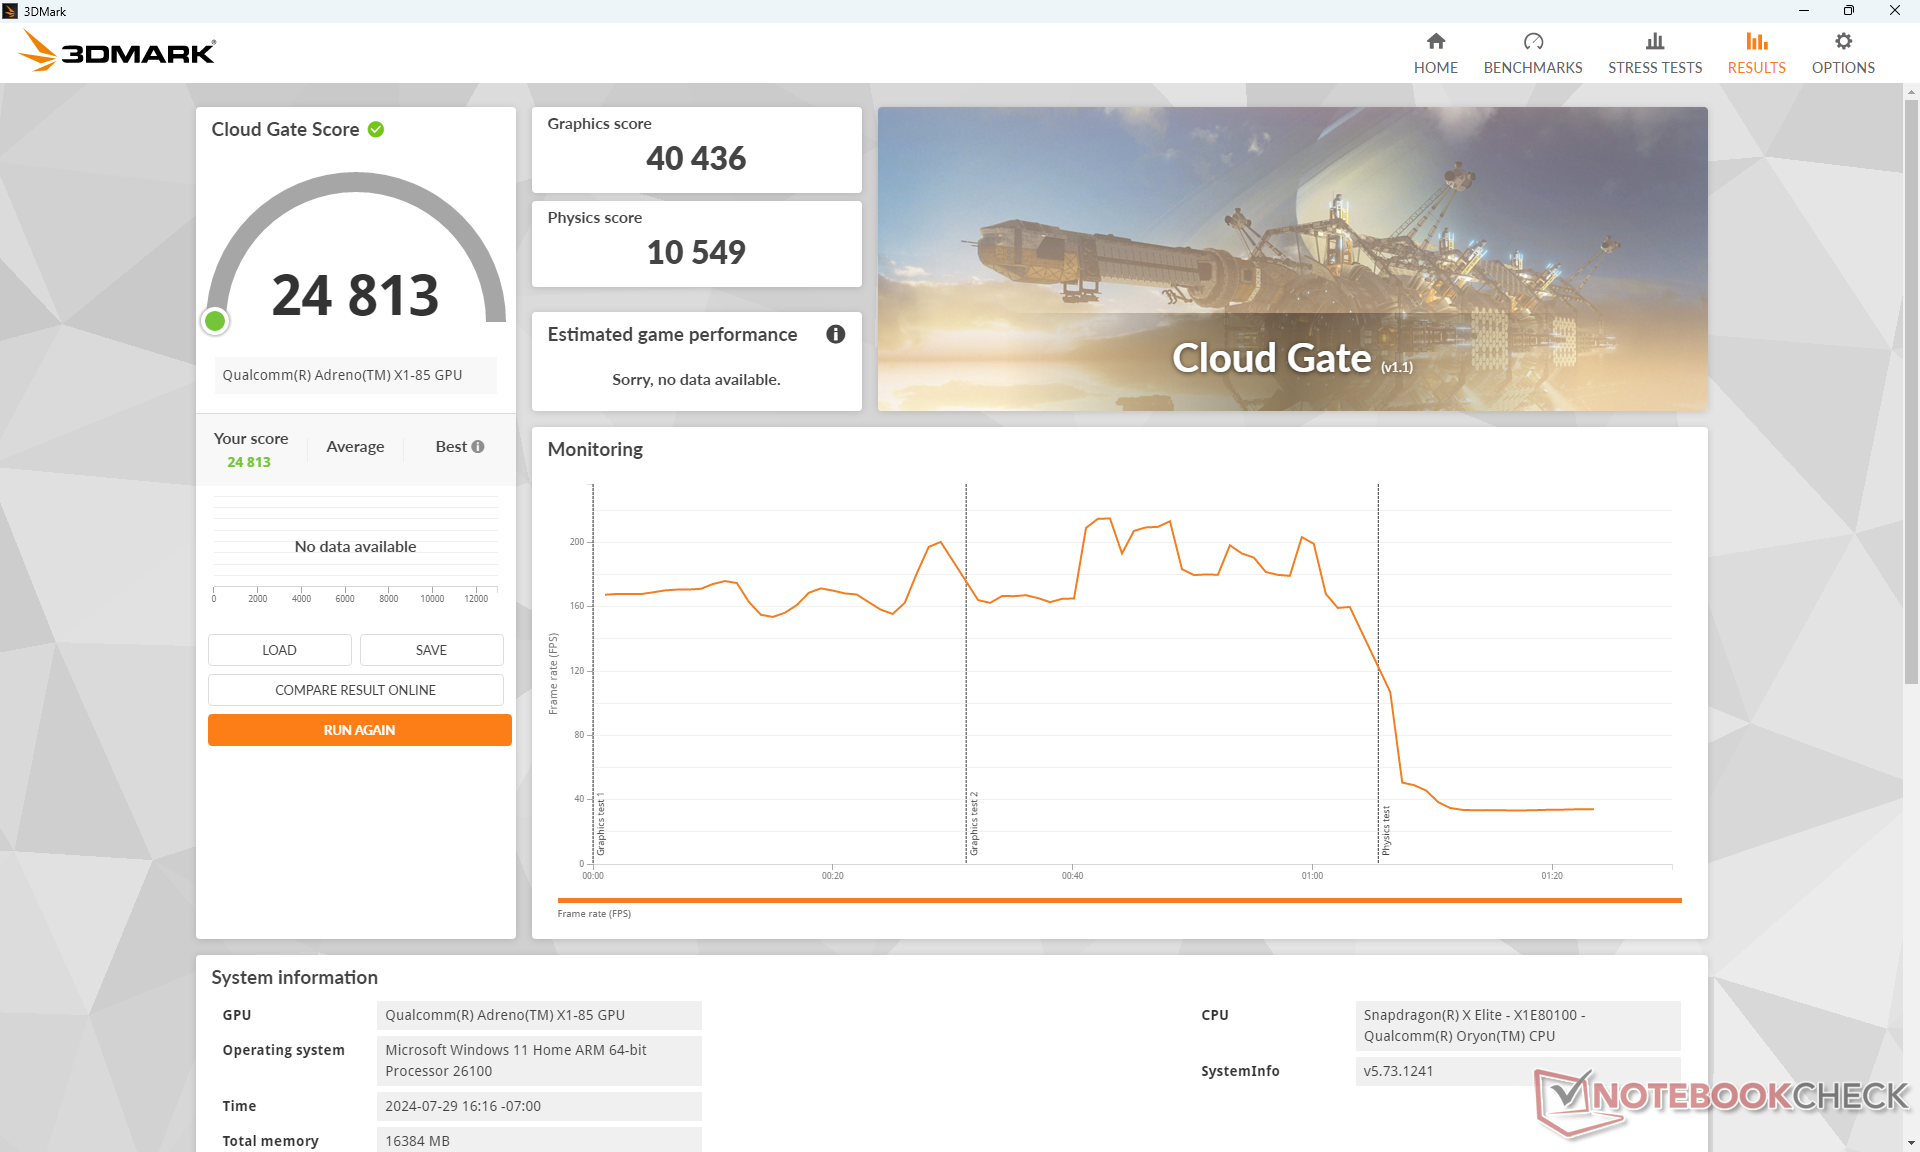
| 3DMark Cloud Gate Standard Score | 24813 points | |
| 3DMark Fire Strike Score | 6012 points | |
| 3DMark Time Spy Score | 1900 points | |
Help | ||
* ... smaller is better
Gaming Performance
Our slightly higher 3DMark results over the EliteBook Ultra G1q 14 translate to slightly faster performance in the tested titles below. Interestingly, some titles would run on our Dell unit but not on our HP unit and vice versa. For example, Far Cry 5 would run on our Dell but not the HP and Baldur's Gate 3 would run on our HP but not the Dell no matter the DirectX mode. The discrepancy may be due to driver differences between the two models, but this also shows that more work needs to be done with regards to the graphics driver.
| Performance rating - Percent | |
| Lenovo ThinkBook 13x G4 21KR0008GE -2! | |
| Dell XPS 13 9340 Core Ultra 7 -2! | |
| Dell XPS 13 9345 | |
| Microsoft Surface Laptop 7 13.8 Copilot+ -2! | |
| HP EliteBook Ultra G1q 14 -1! | |
| Asus ZenBook S13 OLED UX5304 -1! | |
| The Witcher 3 - 1920x1080 Ultra Graphics & Postprocessing (HBAO+) | |
| Lenovo ThinkBook 13x G4 21KR0008GE | |
| Dell XPS 13 9340 Core Ultra 7 | |
| Dell XPS 13 9345 | |
| HP EliteBook Ultra G1q 14 | |
| Asus ZenBook S13 OLED UX5304 | |
| GTA V - 1920x1080 Highest AA:4xMSAA + FX AF:16x | |
| Microsoft Surface Laptop 7 13.8 Copilot+ | |
| Dell XPS 13 9345 | |
| Lenovo ThinkBook 13x G4 21KR0008GE | |
| Dell XPS 13 9340 Core Ultra 7 | |
| Asus ZenBook S13 OLED UX5304 | |
| Final Fantasy XV Benchmark - 1920x1080 High Quality | |
| Dell XPS 13 9340 Core Ultra 7 | |
| Lenovo ThinkBook 13x G4 21KR0008GE | |
| Microsoft Surface Laptop 7 13.8 Copilot+ | |
| Dell XPS 13 9345 | |
| Asus ZenBook S13 OLED UX5304 | |
| HP EliteBook Ultra G1q 14 | |
| Strange Brigade - 1920x1080 ultra AA:ultra AF:16 | |
| Lenovo ThinkBook 13x G4 21KR0008GE | |
| Dell XPS 13 9340 Core Ultra 7 | |
| Microsoft Surface Laptop 7 13.8 Copilot+ | |
| Dell XPS 13 9345 | |
| HP EliteBook Ultra G1q 14 | |
| Asus ZenBook S13 OLED UX5304 | |
| Dota 2 Reborn - 1920x1080 ultra (3/3) best looking | |
| Dell XPS 13 9340 Core Ultra 7 | |
| Lenovo ThinkBook 13x G4 21KR0008GE | |
| Microsoft Surface Laptop 7 13.8 Copilot+ | |
| Asus ZenBook S13 OLED UX5304 | |
| Dell XPS 13 9345 | |
| HP EliteBook Ultra G1q 14 | |
| Tiny Tina's Wonderlands - 1920x1080 Badass Preset (DX12) | |
| Dell XPS 13 9345 | |
| HP EliteBook Ultra G1q 14 | |
| F1 22 - 1920x1080 High Preset AA:T AF:16x | |
| Dell XPS 13 9345 | |
| Microsoft Surface Laptop 7 13.8 Copilot+ | |
| HP EliteBook Ultra G1q 14 | |
| Asus ZenBook S13 OLED UX5304 | |
| Tiny Tina's Wonderlands | |
| 1280x720 Lowest Preset (DX12) | |
| Dell XPS 13 9345 | |
| Average Qualcomm SD X Adreno X1-85 3.8 TFLOPS (67.6 - 73.9, n=3) | |
| HP EliteBook Ultra G1q 14 | |
| Dell XPS 13 Plus 9320 Core i7-1360P | |
| 1920x1080 Low Preset (DX12) | |
| Dell XPS 13 9345 | |
| Average Qualcomm SD X Adreno X1-85 3.8 TFLOPS (41.5 - 44.7, n=3) | |
| HP EliteBook Ultra G1q 14 | |
| Dell XPS 13 Plus 9320 Core i7-1360P | |
| 1920x1080 Medium Preset (DX12) | |
| Dell XPS 13 9345 | |
| Average Qualcomm SD X Adreno X1-85 3.8 TFLOPS (30.8 - 33.7, n=3) | |
| HP EliteBook Ultra G1q 14 | |
| Dell XPS 13 Plus 9320 Core i7-1360P | |
| 1920x1080 High Preset (DX12) | |
| Dell XPS 13 9345 | |
| Average Qualcomm SD X Adreno X1-85 3.8 TFLOPS (20.6 - 22.4, n=3) | |
| HP EliteBook Ultra G1q 14 | |
| Dell XPS 13 Plus 9320 Core i7-1360P | |
| 1920x1080 Badass Preset (DX12) | |
| Dell XPS 13 9345 | |
| Average Qualcomm SD X Adreno X1-85 3.8 TFLOPS (16.8 - 18, n=3) | |
| HP EliteBook Ultra G1q 14 | |
| Dell XPS 13 Plus 9320 Core i7-1360P | |
Cyberpunk 2077 ultra FPS Chart
| low | med. | high | ultra | |
|---|---|---|---|---|
| GTA V (2015) | 96.3 | 94.2 | 49.5 | 21.2 |
| The Witcher 3 (2015) | 104 | 74.5 | 43.7 | 19.2 |
| Dota 2 Reborn (2015) | 80 | 60.7 | 57.4 | 50.7 |
| Final Fantasy XV Benchmark (2018) | 56.1 | 25 | 15.8 | |
| X-Plane 11.11 (2018) | 38 | |||
| Far Cry 5 (2018) | 42 | 33 | 31 | 28 |
| Strange Brigade (2018) | 123.9 | 50.8 | 41.8 | 33.9 |
| Tiny Tina's Wonderlands (2022) | 44.5 | 33.6 | 22.4 | 18 |
| F1 22 (2022) | 62.9 | 55.4 | 38.5 | |
| Cyberpunk 2077 (2023) | 24.1 | 19.5 | 16.9 | 14.7 |
Emissions
System Noise — More Relaxed Fan Activity
Fan noise is slightly quieter than the Intel Core Ultra 7 model in the sense that the internal fans ramp up more slowly in response to increased loads. Otherwise, the fans between both models would settle at similar maximum RPMs when running demanding loads for extended periods. For example, fan noise would top out at 32.8 dB(A) towards the end of the first 90-second benchmark scene in 3DMark 06 compared to 37.4 dB(A) on the Intel model under similar conditions. When running games like Cyberpunk 2077, however, both models would each settle at the low 40 dB(A) range. The Qualcomm-powered system isn't necessarily any quieter when running high loads, but you're also less likely to notice any fan activity when web browsing or video streaming.
Noise level
| Idle |
| 22.9 / 22.9 / 22.9 dB(A) |
| Load |
| 32.8 / 40.6 dB(A) |
 | ||
30 dB silent 40 dB(A) audible 50 dB(A) loud |
||
min: | ||
| Dell XPS 13 9345 Adreno X1-85 3.8 TFLOPS, SD X Elite X1E-80-100 | Dell XPS 13 9340 Core Ultra 7 Arc 8-Core, Ultra 7 155H, Micron 2550 512GB | Microsoft Surface Laptop 7 13.8 Copilot+ Adreno X1-85 3.8 TFLOPS, SD X Elite X1E-80-100, Samsung MZ9L4512HBLU-00BMV | Lenovo ThinkBook 13x G4 21KR0008GE Arc 7-Core, Ultra 5 125H, Samsung PM9C1a MZAL8512HDLU | HP EliteBook Ultra G1q 14 Adreno X1-85 3.8 TFLOPS, SD X Elite X1E-78-100, SK hynix PC801 HFS512GEJ9X101N BF | Asus ZenBook S13 OLED UX5304 Iris Xe G7 96EUs, i7-1355U, Samsung PM9A1 MZVL21T0HCLR | |
|---|---|---|---|---|---|---|
| Noise | -10% | 4% | -7% | 4% | -4% | |
| off / environment * (dB) | 22.9 | 25.1 -10% | 23.8 -4% | 24.5 -7% | 23.4 -2% | 23.3 -2% |
| Idle Minimum * (dB) | 22.9 | 25.1 -10% | 23.8 -4% | 24.5 -7% | 23.4 -2% | 23.3 -2% |
| Idle Average * (dB) | 22.9 | 25.1 -10% | 23.8 -4% | 24.5 -7% | 23.4 -2% | 23.3 -2% |
| Idle Maximum * (dB) | 22.9 | 25.1 -10% | 23.8 -4% | 27.1 -18% | 24.3 -6% | 23.3 -2% |
| Load Average * (dB) | 32.8 | 37.4 -14% | 26 21% | 33.3 -2% | 25 24% | 37.7 -15% |
| Cyberpunk 2077 ultra * (dB) | 40.6 | 31.5 22% | ||||
| Load Maximum * (dB) | 40.6 | 42.5 -5% | 40.3 1% | 40.7 -0% | 34.8 14% | 40.1 1% |
| Witcher 3 ultra * (dB) | 42.5 | 36.8 | 30.6 | 40.1 |
* ... smaller is better
Temperature
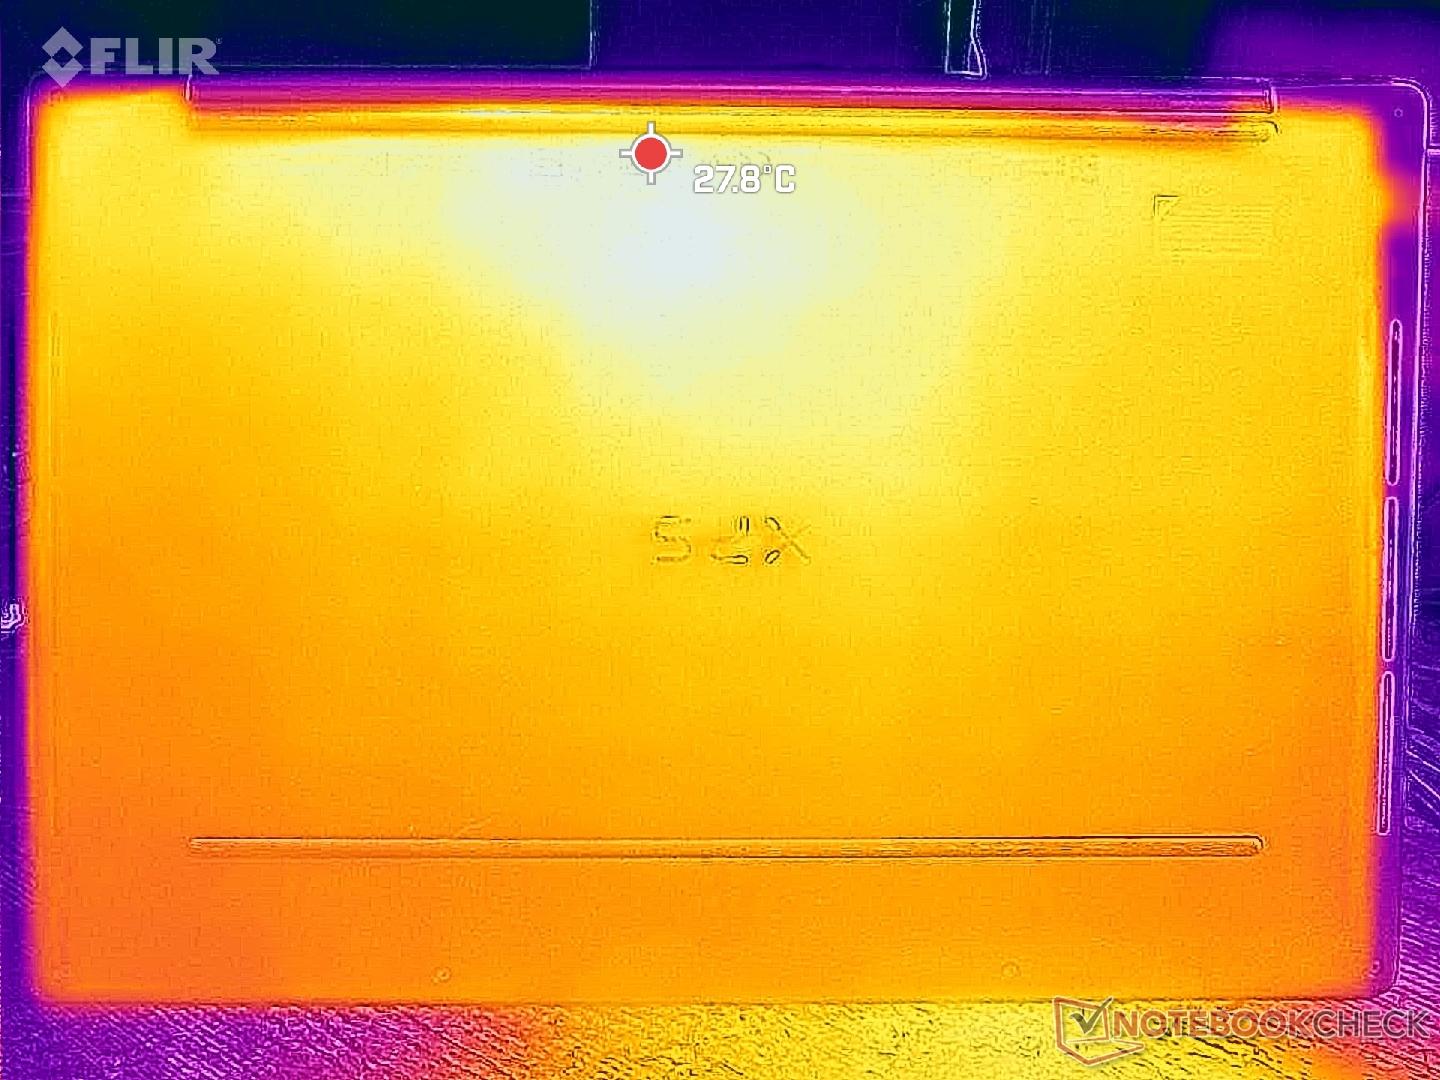
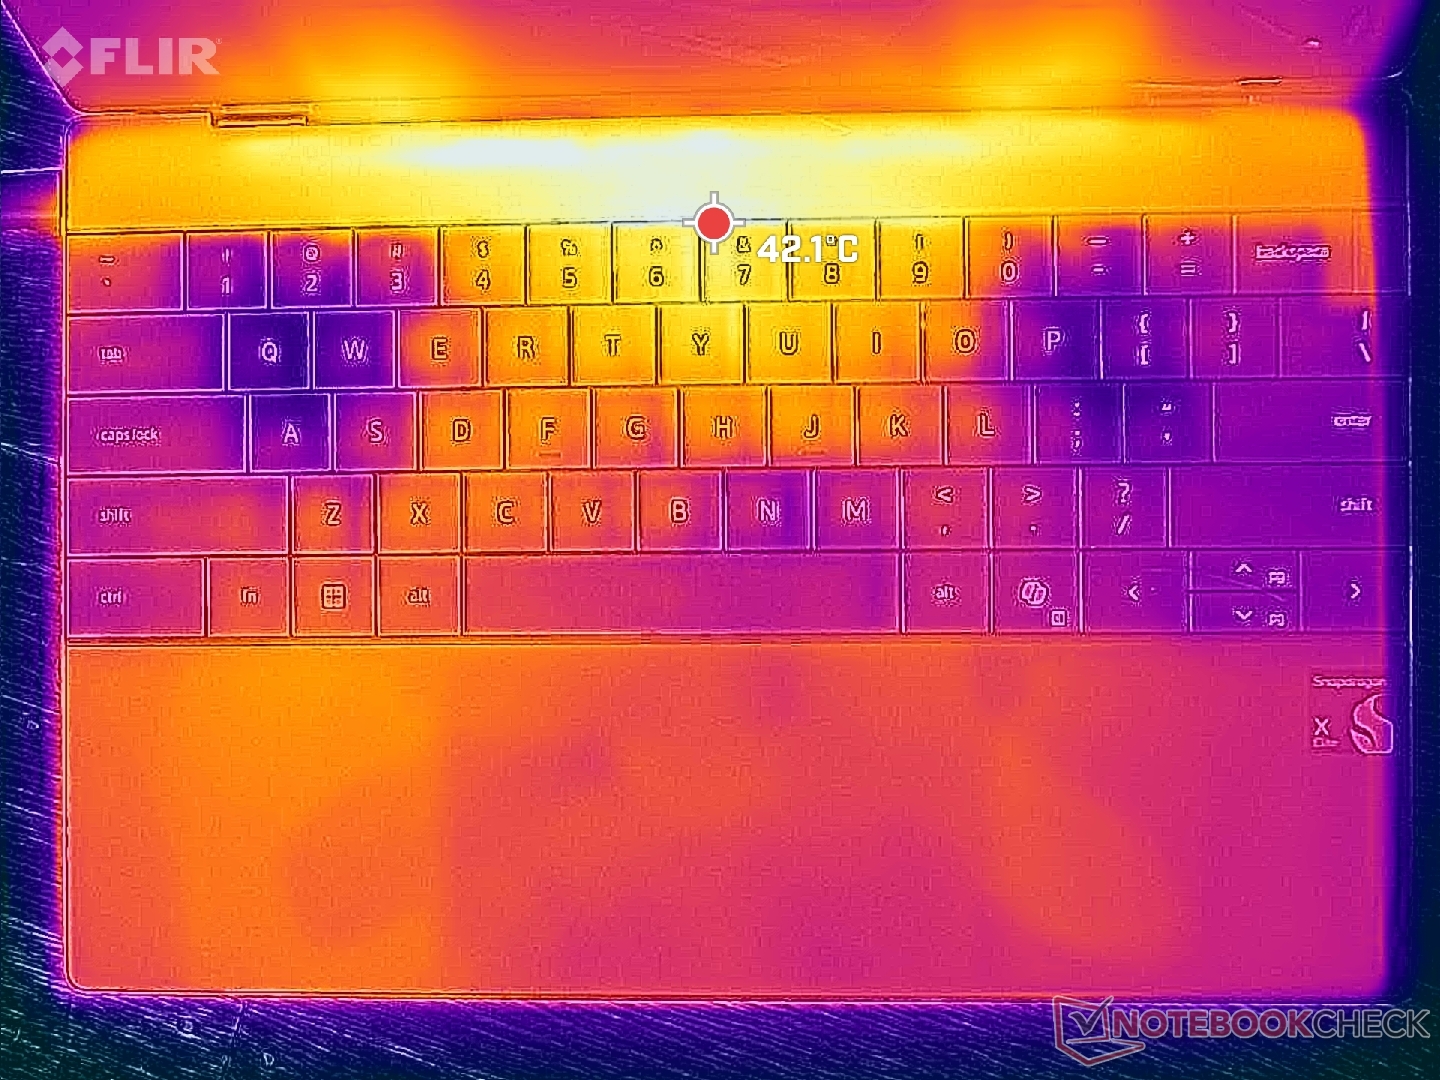
Surface temperatures are very close to what we recorded on the Intel-powered XPS 13 9340 to show that the Qualcomm model doesn't run noticeably warmer or cooler despite the processor swap. Hot spots toward the center of the system can reach up to 45 C which is similar to the Intel model when both are running demanding loads for extended periods. Average temperatures are cooler than what we recorded on the Microsoft Surface Laptop 7 13.8 but warmer than on the HP EliteBook Ultra G1q 14 each with similar Snapdragon Elite CPUs.
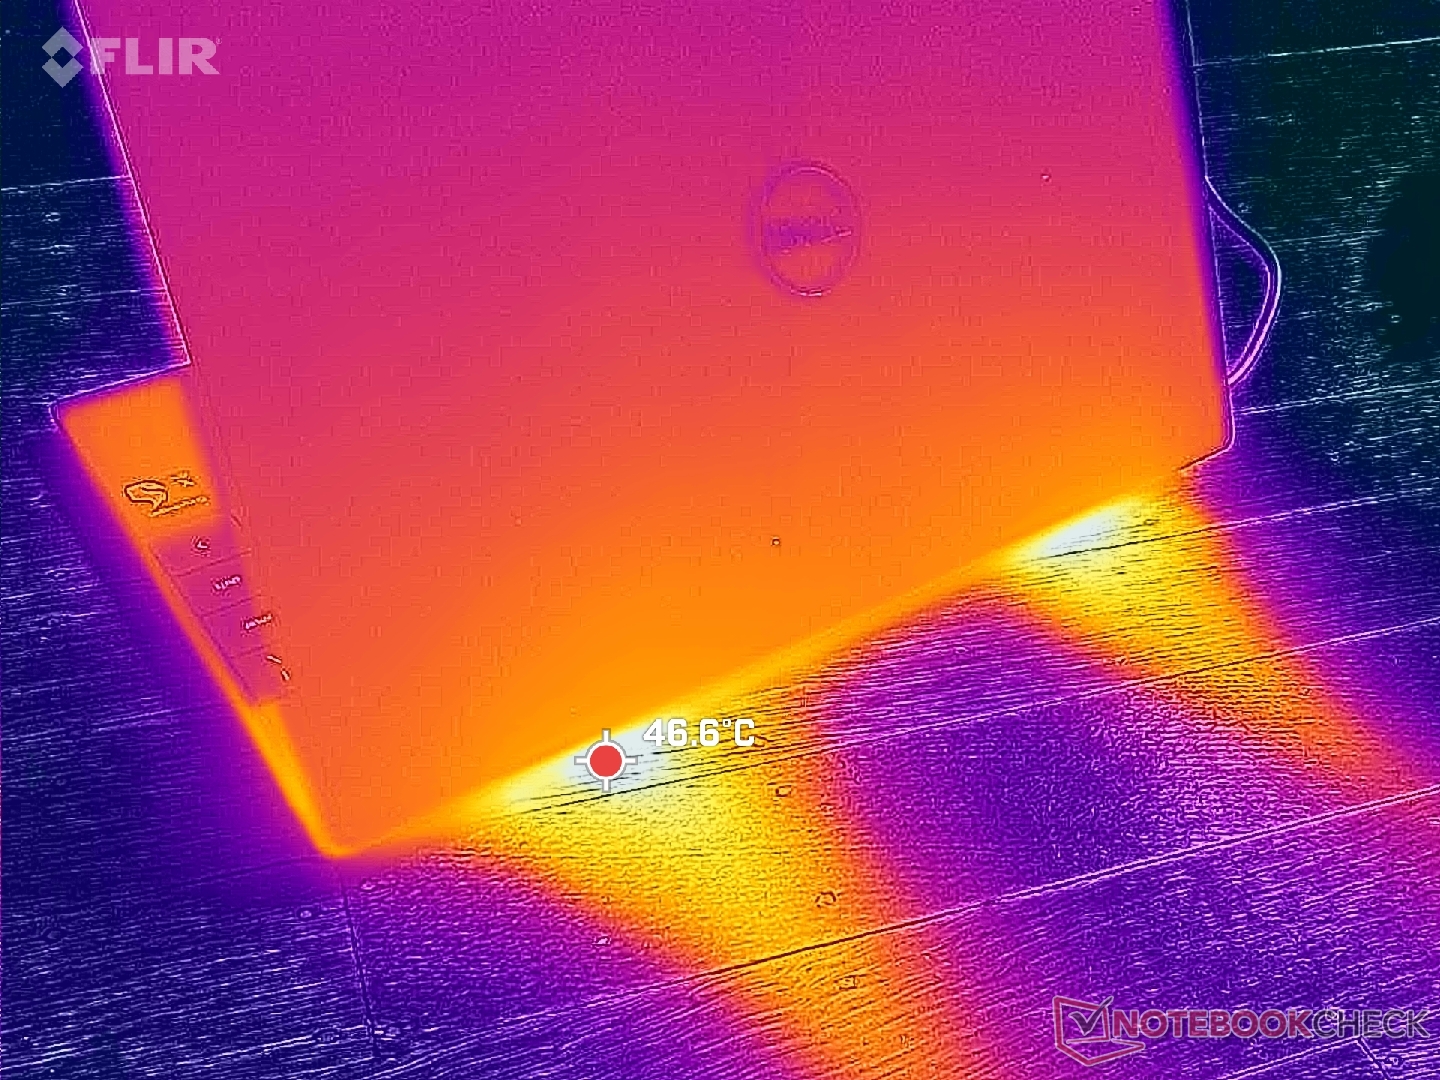
(-) The maximum temperature on the upper side is 45.2 °C / 113 F, compared to the average of 35.9 °C / 97 F, ranging from 21.4 to 59 °C for the class Subnotebook.
(±) The bottom heats up to a maximum of 44.2 °C / 112 F, compared to the average of 39.2 °C / 103 F
(+) In idle usage, the average temperature for the upper side is 29.1 °C / 84 F, compared to the device average of 30.8 °C / 87 F.
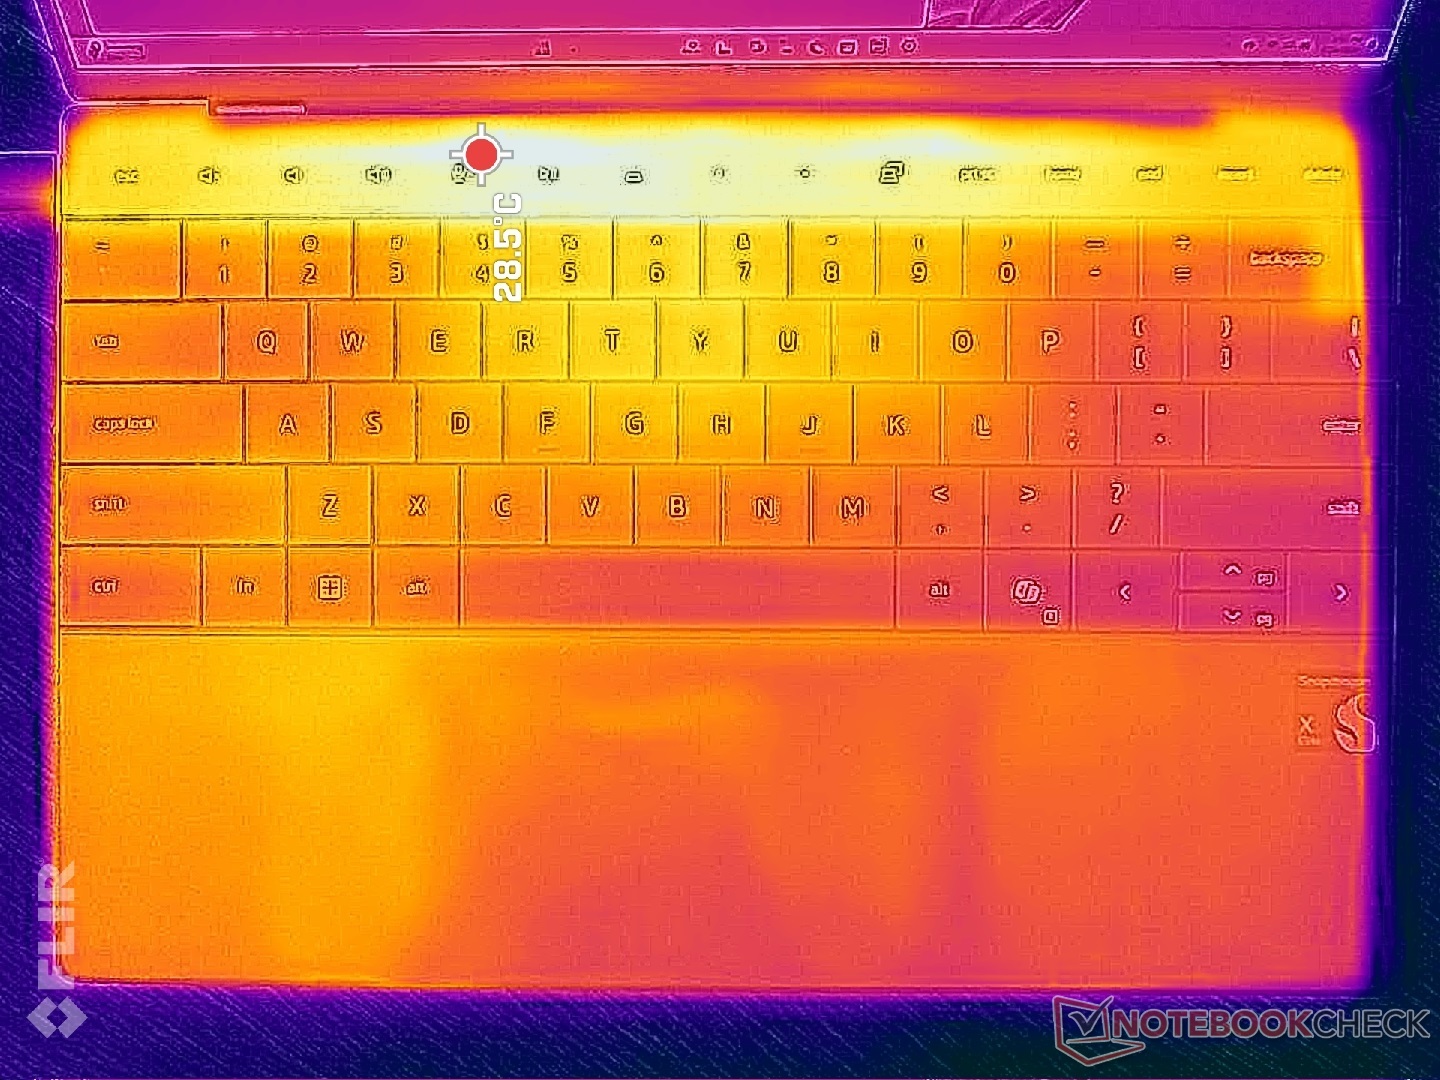
(+) The palmrests and touchpad are reaching skin temperature as a maximum (34.4 °C / 93.9 F) and are therefore not hot.
(-) The average temperature of the palmrest area of similar devices was 28.2 °C / 82.8 F (-6.2 °C / -11.1 F).

| Dell XPS 13 9345 Qualcomm Snapdragon X Elite X1E-80-100, Qualcomm SD X Adreno X1-85 3.8 TFLOPS | Dell XPS 13 9340 Core Ultra 7 Intel Core Ultra 7 155H, Intel Arc 8-Core iGPU | Microsoft Surface Laptop 7 13.8 Copilot+ Qualcomm Snapdragon X Elite X1E-80-100, Qualcomm SD X Adreno X1-85 3.8 TFLOPS | Lenovo ThinkBook 13x G4 21KR0008GE Intel Core Ultra 5 125H, Intel Arc 7-Core iGPU | HP EliteBook Ultra G1q 14 Qualcomm Snapdragon X Elite X1E-78-100, Qualcomm SD X Adreno X1-85 3.8 TFLOPS | Asus ZenBook S13 OLED UX5304 Intel Core i7-1355U, Intel Iris Xe Graphics G7 96EUs | |
|---|---|---|---|---|---|---|
| Heat | 12% | 9% | 9% | 4% | 6% | |
| Maximum Upper Side * (°C) | 45.2 | 41 9% | 47.1 -4% | 43.1 5% | 40.8 10% | 43.1 5% |
| Maximum Bottom * (°C) | 44.2 | 43.5 2% | 44.6 -1% | 39.2 11% | 40.4 9% | 45 -2% |
| Idle Upper Side * (°C) | 30.4 | 25.3 17% | 24.7 19% | 28.3 7% | 32.2 -6% | 27.3 10% |
| Idle Bottom * (°C) | 31.6 | 25.5 19% | 24.5 22% | 28 11% | 31.2 1% | 27.8 12% |
* ... smaller is better
Speakers
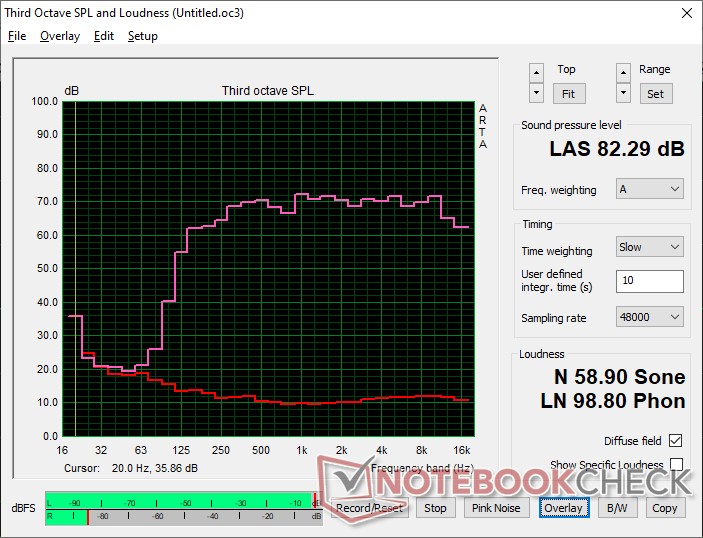
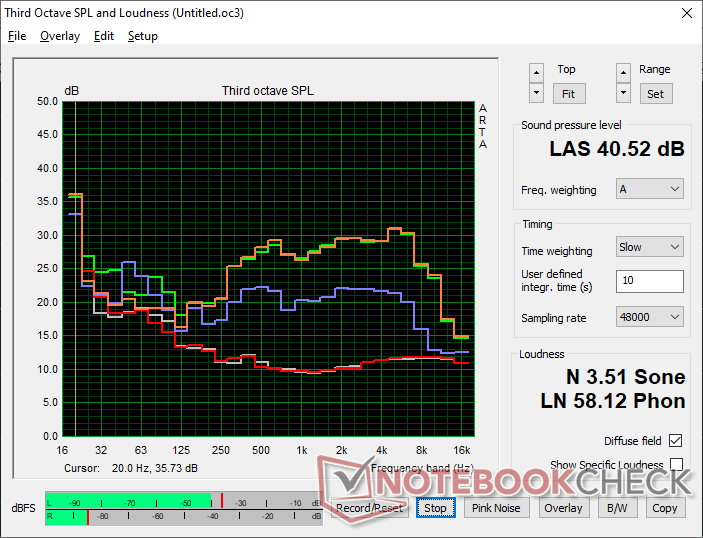
Dell XPS 13 9345 audio analysis
(+) | speakers can play relatively loud (82.3 dB)
Bass 100 - 315 Hz
(±) | reduced bass - on average 9.9% lower than median
(±) | linearity of bass is average (12.4% delta to prev. frequency)
Mids 400 - 2000 Hz
(+) | balanced mids - only 1.9% away from median
(+) | mids are linear (3.2% delta to prev. frequency)
Highs 2 - 16 kHz
(+) | balanced highs - only 1.5% away from median
(+) | highs are linear (3% delta to prev. frequency)
Overall 100 - 16.000 Hz
(+) | overall sound is linear (8.2% difference to median)
Compared to same class
» 2% of all tested devices in this class were better, 1% similar, 97% worse
» The best had a delta of 5%, average was 18%, worst was 53%
Compared to all devices tested
» 2% of all tested devices were better, 1% similar, 97% worse
» The best had a delta of 4%, average was 24%, worst was 134%
Apple MacBook Pro 16 2021 M1 Pro audio analysis
(+) | speakers can play relatively loud (84.7 dB)
Bass 100 - 315 Hz
(+) | good bass - only 3.8% away from median
(+) | bass is linear (5.2% delta to prev. frequency)
Mids 400 - 2000 Hz
(+) | balanced mids - only 1.3% away from median
(+) | mids are linear (2.1% delta to prev. frequency)
Highs 2 - 16 kHz
(+) | balanced highs - only 1.9% away from median
(+) | highs are linear (2.7% delta to prev. frequency)
Overall 100 - 16.000 Hz
(+) | overall sound is linear (4.6% difference to median)
Compared to same class
» 0% of all tested devices in this class were better, 0% similar, 100% worse
» The best had a delta of 5%, average was 17%, worst was 45%
Compared to all devices tested
» 0% of all tested devices were better, 0% similar, 100% worse
» The best had a delta of 4%, average was 24%, worst was 134%
Energy Management
Power Consumption
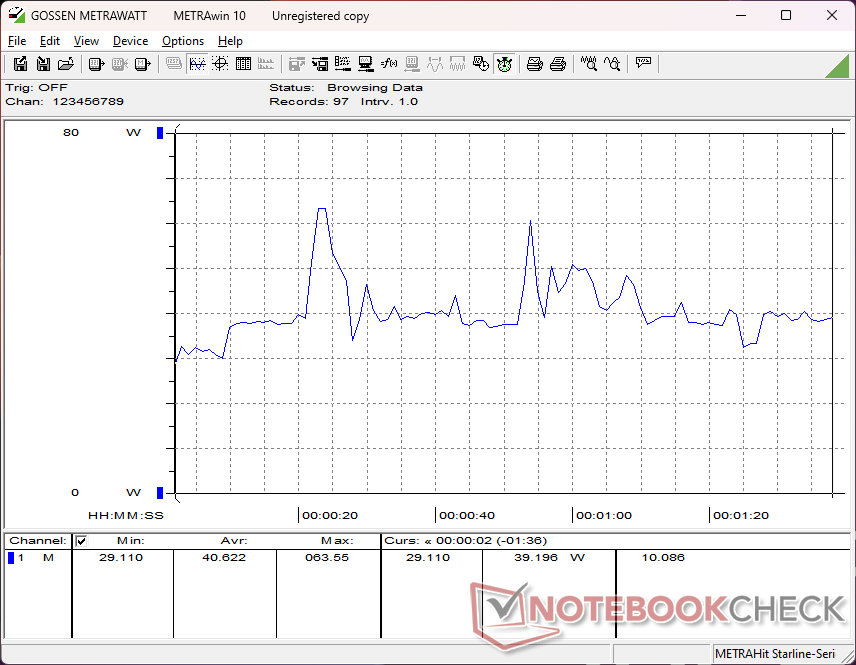
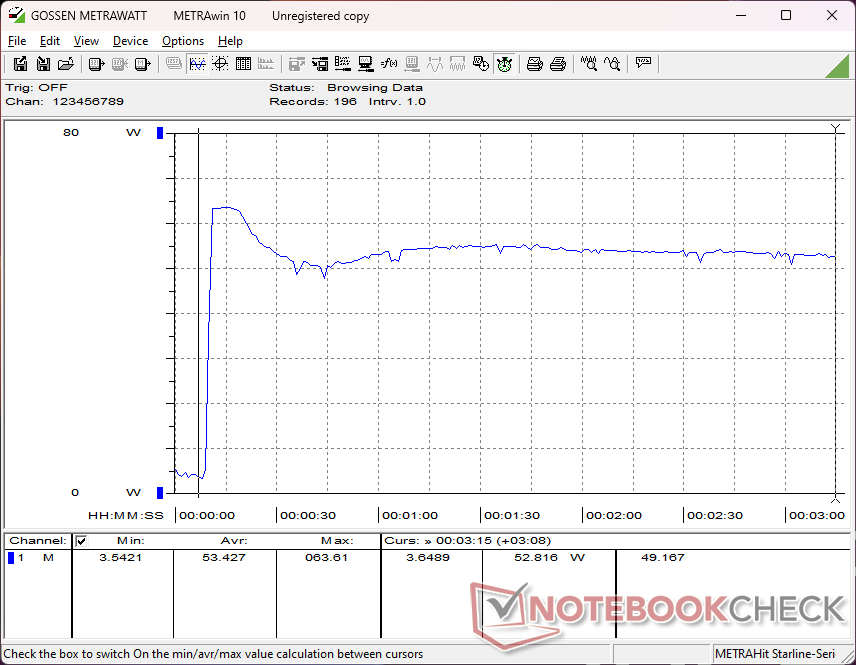
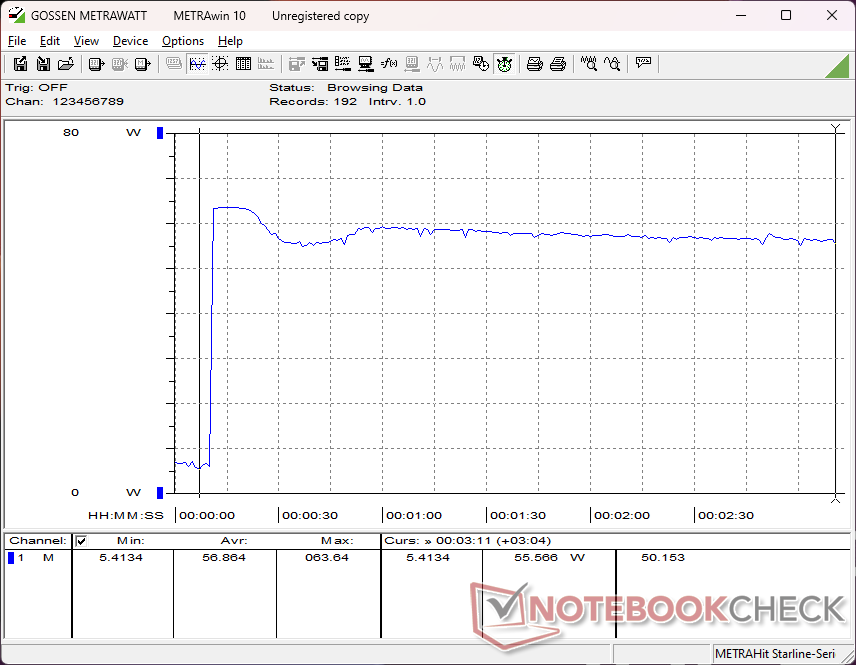
Power consumption measurements show some interesting results when compared to the Core Ultra 7 XPS 13. When running medium or lower loads, our Snapdragon XPS 13 would demand consistently less power than the Intel version which paves the way for longer battery life as exemplified in the next section below. When running more demanding loads like games, however, average consumption would be about the same at around 40 W each even though the Core Ultra 7 generally offers faster graphics performance.
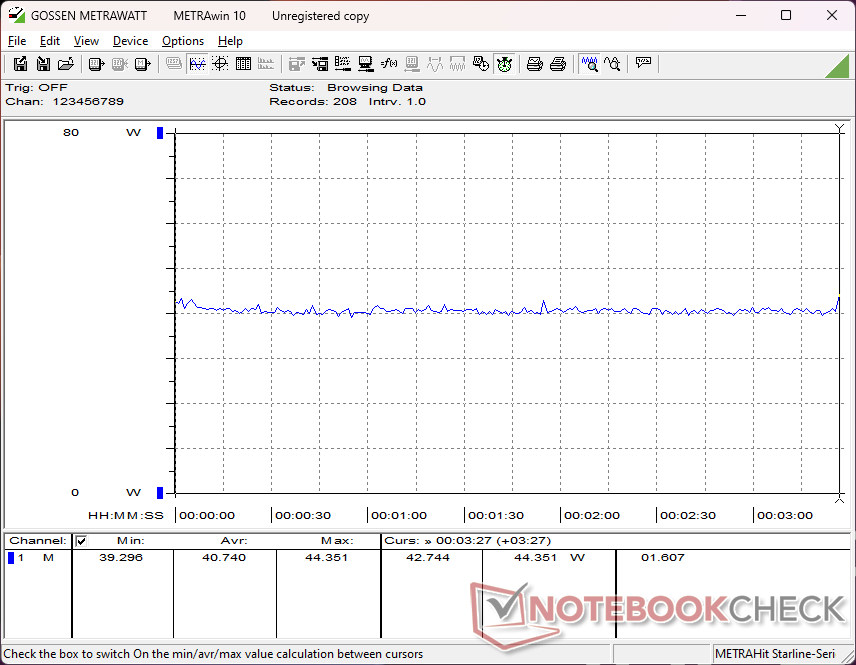
Consumption when running Prime95 to stress the CPU shows the Snapdragon model demanding more power than the Intel model on average as the latter would throttle more steeply over time. On the other hand, consumption when running FurMark to stress the GPU would average just 18 W compared to 34 W or higher on the Intel model. This suggests that Qualcomm may be devoting less surface area or silicon budget for its integrated GPU design than the competing Arc 8 series which is both more powerful and more demanding on average.
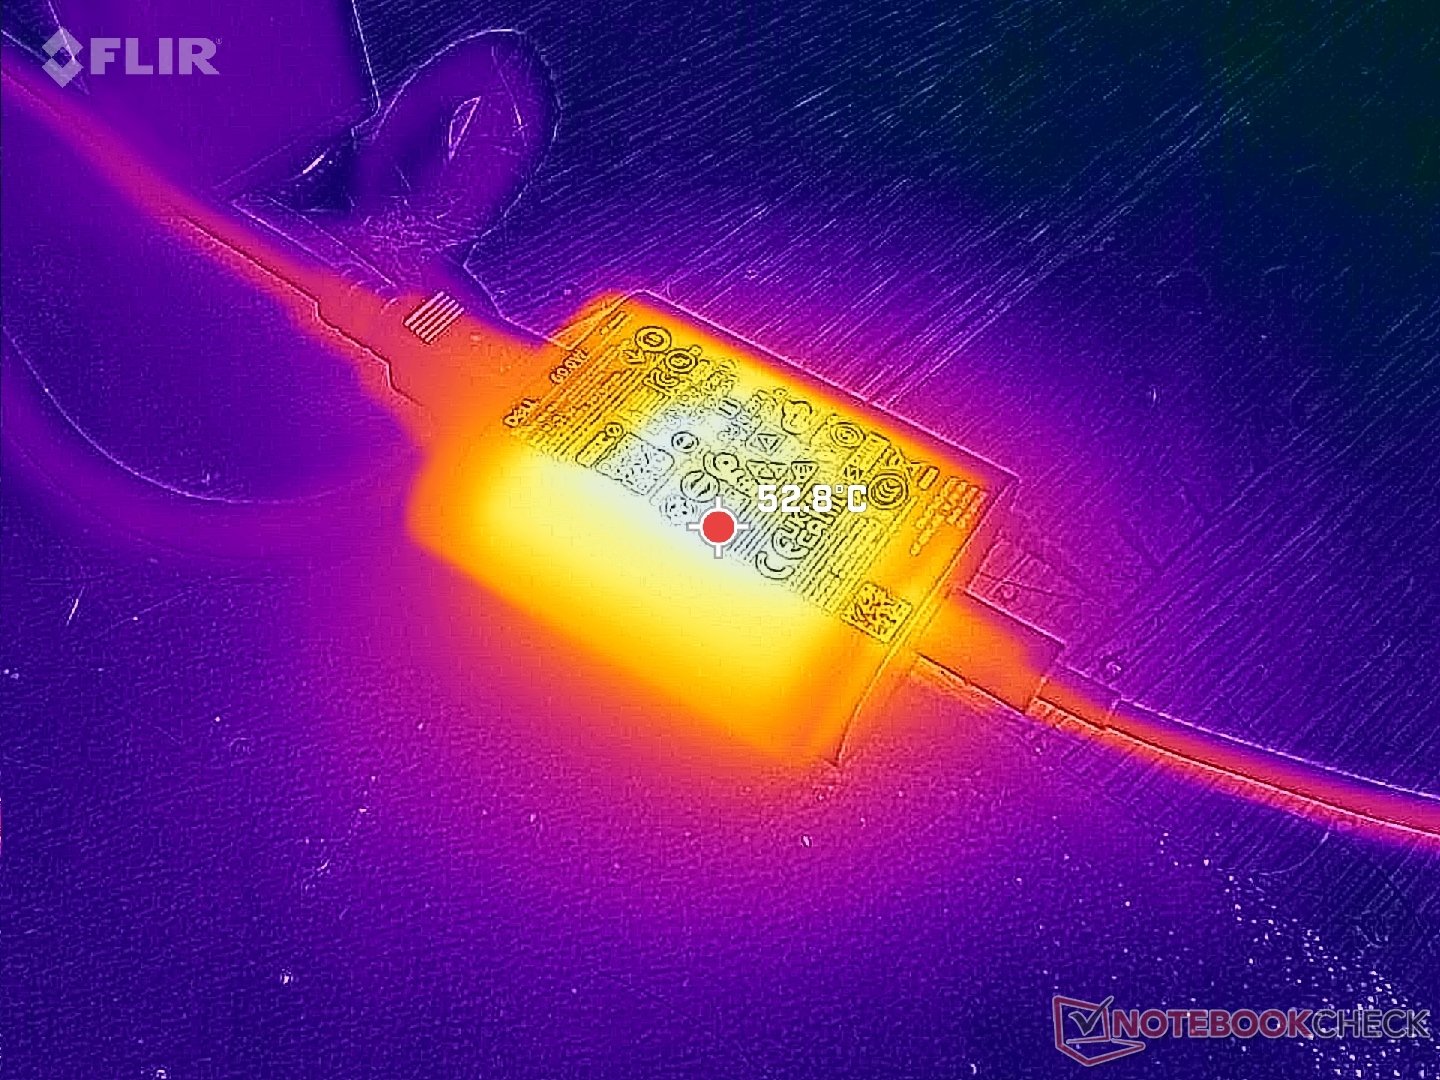
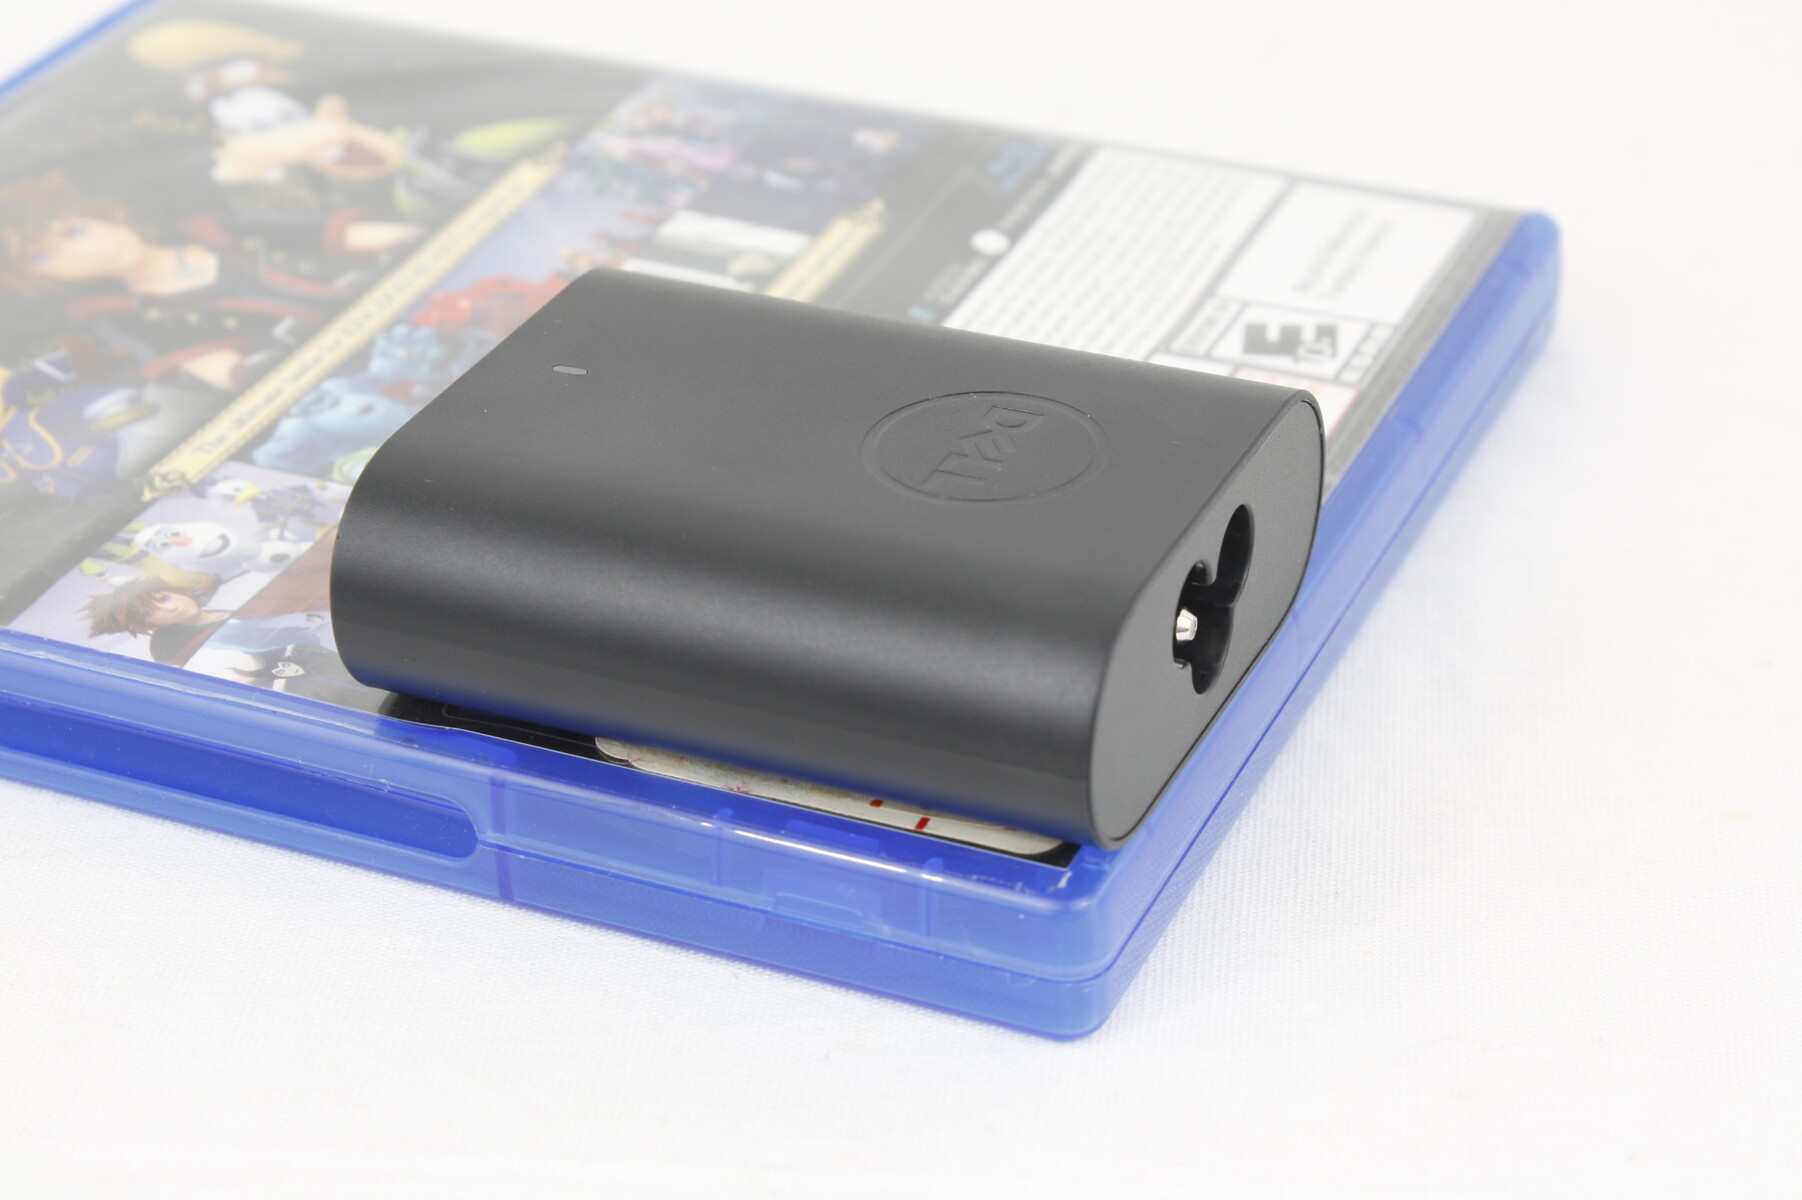
Maximum consumption can reach 64 W from the extra-small (~6.5 x 5.5 x 2.3 cm) 65 W USB-C AC adapter just like on the Intel model.
| Off / Standby | |
| Idle | |
| Load |
|
Key:
min: | |
| Dell XPS 13 9345 SD X Elite X1E-80-100, Adreno X1-85 3.8 TFLOPS, , IPS, 1920x1200, 13.4" | Dell XPS 13 9340 Core Ultra 7 Ultra 7 155H, Arc 8-Core, Micron 2550 512GB, IPS, 1920x1200, 13.4" | Microsoft Surface Laptop 7 13.8 Copilot+ SD X Elite X1E-80-100, Adreno X1-85 3.8 TFLOPS, Samsung MZ9L4512HBLU-00BMV, IPS, 2304x1536, 13.8" | Lenovo ThinkBook 13x G4 21KR0008GE Ultra 5 125H, Arc 7-Core, Samsung PM9C1a MZAL8512HDLU, IPS, 2880x1920, 13.5" | HP EliteBook Ultra G1q 14 SD X Elite X1E-78-100, Adreno X1-85 3.8 TFLOPS, SK hynix PC801 HFS512GEJ9X101N BF, IPS, 2240x1400, 14" | Asus ZenBook S13 OLED UX5304 i7-1355U, Iris Xe G7 96EUs, Samsung PM9A1 MZVL21T0HCLR, OLED, 2880x1800, 13.3" | |
|---|---|---|---|---|---|---|
| Power Consumption | -27% | 11% | -48% | 11% | -43% | |
| Idle Minimum * (Watt) | 2.8 | 3.8 -36% | 1.4 50% | 5.4 -93% | 2.5 11% | 5.8 -107% |
| Idle Average * (Watt) | 4.9 | 7 -43% | 6.3 -29% | 7.8 -59% | 5.7 -16% | 8.5 -73% |
| Idle Maximum * (Watt) | 5.7 | 7.3 -28% | 7.6 -33% | 8.9 -56% | 5.8 -2% | 8.8 -54% |
| Load Average * (Watt) | 40.6 | 52.6 -30% | 26.9 34% | 49.4 -22% | 24.2 40% | 35.1 14% |
| Cyberpunk 2077 ultra external monitor * (Watt) | 39.4 | 26.8 32% | ||||
| Cyberpunk 2077 ultra * (Watt) | 40.7 | 38.5 5% | 33.5 18% | |||
| Load Maximum * (Watt) | 64 | 62.7 2% | 40.7 36% | 68.8 -8% | 66.4 -4% | 59.5 7% |
| Witcher 3 ultra * (Watt) | 38.3 | 44.4 | 23.1 | 27.6 |
* ... smaller is better
Power Consumption Cyberpunk / Stress Test
Power Consumption external Monitor
Battery Life
If there's one thing the system unequivocally excels at, it has got to be battery life. We're able to record a real-world WLAN browsing runtime of almost 26.5 hours or over 2x longer than the XPS 13 9340 equipped with the Core Ultra 7 155H and identical 1200p IPS display. Runtimes are guaranteed to be shorter if configured with the OLED panel instead, but they'll still be incredible long nonetheless and one of the longest of any 13-inch subnotebook including even the MacBook Air series.
Our test was performed after applying the latest BIOS update from Dell which was specifically designed to improve battery life on the Snapdragon model. We recommend installing the update here.
Charging from empty to full capacity takes a little over 90 minutes which is common on most laptops.
| Dell XPS 13 9345 SD X Elite X1E-80-100, Adreno X1-85 3.8 TFLOPS, 55 Wh | Dell XPS 13 9340 Core Ultra 7 Ultra 7 155H, Arc 8-Core, 55 Wh | Microsoft Surface Laptop 7 13.8 Copilot+ SD X Elite X1E-80-100, Adreno X1-85 3.8 TFLOPS, 54 Wh | Lenovo ThinkBook 13x G4 21KR0008GE Ultra 5 125H, Arc 7-Core, 74 Wh | HP EliteBook Ultra G1q 14 SD X Elite X1E-78-100, Adreno X1-85 3.8 TFLOPS, 59 Wh | Asus ZenBook S13 OLED UX5304 i7-1355U, Iris Xe G7 96EUs, 63 Wh | |
|---|---|---|---|---|---|---|
| Battery runtime | 34% | -8% | 17% | 1% | 42% | |
| Reader / Idle (h) | 46.4 | 20.4 -56% | ||||
| WiFi v1.3 (h) | 26.4 | 12.8 -52% | 14.2 -46% | 11.4 -57% | 13.2 -50% | 11.3 -57% |
| Load (h) | 1 | 2.2 120% | 1.3 30% | 1.9 90% | 2.1 110% | 2.4 140% |
| H.264 (h) | 17.6 | 19.7 | 20.5 | 13.8 |
Pros
Cons
Verdict — Respectable Alternative To The Intel XPS 13
The $1300 Snapdragon XPS 13 comes in slightly cheaper than the $1400 Core Ultra 7 XPS 13 while offering significantly longer battery life, Co-Pilot+ integration, and identical hardware features. The actual user experience, however, will depend heavily on the workload and application. If used mostly for browsing, word processing, video, and streaming, then the Snapdragon XPS 13 tends to be more efficient especially when the programs can run natively on ARM. On the other hand, more demanding tasks like graphics editing, video encoding, Thunderbolt docking, or specific applications that must be emulated on ARM would be best suited on the traditional Intel XPS 13. To that end, the Intel model provides a more predictable level of performance across all usage scenarios which arguably outweighs the few edge cases where the Snapdragon model may come out ahead.
The Snapdragon XPS 13 is a great alternative to the Intel XPS 13 dollar for dollar. The user experience, however, will vary greatly depending on the kinds of applications and tasks you intend to use the system for.
The advantages in battery life and Co-Pilot+ compatibility may not be enough to convince buyers when battery life with the Intel XPS 13 is already pretty good and that Co-Pilot+ is expected to come to future Intel and AMD CPUs. However, users who want to maximize runtimes and experience the latest Microsoft AI features today may find the Snapdragon XPS 13 to be the more productive option.
Price and Availability
Dell is now shipping the XPS 13 9345 as configured for $1300 up to $1800+ if configured with the OLED panel.
Hinweis: Wir haben unser Rating-System kürzlich aktualisiert und die Ergebnisse von Version 8 sind nicht mit den Ergebnissen von Version 7 vergleichbar. Weitere Informationen dazu sind hier verfügbar.
Note: We have recently updated our rating system and the results of version 8 are not comparable with the results of version 7. More information is available here .
Dell XPS 13 9345
- 08/04/2024 v8
Allen Ngo
 Total Sustainability Score:
 Transparency
The selection of devices to be reviewed is made by our editorial team. The test sample was provided to the author as a loan by the manufacturer or retailer for the purpose of this review. The lender had no influence on this review, nor did the manufacturer receive a copy of this review before publication. There was no obligation to publish this review. As an independent media company, Notebookcheck is not subjected to the authority of manufacturers, retailers or publishers.
This is how Notebookcheck is testing
Every year, Notebookcheck independently reviews hundreds of laptops and smartphones using standardized procedures to ensure that all results are comparable. We have continuously developed our test methods for around 20 years and set industry standards in the process. In our test labs, high-quality measuring equipment is utilized by experienced technicians and editors. These tests involve a multi-stage validation process. Our complex rating system is based on hundreds of well-founded measurements and benchmarks, which maintains objectivity. Further information on our test methods can be found here.
Price comparison
