Dell XPS 13 Plus 9320 Laptop Review - The XPS 13 now has a Touch Bar
Dell offers two versions of the compact XPS 13 from now on; the regular XPS 13 with Alder Lake U-series CPUs starting at $999 as well as the new XPS 13 Plus with more powerful Alder Lake P-series chips starting at $1299. Both models use completely new cases and there are big changes over the previous XPS 13 9310, which was basically unchanged for a couple of years.
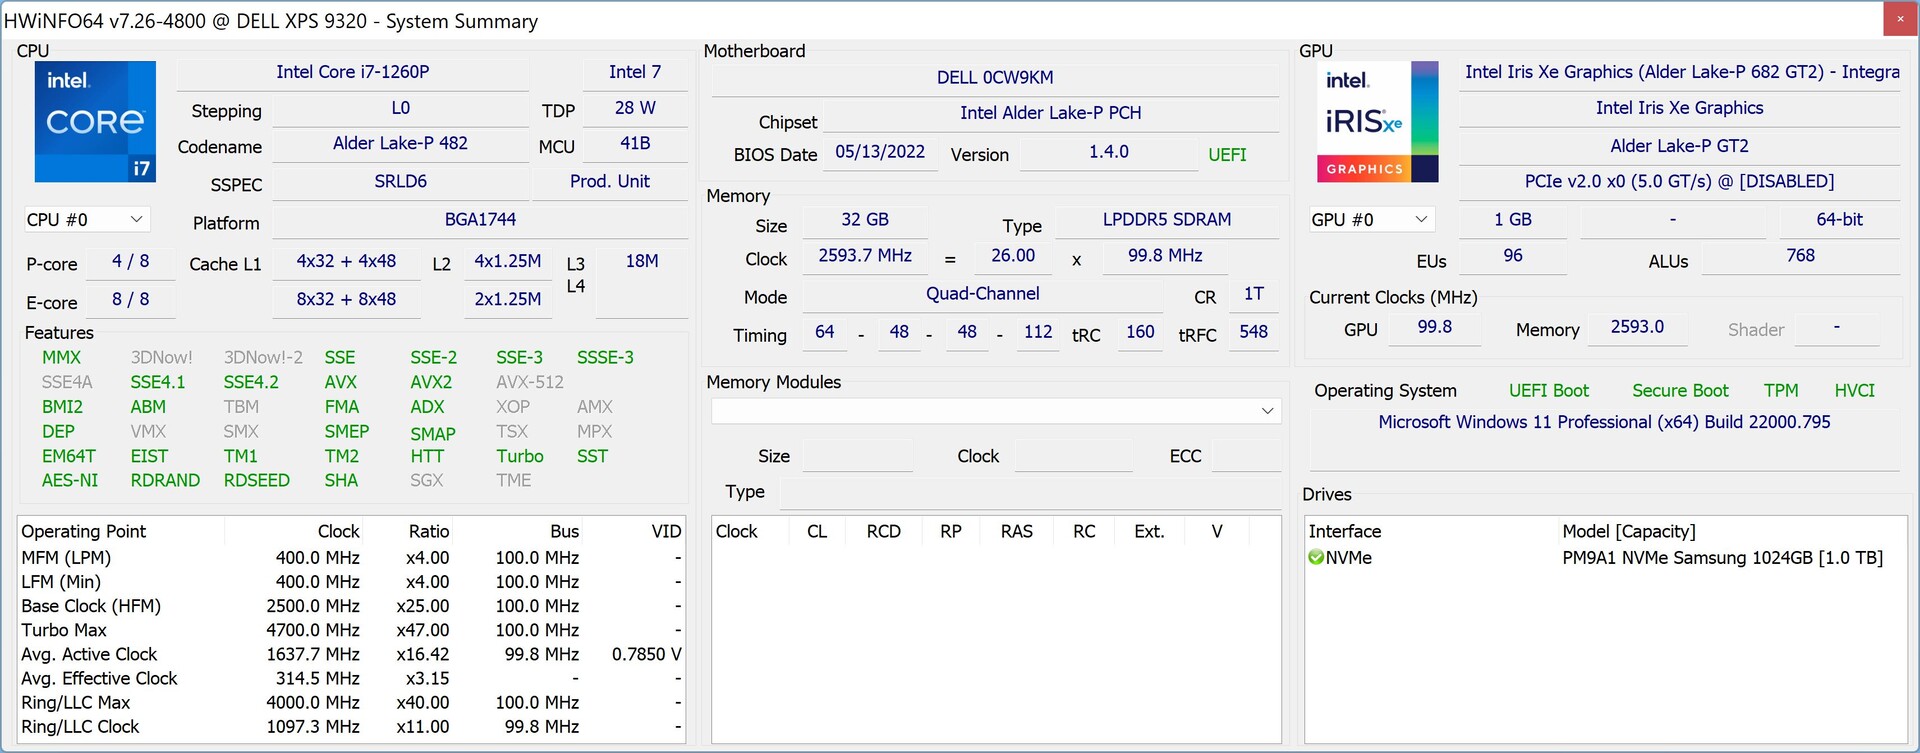
Our review unit of the new XPS 13 Plus is well-equipped with the Intel Core i7-1260P, 32 GB LPDDR5-5200 RAM and a 1 TB PCIe 4.0 SSD. The display is the familiar 4K panel with a 16:10 aspect ratio, which also features a touchscreen. Contrary to the regular XPS 13 9320, the XPS 13 Plus can also be configured with a 3.5K OLED screen. Our review unit has an RRP of $2099 and Dell once again offers a Developer’s Edition with Linux.
Potential Rivals
Rating | Date | Model | Weight | Height | Size | Resolution | Price |
|---|---|---|---|---|---|---|---|
| 86.9 % v7 (old) | 07 / 2022 | Dell XPS 13 Plus 9320 4K i7-1260P, Iris Xe G7 96EUs | 1.2 kg | 15.3 mm | 13.40" | 3840x2400 | |
| 90.1 % v7 (old) | 07 / 2022 | Asus Zenbook S 13 OLED R7 6800U, Radeon 680M | 1.1 kg | 14.9 mm | 13.30" | 2880x1800 | |
| 89.8 % v7 (old) | 02 / 2021 | Lenovo ThinkPad X1 Nano-20UN002UGE i7-1160G7, Iris Xe G7 96EUs | 946 g | 16 mm | 13.00" | 2160x1350 | |
| 91.1 % v7 (old) | 12 / 2020 | Apple MacBook Air 2020 M1 Entry M1, M1 7-Core GPU | 1.3 kg | 16.1 mm | 13.30" | 2560x1600 | |
| 88.8 % v7 (old) | 02 / 2022 | Huawei MateBook 13s i5 11300H i5-11300H, Iris Xe G7 80EUs | 1.3 kg | 16.5 mm | 13.40" | 2520x1680 | |
| 87.4 % v7 (old) | 12 / 2020 | Dell XPS 13 9310 Core i7 4K i7-1185G7, Iris Xe G7 96EUs | 1.3 kg | 14.8 mm | 13.40" | 3840x2400 |
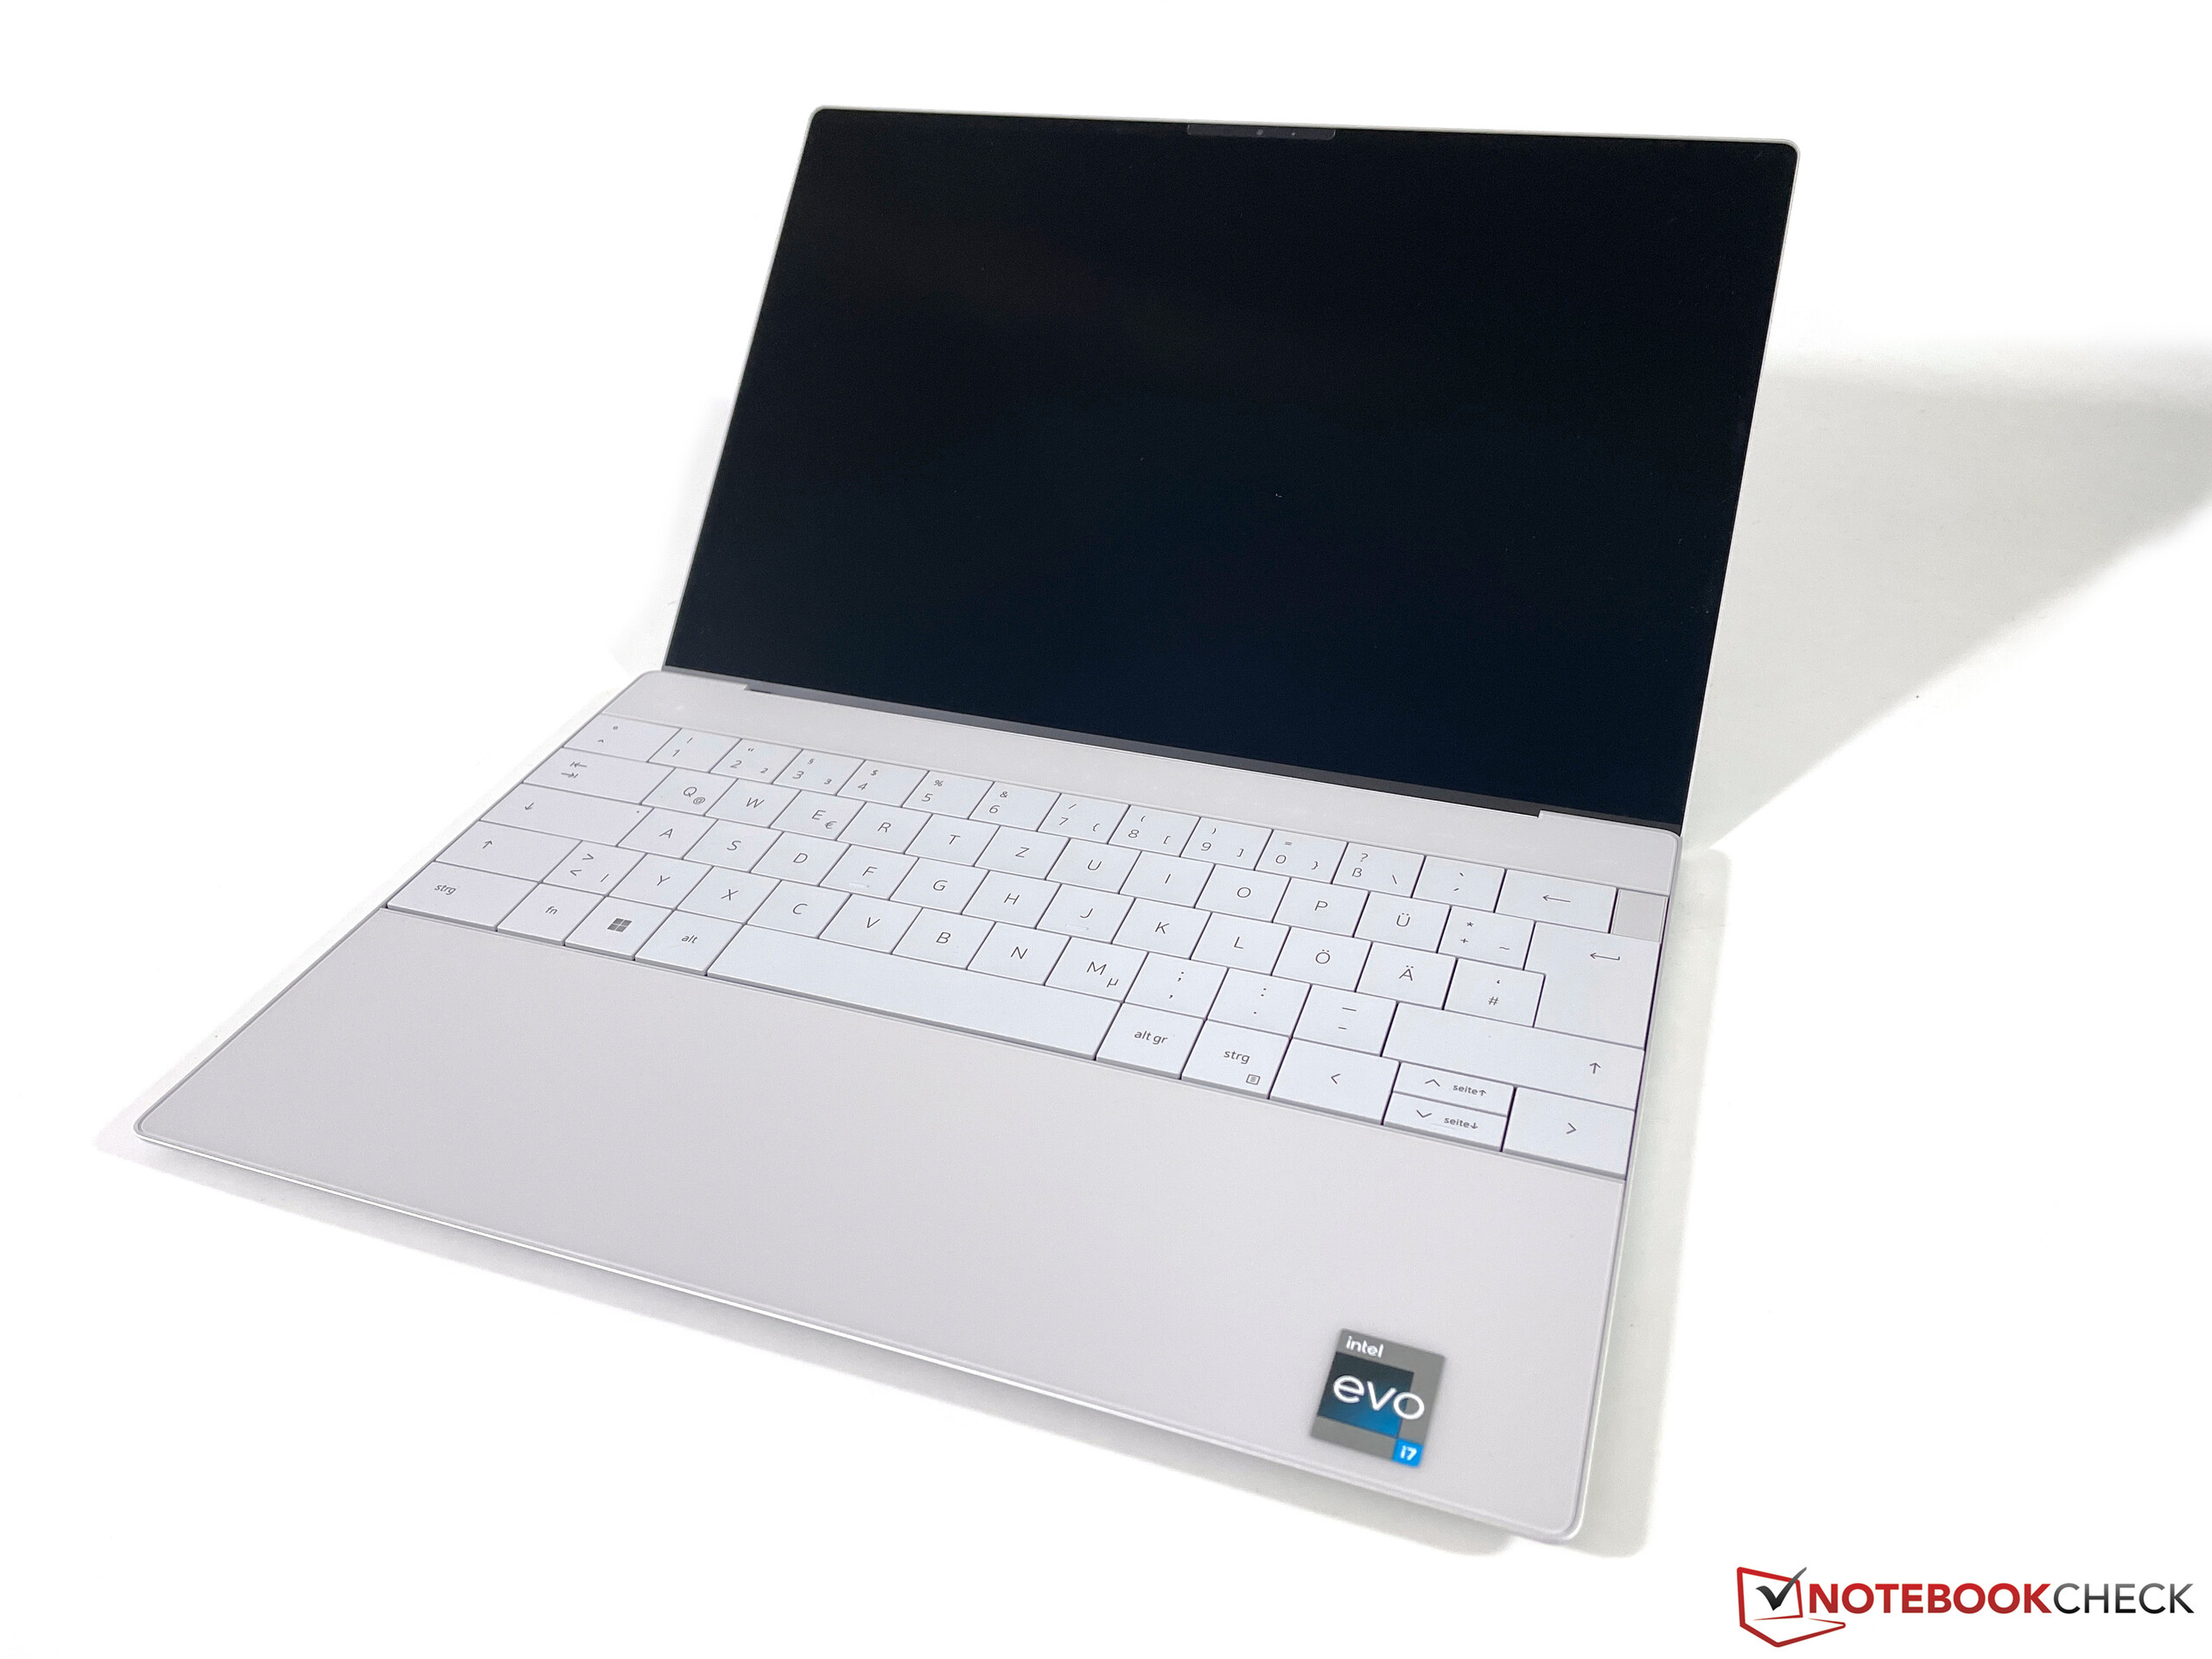
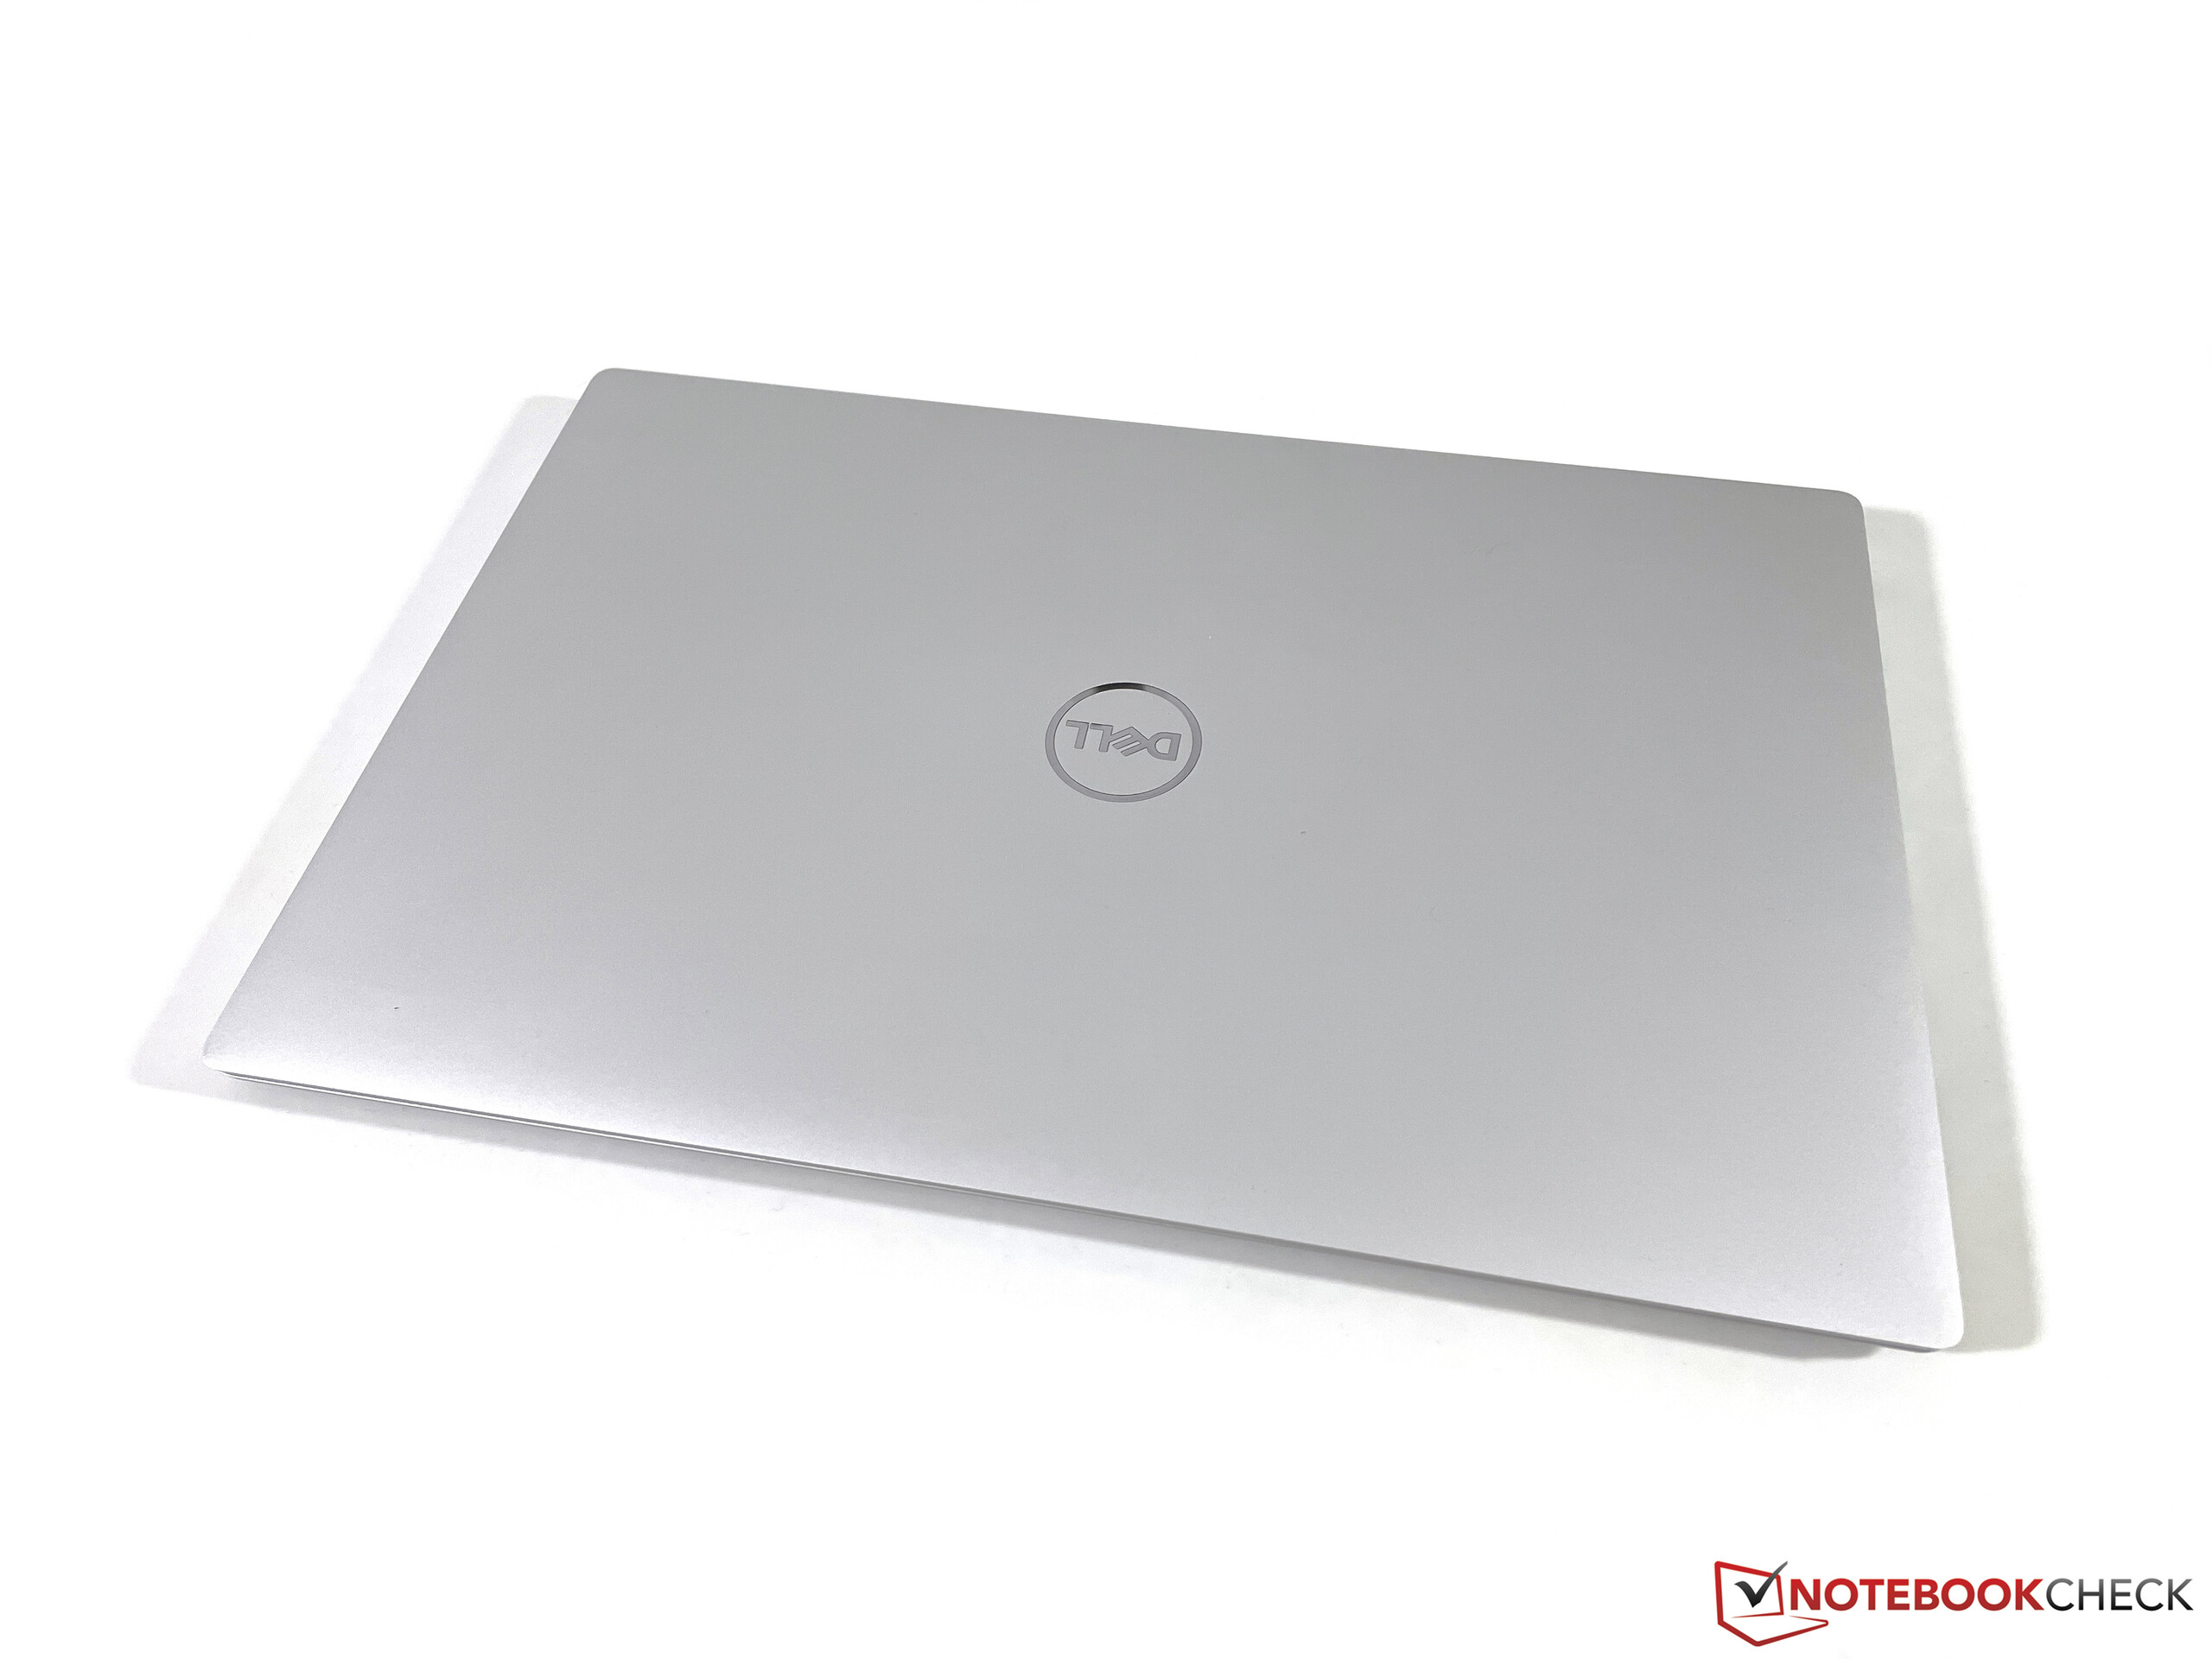
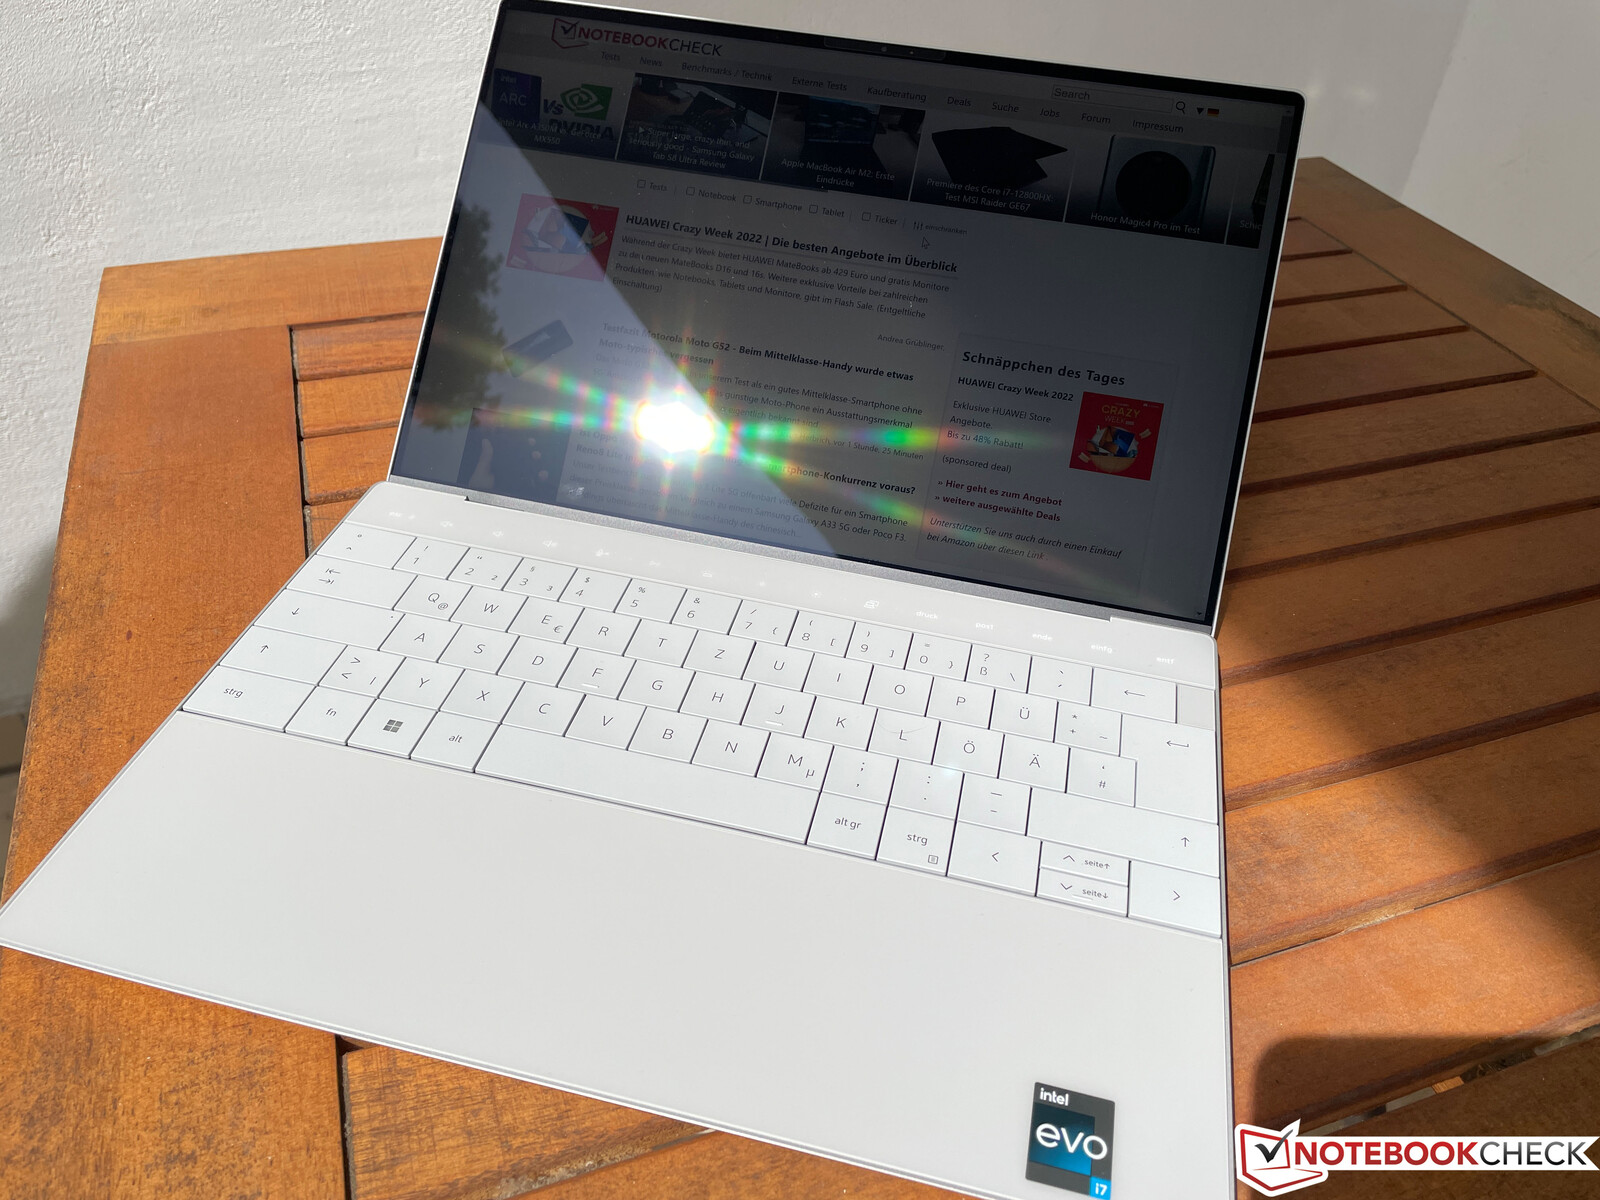
Case - XPS 13 with a new design
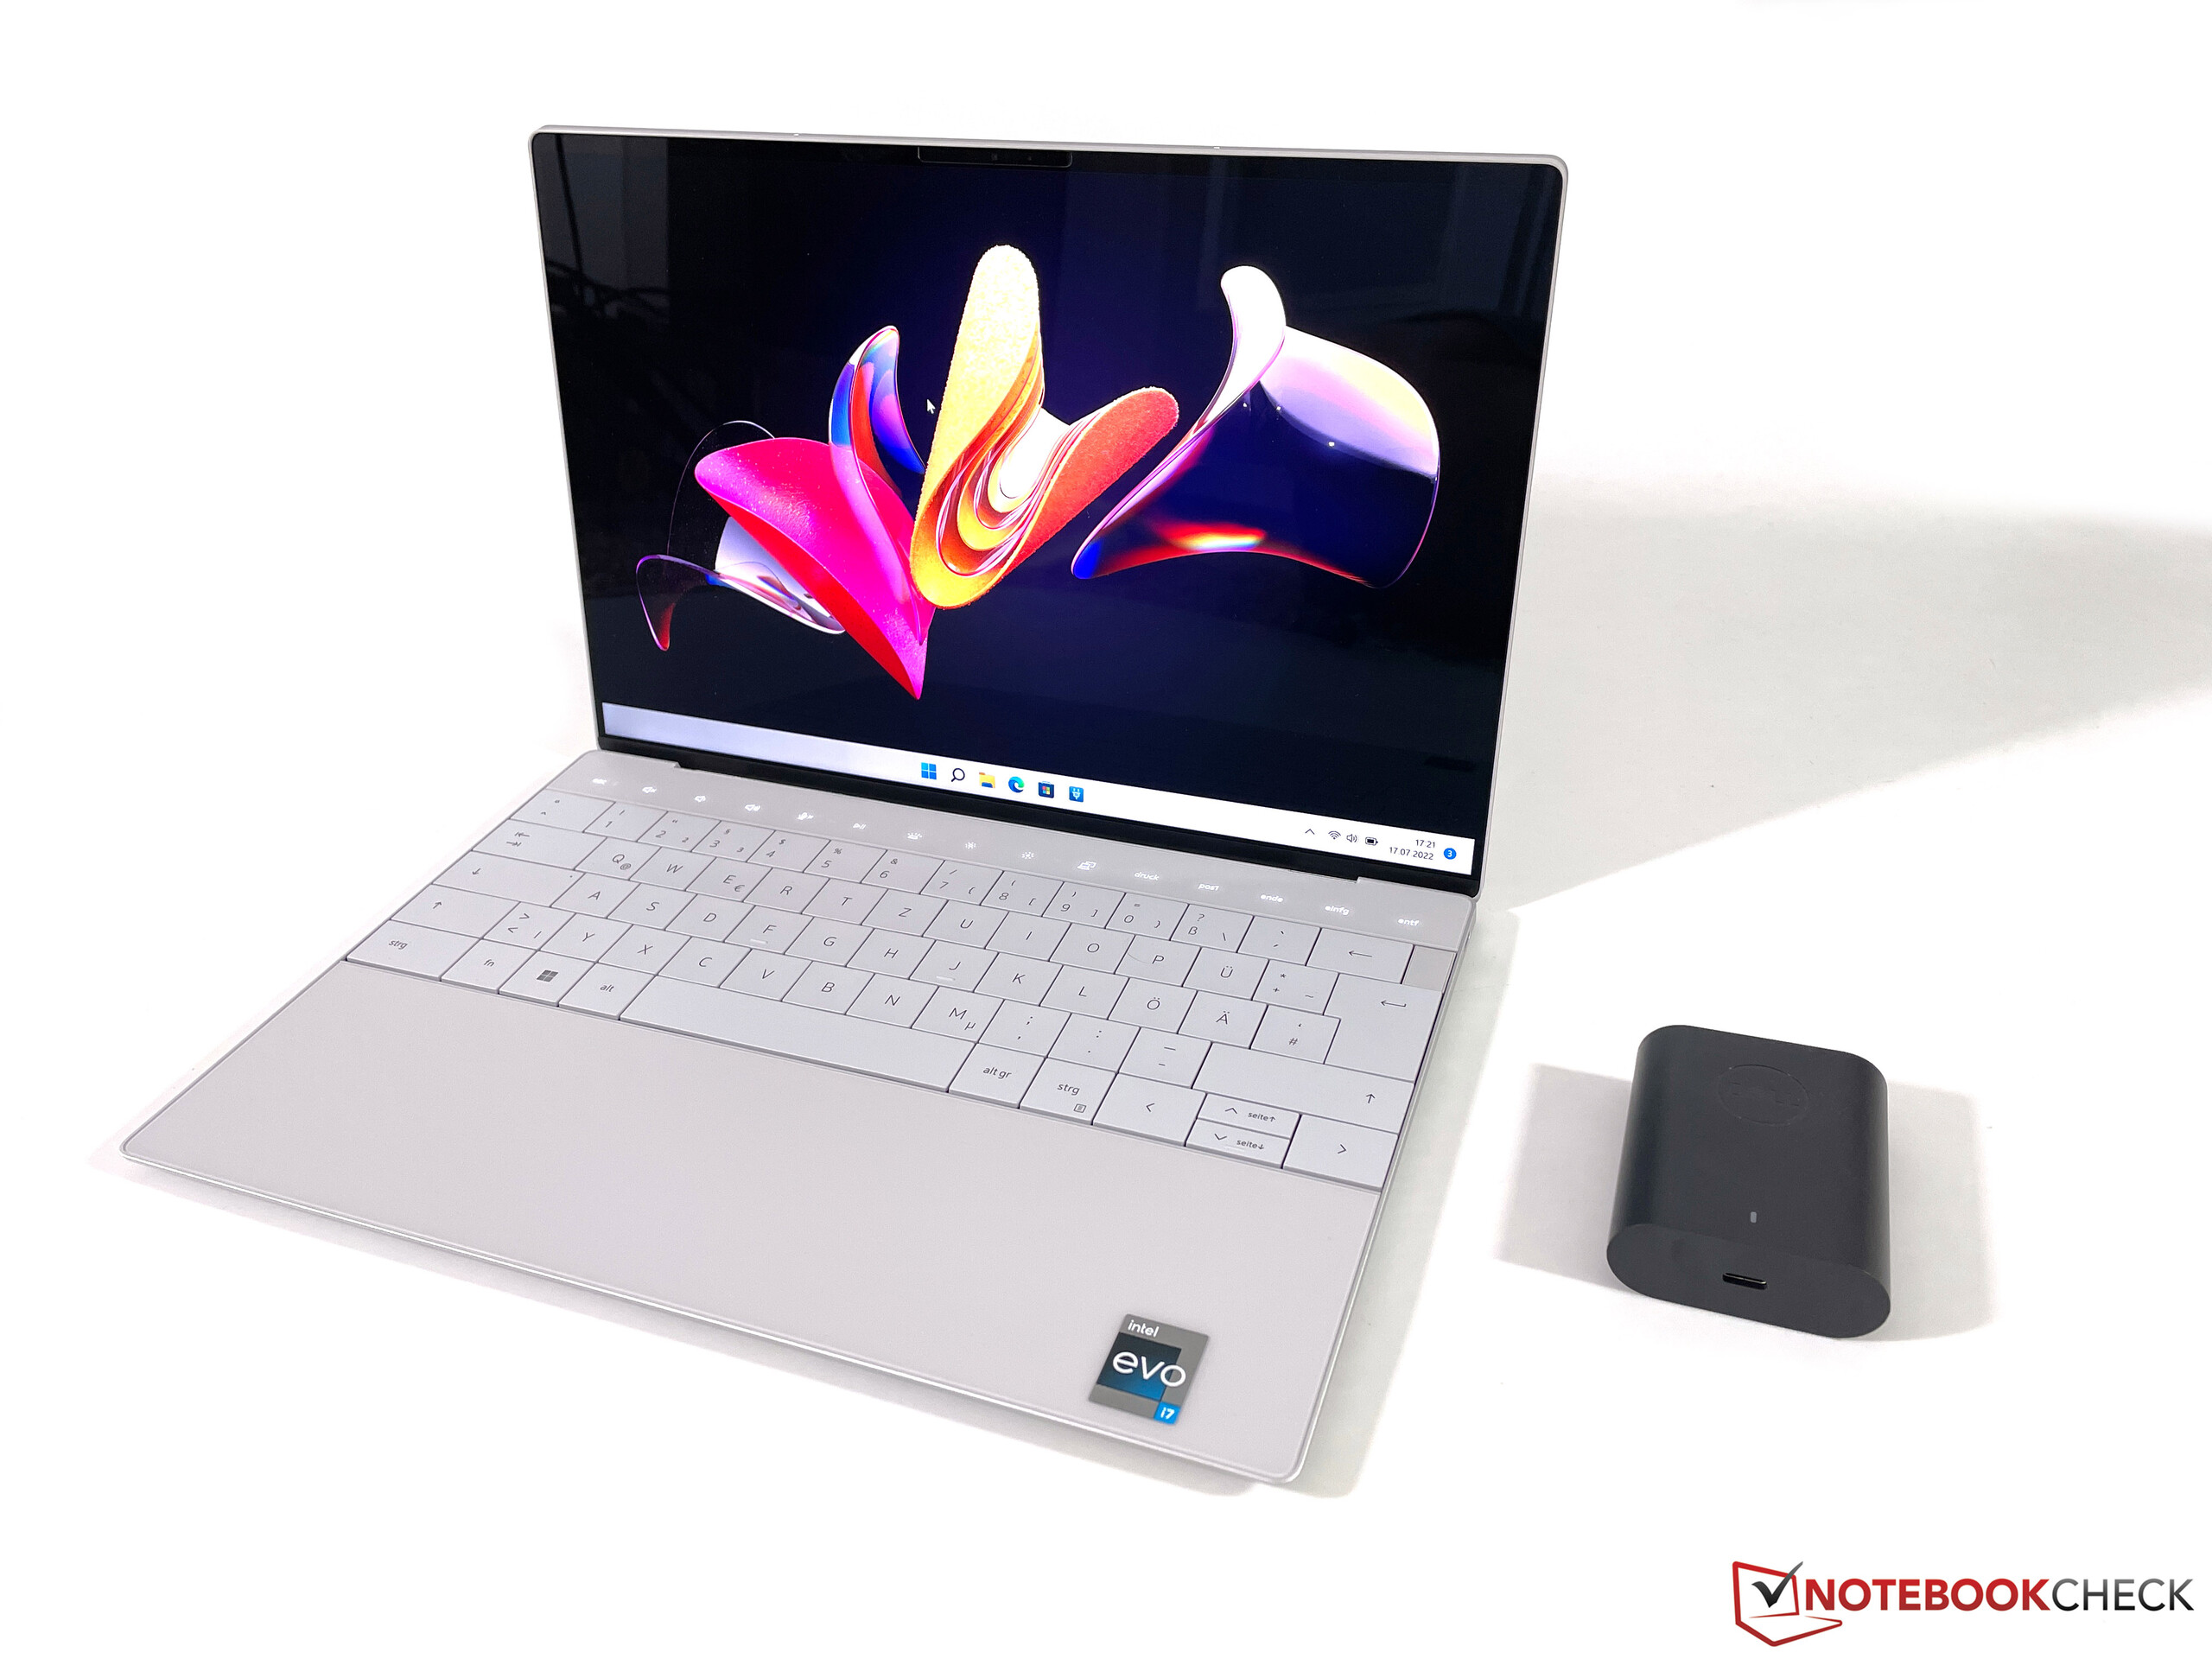
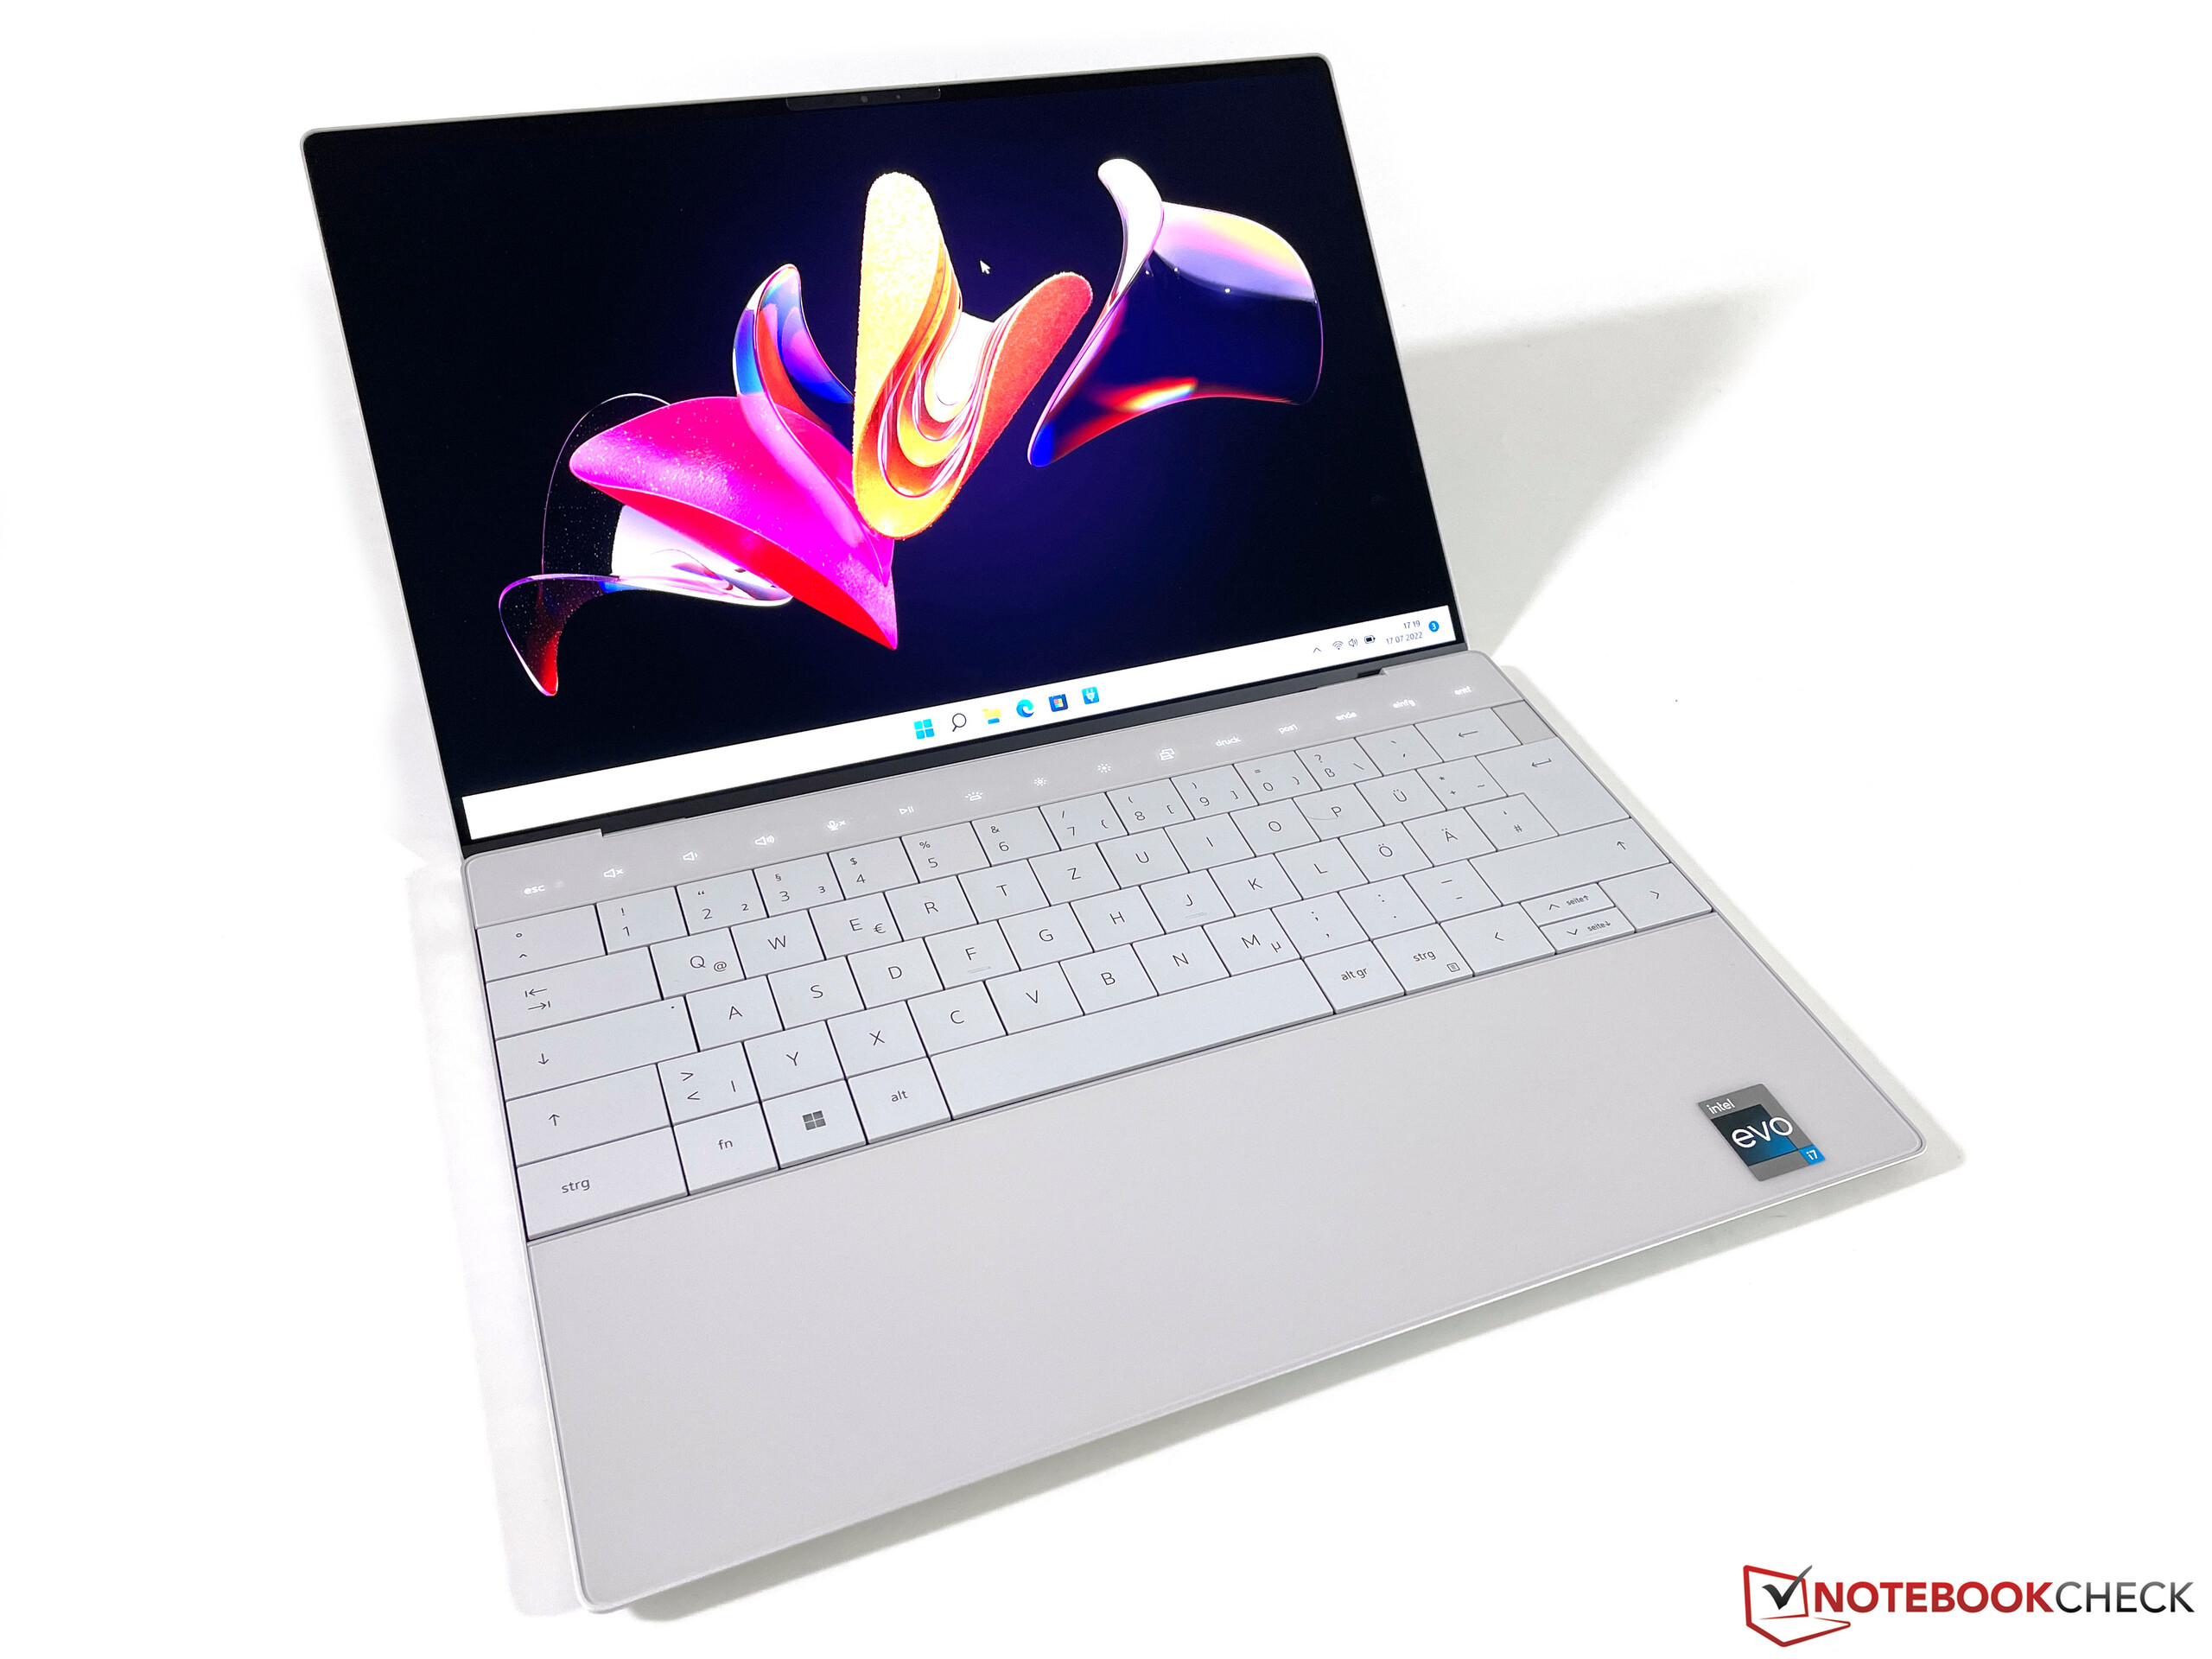
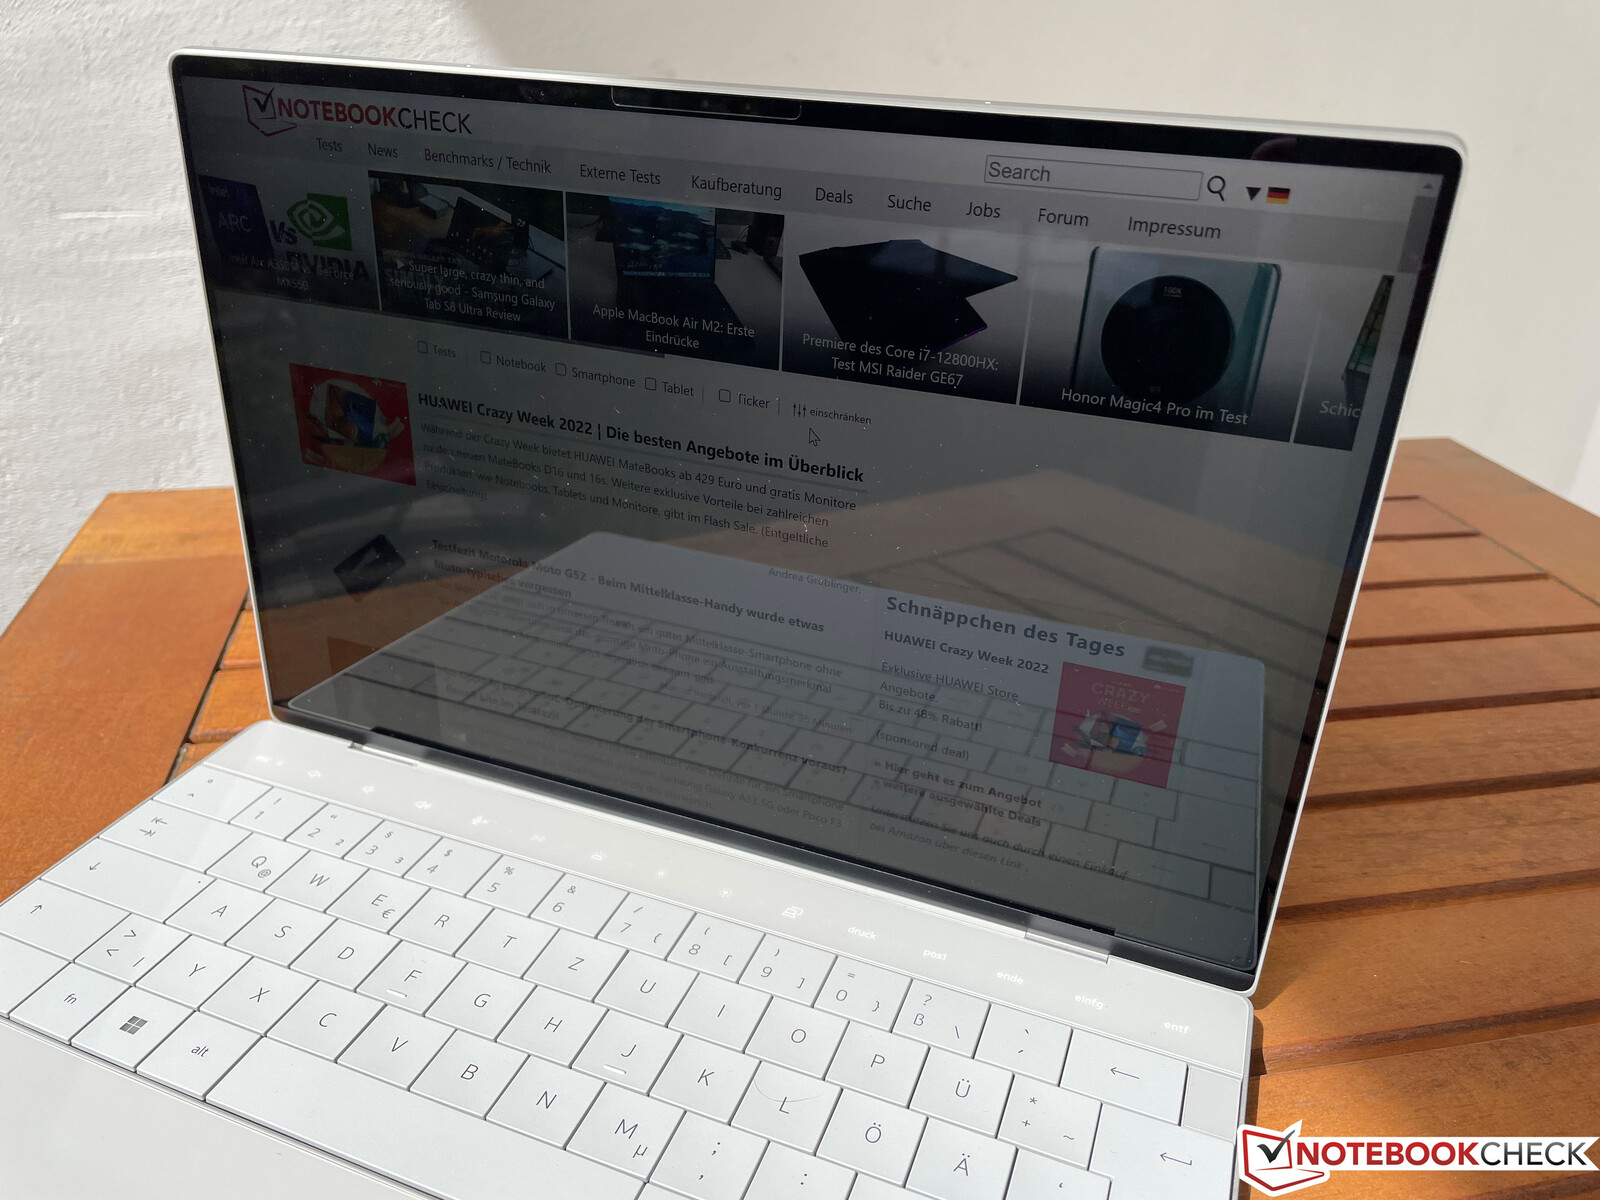
It is not easy to distinguish the new XPS 13 Plus from its predecessor when the lid is closed, especially in our Platinum color option. You can also get the XPS 13 Plus in a dark gray (Graphite). The basic design with the angled rear and the wedge-shaped base unit is still the same, but you will immediately see the major differences when you open the lid. Dell throws out the chiclet keyboard and implements a more traditional unit without gaps between the keys. There are no typical function keys, instead you now get a capacitive touch bar (more on that later). We especially like the new palm rest area, which uses one piece of glass and fingerprints are no problem at all. Especially the darker models of previous versions were quickly covered in fingerprints. The display bezels are very narrow and result in a very good screen-to-body ratio of 89 %.
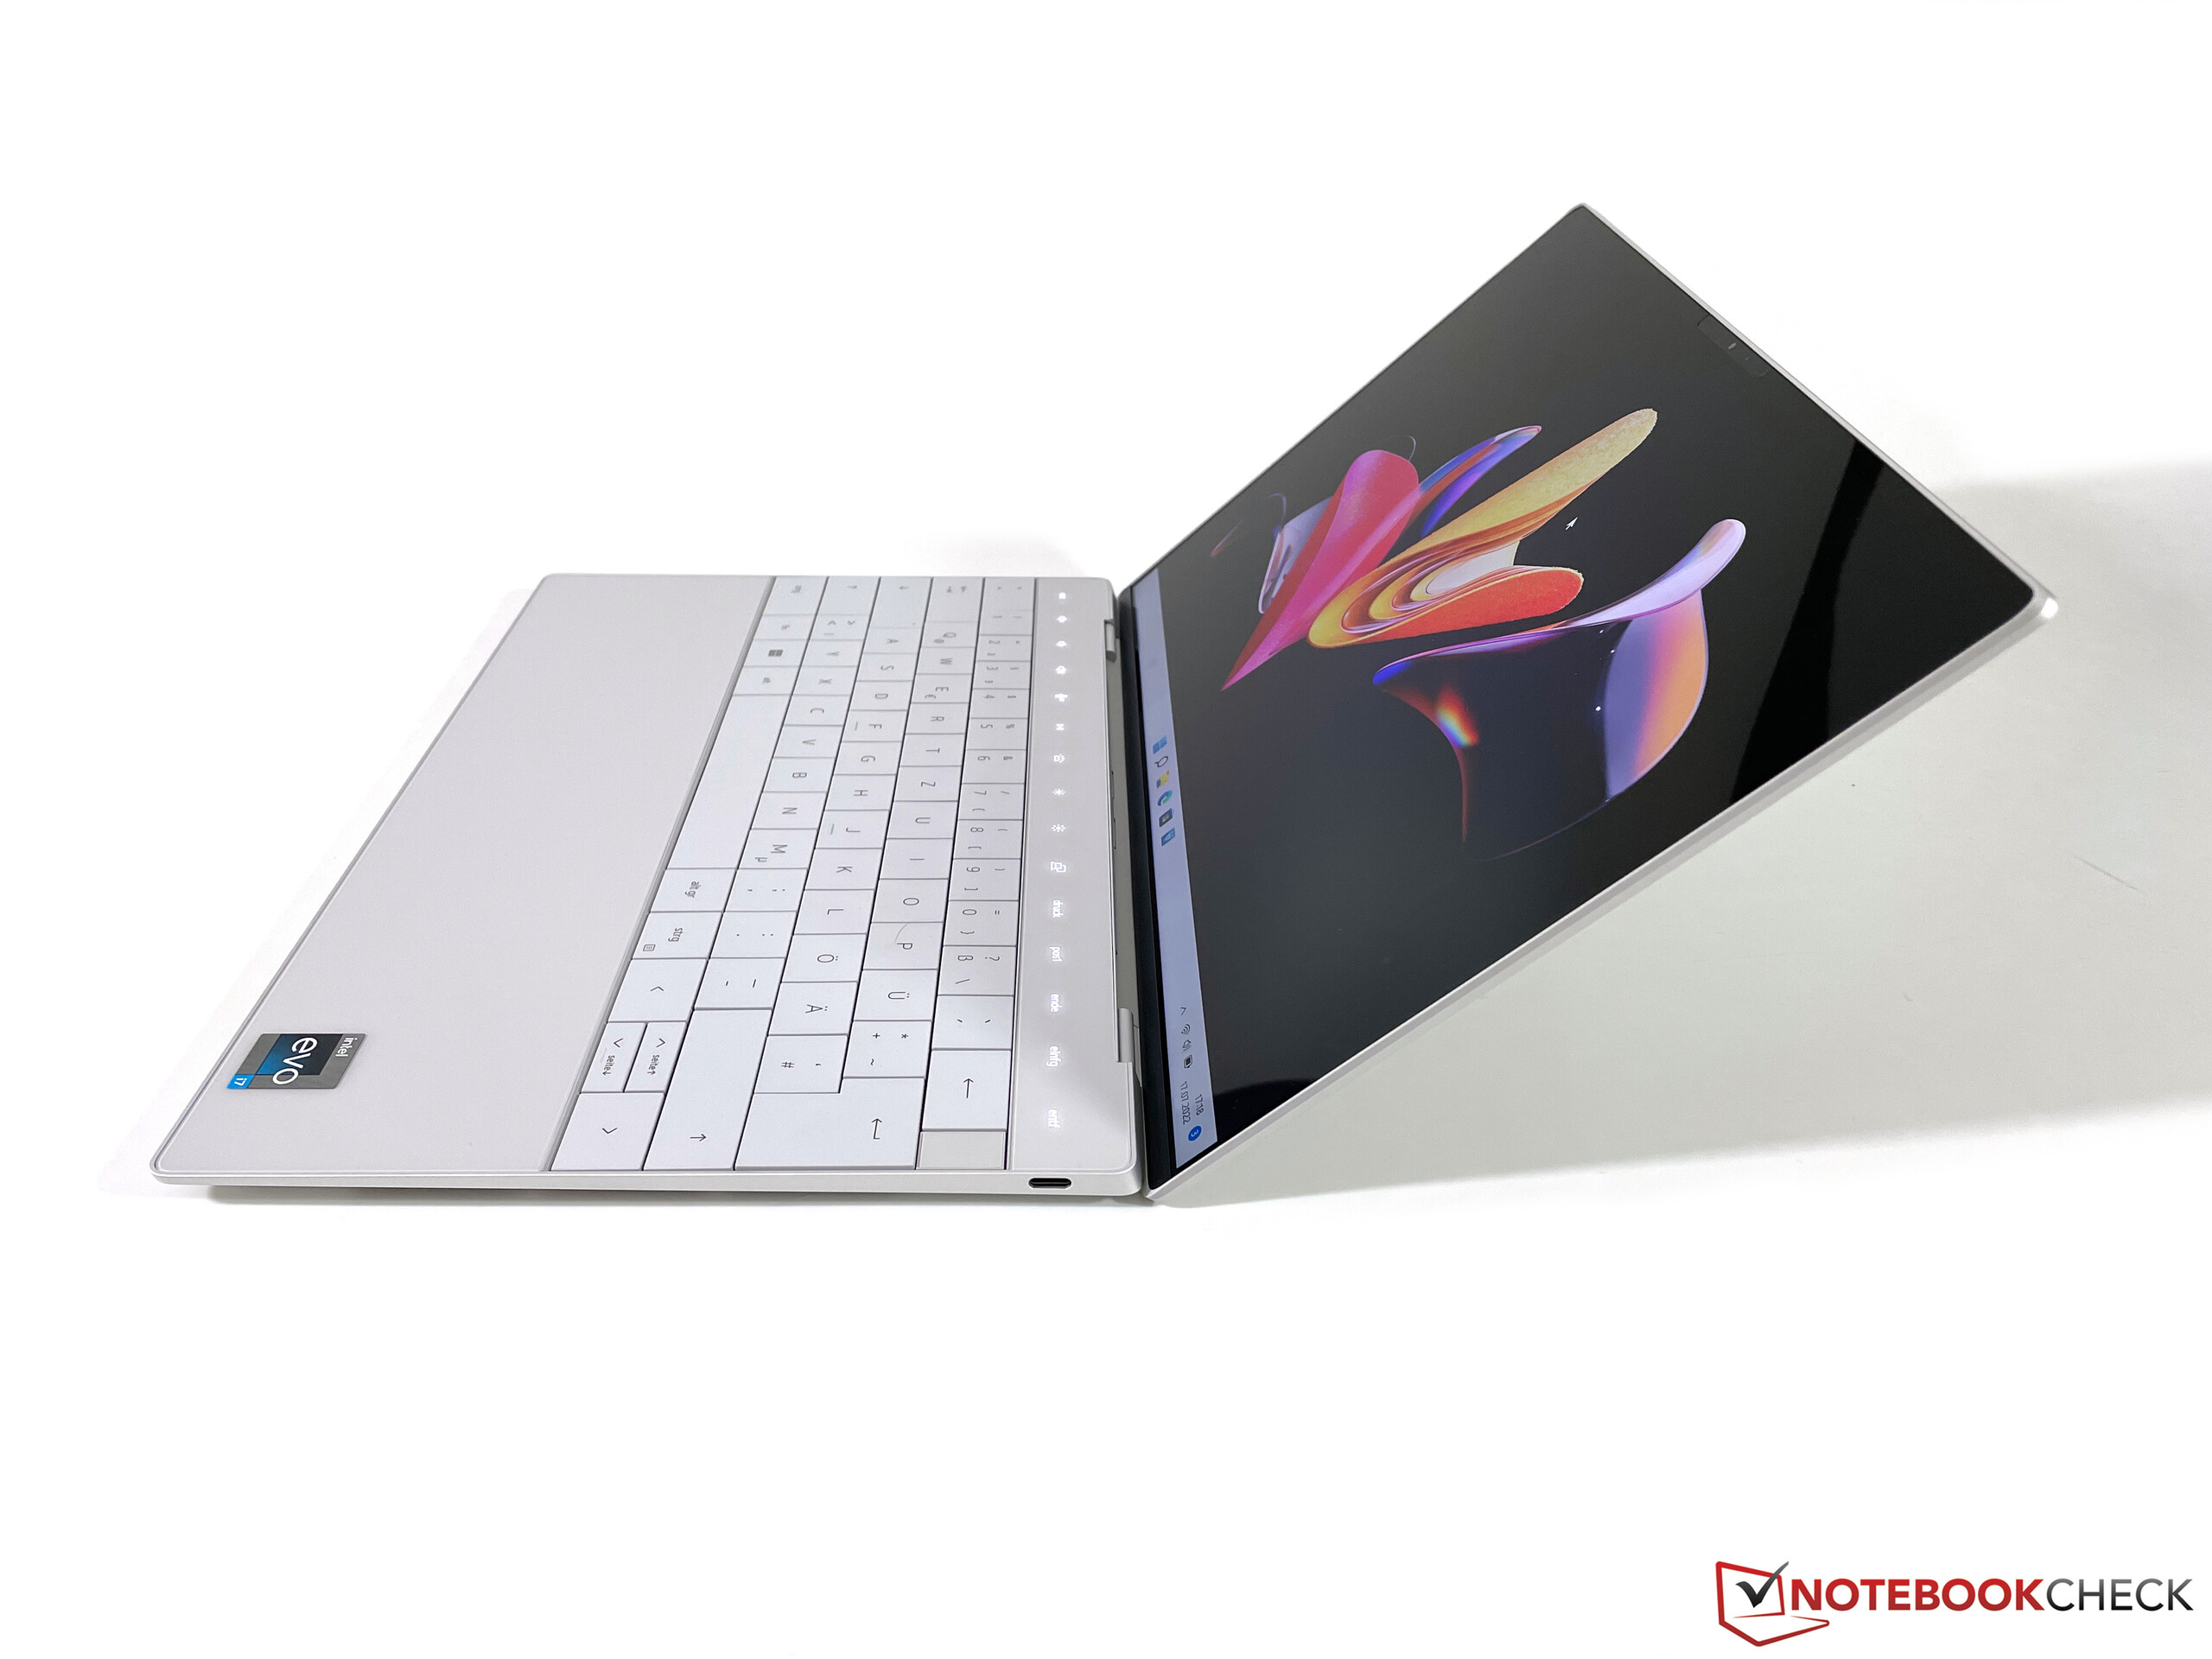
The stability of the XPS 13 Plus is excellent and the whole device, which is mainly manufactured from aluminum, also leaves a very robust impression. Neither the base unit, nor the lid can be pushed in or twisted. We also like the adjustment of the hinges, but it is not easy to open the lid with one hand since there is no indentation at the front of the base unit. The maximum opening angle is 135 degrees.
Both the old Dell XPS 13 9310 and the new XPS 13 Plus are the most compact devices within our comparison group and it is no problem to put the XPS 13 in a bag/backpack. The weight on the other hand is average and both the Asus Zenbook S 13 as well as the ThinkPad X1 Nano are noticeably lighter. The 60W power adapter is very compact, but the long connection cables still increase the overall weight to 254 grams.
Connectivity - Dell throws out the 3.5 mm stereo jack
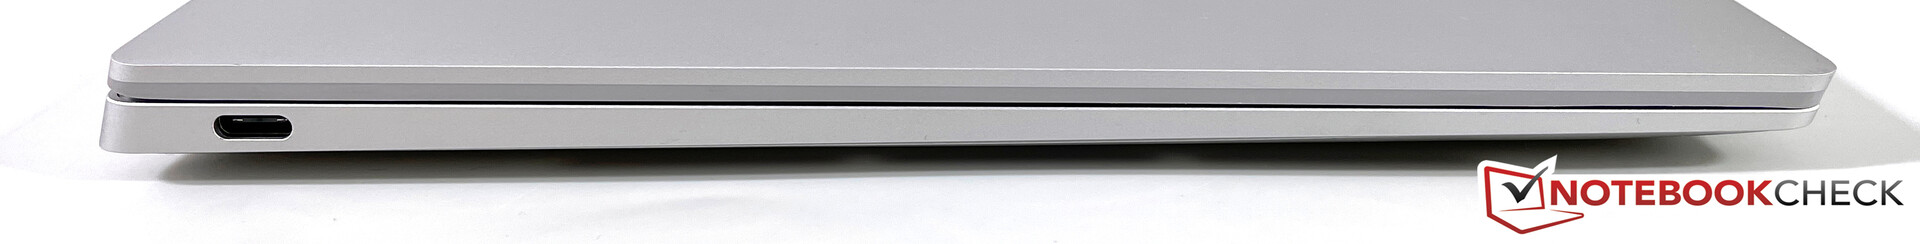
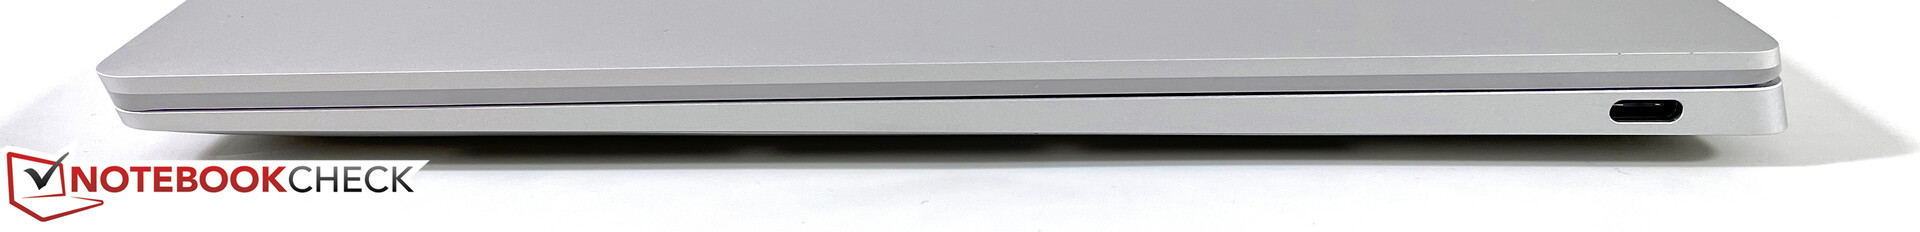
The continuously reduced the number of ports on the XPS 13 over the last couple of years and this trend unfortunately continues with the new XPS 13 Plus (and also the regular XPS 13). While Apple starts to include more ports (on the new MacBook Air M2, for example), Dell even goes a step further and removes the 3.5 mm stereo jack. There is only one USB-C port with full Thunderbolt 4 support on each side. Dell does at least include two adapters (for USB-A and 3.5 mm) by default, but we would prefer more ports at the device. The card reader of the predecessor was also removed.
Communication
Dell equips the new XPS 13 Plus with a modern AX211E module from Intel, which supports the latest Wi-Fi 6E standard. However, we were not able to use the corresponding 6 GHz network of our reference router. We already saw this issue on the new versions of the XPS 15 and XPS 17, where the configuration of the antennas did not support 6 GHz, but this would be very strange for a completely new design. We are already in contact with Dell and will update the article as soon as we get new information.
The Wi-Fi performance in regular Wi-Fi 6 networks is still very good and stable. We did not notice any connection issues during our review, neither with our reference router, nor the AVM Frtitz!Box 7490 (Wi-Fi 5). Bluetooth 5.2 is supported as well.
Webcam
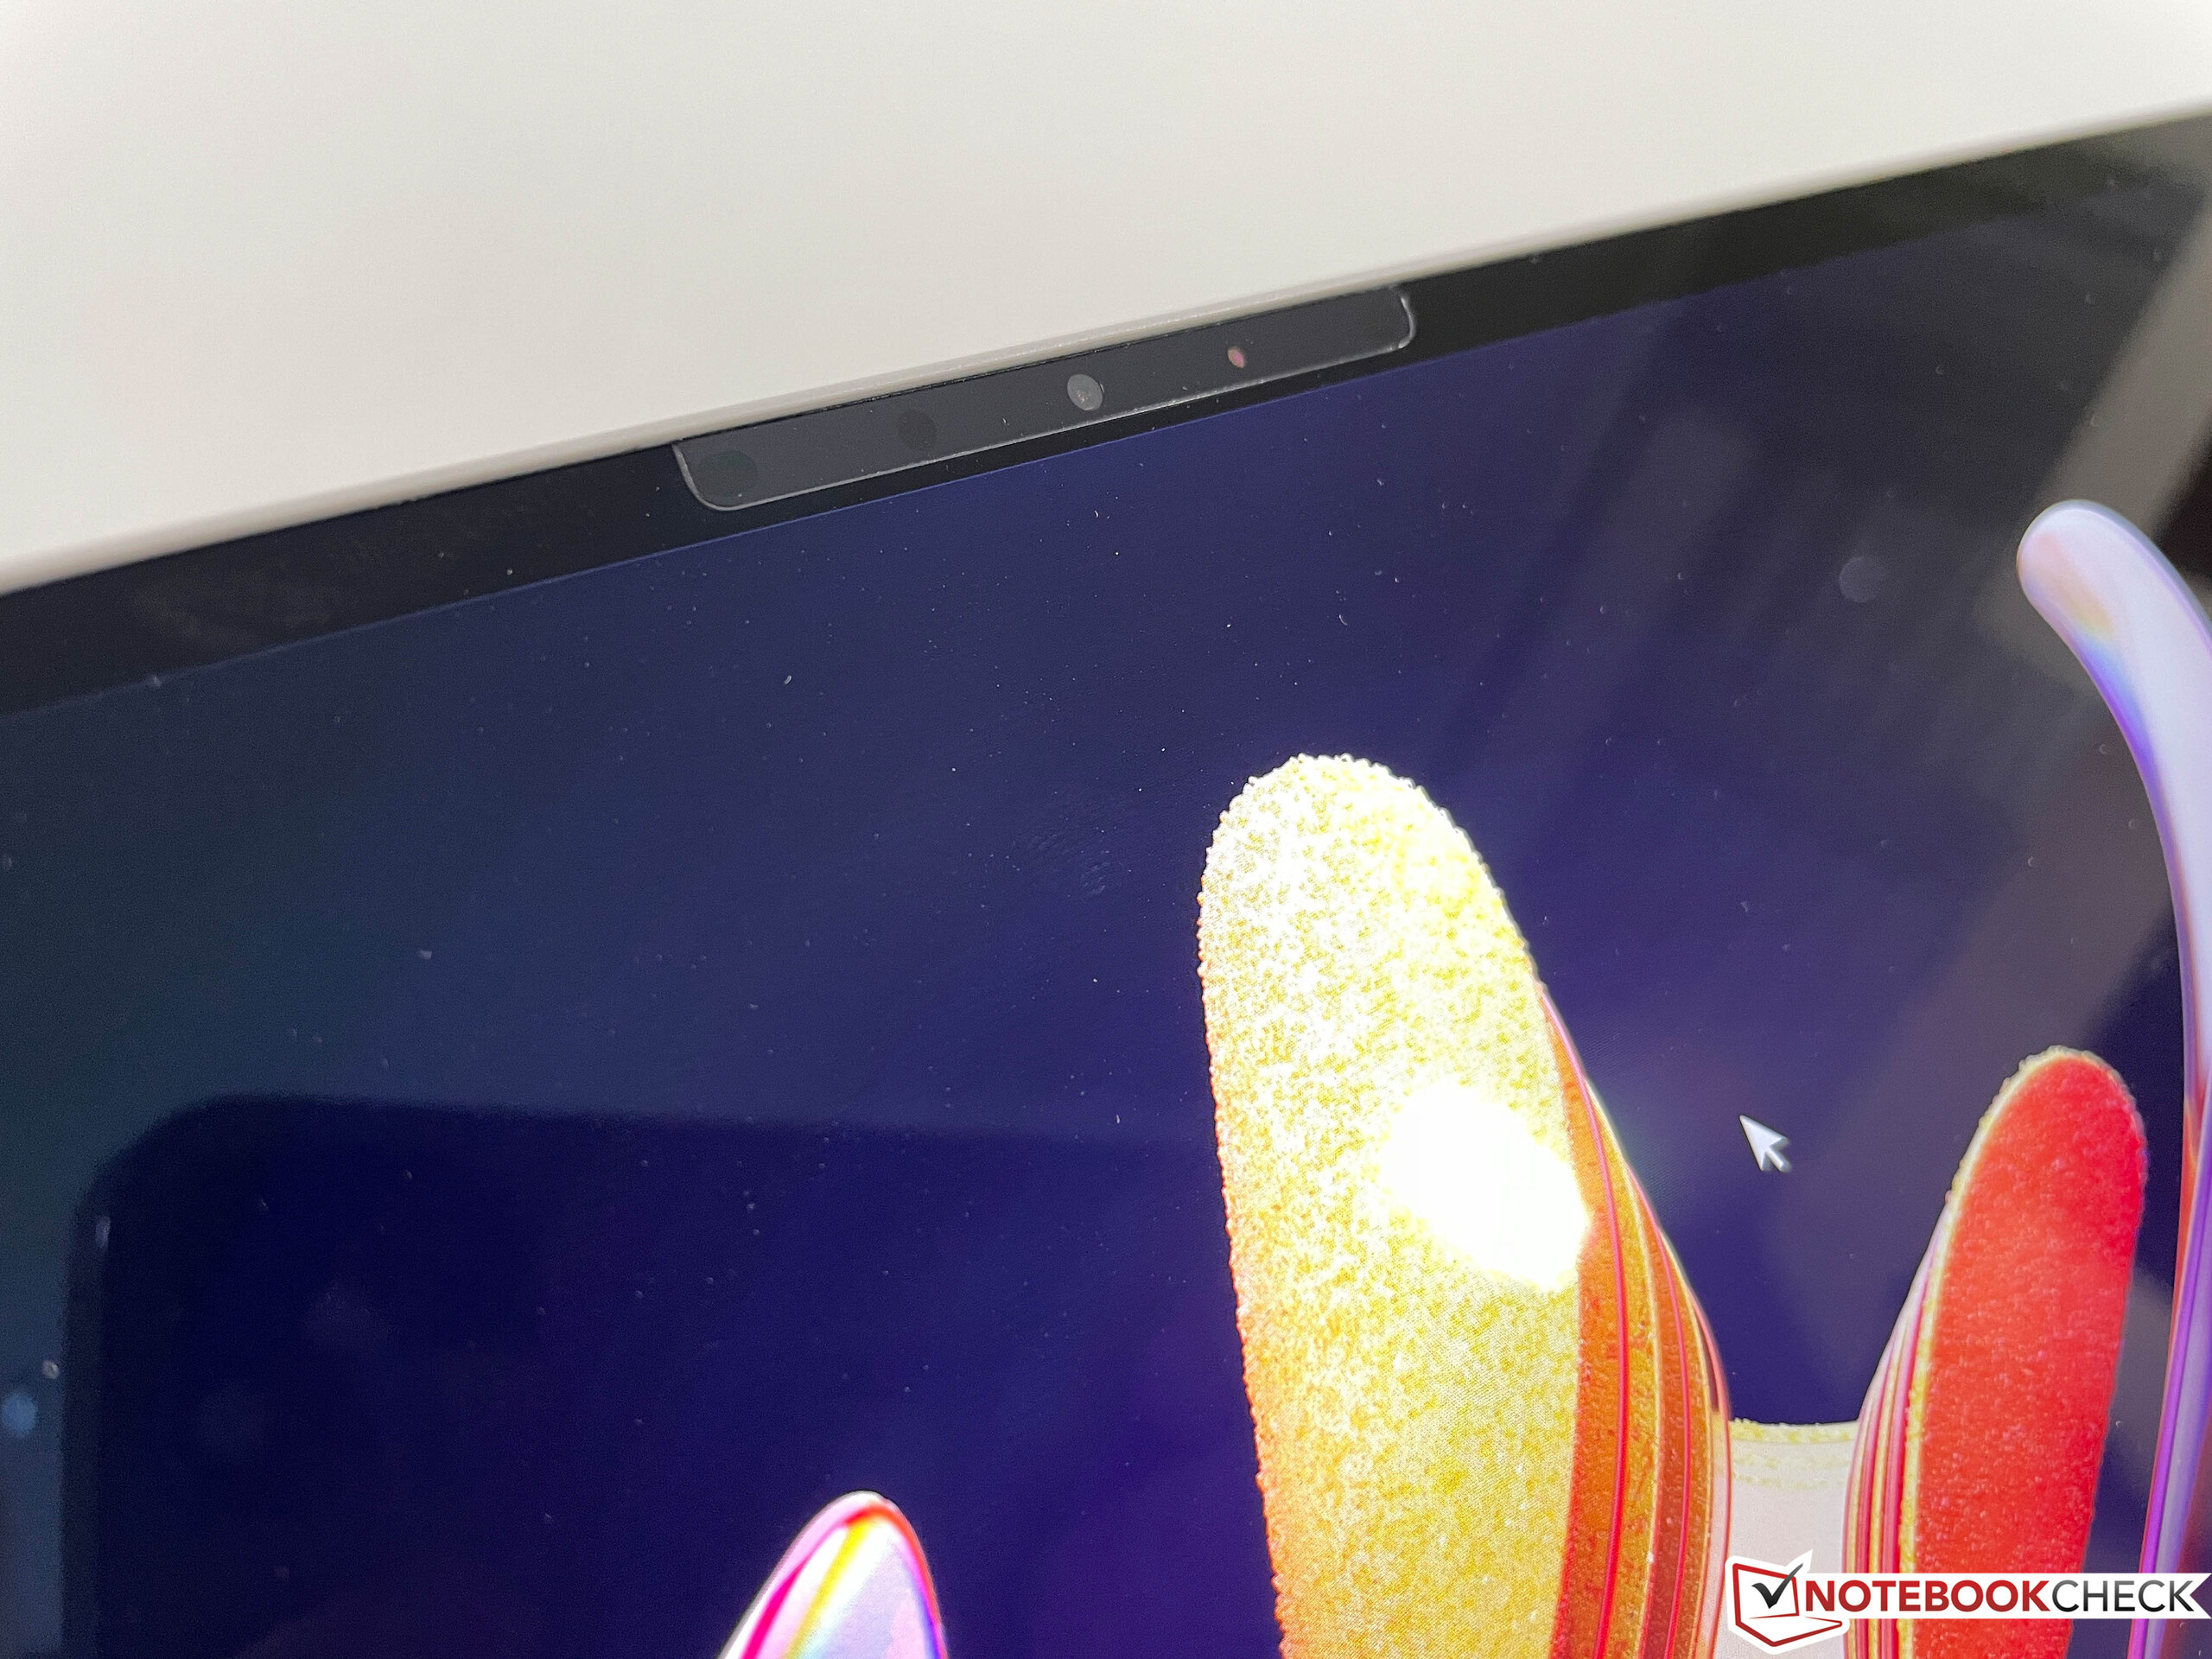
Dell still uses a 720p webcam, but the picture quality is okay, at least in good lighting conditions. Still, a 1080p sensor would have been more adequate considering the increasing number of video conferences and many manufacturers acknowledge that.


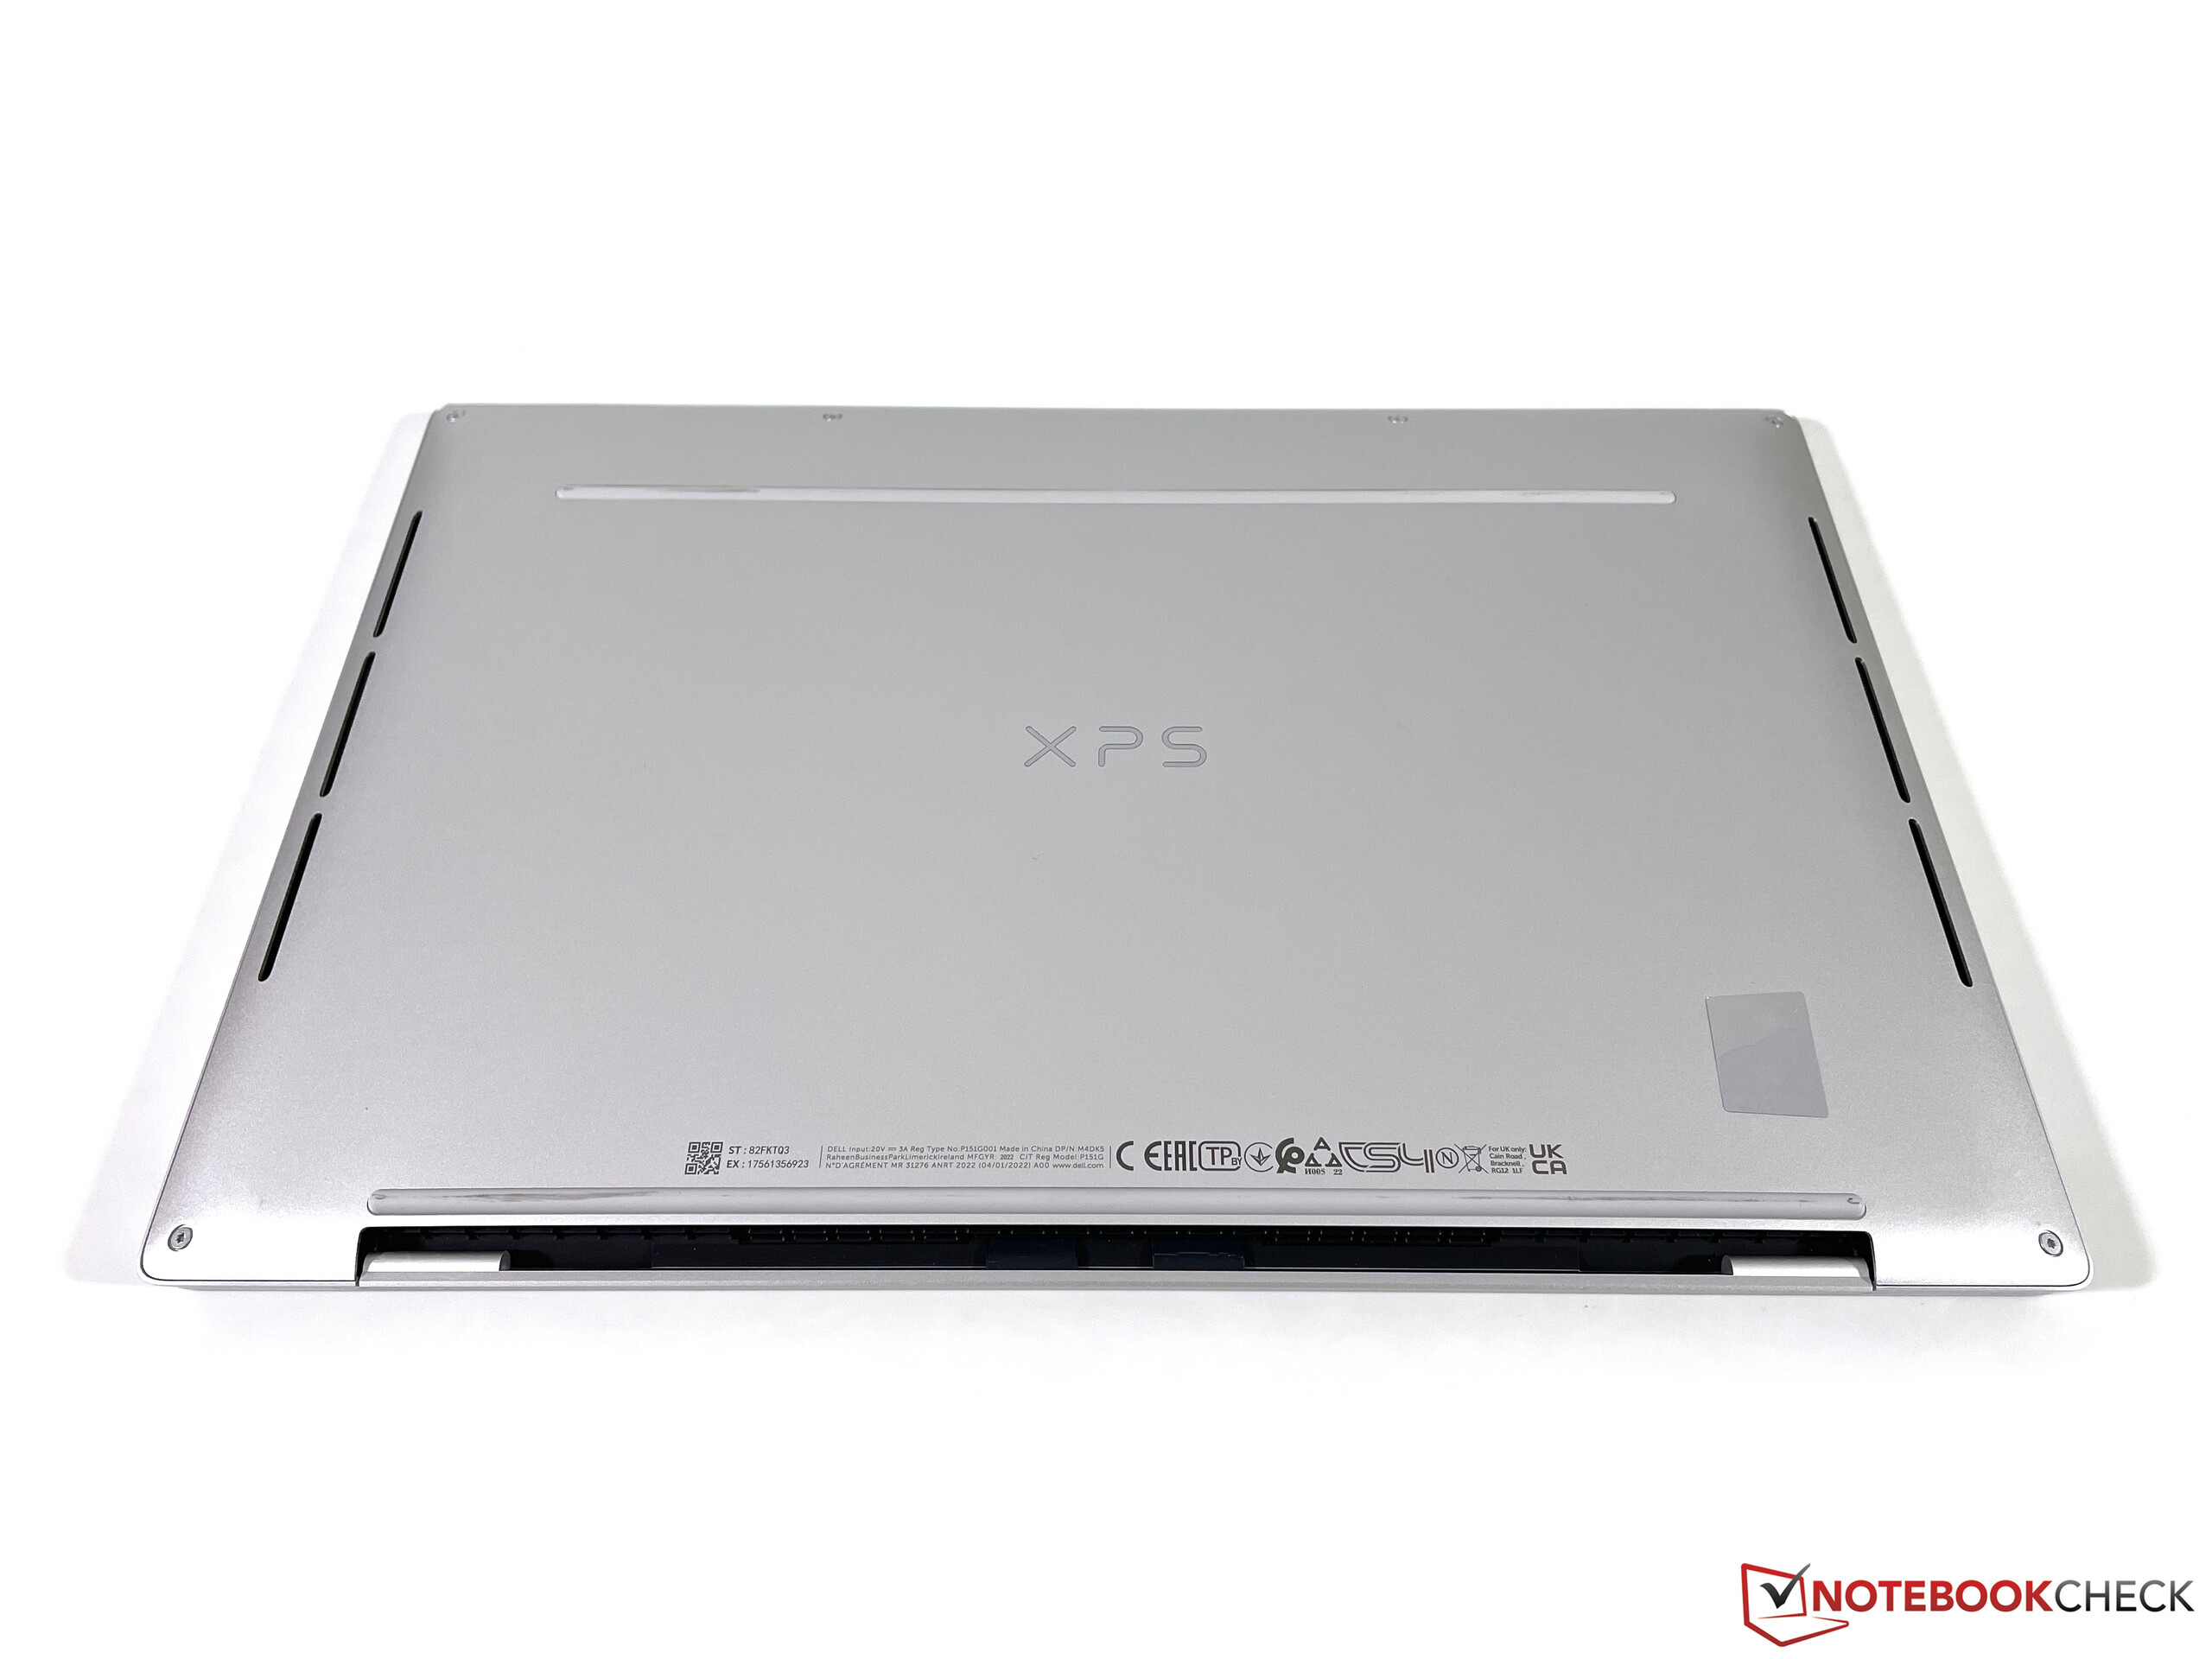
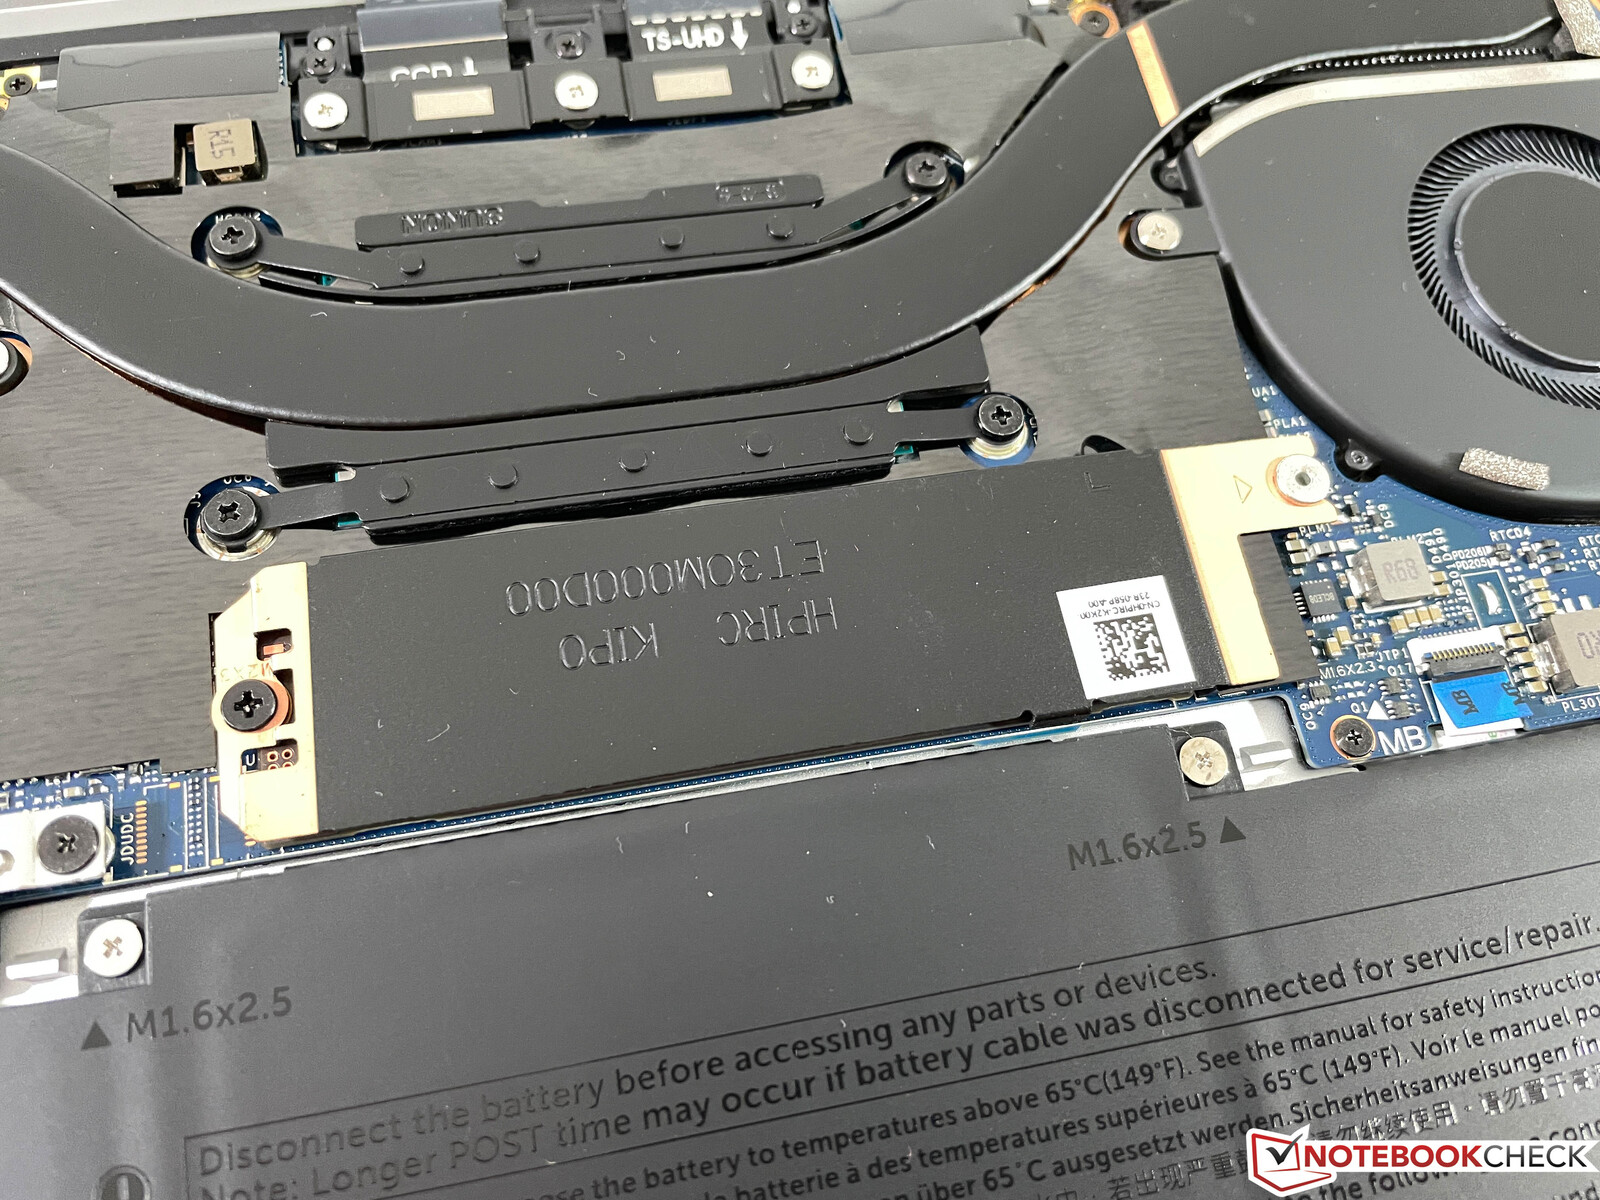
Maintenance
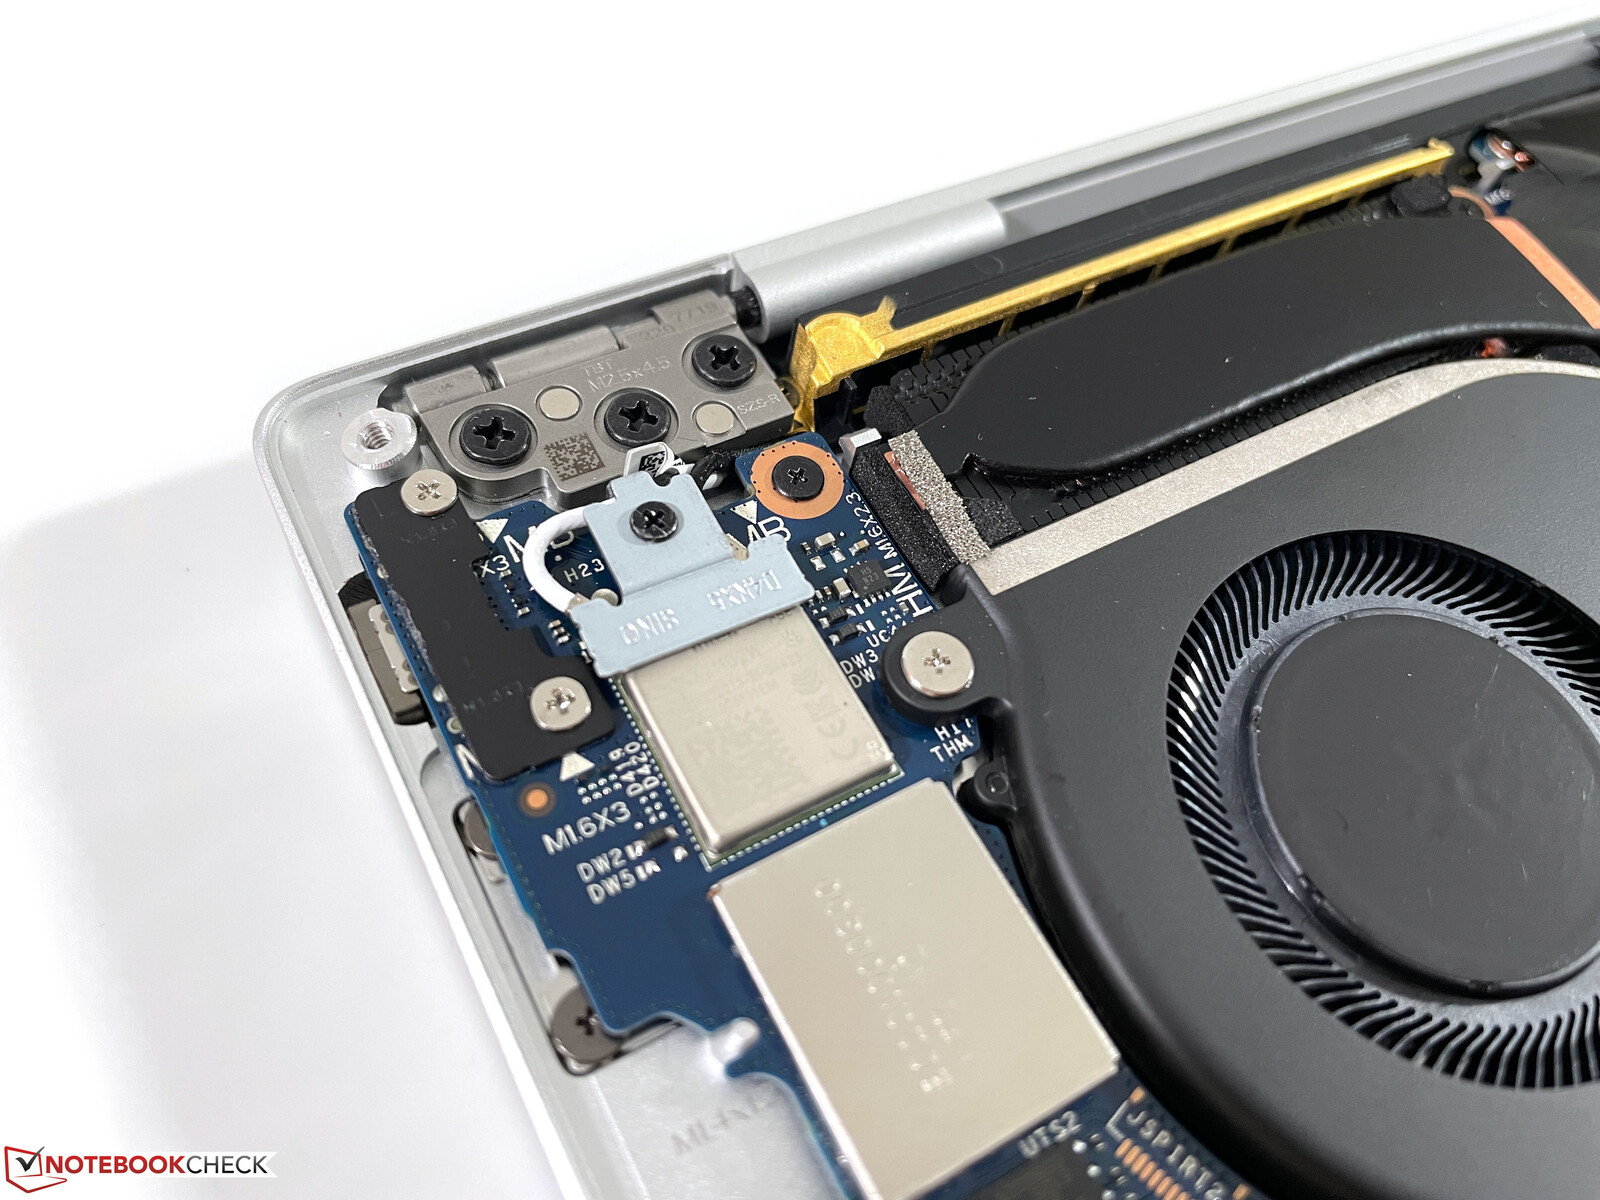
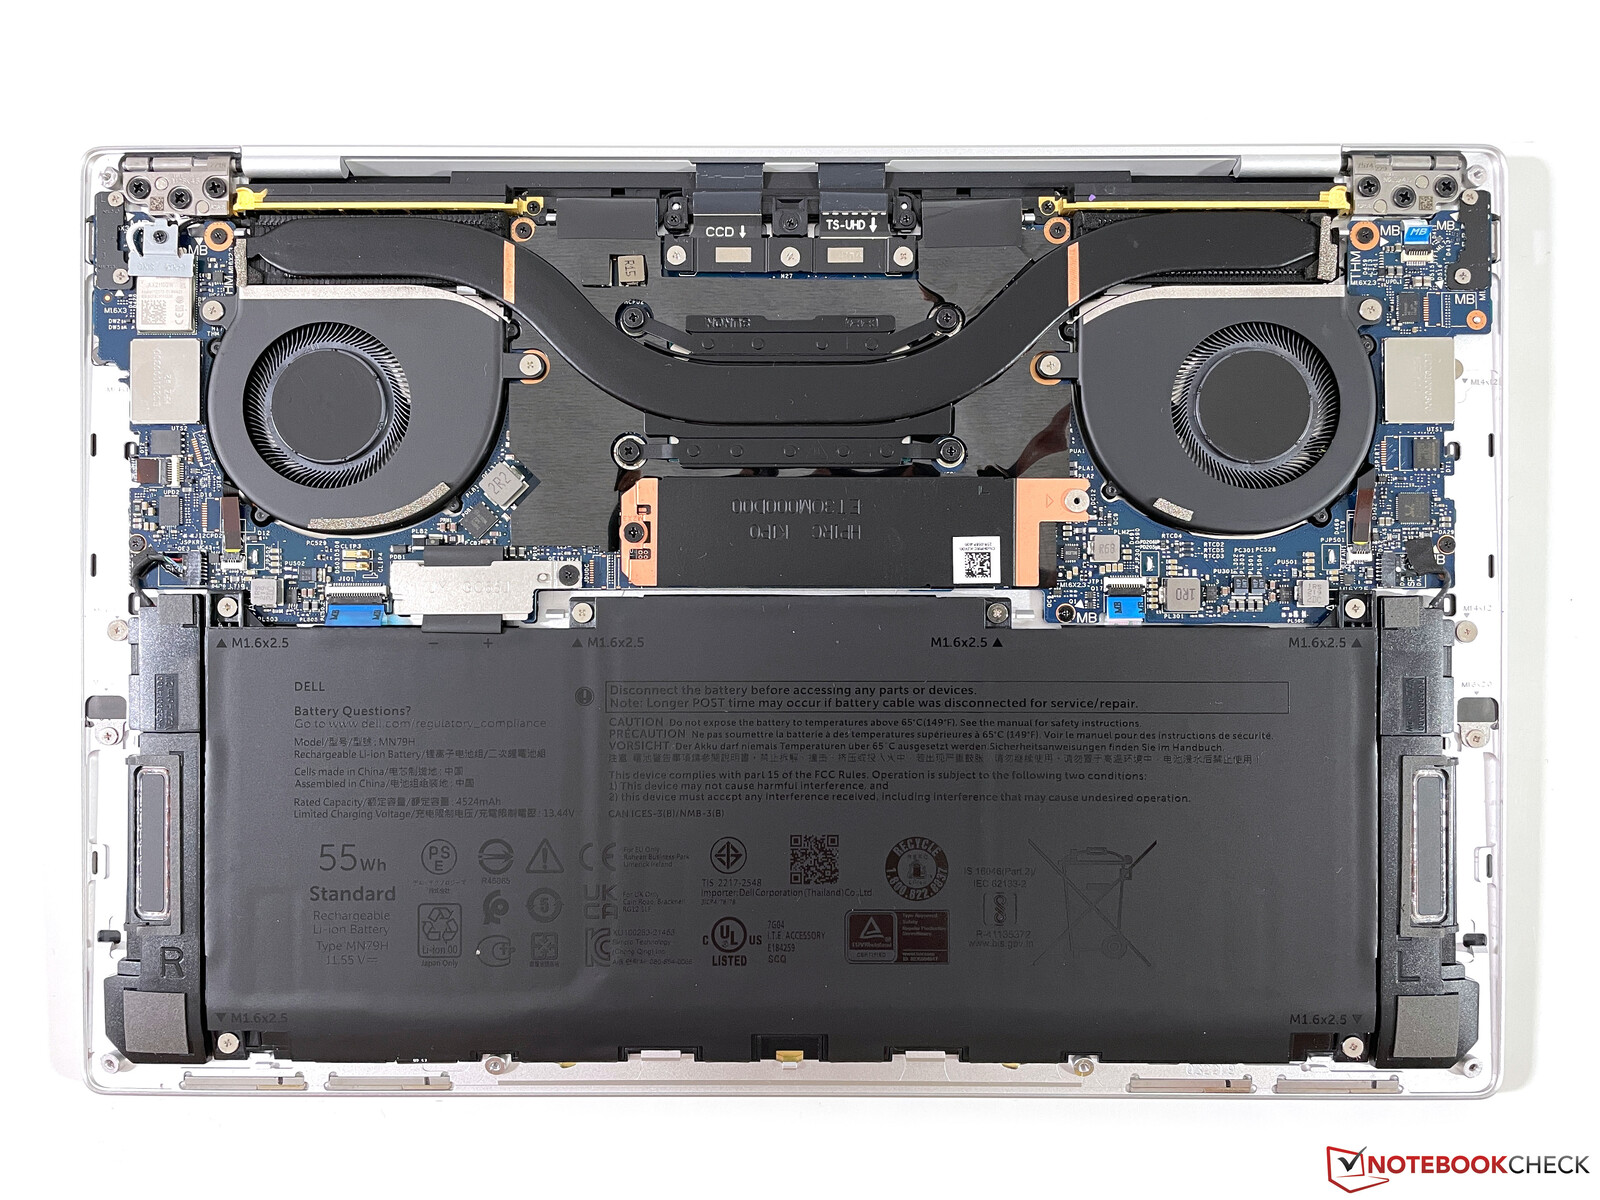
It is easy to remove the bottom panel, which is only secured by 6 Torx screws (T5). The internal layout is very tidy, but your maintenance actions are limited to the cleaning of the fans and the replacement of the M.2-2280 SSD, if necessary.
Input Devices - XPS 13 uses a new keyboard design
Keyboard
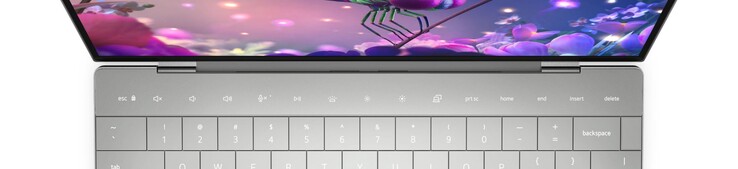
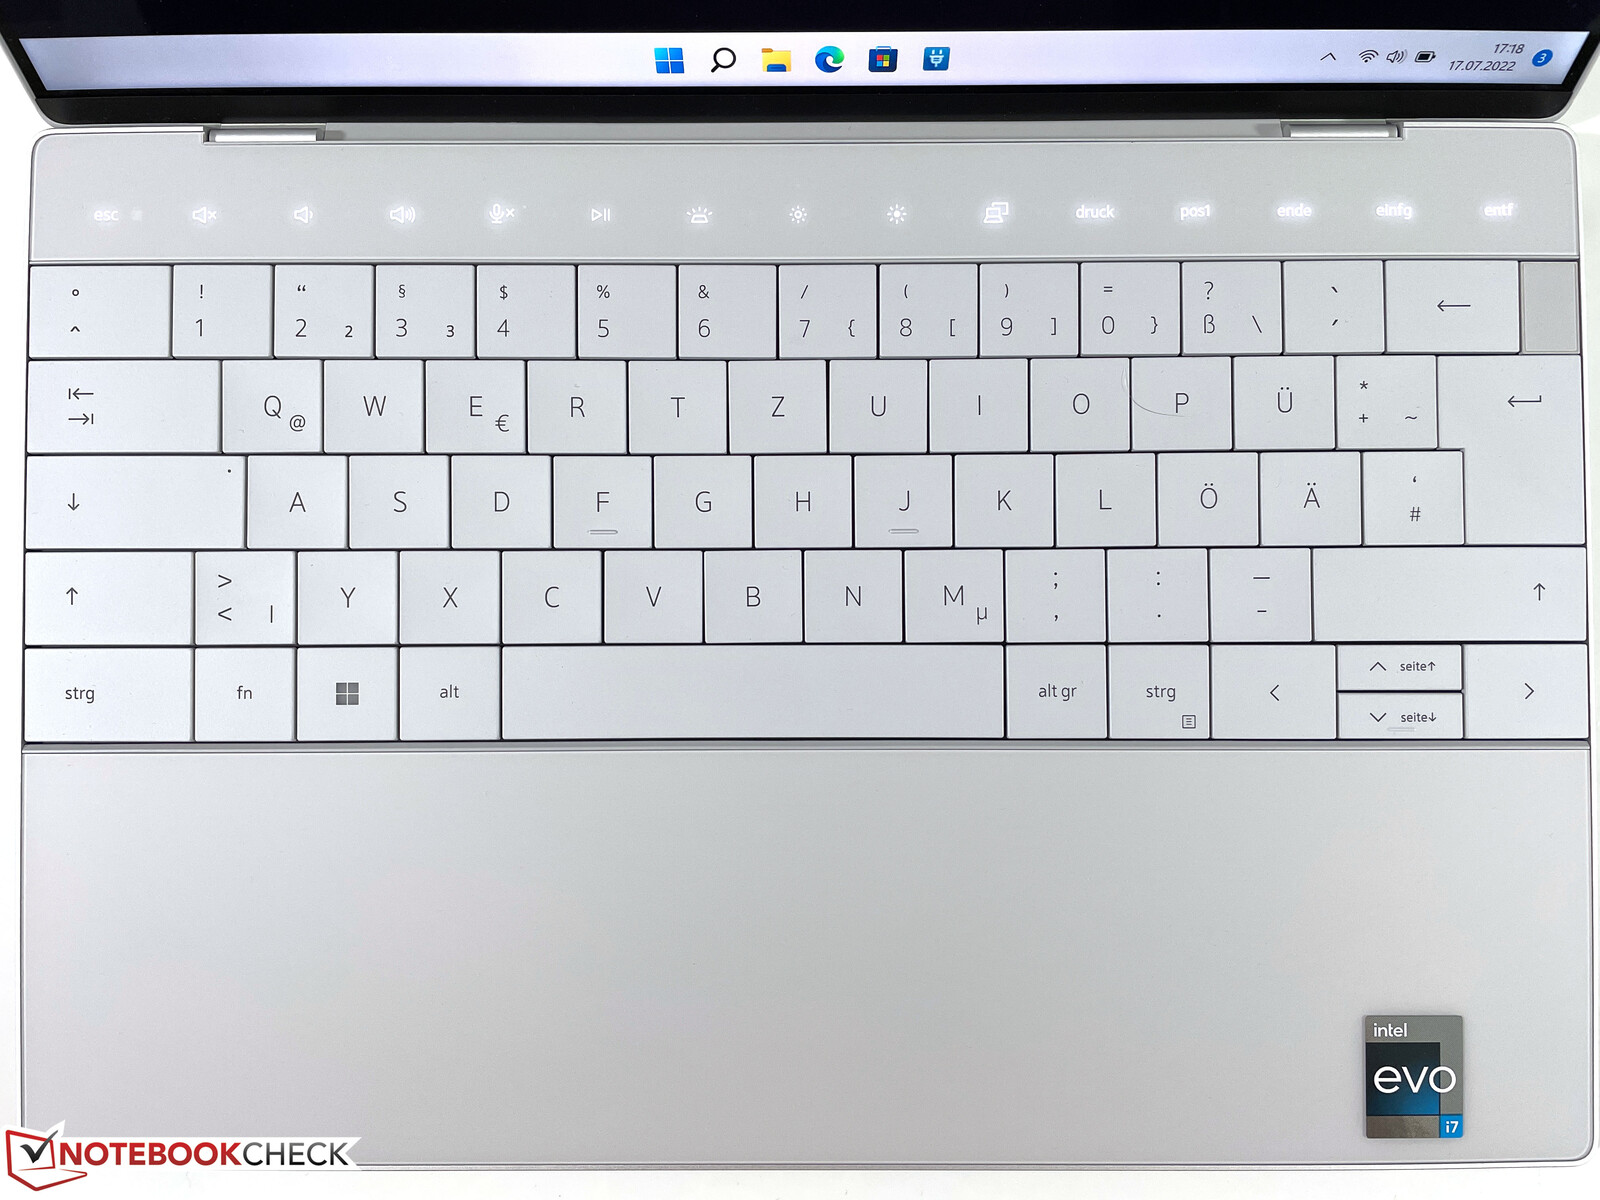
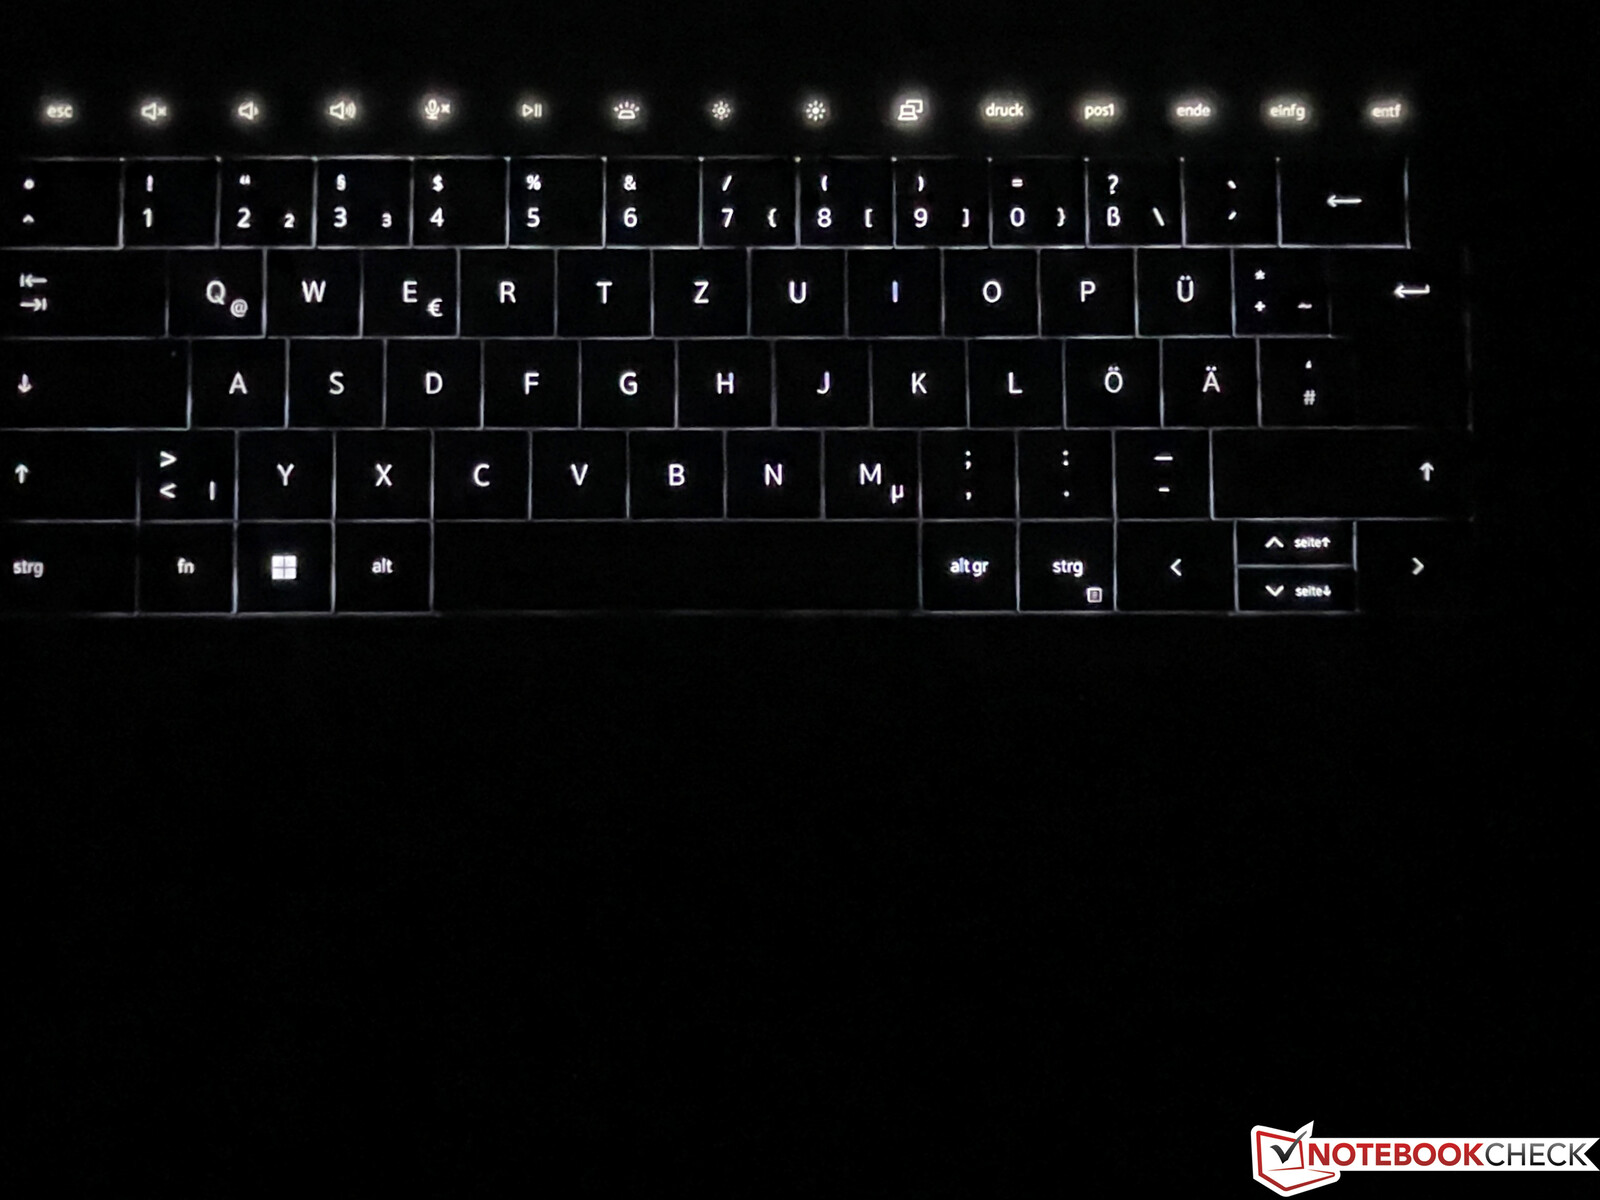
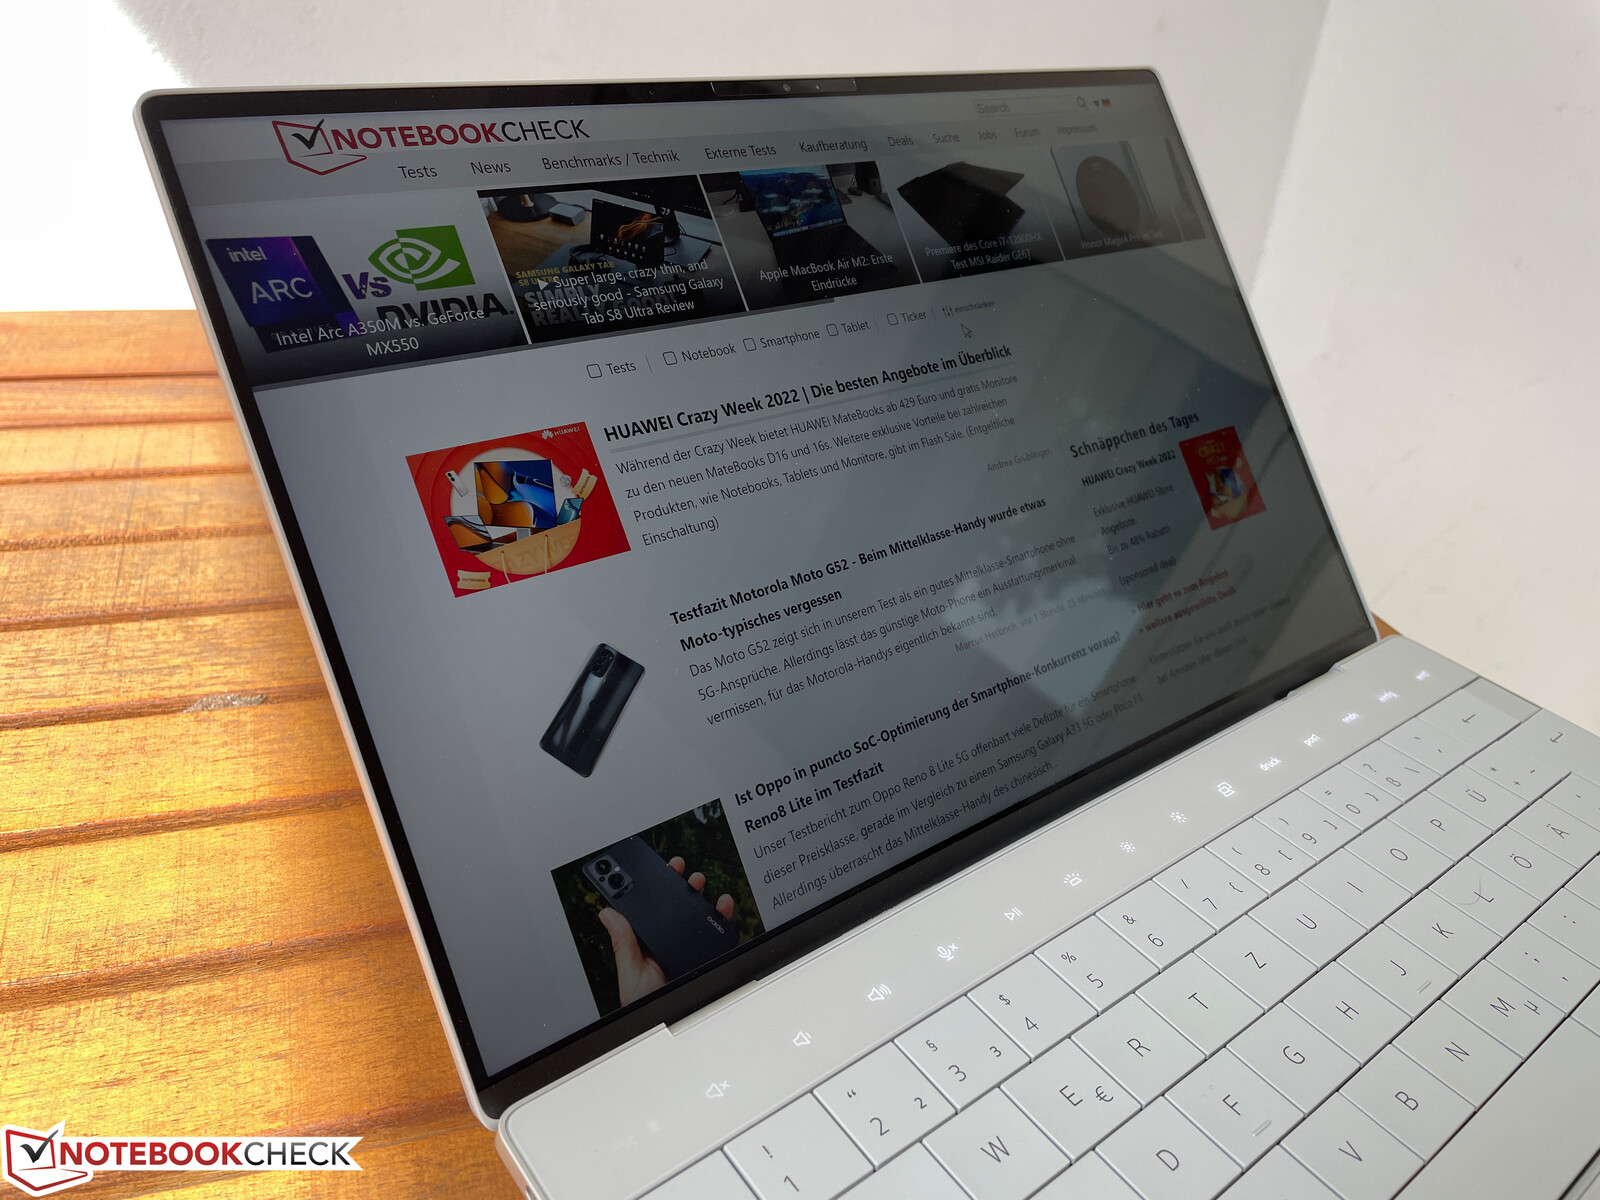
The input devices got a major overhaul and the XPS 13 Plus also differs from the regular XPS 13. Dell waives the chiclet keyboard for the Plus model and now uses a more traditional layout without gaps between the individual keys. The manufacturer uses the whole width of the chassis and the keys are conveniently big. We are also positively surprised by the smooth typing experience with precise feedback, despite the limited key travel (1.0 mm). All in all, this is a good keyboard and we prefer it to the old one. If you are only used to chiclet keyboards, however, it might take a little time to get used to the layout since it is harder to feel the transition between the keys. The power button is located in the upper right corner and is very narrow, so it does not disturb during typing. It is also a fingerprint scanner.
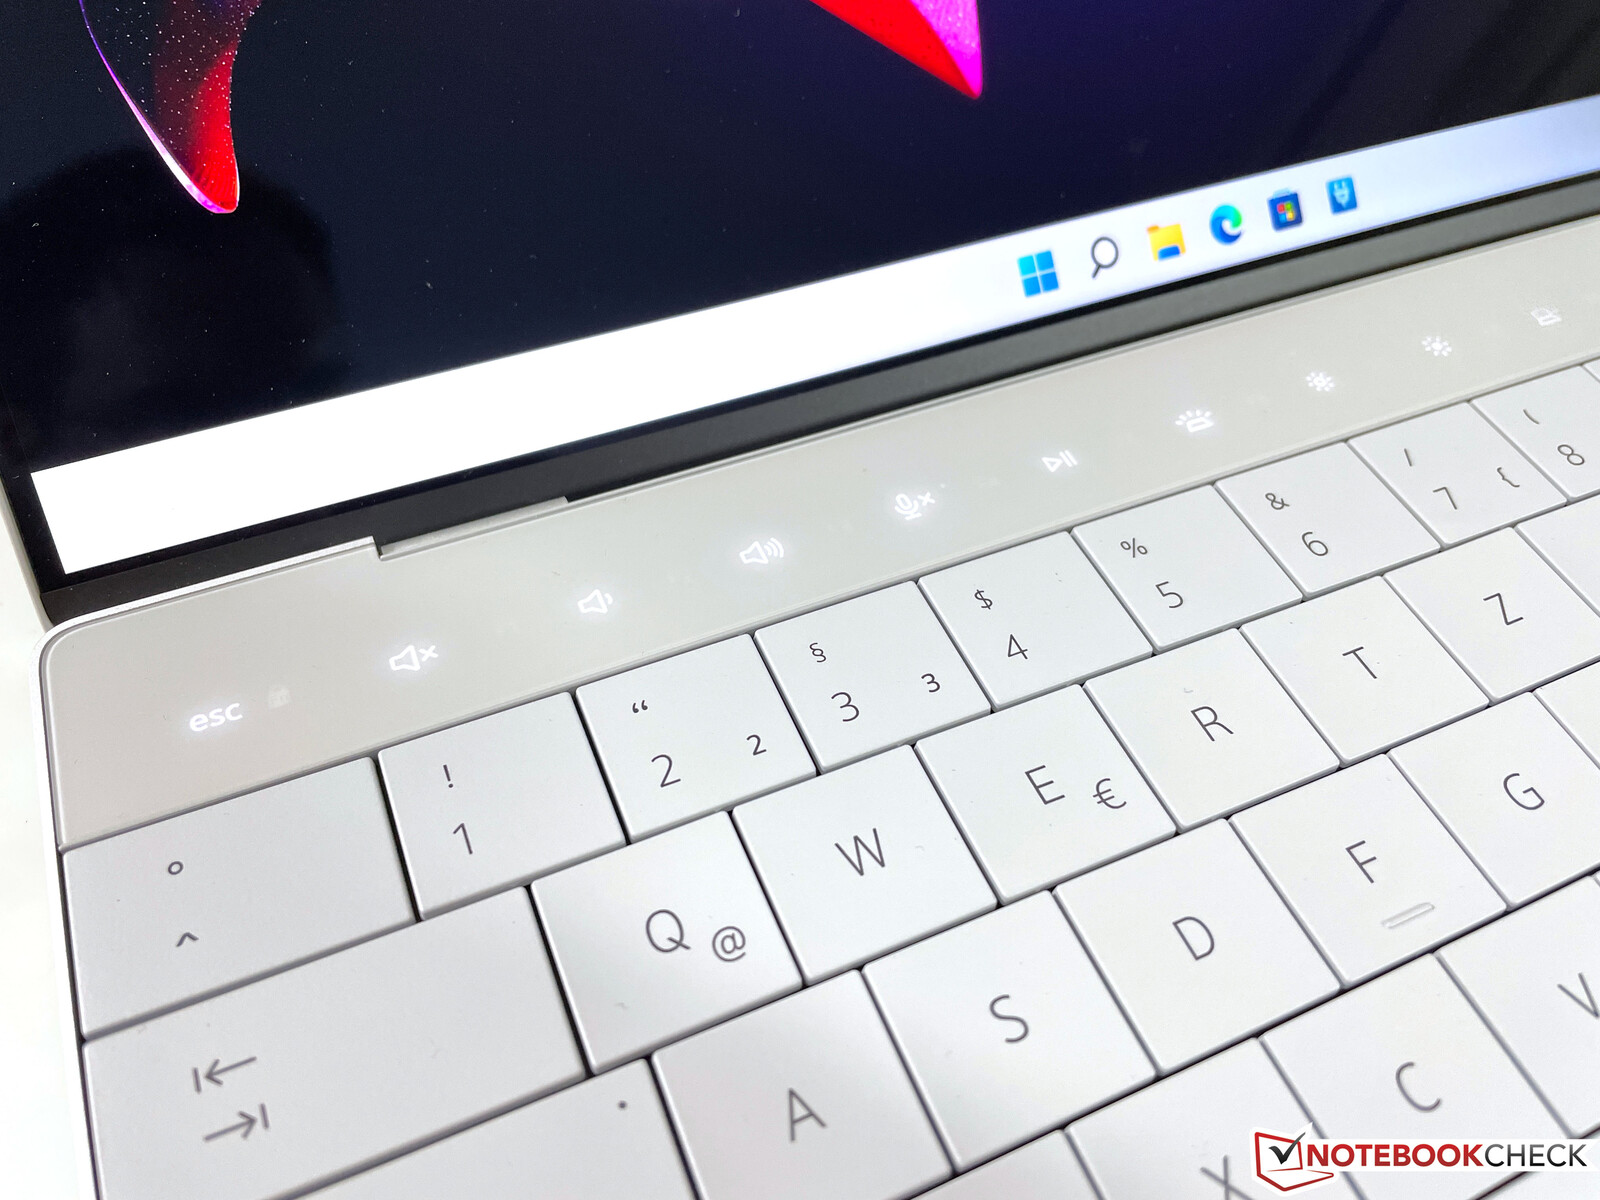
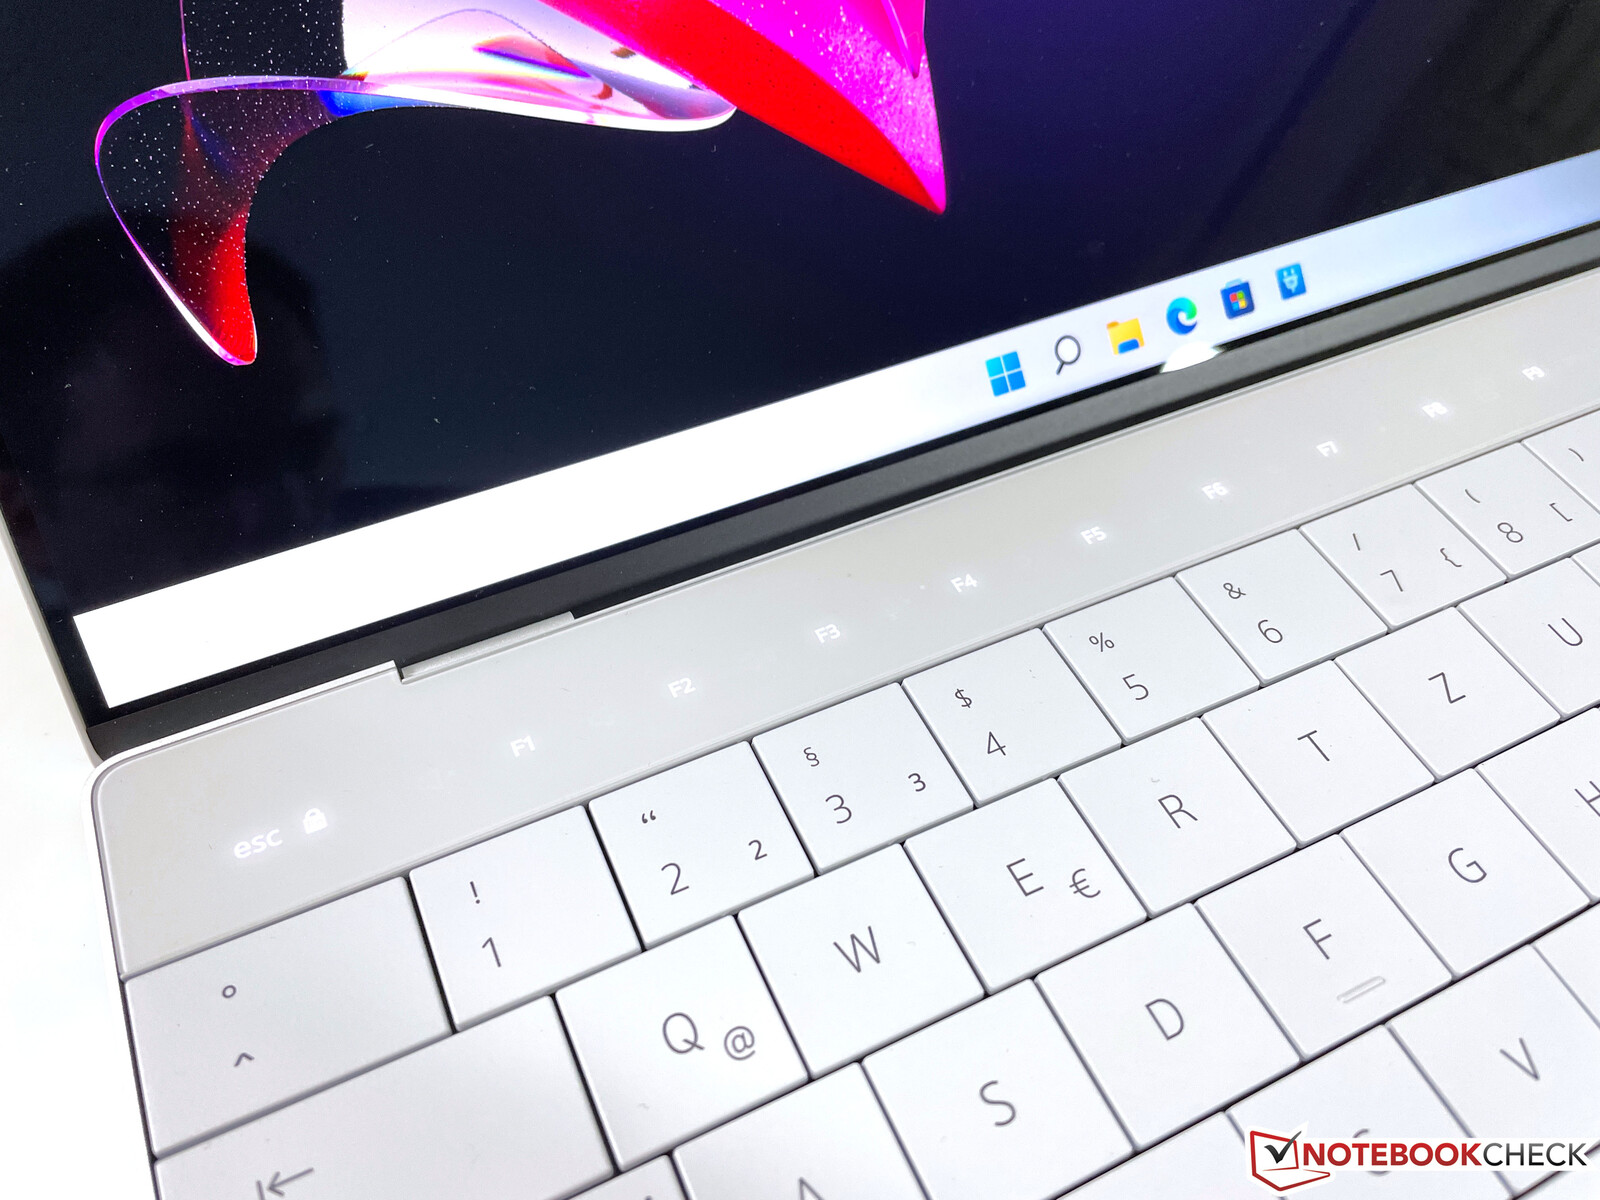
Then there is the touch sensitive bar with function keys, which is always illuminated and it either shows special functions like brightness or volume control or the regular F keys. It works well in general, but the illumination can be annoying in darker environments and you cannot adjust it. There are two different intensities, but the automatic regulation did not always work reliably on our unit. The illumination can also be a problem if you watch a video in the evening, even when it is on the lower brightness setting. All in all, the touch bar is more of a gimmick and we do not see an advantage over regular buttons. The keyboard illumination cannot be controlled via sensor and is also not very bright on the highest setting.
Touchpad & Touchscreen
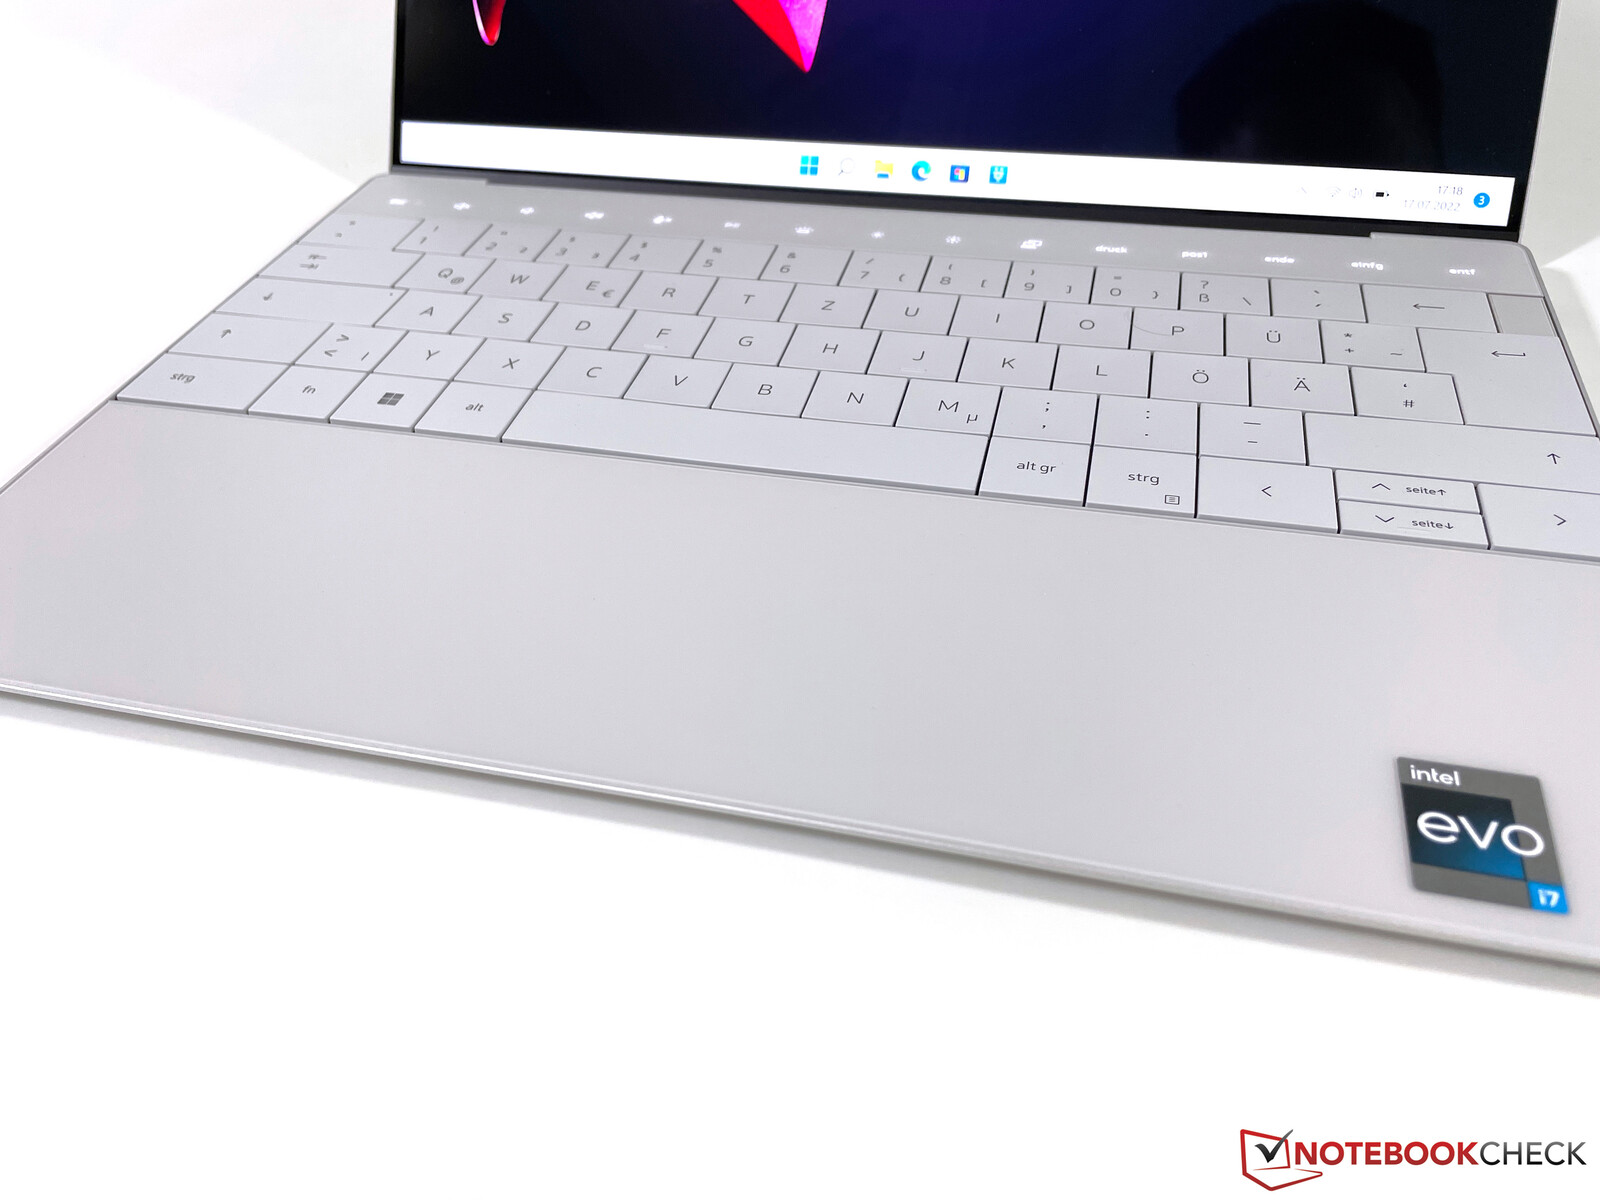
Dell has hidden the clickpad underneath the palm rests and you cannot see any borders or transitions. The input area starts at the left edge of the space bar and ends on the right edge of the Alt Gr key. We got used to it pretty quickly and did not have any issues with the missing transition, but it gets a bit more complicated if you want to trigger a right click in the lower right corner. We would recommend you simple tap with two fingers for right clicks. You can click the pad across the whole surface, and the clicking noise is not too loud. We really liked the good gliding capabilities of the glass surface during our review period.
You can also use the capacitive touchscreen, which works as expected. However, the display always wobbles a bit when you touch it.
Display - Dell offers IPS and OLED panels
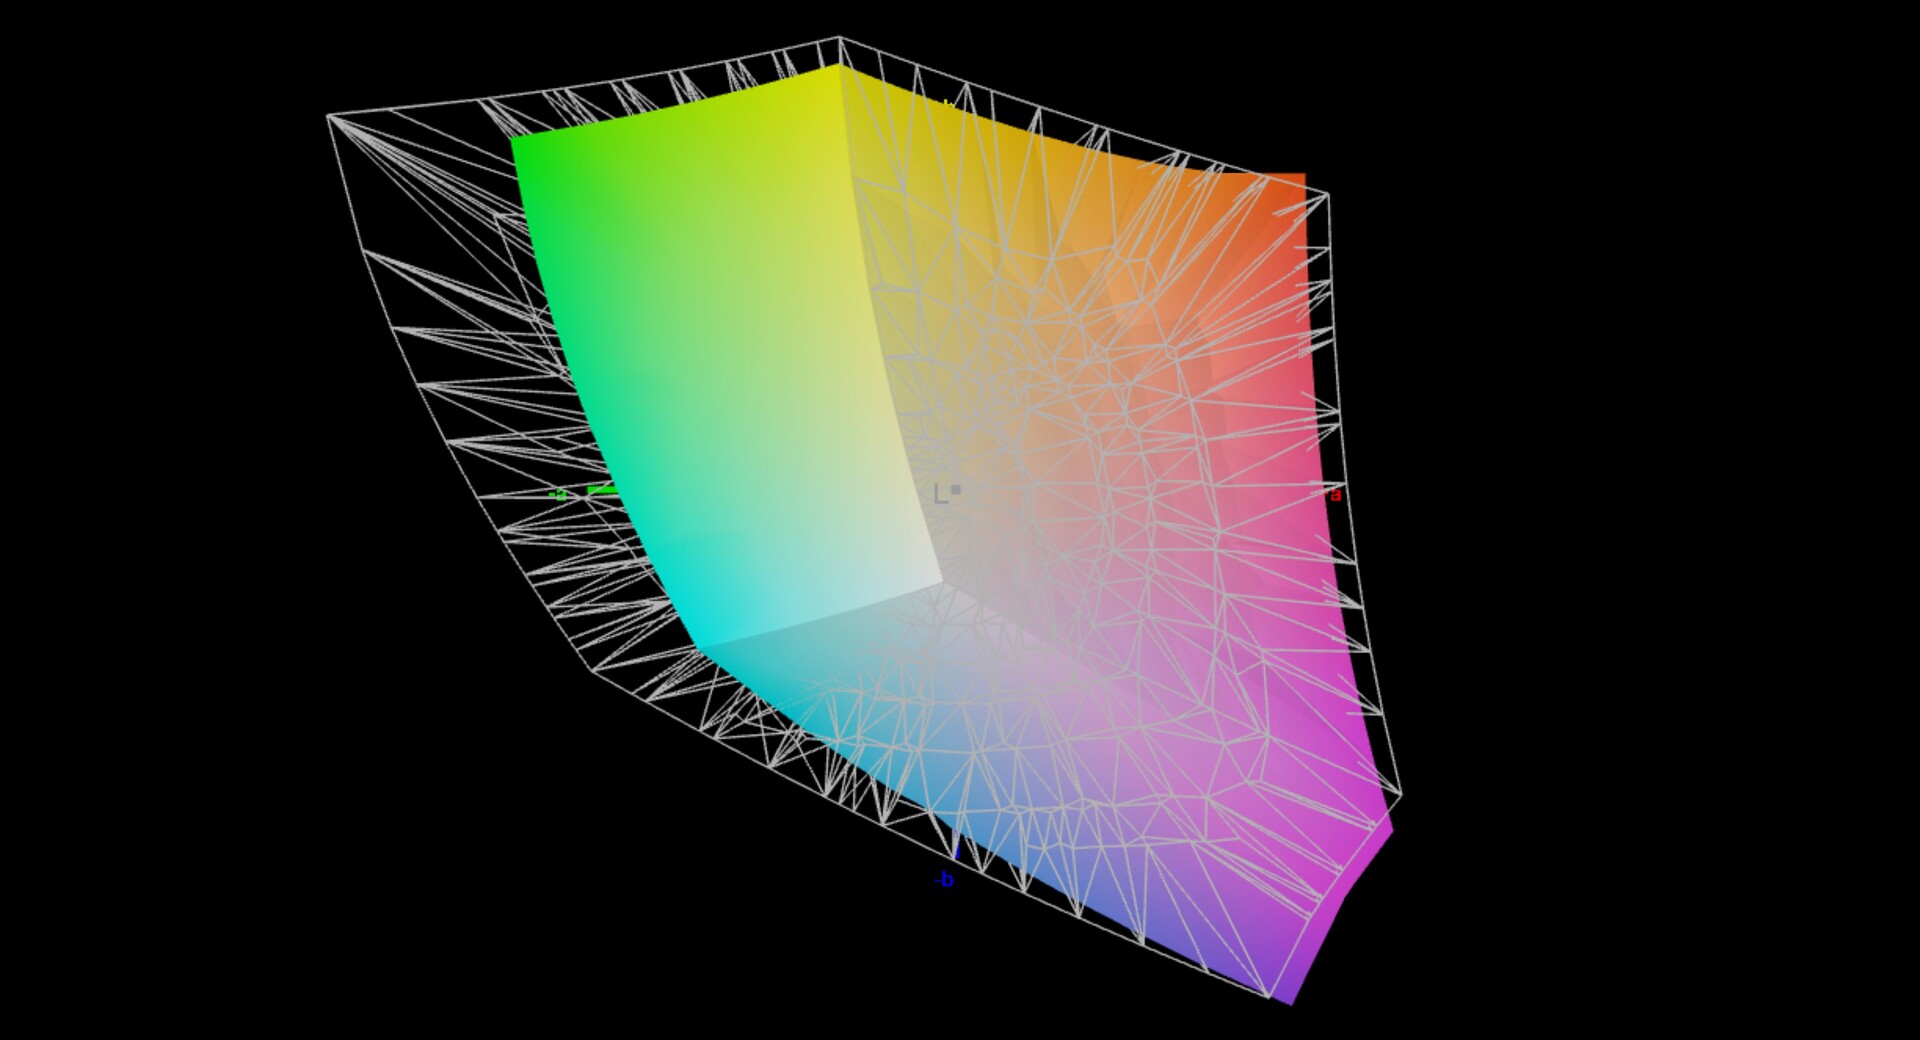
Dell offers four different panels for the XPS 13 Plus. In addition to two FHD models with and without touchscreen (the non-touch unit also has a glass layer and there is no matte option), there is a 3.5K OLED screen as well as the 4K IPS screen from our review unit. The panel is once again provided by Sharp and the model number is also identical to the previous model, but we noticed some differences. The subjective picture quality is still excellent, but there can still be scaling issues with some applications.
Dell advertises a brightness of 500 cd/m², but our review unit only manages 474 nits on average. The black value (0.28) is still okay considering the brightness and the contrast ratio is very good at ~1700:1. The minimum brightness of ~30 nits can be a problem though, especially if you use it in very dark environments. This is obviously not very ergonomic, but it happens.
While the optional OLED screen of the XPS 13 suffers from PWM flickering, we were not able to detect any flickering on the IPS display this time. The response times are also noticeably better compared to 4K screen of the previous XPS 13 9310 and there are no major problems with ghosting. Backlight bleeding is only a minor issue at the upper edge when you use the full brightness, but this is hardly noticeable in practice. The viewing angle stability of the IPS screen is also very good.
| |||||||||||||||||||||||||
Brightness Distribution: 89 %
Center on Battery: 493 cd/m²
Contrast: 1764:1 (Black: 0.28 cd/m²)
ΔE ColorChecker Calman: 3.1 | ∀{0.5-29.43 Ø4.71}
calibrated: 1.5
ΔE Greyscale Calman: 3.2 | ∀{0.09-98 Ø4.96}
76% AdobeRGB 1998 (Argyll 3D)
100% sRGB (Argyll 3D)
76.5% Display P3 (Argyll 3D)
Gamma: 2.41
CCT: 6189 K
| Dell XPS 13 Plus 9320 4K LQ134R1, IPS, 3840x2400, 13.4" | Asus Zenbook S 13 OLED SDC4172, OLED, 2880x1800, 13.3" | Lenovo ThinkPad X1 Nano-20UN002UGE MND007ZA1-2, IPS, 2160x1350, 13" | Apple MacBook Air 2020 M1 Entry IPS, 2560x1600, 13.3" | Huawei MateBook 13s i5 11300H TL134GDXP02-0, LTPS, 2520x1680, 13.4" | Dell XPS 13 9310 Core i7 4K Sharp LQ134R1, IPS, 3840x2400, 13.4" | Dell XPS 13 9310 OLED Samsung 134XK01, OLED, 3456x2160, 13.4" | |
|---|---|---|---|---|---|---|---|
| Display | 20% | -4% | 14% | -11% | 3% | 20% | |
| Display P3 Coverage (%) | 76.5 | 99.8 30% | 70.4 -8% | 98.6 29% | 65.2 -15% | 80.2 5% | 99.7 30% |
| sRGB Coverage (%) | 100 | 100 0% | 99.9 0% | 100 0% | 92 -8% | 100 0% | 100 0% |
| AdobeRGB 1998 Coverage (%) | 76 | 97.8 29% | 72 -5% | 85.9 13% | 67.5 -11% | 78.9 4% | 97.7 29% |
| Response Times | 94% | -24% | 1% | -10% | -68% | 92% | |
| Response Time Grey 50% / Grey 80% * (ms) | 38.9 ? | 2.1 ? 95% | 46.8 ? -20% | 31 ? 20% | 44.8 ? -15% | 59.2 ? -52% | 2.2 ? 94% |
| Response Time Black / White * (ms) | 21.9 ? | 1.68 ? 92% | 28 ? -28% | 26.1 ? -19% | 22.8 ? -4% | 40.4 ? -84% | 2.2 ? 90% |
| PWM Frequency (Hz) | 240.4 ? | 118000 ? | 9804 ? | 2137 ? | 240.4 ? | ||
| Screen | 111% | 14% | 10% | 5% | -5% | -43% | |
| Brightness middle (cd/m²) | 494 | 336 -32% | 460 -7% | 417 -16% | 468 -5% | 508.7 3% | 384 -22% |
| Brightness (cd/m²) | 474 | 338 -29% | 434 -8% | 395 -17% | 450 -5% | 479 1% | 387 -18% |
| Brightness Distribution (%) | 89 | 99 11% | 92 3% | 91 2% | 92 3% | 84 -6% | 97 9% |
| Black Level * (cd/m²) | 0.28 | 0.02 93% | 0.27 4% | 0.39 -39% | 0.23 18% | 0.3 -7% | |
| Contrast (:1) | 1764 | 16800 852% | 1704 -3% | 1069 -39% | 2035 15% | 1696 -4% | |
| Colorchecker dE 2000 * | 3.1 | 1.8 42% | 1.1 65% | 1.12 64% | 2 35% | 2.72 12% | 4.56 -47% |
| Colorchecker dE 2000 max. * | 4.2 | 3.8 10% | 4.5 -7% | 2.71 35% | 5.5 -31% | 4.7 -12% | 7.27 -73% |
| Colorchecker dE 2000 calibrated * | 1.5 | 1.8 -20% | 1 33% | 0.77 49% | 1.5 -0% | 1.92 -28% | 4.52 -201% |
| Greyscale dE 2000 * | 3.2 | 0.9 72% | 1.6 50% | 1.7 47% | 2.6 19% | 3.4 -6% | 1.5 53% |
| Gamma | 2.41 91% | 2.22 99% | 2.2 100% | 2207 0% | 2.17 101% | 2.11 104% | 2.26 97% |
| CCT | 6189 105% | 6580 99% | 6475 100% | 6870 95% | 6511 100% | 6245 104% | 6219 105% |
| Color Space (Percent of AdobeRGB 1998) (%) | 65.7 | 70.7 | 87.1 | ||||
| Color Space (Percent of sRGB) (%) | 99.9 | 100 | 100 | ||||
| Total Average (Program / Settings) | 75% /
89% | -5% /
5% | 8% /
9% | -5% /
-0% | -23% /
-12% | 23% /
-5% |
* ... smaller is better
During our analysis with the professional CalMAN software (X-Rite i1 Pro 2) we noticed that the panel only covers the small sRGB color reference, even though Dell advertises a 90 % coverage of the wider P3 gamut. We cannot support that claim and are already in contact with the manufacturer. The previous model was not much better in this respect either, though.

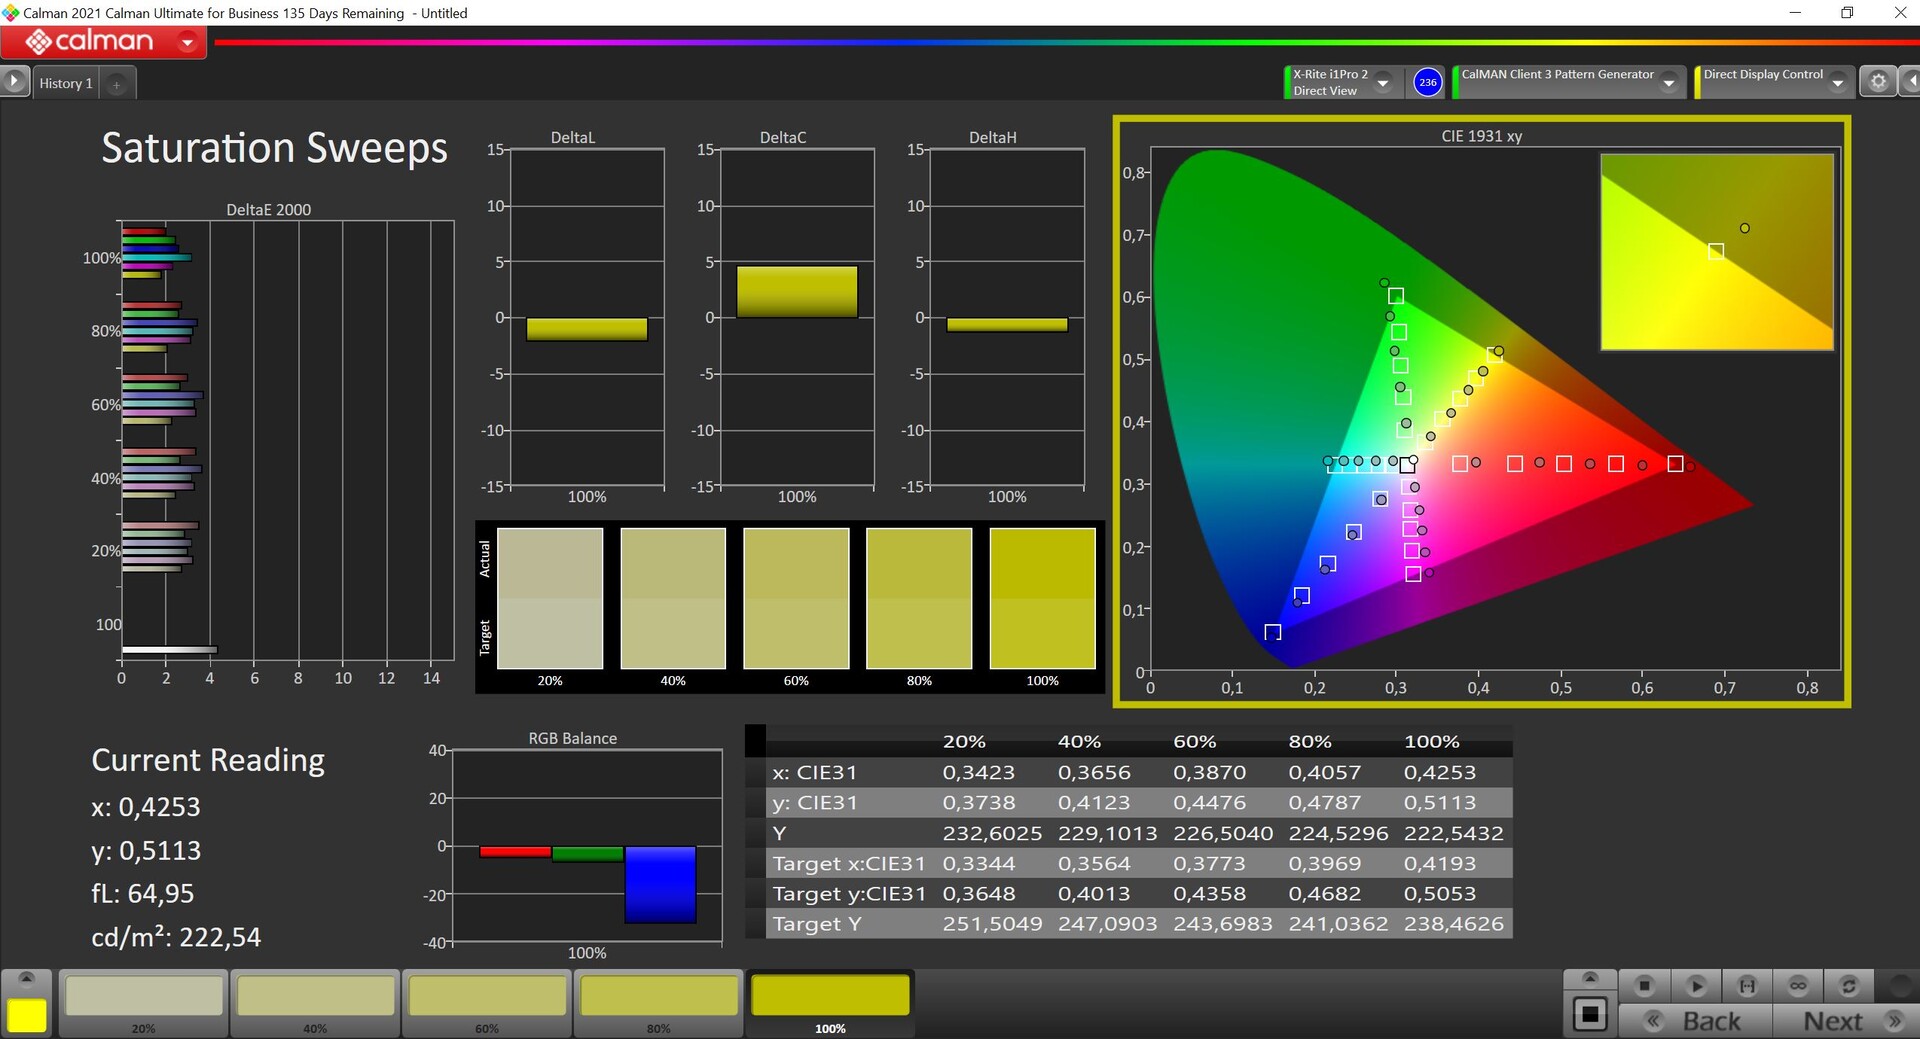
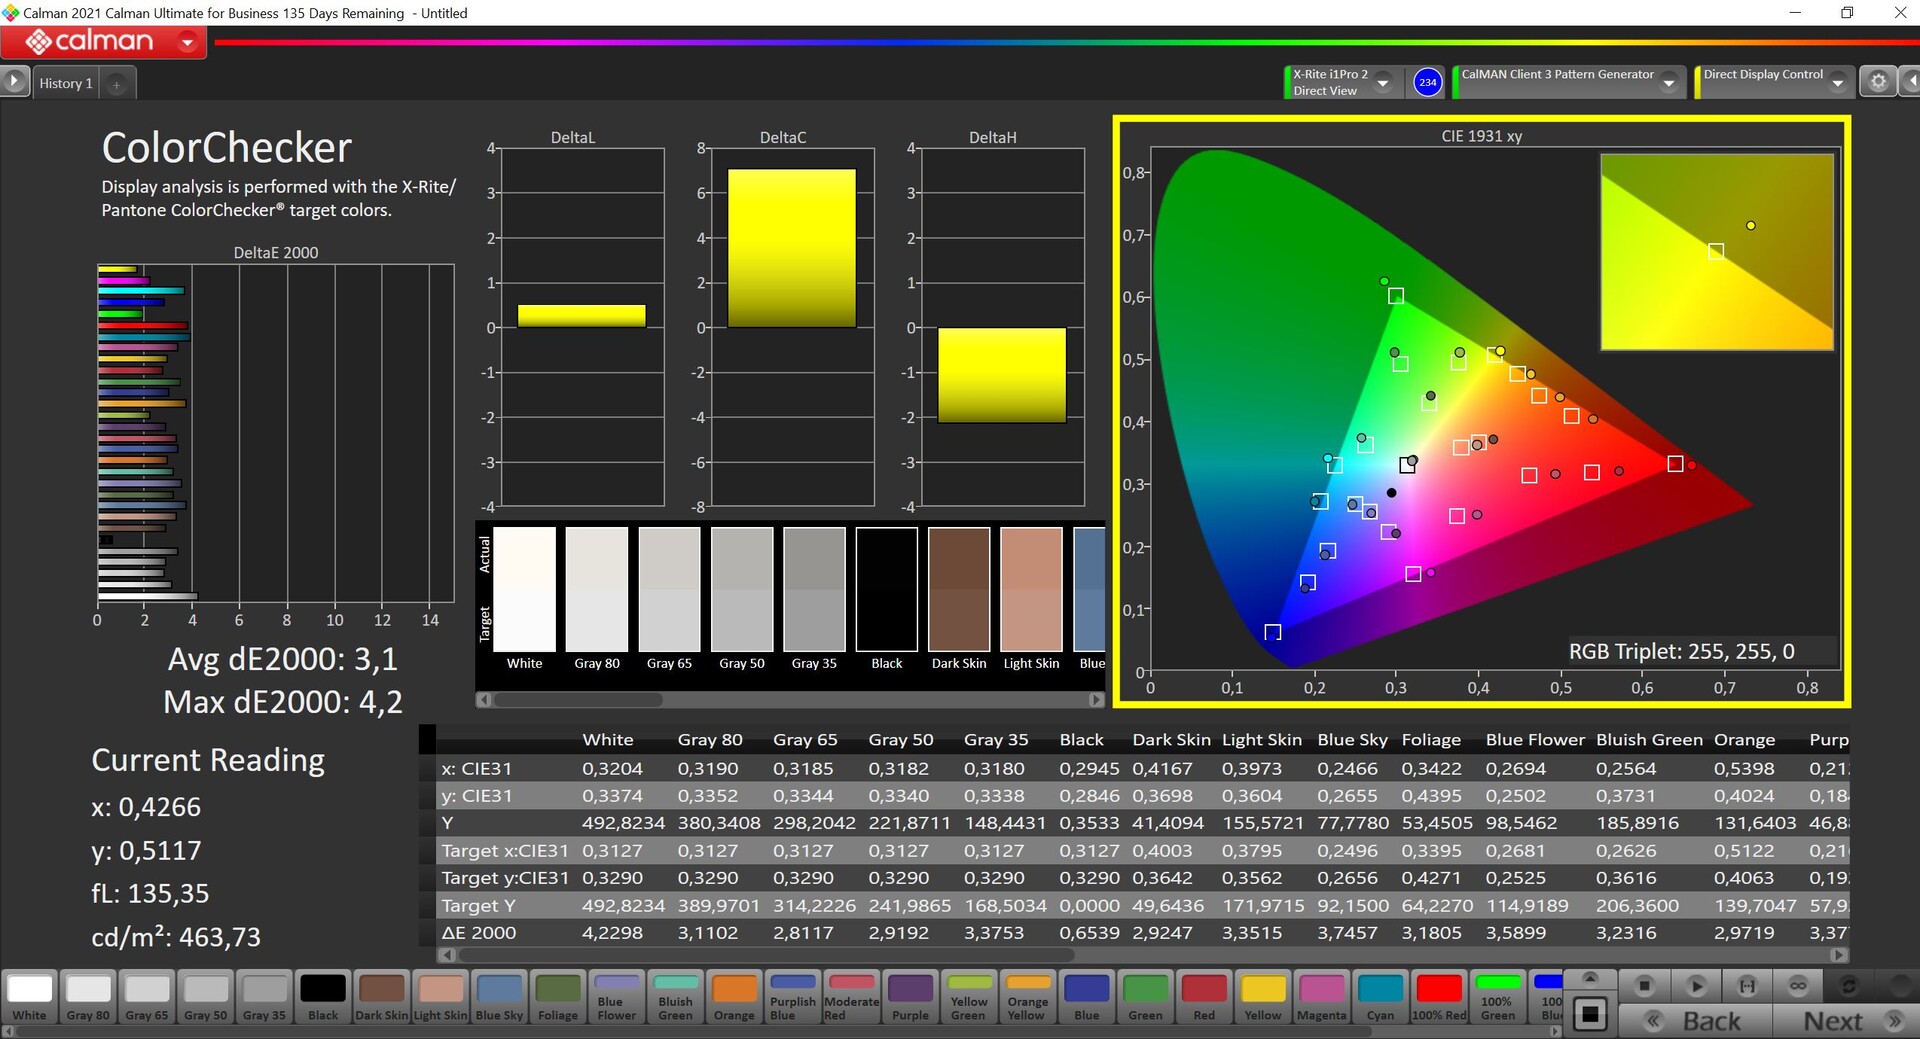
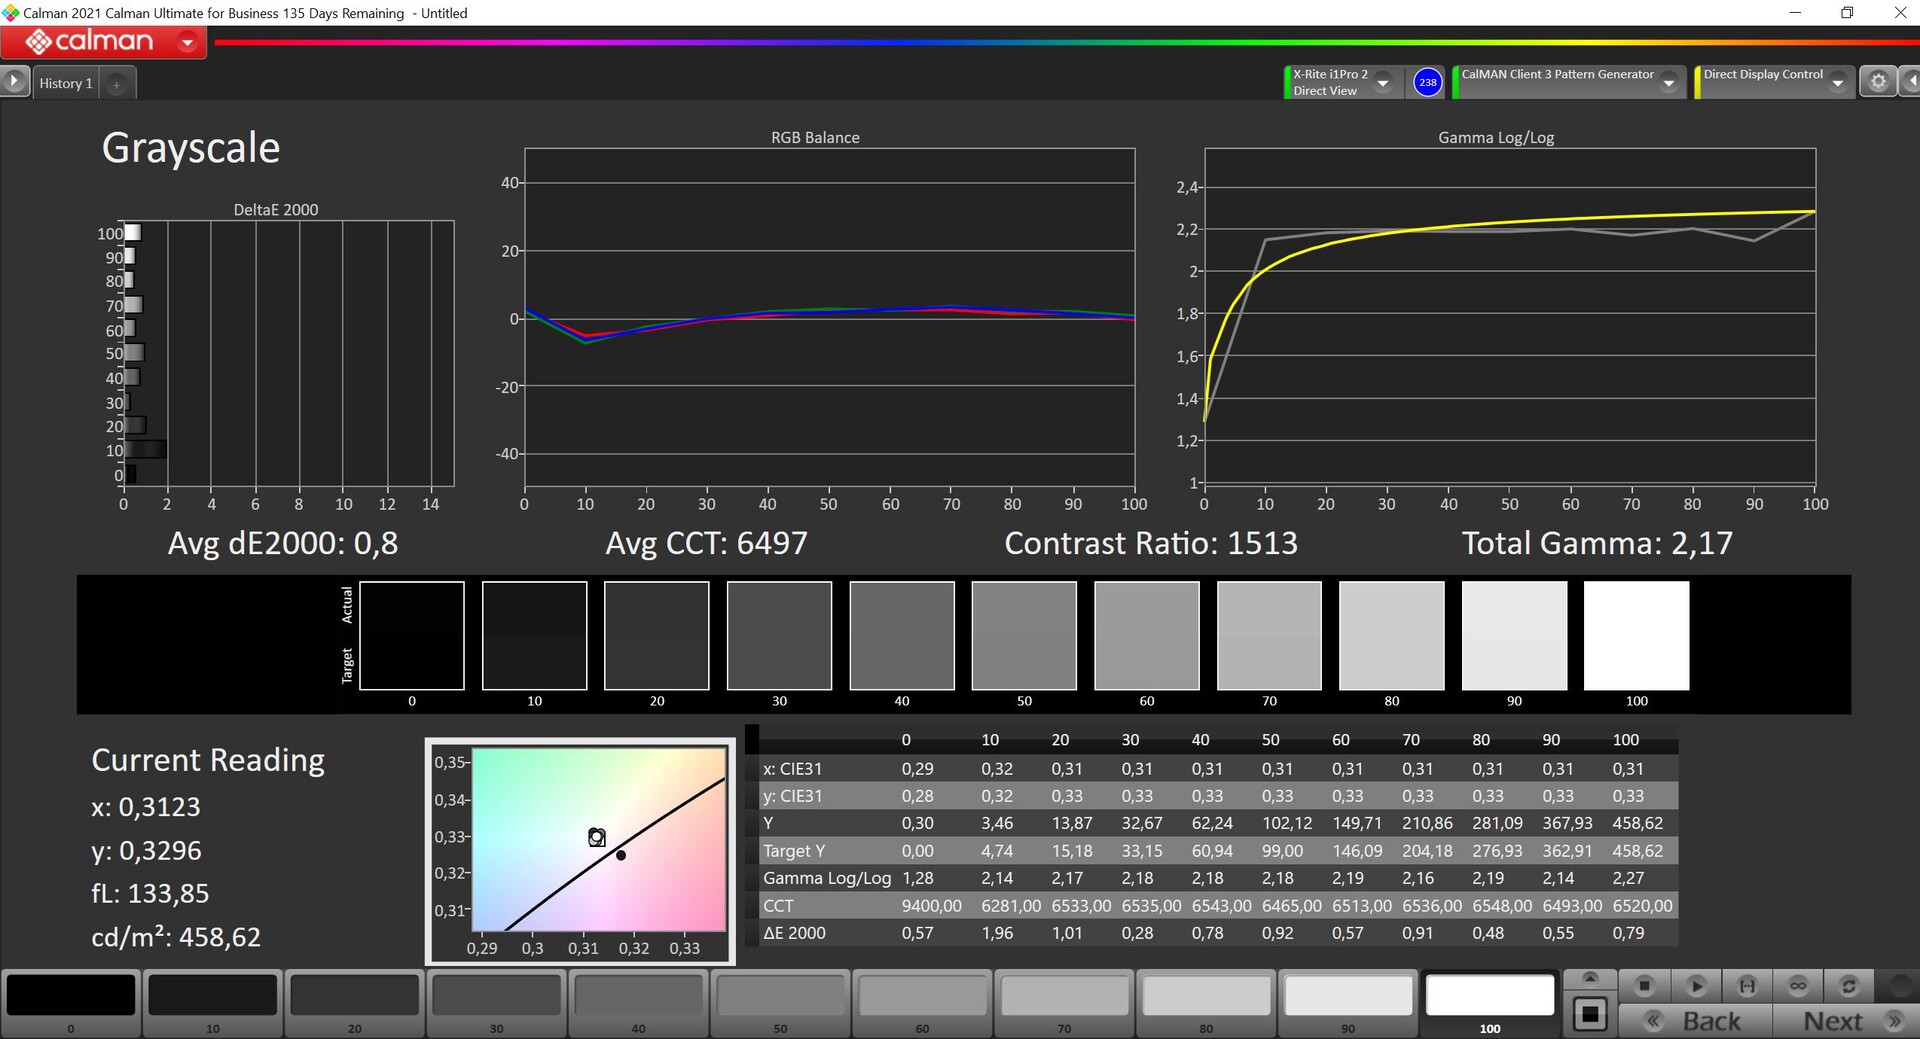
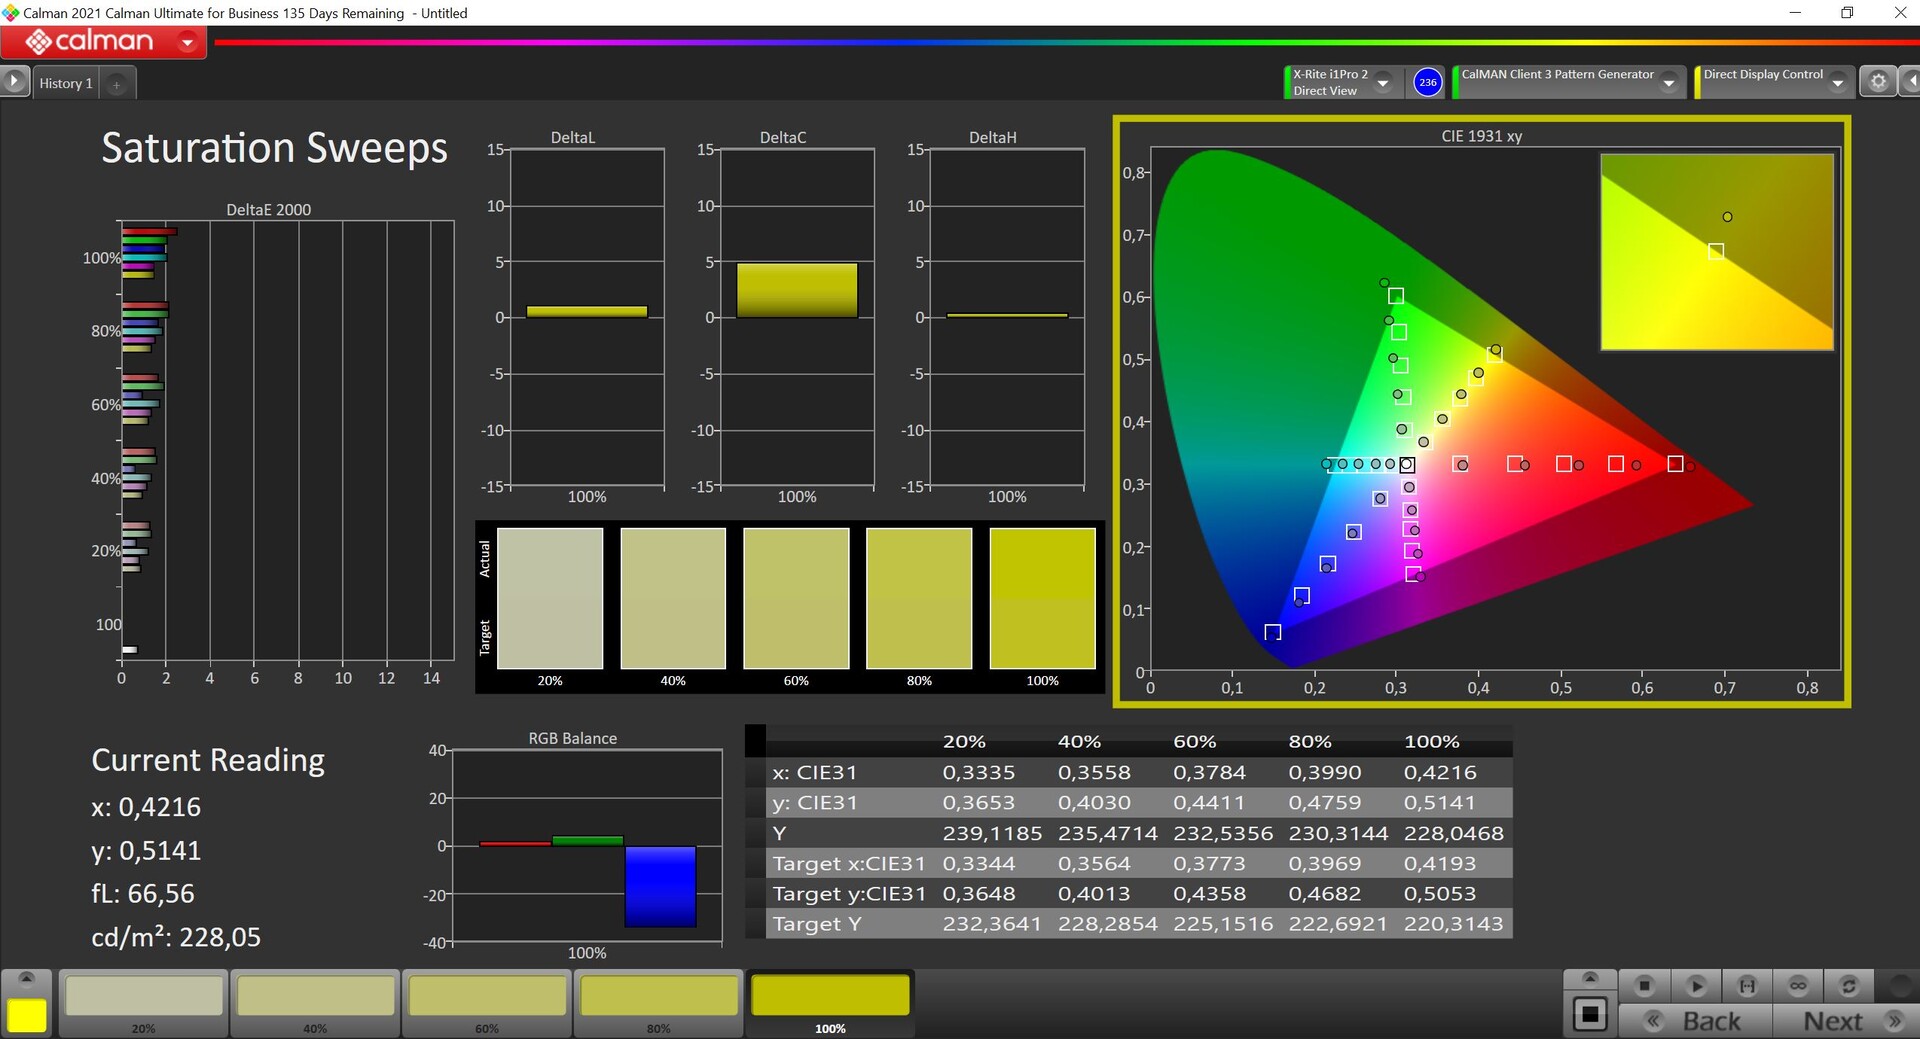
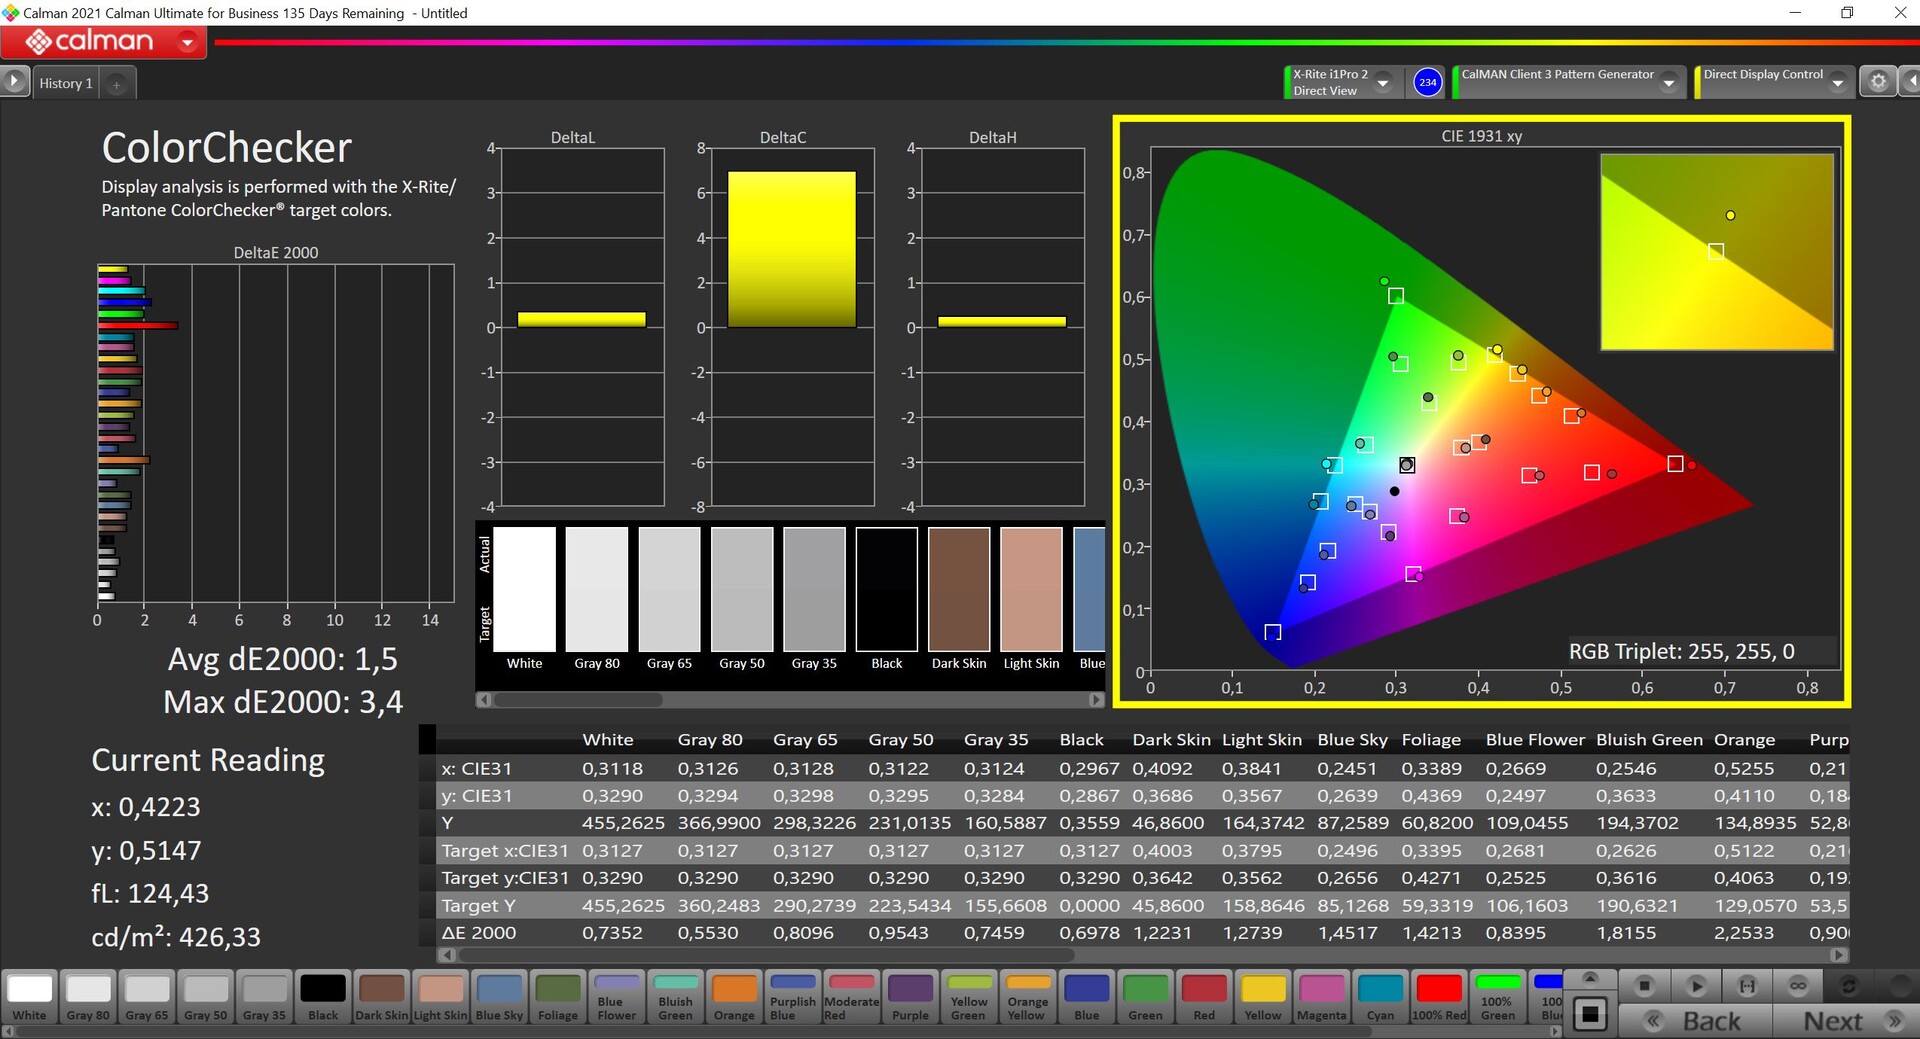
The image is a bit warm out of the box and there is a slight yellow hue, which is noticeable. The color deviations compared to the sRGB reference are in the range between 3-4 without any outliers, which is perfectly fine for daily usage scenarios. Our own calibration (profile can be downloaded for free in the box above) gets rid of the color cast and the color deviations are also better, only 100 % red is still slightly above the important mark of 3. Our calibration improves the picture, but the maximum brightness also drops by around 35 nits. We already mentioned that the panel only covers the small sRGB gamut and P3 as well as AdobeRGB only by 76 %. If you need wider gamut, you are forced to get the XPS 13 with the optional OLED screen.
Display Response Times
| ↔ Response Time Black to White | ||
|---|---|---|
| 21.9 ms ... rise ↗ and fall ↘ combined | ↗ 11.9 ms rise | 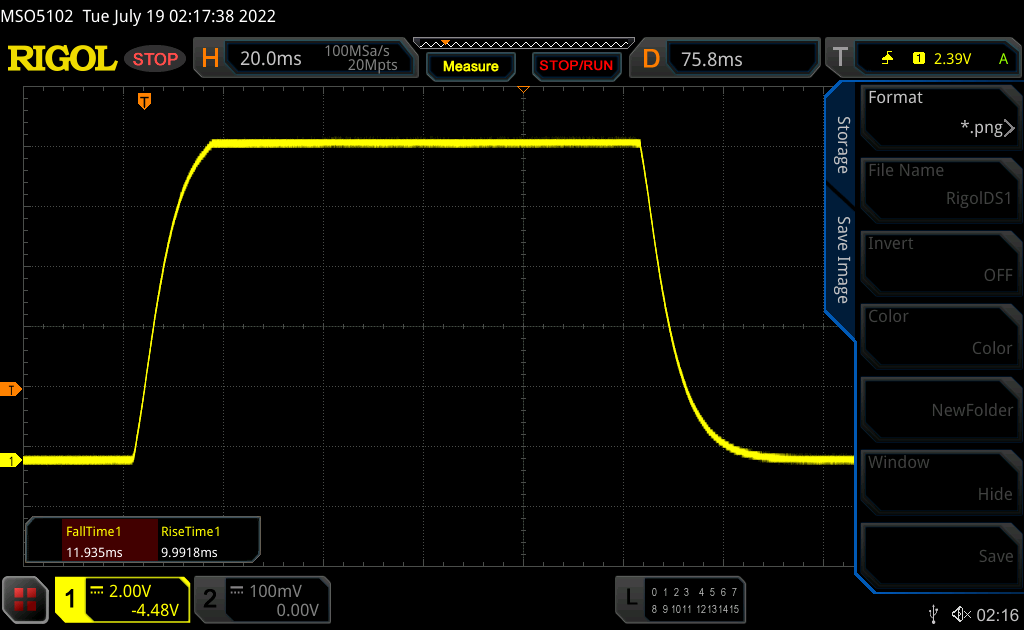 |
| ↘ 10 ms fall | ||
| The screen shows good response rates in our tests, but may be too slow for competitive gamers. In comparison, all tested devices range from 0.1 (minimum) to 240 (maximum) ms. » 49 % of all devices are better. This means that the measured response time is worse than the average of all tested devices (19.8 ms). | ||
| ↔ Response Time 50% Grey to 80% Grey | ||
| 38.9 ms ... rise ↗ and fall ↘ combined | ↗ 21.4 ms rise | 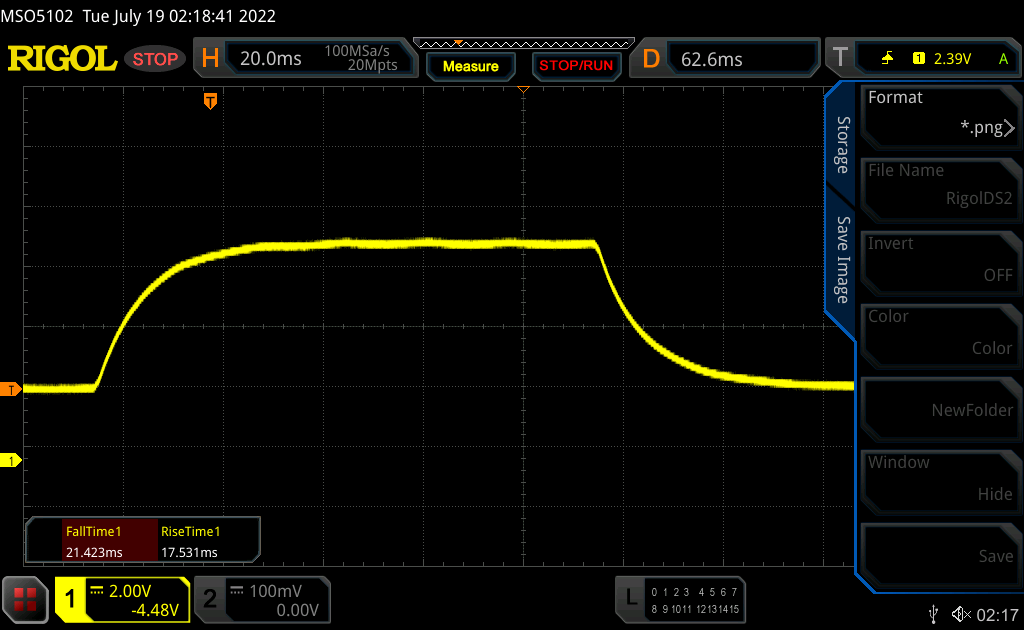 |
| ↘ 17.5 ms fall | ||
| The screen shows slow response rates in our tests and will be unsatisfactory for gamers. In comparison, all tested devices range from 0.165 (minimum) to 636 (maximum) ms. » 59 % of all devices are better. This means that the measured response time is worse than the average of all tested devices (30.9 ms). | ||
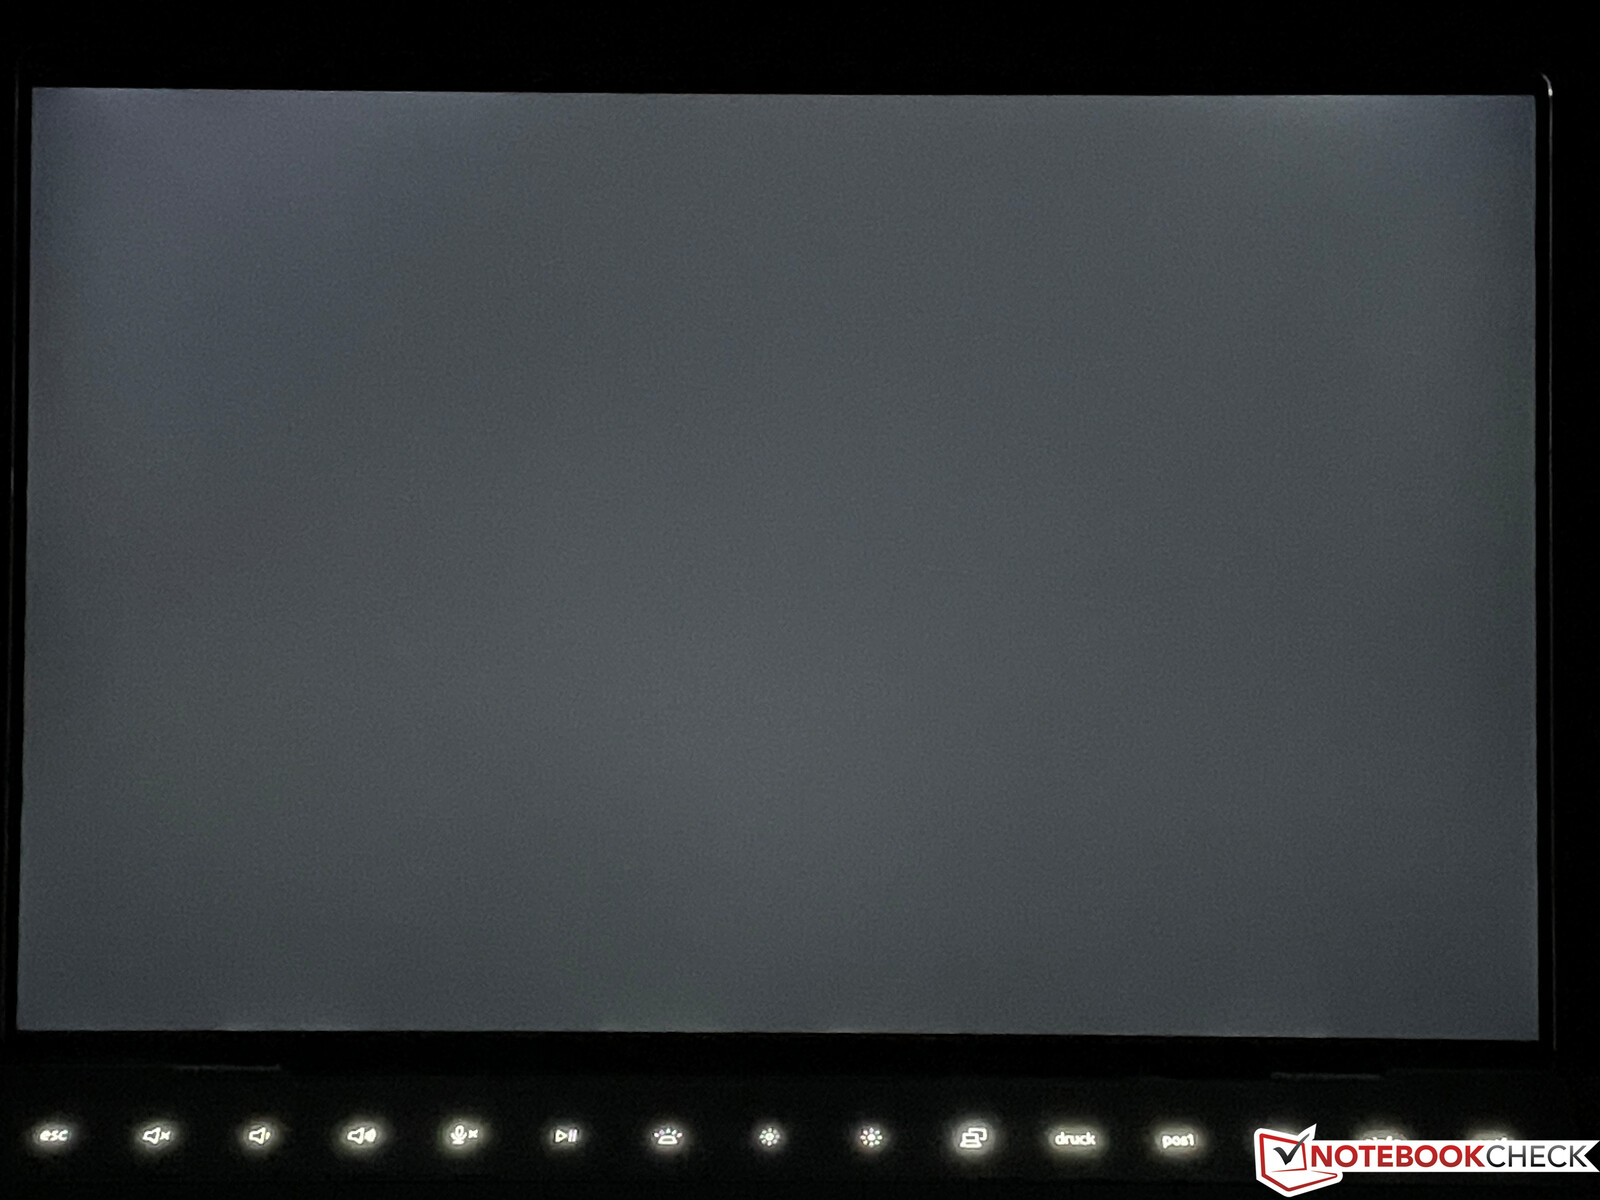
Screen Flickering / PWM (Pulse-Width Modulation)
| Screen flickering / PWM not detected | 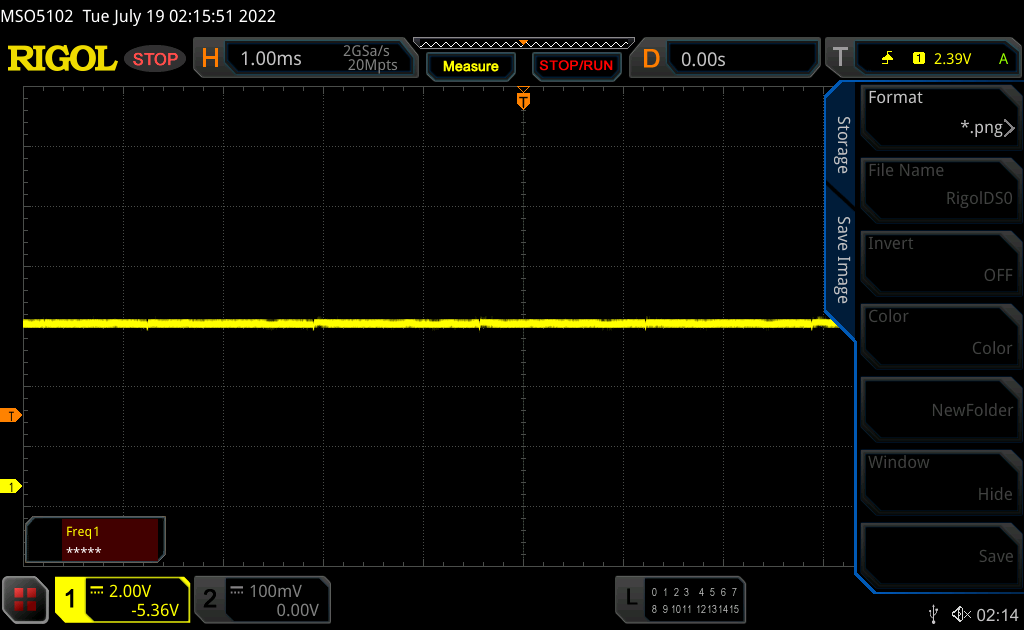 | ||
In comparison: 52 % of all tested devices do not use PWM to dim the display. If PWM was detected, an average of 7741 (minimum: 5 - maximum: 343500) Hz was measured. | |||
It is not easy to prevent reflections in very bright environments, but the brightness is good and you should be able to find a place in the shade where you can see the display content pretty comfortably.
Performance - Alder Lake-P and PCIe 4.0
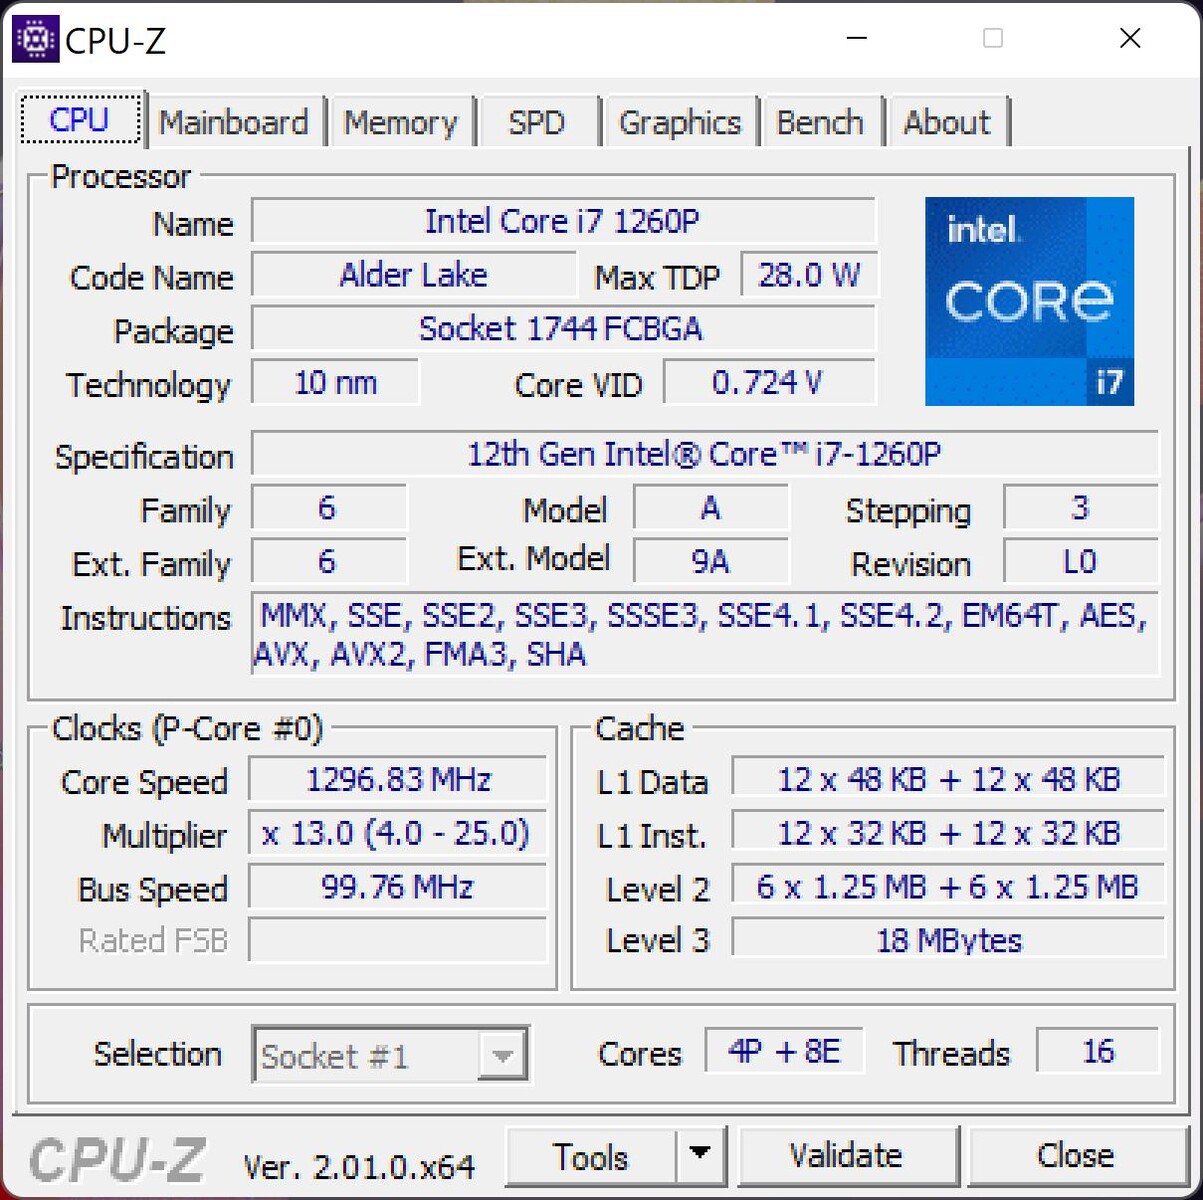
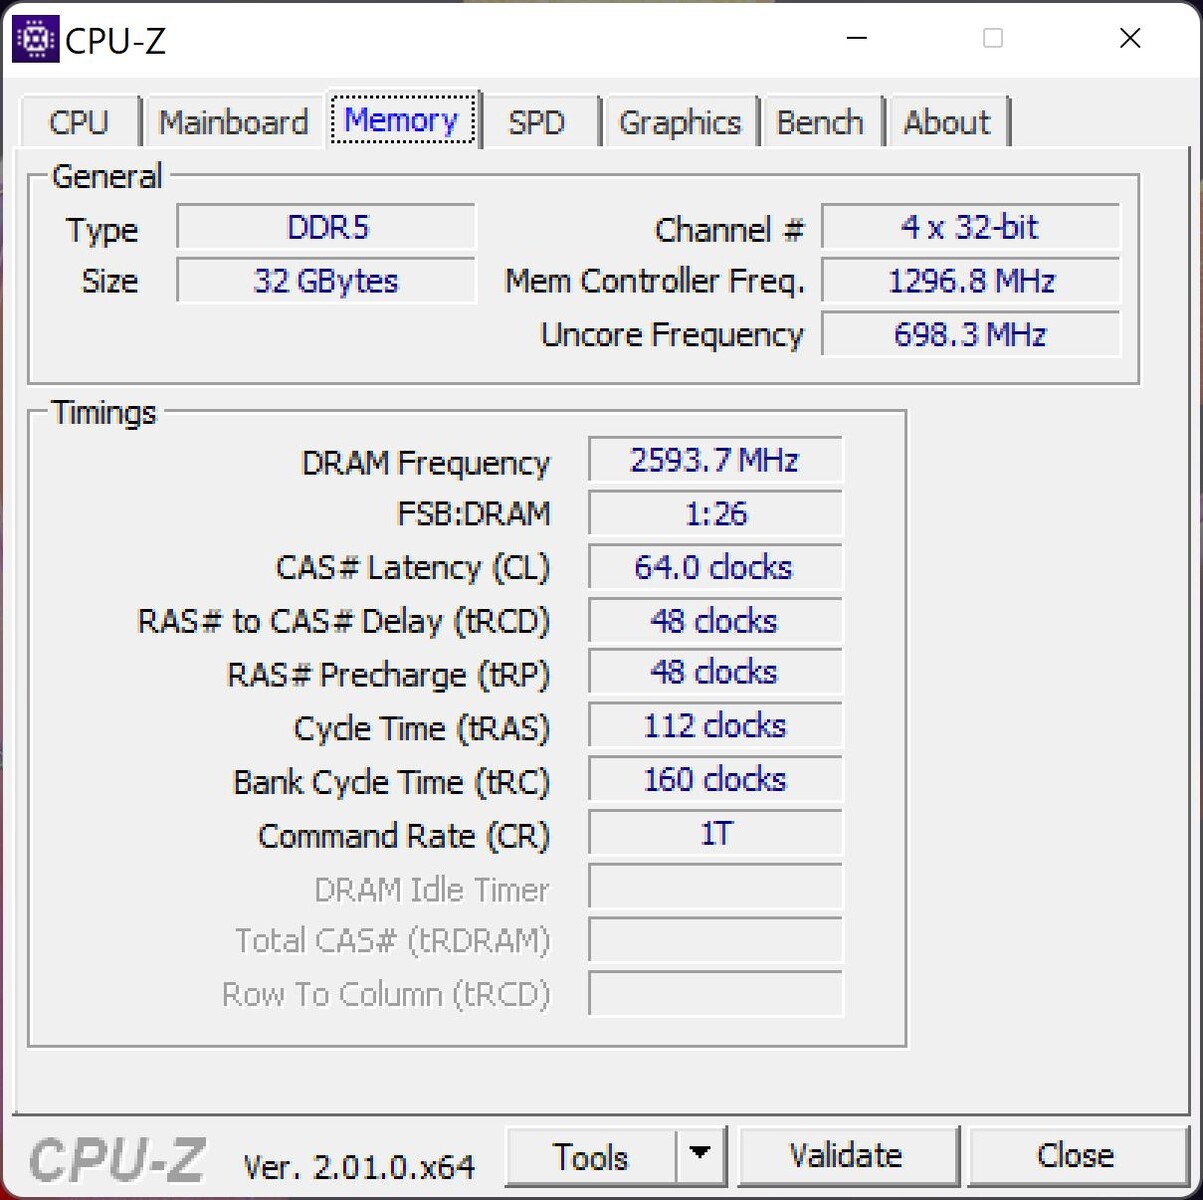
The new XPS 13 Plus is only available with Alder Lake-P CPUs starting with the Core i5-1240P and the Core i7-1260P (each with 4 performance and 8 efficiency cores) all the way up to the Core i7-1280P with two additional performance cores (the configuration is similar to the Core i7-12700H). Users can also choose between 8, 16, or 32 GB RAM (LPDDR5-5200), but the 32 GB option is only available with the i7 CPUs.
Review Settings
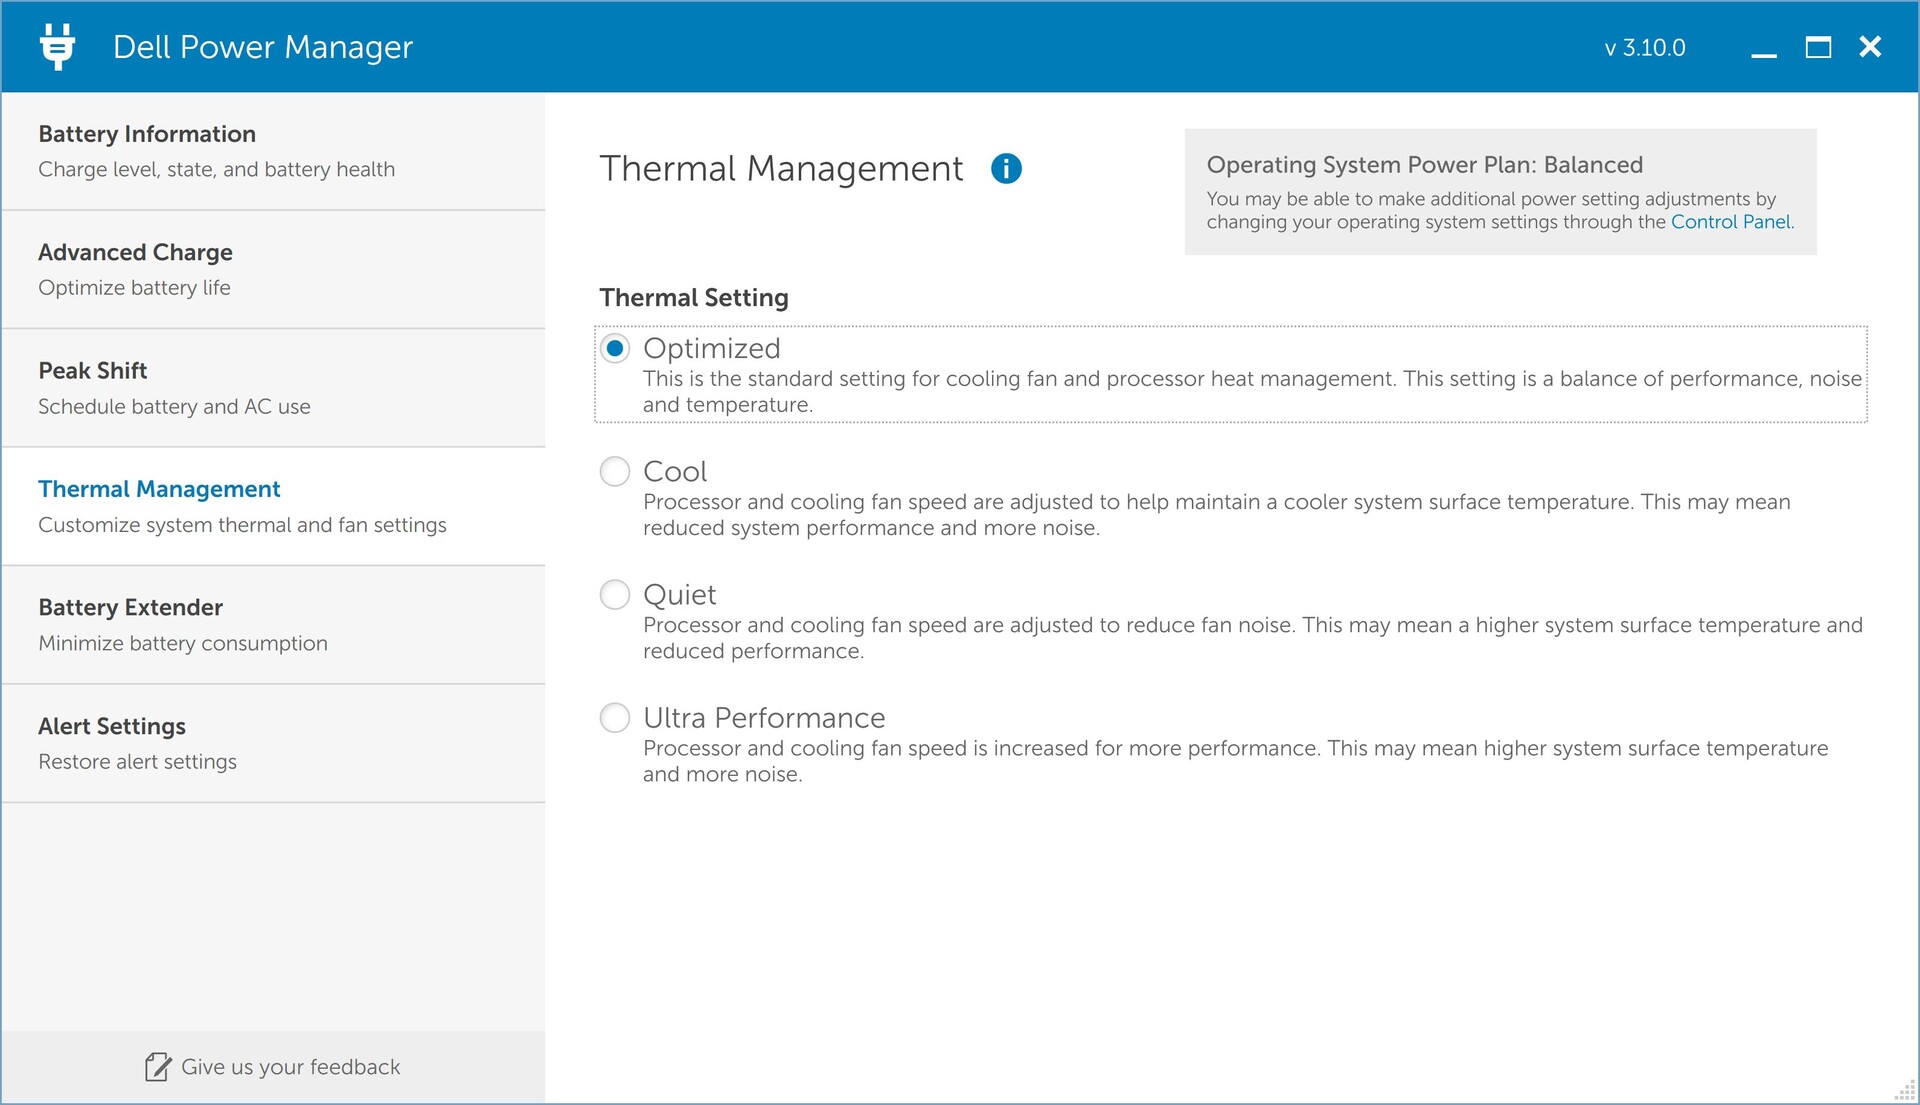
Dell offers four different performance profiles in the preloaded Power Manager software (Optimized, Quiet, Ultra Performance, and Cool), but we do not have a closer look at the profile Cool. The TDP settings of the other profiles are listed in the table below.
| Quiet | Optimized | Ultra Performance | |
|---|---|---|---|
| TDP CPU load | 64 -> 13 Watts | 64 -> 20 Watts | 64 -> 34 Watts |
| TDP Stress test | 64 -> 13 Watts | 64 -> 20 Watts | 64 -> 64 Watts |
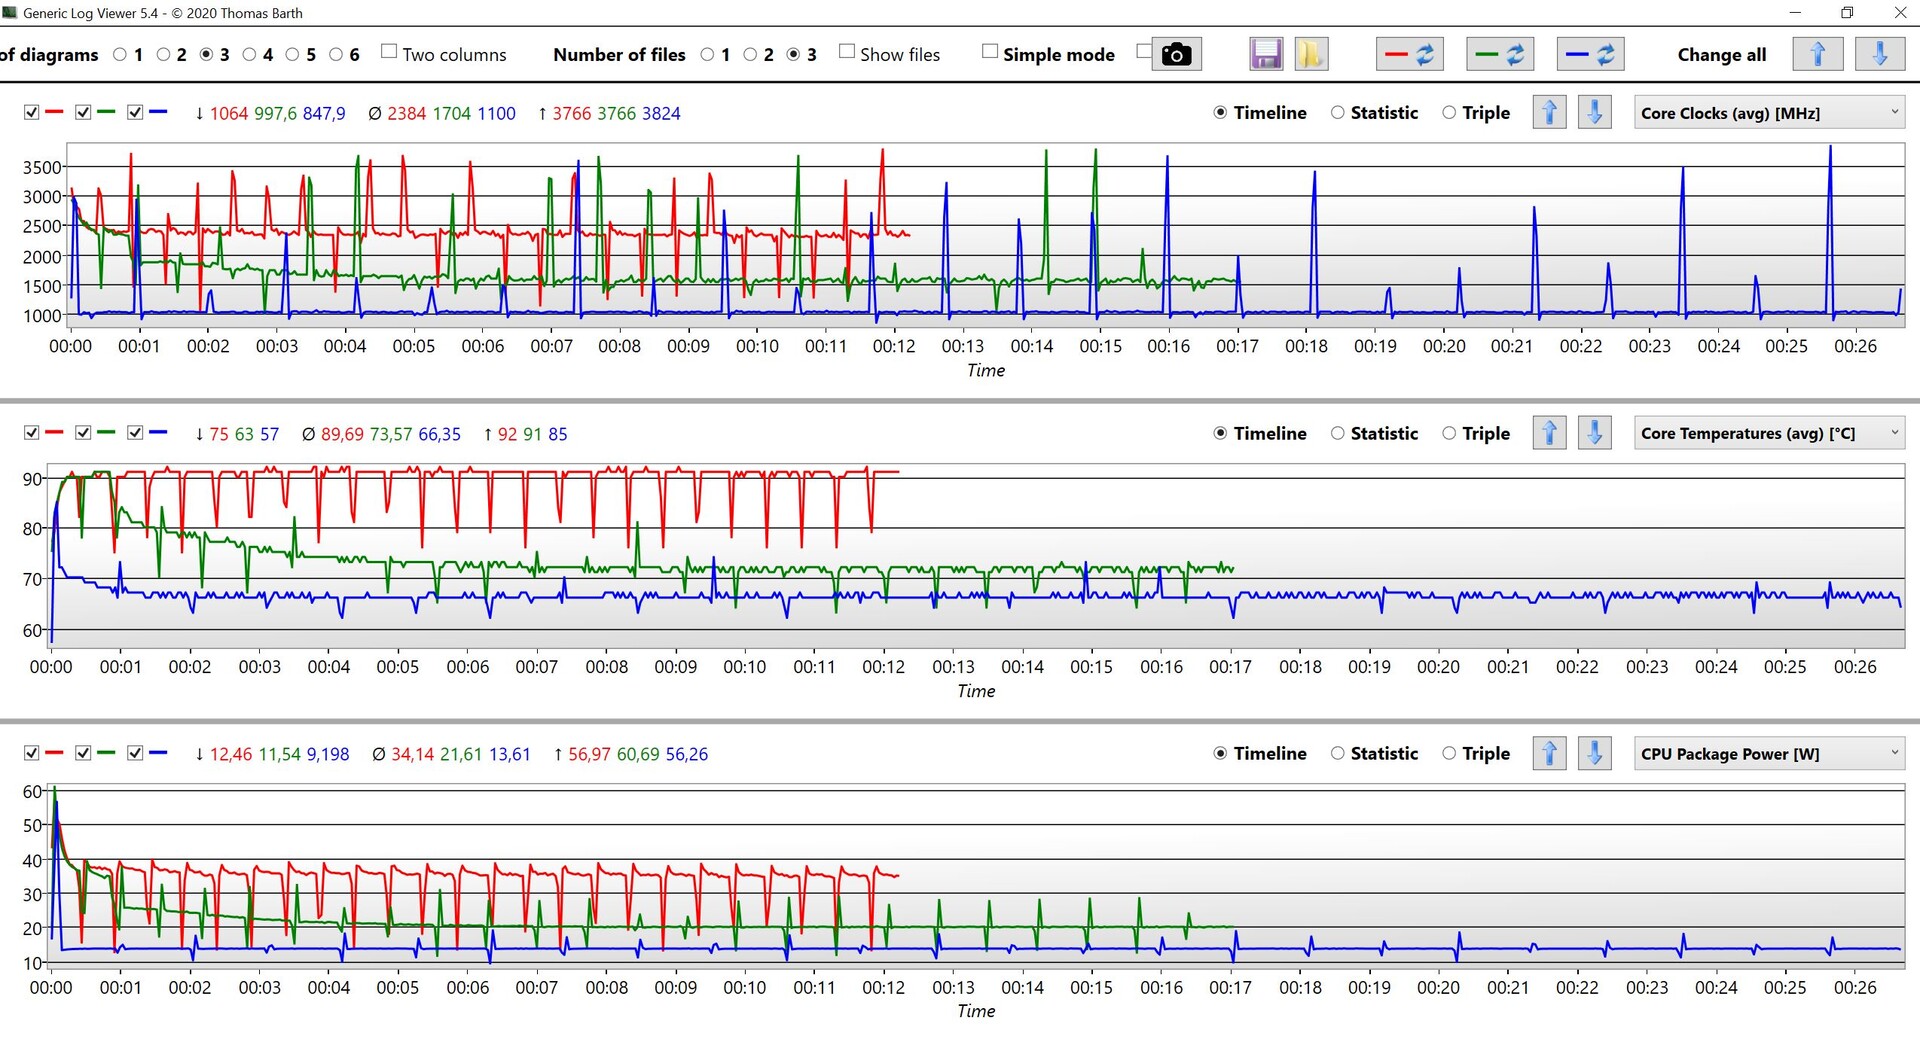
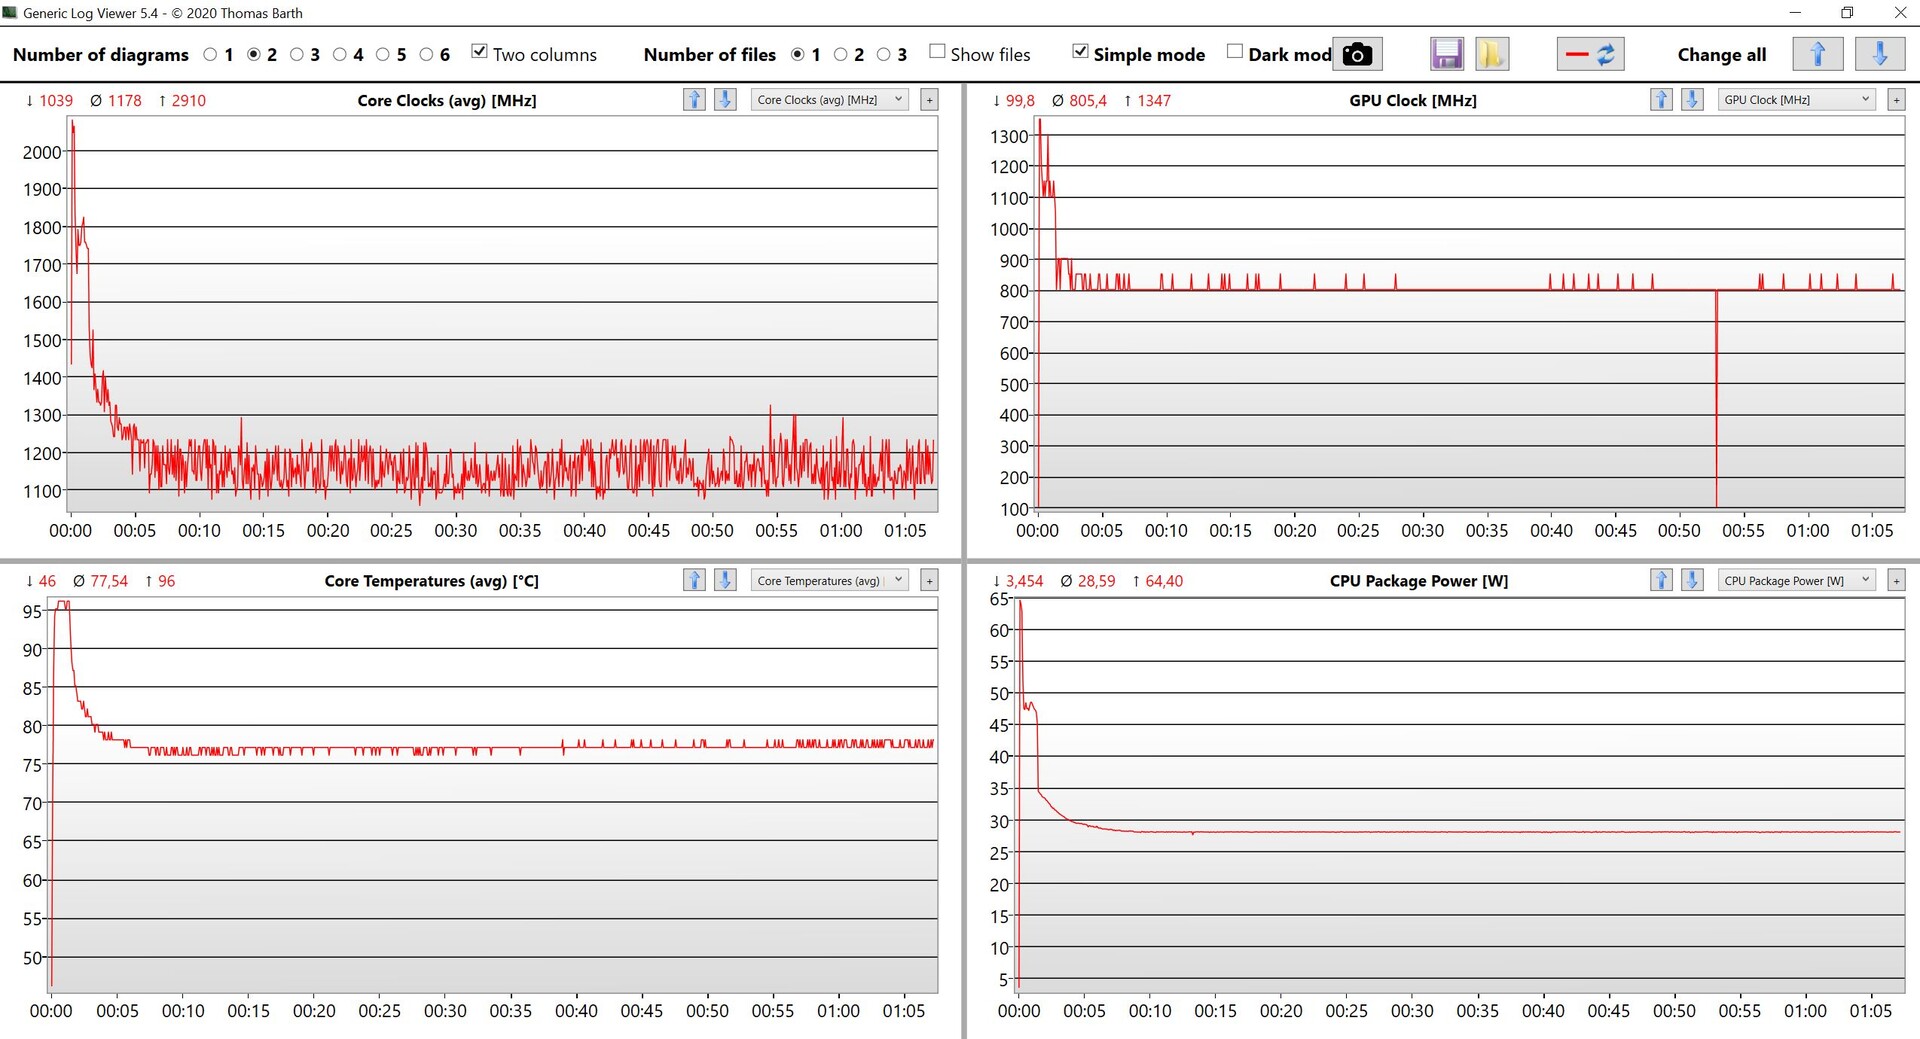
The CPU performance drops pretty quickly with the default Optimized setting, wo we used the Ultra Performance profile for the following benchmarks and measurements. The cooling performance of the new XPS 13 Plus is actually pretty good for a compact device and the fans are usually quiet in daily situations or during short peak load scenarios. The two fans will get a bit louder in this setting under sustained workloads, but the performance is also pretty good in return. The processor can use up to 64W in all three modes, but this value is usually only reached for one second.
Processor - Core i7-1260P
The Core i7-1260P is currently a very popular choice for expensive subnotebooks and the performance potential with its hybrid configuration (4 performance and 8 efficiency cores) is very high. Compared to the old XPS 13 9310 with the Tiger Lake Core i7-1185G7, the performance is about 50 % higher (on average) in the synthetic benchmarks.
Cinebench R15 Multi Loop
Our Cinebench Multi loop confirms the current problem of Intel’s Alder Lake processors. The multi-core performance is pretty much on par with the current AMD Ryzen 7 6800U at first, but the Ryzen only consumes 30W. The i7 in the XPS 13 Plus stabilizes at 34W over the course of the test and the performance is a bit lower compared to the Zenbook S 13 with the 6800U at 25W.
The performance profile Optimized also confirms that Alder Lake-P is not competitive at lower power limits, because the XPS 13 Plus at 20W is just slightly ahead of the older Tiger Lake CPUs with four cores. The Quiet profile reduces the TDP further to 13W, which results in 650-700 points in the CB R15 multi loop.
The single-core performance (which is important for daily scenarios) is undoubtedly very good, but at the cost of high consumption figures.
The multi-core performance is a bit lower on battery power (-6 %) due to slightly lower power limits (54/27W). More CPU benchmarks are available here.
Cinebench R23: Multi Core | Single Core
Cinebench R20: CPU (Multi Core) | CPU (Single Core)
Cinebench R15: CPU Multi 64Bit | CPU Single 64Bit
Blender: v2.79 BMW27 CPU
7-Zip 18.03: 7z b 4 | 7z b 4 -mmt1
Geekbench 5.5: Multi-Core | Single-Core
HWBOT x265 Benchmark v2.2: 4k Preset
LibreOffice : 20 Documents To PDF
R Benchmark 2.5: Overall mean
| CPU Performance rating | |
| Average of class Subnotebook | |
| Dell XPS 13 Plus 9320 4K | |
| Asus Zenbook S 13 OLED | |
| Average Intel Core i7-1260P | |
| Apple MacBook Pro 13 2022 M2 -5! | |
| Apple MacBook Air 2020 M1 Entry -1! | |
| Dell XPS 13 9310 Core i7 4K | |
| Huawei MateBook 13s i5 11300H | |
| Lenovo ThinkPad X1 Nano-20UN002UGE -1! | |
| Cinebench R23 / Multi Core | |
| Average of class Subnotebook (1555 - 21812, n=59, last 2 years) | |
| Asus Zenbook S 13 OLED | |
| Dell XPS 13 Plus 9320 4K | |
| Average Intel Core i7-1260P (3173 - 12150, n=27) | |
| Apple MacBook Pro 13 2022 M2 | |
| Apple MacBook Air 2020 M1 Entry | |
| Lenovo ThinkPad X1 Nano-20UN002UGE | |
| Huawei MateBook 13s i5 11300H | |
| Dell XPS 13 9310 Core i7 4K | |
| Cinebench R23 / Single Core | |
| Average of class Subnotebook (358 - 2213, n=60, last 2 years) | |
| Dell XPS 13 Plus 9320 4K | |
| Average Intel Core i7-1260P (1155 - 1812, n=25) | |
| Apple MacBook Pro 13 2022 M2 | |
| Apple MacBook Air 2020 M1 Entry | |
| Asus Zenbook S 13 OLED | |
| Dell XPS 13 9310 Core i7 4K | |
| Huawei MateBook 13s i5 11300H | |
| Cinebench R20 / CPU (Multi Core) | |
| Average of class Subnotebook (579 - 8541, n=56, last 2 years) | |
| Asus Zenbook S 13 OLED | |
| Dell XPS 13 Plus 9320 4K | |
| Average Intel Core i7-1260P (1234 - 4748, n=25) | |
| Apple MacBook Pro 13 2022 M2 | |
| Huawei MateBook 13s i5 11300H | |
| Dell XPS 13 9310 Core i7 4K | |
| Apple MacBook Air 2020 M1 Entry | |
| Lenovo ThinkPad X1 Nano-20UN002UGE | |
| Cinebench R20 / CPU (Single Core) | |
| Average of class Subnotebook (128 - 832, n=56, last 2 years) | |
| Dell XPS 13 Plus 9320 4K | |
| Average Intel Core i7-1260P (448 - 698, n=25) | |
| Dell XPS 13 9310 Core i7 4K | |
| Asus Zenbook S 13 OLED | |
| Lenovo ThinkPad X1 Nano-20UN002UGE | |
| Huawei MateBook 13s i5 11300H | |
| Apple MacBook Air 2020 M1 Entry | |
| Apple MacBook Pro 13 2022 M2 | |
| Cinebench R15 / CPU Multi 64Bit | |
| Average of class Subnotebook (327 - 3345, n=56, last 2 years) | |
| Asus Zenbook S 13 OLED | |
| Dell XPS 13 Plus 9320 4K | |
| Dell XPS 13 Plus 9320 4K | |
| Average Intel Core i7-1260P (549 - 2034, n=29) | |
| Apple MacBook Pro 13 2022 M2 | |
| Apple MacBook Air 2020 M1 Entry | |
| Huawei MateBook 13s i5 11300H | |
| Huawei MateBook 13s i5 11300H | |
| Dell XPS 13 9310 Core i7 4K | |
| Lenovo ThinkPad X1 Nano-20UN002UGE | |
| Cinebench R15 / CPU Single 64Bit | |
| Average of class Subnotebook (72.4 - 322, n=56, last 2 years) | |
| Dell XPS 13 Plus 9320 4K | |
| Asus Zenbook S 13 OLED | |
| Average Intel Core i7-1260P (165.4 - 260, n=27) | |
| Apple MacBook Pro 13 2022 M2 | |
| Dell XPS 13 9310 Core i7 4K | |
| Apple MacBook Air 2020 M1 Entry | |
| Lenovo ThinkPad X1 Nano-20UN002UGE | |
| Huawei MateBook 13s i5 11300H | |
| Blender / v2.79 BMW27 CPU | |
| Apple MacBook Air 2020 M1 Entry | |
| Dell XPS 13 9310 Core i7 4K | |
| Lenovo ThinkPad X1 Nano-20UN002UGE | |
| Apple MacBook Pro 13 2022 M2 | |
| Huawei MateBook 13s i5 11300H | |
| Average of class Subnotebook (159 - 2271, n=57, last 2 years) | |
| Average Intel Core i7-1260P (264 - 906, n=26) | |
| Dell XPS 13 Plus 9320 4K | |
| Asus Zenbook S 13 OLED | |
| 7-Zip 18.03 / 7z b 4 | |
| Asus Zenbook S 13 OLED | |
| Average of class Subnotebook (11668 - 77867, n=56, last 2 years) | |
| Dell XPS 13 Plus 9320 4K | |
| Average Intel Core i7-1260P (16146 - 47064, n=25) | |
| Apple MacBook Air 2020 M1 Entry | |
| Huawei MateBook 13s i5 11300H | |
| Lenovo ThinkPad X1 Nano-20UN002UGE | |
| Dell XPS 13 9310 Core i7 4K | |
| 7-Zip 18.03 / 7z b 4 -mmt1 | |
| Average of class Subnotebook (2643 - 6699, n=58, last 2 years) | |
| Apple MacBook Air 2020 M1 Entry | |
| Asus Zenbook S 13 OLED | |
| Dell XPS 13 Plus 9320 4K | |
| Average Intel Core i7-1260P (4064 - 5791, n=25) | |
| Dell XPS 13 9310 Core i7 4K | |
| Huawei MateBook 13s i5 11300H | |
| Lenovo ThinkPad X1 Nano-20UN002UGE | |
| Geekbench 5.5 / Multi-Core | |
| Average of class Subnotebook (2557 - 17218, n=49, last 2 years) | |
| Dell XPS 13 Plus 9320 4K | |
| Apple MacBook Pro 13 2022 M2 | |
| Average Intel Core i7-1260P (3866 - 10570, n=25) | |
| Asus Zenbook S 13 OLED | |
| Apple MacBook Air 2020 M1 Entry | |
| Dell XPS 13 9310 Core i7 4K | |
| Huawei MateBook 13s i5 11300H | |
| Lenovo ThinkPad X1 Nano-20UN002UGE | |
| Geekbench 5.5 / Single-Core | |
| Apple MacBook Pro 13 2022 M2 | |
| Average of class Subnotebook (726 - 2224, n=49, last 2 years) | |
| Apple MacBook Air 2020 M1 Entry | |
| Dell XPS 13 Plus 9320 4K | |
| Average Intel Core i7-1260P (1436 - 1786, n=25) | |
| Dell XPS 13 9310 Core i7 4K | |
| Asus Zenbook S 13 OLED | |
| Huawei MateBook 13s i5 11300H | |
| Lenovo ThinkPad X1 Nano-20UN002UGE | |
| HWBOT x265 Benchmark v2.2 / 4k Preset | |
| Average of class Subnotebook (0.97 - 25.1, n=56, last 2 years) | |
| Asus Zenbook S 13 OLED | |
| Dell XPS 13 Plus 9320 4K | |
| Average Intel Core i7-1260P (3.45 - 13.6, n=26) | |
| Huawei MateBook 13s i5 11300H | |
| Lenovo ThinkPad X1 Nano-20UN002UGE | |
| Dell XPS 13 9310 Core i7 4K | |
| LibreOffice / 20 Documents To PDF | |
| Average of class Subnotebook (39.9 - 220, n=55, last 2 years) | |
| Asus Zenbook S 13 OLED | |
| Lenovo ThinkPad X1 Nano-20UN002UGE | |
| Huawei MateBook 13s i5 11300H | |
| Average Intel Core i7-1260P (40.2 - 65.7, n=25) | |
| Dell XPS 13 9310 Core i7 4K | |
| Dell XPS 13 Plus 9320 4K | |
| Apple MacBook Air 2020 M1 Entry | |
| R Benchmark 2.5 / Overall mean | |
| Apple MacBook Air 2020 M1 Entry | |
| Lenovo ThinkPad X1 Nano-20UN002UGE | |
| Huawei MateBook 13s i5 11300H | |
| Dell XPS 13 9310 Core i7 4K | |
| Asus Zenbook S 13 OLED | |
| Average of class Subnotebook (0.4024 - 1.456, n=57, last 2 years) | |
| Average Intel Core i7-1260P (0.4559 - 0.727, n=25) | |
| Dell XPS 13 Plus 9320 4K | |
* ... smaller is better
| Power Consumption - Cinebench R15 Multi Efficiency (external Monitor) | |
| Apple MacBook Pro 13 2022 M2 | |
| Asus Zenbook S 13 OLED | |
| Apple MacBook Air 2020 M1 Entry | |
| Dell XPS 13 Plus 9320 4K | |
| Huawei MateBook 13s i5 11300H | |
AIDA64: FP32 Ray-Trace | FPU Julia | CPU SHA3 | CPU Queen | FPU SinJulia | FPU Mandel | CPU AES | CPU ZLib | FP64 Ray-Trace | CPU PhotoWorxx
| Performance rating | |
| Asus Zenbook S 13 OLED | |
| Average of class Subnotebook | |
| Huawei MateBook 13s i5 11300H | |
| Average Intel Core i7-1260P | |
| Dell XPS 13 Plus 9320 4K | |
| Lenovo ThinkPad X1 Nano-20UN002UGE | |
| AIDA64 / FP32 Ray-Trace | |
| Average of class Subnotebook (1135 - 32888, n=57, last 2 years) | |
| Asus Zenbook S 13 OLED | |
| Huawei MateBook 13s i5 11300H | |
| Lenovo ThinkPad X1 Nano-20UN002UGE | |
| Average Intel Core i7-1260P (2176 - 10898, n=26) | |
| Dell XPS 13 Plus 9320 4K | |
| AIDA64 / FPU Julia | |
| Asus Zenbook S 13 OLED | |
| Average of class Subnotebook (5218 - 123315, n=57, last 2 years) | |
| Huawei MateBook 13s i5 11300H | |
| Average Intel Core i7-1260P (11015 - 56906, n=26) | |
| Lenovo ThinkPad X1 Nano-20UN002UGE | |
| Dell XPS 13 Plus 9320 4K | |
| AIDA64 / CPU SHA3 | |
| Average of class Subnotebook (444 - 5287, n=57, last 2 years) | |
| Asus Zenbook S 13 OLED | |
| Huawei MateBook 13s i5 11300H | |
| Lenovo ThinkPad X1 Nano-20UN002UGE | |
| Average Intel Core i7-1260P (669 - 2709, n=26) | |
| Dell XPS 13 Plus 9320 4K | |
| AIDA64 / CPU Queen | |
| Asus Zenbook S 13 OLED | |
| Dell XPS 13 Plus 9320 4K | |
| Average Intel Core i7-1260P (42571 - 82493, n=26) | |
| Average of class Subnotebook (10579 - 95002, n=47, last 2 years) | |
| Huawei MateBook 13s i5 11300H | |
| Lenovo ThinkPad X1 Nano-20UN002UGE | |
| AIDA64 / FPU SinJulia | |
| Asus Zenbook S 13 OLED | |
| Average of class Subnotebook (744 - 18418, n=57, last 2 years) | |
| Dell XPS 13 Plus 9320 4K | |
| Average Intel Core i7-1260P (2901 - 6975, n=26) | |
| Huawei MateBook 13s i5 11300H | |
| Lenovo ThinkPad X1 Nano-20UN002UGE | |
| AIDA64 / FPU Mandel | |
| Asus Zenbook S 13 OLED | |
| Average of class Subnotebook (3341 - 65433, n=57, last 2 years) | |
| Huawei MateBook 13s i5 11300H | |
| Lenovo ThinkPad X1 Nano-20UN002UGE | |
| Average Intel Core i7-1260P (5950 - 26376, n=26) | |
| Dell XPS 13 Plus 9320 4K | |
| AIDA64 / CPU AES | |
| Asus Zenbook S 13 OLED | |
| Huawei MateBook 13s i5 11300H | |
| Lenovo ThinkPad X1 Nano-20UN002UGE | |
| Average of class Subnotebook (638 - 96917, n=57, last 2 years) | |
| Average Intel Core i7-1260P (16041 - 92356, n=26) | |
| Dell XPS 13 Plus 9320 4K | |
| AIDA64 / CPU ZLib | |
| Average of class Subnotebook (164.9 - 1379, n=57, last 2 years) | |
| Dell XPS 13 Plus 9320 4K | |
| Asus Zenbook S 13 OLED | |
| Average Intel Core i7-1260P (259 - 771, n=26) | |
| Huawei MateBook 13s i5 11300H | |
| Lenovo ThinkPad X1 Nano-20UN002UGE | |
| AIDA64 / FP64 Ray-Trace | |
| Average of class Subnotebook (610 - 17495, n=57, last 2 years) | |
| Asus Zenbook S 13 OLED | |
| Huawei MateBook 13s i5 11300H | |
| Lenovo ThinkPad X1 Nano-20UN002UGE | |
| Average Intel Core i7-1260P (1237 - 5858, n=26) | |
| Dell XPS 13 Plus 9320 4K | |
| AIDA64 / CPU PhotoWorxx | |
| Average of class Subnotebook (6569 - 85600, n=57, last 2 years) | |
| Dell XPS 13 Plus 9320 4K | |
| Lenovo ThinkPad X1 Nano-20UN002UGE | |
| Huawei MateBook 13s i5 11300H | |
| Average Intel Core i7-1260P (13261 - 43652, n=26) | |
| Asus Zenbook S 13 OLED | |
System Performance
The new XPS 13 Plus is a very responsive device, which is also supported by the good benchmark scores. We did not experience any stutters or crashes during our review period.
CrossMark: Overall | Productivity | Creativity | Responsiveness
| PCMark 10 / Score | |
| Average of class Subnotebook (4920 - 9939, n=46, last 2 years) | |
| Asus Zenbook S 13 OLED | |
| Dell XPS 13 Plus 9320 4K | |
| Average Intel Core i7-1260P, Intel Iris Xe Graphics G7 96EUs (4796 - 6068, n=17) | |
| Huawei MateBook 13s i5 11300H | |
| Dell XPS 13 9310 Core i7 4K | |
| Lenovo ThinkPad X1 Nano-20UN002UGE | |
| PCMark 10 / Essentials | |
| Asus Zenbook S 13 OLED | |
| Average of class Subnotebook (8552 - 11646, n=46, last 2 years) | |
| Dell XPS 13 Plus 9320 4K | |
| Average Intel Core i7-1260P, Intel Iris Xe Graphics G7 96EUs (9260 - 11251, n=17) | |
| Huawei MateBook 13s i5 11300H | |
| Dell XPS 13 9310 Core i7 4K | |
| Lenovo ThinkPad X1 Nano-20UN002UGE | |
| PCMark 10 / Productivity | |
| Average of class Subnotebook (5435 - 16606, n=46, last 2 years) | |
| Asus Zenbook S 13 OLED | |
| Average Intel Core i7-1260P, Intel Iris Xe Graphics G7 96EUs (6167 - 8629, n=17) | |
| Dell XPS 13 Plus 9320 4K | |
| Dell XPS 13 9310 Core i7 4K | |
| Huawei MateBook 13s i5 11300H | |
| Lenovo ThinkPad X1 Nano-20UN002UGE | |
| PCMark 10 / Digital Content Creation | |
| Average of class Subnotebook (5722 - 13779, n=46, last 2 years) | |
| Asus Zenbook S 13 OLED | |
| Dell XPS 13 Plus 9320 4K | |
| Average Intel Core i7-1260P, Intel Iris Xe Graphics G7 96EUs (5231 - 6908, n=17) | |
| Huawei MateBook 13s i5 11300H | |
| Dell XPS 13 9310 Core i7 4K | |
| Lenovo ThinkPad X1 Nano-20UN002UGE | |
| CrossMark / Overall | |
| Average of class Subnotebook (365 - 2356, n=59, last 2 years) | |
| Dell XPS 13 Plus 9320 4K | |
| Average Intel Core i7-1260P, Intel Iris Xe Graphics G7 96EUs (1484 - 1811, n=16) | |
| Asus Zenbook S 13 OLED | |
| Apple MacBook Air 2020 M1 Entry | |
| Huawei MateBook 13s i5 11300H | |
| CrossMark / Productivity | |
| Average Intel Core i7-1260P, Intel Iris Xe Graphics G7 96EUs (1486 - 1755, n=16) | |
| Average of class Subnotebook (364 - 2277, n=59, last 2 years) | |
| Dell XPS 13 Plus 9320 4K | |
| Asus Zenbook S 13 OLED | |
| Huawei MateBook 13s i5 11300H | |
| Apple MacBook Air 2020 M1 Entry | |
| CrossMark / Creativity | |
| Average of class Subnotebook (372 - 2743, n=59, last 2 years) | |
| Dell XPS 13 Plus 9320 4K | |
| Average Intel Core i7-1260P, Intel Iris Xe Graphics G7 96EUs (1451 - 1872, n=16) | |
| Apple MacBook Air 2020 M1 Entry | |
| Asus Zenbook S 13 OLED | |
| Huawei MateBook 13s i5 11300H | |
| CrossMark / Responsiveness | |
| Average Intel Core i7-1260P, Intel Iris Xe Graphics G7 96EUs (1253 - 1807, n=16) | |
| Huawei MateBook 13s i5 11300H | |
| Dell XPS 13 Plus 9320 4K | |
| Average of class Subnotebook (312 - 1854, n=59, last 2 years) | |
| Asus Zenbook S 13 OLED | |
| Apple MacBook Air 2020 M1 Entry | |
| PCMark 10 Score | 5558 points | |
Help | ||
| AIDA64 / Memory Copy | |
| Average of class Subnotebook (14554 - 131023, n=57, last 2 years) | |
| Dell XPS 13 Plus 9320 4K | |
| Average Intel Core i7-1260P (25125 - 71544, n=25) | |
| Huawei MateBook 13s i5 11300H | |
| Asus Zenbook S 13 OLED | |
| Lenovo ThinkPad X1 Nano-20UN002UGE | |
| AIDA64 / Memory Read | |
| Average of class Subnotebook (15948 - 127174, n=57, last 2 years) | |
| Dell XPS 13 Plus 9320 4K | |
| Huawei MateBook 13s i5 11300H | |
| Average Intel Core i7-1260P (24983 - 72065, n=25) | |
| Lenovo ThinkPad X1 Nano-20UN002UGE | |
| Asus Zenbook S 13 OLED | |
| AIDA64 / Memory Write | |
| Average of class Subnotebook (15709 - 135141, n=57, last 2 years) | |
| Dell XPS 13 Plus 9320 4K | |
| Huawei MateBook 13s i5 11300H | |
| Average Intel Core i7-1260P (23512 - 66799, n=25) | |
| Lenovo ThinkPad X1 Nano-20UN002UGE | |
| Asus Zenbook S 13 OLED | |
| AIDA64 / Memory Latency | |
| Asus Zenbook S 13 OLED | |
| Lenovo ThinkPad X1 Nano-20UN002UGE | |
| Average of class Subnotebook (6.1 - 159.9, n=55, last 2 years) | |
| Huawei MateBook 13s i5 11300H | |
| Average Intel Core i7-1260P (77.9 - 118.4, n=21) | |
* ... smaller is better
DPC Latency
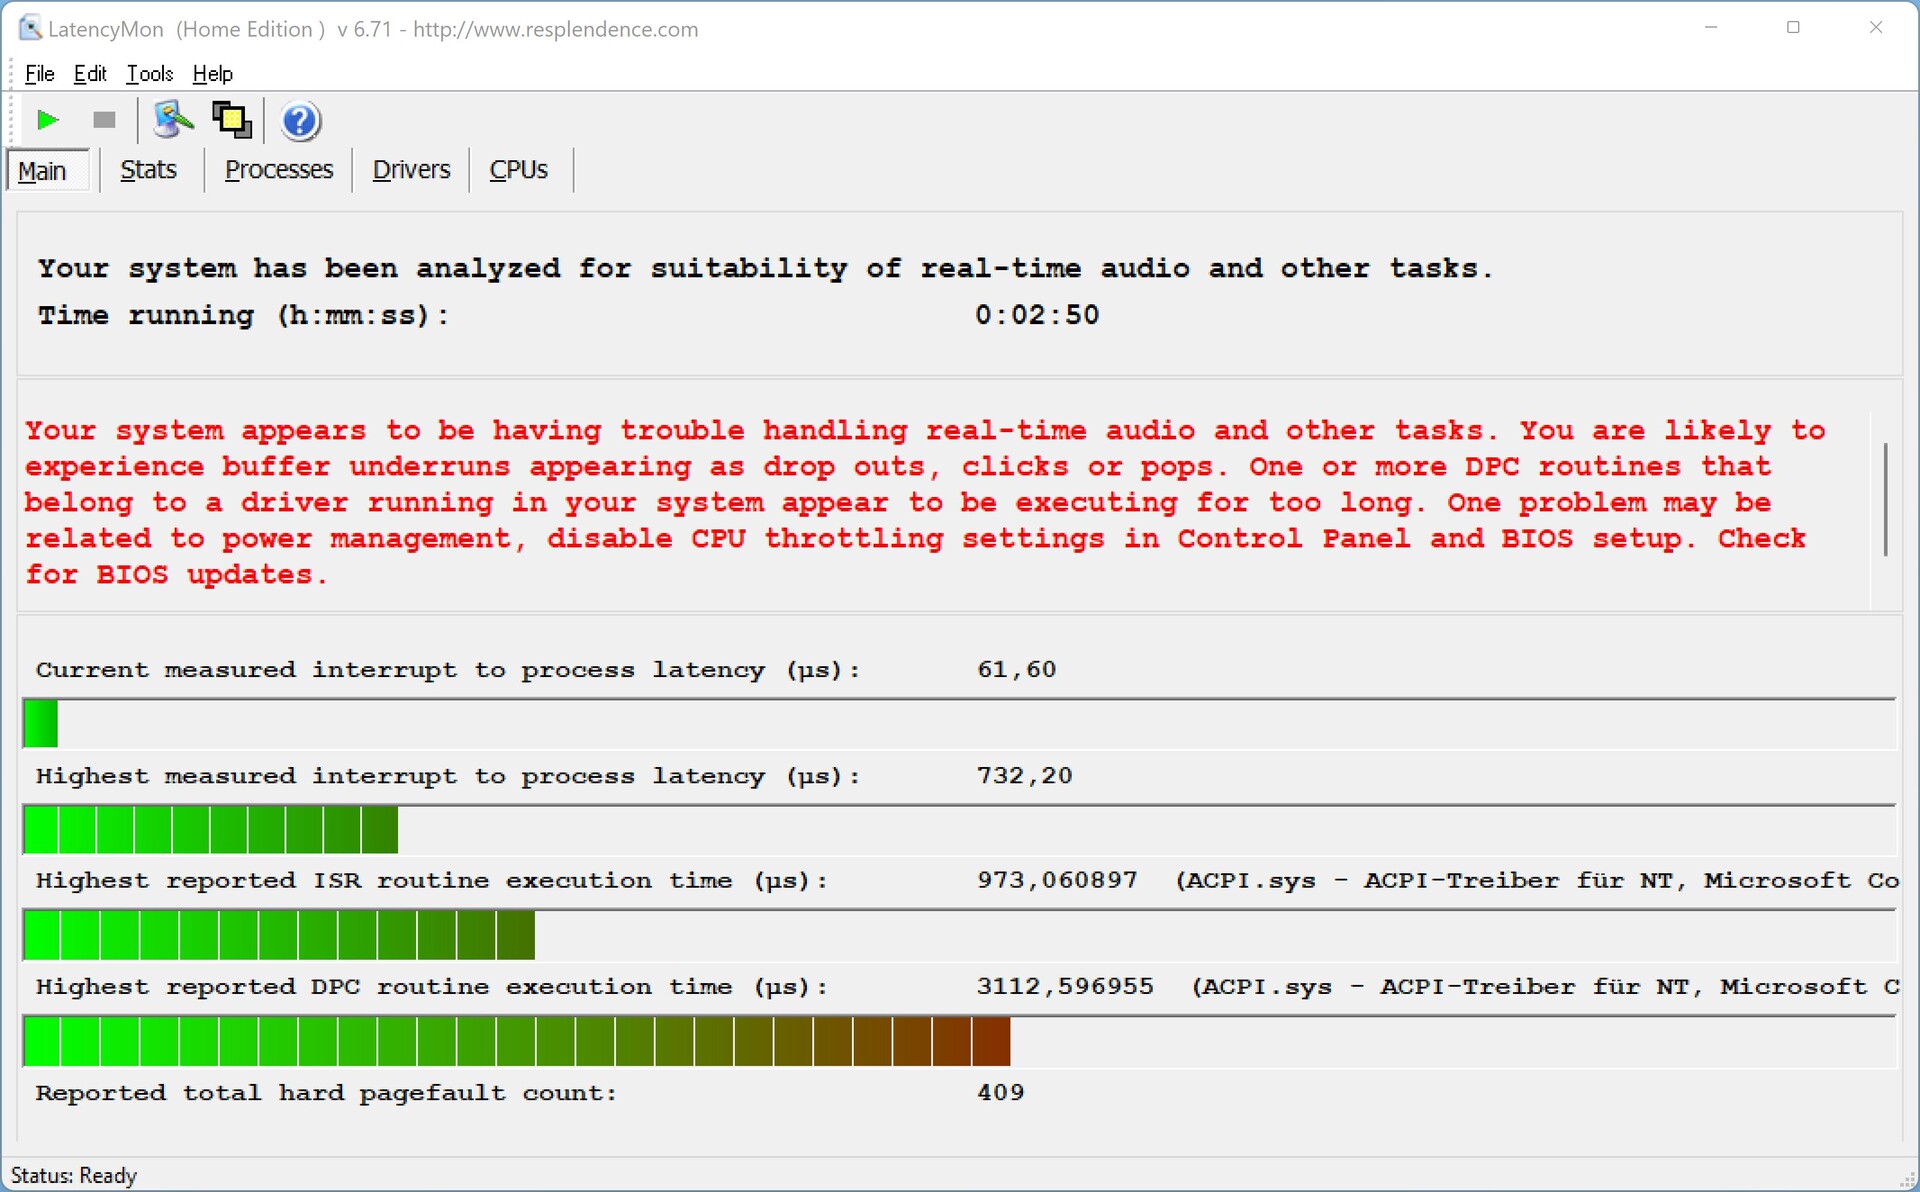
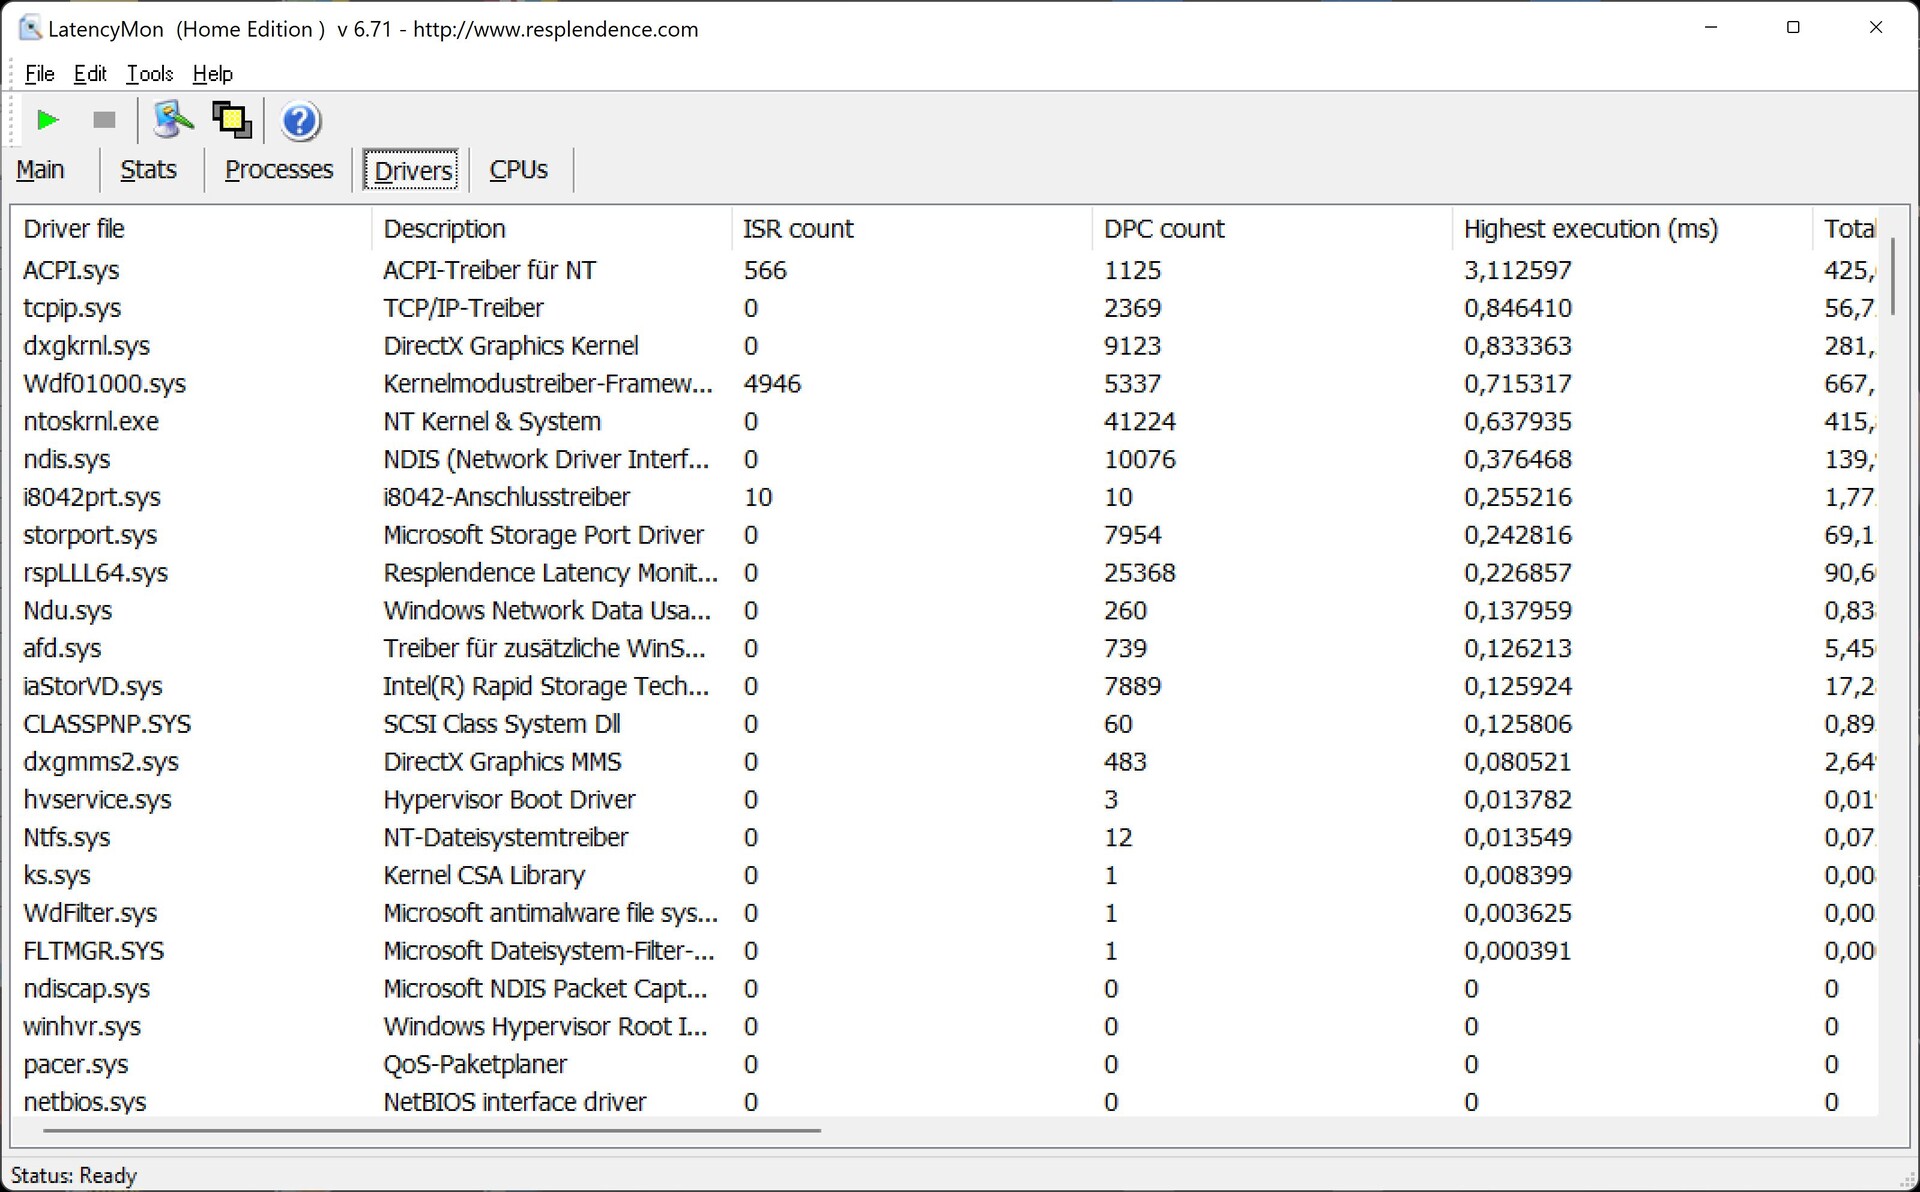
Our standardized Latency test (web browsing, YouTube 4K, CPU load) does not show any basic issues, but one driver makes some problems. This means the XPS 13 Plus is not ideal for real-time audio applications with the current BIOS version.
| DPC Latencies / LatencyMon - interrupt to process latency (max), Web, Youtube, Prime95 | |
| Lenovo ThinkPad X1 Nano-20UN002UGE | |
| Dell XPS 13 9310 Core i7 4K | |
| Huawei MateBook 13s i5 11300H | |
| Dell XPS 13 Plus 9320 4K | |
| Asus Zenbook S 13 OLED | |
* ... smaller is better
Storage Devices
Dell uses fast PCIe-4.0 SSDs for the new XPS 13 Plus. Our review unit is equipped with a 1 TB drive, but you can only use 813 GB for your own files after the initial set-up. Windows laptops usually offer around 900 GB (with 1 TB drives). The performance of the Samsung SSD (PM9A1) is very good and stable under sustained workloads, which is not a matter of course considering the location right next to the cooling unit and the heat pipe. More SSD benchmarks are listed here.

* ... smaller is better
Disk Throttling: DiskSpd Read Loop, Queue Depth 8
GPU Performance
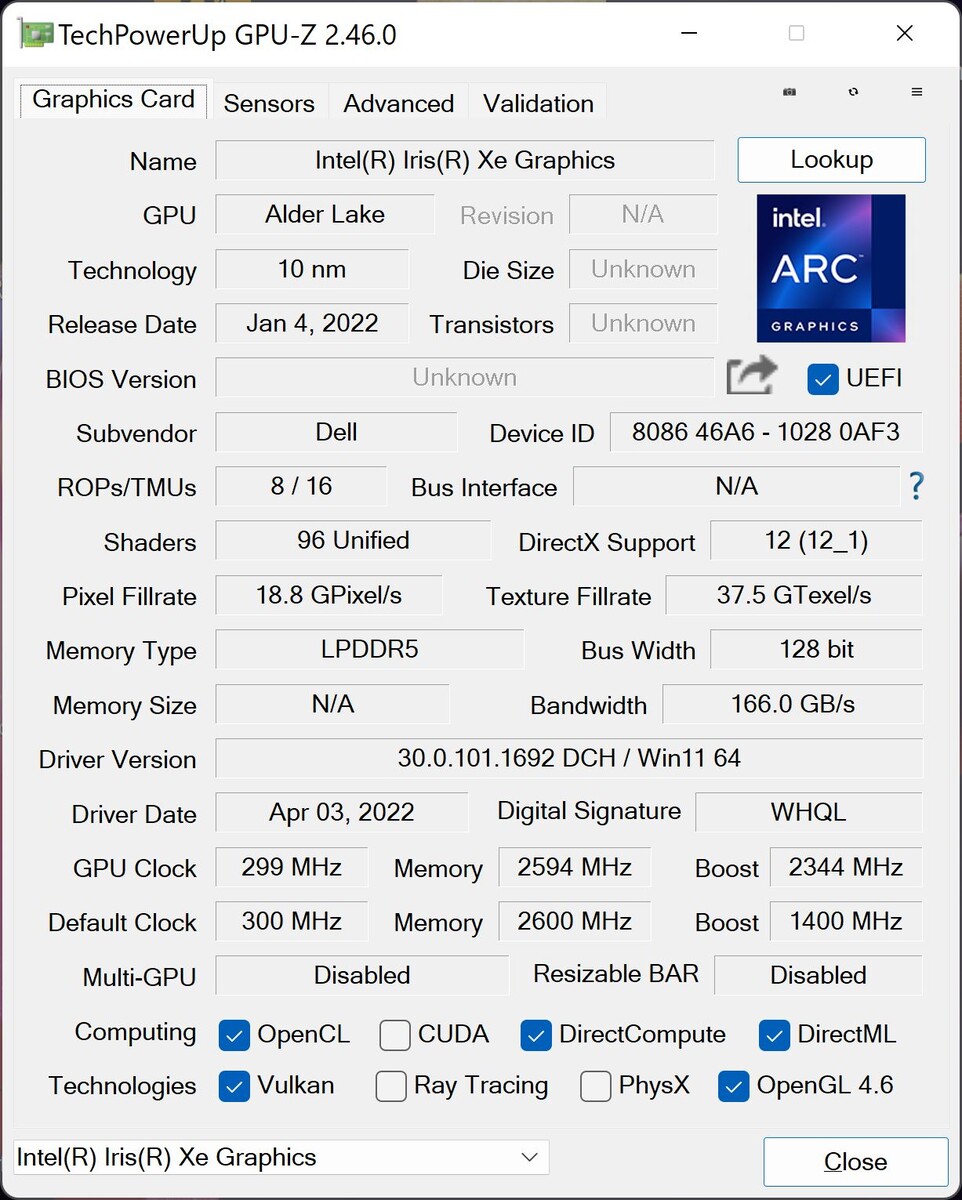
We can keep it short for the GPU since the Alder Lake CPUs still use the same Iris Xe Graphics G7 we already know from the Tiger Lake generation of the previous XPS 13 9310. The new XPS 13 Plus benefits slightly from the faster RAM modules, but the overall GPU performance is comparable to the old model. AMD’s new Radeon 680M iGPU is noticeably faster, both in synthetic as well as gaming benchmarks. You are usually limited to medium/high details in simple titles when you play on the XPS 13 Plus.
The XPS does not pass the 3DMark Time Spy stress test, even with the Ultra Performance profile, even though the performance drop is very small (96.4 %) and you will not notice it during gaming. Our Witcher 3 loop also shows a steady performance (although the CPU load in this title is comparatively low).
Intel’s Iris Xe Graphics G7 is still a decent choice for multimedia purposes including high-resolution video playback and the graphics performance is just slightly slower on battery power. More GPU benchmarks are available in our tech section.
| Power Consumption - Witcher 3 ultra Efficiency (external Monitor) | |
| Average of class Subnotebook (0.4806 - 0.882, n=2, last 2 years) | |
| Asus Zenbook S 13 OLED | |
| Average Intel Iris Xe Graphics G7 96EUs (0.2055 - 0.842, n=110) | |
| Huawei MateBook 13s i5 11300H | |
| Dell XPS 13 Plus 9320 4K | |
| 3DMark 11 Performance | 7499 points | |
| 3DMark Cloud Gate Standard Score | 22229 points | |
| 3DMark Fire Strike Score | 4985 points | |
| 3DMark Time Spy Score | 1974 points | |
Help | ||
Witcher 3 FPS Chart
| low | med. | high | ultra | QHD | 4K | |
|---|---|---|---|---|---|---|
| GTA V (2015) | 115.1 | 102.1 | 26.2 | 11 | ||
| The Witcher 3 (2015) | 99 | 62 | 34 | 14.3 | ||
| Dota 2 Reborn (2015) | 109.9 | 85.2 | 68.2 | 60.6 | 26.7 | |
| Final Fantasy XV Benchmark (2018) | 44.7 | 25.3 | 25.3 | 13.9 | ||
| X-Plane 11.11 (2018) | 55.5 | 42.9 | 36.9 | 19.1 | ||
| Far Cry 5 (2018) | 59 | 32 | 29 | 26 | ||
| Strange Brigade (2018) | 95.2 | 45.9 | 36.4 | 29.5 | ||
| F1 2021 (2021) | 112.6 | 53.1 | 42.4 | 29.7 | ||
| Farming Simulator 22 (2021) | 103 | 46 | 34 | 31 |
Emissions - XPS 13 Plus with louder fans
System Noise
The two fans of the new XPS 13 Plus are usually deactivated or running on the lowest speed (which is only audible in silent environments) during light workloads. It gets noisier pretty quickly when you stress the system, both with the Optimized and the Ultra Performance profiles, which is a result of the high power limits for the Alder Lake processor. We can measure up to 45 dB(A) during the stress test and high CPU load, which is clearly audible, but there are no annoying frequencies from the fans. The profile Optimized results in up to 40.4 dB(A). You should use the Quiet profile if you want it as quiet as possible with up to 35 dB(A) under high workloads.
| Quiet | Optimized | Ultra Performance | |
|---|---|---|---|
| 3DMark 06 | 33.1 dB(A) | 40.4 dB(A) | 40.4 dB(A) |
| CB R23 Single | 33.1 dB(A) | 40.4 dB(A) | 40.4 dB(A) |
| CB R23 Multi | 35 dB(A) | 40.4 dB(A) | 45.5 dB(A) |
| The Witcher 3 | 35 dB(A) | 40.4 dB(A) | 45.5 dB(A) |
| Stress test | 35 dB(A) | 40.4 dB(A) | 45.5 dB(A) |
All in all, the new XPS 13 Plus is noticeably louder than the old model and also one of the loudest within the comparison group. We noticed some electronic noise from the SSD during our benchmarks, but this was the only situation.
Noise level
| Idle |
| 24.4 / 24.4 / 25.5 dB(A) |
| Load |
| 40.4 / 45.5 dB(A) |
 | ||
30 dB silent 40 dB(A) audible 50 dB(A) loud |
||
min: | ||
| Dell XPS 13 Plus 9320 4K Iris Xe G7 96EUs, i7-1260P, Samsung PM9A1 MZVL21T0HCLR | Asus Zenbook S 13 OLED Radeon 680M, R7 6800U, Samsung PM9A1 MZVL21T0HCLR | Lenovo ThinkPad X1 Nano-20UN002UGE Iris Xe G7 96EUs, i7-1160G7, WDC PC SN530 SDBPNPZ-512G | Huawei MateBook 13s i5 11300H Iris Xe G7 80EUs, i5-11300H, Phison Electronics PS5012 | Dell XPS 13 9310 Core i7 4K Iris Xe G7 96EUs, i7-1185G7, Micron 2300 512GB MTFDHBA512TDV | |
|---|---|---|---|---|---|
| Noise | 7% | 3% | 5% | 4% | |
| off / environment * (dB) | 24.4 | 24 2% | 24.9 -2% | 24.5 -0% | 27.7 -14% |
| Idle Minimum * (dB) | 24.4 | 24 2% | 24.9 -2% | 24.5 -0% | 27.8 -14% |
| Idle Average * (dB) | 24.4 | 24 2% | 26.3 -8% | 24.5 -0% | 27.8 -14% |
| Idle Maximum * (dB) | 25.5 | 24 6% | 31.8 -25% | 28 -10% | 27.8 -9% |
| Load Average * (dB) | 40.4 | 33.1 18% | 34.3 15% | 35.9 11% | 27.9 31% |
| Witcher 3 ultra * (dB) | 45.5 | 40.2 12% | 34.3 25% | 35.9 21% | 32.8 28% |
| Load Maximum * (dB) | 45.5 | 41.7 8% | 37.5 18% | 38.6 15% | 37 19% |
* ... smaller is better
Temperature
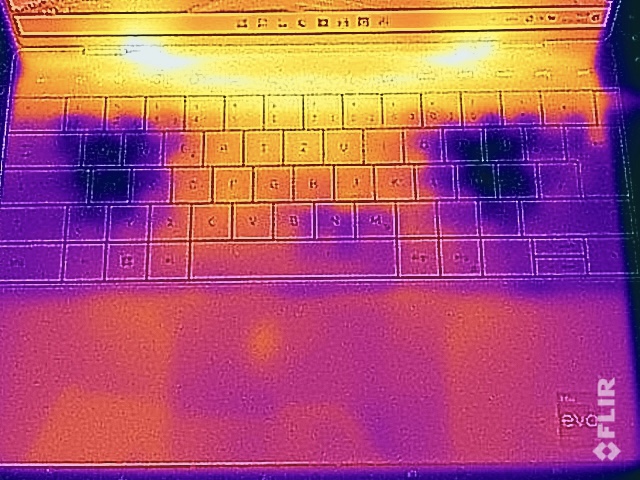
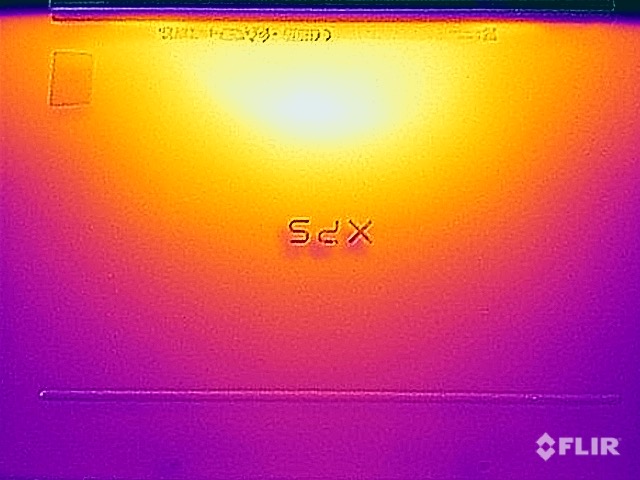
The chassis of the XPS 13 Plus stays comfortably cool during everyday workloads and you can also put it on your lap without any issues. High sustained workloads or gaming on the other hand results in high surface temperatures at the bottom and the top of the keyboard area (along the large heat pipe) and we would recommend a solid surface. The compact power adapter does not get overly hot at up to 47 °C.
The processor consumption eventually levels off at 27W during the stress test and we did not notice any performance deficits immediately after the stress test.
(±) The maximum temperature on the upper side is 41.1 °C / 106 F, compared to the average of 35.9 °C / 97 F, ranging from 21.4 to 59 °C for the class Subnotebook.
(-) The bottom heats up to a maximum of 48.8 °C / 120 F, compared to the average of 39.2 °C / 103 F
(+) In idle usage, the average temperature for the upper side is 26.8 °C / 80 F, compared to the device average of 30.8 °C / 87 F.
(±) Playing The Witcher 3, the average temperature for the upper side is 34.4 °C / 94 F, compared to the device average of 30.8 °C / 87 F.
(+) The palmrests and touchpad are reaching skin temperature as a maximum (33 °C / 91.4 F) and are therefore not hot.
(-) The average temperature of the palmrest area of similar devices was 28.2 °C / 82.8 F (-4.8 °C / -8.6 F).
| Dell XPS 13 Plus 9320 4K Intel Core i7-1260P, Intel Iris Xe Graphics G7 96EUs | Asus Zenbook S 13 OLED AMD Ryzen 7 6800U, AMD Radeon 680M | Lenovo ThinkPad X1 Nano-20UN002UGE Intel Core i7-1160G7, Intel Iris Xe Graphics G7 96EUs | Apple MacBook Air 2020 M1 Entry Apple M1, Apple M1 7-Core GPU | Huawei MateBook 13s i5 11300H Intel Core i5-11300H, Intel Iris Xe Graphics G7 80EUs | Dell XPS 13 9310 Core i7 4K Intel Core i7-1185G7, Intel Iris Xe Graphics G7 96EUs | |
|---|---|---|---|---|---|---|
| Heat | -5% | 7% | 4% | 5% | -1% | |
| Maximum Upper Side * (°C) | 41.1 | 47.9 -17% | 42.2 -3% | 44 -7% | 42.8 -4% | 47 -14% |
| Maximum Bottom * (°C) | 48.8 | 56.1 -15% | 47.5 3% | 44 10% | 46.9 4% | 45 8% |
| Idle Upper Side * (°C) | 28 | 26.8 4% | 24.3 13% | 27 4% | 25.2 10% | 27.8 1% |
| Idle Bottom * (°C) | 29.3 | 27.3 7% | 25.3 14% | 27 8% | 26 11% | 28.6 2% |
* ... smaller is better
Speakers
Dell uses a new quad-speaker system for the XPS 13 Plus and the quality is better compared to the old XPS 13 9310 and on par with the MacBook Air M1. The sound is very rich and videos or some background music is definitely enjoyable.
Dell XPS 13 Plus 9320 4K audio analysis
(±) | speaker loudness is average but good (79 dB)
Bass 100 - 315 Hz
(±) | reduced bass - on average 7.3% lower than median
(±) | linearity of bass is average (9.4% delta to prev. frequency)
Mids 400 - 2000 Hz
(+) | balanced mids - only 3.7% away from median
(+) | mids are linear (5.7% delta to prev. frequency)
Highs 2 - 16 kHz
(+) | balanced highs - only 3.4% away from median
(+) | highs are linear (4.3% delta to prev. frequency)
Overall 100 - 16.000 Hz
(+) | overall sound is linear (10.7% difference to median)
Compared to same class
» 9% of all tested devices in this class were better, 3% similar, 88% worse
» The best had a delta of 5%, average was 18%, worst was 53%
Compared to all devices tested
» 6% of all tested devices were better, 2% similar, 93% worse
» The best had a delta of 4%, average was 23%, worst was 134%
Apple MacBook Air 2020 M1 Entry audio analysis
(±) | speaker loudness is average but good (79.6 dB)
Bass 100 - 315 Hz
(±) | reduced bass - on average 7.1% lower than median
(±) | linearity of bass is average (9.5% delta to prev. frequency)
Mids 400 - 2000 Hz
(+) | balanced mids - only 2.2% away from median
(+) | mids are linear (5.3% delta to prev. frequency)
Highs 2 - 16 kHz
(+) | balanced highs - only 2.3% away from median
(+) | highs are linear (4% delta to prev. frequency)
Overall 100 - 16.000 Hz
(+) | overall sound is linear (8.7% difference to median)
Compared to same class
» 3% of all tested devices in this class were better, 1% similar, 96% worse
» The best had a delta of 5%, average was 18%, worst was 53%
Compared to all devices tested
» 3% of all tested devices were better, 1% similar, 97% worse
» The best had a delta of 4%, average was 23%, worst was 134%
Dell XPS 13 9310 Core i7 4K audio analysis
(+) | speakers can play relatively loud (84.6 dB)
Bass 100 - 315 Hz
(±) | reduced bass - on average 13.1% lower than median
(±) | linearity of bass is average (11.1% delta to prev. frequency)
Mids 400 - 2000 Hz
(+) | balanced mids - only 4.3% away from median
(+) | mids are linear (4.2% delta to prev. frequency)
Highs 2 - 16 kHz
(+) | balanced highs - only 1.5% away from median
(+) | highs are linear (3.8% delta to prev. frequency)
Overall 100 - 16.000 Hz
(+) | overall sound is linear (10.9% difference to median)
Compared to same class
» 10% of all tested devices in this class were better, 3% similar, 87% worse
» The best had a delta of 5%, average was 18%, worst was 53%
Compared to all devices tested
» 6% of all tested devices were better, 2% similar, 92% worse
» The best had a delta of 4%, average was 23%, worst was 134%
Energy Management - 4K and Alder Lake affect battery runtime
Power Consumption
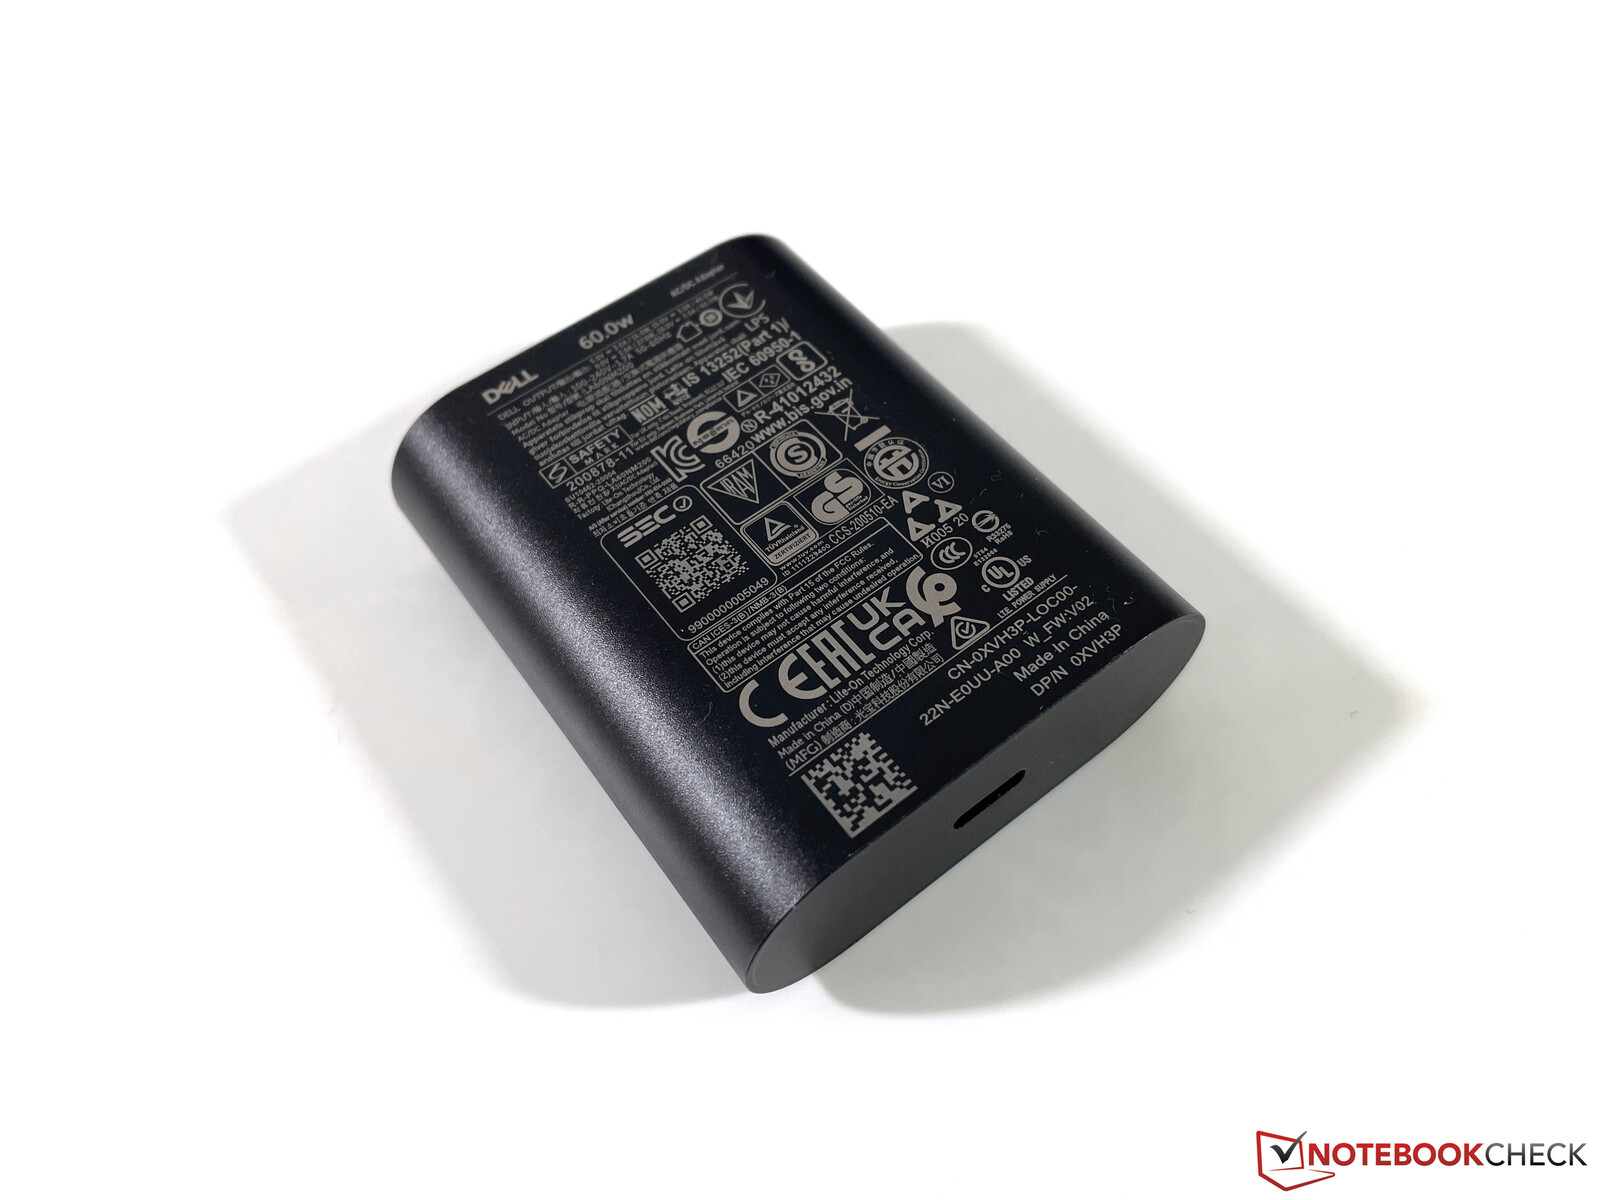
We already saw that the CPU can consume more than 50W for short periods, so it is no surprise that the included 60W power adapter is insufficient in these scenarios. We can currently observe this problem on many compact Alder Lake systems. However, the duration of the peak load is very limited in this case, so this is not a big problem in practice and the battery does not discharge.
Charging the battery when you stress the device will be very slow, though. Our idle measurements also show increased consumption figures compared to the previous model, which was also equipped with the 4K display.
| Off / Standby | |
| Idle | |
| Load |
|
Key:
min: | |
| Dell XPS 13 Plus 9320 4K i7-1260P, Iris Xe G7 96EUs, Samsung PM9A1 MZVL21T0HCLR, IPS, 3840x2400, 13.4" | Asus Zenbook S 13 OLED R7 6800U, Radeon 680M, Samsung PM9A1 MZVL21T0HCLR, OLED, 2880x1800, 13.3" | Lenovo ThinkPad X1 Nano-20UN002UGE i7-1160G7, Iris Xe G7 96EUs, WDC PC SN530 SDBPNPZ-512G, IPS, 2160x1350, 13" | Apple MacBook Air 2020 M1 Entry M1, M1 7-Core GPU, Apple SSD AP0256Q, IPS, 2560x1600, 13.3" | Huawei MateBook 13s i5 11300H i5-11300H, Iris Xe G7 80EUs, Phison Electronics PS5012, LTPS, 2520x1680, 13.4" | Dell XPS 13 9310 Core i7 4K i7-1185G7, Iris Xe G7 96EUs, Micron 2300 512GB MTFDHBA512TDV, IPS, 3840x2400, 13.4" | Dell XPS 13 9310 OLED i7-1185G7, Iris Xe G7 96EUs, Toshiba XG6 KXG60ZNV512G, OLED, 3456x2160, 13.4" | Average Intel Iris Xe Graphics G7 96EUs | Average of class Subnotebook | |
|---|---|---|---|---|---|---|---|---|---|
| Power Consumption | 20% | 38% | 53% | 21% | 25% | 22% | 12% | 29% | |
| Idle Minimum * (Watt) | 7 | 4.8 31% | 3.3 53% | 1.9 73% | 4.2 40% | 4.3 39% | 5.7 19% | 5.51 ? 21% | 3.73 ? 47% |
| Idle Average * (Watt) | 11 | 8.7 21% | 5.7 48% | 6.4 42% | 8.1 26% | 8.3 25% | 6 45% | 8.66 ? 21% | 6.57 ? 40% |
| Idle Maximum * (Watt) | 11.4 | 10.1 11% | 9.1 20% | 7 39% | 9 21% | 8.8 23% | 12.3 -8% | 10.9 ? 4% | 7.93 ? 30% |
| Load Average * (Watt) | 59.7 | 45.6 24% | 29.6 50% | 25 58% | 41.7 30% | 46.2 23% | 44.4 26% | 45.6 ? 24% | 42.1 ? 29% |
| Witcher 3 ultra * (Watt) | 49.4 | 42.4 14% | 27.7 44% | 40.1 19% | 42.2 15% | 36.5 26% | |||
| Load Maximum * (Watt) | 63 | 49.5 21% | 55.1 13% | 30.3 52% | 68 -8% | 47.3 25% | 47.8 24% | 67.8 ? -8% | 65.1 ? -3% |
* ... smaller is better
Power Consumption Witcher 3 / Stress test
Power Consumption with external screen
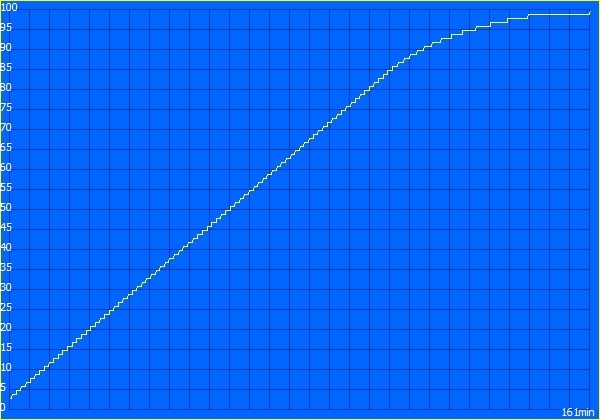
Battery Runtime
Dell increased the battery capacity from 52 to 55 Wh, but the battery runtime has still decreased compared to the 4K predecessor due to the higher consumption figures. At 150 nits (47 % of the maximum brightness on our review unit), our Wi-Fi test only runs for 7 hours and just ~5.5 hours at the maximum brightness. The difference to the video test at 150 nits, which runs for almost 11 hours, is particularly noticeable. This is a result of the Alder Lake CPU, which also consumes a lot of power in single-core load scenarios.
The OLED panel of the old XPS 13 9310 was slightly worse than its 4K IPS counterpart in terms of battery power, so we expect the same for this generation. If you are looking for the XPS 13 Plus with the best battery runtime, we definitely recommend the standard 1200p panel (1920 x 1200 pixels).
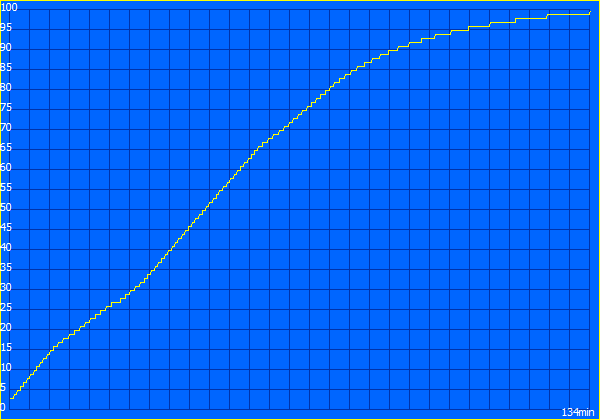
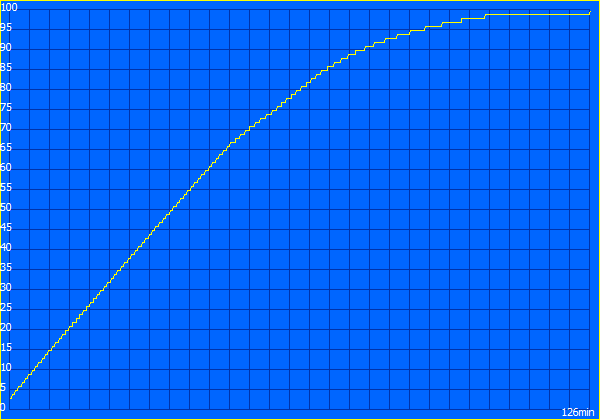
Dell offers different settings for the charging of the battery and you can also set manual limits. It takes around 160 minutes in the default setting, before the battery is fully charged when the device is turned on. The Express mode reduces the time by 25 minutes, and a 100W PSU by another 10 minutes.
| Dell XPS 13 Plus 9320 4K i7-1260P, Iris Xe G7 96EUs, 55 Wh | Asus Zenbook S 13 OLED R7 6800U, Radeon 680M, 67 Wh | Lenovo ThinkPad X1 Nano-20UN002UGE i7-1160G7, Iris Xe G7 96EUs, 48.2 Wh | Apple MacBook Air 2020 M1 Entry M1, M1 7-Core GPU, 49.9 Wh | Huawei MateBook 13s i5 11300H i5-11300H, Iris Xe G7 80EUs, 60 Wh | Dell XPS 13 9310 Core i7 4K i7-1185G7, Iris Xe G7 96EUs, 52 Wh | Dell XPS 13 9310 OLED i7-1185G7, Iris Xe G7 96EUs, 52 Wh | Average of class Subnotebook | |
|---|---|---|---|---|---|---|---|---|
| Battery runtime | 52% | 35% | 132% | 20% | 4% | -6% | 66% | |
| H.264 (h) | 11 | 15.2 38% | 15.4 40% | 11 0% | 15.3 ? 39% | |||
| WiFi v1.3 (h) | 6.9 | 9.2 33% | 9.9 43% | 16 132% | 9.4 36% | 7.2 4% | 6.5 -6% | 13.9 ? 101% |
| Load (h) | 1.3 | 2.4 85% | 1.6 23% | 1.6 23% | 2.04 ? 57% |
Pros
Cons
Verdict - XPS 13 Plus is powerful, but has its drawbacks
There are plenty of topics we have to talk about after our review of the new XPS 13 Plus. Dell did not only update the processor generation, but also decided to offer two completely different models from now on. The XPS 13 Plus gets the faster Intel Alder Lake-P chips, and the Core i7-1260P in our review unit offers good performance figures. However, the device once again shows the problems of the current Intel CPUs, because the high performance requires a lot of power. This affects the battery runtime as well as temperatures, so the new model (even with the Optimized power profile) is louder than the old XPS 13 9310. The GPU performance did not change, either, and AMD’s Ryzen 6000 CPUs like in the Zenbook S 13 offer more performance and are also much more efficient.
Dell also continues the trend towards minimalism, because the XPS 13 Plus does not get the card reader or even the 3.5 mm stereo jack anymore, which means there are only two USB-C ports left. They are very versatile thanks to Thunderbolt 4 support, but it is just inconvenient in practice. We were also surprised by the capacitive touch bar after the experiment failed for Apple. The touch bar with the function keys works well in general, but there is no added value here and the automatic brightness control does not always work reliably. The new keyboard leaves a decent impression, but we really liked the one-piece palm rest area made of glass, which means fingerprints are no problem and it was easy to use. The new sound system is also very good and an improvement over the old model.
The new Dell XPS 13 offers plenty of performance, but at the cost of louder fans and shorter battery runtimes. There are also some design decisions like the capacitive touch bar above the keyboard and the minimalism in terms of ports that can be annoying.
Dell also has to be careful not to lose touch with the rivals in terms of displays, because the optional 4K screen only covers the small sRGB gamut. If you want P3, you are currently forced to get the optional 3.5K OLED panel, which suffered from PWM flickering in the old model. The subjective picture quality of the 4K screen is still very good, though. However, the high resolution also affects the battery runtime and 5.5-7 hours in our Wi-Fi test are not record braking. If you need longer runtimes, you should definitely get one of the Full-HD panels (with and without touch support). Smaller issues like the lack of 6 GHz Wi-Fi support or the 720p webcam also affect the overall impression a bit.
The XPS 13 Plus has to compete with very good rivals. For starter, we are curious to review the standard XPS 13 with Alder Lake-U CPUs and without the touch bar (we expect the review unit in a couple of days). The current Asus Zenbook S 13 with the AMD Ryzen 6000 CPU is superior in many aspects and the XPS 13 Plus even struggles to keep up with the old Apple MacBook Air M1 in some regards, which is much cheaper. And we do not think the situation will change against the new MacBook Air M2, which is currently in review as well.
Price and Availability
You can order the XPS 13 Plus from Dell’s online store starting at $1299. Our review unit with the Core i7, 32 GB RAM, 1 TB SSD storage and 4K screen costs $2099 and is available from Best Buy, for example.
Dell XPS 13 Plus 9320 4K
- 07/19/2022 v7 (old)
Andreas Osthoff
Price comparison
