Dell Latitude 9430 2-in-1 convertible review: The Intel 12th gen upgrade
After having fully refreshed the series last year with the Latitude 9420 2-in-1, this year's Latitude 9430 2-in-1 is a relatively minor step forward for the series. The latest model incorporates Intel 12th gen Alder Lake-U CPUs to replace the 11th gen Tiger Lake-U options on the Latitude 9420 2-in-1. There are some other upgrades as well that we'll go over in the review, but the chassis design remains unchanged and so most of our existing comments on the Latitude 9420 2-in-1 also apply here for the Latitude 9430 2-in-1.
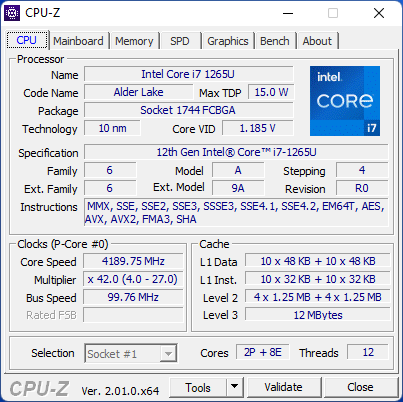
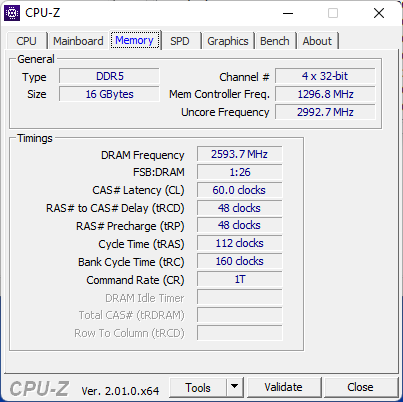
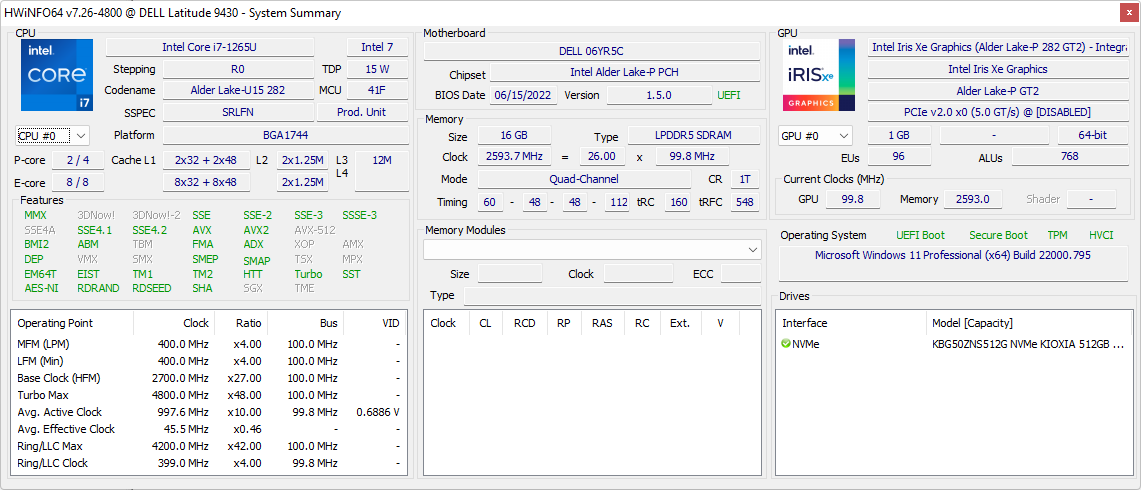
Our test unit with the Core i7-1265U CPU, 16 GB of soldered RAM, QHD+ 1600p touchscreen, and 512 GB NVMe SSD can be found online for approximately $2700 USD. Core i5-1245U SKUs are also available, but the QHD+ panel is fixed for the 2-in-1 form factor. Competitors in this space include other 14-inch office-centric laptops like the Lenovo ThinkPad X1 Yoga G7, HP EliteBook 840 series, MSI Summit E14 Flip, LG Gram 14T90P, or Huawei MateBook 14.
More Dell reviews:
Potential Competitors in Comparison
Rating | Date | Model | Weight | Height | Size | Resolution | Price |
|---|---|---|---|---|---|---|---|
| 89.8 % v7 (old) | 08 / 2022 | Dell Latitude 9430 2-in-1 i7-1265U, Iris Xe G7 96EUs | 1.5 kg | 13.94 mm | 14.00" | 2560x1600 | |
| 89 % v7 (old) | 07 / 2021 | Dell Latitude 9420 2-in-1 i7-1185G7, Iris Xe G7 96EUs | 1.5 kg | 13.94 mm | 14.00" | 2560x1600 | |
| 86.1 % v7 (old) | 07 / 2022 | MSI Summit E14 Flip Evo A12MT i7-1260P, Iris Xe G7 96EUs | 1.6 kg | 17.9 mm | 14.00" | 2880x1800 | |
| 87.5 % v7 (old) | 05 / 2022 | LG Gram 14T90P i5-1135G7, Iris Xe G7 80EUs | 1.2 kg | 17 mm | 14.00" | 1900x1200 | |
| 89.4 % v7 (old) | 05 / 2022 | Lenovo ThinkPad X1 Yoga G7 21CE002HGE i7-1270P, Iris Xe G7 96EUs | 1.5 kg | 15.53 mm | 14.00" | 1920x1200 | |
| 86.5 % v7 (old) | 05 / 2022 | Asus ZenBook Flip 14 UN5401QA-KN085W R7 5800H, Vega 8 | 1.4 kg | 15.9 mm | 14.00" | 2880x1800 |
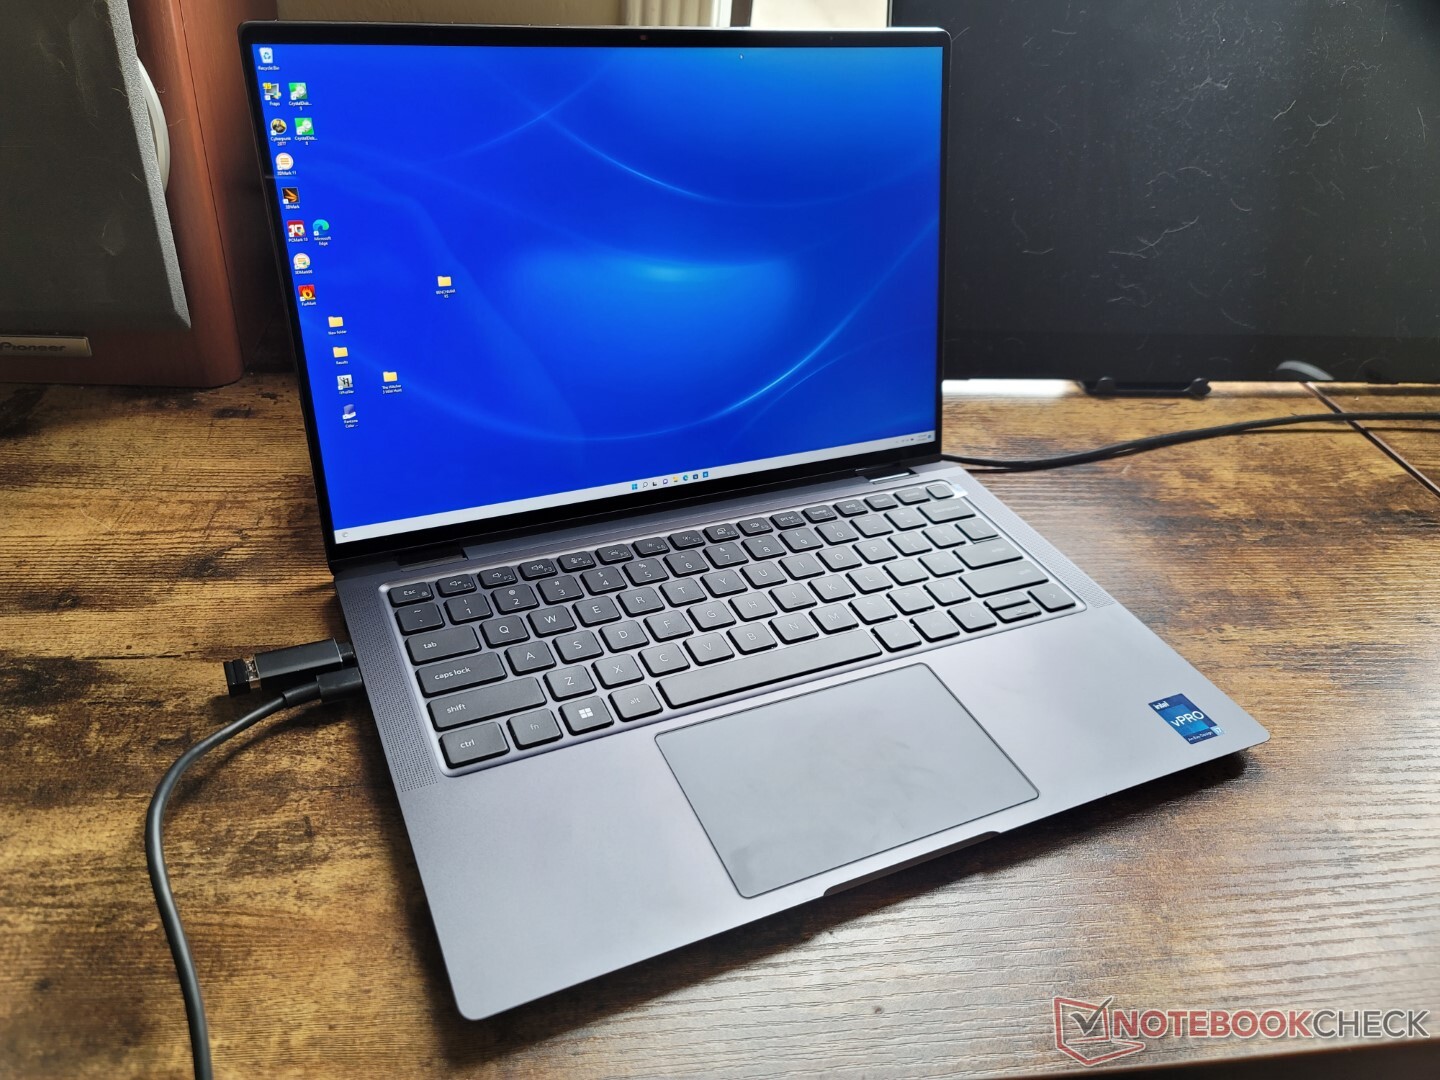
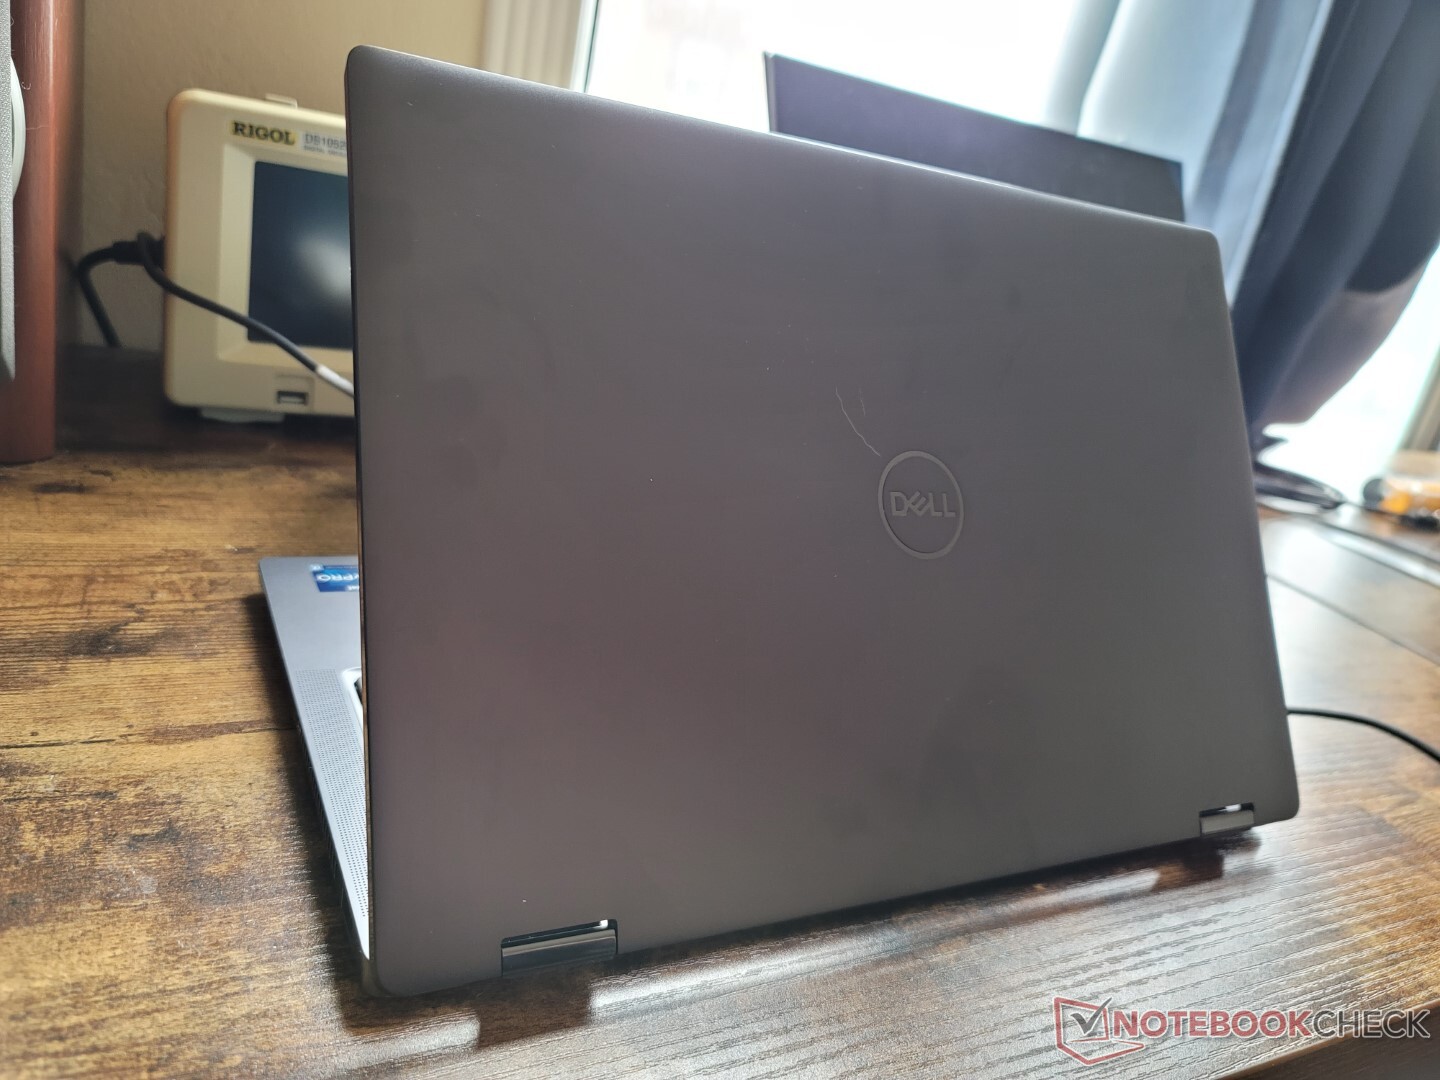
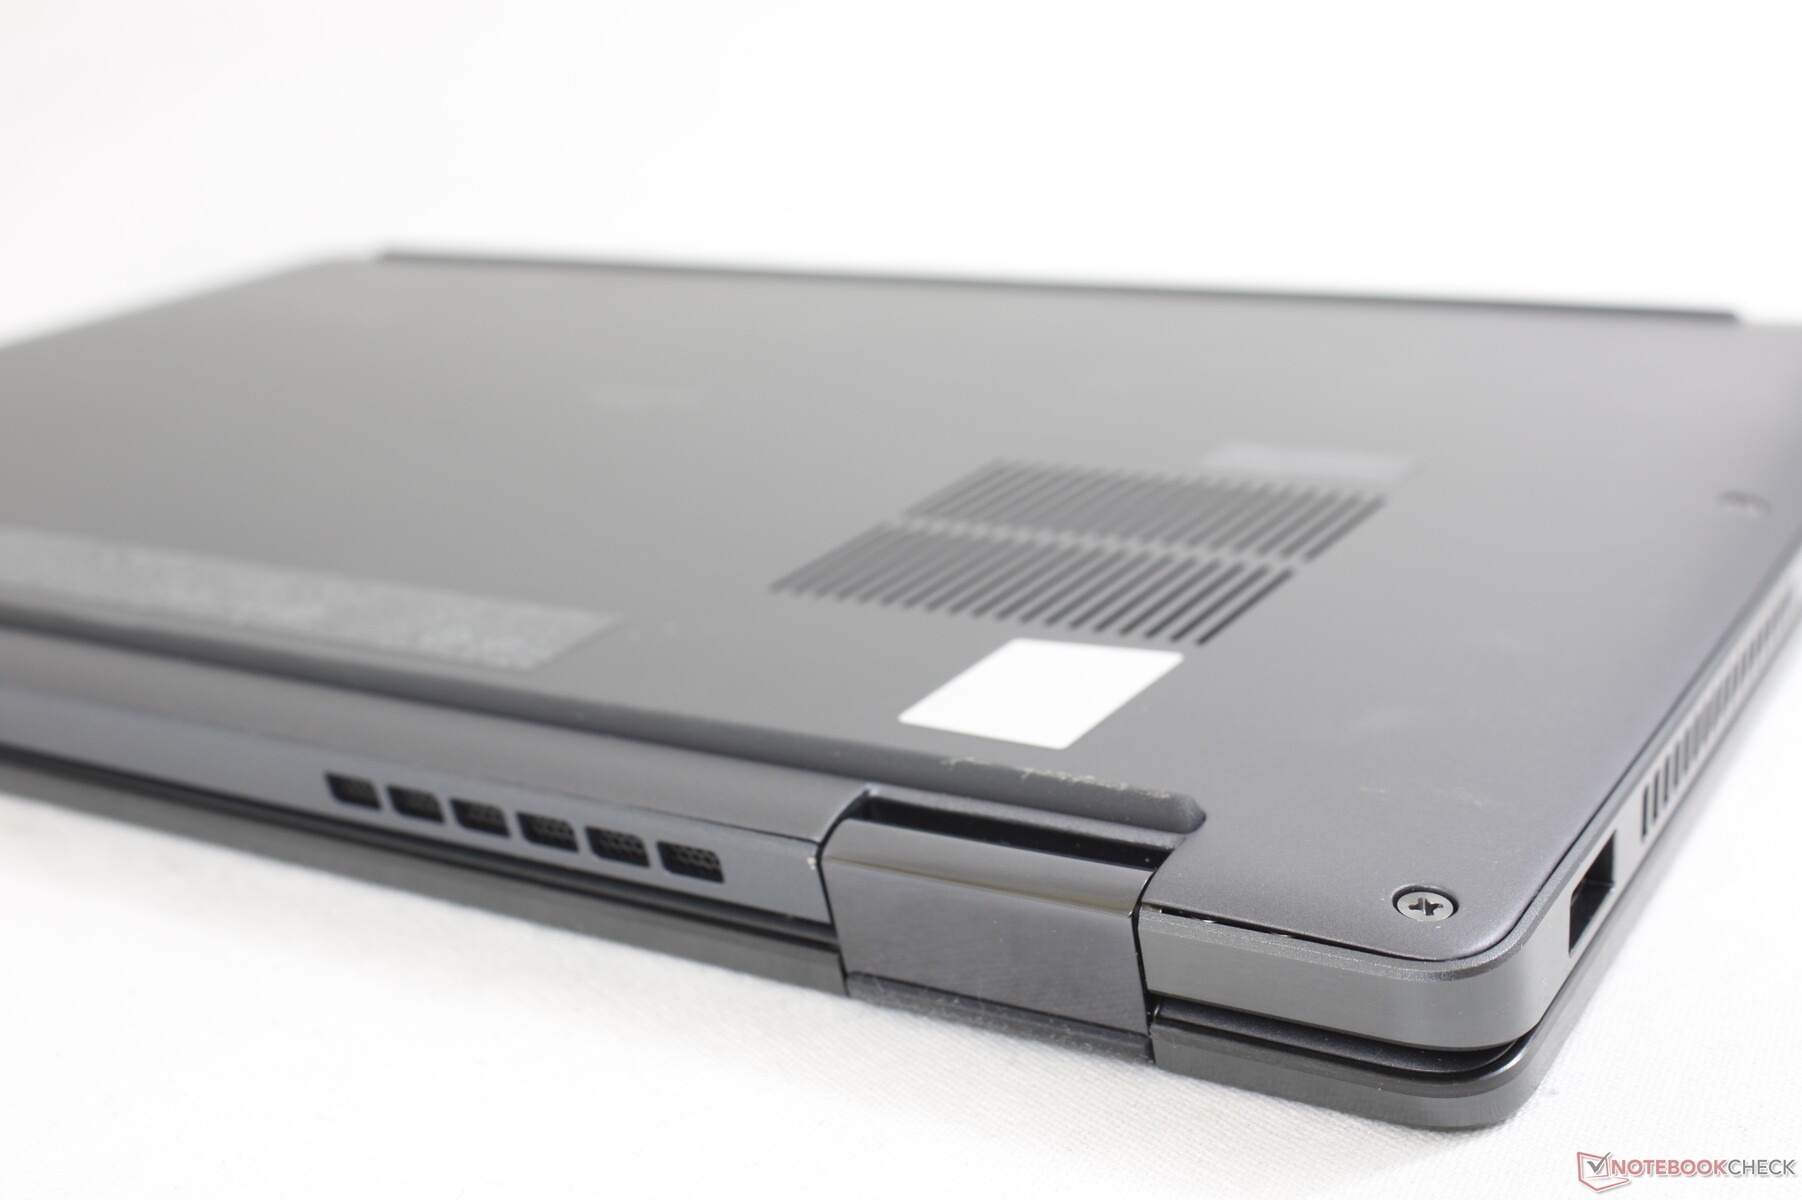
Case
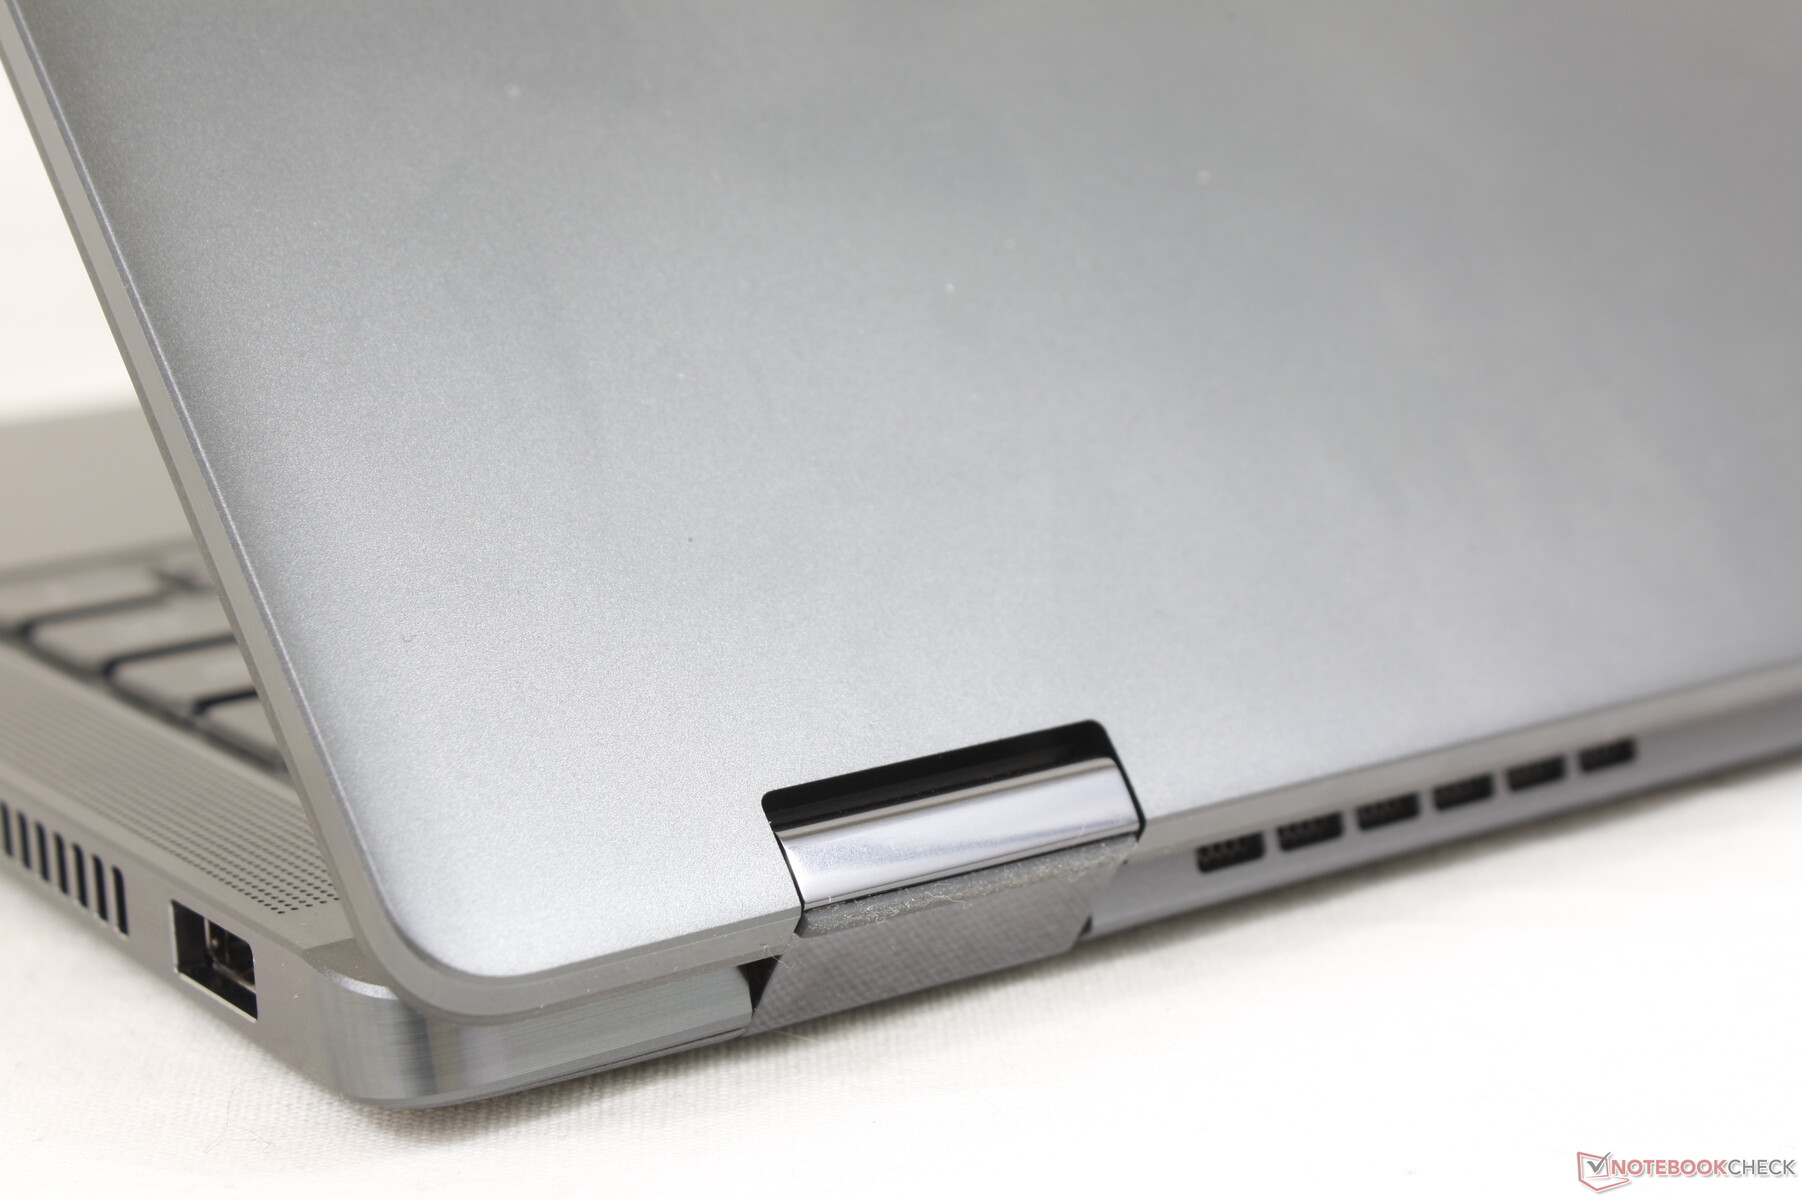
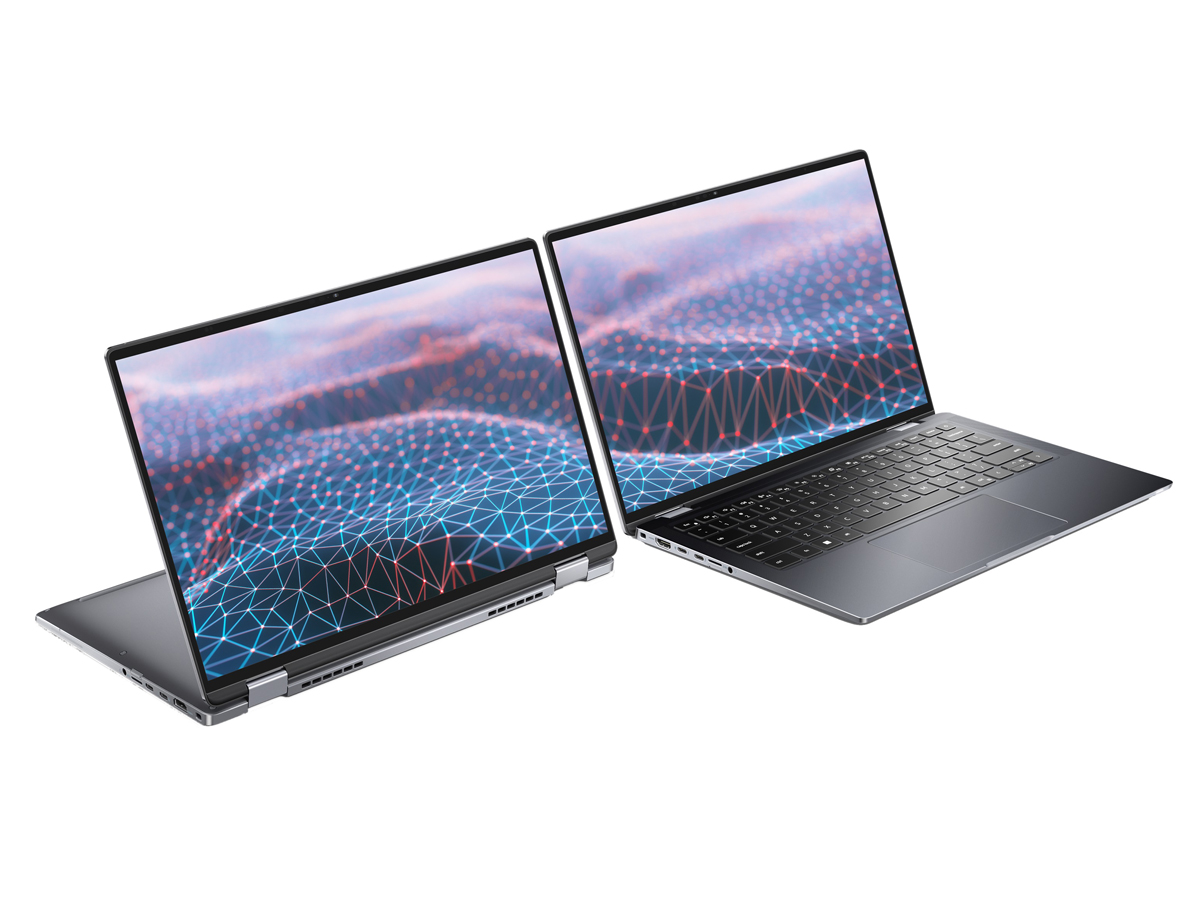
Dell has seemingly dropped the lighter gray color of the Latitude 9420 2-in-1 for darker tones on the Latitude 9430 2-in-1. There are otherwise no major visual changes beyond the distinctive new color.
The design is still one the smallest and thinnest in the 14-inch size category even after a year in the market. It's not any lighter, however, since the model is generally packed with more features including optional 5G connectivity.
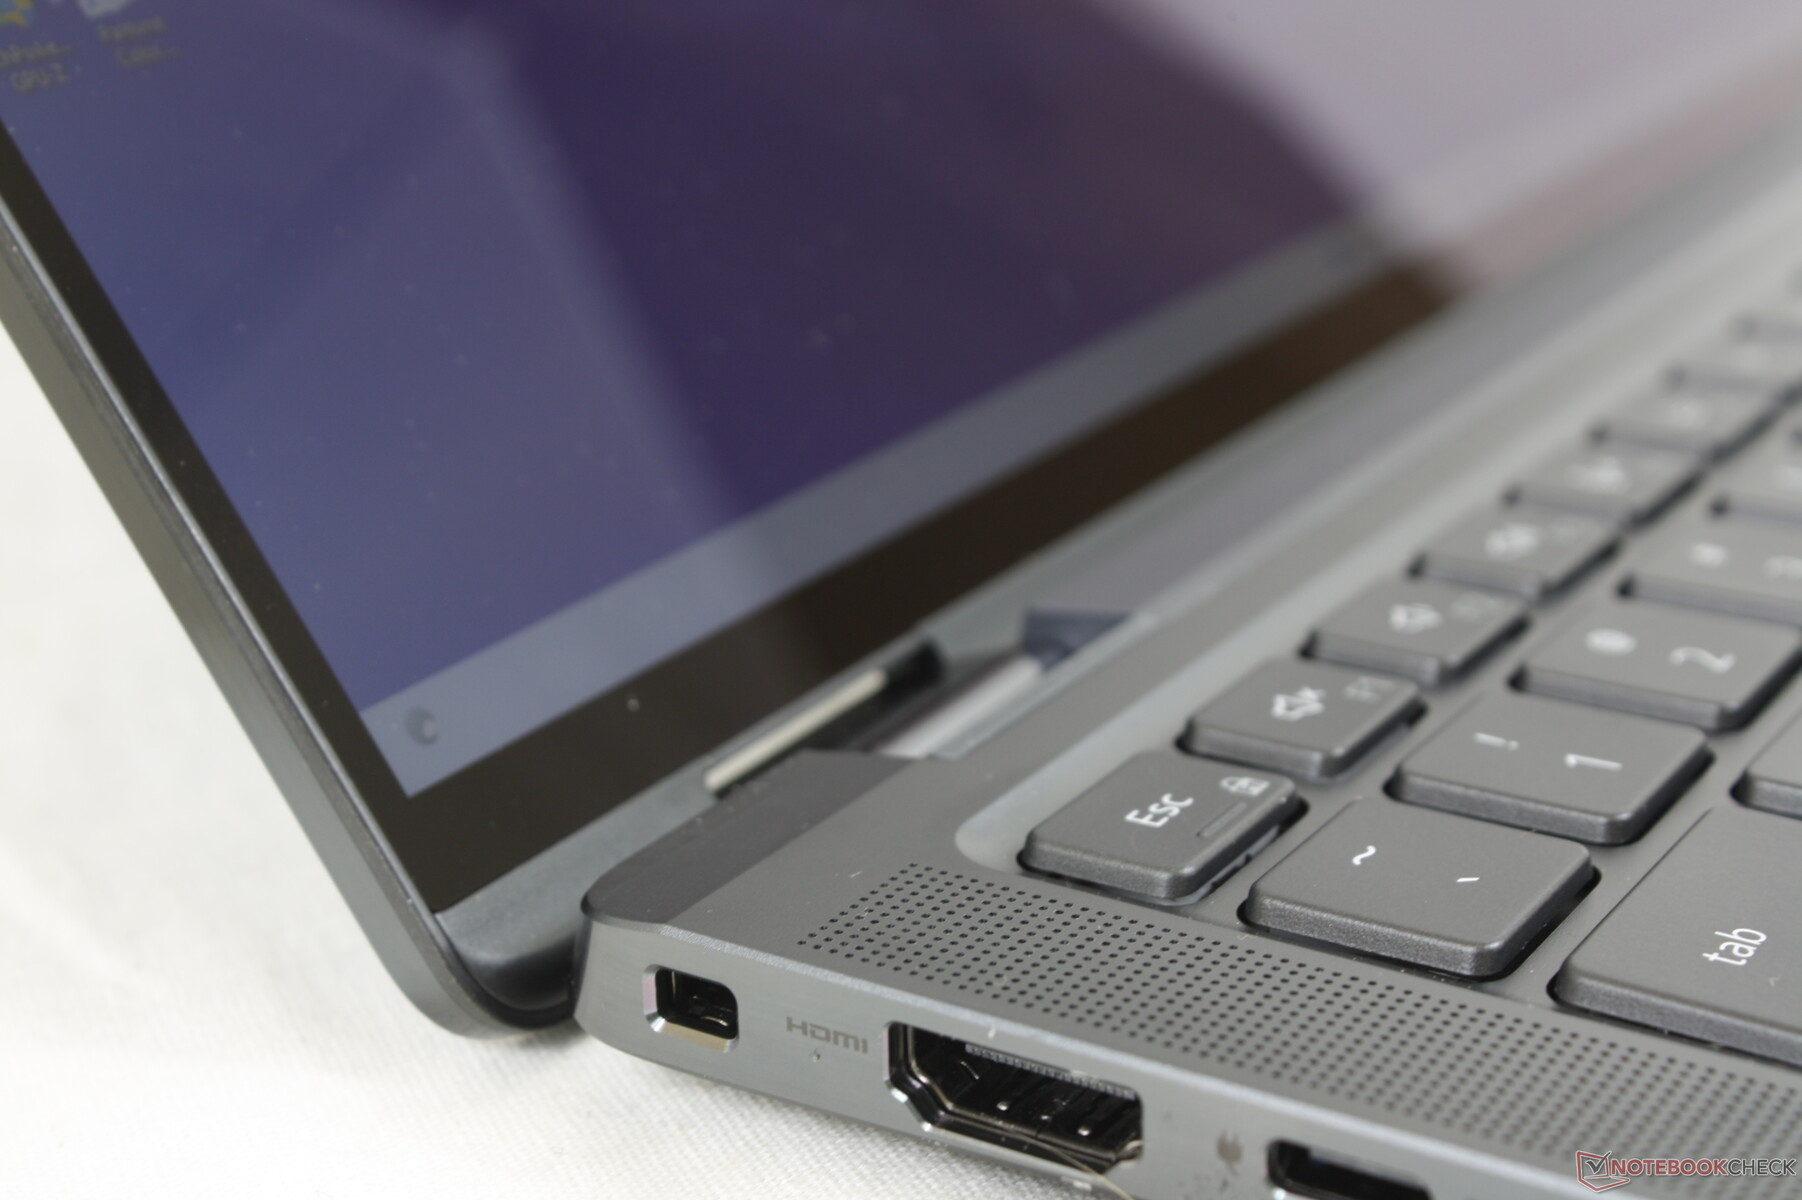
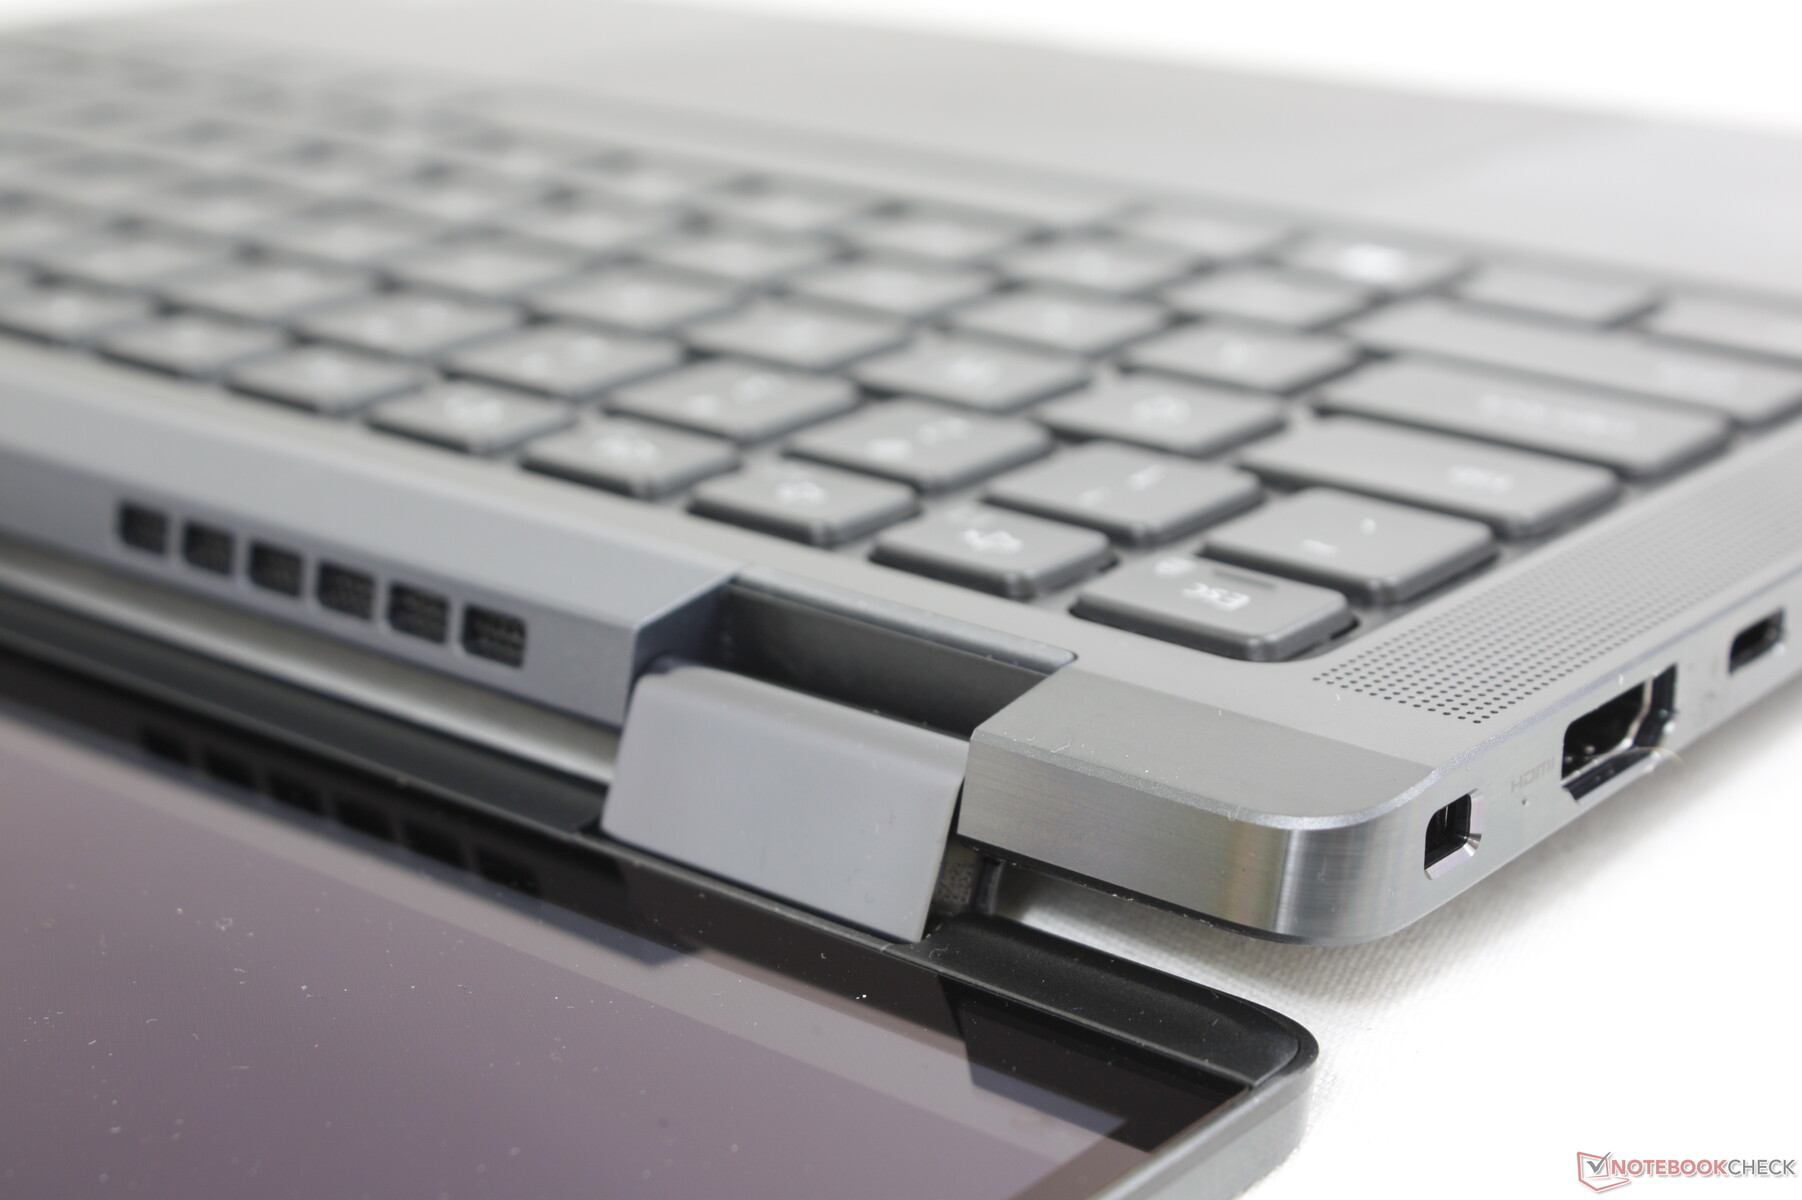
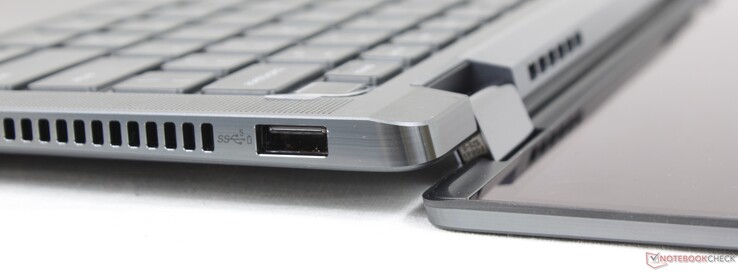
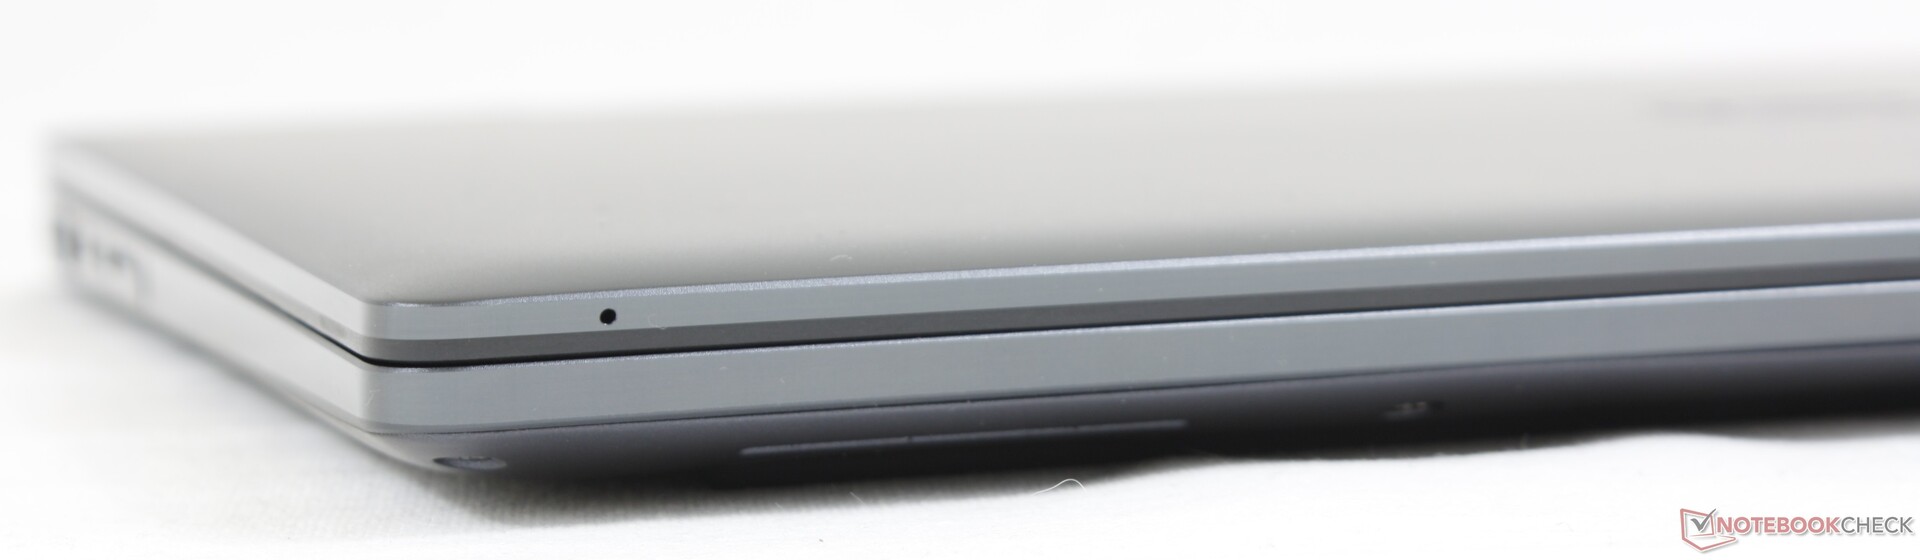
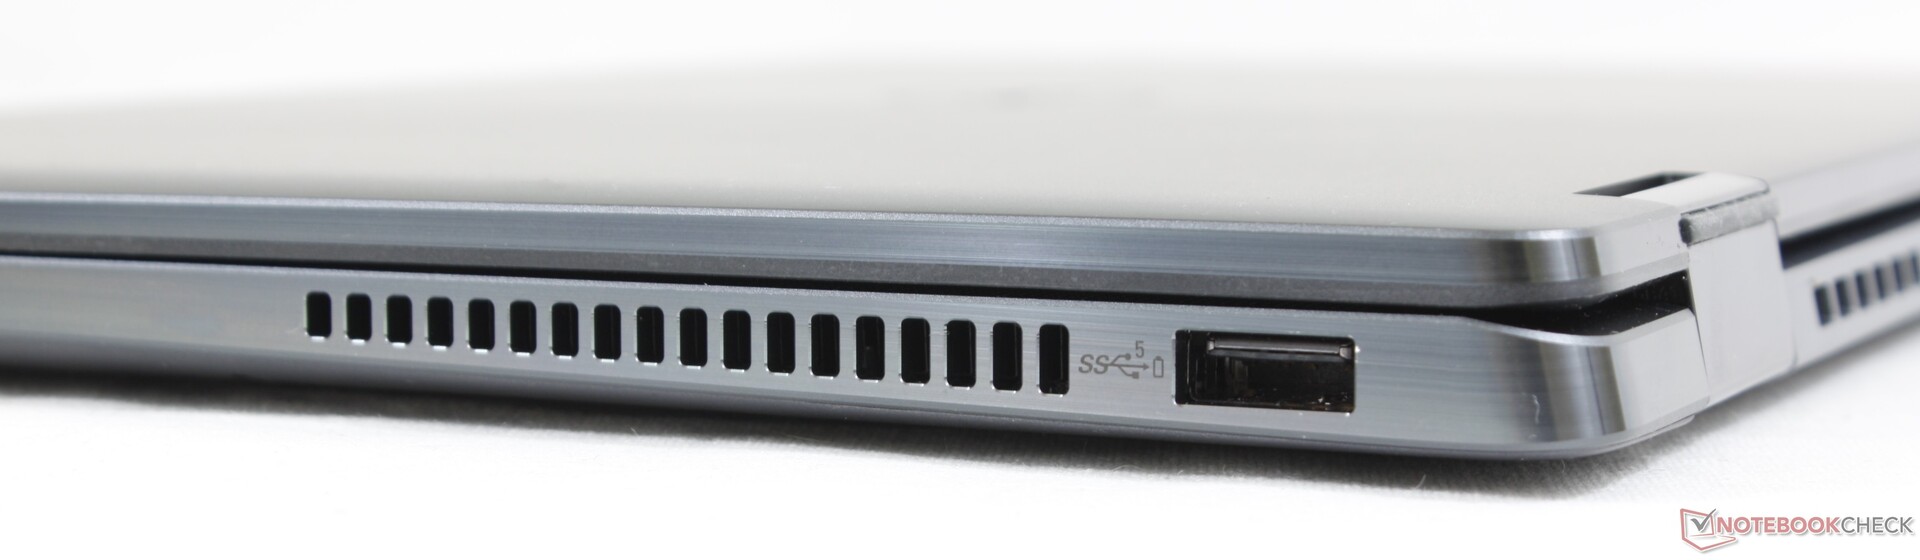
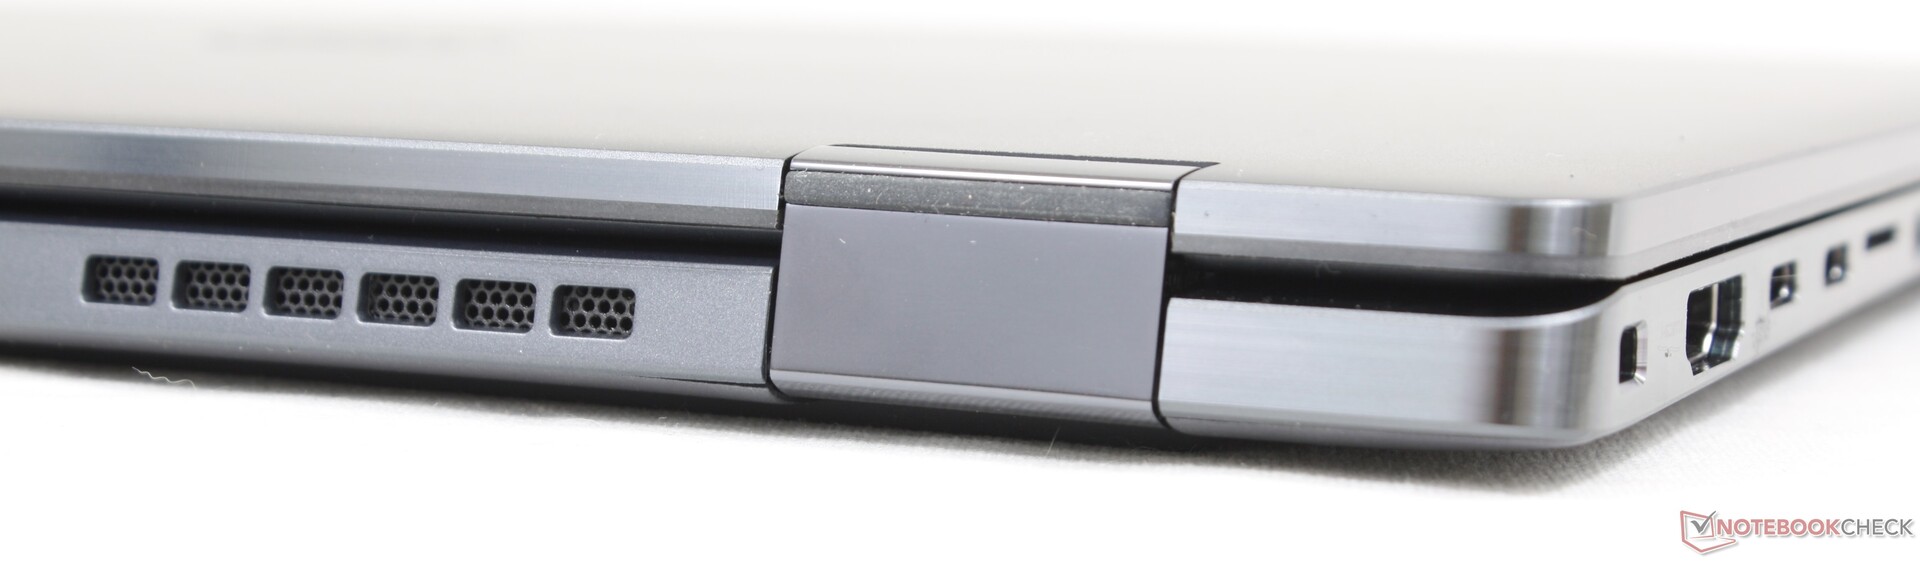
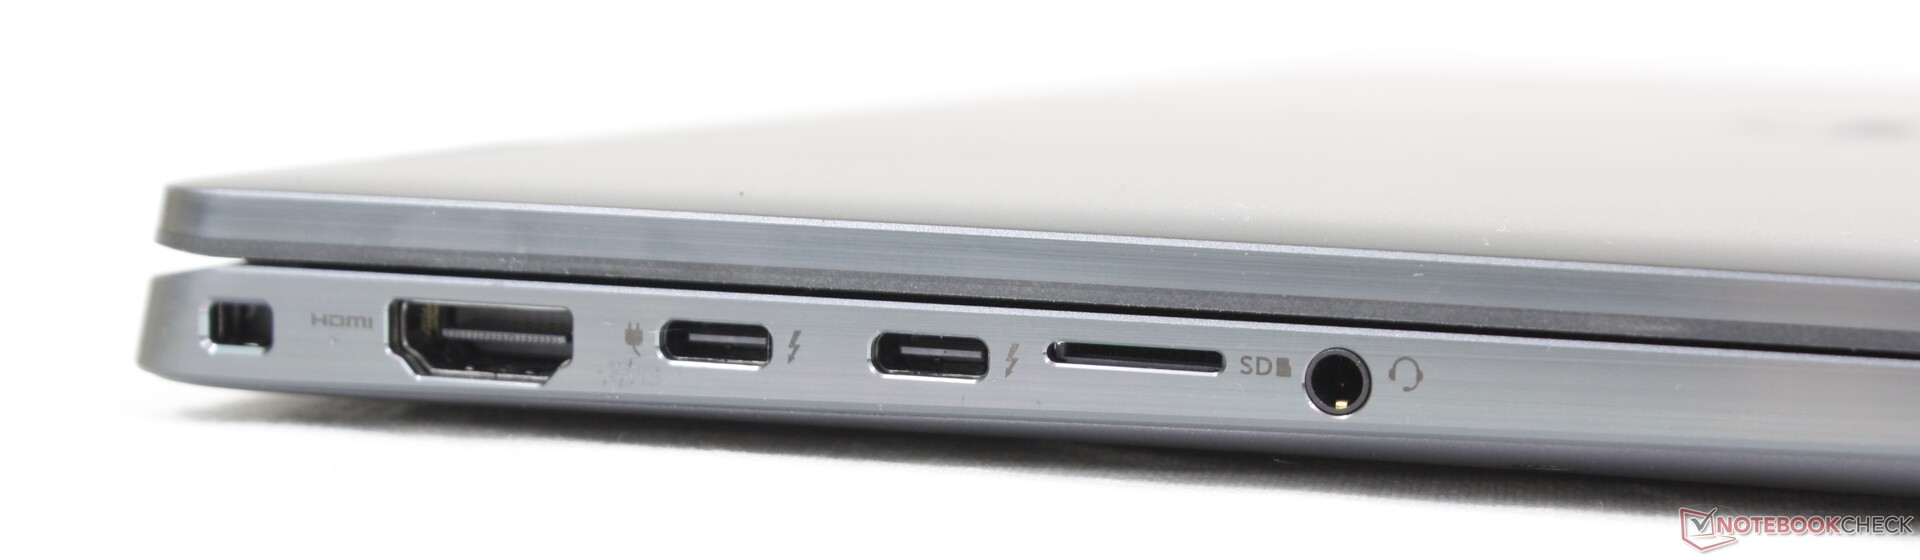
Connectivity
Port options have not changed from the Latitude 9420 2-in-1. It would have been great to see USB-A 3.2 Gen. 2 ports instead of Gen. 1, but not many devices take advantage of Gen. 2 speeds, anyway.
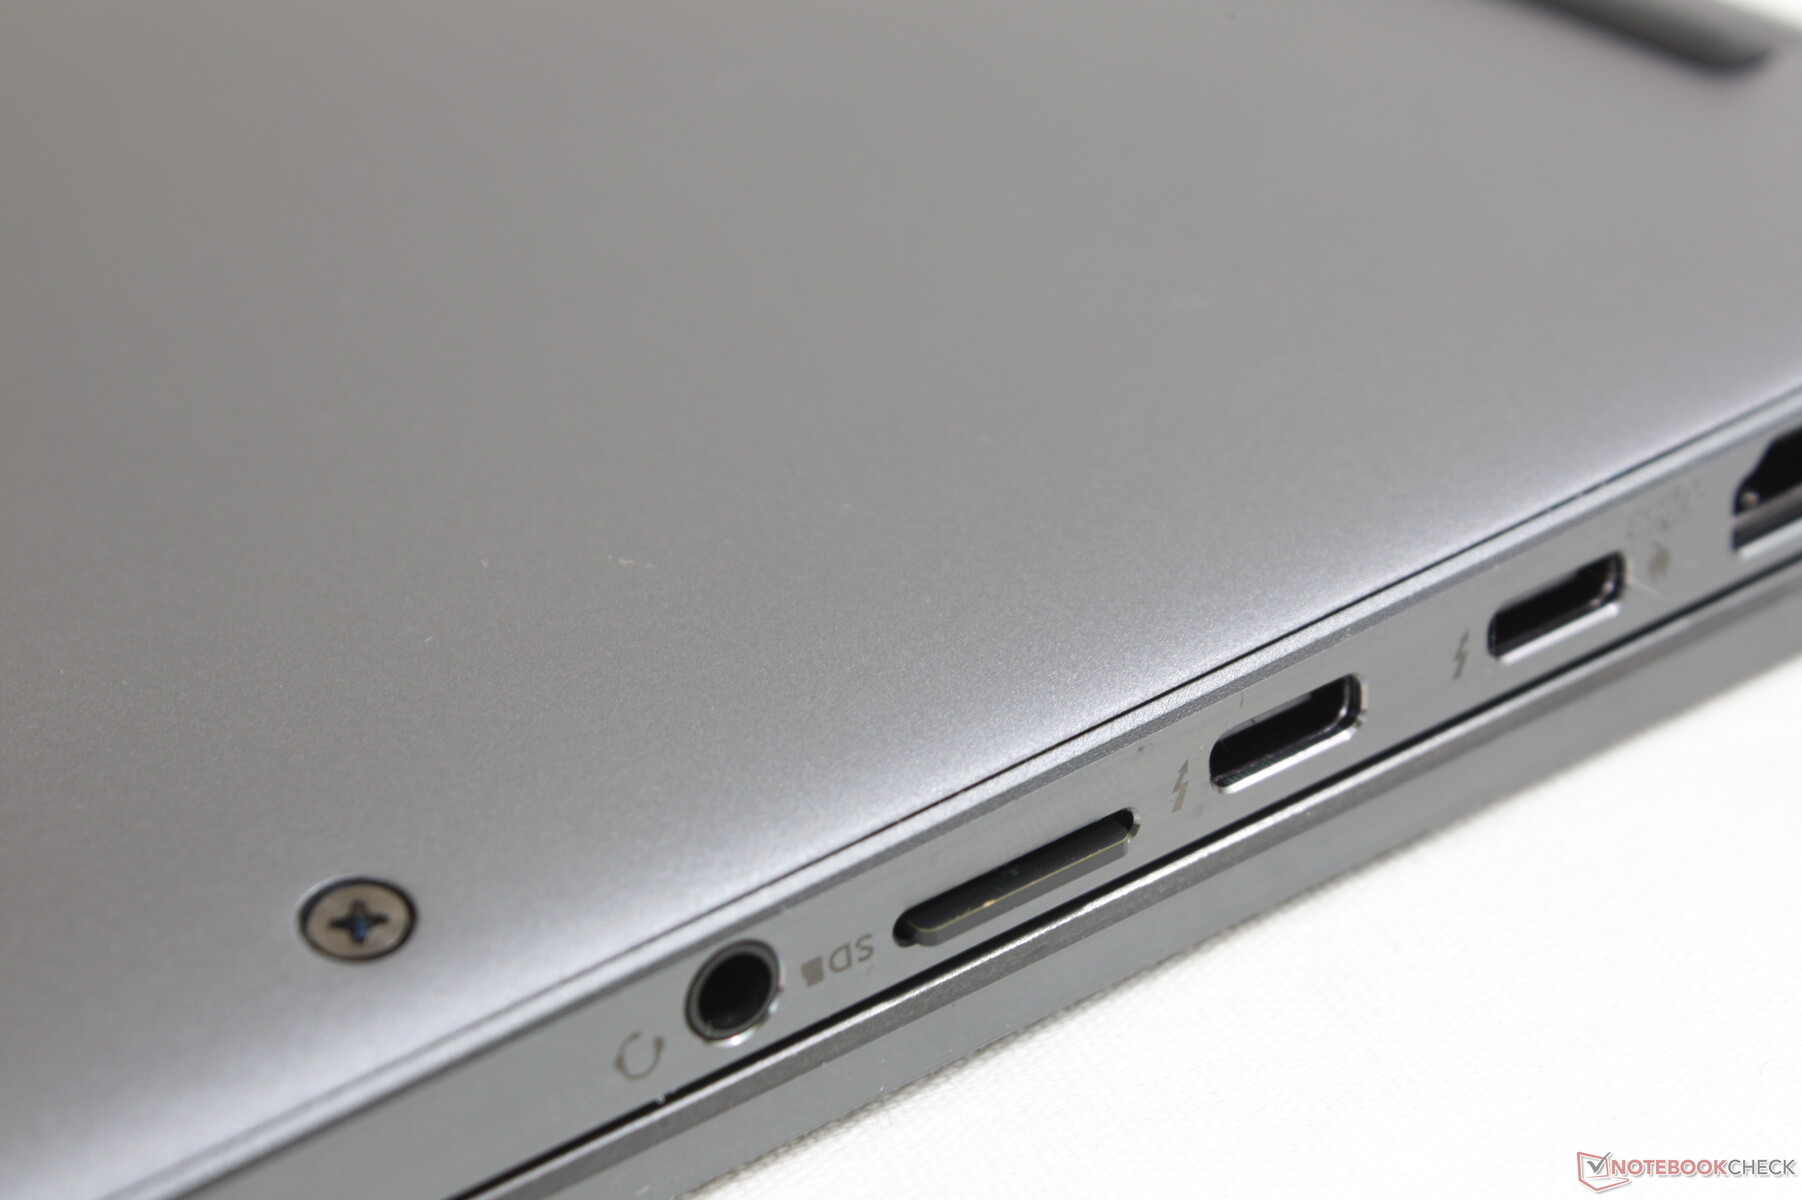
SD Card Reader
Transfer rates from the MicroSD card reader are some of the fastest on a subnotebook. When compared to the Asus ZenBook Flip 14, for example, file transfers are about 2x faster on the Dell when using a UHS-II card.
| SD Card Reader | |
| average JPG Copy Test (av. of 3 runs) | |
| Dell Latitude 9430 2-in-1 (AV Pro UHS-II V60) | |
| Dell Latitude 9420 2-in-1 (AV PRO microSD 128 GB V60) | |
| Asus ZenBook Flip 14 UN5401QA-KN085W (AV Pro SD microSD 128 GB V60) | |
| LG Gram 14T90P (AV Pro V60) | |
| MSI Summit E14 Flip Evo A12MT (AV Pro V60) | |
| maximum AS SSD Seq Read Test (1GB) | |
| Dell Latitude 9420 2-in-1 (AV PRO microSD 128 GB V60) | |
| Dell Latitude 9430 2-in-1 (AV Pro UHS-II V60) | |
| Asus ZenBook Flip 14 UN5401QA-KN085W (AV Pro SD microSD 128 GB V60) | |
| LG Gram 14T90P (AV Pro V60) | |
| MSI Summit E14 Flip Evo A12MT (AV Pro V60) | |
Communication
5G is now an option for the series. However, the feature must be configured before purchasing because the antennae are otherwise not included to discourage users from installing their own 4G or 5G modules.
| Networking | |
| iperf3 transmit AX12 | |
| Asus ZenBook Flip 14 UN5401QA-KN085W | |
| Dell Latitude 9420 2-in-1 | |
| iperf3 receive AX12 | |
| Asus ZenBook Flip 14 UN5401QA-KN085W | |
| Dell Latitude 9420 2-in-1 | |
| iperf3 receive AXE11000 6GHz | |
| Lenovo ThinkPad X1 Yoga G7 21CE002HGE | |
| Dell Latitude 9430 2-in-1 | |
| MSI Summit E14 Flip Evo A12MT | |
| iperf3 transmit AXE11000 6GHz | |
| Lenovo ThinkPad X1 Yoga G7 21CE002HGE | |
| MSI Summit E14 Flip Evo A12MT | |
| Dell Latitude 9430 2-in-1 | |
Webcam
Dell has upped the webcam resolution from 720p to 1080p for a sharper picture. HP is one step ahead in this regard as a number of Spectre and EliteBook models have already begun shipping with 5 MP webcams.


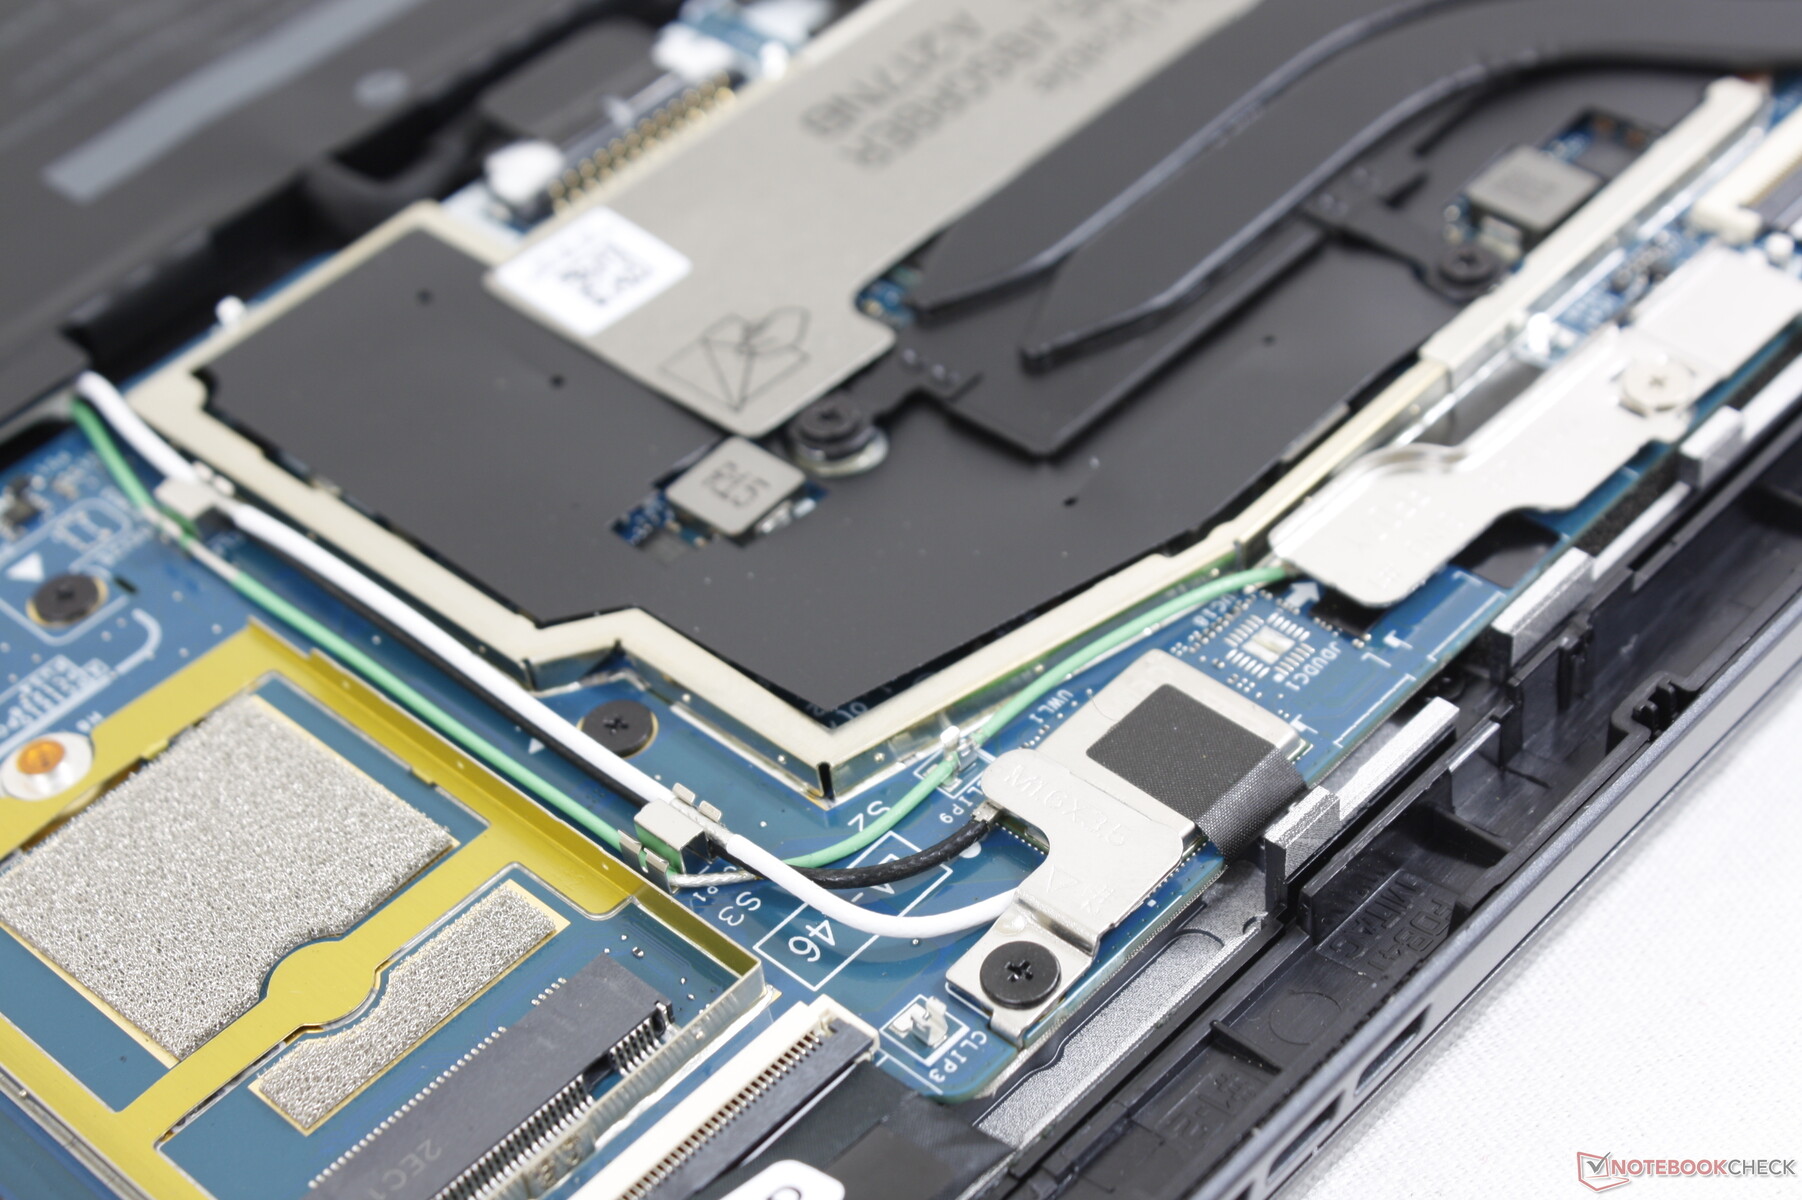
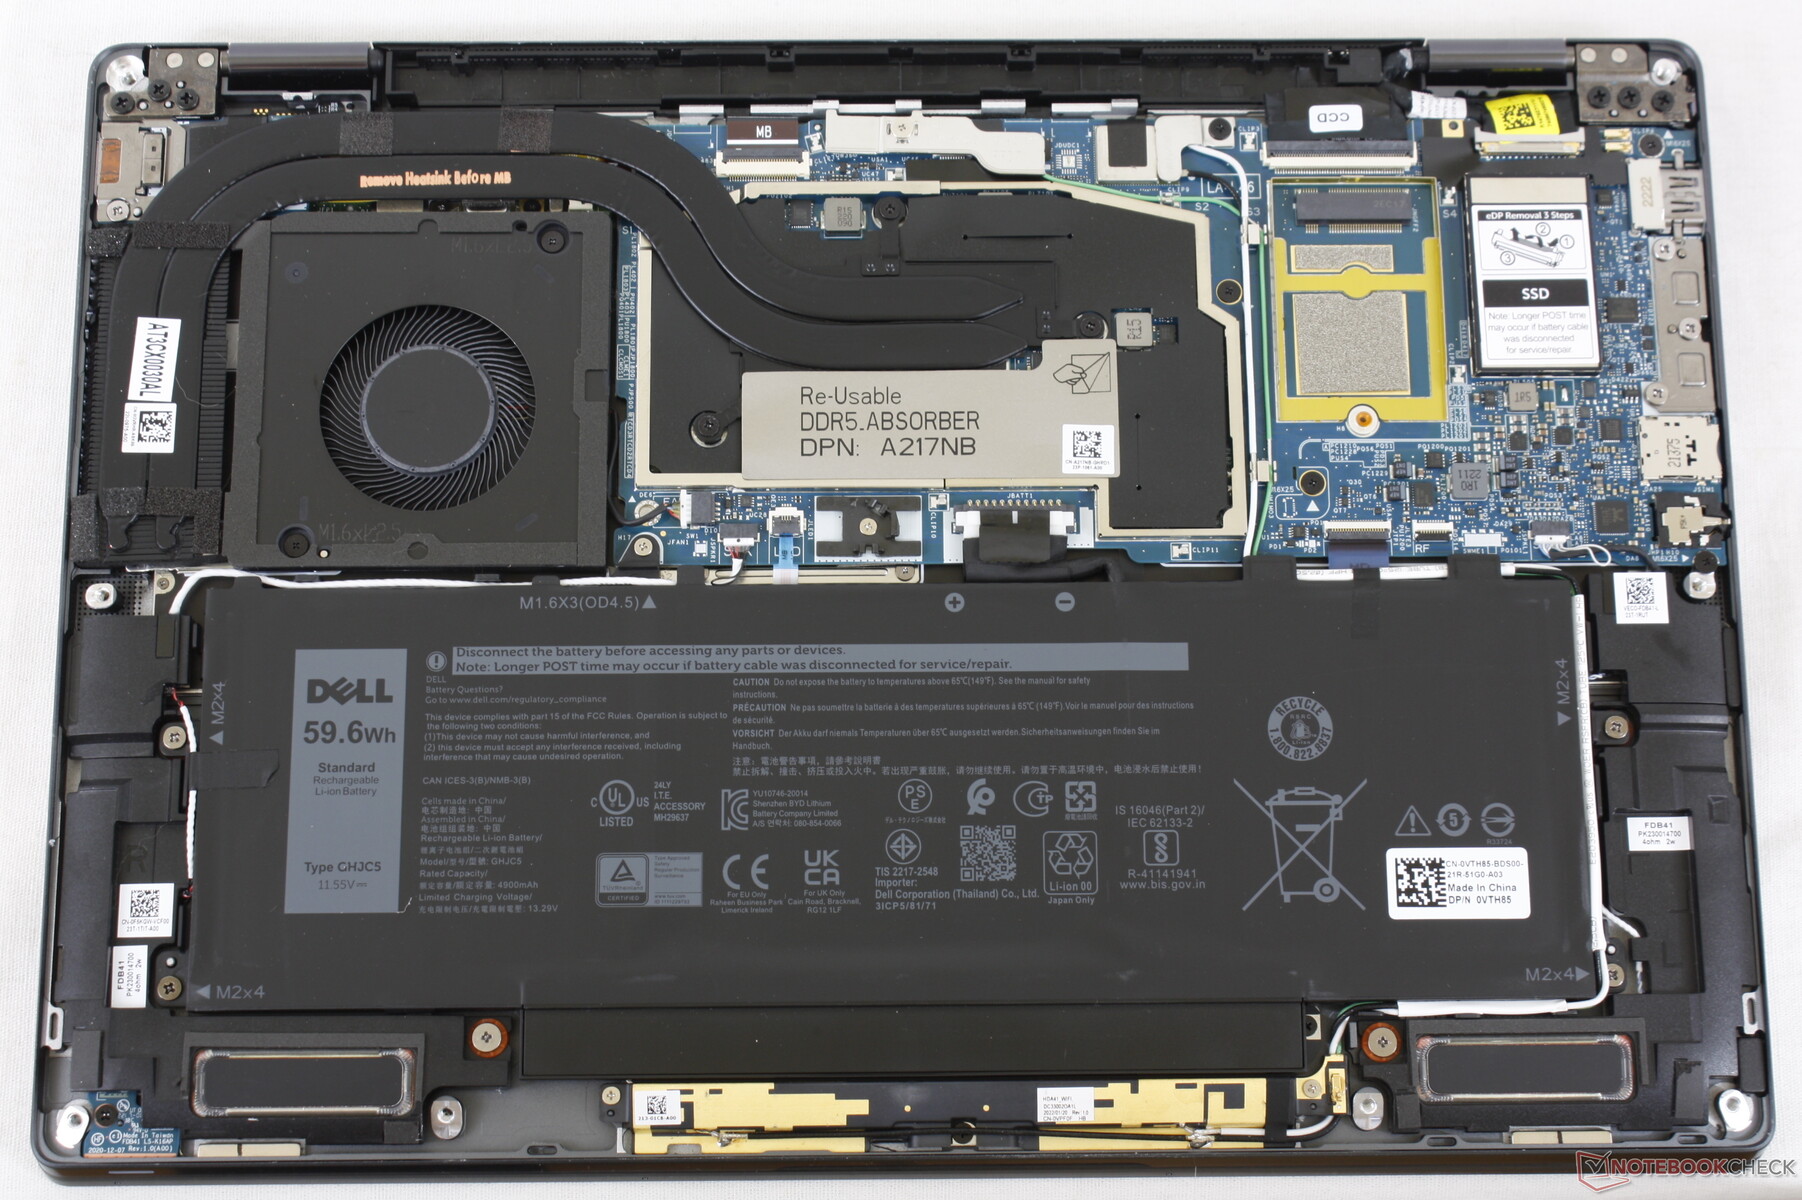
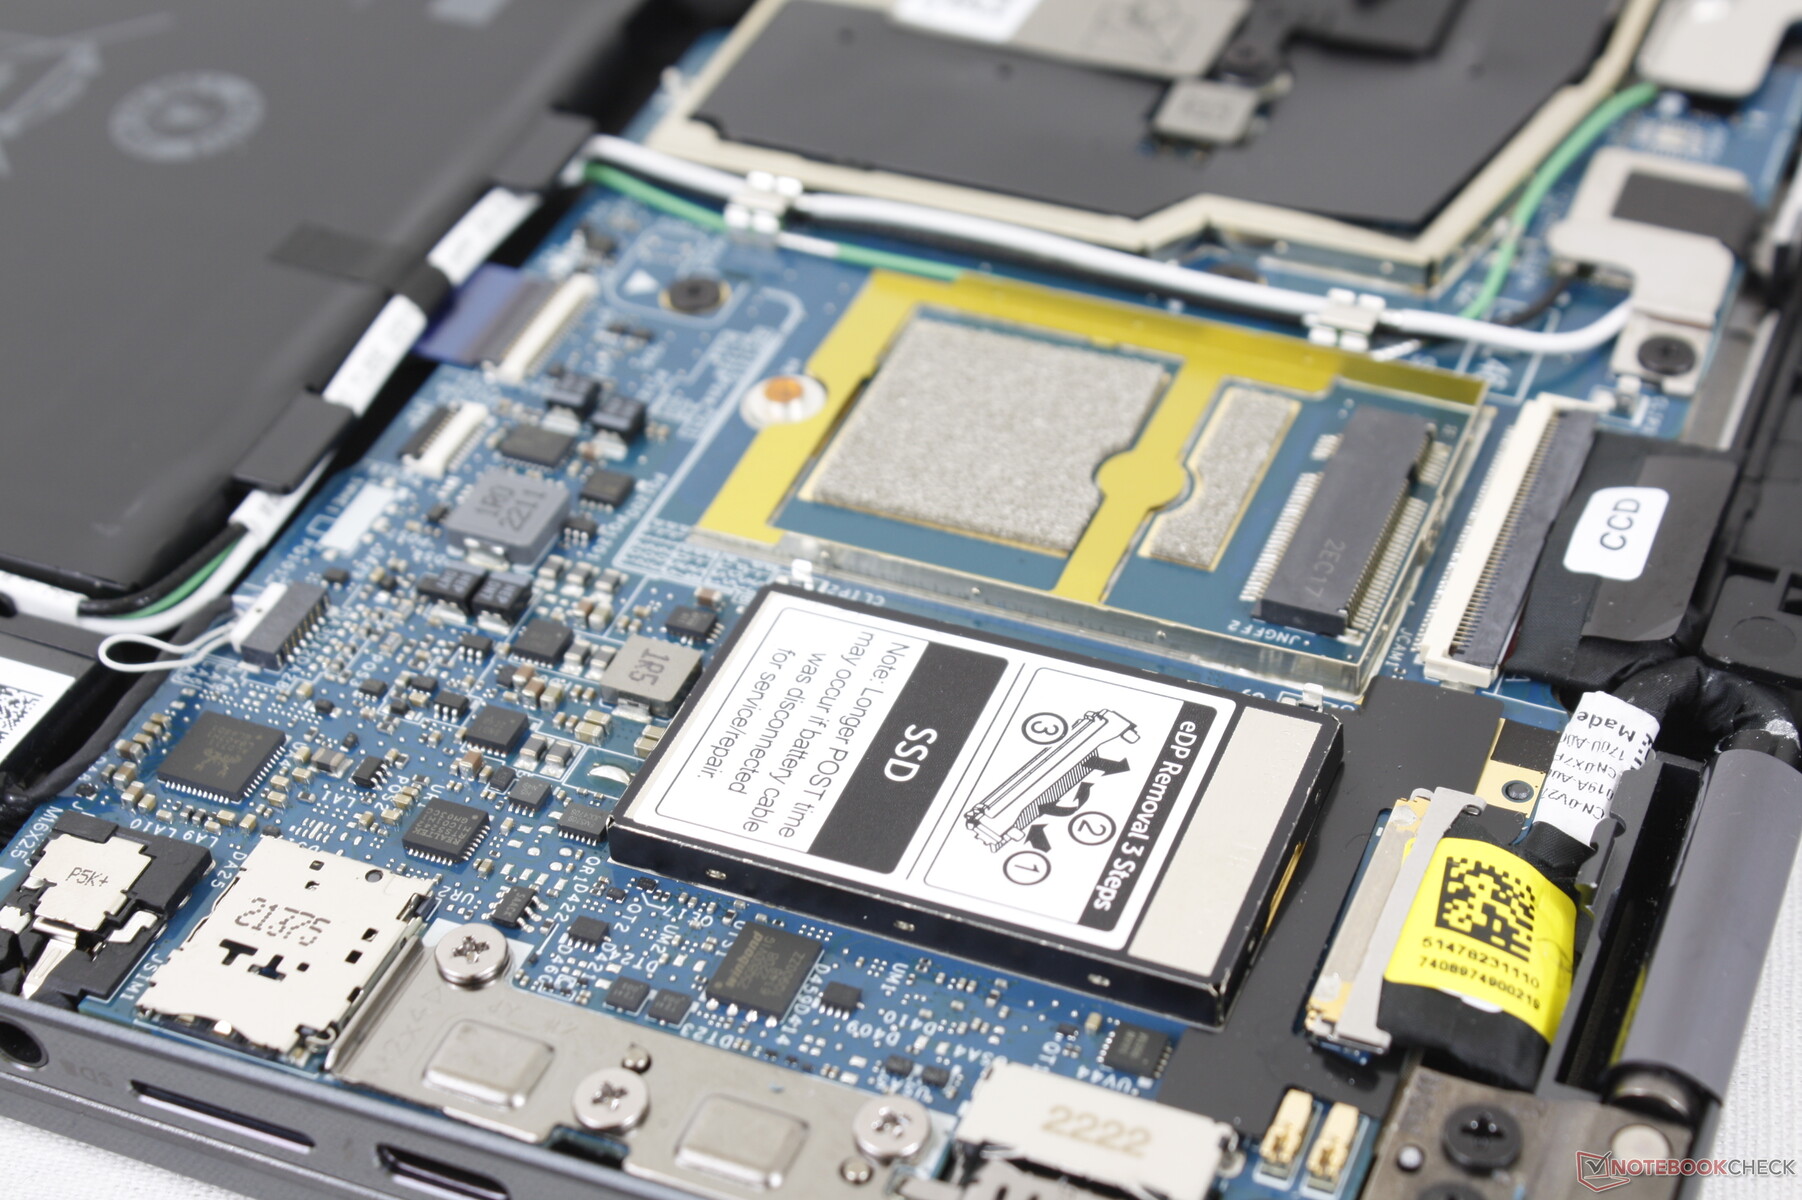
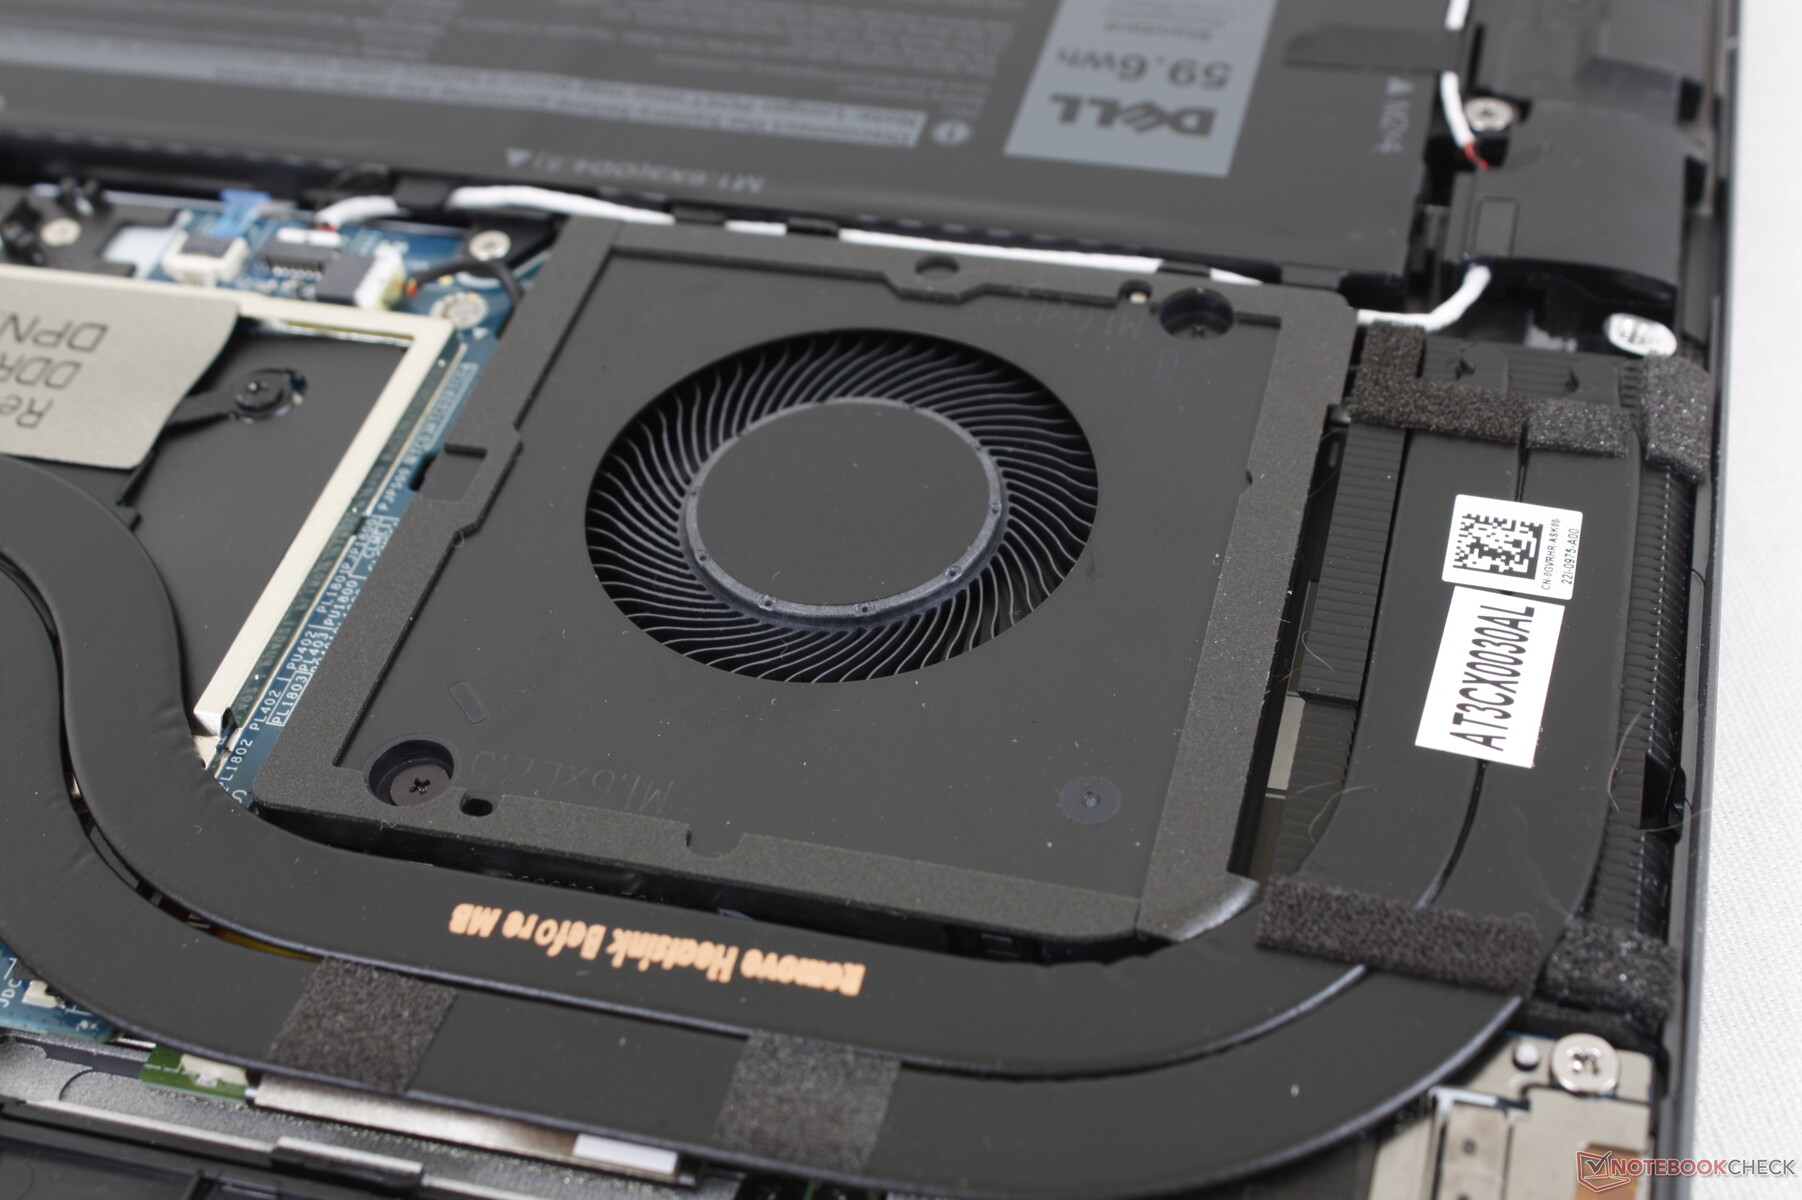
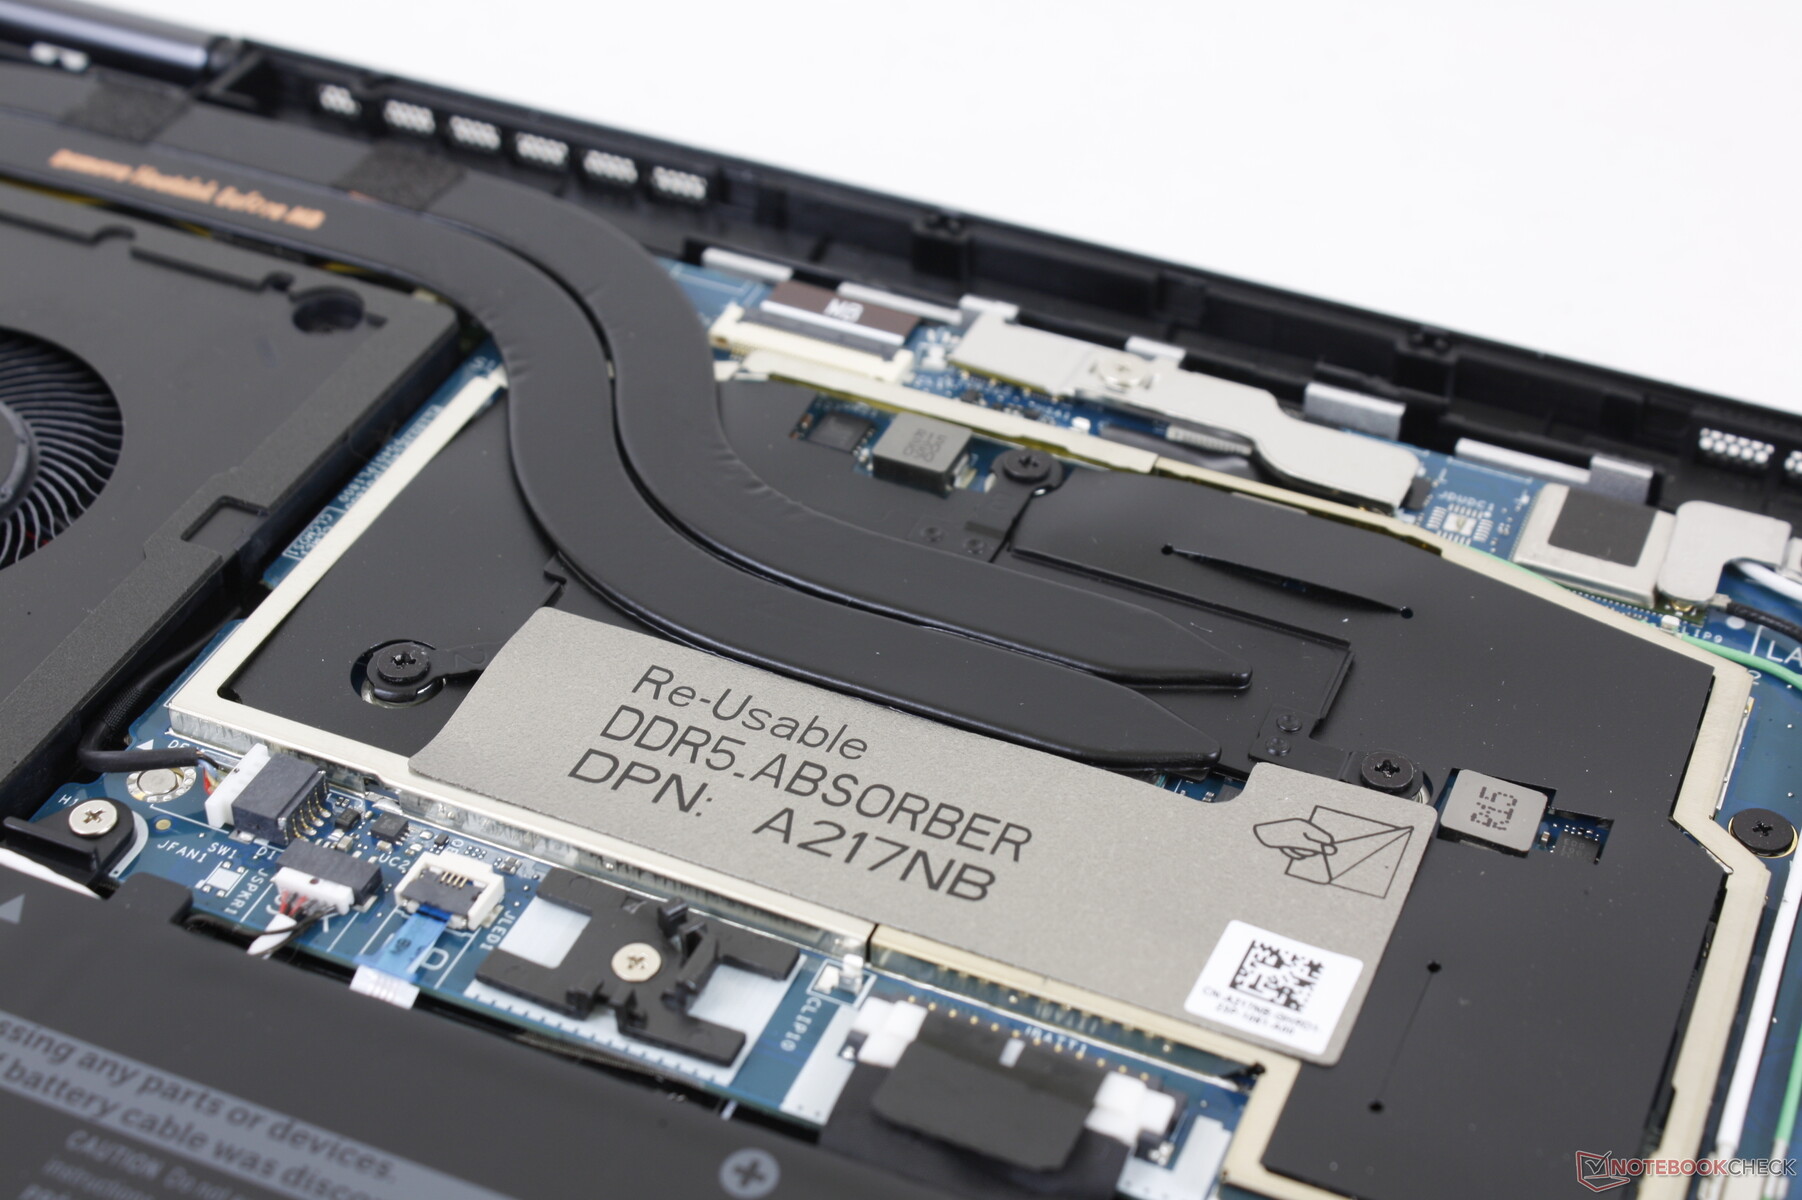
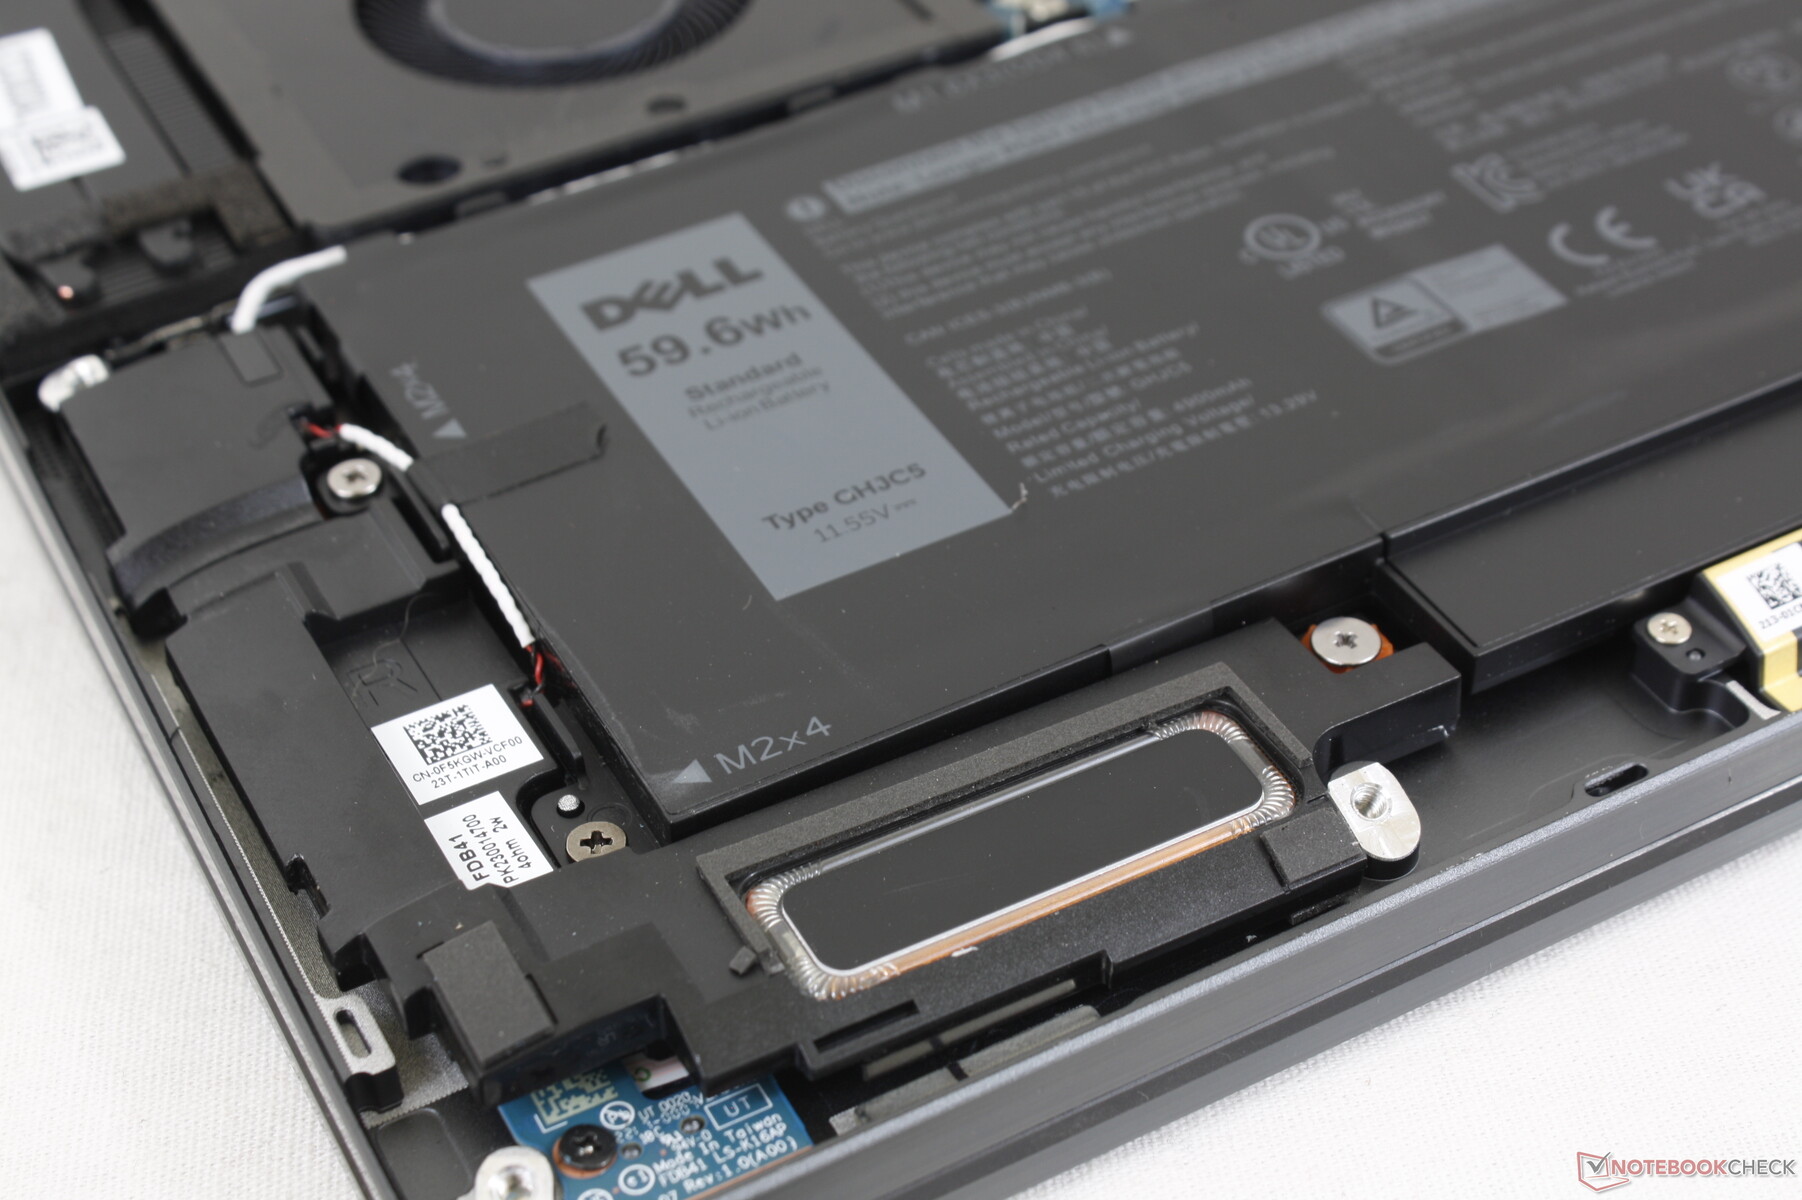
Maintenance
The bottom panel remains very easy to remove. There isn't much to service beyond the SSD and battery, however, as the WLAN and RAM modules are soldered.
Accessories and Warranty
There are no extras in the box beyond the AC adapter and paperwork. The PN7522W active pen must be purchased separately for $80 to $110 USD.
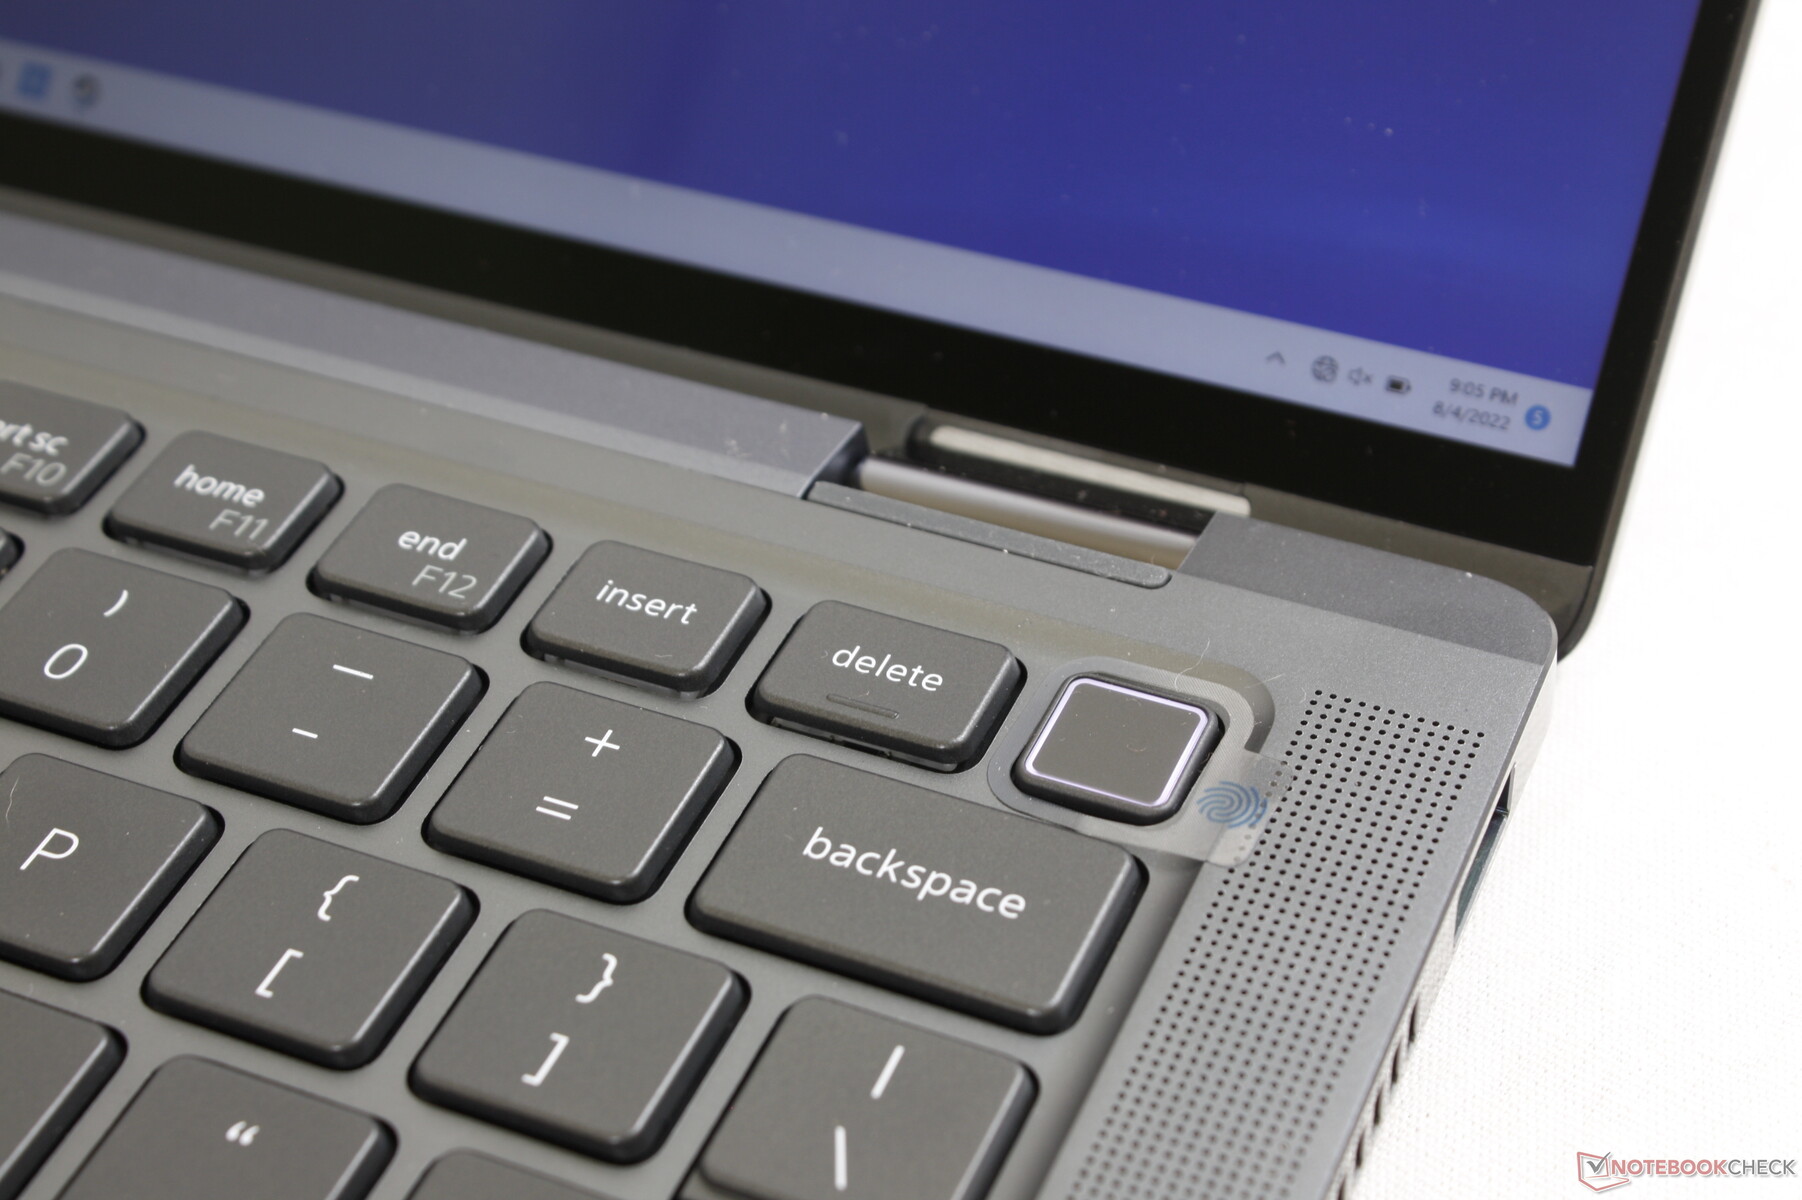
Input Devices
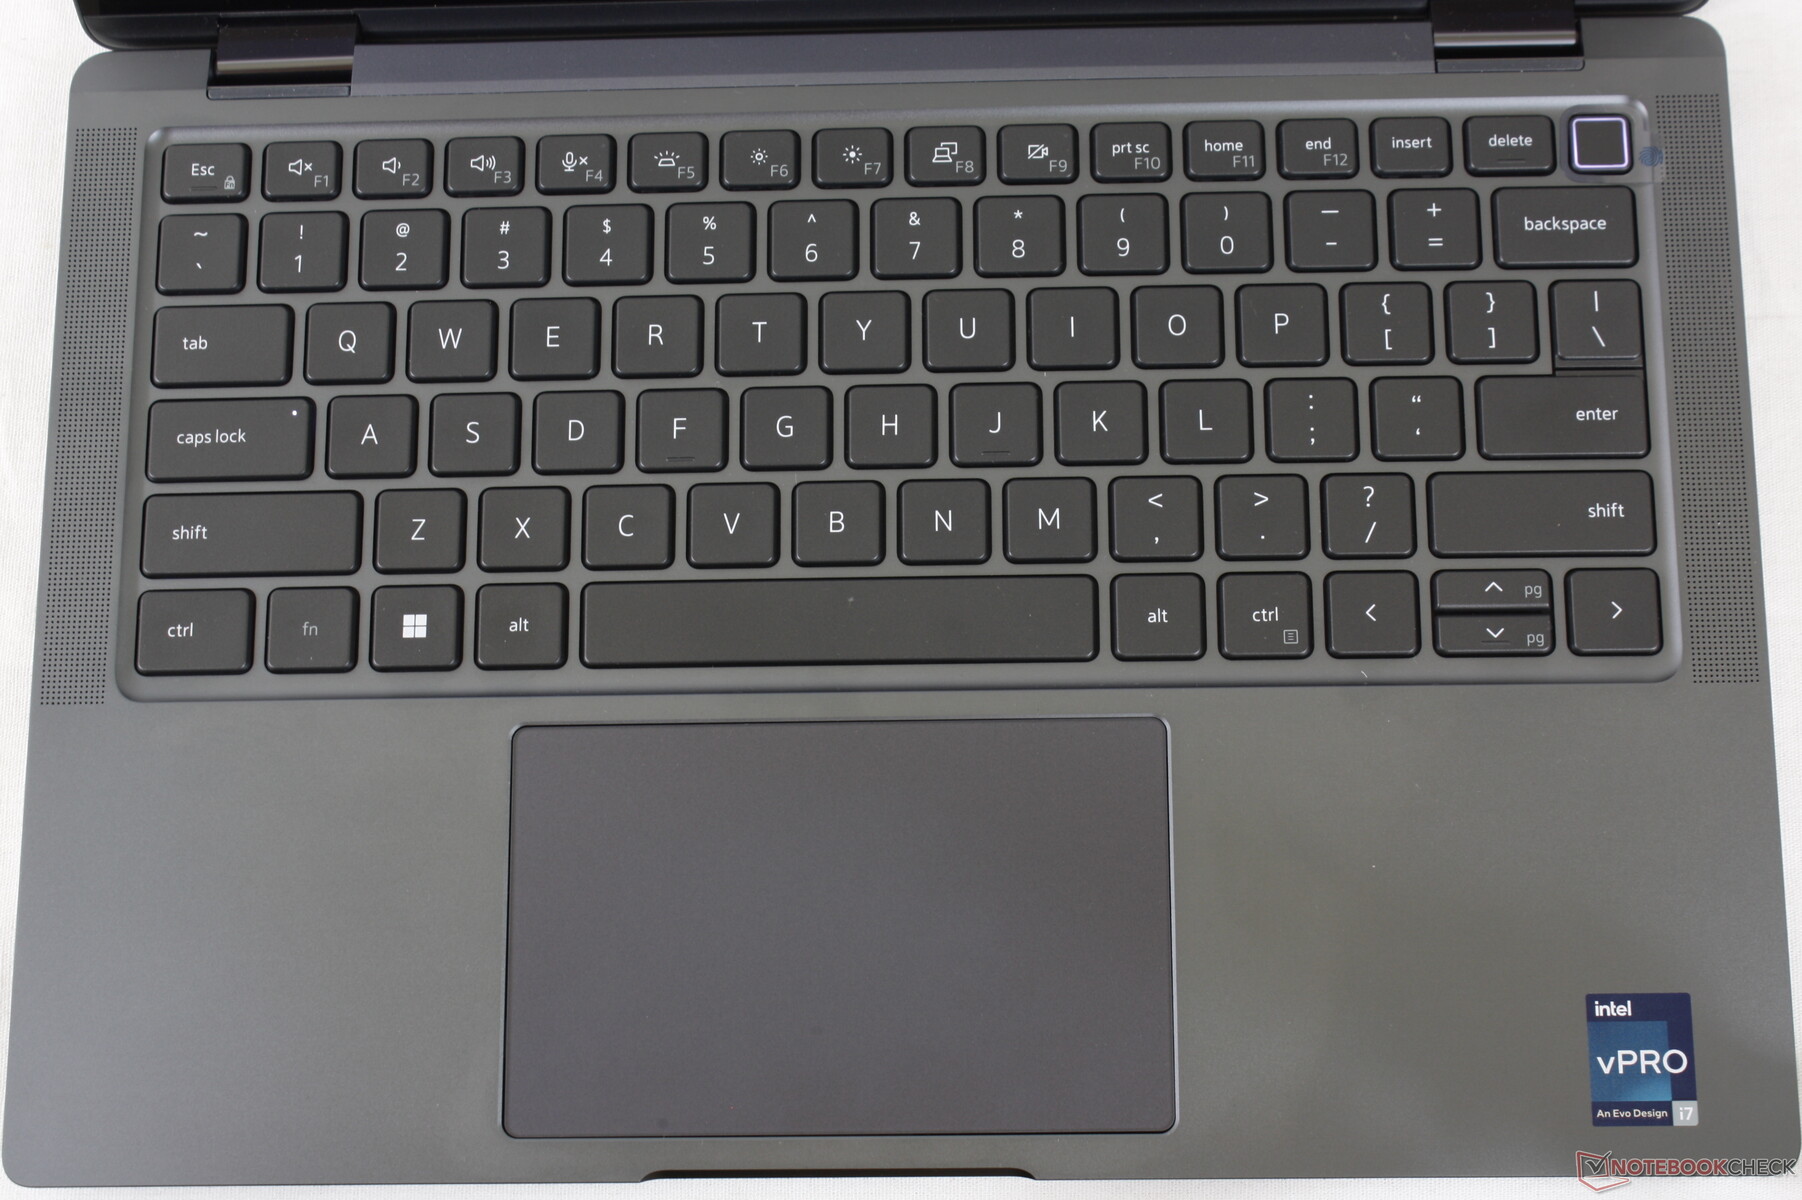
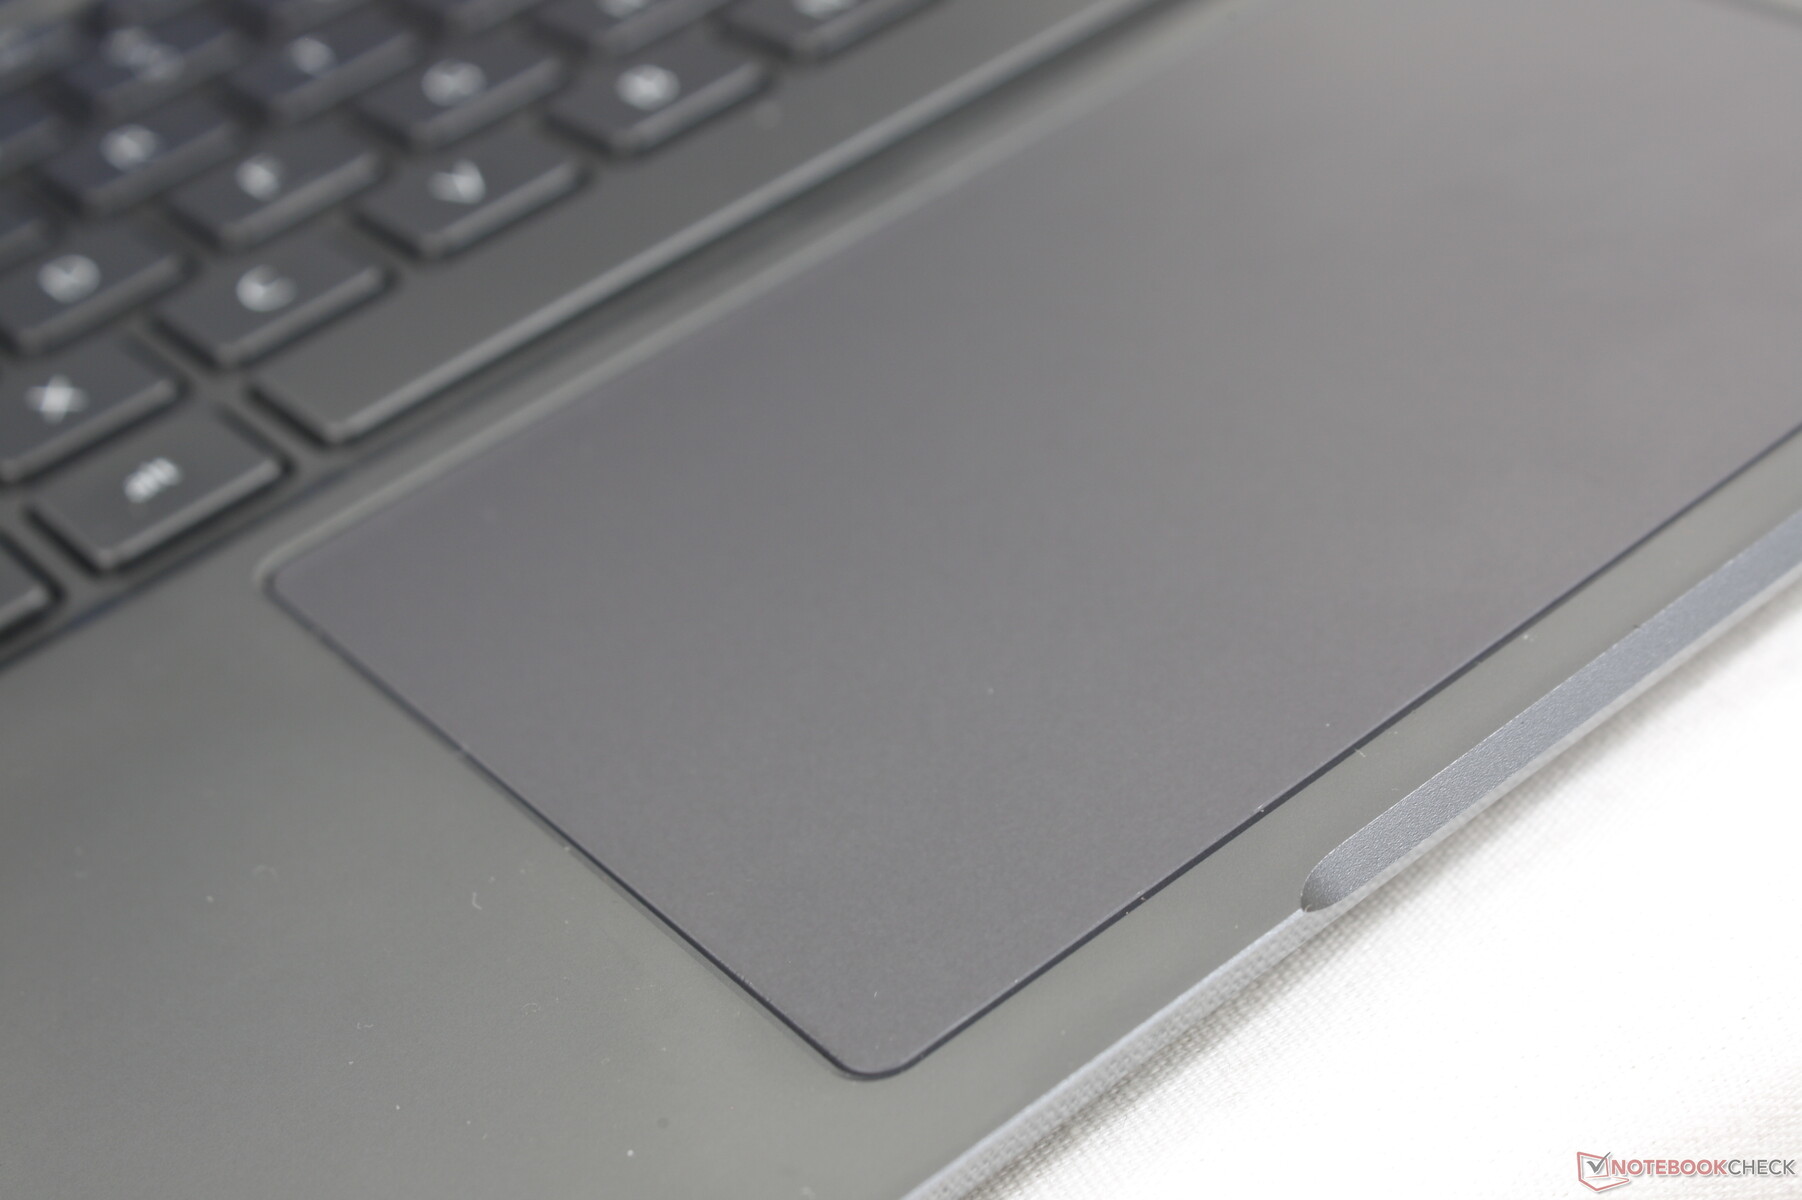
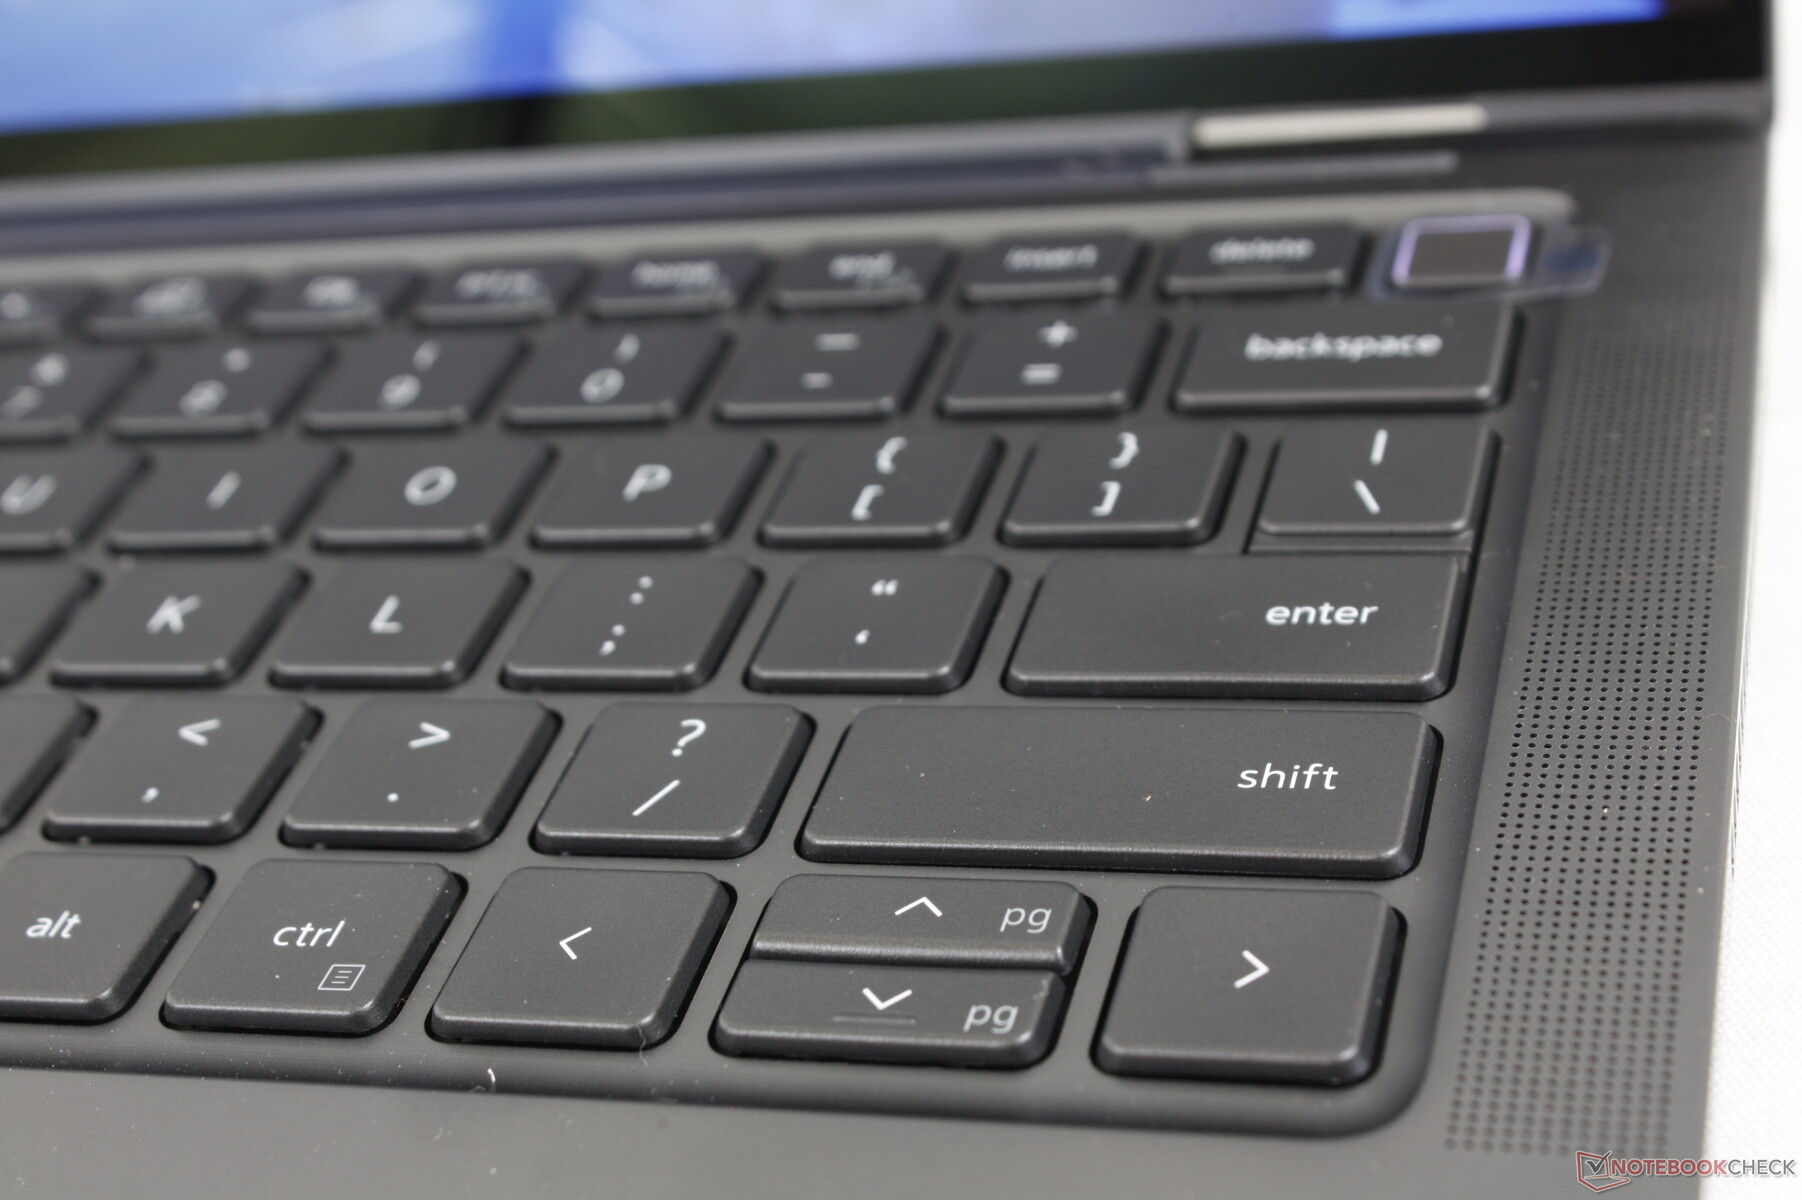
Keyboard and Touchpad
When compared to the keyboards on a HP EliteBook or Spectre, the keyboard on our Latitude is slightly quieter but softer. It's not any less comfortable as it mostly comes down to user preference. However, an extra point goes to the HP models as they incorporate a dedicated key for launching HP specific apps like Command Center or myHP. Such a key on the Dell Latitude for launching Optimizer or Power Manager would have been very useful.

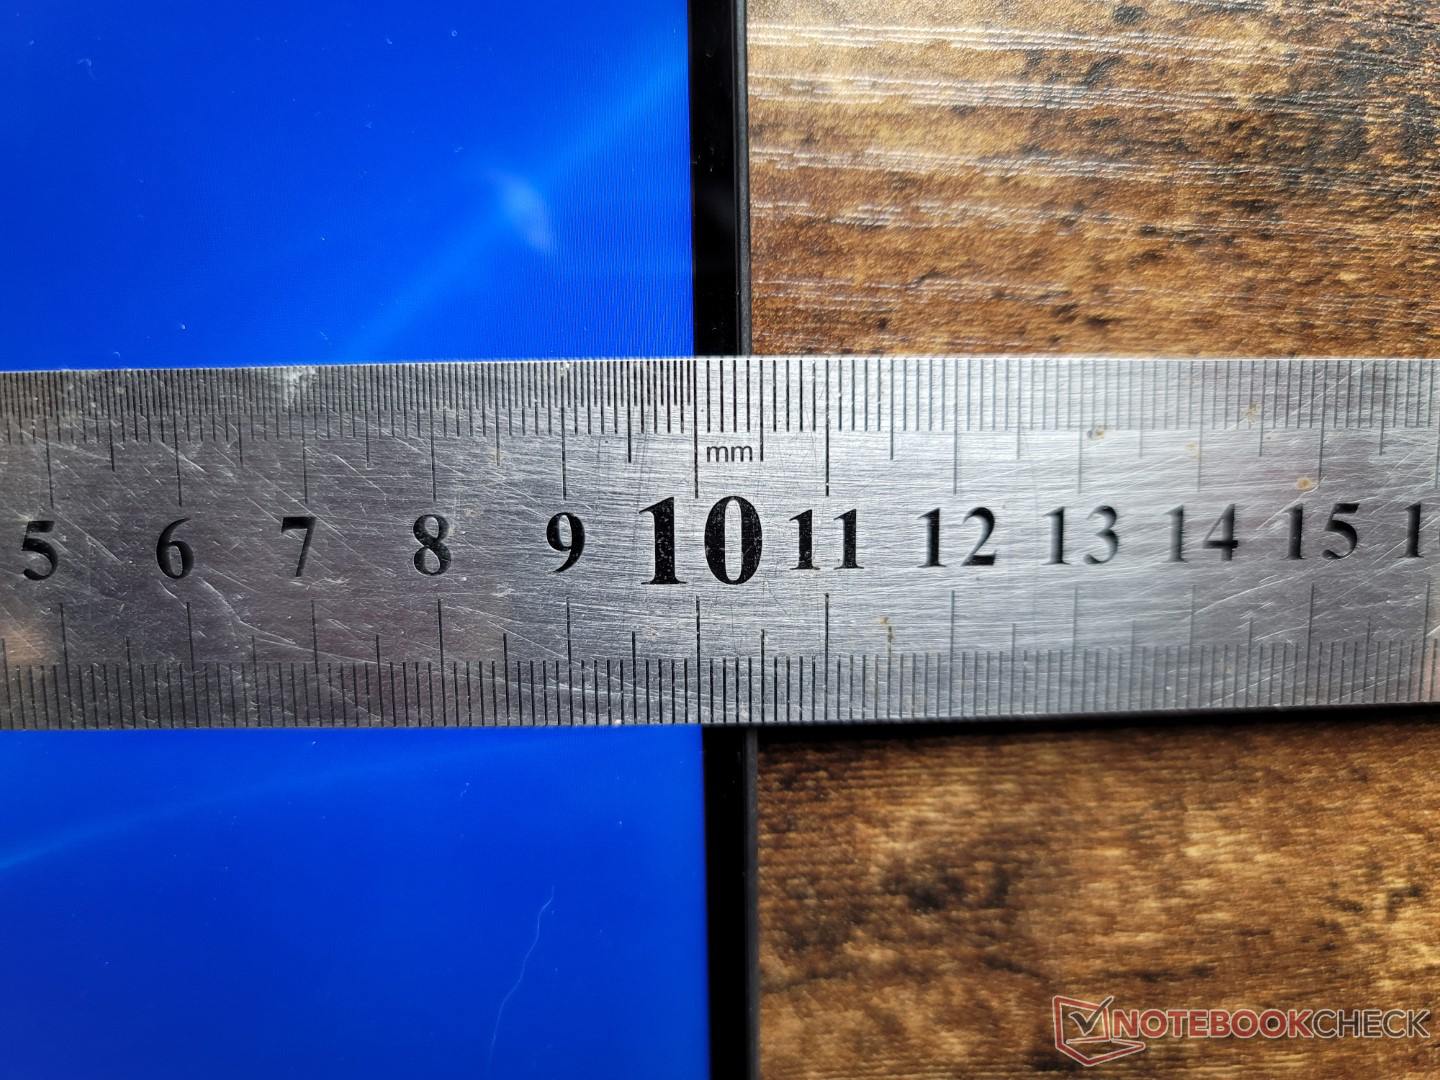
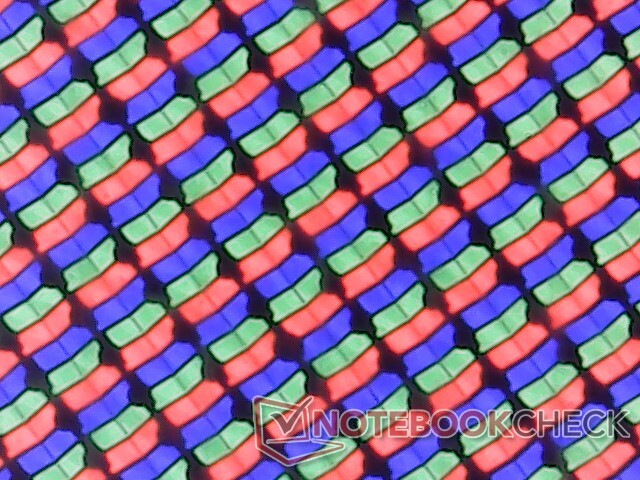
Display
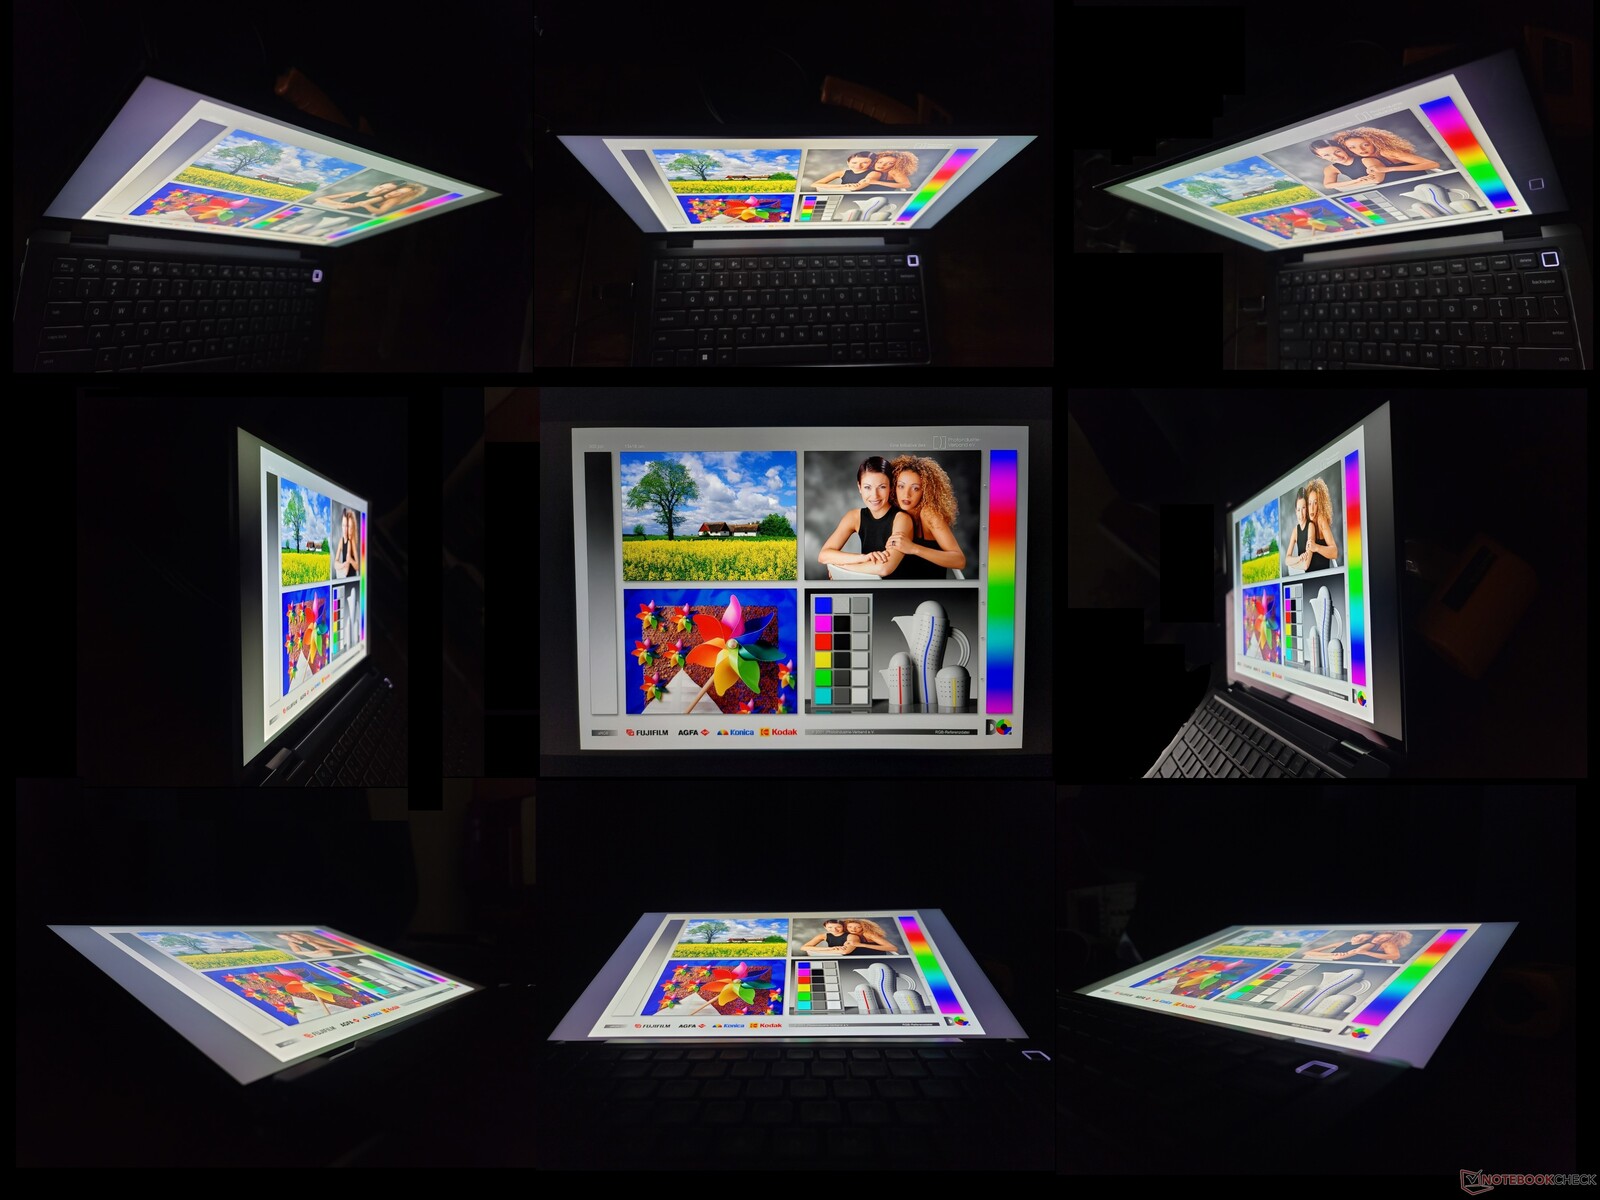
The AU Optronics B140QAN IPS panel on last year's model has returned meaning users can expect the same viewing experience between the Latitude 9420 2-in-1 and Latitude 9430 2-in-1. Still, it would have been great to at least see new options with faster refresh rates or even OLED like on the latest Asus ZenBook 14 or HP Spectre series. The very slow black-white and gray-gray response times in particular continue to be noticeable. The panel is nonetheless excellent for office-type workloads where slow response times have less of an impact.
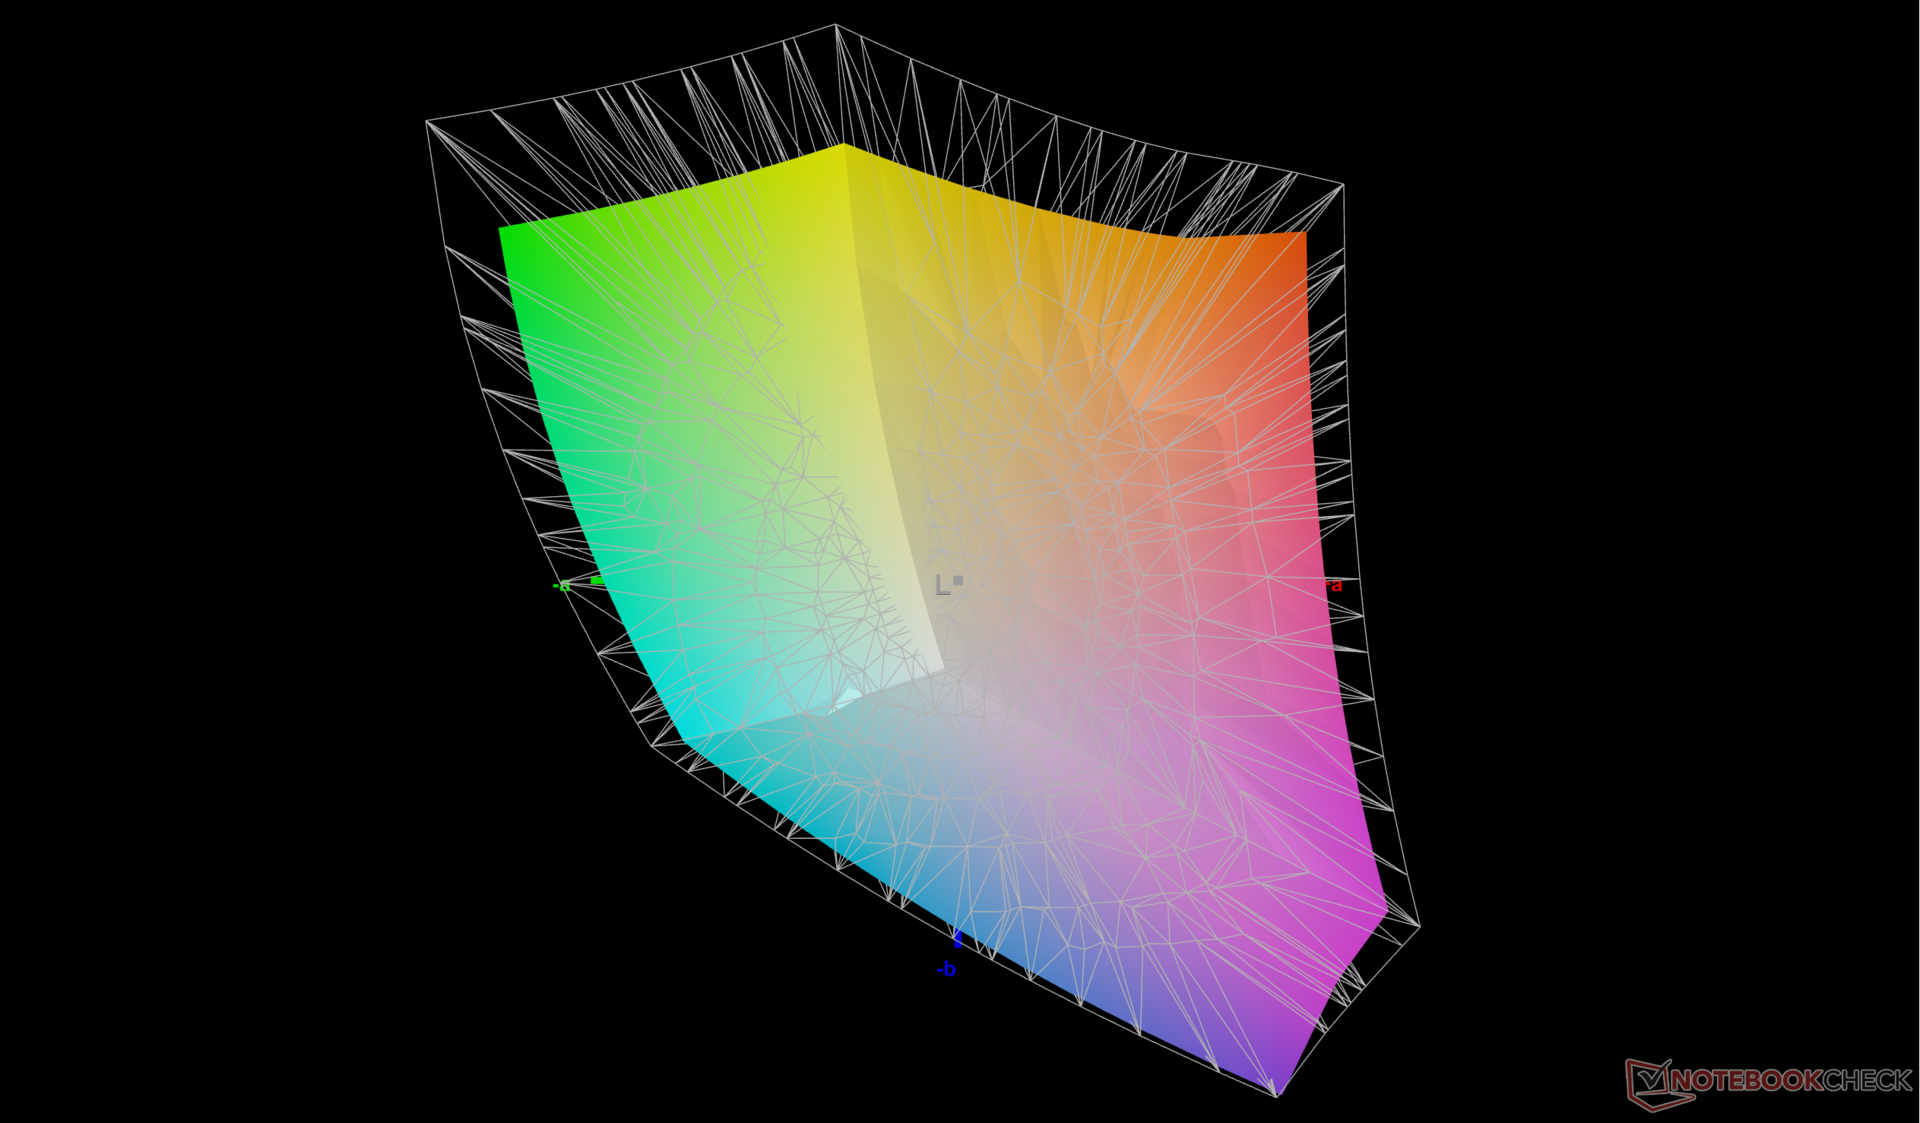
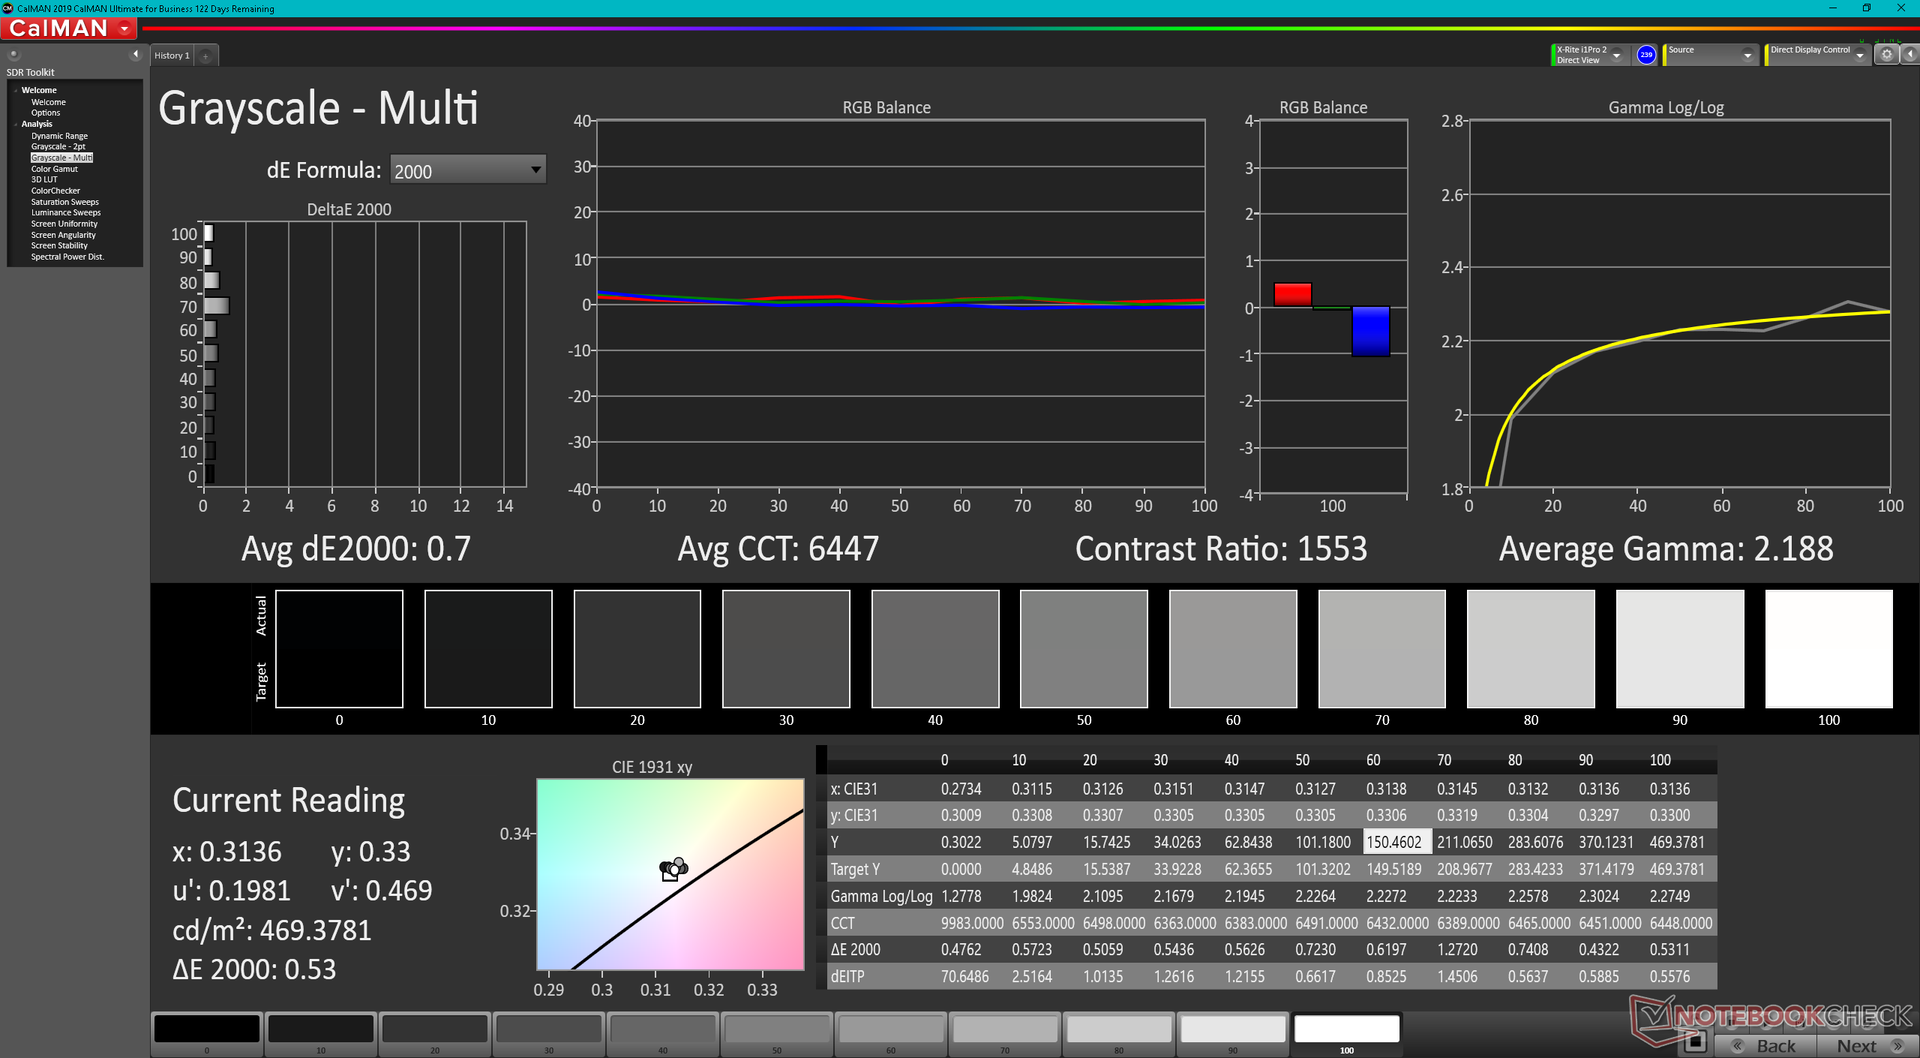
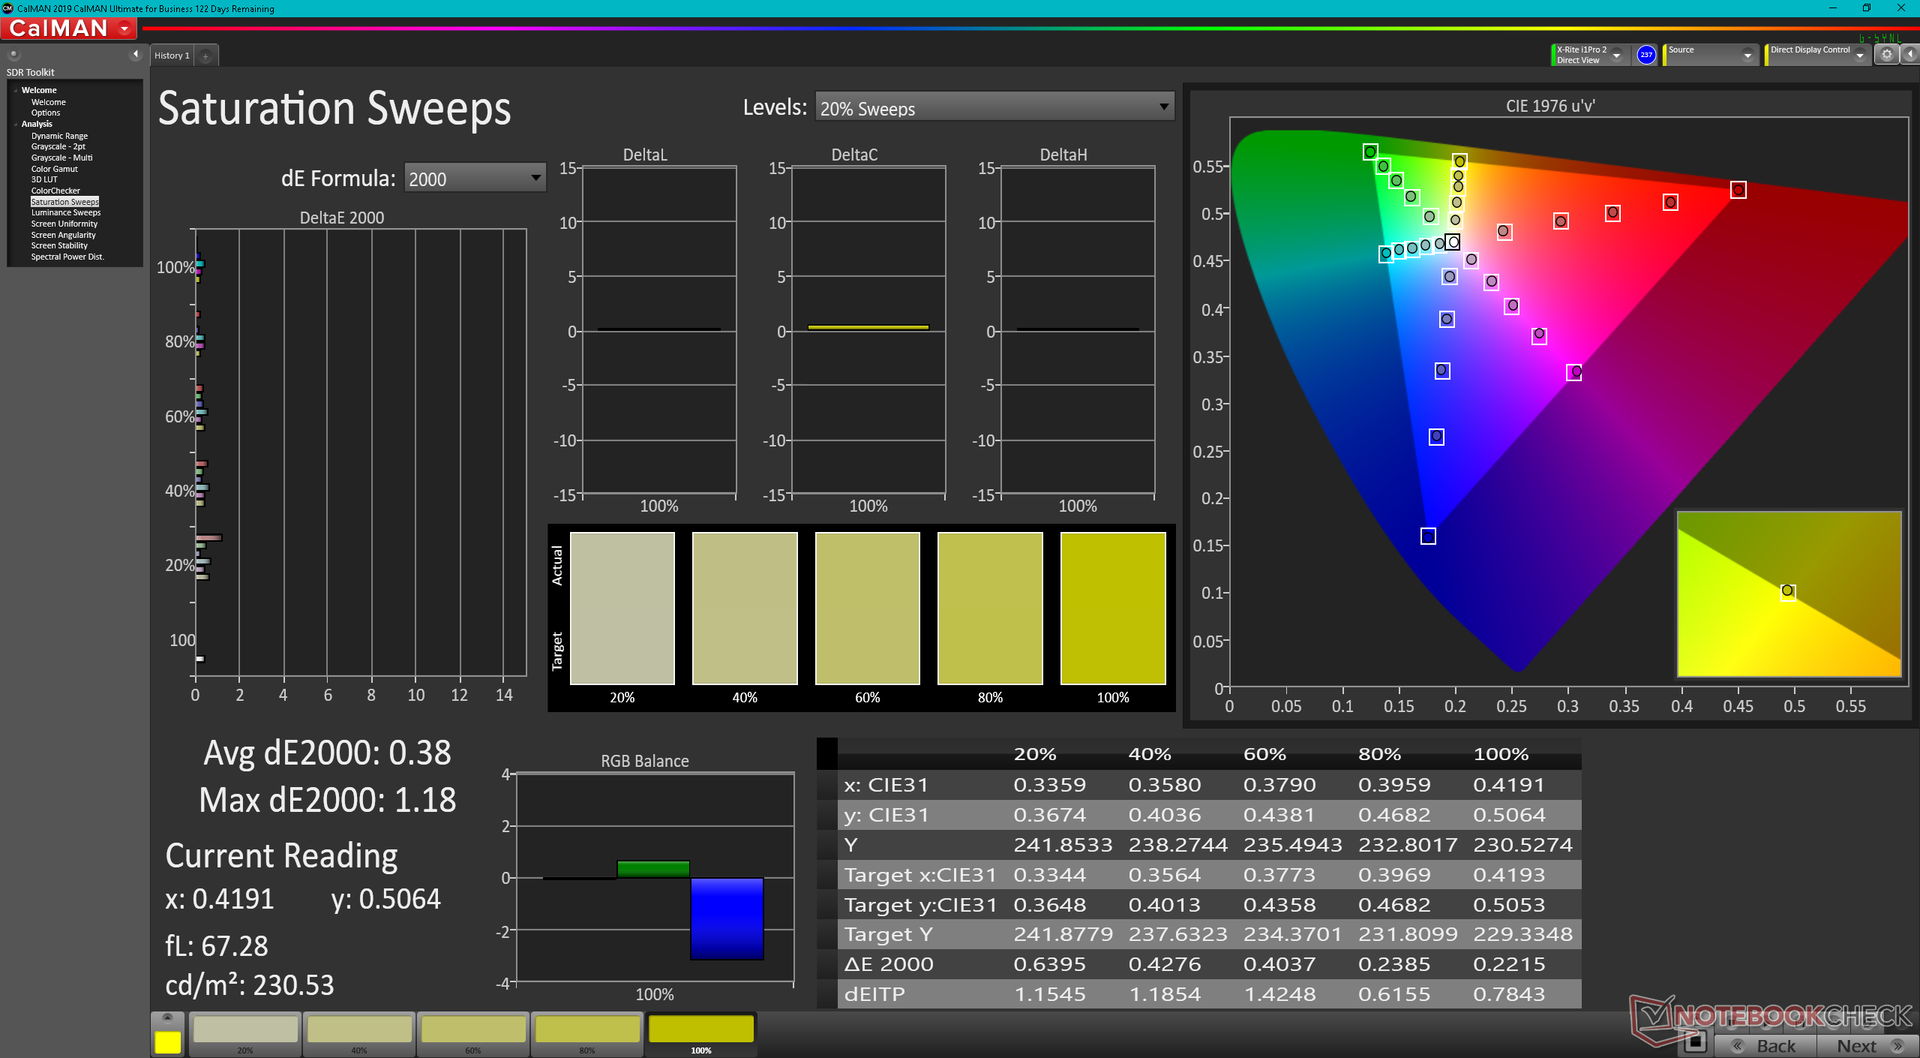
Dell advertises full sRGB coverage which we can independently confirm. We wouldn't expect anything less from a high-end Latitude 9000 series model.
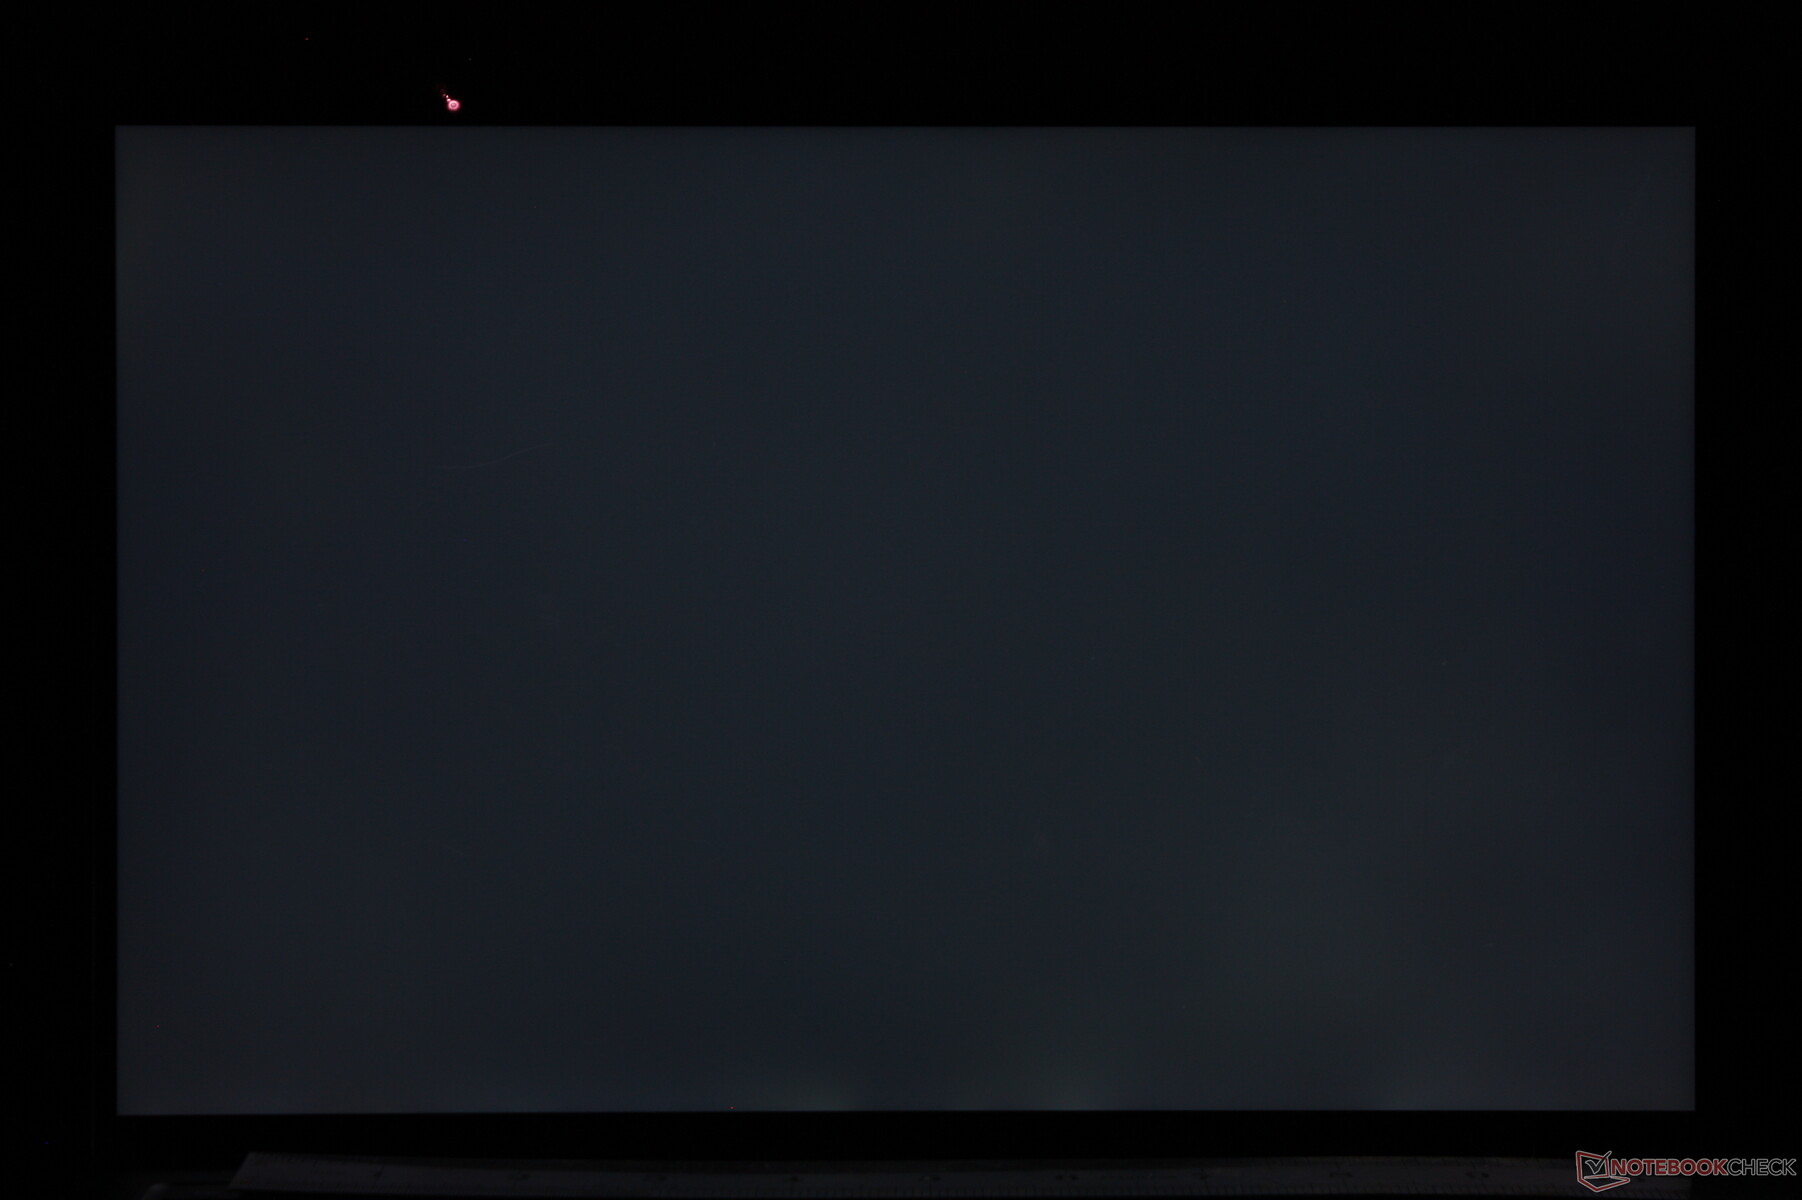
We encountered a bug on our unit where the brightness would not change within the 0 to 28 percent brightness setting range. Brightness would be stuck at 32 nits until the setting reaches 29 percent or higher. Dell is aware of this issue.
| |||||||||||||||||||||||||
Brightness Distribution: 90 %
Center on Battery: 517.7 cd/m²
Contrast: 1569:1 (Black: 0.33 cd/m²)
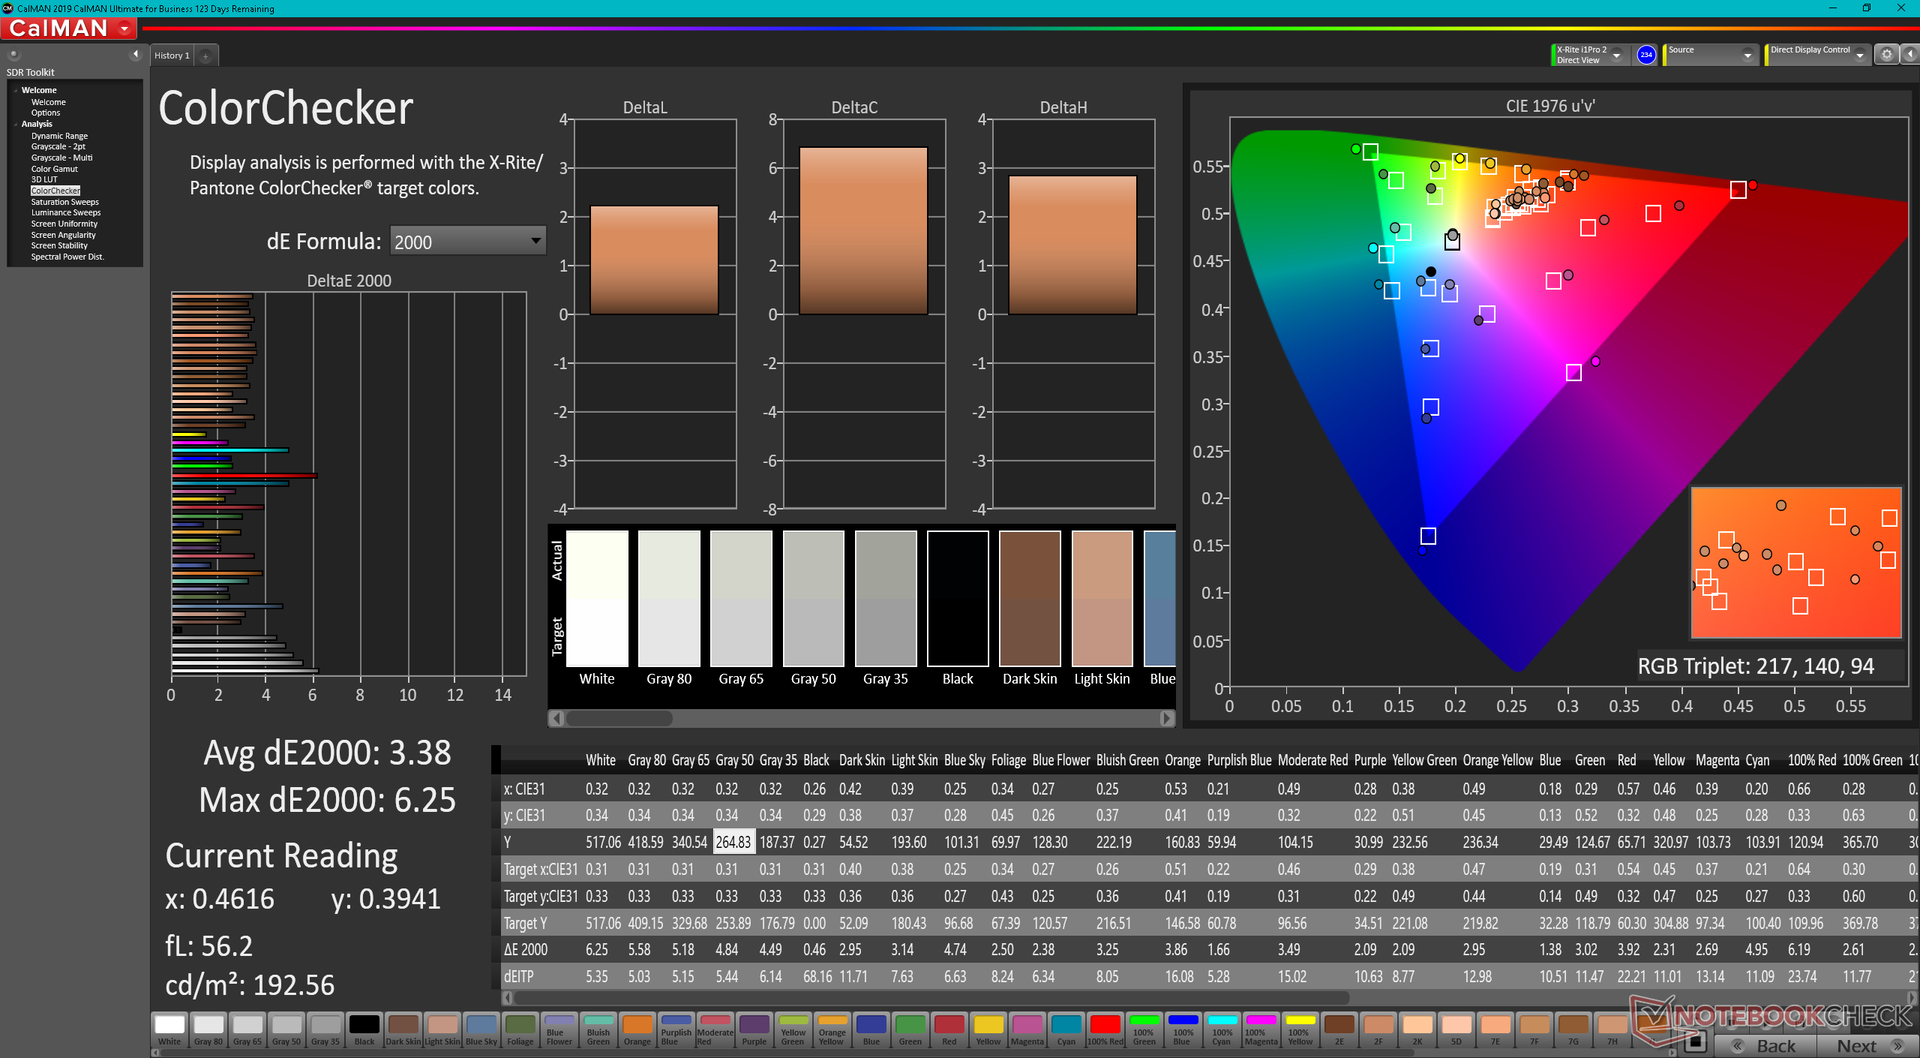
ΔE ColorChecker Calman: 3.38 | ∀{0.5-29.43 Ø4.71}
calibrated: 0.41
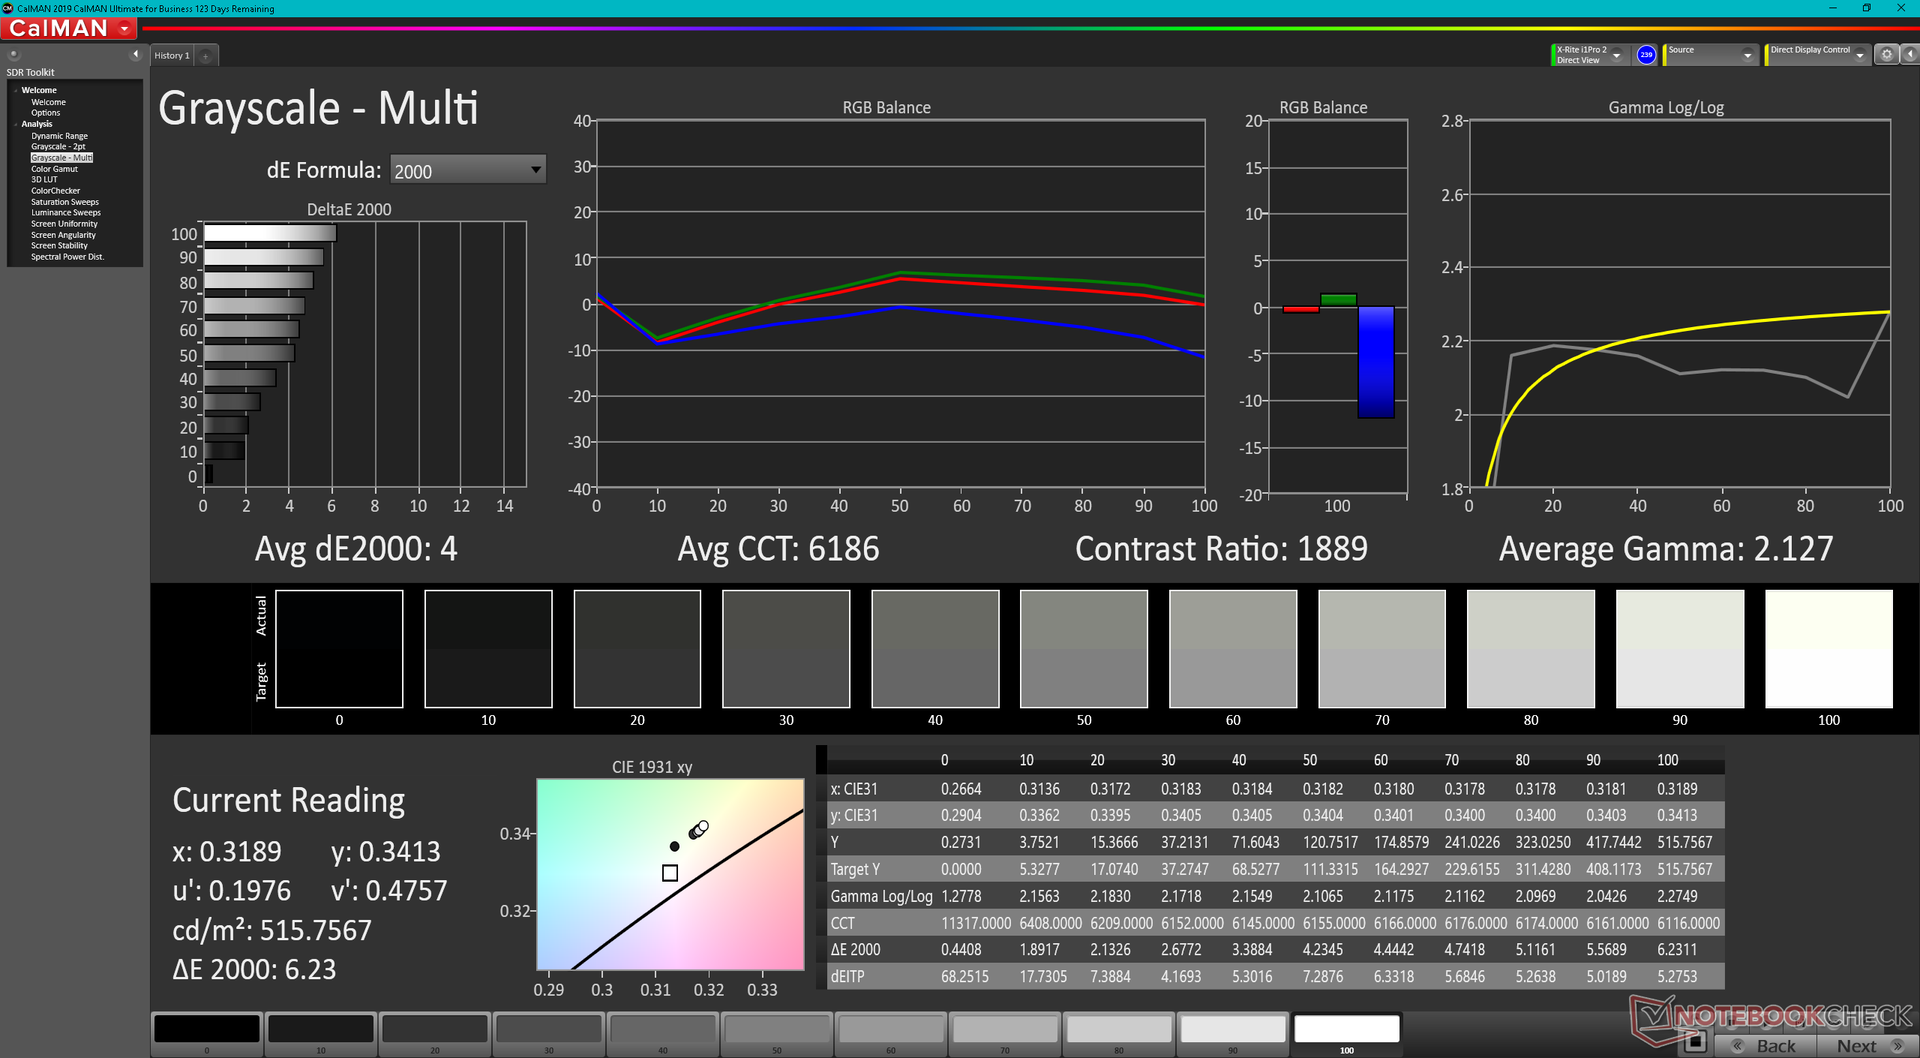
ΔE Greyscale Calman: 4 | ∀{0.09-98 Ø4.96}
79.4% AdobeRGB 1998 (Argyll 3D)
100% sRGB (Argyll 3D)
79.4% Display P3 (Argyll 3D)
Gamma: 2.13
CCT: 6186 K
| Dell Latitude 9430 2-in-1 AU Optronics B140QAN, IPS, 2560x1600, 14" | Dell Latitude 9420 2-in-1 AU Optronics B140QAN, IPS, 2560x1600, 14" | MSI Summit E14 Flip Evo A12MT AU Optronics B140QAN04.R, IPS, 2880x1800, 14" | LG Gram 14T90P LG Philips LP140WU1-SPA1, IPS, 1900x1200, 14" | Lenovo ThinkPad X1 Yoga G7 21CE002HGE MNE007JA1-1, IPS, 1920x1200, 14" | Asus ZenBook Flip 14 UN5401QA-KN085W SDC4154, OLED, 2880x1800, 14" | |
|---|---|---|---|---|---|---|
| Display | 1% | 10% | 12% | -8% | 17% | |
| Display P3 Coverage (%) | 79.4 | 80.7 2% | 97.8 23% | 98.8 24% | 69.3 -13% | 99.7 26% |
| sRGB Coverage (%) | 100 | 100 0% | 99.9 0% | 100 0% | 99.7 0% | 100 0% |
| AdobeRGB 1998 Coverage (%) | 79.4 | 79.7 0% | 85.9 8% | 71.3 -10% | 98.6 24% | |
| Response Times | 9% | 64% | 21% | 34% | 96% | |
| Response Time Grey 50% / Grey 80% * (ms) | 63.6 ? | 54 ? 15% | 16.9 ? 73% | 44 ? 31% | 42 ? 34% | 2 ? 97% |
| Response Time Black / White * (ms) | 33.6 ? | 32.8 ? 2% | 15.4 ? 54% | 30 ? 11% | 22.4 ? 33% | 2 ? 94% |
| PWM Frequency (Hz) | ||||||
| Screen | -45% | -33% | -5% | 8% | -80% | |
| Brightness middle (cd/m²) | 517.7 | 483.6 -7% | 496.7 -4% | 305.5 -41% | 371 -28% | 366 -29% |
| Brightness (cd/m²) | 493 | 465 -6% | 468 -5% | 289 -41% | 363 -26% | 369 -25% |
| Brightness Distribution (%) | 90 | 92 2% | 87 -3% | 87 -3% | 92 2% | 96 7% |
| Black Level * (cd/m²) | 0.33 | 0.32 3% | 0.3 9% | 0.27 18% | 0.21 36% | |
| Contrast (:1) | 1569 | 1511 -4% | 1656 6% | 1131 -28% | 1767 13% | |
| Colorchecker dE 2000 * | 3.38 | 3.69 -9% | 3.93 -16% | 3.31 2% | 1.3 62% | 2.84 16% |
| Colorchecker dE 2000 max. * | 6.25 | 5.97 4% | 7.9 -26% | 6.12 2% | 2.6 58% | 5.29 15% |
| Colorchecker dE 2000 calibrated * | 0.41 | 2.05 -400% | 1.27 -210% | 0.8 -95% | 2.81 -585% | |
| Greyscale dE 2000 * | 4 | 3.5 12% | 5.9 -48% | 1.9 52% | 2.1 47% | 2.32 42% |
| Gamma | 2.13 103% | 2.04 108% | 2.04 108% | 2.04 108% | 2.15 102% | 2.44 90% |
| CCT | 6186 105% | 6158 106% | 7618 85% | 6706 97% | 6759 96% | 6170 105% |
| Total Average (Program / Settings) | -12% /
-28% | 14% /
-10% | 9% /
2% | 11% /
8% | 11% /
-27% |
* ... smaller is better
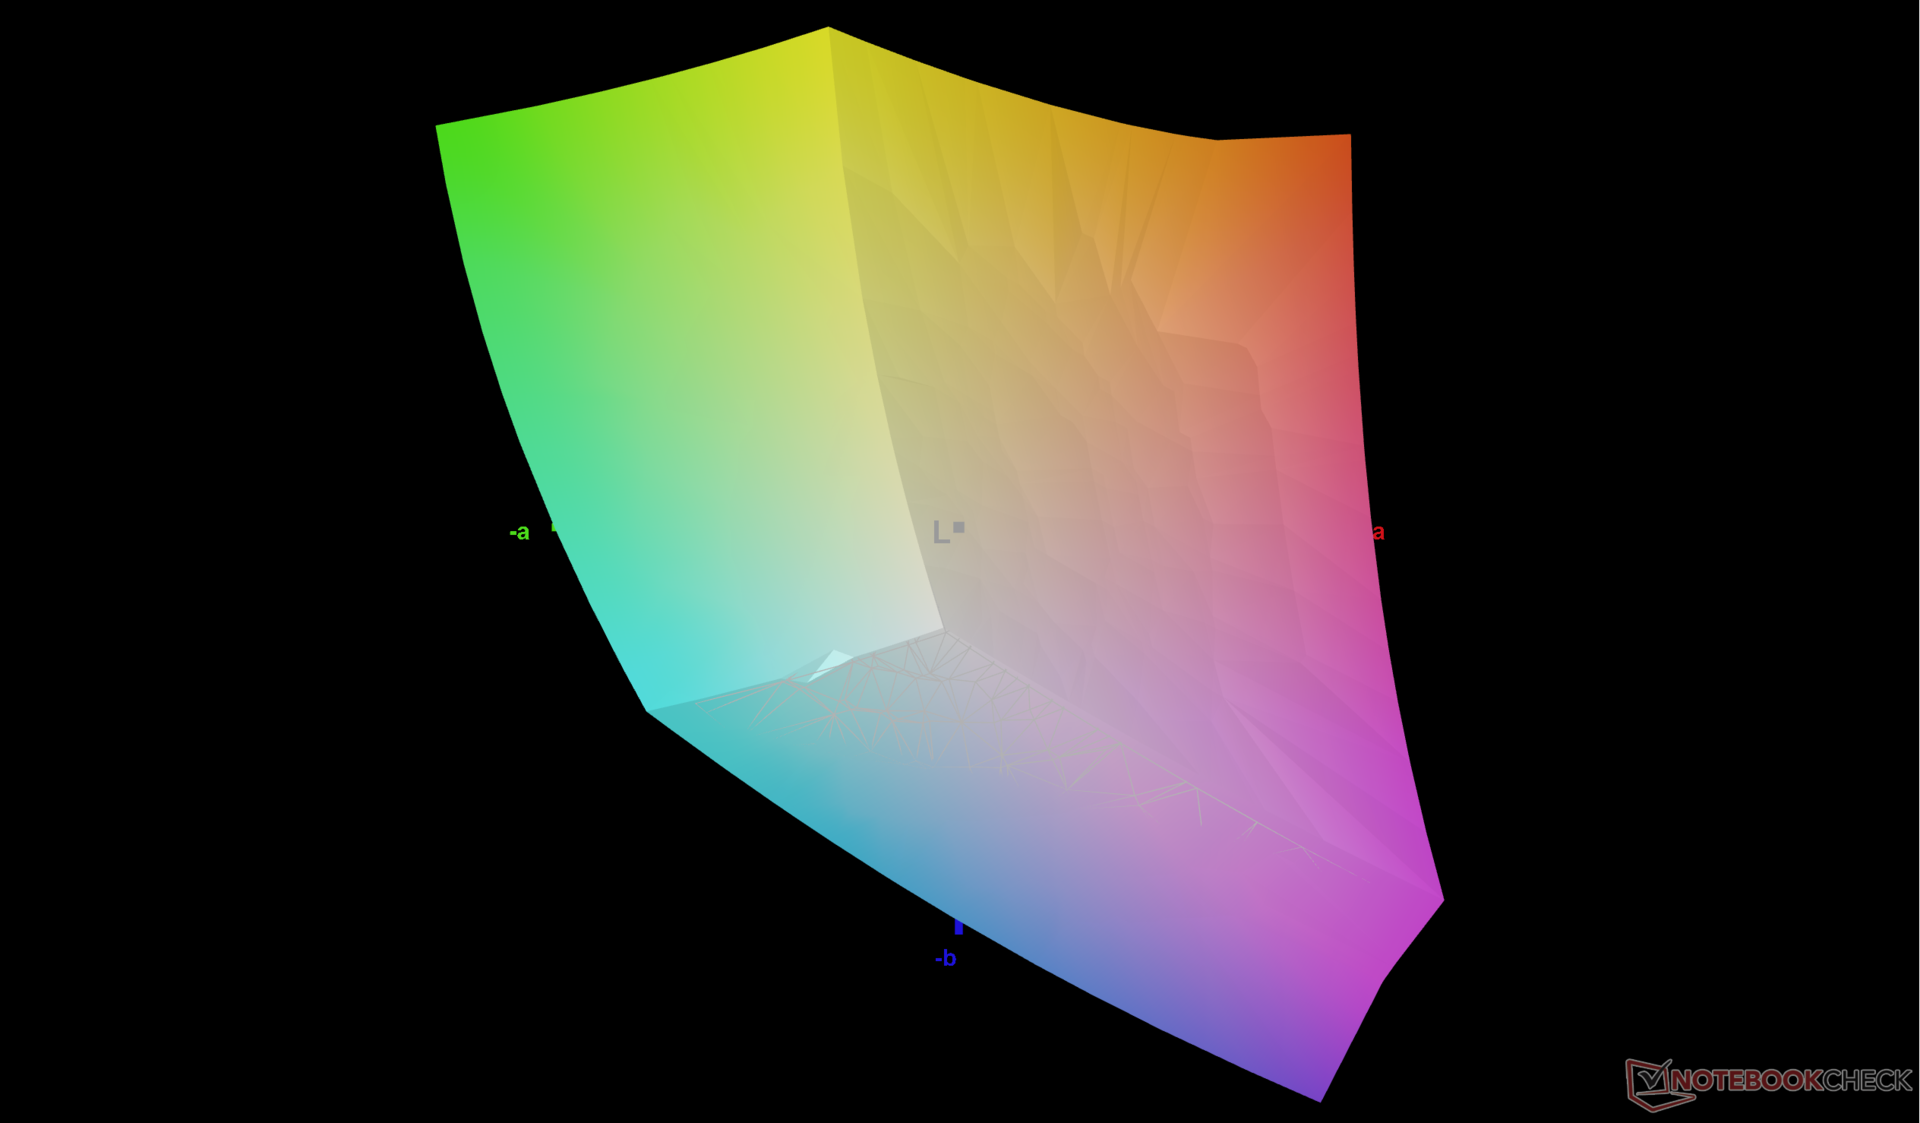
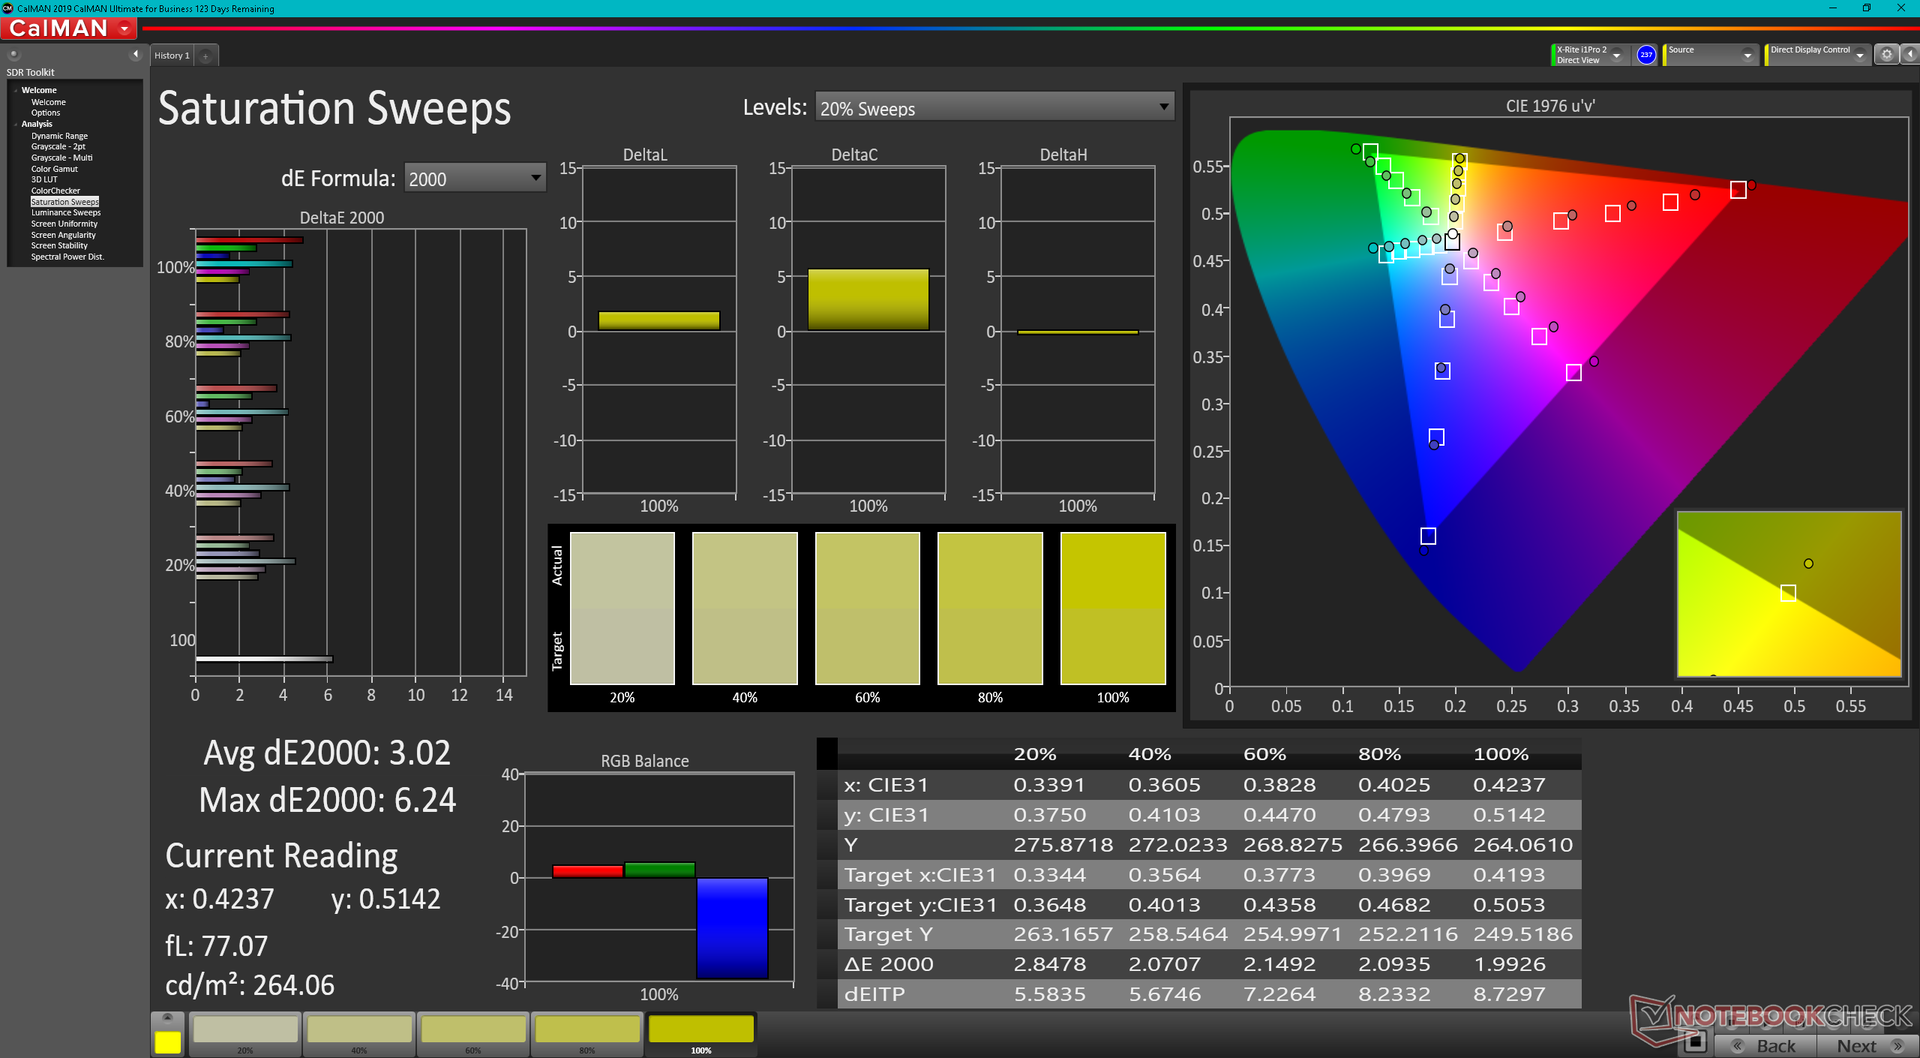
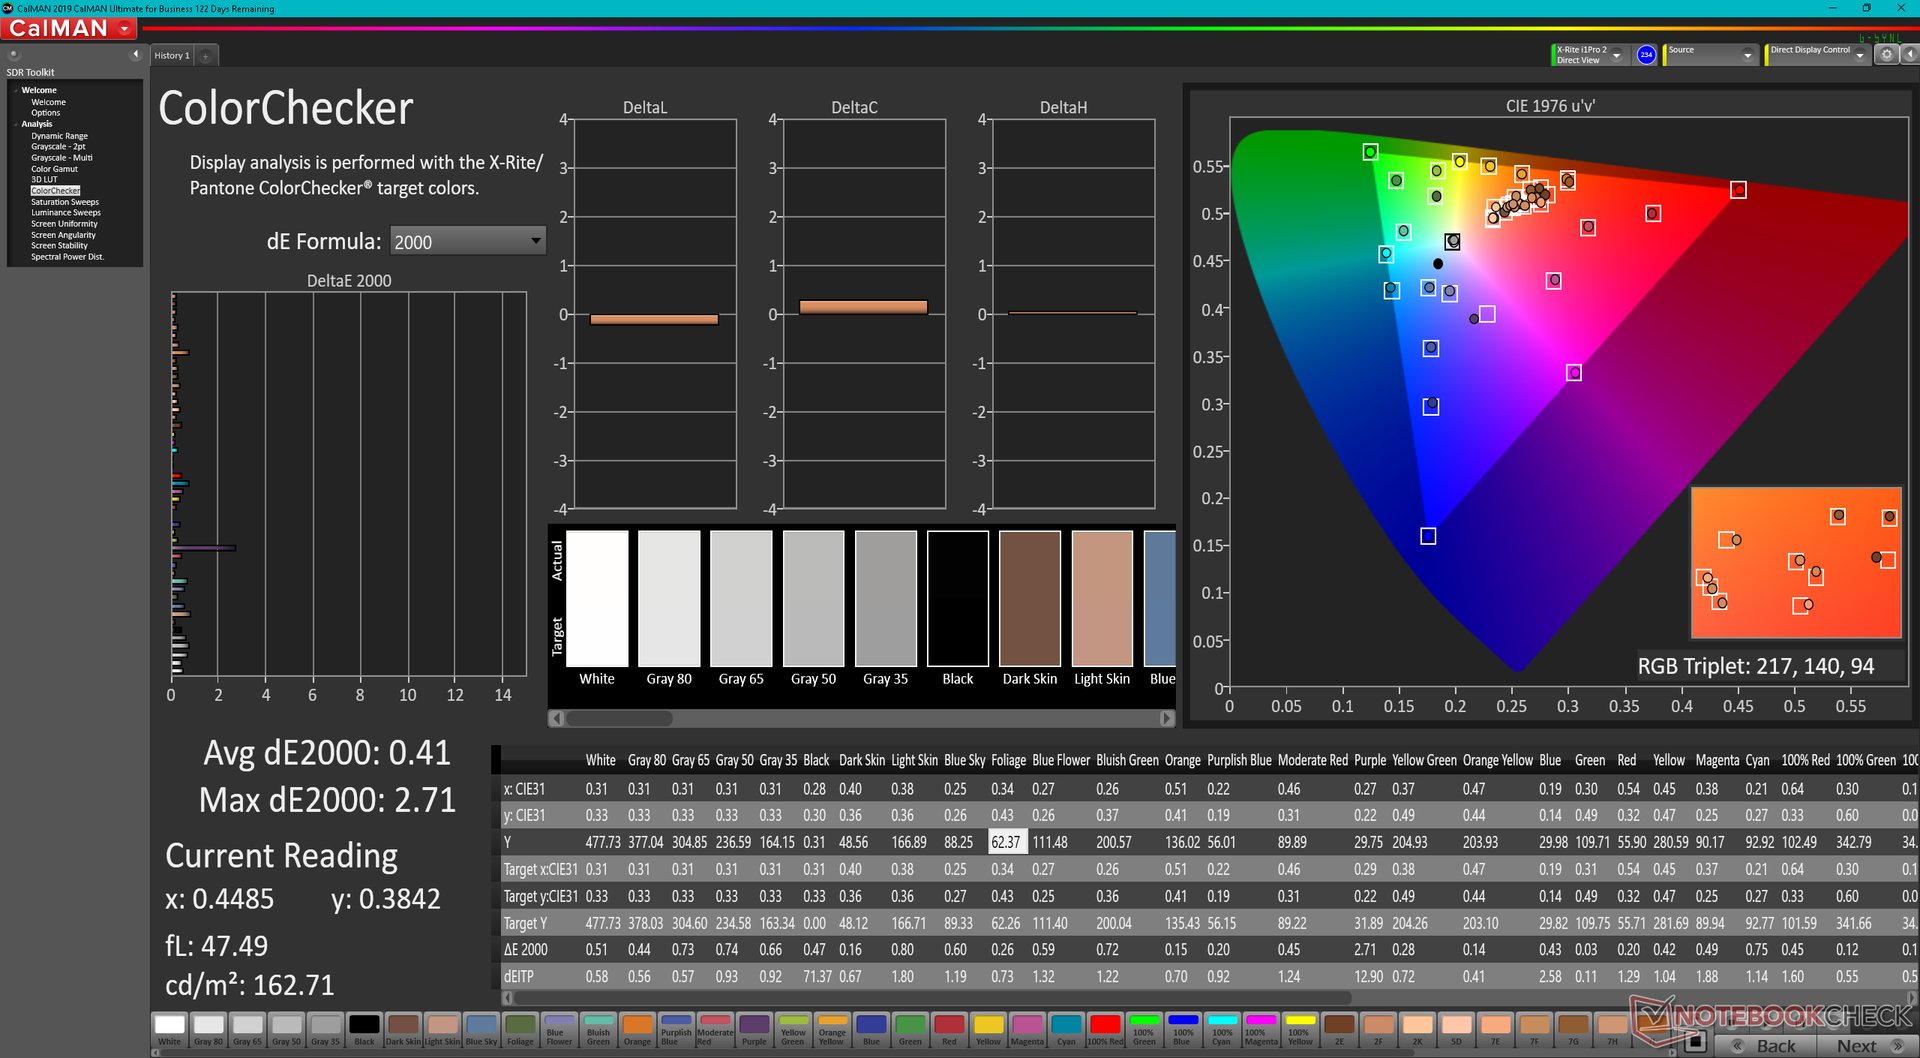
The display is not calibrated very well out of the box with average grayscale and color DeltaE values at 4 and 3.38, respectively. We're able to get these average values down to just 0.7 and 0.41 with an X-Rite colorimeter. We recommend installing our ICM profile above to better exploit the full sRGB coverage of the panel.
Display Response Times
| ↔ Response Time Black to White | ||
|---|---|---|
| 33.6 ms ... rise ↗ and fall ↘ combined | ↗ 17.2 ms rise | 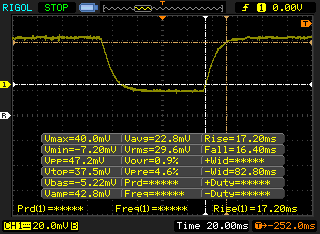 |
| ↘ 16.4 ms fall | ||
| The screen shows slow response rates in our tests and will be unsatisfactory for gamers. In comparison, all tested devices range from 0.1 (minimum) to 240 (maximum) ms. » 90 % of all devices are better. This means that the measured response time is worse than the average of all tested devices (19.8 ms). | ||
| ↔ Response Time 50% Grey to 80% Grey | ||
| 63.6 ms ... rise ↗ and fall ↘ combined | ↗ 33.2 ms rise | 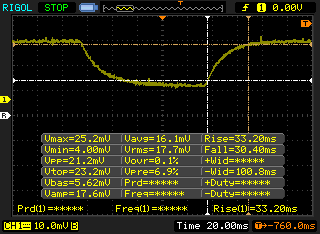 |
| ↘ 30.4 ms fall | ||
| The screen shows slow response rates in our tests and will be unsatisfactory for gamers. In comparison, all tested devices range from 0.165 (minimum) to 636 (maximum) ms. » 97 % of all devices are better. This means that the measured response time is worse than the average of all tested devices (31 ms). | ||
Screen Flickering / PWM (Pulse-Width Modulation)
| Screen flickering / PWM not detected | 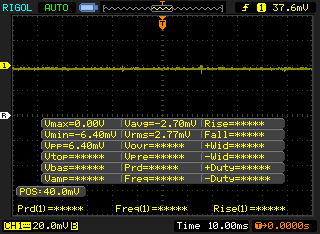 | ||
In comparison: 52 % of all tested devices do not use PWM to dim the display. If PWM was detected, an average of 7754 (minimum: 5 - maximum: 343500) Hz was measured. | |||
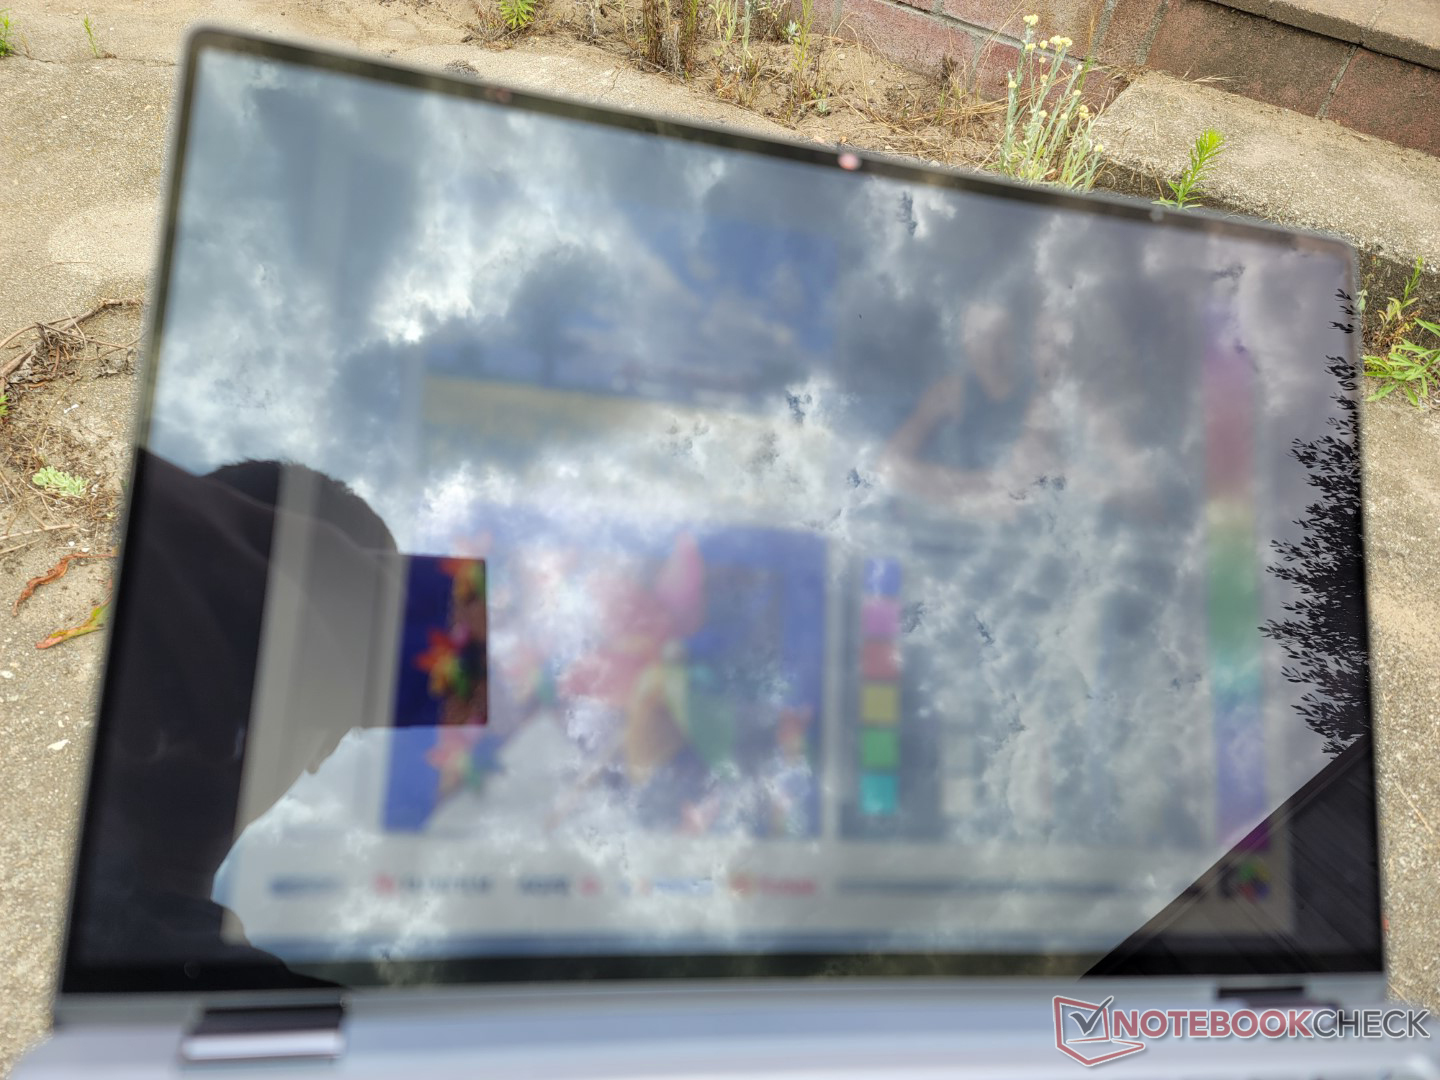
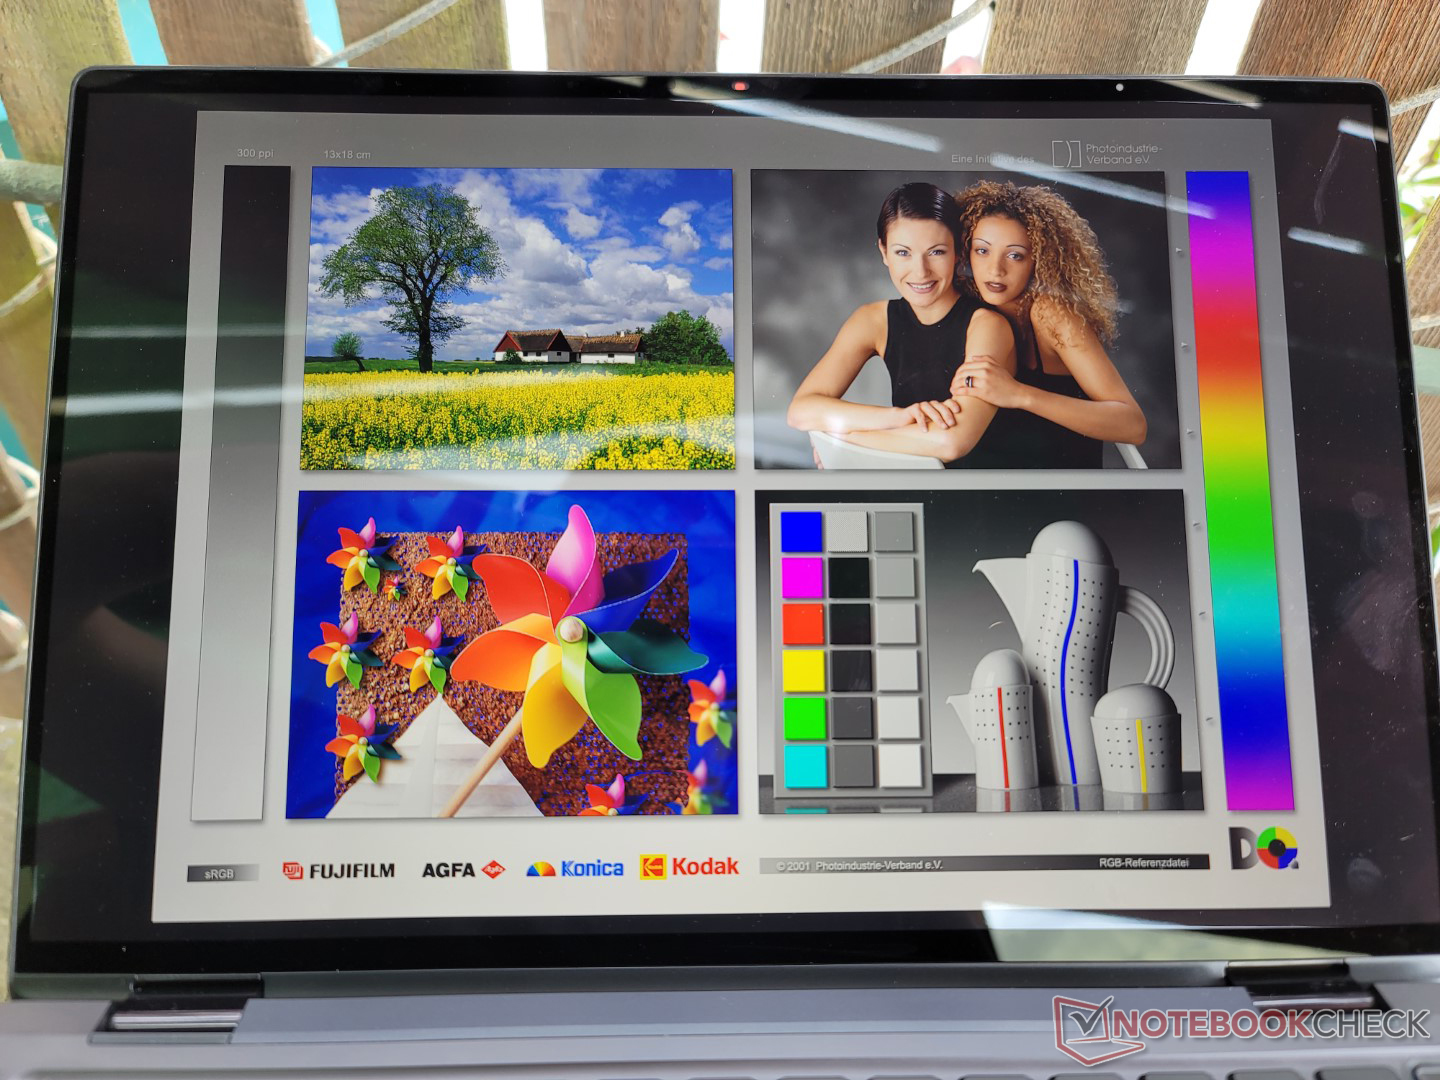
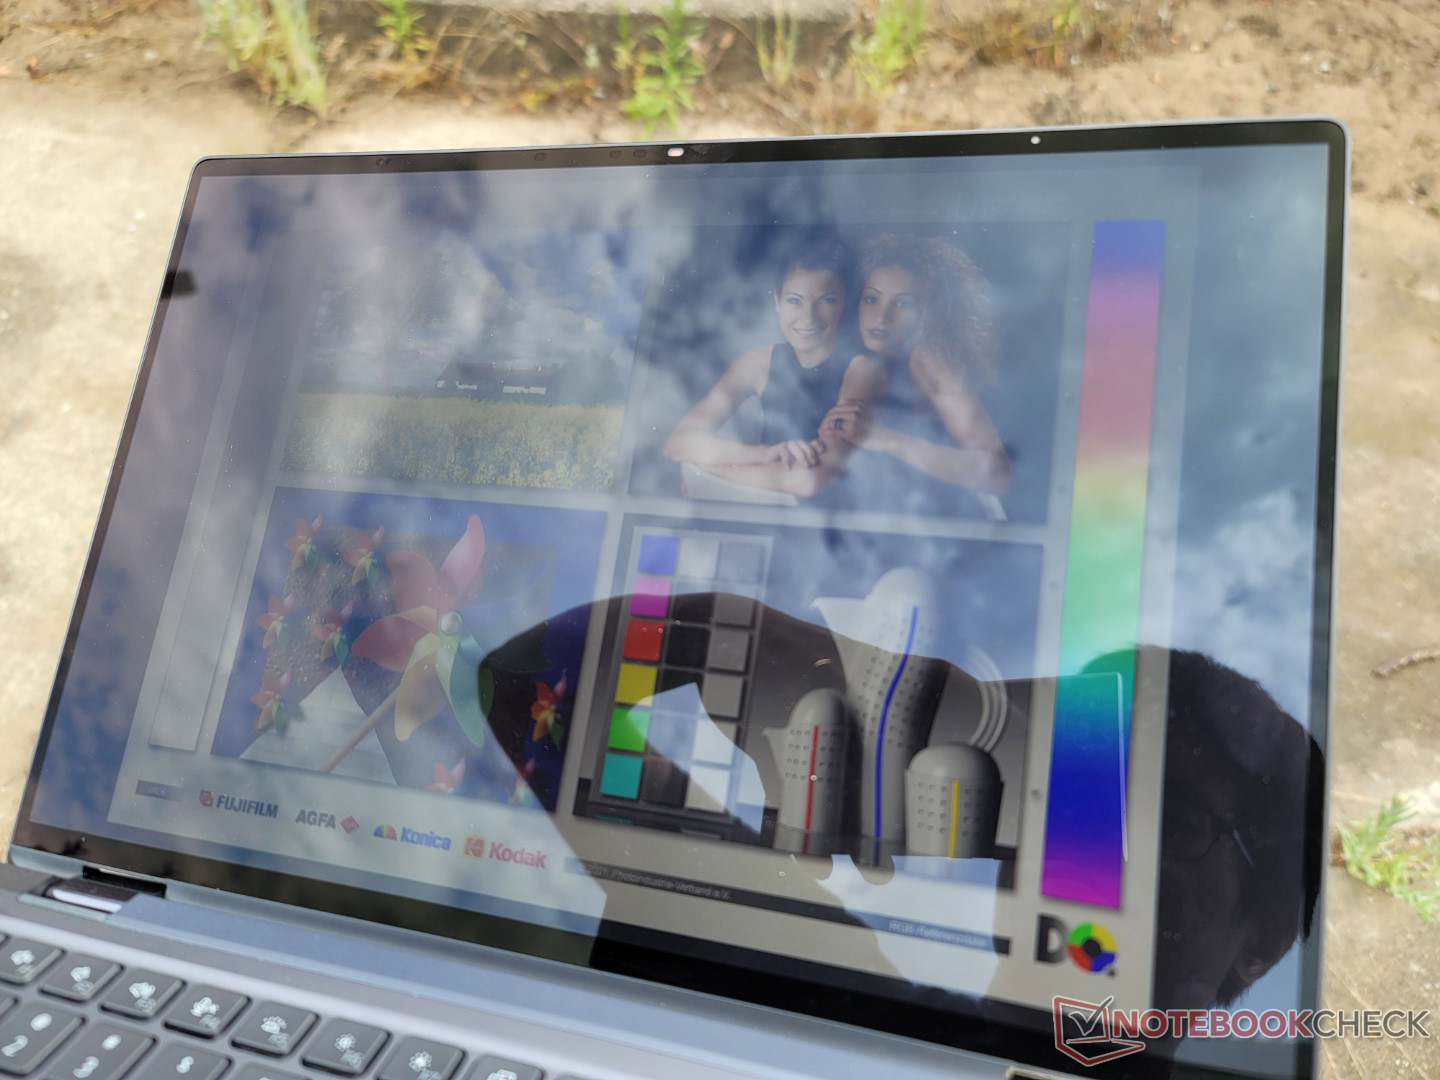
At 500 nits, the display is brighter than on many other 14-inch laptops for better outdoor visibility than the Lenovo ThinkPad X1 Yoga G7 or LG Gram 16 2-in-1. Glare is still inevitable in most scenarios, however, but onscreen text and images remain clear and colorful if working under shade.
Performance
Testing Conditions
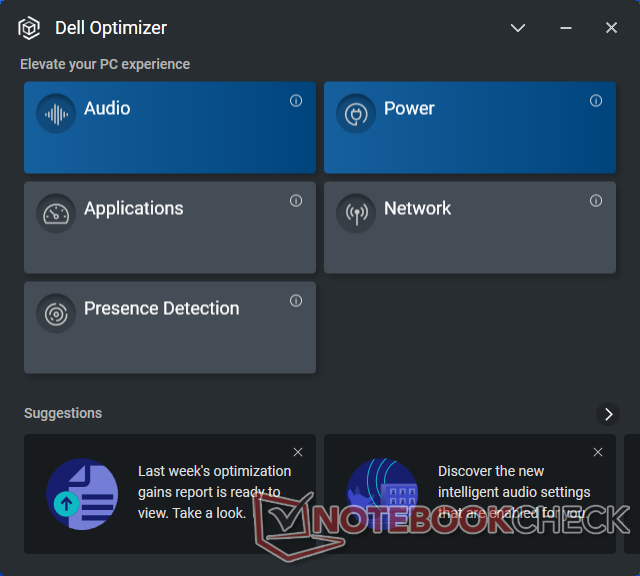
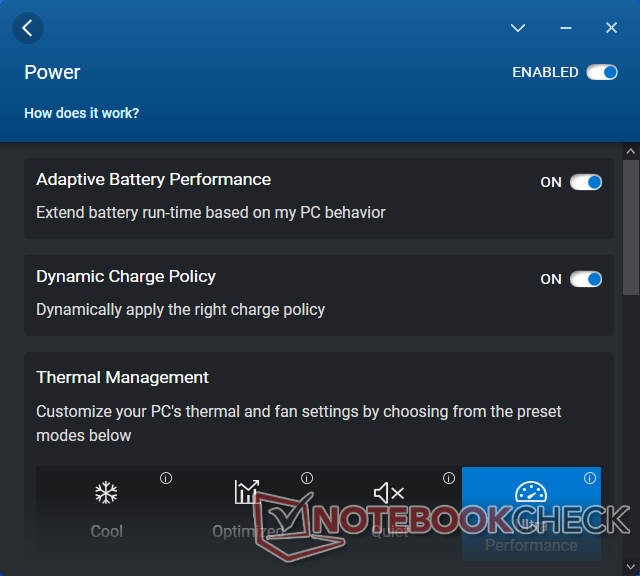
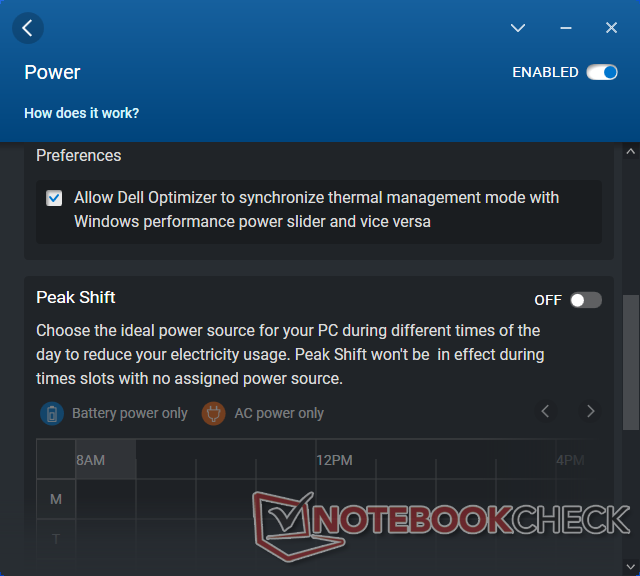
We set our unit to Ultra Performance mode via the Dell Optimizer software prior to running any benchmarks below. We love that Optimizer has a setting to synchronize Windows power profile settings to the current Optimizer performance setting. For example, if Optimizer is set to Quiet mode, then the Windows power profile will automatically switch to Power Saver mode. If Optimizer is set to Ultra Performance mode, then Windows will automatically switch to its equivalent Performance mode and so on. This fixes the problem of having conflicting thermal settings across multiple applications (i.e., Windows set to Power Saver mode while Optimizer is set to Ultra Performance mode).
Annoyingly, Optimizer cannot be maximized and so its very small window size is fixed. For having so many buttons and options, the app could definitely benefit from a bigger UI.
Processor
CPU gains over the 11th gen Core i7-1185G7 in last year's Latitude 9420 2-in-1 are significant especially in terms of multi-thread performance. Our Core i7-1265U offers 20 percent and 55 percent faster single-thread and multi-thread performance, respectively, when compared to the Core i7-1185G7. The CPU is even able to stand neck-to-neck with the Core i7-1260P despite the fact that the Core P series is marketed as the faster family. Results are especially good after having just experienced the very disappointing Core i5-1235U.
Performance sustainability could have been better. When running CineBench R15 xT in a loop, the initial score of 1572 points would steadily fall and stabilize at around 1230 points to represent a performance drop of around 20 percent over time due to thermal limitations.
Cinebench R15 Multi Loop
Cinebench R23: Multi Core | Single Core
Cinebench R15: CPU Multi 64Bit | CPU Single 64Bit
Blender: v2.79 BMW27 CPU
7-Zip 18.03: 7z b 4 | 7z b 4 -mmt1
Geekbench 5.5: Multi-Core | Single-Core
HWBOT x265 Benchmark v2.2: 4k Preset
LibreOffice : 20 Documents To PDF
R Benchmark 2.5: Overall mean
Cinebench R23: Multi Core | Single Core
Cinebench R15: CPU Multi 64Bit | CPU Single 64Bit
Blender: v2.79 BMW27 CPU
7-Zip 18.03: 7z b 4 | 7z b 4 -mmt1
Geekbench 5.5: Multi-Core | Single-Core
HWBOT x265 Benchmark v2.2: 4k Preset
LibreOffice : 20 Documents To PDF
R Benchmark 2.5: Overall mean
* ... smaller is better
AIDA64: FP32 Ray-Trace | FPU Julia | CPU SHA3 | CPU Queen | FPU SinJulia | FPU Mandel | CPU AES | CPU ZLib | FP64 Ray-Trace | CPU PhotoWorxx
| Performance rating | |
| Asus ZenBook Flip 14 UN5401QA-KN085W | |
| Dell Latitude 9430 2-in-1 | |
| Dell Latitude 9420 2-in-1 | |
| MSI Summit E14 Flip Evo A12MT | |
| LG Gram 14T90P | |
| Average Intel Core i7-1265U | |
| Lenovo ThinkPad X1 Yoga G7 21CE002HGE | |
| AIDA64 / FP32 Ray-Trace | |
| Asus ZenBook Flip 14 UN5401QA-KN085W | |
| Dell Latitude 9430 2-in-1 | |
| Dell Latitude 9420 2-in-1 | |
| LG Gram 14T90P | |
| Average Intel Core i7-1265U (2619 - 8178, n=10) | |
| MSI Summit E14 Flip Evo A12MT | |
| Lenovo ThinkPad X1 Yoga G7 21CE002HGE | |
| AIDA64 / FPU Julia | |
| Asus ZenBook Flip 14 UN5401QA-KN085W | |
| Dell Latitude 9430 2-in-1 | |
| Average Intel Core i7-1265U (12909 - 41649, n=10) | |
| Dell Latitude 9420 2-in-1 | |
| LG Gram 14T90P | |
| MSI Summit E14 Flip Evo A12MT | |
| Lenovo ThinkPad X1 Yoga G7 21CE002HGE | |
| AIDA64 / CPU SHA3 | |
| Asus ZenBook Flip 14 UN5401QA-KN085W | |
| Dell Latitude 9430 2-in-1 | |
| Dell Latitude 9420 2-in-1 | |
| LG Gram 14T90P | |
| MSI Summit E14 Flip Evo A12MT | |
| Average Intel Core i7-1265U (824 - 2183, n=10) | |
| Lenovo ThinkPad X1 Yoga G7 21CE002HGE | |
| AIDA64 / CPU Queen | |
| Asus ZenBook Flip 14 UN5401QA-KN085W | |
| MSI Summit E14 Flip Evo A12MT | |
| Dell Latitude 9430 2-in-1 | |
| Average Intel Core i7-1265U (63615 - 67065, n=10) | |
| Lenovo ThinkPad X1 Yoga G7 21CE002HGE | |
| Dell Latitude 9420 2-in-1 | |
| LG Gram 14T90P | |
| AIDA64 / FPU SinJulia | |
| Asus ZenBook Flip 14 UN5401QA-KN085W | |
| MSI Summit E14 Flip Evo A12MT | |
| Lenovo ThinkPad X1 Yoga G7 21CE002HGE | |
| Dell Latitude 9430 2-in-1 | |
| Dell Latitude 9420 2-in-1 | |
| LG Gram 14T90P | |
| Average Intel Core i7-1265U (3105 - 5135, n=10) | |
| AIDA64 / FPU Mandel | |
| Asus ZenBook Flip 14 UN5401QA-KN085W | |
| Dell Latitude 9430 2-in-1 | |
| Dell Latitude 9420 2-in-1 | |
| LG Gram 14T90P | |
| Average Intel Core i7-1265U (6967 - 20804, n=10) | |
| MSI Summit E14 Flip Evo A12MT | |
| Lenovo ThinkPad X1 Yoga G7 21CE002HGE | |
| AIDA64 / CPU AES | |
| Asus ZenBook Flip 14 UN5401QA-KN085W | |
| Dell Latitude 9420 2-in-1 | |
| LG Gram 14T90P | |
| Dell Latitude 9430 2-in-1 | |
| MSI Summit E14 Flip Evo A12MT | |
| Average Intel Core i7-1265U (19489 - 42966, n=10) | |
| Lenovo ThinkPad X1 Yoga G7 21CE002HGE | |
| AIDA64 / CPU ZLib | |
| Asus ZenBook Flip 14 UN5401QA-KN085W | |
| Dell Latitude 9430 2-in-1 | |
| MSI Summit E14 Flip Evo A12MT | |
| Lenovo ThinkPad X1 Yoga G7 21CE002HGE | |
| Average Intel Core i7-1265U (314 - 632, n=10) | |
| Dell Latitude 9420 2-in-1 | |
| LG Gram 14T90P | |
| AIDA64 / FP64 Ray-Trace | |
| Asus ZenBook Flip 14 UN5401QA-KN085W | |
| Dell Latitude 9430 2-in-1 | |
| Dell Latitude 9420 2-in-1 | |
| LG Gram 14T90P | |
| Average Intel Core i7-1265U (1473 - 4376, n=10) | |
| MSI Summit E14 Flip Evo A12MT | |
| Lenovo ThinkPad X1 Yoga G7 21CE002HGE | |
| AIDA64 / CPU PhotoWorxx | |
| Dell Latitude 9430 2-in-1 | |
| Dell Latitude 9420 2-in-1 | |
| LG Gram 14T90P | |
| MSI Summit E14 Flip Evo A12MT | |
| Average Intel Core i7-1265U (20213 - 47031, n=10) | |
| Lenovo ThinkPad X1 Yoga G7 21CE002HGE | |
| Asus ZenBook Flip 14 UN5401QA-KN085W | |
System Performance
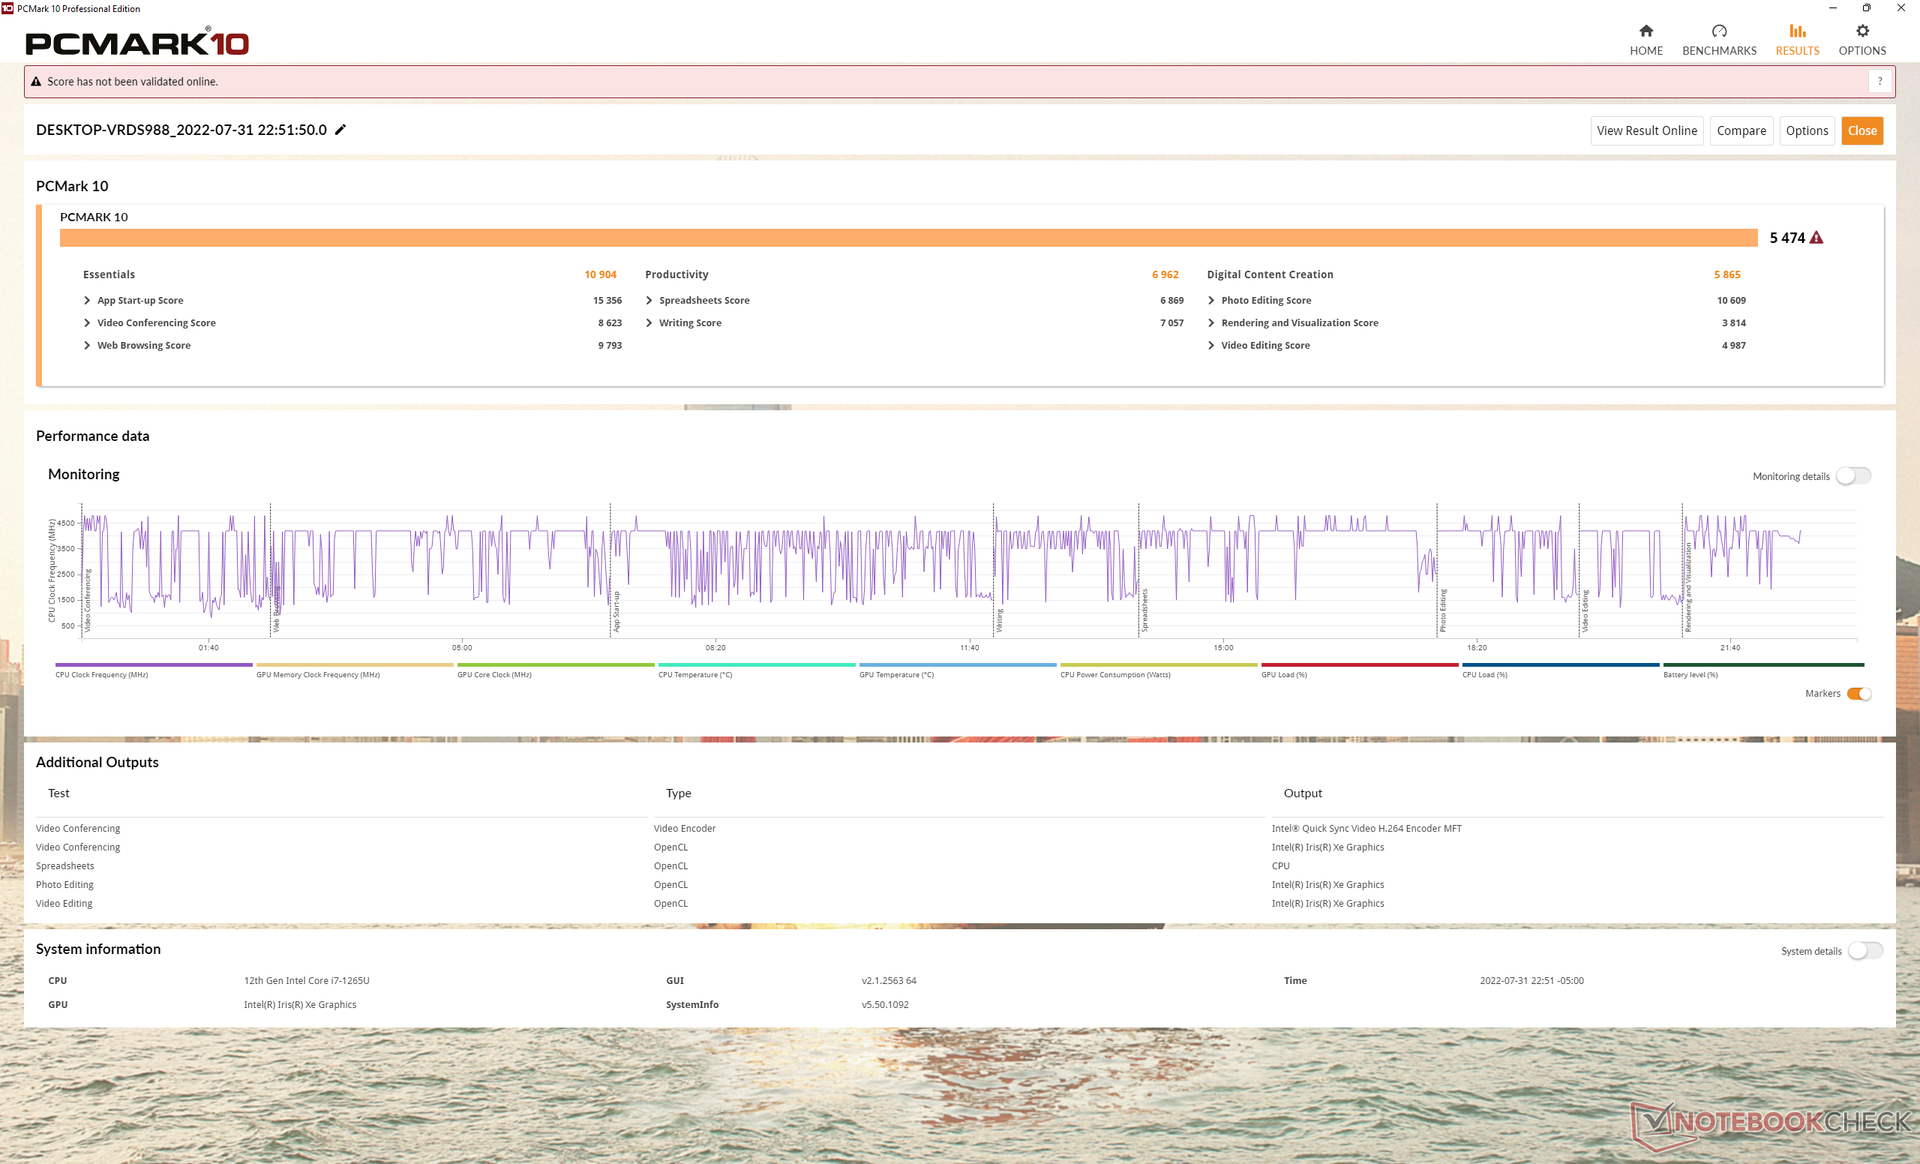
PCMark 10 scores are consistently higher than what we recorded on the older Latitude 9420 2-in-1 albeit by just a few percentage points. Typical office loads like web browsing, video streaming, or light editing aren't going to feel much faster when compared to most 11th gen Core i7-1165G7 laptops as a result.
CrossMark: Overall | Productivity | Creativity | Responsiveness
| PCMark 10 / Score | |
| Asus ZenBook Flip 14 UN5401QA-KN085W | |
| Lenovo ThinkPad X1 Yoga G7 21CE002HGE | |
| Dell Latitude 9430 2-in-1 | |
| MSI Summit E14 Flip Evo A12MT | |
| Average Intel Core i7-1265U, Intel Iris Xe Graphics G7 96EUs (4753 - 5766, n=7) | |
| Dell Latitude 9420 2-in-1 | |
| LG Gram 14T90P | |
| PCMark 10 / Essentials | |
| Lenovo ThinkPad X1 Yoga G7 21CE002HGE | |
| Dell Latitude 9430 2-in-1 | |
| MSI Summit E14 Flip Evo A12MT | |
| Average Intel Core i7-1265U, Intel Iris Xe Graphics G7 96EUs (9278 - 11418, n=7) | |
| Dell Latitude 9420 2-in-1 | |
| Asus ZenBook Flip 14 UN5401QA-KN085W | |
| LG Gram 14T90P | |
| PCMark 10 / Productivity | |
| Asus ZenBook Flip 14 UN5401QA-KN085W | |
| Dell Latitude 9430 2-in-1 | |
| Dell Latitude 9420 2-in-1 | |
| MSI Summit E14 Flip Evo A12MT | |
| Lenovo ThinkPad X1 Yoga G7 21CE002HGE | |
| Average Intel Core i7-1265U, Intel Iris Xe Graphics G7 96EUs (5828 - 7311, n=7) | |
| LG Gram 14T90P | |
| PCMark 10 / Digital Content Creation | |
| Lenovo ThinkPad X1 Yoga G7 21CE002HGE | |
| Asus ZenBook Flip 14 UN5401QA-KN085W | |
| Dell Latitude 9430 2-in-1 | |
| MSI Summit E14 Flip Evo A12MT | |
| Average Intel Core i7-1265U, Intel Iris Xe Graphics G7 96EUs (5127 - 6330, n=7) | |
| Dell Latitude 9420 2-in-1 | |
| LG Gram 14T90P | |
| CrossMark / Overall | |
| MSI Summit E14 Flip Evo A12MT | |
| Lenovo ThinkPad X1 Yoga G7 21CE002HGE | |
| Dell Latitude 9430 2-in-1 | |
| Average Intel Core i7-1265U, Intel Iris Xe Graphics G7 96EUs (1301 - 1615, n=7) | |
| LG Gram 14T90P | |
| CrossMark / Productivity | |
| MSI Summit E14 Flip Evo A12MT | |
| Lenovo ThinkPad X1 Yoga G7 21CE002HGE | |
| Dell Latitude 9430 2-in-1 | |
| Average Intel Core i7-1265U, Intel Iris Xe Graphics G7 96EUs (1230 - 1586, n=7) | |
| LG Gram 14T90P | |
| CrossMark / Creativity | |
| MSI Summit E14 Flip Evo A12MT | |
| Lenovo ThinkPad X1 Yoga G7 21CE002HGE | |
| Dell Latitude 9430 2-in-1 | |
| Average Intel Core i7-1265U, Intel Iris Xe Graphics G7 96EUs (1413 - 1706, n=7) | |
| LG Gram 14T90P | |
| CrossMark / Responsiveness | |
| MSI Summit E14 Flip Evo A12MT | |
| Lenovo ThinkPad X1 Yoga G7 21CE002HGE | |
| Dell Latitude 9430 2-in-1 | |
| Average Intel Core i7-1265U, Intel Iris Xe Graphics G7 96EUs (1193 - 1521, n=7) | |
| LG Gram 14T90P | |
| PCMark 10 Score | 5474 points | |
Help | ||
| AIDA64 / Memory Copy | |
| Dell Latitude 9430 2-in-1 | |
| MSI Summit E14 Flip Evo A12MT | |
| Dell Latitude 9420 2-in-1 | |
| LG Gram 14T90P | |
| Lenovo ThinkPad X1 Yoga G7 21CE002HGE | |
| Average Intel Core i7-1265U (40212 - 72204, n=10) | |
| Asus ZenBook Flip 14 UN5401QA-KN085W | |
| AIDA64 / Memory Read | |
| Lenovo ThinkPad X1 Yoga G7 21CE002HGE | |
| MSI Summit E14 Flip Evo A12MT | |
| Dell Latitude 9420 2-in-1 | |
| LG Gram 14T90P | |
| Average Intel Core i7-1265U (41808 - 69493, n=10) | |
| Dell Latitude 9430 2-in-1 | |
| Asus ZenBook Flip 14 UN5401QA-KN085W | |
| AIDA64 / Memory Write | |
| LG Gram 14T90P | |
| Dell Latitude 9420 2-in-1 | |
| Dell Latitude 9430 2-in-1 | |
| Lenovo ThinkPad X1 Yoga G7 21CE002HGE | |
| Average Intel Core i7-1265U (41382 - 76027, n=10) | |
| MSI Summit E14 Flip Evo A12MT | |
| Asus ZenBook Flip 14 UN5401QA-KN085W | |
| AIDA64 / Memory Latency | |
| Asus ZenBook Flip 14 UN5401QA-KN085W | |
| Dell Latitude 9430 2-in-1 | |
| Average Intel Core i7-1265U (74.6 - 112.4, n=10) | |
| Dell Latitude 9420 2-in-1 | |
| LG Gram 14T90P | |
| Lenovo ThinkPad X1 Yoga G7 21CE002HGE | |
| MSI Summit E14 Flip Evo A12MT | |
* ... smaller is better
DPC Latency
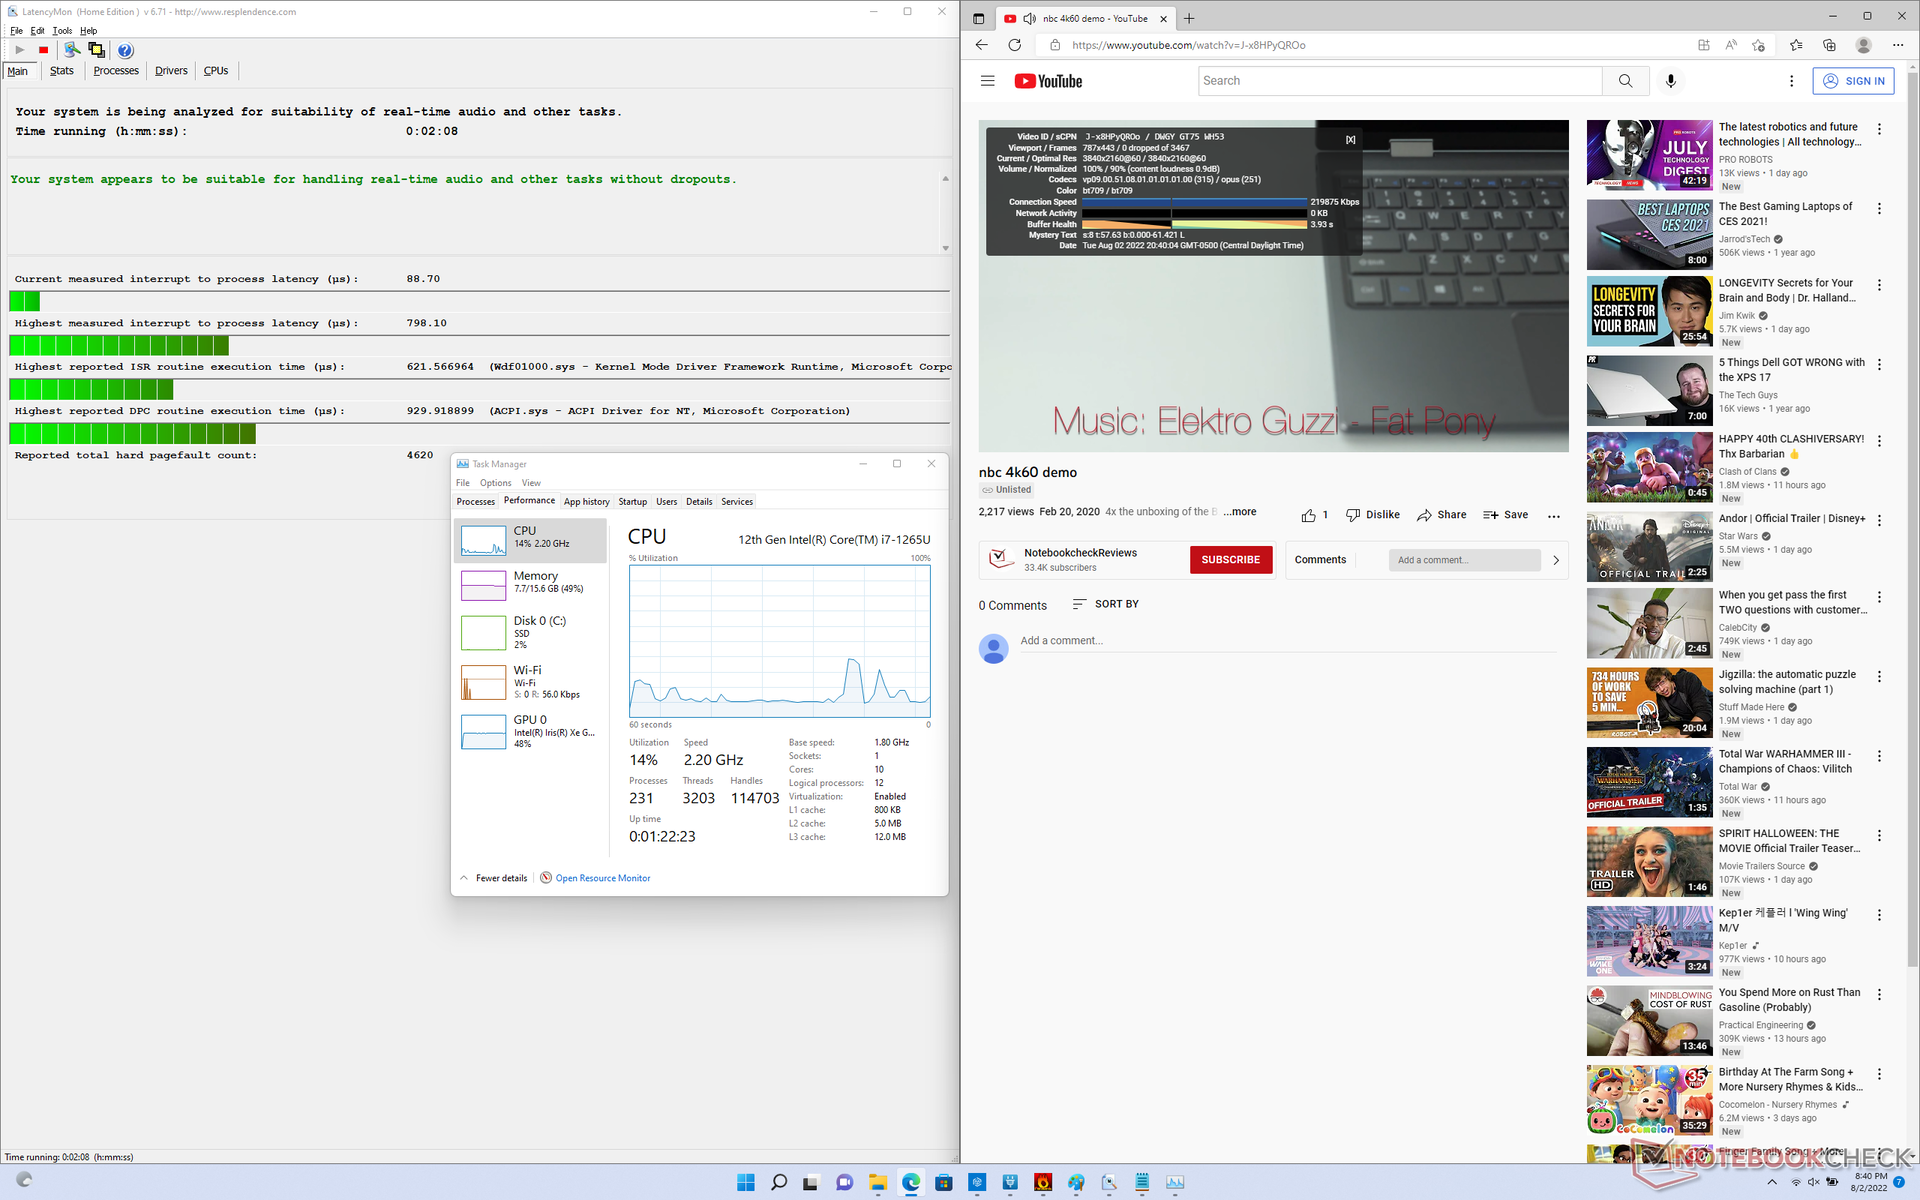
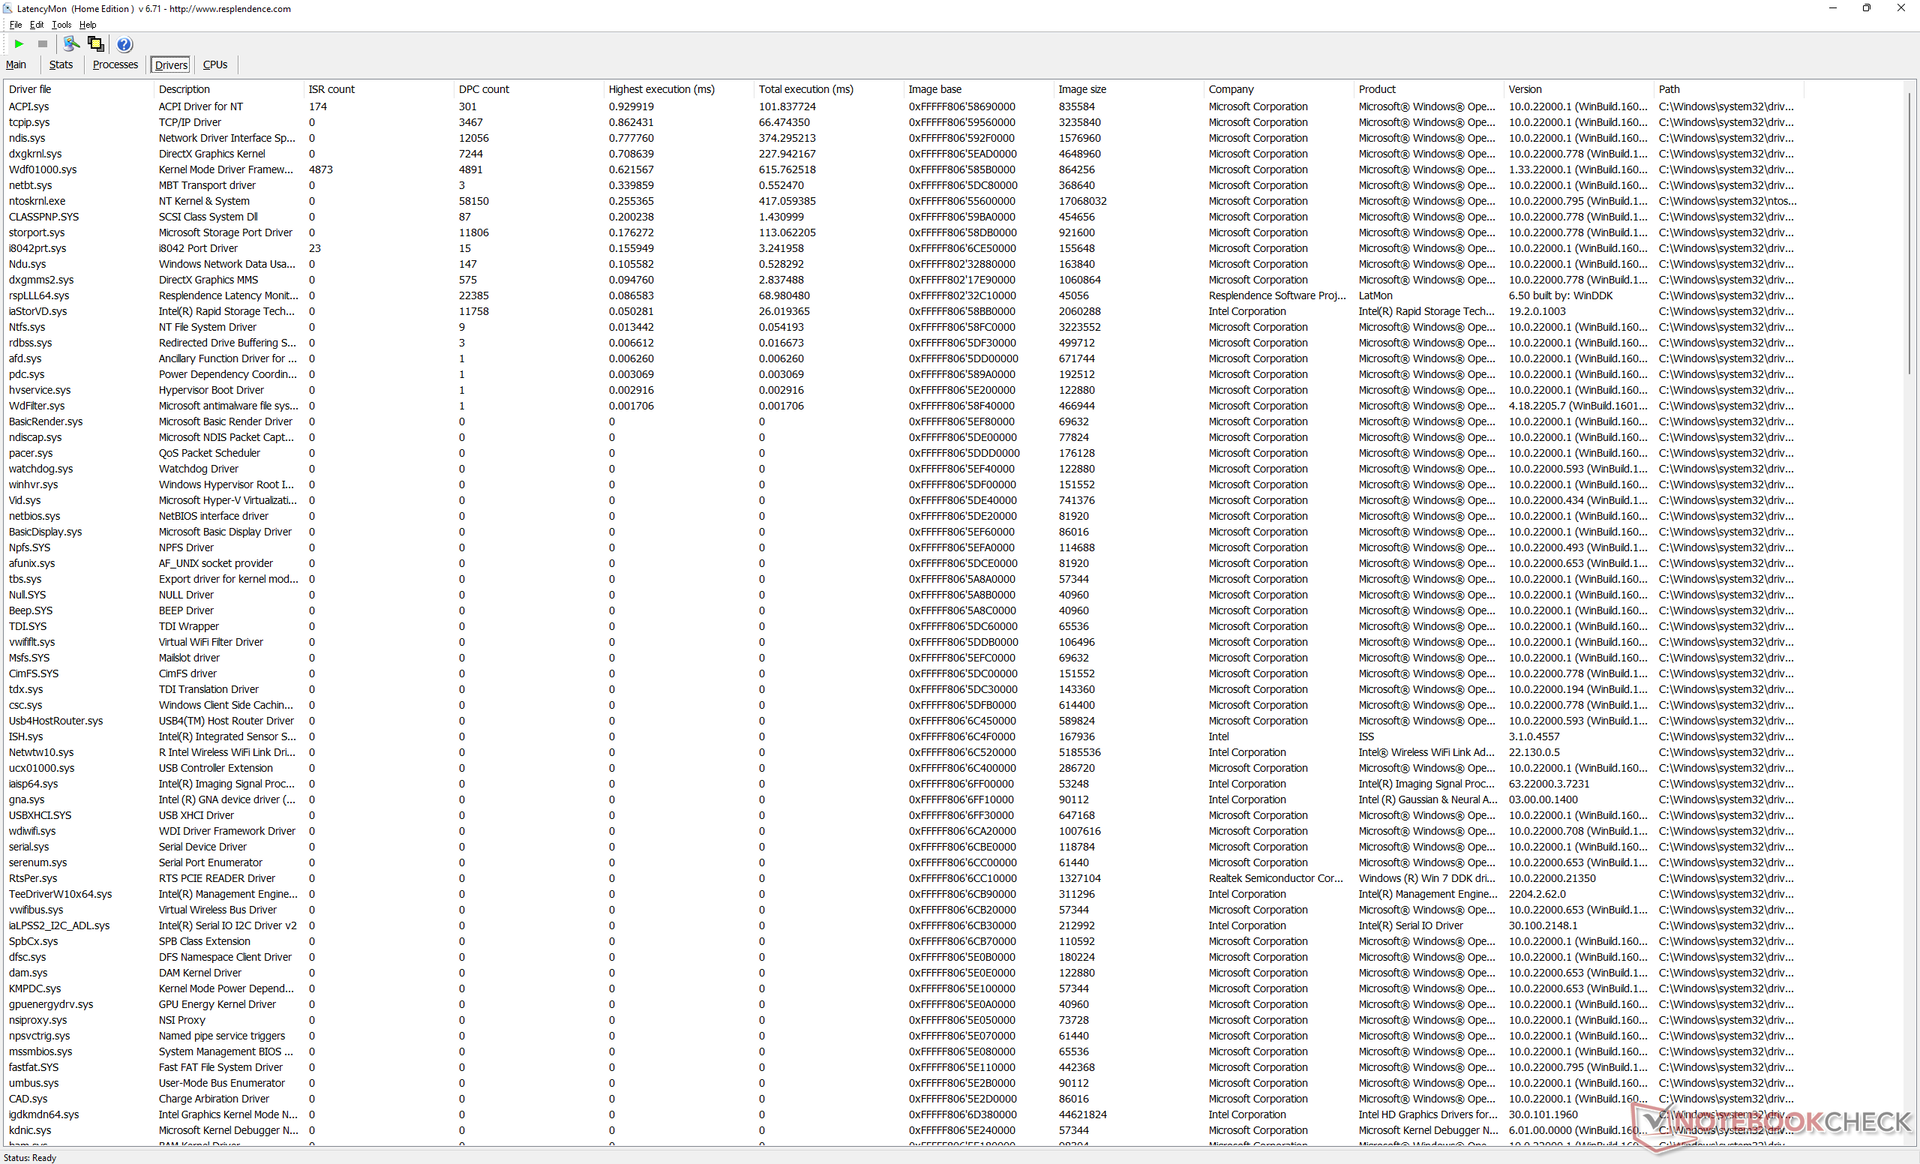
LatencyMon reveals no major DPC issues when opening multiple tabs of our homepage or when running Prime95 stress. 4K video playback at 60 FPS is perfect as well with no dropped frames.
| DPC Latencies / LatencyMon - interrupt to process latency (max), Web, Youtube, Prime95 | |
| MSI Summit E14 Flip Evo A12MT | |
| Lenovo ThinkPad X1 Yoga G7 21CE002HGE | |
| LG Gram 14T90P | |
| Asus ZenBook Flip 14 UN5401QA-KN085W | |
| Dell Latitude 9430 2-in-1 | |
| Dell Latitude 9420 2-in-1 | |
* ... smaller is better
Storage Devices
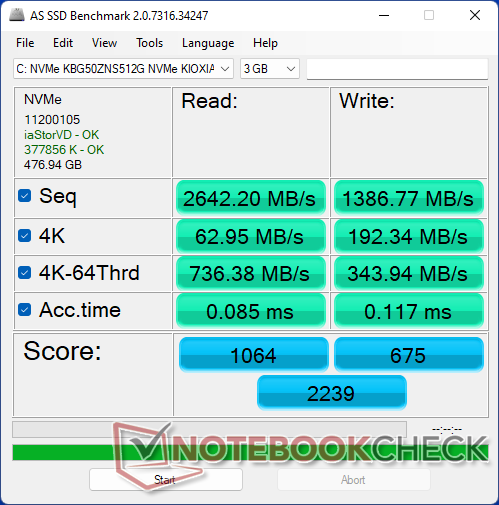
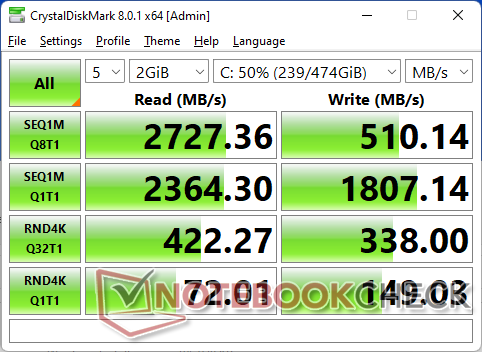
Our test unit utilizes a 512 GB Toshiba Kioxia NVMe SSD with optional Opal self-encryption. Transfer rates are good and relatively steady, but write rates are a lot slower than on the Samsung PM981a commonly found on flagship Ultrabooks.

* ... smaller is better
Disk Throttling: DiskSpd Read Loop, Queue Depth 8
GPU Performance
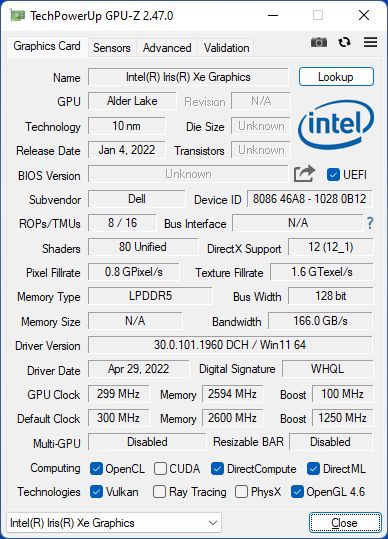
Graphics performance is about where we expect it to be when compared to other laptops with the same integrated Iris Xe 96 EUs even though the Latitude is carrying a newer 12th gen Intel CPU. Thus, users should expect only marginal GPU performance improvements at best year-over-year. The competing Radeon 680M or GeForce MX450/550 are able to offer significantly faster performance than the Iris Xe 96 EUs.
The model utilizes faster LPDDR5 RAM compared to LPDDR4 on the Latitude 9420 2-in-1, but the performance boost is minor.
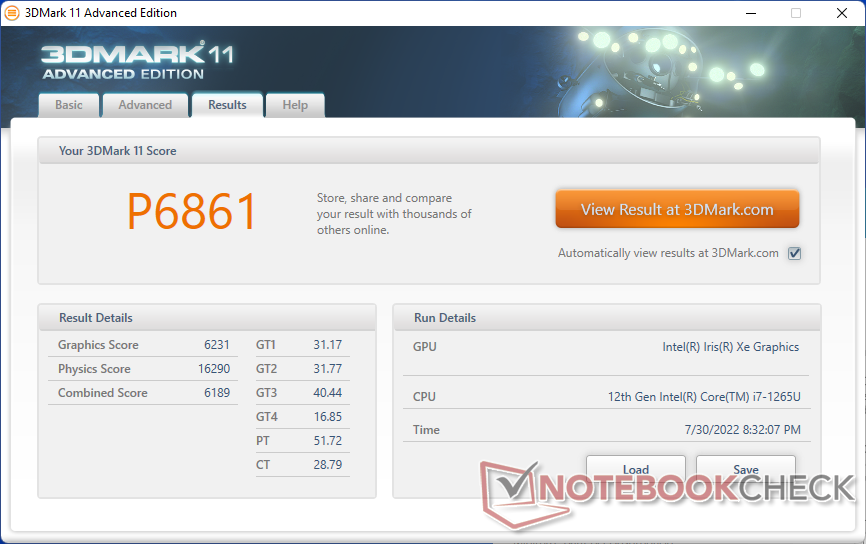
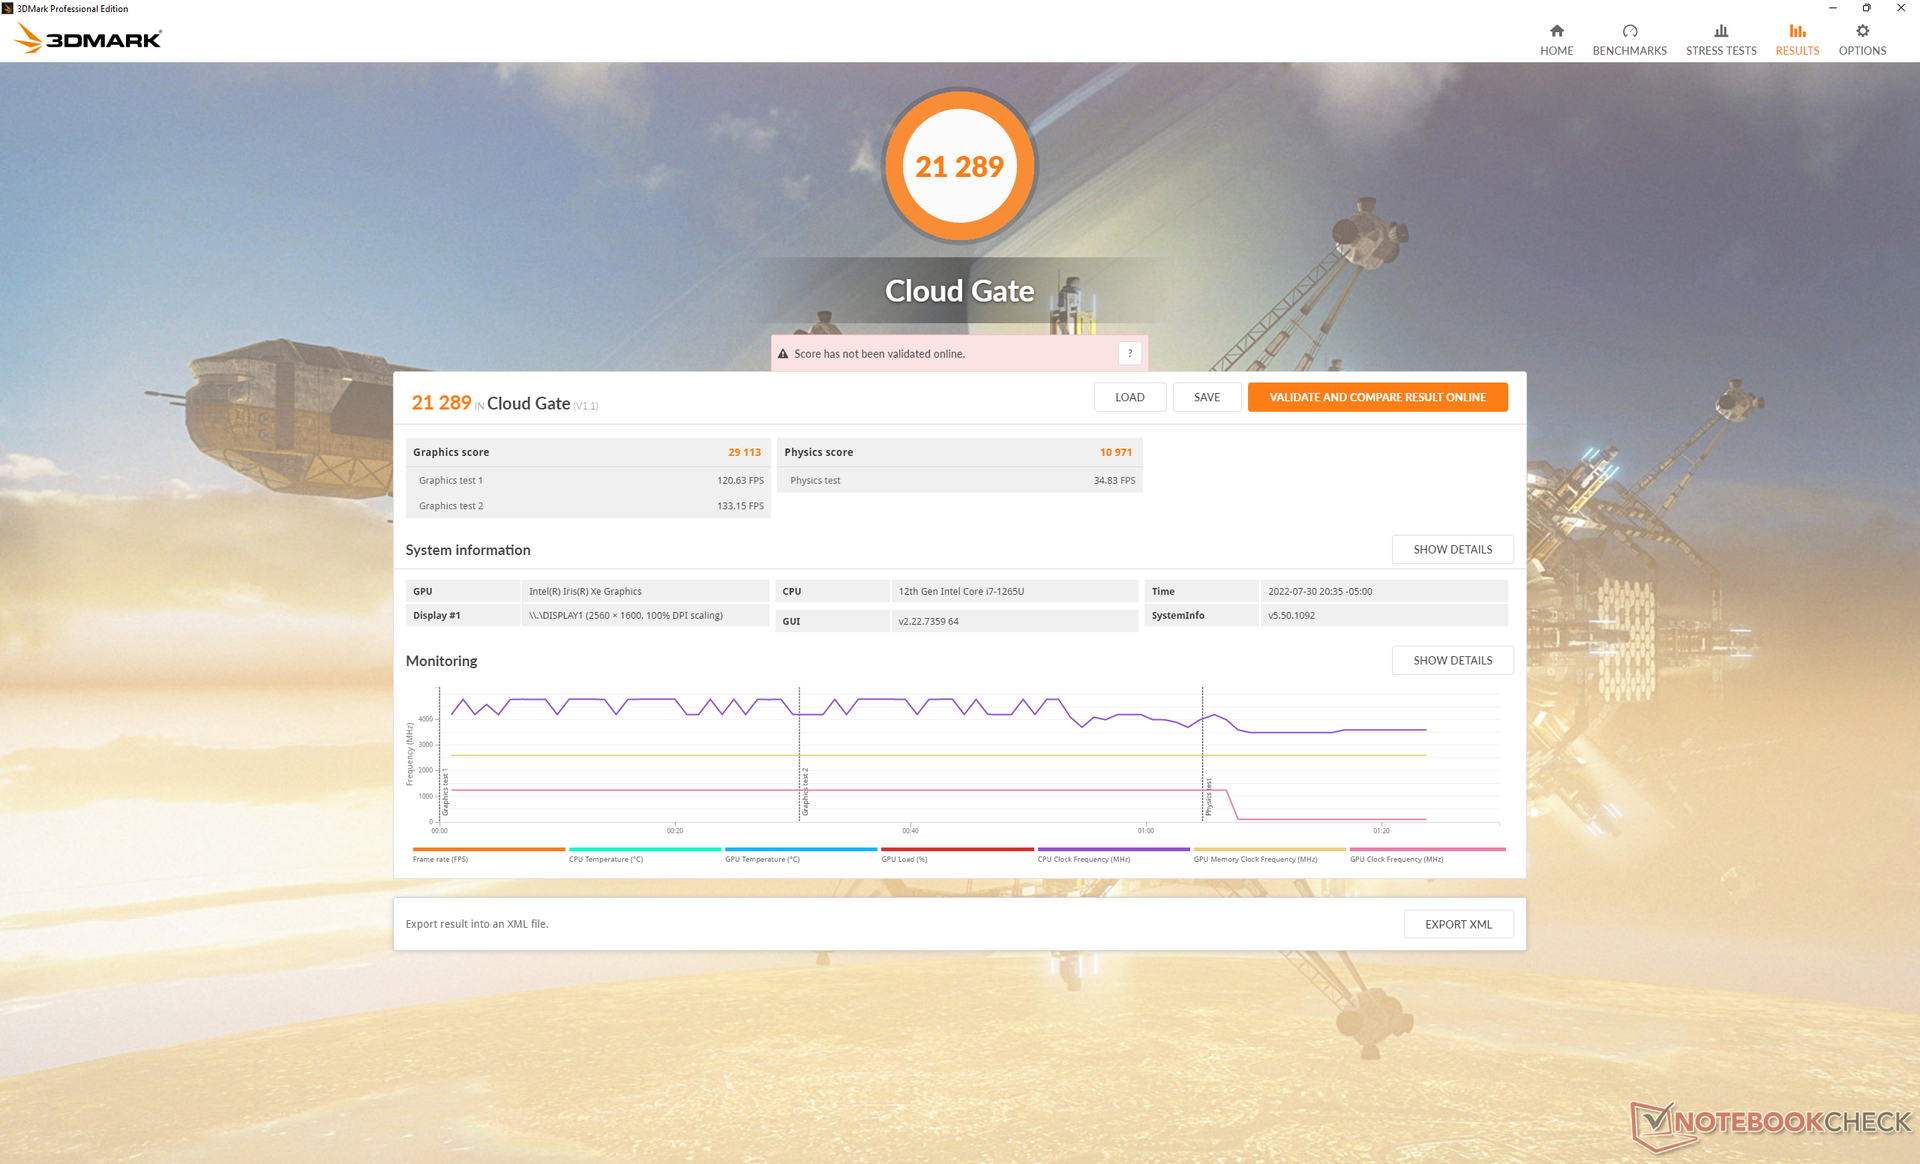
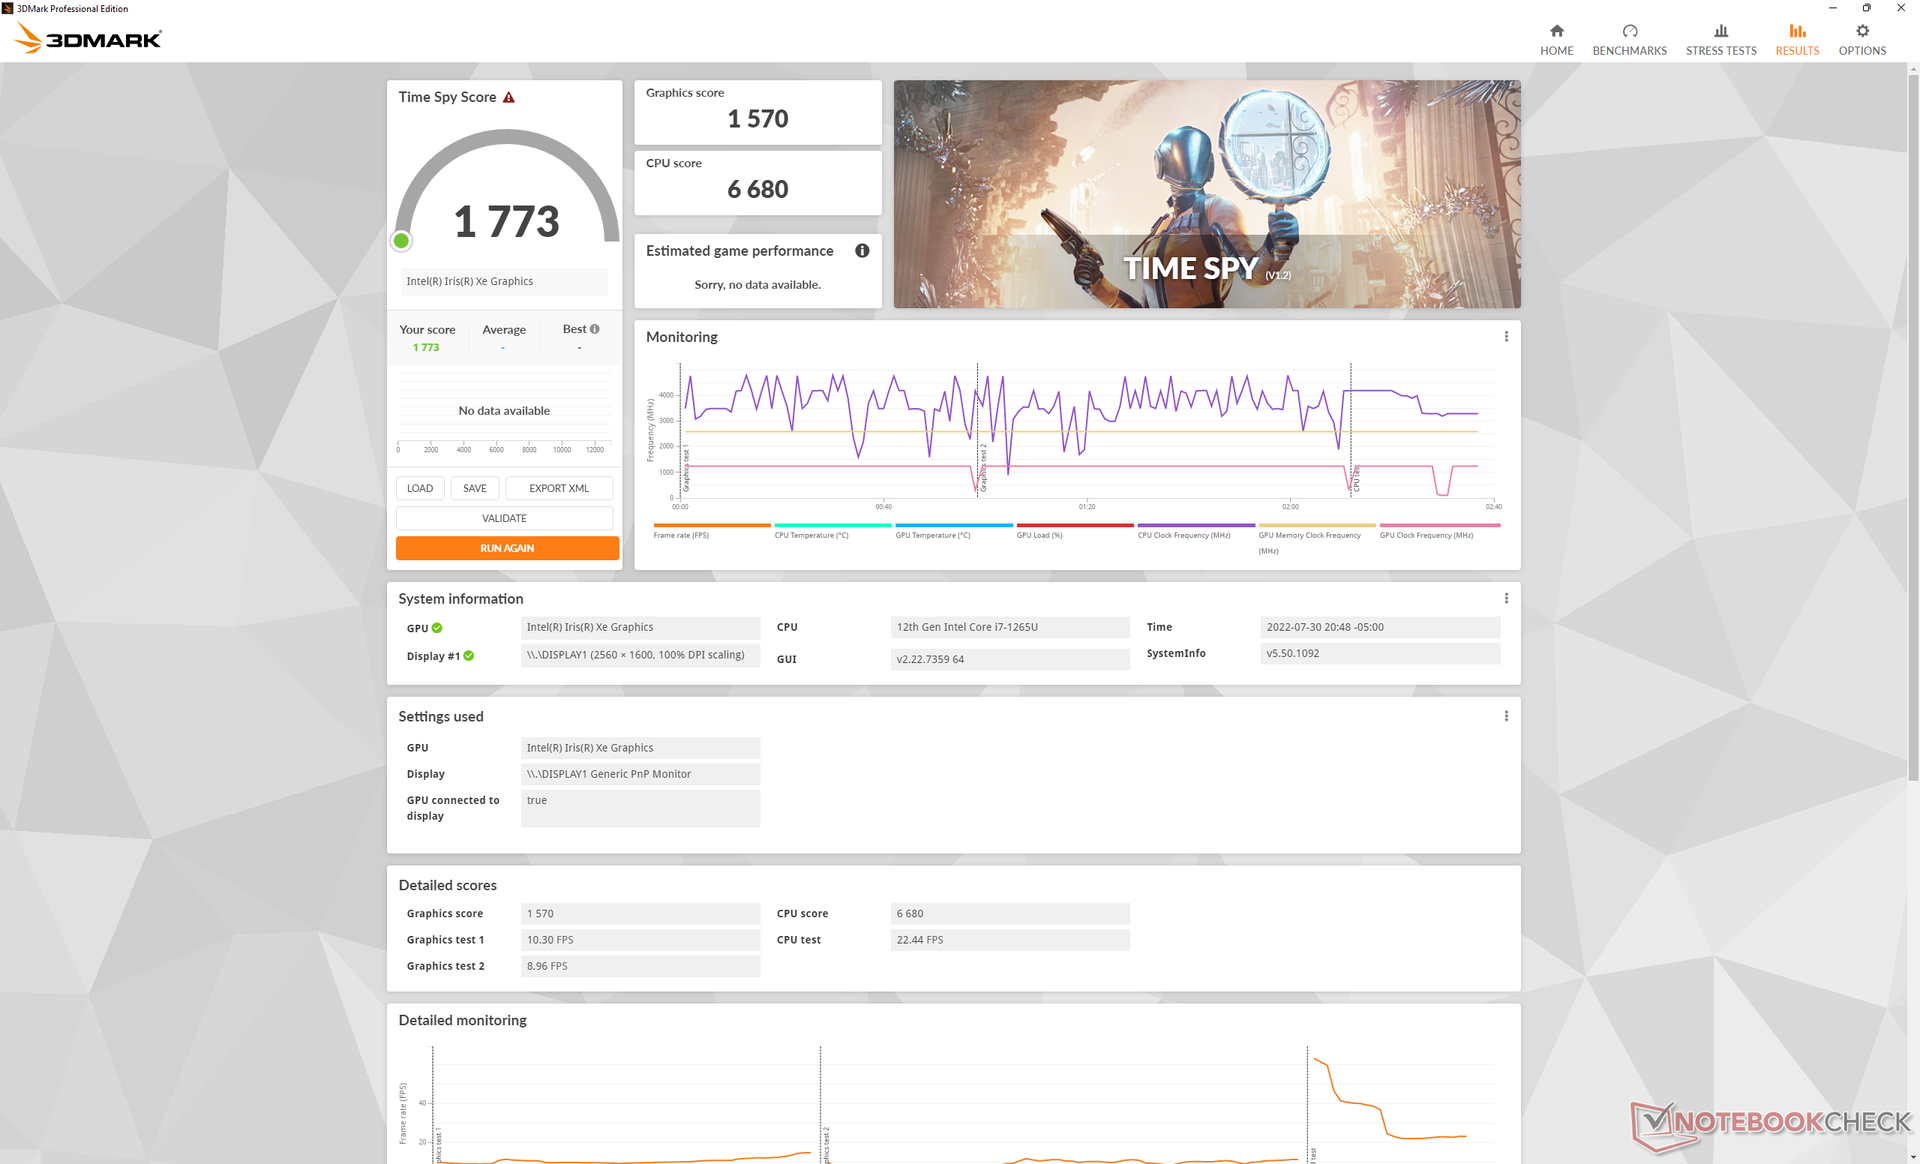
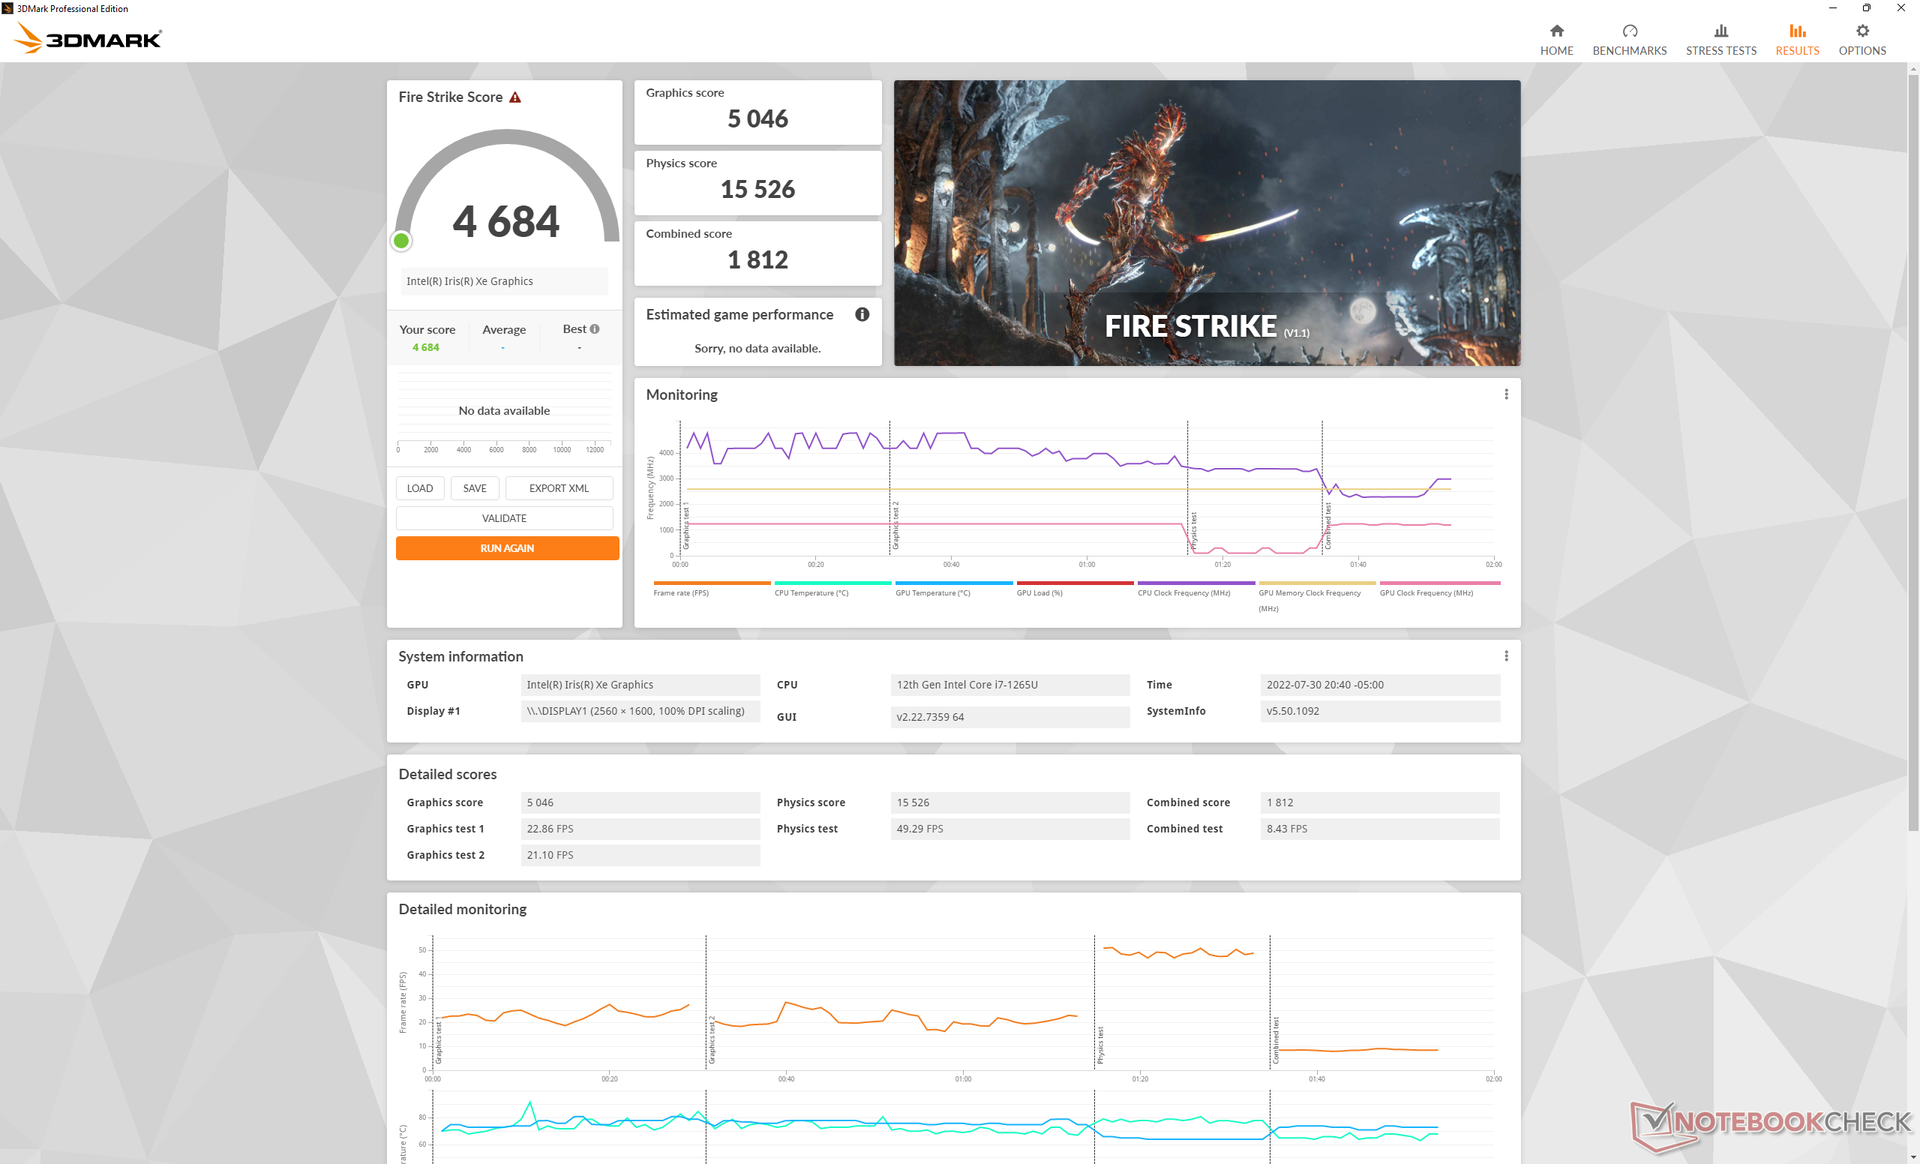
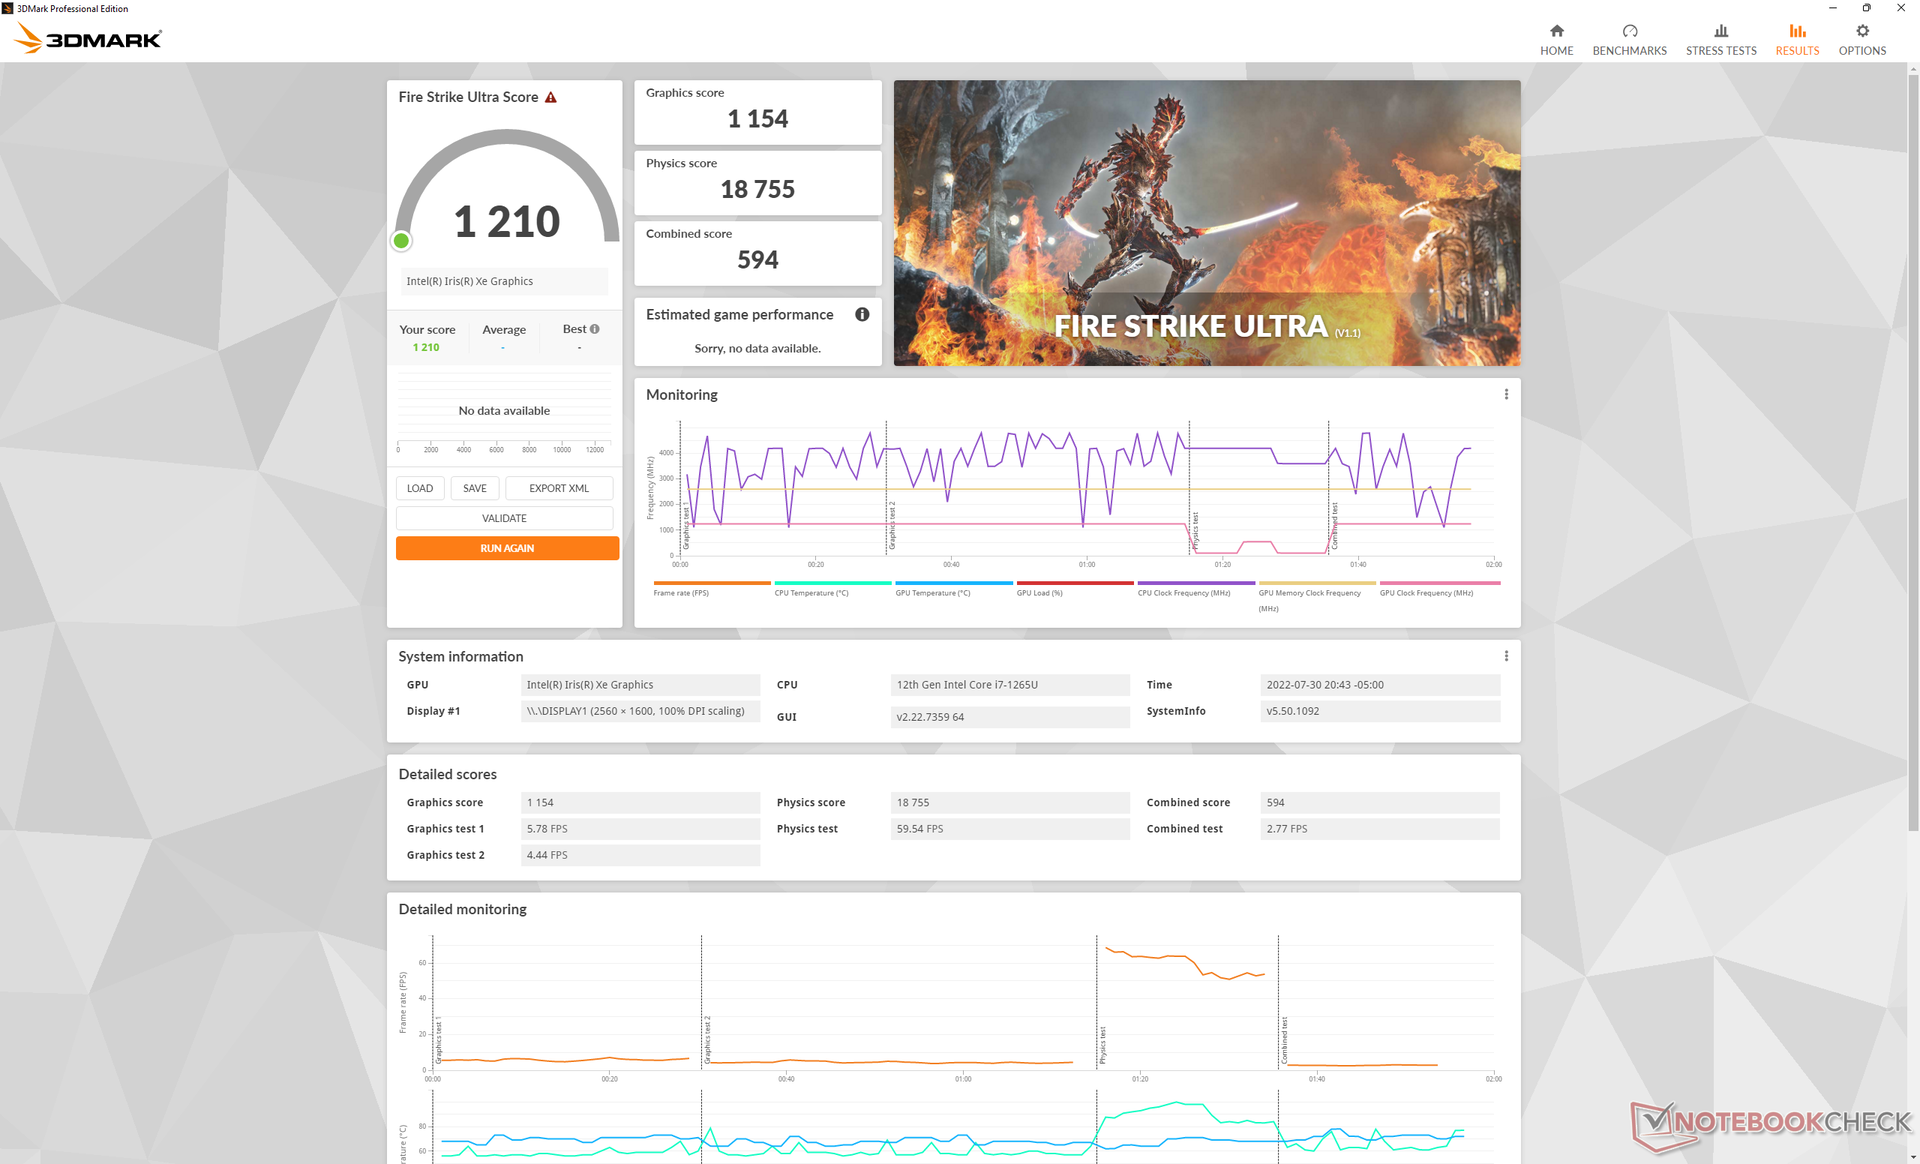
| 3DMark 11 Performance | 6861 points | |
| 3DMark Cloud Gate Standard Score | 21289 points | |
| 3DMark Fire Strike Score | 4684 points | |
| 3DMark Time Spy Score | 1773 points | |
Help | ||
| Cyberpunk 2077 1.6 | |
| 1920x1080 Low Preset | |
| MSI Summit E14 Flip Evo A12MT | |
| Dell Latitude 9430 2-in-1 | |
| Average Intel Iris Xe Graphics G7 96EUs (13 - 25.9, n=42) | |
| 1920x1080 Medium Preset | |
| MSI Summit E14 Flip Evo A12MT | |
| Dell Latitude 9430 2-in-1 | |
| Average Intel Iris Xe Graphics G7 96EUs (10.8 - 21.7, n=37) | |
| 1920x1080 High Preset | |
| MSI Summit E14 Flip Evo A12MT | |
| Dell Latitude 9430 2-in-1 | |
| Average Intel Iris Xe Graphics G7 96EUs (9.8 - 16.9, n=34) | |
| 1920x1080 Ultra Preset | |
| MSI Summit E14 Flip Evo A12MT | |
| Dell Latitude 9430 2-in-1 | |
| Average Intel Iris Xe Graphics G7 96EUs (7.4 - 16.8, n=32) | |
Witcher 3 FPS Chart
| low | med. | high | ultra | |
|---|---|---|---|---|
| GTA V (2015) | 111.6 | 93.9 | 24.8 | 10.7 |
| The Witcher 3 (2015) | 88 | 55.8 | 29.9 | 14.4 |
| Dota 2 Reborn (2015) | 114 | 87.9 | 67.6 | 57.4 |
| Final Fantasy XV Benchmark (2018) | 43.3 | 24.6 | 17 | |
| X-Plane 11.11 (2018) | 37.9 | 41.2 | 36.6 | |
| Strange Brigade (2018) | 89.6 | 41.7 | 32.5 | 26.4 |
| Cyberpunk 2077 1.6 (2022) | 22.2 | 18.8 | 14.1 | 11.3 |
Emissions
System Noise
The system is silent or near silent in most web browsing or streaming conditions. However, the fan would begin to ramp up sooner than what we experienced on the Latitude 9420 2-in-1. For example, when running the first 90-second benchmark scene of 3DMark 06, the fan in the Latitude 9420 2-in-1 would remain silent throughout the entire run. In contrast, the fan in the Latitude 9430 2-in-1 would become audible at 35 dB(A) against a silent background of 23.7 dB(A).
Running demanding loads like games on Ultra Performance mode would result in louder fan noise than on the ThinkPad X1 Yoga G7 or LG Gram 14T90P.
Noise level
| Idle |
| 23.7 / 23.7 / 23.7 dB(A) |
| Load |
| 35.1 / 43 dB(A) |
 | ||
30 dB silent 40 dB(A) audible 50 dB(A) loud |
||
min: | ||
| Dell Latitude 9430 2-in-1 Iris Xe G7 96EUs, i7-1265U | Dell Latitude 9420 2-in-1 Iris Xe G7 96EUs, i7-1185G7, WDC PC SN530 SDBPNPZ-512G | MSI Summit E14 Flip Evo A12MT Iris Xe G7 96EUs, i7-1260P, Samsung PM9A1 MZVL21T0HCLR | LG Gram 14T90P Iris Xe G7 80EUs, i5-1135G7, Samsung SSD PM981a MZVLB512HBJQ | Lenovo ThinkPad X1 Yoga G7 21CE002HGE Iris Xe G7 96EUs, i7-1270P, Samsung PM9A1 MZVL2512HCJQ | Asus ZenBook Flip 14 UN5401QA-KN085W Vega 8, R7 5800H, Intel SSD 600p SSDPEKKW512G7 | |
|---|---|---|---|---|---|---|
| Noise | 1% | 4% | 4% | 4% | -10% | |
| off / environment * (dB) | 23.7 | 25.4 -7% | 23.3 2% | 25.4 -7% | 22.7 4% | 26 -10% |
| Idle Minimum * (dB) | 23.7 | 25.4 -7% | 23.3 2% | 25.5 -8% | 22.7 4% | 26 -10% |
| Idle Average * (dB) | 23.7 | 25.4 -7% | 23.3 2% | 25.5 -8% | 22.7 4% | 26 -10% |
| Idle Maximum * (dB) | 23.7 | 25.4 -7% | 23.3 2% | 25.5 -8% | 27.1 -14% | 27.3 -15% |
| Load Average * (dB) | 35.1 | 25.4 28% | 24 32% | 28.3 19% | 34.5 2% | 39.8 -13% |
| Witcher 3 ultra * (dB) | 43.3 | 41.3 5% | 35.6 18% | 35 19% | 34.5 20% | |
| Load Maximum * (dB) | 43 | 41.3 4% | 55.8 -30% | 35 19% | 38.7 10% | 42.4 1% |
* ... smaller is better
Temperature
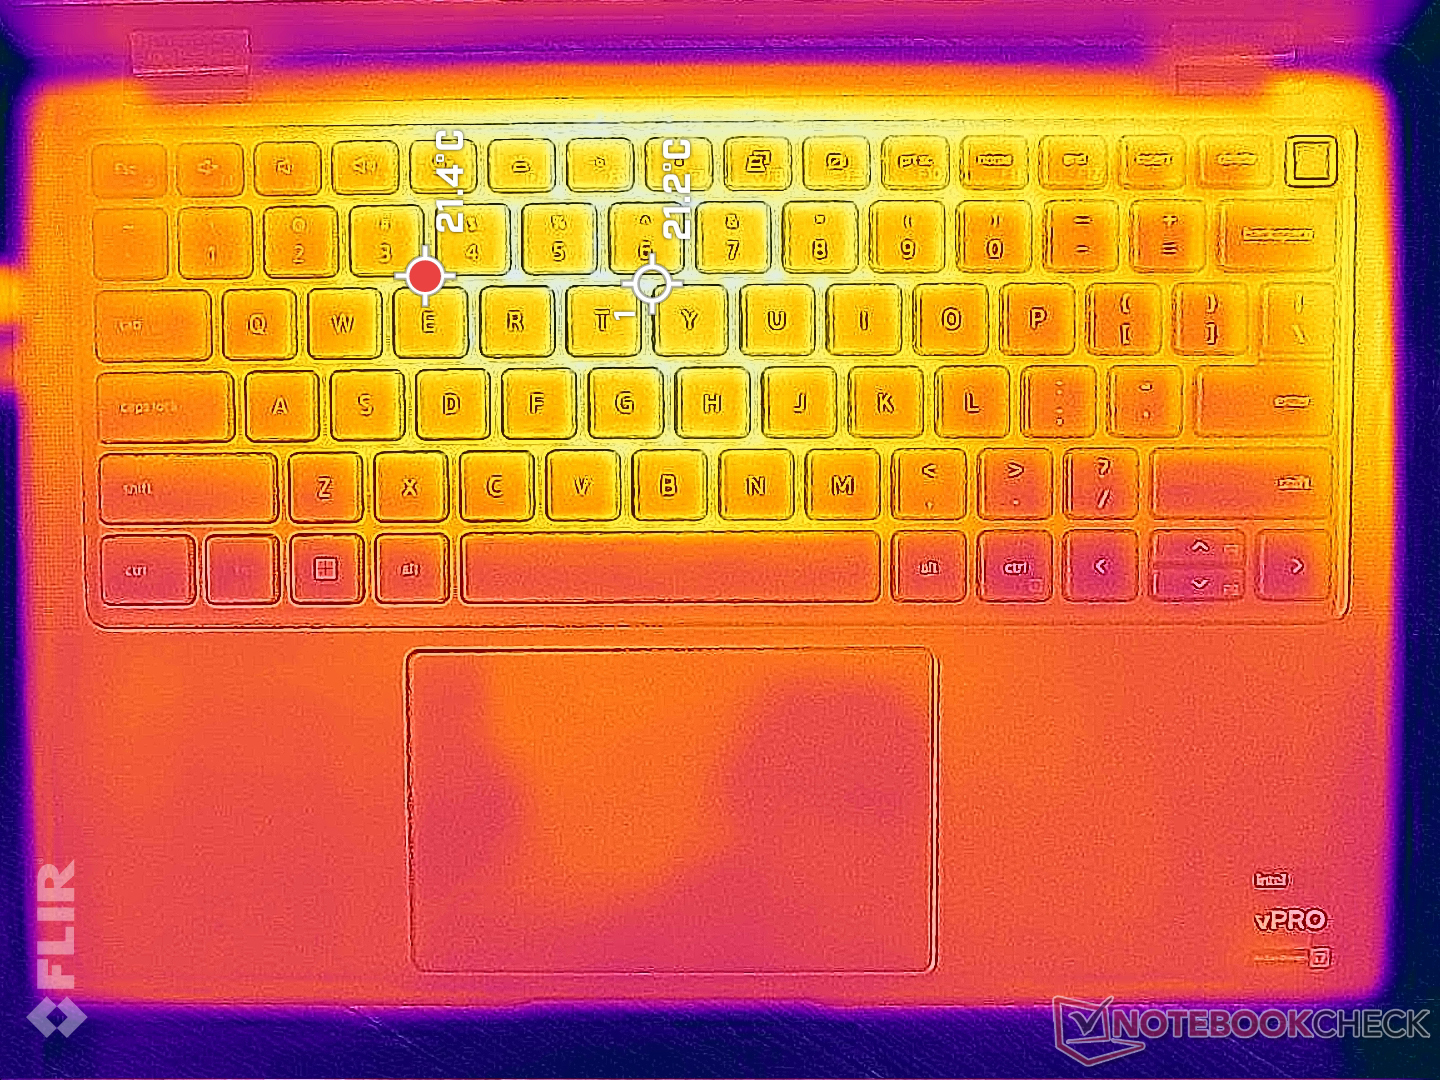
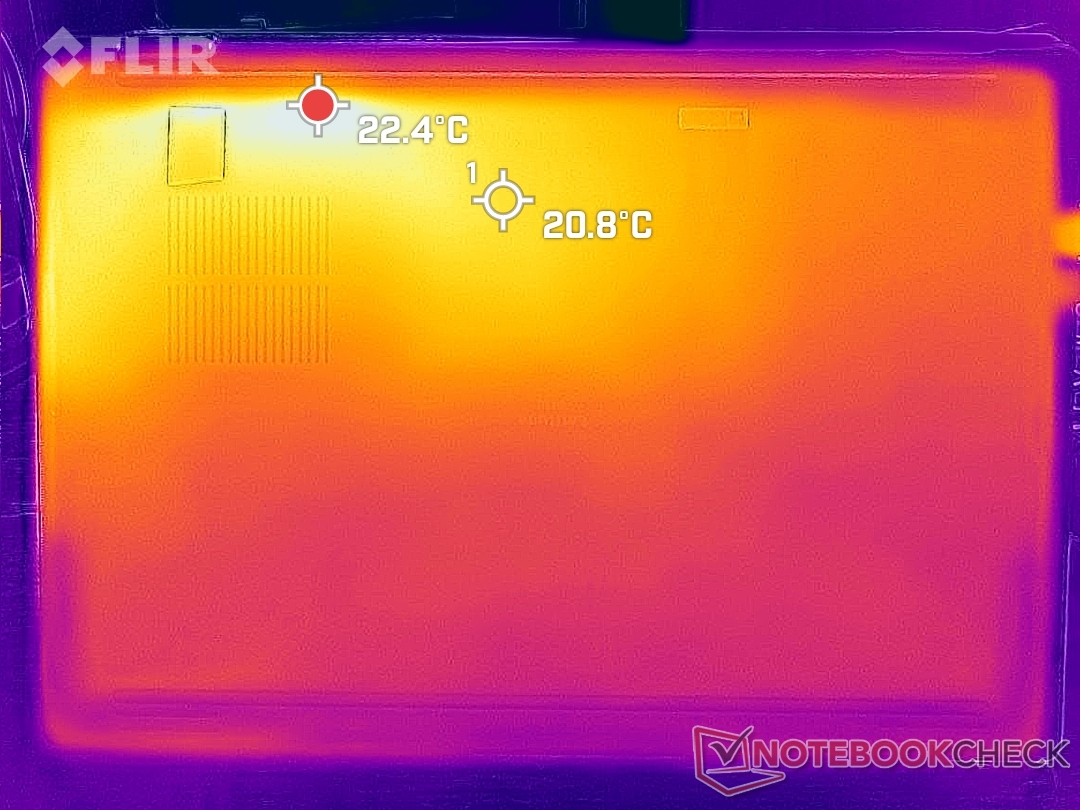
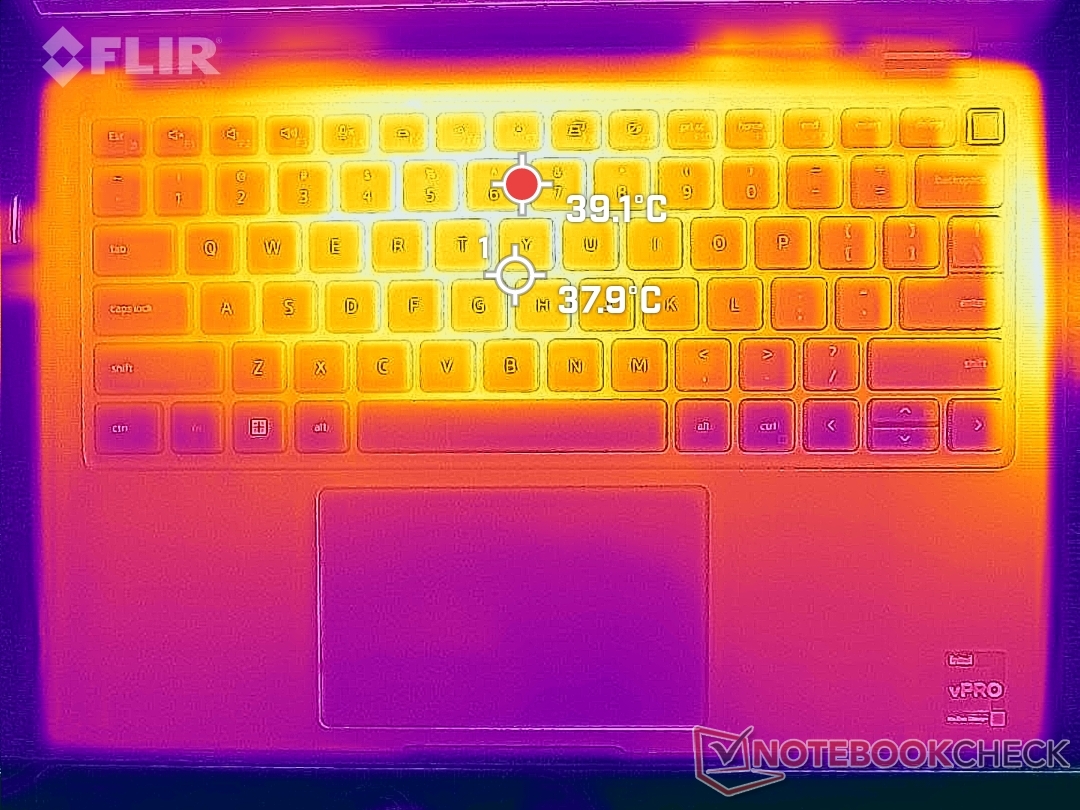
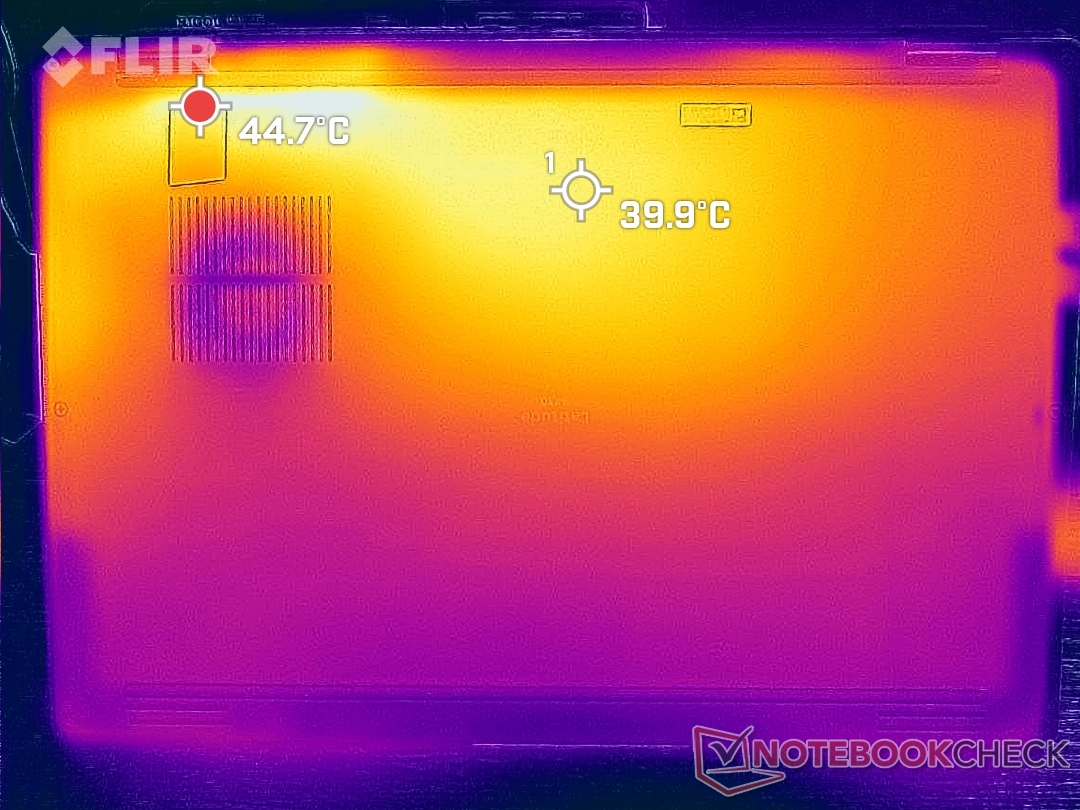
Surface temperatures are warmest near the keyboard center and back half of the laptop where hot spots can reach 40 C on both the top and bottom. Results are cooler than what we observed on the Latitude 9420 2-in-1 and about the same as on the MSI Summit E14 Flip when under similar loads. Heat escapes along the right edge and rear of the chassis.
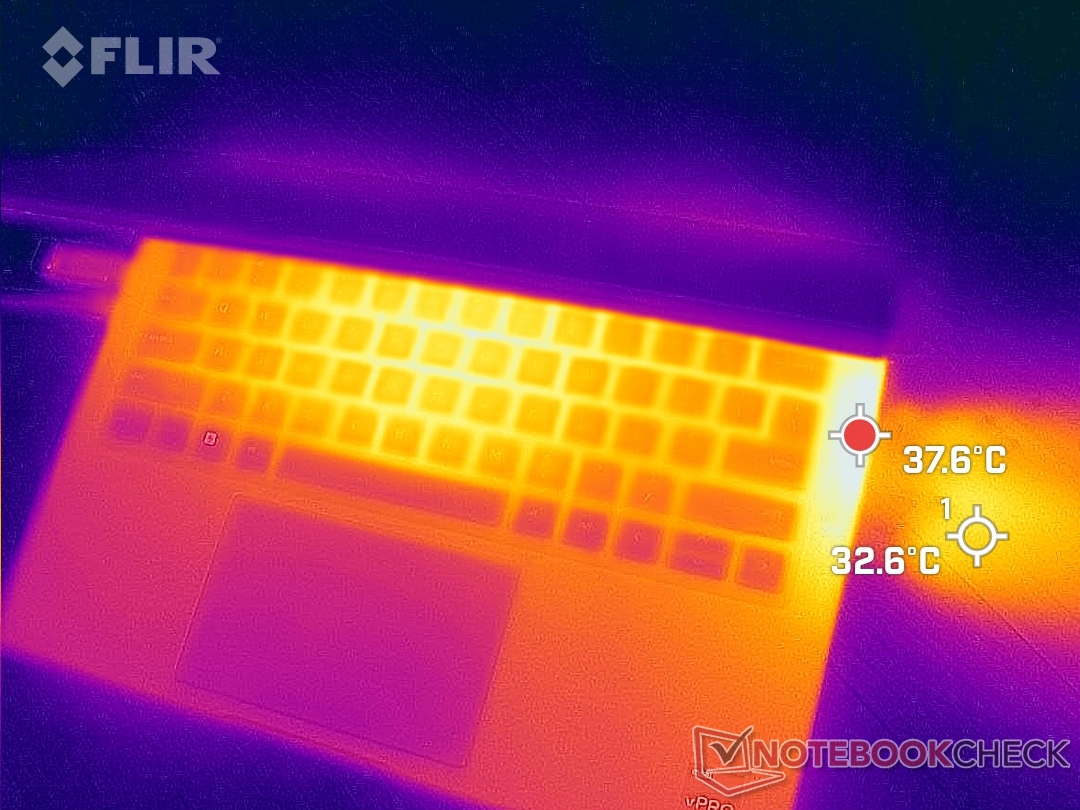
(+) The maximum temperature on the upper side is 39.2 °C / 103 F, compared to the average of 35.4 °C / 96 F, ranging from 19.6 to 60 °C for the class Convertible.
(±) The bottom heats up to a maximum of 44.8 °C / 113 F, compared to the average of 36.9 °C / 98 F
(+) In idle usage, the average temperature for the upper side is 19.7 °C / 67 F, compared to the device average of 30.3 °C / 87 F.
(+) The palmrests and touchpad are cooler than skin temperature with a maximum of 28.4 °C / 83.1 F and are therefore cool to the touch.
(±) The average temperature of the palmrest area of similar devices was 28 °C / 82.4 F (-0.4 °C / -0.7 F).
| Dell Latitude 9430 2-in-1 Intel Core i7-1265U, Intel Iris Xe Graphics G7 96EUs | Dell Latitude 9420 2-in-1 Intel Core i7-1185G7, Intel Iris Xe Graphics G7 96EUs | MSI Summit E14 Flip Evo A12MT Intel Core i7-1260P, Intel Iris Xe Graphics G7 96EUs | LG Gram 14T90P Intel Core i5-1135G7, Intel Iris Xe Graphics G7 80EUs | Lenovo ThinkPad X1 Yoga G7 21CE002HGE Intel Core i7-1270P, Intel Iris Xe Graphics G7 96EUs | Asus ZenBook Flip 14 UN5401QA-KN085W AMD Ryzen 7 5800H, AMD Radeon RX Vega 8 (Ryzen 4000/5000) | |
|---|---|---|---|---|---|---|
| Heat | -21% | -1% | -5% | -15% | -35% | |
| Maximum Upper Side * (°C) | 39.2 | 43.4 -11% | 44.2 -13% | 41.6 -6% | 43.3 -10% | 42.7 -9% |
| Maximum Bottom * (°C) | 44.8 | 48 -7% | 45.8 -2% | 46.2 -3% | 45.1 -1% | 53.1 -19% |
| Idle Upper Side * (°C) | 21.4 | 29.8 -39% | 19.6 8% | 22.6 -6% | 26.5 -24% | 32.9 -54% |
| Idle Bottom * (°C) | 22.4 | 28 -25% | 22 2% | 23.2 -4% | 27.6 -23% | 35.2 -57% |
* ... smaller is better
Stress Test
Clock rates, core temperature, and board power draw would spike to 3.6 GHz, 98 C and 48 W, respectively, for only a few short seconds when running Prime95. Clock rates would then steadily fall before finally stabilizing at 2.4 GHz in order to maintain a more manageable board power draw and core temperature of 24 W and 74 C, respectively. We appreciate the steady and more predictable performance this time around whereas clock rates and temperature on the Latitude 9420 2-in-1 would fluctuate more wildly under similar conditions.
GPU clock rates and temperature when running Witcher 3 would stabilize at 1097 MHz and 66 C, respectively, compared to ~1200 MHz and 73 C on the Latitude 9420 2-in-1 or 1197 MHz and 85 C on the MSI Summit E14 Flip.
Running on battery power limits performance. A 3DMark 11 test on batteries would return Physics and Graphics scores of 9711 and 5679 points, respectively, compared to 16290 and 6231 points when on mains.
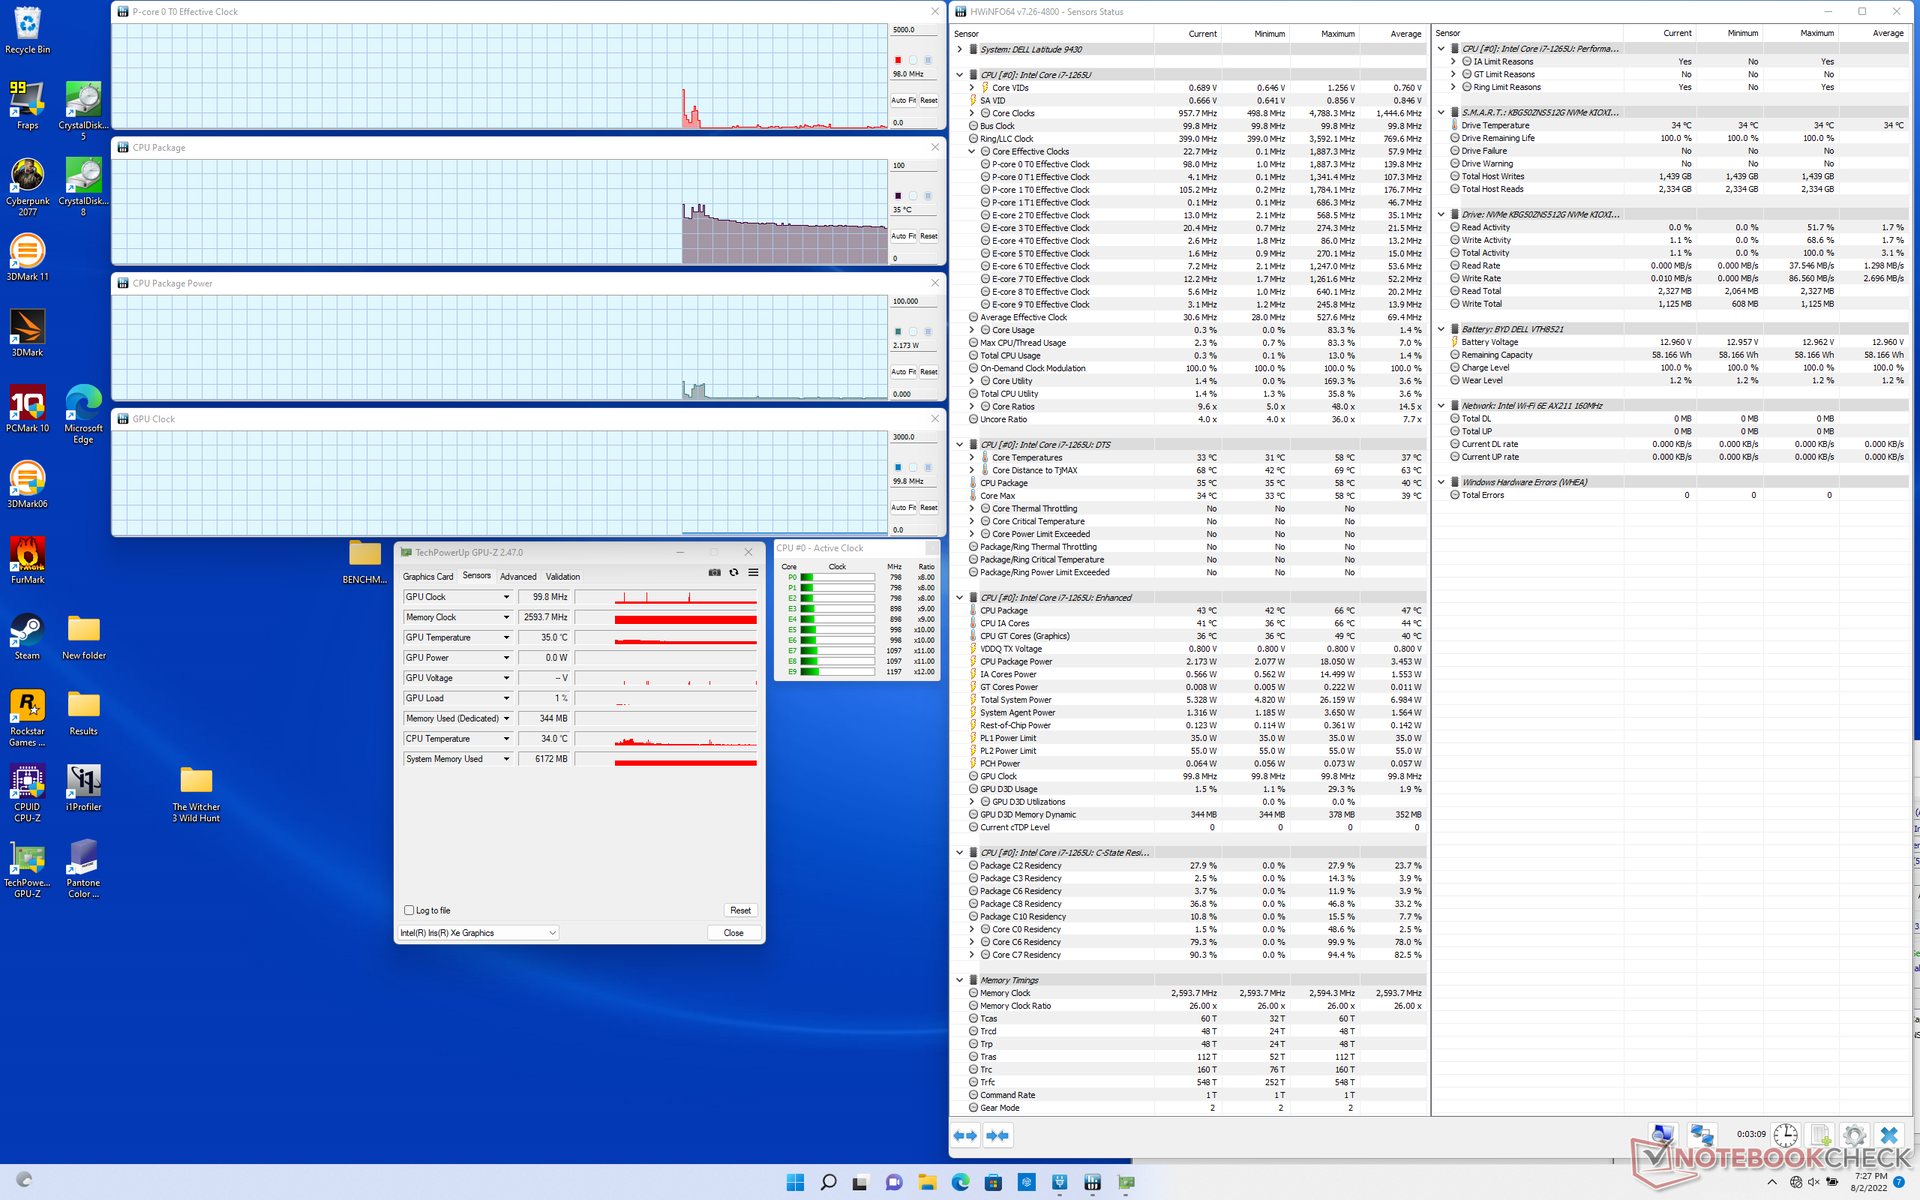
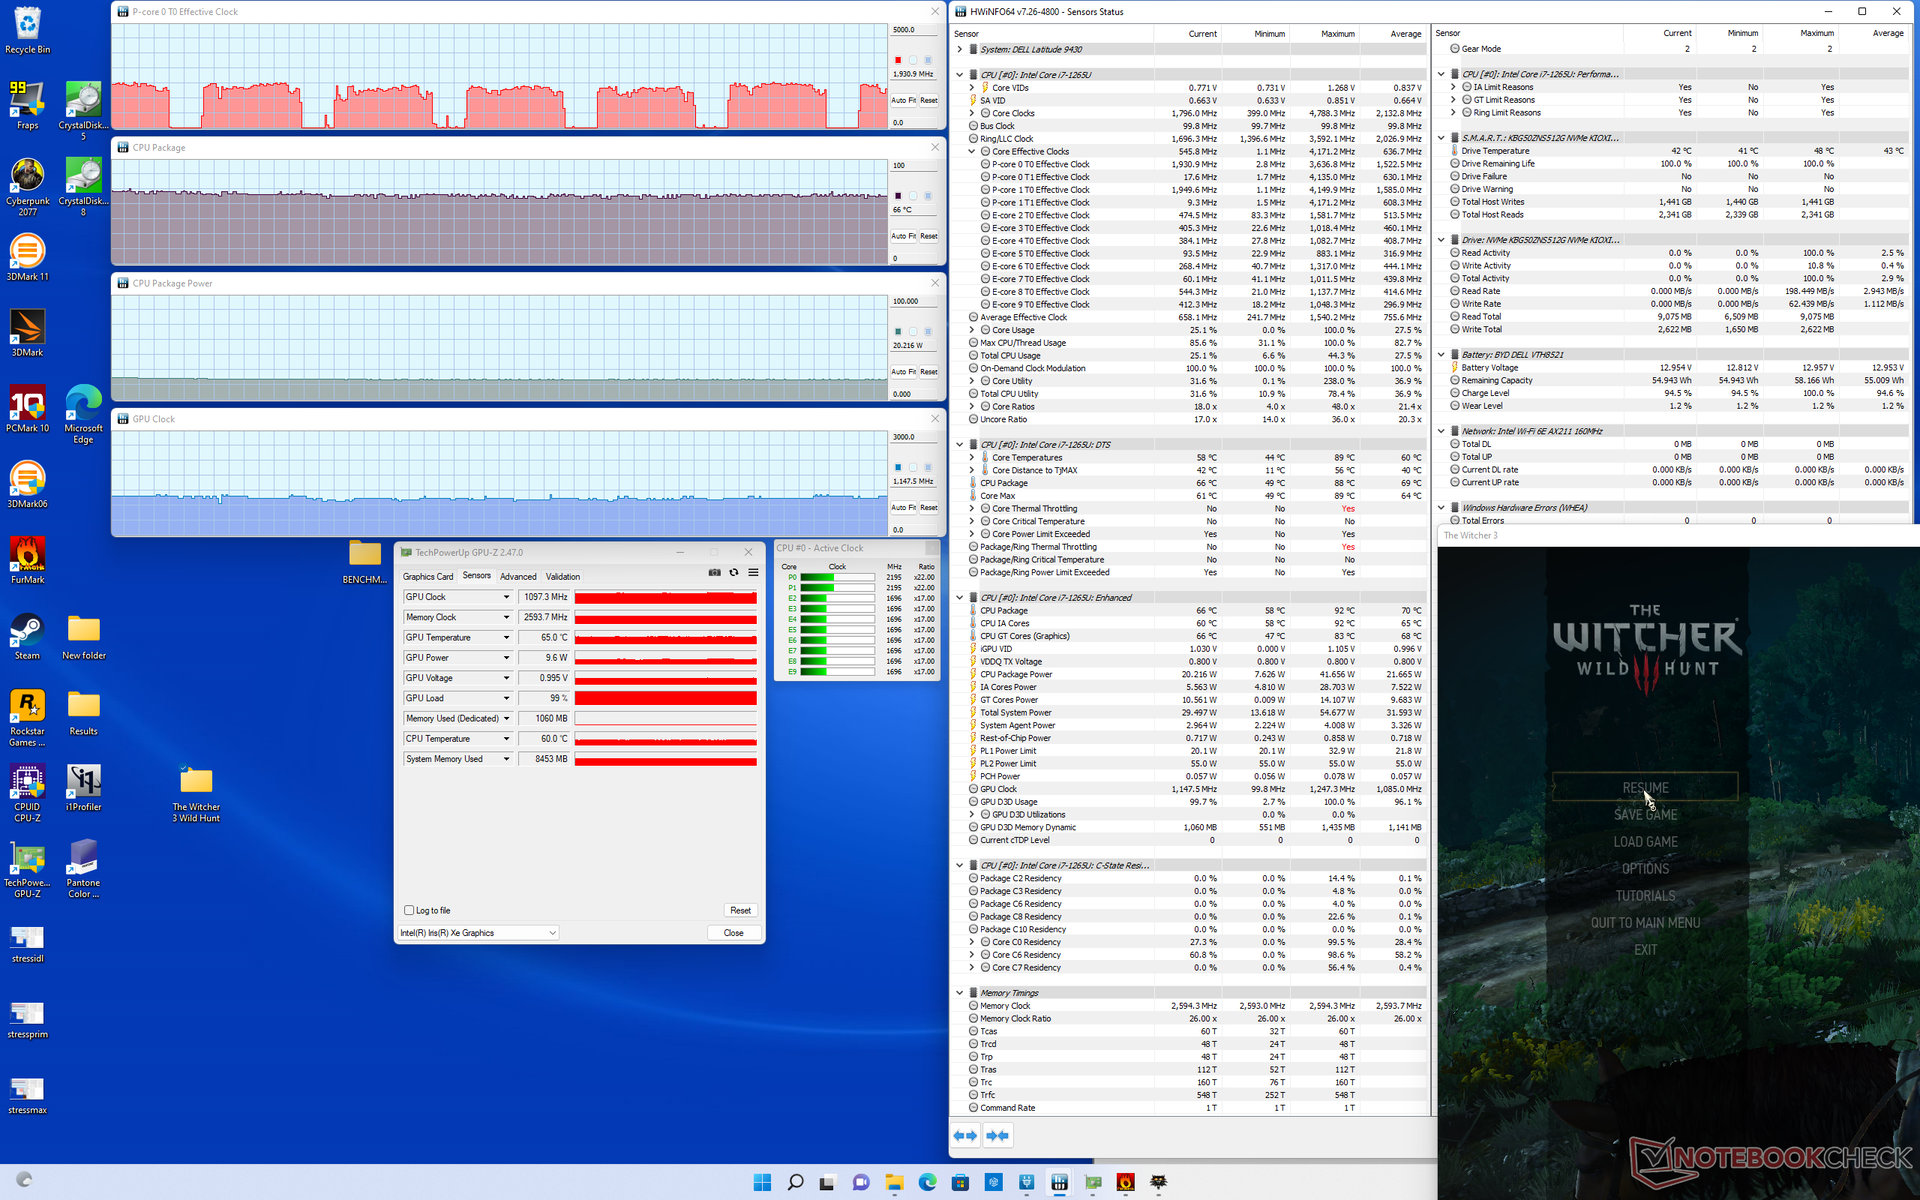
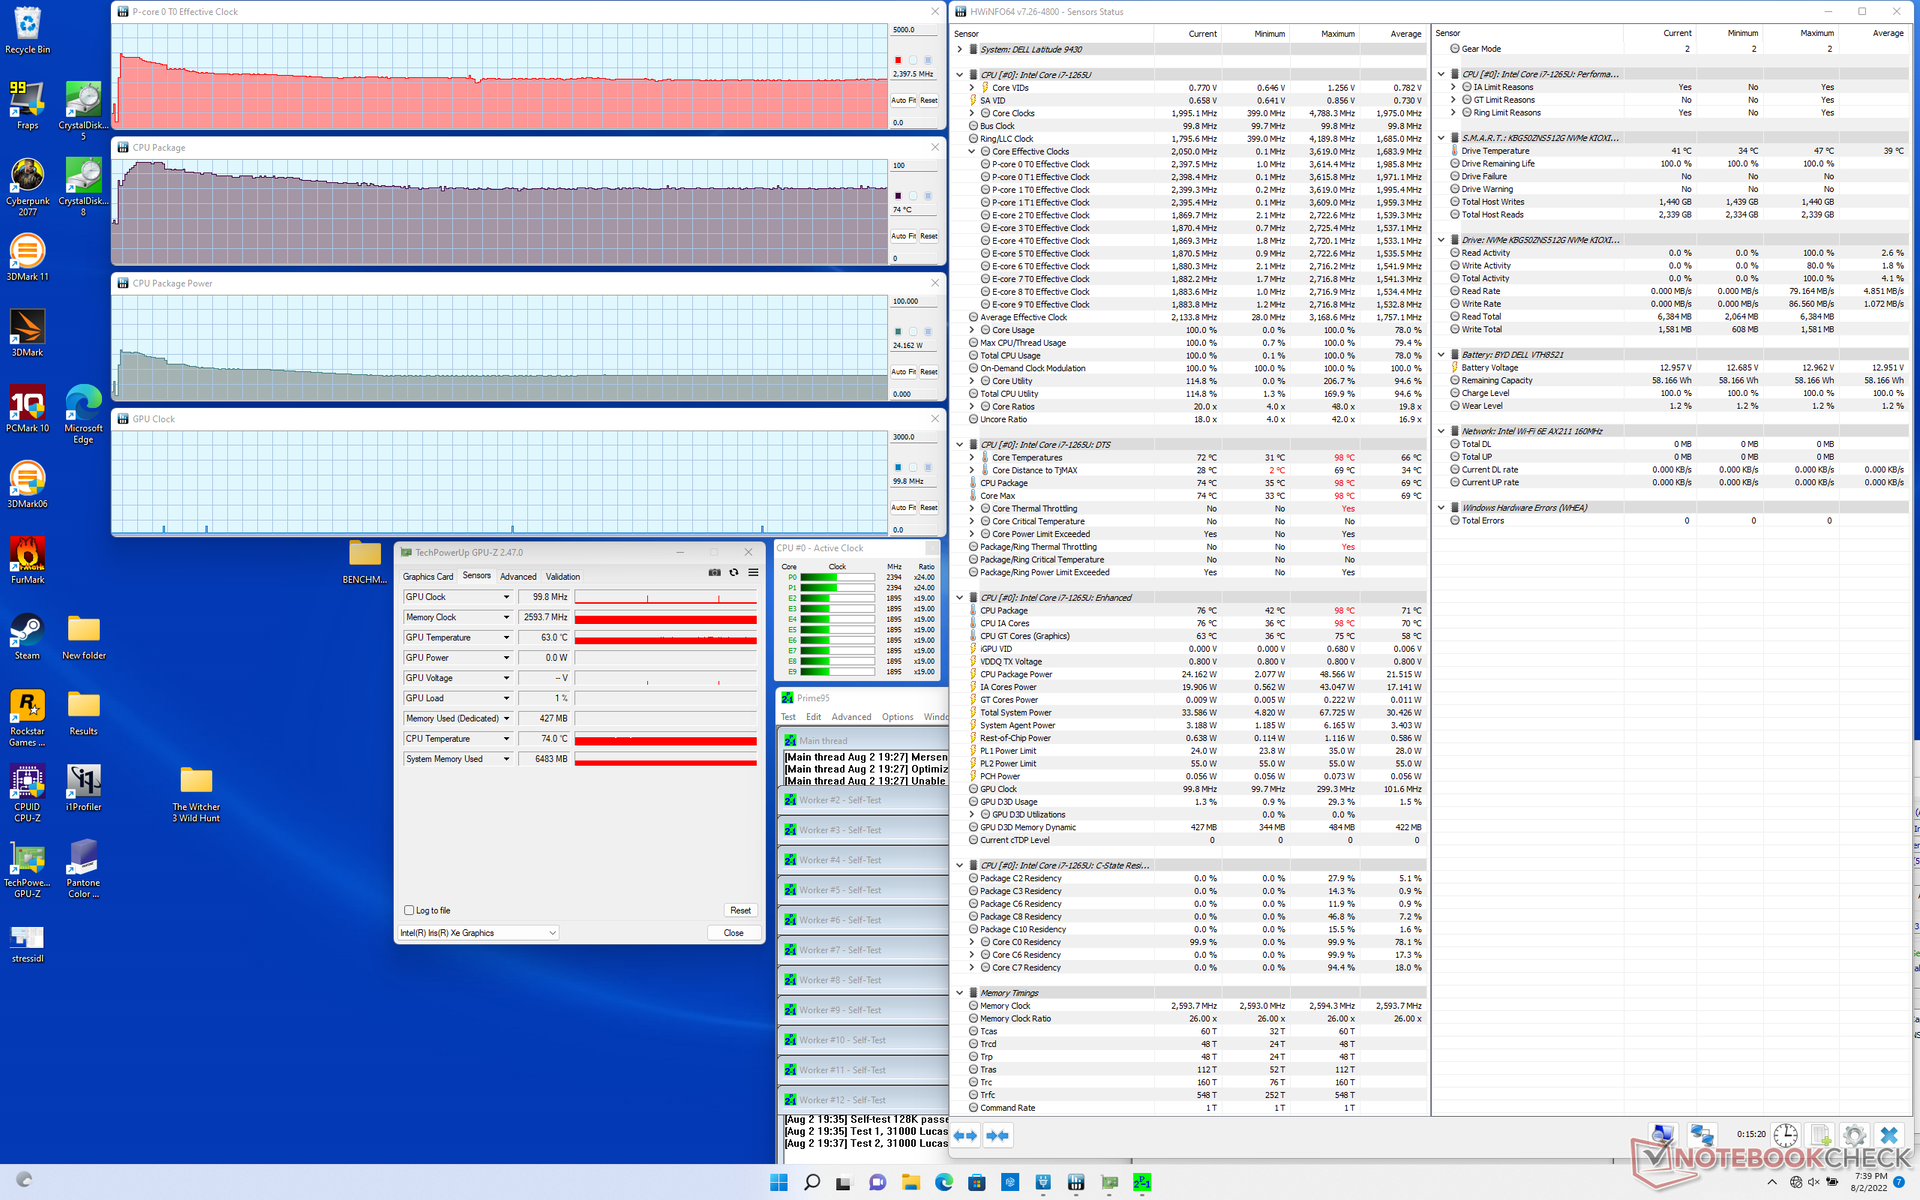
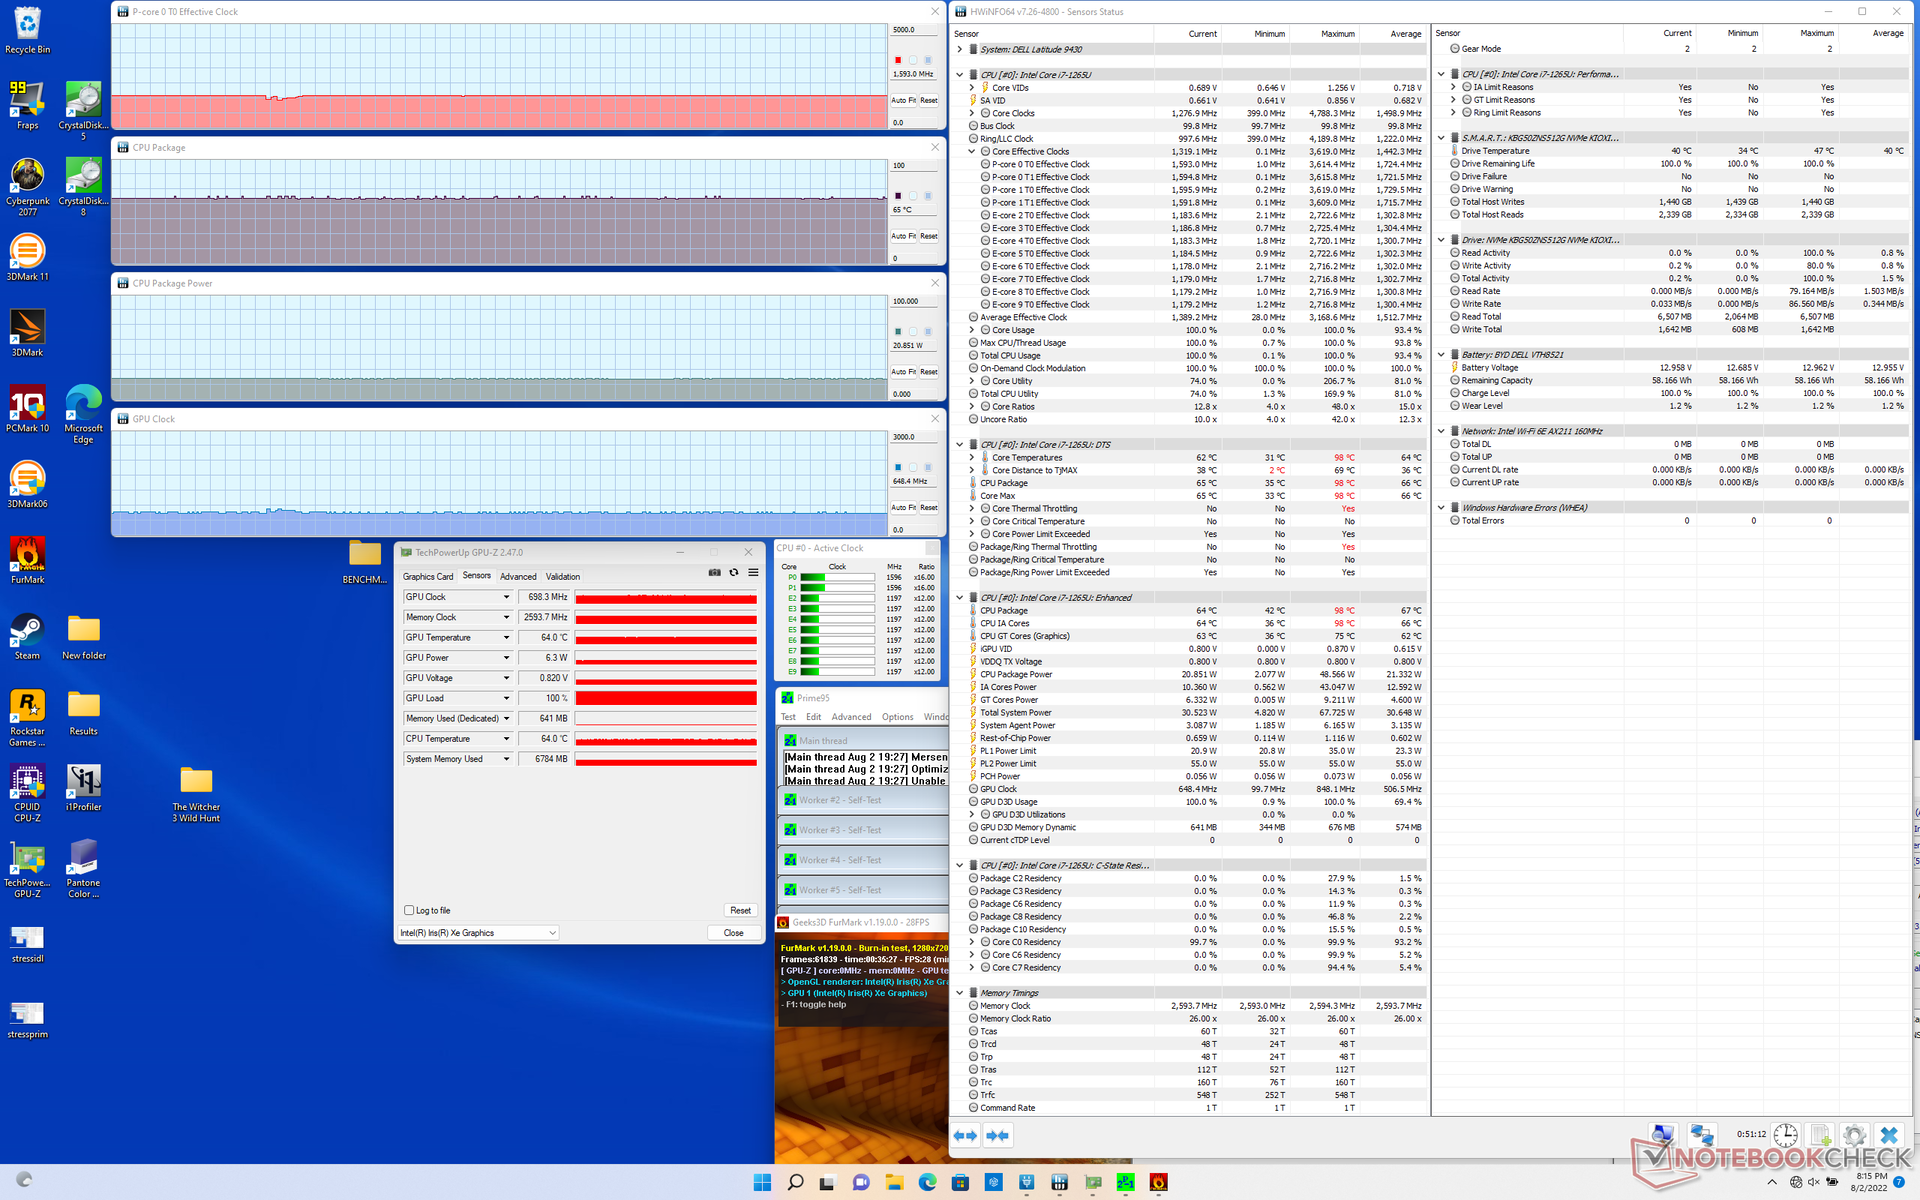
| CPU Clock (GHz) | GPU Clock (MHz) | Average CPU Temperature (°C) | |
| System Idle | -- | -- | 35 |
| Prime95 Stress | 2.4 | -- | 74 |
| Prime95 + FurMark Stress | 1.6 | 698 | 65 |
| Witcher 3 Stress | ~2.0 | 1097 | 66 |
Speakers
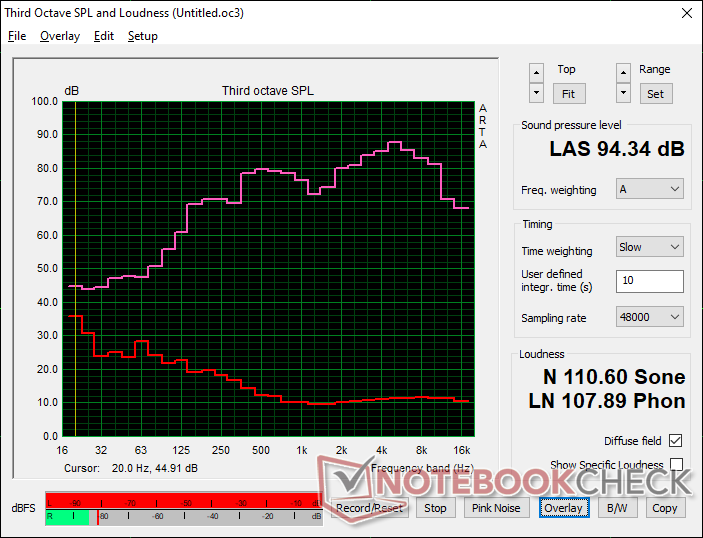
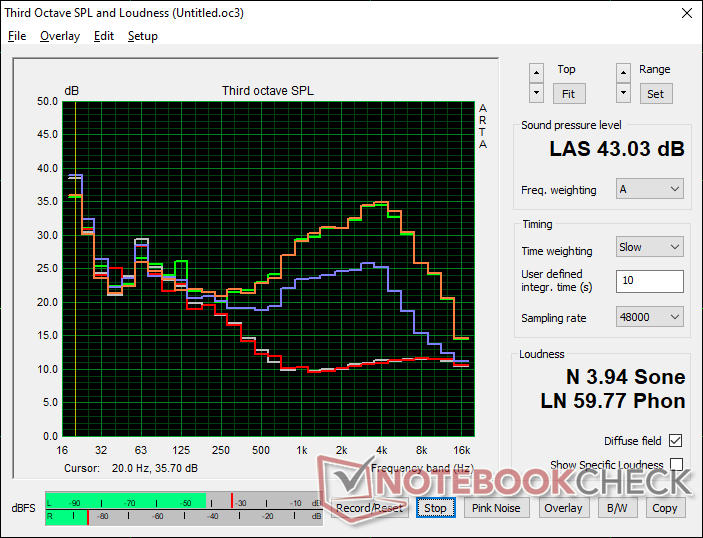
Dell Latitude 9430 2-in-1 audio analysis
(+) | speakers can play relatively loud (94.3 dB)
Bass 100 - 315 Hz
(±) | reduced bass - on average 12.3% lower than median
(+) | bass is linear (5.3% delta to prev. frequency)
Mids 400 - 2000 Hz
(+) | balanced mids - only 2% away from median
(+) | mids are linear (4.7% delta to prev. frequency)
Highs 2 - 16 kHz
(±) | higher highs - on average 5.4% higher than median
(+) | highs are linear (3% delta to prev. frequency)
Overall 100 - 16.000 Hz
(+) | overall sound is linear (11.6% difference to median)
Compared to same class
» 10% of all tested devices in this class were better, 4% similar, 86% worse
» The best had a delta of 6%, average was 20%, worst was 57%
Compared to all devices tested
» 8% of all tested devices were better, 2% similar, 90% worse
» The best had a delta of 4%, average was 23%, worst was 134%
Apple MacBook Pro 16 2021 M1 Pro audio analysis
(+) | speakers can play relatively loud (84.7 dB)
Bass 100 - 315 Hz
(+) | good bass - only 3.8% away from median
(+) | bass is linear (5.2% delta to prev. frequency)
Mids 400 - 2000 Hz
(+) | balanced mids - only 1.3% away from median
(+) | mids are linear (2.1% delta to prev. frequency)
Highs 2 - 16 kHz
(+) | balanced highs - only 1.9% away from median
(+) | highs are linear (2.7% delta to prev. frequency)
Overall 100 - 16.000 Hz
(+) | overall sound is linear (4.6% difference to median)
Compared to same class
» 0% of all tested devices in this class were better, 0% similar, 100% worse
» The best had a delta of 5%, average was 17%, worst was 45%
Compared to all devices tested
» 0% of all tested devices were better, 0% similar, 100% worse
» The best had a delta of 4%, average was 23%, worst was 134%
Energy Management
Power Consumption
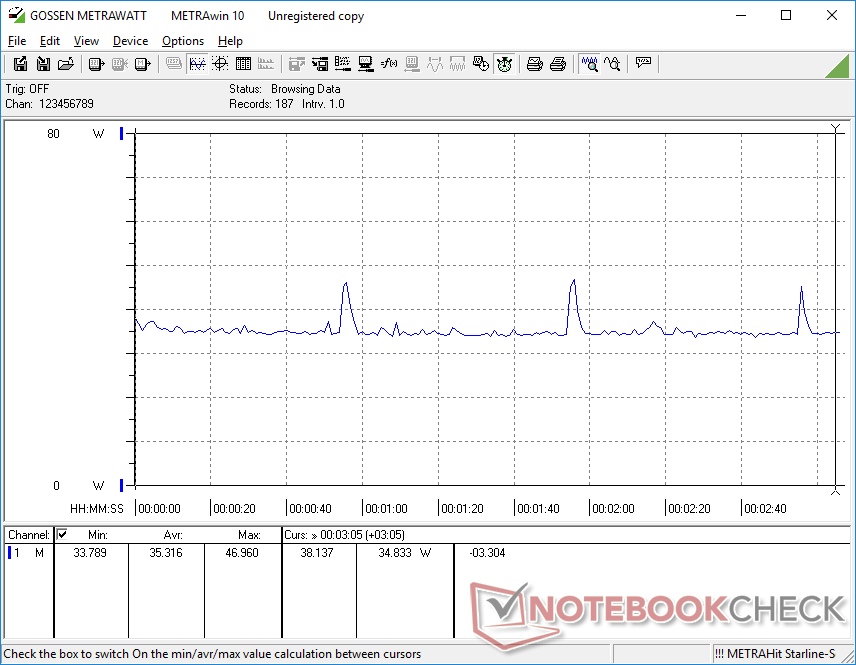
Idling on desktop demands between 3 W and 7 W depending on the brightness profile and power setting which is slightly less than what we recorded on the Latitude 9420 2-in-1. Meanwhile, running Prime95 consumes about 62 W compared to only 32 W on last year's model for a whopping 94 percent increase in power consumption when the CPU is stressed. The 50 percent higher multi-thread performance when jumping from the Core i7-1185G7 to the Core i7-1265U doesn't come free in this regard.
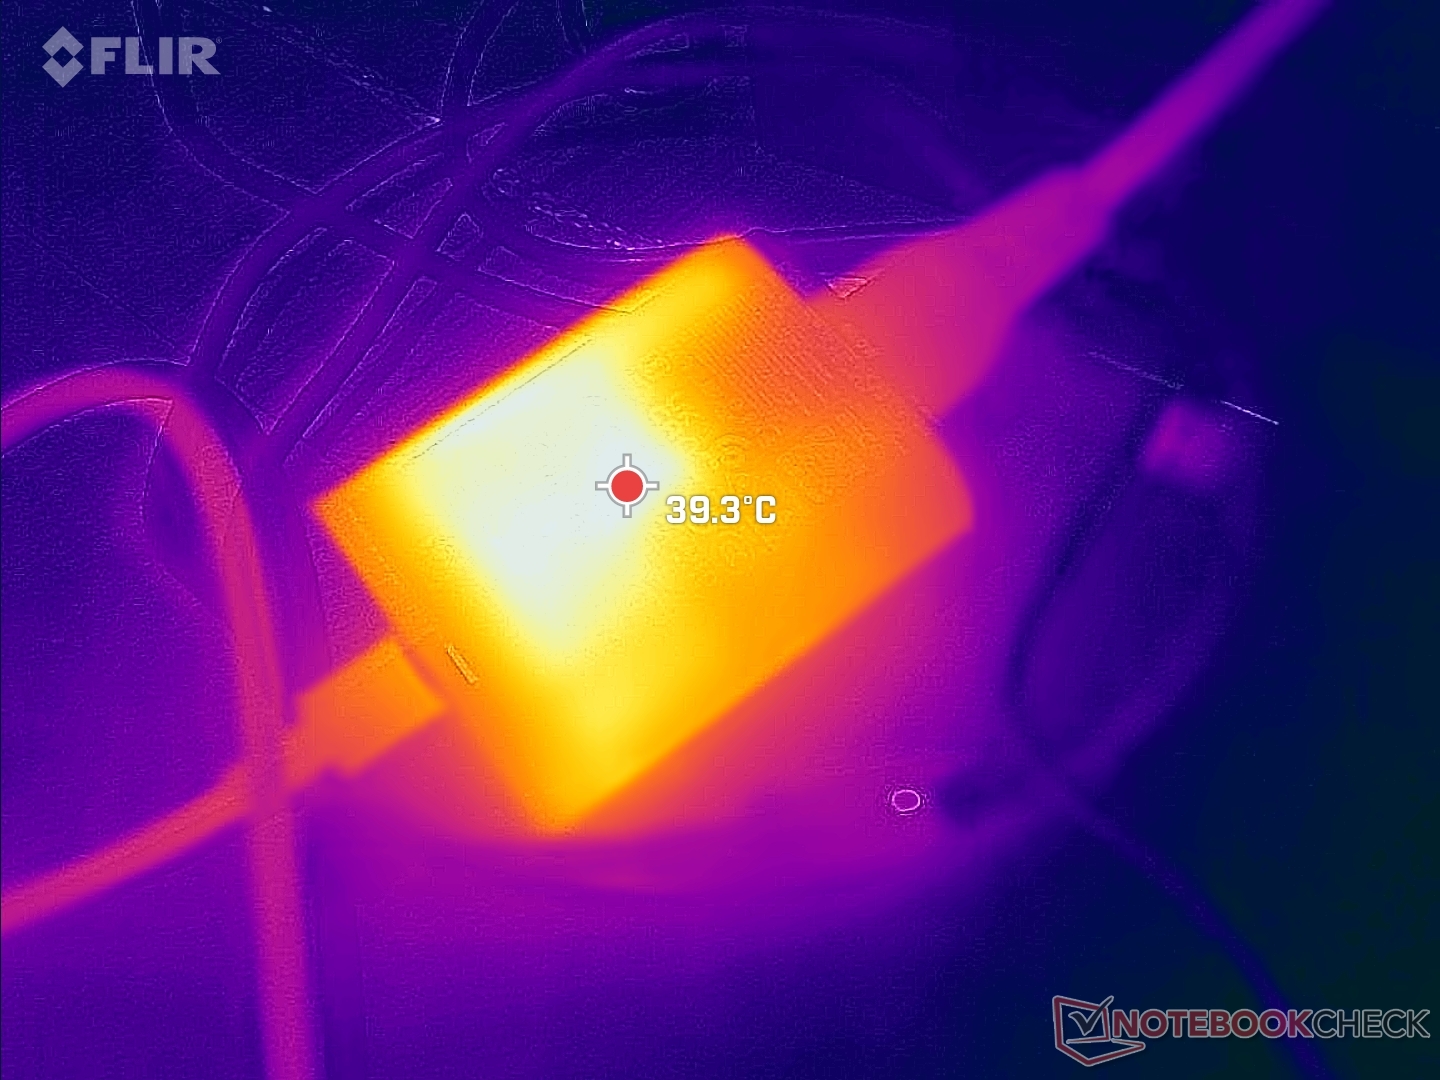
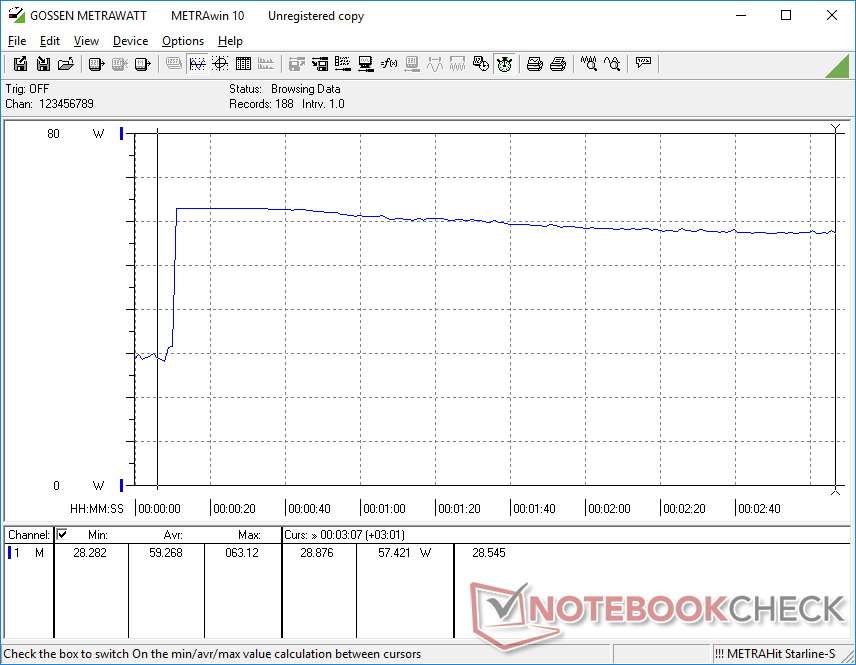
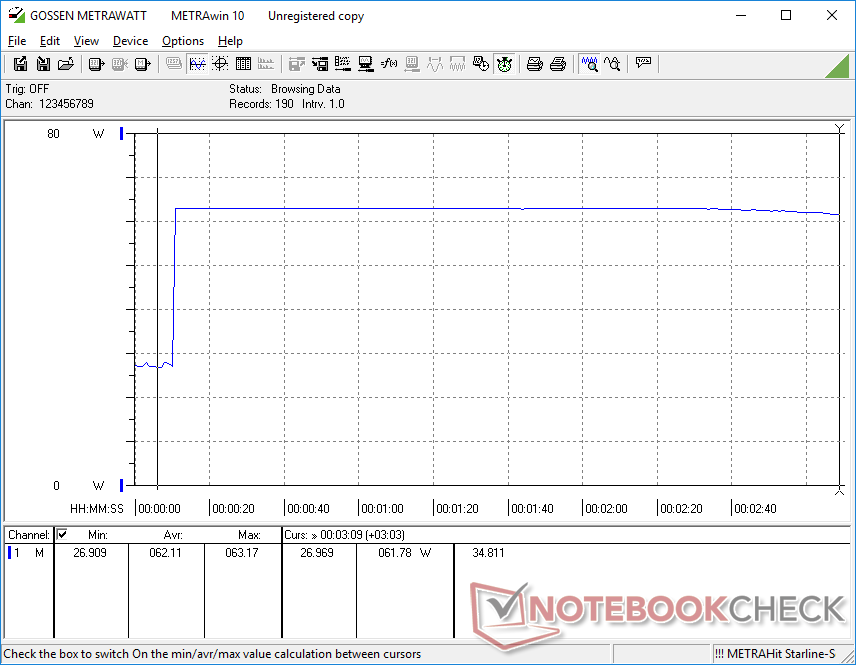
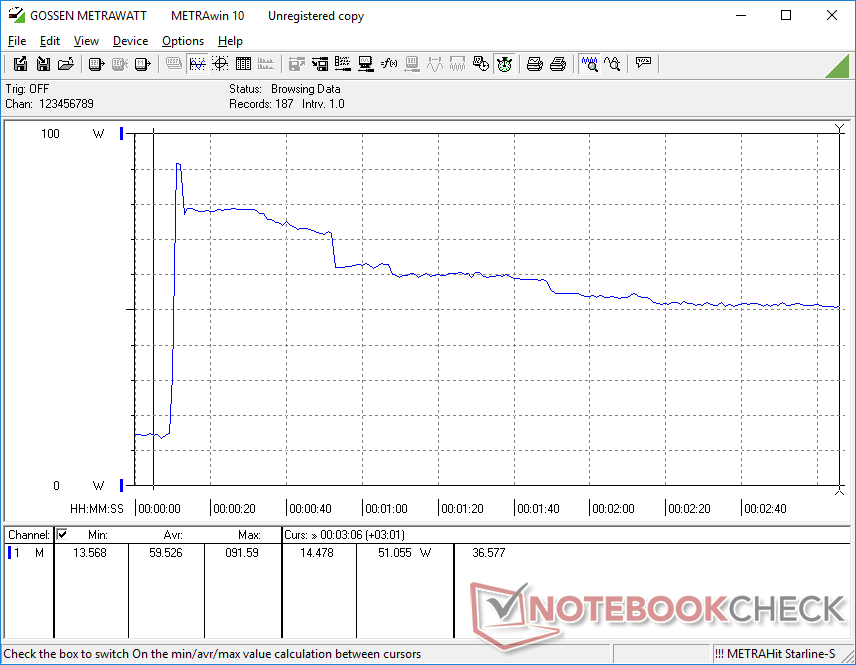
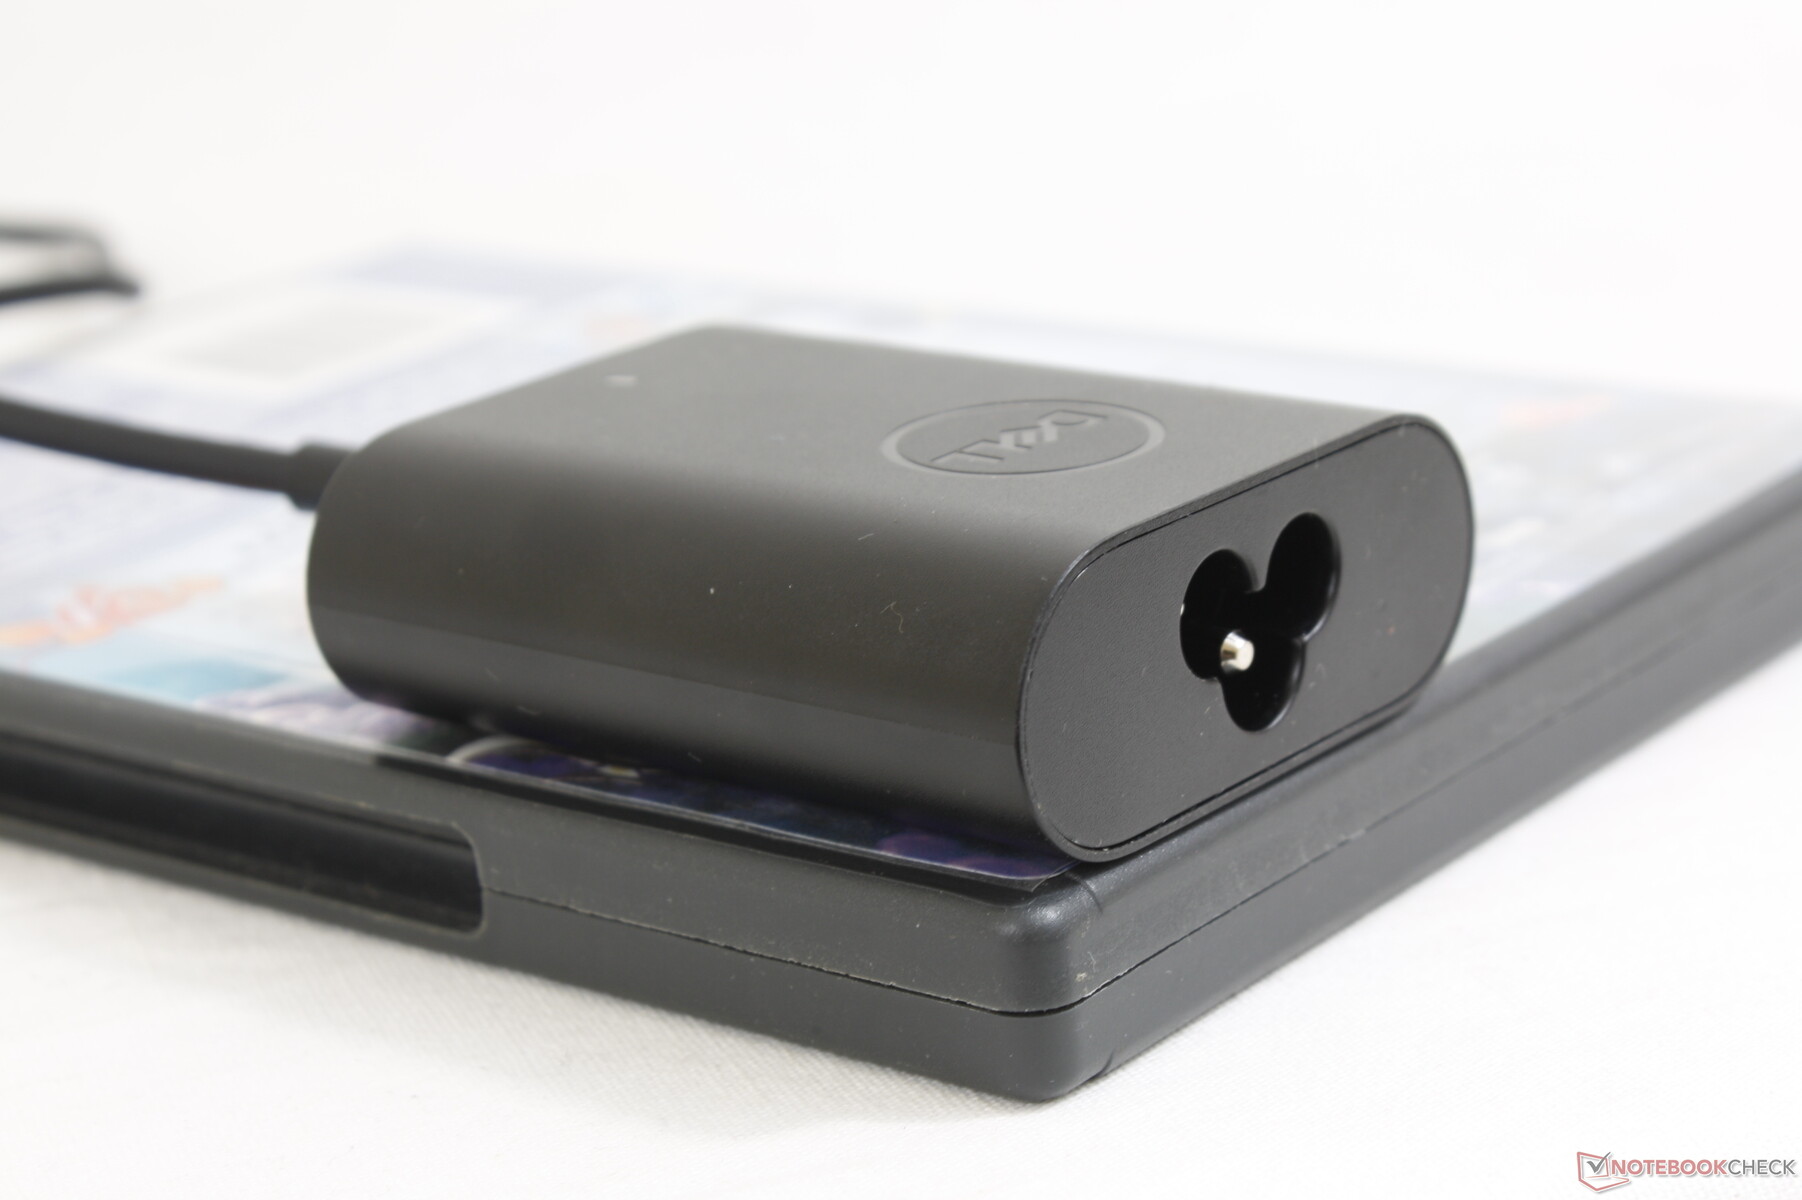
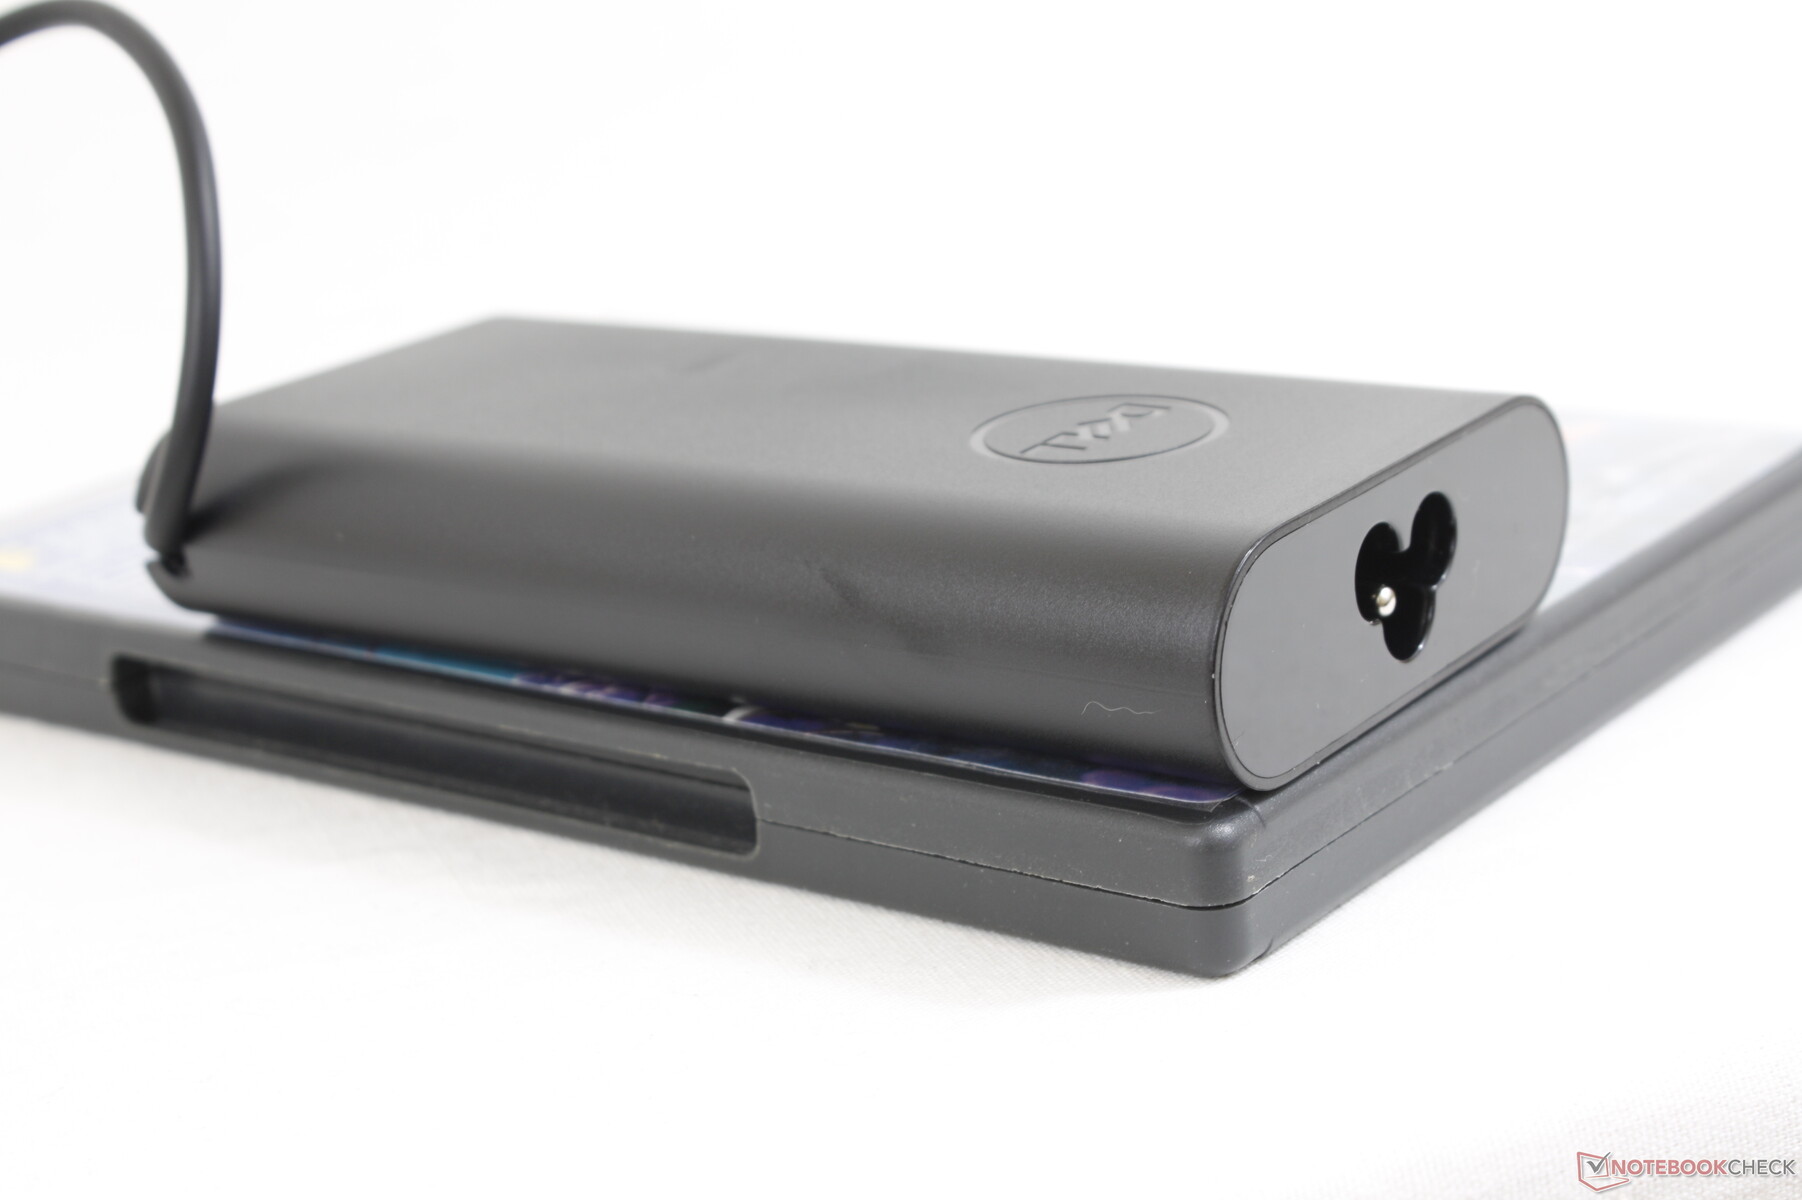
Unlike on most other laptops, Dell offers three AC adapter options at checkout: 60 W, 65 W, and 90 W. The 90 W option is useful for feeding the CPU more power for higher Turbo Boost clock rates and thus higher performance. However, our stress tests have shown that the system can't maintain very high Turbo Boost clock rates for long periods anyway and so any performance boosts from the 90 W AC adapter will be short lived. For example, power consumption would stabilize at 61 W when running Prime95 on the small (~6.7 x 5.5 x 2.2 cm) 60 W AC adapter. Repeating this test with the larger (~13 x 6.5 x 2.3 cm) 90 W AC adapter would cause consumption to spike to as high as 91.6 W during the start of the test before eventually falling and stabilizing at 51 W after about 90 seconds as shown by our graphs below. The 90 W adapter is still a good option if you plan on running demanding programs as the short bursts in CPU performance can save time when loading applications or processing images.
| Off / Standby | |
| Idle | |
| Load |
|
Key:
min: | |
| Dell Latitude 9430 2-in-1 i7-1265U, Iris Xe G7 96EUs, , IPS, 2560x1600, 14" | Dell Latitude 9420 2-in-1 i7-1185G7, Iris Xe G7 96EUs, WDC PC SN530 SDBPNPZ-512G, IPS, 2560x1600, 14" | MSI Summit E14 Flip Evo A12MT i7-1260P, Iris Xe G7 96EUs, Samsung PM9A1 MZVL21T0HCLR, IPS, 2880x1800, 14" | LG Gram 14T90P i5-1135G7, Iris Xe G7 80EUs, Samsung SSD PM981a MZVLB512HBJQ, IPS, 1900x1200, 14" | Lenovo ThinkPad X1 Yoga G7 21CE002HGE i7-1270P, Iris Xe G7 96EUs, Samsung PM9A1 MZVL2512HCJQ, IPS, 1920x1200, 14" | Asus ZenBook Flip 14 UN5401QA-KN085W R7 5800H, Vega 8, Intel SSD 600p SSDPEKKW512G7, OLED, 2880x1800, 14" | |
|---|---|---|---|---|---|---|
| Power Consumption | -27% | -49% | 3% | -13% | -52% | |
| Idle Minimum * (Watt) | 2.9 | 4.6 -59% | 5.4 -86% | 2.8 3% | 4.2 -45% | 6.4 -121% |
| Idle Average * (Watt) | 5.8 | 7.8 -34% | 9.5 -64% | 5.5 5% | 6.9 -19% | 9.4 -62% |
| Idle Maximum * (Watt) | 6.6 | 8.2 -24% | 12.4 -88% | 6.4 3% | 7.6 -15% | 10.7 -62% |
| Load Average * (Watt) | 49.2 | 47.9 3% | 54.7 -11% | 45.4 8% | 36.2 26% | 52.2 -6% |
| Witcher 3 ultra * (Watt) | 35.3 | 38.8 -10% | 52 -47% | 34 4% | 43.2 -22% | 53 -50% |
| Load Maximum * (Watt) | 63.1 | 87.1 -38% | 63.4 -0% | 65.9 -4% | 63.5 -1% | 69 -9% |
* ... smaller is better
Power Consumption Witcher 3 / Stresstest
Power Consumption external Monitor
Battery Life
Expect over 12 hours of real-world WLAN use before needing to recharge the 60 Wh battery. A smaller 40 Wh option is available as well for a lighter overall weight and approximately two-third the runtime.
Charging from empty to full capacity with the included 60 W AC adapter takes just under 2 hours.
| Dell Latitude 9430 2-in-1 i7-1265U, Iris Xe G7 96EUs, 60 Wh | Dell Latitude 9420 2-in-1 i7-1185G7, Iris Xe G7 96EUs, 60 Wh | MSI Summit E14 Flip Evo A12MT i7-1260P, Iris Xe G7 96EUs, 72 Wh | LG Gram 14T90P i5-1135G7, Iris Xe G7 80EUs, 72 Wh | Lenovo ThinkPad X1 Yoga G7 21CE002HGE i7-1270P, Iris Xe G7 96EUs, 57 Wh | Asus ZenBook Flip 14 UN5401QA-KN085W R7 5800H, Vega 8, 63 Wh | |
|---|---|---|---|---|---|---|
| Battery runtime | -2% | -26% | -5% | -30% | -22% | |
| Reader / Idle (h) | 27.8 | 28.7 3% | 22.1 -21% | |||
| WiFi v1.3 (h) | 12.8 | 11.7 -9% | 8.2 -36% | 12.1 -5% | 8.9 -30% | 8.7 -32% |
| Load (h) | 2.4 | 2.4 0% | 1.9 -21% | 2.3 -4% | 1.7 -29% | 2.1 -12% |
| H.264 (h) | 12.2 | 9 |
Pros
Cons
Verdict — Same Packaging, New Name
Everything we loved about the Latitude 9420 2-in-1 is back in full force for the Latitude 9430 2-in-1 since the newer model is mostly a processor update. The CPU brings much faster performance albeit at higher power consumption levels which is in line with what what we've observed on other Alder Lake laptops in general. If the faster CPU, 5G options, or 2 MP webcam don't appeal to your daily workloads, then the Latitude 9420 2-in-1 can provide essentially the same experience for less.
The Latitude 9430 2-in-1 is for power users who know they can exploit the Intel 12th gen CPU. Otherwise, the physically identical Latitude 9420 2-in-1 is already sufficient for the target office user.
Some minor annoyances to keep in mind include the lack of support for 80 mm M.2 SSDs and WAN antennae if configuring without WAN support. CPU Turbo Boost is limited while performance is reduced if running on battery power. It's also a bummer that the active stylus pen is sold separately whereas competitors like the Lenovo ThinkPad X1 Yoga G7 include the stylus for every purchase. Most laptops support the more common 80 mm SSD which can make SSD swapping a bit more difficult on the Dell. Meanwhile, the HP EliteBook 1040 carries a much brighter touchscreen albeit at a lower 1200p resolution. Perhaps Dell can make the next year's eventual model more attractive with 5 MP webcams and high refresh rate OLED displays to improve the visual experience.
Price and Availability
Dell is currently shipping the Latitude 9430 clamshell and 2-in-1. Our specific configuration with the Core i7-1265U and 16 GB RAM retails for approximately $2800 USD.
Dell Latitude 9430 2-in-1
- 08/05/2022 v7 (old)
Allen Ngo
Price comparison
