Alienware x17 R2 laptop review: Peak 175 W GeForce RTX 3080 Ti performance
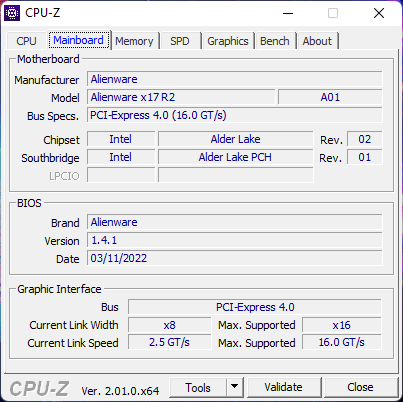
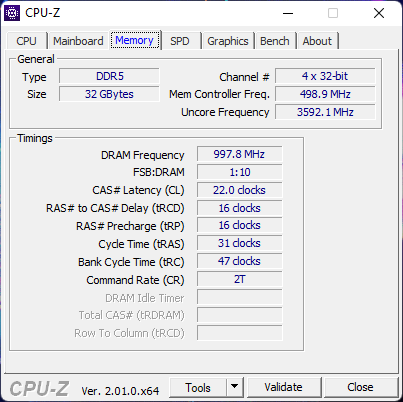
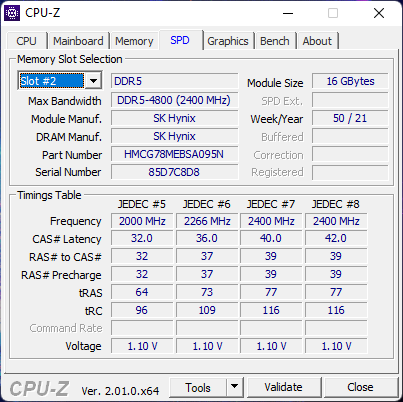
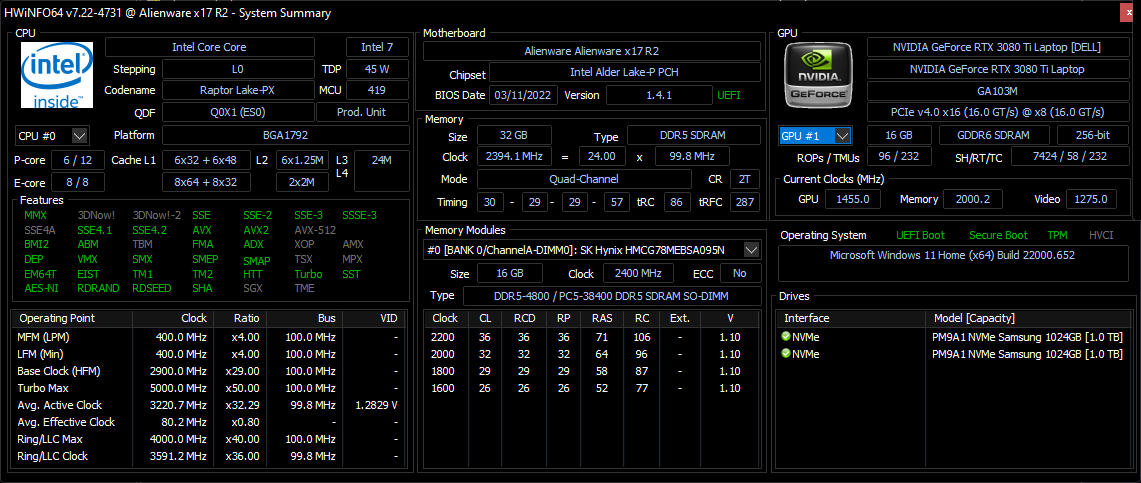
Dell introduced its Alienware x17 series late last year with a completely new chassis design to distinguish it from the existing Alienware m17 series. For this year, the manufacturer has refreshed the lineup with the launch of the Alienware x17 R2 complete with 12th gen Intel Alder Lake-H CPUs and GeForce RTX 3070/3080 Ti graphics to replace last year's 11th gen Tiger Lake-H and RTX 3070/3080 options, respectively. Other updates are present as well including the faster RAM (DDR4-3466 to DDR5-4800), newer display options, and support for MUX and Advanced Optimus.
Other than the internal updates mentioned above, the Alienware x17 R2 uses the same chassis as the Alienware x17 R1. We recommend checking out our review on the x17 R1 as our existing comments on the chassis, Cherry mechanical keyboard, and ports are also relevant on the x17 R2.
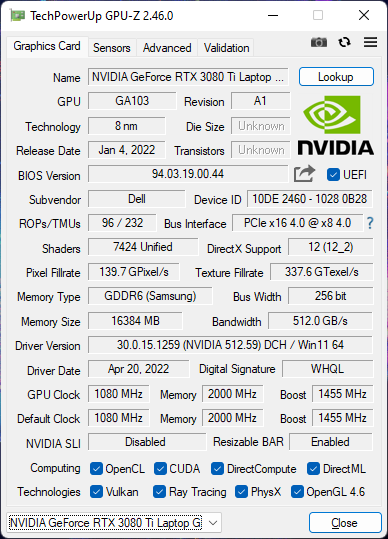
See the official technical specifications below for all configurable options. Our specific test unit is a higher-end SKU with the Core i9-12900HK, 360 Hz 1080p display, and 175 W GeForce RTX 3080 Ti graphics for just under $4000 USD. Competitors in this space include other ultra-thin 17.3-inch gaming laptops like the MSI GS77, Razer Blade 17, and Asus Zephyrus S17.
More Alienware reviews:

Potential Competitors in Comparison
Rating | Date | Model | Weight | Height | Size | Resolution | Price |
|---|---|---|---|---|---|---|---|
| 89.2 % v7 (old) | 05 / 2022 | Alienware x17 R2 P48E i9-12900HK, GeForce RTX 3080 Ti Laptop GPU | 3.1 kg | 20.9 mm | 17.30" | 1920x1080 | |
| 89 % v7 (old) | 09 / 2021 | Alienware x17 RTX 3080 P48E i7-11800H, GeForce RTX 3080 Laptop GPU | 3.2 kg | 21.4 mm | 17.30" | 3840x2160 | |
| 90.1 % v7 (old) | 07 / 2021 | Asus ROG Zephyrus S17 GX703HSD i9-11900H, GeForce RTX 3080 Laptop GPU | 2.8 kg | 19.9 mm | 17.30" | 2560x1440 | |
| 87.2 % v7 (old) | 04 / 2022 | MSI Stealth GS77 12UHS-083US i7-12700H, GeForce RTX 3080 Ti Laptop GPU | 2.9 kg | 20.8 mm | 17.30" | 2560x1440 | |
| 87.4 % v7 (old) | 10 / 2020 | MSI GT76 Titan DT 10SGS i9-10900K, GeForce RTX 2080 Super Mobile | 4.2 kg | 42 mm | 17.30" | 3840x2160 | |
| 83.2 % v7 (old) | 10 / 2021 | Gigabyte A7 X1 R9 5900HX, GeForce RTX 3070 Laptop GPU | 2.5 kg | 34 mm | 17.30" | 1920x1080 |
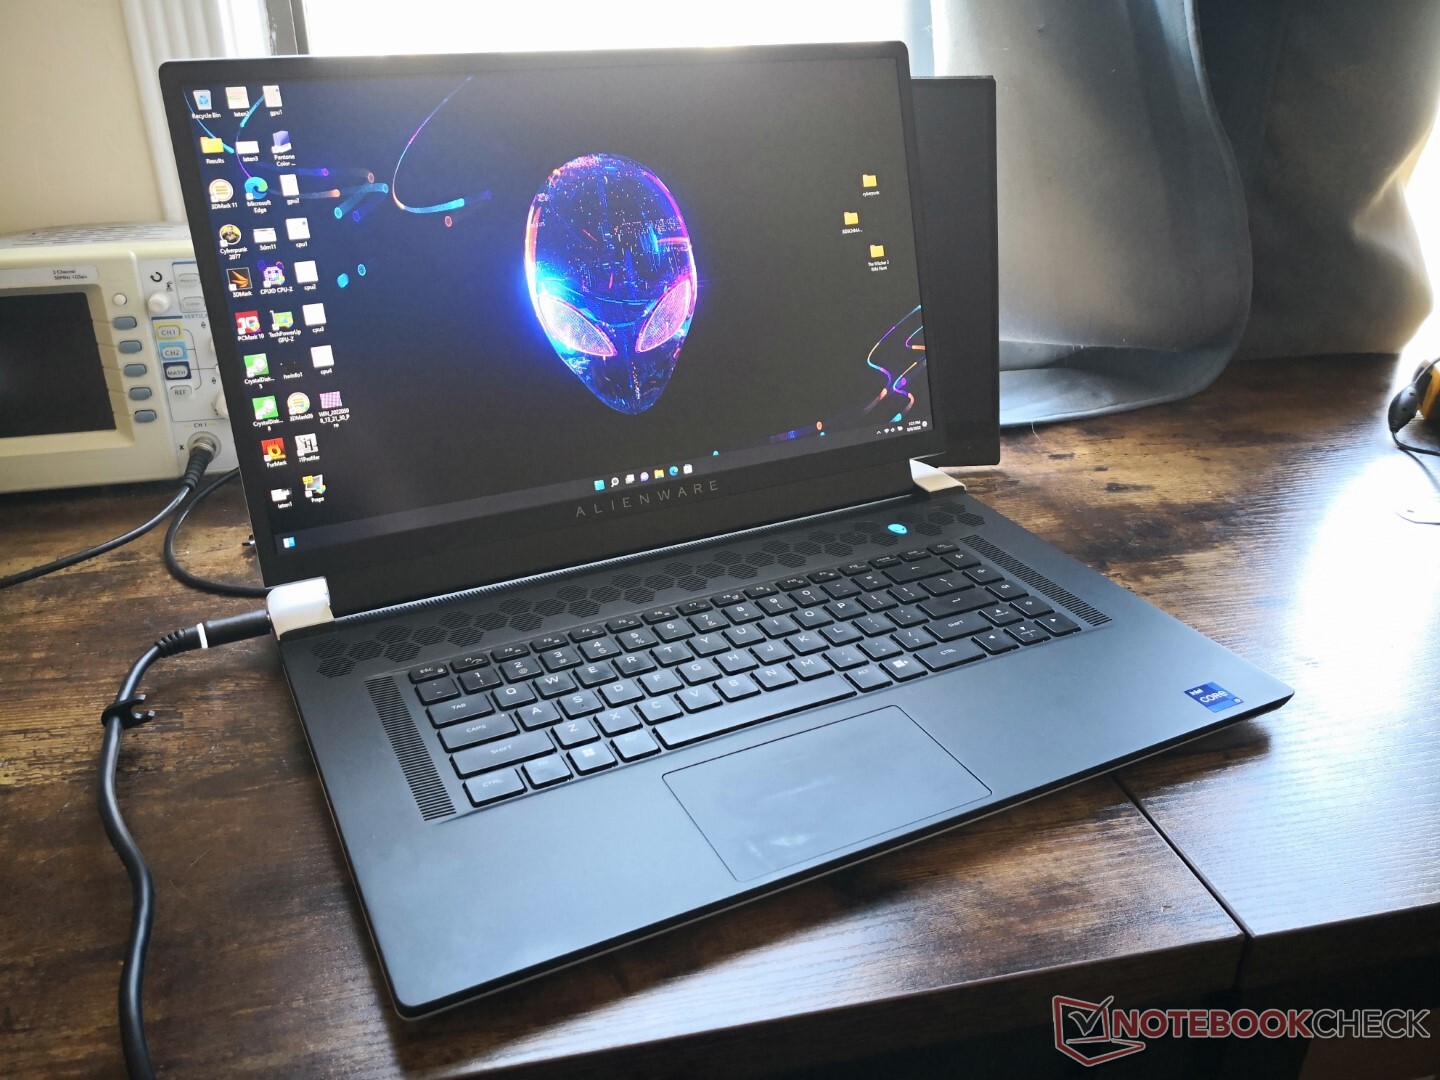
Case
Though it's marketed as an ultrathin gaming laptop, the Alienware x17 R2 chassis is still noticeably heavier and larger than alternatives like the Asus Zephyrus S17, MSI GS77, or Razer Blade 17. In return, the Alienware system is able to carry a more powerful 175 W GPU whereas most other ultrathin gaming laptops are limited to 140 W or less.
SD Card Reader
| SD Card Reader | |
| average JPG Copy Test (av. of 3 runs) | |
| MSI GT76 Titan DT 10SGS (Toshiba Exceria Pro M501 UHS-II) | |
| Asus ROG Zephyrus S17 GX703HSD | |
| Alienware x17 R2 P48E (AV Pro V60) | |
| Alienware x17 RTX 3080 P48E (AV Pro V60) | |
| MSI Stealth GS77 12UHS-083US (AV Pro V60) | |
| maximum AS SSD Seq Read Test (1GB) | |
| Asus ROG Zephyrus S17 GX703HSD | |
| Alienware x17 RTX 3080 P48E (AV Pro V60) | |
| Alienware x17 R2 P48E (AV Pro V60) | |
| MSI GT76 Titan DT 10SGS (Toshiba Exceria Pro M501 UHS-II) | |
| MSI Stealth GS77 12UHS-083US (AV Pro V60) | |
Communication
Webcam
The webcam remains 720p with no physical privacy shutter compared to 1080p on the latest Razer Blade 17. Windows Hello is supported.

")
")
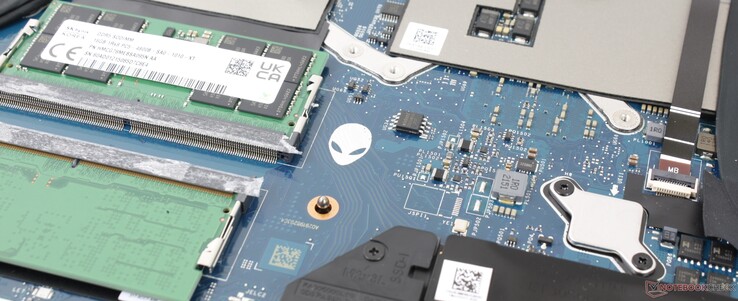
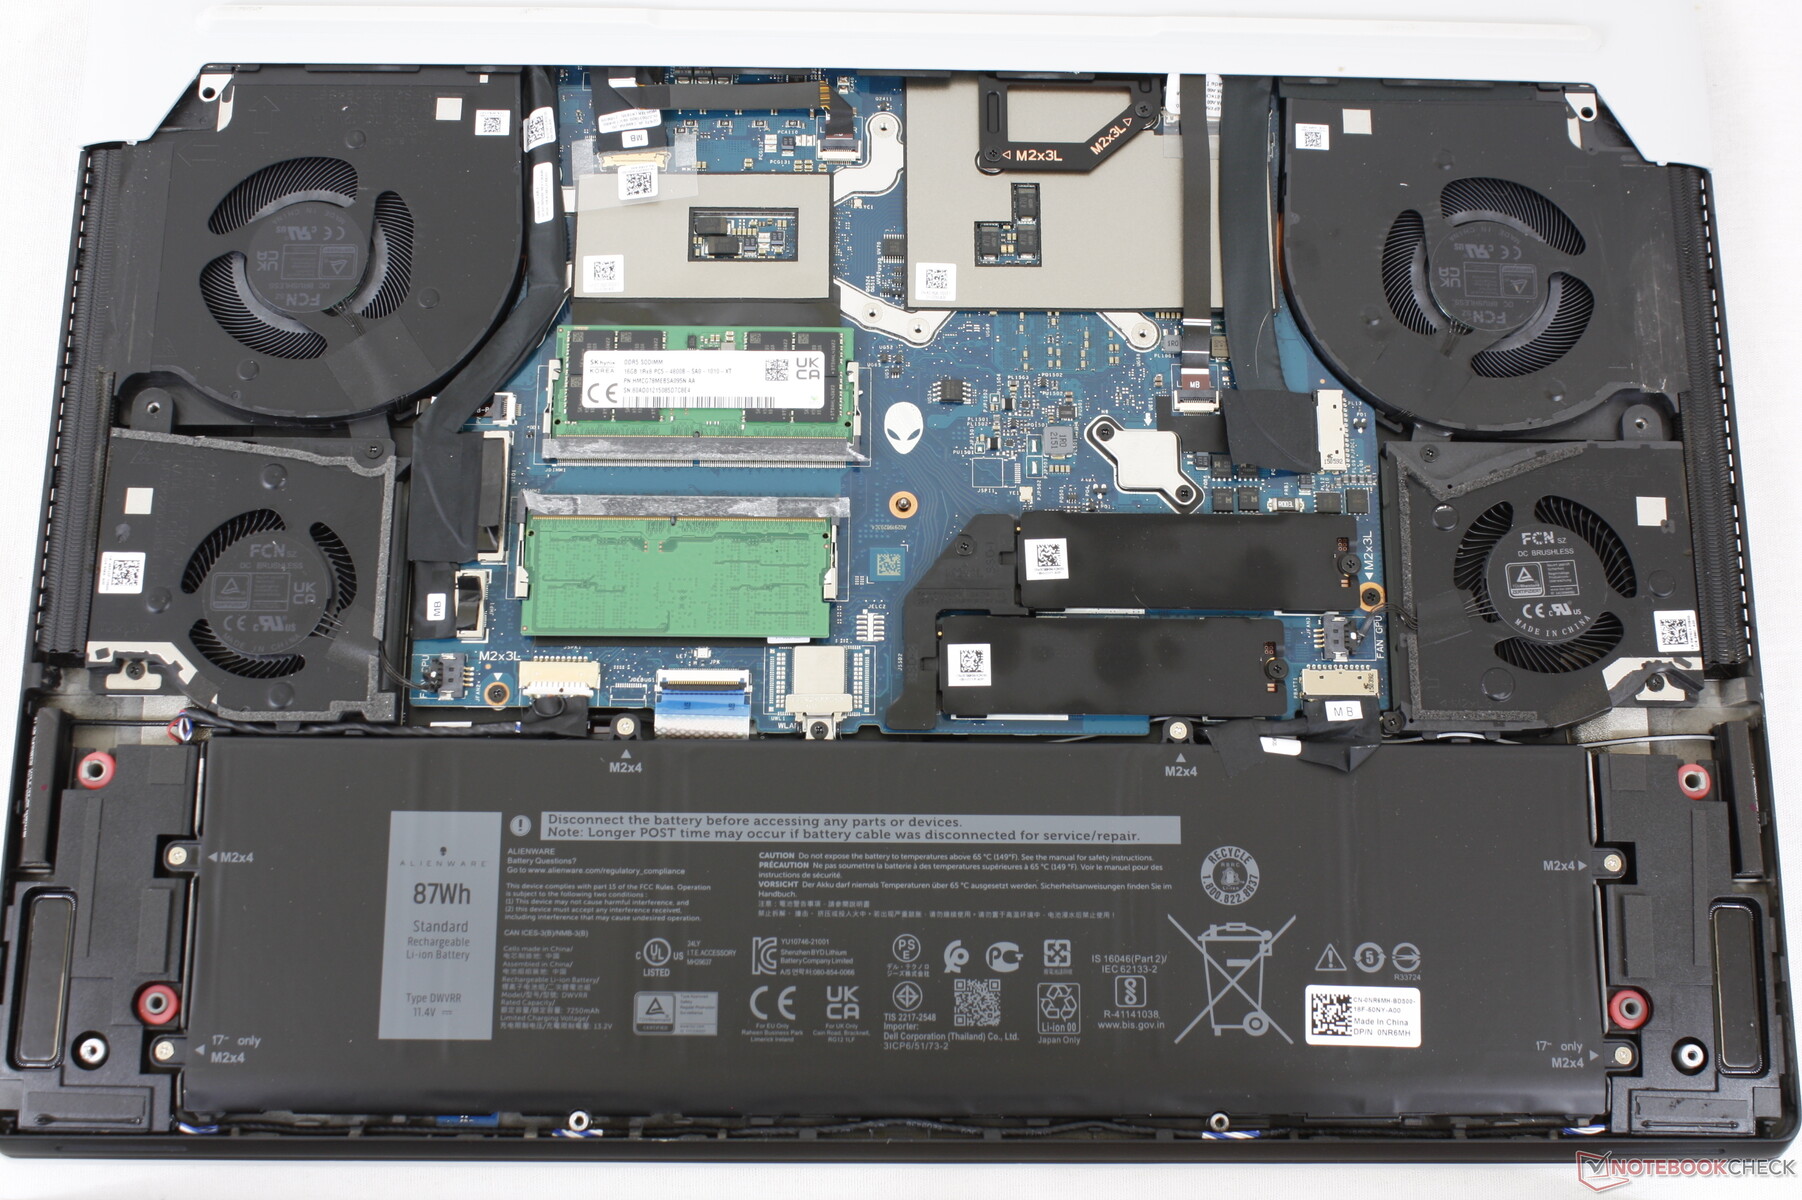
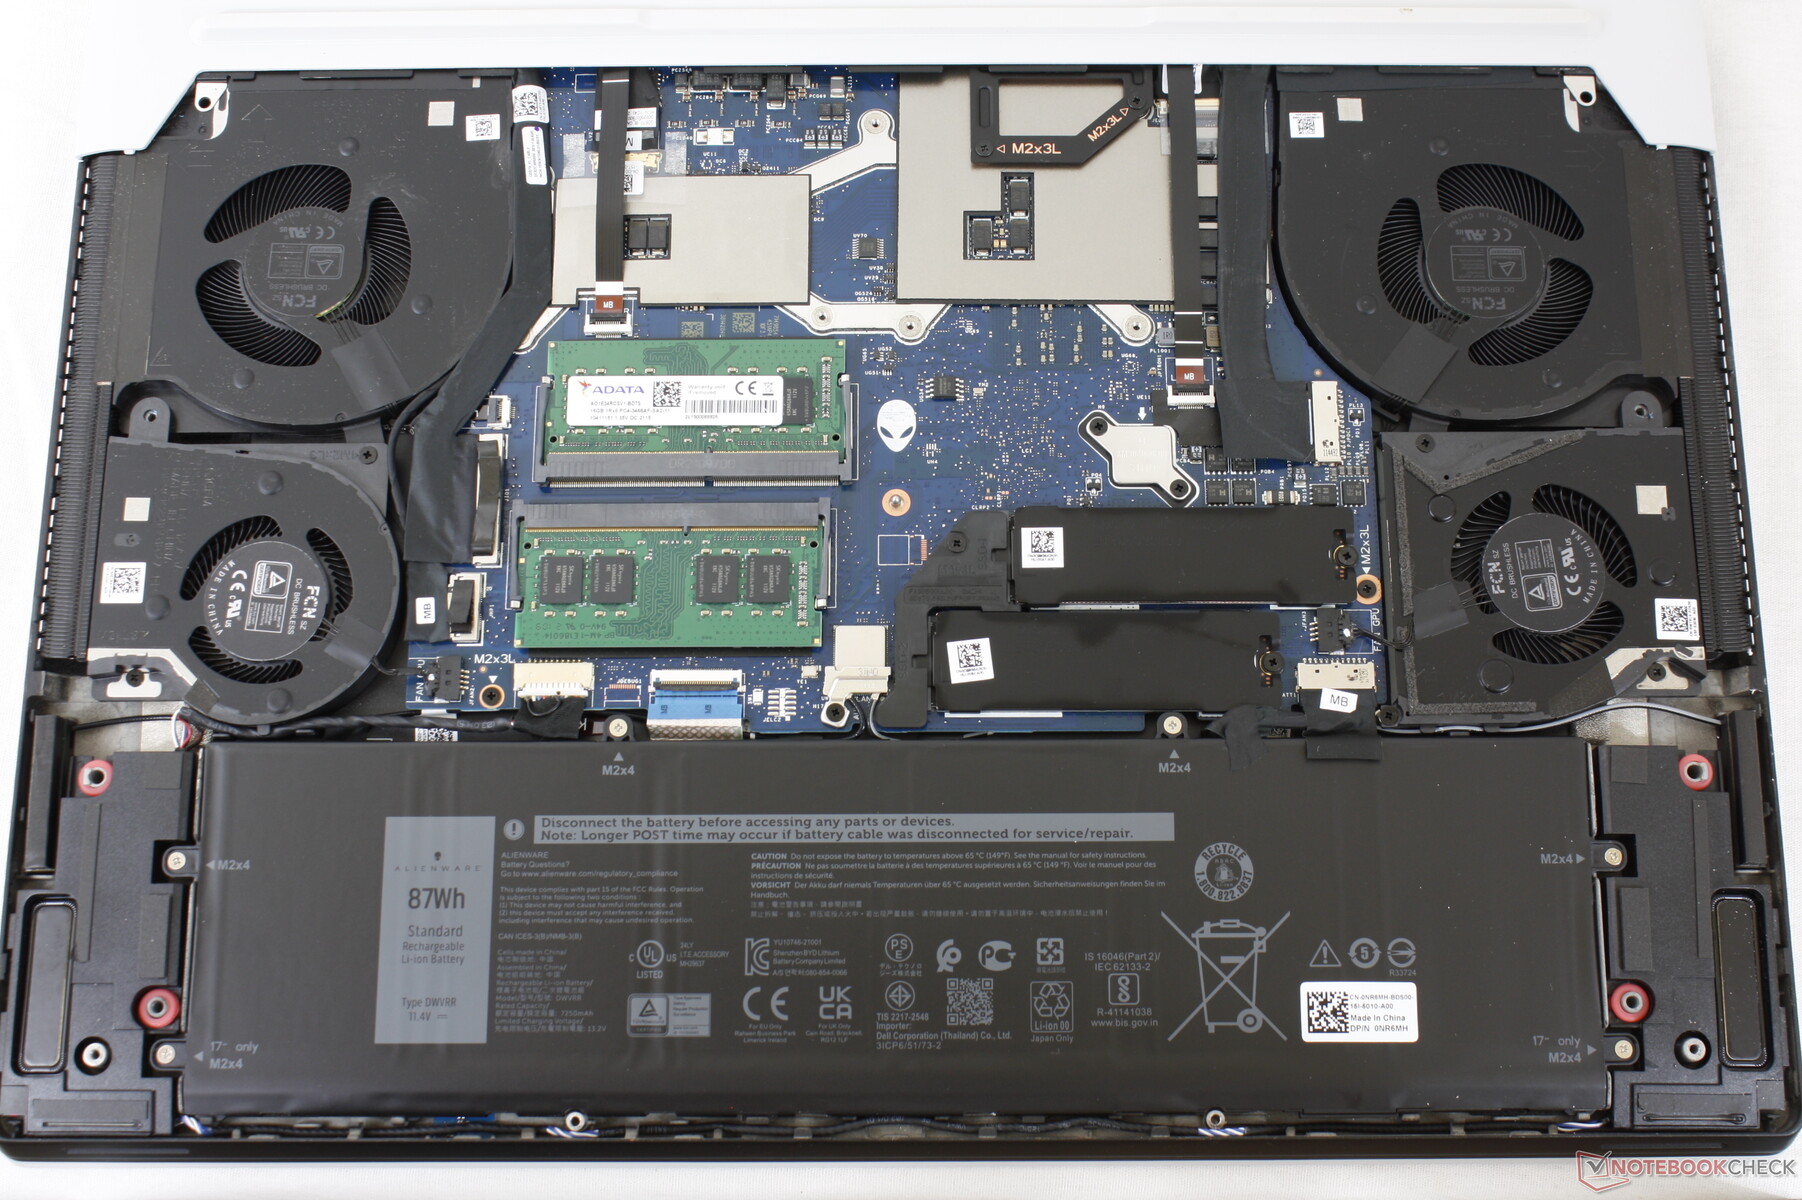
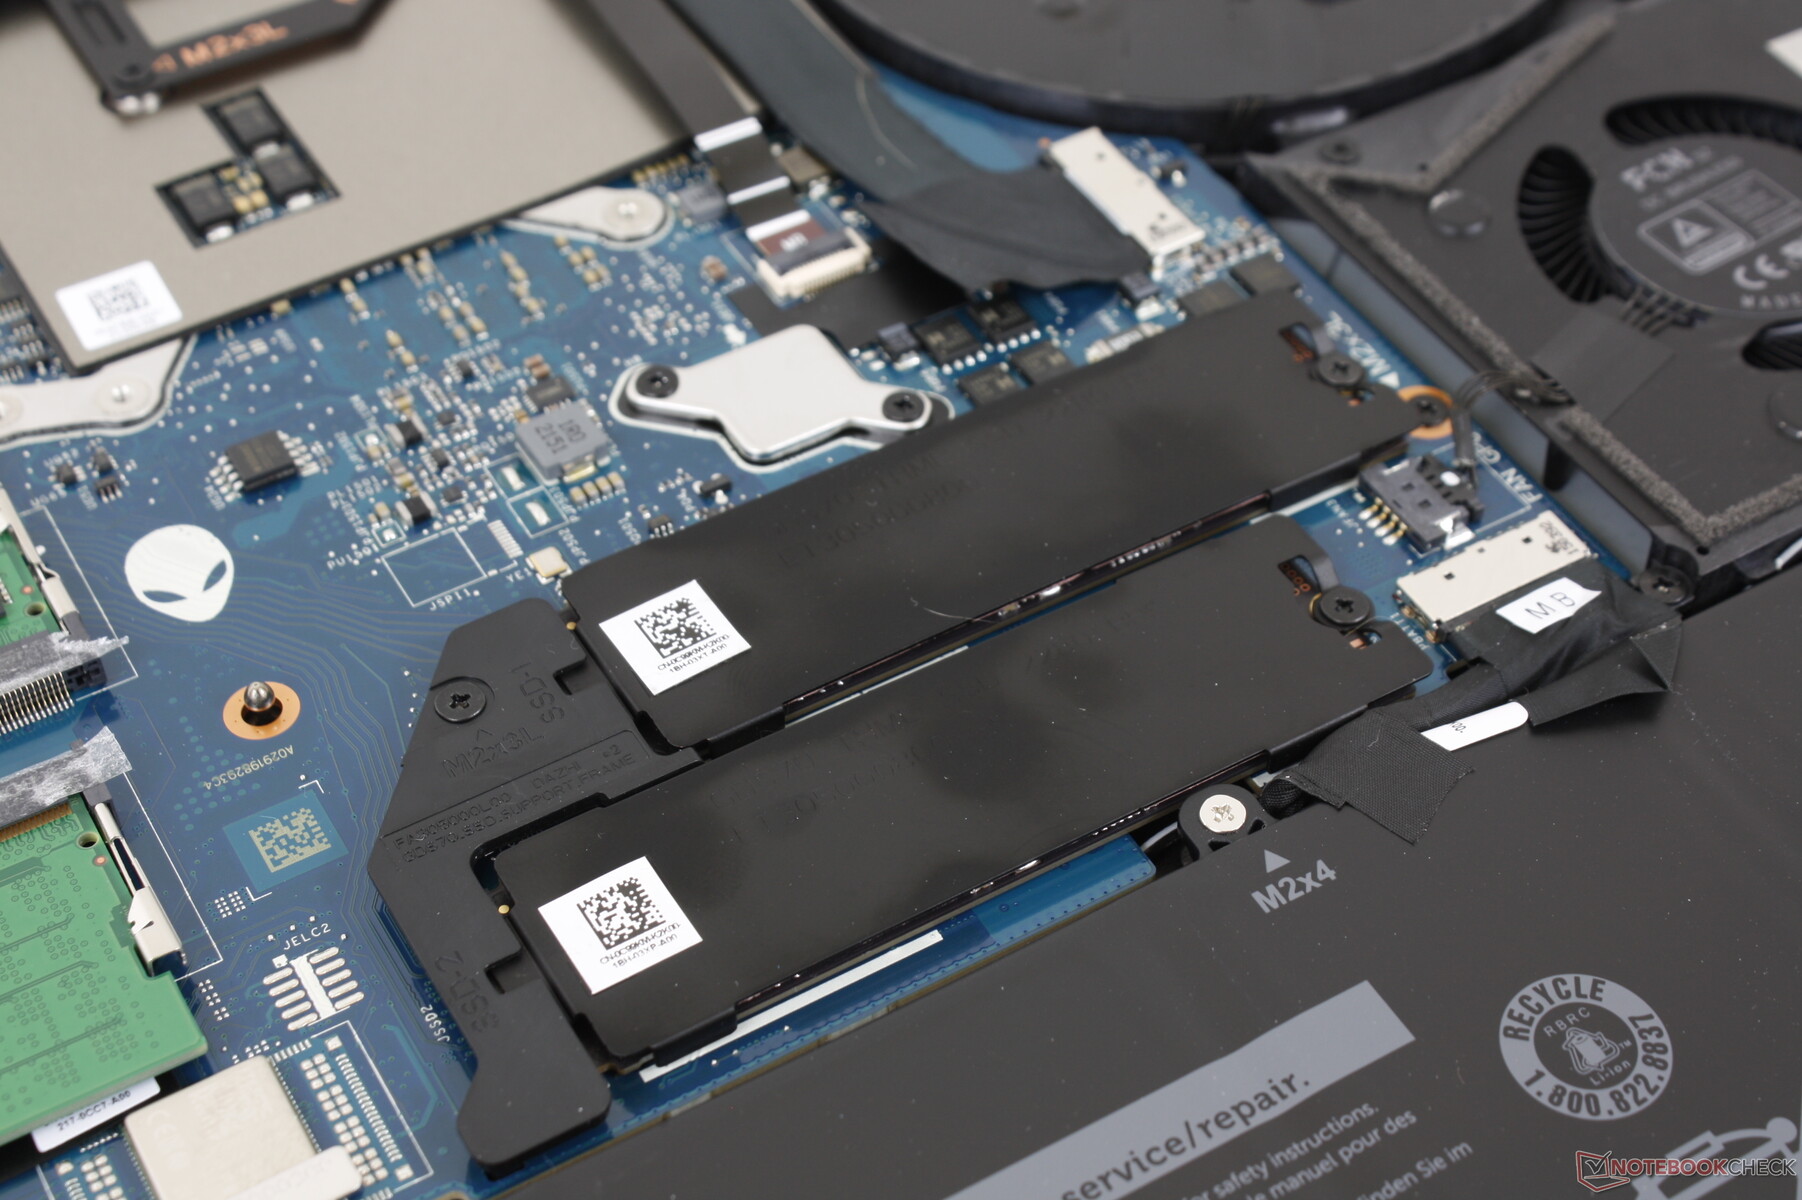
Maintenance
Display
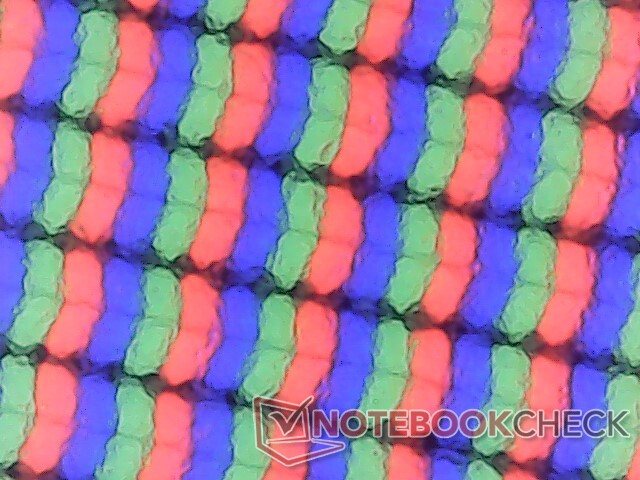
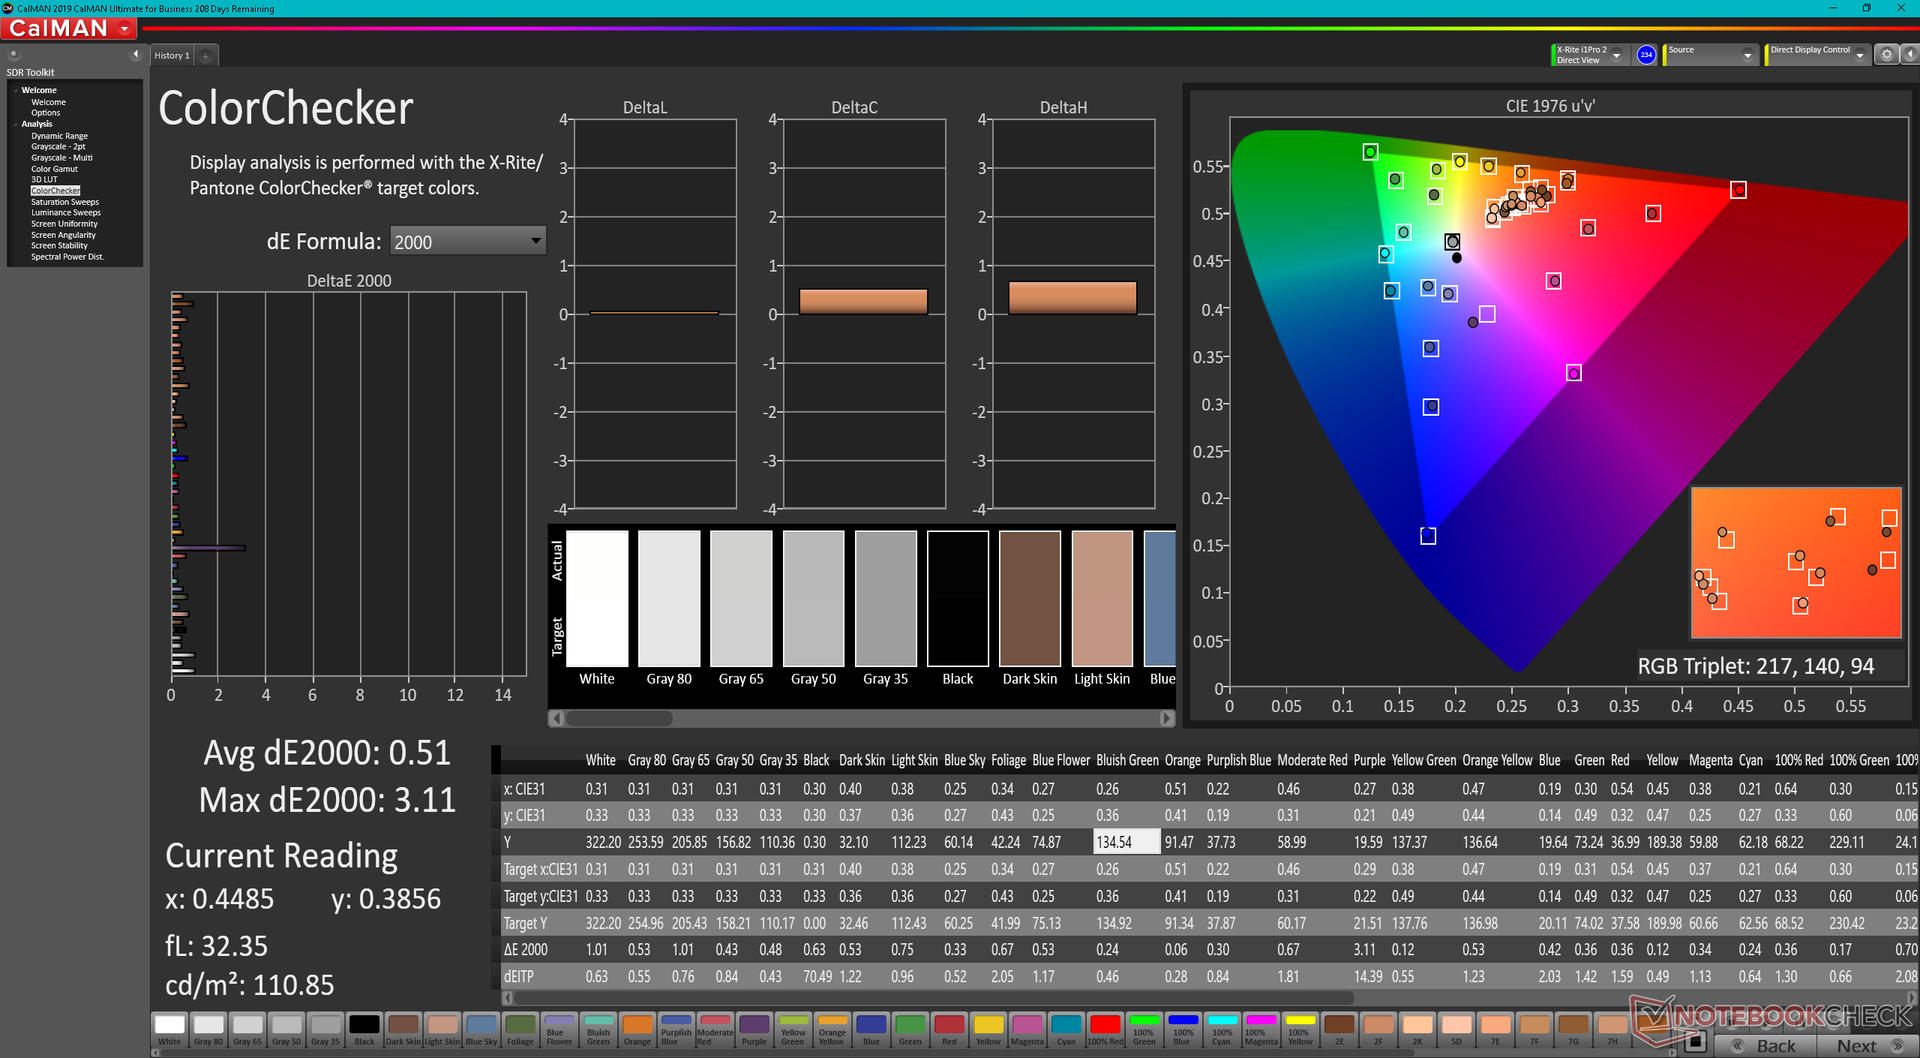
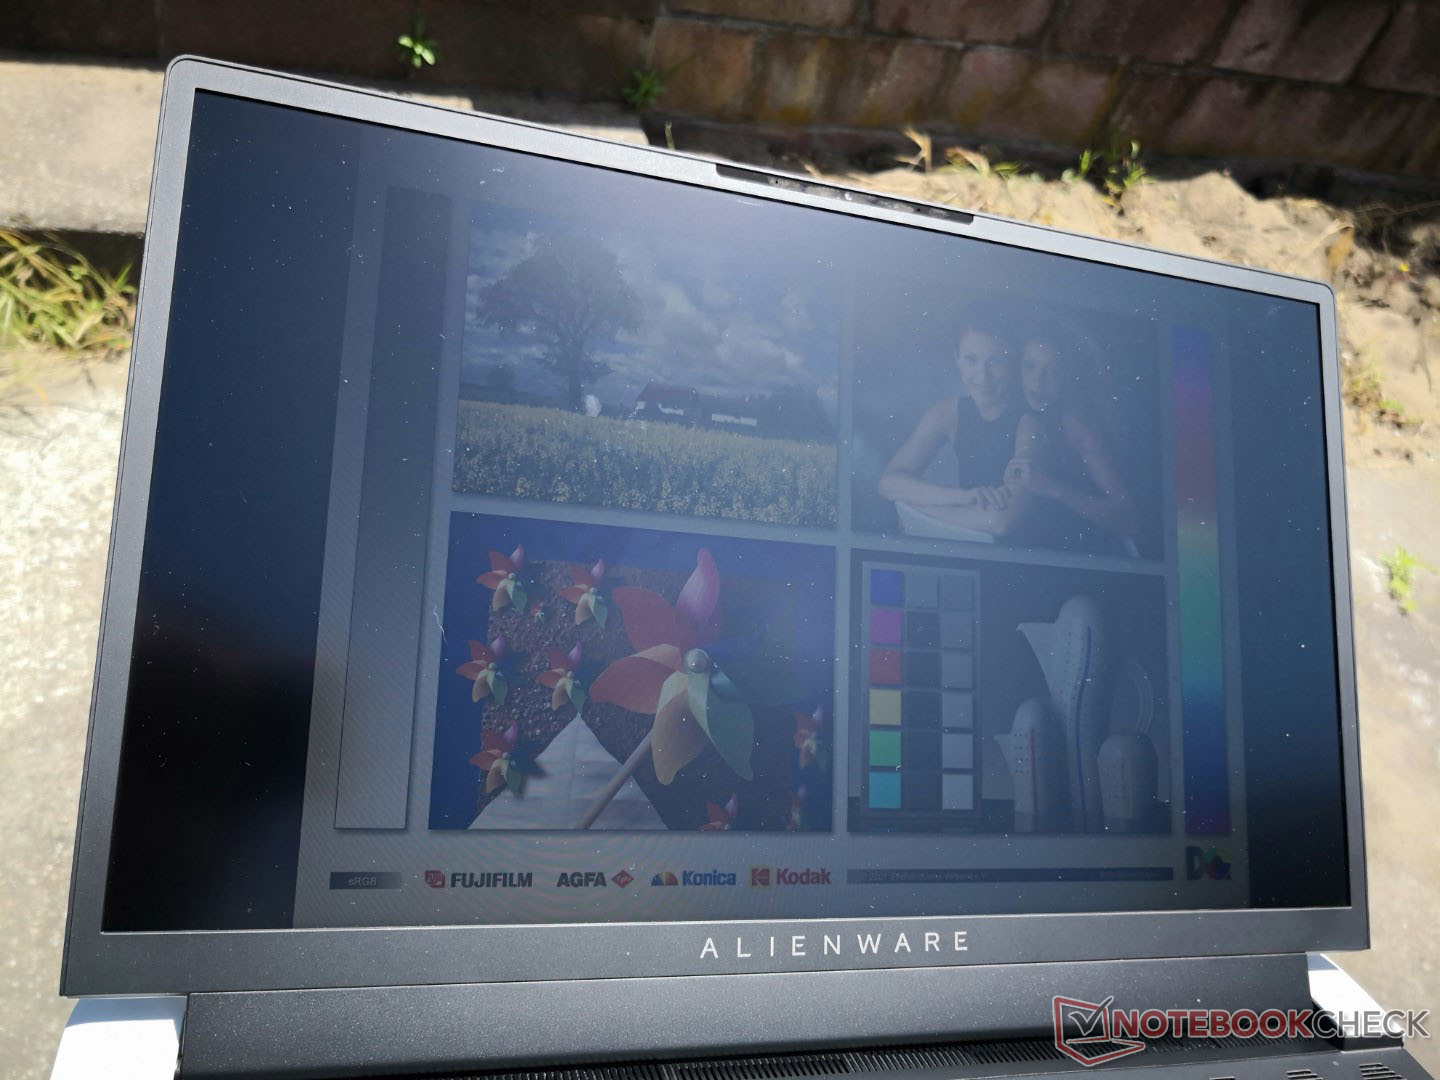
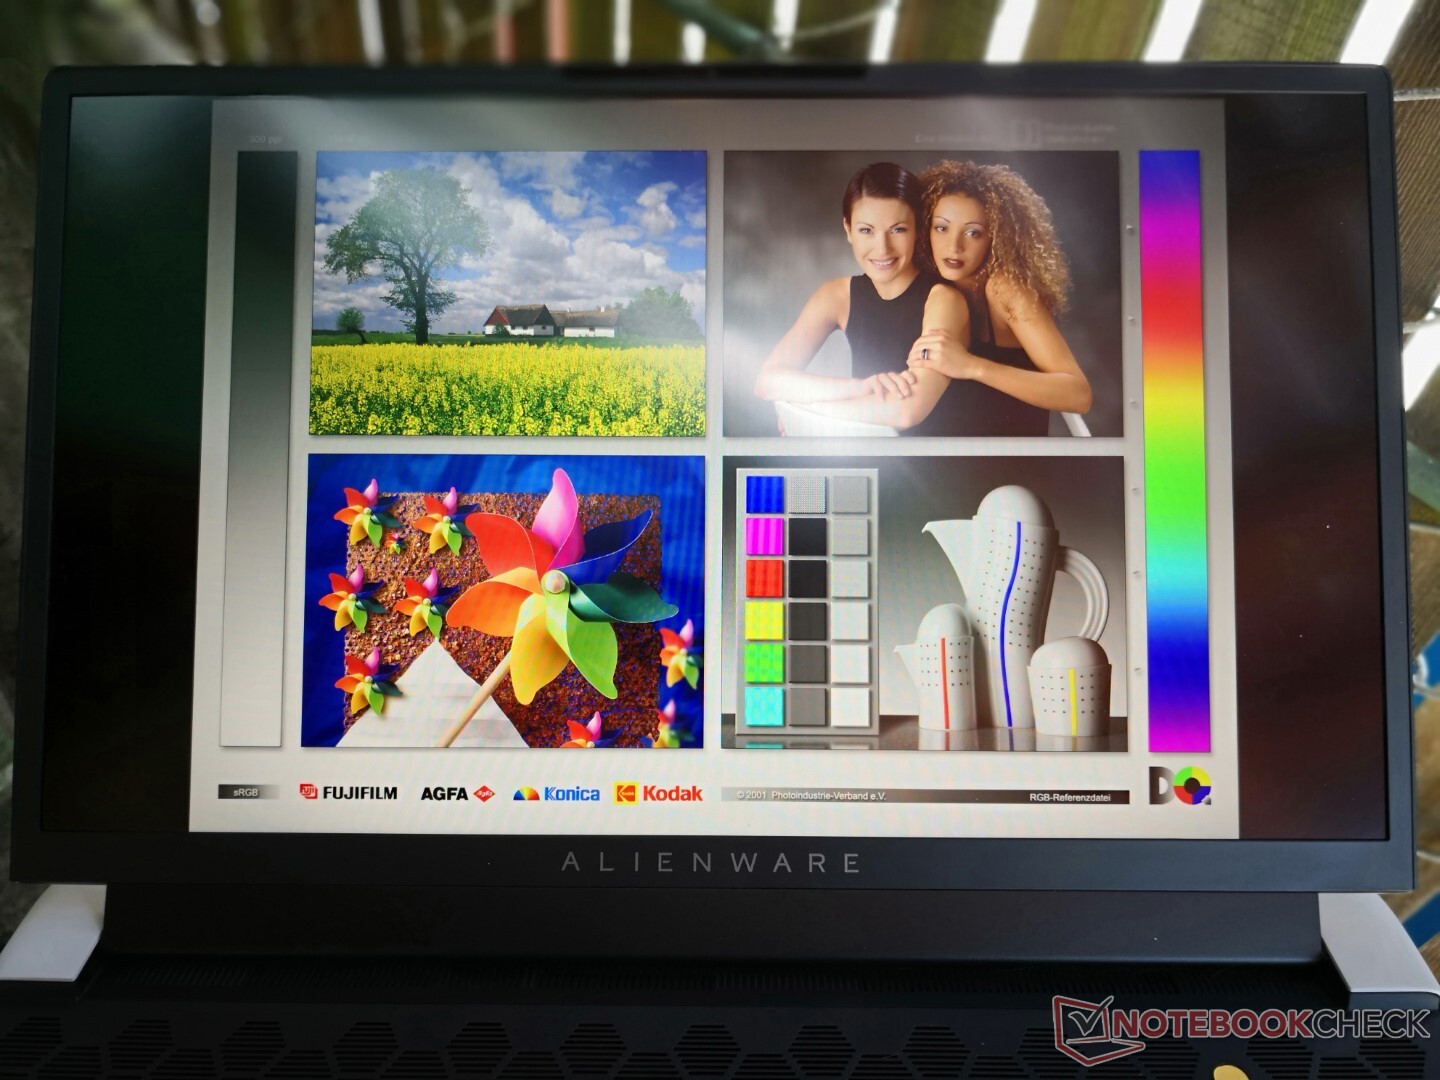
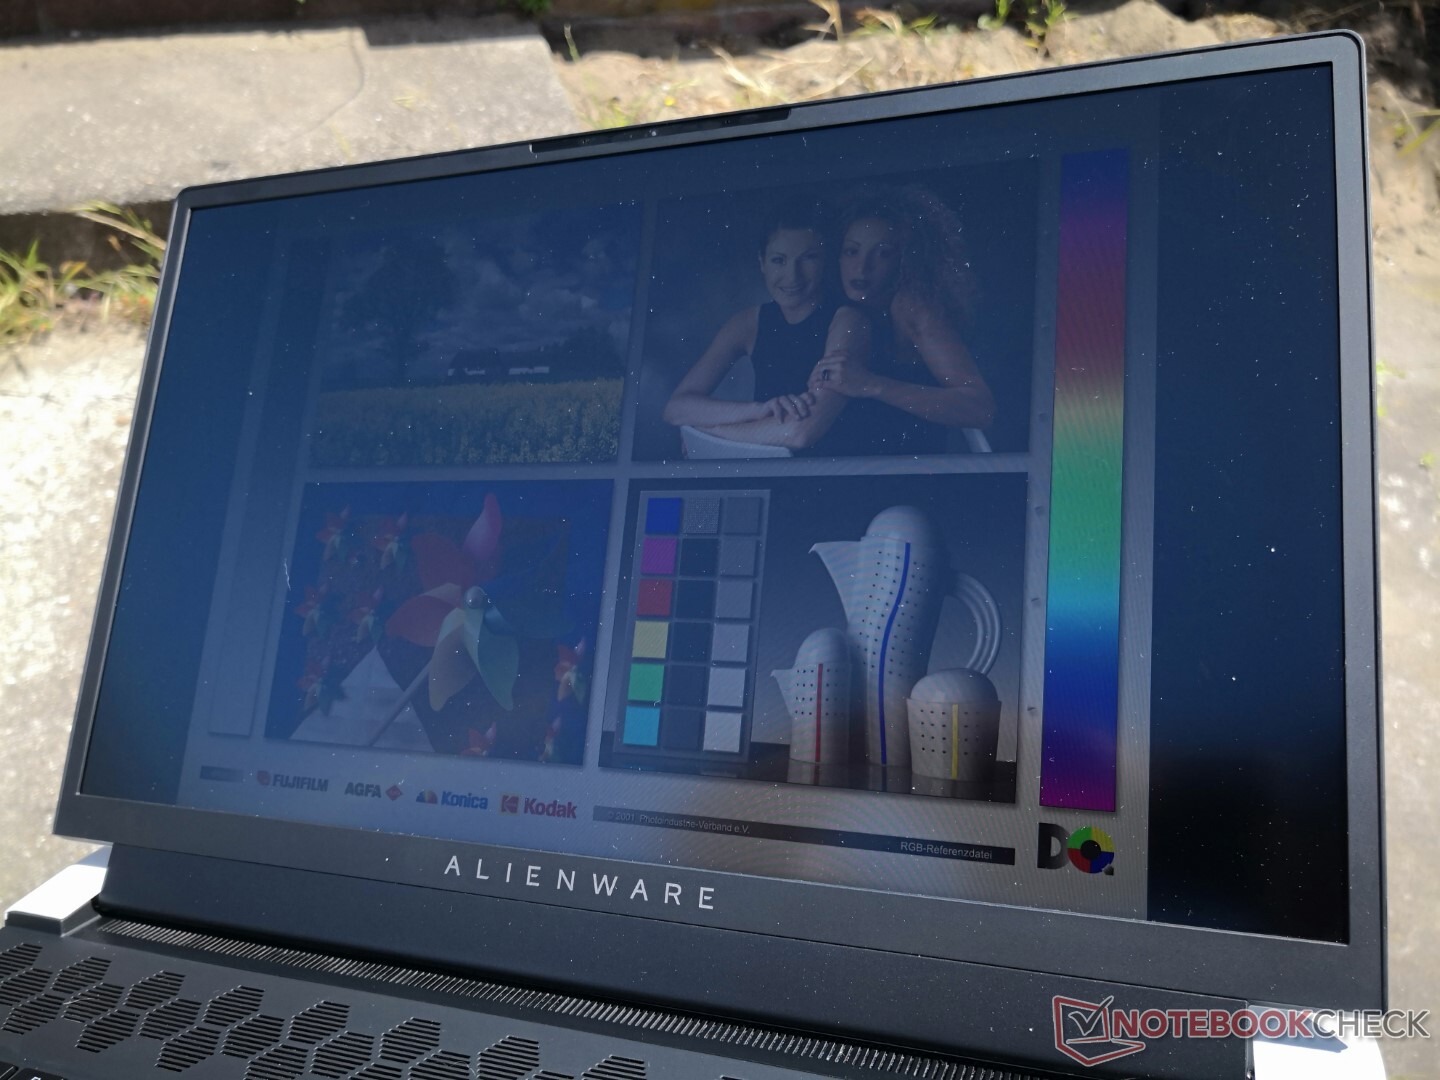
Our AU Optronics B173HAN IPS panel checks almost all the typical boxes including a fast 360 Hz refresh rate, fast black-white and gray-gray response times, and full sRGB coverage to be fit for both gaming and most graphics editing. Other laptop makers with 17.3-inch 1080p 360 Hz display options will likely use the same AU Optronics panel as found on our Alienware. A higher-end 4K 120 Hz option is available as well all with G-Sync support.
There are currently no OLED options which would have offered wider DCI-P3 color coverage and deeper black levels than the usual IPS solution.
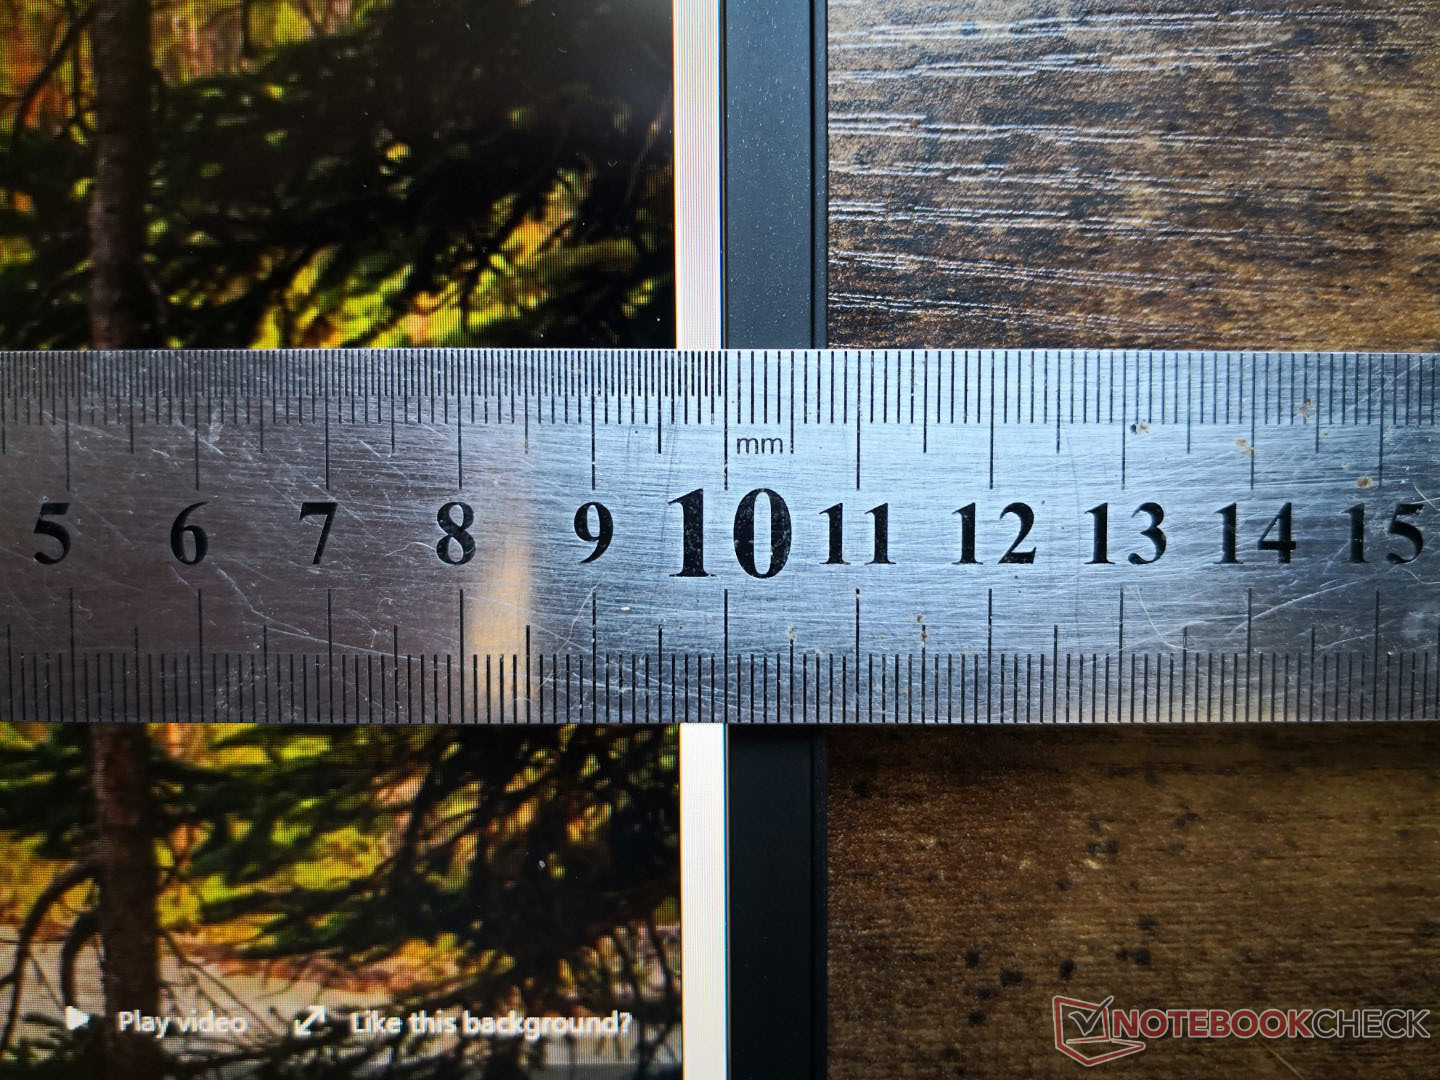
Interestingly, our FHD panel is not as bright as the 4K UHD panel on the original x17 R1. We're able to measure a maximum brightness of 365 nits here compared to 439 nits on the 4K x17 R1.
| |||||||||||||||||||||||||
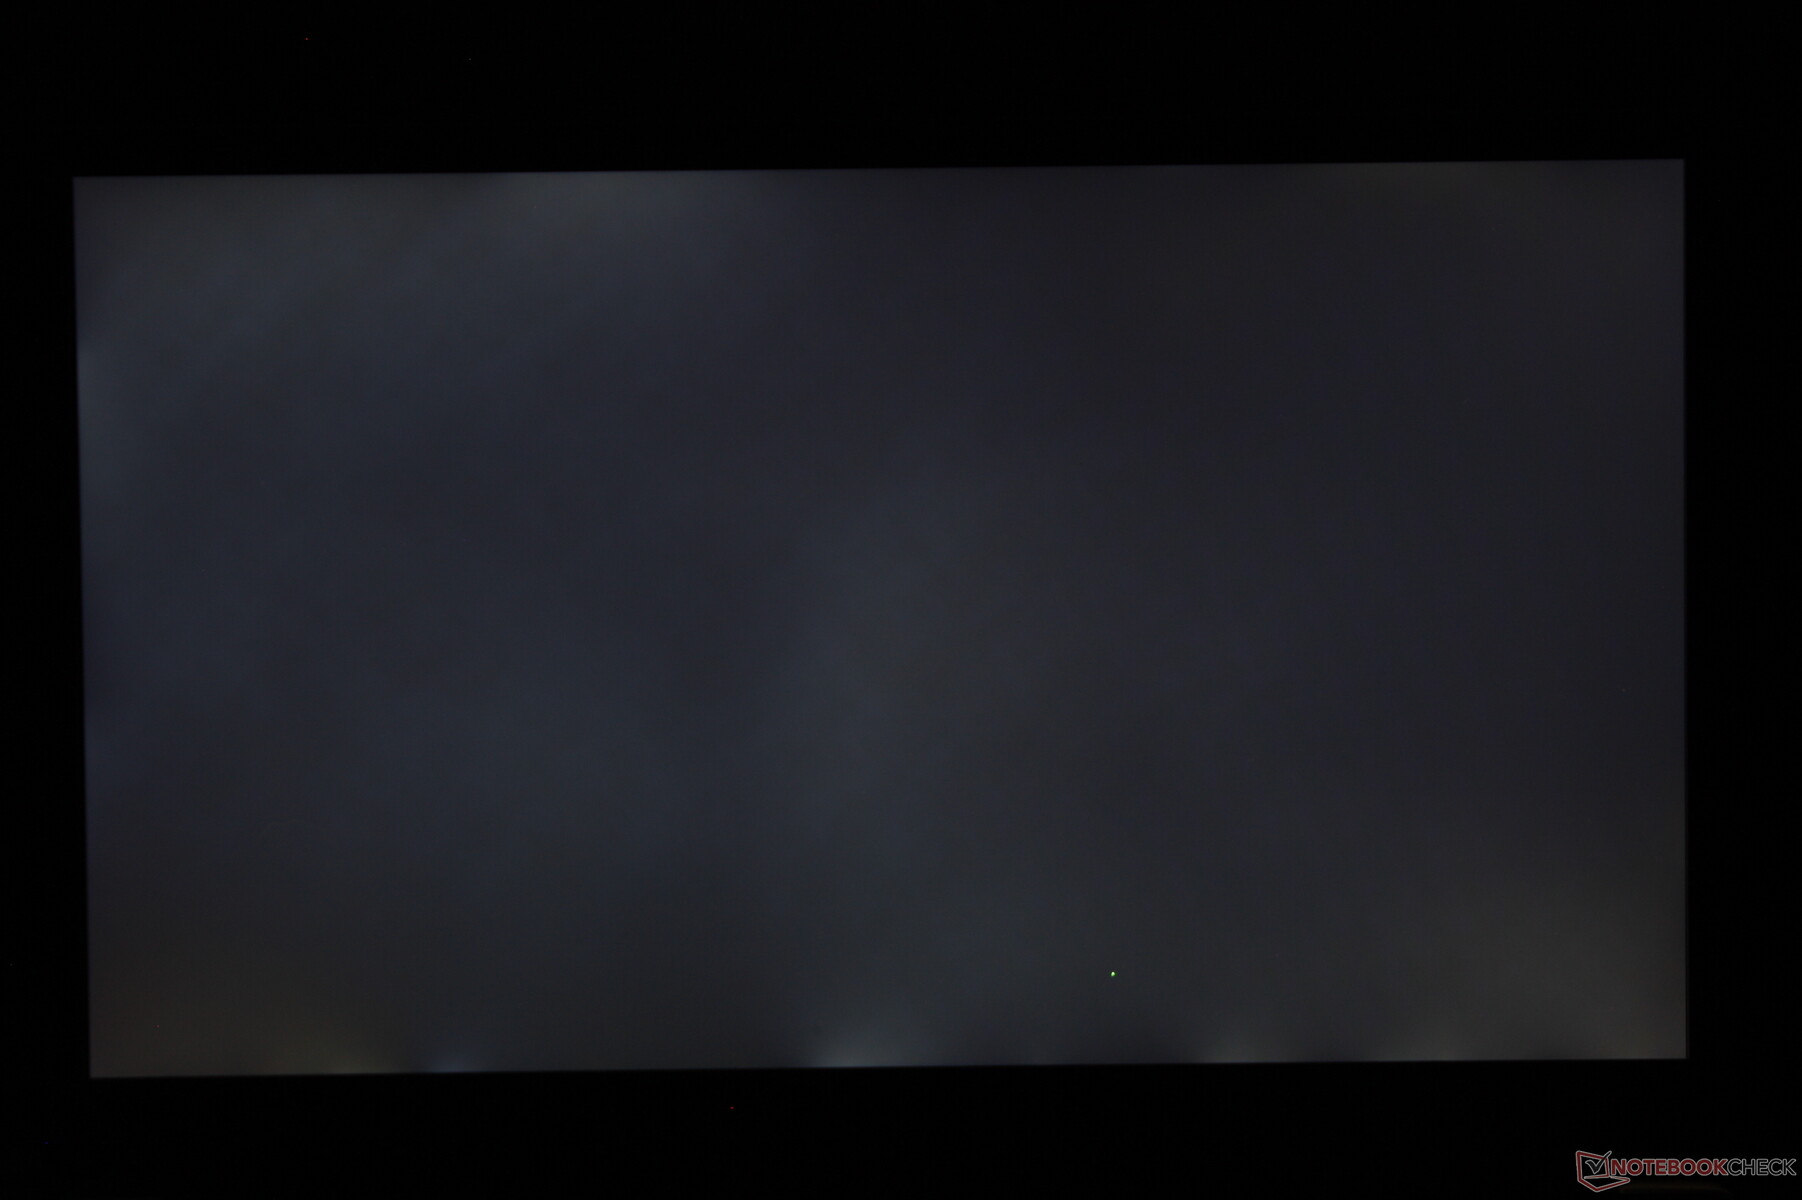
Brightness Distribution: 85 %
Center on Battery: 365.4 cd/m²
Contrast: 1260:1 (Black: 0.29 cd/m²)
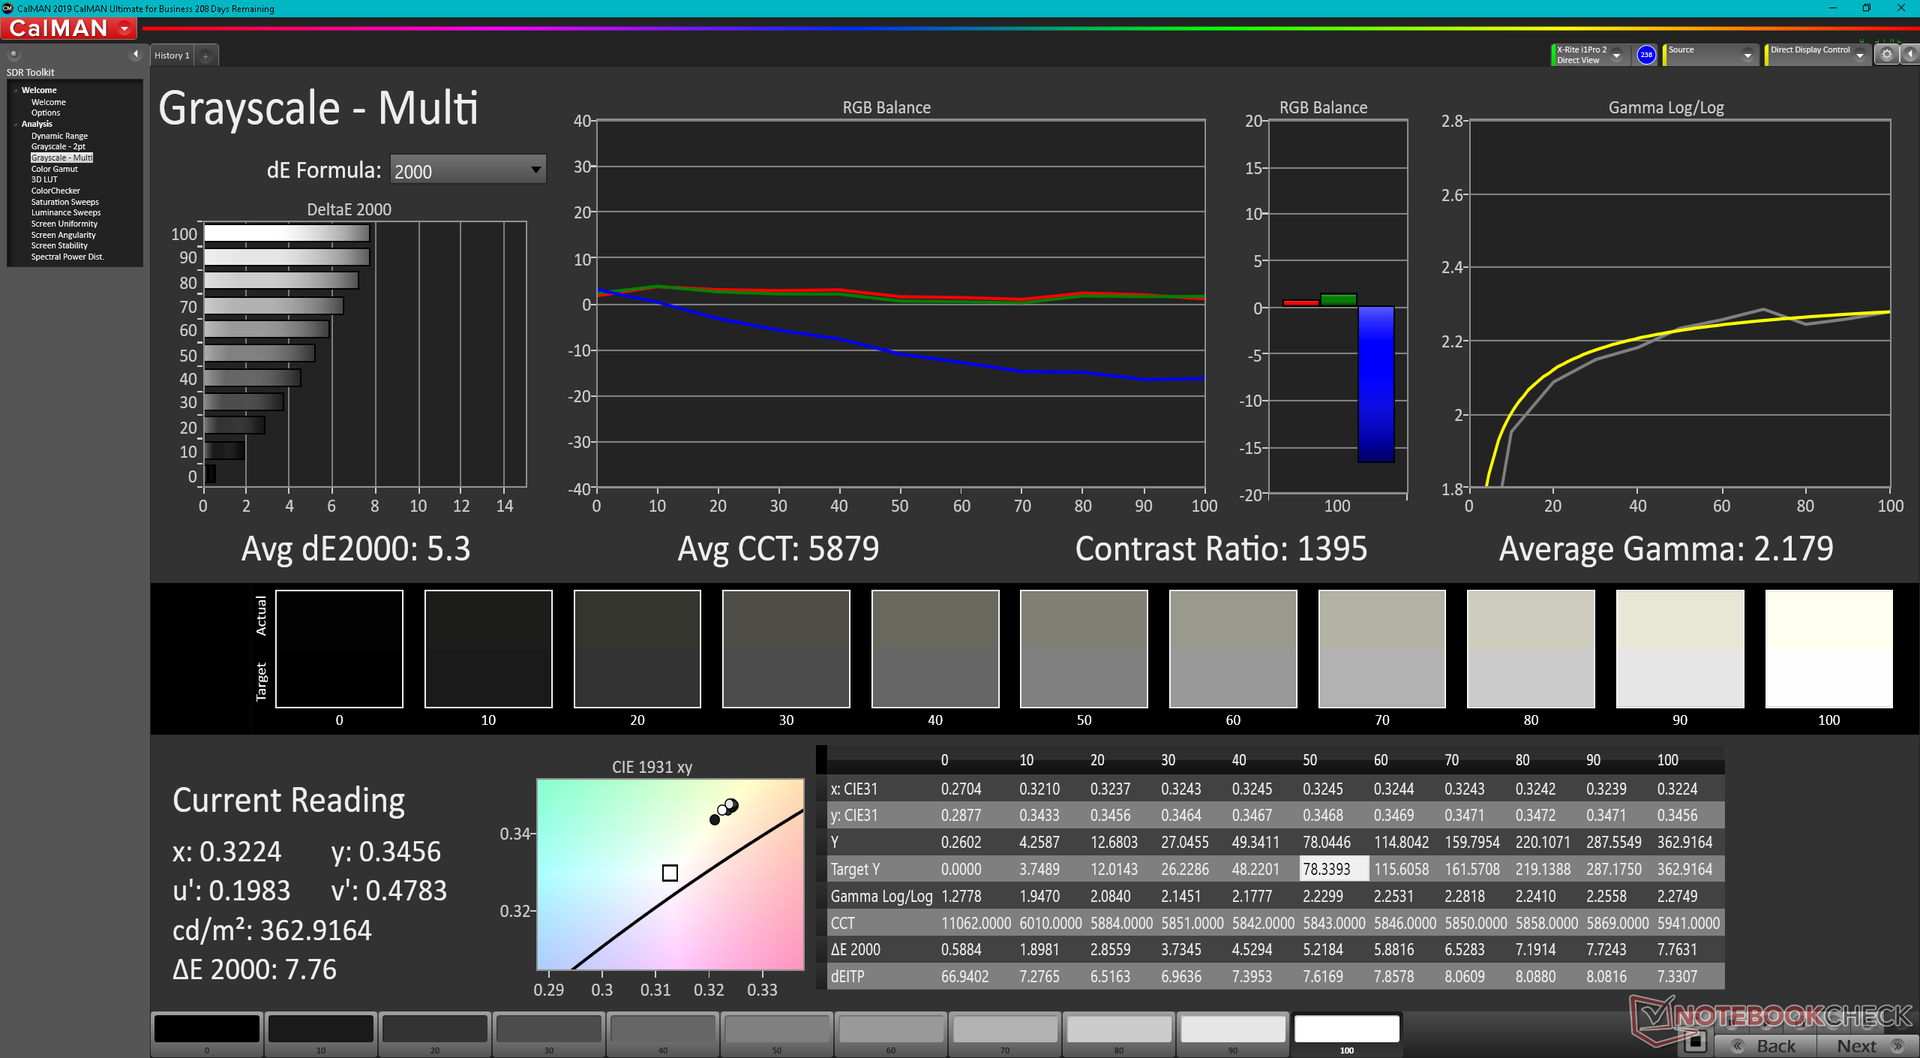
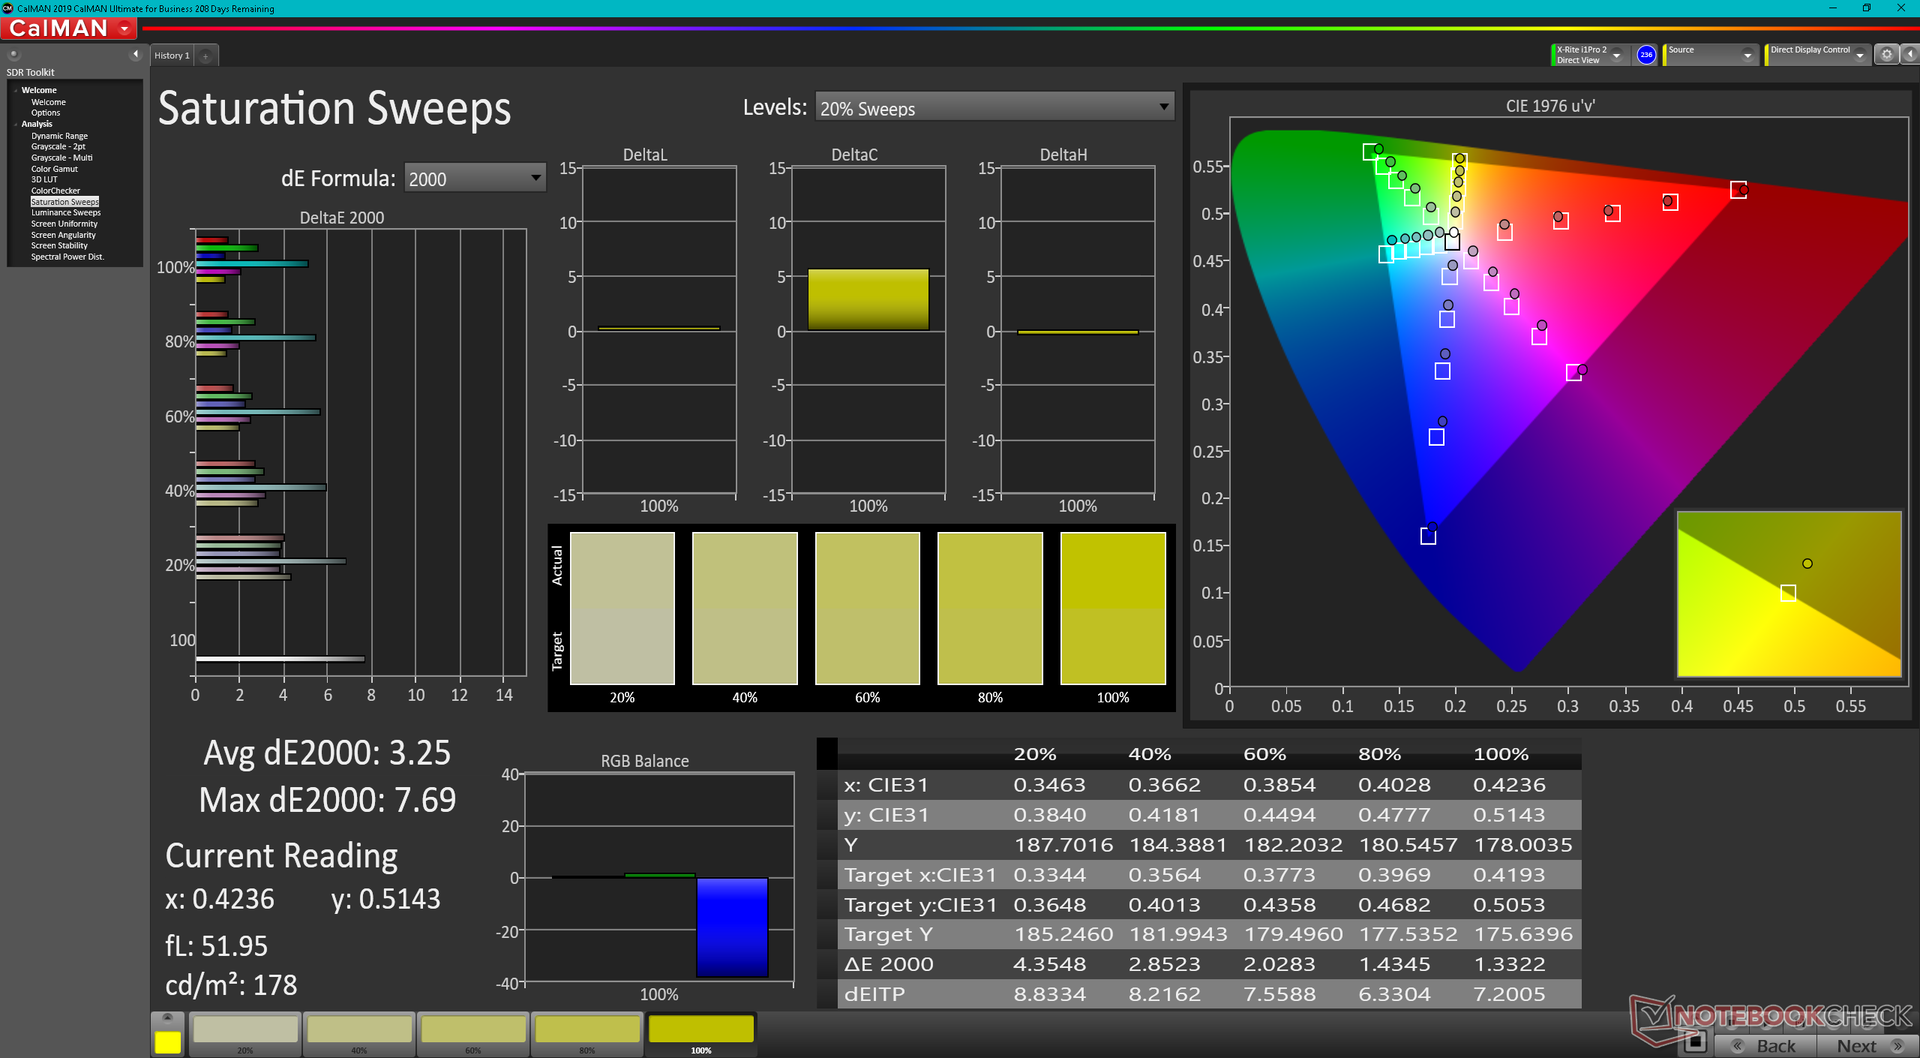
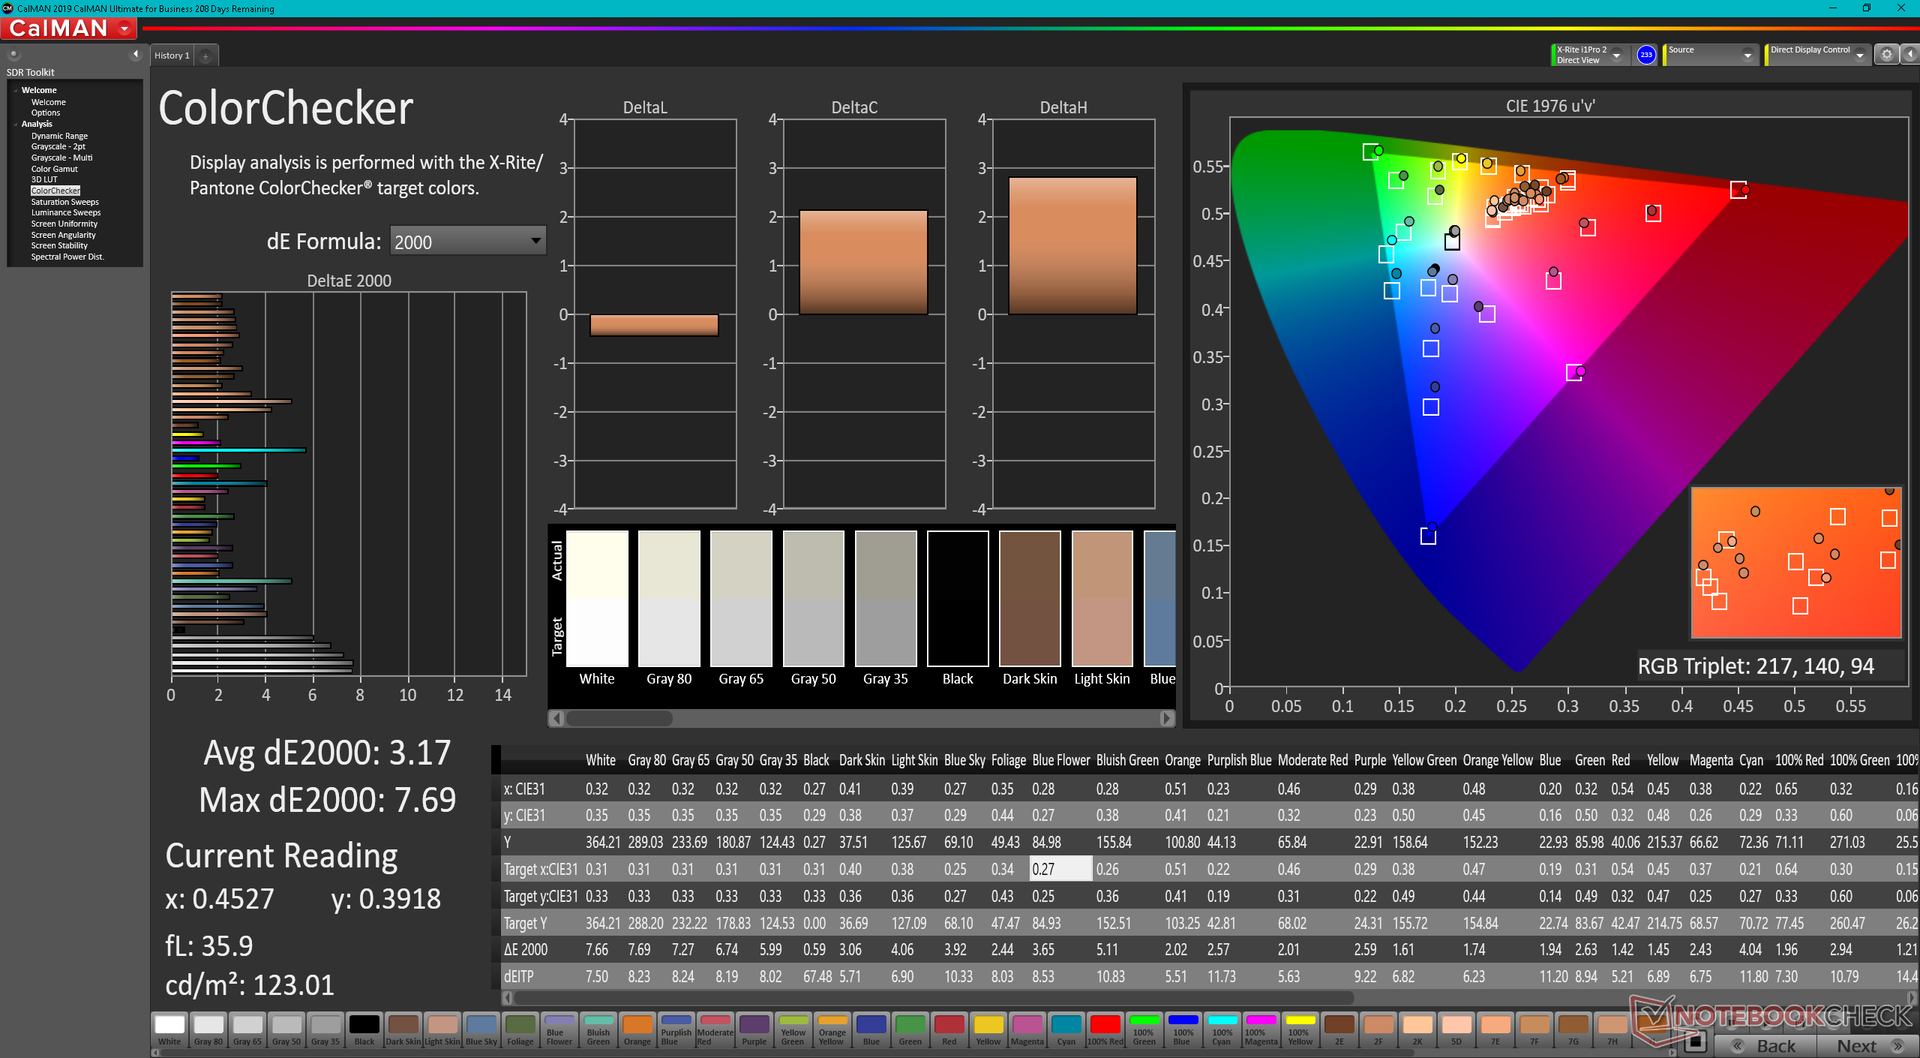
ΔE ColorChecker Calman: 3.17 | ∀{0.5-29.43 Ø4.75}
calibrated: 0.51
ΔE Greyscale Calman: 5.3 | ∀{0.09-98 Ø5}
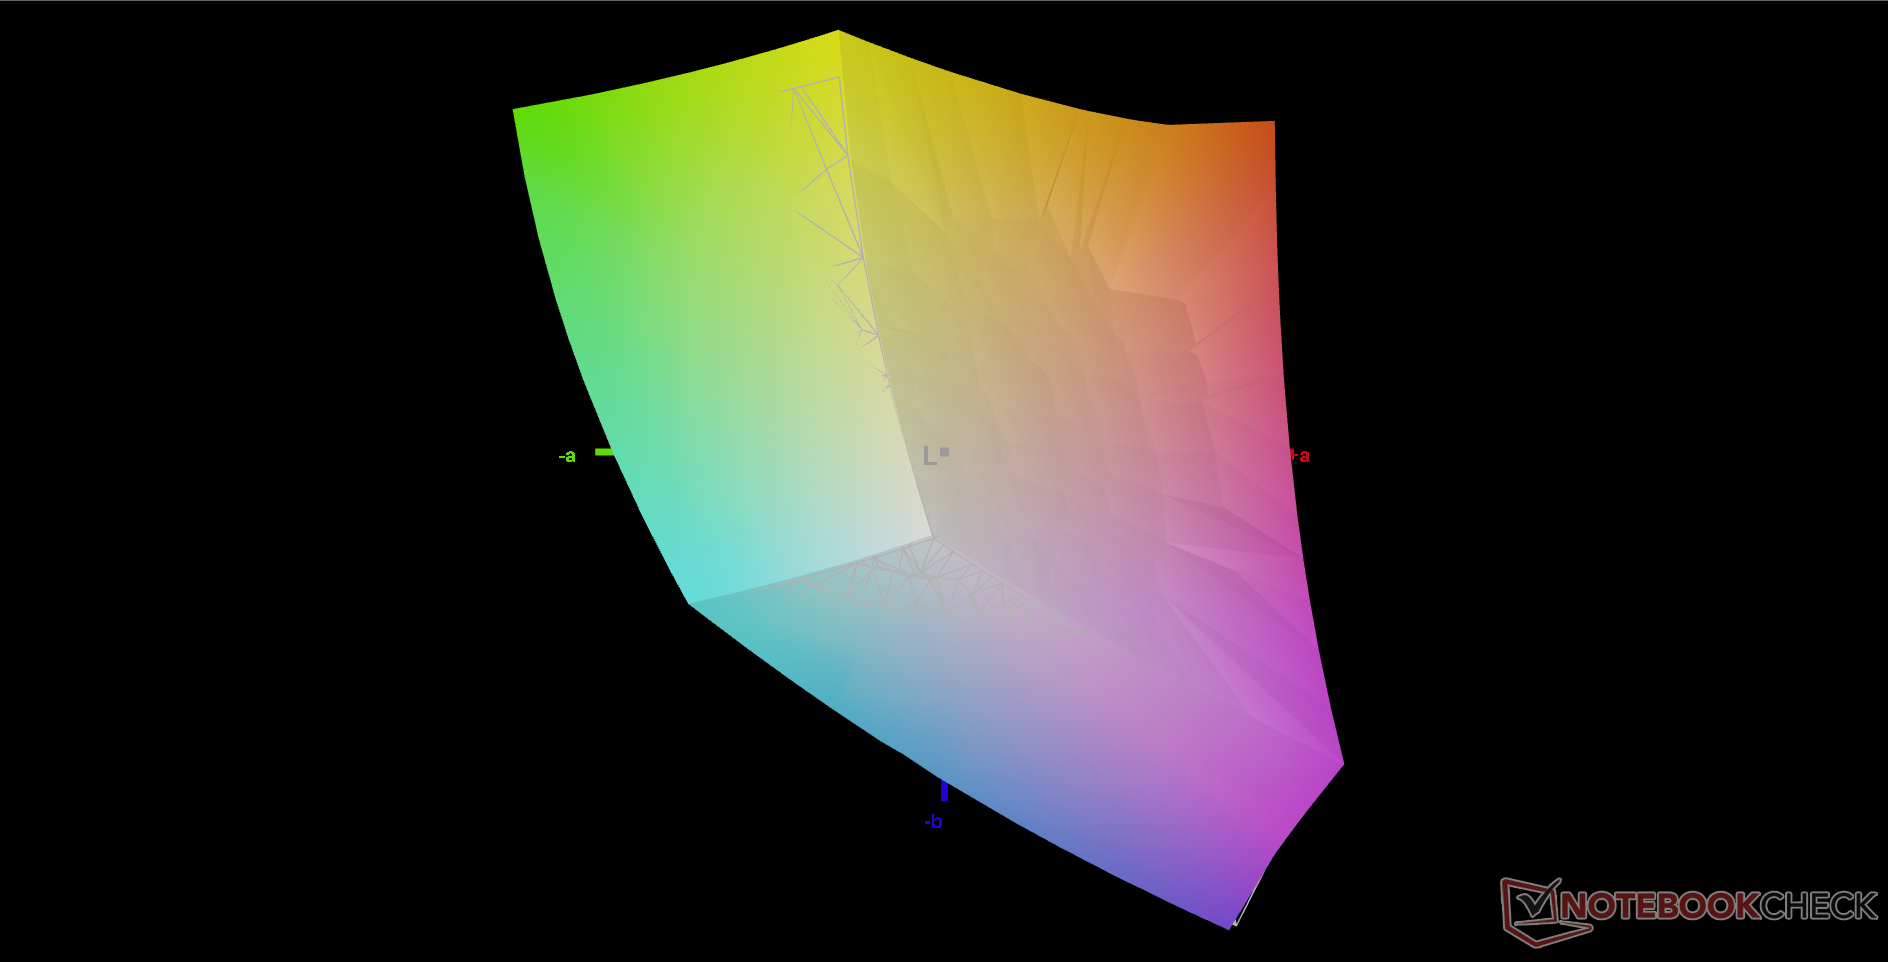
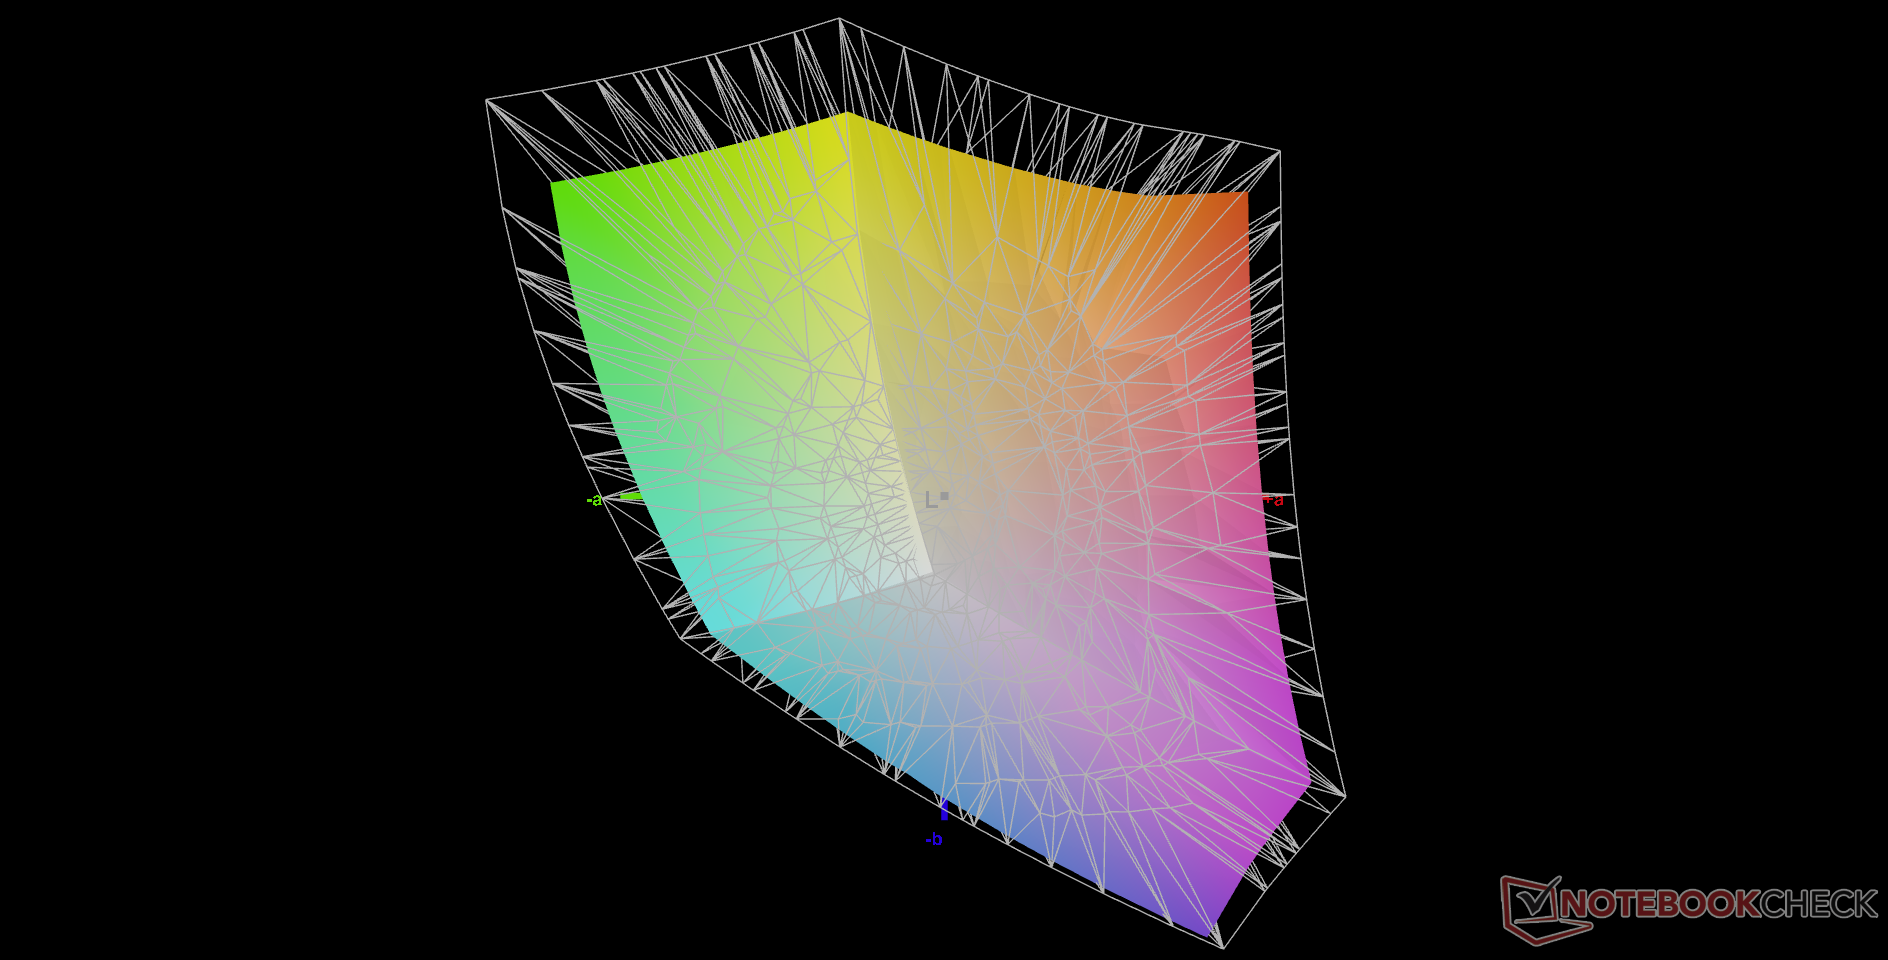
79.6% AdobeRGB 1998 (Argyll 3D)
99.8% sRGB (Argyll 3D)
79.2% Display P3 (Argyll 3D)
Gamma: 2.18
CCT: 5879 K
| Alienware x17 R2 P48E AU Optronics B173HAN, IPS, 1920x1080, 17.3" | Alienware x17 RTX 3080 P48E AU Optronics B173ZAN, IPS, 3840x2160, 17.3" | Asus ROG Zephyrus S17 GX703HSD BOE099D (BOE CQ NE173QHM-NY3), IPS, 2560x1440, 17.3" | MSI Stealth GS77 12UHS-083US BOE NE173QHM-NZ1, IPS, 2560x1440, 17.3" | MSI GT76 Titan DT 10SGS AU Optronics B173ZAN03.3, IPS, 3840x2160, 17.3" | Gigabyte A7 X1 AU Optronics AUO8E8D, IPS, 1920x1080, 17.3" | |
|---|---|---|---|---|---|---|
| Display | 12% | 8% | 10% | 8% | -17% | |
| Display P3 Coverage (%) | 79.2 | 88.3 11% | 94.2 19% | 96.2 21% | 82.5 4% | 61.5 -22% |
| sRGB Coverage (%) | 99.8 | 100 0% | 98.7 -1% | 99.7 0% | 98 -2% | 90.9 -9% |
| AdobeRGB 1998 Coverage (%) | 79.6 | 100 26% | 84.4 6% | 85.8 8% | 96.6 21% | 63.2 -21% |
| Response Times | -15% | 37% | -41% | -57% | -23% | |
| Response Time Grey 50% / Grey 80% * (ms) | 12.4 ? | 14.4 ? -16% | 4.8 61% | 17.6 ? -42% | 23.2 ? -87% | 16 ? -29% |
| Response Time Black / White * (ms) | 9.2 ? | 10.4 ? -13% | 8 13% | 12.8 ? -39% | 11.6 ? -26% | 10.8 ? -17% |
| PWM Frequency (Hz) | ||||||
| Screen | -6% | -29% | -12% | -55% | -39% | |
| Brightness middle (cd/m²) | 365.4 | 438.7 20% | 322 -12% | 334.8 -8% | 419.5 15% | 325 -11% |
| Brightness (cd/m²) | 344 | 435 26% | 288 -16% | 305 -11% | 413 20% | 318 -8% |
| Brightness Distribution (%) | 85 | 91 7% | 72 -15% | 79 -7% | 93 9% | 95 12% |
| Black Level * (cd/m²) | 0.29 | 0.48 -66% | 0.3 -3% | 0.34 -17% | 0.4 -38% | 0.29 -0% |
| Contrast (:1) | 1260 | 914 -27% | 1073 -15% | 985 -22% | 1049 -17% | 1121 -11% |
| Colorchecker dE 2000 * | 3.17 | 4.34 -37% | 3.05 4% | 4.1 -29% | 3.4 -7% | 4.33 -37% |
| Colorchecker dE 2000 max. * | 7.69 | 7.3 5% | 5.23 32% | 7.28 5% | 7.4 4% | 8.6 -12% |
| Colorchecker dE 2000 calibrated * | 0.51 | 0.72 -41% | 1.92 -276% | 3.28 -543% | 1.95 -282% | |
| Greyscale dE 2000 * | 5.3 | 2.4 55% | 3.11 41% | 5.6 -6% | 2 62% | 5.5 -4% |
| Gamma | 2.18 101% | 2.09 105% | 2.13 103% | 2.16 102% | 2.14 103% | 2.142 103% |
| CCT | 5879 111% | 6413 101% | 6553 99% | 6314 103% | 6858 95% | 7893 82% |
| Color Space (Percent of AdobeRGB 1998) (%) | 84 | 84.6 | ||||
| Color Space (Percent of sRGB) (%) | 99 | 97.9 | ||||
| Total Average (Program / Settings) | -3% /
-4% | 5% /
-12% | -14% /
-11% | -35% /
-42% | -26% /
-32% |
* ... smaller is better
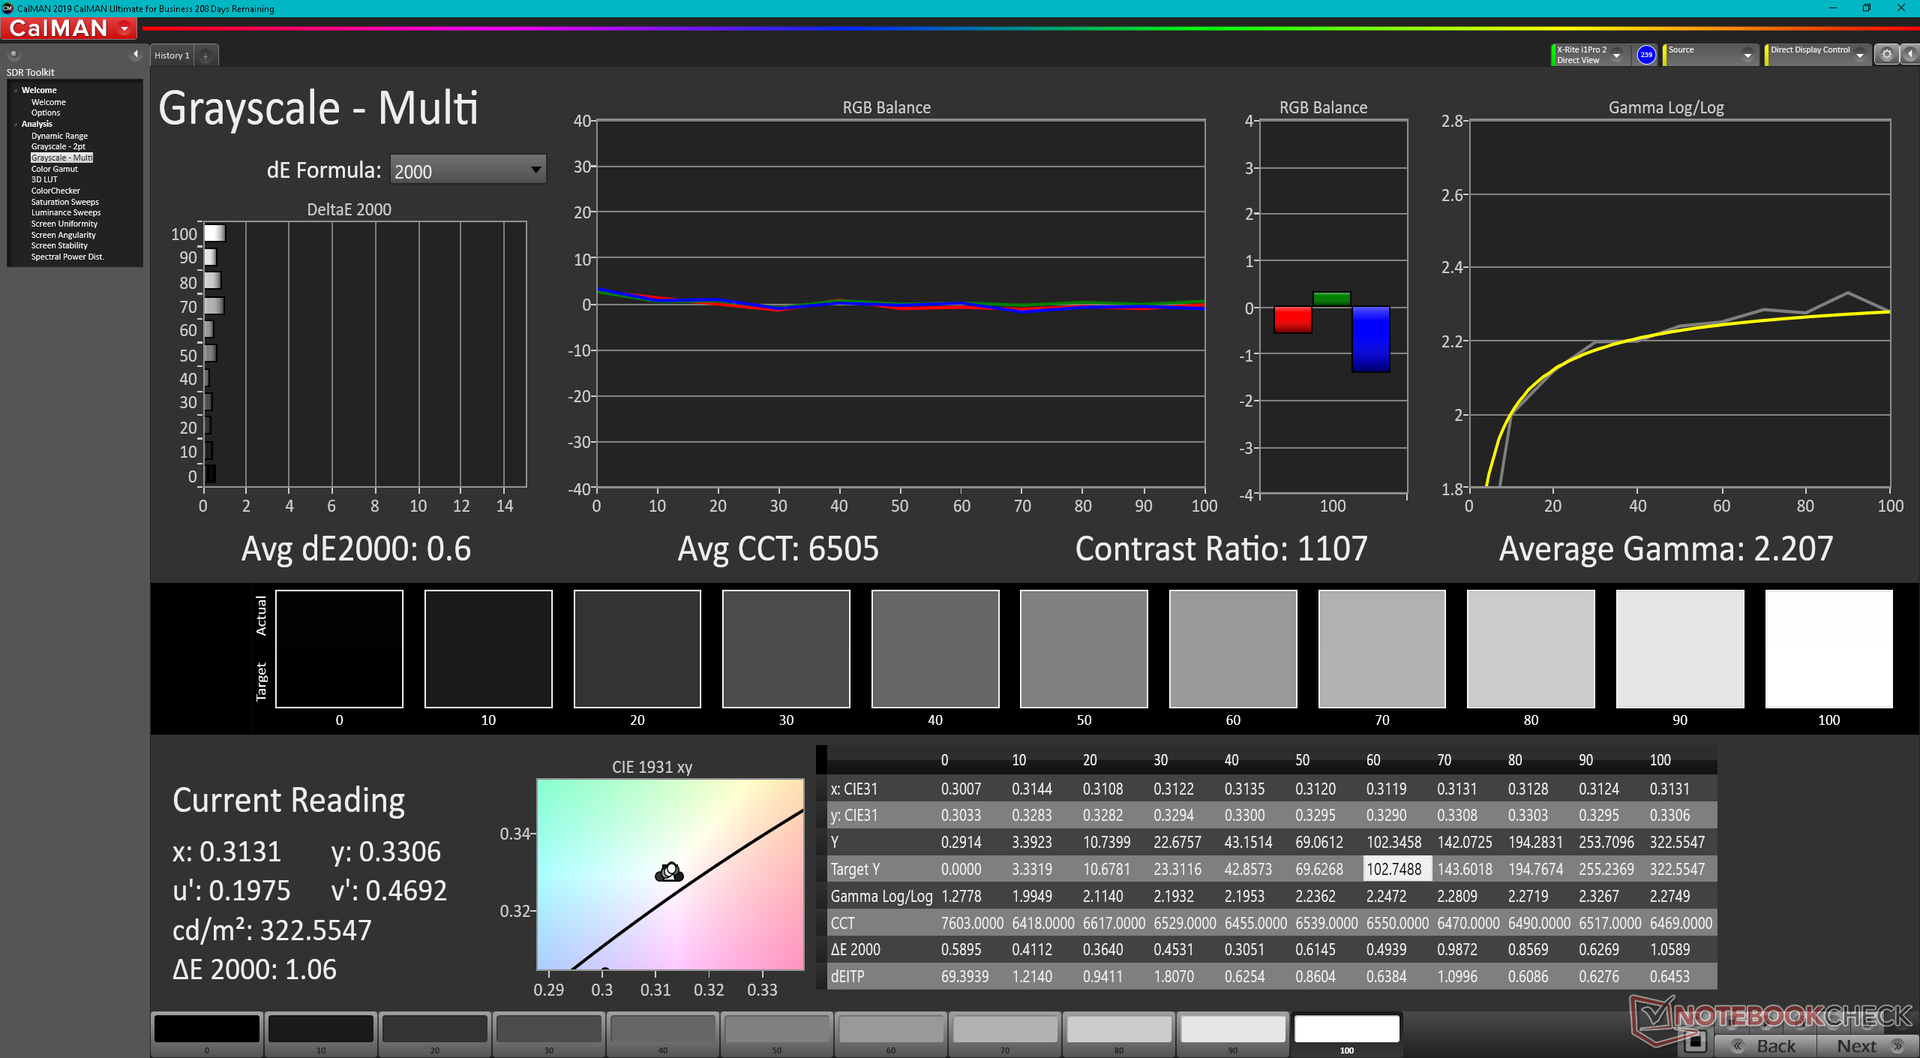
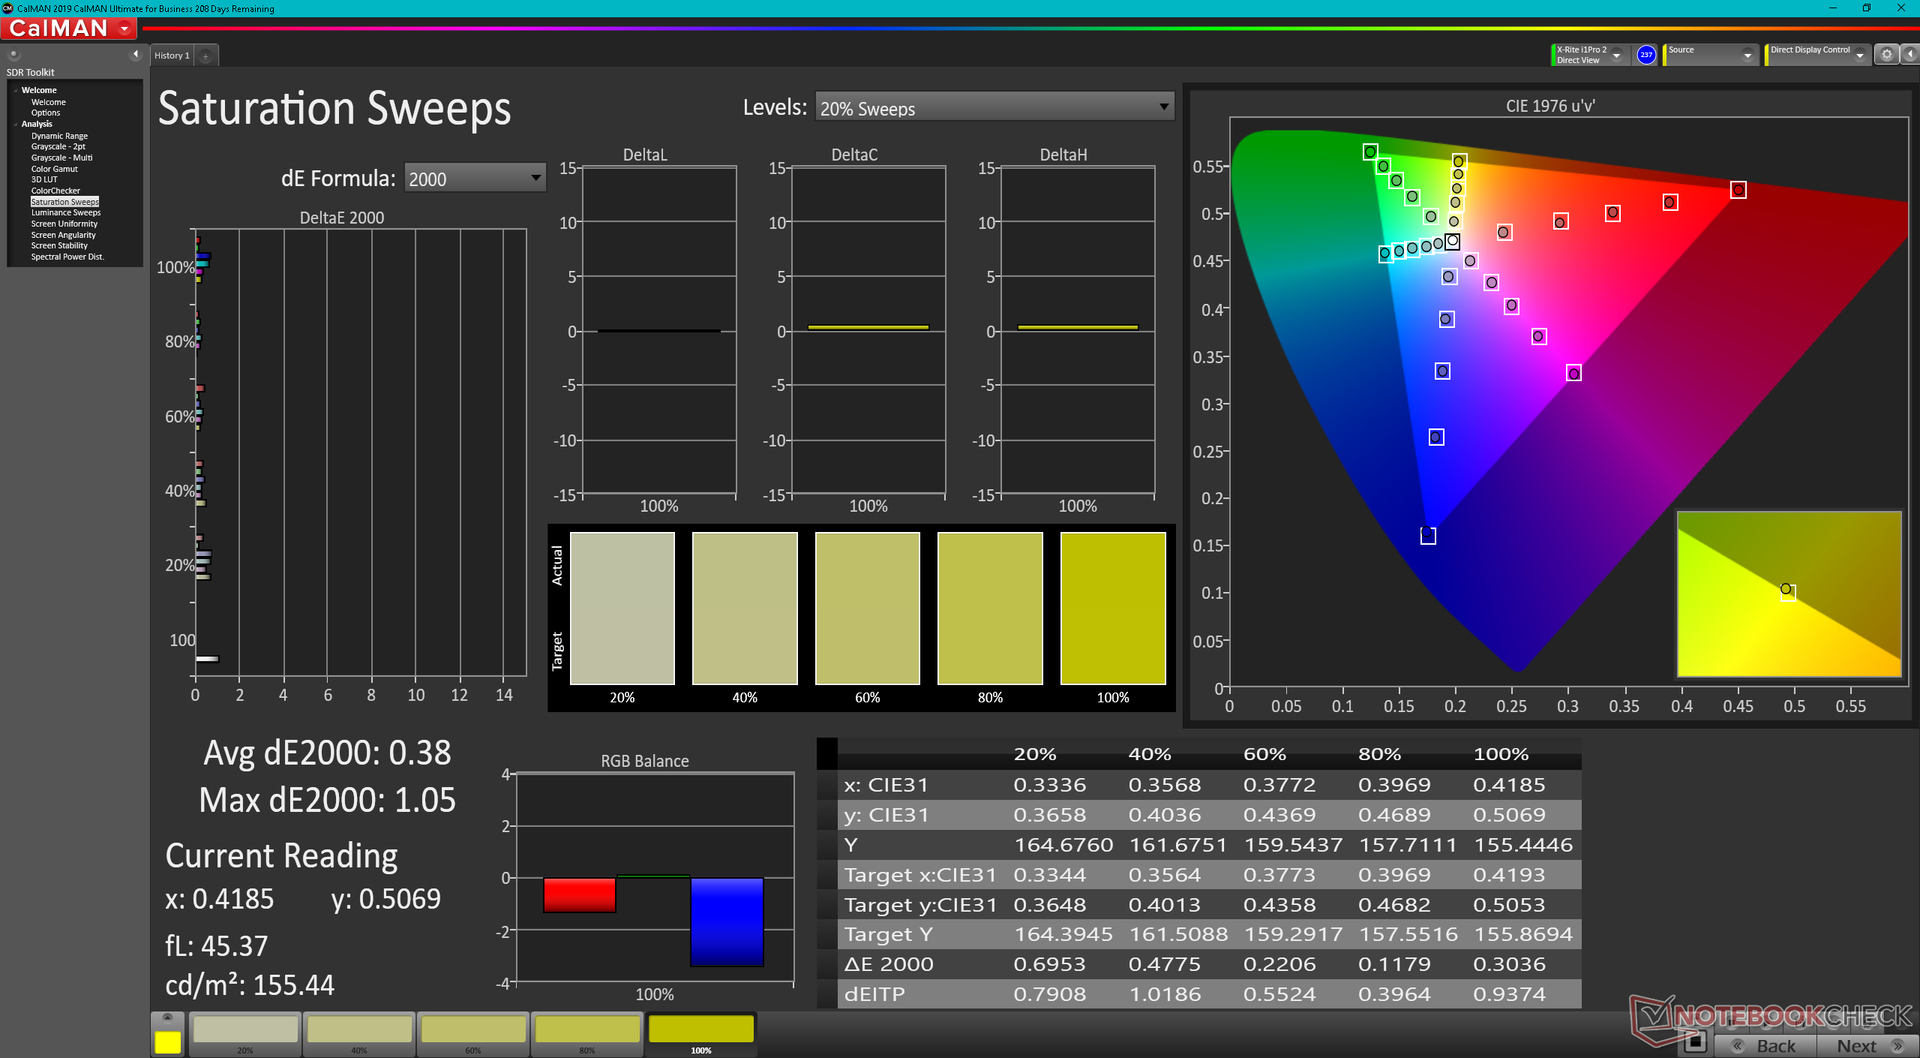
The display is not calibrated very well out of the box especially since color temperature is overly warm. Once properly calibrated against sRGB, however, we're able to achieve average grayscale and color deltaE values down to just 0.6 and 0.51, respectively.
Display Response Times
| ↔ Response Time Black to White | ||
|---|---|---|
| 9.2 ms ... rise ↗ and fall ↘ combined | ↗ 5.2 ms rise | 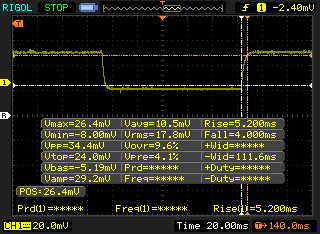 |
| ↘ 4 ms fall | ||
| The screen shows fast response rates in our tests and should be suited for gaming. In comparison, all tested devices range from 0.1 (minimum) to 240 (maximum) ms. » 25 % of all devices are better. This means that the measured response time is better than the average of all tested devices (20.1 ms). | ||
| ↔ Response Time 50% Grey to 80% Grey | ||
| 12.4 ms ... rise ↗ and fall ↘ combined | ↗ 6.4 ms rise | 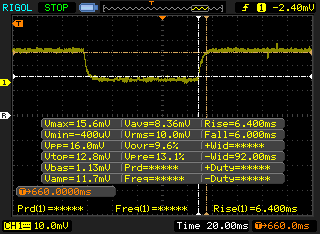 |
| ↘ 6 ms fall | ||
| The screen shows good response rates in our tests, but may be too slow for competitive gamers. In comparison, all tested devices range from 0.165 (minimum) to 636 (maximum) ms. » 25 % of all devices are better. This means that the measured response time is better than the average of all tested devices (31.4 ms). | ||
Screen Flickering / PWM (Pulse-Width Modulation)
| Screen flickering / PWM not detected | 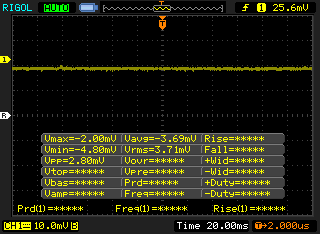 | ||
In comparison: 53 % of all tested devices do not use PWM to dim the display. If PWM was detected, an average of 7986 (minimum: 5 - maximum: 343500) Hz was measured. | |||

Performance
Testing Conditions
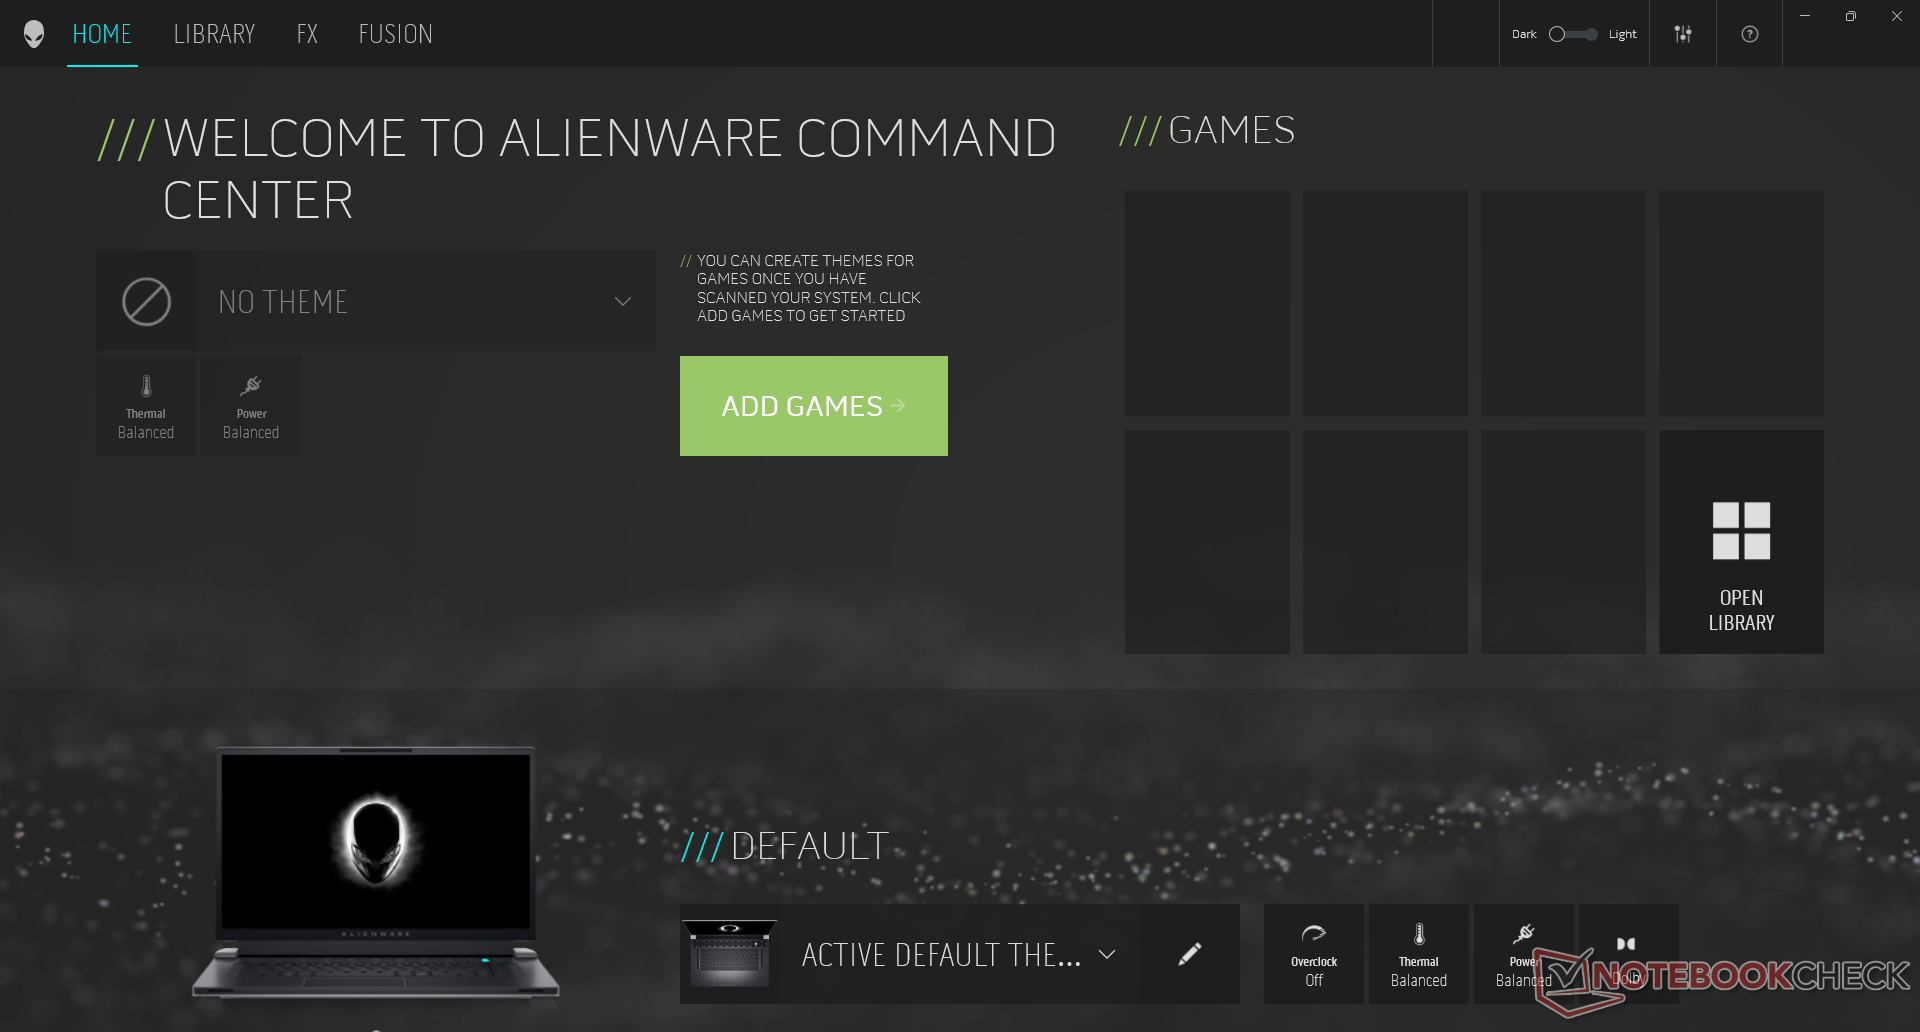
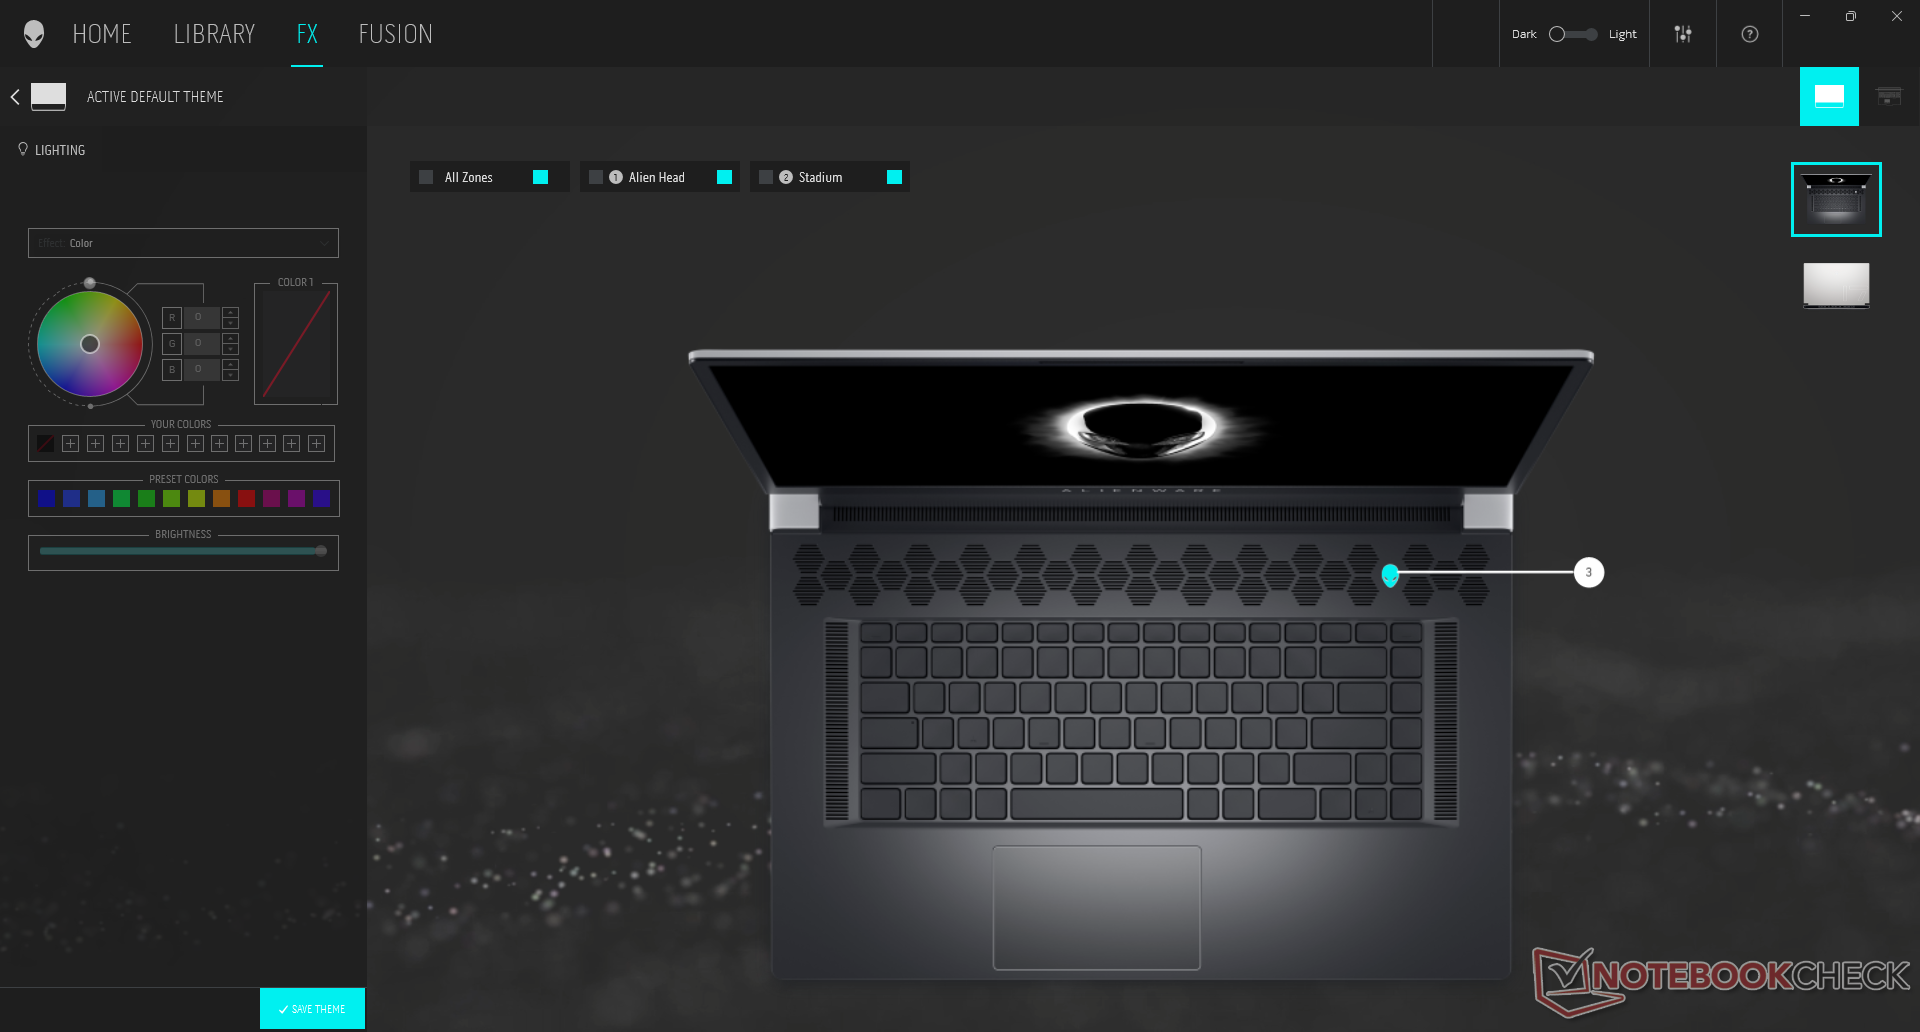
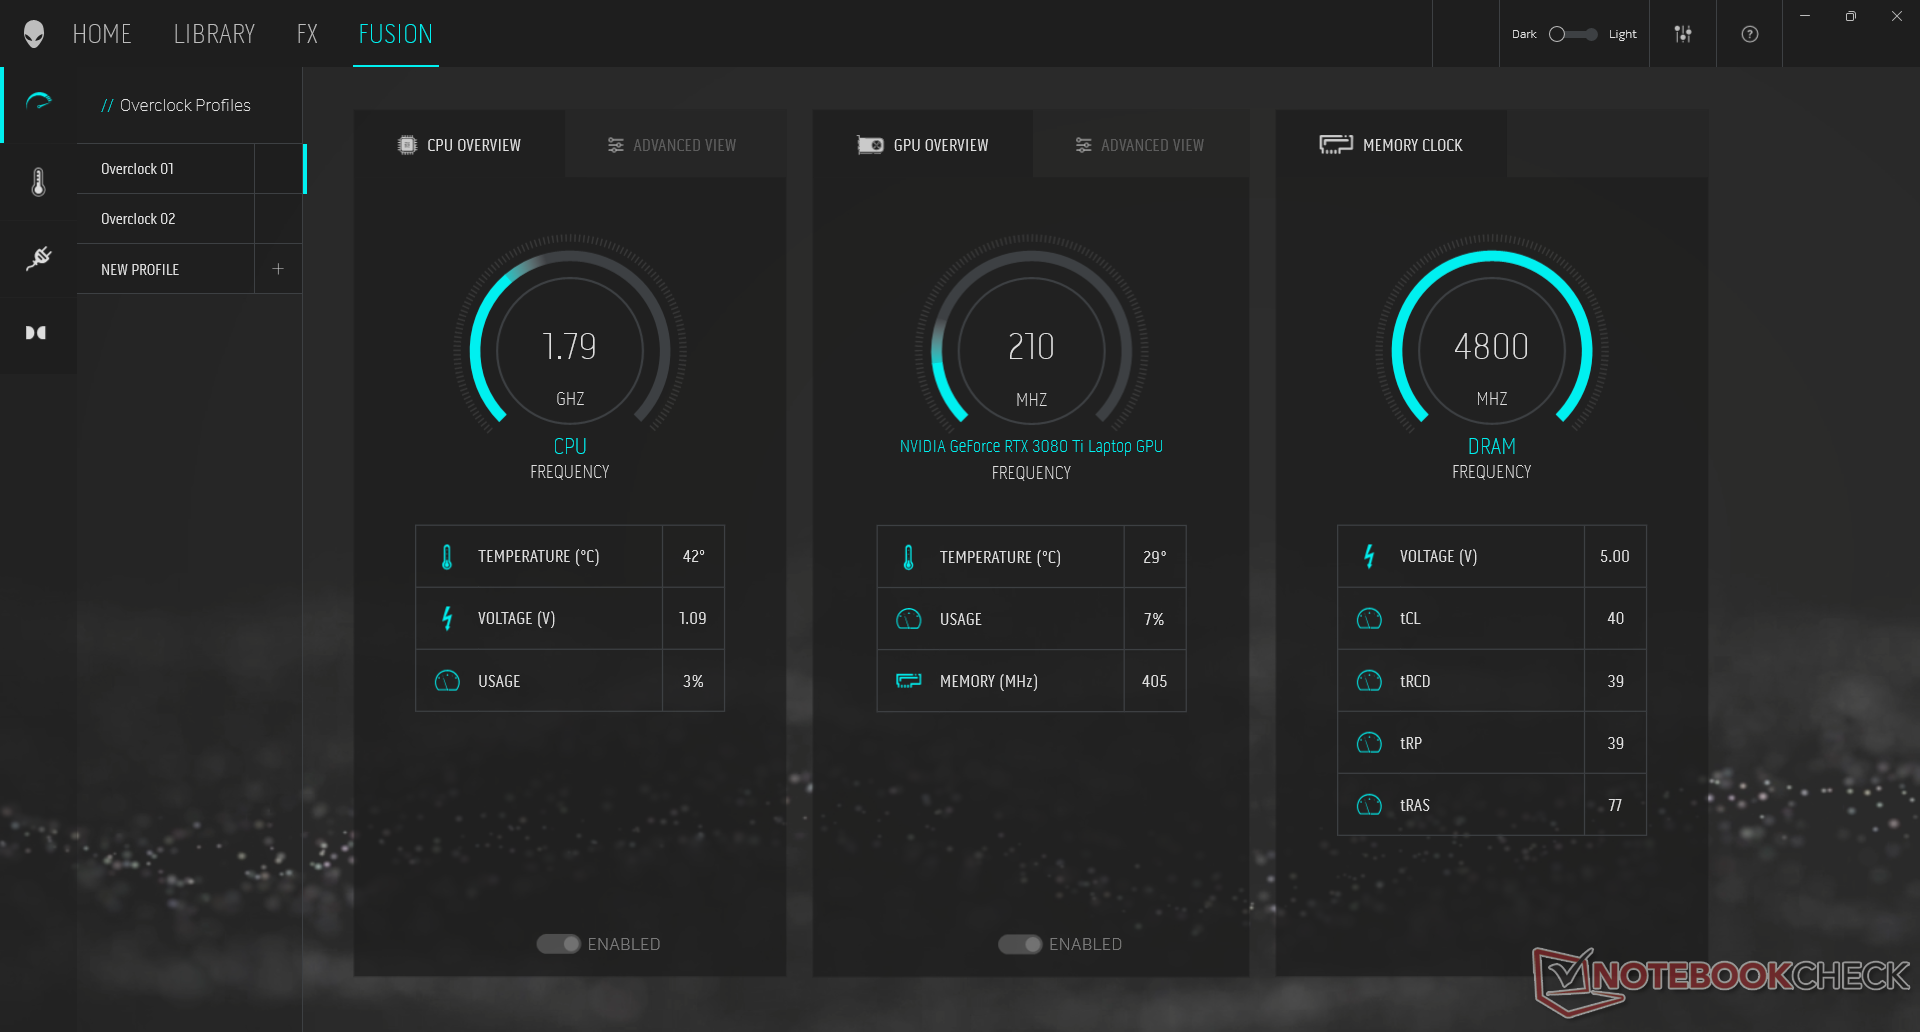
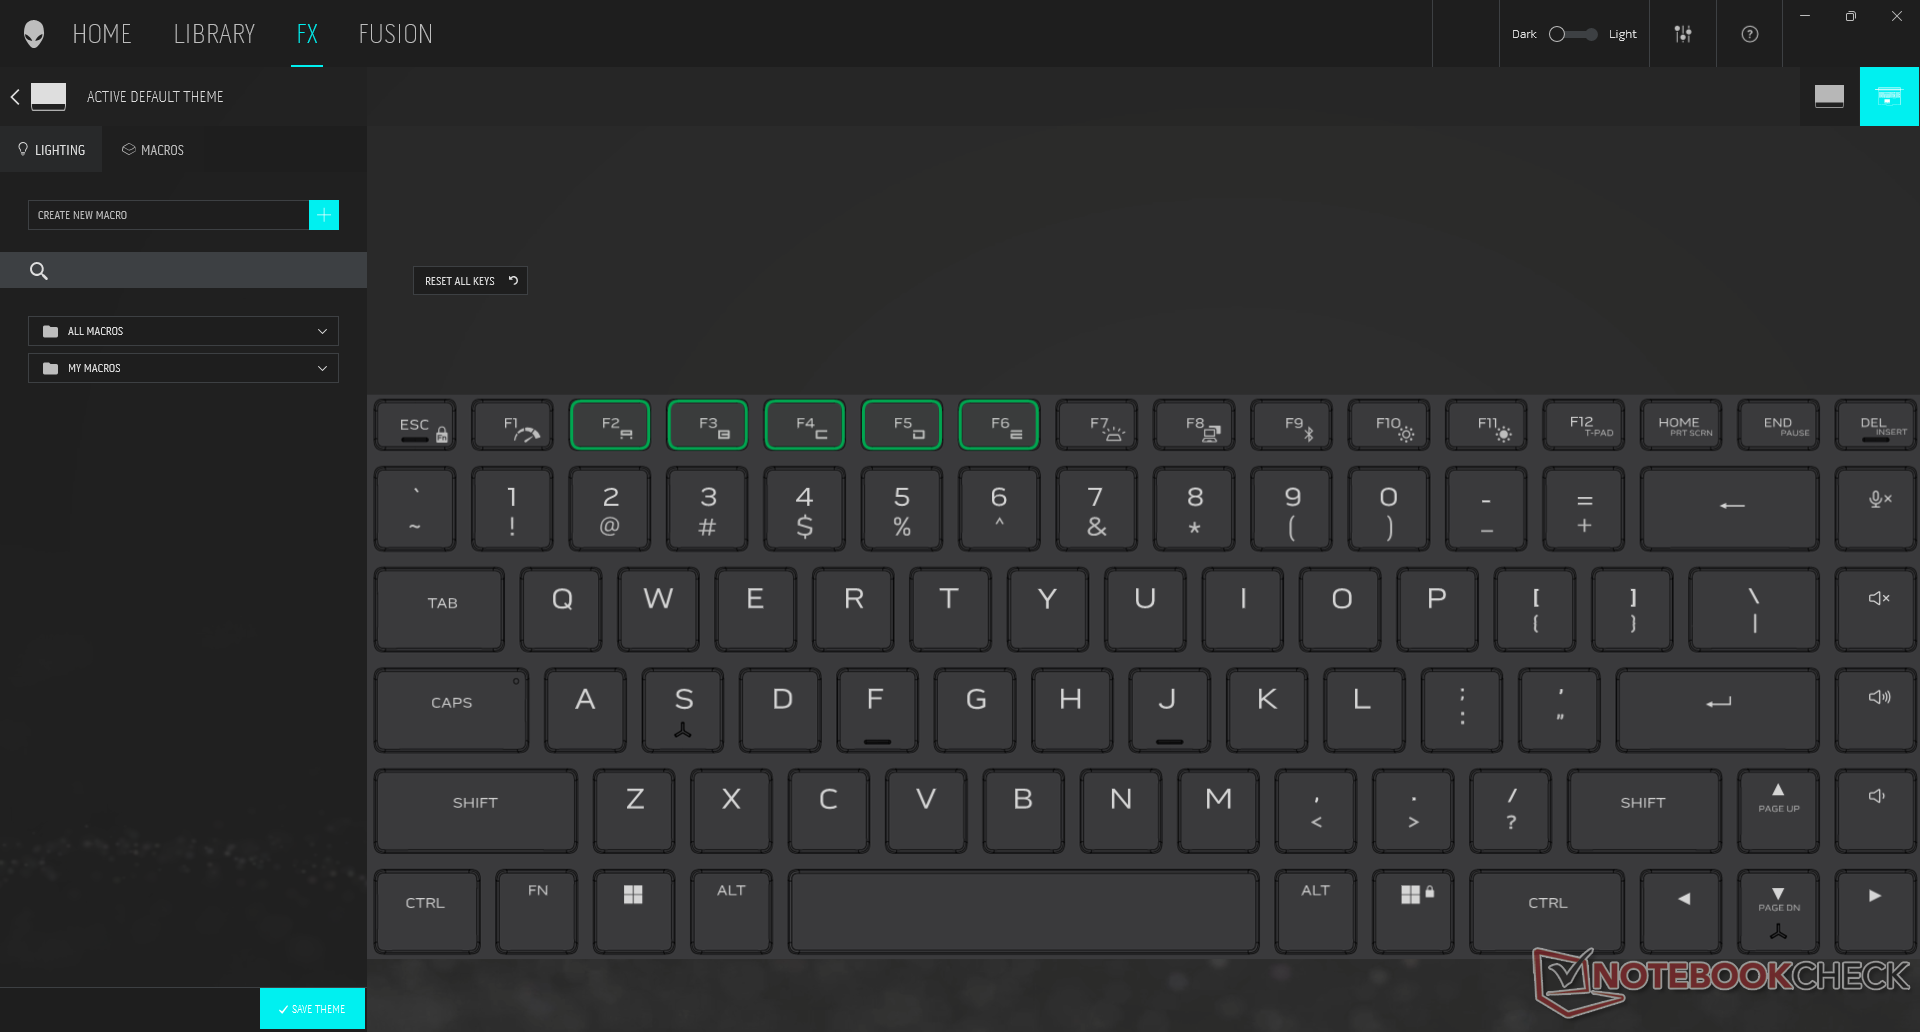
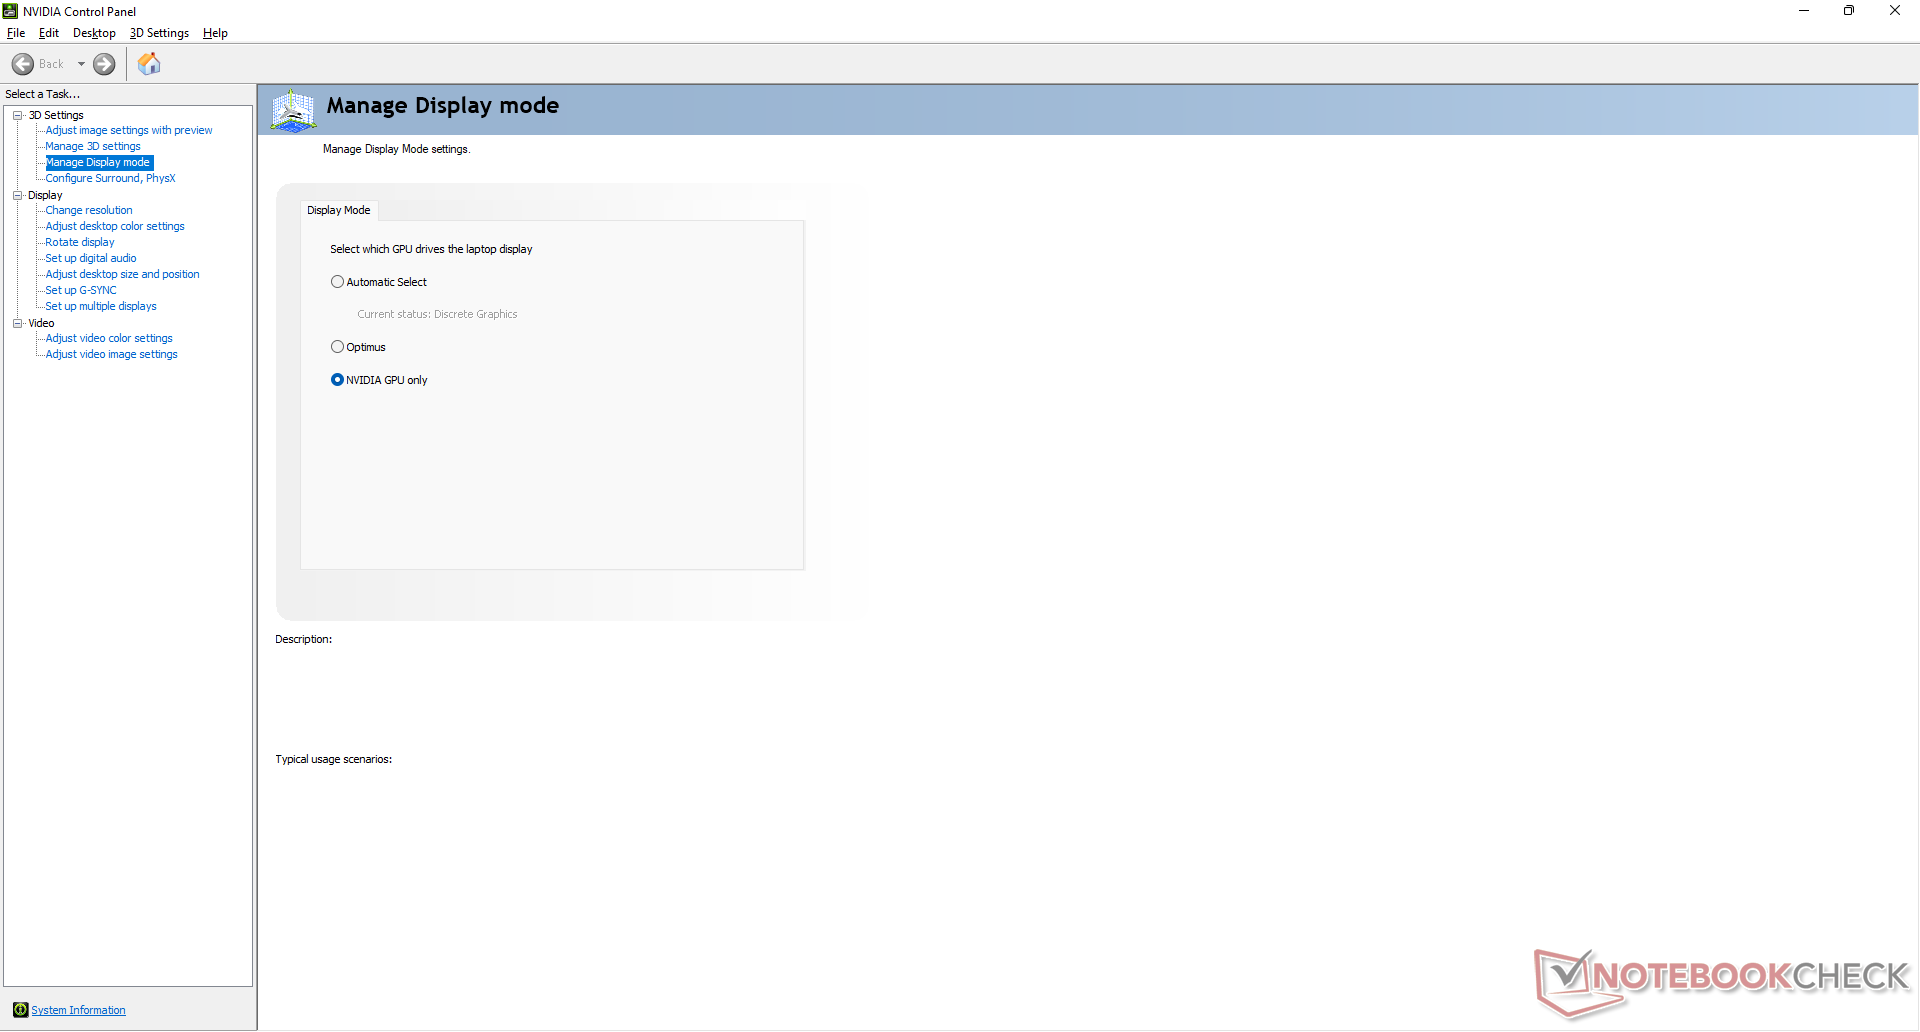
We set our unit to High Performance mode and with the discrete GPU active prior to running any performance benchmarks below for the highest possible scores. High Performance mode can be easily toggled via Fn+F1 while the MUX switch can be accessed via the Nvidia Control Panel. We highly recommend users become familiar with the Alienware Command Center software as the power profiles, RGB settings, real-time monitoring, and other features are found here.
Processor
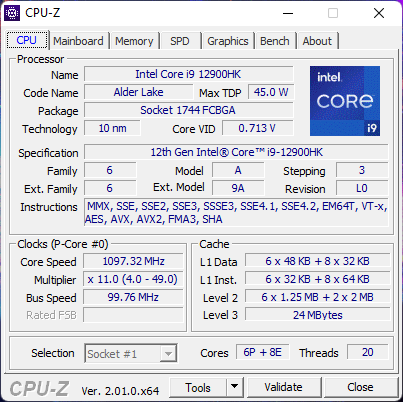
Raw CPU performance is about 10 to 15 percent faster than the average laptop in our database with the same Core i9-12900HK. It's a decent boost over the Core i7-12800H or last generation Core i7-11800H by up to 30 percent each in multi-threaded workloads. AMD's latest Zen 3+ CPU, the Ryzen 9 6900HX, is also consistently slower in raw CineBench benchmarks, but it will outperform the Core i9-12900HK in certain AIDA64 benchmarks.
Cinebench R15 Multi Loop
Cinebench R23: Multi Core | Single Core
Cinebench R15: CPU Multi 64Bit | CPU Single 64Bit
Blender: v2.79 BMW27 CPU
7-Zip 18.03: 7z b 4 | 7z b 4 -mmt1
Geekbench 5.5: Multi-Core | Single-Core
HWBOT x265 Benchmark v2.2: 4k Preset
LibreOffice : 20 Documents To PDF
R Benchmark 2.5: Overall mean
| Cinebench R20 / CPU (Multi Core) | |
| AMD Radeon RX 6800 XT | |
| Corsair One i300 | |
| Alienware x17 R2 P48E | |
| Average Intel Core i9-12900HK (1828 - 7366, n=14) | |
| Razer Blade 14 Ryzen 9 6900HX | |
| Alienware x17 RTX 3080 P48E | |
| Razer Blade 17 (i7-12800H, RTX 3070 Ti) | |
| Gigabyte A7 X1 | |
| Razer Blade Pro 17 2021 (QHD Touch) | |
| Lenovo Legion Y740-17IRHg-81UJ001VGE | |
| Cinebench R20 / CPU (Single Core) | |
| Corsair One i300 | |
| Alienware x17 R2 P48E | |
| Razer Blade 17 (i7-12800H, RTX 3070 Ti) | |
| Average Intel Core i9-12900HK (316 - 739, n=14) | |
| AMD Radeon RX 6800 XT | |
| Razer Blade 14 Ryzen 9 6900HX | |
| Alienware x17 RTX 3080 P48E | |
| Gigabyte A7 X1 | |
| Razer Blade Pro 17 2021 (QHD Touch) | |
| Lenovo Legion Y740-17IRHg-81UJ001VGE | |
| Cinebench R23 / Multi Core | |
| Corsair One i300 | |
| AMD Radeon RX 6800 XT | |
| Alienware x17 R2 P48E | |
| Average Intel Core i9-12900HK (4796 - 19282, n=14) | |
| Razer Blade 17 (i7-12800H, RTX 3070 Ti) | |
| Razer Blade 14 Ryzen 9 6900HX | |
| Alienware x17 RTX 3080 P48E | |
| Gigabyte A7 X1 | |
| Razer Blade Pro 17 2021 (QHD Touch) | |
| Cinebench R23 / Single Core | |
| Corsair One i300 | |
| Alienware x17 R2 P48E | |
| Razer Blade 17 (i7-12800H, RTX 3070 Ti) | |
| Average Intel Core i9-12900HK (819 - 1940, n=15) | |
| AMD Radeon RX 6800 XT | |
| Razer Blade 14 Ryzen 9 6900HX | |
| Alienware x17 RTX 3080 P48E | |
| Gigabyte A7 X1 | |
| Razer Blade Pro 17 2021 (QHD Touch) | |
| Cinebench R15 / CPU Multi 64Bit | |
| AMD Radeon RX 6800 XT | |
| Corsair One i300 | |
| Alienware x17 R2 P48E | |
| Razer Blade 17 (i7-12800H, RTX 3070 Ti) | |
| Average Intel Core i9-12900HK (965 - 2944, n=14) | |
| Razer Blade 14 Ryzen 9 6900HX | |
| Alienware x17 RTX 3080 P48E | |
| Gigabyte A7 X1 | |
| Razer Blade Pro 17 2021 (QHD Touch) | |
| Lenovo Legion Y740-17IRHg-81UJ001VGE | |
| Cinebench R15 / CPU Single 64Bit | |
| Corsair One i300 | |
| Alienware x17 R2 P48E | |
| Razer Blade 17 (i7-12800H, RTX 3070 Ti) | |
| AMD Radeon RX 6800 XT | |
| Razer Blade 14 Ryzen 9 6900HX | |
| Gigabyte A7 X1 | |
| Average Intel Core i9-12900HK (119 - 279, n=14) | |
| Alienware x17 RTX 3080 P48E | |
| Razer Blade Pro 17 2021 (QHD Touch) | |
| Lenovo Legion Y740-17IRHg-81UJ001VGE | |
| Blender / v2.79 BMW27 CPU | |
| Lenovo Legion Y740-17IRHg-81UJ001VGE | |
| Razer Blade Pro 17 2021 (QHD Touch) | |
| Gigabyte A7 X1 | |
| Average Intel Core i9-12900HK (172.5 - 483, n=13) | |
| Razer Blade 14 Ryzen 9 6900HX | |
| Razer Blade 17 (i7-12800H, RTX 3070 Ti) | |
| Alienware x17 RTX 3080 P48E | |
| Alienware x17 R2 P48E | |
| Corsair One i300 | |
| AMD Radeon RX 6800 XT | |
| 7-Zip 18.03 / 7z b 4 | |
| AMD Radeon RX 6800 XT | |
| Corsair One i300 | |
| Alienware x17 R2 P48E | |
| Razer Blade 17 (i7-12800H, RTX 3070 Ti) | |
| Razer Blade 14 Ryzen 9 6900HX | |
| Average Intel Core i9-12900HK (25736 - 75564, n=14) | |
| Gigabyte A7 X1 | |
| Alienware x17 RTX 3080 P48E | |
| Razer Blade Pro 17 2021 (QHD Touch) | |
| Lenovo Legion Y740-17IRHg-81UJ001VGE | |
| 7-Zip 18.03 / 7z b 4 -mmt1 | |
| AMD Radeon RX 6800 XT | |
| Corsair One i300 | |
| Razer Blade 14 Ryzen 9 6900HX | |
| Alienware x17 R2 P48E | |
| Razer Blade 17 (i7-12800H, RTX 3070 Ti) | |
| Gigabyte A7 X1 | |
| Average Intel Core i9-12900HK (2898 - 6186, n=14) | |
| Alienware x17 RTX 3080 P48E | |
| Razer Blade Pro 17 2021 (QHD Touch) | |
| Lenovo Legion Y740-17IRHg-81UJ001VGE | |
| Geekbench 5.5 / Multi-Core | |
| Corsair One i300 | |
| AMD Radeon RX 6800 XT | |
| Alienware x17 R2 P48E | |
| Razer Blade 17 (i7-12800H, RTX 3070 Ti) | |
| Average Intel Core i9-12900HK (5869 - 14294, n=13) | |
| Razer Blade 14 Ryzen 9 6900HX | |
| Razer Blade Pro 17 2021 (QHD Touch) | |
| Gigabyte A7 X1 | |
| Lenovo Legion Y740-17IRHg-81UJ001VGE | |
| Geekbench 5.5 / Single-Core | |
| Corsair One i300 | |
| Alienware x17 R2 P48E | |
| Razer Blade 17 (i7-12800H, RTX 3070 Ti) | |
| Average Intel Core i9-12900HK (843 - 1918, n=13) | |
| AMD Radeon RX 6800 XT | |
| Razer Blade 14 Ryzen 9 6900HX | |
| Gigabyte A7 X1 | |
| Razer Blade Pro 17 2021 (QHD Touch) | |
| Lenovo Legion Y740-17IRHg-81UJ001VGE | |
| HWBOT x265 Benchmark v2.2 / 4k Preset | |
| AMD Radeon RX 6800 XT | |
| Corsair One i300 | |
| Alienware x17 R2 P48E | |
| Razer Blade 14 Ryzen 9 6900HX | |
| Alienware x17 RTX 3080 P48E | |
| Average Intel Core i9-12900HK (5.33 - 21.6, n=14) | |
| Razer Blade 17 (i7-12800H, RTX 3070 Ti) | |
| Gigabyte A7 X1 | |
| Razer Blade Pro 17 2021 (QHD Touch) | |
| Lenovo Legion Y740-17IRHg-81UJ001VGE | |
| LibreOffice / 20 Documents To PDF | |
| Gigabyte A7 X1 | |
| AMD Radeon RX 6800 XT | |
| Razer Blade 14 Ryzen 9 6900HX | |
| Average Intel Core i9-12900HK (34.8 - 89.1, n=14) | |
| Alienware x17 RTX 3080 P48E | |
| Razer Blade Pro 17 2021 (QHD Touch) | |
| Razer Blade 17 (i7-12800H, RTX 3070 Ti) | |
| Alienware x17 R2 P48E | |
| Corsair One i300 | |
| R Benchmark 2.5 / Overall mean | |
| Lenovo Legion Y740-17IRHg-81UJ001VGE | |
| Razer Blade Pro 17 2021 (QHD Touch) | |
| Alienware x17 RTX 3080 P48E | |
| Average Intel Core i9-12900HK (0.4155 - 0.994, n=14) | |
| Gigabyte A7 X1 | |
| Razer Blade 14 Ryzen 9 6900HX | |
| AMD Radeon RX 6800 XT | |
| Razer Blade 17 (i7-12800H, RTX 3070 Ti) | |
| Alienware x17 R2 P48E | |
| Corsair One i300 | |
* ... smaller is better
AIDA64: FP32 Ray-Trace | FPU Julia | CPU SHA3 | CPU Queen | FPU SinJulia | FPU Mandel | CPU AES | CPU ZLib | FP64 Ray-Trace | CPU PhotoWorxx
| Performance rating | |
| Razer Blade 14 Ryzen 9 6900HX | |
| Gigabyte A7 X1 | |
| Alienware x17 R2 P48E | |
| MSI Stealth GS77 12UHS-083US | |
| Average Intel Core i9-12900HK | |
| AIDA64 / FP32 Ray-Trace | |
| Razer Blade 14 Ryzen 9 6900HX | |
| Gigabyte A7 X1 | |
| Alienware x17 R2 P48E | |
| Average Intel Core i9-12900HK (2677 - 13948, n=15) | |
| MSI Stealth GS77 12UHS-083US | |
| AIDA64 / FPU Julia | |
| Razer Blade 14 Ryzen 9 6900HX | |
| Gigabyte A7 X1 | |
| Average Intel Core i9-12900HK (12762 - 70764, n=15) | |
| Alienware x17 R2 P48E | |
| MSI Stealth GS77 12UHS-083US | |
| AIDA64 / CPU SHA3 | |
| Alienware x17 R2 P48E | |
| Razer Blade 14 Ryzen 9 6900HX | |
| Gigabyte A7 X1 | |
| MSI Stealth GS77 12UHS-083US | |
| Average Intel Core i9-12900HK (841 - 3504, n=15) | |
| AIDA64 / CPU Queen | |
| Alienware x17 R2 P48E | |
| Razer Blade 14 Ryzen 9 6900HX | |
| Gigabyte A7 X1 | |
| MSI Stealth GS77 12UHS-083US | |
| Average Intel Core i9-12900HK (60202 - 107161, n=15) | |
| AIDA64 / FPU SinJulia | |
| Razer Blade 14 Ryzen 9 6900HX | |
| Gigabyte A7 X1 | |
| Alienware x17 R2 P48E | |
| MSI Stealth GS77 12UHS-083US | |
| Average Intel Core i9-12900HK (3225 - 10402, n=15) | |
| AIDA64 / FPU Mandel | |
| Razer Blade 14 Ryzen 9 6900HX | |
| Gigabyte A7 X1 | |
| Alienware x17 R2 P48E | |
| Average Intel Core i9-12900HK (7417 - 34233, n=15) | |
| MSI Stealth GS77 12UHS-083US | |
| AIDA64 / CPU AES | |
| Razer Blade 14 Ryzen 9 6900HX | |
| Gigabyte A7 X1 | |
| Alienware x17 R2 P48E | |
| MSI Stealth GS77 12UHS-083US | |
| Average Intel Core i9-12900HK (32382 - 112498, n=15) | |
| AIDA64 / CPU ZLib | |
| Alienware x17 R2 P48E | |
| MSI Stealth GS77 12UHS-083US | |
| Average Intel Core i9-12900HK (314 - 1209, n=15) | |
| Razer Blade 14 Ryzen 9 6900HX | |
| Gigabyte A7 X1 | |
| AIDA64 / FP64 Ray-Trace | |
| Razer Blade 14 Ryzen 9 6900HX | |
| Gigabyte A7 X1 | |
| Alienware x17 R2 P48E | |
| Average Intel Core i9-12900HK (1501 - 7616, n=15) | |
| MSI Stealth GS77 12UHS-083US | |
| AIDA64 / CPU PhotoWorxx | |
| MSI Stealth GS77 12UHS-083US | |
| Average Intel Core i9-12900HK (24446 - 42462, n=15) | |
| Alienware x17 R2 P48E | |
| Razer Blade 14 Ryzen 9 6900HX | |
| Gigabyte A7 X1 | |
System Performance
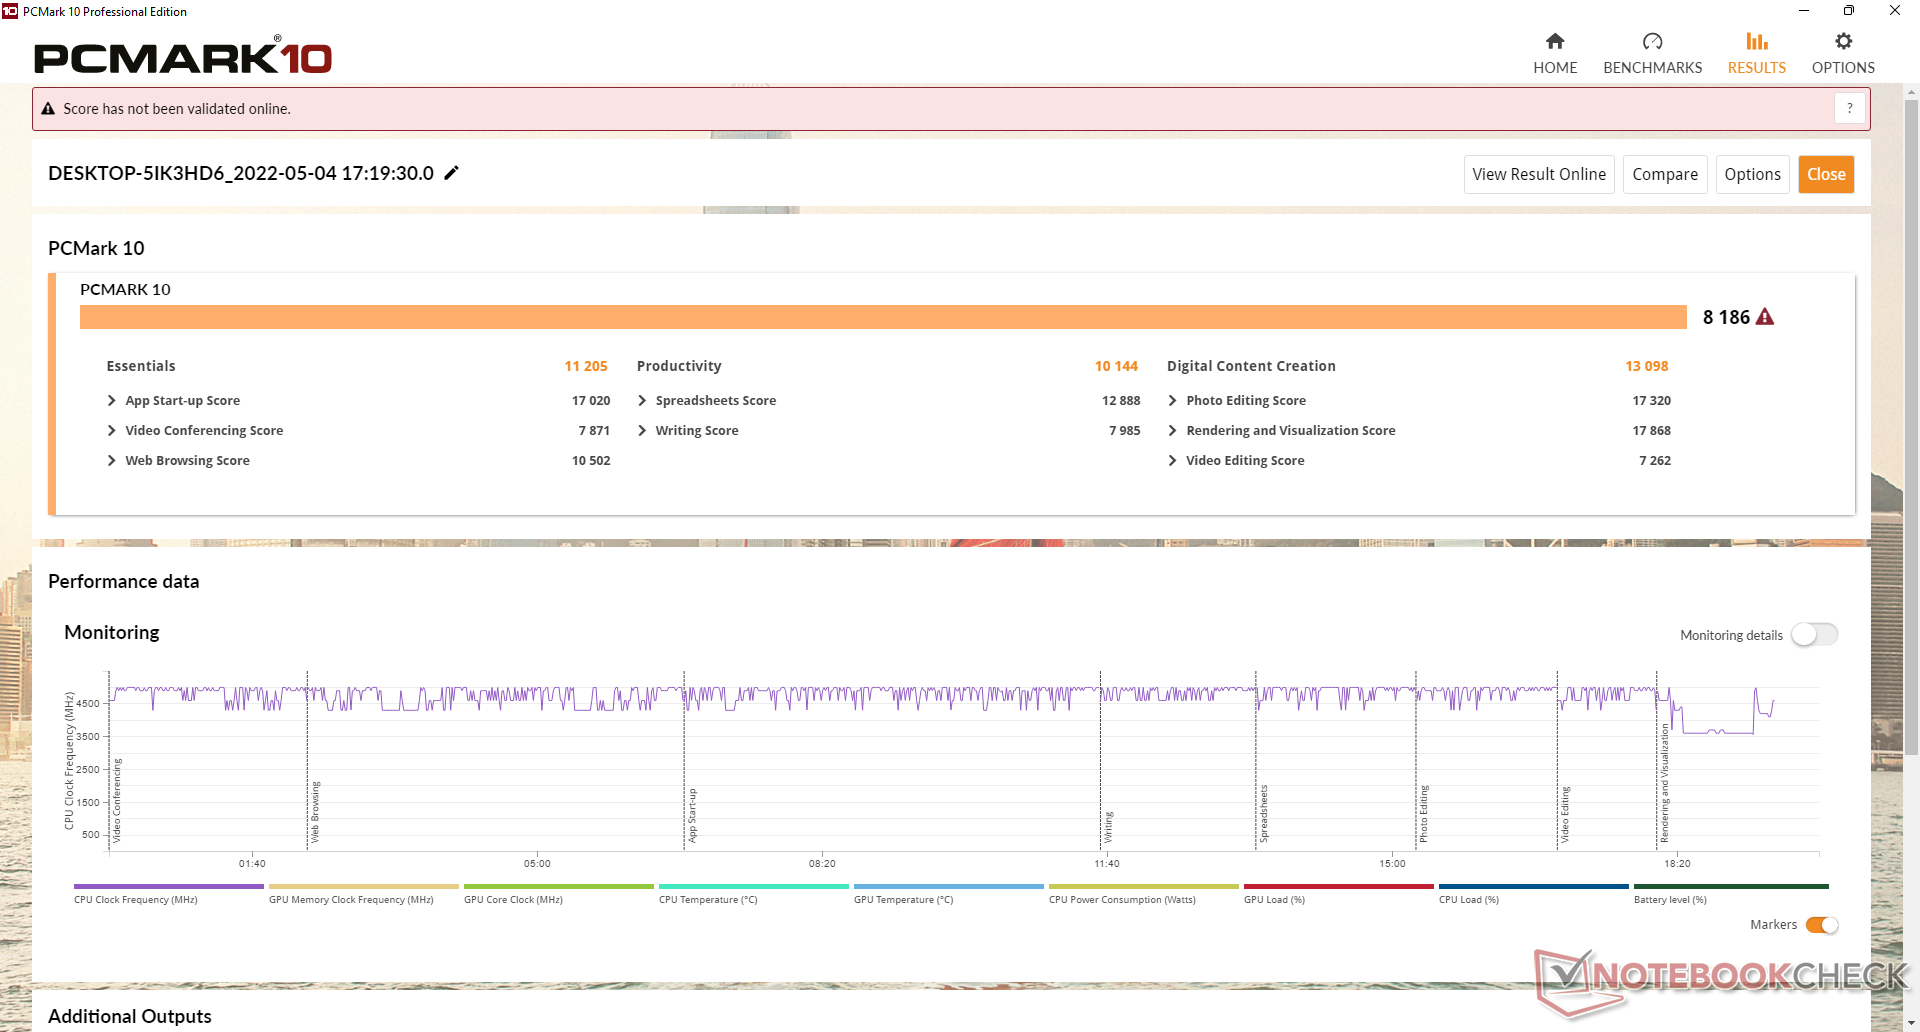
PCMark results are consistently higher than what we recorded on last year's x17 R1 by relatively slight margins.
It's worth noting that the laptop consumes a lot of power even when on standby or sleep mode. We're able to record a consumption of almost 12 W when in sleep mode compared to <2 W on most other laptops. Furthermore, the fans in our test unit would sometimes be active even when in sleep mode and the unit would at times have trouble waking up properly as well.
CrossMark: Overall | Productivity | Creativity | Responsiveness
| PCMark 10 / Score | |
| Alienware x17 R2 P48E | |
| Average Intel Core i9-12900HK, NVIDIA GeForce RTX 3080 Ti Laptop GPU (7149 - 8186, n=5) | |
| Alienware x17 RTX 3080 P48E | |
| MSI Stealth GS77 12UHS-083US | |
| MSI GT76 Titan DT 10SGS | |
| Asus ROG Zephyrus S17 GX703HSD | |
| Gigabyte A7 X1 | |
| PCMark 10 / Essentials | |
| Alienware x17 R2 P48E | |
| Average Intel Core i9-12900HK, NVIDIA GeForce RTX 3080 Ti Laptop GPU (9870 - 11205, n=5) | |
| Asus ROG Zephyrus S17 GX703HSD | |
| MSI GT76 Titan DT 10SGS | |
| MSI Stealth GS77 12UHS-083US | |
| Alienware x17 RTX 3080 P48E | |
| Gigabyte A7 X1 | |
| PCMark 10 / Productivity | |
| Alienware x17 R2 P48E | |
| Average Intel Core i9-12900HK, NVIDIA GeForce RTX 3080 Ti Laptop GPU (9173 - 10422, n=5) | |
| Alienware x17 RTX 3080 P48E | |
| MSI Stealth GS77 12UHS-083US | |
| Gigabyte A7 X1 | |
| Asus ROG Zephyrus S17 GX703HSD | |
| MSI GT76 Titan DT 10SGS | |
| PCMark 10 / Digital Content Creation | |
| Alienware x17 R2 P48E | |
| Average Intel Core i9-12900HK, NVIDIA GeForce RTX 3080 Ti Laptop GPU (10951 - 13098, n=5) | |
| MSI GT76 Titan DT 10SGS | |
| Alienware x17 RTX 3080 P48E | |
| MSI Stealth GS77 12UHS-083US | |
| Asus ROG Zephyrus S17 GX703HSD | |
| Gigabyte A7 X1 | |
| CrossMark / Overall | |
| Alienware x17 R2 P48E | |
| Average Intel Core i9-12900HK, NVIDIA GeForce RTX 3080 Ti Laptop GPU (970 - 2138, n=5) | |
| CrossMark / Productivity | |
| Alienware x17 R2 P48E | |
| Average Intel Core i9-12900HK, NVIDIA GeForce RTX 3080 Ti Laptop GPU (921 - 2038, n=5) | |
| CrossMark / Creativity | |
| Alienware x17 R2 P48E | |
| Average Intel Core i9-12900HK, NVIDIA GeForce RTX 3080 Ti Laptop GPU (1007 - 2210, n=5) | |
| CrossMark / Responsiveness | |
| Average Intel Core i9-12900HK, NVIDIA GeForce RTX 3080 Ti Laptop GPU (1012 - 2234, n=5) | |
| Alienware x17 R2 P48E | |
| PCMark 10 Score | 8186 points | |
Help | ||
| AIDA64 / Memory Copy | |
| MSI Stealth GS77 12UHS-083US | |
| Average Intel Core i9-12900HK (42967 - 62959, n=15) | |
| Alienware x17 R2 P48E | |
| Gigabyte A7 X1 | |
| AIDA64 / Memory Read | |
| MSI Stealth GS77 12UHS-083US | |
| Average Intel Core i9-12900HK (44419 - 66989, n=15) | |
| Alienware x17 R2 P48E | |
| Gigabyte A7 X1 | |
| AIDA64 / Memory Write | |
| MSI Stealth GS77 12UHS-083US | |
| Average Intel Core i9-12900HK (42144 - 65268, n=15) | |
| Alienware x17 R2 P48E | |
| Gigabyte A7 X1 | |
| AIDA64 / Memory Latency | |
| Alienware x17 R2 P48E | |
| MSI Stealth GS77 12UHS-083US | |
| Gigabyte A7 X1 | |
| Average Intel Core i9-12900HK (79.9 - 109, n=15) | |
| Asus ROG Zephyrus S17 GX703HSD | |
| Alienware x17 RTX 3080 P48E | |
* ... smaller is better
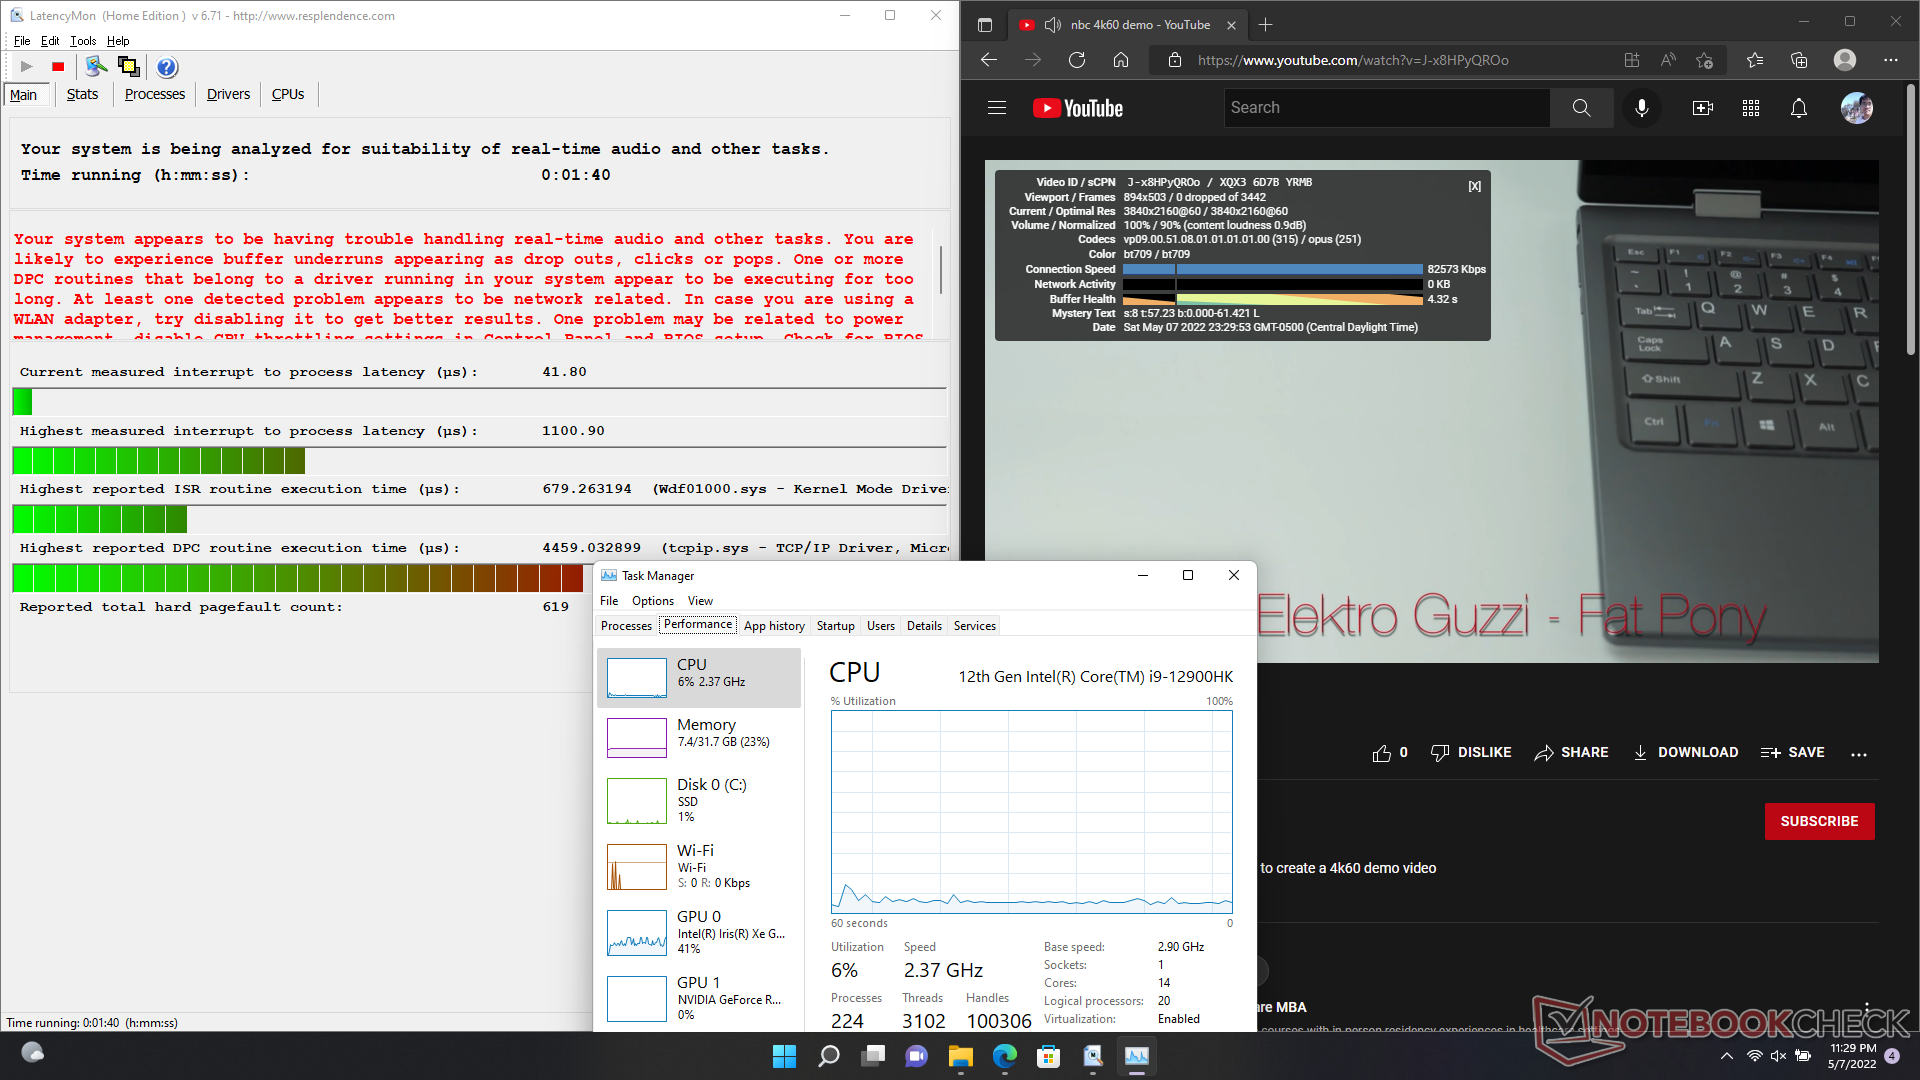
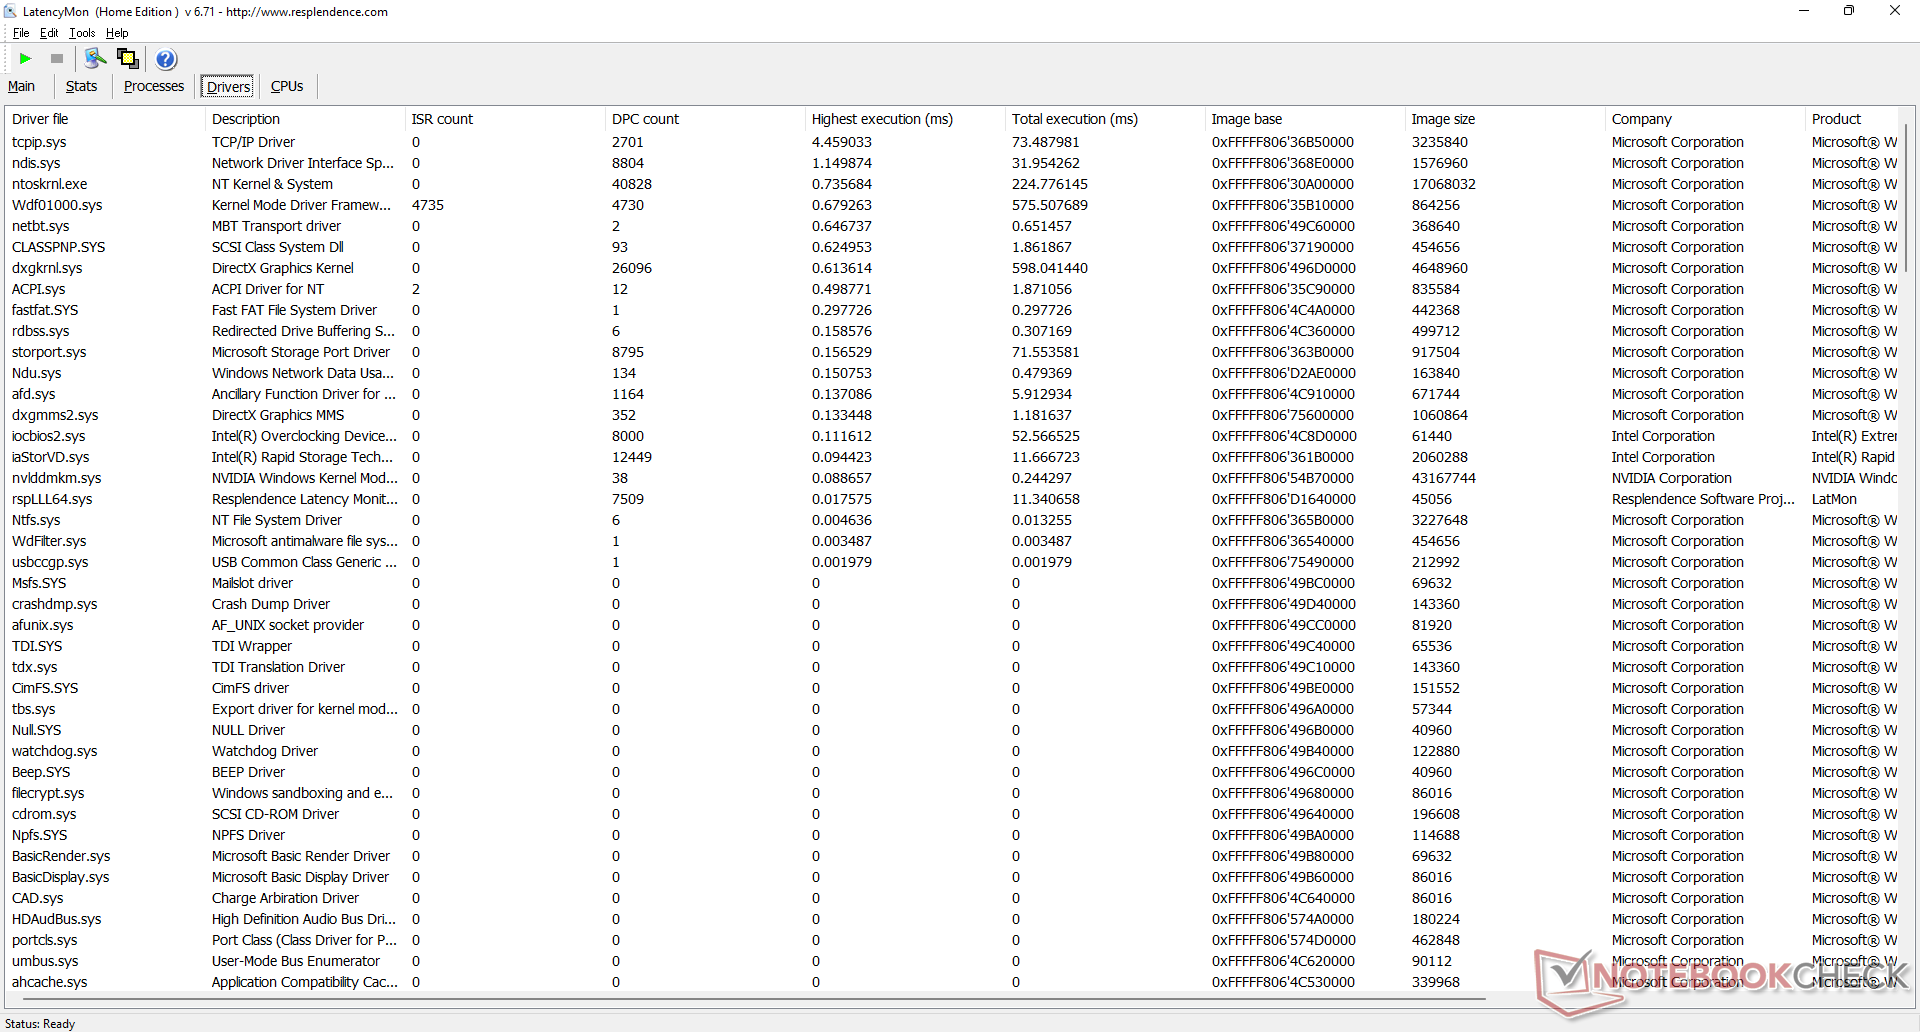
DPC Latency
LatencyMon reveals DPC issues when opening multiple browser tabs of homepage. 4K video playback at 60 FPS is otherwise smooth and without any dropped frames.
| DPC Latencies / LatencyMon - interrupt to process latency (max), Web, Youtube, Prime95 | |
| MSI GT76 Titan DT 10SGS | |
| Alienware x17 RTX 3080 P48E | |
| MSI Stealth GS77 12UHS-083US | |
| Asus ROG Zephyrus S17 GX703HSD | |
| Alienware x17 R2 P48E | |
| Gigabyte A7 X1 | |
* ... smaller is better
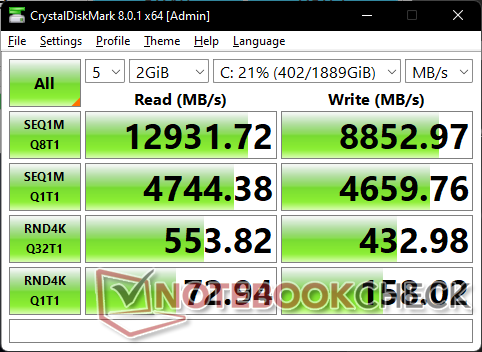
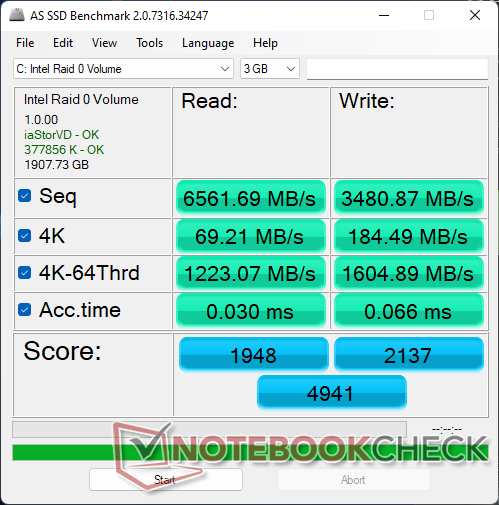
Storage Devices

* ... smaller is better
Disk Throttling: DiskSpd Read Loop, Queue Depth 8
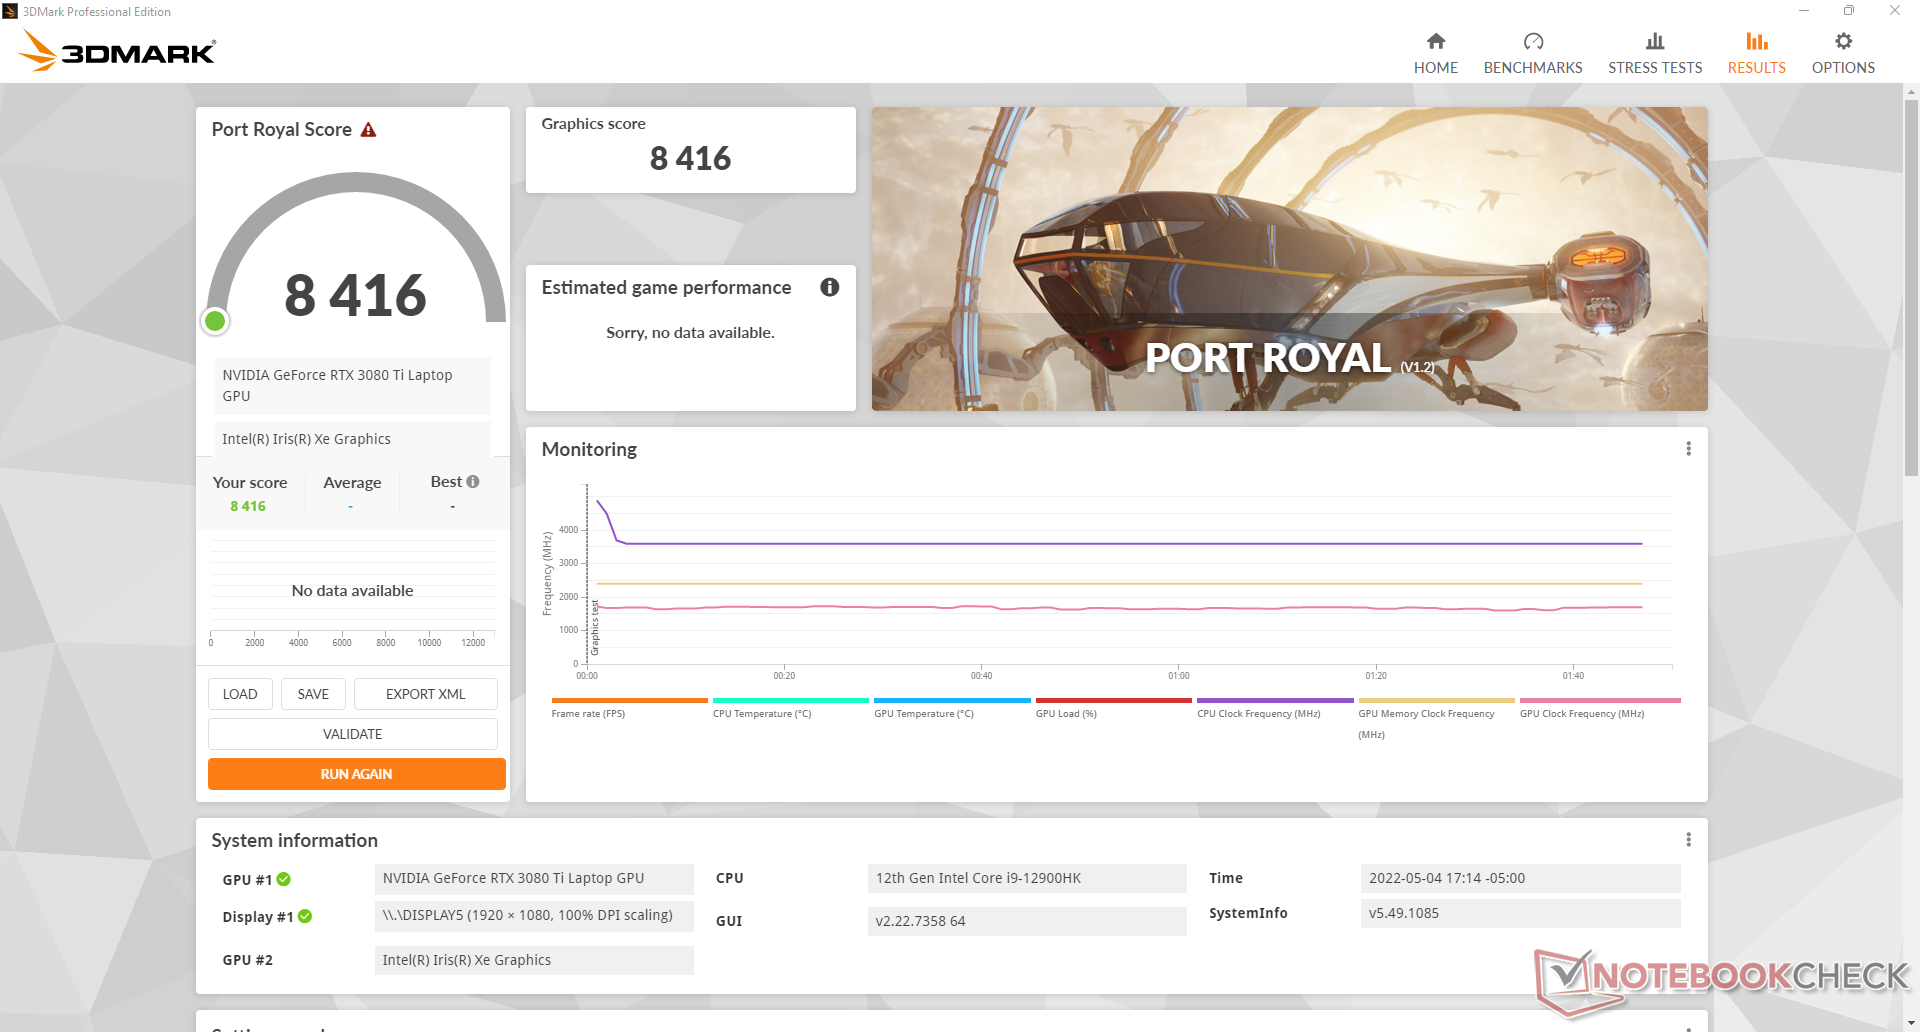
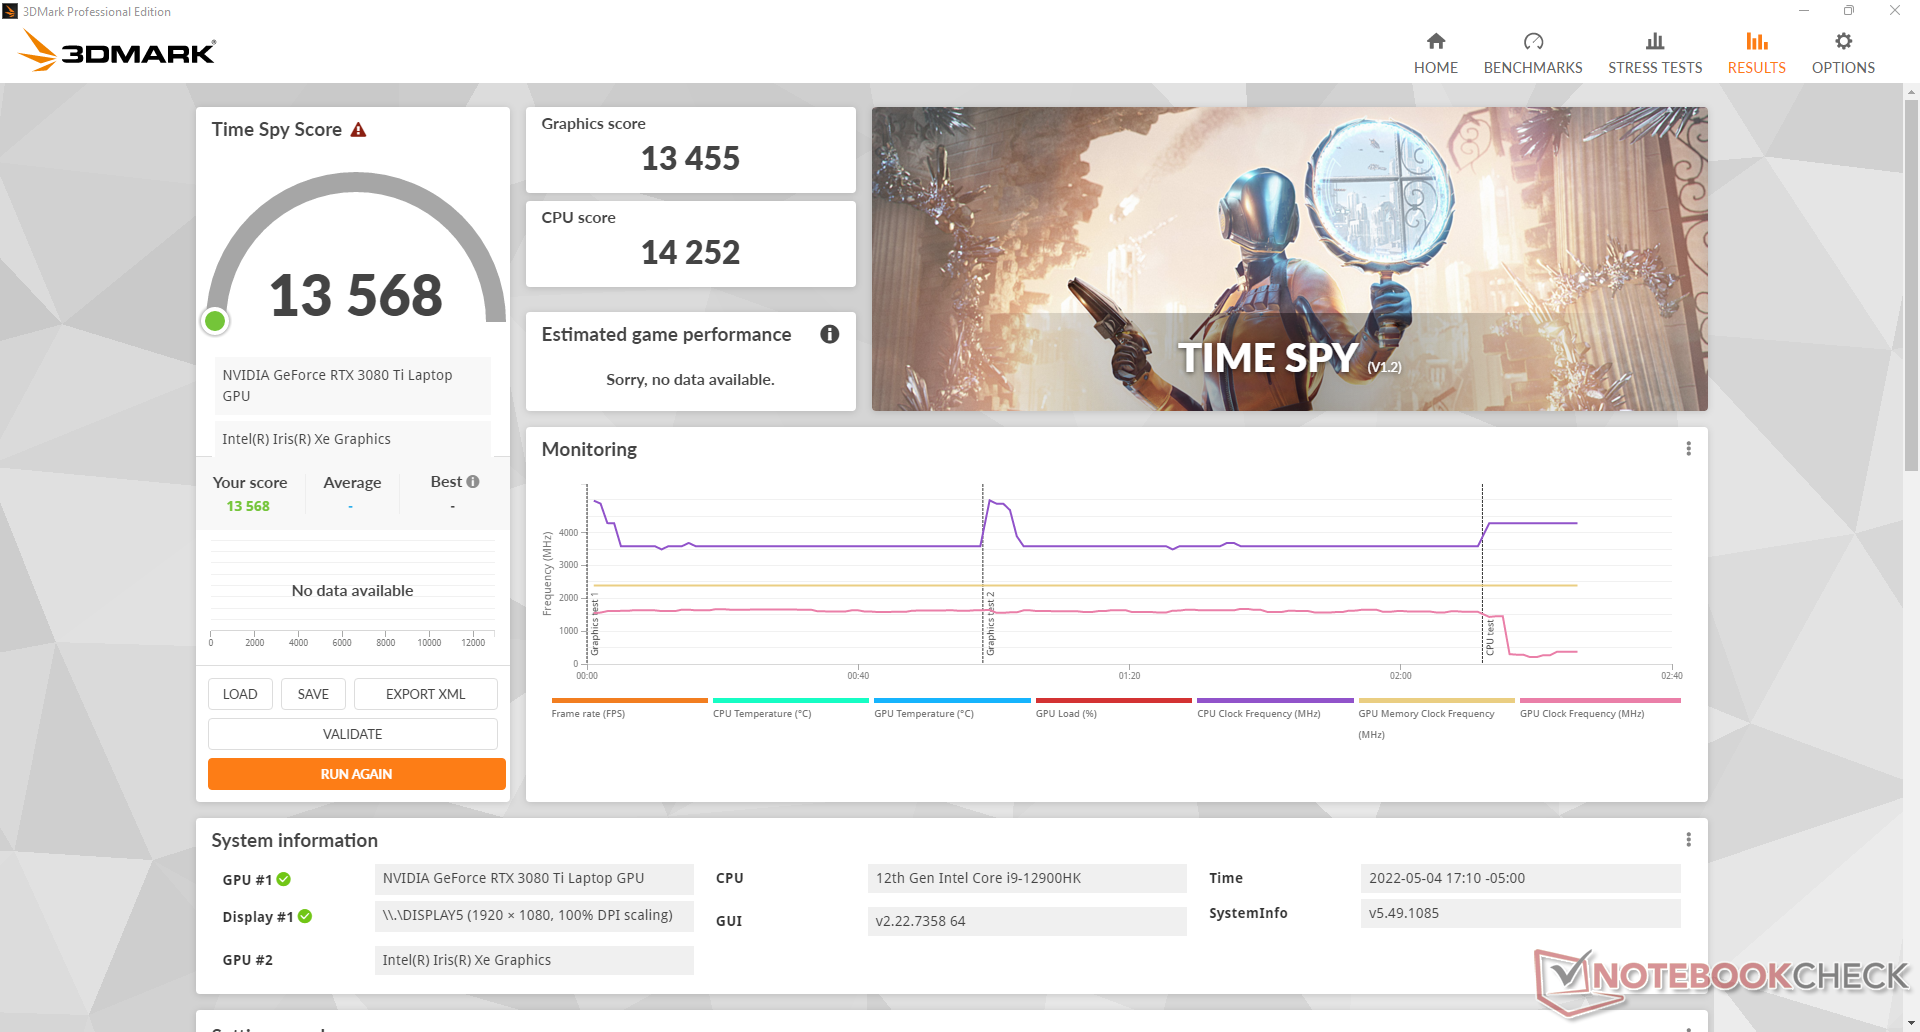
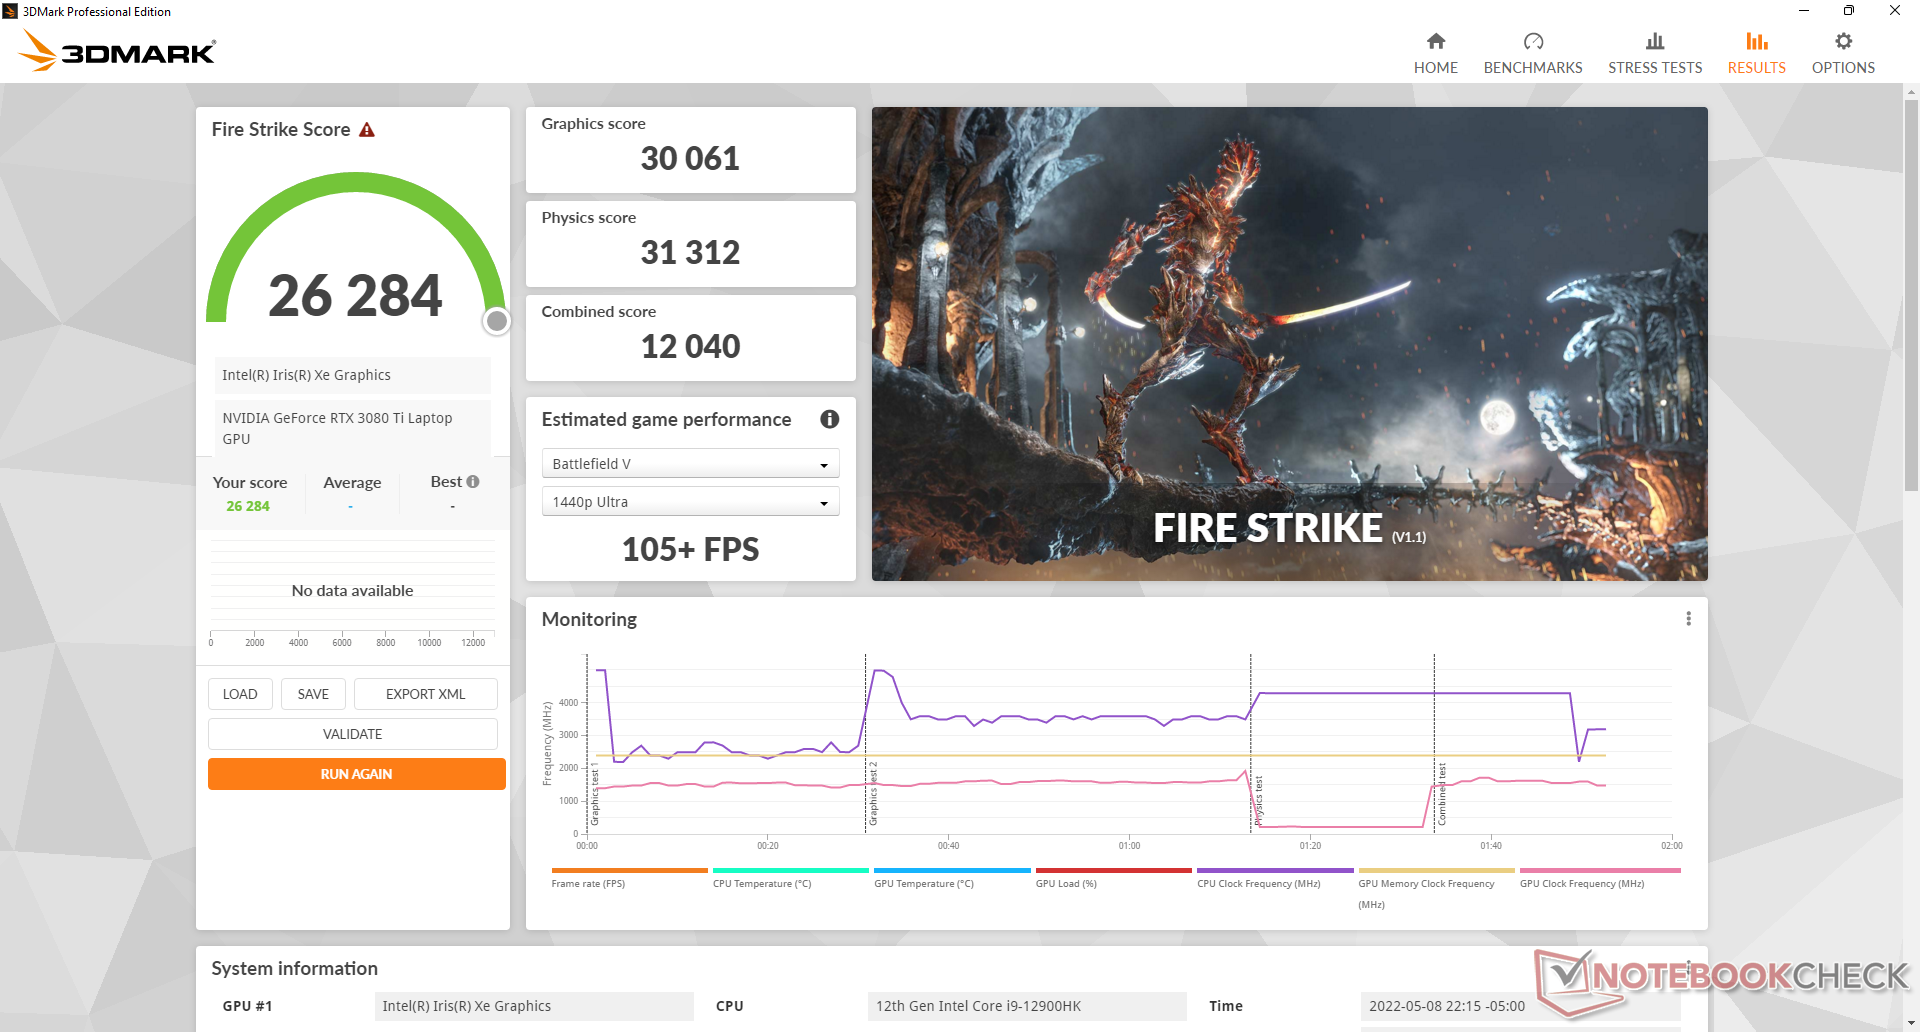
GPU Performance
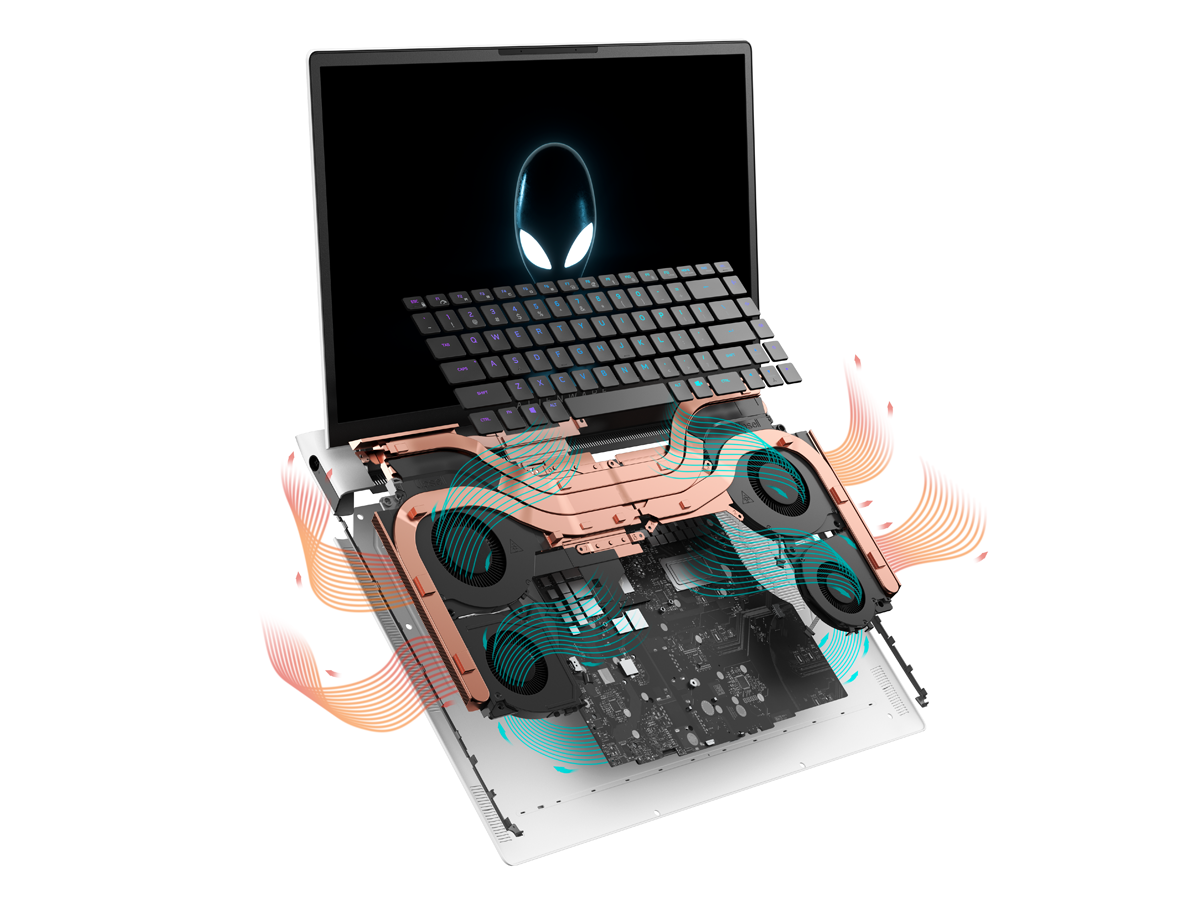
With its very high TGP target of 175 W, graphics performance is one of the fastest on any gaming laptop. The 2022 Razer Blade 15, for example, comes with the same GeForce RTX 3080 Ti GPU albeit at a lower 110 W TGP target for 25 to 30 percent slower performance. Similar deficits can be observed when comparing the GPU in the Alienware to the same GPU in the MSI GS77 as well. When combined with the faster-than-average CPU, users can expect frame rates to be slightly higher than most other gaming laptops equipped with GeForce RTX 3080 graphics.
The mobile RTX 3080 Ti in our Alienware x17 R2 is most similar to the desktop GeForce RTX 3070. A desktop RTX 3080 Ti can still offer almost 50 percent faster performance than our Alienware mobile version.
Keep in mind that graphics performance is slower if running on Balanced mode instead of maximum fan mode. Fire Strike Graphics score would be about 8 to 9 percent lower when on the Balanced power profile.
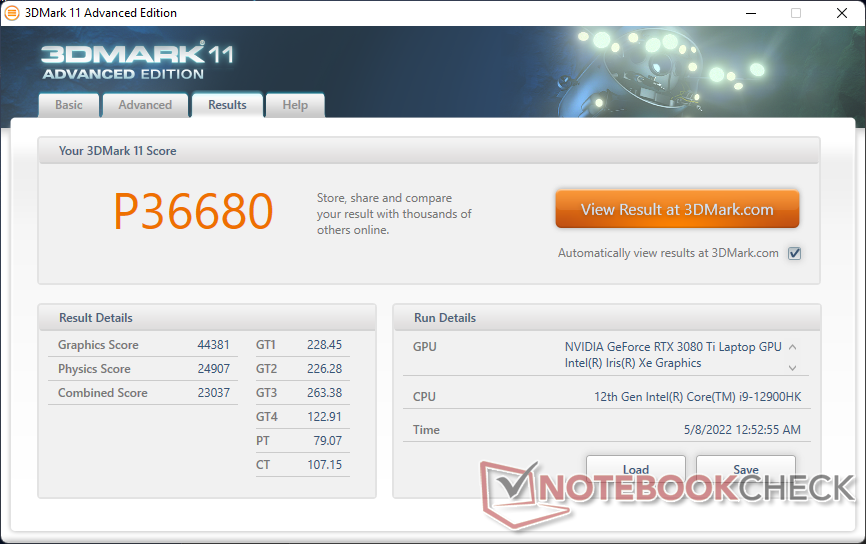
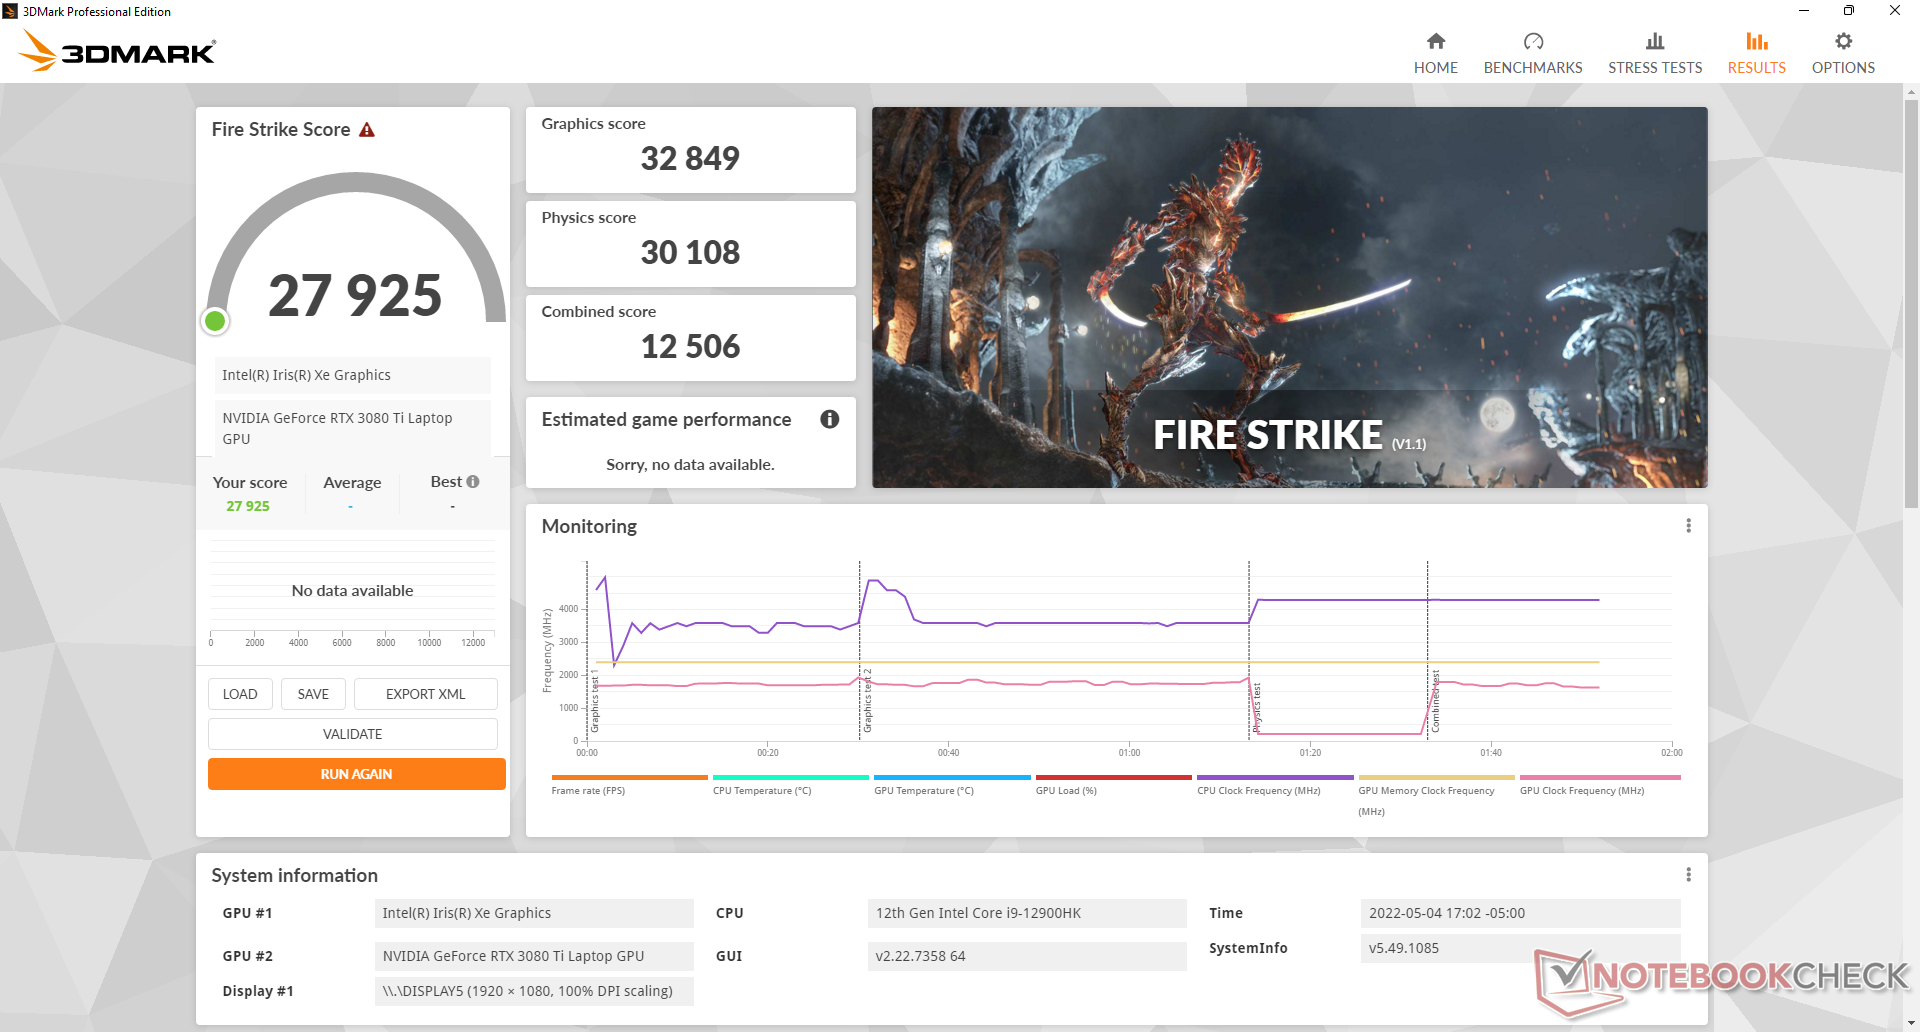
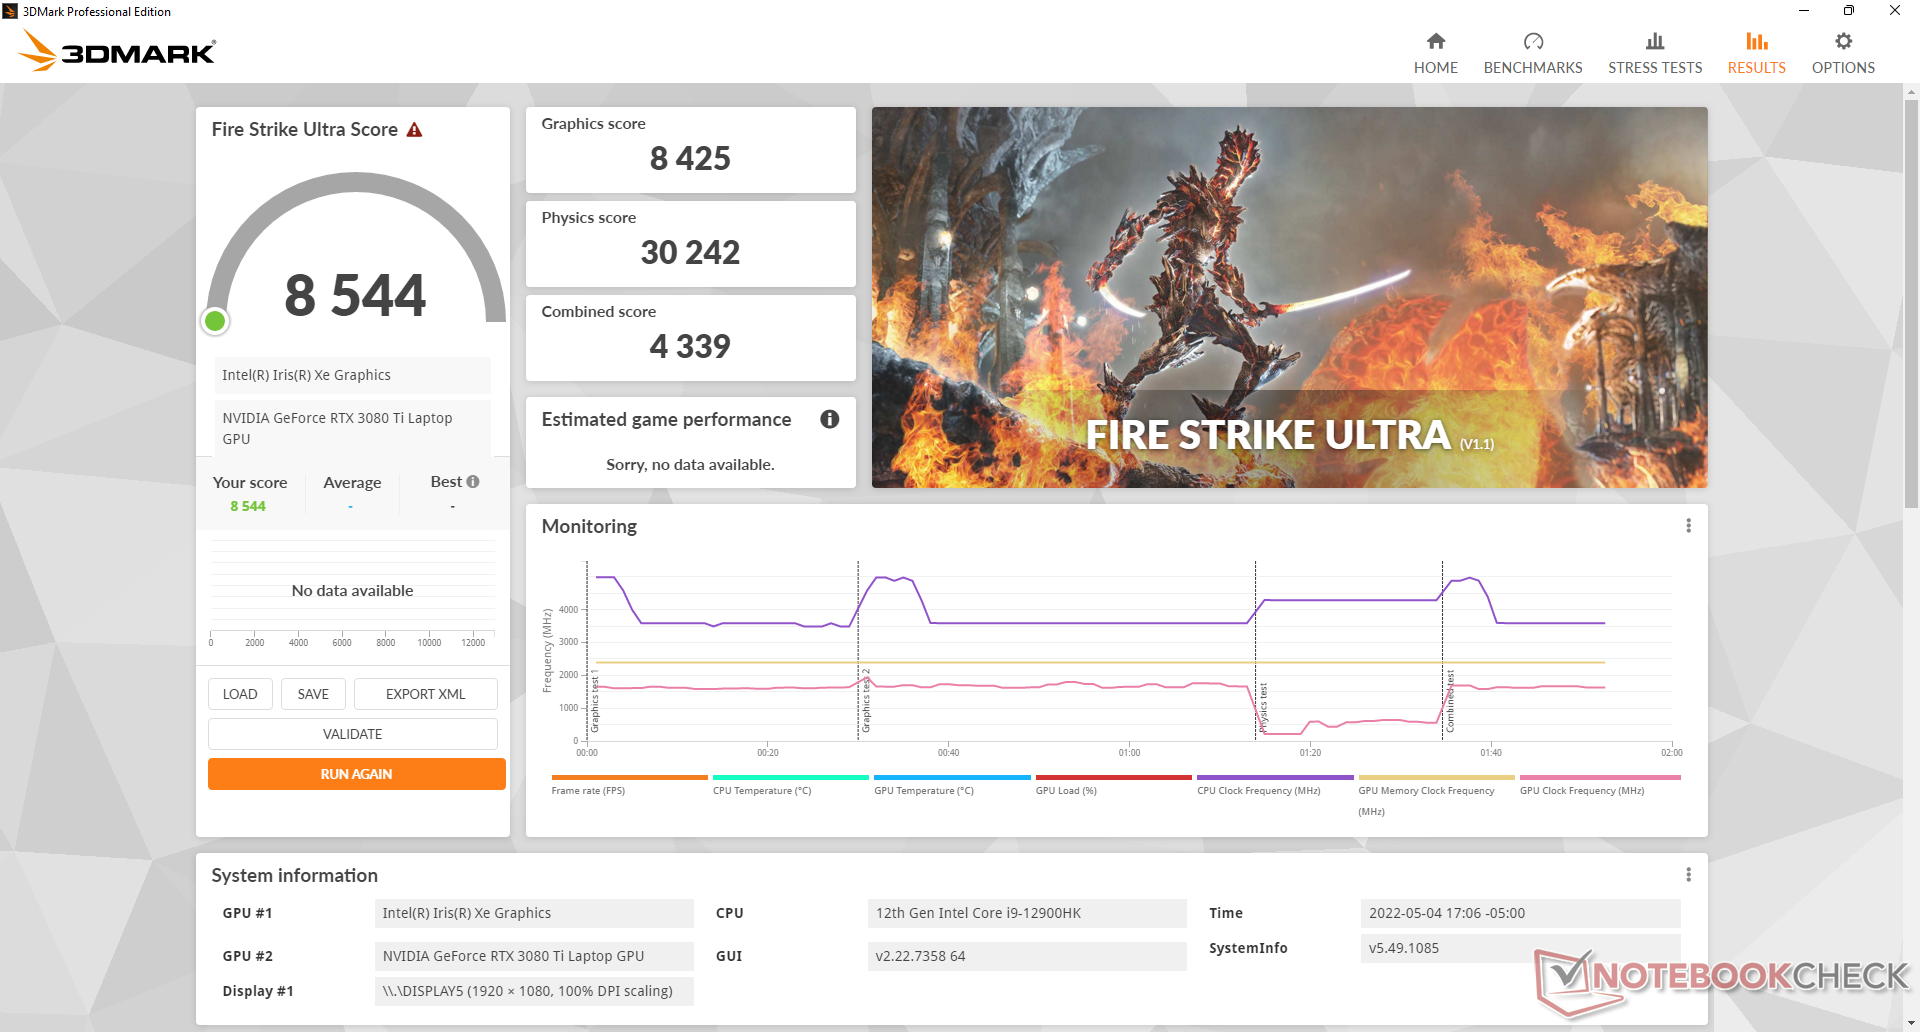
| 3DMark 11 Performance | 36680 points | |
| 3DMark Cloud Gate Standard Score | 63911 points | |
| 3DMark Fire Strike Score | 27925 points | |
| 3DMark Time Spy Score | 13568 points | |
Help | ||
Witcher 3 FPS Chart
| low | med. | high | ultra | |
|---|---|---|---|---|
| GTA V (2015) | 187 | 185.1 | 180.8 | 126.3 |
| The Witcher 3 (2015) | 500.9 | 388.5 | 267.7 | 128 |
| Dota 2 Reborn (2015) | 186.1 | 172.3 | 166.6 | 158.9 |
| Final Fantasy XV Benchmark (2018) | 215 | 167.8 | 127.8 | |
| X-Plane 11.11 (2018) | 161 | 143.9 | 112.9 | |
| Strange Brigade (2018) | 474 | 300 | 243 | 213 |
| Cyberpunk 2077 1.6 (2022) | 167.7 | 142 | 116.2 | 115.7 |
Emissions
System Noise
Fan noise is dependent on the Alienware Command Center settings. The fans on the Alienware tend to pulse frequently when on Balanced mode or higher and so Quiet mode is recommended when browsing, emailing, or streaming. Our unit would seldom go over 32 dB(A) when running such undemanding loads to be noticeable but not bothersome.
When gaming on Balanced mode, fan noise would stabilize at around 43.3 dB(A) versus 52.5 dB(A) if on maximum fan mode. Users may want to game on Balanced mode for the significantly quieter fan noise despite the aforementioned deficit in performance that entails.
Noise level
| Idle |
| 23.1 / 23.1 / 23.1 dB(A) |
| Load |
| 31.9 / 52.5 dB(A) |
 | ||
30 dB silent 40 dB(A) audible 50 dB(A) loud |
||
min: | ||
| Alienware x17 R2 P48E GeForce RTX 3080 Ti Laptop GPU, i9-12900HK, 2x Samsung PM9A1 1TB (RAID 0) | Alienware x17 RTX 3080 P48E GeForce RTX 3080 Laptop GPU, i7-11800H, 2x WDC PC SN730 SDBPNTY-1T00 (RAID 0) | Asus ROG Zephyrus S17 GX703HSD GeForce RTX 3080 Laptop GPU, i9-11900H, Samsung PM9A1 MZVL22T0HBLB | MSI Stealth GS77 12UHS-083US GeForce RTX 3080 Ti Laptop GPU, i7-12700H, Micron 3400 1TB MTFDKBA1T0TFH | MSI GT76 Titan DT 10SGS GeForce RTX 2080 Super Mobile, i9-10900K, 2x WDC PC SN730 SDBPNTY-1T00 (RAID 0) | Gigabyte A7 X1 GeForce RTX 3070 Laptop GPU, R9 5900HX, ESR512GTLCG-EAC-4 | |
|---|---|---|---|---|---|---|
| Noise | -7% | -2% | -8% | -18% | -28% | |
| off / environment * (dB) | 22.7 | 24.9 -10% | 23 -1% | 24.5 -8% | 26.4 -16% | 24 -6% |
| Idle Minimum * (dB) | 23.1 | 24.9 -8% | 23 -0% | 24.5 -6% | 27.5 -19% | 25 -8% |
| Idle Average * (dB) | 23.1 | 24.9 -8% | 23 -0% | 24.5 -6% | 27.5 -19% | 29 -26% |
| Idle Maximum * (dB) | 23.1 | 29.6 -28% | 23 -0% | 30.8 -33% | 29.8 -29% | 35 -52% |
| Load Average * (dB) | 31.9 | 31.1 3% | 41 -29% | 34.6 -8% | 30.9 3% | 58 -82% |
| Witcher 3 ultra * (dB) | 52.5 | 49.7 5% | 45 14% | 46.2 12% | 60.7 -16% | 57 -9% |
| Load Maximum * (dB) | 52.5 | 54.8 -4% | 52 1% | 56.8 -8% | 66.6 -27% | 59 -12% |
* ... smaller is better
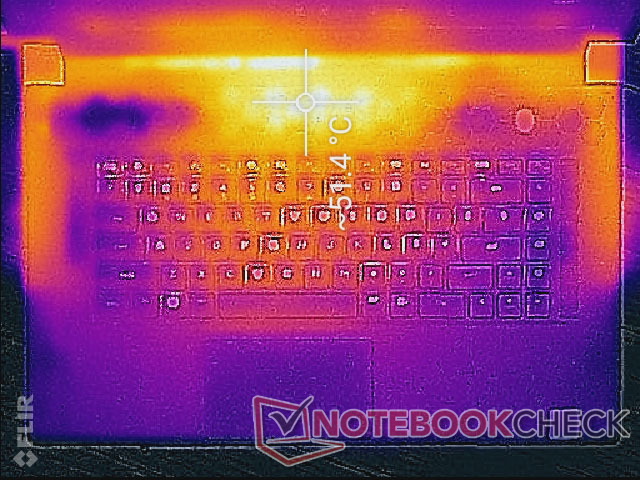
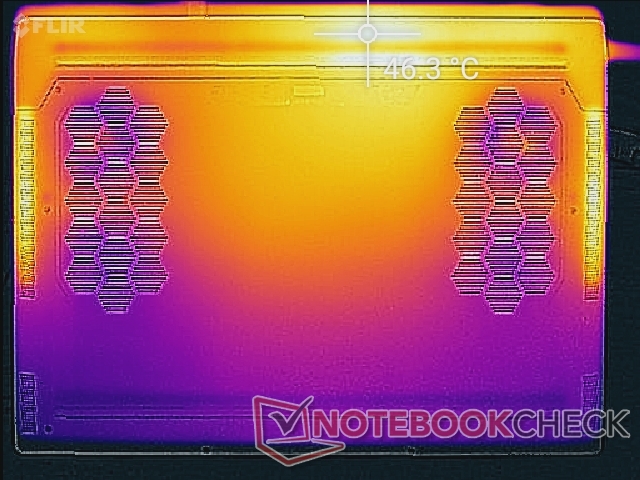
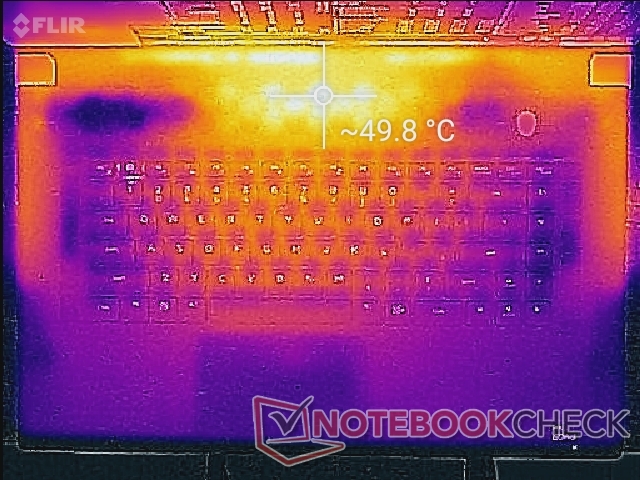
Temperature
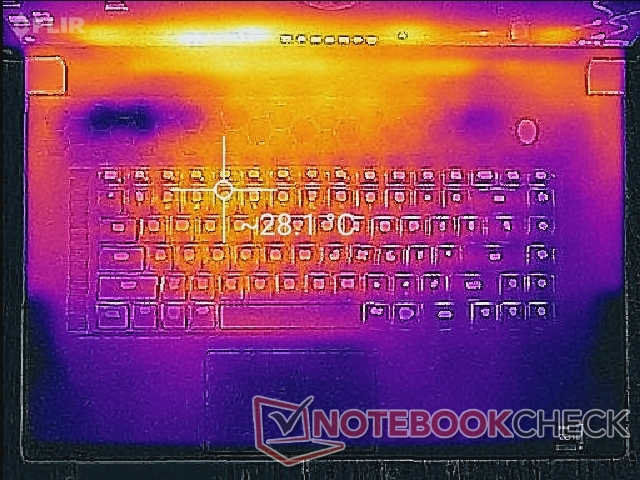
Surface temperatures are generally cooler than we were expecting given the extreme performance levels Dell is targeting with such a thin design. Hot spots can reach over 45 C or 50 C when running high loads, but these areas are toward the rear of the chassis and away from the keyboard keys and palm rests. The system is warm but never uncomfortably so when gaming.
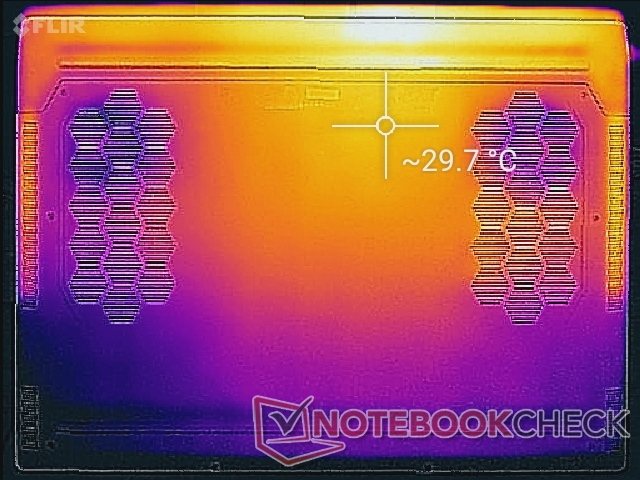
Keep in mind that there are lots of ventilation grilles on nearly all sides of the system. With CPU temperatures reaching as high as they do when under load, it'll be important to not block any openings whenever possible.
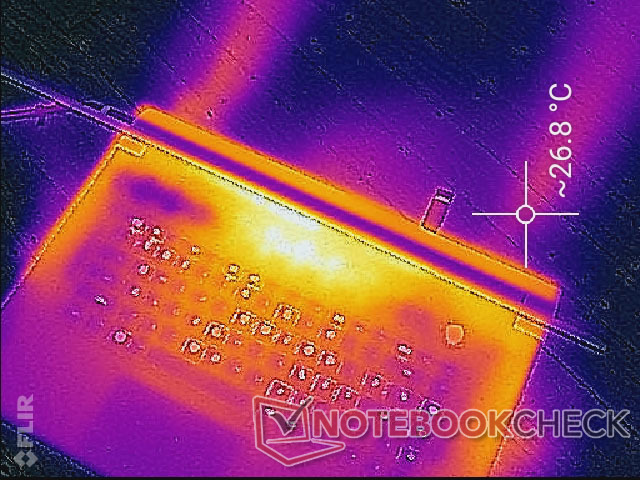
(-) The maximum temperature on the upper side is 49.6 °C / 121 F, compared to the average of 40.4 °C / 105 F, ranging from 21.2 to 68.8 °C for the class Gaming.
(±) The bottom heats up to a maximum of 42.4 °C / 108 F, compared to the average of 43.3 °C / 110 F
(+) In idle usage, the average temperature for the upper side is 26.1 °C / 79 F, compared to the device average of 33.9 °C / 93 F.
(±) Playing The Witcher 3, the average temperature for the upper side is 34.7 °C / 94 F, compared to the device average of 33.9 °C / 93 F.
(+) The palmrests and touchpad are cooler than skin temperature with a maximum of 29.2 °C / 84.6 F and are therefore cool to the touch.
(±) The average temperature of the palmrest area of similar devices was 28.8 °C / 83.8 F (-0.4 °C / -0.8 F).

| Alienware x17 R2 P48E Intel Core i9-12900HK, NVIDIA GeForce RTX 3080 Ti Laptop GPU | Alienware x17 RTX 3080 P48E Intel Core i7-11800H, NVIDIA GeForce RTX 3080 Laptop GPU | Asus ROG Zephyrus S17 GX703HSD Intel Core i9-11900H, NVIDIA GeForce RTX 3080 Laptop GPU | MSI Stealth GS77 12UHS-083US Intel Core i7-12700H, NVIDIA GeForce RTX 3080 Ti Laptop GPU | MSI GT76 Titan DT 10SGS Intel Core i9-10900K, NVIDIA GeForce RTX 2080 Super Mobile | Gigabyte A7 X1 AMD Ryzen 9 5900HX, NVIDIA GeForce RTX 3070 Laptop GPU | |
|---|---|---|---|---|---|---|
| Heat | -14% | -18% | -16% | 7% | 2% | |
| Maximum Upper Side * (°C) | 49.6 | 58.4 -18% | 59 -19% | 50.6 -2% | 36.4 27% | 44 11% |
| Maximum Bottom * (°C) | 42.4 | 49 -16% | 53 -25% | 59.6 -41% | 43 -1% | 49 -16% |
| Idle Upper Side * (°C) | 29.2 | 33.6 -15% | 35 -20% | 30 -3% | 28 4% | 27 8% |
| Idle Bottom * (°C) | 32 | 34.6 -8% | 35 -9% | 37.4 -17% | 33.4 -4% | 30 6% |
* ... smaller is better
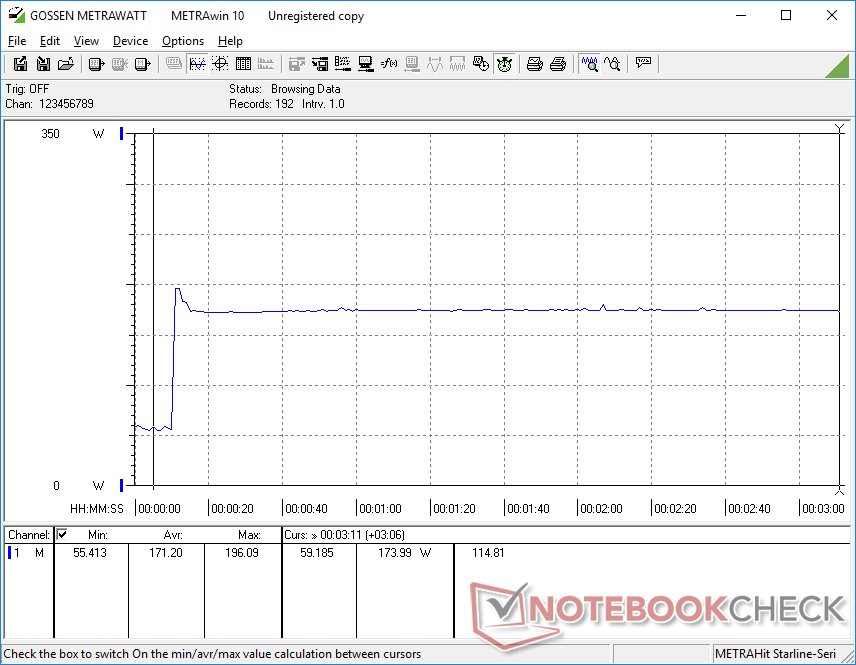
Stress Test
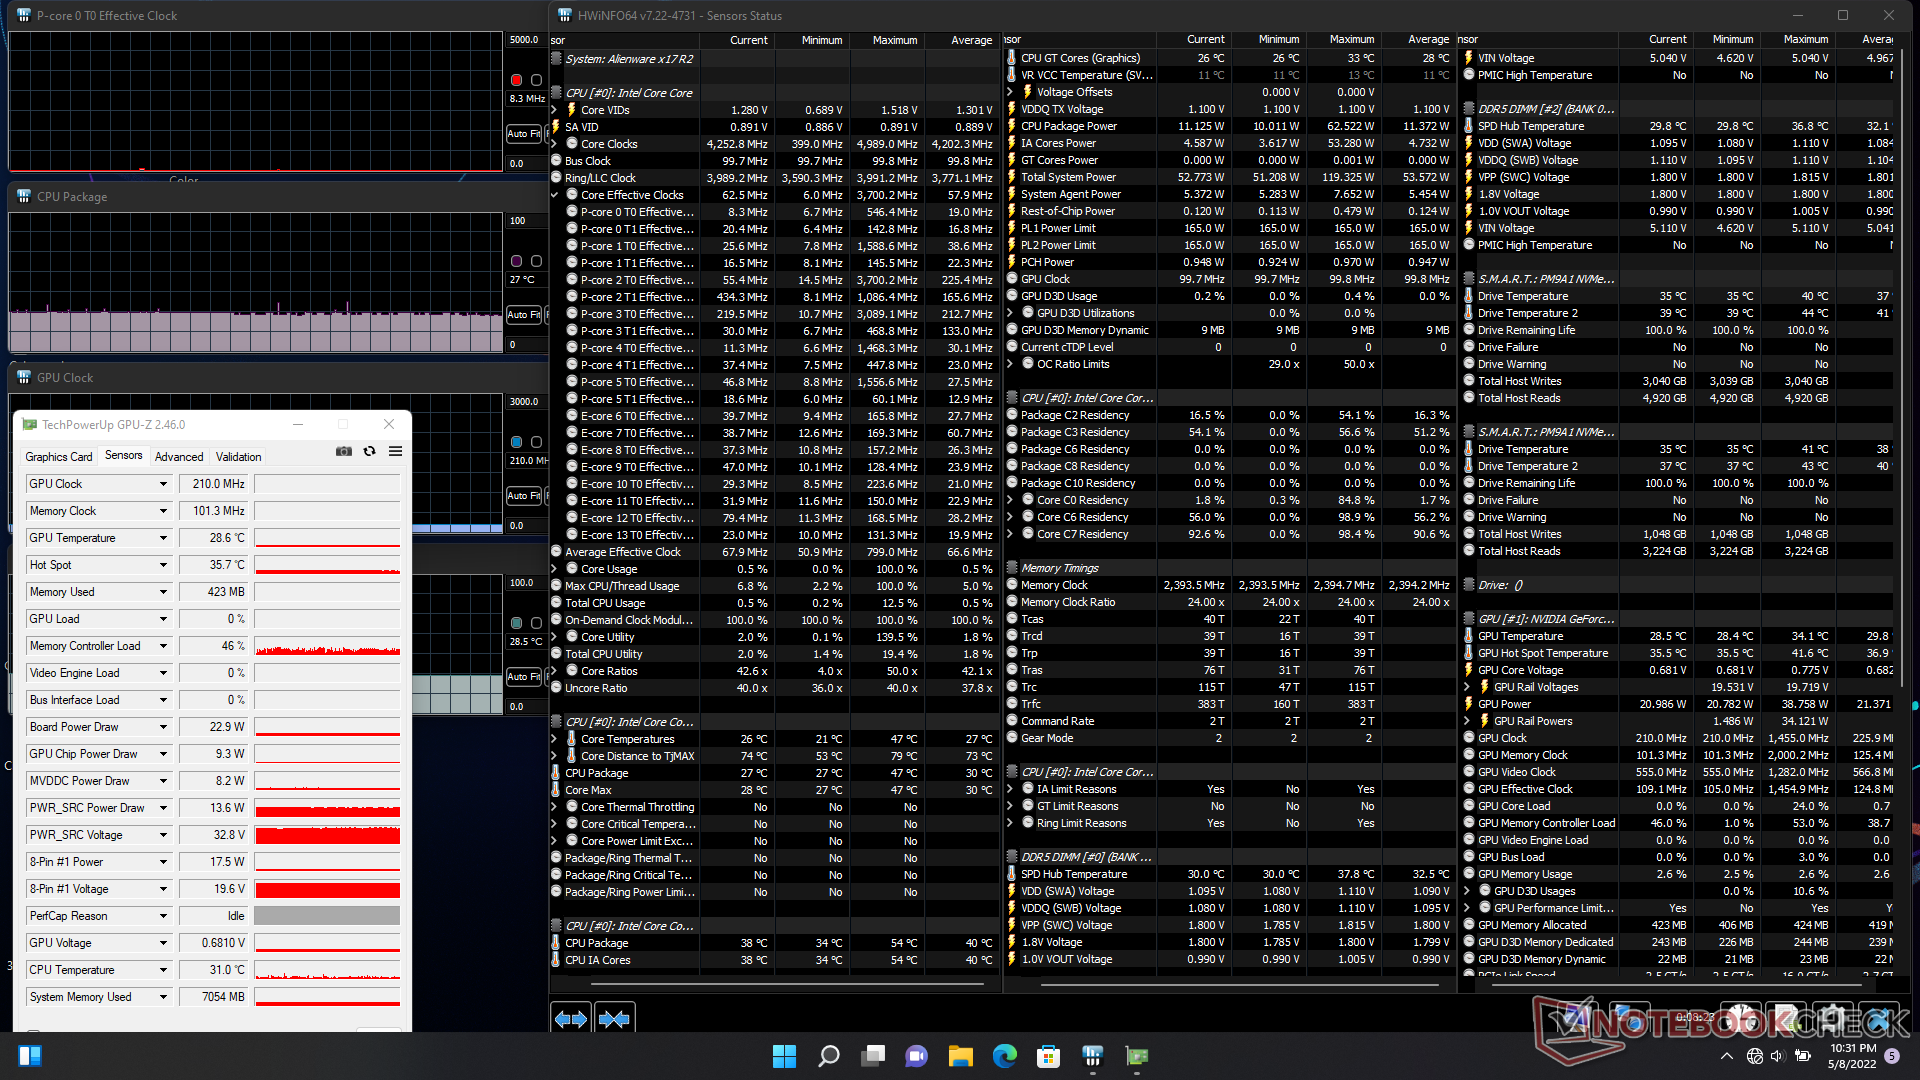
When running Prime95, CPU clock rates would boost to 4.3 GHz for just a couple of seconds before hitting a core temperature of 100 C. Clock rates would eventually stabilize at 3.6 GHz while maintaining a core temperature just below 100 C. Meanwhile, CPU package power draw would be as high as 165 W during the start of the test before stabilizing at 134 W due to thermal limitations. It's clear that the CPU is running as fast and as it can given the confines of the Alienware cooling solution. In comparison, the Core i7-12700H in the MSI GS77 would stabilize at a slower 2.7 to 3 GHz range when under similar conditions.
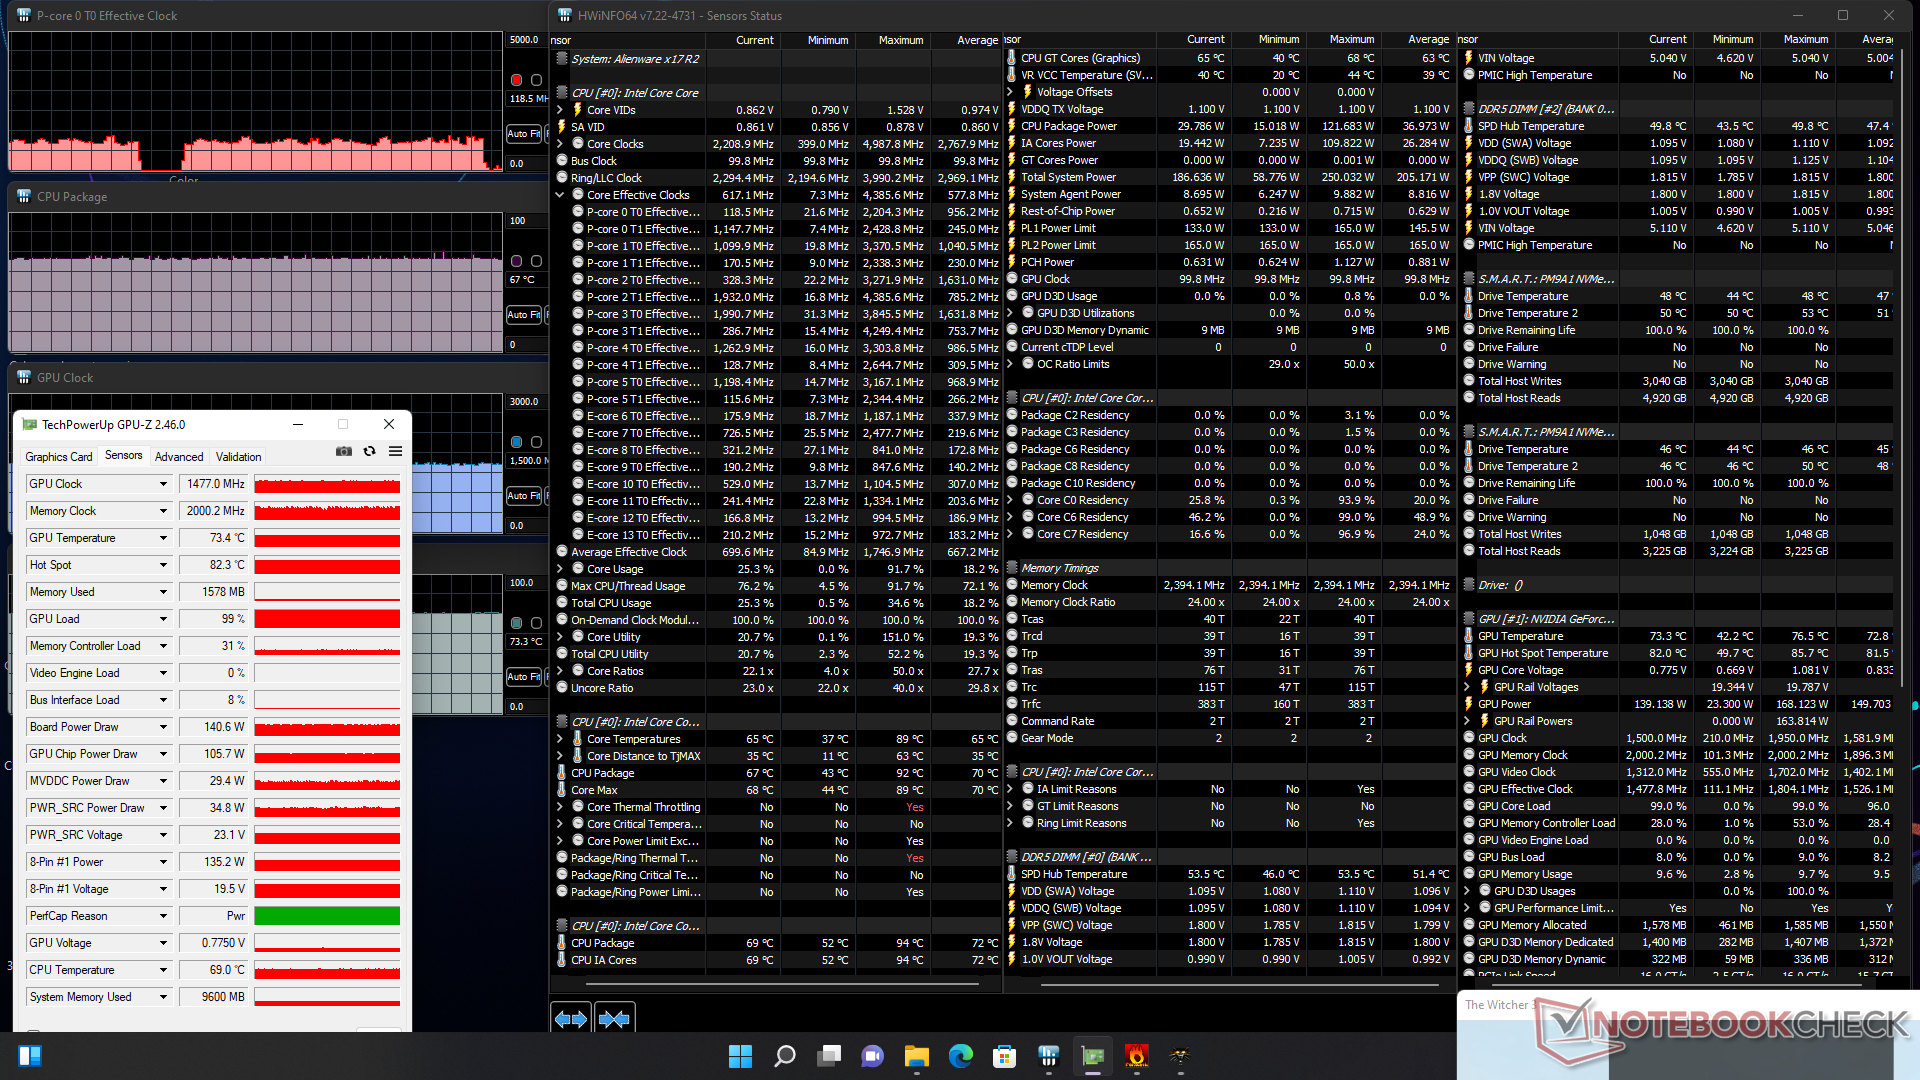
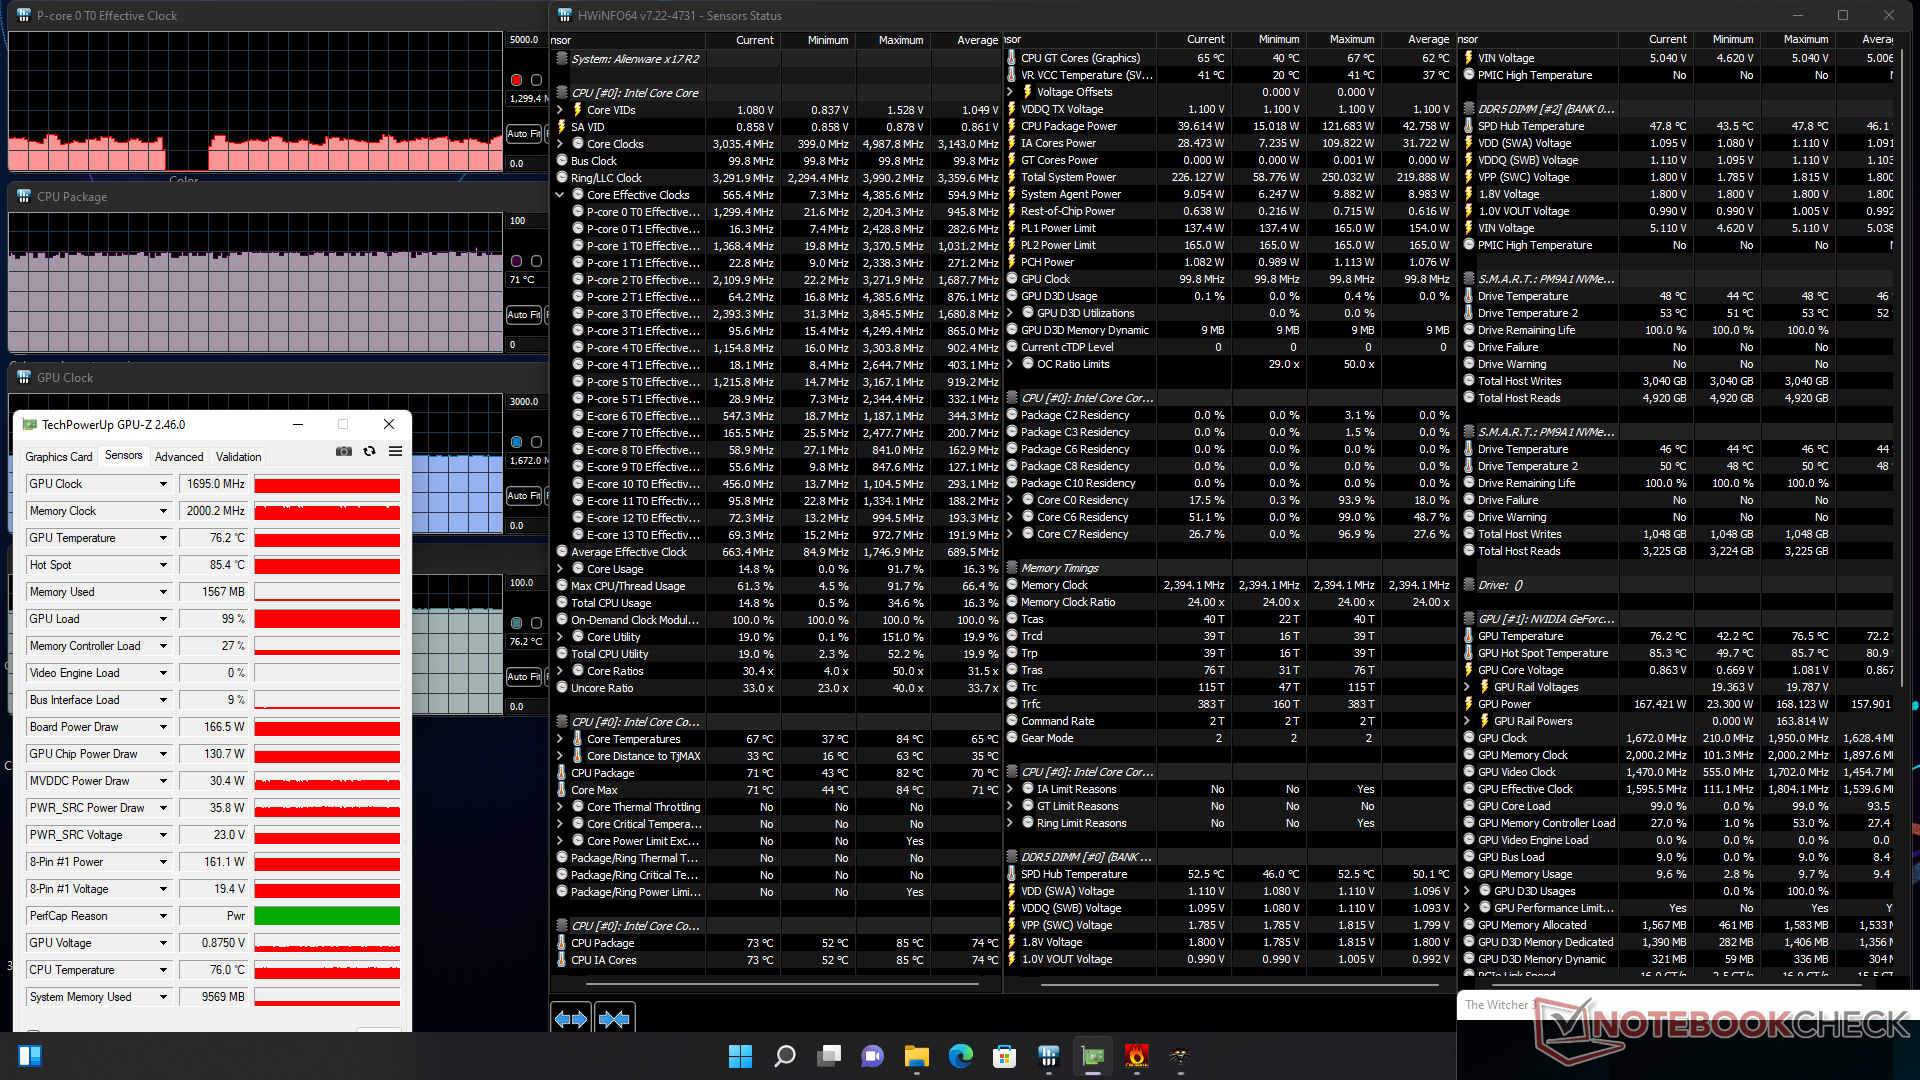
GPU clock rate, memory clock, and board power draw would stabilize at 1695 MHz, 2000 MHz, and 167 W, respectively, when running Witcher 3 on maximum fan mode. If on Balanced mode, the GPU clock and board power draw would drop to 1477 MHz and 141 W, respectively. Thus, users must endure maximum fan noise mode if they want the full performance potential of the x17 R2. Running this same test on the MSI GS77 would result in a slower GPU clock rate and memory clock of 1432 MHz and 1750 MHz, respectively.
Running on battery power will limit performance significantly. A Fire Strike test on batteries would return Physics and Graphics scores of 27369 and 12095 points, respectively, compared to 30108 and 32849 points when on mains.

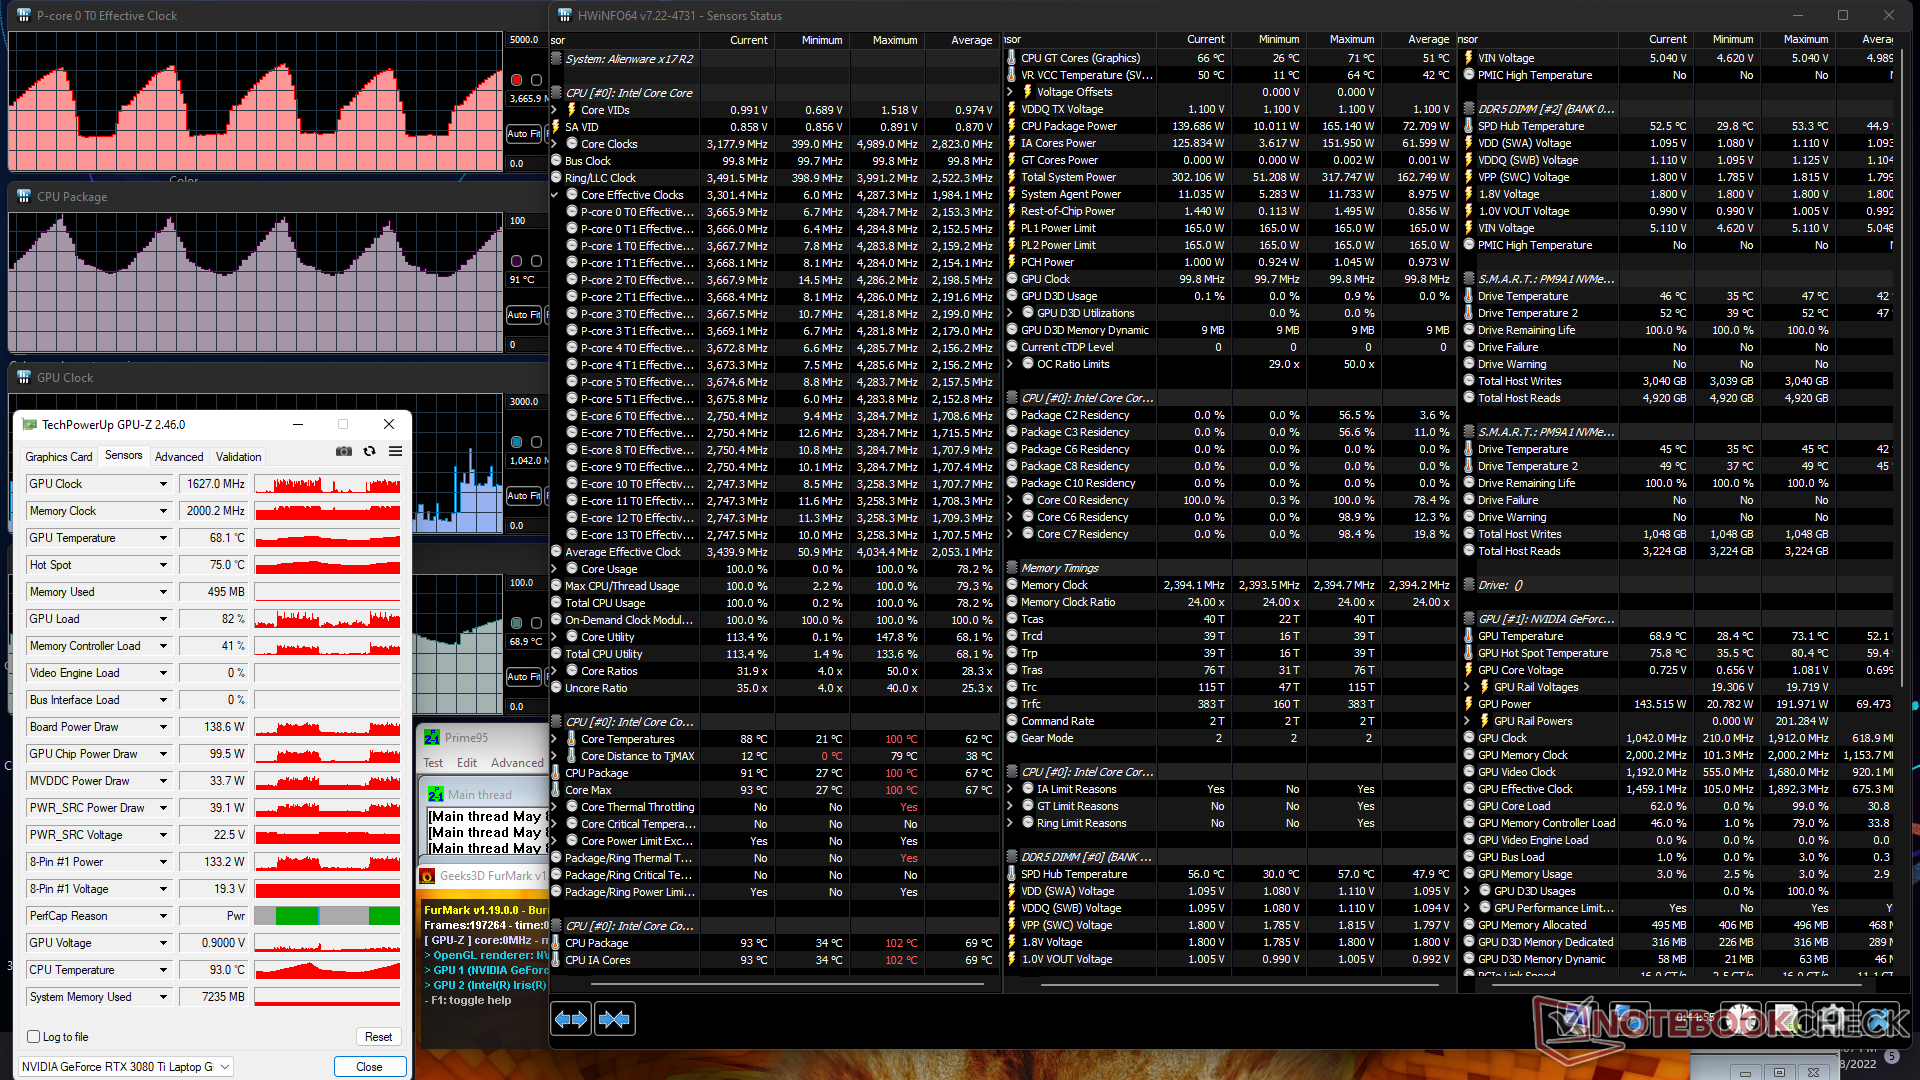
| CPU Clock (GHz) | GPU Clock (MHz) | Average CPU Temperature (°C) | Average GPU Temperature (°C) | |
| System Idle (Maximum fan mode) | -- | -- | 27 | 29 |
| Prime95 Stress (Maximum fan mode) | 3.6 | -- | -- | 100 |
| Prime95 + FurMark Stress (Maximum fan mode) | 1.4 - 3.7 | 337 - 1770 | 53 - 100 | 49 - 71 |
| Witcher 3 Stress (Balanced mode) | ~0.6 | 1477 | 67 | 73 |
| Witcher 3 Stress (Maximum fan mode) | ~1.3 | 1695 | 71 | 76 |
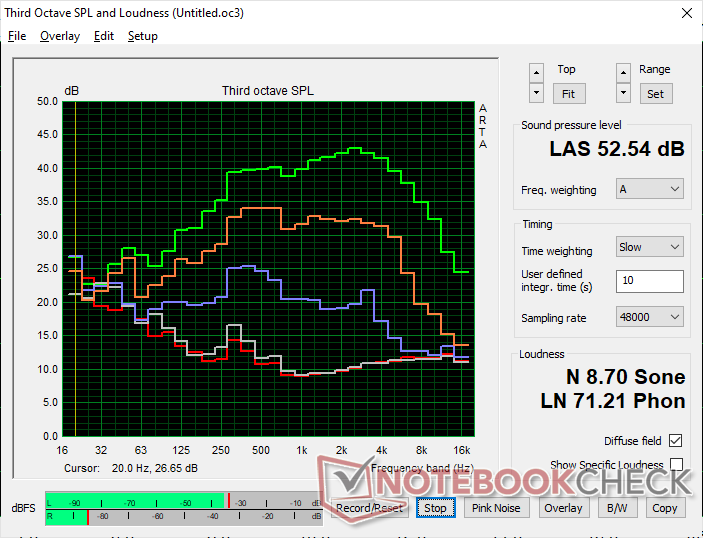
Speakers
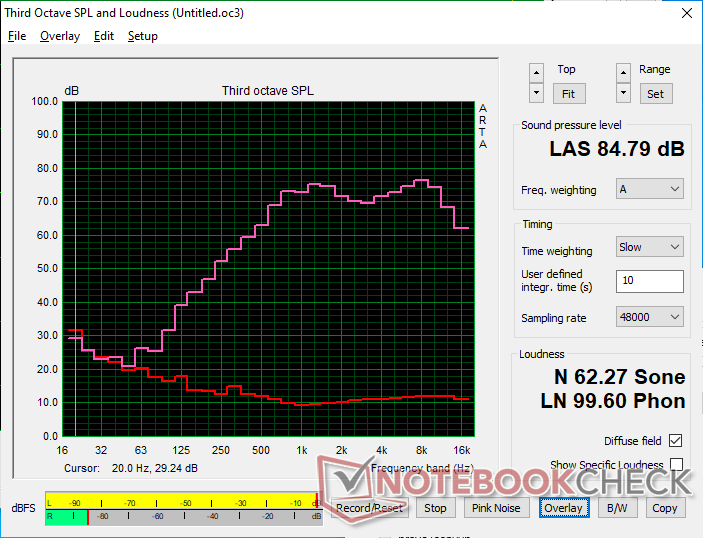
Alienware x17 R2 P48E audio analysis
(+) | speakers can play relatively loud (84.3 dB)
Bass 100 - 315 Hz
(±) | reduced bass - on average 9.7% lower than median
(+) | bass is linear (5.5% delta to prev. frequency)
Mids 400 - 2000 Hz
(+) | balanced mids - only 1.6% away from median
(+) | mids are linear (3% delta to prev. frequency)
Highs 2 - 16 kHz
(±) | higher highs - on average 5% higher than median
(±) | linearity of highs is average (7.6% delta to prev. frequency)
Overall 100 - 16.000 Hz
(+) | overall sound is linear (9.3% difference to median)
Compared to same class
» 3% of all tested devices in this class were better, 2% similar, 95% worse
» The best had a delta of 6%, average was 18%, worst was 132%
Compared to all devices tested
» 3% of all tested devices were better, 1% similar, 96% worse
» The best had a delta of 4%, average was 24%, worst was 134%
Apple MacBook Pro 16 2021 M1 Pro audio analysis
(+) | speakers can play relatively loud (84.7 dB)
Bass 100 - 315 Hz
(+) | good bass - only 3.8% away from median
(+) | bass is linear (5.2% delta to prev. frequency)
Mids 400 - 2000 Hz
(+) | balanced mids - only 1.3% away from median
(+) | mids are linear (2.1% delta to prev. frequency)
Highs 2 - 16 kHz
(+) | balanced highs - only 1.9% away from median
(+) | highs are linear (2.7% delta to prev. frequency)
Overall 100 - 16.000 Hz
(+) | overall sound is linear (4.6% difference to median)
Compared to same class
» 0% of all tested devices in this class were better, 0% similar, 100% worse
» The best had a delta of 5%, average was 17%, worst was 45%
Compared to all devices tested
» 0% of all tested devices were better, 0% similar, 100% worse
» The best had a delta of 4%, average was 24%, worst was 134%
Energy Management
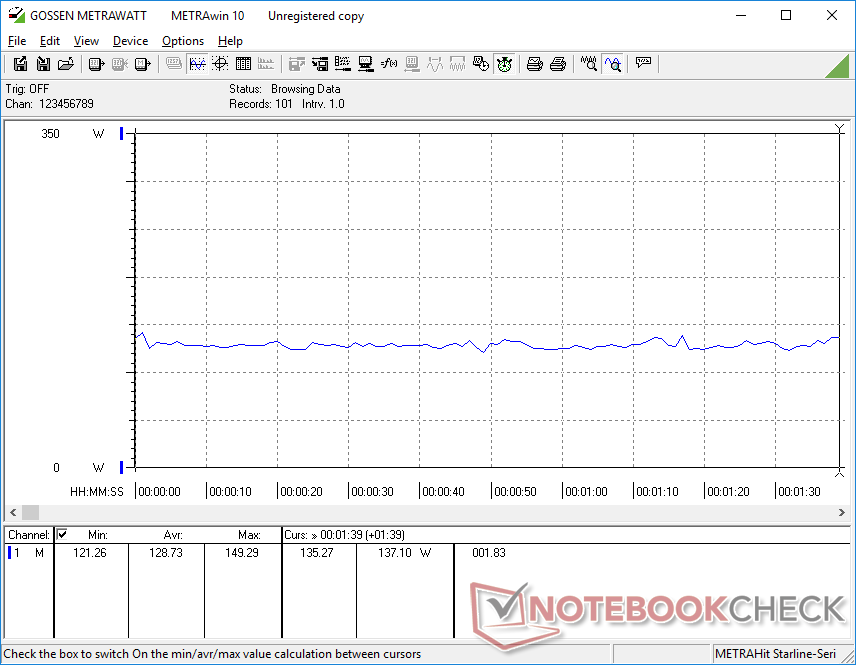
Power Consumption
Alienware laptops have always been more power-hungry than competing alternatives and the x17 R2 is no different. Simply idling on desktop can demand up to 60 W when set to High Performance mode which is more than most U-series-powered Ultrabooks when under load. The very high consumption is likely responsible for the poor battery life recorded in the next section.
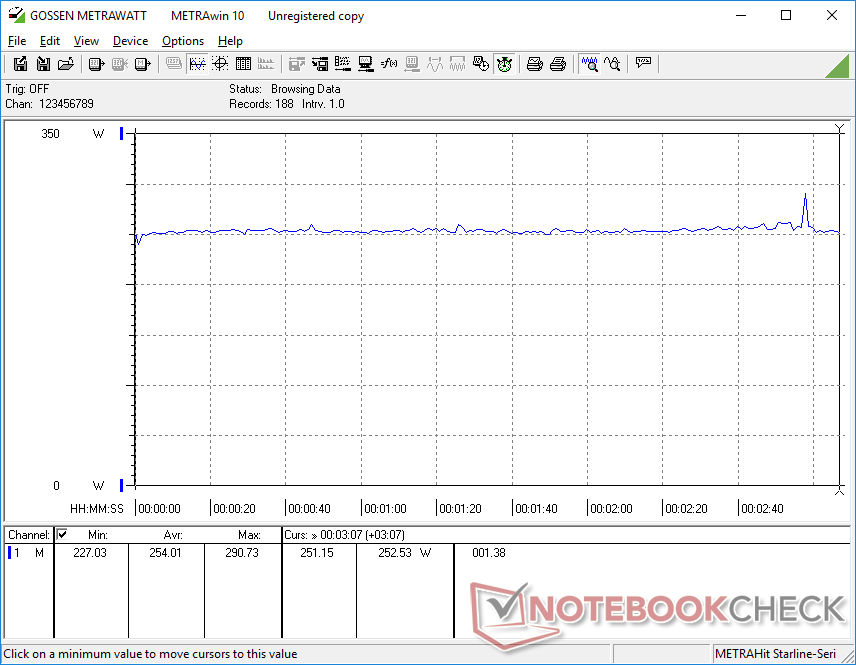
Running Witcher 3 consumes 54 percent more power than on the MSI GS77 even though both are equipped with 12th gen Core-H CPUs and the same GeForce RTX 3080 Ti GPU. In return, the Alienware system is able to offer up to 15 percent and 25 percent faster CPU performance and graphics performance, respectively, than the competing MSI.
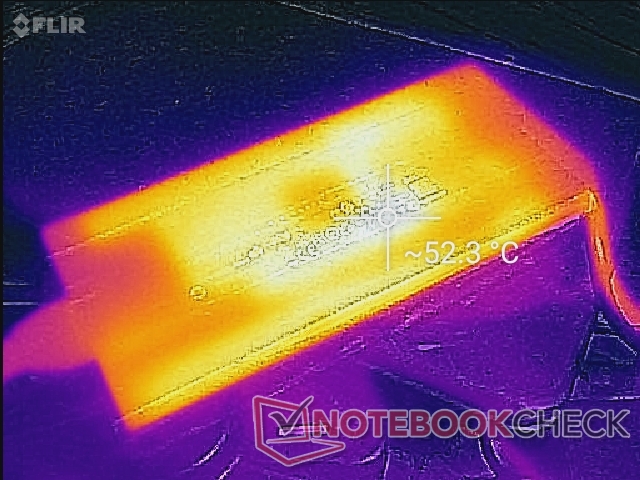
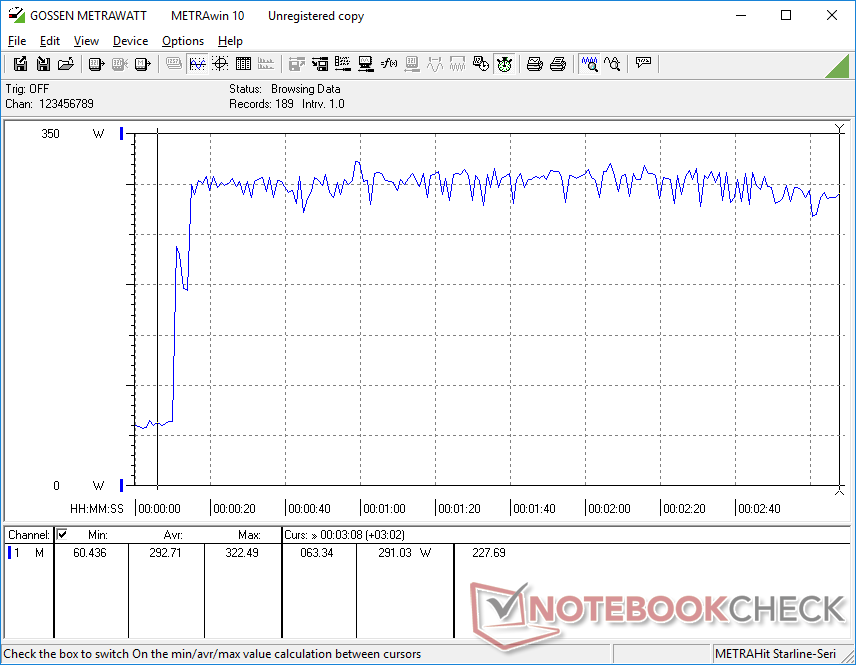
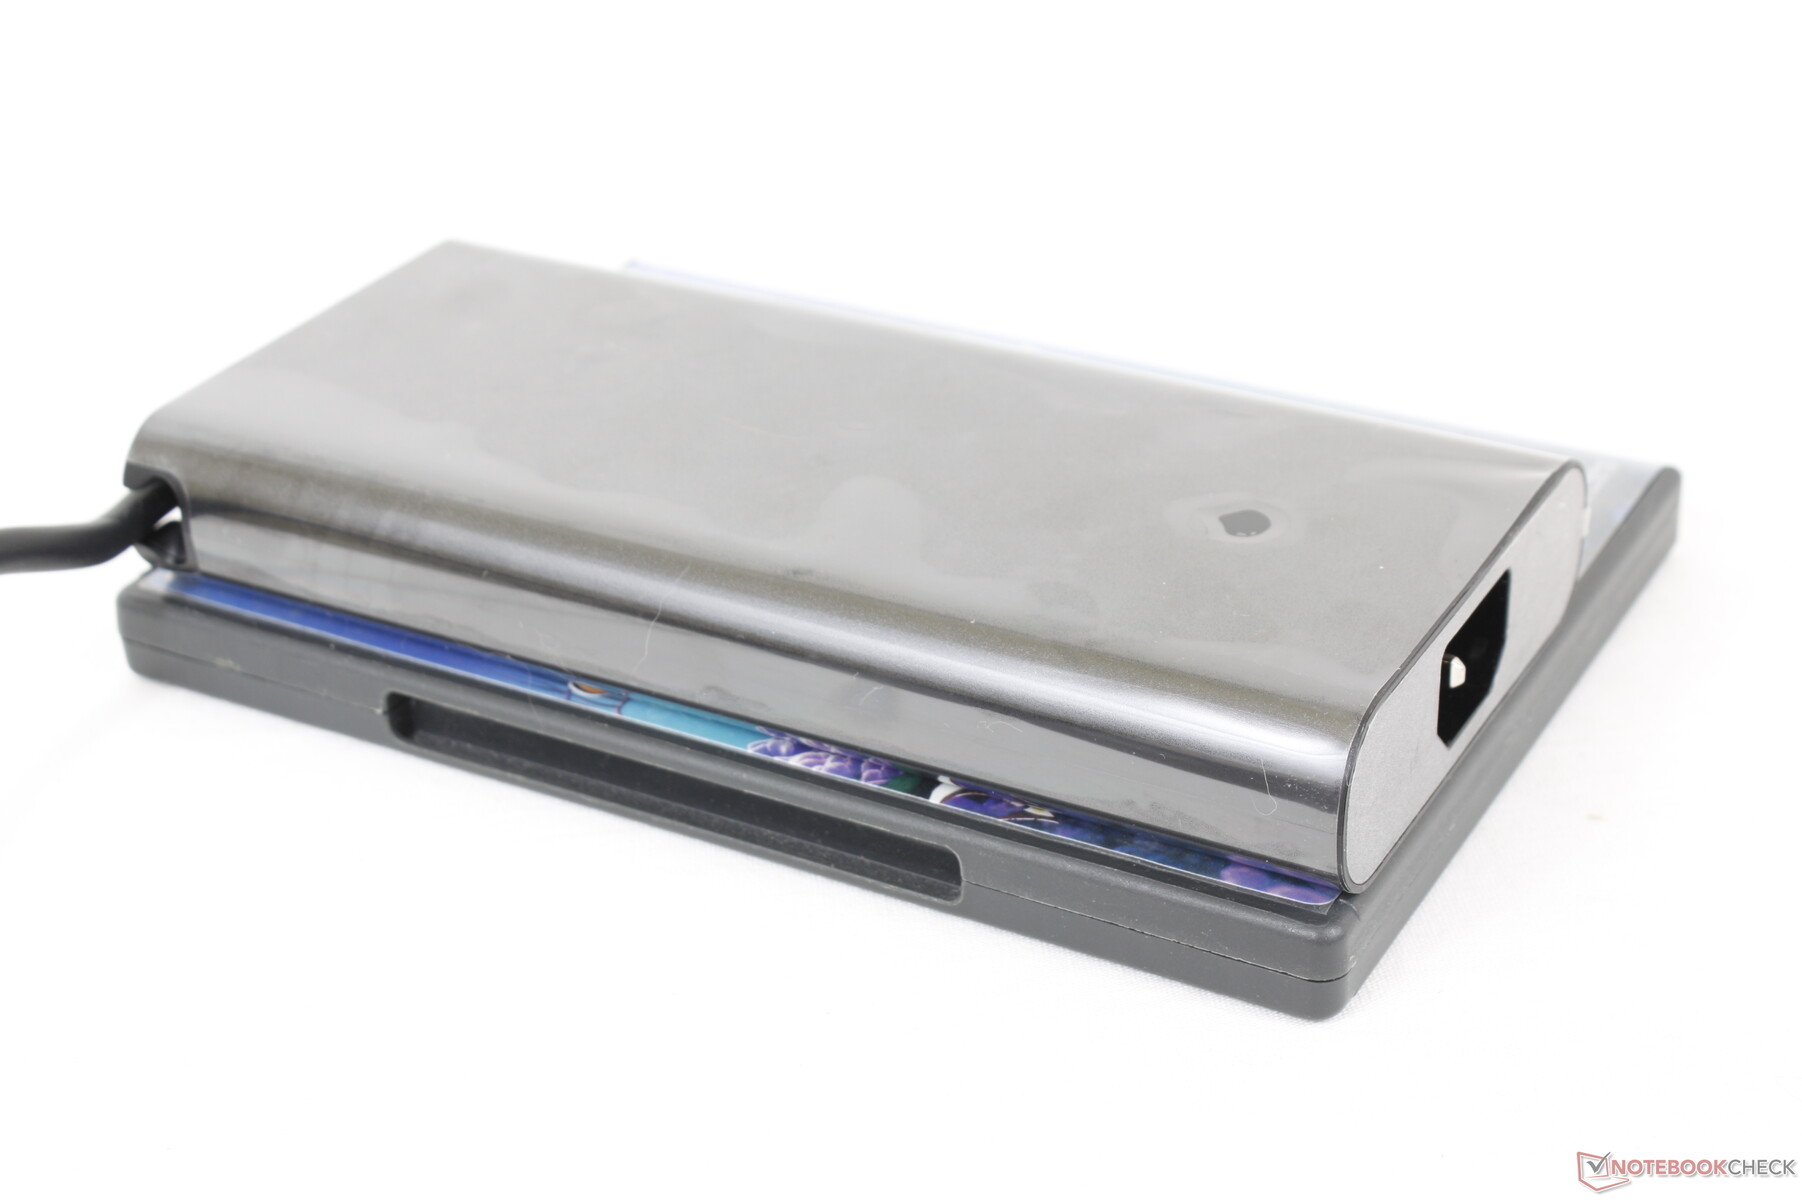
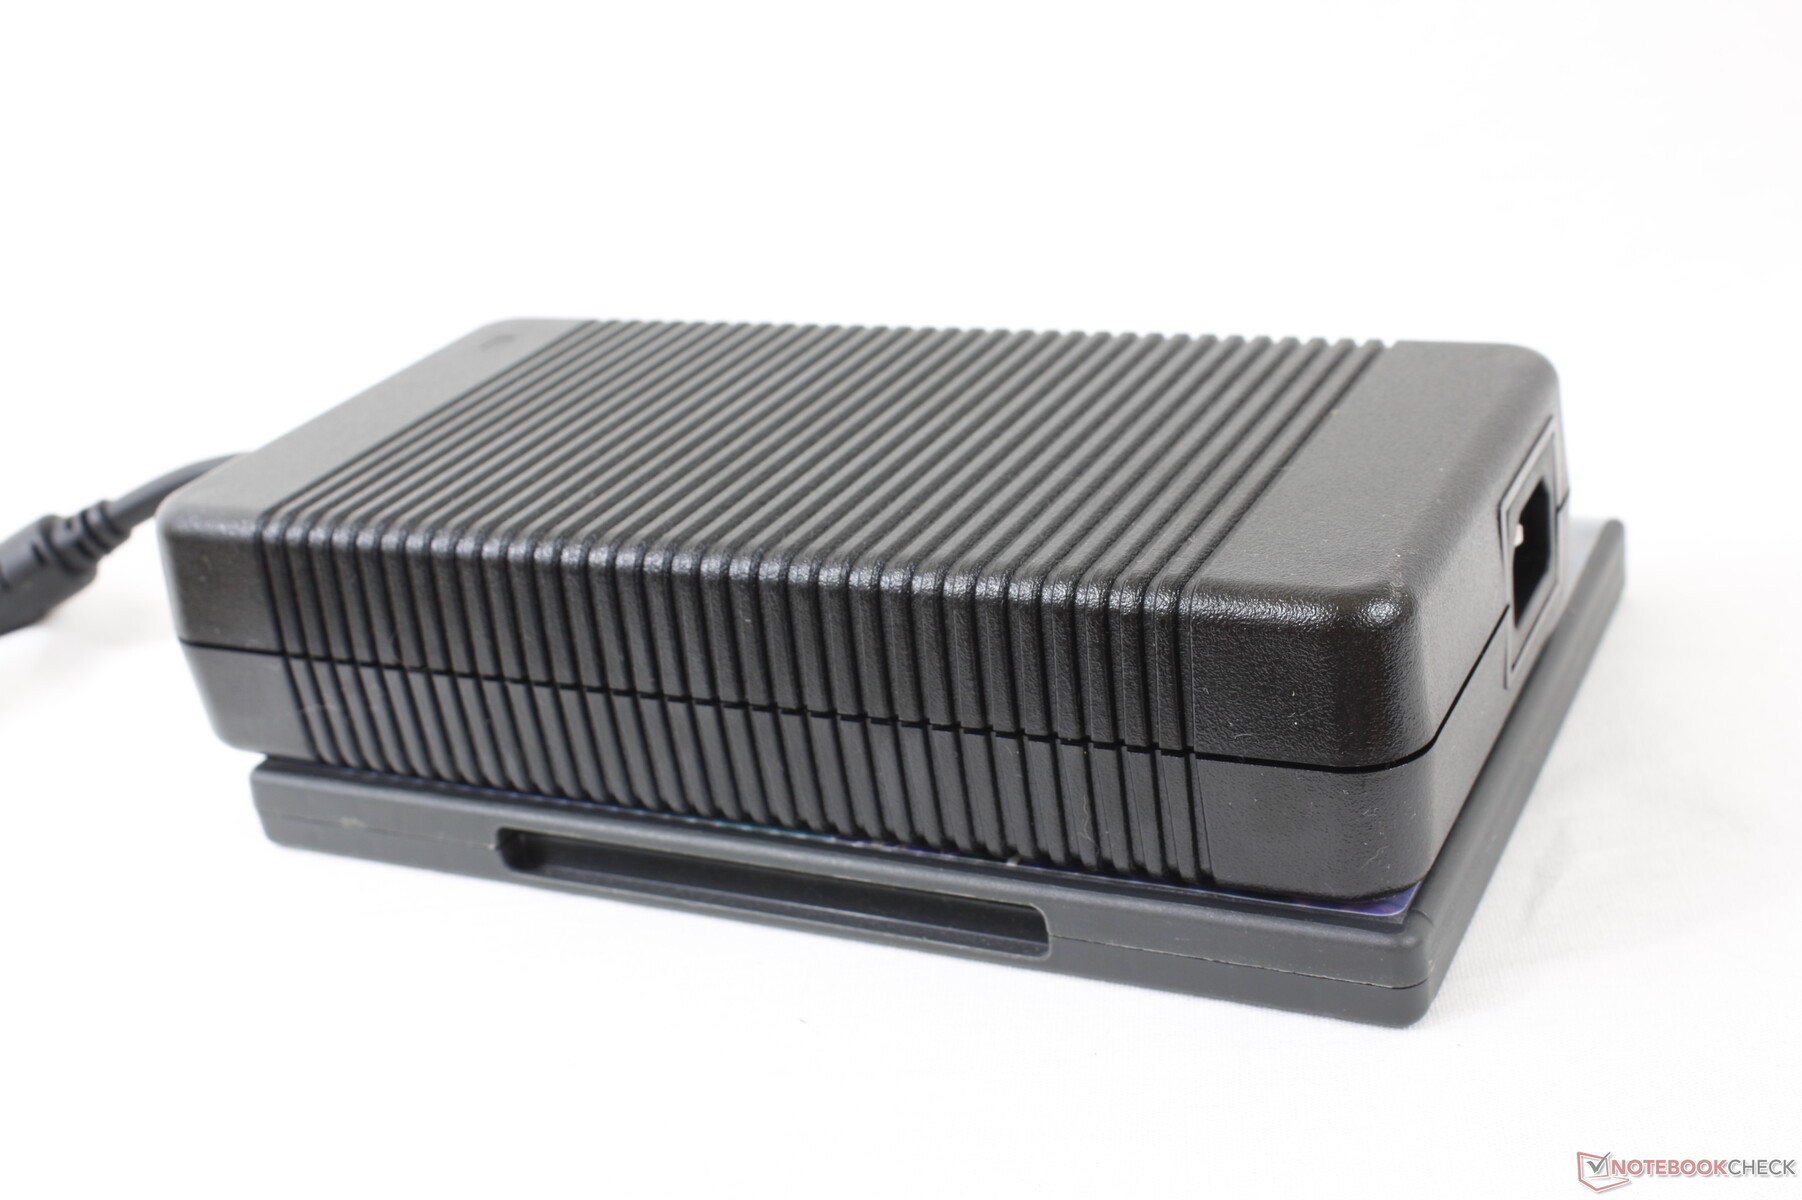
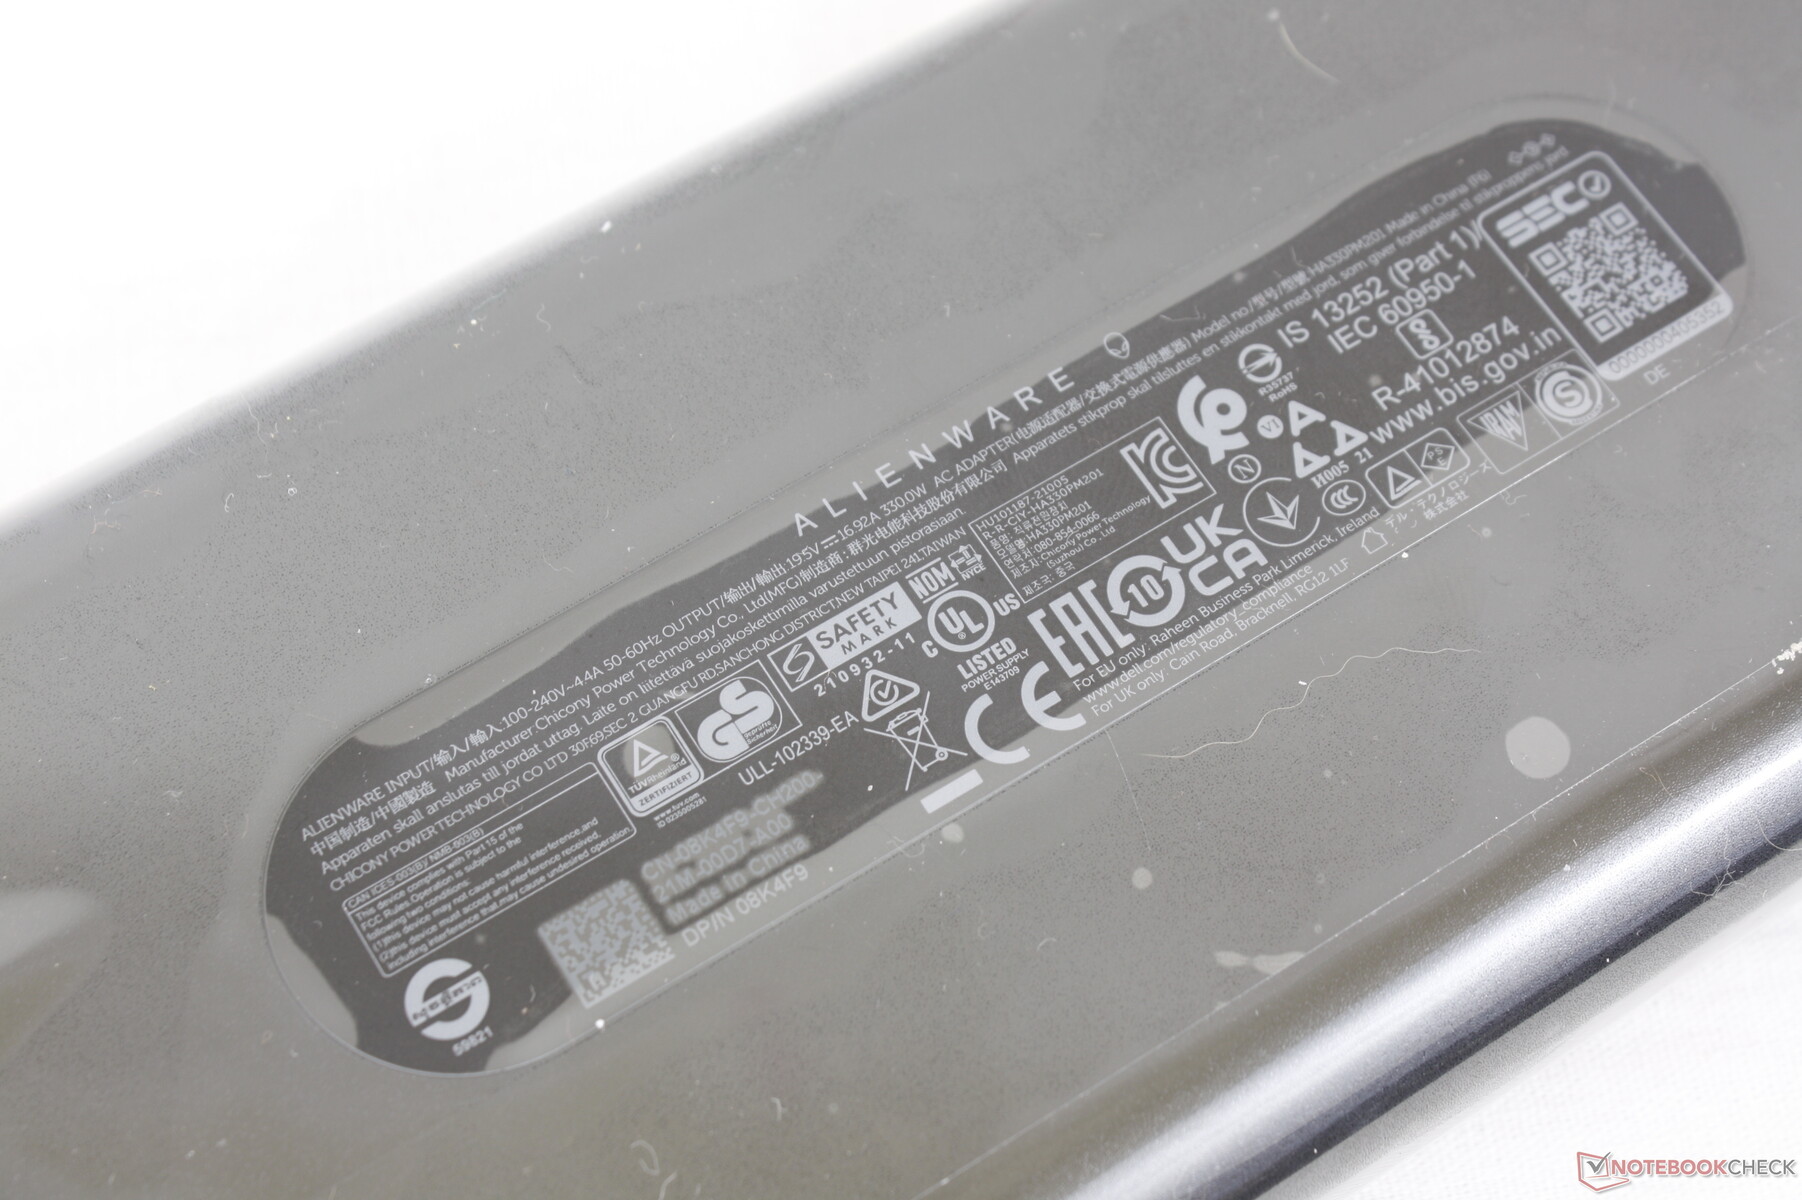
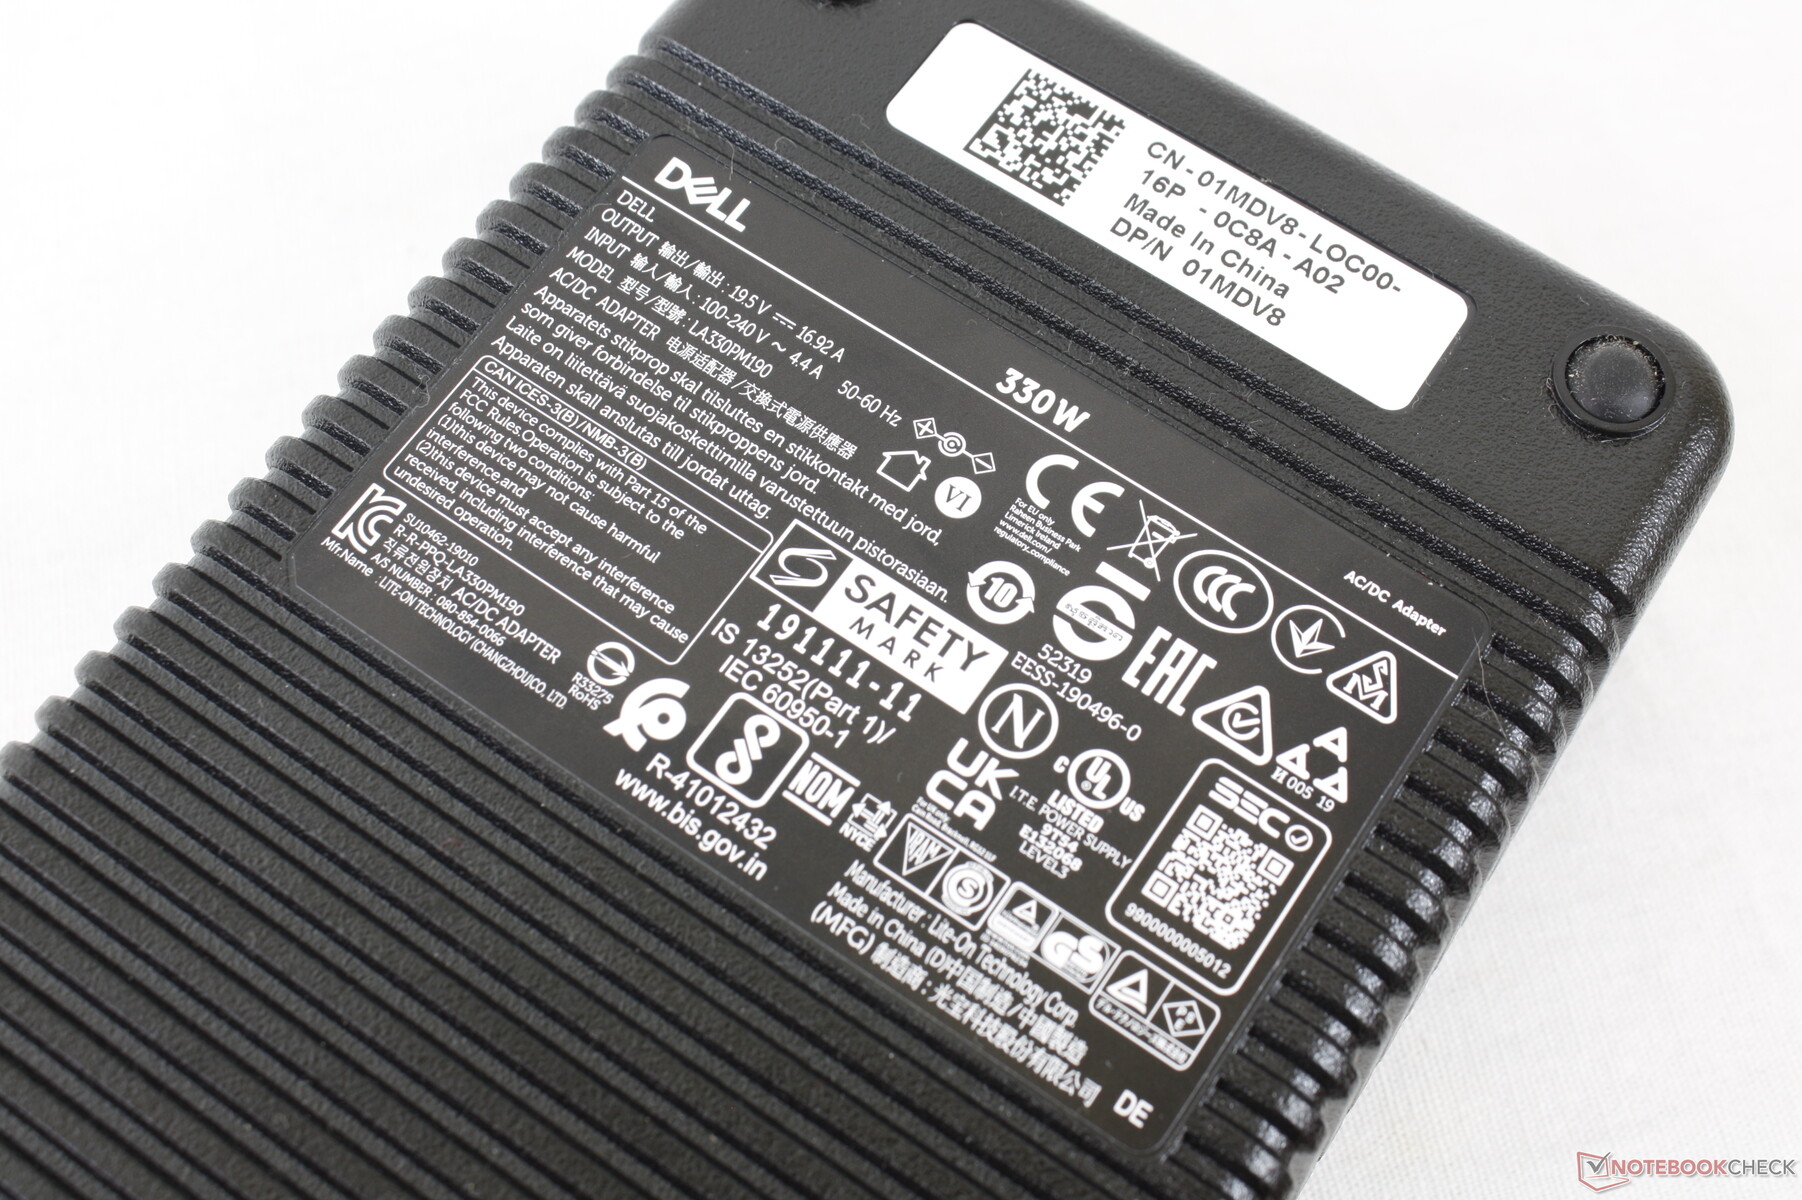
We're able to record a maximum consumption of 323 W from the 330 W AC adapter when both the CPU and GPU are at 100 percent utilization. The AC adapter is smaller this time around when compared to the one that shipped with last year's x17 R1 (~18.3 x 8.7 x 2.5 cm vs. ~20 x 9.9 x 4.3 cm). Note that most other gaming laptops ship with smaller AC adapters of well under 280 W. Lesser Alienware x17 R2 configurations may come with even smaller AC adapters.
| Off / Standby | |
| Idle | |
| Load |
|
Key:
min: | |
| Alienware x17 R2 P48E i9-12900HK, GeForce RTX 3080 Ti Laptop GPU, 2x Samsung PM9A1 1TB (RAID 0), IPS, 1920x1080, 17.3" | Alienware x17 RTX 3080 P48E i7-11800H, GeForce RTX 3080 Laptop GPU, 2x WDC PC SN730 SDBPNTY-1T00 (RAID 0), IPS, 3840x2160, 17.3" | Asus ROG Zephyrus S17 GX703HSD i9-11900H, GeForce RTX 3080 Laptop GPU, Samsung PM9A1 MZVL22T0HBLB, IPS, 2560x1440, 17.3" | MSI Stealth GS77 12UHS-083US i7-12700H, GeForce RTX 3080 Ti Laptop GPU, Micron 3400 1TB MTFDKBA1T0TFH, IPS, 2560x1440, 17.3" | MSI GT76 Titan DT 10SGS i9-10900K, GeForce RTX 2080 Super Mobile, 2x WDC PC SN730 SDBPNTY-1T00 (RAID 0), IPS, 3840x2160, 17.3" | Gigabyte A7 X1 R9 5900HX, GeForce RTX 3070 Laptop GPU, ESR512GTLCG-EAC-4, IPS, 1920x1080, 17.3" | |
|---|---|---|---|---|---|---|
| Power Consumption | 22% | 22% | 30% | -15% | 38% | |
| Idle Minimum * (Watt) | 24.1 | 10.2 58% | 21.7 10% | 20 17% | 25.9 -7% | 12 50% |
| Idle Average * (Watt) | 28.5 | 21.2 26% | 27 5% | 21.4 25% | 38 -33% | 14 51% |
| Idle Maximum * (Watt) | 60 | 48.4 19% | 33 45% | 27 55% | 53.2 11% | 19 68% |
| Load Average * (Watt) | 128.7 | 118.7 8% | 108 16% | 100.5 22% | 123.8 4% | 118 8% |
| Witcher 3 ultra * (Watt) | 254 | 249 2% | 195 23% | 165 35% | 312.5 -23% | 205 19% |
| Load Maximum * (Watt) | 323 | 262 19% | 210 35% | 247.1 23% | 459.8 -42% | 229 29% |
* ... smaller is better
Power Consumption Witcher 3 / Stresstest
Power Consumption external Monitor
Battery Life
Battery runtimes are some of the worst we've seen on any gaming laptop. Even idling on desktop at the lowest brightness setting, lowest power profile, and Optimus graphics active will only last just short of 4 hours. Expect just 2 hours of real-world WLAN browsing compared to over 7 hours from the Asus ROG Zephyrus S17.
Charging from empty to full capacity takes about 100 minutes. Users can also recharge with third-party USB-C adapters.
| Alienware x17 R2 P48E i9-12900HK, GeForce RTX 3080 Ti Laptop GPU, 87 Wh | Alienware x17 RTX 3080 P48E i7-11800H, GeForce RTX 3080 Laptop GPU, 87 Wh | Asus ROG Zephyrus S17 GX703HSD i9-11900H, GeForce RTX 3080 Laptop GPU, 90 Wh | MSI Stealth GS77 12UHS-083US i7-12700H, GeForce RTX 3080 Ti Laptop GPU, 99 Wh | MSI GT76 Titan DT 10SGS i9-10900K, GeForce RTX 2080 Super Mobile, 90 Wh | Gigabyte A7 X1 R9 5900HX, GeForce RTX 3070 Laptop GPU, 48.96 Wh | |
|---|---|---|---|---|---|---|
| Battery runtime | 91% | 257% | 154% | 20% | 93% | |
| Reader / Idle (h) | 3.9 | 7 79% | 10.8 177% | |||
| WiFi v1.3 (h) | 2 | 5.9 195% | 7.5 275% | 6.2 210% | 2.4 20% | 4.7 135% |
| Load (h) | 0.8 | 0.8 0% | 2.7 238% | 1.4 75% | 1.2 50% | |
| H.264 (h) | 7.2 | |||||
| Witcher 3 ultra (h) | 1 |
Pros
Cons
Verdict — Higher TGP Means Higher Performance
When Nvidia announced the GeForce RTX 3080 Ti for laptops, we were disappointed to find that some models would be targeting very low TGP ratings of only about 100 W. While such an approach would allow for super-thin designs, it also sacrificed performance along the way as the GPU would effectively be underclocked. The Alienware x17 R2 recognizes this tradeoff and instead targets a significantly higher TGP of 175 W for a roughly 30 percent performance boost over laptops running on the ~100 W GeForce RTX 3080 Ti like the Razer Blade 15 or Gigabyte Aero YE5. Similar results can be found through the CPU as well. This single aspect of the Alienware is perhaps the biggest differentiating factor between it and other ultrathin gaming laptops.
Of course, the "performance at all cost" approach comes with drawbacks. Power consumption in particular is through the roof and battery life suffers because of it even when on the lowest performance settings. The system is also noticeably heavier and larger, respectively, than other ultrathin gaming laptops even though the chassis is still considered an ultrathin. Port positioning takes some getting used to as well.
if you want to maximize performance without settling for huge gaming laptops like the MSI GT series, Asus ROG Chimera series, or the Alienware Area-51m series, then the Alienware x17 R2 and its surprisingly satisfying mechanical keyboard are worth considering.
Price and Availability
The Alienware x17 R2 is now shipping on Amazon in multiple SKUs albeit none are our exact configuration. Alternatively, users can purchase directly from Dell.
Alienware x17 R2 P48E
- 05/11/2022 v7 (old)
Allen Ngo
Price comparison
