AMD Ryzen 9 7845HX performance debut: Alienware m16 R1 laptop review

After having launched the 15.6-inch Alienware m15, 17-inch Alienware m17, and 18-inch Alienware m18, Dell is now ready ship the 16-inch Alienware m16 complete with the newest Nvidia Ada Lovelace GPUs and the choice of either Intel 13th gen Raptor Lake or AMD Zen 4 processors. The Alienware m16 is distinct from the recent Alienware x16 which is an even thinner model with different specifications and features.
Our review unit is an upper-midrange AMD configuration with the Ryzen 9 7845HX, 175 W GeForce RTX 4080 GPU, and 1600p240 IPS display for approximately $2350 USD. Lesser SKUs come equipped with the Ryzen 7 7745HX CPU and Radeon RX 7600M GPU for $2150 while pricier ones with the Ryzen 9 7945HX and RTX 4090 can retail for over $3100+ depending on RAM and SSD preferences. Meanwhile, the Intel versions come with the same display and Nvidia GPU options but with the Core i7-13700HX or i9-13900HX instead.
Competitors include other flagship 16-inch gaming laptops like the HP Omen 16, Lenovo Legion Pro 7 16, Asus ROG Strix G16, or the Razer Blade 16.
More Dell reviews:
Potential Competitors in Comparison
Rating | Date | Model | Weight | Height | Size | Resolution | Price |
|---|---|---|---|---|---|---|---|
| 89.2 % v7 (old) | 08 / 2023 | Alienware m16 R1 AMD R9 7845HX, GeForce RTX 4080 Laptop GPU | 3.1 kg | 25.4 mm | 16.00" | 2560x1600 | |
| 88.4 % v7 (old) | 06 / 2023 | Alienware x16 R1 i9-13900HK, GeForce RTX 4080 Laptop GPU | 2.6 kg | 18.57 mm | 16.00" | 2560x1600 | |
| 87.9 % v7 (old) | 08 / 2023 | HP Omen Transcend 16 i9-13900HX, GeForce RTX 4070 Laptop GPU | 2.3 kg | 19.8 mm | 16.00" | 2560x1600 | |
| 88.8 % v7 (old) | 06 / 2023 | Lenovo Legion Pro 7 RTX4090 i9-13900HX, GeForce RTX 4090 Laptop GPU | 2.7 kg | 26 mm | 16.00" | 2560x1600 | |
| 88.4 % v7 (old) | 03 / 2023 | Asus ROG Strix G16 G614JZ i9-13980HX, GeForce RTX 4080 Laptop GPU | 2.4 kg | 30.4 mm | 16.00" | 2560x1600 | |
| 91.2 % v7 (old) | 02 / 2023 | Razer Blade 16 Early 2023 i9-13950HX, GeForce RTX 4080 Laptop GPU | 2.4 kg | 21.99 mm | 16.00" | 2560x1600 |
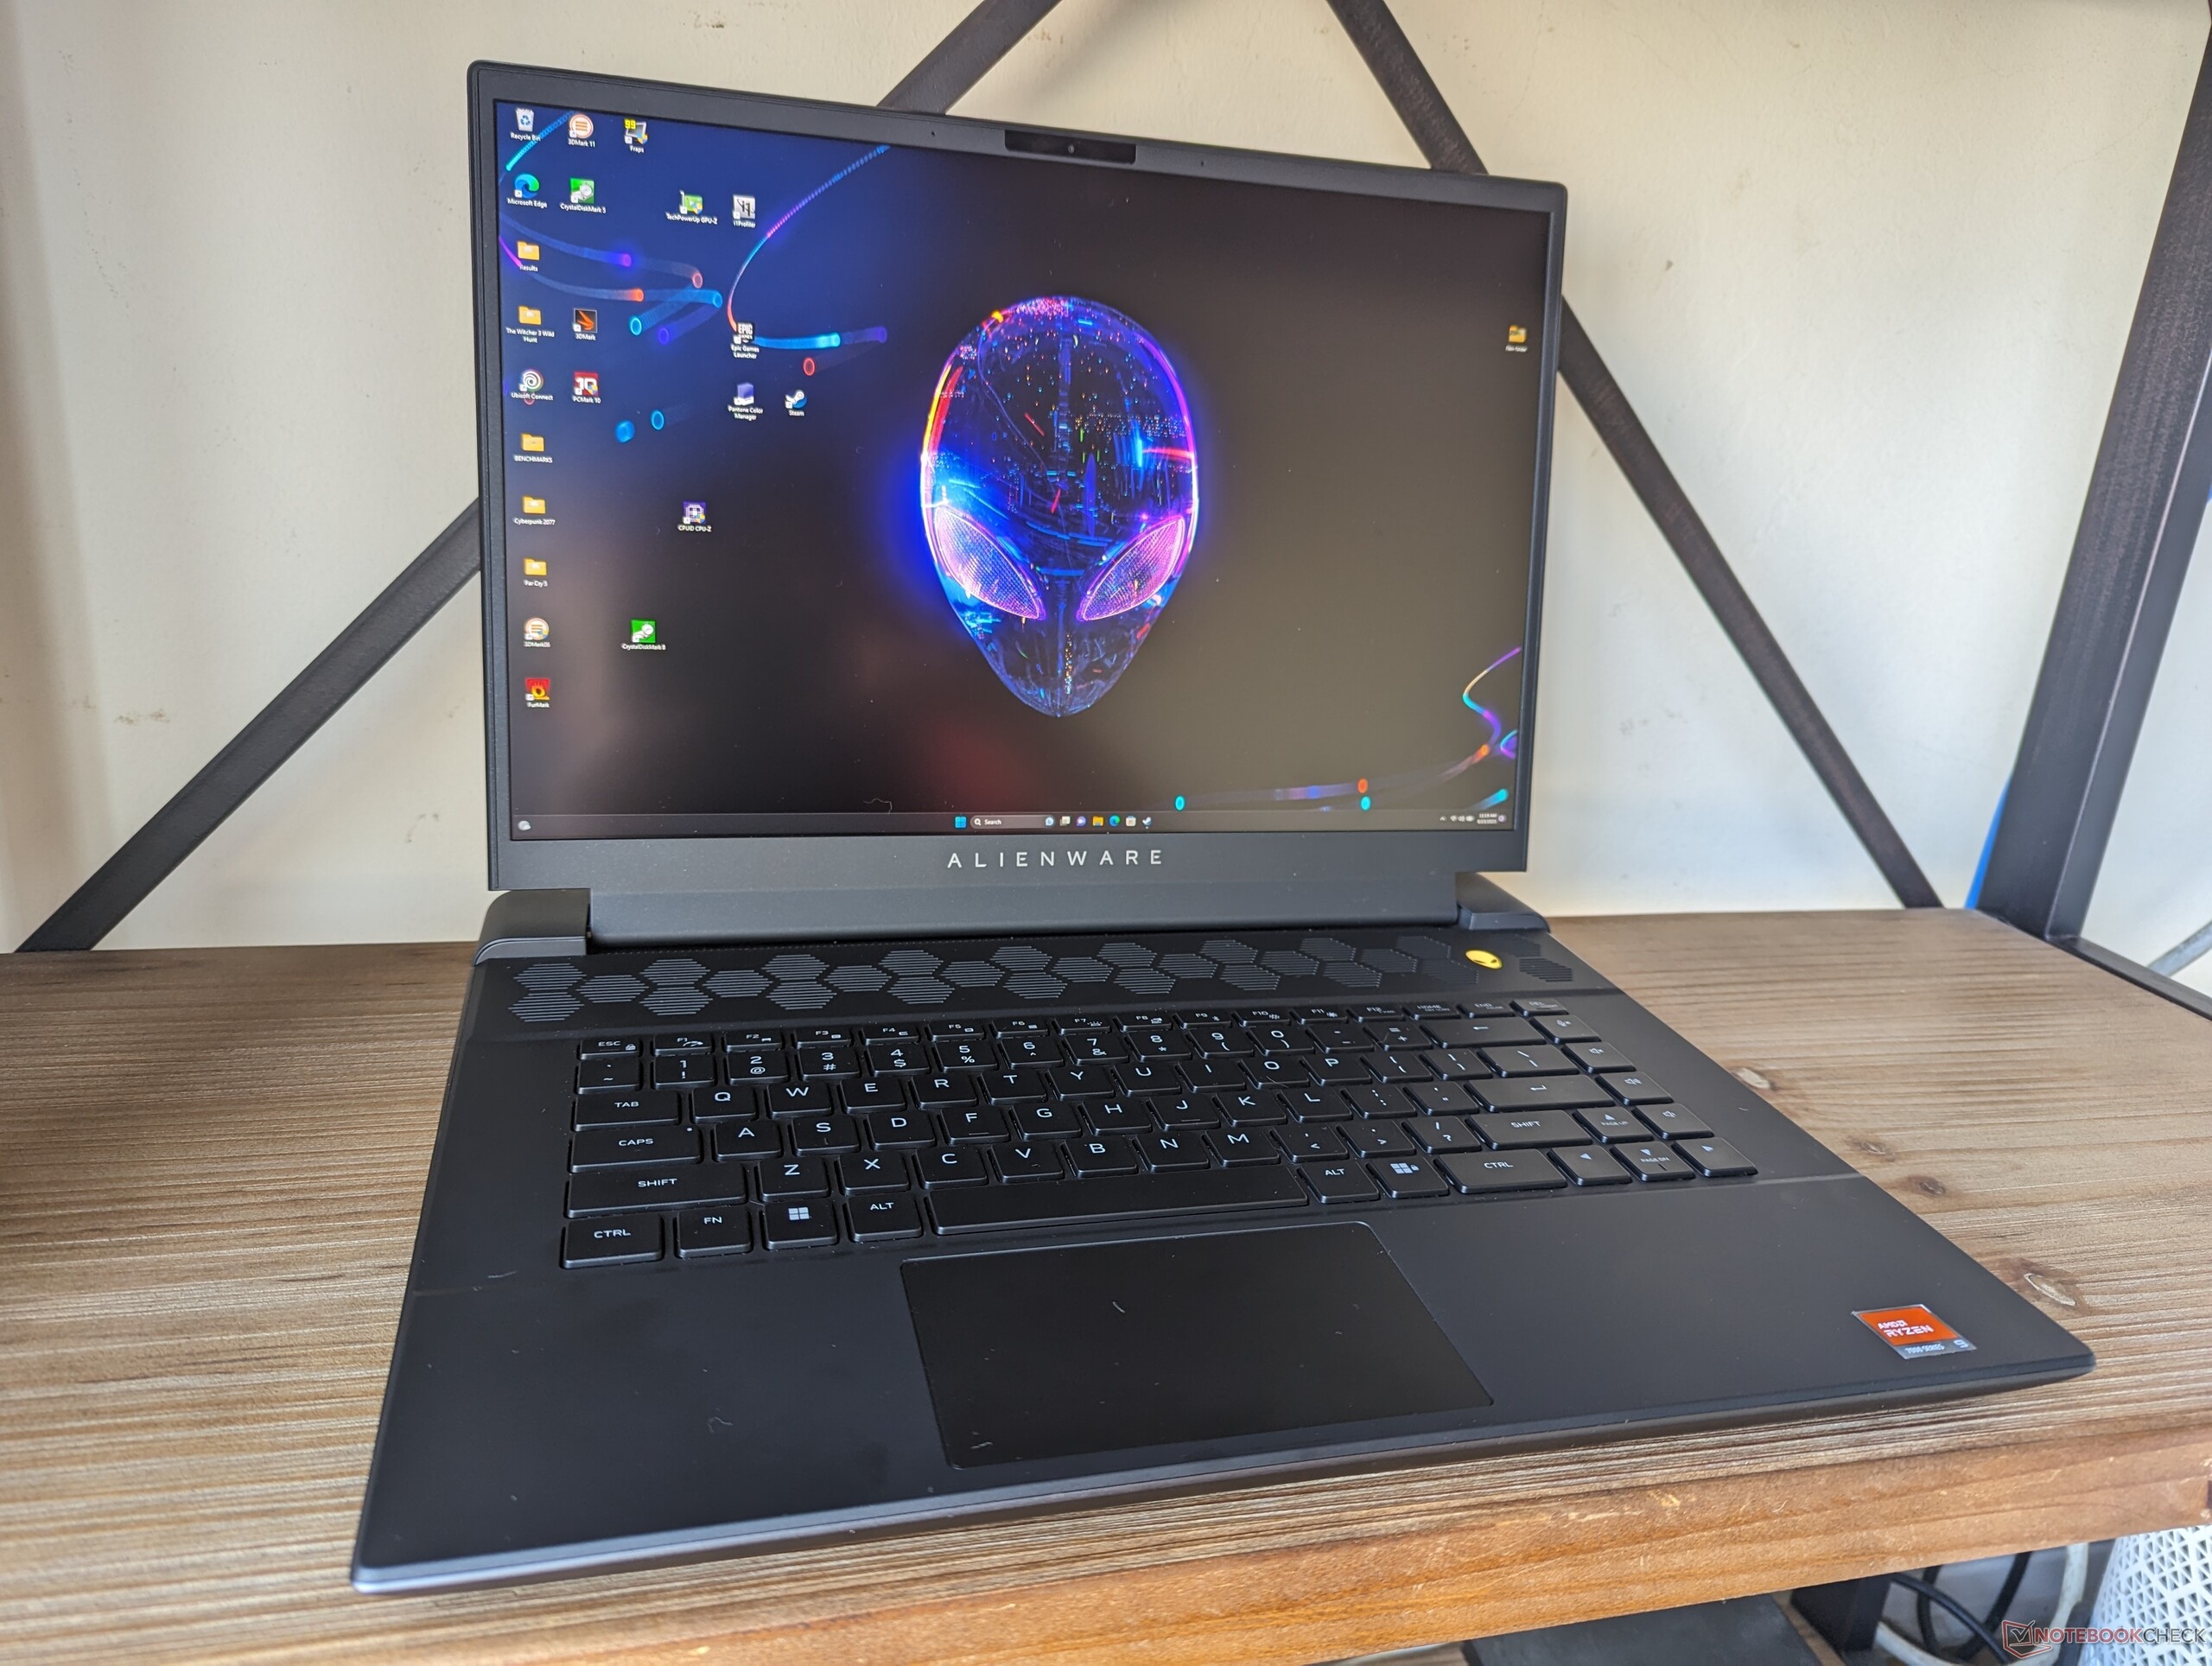
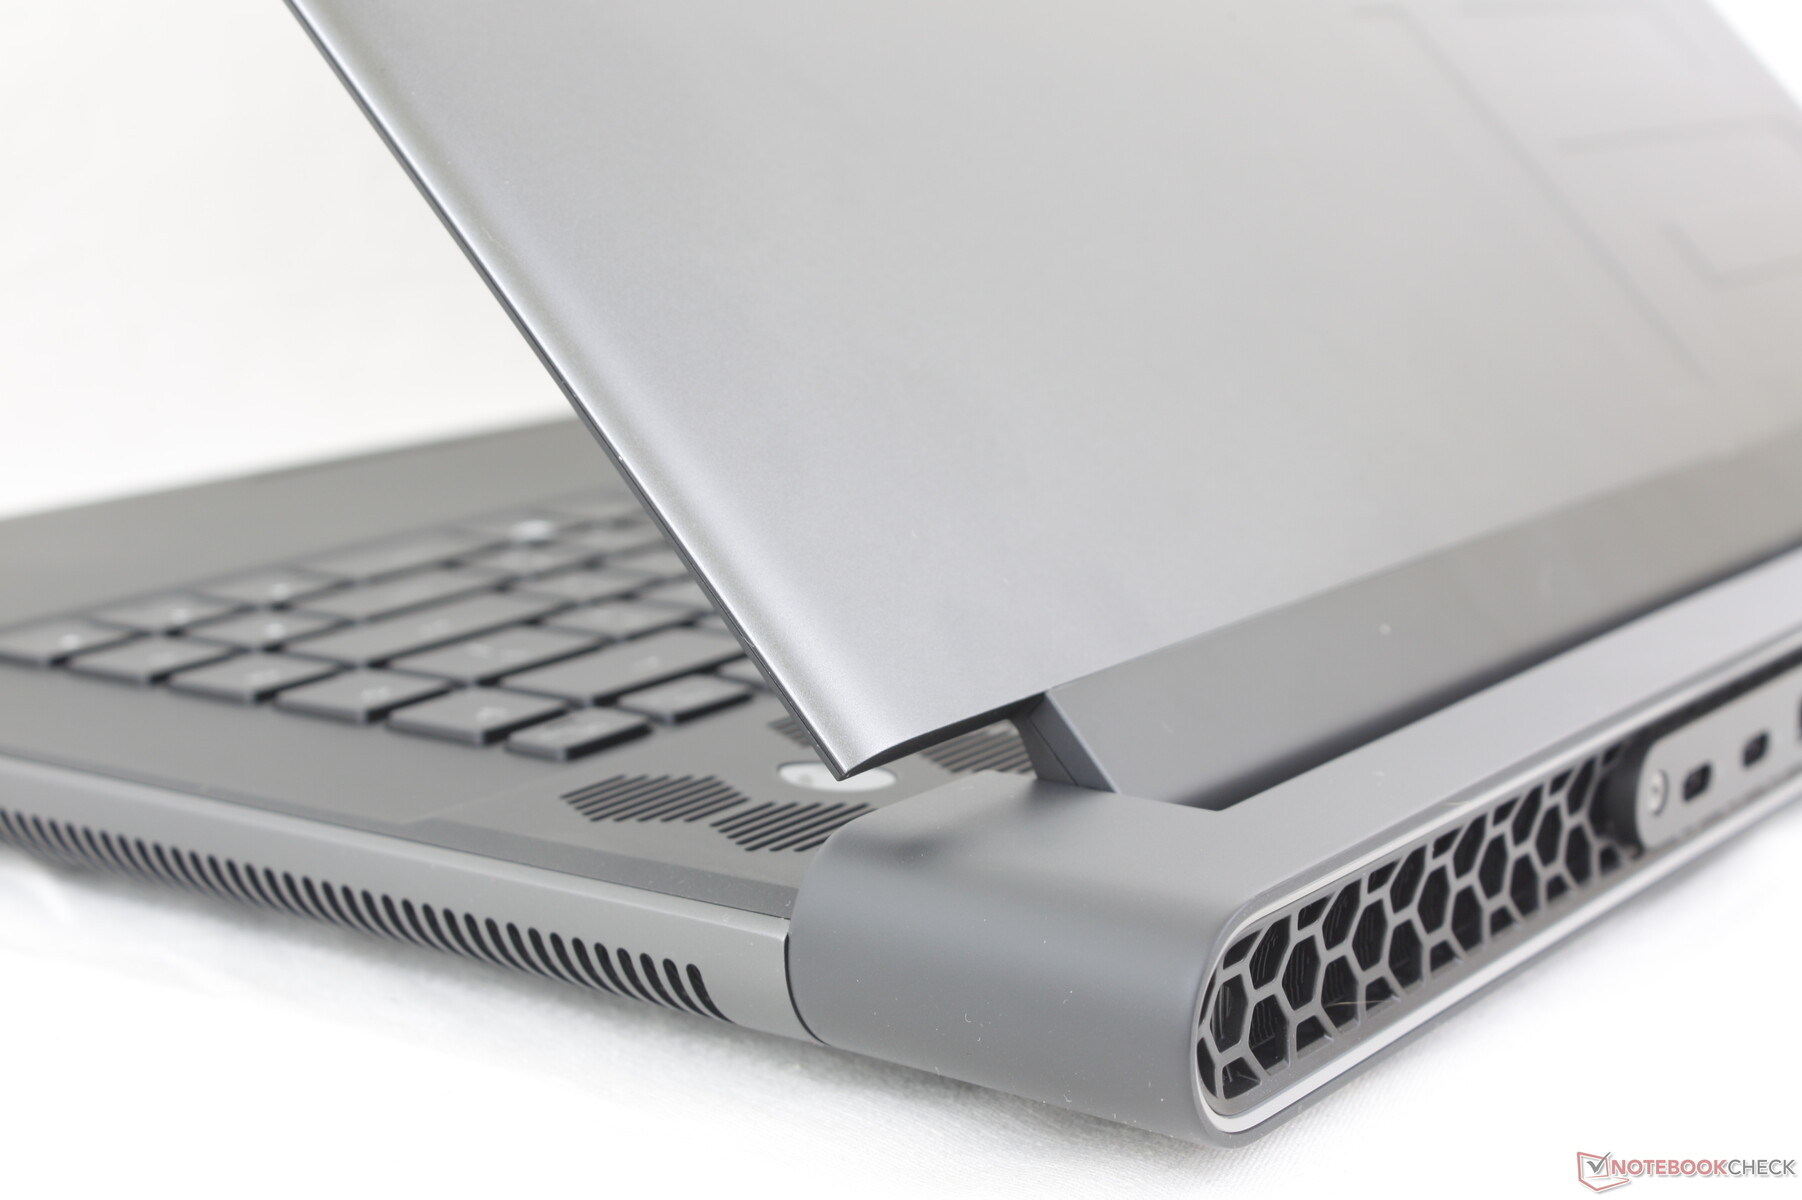
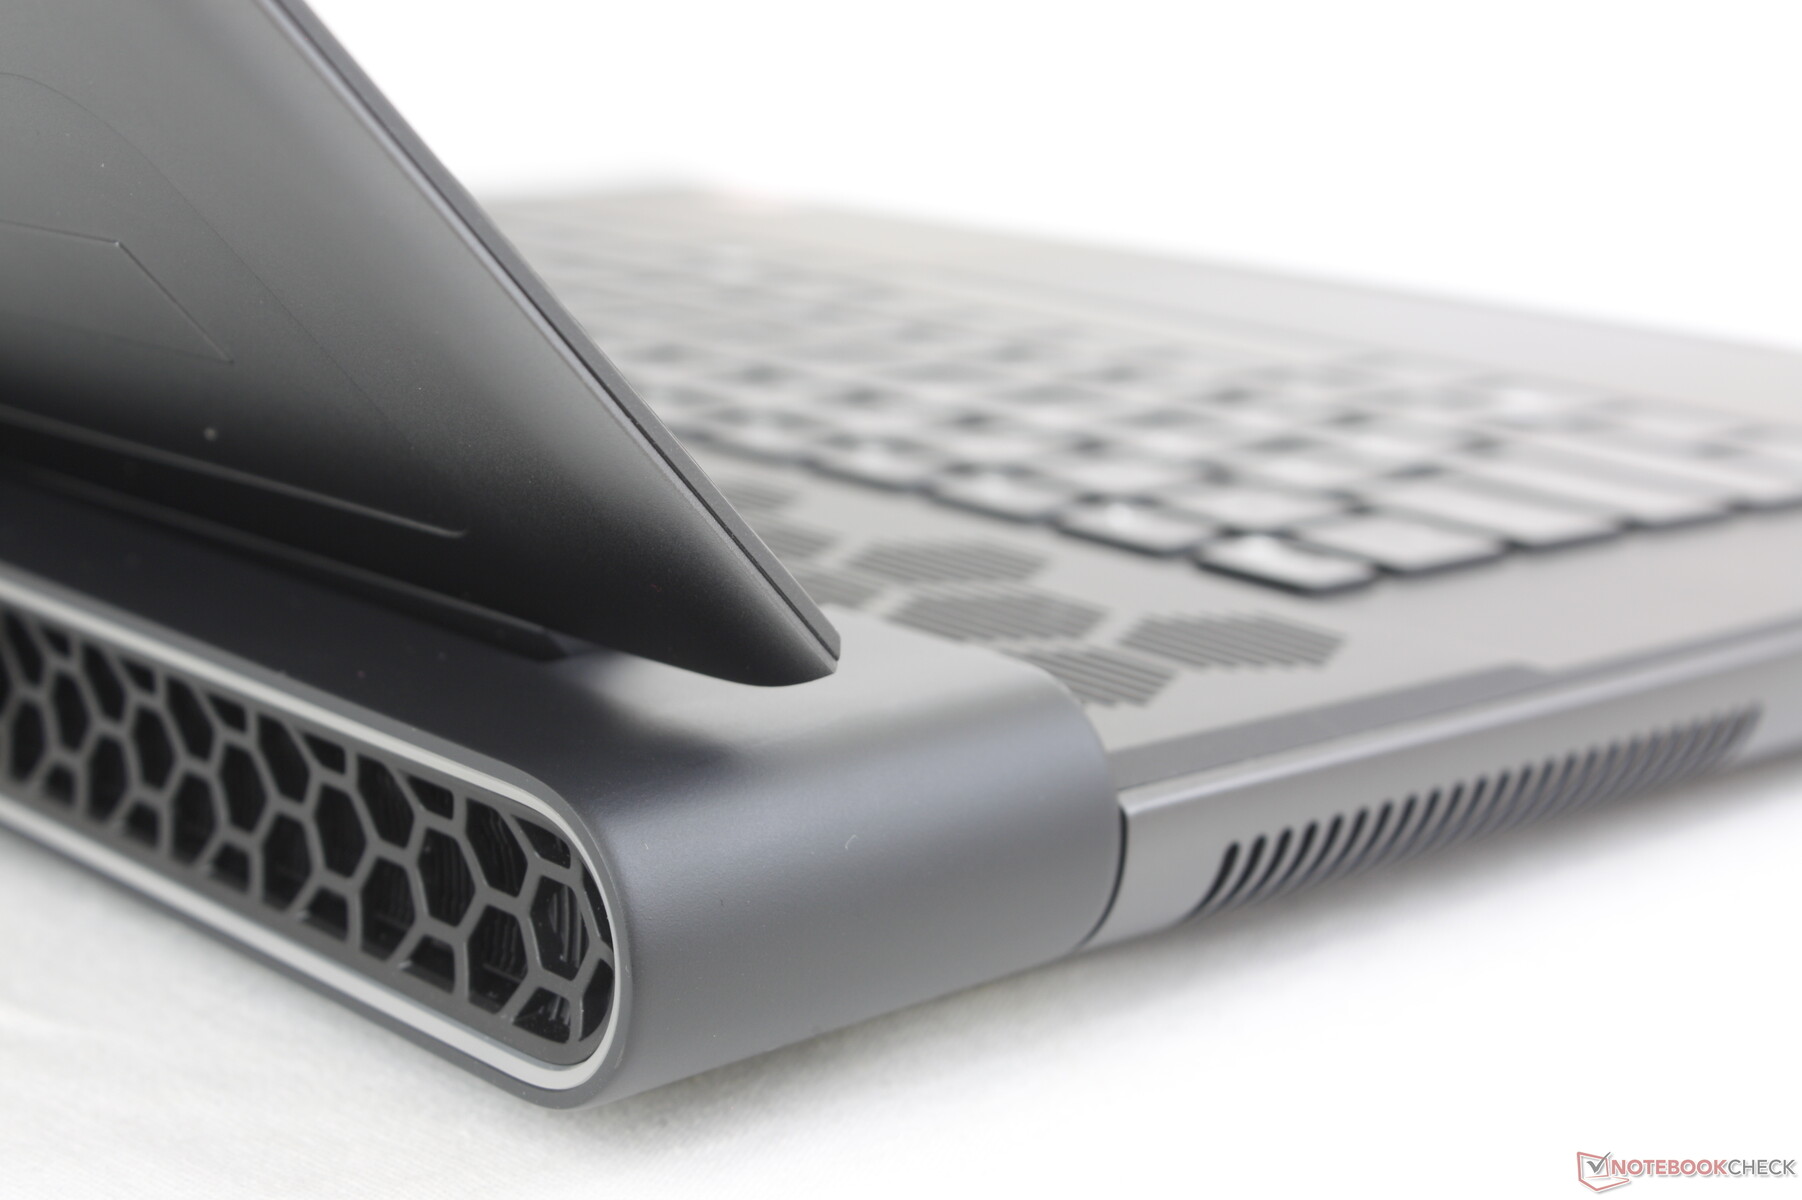
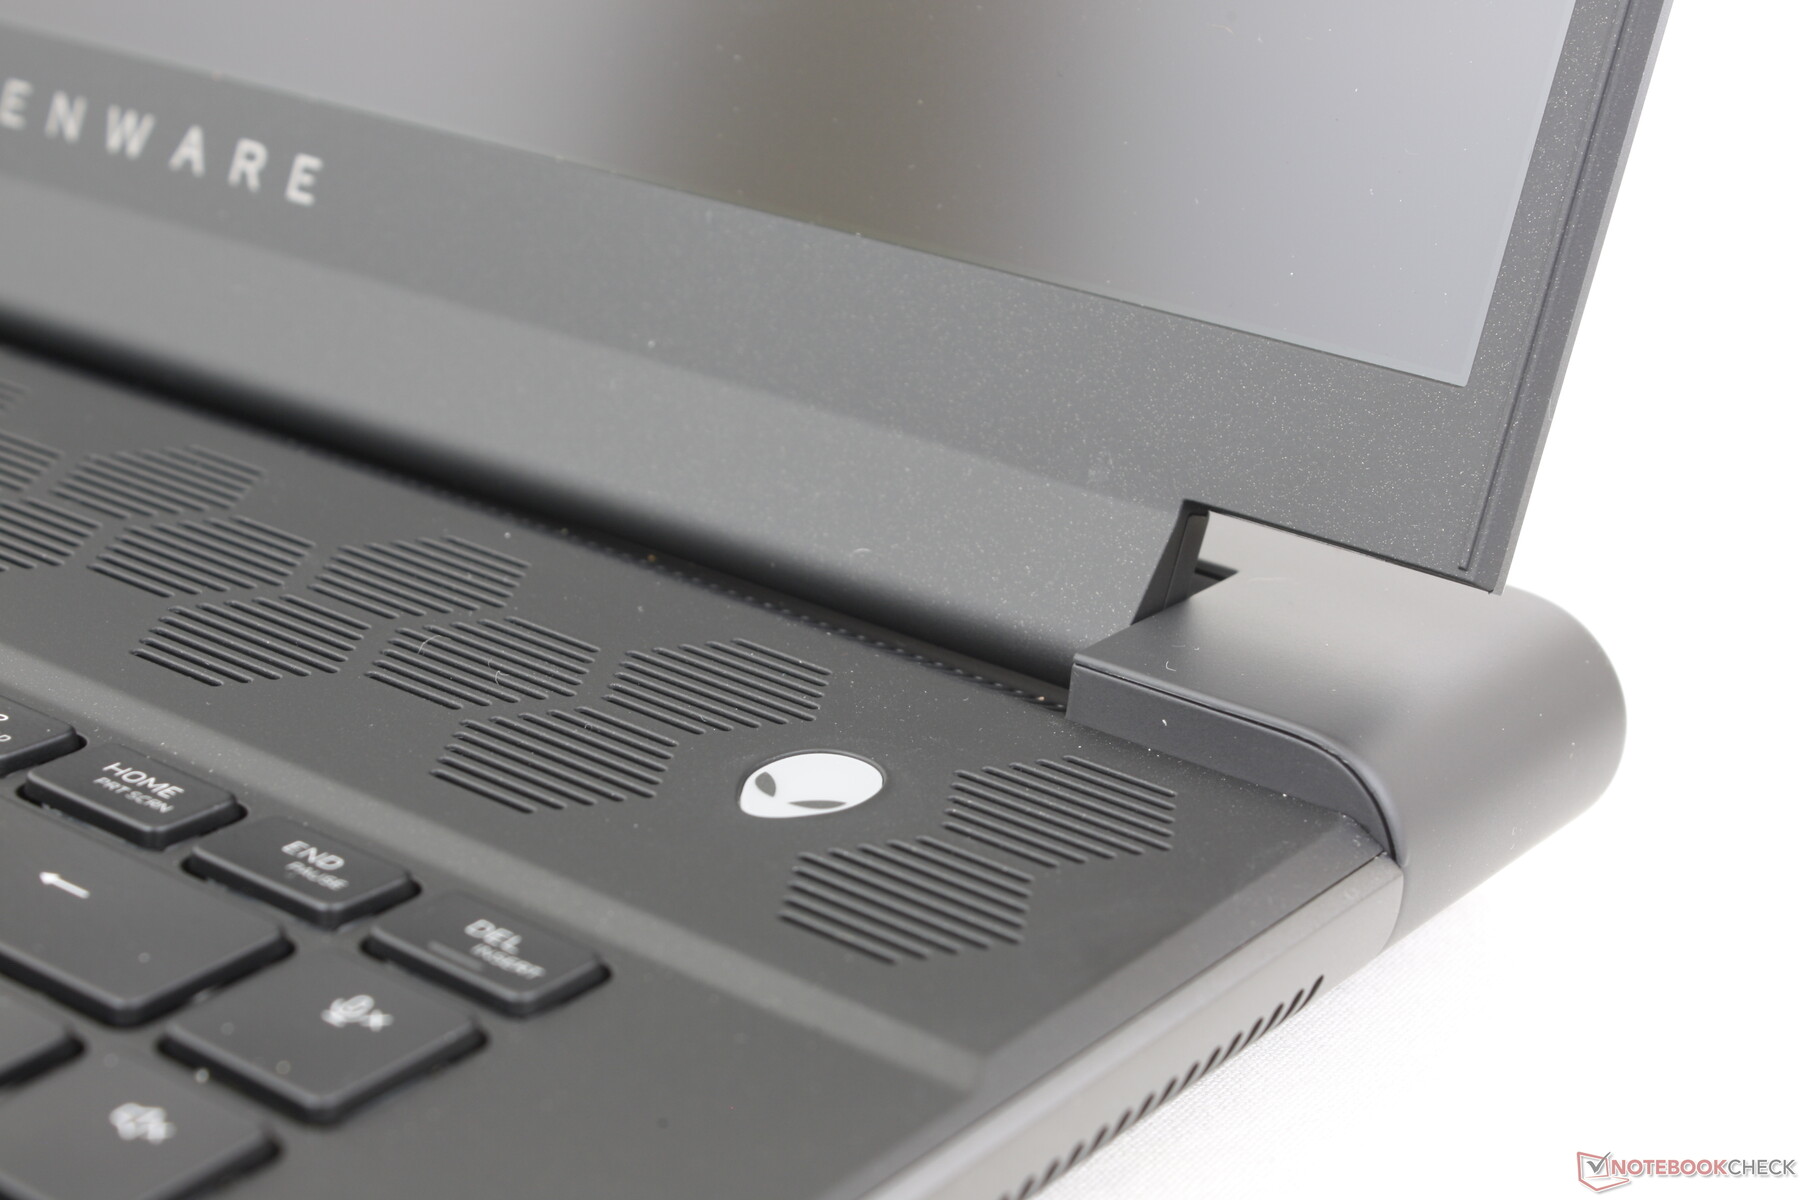
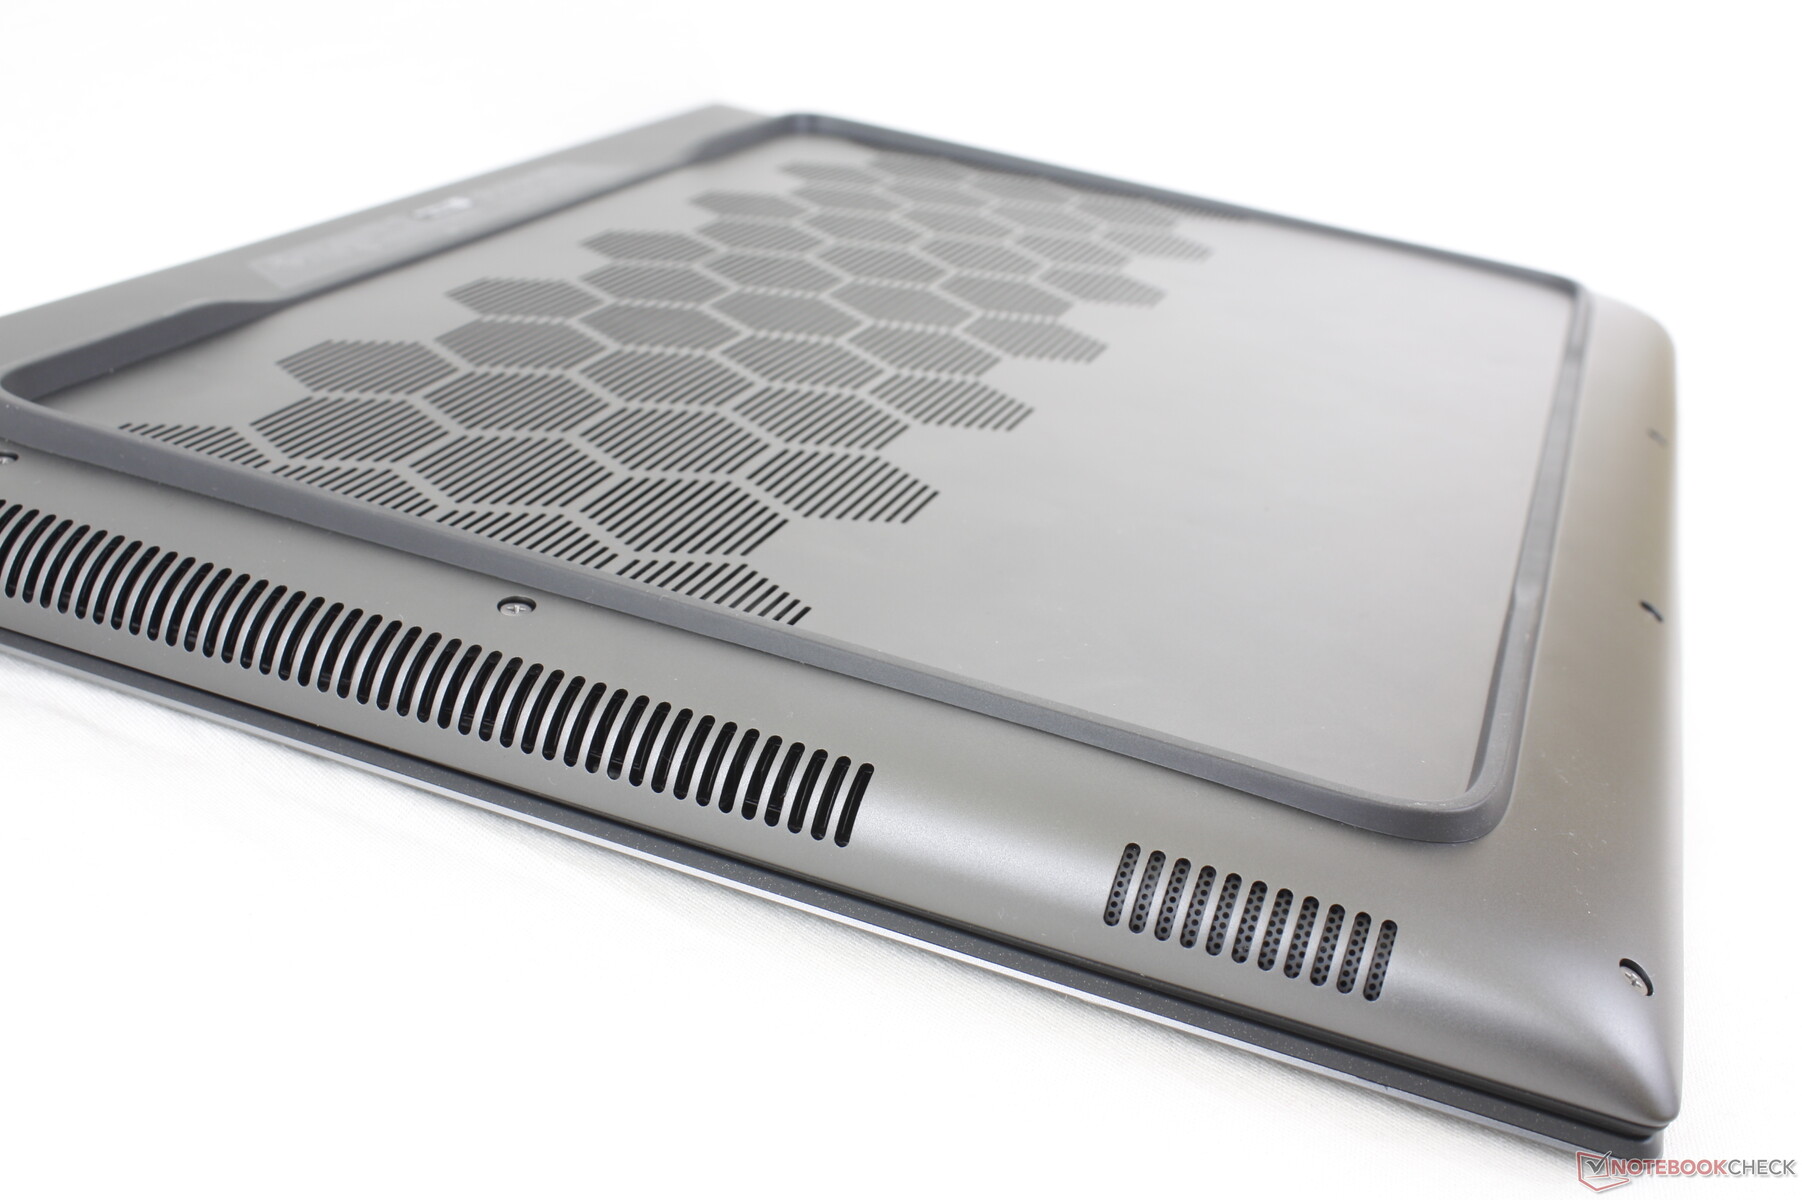
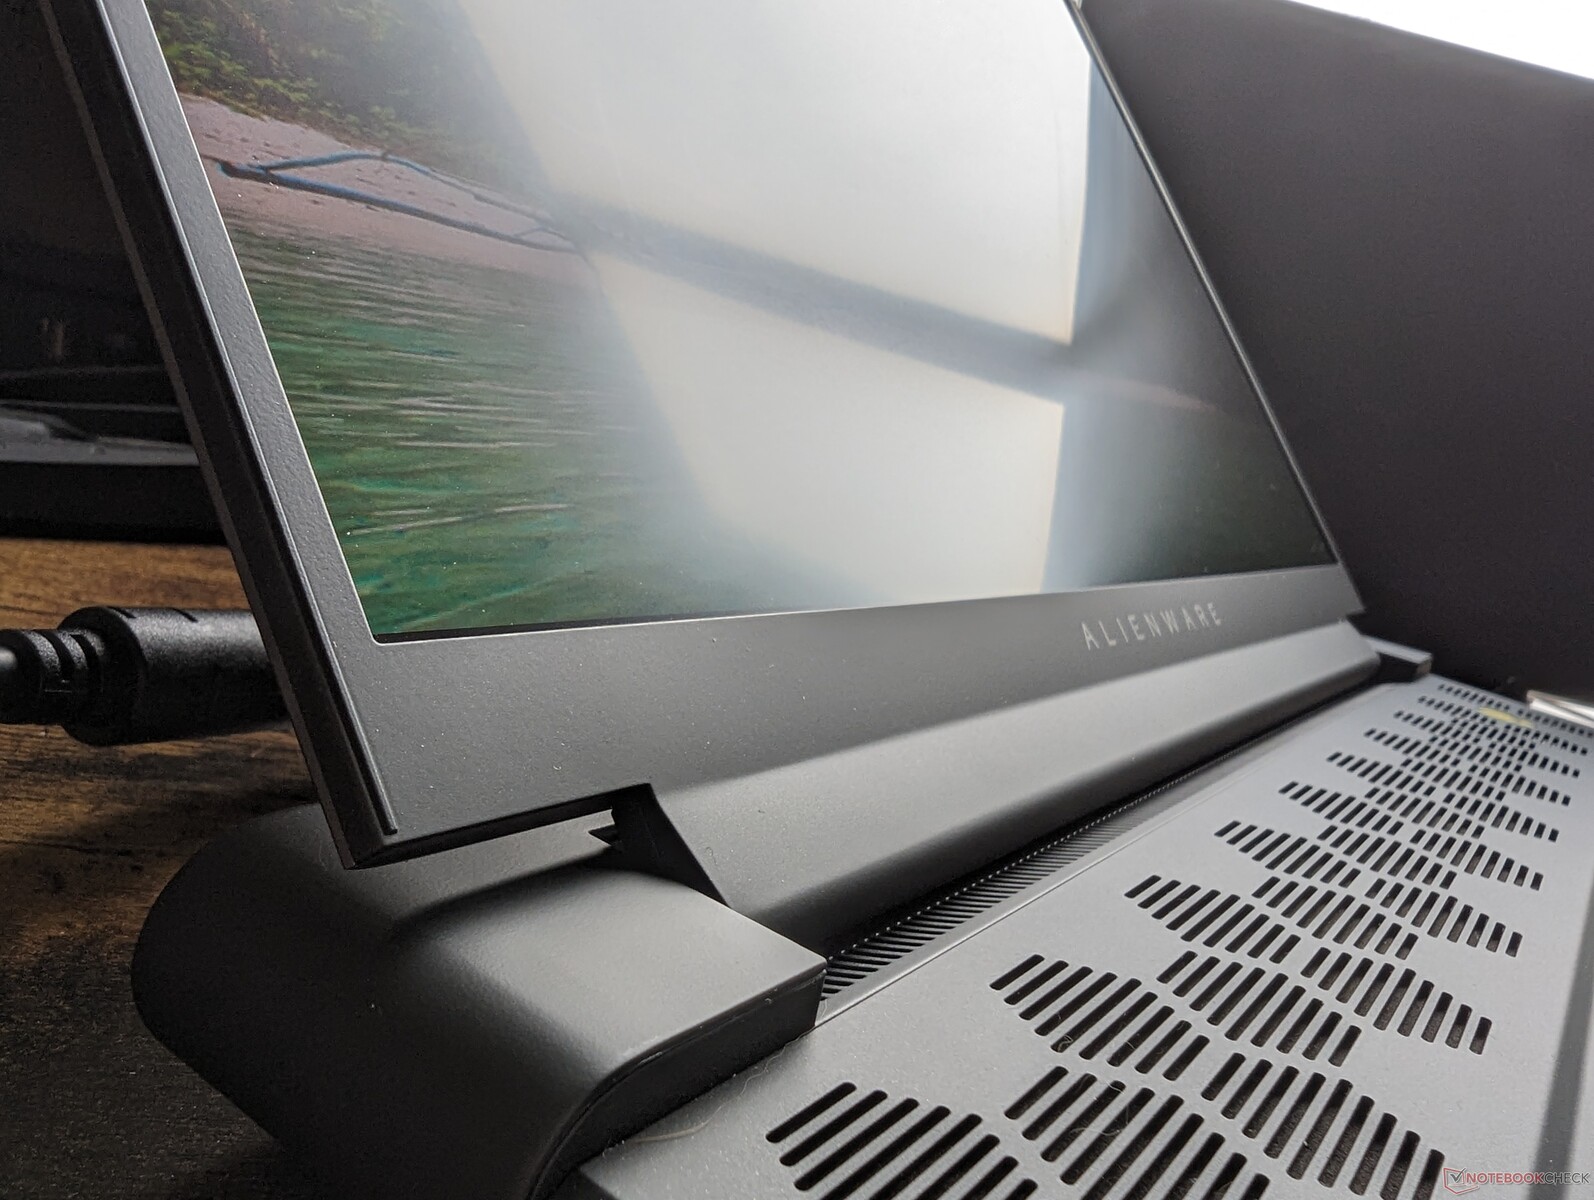
Case — Unmistakably Alienware
The chassis is essentially a thicker version of the Alienware x16 R1 as both models are based on the same Legend 3.0 industrial design. The rubberized perimeter foot, aluminum outer lid, hexagonal ventilation grilles, rear LED ring, and matte black keyboard deck are a combination not seen on any competing model. The base, lid, and hinges are all firm with no audible creaking when attempting to twist or bend them for stronger first impressions than an Asus TUF Gaming A16 or Lenovo Legion Pro 7 16.
The black palm rests, clickpad, and keyboard keys continue to be fingerprint magnets. Dell is not offering any other color options beyond Dark Metallic Moon at the moment.
The Alienware m16 R1 is one of the heaviest 16-inch gaming laptops and also one of the largest in terms of length and width due to its extended rear. Its dense design makes for a very sturdy build albeit at the cost of portability. The Legion Pro 7, for example, is 400 g lighter and with a much smaller footprint while offering similar HX-class CPUs and high-end GPUs.
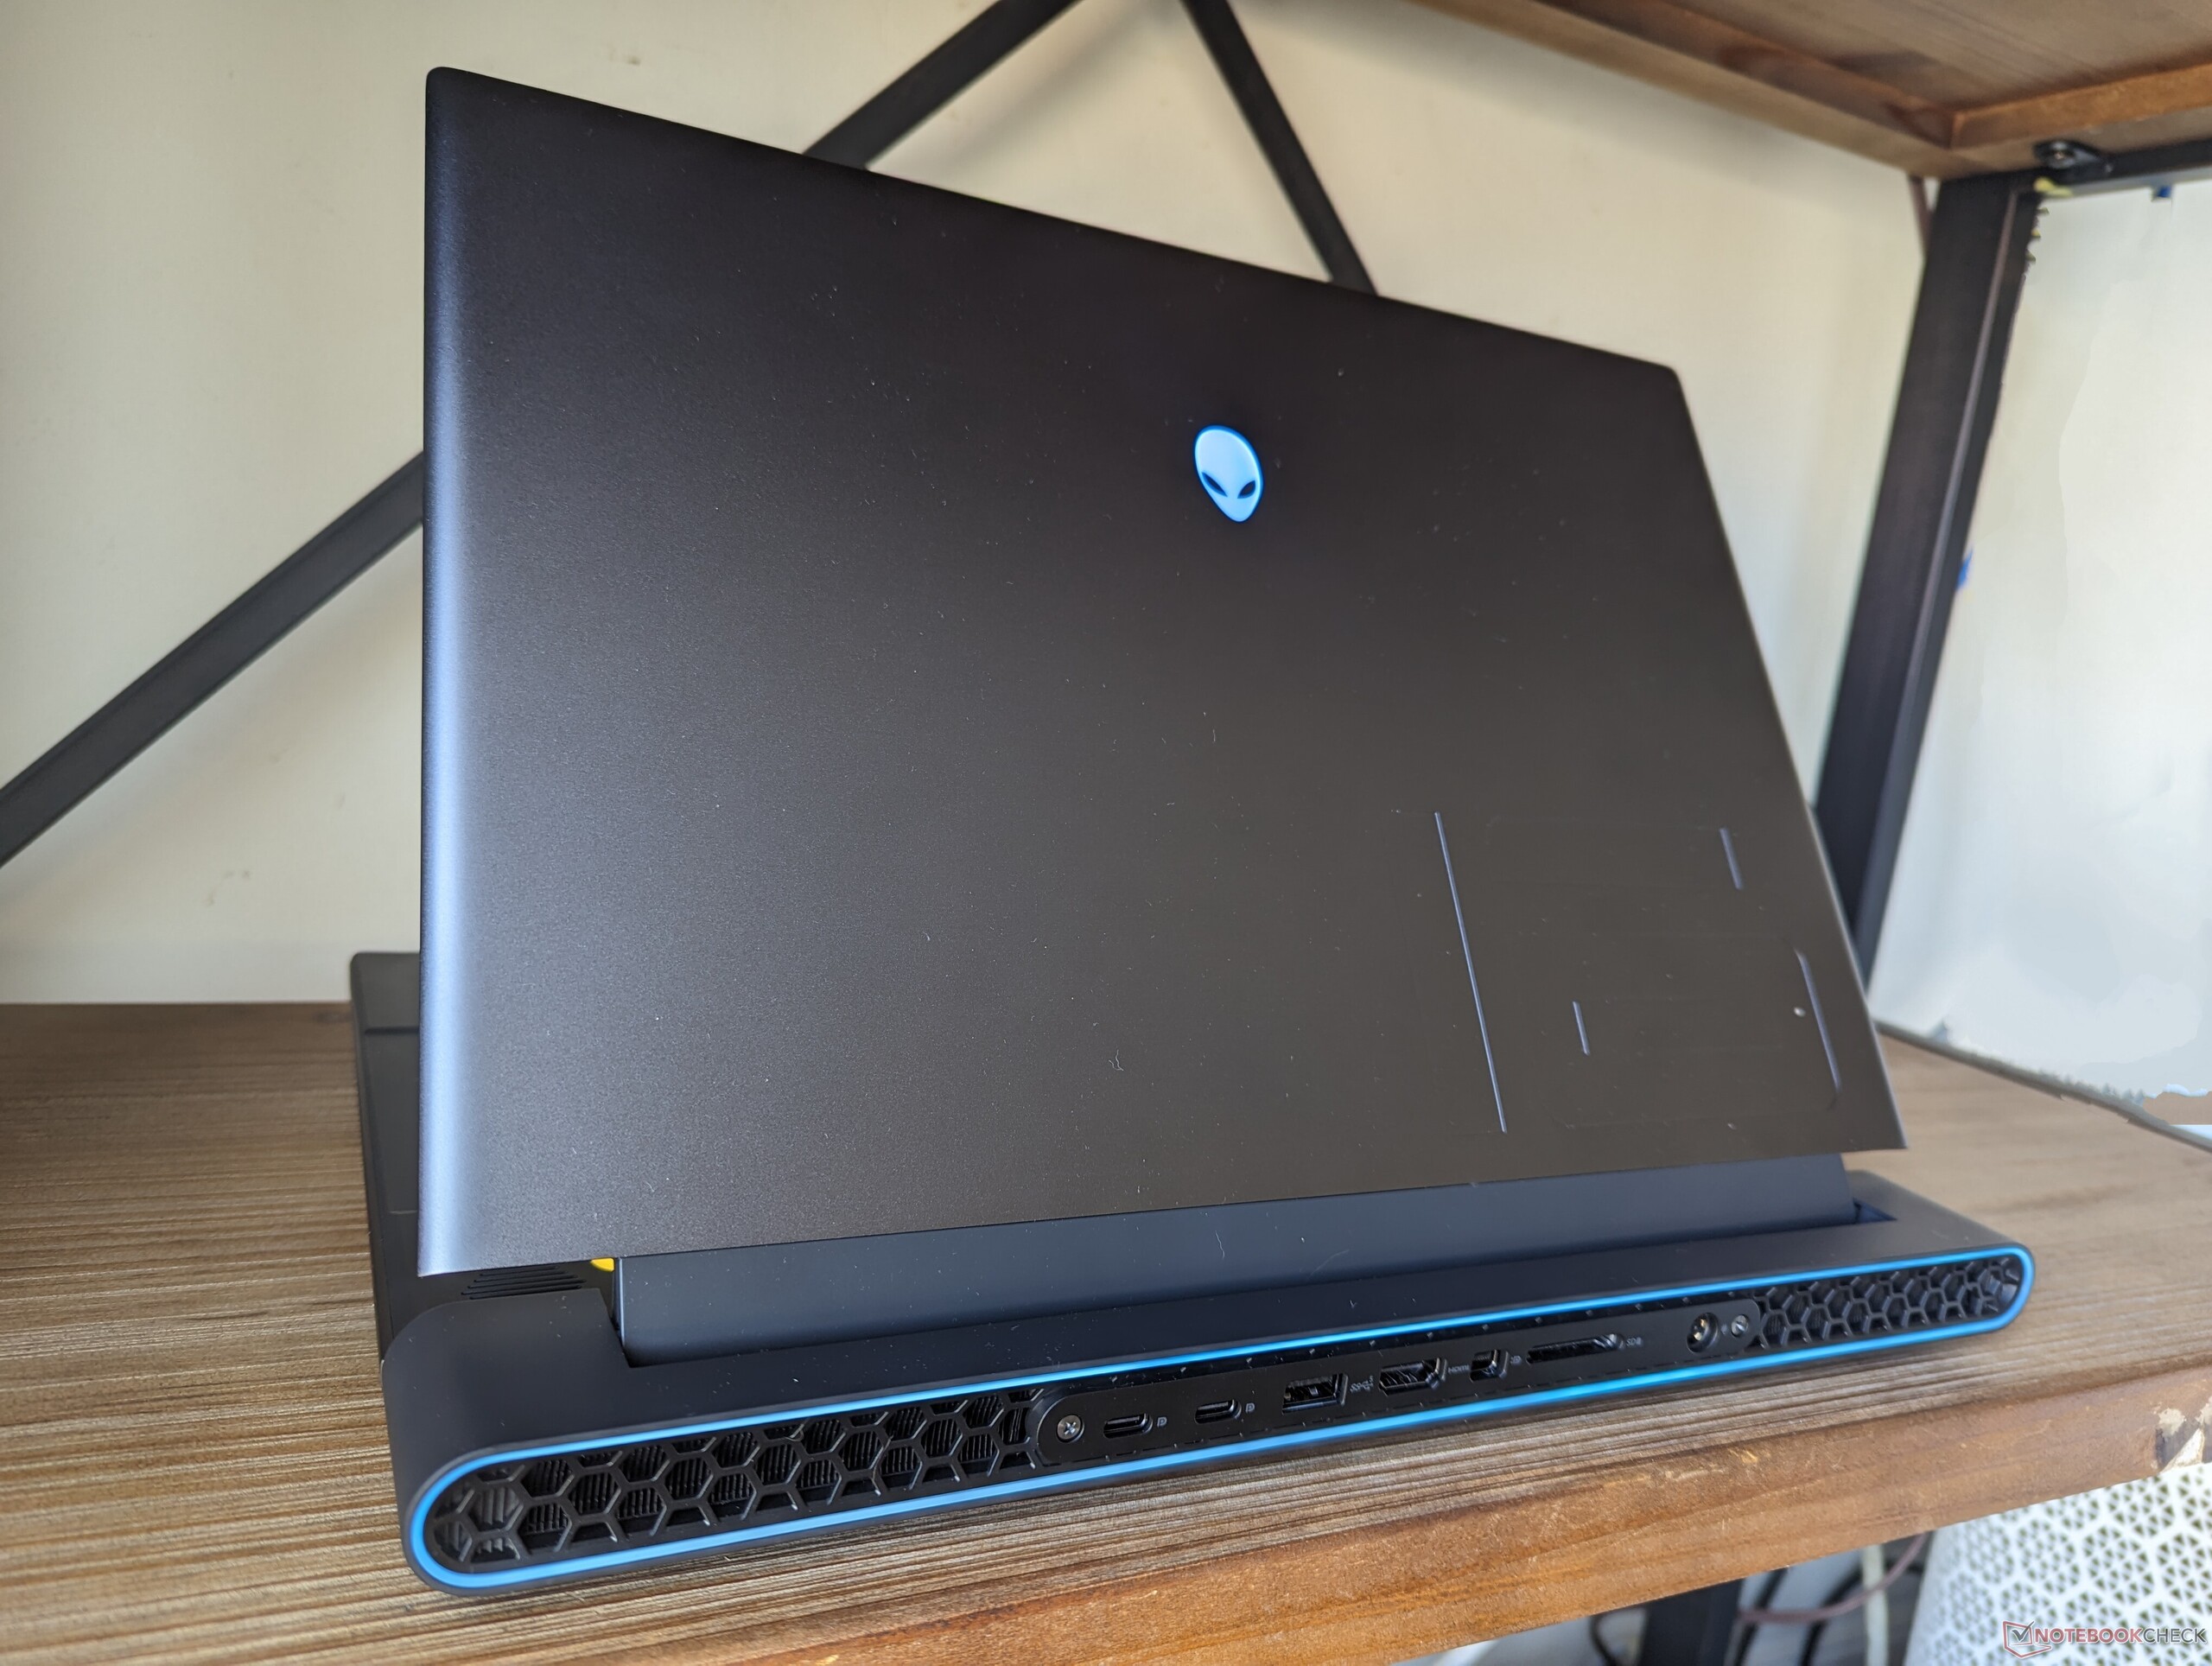
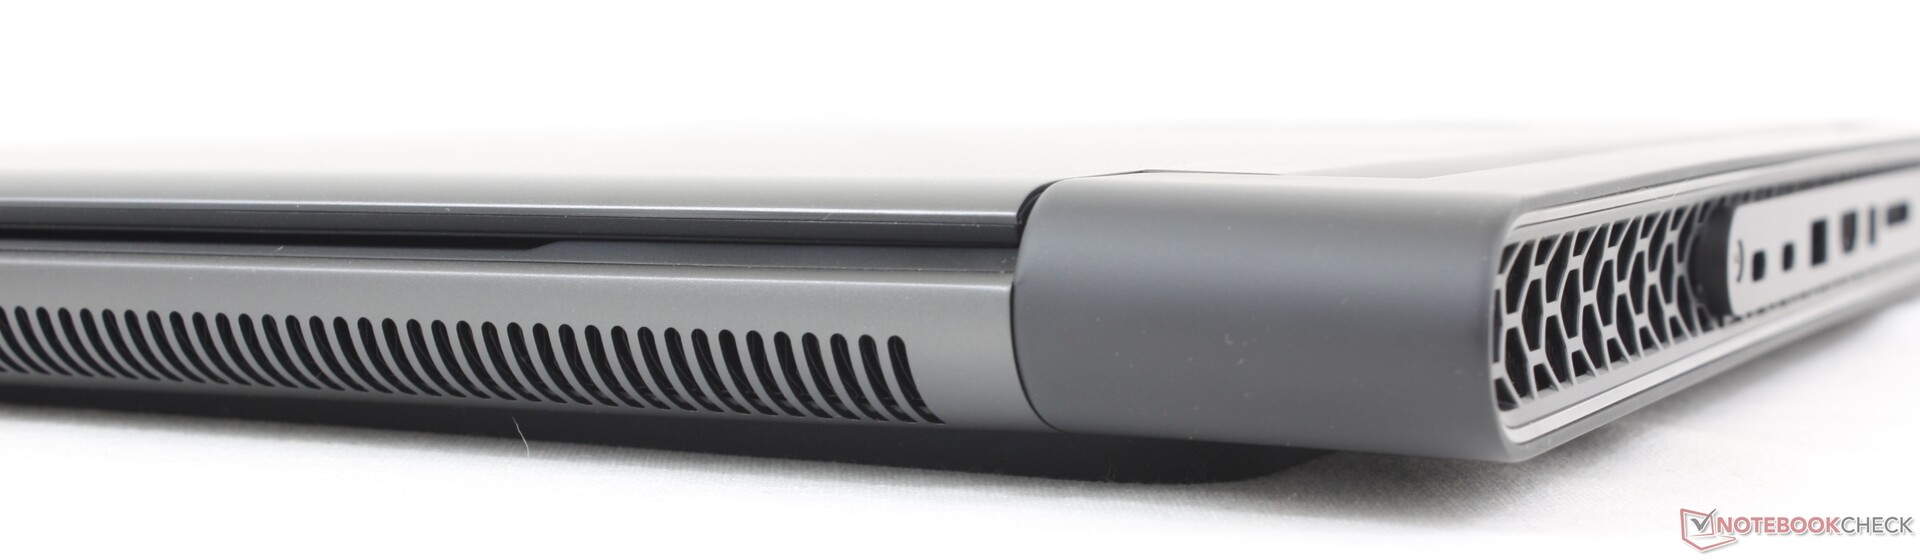
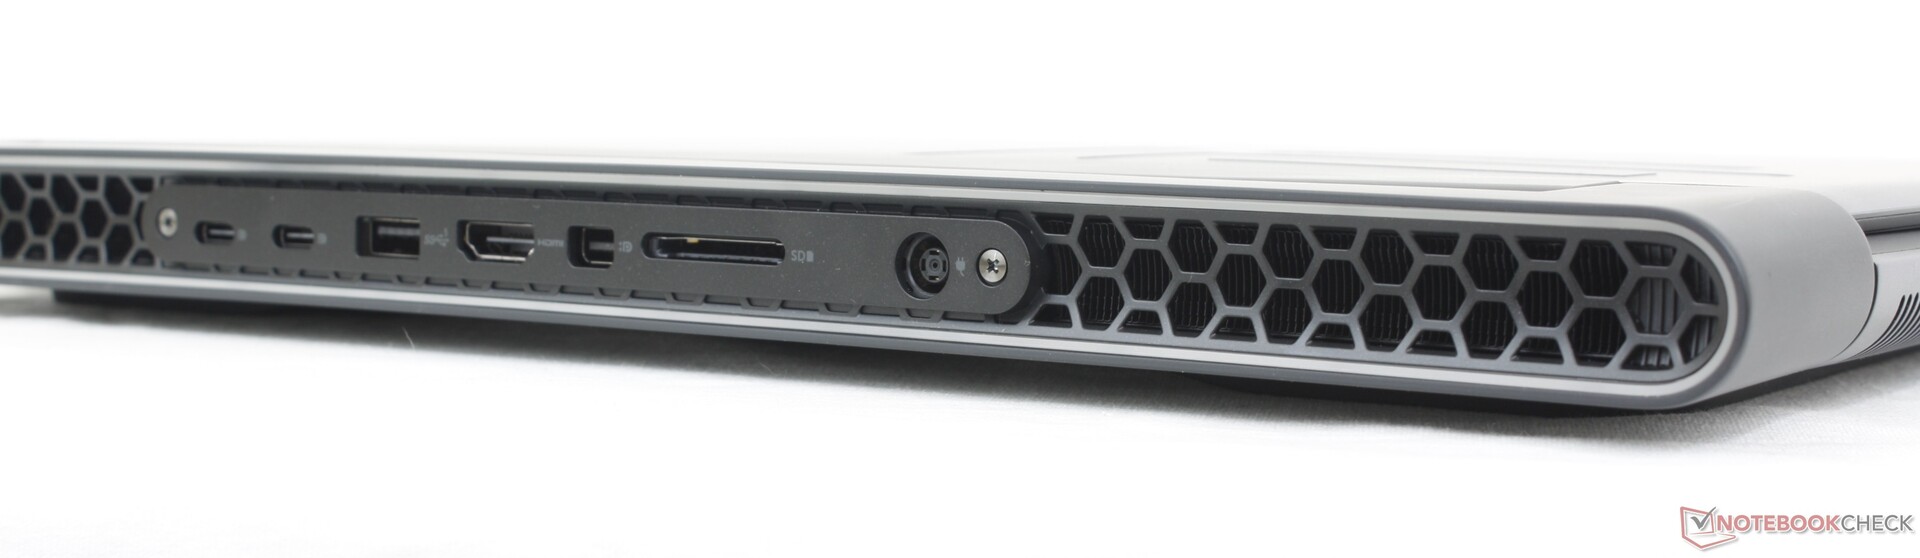
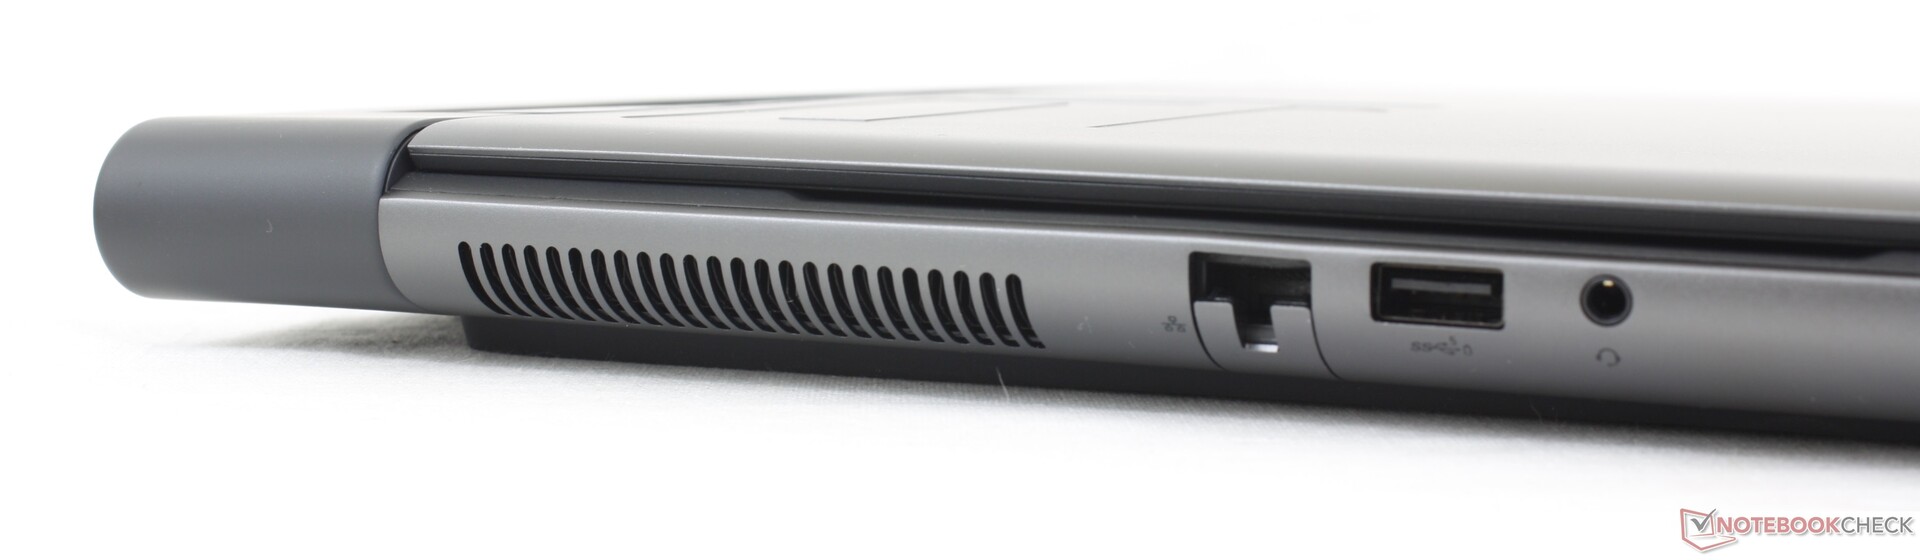
Connectivity — Thunderbolt For Intel Versions Only
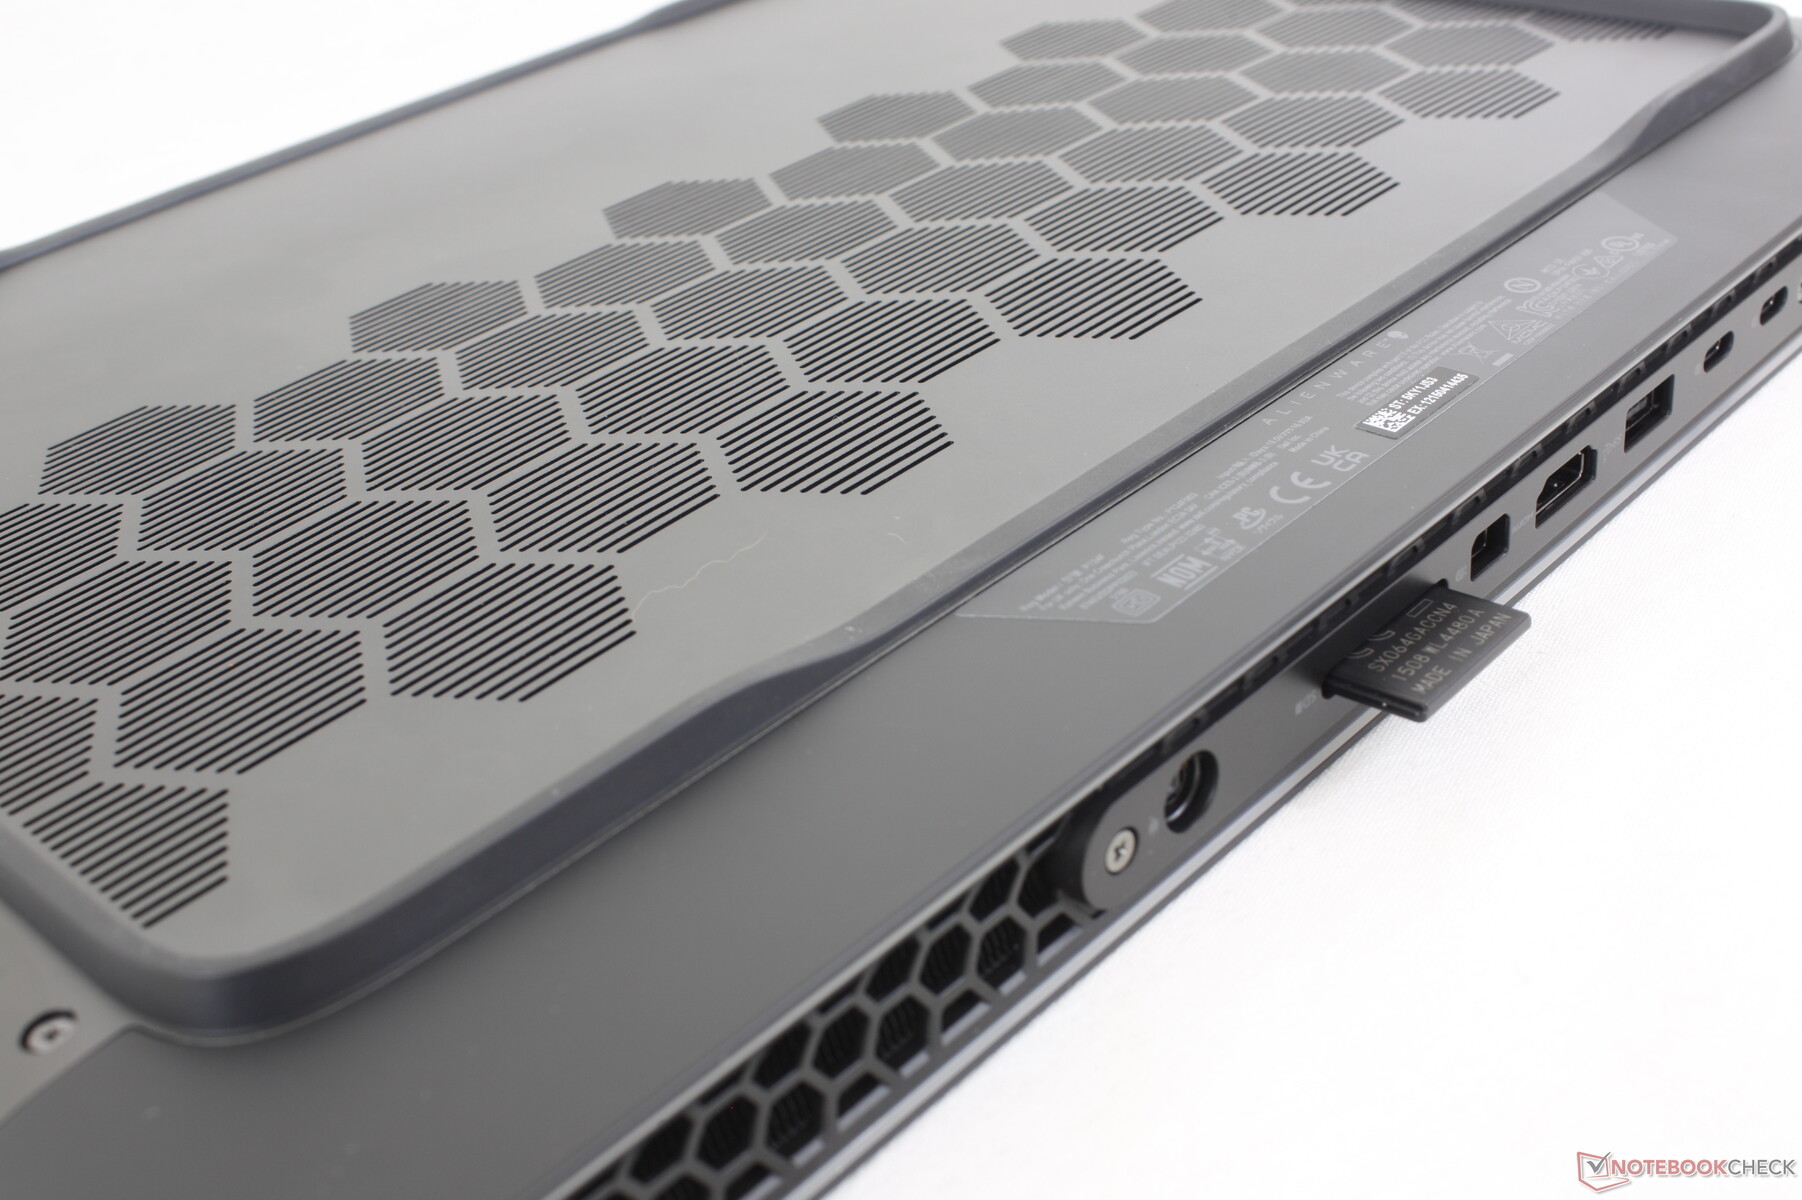
Port options include everything found on the Alienware x16 R1 plus RJ-45 and a full-size SD reader instead of MicroSD. A few ports have also been relocated to the left edge whereas they are all crammed along the rear on the x16. The mini-DisplayPort is notable as well since it is uncommon on newer gaming laptops.
USB4 and Thunderbolt are not supported on our AMD model.
SD Card Reader
Transfer rates from the SD card reader are faster than on most other gaming laptops which should satisfy content creators. Moving 1 GB of pictures from our UHS-II test card to desktop takes just over 5 seconds.
| SD Card Reader | |
| average JPG Copy Test (av. of 3 runs) | |
| Alienware m16 R1 AMD (Toshiba Exceria Pro SDXC 64 GB UHS-II) | |
| Razer Blade 16 Early 2023 (AV PRO microSD 128 GB V60) | |
| Alienware x16 R1 (AV PRO microSD 128 GB V60) | |
| maximum AS SSD Seq Read Test (1GB) | |
| Alienware x16 R1 (AV PRO microSD 128 GB V60) | |
| Alienware m16 R1 AMD (Toshiba Exceria Pro SDXC 64 GB UHS-II) | |
| Razer Blade 16 Early 2023 (AV PRO microSD 128 GB V60) | |
Communication
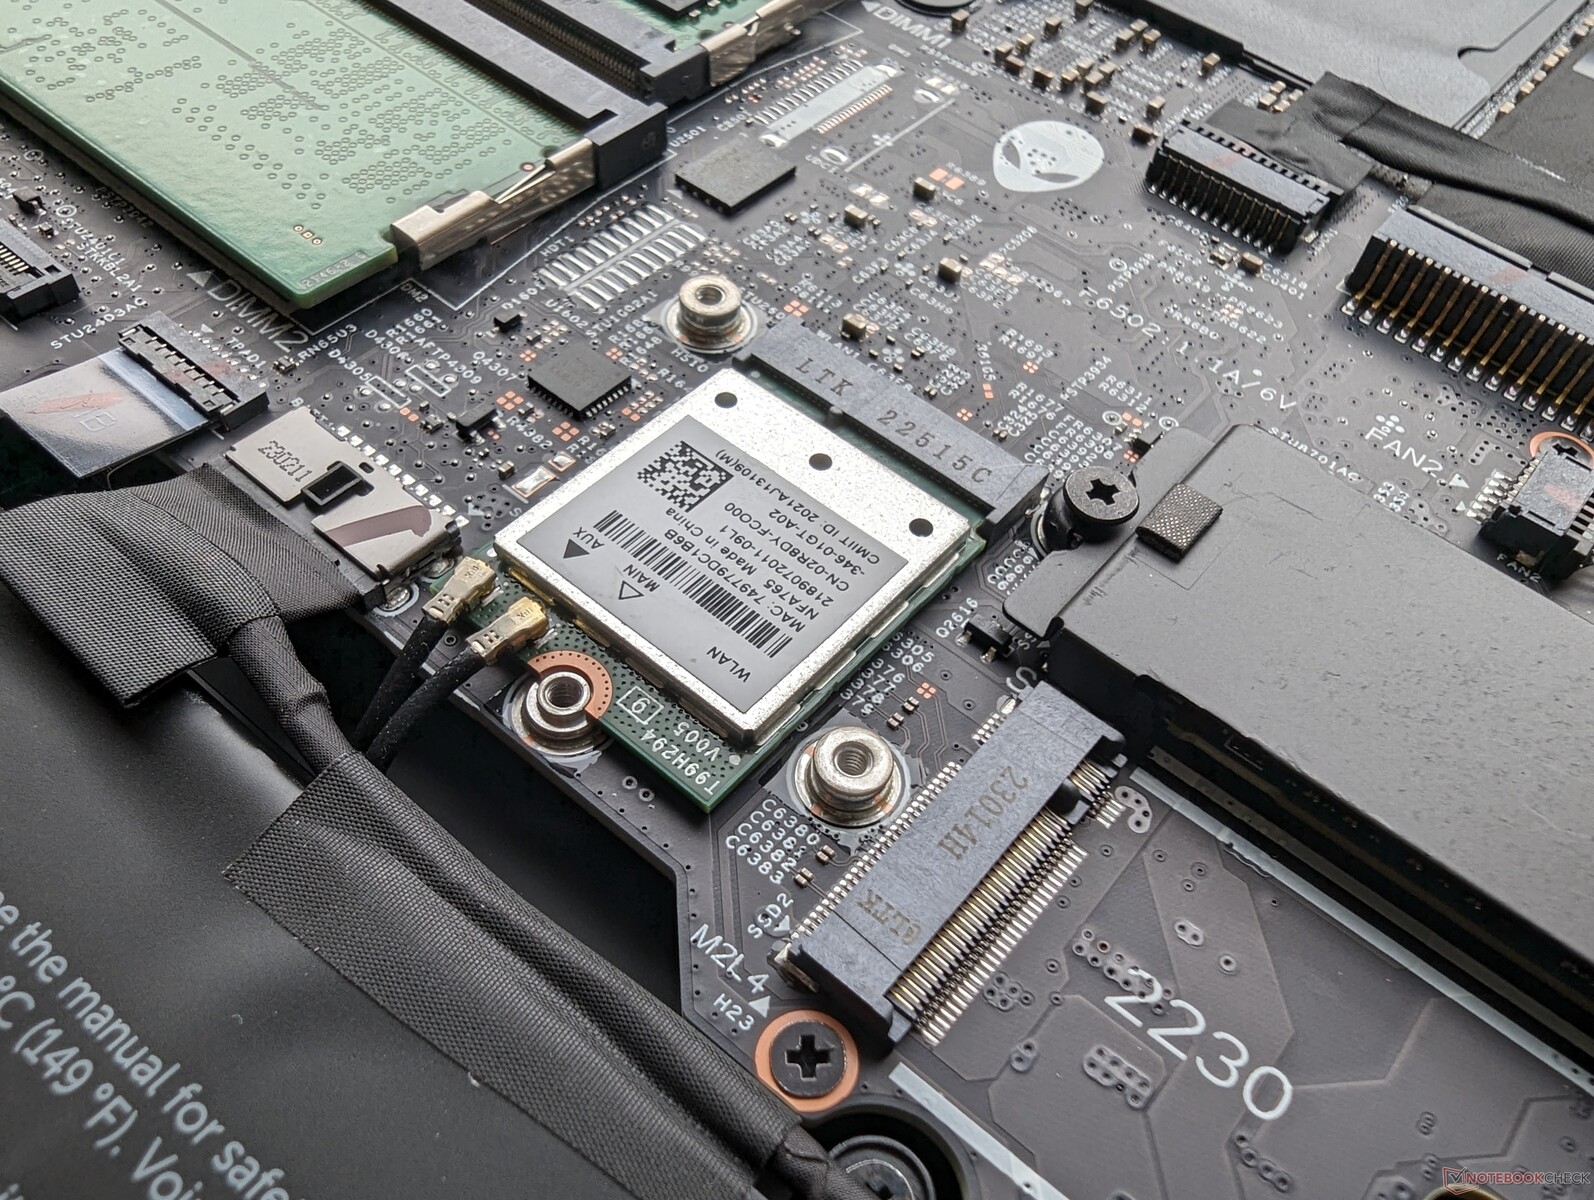
AMD SKUs come with the Qualcomm WCN685x while Intel SKUs come with the Killer AX1675 each with Wi-Fi 6E connectivity. Performance is both steady and reliable when paired to our 6 GHz network.
| Networking | |
| iperf3 transmit AXE11000 | |
| Lenovo Legion Pro 7 RTX4090 | |
| Asus ROG Strix G16 G614JZ | |
| Alienware m16 R1 AMD | |
| HP Omen Transcend 16 | |
| Razer Blade 16 Early 2023 | |
| Alienware x16 R1 | |
| iperf3 receive AXE11000 | |
| Lenovo Legion Pro 7 RTX4090 | |
| Asus ROG Strix G16 G614JZ | |
| Alienware m16 R1 AMD | |
| HP Omen Transcend 16 | |
| Razer Blade 16 Early 2023 | |
| Alienware x16 R1 | |
| iperf3 transmit AXE11000 6GHz | |
| Alienware m16 R1 AMD | |
| HP Omen Transcend 16 | |
| Razer Blade 16 Early 2023 | |
| Alienware x16 R1 | |
| iperf3 receive AXE11000 6GHz | |
| Alienware m16 R1 AMD | |
| HP Omen Transcend 16 | |
| Razer Blade 16 Early 2023 | |
| Alienware x16 R1 | |
Webcam
There is a 2 MP webcam with IR and no privacy shutter much like on the Alienware x16.


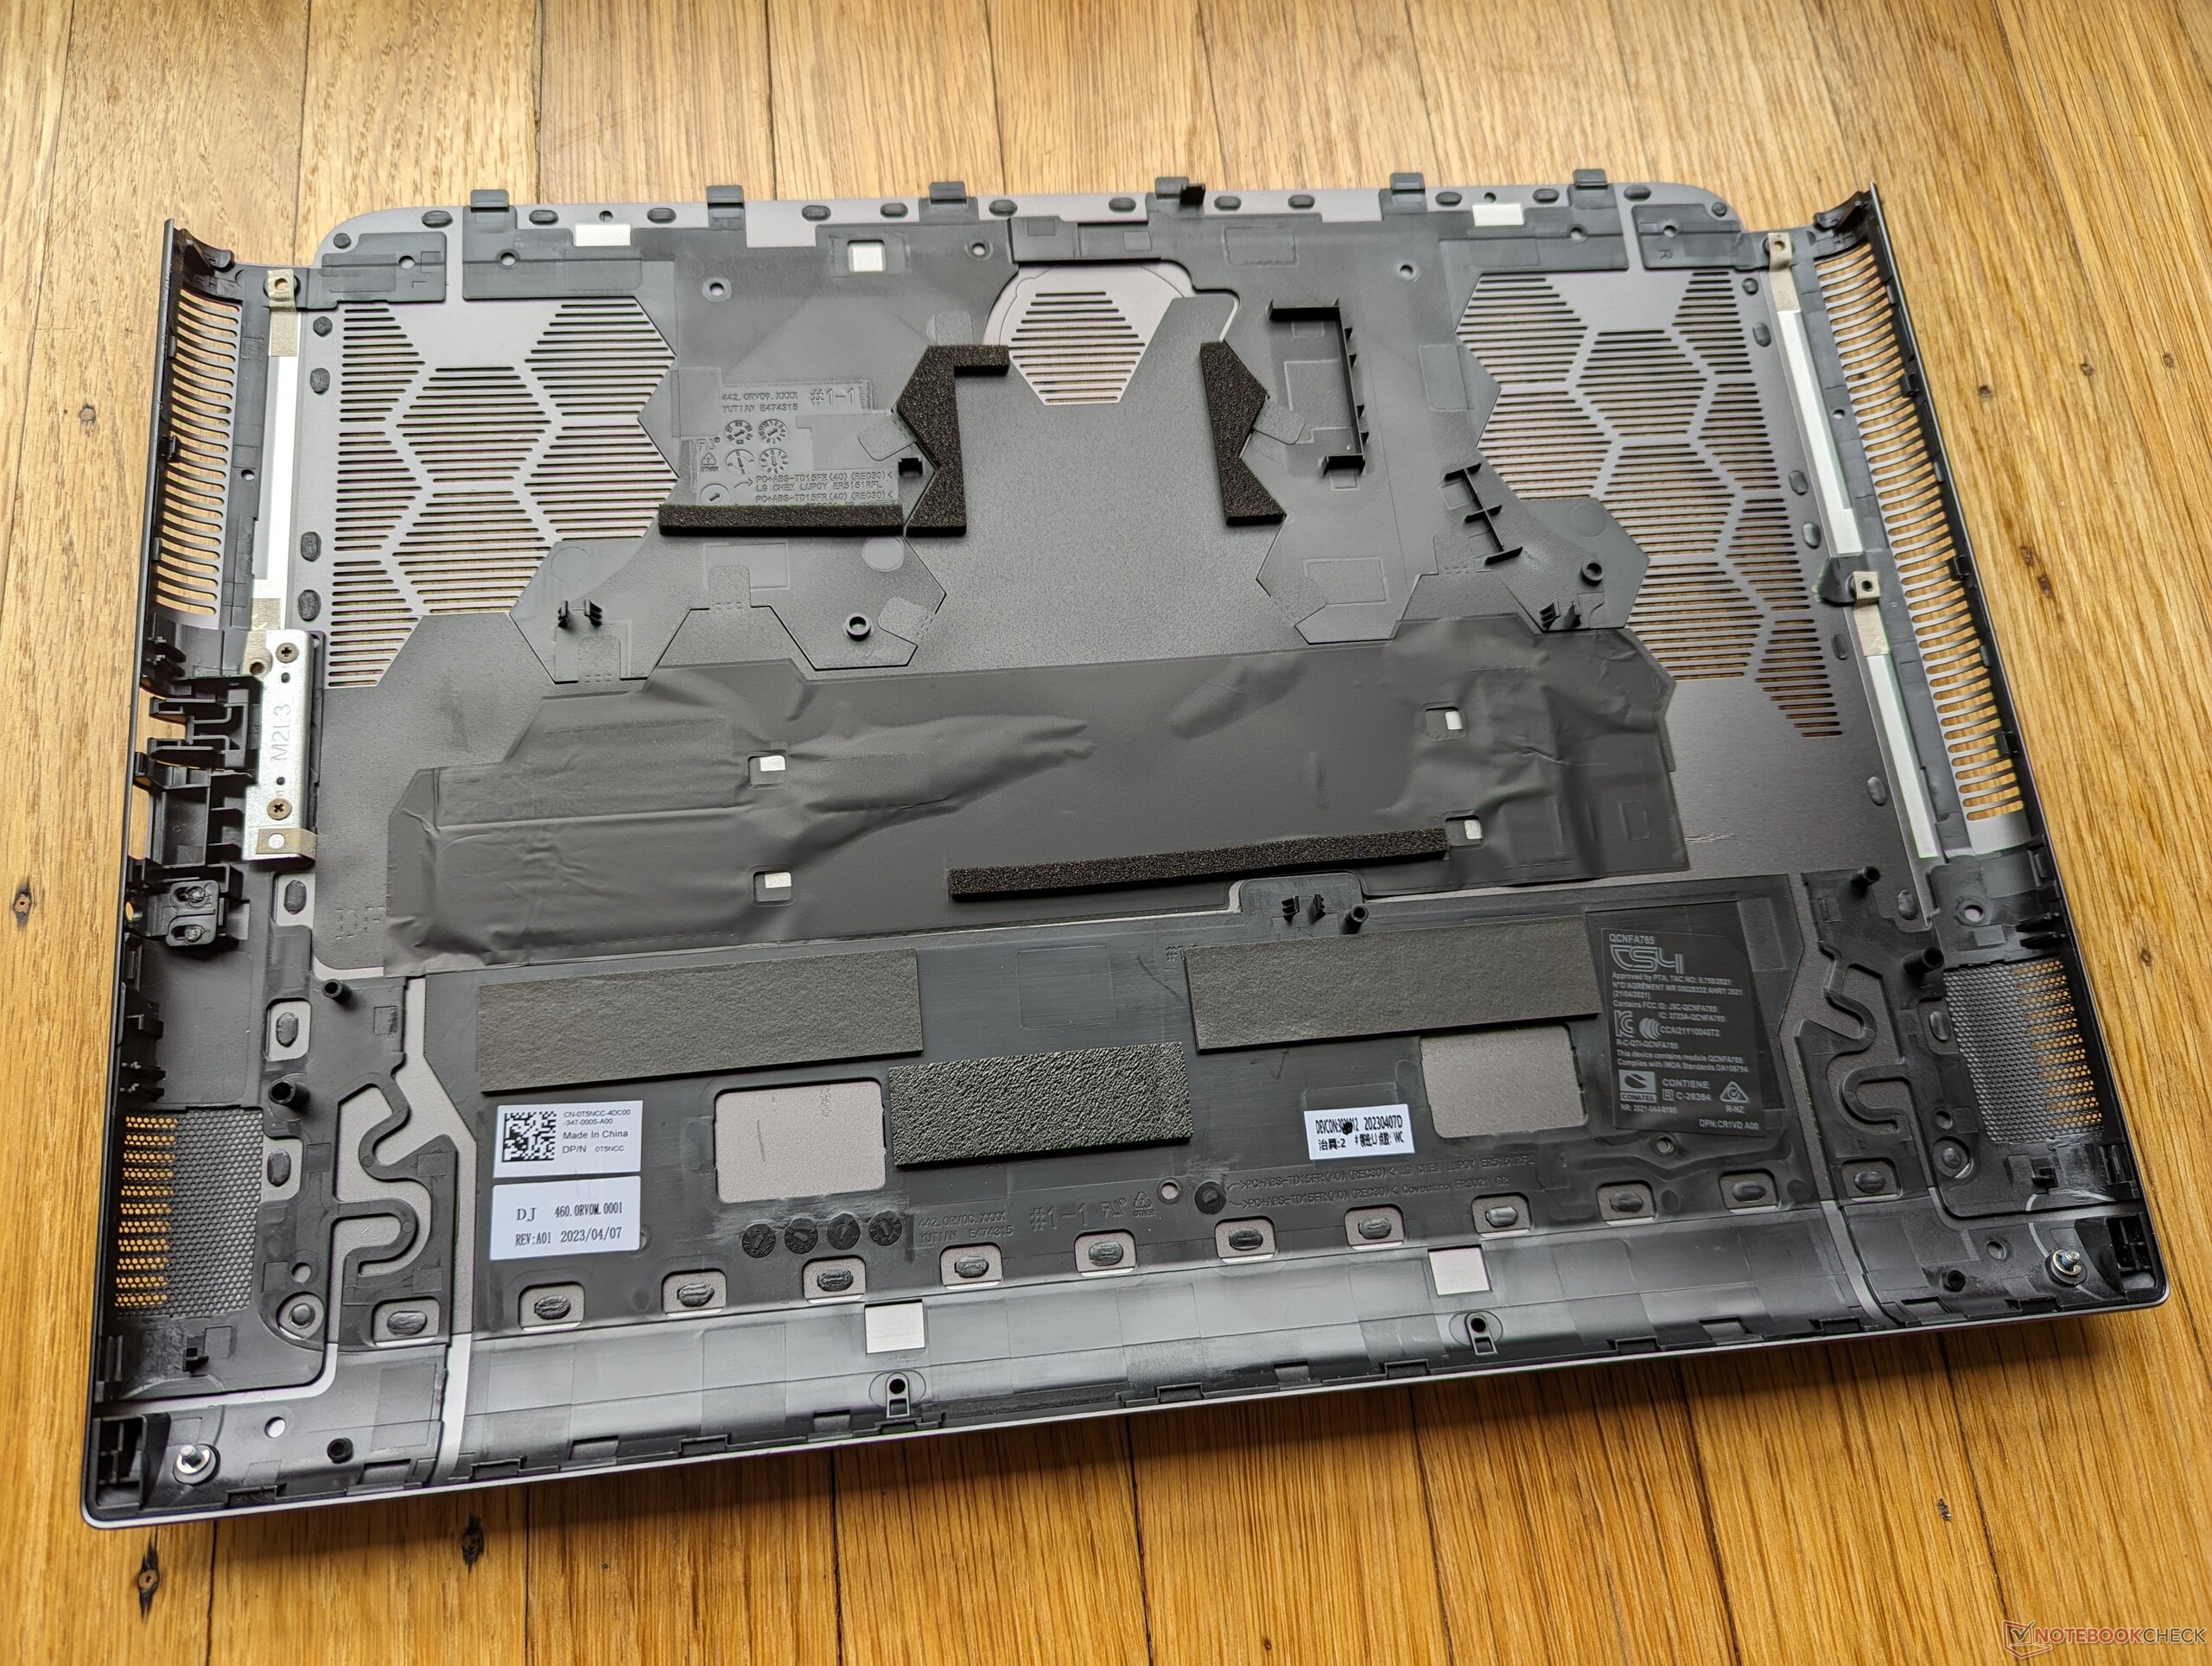
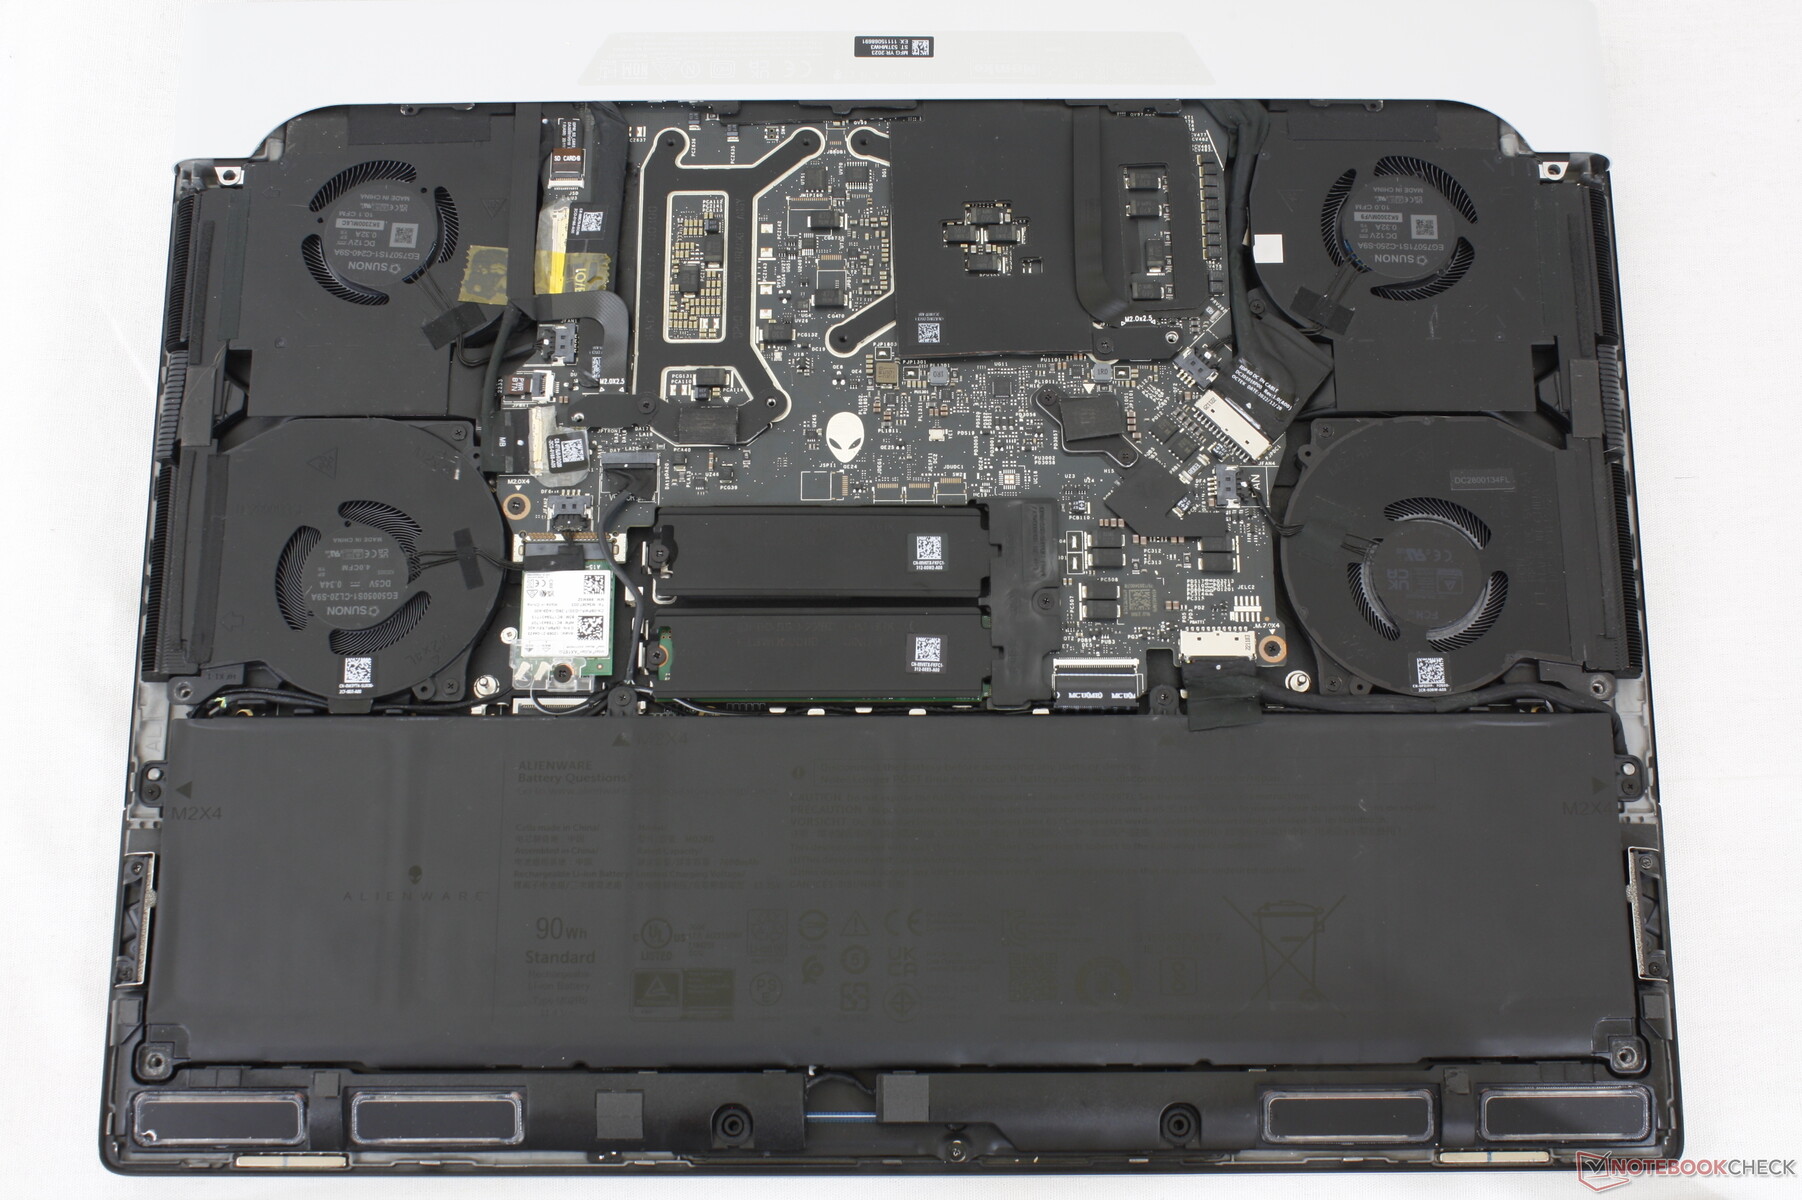
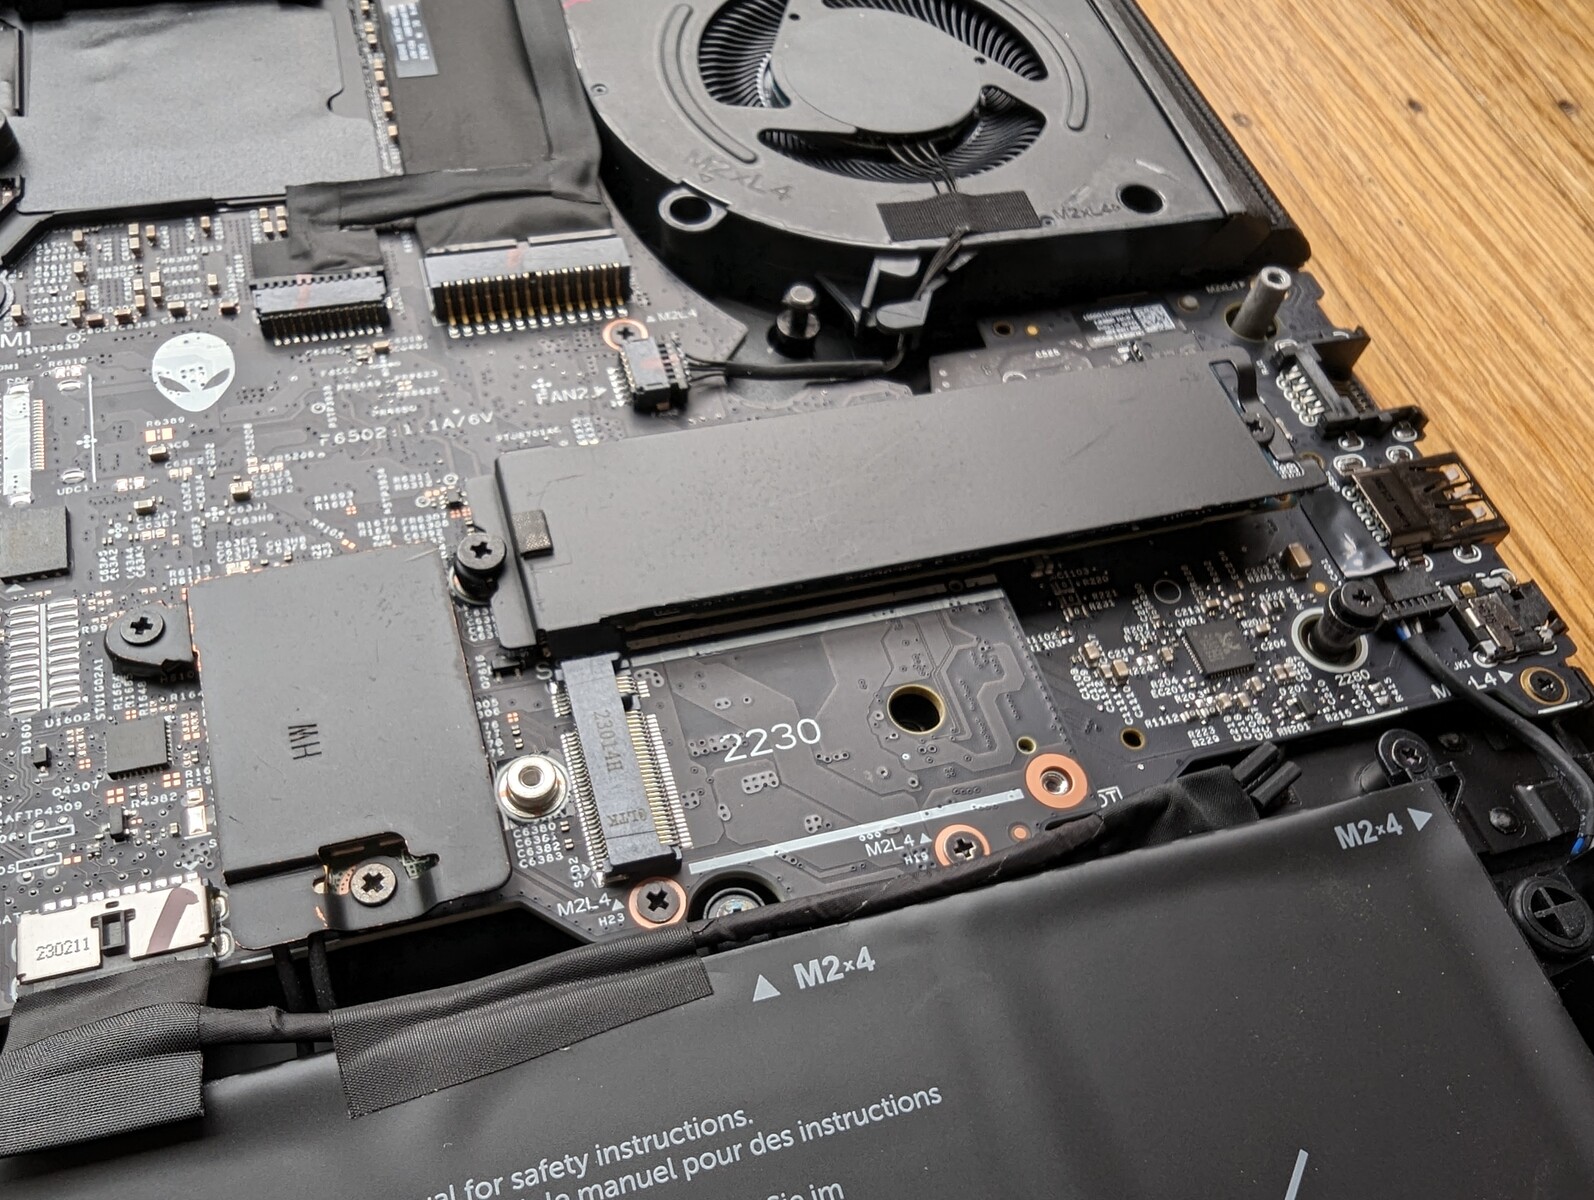
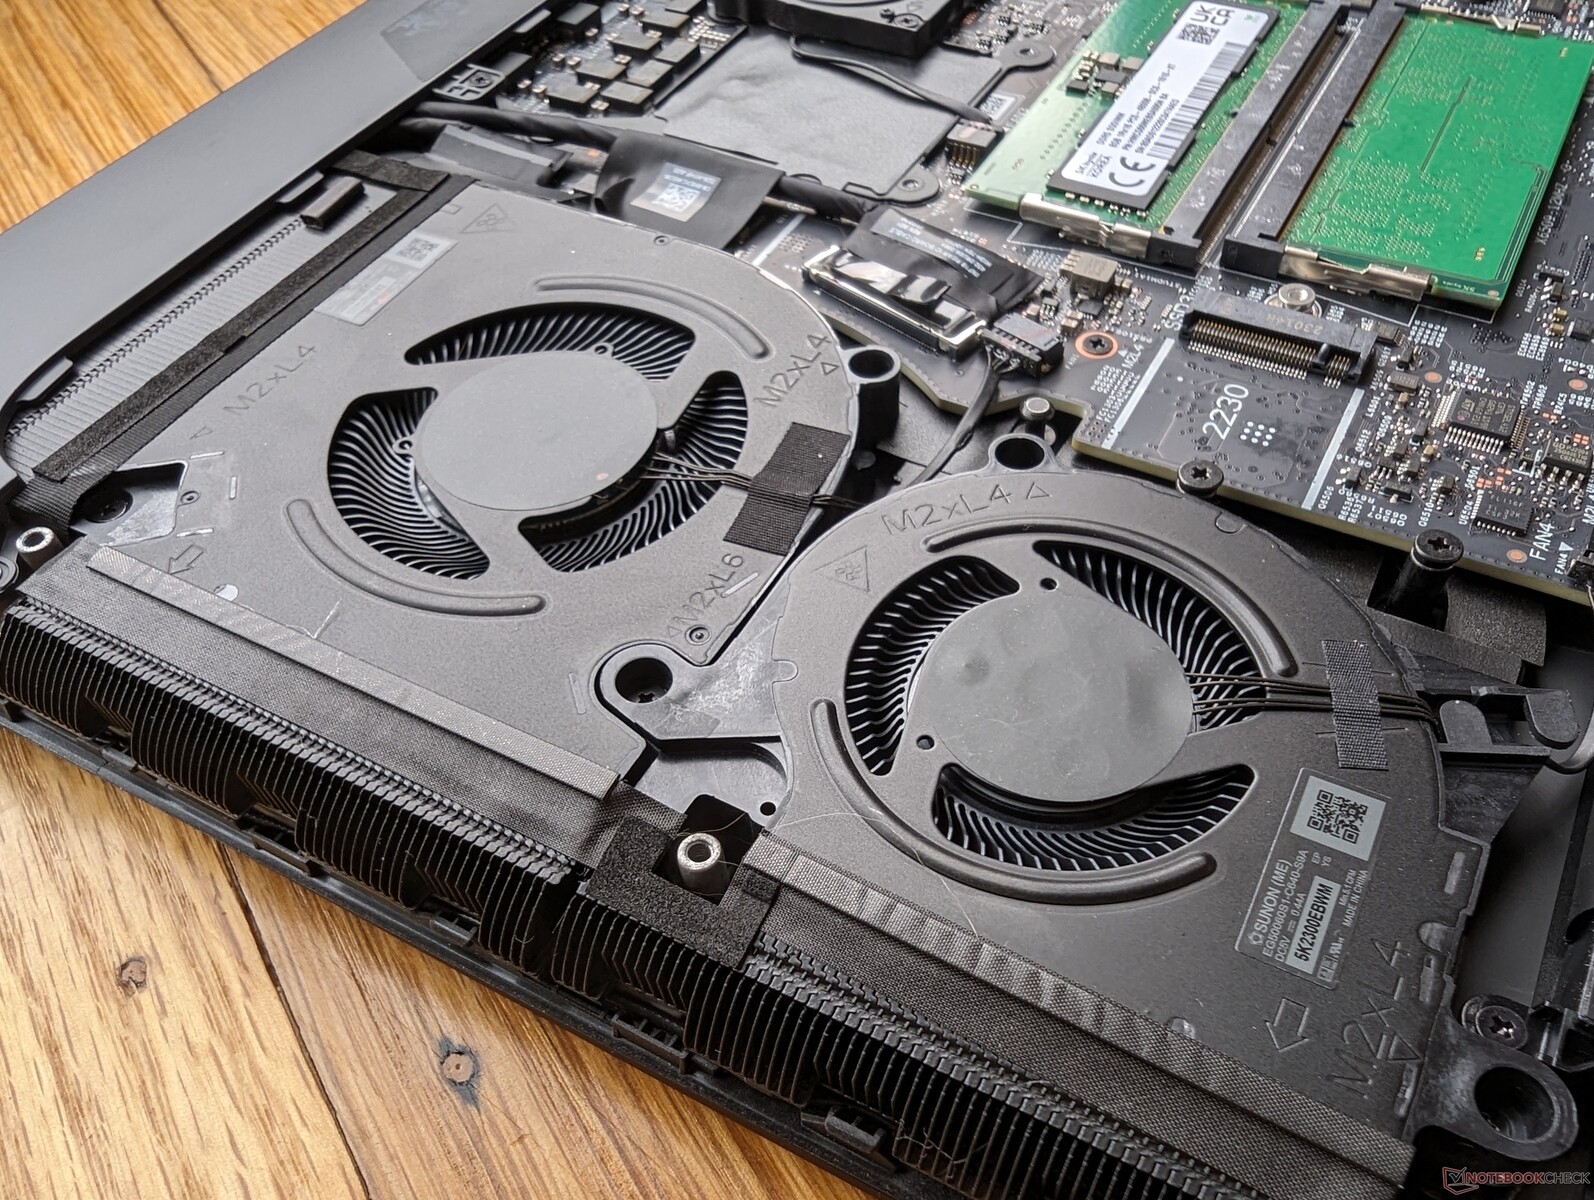
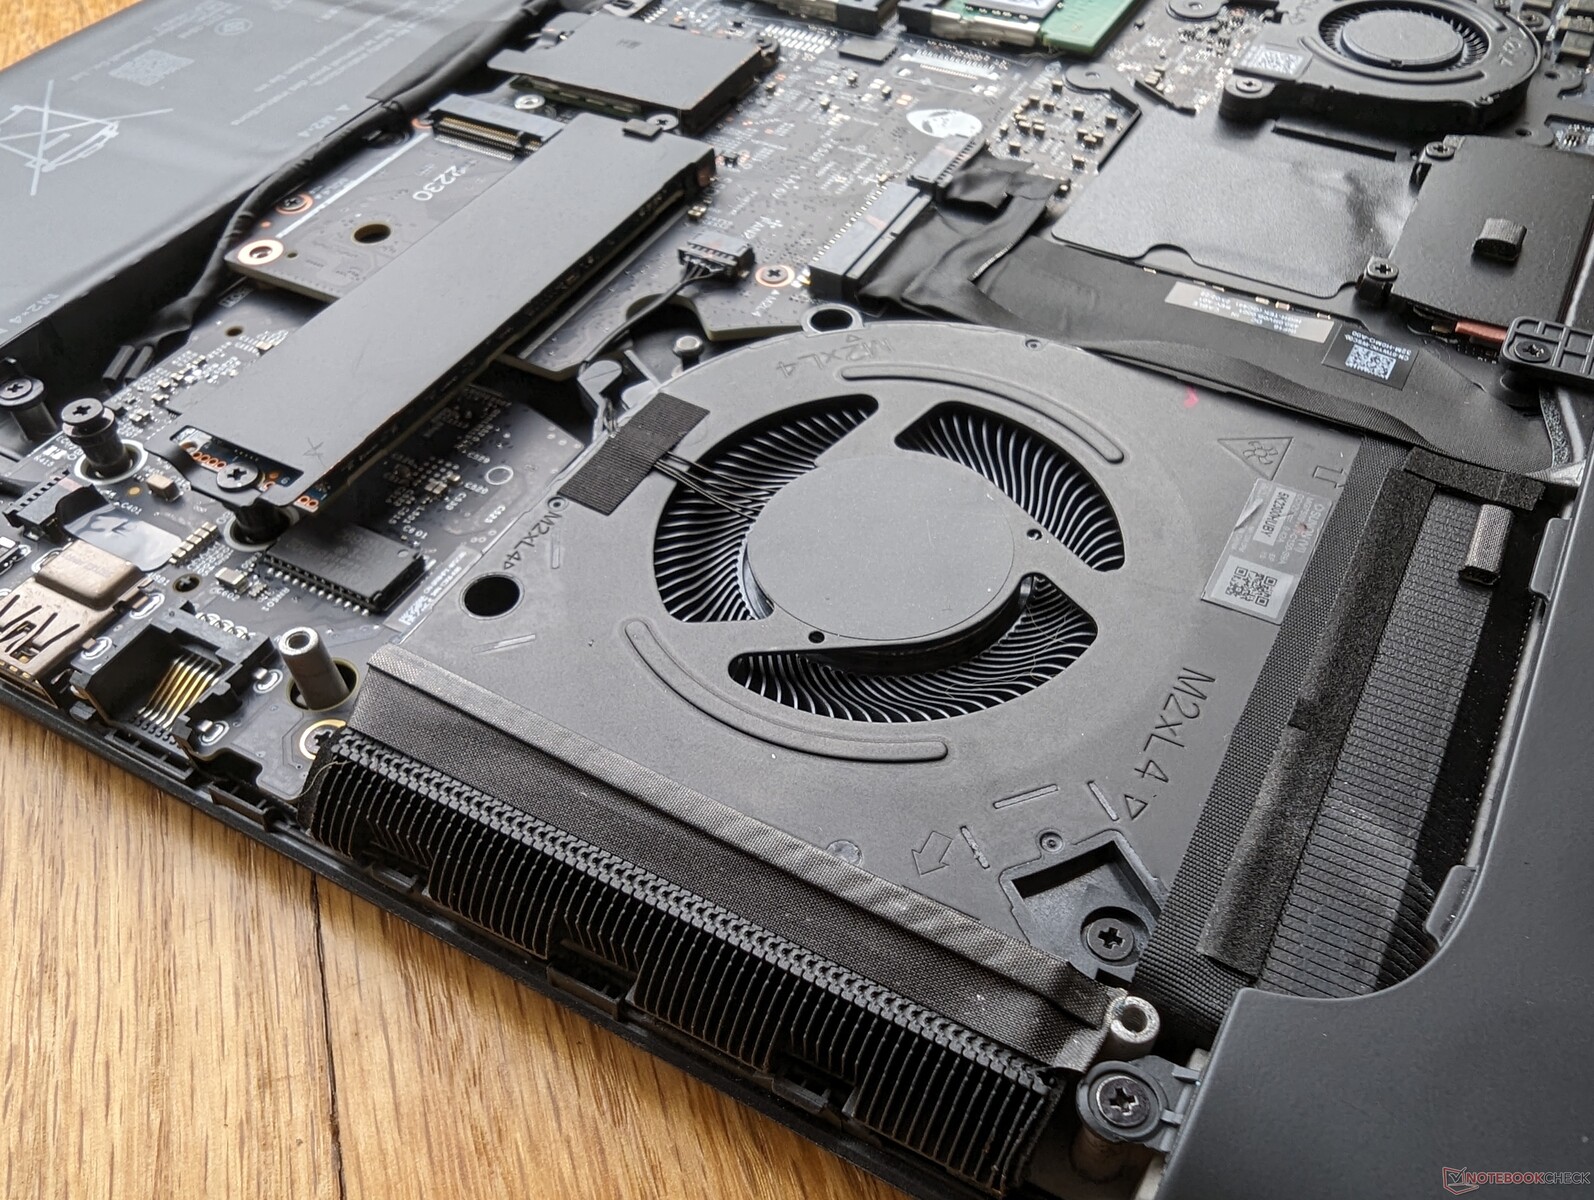
Maintenance
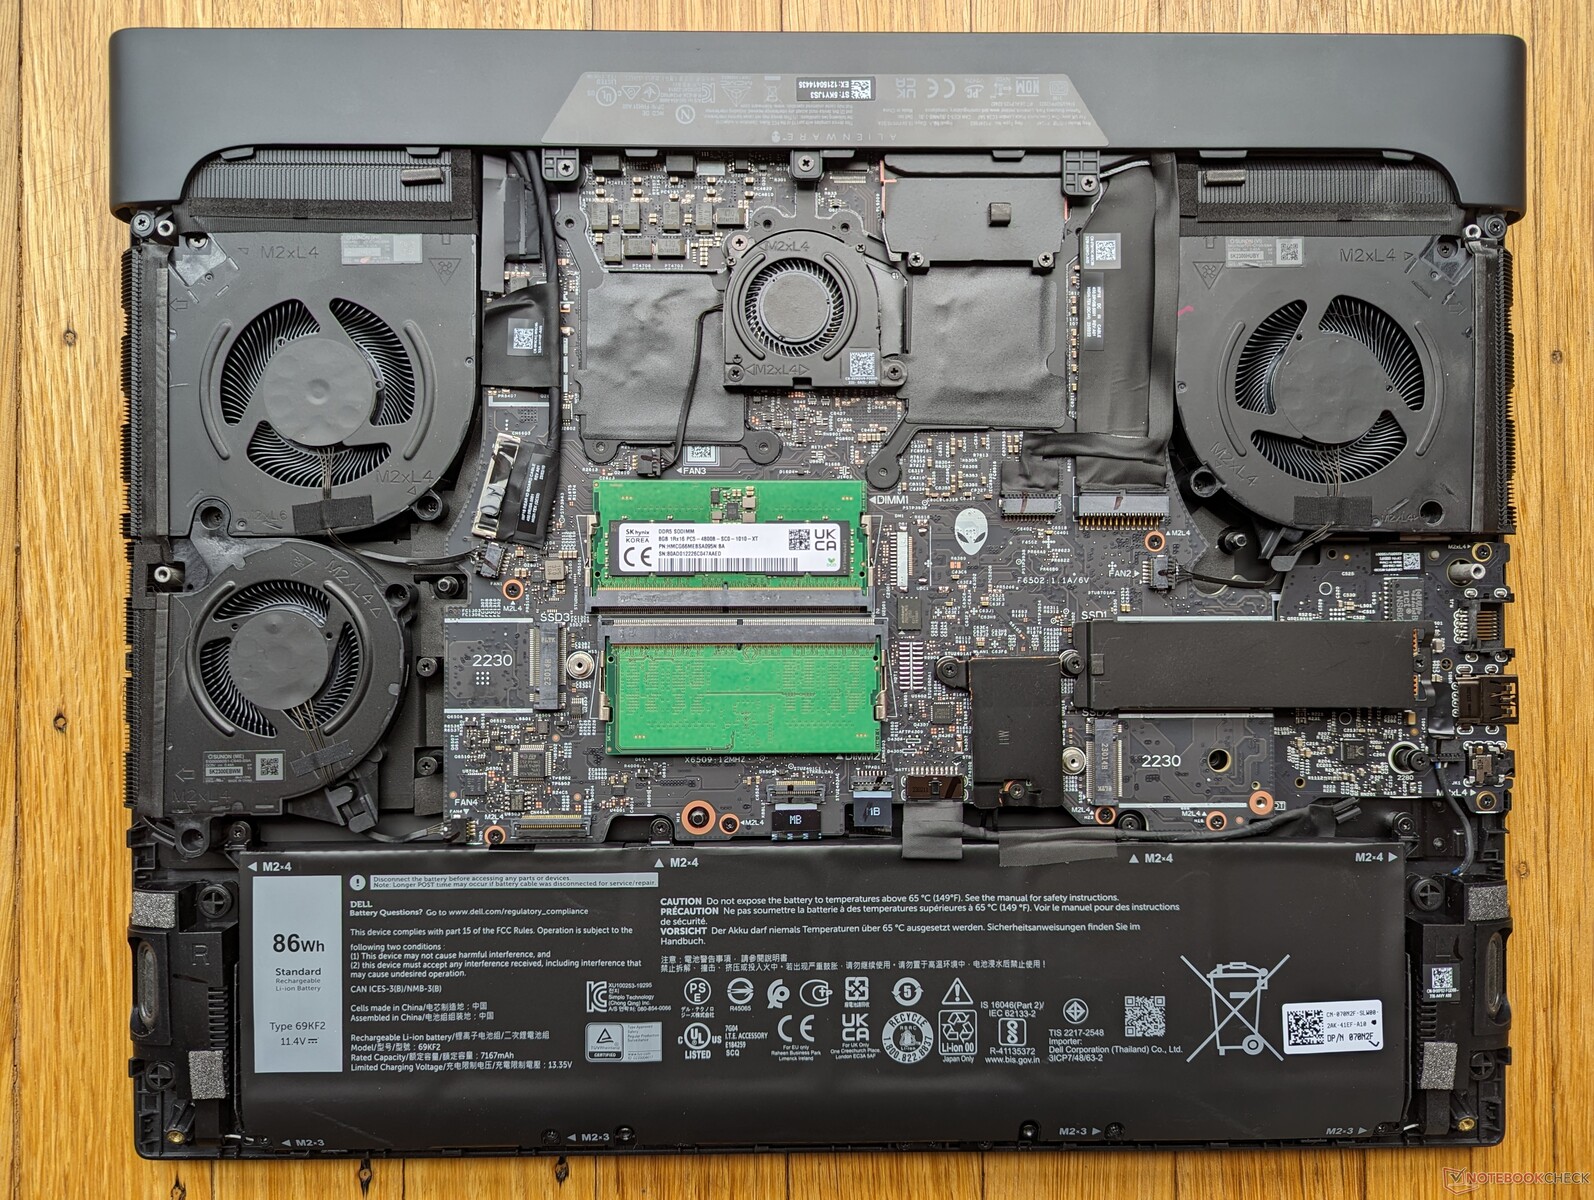
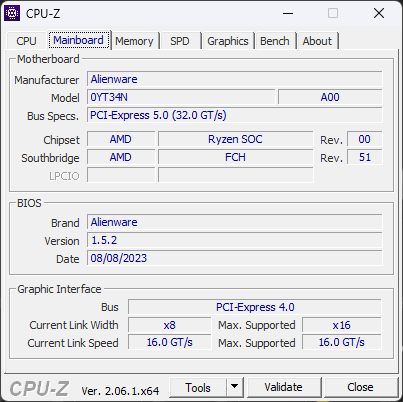
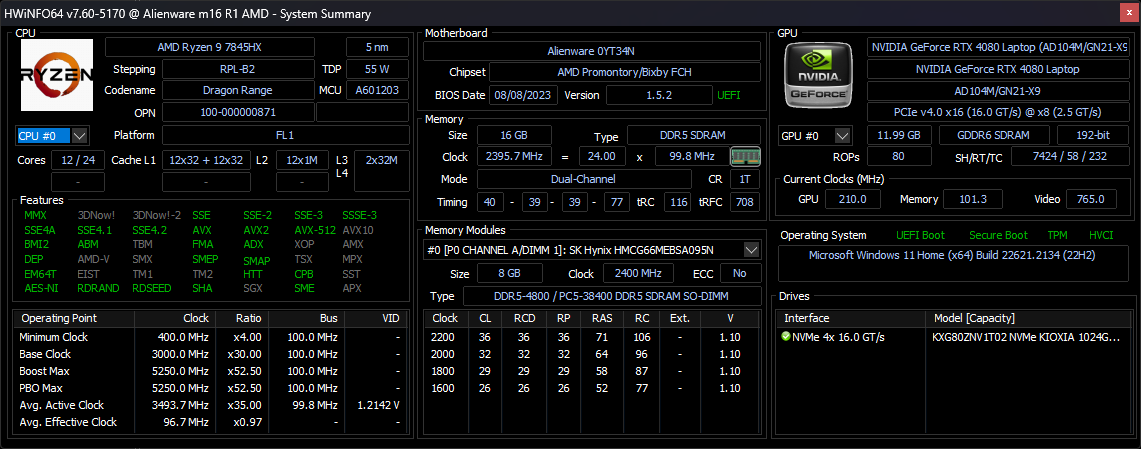
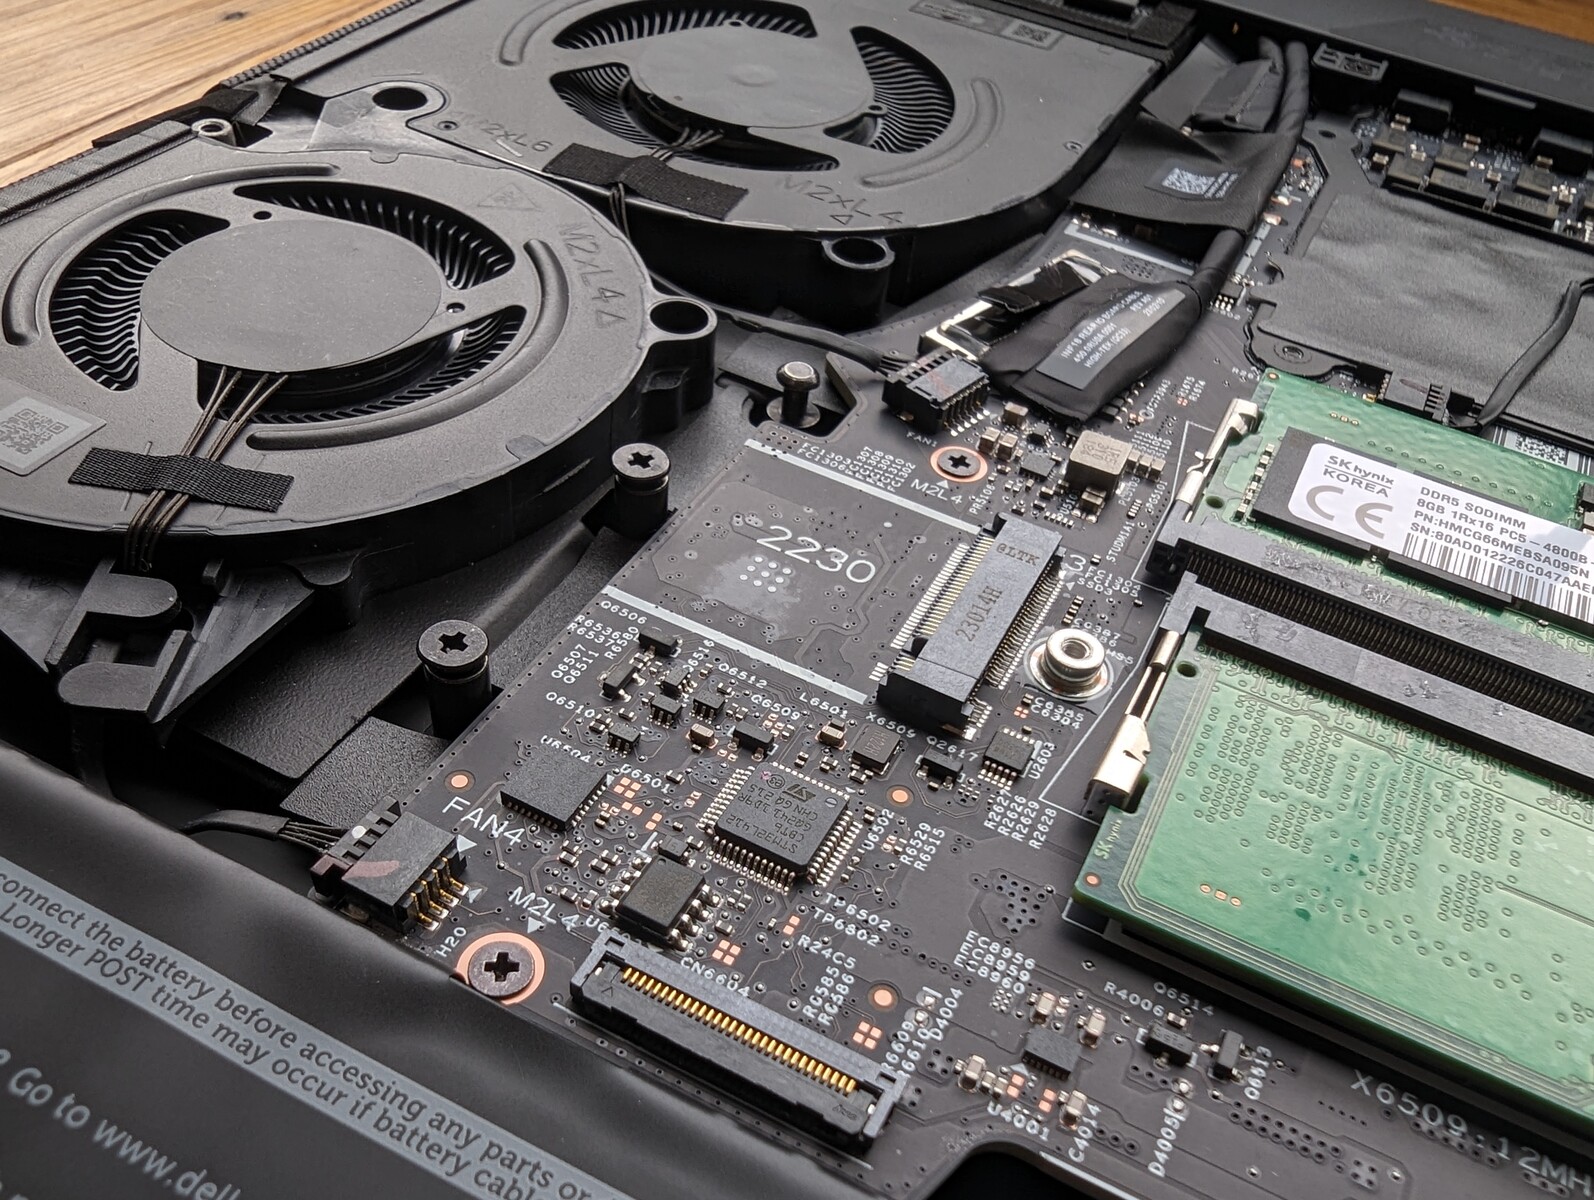
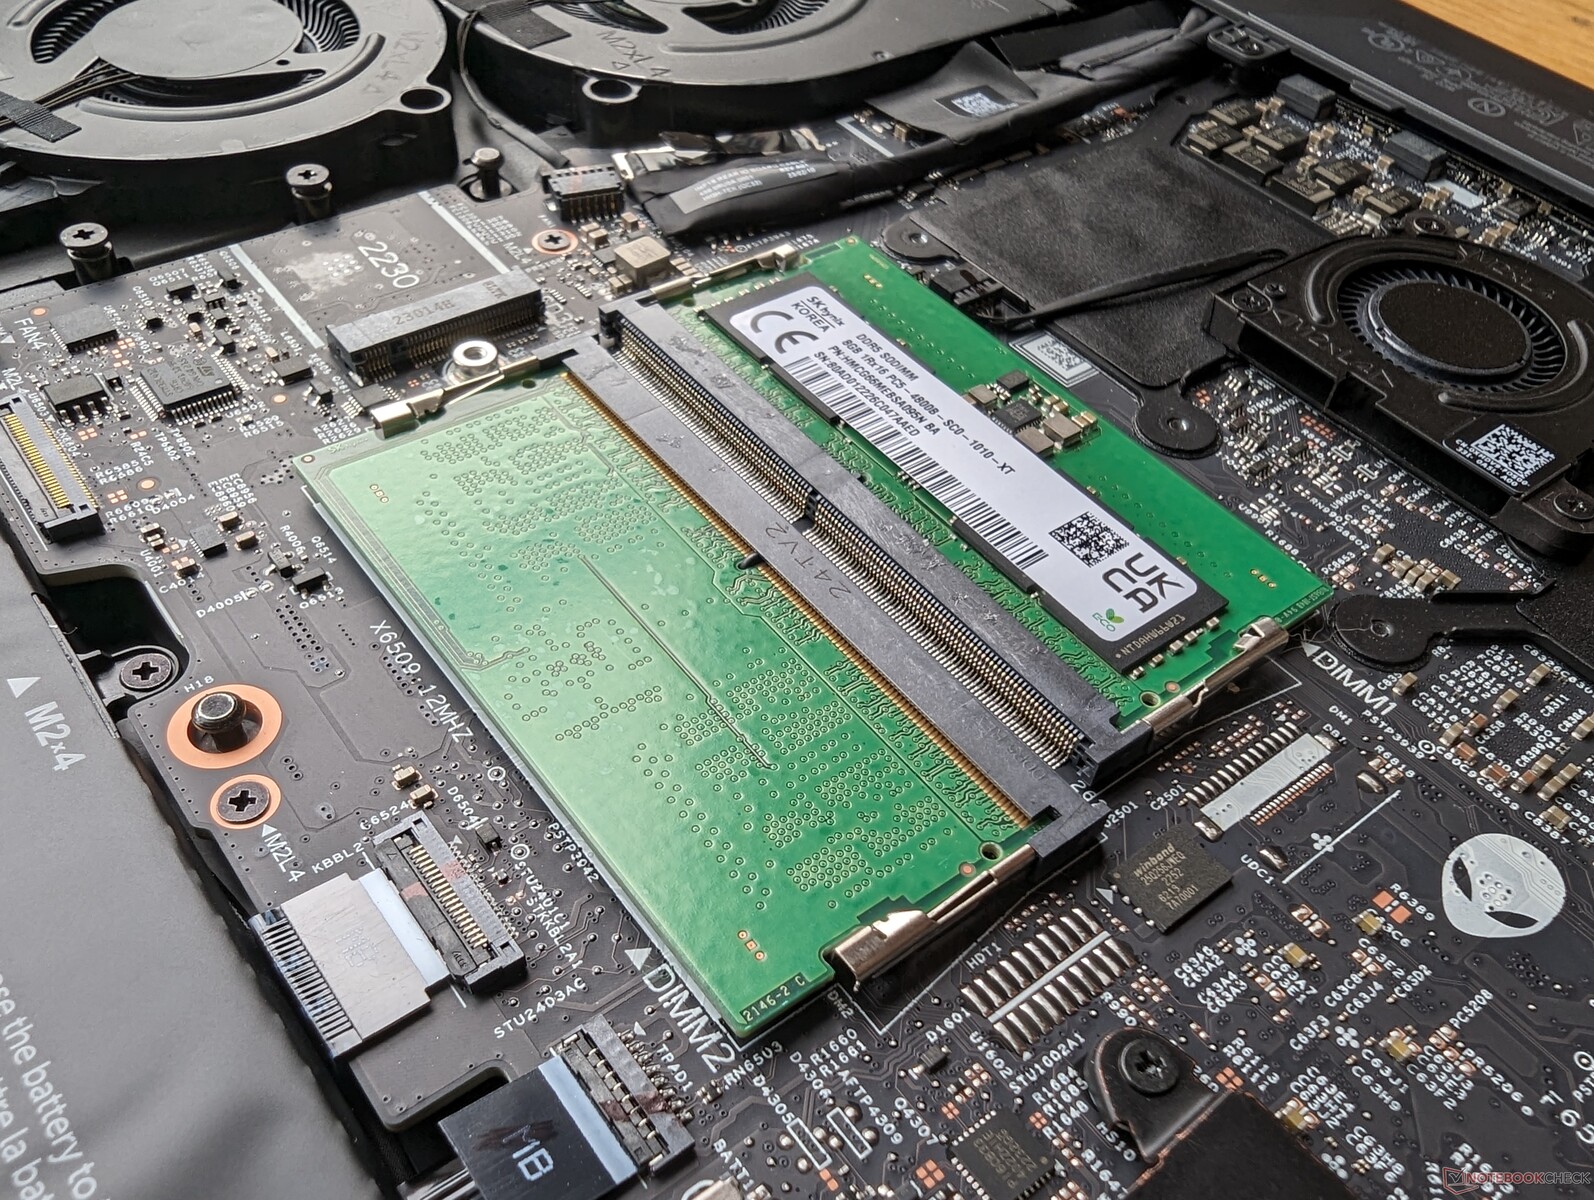
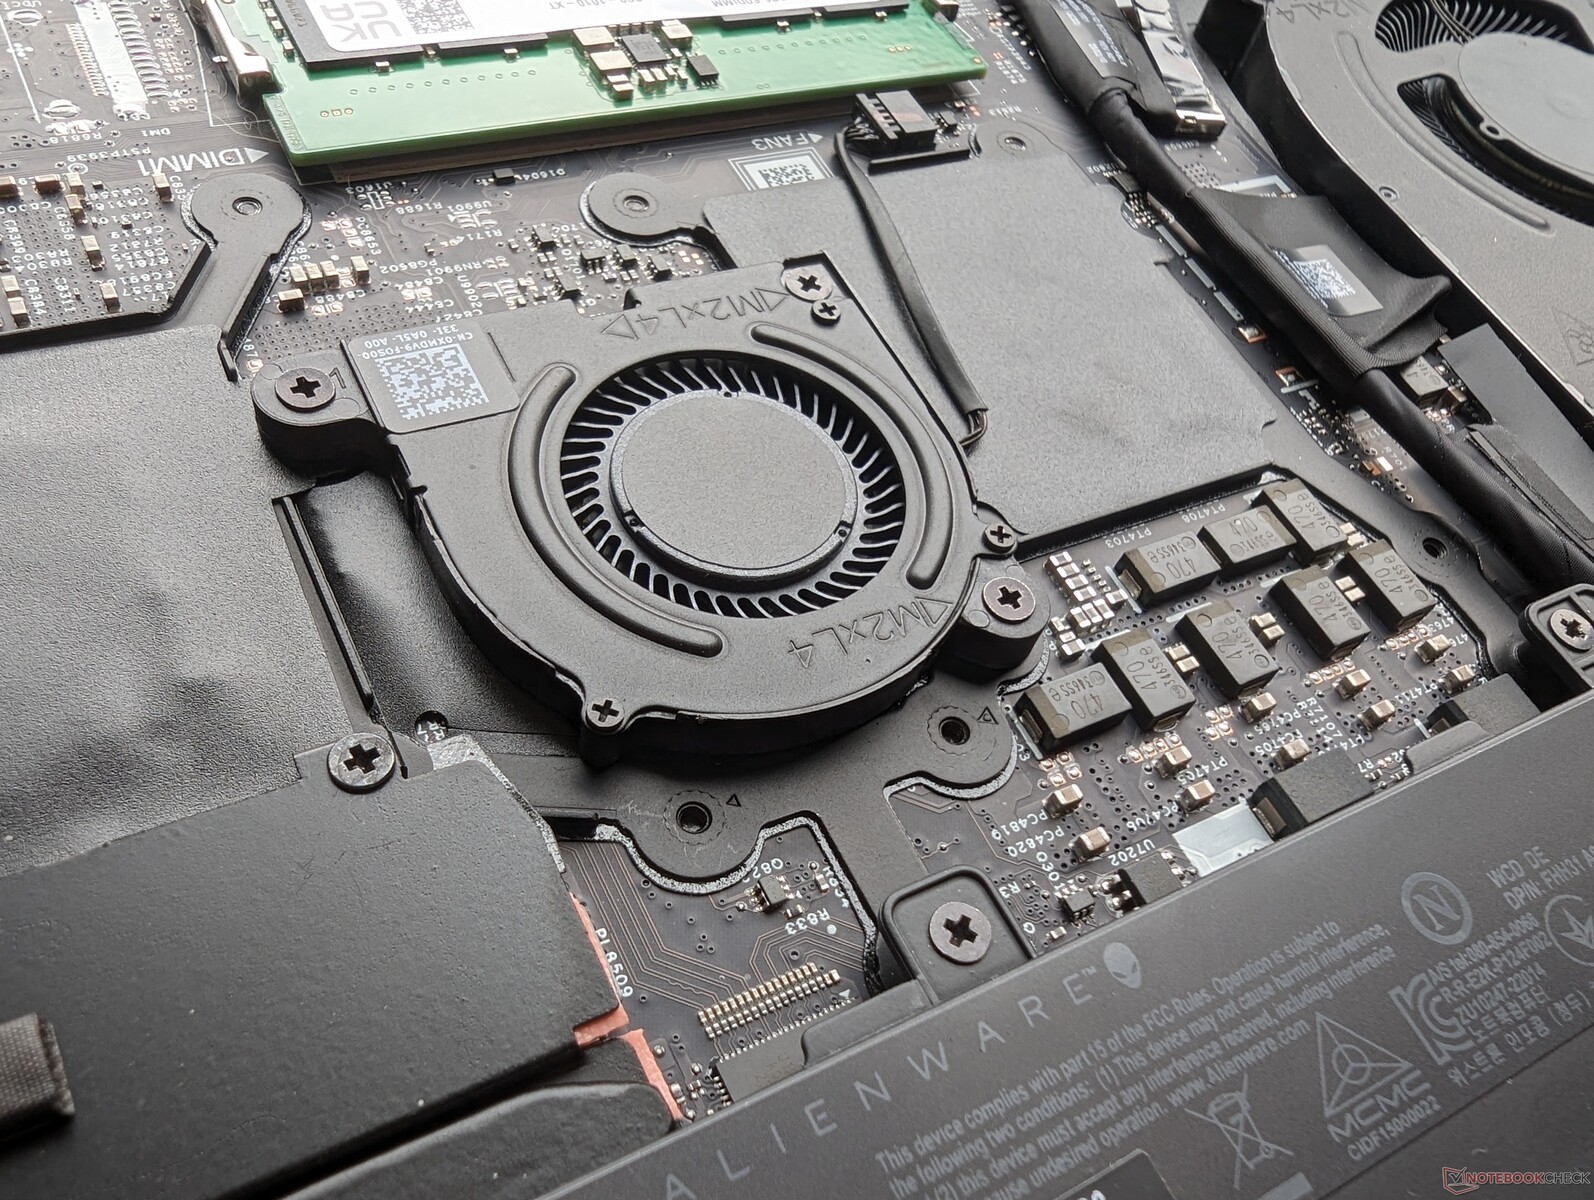
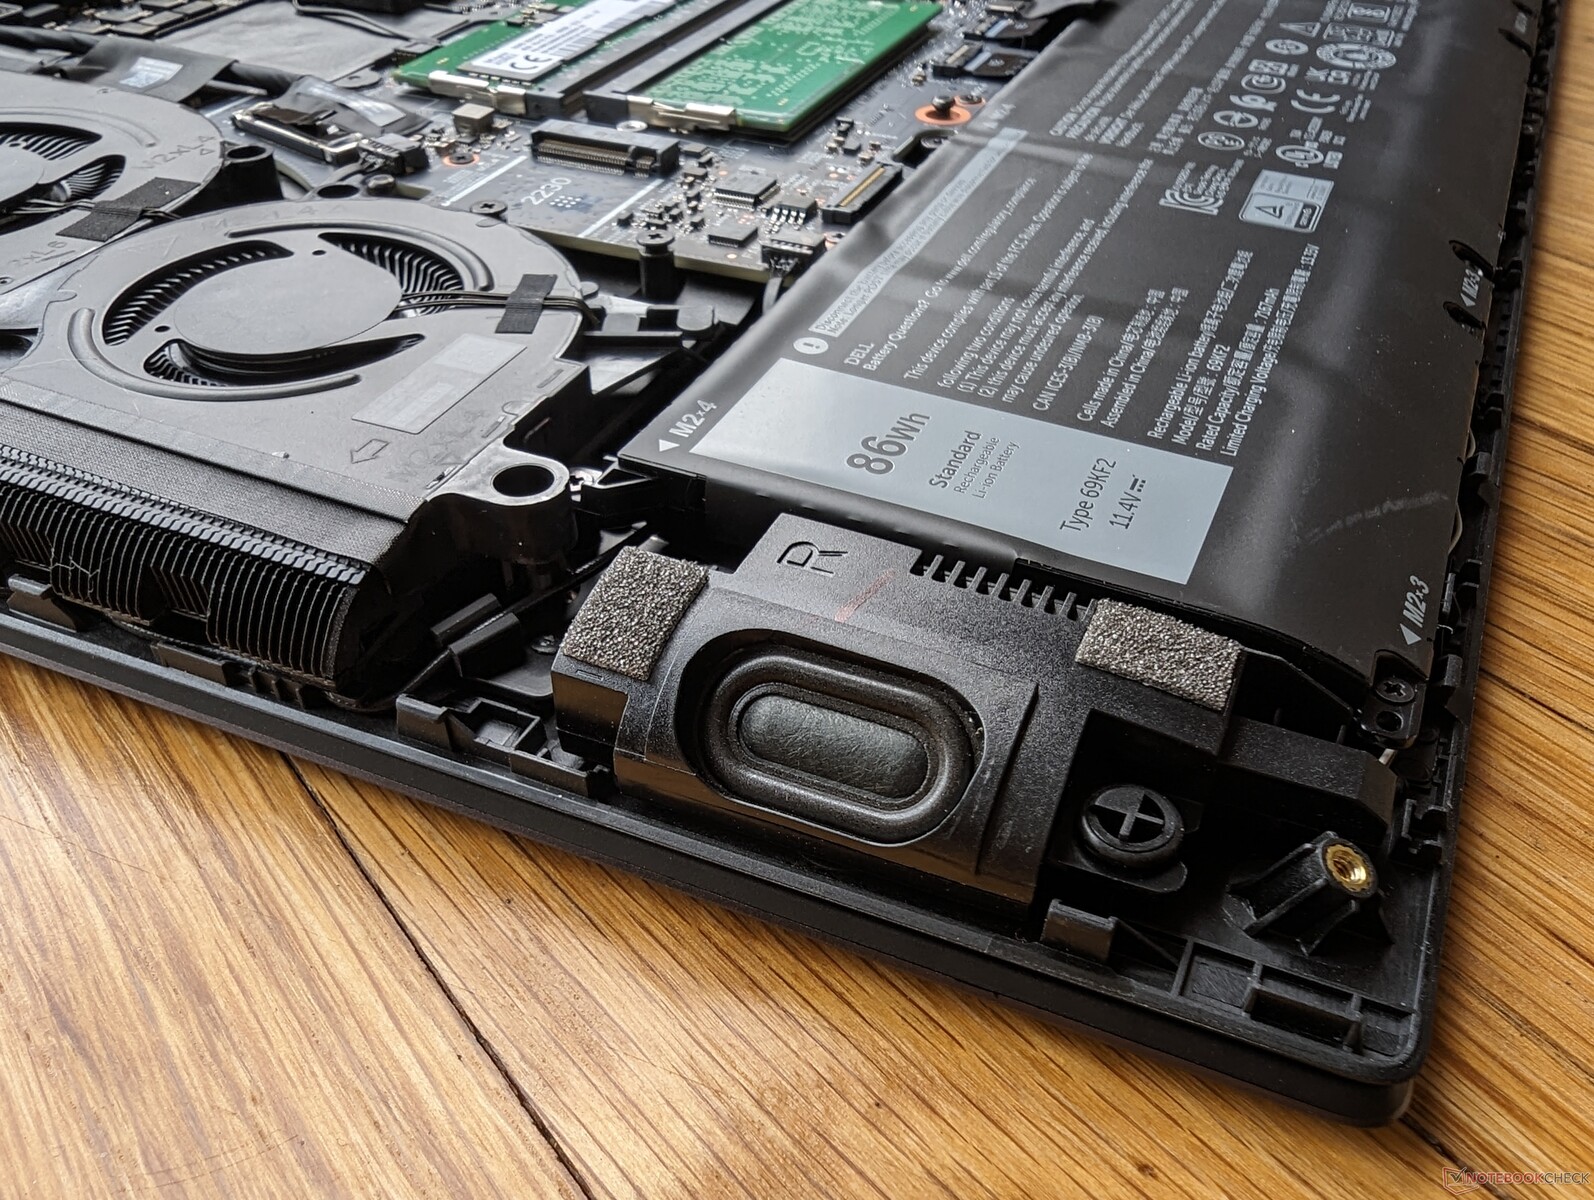
The bottom panel is secured by 8 Phillips screws for easy servicing. Users have direct access to 3x storage bays, 2x SODIMM slots, and the removable WLAN module. Note that the motherboard is upside-down meaning the processors are on the opposite side.
The motherboard design is completely different from the Alienware x16 even though the two models share many external features. It is instead most similar to the Alienware m18.
Accessories And Warranty
The retail box includes two Alienware logo stickers alongside the usual AC adapter and paperwork. A one-year limited manufacturer warranty applies if purchased in the US.
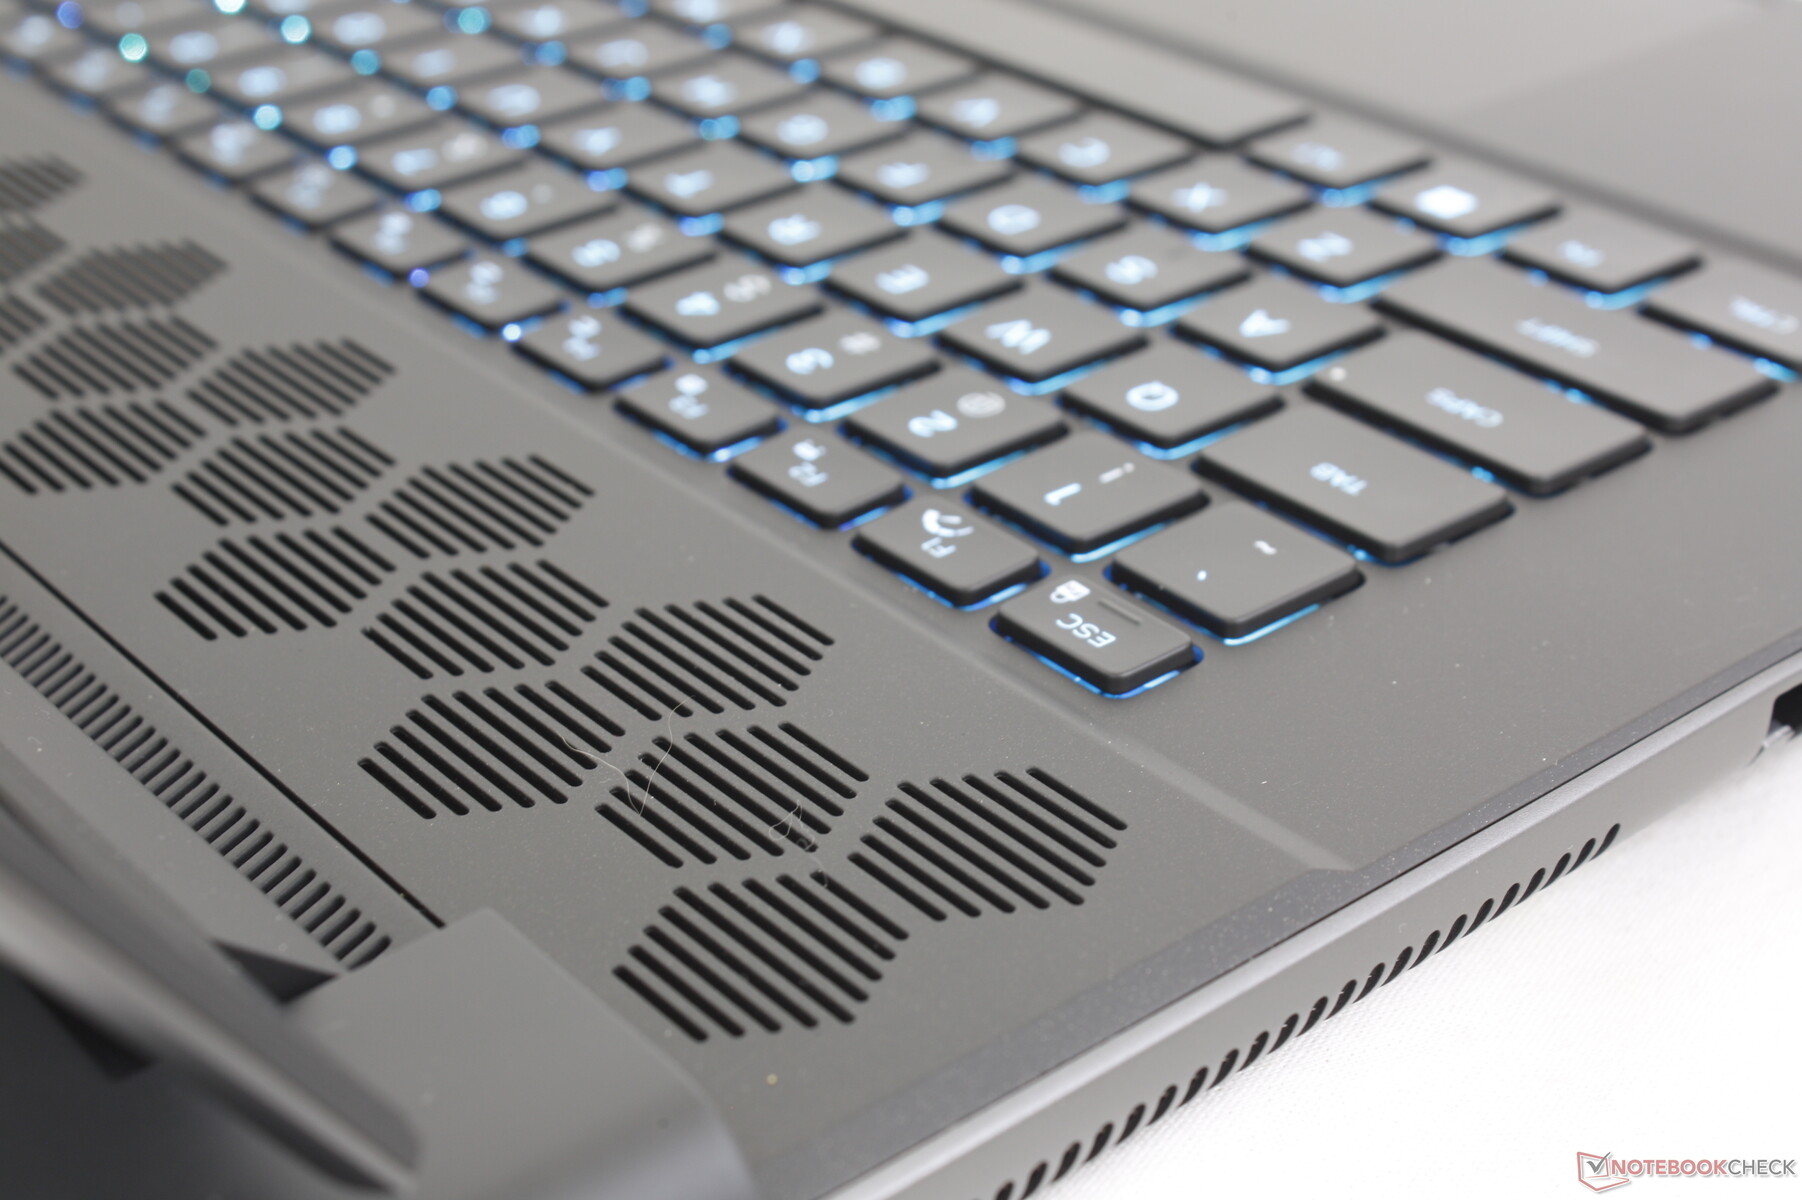
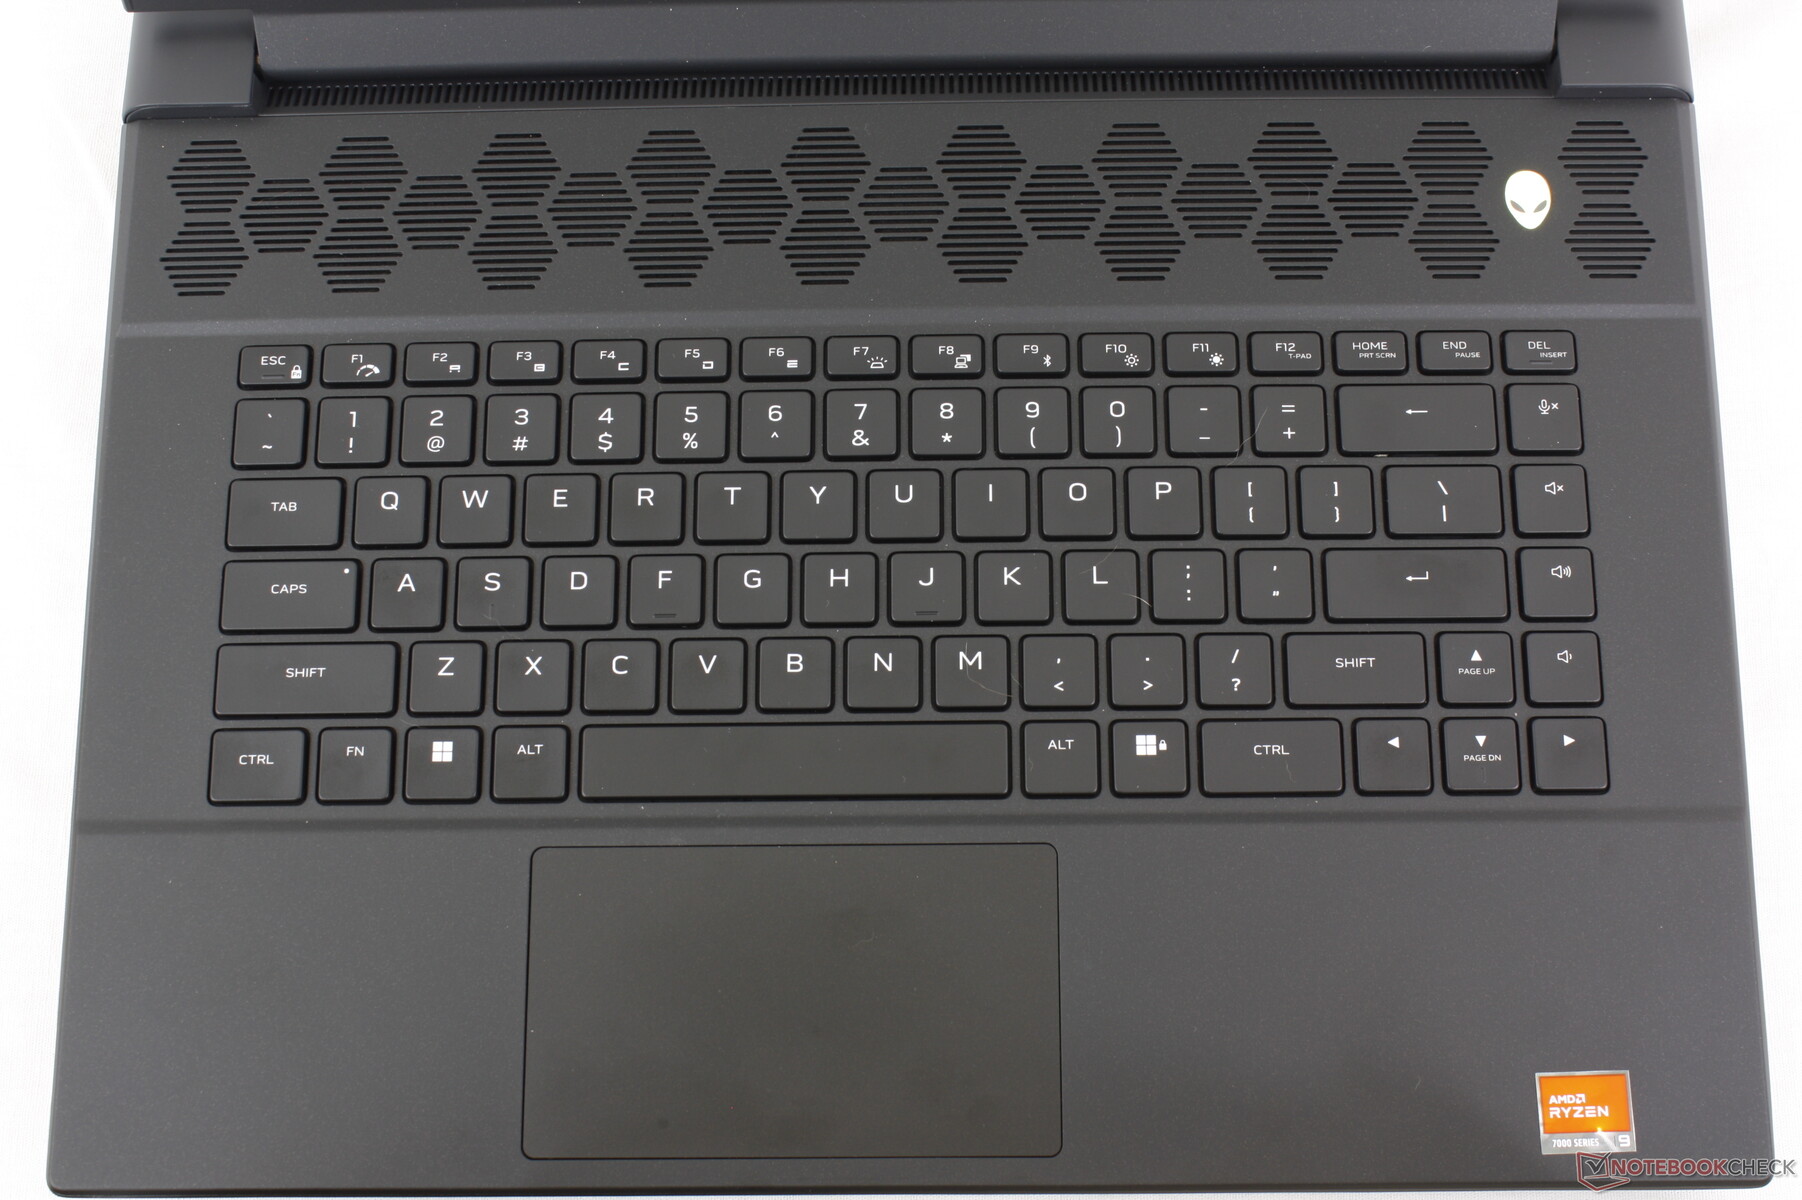
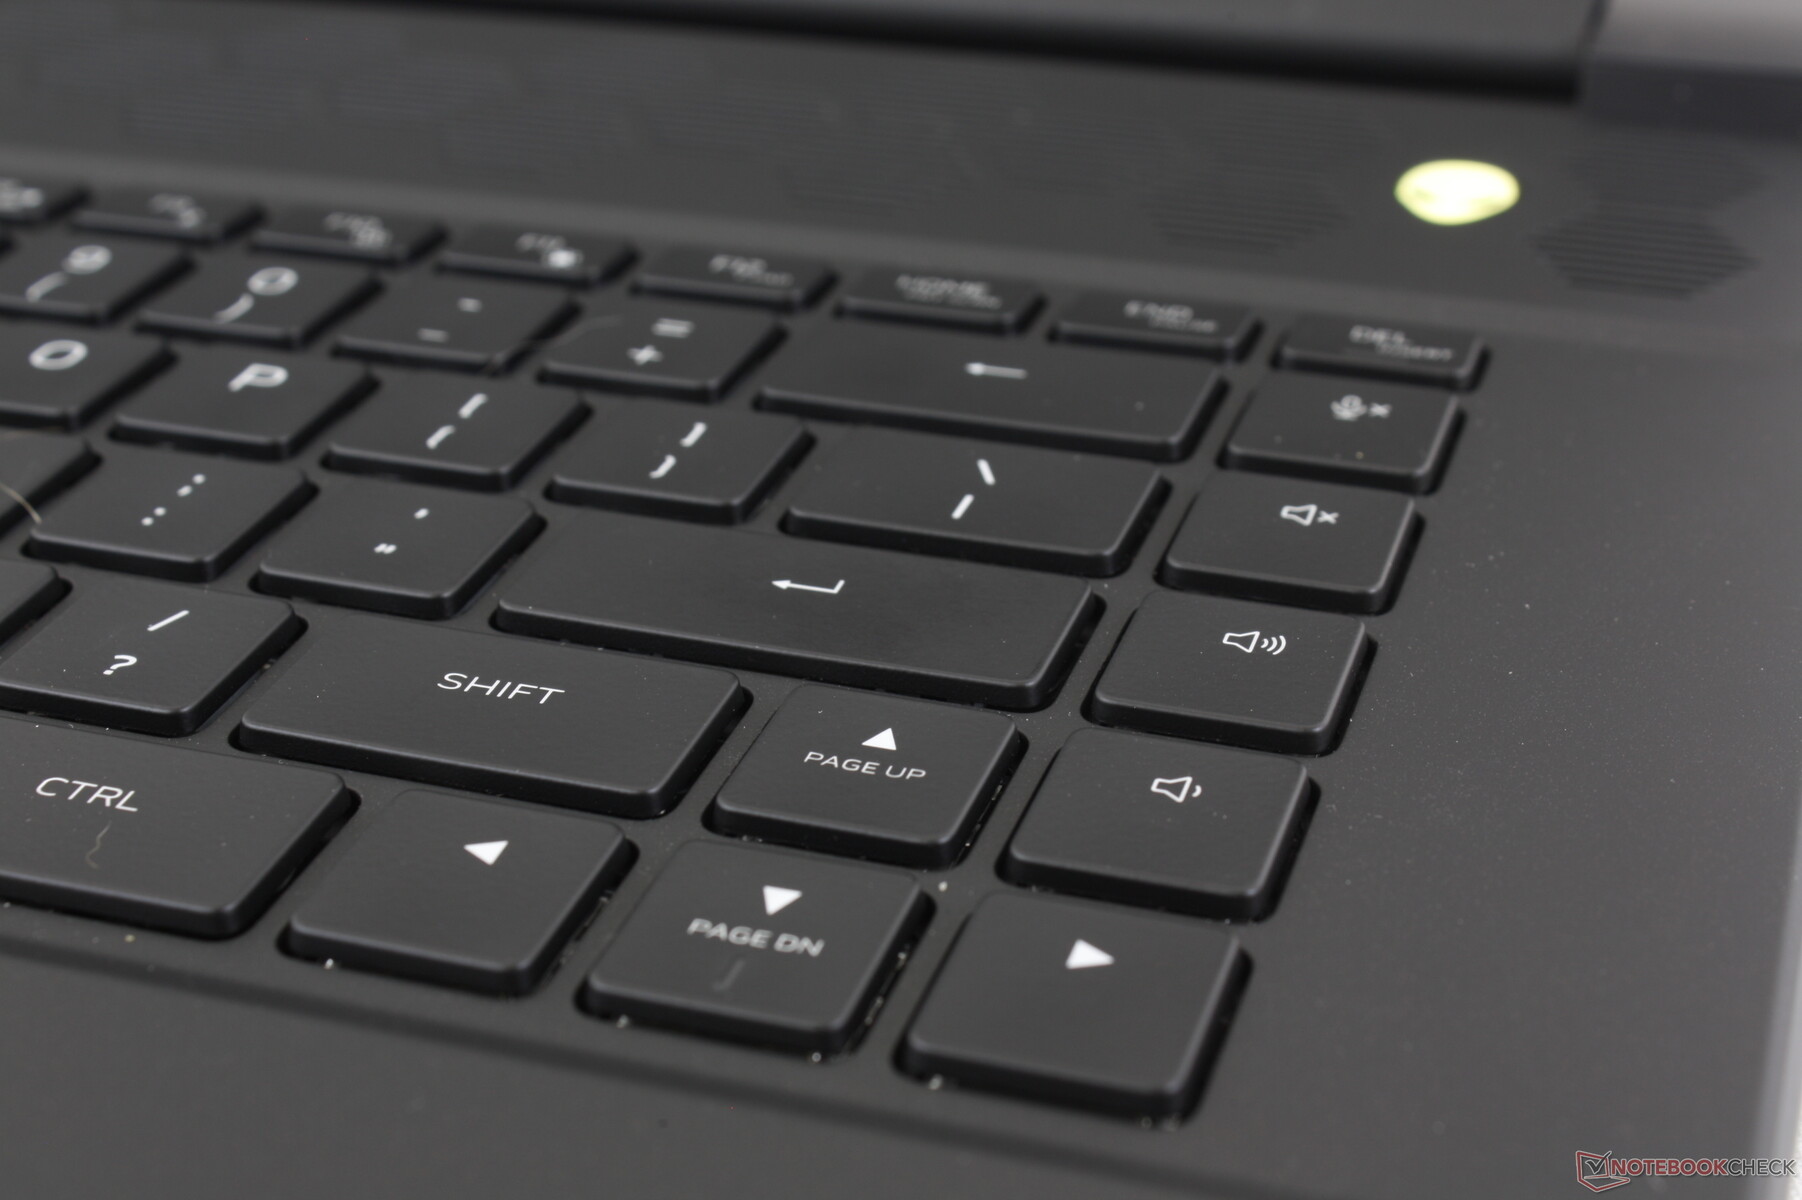
Input Devices — Mechanical Or Standard Available
Keyboard
Users can configure with either a standard membrane-based keyboard or a CherryMX ultra low-profile mechanical keyboard with per-key RGB lighting. The CherryMX keyboard was introduced a couple of years ago on the Alienware x17 R1 and it remains one of our favorite keyboards on any gaming laptop for its clicky feedback and deep travel. The main drawback, of course, is the sharp and very loud clatter. You may want to consider the standard keyboard option instead for noise-sensitive environments like libraries, classrooms, or dorm rooms.
The backlight illuminates all keys and symbols whereas this was not true on older models.
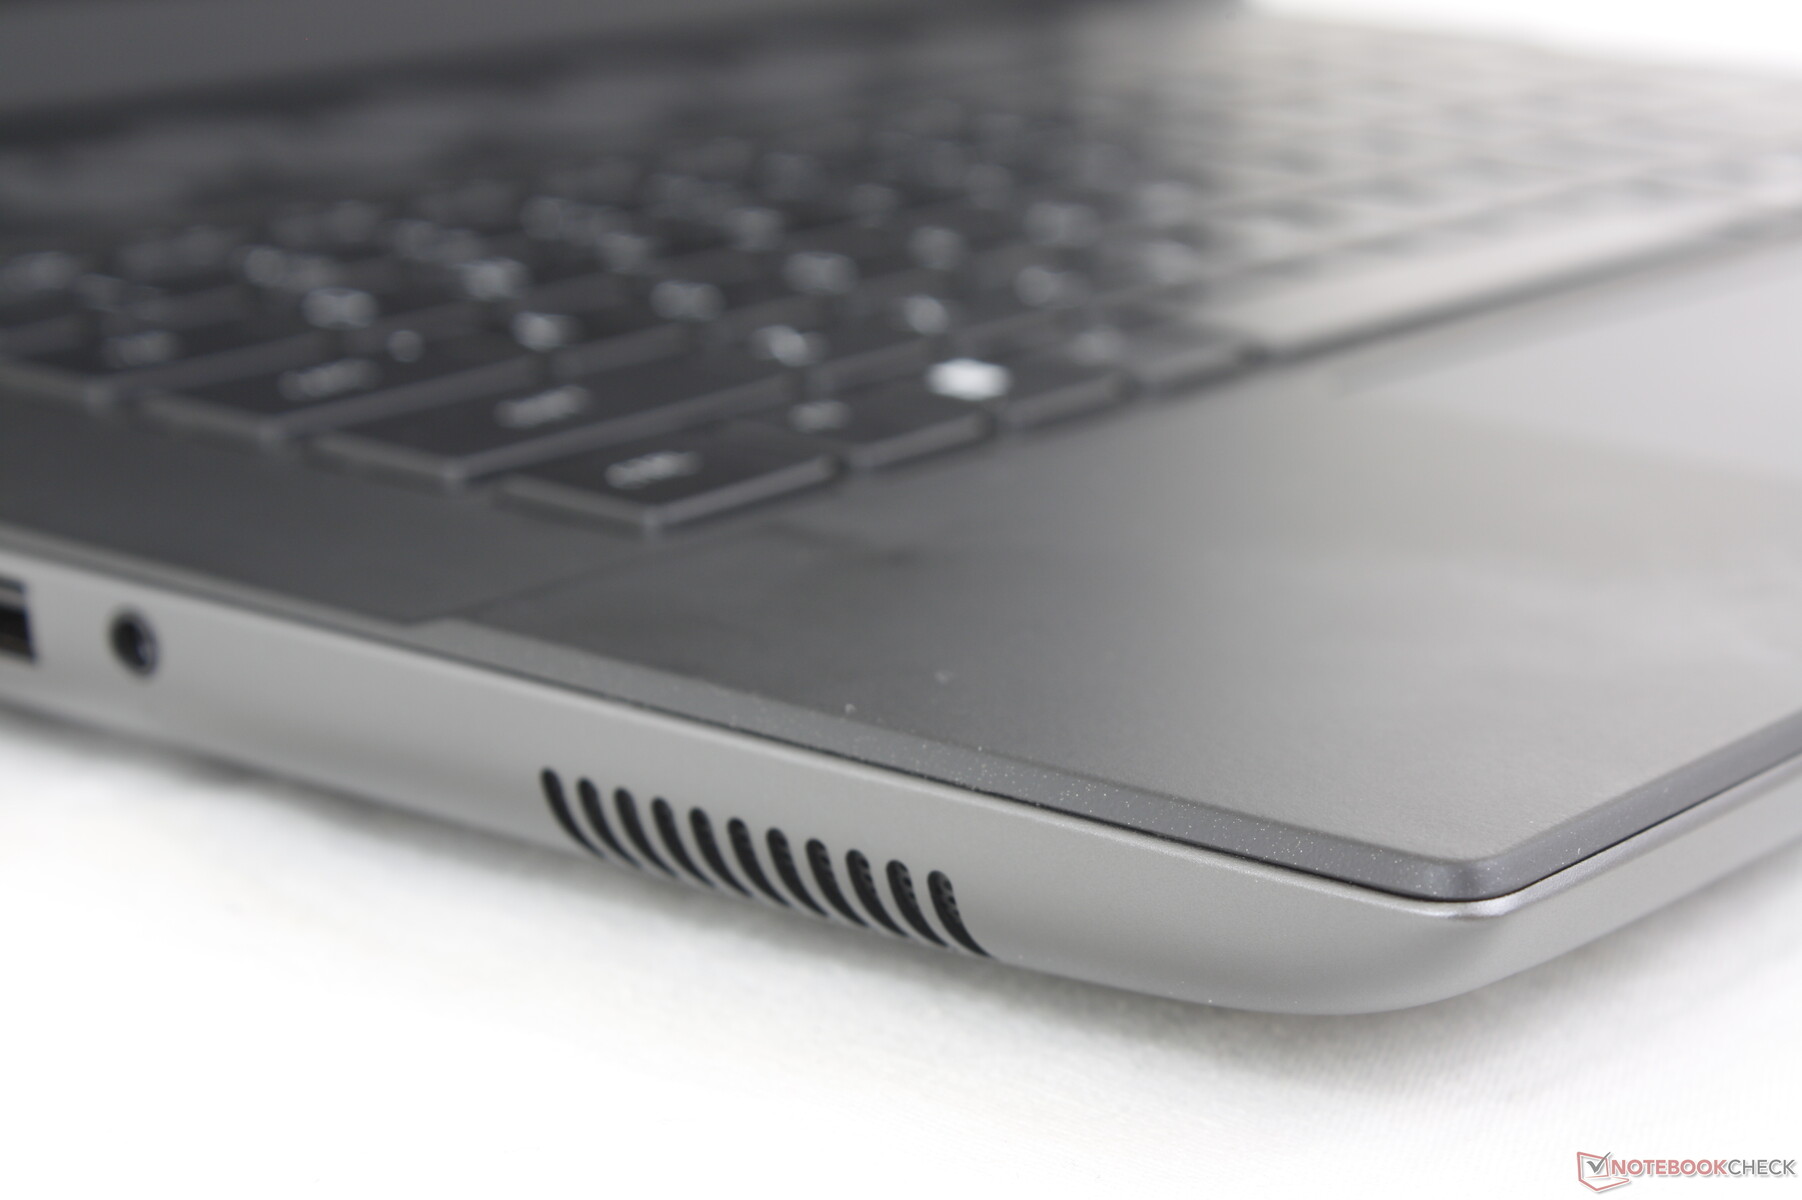
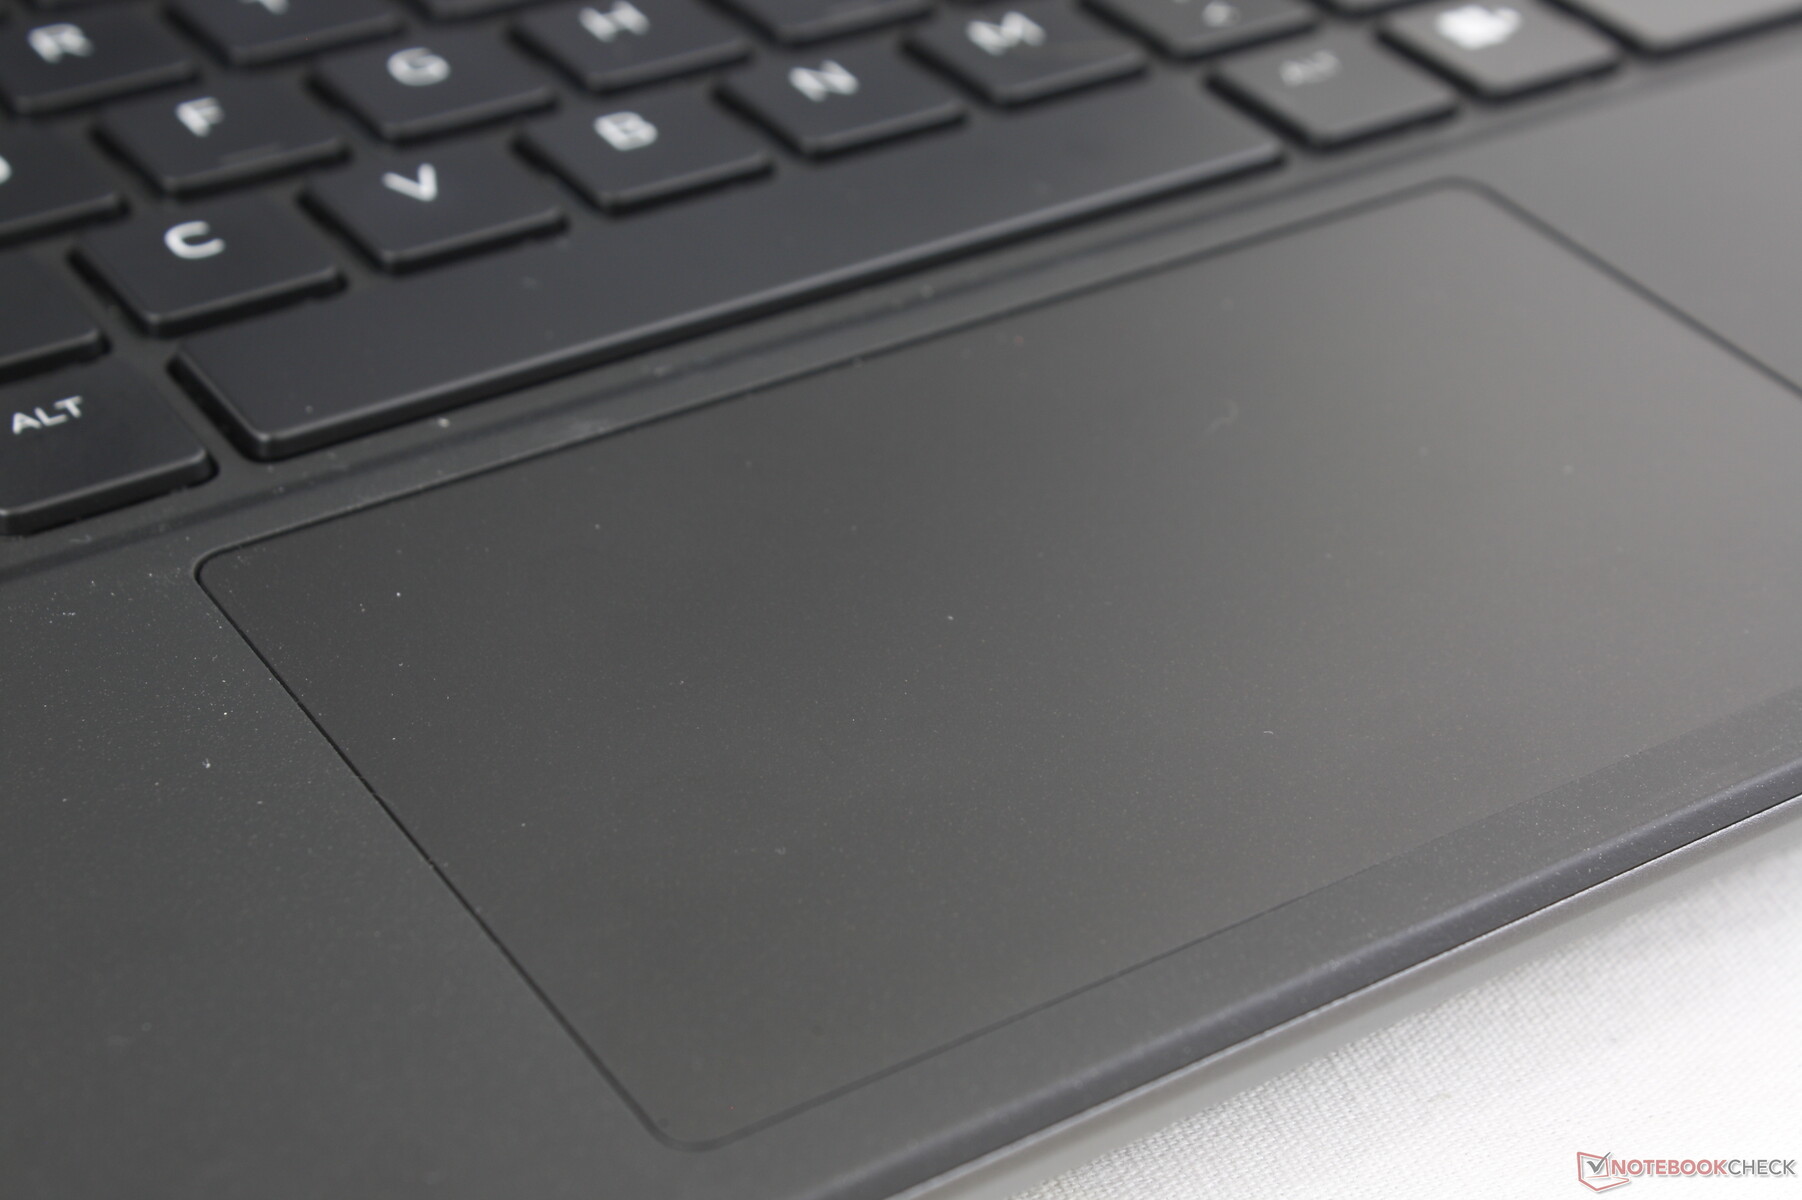
Touchpad
The clickpad is relatively small (11.3 x 6.6 cm) since much of the keyboard deck is occupied by the large ventilation grilles. The clickpads on the HP Omen Transcend 16 and Razer Blade 16, for example, are more spacious at 12.5 x 8 cm and 17 x 9.7 cm, respectively. Traction is otherwise smooth and with firm and clicky feedback when pressed despite the cramped surface area.

Display
Three display options are available as follows:
- 2560 x 1600, 165 Hz, 3 ms, IPS, 100% sRGB
- 2560 x 1600, 240 Hz, 3 ms, IPS, 100% DCI-P3
- 1920 x 1200, 480 Hz, 3 ms, IPS, 100% DCI-P3
Our unit is configured with the bolded option above which we believe is the sweet spot for the model as it offers full P3 colors, fast refresh rates, and a high resolution all-in-one. The 1200p option offers even faster refresh rates, but the benefits become increasingly marginal after 240 Hz.
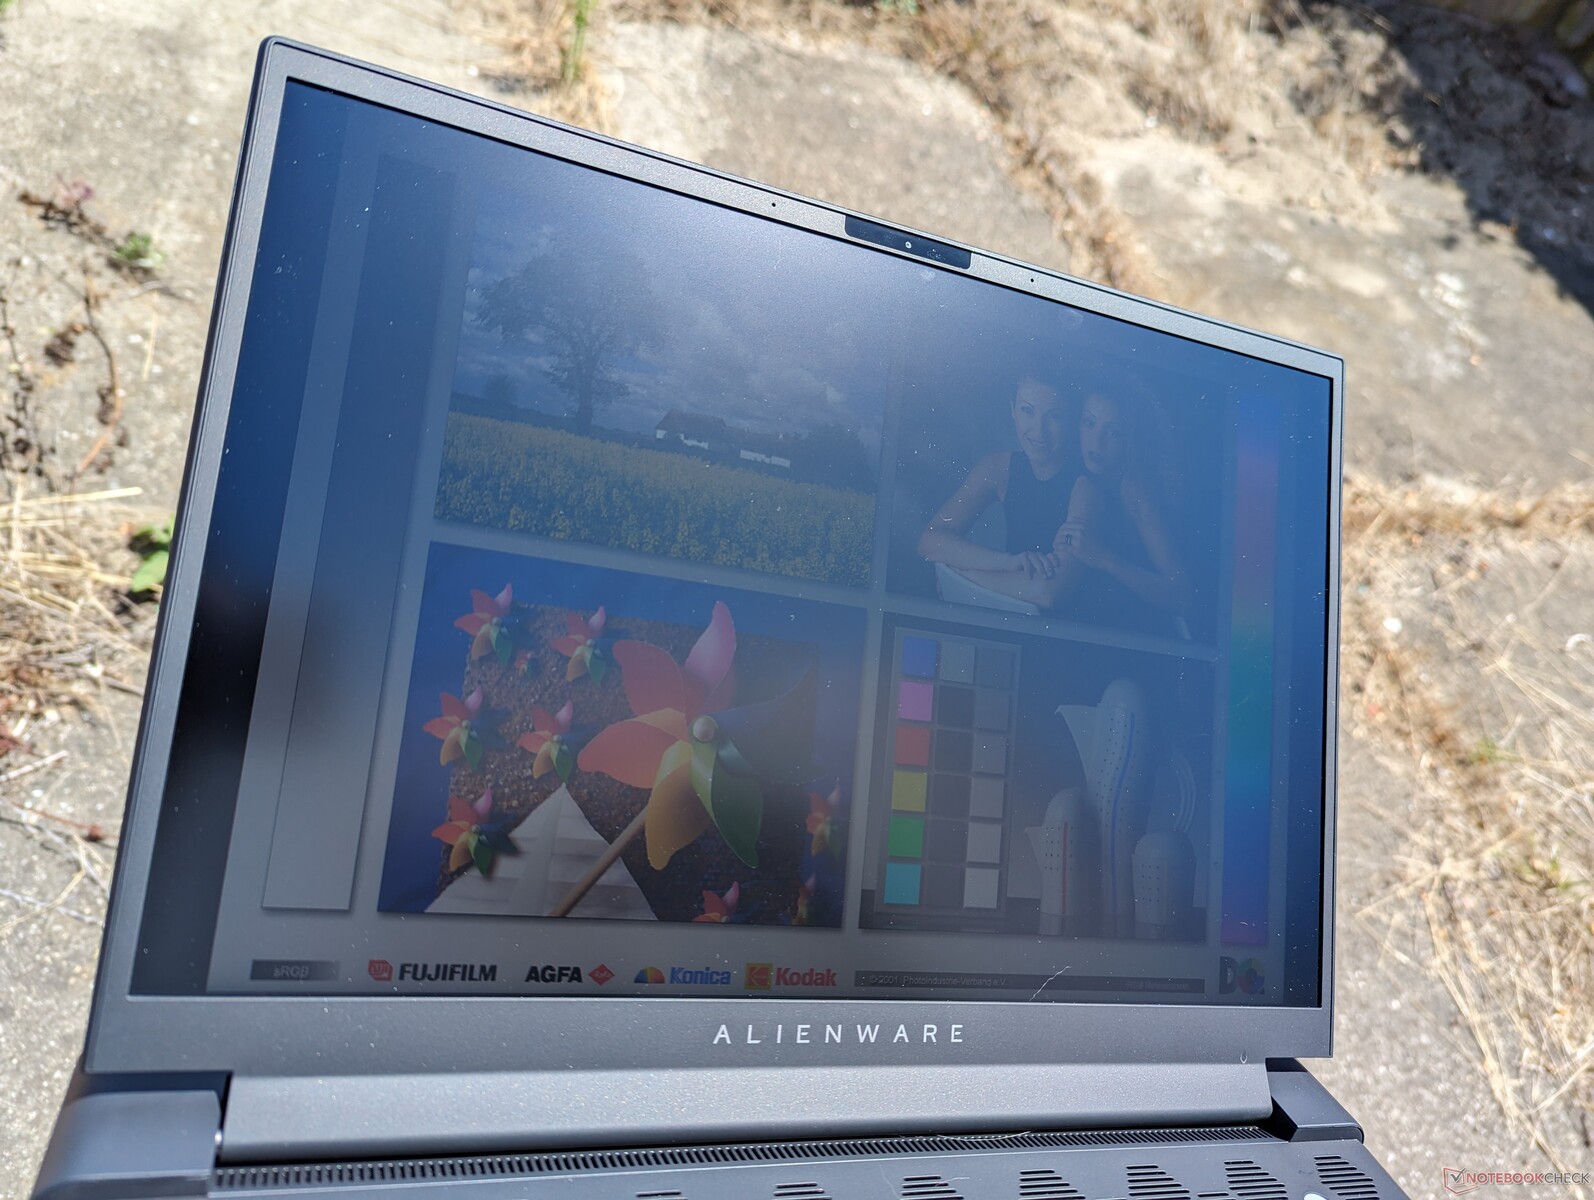
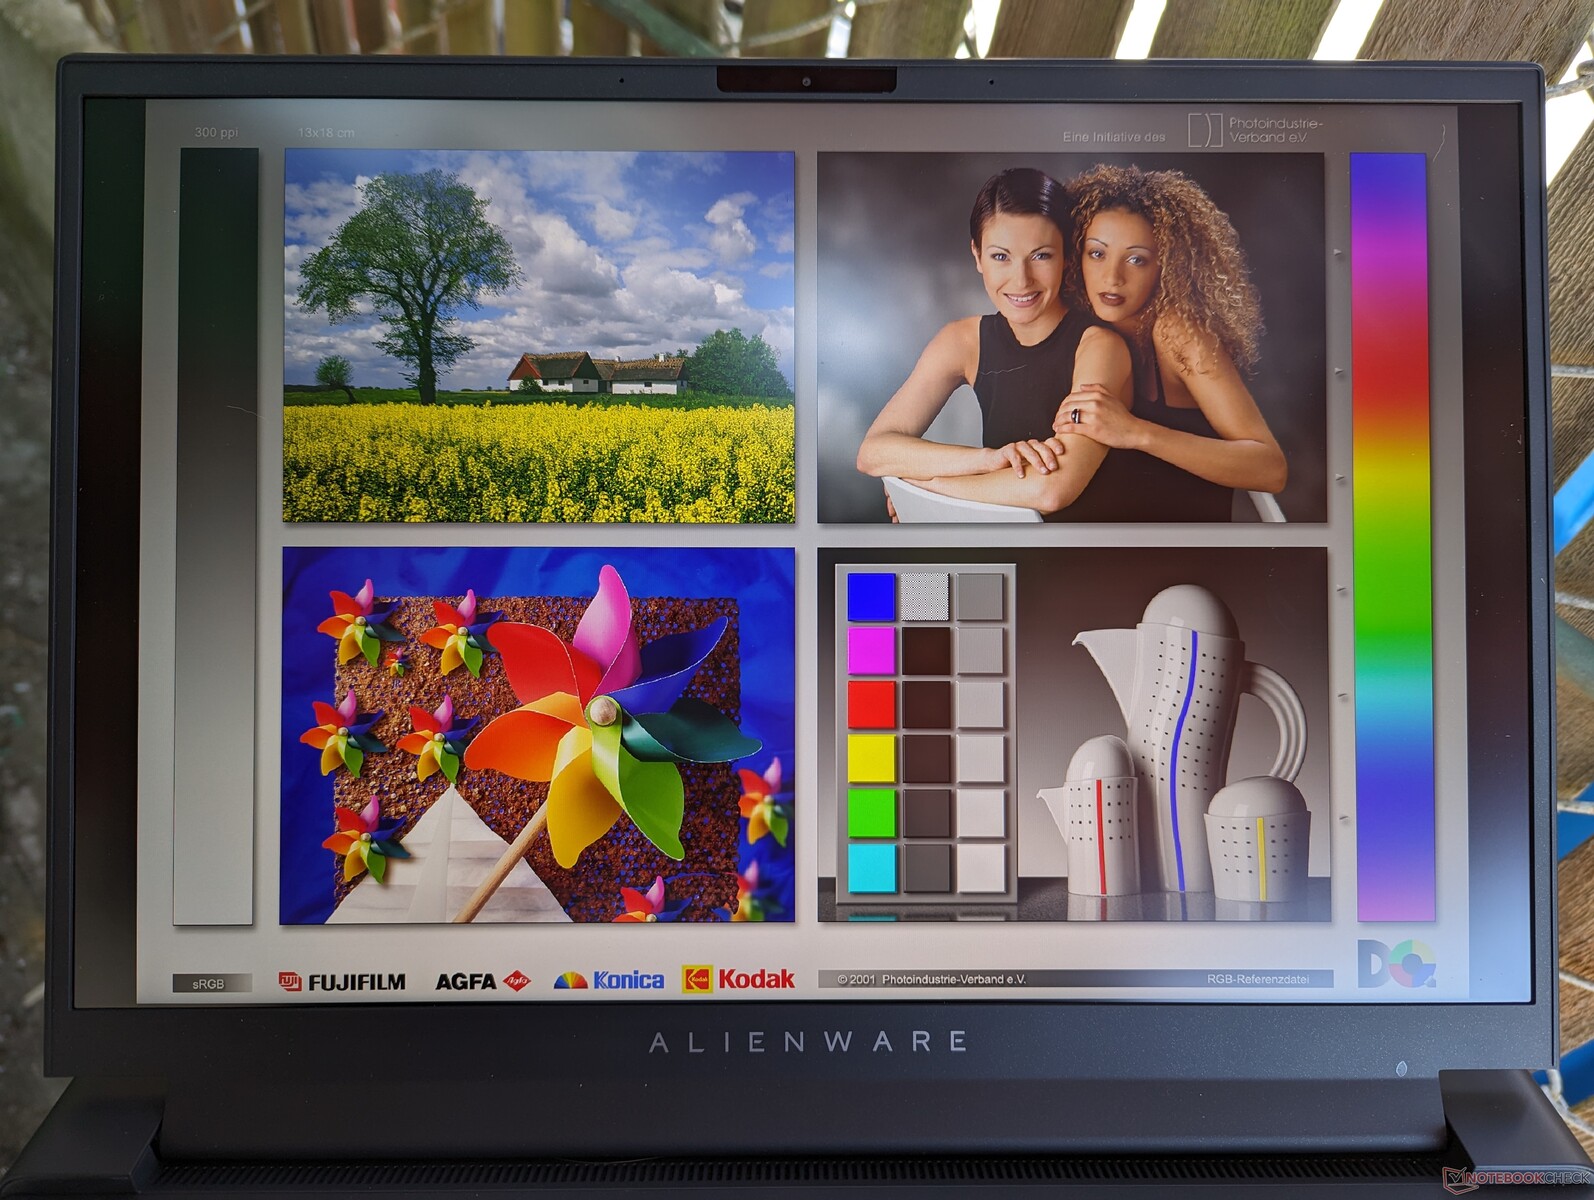
The Alienware m16 R1 utilizes the same BOE NE16NZ4 panel as found on the Alienware x16 R1 and so the viewing experience is essentially identical between the two models. This high-end panel is fit for both gaming and content creation with wider colors than the MNG007DA2-3 panel on the Legion Pro 7. However, the displays on the Razer Blade 16 Early 2023 or Mini-LED-based HP Omen Transcend 16 are noticeably brighter which can come in handy for HDR content.


| |||||||||||||||||||||||||
Brightness Distribution: 89 %
Center on Battery: 329 cd/m²
Contrast: 1028:1 (Black: 0.32 cd/m²)
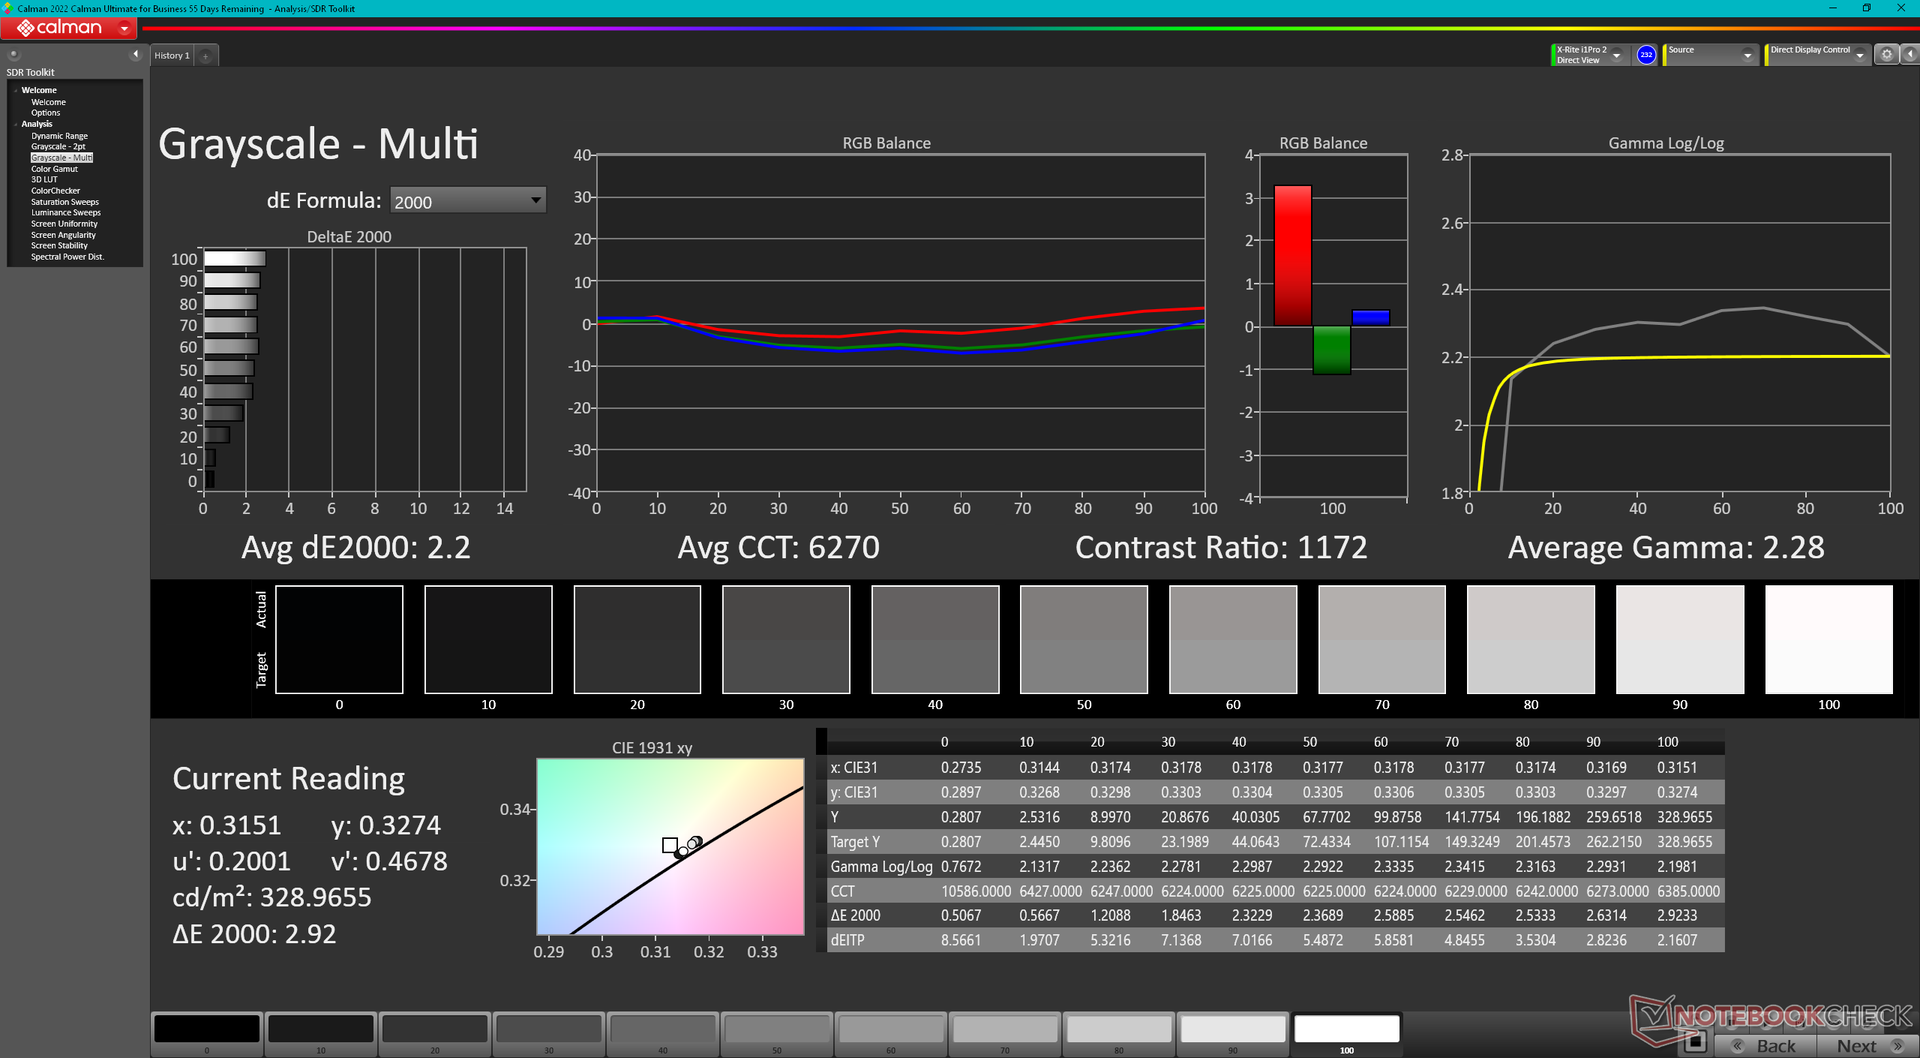
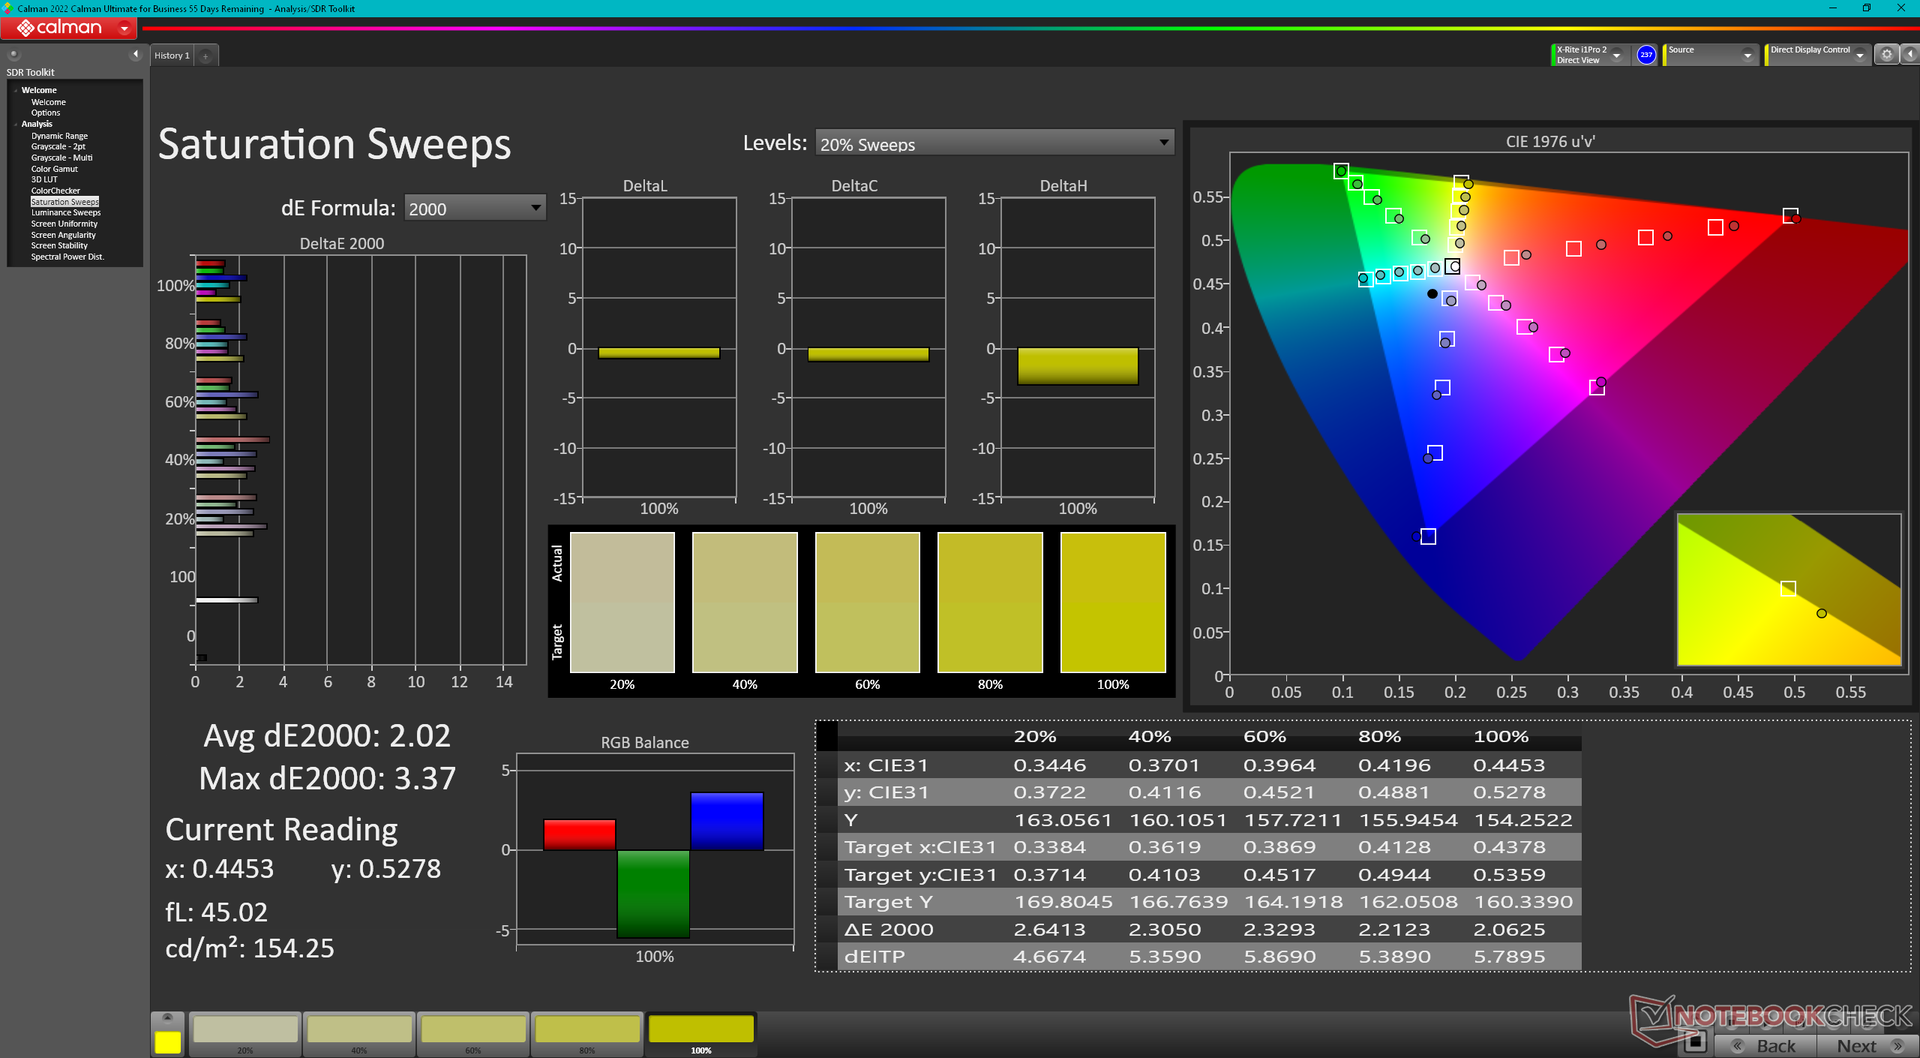
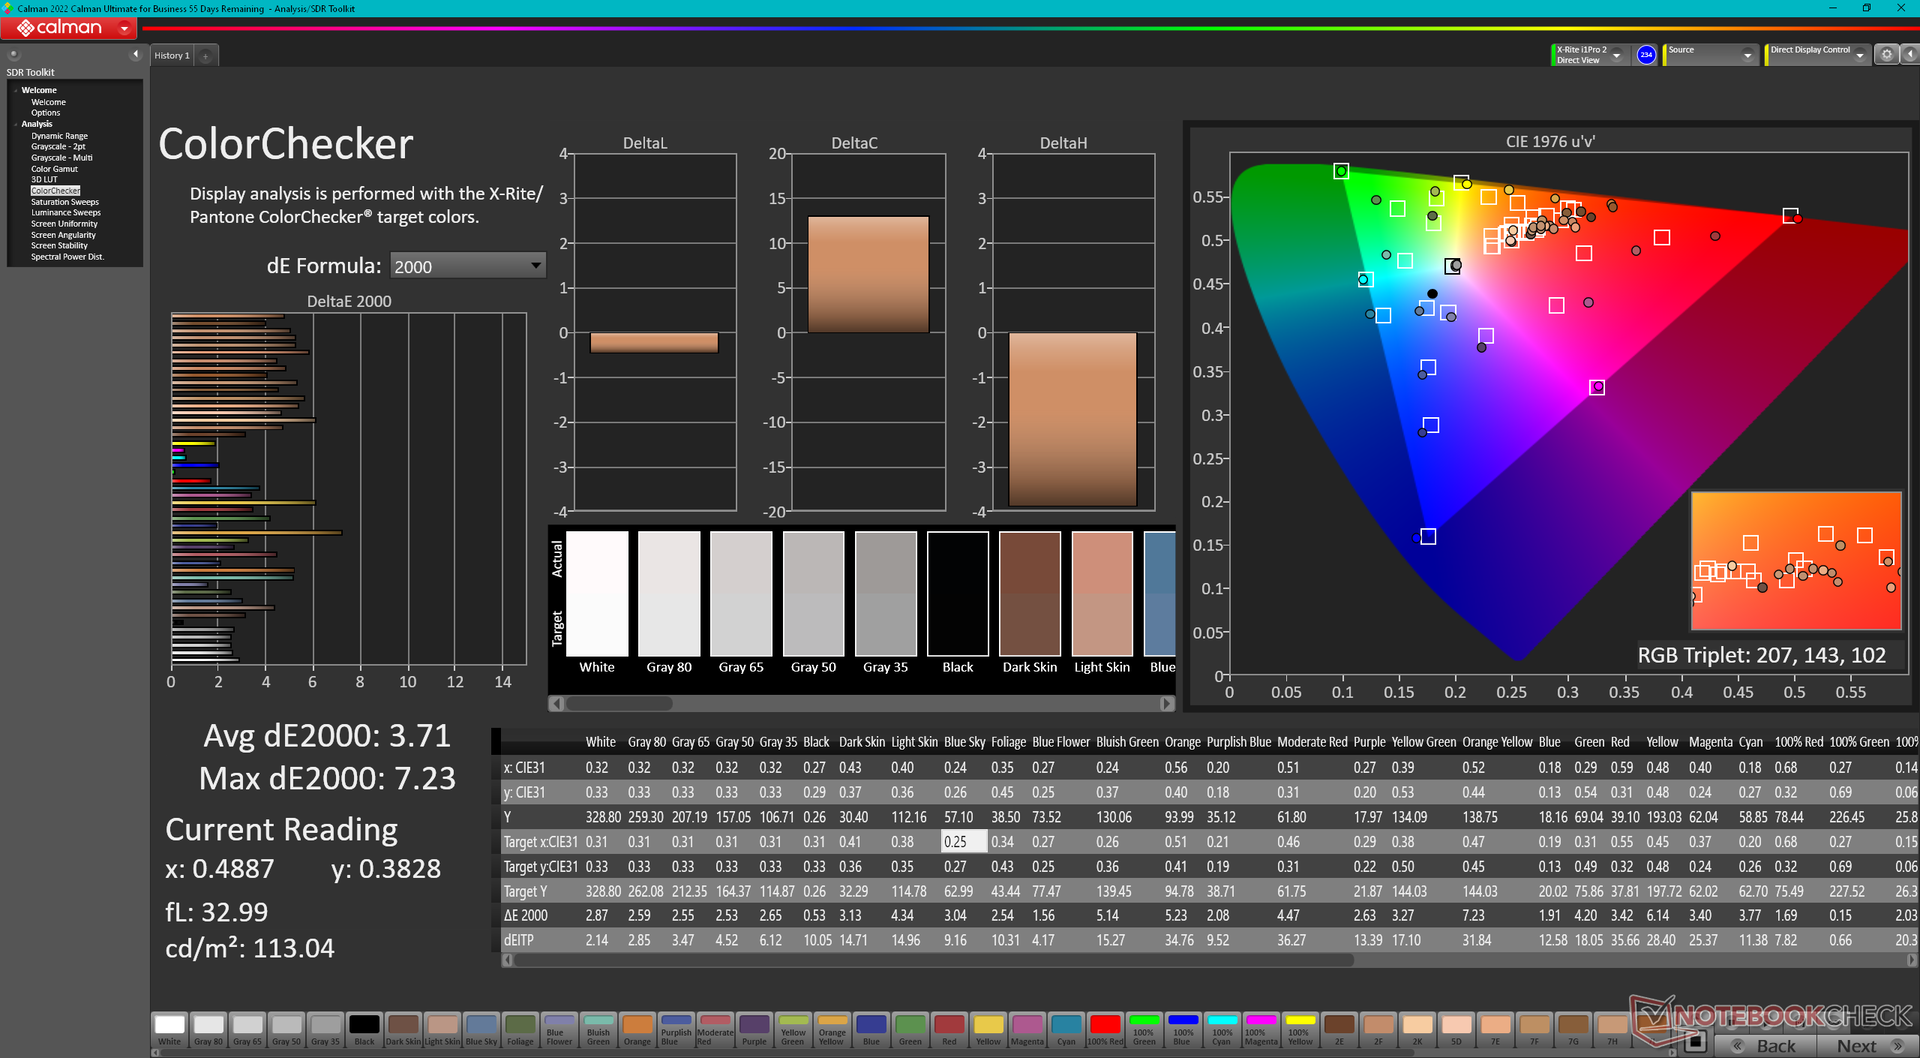
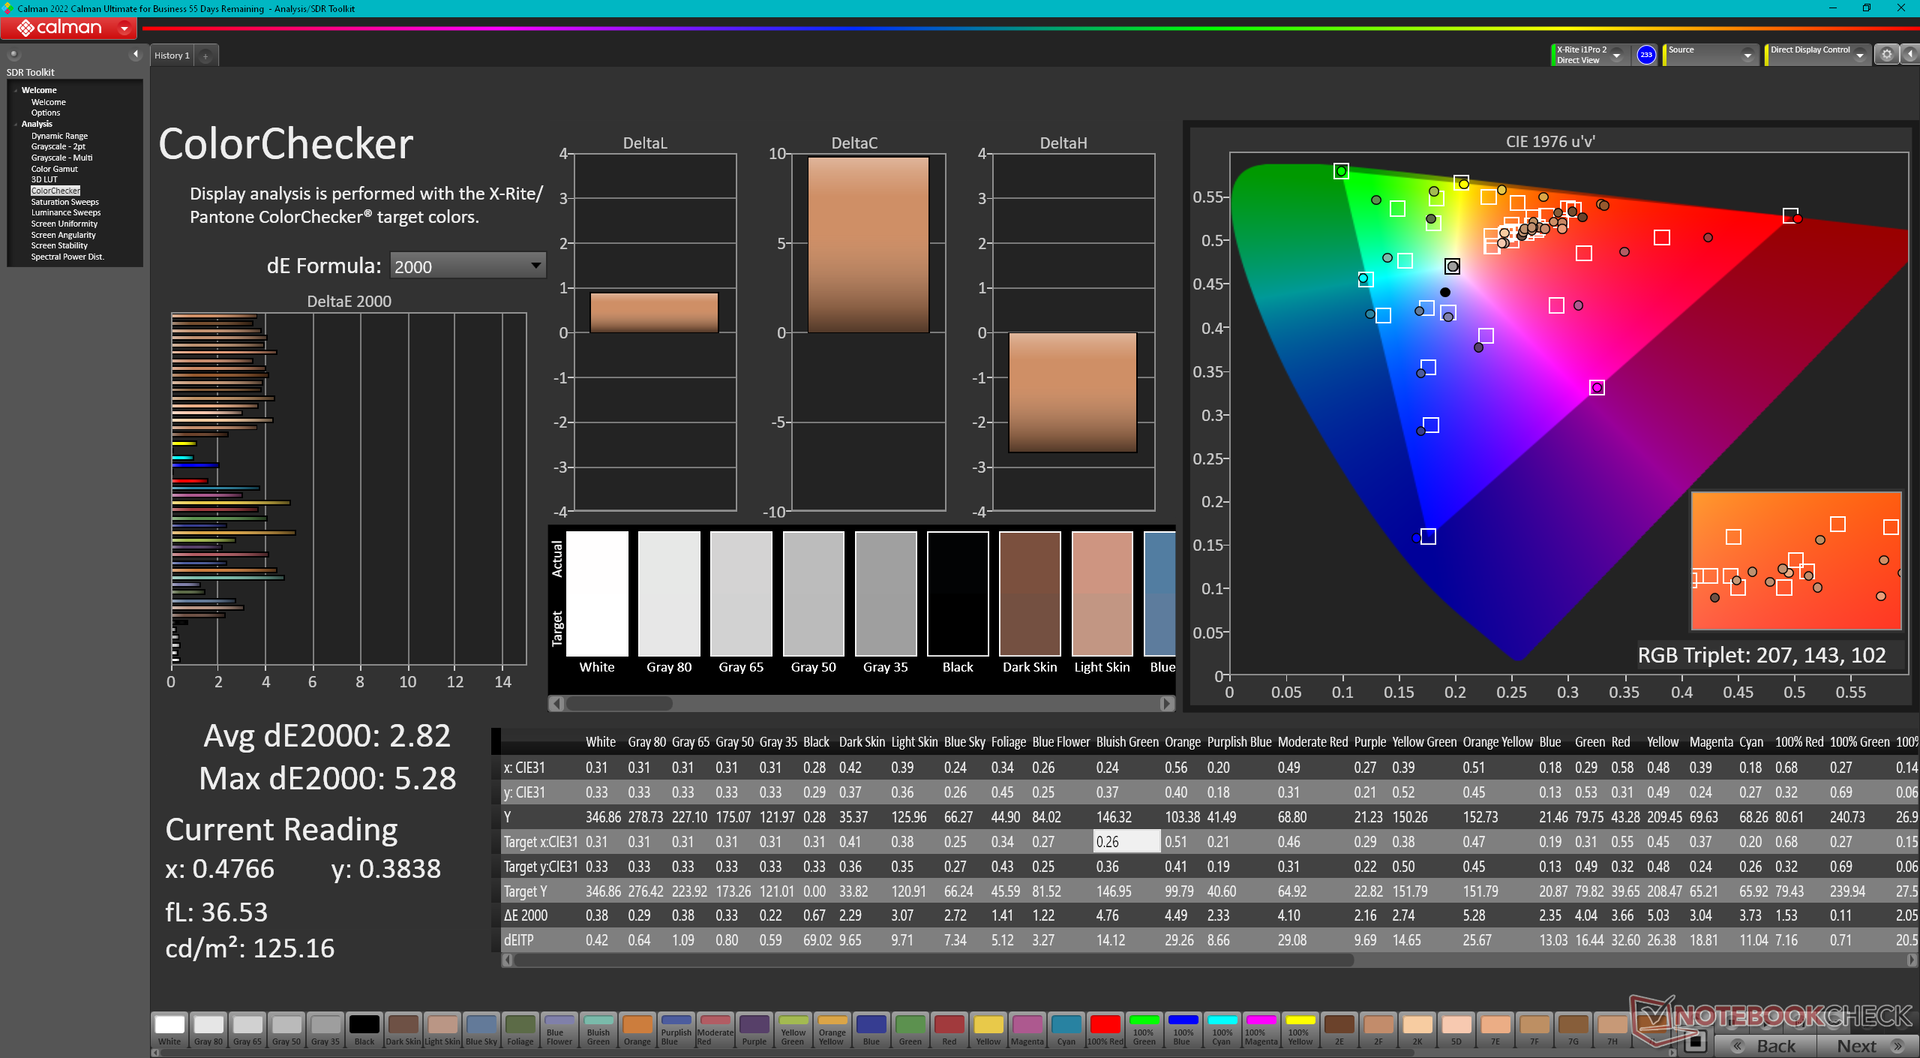
ΔE ColorChecker Calman: 3.71 | ∀{0.5-29.43 Ø4.71}
calibrated: 2.82
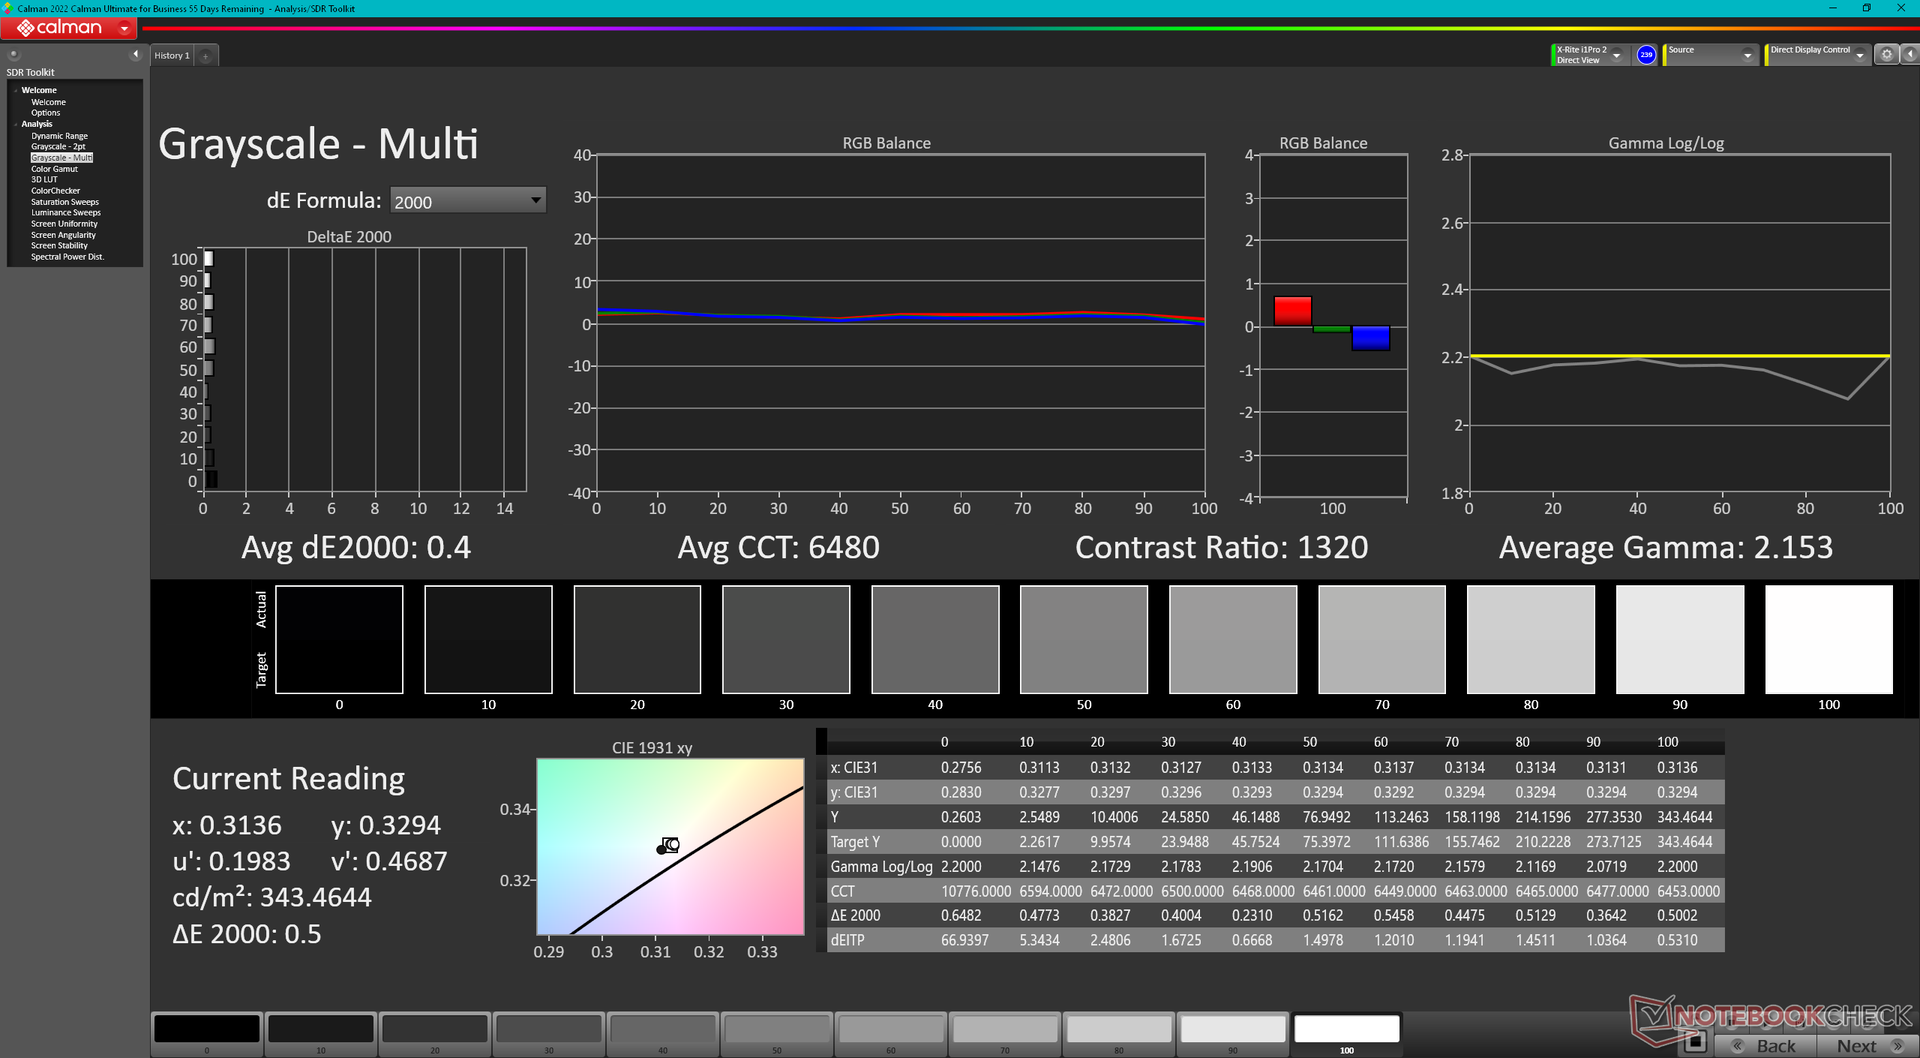
ΔE Greyscale Calman: 2.2 | ∀{0.09-98 Ø4.96}
88.9% AdobeRGB 1998 (Argyll 3D)
99.9% sRGB (Argyll 3D)
98.6% Display P3 (Argyll 3D)
Gamma: 2.3
CCT: 6270 K
| Alienware m16 R1 AMD BOE NE16NZ4, IPS, 2560x1600, 16" | Alienware x16 R1 BOE NE16NZ4, IPS, 2560x1600, 16" | HP Omen Transcend 16 AUOA3A6, Mini-LED, 2560x1600, 16" | Lenovo Legion Pro 7 RTX4090 MNG007DA2-3 (CSO1628), IPS, 2560x1600, 16" | Asus ROG Strix G16 G614JZ TL160ADMP03-0, IPS, 2560x1600, 16" | Razer Blade 16 Early 2023 CSOT T3 MNG007DA4-1, IPS, 2560x1600, 16" | |
|---|---|---|---|---|---|---|
| Display | 0% | 0% | -16% | -2% | 0% | |
| Display P3 Coverage (%) | 98.6 | 99.2 1% | 99.2 1% | 69.5 -30% | 97 -2% | 98.5 0% |
| sRGB Coverage (%) | 99.9 | 100 0% | 100 0% | 99.8 0% | 99.9 0% | 100 0% |
| AdobeRGB 1998 Coverage (%) | 88.9 | 88.6 0% | 87.6 -1% | 71.6 -19% | 84.9 -4% | 89.7 1% |
| Response Times | -7% | -316% | -33% | 14% | -31% | |
| Response Time Grey 50% / Grey 80% * (ms) | 5.1 ? | 5.1 ? -0% | 26.4 ? -418% | 10.9 ? -114% | 5.1 ? -0% | 6.6 ? -29% |
| Response Time Black / White * (ms) | 9 ? | 10.3 ? -14% | 28.2 ? -213% | 4.6 ? 49% | 6.6 ? 27% | 12 ? -33% |
| PWM Frequency (Hz) | 3506 ? | |||||
| Screen | 18% | 224% | 23% | 23% | 18% | |
| Brightness middle (cd/m²) | 329 | 302.2 -8% | 791.1 140% | 491 49% | 470 43% | 456.8 39% |
| Brightness (cd/m²) | 317 | 285 -10% | 800 152% | 472 49% | 459 45% | 437 38% |
| Brightness Distribution (%) | 89 | 89 0% | 95 7% | 91 2% | 93 4% | 83 -7% |
| Black Level * (cd/m²) | 0.32 | 0.26 19% | 0.04 87% | 0.4 -25% | 0.42 -31% | 0.35 -9% |
| Contrast (:1) | 1028 | 1162 13% | 19778 1824% | 1228 19% | 1119 9% | 1305 27% |
| Colorchecker dE 2000 * | 3.71 | 1.63 56% | 4.37 -18% | 1.6 57% | 1.86 50% | 3.7 -0% |
| Colorchecker dE 2000 max. * | 7.23 | 4.13 43% | 10.39 -44% | 5.15 29% | 3.87 46% | 6.42 11% |
| Colorchecker dE 2000 calibrated * | 2.82 | 1.17 59% | 1.04 63% | 0.97 66% | 0.93 67% | 0.66 77% |
| Greyscale dE 2000 * | 2.2 | 2.5 -14% | 6.5 -195% | 3 -36% | 2.7 -23% | 2.6 -18% |
| Gamma | 2.3 96% | 2.23 99% | 2.28 96% | 2.211 100% | 2.246 98% | 2.3 96% |
| CCT | 6270 104% | 6590 99% | 6000 108% | 6979 93% | 6711 97% | 6108 106% |
| Total Average (Program / Settings) | 4% /
10% | -31% /
99% | -9% /
7% | 12% /
17% | -4% /
7% |
* ... smaller is better
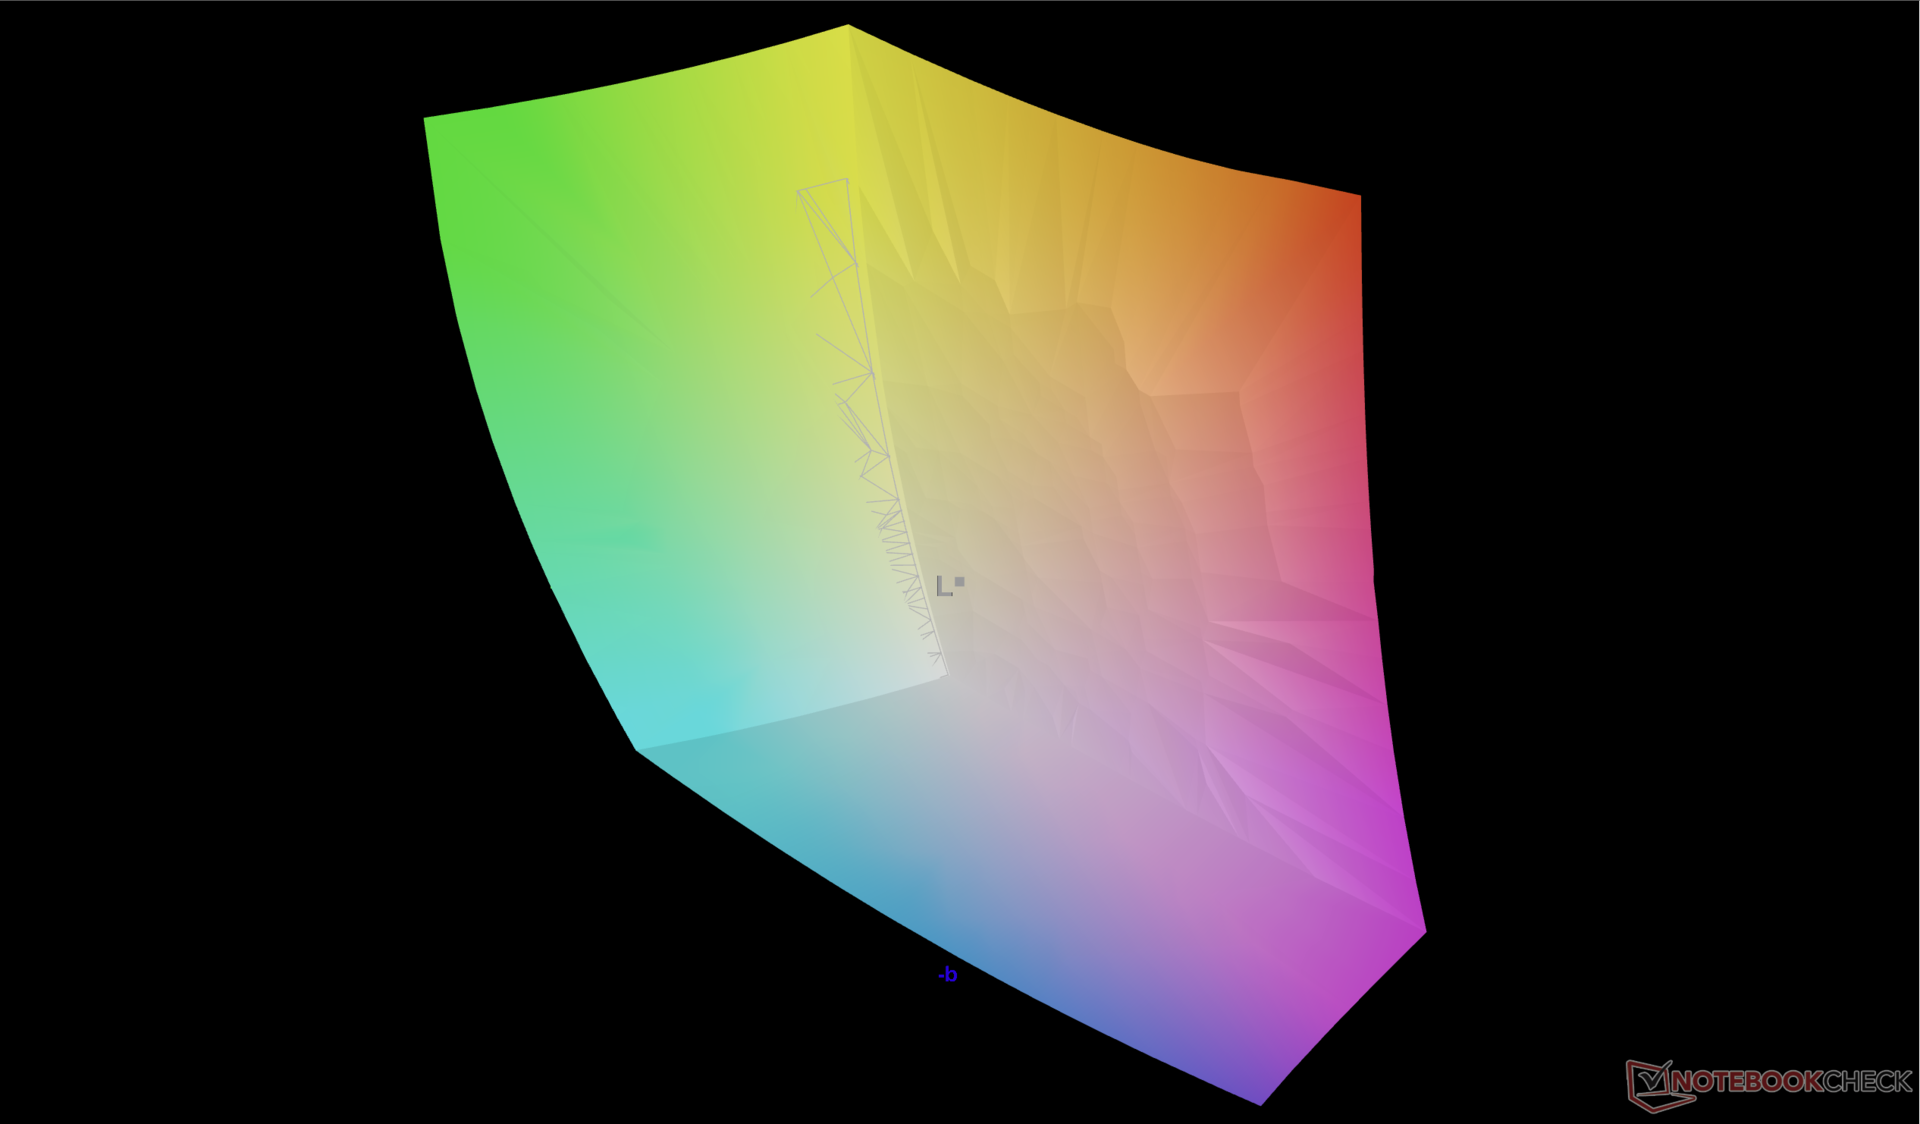
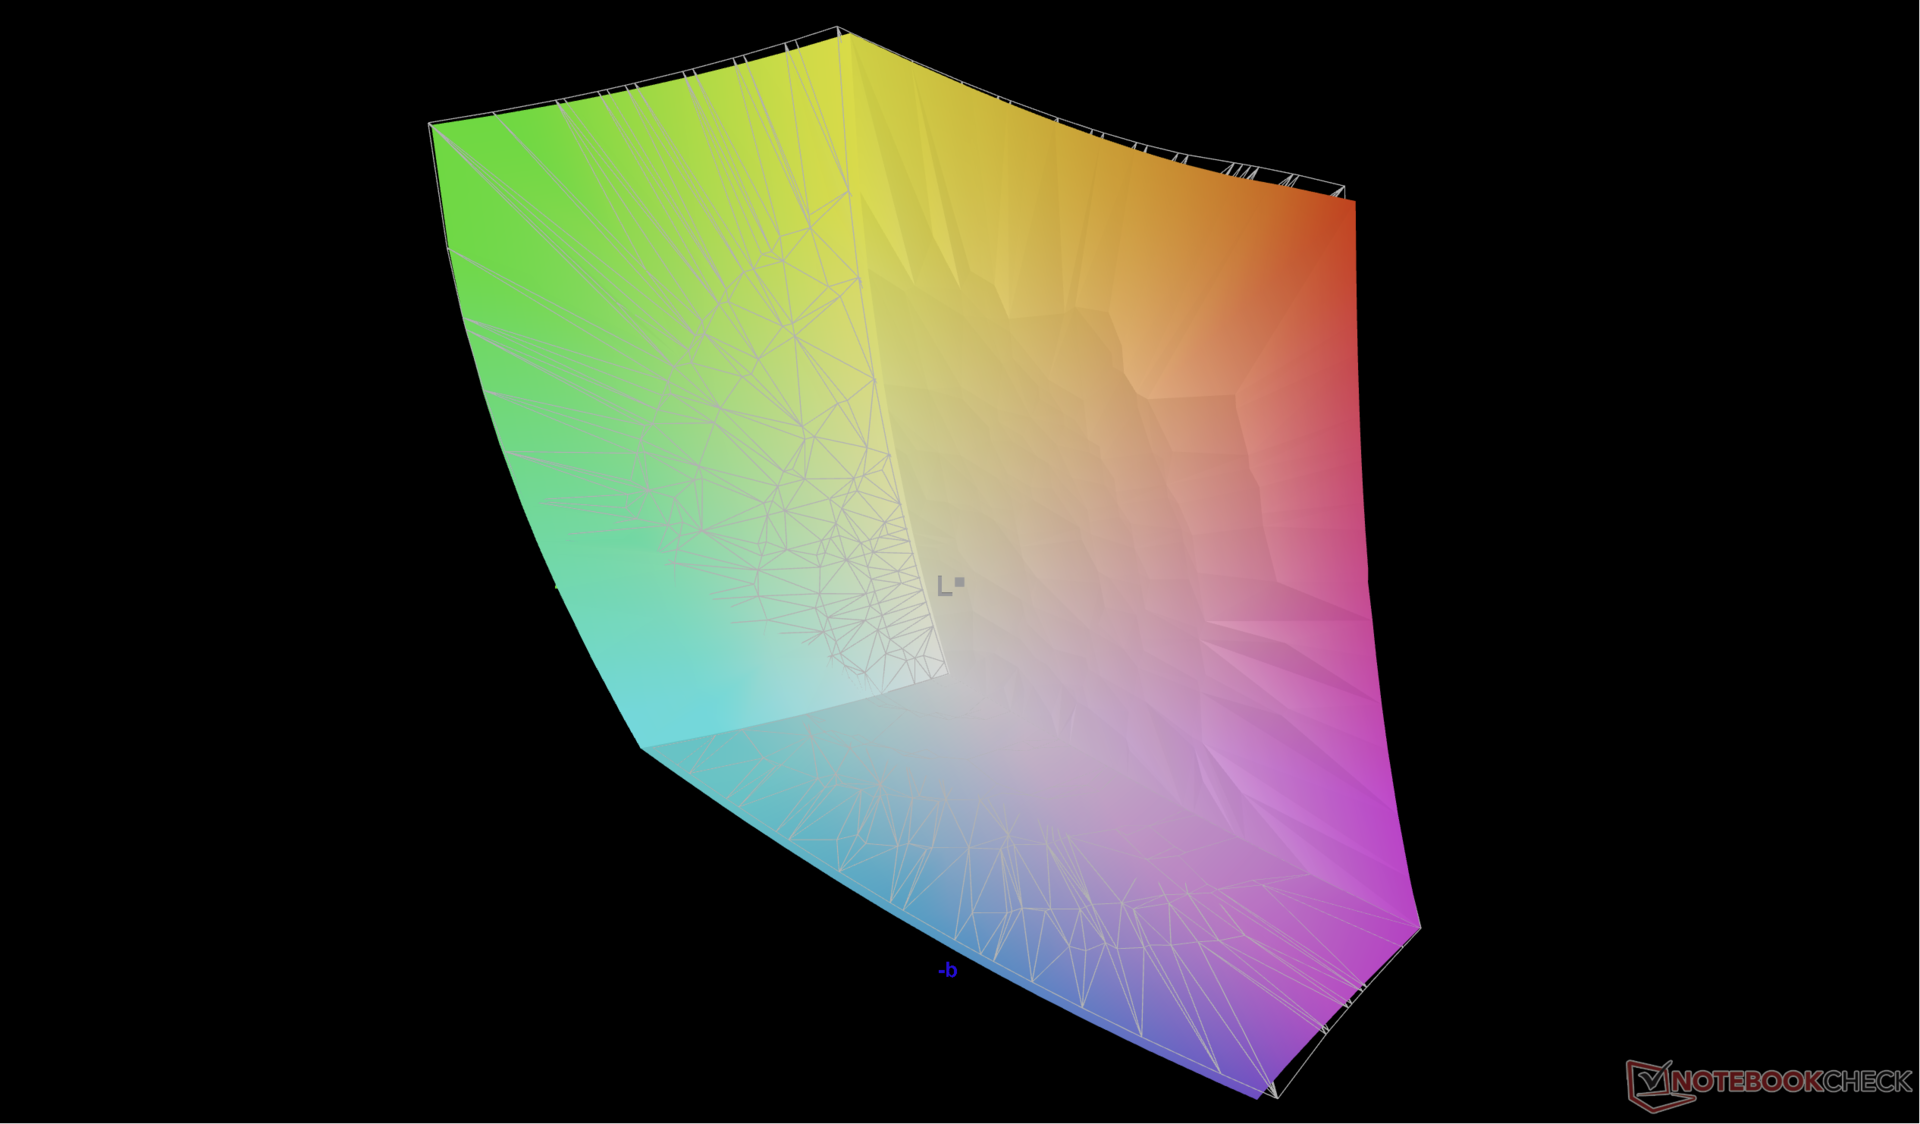
The display is decently calibrated out of the box against the P3 standard with average grayscale and color DeltaE values of only 2.2 and 3.71, respectively. Calibrating the display ourselves with an X-Rite colorimeter would improve grayscale even further to an average deltaE of just 0.4 for more accurate colors overall. Our calibrated ICM profile is available to download above for free.
Display Response Times
| ↔ Response Time Black to White | ||
|---|---|---|
| 9 ms ... rise ↗ and fall ↘ combined | ↗ 4.8 ms rise | 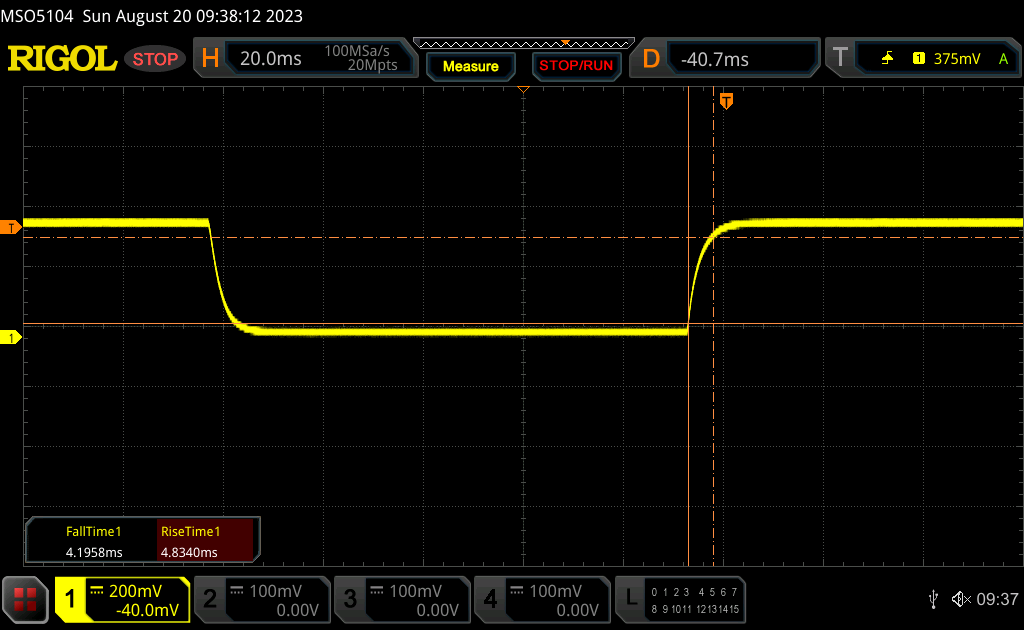 |
| ↘ 4.2 ms fall | ||
| The screen shows fast response rates in our tests and should be suited for gaming. In comparison, all tested devices range from 0.1 (minimum) to 240 (maximum) ms. » 25 % of all devices are better. This means that the measured response time is better than the average of all tested devices (19.8 ms). | ||
| ↔ Response Time 50% Grey to 80% Grey | ||
| 5.1 ms ... rise ↗ and fall ↘ combined | ↗ 2.5 ms rise | 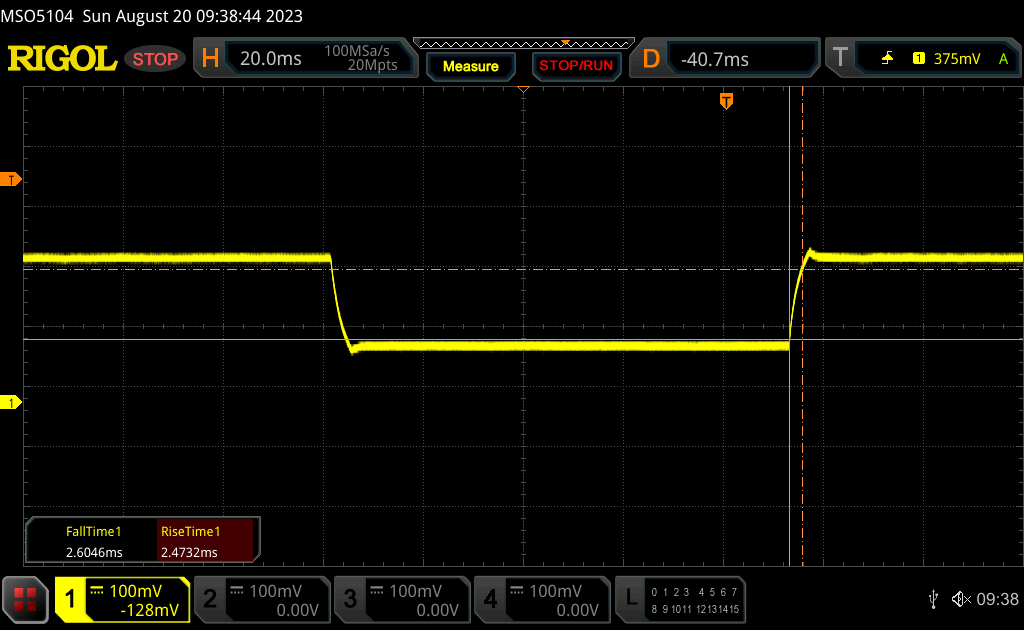 |
| ↘ 2.6 ms fall | ||
| The screen shows very fast response rates in our tests and should be very well suited for fast-paced gaming. In comparison, all tested devices range from 0.165 (minimum) to 636 (maximum) ms. » 17 % of all devices are better. This means that the measured response time is better than the average of all tested devices (30.9 ms). | ||
Screen Flickering / PWM (Pulse-Width Modulation)
| Screen flickering / PWM not detected | 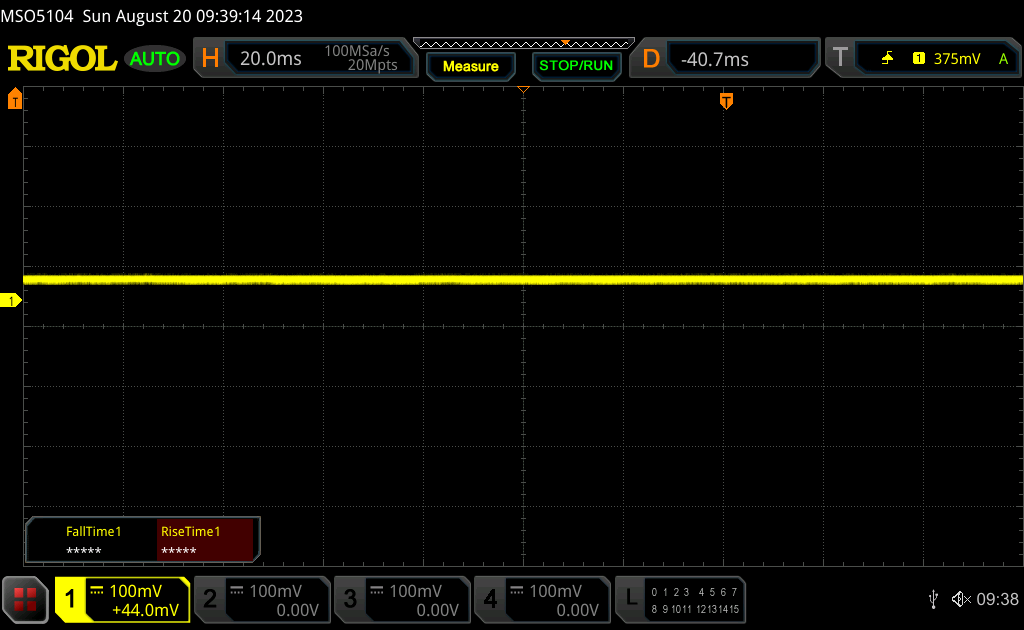 | ||
In comparison: 52 % of all tested devices do not use PWM to dim the display. If PWM was detected, an average of 7748 (minimum: 5 - maximum: 343500) Hz was measured. | |||
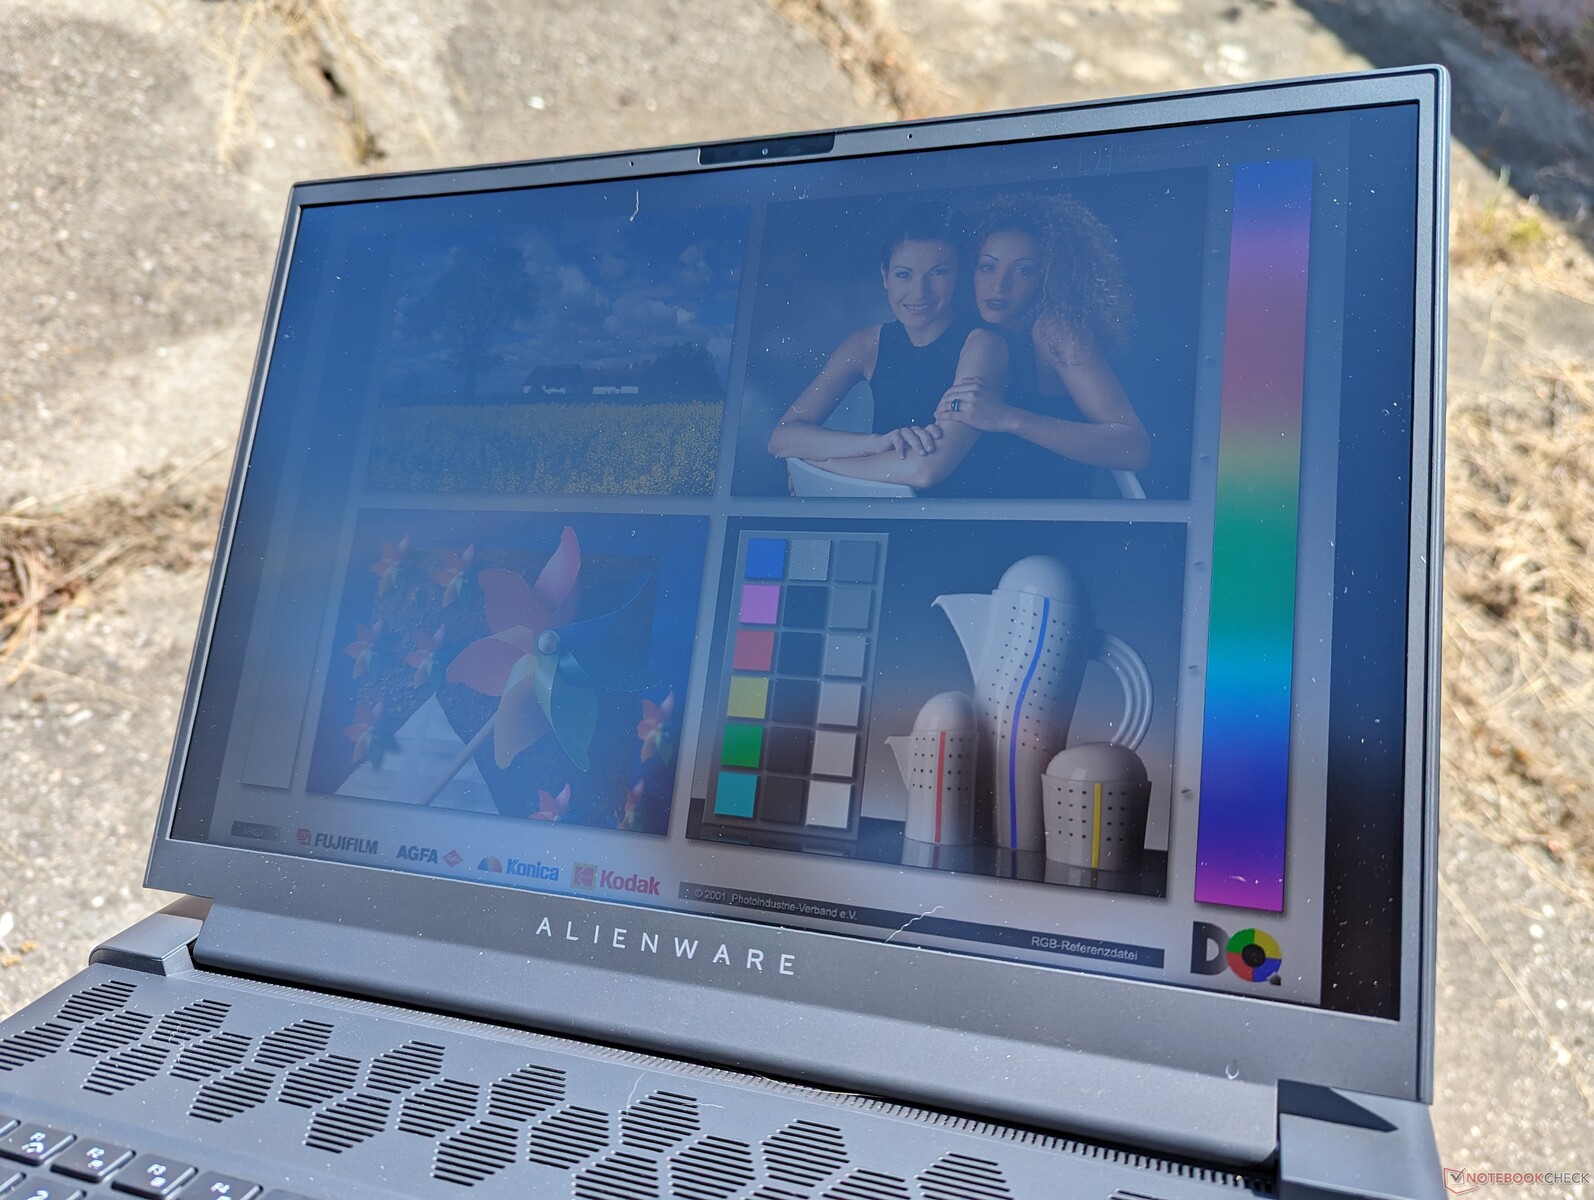
Outdoor visibility is decent only when under shade. The Omen Transcend 16 and its mini-LED display is over 2x brighter if outdoor visibility is a concern.

Performance — AMD Or Intel?
Testing Conditions
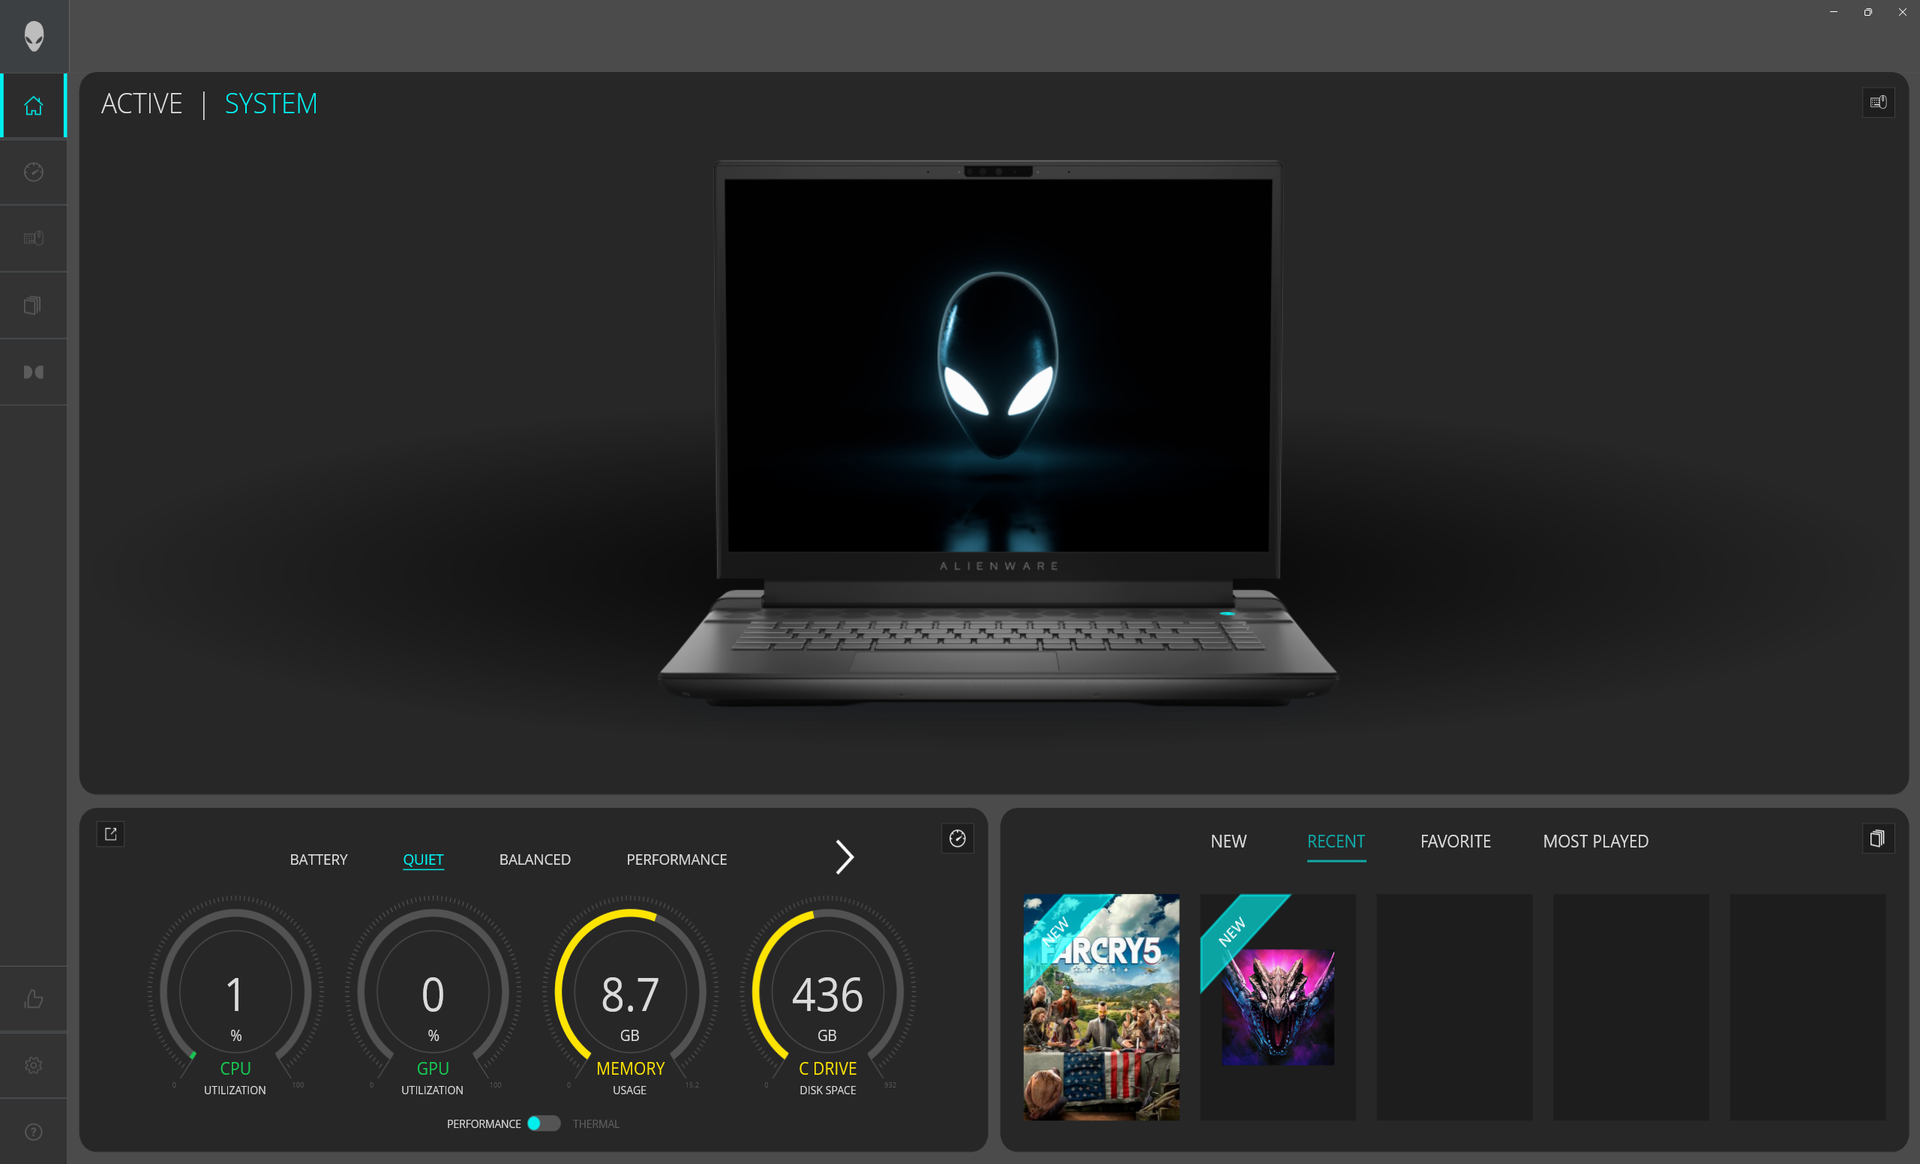
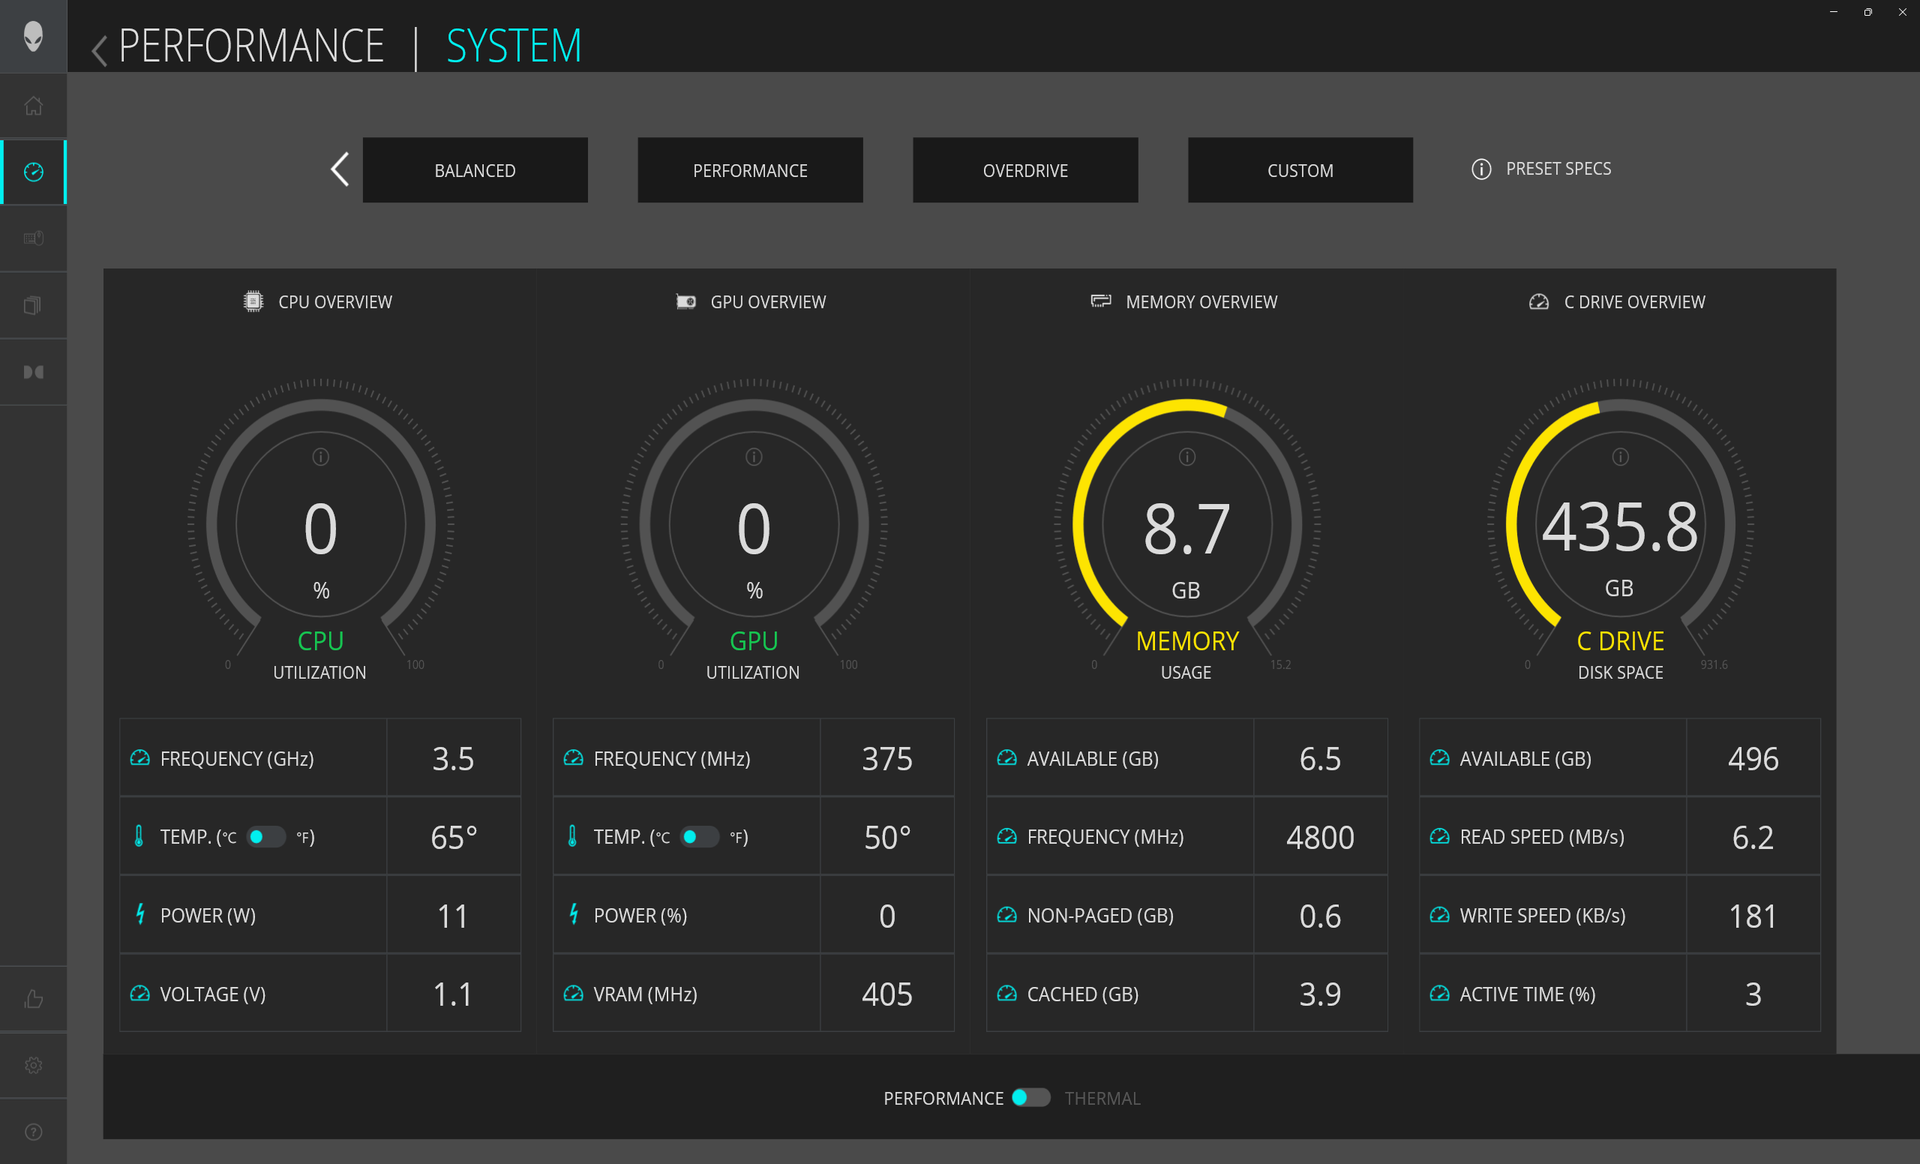
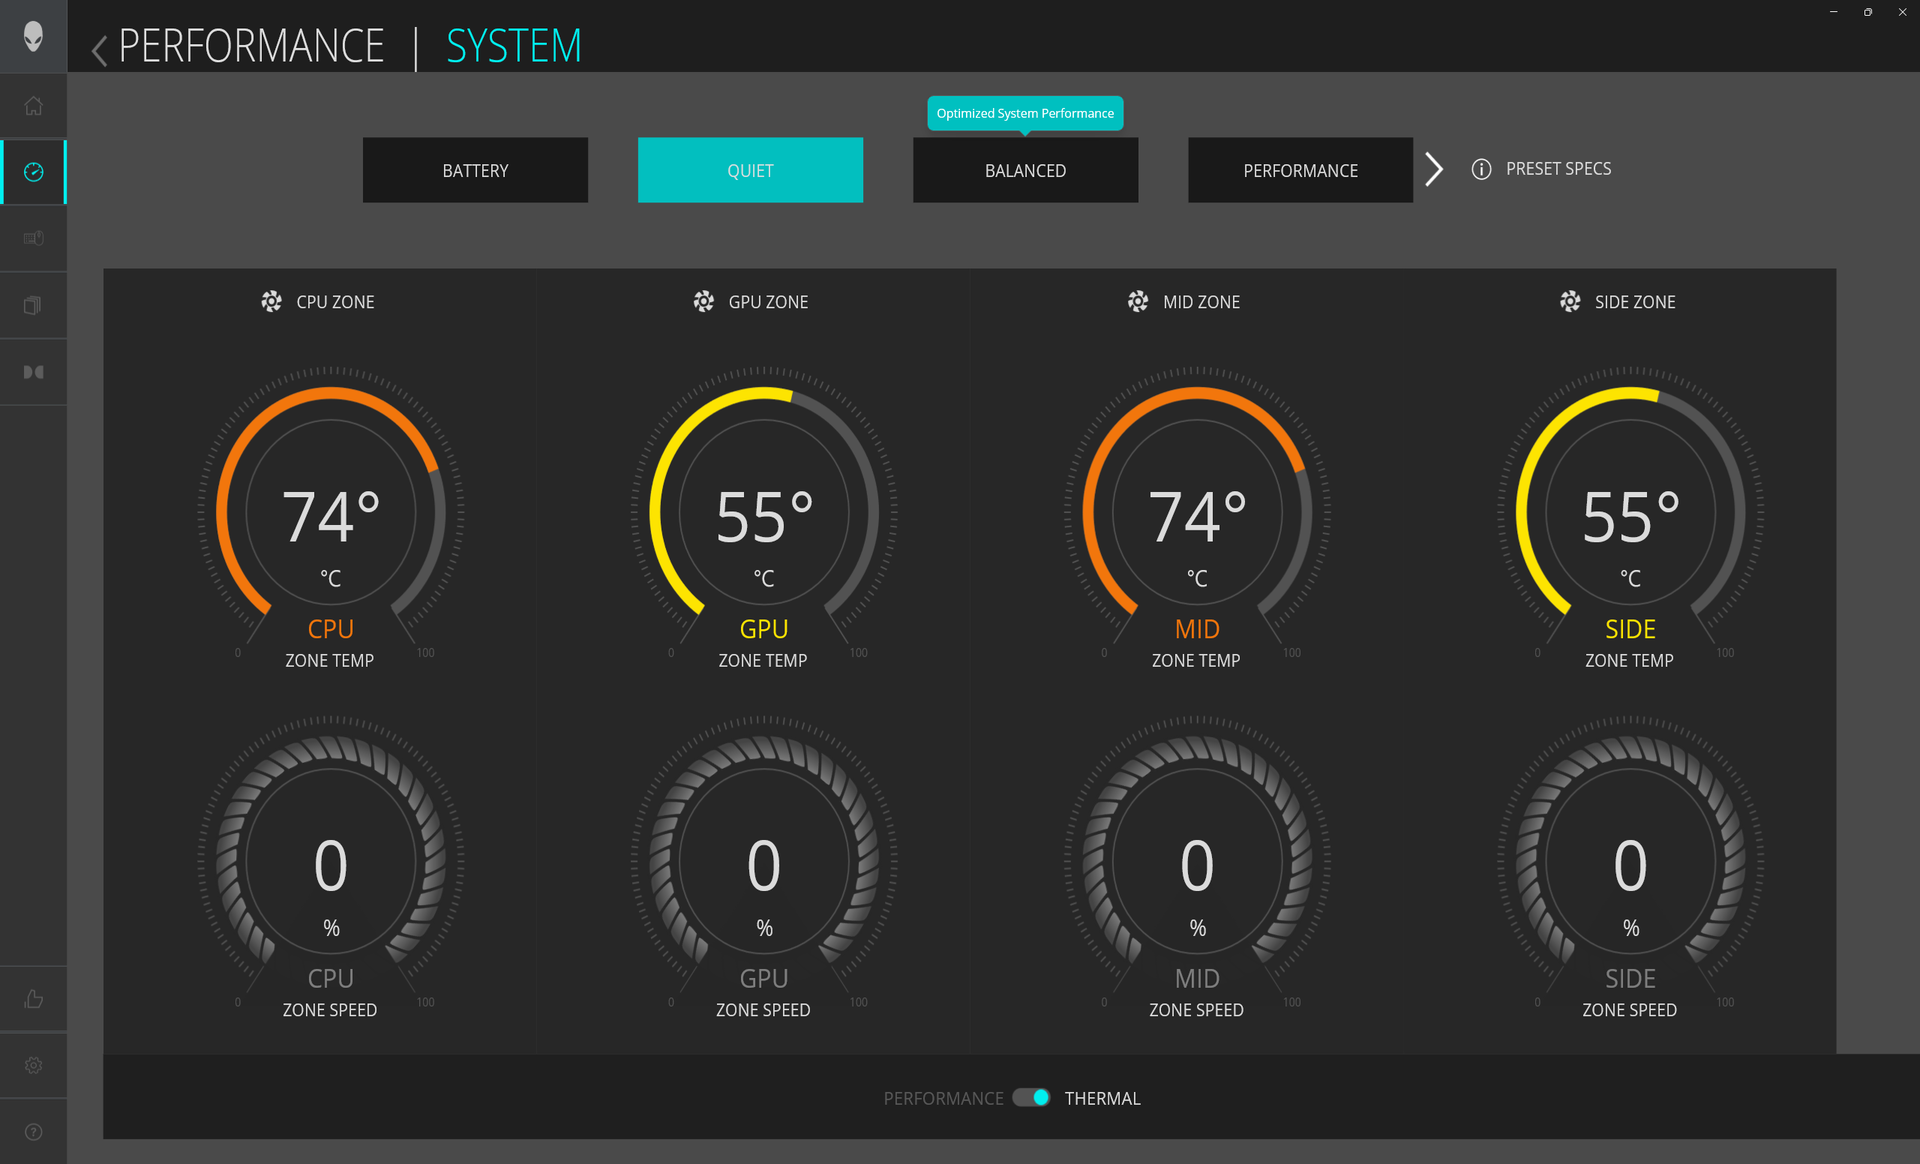
We set our unit to Overdrive mode via Alienware Command Center and the GPU to dGPU mode prior to running the benchmarks below. Users should become familiar with Command Center as it is the control hub for system features related to Performance, vitals, and lighting. Command Center should not be confused with My Alienware which is the warranty and support software.
Advanced Optimus or MUX is supported. G-Sync, however, is not supported on the internal display for the AMD versions of the Alienware m16 as that feature is currently exclusive to the Intel versions. Instead, FreeSync is supported in its place.
Processor
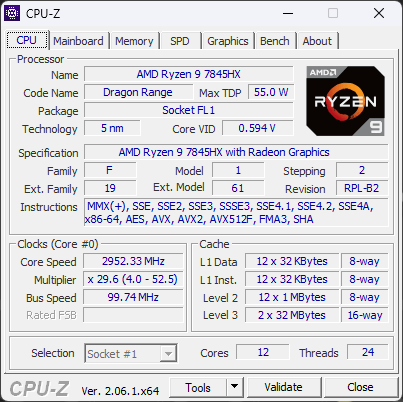
The Ryzen 9 7845HX performs closer to the impressive Ryzen 9 7945HX than to the Ryzen 7 7745HX. Multi-thread performance is about 20 to 25 percent slower than the Ryzen 9 7945HX or roughly 50 percent ahead than the Ryzen 7 7745HX. The CPU is therefore just shy of the competing Core i9-13900HX but well ahead of the Core i7-13700HX. The concept of settling for slower CPU performance by opting for AMD instead of Intel doesn't apply to this generation.
Performance sustainability is excellent as shown by the stable Cinebench R15 xT results below.
Cinebench R15 Multi Loop
Cinebench R23: Multi Core | Single Core
Cinebench R20: CPU (Multi Core) | CPU (Single Core)
Cinebench R15: CPU Multi 64Bit | CPU Single 64Bit
Blender: v2.79 BMW27 CPU
7-Zip 18.03: 7z b 4 | 7z b 4 -mmt1
Geekbench 5.5: Multi-Core | Single-Core
HWBOT x265 Benchmark v2.2: 4k Preset
LibreOffice : 20 Documents To PDF
R Benchmark 2.5: Overall mean
* ... smaller is better
AIDA64: FP32 Ray-Trace | FPU Julia | CPU SHA3 | CPU Queen | FPU SinJulia | FPU Mandel | CPU AES | CPU ZLib | FP64 Ray-Trace | CPU PhotoWorxx
| Performance rating | |
| Alienware m16 R1 AMD | |
| Average AMD Ryzen 9 7845HX | |
| Lenovo Legion Pro 7 RTX4090 | |
| Asus ROG Strix G16 G614JZ | |
| HP Omen Transcend 16 | |
| Razer Blade 16 Early 2023 | |
| Alienware x16 R1 | |
| AIDA64 / FP32 Ray-Trace | |
| Alienware m16 R1 AMD | |
| Average AMD Ryzen 9 7845HX (n=1) | |
| Asus ROG Strix G16 G614JZ | |
| Lenovo Legion Pro 7 RTX4090 | |
| Razer Blade 16 Early 2023 | |
| Razer Blade 16 Early 2023 | |
| Razer Blade 16 Early 2023 | |
| HP Omen Transcend 16 | |
| Alienware x16 R1 | |
| AIDA64 / FPU Julia | |
| Alienware m16 R1 AMD | |
| Average AMD Ryzen 9 7845HX (n=1) | |
| Lenovo Legion Pro 7 RTX4090 | |
| Asus ROG Strix G16 G614JZ | |
| Razer Blade 16 Early 2023 | |
| Razer Blade 16 Early 2023 | |
| Razer Blade 16 Early 2023 | |
| HP Omen Transcend 16 | |
| Alienware x16 R1 | |
| AIDA64 / CPU SHA3 | |
| Alienware m16 R1 AMD | |
| Average AMD Ryzen 9 7845HX (n=1) | |
| Lenovo Legion Pro 7 RTX4090 | |
| Asus ROG Strix G16 G614JZ | |
| Razer Blade 16 Early 2023 | |
| Razer Blade 16 Early 2023 | |
| Razer Blade 16 Early 2023 | |
| HP Omen Transcend 16 | |
| Alienware x16 R1 | |
| AIDA64 / CPU Queen | |
| Alienware m16 R1 AMD | |
| Average AMD Ryzen 9 7845HX (n=1) | |
| Asus ROG Strix G16 G614JZ | |
| Lenovo Legion Pro 7 RTX4090 | |
| Razer Blade 16 Early 2023 | |
| Razer Blade 16 Early 2023 | |
| HP Omen Transcend 16 | |
| Alienware x16 R1 | |
| AIDA64 / FPU SinJulia | |
| Alienware m16 R1 AMD | |
| Average AMD Ryzen 9 7845HX (n=1) | |
| Asus ROG Strix G16 G614JZ | |
| Razer Blade 16 Early 2023 | |
| Razer Blade 16 Early 2023 | |
| Razer Blade 16 Early 2023 | |
| Lenovo Legion Pro 7 RTX4090 | |
| HP Omen Transcend 16 | |
| Alienware x16 R1 | |
| AIDA64 / FPU Mandel | |
| Alienware m16 R1 AMD | |
| Average AMD Ryzen 9 7845HX (n=1) | |
| Lenovo Legion Pro 7 RTX4090 | |
| Asus ROG Strix G16 G614JZ | |
| Razer Blade 16 Early 2023 | |
| Razer Blade 16 Early 2023 | |
| Razer Blade 16 Early 2023 | |
| HP Omen Transcend 16 | |
| Alienware x16 R1 | |
| AIDA64 / CPU ZLib | |
| Lenovo Legion Pro 7 RTX4090 | |
| Asus ROG Strix G16 G614JZ | |
| Razer Blade 16 Early 2023 | |
| Razer Blade 16 Early 2023 | |
| Razer Blade 16 Early 2023 | |
| Alienware m16 R1 AMD | |
| Average AMD Ryzen 9 7845HX (n=1) | |
| HP Omen Transcend 16 | |
| Alienware x16 R1 | |
| AIDA64 / FP64 Ray-Trace | |
| Alienware m16 R1 AMD | |
| Average AMD Ryzen 9 7845HX (n=1) | |
| Asus ROG Strix G16 G614JZ | |
| Lenovo Legion Pro 7 RTX4090 | |
| Razer Blade 16 Early 2023 | |
| Razer Blade 16 Early 2023 | |
| Razer Blade 16 Early 2023 | |
| HP Omen Transcend 16 | |
| Alienware x16 R1 | |
| AIDA64 / CPU PhotoWorxx | |
| Razer Blade 16 Early 2023 | |
| Razer Blade 16 Early 2023 | |
| Razer Blade 16 Early 2023 | |
| Lenovo Legion Pro 7 RTX4090 | |
| HP Omen Transcend 16 | |
| Alienware x16 R1 | |
| Asus ROG Strix G16 G614JZ | |
| Alienware m16 R1 AMD | |
| Average AMD Ryzen 9 7845HX (n=1) | |
System Performance
PCMark scores are some of the highest of any gaming laptop. The widest margin is in the Productivity subtest which focuses on CPU performance.
Unfortunately, we experienced several wake-from-sleep issues on our test unit. The system would sometimes reboot for no reason when opening the lid or show the blue screen of death even after updating to the latest drivers from Dell and Nvidia at the time of review.

CrossMark: Overall | Productivity | Creativity | Responsiveness
| PCMark 10 / Score | |
| Alienware m16 R1 AMD | |
| Average AMD Ryzen 9 7845HX, NVIDIA GeForce RTX 4080 Laptop GPU (n=1) | |
| Alienware x16 R1 | |
| Lenovo Legion Pro 7 RTX4090 | |
| HP Omen Transcend 16 | |
| Razer Blade 16 Early 2023 | |
| Asus ROG Strix G16 G614JZ | |
| PCMark 10 / Essentials | |
| Asus ROG Strix G16 G614JZ | |
| Alienware m16 R1 AMD | |
| Average AMD Ryzen 9 7845HX, NVIDIA GeForce RTX 4080 Laptop GPU (n=1) | |
| HP Omen Transcend 16 | |
| Alienware x16 R1 | |
| Lenovo Legion Pro 7 RTX4090 | |
| Razer Blade 16 Early 2023 | |
| PCMark 10 / Productivity | |
| Alienware m16 R1 AMD | |
| Average AMD Ryzen 9 7845HX, NVIDIA GeForce RTX 4080 Laptop GPU (n=1) | |
| Alienware x16 R1 | |
| HP Omen Transcend 16 | |
| Lenovo Legion Pro 7 RTX4090 | |
| Razer Blade 16 Early 2023 | |
| Asus ROG Strix G16 G614JZ | |
| PCMark 10 / Digital Content Creation | |
| Alienware m16 R1 AMD | |
| Average AMD Ryzen 9 7845HX, NVIDIA GeForce RTX 4080 Laptop GPU (n=1) | |
| Lenovo Legion Pro 7 RTX4090 | |
| Razer Blade 16 Early 2023 | |
| Alienware x16 R1 | |
| HP Omen Transcend 16 | |
| Asus ROG Strix G16 G614JZ | |
| CrossMark / Overall | |
| Asus ROG Strix G16 G614JZ | |
| Alienware m16 R1 AMD | |
| Average AMD Ryzen 9 7845HX, NVIDIA GeForce RTX 4080 Laptop GPU (n=1) | |
| HP Omen Transcend 16 | |
| Alienware x16 R1 | |
| Razer Blade 16 Early 2023 | |
| CrossMark / Productivity | |
| Asus ROG Strix G16 G614JZ | |
| Alienware m16 R1 AMD | |
| Average AMD Ryzen 9 7845HX, NVIDIA GeForce RTX 4080 Laptop GPU (n=1) | |
| Alienware x16 R1 | |
| HP Omen Transcend 16 | |
| Razer Blade 16 Early 2023 | |
| CrossMark / Creativity | |
| Asus ROG Strix G16 G614JZ | |
| HP Omen Transcend 16 | |
| Alienware m16 R1 AMD | |
| Average AMD Ryzen 9 7845HX, NVIDIA GeForce RTX 4080 Laptop GPU (n=1) | |
| Alienware x16 R1 | |
| Razer Blade 16 Early 2023 | |
| CrossMark / Responsiveness | |
| Asus ROG Strix G16 G614JZ | |
| Alienware x16 R1 | |
| Alienware m16 R1 AMD | |
| Average AMD Ryzen 9 7845HX, NVIDIA GeForce RTX 4080 Laptop GPU (n=1) | |
| HP Omen Transcend 16 | |
| Razer Blade 16 Early 2023 | |
| PCMark 10 Score | 8867 points | |
Help | ||
| AIDA64 / Memory Copy | |
| Razer Blade 16 Early 2023 | |
| Razer Blade 16 Early 2023 | |
| Razer Blade 16 Early 2023 | |
| Lenovo Legion Pro 7 RTX4090 | |
| HP Omen Transcend 16 | |
| Alienware x16 R1 | |
| Asus ROG Strix G16 G614JZ | |
| Alienware m16 R1 AMD | |
| Average AMD Ryzen 9 7845HX (n=1) | |
| AIDA64 / Memory Read | |
| Lenovo Legion Pro 7 RTX4090 | |
| Razer Blade 16 Early 2023 | |
| Razer Blade 16 Early 2023 | |
| Razer Blade 16 Early 2023 | |
| HP Omen Transcend 16 | |
| Asus ROG Strix G16 G614JZ | |
| Alienware x16 R1 | |
| Alienware m16 R1 AMD | |
| Average AMD Ryzen 9 7845HX (n=1) | |
| AIDA64 / Memory Write | |
| Alienware x16 R1 | |
| Razer Blade 16 Early 2023 | |
| Razer Blade 16 Early 2023 | |
| Razer Blade 16 Early 2023 | |
| Lenovo Legion Pro 7 RTX4090 | |
| HP Omen Transcend 16 | |
| Asus ROG Strix G16 G614JZ | |
| Alienware m16 R1 AMD | |
| Average AMD Ryzen 9 7845HX (n=1) | |
| AIDA64 / Memory Latency | |
| Alienware x16 R1 | |
| Razer Blade 16 Early 2023 | |
| Razer Blade 16 Early 2023 | |
| Razer Blade 16 Early 2023 | |
| Alienware m16 R1 AMD | |
| Average AMD Ryzen 9 7845HX (n=1) | |
| HP Omen Transcend 16 | |
| Asus ROG Strix G16 G614JZ | |
| Lenovo Legion Pro 7 RTX4090 | |
* ... smaller is better
DPC Latency
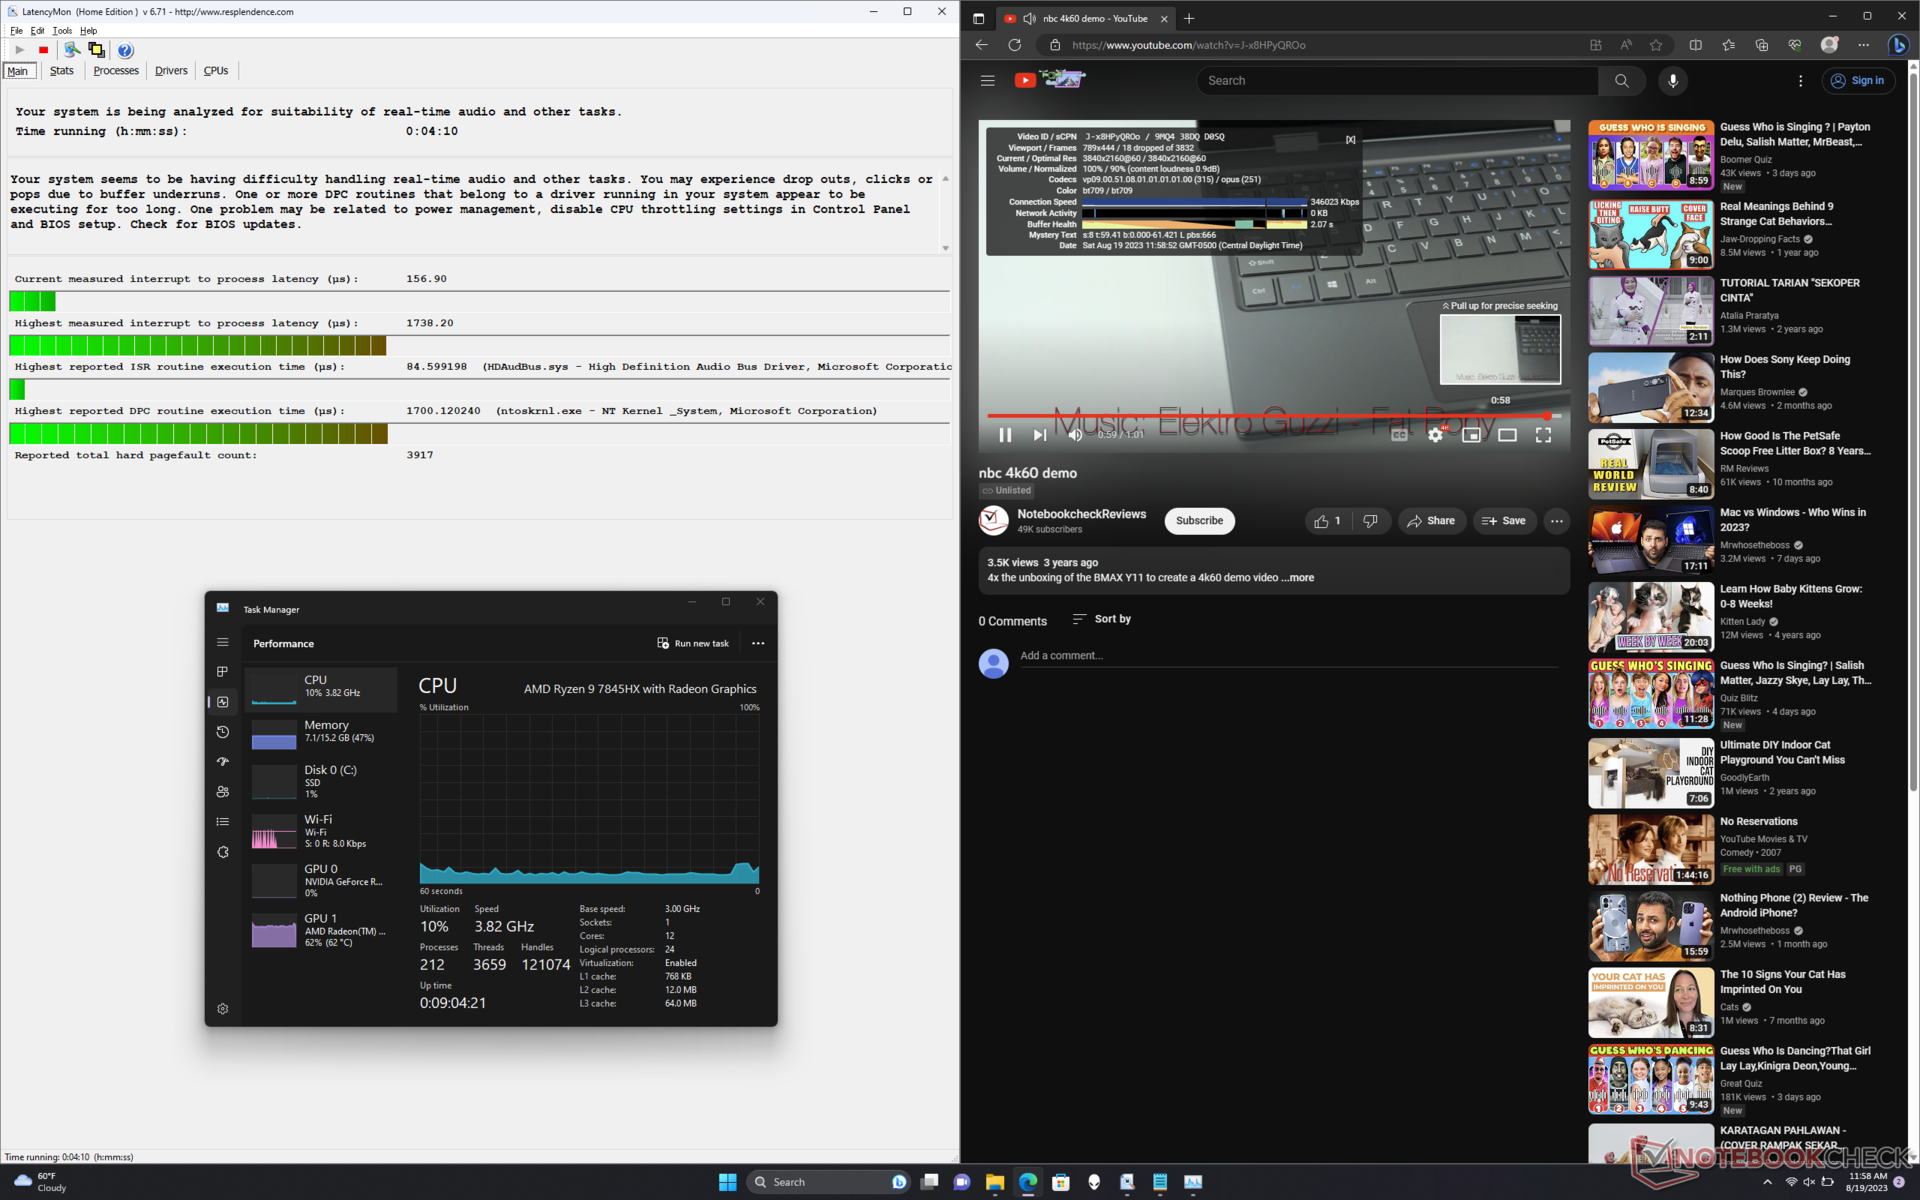
LatencyMon reveals slight DPC issues related to ntoskrnl.exe. Additionally, 4K video playback at 60 FPS is imperfect with 18 dropped frames recorded during a one-minute video test to suggest a potential bug in the AMD hardware acceleration. Results would not improve even after repeat testing.

| DPC Latencies / LatencyMon - interrupt to process latency (max), Web, Youtube, Prime95 | |
| Lenovo Legion Pro 7 RTX4090 | |
| Asus ROG Strix G16 G614JZ | |
| Razer Blade 16 Early 2023 | |
| Alienware m16 R1 AMD | |
| HP Omen Transcend 16 | |
| Alienware x16 R1 | |
* ... smaller is better
Storage Devices
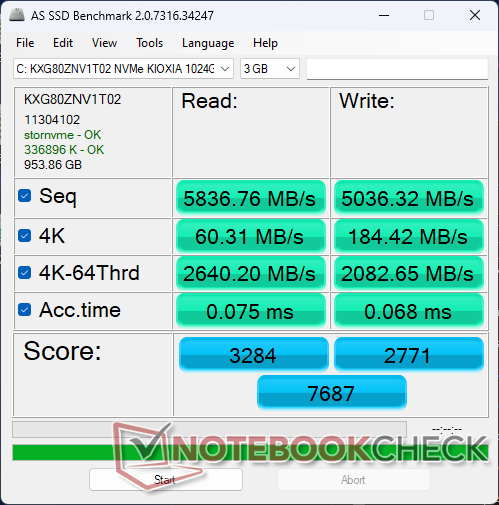
Our unit ships with a high-end 1 TB Kioxia KXG80ZNV1T02 offering sequential read and write rates of up to 7000 MB/s and 5600 MB/s, respectively, according to the manufacturer. The drive is able to sustain maximum transfer rates of over 6500 MB/s for extended periods with no throttling issues.
Up to three M.2 SSDs can be installed whereas the Alienware x16 and HP Omen 16 can only support up to two each. The third drive, however, must be 30 mm in length.


| Drive Performance rating - Percent | |
| Alienware x16 R1 | |
| Lenovo Legion Pro 7 RTX4090 | |
| Alienware m16 R1 AMD | |
| Razer Blade 16 Early 2023 | |
| HP Omen Transcend 16 | |
| Asus ROG Strix G16 G614JZ | |
* ... smaller is better
Disk Throttling: DiskSpd Read Loop, Queue Depth 8
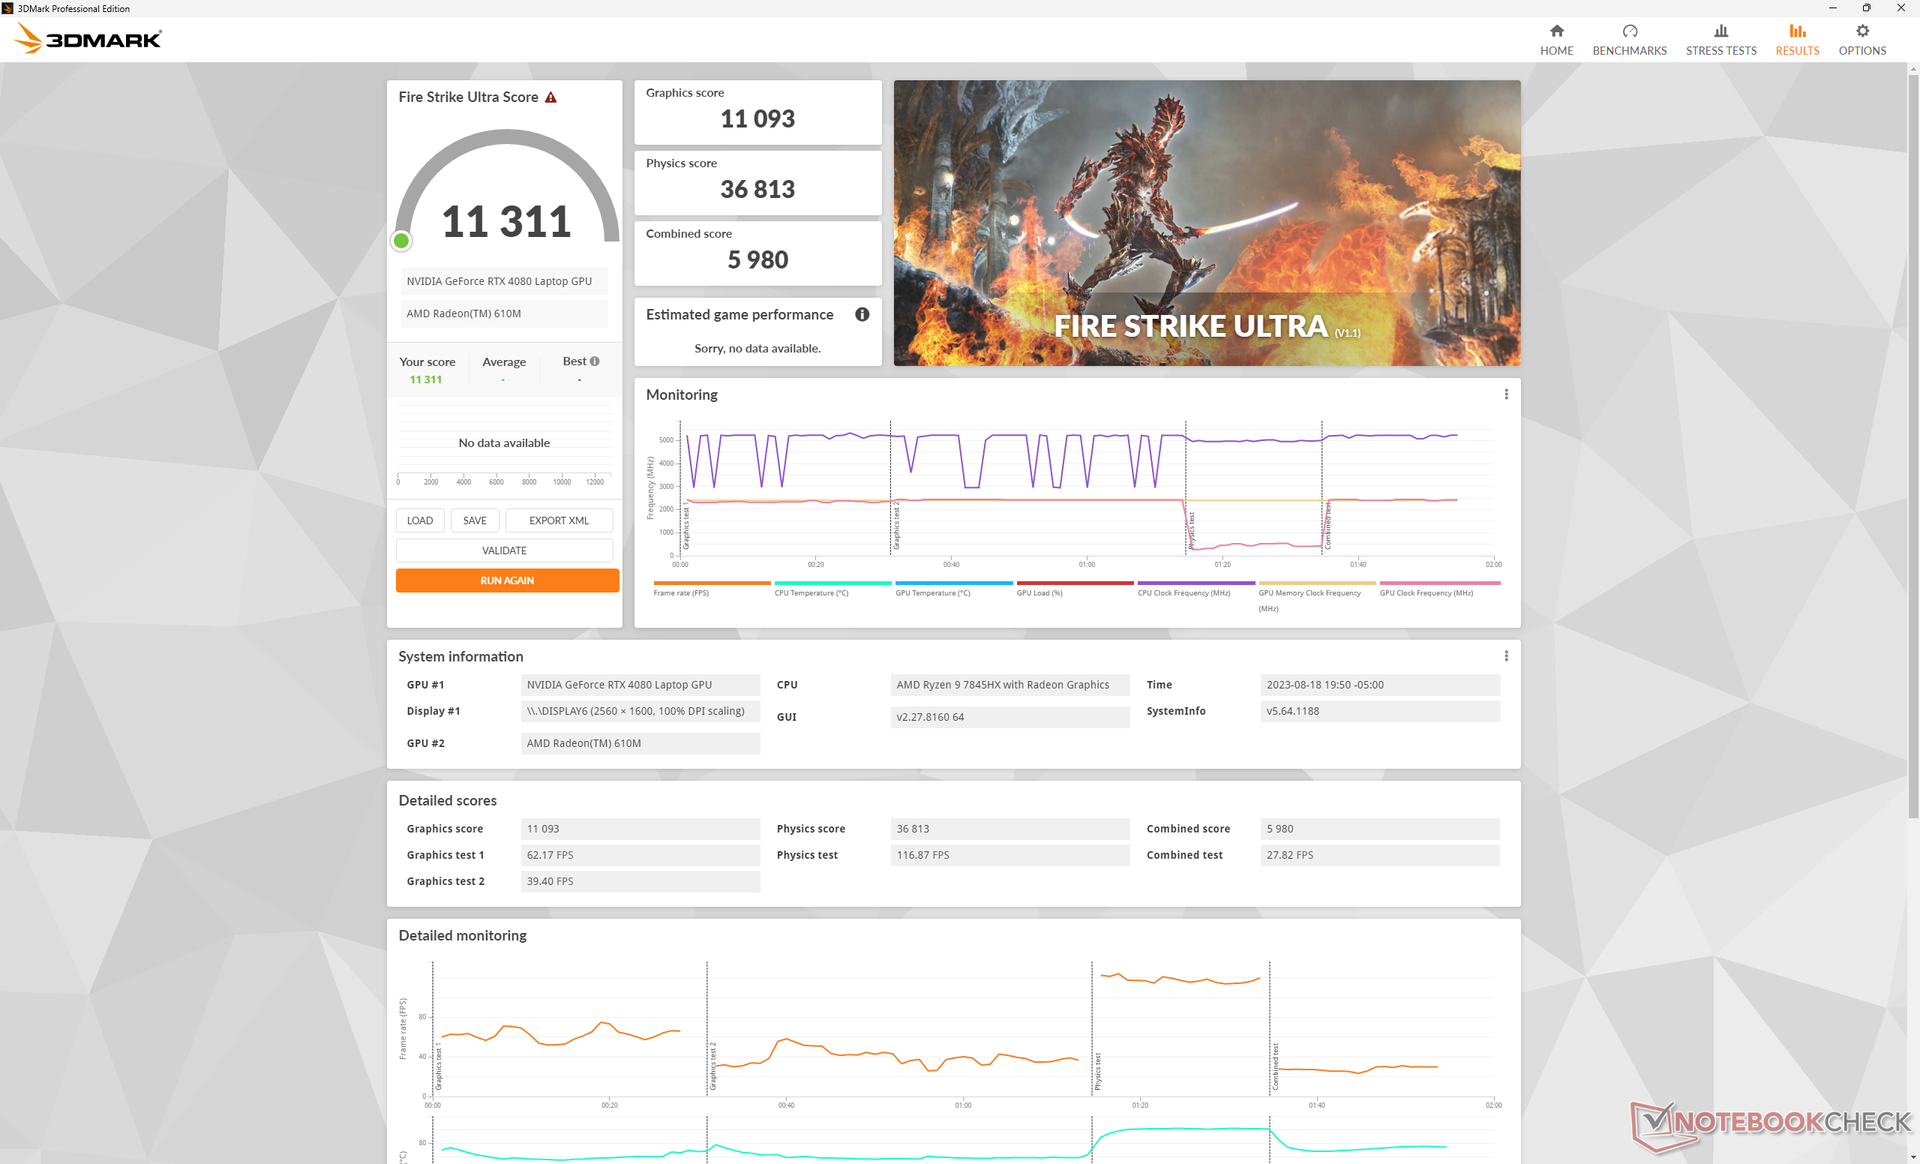
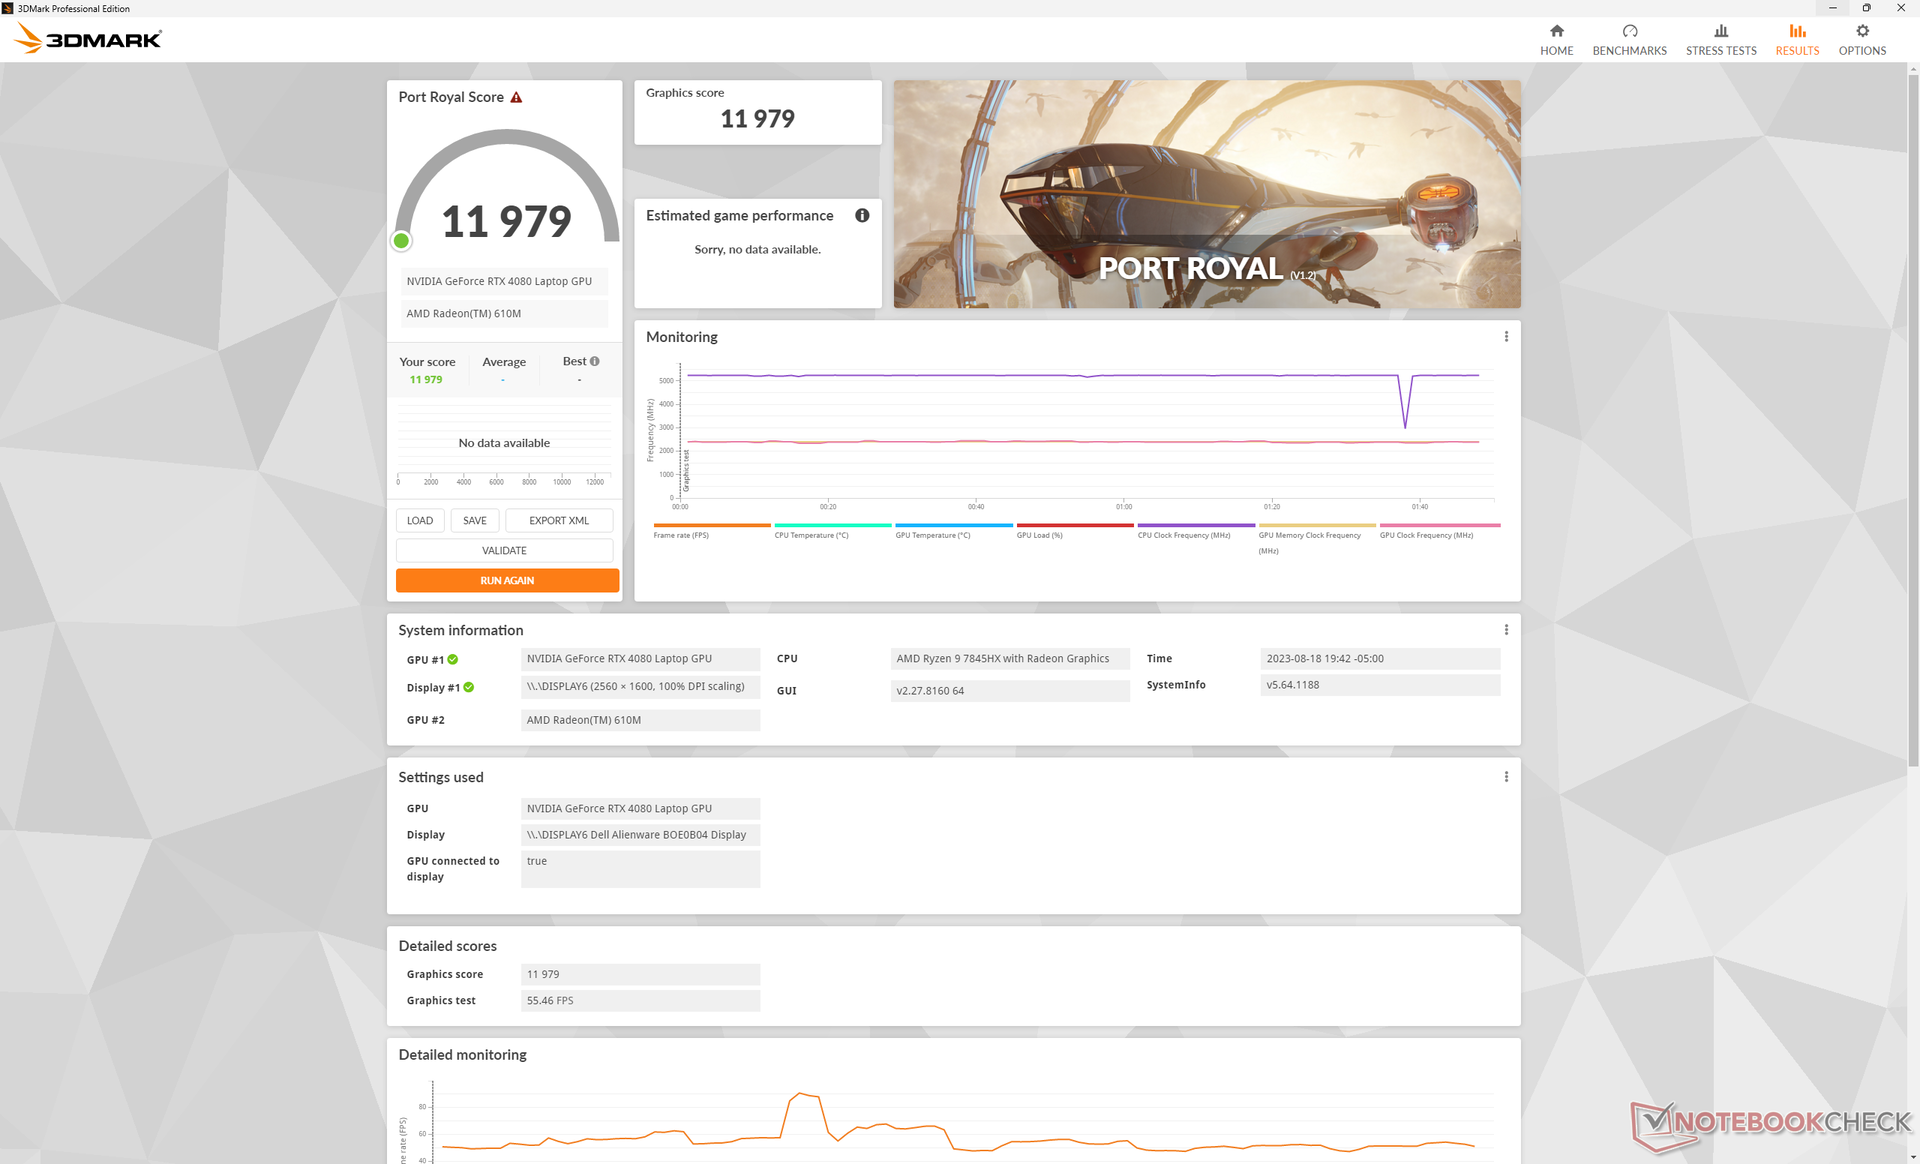
GPU Performance — 175 W TGP Graphics
Graphics performance is about 5 to 10 percent faster than the average gaming laptop in our database equipped with the same RTX 4080 GPU as the Alienware targets a relatively high 175 W TGP. In fact, performance is only about 5 percent slower than the Asus Zephyrus Duo 16 running on the RTX 4090.
Upgrading to the RTX 4090 SKU is expected to boost performance by just 10 percent over our RTX 4080 while downgrading to the RTX 4070 should decrease performance more significantly by up to 30 to 40 percent based on our time with the HP Omen Transcend 16. Enthusiasts should therefore consider SKUs with the RTX 4080 at the least.
Interestingly, there are only minor performance differences between the Balanced, Performance, and Overdrive modes as shown by the Fire Strike scores in the table below. This is important to note as the modes differ significantly in terms of fan noise.
| Power Profile | Graphics Score | Physics Score | Combined Score |
| Battery Power | 22290 (-50%) | 30178 (-17%) | 9109 (-35%) |
| Balanced Mode | 43406 (-3%) | 35237 (-4%) | 14721 (+5%) |
| Performance Mode | 44306 (-1%) | 36106 (-1%) | 13682 (-3%) |
| Overdrive Mode | 44782 | 36557 | 14045 |
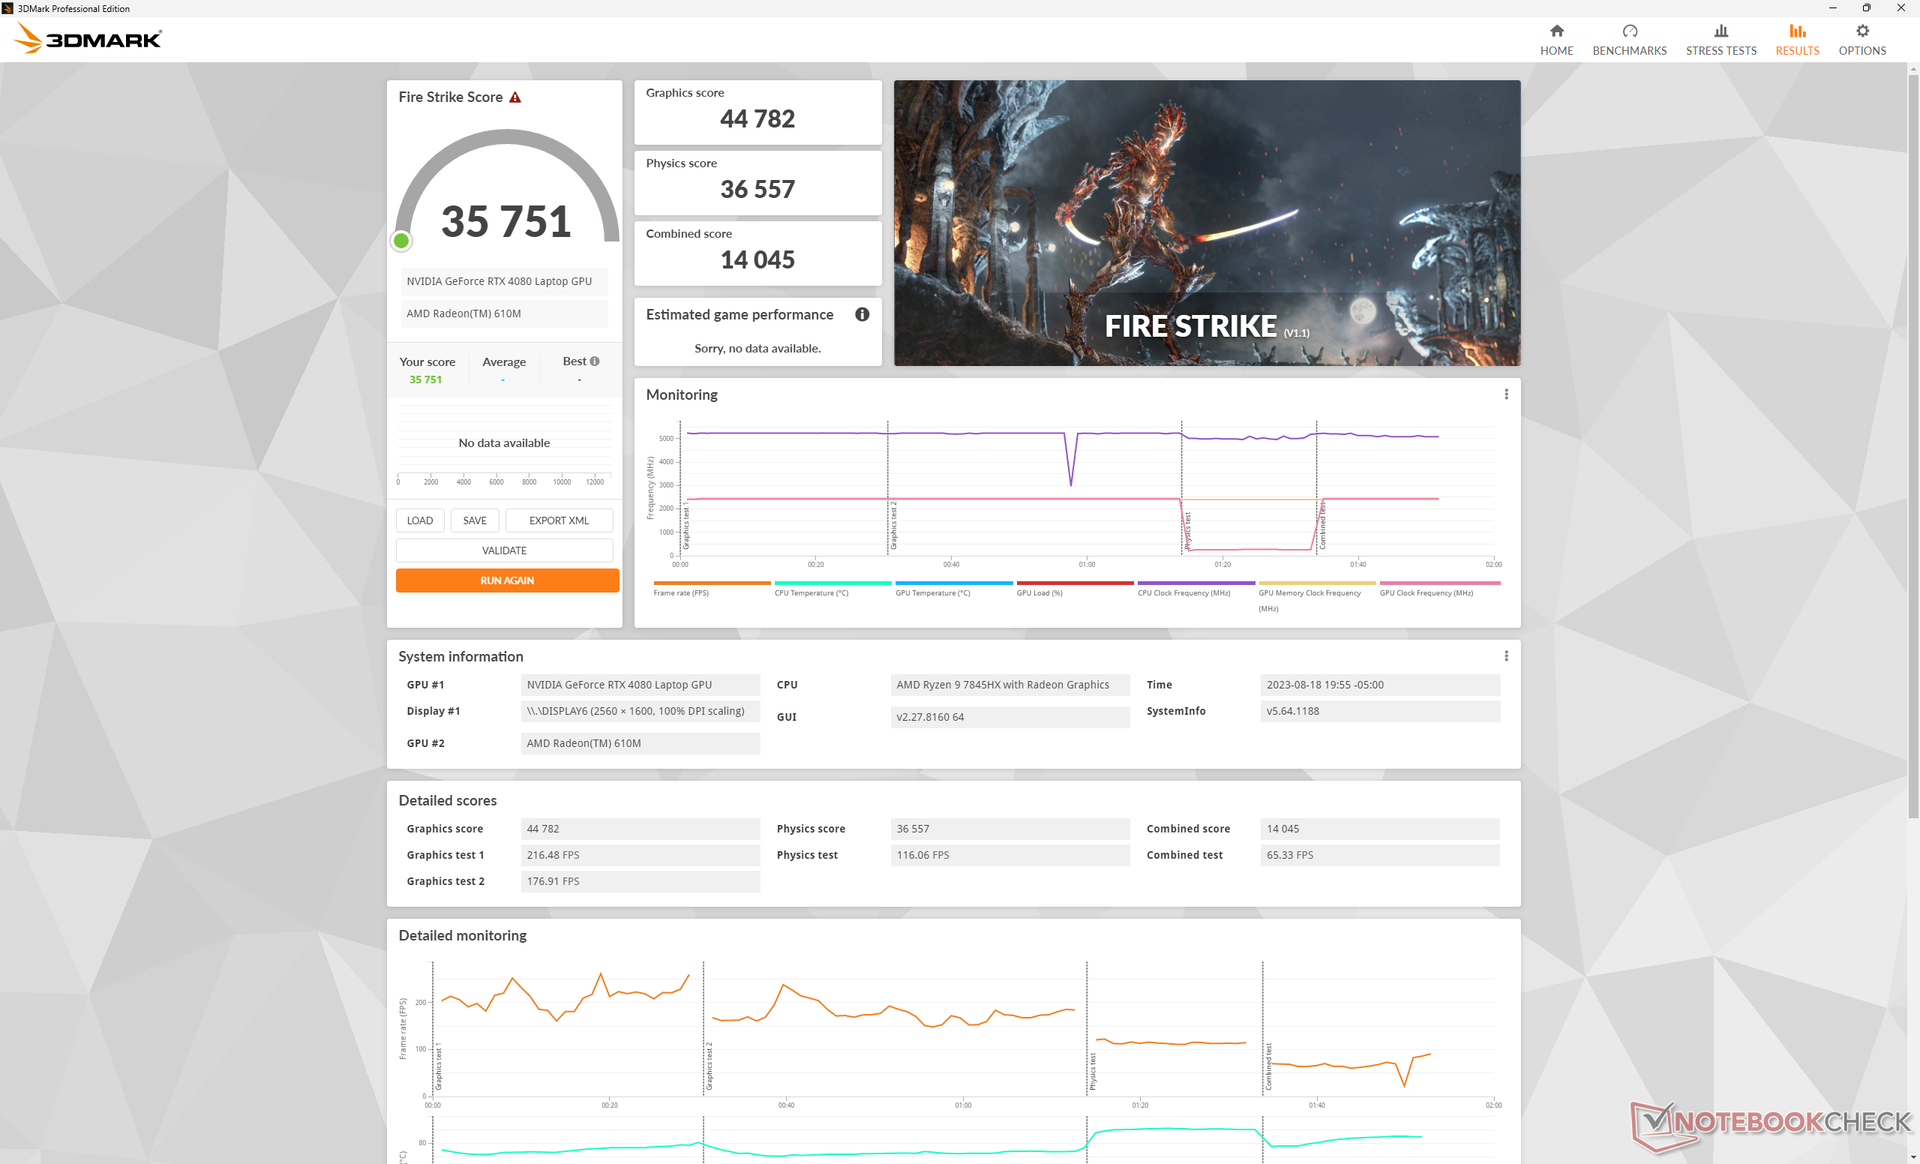

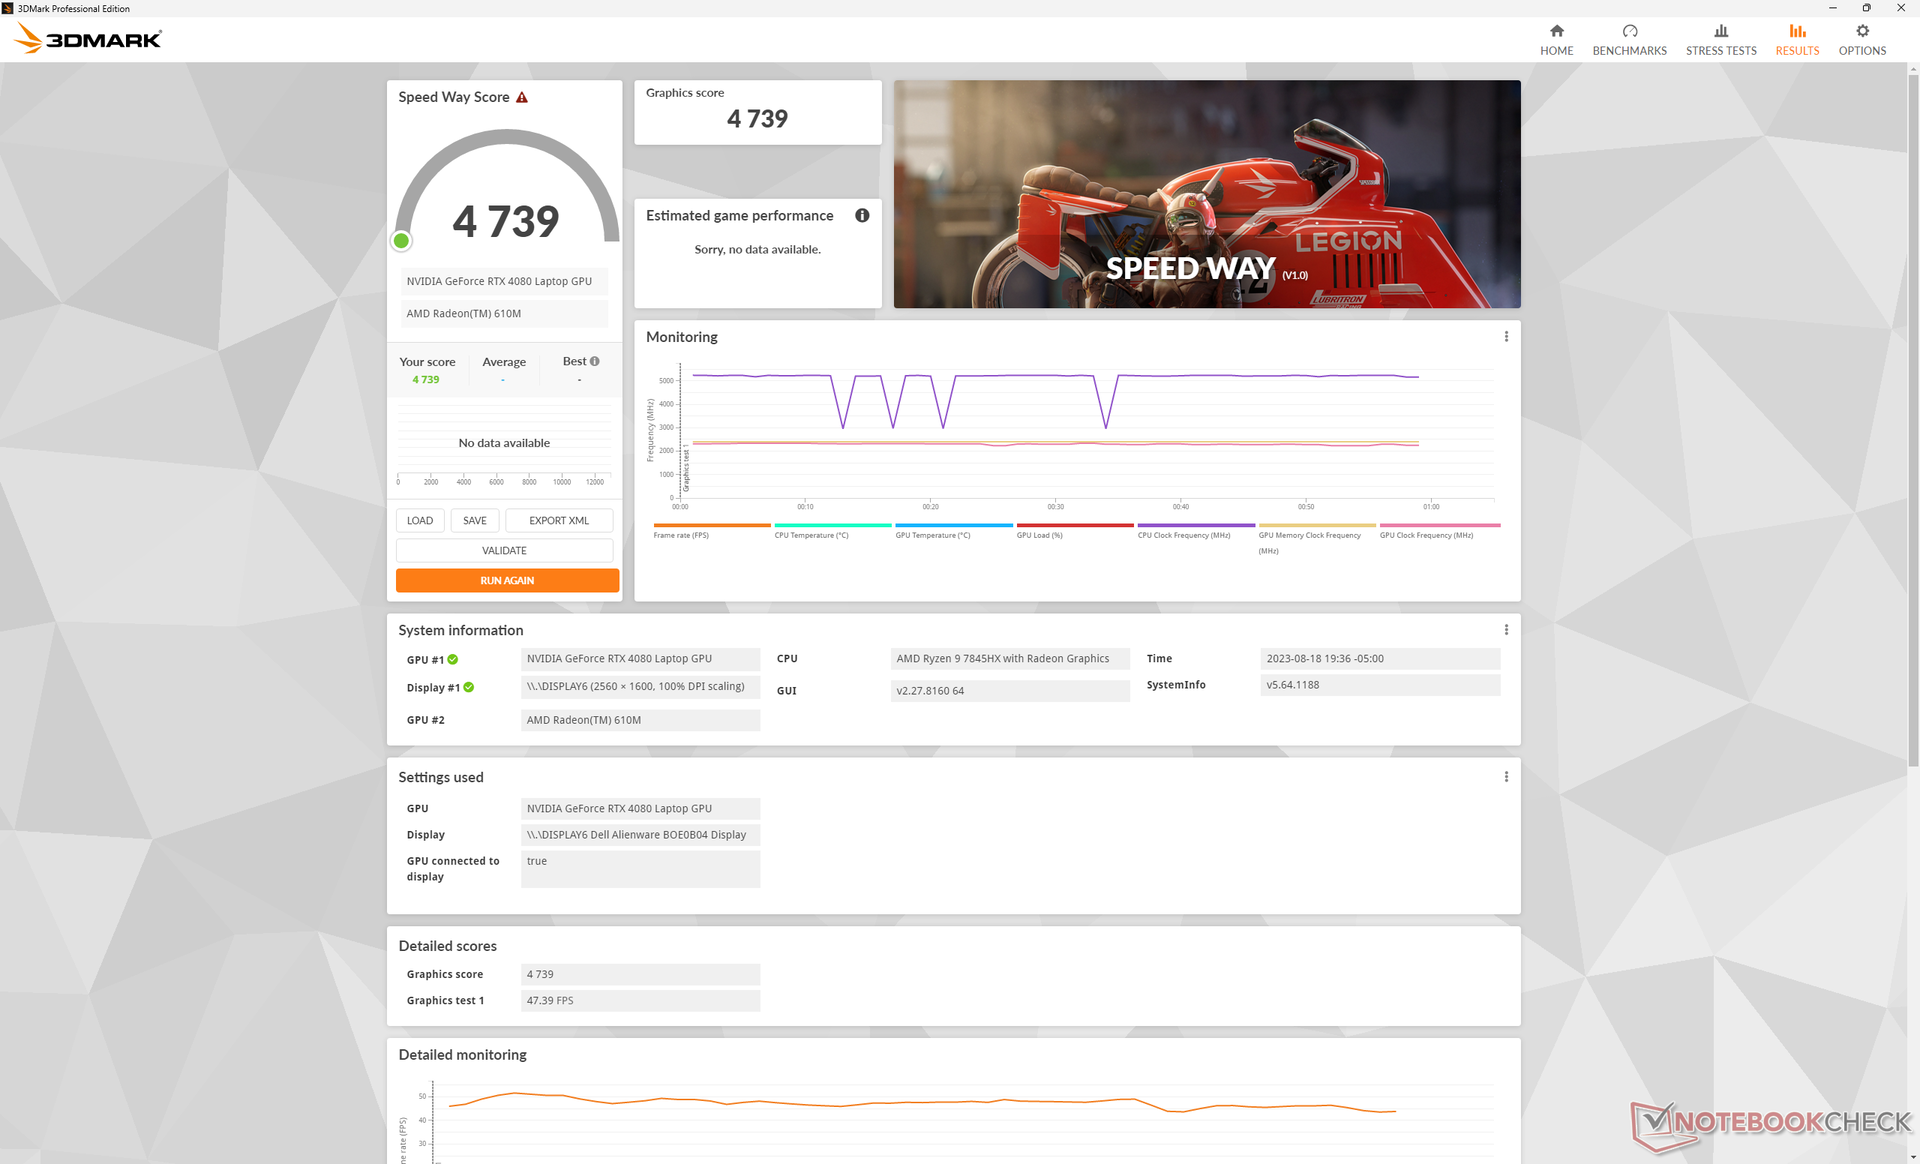
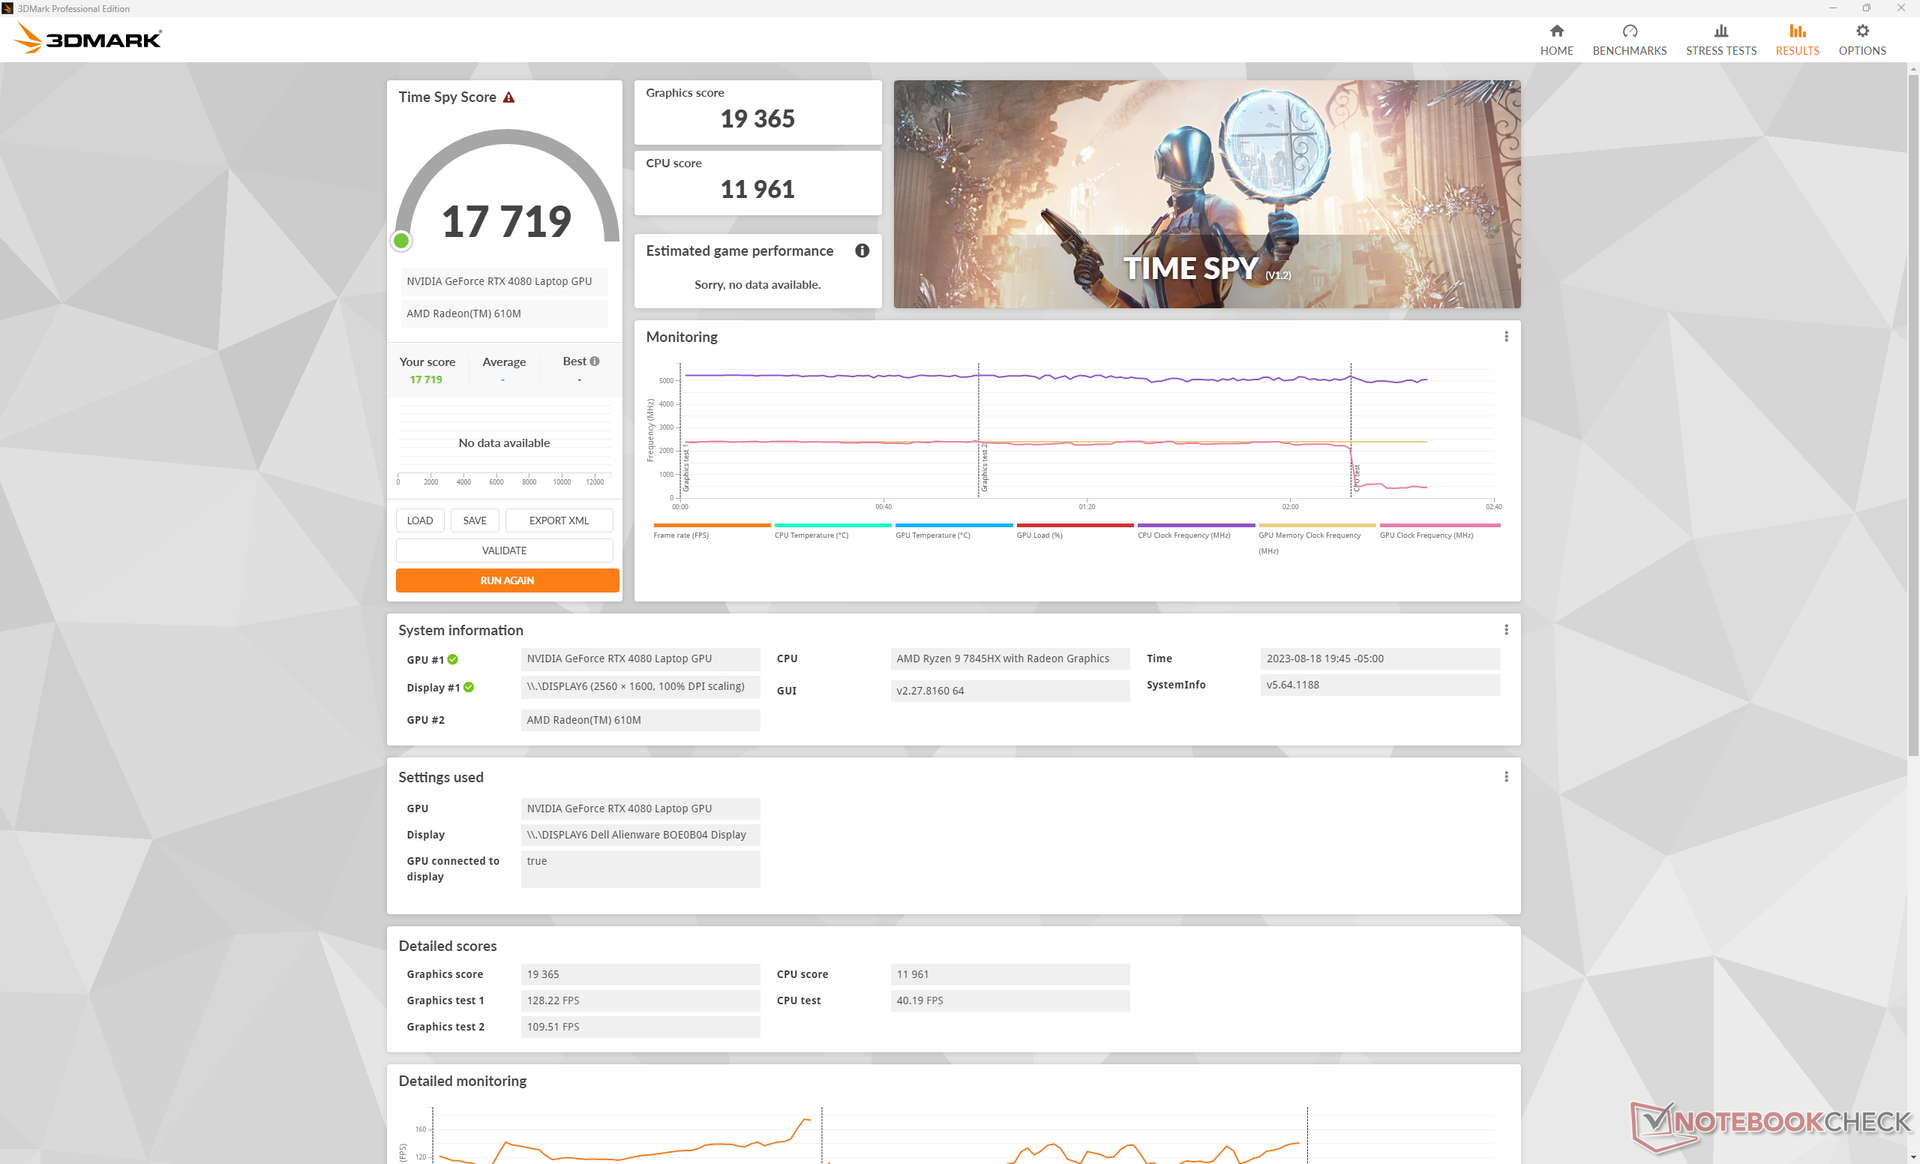
| 3DMark 11 Performance | 40681 points | |
| 3DMark Fire Strike Score | 35751 points | |
| 3DMark Time Spy Score | 17719 points | |
Help | ||
* ... smaller is better
Gaming Performance
Performance in games is excellent with results that are 5 to 10 percent faster than other laptops with the same RTX 4080 GPU as predicted by 3DMark. The benefits extend into lower graphical settings as well which can help gamers who prefer maximizing frame rates over resolution. The mobile RTX 4080 is powerful enough to play any current title at the native QHD+ resolution at over 60 FPS even though it's much weaker than a desktop RTX 4080.
Performance stability is unfortunately imperfect. When idling on Witcher 3, for example, frame rates would occasionally stutter to 70 FPS before bouncing back up to the 150+ FPS range as shown by the graph below. This suggests poor optimization of background resources which may be interrupting the application in focus.
Witcher 3 FPS Chart
| low | med. | high | ultra | QHD | 4K | |
|---|---|---|---|---|---|---|
| The Witcher 3 (2015) | 573.1 | 452.2 | 349.3 | 169.7 | 121.5 | |
| Dota 2 Reborn (2015) | 229 | 191.8 | 180.4 | 164.7 | 161 | |
| Final Fantasy XV Benchmark (2018) | 230 | 218 | 167.6 | 131.6 | 76.1 | |
| X-Plane 11.11 (2018) | 171.1 | 149 | 113.1 | 95 | ||
| Far Cry 5 (2018) | 160 | 145 | 141 | 136 | 131 | 91 |
| Strange Brigade (2018) | 572 | 461 | 400 | 357 | 248 | 123.1 |
| Cyberpunk 2077 1.6 (2022) | 154 | 151.4 | 137.5 | 128.3 | 84.5 | 39.7 |
| Tiny Tina's Wonderlands (2022) | 317.1 | 265.9 | 201.1 | 160.8 | 112.9 | 59 |
| F1 22 (2022) | 323 | 296 | 285 | 124.2 | 78.1 | 39.5 |
| Returnal (2023) | 128 | 122 | 117 | 107 | 80 | 44 |
Emissions
System Noise — Big Differences Between Power Profiles
The fans are almost always active at just under 30 dB(A) against a silent background of 23 dB(A). While audible, the noise is at least steady as the fans don't pulse any louder when running undemanding loads like browsers or video.
Fan noise when gaming on Balanced, Performance, or Overdrive modes can be as loud as 49.4 dB(A), 51 dB(A), and 54.7 dB(A), respectively. Since the performance loss on Balanced mode is so minimal as mentioned above, users may want to consider gaming on Balanced mode instead of Performance or Overdrive mode for the noticeably quieter fan noise. Other 16-inch gaming laptops like the Razer Blade 16 or Omen Transcend 16 tend to stabilize in the louder low-to-mid 50 dB(A) range when running games.
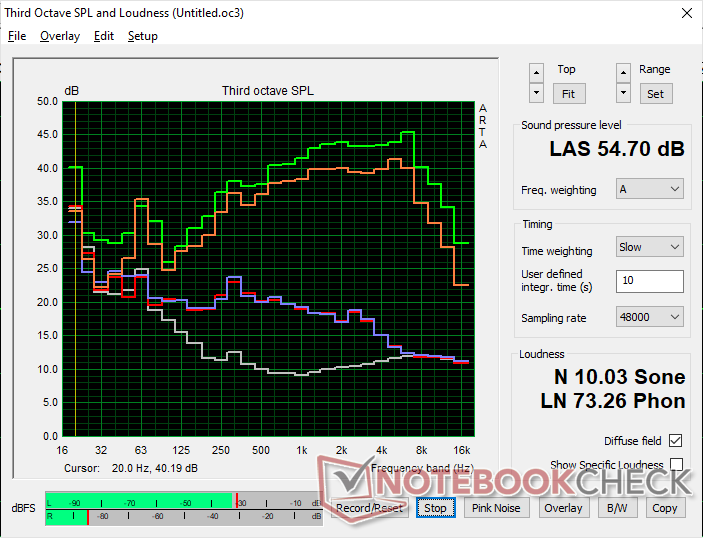
Noise level
| Idle |
| 22.9 / 29.7 / 29.7 dB(A) |
| Load |
| 29.8 / 54.7 dB(A) |
 | ||
30 dB silent 40 dB(A) audible 50 dB(A) loud |
||
min: | ||
| Alienware m16 R1 AMD GeForce RTX 4080 Laptop GPU, R9 7845HX, Kioxia XG8 KXG80ZNV1T02 | Alienware x16 R1 GeForce RTX 4080 Laptop GPU, i9-13900HK, SK hynix PC801 HFS001TEJ9X101N | HP Omen Transcend 16 GeForce RTX 4070 Laptop GPU, i9-13900HX, SK hynix PC801 HFS002TEJ9X101N | Lenovo Legion Pro 7 RTX4090 GeForce RTX 4090 Laptop GPU, i9-13900HX, Samsung PM9A1 MZVL21T0HCLR | Asus ROG Strix G16 G614JZ GeForce RTX 4080 Laptop GPU, i9-13980HX, WD PC SN560 SDDPNQE-1T00 | Razer Blade 16 Early 2023 GeForce RTX 4080 Laptop GPU, i9-13950HX, SSSTC CA6-8D1024 | |
|---|---|---|---|---|---|---|
| Noise | 0% | -11% | -17% | -9% | 4% | |
| off / environment * (dB) | 22.9 | 22.7 1% | 22.9 -0% | 25 -9% | 25 -9% | 23 -0% |
| Idle Minimum * (dB) | 22.9 | 23.1 -1% | 29.1 -27% | 28 -22% | 26 -14% | 23 -0% |
| Idle Average * (dB) | 29.7 | 25.8 13% | 29.1 2% | 30 -1% | 28 6% | 23 23% |
| Idle Maximum * (dB) | 29.7 | 25.8 13% | 29.1 2% | 38 -28% | 30 -1% | 23.6 21% |
| Load Average * (dB) | 29.8 | 39.3 -32% | 45.7 -53% | 48 -61% | 48 -61% | 39 -31% |
| Witcher 3 ultra * (dB) | 54.7 | 49.9 9% | 54.3 1% | 53 3% | 49 10% | 51.6 6% |
| Load Maximum * (dB) | 54.7 | 54.8 -0% | 54.3 1% | 55 -1% | 52 5% | 51.3 6% |
* ... smaller is better
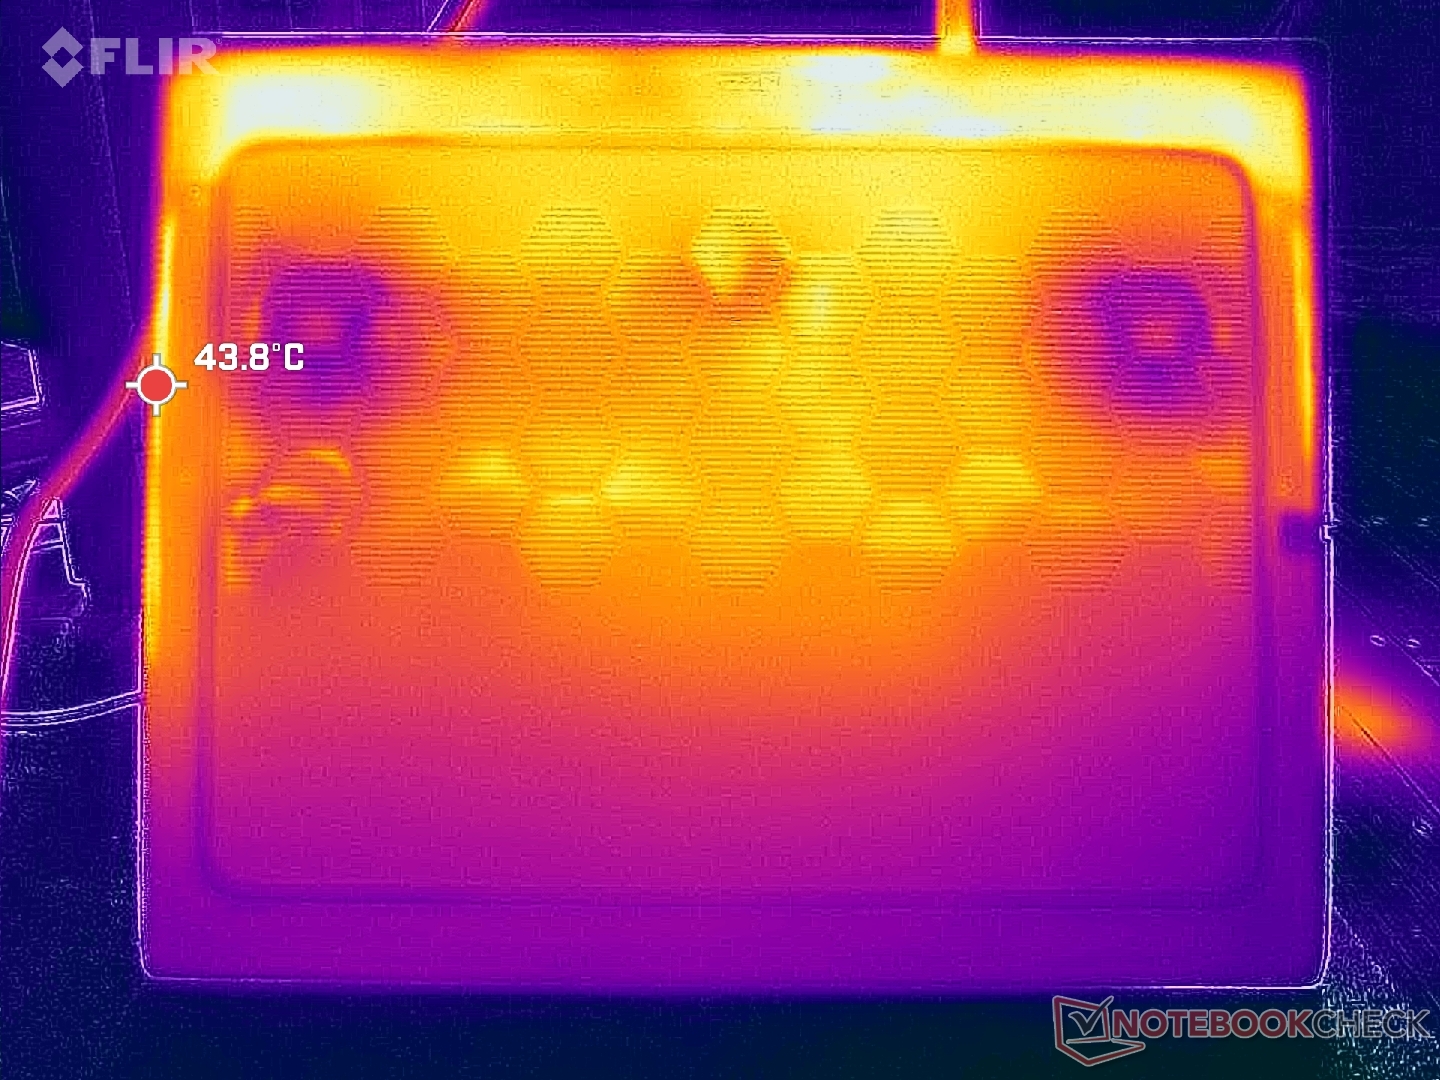
Temperature
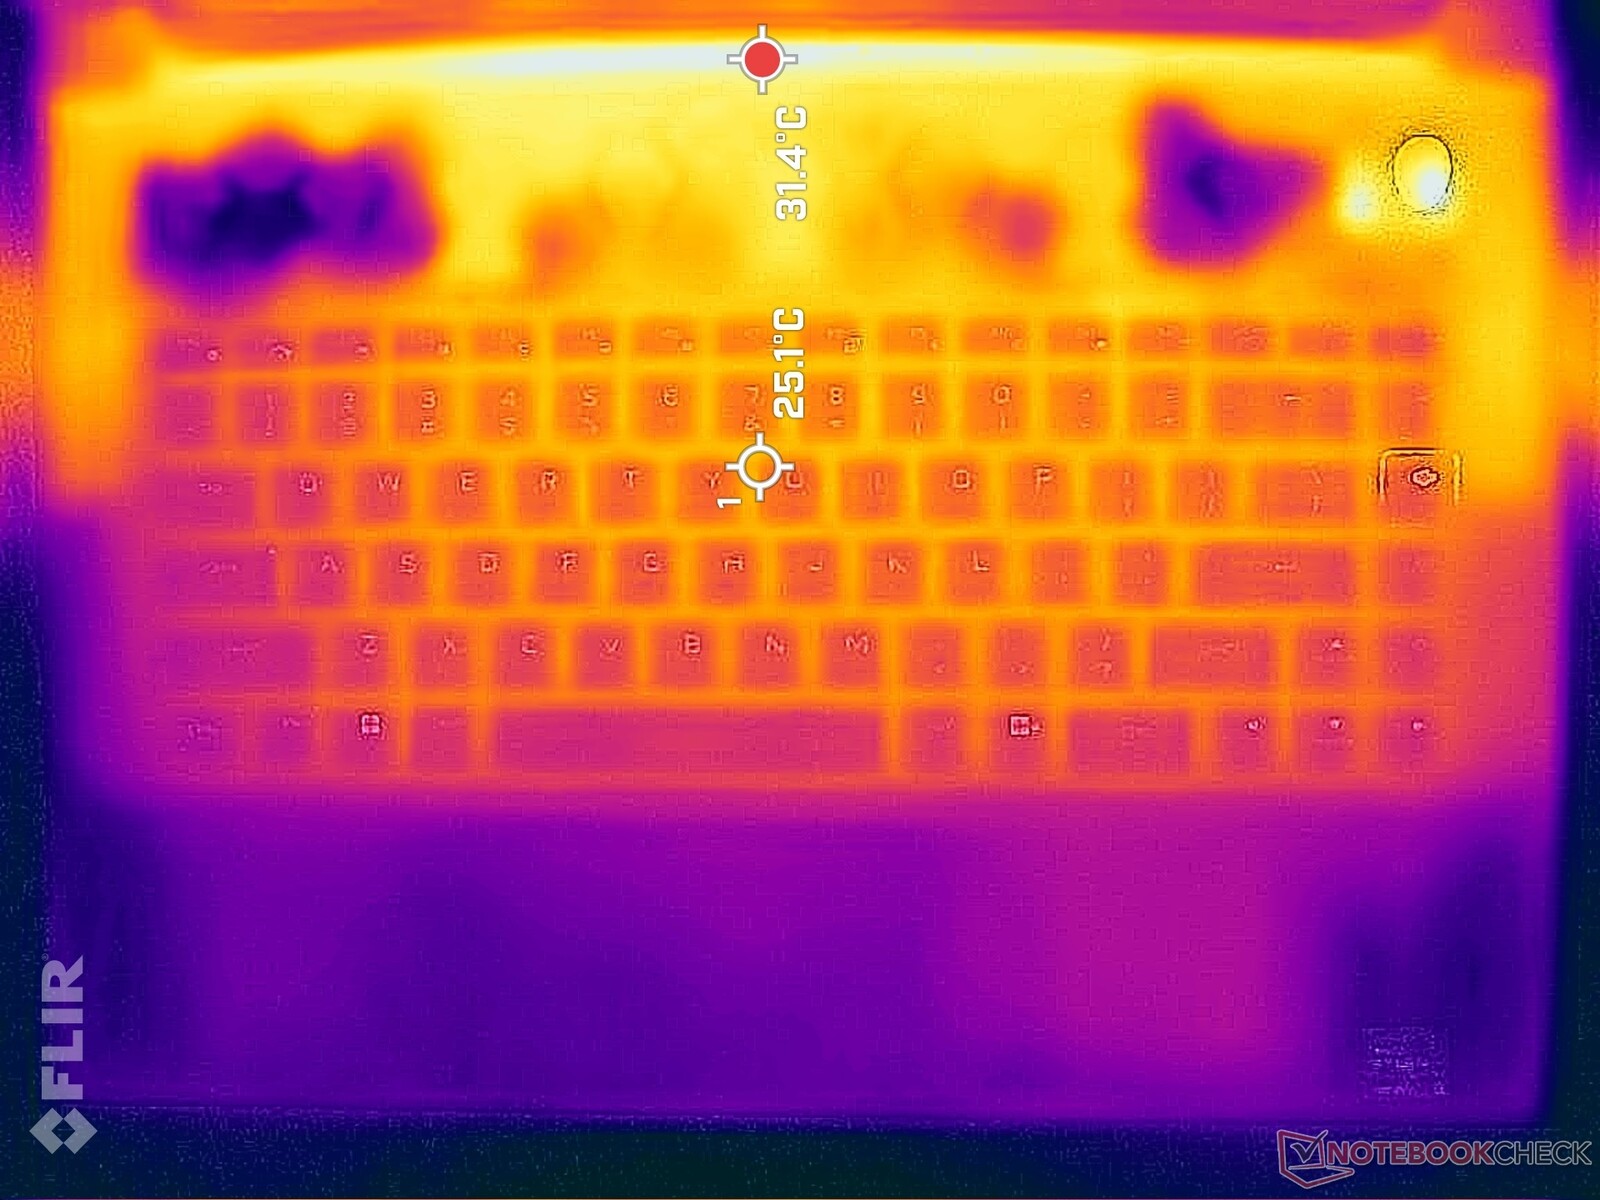
Surface temperatures can be very warm at up to 50 C along the rear. Thankfully, the palm rests and keyboard regions remain cooler to the touch for better comfort due in part to the expansive ventilation grilles. The keyboard center, for example, reaches 42 C when gaming compared to 46 C on the Lenovo Legion Pro 7 16.
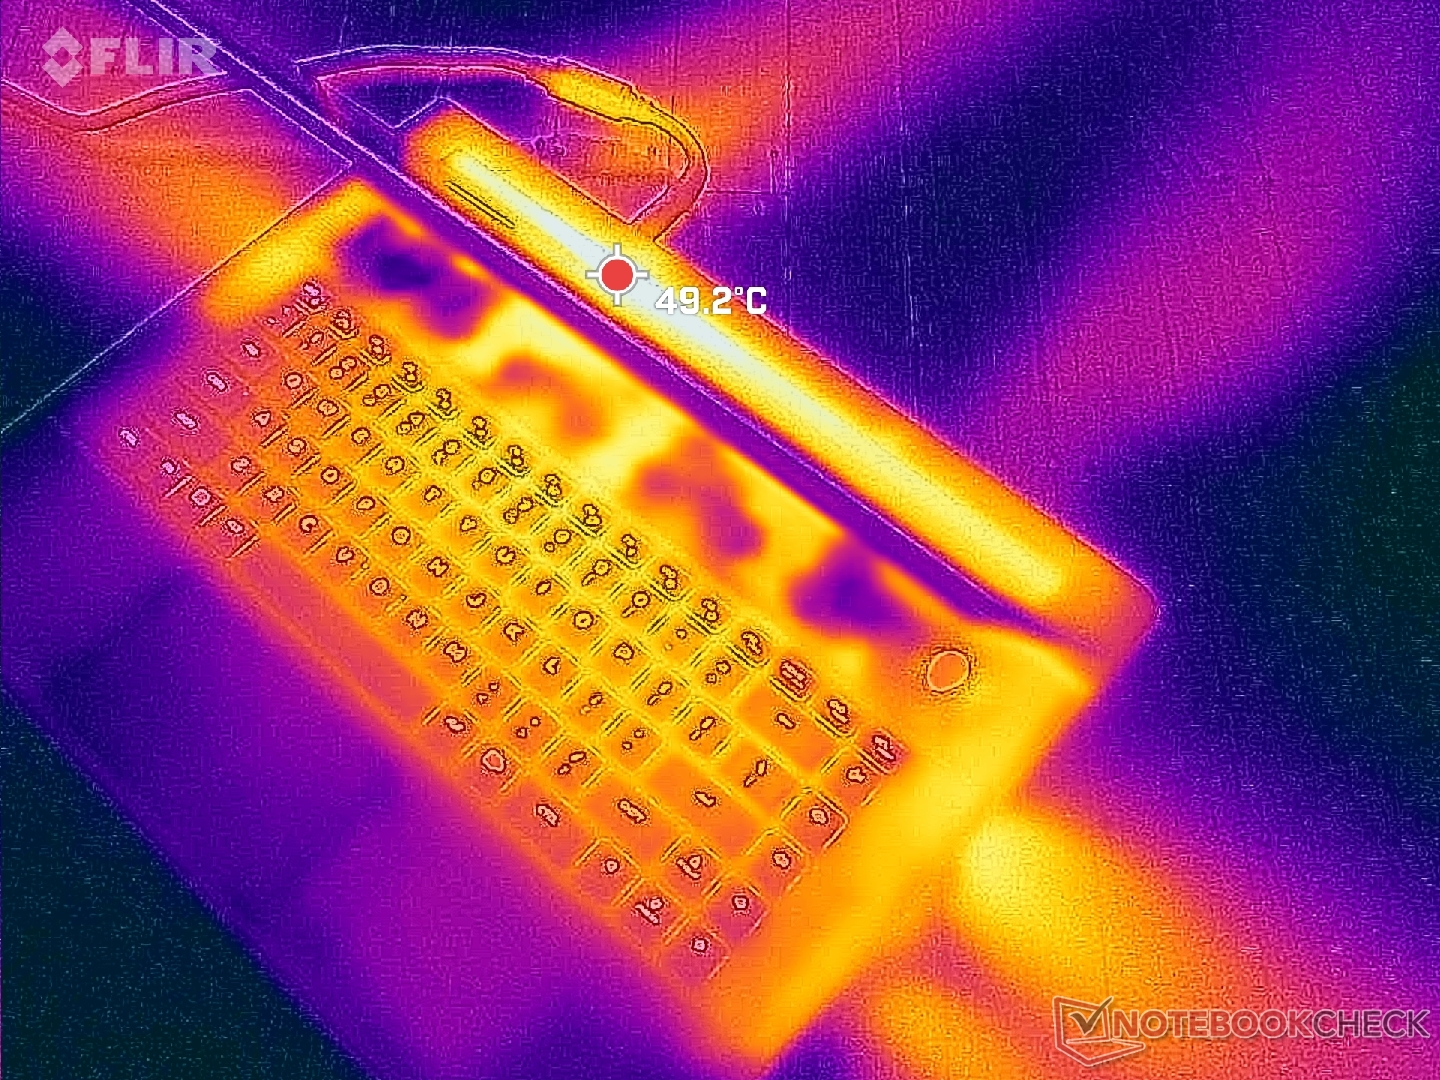
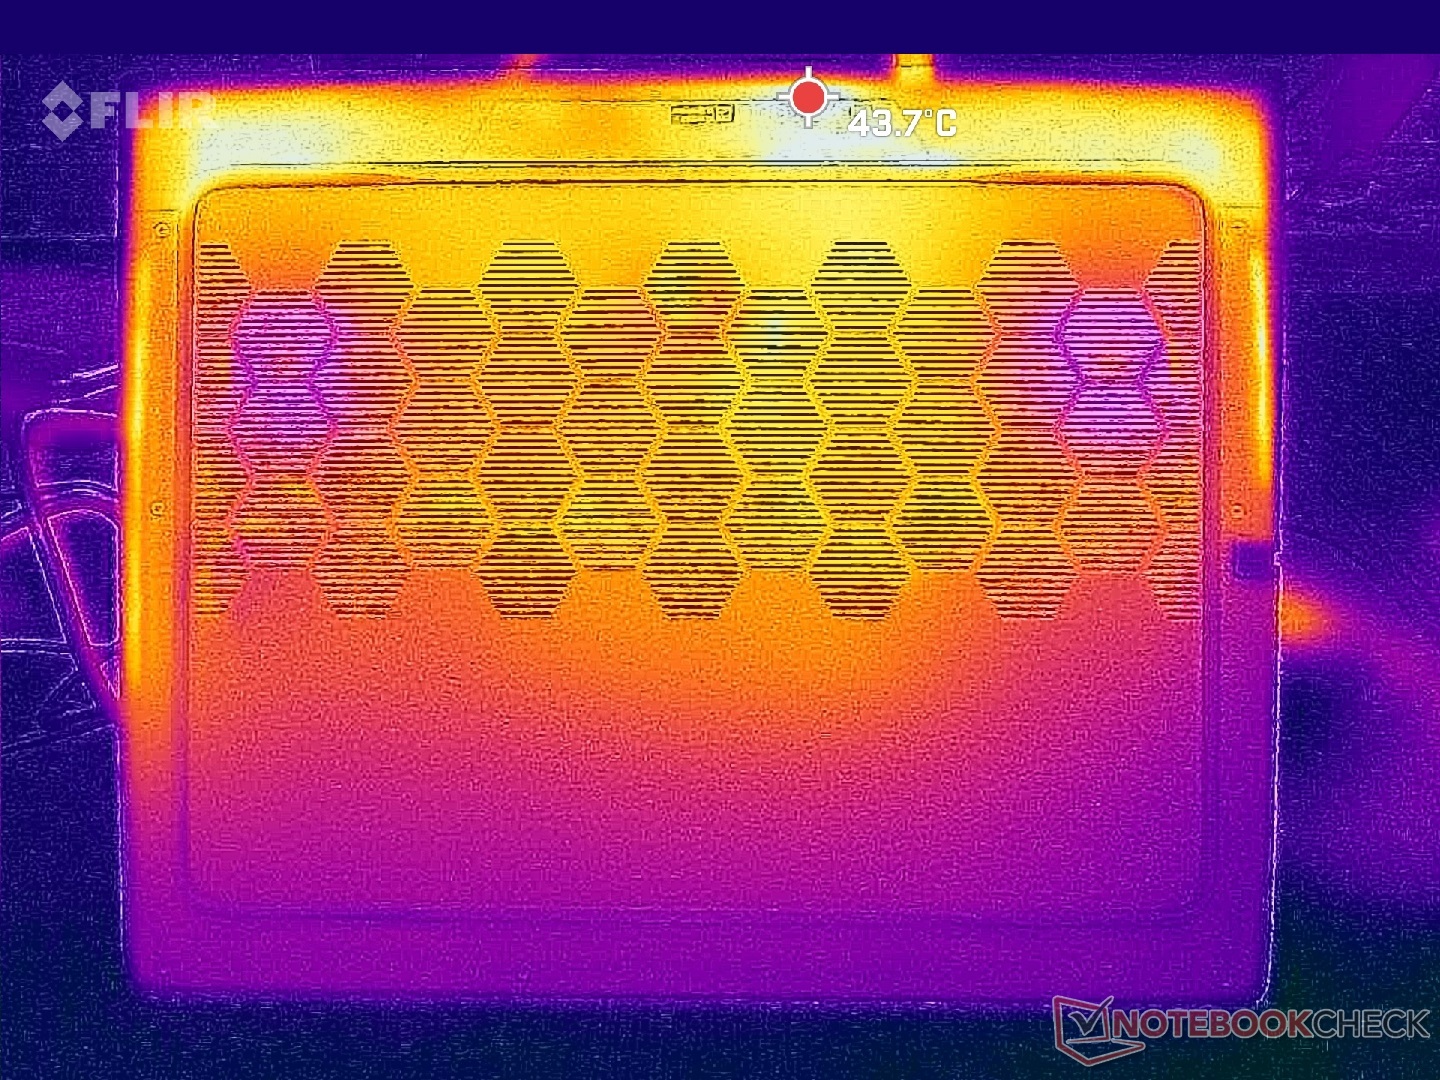
(-) The maximum temperature on the upper side is 48 °C / 118 F, compared to the average of 40.4 °C / 105 F, ranging from 21.2 to 68.8 °C for the class Gaming.
(+) The bottom heats up to a maximum of 39 °C / 102 F, compared to the average of 43.2 °C / 110 F
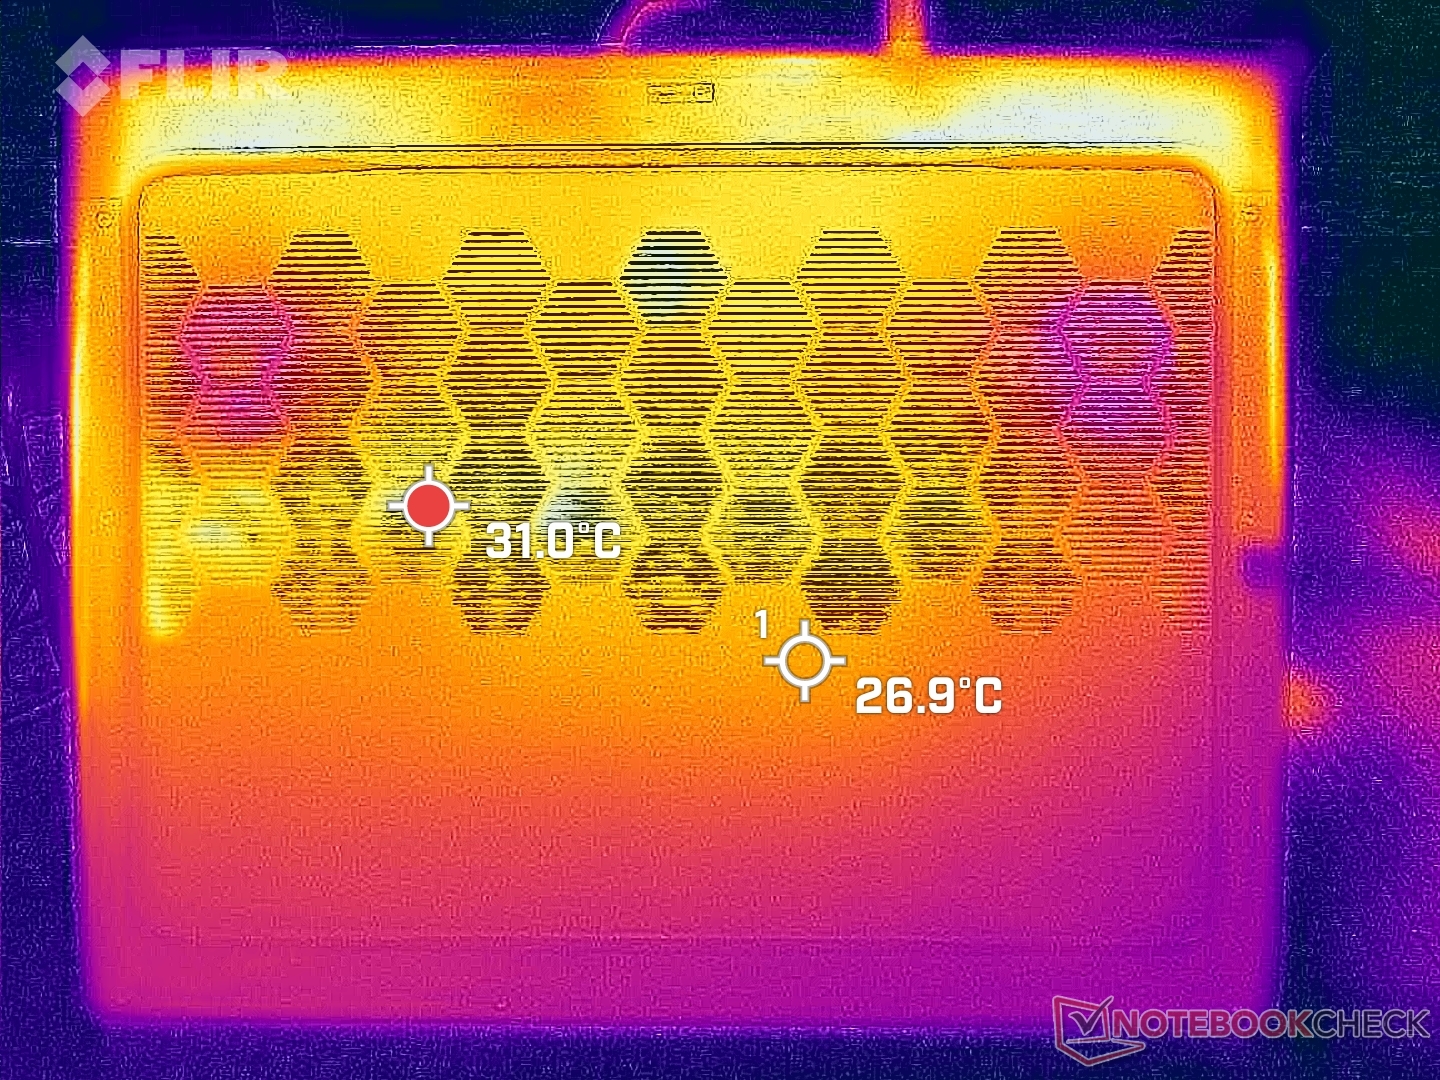
(±) In idle usage, the average temperature for the upper side is 32.2 °C / 90 F, compared to the device average of 33.9 °C / 93 F.
(-) Playing The Witcher 3, the average temperature for the upper side is 38.1 °C / 101 F, compared to the device average of 33.9 °C / 93 F.
(+) The palmrests and touchpad are cooler than skin temperature with a maximum of 30.4 °C / 86.7 F and are therefore cool to the touch.
(±) The average temperature of the palmrest area of similar devices was 28.8 °C / 83.8 F (-1.6 °C / -2.9 F).


| Alienware m16 R1 AMD AMD Ryzen 9 7845HX, NVIDIA GeForce RTX 4080 Laptop GPU | Alienware x16 R1 Intel Core i9-13900HK, NVIDIA GeForce RTX 4080 Laptop GPU | HP Omen Transcend 16 Intel Core i9-13900HX, NVIDIA GeForce RTX 4070 Laptop GPU | Lenovo Legion Pro 7 RTX4090 Intel Core i9-13900HX, NVIDIA GeForce RTX 4090 Laptop GPU | Asus ROG Strix G16 G614JZ Intel Core i9-13980HX, NVIDIA GeForce RTX 4080 Laptop GPU | Razer Blade 16 Early 2023 Intel Core i9-13950HX, NVIDIA GeForce RTX 4080 Laptop GPU | |
|---|---|---|---|---|---|---|
| Heat | -5% | 1% | -10% | -6% | 12% | |
| Maximum Upper Side * (°C) | 48 | 47.2 2% | 47.4 1% | 53 -10% | 54 -13% | 40 17% |
| Maximum Bottom * (°C) | 39 | 47.8 -23% | 54.4 -39% | 59 -51% | 55 -41% | 37.6 4% |
| Idle Upper Side * (°C) | 37 | 36.8 1% | 28.4 23% | 34 8% | 29 22% | 32.4 12% |
| Idle Bottom * (°C) | 36.2 | 35.8 1% | 29.2 19% | 32 12% | 33 9% | 31.4 13% |
* ... smaller is better
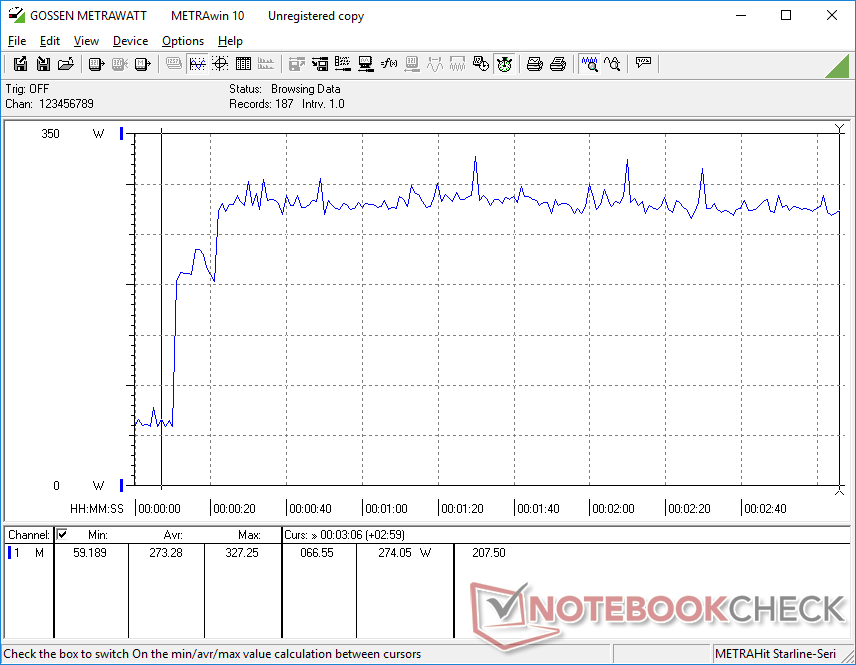
Stress Test

Initiating Prime95 causes the CPU to boost to 5 GHz, 132 W, and a toasty 99 C for several seconds before eventually stabilizing at 4.6 GHz, 118 W, and 85 C.
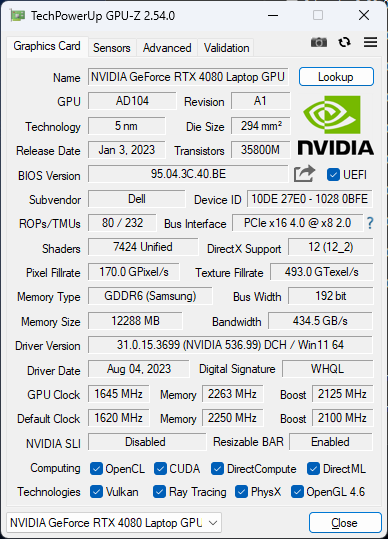
Running Witcher 3 on Overdrive mode would see the GPU stabilize at 2430 MHz clock, 2263 MHz VRAM, and 158 W board power draw compared to 2415 MHz clock, 2250 MHz VRAM, and 156 W when on Balanced mode according to GPU-Z. The very slight performance differences between the two modes align with our Fire Strike observations mentioned above. Core temperatures would be a few degrees warmer on Balanced mode versus Overdrive mode since the fans are noticeably quieter on Balanced mode.
Note that while the GPU is rated for 175 W TGP, we're only able to reach up to 160 W in real-world gaming conditions.
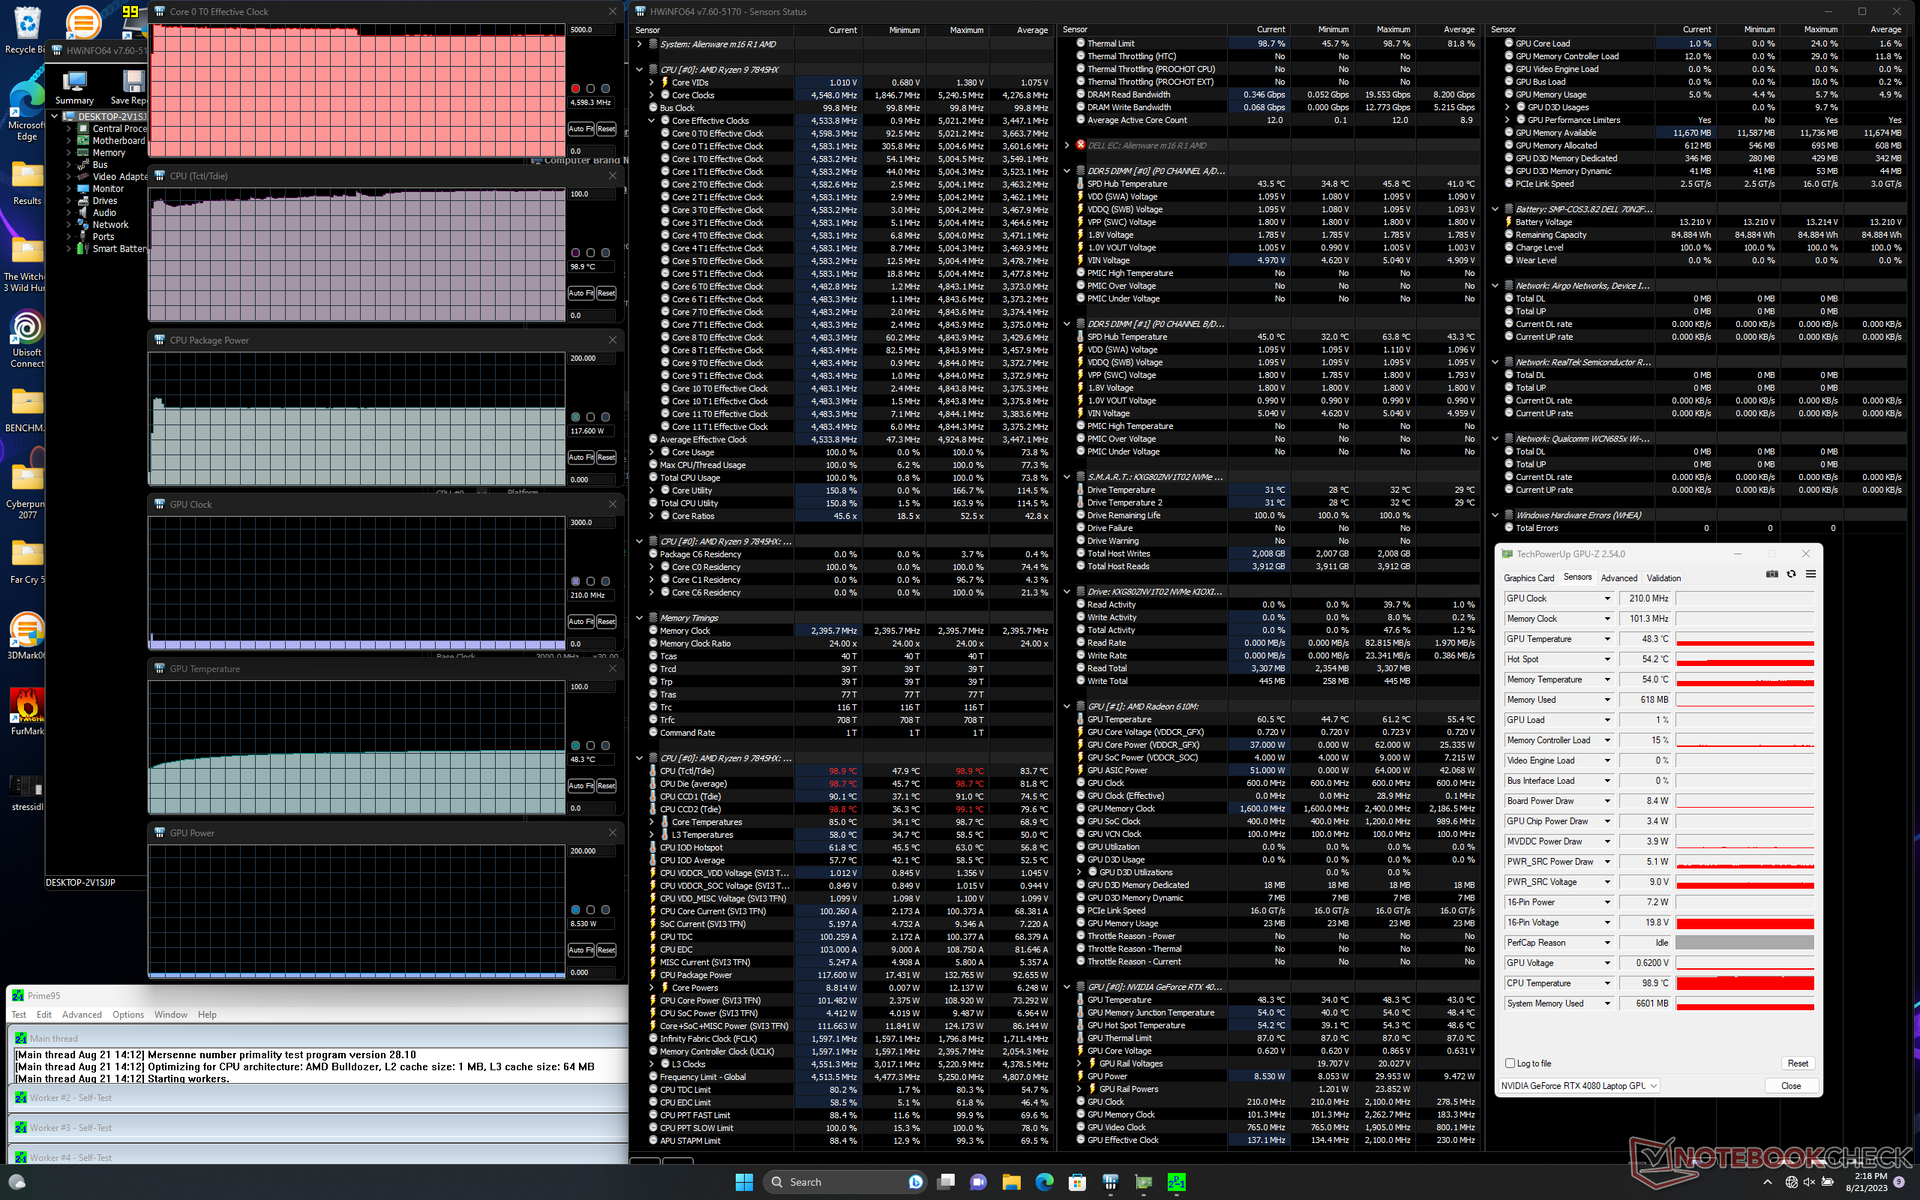
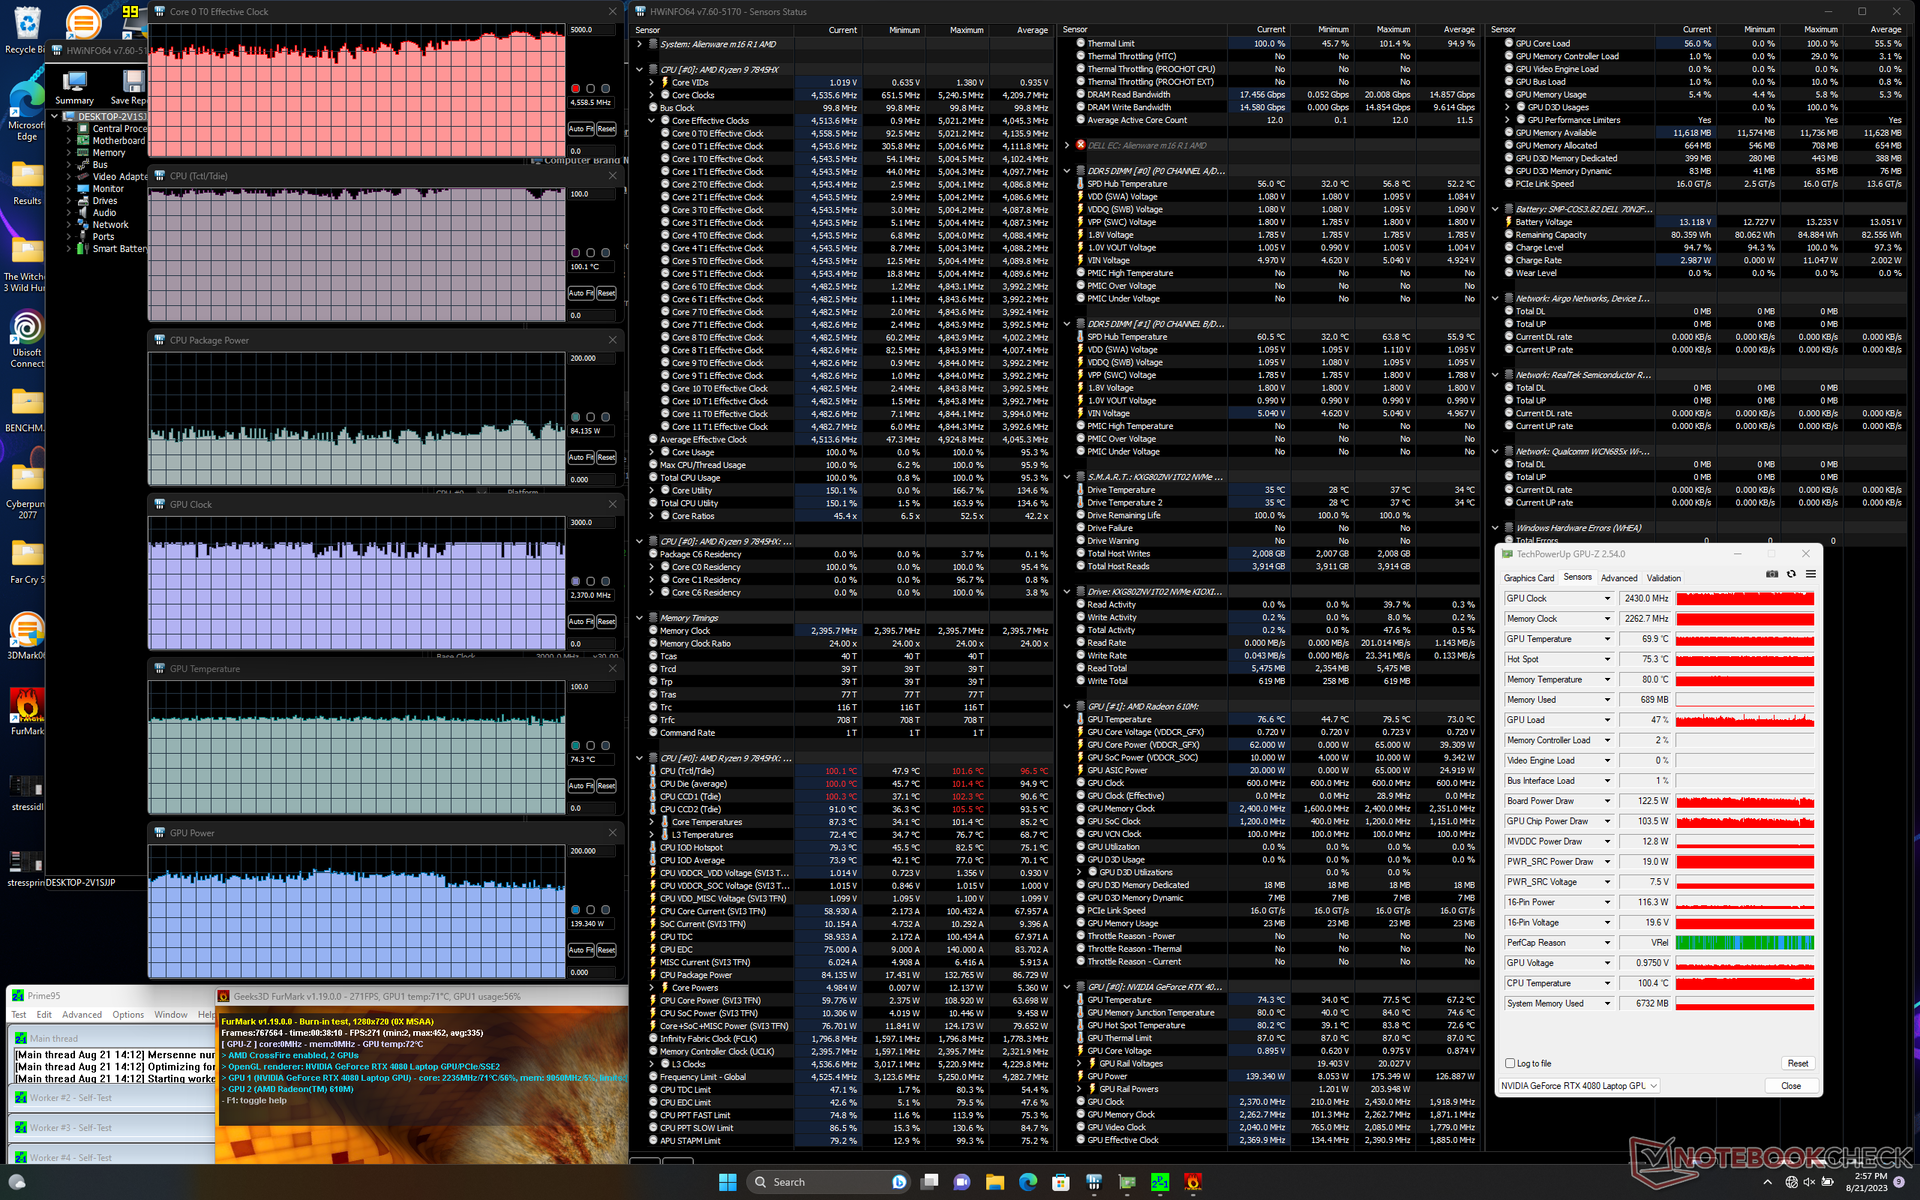

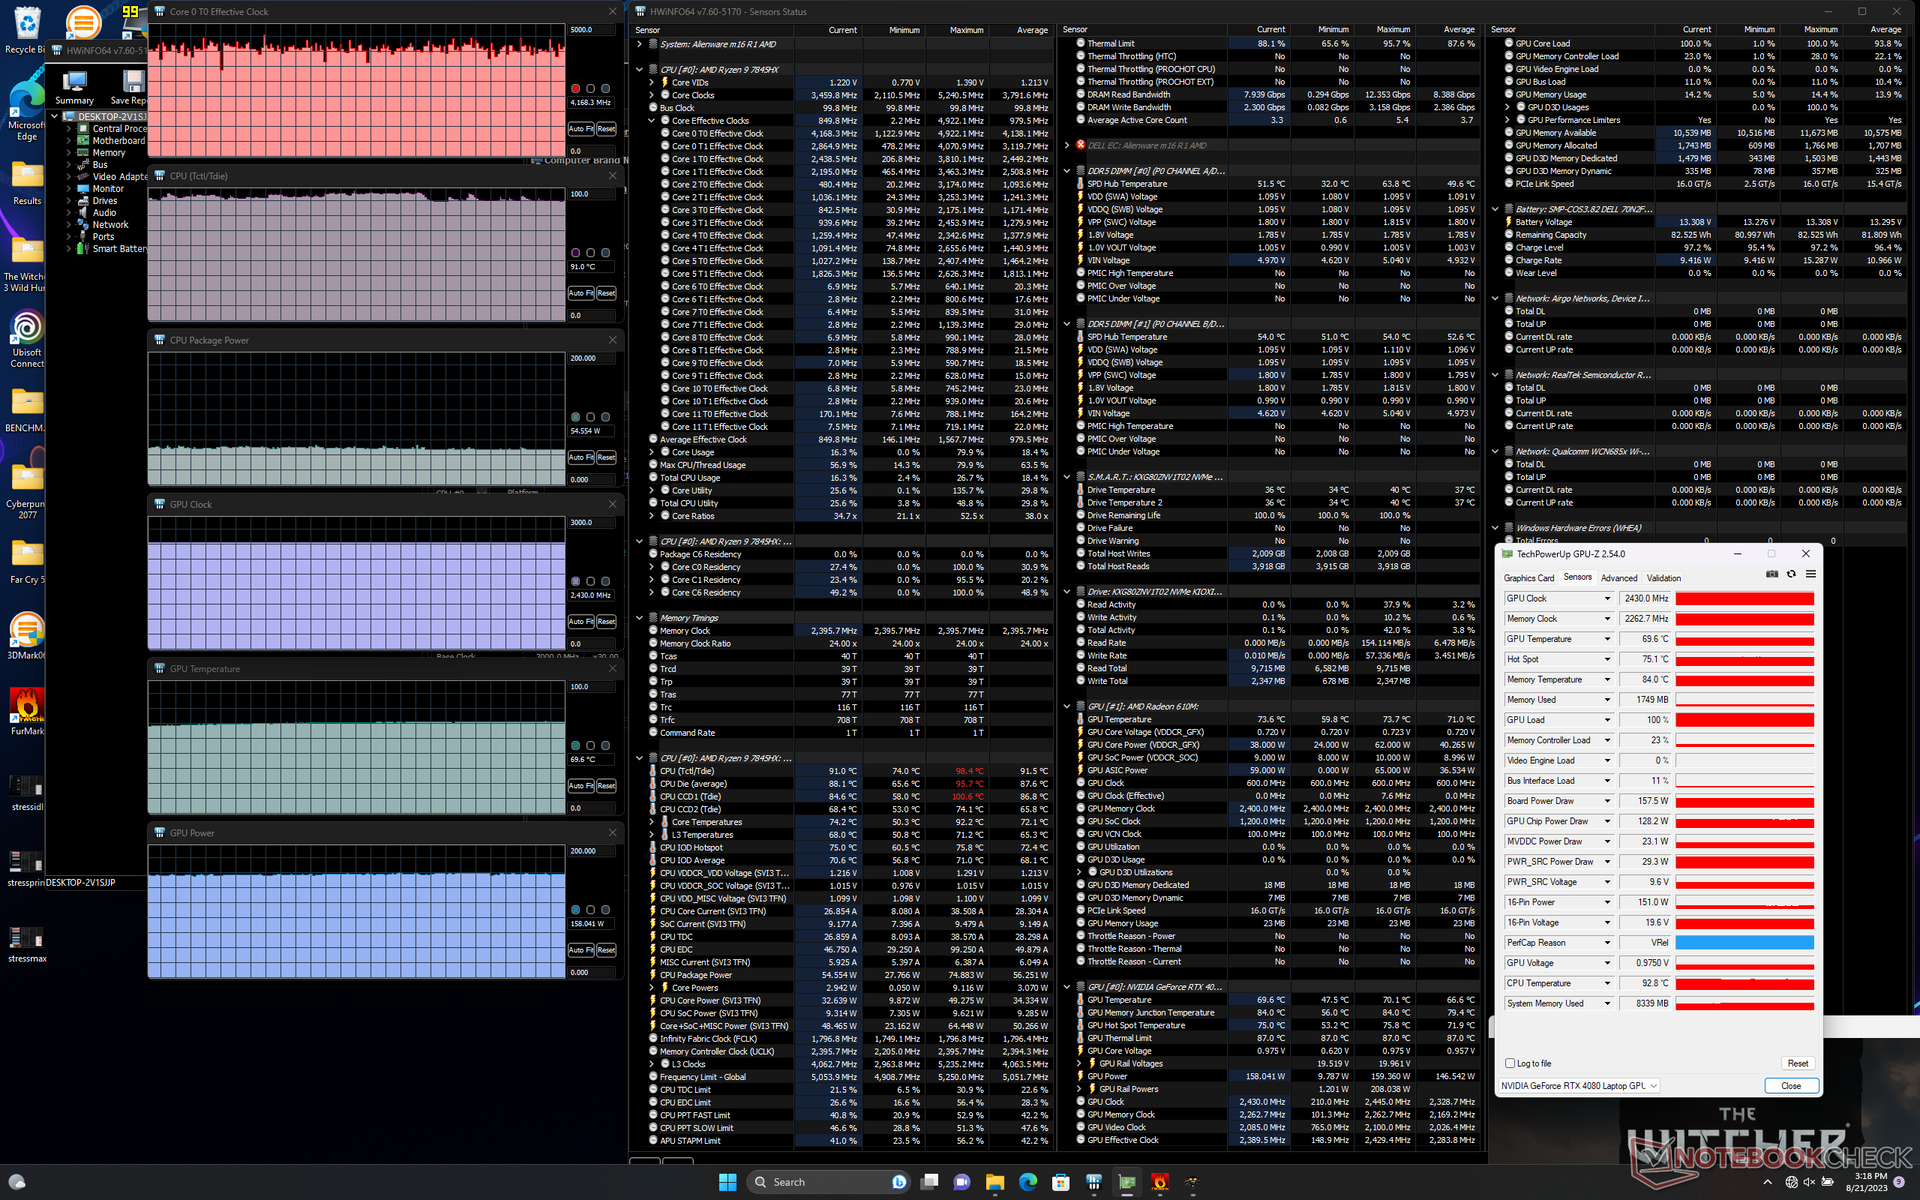
| CPU Clock (GHz) | GPU Clock (MHz) | Average CPU Temperature (°C) | Average GPU Temperature (°C) | |
| System Idle | -- | - | 49 | 34 |
| Prime95 Stress | 4.6 | -- | 85 | 49 |
| Prime95 + FurMark Stress | ~4.0 - 4.6 | ~2430 | 87 | 74 |
| Witcher 3 Stress (Balanced mode) | ~4.1 | 2415 | 75 | 73 |
| Witcher 3 Stress (Overdrive mode) | ~4.1 | 2430 | 74 | 70 |
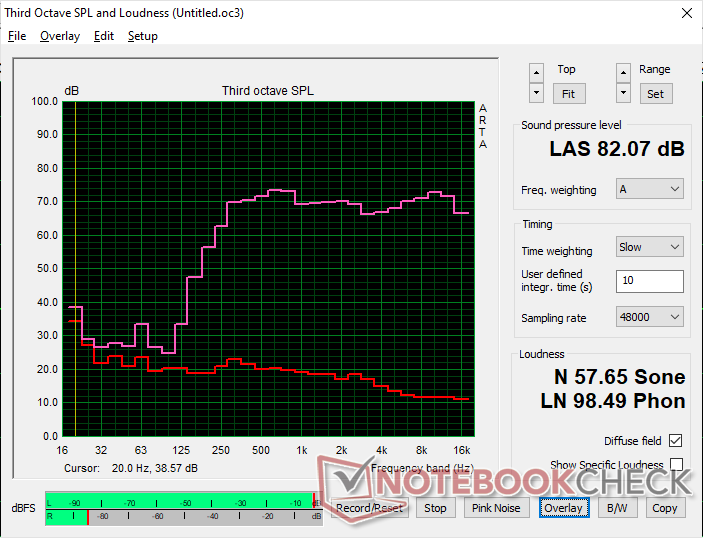
Speakers
Alienware m16 R1 AMD audio analysis
(+) | speakers can play relatively loud (82.1 dB)
Bass 100 - 315 Hz
(-) | nearly no bass - on average 20.6% lower than median
(-) | bass is not linear (15.3% delta to prev. frequency)
Mids 400 - 2000 Hz
(+) | balanced mids - only 1.4% away from median
(+) | mids are linear (2.1% delta to prev. frequency)
Highs 2 - 16 kHz
(+) | balanced highs - only 1.9% away from median
(+) | highs are linear (2.9% delta to prev. frequency)
Overall 100 - 16.000 Hz
(+) | overall sound is linear (13.9% difference to median)
Compared to same class
» 22% of all tested devices in this class were better, 7% similar, 71% worse
» The best had a delta of 6%, average was 18%, worst was 132%
Compared to all devices tested
» 16% of all tested devices were better, 4% similar, 80% worse
» The best had a delta of 4%, average was 23%, worst was 134%
Apple MacBook Pro 16 2021 M1 Pro audio analysis
(+) | speakers can play relatively loud (84.7 dB)
Bass 100 - 315 Hz
(+) | good bass - only 3.8% away from median
(+) | bass is linear (5.2% delta to prev. frequency)
Mids 400 - 2000 Hz
(+) | balanced mids - only 1.3% away from median
(+) | mids are linear (2.1% delta to prev. frequency)
Highs 2 - 16 kHz
(+) | balanced highs - only 1.9% away from median
(+) | highs are linear (2.7% delta to prev. frequency)
Overall 100 - 16.000 Hz
(+) | overall sound is linear (4.6% difference to median)
Compared to same class
» 0% of all tested devices in this class were better, 0% similar, 100% worse
» The best had a delta of 5%, average was 17%, worst was 45%
Compared to all devices tested
» 0% of all tested devices were better, 0% similar, 100% worse
» The best had a delta of 4%, average was 23%, worst was 134%
Energy Management
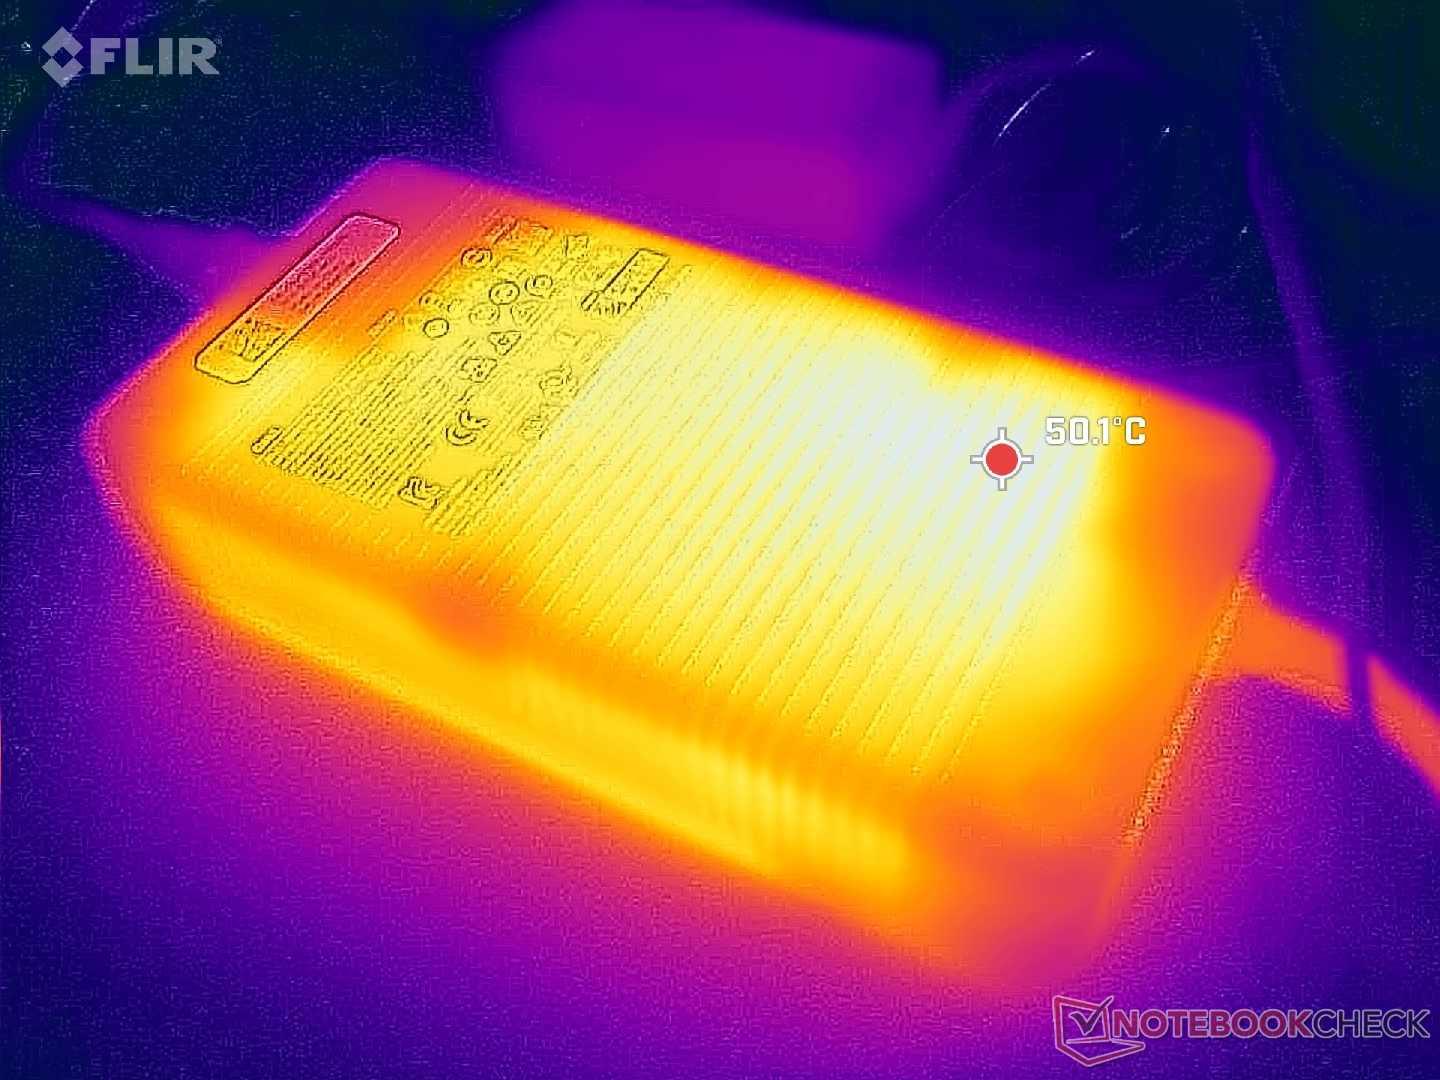
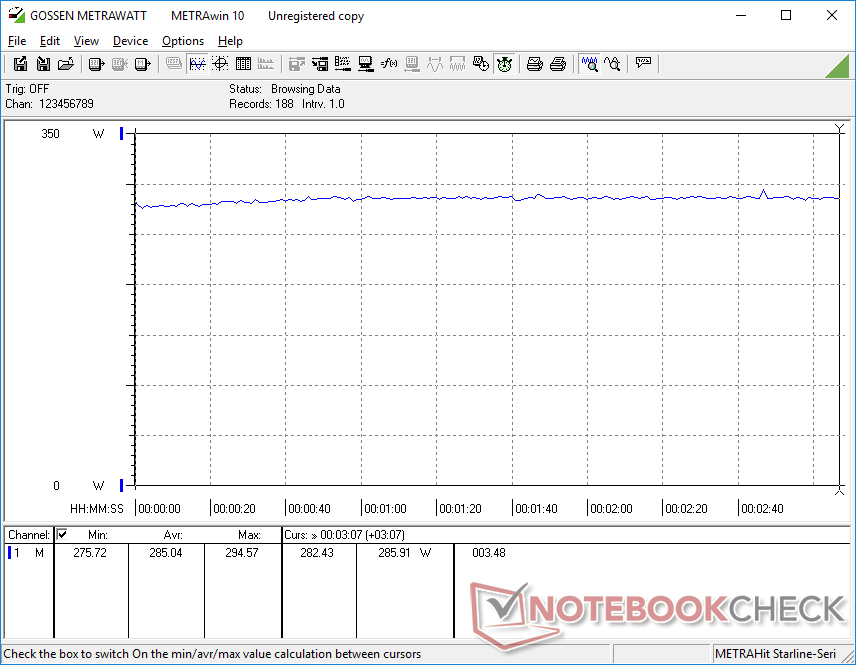
Power Consumption
Alienware laptops have always had some of the highest power consumption numbers and our Alienware m16 R1 is no different. Simply idling on desktop would draw between 39 W and 69 W compared to less than half on the Lenovo Legion Pro 7 or Asus ROG Strix G16. These high idling levels are likely responsible for the underwhelming battery life results in the next section.
Power consumption when gaming averages 285 W which is again more than most other gaming laptops including even Dell's own Alienware x16.
The 330 W AC adapter is large (~20 x 10 x 4.5 cm) and bulky. In comparison, the GaN 330 W AC adapter currently shipping with the latest Razer laptops is noticeably more portable.


| Off / Standby | |
| Idle | |
| Load |
|
Key:
min: | |
| Alienware m16 R1 AMD R9 7845HX, GeForce RTX 4080 Laptop GPU, Kioxia XG8 KXG80ZNV1T02, IPS, 2560x1600, 16" | Alienware x16 R1 i9-13900HK, GeForce RTX 4080 Laptop GPU, SK hynix PC801 HFS001TEJ9X101N, IPS, 2560x1600, 16" | HP Omen Transcend 16 i9-13900HX, GeForce RTX 4070 Laptop GPU, SK hynix PC801 HFS002TEJ9X101N, Mini-LED, 2560x1600, 16" | Lenovo Legion Pro 7 RTX4090 i9-13900HX, GeForce RTX 4090 Laptop GPU, Samsung PM9A1 MZVL21T0HCLR, IPS, 2560x1600, 16" | Asus ROG Strix G16 G614JZ i9-13980HX, GeForce RTX 4080 Laptop GPU, WD PC SN560 SDDPNQE-1T00, IPS, 2560x1600, 16" | Razer Blade 16 Early 2023 i9-13950HX, GeForce RTX 4080 Laptop GPU, SSSTC CA6-8D1024, IPS, 2560x1600, 16" | |
|---|---|---|---|---|---|---|
| Power Consumption | 21% | 27% | 23% | 35% | 29% | |
| Idle Minimum * (Watt) | 39 | 25.2 35% | 19.2 51% | 20 49% | 10 74% | 15.2 61% |
| Idle Average * (Watt) | 44.6 | 29.9 33% | 22.7 49% | 25 44% | 16 64% | 22.8 49% |
| Idle Maximum * (Watt) | 68.1 | 49.8 27% | 55.4 19% | 35 49% | 27 60% | 49.8 27% |
| Load Average * (Watt) | 129.8 | 105.4 19% | 128.4 1% | 136 -5% | 129 1% | 121.2 7% |
| Witcher 3 ultra * (Watt) | 285 | 263 8% | 206 28% | 282 1% | 247 13% | 242 15% |
| Load Maximum * (Watt) | 327.3 | 313.8 4% | 292 11% | 320 2% | 342 -4% | 273.7 16% |
* ... smaller is better
Power Consumption Witcher 3 / Stresstest
Power Consumption external Monitor
Battery Life

Battery life remains poor at just under 4 hours of real-world WLAN browsing when on the Balanced power profile with the iGPU active. We even tried using the special "Battery" power profile through Alienware Command Center and our results would still not improve. Competing models like the Lenovo Legion Pro 7 or Asus ROG Strix G16 are each able to last much longer.
Charging from empty to full capacity takes a little over 2 hours. The system can also be recharged via USB-C albeit at a slower rate.
| Alienware m16 R1 AMD R9 7845HX, GeForce RTX 4080 Laptop GPU, 86 Wh | Alienware x16 R1 i9-13900HK, GeForce RTX 4080 Laptop GPU, 90 Wh | HP Omen Transcend 16 i9-13900HX, GeForce RTX 4070 Laptop GPU, 97 Wh | Lenovo Legion Pro 7 RTX4090 i9-13900HX, GeForce RTX 4090 Laptop GPU, 99.9 Wh | Asus ROG Strix G16 G614JZ i9-13980HX, GeForce RTX 4080 Laptop GPU, 90 Wh | Razer Blade 16 Early 2023 i9-13950HX, GeForce RTX 4080 Laptop GPU, 95.2 Wh | |
|---|---|---|---|---|---|---|
| Battery runtime | 13% | 41% | 38% | 100% | 88% | |
| Reader / Idle (h) | 4 | 7.3 83% | 6.3 58% | 8.9 123% | ||
| WiFi v1.3 (h) | 3.7 | 2.5 -32% | 4.2 14% | 5.1 38% | 9.7 162% | 6.1 65% |
| Load (h) | 0.8 | 0.7 -13% | 1.2 50% | 1.1 38% | 1.4 75% |
Pros
Cons
Verdict — Fast And Feature-Packed In Need Of Optimizations
The Alienware m16 R1 crams an insane amount of power and features for a 16-inch laptop. We're talking liquid metal, vapor chamber, four fans, 3x SSD bays, CherryMX mechanical keyboard, 175 W graphics, upgradeable RAM, and even CPU and GPU options from both Intel and AMD. Competing 16-inch gaming models like the HP Omen Transcend 16, Razer Blade 16, or Asus Zephyrus M16 have comparatively smaller sets of features and are generally slower as well even when configured with the same GPU as our test configuration. The engineers at Alienware deserve a ton of credit considering how densely-packed the Alienware m16 R1 is.
On the other hand, the long list of integrated features can also work against the laptop as the Alienware m16 is both heavier and larger than many alternatives by wide margins. Battery life in particular suffers quite heavily no matter the power profile setting. If you value portability, then you might want to look elsewhere. Additionally, the model is still lacking a couple of popular features like OLED and mini-LED.
The Alienware m16 R1 is undeniably fast and feature-packed with above-average results all-around. However, the performance benefits come at the cost of heavier weight and a larger size.
The bugs we encountered during our review deserve a mention. The frame skips during 4K video playback, frame rate stutters when gaming, and wake-from-sleep issues are unfortunate to see considering that Alienware is supposed to be an enthusiast brand. Perhaps Dell is biting off a bit more than it can chew with its numerous Intel-Nvidia, AMD-Nvidia, and AMD-AMD configurations which can make troubleshooting quite tricky.
Price and Availability
Dell is now shipping its Alienware m16 model in both Intel and AMD versions. The AMD version starts at $1700 USD up to over $3000 to $4000 if fully configured.
Alienware m16 R1 AMD
- 08/23/2023 v7 (old)
Allen Ngo
Transparency
The selection of devices to be reviewed is made by our editorial team. The test sample was provided to the author as a loan by the manufacturer or retailer for the purpose of this review. The lender had no influence on this review, nor did the manufacturer receive a copy of this review before publication. There was no obligation to publish this review. As an independent media company, Notebookcheck is not subjected to the authority of manufacturers, retailers or publishers.
This is how Notebookcheck is testing
Every year, Notebookcheck independently reviews hundreds of laptops and smartphones using standardized procedures to ensure that all results are comparable. We have continuously developed our test methods for around 20 years and set industry standards in the process. In our test labs, high-quality measuring equipment is utilized by experienced technicians and editors. These tests involve a multi-stage validation process. Our complex rating system is based on hundreds of well-founded measurements and benchmarks, which maintains objectivity. Further information on our test methods can be found here.
Price comparison
