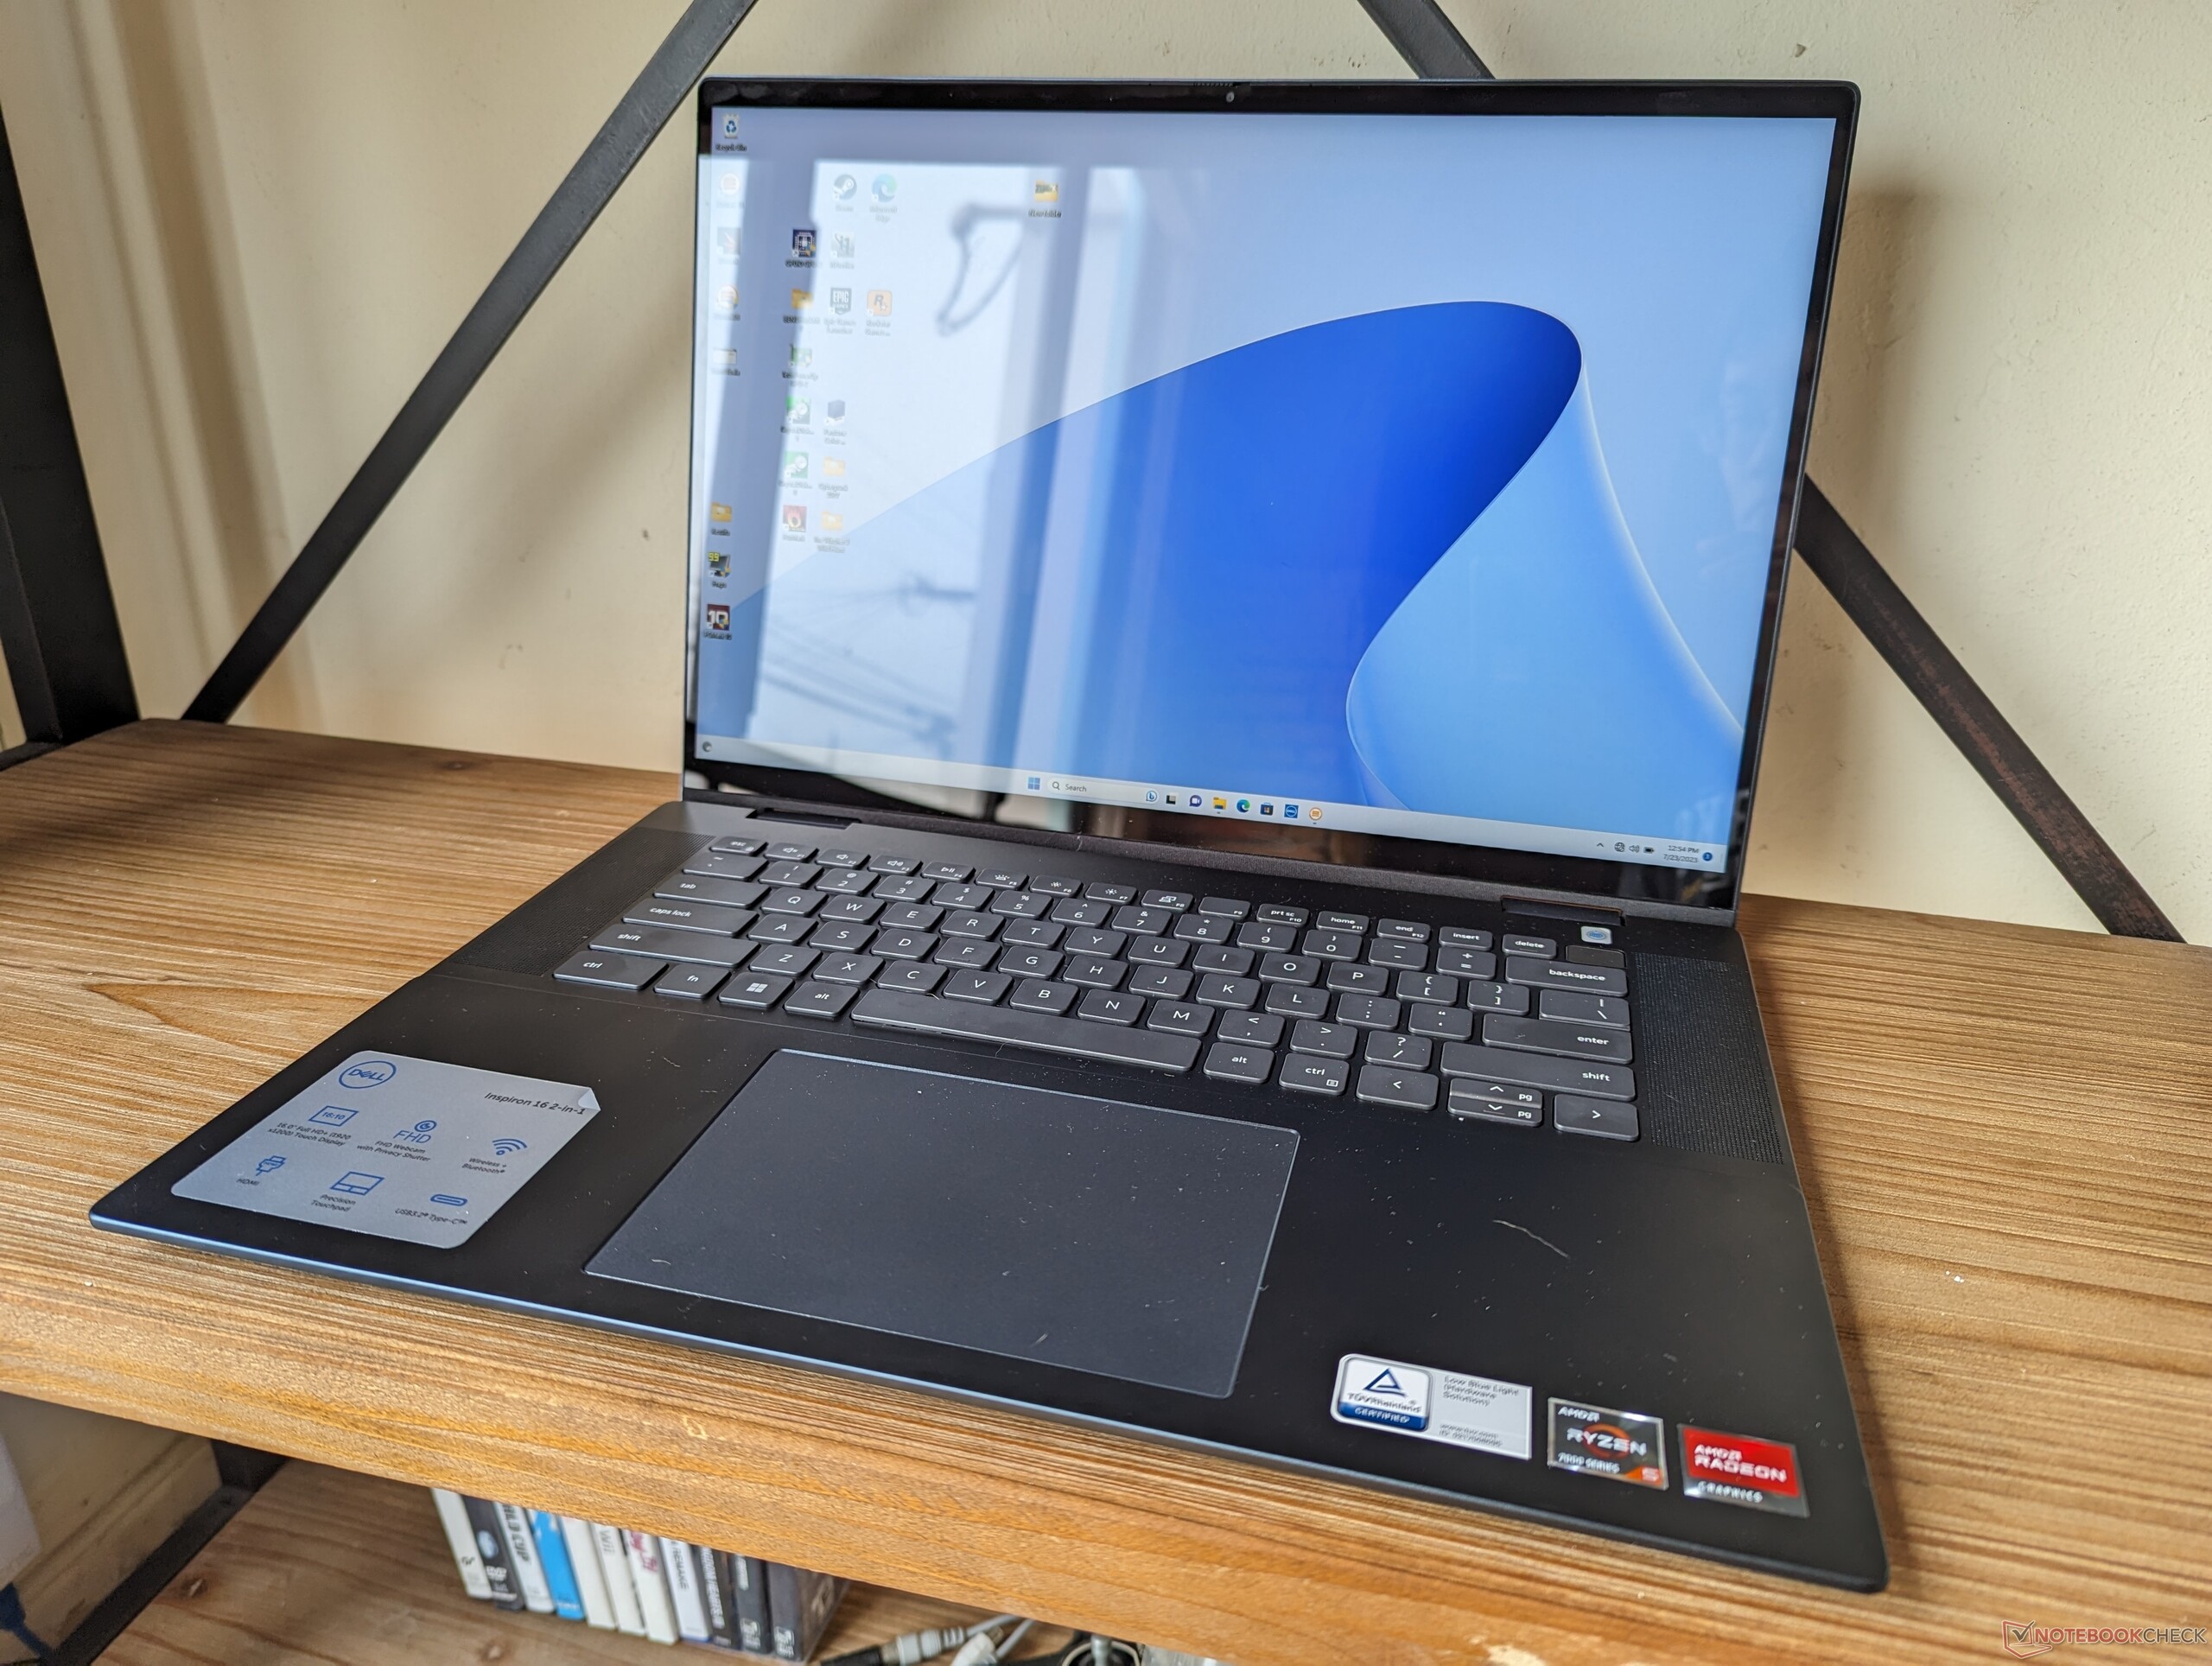
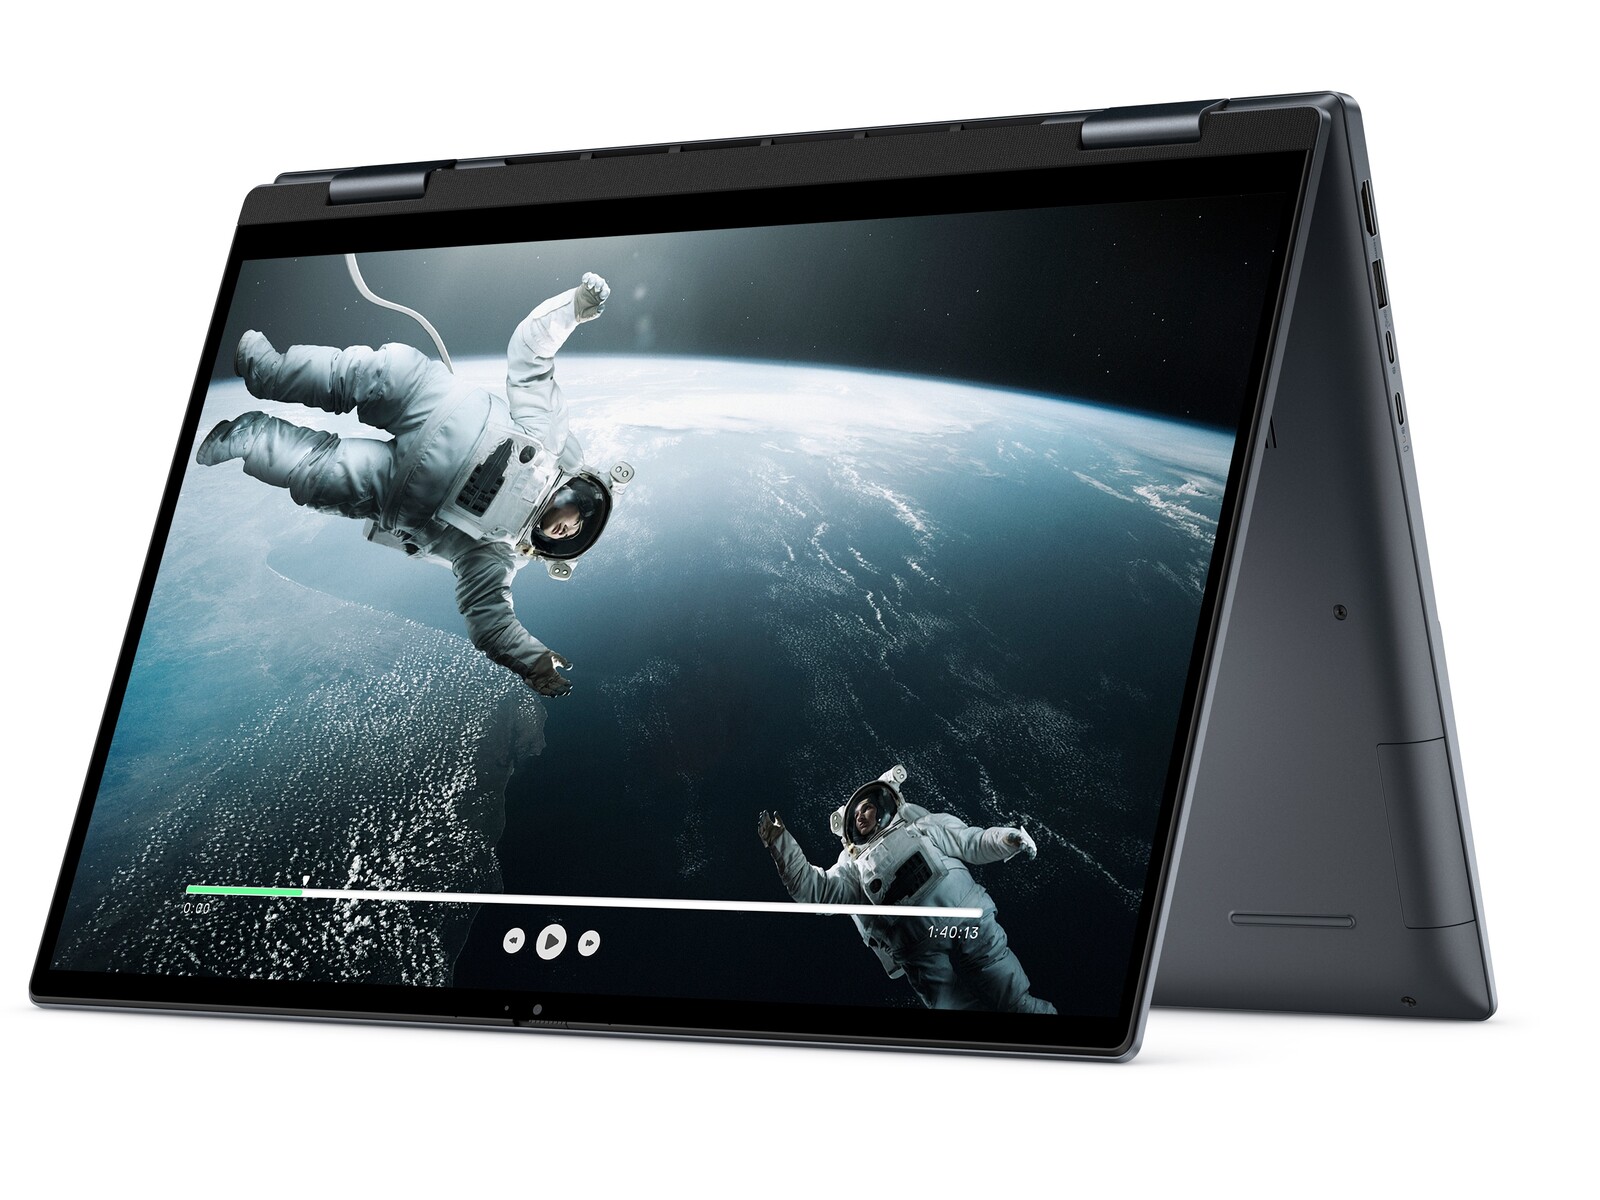
Dell Inspiron 16 7635 2-in-1 laptop review: A watered-down Inspiron 16 7630 with AMD Ryzen

The Inspiron 16 7635 2-in-1 is the AMD version of the Intel-based Inspiron 16 7630 2-in-1. Like other Inspiron models, it targets the budget to midrange consumer category in contrast to the higher-end business-centric Latitude or prosumer XPS series. It directly succeeds last year's Inspiron 16 7620 2-in-1 with both new CPUs and a revised exterior design.
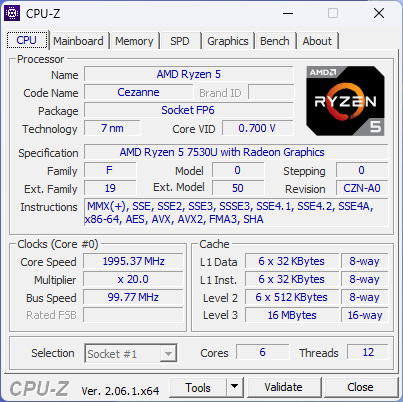
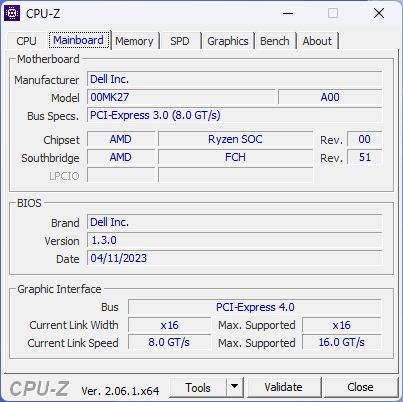
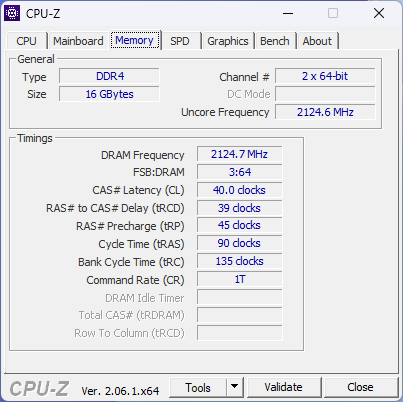
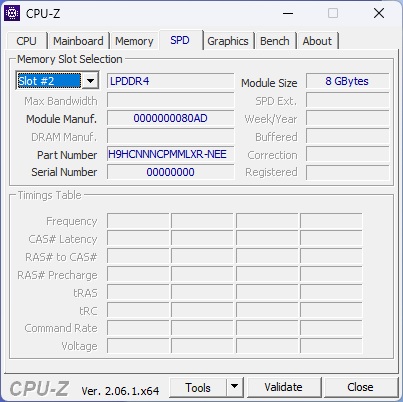
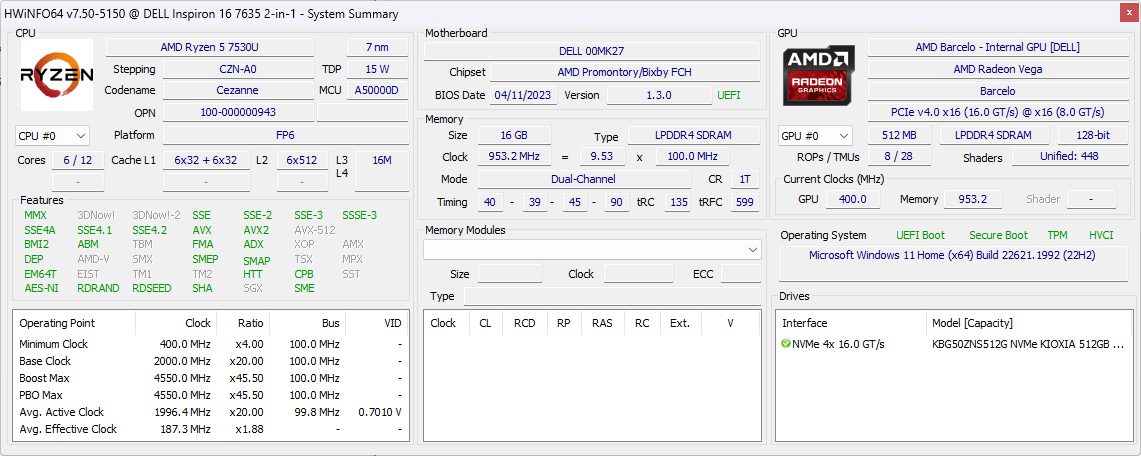
Our specific test unit is a lower-end configuration with the Zen 3 Ryzen 5 7530U CPU, 16 GB of soldered LPDDR4x 4266 MHz RAM, and 512 GB NVMe SSD for approximately $900 USD retail. A higher-end Ryzen 7 7730U option is available, but all AMD SKUs at the moment ship with the same 1200p IPS panel whereas the Intel version has a pricier 2400p OLED option.
Alternatives to the Inspiron 16 7635 2-in-1 include other large convertible laptops like the Lenovo Flex 5 16 or the more powerful MSI Summit E16 Flip or HP Spectre x360 16.
More Dell reviews:
Potential Competitors in Comparison
Rating | Date | Model | Weight | Height | Size | Resolution | Price |
|---|---|---|---|---|---|---|---|
| 84.6 % v7 (old) | 07 / 2023 | Dell Inspiron 16 7635 2-in-1 R5 7530U, Vega 7 | 2 kg | 18.99 mm | 16.00" | 1920x1200 | |
| 87.5 % v7 (old) | 06 / 2023 | Acer Swift Edge SFE16-42-R1GM R7 7735U, Radeon 680M | 1.2 kg | 13.95 mm | 16.00" | 3840x2400 | |
| 85.8 % v7 (old) | 04 / 2023 | Lenovo Yoga 7 16IRL8 i7-1355U, Iris Xe G7 96EUs | 2 kg | 16.99 mm | 16.00" | 1920x1200 | |
| 85.6 % v7 (old) | 05 / 2023 | Samsung Galaxy Book3 Pro 16 i5-1340P, Iris Xe G7 80EUs | 1.6 kg | 12.5 mm | 16.00" | 2880x1800 | |
| 80.7 % v7 (old) | 04 / 2023 | Lenovo IdeaPad Flex 5 16ABR G8 R7 7730U, Vega 8 | 2 kg | 18.7 mm | 16.00" | 1920x1200 | |
| 85.7 % v7 (old) | 06 / 2022 | Dell Inspiron 16 7620 2-in-1 i7-1260P, Iris Xe G7 96EUs | 2.1 kg | 18.41 mm | 16.00" | 1920x1200 |
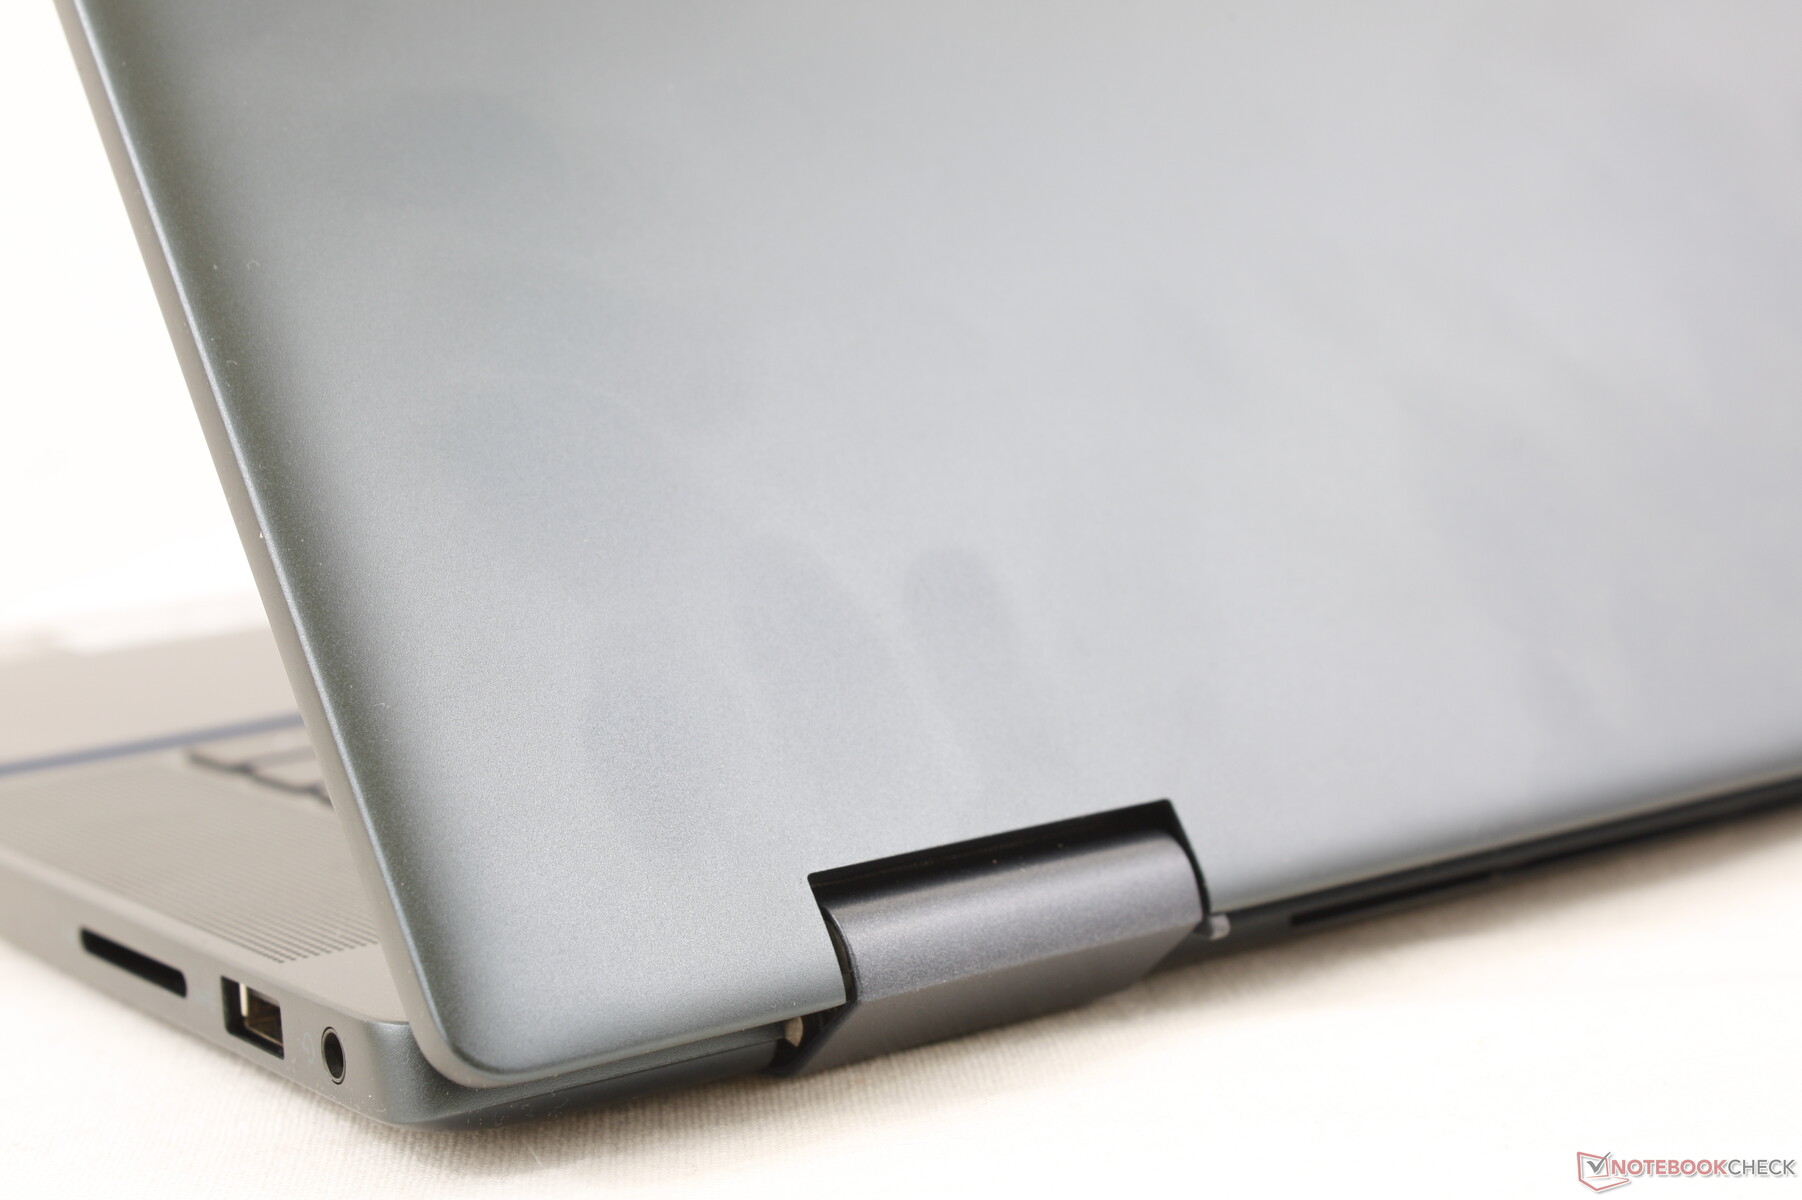
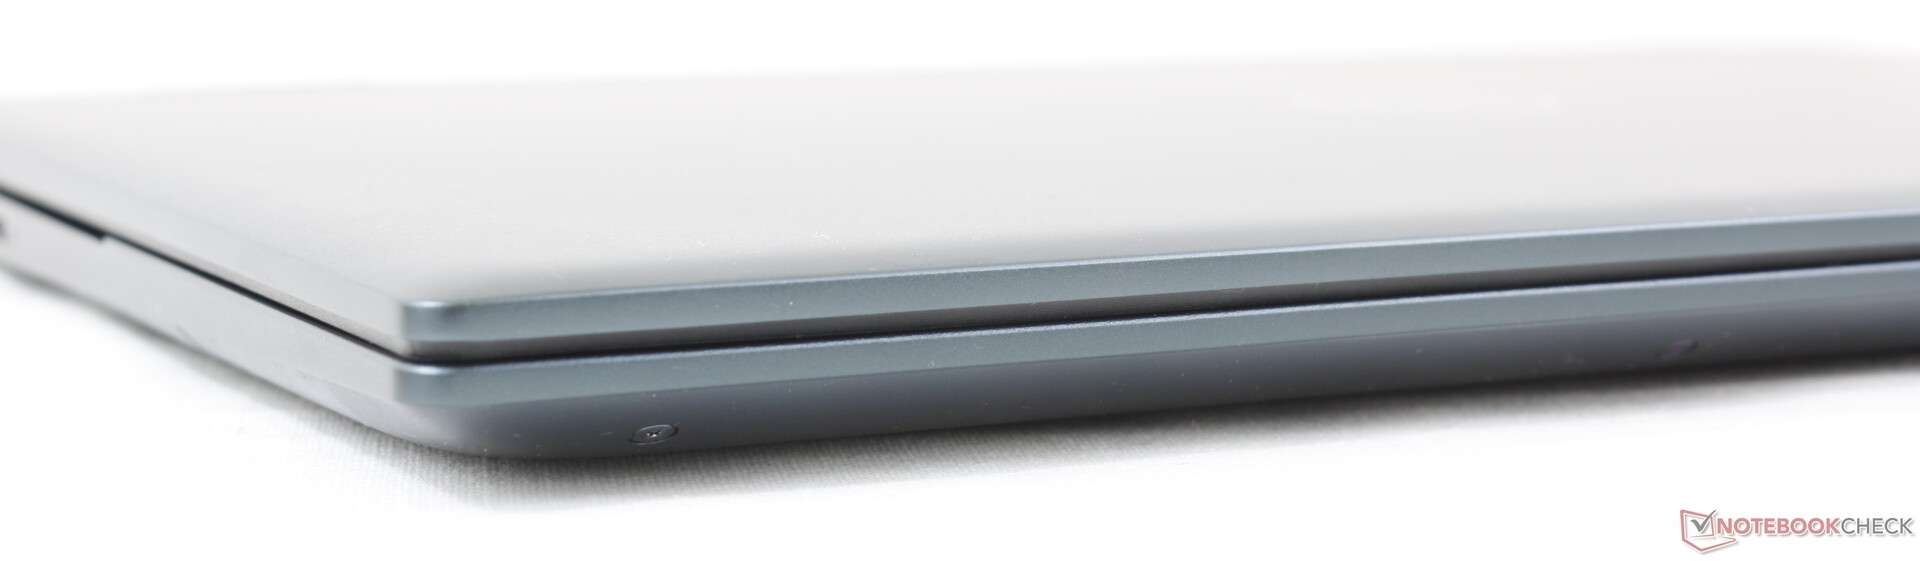
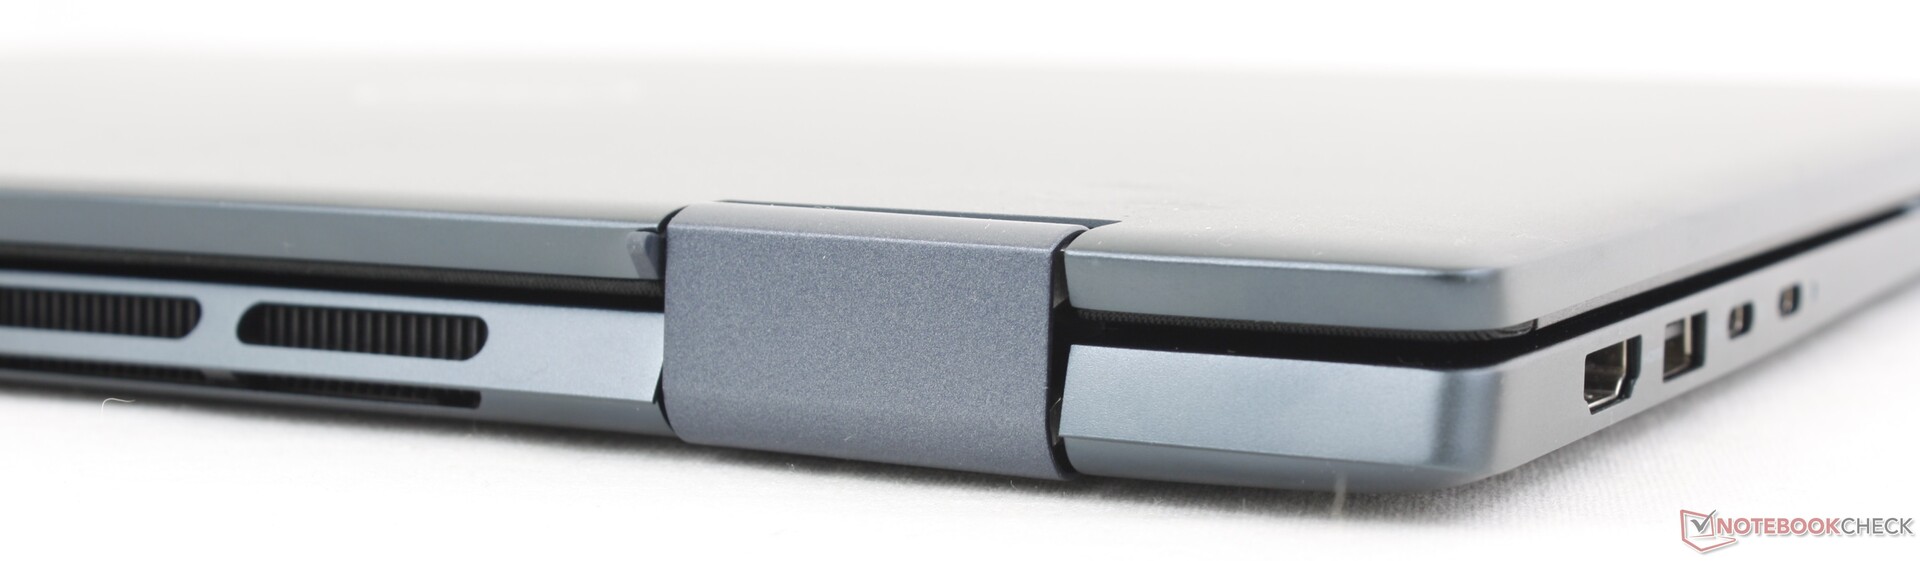
Case — Silently Dropping Mylar
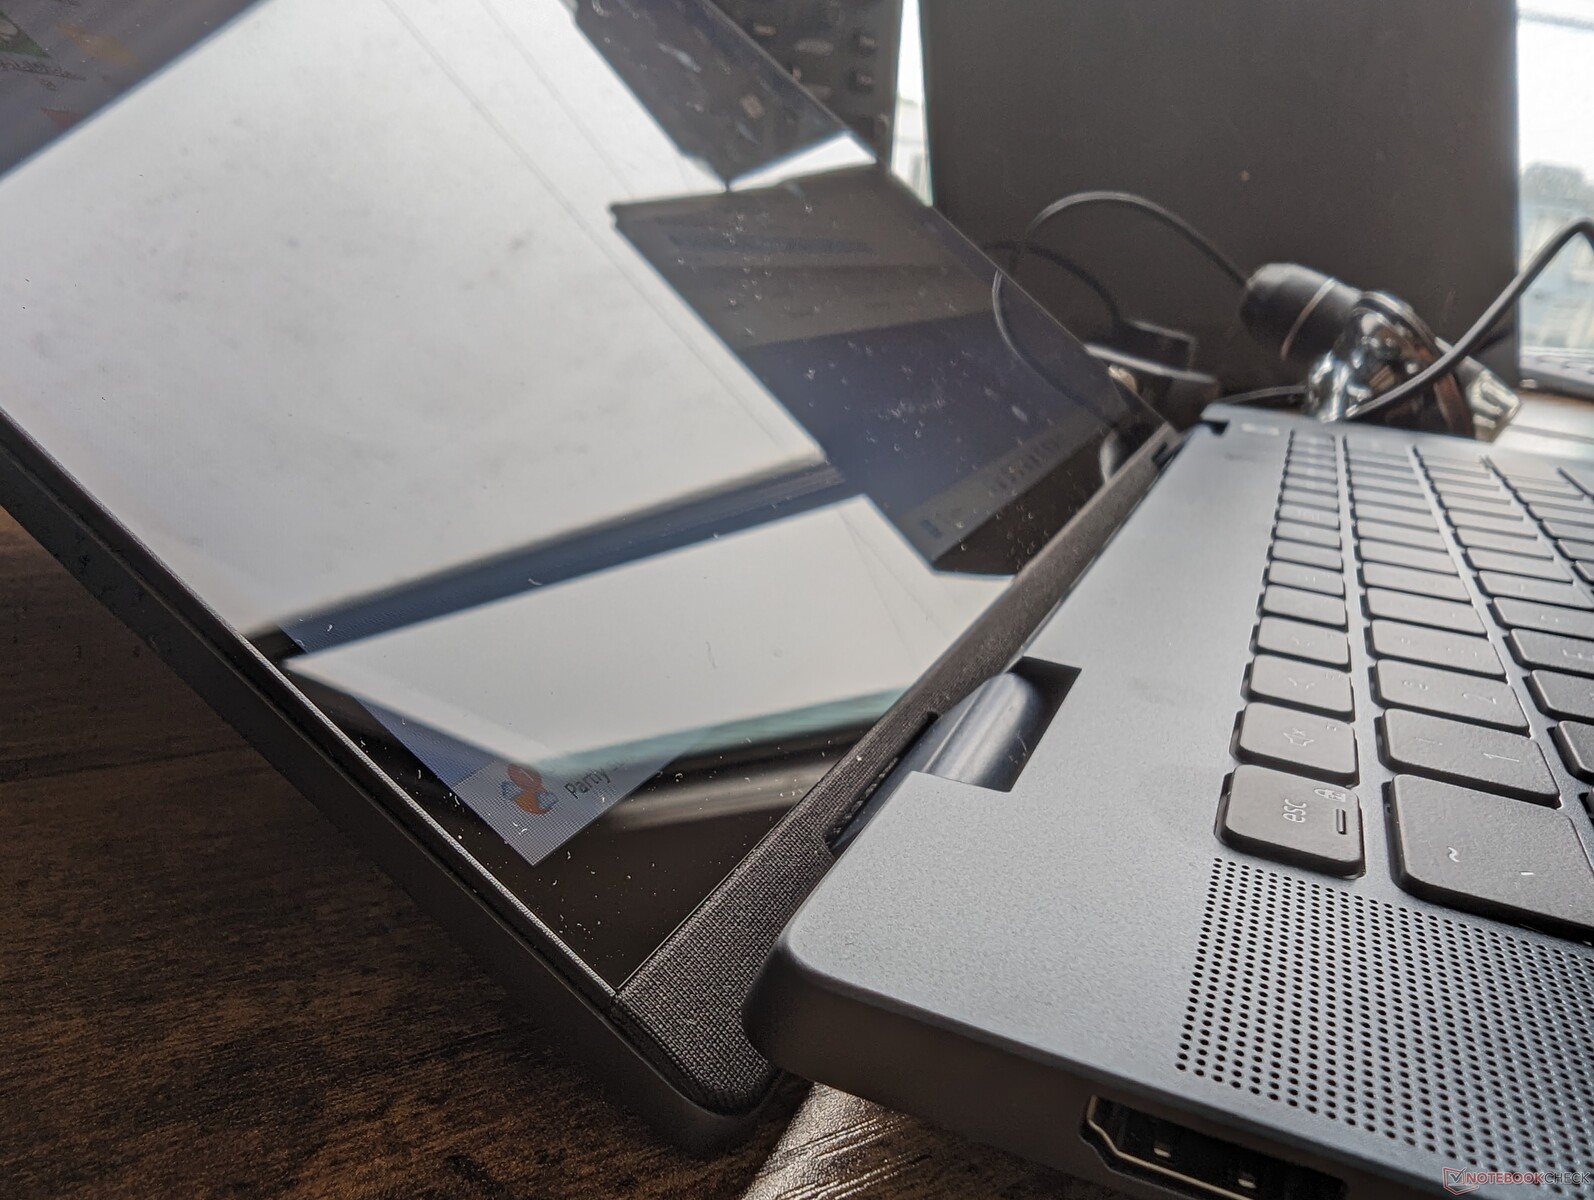
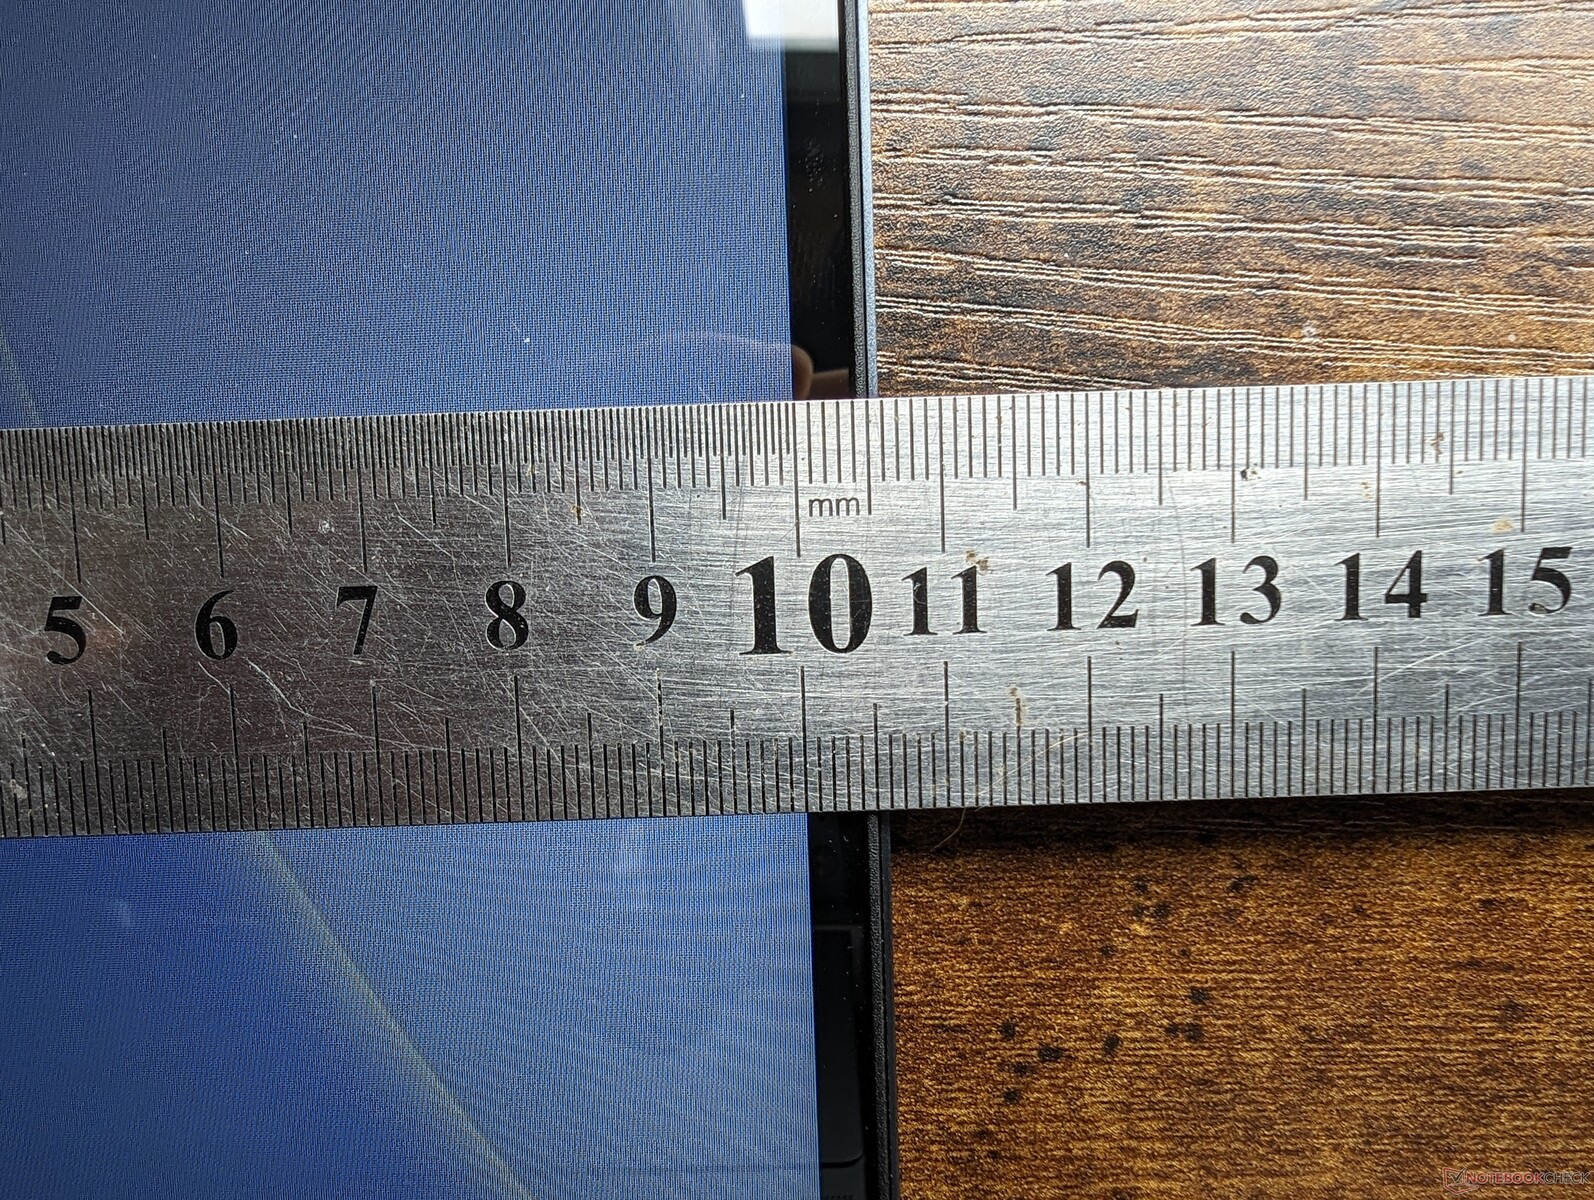
Dell made a big deal about its use of Mylar on last year's Inspiron 16 7620 2-in-1 and so it's a bit perplexing to suddenly see it gone for this year's Inspiron 16 7630/7635 refresh. Instead, the chassis now consists of a combination of aluminum and recycled plastics for a more monotone color scheme and appearance. The hinges have also been redesigned to be flatter and there are now additional ventilation grilles along the rear to aid in cooling.
Chassis quality remains about the same year-over-year despite the exterior changes. The dense weight contributes to an unyielding base for strong first impressions that's only a step or two down from the much more expensive and equally heavy HP Spectre x360 16.
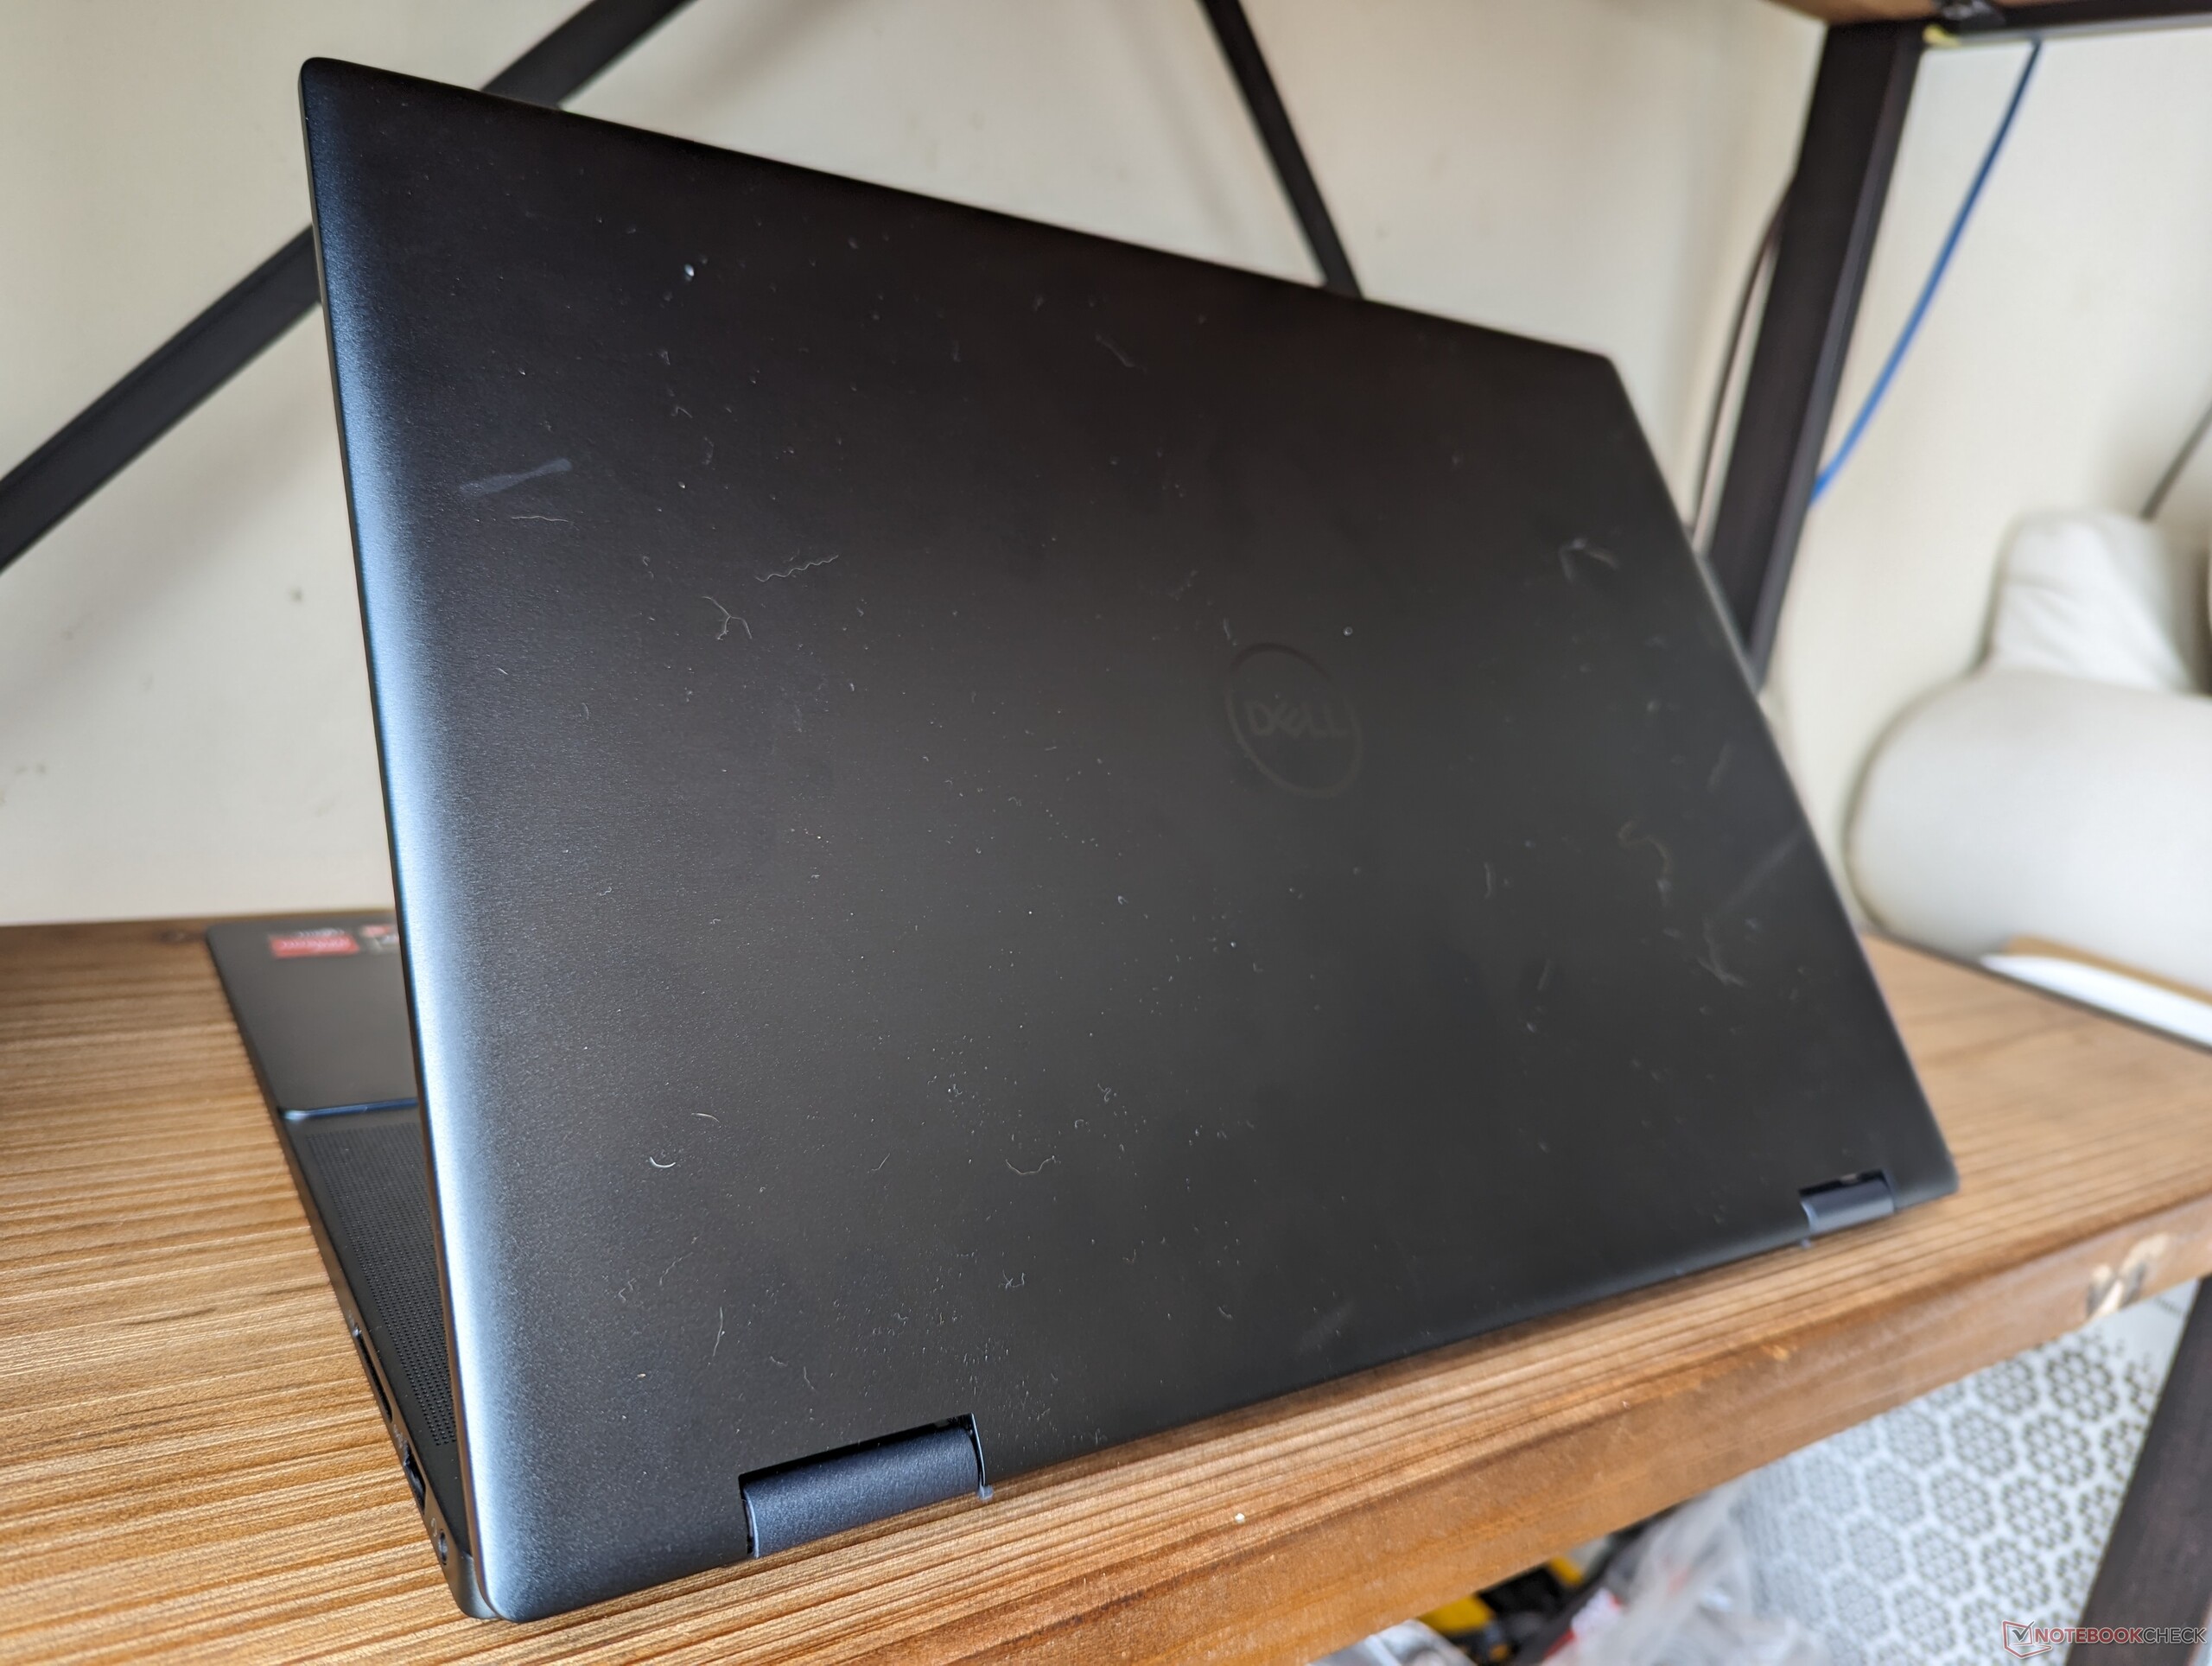
Perhaps by coincidence, dimensions and weight are almost identical to the competing IdeaPad Flex 5 16. The new model is unfortunately not smaller or lighter than on last year's Inspiron 16 7620 2-in-1 and so it remains a relatively heavy laptop even for the 16-inch size category.

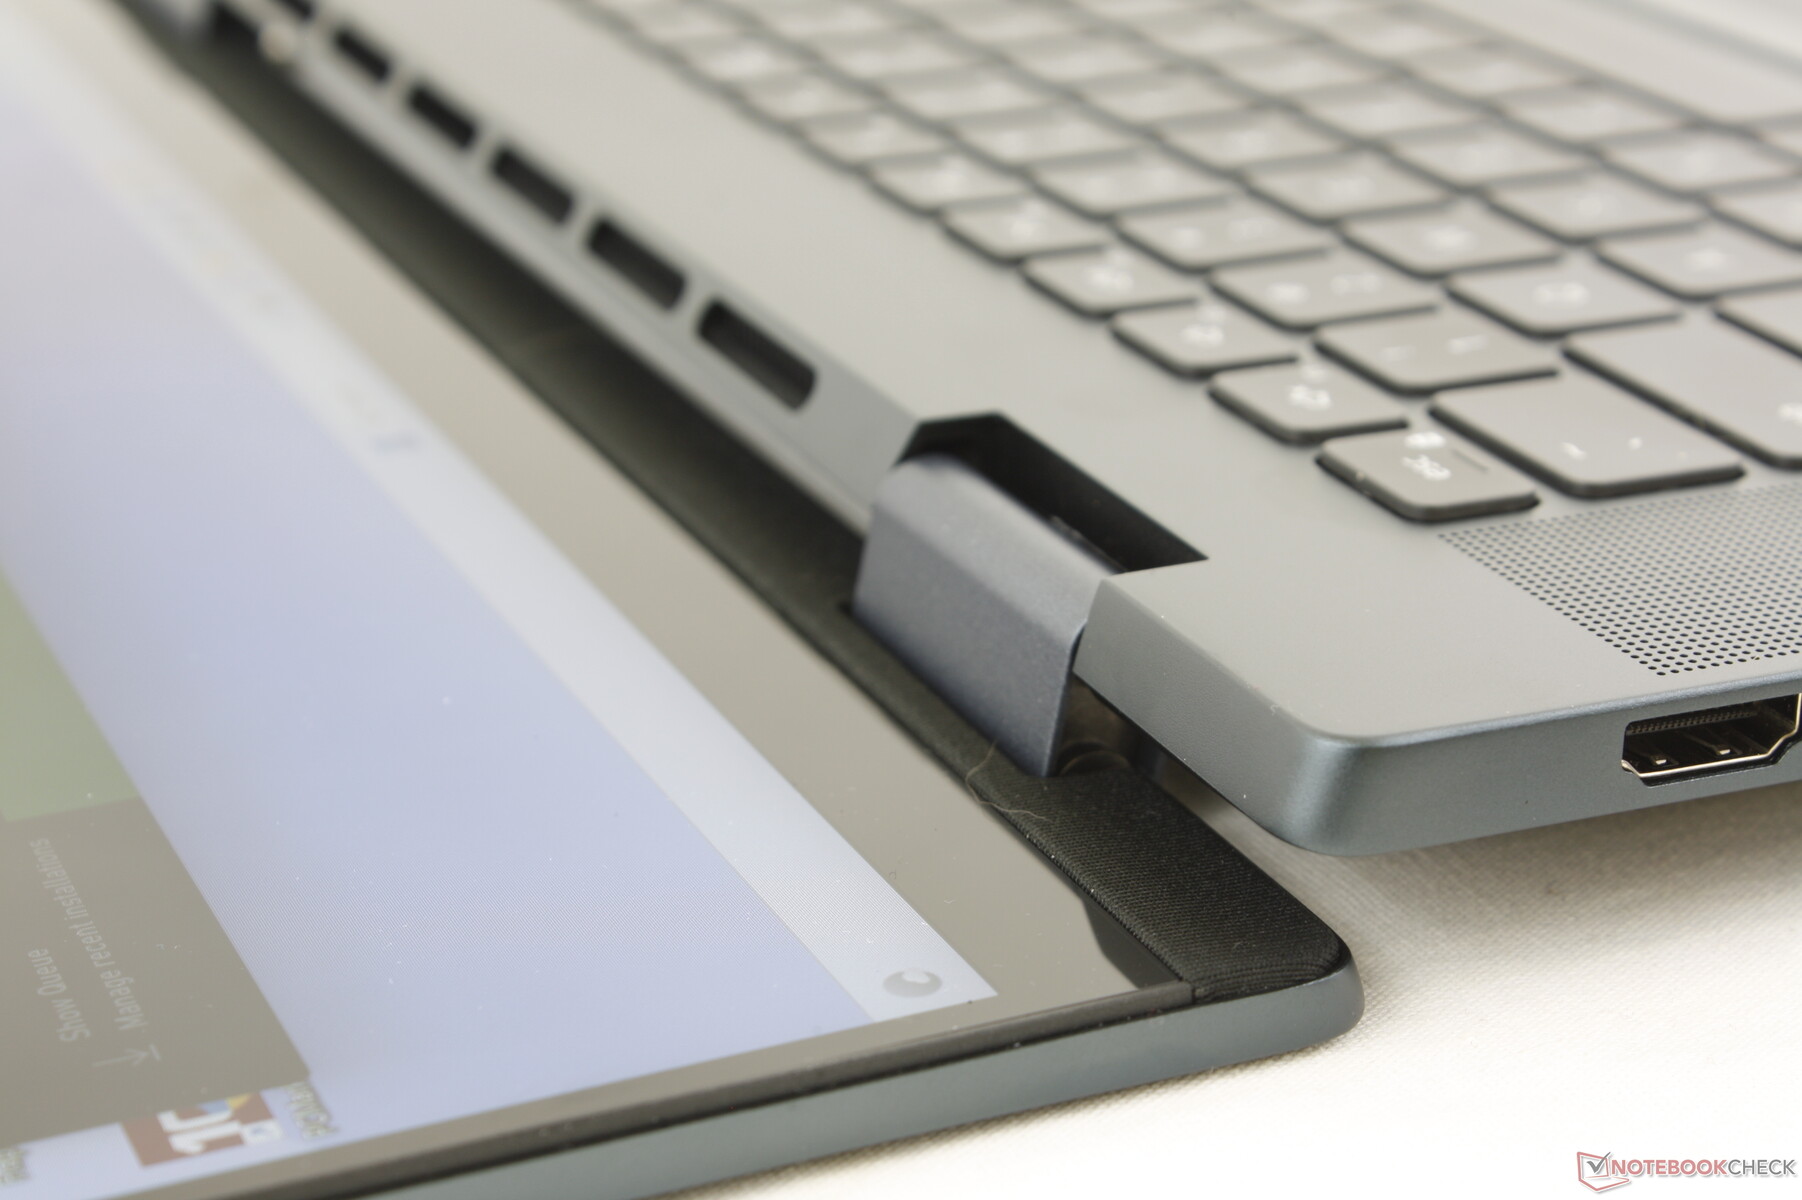
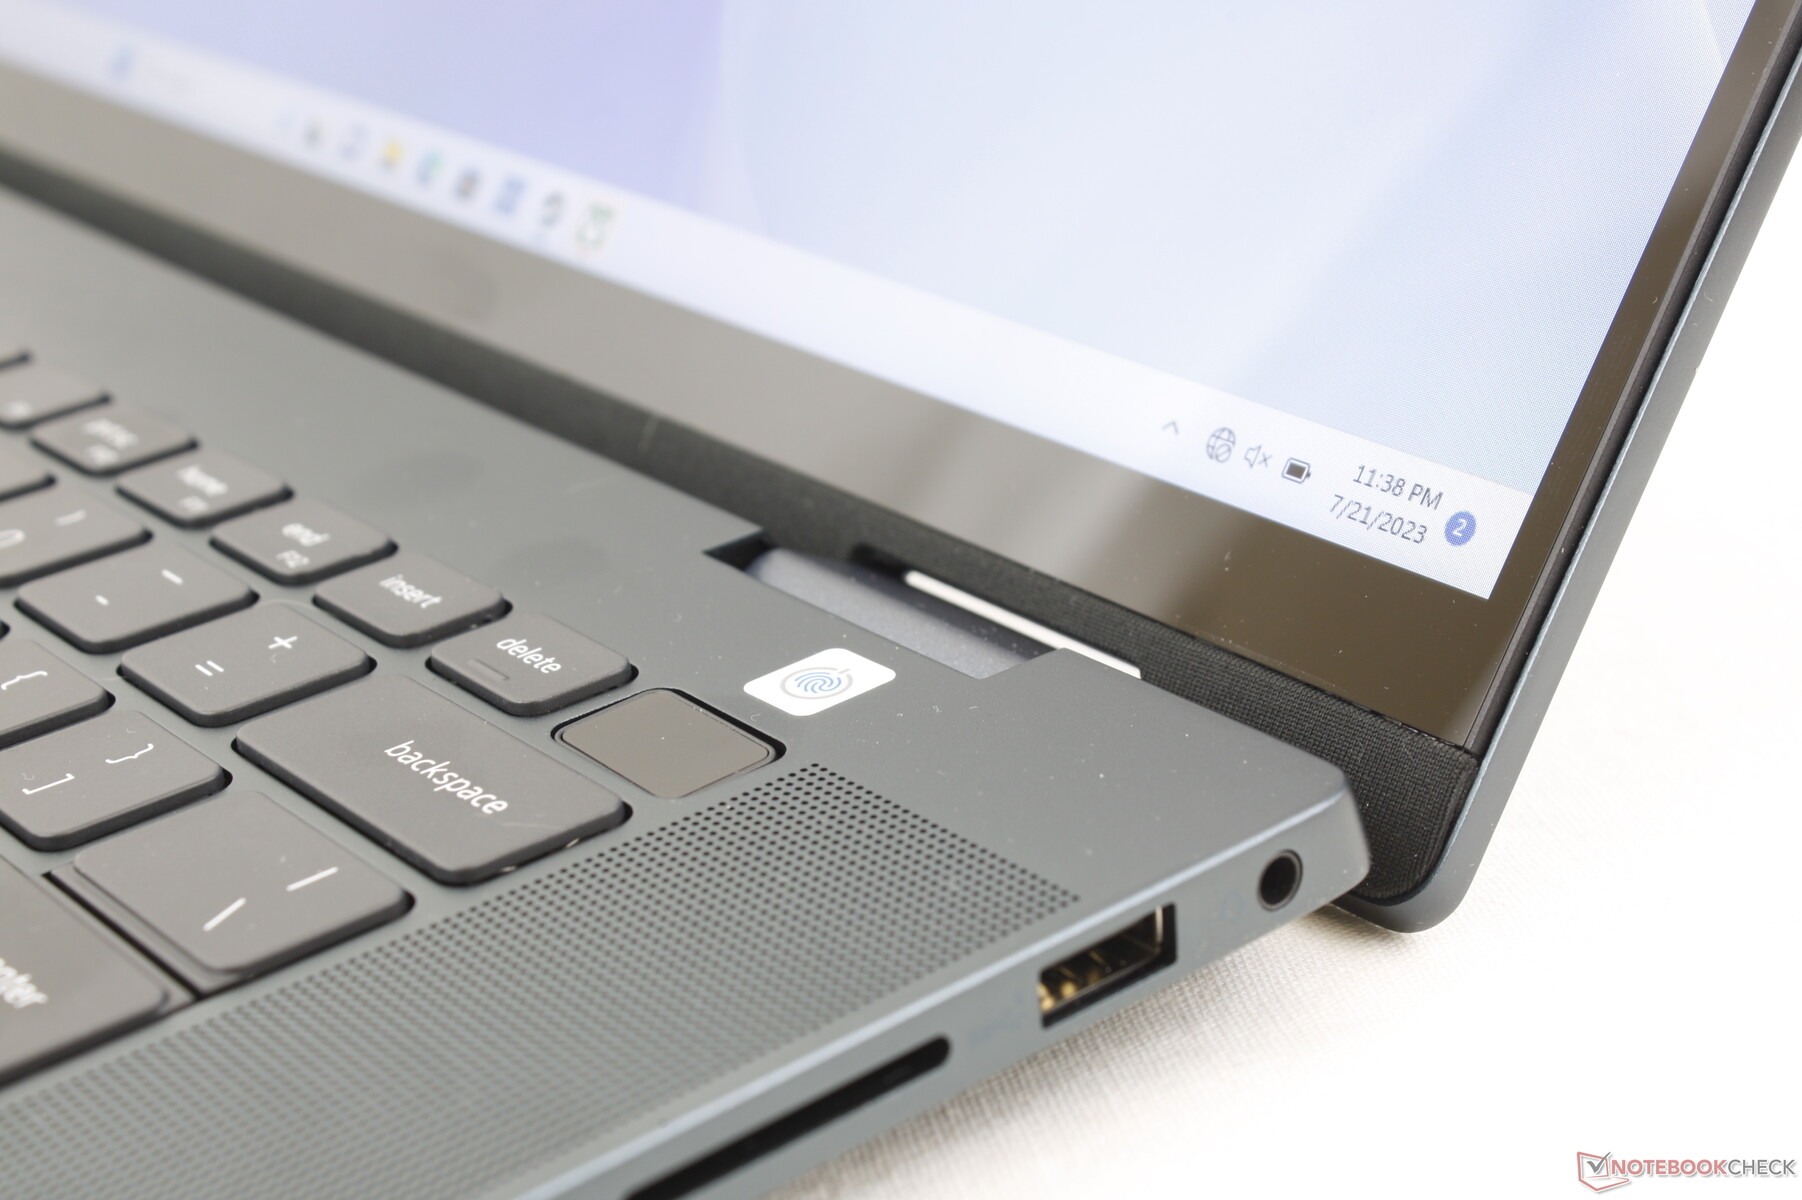
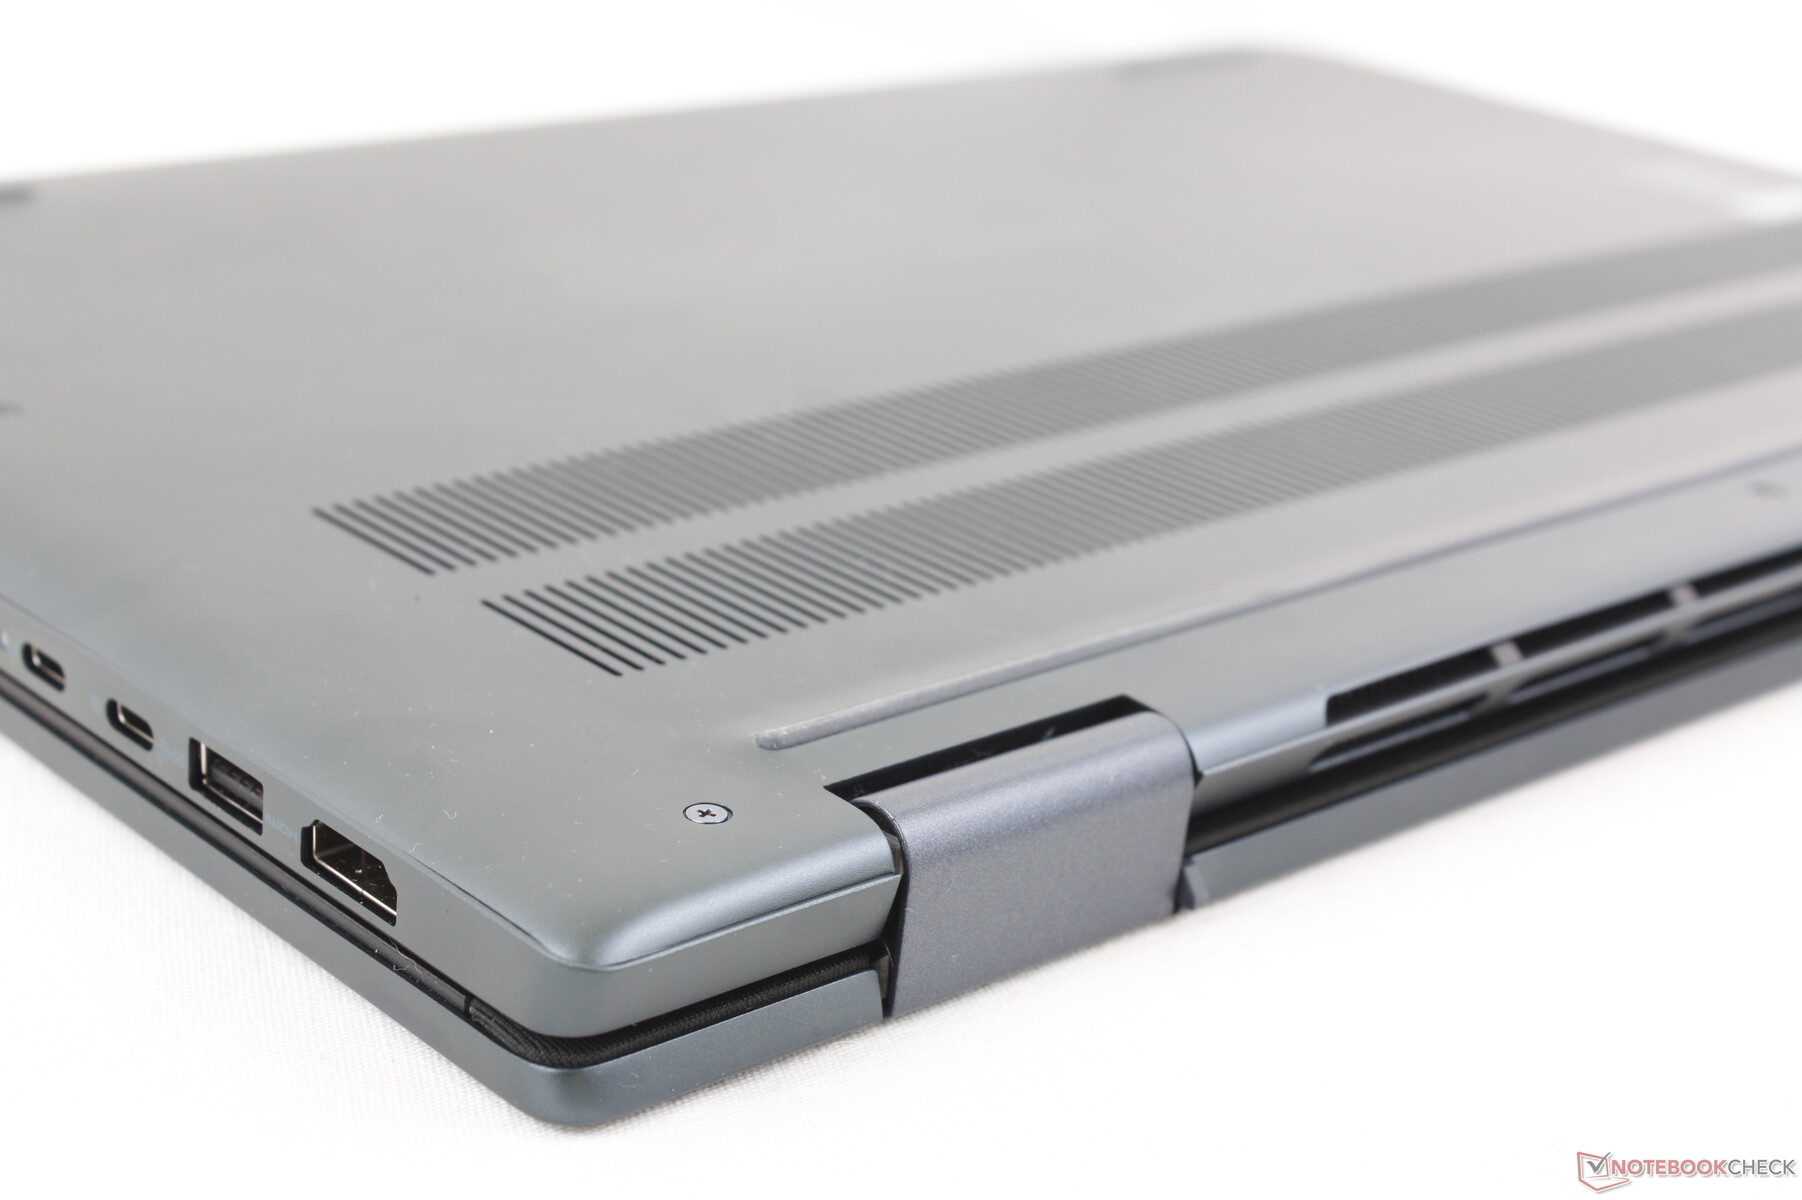
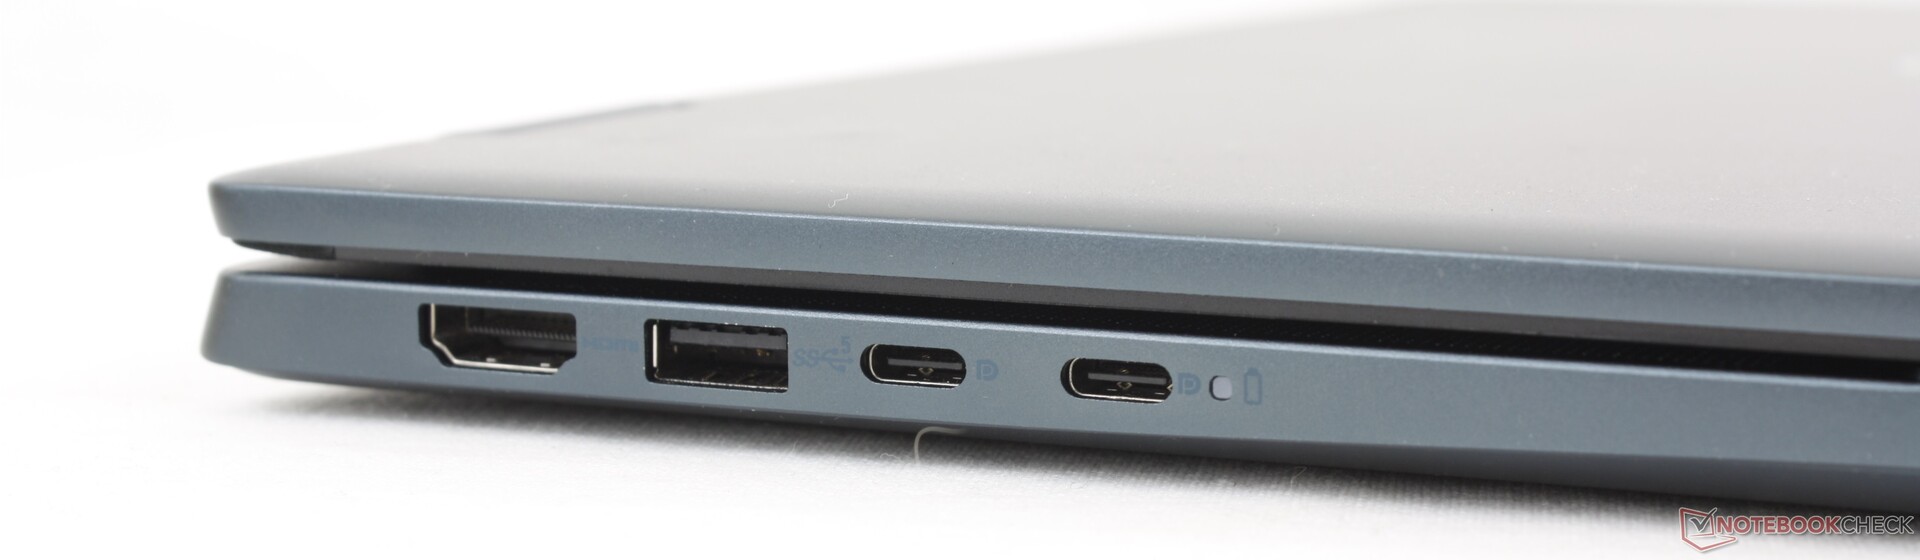
Connectivity — No Thunderbolt Support
The model retains all the ports as found on last year's Inspiron 16 7620 2-in-1. The main difference, however, is that our AMD configuration lacks Thunderbolt support. Port variety is still comparable to other 16-inch laptops nonetheless like the IdeaPad Flex 5 16 or the Acer Swift Edge SFE16.
Keep in mind that the HDMI port is only 1.4 instead of 2.0. For proper support of external 4K monitors at 60 Hz, be sure to use the USB-C ports instead.
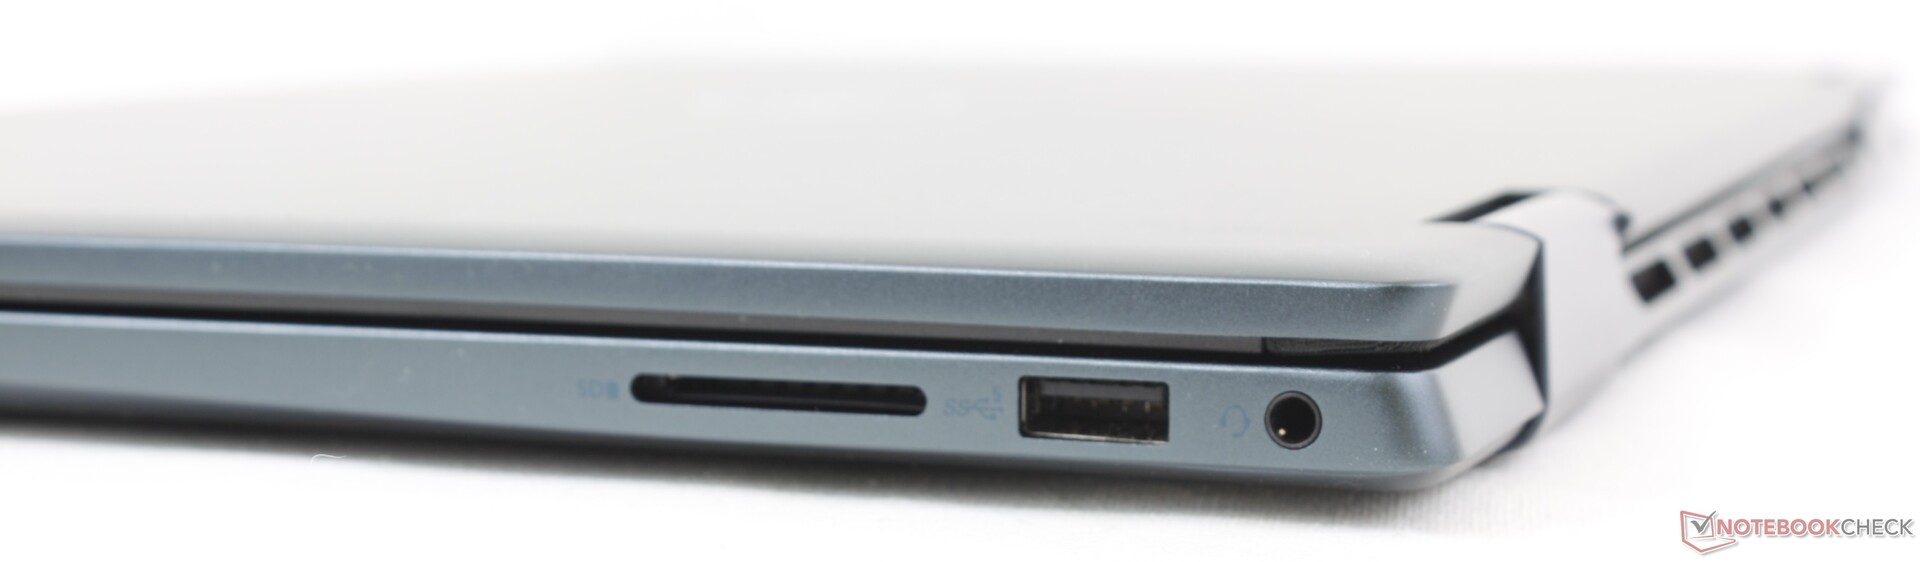
SD Card Reader
The integrated card reader performs slightly faster than before, but transfer rates are still about half as fast as on the Lenovo IdeaPad Flex 5 16 or Galaxy Book3 Pro 16. Moving 1 GB of pictures from our PNY UHS-II test card to desktop takes about 32 seconds compared to 17 seconds on the aforementioned Lenovo.

| SD Card Reader | |
| average JPG Copy Test (av. of 3 runs) | |
| Lenovo IdeaPad Flex 5 16ABR G8 (Angelibird AV Pro V60) | |
| Samsung Galaxy Book3 Pro 16 | |
| Lenovo Yoga 7 16IRL8 (AV Pro SD microSD 128 GB V60) | |
| Dell Inspiron 16 7635 2-in-1 (PNY EliteX-Pro60 V60 256 GB) | |
| Dell Inspiron 16 7620 2-in-1 (Toshiba Exceria Pro SDXC 64 GB UHS-II) | |
| maximum AS SSD Seq Read Test (1GB) | |
| Lenovo Yoga 7 16IRL8 (AV Pro SD microSD 128 GB V60) | |
| Lenovo IdeaPad Flex 5 16ABR G8 (Angelibird AV Pro V60) | |
| Samsung Galaxy Book3 Pro 16 | |
| Dell Inspiron 16 7635 2-in-1 (PNY EliteX-Pro60 V60 256 GB) | |
| Dell Inspiron 16 7620 2-in-1 (Toshiba Exceria Pro SDXC 64 GB UHS-II) | |
Communication
The AMD Inspiron ships with the MediaTek Wi-Fi 6E MT7922 whereas the Intel Inspiron ships with the AX211. Both modules are compatible with Wi-Fi 6E or 6 GHz routers. Performance is steady and with no issues when paired to our Asus AXE11000.
Webcam
A 1080p webcam and privacy shutter ship standard on all configurations for no surprises in terms of image quality. Only the Intel model, however, comes with an optional IR sensor.


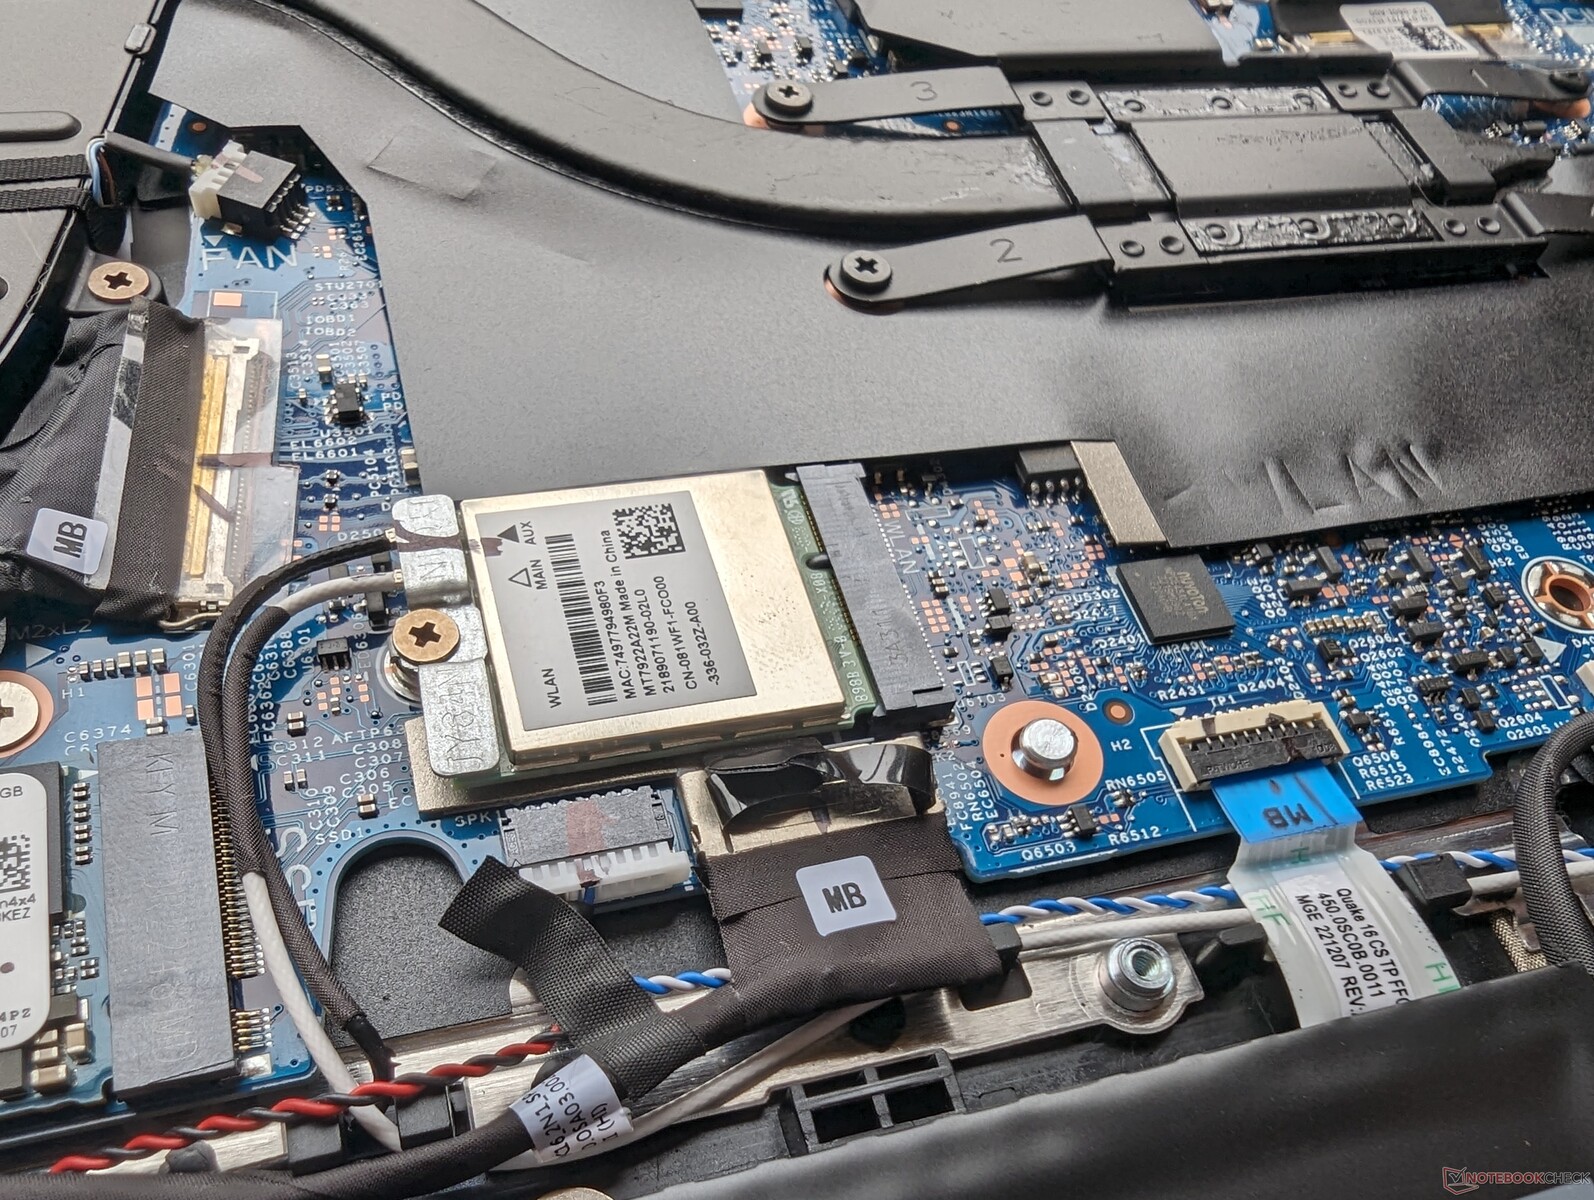
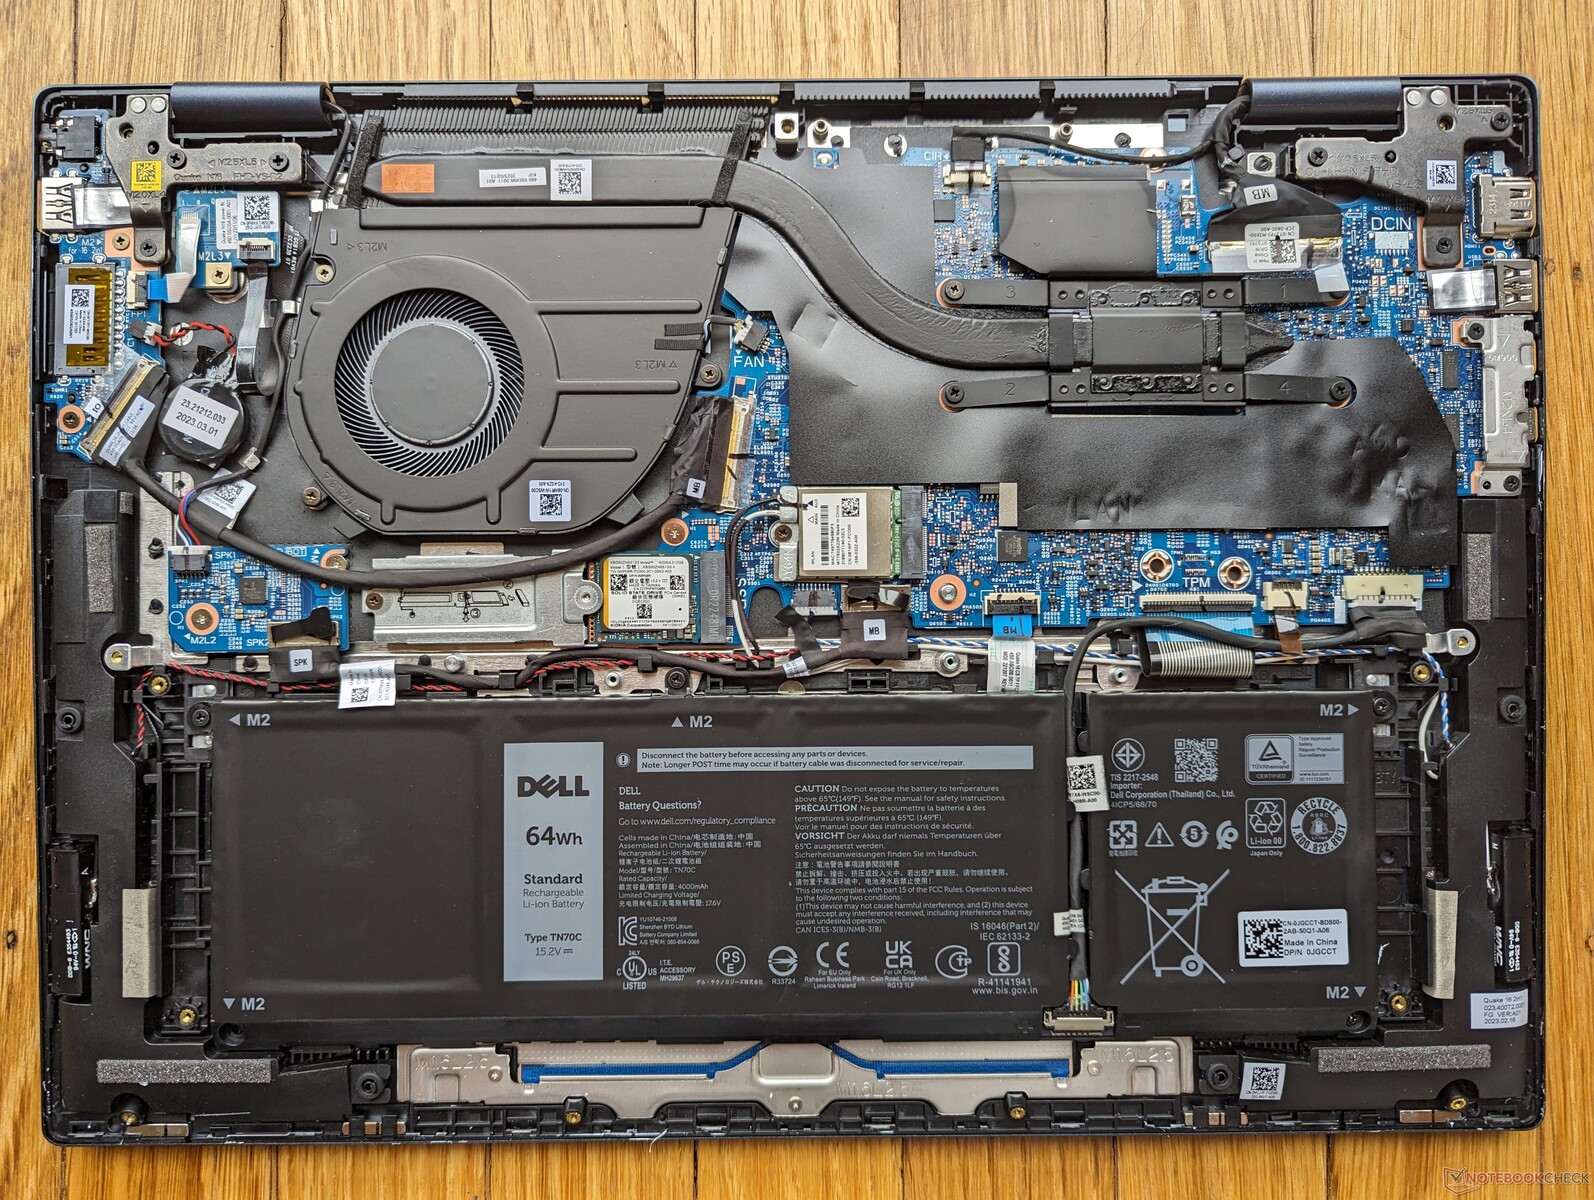
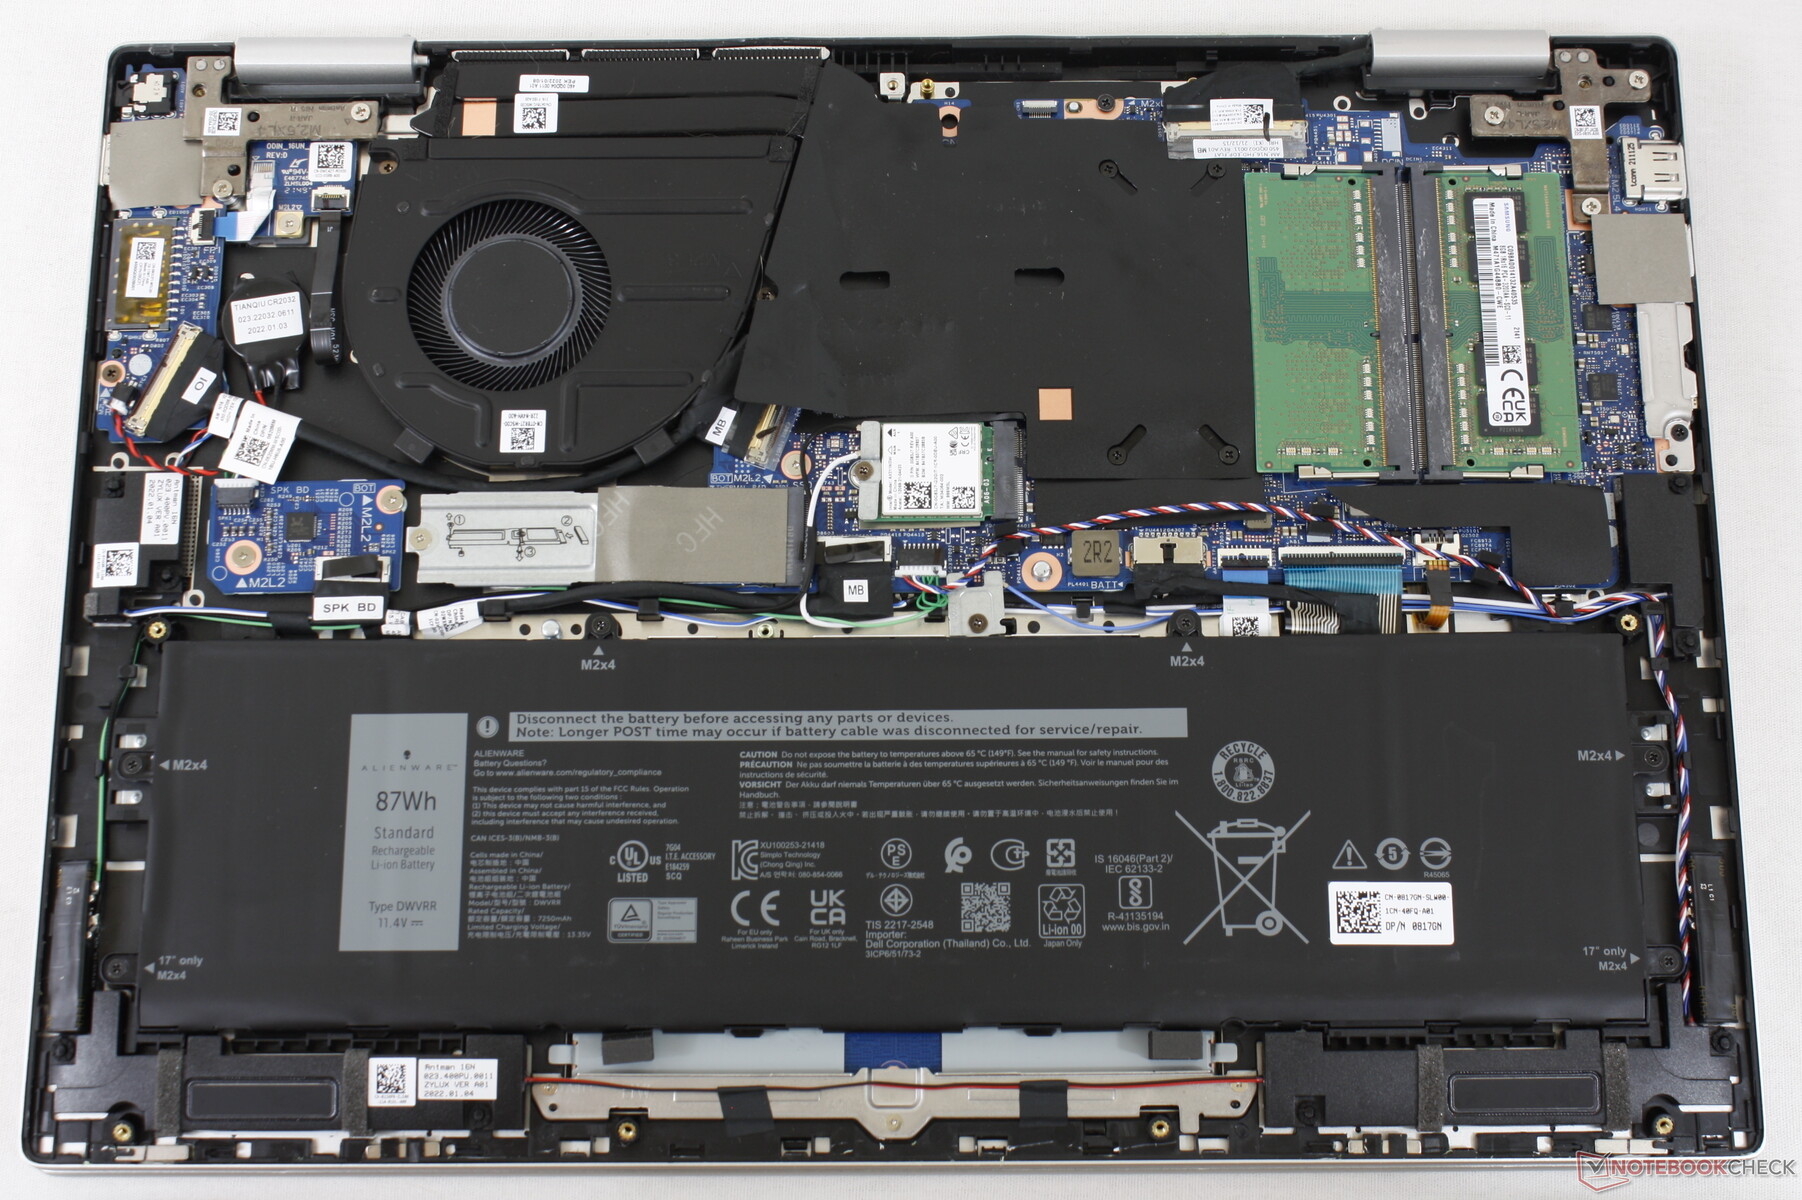
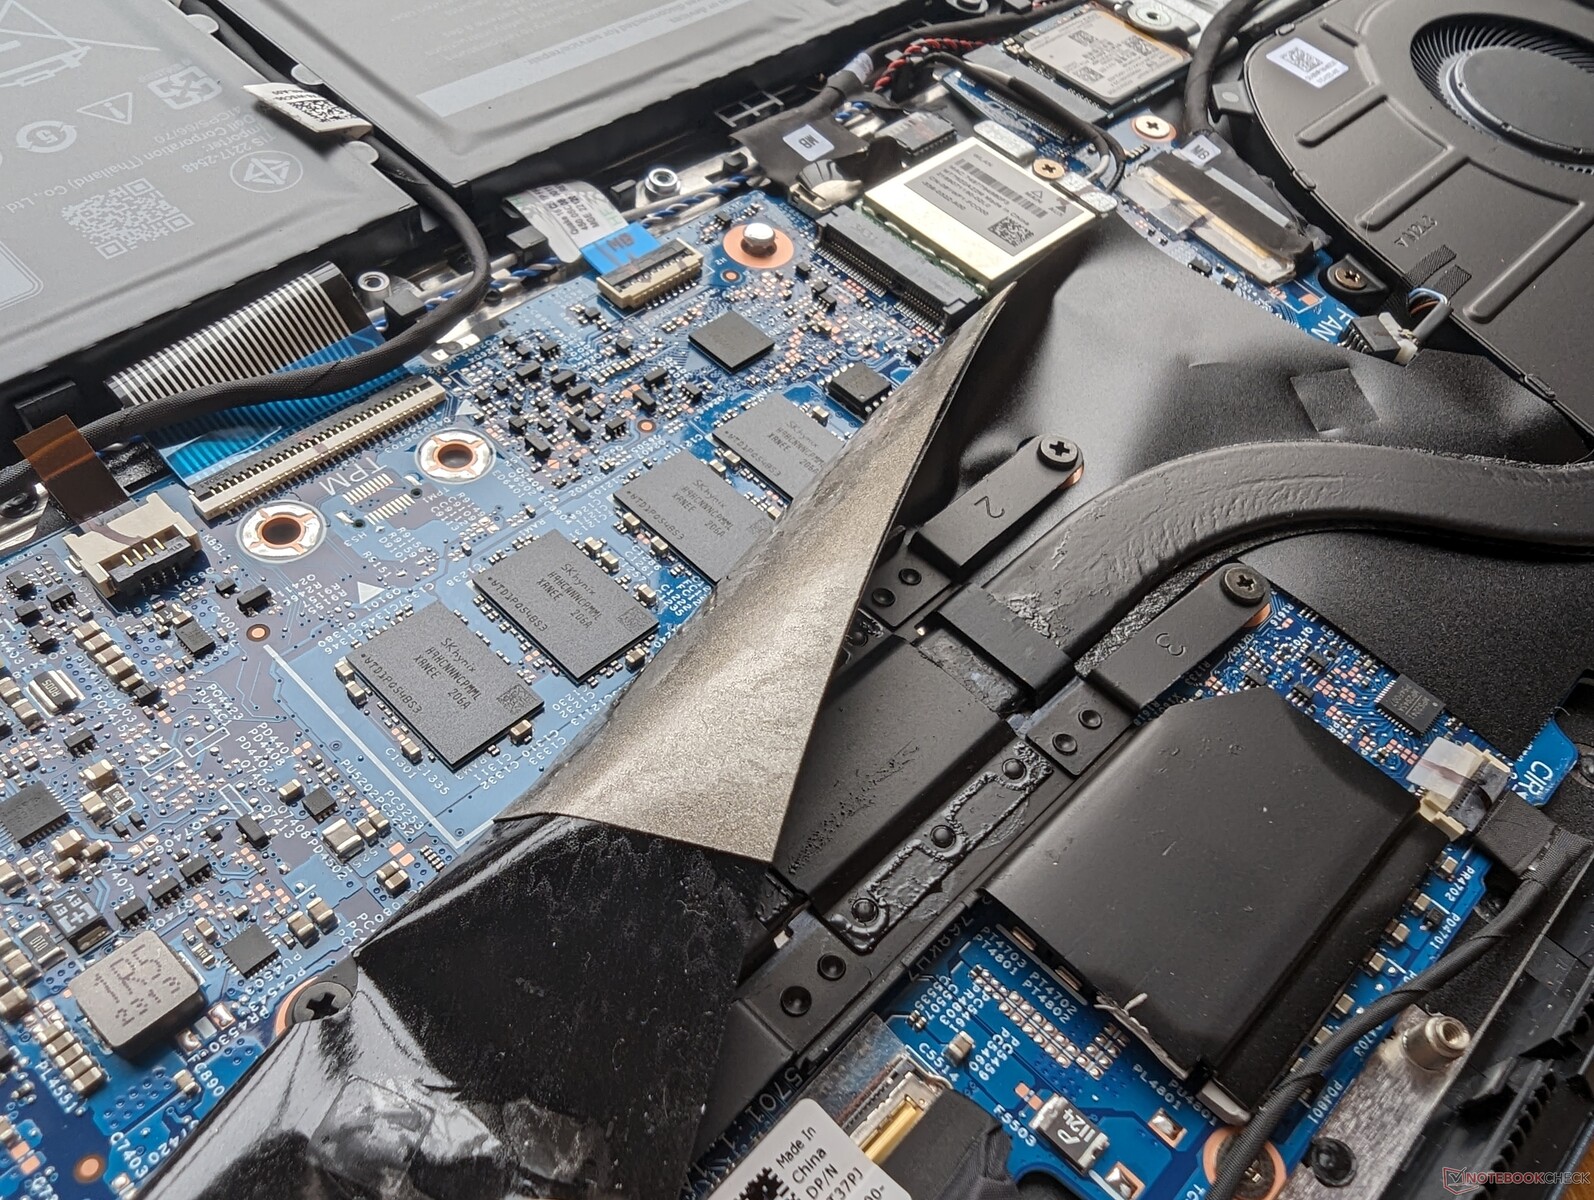
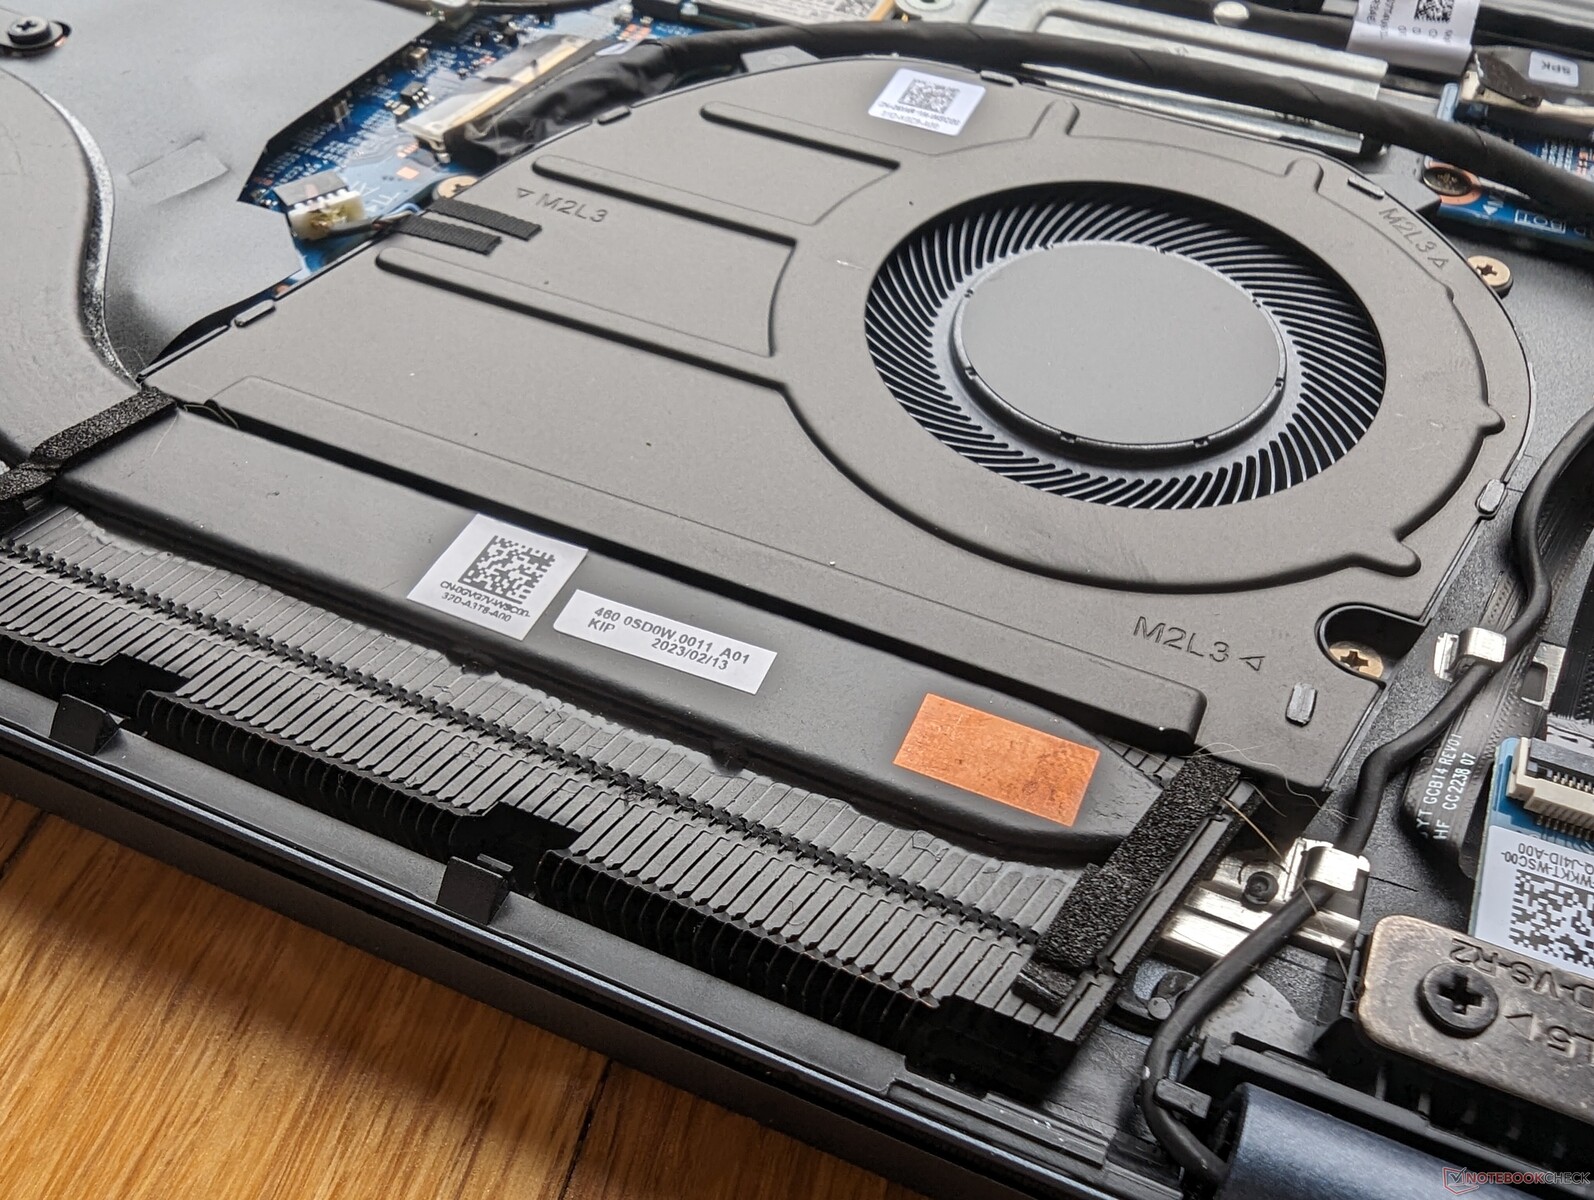
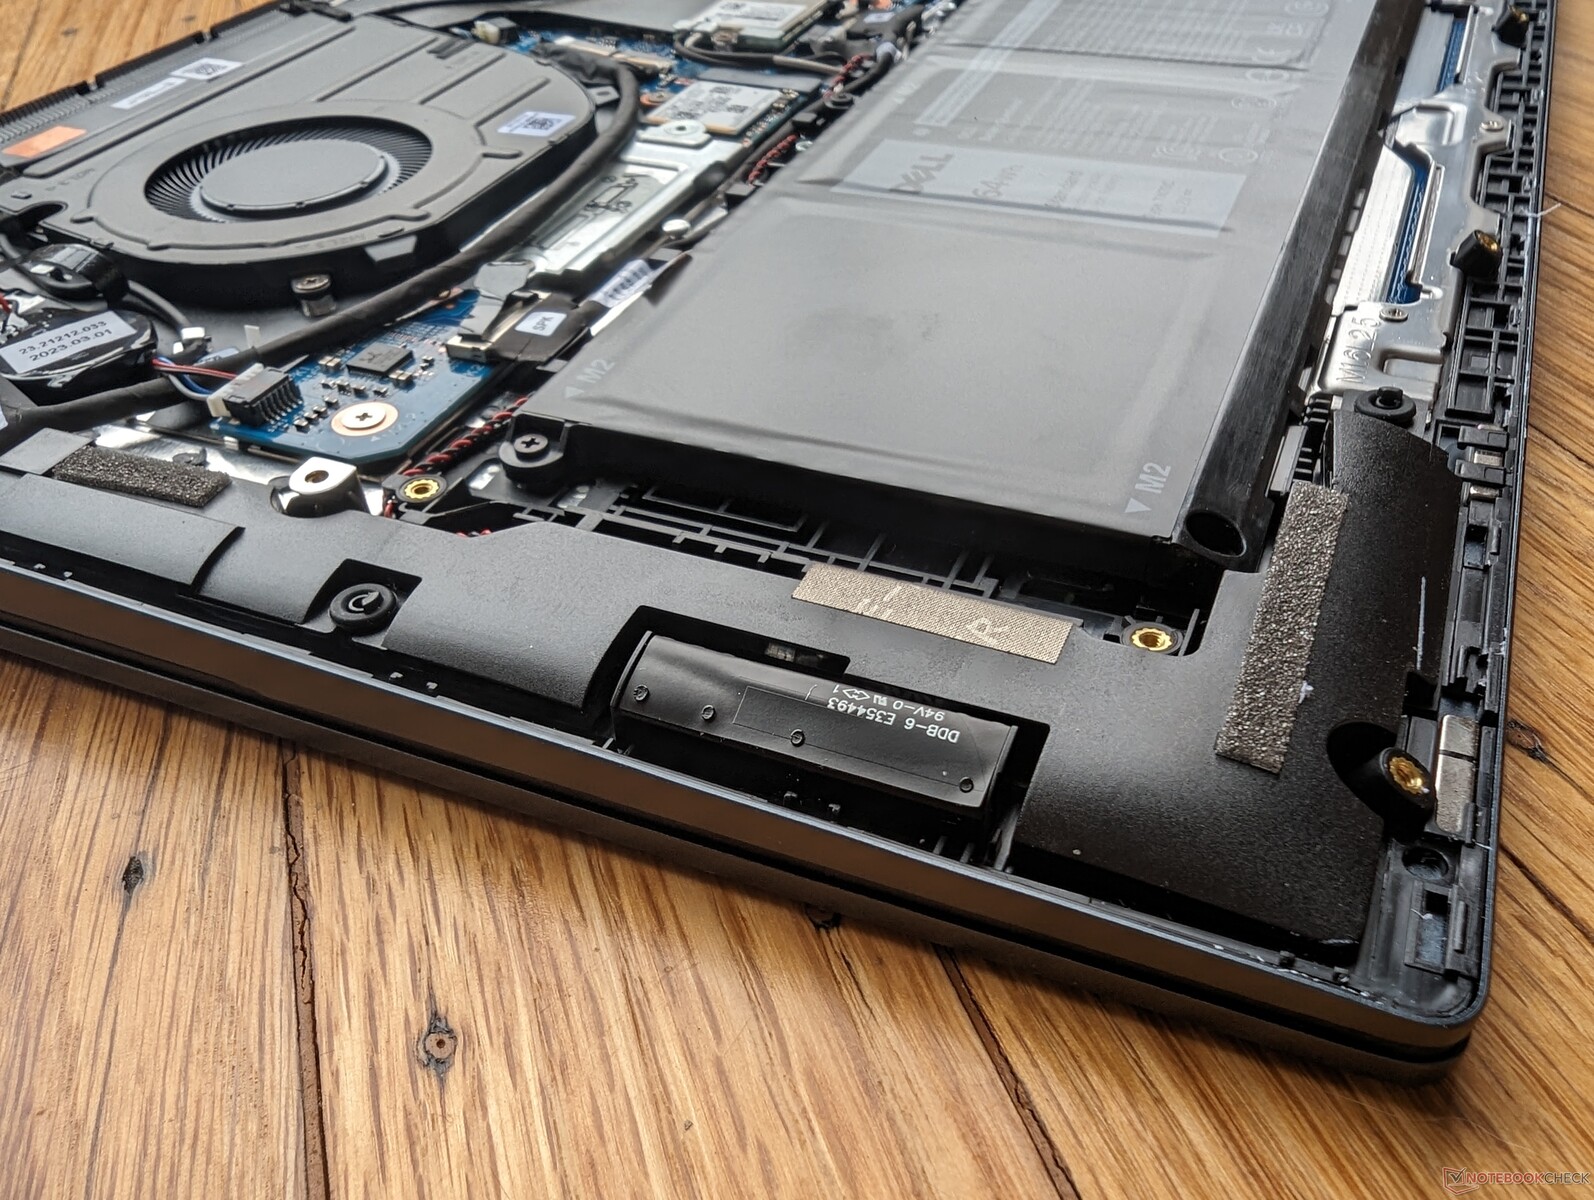
Maintenance
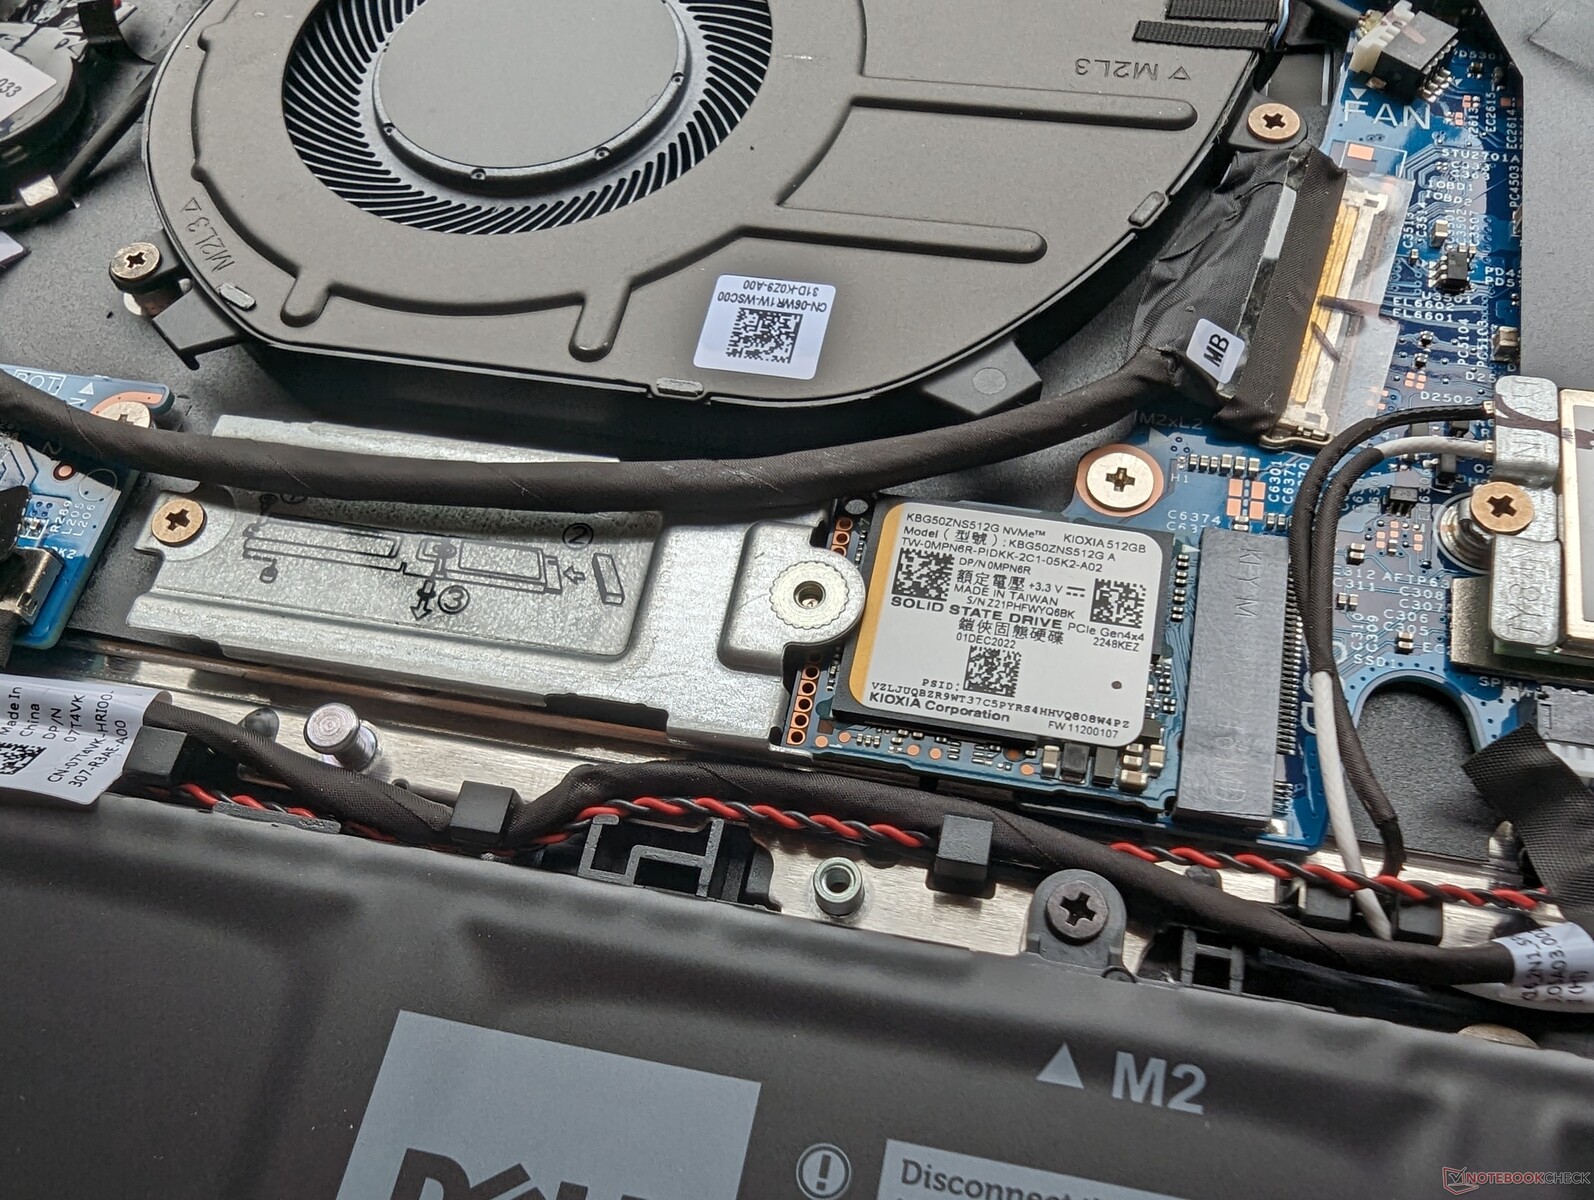
The bottom panel is secured by nine Phillips screws. Note that the latches around the edges are very tight and so we recommend using a sharp plastic edge to carefully pry open the panel starting from the back.
RAM is now soldered on the 2023 model whereas it was user-upgradeable on the 2022 version as shown by the images below.
Accessories And Warranty
There are no extras in the box other than the AC adapter and paperwork. The usual one-year limited manufacturer warranty applies if purchased in the US.
Input Devices
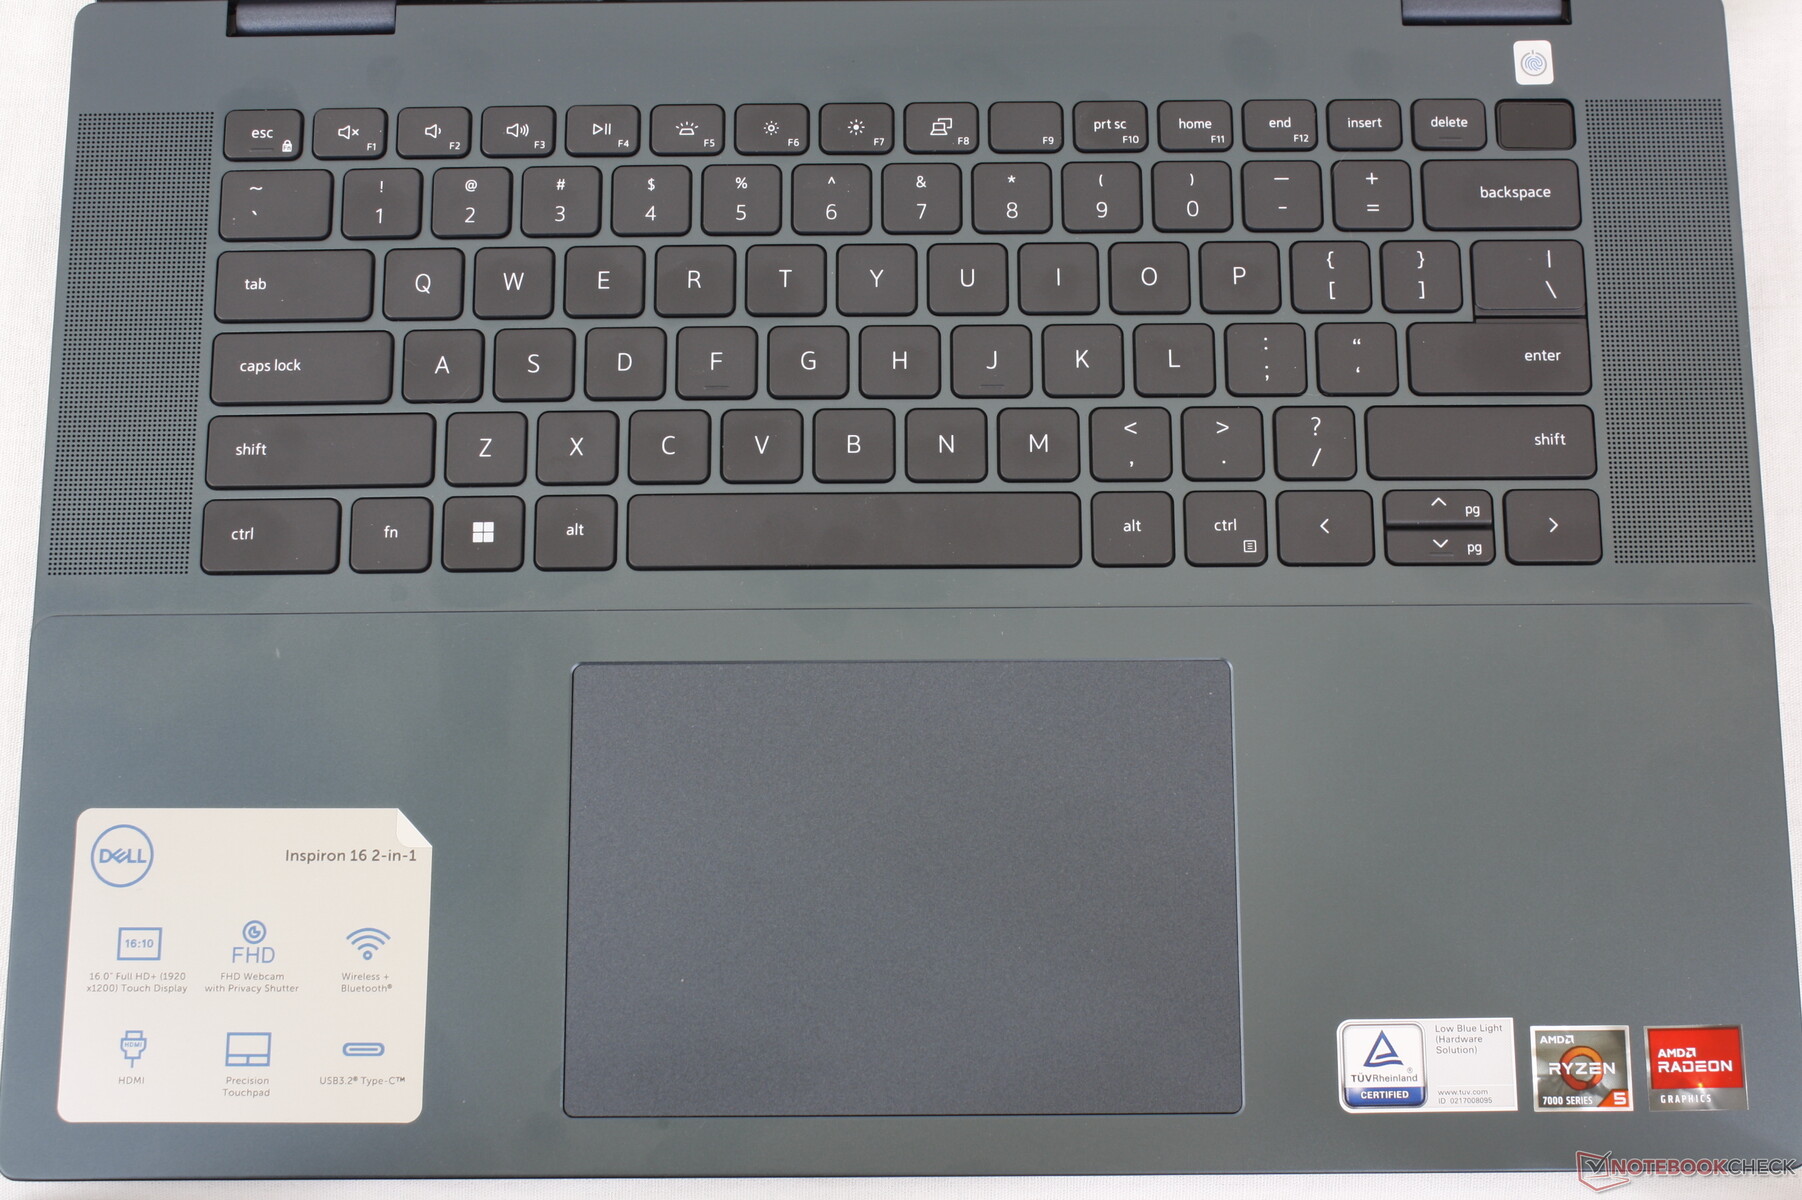
Keyboard
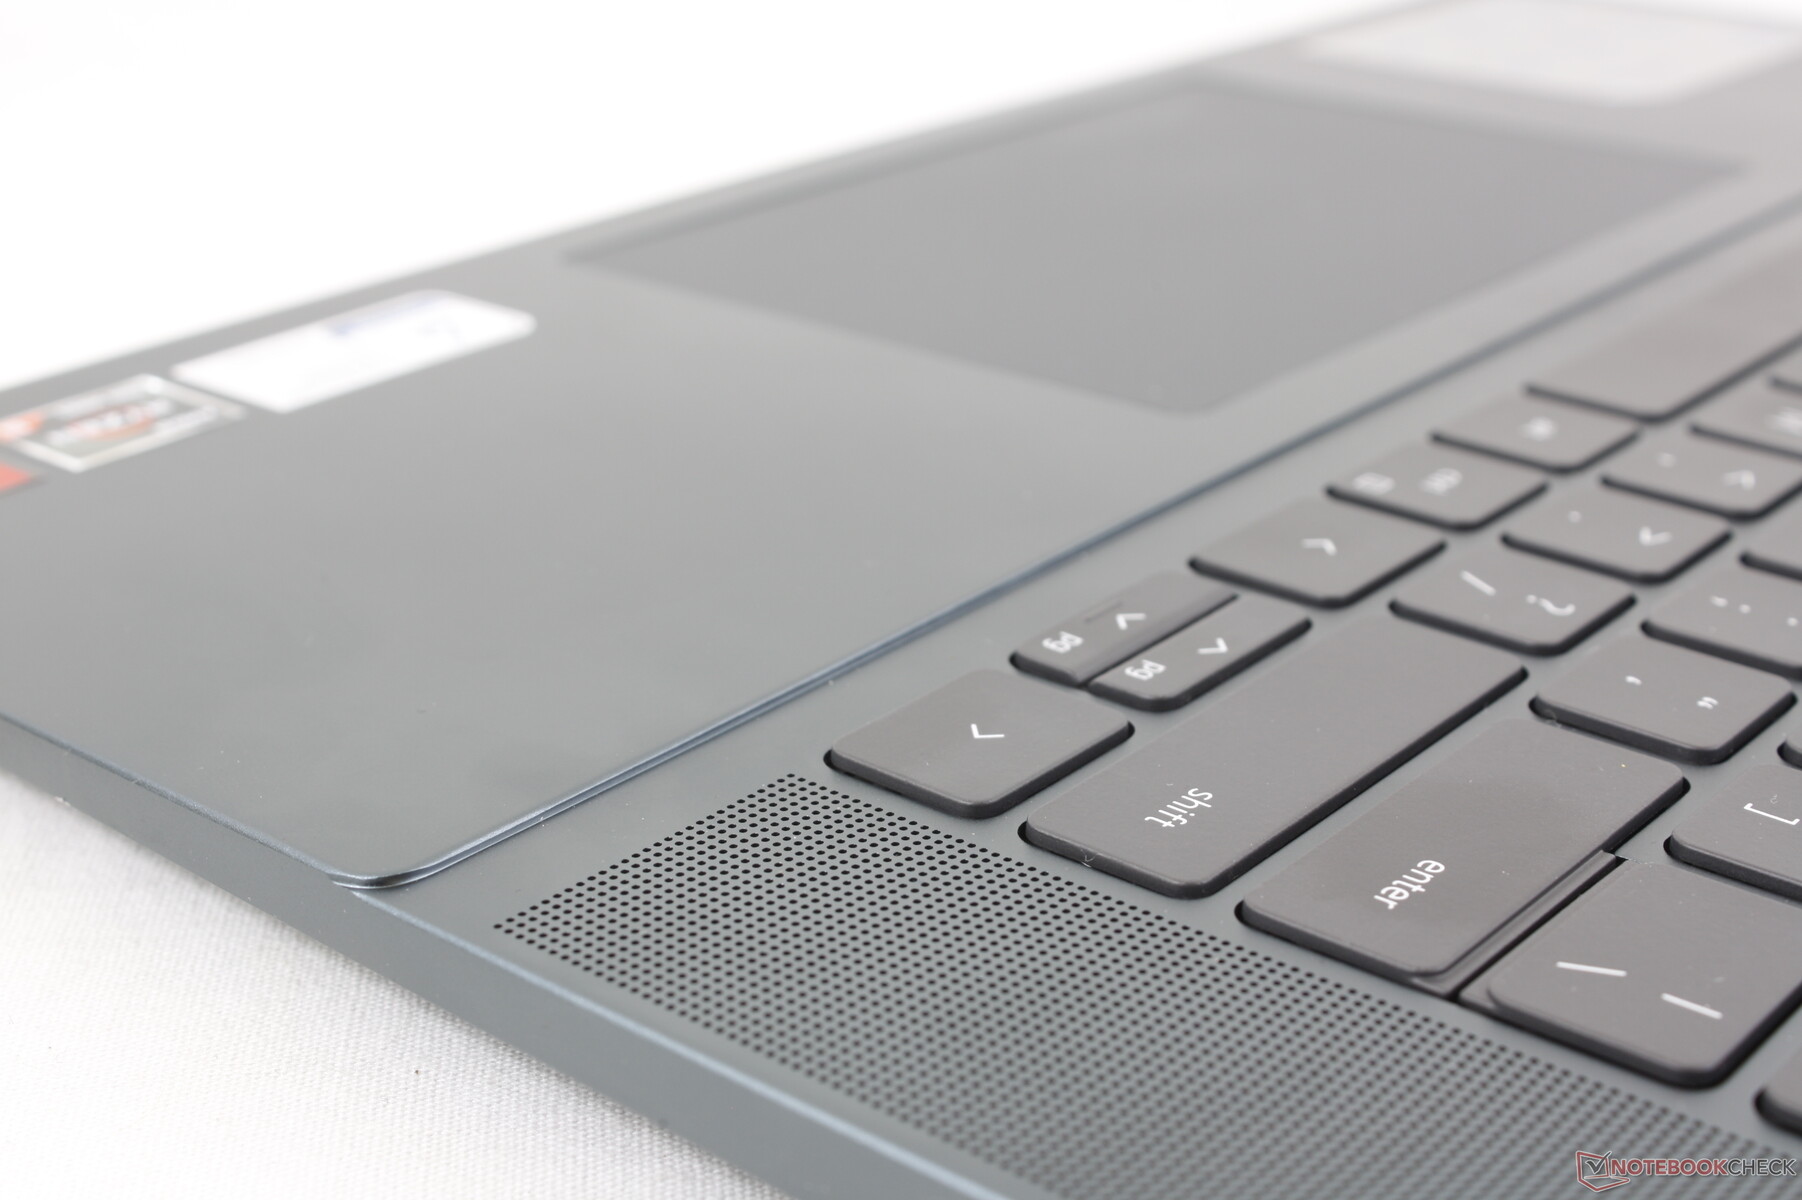
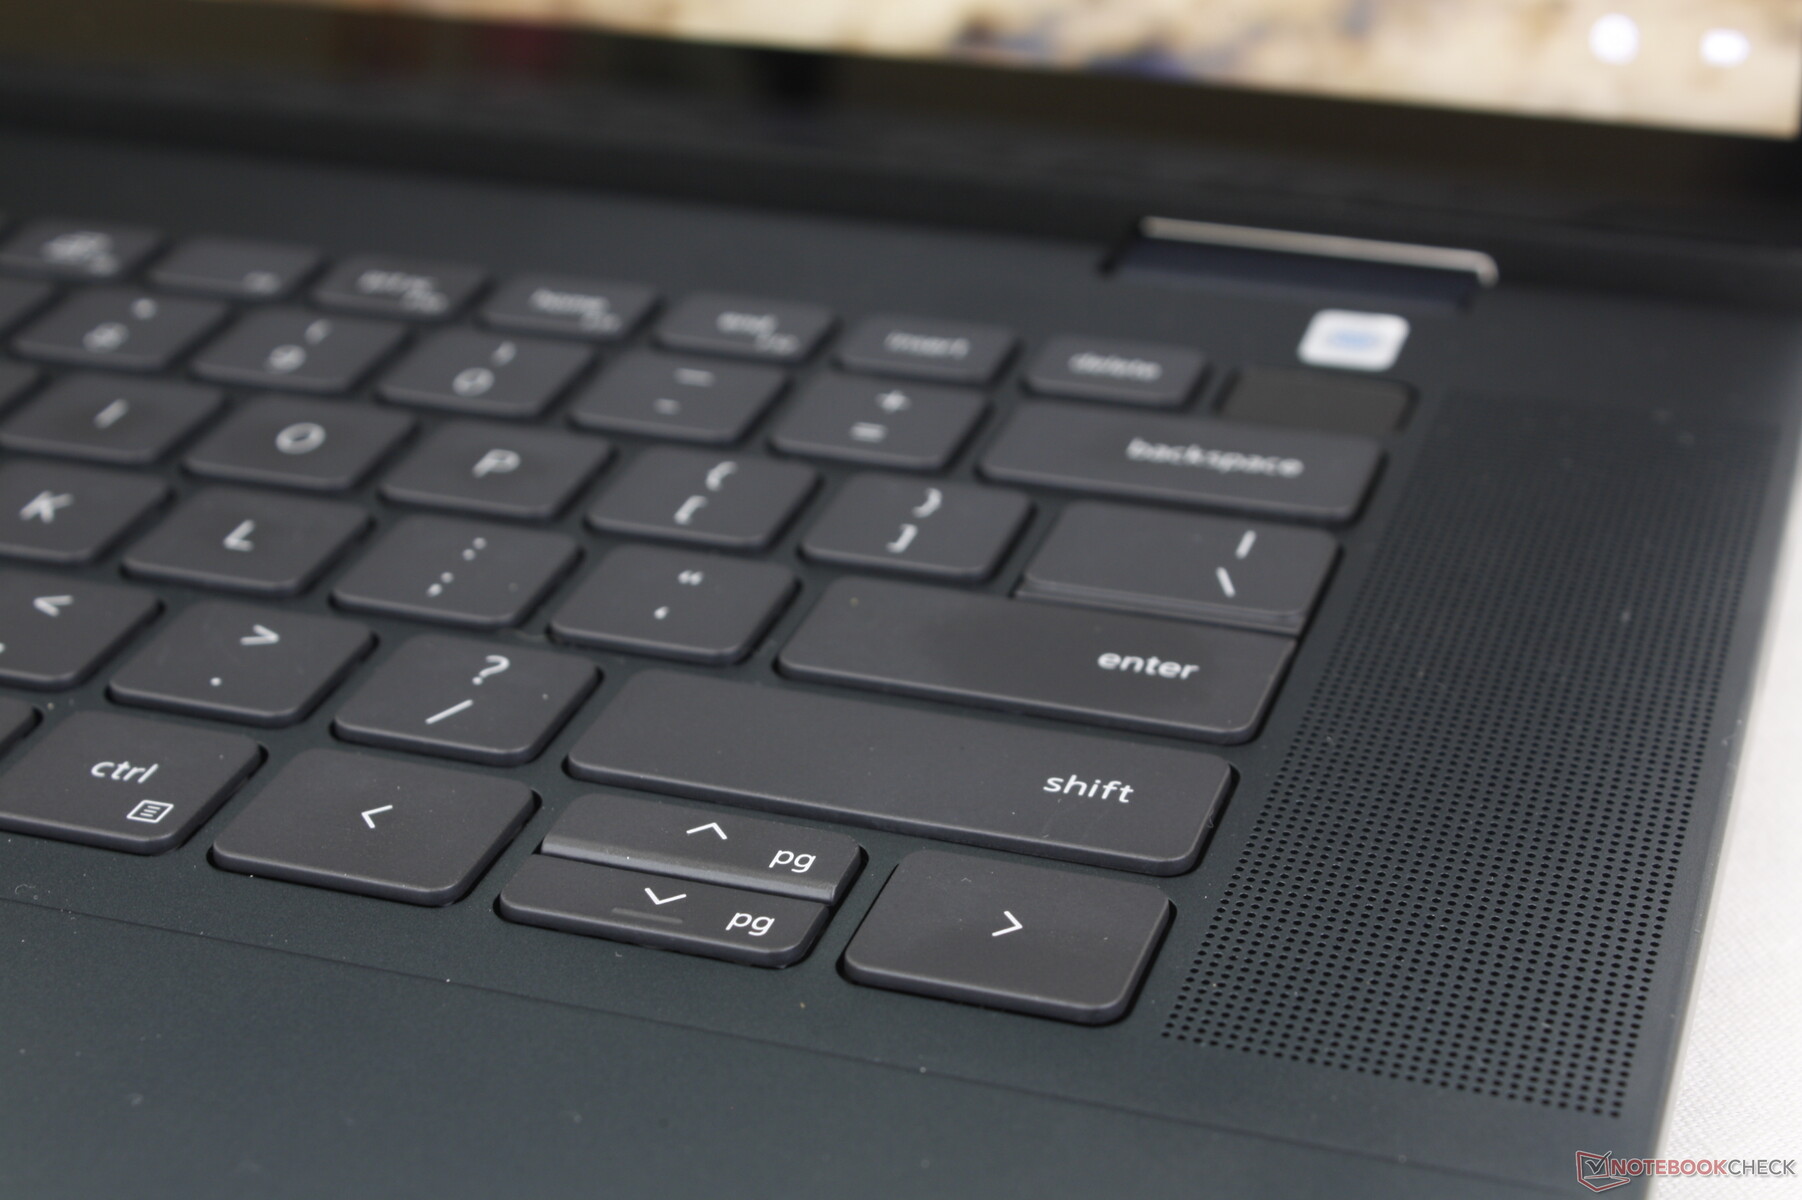
The typing experience is fairly consistent across Inspiron laptops and so the QWERTY keys remain relatively soft and with shallow travel. Even the 14-inch Inspiron 14 uses the same keyboard as on our larger 16-inch Inspiron 16; the only difference is that the Inspiron 16 integrates additional up-firing speakers along the sides of the keyboard. The added speakers in lieu of a numpad ride home the fact that the Inspiron 16 7635 2-in-1 is primarily a multimedia PC.
Touchpad
The size of the clickpad (13.3 x 9 cm) is unchanged from last year's model even though the visual design of the clickpad has reverted back to a more traditional appearance. Unfortunately, feedback when clicking on the surface hasn't improved and so it remains soft and shallow when compared to the firmer clickpad on the HP Spectre clickpad.

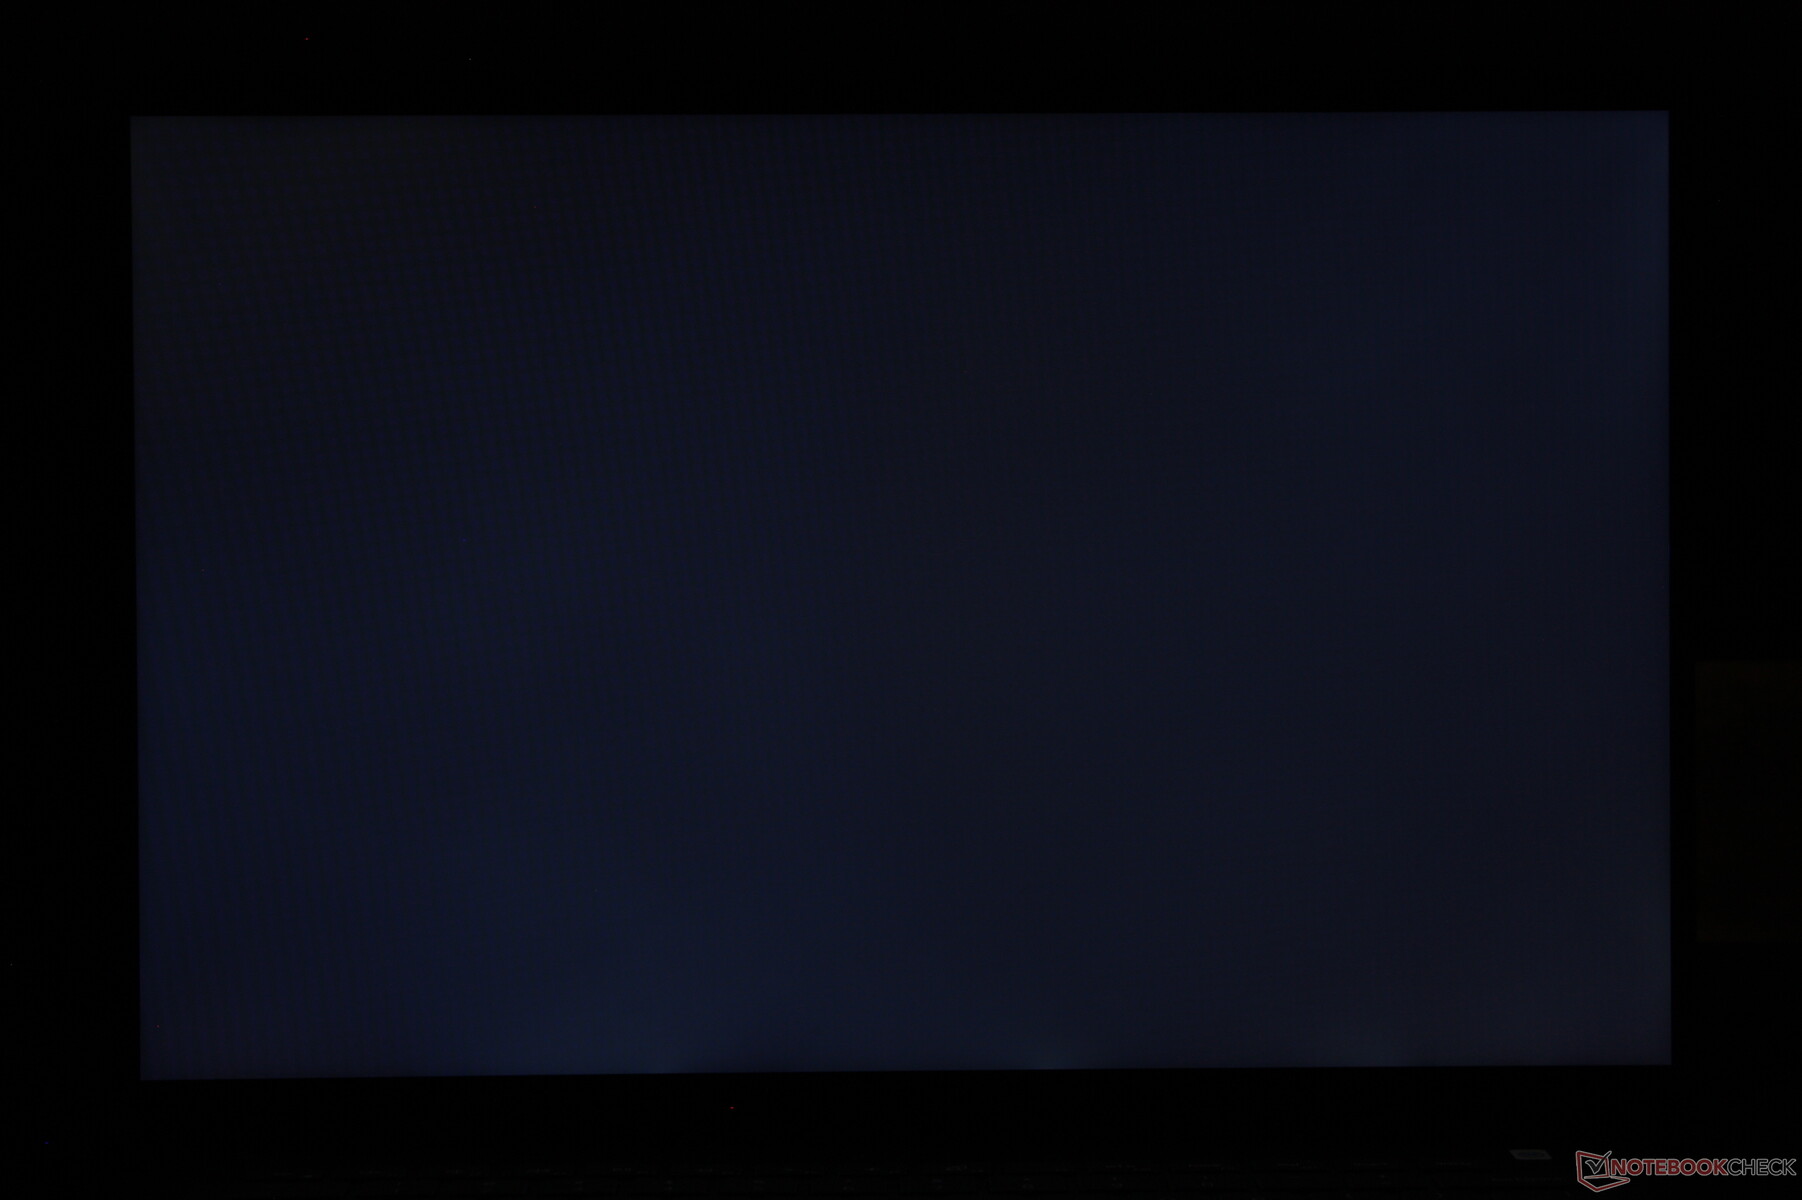
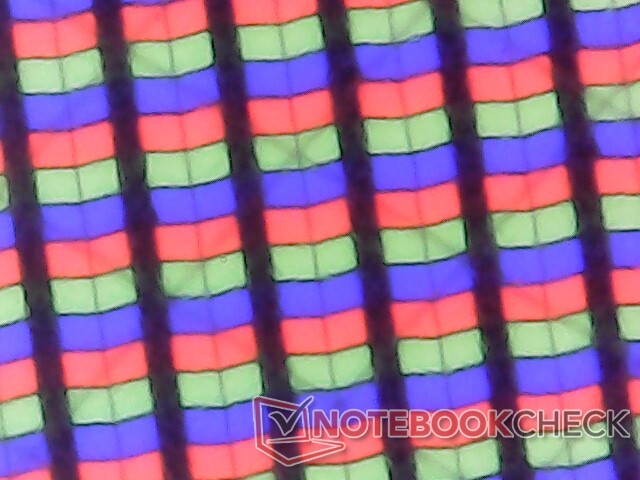
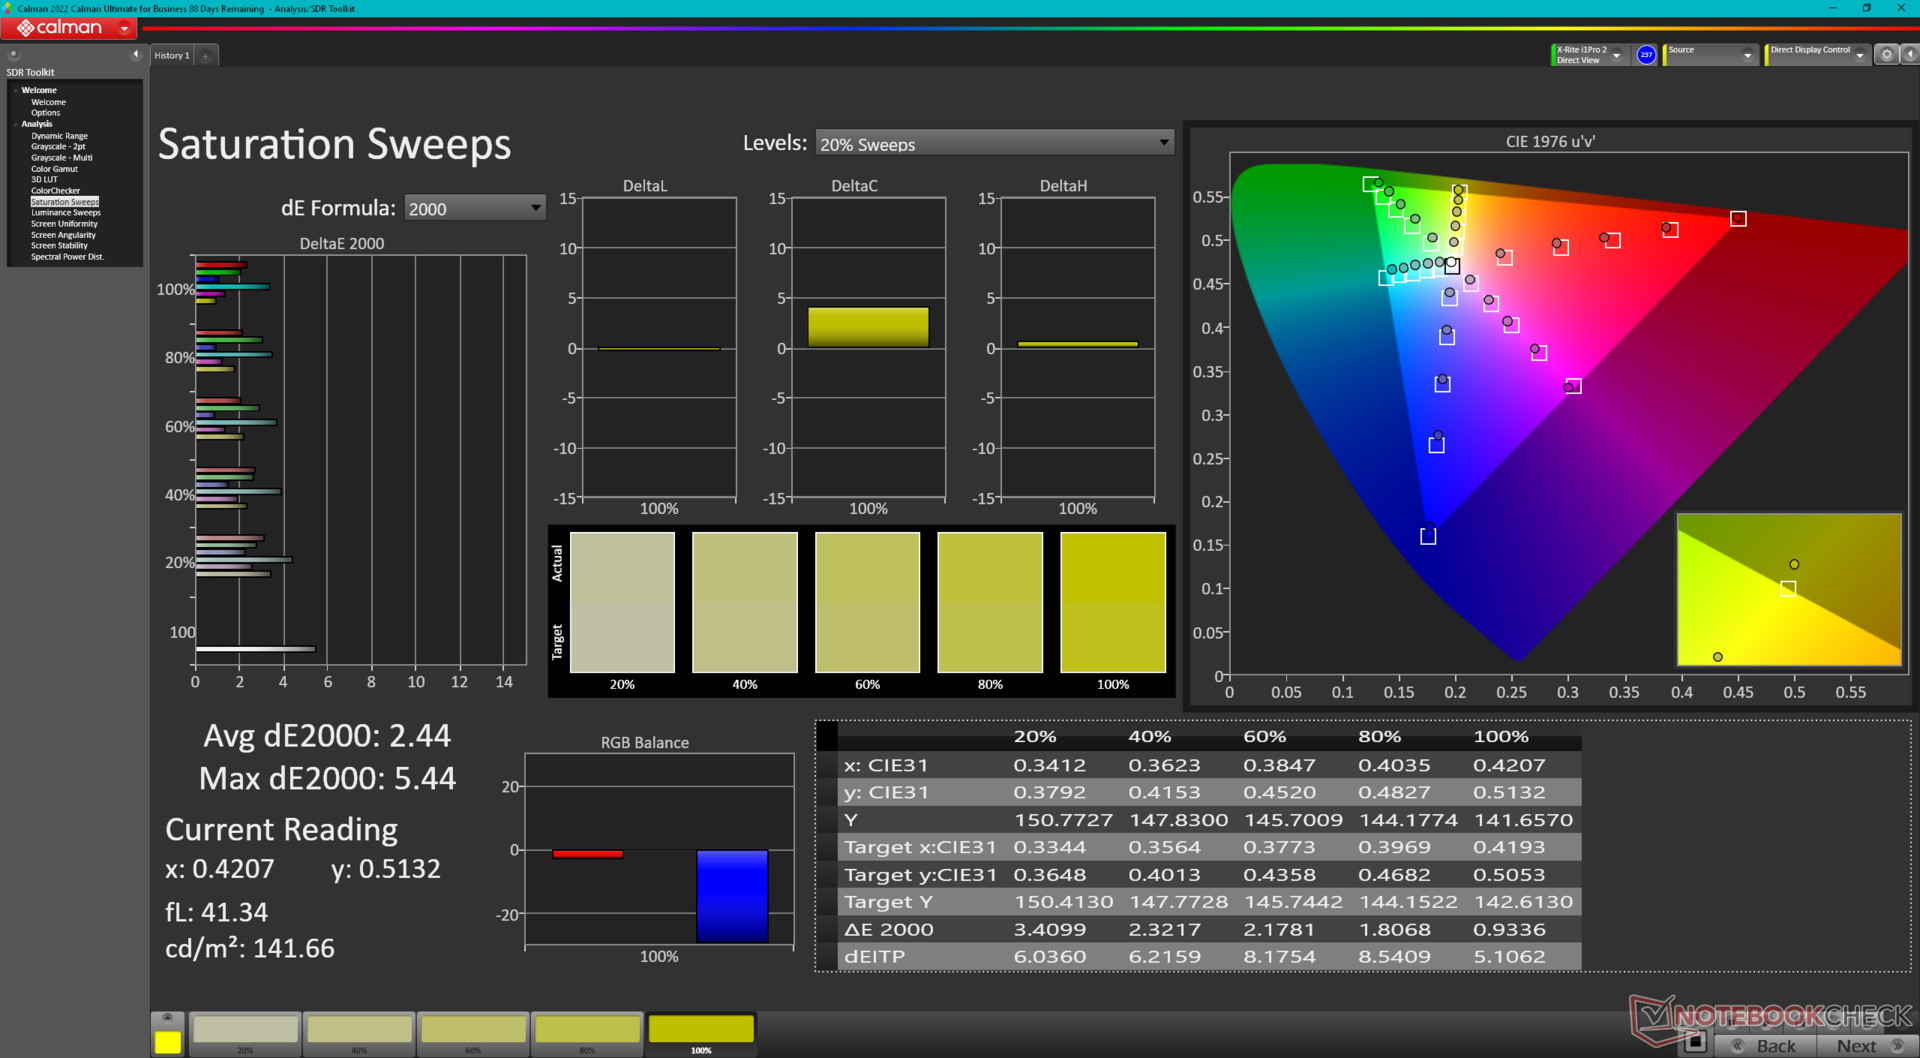
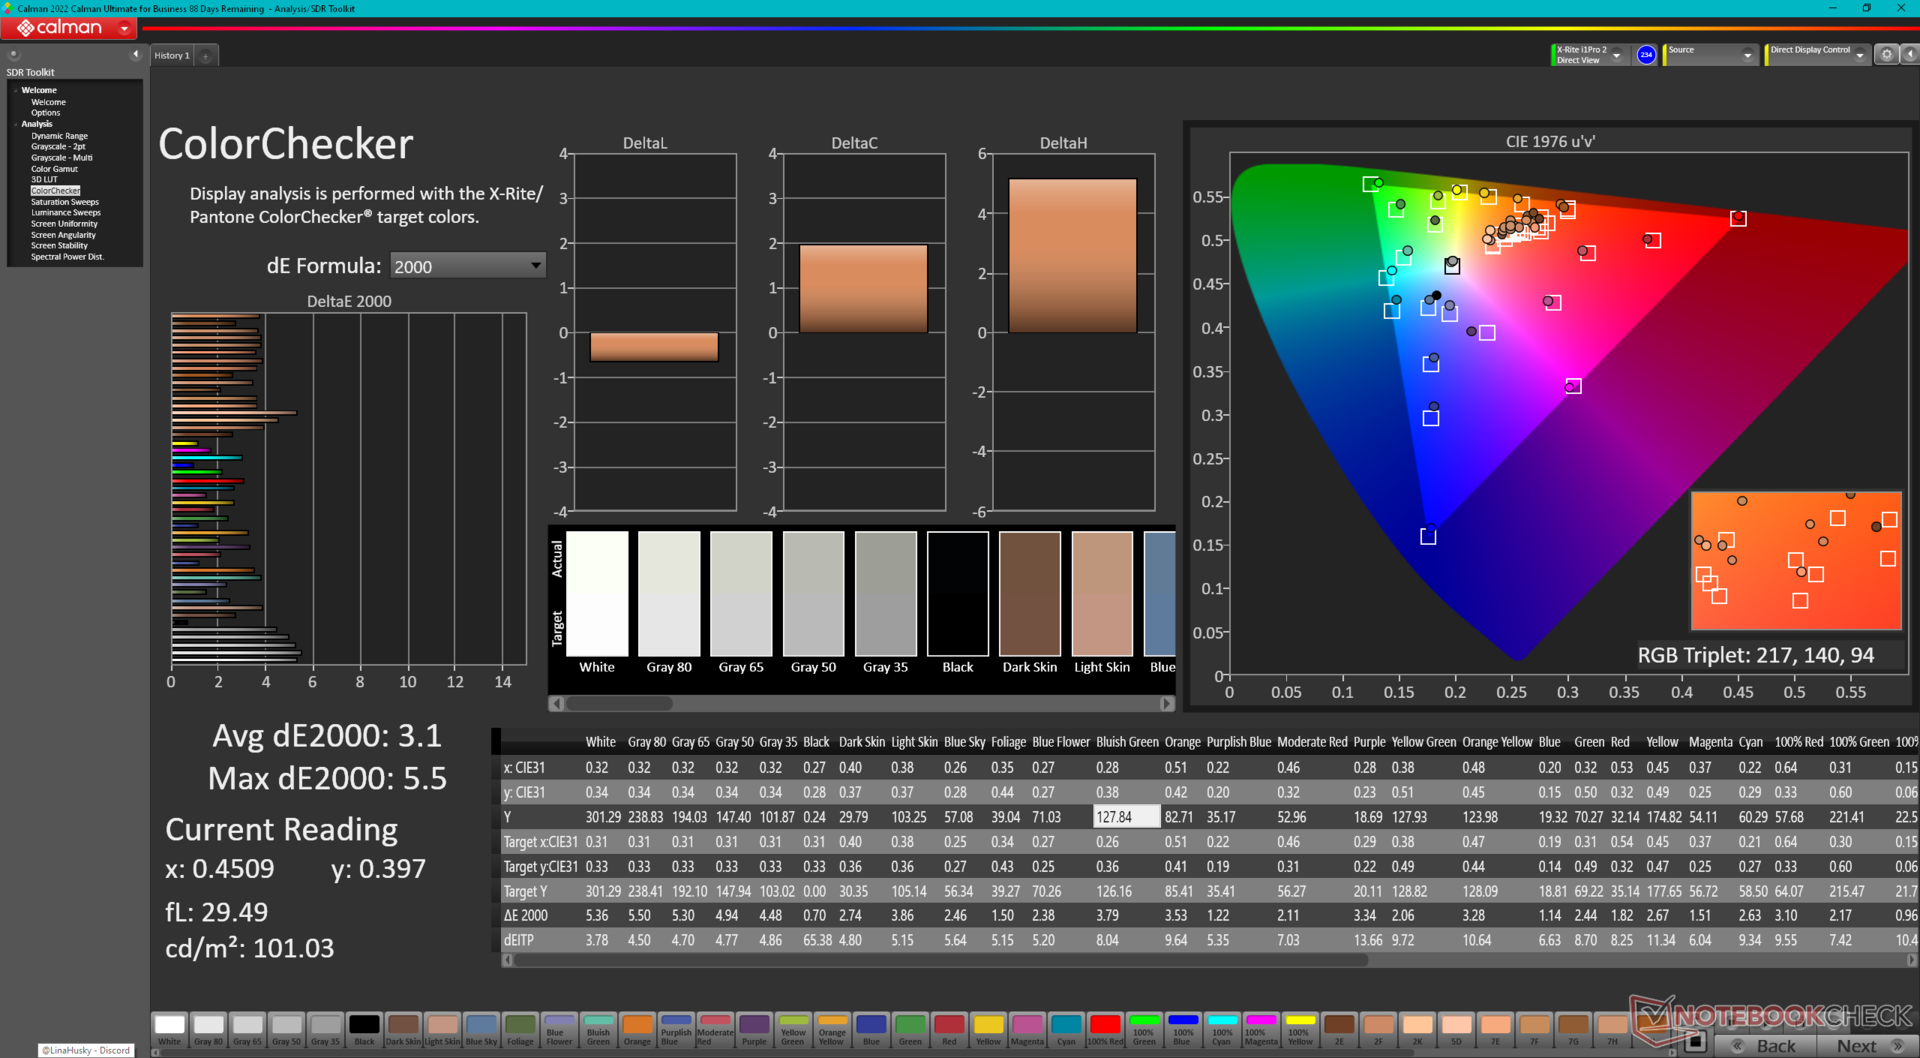
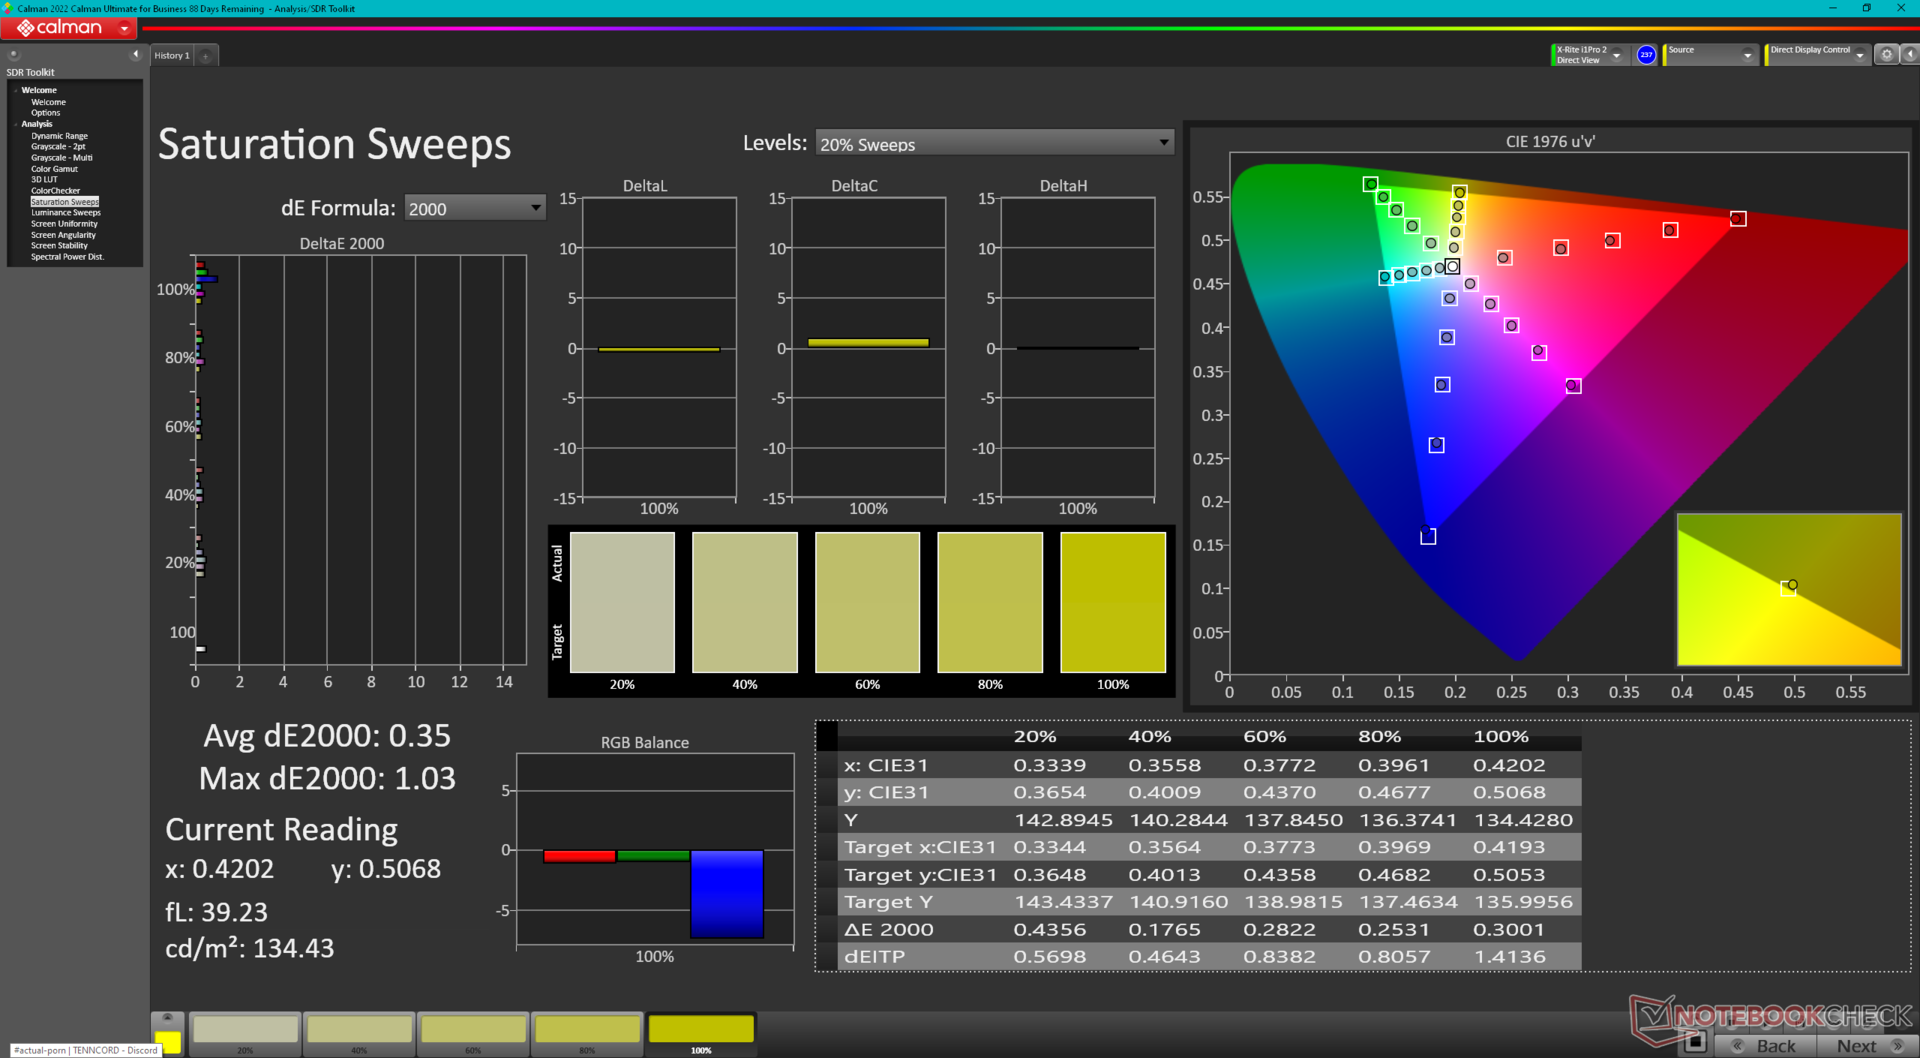
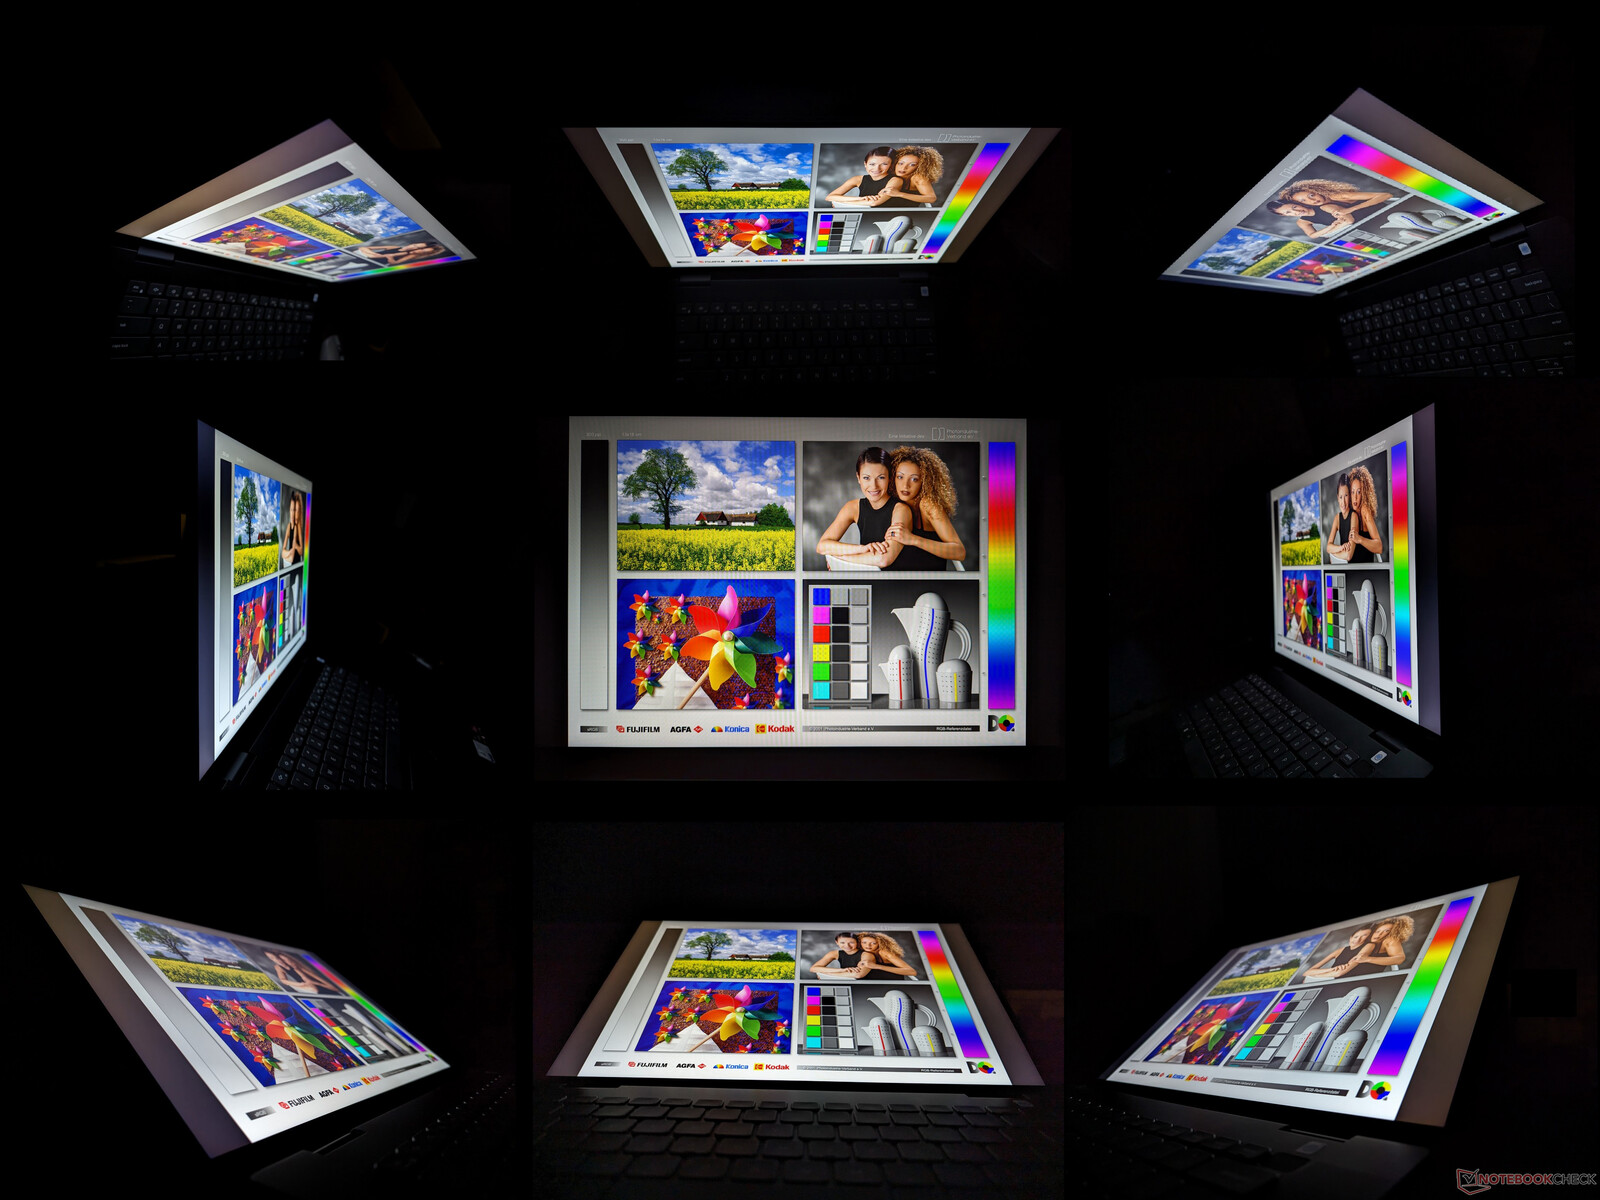
Display — Full sRGB Colors
The model is the first in our database to ship with the Chi Mei 160JCA IPS panel whereas the panel on last year's model was the BOE NV16N45. Core attributes are otherwise nearly identical between the two panels including their ~1000:1 contrast ratios, full sRGB coverage, 60 Hz refresh rate, and average response times. The visual experience is therefore essentially the same between the 2022 and 2023 models unless if configured with the 2400p OLED option on the Intel-based Inspiron 16 7630 2-in-1.
While our Chi Mei panel is of higher quality than the LEN160WUXGA on the IdeaPad Flex 5 16 in terms of colors, it would have been nice to see Dell go the extra mile this year by including faster 90 Hz or 120 Hz refresh rate options for a smoother UI.
| |||||||||||||||||||||||||
Brightness Distribution: 79 %
Center on Battery: 301.3 cd/m²
Contrast: 1076:1 (Black: 0.28 cd/m²)
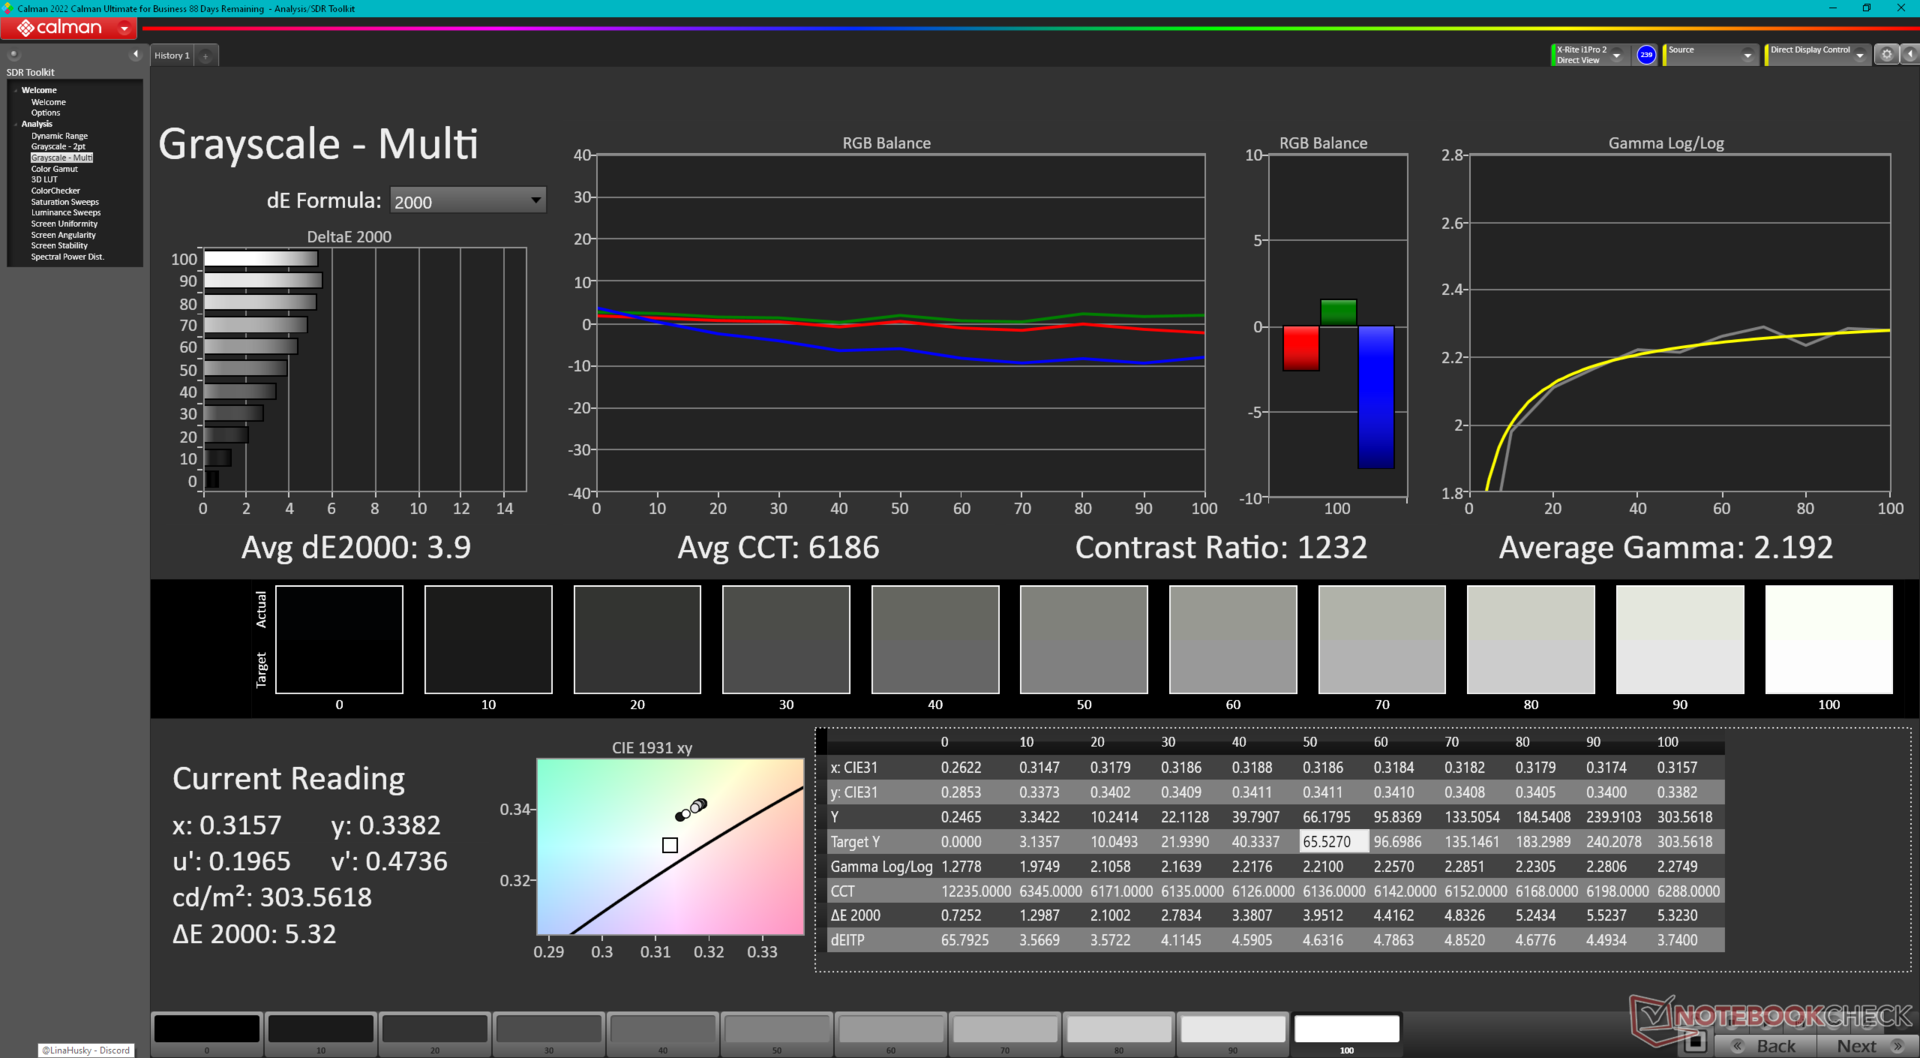
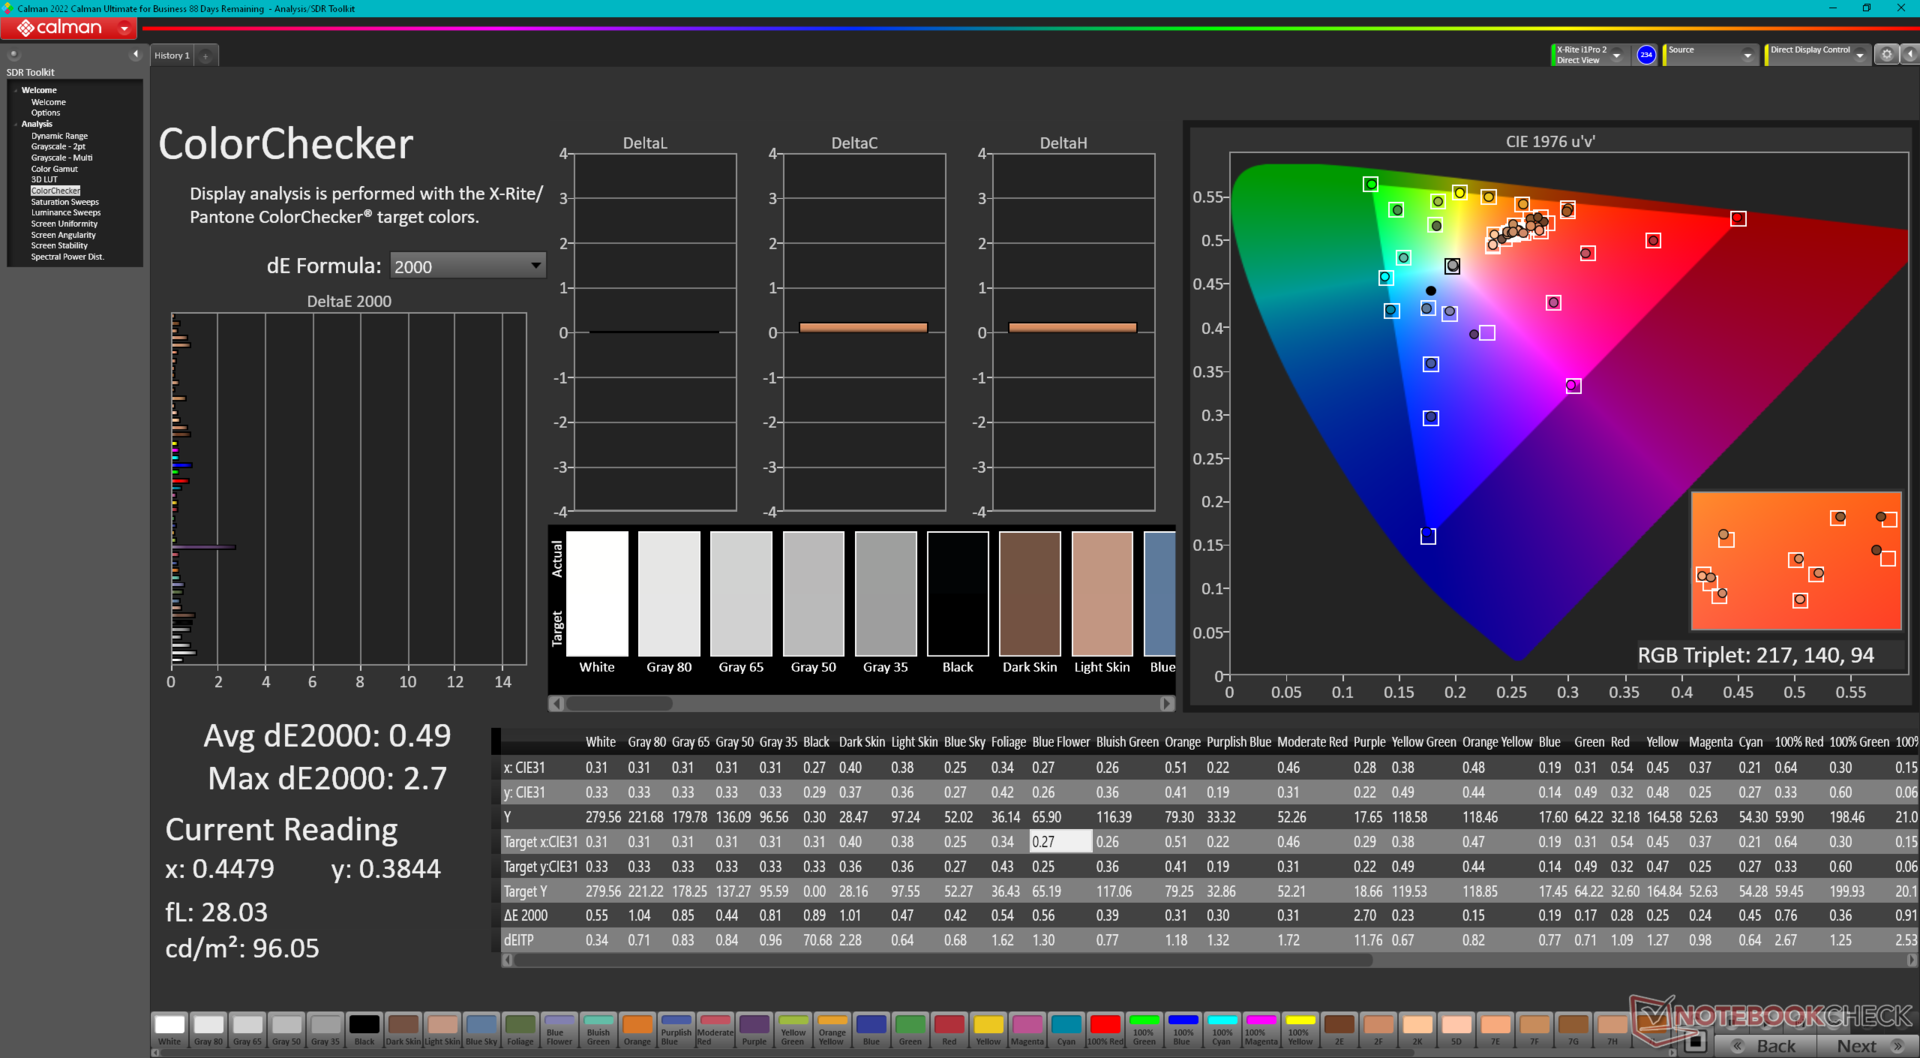
ΔE ColorChecker Calman: 3.1 | ∀{0.5-29.43 Ø4.71}
calibrated: 0.49
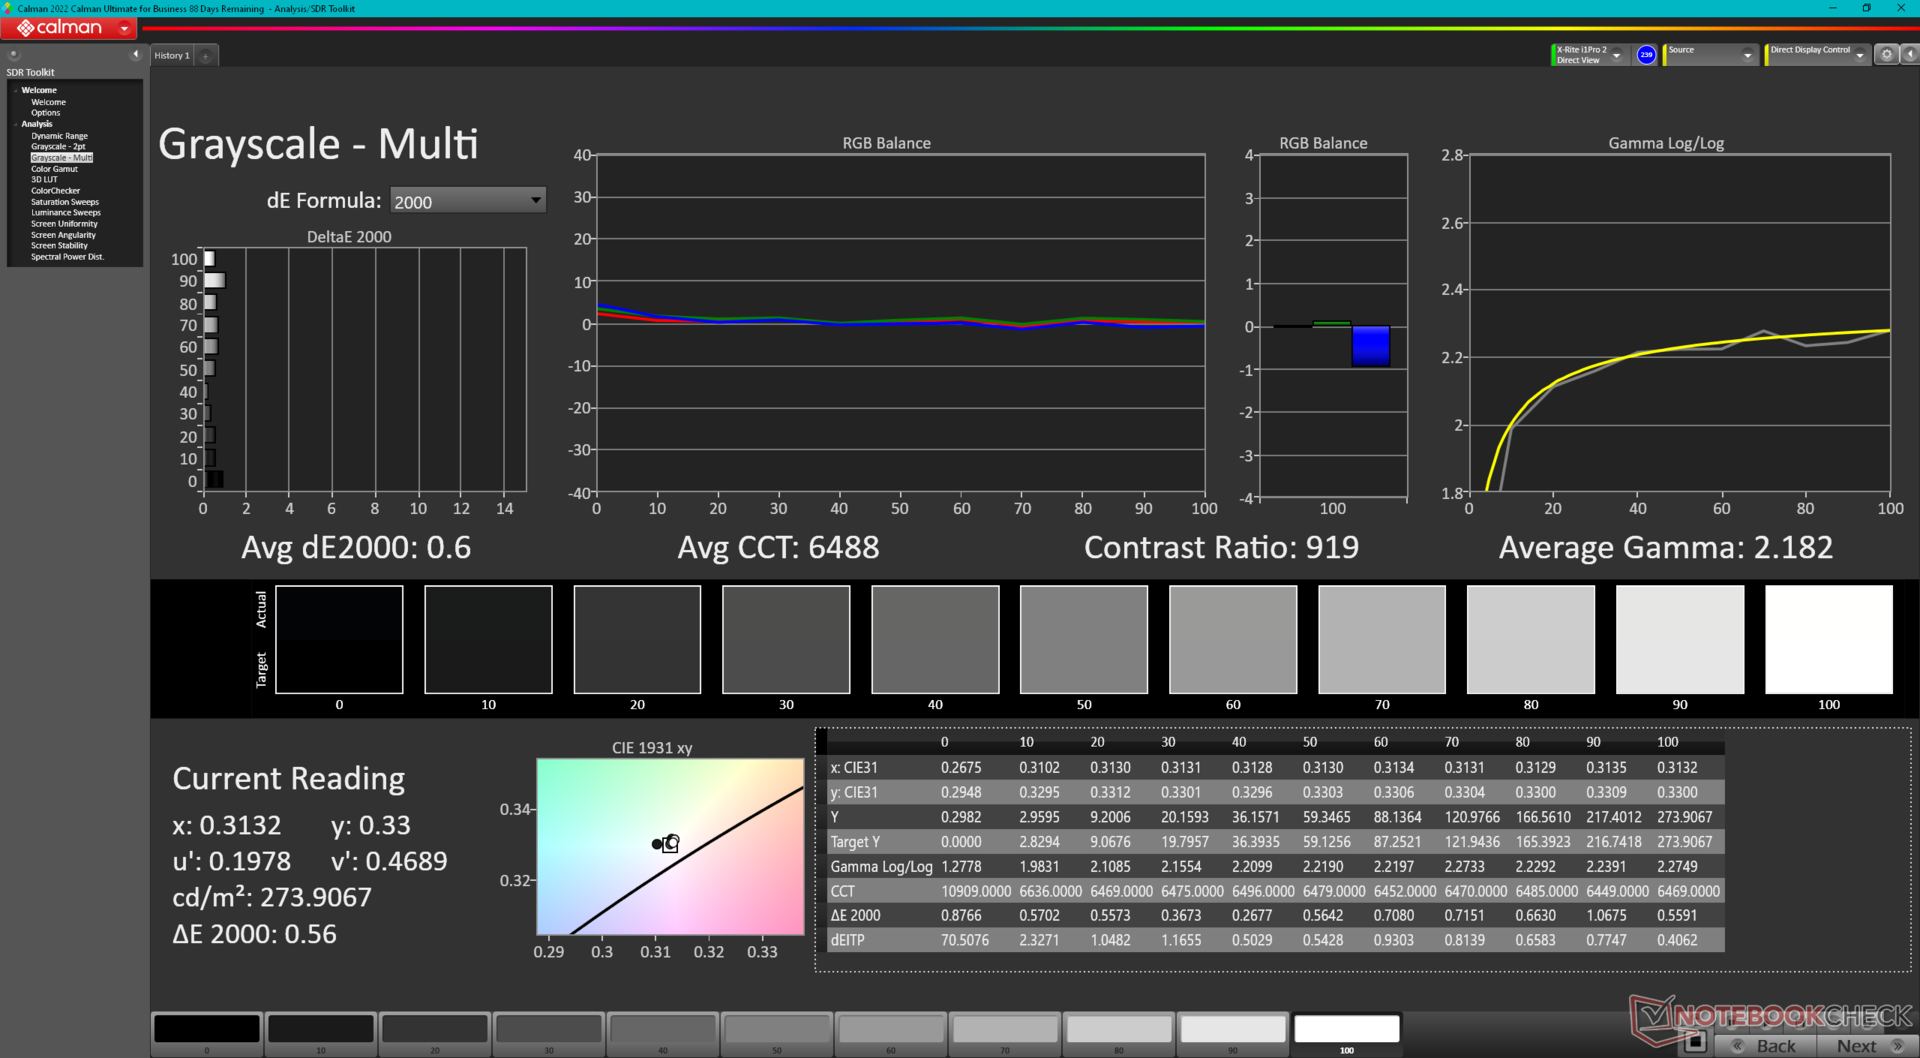
ΔE Greyscale Calman: 3.9 | ∀{0.09-98 Ø4.96}
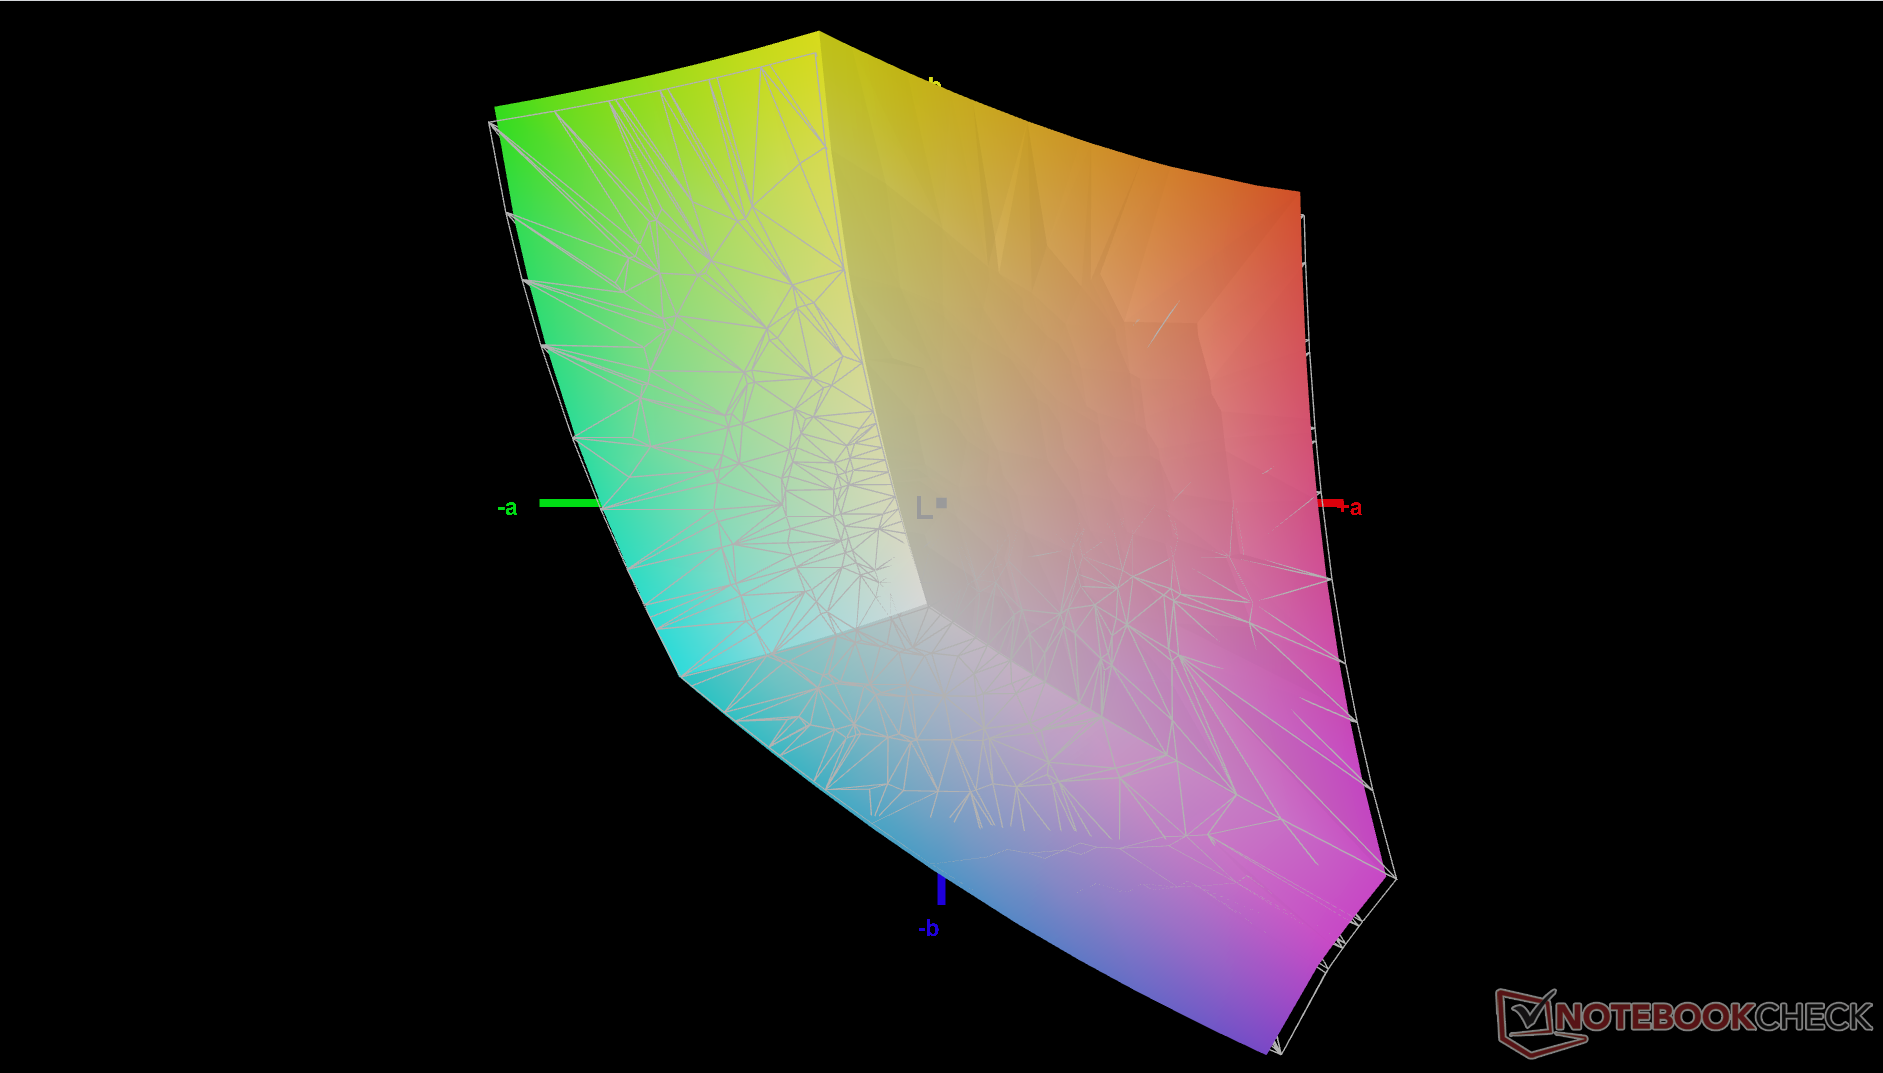
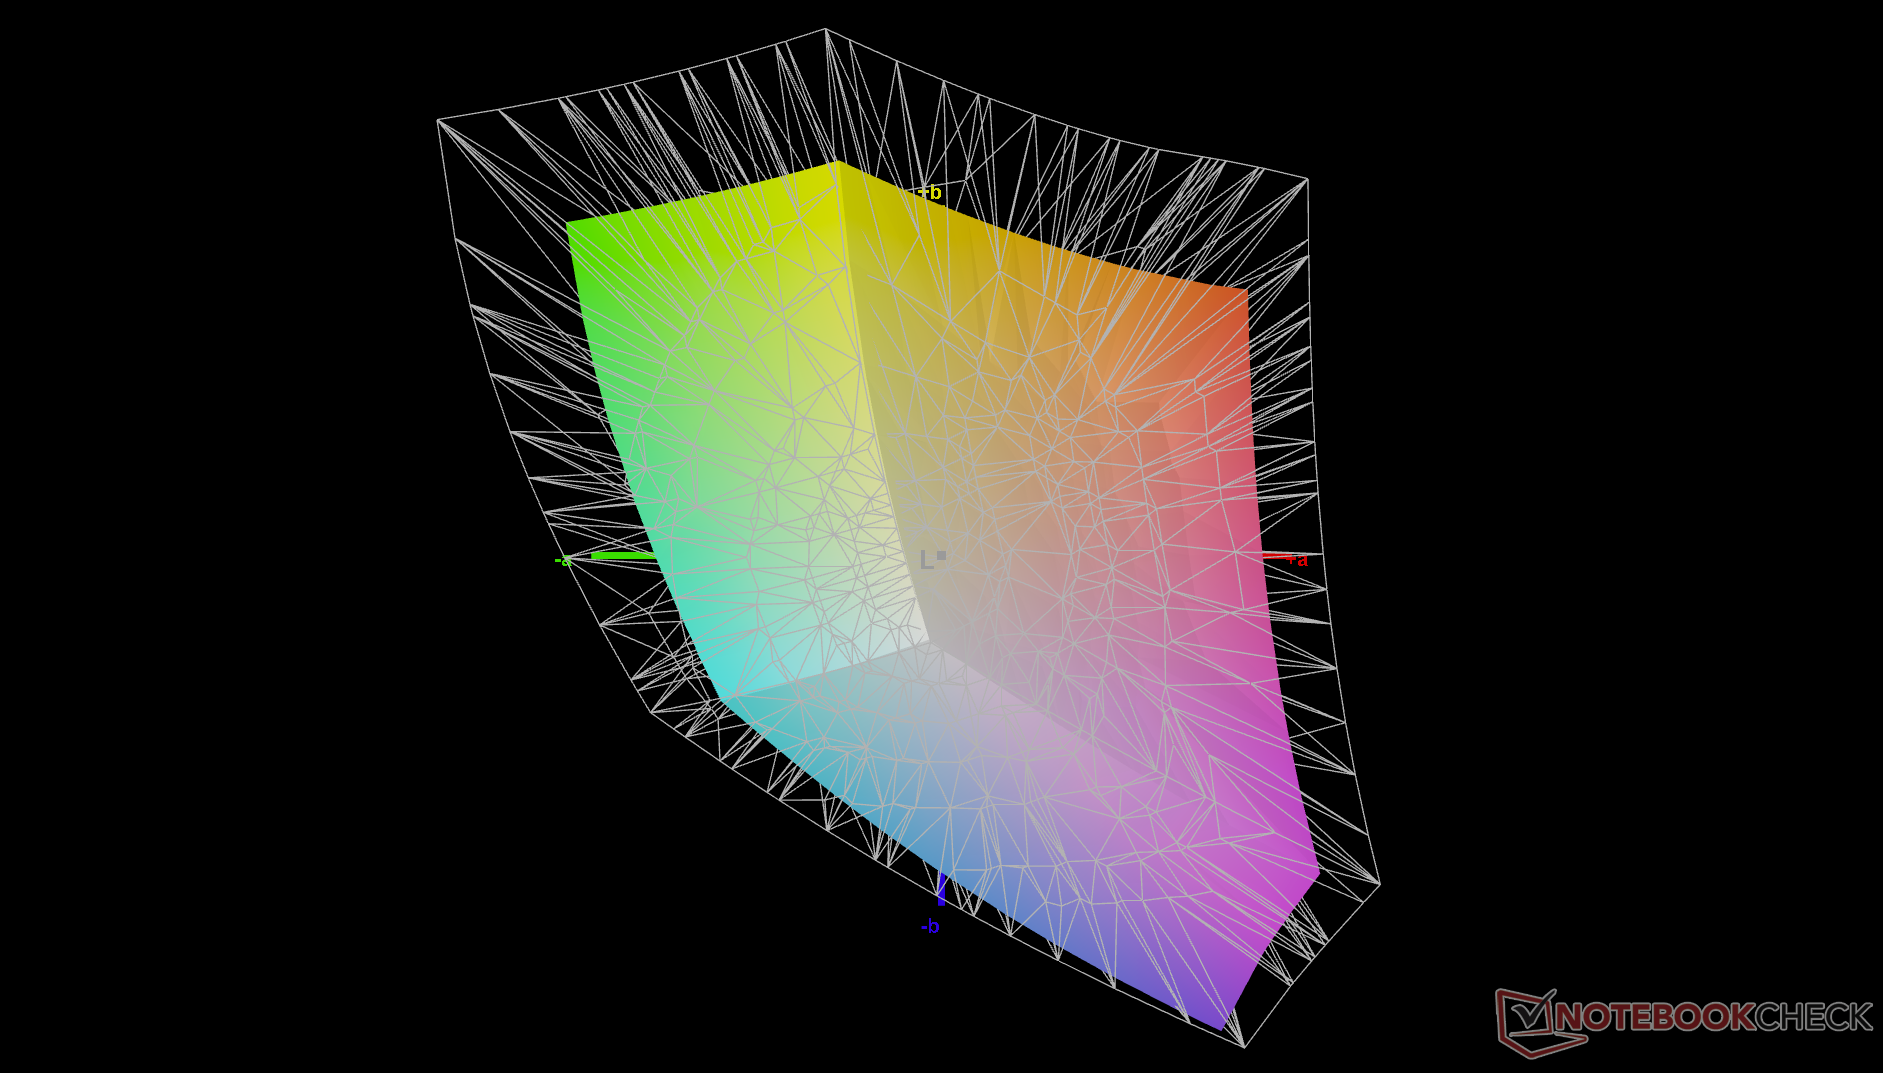
69.5% AdobeRGB 1998 (Argyll 3D)
98.2% sRGB (Argyll 3D)
67.4% Display P3 (Argyll 3D)
Gamma: 2.19
CCT: 6186 K
| Dell Inspiron 16 7635 2-in-1 Chi Mei 160JCA, IPS, 1920x1200, 16" | Acer Swift Edge SFE16-42-R1GM Samsung SDC4168, OLED, 3840x2400, 16" | Lenovo Yoga 7 16IRL8 LEN160FHD, IPS, 1920x1200, 16" | Samsung Galaxy Book3 Pro 16 Samsung ATNA60CL03-0, AMOLED, 2880x1800, 16" | Lenovo IdeaPad Flex 5 16ABR G8 LEN160WUXGA, IPS, 1920x1200, 16" | Dell Inspiron 16 7620 2-in-1 BOE NV16N45, IPS, 1920x1200, 16" | |
|---|---|---|---|---|---|---|
| Display | 30% | -37% | 30% | -41% | -1% | |
| Display P3 Coverage (%) | 67.4 | 99.7 48% | 42 -38% | 99.7 48% | 40 -41% | 67 -1% |
| sRGB Coverage (%) | 98.2 | 100 2% | 62.8 -36% | 100 2% | 57.6 -41% | 95.9 -2% |
| AdobeRGB 1998 Coverage (%) | 69.5 | 97.2 40% | 43.5 -37% | 97 40% | 41.3 -41% | 69.3 0% |
| Response Times | 89% | -15% | 91% | -16% | -15% | |
| Response Time Grey 50% / Grey 80% * (ms) | 27.6 ? | 2 ? 93% | 31.8 ? -15% | 2 ? 93% | 33 ? -20% | 32 ? -16% |
| Response Time Black / White * (ms) | 18.2 ? | 3 ? 84% | 20.9 ? -15% | 2 ? 89% | 20.2 ? -11% | 20.8 ? -14% |
| PWM Frequency (Hz) | 239 ? | |||||
| Screen | -43% | -63% | 250% | -149% | -24% | |
| Brightness middle (cd/m²) | 301.3 | 369 22% | 279.4 -7% | 412 37% | 392 30% | 320.7 6% |
| Brightness (cd/m²) | 269 | 371 38% | 257 -4% | 412 53% | 371 38% | 309 15% |
| Brightness Distribution (%) | 79 | 97 23% | 81 3% | 98 24% | 89 13% | 90 14% |
| Black Level * (cd/m²) | 0.28 | 0.18 36% | 0.015 95% | 0.25 11% | 0.36 -29% | |
| Contrast (:1) | 1076 | 1552 44% | 27467 2453% | 1568 46% | 891 -17% | |
| Colorchecker dE 2000 * | 3.1 | 2.3 26% | 5.12 -65% | 2.34 25% | 7.3 -135% | 4.18 -35% |
| Colorchecker dE 2000 max. * | 5.5 | 4.37 21% | 19.42 -253% | 3.34 39% | 20.8 -278% | 8.48 -54% |
| Colorchecker dE 2000 calibrated * | 0.49 | 2.87 -486% | 1.84 -276% | 2.95 -502% | 5.4 -1002% | 0.77 -57% |
| Greyscale dE 2000 * | 3.9 | 1.83 53% | 5.5 -41% | 2.78 29% | 6.5 -67% | 6.3 -62% |
| Gamma | 2.19 100% | 2.39 92% | 2.22 99% | 2.5 88% | 2.29 96% | 2.21 100% |
| CCT | 6186 105% | 6392 102% | 6407 101% | 6879 94% | 5993 108% | 6258 104% |
| Total Average (Program / Settings) | 25% /
-3% | -38% /
-50% | 124% /
180% | -69% /
-107% | -13% /
-18% |
* ... smaller is better
The display does not come pre-calibrated which is to be expected from a budget machine. Nonetheless, average grayscale and color deltaE values aren't bad out-of-the-box at just 3.9 and 3.1, respectively. A proper calibration would improve the averages even further to just 0.6 and 0.49 and so we recommend applying our calibrated ICM profile above to better exploit the full sRGB colors of the panel.
Display Response Times
| ↔ Response Time Black to White | ||
|---|---|---|
| 18.2 ms ... rise ↗ and fall ↘ combined | ↗ 9.6 ms rise | 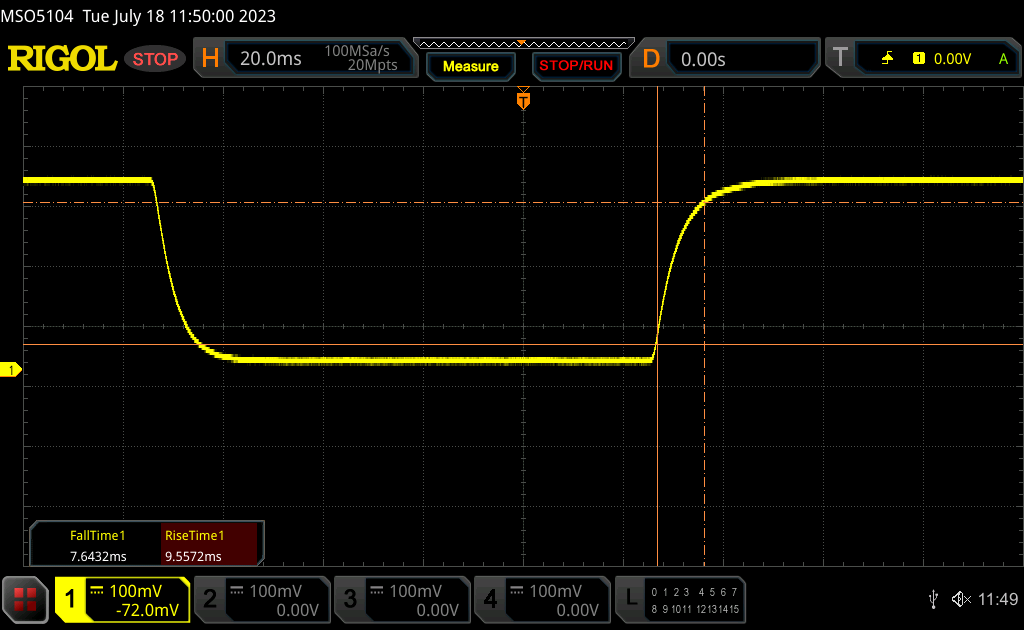 |
| ↘ 7.6 ms fall | ||
| The screen shows good response rates in our tests, but may be too slow for competitive gamers. In comparison, all tested devices range from 0.1 (minimum) to 240 (maximum) ms. » 41 % of all devices are better. This means that the measured response time is similar to the average of all tested devices (19.8 ms). | ||
| ↔ Response Time 50% Grey to 80% Grey | ||
| 27.6 ms ... rise ↗ and fall ↘ combined | ↗ 13.2 ms rise | 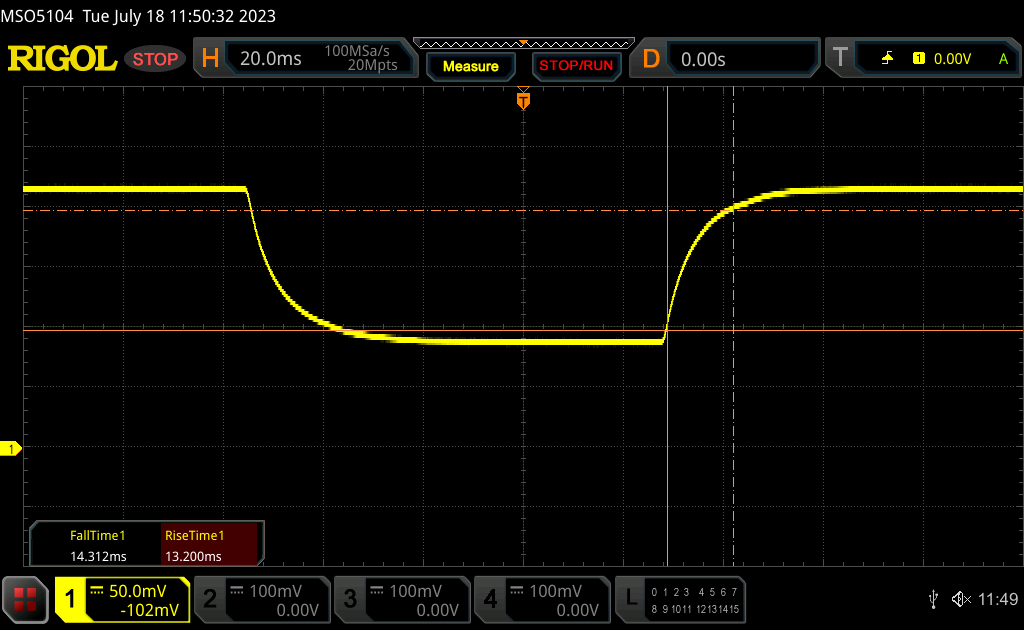 |
| ↘ 14.3 ms fall | ||
| The screen shows relatively slow response rates in our tests and may be too slow for gamers. In comparison, all tested devices range from 0.165 (minimum) to 636 (maximum) ms. » 38 % of all devices are better. This means that the measured response time is better than the average of all tested devices (30.9 ms). | ||
Screen Flickering / PWM (Pulse-Width Modulation)
| Screen flickering / PWM not detected | 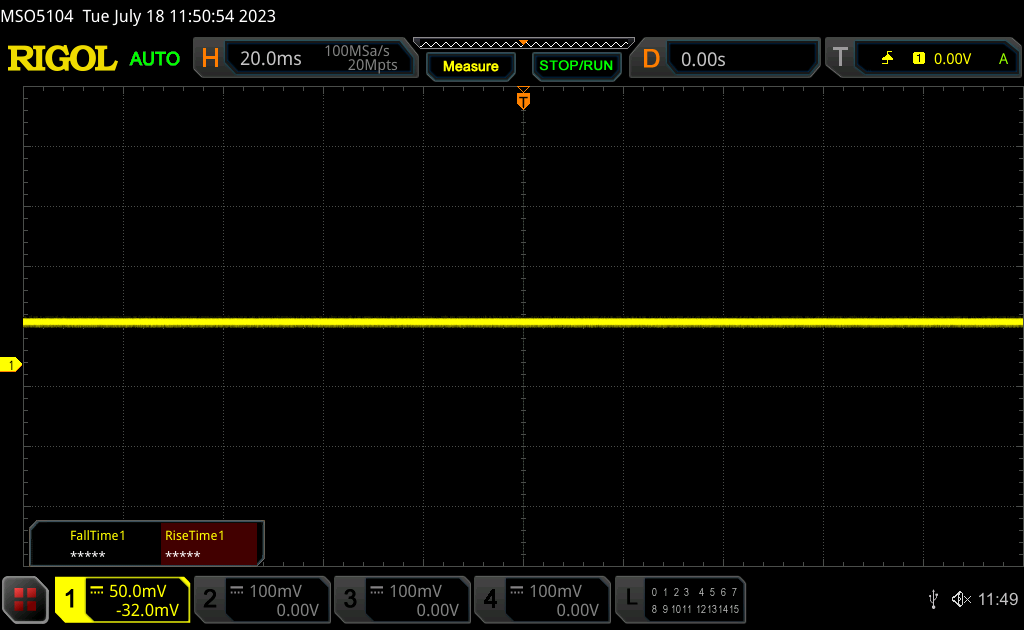 | ||
In comparison: 52 % of all tested devices do not use PWM to dim the display. If PWM was detected, an average of 7744 (minimum: 5 - maximum: 343500) Hz was measured. | |||
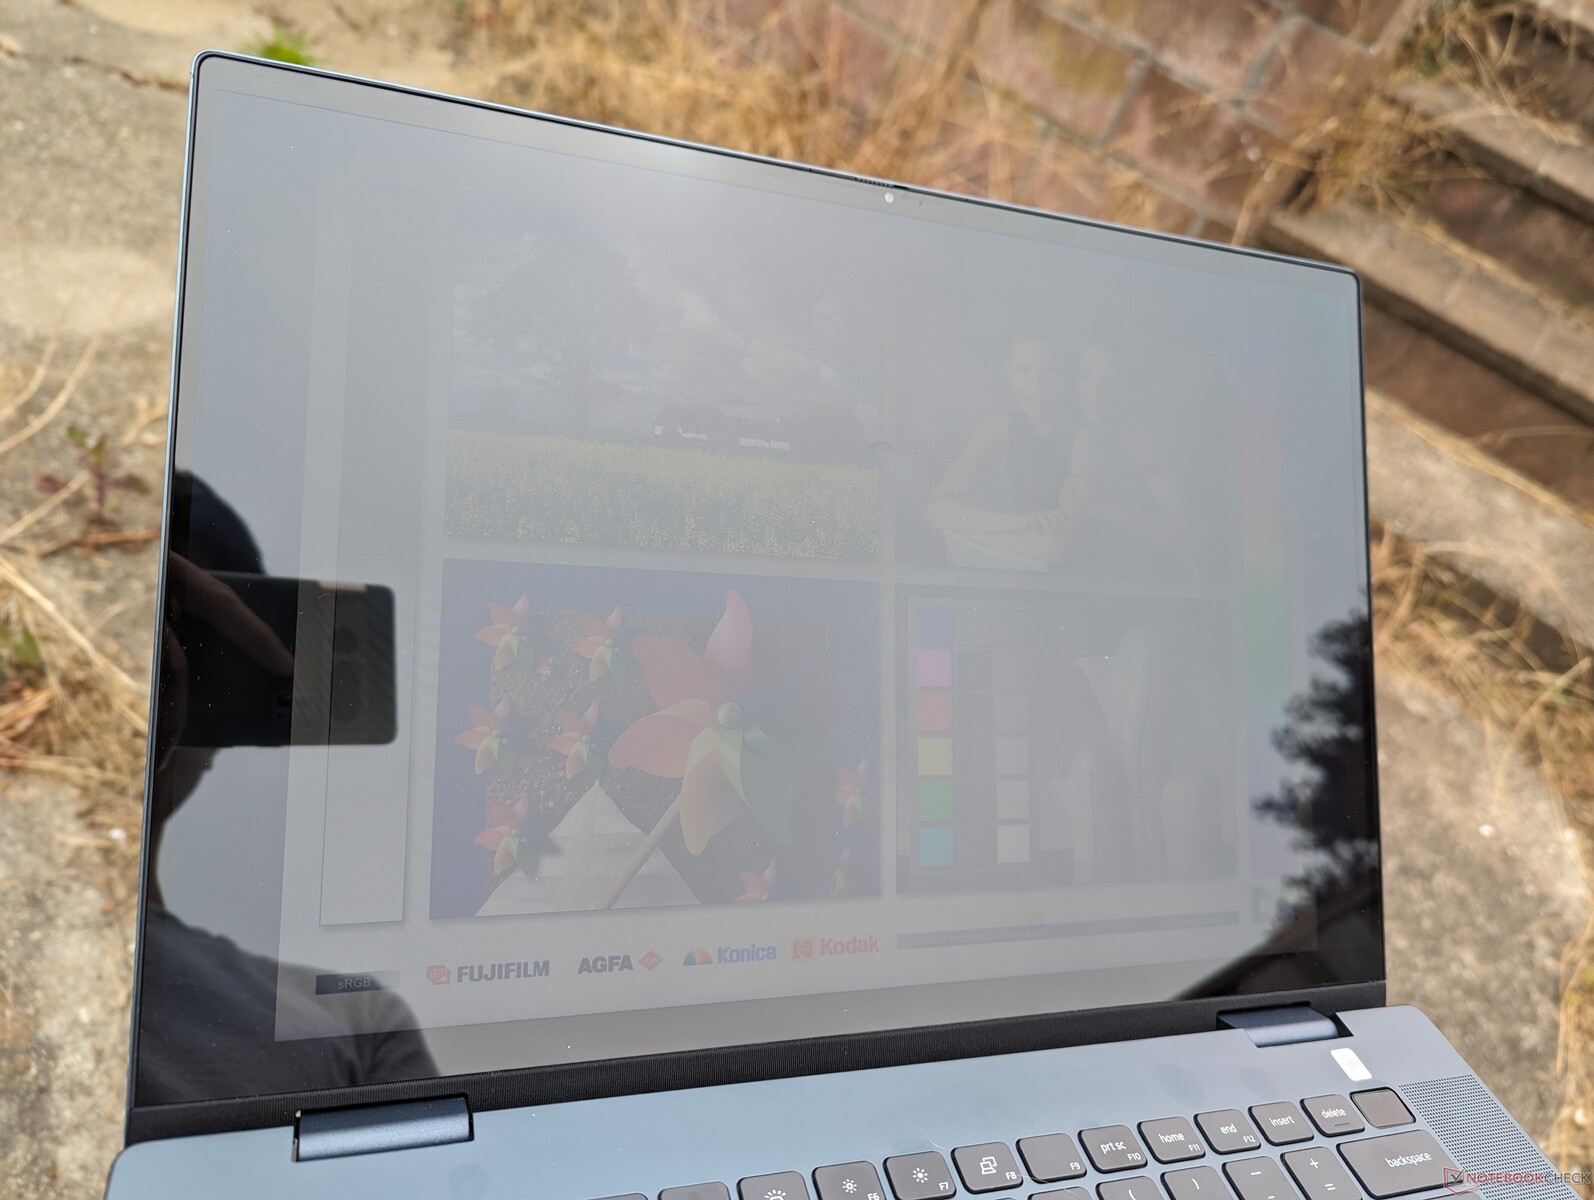
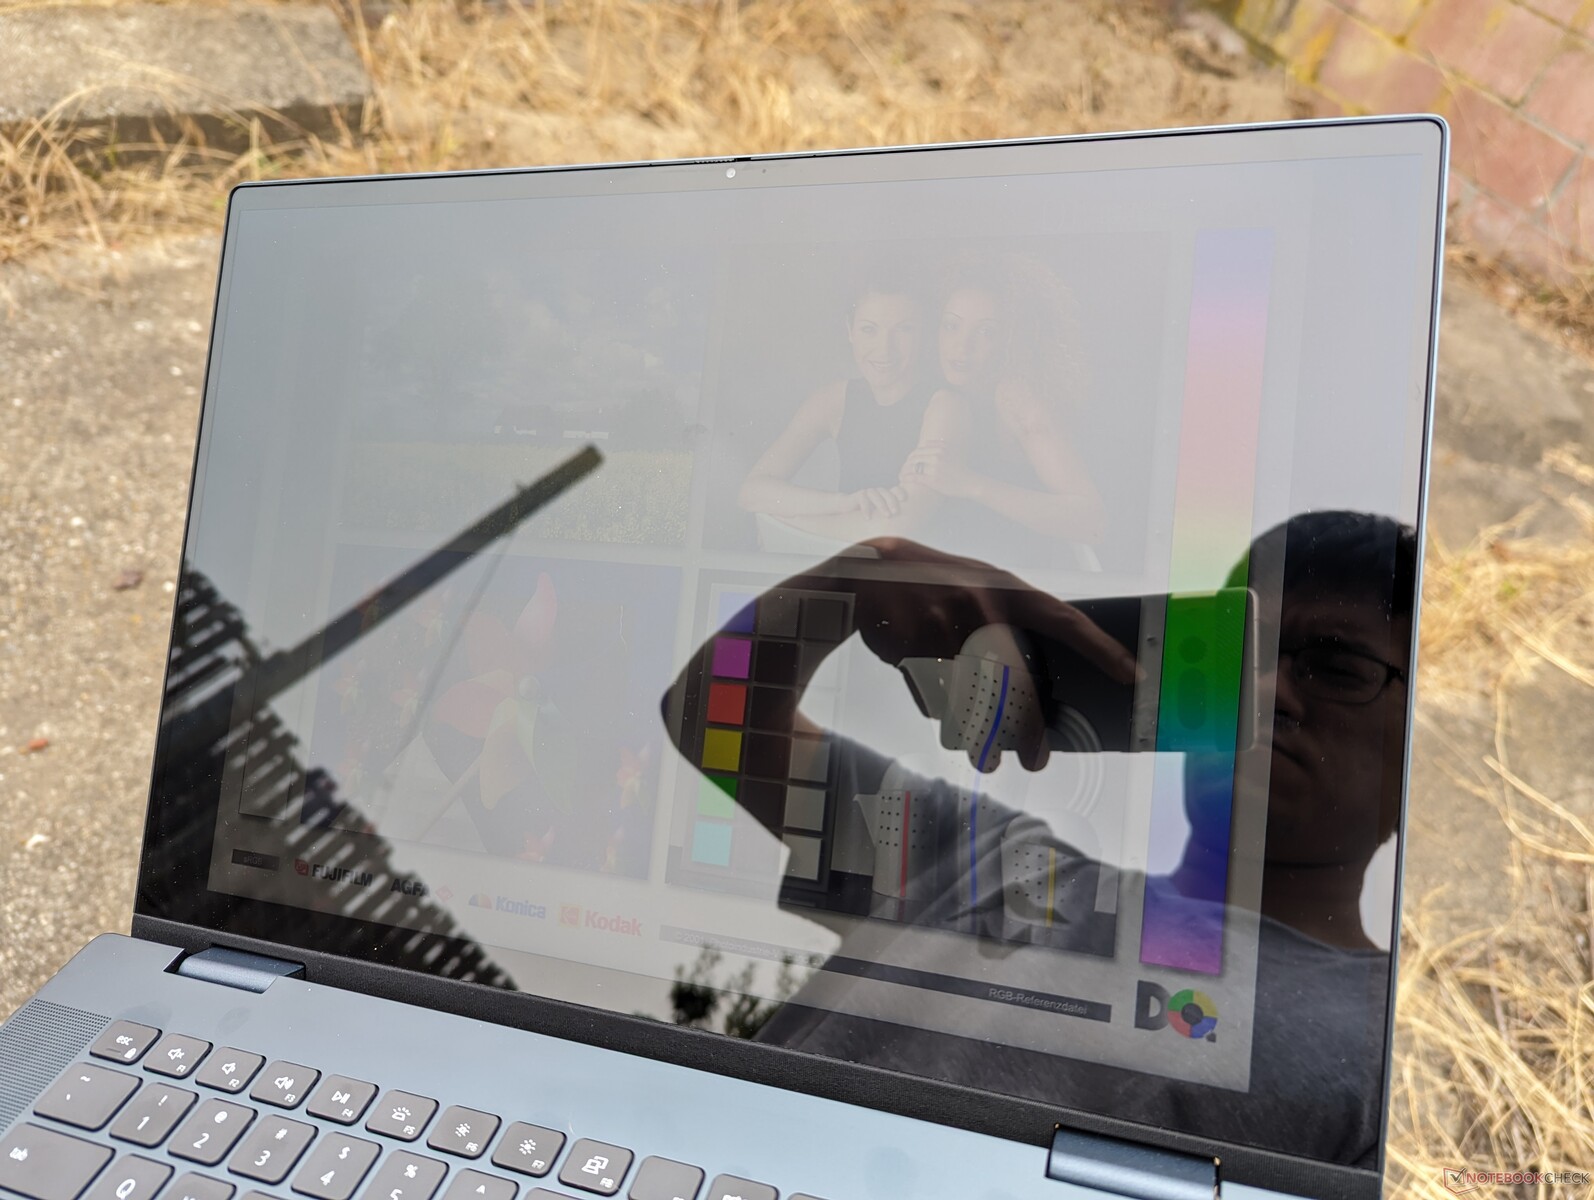
Outdoor visibility is average at best as the 300-nit touchscreen isn't bright enough to significantly reduce or overcome glare. Tablets like the iPad Pro 12.6 can be two times brighter or more. The Dell is first and foremost a multimedia convertible for indoor environments.
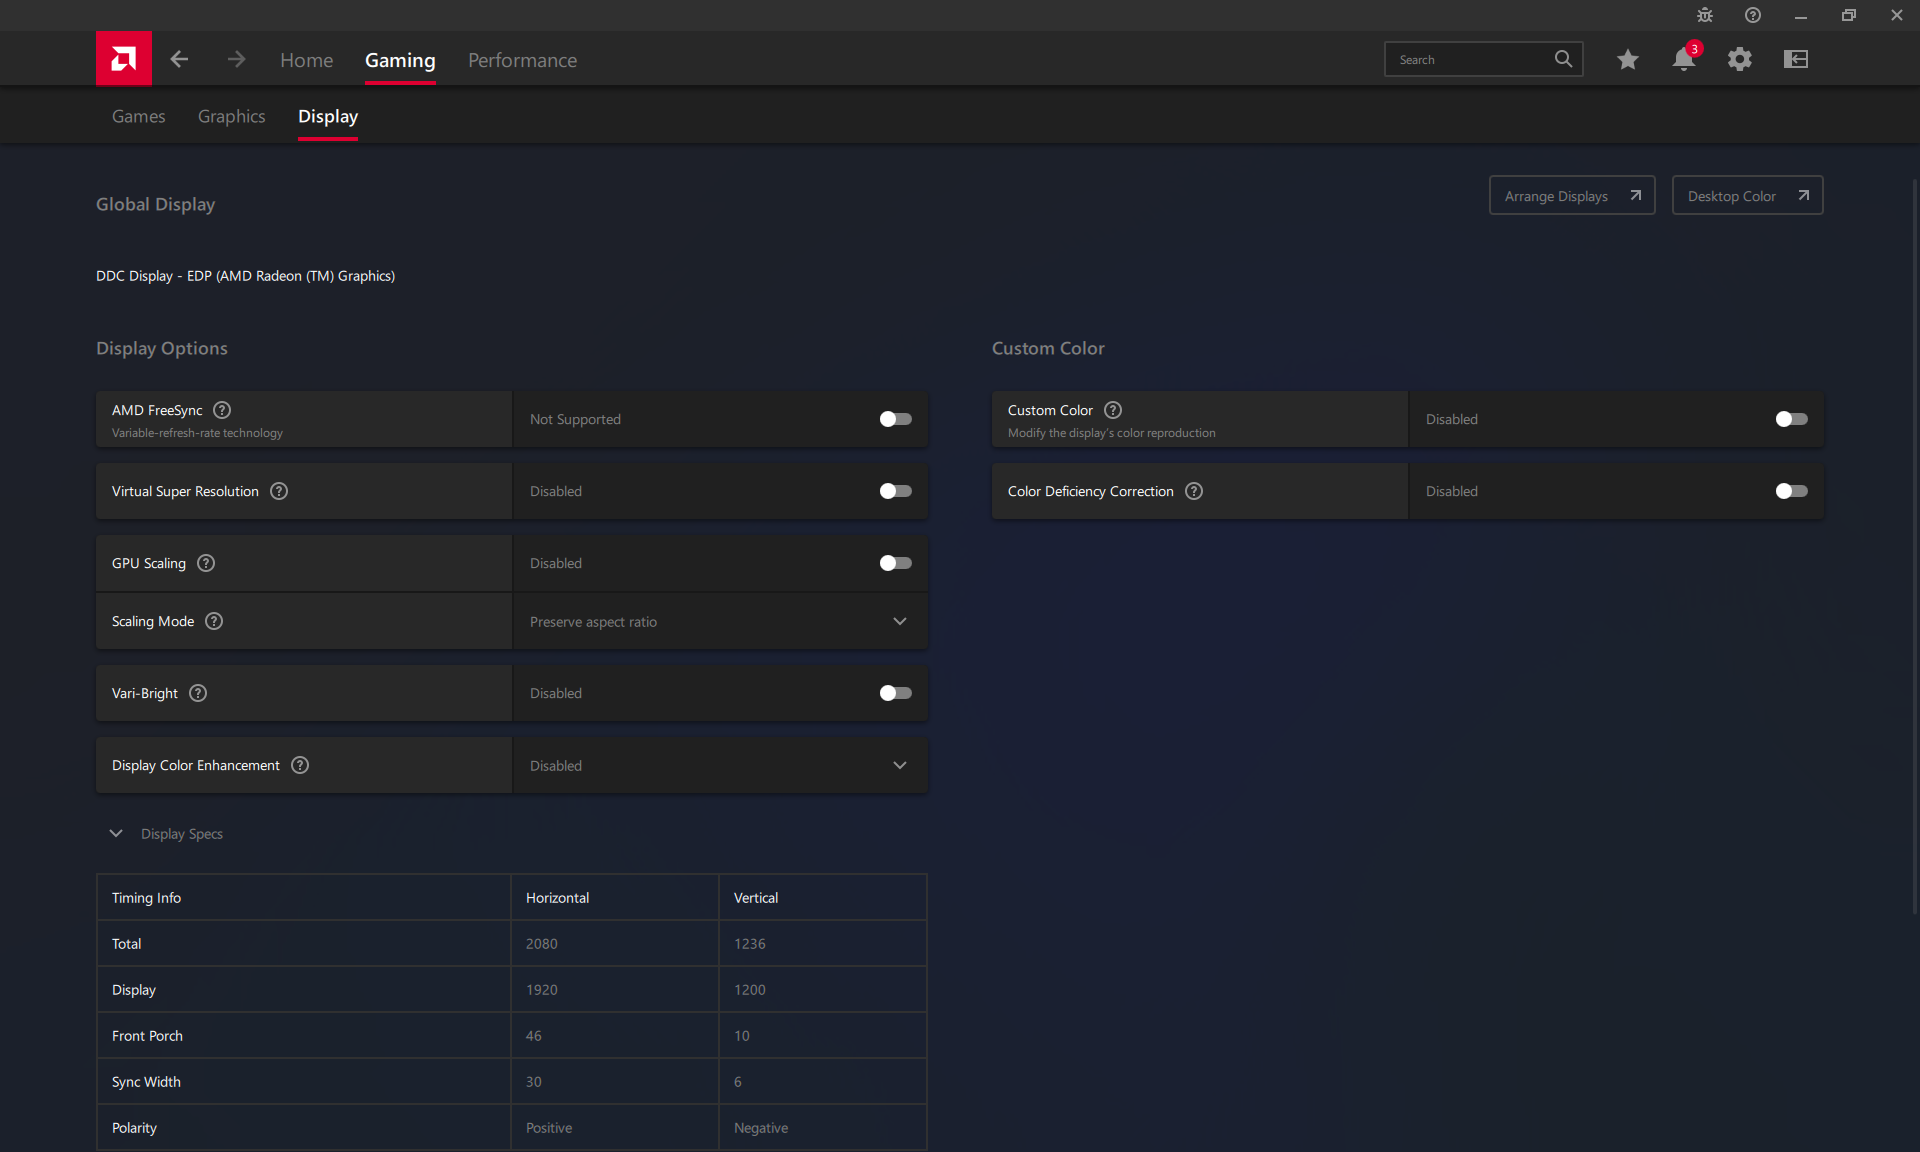
Be sure to disable AMD Vari-Bright via the AMD Adrenalin or else maximum brightness is reduced when running on battery power.

Performance — Not All Ryzen 7000 CPUs Are Zen 4
Testing Conditions
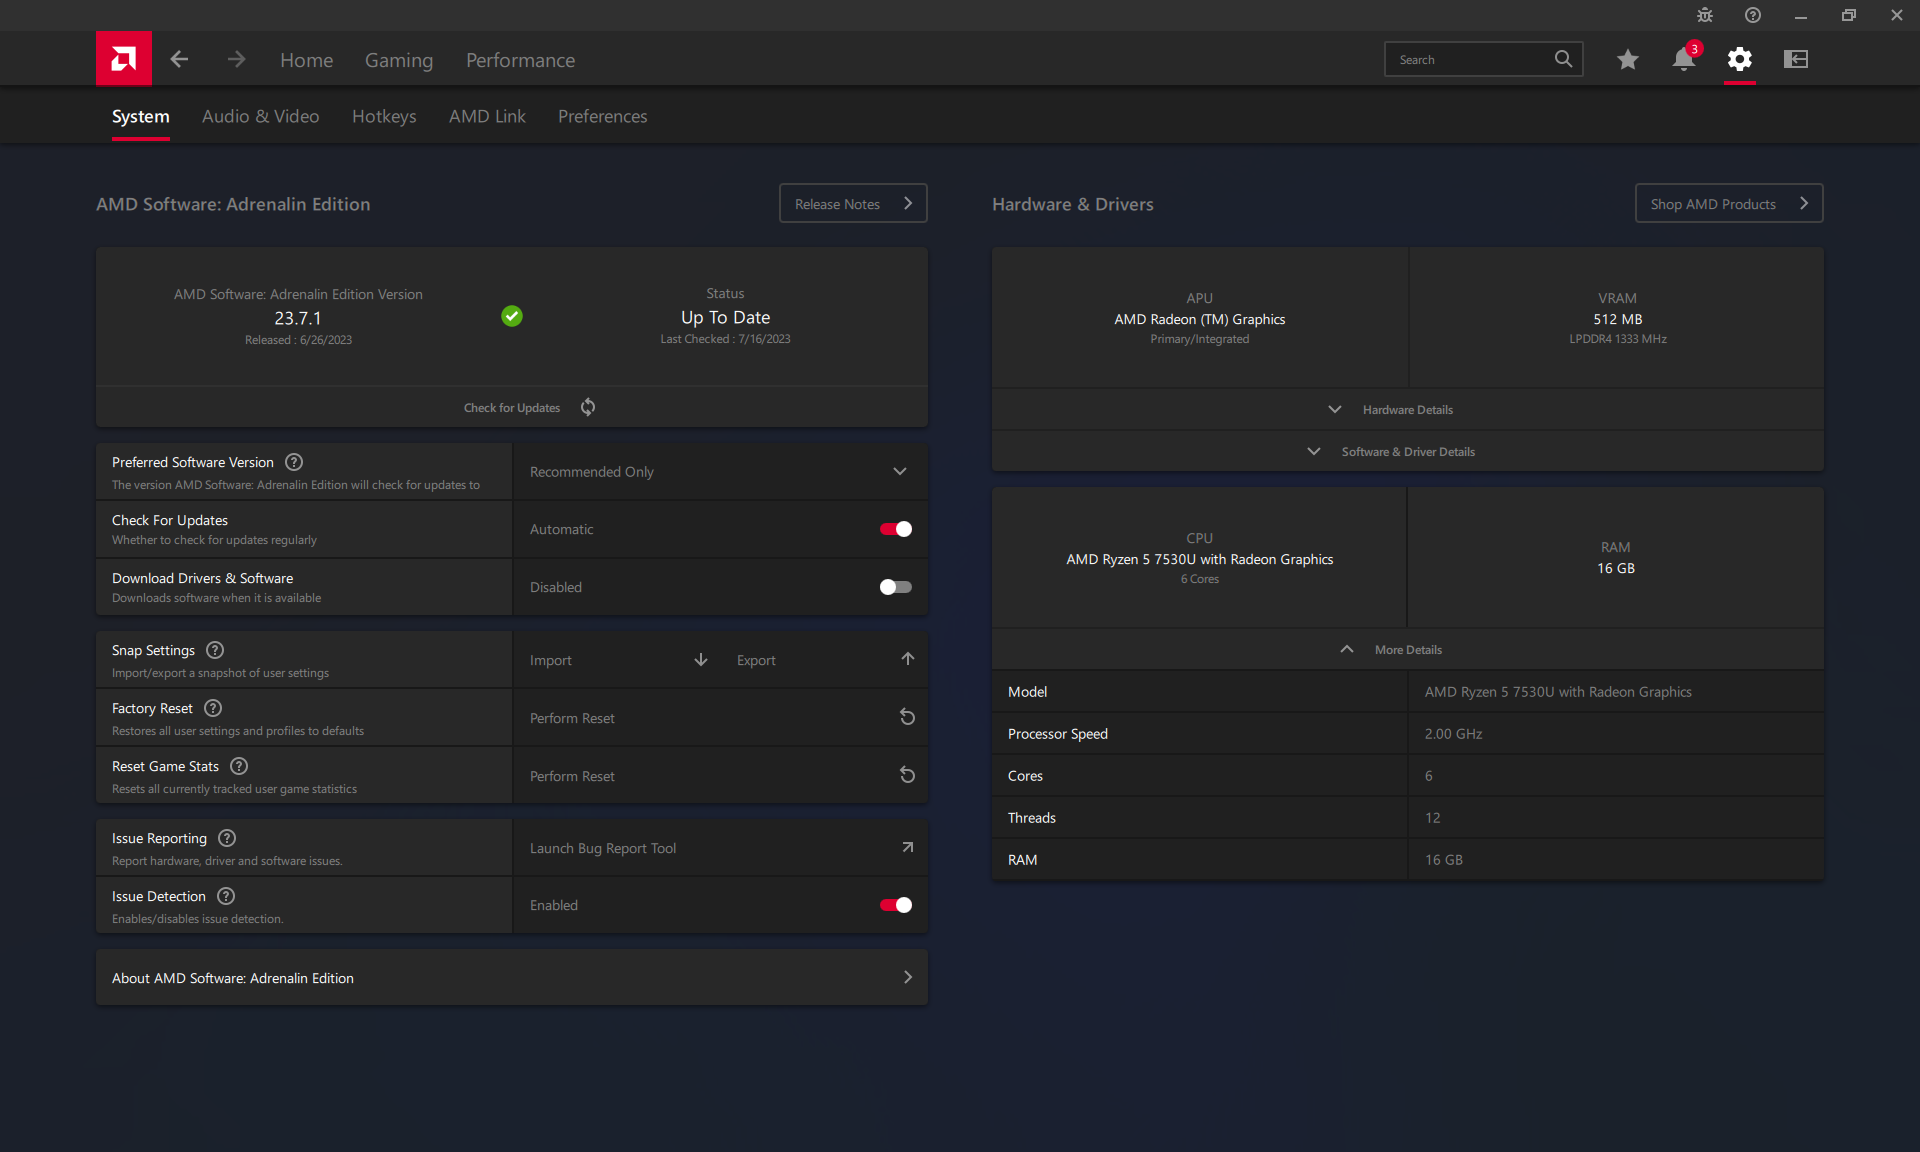
We set our unit to Performance mode via Windows prior to running the benchmarks below. Additional graphical settings are available on AMD Adrenalin which did not come preloaded onto our unit. We recommend installing the AMD auto-detect tool for Adrenalin and the latest graphics drivers.
Processor
The Ryzen 5 7530U performs almost identically to last year's Ryzen 5 6600H albeit at a lower power envelope for higher performance-per-watt. It's therefore a midrange CPU comparable to the competing Core i5-1235U or Core i7-1255U as found on many Ultrabooks like the HP Spectre x360 13.5. In typical AMD fashion, however, single-thread performance is slower by about 15 to 20 percent than the aforementioned Intel processors.
Upgrading to the 8-core Ryzen 7 7730U from our 6-core Ryzen 5 7530U is expected to boost multi-thread performance by about 15 to 35 percent based on our time with the IdeaPad Flex 5 16. The Core i7-1360P option on the Intel Inspiron would perform even faster.
Cinebench R15 Multi Loop
Cinebench R23: Multi Core | Single Core
Cinebench R20: CPU (Multi Core) | CPU (Single Core)
Cinebench R15: CPU Multi 64Bit | CPU Single 64Bit
Blender: v2.79 BMW27 CPU
7-Zip 18.03: 7z b 4 | 7z b 4 -mmt1
Geekbench 5.5: Multi-Core | Single-Core
HWBOT x265 Benchmark v2.2: 4k Preset
LibreOffice : 20 Documents To PDF
R Benchmark 2.5: Overall mean
* ... smaller is better
AIDA64: FP32 Ray-Trace | FPU Julia | CPU SHA3 | CPU Queen | FPU SinJulia | FPU Mandel | CPU AES | CPU ZLib | FP64 Ray-Trace | CPU PhotoWorxx
| Performance rating | |
| Acer Swift Edge SFE16-42-R1GM | |
| Lenovo IdeaPad Flex 5 16ABR G8 | |
| Samsung Galaxy Book3 Pro 16 | |
| Dell Inspiron 16 7635 2-in-1 | |
| Average AMD Ryzen 5 7530U | |
| Lenovo Yoga 7 16IRL8 | |
| Dell Inspiron 16 7620 2-in-1 | |
| AIDA64 / FP32 Ray-Trace | |
| Lenovo IdeaPad Flex 5 16ABR G8 | |
| Acer Swift Edge SFE16-42-R1GM | |
| Dell Inspiron 16 7635 2-in-1 | |
| Average AMD Ryzen 5 7530U (7609 - 10970, n=9) | |
| Samsung Galaxy Book3 Pro 16 | |
| Lenovo Yoga 7 16IRL8 | |
| Dell Inspiron 16 7620 2-in-1 | |
| AIDA64 / FPU Julia | |
| Lenovo IdeaPad Flex 5 16ABR G8 | |
| Acer Swift Edge SFE16-42-R1GM | |
| Dell Inspiron 16 7635 2-in-1 | |
| Average AMD Ryzen 5 7530U (48473 - 68384, n=9) | |
| Samsung Galaxy Book3 Pro 16 | |
| Lenovo Yoga 7 16IRL8 | |
| Dell Inspiron 16 7620 2-in-1 | |
| AIDA64 / CPU SHA3 | |
| Samsung Galaxy Book3 Pro 16 | |
| Lenovo IdeaPad Flex 5 16ABR G8 | |
| Acer Swift Edge SFE16-42-R1GM | |
| Lenovo Yoga 7 16IRL8 | |
| Dell Inspiron 16 7635 2-in-1 | |
| Average AMD Ryzen 5 7530U (1591 - 2323, n=9) | |
| Dell Inspiron 16 7620 2-in-1 | |
| AIDA64 / CPU Queen | |
| Lenovo IdeaPad Flex 5 16ABR G8 | |
| Acer Swift Edge SFE16-42-R1GM | |
| Samsung Galaxy Book3 Pro 16 | |
| Dell Inspiron 16 7620 2-in-1 | |
| Dell Inspiron 16 7635 2-in-1 | |
| Average AMD Ryzen 5 7530U (66646 - 78105, n=8) | |
| Lenovo Yoga 7 16IRL8 | |
| AIDA64 / FPU SinJulia | |
| Acer Swift Edge SFE16-42-R1GM | |
| Lenovo IdeaPad Flex 5 16ABR G8 | |
| Dell Inspiron 16 7635 2-in-1 | |
| Average AMD Ryzen 5 7530U (7611 - 9248, n=9) | |
| Samsung Galaxy Book3 Pro 16 | |
| Dell Inspiron 16 7620 2-in-1 | |
| Lenovo Yoga 7 16IRL8 | |
| AIDA64 / FPU Mandel | |
| Lenovo IdeaPad Flex 5 16ABR G8 | |
| Acer Swift Edge SFE16-42-R1GM | |
| Dell Inspiron 16 7635 2-in-1 | |
| Average AMD Ryzen 5 7530U (26912 - 37624, n=9) | |
| Samsung Galaxy Book3 Pro 16 | |
| Lenovo Yoga 7 16IRL8 | |
| Dell Inspiron 16 7620 2-in-1 | |
| AIDA64 / CPU AES | |
| Samsung Galaxy Book3 Pro 16 | |
| Average AMD Ryzen 5 7530U (33314 - 92360, n=9) | |
| Lenovo Yoga 7 16IRL8 | |
| Lenovo IdeaPad Flex 5 16ABR G8 | |
| Acer Swift Edge SFE16-42-R1GM | |
| Dell Inspiron 16 7620 2-in-1 | |
| Dell Inspiron 16 7635 2-in-1 | |
| AIDA64 / CPU ZLib | |
| Samsung Galaxy Book3 Pro 16 | |
| Lenovo Yoga 7 16IRL8 | |
| Acer Swift Edge SFE16-42-R1GM | |
| Lenovo IdeaPad Flex 5 16ABR G8 | |
| Dell Inspiron 16 7620 2-in-1 | |
| Dell Inspiron 16 7635 2-in-1 | |
| Average AMD Ryzen 5 7530U (443 - 612, n=9) | |
| AIDA64 / FP64 Ray-Trace | |
| Lenovo IdeaPad Flex 5 16ABR G8 | |
| Acer Swift Edge SFE16-42-R1GM | |
| Dell Inspiron 16 7635 2-in-1 | |
| Average AMD Ryzen 5 7530U (4008 - 5738, n=9) | |
| Samsung Galaxy Book3 Pro 16 | |
| Lenovo Yoga 7 16IRL8 | |
| Dell Inspiron 16 7620 2-in-1 | |
| AIDA64 / CPU PhotoWorxx | |
| Samsung Galaxy Book3 Pro 16 | |
| Lenovo Yoga 7 16IRL8 | |
| Acer Swift Edge SFE16-42-R1GM | |
| Dell Inspiron 16 7635 2-in-1 | |
| Lenovo IdeaPad Flex 5 16ABR G8 | |
| Dell Inspiron 16 7620 2-in-1 | |
| Average AMD Ryzen 5 7530U (9832 - 19525, n=9) | |
System Performance
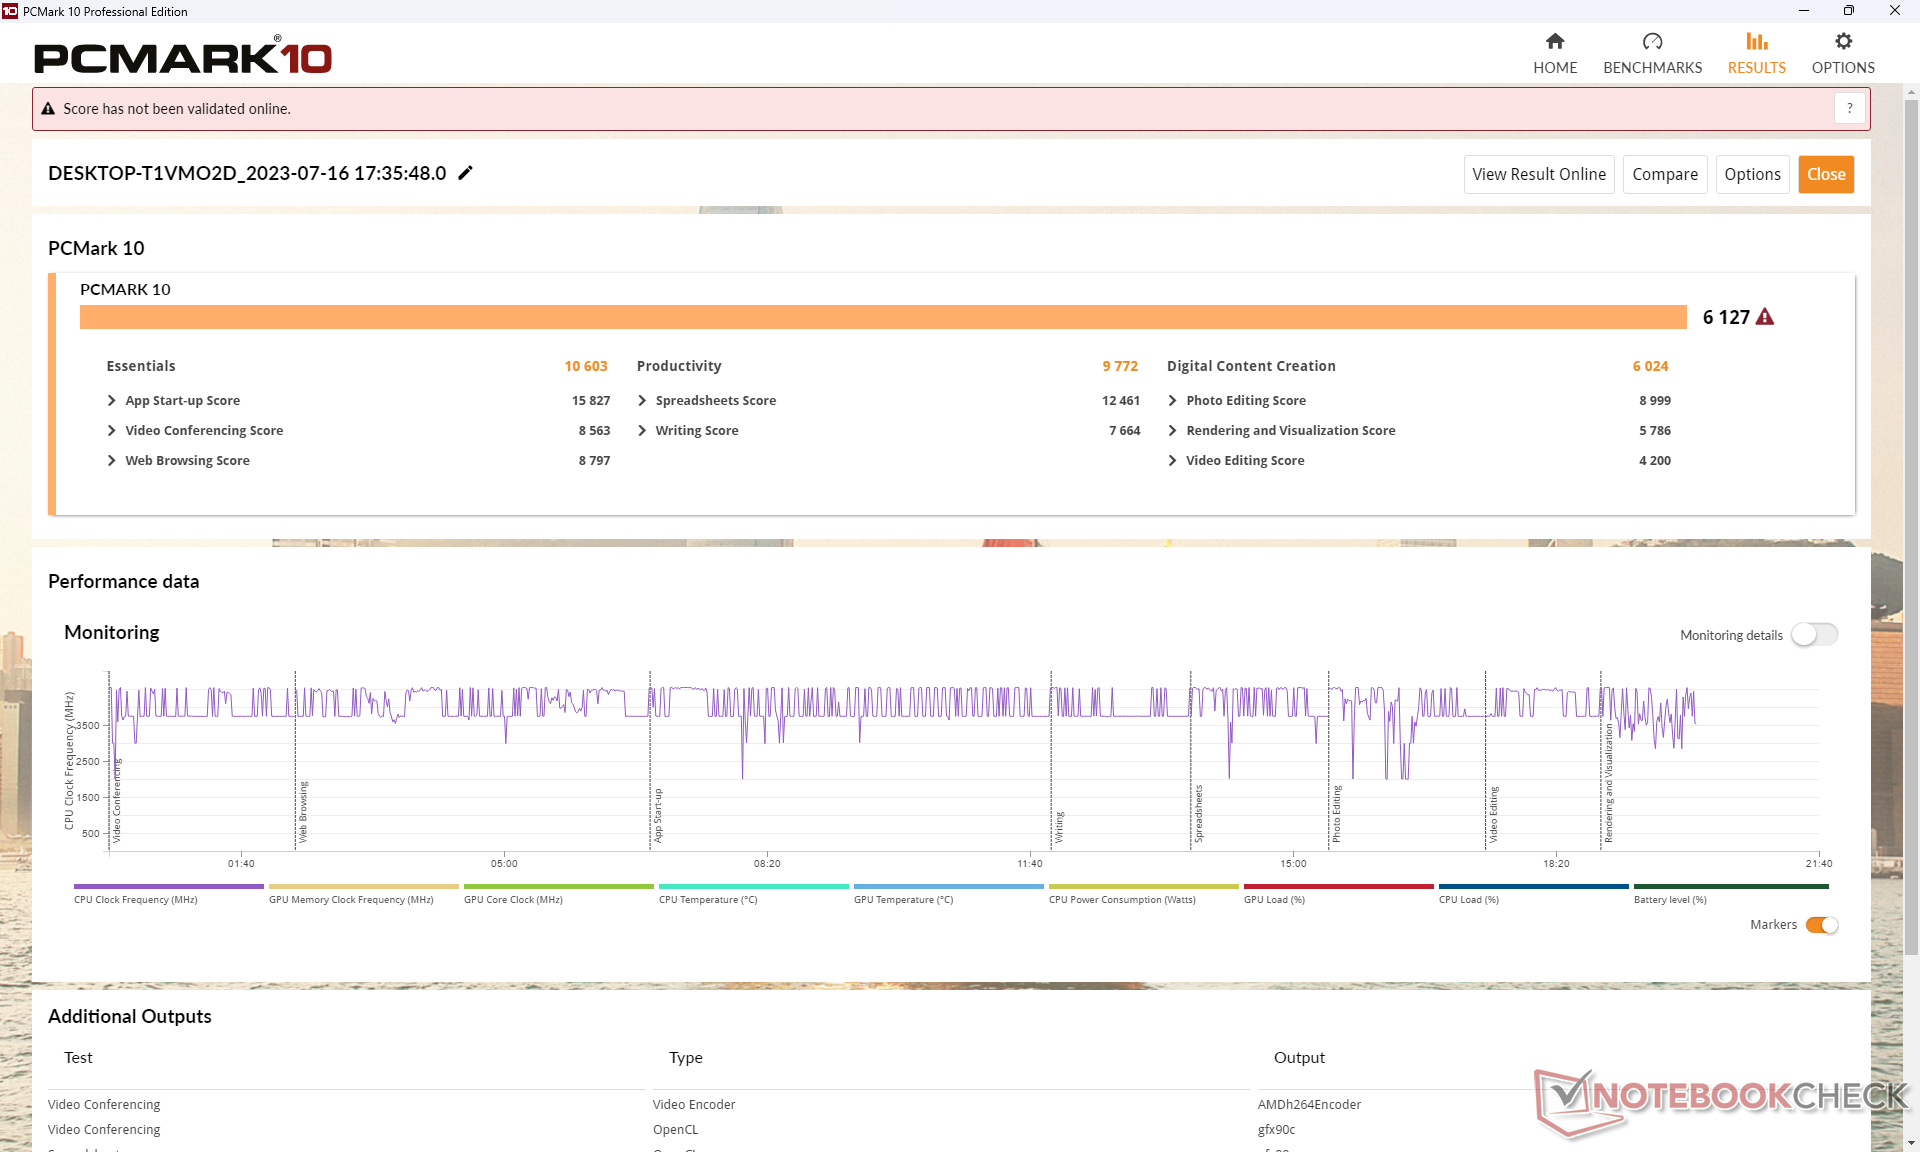
PCMark results are comparable to alternatives running on Core-U and even Core-P processors like the Samsung Galaxy Book3 Pro 16 or last year's Dell Inspiron 16 7620 2-in-1. Interestingly, the Productivity subtest favors our Dell system by wider margins.
CrossMark: Overall | Productivity | Creativity | Responsiveness
| PCMark 10 / Score | |
| Lenovo IdeaPad Flex 5 16ABR G8 | |
| Acer Swift Edge SFE16-42-R1GM | |
| Dell Inspiron 16 7635 2-in-1 | |
| Average AMD Ryzen 5 7530U, AMD Radeon RX Vega 7 (5686 - 6209, n=8) | |
| Lenovo Yoga 7 16IRL8 | |
| Samsung Galaxy Book3 Pro 16 | |
| Dell Inspiron 16 7620 2-in-1 | |
| PCMark 10 / Essentials | |
| Lenovo Yoga 7 16IRL8 | |
| Lenovo IdeaPad Flex 5 16ABR G8 | |
| Dell Inspiron 16 7635 2-in-1 | |
| Samsung Galaxy Book3 Pro 16 | |
| Average AMD Ryzen 5 7530U, AMD Radeon RX Vega 7 (9183 - 11242, n=8) | |
| Dell Inspiron 16 7620 2-in-1 | |
| Acer Swift Edge SFE16-42-R1GM | |
| PCMark 10 / Productivity | |
| Average AMD Ryzen 5 7530U, AMD Radeon RX Vega 7 (8983 - 14037, n=8) | |
| Dell Inspiron 16 7635 2-in-1 | |
| Lenovo IdeaPad Flex 5 16ABR G8 | |
| Acer Swift Edge SFE16-42-R1GM | |
| Lenovo Yoga 7 16IRL8 | |
| Samsung Galaxy Book3 Pro 16 | |
| Dell Inspiron 16 7620 2-in-1 | |
| PCMark 10 / Digital Content Creation | |
| Acer Swift Edge SFE16-42-R1GM | |
| Lenovo Yoga 7 16IRL8 | |
| Samsung Galaxy Book3 Pro 16 | |
| Lenovo IdeaPad Flex 5 16ABR G8 | |
| Dell Inspiron 16 7635 2-in-1 | |
| Dell Inspiron 16 7620 2-in-1 | |
| Average AMD Ryzen 5 7530U, AMD Radeon RX Vega 7 (4941 - 6093, n=8) | |
| CrossMark / Overall | |
| Lenovo Yoga 7 16IRL8 | |
| Samsung Galaxy Book3 Pro 16 | |
| Dell Inspiron 16 7620 2-in-1 | |
| Acer Swift Edge SFE16-42-R1GM | |
| Lenovo IdeaPad Flex 5 16ABR G8 | |
| Average AMD Ryzen 5 7530U, AMD Radeon RX Vega 7 (1029 - 1336, n=7) | |
| Dell Inspiron 16 7635 2-in-1 | |
| CrossMark / Productivity | |
| Lenovo Yoga 7 16IRL8 | |
| Samsung Galaxy Book3 Pro 16 | |
| Dell Inspiron 16 7620 2-in-1 | |
| Acer Swift Edge SFE16-42-R1GM | |
| Lenovo IdeaPad Flex 5 16ABR G8 | |
| Average AMD Ryzen 5 7530U, AMD Radeon RX Vega 7 (1115 - 1370, n=7) | |
| Dell Inspiron 16 7635 2-in-1 | |
| CrossMark / Creativity | |
| Lenovo Yoga 7 16IRL8 | |
| Samsung Galaxy Book3 Pro 16 | |
| Dell Inspiron 16 7620 2-in-1 | |
| Lenovo IdeaPad Flex 5 16ABR G8 | |
| Acer Swift Edge SFE16-42-R1GM | |
| Dell Inspiron 16 7635 2-in-1 | |
| Average AMD Ryzen 5 7530U, AMD Radeon RX Vega 7 (992 - 1390, n=7) | |
| CrossMark / Responsiveness | |
| Samsung Galaxy Book3 Pro 16 | |
| Lenovo Yoga 7 16IRL8 | |
| Dell Inspiron 16 7620 2-in-1 | |
| Acer Swift Edge SFE16-42-R1GM | |
| Average AMD Ryzen 5 7530U, AMD Radeon RX Vega 7 (900 - 1096, n=7) | |
| Lenovo IdeaPad Flex 5 16ABR G8 | |
| Dell Inspiron 16 7635 2-in-1 | |
| PCMark 10 Score | 6127 points | |
Help | ||
| AIDA64 / Memory Copy | |
| Samsung Galaxy Book3 Pro 16 | |
| Lenovo Yoga 7 16IRL8 | |
| Acer Swift Edge SFE16-42-R1GM | |
| Dell Inspiron 16 7635 2-in-1 | |
| Lenovo IdeaPad Flex 5 16ABR G8 | |
| Dell Inspiron 16 7620 2-in-1 | |
| Average AMD Ryzen 5 7530U (20155 - 42853, n=9) | |
| AIDA64 / Memory Read | |
| Samsung Galaxy Book3 Pro 16 | |
| Lenovo Yoga 7 16IRL8 | |
| Acer Swift Edge SFE16-42-R1GM | |
| Dell Inspiron 16 7620 2-in-1 | |
| Dell Inspiron 16 7635 2-in-1 | |
| Lenovo IdeaPad Flex 5 16ABR G8 | |
| Average AMD Ryzen 5 7530U (23068 - 40270, n=9) | |
| AIDA64 / Memory Write | |
| Samsung Galaxy Book3 Pro 16 | |
| Lenovo Yoga 7 16IRL8 | |
| Acer Swift Edge SFE16-42-R1GM | |
| Dell Inspiron 16 7620 2-in-1 | |
| Dell Inspiron 16 7635 2-in-1 | |
| Lenovo IdeaPad Flex 5 16ABR G8 | |
| Average AMD Ryzen 5 7530U (22954 - 41838, n=9) | |
| AIDA64 / Memory Latency | |
| Lenovo IdeaPad Flex 5 16ABR G8 | |
| Dell Inspiron 16 7635 2-in-1 | |
| Acer Swift Edge SFE16-42-R1GM | |
| Average AMD Ryzen 5 7530U (88.1 - 110.8, n=9) | |
| Lenovo Yoga 7 16IRL8 | |
| Samsung Galaxy Book3 Pro 16 | |
* ... smaller is better
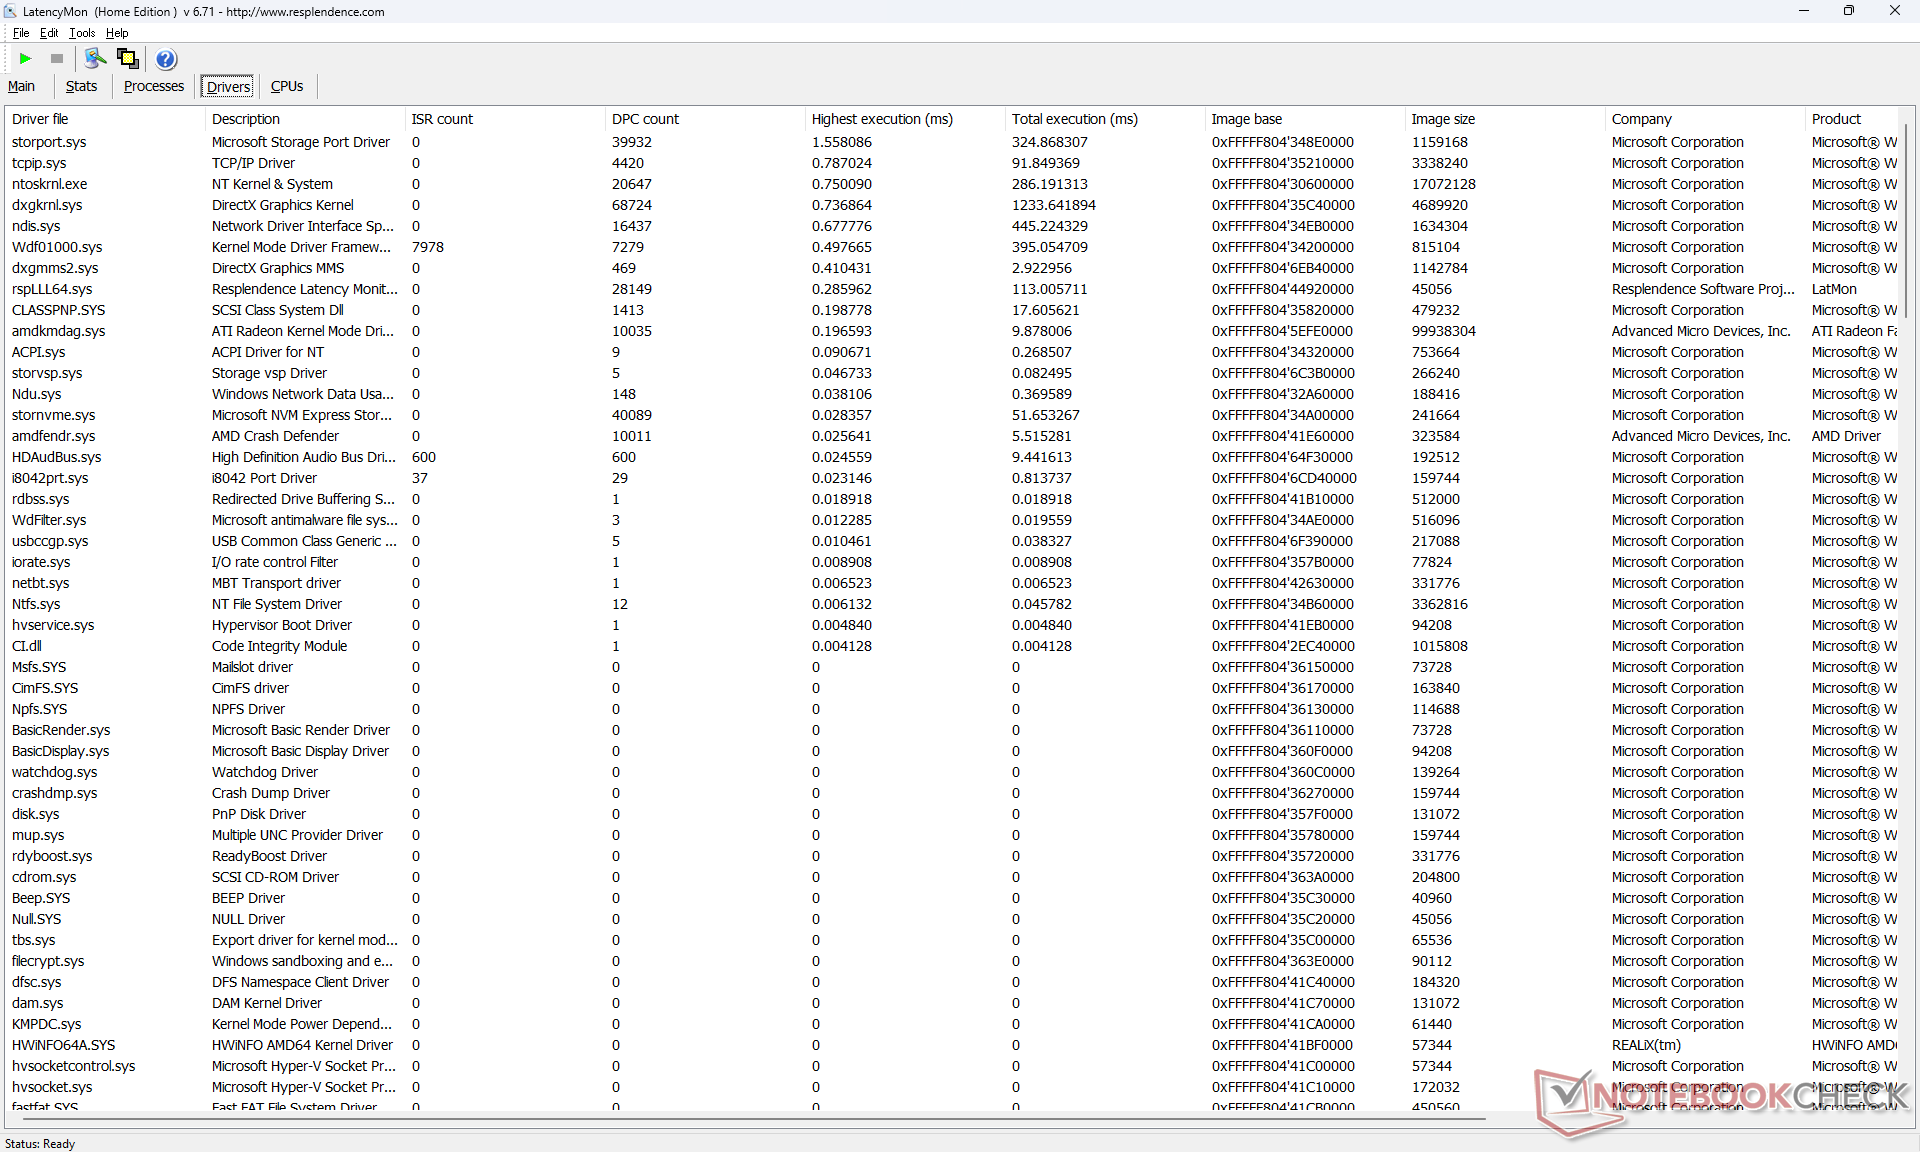
DPC Latency
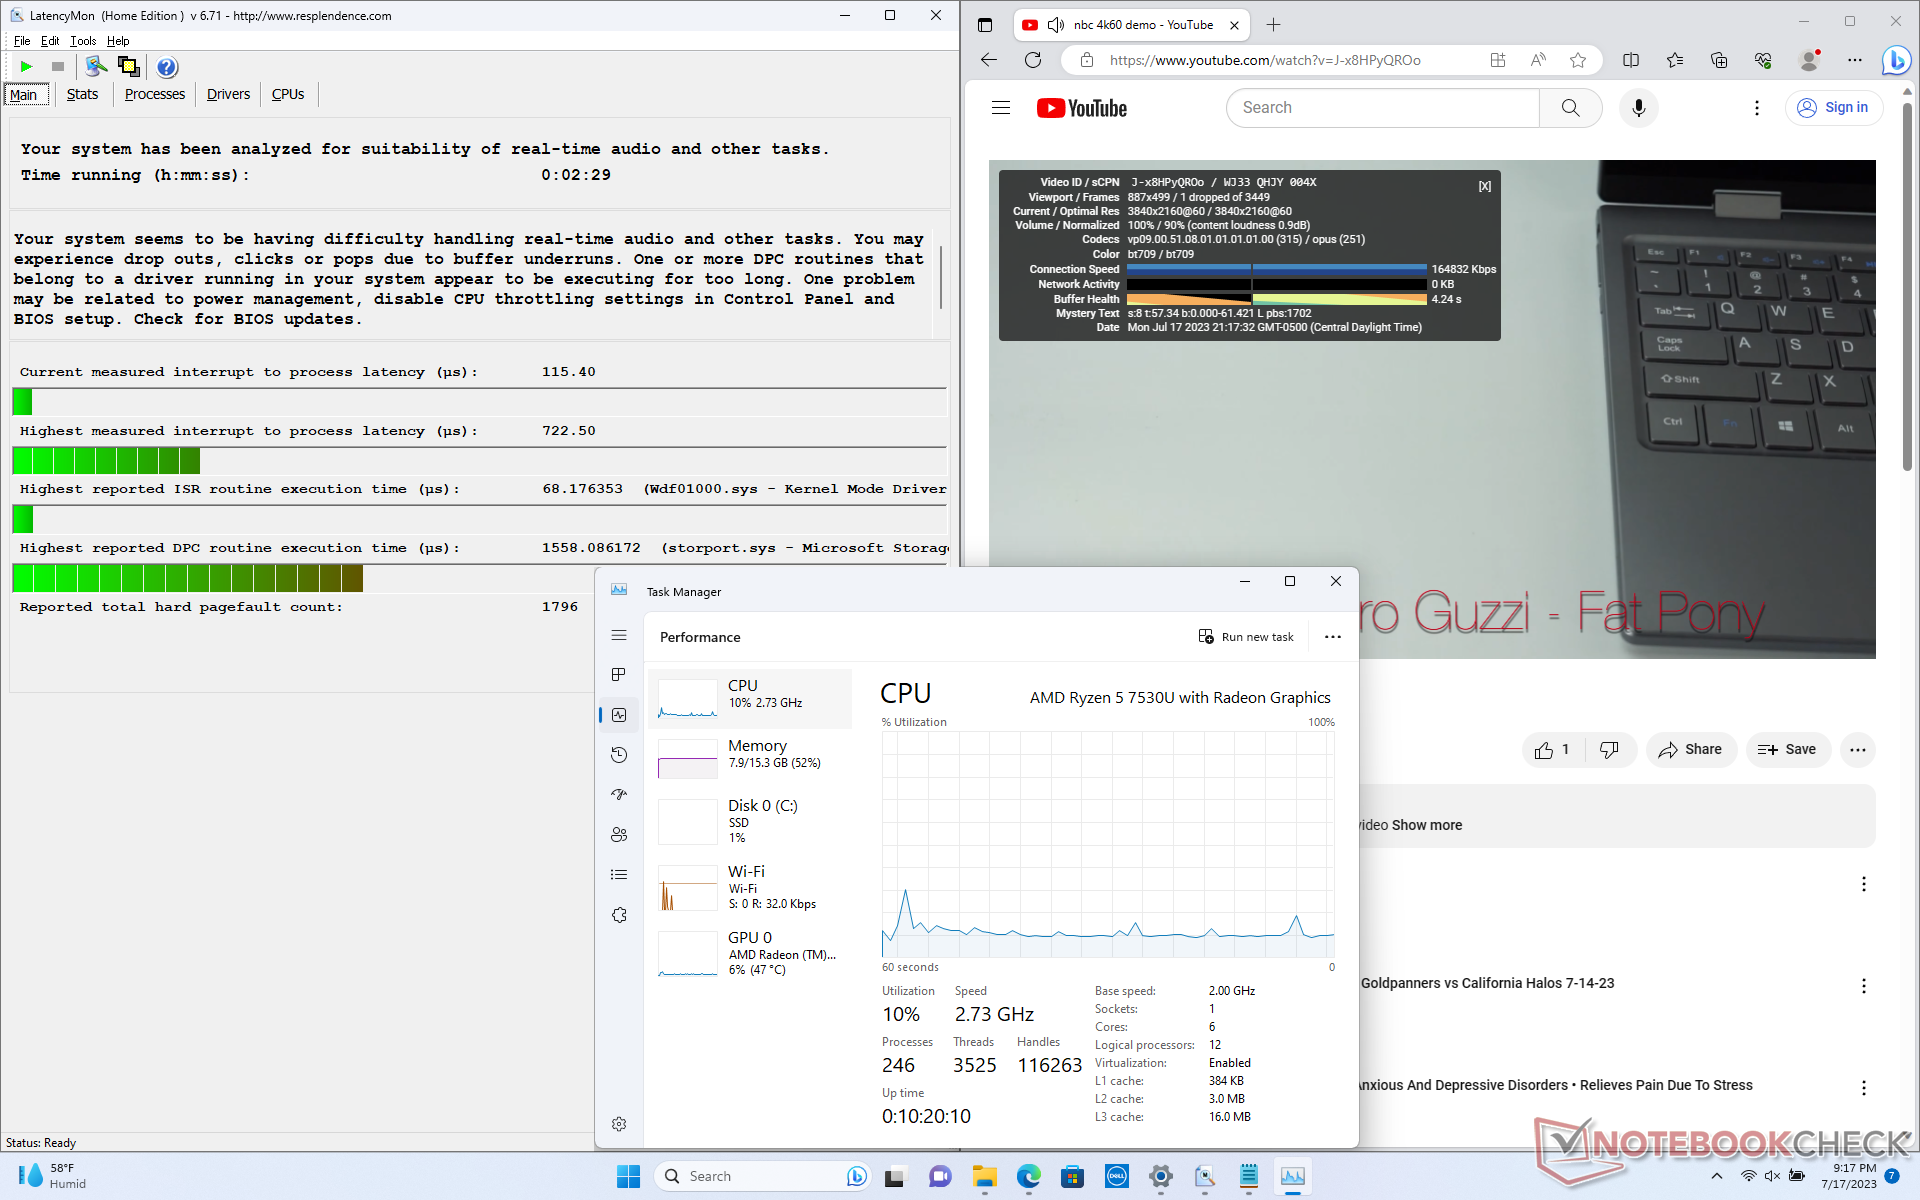
LatencyMon reports only minor DPC issues when opening multiple tabs of our homepage. 4K video playback at 60 FPS is otherwise excellent with just one dropped frame recorded during our minute-long test video.
| DPC Latencies / LatencyMon - interrupt to process latency (max), Web, Youtube, Prime95 | |
| Acer Swift Edge SFE16-42-R1GM | |
| Lenovo IdeaPad Flex 5 16ABR G8 | |
| Lenovo Yoga 7 16IRL8 | |
| Dell Inspiron 16 7635 2-in-1 | |
| Dell Inspiron 16 7620 2-in-1 | |
| Samsung Galaxy Book3 Pro 16 | |
* ... smaller is better
Storage Devices
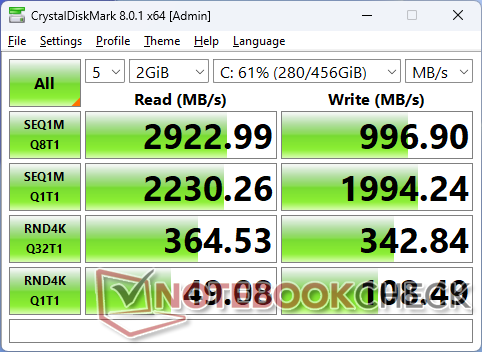
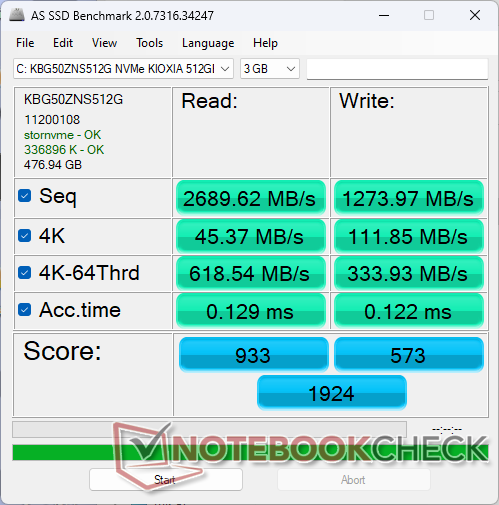
Our test unit ships with a budget Kioxia KBG50ZNS512G PCIe4 x4 NVMe SSD which offers maximum sequential read and write rates of up to 3500 MB/s and 2700 MB/s, respectively, according to the manufacturer. In our stress tests, however, we're only able to reach just over 2200 MB/s even after multiple retests to suggest that the drive may have problems maintaining maximum transfer rates for extended periods. Nonetheless, this is generally a nonissue for most multimedia scenarios and day-to-day browser workloads.

| Drive Performance rating - Percent | |
| Acer Swift Edge SFE16-42-R1GM | |
| Lenovo Yoga 7 16IRL8 | |
| Samsung Galaxy Book3 Pro 16 | |
| Lenovo IdeaPad Flex 5 16ABR G8 | |
| Dell Inspiron 16 7635 2-in-1 | |
| Dell Inspiron 16 7620 2-in-1 | |
* ... smaller is better
Disk Throttling: DiskSpd Read Loop, Queue Depth 8
GPU Performance
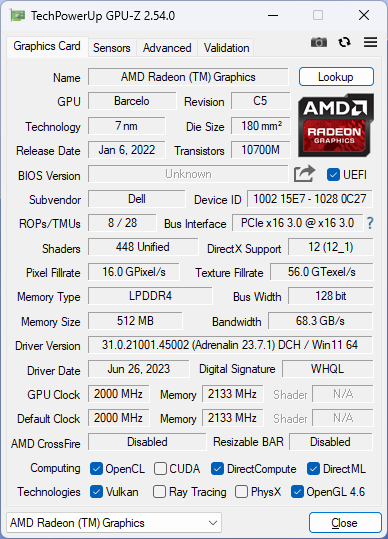
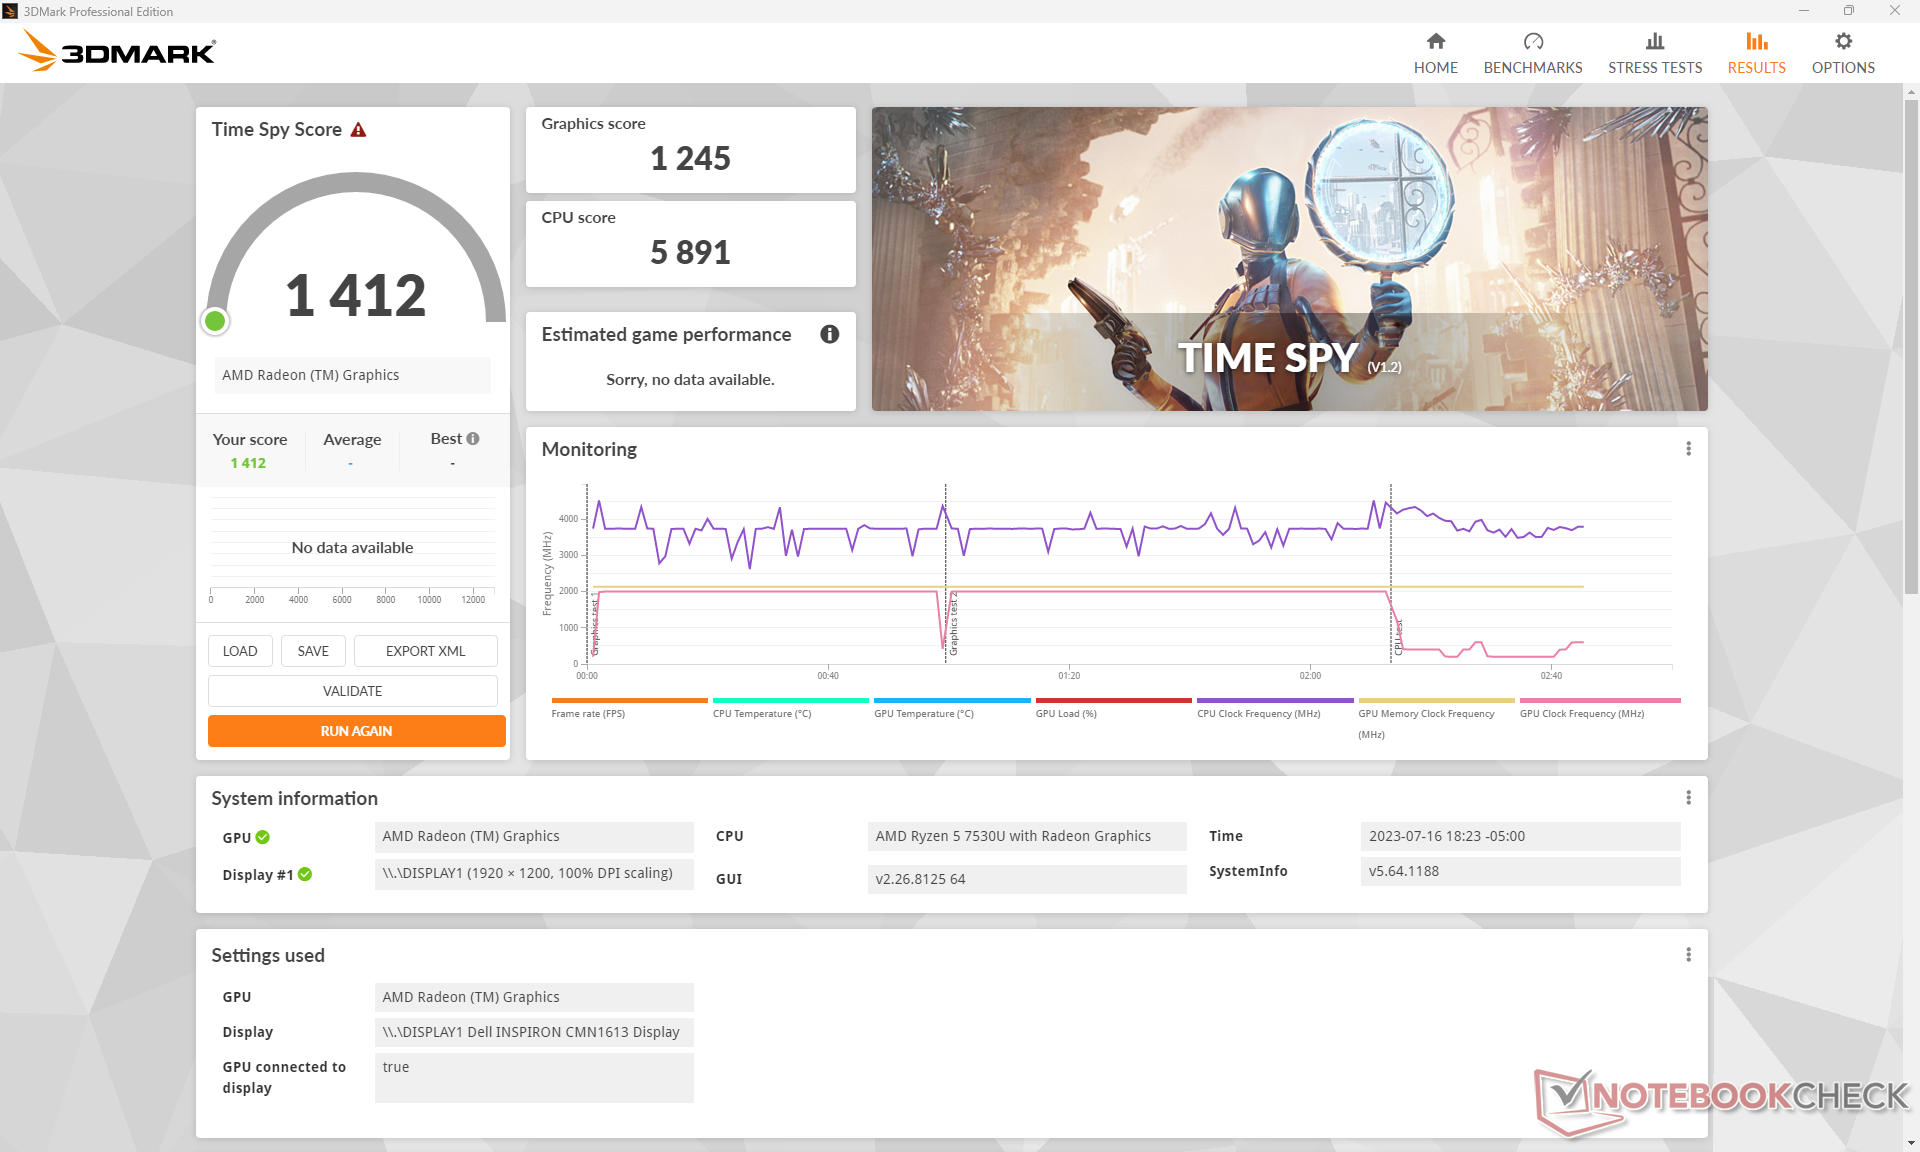
As a Zen 3 processor, the Ryzen 5 7530U utilizes the older Radeon RX Vega 7 instead of the newer Radeon 680M or 780M as found on Zen 3+ and Zen 4 processors, respectively. This is unfortunate as the Radeon 680M would have boosted graphics performance significantly by 70 to 80 percent to be faster than any current Intel Iris Xe solution. Instead, overall graphics performance is roughly 25 percent behind the aging Iris Xe 96 EUs. We expect performance to be even lower if configured with just 8 GB of soldered system RAM.
Upgrading to the Radeon RX Vega 8 in the higher-end Ryzen 7 7730U configuration is expected to boost graphics performance just marginally by 5 percent.
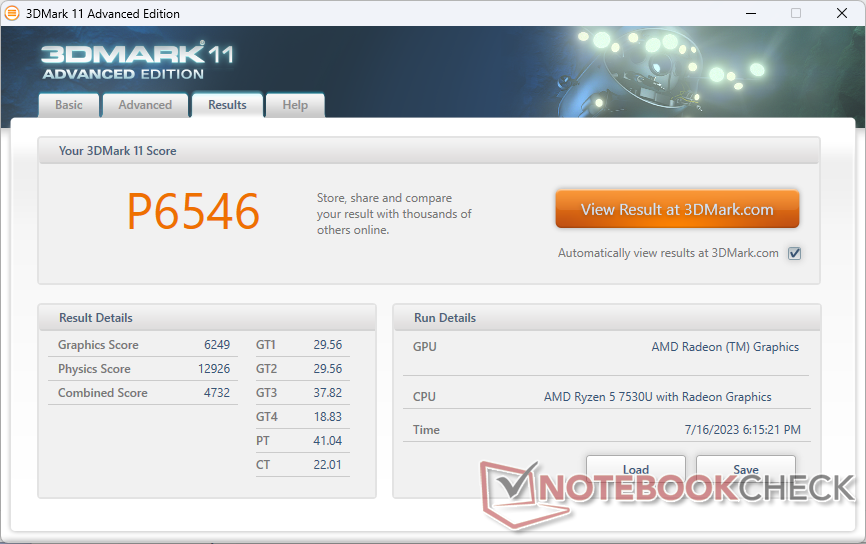
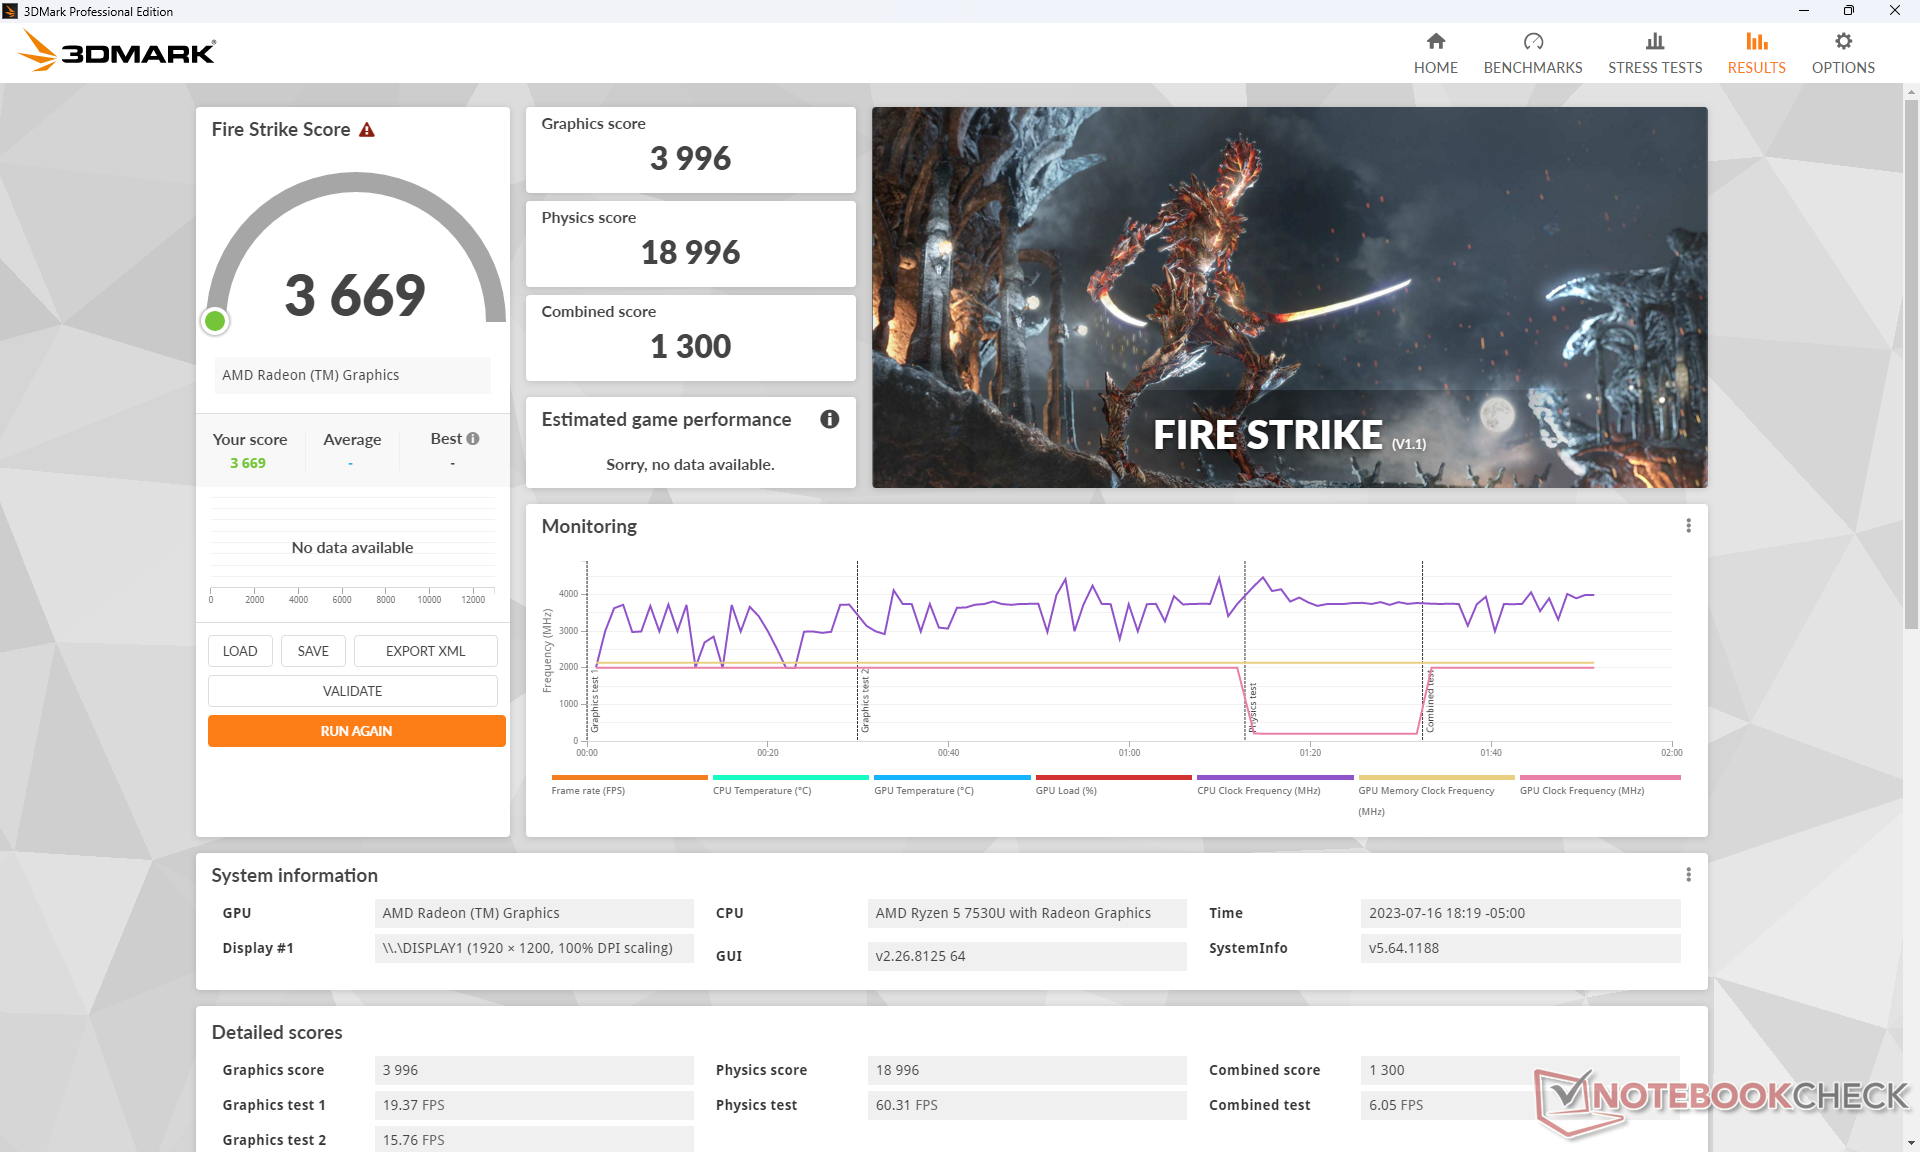
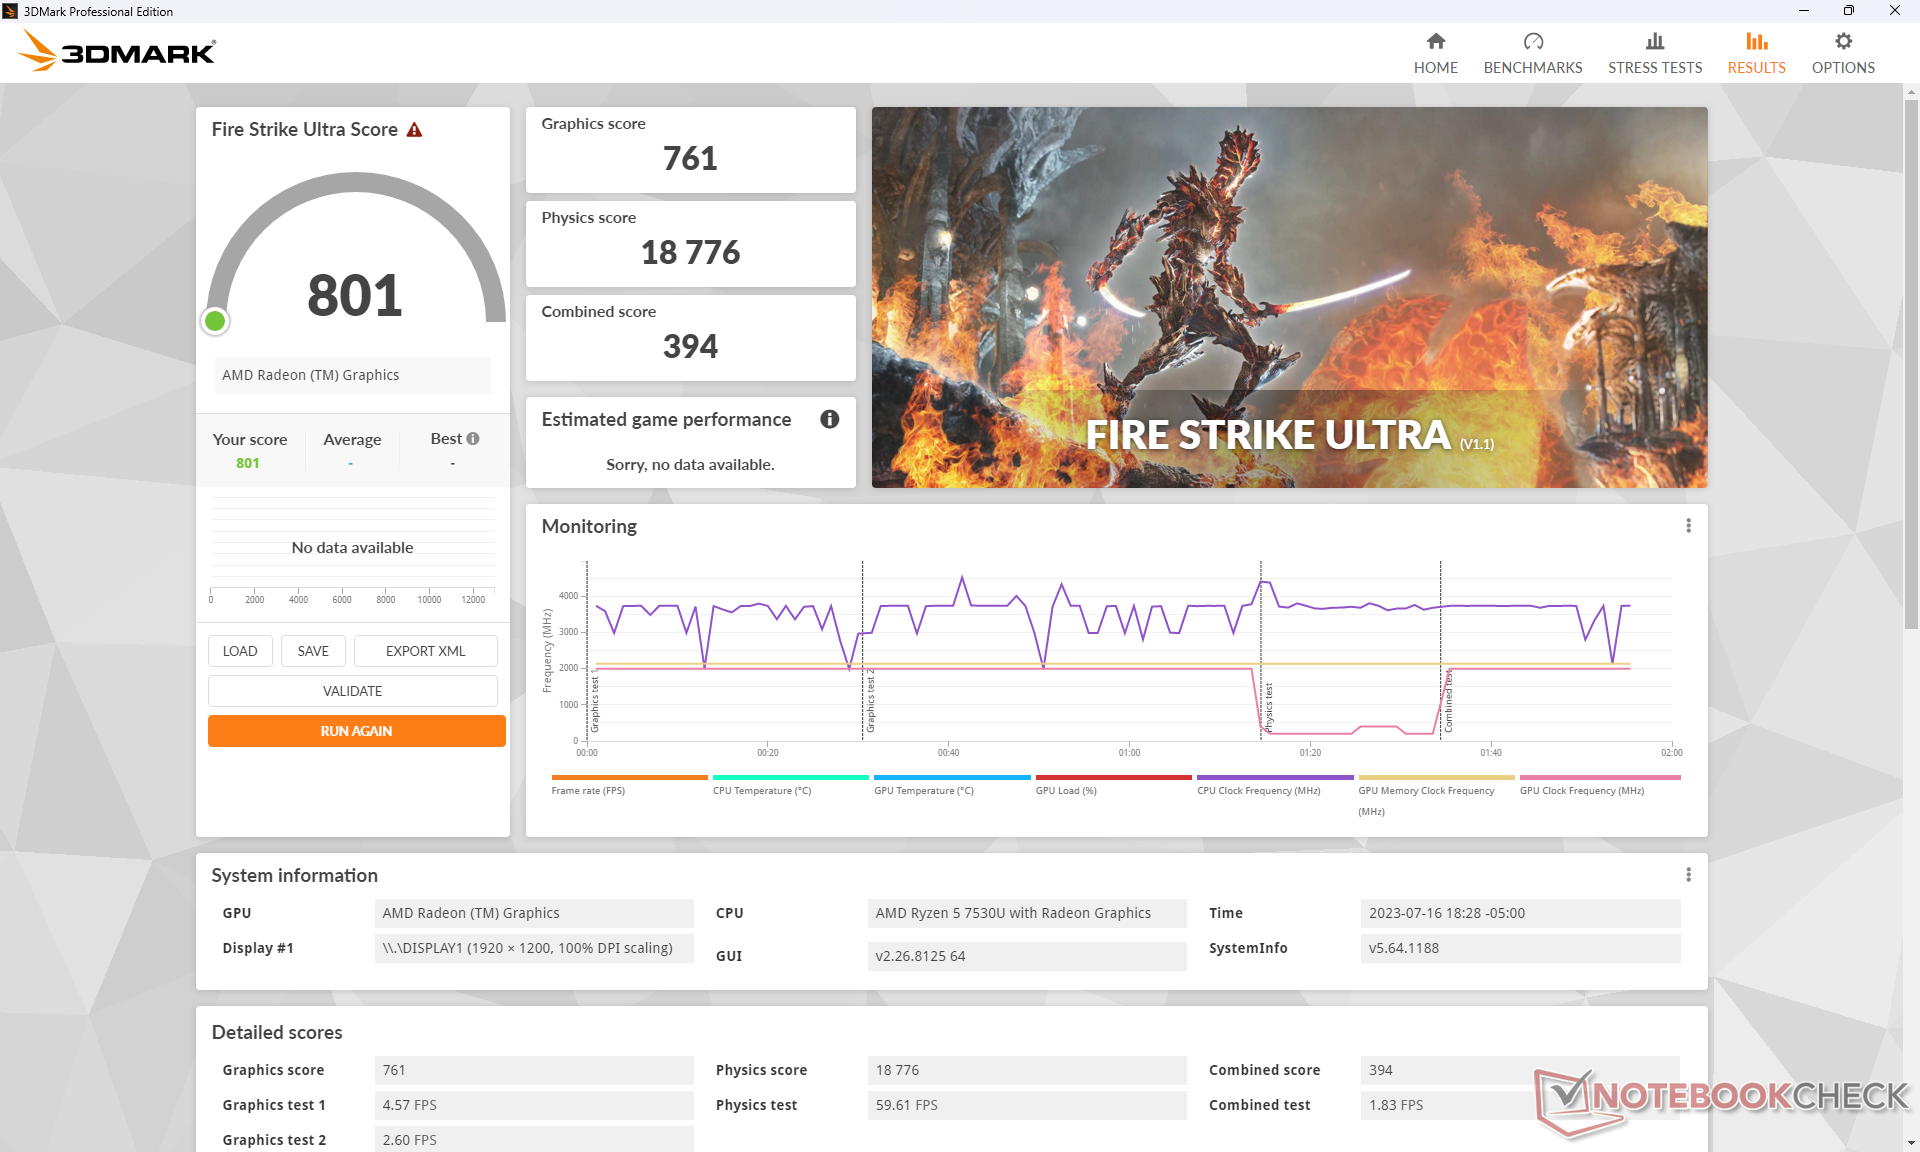
| 3DMark 11 Performance | 6546 points | |
| 3DMark Fire Strike Score | 3669 points | |
| 3DMark Time Spy Score | 1412 points | |
Help | ||
* ... smaller is better
| Returnal | |
| 1280x720 Low Preset | |
| Beelink GTR7 7840HS | |
| Dell Inspiron 16 7635 2-in-1 | |
| Average AMD Radeon RX Vega 7 (18 - 18, n=2) | |
| 1920x1080 Low Preset | |
| Beelink GTR7 7840HS | |
| Dell Inspiron 16 7635 2-in-1 | |
| Average AMD Radeon RX Vega 7 (12 - 13, n=2) | |
| 1920x1080 Medium Preset | |
| Beelink GTR7 7840HS | |
| Dell Inspiron 16 7635 2-in-1 | |
| Average AMD Radeon RX Vega 7 (11 - 12, n=2) | |
Frame rates when idling on Witcher 3 would occasionally but consistently dip by almost 15 FPS for short periods before returning to normal. This behavior is unfavorable as it suggests graphics driver issues or interrupting background activity at an OS level.
Witcher 3 FPS Chart
| low | med. | high | ultra | |
|---|---|---|---|---|
| GTA V (2015) | 24.1 | 9.55 | ||
| The Witcher 3 (2015) | 79.6 | 24.5 | 15.7 | |
| Dota 2 Reborn (2015) | 109 | 90.7 | 55.4 | 52.4 |
| Final Fantasy XV Benchmark (2018) | 37.5 | 18.8 | 12.9 | |
| X-Plane 11.11 (2018) | 38.4 | 30.4 | 26.3 | |
| Strange Brigade (2018) | 86.8 | 33.8 | 28.1 | 23.2 |
| Cyberpunk 2077 1.6 (2022) | 20.3 | 15.3 | 10.5 | 8.5 |
| Tiny Tina's Wonderlands (2022) | 28.8 | 21.2 | 12.9 | 9.2 |
| F1 22 (2022) | 36.2 | 32.3 | 23.9 | 17.1 |
| Returnal (2023) | 13 | 12 |
Emissions
System Noise
The fan is generally quiet during low loads like browsing or video streaming where it tends to hover in the 27 dB(A) range against a silent background of 23.6 dB(A). When under heavier loads like 3DMark 06, however, fan noise would quickly jump to just over 40 dB(A) even when on the Balanced power profile. We're able to record a maximum fan noise of just over 44 dB(A) when running high loads like games to be even louder than what we recorded on the older Inspiron 16 7620 2-in-1.
Noise level
| Idle |
| 23.6 / 23.6 / 23.6 dB(A) |
| Load |
| 40.3 / 44.2 dB(A) |
 | ||
30 dB silent 40 dB(A) audible 50 dB(A) loud |
||
min: | ||
| Dell Inspiron 16 7635 2-in-1 Vega 7, R5 7530U, Kioxia BG5 KBG50ZNS512G | Acer Swift Edge SFE16-42-R1GM Radeon 680M, R7 7735U, Micron 3400 1TB MTFDKBA1T0TFH | Lenovo Yoga 7 16IRL8 Iris Xe G7 96EUs, i7-1355U, WD PC SN740 512GB SDDPMQD-512G-1101 | Samsung Galaxy Book3 Pro 16 Iris Xe G7 80EUs, i5-1340P, WD PC SN740 256GB SDDPNQD-256G | Lenovo IdeaPad Flex 5 16ABR G8 Vega 8, R7 7730U, Samsung PM9B1 1024GB MZAL41T0HBLB | Dell Inspiron 16 7620 2-in-1 Iris Xe G7 96EUs, i7-1260P, Toshiba KBG40ZNS512G NVMe | |
|---|---|---|---|---|---|---|
| Noise | -10% | -0% | -11% | -0% | 8% | |
| off / environment * (dB) | 23.6 | 25.7 -9% | 22.8 3% | 25.2 -7% | 24.2 -3% | 23.2 2% |
| Idle Minimum * (dB) | 23.6 | 25.7 -9% | 22.9 3% | 25.2 -7% | 24.2 -3% | 23.5 -0% |
| Idle Average * (dB) | 23.6 | 27 -14% | 22.9 3% | 25.2 -7% | 24.2 -3% | 23.5 -0% |
| Idle Maximum * (dB) | 23.6 | 29.3 -24% | 26.9 -14% | 29.3 -24% | 28.7 -22% | 23.5 -0% |
| Load Average * (dB) | 40.3 | 42.3 -5% | 41.7 -3% | 46.4 -15% | 33.1 18% | 29.4 27% |
| Witcher 3 ultra * (dB) | 44.2 | 41.5 6% | 41.8 5% | 35.6 19% | ||
| Load Maximum * (dB) | 44.2 | 42.7 3% | 43.6 1% | 46.4 -5% | 41.8 5% | 39.7 10% |
* ... smaller is better
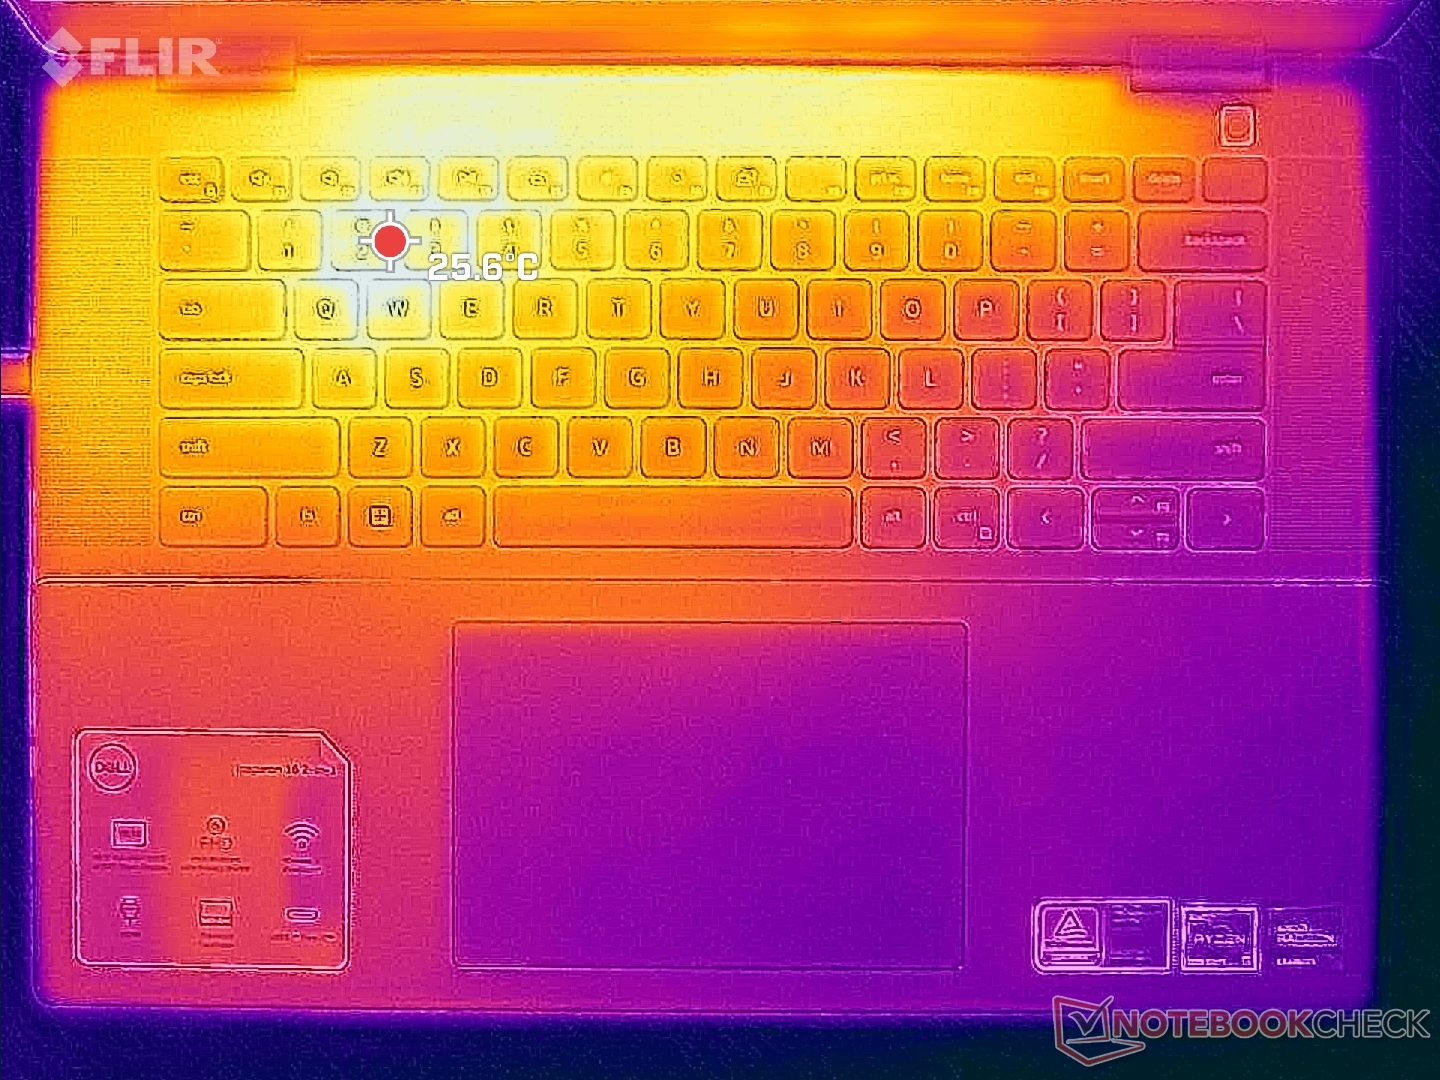
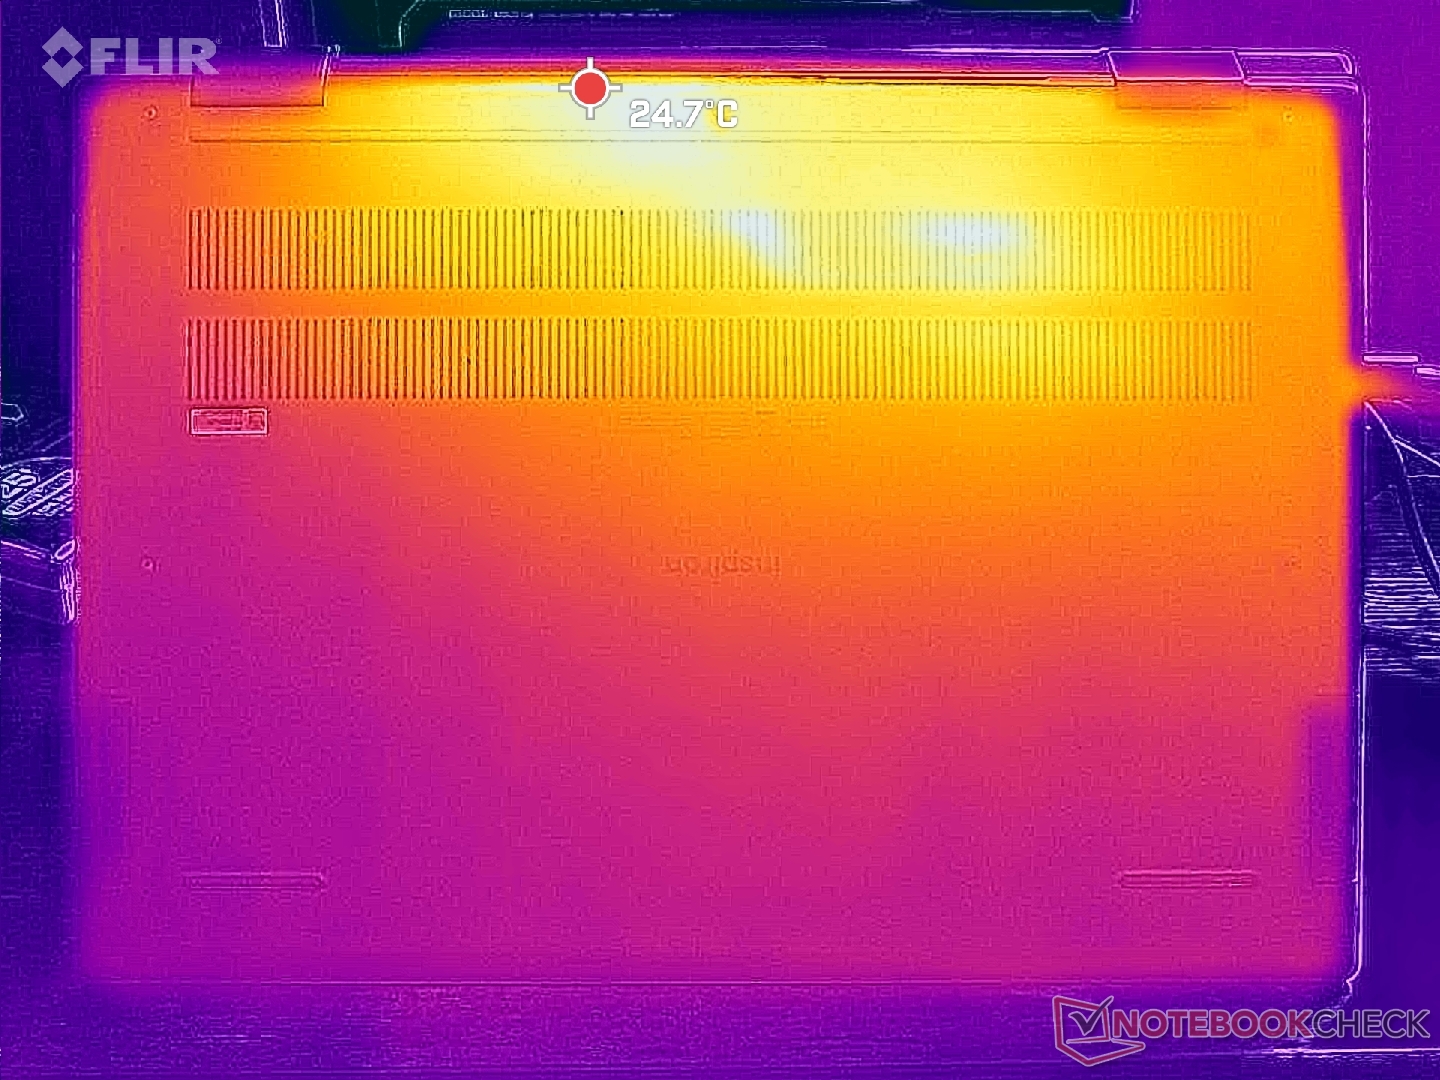
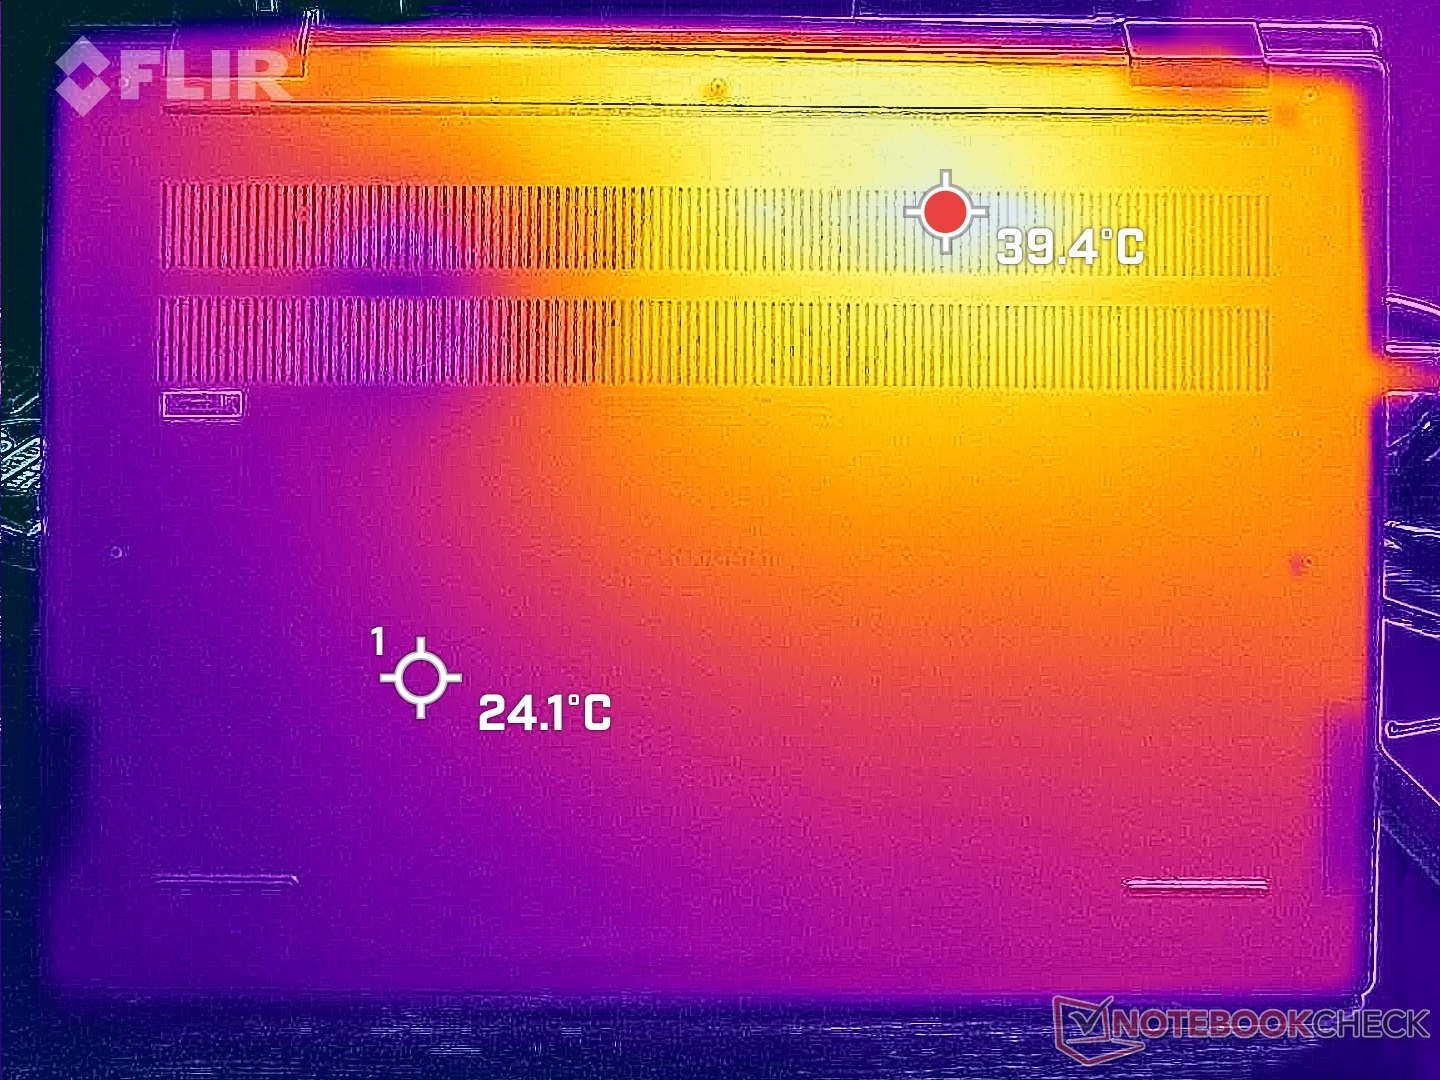
Temperature
Surface temperatures are warmest on the left half of the keyboard instead of the center since the positioning of the processor has shifted from last year's design. Hot spots can reach just over 40 C on the top and bottom surfaces which is still noticeably cooler than on the IdeaPad Flex 5 16 or older Inspiron 16 7620 2-in-1 where surface temperatures can reach closer to 50 C when under load. The generally louder fan noise of the Inspiron 16 7635 2-in-1 may be partly responsible for its cooler surface temperatures.
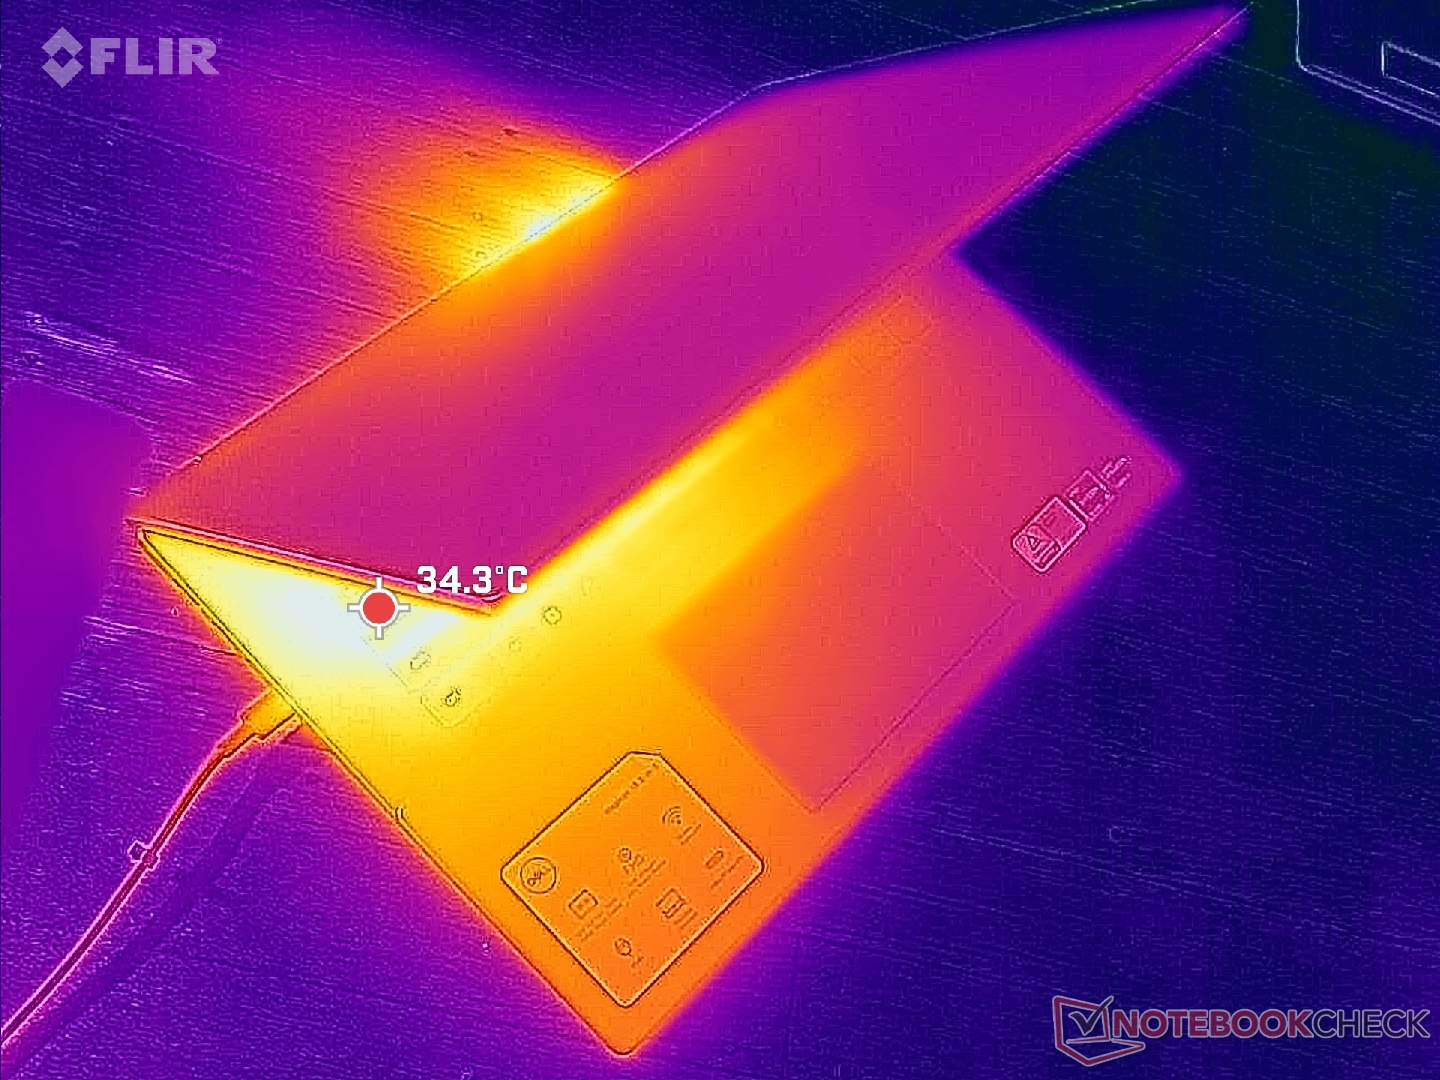
(±) The maximum temperature on the upper side is 41.6 °C / 107 F, compared to the average of 35.4 °C / 96 F, ranging from 19.6 to 60 °C for the class Convertible.
(+) The bottom heats up to a maximum of 39 °C / 102 F, compared to the average of 36.9 °C / 98 F
(+) In idle usage, the average temperature for the upper side is 25.8 °C / 78 F, compared to the device average of 30.3 °C / 87 F.
(+) The palmrests and touchpad are cooler than skin temperature with a maximum of 31.4 °C / 88.5 F and are therefore cool to the touch.
(-) The average temperature of the palmrest area of similar devices was 28 °C / 82.4 F (-3.4 °C / -6.1 F).

| Dell Inspiron 16 7635 2-in-1 AMD Ryzen 5 7530U, AMD Radeon RX Vega 7 | Acer Swift Edge SFE16-42-R1GM AMD Ryzen 7 7735U, AMD Radeon 680M | Lenovo Yoga 7 16IRL8 Intel Core i7-1355U, Intel Iris Xe Graphics G7 96EUs | Samsung Galaxy Book3 Pro 16 Intel Core i5-1340P, Intel Iris Xe Graphics G7 80EUs | Lenovo IdeaPad Flex 5 16ABR G8 AMD Ryzen 7 7730U, AMD Radeon RX Vega 8 (Ryzen 4000/5000) | Dell Inspiron 16 7620 2-in-1 Intel Core i7-1260P, Intel Iris Xe Graphics G7 96EUs | |
|---|---|---|---|---|---|---|
| Heat | -15% | -1% | -9% | -5% | -13% | |
| Maximum Upper Side * (°C) | 41.6 | 49.4 -19% | 37.6 10% | 41.6 -0% | 51.4 -24% | 42.2 -1% |
| Maximum Bottom * (°C) | 39 | 44.7 -15% | 40 -3% | 45 -15% | 47.8 -23% | 47.4 -22% |
| Idle Upper Side * (°C) | 29.4 | 34 -16% | 30.4 -3% | 31 -5% | 24.8 16% | 32.2 -10% |
| Idle Bottom * (°C) | 28.6 | 31.6 -10% | 30.6 -7% | 33.6 -17% | 24.9 13% | 33.6 -17% |
* ... smaller is better
Stress Test
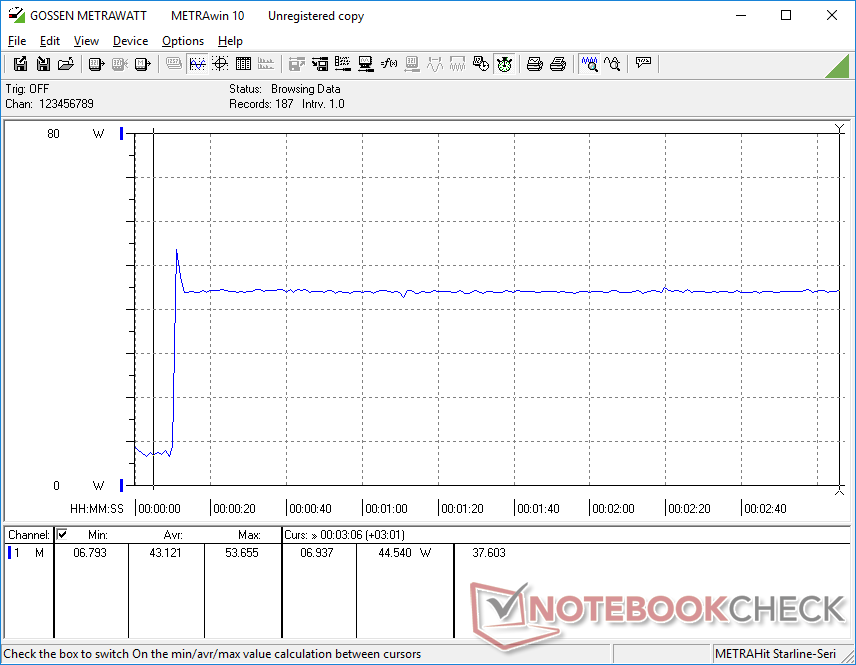
Processor clock rates, board power draw, and temperature when running Prime95 would spike to 3.4 GHz, 35 W, and 81 C, respectively. The CPU would eventually stabilize at 3 GHz, 28 W, and 90 C after just a minute or so compared to 81 C on last year's Intel-powered Inspiron 16 7620 2-in-1.
Running on battery power reduces performance slightly. A 3DMark 11 test on batteries would return Physics and Graphics scores of 12497 and 5935 points, respectively, compared to 12926 and 6249 points when on mains.
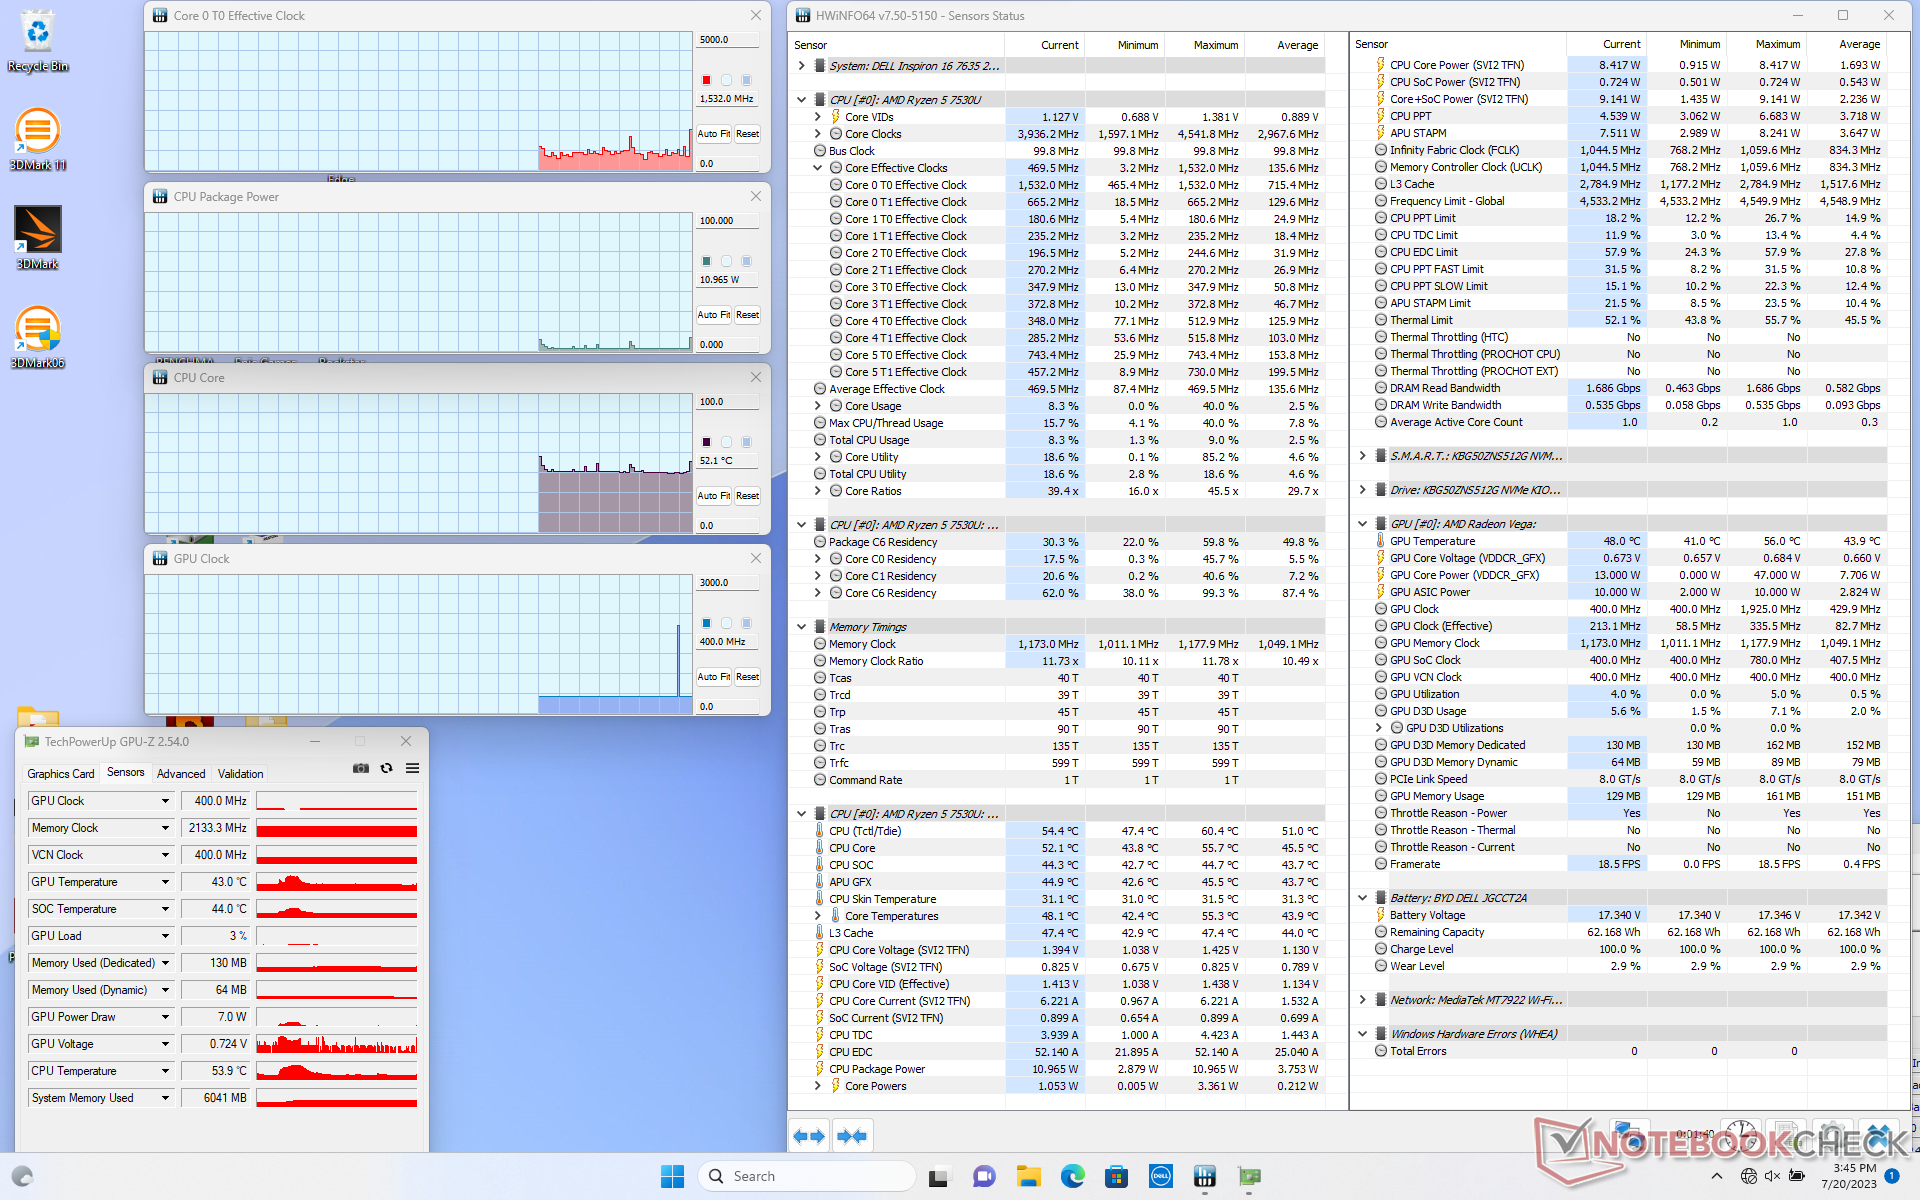
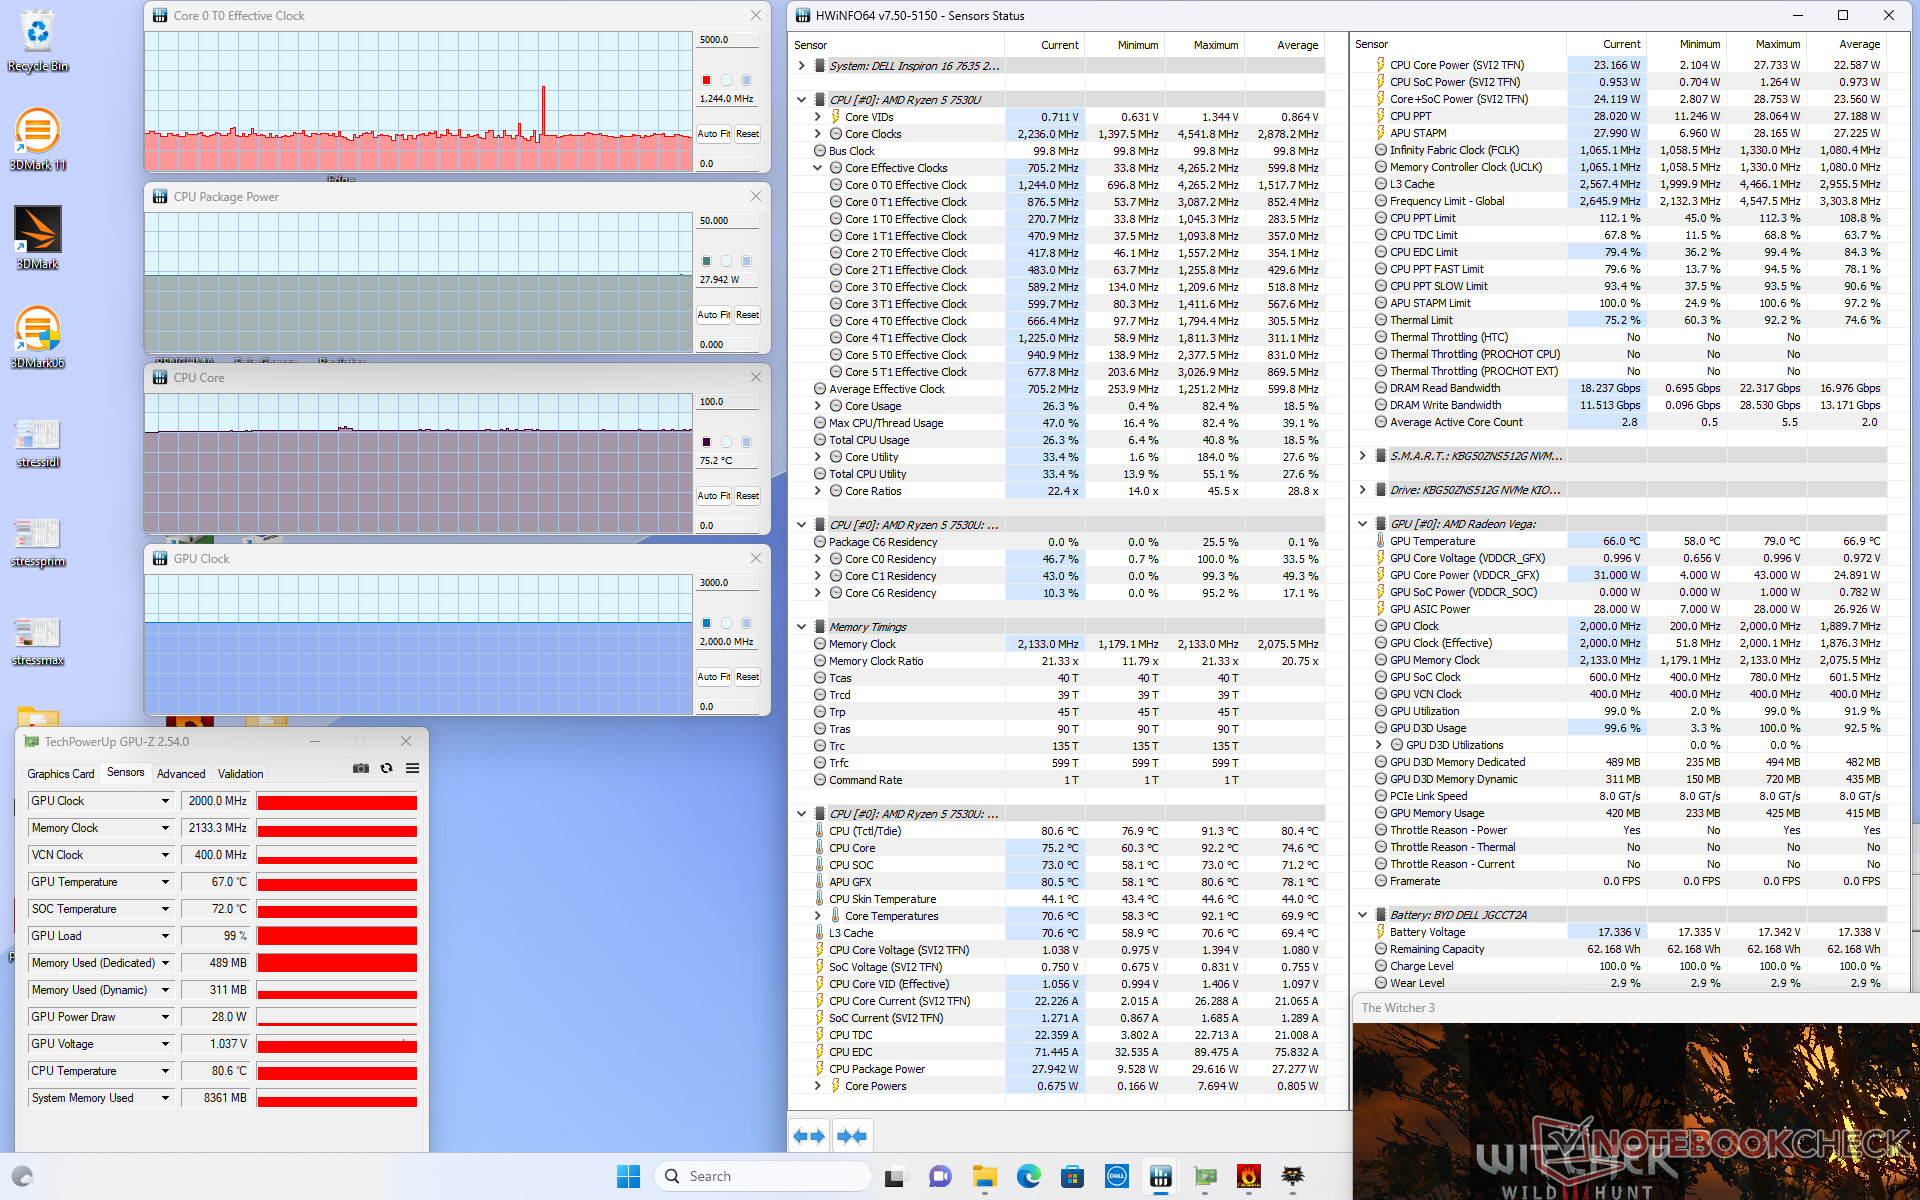
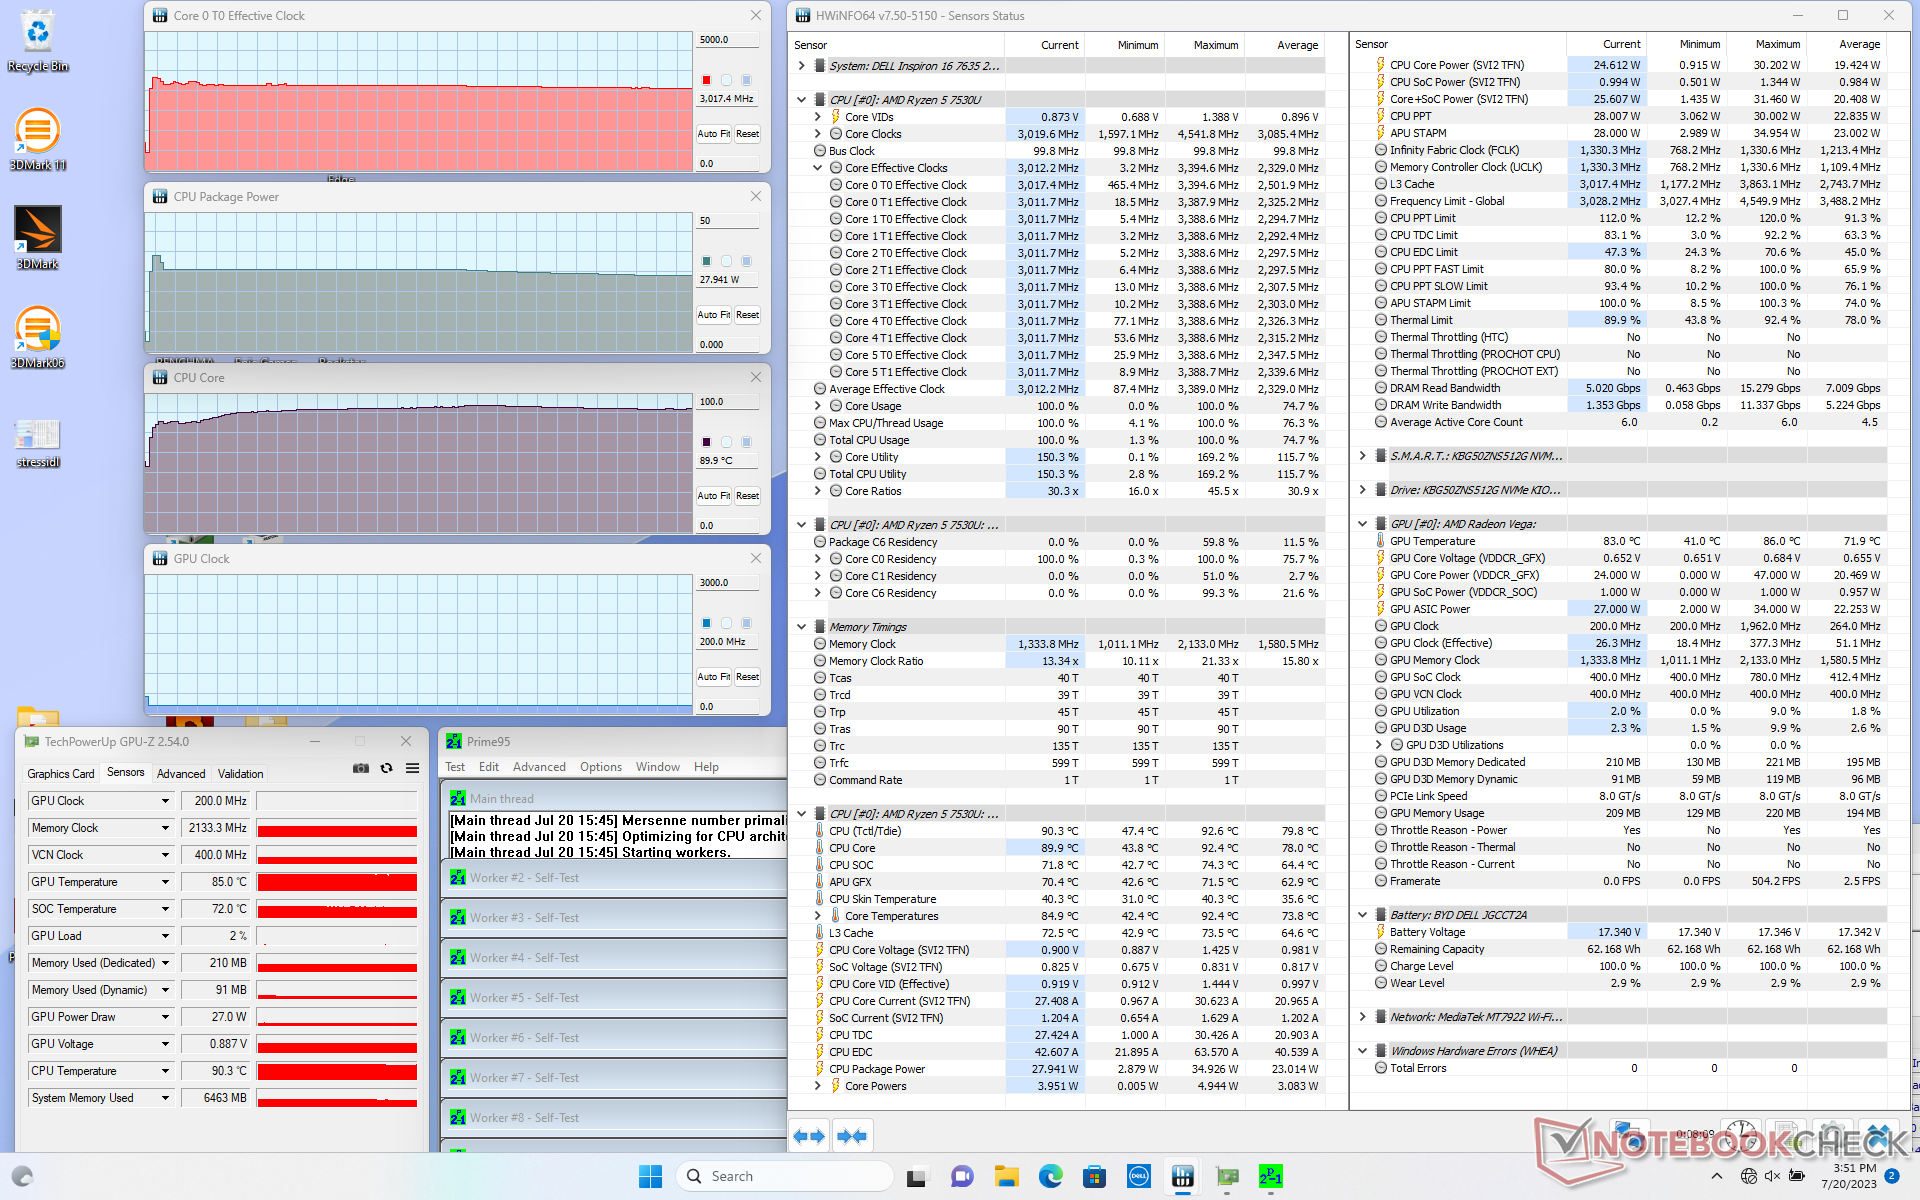
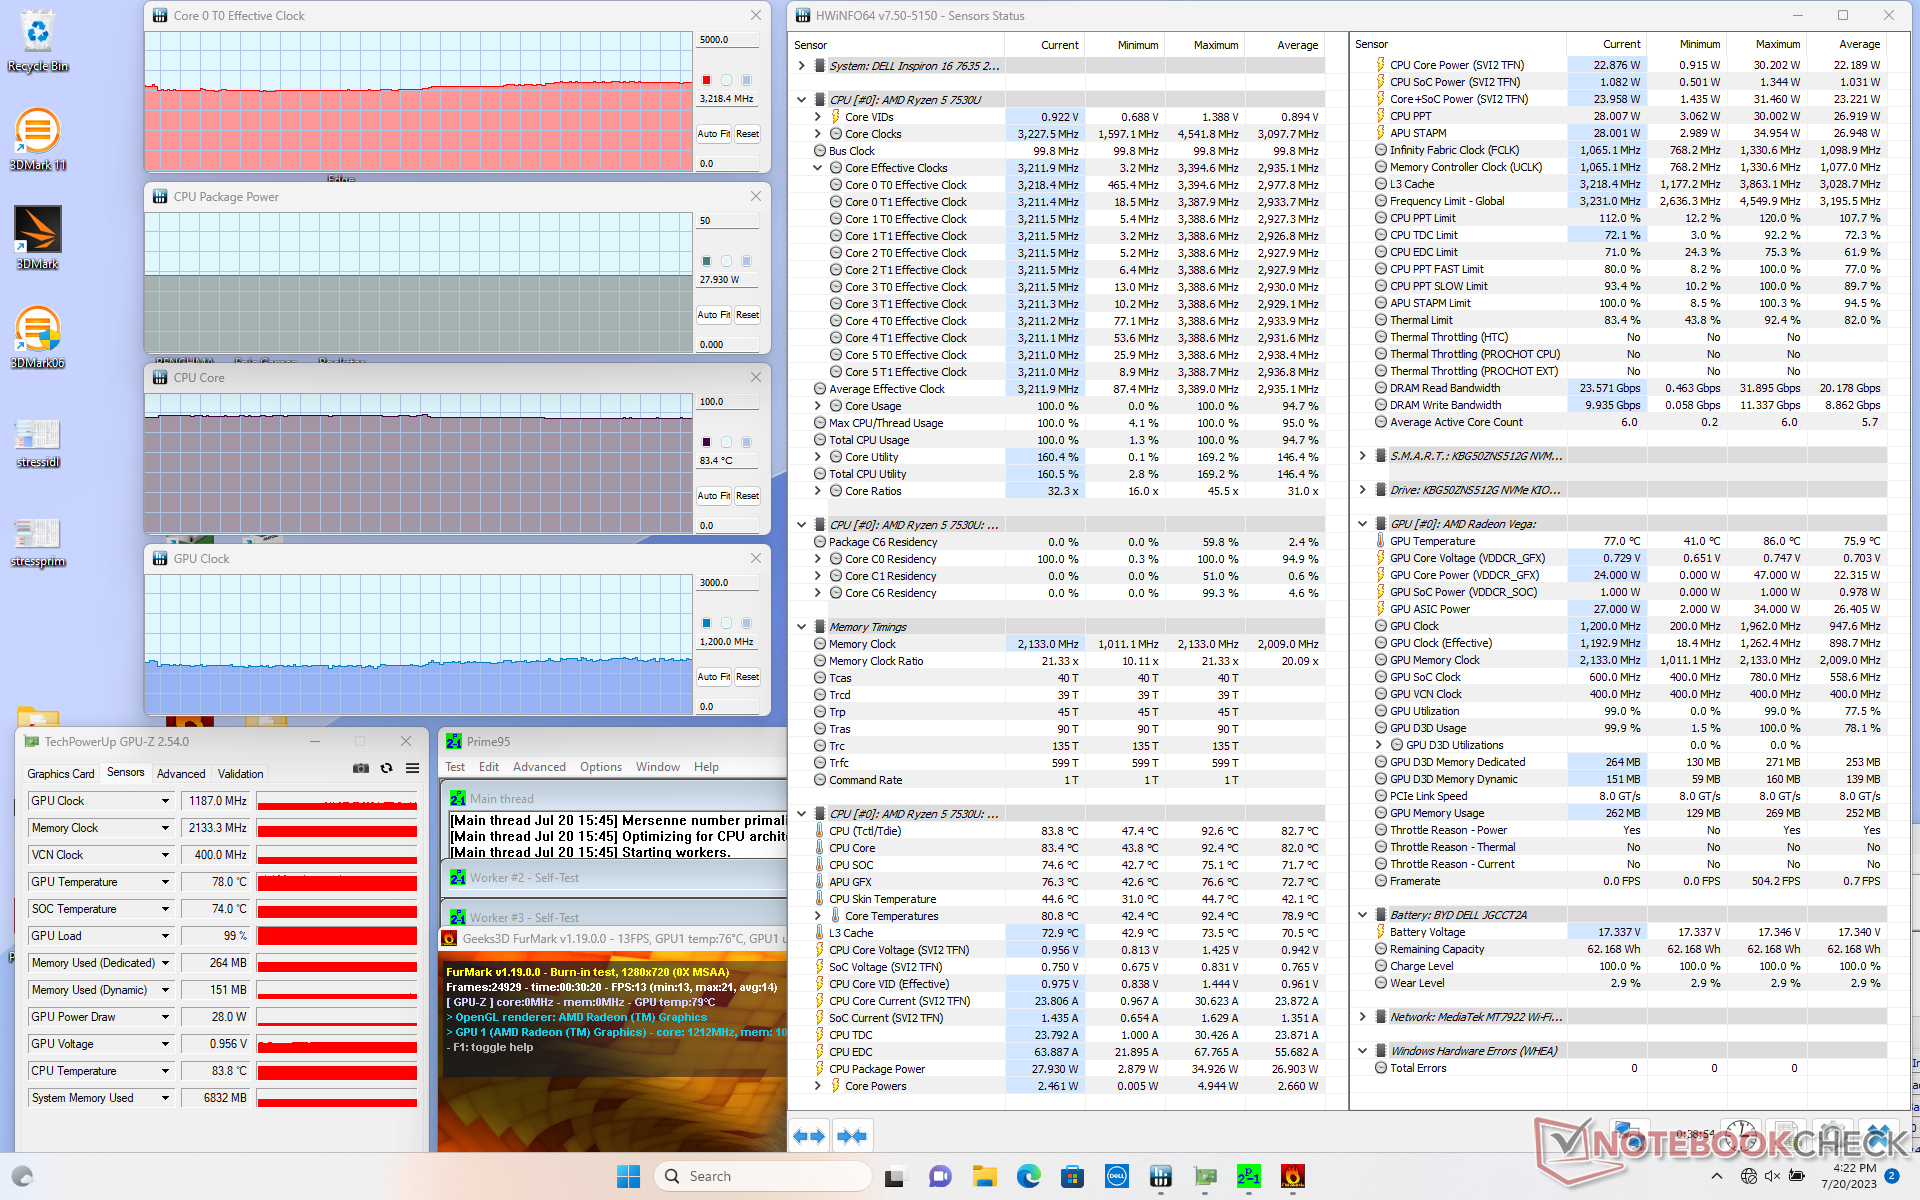
| CPU Clock (GHz) | GPU Clock (MHz) | Average CPU Temperature (°C) | |
| System Idle | -- | -- | 52 |
| Prime95 Stress | 3.0 | -- | 90 |
| Prime95 + FurMark Stress | 3.1 - 3.2 | 1187 | 83 |
| Witcher 3 Stress | 1.2 | 2000 | 75 |
Speakers
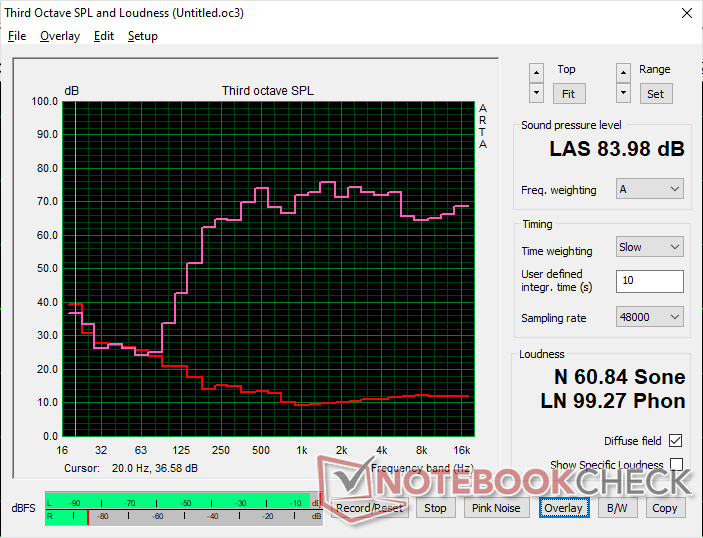
Dell Inspiron 16 7635 2-in-1 audio analysis
(+) | speakers can play relatively loud (84 dB)
Bass 100 - 315 Hz
(±) | reduced bass - on average 14.9% lower than median
(±) | linearity of bass is average (11.9% delta to prev. frequency)
Mids 400 - 2000 Hz
(+) | balanced mids - only 3.5% away from median
(+) | mids are linear (6.9% delta to prev. frequency)
Highs 2 - 16 kHz
(+) | balanced highs - only 4.1% away from median
(+) | highs are linear (3.7% delta to prev. frequency)
Overall 100 - 16.000 Hz
(+) | overall sound is linear (12.2% difference to median)
Compared to same class
» 12% of all tested devices in this class were better, 4% similar, 84% worse
» The best had a delta of 6%, average was 20%, worst was 57%
Compared to all devices tested
» 10% of all tested devices were better, 2% similar, 88% worse
» The best had a delta of 4%, average was 23%, worst was 134%
Apple MacBook Pro 16 2021 M1 Pro audio analysis
(+) | speakers can play relatively loud (84.7 dB)
Bass 100 - 315 Hz
(+) | good bass - only 3.8% away from median
(+) | bass is linear (5.2% delta to prev. frequency)
Mids 400 - 2000 Hz
(+) | balanced mids - only 1.3% away from median
(+) | mids are linear (2.1% delta to prev. frequency)
Highs 2 - 16 kHz
(+) | balanced highs - only 1.9% away from median
(+) | highs are linear (2.7% delta to prev. frequency)
Overall 100 - 16.000 Hz
(+) | overall sound is linear (4.6% difference to median)
Compared to same class
» 0% of all tested devices in this class were better, 0% similar, 100% worse
» The best had a delta of 5%, average was 17%, worst was 45%
Compared to all devices tested
» 0% of all tested devices were better, 0% similar, 100% worse
» The best had a delta of 4%, average was 23%, worst was 134%
Energy Management
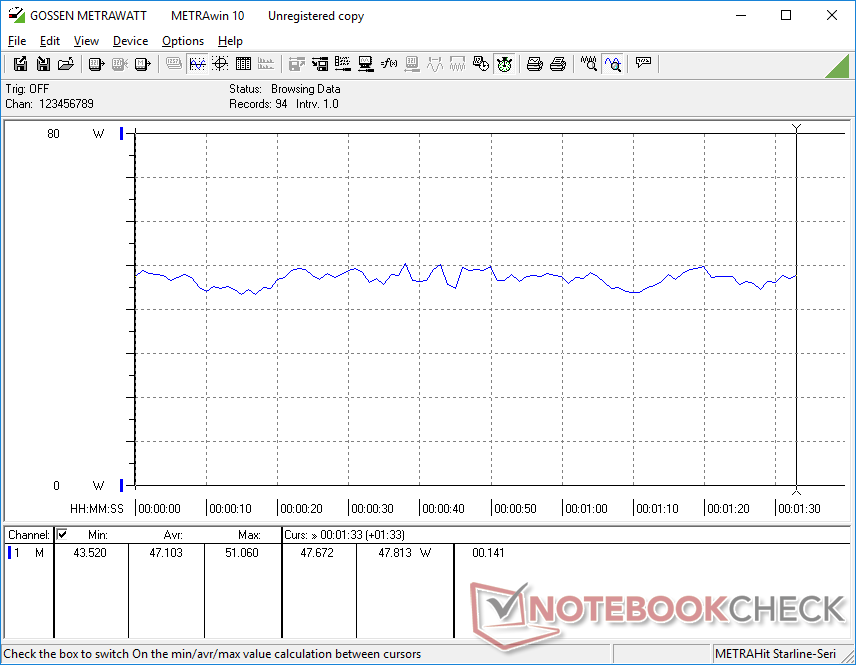
Power Consumption
Power consumption under most conditions is consistently lower than on last year's Core-P-powered Inspiron 16 7620 2-in-1 which may be responsible for the good battery life results in the next section. It's also lower than the Core-U-powered Yoga 7 16IRL8 on average to show excellent performance-per-watt against the competition.
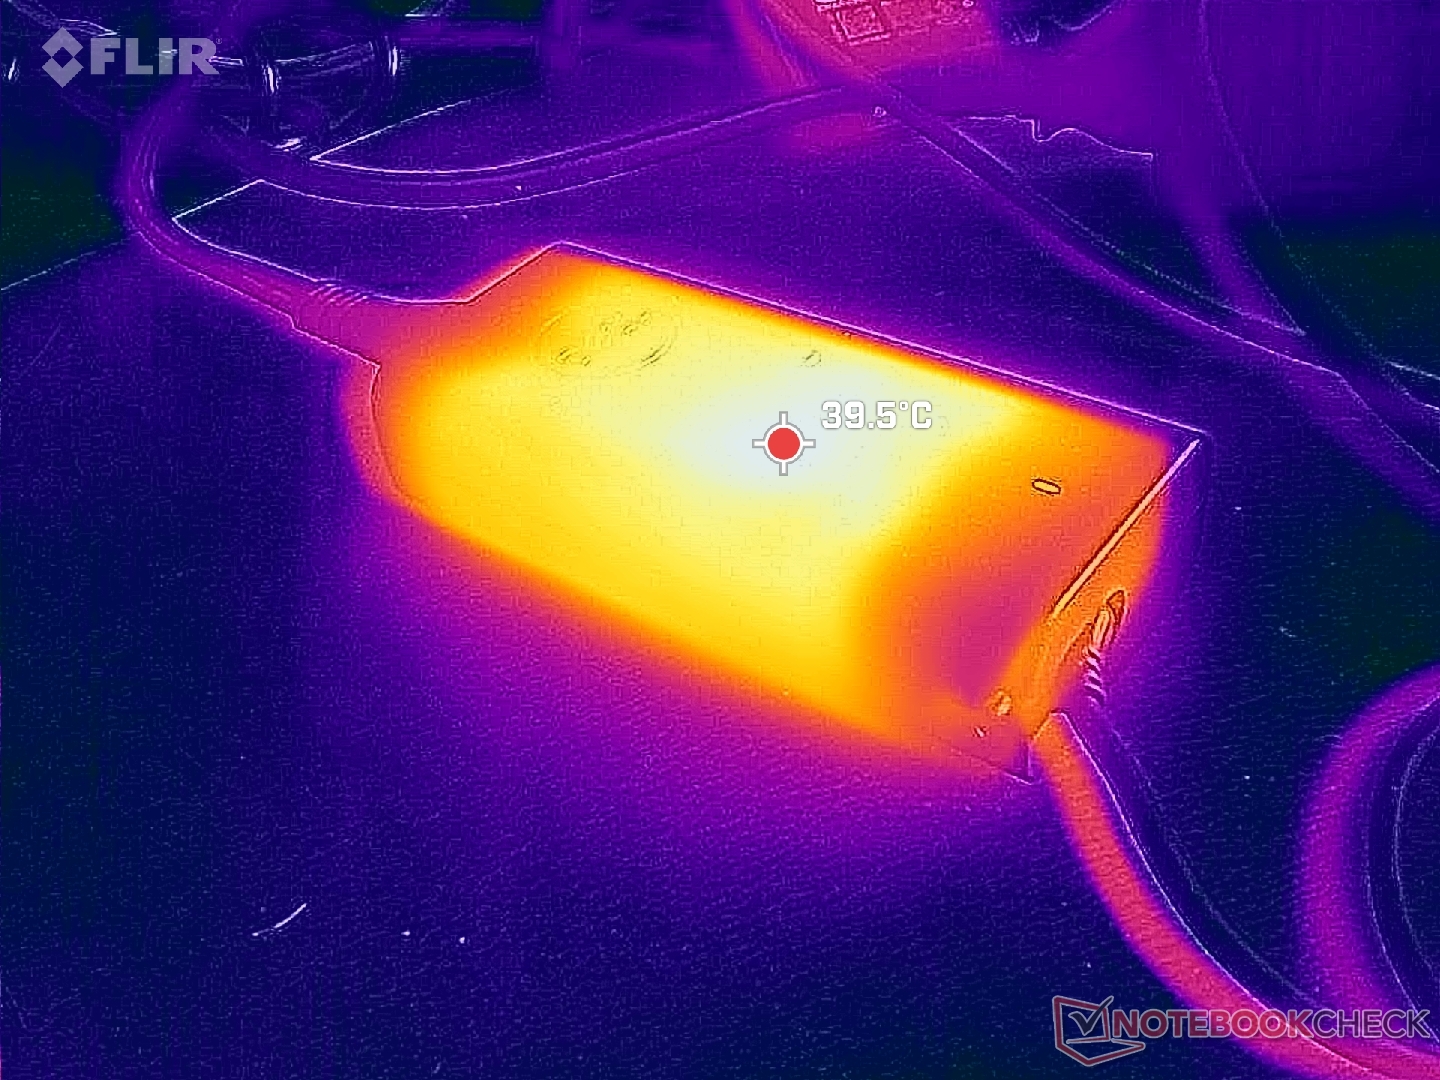
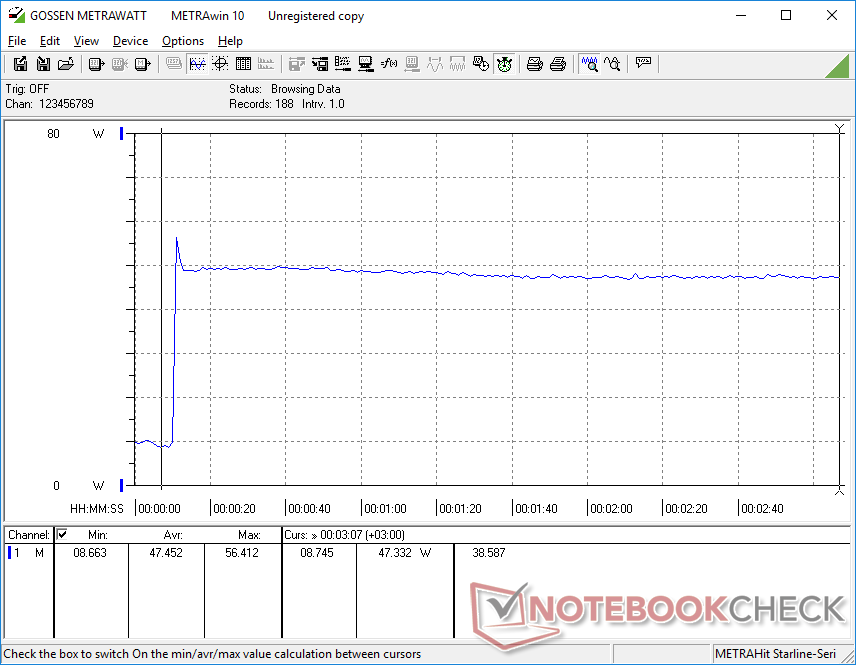
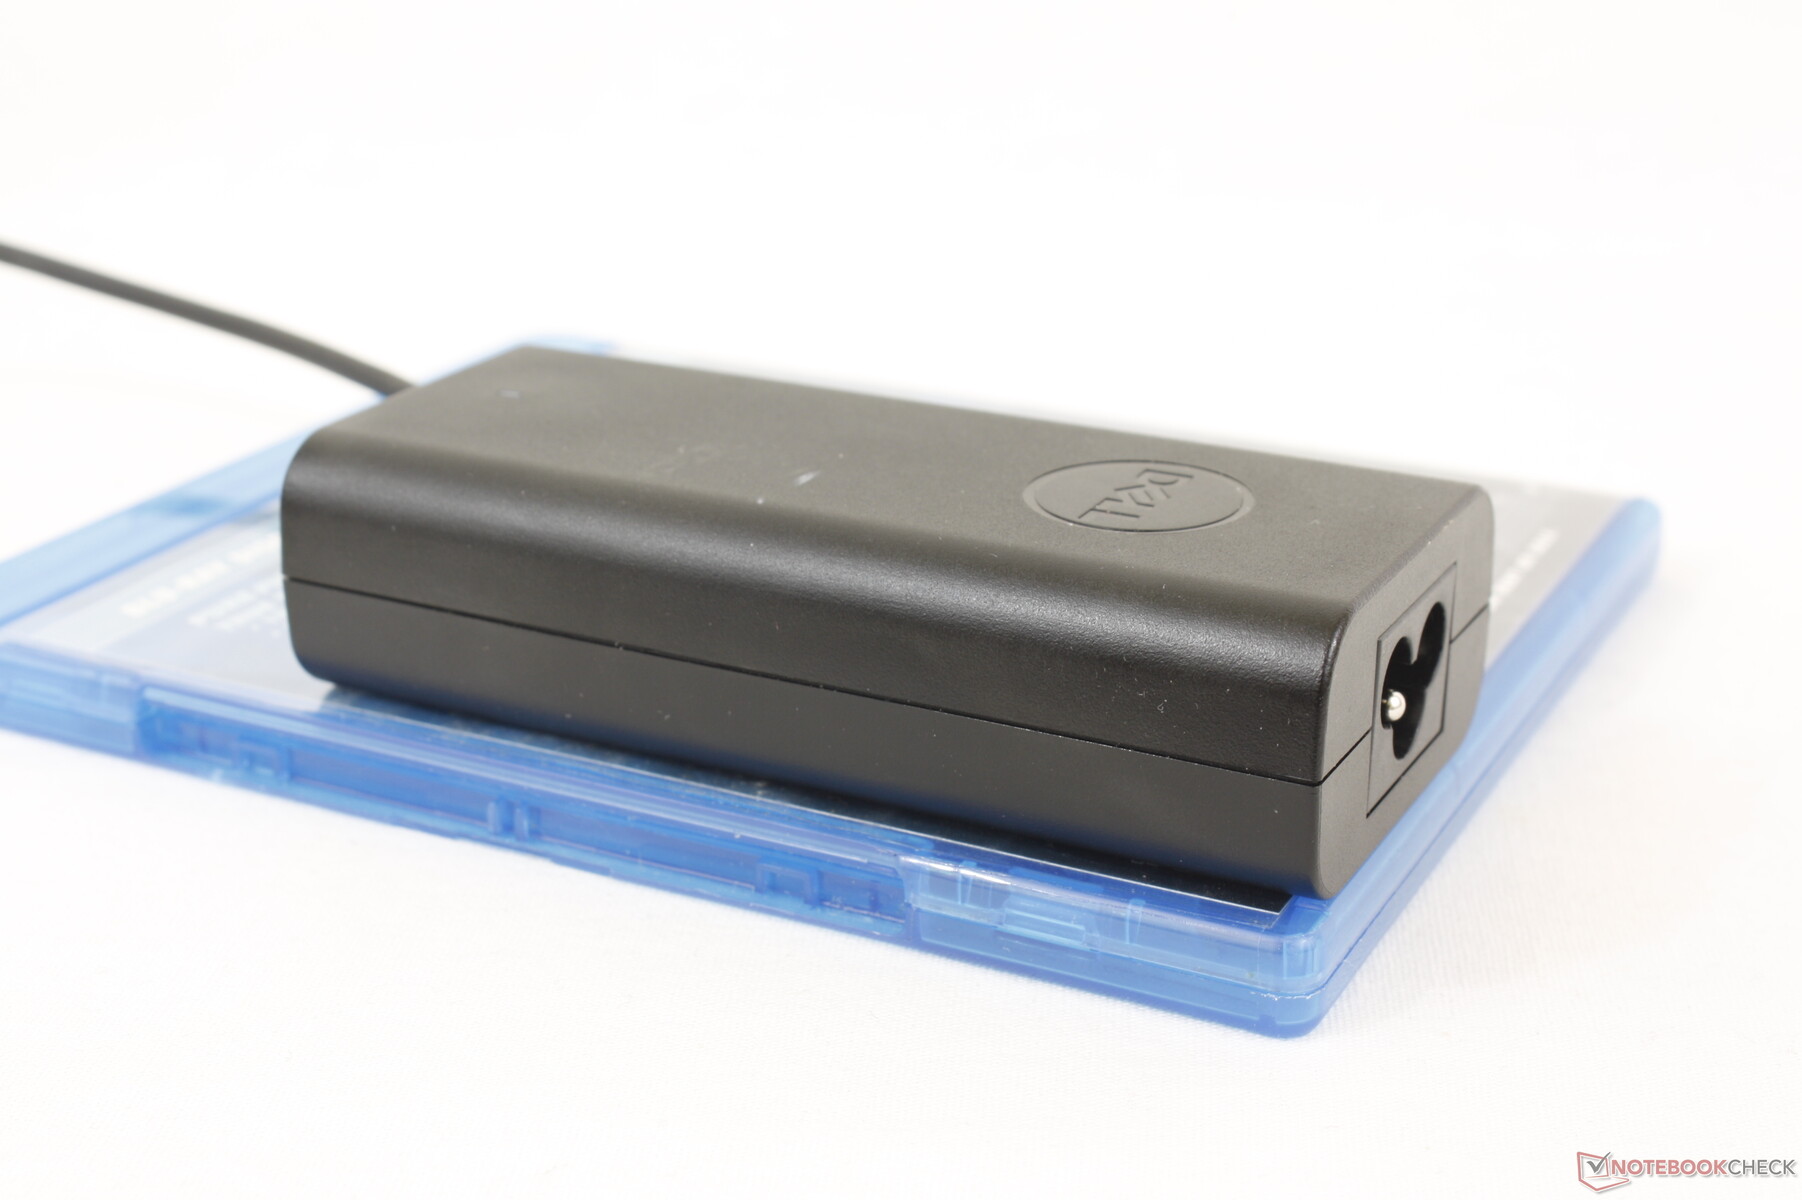
We're able to measure a maximum draw of 57 W from the small-medium (~11.2 x 5 x 2.8 cm) 65 W AC adapter when the CPU is at 100 percent utilization. The spacious overhead ensures that the system can still charge when running demanding loads even if at a slower rate and that the CPU is not bottlenecked by an insufficient AC adapter size.

| Off / Standby | |
| Idle | |
| Load |
|
Key:
min: | |
| Dell Inspiron 16 7635 2-in-1 R5 7530U, Vega 7, Kioxia BG5 KBG50ZNS512G, IPS, 1920x1200, 16" | Acer Swift Edge SFE16-42-R1GM R7 7735U, Radeon 680M, Micron 3400 1TB MTFDKBA1T0TFH, OLED, 3840x2400, 16" | Lenovo Yoga 7 16IRL8 i7-1355U, Iris Xe G7 96EUs, WD PC SN740 512GB SDDPMQD-512G-1101, IPS, 1920x1200, 16" | Samsung Galaxy Book3 Pro 16 i5-1340P, Iris Xe G7 80EUs, WD PC SN740 256GB SDDPNQD-256G, AMOLED, 2880x1800, 16" | Lenovo IdeaPad Flex 5 16ABR G8 R7 7730U, Vega 8, Samsung PM9B1 1024GB MZAL41T0HBLB, IPS, 1920x1200, 16" | Dell Inspiron 16 7620 2-in-1 i7-1260P, Iris Xe G7 96EUs, Toshiba KBG40ZNS512G NVMe, IPS, 1920x1200, 16" | |
|---|---|---|---|---|---|---|
| Power Consumption | -15% | -8% | 8% | -21% | -10% | |
| Idle Minimum * (Watt) | 4.8 | 8.6 -79% | 3.3 31% | 3.9 19% | 5.4 -13% | 5.3 -10% |
| Idle Average * (Watt) | 7.6 | 7.7 -1% | 10.2 -34% | 4.8 37% | 11.1 -46% | 8.3 -9% |
| Idle Maximum * (Watt) | 8.7 | 9.3 -7% | 10.3 -18% | 10 -15% | 11.6 -33% | 9.6 -10% |
| Load Average * (Watt) | 47.1 | 47.9 -2% | 55.2 -17% | 44 7% | 52.7 -12% | 54.3 -15% |
| Witcher 3 ultra * (Watt) | 46.6 | 46.3 1% | 43.8 6% | 42.3 9% | 47.6 -2% | 43.9 6% |
| Load Maximum * (Watt) | 56.4 | 56 1% | 65.7 -16% | 63 -12% | 67 -19% | 70 -24% |
* ... smaller is better
Power Consumption Witcher 3 / Stresstest
Power Consumption external Monitor
Battery Life
The Inspiron 16 7635 2-in-1 comes with a 64 Wh battery pack compared to the larger 86 Wh pack for the Inspiron 16 7630 2-in-1 or 7620 2-in-1. AMD users are therefore getting the short end of the stick as the larger battery is currently exclusive to the Intel configurations.
Battery life is nevertheless still very good despite the smaller battery pack on our AMD unit. We're able to record 14.5 hours of real-world WLAN browsing use which is almost the same as what we recorded on last year's Intel-powered Inspiron 16 7620 2-in-1. It's longer than the similarly equipped IdeaPad Flex 5 16 as well by several hours.
Charging from empty to full capacity with the included AC adapter takes about 2 hours.
| Dell Inspiron 16 7635 2-in-1 R5 7530U, Vega 7, 64 Wh | Acer Swift Edge SFE16-42-R1GM R7 7735U, Radeon 680M, 54 Wh | Lenovo Yoga 7 16IRL8 i7-1355U, Iris Xe G7 96EUs, 71 Wh | Samsung Galaxy Book3 Pro 16 i5-1340P, Iris Xe G7 80EUs, 76 Wh | Lenovo IdeaPad Flex 5 16ABR G8 R7 7730U, Vega 8, 52.5 Wh | Dell Inspiron 16 7620 2-in-1 i7-1260P, Iris Xe G7 96EUs, 87 Wh | |
|---|---|---|---|---|---|---|
| Battery runtime | -43% | -17% | -3% | -37% | 11% | |
| Reader / Idle (h) | 26 | 10.9 -58% | 19 -27% | 30.4 17% | 17 -35% | |
| WiFi v1.3 (h) | 14.5 | 7.3 -50% | 9.4 -35% | 10.2 -30% | 9.8 -32% | 14.6 1% |
| Load (h) | 1.9 | 1.5 -21% | 2.1 11% | 2 5% | 1.1 -42% | 3.2 68% |
| H.264 (h) | 8.6 | 14.4 | 13.1 |
Pros
Cons
Verdict — Lots Of Cut Corners Compared To The Inspiron 16 7630 2-in-1
The AMD-powered Inspiron 16 7635 2-in-1 is more than just a processor swap when compared to the Intel-powered Inspiron 16 7630 2-in-1. It lacks options for a higher resolution OLED touchscreen, IR sensor, discrete graphics options, larger battery pack, and Thunderbolt support all in the name of being a little cheaper. If you're willing to pay just $100 more, then we recommend considering the Core i7-1360P Inspiron 16 7630 2-in-1 instead of our Ryzen 5 configuration as it will provide both faster CPU and GPU performance and double the storage capacity. It's a little heavier by 100 g, but both versions of the model are already quite heavy in the first place starting at 2 kg each.
The deeper sRGB colors of the Inspiron 16 7635 2-in-1 give Dell the edge against the competing Lenovo Flex 5 16.
For future revisions, we would definitely like to see Zen 4 or at least Zen 3+ processor options to boost the mediocre graphics performance. The Ryzen 7 7730U option is not recommended as it is more expensive, slower, and with fewer features than the Core i7-1360P configuration. Last year's Inspiron 16 7620 2-in-1 would still be worth considering especially since this latest revision isn't any lighter or more portable.
Price and Availability
The Inspiron 16 7635 2-in-1 and Inspiron 16 7630 2-in-1 are now shipping directly from Dell starting at $650 and $800 USD, respectively. Our specific configuration as reviewed retails for $900.
Dell Inspiron 16 7635 2-in-1
- 07/23/2023 v7 (old)
Allen Ngo
Transparency
The selection of devices to be reviewed is made by our editorial team. The test sample was provided to the author as a loan by the manufacturer or retailer for the purpose of this review. The lender had no influence on this review, nor did the manufacturer receive a copy of this review before publication. There was no obligation to publish this review. As an independent media company, Notebookcheck is not subjected to the authority of manufacturers, retailers or publishers.
This is how Notebookcheck is testing
Every year, Notebookcheck independently reviews hundreds of laptops and smartphones using standardized procedures to ensure that all results are comparable. We have continuously developed our test methods for around 20 years and set industry standards in the process. In our test labs, high-quality measuring equipment is utilized by experienced technicians and editors. These tests involve a multi-stage validation process. Our complex rating system is based on hundreds of well-founded measurements and benchmarks, which maintains objectivity. Further information on our test methods can be found here.
Price comparison
