Dell OptiPlex Micro Plus 7010 review: Desktop Core i7-13700 in a mini PC package

The OptiPlex Micro is a mini PC designed for commercial and professional purposes, but its compact form factor has its applications for WFH environments especially when compared to the standard full-size OptiPlex models. This particular model is notable for its desktop processor whereas most other mini PCs rely on mobile H or HX series CPUs instead.
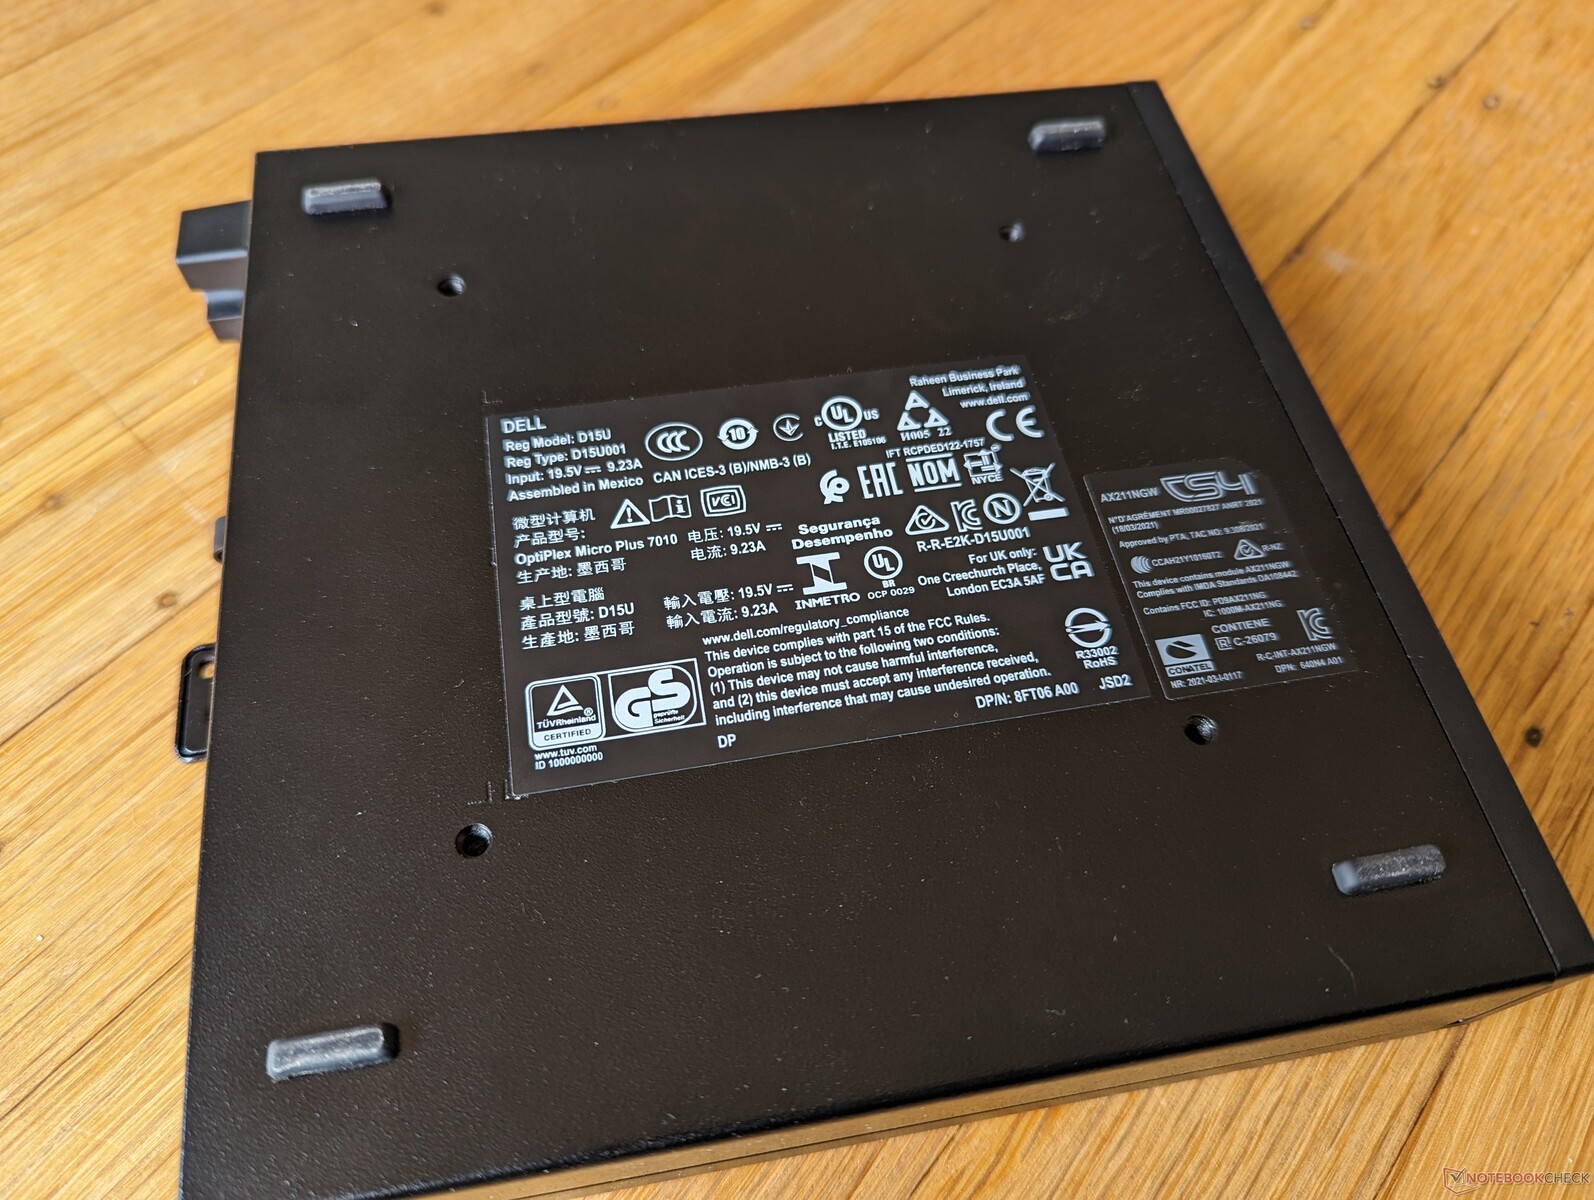
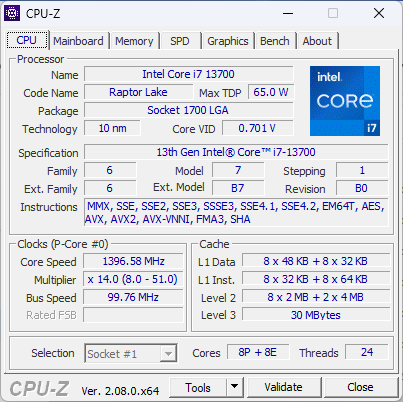
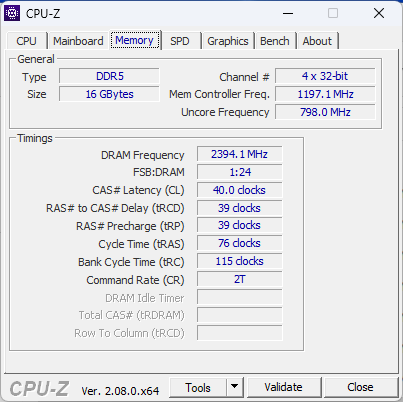
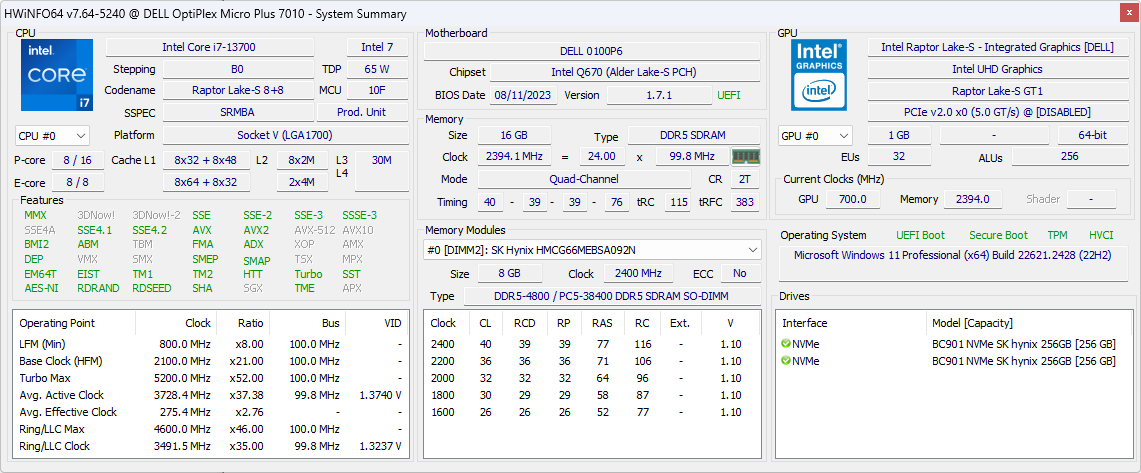
Our specific test unit has been configured with the 13th gen Core i7-13700 CPU, 16 GB DDR5-4800 RAM, and 512 GB SSD in RAID 0. Lower-end configurations start with the Core i3-13100T for under $900 up to the Core i9-13900 vPro. Non-Plus SKUs can ship with an even slower Pentium Gold G7400T. No configurations at the moment offer discrete graphics or any AMD alternatives.
The OptiPlex Micro competes against other semi-professional mini PCs like the Apple Mac Mini M2, Beelink GTR7, or the Intel NUC series.
More Dell reviews:
Potential Competitors in Comparison
Rating | Date | Model | Weight | Height | Size | Resolution | Price |
|---|---|---|---|---|---|---|---|
| 80.2 % v7 (old) | 10 / 2023 | Dell OptiPlex Micro i7-13700, UHD Graphics 770 | 1.2 kg | 36 mm | x | ||
| 87.3 % v7 (old) | 09 / 2023 | Apple Mac Mini M2 M2, M2 10-Core GPU | 1.2 kg | 36 mm | x | ||
| 81 % v7 (old) | 09 / 2023 | Lenovo IdeaCentre Mini 01IRH8 i7-13700H, Iris Xe G7 96EUs | 1.8 kg | 39 mm | x | ||
| 82.8 % v7 (old) | 10 / 2023 | GMK NucBox K3 Pro i7-12650H, UHD Graphics 64EUs | 396 g | 43.2 mm | x | ||
| 86.3 % v7 (old) | 07 / 2023 | Beelink GTR7 7840HS R7 7840HS, Radeon 780M | 890 g | 48.8 mm | x | ||
| 86.6 % v7 (old) | 09 / 2023 | Beelink SER7 R7 7840HS, Radeon 780M | 640 g | 49 mm | x |
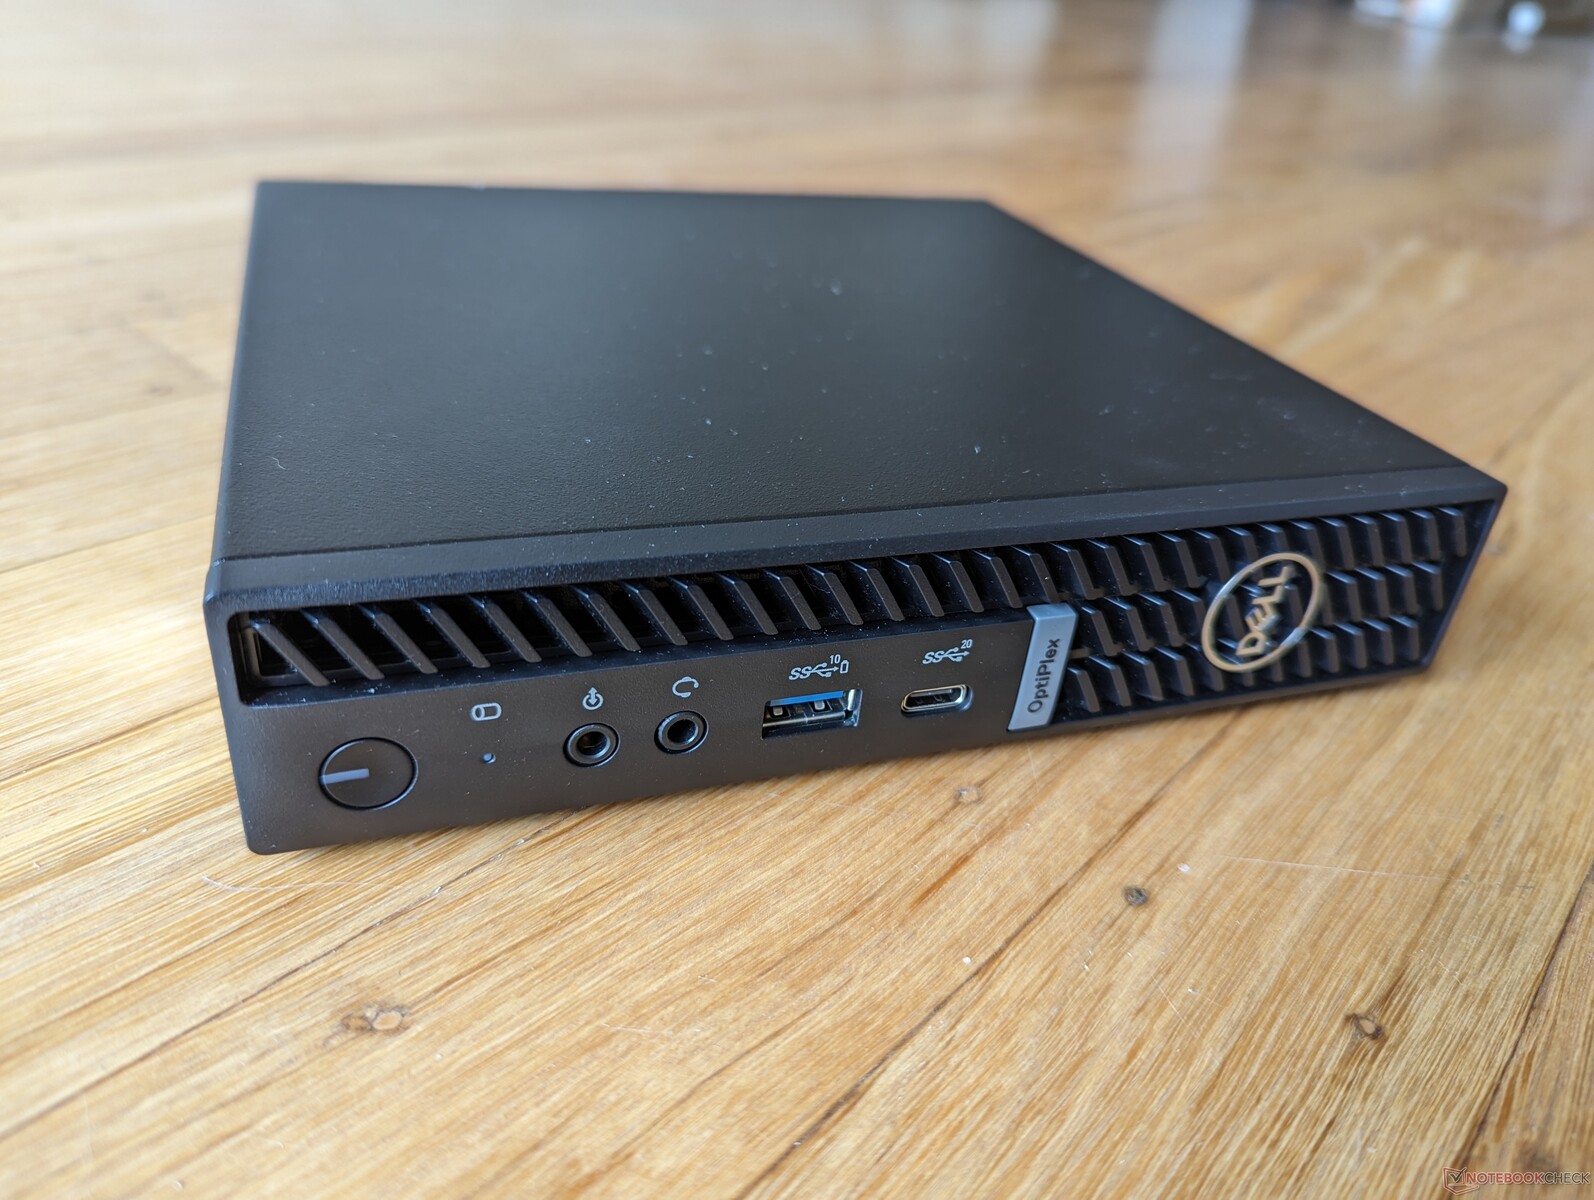
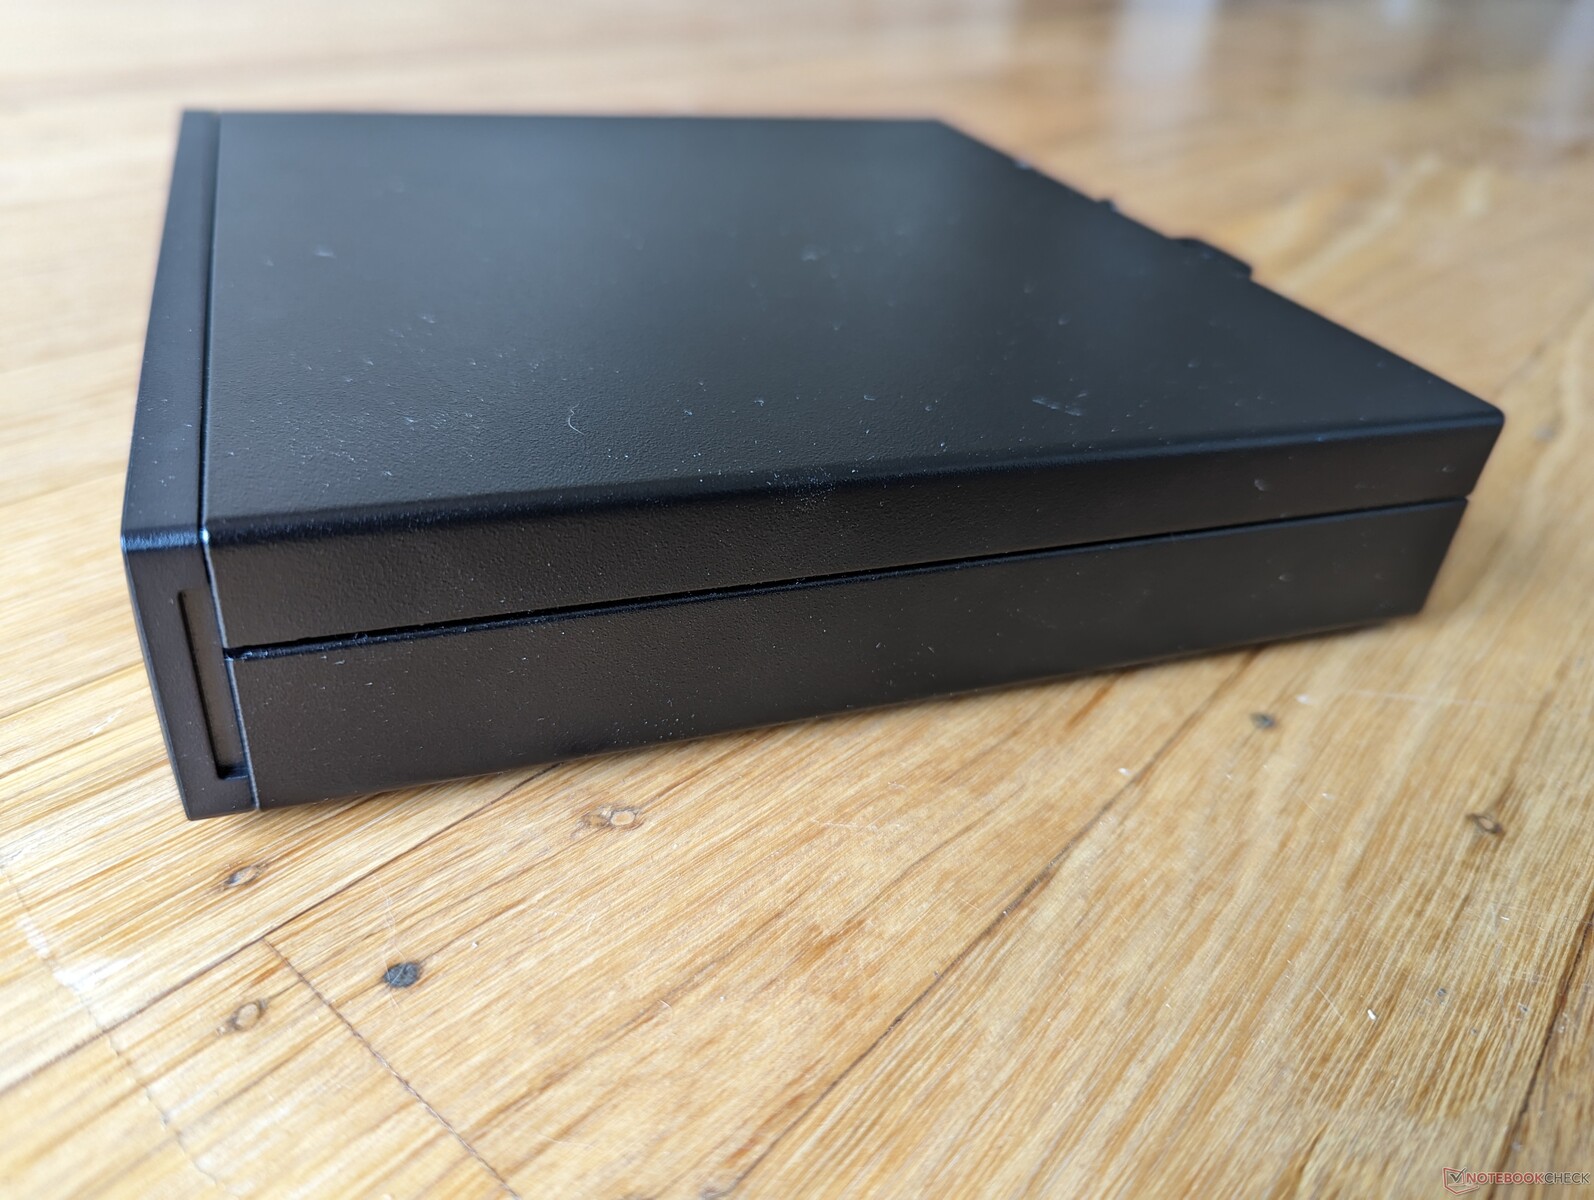
Case — Mini Tower Look
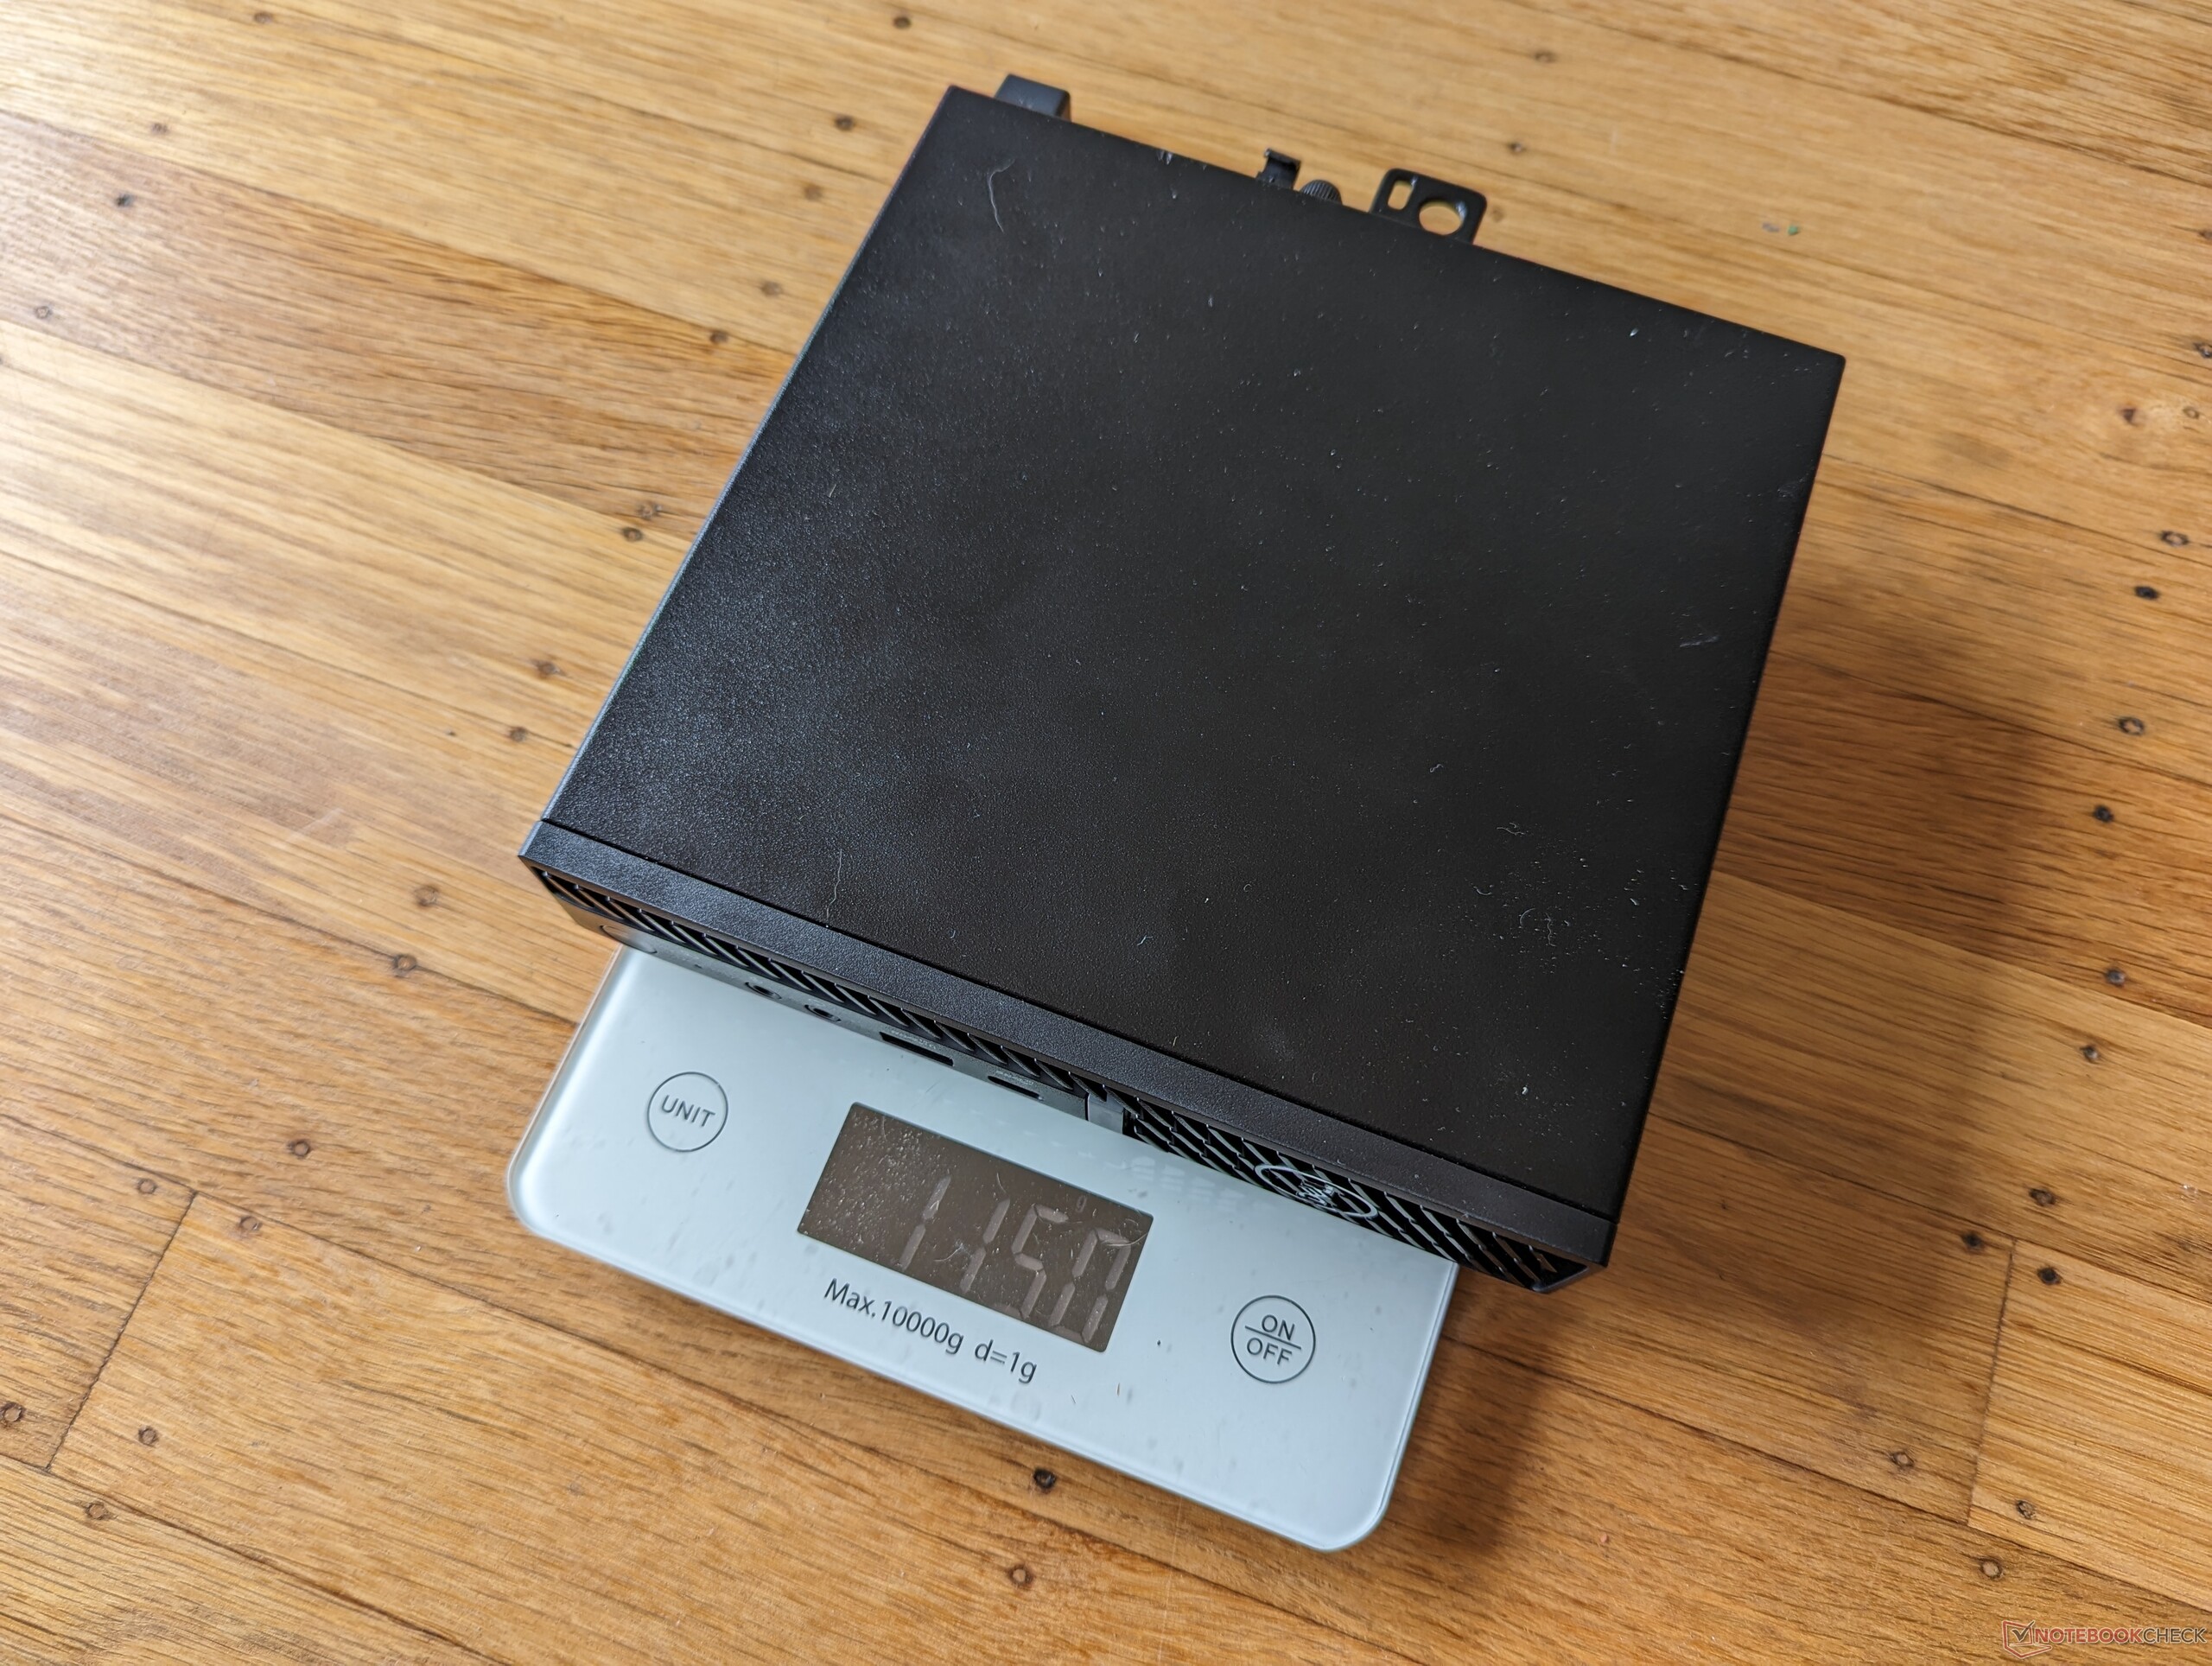
The OptiPlex Micro is twice the size and weight of the Intel NUC 13 Pro but still smaller than the Mac Mini and especially the OptiPlex SFF. The all-metal chassis and distinctive front grille design are otherwise unmistakably OptiPlex.
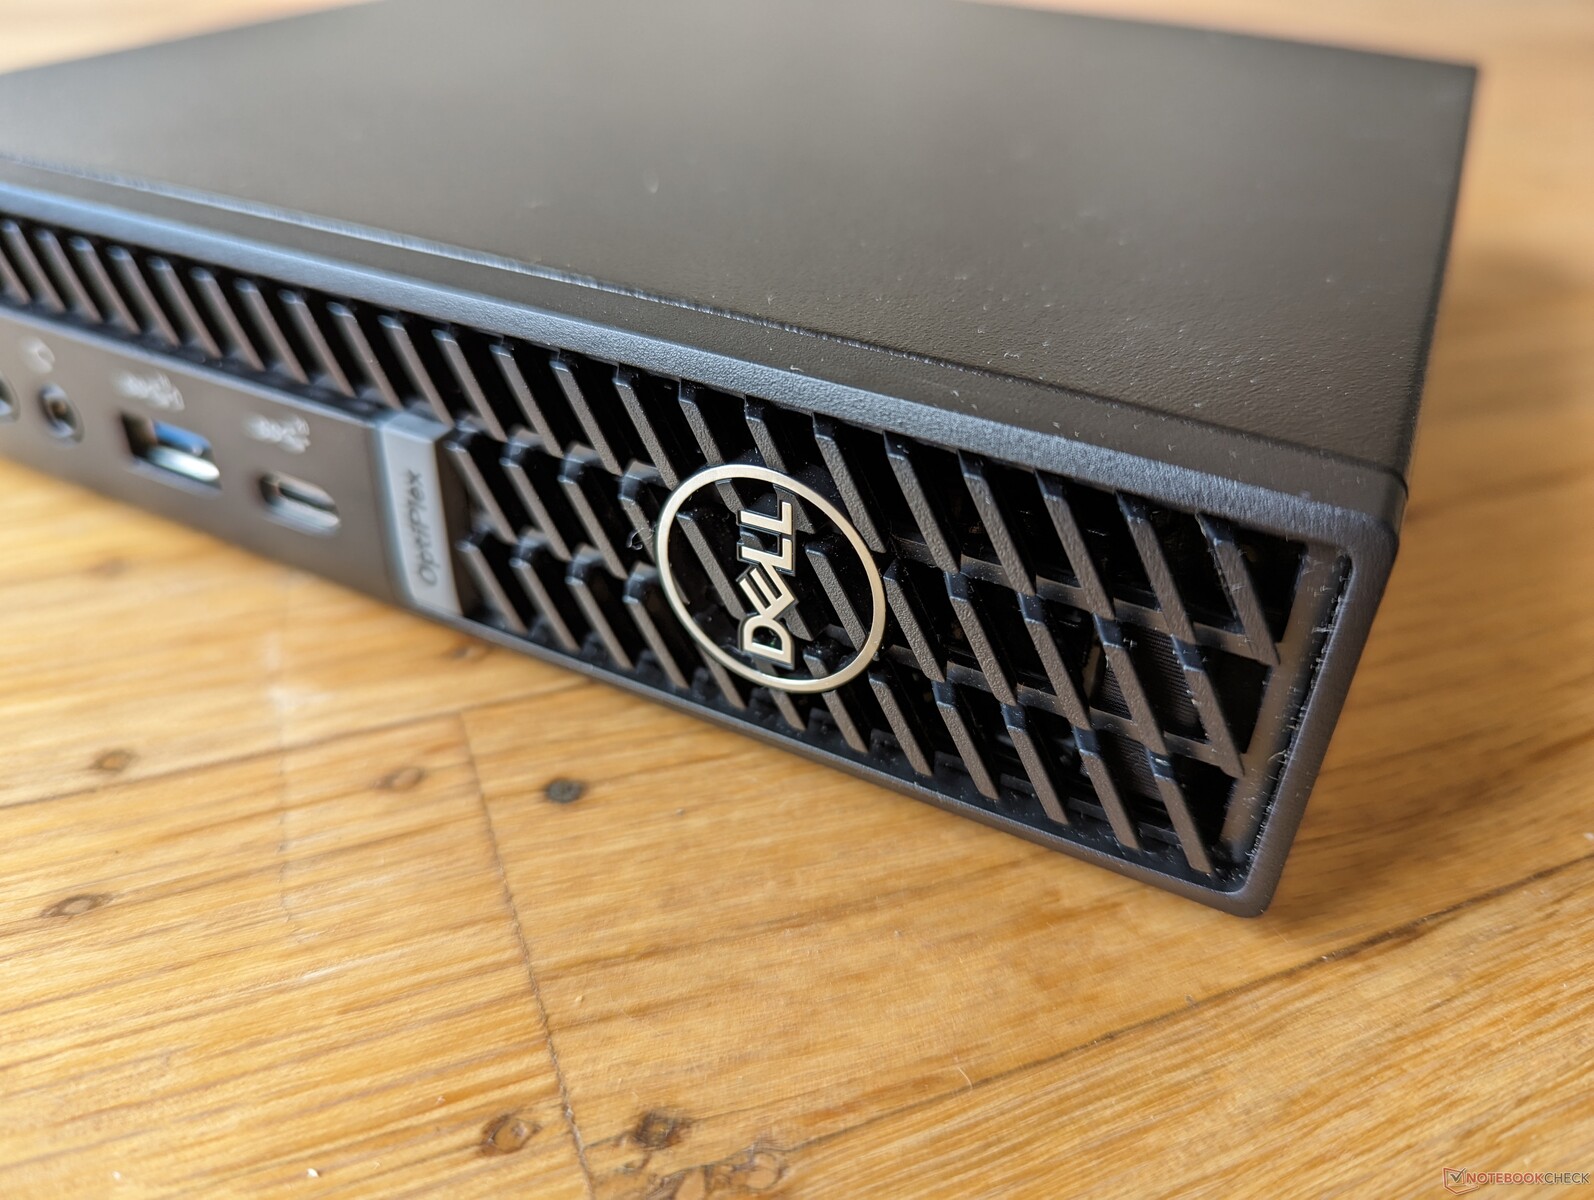
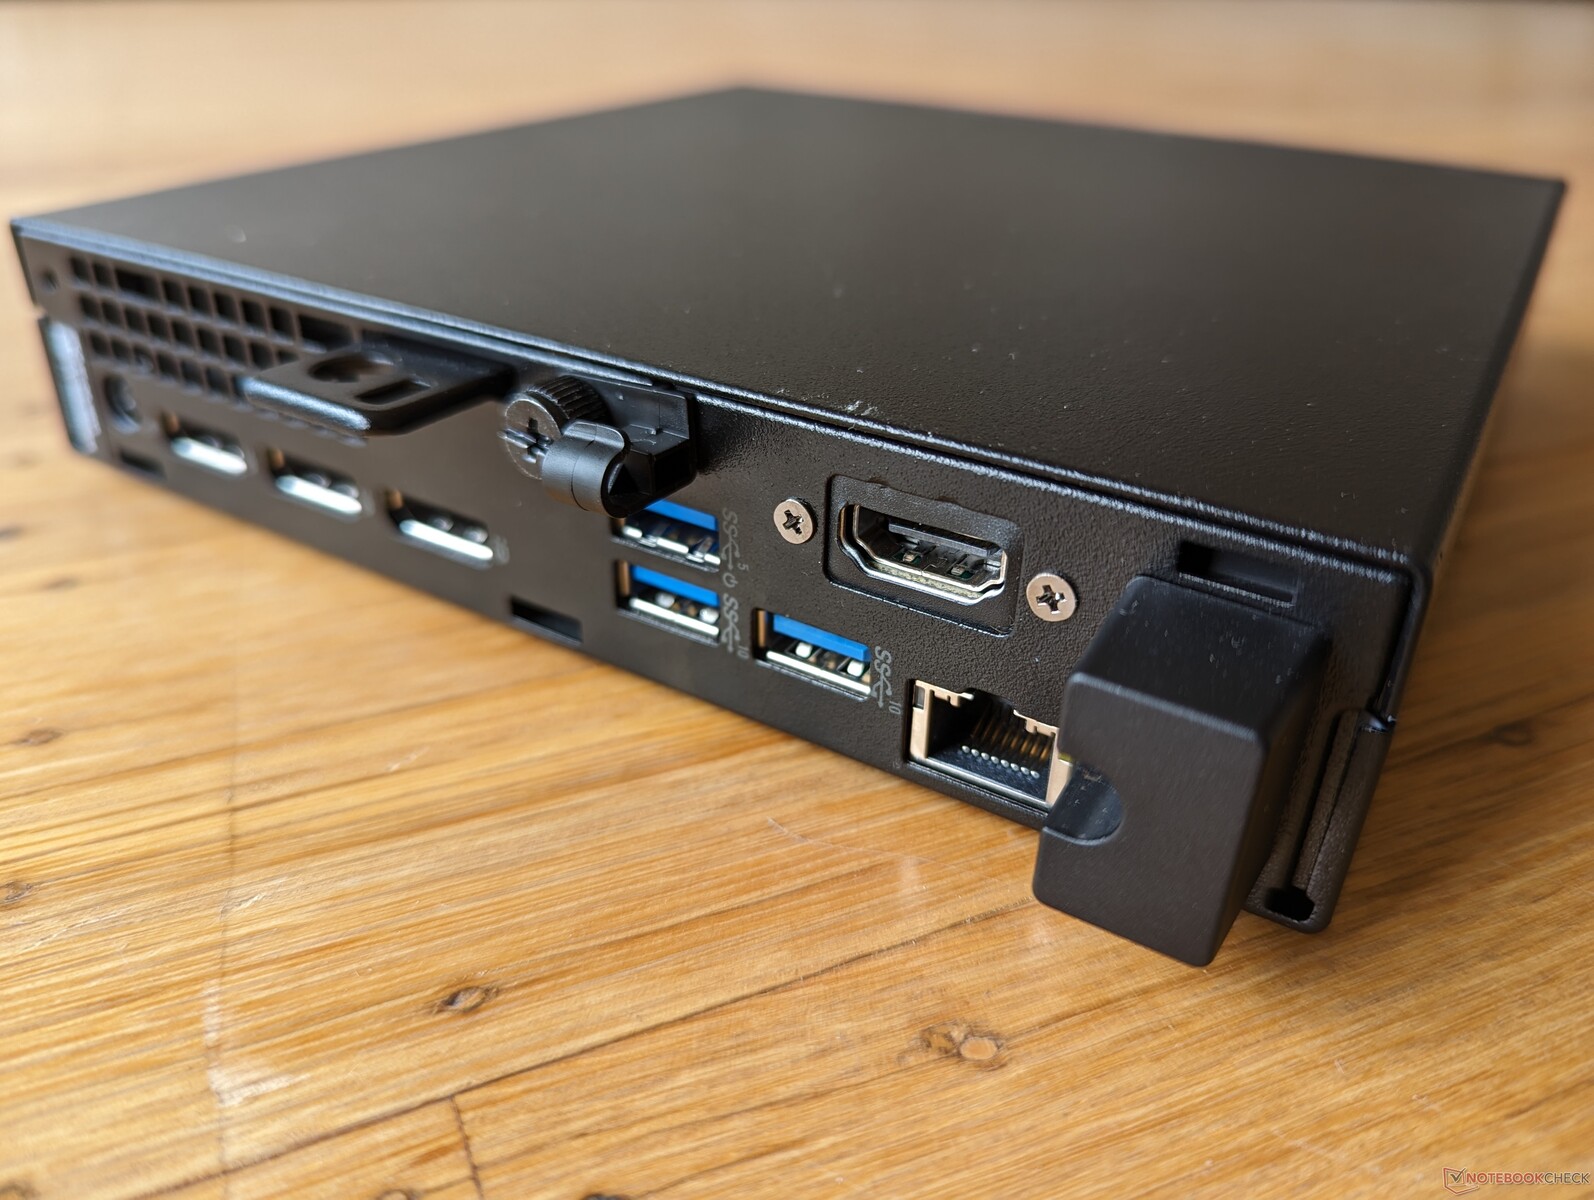
Connectivity
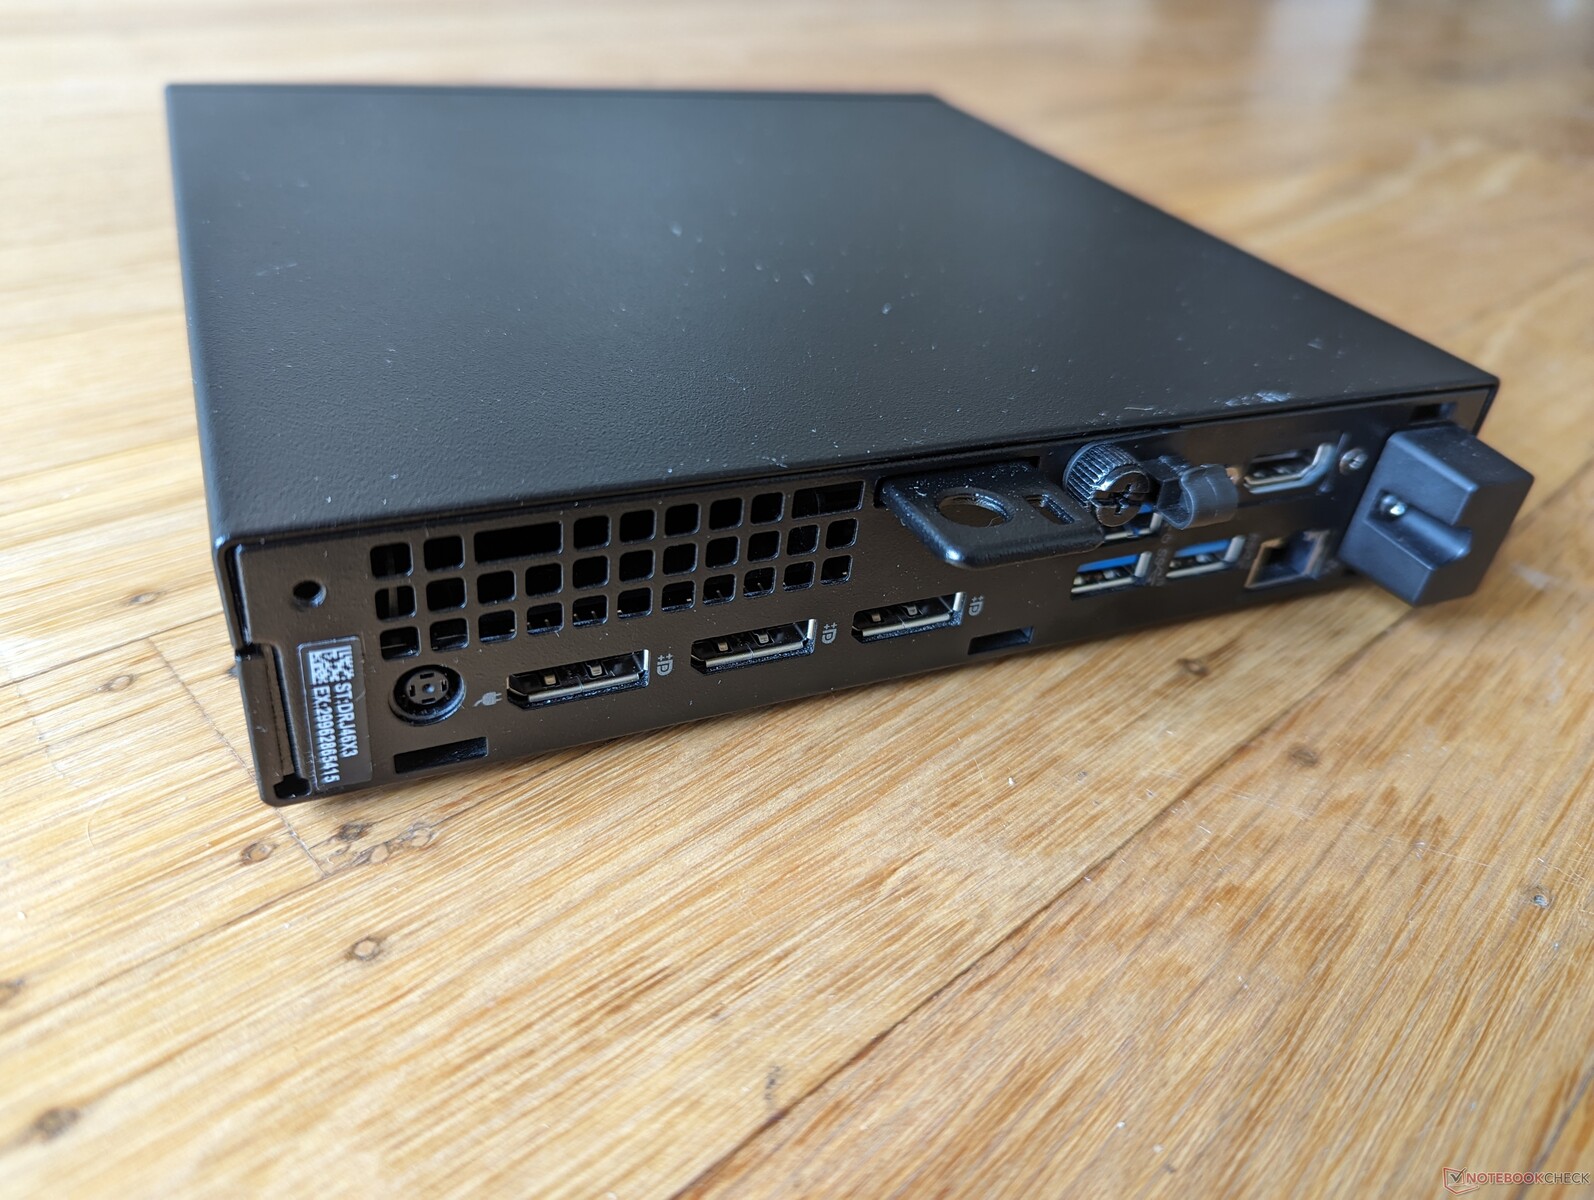
Port options are varied with the most notable being the four individual video-out ports. The single USB-C port, however, does not support USB4, Thunderbolt, Power Delivery, or even DisplayPort unlike the USB-C ports on most Intel NUCs or Beelink mini PCs.
Communication
The included Intel AX211 offers Wi-Fi 6E and Bluetooth 5.3 connectivity. Performance is reliable with no major differences between 5 GHz or 6 GHz in networks.
| Networking | |
| iperf3 transmit AXE11000 | |
| Apple Mac Mini M2 | |
| Beelink SER7 | |
| GMK NucBox K3 Pro | |
| Beelink GTR7 7840HS | |
| Dell OptiPlex Micro | |
| Lenovo IdeaCentre Mini 01IRH8 | |
| iperf3 receive AXE11000 | |
| Apple Mac Mini M2 | |
| GMK NucBox K3 Pro | |
| Beelink GTR7 7840HS | |
| Beelink SER7 | |
| Dell OptiPlex Micro | |
| Lenovo IdeaCentre Mini 01IRH8 | |
| iperf3 transmit AXE11000 6GHz | |
| Dell OptiPlex Micro | |
| iperf3 receive AXE11000 6GHz | |
| Dell OptiPlex Micro | |
Maintenance
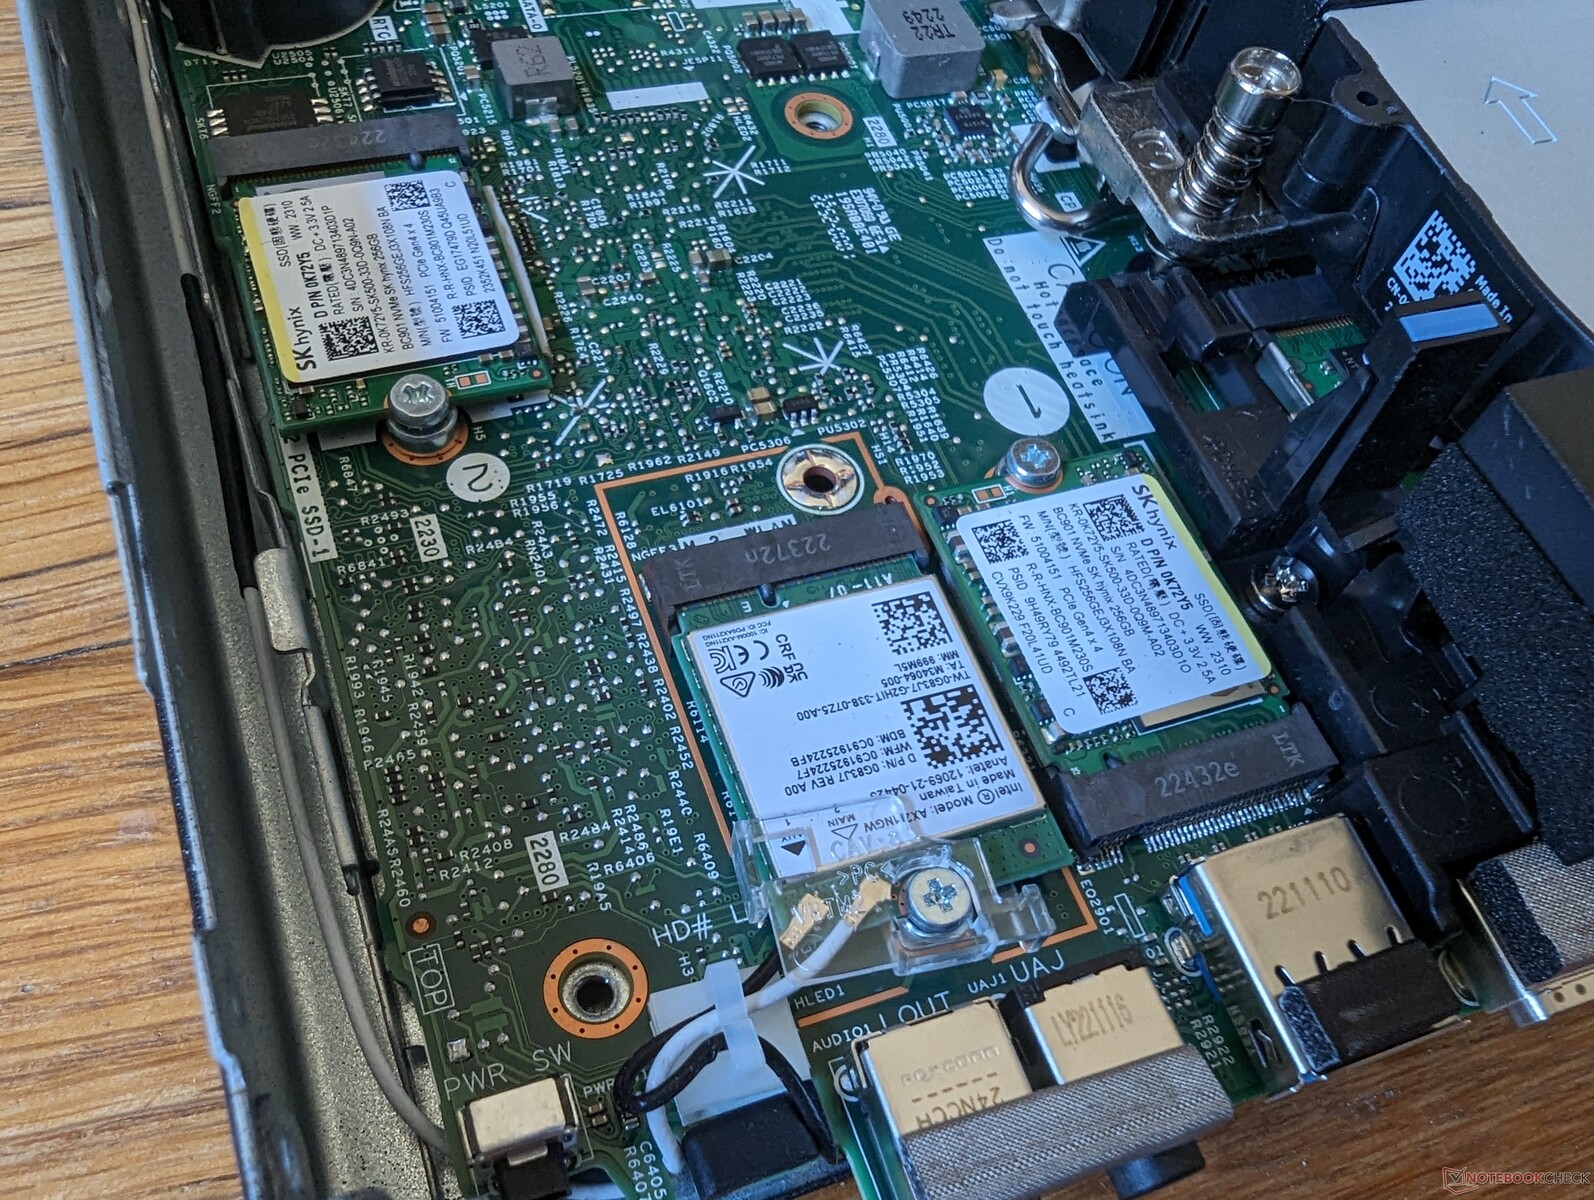
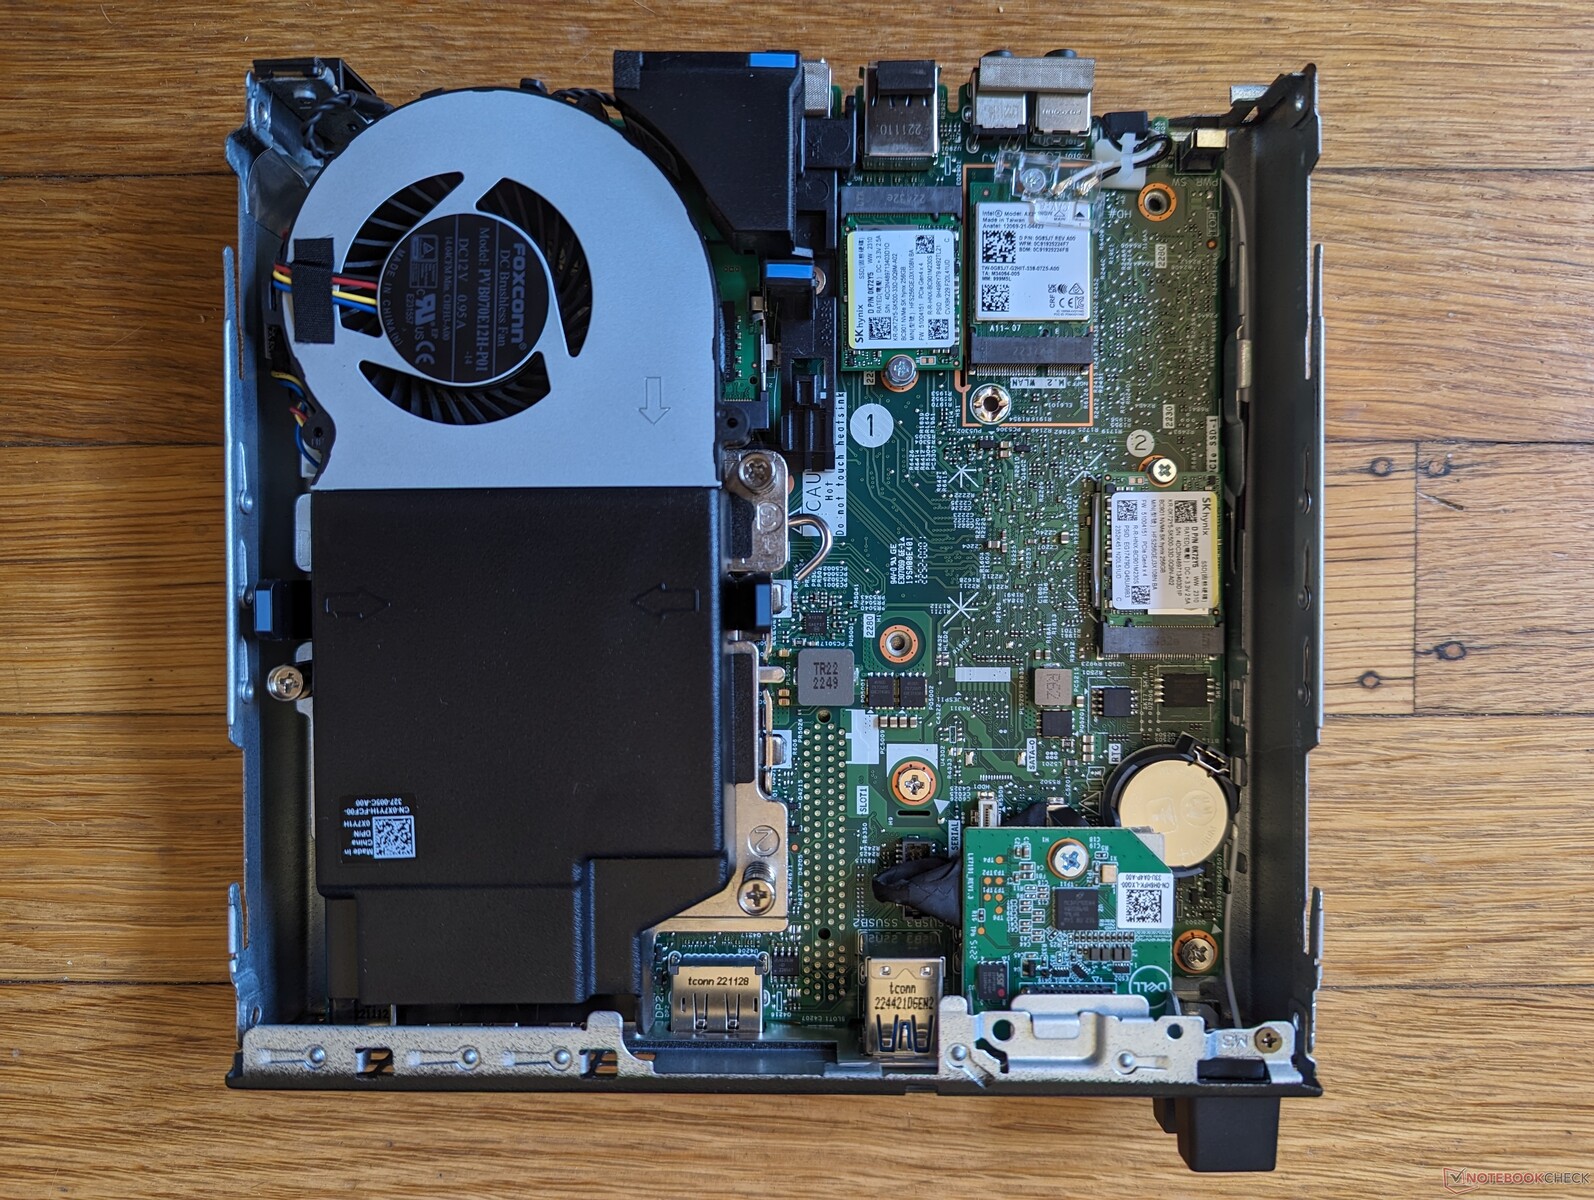
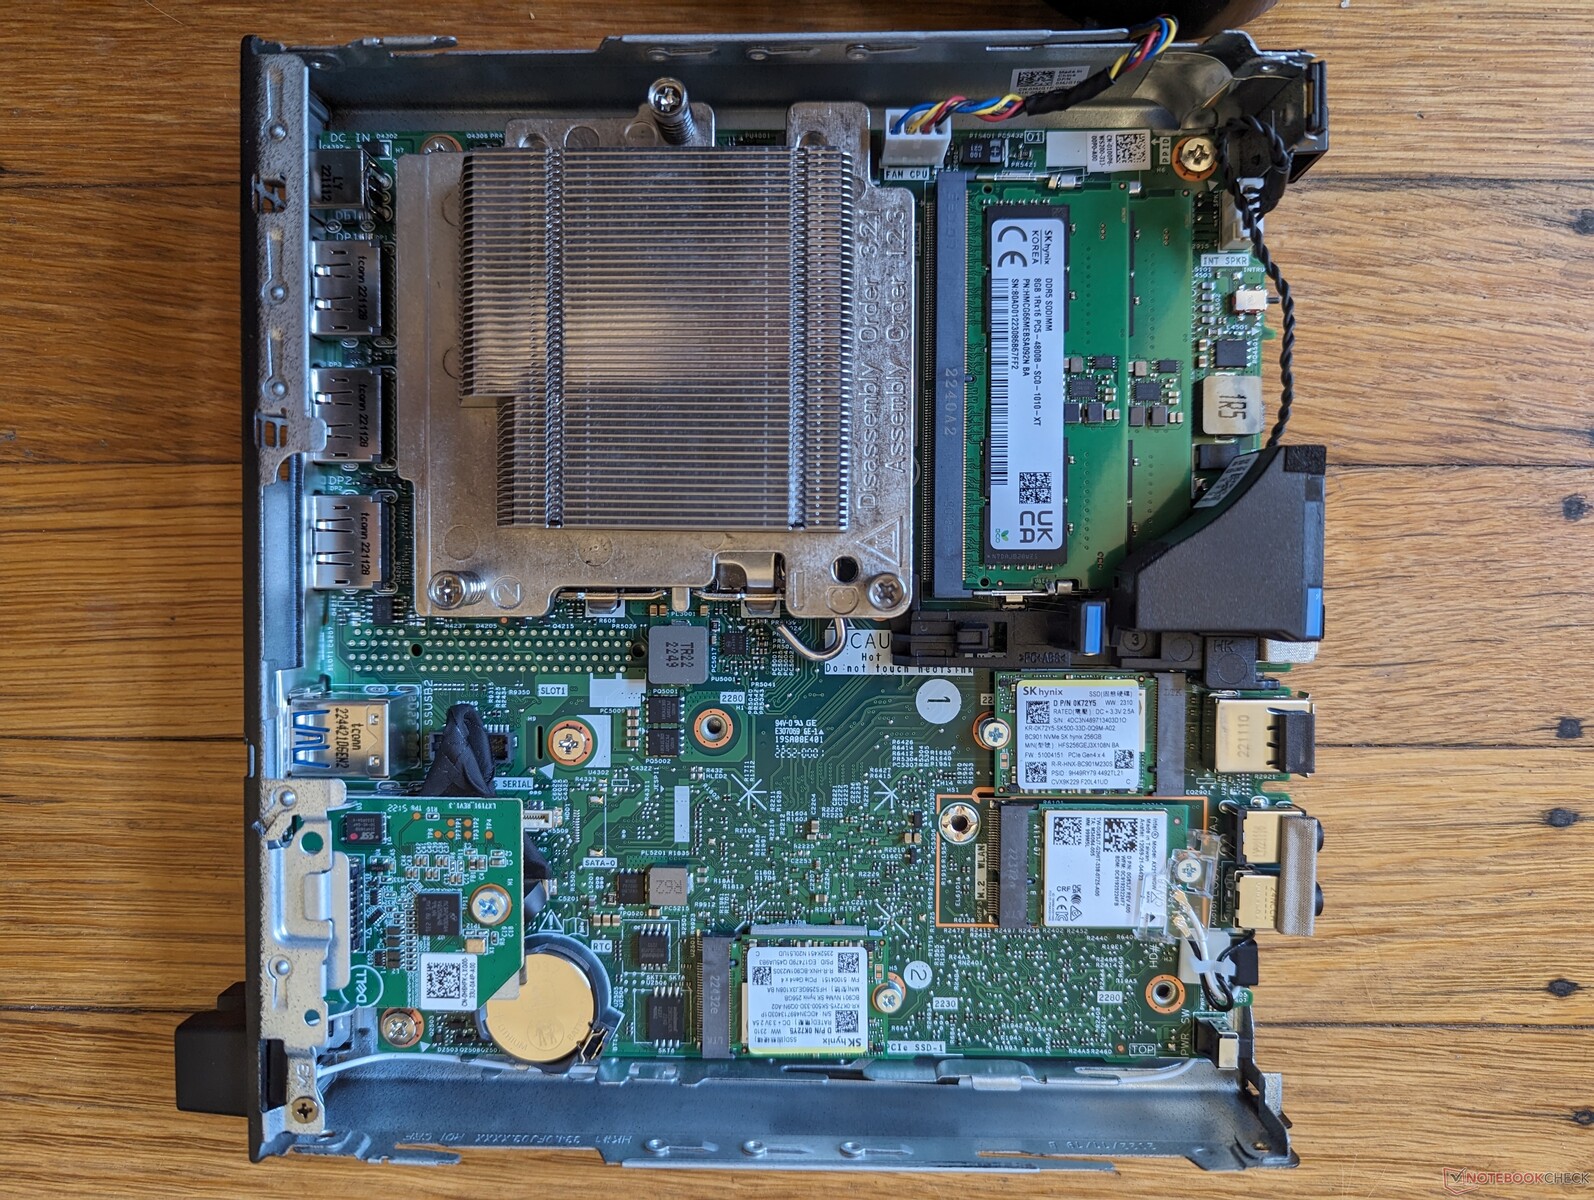
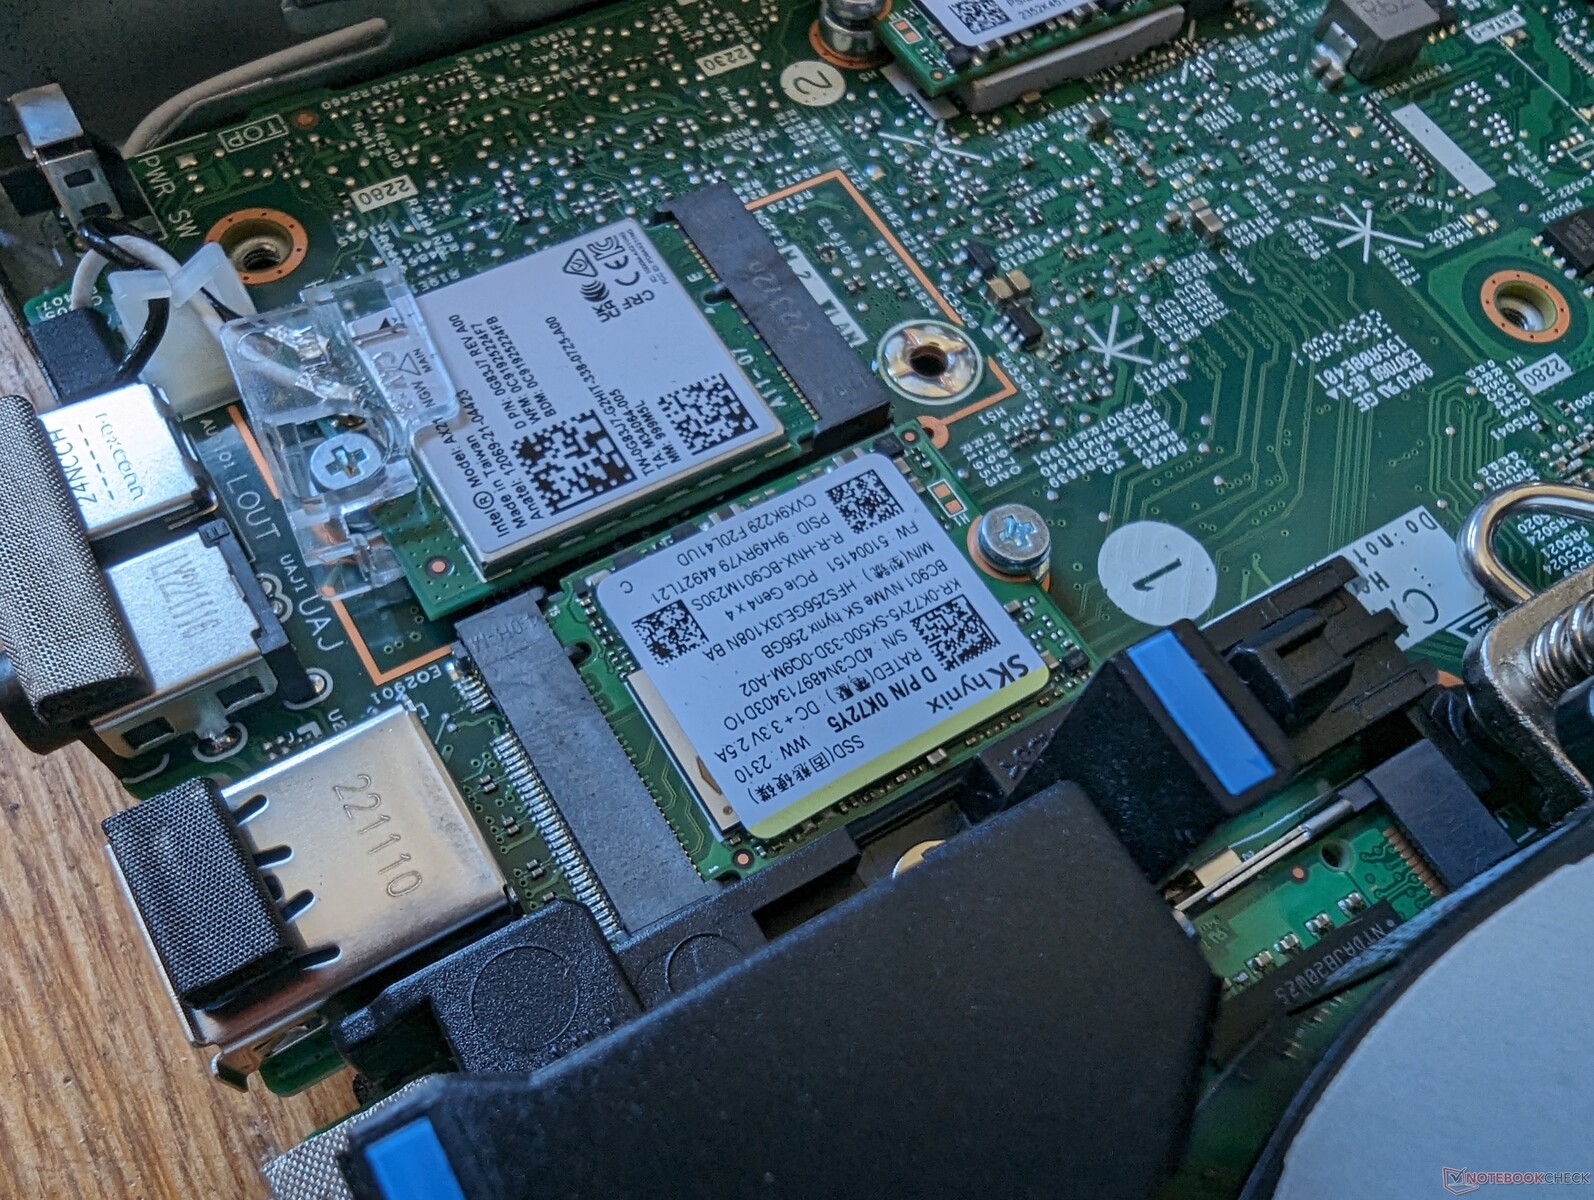
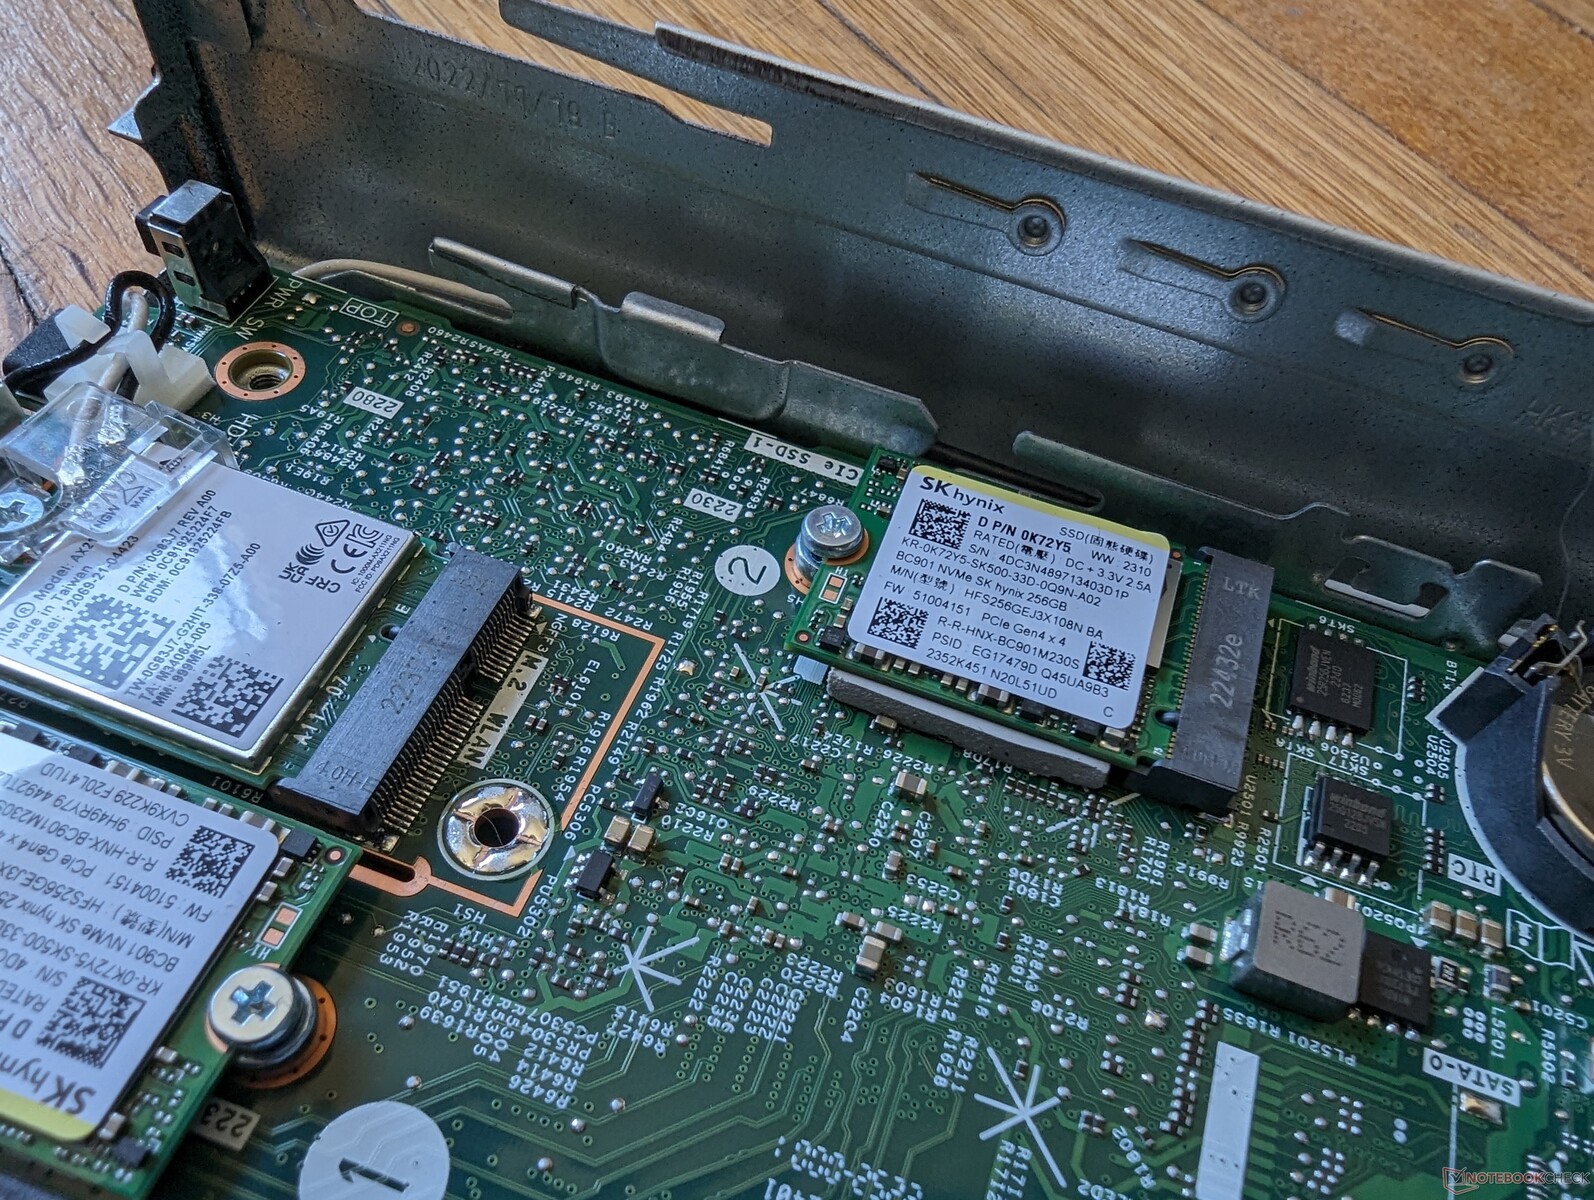
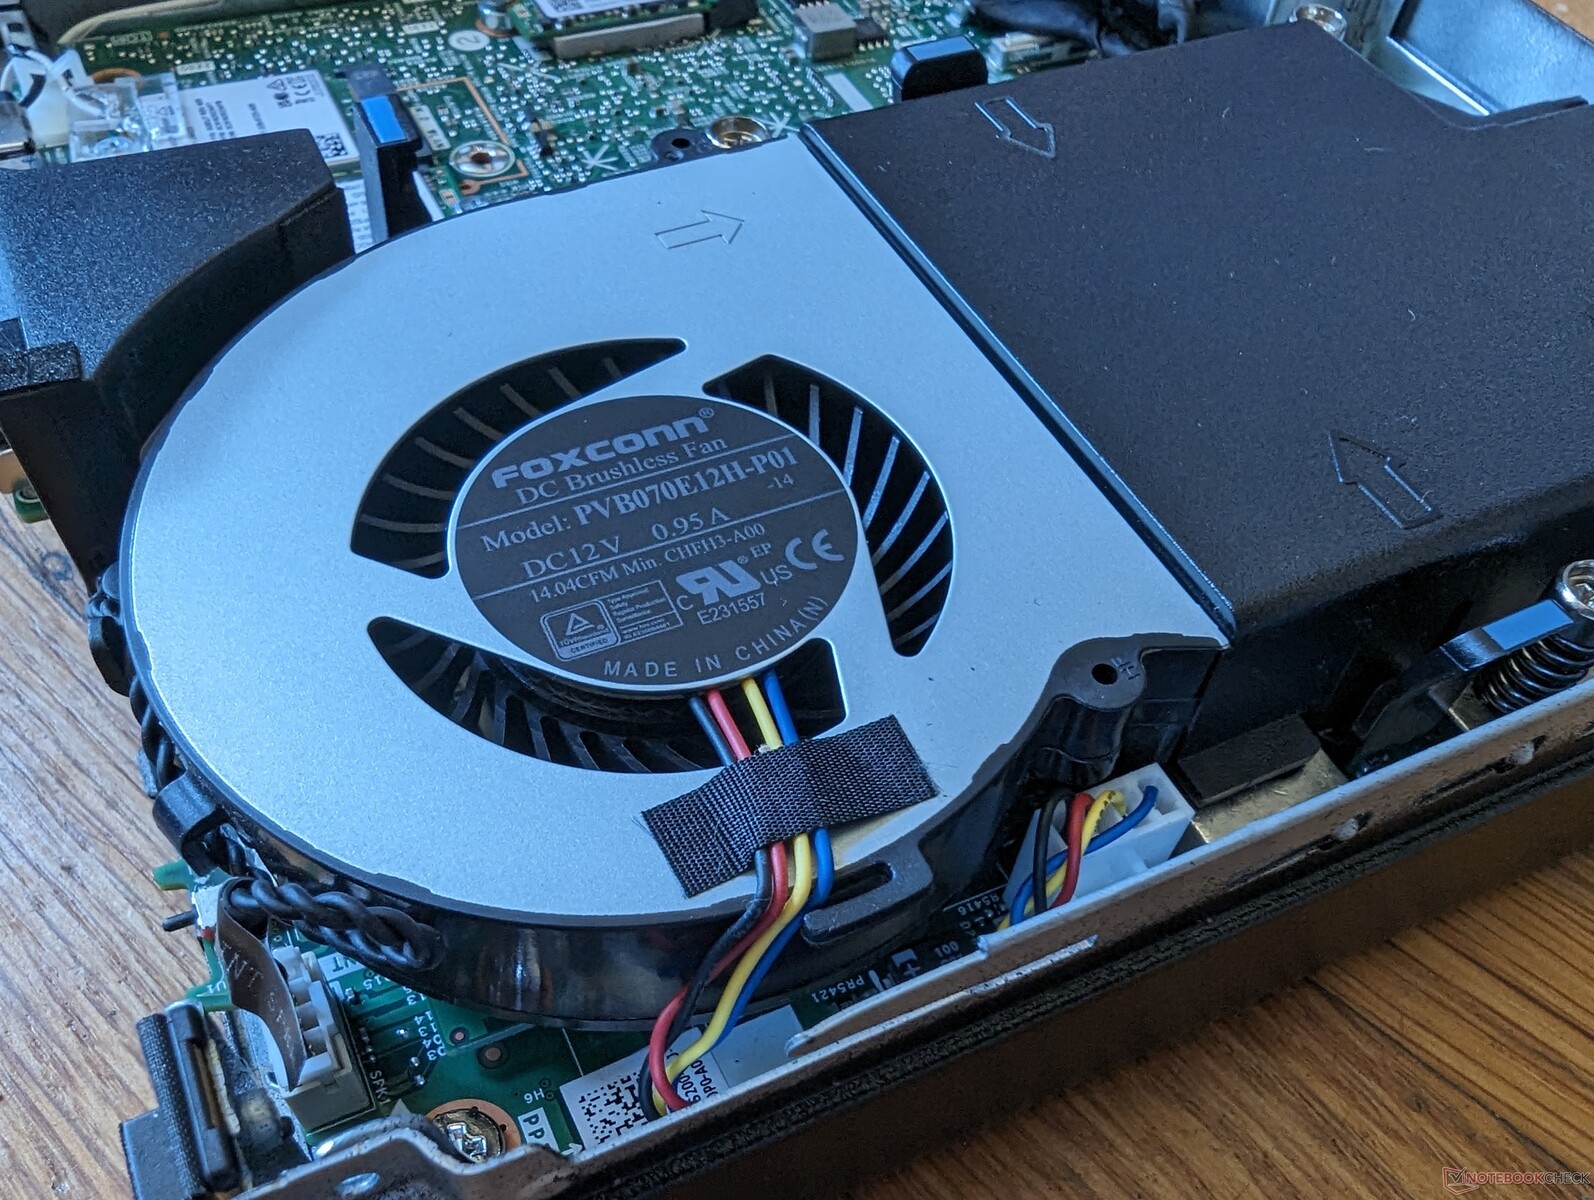
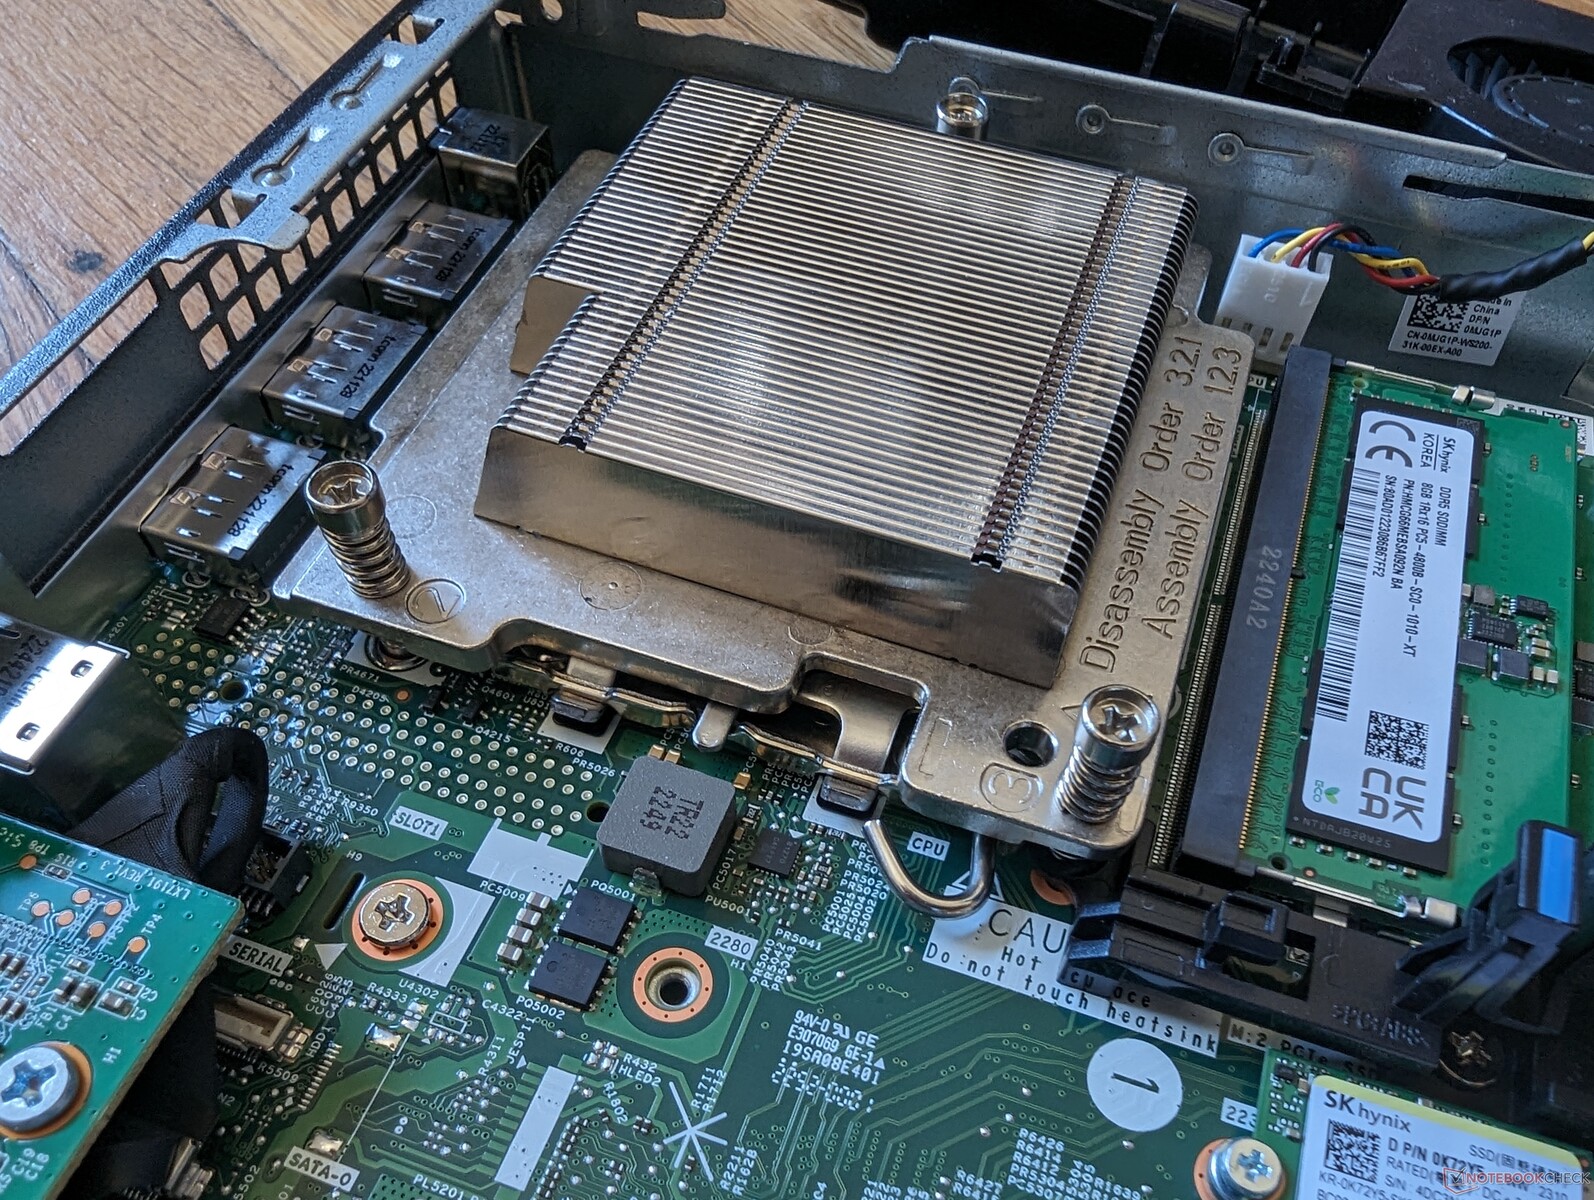
The top panel slides off easily after removing just a single thumb screw from the rear to reveal the removable WLAN module and two SSD slots. The fan must be removed to access the two SODIMM slots, but the entire process is tool-less for easy servicing.
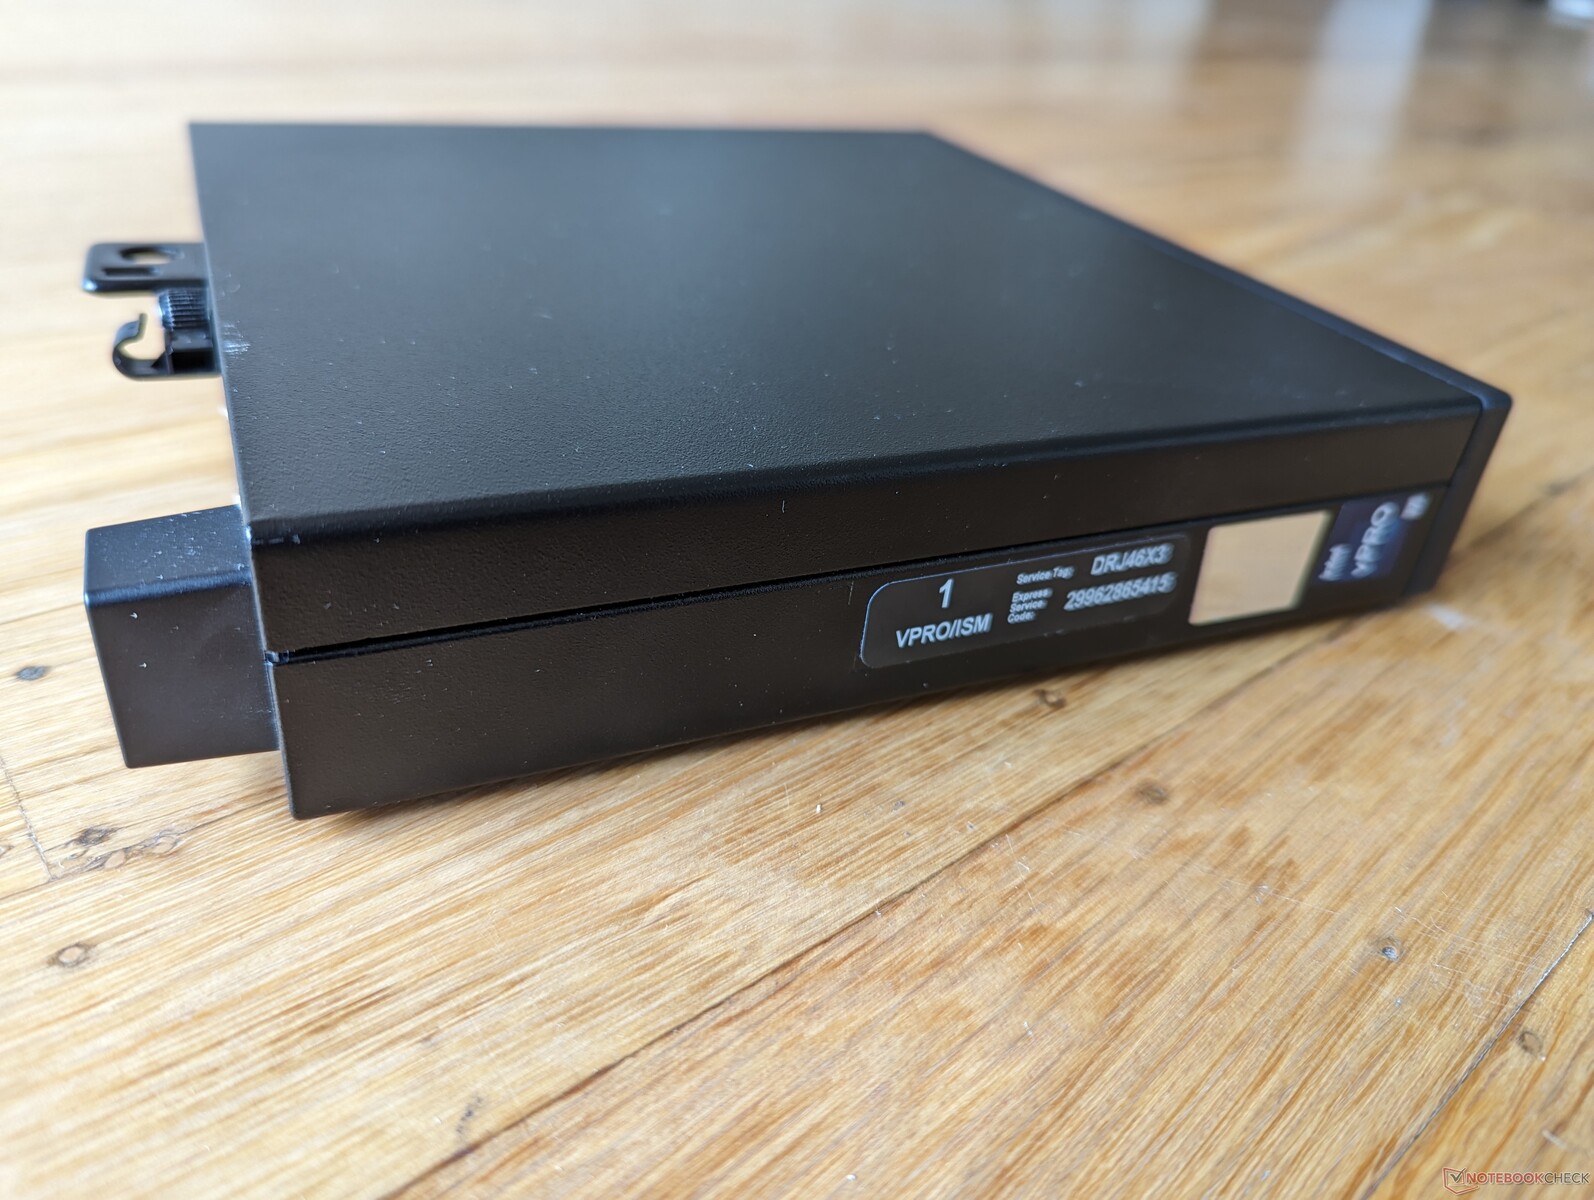
Note that the FCLGA1700 processor is removable and swappable unlike on most other mini PCs.
Accessories And Warranty
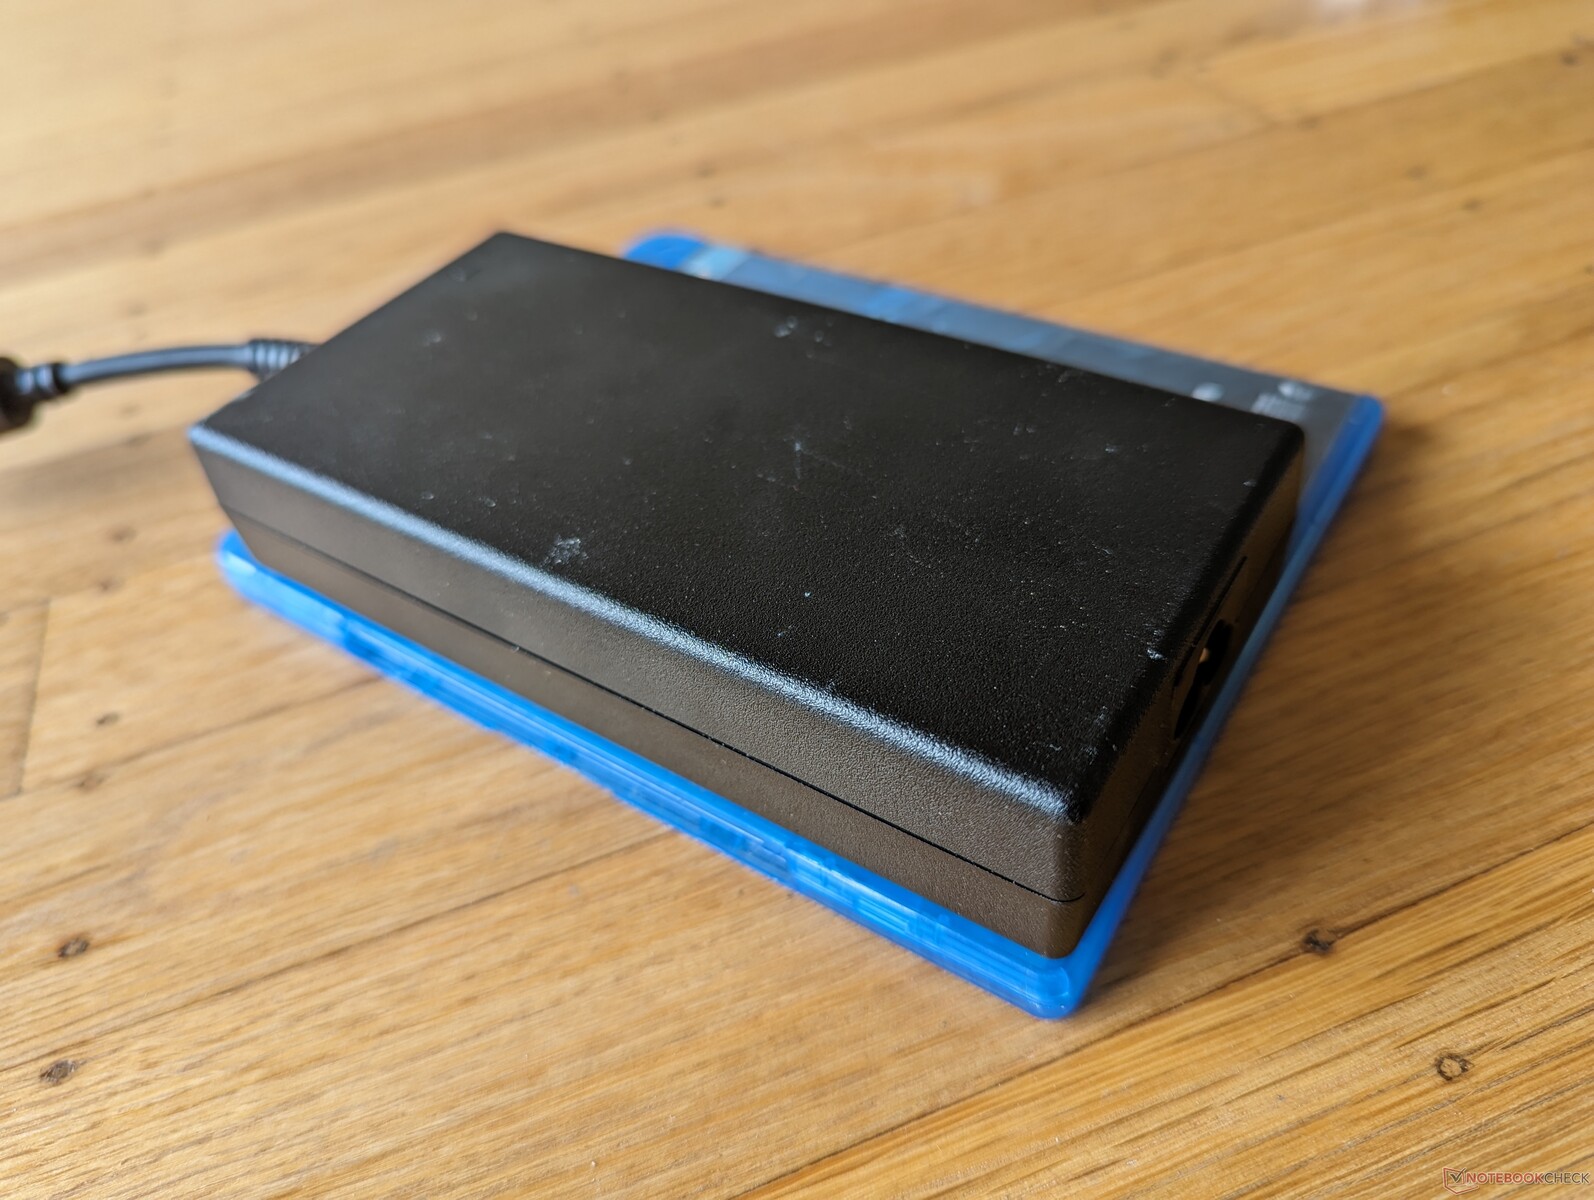
There are no extras in the box other than the external power brick and paperwork. It's too bad that the vertical stand is sold separately since the system can tip over rather easily.
A three-year limited manufacturer warranty applies much like on most other high-end business-centric PCs from Dell.
Performance — Desktop CPU Power
Testing Conditions
We set Windows to Performance mode prior to running the benchmarks below. Dell Optimizer comes pre-installed, but it offers no specialized power profiles unlike on most Dell laptops.
Processor
CPU performance is incredible for the form factor. When compared to the H-series Core i7-13700H as found on laptops like the Inspiron 16 Plus 7630, our desktop-series Core i7-13700 offers 15 to 30 percent faster multi-thread performance due mostly to its higher power envelope and faster clock rates. Its advantages over the Apple M2 are noticeable when it comes to CPU-heavy loads.
Unfortunately, the Core i7-13700 in the OptiPlex Micro is more susceptible to throttling when compared to a larger desktop with the same processor. Our reference Core i7-13700 running on a full-size tower, for example, would return multi-thread benchmark scores that are 40 to 60 percent faster than our mini PC. This isn't to say that the Dell unit is slow, but there's no denying that its small cooling solution is a limiting factor. When running CineBench R15 xT in a loop, for example, performance would dip by about 20 percent after the first few loops to suggest throttling behavior.
Cinebench R15 Multi Loop
Cinebench R23: Multi Core | Single Core
Cinebench R20: CPU (Multi Core) | CPU (Single Core)
Cinebench R15: CPU Multi 64Bit | CPU Single 64Bit
Blender: v2.79 BMW27 CPU
7-Zip 18.03: 7z b 4 | 7z b 4 -mmt1
Geekbench 5.5: Multi-Core | Single-Core
HWBOT x265 Benchmark v2.2: 4k Preset
LibreOffice : 20 Documents To PDF
R Benchmark 2.5: Overall mean
| CPU Performance rating | |
| Intel Core i7-13700 | |
| Average Intel Core i7-13700 | |
| Dell OptiPlex Micro | |
| Alienware m16 R1 Intel | |
| Beelink GTR7 7840HS | |
| Lenovo IdeaCentre Mini 01IRH8 | |
| Intel NUC 12, NUC12SNKi72_Serpent Canyon | |
| GMK NucBox K3 Pro | |
| Acemagic AM20 | |
| Apple Mac Mini M2 -5! | |
| Geekom A5 | |
| Acemagic AD15 | |
| Minisforum Venus Series UN1245 | |
| Cinebench R23 / Multi Core | |
| Intel Core i7-13700 | |
| Average Intel Core i7-13700 (21013 - 29725, n=2) | |
| Alienware m16 R1 Intel | |
| Dell OptiPlex Micro | |
| Beelink GTR7 7840HS | |
| Intel NUC 12, NUC12SNKi72_Serpent Canyon | |
| Lenovo IdeaCentre Mini 01IRH8 | |
| Acemagic AM20 | |
| Geekom A5 | |
| GMK NucBox K3 Pro | |
| Acemagic AD15 | |
| Minisforum Venus Series UN1245 | |
| Apple Mac Mini M2 | |
| Cinebench R23 / Single Core | |
| Intel Core i7-13700 | |
| Average Intel Core i7-13700 (1997 - 2020, n=2) | |
| Dell OptiPlex Micro | |
| Alienware m16 R1 Intel | |
| Lenovo IdeaCentre Mini 01IRH8 | |
| Beelink GTR7 7840HS | |
| Intel NUC 12, NUC12SNKi72_Serpent Canyon | |
| GMK NucBox K3 Pro | |
| Minisforum Venus Series UN1245 | |
| Apple Mac Mini M2 | |
| Acemagic AM20 | |
| Acemagic AD15 | |
| Geekom A5 | |
| Cinebench R20 / CPU (Multi Core) | |
| Intel Core i7-13700 | |
| Average Intel Core i7-13700 (7027 - 11361, n=2) | |
| Alienware m16 R1 Intel | |
| Dell OptiPlex Micro | |
| Beelink GTR7 7840HS | |
| Intel NUC 12, NUC12SNKi72_Serpent Canyon | |
| Lenovo IdeaCentre Mini 01IRH8 | |
| Acemagic AM20 | |
| Geekom A5 | |
| GMK NucBox K3 Pro | |
| Acemagic AD15 | |
| Minisforum Venus Series UN1245 | |
| Apple Mac Mini M2 | |
| Cinebench R20 / CPU (Single Core) | |
| Intel Core i7-13700 | |
| Average Intel Core i7-13700 (703 - 776, n=2) | |
| Alienware m16 R1 Intel | |
| Lenovo IdeaCentre Mini 01IRH8 | |
| Beelink GTR7 7840HS | |
| Dell OptiPlex Micro | |
| Intel NUC 12, NUC12SNKi72_Serpent Canyon | |
| GMK NucBox K3 Pro | |
| Minisforum Venus Series UN1245 | |
| Acemagic AM20 | |
| Acemagic AD15 | |
| Geekom A5 | |
| Apple Mac Mini M2 | |
| Cinebench R15 / CPU Multi 64Bit | |
| Intel Core i7-13700 | |
| Average Intel Core i7-13700 (2986 - 4398, n=2) | |
| Alienware m16 R1 Intel | |
| Dell OptiPlex Micro | |
| Beelink GTR7 7840HS | |
| Intel NUC 12, NUC12SNKi72_Serpent Canyon | |
| Lenovo IdeaCentre Mini 01IRH8 | |
| Acemagic AM20 | |
| Geekom A5 | |
| GMK NucBox K3 Pro | |
| Acemagic AD15 | |
| Minisforum Venus Series UN1245 | |
| Apple Mac Mini M2 | |
| Cinebench R15 / CPU Single 64Bit | |
| Intel Core i7-13700 | |
| Beelink GTR7 7840HS | |
| Average Intel Core i7-13700 (279 - 291, n=2) | |
| Dell OptiPlex Micro | |
| Alienware m16 R1 Intel | |
| Lenovo IdeaCentre Mini 01IRH8 | |
| Intel NUC 12, NUC12SNKi72_Serpent Canyon | |
| GMK NucBox K3 Pro | |
| Acemagic AM20 | |
| Minisforum Venus Series UN1245 | |
| Apple Mac Mini M2 | |
| Geekom A5 | |
| Acemagic AD15 | |
| Blender / v2.79 BMW27 CPU | |
| Apple Mac Mini M2 | |
| Minisforum Venus Series UN1245 | |
| GMK NucBox K3 Pro | |
| Acemagic AD15 | |
| Geekom A5 | |
| Acemagic AM20 | |
| Beelink GTR7 7840HS | |
| Lenovo IdeaCentre Mini 01IRH8 | |
| Intel NUC 12, NUC12SNKi72_Serpent Canyon | |
| Dell OptiPlex Micro | |
| Alienware m16 R1 Intel | |
| Average Intel Core i7-13700 (111 - 178, n=2) | |
| Intel Core i7-13700 | |
| 7-Zip 18.03 / 7z b 4 | |
| Intel Core i7-13700 | |
| Average Intel Core i7-13700 (74475 - 108733, n=2) | |
| Alienware m16 R1 Intel | |
| Dell OptiPlex Micro | |
| Beelink GTR7 7840HS | |
| Intel NUC 12, NUC12SNKi72_Serpent Canyon | |
| Lenovo IdeaCentre Mini 01IRH8 | |
| Geekom A5 | |
| Acemagic AM20 | |
| Acemagic AD15 | |
| GMK NucBox K3 Pro | |
| Minisforum Venus Series UN1245 | |
| 7-Zip 18.03 / 7z b 4 -mmt1 | |
| Intel Core i7-13700 | |
| Beelink GTR7 7840HS | |
| Average Intel Core i7-13700 (6466 - 6819, n=2) | |
| Dell OptiPlex Micro | |
| Alienware m16 R1 Intel | |
| Lenovo IdeaCentre Mini 01IRH8 | |
| Intel NUC 12, NUC12SNKi72_Serpent Canyon | |
| GMK NucBox K3 Pro | |
| Acemagic AD15 | |
| Acemagic AM20 | |
| Geekom A5 | |
| Minisforum Venus Series UN1245 | |
| Geekbench 5.5 / Multi-Core | |
| Intel Core i7-13700 | |
| Average Intel Core i7-13700 (15525 - 19602, n=2) | |
| Dell OptiPlex Micro | |
| Alienware m16 R1 Intel | |
| Beelink GTR7 7840HS | |
| Lenovo IdeaCentre Mini 01IRH8 | |
| Intel NUC 12, NUC12SNKi72_Serpent Canyon | |
| GMK NucBox K3 Pro | |
| Apple Mac Mini M2 | |
| Geekom A5 | |
| Acemagic AM20 | |
| Acemagic AD15 | |
| Minisforum Venus Series UN1245 | |
| Geekbench 5.5 / Single-Core | |
| Beelink GTR7 7840HS | |
| Intel Core i7-13700 | |
| Average Intel Core i7-13700 (1958 - 2009, n=2) | |
| Dell OptiPlex Micro | |
| Apple Mac Mini M2 | |
| Alienware m16 R1 Intel | |
| Lenovo IdeaCentre Mini 01IRH8 | |
| GMK NucBox K3 Pro | |
| Minisforum Venus Series UN1245 | |
| Acemagic AD15 | |
| Intel NUC 12, NUC12SNKi72_Serpent Canyon | |
| Acemagic AM20 | |
| Geekom A5 | |
| HWBOT x265 Benchmark v2.2 / 4k Preset | |
| Intel Core i7-13700 | |
| Average Intel Core i7-13700 (21.4 - 33.1, n=2) | |
| Alienware m16 R1 Intel | |
| Dell OptiPlex Micro | |
| Intel NUC 12, NUC12SNKi72_Serpent Canyon | |
| Lenovo IdeaCentre Mini 01IRH8 | |
| Acemagic AM20 | |
| Geekom A5 | |
| GMK NucBox K3 Pro | |
| Acemagic AD15 | |
| Beelink GTR7 7840HS | |
| Minisforum Venus Series UN1245 | |
| LibreOffice / 20 Documents To PDF | |
| Geekom A5 | |
| Minisforum Venus Series UN1245 | |
| Acemagic AD15 | |
| Acemagic AM20 | |
| Alienware m16 R1 Intel | |
| Intel NUC 12, NUC12SNKi72_Serpent Canyon | |
| GMK NucBox K3 Pro | |
| Beelink GTR7 7840HS | |
| Lenovo IdeaCentre Mini 01IRH8 | |
| Dell OptiPlex Micro | |
| Average Intel Core i7-13700 (34.1 - 36.4, n=2) | |
| Intel Core i7-13700 | |
| R Benchmark 2.5 / Overall mean | |
| Acemagic AD15 | |
| Acemagic AM20 | |
| Geekom A5 | |
| Minisforum Venus Series UN1245 | |
| GMK NucBox K3 Pro | |
| Intel NUC 12, NUC12SNKi72_Serpent Canyon | |
| Lenovo IdeaCentre Mini 01IRH8 | |
| Alienware m16 R1 Intel | |
| Dell OptiPlex Micro | |
| Beelink GTR7 7840HS | |
| Average Intel Core i7-13700 (0.4075 - 0.423, n=2) | |
| Intel Core i7-13700 | |
Cinebench R23: Multi Core | Single Core
Cinebench R20: CPU (Multi Core) | CPU (Single Core)
Cinebench R15: CPU Multi 64Bit | CPU Single 64Bit
Blender: v2.79 BMW27 CPU
7-Zip 18.03: 7z b 4 | 7z b 4 -mmt1
Geekbench 5.5: Multi-Core | Single-Core
HWBOT x265 Benchmark v2.2: 4k Preset
LibreOffice : 20 Documents To PDF
R Benchmark 2.5: Overall mean
* ... smaller is better
AIDA64: FP32 Ray-Trace | FPU Julia | CPU SHA3 | CPU Queen | FPU SinJulia | FPU Mandel | CPU AES | CPU ZLib | FP64 Ray-Trace | CPU PhotoWorxx
| Performance rating | |
| Beelink GTR7 7840HS | |
| Beelink SER7 | |
| Average Intel Core i7-13700 | |
| Dell OptiPlex Micro | |
| Lenovo IdeaCentre Mini 01IRH8 | |
| GMK NucBox K3 Pro | |
| AIDA64 / FP32 Ray-Trace | |
| Beelink GTR7 7840HS | |
| Beelink SER7 | |
| Average Intel Core i7-13700 (16408 - 29348, n=2) | |
| Dell OptiPlex Micro | |
| Lenovo IdeaCentre Mini 01IRH8 | |
| GMK NucBox K3 Pro | |
| AIDA64 / FPU Julia | |
| Beelink GTR7 7840HS | |
| Average Intel Core i7-13700 (83757 - 138865, n=2) | |
| Beelink SER7 | |
| Dell OptiPlex Micro | |
| Lenovo IdeaCentre Mini 01IRH8 | |
| GMK NucBox K3 Pro | |
| AIDA64 / CPU SHA3 | |
| Beelink GTR7 7840HS | |
| Average Intel Core i7-13700 (3648 - 6169, n=2) | |
| Beelink SER7 | |
| Dell OptiPlex Micro | |
| Lenovo IdeaCentre Mini 01IRH8 | |
| GMK NucBox K3 Pro | |
| AIDA64 / CPU Queen | |
| Average Intel Core i7-13700 (113697 - 128088, n=2) | |
| Beelink GTR7 7840HS | |
| Dell OptiPlex Micro | |
| Beelink SER7 | |
| Lenovo IdeaCentre Mini 01IRH8 | |
| GMK NucBox K3 Pro | |
| AIDA64 / FPU SinJulia | |
| Beelink GTR7 7840HS | |
| Beelink SER7 | |
| Average Intel Core i7-13700 (10833 - 15314, n=2) | |
| Dell OptiPlex Micro | |
| Lenovo IdeaCentre Mini 01IRH8 | |
| GMK NucBox K3 Pro | |
| AIDA64 / FPU Mandel | |
| Beelink GTR7 7840HS | |
| Beelink SER7 | |
| Average Intel Core i7-13700 (40920 - 72217, n=2) | |
| Dell OptiPlex Micro | |
| Lenovo IdeaCentre Mini 01IRH8 | |
| GMK NucBox K3 Pro | |
| AIDA64 / CPU AES | |
| Beelink GTR7 7840HS | |
| Beelink SER7 | |
| Average Intel Core i7-13700 (76357 - 120512, n=2) | |
| GMK NucBox K3 Pro | |
| Dell OptiPlex Micro | |
| Lenovo IdeaCentre Mini 01IRH8 | |
| AIDA64 / CPU ZLib | |
| Average Intel Core i7-13700 (1045 - 1703, n=2) | |
| Beelink GTR7 7840HS | |
| Dell OptiPlex Micro | |
| Lenovo IdeaCentre Mini 01IRH8 | |
| Beelink SER7 | |
| GMK NucBox K3 Pro | |
| AIDA64 / FP64 Ray-Trace | |
| Beelink GTR7 7840HS | |
| Beelink SER7 | |
| Average Intel Core i7-13700 (8712 - 16164, n=2) | |
| Dell OptiPlex Micro | |
| Lenovo IdeaCentre Mini 01IRH8 | |
| GMK NucBox K3 Pro | |
| AIDA64 / CPU PhotoWorxx | |
| GMK NucBox K3 Pro | |
| Average Intel Core i7-13700 (37819 - 48448, n=2) | |
| Beelink SER7 | |
| Beelink GTR7 7840HS | |
| Dell OptiPlex Micro | |
| Lenovo IdeaCentre Mini 01IRH8 | |
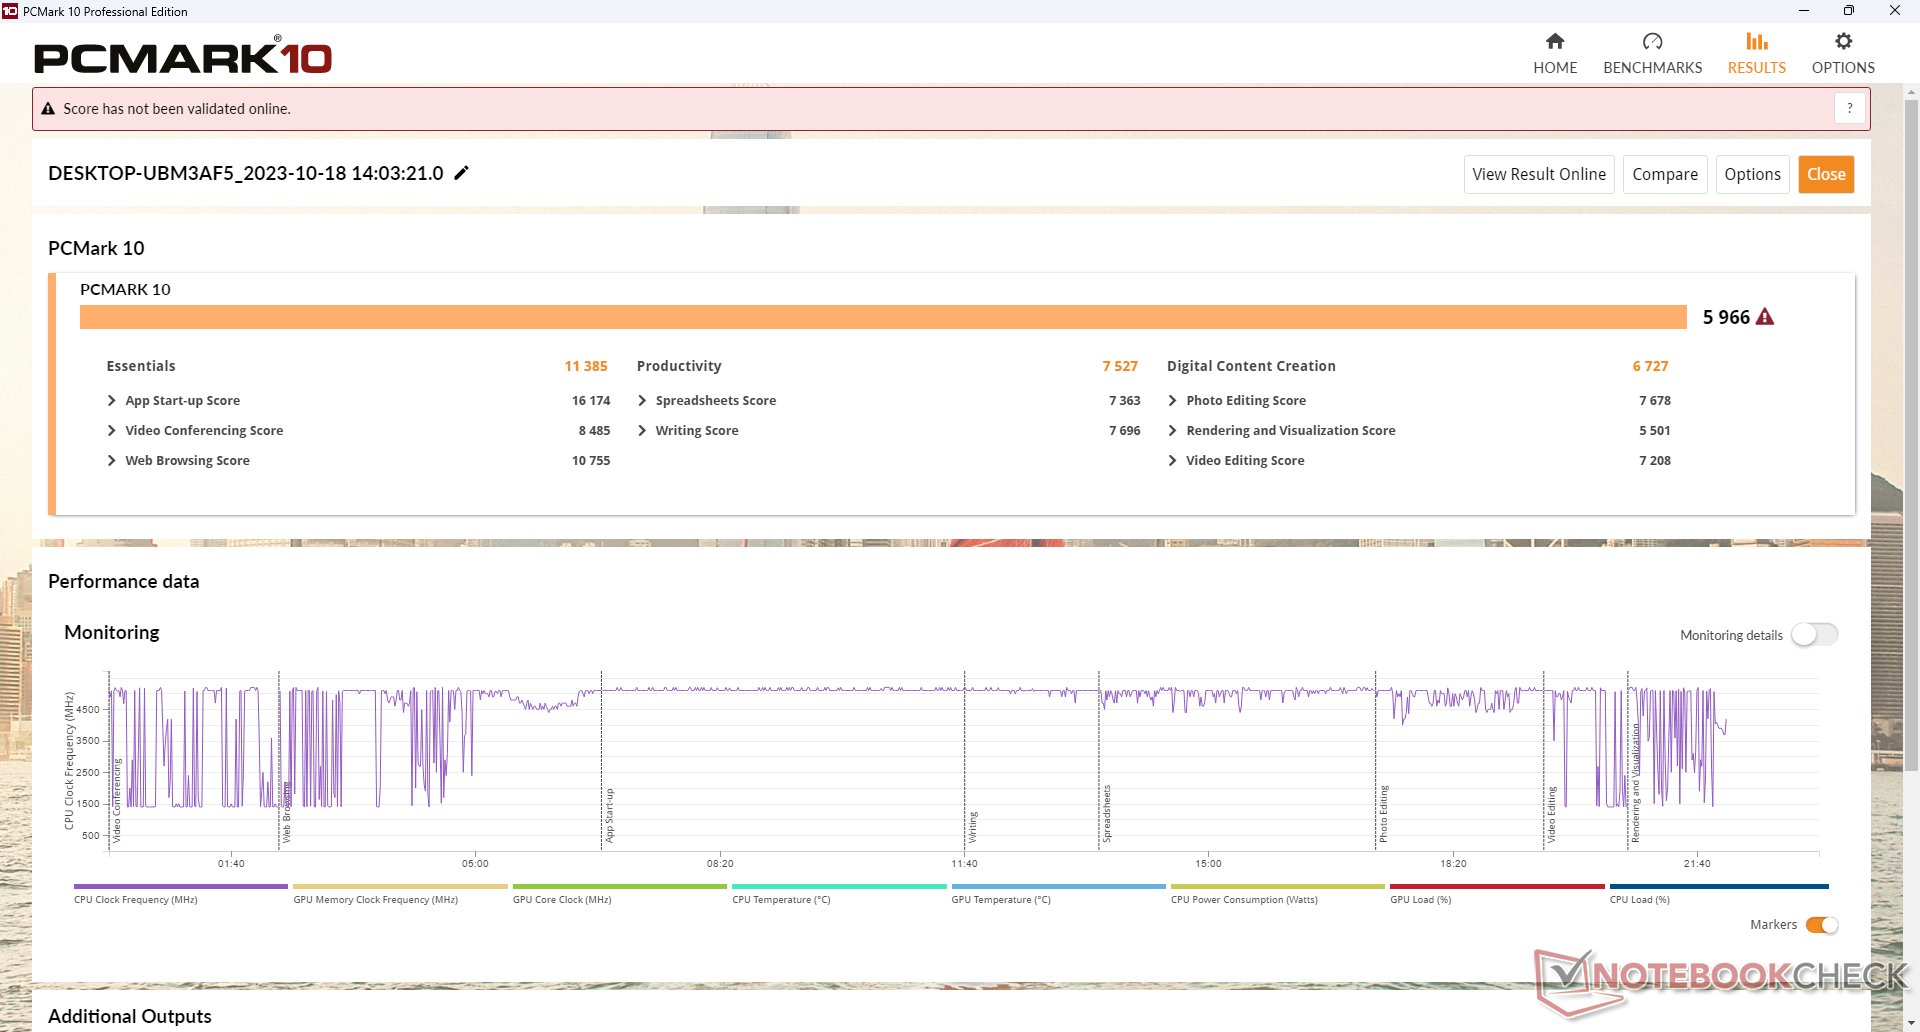
System Performance
PCMark results are comparable to the GMK NucBox K3 Pro but sill behind AMD-based mini PCs like the Beelink SER7. The deficit can be largely attributed to the faster integrated Radeon GPU on competing Ryzen Zen 3+ or Zen 4 platforms.
CrossMark: Overall | Productivity | Creativity | Responsiveness
| PCMark 10 / Score | |
| Beelink GTR7 7840HS | |
| Beelink SER7 | |
| Lenovo IdeaCentre Mini 01IRH8 | |
| Dell OptiPlex Micro | |
| Average Intel Core i7-13700, Intel UHD Graphics 770 (n=1) | |
| GMK NucBox K3 Pro | |
| PCMark 10 / Essentials | |
| Lenovo IdeaCentre Mini 01IRH8 | |
| Dell OptiPlex Micro | |
| Average Intel Core i7-13700, Intel UHD Graphics 770 (n=1) | |
| Beelink GTR7 7840HS | |
| Beelink SER7 | |
| GMK NucBox K3 Pro | |
| PCMark 10 / Productivity | |
| Beelink GTR7 7840HS | |
| Beelink SER7 | |
| GMK NucBox K3 Pro | |
| Lenovo IdeaCentre Mini 01IRH8 | |
| Dell OptiPlex Micro | |
| Average Intel Core i7-13700, Intel UHD Graphics 770 (n=1) | |
| PCMark 10 / Digital Content Creation | |
| Beelink GTR7 7840HS | |
| Beelink SER7 | |
| Lenovo IdeaCentre Mini 01IRH8 | |
| Dell OptiPlex Micro | |
| Average Intel Core i7-13700, Intel UHD Graphics 770 (n=1) | |
| GMK NucBox K3 Pro | |
| CrossMark / Overall | |
| Dell OptiPlex Micro | |
| Average Intel Core i7-13700, Intel UHD Graphics 770 (n=1) | |
| Lenovo IdeaCentre Mini 01IRH8 | |
| Beelink SER7 | |
| GMK NucBox K3 Pro | |
| Beelink GTR7 7840HS | |
| Apple Mac Mini M2 | |
| CrossMark / Productivity | |
| Dell OptiPlex Micro | |
| Average Intel Core i7-13700, Intel UHD Graphics 770 (n=1) | |
| Lenovo IdeaCentre Mini 01IRH8 | |
| Beelink SER7 | |
| Beelink GTR7 7840HS | |
| GMK NucBox K3 Pro | |
| Apple Mac Mini M2 | |
| CrossMark / Creativity | |
| Dell OptiPlex Micro | |
| Average Intel Core i7-13700, Intel UHD Graphics 770 (n=1) | |
| Beelink SER7 | |
| Lenovo IdeaCentre Mini 01IRH8 | |
| Apple Mac Mini M2 | |
| GMK NucBox K3 Pro | |
| Beelink GTR7 7840HS | |
| CrossMark / Responsiveness | |
| Beelink GTR7 7840HS | |
| Dell OptiPlex Micro | |
| Average Intel Core i7-13700, Intel UHD Graphics 770 (n=1) | |
| Lenovo IdeaCentre Mini 01IRH8 | |
| GMK NucBox K3 Pro | |
| Beelink SER7 | |
| Apple Mac Mini M2 | |
| PCMark 10 Score | 5966 points | |
Help | ||
| AIDA64 / Memory Copy | |
| GMK NucBox K3 Pro | |
| Beelink SER7 | |
| Beelink GTR7 7840HS | |
| Average Intel Core i7-13700 (61152 - 73900, n=2) | |
| Dell OptiPlex Micro | |
| Lenovo IdeaCentre Mini 01IRH8 | |
| AIDA64 / Memory Read | |
| Average Intel Core i7-13700 (71285 - 81167, n=2) | |
| Dell OptiPlex Micro | |
| GMK NucBox K3 Pro | |
| Beelink SER7 | |
| Beelink GTR7 7840HS | |
| Lenovo IdeaCentre Mini 01IRH8 | |
| AIDA64 / Memory Write | |
| Beelink SER7 | |
| Beelink GTR7 7840HS | |
| Average Intel Core i7-13700 (60029 - 73720, n=2) | |
| Dell OptiPlex Micro | |
| GMK NucBox K3 Pro | |
| Lenovo IdeaCentre Mini 01IRH8 | |
| AIDA64 / Memory Latency | |
| GMK NucBox K3 Pro | |
| Dell OptiPlex Micro | |
| Beelink GTR7 7840HS | |
| Beelink SER7 | |
| Lenovo IdeaCentre Mini 01IRH8 | |
| Average Intel Core i7-13700 (71.8 - 87, n=2) | |
* ... smaller is better
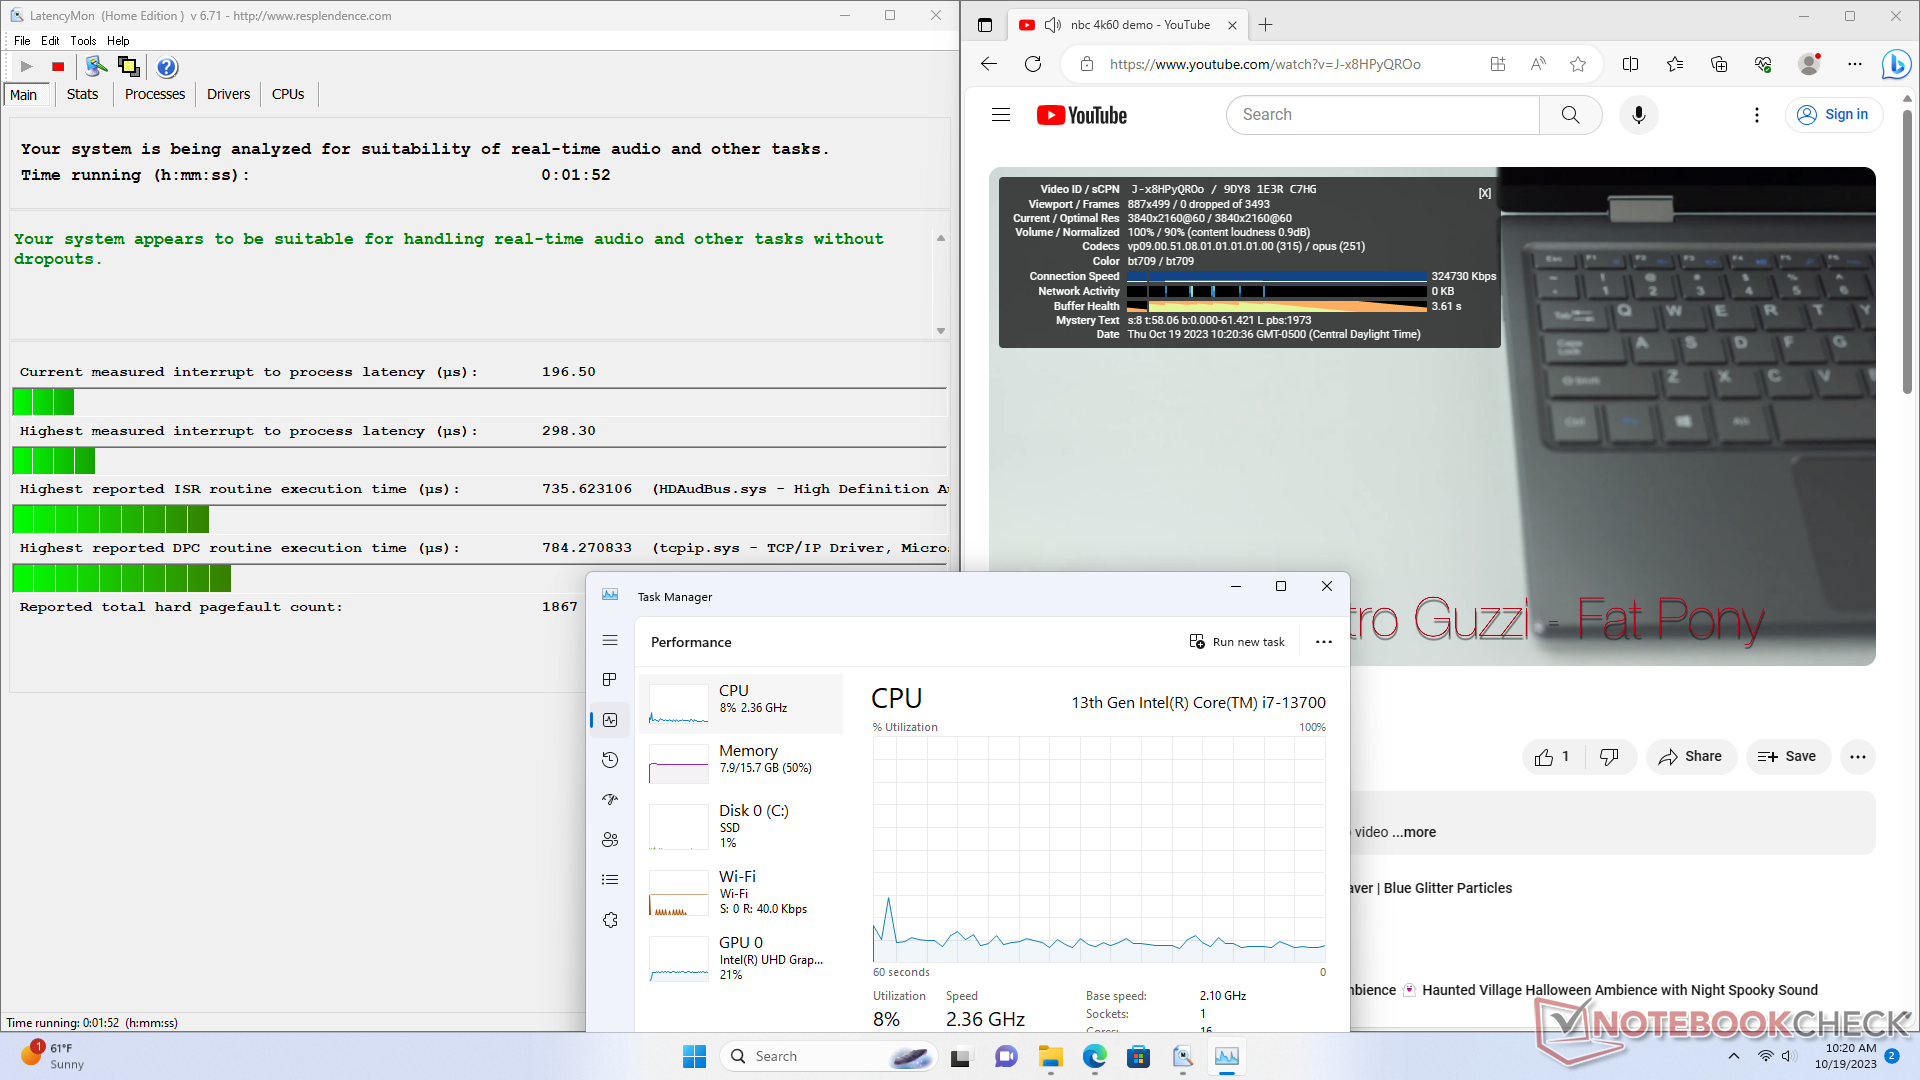
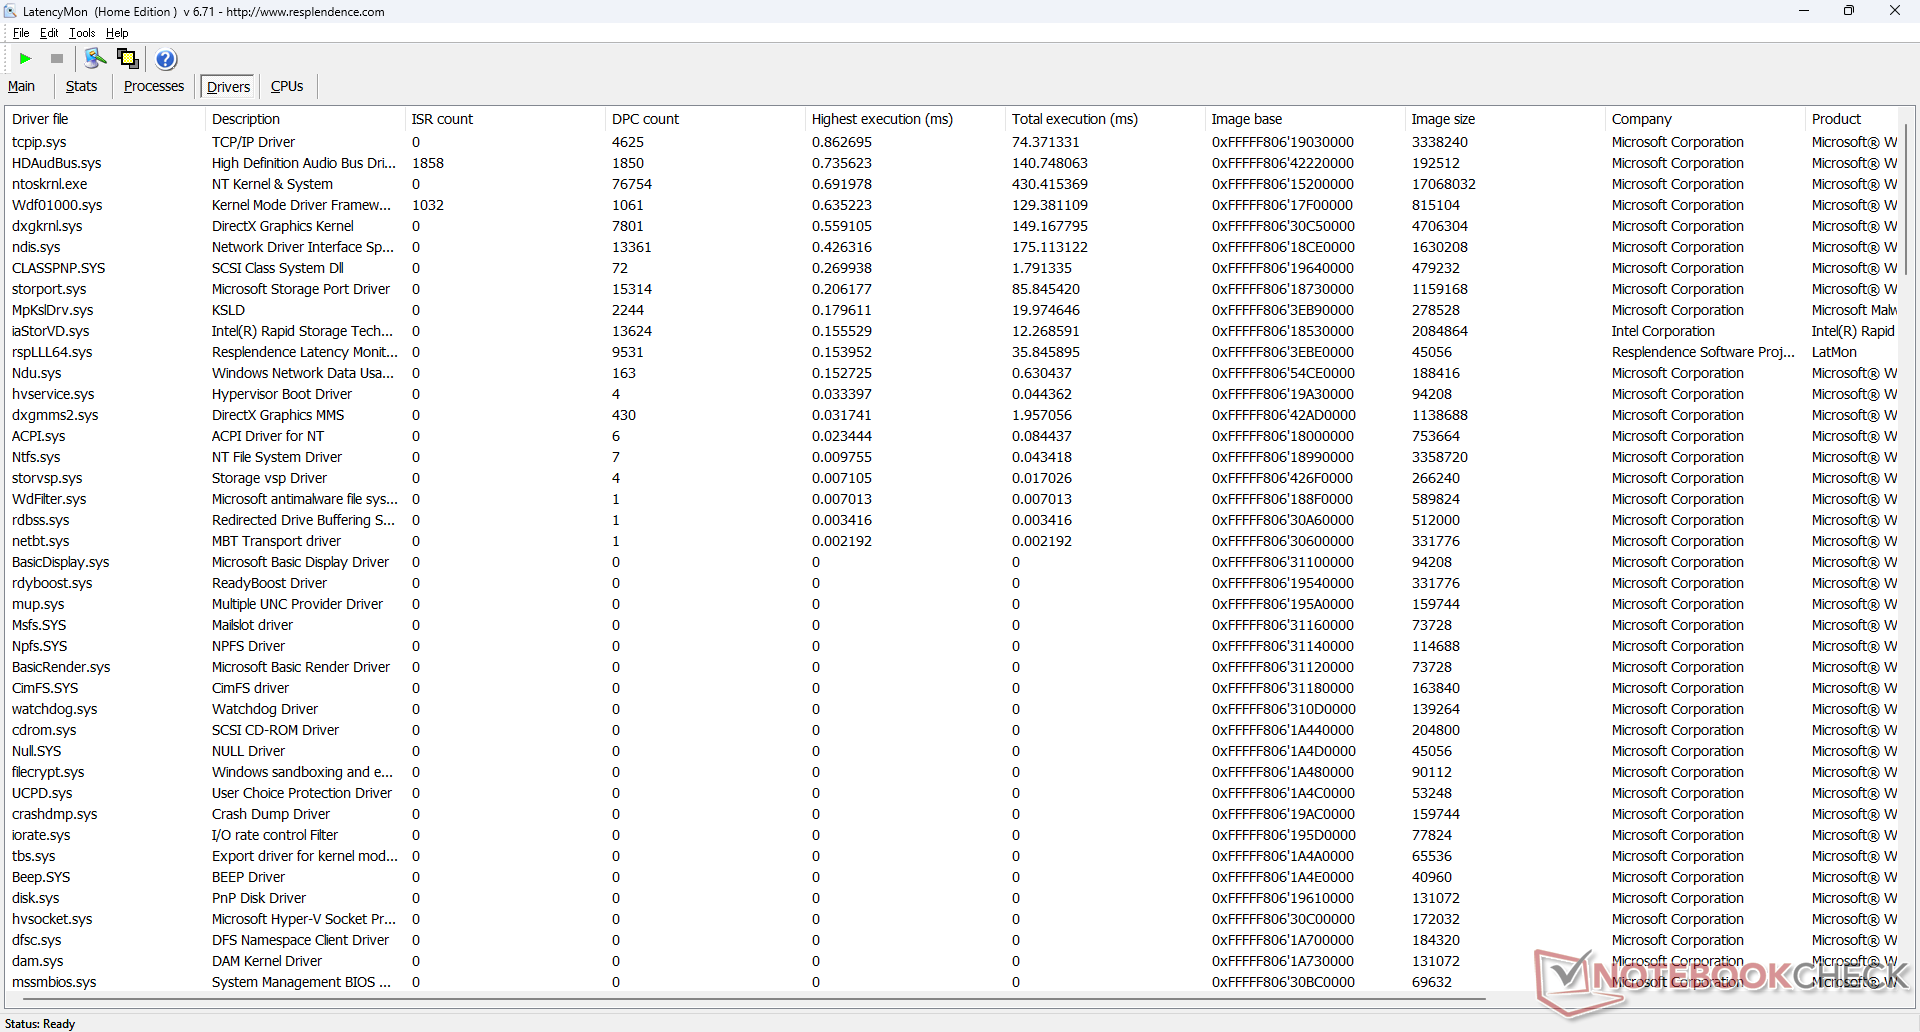
DPC Latency
LatencyMon reveals no major DPC issues when opening multiple browser tabs of our homepage and no dropped frames during 4K playback at 60 FPS.
| DPC Latencies / LatencyMon - interrupt to process latency (max), Web, Youtube, Prime95 | |
| Lenovo IdeaCentre Mini 01IRH8 | |
| GMK NucBox K3 Pro | |
| Beelink GTR7 7840HS | |
| Beelink SER7 | |
| Dell OptiPlex Micro | |
* ... smaller is better
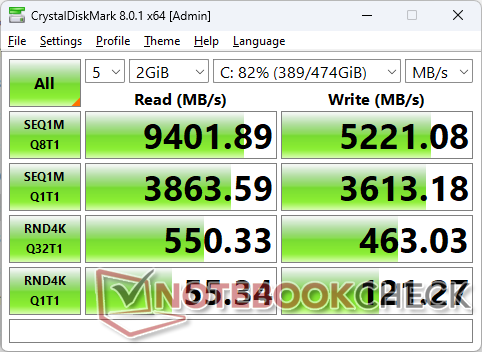
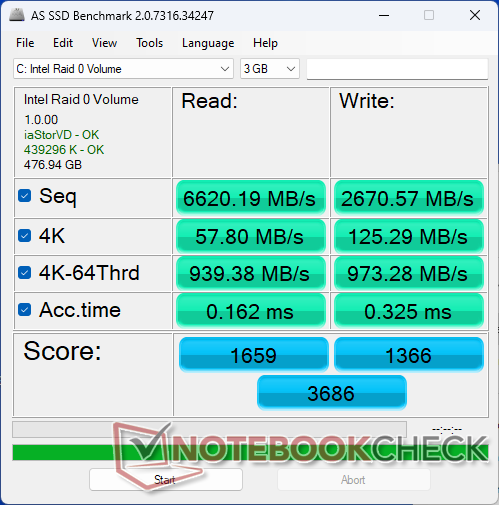
Storage Devices
Our unit utilizes two SK hynix BC901 NVMe SSDs in RAID 0 configuration which is an uncommon sight as each drive is only 30 mm in length instead of the more typical 80 mm. The shorter length and lack of any heat spreaders mean performance throttling is more likely to occur when the drives are stressed. Unfortunately, this is exactly what happens as shown by our DiskSpd loop test results below where transfer rates would be as high as 8600 MB/s only during the first minute or so before throttling to the 1500 to 2500 MB/s range.
Note that the system can still support two full-length 2280 M.2 SSDs if desired.

| Drive Performance rating - Percent | |
| Beelink GTR7 7840HS | |
| Dell OptiPlex Micro | |
| Lenovo IdeaCentre Mini 01IRH8 | |
| Beelink SER7 | |
| GMK NucBox K3 Pro | |
* ... smaller is better
Disk Throttling: DiskSpd Read Loop, Queue Depth 8
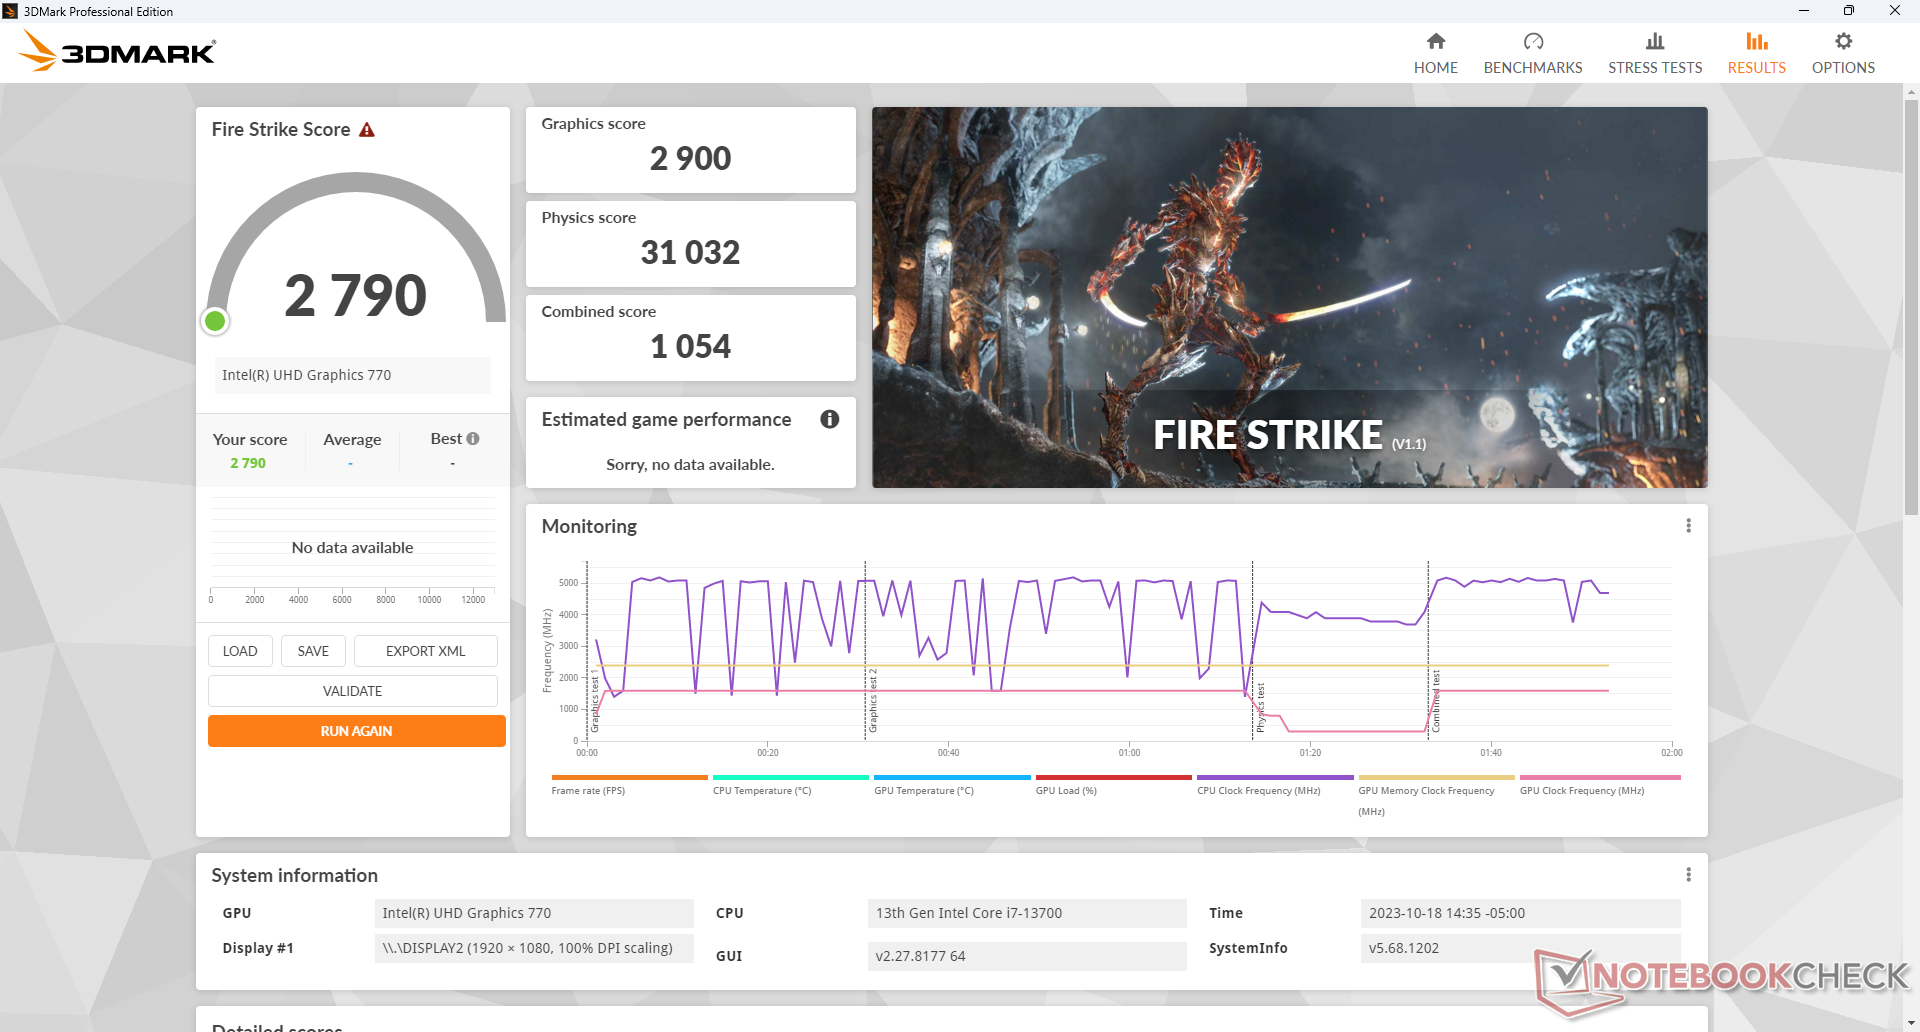
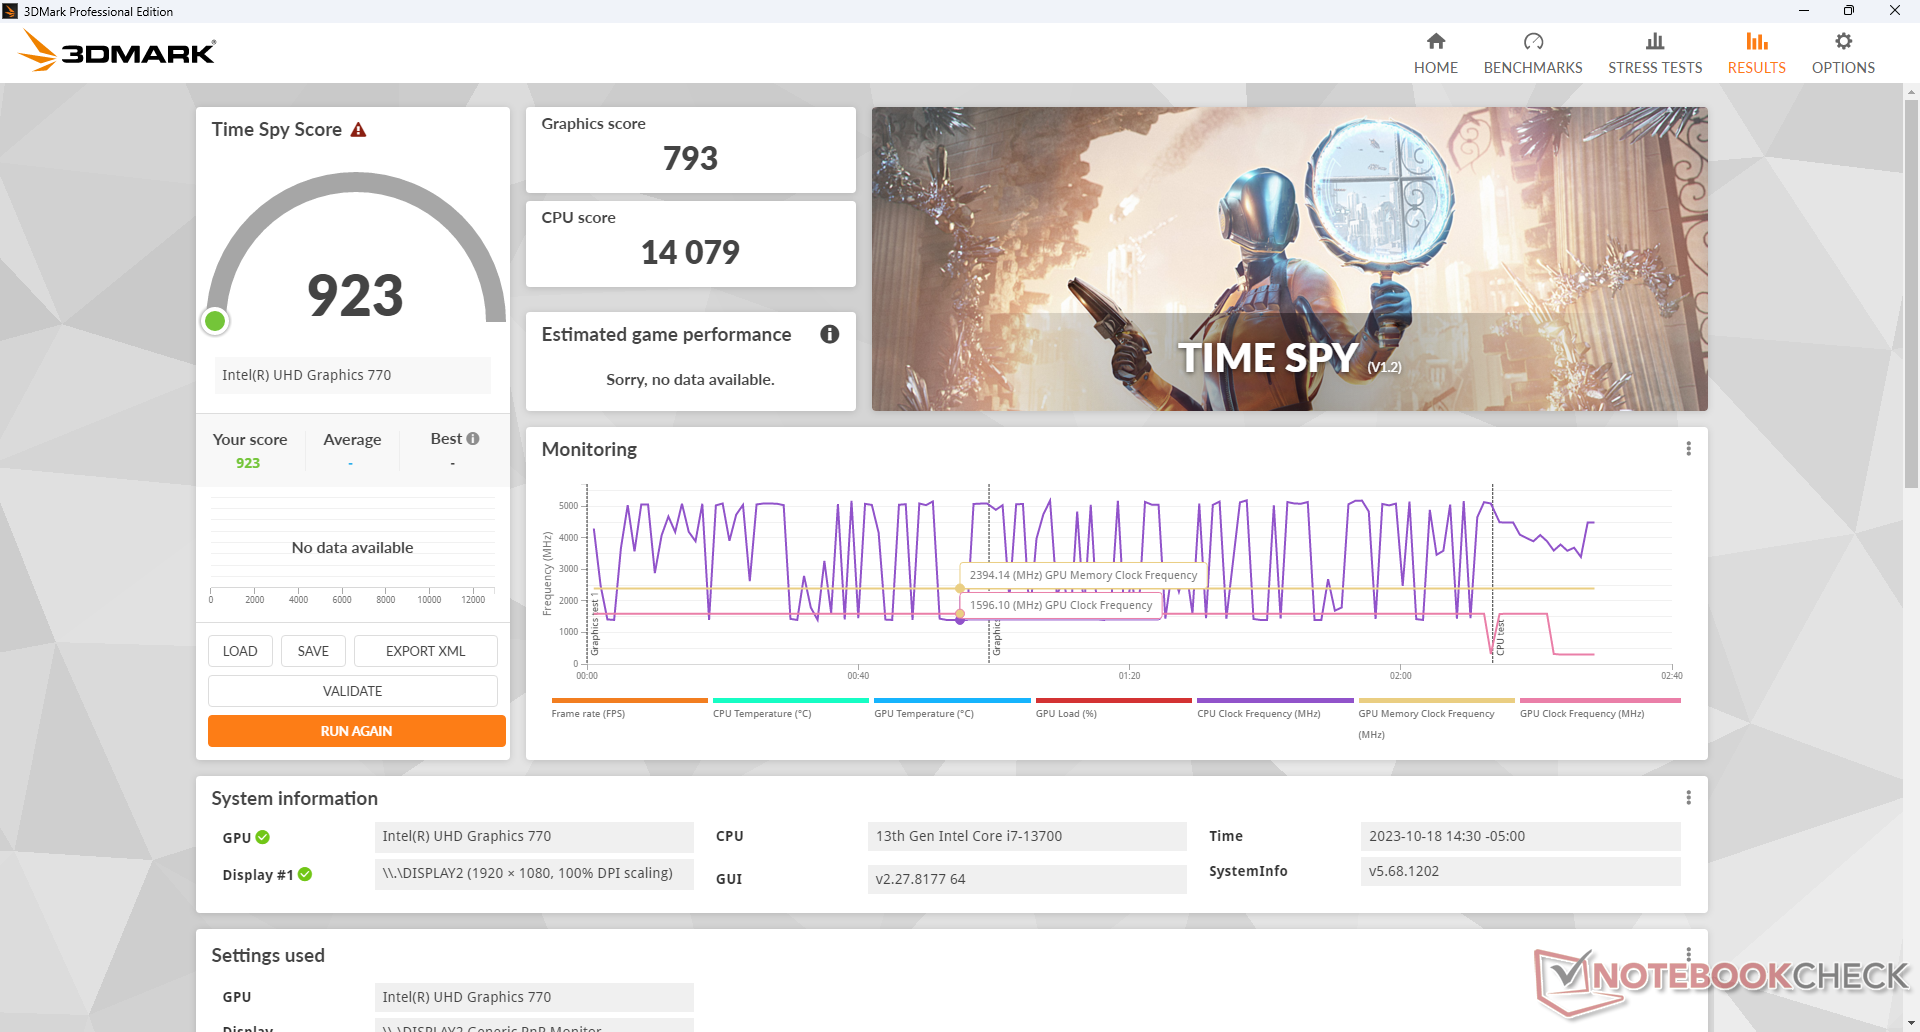
GPU Performance
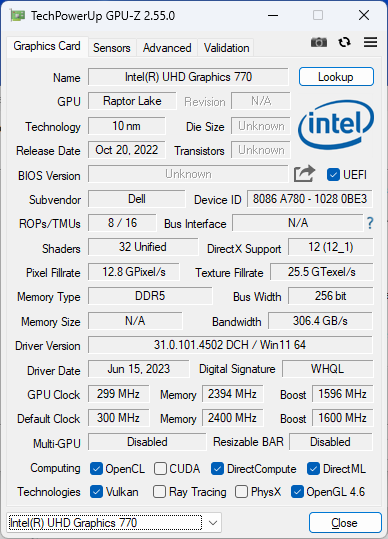
Graphics performance is poor especially when compared to the more impressive CPU. The UHD Graphics 770 has become outdated and it's only really useful for streaming purposes or basic 4K60 video output. Nonetheless, this shouldn't be an issue for the target audience as the OptiPlex Micro was not designed to be a graphics powerhouse.
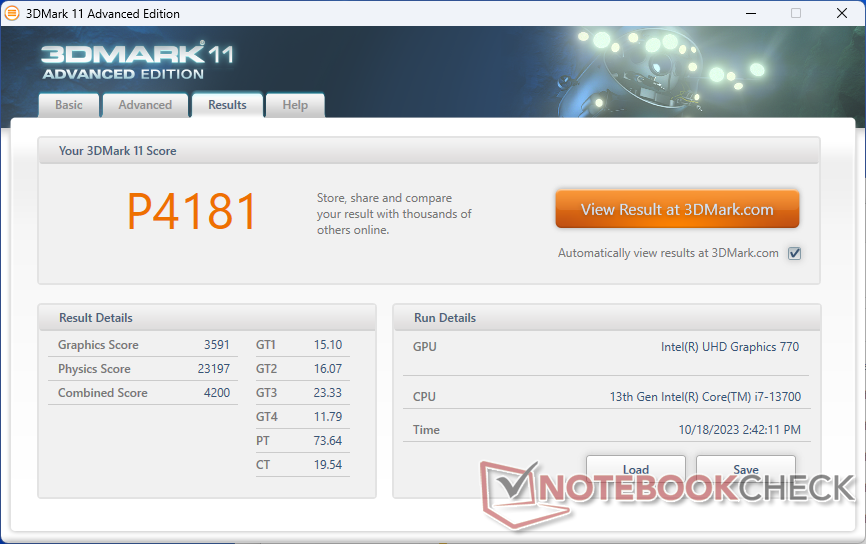
| 3DMark 11 Performance | 4181 points | |
| 3DMark Fire Strike Score | 2790 points | |
| 3DMark Time Spy Score | 923 points | |
Help | ||
| Blender | |
| v3.3 Classroom METAL | |
| Apple Mac Mini M2 | |
| v3.3 Classroom HIP/AMD | |
| Geekom A5 | |
| Acemagic AM20 | |
| v3.3 Classroom CPU | |
| Minisforum Venus Series UN1245 | |
| GMK NucBox K3 Pro | |
| Acemagic AD15 | |
| Apple Mac Mini M2 | |
| Geekom A5 | |
| Acemagic AM20 | |
| Beelink GTR7 7840HS | |
| Lenovo IdeaCentre Mini 01IRH8 | |
| Average Intel UHD Graphics 770 (320 - 533, n=5) | |
| Intel NUC 12, NUC12SNKi72_Serpent Canyon | |
| Dell OptiPlex Micro | |
* ... smaller is better
| The Witcher 3 | |
| 1024x768 Low Graphics & Postprocessing | |
| Beelink GTR7 7840HS | |
| Acemagic AM20 | |
| Lenovo IdeaCentre Mini 01IRH8 | |
| Geekom A5 | |
| GMK NucBox K3 Pro | |
| Minisforum Venus Series UN1245 | |
| Dell OptiPlex Micro | |
| Average Intel UHD Graphics 770 (41.8 - 58, n=4) | |
| Acemagic AD15 | |
| 1366x768 Medium Graphics & Postprocessing | |
| Beelink GTR7 7840HS | |
| GMK NucBox K3 Pro | |
| Lenovo IdeaCentre Mini 01IRH8 | |
| Geekom A5 | |
| Acemagic AM20 | |
| Minisforum Venus Series UN1245 | |
| Dell OptiPlex Micro | |
| Average Intel UHD Graphics 770 (34.2 - 37.9, n=2) | |
| Cyberpunk 2077 1.6 | |
| 1280x720 Low Preset | |
| Beelink GTR7 7840HS | |
| Lenovo IdeaCentre Mini 01IRH8 | |
| Average Intel UHD Graphics 770 (18.6 - 22.2, n=2) | |
| Dell OptiPlex Micro | |
| 1920x1080 Low Preset | |
| Beelink GTR7 7840HS | |
| Lenovo IdeaCentre Mini 01IRH8 | |
| Average Intel UHD Graphics 770 (10.2 - 11.8, n=2) | |
| Dell OptiPlex Micro | |
Witcher 3 FPS Chart
| low | med. | high | ultra | |
|---|---|---|---|---|
| The Witcher 3 (2015) | 58 | 37.9 | ||
| Dota 2 Reborn (2015) | 153.1 | 96.1 | 44.2 | 40.8 |
| Final Fantasy XV Benchmark (2018) | 28.2 | 14.6 | 10.2 | |
| X-Plane 11.11 (2018) | 51.4 | 32.7 | 29.7 | |
| Cyberpunk 2077 1.6 (2022) | 10.2 | |||
| Tiny Tina's Wonderlands (2022) | 16.4 |
Emissions
System Noise
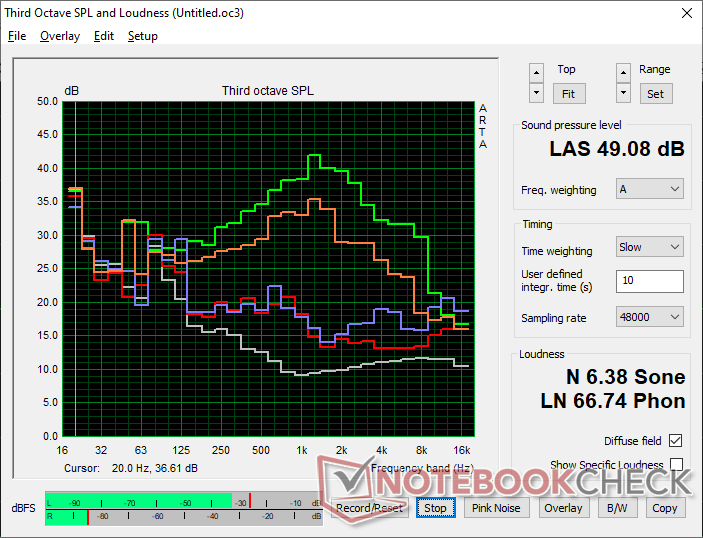
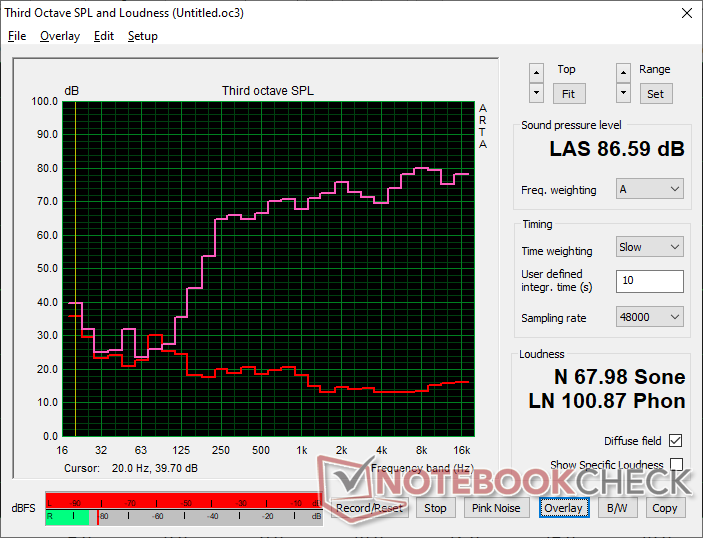
The internal fan is always active at a minimum of 28.2 dB(A) against a silent background of 23.2 dB(A). It remains relatively quiet at around 30 dB(A) when running typical loads like browsers or spreadsheets, but extreme loads like Prime95 stress can induce a fan noise of almost 50 dB(A) to be louder than most other mini PCs. In other words, the OptiPlex Micro only becomes loud when demanding applications are introduced.
Noise level
| Idle |
| 28.2 / 28.2 / 29.1 dB(A) |
| Load |
| 30.2 / 49.1 dB(A) |
 | ||
30 dB silent 40 dB(A) audible 50 dB(A) loud |
||
min: | ||
| Dell OptiPlex Micro UHD Graphics 770, i7-13700 | Apple Mac Mini M2 M2 10-Core GPU, M2, Apple SSD AP0512Z | Lenovo IdeaCentre Mini 01IRH8 Iris Xe G7 96EUs, i7-13700H, Samsung PM9B1 512GB MZVL4512HBLU | GMK NucBox K3 Pro UHD Graphics 64EUs, i7-12650H, Lexar NM610 Pro NM610P001T-HNNNG | Beelink GTR7 7840HS Radeon 780M, R7 7840HS, Crucial P3 Plus CT1000P3PSSD8 | Beelink SER7 Radeon 780M, R7 7840HS, Crucial P3 Plus CT1000P3PSSD8 | |
|---|---|---|---|---|---|---|
| Noise | 15% | 2% | 4% | 1% | 5% | |
| off / environment * (dB) | 23.2 | 24.7 -6% | 23.4 -1% | 23.1 -0% | 25.6 -10% | 24.5 -6% |
| Idle Minimum * (dB) | 28.2 | 24.7 12% | 30.4 -8% | 25 11% | 28.1 -0% | 25.1 11% |
| Idle Average * (dB) | 28.2 | 24.7 12% | 30.4 -8% | 25.5 10% | 28.1 -0% | 25.1 11% |
| Idle Maximum * (dB) | 29.1 | 24.7 15% | 30.4 -4% | 25.5 12% | 28.1 3% | 25.1 14% |
| Load Average * (dB) | 30.2 | 24.7 18% | 30.7 -2% | 39.9 -32% | 34.9 -16% | 35.9 -19% |
| Witcher 3 ultra * (dB) | 42.6 | 33.9 20% | 39.9 6% | 36.4 15% | 35.6 16% | |
| Load Maximum * (dB) | 49.1 | 29.4 40% | 41 16% | 39.9 19% | 42.4 14% | 45.4 8% |
* ... smaller is better
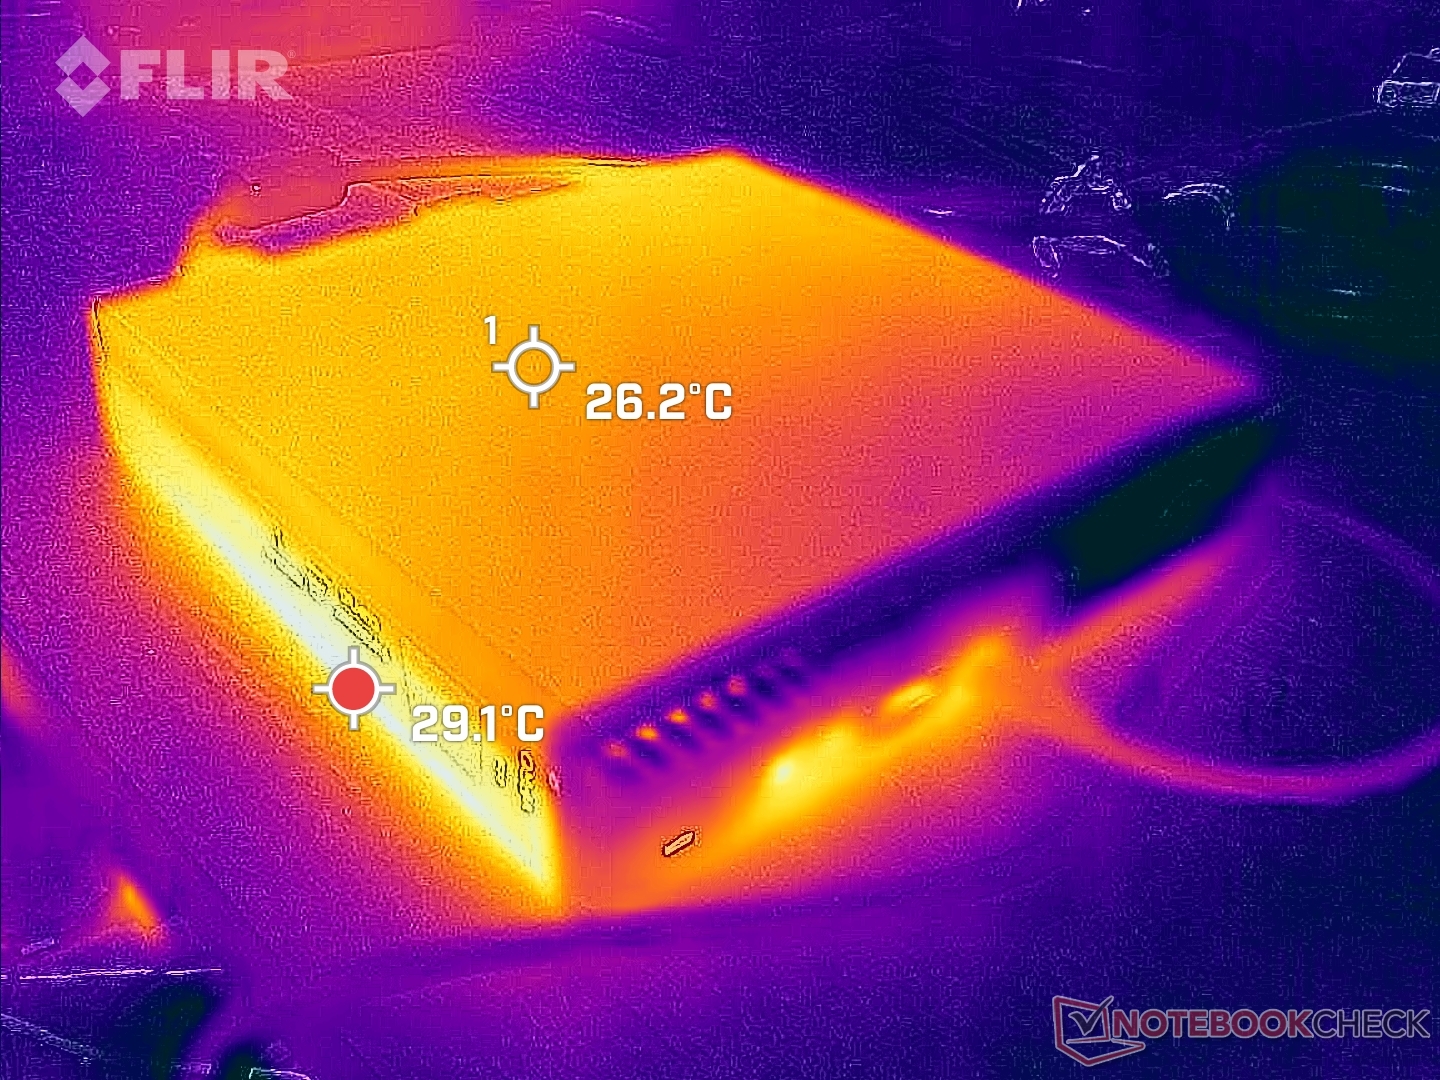
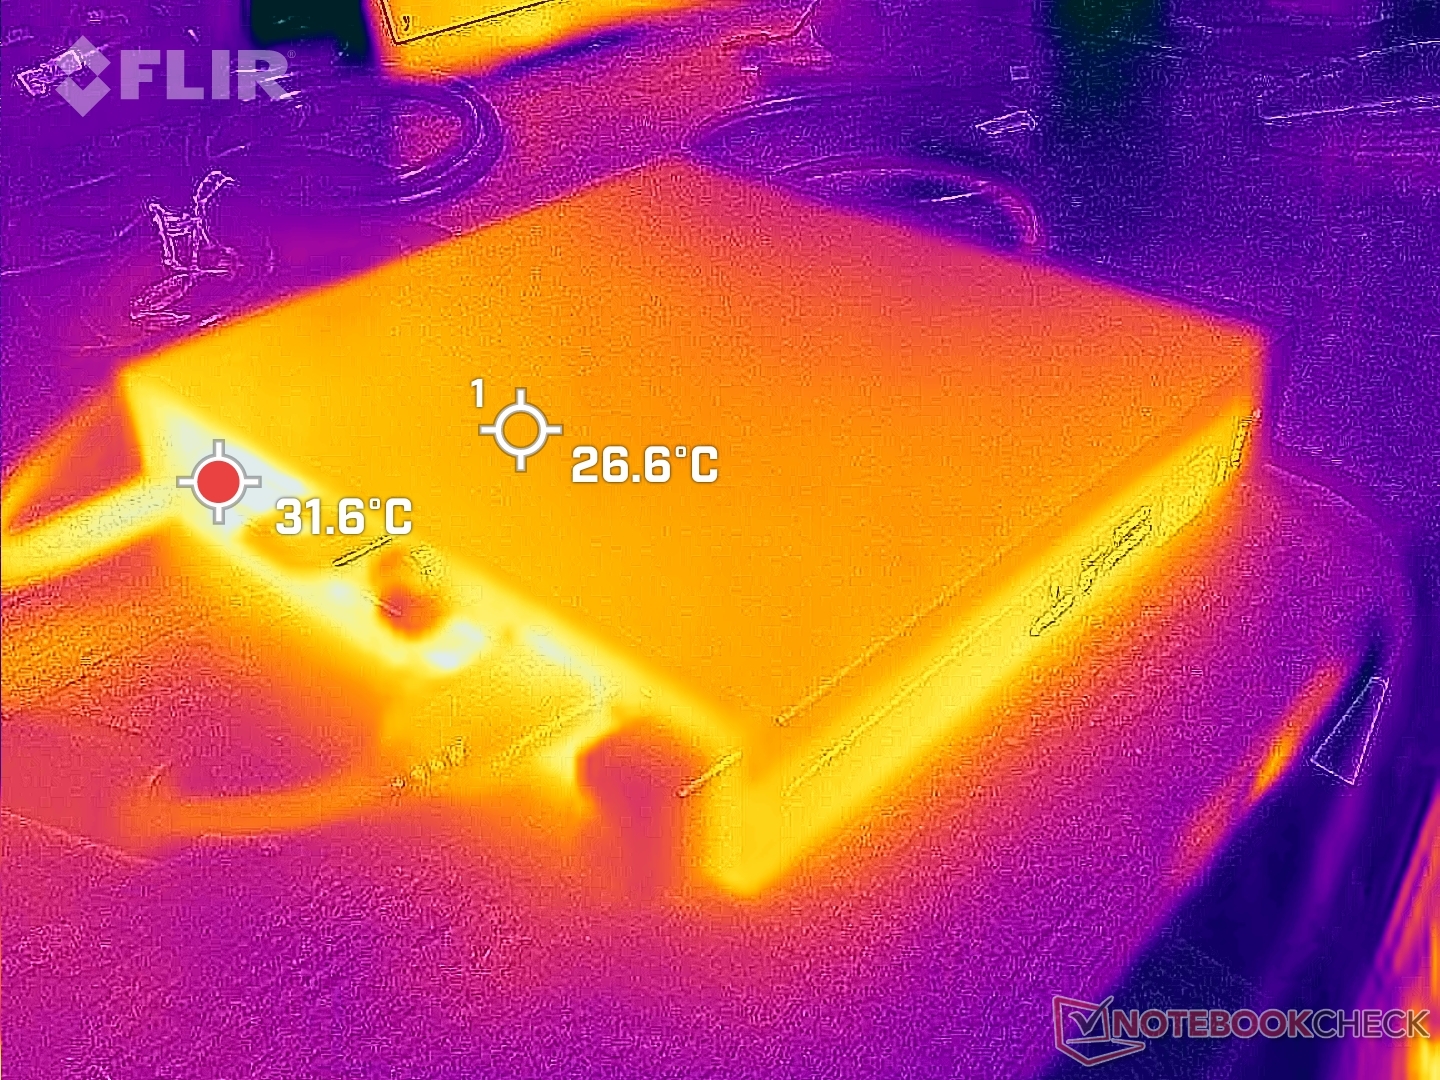
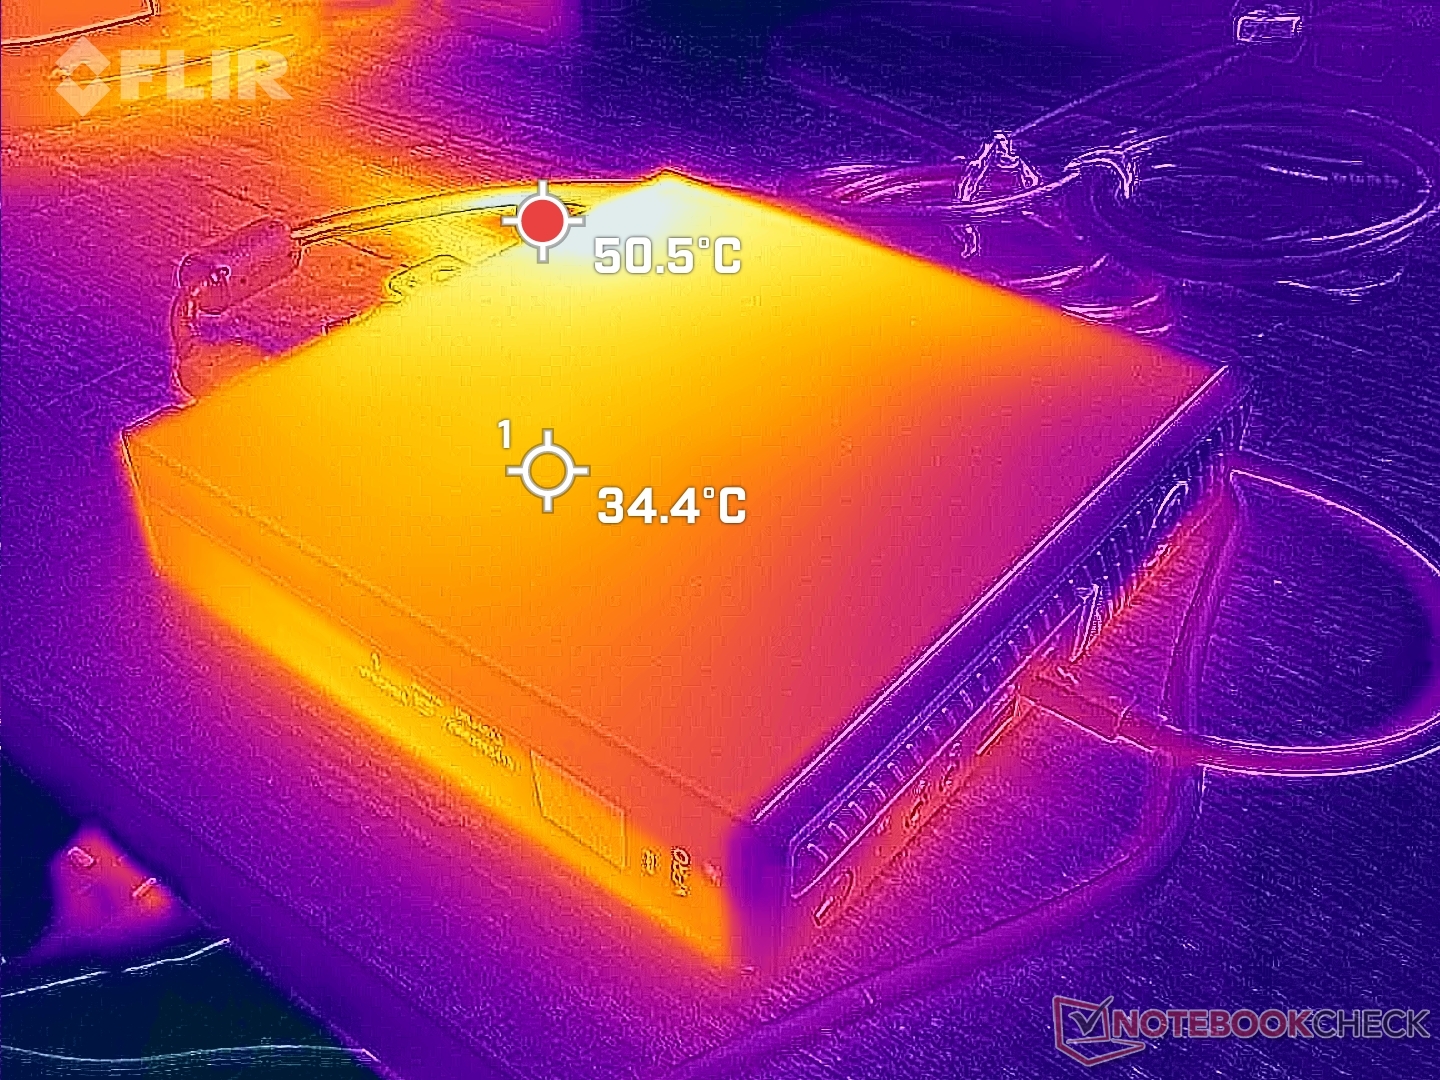
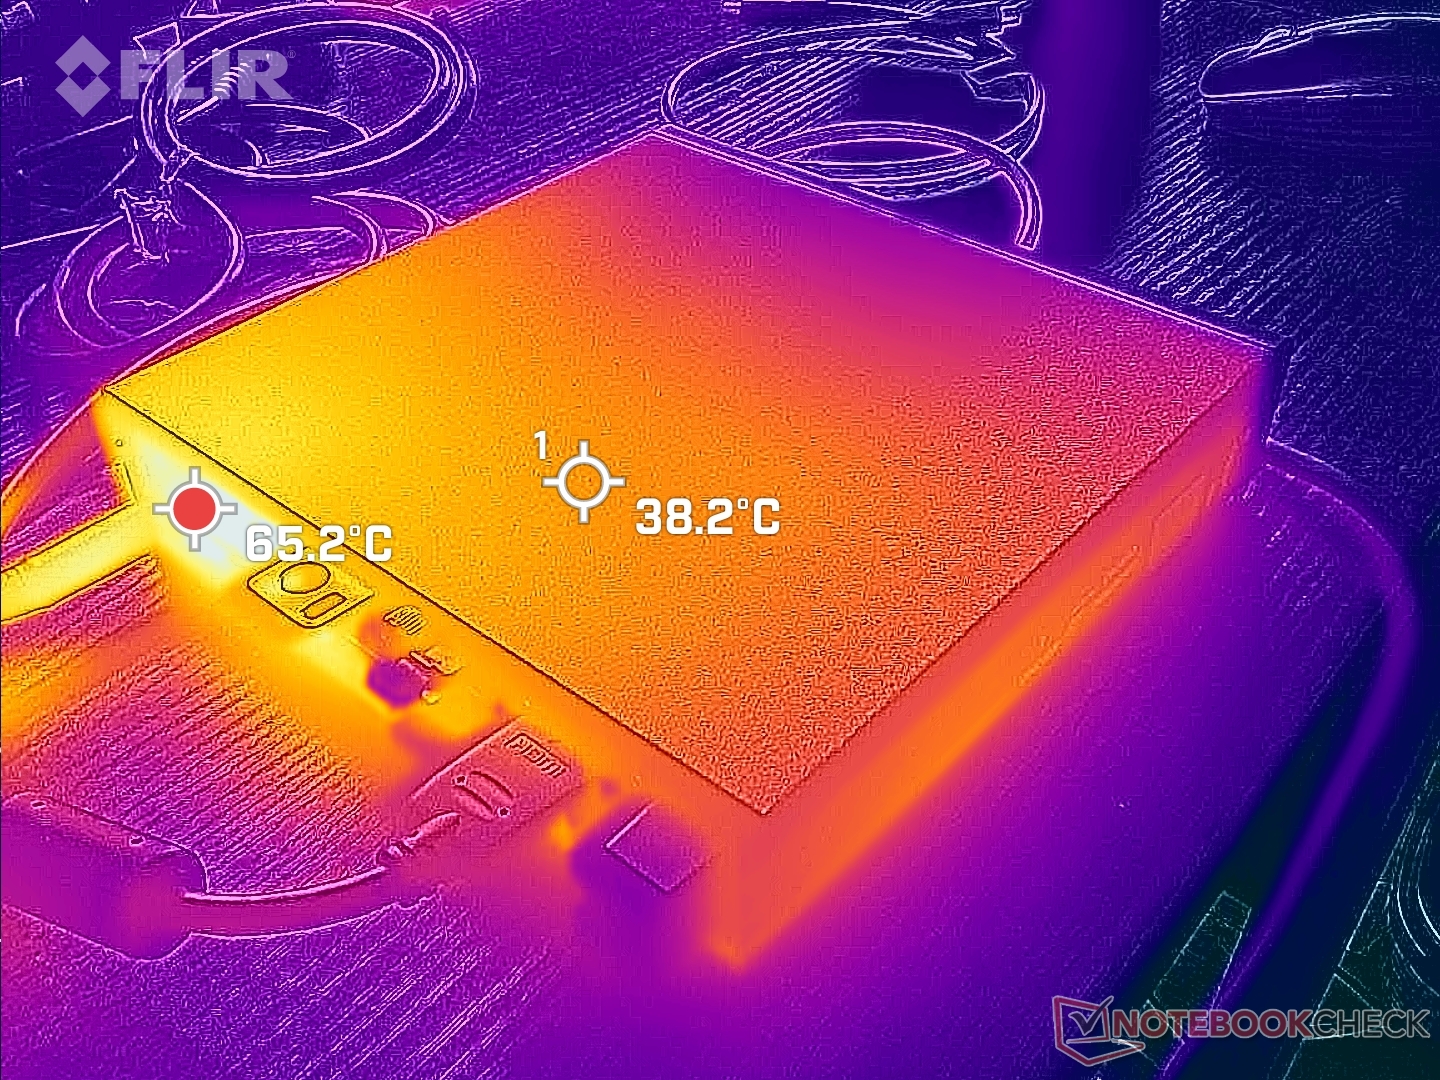
Temperature — Hot Top
Surface temperatures can be quite warm as the model houses a desktop-class CPU in a mostly metal exterior. The top surface is a balmy 30 C to 35 C when simply web browsing and it can go as high 51 C when running demanding loads. You'll definitely want to be wary of the temperature if placing any items on top of the unit.
Stress Test
Core temperatures can be very high which correlate with the high surface temperatures and throttling behavior mentioned above. When running Prime95, for example, the CPU would boost to 3.6 GHz, 155 W, and almost 100 C lasting for only a minute or two at most. Thereafter, the CPU would stabilize at 2.7 GHz and 66 W in order to maintain a slightly cooler core temperature of 90 C. Repeating this test on the Lenovo IdeaCentre Mini with the slower Core i7-13700H would result in a cooler core temperature of 81 C instead.
Furthermore, reaching such high core temperatures doesn't take all that much. Core temperature would stabilize at 94 C just from running Witcher 3 to represent high loads compared to only 68 C on the Beelink GTR7.
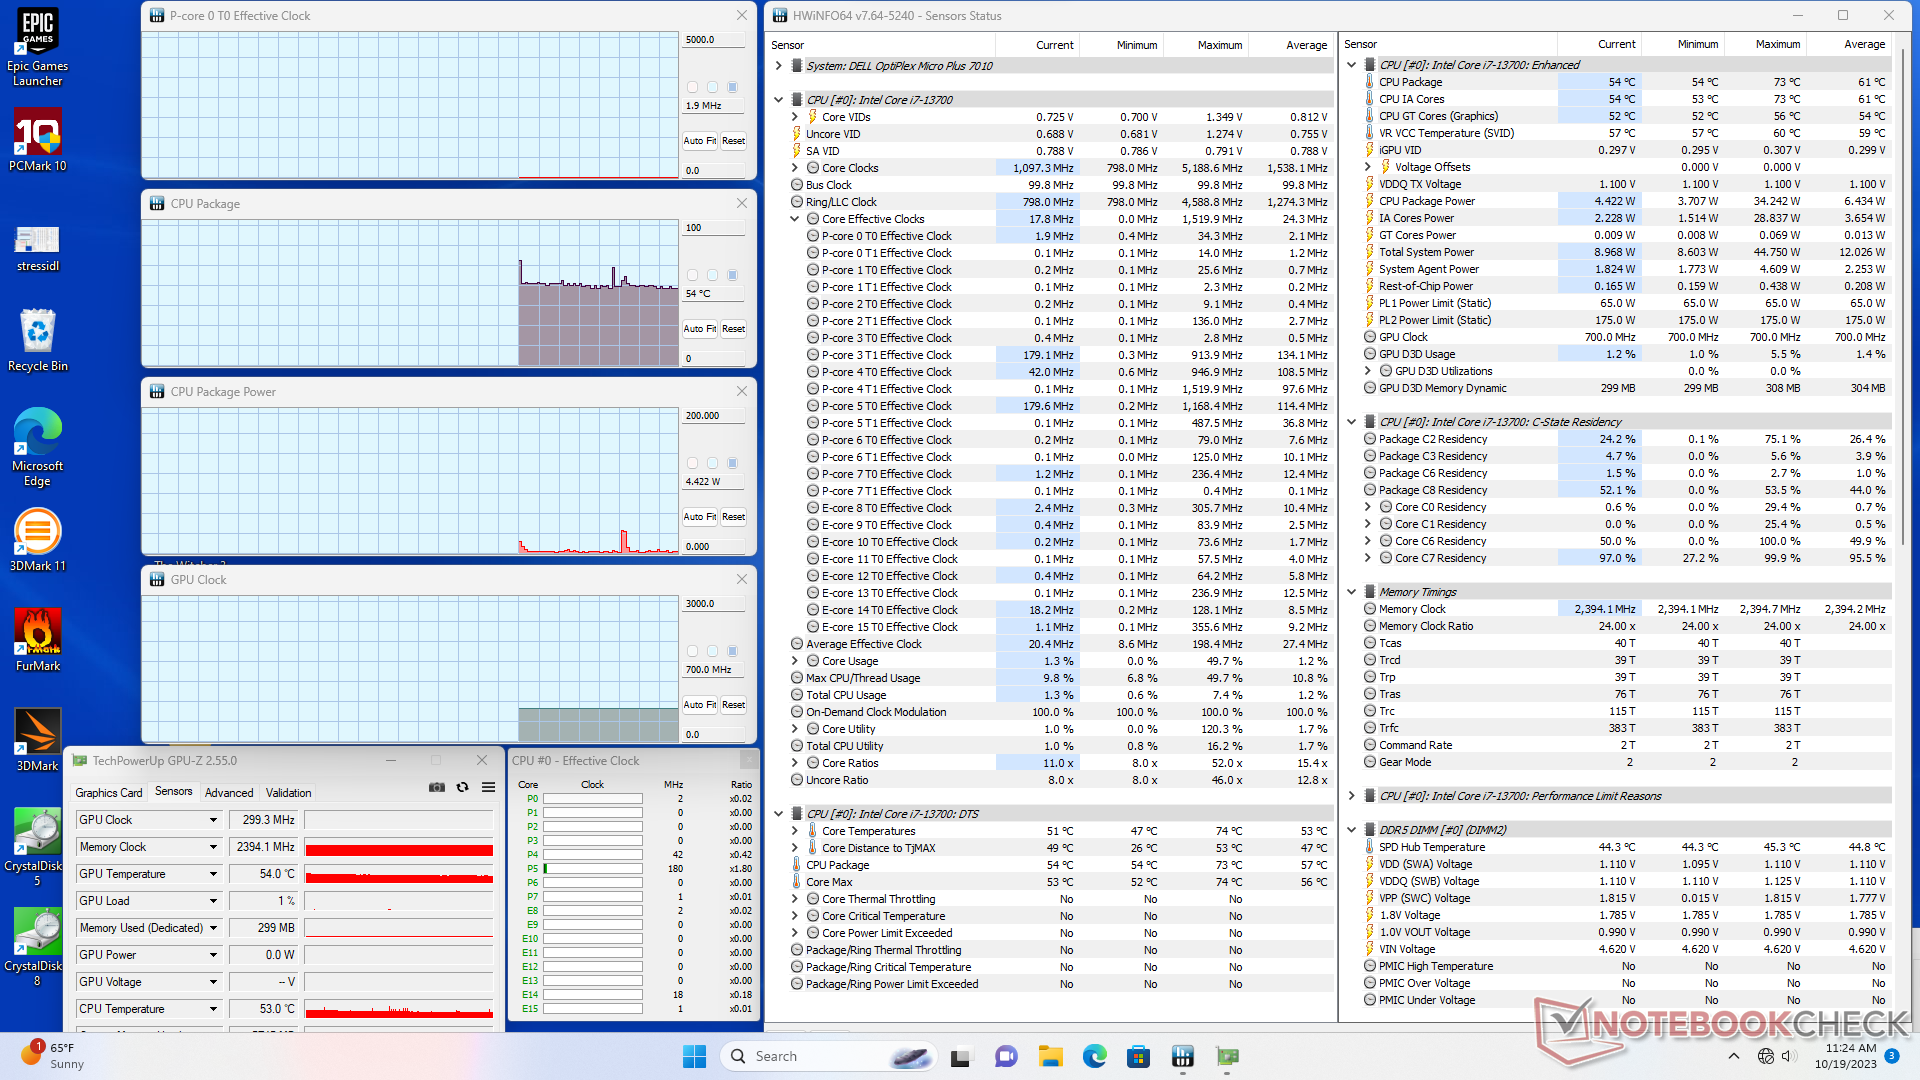
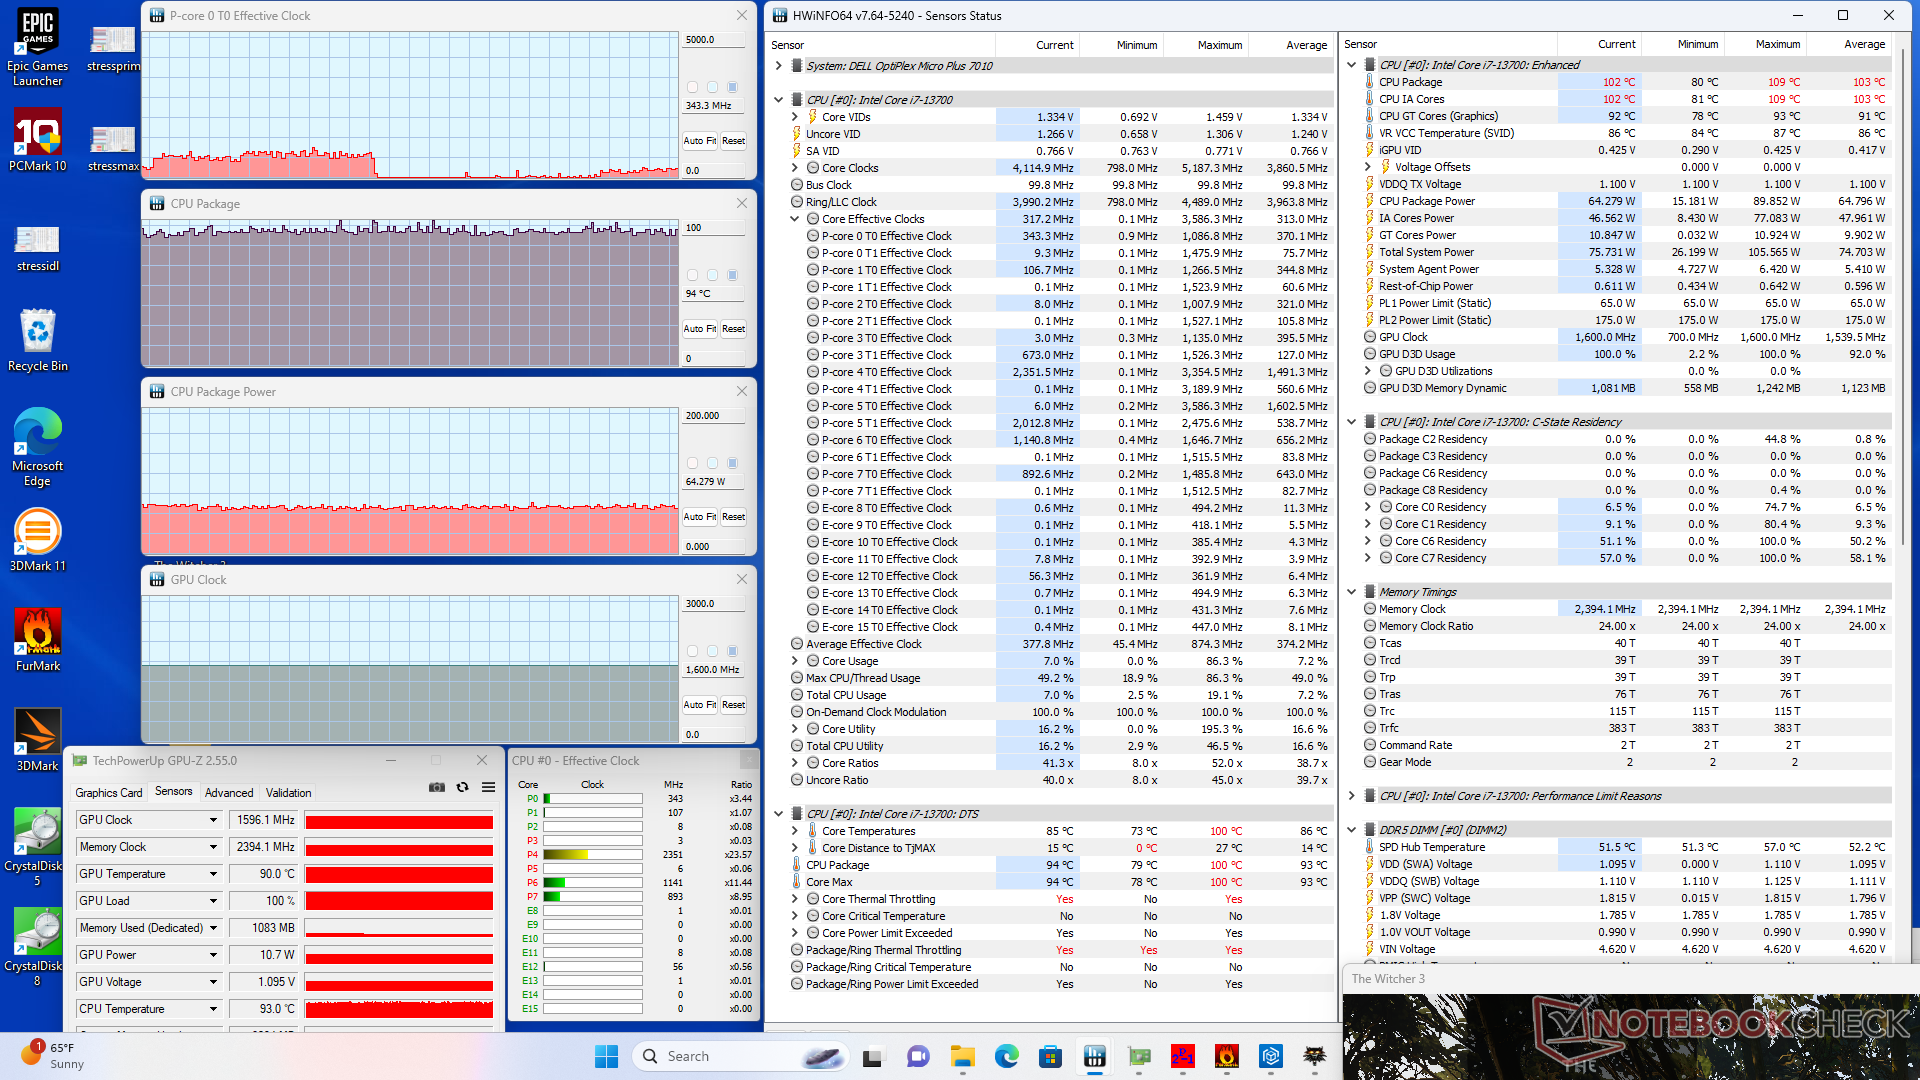
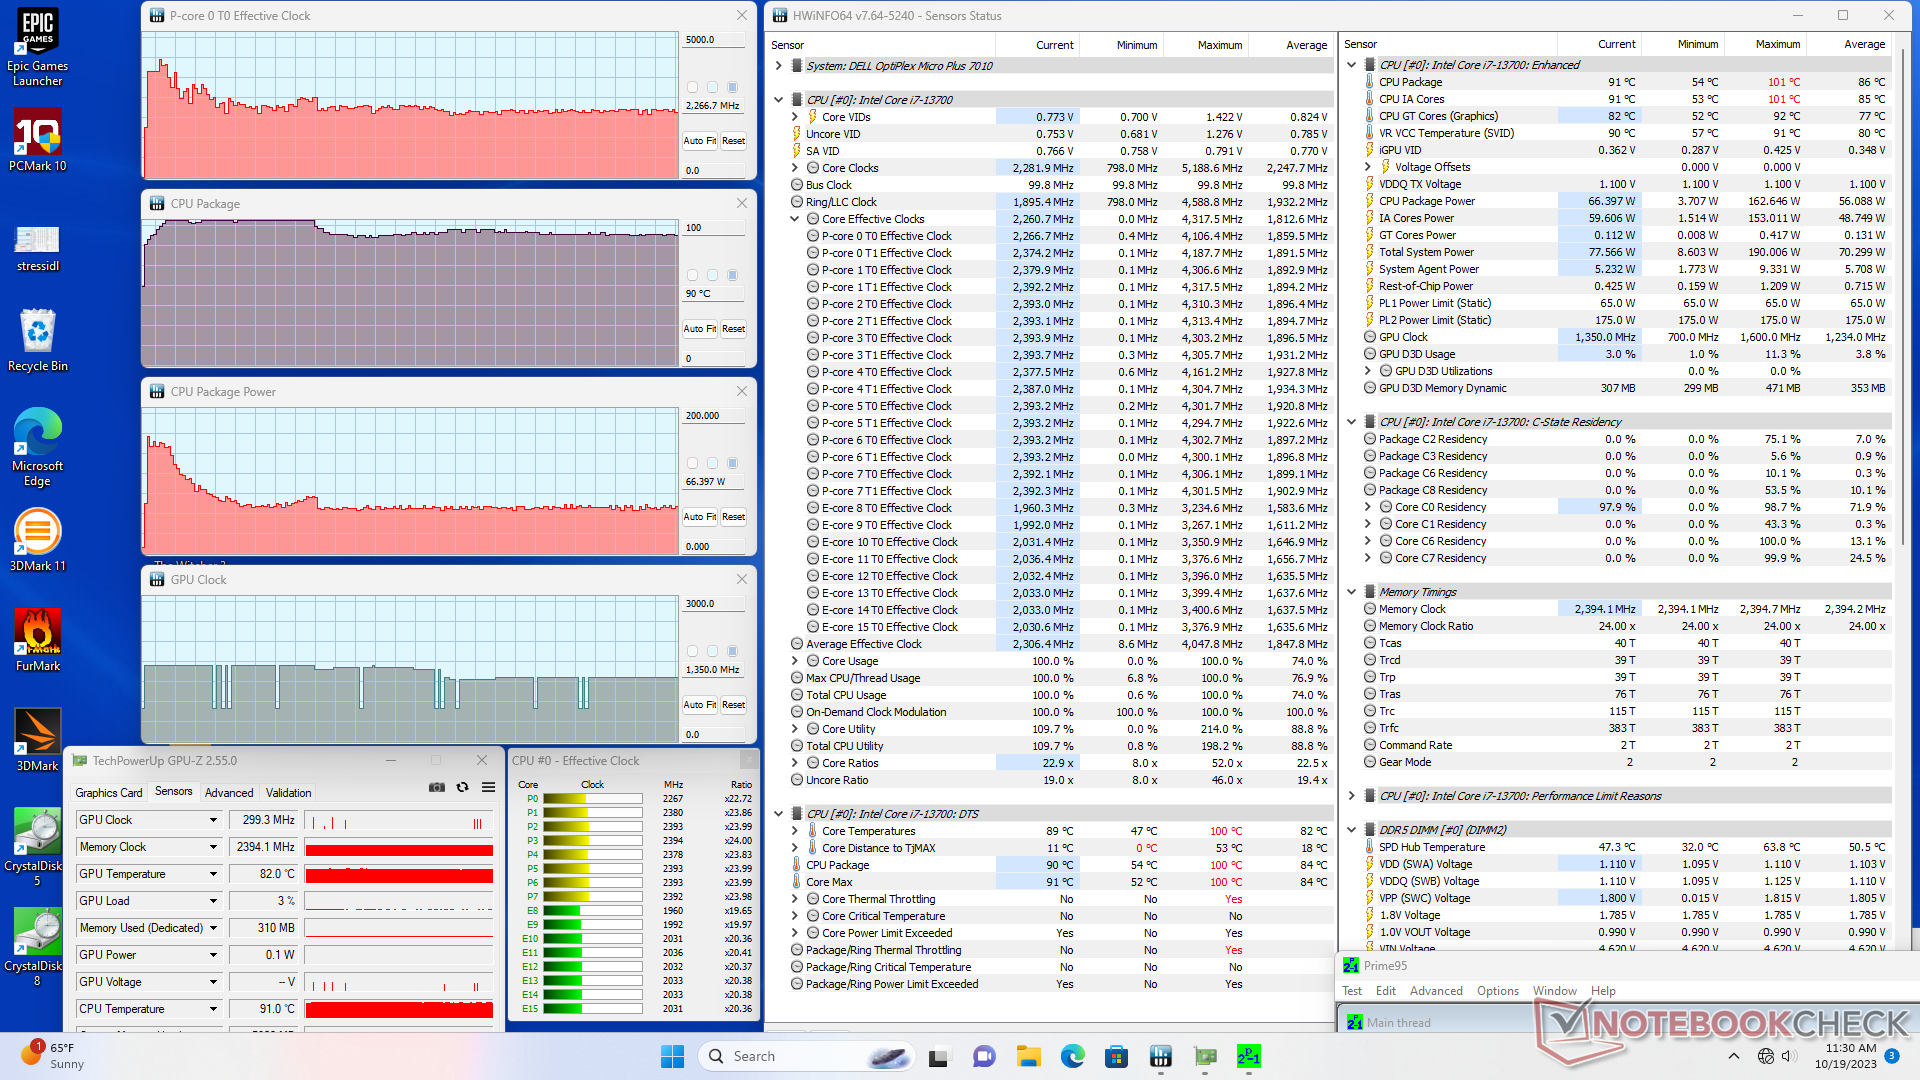
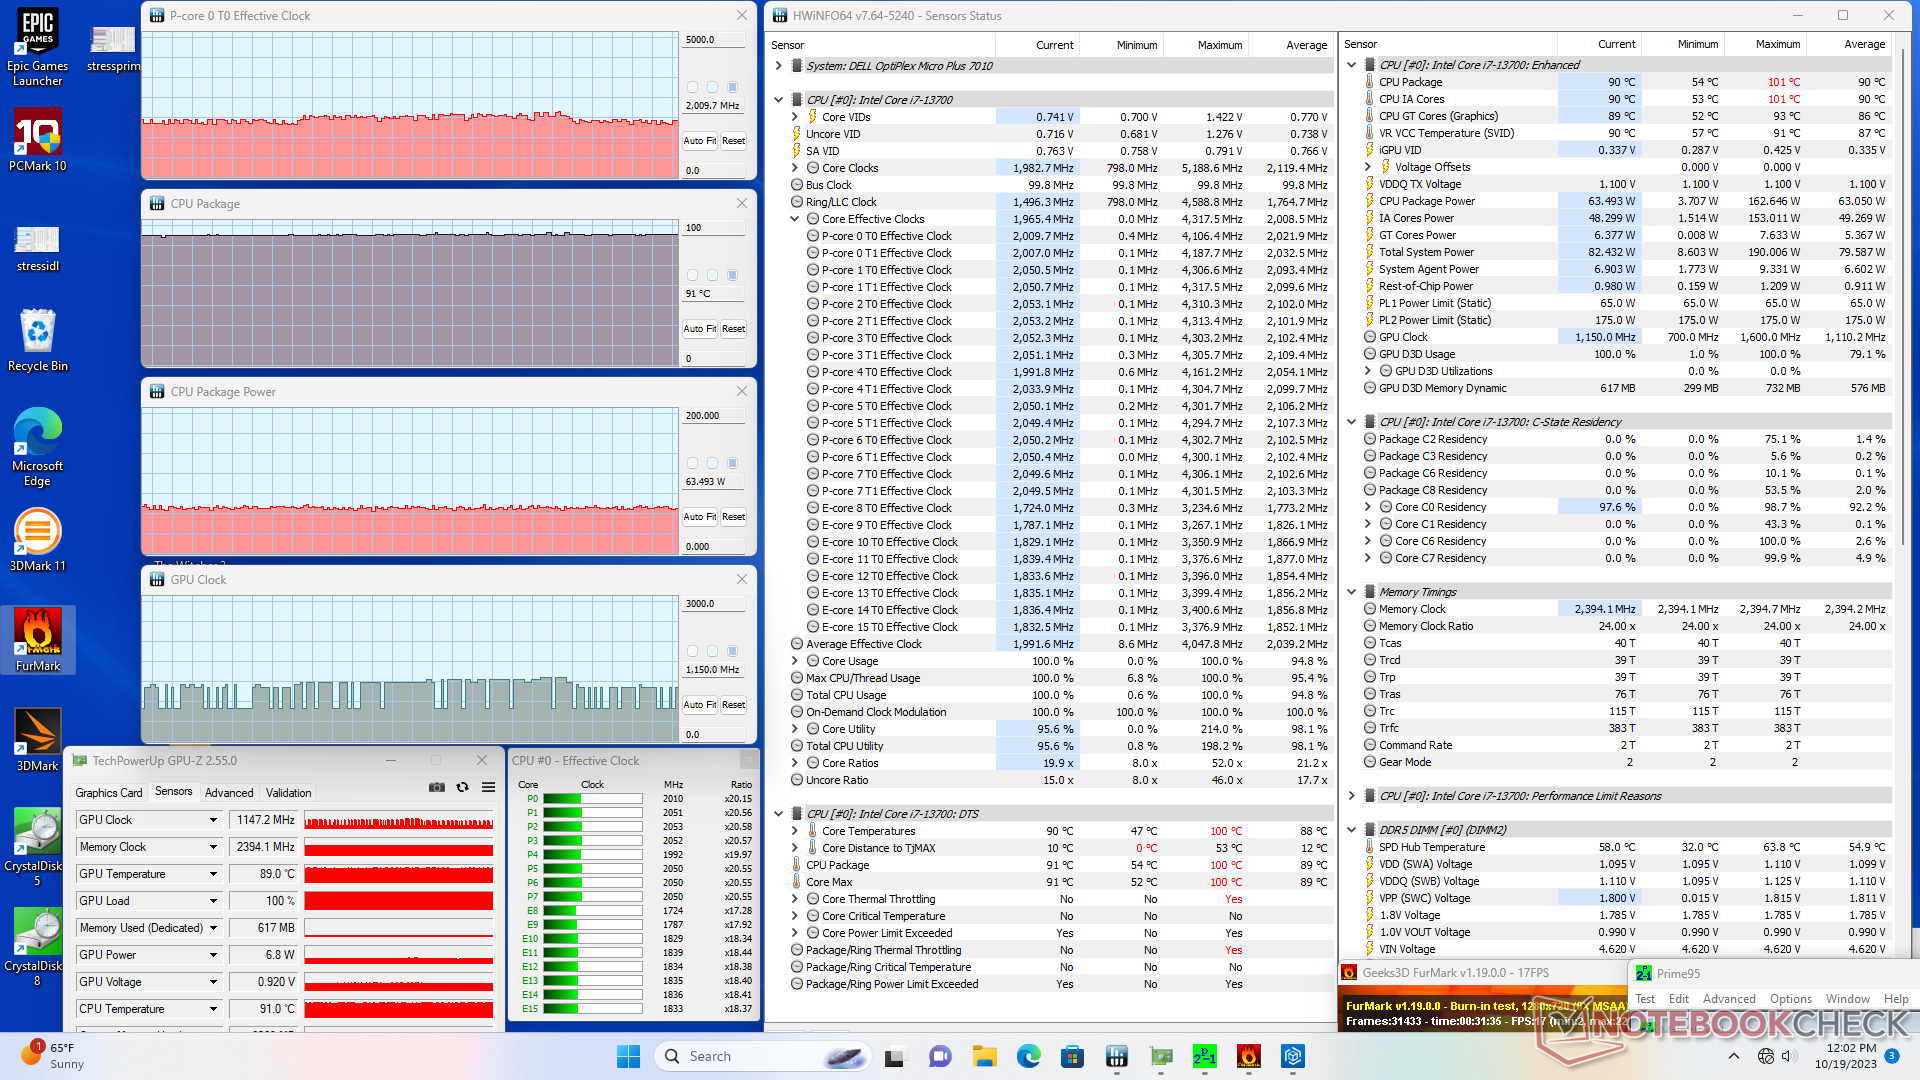
| CPU Clock (GHz) | GPU Clock (MHz) | Average CPU Temperature (°C) | |
| System Idle | -- | -- | 54 |
| Prime95 Stress | 2.3 | -- | 90 |
| Prime95 + FurMark Stress | 2.0 | 700 - 1350 | 91 |
| Witcher 3 Stress | ~0.3 | 1596 | 94 |
Speakers
The model integrates monaural audio unlike on other mini PCs where integrated speakers are uncommon. The speaker is loud enough for small offices but definitely not powerful enough for conference rooms.
Dell OptiPlex Micro audio analysis
(+) | speakers can play relatively loud (86.6 dB)
Bass 100 - 315 Hz
(-) | nearly no bass - on average 22% lower than median
(±) | linearity of bass is average (12.2% delta to prev. frequency)
Mids 400 - 2000 Hz
(+) | balanced mids - only 2.6% away from median
(+) | mids are linear (4.1% delta to prev. frequency)
Highs 2 - 16 kHz
(+) | balanced highs - only 4.7% away from median
(+) | highs are linear (4.4% delta to prev. frequency)
Overall 100 - 16.000 Hz
(±) | linearity of overall sound is average (15.9% difference to median)
Compared to same class
» 7% of all tested devices in this class were better, 7% similar, 86% worse
» The best had a delta of 13%, average was 24%, worst was 64%
Compared to all devices tested
» 25% of all tested devices were better, 5% similar, 70% worse
» The best had a delta of 4%, average was 23%, worst was 134%
Apple MacBook Pro 16 2021 M1 Pro audio analysis
(+) | speakers can play relatively loud (84.7 dB)
Bass 100 - 315 Hz
(+) | good bass - only 3.8% away from median
(+) | bass is linear (5.2% delta to prev. frequency)
Mids 400 - 2000 Hz
(+) | balanced mids - only 1.3% away from median
(+) | mids are linear (2.1% delta to prev. frequency)
Highs 2 - 16 kHz
(+) | balanced highs - only 1.9% away from median
(+) | highs are linear (2.7% delta to prev. frequency)
Overall 100 - 16.000 Hz
(+) | overall sound is linear (4.6% difference to median)
Compared to same class
» 0% of all tested devices in this class were better, 0% similar, 100% worse
» The best had a delta of 5%, average was 17%, worst was 45%
Compared to all devices tested
» 0% of all tested devices were better, 0% similar, 100% worse
» The best had a delta of 4%, average was 23%, worst was 134%
Energy Management
Power Consumption — Demanding Little Machine
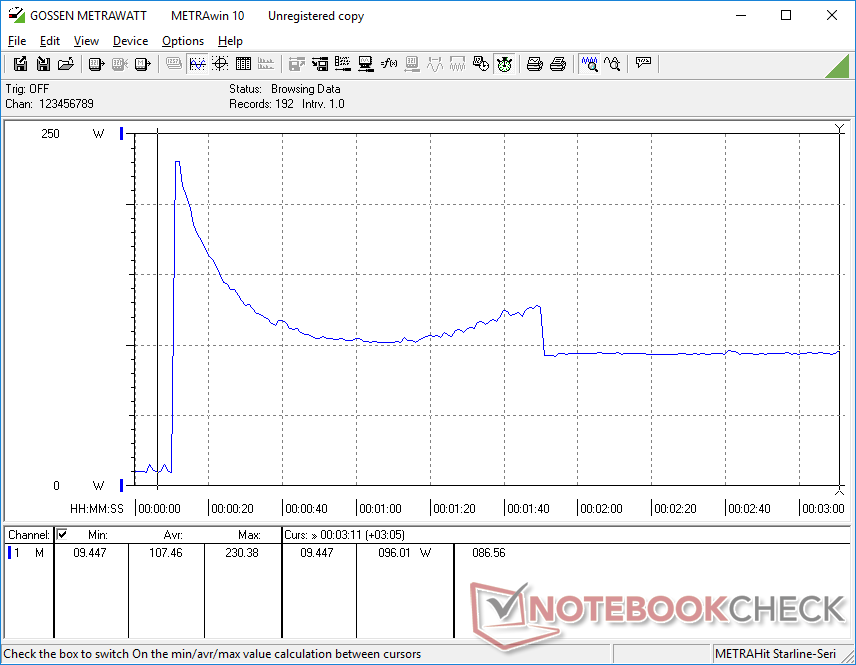
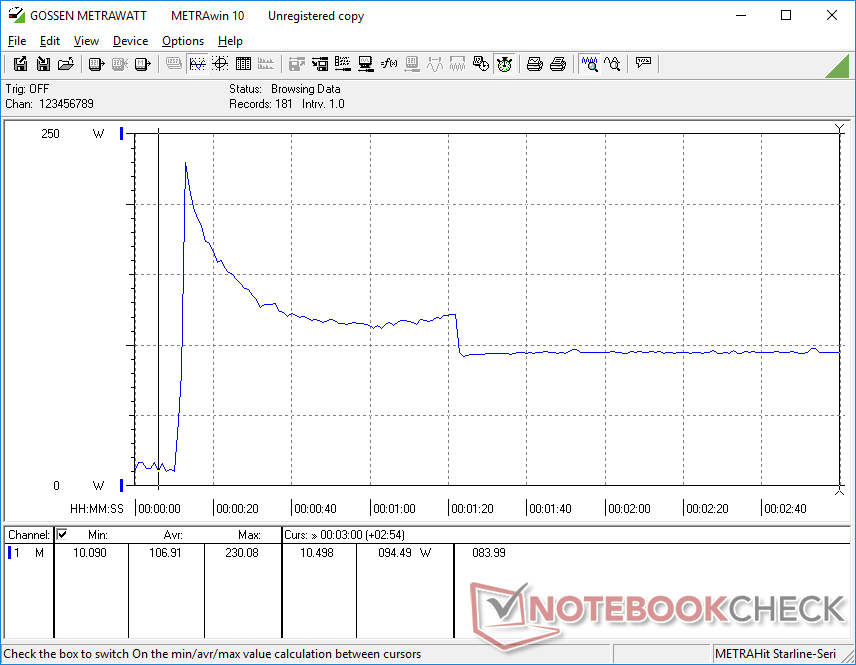
Power consumption can be quite high which is perhaps not unexpected given the desktop processor inside. The high Turbo Boost potential of the Core i7-13700 can cause the system to draw as much as 190 W to 230 W when launching applications or running CPU-intensive tasks as shown by the graphs below. Nonetheless, the low Turbo Boost sustainability of the mini PC means that such extreme power draws are only temporary.
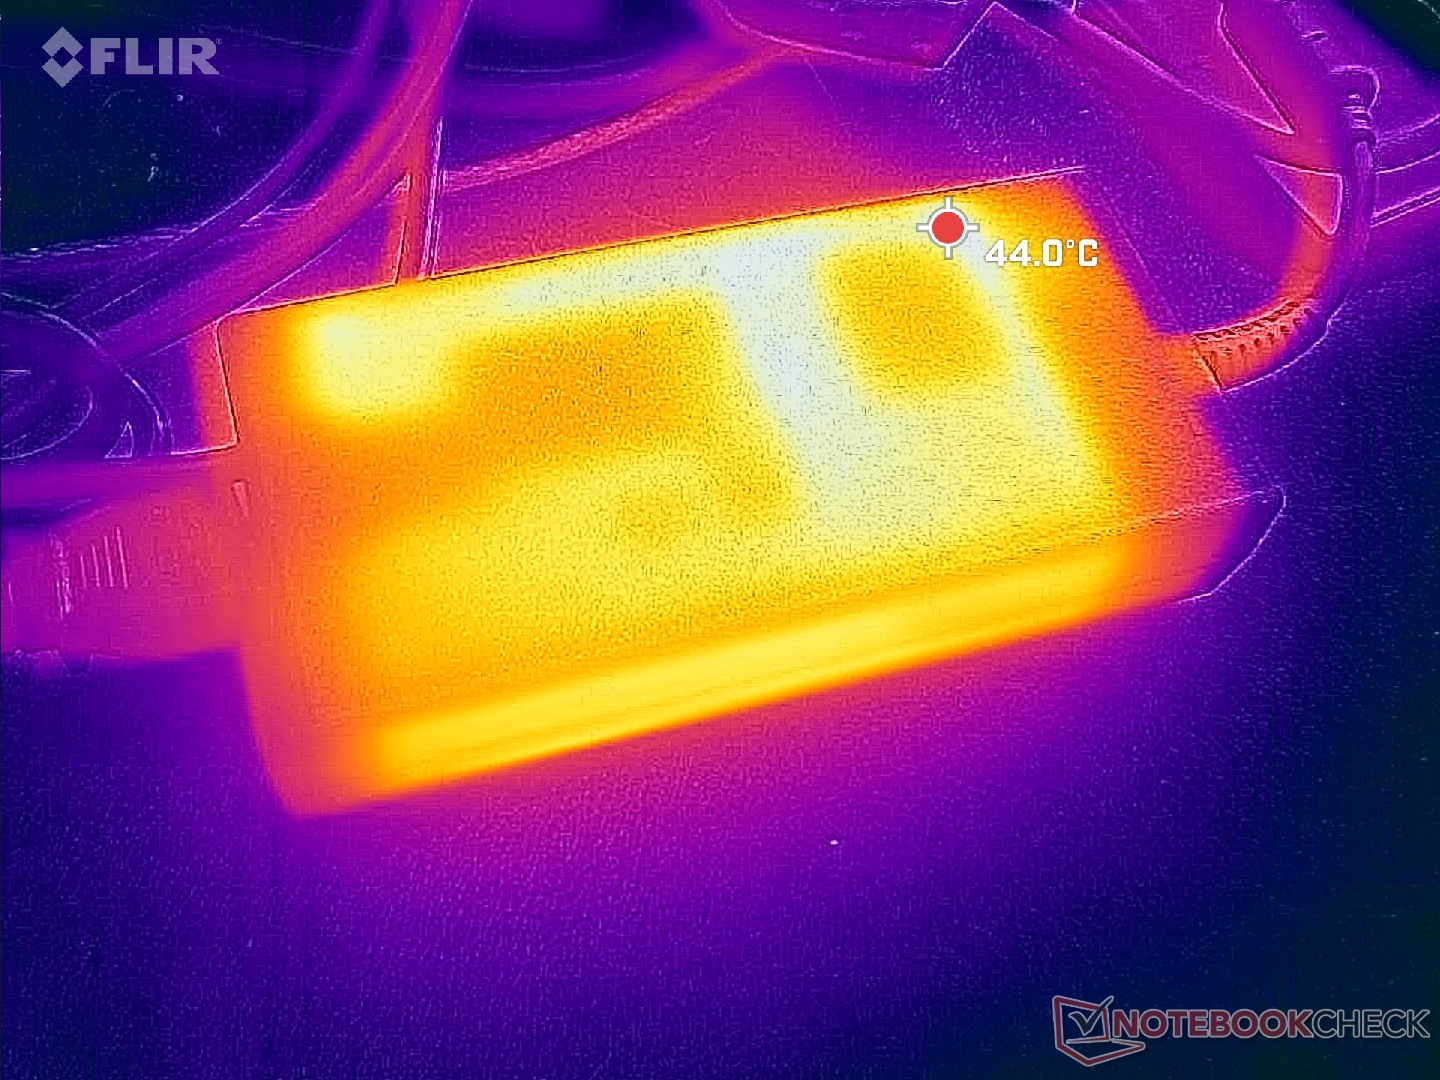
USB-C Power Delivery is not supported and so the included 180 W power brick (~15.4 x 7.5 x 3.2 cm) must be connected at all times to run the system. In comparison, some mini PCs like the Beelink SER7 can run exclusively on third-party USB-C AC adapters while others like the Lenovo IdeaCentre Mini have no external power brick at all.
| Off / Standby | |
| Idle | |
| Load |
|
Key:
min: | |
| Dell OptiPlex Micro i7-13700, UHD Graphics 770, , , x, | Apple Mac Mini M2 M2, M2 10-Core GPU, Apple SSD AP0512Z, , x, | Lenovo IdeaCentre Mini 01IRH8 i7-13700H, Iris Xe G7 96EUs, Samsung PM9B1 512GB MZVL4512HBLU, , x, | GMK NucBox K3 Pro i7-12650H, UHD Graphics 64EUs, Lexar NM610 Pro NM610P001T-HNNNG, , x, | Beelink GTR7 7840HS R7 7840HS, Radeon 780M, Crucial P3 Plus CT1000P3PSSD8, , x, | Beelink SER7 R7 7840HS, Radeon 780M, Crucial P3 Plus CT1000P3PSSD8, , x, | |
|---|---|---|---|---|---|---|
| Power Consumption | 62% | 4% | -18% | 5% | -8% | |
| Idle Minimum * (Watt) | 3.7 | 2.2 41% | 6.7 -81% | 7.1 -92% | 5.5 -49% | 6.7 -81% |
| Idle Average * (Watt) | 7.2 | 6.7 7% | 10.1 -40% | 5.8 19% | 7.3 -1% | |
| Idle Maximum * (Watt) | 8.7 | 2.6 70% | 7.1 18% | 18.6 -114% | 7.7 11% | 11.6 -33% |
| Load Average * (Watt) | 69.5 | 28.7 59% | 68.5 1% | 45.3 35% | 70.6 -2% | 64.1 8% |
| Witcher 3 ultra * (Watt) | 77.1 | 58.3 24% | 55.2 28% | 79.8 -4% | 75.8 2% | |
| Load Maximum * (Watt) | 230.6 | 51.5 78% | 104.3 55% | 52.9 77% | 111.8 52% | 94.8 59% |
* ... smaller is better
Power Consumption Witcher 3 / Stresstest
Power Consumption external Monitor
Pros
Cons
Verdict — Big CPU For A Micro Form Factor
Highlights of the OptiPlex Micro include its removable desktop CPU, tool-less serviceability, high processor performance-per-volume, and four individual video-out ports. Users who multitask between two or more monitors for graphs, spreadsheets, and word processing will find the OptiPlex Micro to be a reliable "set and forget" option.
Running a full-fledged Core i7 CPU designed for desktops in a mini PC form factor has its drawbacks. Turbo Boost potential in particular is lower and so average performance is decently slower than a larger OptiPlex system equipped with the same processor. Secondly, core temperatures are very high at over 90 C which, while technically safe, is generally not ideal especially when most other mini PCs run cooler. And lastly, the outdated integrated GPU is insufficient for most modern 3D rendering and this is made even worse by the lack of USB4 or Thunderbolt eGPU support. We recommend mini PCs with Iris Xe or Radeon 680M/780M graphics if your workloads involve a bit of graphics editing.
Mini PC users who value raw CPU performance will find the OptiPlex Micro to be worthwhile. Otherwise, alternatives like the Intel NUC 13 Pro or Beelink GTR7 are better balanced in terms of CPU and GPU performance.
The SSD throttling is also unfortunate to see. Dedicated SSD heat spreaders would have likely addressed the issue, but this would have bumped up the weight and price.
Price and Availability
Dell is currently shipping the OptiPlex Micro Plus 7010 starting at $929 USD, but only configurations with the slower Core T-series CPUs are available as of this writing.
Dell OptiPlex Micro
- 10/24/2023 v7 (old)
Allen Ngo
Transparency
The selection of devices to be reviewed is made by our editorial team. The test sample was provided to the author as a loan by the manufacturer or retailer for the purpose of this review. The lender had no influence on this review, nor did the manufacturer receive a copy of this review before publication. There was no obligation to publish this review. As an independent media company, Notebookcheck is not subjected to the authority of manufacturers, retailers or publishers.
This is how Notebookcheck is testing
Every year, Notebookcheck independently reviews hundreds of laptops and smartphones using standardized procedures to ensure that all results are comparable. We have continuously developed our test methods for around 20 years and set industry standards in the process. In our test labs, high-quality measuring equipment is utilized by experienced technicians and editors. These tests involve a multi-stage validation process. Our complex rating system is based on hundreds of well-founded measurements and benchmarks, which maintains objectivity. Further information on our test methods can be found here.
Price comparison
