Notebookcheck Logo

AMD Ryzen 7 7840HS performance debut: Beelink GTR7 mini PC review

Look like a butterfly, sting like a Beelink. The Ryzen 7 7840HS and integrated Radeon 780M further cement AMD's status as a mini PC powerhouse. Early Beelink models were seen as low-cost alternatives to the Intel NUC, but the latest GTR7 now outperforms most options from Intel.
2023 Beelink GTR7 Ryzen 7 7840HS

The GTR7 is the latest mini PC from Beelink designed with HS-series CPUs for high-performance users. It's one of these first in its category to ship with the Zen 4 Ryzen 7 7840HS whereas last year's SER6 would ship with the Zen 3+ Ryzen 9 6900HX.

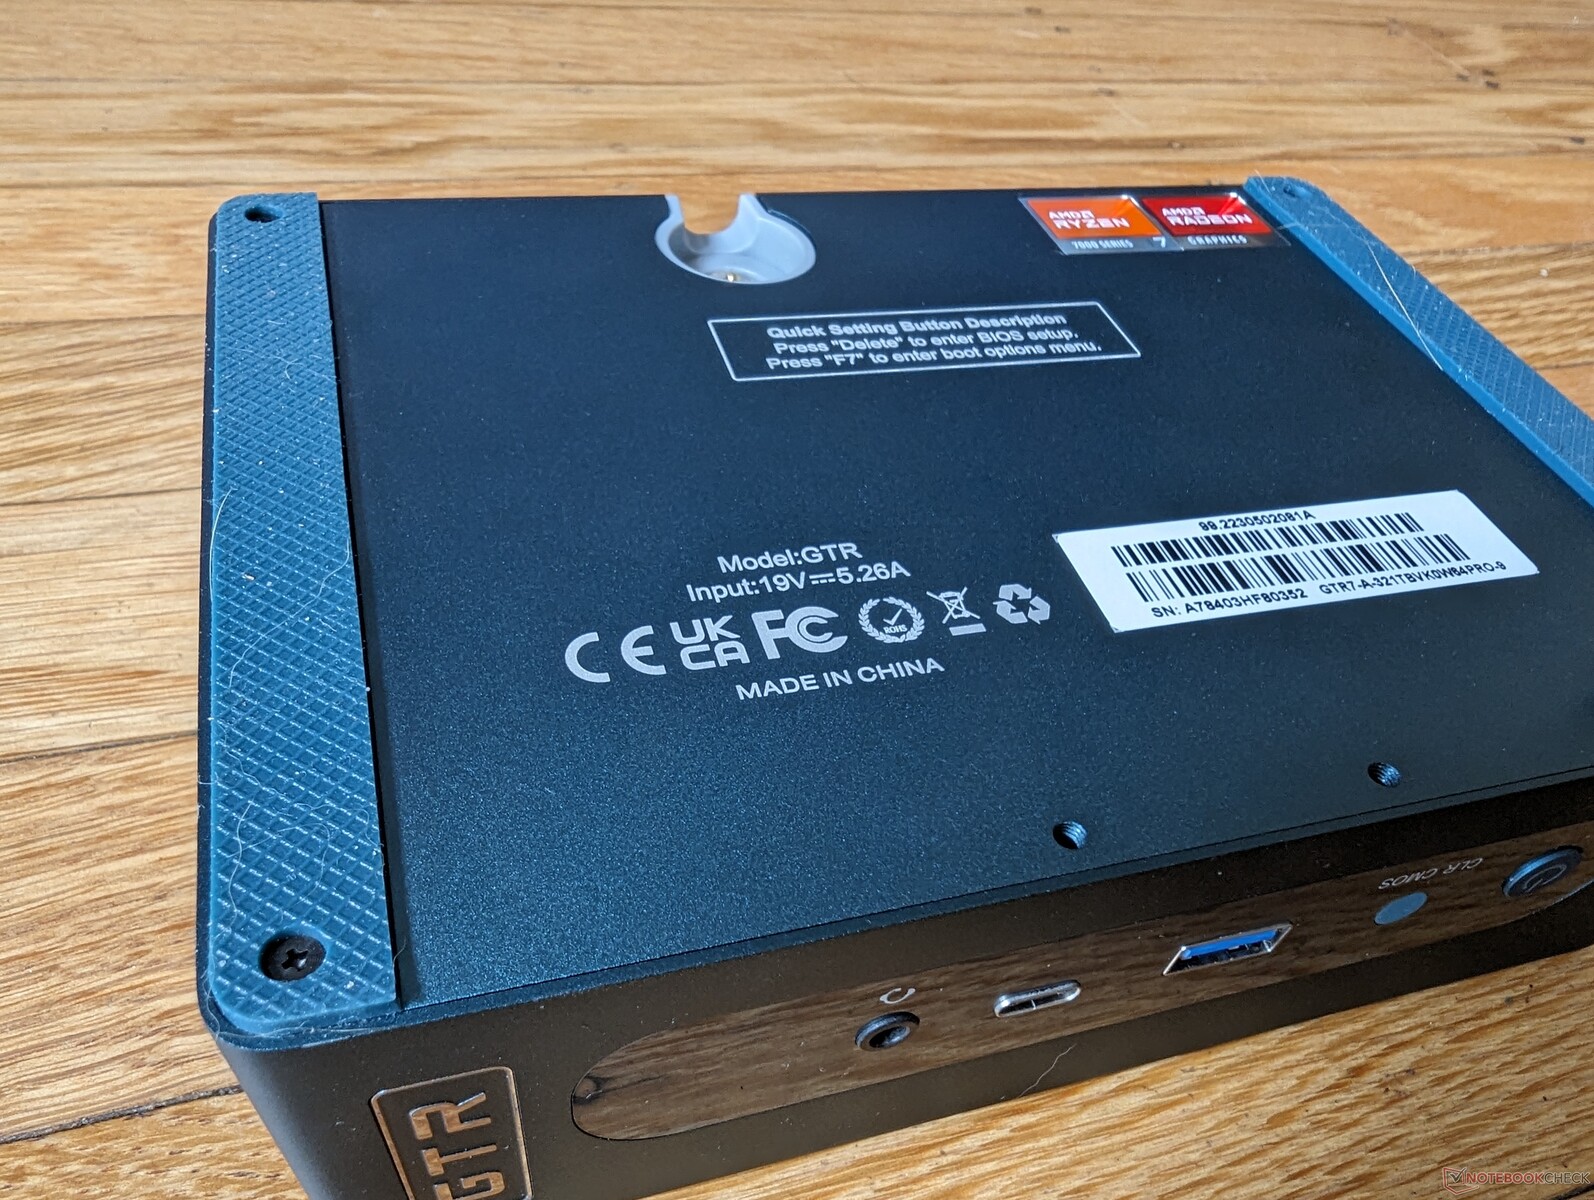
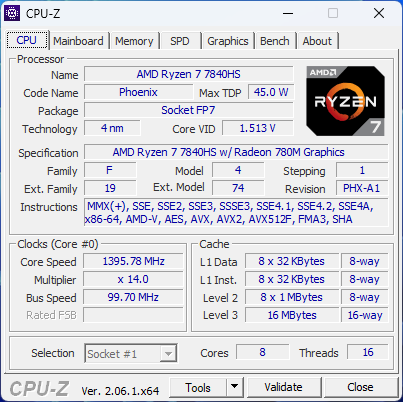
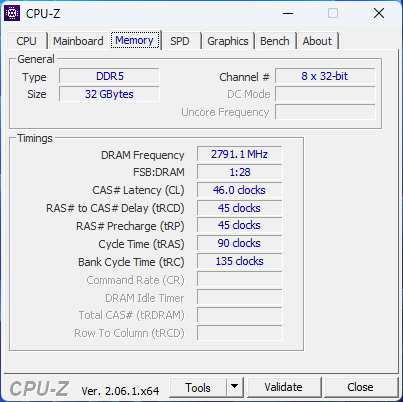
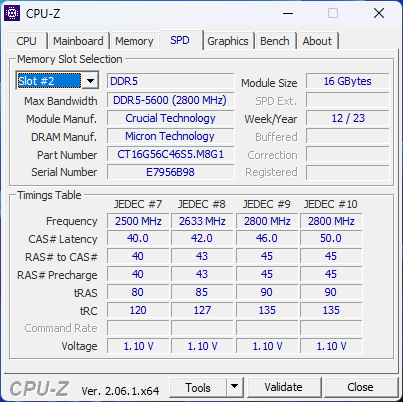
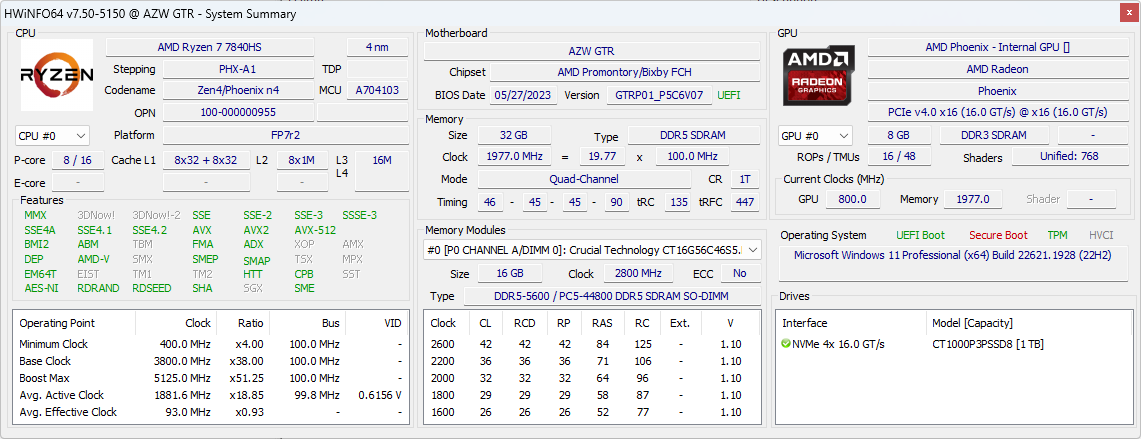
Our review unit comes configured with the Ryzen 7 7840HS CPU, integrated Radeon 780M GPU, 32 GB DDR5-5600 RAM, and 1 TB NVMe SSD for approximately $780 USD. No other CPU, RAM, or SSD options are available at the time of writing. We're hopeful for a barebones version in the near future.

Competitors to the Beelink GTR7 include other H-series mini PCs like the Minisforum Mercury Series EM680, Intel NUC 13 Pro, or the Ace Magician AM08 Pro.

More Beelink reviews:

Beelink GTR7 7840HS
Processor
AMD Ryzen 7 7840HS 8 x 3.8 - 5.1 GHz, 60 W PL2 / Short Burst, 60 W PL1 / Sustained, Phoenix-HS (Zen 4)
Graphics adapter
AMD Radeon 780M - 8 GB VRAM, Memory: 2800 MHz, DDR5, 22.40.03.38
Memory
32 GB 
, Crucial, DDR5-5600, 46-45-45-90, Dual-Channel, 2x SODIMM
Mainboard
AMD Promontory/Bixby FCH
Storage
Soundcard
AMD Zen - Audio Processor - HD Audio Controller
Connections
2 USB 2.0, 3 USB 3.0 / 3.1 Gen1, 2 USB 4.0 40 Gbps, 1 HDMI, 3 DisplayPort, Audio Connections: 3.5 mm headset, 1 Fingerprint Reader
Networking
Intel Ethernet Controller I225-V (10/100/1000/2500MBit/s), Intel Wi-Fi 6 AX200 (a/b/g/n = Wi-Fi 4/ac = Wi-Fi 5/ax = Wi-Fi 6/), Bluetooth 5.2
Size
height x width x depth (in mm): 48.8 x 168 x 120 ( = 1.92 x 6.61 x 4.72 in)
Operating System
Microsoft Windows 11 Pro
Additional features
User manual, wall-mounted bracket, HDMI cable, Power adapter, 12 Months Warranty
Weight
890 g ( = 31.39 oz / 1.96 pounds), Power Supply: 273 g ( = 9.63 oz / 0.6 pounds)
Price
790 USD
Note: The manufacturer may use components from different suppliers including display panels, drives or memory sticks with similar specifications.


Potential Competitors in Comparison

Rating
Date
Model
Weight
Height
Size
Resolution
Best Price
86.3 %
07/2023
Beelink GTR7 7840HS
R7 7840HS, Radeon 780M
890 g48.8 mmx
84.8 %
04/2023
Beelink SER6 Pro Ryzen 7 7735HS
R7 7735HS, Radeon 680M
506 g42 mmx
11/2022
Beelink GTR6
R9 6900HX, Radeon 680M
815 g43 mmx
09/2022
Beelink SEi11 Pro
i5-11320H, Iris Xe G7 96EUs
440 g40 mmx
80.8 %
04/2023
Intel NUC 13 Pro Kit NUC13ANK
i7-1360P, Iris Xe G7 96EUs
538 g37 mmx
81.8 %
06/2023
Minisforum Mercury Series EM680
R7 6800U, Radeon 680M
239 g43 mmx

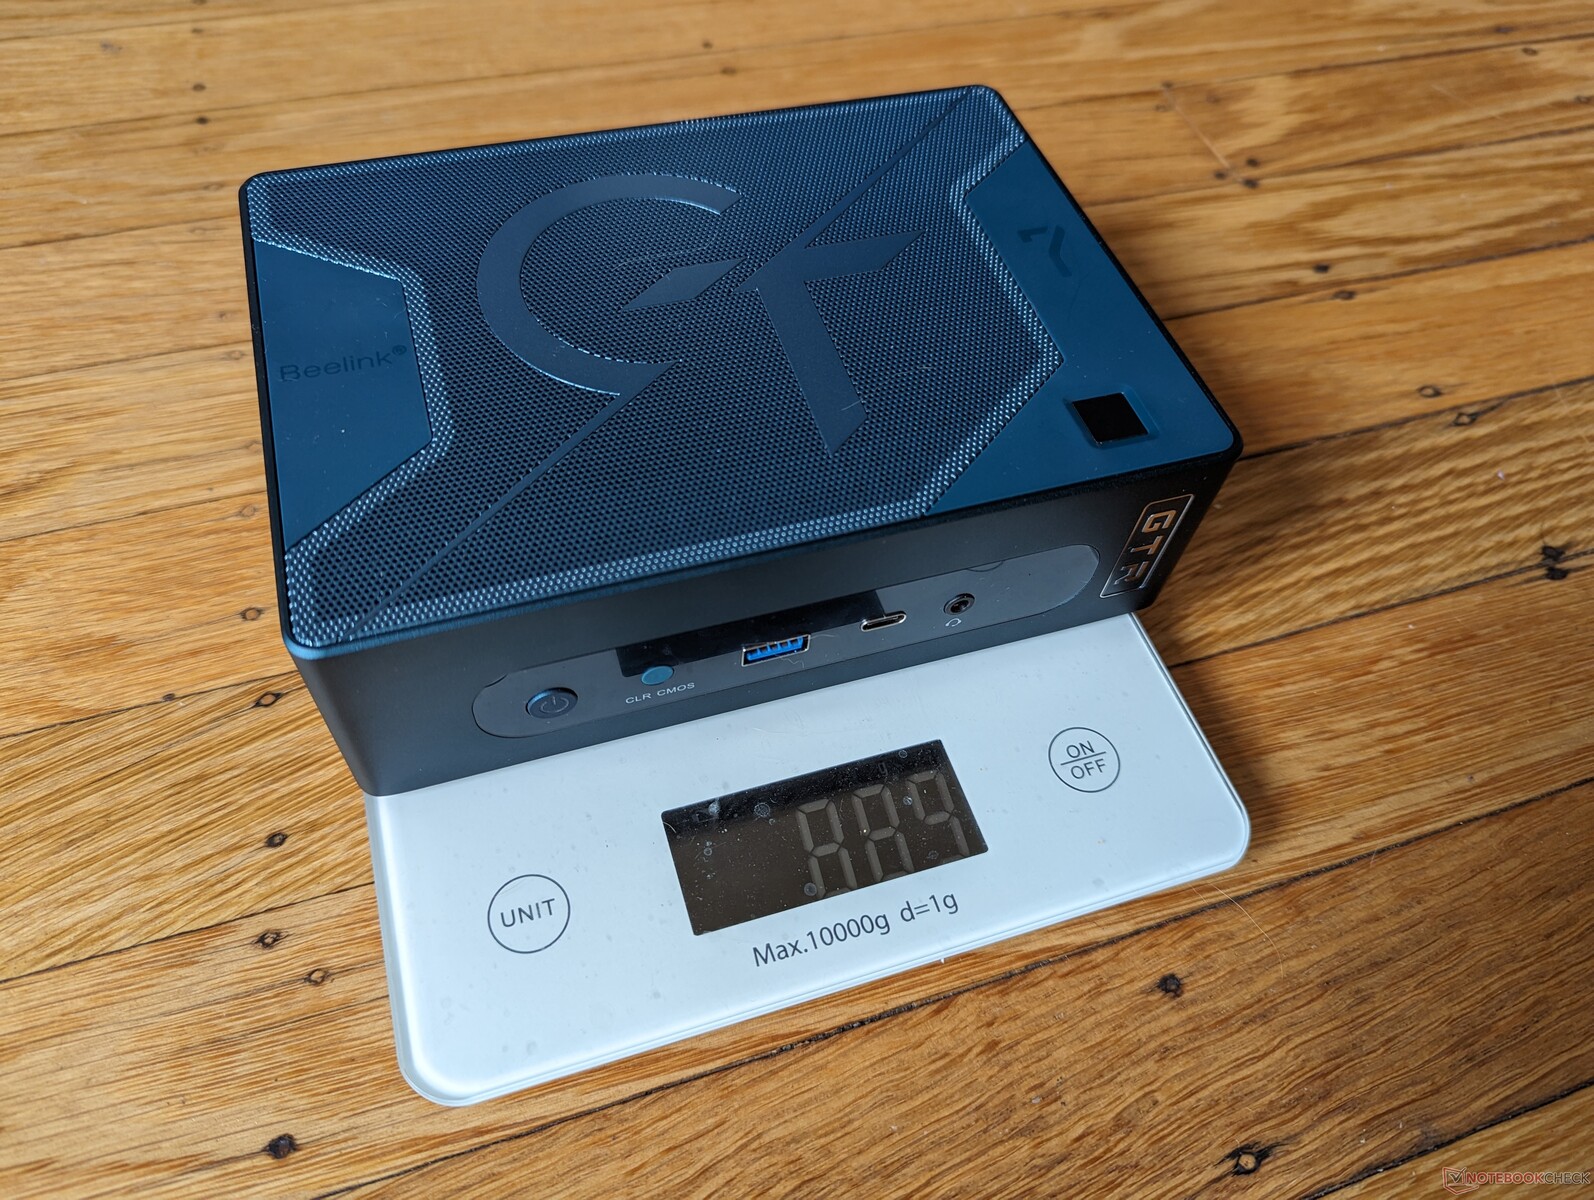
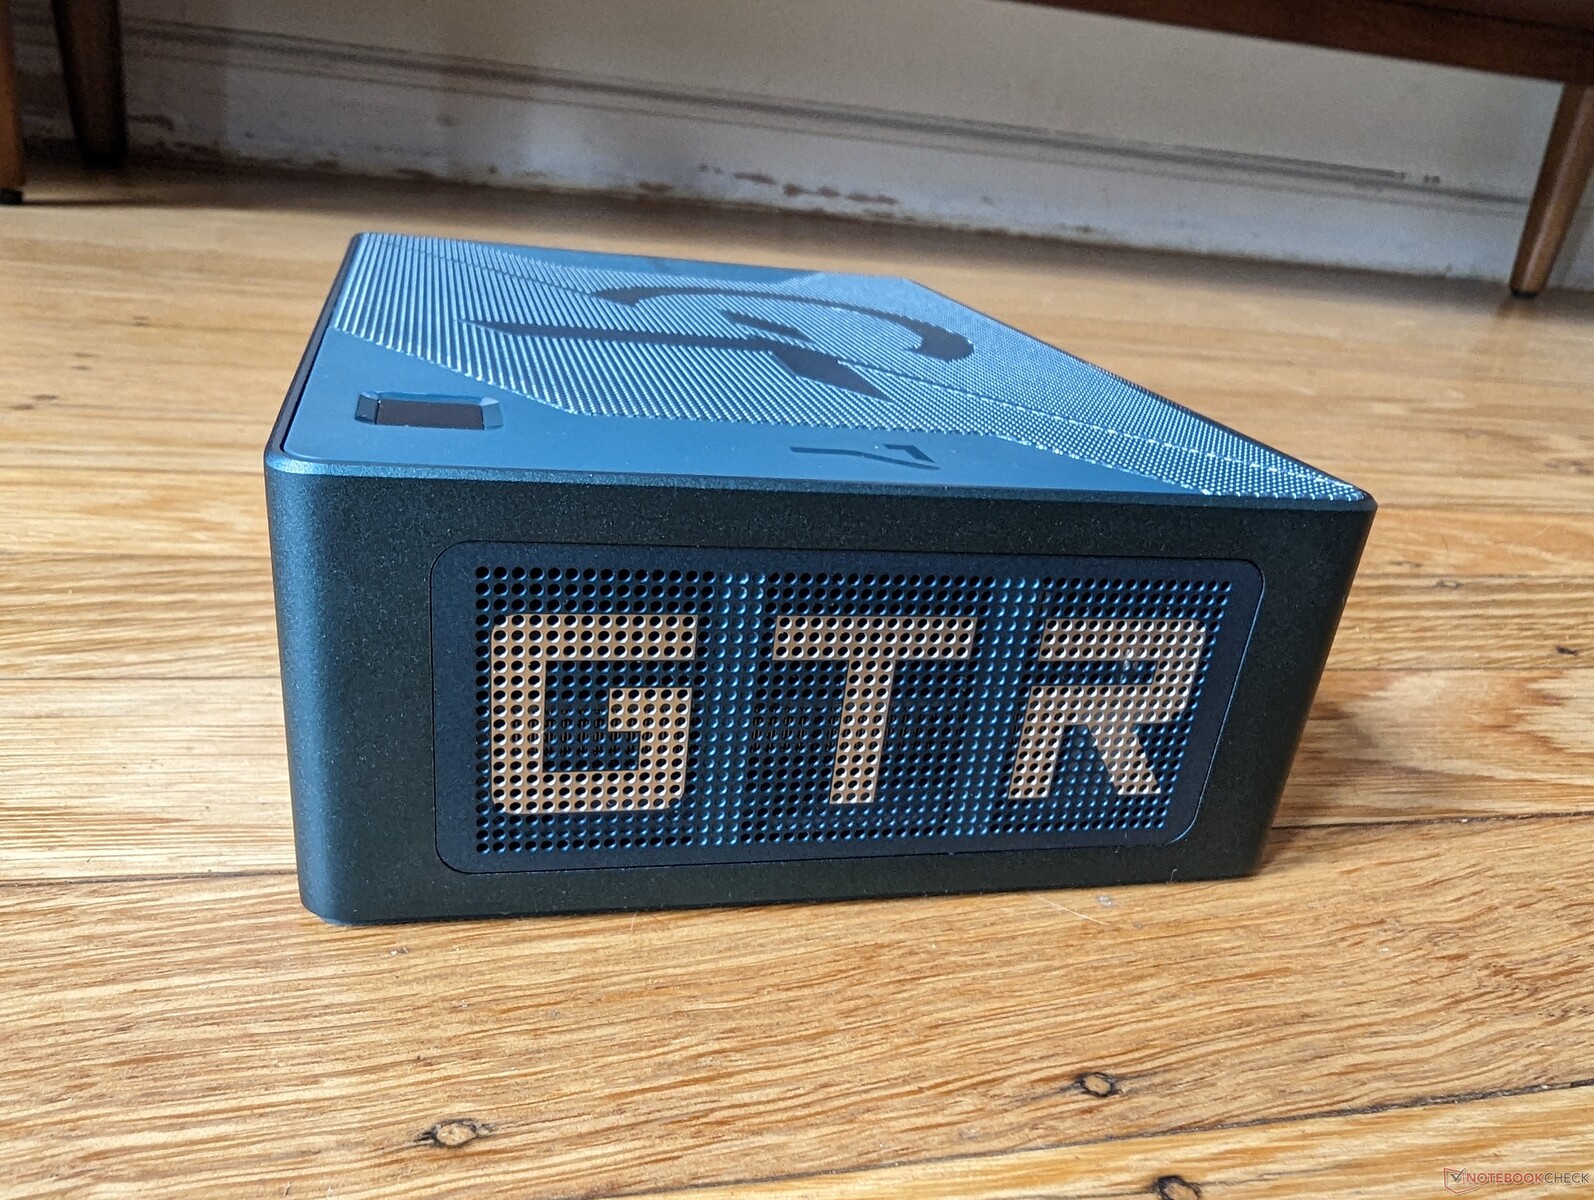
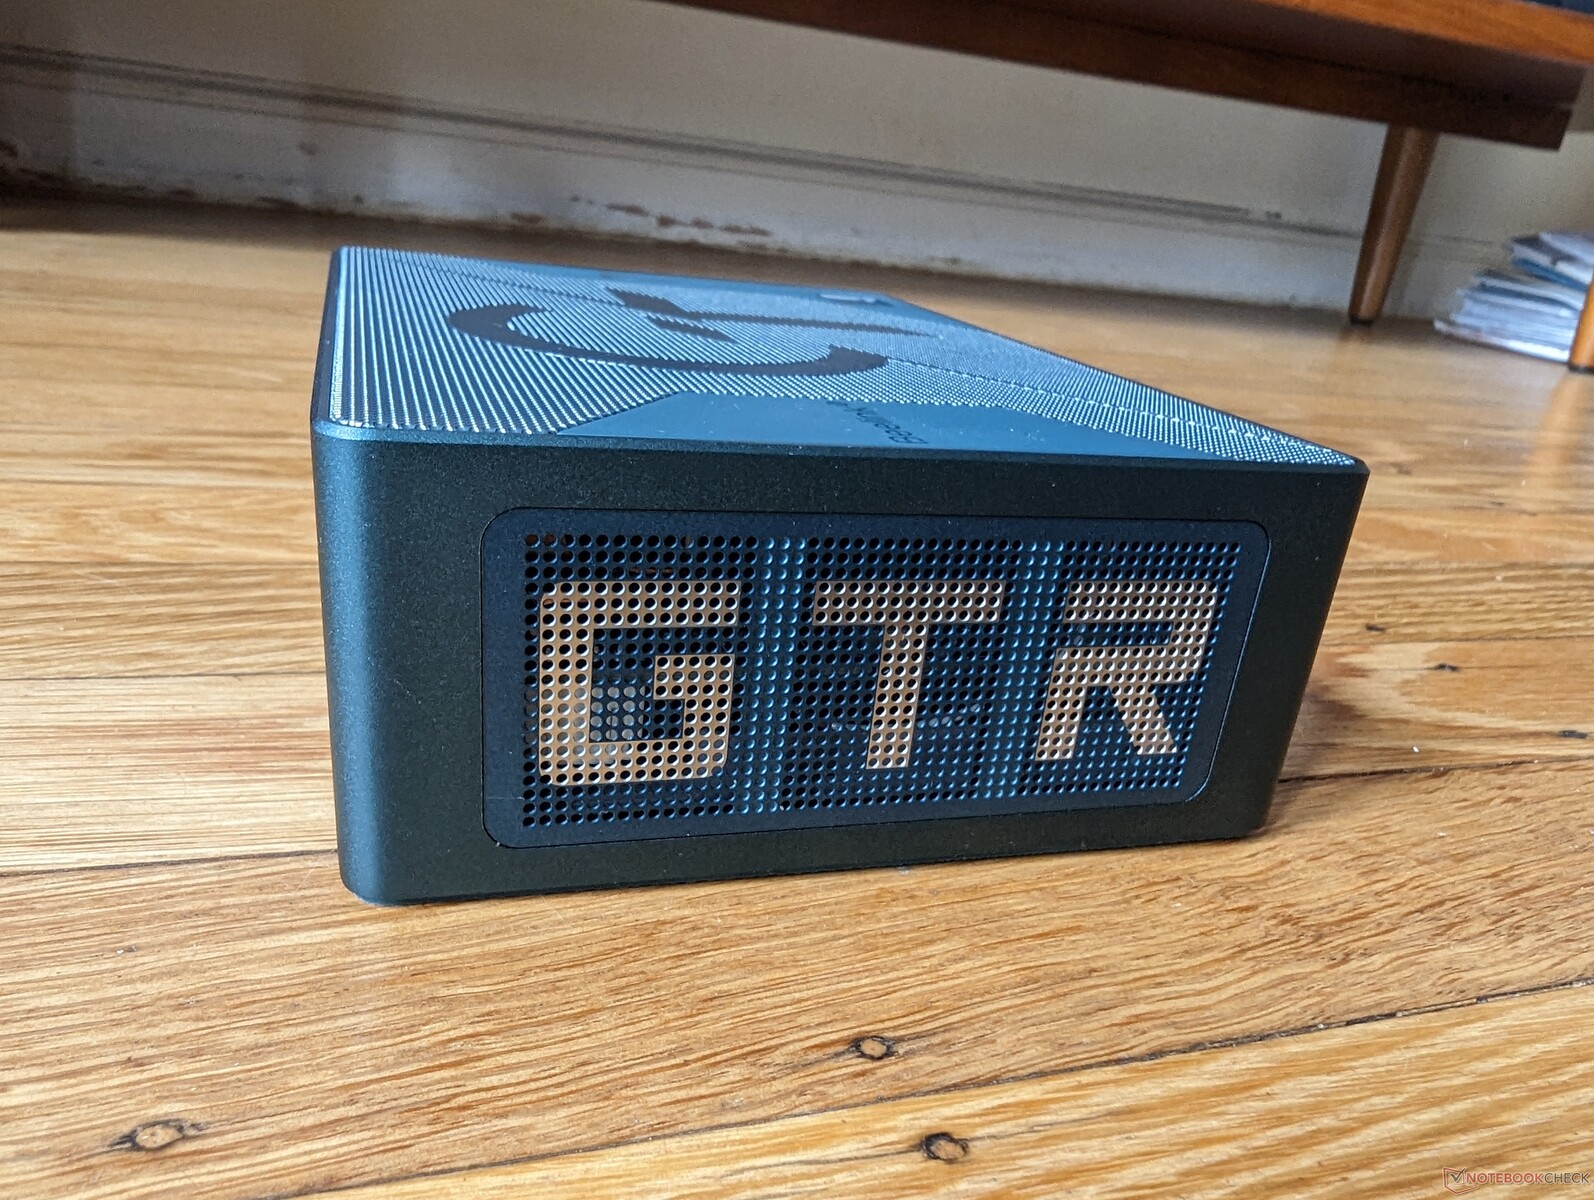
Case — Putting On Weight

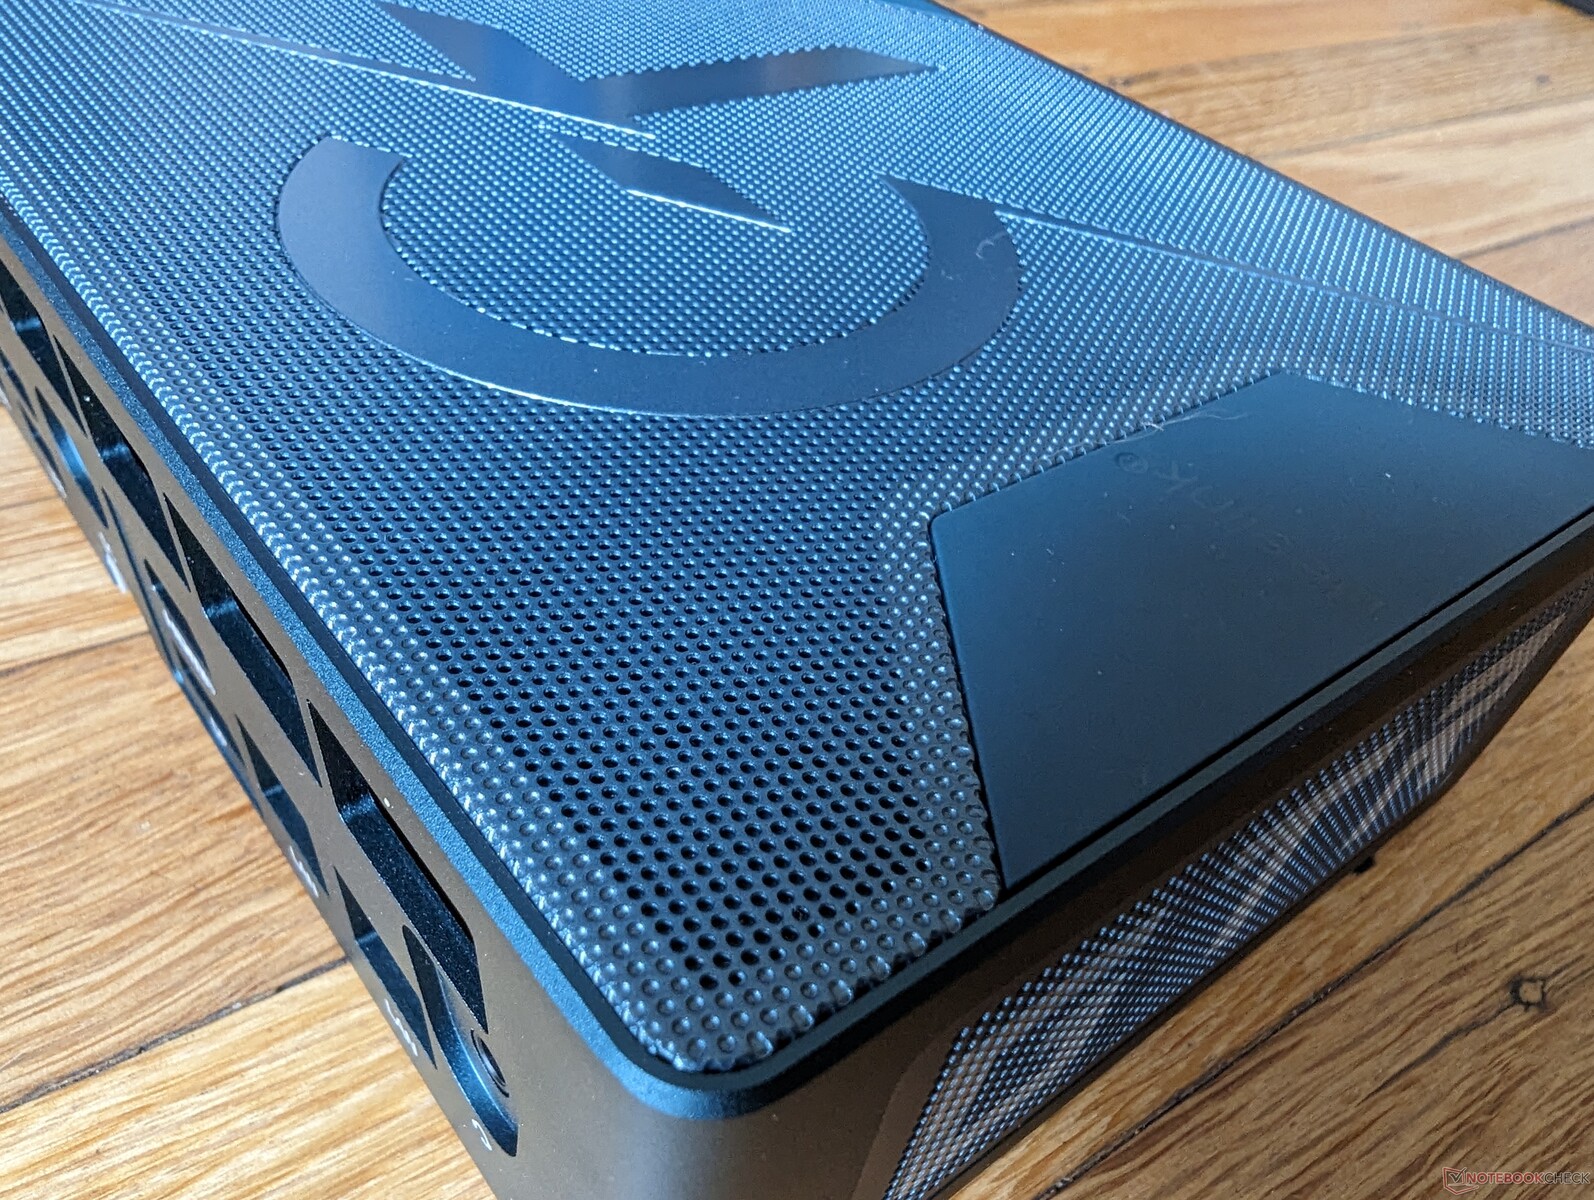
The Beelink GTR and GTI series are upper-end mini PCs when compared to the smaller and less expensive SER and SEI series. Thus, the GTR is more intricately designed with metal materials that are comparable to what you would find on an Intel NUC. All six sides are rigid metal including the top mesh which was a softer fabric on the older GTR6 design. We especially appreciate the lack of any glossy plastic surfaces which have a tendency to attract scratches and fingerprints very easily.

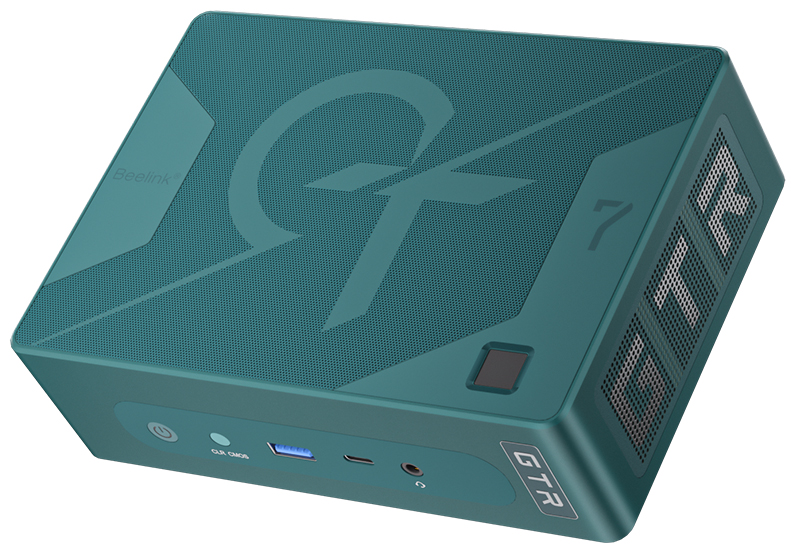
Four color options are available: Green, Gray, Orange, and Blue. These are notable because such options are uncommon on mini PCs where black is by far the only color.

Left: Beelink GTR7, RIght: Intel NUC11PAQ

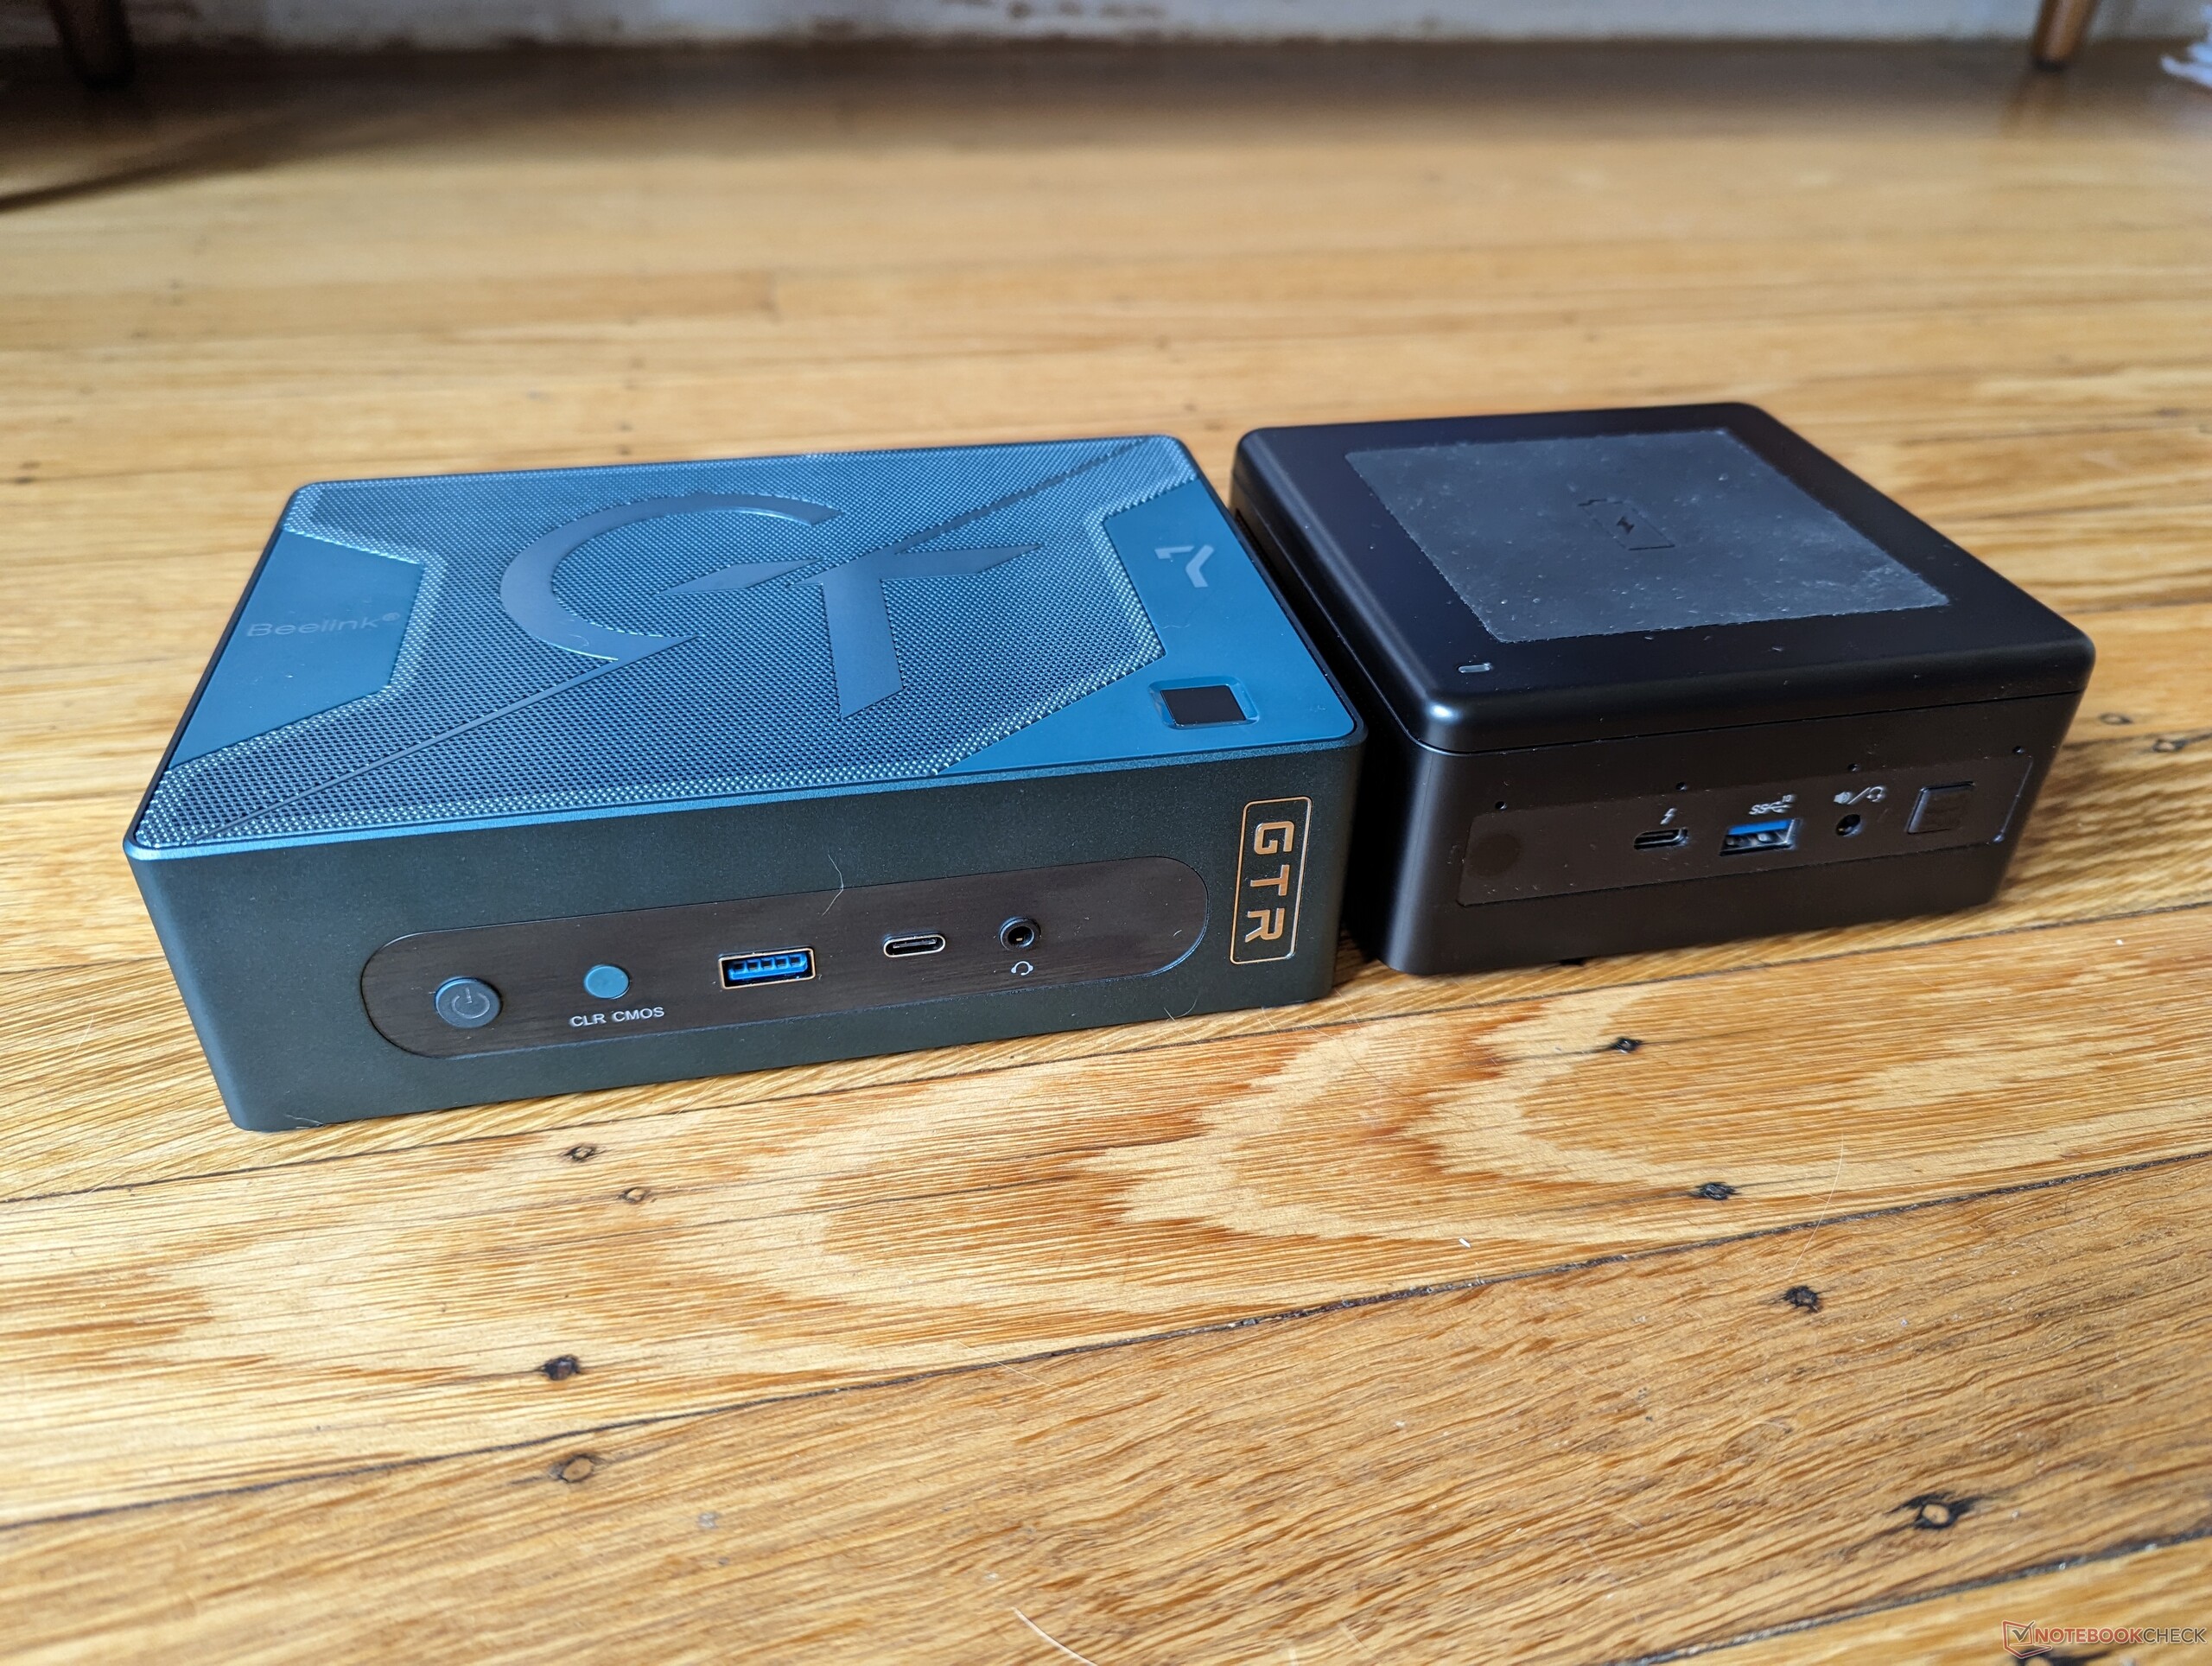
The GTR7 maintains the footprint of the older GTR6 but with a thicker profile and heavier weight likely due to the revised internals and addition of a vapor chamber cooler. It's now one of the larger and weightier mini PCs in the market not including those with discrete GPUs.

The top cover is no longer easily removable
Fingerprint-enabled Power button
Bottom of unit supports a specialized bracket for VESA mounting
Magnetic AC adapter attaches to the bottom of the mini PC to prevent accidental disconnects
The new vapor chamber cooler makes for a very dense mini PC
Wall wart 100 W proprietary AC adapter

Size Comparison

168 mm / 6.61 inch 120 mm / 4.72 inch 48.8 mm / 1.921 inch 890 g1.962 lbs168 mm / 6.61 inch 120 mm / 4.72 inch 43 mm / 1.693 inch 815 g1.797 lbs126 mm / 4.96 inch 113 mm / 4.45 inch 42 mm / 1.654 inch 506 g1.116 lbs126 mm / 4.96 inch 113 mm / 4.45 inch 40 mm / 1.575 inch 440 g0.97 lbs117 mm / 4.61 inch 112 mm / 4.41 inch 37 mm / 1.457 inch 538 g1.186 lbs80 mm / 3.15 inch 80 mm / 3.15 inch 43 mm / 1.693 inch 239 g0.527 lbs210 mm / 8.27 inch 148 mm / 5.83 inch 1 mm / 0.03937 inch 2.9 g0.00639 lbs

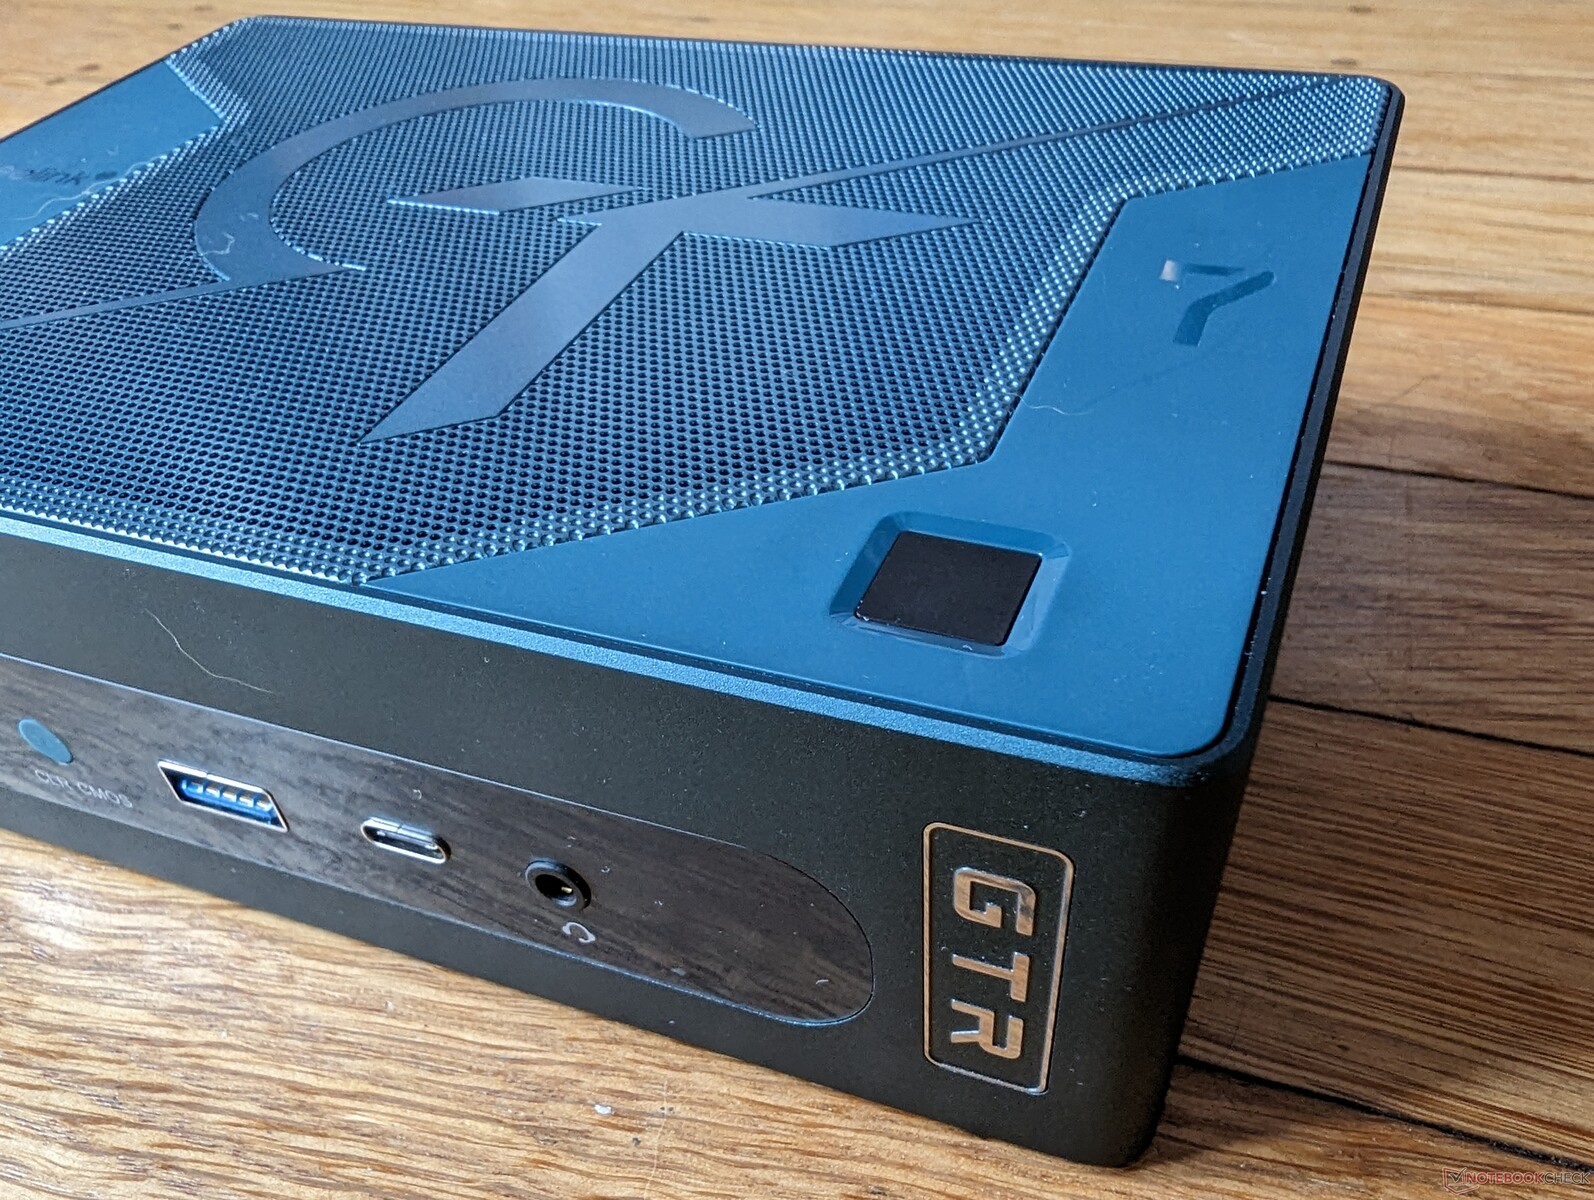
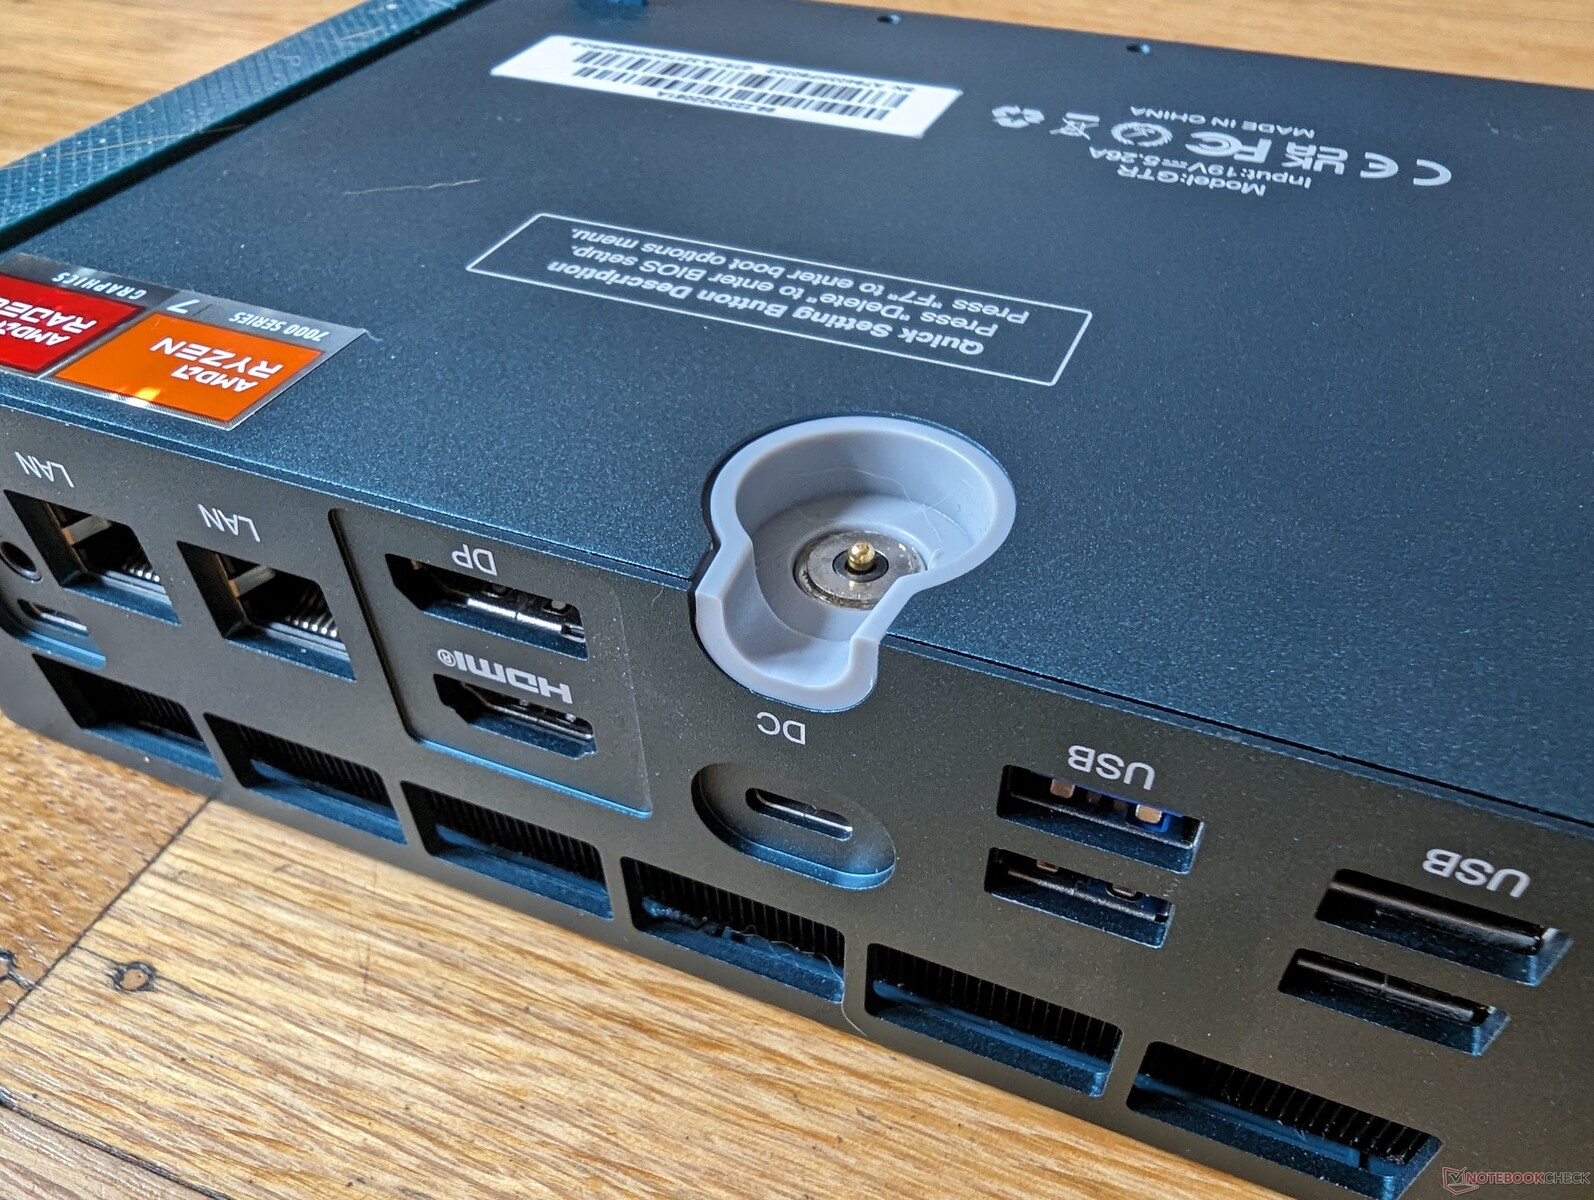
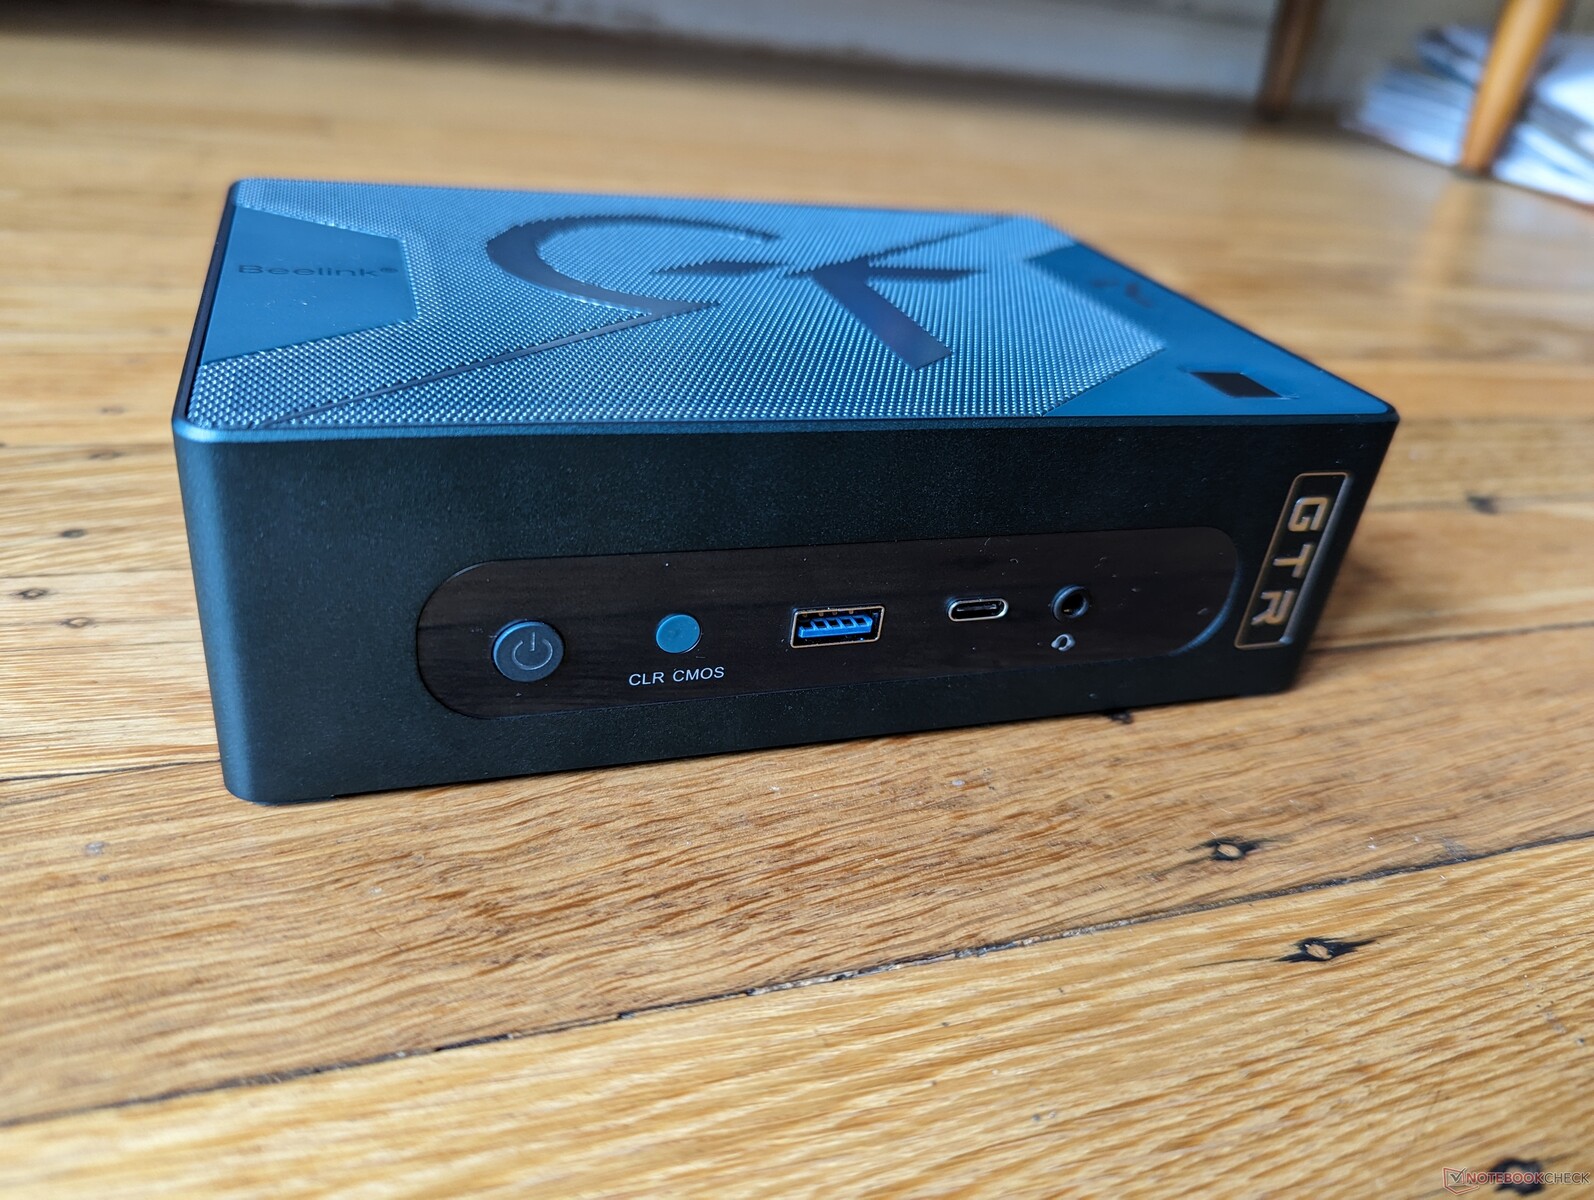
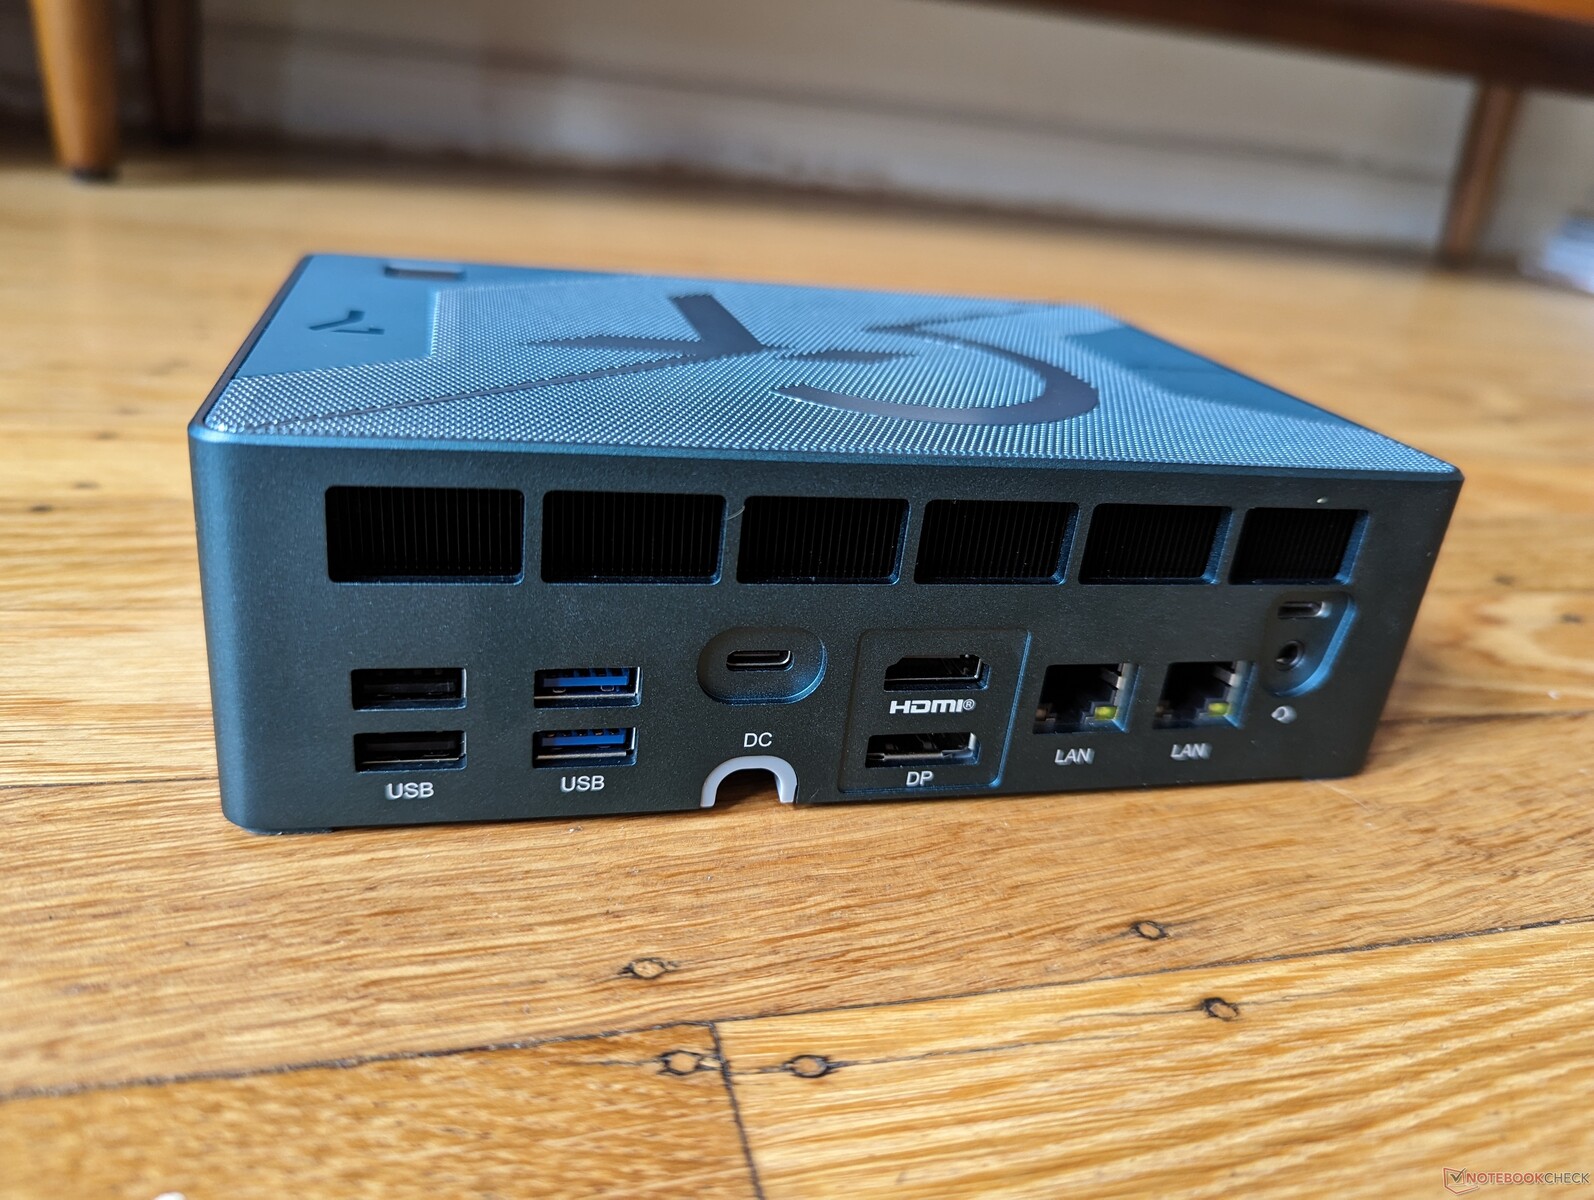
Connectivity — A Lot To Choose From

While the ports on front haven't changed from last year's SER6, the ports along the rear are now different. The AC adapter port has been redesigned to be magnetic while two of the four HDMI ports have been dropped in favor of full-size DisplayPort.

The two rear USB-C ports support USB4 and eGPUs according to the manufacturer similar to last year's GTR6. However, note that the front USB-C port lacks DisplayPort support and so external monitors are only compatible with the rear USB-C ports.

We would have preferred a universal USB-C AC adapter similar to most Ultrabooks these days instead of a proprietary magnetic one. Attempting to power the unit with our 130 W USB-C AC adapter from Dell would result in an automatic shutdown a few seconds later.

This is also one of the very few consumer mini PCs with two 2.5 Gbps RJ-45 ports and two 3.5 mm headset ports. Most users likely won't need so many of each, but the option is there nonetheless.

Front: Power button, Clear CMOS button, USB-A 3.2 (1o Gbps), USB-C 3.2 (data and charging only), 3.5 mm headset
Right: No ports
Right: No ports
Rear: 2x USB-A 2.0 (480 Mbps), 2x USB-A 3.2 (10 Gbps), 2x USB-C 4 w/ DisplayPort (40 Gbps), HDMI 2.1, DisplayPort 1.4, 2x 2.5 Gbps RJ-45, 3.5 mm headset
Left: No ports
Left: No ports

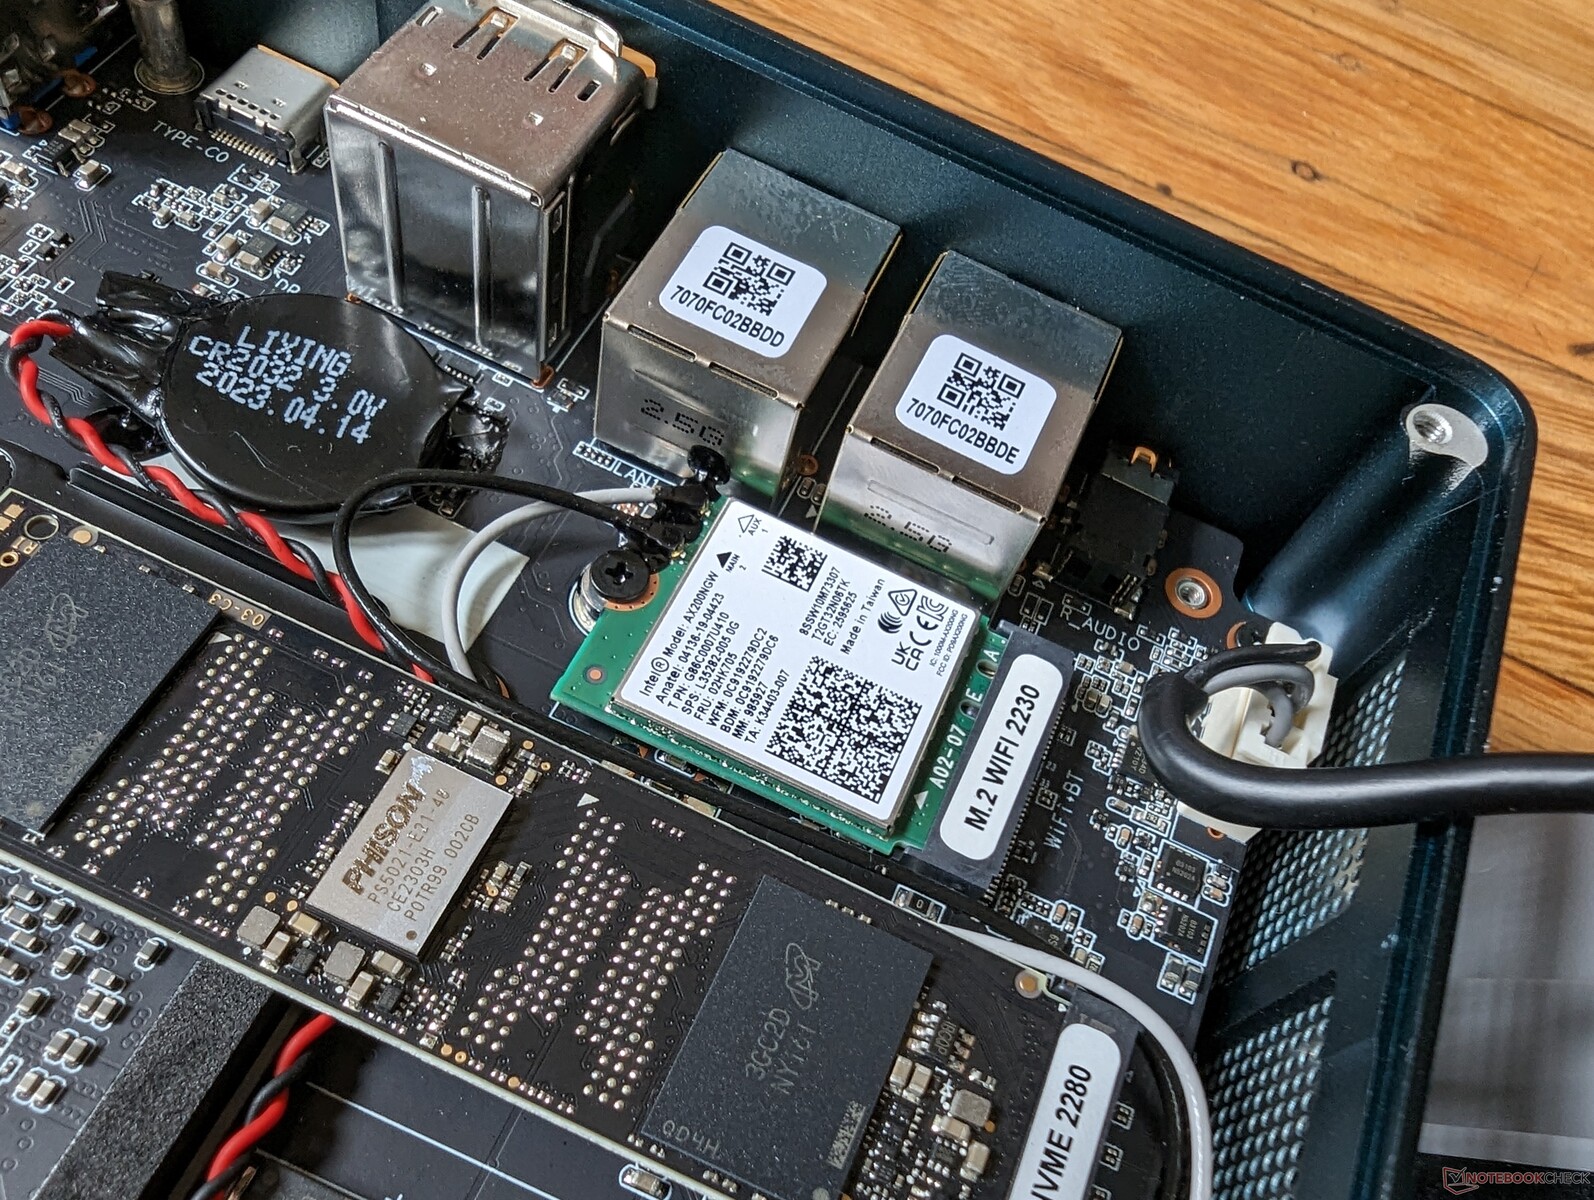
Communication — No W-Fi 6E

The system comes with an older Intel AX200 module instead of the newer AX210/211 series. Thus, Wi-Fi 6E or 6 GHz is not supported out of the box which is somewhat disappointing considering the high-end design and performance of the model series. Transfer rates are otherwise steady when paired to our Wi-Fi 6 AXE11000 network.

Removable M.2 WLAN module can be upgraded to Wi-Fi 6E by the end user
Networking
iperf3 transmit AXE11000
Beelink SER6 Pro Ryzen 7 7735HS
Intel Wi-Fi 6 AX200
1069 (800min - 1158max) MBit/s +4%
Beelink GTR7 7840HS
Intel Wi-Fi 6 AX200
1031 (961min - 1109max) MBit/s
Beelink GTR6
MediaTek RZ608
909 (429min - 966max) MBit/s -12%
Intel NUC 13 Pro Kit NUC13ANK
Intel Wi-Fi 6E AX211
833 (805min - 866max) MBit/s -19%
Minisforum Mercury Series EM680
MediaTek RZ616
662 (562min - 783max) MBit/s -36%
iperf3 receive AXE11000
Beelink SER6 Pro Ryzen 7 7735HS
Intel Wi-Fi 6 AX200
1356 (1119min - 1463max) MBit/s +12%
Beelink GTR7 7840HS
Intel Wi-Fi 6 AX200
1211 (1112min - 1284max) MBit/s
Intel NUC 13 Pro Kit NUC13ANK
Intel Wi-Fi 6E AX211
939 (921min - 952max) MBit/s -22%
Beelink GTR6
MediaTek RZ608
860 (440min - 882max) MBit/s -29%
Minisforum Mercury Series EM680
MediaTek RZ616
750 (653min - 821max) MBit/s -38%
iperf3 transmit AXE11000 6GHz
Minisforum Mercury Series EM680
MediaTek RZ616
1677 (1586min - 1731max) MBit/s
Intel NUC 13 Pro Kit NUC13ANK
Intel Wi-Fi 6E AX211
1445 (736min - 1476max) MBit/s
Beelink GTR6
MediaTek RZ608
948 (476min - 1030max) MBit/s
Beelink SEi11 Pro
MediaTek RZ608
722 (447min - 789max) MBit/s
iperf3 receive AXE11000 6GHz
Intel NUC 13 Pro Kit NUC13ANK
Intel Wi-Fi 6E AX211
1668 (1467min - 1725max) MBit/s
Minisforum Mercury Series EM680
MediaTek RZ616
1572 (1554min - 1590max) MBit/s
Beelink GTR6
MediaTek RZ608
886 (867min - 900max) MBit/s
Beelink SEi11 Pro
MediaTek RZ608
743 (453min - 793max) MBit/s
050100150200250300350400450500550600650700750800850900950100010501100115012001250Tooltip
Beelink GTR7 7840HS; iperf3 transmit AXE11000; iperf 3.1.3: Ø1031 (961-1109)
Beelink GTR7 7840HS; iperf3 receive AXE11000; iperf 3.1.3: Ø1210 (1112-1284)

Maintenance

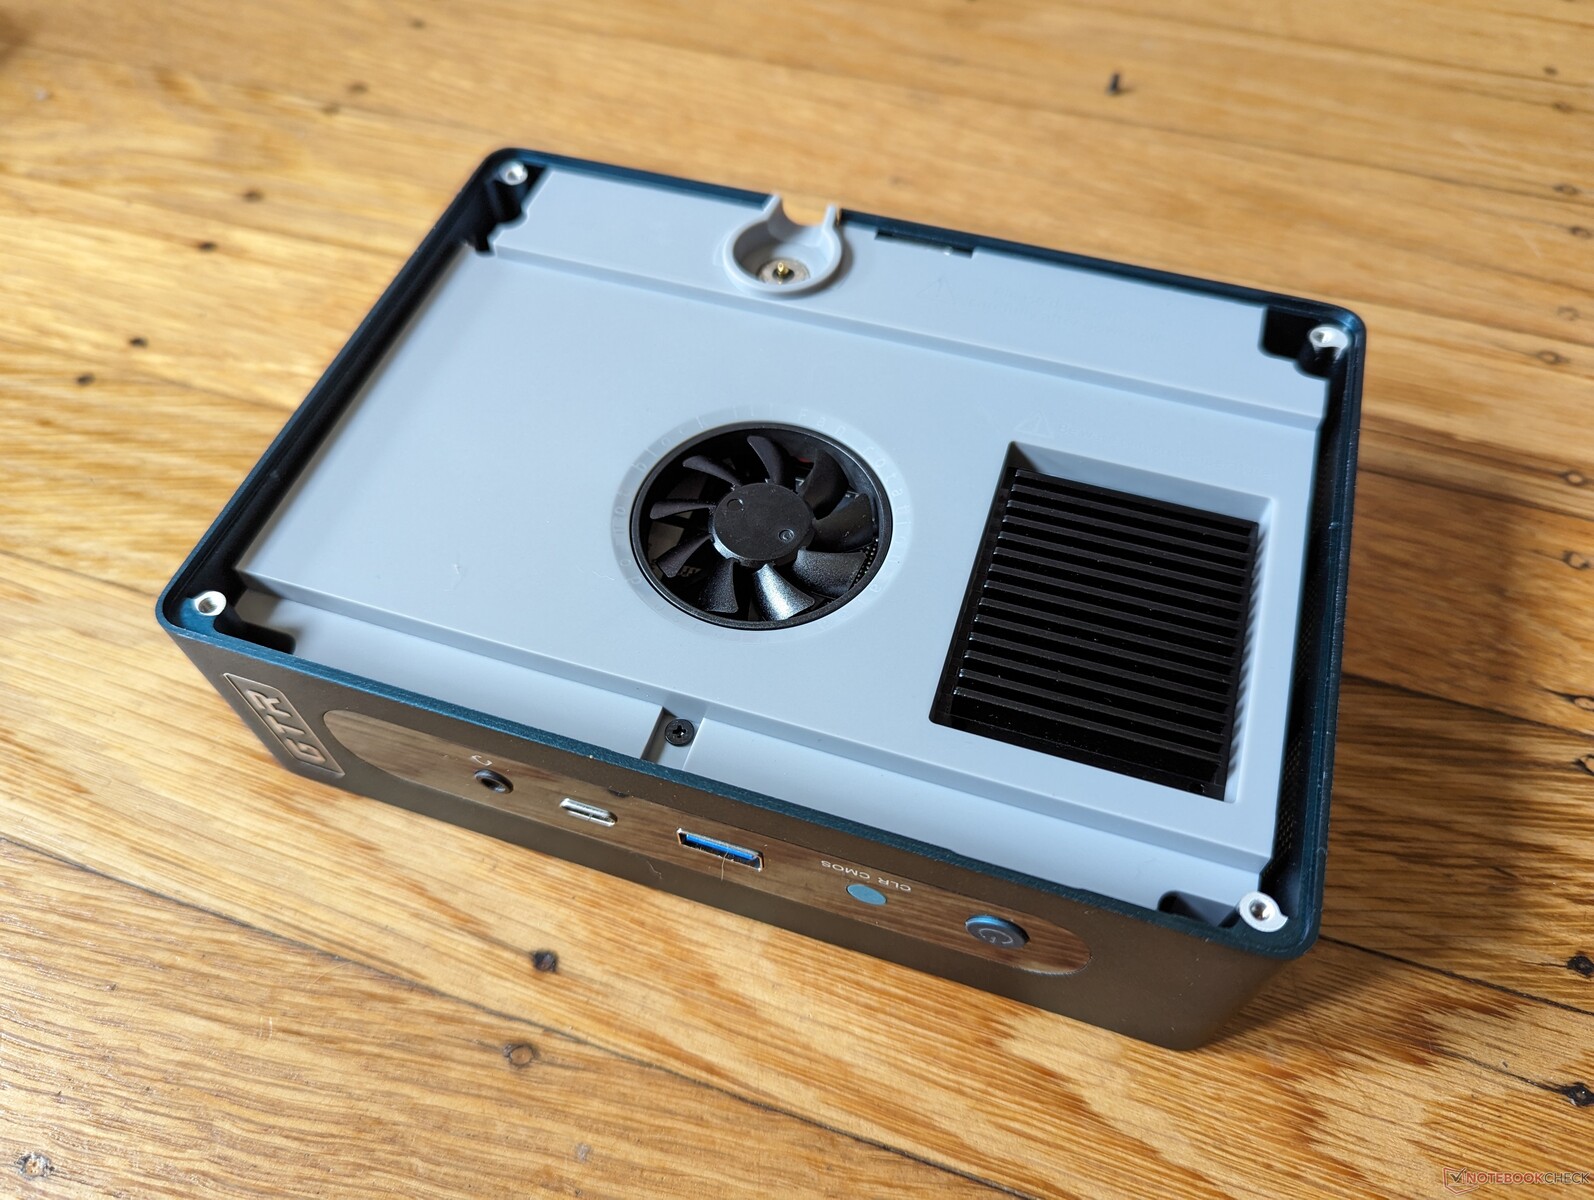
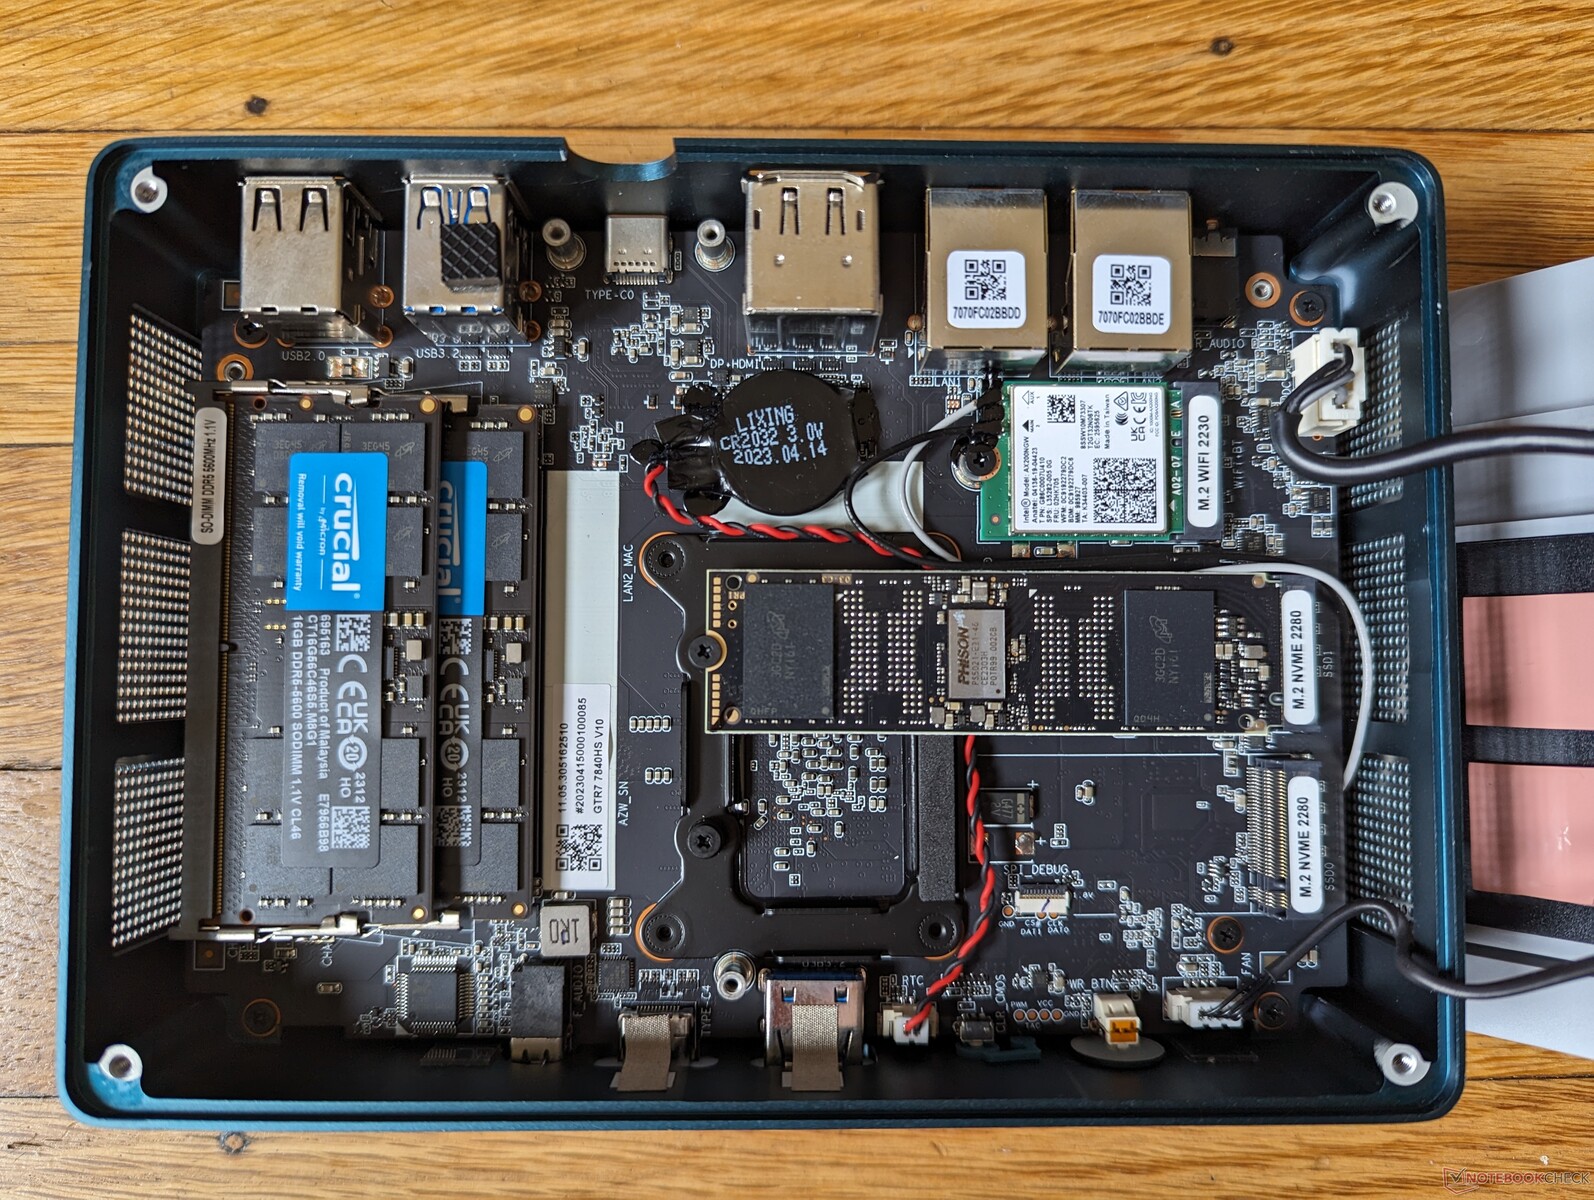
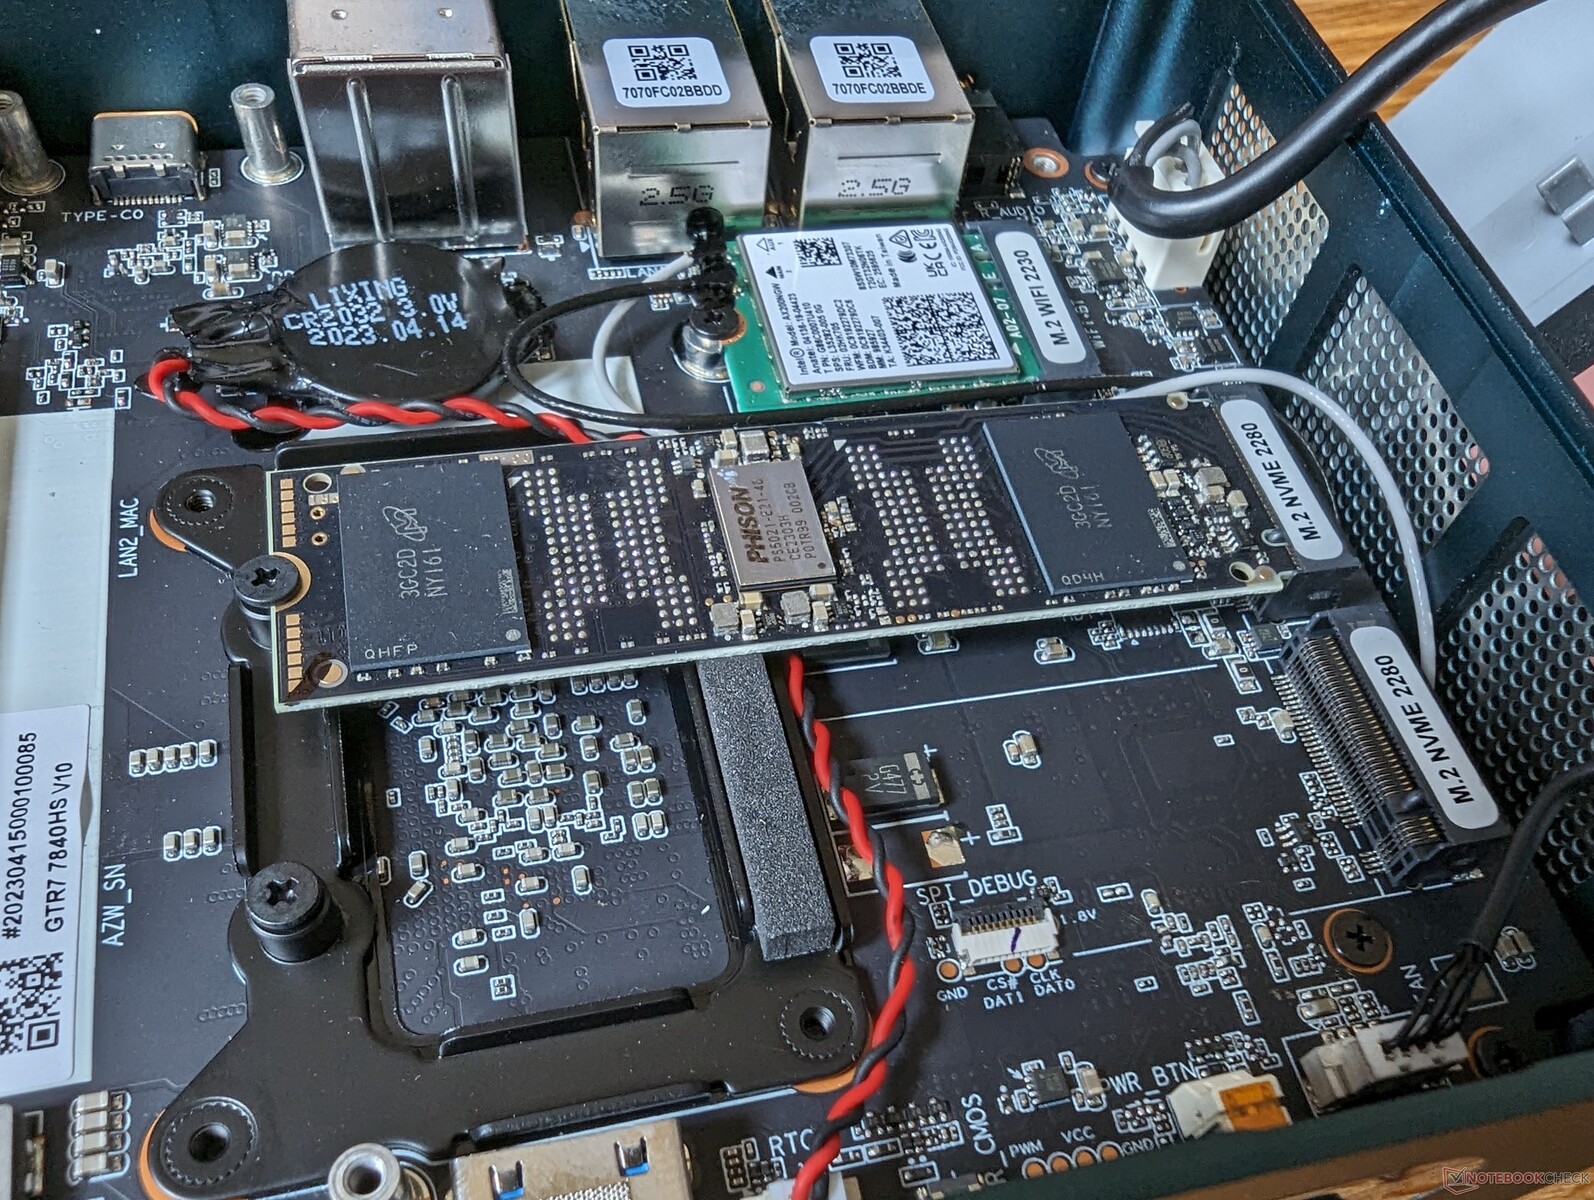
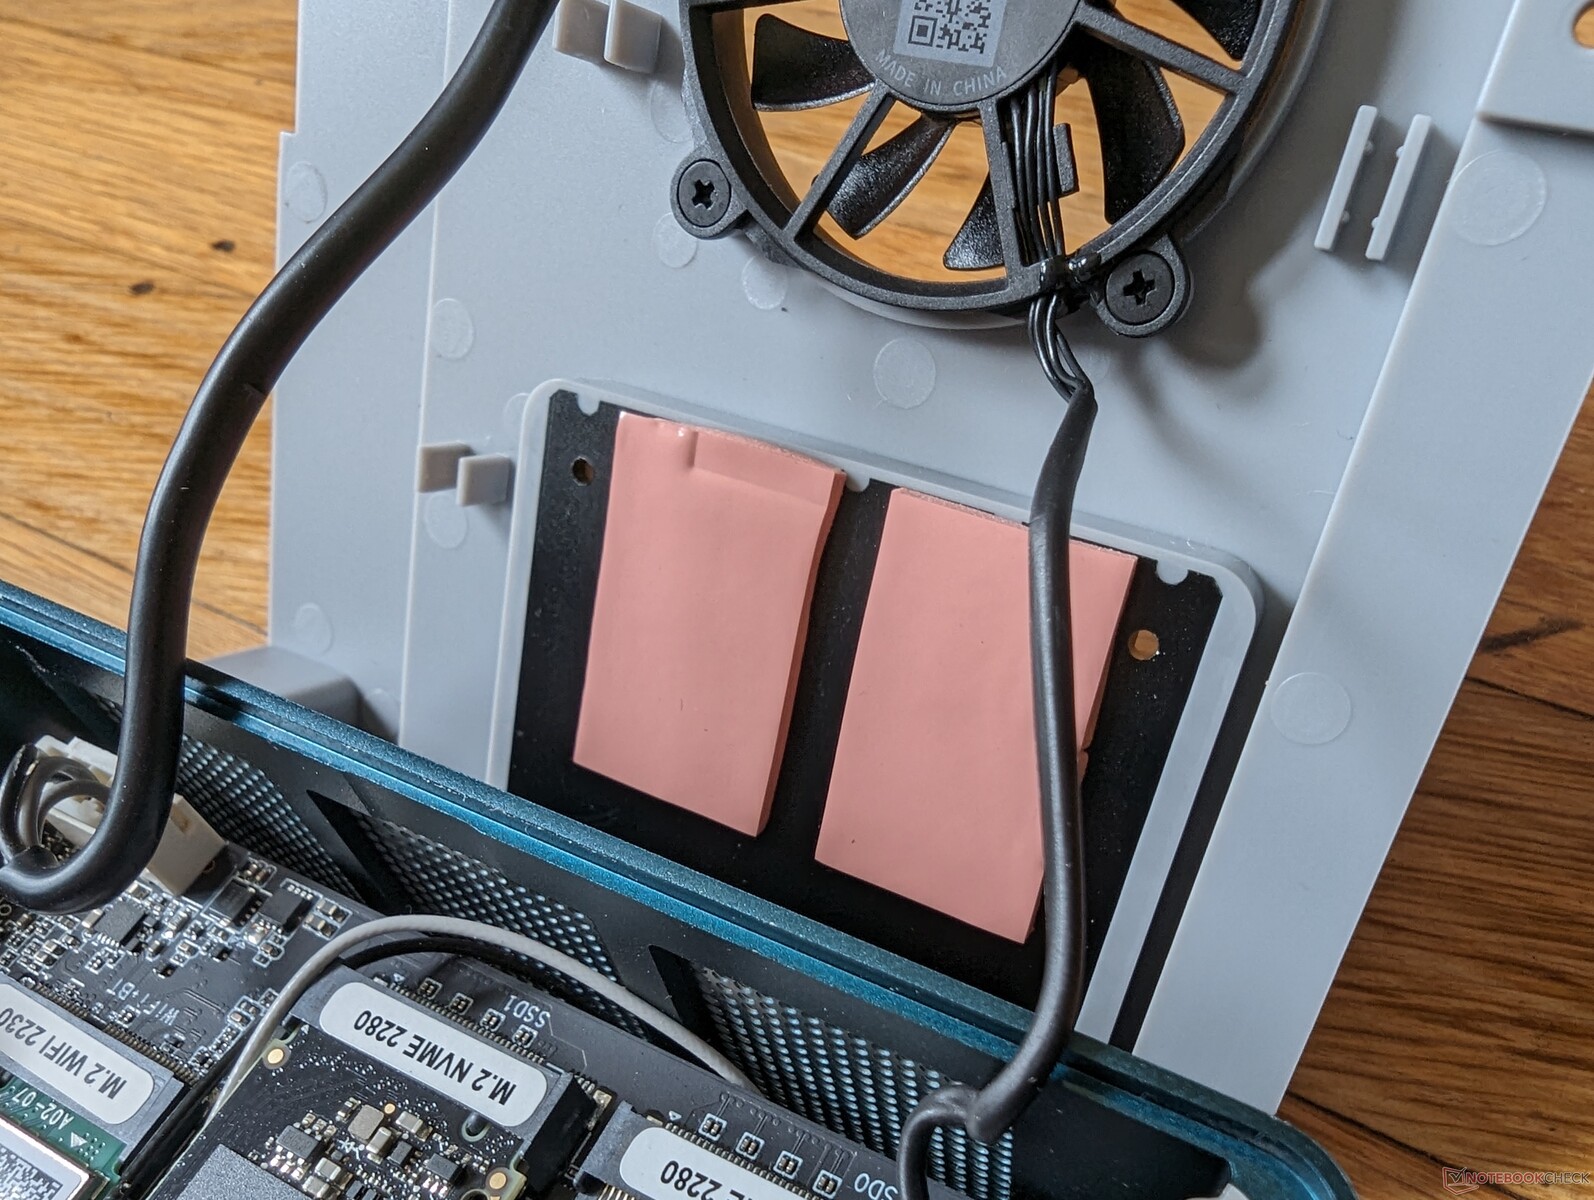
Two layers must be removed before gaining access to the motherboard: the outer metal plate and the inner fan bracket as shown by the pictures below. Both pieces are thankfully easy to remove with just a Phillips screwdriver. Users can install up to 2x SODIMM modules, 2x M.2 2280 PCIe4 x4 NVMe SSDs, and the single WLAN module.

Unfortunately, the other side of the motherboard with the CPU and vapor chamber were not designed to be easily accessible. Cleaning is therefore difficult since there is a larger fan in between the vapor chamber and top mesh cover that cannot be easily reached.

GTR7 with bottom metal cover removed
Removing the fan bracket reveals the underside of the motherboard and the upgradeable components

Accessories And Warranty

The retail box includes a wall-mounted VESA bracket, manual, HDMI cable, and AC power adapter depending on the region. The top cover is not removable unlike on older models from Beelink.

A standard one-year limited manufacturer warranty applies if purchased in the US.

Performance — The Zen 4 Boost


Testing Conditions

We set our unit to Performance mode via Windows prior to running the benchmarks below. There are no specialized "Command Center" applications or other pre-installed bloatware included with the mini PC. AMD Precision Boost Overdrive settings are available through BIOS, but these are set to Auto by default.

Attempting to install AMD drivers via the official AMD auto-installer would result in error messages each time.

Processor

We have our hopes high for the Zen 4 Ryzen 7 7840HS after the disappointing Zen 3 Ryzen 7 7735HS last month. Thankfully, the processor pulls through with excellent results that are comparable to both the Core i7-12700H and Core i7-13700H. It's nowhere near as fast as the demanding Ryzen 9 7945HX or Core i9-13900HX, of course, but it's still appreciably faster than most other mini PCs including the newest Intel NUC 13 Pro.

Performance stability is excellent as well with no dips even when stressed over long periods. Upgrading from the barely one year-old Zen 3+ Ryzen 9 6900HX can boost multi-thread performance by about 35 percent.

Cinebench R15 Multi Loop

0135270405540675810945108012151350148516201755189020252160229524302565Tooltip
Beelink GTR7 7840HS AMD Ryzen 7 7840HS: Ø2669 (2587.99-2689.08)
Beelink SER6 Pro Ryzen 7 7735HS AMD Ryzen 7 7735HS: Ø1891 (1862.98-1952.55)
Beelink GTR6 AMD Ryzen 9 6900HX: Ø1922 (1894.3-1968.5)
Beelink SEi11 Pro Intel Core i5-11320H: Ø851 (845.25-856.84)
Intel NUC 13 Pro Kit NUC13ANK Intel Core i7-1360P: Ø1825 (1794.93-2181.38)
Minisforum Mercury Series EM680 AMD Ryzen 7 6800U: Ø1739 (1710.13-1808.24)
CPU Performance Rating: Percent
Cinebench R20: CPU (Multi Core) | CPU (Single Core)
Cinebench R23: Multi Core | Single Core
Cinebench R15: CPU Multi 64Bit | CPU Single 64Bit
Blender: v2.79 BMW27 CPU
7-Zip 18.03: 7z b 4 | 7z b 4 -mmt1
Geekbench 5.5: Multi-Core | Single-Core
HWBOT x265 Benchmark v2.2: 4k Preset
LibreOffice : 20 Documents To PDF
R Benchmark 2.5: Overall mean
CPU Performance Rating
Asus Zephyrus Duo 16 GX650PY-NM006W
AMD Ryzen 9 7945HX
88.7 pt
Lenovo Legion Pro 5 16ARX8
AMD Ryzen 7 7745HX
70.5 pt
Beelink GTR7 7840HS
AMD Ryzen 7 7840HS
64.6 pt
Average AMD Ryzen 7 7840HS
 
64.6 pt
Intel NUC 12, NUC12SNKi72_Serpent Canyon
Intel Core i7-12700H
61.7 pt
Intel NUC 13 Pro Kit NUC13ANK
Intel Core i7-1360P
59.4 pt
Minisforum Venus Series NAB6
Intel Core i7-12650H
57.3 pt
Beelink GTR6
AMD Ryzen 9 6900HX
55.8 pt
Beelink SER6 Pro Ryzen 7 7735HS
AMD Ryzen 7 7735HS
54.1 pt
Morefine S600-Apex Engineer -2!
Intel Core i9-12900HK
53.9 pt
Geekom AS 5
AMD Ryzen 9 5900HX
52.3 pt
Minisforum Mercury Series EM680
AMD Ryzen 7 6800U
49.6 pt
Minisforum Venus Series UM560 XT
AMD Ryzen 5 5600H
46.1 pt
Beelink SEi11 Pro
Intel Core i5-11320H
39 pt
ACEMagician ACE-CK10-8259U
Intel Core i5-8259U
23.3 pt
Cinebench R20 / CPU (Multi Core)
Asus Zephyrus Duo 16 GX650PY-NM006W
AMD Ryzen 9 7945HX
13457 Points +100%
Lenovo Legion Pro 5 16ARX8
AMD Ryzen 7 7745HX
7072 Points +5%
Beelink GTR7 7840HS
AMD Ryzen 7 7840HS
6744 Points
Intel NUC 12, NUC12SNKi72_Serpent Canyon
Intel Core i7-12700H
6459 Points -4%
Average AMD Ryzen 7 7840HS
  (6061 - 6744, n=15)
6398 Points -5%
Morefine S600-Apex Engineer
Intel Core i9-12900HK
5168 Points -23%
Intel NUC 13 Pro Kit NUC13ANK
Intel Core i7-1360P
4887 Points -28%
Minisforum Venus Series NAB6
Intel Core i7-12650H
4781 Points -29%
Beelink GTR6
AMD Ryzen 9 6900HX
4619 Points -32%
Geekom AS 5
AMD Ryzen 9 5900HX
4574 Points -32%
Beelink SER6 Pro Ryzen 7 7735HS
AMD Ryzen 7 7735HS
4524 Points -33%
Minisforum Mercury Series EM680
AMD Ryzen 7 6800U
4386 Points -35%
Minisforum Venus Series UM560 XT
AMD Ryzen 5 5600H
3768 Points -44%
Beelink SEi11 Pro
Intel Core i5-11320H
2208 Points -67%
ACEMagician ACE-CK10-8259U
Intel Core i5-8259U
1567 Points -77%
Cinebench R20 / CPU (Single Core)
Asus Zephyrus Duo 16 GX650PY-NM006W
AMD Ryzen 9 7945HX
756 Points +7%
Intel NUC 13 Pro Kit NUC13ANK
Intel Core i7-1360P
736 Points +4%
Lenovo Legion Pro 5 16ARX8
AMD Ryzen 7 7745HX
717 Points +2%
Beelink GTR7 7840HS
AMD Ryzen 7 7840HS
705 Points
Minisforum Venus Series NAB6
Intel Core i7-12650H
696 Points -1%
Intel NUC 12, NUC12SNKi72_Serpent Canyon
Intel Core i7-12700H
692 Points -2%
Average AMD Ryzen 7 7840HS
  (668 - 705, n=15)
688 Points -2%
Beelink GTR6
AMD Ryzen 9 6900HX
631 Points -10%
Morefine S600-Apex Engineer
Intel Core i9-12900HK
608 Points -14%
Beelink SER6 Pro Ryzen 7 7735HS
AMD Ryzen 7 7735HS
598 Points -15%
Minisforum Mercury Series EM680
AMD Ryzen 7 6800U
592 Points -16%
Geekom AS 5
AMD Ryzen 9 5900HX
581 Points -18%
Beelink SEi11 Pro
Intel Core i5-11320H
561 Points -20%
Minisforum Venus Series UM560 XT
AMD Ryzen 5 5600H
533 Points -24%
ACEMagician ACE-CK10-8259U
Intel Core i5-8259U
372 Points -47%
Cinebench R23 / Multi Core
Asus Zephyrus Duo 16 GX650PY-NM006W
AMD Ryzen 9 7945HX
34521 (32987.6min - 34521.3max) Points +101%
Lenovo Legion Pro 5 16ARX8
AMD Ryzen 7 7745HX
18060 (17729.5min - 18059.9max) Points +5%
Beelink GTR7 7840HS
AMD Ryzen 7 7840HS
17214 (17017.5min - 17213.9max) Points
Intel NUC 12, NUC12SNKi72_Serpent Canyon
Intel Core i7-12700H
16674 Points -3%
Average AMD Ryzen 7 7840HS
  (15515 - 17214, n=15)
16411 Points -5%
Morefine S600-Apex Engineer
Intel Core i9-12900HK
13410 Points -22%
Intel NUC 13 Pro Kit NUC13ANK
Intel Core i7-1360P
12637 Points -27%
Minisforum Venus Series NAB6
Intel Core i7-12650H
12072 Points -30%
Beelink GTR6
AMD Ryzen 9 6900HX
11862 (11361.7min - 11862.4max) Points -31%
Geekom AS 5
AMD Ryzen 9 5900HX
11662 Points -32%
Beelink SER6 Pro Ryzen 7 7735HS
AMD Ryzen 7 7735HS
11626 (11015.5min - 11625.6max) Points -32%
Minisforum Mercury Series EM680
AMD Ryzen 7 6800U
11171 Points -35%
Minisforum Venus Series UM560 XT
AMD Ryzen 5 5600H
9564 Points -44%
Beelink SEi11 Pro
Intel Core i5-11320H
5720 (5681.08min - 5720.38max) Points -67%
ACEMagician ACE-CK10-8259U
Intel Core i5-8259U
4025 Points -77%
Cinebench R23 / Single Core
Asus Zephyrus Duo 16 GX650PY-NM006W
AMD Ryzen 9 7945HX
1940 Points +7%
Intel NUC 13 Pro Kit NUC13ANK
Intel Core i7-1360P
1909 Points +5%
Lenovo Legion Pro 5 16ARX8
AMD Ryzen 7 7745HX
1846 Points +2%
Beelink GTR7 7840HS
AMD Ryzen 7 7840HS
1812 Points
Minisforum Venus Series NAB6
Intel Core i7-12650H
1804 Points 0%
Intel NUC 12, NUC12SNKi72_Serpent Canyon
Intel Core i7-12700H
1801 Points -1%
Average AMD Ryzen 7 7840HS
  (1737 - 1812, n=15)
1773 Points -2%
Beelink GTR6
AMD Ryzen 9 6900HX
1608 Points -11%
Morefine S600-Apex Engineer
Intel Core i9-12900HK
1586 Points -12%
Beelink SER6 Pro Ryzen 7 7735HS
AMD Ryzen 7 7735HS
1537 Points -15%
Minisforum Mercury Series EM680
AMD Ryzen 7 6800U
1506 Points -17%
Geekom AS 5
AMD Ryzen 9 5900HX
1490 Points -18%
Beelink SEi11 Pro
Intel Core i5-11320H
1467 Points -19%
Minisforum Venus Series UM560 XT
AMD Ryzen 5 5600H
1375 Points -24%
ACEMagician ACE-CK10-8259U
Intel Core i5-8259U
959 Points -47%
Cinebench R15 / CPU Multi 64Bit
Asus Zephyrus Duo 16 GX650PY-NM006W
AMD Ryzen 9 7945HX
5554 (5255.55min - 5554.01max) Points +107%
Lenovo Legion Pro 5 16ARX8
AMD Ryzen 7 7745HX
2978 (2861.03min - 2977.96max) Points +11%
Beelink GTR7 7840HS
AMD Ryzen 7 7840HS
2689 (2587.99min - 2689.08max) Points
Intel NUC 12, NUC12SNKi72_Serpent Canyon
Intel Core i7-12700H
2632 Points -2%
Average AMD Ryzen 7 7840HS
  (2473 - 2729, n=15)
2592 Points -4%
Intel NUC 13 Pro Kit NUC13ANK
Intel Core i7-1360P
2030 Points -25%
Morefine S600-Apex Engineer
Intel Core i9-12900HK
1975 Points -27%
Beelink GTR6
AMD Ryzen 9 6900HX
1969 (1894.3min - 1968.5max) Points -27%
Beelink SER6 Pro Ryzen 7 7735HS
AMD Ryzen 7 7735HS
1953 (1862.98min - 1952.55max) Points -27%
Geekom AS 5
AMD Ryzen 9 5900HX
1928 Points -28%
Minisforum Venus Series NAB6
Intel Core i7-12650H
1893 Points -30%
Minisforum Mercury Series EM680
AMD Ryzen 7 6800U
1837 Points -32%
Minisforum Venus Series UM560 XT
AMD Ryzen 5 5600H
1596 Points -41%
Beelink SEi11 Pro
Intel Core i5-11320H
857 (845.25min - 856.84max) Points -68%
ACEMagician ACE-CK10-8259U
Intel Core i5-8259U
634 Points -76%
Cinebench R15 / CPU Single 64Bit
Asus Zephyrus Duo 16 GX650PY-NM006W
AMD Ryzen 9 7945HX
307 Points +7%
Lenovo Legion Pro 5 16ARX8
AMD Ryzen 7 7745HX
294 Points +3%
Beelink GTR7 7840HS
AMD Ryzen 7 7840HS
286 Points
Average AMD Ryzen 7 7840HS
  (270 - 286, n=15)
278 Points -3%
Intel NUC 13 Pro Kit NUC13ANK
Intel Core i7-1360P
271 Points -5%
Beelink GTR6
AMD Ryzen 9 6900HX
260 Points -9%
Minisforum Venus Series NAB6
Intel Core i7-12650H
260 Points -9%
Intel NUC 12, NUC12SNKi72_Serpent Canyon
Intel Core i7-12700H
259 Points -9%
Beelink SER6 Pro Ryzen 7 7735HS
AMD Ryzen 7 7735HS
247 Points -14%
Minisforum Mercury Series EM680
AMD Ryzen 7 6800U
243 Points -15%
Geekom AS 5
AMD Ryzen 9 5900HX
241 Points -16%
Morefine S600-Apex Engineer
Intel Core i9-12900HK
226 Points -21%
Minisforum Venus Series UM560 XT
AMD Ryzen 5 5600H
225 Points -21%
Beelink SEi11 Pro
Intel Core i5-11320H
214 Points -25%
ACEMagician ACE-CK10-8259U
Intel Core i5-8259U
146 Points -49%
Blender / v2.79 BMW27 CPU
ACEMagician ACE-CK10-8259U
Intel Core i5-8259U
688 Seconds * -200%
Beelink SEi11 Pro
Intel Core i5-11320H
541 Seconds * -136%
Minisforum Venus Series UM560 XT
AMD Ryzen 5 5600H
319 Seconds * -39%
Minisforum Venus Series NAB6
Intel Core i7-12650H
285 Seconds * -24%
Minisforum Mercury Series EM680
AMD Ryzen 7 6800U
282 Seconds * -23%
Intel NUC 13 Pro Kit NUC13ANK
Intel Core i7-1360P
275 Seconds * -20%
Beelink SER6 Pro Ryzen 7 7735HS
AMD Ryzen 7 7735HS
263 Seconds * -15%
Geekom AS 5
AMD Ryzen 9 5900HX
260 Seconds * -14%
Beelink GTR6
AMD Ryzen 9 6900HX
257 Seconds * -12%
Morefine S600-Apex Engineer
Intel Core i9-12900HK
232 Seconds * -1%
Beelink GTR7 7840HS
AMD Ryzen 7 7840HS
229 Seconds *
Average AMD Ryzen 7 7840HS
  (185 - 229, n=17)
198.7 Seconds * +13%
Intel NUC 12, NUC12SNKi72_Serpent Canyon
Intel Core i7-12700H
198 Seconds * +14%
Lenovo Legion Pro 5 16ARX8
AMD Ryzen 7 7745HX
174 Seconds * +24%
Asus Zephyrus Duo 16 GX650PY-NM006W
AMD Ryzen 9 7945HX
93 Seconds * +59%
7-Zip 18.03 / 7z b 4
Asus Zephyrus Duo 16 GX650PY-NM006W
AMD Ryzen 9 7945HX
135927 MIPS +107%
Lenovo Legion Pro 5 16ARX8
AMD Ryzen 7 7745HX
75557 MIPS +15%
Average AMD Ryzen 7 7840HS
  (59538 - 73035, n=17)
69052 MIPS +5%
Beelink GTR7 7840HS
AMD Ryzen 7 7840HS
65706 MIPS
Intel NUC 12, NUC12SNKi72_Serpent Canyon
Intel Core i7-12700H
64403 MIPS -2%
Beelink SER6 Pro Ryzen 7 7735HS
AMD Ryzen 7 7735HS
57693 MIPS -12%
Beelink GTR6
AMD Ryzen 9 6900HX
57261 MIPS -13%
Morefine S600-Apex Engineer
Intel Core i9-12900HK
56455 MIPS -14%
Intel NUC 13 Pro Kit NUC13ANK
Intel Core i7-1360P
52959 MIPS -19%
Minisforum Mercury Series EM680
AMD Ryzen 7 6800U
52046 MIPS -21%
Geekom AS 5
AMD Ryzen 9 5900HX
50673 MIPS -23%
Minisforum Venus Series NAB6
Intel Core i7-12650H
47893 MIPS -27%
Minisforum Venus Series UM560 XT
AMD Ryzen 5 5600H
46562 MIPS -29%
Beelink SEi11 Pro
Intel Core i5-11320H
24798 MIPS -62%
ACEMagician ACE-CK10-8259U
Intel Core i5-8259U
18729 MIPS -71%
7-Zip 18.03 / 7z b 4 -mmt1
Asus Zephyrus Duo 16 GX650PY-NM006W
AMD Ryzen 9 7945HX
7319 MIPS +8%
Lenovo Legion Pro 5 16ARX8
AMD Ryzen 7 7745HX
7244 MIPS +7%
Beelink GTR7 7840HS
AMD Ryzen 7 7840HS
6749 MIPS
Average AMD Ryzen 7 7840HS
  (6049 - 6754, n=17)
6559 MIPS -3%
Minisforum Venus Series NAB6
Intel Core i7-12650H
6116 MIPS -9%
Beelink GTR6
AMD Ryzen 9 6900HX
6005 MIPS -11%
Intel NUC 12, NUC12SNKi72_Serpent Canyon
Intel Core i7-12700H
5972 MIPS -12%
Intel NUC 13 Pro Kit NUC13ANK
Intel Core i7-1360P
5961 MIPS -12%
Beelink SER6 Pro Ryzen 7 7735HS
AMD Ryzen 7 7735HS
5809 MIPS -14%
Geekom AS 5
AMD Ryzen 9 5900HX
5653 MIPS -16%
Minisforum Mercury Series EM680
AMD Ryzen 7 6800U
5433 MIPS -19%
Minisforum Venus Series UM560 XT
AMD Ryzen 5 5600H
5369 MIPS -20%
Morefine S600-Apex Engineer
Intel Core i9-12900HK
5347 MIPS -21%
Beelink SEi11 Pro
Intel Core i5-11320H
5105 MIPS -24%
ACEMagician ACE-CK10-8259U
Intel Core i5-8259U
3753 MIPS -44%
Geekbench 5.5 / Multi-Core
Asus Zephyrus Duo 16 GX650PY-NM006W
AMD Ryzen 9 7945HX
19583 Points +82%
Lenovo Legion Pro 5 16ARX8
AMD Ryzen 7 7745HX
12378 Points +15%
Average AMD Ryzen 7 7840HS
  (8446 - 12339, n=19)
11651 Points +8%
Beelink GTR7 7840HS
AMD Ryzen 7 7840HS
10752 Points
Intel NUC 13 Pro Kit NUC13ANK
Intel Core i7-1360P
10574 Points -2%
Intel NUC 12, NUC12SNKi72_Serpent Canyon
Intel Core i7-12700H
10126 Points -6%
Minisforum Venus Series NAB6
Intel Core i7-12650H
9363 Points -13%
Beelink SER6 Pro Ryzen 7 7735HS
AMD Ryzen 7 7735HS
9357 Points -13%
Beelink GTR6
AMD Ryzen 9 6900HX
9350 Points -13%
Geekom AS 5
AMD Ryzen 9 5900HX
8826 Points -18%
Minisforum Mercury Series EM680
AMD Ryzen 7 6800U
7986 Points -26%
Minisforum Venus Series UM560 XT
AMD Ryzen 5 5600H
7253 Points -33%
Beelink SEi11 Pro
Intel Core i5-11320H
4959 Points -54%
ACEMagician ACE-CK10-8259U
Intel Core i5-8259U
3839 Points -64%
Geekbench 5.5 / Single-Core
Asus Zephyrus Duo 16 GX650PY-NM006W
AMD Ryzen 9 7945HX
2132 Points +6%
Lenovo Legion Pro 5 16ARX8
AMD Ryzen 7 7745HX
2040 Points +1%
Beelink GTR7 7840HS
AMD Ryzen 7 7840HS
2010 Points
Average AMD Ryzen 7 7840HS
  (1837 - 2017, n=19)
1968 Points -2%
Intel NUC 13 Pro Kit NUC13ANK
Intel Core i7-1360P
1850 Points -8%
Minisforum Venus Series NAB6
Intel Core i7-12650H
1767 Points -12%
Beelink GTR6
AMD Ryzen 9 6900HX
1652 Points -18%
Intel NUC 12, NUC12SNKi72_Serpent Canyon
Intel Core i7-12700H
1590 Points -21%
Beelink SER6 Pro Ryzen 7 7735HS
AMD Ryzen 7 7735HS
1580 Points -21%
Geekom AS 5
AMD Ryzen 9 5900HX
1574 Points -22%
Beelink SEi11 Pro
Intel Core i5-11320H
1518 Points -24%
Minisforum Mercury Series EM680
AMD Ryzen 7 6800U
1499 Points -25%
Minisforum Venus Series UM560 XT
AMD Ryzen 5 5600H
1443 Points -28%
ACEMagician ACE-CK10-8259U
Intel Core i5-8259U
948 Points -53%
HWBOT x265 Benchmark v2.2 / 4k Preset
Asus Zephyrus Duo 16 GX650PY-NM006W
AMD Ryzen 9 7945HX
34.8 fps +197%
Lenovo Legion Pro 5 16ARX8
AMD Ryzen 7 7745HX
23.2 fps +98%
Average AMD Ryzen 7 7840HS
  (11.7 - 21.8, n=17)
19.8 fps +69%
Intel NUC 12, NUC12SNKi72_Serpent Canyon
Intel Core i7-12700H
18.7 fps +60%
Morefine S600-Apex Engineer
Intel Core i9-12900HK
15.7 fps +34%
Beelink GTR6
AMD Ryzen 9 6900HX
15.4 fps +32%
Beelink SER6 Pro Ryzen 7 7735HS
AMD Ryzen 7 7735HS
15.1 fps +29%
Geekom AS 5
AMD Ryzen 9 5900HX
15 fps +28%
Intel NUC 13 Pro Kit NUC13ANK
Intel Core i7-1360P
14.2 fps +21%
Minisforum Venus Series NAB6
Intel Core i7-12650H
13.6 fps +16%
Minisforum Mercury Series EM680
AMD Ryzen 7 6800U
13.3 fps +14%
Minisforum Venus Series UM560 XT
AMD Ryzen 5 5600H
12.4 fps +6%
Beelink GTR7 7840HS
AMD Ryzen 7 7840HS
11.7 fps
Beelink SEi11 Pro
Intel Core i5-11320H
7.28 fps -38%
ACEMagician ACE-CK10-8259U
Intel Core i5-8259U
5.49 fps -53%
LibreOffice / 20 Documents To PDF
ACEMagician ACE-CK10-8259U
Intel Core i5-8259U
62.7 s * -61%
Asus Zephyrus Duo 16 GX650PY-NM006W
AMD Ryzen 9 7945HX
60.4 s * -55%
Minisforum Mercury Series EM680
AMD Ryzen 7 6800U
60.2 s * -54%
Minisforum Venus Series UM560 XT
AMD Ryzen 5 5600H
56.7 s * -45%
Geekom AS 5
AMD Ryzen 9 5900HX
50.1 s * -28%
Beelink SEi11 Pro
Intel Core i5-11320H
49.1 s * -26%
Average AMD Ryzen 7 7840HS
  (38.3 - 68.3, n=17)
48.6 s * -25%
Beelink GTR6
AMD Ryzen 9 6900HX
46 s * -18%
Intel NUC 12, NUC12SNKi72_Serpent Canyon
Intel Core i7-12700H
44.9 s * -15%
Beelink SER6 Pro Ryzen 7 7735HS
AMD Ryzen 7 7735HS
44.3 s * -14%
Intel NUC 13 Pro Kit NUC13ANK
Intel Core i7-1360P
43.7 s * -12%
Morefine S600-Apex Engineer
Intel Core i9-12900HK
41.9 s * -7%
Minisforum Venus Series NAB6
Intel Core i7-12650H
39.6 s * -2%
Beelink GTR7 7840HS
AMD Ryzen 7 7840HS
39 s *
Lenovo Legion Pro 5 16ARX8
AMD Ryzen 7 7745HX
37.9 s * +3%
R Benchmark 2.5 / Overall mean
ACEMagician ACE-CK10-8259U
Intel Core i5-8259U
0.818 sec * -96%
Beelink SEi11 Pro
Intel Core i5-11320H
0.581 sec * -39%
Minisforum Venus Series UM560 XT
AMD Ryzen 5 5600H
0.526 sec * -26%
Minisforum Mercury Series EM680
AMD Ryzen 7 6800U
0.525 sec * -25%
Beelink SER6 Pro Ryzen 7 7735HS
AMD Ryzen 7 7735HS
0.512 sec * -22%
Geekom AS 5
AMD Ryzen 9 5900HX
0.506 sec * -21%
Morefine S600-Apex Engineer
Intel Core i9-12900HK
0.4997 sec * -19%
Intel NUC 12, NUC12SNKi72_Serpent Canyon
Intel Core i7-12700H
0.4643 sec * -11%
Beelink GTR6
AMD Ryzen 9 6900HX
0.4627 sec * -11%
Minisforum Venus Series NAB6
Intel Core i7-12650H
0.462 sec * -10%
Intel NUC 13 Pro Kit NUC13ANK
Intel Core i7-1360P
0.445 sec * -6%
Average AMD Ryzen 7 7840HS
  (0.4184 - 0.4739, n=17)
0.4393 sec * -5%
Lenovo Legion Pro 5 16ARX8
AMD Ryzen 7 7745HX
0.421 sec * -1%
Beelink GTR7 7840HS
AMD Ryzen 7 7840HS
0.4184 sec *
Asus Zephyrus Duo 16 GX650PY-NM006W
AMD Ryzen 9 7945HX
0.3982 sec * +5%
CPU Performance Rating: Percent
Cinebench R20: CPU (Multi Core) | CPU (Single Core)
Cinebench R23: Multi Core | Single Core
Cinebench R15: CPU Multi 64Bit | CPU Single 64Bit
Blender: v2.79 BMW27 CPU
7-Zip 18.03: 7z b 4 | 7z b 4 -mmt1
Geekbench 5.5: Multi-Core | Single-Core
HWBOT x265 Benchmark v2.2: 4k Preset
LibreOffice : 20 Documents To PDF
R Benchmark 2.5: Overall mean

* ... smaller is better

Cinebench R15 CPU Multi 64Bit
2689 Points
Cinebench R15 OpenGL 64Bit
235 fps
Cinebench R15 Ref. Match 64Bit
97.9 %
Cinebench R15 CPU Single 64Bit
286 Points
Help
Performance Rating
Beelink GTR7 7840HS
AMD Ryzen 7 7840HS, Radeon 780M
100 pt
Beelink GTR6
AMD Ryzen 9 6900HX, Radeon 680M
68 pt
Beelink SER6 Pro Ryzen 7 7735HS
AMD Ryzen 7 7735HS, Radeon 680M
66.2 pt
Minisforum Mercury Series EM680
AMD Ryzen 7 6800U, Radeon 680M
62.5 pt
Intel NUC 13 Pro Kit NUC13ANK
Intel Core i7-1360P, Iris Xe G7 96EUs
54.7 pt
Beelink SEi11 Pro
Intel Core i5-11320H, Iris Xe G7 96EUs
35.3 pt
AIDA64 / FP32 Ray-Trace
Beelink GTR7 7840HS
AMD Ryzen 7 7840HS, Radeon 780M
27538 KRay/s
Beelink GTR6
AMD Ryzen 9 6900HX, Radeon 680M
13630 KRay/s -51%
Beelink SER6 Pro Ryzen 7 7735HS
AMD Ryzen 7 7735HS, Radeon 680M
13148 KRay/s -52%
Minisforum Mercury Series EM680
AMD Ryzen 7 6800U, Radeon 680M
12284 KRay/s -55%
Intel NUC 13 Pro Kit NUC13ANK
Intel Core i7-1360P, Iris Xe G7 96EUs
11040 KRay/s -60%
Beelink SEi11 Pro
Intel Core i5-11320H, Iris Xe G7 96EUs
7047 KRay/s -74%
AIDA64 / FPU Julia
Beelink GTR7 7840HS
AMD Ryzen 7 7840HS, Radeon 780M
116903 Points
Beelink GTR6
AMD Ryzen 9 6900HX, Radeon 680M
86563 Points -26%
Beelink SER6 Pro Ryzen 7 7735HS
AMD Ryzen 7 7735HS, Radeon 680M
83889 Points -28%
Minisforum Mercury Series EM680
AMD Ryzen 7 6800U, Radeon 680M
80261 Points -31%
Intel NUC 13 Pro Kit NUC13ANK
Intel Core i7-1360P, Iris Xe G7 96EUs
55557 Points -52%
Beelink SEi11 Pro
Intel Core i5-11320H, Iris Xe G7 96EUs
29972 Points -74%
AIDA64 / CPU SHA3
Beelink GTR7 7840HS
AMD Ryzen 7 7840HS, Radeon 780M
5096 MB/s
Beelink GTR6
AMD Ryzen 9 6900HX, Radeon 680M
3033 MB/s -40%
Beelink SER6 Pro Ryzen 7 7735HS
AMD Ryzen 7 7735HS, Radeon 680M
2885 MB/s -43%
Intel NUC 13 Pro Kit NUC13ANK
Intel Core i7-1360P, Iris Xe G7 96EUs
2728 MB/s -46%
Minisforum Mercury Series EM680
AMD Ryzen 7 6800U, Radeon 680M
2707 MB/s -47%
Beelink SEi11 Pro
Intel Core i5-11320H, Iris Xe G7 96EUs
1992 MB/s -61%
AIDA64 / CPU Queen
Beelink GTR7 7840HS
AMD Ryzen 7 7840HS, Radeon 780M
117764 Points
Beelink SER6 Pro Ryzen 7 7735HS
AMD Ryzen 7 7735HS, Radeon 680M
95566 Points -19%
Beelink GTR6
AMD Ryzen 9 6900HX, Radeon 680M
94363 Points -20%
Minisforum Mercury Series EM680
AMD Ryzen 7 6800U, Radeon 680M
91739 Points -22%
Intel NUC 13 Pro Kit NUC13ANK
Intel Core i7-1360P, Iris Xe G7 96EUs
86691 Points -26%
Beelink SEi11 Pro
Intel Core i5-11320H, Iris Xe G7 96EUs
48212 Points -59%
AIDA64 / FPU SinJulia
Beelink GTR7 7840HS
AMD Ryzen 7 7840HS, Radeon 780M
15525 Points
Beelink GTR6
AMD Ryzen 9 6900HX, Radeon 680M
12291 Points -21%
Beelink SER6 Pro Ryzen 7 7735HS
AMD Ryzen 7 7735HS, Radeon 680M
12094 Points -22%
Minisforum Mercury Series EM680
AMD Ryzen 7 6800U, Radeon 680M
11660 Points -25%
Intel NUC 13 Pro Kit NUC13ANK
Intel Core i7-1360P, Iris Xe G7 96EUs
7269 Points -53%
Beelink SEi11 Pro
Intel Core i5-11320H, Iris Xe G7 96EUs
4771 Points -69%
AIDA64 / FPU Mandel
Beelink GTR7 7840HS
AMD Ryzen 7 7840HS, Radeon 780M
62378 Points
Beelink GTR6
AMD Ryzen 9 6900HX, Radeon 680M
47561 Points -24%
Beelink SER6 Pro Ryzen 7 7735HS
AMD Ryzen 7 7735HS, Radeon 680M
45982 Points -26%
Minisforum Mercury Series EM680
AMD Ryzen 7 6800U, Radeon 680M
44145 Points -29%
Intel NUC 13 Pro Kit NUC13ANK
Intel Core i7-1360P, Iris Xe G7 96EUs
27772 Points -55%
Beelink SEi11 Pro
Intel Core i5-11320H, Iris Xe G7 96EUs
17987 Points -71%
AIDA64 / CPU AES
Beelink GTR7 7840HS
AMD Ryzen 7 7840HS, Radeon 780M
177158 MB/s
Beelink GTR6
AMD Ryzen 9 6900HX, Radeon 680M
122402 MB/s -31%
Beelink SER6 Pro Ryzen 7 7735HS
AMD Ryzen 7 7735HS, Radeon 680M
117400 MB/s -34%
Minisforum Mercury Series EM680
AMD Ryzen 7 6800U, Radeon 680M
113160 MB/s -36%
Intel NUC 13 Pro Kit NUC13ANK
Intel Core i7-1360P, Iris Xe G7 96EUs
99244 MB/s -44%
Beelink SEi11 Pro
Intel Core i5-11320H, Iris Xe G7 96EUs
68683 MB/s -61%
AIDA64 / CPU ZLib
Beelink GTR7 7840HS
AMD Ryzen 7 7840HS, Radeon 780M
1103 MB/s
Intel NUC 13 Pro Kit NUC13ANK
Intel Core i7-1360P, Iris Xe G7 96EUs
807 MB/s -27%
Beelink GTR6
AMD Ryzen 9 6900HX, Radeon 680M
757 MB/s -31%
Beelink SER6 Pro Ryzen 7 7735HS
AMD Ryzen 7 7735HS, Radeon 680M
712 MB/s -35%
Minisforum Mercury Series EM680
AMD Ryzen 7 6800U, Radeon 680M
669 MB/s -39%
Beelink SEi11 Pro
Intel Core i5-11320H, Iris Xe G7 96EUs
368 MB/s -67%
AIDA64 / FP64 Ray-Trace
Beelink GTR7 7840HS
AMD Ryzen 7 7840HS, Radeon 780M
14722 KRay/s
Beelink GTR6
AMD Ryzen 9 6900HX, Radeon 680M
7214 KRay/s -51%
Beelink SER6 Pro Ryzen 7 7735HS
AMD Ryzen 7 7735HS, Radeon 680M
7032 KRay/s -52%
Minisforum Mercury Series EM680
AMD Ryzen 7 6800U, Radeon 680M
6438 KRay/s -56%
Intel NUC 13 Pro Kit NUC13ANK
Intel Core i7-1360P, Iris Xe G7 96EUs
5920 KRay/s -60%
Beelink SEi11 Pro
Intel Core i5-11320H, Iris Xe G7 96EUs
3811 KRay/s -74%
AIDA64 / CPU PhotoWorxx
Beelink GTR7 7840HS
AMD Ryzen 7 7840HS, Radeon 780M
40726 MPixel/s
Beelink GTR6
AMD Ryzen 9 6900HX, Radeon 680M
30600 MPixel/s -25%
Beelink SER6 Pro Ryzen 7 7735HS
AMD Ryzen 7 7735HS, Radeon 680M
30542 MPixel/s -25%
Intel NUC 13 Pro Kit NUC13ANK
Intel Core i7-1360P, Iris Xe G7 96EUs
29108 MPixel/s -29%
Minisforum Mercury Series EM680
AMD Ryzen 7 6800U, Radeon 680M
27274 MPixel/s -33%
Beelink SEi11 Pro
Intel Core i5-11320H, Iris Xe G7 96EUs
25964 MPixel/s -36%

System Performance

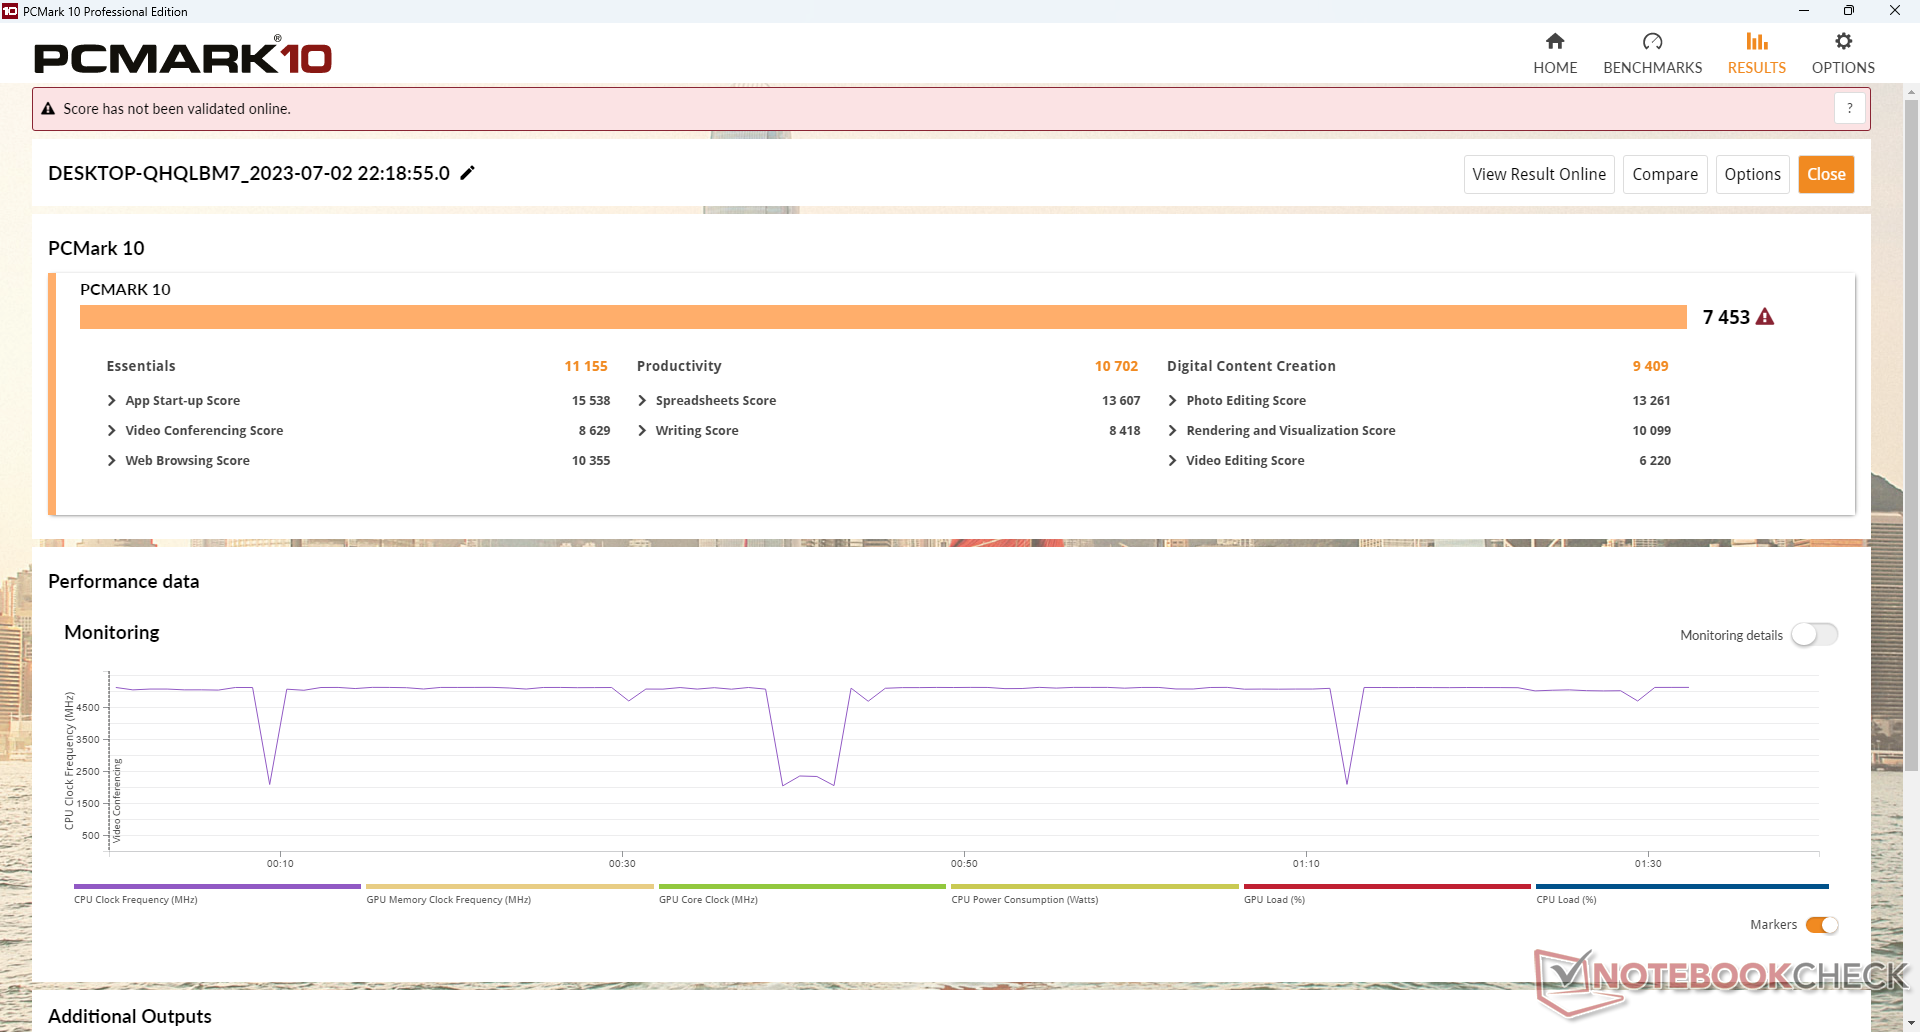
PCMark scores are some of the highest for any mini PC not powered by discrete graphics. The GTR7 holds its biggest advantages over the NUC 13 Pro in the Productivity and Digital Content Creation subtests where processor and graphics performances matter most.

It's worth noting that the AIDA64 memory results are quite high even when compared to gaming laptops like the MSI Stealth GS66. This can be attributed to the very fast DDR5-5600 RAM whereas the RAM on most other mini PCs and laptops tend to be at 5200 MHz or slower. Our Intel NUC 13 Pro, for example, shipped with much slower DDR4-3200 memory. Integrated GPUs in particular are known to benefit significantly from faster system RAM since they have no pool of dedicated VRAM.

PCMark 10 Standard
PCMark 10 Standard
PCMark 10 / Score
Intel NUC13 Raptor Canyon
NVIDIA GeForce RTX 3080 Ti, i9-13900K, Kingston Fury Renegade SFYRS1000G
9118 Points +22%
Beelink GTR7 7840HS
Radeon 780M, R7 7840HS, Crucial P3 Plus CT1000P3PSSD8
7453 Points
Average AMD Ryzen 7 7840HS, AMD Radeon 780M
  (7039 - 7651, n=7)
7407 Points -1%
Beelink GTR6
Radeon 680M, R9 6900HX, Kingston KC3000 512G SKC3000S512G
7109 Points -5%
Beelink SER6 Pro Ryzen 7 7735HS
Radeon 680M, R7 7735HS, Kingston NV2 500GB SNV2S/500G
6950 Points -7%
Intel NUC 13 Pro Kit NUC13ANK
Iris Xe G7 96EUs, i7-1360P, Samsung PM9A1 MZVL2512HCJQ
6281 Points -16%
Minisforum Mercury Series EM680
Radeon 680M, R7 6800U, Kingston OM3PGP4512Q
5352 Points -28%
Beelink SEi11 Pro
Iris Xe G7 96EUs, i5-11320H, Kingston NV1 SNVS/500GCN
5095 Points -32%
PCMark 10 / Essentials
Intel NUC13 Raptor Canyon
NVIDIA GeForce RTX 3080 Ti, i9-13900K, Kingston Fury Renegade SFYRS1000G
11598 Points +4%
Intel NUC 13 Pro Kit NUC13ANK
Iris Xe G7 96EUs, i7-1360P, Samsung PM9A1 MZVL2512HCJQ
11596 Points +4%
Beelink GTR6
Radeon 680M, R9 6900HX, Kingston KC3000 512G SKC3000S512G
11323 Points +2%
Beelink GTR7 7840HS
Radeon 780M, R7 7840HS, Crucial P3 Plus CT1000P3PSSD8
11155 Points
Beelink SER6 Pro Ryzen 7 7735HS
Radeon 680M, R7 7735HS, Kingston NV2 500GB SNV2S/500G
11124 Points 0%
Average AMD Ryzen 7 7840HS, AMD Radeon 780M
  (10519 - 11214, n=7)
10998 Points -1%
Beelink SEi11 Pro
Iris Xe G7 96EUs, i5-11320H, Kingston NV1 SNVS/500GCN
10281 Points -8%
Minisforum Mercury Series EM680
Radeon 680M, R7 6800U, Kingston OM3PGP4512Q
8143 Points -27%
PCMark 10 / Productivity
Intel NUC13 Raptor Canyon
NVIDIA GeForce RTX 3080 Ti, i9-13900K, Kingston Fury Renegade SFYRS1000G
10988 Points +3%
Beelink GTR7 7840HS
Radeon 780M, R7 7840HS, Crucial P3 Plus CT1000P3PSSD8
10702 Points
Average AMD Ryzen 7 7840HS, AMD Radeon 780M
  (9717 - 10970, n=7)
10506 Points -2%
Beelink GTR6
Radeon 680M, R9 6900HX, Kingston KC3000 512G SKC3000S512G
10210 Points -5%
Beelink SER6 Pro Ryzen 7 7735HS
Radeon 680M, R7 7735HS, Kingston NV2 500GB SNV2S/500G
9862 Points -8%
Minisforum Mercury Series EM680
Radeon 680M, R7 6800U, Kingston OM3PGP4512Q
8424 Points -21%
Intel NUC 13 Pro Kit NUC13ANK
Iris Xe G7 96EUs, i7-1360P, Samsung PM9A1 MZVL2512HCJQ
7893 Points -26%
Beelink SEi11 Pro
Iris Xe G7 96EUs, i5-11320H, Kingston NV1 SNVS/500GCN
6915 Points -35%
PCMark 10 / Digital Content Creation
Intel NUC13 Raptor Canyon
NVIDIA GeForce RTX 3080 Ti, i9-13900K, Kingston Fury Renegade SFYRS1000G
16145 Points +72%
Average AMD Ryzen 7 7840HS, AMD Radeon 780M
  (9052 - 9987, n=7)
9550 Points +1%
Beelink GTR7 7840HS
Radeon 780M, R7 7840HS, Crucial P3 Plus CT1000P3PSSD8
9409 Points
Beelink GTR6
Radeon 680M, R9 6900HX, Kingston KC3000 512G SKC3000S512G
8432 Points -10%
Beelink SER6 Pro Ryzen 7 7735HS
Radeon 680M, R7 7735HS, Kingston NV2 500GB SNV2S/500G
8306 Points -12%
Intel NUC 13 Pro Kit NUC13ANK
Iris Xe G7 96EUs, i7-1360P, Samsung PM9A1 MZVL2512HCJQ
7348 Points -22%
Minisforum Mercury Series EM680
Radeon 680M, R7 6800U, Kingston OM3PGP4512Q
6066 Points -36%
Beelink SEi11 Pro
Iris Xe G7 96EUs, i5-11320H, Kingston NV1 SNVS/500GCN
5048 Points -46%
CrossMark / Overall
Intel NUC13 Raptor Canyon
NVIDIA GeForce RTX 3080 Ti, i9-13900K, Kingston Fury Renegade SFYRS1000G
2263 Points +45%
Intel NUC 13 Pro Kit NUC13ANK
Iris Xe G7 96EUs, i7-1360P, Samsung PM9A1 MZVL2512HCJQ
1810 Points +16%
Beelink SER6 Pro Ryzen 7 7735HS
Radeon 680M, R7 7735HS, Kingston NV2 500GB SNV2S/500G
1736 Points +11%
Average AMD Ryzen 7 7840HS, AMD Radeon 780M
  (1566 - 1873, n=7)
1736 Points +11%
Beelink GTR6
Radeon 680M, R9 6900HX, Kingston KC3000 512G SKC3000S512G
1691 Points +8%
Beelink GTR7 7840HS
Radeon 780M, R7 7840HS, Crucial P3 Plus CT1000P3PSSD8
1566 Points
Minisforum Mercury Series EM680
Radeon 680M, R7 6800U, Kingston OM3PGP4512Q
1477 Points -6%
Beelink SEi11 Pro
Iris Xe G7 96EUs, i5-11320H, Kingston NV1 SNVS/500GCN
1335 Points -15%
CrossMark / Productivity
Intel NUC13 Raptor Canyon
NVIDIA GeForce RTX 3080 Ti, i9-13900K, Kingston Fury Renegade SFYRS1000G
2059 Points +32%
Intel NUC 13 Pro Kit NUC13ANK
Iris Xe G7 96EUs, i7-1360P, Samsung PM9A1 MZVL2512HCJQ
1740 Points +12%
Beelink SER6 Pro Ryzen 7 7735HS
Radeon 680M, R7 7735HS, Kingston NV2 500GB SNV2S/500G
1721 Points +10%
Beelink GTR6
Radeon 680M, R9 6900HX, Kingston KC3000 512G SKC3000S512G
1701 Points +9%
Average AMD Ryzen 7 7840HS, AMD Radeon 780M
  (1535 - 1816, n=7)
1671 Points +7%
Beelink GTR7 7840HS
Radeon 780M, R7 7840HS, Crucial P3 Plus CT1000P3PSSD8
1559 Points
Minisforum Mercury Series EM680
Radeon 680M, R7 6800U, Kingston OM3PGP4512Q
1493 Points -4%
Beelink SEi11 Pro
Iris Xe G7 96EUs, i5-11320H, Kingston NV1 SNVS/500GCN
1419 Points -9%
CrossMark / Creativity
Intel NUC13 Raptor Canyon
NVIDIA GeForce RTX 3080 Ti, i9-13900K, Kingston Fury Renegade SFYRS1000G
2625 Points +69%
Intel NUC 13 Pro Kit NUC13ANK
Iris Xe G7 96EUs, i7-1360P, Samsung PM9A1 MZVL2512HCJQ
1970 Points +27%
Average AMD Ryzen 7 7840HS, AMD Radeon 780M
  (1556 - 2040, n=7)
1901 Points +22%
Beelink SER6 Pro Ryzen 7 7735HS
Radeon 680M, R7 7735HS, Kingston NV2 500GB SNV2S/500G
1785 Points +15%
Beelink GTR6
Radeon 680M, R9 6900HX, Kingston KC3000 512G SKC3000S512G
1698 Points +9%
Beelink GTR7 7840HS
Radeon 780M, R7 7840HS, Crucial P3 Plus CT1000P3PSSD8
1556 Points
Minisforum Mercury Series EM680
Radeon 680M, R7 6800U, Kingston OM3PGP4512Q
1462 Points -6%
Beelink SEi11 Pro
Iris Xe G7 96EUs, i5-11320H, Kingston NV1 SNVS/500GCN
1256 Points -19%
CrossMark / Responsiveness
Intel NUC13 Raptor Canyon
NVIDIA GeForce RTX 3080 Ti, i9-13900K, Kingston Fury Renegade SFYRS1000G
1929 Points +19%
Beelink SER6 Pro Ryzen 7 7735HS
Radeon 680M, R7 7735HS, Kingston NV2 500GB SNV2S/500G
1640 Points +1%
Beelink GTR6
Radeon 680M, R9 6900HX, Kingston KC3000 512G SKC3000S512G
1639 Points +1%
Beelink GTR7 7840HS
Radeon 780M, R7 7840HS, Crucial P3 Plus CT1000P3PSSD8
1620 Points
Intel NUC 13 Pro Kit NUC13ANK
Iris Xe G7 96EUs, i7-1360P, Samsung PM9A1 MZVL2512HCJQ
1578 Points -3%
Average AMD Ryzen 7 7840HS, AMD Radeon 780M
  (1293 - 1706, n=7)
1496 Points -8%
Minisforum Mercury Series EM680
Radeon 680M, R7 6800U, Kingston OM3PGP4512Q
1473 Points -9%
Beelink SEi11 Pro
Iris Xe G7 96EUs, i5-11320H, Kingston NV1 SNVS/500GCN
1336 Points -18%
PCMark 10 Score
7453 points
Help
AIDA64 / Memory Copy
Beelink GTR7 7840HS
AMD Ryzen 7 7840HS, Radeon 780M
69199 MB/s
Average AMD Ryzen 7 7840HS
  (30937 - 72158, n=17)
65945 MB/s -5%
Minisforum Mercury Series EM680
AMD Ryzen 7 6800U, Radeon 680M
51798 MB/s -25%
Beelink SER6 Pro Ryzen 7 7735HS
AMD Ryzen 7 7735HS, Radeon 680M
51235 MB/s -26%
Beelink GTR6
AMD Ryzen 9 6900HX, Radeon 680M
50935 MB/s -26%
Intel NUC 13 Pro Kit NUC13ANK
Intel Core i7-1360P, Iris Xe G7 96EUs
44892 MB/s -35%
Beelink SEi11 Pro
Intel Core i5-11320H, Iris Xe G7 96EUs
41106 MB/s -41%
AIDA64 / Memory Read
Beelink GTR7 7840HS
AMD Ryzen 7 7840HS, Radeon 780M
61838 MB/s
Average AMD Ryzen 7 7840HS
  (30497 - 61911, n=17)
57613 MB/s -7%
Beelink GTR6
AMD Ryzen 9 6900HX, Radeon 680M
51869 MB/s -16%
Beelink SER6 Pro Ryzen 7 7735HS
AMD Ryzen 7 7735HS, Radeon 680M
51856 MB/s -16%
Beelink SEi11 Pro
Intel Core i5-11320H, Iris Xe G7 96EUs
46516 MB/s -25%
Intel NUC 13 Pro Kit NUC13ANK
Intel Core i7-1360P, Iris Xe G7 96EUs
45196 MB/s -27%
Minisforum Mercury Series EM680
AMD Ryzen 7 6800U, Radeon 680M
45084 MB/s -27%
AIDA64 / Memory Write
Beelink GTR7 7840HS
AMD Ryzen 7 7840HS, Radeon 780M
87226 MB/s
Average AMD Ryzen 7 7840HS
  (34590 - 93323, n=17)
83733 MB/s -4%
Beelink GTR6
AMD Ryzen 9 6900HX, Radeon 680M
55316 MB/s -37%
Beelink SER6 Pro Ryzen 7 7735HS
AMD Ryzen 7 7735HS, Radeon 680M
55284 MB/s -37%
Minisforum Mercury Series EM680
AMD Ryzen 7 6800U, Radeon 680M
51052 MB/s -41%
Beelink SEi11 Pro
Intel Core i5-11320H, Iris Xe G7 96EUs
46760 MB/s -46%
Intel NUC 13 Pro Kit NUC13ANK
Intel Core i7-1360P, Iris Xe G7 96EUs
46179 MB/s -47%
AIDA64 / Memory Latency
Minisforum Mercury Series EM680
AMD Ryzen 7 6800U, Radeon 680M
108.3 ns * -27%
Intel NUC 13 Pro Kit NUC13ANK
Intel Core i7-1360P, Iris Xe G7 96EUs
96.1 ns * -13%
Average AMD Ryzen 7 7840HS
  (85.1 - 112, n=17)
92.4 ns * -9%
Beelink GTR7 7840HS
AMD Ryzen 7 7840HS, Radeon 780M
85.1 ns *
Beelink GTR6
AMD Ryzen 9 6900HX, Radeon 680M
82.9 ns * +3%
Beelink SER6 Pro Ryzen 7 7735HS
AMD Ryzen 7 7735HS, Radeon 680M
82.5 ns * +3%
Beelink SEi11 Pro
Intel Core i5-11320H, Iris Xe G7 96EUs
81 ns * +5%

* ... smaller is better

DPC Latency

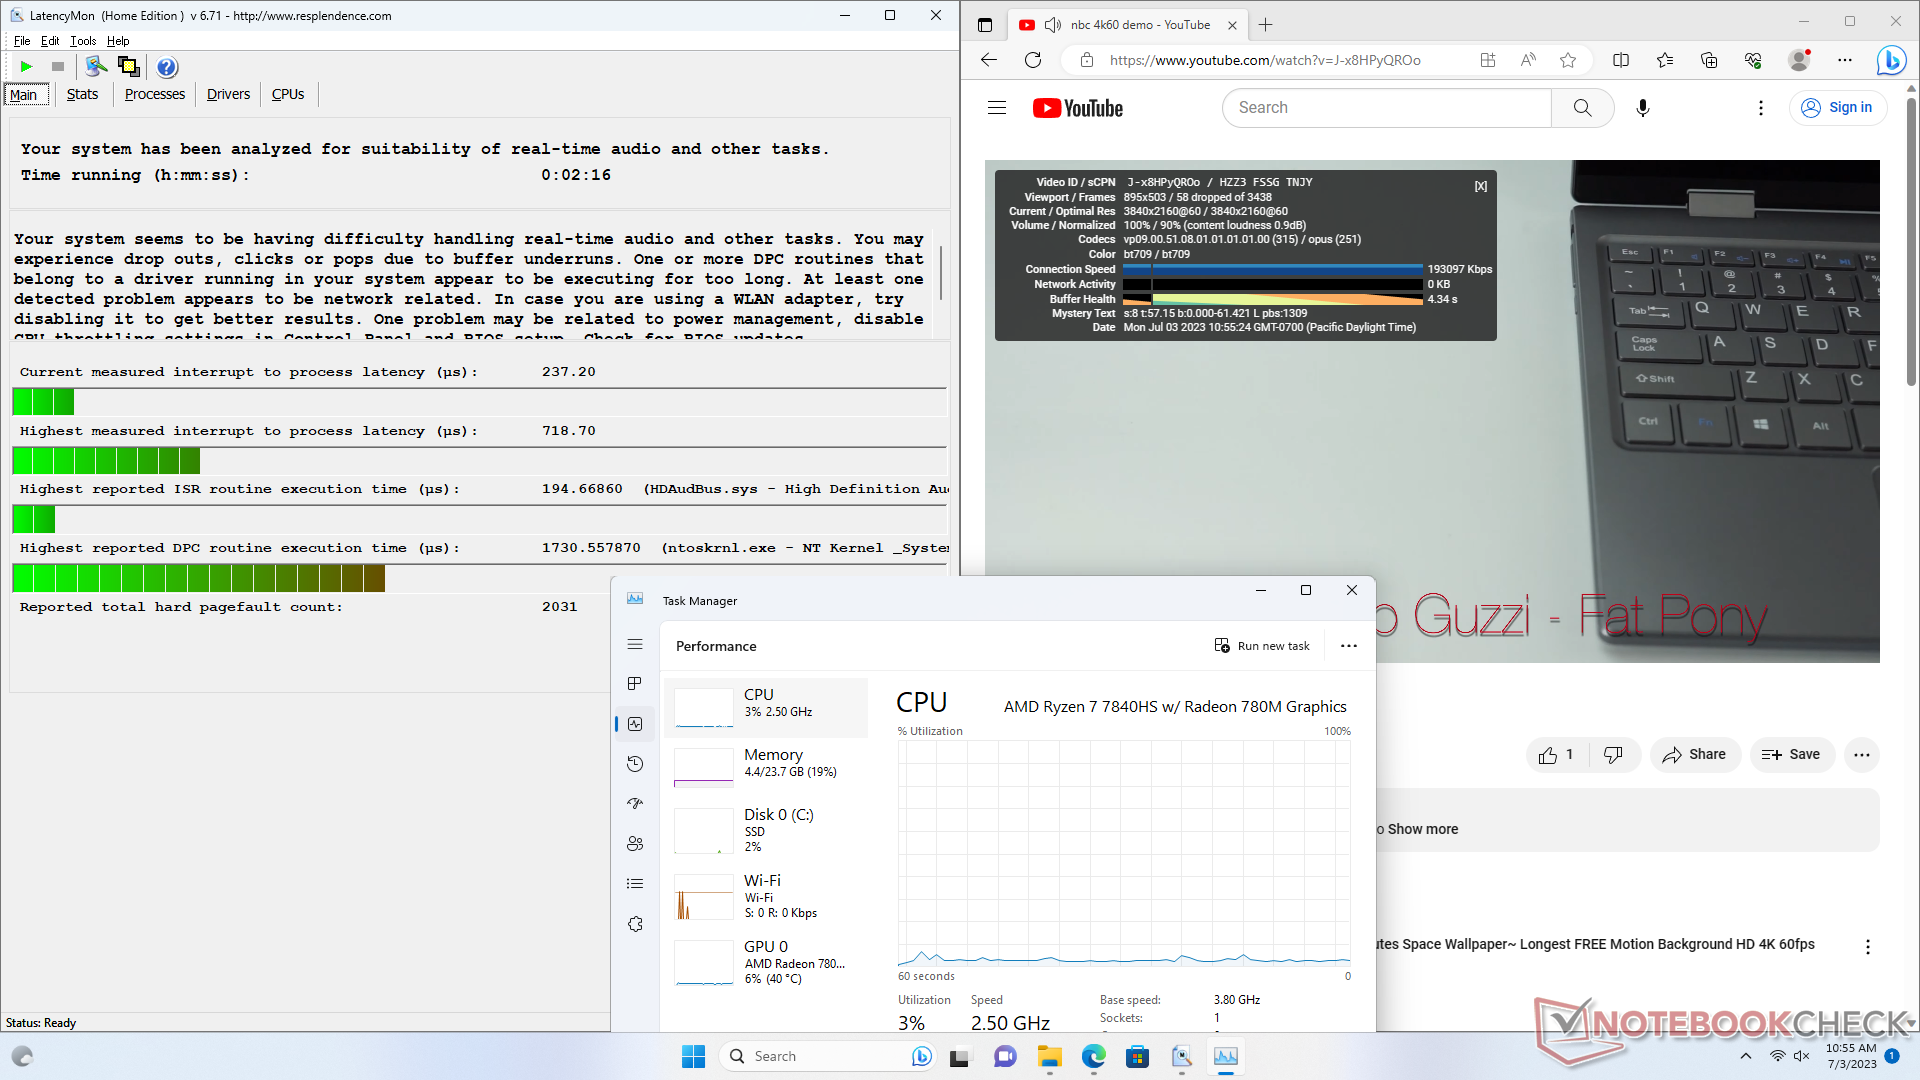
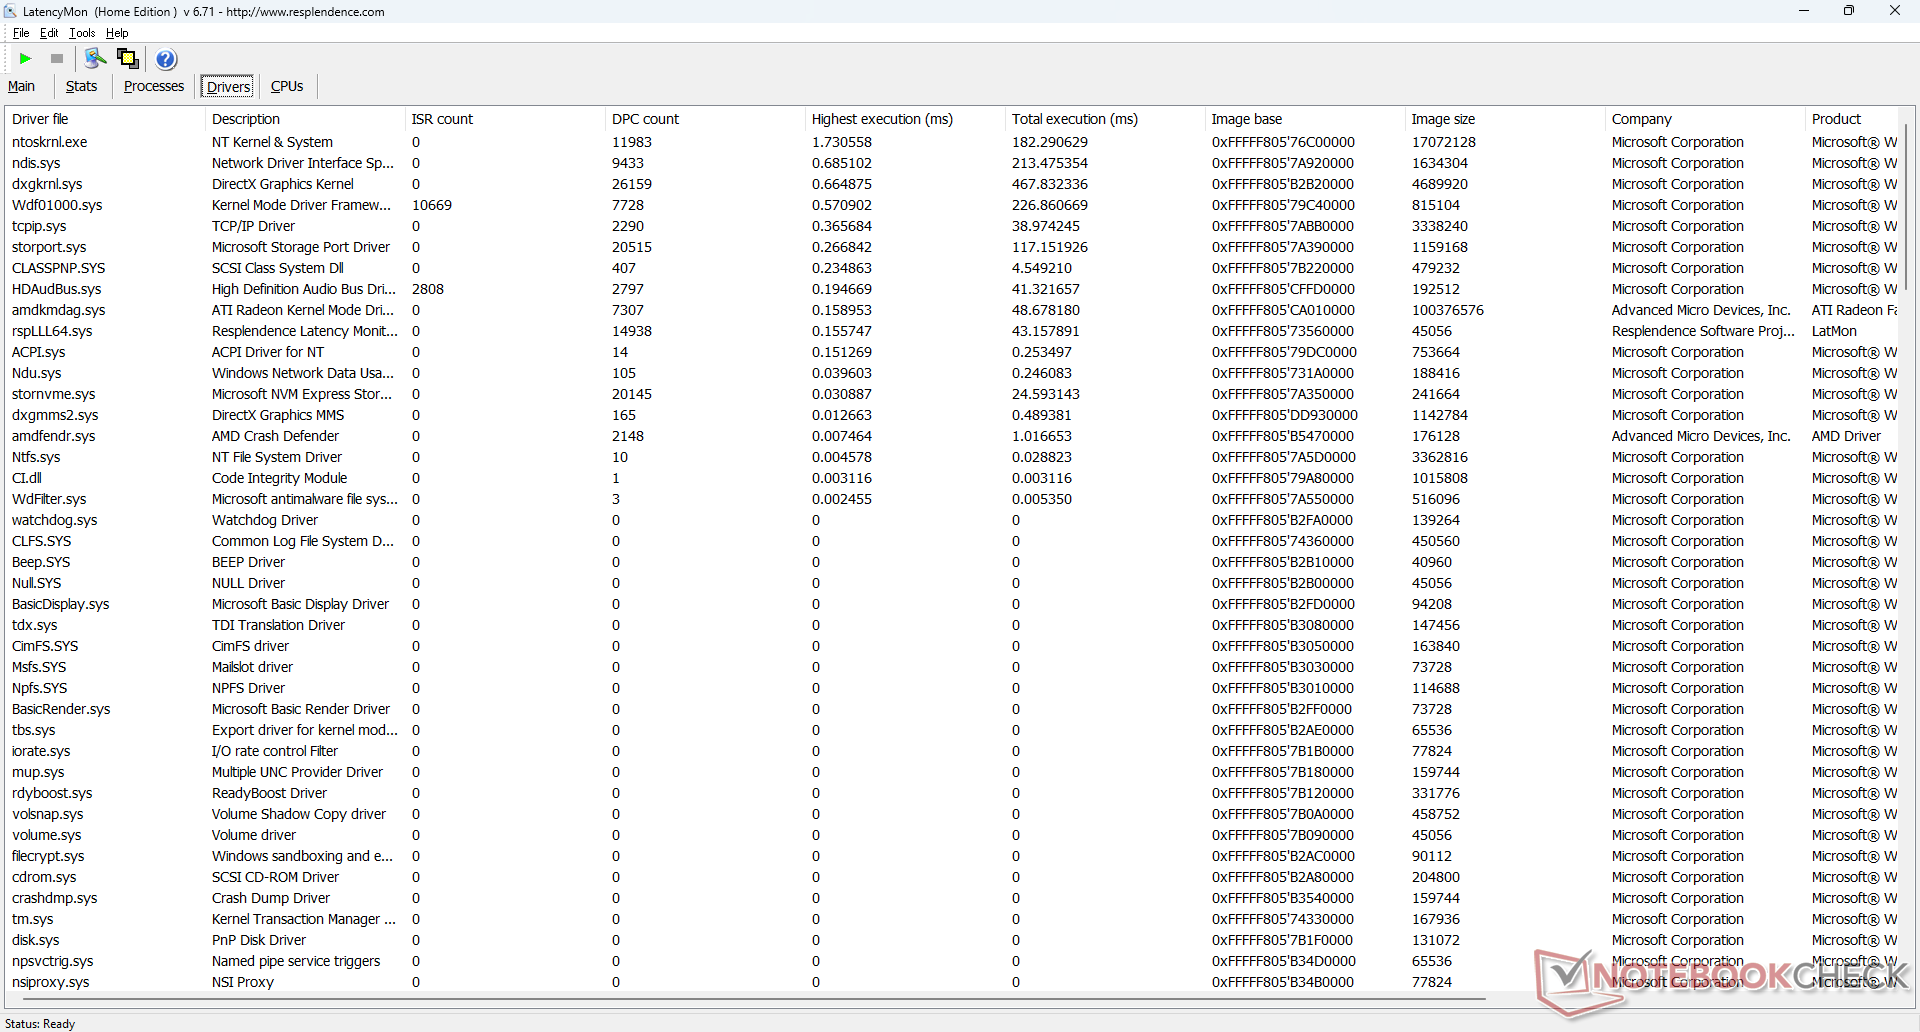
Our unit would exhibit both DPC latency issues and 58 frame drops during our minute-long 4K60 test video even after multiple retests. The latter in particular is a notable issue as it means 4K video streams from Netflix, Hulu, and others may have unnecessary frame skips or stuttering whereas most other mini PCs or laptops would stream them smoothly. A similar issue was observed on some older Zen 2 laptops before it was quickly patched and so we're hopeful that a fix will come sooner rather than later.

LatencyMon
LatencyMon
Drivers list
Drivers list
DPC Latencies / LatencyMon - interrupt to process latency (max), Web, Youtube, Prime95
Minisforum Mercury Series EM680
Radeon 680M, R7 6800U, Kingston OM3PGP4512Q
1920.7 μs * -167%
Beelink SER6 Pro Ryzen 7 7735HS
Radeon 680M, R7 7735HS, Kingston NV2 500GB SNV2S/500G
1137.6 μs * -58%
Intel NUC 13 Pro Kit NUC13ANK
Iris Xe G7 96EUs, i7-1360P, Samsung PM9A1 MZVL2512HCJQ
1087 μs * -51%
Beelink GTR7 7840HS
Radeon 780M, R7 7840HS, Crucial P3 Plus CT1000P3PSSD8
718.7 μs *
Beelink GTR6
Radeon 680M, R9 6900HX, Kingston KC3000 512G SKC3000S512G
509.9 μs * +29%
Beelink SEi11 Pro
Iris Xe G7 96EUs, i5-11320H, Kingston NV1 SNVS/500GCN
167.2 μs * +77%

* ... smaller is better

Storage Devices — Up To Two PCIe4 x4 NVMe SSDs

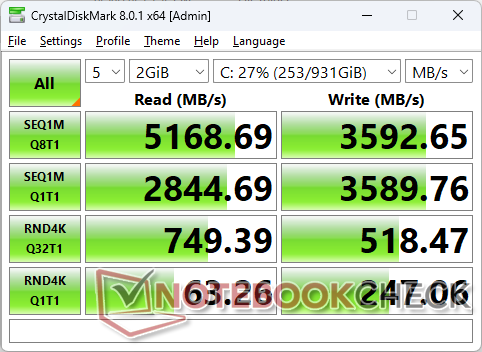
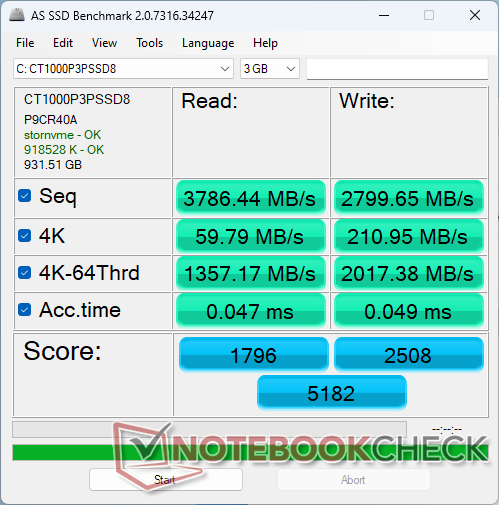
Our test unit ships with a Crucial P3 Plus CT1000P3PSSD8 which is a midrange PCIe4 x4 NVMe SSD offering sequential read and write rates of up to 5000 MB/s and 3600 MB/s respectively. The faster Samsung PM9A1 can go up to 7000 MB/s in comparison, but this was likely excluded to cut costs. Nonetheless, our Crucial drive would exhibit no performance throttling issues when subjected to DiskSpd stress as shown by the graph below.

CDM 8
CDM 8
AS SSD
AS SSD
The two M.2 slots do not support PCIe5 speeds
Each SSD slot has its own thermal pad attached to a larger heat sink on the fan bracket
Crucial P3 Plus CT1000P3PSSD8
CDM 5/6 Read Seq Q32T1: 5161 MB/s
CDM 5/6 Write Seq Q32T1: 3588 MB/s
CDM 5/6 Read 4K Q32T1: 749.9 MB/s
CDM 5/6 Write 4K Q32T1: 516.2 MB/s
CDM 5 Read Seq: 2830 MB/s
CDM 5 Write Seq: 3595 MB/s
CDM 5/6 Read 4K: 63 MB/s
CDM 5/6 Write 4K: 245.5 MB/s
Drive Performance Rating - Percent
Beelink GTR6
Kingston KC3000 512G SKC3000S512G
94.2 pt
Beelink GTR7 7840HS
Crucial P3 Plus CT1000P3PSSD8
79.8 pt
Intel NUC 13 Pro Kit NUC13ANK
Samsung PM9A1 MZVL2512HCJQ
76.2 pt
Minisforum Mercury Series EM680
Kingston OM3PGP4512Q
70.9 pt
Beelink SER6 Pro Ryzen 7 7735HS
Kingston NV2 500GB SNV2S/500G
53.3 pt
Beelink SEi11 Pro
Kingston NV1 SNVS/500GCN
43.4 pt
DiskSpd
seq read
Beelink GTR6
Kingston KC3000 512G SKC3000S512G
4168 (3579.63min - 4168.09max) MB/s +37%
Intel NUC 13 Pro Kit NUC13ANK
Samsung PM9A1 MZVL2512HCJQ
3375 (3310.44min - 3375.33max) MB/s +11%
Beelink GTR7 7840HS
Crucial P3 Plus CT1000P3PSSD8
3033 (3026.64min - 3032.69max) MB/s
Minisforum Mercury Series EM680
Kingston OM3PGP4512Q
3019 (2971.38min - 3018.85max) MB/s 0%
Beelink SER6 Pro Ryzen 7 7735HS
Kingston NV2 500GB SNV2S/500G
2312 (2299.53min - 2312.11max) MB/s -24%
Beelink SEi11 Pro
Kingston NV1 SNVS/500GCN
1638 (1628.34min - 1637.59max) MB/s -46%
seq write
Beelink GTR6
Kingston KC3000 512G SKC3000S512G
3938 (3783.49min - 3937.52max) MB/s +10%
Beelink GTR7 7840HS
Crucial P3 Plus CT1000P3PSSD8
3591 (3535.23min - 3591.16max) MB/s
Intel NUC 13 Pro Kit NUC13ANK
Samsung PM9A1 MZVL2512HCJQ
3360 (1416.73min - 3360.47max) MB/s -6%
Minisforum Mercury Series EM680
Kingston OM3PGP4512Q
3266 (1532.89min - 3266.28max) MB/s -9%
Beelink SER6 Pro Ryzen 7 7735HS
Kingston NV2 500GB SNV2S/500G
2243 (2200.96min - 2243.2max) MB/s -38%
Beelink SEi11 Pro
Kingston NV1 SNVS/500GCN
1661 (336.85min - 1661.33max) MB/s -54%
seq q8 t1 read
Beelink GTR6
Kingston KC3000 512G SKC3000S512G
7061 (6122.84min - 7060.97max) MB/s +36%
Intel NUC 13 Pro Kit NUC13ANK
Samsung PM9A1 MZVL2512HCJQ
6729 (6134.8min - 6728.5max) MB/s +30%
Beelink GTR7 7840HS
Crucial P3 Plus CT1000P3PSSD8
5174 (4541.87min - 5174.3max) MB/s
Minisforum Mercury Series EM680
Kingston OM3PGP4512Q
4956 (4372.21min - 4955.99max) MB/s -4%
Beelink SER6 Pro Ryzen 7 7735HS
Kingston NV2 500GB SNV2S/500G
2849 (2731.13min - 2849.44max) MB/s -45%
Beelink SEi11 Pro
Kingston NV1 SNVS/500GCN
2374 (2218.75min - 2374.19max) MB/s -54%
seq q8 t1 write
Beelink GTR6
Kingston KC3000 512G SKC3000S512G
3938 (3914.12min - 3937.52max) MB/s +10%
Beelink GTR7 7840HS
Crucial P3 Plus CT1000P3PSSD8
3570 (3522.17min - 3569.77max) MB/s
Minisforum Mercury Series EM680
Kingston OM3PGP4512Q
3289 (1283.62min - 3288.54max) MB/s -8%
Intel NUC 13 Pro Kit NUC13ANK
Samsung PM9A1 MZVL2512HCJQ
2830 (1138.15min - 2830.32max) MB/s -21%
Beelink SER6 Pro Ryzen 7 7735HS
Kingston NV2 500GB SNV2S/500G
2195 (2178.89min - 2194.65max) MB/s -39%
Beelink SEi11 Pro
Kingston NV1 SNVS/500GCN
1433 (67.32min - 1432.98max) MB/s -60%
4k q1 t1 read
Beelink GTR6
Kingston KC3000 512G SKC3000S512G
80.4 (79.66min - 80.38max) MB/s +28%
Beelink GTR7 7840HS
Crucial P3 Plus CT1000P3PSSD8
62.6 (62.13min - 62.62max) MB/s
Intel NUC 13 Pro Kit NUC13ANK
Samsung PM9A1 MZVL2512HCJQ
51.8 (51.62min - 51.84max) MB/s -17%
Beelink SEi11 Pro
Kingston NV1 SNVS/500GCN
50.5 (48.13min - 50.48max) MB/s -19%
Minisforum Mercury Series EM680
Kingston OM3PGP4512Q
47.4 (45.85min - 47.42max) MB/s -24%
Beelink SER6 Pro Ryzen 7 7735HS
Kingston NV2 500GB SNV2S/500G
40 (39.84min - 39.95max) MB/s -36%
4k q1 t1 write
Beelink GTR6
Kingston KC3000 512G SKC3000S512G
284 (282.24min - 284.12max) MB/s +6%
Beelink GTR7 7840HS
Crucial P3 Plus CT1000P3PSSD8
269 (266.85min - 269.05max) MB/s
Beelink SER6 Pro Ryzen 7 7735HS
Kingston NV2 500GB SNV2S/500G
250 (246.86min - 249.77max) MB/s -7%
Minisforum Mercury Series EM680
Kingston OM3PGP4512Q
246 (197.53min - 246.23max) MB/s -9%
Intel NUC 13 Pro Kit NUC13ANK
Samsung PM9A1 MZVL2512HCJQ
177.7 (176.17min - 177.7max) MB/s -34%
Beelink SEi11 Pro
Kingston NV1 SNVS/500GCN
173.6 (113.3min - 173.62max) MB/s -35%
4k q32 t16 read
Beelink GTR7 7840HS
Crucial P3 Plus CT1000P3PSSD8
2765 (2513.4min - 2765.45max) MB/s
Minisforum Mercury Series EM680
Kingston OM3PGP4512Q
1944 (1939.68min - 1943.5max) MB/s -30%
Beelink GTR6
Kingston KC3000 512G SKC3000S512G
1942 (1940.94min - 1941.94max) MB/s -30%
Beelink SER6 Pro Ryzen 7 7735HS
Kingston NV2 500GB SNV2S/500G
1227 (1221.9min - 1227.11max) MB/s -56%
Intel NUC 13 Pro Kit NUC13ANK
Samsung PM9A1 MZVL2512HCJQ
1225 (1194.7min - 1224.8max) MB/s -56%
Beelink SEi11 Pro
Kingston NV1 SNVS/500GCN
745 (742.2min - 744.53max) MB/s -73%
4k q32 t16 write
Beelink GTR6
Kingston KC3000 512G SKC3000S512G
3741 (3667.09min - 3740.76max) MB/s +15%
Beelink GTR7 7840HS
Crucial P3 Plus CT1000P3PSSD8
3254 (3139.57min - 3253.57max) MB/s
Beelink SER6 Pro Ryzen 7 7735HS
Kingston NV2 500GB SNV2S/500G
1362 (1327.37min - 1362.29max) MB/s -58%
Minisforum Mercury Series EM680
Kingston OM3PGP4512Q
981 (306.52min - 980.6max) MB/s -70%
Beelink SEi11 Pro
Kingston NV1 SNVS/500GCN
733 (332min - 733.18max) MB/s -77%
Intel NUC 13 Pro Kit NUC13ANK
Samsung PM9A1 MZVL2512HCJQ
626 (605.6min - 625.63max) MB/s -81%
AS SSD
Score Total
Beelink GTR6
Kingston KC3000 512G SKC3000S512G
6722 Points +30%
Intel NUC 13 Pro Kit NUC13ANK
Samsung PM9A1 MZVL2512HCJQ
6005 Points +16%
Minisforum Mercury Series EM680
Kingston OM3PGP4512Q
5415 Points +4%
Beelink GTR7 7840HS
Crucial P3 Plus CT1000P3PSSD8
5182 Points
Beelink SER6 Pro Ryzen 7 7735HS
Kingston NV2 500GB SNV2S/500G
4129 Points -20%
Beelink SEi11 Pro
Kingston NV1 SNVS/500GCN
2742 Points -47%
Score Read
Minisforum Mercury Series EM680
Kingston OM3PGP4512Q
2265 Points +26%
Beelink GTR6
Kingston KC3000 512G SKC3000S512G
2207 Points +23%
Beelink GTR7 7840HS
Crucial P3 Plus CT1000P3PSSD8
1796 Points
Intel NUC 13 Pro Kit NUC13ANK
Samsung PM9A1 MZVL2512HCJQ
1673 Points -7%
Beelink SER6 Pro Ryzen 7 7735HS
Kingston NV2 500GB SNV2S/500G
1530 Points -15%
Beelink SEi11 Pro
Kingston NV1 SNVS/500GCN
975 Points -46%
Score Write
Intel NUC 13 Pro Kit NUC13ANK
Samsung PM9A1 MZVL2512HCJQ
3574 Points +43%
Beelink GTR6
Kingston KC3000 512G SKC3000S512G
3477 Points +39%
Beelink GTR7 7840HS
Crucial P3 Plus CT1000P3PSSD8
2508 Points
Minisforum Mercury Series EM680
Kingston OM3PGP4512Q
2037 Points -19%
Beelink SER6 Pro Ryzen 7 7735HS
Kingston NV2 500GB SNV2S/500G
1862 Points -26%
Beelink SEi11 Pro
Kingston NV1 SNVS/500GCN
1282 Points -49%
Seq Read
Beelink GTR6
Kingston KC3000 512G SKC3000S512G
5799.1 MB/s +53%
Intel NUC 13 Pro Kit NUC13ANK
Samsung PM9A1 MZVL2512HCJQ
4767 MB/s +26%
Minisforum Mercury Series EM680
Kingston OM3PGP4512Q
3979 MB/s +5%
Beelink GTR7 7840HS
Crucial P3 Plus CT1000P3PSSD8
3786.44 MB/s
Beelink SER6 Pro Ryzen 7 7735HS
Kingston NV2 500GB SNV2S/500G
3138.31 MB/s -17%
Beelink SEi11 Pro
Kingston NV1 SNVS/500GCN
2246.84 MB/s -41%
Seq Write
Beelink GTR6
Kingston KC3000 512G SKC3000S512G
3737.17 MB/s +33%
Minisforum Mercury Series EM680
Kingston OM3PGP4512Q
2874 MB/s +3%
Beelink GTR7 7840HS
Crucial P3 Plus CT1000P3PSSD8
2799.85 MB/s
Intel NUC 13 Pro Kit NUC13ANK
Samsung PM9A1 MZVL2512HCJQ
2442 MB/s -13%
Beelink SER6 Pro Ryzen 7 7735HS
Kingston NV2 500GB SNV2S/500G
2204.04 MB/s -21%
Beelink SEi11 Pro
Kingston NV1 SNVS/500GCN
1764.26 MB/s -37%
4K Read
Intel NUC 13 Pro Kit NUC13ANK
Samsung PM9A1 MZVL2512HCJQ
78.3 MB/s +31%
Beelink GTR6
Kingston KC3000 512G SKC3000S512G
75.39 MB/s +26%
Minisforum Mercury Series EM680
Kingston OM3PGP4512Q
71.5 MB/s +20%
Beelink GTR7 7840HS
Crucial P3 Plus CT1000P3PSSD8
59.79 MB/s
Beelink SEi11 Pro
Kingston NV1 SNVS/500GCN
44.12 MB/s -26%
Beelink SER6 Pro Ryzen 7 7735HS
Kingston NV2 500GB SNV2S/500G
37.78 MB/s -37%
4K Write
Beelink GTR6
Kingston KC3000 512G SKC3000S512G
237.79 MB/s +13%
Beelink SER6 Pro Ryzen 7 7735HS
Kingston NV2 500GB SNV2S/500G
213.73 MB/s +1%
Beelink GTR7 7840HS
Crucial P3 Plus CT1000P3PSSD8
210.95 MB/s
Intel NUC 13 Pro Kit NUC13ANK
Samsung PM9A1 MZVL2512HCJQ
209 MB/s -1%
Beelink SEi11 Pro
Kingston NV1 SNVS/500GCN
192.62 MB/s -9%
Minisforum Mercury Series EM680
Kingston OM3PGP4512Q
189.8 MB/s -10%
4K-64 Read
Minisforum Mercury Series EM680
Kingston OM3PGP4512Q
1796 MB/s +32%
Beelink GTR6
Kingston KC3000 512G SKC3000S512G
1551.47 MB/s +14%
Beelink GTR7 7840HS
Crucial P3 Plus CT1000P3PSSD8
1357.17 MB/s
Beelink SER6 Pro Ryzen 7 7735HS
Kingston NV2 500GB SNV2S/500G
1178.08 MB/s -13%
Intel NUC 13 Pro Kit NUC13ANK
Samsung PM9A1 MZVL2512HCJQ
1118 MB/s -18%
Beelink SEi11 Pro
Kingston NV1 SNVS/500GCN
706.35 MB/s -48%
4K-64 Write
Intel NUC 13 Pro Kit NUC13ANK
Samsung PM9A1 MZVL2512HCJQ
3120 MB/s +55%
Beelink GTR6
Kingston KC3000 512G SKC3000S512G
2865.66 MB/s +42%
Beelink GTR7 7840HS
Crucial P3 Plus CT1000P3PSSD8
2017.38 MB/s
Minisforum Mercury Series EM680
Kingston OM3PGP4512Q
1559 MB/s -23%
Beelink SER6 Pro Ryzen 7 7735HS
Kingston NV2 500GB SNV2S/500G
1427.97 MB/s -29%
Beelink SEi11 Pro
Kingston NV1 SNVS/500GCN
912.72 MB/s -55%
Access Time Read
Minisforum Mercury Series EM680
Kingston OM3PGP4512Q
0.146 ms * -211%
Beelink SER6 Pro Ryzen 7 7735HS
Kingston NV2 500GB SNV2S/500G
0.084 ms * -79%
Beelink GTR6
Kingston KC3000 512G SKC3000S512G
0.057 ms * -21%
Beelink SEi11 Pro
Kingston NV1 SNVS/500GCN
0.053 ms * -13%
Beelink GTR7 7840HS
Crucial P3 Plus CT1000P3PSSD8
0.047 ms *
Intel NUC 13 Pro Kit NUC13ANK
Samsung PM9A1 MZVL2512HCJQ
0.045 ms * +4%
Access Time Write
Beelink SER6 Pro Ryzen 7 7735HS
Kingston NV2 500GB SNV2S/500G
0.465 ms * -849%
Beelink SEi11 Pro
Kingston NV1 SNVS/500GCN
0.342 ms * -598%
Beelink GTR7 7840HS
Crucial P3 Plus CT1000P3PSSD8
0.049 ms *
Beelink GTR6
Kingston KC3000 512G SKC3000S512G
0.047 ms * +4%
Minisforum Mercury Series EM680
Kingston OM3PGP4512Q
0.037 ms * +24%
Intel NUC 13 Pro Kit NUC13ANK
Samsung PM9A1 MZVL2512HCJQ
0.02 ms * +59%

* ... smaller is better

Disk Throttling: DiskSpd Read Loop, Queue Depth 8

02605207801040130015601820208023402600286031203380364039004160442046804940Tooltip
Beelink GTR7 7840HS: Ø5127 (4403.6-5148.3)

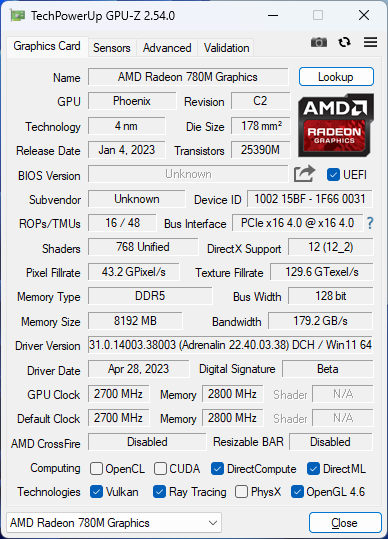
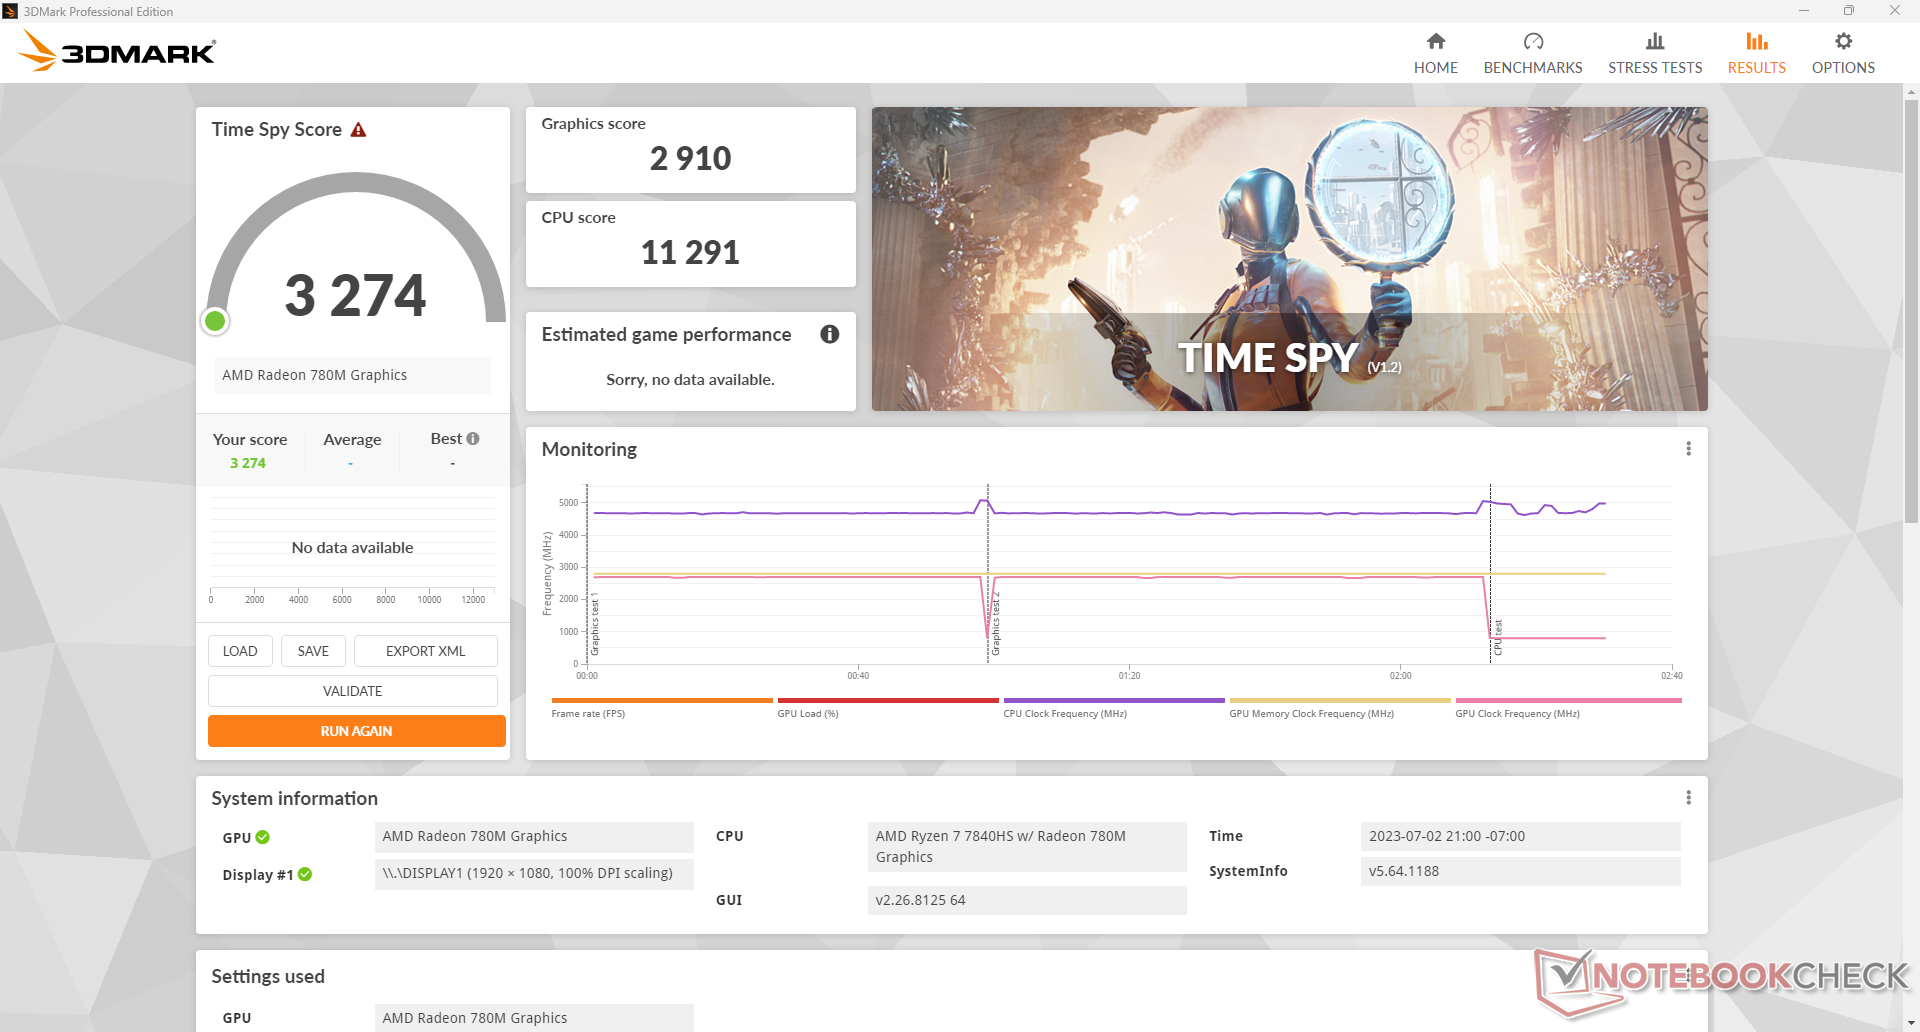
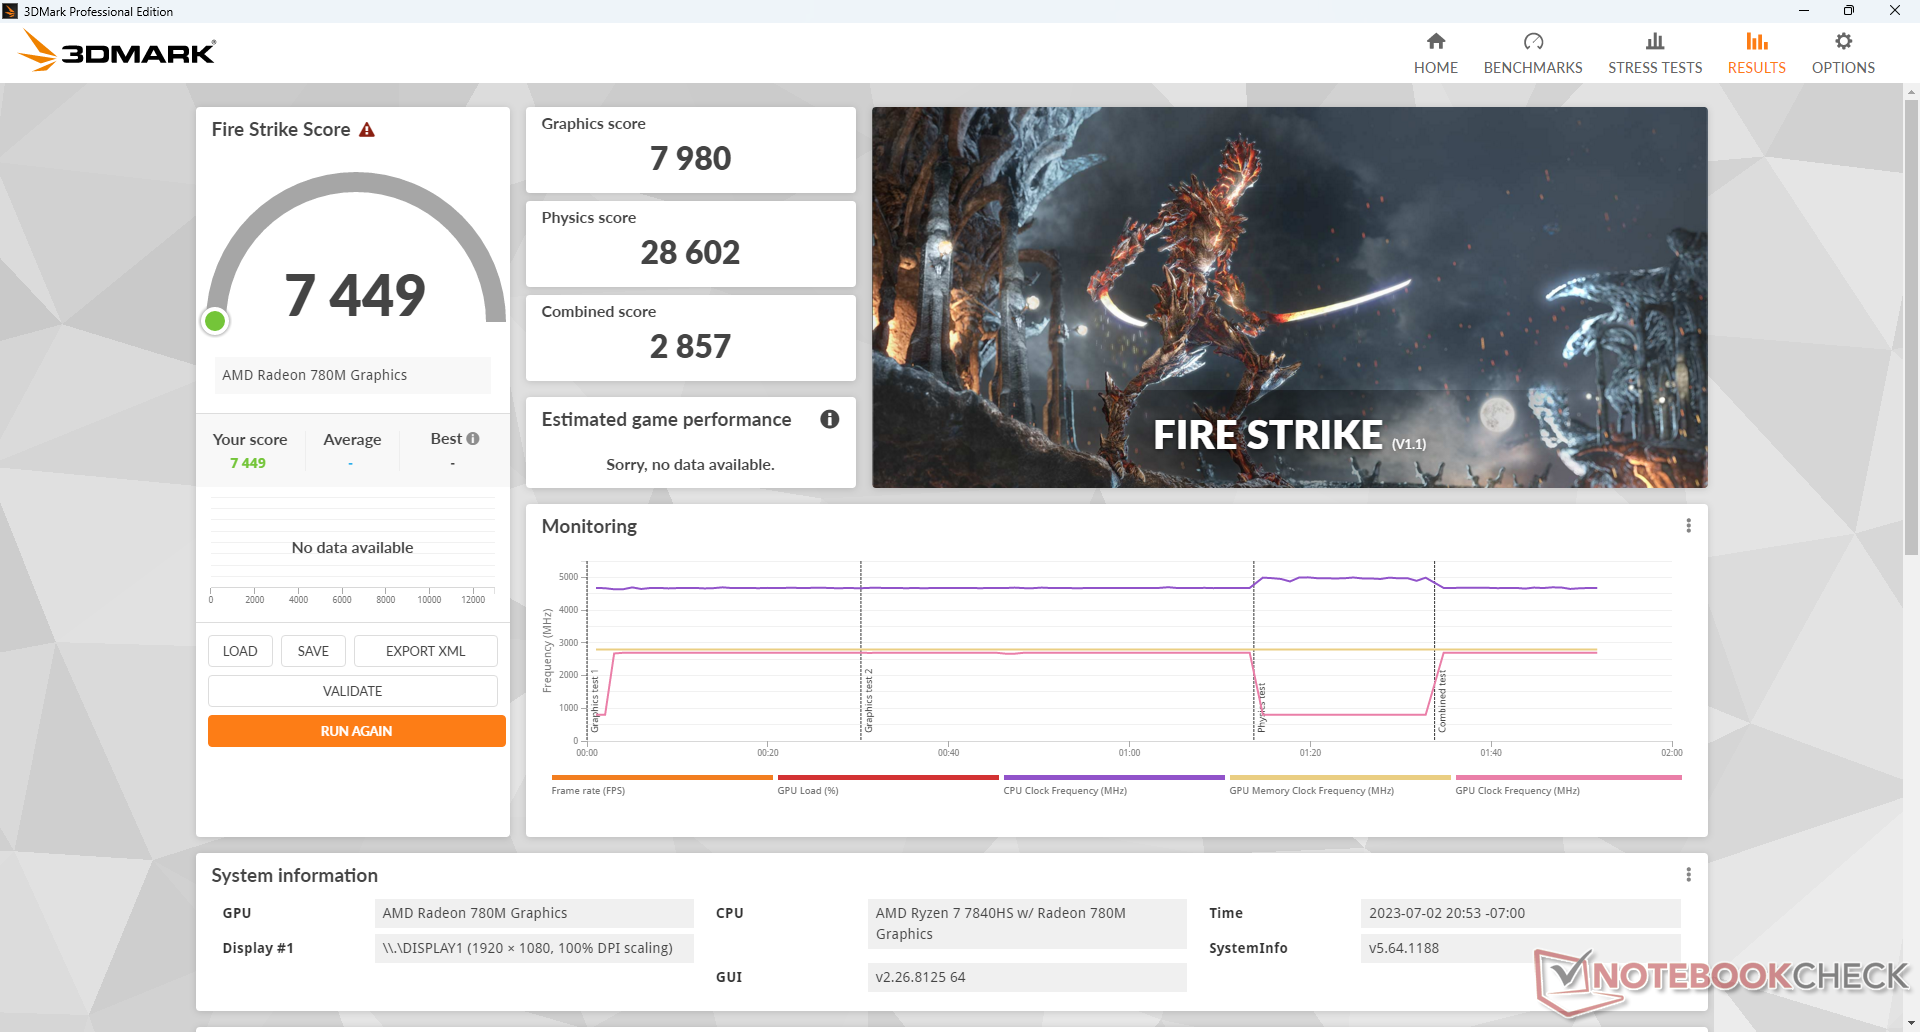
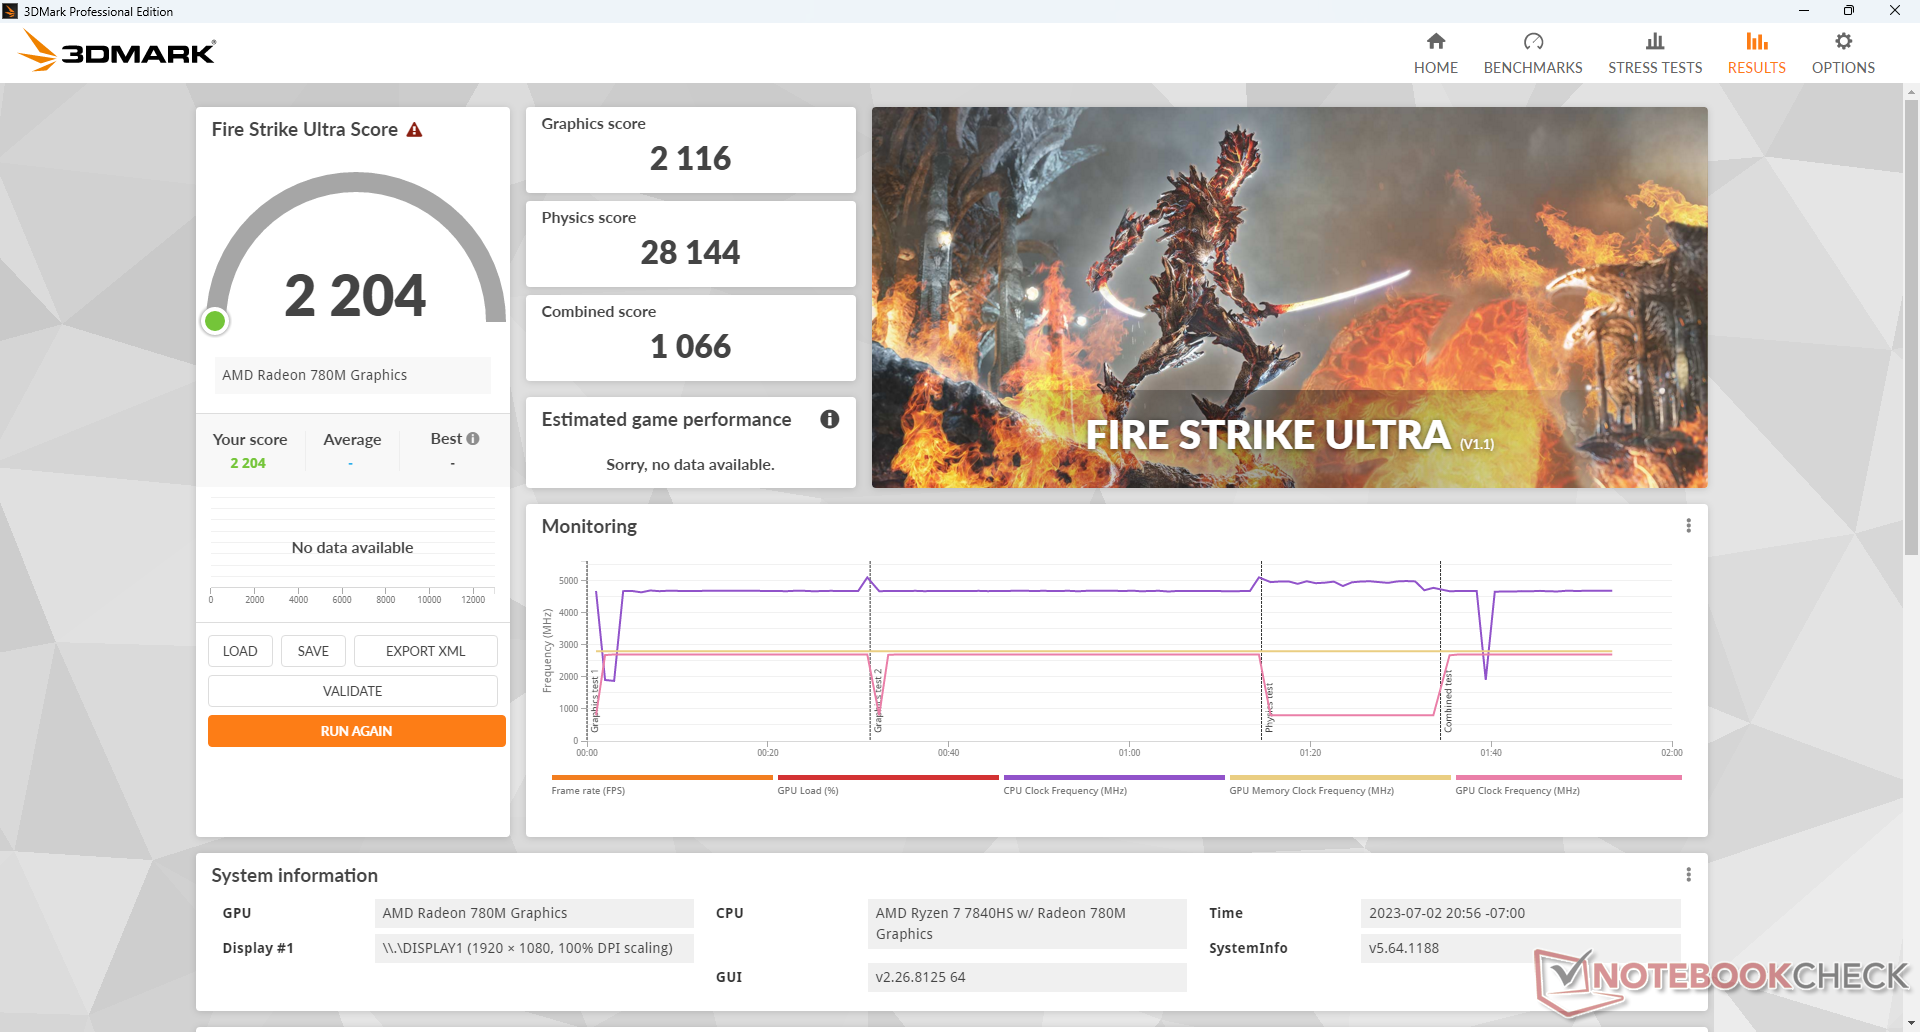
GPU Performance — Playstation 4 Graphics

Last year's integrated Radeon 680M was already leaps beyond the competing Iris Xe series and this year's Radeon 780M adds more salt to the wound for Intel. Graphics performance is roughly 10 to 20 percent faster than the Radeon 680M for an overall performance boost of 1.5x to 1.75x percent over the Iris Xe 96 EUs. Performance is most notably improved when running DX12 titles which was a bit of a weak spot for the Radeon 680M.

Strangely, the Blender v3.3 Classroom HIP benchmark would not run correctly on our unit even after multiple retries and driver updates. This is unfortunate because the Classroom scene would have rendered around 3 minutes faster than without HIP acceleration.
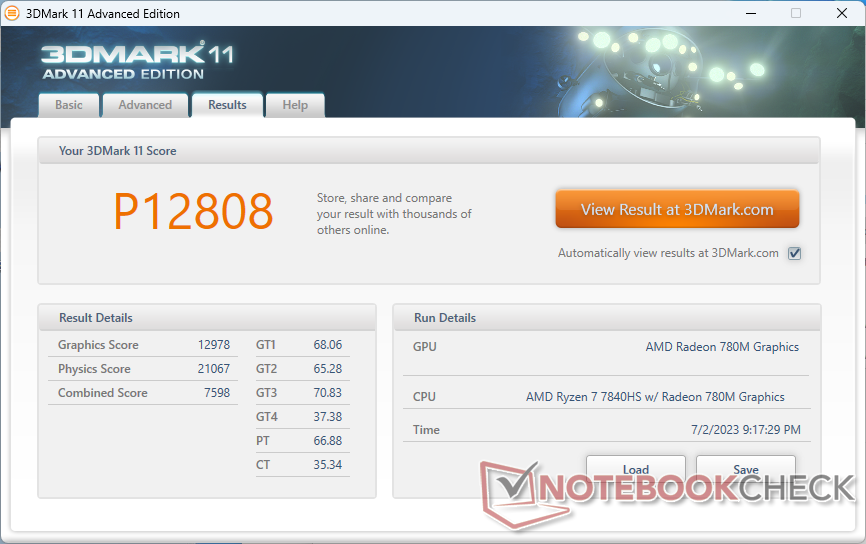
3DMark 11
3DMark 11
Time Spy
Time Spy
Fire Strike
Fire Strike
Fire Strike Ultra
Fire Strike Ultra
3DMark Performance Rating - Percent
Beelink GTR7 7840HS
AMD Radeon 780M, AMD Ryzen 7 7840HS
100 pt
Average AMD Radeon 780M
 
92.9 pt
Beelink SER6 Pro Ryzen 7 7735HS
AMD Radeon 680M, AMD Ryzen 7 7735HS
84.3 pt
Beelink GTR6
AMD Radeon 680M, AMD Ryzen 9 6900HX
84 pt
Minisforum Mercury Series EM680
AMD Radeon 680M, AMD Ryzen 7 6800U
64.1 pt
Intel NUC 13 Pro Kit NUC13ANK
Intel Iris Xe Graphics G7 96EUs, Intel Core i7-1360P
59.1 pt
Morefine S600-Apex Engineer
Intel Iris Xe Graphics G7 96EUs, Intel Core i9-12900HK
58.5 pt
Geekom AS 5
AMD Radeon RX Vega 8 (Ryzen 4000/5000), AMD Ryzen 9 5900HX
52.4 pt
Beelink SEi11 Pro
Intel Iris Xe Graphics G7 96EUs, Intel Core i5-11320H
51.5 pt
Minisforum Venus Series UM560 XT
AMD Radeon RX Vega 7, AMD Ryzen 5 5600H
45.7 pt
Minisforum Venus Series NAB6
Intel UHD Graphics 64EUs (Alder Lake 12th Gen), Intel Core i7-12650H
44.5 pt
ACEMagician ACE-CK10-8259U
Intel Iris Plus Graphics 655, Intel Core i5-8259U
22.7 pt
3DMark 11 - 1280x720 Performance GPU
Beelink GTR7 7840HS
AMD Radeon 780M, AMD Ryzen 7 7840HS
12978 Points
Average AMD Radeon 780M
  (7868 - 13932, n=35)
12196 Points -6%
Beelink SER6 Pro Ryzen 7 7735HS
AMD Radeon 680M, AMD Ryzen 7 7735HS
10734 Points -17%
Beelink GTR6
AMD Radeon 680M, AMD Ryzen 9 6900HX
10566 Points -19%
Minisforum Mercury Series EM680
AMD Radeon 680M, AMD Ryzen 7 6800U
7718 Points -41%
Geekom AS 5
AMD Radeon RX Vega 8 (Ryzen 4000/5000), AMD Ryzen 9 5900HX
7166 Points -45%
Intel NUC 13 Pro Kit NUC13ANK
Intel Iris Xe Graphics G7 96EUs, Intel Core i7-1360P
7143 Points -45%
Morefine S600-Apex Engineer
Intel Iris Xe Graphics G7 96EUs, Intel Core i9-12900HK
6687 Points -48%
Beelink SEi11 Pro
Intel Iris Xe Graphics G7 96EUs, Intel Core i5-11320H
6571 Points -49%
Minisforum Venus Series UM560 XT
AMD Radeon RX Vega 7, AMD Ryzen 5 5600H
6079 Points -53%
Minisforum Venus Series NAB6
Intel UHD Graphics 64EUs (Alder Lake 12th Gen), Intel Core i7-12650H
5462 Points -58%
ACEMagician ACE-CK10-8259U
Intel Iris Plus Graphics 655, Intel Core i5-8259U
2888 Points -78%
3DMark
1920x1080 Fire Strike Graphics
Beelink GTR7 7840HS
AMD Radeon 780M, AMD Ryzen 7 7840HS
7980 Points
Average AMD Radeon 780M
  (4550 - 8538, n=34)
7595 Points -5%
Beelink SER6 Pro Ryzen 7 7735HS
AMD Radeon 680M, AMD Ryzen 7 7735HS
7180 Points -10%
Beelink GTR6
AMD Radeon 680M, AMD Ryzen 9 6900HX
6962 Points -13%
Minisforum Mercury Series EM680
AMD Radeon 680M, AMD Ryzen 7 6800U
5660 Points -29%
Morefine S600-Apex Engineer
Intel Iris Xe Graphics G7 96EUs, Intel Core i9-12900HK
5543 Points -31%
Intel NUC 13 Pro Kit NUC13ANK
Intel Iris Xe Graphics G7 96EUs, Intel Core i7-1360P
5229 Points -34%
Beelink SEi11 Pro
Intel Iris Xe Graphics G7 96EUs, Intel Core i5-11320H
4523 Points -43%
Geekom AS 5
AMD Radeon RX Vega 8 (Ryzen 4000/5000), AMD Ryzen 9 5900HX
4419 Points -45%
Minisforum Venus Series NAB6
Intel UHD Graphics 64EUs (Alder Lake 12th Gen), Intel Core i7-12650H
4098 Points -49%
Minisforum Venus Series UM560 XT
AMD Radeon RX Vega 7, AMD Ryzen 5 5600H
3971 Points -50%
ACEMagician ACE-CK10-8259U
Intel Iris Plus Graphics 655, Intel Core i5-8259U
1987 Points -75%
2560x1440 Time Spy Graphics
Beelink GTR7 7840HS
AMD Radeon 780M, AMD Ryzen 7 7840HS
2910 Points
Average AMD Radeon 780M
  (1496 - 3027, n=34)
2667 Points -8%
Beelink GTR6
AMD Radeon 680M, AMD Ryzen 9 6900HX
2437 Points -16%
Beelink SER6 Pro Ryzen 7 7735HS
AMD Radeon 680M, AMD Ryzen 7 7735HS
2395 Points -18%
Minisforum Mercury Series EM680
AMD Radeon 680M, AMD Ryzen 7 6800U
1838 Points -37%
Intel NUC 13 Pro Kit NUC13ANK
Intel Iris Xe Graphics G7 96EUs, Intel Core i7-1360P
1673 Points -43%
Morefine S600-Apex Engineer
Intel Iris Xe Graphics G7 96EUs, Intel Core i9-12900HK
1633 Points -44%
Beelink SEi11 Pro
Intel Iris Xe Graphics G7 96EUs, Intel Core i5-11320H
1443 Points -50%
Geekom AS 5
AMD Radeon RX Vega 8 (Ryzen 4000/5000), AMD Ryzen 9 5900HX
1430 Points -51%
Minisforum Venus Series UM560 XT
AMD Radeon RX Vega 7, AMD Ryzen 5 5600H
1247 Points -57%
Minisforum Venus Series NAB6
Intel UHD Graphics 64EUs (Alder Lake 12th Gen), Intel Core i7-12650H
1217 Points -58%
ACEMagician ACE-CK10-8259U
Intel Iris Plus Graphics 655, Intel Core i5-8259U
633 Points -78%
2560x1440 Time Spy Score
Beelink GTR7 7840HS
AMD Radeon 780M, AMD Ryzen 7 7840HS
3274 Points
Average AMD Radeon 780M
  (1707 - 3380, n=33)
2977 Points -9%
Beelink GTR6
AMD Radeon 680M, AMD Ryzen 9 6900HX
2735 Points -16%
Beelink SER6 Pro Ryzen 7 7735HS
AMD Radeon 680M, AMD Ryzen 7 7735HS
2693 Points -18%
Minisforum Mercury Series EM680
AMD Radeon 680M, AMD Ryzen 7 6800U
2057 Points -37%
Intel NUC 13 Pro Kit NUC13ANK
Intel Iris Xe Graphics G7 96EUs, Intel Core i7-1360P
1907 Points -42%
Morefine S600-Apex Engineer
Intel Iris Xe Graphics G7 96EUs, Intel Core i9-12900HK
1864 Points -43%
Geekom AS 5
AMD Radeon RX Vega 8 (Ryzen 4000/5000), AMD Ryzen 9 5900HX
1634 Points -50%
Beelink SEi11 Pro
Intel Iris Xe Graphics G7 96EUs, Intel Core i5-11320H
1612 Points -51%
Minisforum Venus Series UM560 XT
AMD Radeon RX Vega 7, AMD Ryzen 5 5600H
1420 Points -57%
Minisforum Venus Series NAB6
Intel UHD Graphics 64EUs (Alder Lake 12th Gen), Intel Core i7-12650H
1398 Points -57%
ACEMagician ACE-CK10-8259U
Intel Iris Plus Graphics 655, Intel Core i5-8259U
720 Points -78%
3DMark 11 Performance
12808 points
3DMark Fire Strike Score
7449 points
3DMark Time Spy Score
3274 points
Help
Blender
v3.3 Classroom HIP/AMD
Minisforum Venus Series UM560 XT
AMD Radeon RX Vega 7, AMD Ryzen 5 5600H
570 Seconds *
Geekom AS 5
AMD Radeon RX Vega 8 (Ryzen 4000/5000), AMD Ryzen 9 5900HX
524 Seconds *
Minisforum Mercury Series EM680
AMD Radeon 680M, AMD Ryzen 7 6800U
504 Seconds *
Beelink GTR6
AMD Radeon 680M, AMD Ryzen 9 6900HX
356 Seconds *
Beelink SER6 Pro Ryzen 7 7735HS
AMD Radeon 680M, AMD Ryzen 7 7735HS
314 Seconds *
v3.3 Classroom CPU
ACEMagician ACE-CK10-8259U
Intel Iris Plus Graphics 655, Intel Core i5-8259U
1331 Seconds * -187%
Beelink SEi11 Pro
Intel Iris Xe Graphics G7 96EUs, Intel Core i5-11320H
995 Seconds * -115%
Minisforum Venus Series UM560 XT
AMD Radeon RX Vega 7, AMD Ryzen 5 5600H
556 Seconds * -20%
Minisforum Venus Series NAB6
Intel UHD Graphics 64EUs (Alder Lake 12th Gen), Intel Core i7-12650H
494 Seconds * -7%
Minisforum Mercury Series EM680
AMD Radeon 680M, AMD Ryzen 7 6800U
479 Seconds * -3%
Intel NUC 13 Pro Kit NUC13ANK
Intel Iris Xe Graphics G7 96EUs, Intel Core i7-1360P
464 Seconds * -0%
Geekom AS 5
AMD Radeon RX Vega 8 (Ryzen 4000/5000), AMD Ryzen 9 5900HX
463 Seconds * -0%
Beelink GTR7 7840HS
AMD Radeon 780M, AMD Ryzen 7 7840HS
463 Seconds *
Beelink SER6 Pro Ryzen 7 7735HS
AMD Radeon 680M, AMD Ryzen 7 7735HS
445 Seconds * +4%
Beelink GTR6
AMD Radeon 680M, AMD Ryzen 9 6900HX
436 Seconds * +6%
Average AMD Radeon 780M
  (305 - 503, n=33)
376 Seconds * +19%
Intel NUC 12, NUC12SNKi72_Serpent Canyon
Intel Arc A770M, Intel Core i7-12700H
347 Seconds * +25%

* ... smaller is better

Gaming Performance

The Radeon 780M can be considered a minor refinement over the Radeon 680M. All games are playable at 1080p including even the most demanding of titles like Cyberpunk 2077 and Returnal while many older titles can reach 60 FPS on low-to-medium settings like Tiny Tina's Wonderlands. The frame rate advantages over Iris Xe 96 EUs can be significant by over 2x in titles like F1 22 and Cyberpunk 2077.

AMD FreeSync is supported which pairs very well the Radeon 780M since it dips below 60 FPS in many cases.

Final Fantasy XV Benchmark
1280x720 Lite Quality
Intel NUC 12, NUC12SNKi72_Serpent Canyon
Intel Core i7-12700H, Intel Arc A770M
132.4 fps +71%
Beelink GTR7 7840HS
AMD Ryzen 7 7840HS, AMD Radeon 780M
77.6 fps
Average AMD Radeon 780M
  (41.1 - 81.9, n=31)
69.7 fps -10%
Beelink GTR6
AMD Ryzen 9 6900HX, AMD Radeon 680M
68.5 fps -12%
Beelink SER6 Pro Ryzen 7 7735HS
AMD Ryzen 7 7735HS, AMD Radeon 680M
62.2 fps -20%
Minisforum Mercury Series EM680
AMD Ryzen 7 6800U, AMD Radeon 680M
45.7 fps -41%
Morefine S600-Apex Engineer
Intel Core i9-12900HK, Intel Iris Xe Graphics G7 96EUs
44.8 fps -42%
Geekom AS 5
AMD Ryzen 9 5900HX, AMD Radeon RX Vega 8 (Ryzen 4000/5000)
44.4 fps -43%
Minisforum Venus Series UM560 XT
AMD Ryzen 5 5600H, AMD Radeon RX Vega 7
40.8 fps -47%
Beelink SEi11 Pro
Intel Core i5-11320H, Intel Iris Xe Graphics G7 96EUs
38.6 fps -50%
Minisforum Venus Series NAB6
Intel Core i7-12650H, Intel UHD Graphics 64EUs (Alder Lake 12th Gen)
38.2 fps -51%
ACEMagician ACE-CK10-8259U
Intel Core i5-8259U, Intel Iris Plus Graphics 655
18.1 fps -77%
1920x1080 Standard Quality
Intel NUC 12, NUC12SNKi72_Serpent Canyon
Intel Core i7-12700H, Intel Arc A770M
91.3 fps +136%
Beelink GTR7 7840HS
AMD Ryzen 7 7840HS, AMD Radeon 780M
38.7 fps
Beelink GTR6
AMD Ryzen 9 6900HX, AMD Radeon 680M
34.9 fps -10%
Average AMD Radeon 780M
  (21 - 39.3, n=32)
34.9 fps -10%
Beelink SER6 Pro Ryzen 7 7735HS
AMD Ryzen 7 7735HS, AMD Radeon 680M
33 fps -15%
Minisforum Mercury Series EM680
AMD Ryzen 7 6800U, AMD Radeon 680M
28.9 fps -25%
Morefine S600-Apex Engineer
Intel Core i9-12900HK, Intel Iris Xe Graphics G7 96EUs
24.4 fps -37%
Geekom AS 5
AMD Ryzen 9 5900HX, AMD Radeon RX Vega 8 (Ryzen 4000/5000)
22.2 fps -43%
Beelink SEi11 Pro
Intel Core i5-11320H, Intel Iris Xe Graphics G7 96EUs
20.3 fps -48%
Minisforum Venus Series UM560 XT
AMD Ryzen 5 5600H, AMD Radeon RX Vega 7
20.2 fps -48%
Minisforum Venus Series NAB6
Intel Core i7-12650H, Intel UHD Graphics 64EUs (Alder Lake 12th Gen)
20.1 fps -48%
ACEMagician ACE-CK10-8259U
Intel Core i5-8259U, Intel Iris Plus Graphics 655
9.73 fps -75%
1920x1080 High Quality
Intel NUC 12, NUC12SNKi72_Serpent Canyon
Intel Core i7-12700H, Intel Arc A770M
50.7 fps +75%
Beelink GTR7 7840HS
AMD Ryzen 7 7840HS, AMD Radeon 780M
28.9 fps
Average AMD Radeon 780M
  (15.9 - 29.4, n=33)
26.1 fps -10%
Beelink SER6 Pro Ryzen 7 7735HS
AMD Ryzen 7 7735HS, AMD Radeon 680M
24.7 fps -15%
Beelink GTR6
AMD Ryzen 9 6900HX, AMD Radeon 680M
24.5 fps -15%
Morefine S600-Apex Engineer
Intel Core i9-12900HK, Intel Iris Xe Graphics G7 96EUs
24.4 fps -16%
Minisforum Mercury Series EM680
AMD Ryzen 7 6800U, AMD Radeon 680M
20.9 fps -28%
Geekom AS 5
AMD Ryzen 9 5900HX, AMD Radeon RX Vega 8 (Ryzen 4000/5000)
16 fps -45%
Beelink SEi11 Pro
Intel Core i5-11320H, Intel Iris Xe Graphics G7 96EUs
14.9 fps -48%
Minisforum Venus Series NAB6
Intel Core i7-12650H, Intel UHD Graphics 64EUs (Alder Lake 12th Gen)
14.5 fps -50%
Minisforum Venus Series UM560 XT
AMD Ryzen 5 5600H, AMD Radeon RX Vega 7
14.3 fps -51%
ACEMagician ACE-CK10-8259U
Intel Core i5-8259U, Intel Iris Plus Graphics 655
6.55 fps -77%
The Witcher 3
1024x768 Low Graphics & Postprocessing
Intel NUC 12, NUC12SNKi72_Serpent Canyon
Intel Core i7-12700H, Intel Arc A770M
274.7 fps +84%
Beelink GTR7 7840HS
AMD Ryzen 7 7840HS, AMD Radeon 780M
148.9 (122min) fps
Beelink GTR6
AMD Ryzen 9 6900HX, AMD Radeon 680M
139.2 (119min) fps -7%
Average AMD Radeon 780M
  (74 - 160, n=27)
134 fps -10%
Beelink SER6 Pro Ryzen 7 7735HS
AMD Ryzen 7 7735HS, AMD Radeon 680M
115.6 (84min) fps -22%
Intel NUC 13 Pro Kit NUC13ANK
Intel Core i7-1360P, Intel Iris Xe Graphics G7 96EUs
101.7 fps -32%
Morefine S600-Apex Engineer
Intel Core i9-12900HK, Intel Iris Xe Graphics G7 96EUs
97.6 (8.8min, 27.5P0.1, 58.5P1) fps -34%
Beelink SEi11 Pro
Intel Core i5-11320H, Intel Iris Xe Graphics G7 96EUs
89.7 (45min) fps -40%
Geekom AS 5
AMD Ryzen 9 5900HX, AMD Radeon RX Vega 8 (Ryzen 4000/5000)
84.7 fps -43%
Minisforum Venus Series NAB6
Intel Core i7-12650H, Intel UHD Graphics 64EUs (Alder Lake 12th Gen)
80.8 fps -46%
Minisforum Venus Series UM560 XT
AMD Ryzen 5 5600H, AMD Radeon RX Vega 7
75.4 fps -49%
Minisforum Mercury Series EM680
AMD Ryzen 7 6800U, AMD Radeon 680M
67.4 fps -55%
ACEMagician ACE-CK10-8259U
Intel Core i5-8259U, Intel Iris Plus Graphics 655
27.9 fps -81%
1366x768 Medium Graphics & Postprocessing
Beelink GTR7 7840HS
AMD Ryzen 7 7840HS, AMD Radeon 780M
101.5 (93min) fps
Average AMD Radeon 780M
  (47.7 - 101.5, n=16)
88.6 fps -13%
Beelink GTR6
AMD Ryzen 9 6900HX, AMD Radeon 680M
84 (77min) fps -17%
Beelink SER6 Pro Ryzen 7 7735HS
AMD Ryzen 7 7735HS, AMD Radeon 680M
79.8 (72min) fps -21%
Beelink SEi11 Pro
Intel Core i5-11320H, Intel Iris Xe Graphics G7 96EUs
53.7 (44min) fps -47%
Minisforum Mercury Series EM680
AMD Ryzen 7 6800U, AMD Radeon 680M
47.7 fps -53%
Minisforum Venus Series UM560 XT
AMD Ryzen 5 5600H, AMD Radeon RX Vega 7
45.4 fps -55%
ACEMagician ACE-CK10-8259U
Intel Core i5-8259U, Intel Iris Plus Graphics 655
17.8 fps -82%
1920x1080 High Graphics & Postprocessing (Nvidia HairWorks Off)
Intel NUC 12, NUC12SNKi72_Serpent Canyon
Intel Core i7-12700H, Intel Arc A770M
172.7 fps +244%
Beelink GTR7 7840HS
AMD Ryzen 7 7840HS, AMD Radeon 780M
50.2 (45min) fps
Beelink GTR6
AMD Ryzen 9 6900HX, AMD Radeon 680M
46 (41min) fps -8%
Average AMD Radeon 780M
  (21.3 - 50.9, n=31)
43.9 fps -13%
Beelink SER6 Pro Ryzen 7 7735HS
AMD Ryzen 7 7735HS, AMD Radeon 680M
42.4 (38min) fps -16%
Morefine S600-Apex Engineer
Intel Core i9-12900HK, Intel Iris Xe Graphics G7 96EUs
32.1 (3.28min, 14.8P0.1, 18.7P1) fps -36%
Minisforum Mercury Series EM680
AMD Ryzen 7 6800U, AMD Radeon 680M
32.1 fps -36%
Intel NUC 13 Pro Kit NUC13ANK
Intel Core i7-1360P, Intel Iris Xe Graphics G7 96EUs
31.1 fps -38%
Beelink SEi11 Pro
Intel Core i5-11320H, Intel Iris Xe Graphics G7 96EUs
27.8 (25min) fps -45%
Minisforum Venus Series NAB6
Intel Core i7-12650H, Intel UHD Graphics 64EUs (Alder Lake 12th Gen)
26.2 fps -48%
Geekom AS 5
AMD Ryzen 9 5900HX, AMD Radeon RX Vega 8 (Ryzen 4000/5000)
25.9 fps -48%
Minisforum Venus Series UM560 XT
AMD Ryzen 5 5600H, AMD Radeon RX Vega 7
23 fps -54%
ACEMagician ACE-CK10-8259U
Intel Core i5-8259U, Intel Iris Plus Graphics 655
10.1 fps -80%
1920x1080 Ultra Graphics & Postprocessing (HBAO+)
Intel NUC 12, NUC12SNKi72_Serpent Canyon
Intel Core i7-12700H, Intel Arc A770M
50.7 fps +61%
Beelink GTR7 7840HS
AMD Ryzen 7 7840HS, AMD Radeon 780M
31.5 (29min) fps
Average AMD Radeon 780M
  (14.3 - 33.9, n=33)
27.7 fps -12%
Beelink GTR6
AMD Ryzen 9 6900HX, AMD Radeon 680M
27.1 (24min) fps -14%
Beelink SER6 Pro Ryzen 7 7735HS
AMD Ryzen 7 7735HS, AMD Radeon 680M
25.2 (23min) fps -20%
Minisforum Mercury Series EM680
AMD Ryzen 7 6800U, AMD Radeon 680M
20.1 fps -36%
Geekom AS 5
AMD Ryzen 9 5900HX, AMD Radeon RX Vega 8 (Ryzen 4000/5000)
17.3 fps -45%
Intel NUC 13 Pro Kit NUC13ANK
Intel Core i7-1360P, Intel Iris Xe Graphics G7 96EUs
16.3 fps -48%
Morefine S600-Apex Engineer
Intel Core i9-12900HK, Intel Iris Xe Graphics G7 96EUs
15.2 (7.41min, 7.72P0.1, 9.87P1) fps -52%
Minisforum Venus Series UM560 XT
AMD Ryzen 5 5600H, AMD Radeon RX Vega 7
14.8 fps -53%
Beelink SEi11 Pro
Intel Core i5-11320H, Intel Iris Xe Graphics G7 96EUs
13.8 (12min) fps -56%
Minisforum Venus Series NAB6
Intel Core i7-12650H, Intel UHD Graphics 64EUs (Alder Lake 12th Gen)
11.9 fps -62%
GTA V
1024x768 Lowest Settings possible
Intel NUC 12, NUC12SNKi72_Serpent Canyon
Intel Core i7-12700H, Intel Arc A770M
174.5 (4.62min, 111.1P1) fps +6%
Beelink GTR7 7840HS
AMD Ryzen 7 7840HS, AMD Radeon 780M
164.7 (4.69min, 111.1P1) fps
Beelink GTR6
AMD Ryzen 9 6900HX, AMD Radeon 680M
152.6 (4.69min, 100P1) fps -7%
Geekom AS 5
AMD Ryzen 9 5900HX, AMD Radeon RX Vega 8 (Ryzen 4000/5000)
141.6 (8.77min, 90.9P1) fps -14%
Average AMD Radeon 780M
  (91.6 - 167.5, n=32)
141.6 fps -14%
Minisforum Venus Series UM560 XT
AMD Ryzen 5 5600H, AMD Radeon RX Vega 7
140.7 (5.04min, 90.9P1) fps -15%
Minisforum Venus Series NAB6
Intel Core i7-12650H, Intel UHD Graphics 64EUs (Alder Lake 12th Gen)
129.9 (16.1min, 83.3P1) fps -21%
Intel NUC 13 Pro Kit NUC13ANK
Intel Core i7-1360P, Intel Iris Xe Graphics G7 96EUs
126.2 (50.6min, 76.9P1) fps -23%
Morefine S600-Apex Engineer
Intel Core i9-12900HK, Intel Iris Xe Graphics G7 96EUs
114.9 (9.31min, 76.9P1) fps -30%
Beelink SEi11 Pro
Intel Core i5-11320H, Intel Iris Xe Graphics G7 96EUs
94.2 (16.5min, 58.8P1) fps -43%
Minisforum Mercury Series EM680
AMD Ryzen 7 6800U, AMD Radeon 680M
67.7 (4.02min, 38.5P1) fps -59%
ACEMagician ACE-CK10-8259U
Intel Core i5-8259U, Intel Iris Plus Graphics 655
57 (12.6min, 32.3P1) fps -65%
1920x1080 Lowest Settings possible
Intel NUC 12, NUC12SNKi72_Serpent Canyon
Intel Core i7-12700H, Intel Arc A770M
174.2 (4.34min, 111.1P1) fps +39%
Beelink GTR7 7840HS
AMD Ryzen 7 7840HS, AMD Radeon 780M
125.4 (20.8min, 90.9P1) fps
Beelink GTR6
AMD Ryzen 9 6900HX, AMD Radeon 680M
112 (30.2min, 71.4P1) fps -11%
Average AMD Radeon 780M
  (60.9 - 129.1, n=22)
111.8 fps -11%
Morefine S600-Apex Engineer
Intel Core i9-12900HK, Intel Iris Xe Graphics G7 96EUs
87.9 (29.2min, 62.5P1) fps -30%
Intel NUC 13 Pro Kit NUC13ANK
Intel Core i7-1360P, Intel Iris Xe Graphics G7 96EUs
86.4 (9.46min, 58.8P1) fps -31%
Geekom AS 5
AMD Ryzen 9 5900HX, AMD Radeon RX Vega 8 (Ryzen 4000/5000)
81.5 (25.1min, 58.8P1) fps -35%
Minisforum Venus Series UM560 XT
AMD Ryzen 5 5600H, AMD Radeon RX Vega 7
81.3 (8.33min, 58.8P1) fps -35%
Minisforum Venus Series NAB6
Intel Core i7-12650H, Intel UHD Graphics 64EUs (Alder Lake 12th Gen)
74 (24.4min, 55.6P1) fps -41%
Beelink SEi11 Pro
Intel Core i5-11320H, Intel Iris Xe Graphics G7 96EUs
65.9 (13.2min, 45.5P1) fps -47%
Minisforum Mercury Series EM680
AMD Ryzen 7 6800U, AMD Radeon 680M
56.9 (8.92min, 35.7P1) fps -55%
ACEMagician ACE-CK10-8259U
Intel Core i5-8259U, Intel Iris Plus Graphics 655
39.9 (20.2min, 26.3P1) fps -68%
1366x768 Normal/Off AF:4x
Intel NUC 12, NUC12SNKi72_Serpent Canyon
Intel Core i7-12700H, Intel Arc A770M
165.6 (4.3min, 100P1) fps +6%
Beelink GTR7 7840HS
AMD Ryzen 7 7840HS, AMD Radeon 780M
156.1 (5.05min, 111.1P1) fps
Beelink GTR6
AMD Ryzen 9 6900HX, AMD Radeon 680M
138 (28min, 90.9P1) fps -12%
Average AMD Radeon 780M
  (91.2 - 158.4, n=25)
136.3 fps -13%
Geekom AS 5
AMD Ryzen 9 5900HX, AMD Radeon RX Vega 8 (Ryzen 4000/5000)
129.5 (30.7min, 83.3P1) fps -17%
Minisforum Venus Series UM560 XT
AMD Ryzen 5 5600H, AMD Radeon RX Vega 7
123 (64.2min, 83.3P1) fps -21%
Minisforum Venus Series NAB6
Intel Core i7-12650H, Intel UHD Graphics 64EUs (Alder Lake 12th Gen)
113.4 (7.15min, 71.4P1) fps -27%
Intel NUC 13 Pro Kit NUC13ANK
Intel Core i7-1360P, Intel Iris Xe Graphics G7 96EUs
107.3 (19min, 62.5P1) fps -31%
Beelink SEi11 Pro
Intel Core i5-11320H, Intel Iris Xe Graphics G7 96EUs
77.6 (21.9min, 50P1) fps -50%
Minisforum Mercury Series EM680
AMD Ryzen 7 6800U, AMD Radeon 680M
61.7 (8.03min, 38.5P1) fps -60%
ACEMagician ACE-CK10-8259U
Intel Core i5-8259U, Intel Iris Plus Graphics 655
51.2 (20.4min, 29.4P1) fps -67%
1920x1080 Normal/Off AF:4x
Intel NUC 12, NUC12SNKi72_Serpent Canyon
Intel Core i7-12700H, Intel Arc A770M
166.6 (9.93min, 111.1P1) fps +30%
Beelink GTR7 7840HS
AMD Ryzen 7 7840HS, AMD Radeon 780M
128 (8.94min, 90.9P1) fps
Average AMD Radeon 780M
  (64.9 - 132.3, n=20)
111.9 fps -13%
Beelink GTR6
AMD Ryzen 9 6900HX, AMD Radeon 680M
109.6 (8.03min, 71.4P1) fps -14%
Geekom AS 5
AMD Ryzen 9 5900HX, AMD Radeon RX Vega 8 (Ryzen 4000/5000)
84.6 (14min, 58.8P1) fps -34%
Minisforum Venus Series UM560 XT
AMD Ryzen 5 5600H, AMD Radeon RX Vega 7
82.7 (12.3min, 58.8P1) fps -35%
Morefine S600-Apex Engineer
Intel Core i9-12900HK, Intel Iris Xe Graphics G7 96EUs
79.2 (29min, 55.6P1) fps -38%
Intel NUC 13 Pro Kit NUC13ANK
Intel Core i7-1360P, Intel Iris Xe Graphics G7 96EUs
75.9 (6.19min, 50P1) fps -41%
Minisforum Venus Series NAB6
Intel Core i7-12650H, Intel UHD Graphics 64EUs (Alder Lake 12th Gen)
73.4 (33.7min, 52.6P1) fps -43%
Beelink SEi11 Pro
Intel Core i5-11320H, Intel Iris Xe Graphics G7 96EUs
57.3 (22.2min, 38.5P1) fps -55%
Minisforum Mercury Series EM680
AMD Ryzen 7 6800U, AMD Radeon 680M
54.9 (8.78min, 33.3P1) fps -57%
ACEMagician ACE-CK10-8259U
Intel Core i5-8259U, Intel Iris Plus Graphics 655
38.2 (22min, 26.3P1) fps -70%
1920x1080 High/On (Advanced Graphics Off) AA:2xMSAA + FX AF:8x
Intel NUC 12, NUC12SNKi72_Serpent Canyon
Intel Core i7-12700H, Intel Arc A770M
119.4 (4.53min, 76.9P1) fps +74%
Beelink GTR7 7840HS
AMD Ryzen 7 7840HS, AMD Radeon 780M
68.6 (4.91min, 45.5P1) fps
Average AMD Radeon 780M
  (32.5 - 68.6, n=32)
59.5 fps -13%
Beelink GTR6
AMD Ryzen 9 6900HX, AMD Radeon 680M
51.8 (9.91min, 35.7P1) fps -24%
Minisforum Mercury Series EM680
AMD Ryzen 7 6800U, AMD Radeon 680M
34 (1.184min, 19.2P1) fps -50%
Geekom AS 5
AMD Ryzen 9 5900HX, AMD Radeon RX Vega 8 (Ryzen 4000/5000)
33.1 (15.2min, 23.8P1) fps -52%
Minisforum Venus Series UM560 XT
AMD Ryzen 5 5600H, AMD Radeon RX Vega 7
31.7 (15.9min, 23.3P1) fps -54%
Beelink SEi11 Pro
Intel Core i5-11320H, Intel Iris Xe Graphics G7 96EUs
23.2 (11.5min, 15.9P1) fps -66%
Morefine S600-Apex Engineer
Intel Core i9-12900HK, Intel Iris Xe Graphics G7 96EUs
22.2 (5.57min, 17.5P1) fps -68%
Intel NUC 13 Pro Kit NUC13ANK
Intel Core i7-1360P, Intel Iris Xe Graphics G7 96EUs
20.7 (9.05min, 15.9P1) fps -70%
Minisforum Venus Series NAB6
Intel Core i7-12650H, Intel UHD Graphics 64EUs (Alder Lake 12th Gen)
18.5 (6.9min, 14.3P1) fps -73%
ACEMagician ACE-CK10-8259U
Intel Core i5-8259U, Intel Iris Plus Graphics 655
14.3 (9.08min, 10.6P1) fps -79%
1920x1080 Highest Settings possible AA:4xMSAA + FX AF:16x
Intel NUC 12, NUC12SNKi72_Serpent Canyon
Intel Core i7-12700H, Intel Arc A770M
53.3 (3.84min, 32.3P1) fps +93%
Beelink GTR7 7840HS
AMD Ryzen 7 7840HS, AMD Radeon 780M
27.6 (3.56min, 18.9P1) fps
Average AMD Radeon 780M
  (12.2 - 27.6, n=32)
24.4 fps -12%
Beelink GTR6
AMD Ryzen 9 6900HX, AMD Radeon 680M
23.7 (7.88min, 16.4P1) fps -14%
Minisforum Mercury Series EM680
AMD Ryzen 7 6800U, AMD Radeon 680M
19.6 (0.569min, 10.2P1) fps -29%
Minisforum Venus Series UM560 XT
AMD Ryzen 5 5600H, AMD Radeon RX Vega 7
15 (2.37min, 10.6P1) fps -46%
Geekom AS 5
AMD Ryzen 9 5900HX, AMD Radeon RX Vega 8 (Ryzen 4000/5000)
14.5 (4.93min, 10.8P1) fps -47%
Morefine S600-Apex Engineer
Intel Core i9-12900HK, Intel Iris Xe Graphics G7 96EUs
9.15 (4.52min, 7.52P1) fps -67%
Minisforum Venus Series NAB6
Intel Core i7-12650H, Intel UHD Graphics 64EUs (Alder Lake 12th Gen)
8.01 (3.57min, 4.27P1) fps -71%
ACEMagician ACE-CK10-8259U
Intel Core i5-8259U, Intel Iris Plus Graphics 655
5.18 (2.67min, 3.65P1) fps -81%
Strange Brigade
1280x720 lowest AF:1
Intel NUC 12, NUC12SNKi72_Serpent Canyon
Intel Core i7-12700H, Intel Arc A770M
439 (134.3min, 336P1) fps +170%
Beelink GTR7 7840HS
AMD Ryzen 7 7840HS, AMD Radeon 780M
162.3 (84.5min, 138P1) fps
Average AMD Radeon 780M
  (77.8 - 170.5, n=31)
148.8 fps -8%
Beelink GTR6
AMD Ryzen 9 6900HX, AMD Radeon 680M
142.4 (86.5min, 118P1) fps -12%
Beelink SER6 Pro Ryzen 7 7735HS
AMD Ryzen 7 7735HS, AMD Radeon 680M
137.8 (107.9min, 119.9P1) fps -15%
Geekom AS 5
AMD Ryzen 9 5900HX, AMD Radeon RX Vega 8 (Ryzen 4000/5000)
97.8 (28min, 76.9P1) fps -40%
Morefine S600-Apex Engineer
Intel Core i9-12900HK, Intel Iris Xe Graphics G7 96EUs
97.4 (21.9min, 40.2P1) fps -40%
Intel NUC 13 Pro Kit NUC13ANK
Intel Core i7-1360P, Intel Iris Xe Graphics G7 96EUs
95.4 (19.5min, 37.2P1) fps -41%
Minisforum Venus Series UM560 XT
AMD Ryzen 5 5600H, AMD Radeon RX Vega 7
94.4 (16.2min, 81.3P1) fps -42%
Minisforum Venus Series NAB6
Intel Core i7-12650H, Intel UHD Graphics 64EUs (Alder Lake 12th Gen)
84.5 (18.9min, 28.2P1) fps -48%
Minisforum Mercury Series EM680
AMD Ryzen 7 6800U, AMD Radeon 680M
84.5 (32.3min, 62.9P1) fps -48%
Beelink SEi11 Pro
Intel Core i5-11320H, Intel Iris Xe Graphics G7 96EUs
79.3 (18.8min, 25.6P1) fps -51%
ACEMagician ACE-CK10-8259U
Intel Core i5-8259U, Intel Iris Plus Graphics 655
41.4 (9.8min, 11.7P1) fps -74%
1920x1080 medium AA:medium AF:4
Intel NUC 12, NUC12SNKi72_Serpent Canyon
Intel Core i7-12700H, Intel Arc A770M
256 (173.5min, 200P1) fps +291%
Beelink GTR7 7840HS
AMD Ryzen 7 7840HS, AMD Radeon 780M
65.4 (53.3min, 56.4P1) fps
Average AMD Radeon 780M
  (31.7 - 68.2, n=31)
61.3 fps -6%
Beelink GTR6
AMD Ryzen 9 6900HX, AMD Radeon 680M
57.4 (43.4min, 51P1) fps -12%
Beelink SER6 Pro Ryzen 7 7735HS
AMD Ryzen 7 7735HS, AMD Radeon 680M
56.4 (47.8min, 49P1) fps -14%
Minisforum Mercury Series EM680
AMD Ryzen 7 6800U, AMD Radeon 680M
46.2 (28.6min, 35P1) fps -29%
Morefine S600-Apex Engineer
Intel Core i9-12900HK, Intel Iris Xe Graphics G7 96EUs
44.6 (10.8min, 23.9P1) fps -32%
Geekom AS 5
AMD Ryzen 9 5900HX, AMD Radeon RX Vega 8 (Ryzen 4000/5000)
37.9 (18.6min, 32.1P1) fps -42%
Intel NUC 13 Pro Kit NUC13ANK
Intel Core i7-1360P, Intel Iris Xe Graphics G7 96EUs
37.3 (12min, 16.1P1) fps -43%
Minisforum Venus Series UM560 XT
AMD Ryzen 5 5600H, AMD Radeon RX Vega 7
36.1 (25.4min, 31.7P1) fps -45%
Minisforum Venus Series NAB6
Intel Core i7-12650H, Intel UHD Graphics 64EUs (Alder Lake 12th Gen)
34.5 (12.1min, 17.9P1) fps -47%
Beelink SEi11 Pro
Intel Core i5-11320H, Intel Iris Xe Graphics G7 96EUs
33.9 (10.3min, 19.8P1) fps -48%
ACEMagician ACE-CK10-8259U
Intel Core i5-8259U, Intel Iris Plus Graphics 655
17.6 (5min, 5.65P1) fps -73%
1920x1080 high AA:high AF:8
Intel NUC 12, NUC12SNKi72_Serpent Canyon
Intel Core i7-12700H, Intel Arc A770M
211 (14.9min, 161.2P1) fps +278%
Beelink GTR7 7840HS
AMD Ryzen 7 7840HS, AMD Radeon 780M
55.8 (41.7min, 43.2P1) fps
Average AMD Radeon 780M
  (27.3 - 58.1, n=31)
51.9 fps -7%
Beelink GTR6
AMD Ryzen 9 6900HX, AMD Radeon 680M
48.5 (35.1min, 38.2P1) fps -13%
Beelink SER6 Pro Ryzen 7 7735HS
AMD Ryzen 7 7735HS, AMD Radeon 680M
47.1 (35.1min, 37.2P1) fps -16%
Minisforum Mercury Series EM680
AMD Ryzen 7 6800U, AMD Radeon 680M
39.4 (9.7min, 22.8P1) fps -29%
Morefine S600-Apex Engineer
Intel Core i9-12900HK, Intel Iris Xe Graphics G7 96EUs
34.7 (10.3min, 16.3P1) fps -38%
Geekom AS 5
AMD Ryzen 9 5900HX, AMD Radeon RX Vega 8 (Ryzen 4000/5000)
32.1 (16min, 24.6P1) fps -42%
Intel NUC 13 Pro Kit NUC13ANK
Intel Core i7-1360P, Intel Iris Xe Graphics G7 96EUs
31 (8.5min, 12P1) fps -44%
Minisforum Venus Series UM560 XT
AMD Ryzen 5 5600H, AMD Radeon RX Vega 7
30.1 (19.6min, 24.1P1) fps -46%
Beelink SEi11 Pro
Intel Core i5-11320H, Intel Iris Xe Graphics G7 96EUs
27.7 (10min, 15.1P1) fps -50%
Minisforum Venus Series NAB6
Intel Core i7-12650H, Intel UHD Graphics 64EUs (Alder Lake 12th Gen)
27.2 (6.5min, 10P1) fps -51%
ACEMagician ACE-CK10-8259U
Intel Core i5-8259U, Intel Iris Plus Graphics 655
16.9 (5min, 5P1) fps -70%
1920x1080 ultra AA:ultra AF:16
Intel NUC 12, NUC12SNKi72_Serpent Canyon
Intel Core i7-12700H, Intel Arc A770M
178.7 (123.9min, 140.5P1) fps +271%
Beelink GTR7 7840HS
AMD Ryzen 7 7840HS, AMD Radeon 780M
48.2 (36.6min, 37.7P1) fps
Average AMD Radeon 780M
  (23.5 - 49.6, n=32)
44.3 fps -8%
Beelink GTR6
AMD Ryzen 9 6900HX, AMD Radeon 680M
41.6 (26.5min, 33P1) fps -14%
Beelink SER6 Pro Ryzen 7 7735HS
AMD Ryzen 7 7735HS, AMD Radeon 680M
40.7 (31.5min, 32.4P1) fps -16%
Minisforum Mercury Series EM680
AMD Ryzen 7 6800U, AMD Radeon 680M
34.2 (6.7min, 10.3P1) fps -29%
Morefine S600-Apex Engineer
Intel Core i9-12900HK, Intel Iris Xe Graphics G7 96EUs
28 (5.6min, 8.37P1) fps -42%
Geekom AS 5
AMD Ryzen 9 5900HX, AMD Radeon RX Vega 8 (Ryzen 4000/5000)
27.3 (15.6min, 18.4P1) fps -43%
Minisforum Venus Series UM560 XT
AMD Ryzen 5 5600H, AMD Radeon RX Vega 7
25.4 (14.8min, 17.6P1) fps -47%
Intel NUC 13 Pro Kit NUC13ANK
Intel Core i7-1360P, Intel Iris Xe Graphics G7 96EUs
25.2 (5.1min, 6.91P1) fps -48%
Beelink SEi11 Pro
Intel Core i5-11320H, Intel Iris Xe Graphics G7 96EUs
22.2 (5.6min, 7.76P1) fps -54%
Minisforum Venus Series NAB6
Intel Core i7-12650H, Intel UHD Graphics 64EUs (Alder Lake 12th Gen)
22.1 (5min, 5.59P1) fps -54%
ACEMagician ACE-CK10-8259U
Intel Core i5-8259U, Intel Iris Plus Graphics 655
14.5 (5min, 5P1) fps -70%
F1 22
1280x720 Ultra Low Preset AA:T AF:16x
Intel NUC 12, NUC12SNKi72_Serpent Canyon
Intel Core i7-12700H, Intel Arc A770M
228 (176min, 143P1) fps +37%
Beelink GTR7 7840HS
AMD Ryzen 7 7840HS, AMD Radeon 780M
166.2 (135min, 103P1) fps
Average AMD Radeon 780M
  (85.4 - 172.5, n=18)
143.6 fps -14%
Beelink SER6 Pro Ryzen 7 7735HS
AMD Ryzen 7 7735HS, AMD Radeon 680M
141.3 (116min, 93P1) fps -15%
Geekom AS 5
AMD Ryzen 9 5900HX, AMD Radeon RX Vega 8 (Ryzen 4000/5000)
86.9 (72min, 71P1) fps -48%
Minisforum Venus Series UM560 XT
AMD Ryzen 5 5600H, AMD Radeon RX Vega 7
80.8 (68min, 67P1) fps -51%
Morefine S600-Apex Engineer
Intel Core i9-12900HK, Intel Iris Xe Graphics G7 96EUs
80.7 (64min, 65P1) fps -51%
Intel NUC 13 Pro Kit NUC13ANK
Intel Core i7-1360P, Intel Iris Xe Graphics G7 96EUs
80 (64min, 64P1) fps -52%
Minisforum Mercury Series EM680
AMD Ryzen 7 6800U, AMD Radeon 680M
77.5 (64min, 42P1) fps -53%
Minisforum Venus Series NAB6
Intel Core i7-12650H, Intel UHD Graphics 64EUs (Alder Lake 12th Gen)
66.2 (53min, 53P1) fps -60%
1920x1080 Low Preset AA:T AF:16x
Intel NUC 12, NUC12SNKi72_Serpent Canyon
Intel Core i7-12700H, Intel Arc A770M
181.5 (142min, 120P1) fps +82%
Beelink GTR7 7840HS
AMD Ryzen 7 7840HS, AMD Radeon 780M
99.8 (86min, 74P1) fps
Average AMD Radeon 780M
  (47 - 99.8, n=23)
84.1 fps -16%
Beelink SER6 Pro Ryzen 7 7735HS
AMD Ryzen 7 7735HS, AMD Radeon 680M
80.1 (69min, 55P1) fps -20%
Minisforum Mercury Series EM680
AMD Ryzen 7 6800U, AMD Radeon 680M
49.7 (37min, 25P1) fps -50%
Morefine S600-Apex Engineer
Intel Core i9-12900HK, Intel Iris Xe Graphics G7 96EUs
48.1 (39min, 40P1) fps -52%
Intel NUC 13 Pro Kit NUC13ANK
Intel Core i7-1360P, Intel Iris Xe Graphics G7 96EUs
48 (40min, 40P1) fps -52%
Geekom AS 5
AMD Ryzen 9 5900HX, AMD Radeon RX Vega 8 (Ryzen 4000/5000)
46.7 (40min, 39P1) fps -53%
Minisforum Venus Series UM560 XT
AMD Ryzen 5 5600H, AMD Radeon RX Vega 7
42.3 (37min, 33P1) fps -58%
Minisforum Venus Series NAB6
Intel Core i7-12650H, Intel UHD Graphics 64EUs (Alder Lake 12th Gen)
37.6 (31min, 30P1) fps -62%
1920x1080 Medium Preset AA:T AF:16x
Intel NUC 12, NUC12SNKi72_Serpent Canyon
Intel Core i7-12700H, Intel Arc A770M
166 (136min, 115P1) fps +88%
Beelink GTR7 7840HS
AMD Ryzen 7 7840HS, AMD Radeon 780M
88.4 (77min, 69P1) fps
Average AMD Radeon 780M
  (41.5 - 89.8, n=23)
74.5 fps -16%
Beelink SER6 Pro Ryzen 7 7735HS
AMD Ryzen 7 7735HS, AMD Radeon 680M
69.5 (57min, 49P1) fps -21%
Minisforum Mercury Series EM680
AMD Ryzen 7 6800U, AMD Radeon 680M
46.1 (29min, 22P1) fps -48%
Intel NUC 13 Pro Kit NUC13ANK
Intel Core i7-1360P, Intel Iris Xe Graphics G7 96EUs
44.3 (36min, 36P1) fps -50%
Morefine S600-Apex Engineer
Intel Core i9-12900HK, Intel Iris Xe Graphics G7 96EUs
44.1 (38min, 38P1) fps -50%
Geekom AS 5
AMD Ryzen 9 5900HX, AMD Radeon RX Vega 8 (Ryzen 4000/5000)
41.2 (35min, 32P1) fps -53%
Minisforum Venus Series UM560 XT
AMD Ryzen 5 5600H, AMD Radeon RX Vega 7
38 (31min, 31P1) fps -57%
Minisforum Venus Series NAB6
Intel Core i7-12650H, Intel UHD Graphics 64EUs (Alder Lake 12th Gen)
34 (29min, 27P1) fps -62%
1920x1080 High Preset AA:T AF:16x
Intel NUC 12, NUC12SNKi72_Serpent Canyon
Intel Core i7-12700H, Intel Arc A770M
131 (107min, 90P1) fps +98%
Beelink GTR7 7840HS
AMD Ryzen 7 7840HS, AMD Radeon 780M
66.3 (57min, 54P1) fps
Average AMD Radeon 780M
  (31.7 - 66.7, n=23)
55.6 fps -16%
Beelink SER6 Pro Ryzen 7 7735HS
AMD Ryzen 7 7735HS, AMD Radeon 680M
52.9 (43min, 38P1) fps -20%
Minisforum Mercury Series EM680
AMD Ryzen 7 6800U, AMD Radeon 680M
34.8 (19min, 17P1) fps -48%
Intel NUC 13 Pro Kit NUC13ANK
Intel Core i7-1360P, Intel Iris Xe Graphics G7 96EUs
31.2 (27min, 26P1) fps -53%
Geekom AS 5
AMD Ryzen 9 5900HX, AMD Radeon RX Vega 8 (Ryzen 4000/5000)
31.2 (26min, 25P1) fps -53%
Morefine S600-Apex Engineer
Intel Core i9-12900HK, Intel Iris Xe Graphics G7 96EUs
31.1 (21min, 26P1) fps -53%
Minisforum Venus Series UM560 XT
AMD Ryzen 5 5600H, AMD Radeon RX Vega 7
28.2 (24min, 23P1) fps -57%
Minisforum Venus Series NAB6
Intel Core i7-12650H, Intel UHD Graphics 64EUs (Alder Lake 12th Gen)
24.7 (21min, 19P1) fps -63%
1920x1080 Ultra High Preset AA:T AF:16x
Intel NUC 12, NUC12SNKi72_Serpent Canyon
Intel Core i7-12700H, Intel Arc A770M
42 (35min, 33P1) fps +131%
Intel NUC 13 Pro Kit NUC13ANK
Intel Core i7-1360P, Intel Iris Xe Graphics G7 96EUs
24 fps +32%
Geekom AS 5
AMD Ryzen 9 5900HX, AMD Radeon RX Vega 8 (Ryzen 4000/5000)
22.1 (19min, 18P1) fps +21%
Morefine S600-Apex Engineer
Intel Core i9-12900HK, Intel Iris Xe Graphics G7 96EUs
22 (19min, 18P1) fps +21%
Minisforum Venus Series UM560 XT
AMD Ryzen 5 5600H, AMD Radeon RX Vega 7
19.7 fps +8%
Minisforum Venus Series NAB6
Intel Core i7-12650H, Intel UHD Graphics 64EUs (Alder Lake 12th Gen)
18.8 (14min, 15P1) fps +3%
Beelink GTR7 7840HS
AMD Ryzen 7 7840HS, AMD Radeon 780M
18.2 (14min, 14P1) fps
Average AMD Radeon 780M
  (9.92 - 18.5, n=16)
15.6 fps -14%
Beelink SER6 Pro Ryzen 7 7735HS
AMD Ryzen 7 7735HS, AMD Radeon 680M
13.9 (10min, 9P1) fps -24%
Minisforum Mercury Series EM680
AMD Ryzen 7 6800U, AMD Radeon 680M
8.92 (2min, 3P1) fps -51%
Dota 2 Reborn
1280x720 min (0/3) fastest
Beelink GTR7 7840HS
AMD Ryzen 7 7840HS, AMD Radeon 780M
160.6 (139.7min) fps
Beelink SER6 Pro Ryzen 7 7735HS
AMD Ryzen 7 7735HS, AMD Radeon 680M
142.2 (123.6min) fps -11%
Beelink GTR6
AMD Ryzen 9 6900HX, AMD Radeon 680M
141.9 (121.4min) fps -12%
Morefine S600-Apex Engineer
Intel Core i9-12900HK, Intel Iris Xe Graphics G7 96EUs
141 (113.7min) fps -12%
Minisforum Venus Series UM560 XT
AMD Ryzen 5 5600H, AMD Radeon RX Vega 7
137.7 (114.5min) fps -14%
Geekom AS 5
AMD Ryzen 9 5900HX, AMD Radeon RX Vega 8 (Ryzen 4000/5000)
135 (114.8min) fps -16%
Minisforum Venus Series NAB6
Intel Core i7-12650H, Intel UHD Graphics 64EUs (Alder Lake 12th Gen)
134.7 (102.1min) fps -16%
Average AMD Radeon 780M
  (103.7 - 163.1, n=34)
132.4 fps -18%
Intel NUC 13 Pro Kit NUC13ANK
Intel Core i7-1360P, Intel Iris Xe Graphics G7 96EUs
123.8 (98min) fps -23%
Beelink SEi11 Pro
Intel Core i5-11320H, Intel Iris Xe Graphics G7 96EUs
119.6 (108.4min) fps -26%
ACEMagician ACE-CK10-8259U
Intel Core i5-8259U, Intel Iris Plus Graphics 655
86.8 (75.1min) fps -46%
Minisforum Mercury Series EM680
AMD Ryzen 7 6800U, AMD Radeon 680M
62.4 (51.9min) fps -61%
1366x768 med (1/3)
Beelink GTR7 7840HS
AMD Ryzen 7 7840HS, AMD Radeon 780M
123.9 (104.8min) fps
Beelink SER6 Pro Ryzen 7 7735HS
AMD Ryzen 7 7735HS, AMD Radeon 680M
113.5 (96.1min) fps -8%
Beelink GTR6
AMD Ryzen 9 6900HX, AMD Radeon 680M
112.7 (95min) fps -9%
Minisforum Venus Series UM560 XT
AMD Ryzen 5 5600H, AMD Radeon RX Vega 7
107.8 (86.5min) fps -13%
Geekom AS 5
AMD Ryzen 9 5900HX, AMD Radeon RX Vega 8 (Ryzen 4000/5000)
106.6 (88.3min) fps -14%
Average AMD Radeon 780M
  (87.5 - 130.1, n=34)
106.6 fps -14%
Minisforum Venus Series NAB6
Intel Core i7-12650H, Intel UHD Graphics 64EUs (Alder Lake 12th Gen)
99.6 (80.7min) fps -20%
Morefine S600-Apex Engineer
Intel Core i9-12900HK, Intel Iris Xe Graphics G7 96EUs
97.4 (77.5min) fps -21%
Intel NUC 13 Pro Kit NUC13ANK
Intel Core i7-1360P, Intel Iris Xe Graphics G7 96EUs
93.9 (77.2min) fps -24%
Beelink SEi11 Pro
Intel Core i5-11320H, Intel Iris Xe Graphics G7 96EUs
78.6 (66.2min) fps -37%
ACEMagician ACE-CK10-8259U
Intel Core i5-8259U, Intel Iris Plus Graphics 655
77.9 (62.1min) fps -37%
Minisforum Mercury Series EM680
AMD Ryzen 7 6800U, AMD Radeon 680M
57.3 (48.6min) fps -54%
1920x1080 high (2/3)
Beelink GTR7 7840HS
AMD Ryzen 7 7840HS, AMD Radeon 780M
95.1 (84.3min) fps
Beelink SER6 Pro Ryzen 7 7735HS
AMD Ryzen 7 7735HS, AMD Radeon 680M
89.1 (74.5min) fps -6%
Beelink GTR6
AMD Ryzen 9 6900HX, AMD Radeon 680M
80.9 (71.6min) fps -15%
Average AMD Radeon 780M
  (54.9 - 97.5, n=34)
78.8 fps -17%
Intel NUC 13 Pro Kit NUC13ANK
Intel Core i7-1360P, Intel Iris Xe Graphics G7 96EUs
67.6 (59.9min) fps -29%
Morefine S600-Apex Engineer
Intel Core i9-12900HK, Intel Iris Xe Graphics G7 96EUs
67 (61.5min) fps -30%
Geekom AS 5
AMD Ryzen 9 5900HX, AMD Radeon RX Vega 8 (Ryzen 4000/5000)
62.8 (54.9min) fps -34%
Minisforum Venus Series UM560 XT
AMD Ryzen 5 5600H, AMD Radeon RX Vega 7
62.1 (57.1min) fps -35%
Minisforum Venus Series NAB6
Intel Core i7-12650H, Intel UHD Graphics 64EUs (Alder Lake 12th Gen)
57.8 (54.5min) fps -39%
Beelink SEi11 Pro
Intel Core i5-11320H, Intel Iris Xe Graphics G7 96EUs
50.4 (41.9min) fps -47%
Minisforum Mercury Series EM680
AMD Ryzen 7 6800U, AMD Radeon 680M
44.8 (38.3min) fps -53%
ACEMagician ACE-CK10-8259U
Intel Core i5-8259U, Intel Iris Plus Graphics 655
34.5 (31.9min) fps -64%
1920x1080 ultra (3/3) best looking
Beelink GTR7 7840HS
AMD Ryzen 7 7840HS, AMD Radeon 780M
85.5 (75.7min) fps
Beelink SER6 Pro Ryzen 7 7735HS
AMD Ryzen 7 7735HS, AMD Radeon 680M
72.8 (65.3min) fps -15%
Beelink GTR6
AMD Ryzen 9 6900HX, AMD Radeon 680M
71.4 (62.3min) fps -16%
Average AMD Radeon 780M
  (51.3 - 91.2, n=34)
71.1 fps -17%
Intel NUC 13 Pro Kit NUC13ANK
Intel Core i7-1360P, Intel Iris Xe Graphics G7 96EUs
61.6 (54.6min) fps -28%
Morefine S600-Apex Engineer
Intel Core i9-12900HK, Intel Iris Xe Graphics G7 96EUs
61.2 (53.6min) fps -28%
Geekom AS 5
AMD Ryzen 9 5900HX, AMD Radeon RX Vega 8 (Ryzen 4000/5000)
59.1 (52.2min) fps -31%
Minisforum Venus Series UM560 XT
AMD Ryzen 5 5600H, AMD Radeon RX Vega 7
58.2 (54min) fps -32%
Minisforum Venus Series NAB6
Intel Core i7-12650H, Intel UHD Graphics 64EUs (Alder Lake 12th Gen)
53.3 (49.4min) fps -38%
Beelink SEi11 Pro
Intel Core i5-11320H, Intel Iris Xe Graphics G7 96EUs
47.4 (40.8min) fps -45%
Minisforum Mercury Series EM680
AMD Ryzen 7 6800U, AMD Radeon 680M
42 (36.8min) fps -51%
ACEMagician ACE-CK10-8259U
Intel Core i5-8259U, Intel Iris Plus Graphics 655
28.1 (26.2min) fps -67%
X-Plane 11.11
1280x720 low (fps_test=1)
Intel NUC 12, NUC12SNKi72_Serpent Canyon
Intel Core i7-12700H, Intel Arc A770M
67.5 fps +11%
Beelink SER6 Pro Ryzen 7 7735HS
AMD Ryzen 7 7735HS, AMD Radeon 680M
65.2 fps +7%
Beelink GTR6
AMD Ryzen 9 6900HX, AMD Radeon 680M
64.8 fps +7%
Morefine S600-Apex Engineer
Intel Core i9-12900HK, Intel Iris Xe Graphics G7 96EUs
63.2 fps +4%
Beelink GTR7 7840HS
AMD Ryzen 7 7840HS, AMD Radeon 780M
60.8 fps
Beelink SEi11 Pro
Intel Core i5-11320H, Intel Iris Xe Graphics G7 96EUs
58.2 fps -4%
Geekom AS 5
AMD Ryzen 9 5900HX, AMD Radeon RX Vega 8 (Ryzen 4000/5000)
53.2 fps -12%
Minisforum Venus Series NAB6
Intel Core i7-12650H, Intel UHD Graphics 64EUs (Alder Lake 12th Gen)
52.6 fps -13%
Average AMD Radeon 780M
  (39 - 69.6, n=36)
51.6 fps -15%
Minisforum Venus Series UM560 XT
AMD Ryzen 5 5600H, AMD Radeon RX Vega 7
49.5 fps -19%
ACEMagician ACE-CK10-8259U
Intel Core i5-8259U, Intel Iris Plus Graphics 655
26.8 fps -56%
Minisforum Mercury Series EM680
AMD Ryzen 7 6800U, AMD Radeon 680M
26.8 fps -56%
1920x1080 med (fps_test=2)
Intel NUC 12, NUC12SNKi72_Serpent Canyon
Intel Core i7-12700H, Intel Arc A770M
59.4 fps +35%
Beelink GTR6
AMD Ryzen 9 6900HX, AMD Radeon 680M
52.6 fps +19%
Beelink SER6 Pro Ryzen 7 7735HS
AMD Ryzen 7 7735HS, AMD Radeon 680M
52.3 fps +19%
Morefine S600-Apex Engineer
Intel Core i9-12900HK, Intel Iris Xe Graphics G7 96EUs
47.5 fps +8%
Beelink GTR7 7840HS
AMD Ryzen 7 7840HS, AMD Radeon 780M
44.1 fps
Beelink SEi11 Pro
Intel Core i5-11320H, Intel Iris Xe Graphics G7 96EUs
41.2 fps -7%
Geekom AS 5
AMD Ryzen 9 5900HX, AMD Radeon RX Vega 8 (Ryzen 4000/5000)
40.3 fps -9%
Minisforum Venus Series NAB6
Intel Core i7-12650H, Intel UHD Graphics 64EUs (Alder Lake 12th Gen)
39.7 fps -10%
Average AMD Radeon 780M
  (26.2 - 48.2, n=36)
37.7 fps -15%
Minisforum Venus Series UM560 XT
AMD Ryzen 5 5600H, AMD Radeon RX Vega 7
37 fps -16%
Minisforum Mercury Series EM680
AMD Ryzen 7 6800U, AMD Radeon 680M
21.1 fps -52%
ACEMagician ACE-CK10-8259U
Intel Core i5-8259U, Intel Iris Plus Graphics 655
18.4 fps -58%
1920x1080 high (fps_test=3)
Intel NUC 12, NUC12SNKi72_Serpent Canyon
Intel Core i7-12700H, Intel Arc A770M
55.5 fps +48%
Beelink SER6 Pro Ryzen 7 7735HS
AMD Ryzen 7 7735HS, AMD Radeon 680M
42.2 fps +13%
Beelink GTR6
AMD Ryzen 9 6900HX, AMD Radeon 680M
41.8 fps +11%
Morefine S600-Apex Engineer
Intel Core i9-12900HK, Intel Iris Xe Graphics G7 96EUs
41.1 fps +10%
Beelink GTR7 7840HS
AMD Ryzen 7 7840HS, AMD Radeon 780M
37.5 fps
Beelink SEi11 Pro
Intel Core i5-11320H, Intel Iris Xe Graphics G7 96EUs
37.3 fps -1%
Minisforum Venus Series NAB6
Intel Core i7-12650H, Intel UHD Graphics 64EUs (Alder Lake 12th Gen)
35.4 fps -6%
Geekom AS 5
AMD Ryzen 9 5900HX, AMD Radeon RX Vega 8 (Ryzen 4000/5000)
34.5 fps -8%
Minisforum Venus Series UM560 XT
AMD Ryzen 5 5600H, AMD Radeon RX Vega 7
31.9 fps -15%
Average AMD Radeon 780M
  (24.5 - 40.7, n=35)
31.7 fps -15%
Minisforum Mercury Series EM680
AMD Ryzen 7 6800U, AMD Radeon 680M
16.6 fps -56%
ACEMagician ACE-CK10-8259U
Intel Core i5-8259U, Intel Iris Plus Graphics 655
16 fps -57%
Tiny Tina's Wonderlands
1280x720 Lowest Preset (DX12)
Intel NUC 12, NUC12SNKi72_Serpent Canyon
Intel Core i7-12700H, Intel Arc A770M
241 fps +88%
Intel NUC 12, NUC12SNKi72_Serpent Canyon
Intel Core i7-12700H, Intel Arc A770M
241 fps +88%
Beelink GTR7 7840HS
AMD Ryzen 7 7840HS, AMD Radeon 780M
128.4 fps
Average AMD Radeon 780M
  (62.6 - 151.2, n=14)
118.5 fps -8%
Geekom AS 5
AMD Ryzen 9 5900HX, AMD Radeon RX Vega 8 (Ryzen 4000/5000)
82.2 fps -36%
Minisforum Venus Series UM560 XT
AMD Ryzen 5 5600H, AMD Radeon RX Vega 7
70.4 fps -45%
Intel NUC 13 Pro Kit NUC13ANK
Intel Core i7-1360P, Intel Iris Xe Graphics G7 96EUs
59.8 fps -53%
Minisforum Mercury Series EM680
AMD Ryzen 7 6800U, AMD Radeon 680M
59.3 fps -54%
Morefine S600-Apex Engineer
Intel Core i9-12900HK, Intel Iris Xe Graphics G7 96EUs
57.5 fps -55%
Minisforum Venus Series NAB6
Intel Core i7-12650H, Intel UHD Graphics 64EUs (Alder Lake 12th Gen)
46.8 fps -64%
1920x1080 Low Preset (DX12)
Intel NUC 12, NUC12SNKi72_Serpent Canyon
Intel Core i7-12700H, Intel Arc A770M
192.2 fps +167%
Beelink GTR7 7840HS
AMD Ryzen 7 7840HS, AMD Radeon 780M
72 fps
Average AMD Radeon 780M
  (34.3 - 74.9, n=14)
61.7 fps -14%
Beelink SER6 Pro Ryzen 7 7735HS
AMD Ryzen 7 7735HS, AMD Radeon 680M
58.6 fps -19%
Minisforum Mercury Series EM680
AMD Ryzen 7 6800U, AMD Radeon 680M
39.3 fps -45%
Geekom AS 5
AMD Ryzen 9 5900HX, AMD Radeon RX Vega 8 (Ryzen 4000/5000)
38.4 fps -47%
Minisforum Venus Series UM560 XT
AMD Ryzen 5 5600H, AMD Radeon RX Vega 7
33.1 fps -54%
Intel NUC 13 Pro Kit NUC13ANK
Intel Core i7-1360P, Intel Iris Xe Graphics G7 96EUs
32.5 fps -55%
Morefine S600-Apex Engineer
Intel Core i9-12900HK, Intel Iris Xe Graphics G7 96EUs
32 fps -56%
Minisforum Venus Series NAB6
Intel Core i7-12650H, Intel UHD Graphics 64EUs (Alder Lake 12th Gen)
25.1 fps -65%
1920x1080 Medium Preset (DX12)
Intel NUC 12, NUC12SNKi72_Serpent Canyon
Intel Core i7-12700H, Intel Arc A770M
138.5 fps +160%
Beelink GTR7 7840HS
AMD Ryzen 7 7840HS, AMD Radeon 780M
53.3 fps
Average AMD Radeon 780M
  (28.4 - 54.7, n=14)
45 fps -16%
Beelink SER6 Pro Ryzen 7 7735HS
AMD Ryzen 7 7735HS, AMD Radeon 680M
44.4 fps -17%
Minisforum Mercury Series EM680
AMD Ryzen 7 6800U, AMD Radeon 680M
30.6 fps -43%
Geekom AS 5
AMD Ryzen 9 5900HX, AMD Radeon RX Vega 8 (Ryzen 4000/5000)
28.8 fps -46%
Intel NUC 13 Pro Kit NUC13ANK
Intel Core i7-1360P, Intel Iris Xe Graphics G7 96EUs
25.2 fps -53%
Minisforum Venus Series UM560 XT
AMD Ryzen 5 5600H, AMD Radeon RX Vega 7
25.1 fps -53%
Morefine S600-Apex Engineer
Intel Core i9-12900HK, Intel Iris Xe Graphics G7 96EUs
24.8 fps -53%
Minisforum Venus Series NAB6
Intel Core i7-12650H, Intel UHD Graphics 64EUs (Alder Lake 12th Gen)
19.6 fps -63%
1920x1080 High Preset (DX12)
Intel NUC 12, NUC12SNKi72_Serpent Canyon
Intel Core i7-12700H, Intel Arc A770M
95.1 fps +156%
Beelink GTR7 7840HS
AMD Ryzen 7 7840HS, AMD Radeon 780M
37.1 fps
Average AMD Radeon 780M
  (18.6 - 38.8, n=14)
31.5 fps -15%
Beelink SER6 Pro Ryzen 7 7735HS
AMD Ryzen 7 7735HS, AMD Radeon 680M
29.9 fps -19%
Minisforum Mercury Series EM680
AMD Ryzen 7 6800U, AMD Radeon 680M
21.8 fps -41%
Geekom AS 5
AMD Ryzen 9 5900HX, AMD Radeon RX Vega 8 (Ryzen 4000/5000)
18 fps -51%
Intel NUC 13 Pro Kit NUC13ANK
Intel Core i7-1360P, Intel Iris Xe Graphics G7 96EUs
16.1 fps -57%
Minisforum Venus Series UM560 XT
AMD Ryzen 5 5600H, AMD Radeon RX Vega 7
15.7 fps -58%
Morefine S600-Apex Engineer
Intel Core i9-12900HK, Intel Iris Xe Graphics G7 96EUs
15.6 fps -58%
Minisforum Venus Series NAB6
Intel Core i7-12650H, Intel UHD Graphics 64EUs (Alder Lake 12th Gen)
12.1 fps -67%
1920x1080 Badass Preset (DX12)
Intel NUC 12, NUC12SNKi72_Serpent Canyon
Intel Core i7-12700H, Intel Arc A770M
76.8 fps +151%
Beelink GTR7 7840HS
AMD Ryzen 7 7840HS, AMD Radeon 780M
30.6 fps
Average AMD Radeon 780M
  (16.5 - 31.3, n=14)
25.8 fps -16%
Beelink SER6 Pro Ryzen 7 7735HS
AMD Ryzen 7 7735HS, AMD Radeon 680M
23.1 fps -25%
Minisforum Mercury Series EM680
AMD Ryzen 7 6800U, AMD Radeon 680M
18.5 fps -40%
Geekom AS 5
AMD Ryzen 9 5900HX, AMD Radeon RX Vega 8 (Ryzen 4000/5000)
13.1 fps -57%
Intel NUC 13 Pro Kit NUC13ANK
Intel Core i7-1360P, Intel Iris Xe Graphics G7 96EUs
12.7 fps -58%
Morefine S600-Apex Engineer
Intel Core i9-12900HK, Intel Iris Xe Graphics G7 96EUs
12.1 fps -60%
Minisforum Venus Series UM560 XT
AMD Ryzen 5 5600H, AMD Radeon RX Vega 7
11.5 fps -62%
Minisforum Venus Series NAB6
Intel Core i7-12650H, Intel UHD Graphics 64EUs (Alder Lake 12th Gen)
9.33 fps -70%
Returnal
1280x720 Low Preset
Beelink GTR7 7840HS
AMD Ryzen 7 7840HS, AMD Radeon 780M
42 (26min) fps
Average AMD Radeon 780M
  ()
42 fps 0%
1920x1080 Low Preset
Beelink GTR7 7840HS
AMD Ryzen 7 7840HS, AMD Radeon 780M
31 (15min) fps
Average AMD Radeon 780M
  (22 - 31, n=2)
26.5 fps -15%
1920x1080 Medium Preset
Beelink GTR7 7840HS
AMD Ryzen 7 7840HS, AMD Radeon 780M
29 (14min) fps
Average AMD Radeon 780M
  (20 - 29, n=2)
24.5 fps -16%
1920x1080 High Preset
Beelink GTR7 7840HS
AMD Ryzen 7 7840HS, AMD Radeon 780M
27 (12min) fps
Average AMD Radeon 780M
  (18 - 27, n=2)
22.5 fps -17%
1920x1080 Epic Preset
Beelink GTR7 7840HS
AMD Ryzen 7 7840HS, AMD Radeon 780M
22 (11min) fps
Average AMD Radeon 780M
  (15 - 22, n=2)
18.5 fps -16%
Cyberpunk 2077 1.6
1280x720 Low Preset
Intel NUC 12, NUC12SNKi72_Serpent Canyon
Intel Core i7-12700H, Intel Arc A770M
130 (40.2min) fps +47%
Beelink GTR7 7840HS
AMD Ryzen 7 7840HS, AMD Radeon 780M
88.6 (45.6min) fps
Beelink GTR6
AMD Ryzen 9 6900HX, AMD Radeon 680M
72.2 (23.3min) fps -19%
Beelink SER6 Pro Ryzen 7 7735HS
AMD Ryzen 7 7735HS, AMD Radeon 680M
69.2 (26.3min) fps -22%
Average AMD Radeon 780M
  (43 - 88.6, n=7)
63.3 fps -29%
1920x1080 Low Preset
Intel NUC 12, NUC12SNKi72_Serpent Canyon
Intel Core i7-12700H, Intel Arc A770M
112.5 (16.1min) fps +111%
Beelink GTR7 7840HS
AMD Ryzen 7 7840HS, AMD Radeon 780M
53.3 (35min) fps
Beelink GTR6
AMD Ryzen 9 6900HX, AMD Radeon 680M
43 (18min) fps -19%
Beelink SER6 Pro Ryzen 7 7735HS
AMD Ryzen 7 7735HS, AMD Radeon 680M
40.8 (19.7min) fps -23%
Average AMD Radeon 780M
  (22 - 53.3, n=12)
37 fps -31%
Beelink SEi11 Pro
Intel Core i5-11320H, Intel Iris Xe Graphics G7 96EUs
18.6 (8.1min) fps -65%
1920x1080 Medium Preset
Intel NUC 12, NUC12SNKi72_Serpent Canyon
Intel Core i7-12700H, Intel Arc A770M
95.3 (25.9min) fps +127%
Beelink GTR7 7840HS
AMD Ryzen 7 7840HS, AMD Radeon 780M
42 (30.4min) fps
Beelink GTR6
AMD Ryzen 9 6900HX, AMD Radeon 680M
33 (19.6min) fps -21%
Beelink SER6 Pro Ryzen 7 7735HS
AMD Ryzen 7 7735HS, AMD Radeon 680M
31.8 (20.6min) fps -24%
Average AMD Radeon 780M
  (16 - 42, n=12)
29.3 fps -30%
Beelink SEi11 Pro
Intel Core i5-11320H, Intel Iris Xe Graphics G7 96EUs
15.6 (7.8min) fps -63%
1920x1080 High Preset
Intel NUC 12, NUC12SNKi72_Serpent Canyon
Intel Core i7-12700H, Intel Arc A770M
77 (59.8min) fps +152%
Beelink GTR7 7840HS
AMD Ryzen 7 7840HS, AMD Radeon 780M
30.5 (34min) fps
Average AMD Radeon 780M
  (12 - 30.5, n=12)
22.7 fps -26%
Beelink GTR6
AMD Ryzen 9 6900HX, AMD Radeon 680M
22.3 (5.3min) fps -27%
Beelink SER6 Pro Ryzen 7 7735HS
AMD Ryzen 7 7735HS, AMD Radeon 680M
21.8 (6.2min) fps -29%
Beelink SEi11 Pro
Intel Core i5-11320H, Intel Iris Xe Graphics G7 96EUs
11.7 (6.1min) fps -62%
1920x1080 Ultra Preset
Intel NUC 12, NUC12SNKi72_Serpent Canyon
Intel Core i7-12700H, Intel Arc A770M
66.5 (48min) fps +164%
Beelink GTR7 7840HS
AMD Ryzen 7 7840HS, AMD Radeon 780M
25.2 (18.1min) fps
Average AMD Radeon 780M
  (14.2 - 26, n=8)
21.8 fps -13%
Beelink GTR6
AMD Ryzen 9 6900HX, AMD Radeon 680M
17.5 (4min) fps -31%
Beelink SER6 Pro Ryzen 7 7735HS
AMD Ryzen 7 7735HS, AMD Radeon 680M
17.5 (3.4min) fps -31%
Beelink SEi11 Pro
Intel Core i5-11320H, Intel Iris Xe Graphics G7 96EUs
9.8 (4.9min) fps -61%

Witcher 3 FPS Chart

05101520253035404550Tooltip
Beelink GTR7 7840HS: Ø48.7 (45-55)
low med. high ultra
GTA V (2015) 164.7 156.1 68.6 27.6
The Witcher 3 (2015) 148.9 101.5 50.2 31.5
Dota 2 Reborn (2015) 160.6 123.9 95.1 85.5
Final Fantasy XV Benchmark (2018) 77.6 38.7 28.9
X-Plane 11.11 (2018) 60.8 44.1 37.5
Strange Brigade (2018) 162.3 65.4 55.8 48.2
Cyberpunk 2077 1.6 (2022) 53.3 42 30.5 25.2
Tiny Tina's Wonderlands (2022) 72 53.3 37.1 30.6
F1 22 (2022) 99.8 88.4 66.3 18.2
Returnal (2023) 31 29 27 22

Emissions

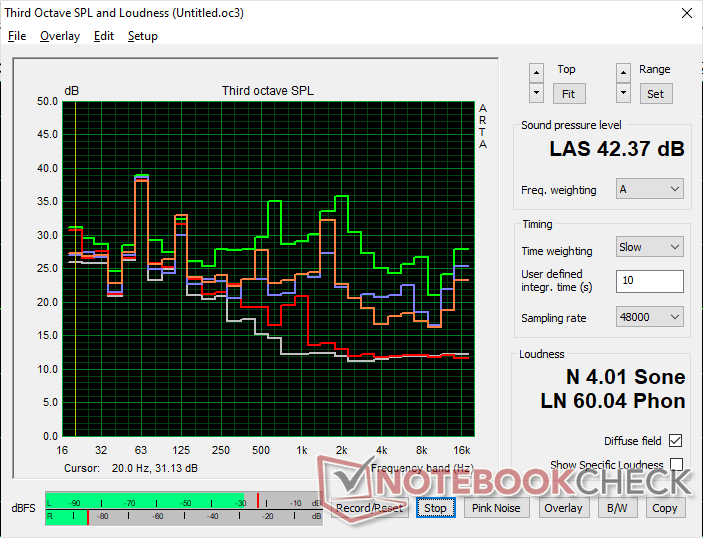
System Noise — Less Annoying Fans

The cooling solution consists of two asymmetric fans plus a vapor chamber cooler. It's not uncommon to see two fans for a mini PC such as on the Minisforum Mercury Series EM680, but a vapor chamber is usually reserved for high-end desktop GPUs and gaming laptops.

Fan noise has changed for the better when compared to last year's GTR6. Most specifically, our complaints about frequent pulsing has been addressed for steadier fan noise levels overall. For example, fan noise on the GTR6 would pulse from silent to as high as 36 dB(A) during low loads like browsing or video streaming whereas our GTR7 would be much quieter in the 28 to 32 dB(A) range instead.

Running higher loads like games may induce a fan noise level between 36 and 43 dB(A) which is in the same range as the Intel NUC 13 Pro but still much louder than the Minisforum Mercury Series EM680. The low 40 dB(A) range is also typical of many Core U-series laptops when running similar loads.

Fan noise profile (White: Background, Red: System idle, Blue: 3DMark 06, Orange: Witcher 3, Green: Prime95+FurMark stress)

Noise Level

Idle
28.1 / 28.1 / 28.1 dB(A)
Load
34.9 / 42.4 dB(A)
  red to green bar
 
 
30 dB
silent
40 dB(A)
audible
50 dB(A)
loud
 
min: dark, med: mid, max: light   Earthworks M23R, Arta (15 cm distance)   environment noise: 25.6 dB(A)
dB(A) 0102030405060708090Deep BassMiddle BassHigh BassLower RangeMidsHigher MidsLower HighsMid HighsUpper HighsSuper Highs2027.32730.72630.82526.827.426.625.829.13127.126.827.625.828.64022.821.521.22124.55027.427.126.526.328.3633838.638.338.638.98025.62525.823.329.210026.424.425.324.927.91253330.131.731.732.416023.722.723.42125.920023.123.521.320.425.32502423.221.520.928.331522.520.722.617.227.740023.523.519.317.52850027.823.519.315.229.863022.82116.614.634.980023.321.419.512.328.7100024.224.120.912.229.2125024.523.713.612.430160032.227.313.912.433.5200022.722.212.91235.7250020.620.61211.230.4315019.121.212.311.127.3400016.820.711.811.625.1500017.9211211.824.2630018.422.612.111.925.7800017.118.512.211.926.61000016.216.511.912211250018.721.912.112.224.11600023.325.411.712.327.9SPL36.434.928.125.642.4N2.32.21.10.84median 23.1median 22.6median 13.9median 12.3median 27.9Delta2.91.54.93.12.3hearing rangehide median Fan NoiseBeelink GTR7 7840HS
Beelink GTR7 7840HS
Radeon 780M, R7 7840HS, Crucial P3 Plus CT1000P3PSSD8
Beelink SER6 Pro Ryzen 7 7735HS
Radeon 680M, R7 7735HS, Kingston NV2 500GB SNV2S/500G
Beelink GTR6
Radeon 680M, R9 6900HX, Kingston KC3000 512G SKC3000S512G
Beelink SEi11 Pro
Iris Xe G7 96EUs, i5-11320H, Kingston NV1 SNVS/500GCN
Intel NUC 13 Pro Kit NUC13ANK
Iris Xe G7 96EUs, i7-1360P, Samsung PM9A1 MZVL2512HCJQ
Minisforum Mercury Series EM680
Radeon 680M, R7 6800U, Kingston OM3PGP4512Q
Noise
5%
-2%
9%
-10%
-0%
off / environment *
25.6
23.3
9%
23.2
9%
22.8
11%
29.8
-16%
29.7
-16%
Idle Minimum *
28.1
23.3
17%
23.6
16%
24.7
12%
30.2
-7%
30.8
-10%
Idle Average *
28.1
23.3
17%
23.8
15%
24.7
12%
31.1
-11%
30.8
-10%
Idle Maximum *
28.1
26.2
7%
36.2
-29%
25.3
10%
31.9
-14%
31
-10%
Load Average *
34.9
40.2
-15%
39.7
-14%
33.2
5%
40
-15%
31.2
11%
Witcher 3 ultra *
36.4
37
-2%
41
-13%
34.5
5%
32.2
12%
Load Maximum *
42.4
40.2
5%
43
-1%
37.8
11%
40.5
4%
33.6
21%

* ... smaller is better

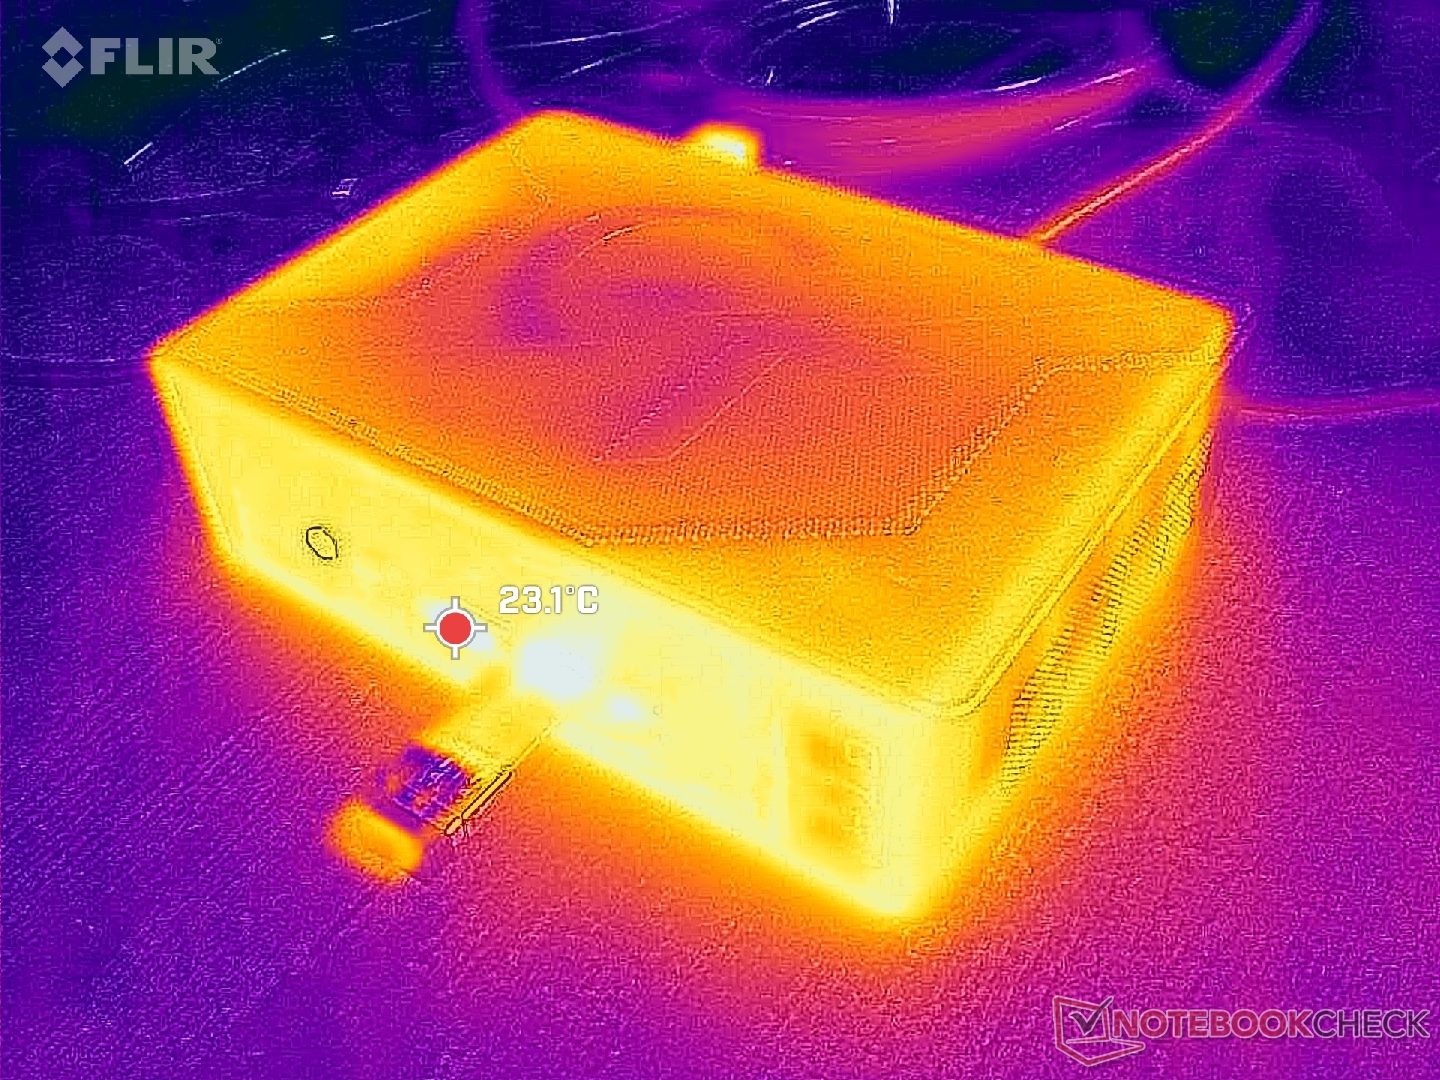
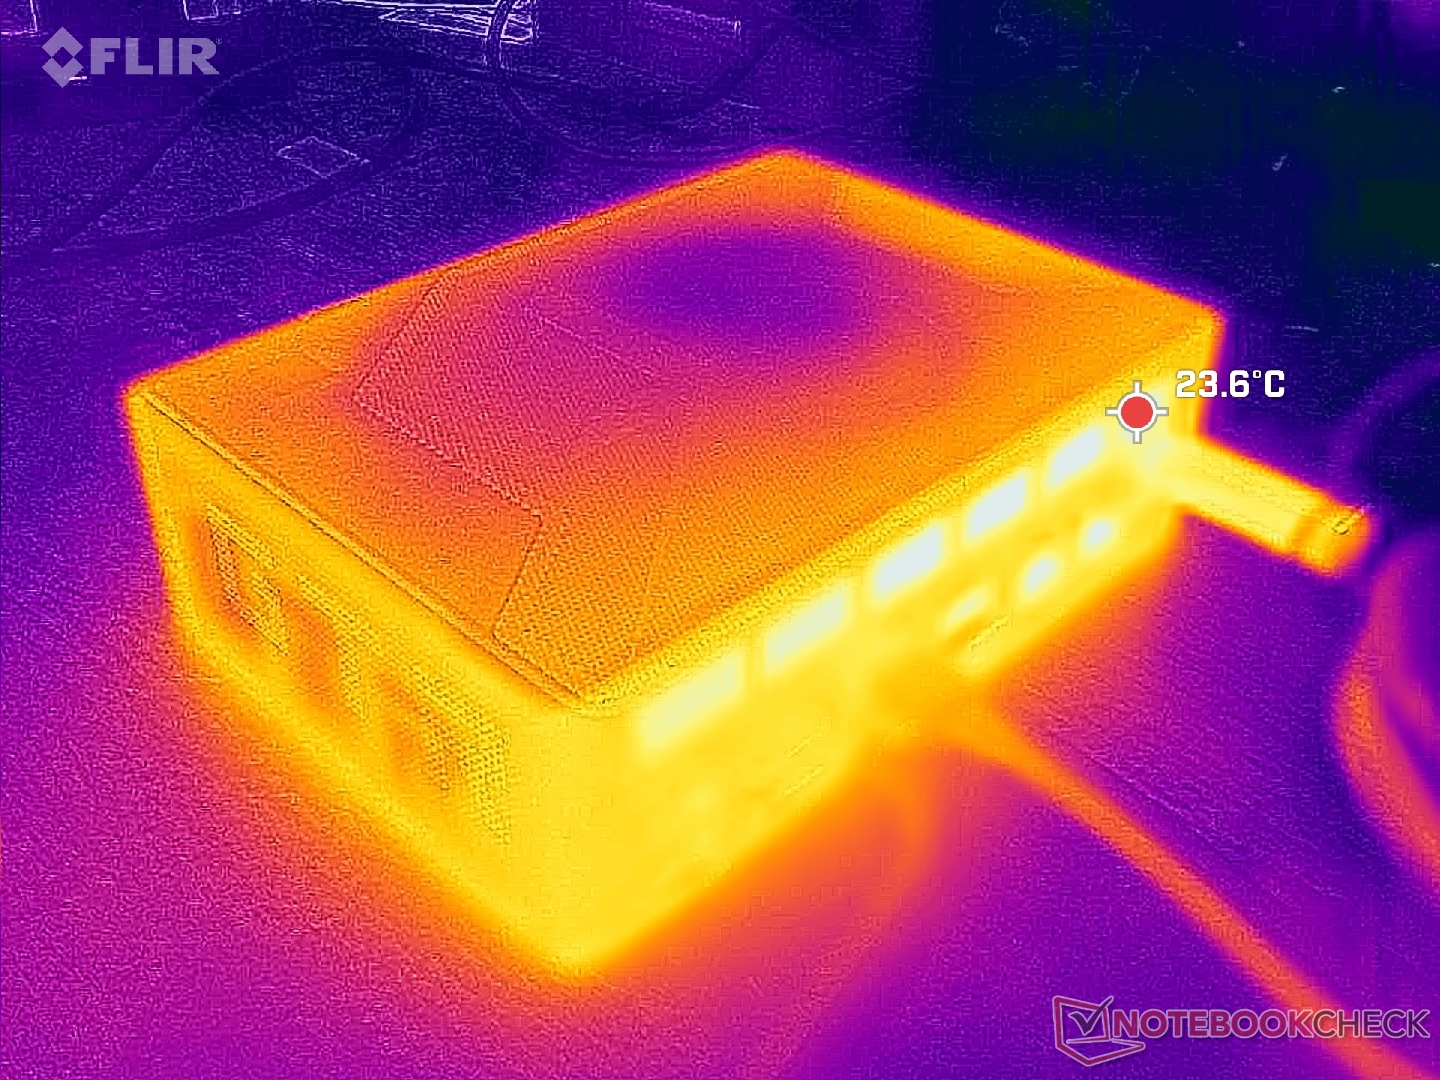
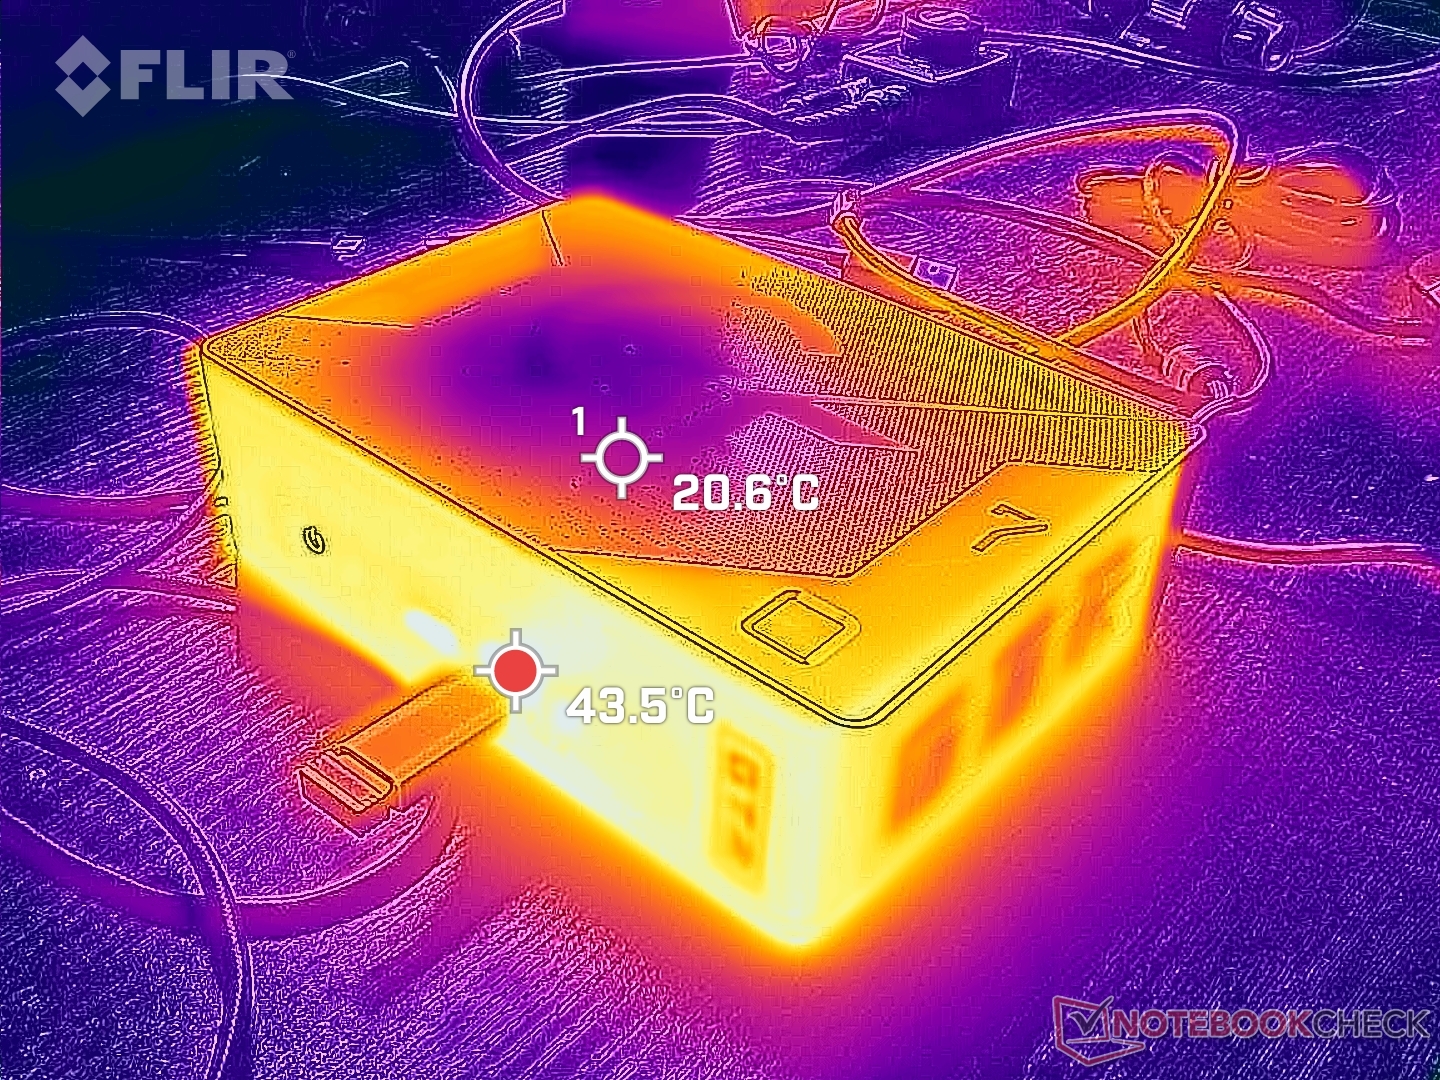
Temperature — Warmer Than Before

AC adapter can reach 50 C when running demanding loads for long periods

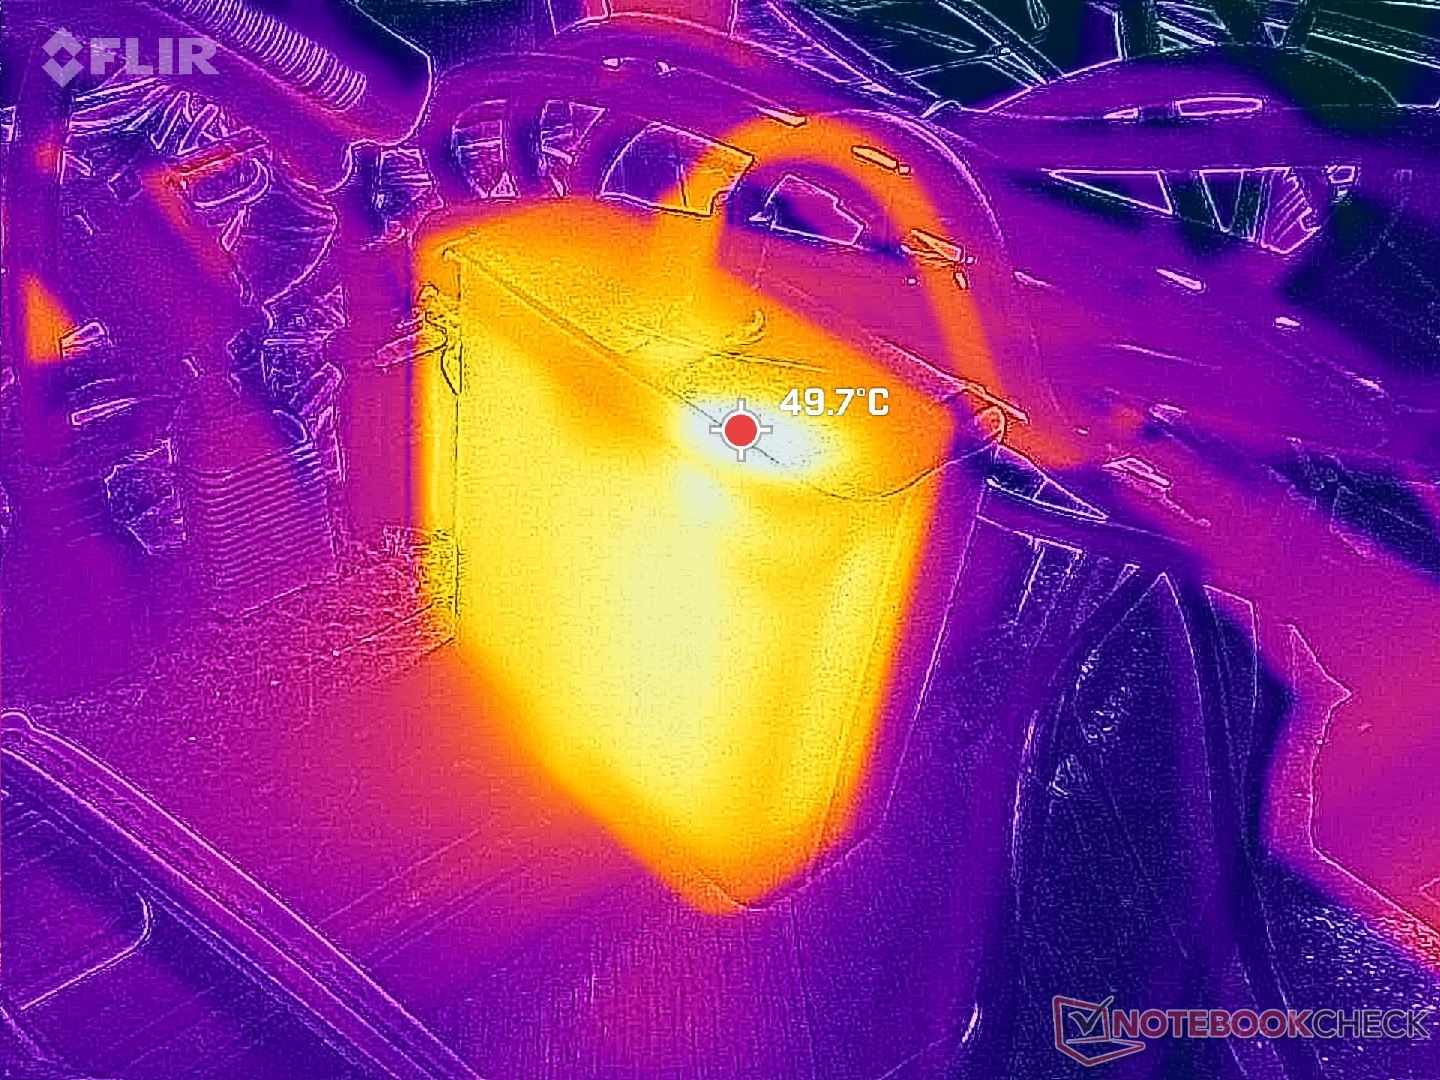
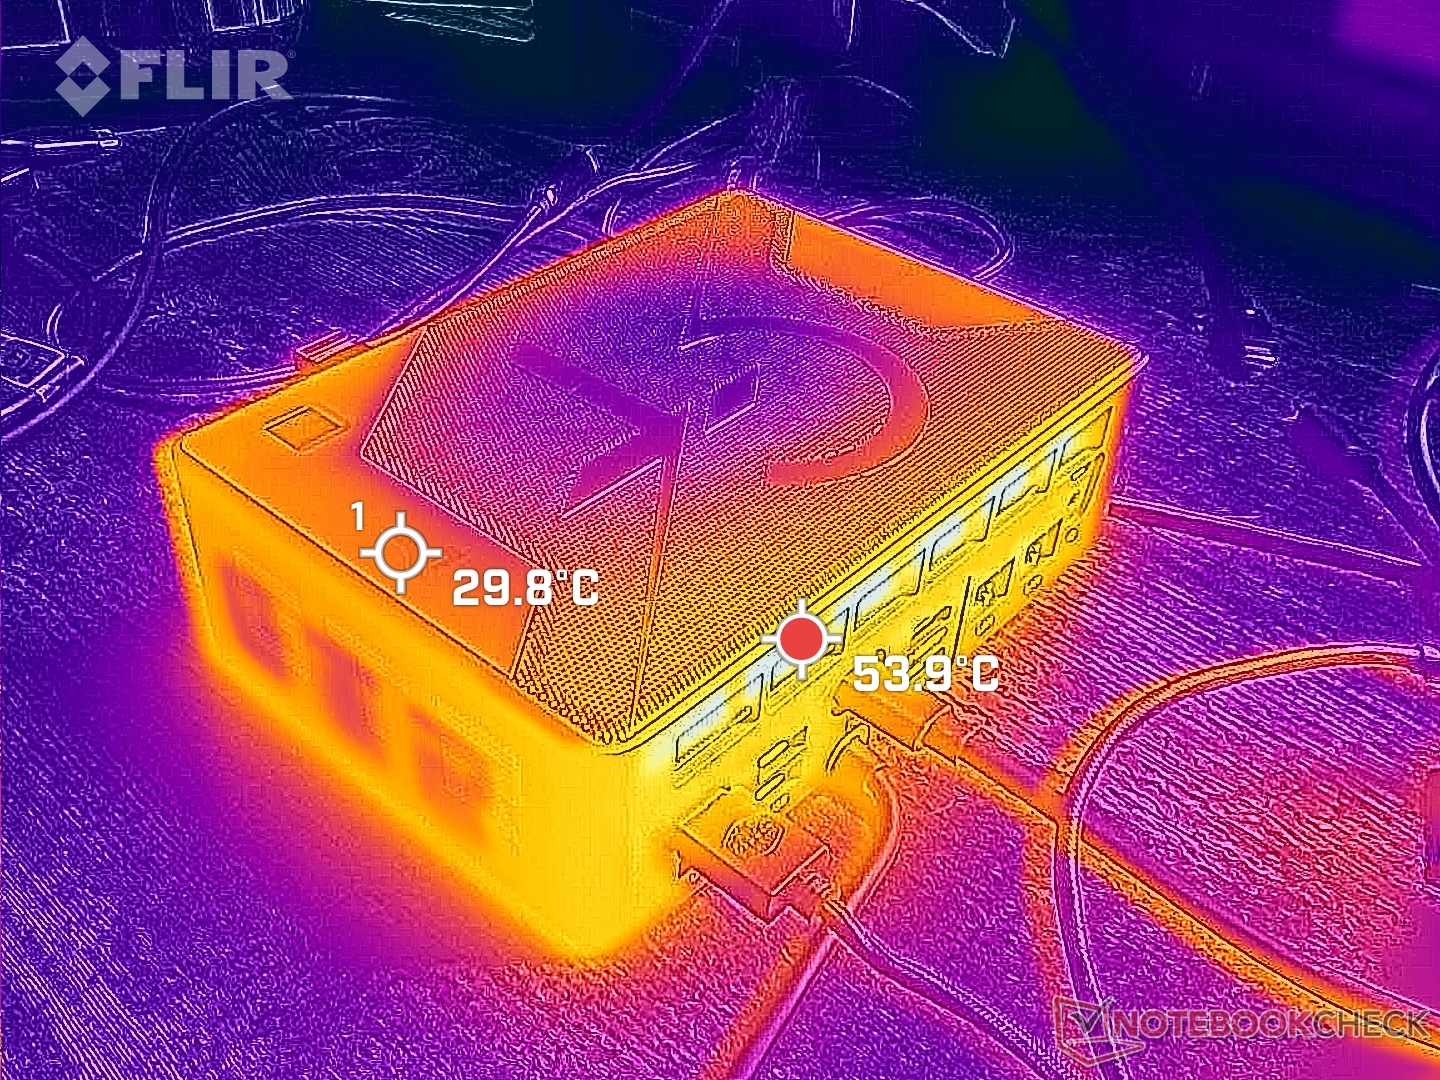
Cool air enters from the top and waste heat exits from the rear as shown by the temperature maps below. Thus, placing any items on top is not recommended to preserve optimal airflow. Standing the unit vertically, however, appears to be safe.

Keep in mind that the exhaust heat from the rear can be very warm at up to 50 C which is warmer than on many other mini PCs including those from the same manufacturer. Be sure to leave ample space between the rear of the unit and the wall for safety reasons.

System idle (front)
System idle (front)
System idle (back)
System idle (back)
Prime95+FurMark stress (front)
Prime95+FurMark stress (back)

Stress Test

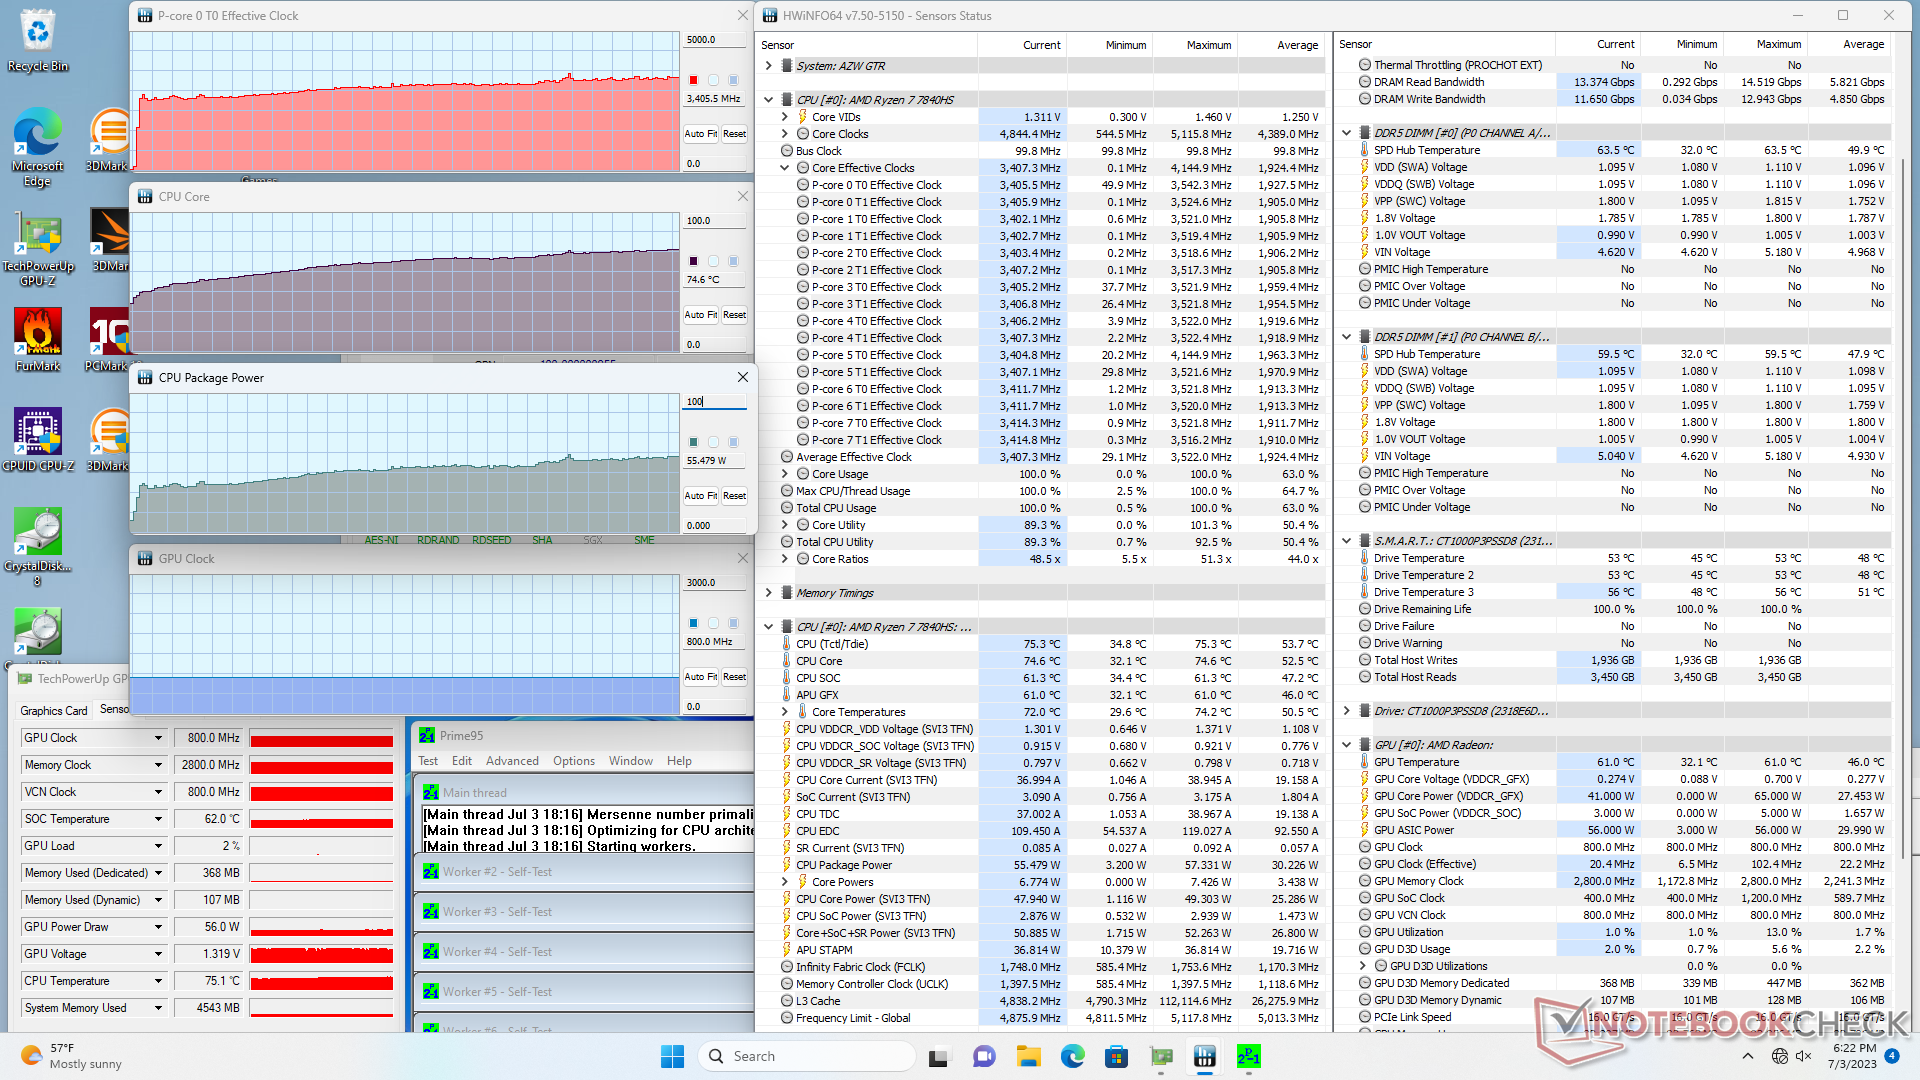
When stressed with Prime95, the CPU would boost to 2.8 GHz and 35 W and then steadily increase from there until it approaches 3.6 GHz, 60 W, and 76 C. The relatively slow boost means it may be more difficult to exploit the high clock rate ceilings of the processor in short bursts such as when editing pictures or launching applications. Repeating the Prime95 test on last year's GTR6 would result in both lower stable clock rates and a cooler core temperature by about 10 degrees.

Running Witcher 3 to represent typical gaming loads would show similar results: higher GPU clock rates than on the GTR6 (2700 MHz vs. 1977 MHz) but with warmer core temperatures as well (68 C vs. 56 C).
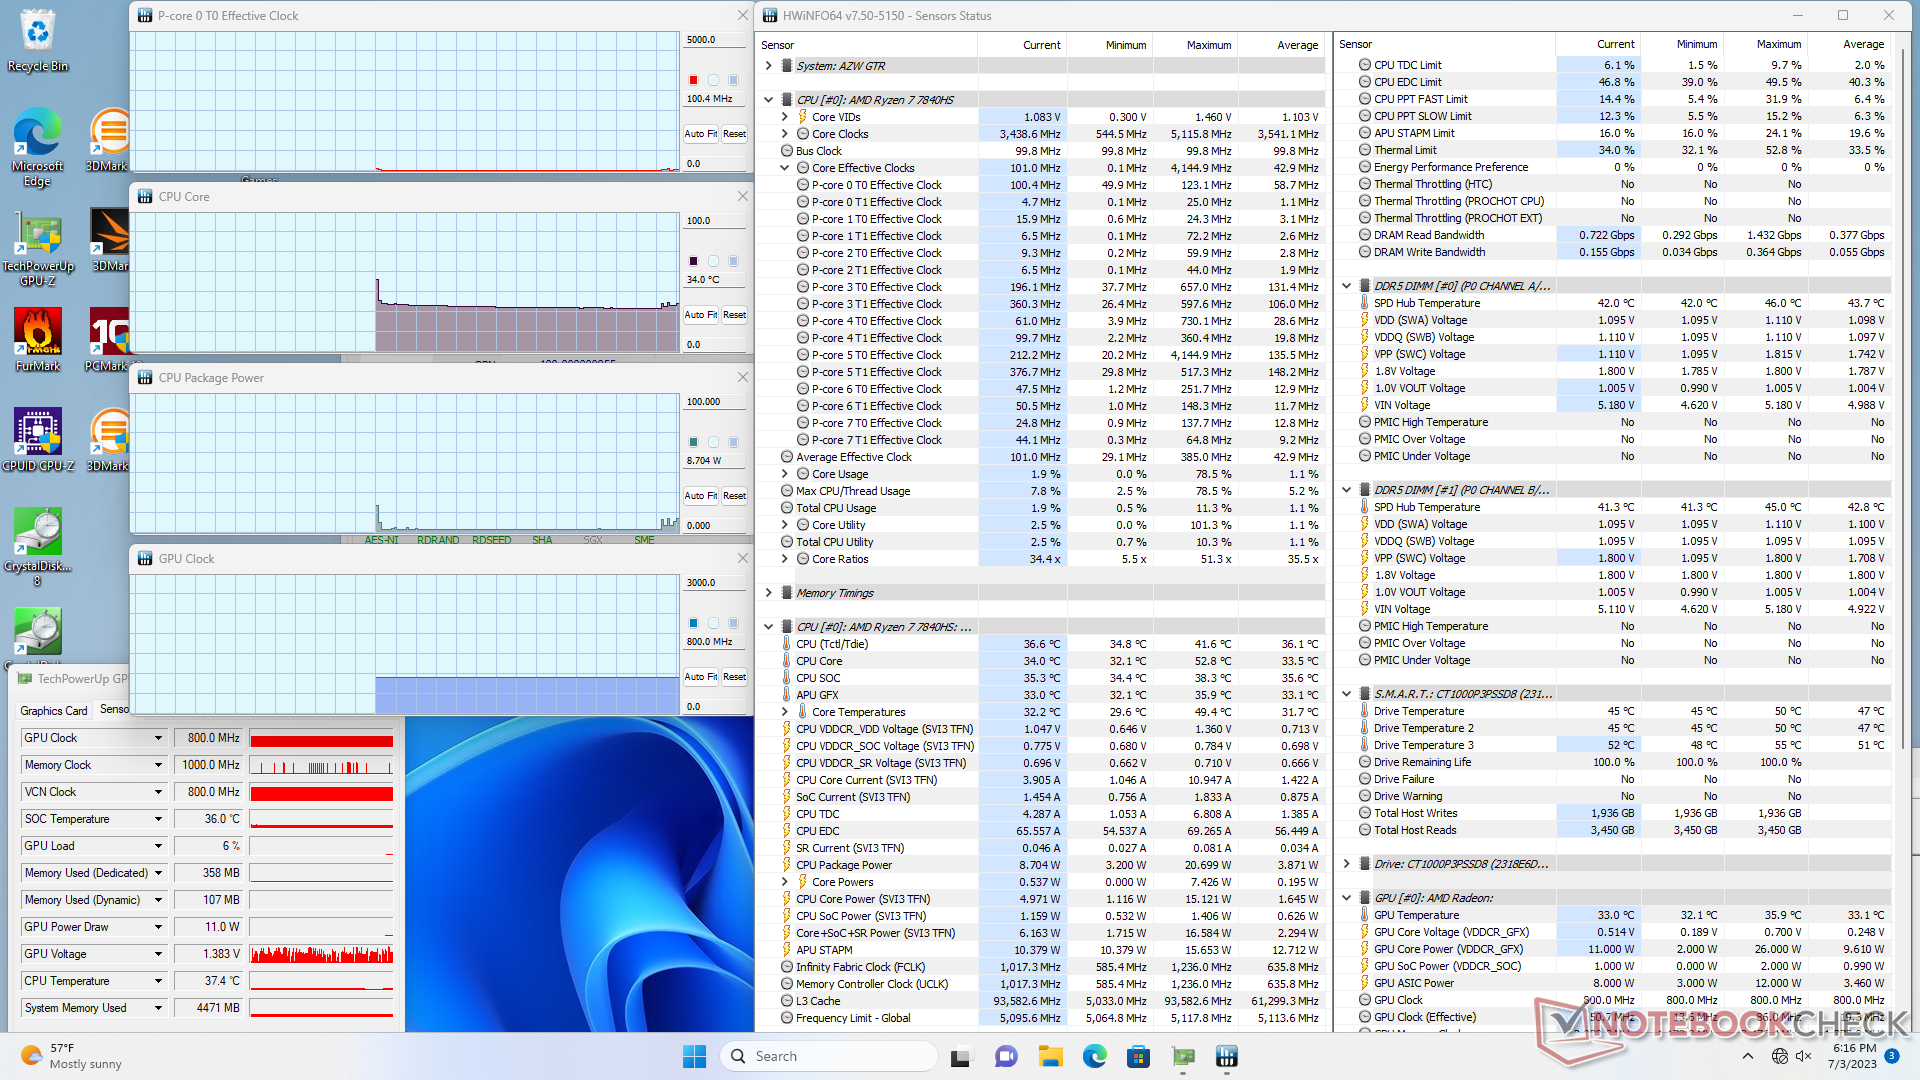
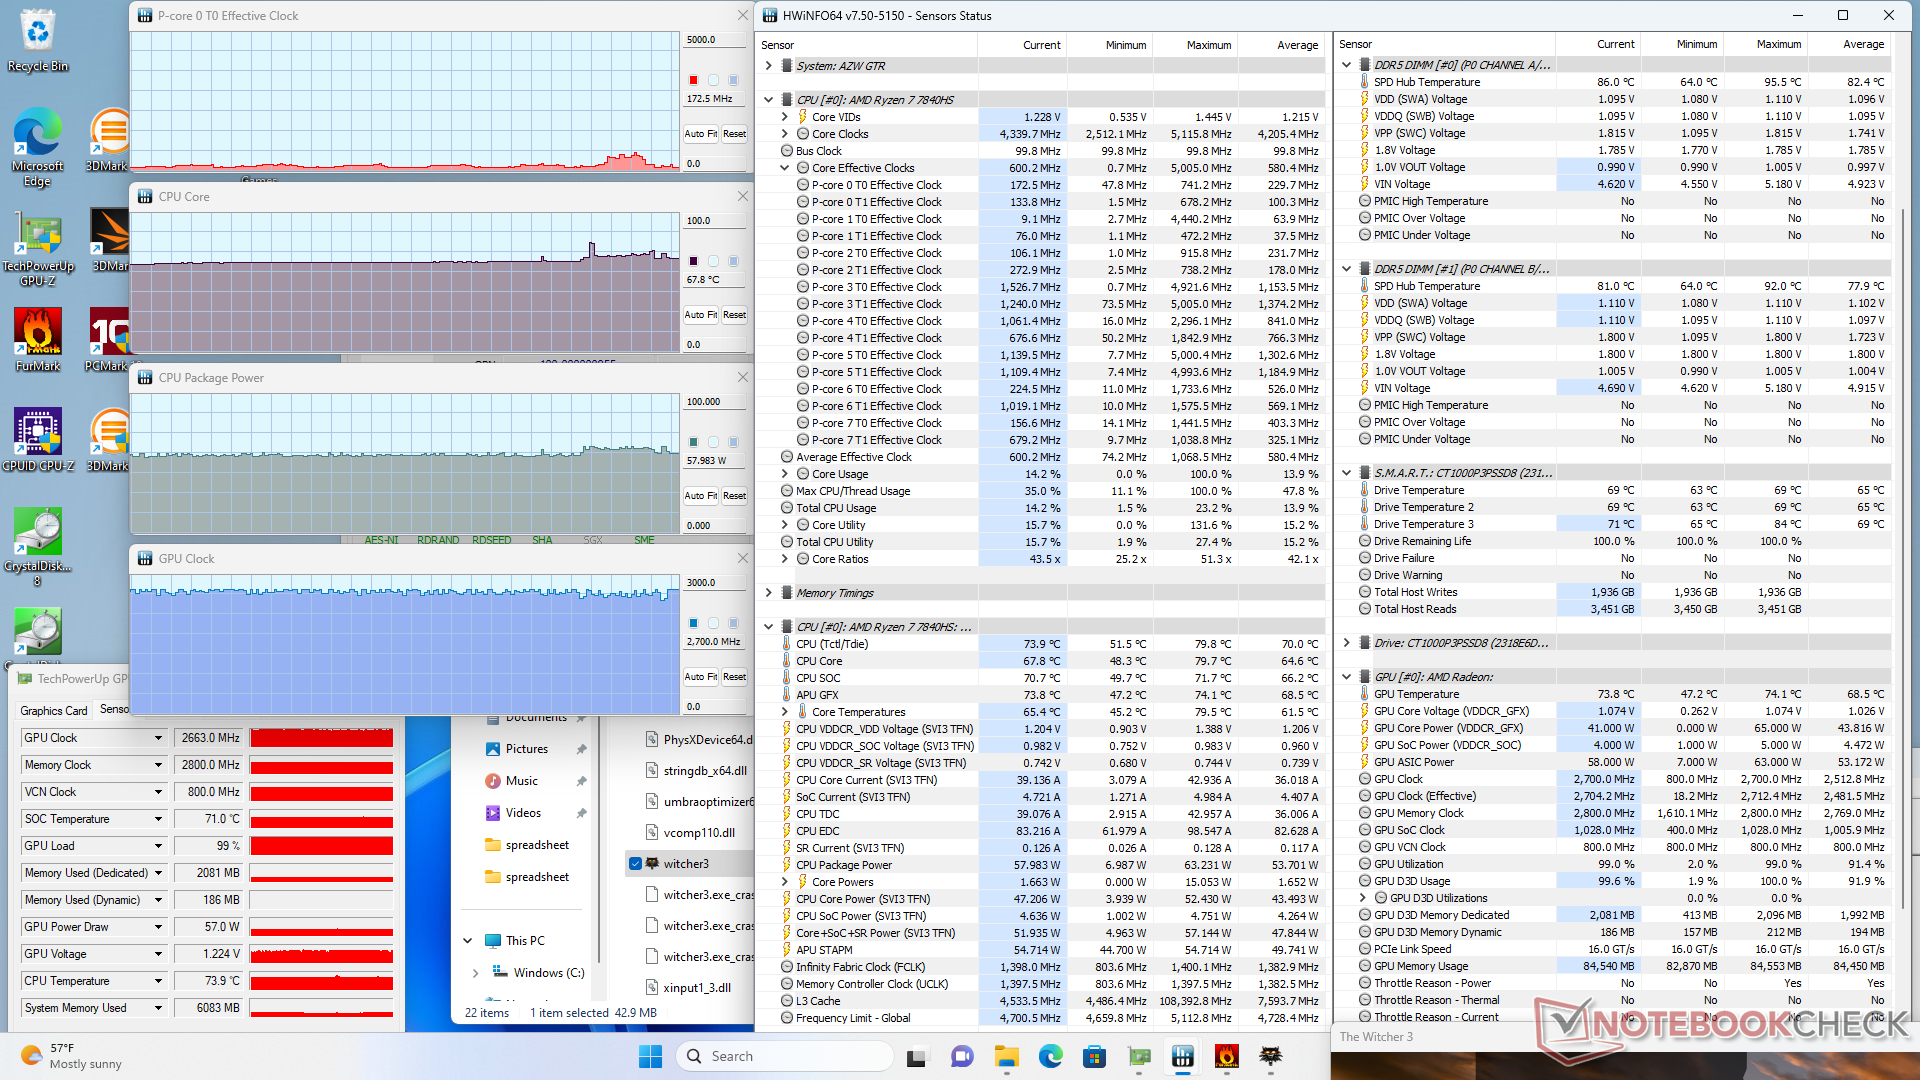
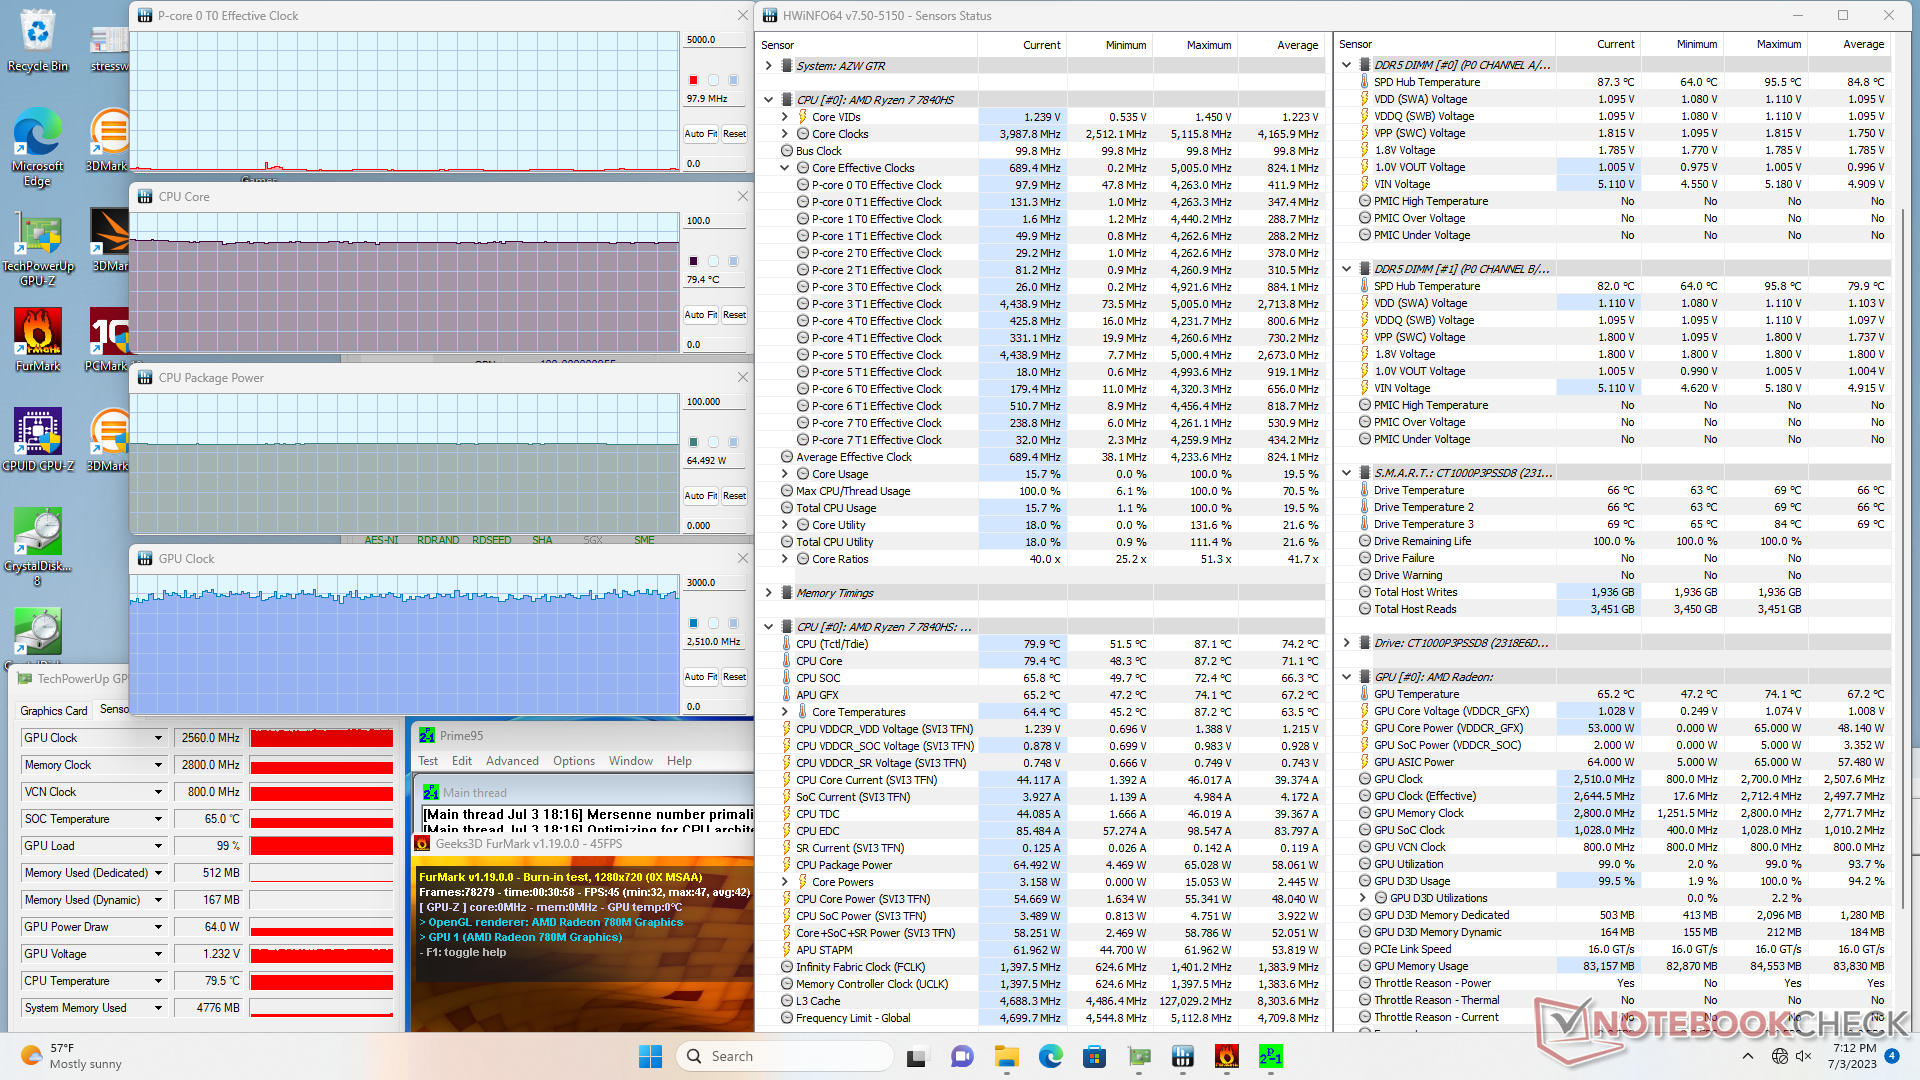
System idle
System idle
Witcher 3 stress
Witcher 3 stress
Prime95 stress
Prime95 stress
Prime95+FurMark stress
CPU Clock (GHz) GPU Clock (MHz) Average CPU Temperature (°C)
System Idle -- -- 34
Prime95 Stress 3.5 -- 76
Prime95 + FurMark Stress ~0.7 2510 80
Witcher 3 Stress ~0.6 2700 68

Energy Management — With Great Power Comes Great Demands

Power Consumption

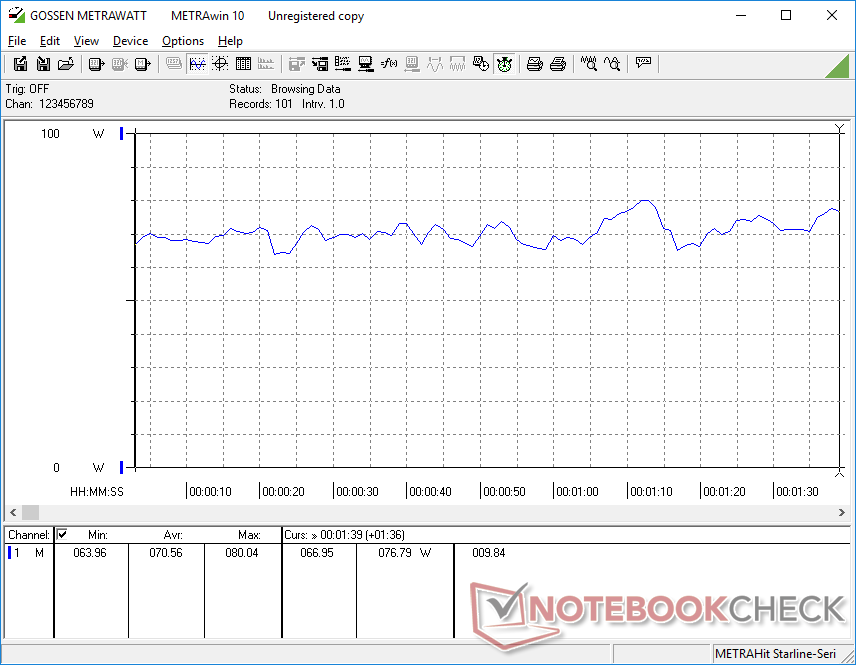
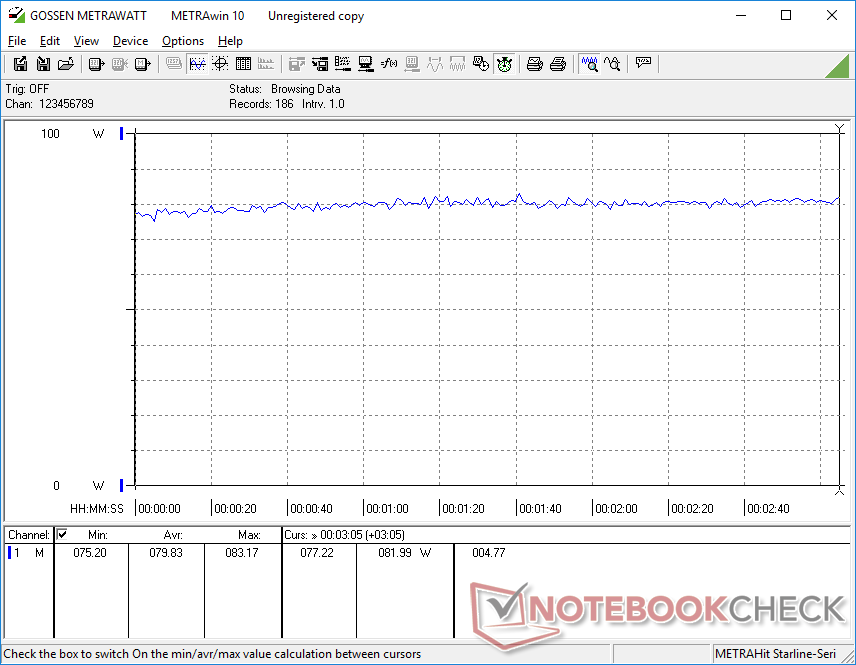
The Ryzen 7 7840HS is definitely fast, but power demand is on the higher side as well. When compared to the Ryzen 7 7735H-powered SER6, our GTR7 would demand up to 30 percent more power when running games and almost 50 percent more power when running Prime95 stress. These differences are enough to propel the Beelink to be one of the more power-hungry mini PCs available not including those with discrete GPUs.

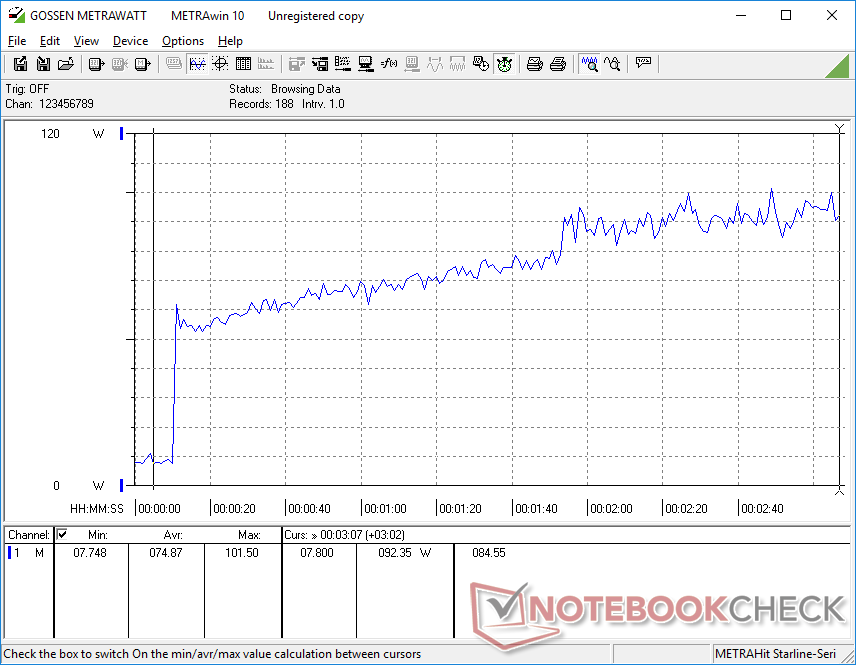
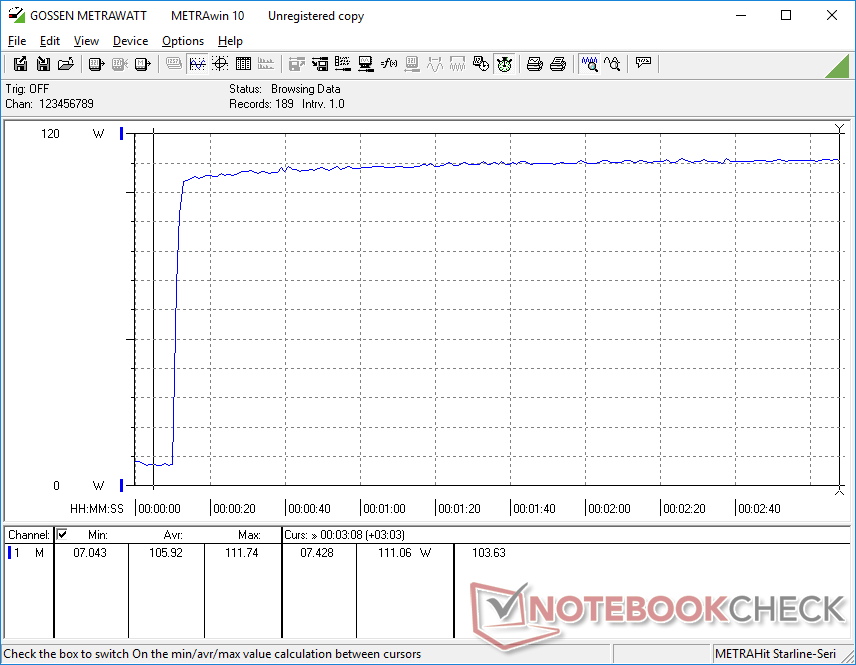
Interestingly, consumption would slowly increase when initiating Prime95 stress as shown by the graphs below whereas the opposite is true on most other laptops and mini PCs. This behavior aligns with our Stress Test observations above where clock rates and board power draw would also steadily increase before settling at stable rates.

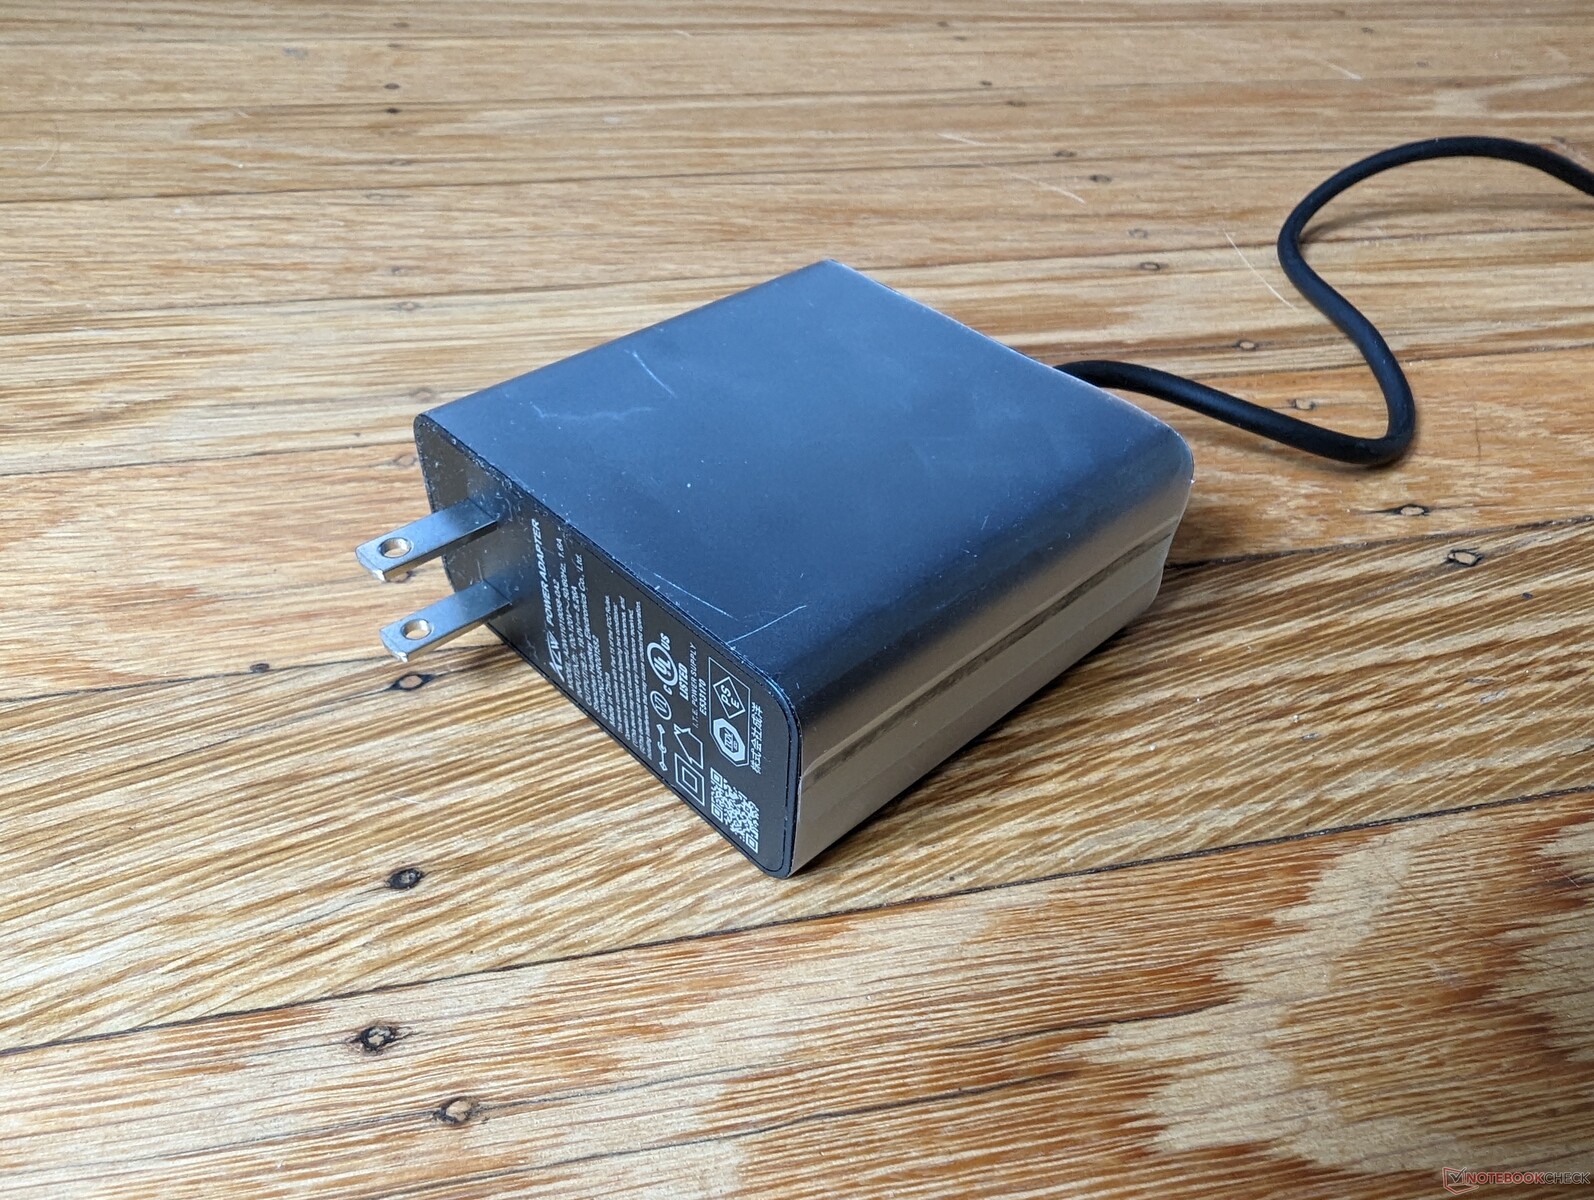
We're able to measure a maximum draw of 112 W from the small (~6.9 x 6.9 x 3 cm) 100 W AC adapter when running both Prime95 and FurMark simultaneously. The system could have likely benefited from a higher capacity AC adapter.

3DMark 06 power consumption
Witcher 3 1080p Ultra consumption
Power consumption increases over time from 61 W to just over 100 W when initiating Prime95 stress
Prime95+FurMark stress initiated at 10s mark
Power Consumption
Off / Standbydarklight 1.5 / 1.7 Watt
Idledarkmidlight 5.5 / 5.8 / 7.7 Watt
Load midlight 70.6 / 111.8 Watt
 color bar
Key: min: dark, med: mid, max: light        Metrahit Energy
Currently we use the Metrahit Energy, a professional single phase power quality and energy measurement digital multimeter, for our measurements. Find out more about it here. All of our test methods can be found here.
Beelink GTR7 7840HS
R7 7840HS, Radeon 780M, Crucial P3 Plus CT1000P3PSSD8, , x,
Beelink SER6 Pro Ryzen 7 7735HS
R7 7735HS, Radeon 680M, Kingston NV2 500GB SNV2S/500G, , x,
Beelink GTR6
R9 6900HX, Radeon 680M, Kingston KC3000 512G SKC3000S512G, , x,
Beelink SEi11 Pro
i5-11320H, Iris Xe G7 96EUs, Kingston NV1 SNVS/500GCN, , x,
Intel NUC 13 Pro Kit NUC13ANK
i7-1360P, Iris Xe G7 96EUs, Samsung PM9A1 MZVL2512HCJQ, , x,
Minisforum Mercury Series EM680
R7 6800U, Radeon 680M, Kingston OM3PGP4512Q, , x,
Power Consumption
-13%
-16%
-15%
-4%
16%
Idle Minimum *
5.5
8.9
-62%
7.6
-38%
9.8
-78%
5.1
7%
7
-27%
Idle Average *
5.8
9
-55%
9.9
-71%
10.3
-78%
5.8
-0%
7.2
-24%
Idle Maximum *
7.7
9.3
-21%
10.6
-38%
10.5
-36%
10.2
-32%
7.2
6%
Load Average *
70.6
62.5
11%
64
9%
54.2
23%
68.1
4%
20
72%
Witcher 3 ultra *
79.8
62.6
22%
69
14%
53.1
33%
Load Maximum *
111.8
80.1
28%
80.4
28%
59
47%
108.3
3%
52.1
53%

* ... smaller is better

Power Consumption Witcher 3 / Stresstest

0102030405060708090100110Tooltip
Beelink GTR7 7840HS R7 7840HS, Radeon 780M; Witcher 3 ultra: Ø79.8 (75.2-83.2)
Beelink SER6 Pro Ryzen 7 7735HS R7 7735HS, Radeon 680M; Witcher 3 ultra: Ø62.6 (60.9-64.9)
Beelink GTR7 7840HS R7 7840HS, Radeon 780M; 1280x720 Prime95 28.10 and Furmark 1.25: Ø109.3 (104-111.7)
Beelink SER6 Pro Ryzen 7 7735HS R7 7735HS, Radeon 680M; 1280x720 Prime95 28.10 and Furmark 1.25: Ø65 (63.6-80.1)

Power Consumption external Monitor

0102030405060708090100Tooltip
Beelink GTR7 7840HS R7 7840HS, Radeon 780M; Prime95 V2810 Stress (external Monitor): Ø77 (52.5-101.5)
Beelink SER6 Pro Ryzen 7 7735HS R7 7735HS, Radeon 680M; Prime95 V2810 Stress (external Monitor): Ø63.6 (62.6-72)
Beelink GTR7 7840HS R7 7840HS, Radeon 780M; Cinebench R15 Multi (external Monitor): Ø97.1 (95.3-98.6)
Beelink SER6 Pro Ryzen 7 7735HS R7 7735HS, Radeon 680M; Cinebench R15 Multi (external Monitor): Ø62.7 (55.1-67.9)
Beelink GTR7 7840HS R7 7840HS, Radeon 780M; 1280x720 FurMark 1.19 GPU Stress Test (external Monitor): Ø73.7 (69.9-85.6)
Beelink SER6 Pro Ryzen 7 7735HS R7 7735HS, Radeon 680M; 1280x720 FurMark 1.19 GPU Stress Test (external Monitor): Ø63.9 (62.7-67.8)
Beelink GTR7 7840HS R7 7840HS, Radeon 780M; 1920x1080 The Witcher 3 ultra (external Monitor): Ø79.8 (75.2-83.2)
Beelink SER6 Pro Ryzen 7 7735HS R7 7735HS, Radeon 680M; 1920x1080 The Witcher 3 ultra (external Monitor): Ø62.6 (60.9-64.9)
Beelink GTR7 7840HS R7 7840HS, Radeon 780M; Idle 1min (external Monitor): Ø6.19 (5.69-7.54)
Beelink SER6 Pro Ryzen 7 7735HS R7 7735HS, Radeon 680M; Idle 1min (external Monitor): Ø9.2 (8.79-12.5)

Pros

+ easy serviceability; 2x M.2 2280 SSDs + 2x SODIMM
+ one of the fastest integrated GPUs in the market
+ high quality metal build
+ reasonable fan noise
+ 2x 2.5G RJ-45 ports

Cons

- no Kensington lock, SD reader, or USB-C Thunderbolt support
- larger and heavier than previous generation
- proprietary AC adapter instead of USB-C
- 4K60 video playback stuttering issues
- relatively high power consumption

Verdict — Faster And Cheaper Than An Intel NUC13 Pro

In review: Beelink GTR7. Test unit provided by Beelink

The Beelink GTR7 improves upon the strengths of the GTR6. The CPU and iGPU, which were already some of the fastest in 2022, are now even faster for this year's refresh. The GTR7 is one of the few mini PCs with integrated graphics that can actually run the latest games to be a powerhouse of an HTPC.

The improvements don't come free, so to speak. The significant performance increases demand more power from the outlet than many other mini PCs which in turn leads to more heat, warmer core temperatures, a new vapor chamber cooler, and ultimately a larger and heavier chassis design. Don't expect the GTR7 to be as tiny as many Intel NUCs.

The GTR7 isn't just a rival to the Intel NUC, but it also outclasses them on many fronts. 

Some bugs should definitely be addressed. The stuttering 4K60 video playback, lack of support for AMD Auto-Detect and Install tool, and Blender HIP crashes all directly hinder the versatility of the GTR7. We've notified the manufacturer about our findings and will update the page should any fixes become available.

We would like to see a few changes to better justify the year-over-year increase in size. Extras features like a Kensington lock, SD reader, easier accessibility to both sides of the motherboard, and default Wi-Fi 6E support would make the already excellent GTR7 an even easier recommendation. The competing Minisforum Mercury Series EM680, for example, integrates liquid metal cooling for potentially more efficient cooling. Beelink says its vapor chamber cooler is a comparatively more expensive solution than liquid metal.

Price and Availability

Beelink is now shipping the GTR7 for $789 USD complete with 32 GB of RAM and 1 TB of storage.

Beelink GTR7 7840HS - 07/07/2023 v7
Allen Ngo

Chassis
84 / 98 → 85%
Connectivity
58 / 81 → 72%
Weight
77%
Games Performance
82%
Application Performance
97%
Noise
87%
Average
81%
86%
Mini PC - Weighted Average

Transparency

The present review sample was made available to the author as a loan by the manufacturer or a shop for the purposes of review. The lender had no influence on this review, nor did the manufacturer receive a copy of this review before publication. There was no obligation to publish this review.

Pricecompare

Read all 11 comments / answer
static version load dynamic
Loading Comments
Comment on this article
Please share our article, every link counts!
> Expert Reviews and News on Laptops, Smartphones and Tech Innovations > Reviews > AMD Ryzen 7 7840HS performance debut: Beelink GTR7 mini PC review
Allen Ngo, 2023-07- 7 (Update: 2023-07-11)