Reviews for the AMD Ryzen 7 7840HS processor
Powerful mini PC for the money? Peladn HA-4 challenges Geekom, Minisforum and co. - the efficiency miracle with Ryzen 7 7840HS review
The Peladn HA-4 is a powerful yet compact mini PC with the AMD Ryzen 7 7840HS processor, 8 Zen4 cores and integrated Radeon 780M graphics. Thanks to fast DDR5 R...
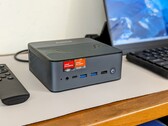
AMD Ryzen 7 7840HS | AMD Radeon 780M | 965 gBosgame M4 Neo test - the affordable alternative to expensive mini PCs
Small, powerful and flexible - with the AMD Ryzen 7 7840HS, Radeon 780M iGPU and OCuLink connection, the Bosgame M4 Neo packs a lot of performance into a mini f...
AMD Ryzen 7 7840HS | AMD Radeon 780M | 560 gBOSGAME M1 mini PC review: Ryzen 7 7840HS is still a beast
If you don't care about AI acceleration, then the Bosgame M1 is one of the fastest mini PCs you can get for the size. It even includes integrated stereo speaker...
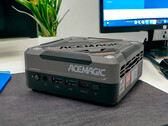
AMD Ryzen 7 7840HS | AMD Radeon 780M | 766 gAcemagic AM18 review: Gaming mini-PC in eye-catching cyberpunk look with AMD Ryzen 7 7840HS and 32 GB RAM
The Acemagic AM18 is advertised as a compact gaming PC. Together with the AMD Ryzen 7 7840HS and the AMD Radeon 780M, it contains exciting hardware that can be ...
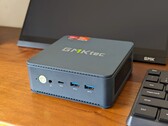
AMD Ryzen 7 7840HS | AMD Radeon 780M | 600 gGMK NucBox K6 mini PC review: As powerful as the latest Intel Core Ultra laptops
The mini PC comes with 16 GB of RAM, 1 TB of storage, and a powerful Ryzen 7 7840HS all for under $500 to be an attractive alternative to the Intel NUC. There a...
AMD Ryzen 7 7840HS | AMD Radeon 780M | 514 gGigabyte Aorus RTX 4090 Gaming Box (eGPU): , 0.00"
Review » Gigabyte Aorus RTX 4090 Gaming Box review: Nvidia's fastest consumer graphics card is massively restrained by Thunderbolt
Tuxedo Pulse 14 Gen3: AMD Radeon 780M, 14.00", 1.4 kg
Review » Tuxedo Pulse 14 Gen3 review - The Linux Ultrabook with AMD Zen4 and a 120-Hz display
Lenovo Yoga Pro 7 14APH G8: AMD Radeon 780M, 14.50", 1.5 kg
Review » Lenovo Yoga Pro 7 14 G8 laptop review - AMD Zen4 isn’t automatically better
Minisforum EliteMini UM780 XTX: AMD Radeon 780M, 0.8 kg
Review » Minisforum EliteMini UM780 XTX review: The mini PC with an AMD Ryzen 7 7840HS and a Radeon 780M has been given OCuLink and USB-4 connections
Lenovo Legion Slim 7 16APH8: NVIDIA GeForce RTX 4060 Laptop GPU, 16.00", 2.1 kg
Review » Lenovo Legion Slim 7 16 gaming laptop in review: Convincing even with AMD Ryzen
Schenker XMG Apex 15 (Late 23): NVIDIA GeForce RTX 4050 Laptop GPU, 15.60", 2.2 kg
Review » XMG Apex 15 (Late 23) review: The gaming laptop with an RTX 4050 that delivers good runtimes
Schenker XMG CORE 16 (L23): NVIDIA GeForce RTX 4070 Laptop GPU, 16.00", 2.4 kg
Review » SCHENKER XMG Core 16 gaming laptop review - A real competitor to the Lenovo Legion Pro 5 16
Schenker XMG Apex 17 (Late 23): NVIDIA GeForce RTX 4060 Laptop GPU, 17.30", 2.5 kg
Review » XMG Apex 17 (late 23) review: a QHD gaming laptop with an RTX 4060
Lenovo Legion Slim 5 14APH8: NVIDIA GeForce RTX 4060 Laptop GPU, 14.50", 1.7 kg
Review » Lenovo Legion Slim 5 14APH8 laptop review: 120 Hz 2.5K OLED sweet spot
HP Omen 16-xf0376ng: NVIDIA GeForce RTX 4070 Laptop GPU, 16.10", 2.4 kg
Review » HP Omen 16 laptop review: A good choice for gamers even with Zen 4
Beelink SER7: AMD Radeon 780M, 0.6 kg
Review » Beelink SER7 mini PC review: Ryzen 7 7840HS with vapor chamber cooling
Lenovo Legion Slim 5 16APH8: NVIDIA GeForce RTX 4060 Laptop GPU, 16.00", 2.4 kg
Review » Lenovo Legion Slim 5 16APH8 laptop review: Underappreciated design with an underperforming GPU
Lenovo LOQ 15APH8: NVIDIA GeForce RTX 4050 Laptop GPU, 15.60", 2.5 kg
Review » Lenovo LOQ 15 Ryzen 7 7840HS laptop review: Don't call it a Legion
Beelink GTR7 7840HS: AMD Radeon 780M, 0.9 kg
Review » AMD Ryzen 7 7840HS performance debut: Beelink GTR7 mini PC review
Acer Nitro 16 AN16-41, R7 7840HS RTX 4060: NVIDIA GeForce RTX 4060 Laptop GPU, 16.00", 2.7 kg
External Review » Acer Nitro 16 AN16-41, R7 7840HS RTX 4060
HP ZBook Firefly 14 G10, R7 7840HS: AMD Radeon 780M, 14.00", 1.5 kg
External Review » HP ZBook Firefly 14 G10, R7 7840HS
Acer Nitro 16 AN16-41-R6KQ: NVIDIA GeForce RTX 4070 Laptop GPU, 16.00", 2.7 kg
External Review » Acer Nitro 16 AN16-41-R6KQ
HP Omen 16-xf0079ng: NVIDIA GeForce RTX 4070 Laptop GPU, 16.10", 2.4 kg
External Review » HP Omen 16-xf0079ng
Lenovo IdeaPad Pro 5 16APH8: AMD Radeon 780M, 16.00", 1.9 kg
External Review » Lenovo IdeaPad Pro 5 16APH8
Acer Swift X SFX16-61G-R0SU: NVIDIA GeForce RTX 4050 Laptop GPU, 16.00", 2 kg
External Review » Acer Swift X SFX16-61G-R0SU
HP Victus 16-s0475ng: NVIDIA GeForce RTX 4060 Laptop GPU, 16.10", 2.3 kg
External Review » HP Victus 16-s0475ng
Acer Nitro 17 AN17-41-R182: NVIDIA GeForce RTX 4060 Laptop GPU, 17.30", 3 kg
External Review » Acer Nitro 17 AN17-41-R182
Acer Nitro 17 AN17-41: NVIDIA GeForce RTX 4070 Laptop GPU, 17.30", 3 kg
External Review » Acer Nitro 17 AN17-41
Schenker XMG CORE 16 (L23): NVIDIA GeForce RTX 4070 Laptop GPU, 16.00", 2.4 kg
External Review » SCHENKER XMG CORE 16 (L23)
HP Omen 16-xf0000: NVIDIA GeForce RTX 4060 Laptop GPU, 16.10", 2.4 kg
External Review » HP Omen 16-xf0000
Lenovo LOQ 15, R7 7840HS RTX 4060: NVIDIA GeForce RTX 4060 Laptop GPU, 15.60", 2.4 kg
External Review » Lenovo LOQ 15, R7 7840HS RTX 4060
Lenovo Yoga Pro 7 14APH G8: AMD Radeon 780M, 14.50", 1.5 kg
External Review » Lenovo Yoga Pro 7 14APH8
HP Victus 16-s0000ng: NVIDIA GeForce RTX 4050 Laptop GPU, 16.10", 2.3 kg
External Review » HP Victus 16-s0000ng
Lenovo IdeaPad 5 Pro 16APH8: AMD Radeon 780M, 16.00", 1.9 kg
External Review » Lenovo IdeaPad 5 Pro 16APH8
HP Victus 16-s0000: NVIDIA GeForce RTX 4070 Laptop GPU, 16.10", 2.3 kg
External Review » HP Victus 16-s0000
Lenovo Legion Slim 5 14APH8: NVIDIA GeForce RTX 4060 Laptop GPU, 14.50", 1.7 kg
External Review » Lenovo Legion Slim 5 14APH8
Xiaomi RedmiBook Pro 15 2023: AMD Radeon 780M, 15.60", 1.8 kg
External Review » Xiaomi RedmiBook Pro 15 2023
Lenovo LOQ 15APH8: NVIDIA GeForce RTX 4050 Laptop GPU, 15.60", 2.5 kg
External Review » Lenovo LOQ 15APH8
Acer Nitro 17 AN17-41-R6L9: NVIDIA GeForce RTX 4050 Laptop GPU, 17.30", 3 kg
External Review » Acer Nitro 17 AN17-41-R6L9
Lenovo Legion Slim 5 16APH8: NVIDIA GeForce RTX 4060 Laptop GPU, 16.00", 2.4 kg
External Review » Lenovo Legion Slim 5 16APH8
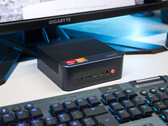
Peladn HA-4, R7 7840HS: AMD Radeon 780M, 1 kg
» Stylish Ryzen 7 mini PC reviewed - Peladn HA-4 scores with top efficiency and RGB lighting
Lenovo LOQ 15APH8: NVIDIA GeForce RTX 4050 Laptop GPU, 15.60", 2.5 kg
» Lenovo LOQ 15 with RTX 4070 is now going for cheaper than many RTX 4060 laptops
Lenovo Legion Slim 5 14APH8: NVIDIA GeForce RTX 4060 Laptop GPU, 14.50", 1.7 kg
» Lenovo Legion Slim 5 Gen 9 (2024) with RTX 4070 and Ryzen 7 8845HS is now available at massive 30% discount
Lenovo Legion Slim 5 16APH8: NVIDIA GeForce RTX 4060 Laptop GPU, 16.00", 2.4 kg
» Lenovo Legion Slim 5 Gen 9 (2024) with RTX 4070 and Ryzen 7 8845HS is now available at massive 30% discount
Lenovo Legion Slim 5 14APH8: NVIDIA GeForce RTX 4060 Laptop GPU, 14.50", 1.7 kg
» Lenovo Legion Slim 5 gaming laptop with RTX 4070 and Ryzen 7 gets steep 31% price cut
» Compact Lenovo Legion Slim 5 gaming laptop with 120Hz OLED display hits record-low price thanks to 28% discount
» Lenovo Legion Slim 5 OLED gaming laptop with RTX 4060 and 32GB RAM discounted by 24%
HP Omen 16-xf0376ng: NVIDIA GeForce RTX 4070 Laptop GPU, 16.10", 2.4 kg
» HP OMEN 16 2023 price drops again to 120-day low at Best Buy for Ryzen 9 7940HS and RTX 4070 SKU
Lenovo Legion Slim 5 14APH8: NVIDIA GeForce RTX 4060 Laptop GPU, 14.50", 1.7 kg
» Big price cut makes Lenovo Legion Slim 5 with 2.8K OLED display, RTX 4060 and AMD Ryzen 7 7840HS a gaming laptop steal
Lenovo Legion Slim 7 16APH8: NVIDIA GeForce RTX 4060 Laptop GPU, 16.00", 2.1 kg
» Lenovo Legion Slim 7 QHD gaming laptop with AMD Ryzen 7 7840HS, RTX 4060 and 32GB RAM now 26% off
Lenovo Legion Slim 5 16APH8: NVIDIA GeForce RTX 4060 Laptop GPU, 16.00", 2.4 kg
» Lenovo Legion Slim 5 gaming laptop with AMD Ryzen 5 7640HS and RTX 4060 now 33% off
Schenker XMG Apex 15 (Late 23): NVIDIA GeForce RTX 4050 Laptop GPU, 15.60", 2.2 kg
» XMG Apex 15 (Late 23): Powerful, frugal, quiet and with great stamina - Ryzen 7 and an RTX 4050 make it all possible