Lenovo Legion Slim 5 16APH8 laptop review: Underappreciated design with an underperforming GPU

(October 18, 2023 update: We received a second unit for retesting purposes and our results can be found here. Our first unit was exhibiting GPU performance issues. Our review on the first unit is below with no changes.)
The Legion Slim 5 16 is the slimmer and lighter version of the existing Legion Pro 5 16. It's an upper-midrange gaming laptop in between the cheaper LOQ 15 or IdeaPad Gaming series and the more expensive Legion Slim 7 16 series.
Our test unit in review is the highest-end SKU with the Ryzen 7 7840HS Zen 4 CPU, GeForce RTX 4060 GPU, and 1600p IPS display for approximately $1200 USD. Lesser SKUs are available with the Ryzen 5 7640HS, RTX 4050, and 1200p display starting at $1000.
Alternatives to the Legion Slim 5 16APH8 include other 16-inch gaming laptops like the Acer Nitro 16 AN16, Dell G16 7620, Asus Zephyrus M16, or the Asus TUF Gaming A16.
More Lenovo reviews:
Potential Competitors in Comparison
Rating | Date | Model | Weight | Height | Size | Resolution | Price |
|---|---|---|---|---|---|---|---|
| 87.7 % v7 (old) | 08 / 2023 | Lenovo Legion Slim 5 16APH8 R7 7840HS, GeForce RTX 4060 Laptop GPU | 2.4 kg | 25.2 mm | 16.00" | 2560x1600 | |
| 86.7 % v7 (old) | 08 / 2023 | Acer Nitro 16 AN16-41-R7YE R5 7535HS, GeForce RTX 4050 Laptop GPU | 2.6 kg | 27.9 mm | 16.00" | 1920x1200 | |
| 89 % v7 (old) | 08 / 2023 | Lenovo Legion Pro 5 16ARX8 (R5 7645HX, RTX 4050) R5 7645HX, GeForce RTX 4050 Laptop GPU | 2.5 kg | 27.3 mm | 16.00" | 2560x1600 | |
| 87.4 % v7 (old) | 06 / 2023 | HP Omen 16-wf000 i7-13700HX, GeForce RTX 4080 Laptop GPU | 2.4 kg | 23.6 mm | 16.10" | 2560x1440 | |
| 86.1 % v7 (old) | 10 / 2022 | Dell G16 7620 i7-12700H, GeForce RTX 3060 Laptop GPU | 2.6 kg | 26.9 mm | 16.00" | 2560x1600 | |
| 86.9 % v7 (old) | 06 / 2023 | Asus TUF Gaming A16 FA617XS R9 7940HS, Radeon RX 7600S | 2.2 kg | 22.1 mm | 16.00" | 1920x1200 |
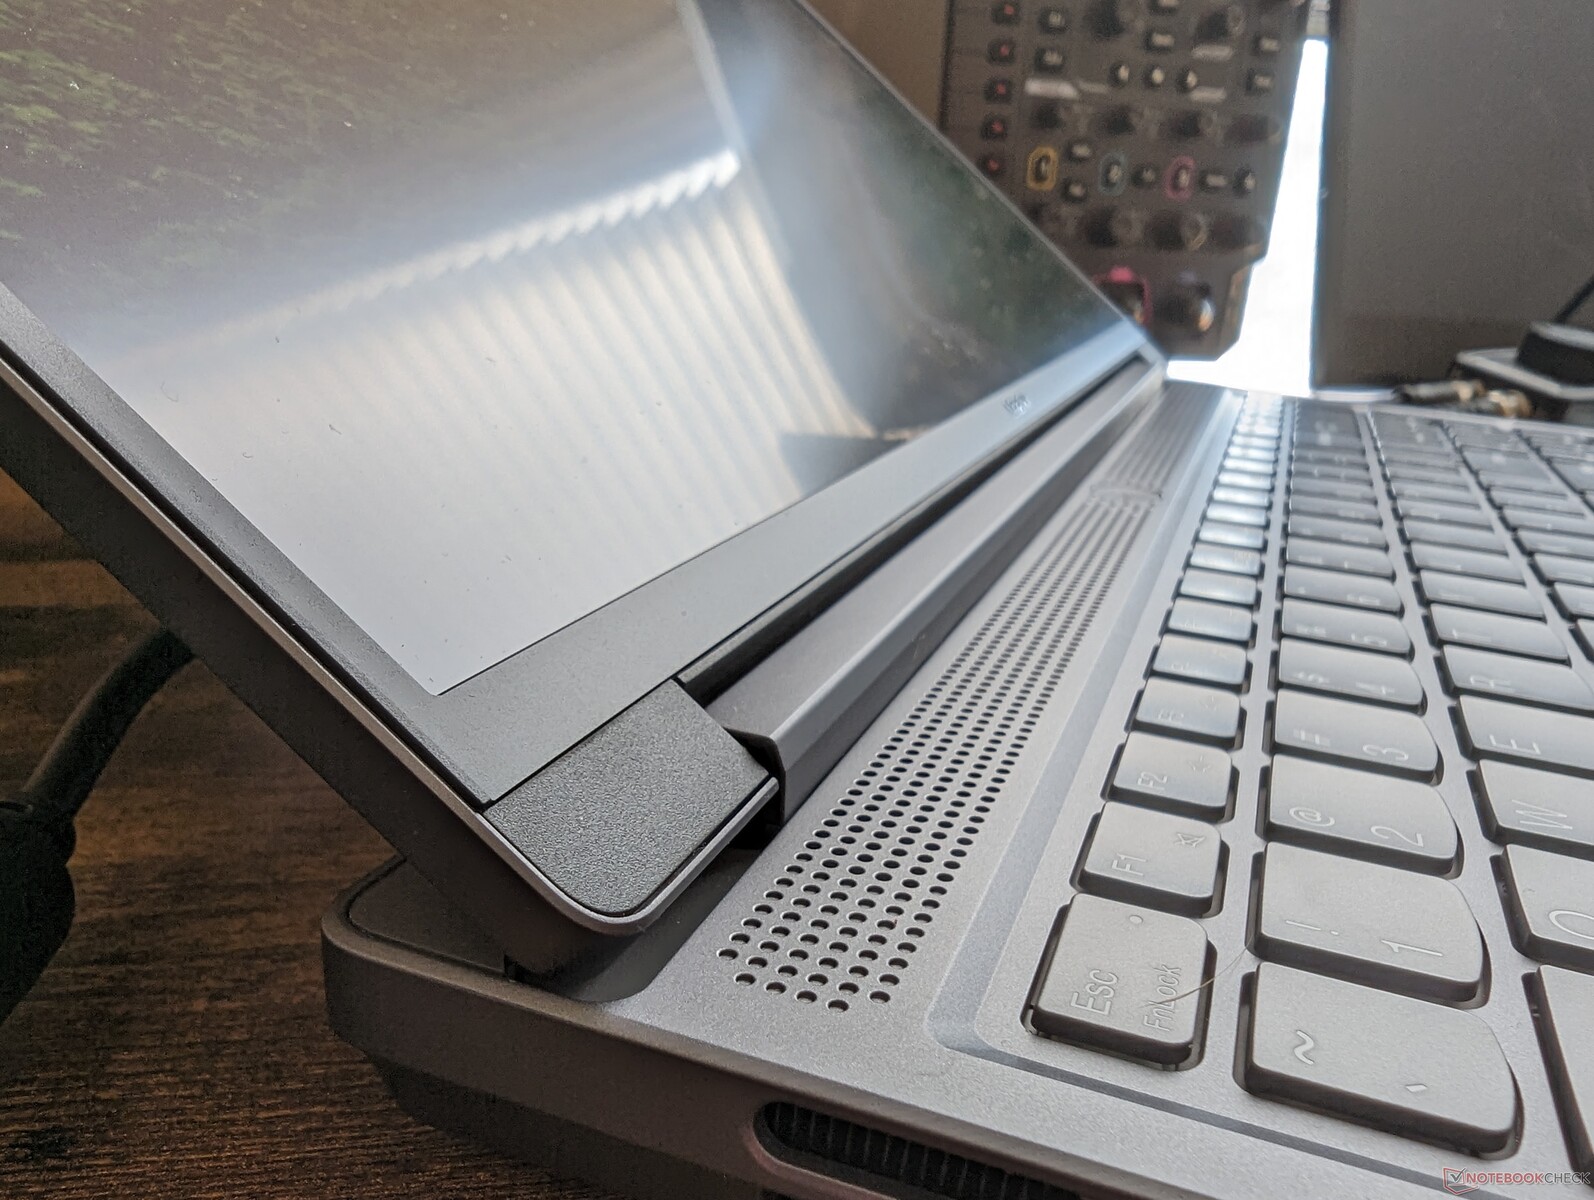
Case — Legion Pro 5 Looks Bulky In Comparison
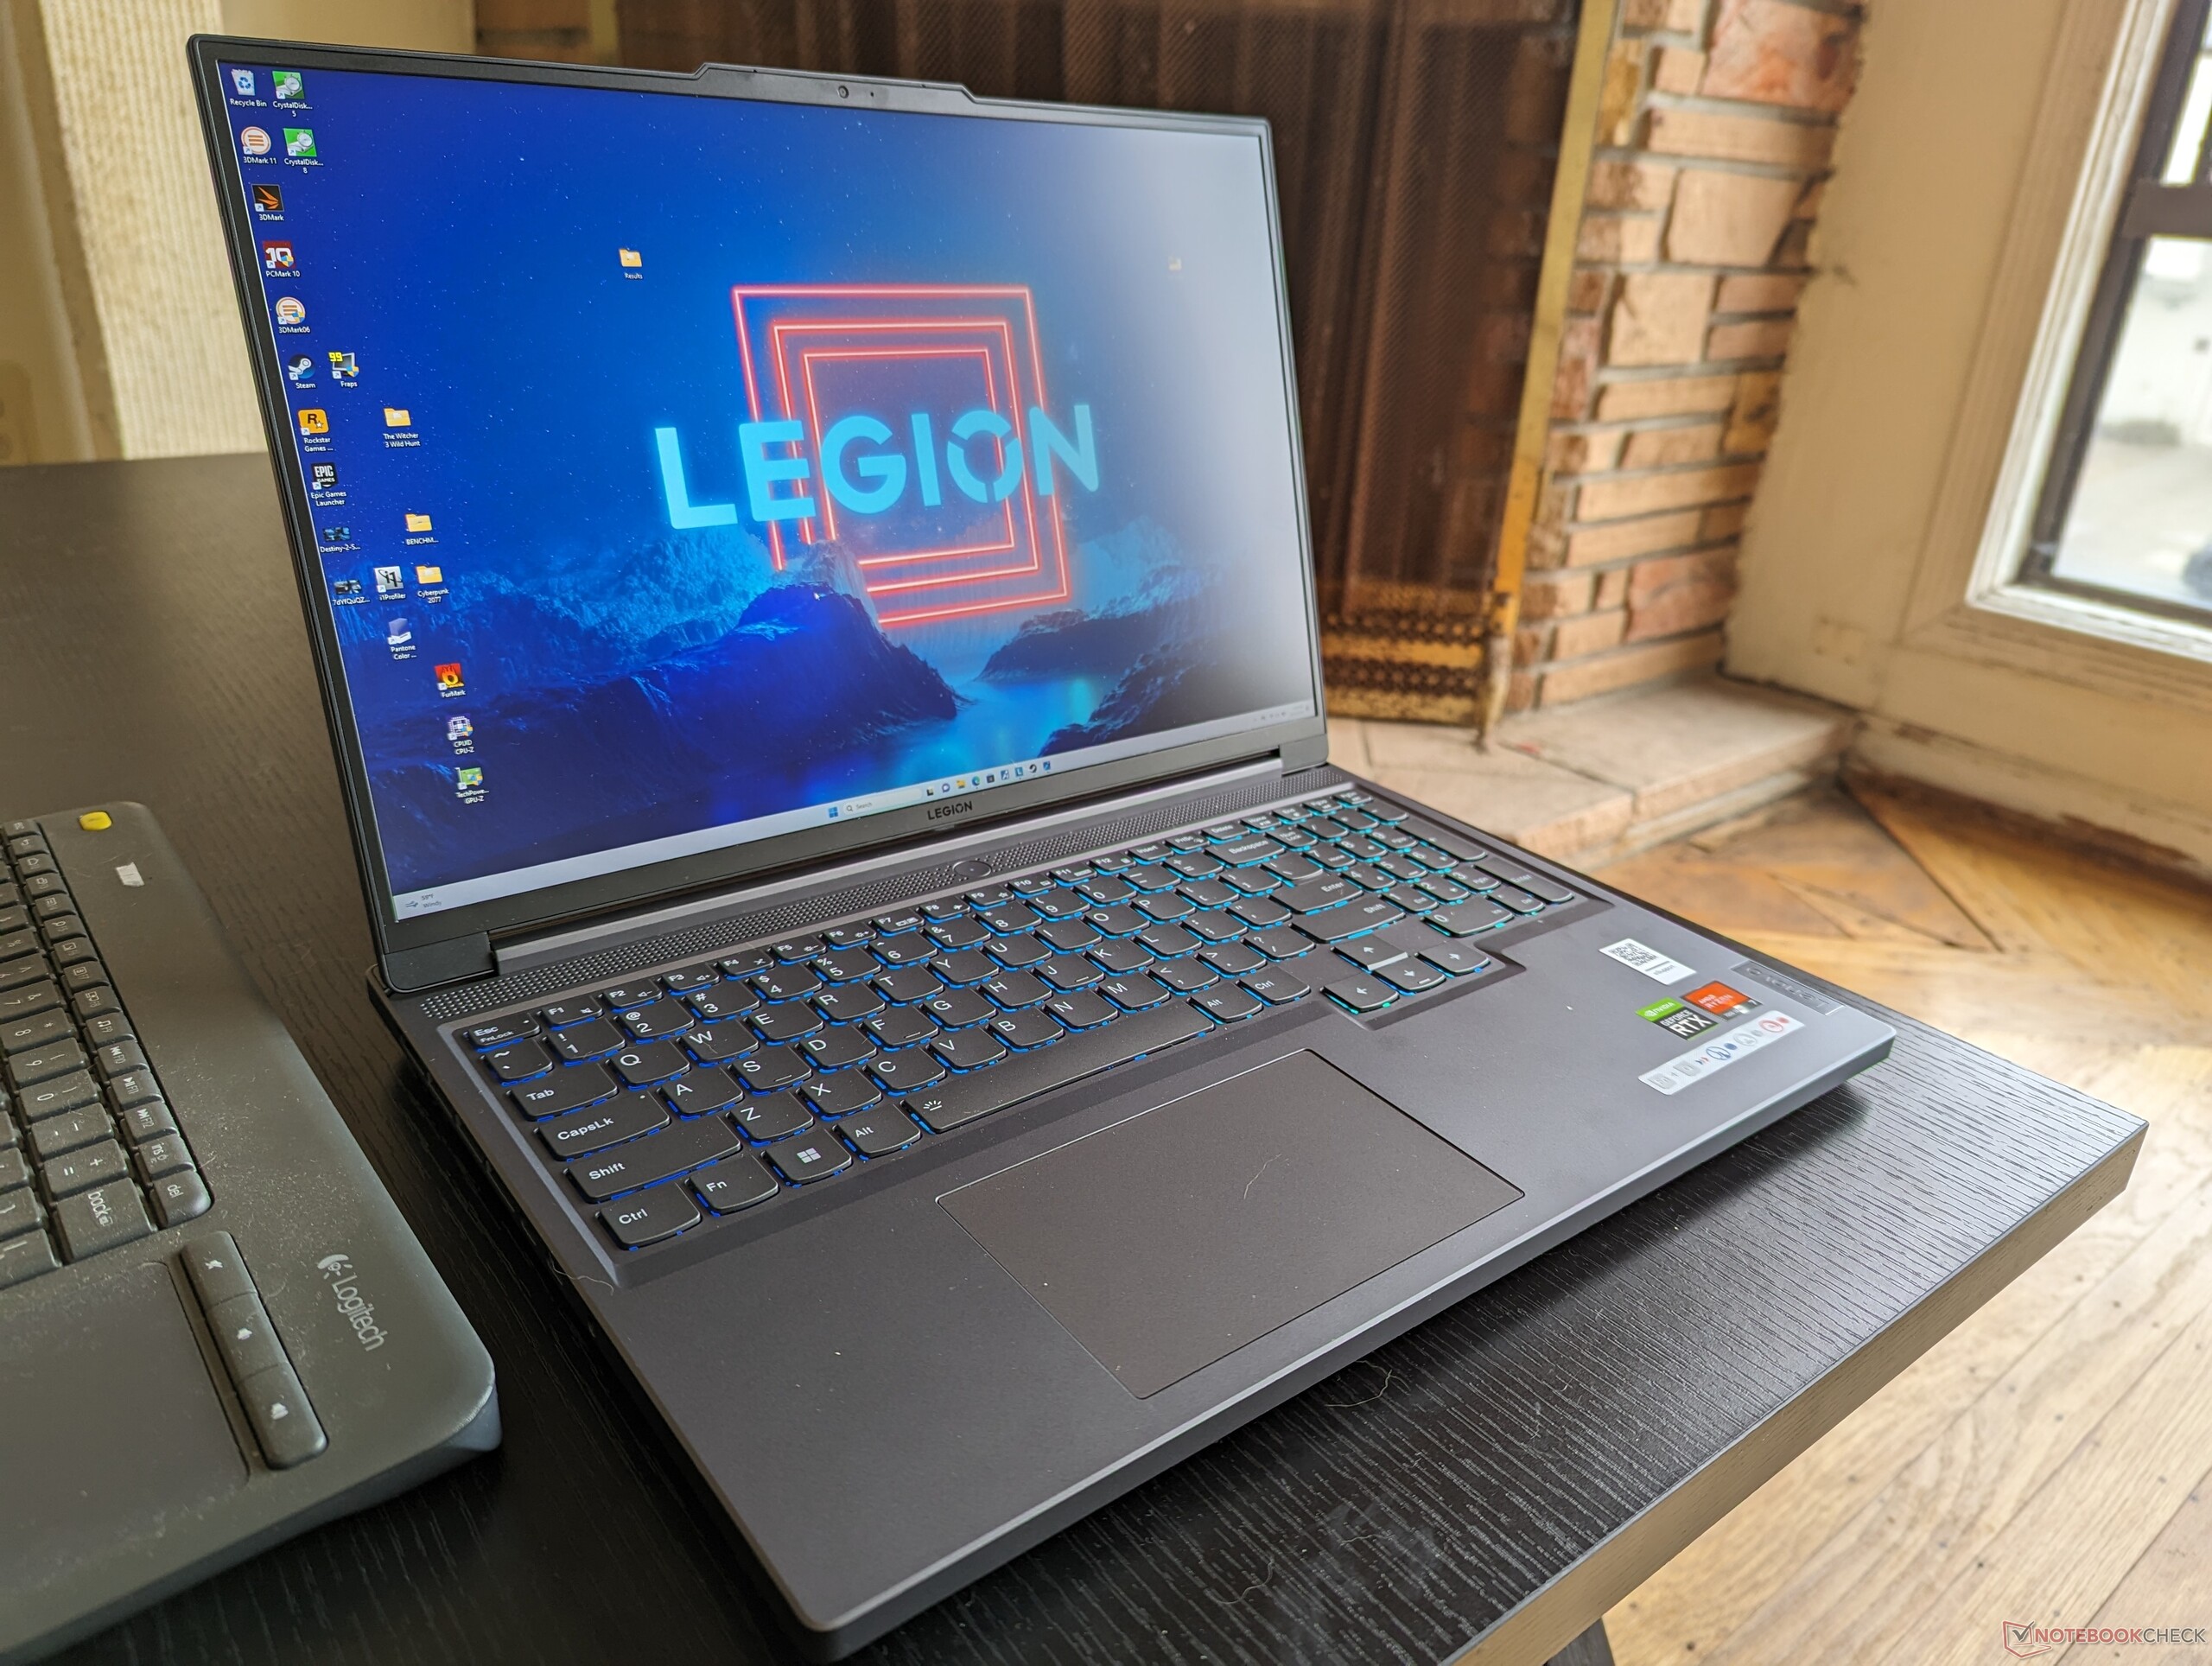
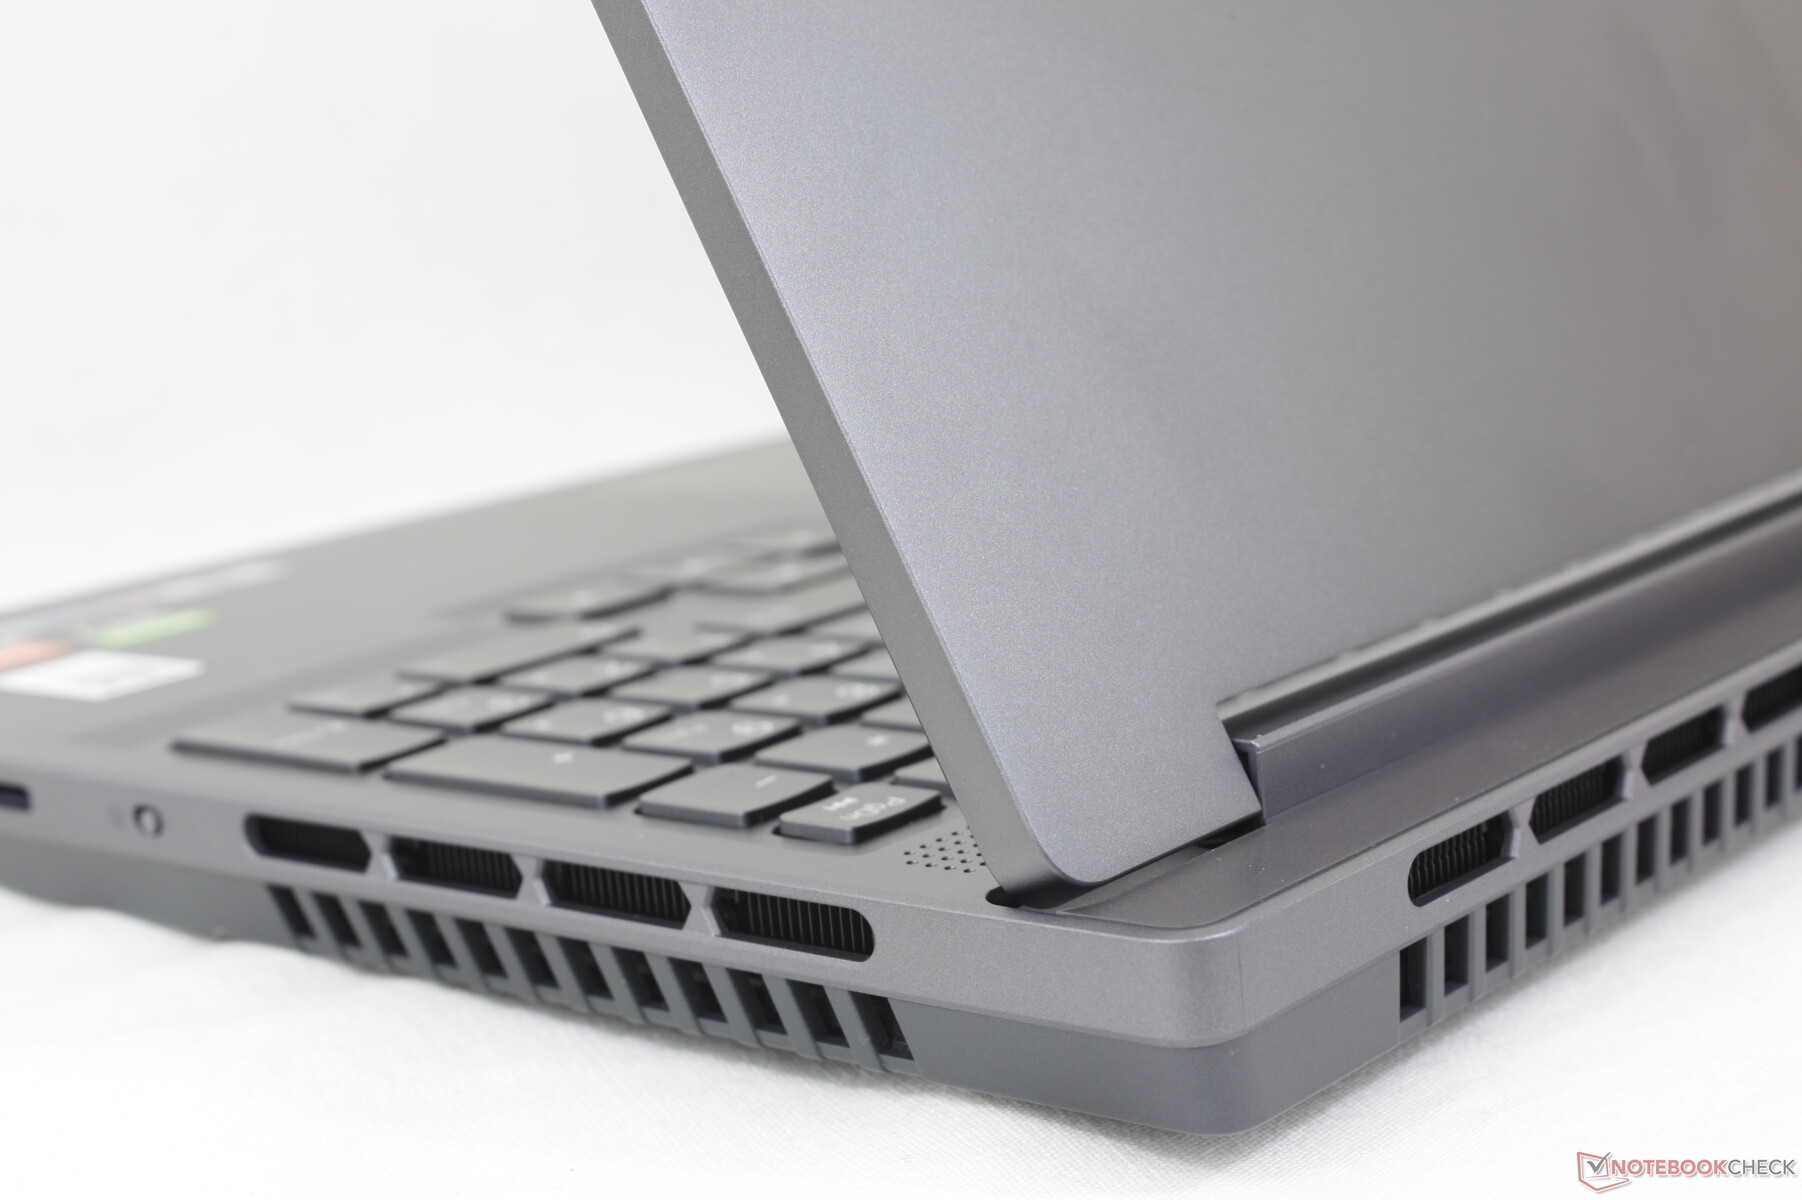
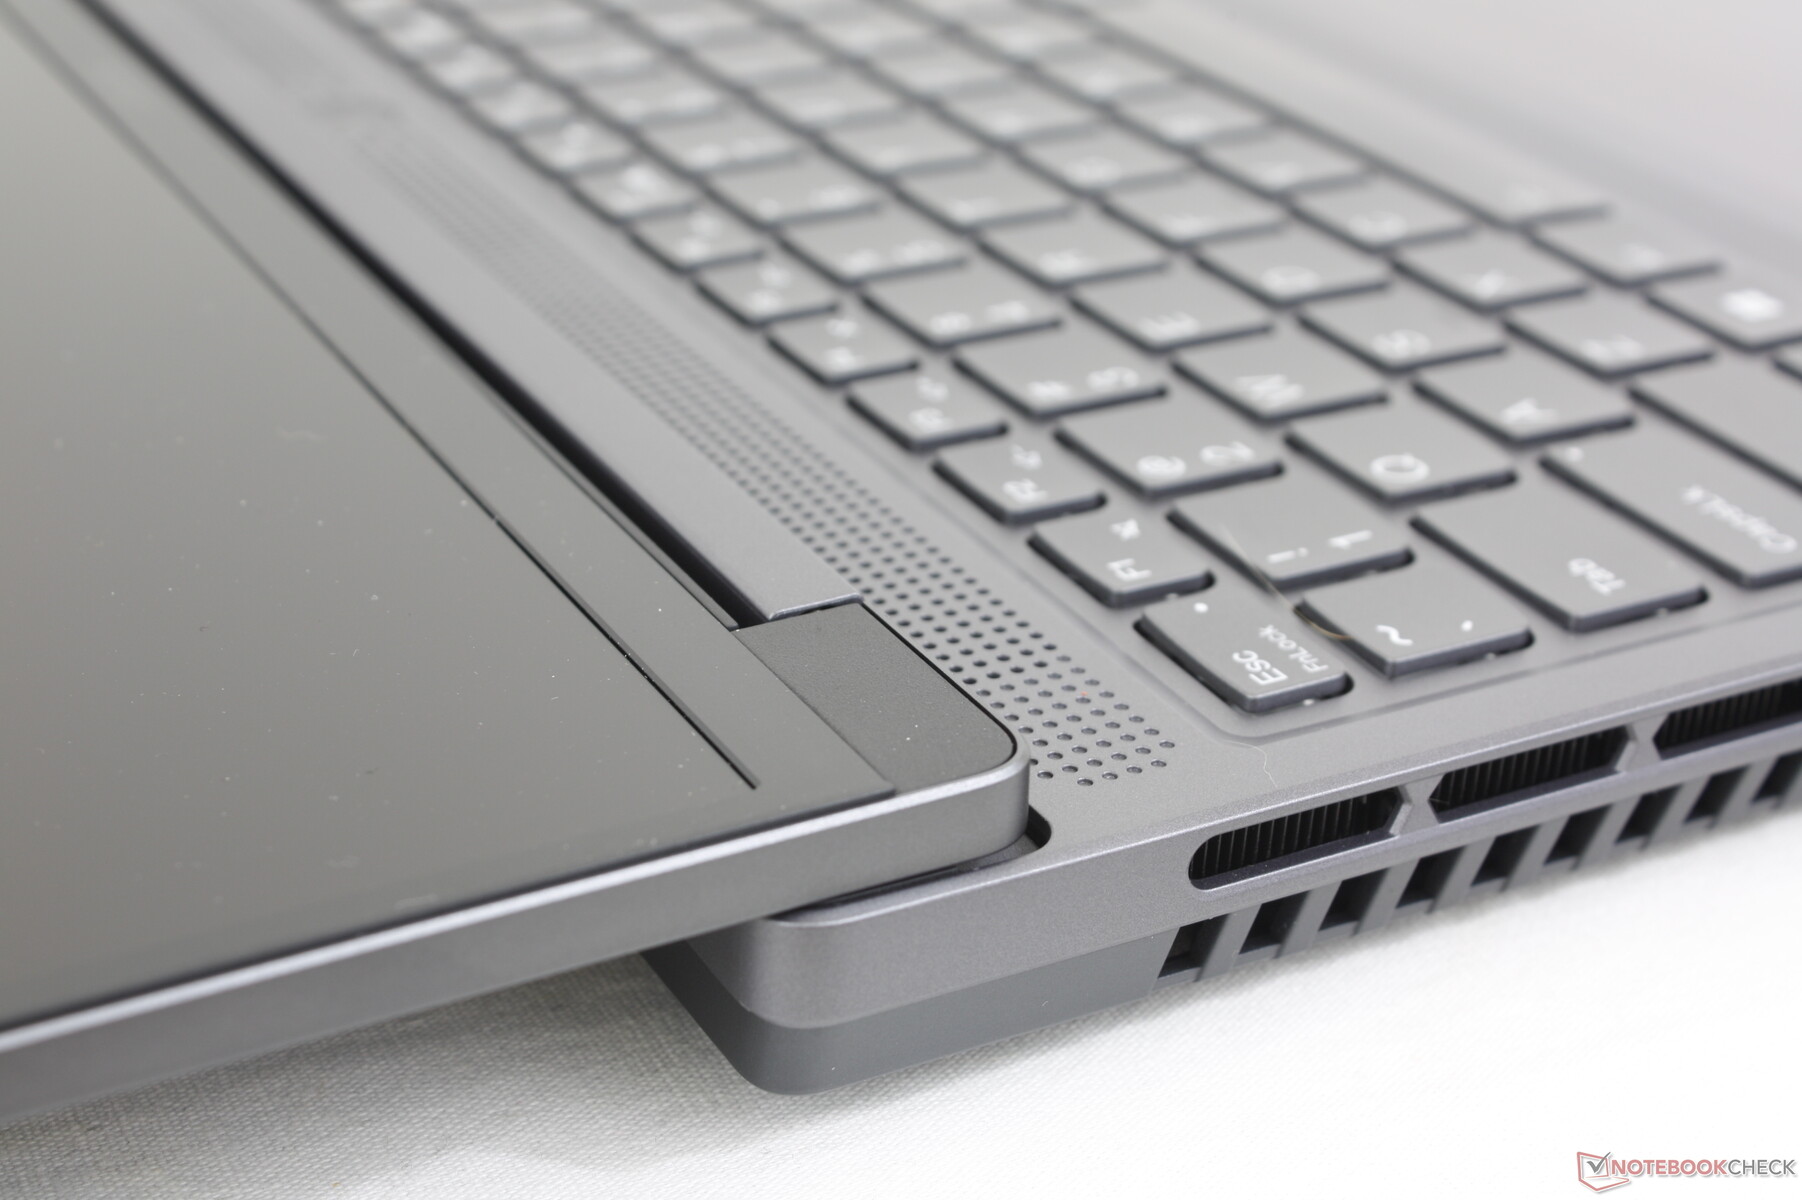
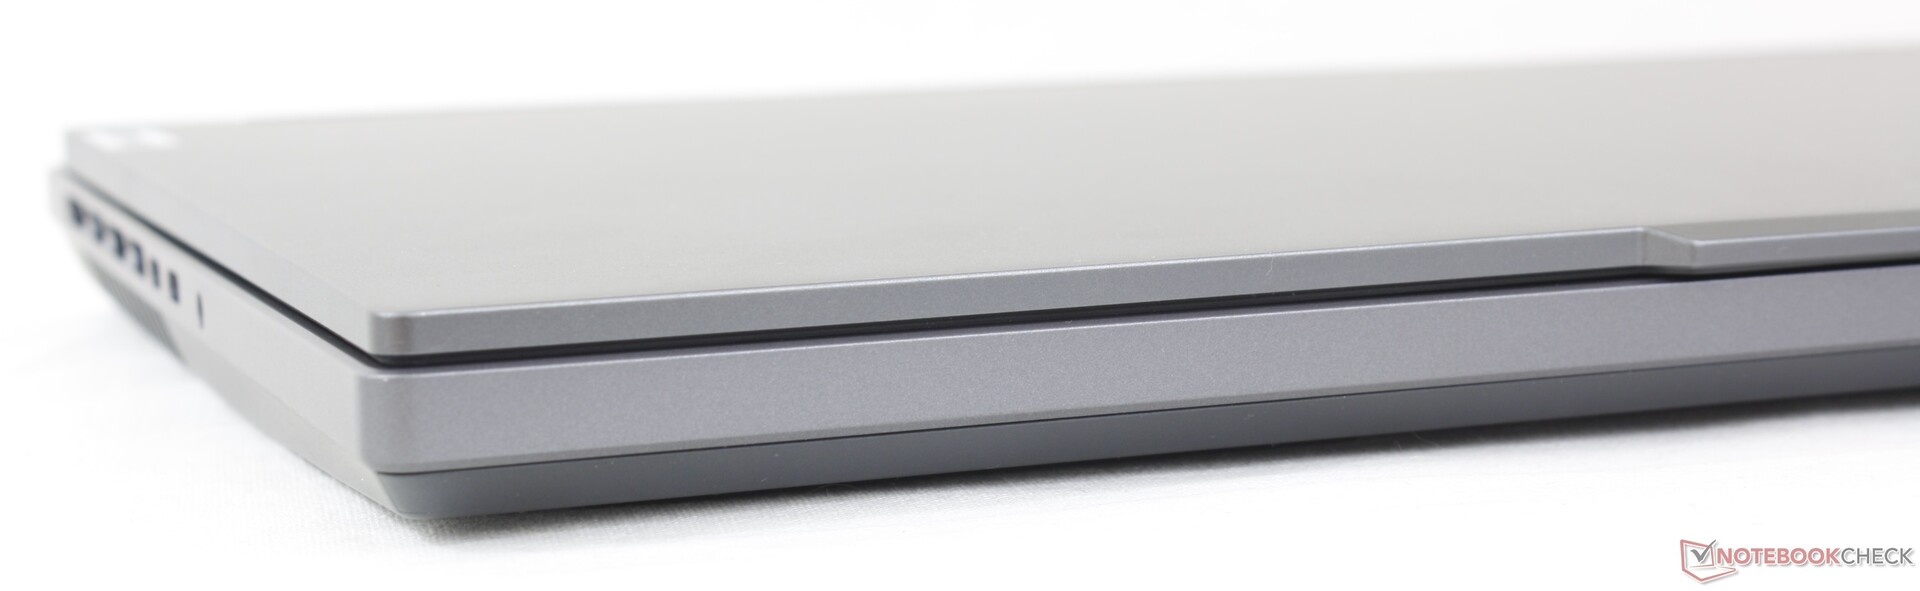
The Legion Slim 5 shaves off the hard edges and protrusions of the Legion Pro 5 design for a slimmer and cleaner appearance. This is most noticeable along the rear, sides, and bottom plate where surfaces are now flatter and not nearly as busy.
Unlike the largely plastic LOQ 15 or aluminum Legion Pro 7, the Legion Pro 5 is a little bit of both with its plastic base base and aluminum top cover. Chassis rigidity is otherwise still comparable to the Legion Pro 5 for good first impressions. The base remains rigid, but some creaking is noticeable when attempting to twist its corners.
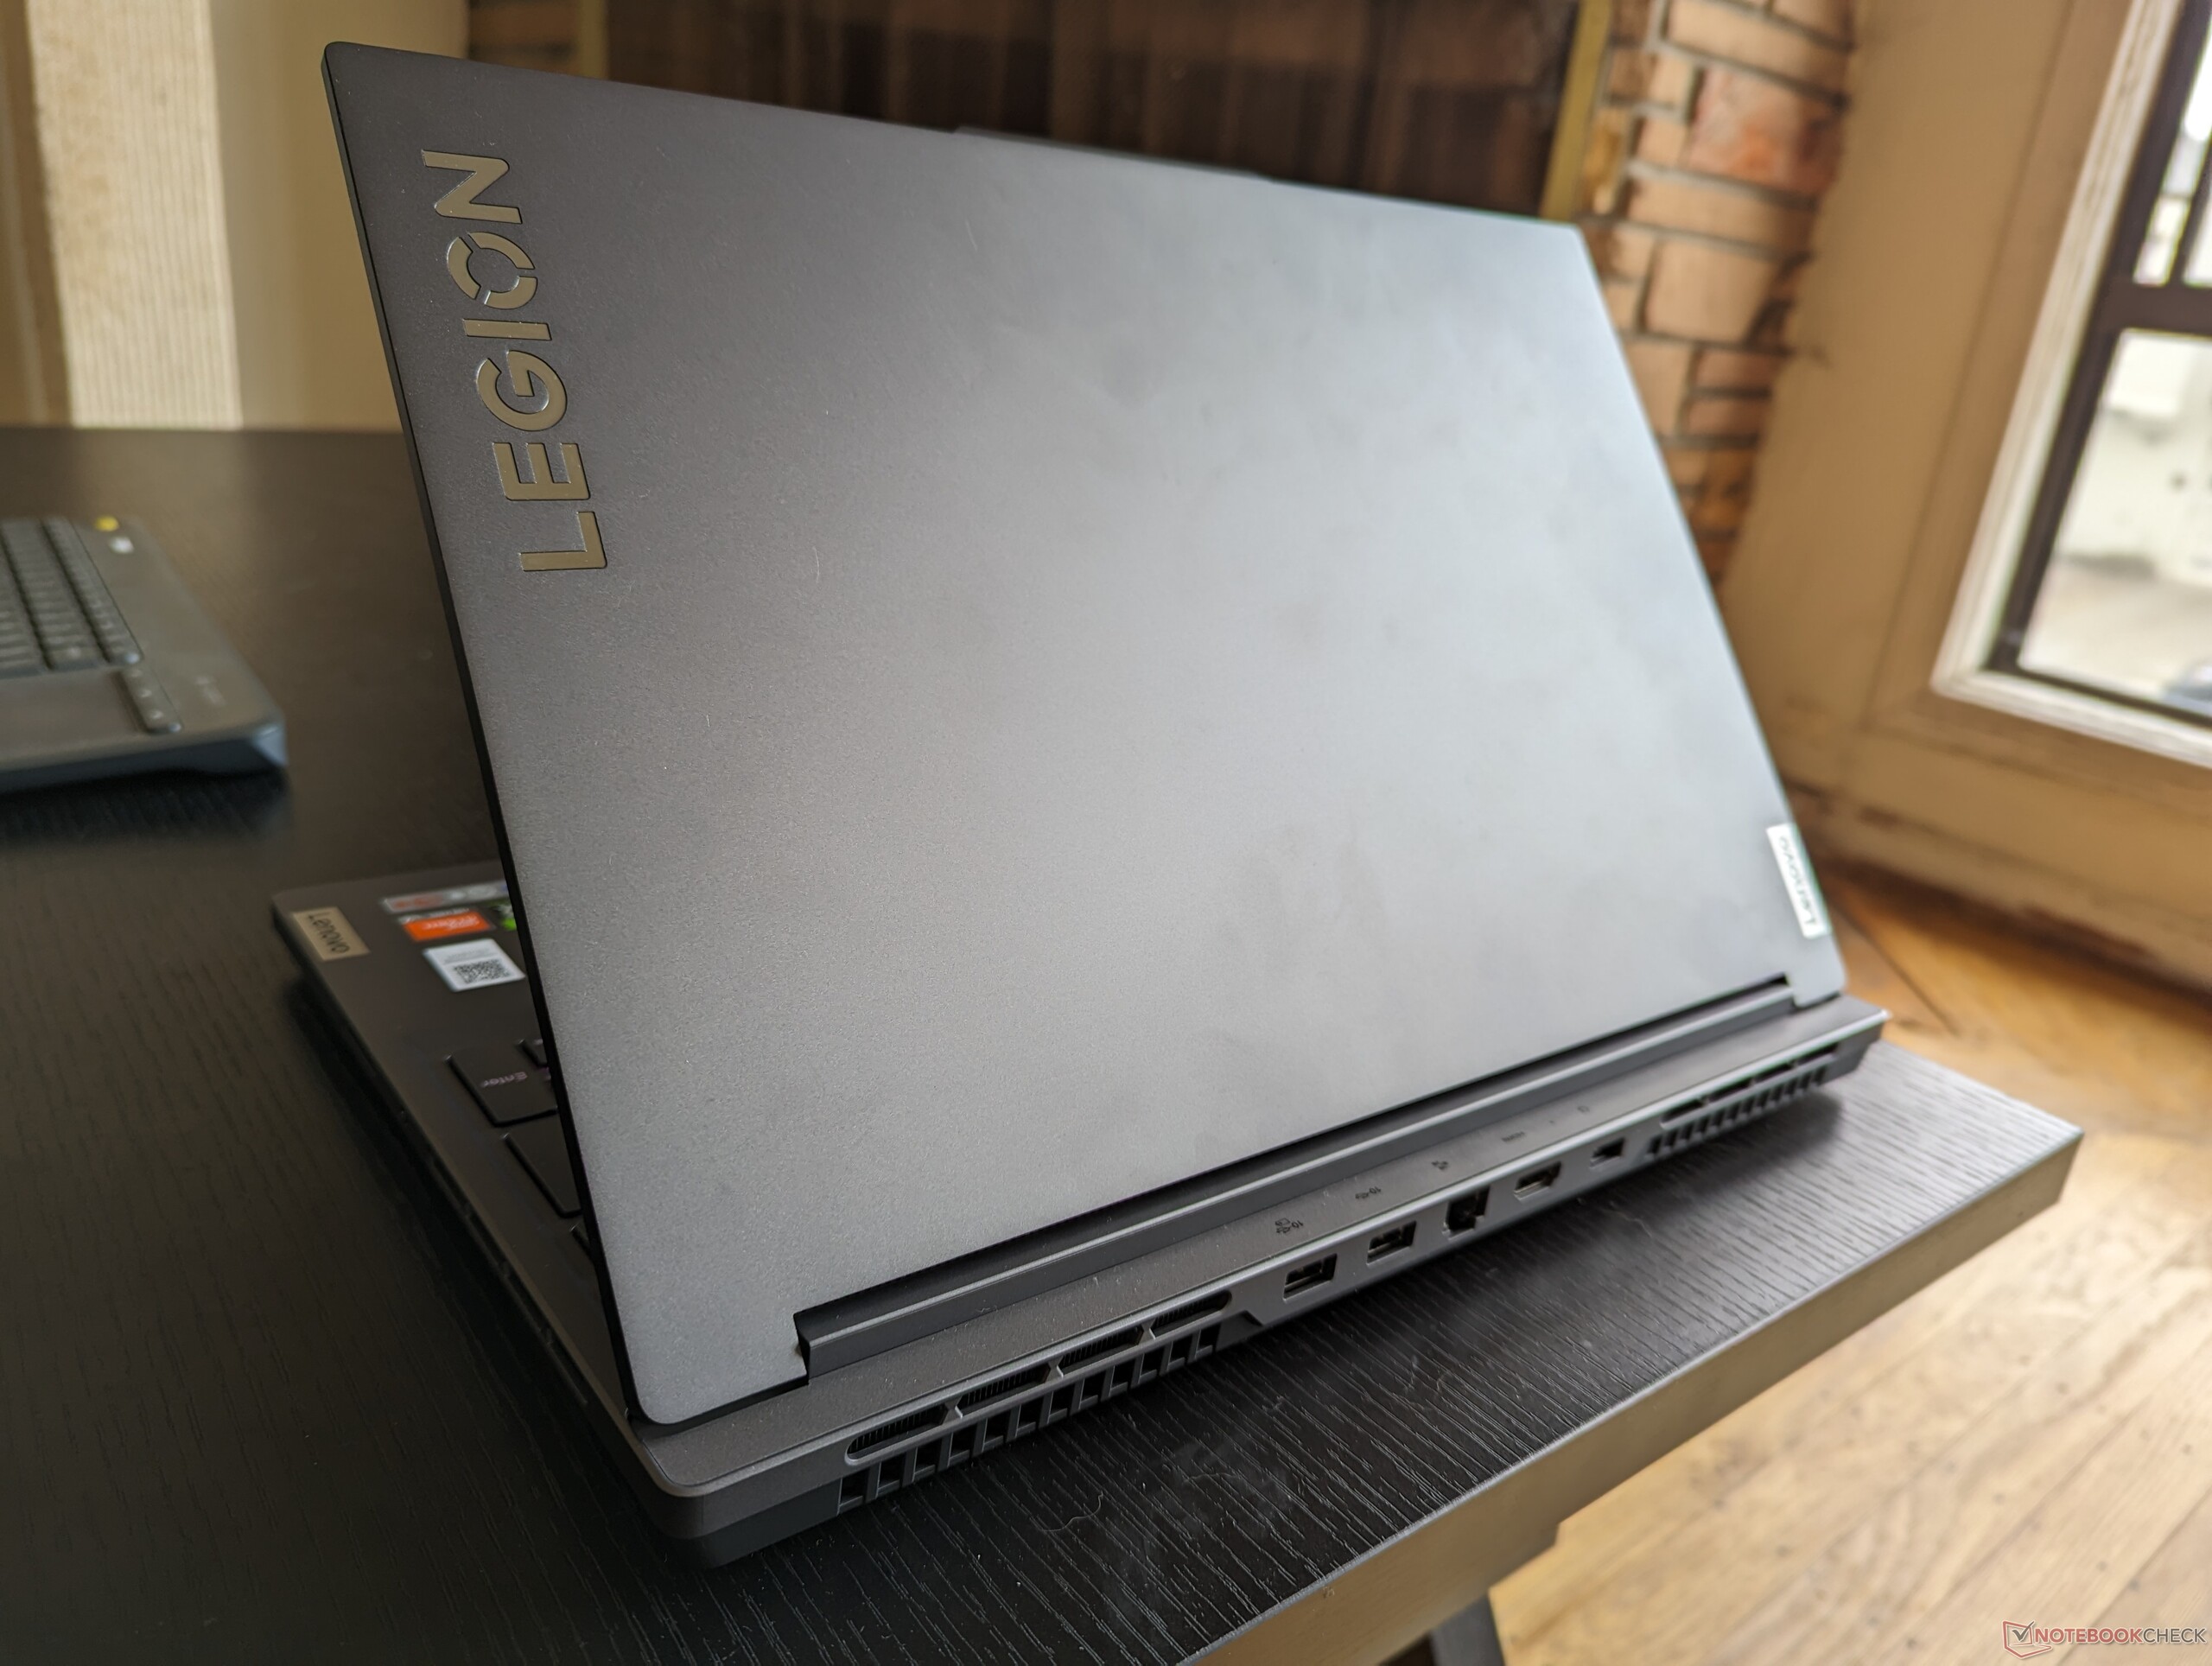
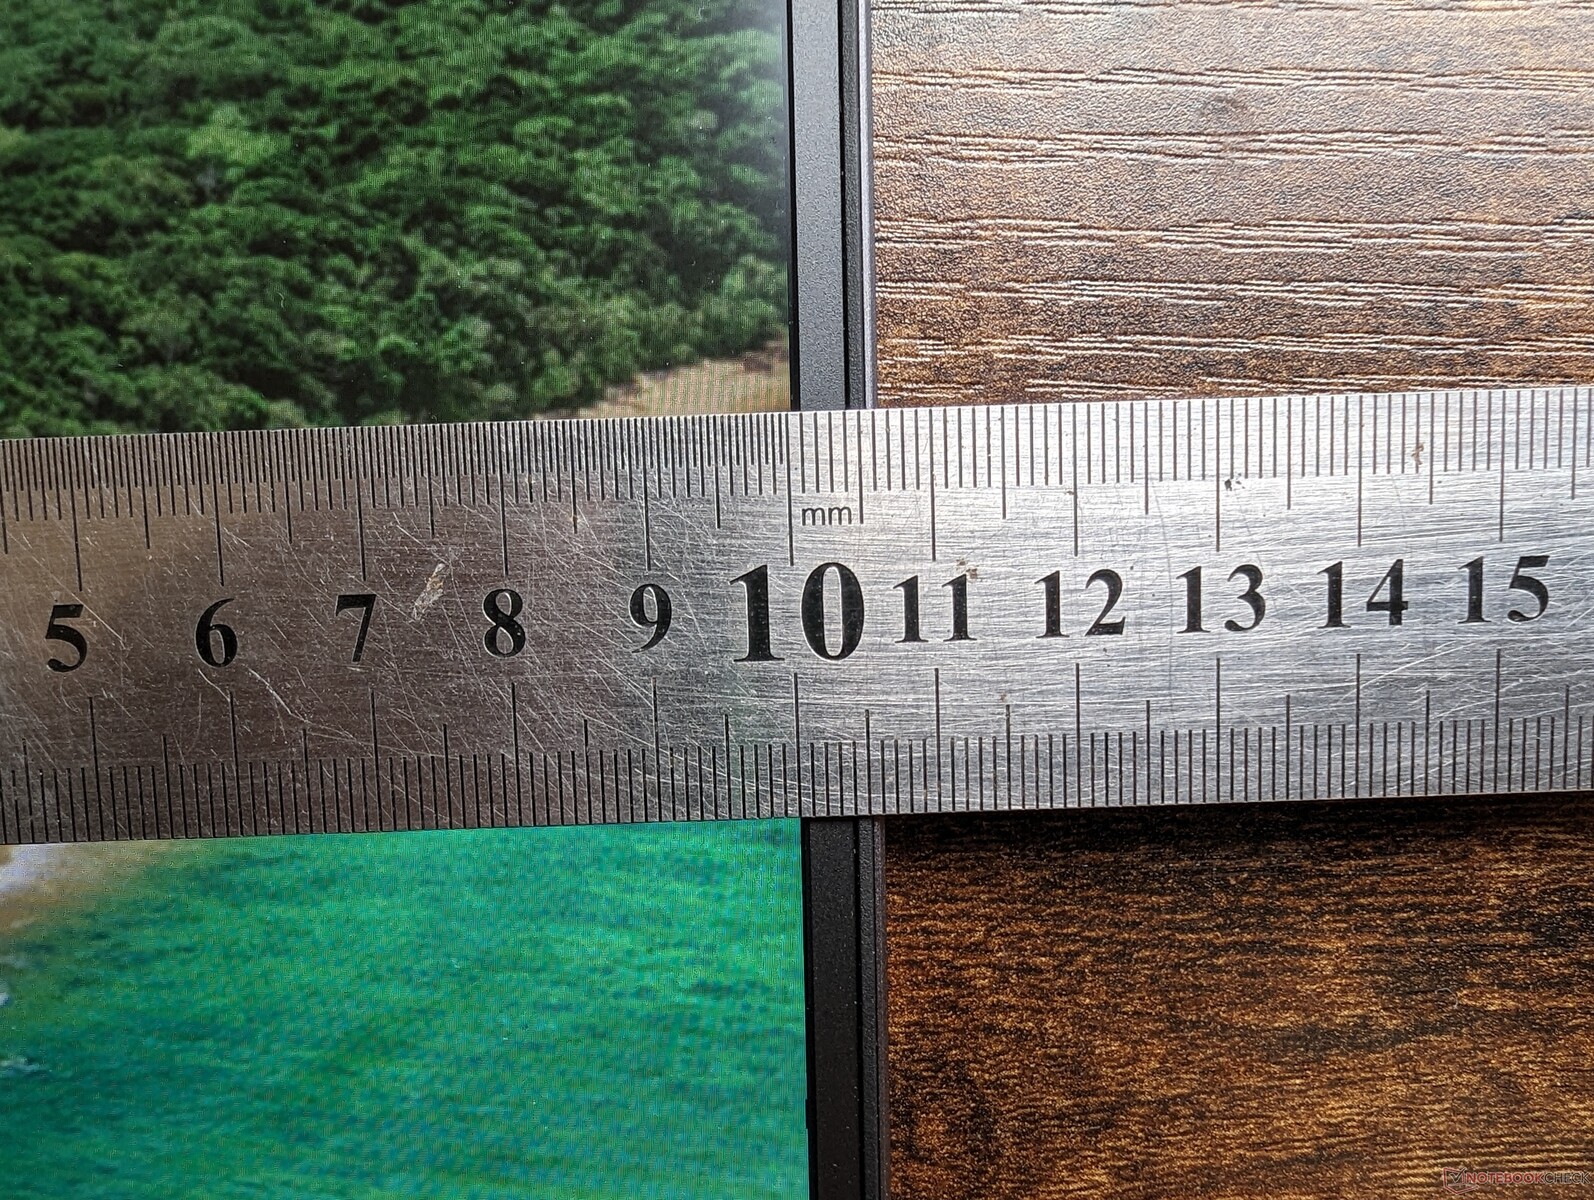
Annoyingly and unlike on most other laptops, our Lenovo model comes in two different thicknesses depending on the your graphics configuration. SKUs with the RTX 4060 are 25.2 mm thick while SKUs with the slower RTX 4050 or 3050 are just 21.9 mm thick. Our RTX 4060 unit is there only 2 mm thinner than the more powerful Legion Pro 5 and so it's a bit of a stretch to call it a "Slim" gaming laptop. In fact, the Legion Slim 5 RTX 4060 is thicker than many other 16-inch alternatives like the HP Omen 16 or Asus TUF Gaming A16.

Connectivity
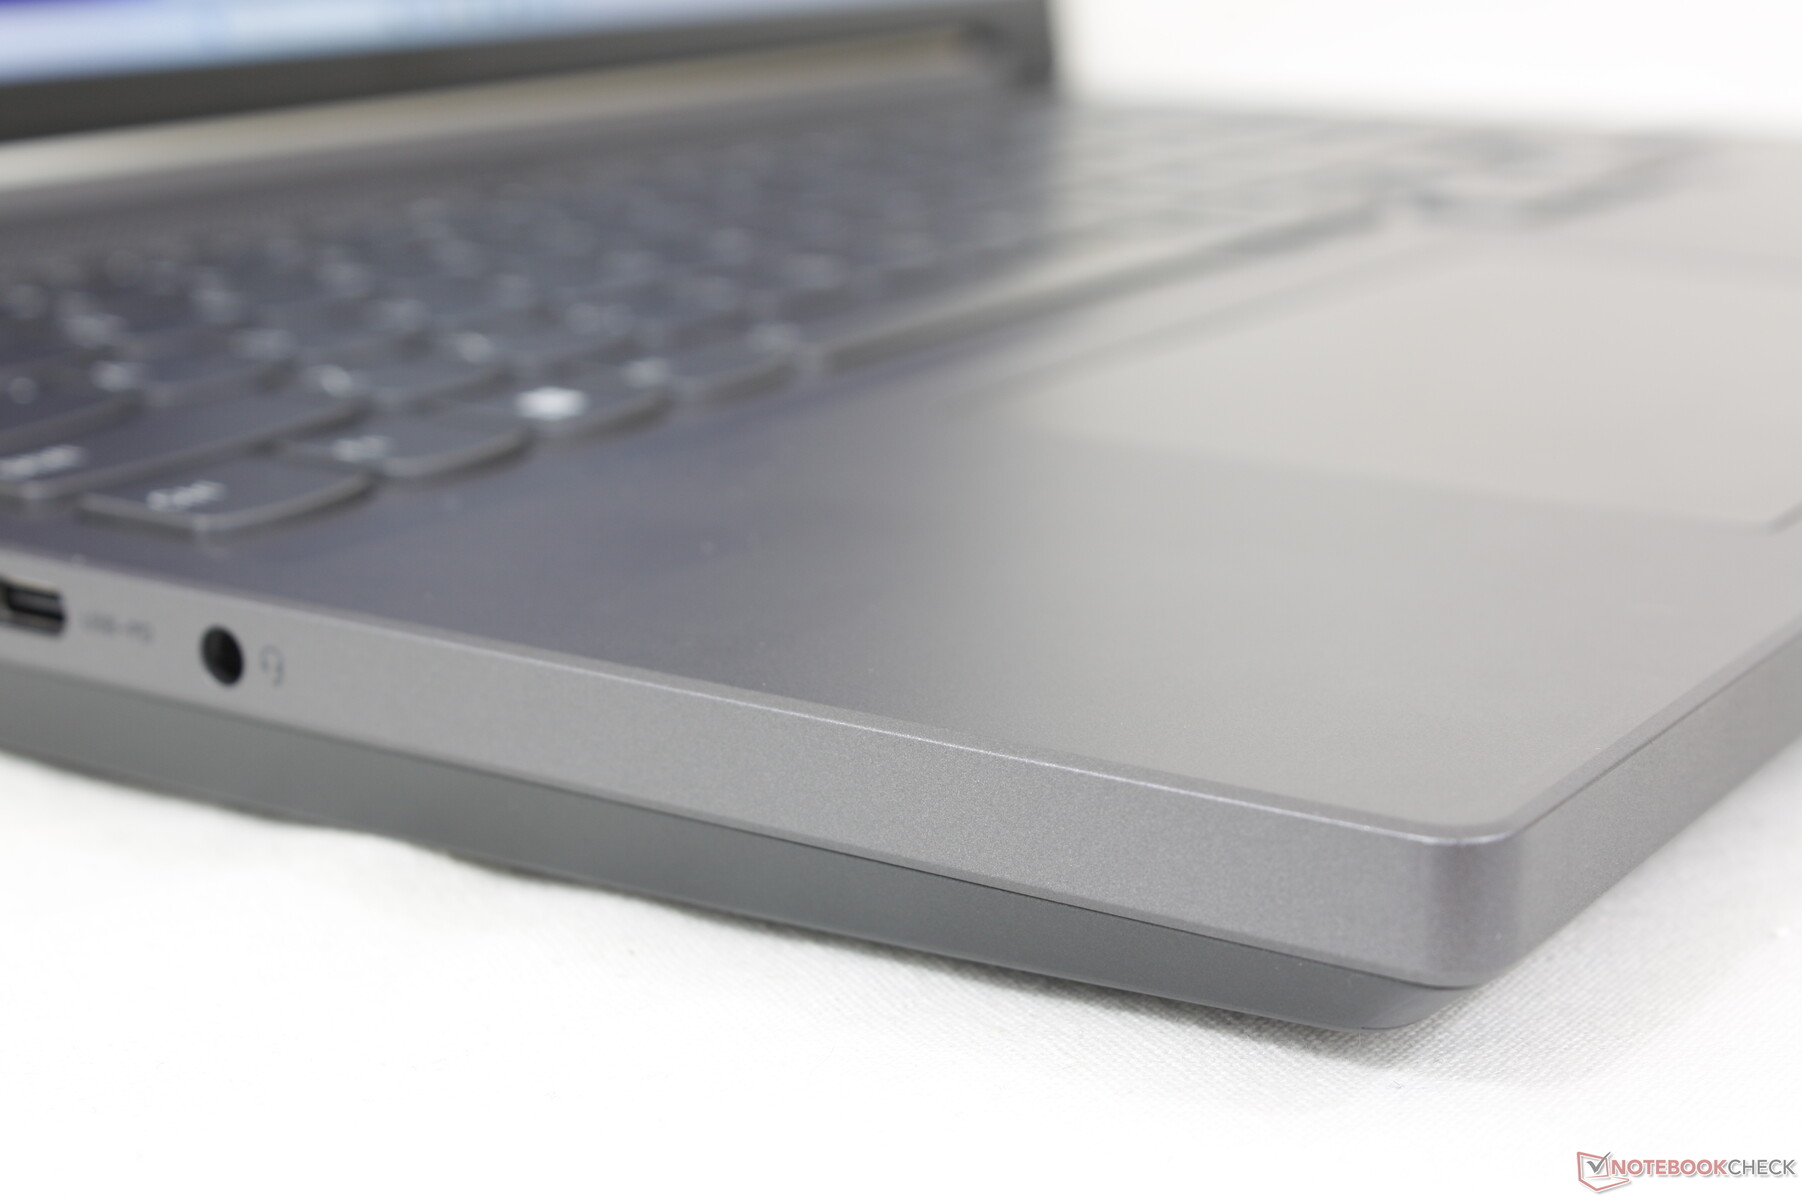
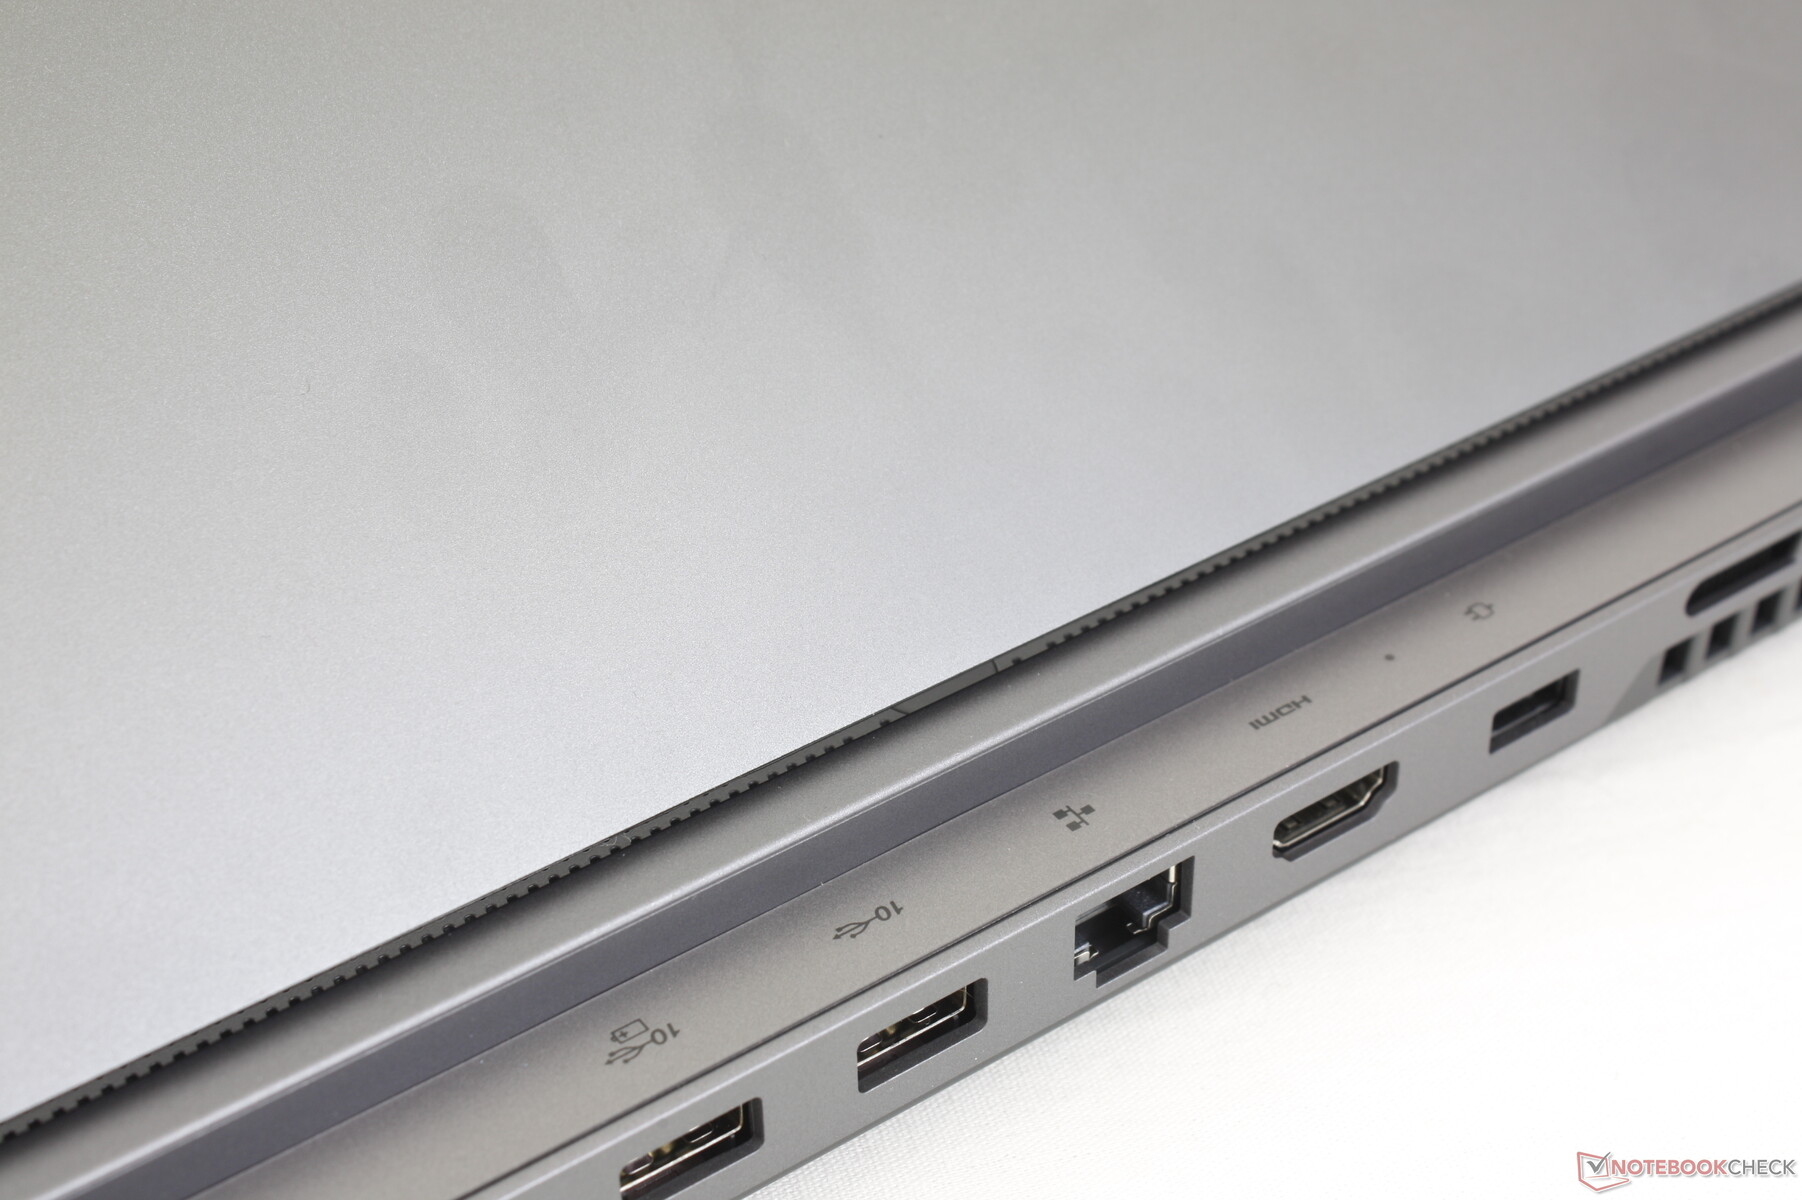
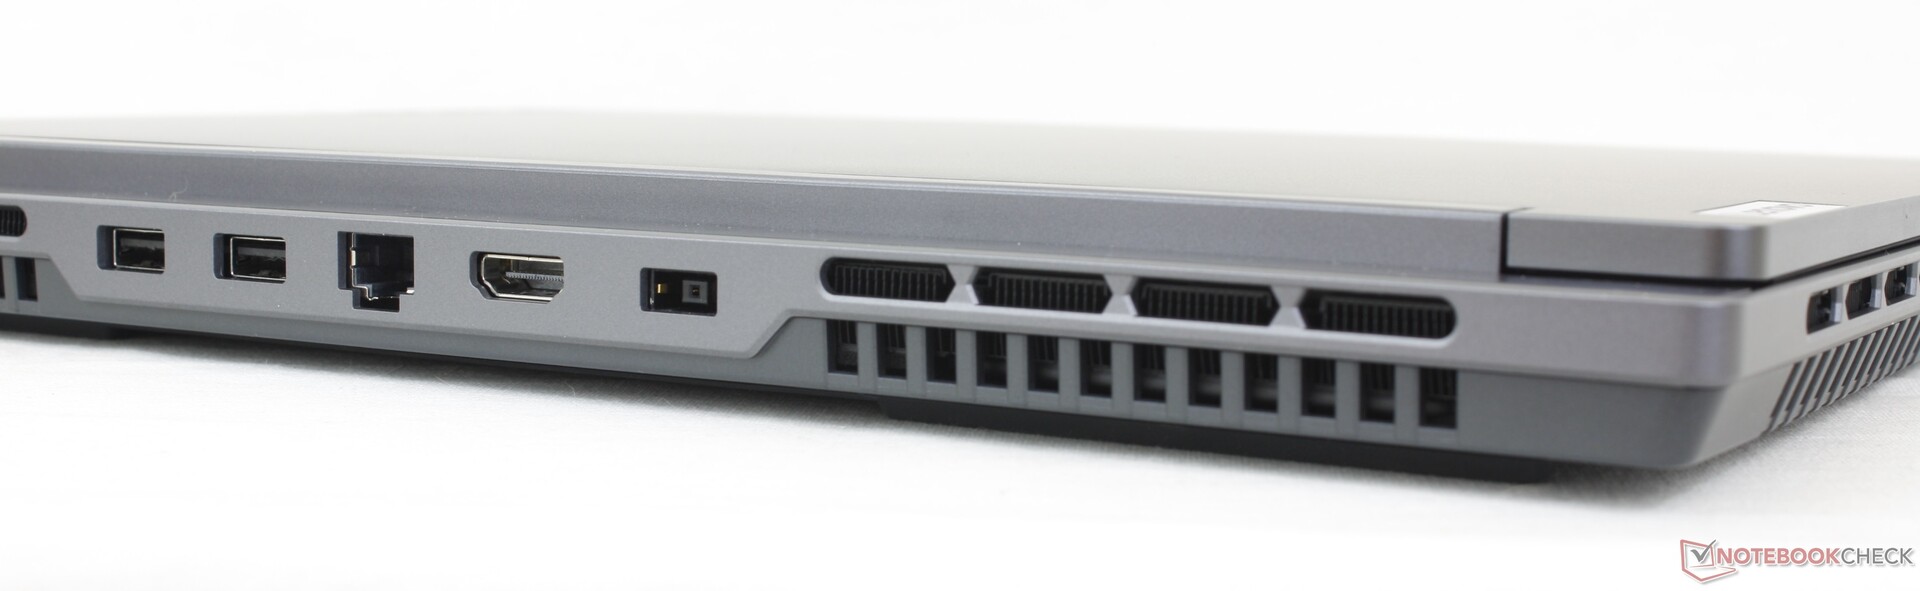
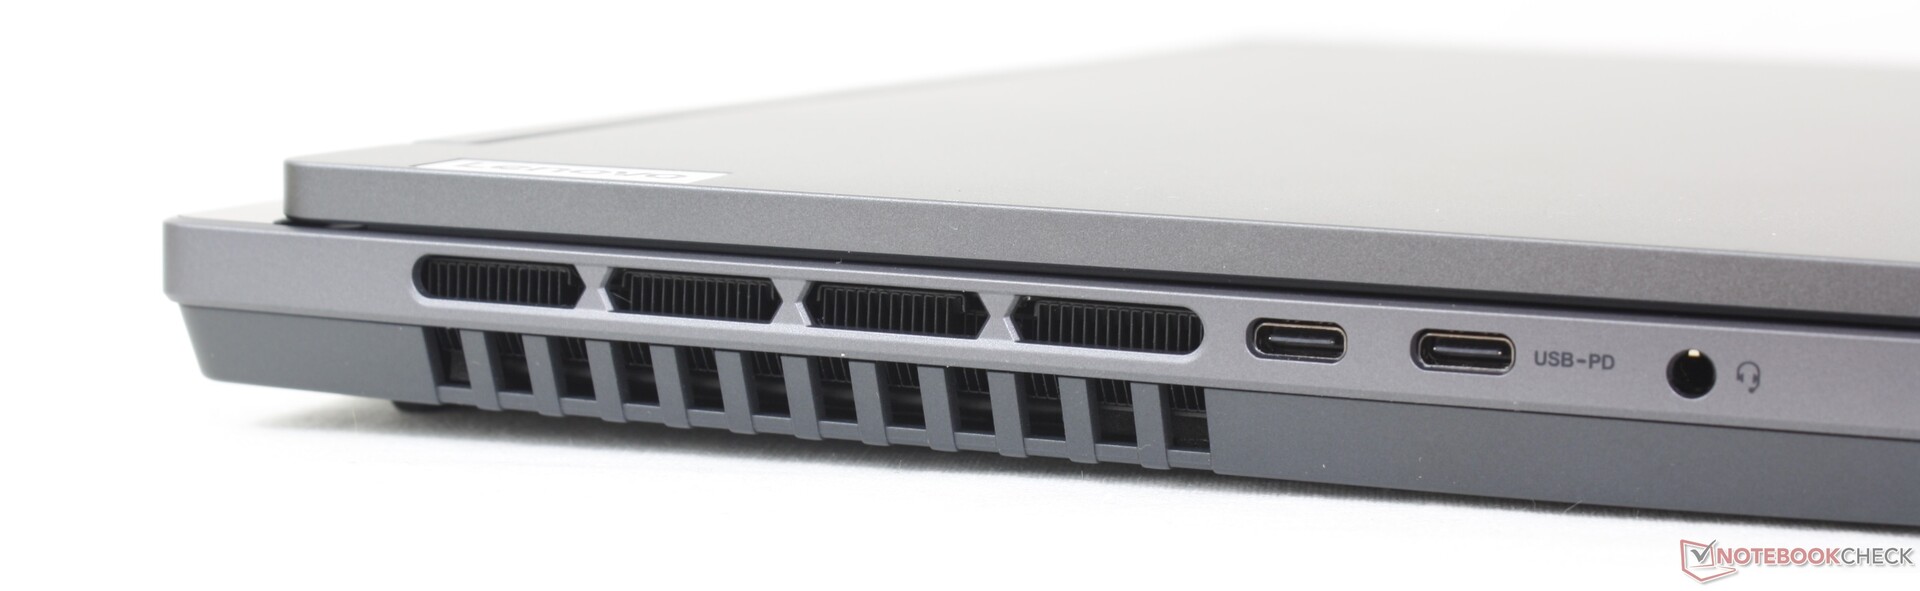
Port options are the same as on the HP Omen 16 albeit with different positioning. The thicker Legion Pro 5 has even more USB ports for a total of six, but four on our Legion Slim 5 should be sufficient for most users.
Keep in mind that Thunderbolt and USB4 are not supported. Additionally, only one of the two USB-C ports supports Power Delivery meaning the system can be recharged via one of the ports only. This port is thankfully labeled on the model.
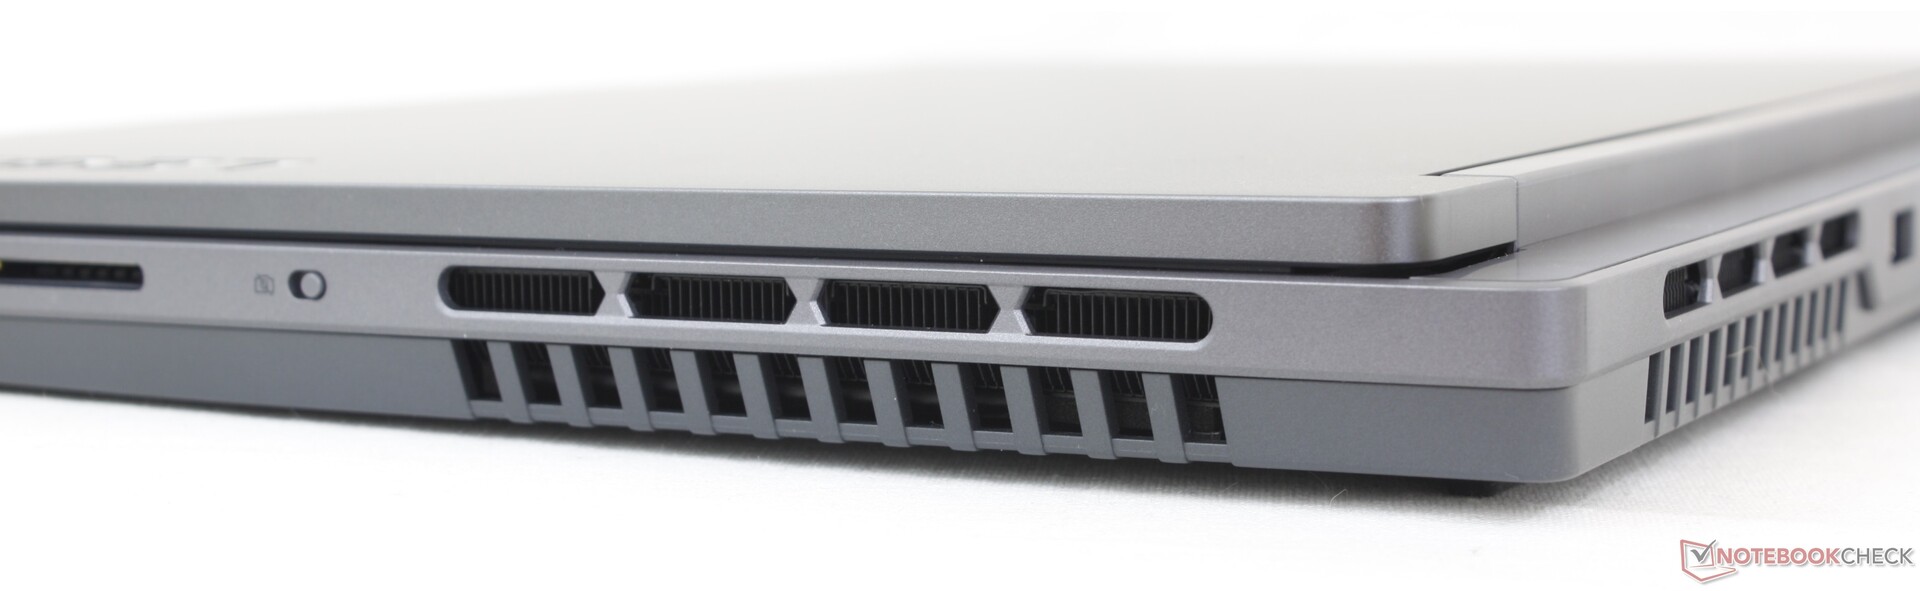
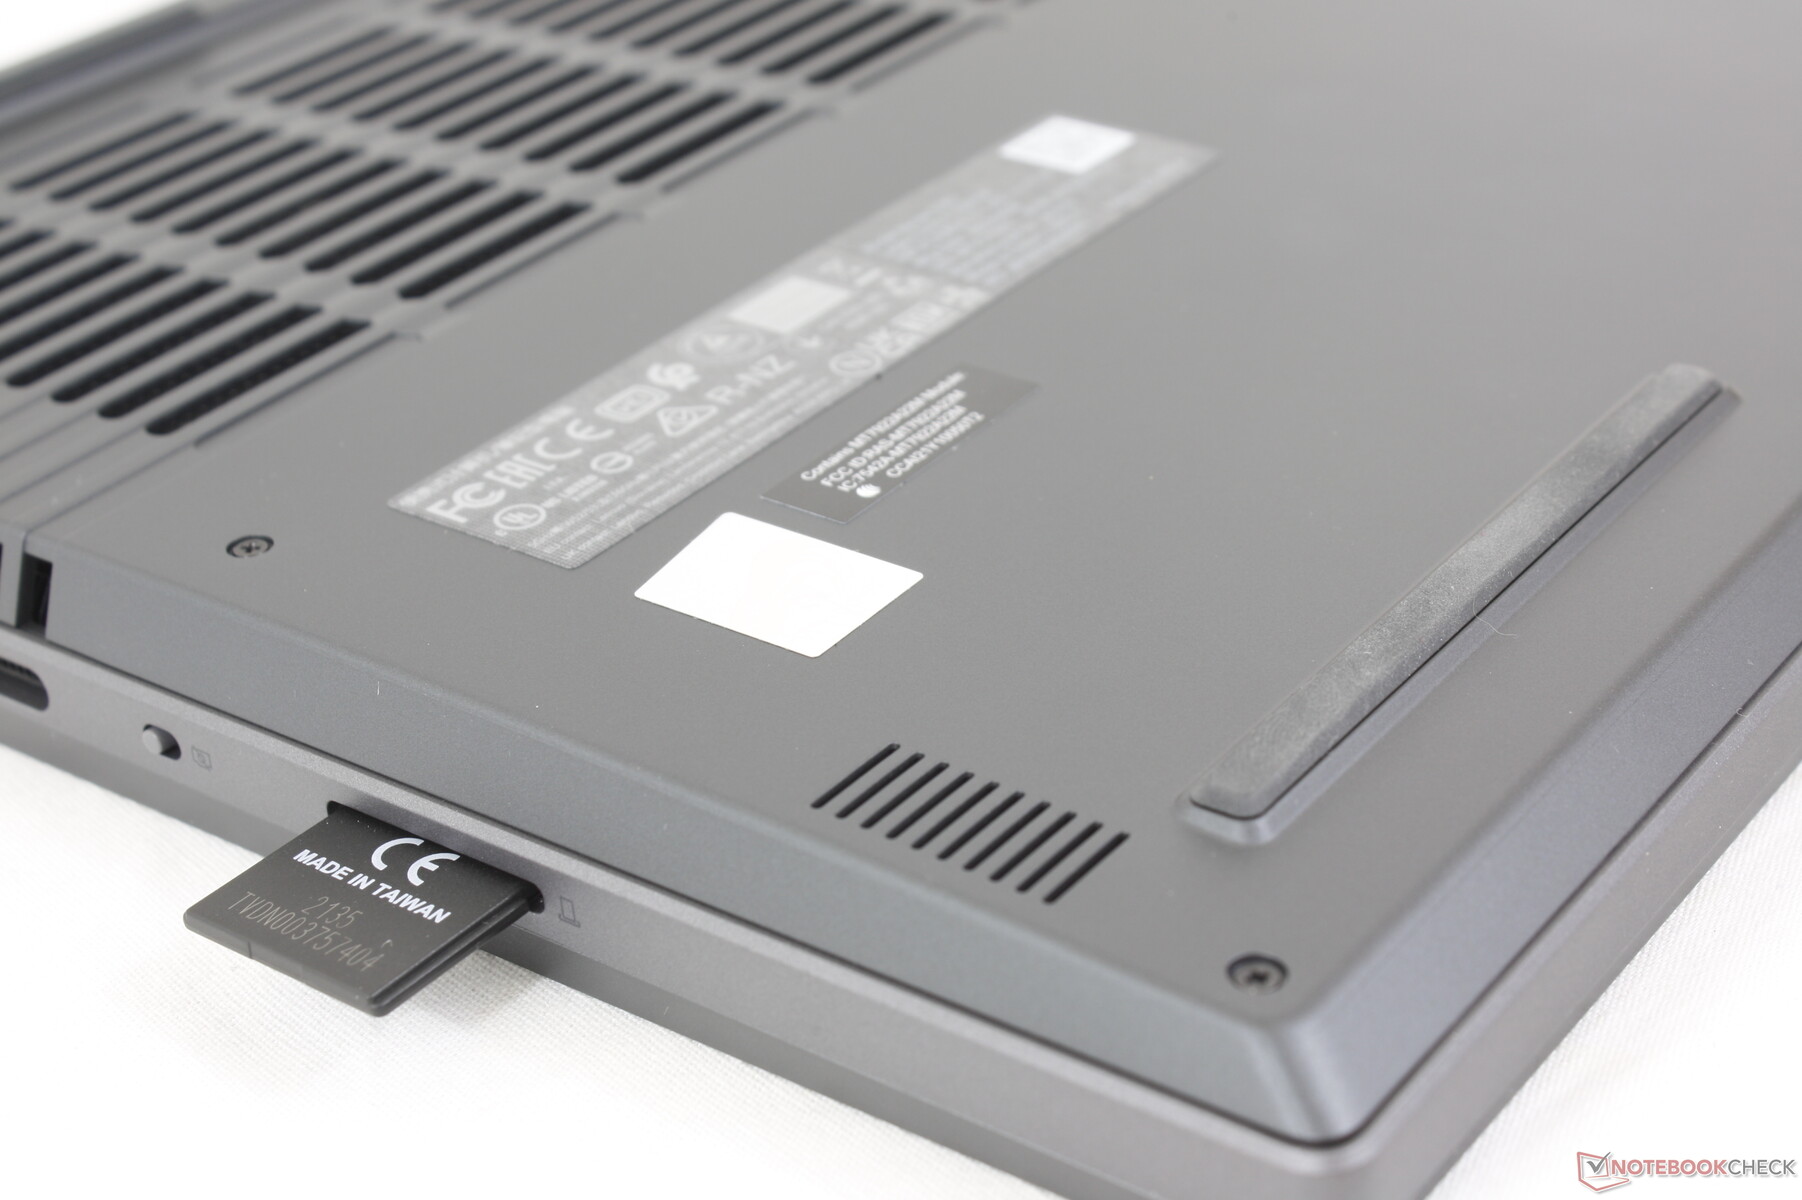
SD Card Reader
Transfer rates from the integrated SD reader is over two times slower than the reader on the more expensive Legion Slim 7i 16 Gen 8. Moving 1 GB of pictures from our PNY UHS-II test card to desktop takes about 27 seconds compared to 12 seconds on the Slim 7i 16.
| SD Card Reader | |
| average JPG Copy Test (av. of 3 runs) | |
| Lenovo Legion Slim 7i 16 Gen 8 (Toshiba Exceria Pro SDXC 64 GB UHS-II) | |
| Acer Nitro 16 AN16-41-R7YE (AV PRO microSD 128 GB V60) | |
| Lenovo Legion Slim 5 16APH8 (PNY EliteX-Pro60 V60 256 GB) | |
| maximum AS SSD Seq Read Test (1GB) | |
| Lenovo Legion Slim 7i 16 Gen 8 (Toshiba Exceria Pro SDXC 64 GB UHS-II) | |
| Acer Nitro 16 AN16-41-R7YE (AV PRO microSD 128 GB V60) | |
| Lenovo Legion Slim 5 16APH8 (PNY EliteX-Pro60 V60 256 GB) | |
Communication
A MediaTek MT7922 comes standard for Wi-Fi 6E and Bluetooth 5.2 connectivity. An Intel AX211 would have likely been more costly and we're glad to not see the slower Realtek RTL8852BE. Transfer rates are steady and reliable when paired to our Asus AXE11000 6 GHz network.
Webcam
The 2 MP webcam is becoming more commonplace on gaming laptops to replace the muddy 1 MP solutions on older models. The camera can be disabled electronically instead of with a physical shutter while IR is not supported.


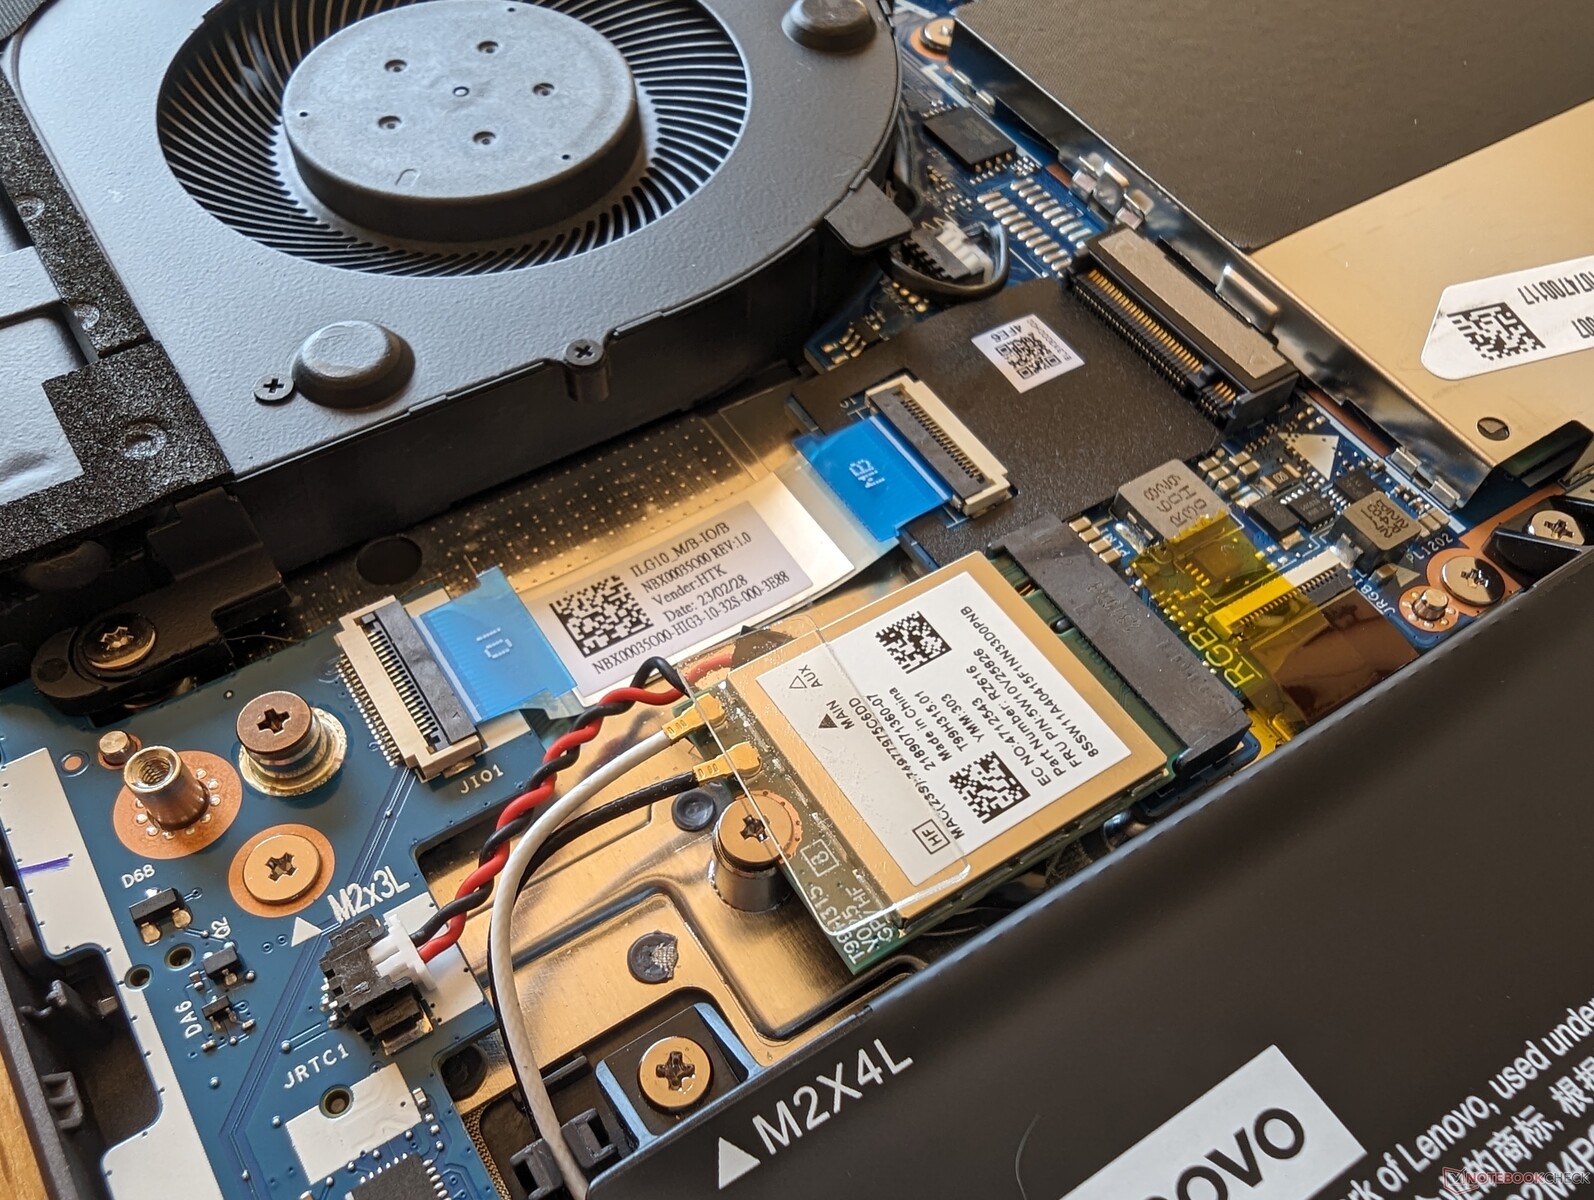
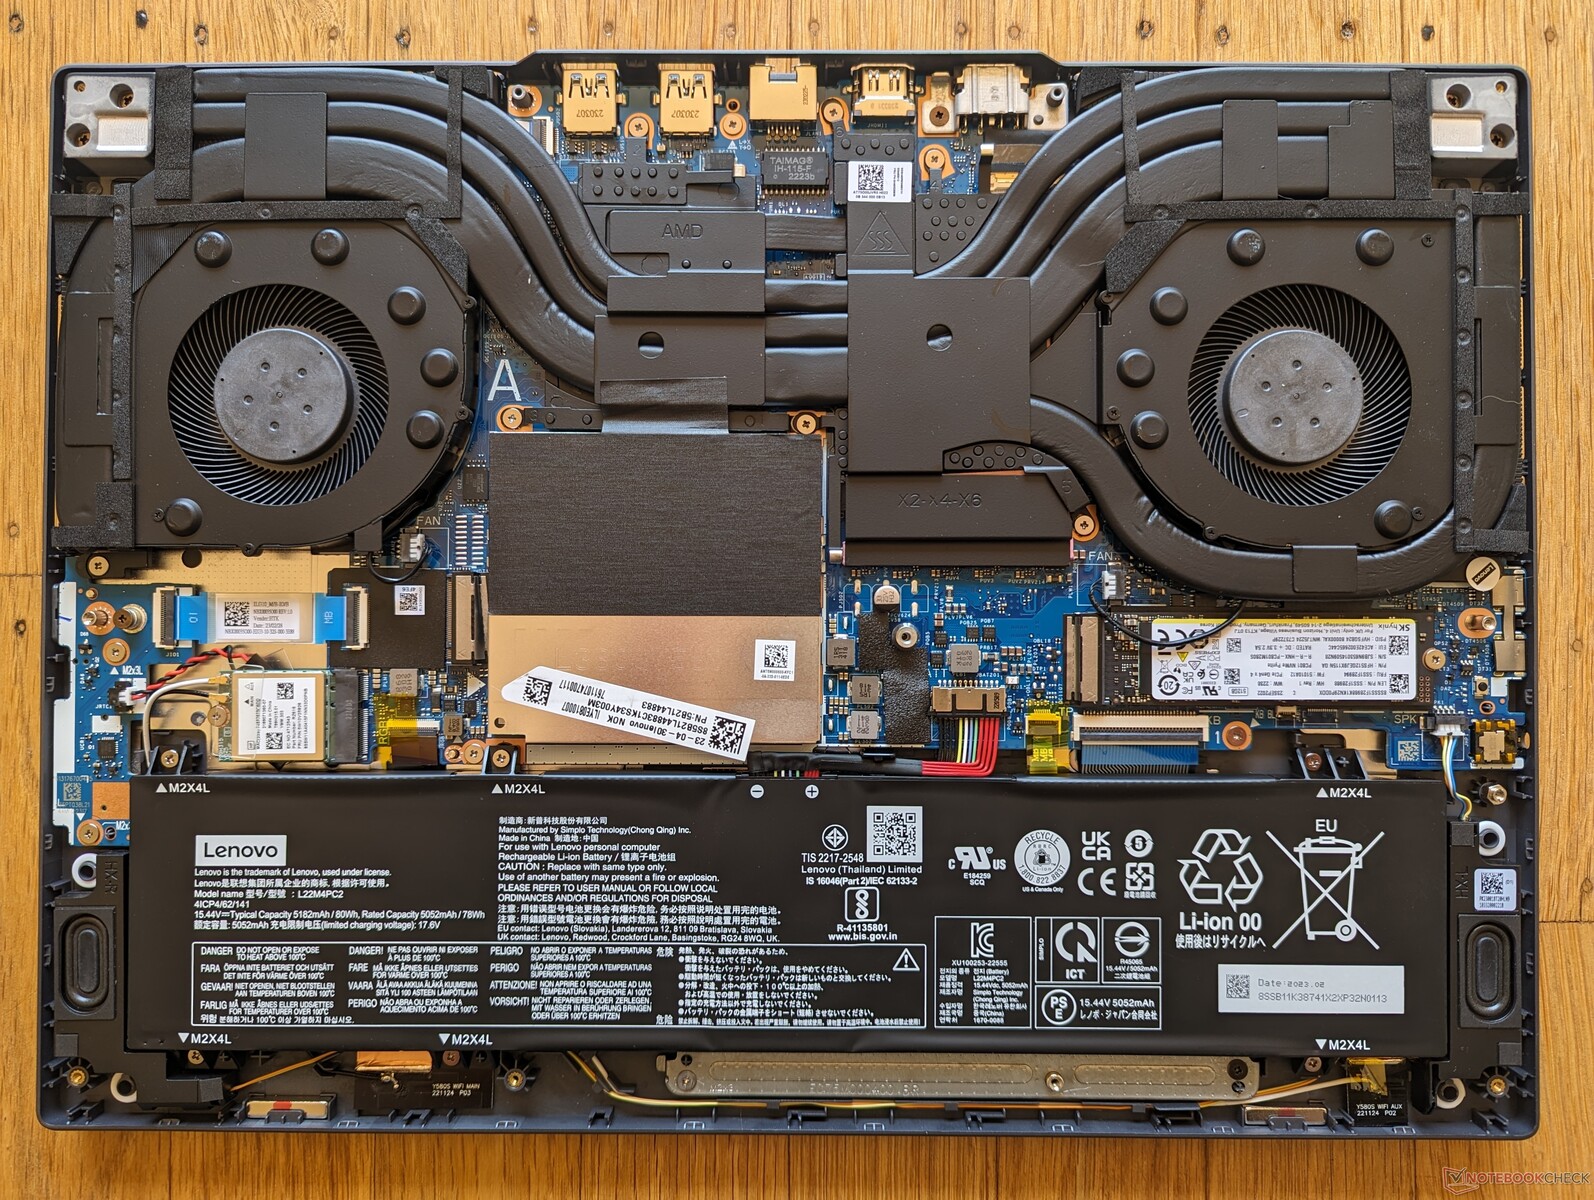
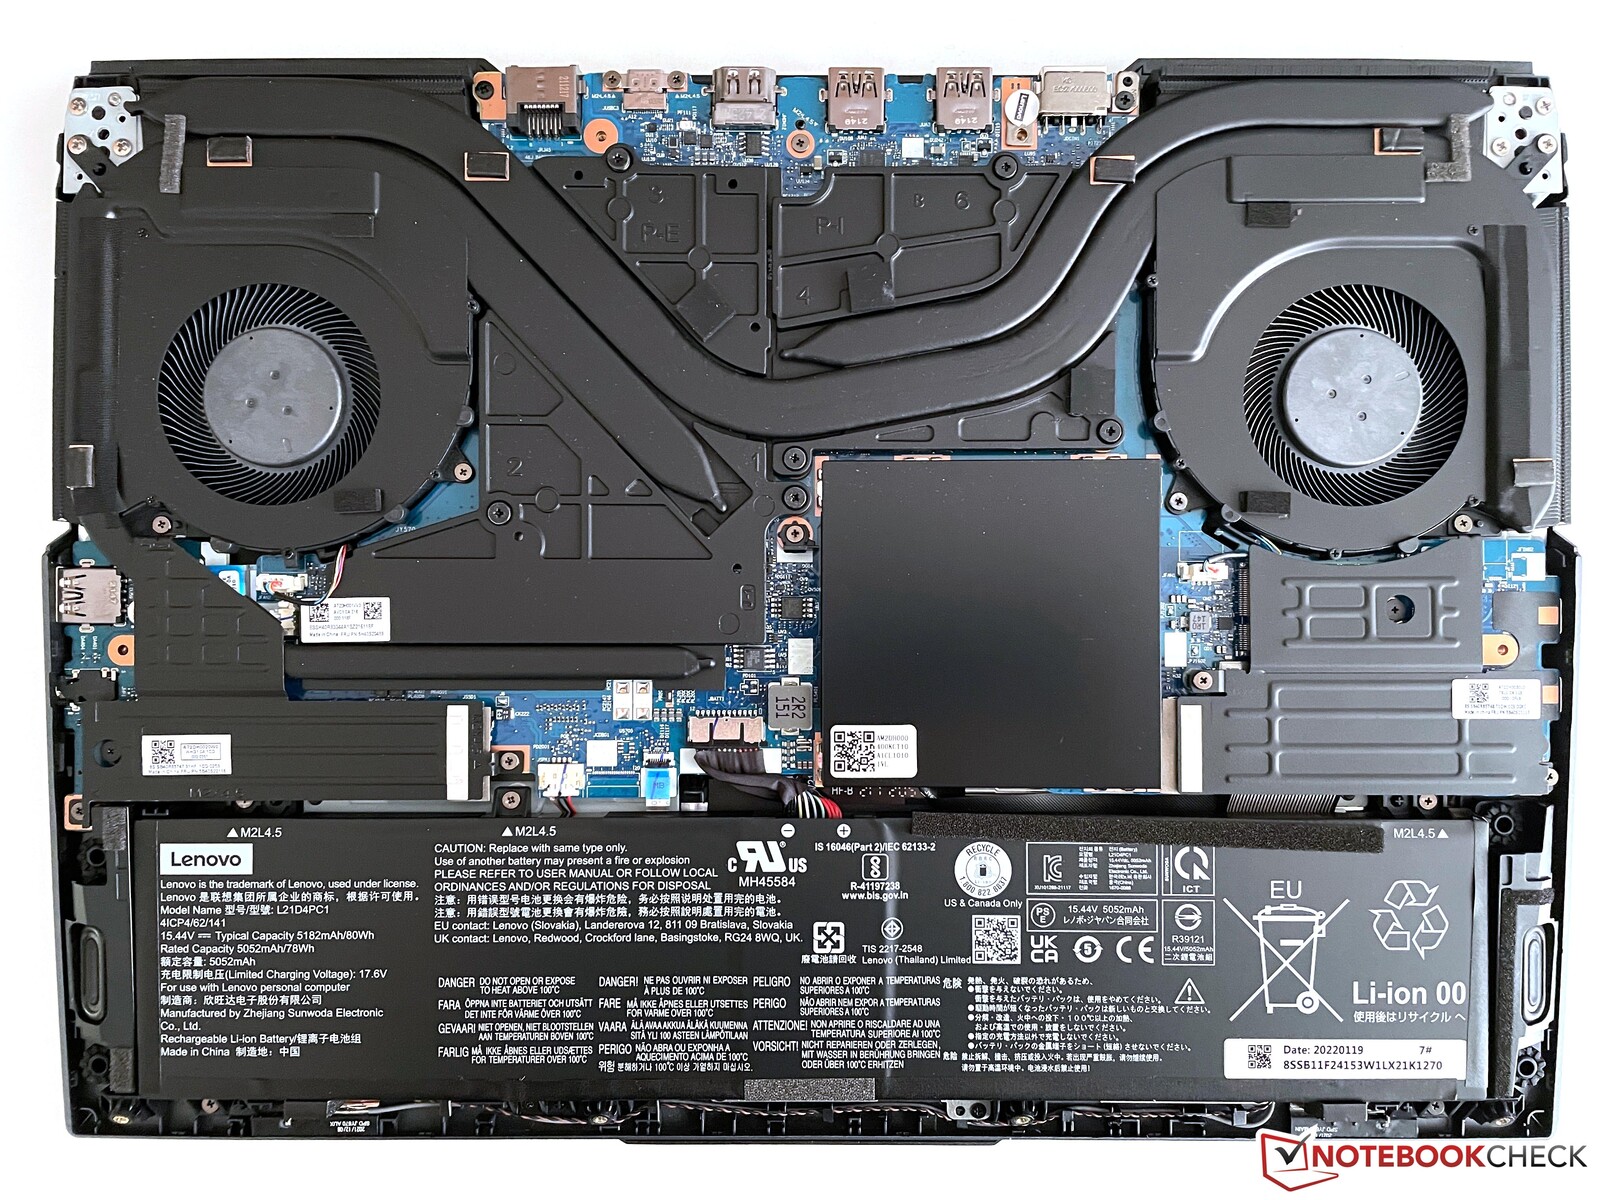
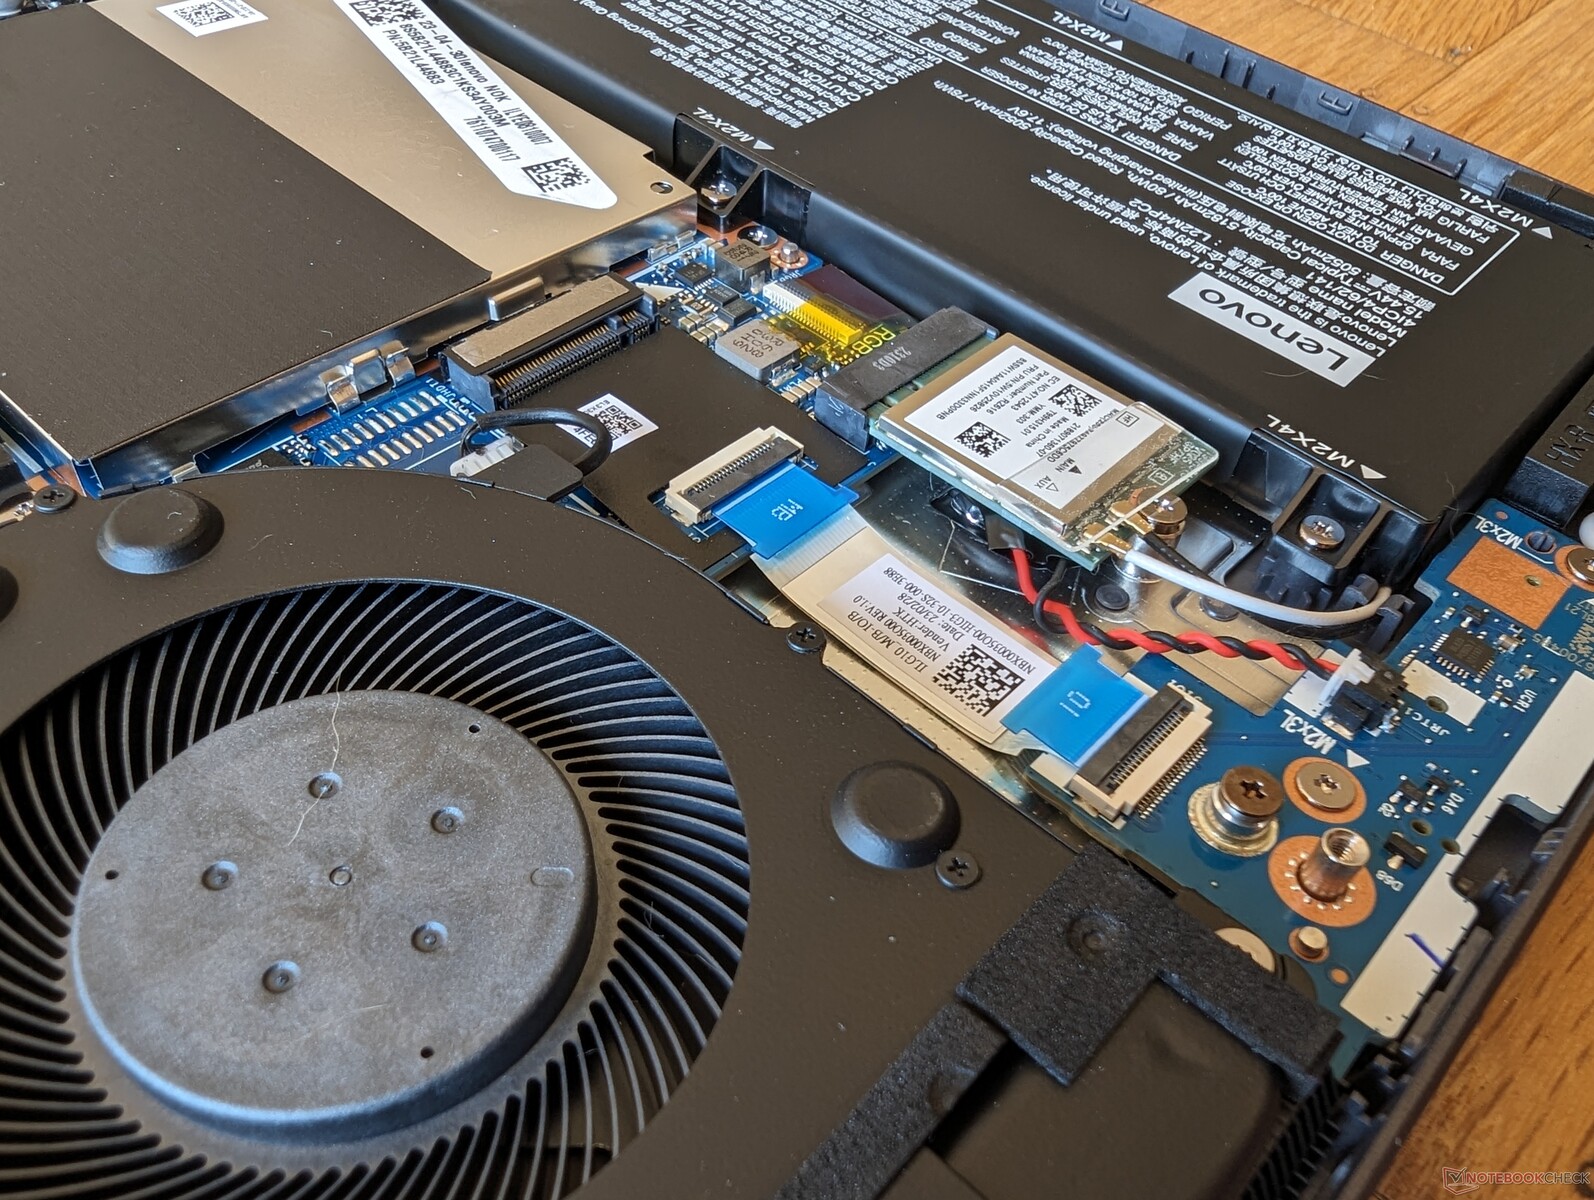
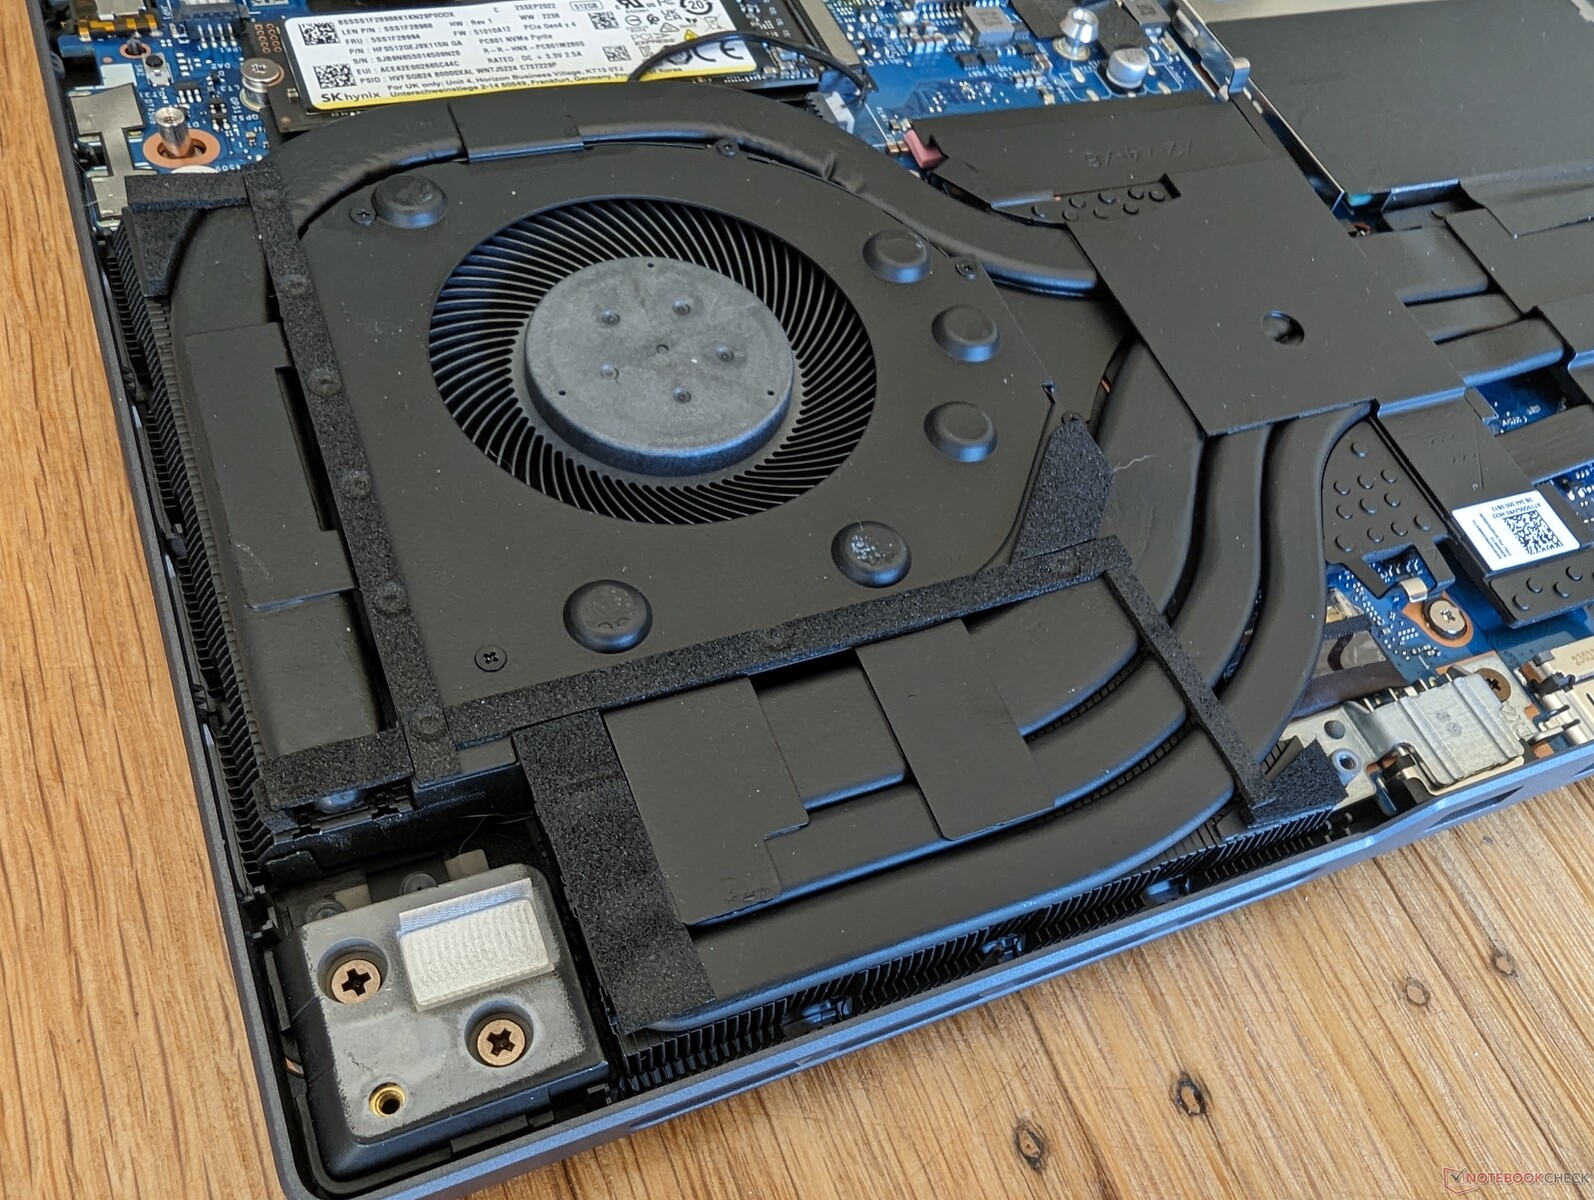
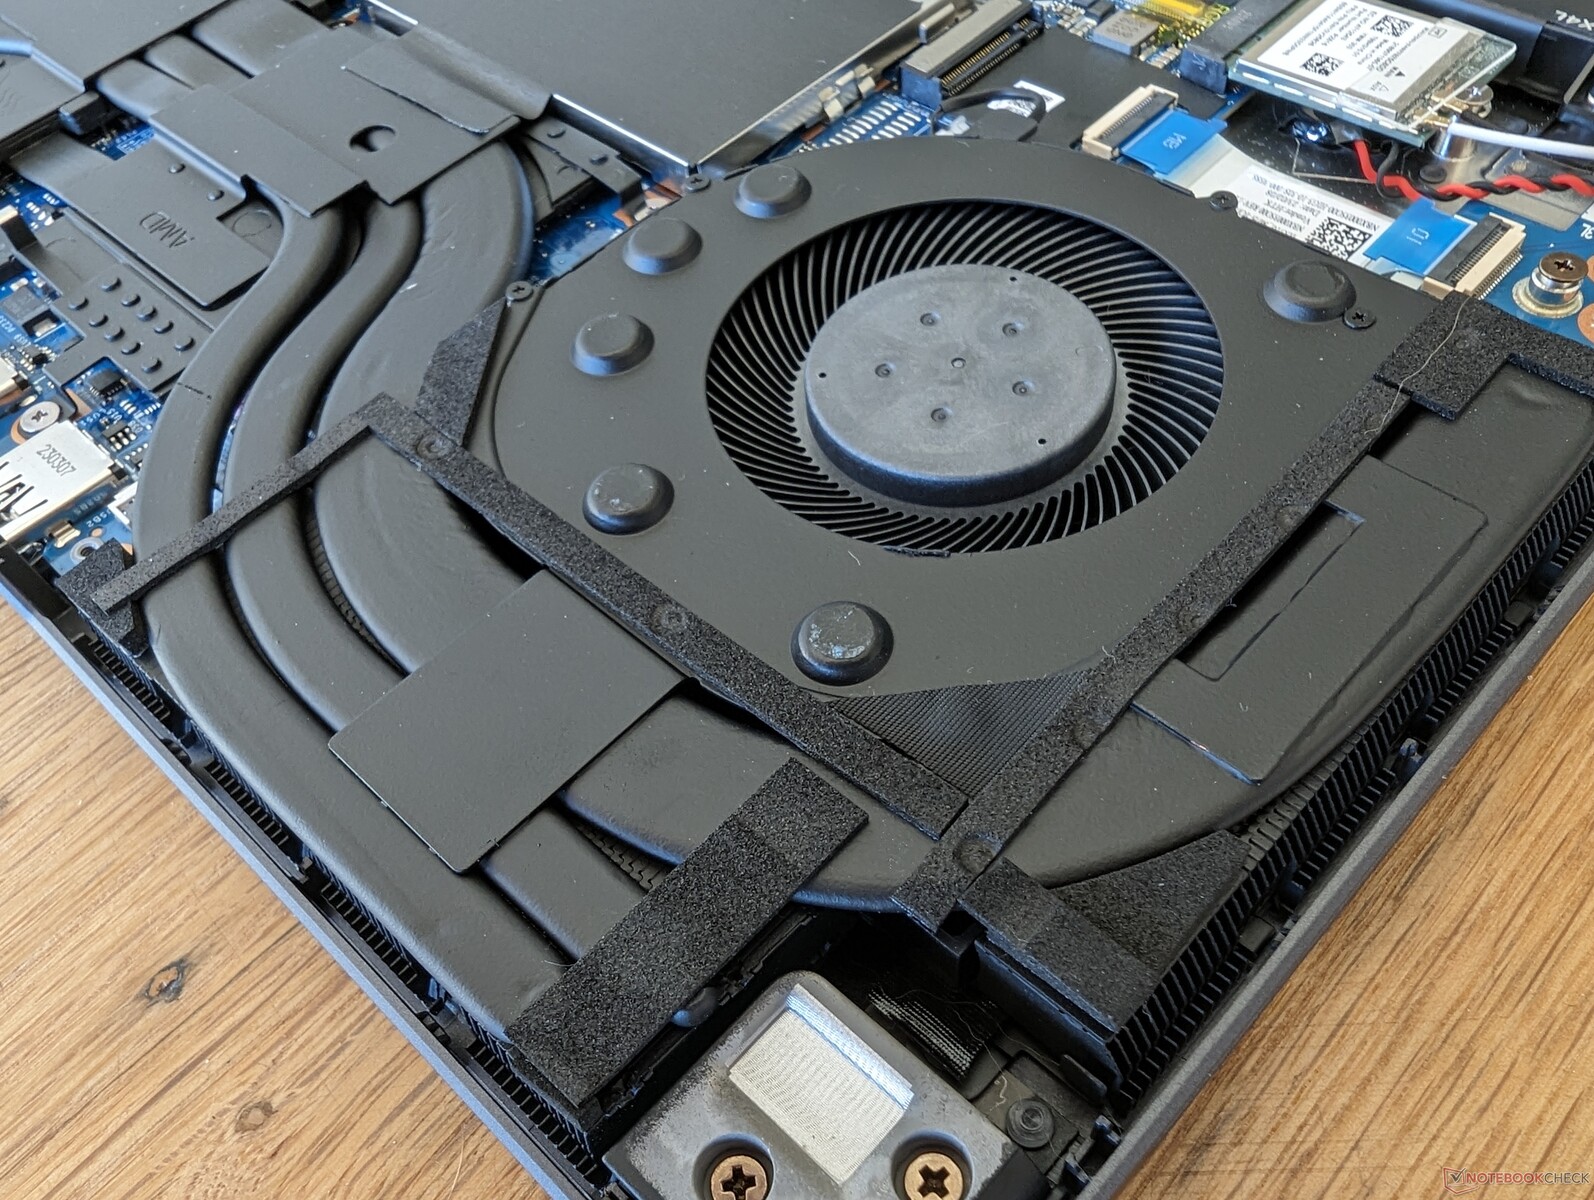
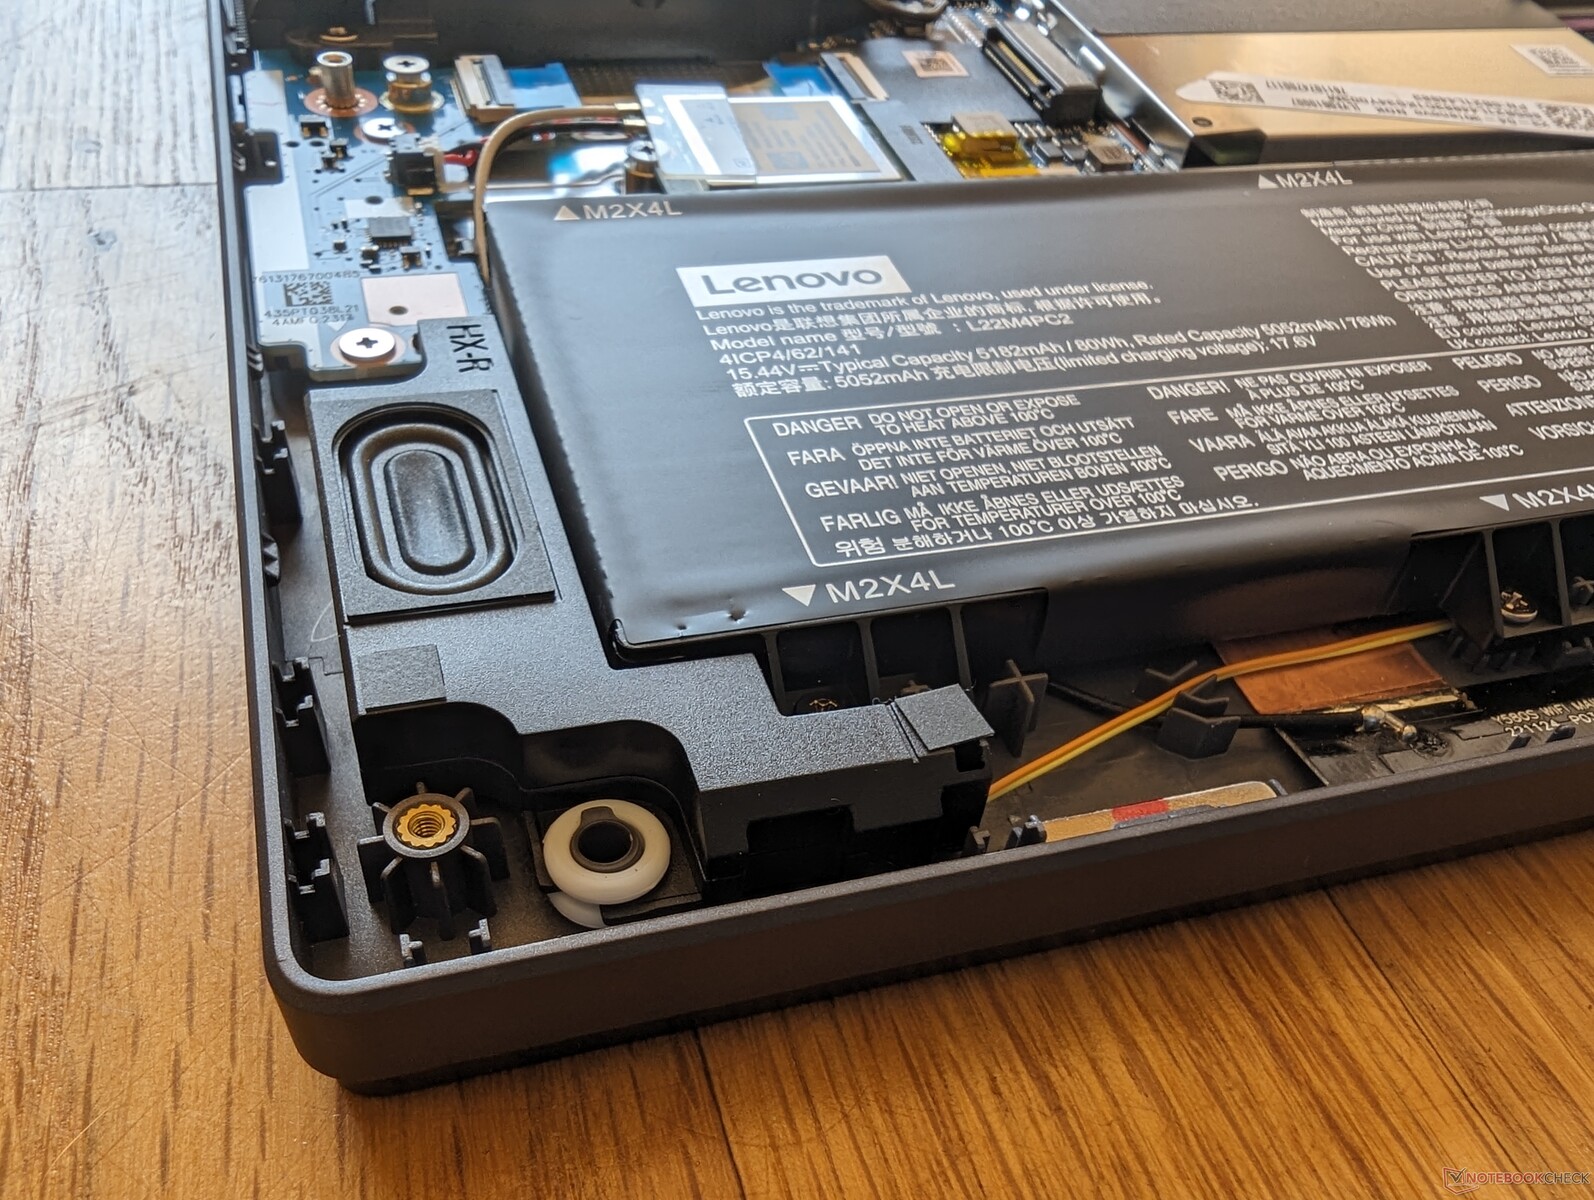
Maintenance
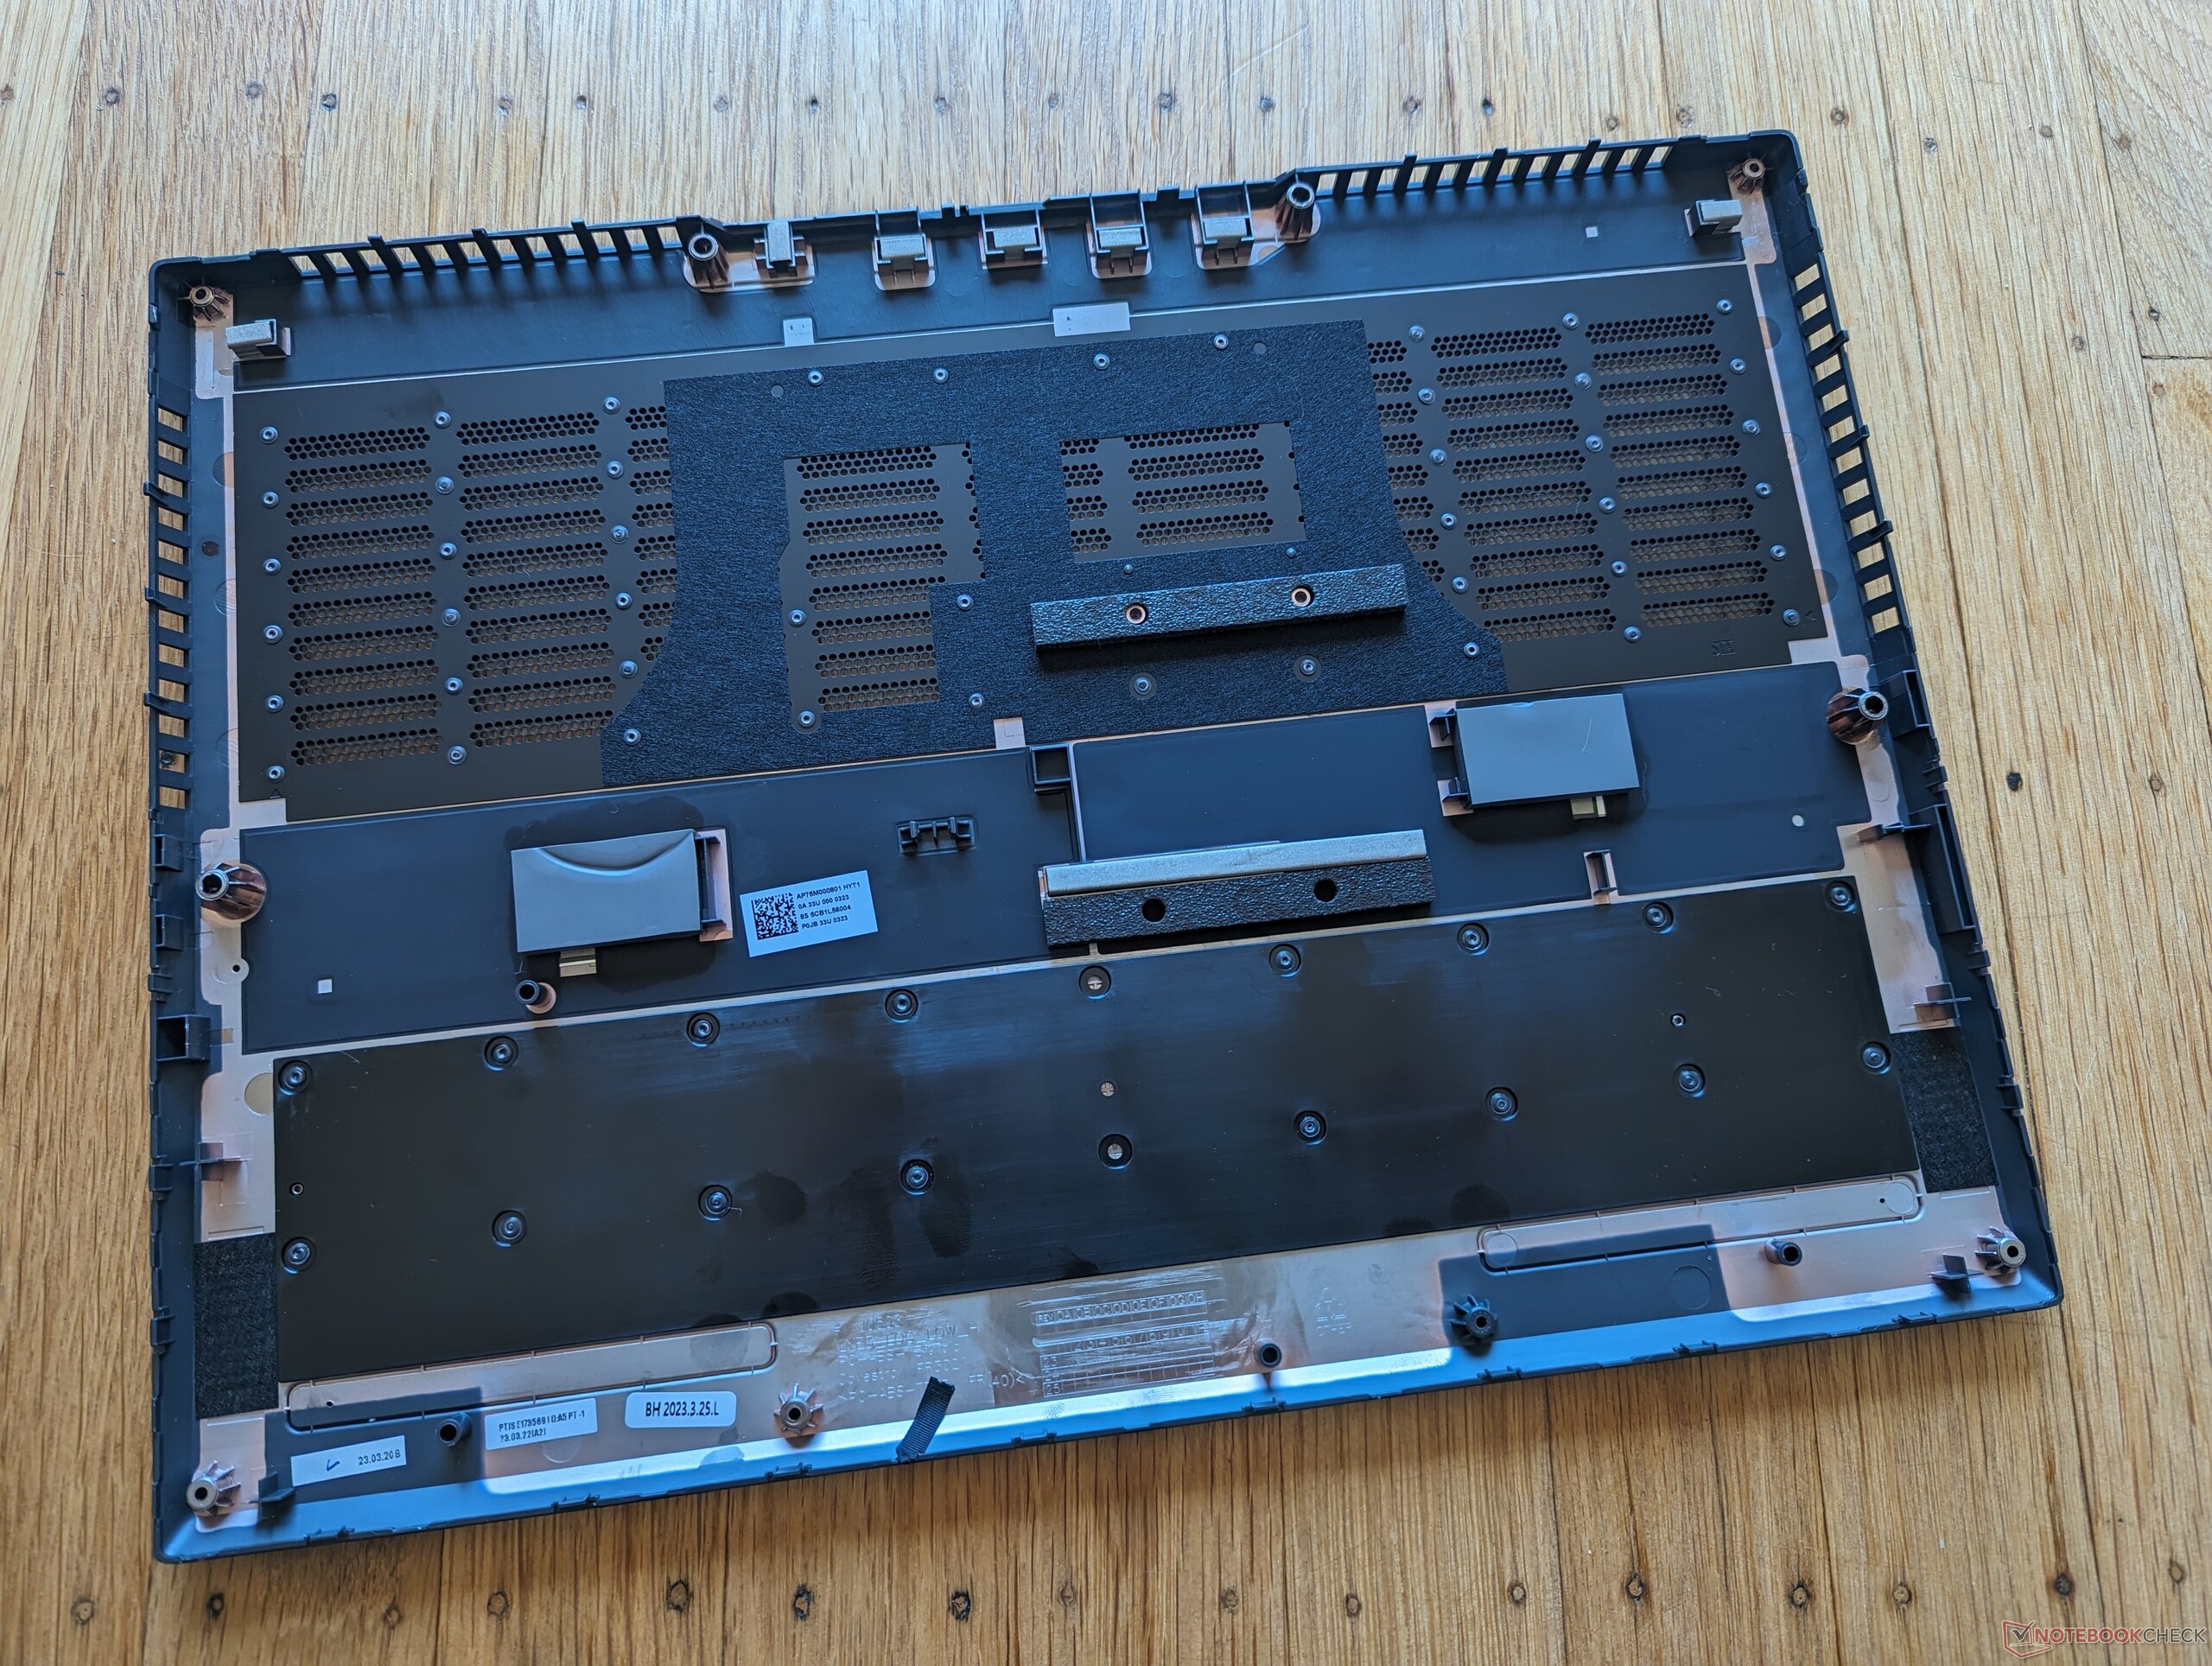
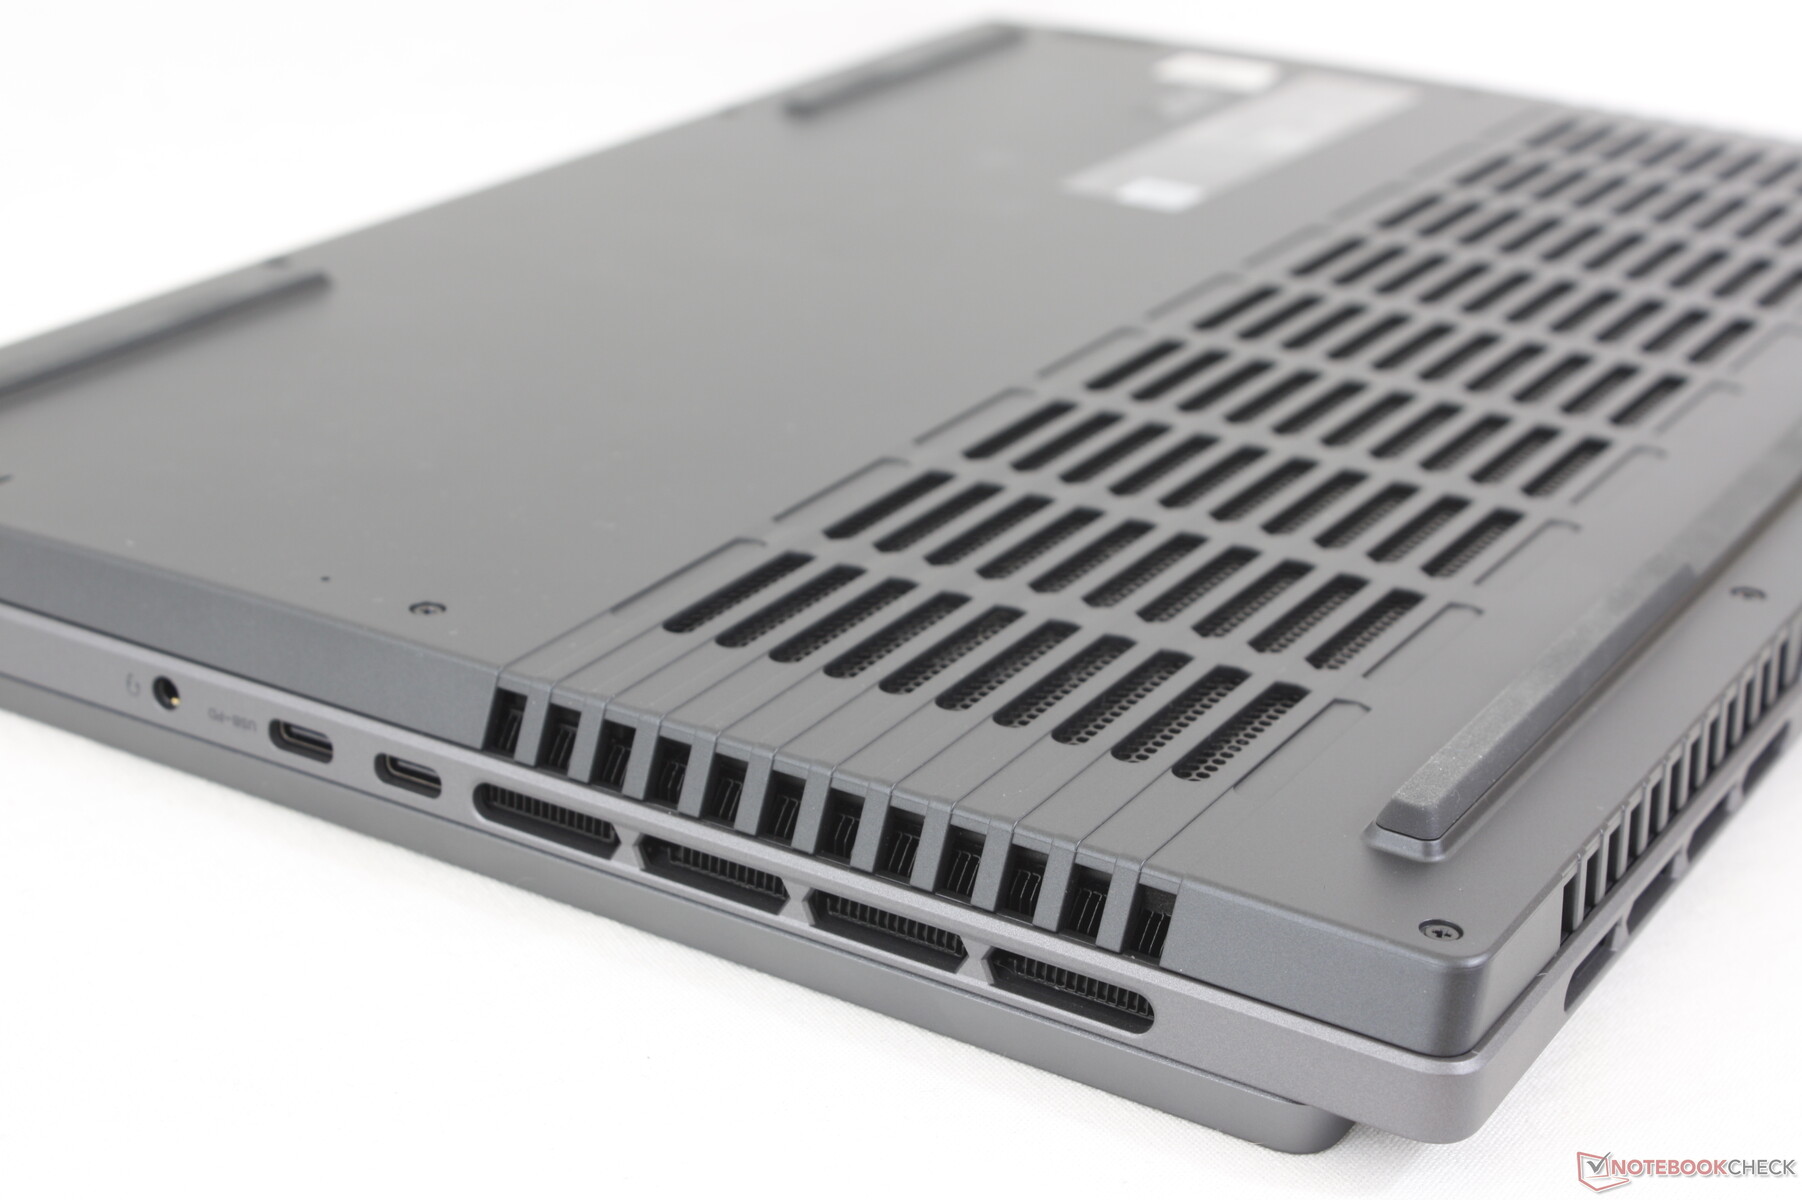
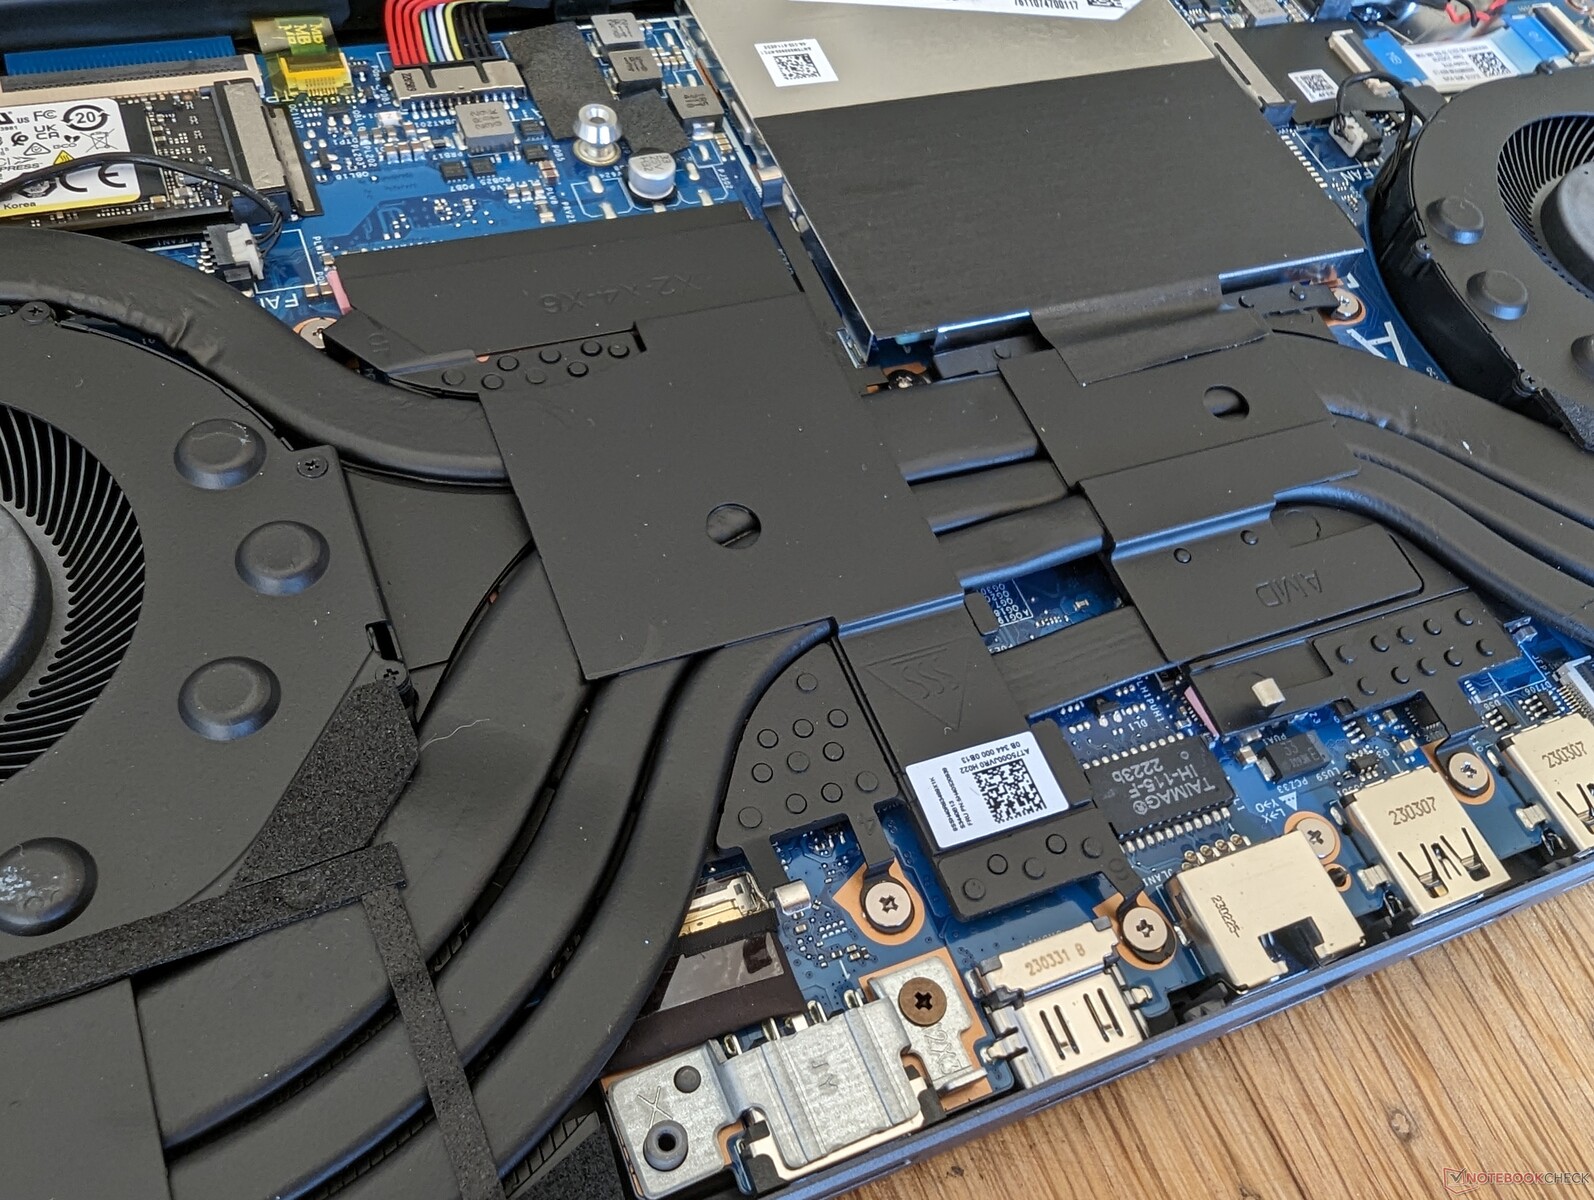
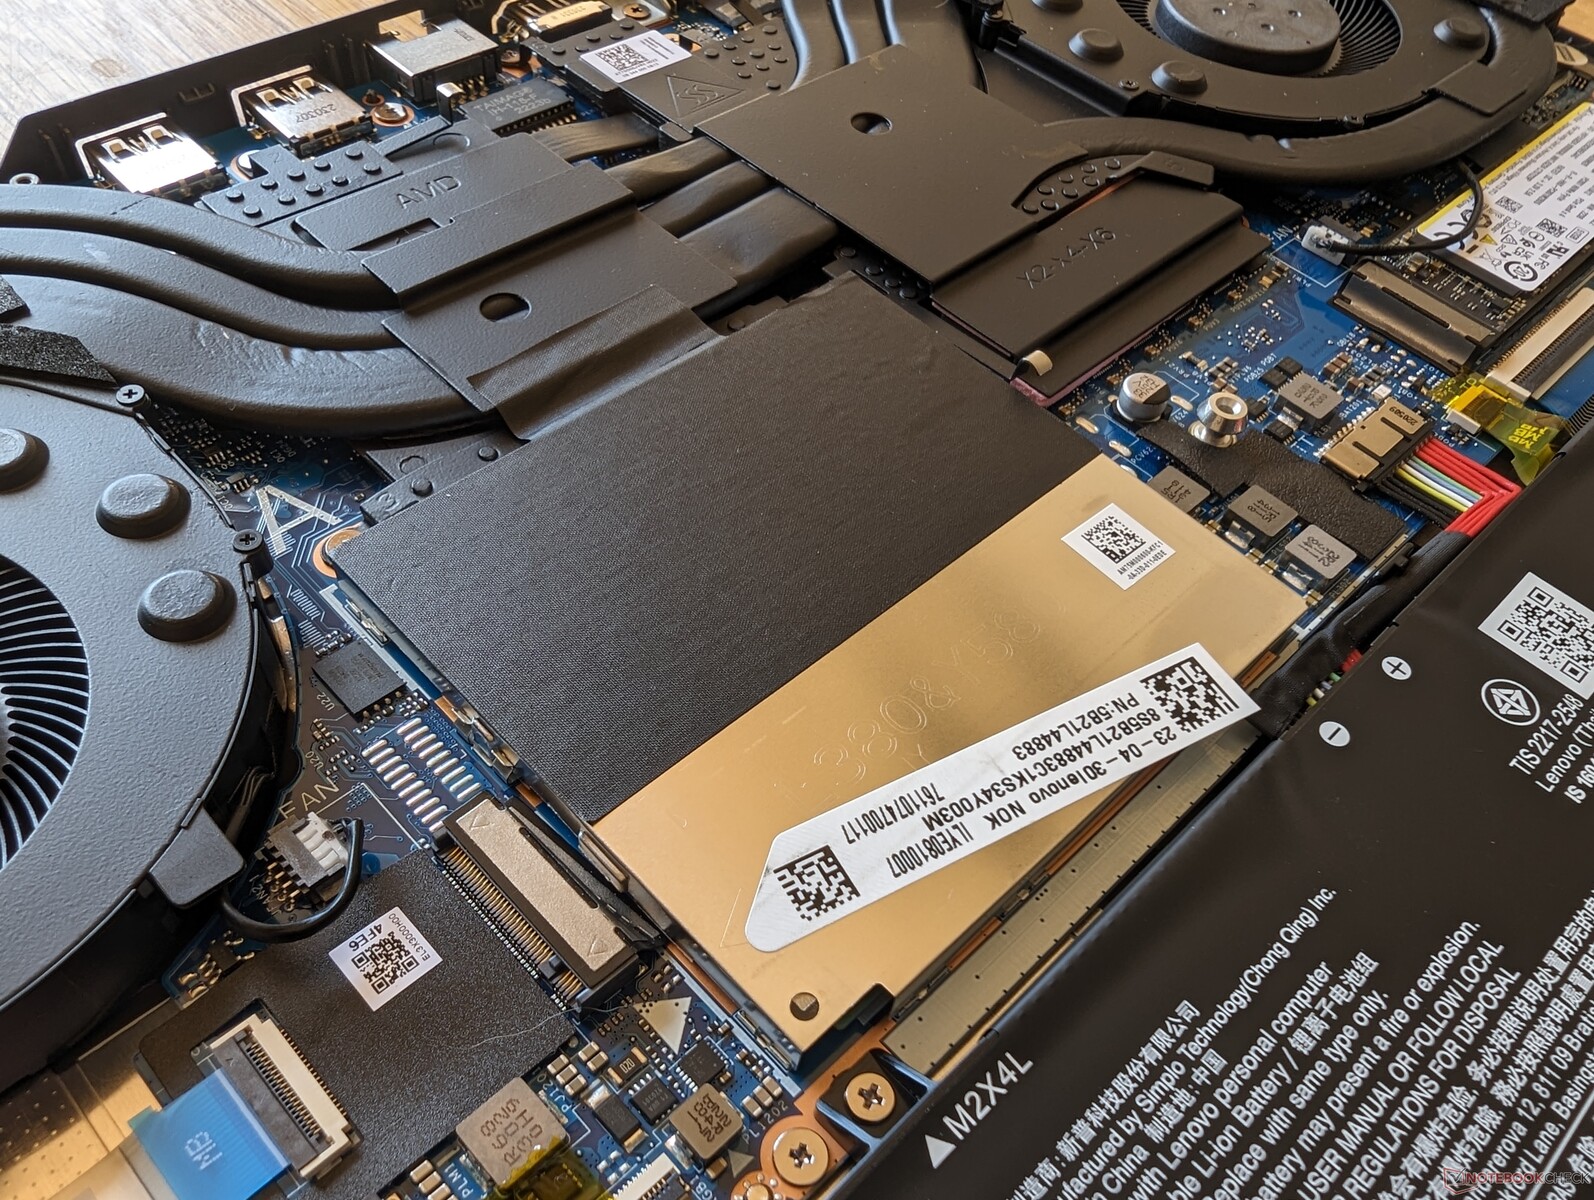
The bottom panel requires only a Phillips screwdriver to remove. Core components are easily upgradeable much like on the thicker Legion 5 Pro 16 including the 2x SODIMM slots, 2x M.2 2280 slots, WLAN module, and battery.
Accessories And Warranty
The retail box includes no accessories outside of the AC adapter and paperwork. The usual one-year limited manufacturer warranty applies if purchased in the US.
Input Devices — No Per-Key RGB Lighting
Keyboard
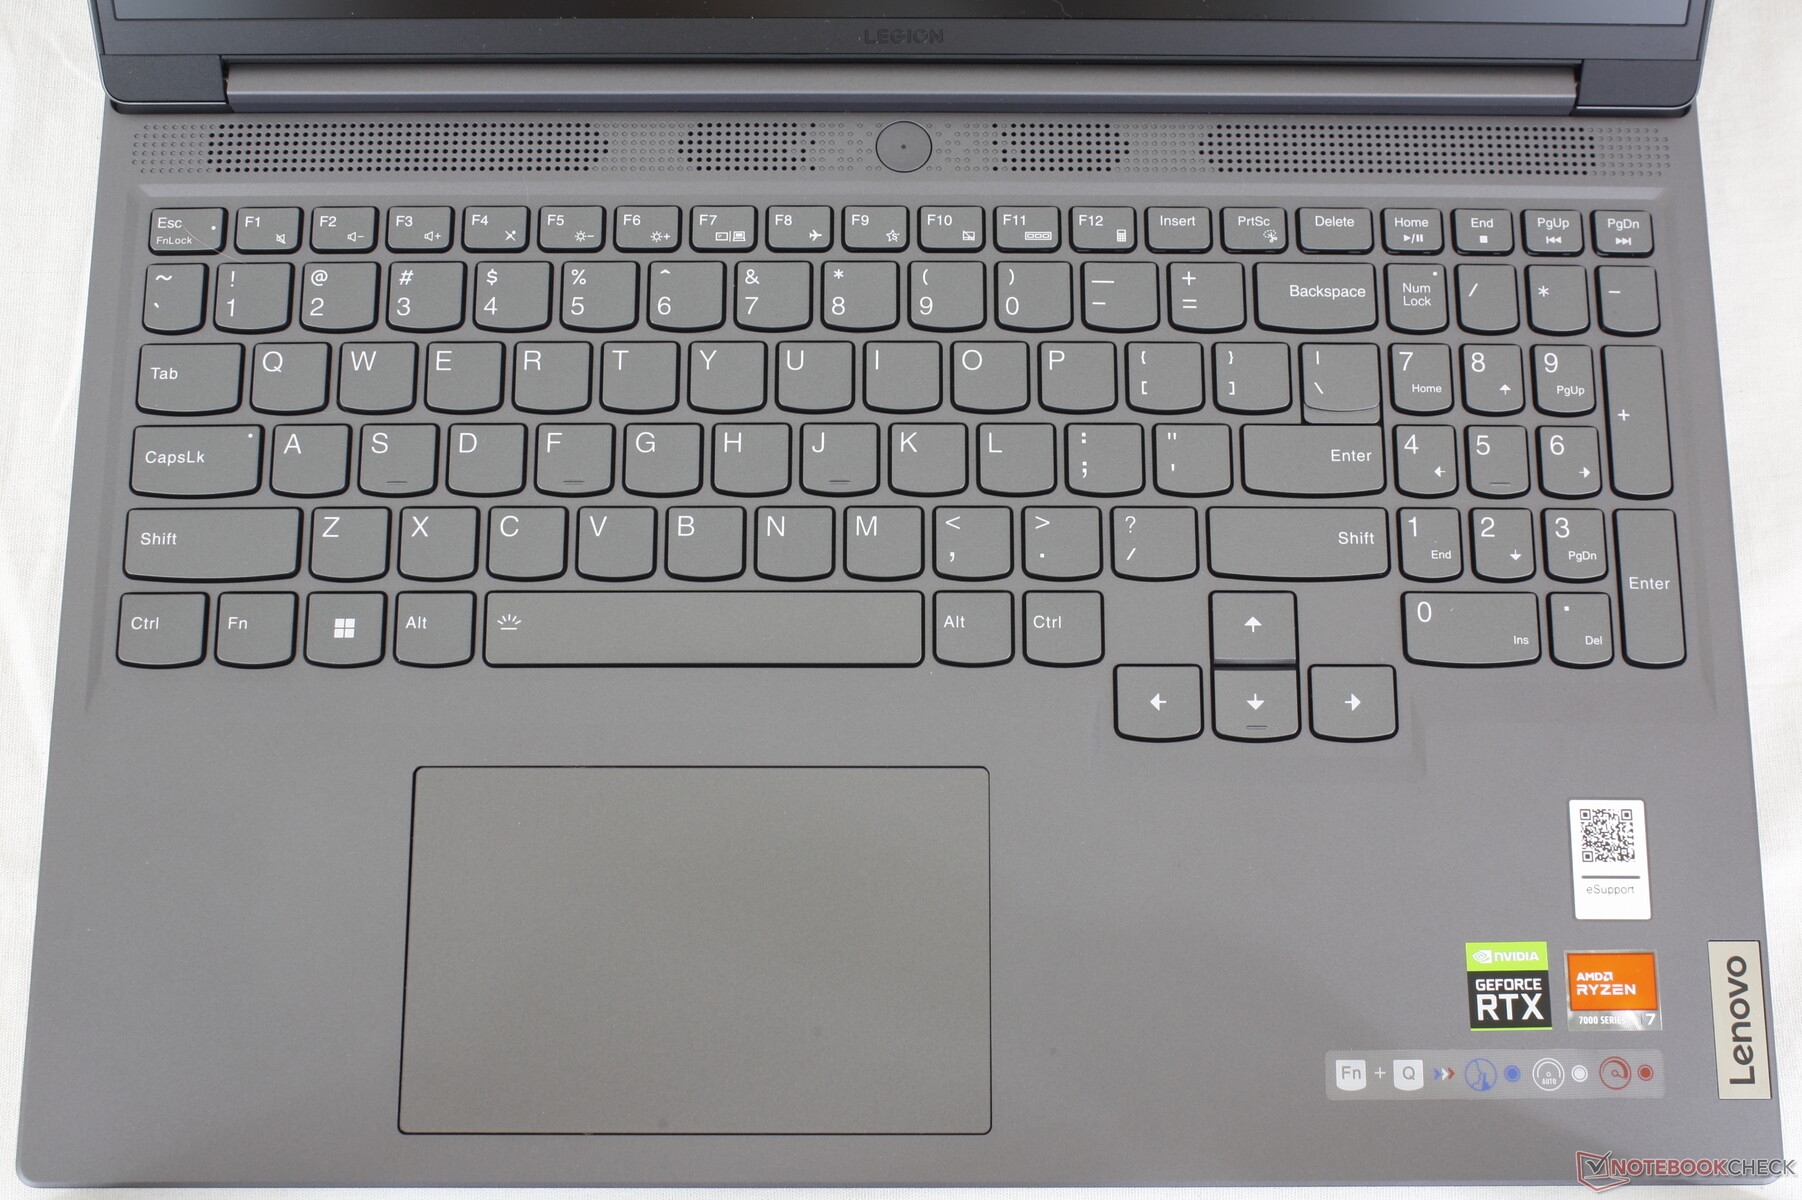
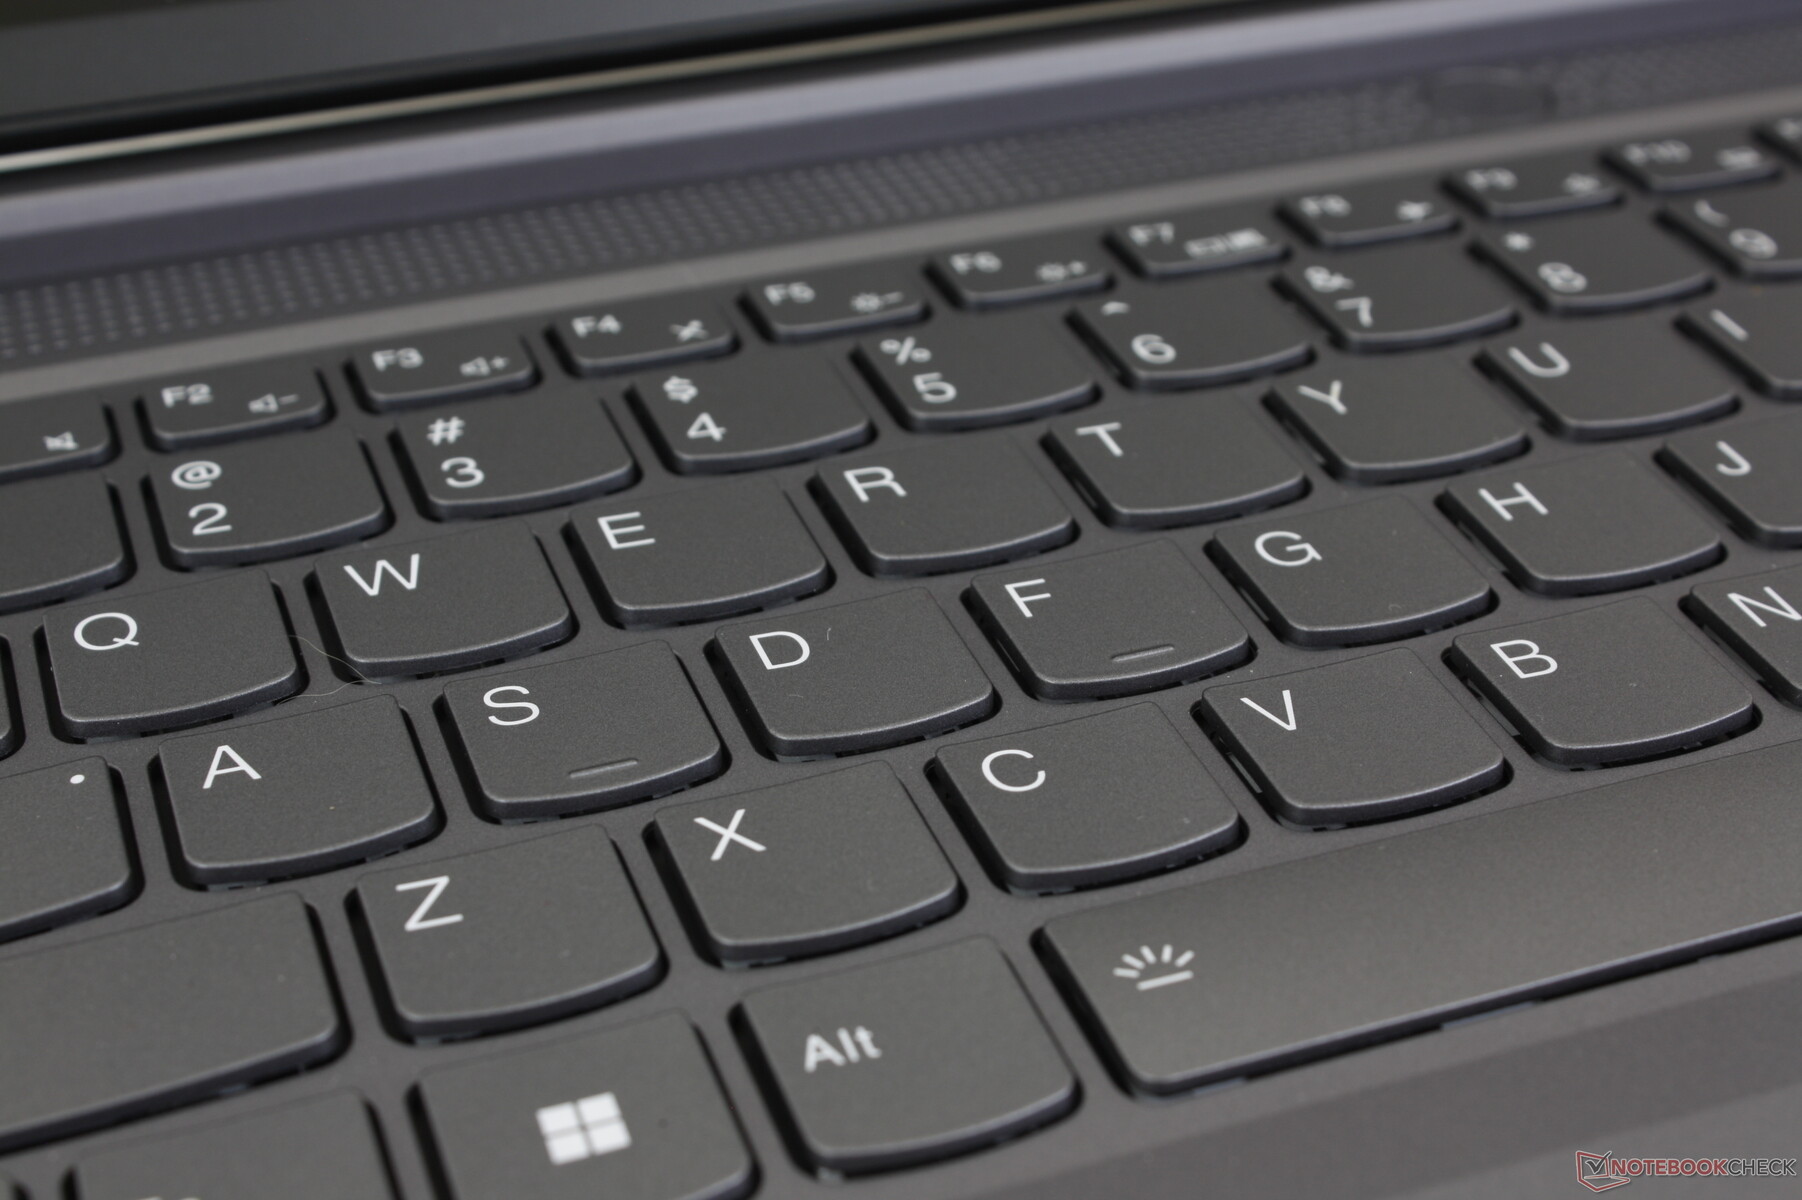
Aside from the few flagship models with mechanical key options, most Legion laptops offer a similar typing experience since Lenovo utilizes the same keyboard layout for much of the series. Thus, users who have typed on the more expensive Legion Slim 7i 16 or even the older Legion 5 15 will feel right at home with the Legion Slim 5. Instead, the main differentiating factor between the keyboards on our midrange Legion Slim 5 and the higher-end Legion Slim 7 is the lighting. The latter includes per-key RGB lighting whereas our Legion Slim 5 has quad-zone RGB lighting only.
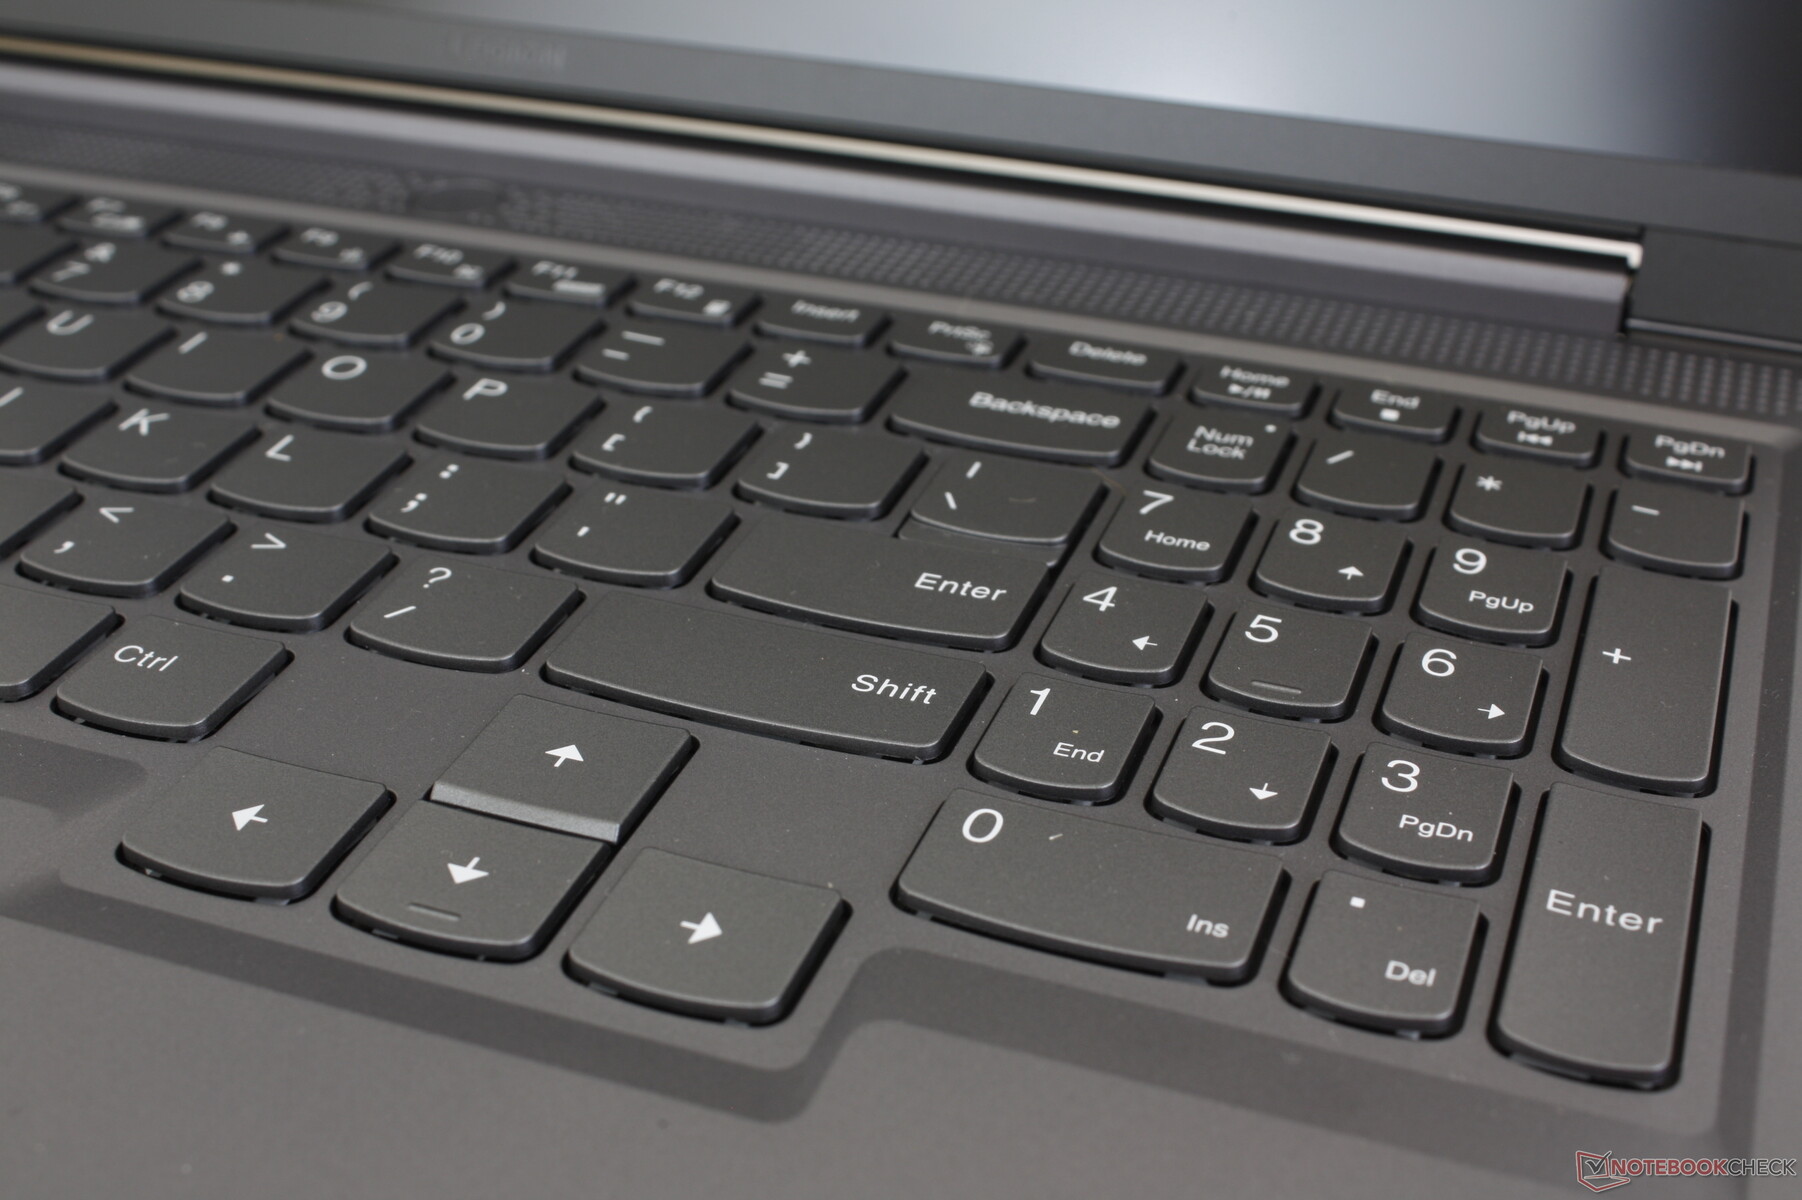
We appreciate the integrated numpad and large arrow keys which can come in handy for racing games and DOTA 2 Reborn, respectively. Other gaming laptops like the Asus TUF Gaming A16 or Omen 16 have more cramped arrow keys or no numpad at all.
Touchpad
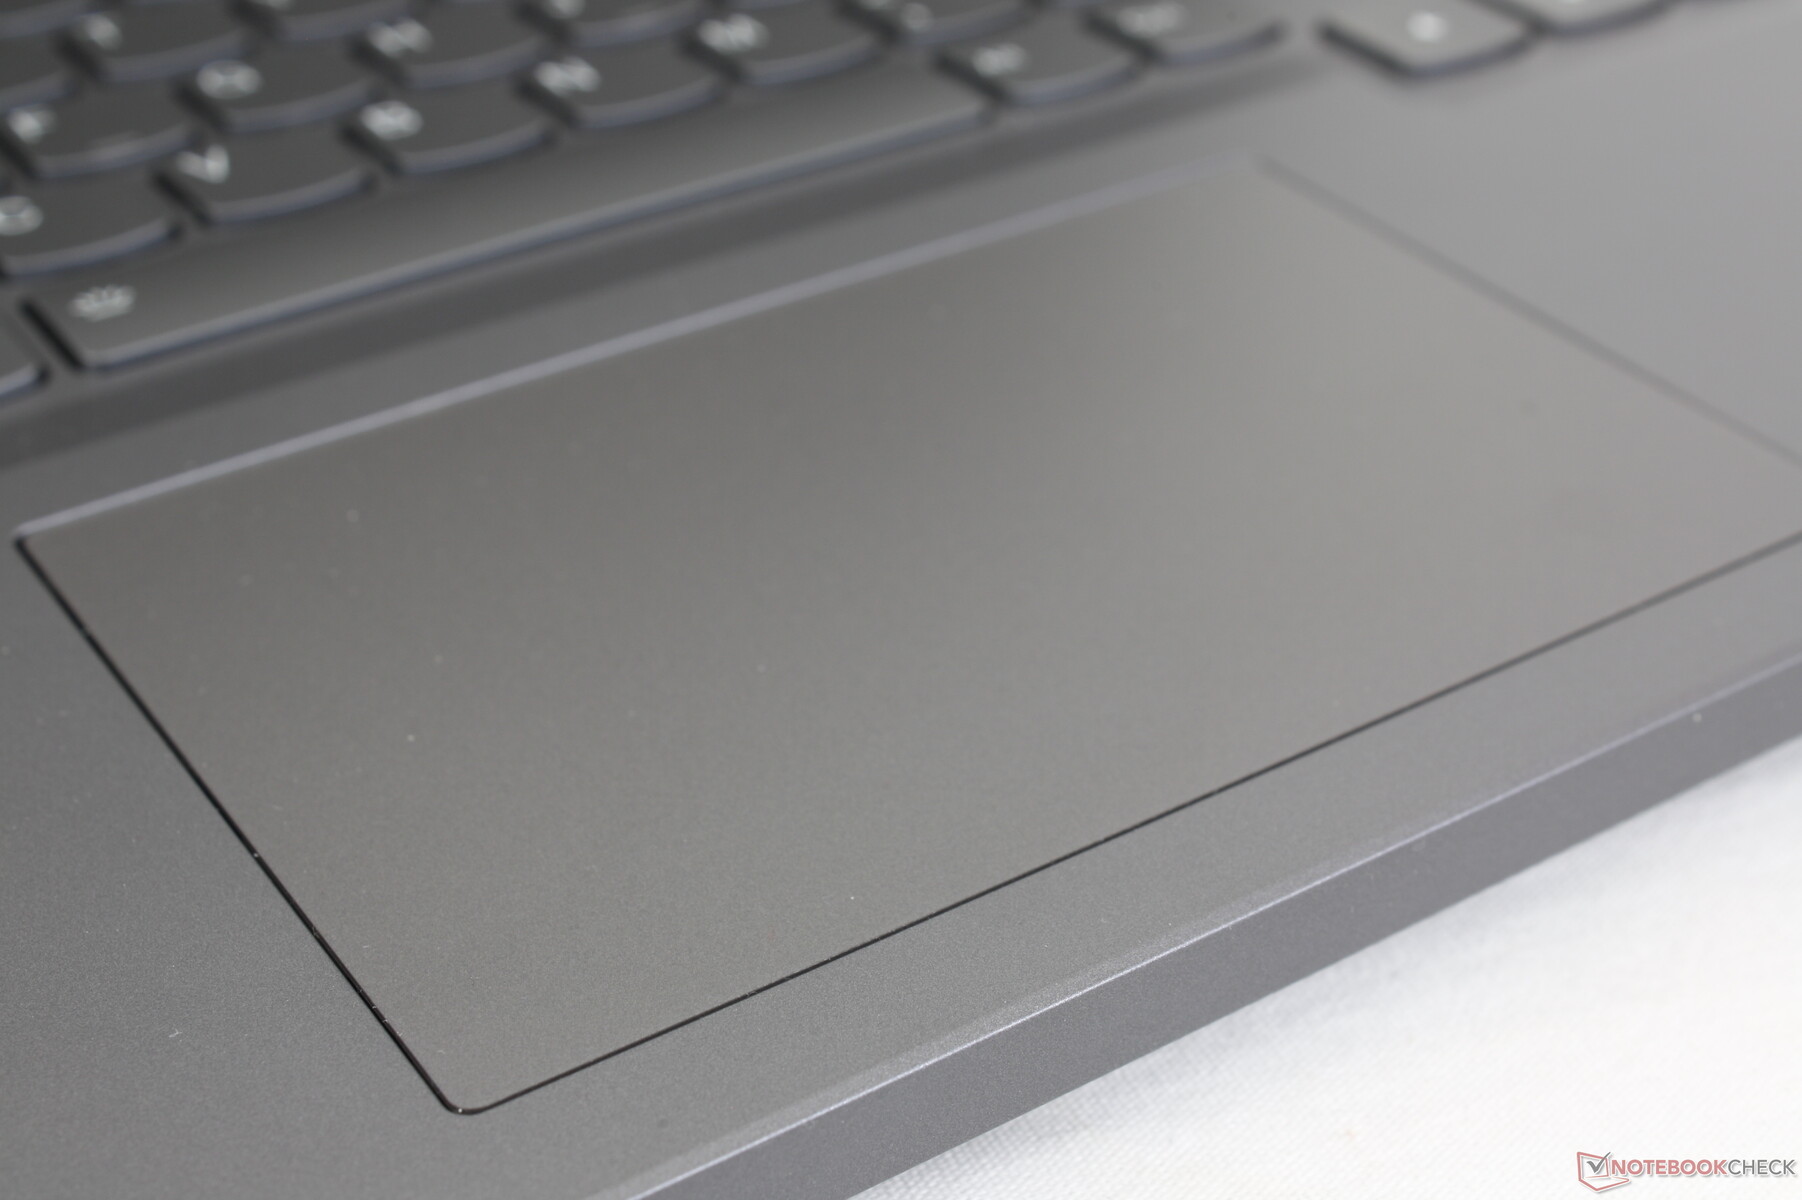
Surface area is identical to the clickpad on the Legion Slim 7i 16 at 12 x 7.5 cm. Though not nearly as large as the clickpad on the Razer Blade 16, it's a comfortable size nonetheless with a satisfying high-pitched click when pressed. Traction is quite sticky, however, and so gliding can feel bumpier than usual especially when performing actions like drag-and-drop.
Display — Excellent Features For The Price
Two display options are available:
- 2560 x 1600, 165 Hz, 100% sRGB, 300 nits, Pantone certified
- 1920 x 1200, 144 Hz, 60% sRGB, 300 nits
Our measurements reflect only the bolded option above. Both panels otherwise support G-Sync and FreeSync Premium. We recommend avoiding the cheaper 1200p panel due to its narrow 45% NTSC color space especially if color accuracy is a must.
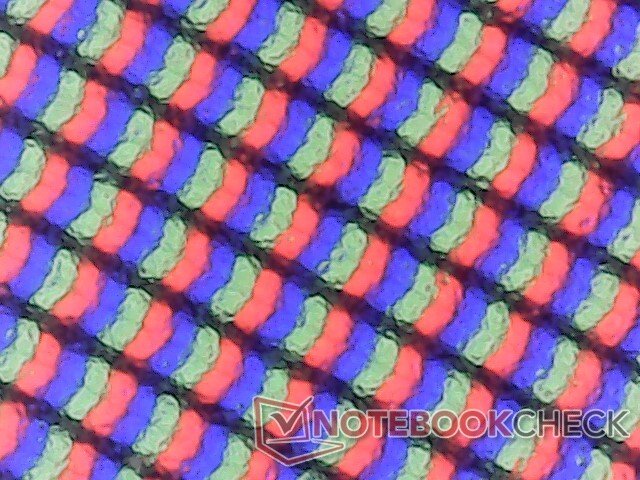
The BOE NE160QDM panel on our unit can also be found on the Dell G16 7620 and so the two models offer very similar visual experiences. This particular panel is perfect for laptop gaming due to its fast response times, deep colors, fast 165 Hz refresh rate, and QHD native resolution which pairs well with most mobile GPUs.
| |||||||||||||||||||||||||
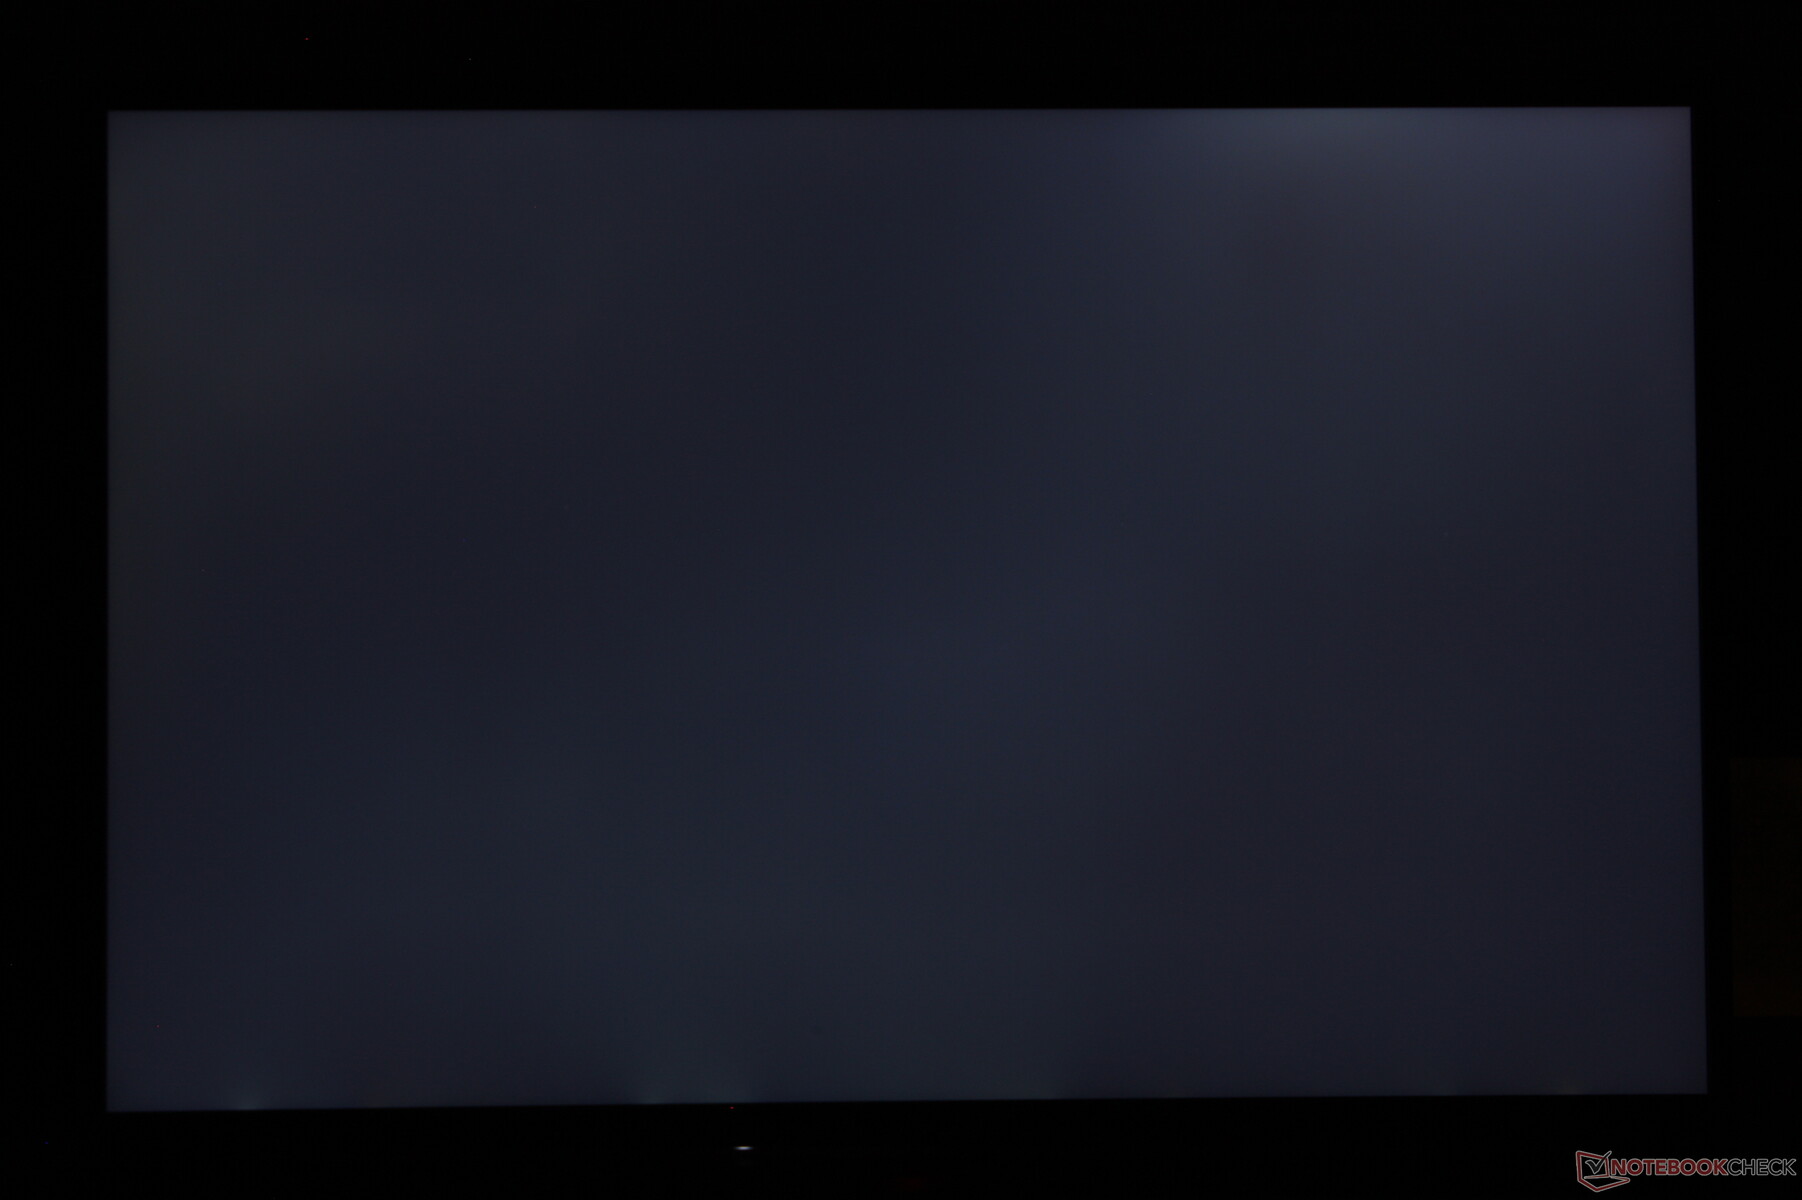
Brightness Distribution: 84 %
Center on Battery: 371.6 cd/m²
Contrast: 845:1 (Black: 0.44 cd/m²)
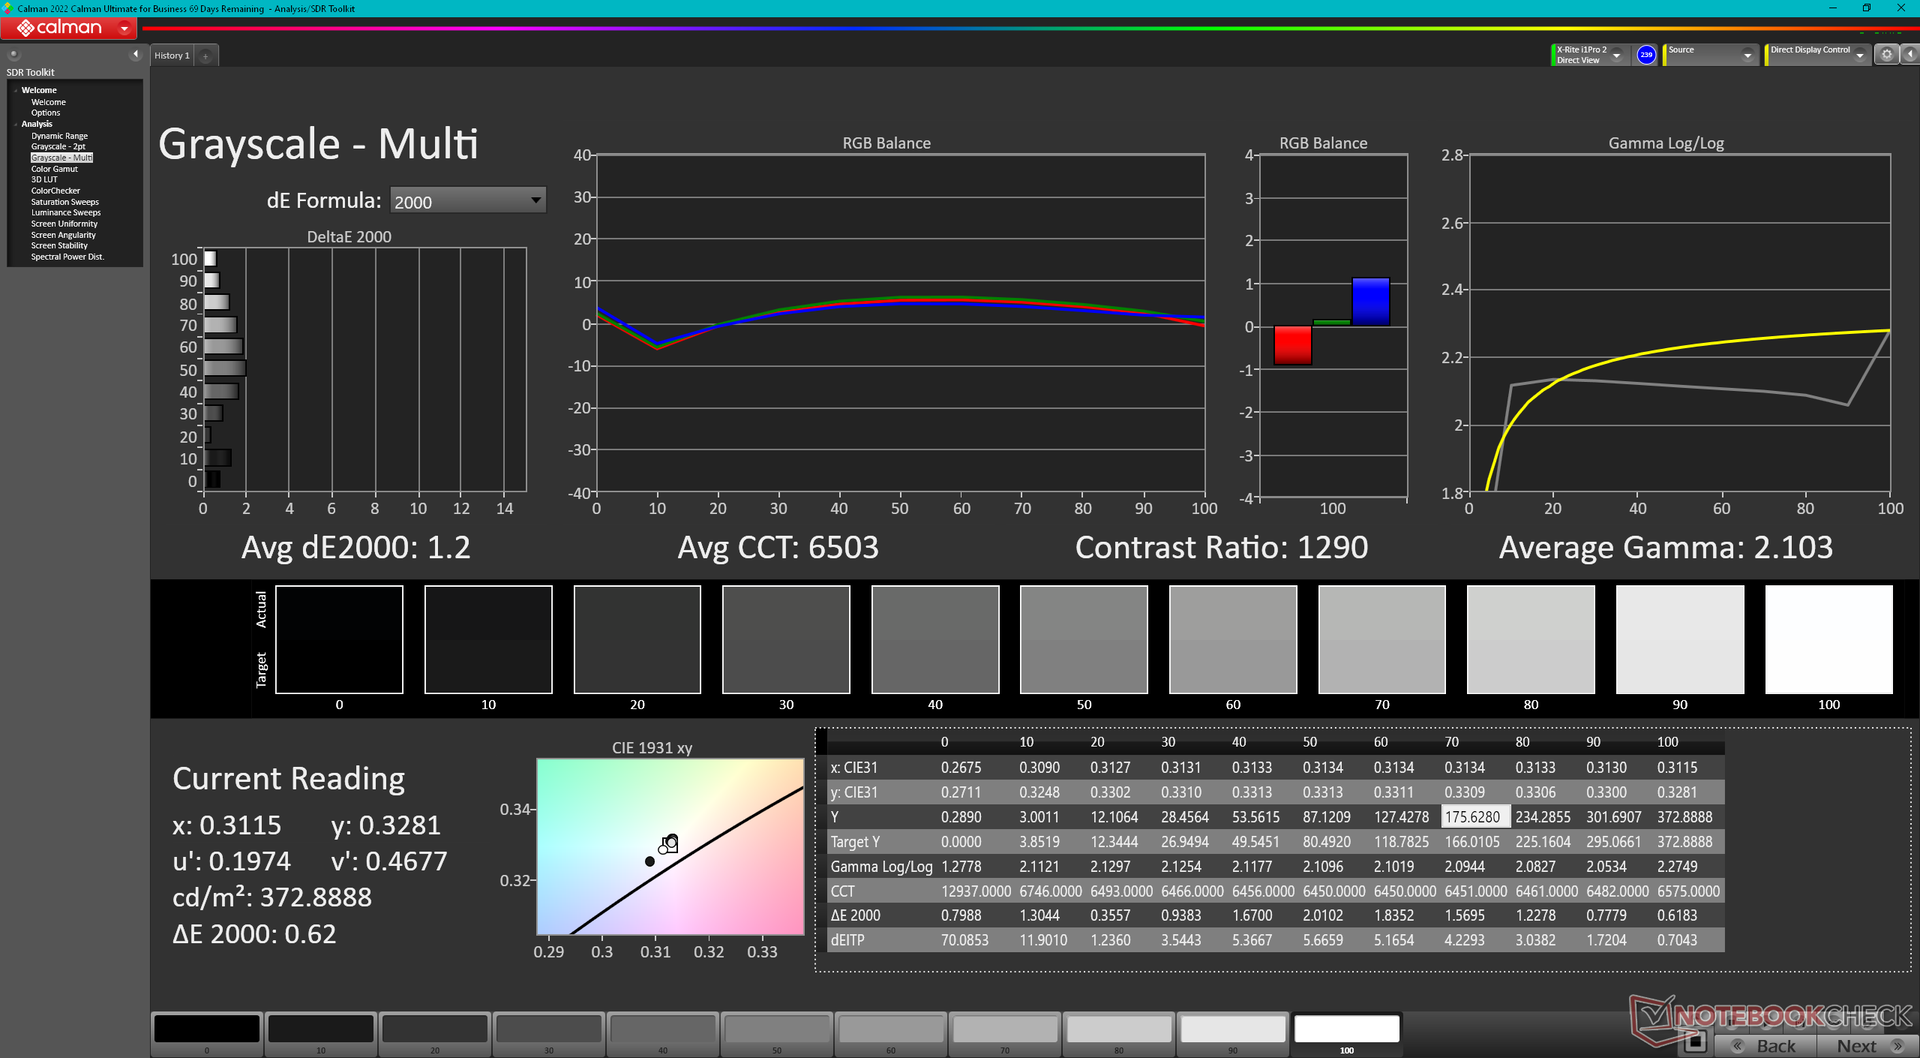
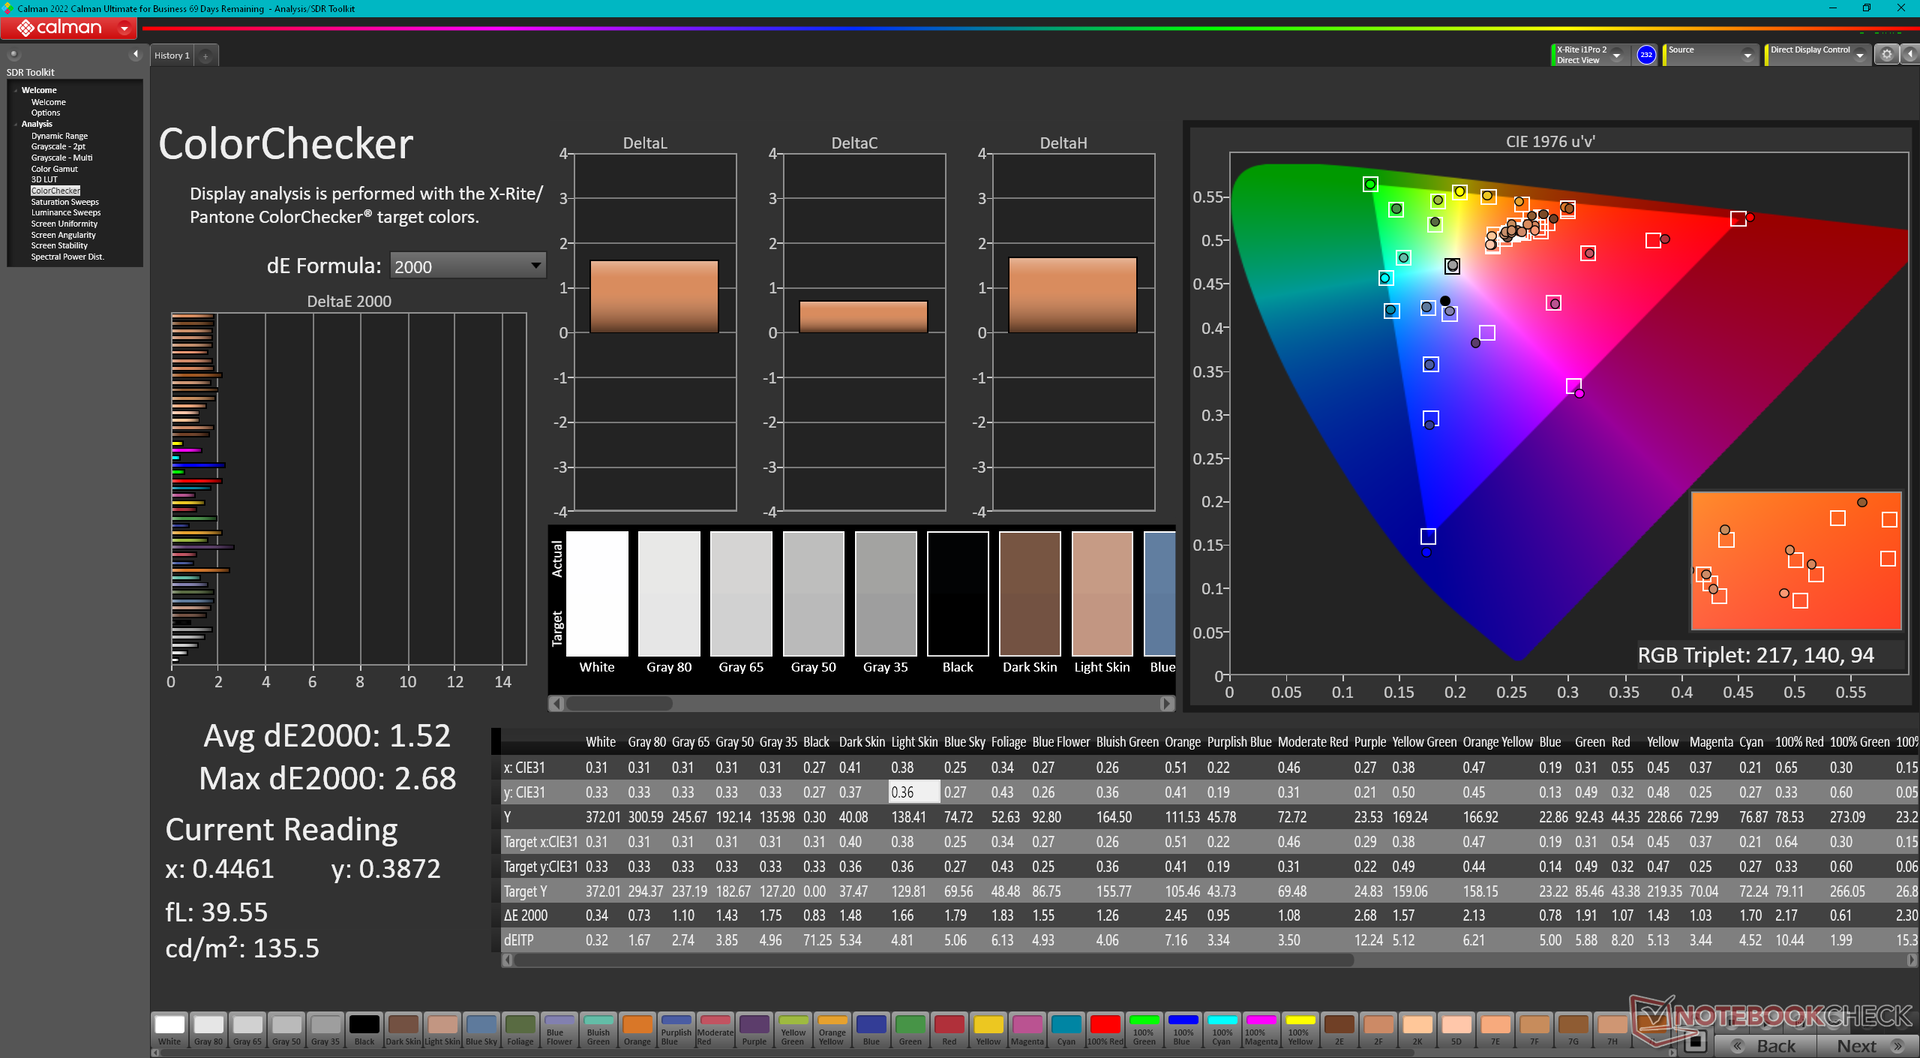
ΔE ColorChecker Calman: 1.52 | ∀{0.5-29.43 Ø4.73}
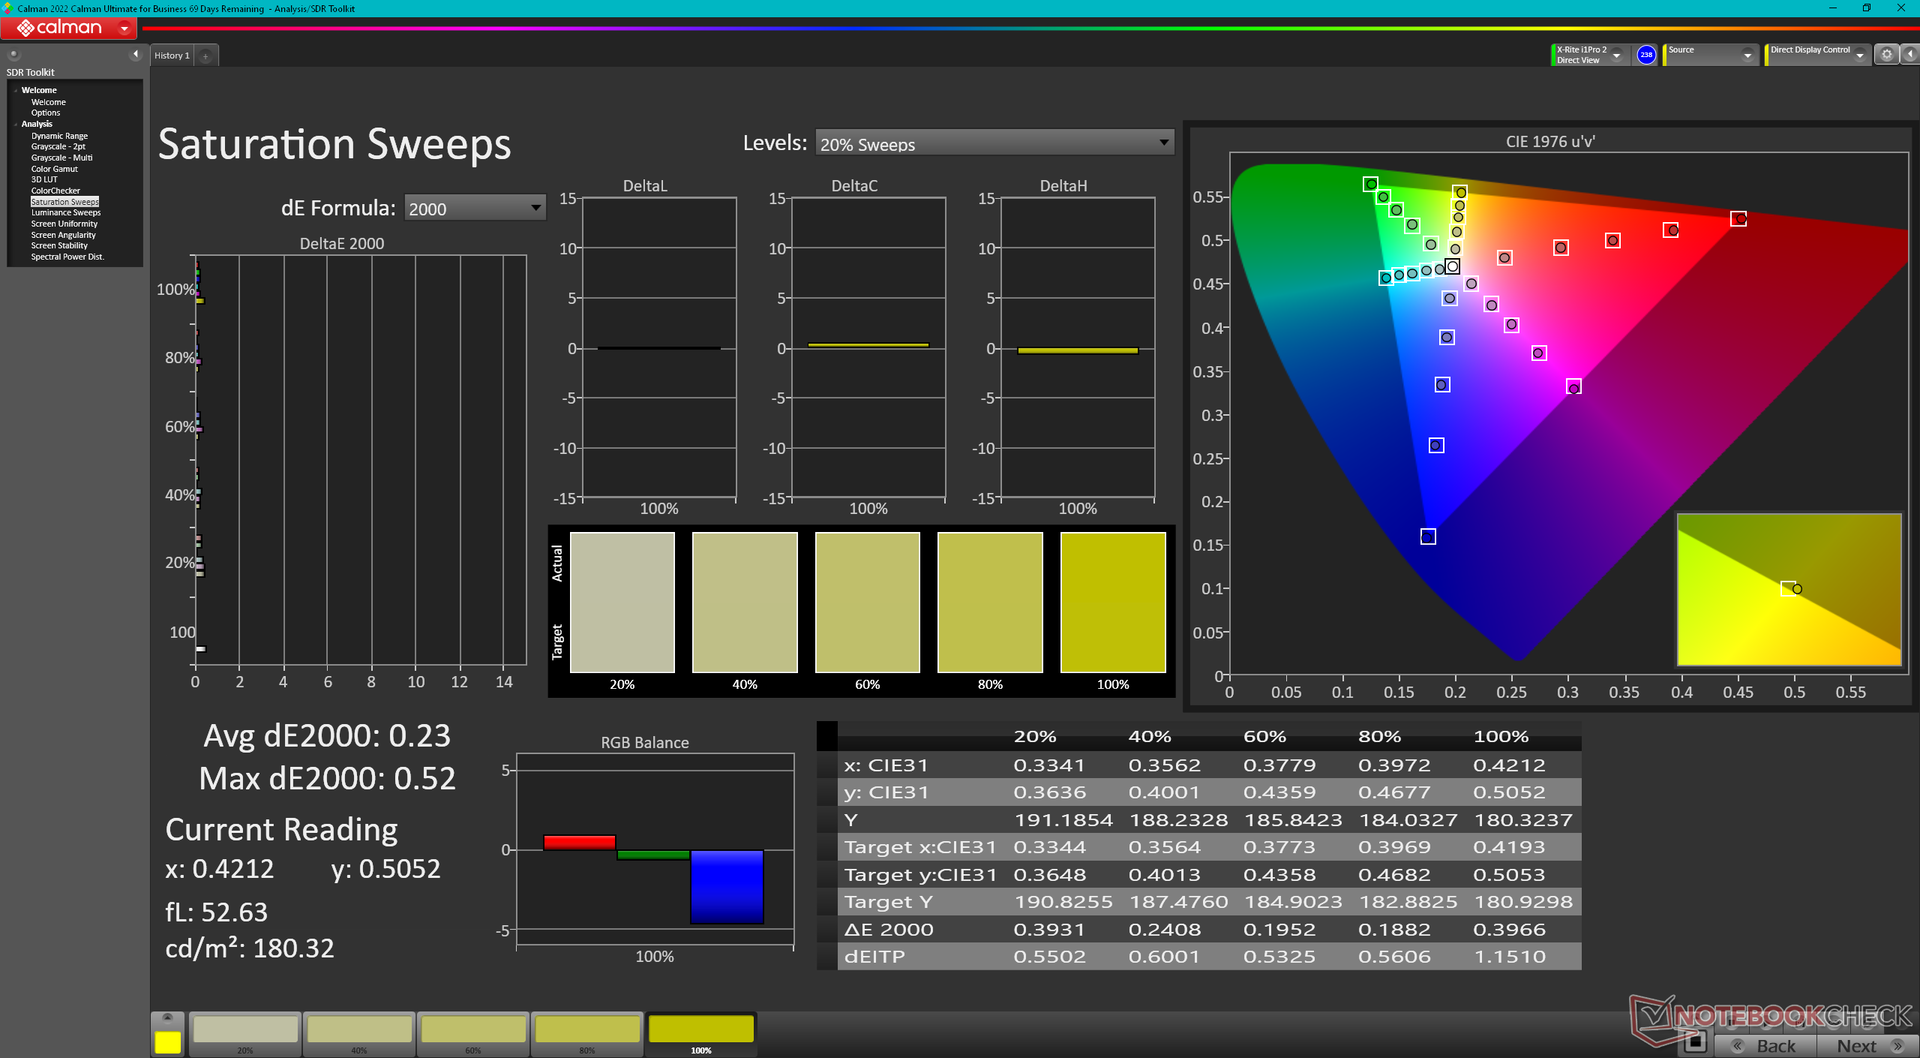
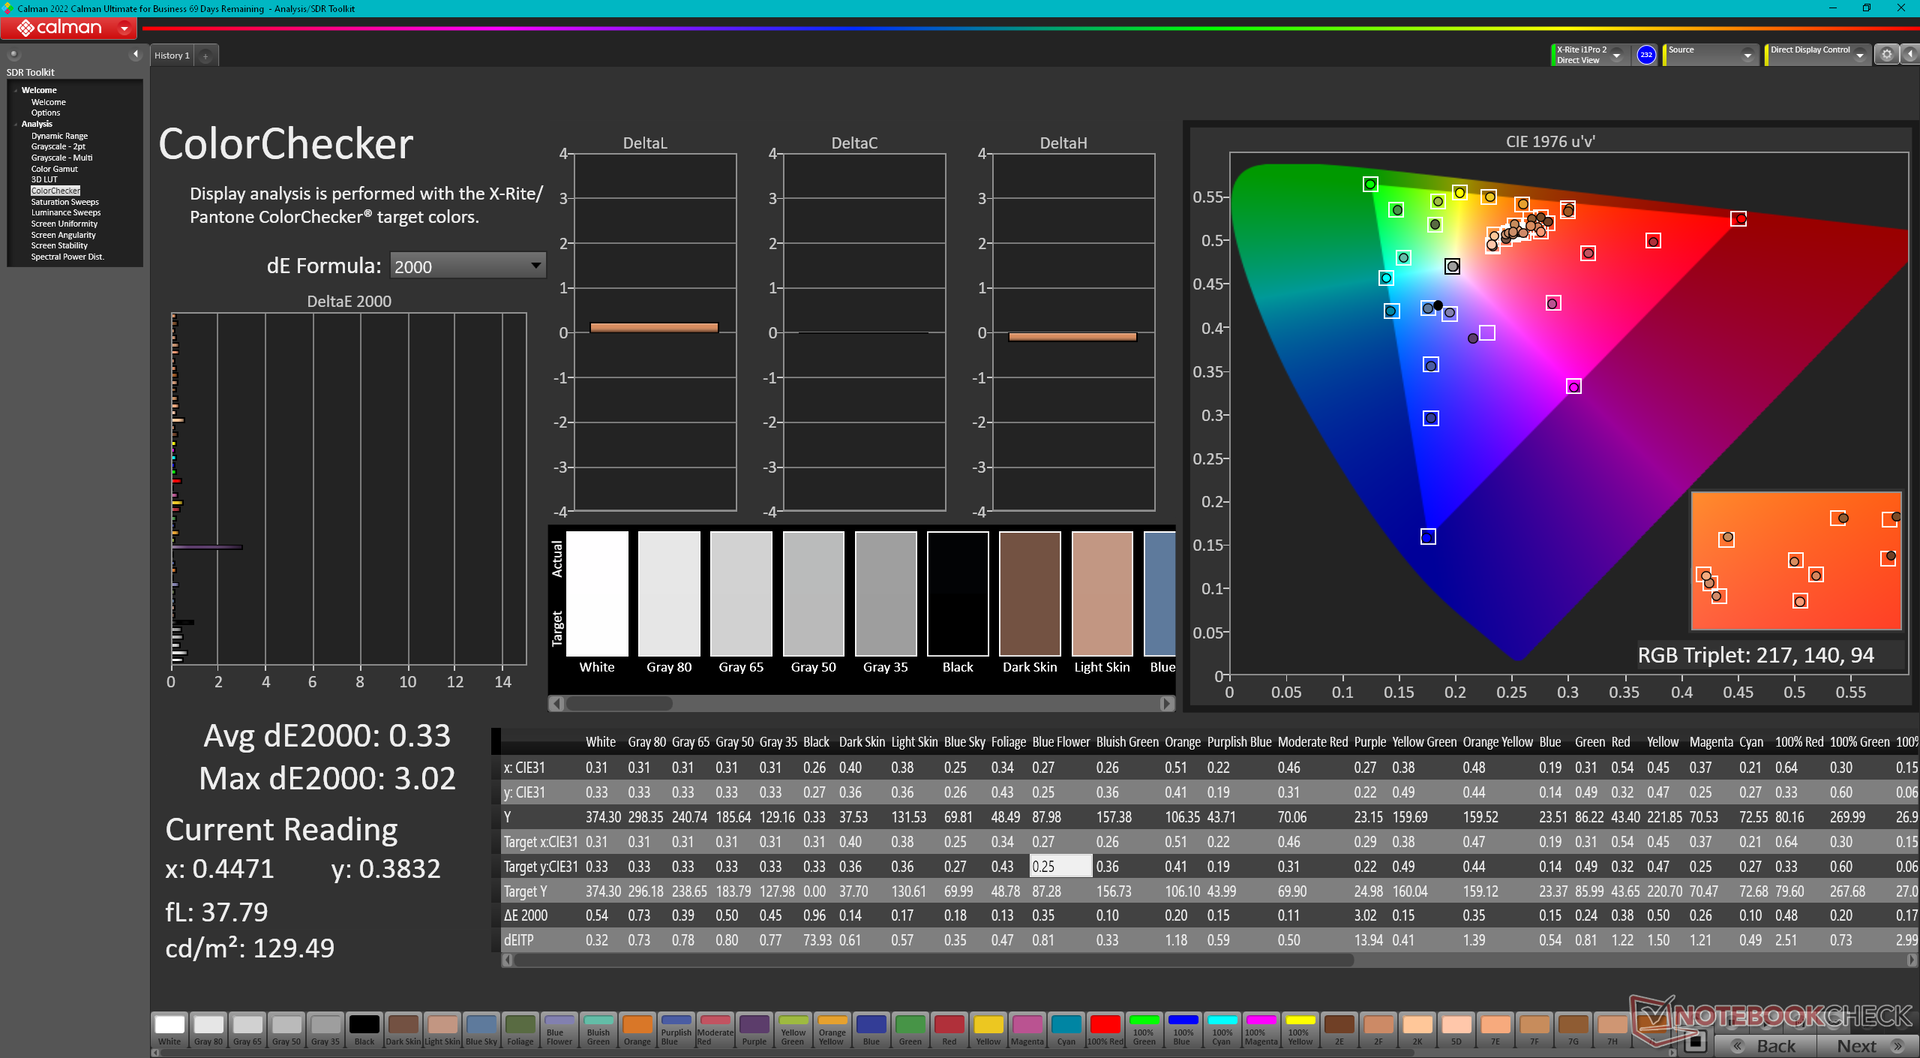
calibrated: 0.33
ΔE Greyscale Calman: 1.2 | ∀{0.09-98 Ø4.97}
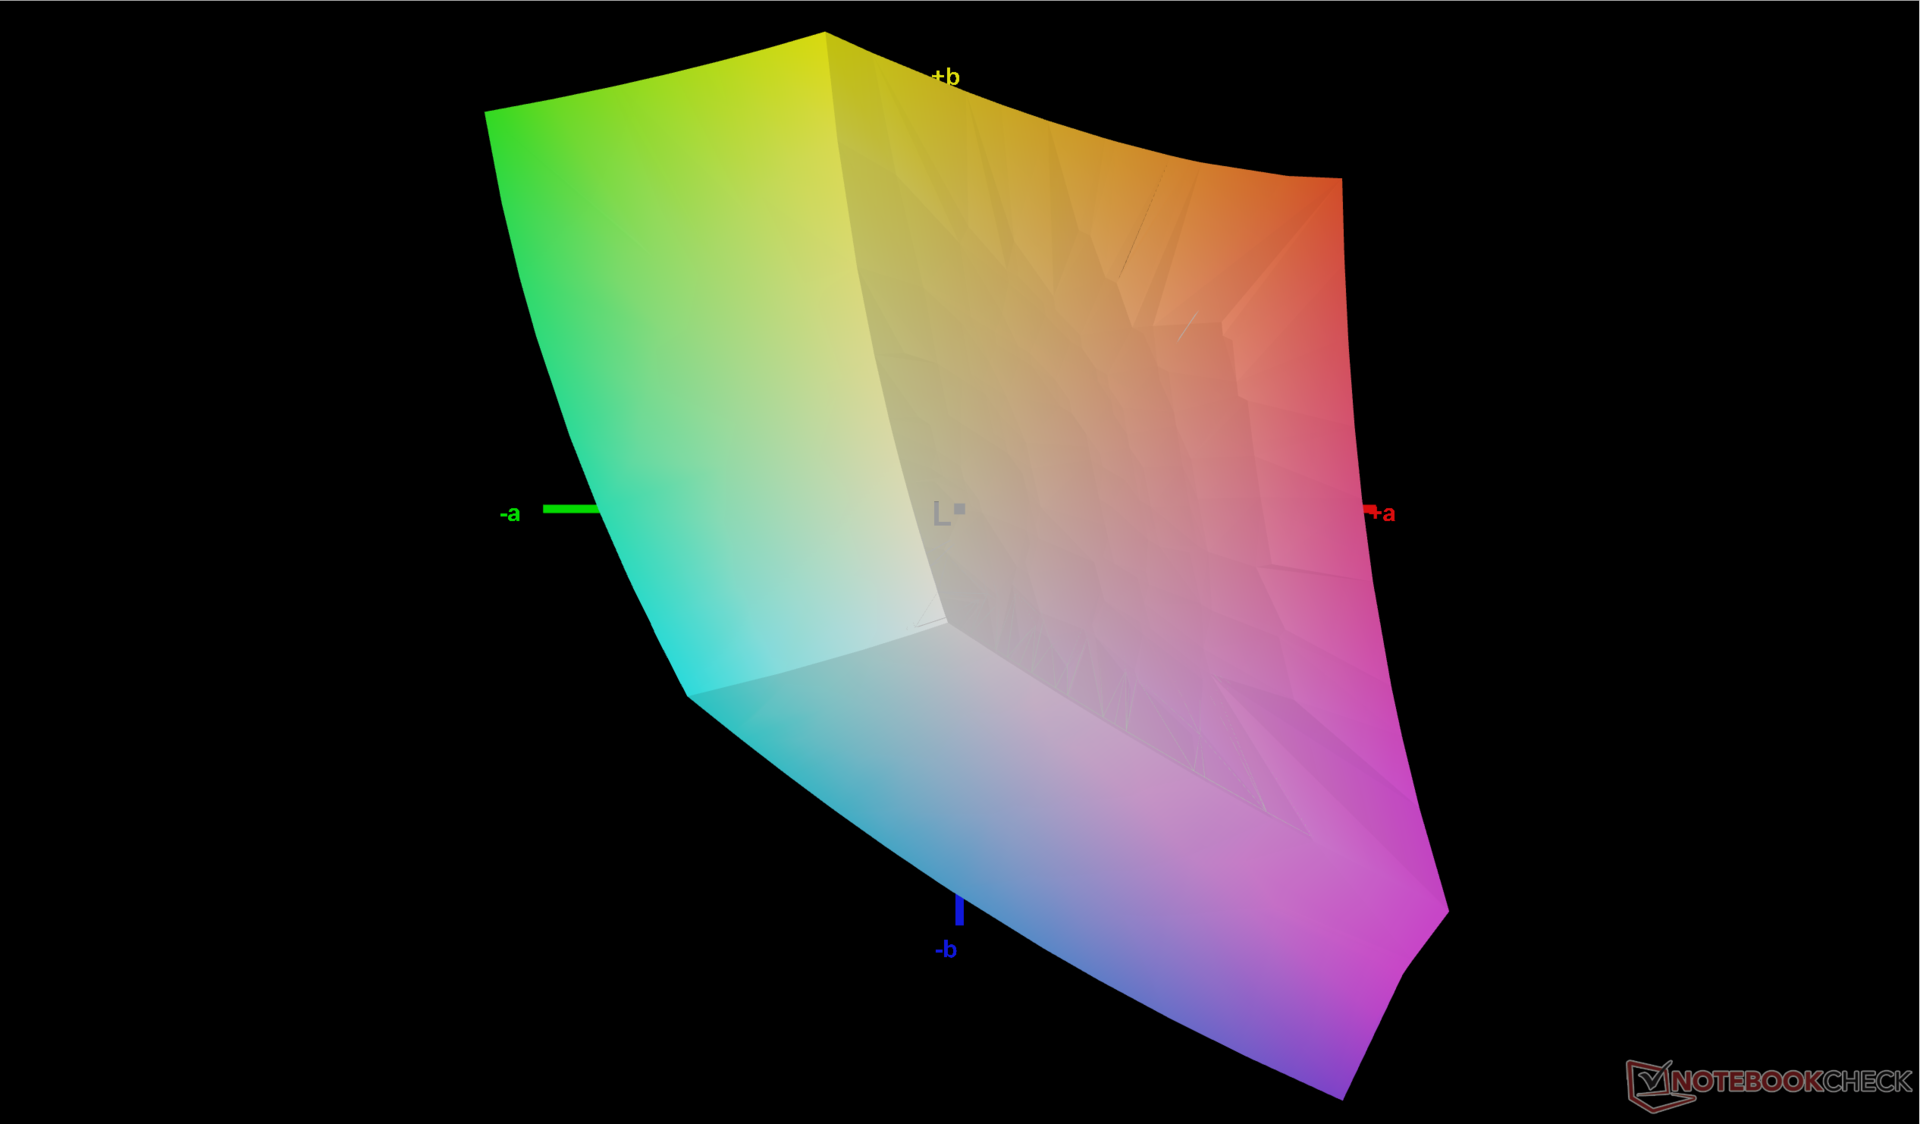
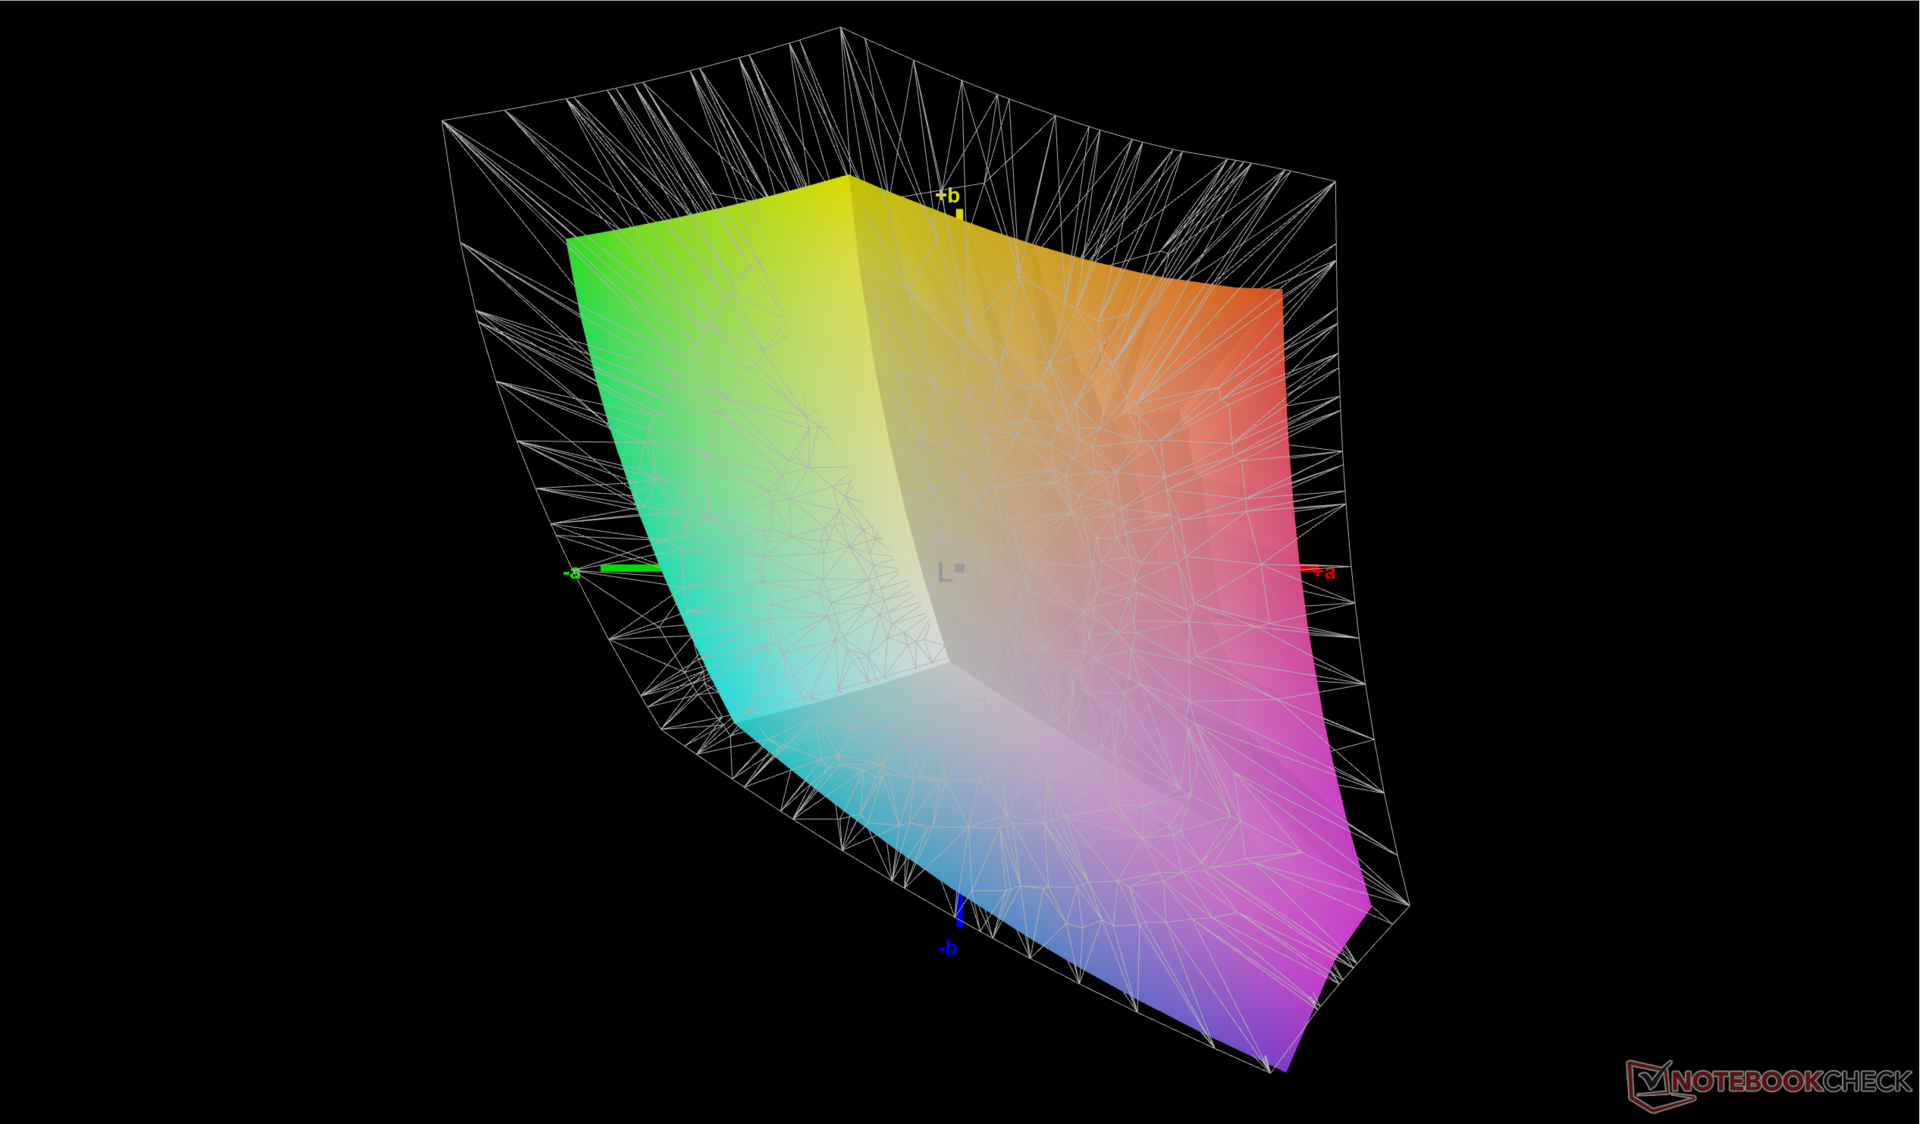
70% AdobeRGB 1998 (Argyll 3D)
100% sRGB (Argyll 3D)
69.3% Display P3 (Argyll 3D)
Gamma: 2.1
CCT: 6503 K
| Lenovo Legion Slim 5 16APH8 BOE NJ NE160QDM-NYC, IPS, 2560x1600, 16" | Acer Nitro 16 AN16-41-R7YE AU Optronics B160UAN01.Q, IPS, 1920x1200, 16" | Lenovo Legion Pro 5 16ARX8 (R5 7645HX, RTX 4050) CSOT T3 MNG007DA2-2, IPS, 2560x1600, 16" | HP Omen 16-wf000 BOE0B7D, IPS, 2560x1440, 16.1" | Dell G16 7620 BOE NE16QDM, IPS, 2560x1600, 16" | Asus TUF Gaming A16 FA617XS BOE NE160WUM-NX2, IPS, 1920x1200, 16" | |
|---|---|---|---|---|---|---|
| Display | 8% | 2% | 0% | -1% | -1% | |
| Display P3 Coverage (%) | 69.3 | 80 15% | 71.6 3% | 69 0% | 68.3 -1% | 69.3 0% |
| sRGB Coverage (%) | 100 | 99.4 -1% | 99.8 0% | 99.2 -1% | 98 -2% | 97.3 -3% |
| AdobeRGB 1998 Coverage (%) | 70 | 77.4 11% | 72.9 4% | 71.2 2% | 70.5 1% | 70.7 1% |
| Response Times | 14% | 11% | 17% | -7% | -37% | |
| Response Time Grey 50% / Grey 80% * (ms) | 10.7 ? | 11.2 ? -5% | 12 ? -12% | 4.6 ? 57% | 8.6 ? 20% | 15.6 ? -46% |
| Response Time Black / White * (ms) | 7.8 ? | 5.2 ? 33% | 5.2 ? 33% | 9.7 ? -24% | 10.4 ? -33% | 10 ? -28% |
| PWM Frequency (Hz) | ||||||
| Screen | -134% | -24% | -29% | -51% | -35% | |
| Brightness middle (cd/m²) | 371.6 | 415 12% | 543 46% | 310.9 -16% | 369.4 -1% | 301 -19% |
| Brightness (cd/m²) | 343 | 380 11% | 516 50% | 296 -14% | 348 1% | 294 -14% |
| Brightness Distribution (%) | 84 | 84 0% | 87 4% | 91 8% | 83 -1% | 94 12% |
| Black Level * (cd/m²) | 0.44 | 0.36 18% | 0.58 -32% | 0.35 20% | 0.32 27% | 0.21 52% |
| Contrast (:1) | 845 | 1153 36% | 936 11% | 888 5% | 1154 37% | 1433 70% |
| Colorchecker dE 2000 * | 1.52 | 4.71 -210% | 1.35 11% | 2.18 -43% | 1.78 -17% | 1.79 -18% |
| Colorchecker dE 2000 max. * | 2.68 | 6.98 -160% | 3.22 -20% | 3.58 -34% | 4.41 -65% | 3.48 -30% |
| Colorchecker dE 2000 calibrated * | 0.33 | 2.68 -712% | 1.31 -297% | 0.52 -58% | 1.22 -270% | 1.2 -264% |
| Greyscale dE 2000 * | 1.2 | 3.6 -200% | 1.03 14% | 2.8 -133% | 3.2 -167% | 2.5 -108% |
| Gamma | 2.1 105% | 2.182 101% | 2.38 92% | 2.18 101% | 2.2 100% | 2.265 97% |
| CCT | 6503 100% | 7153 91% | 6452 101% | 6002 108% | 6750 96% | 6157 106% |
| Total Average (Program / Settings) | -37% /
-82% | -4% /
-13% | -4% /
-17% | -20% /
-34% | -24% /
-28% |
* ... smaller is better
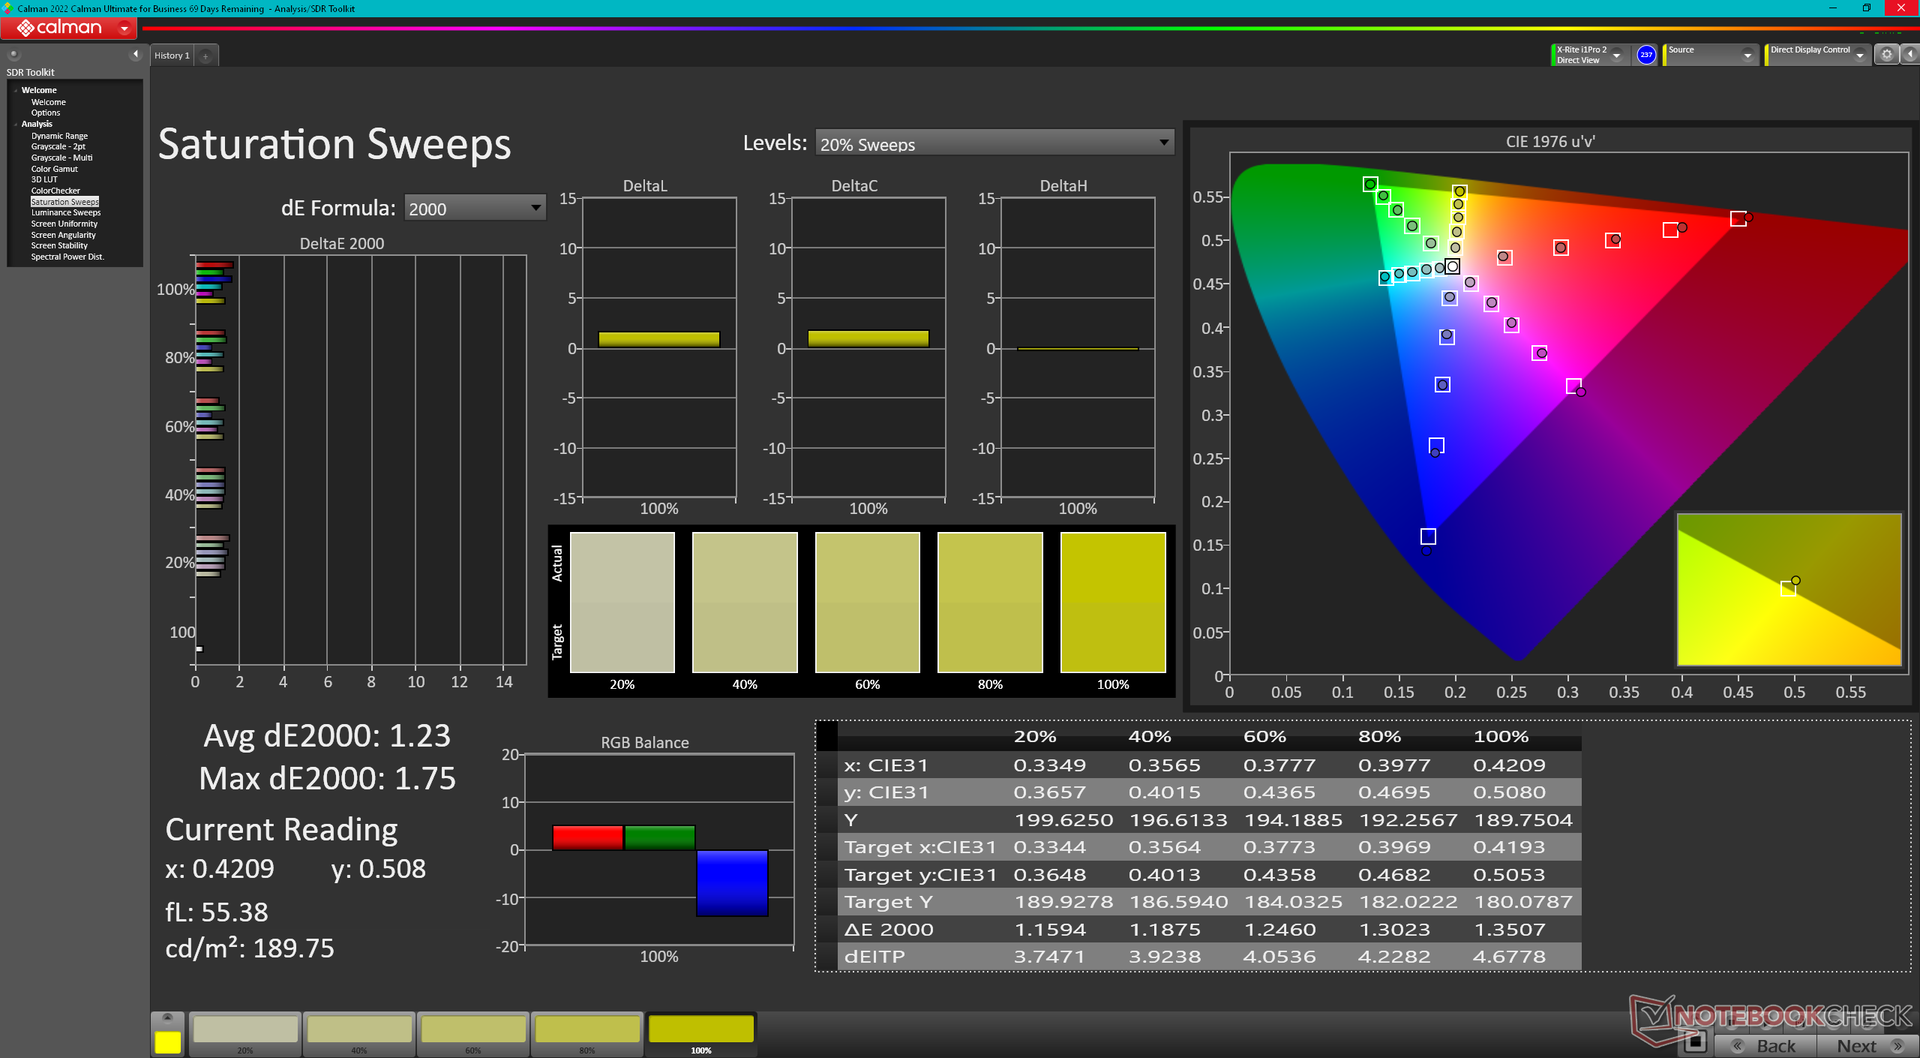
The display is very well calibrated out of the box with average grayscale and color deltaE values of just 1.2 and 1.52, respectively. An end-user calibration is therefore not necessary to get the most out of the full sRGB panel.

Display Response Times
| ↔ Response Time Black to White | ||
|---|---|---|
| 7.8 ms ... rise ↗ and fall ↘ combined | ↗ 3.9 ms rise | 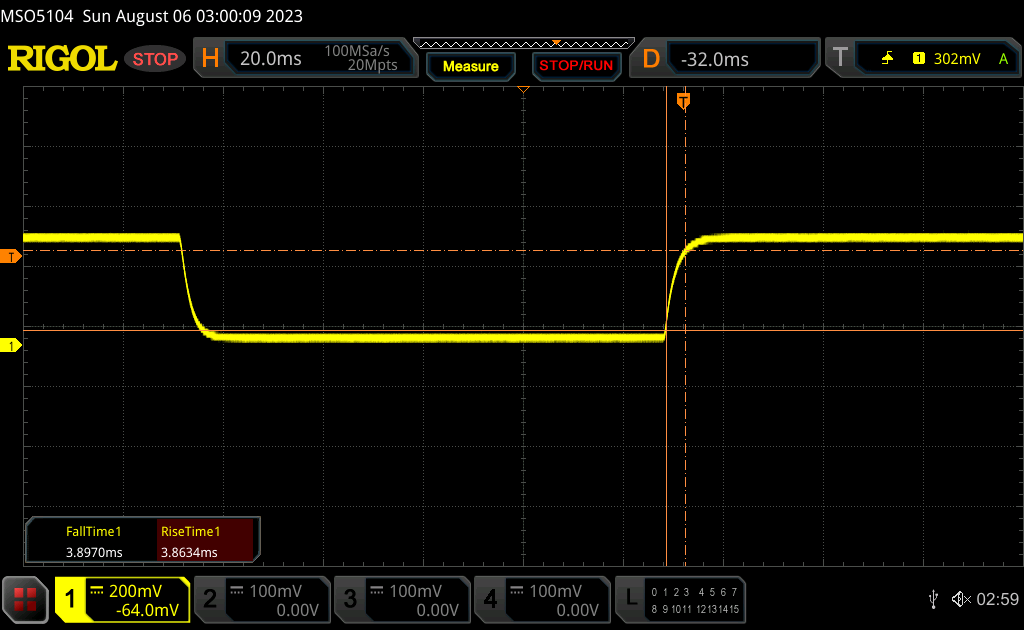 |
| ↘ 3.9 ms fall | ||
| The screen shows very fast response rates in our tests and should be very well suited for fast-paced gaming. In comparison, all tested devices range from 0.1 (minimum) to 240 (maximum) ms. » 22 % of all devices are better. This means that the measured response time is better than the average of all tested devices (19.9 ms). | ||
| ↔ Response Time 50% Grey to 80% Grey | ||
| 10.7 ms ... rise ↗ and fall ↘ combined | ↗ 5.2 ms rise | 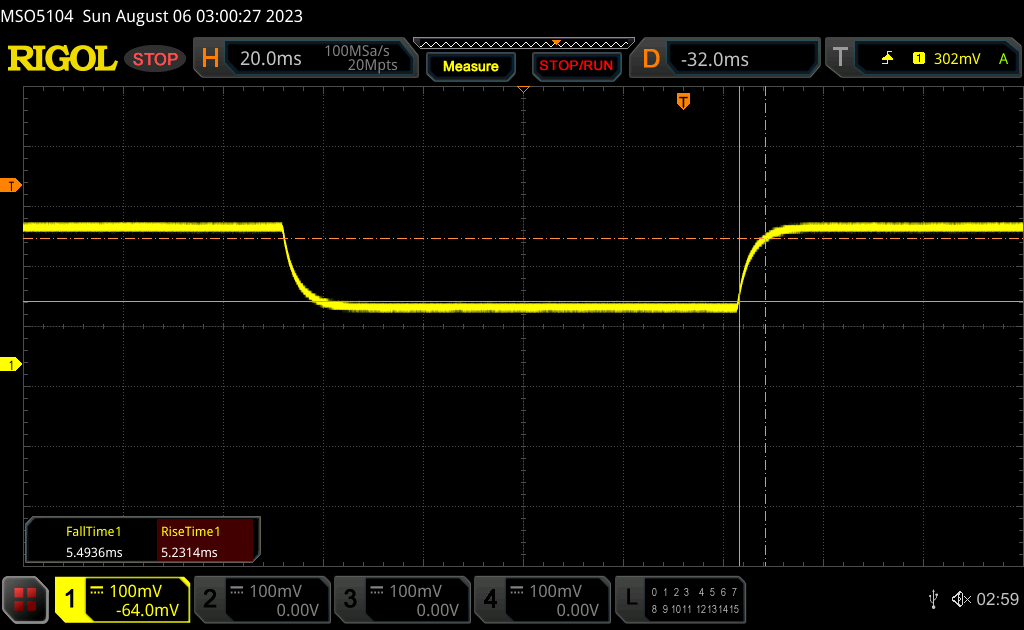 |
| ↘ 5.5 ms fall | ||
| The screen shows good response rates in our tests, but may be too slow for competitive gamers. In comparison, all tested devices range from 0.165 (minimum) to 636 (maximum) ms. » 24 % of all devices are better. This means that the measured response time is better than the average of all tested devices (31.1 ms). | ||
Screen Flickering / PWM (Pulse-Width Modulation)
| Screen flickering / PWM not detected | 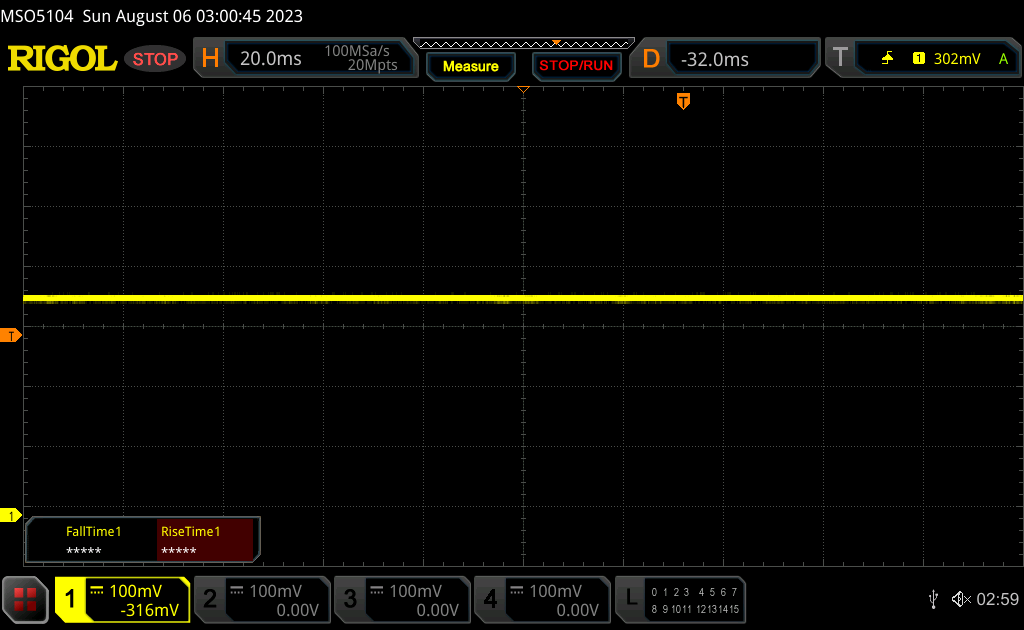 | ||
In comparison: 52 % of all tested devices do not use PWM to dim the display. If PWM was detected, an average of 7801 (minimum: 5 - maximum: 343500) Hz was measured. | |||
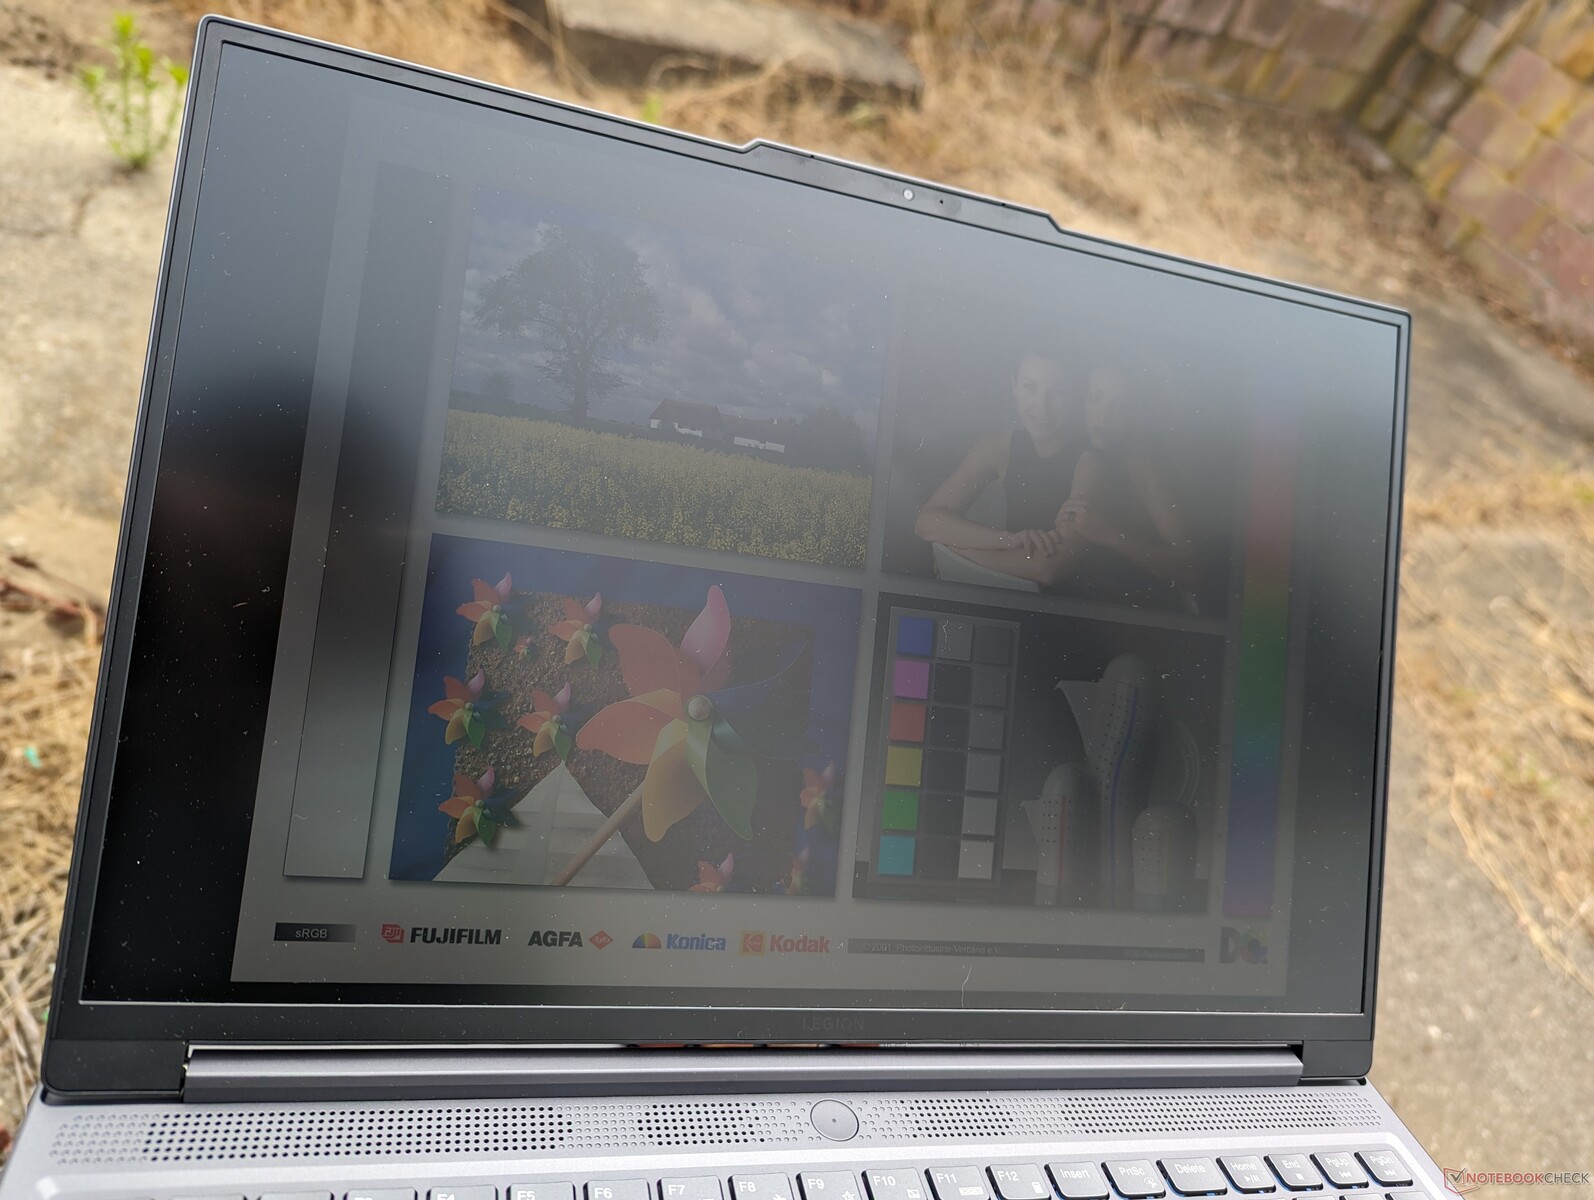
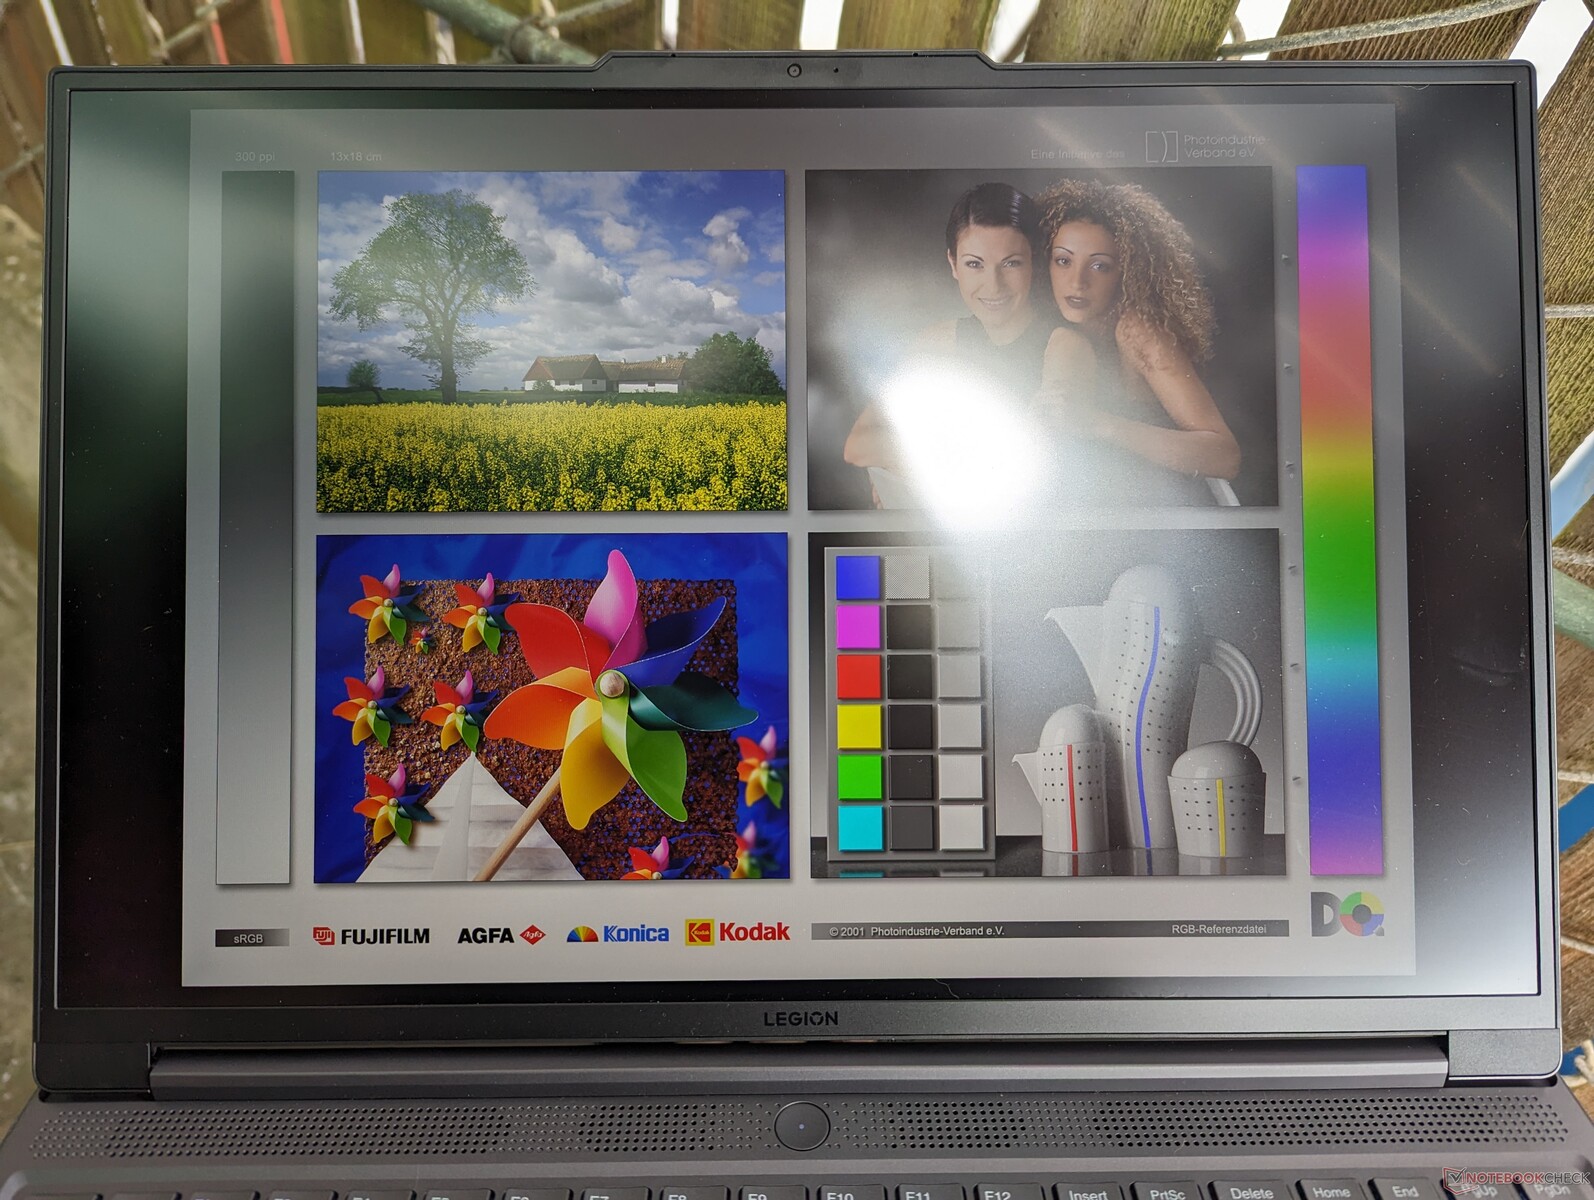
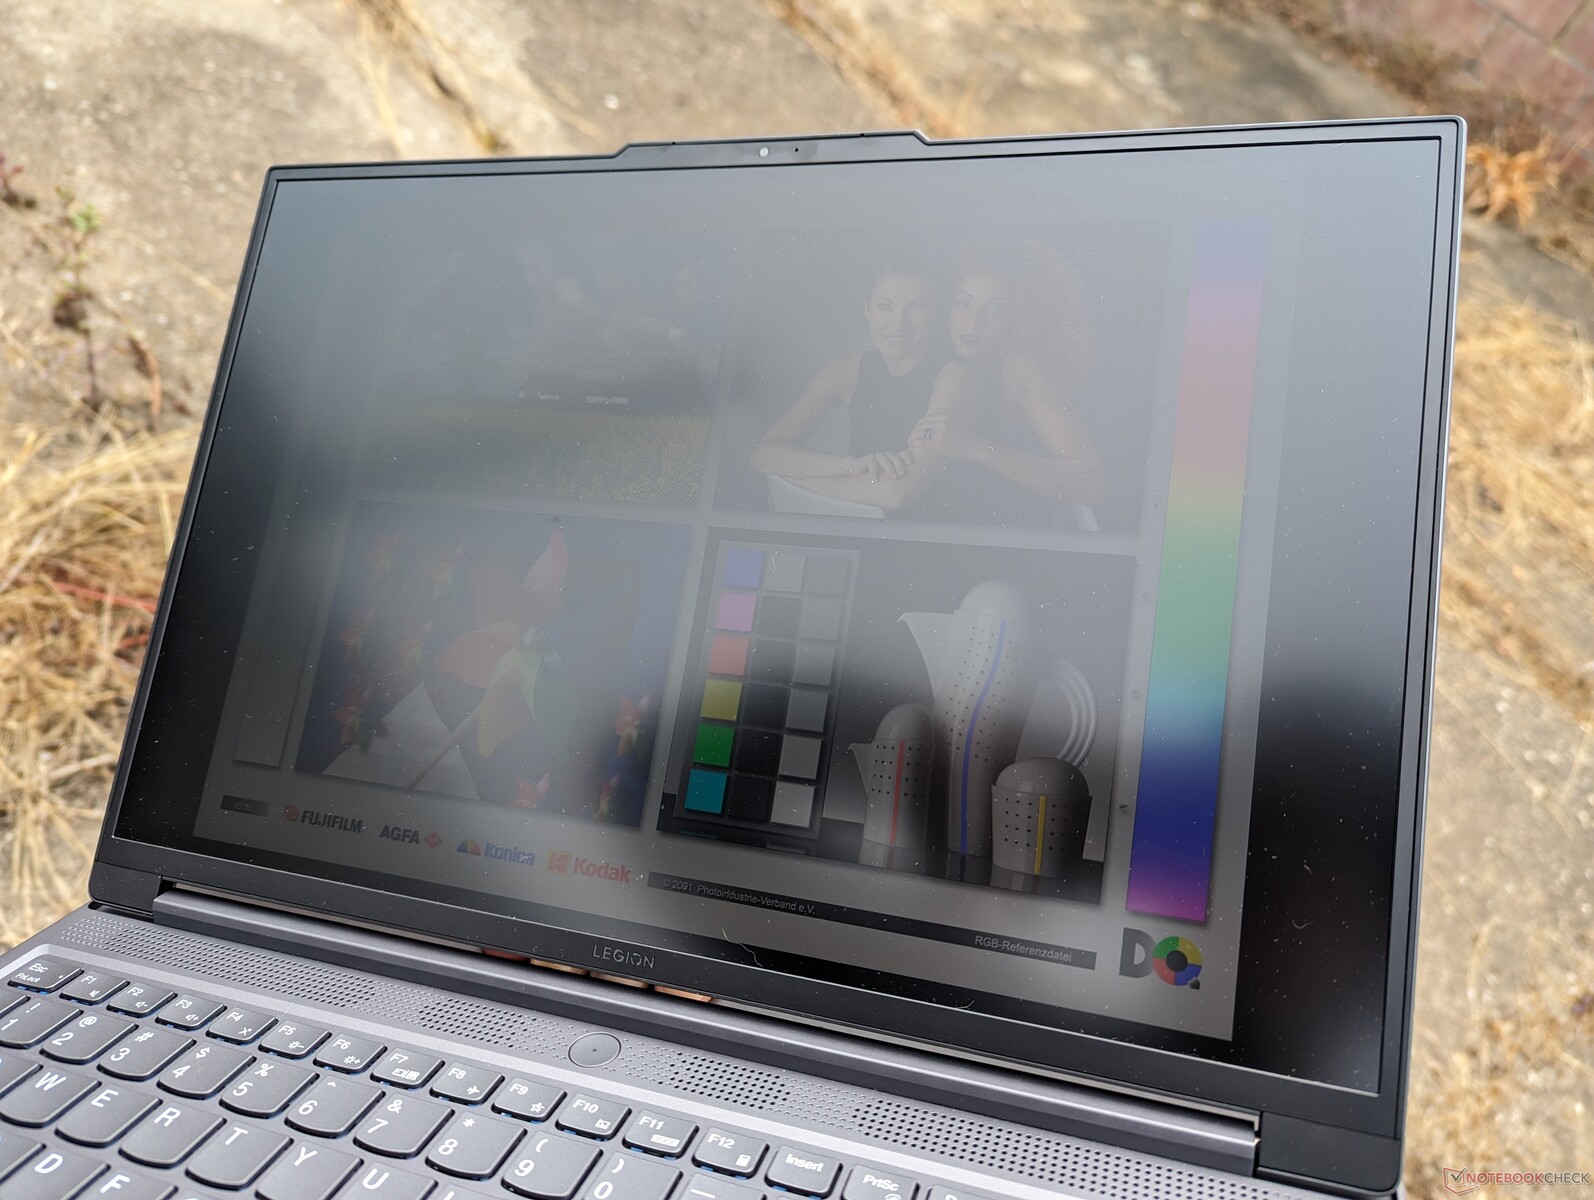
At around 370 nits, our display is dimmer than the 540-nit display on the pricier Legion Pro 5. The 300 to 400-nit range is typical of most gaming laptops, however, and so outdoor visibility isn't noticeably better or worse than others in the same price range. You'll want to work under shade whenever possible to reduce glare and avoid washed out colors.
Performance — Midrange AMD Zen 4 Impresses
Testing Conditions
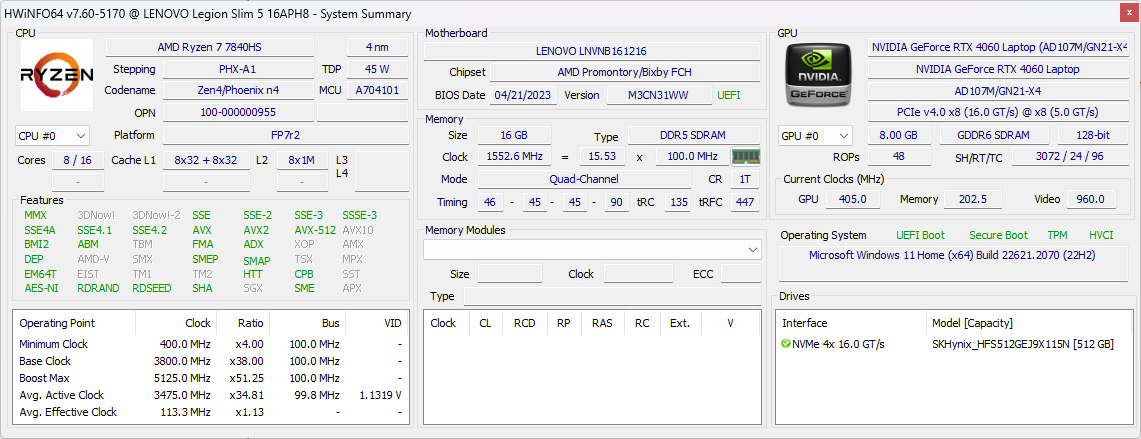
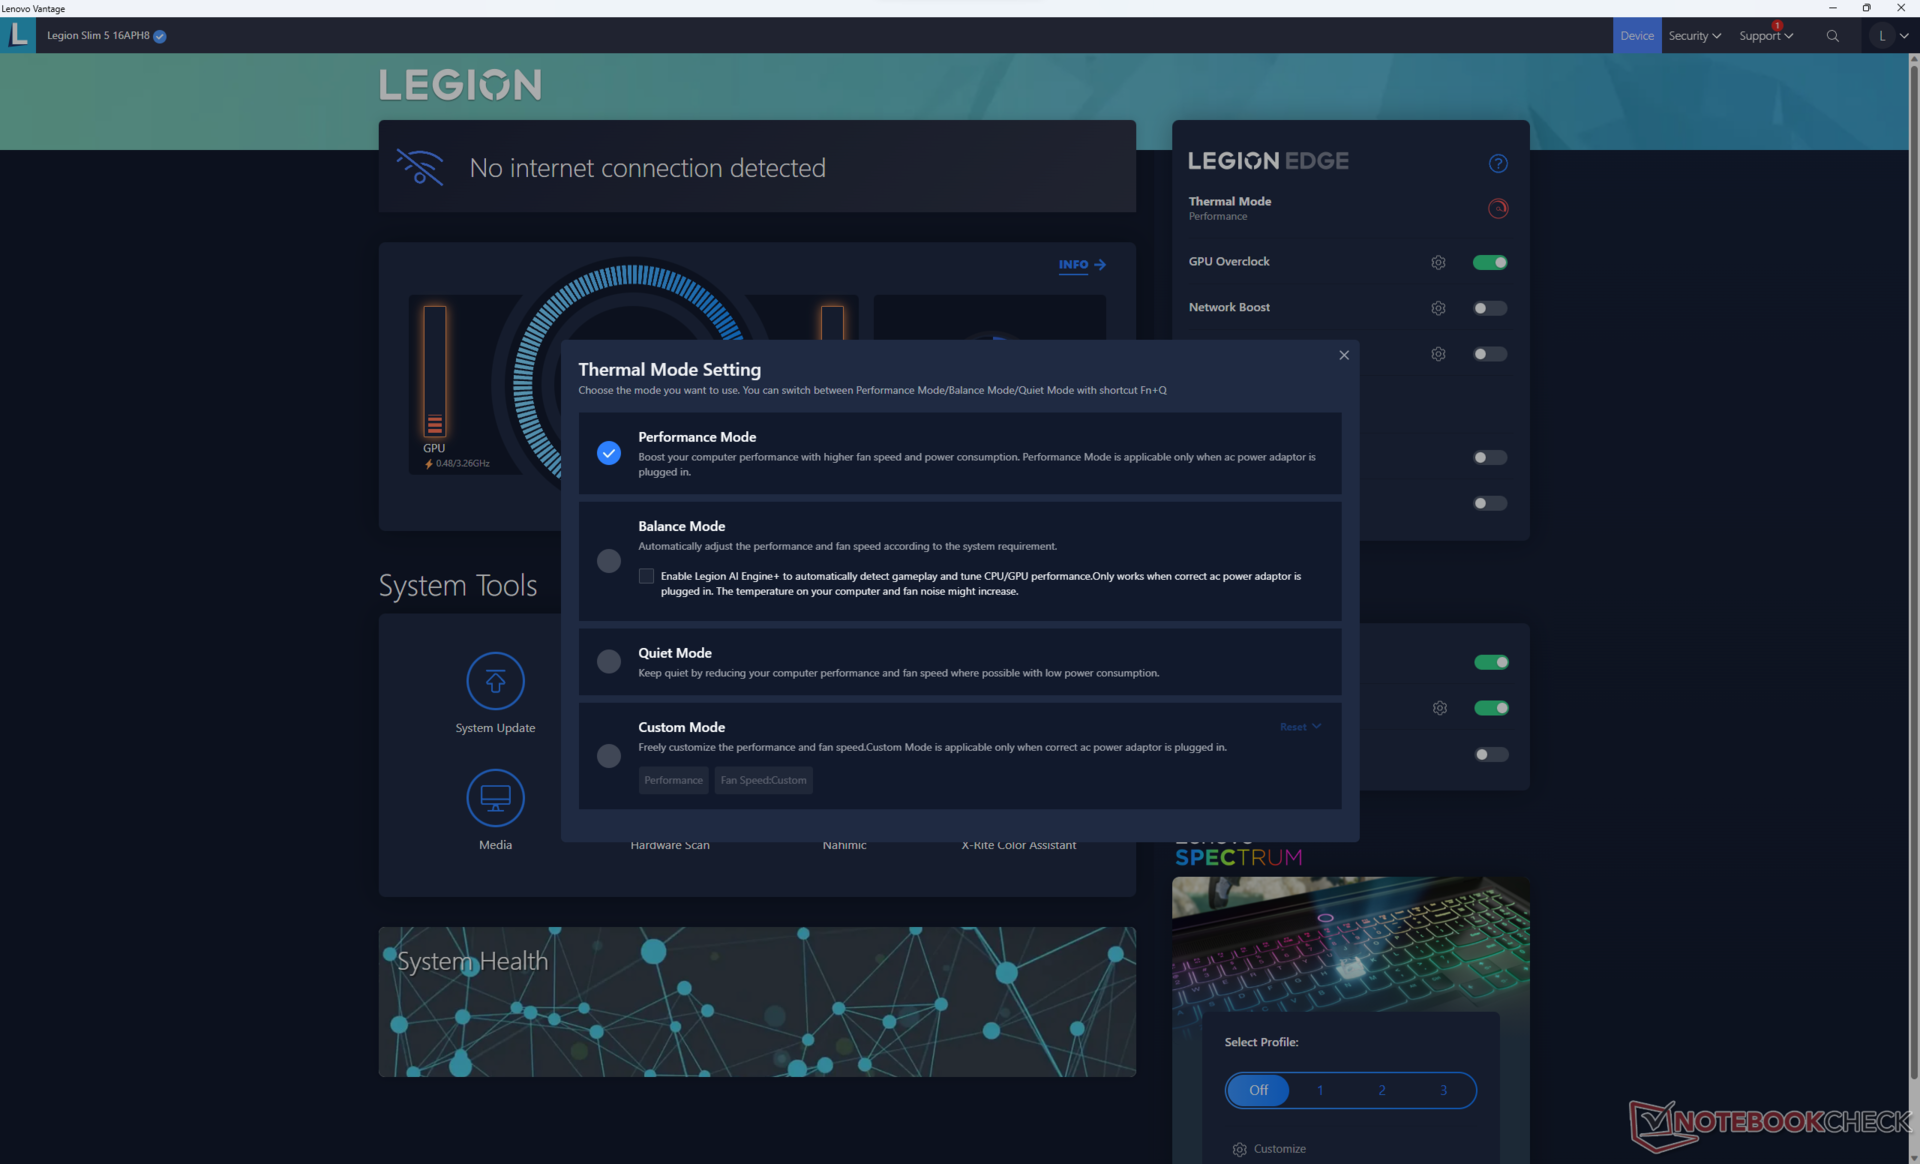
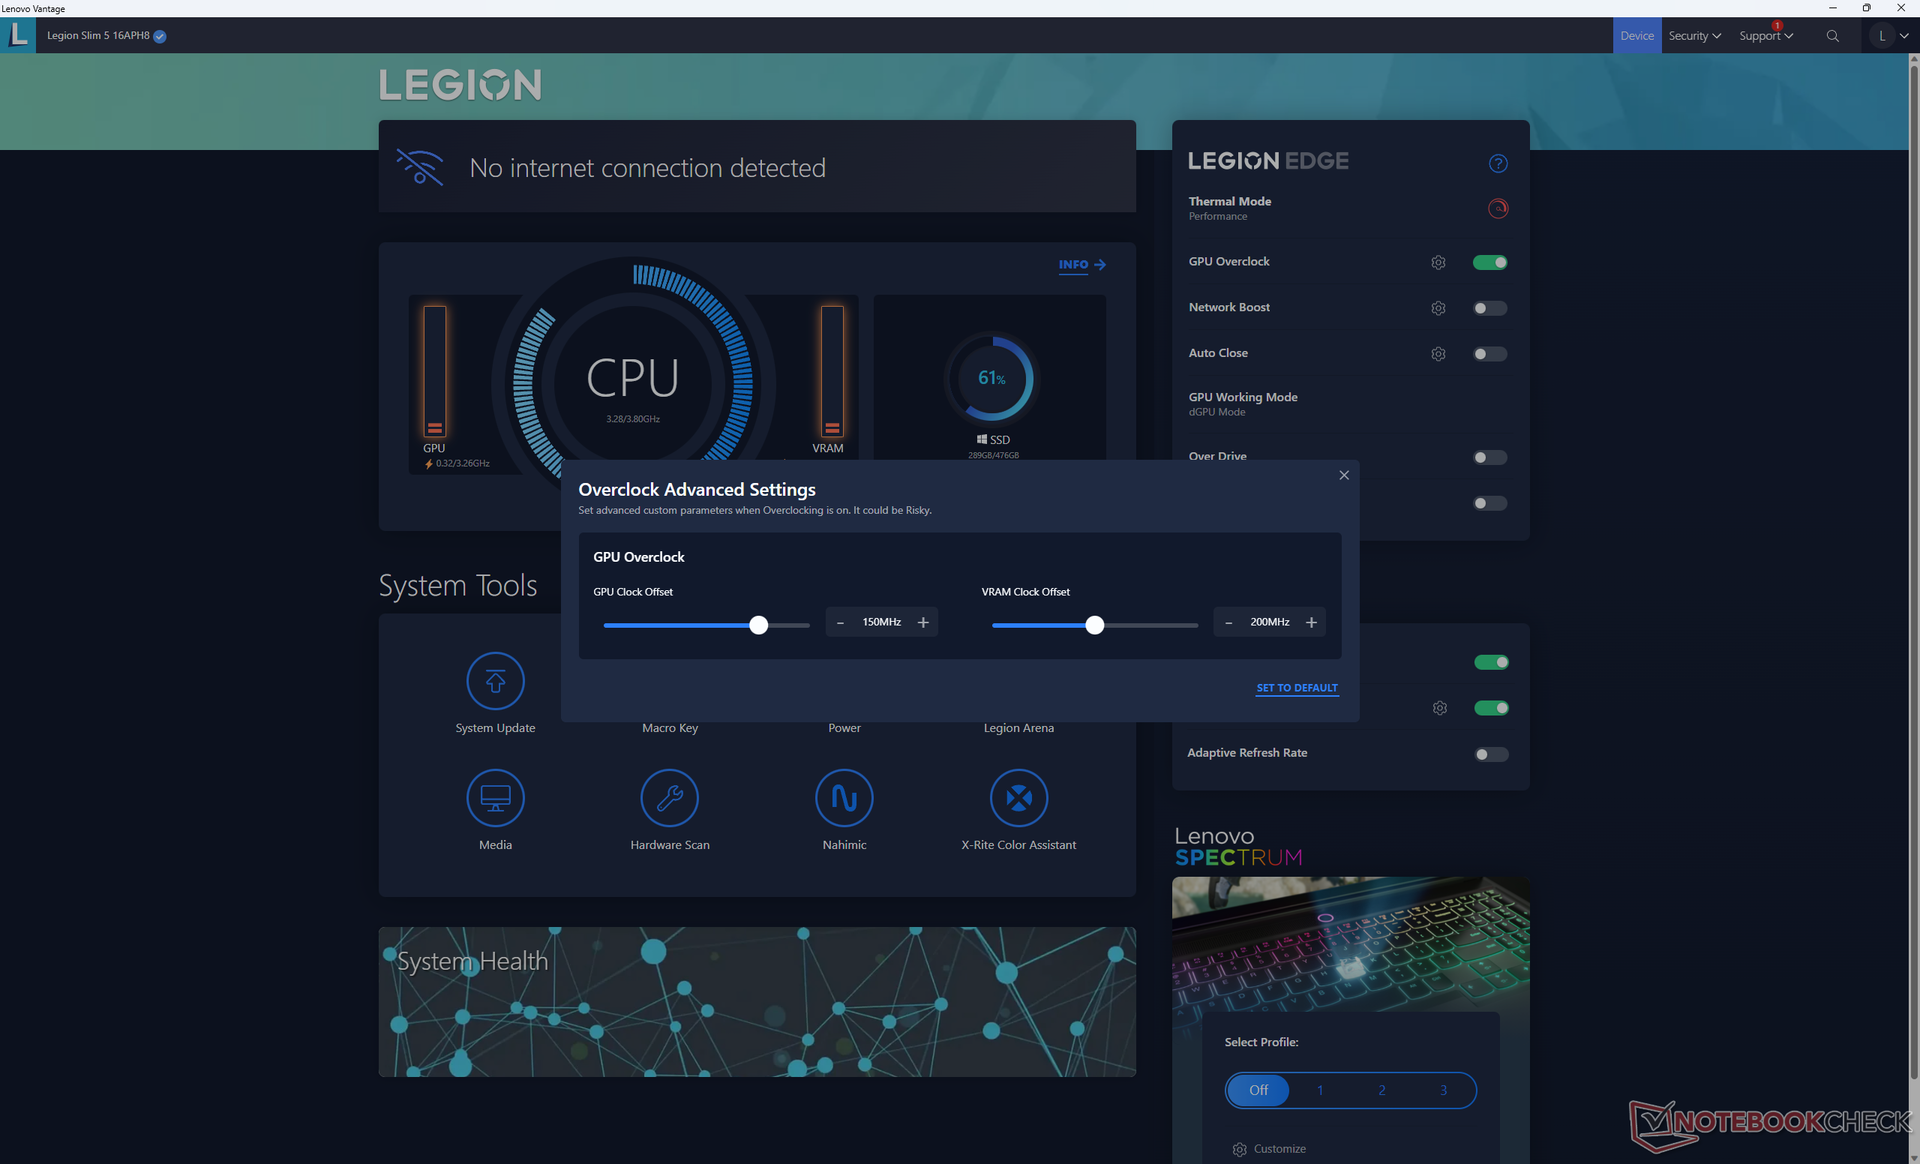
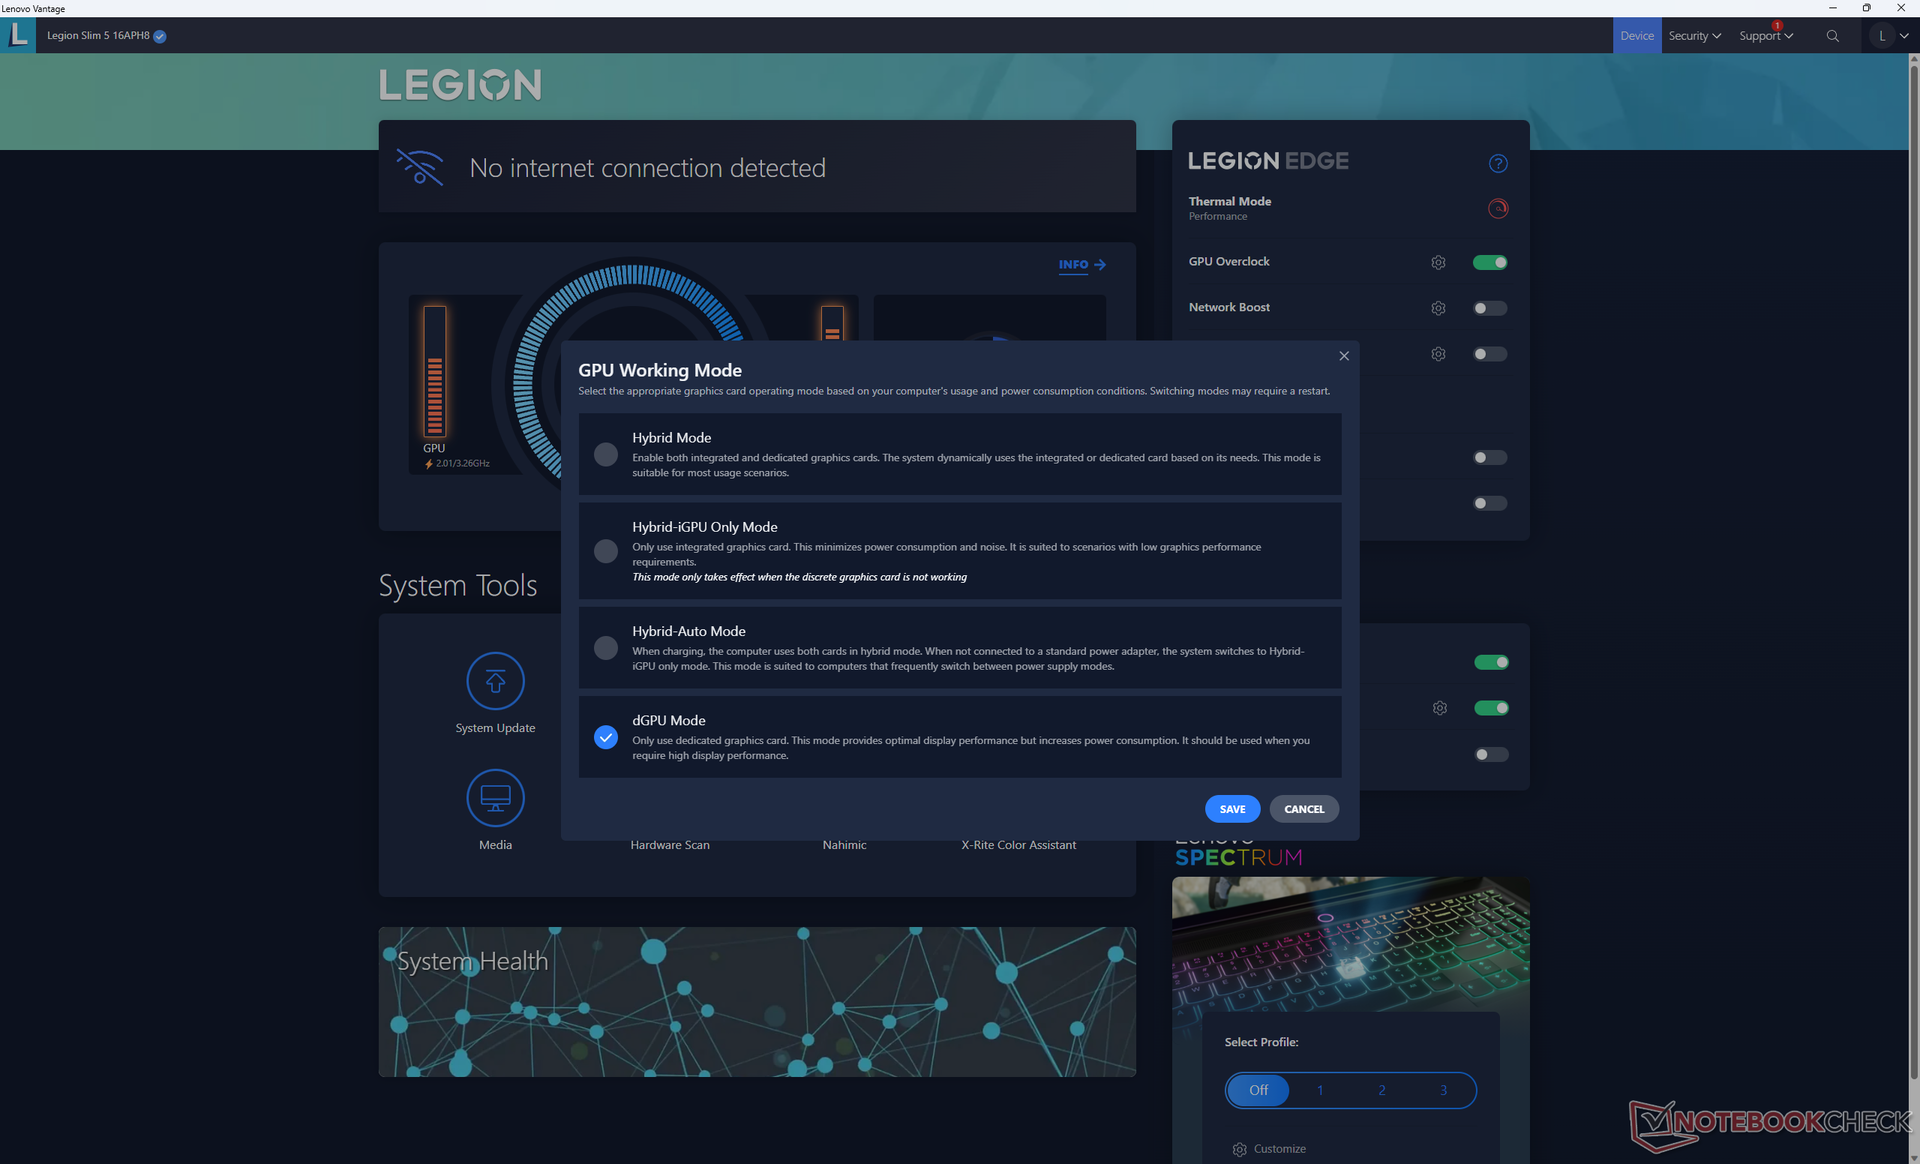
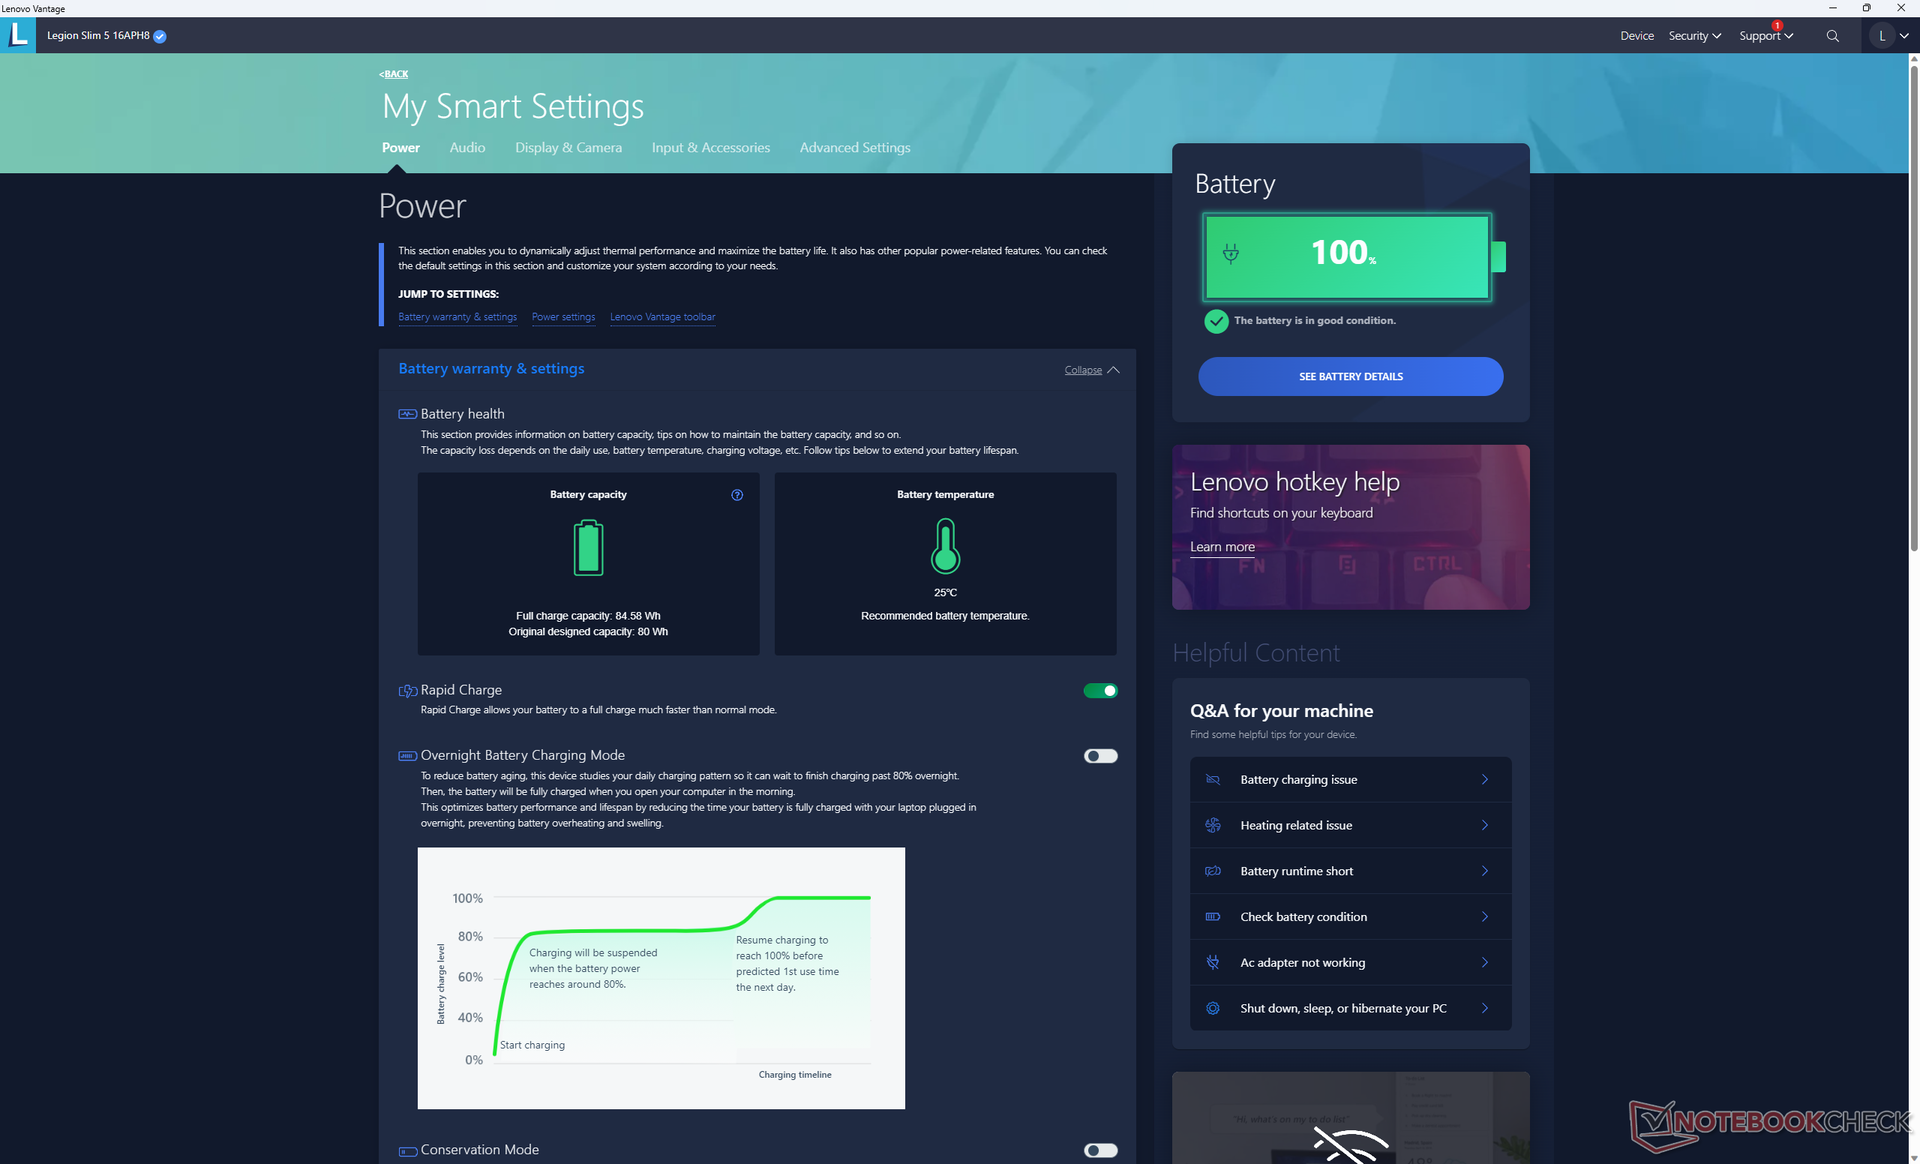
We set our unit to dGPU mode and Performance mode via Lenovo Vantage and Windows prior to running the benchmarks below. We also enabled the default GPU overclock settings (+150 MHz clock, +200 MHz VRAM). Vantage is the control hub for performance profiles, GPU modes, BIOS updates, and other model-specific features as shown by the screenshots below.
Advanced Optimus is supported only when set to Hybrid mode.
Processor
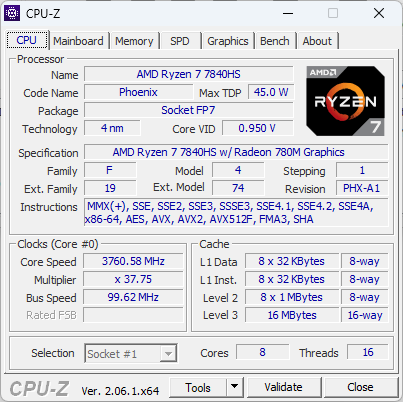
The 8-core Ryzen 7 7840HS may not be common, but it performs very well with results that are just 5 percent behind the Ryzen 7 7745HX or up to 15 percent behind the competing 13th gen Core i7-13700HX. It is most comparable to the 12th gen Core i7-12700H commonly found on gaming laptops of 2022.
Downgrading to the 6-core Ryzen 5 7640HS is expected to reduce multi-thread performance by about 25 percent based on our time with the Lenovo LOQ 15APH8.
Cinebench R15 Multi Loop
Cinebench R23: Multi Core | Single Core
Cinebench R20: CPU (Multi Core) | CPU (Single Core)
Cinebench R15: CPU Multi 64Bit | CPU Single 64Bit
Blender: v2.79 BMW27 CPU
7-Zip 18.03: 7z b 4 | 7z b 4 -mmt1
Geekbench 5.5: Multi-Core | Single-Core
HWBOT x265 Benchmark v2.2: 4k Preset
LibreOffice : 20 Documents To PDF
R Benchmark 2.5: Overall mean
* ... smaller is better
AIDA64: FP32 Ray-Trace | FPU Julia | CPU SHA3 | CPU Queen | FPU SinJulia | FPU Mandel | CPU AES | CPU ZLib | FP64 Ray-Trace | CPU PhotoWorxx
| Performance rating | |
| Average AMD Ryzen 7 7840HS | |
| Lenovo Legion Slim 5 16APH8 | |
| Asus TUF Gaming A16 FA617XS | |
| HP Omen 16-wf000 | |
| Lenovo Legion Pro 5 16ARX8 (R5 7645HX, RTX 4050) | |
| Dell G16 7620 | |
| Acer Nitro 16 AN16-41-R7YE | |
| AIDA64 / FP32 Ray-Trace | |
| Lenovo Legion Slim 5 16APH8 | |
| Asus TUF Gaming A16 FA617XS | |
| Average AMD Ryzen 7 7840HS (22845 - 28921, n=21) | |
| Lenovo Legion Pro 5 16ARX8 (R5 7645HX, RTX 4050) | |
| HP Omen 16-wf000 | |
| Dell G16 7620 | |
| Acer Nitro 16 AN16-41-R7YE | |
| AIDA64 / FPU Julia | |
| Asus TUF Gaming A16 FA617XS | |
| Lenovo Legion Slim 5 16APH8 | |
| Average AMD Ryzen 7 7840HS (97164 - 123167, n=21) | |
| HP Omen 16-wf000 | |
| Lenovo Legion Pro 5 16ARX8 (R5 7645HX, RTX 4050) | |
| Acer Nitro 16 AN16-41-R7YE | |
| Dell G16 7620 | |
| AIDA64 / CPU SHA3 | |
| Lenovo Legion Slim 5 16APH8 | |
| Average AMD Ryzen 7 7840HS (4293 - 5155, n=21) | |
| Asus TUF Gaming A16 FA617XS | |
| HP Omen 16-wf000 | |
| Lenovo Legion Pro 5 16ARX8 (R5 7645HX, RTX 4050) | |
| Dell G16 7620 | |
| Acer Nitro 16 AN16-41-R7YE | |
| AIDA64 / CPU Queen | |
| Asus TUF Gaming A16 FA617XS | |
| Lenovo Legion Slim 5 16APH8 | |
| Average AMD Ryzen 7 7840HS (102271 - 125820, n=21) | |
| HP Omen 16-wf000 | |
| Dell G16 7620 | |
| Lenovo Legion Pro 5 16ARX8 (R5 7645HX, RTX 4050) | |
| Acer Nitro 16 AN16-41-R7YE | |
| AIDA64 / FPU SinJulia | |
| Asus TUF Gaming A16 FA617XS | |
| Lenovo Legion Slim 5 16APH8 | |
| Average AMD Ryzen 7 7840HS (13767 - 15525, n=21) | |
| HP Omen 16-wf000 | |
| Lenovo Legion Pro 5 16ARX8 (R5 7645HX, RTX 4050) | |
| Dell G16 7620 | |
| Acer Nitro 16 AN16-41-R7YE | |
| AIDA64 / FPU Mandel | |
| Lenovo Legion Slim 5 16APH8 | |
| Asus TUF Gaming A16 FA617XS | |
| Average AMD Ryzen 7 7840HS (52084 - 65812, n=21) | |
| Lenovo Legion Pro 5 16ARX8 (R5 7645HX, RTX 4050) | |
| HP Omen 16-wf000 | |
| Acer Nitro 16 AN16-41-R7YE | |
| Dell G16 7620 | |
| AIDA64 / CPU AES | |
| Average AMD Ryzen 7 7840HS (67389 - 177158, n=21) | |
| Acer Nitro 16 AN16-41-R7YE | |
| HP Omen 16-wf000 | |
| Asus TUF Gaming A16 FA617XS | |
| Dell G16 7620 | |
| Lenovo Legion Slim 5 16APH8 | |
| Lenovo Legion Pro 5 16ARX8 (R5 7645HX, RTX 4050) | |
| AIDA64 / CPU ZLib | |
| HP Omen 16-wf000 | |
| Lenovo Legion Slim 5 16APH8 | |
| Asus TUF Gaming A16 FA617XS | |
| Average AMD Ryzen 7 7840HS (944 - 1123, n=21) | |
| Dell G16 7620 | |
| Lenovo Legion Pro 5 16ARX8 (R5 7645HX, RTX 4050) | |
| Acer Nitro 16 AN16-41-R7YE | |
| AIDA64 / FP64 Ray-Trace | |
| Lenovo Legion Slim 5 16APH8 | |
| Asus TUF Gaming A16 FA617XS | |
| Average AMD Ryzen 7 7840HS (12248 - 15599, n=21) | |
| Lenovo Legion Pro 5 16ARX8 (R5 7645HX, RTX 4050) | |
| HP Omen 16-wf000 | |
| Dell G16 7620 | |
| Acer Nitro 16 AN16-41-R7YE | |
| AIDA64 / CPU PhotoWorxx | |
| HP Omen 16-wf000 | |
| Average AMD Ryzen 7 7840HS (17615 - 41516, n=21) | |
| Dell G16 7620 | |
| Lenovo Legion Slim 5 16APH8 | |
| Asus TUF Gaming A16 FA617XS | |
| Acer Nitro 16 AN16-41-R7YE | |
| Lenovo Legion Pro 5 16ARX8 (R5 7645HX, RTX 4050) | |
System Performance
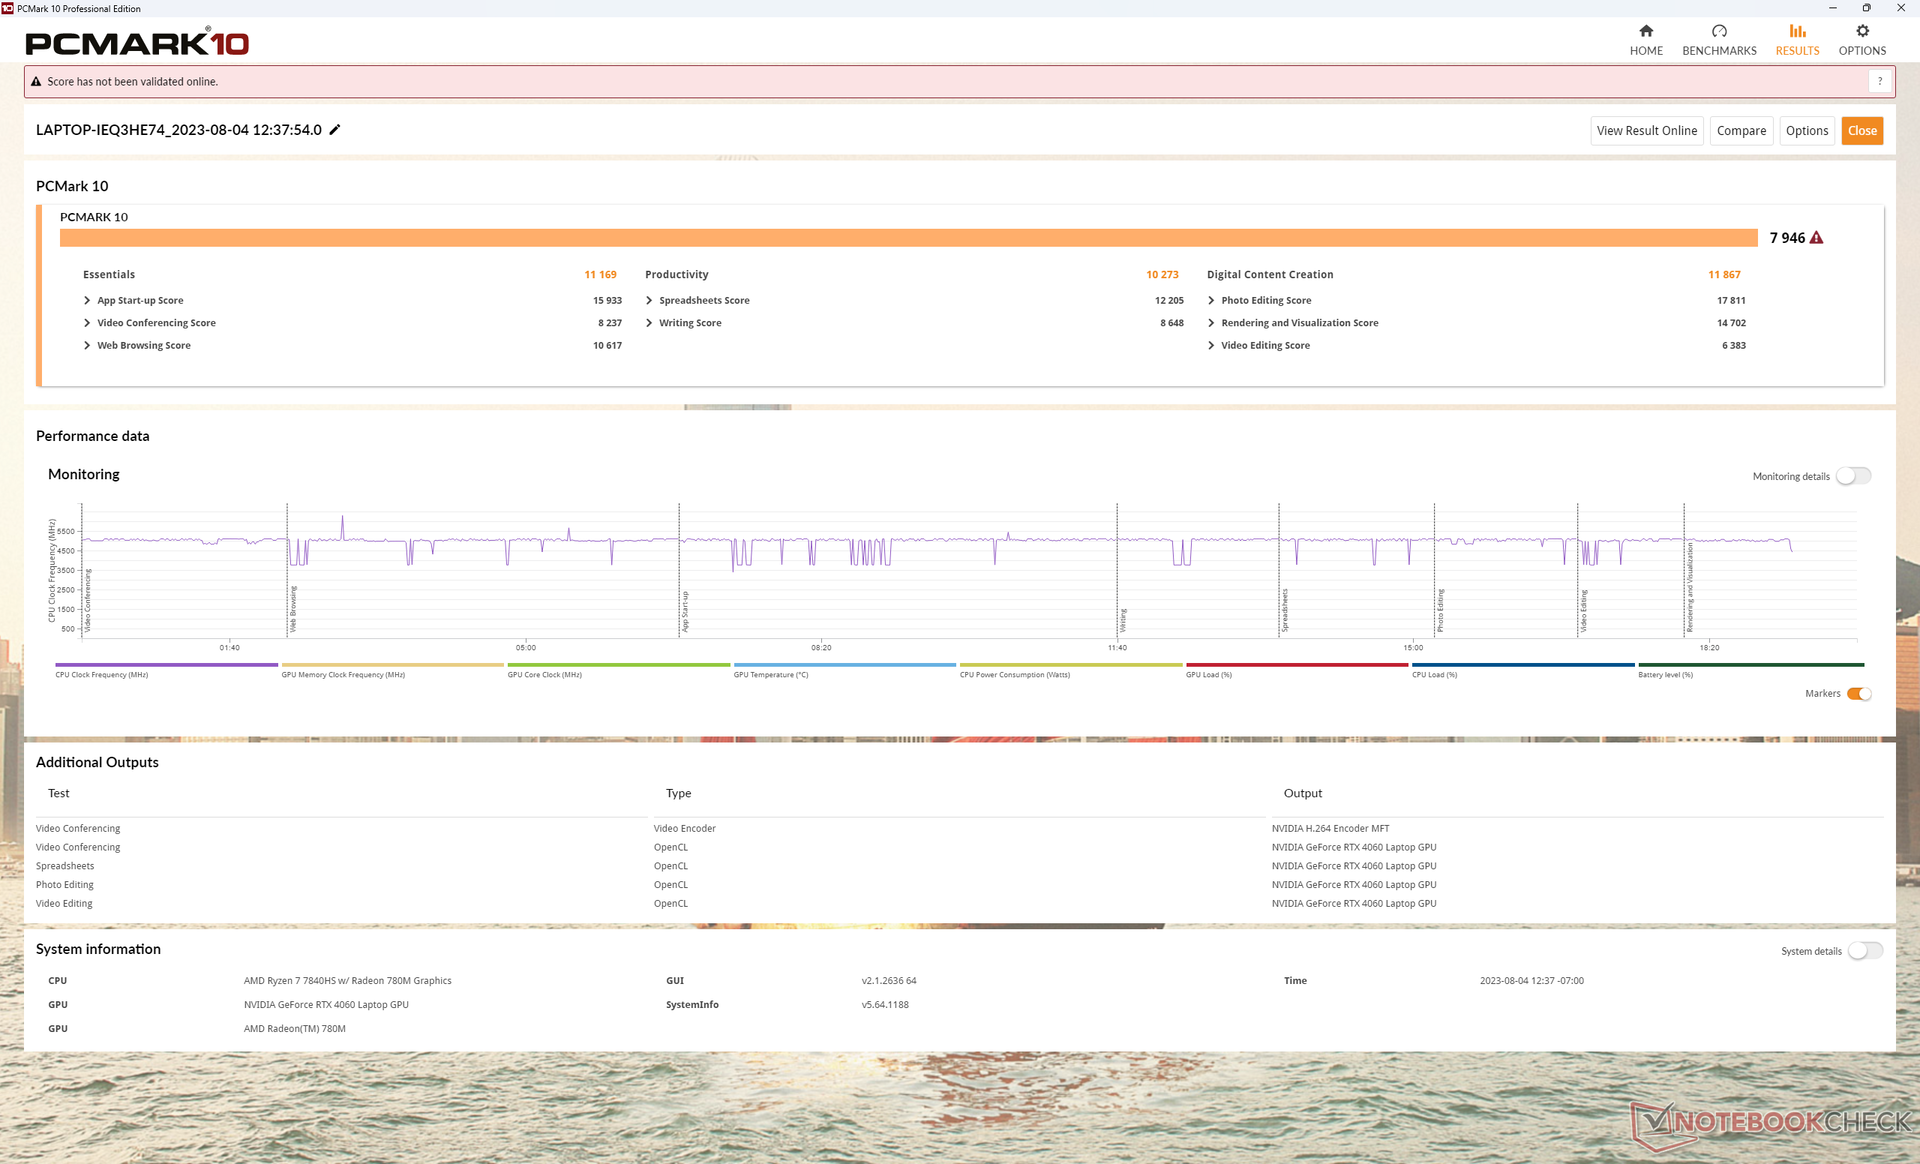
PCMark scores are comparable to alternatives like the Asus TUF Gaming A16 or HP Omen 16 regardless of their processor differences. This means that the Lenovo system can run office-based tasks and workloads reliably despite it being a gaming laptop.
CrossMark: Overall | Productivity | Creativity | Responsiveness
| PCMark 10 / Score | |
| Lenovo Legion Pro 5 16ARX8 (R5 7645HX, RTX 4050) | |
| Lenovo Legion Slim 5 16APH8 | |
| Asus TUF Gaming A16 FA617XS | |
| HP Omen 16-wf000 | |
| Average AMD Ryzen 7 7840HS, NVIDIA GeForce RTX 4060 Laptop GPU (7502 - 7946, n=4) | |
| Dell G16 7620 | |
| Acer Nitro 16 AN16-41-R7YE | |
| PCMark 10 / Essentials | |
| Lenovo Legion Pro 5 16ARX8 (R5 7645HX, RTX 4050) | |
| Lenovo Legion Slim 5 16APH8 | |
| Average AMD Ryzen 7 7840HS, NVIDIA GeForce RTX 4060 Laptop GPU (10441 - 11169, n=4) | |
| Asus TUF Gaming A16 FA617XS | |
| HP Omen 16-wf000 | |
| Dell G16 7620 | |
| Acer Nitro 16 AN16-41-R7YE | |
| PCMark 10 / Productivity | |
| Lenovo Legion Pro 5 16ARX8 (R5 7645HX, RTX 4050) | |
| Asus TUF Gaming A16 FA617XS | |
| Lenovo Legion Slim 5 16APH8 | |
| Average AMD Ryzen 7 7840HS, NVIDIA GeForce RTX 4060 Laptop GPU (9575 - 10273, n=4) | |
| HP Omen 16-wf000 | |
| Dell G16 7620 | |
| Acer Nitro 16 AN16-41-R7YE | |
| PCMark 10 / Digital Content Creation | |
| HP Omen 16-wf000 | |
| Average AMD Ryzen 7 7840HS, NVIDIA GeForce RTX 4060 Laptop GPU (11464 - 12418, n=4) | |
| Asus TUF Gaming A16 FA617XS | |
| Lenovo Legion Slim 5 16APH8 | |
| Dell G16 7620 | |
| Lenovo Legion Pro 5 16ARX8 (R5 7645HX, RTX 4050) | |
| Acer Nitro 16 AN16-41-R7YE | |
| CrossMark / Overall | |
| Lenovo Legion Pro 5 16ARX8 (R5 7645HX, RTX 4050) | |
| Average AMD Ryzen 7 7840HS, NVIDIA GeForce RTX 4060 Laptop GPU (1800 - 1866, n=3) | |
| Lenovo Legion Slim 5 16APH8 | |
| Dell G16 7620 | |
| Asus TUF Gaming A16 FA617XS | |
| HP Omen 16-wf000 | |
| Acer Nitro 16 AN16-41-R7YE | |
| CrossMark / Productivity | |
| Lenovo Legion Pro 5 16ARX8 (R5 7645HX, RTX 4050) | |
| Average AMD Ryzen 7 7840HS, NVIDIA GeForce RTX 4060 Laptop GPU (1743 - 1821, n=3) | |
| Lenovo Legion Slim 5 16APH8 | |
| Asus TUF Gaming A16 FA617XS | |
| Dell G16 7620 | |
| HP Omen 16-wf000 | |
| Acer Nitro 16 AN16-41-R7YE | |
| CrossMark / Creativity | |
| Lenovo Legion Pro 5 16ARX8 (R5 7645HX, RTX 4050) | |
| Asus TUF Gaming A16 FA617XS | |
| HP Omen 16-wf000 | |
| Lenovo Legion Slim 5 16APH8 | |
| Dell G16 7620 | |
| Average AMD Ryzen 7 7840HS, NVIDIA GeForce RTX 4060 Laptop GPU (1908 - 1966, n=3) | |
| Acer Nitro 16 AN16-41-R7YE | |
| CrossMark / Responsiveness | |
| Lenovo Legion Pro 5 16ARX8 (R5 7645HX, RTX 4050) | |
| Average AMD Ryzen 7 7840HS, NVIDIA GeForce RTX 4060 Laptop GPU (1522 - 1776, n=3) | |
| Dell G16 7620 | |
| Lenovo Legion Slim 5 16APH8 | |
| HP Omen 16-wf000 | |
| Asus TUF Gaming A16 FA617XS | |
| Acer Nitro 16 AN16-41-R7YE | |
| PCMark 10 Score | 7946 points | |
Help | ||
| AIDA64 / Memory Copy | |
| Average AMD Ryzen 7 7840HS (30937 - 72158, n=21) | |
| HP Omen 16-wf000 | |
| Lenovo Legion Slim 5 16APH8 | |
| Asus TUF Gaming A16 FA617XS | |
| Dell G16 7620 | |
| Acer Nitro 16 AN16-41-R7YE | |
| Lenovo Legion Pro 5 16ARX8 (R5 7645HX, RTX 4050) | |
| AIDA64 / Memory Read | |
| HP Omen 16-wf000 | |
| Dell G16 7620 | |
| Asus TUF Gaming A16 FA617XS | |
| Lenovo Legion Slim 5 16APH8 | |
| Average AMD Ryzen 7 7840HS (30497 - 62147, n=21) | |
| Acer Nitro 16 AN16-41-R7YE | |
| Lenovo Legion Pro 5 16ARX8 (R5 7645HX, RTX 4050) | |
| AIDA64 / Memory Write | |
| Average AMD Ryzen 7 7840HS (34590 - 93323, n=21) | |
| Lenovo Legion Slim 5 16APH8 | |
| Asus TUF Gaming A16 FA617XS | |
| HP Omen 16-wf000 | |
| Dell G16 7620 | |
| Acer Nitro 16 AN16-41-R7YE | |
| Lenovo Legion Pro 5 16ARX8 (R5 7645HX, RTX 4050) | |
| AIDA64 / Memory Latency | |
| Dell G16 7620 | |
| Lenovo Legion Slim 5 16APH8 | |
| Average AMD Ryzen 7 7840HS (85.1 - 112, n=21) | |
| Asus TUF Gaming A16 FA617XS | |
| Acer Nitro 16 AN16-41-R7YE | |
| HP Omen 16-wf000 | |
| Lenovo Legion Pro 5 16ARX8 (R5 7645HX, RTX 4050) | |
* ... smaller is better
DPC Latency
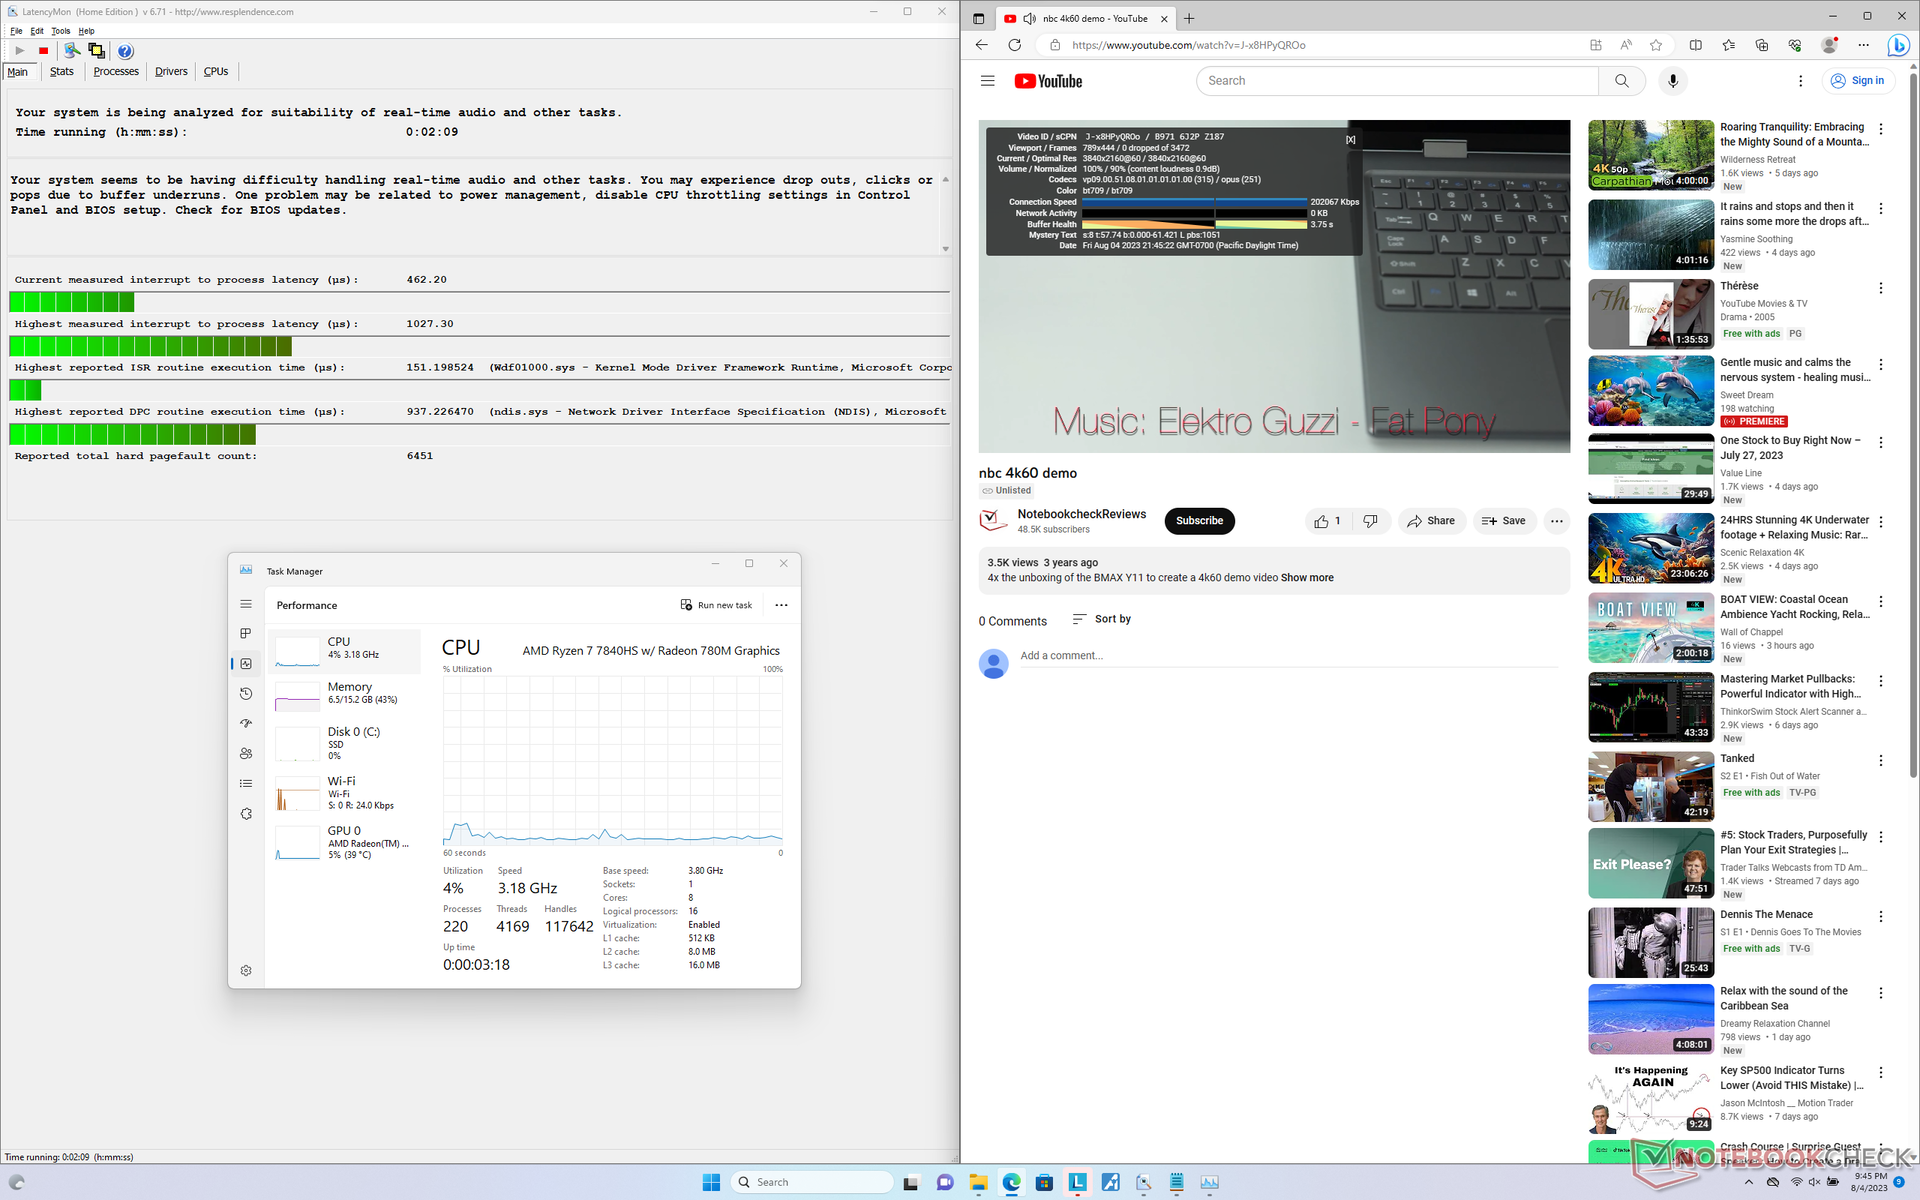
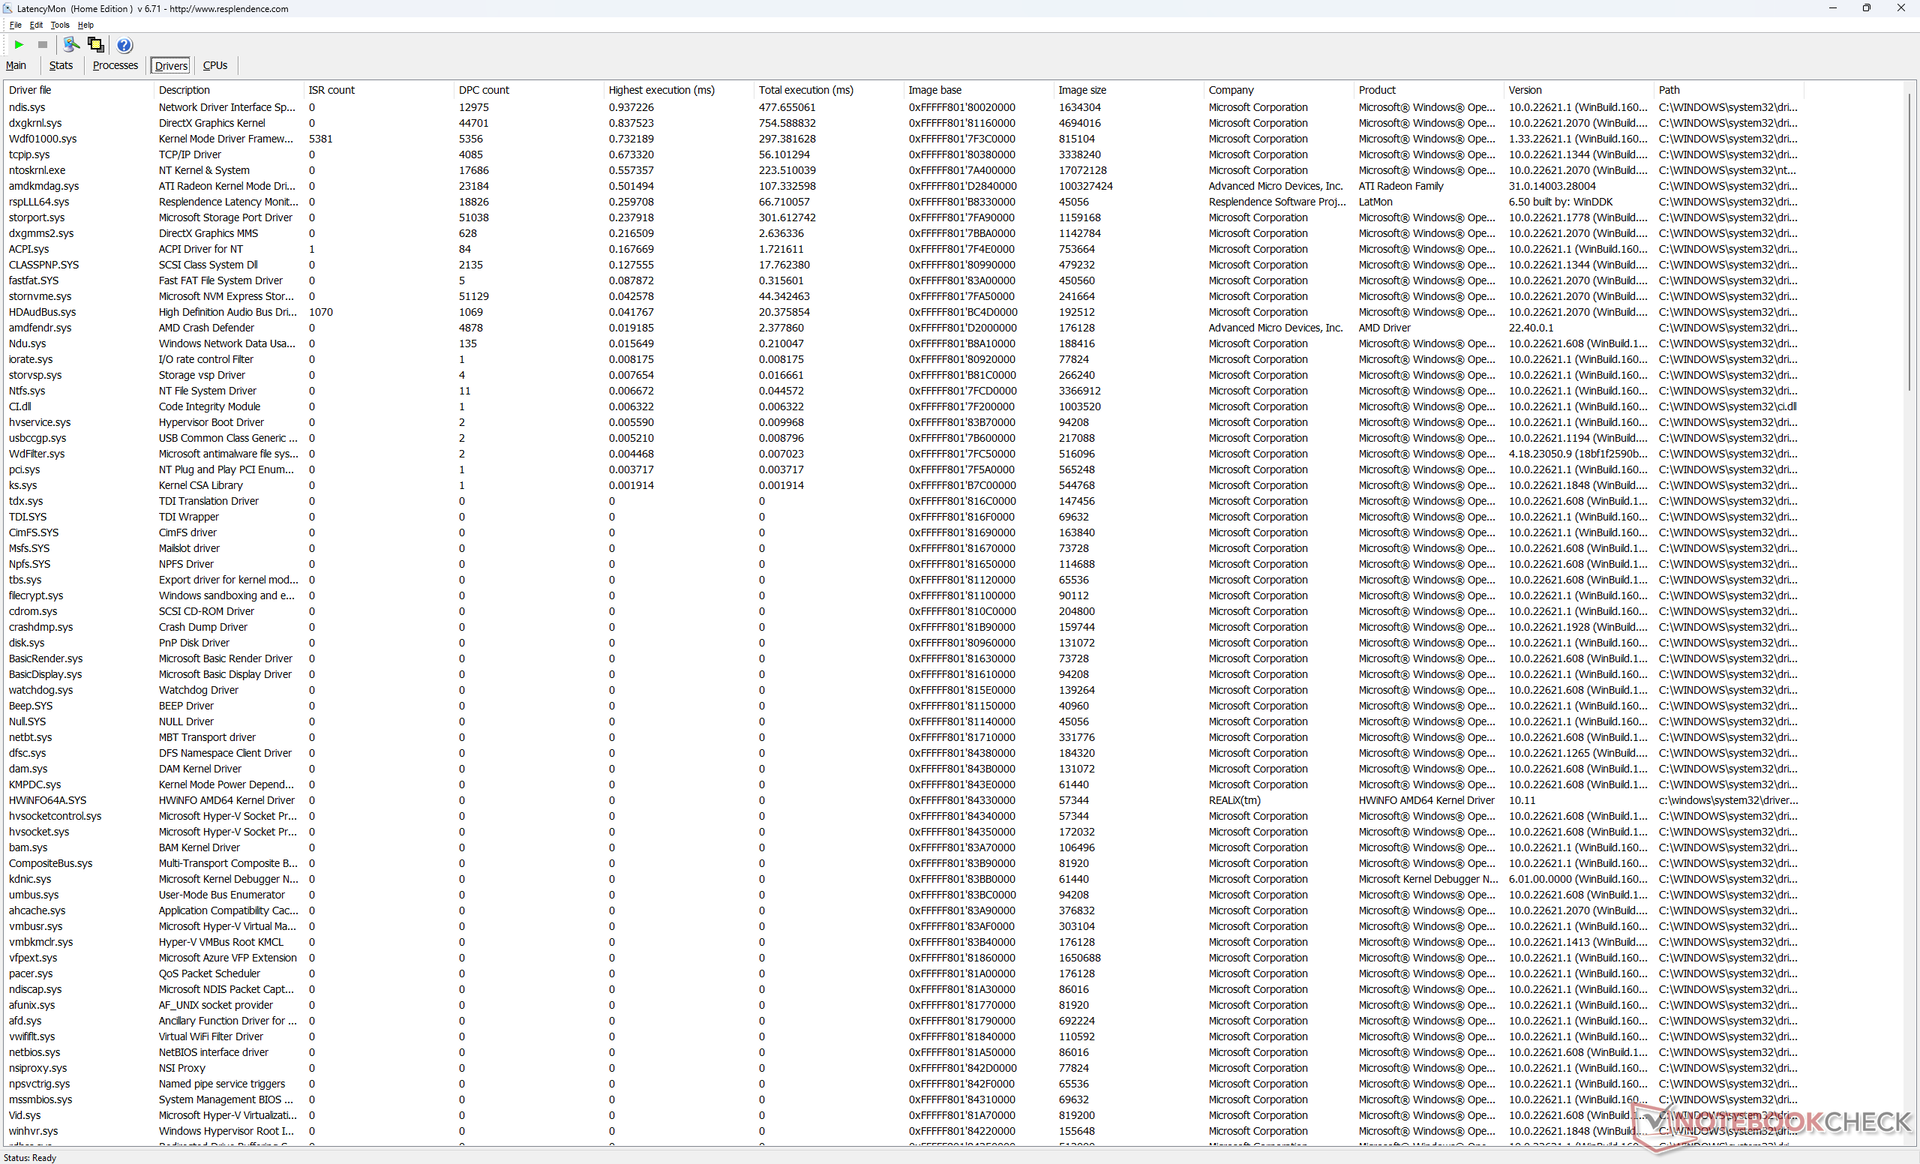
LatencyMon reveals just minor DPC issues when opening multiple browser tabs of our homepage. 4K video playback at 60 FPS is otherwise perfect with no dropped frames recorded.
| DPC Latencies / LatencyMon - interrupt to process latency (max), Web, Youtube, Prime95 | |
| HP Omen 16-wf000 | |
| Asus TUF Gaming A16 FA617XS | |
| Lenovo Legion Slim 5 16APH8 | |
| Dell G16 7620 | |
| Acer Nitro 16 AN16-41-R7YE | |
| Lenovo Legion Pro 5 16ARX8 (R5 7645HX, RTX 4050) | |
* ... smaller is better
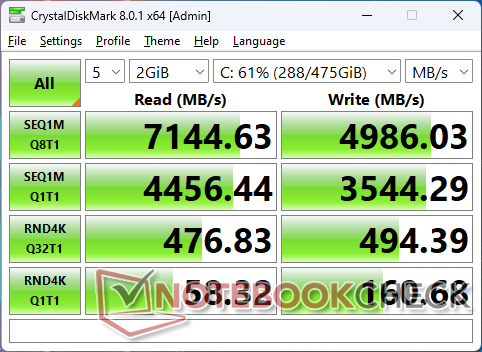
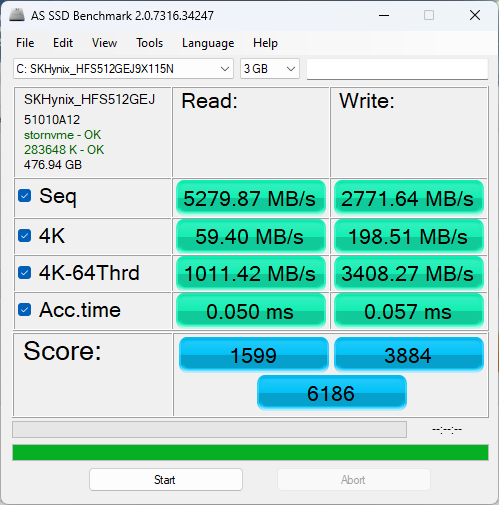
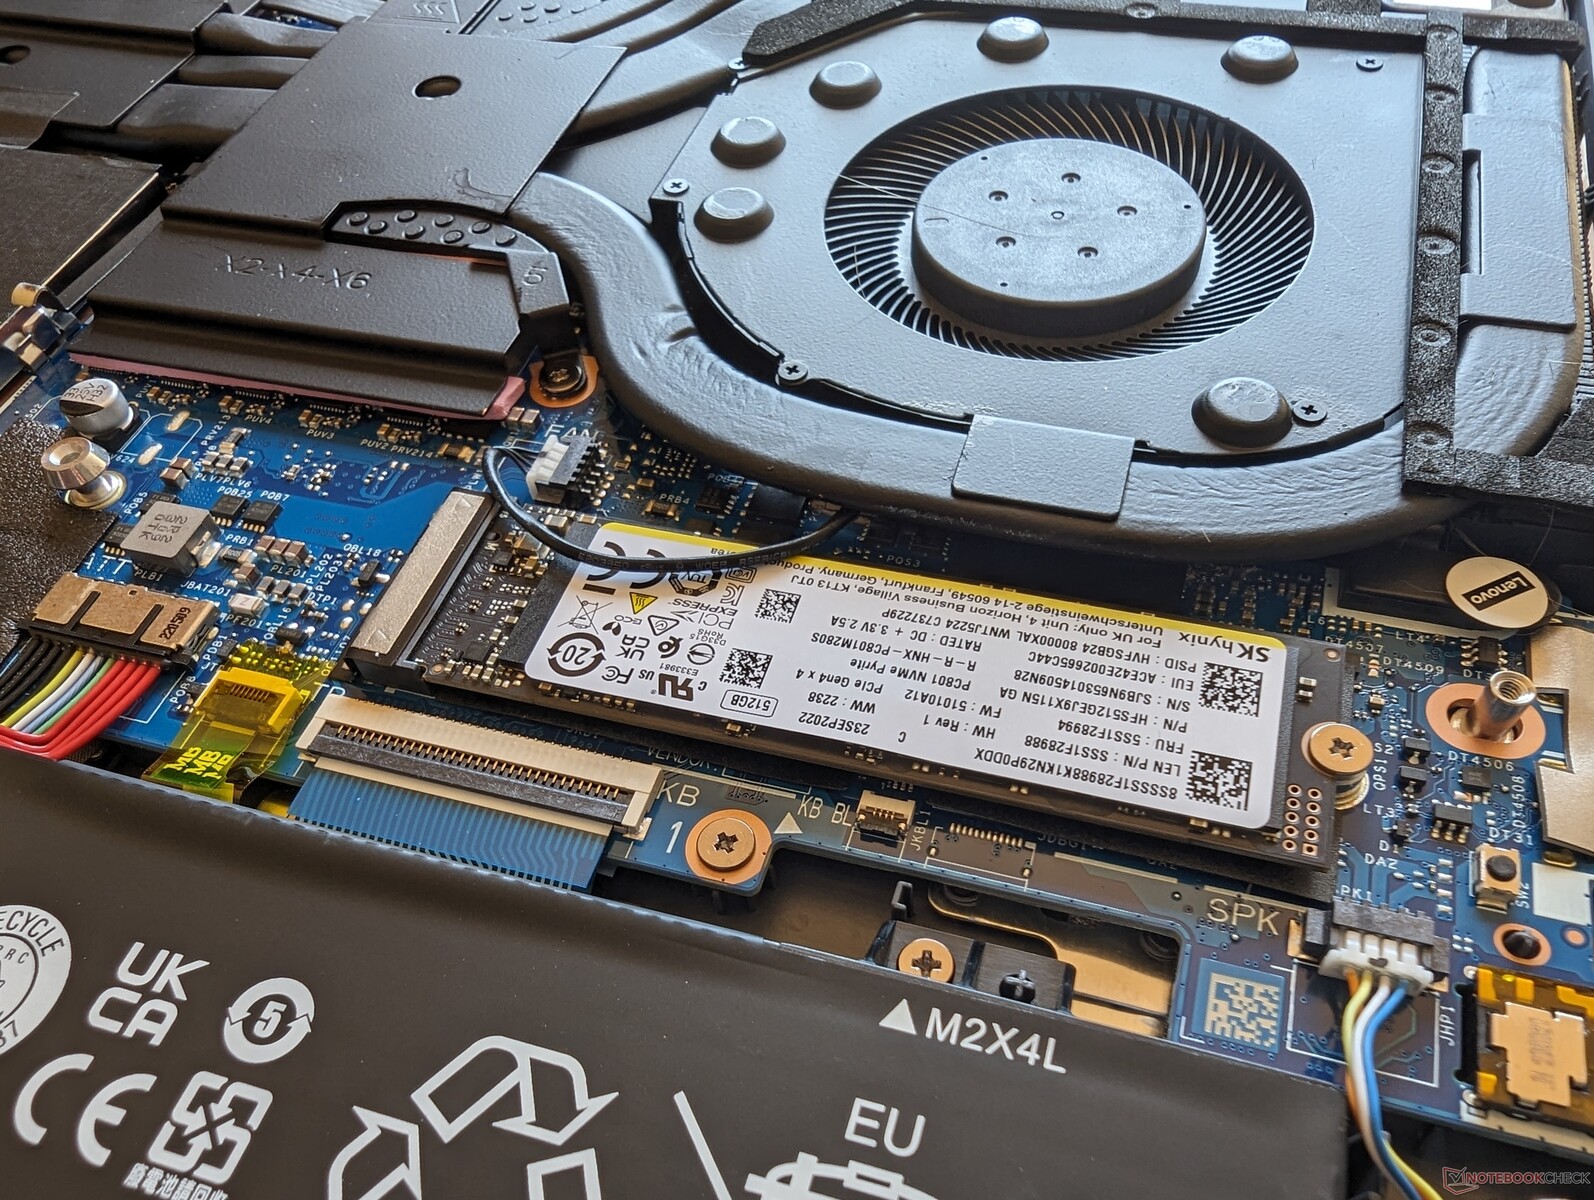
Storage Devices — Up To Two NVMe SSDs
Our test unit comes with the same SK hynix PC801 PCIe4 x4 NVMe SSD as found on the more expensive Legion Pro 5 or Legion Slim 7. The drive would exhibit no issues maintaining a maximum transfer rate of 6900 MB/s for extended periods. In contrast, the SSD in the Alienware x16 R1 would begin to throttle after a few minutes into our DiskSpd stress test as shown by the graph below. Thermal pads are included for each of the two M.2 SSD slots to help dissipate heat onto the underside of the Legion chassis.

| Drive Performance rating - Percent | |
| Lenovo Legion Pro 5 16ARX8 (R5 7645HX, RTX 4050) | |
| Dell G16 7620 | |
| HP Omen 16-wf000 | |
| Lenovo Legion Slim 5 16APH8 | |
| Acer Nitro 16 AN16-41-R7YE | |
| Asus TUF Gaming A16 FA617XS | |
* ... smaller is better
Disk Throttling: DiskSpd Read Loop, Queue Depth 8
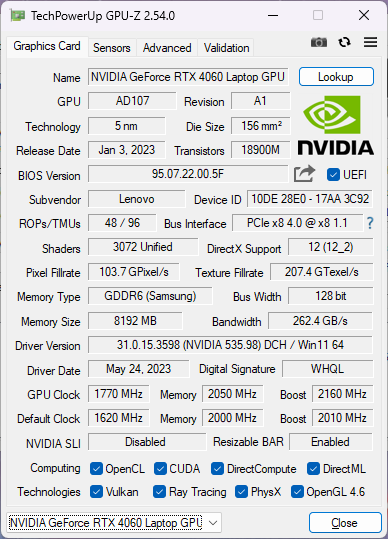
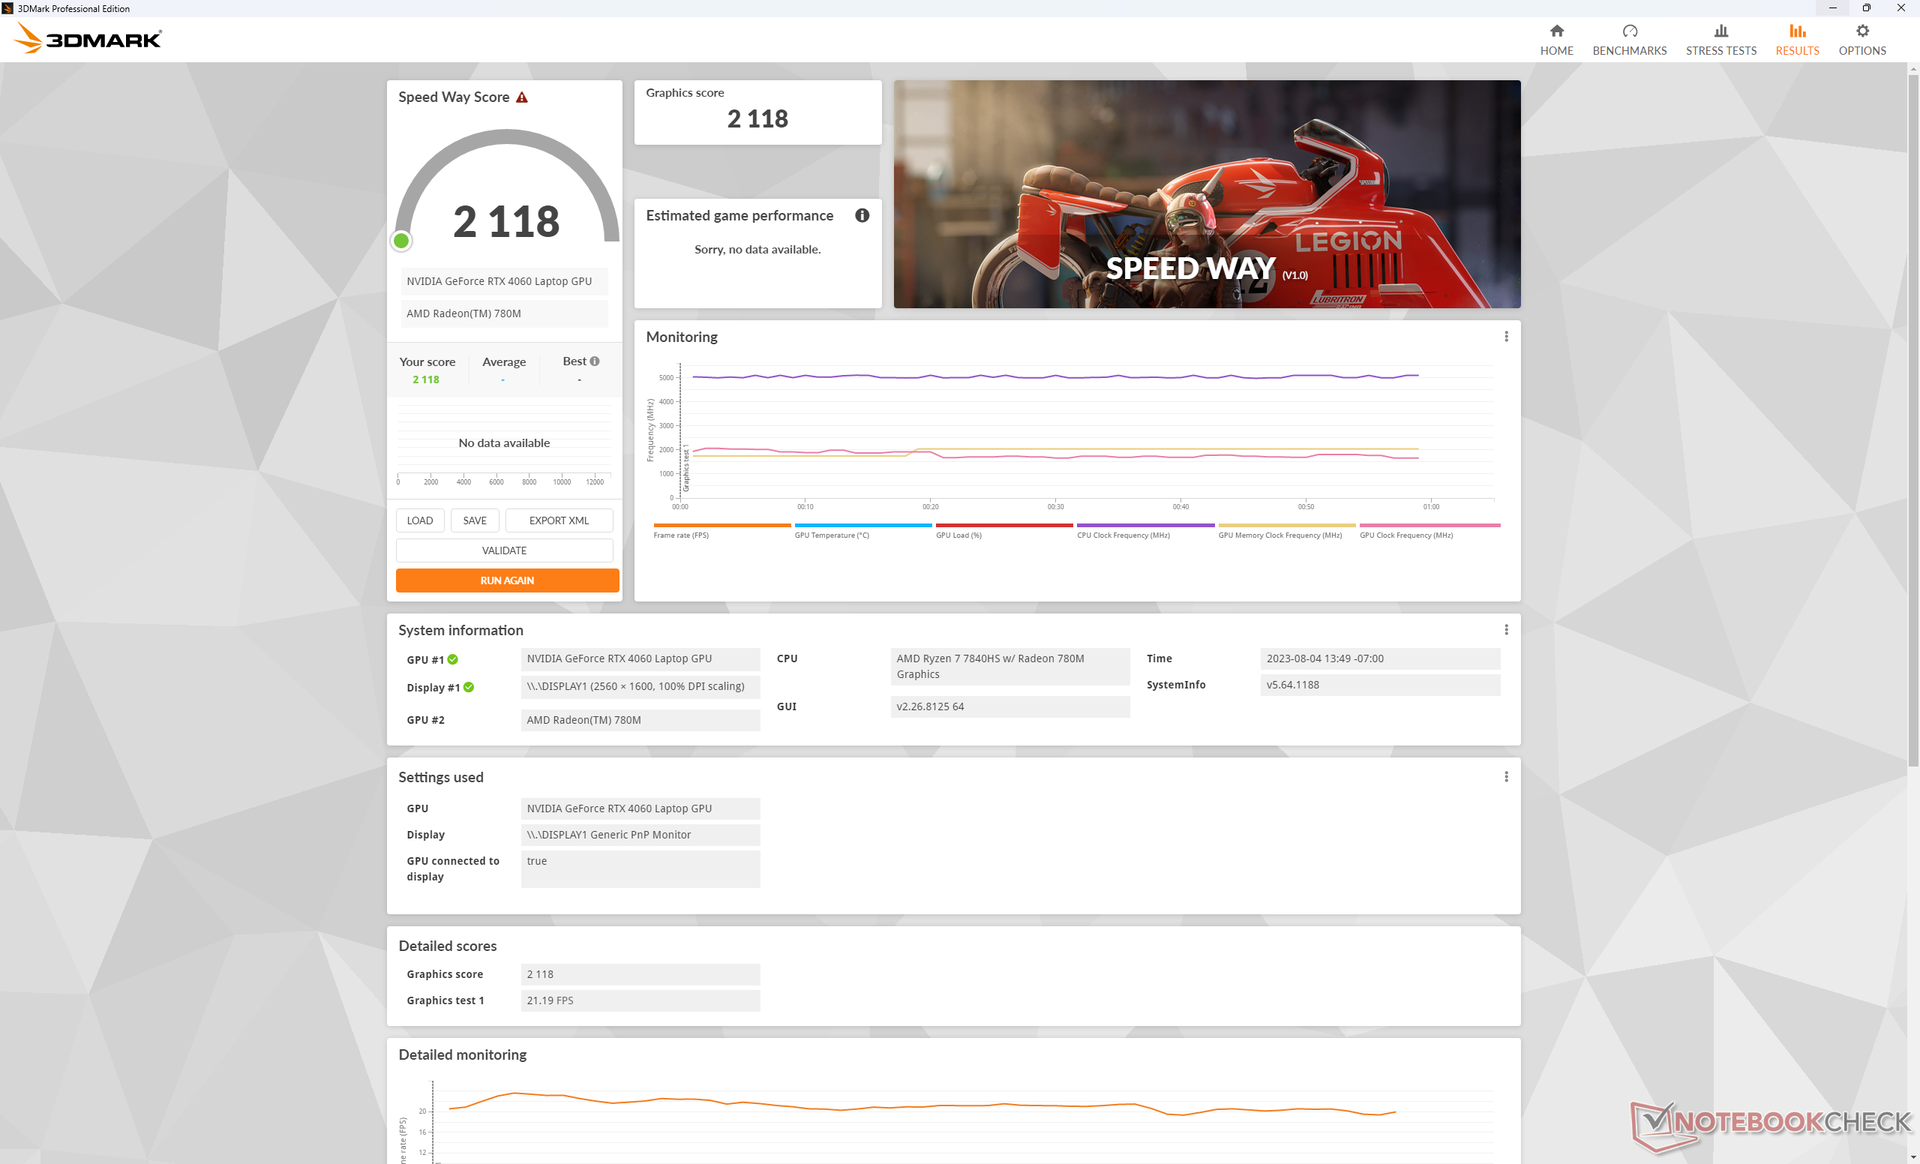
GPU Performance — 100 W TGP Target, But Only 60 W In Real-World Conditions
Whereas the Legion Pro 5 can be configured with the Ryzen 7 7745HX CPU with GeForce RTX 4070 graphics, the Legion Slim 5 is limited to the slower Ryzen 7 7740HS with RTX 4060 graphics. Interestingly, Nvidia control panel claims a maximum graphics power of 140 W on our unit while the official Lenovo specifications claim a target of only 100 W. We're only able to reach a GPU power draw of just 60 W when running games.
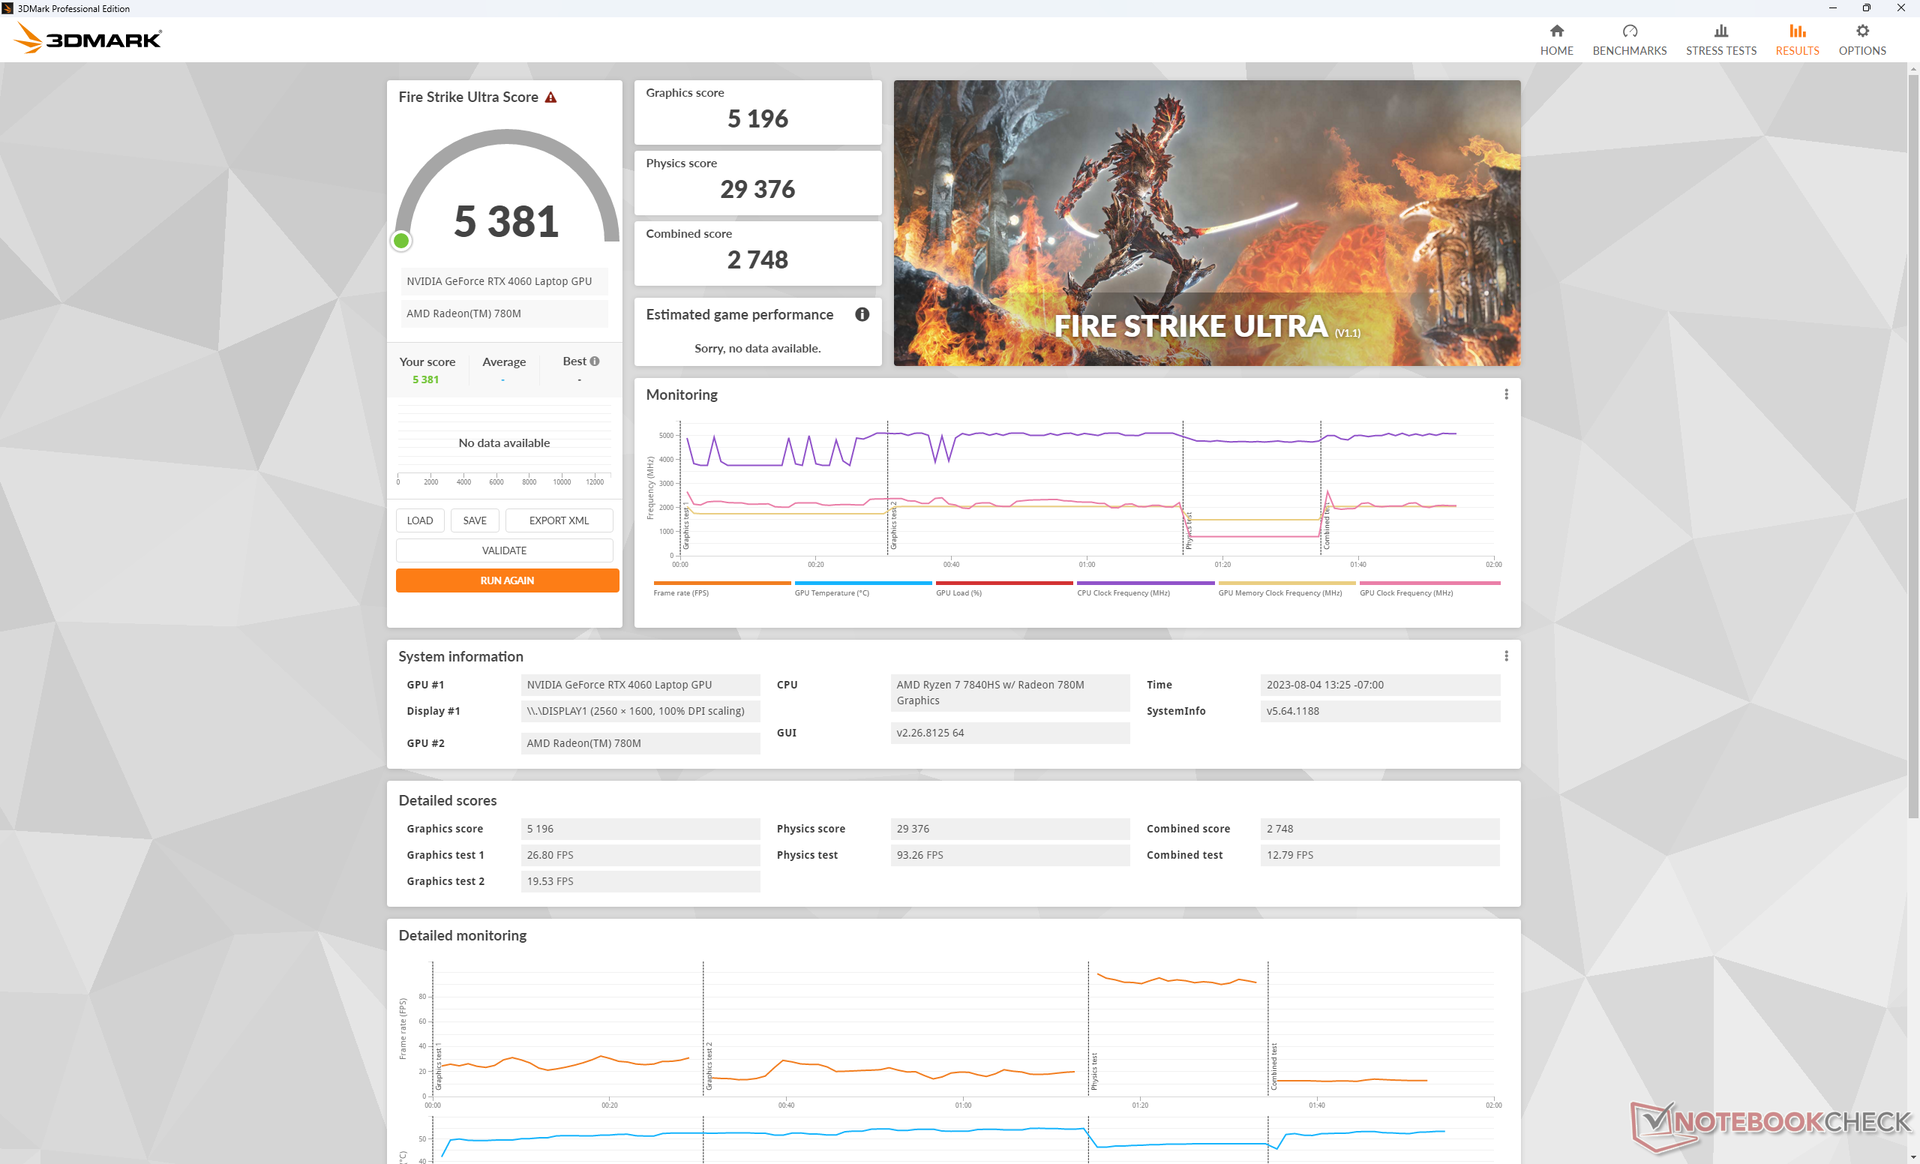
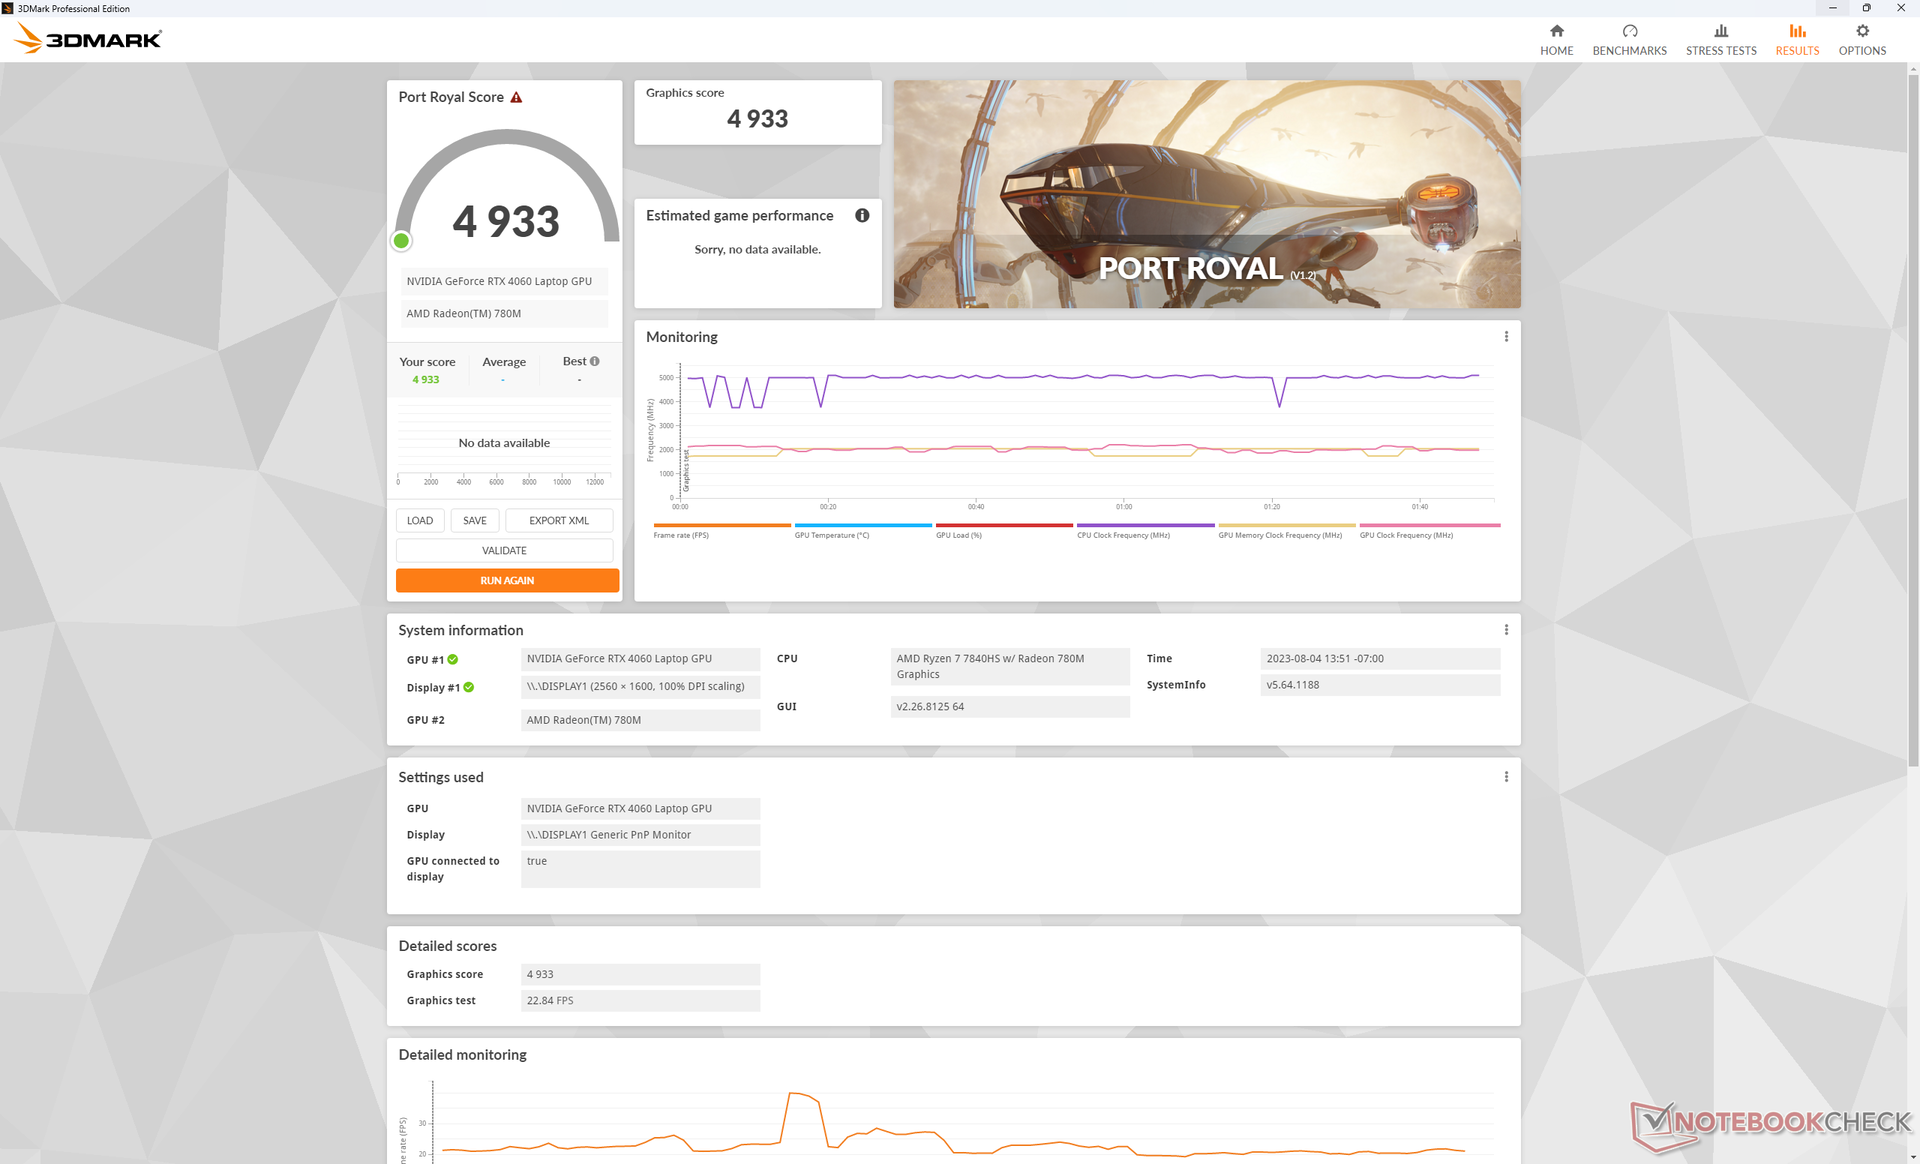
Graphics performance is about 5 to 8 percent slower than the average laptop in our database equipped with the same mobile RTX 4060 GPU which is disappointing because that deficit puts our RTX 4060 much closer to the RTX 4050 in terms of performance. In fact, the GeForce RTX 4050 GPUs in the Legion Pro 5 16 and LOQ 15 are essentially on par with the RTX 4060 in our Legion Slim 5 according to 3DMark benchmarks.
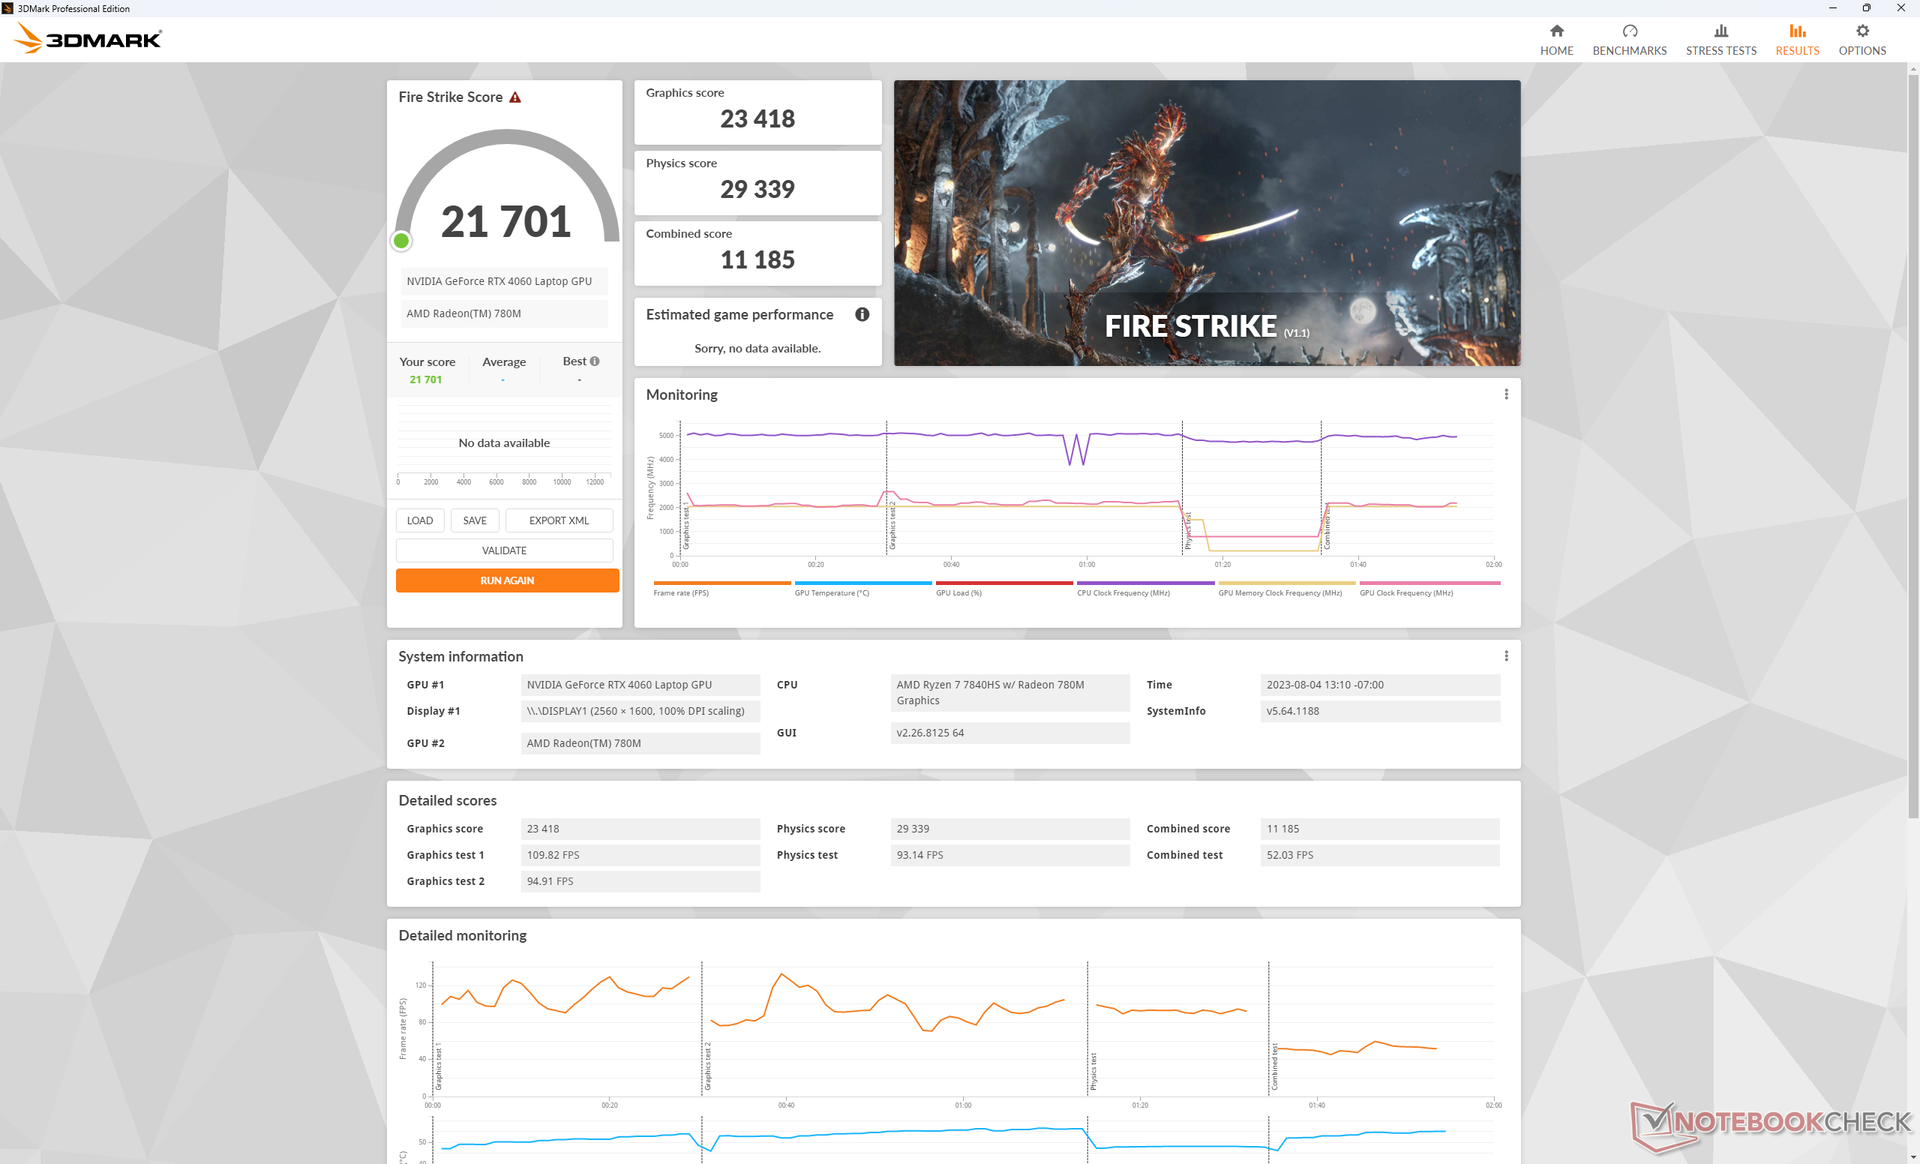
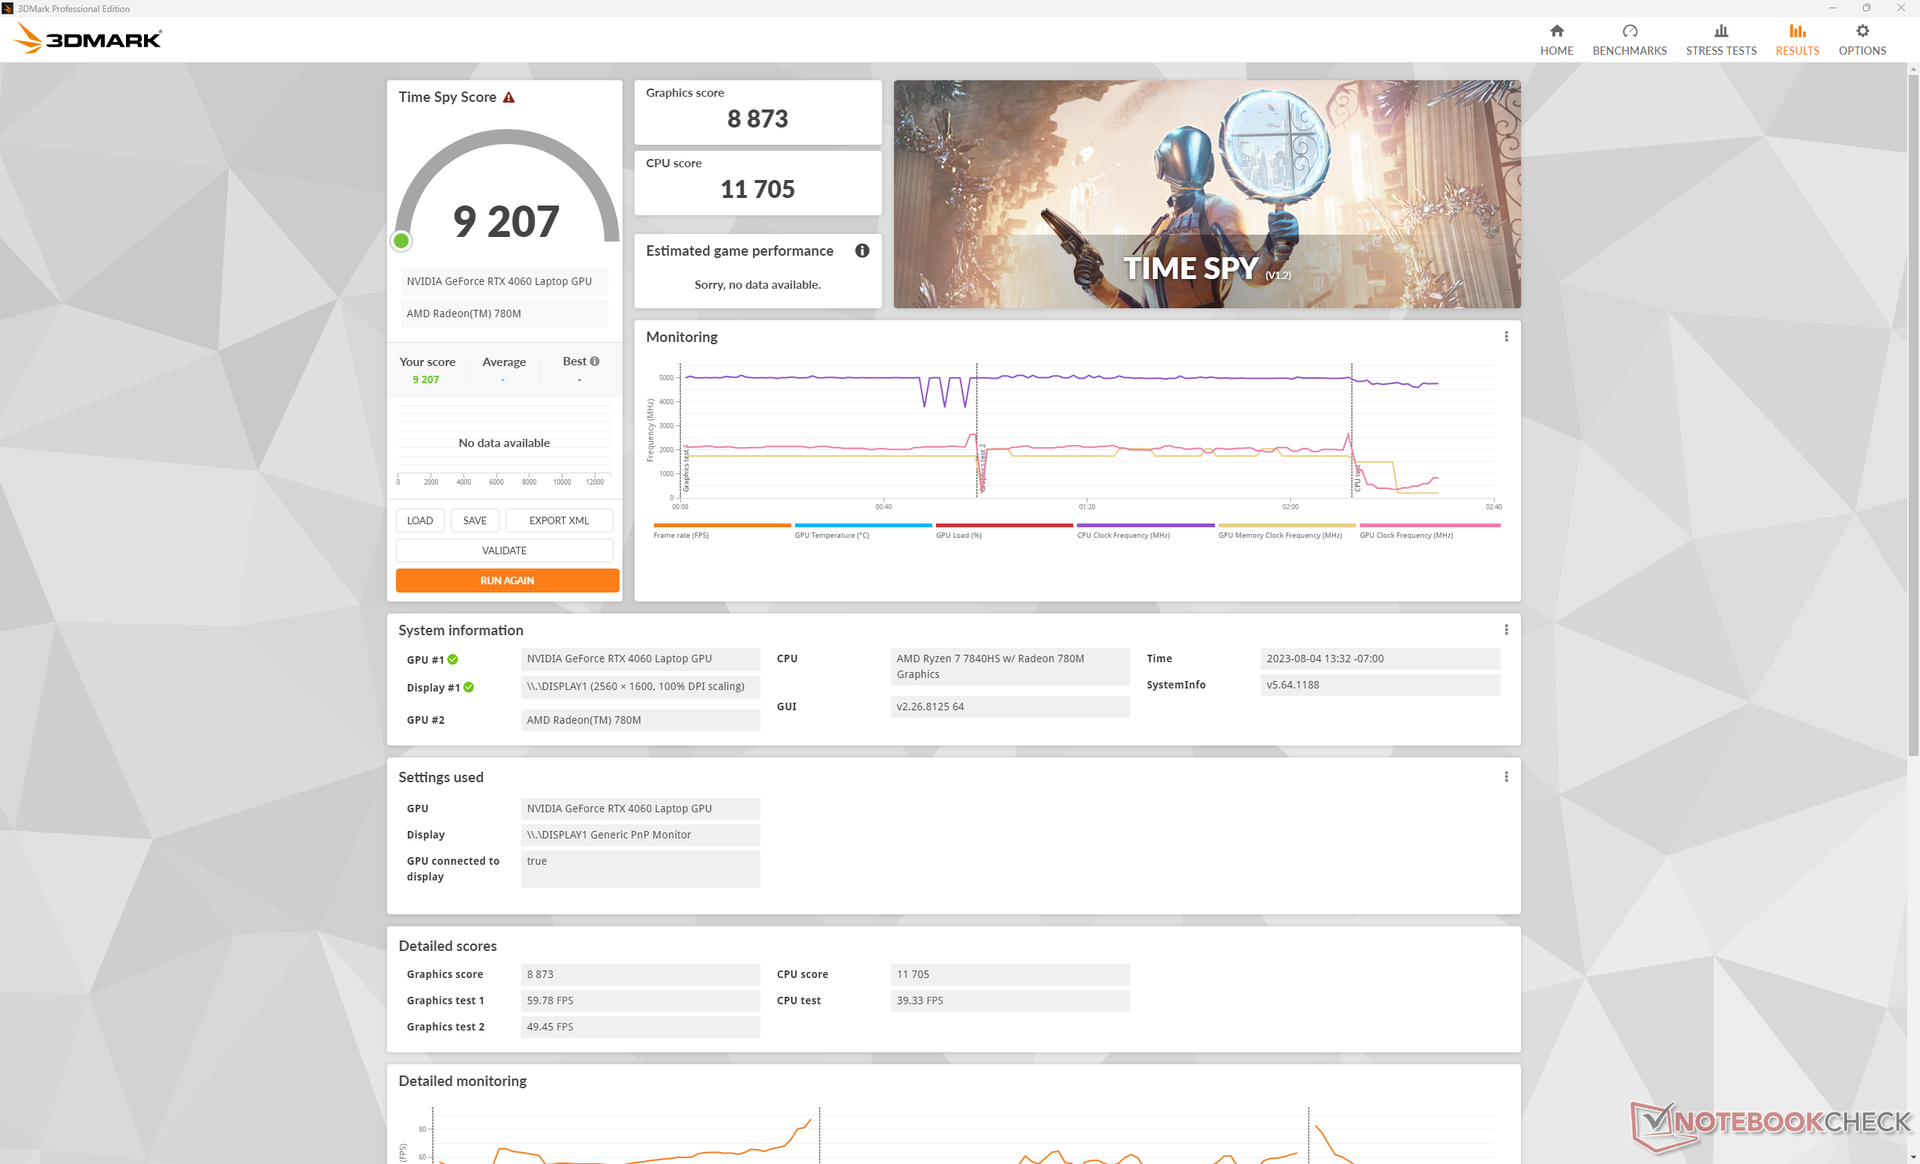
The situation becomes even stranger when switching between Balanced and Performance modes. Usually, Performance mode on most gaming laptops would boost graphics performance by 10 to 20 percent over Balanced mode, but there appears to be no difference on our Legion Slim 5. 3DMark scores on Balanced mode would be essentially identical to our scores on Performance mode as shown by the Fire Strike table below. This behavior is explored further in our Stress Test section.
| Power Profile | Graphics Score | Physics Score | Combined Score |
| Battery | 15850 (-32%) | 27206 (-7%) | 6943 (-38%) |
| Balanced | 23181 (-1%) | 28488 (-3%) | 10888 (-3%) |
| Performance | 23418 | 29339 | 11185 |
Please note that our desktop GeForce RTX 4060 Ti Blender CUDA score below is incorrect due to an error whilst benchmarking.
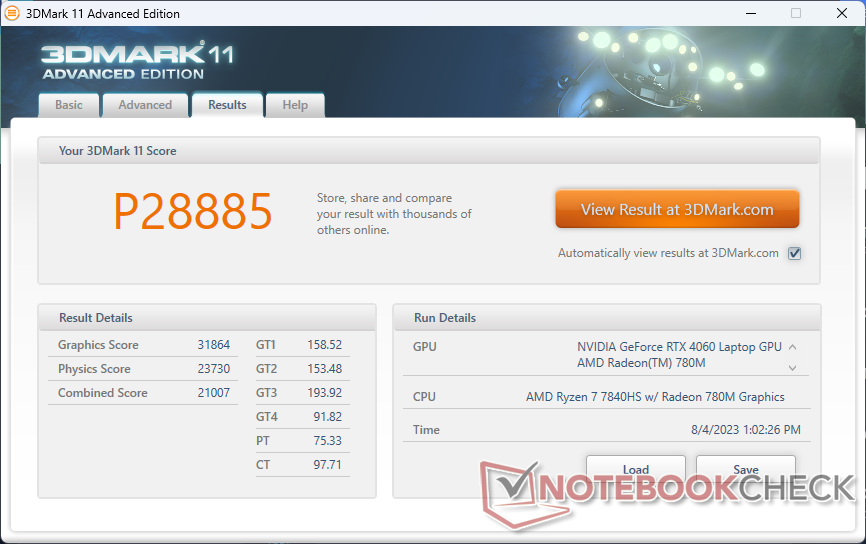
| 3DMark 11 Performance | 28885 points | |
| 3DMark Fire Strike Score | 21701 points | |
| 3DMark Time Spy Score | 9207 points | |
Help | ||
* ... smaller is better
Gaming Performance
Performance when running games at 1080p is only slightly faster than the RTX 4050 by 5 to 10 percent in most titles. When running Cyberpunk 2077, Final Fantasy XV, or Tiny Tina's Wonderlands, for example, our Legion Slim 5 would just barely edge out the cheaper LOQ 15 with half the RAM. The performance advantage would grow in our favor if running on lower resolutions and settings, but most gamers will be aiming for 1080p or higher. The Legion Pro 5 16 with the same RTX 4060 would outperform our Legion Slim 5 by up to 25 percent in some cases as shown by our comparison charts below.
Witcher 3 FPS Chart
| low | med. | high | ultra | QHD | 4K | |
|---|---|---|---|---|---|---|
| GTA V (2015) | 180.1 | 172.8 | 164.2 | 101 | 83 | 76.3 |
| The Witcher 3 (2015) | 350.9 | 289.1 | 180.2 | 93.2 | 57 | |
| Dota 2 Reborn (2015) | 167.5 | 151.3 | 142.7 | 135.6 | 115.7 | |
| Final Fantasy XV Benchmark (2018) | 209 | 131 | 94.3 | 67.7 | 37.6 | |
| X-Plane 11.11 (2018) | 110.1 | 106.3 | 83.3 | 70.9 | ||
| Strange Brigade (2018) | 375 | 242 | 193 | 168.2 | 115.1 | 61.8 |
| Cyberpunk 2077 1.6 (2022) | 136.1 | 113.7 | 84.7 | 69.4 | 40.7 | 17.4 |
| Tiny Tina's Wonderlands (2022) | 197.4 | 164.3 | 104.8 | 80.3 | 54.3 | 26.7 |
| F1 22 (2022) | 233 | 226 | 166.8 | 55.1 | 35.5 | 16.6 |
| Returnal (2023) | 99 | 93 | 87 | 75 | 52 | 29 |
Emissions
System Noise — About The Same As The Legion Pro 5 16
Fan noise is highly dependent on the power profile setting. If on Balanced mode, fan noise when running typical loads like web browsers or video streams would range between 27 and 29 dB(A) which is audible but not distracting. Annoyingly, the fans would occasionally spike to 33 dB(A) for short periods before going back down to its normal range.
Fan noise when running Witcher 3 on Balanced mode would peak at 48 dB(A) compared to 54 dB(A) when on Performance mode. These maximums are similar to what we recorded on the Legion Pro 5 16IRX8 equipped with the same RTX 4060 GPU. Headphones are generally recommended for noise levels in the mid 50 dB(A) range.
Noise level
| Idle |
| 23.1 / 23.1 / 27.7 dB(A) |
| Load |
| 33.3 / 54 dB(A) |
 | ||
30 dB silent 40 dB(A) audible 50 dB(A) loud |
||
min: | ||
| Lenovo Legion Slim 5 16APH8 GeForce RTX 4060 Laptop GPU, R7 7840HS, SK hynix PC801 HFS512GEJ9X115N | Lenovo Legion Pro 5 16IRX8 GeForce RTX 4060 Laptop GPU, i7-13700HX, SK hynix PC801 HFS512GEJ9X115N | Acer Nitro 16 AN16-41-R7YE GeForce RTX 4050 Laptop GPU, R5 7535HS, SK hynix HFS512GEJ9X125N | HP Omen 16-wf000 GeForce RTX 4080 Laptop GPU, i7-13700HX, SK hynix PC801 HFS002TEJ9X101N | Dell G16 7620 GeForce RTX 3060 Laptop GPU, i7-12700H, WDC PC SN810 512GB | Asus TUF Gaming A16 FA617XS Radeon RX 7600S, R9 7940HS, Micron 2400 MTFDKBA512QFM | |
|---|---|---|---|---|---|---|
| Noise | 2% | -2% | -12% | -4% | -7% | |
| off / environment * (dB) | 22.9 | 23 -0% | 24 -5% | 23 -0% | 23.2 -1% | 25 -9% |
| Idle Minimum * (dB) | 23.1 | 23.1 -0% | 25 -8% | 29.6 -28% | 28.3 -23% | 25 -8% |
| Idle Average * (dB) | 23.1 | 23.1 -0% | 26 -13% | 29.8 -29% | 28.8 -25% | 26 -13% |
| Idle Maximum * (dB) | 27.7 | 26.6 4% | 27 3% | 30.4 -10% | 28.9 -4% | 28 -1% |
| Load Average * (dB) | 33.3 | 34.7 -4% | 42 -26% | 33.8 -2% | 32.4 3% | 43 -29% |
| Witcher 3 ultra * (dB) | 54 | 47.6 12% | 43 20% | 57 -6% | 48.3 11% | 51 6% |
| Load Maximum * (dB) | 54 | 54.8 -1% | 45 17% | 58.3 -8% | 48.1 11% | 53 2% |
* ... smaller is better
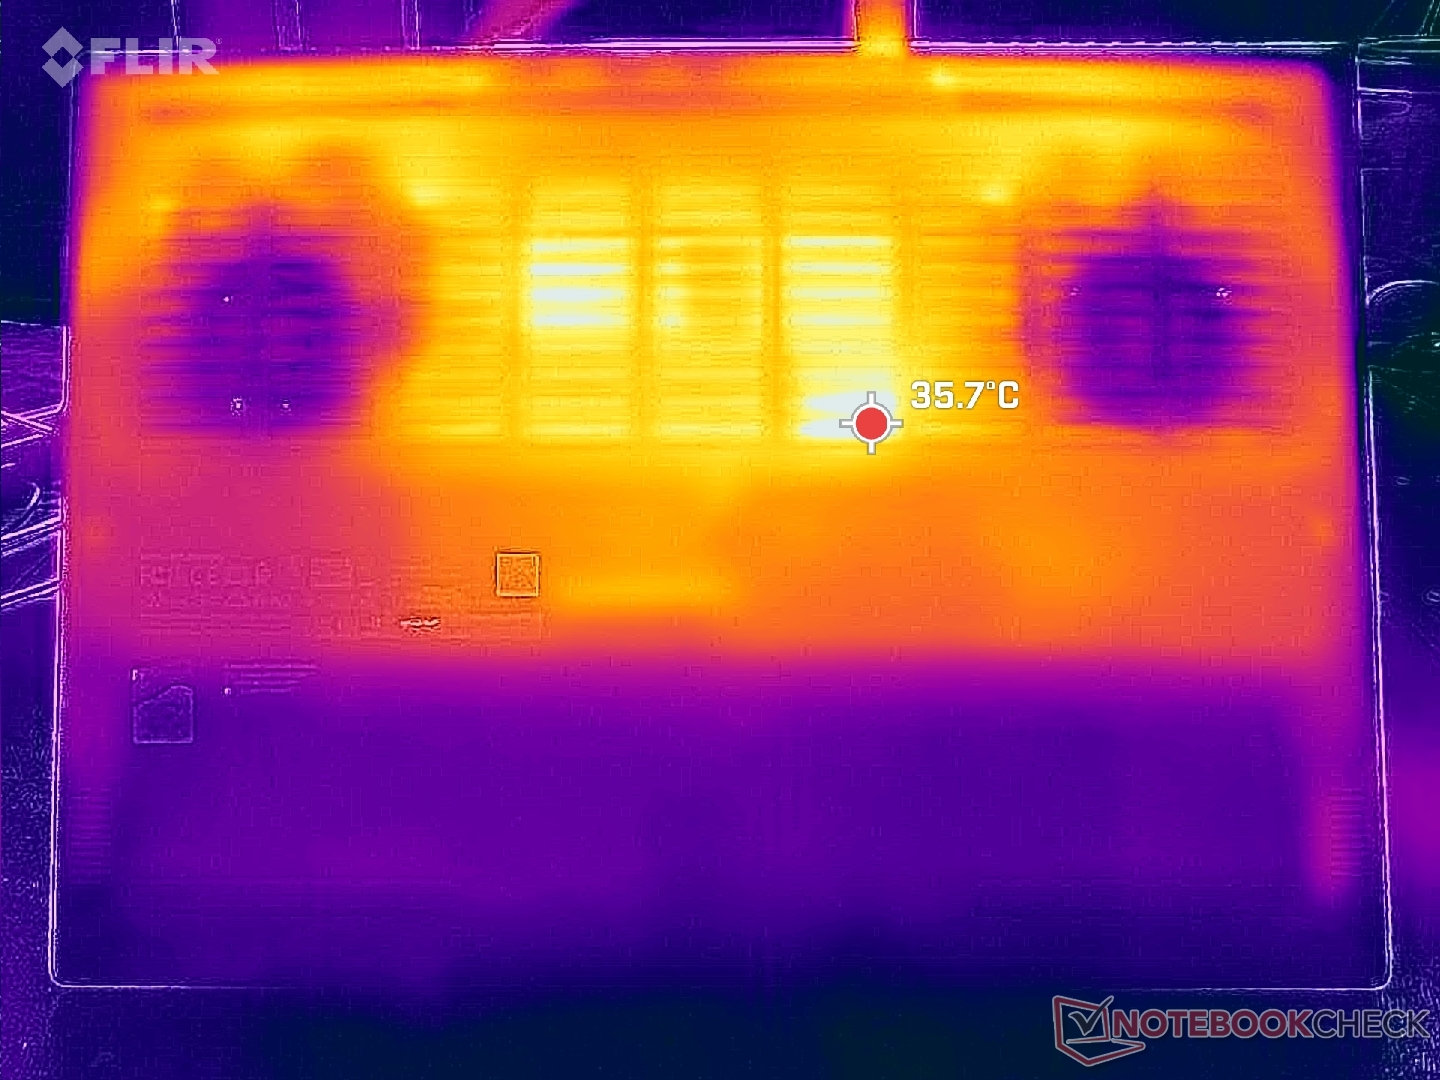
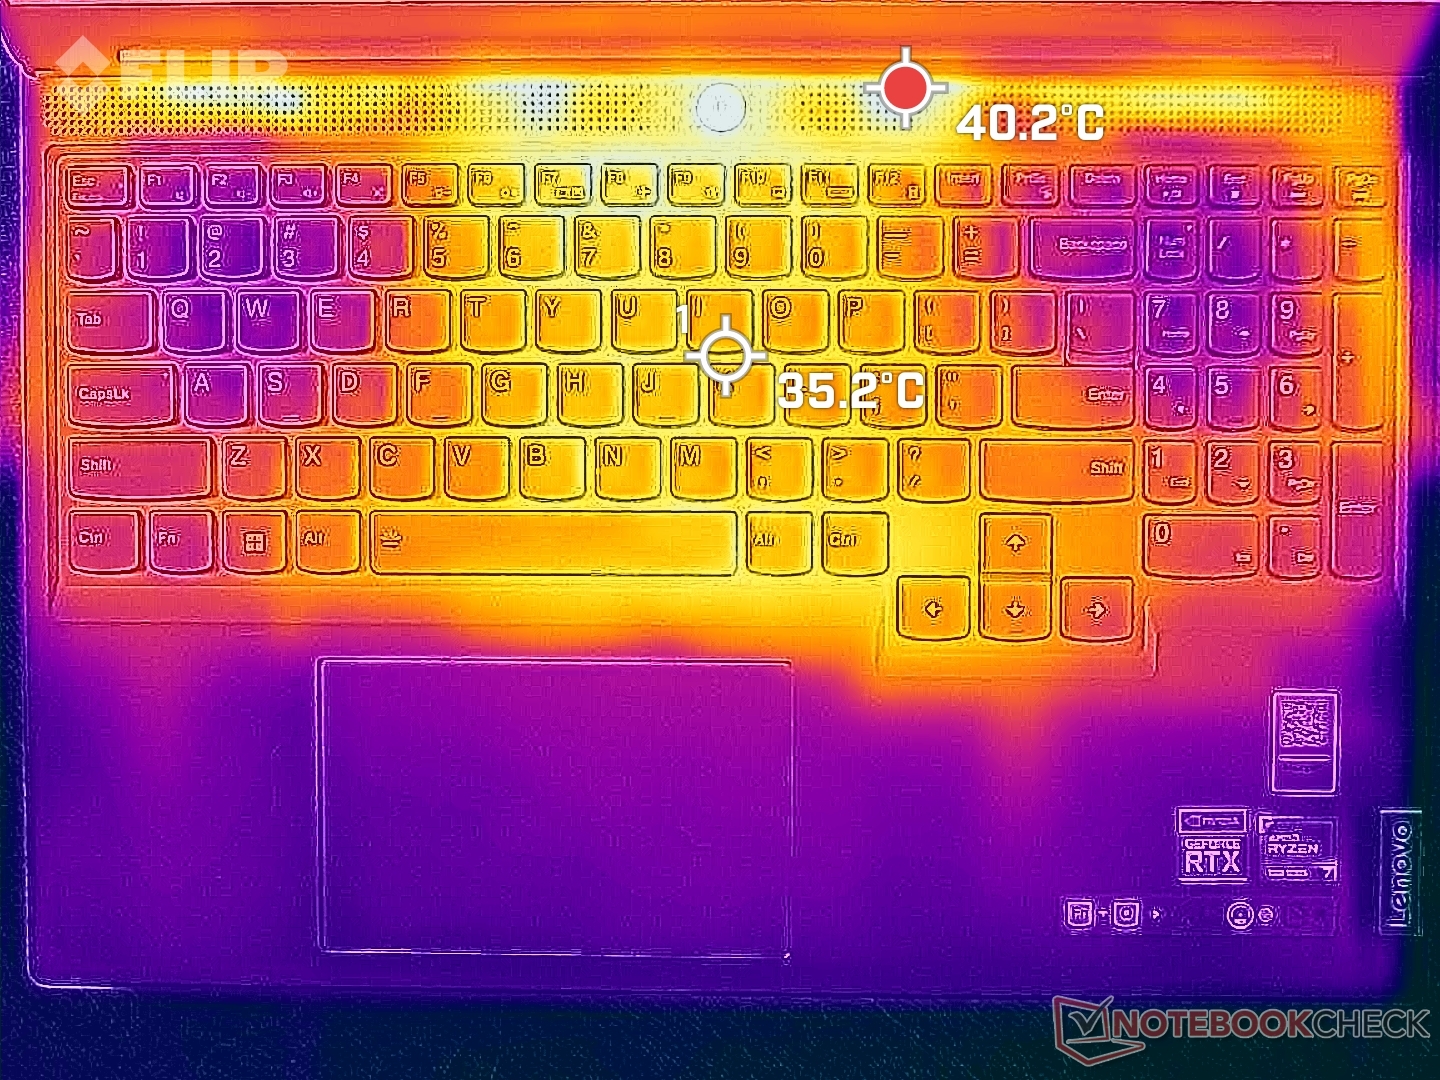
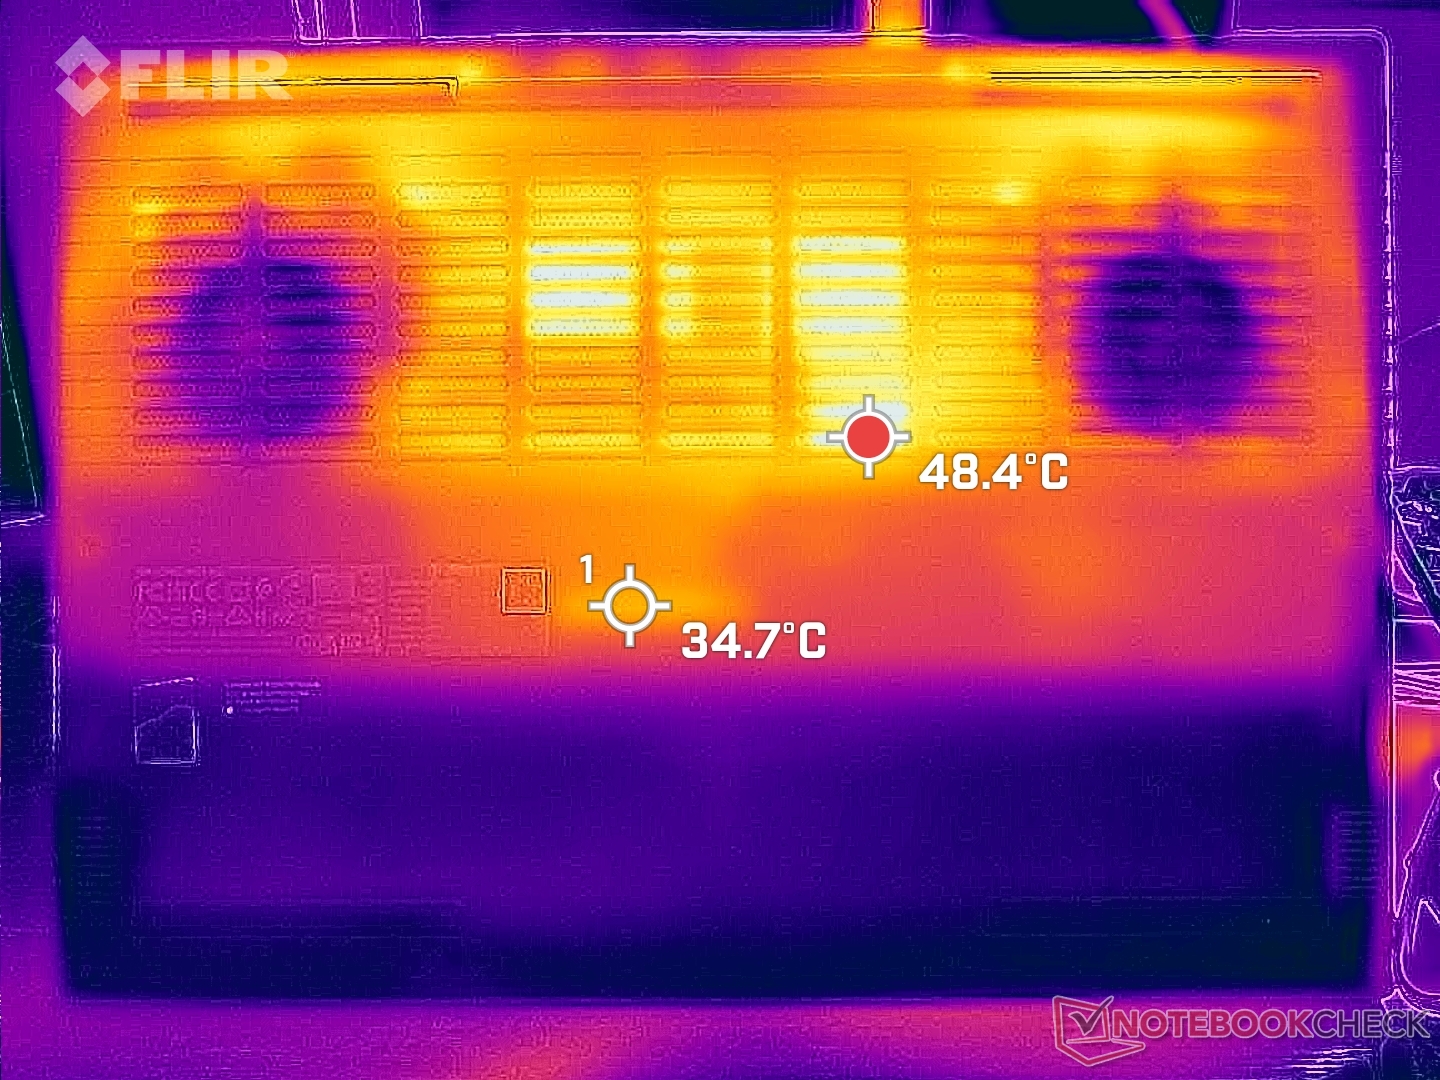
Temperature — Cooler Than Expected
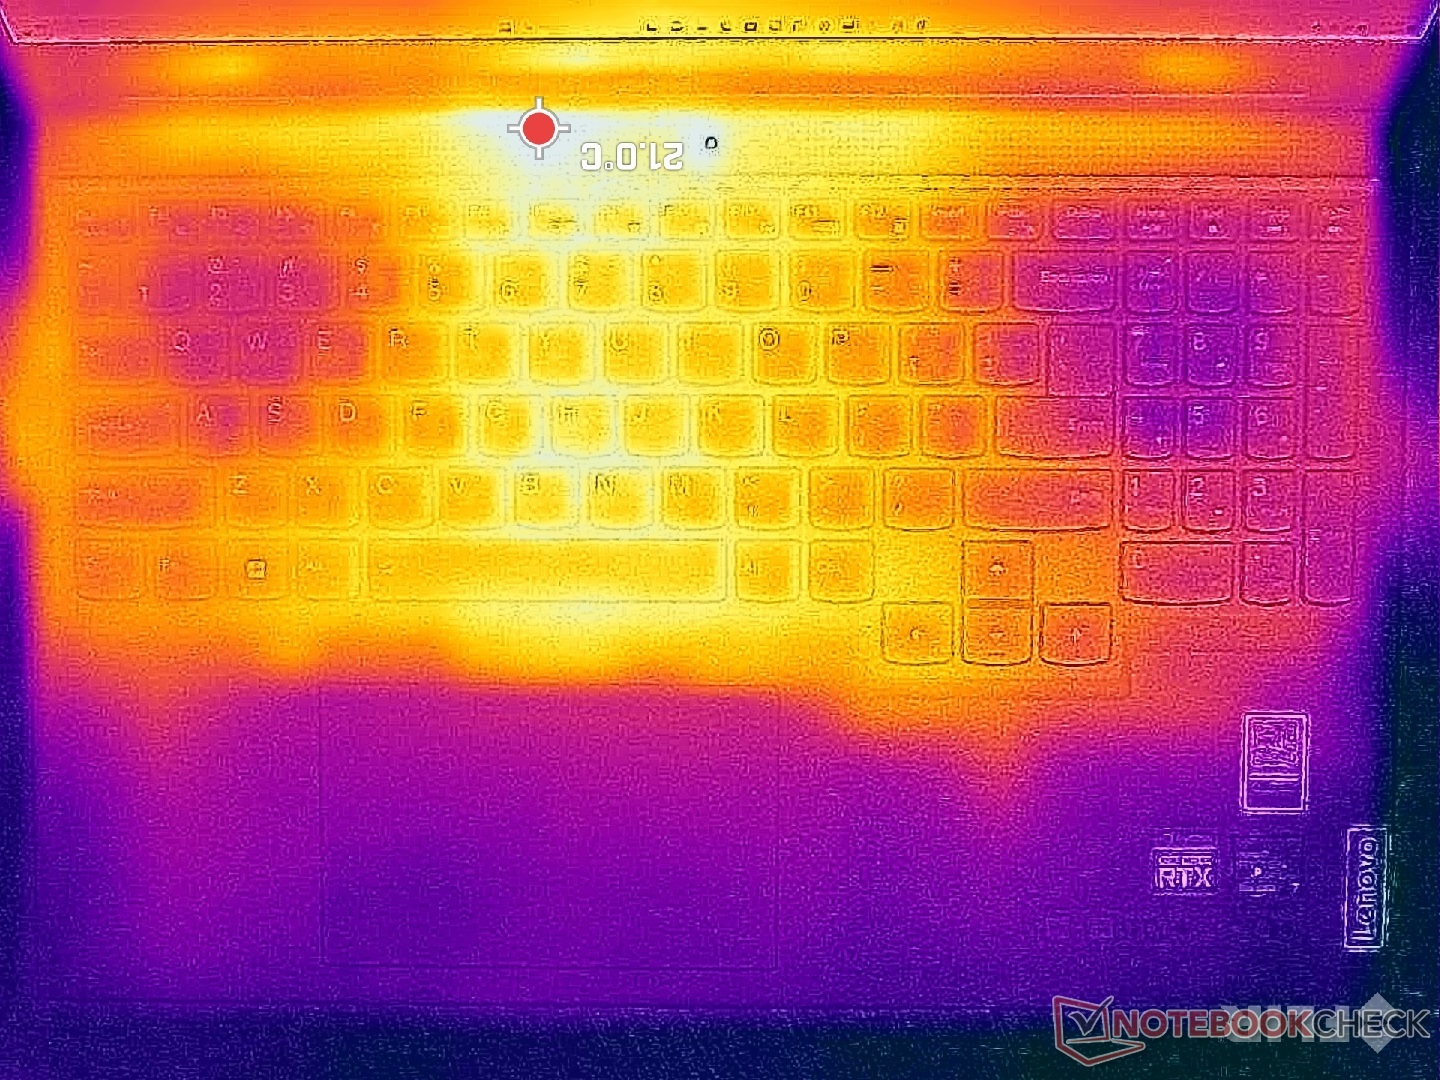
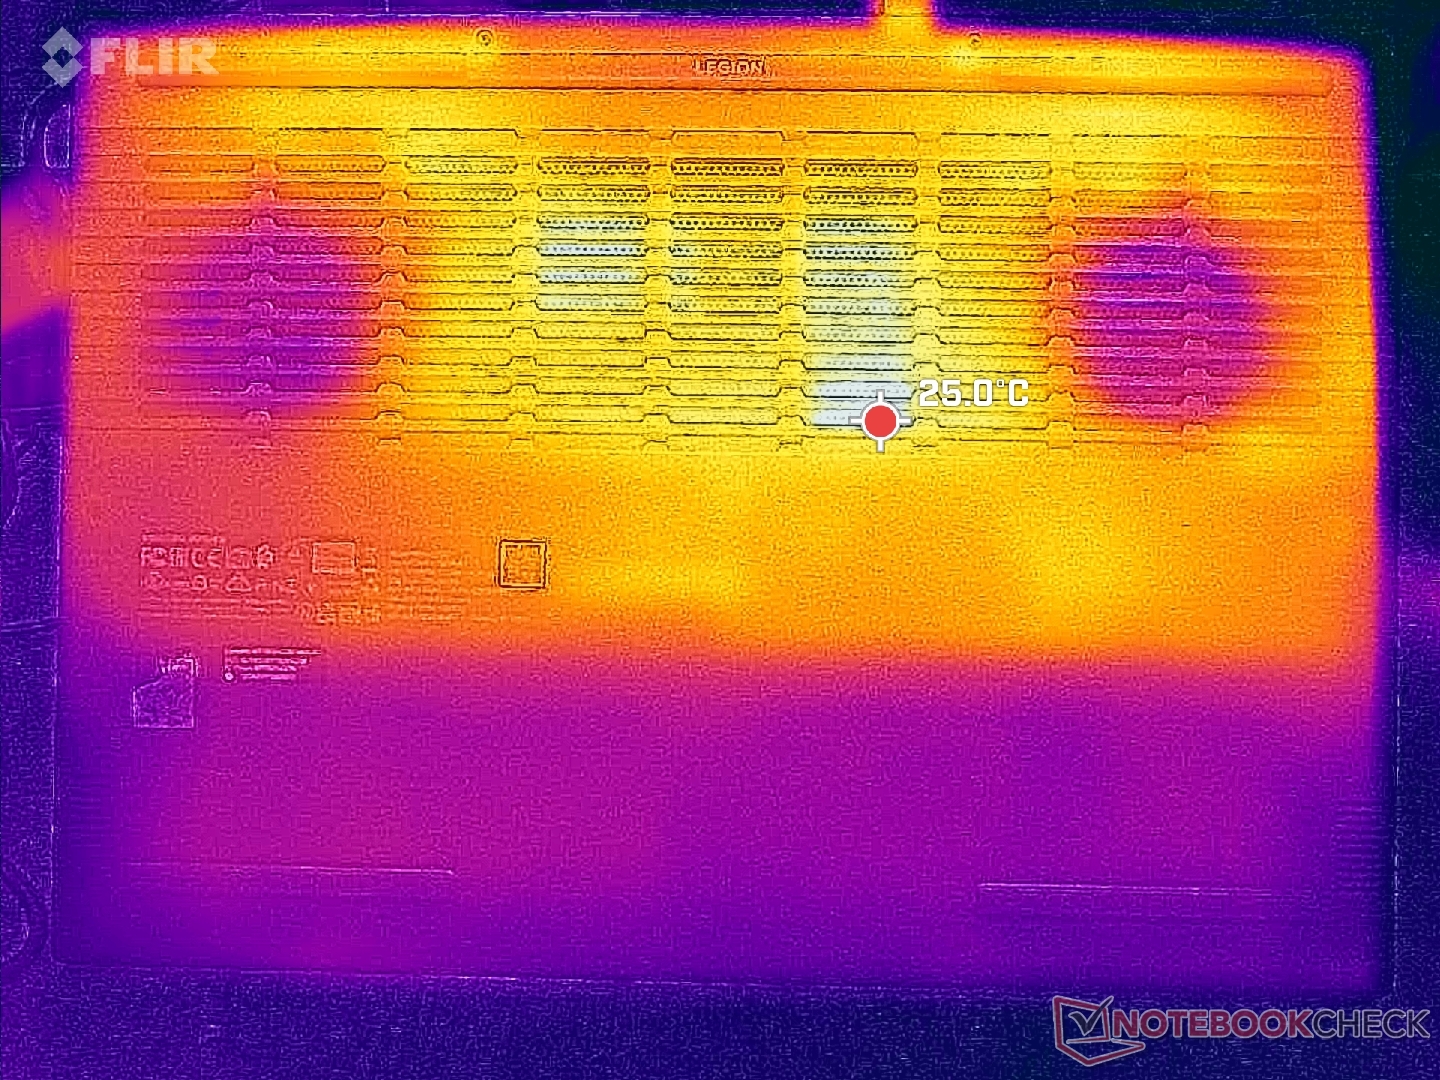
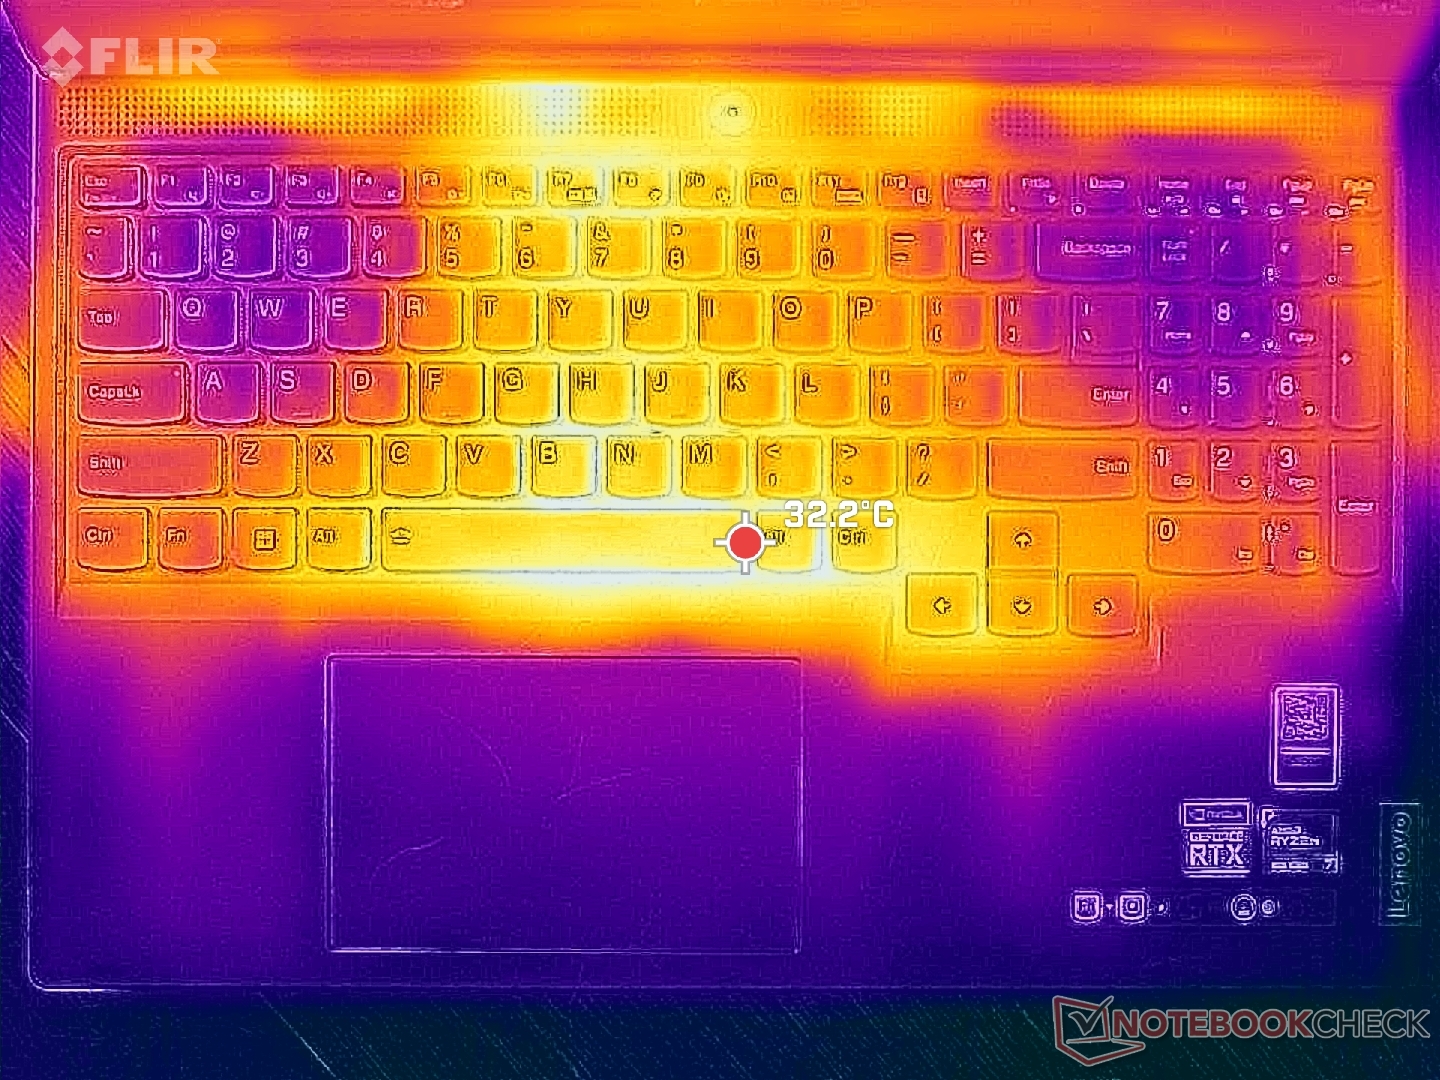
Surface temperatures are cooler than what we recorded on the Legion Pro 5 and some competitors like the Dell G16 7620. Hot spots when running demanding loads on our unit would reach up to 42 C on the top and bottom sides, respectively, compared to 54 C each on the aforementioned Legion Pro 5 and Dell systems. Surface temperatures are some of the coolest we've seen on a thin-style gaming laptop and this can be attributed to the relatively cool core temperatures when gaming as demonstrated in our Stress Test section below.
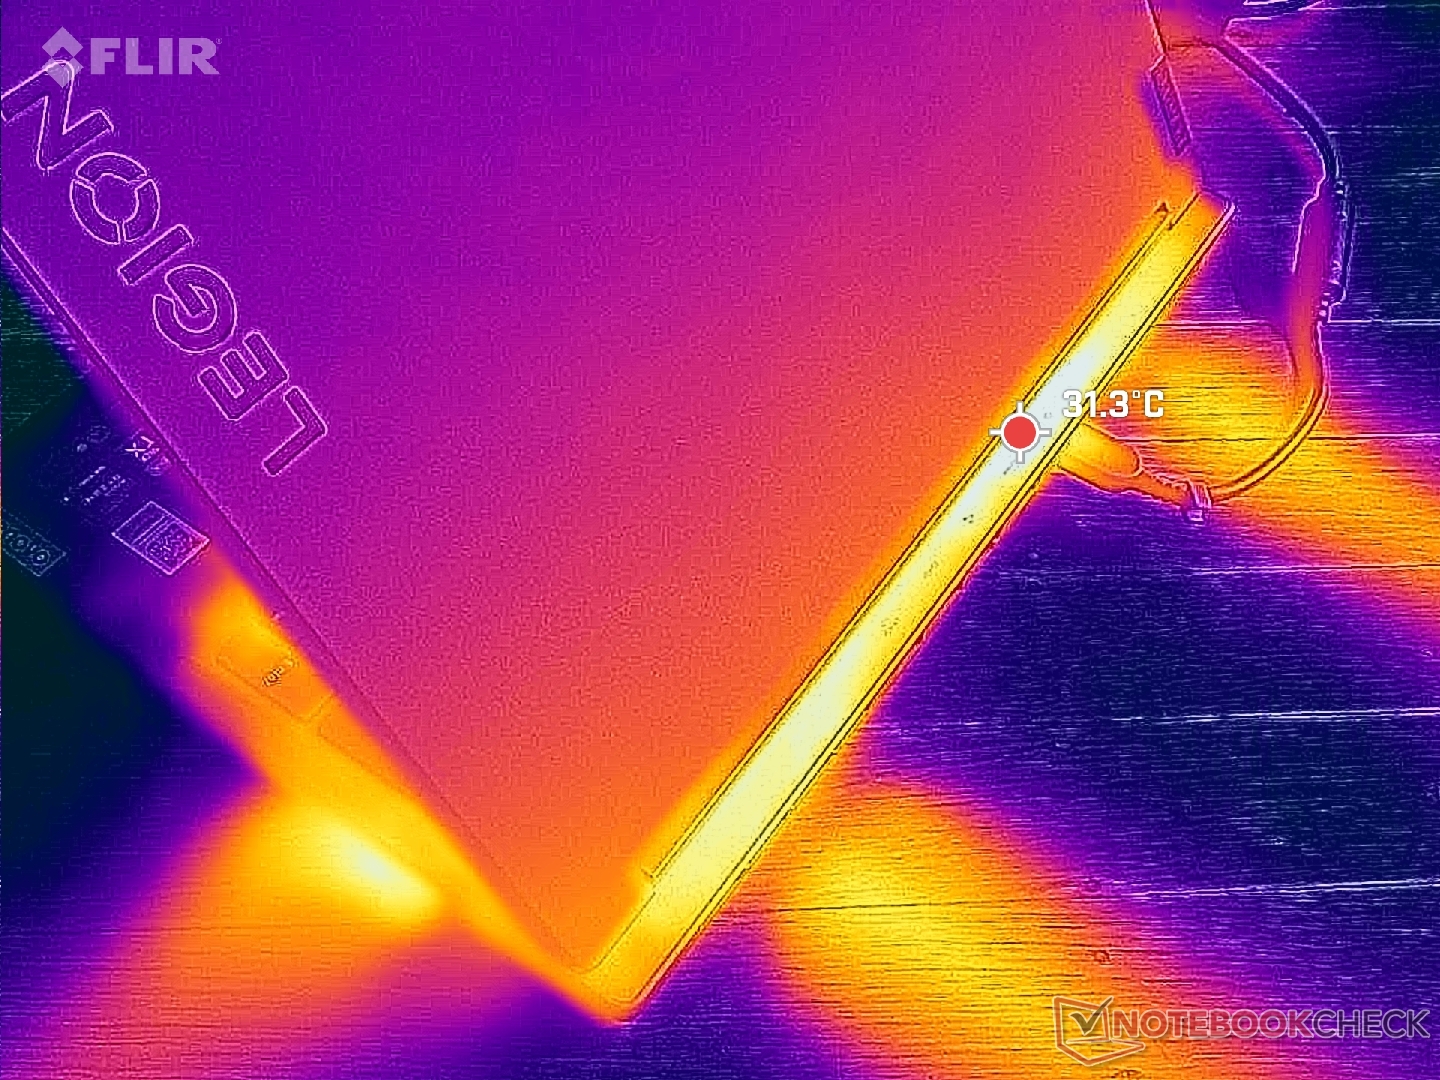
(±) The maximum temperature on the upper side is 40.6 °C / 105 F, compared to the average of 40.4 °C / 105 F, ranging from 21.2 to 68.8 °C for the class Gaming.
(±) The bottom heats up to a maximum of 42 °C / 108 F, compared to the average of 43.2 °C / 110 F
(+) In idle usage, the average temperature for the upper side is 24.6 °C / 76 F, compared to the device average of 33.9 °C / 93 F.
(+) Playing The Witcher 3, the average temperature for the upper side is 28.1 °C / 83 F, compared to the device average of 33.9 °C / 93 F.
(+) The palmrests and touchpad are cooler than skin temperature with a maximum of 27 °C / 80.6 F and are therefore cool to the touch.
(±) The average temperature of the palmrest area of similar devices was 28.8 °C / 83.8 F (+1.8 °C / 3.2 F).
| Lenovo Legion Slim 5 16APH8 AMD Ryzen 7 7840HS, NVIDIA GeForce RTX 4060 Laptop GPU | Acer Nitro 16 AN16-41-R7YE AMD Ryzen 5 7535HS, NVIDIA GeForce RTX 4050 Laptop GPU | Lenovo Legion Pro 5 16ARX8 (R5 7645HX, RTX 4050) AMD Ryzen 5 7645HX, NVIDIA GeForce RTX 4050 Laptop GPU | HP Omen 16-wf000 Intel Core i7-13700HX, NVIDIA GeForce RTX 4080 Laptop GPU | Dell G16 7620 Intel Core i7-12700H, NVIDIA GeForce RTX 3060 Laptop GPU | Asus TUF Gaming A16 FA617XS AMD Ryzen 9 7940HS, AMD Radeon RX 7600S | |
|---|---|---|---|---|---|---|
| Heat | -30% | -28% | -10% | -5% | -17% | |
| Maximum Upper Side * (°C) | 40.6 | 51 -26% | 45 -11% | 45 -11% | 47.6 -17% | 53 -31% |
| Maximum Bottom * (°C) | 42 | 63 -50% | 54 -29% | 48.8 -16% | 54 -29% | 48 -14% |
| Idle Upper Side * (°C) | 27.8 | 34 -22% | 36 -29% | 29.2 -5% | 23 17% | 30 -8% |
| Idle Bottom * (°C) | 26.6 | 32 -20% | 38 -43% | 28.8 -8% | 24.6 8% | 30 -13% |
* ... smaller is better
Stress Test
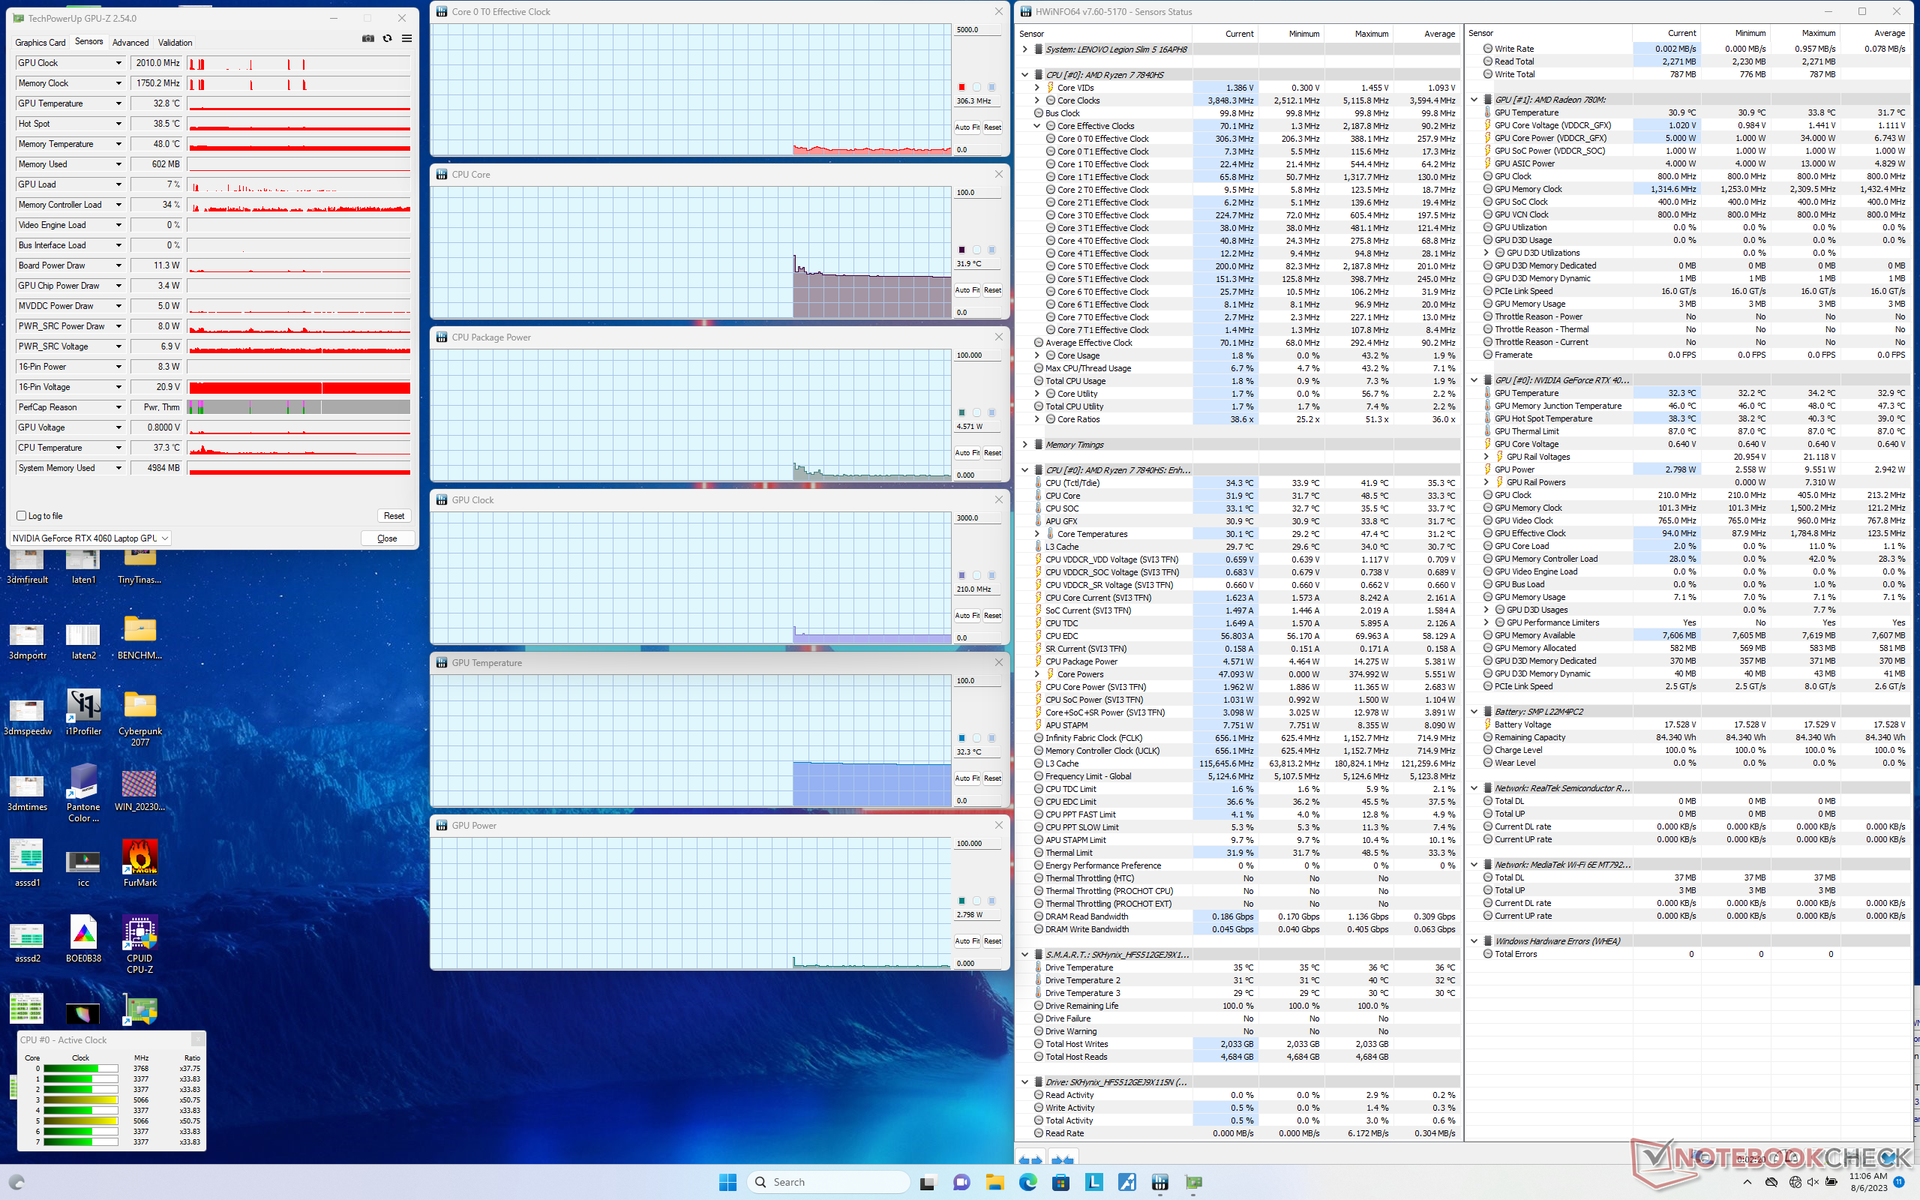
When running Prime95 to stress the CPU, clock rates and board power draw would spike to 4.8 GHz and 88 W, respectively, before quickly stabilizing at 4.3 GHz and 82 W thereafter. Core temperature would plateau at a toasty 100 C compared to 84 C on the Intel-powered Legion Pro 5. The Legion Slim 5 is definitely pushing the limits of its cooling solution more so than on most other gaming laptops.
Continuing from our findings in the GPU Performance section above, graphics performance appears to be identical between the Balanced and Performance modes. When running Witcher 3, for example, GPU power draw would peak at 60 W on each of the two modes which is significantly less than Lenovo's claim of 100 W. Rerunning our test on the more demanding Cyberpunk 2077 would show similar 60 W maximum results. This lower-than-expected power limit is likely holding back our RTX 4060 from performing more on par with other gaming laptops with the same GPU.
Core temperatures when running on Performance mode are cooler than on Balanced mode by 4 to 8 C as shown by the table below since fan noise is louder on Performance mode despite the lack of any performance differences.
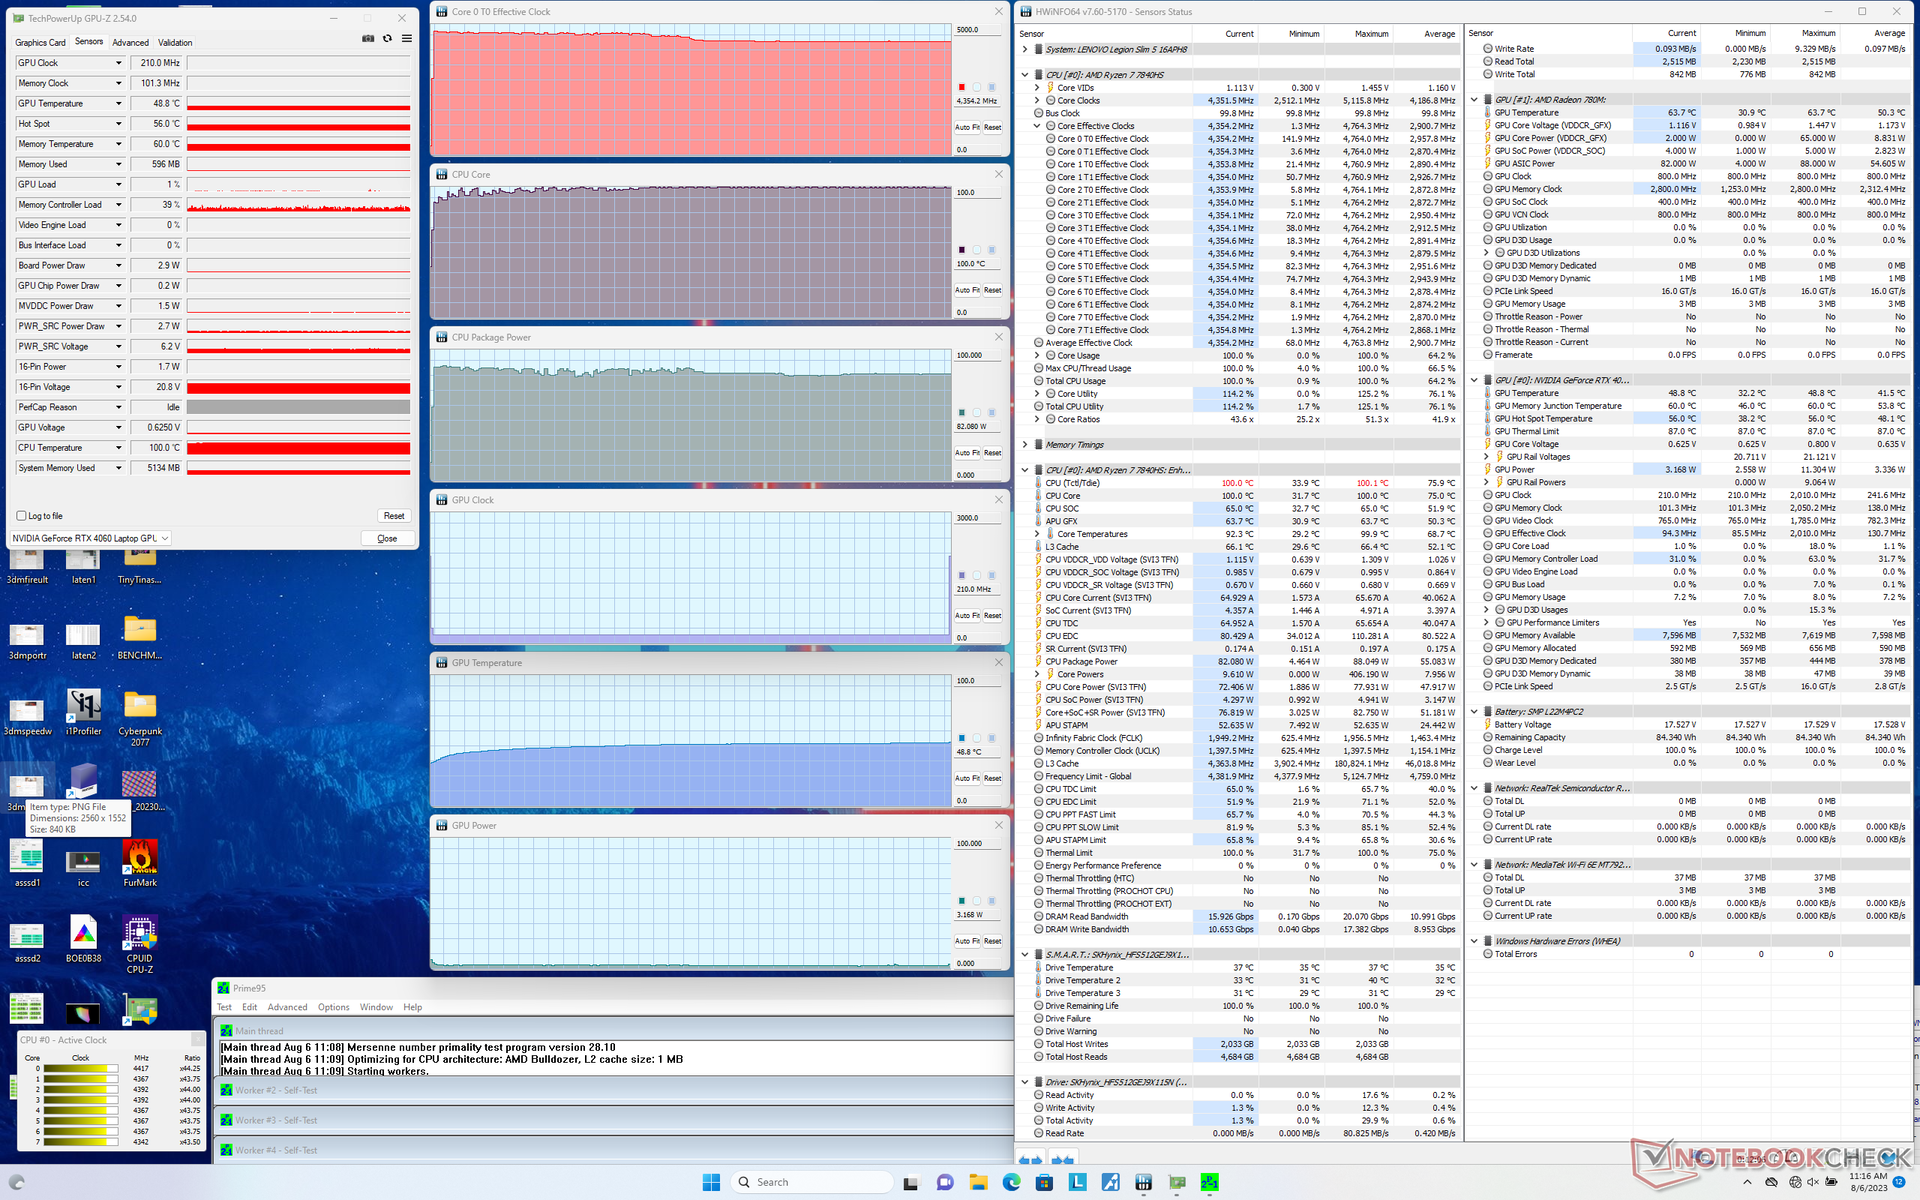

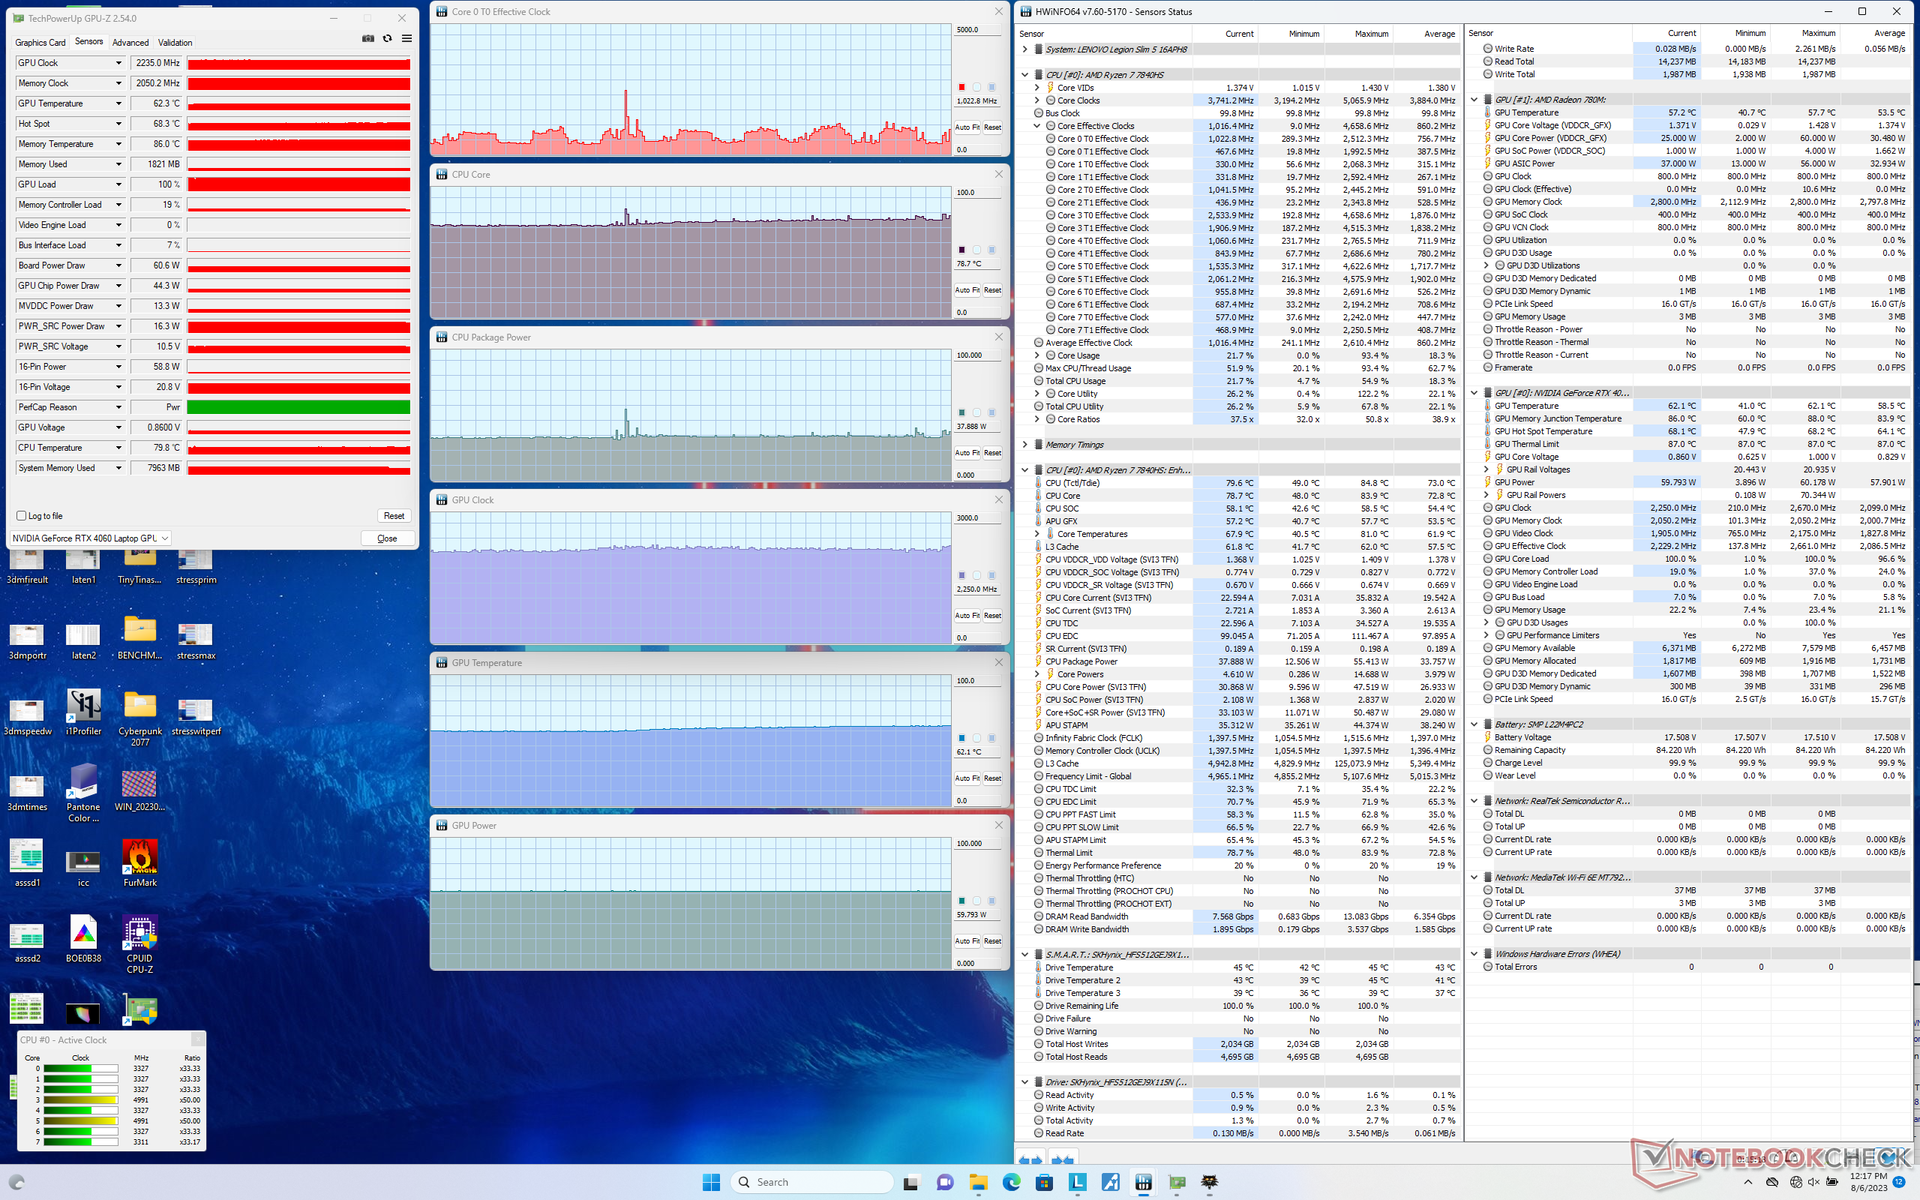

| CPU Clock (GHz) | GPU Clock (MHz) | Average CPU Temperature (°C) | Average GPU Temperature (°C) | |
| System Idle | -- | -- | 32 | 32 |
| Prime95 Stress | 4.4 | -- | 100 | 49 |
| Prime95 + FurMark Stress | 4.0 - 4.3 | ~2025 | 90 - 100 | 69 |
| Witcher 3 Stress (Balanced mode) | 0.5 - 1.1 | 2250 | 79 | 62 |
| Witcher 3 Stress (Performance mode) | 0.5 - 1.1 | 2220 | 71 | 58 |
Speakers
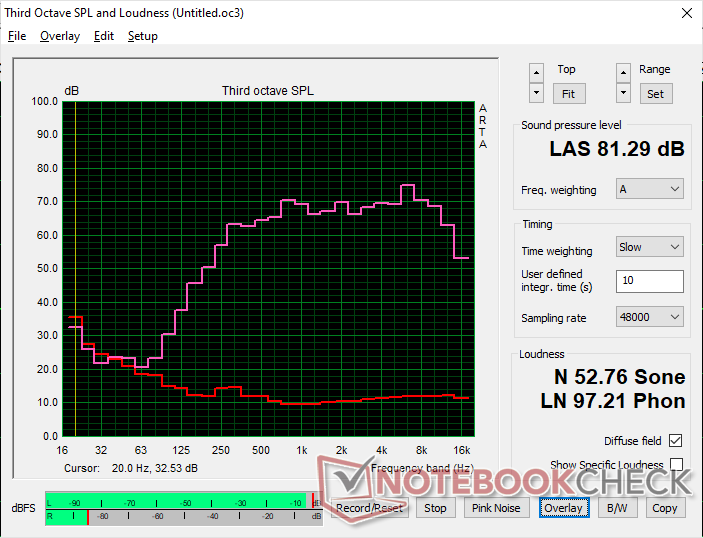
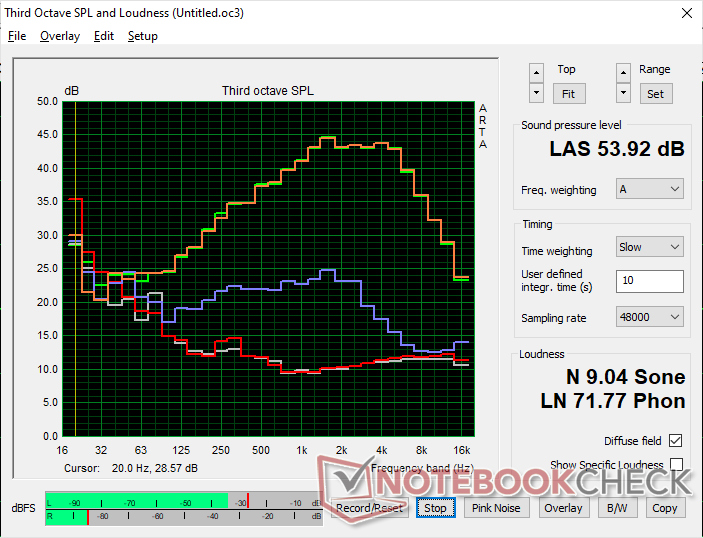
Lenovo Legion Slim 5 16APH8 audio analysis
(±) | speaker loudness is average but good (81.3 dB)
Bass 100 - 315 Hz
(-) | nearly no bass - on average 19% lower than median
(±) | linearity of bass is average (12.2% delta to prev. frequency)
Mids 400 - 2000 Hz
(+) | balanced mids - only 2.2% away from median
(+) | mids are linear (3.7% delta to prev. frequency)
Highs 2 - 16 kHz
(+) | balanced highs - only 3.3% away from median
(+) | highs are linear (5% delta to prev. frequency)
Overall 100 - 16.000 Hz
(+) | overall sound is linear (14.7% difference to median)
Compared to same class
» 28% of all tested devices in this class were better, 7% similar, 64% worse
» The best had a delta of 6%, average was 18%, worst was 132%
Compared to all devices tested
» 19% of all tested devices were better, 4% similar, 77% worse
» The best had a delta of 4%, average was 24%, worst was 134%
Apple MacBook Pro 16 2021 M1 Pro audio analysis
(+) | speakers can play relatively loud (84.7 dB)
Bass 100 - 315 Hz
(+) | good bass - only 3.8% away from median
(+) | bass is linear (5.2% delta to prev. frequency)
Mids 400 - 2000 Hz
(+) | balanced mids - only 1.3% away from median
(+) | mids are linear (2.1% delta to prev. frequency)
Highs 2 - 16 kHz
(+) | balanced highs - only 1.9% away from median
(+) | highs are linear (2.7% delta to prev. frequency)
Overall 100 - 16.000 Hz
(+) | overall sound is linear (4.6% difference to median)
Compared to same class
» 0% of all tested devices in this class were better, 0% similar, 100% worse
» The best had a delta of 5%, average was 17%, worst was 45%
Compared to all devices tested
» 0% of all tested devices were better, 0% similar, 100% worse
» The best had a delta of 4%, average was 24%, worst was 134%
Energy Management — Power Efficient
Power Consumption
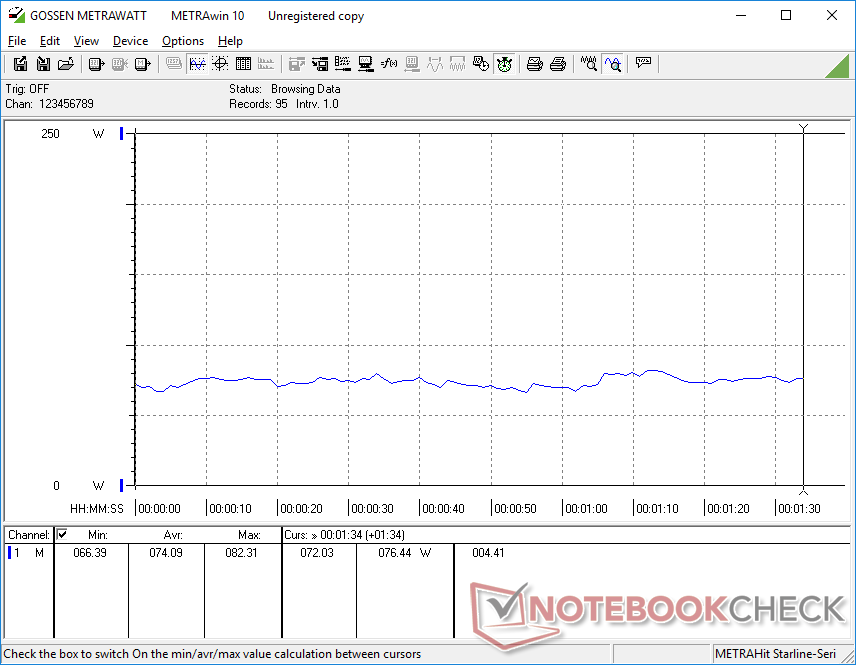
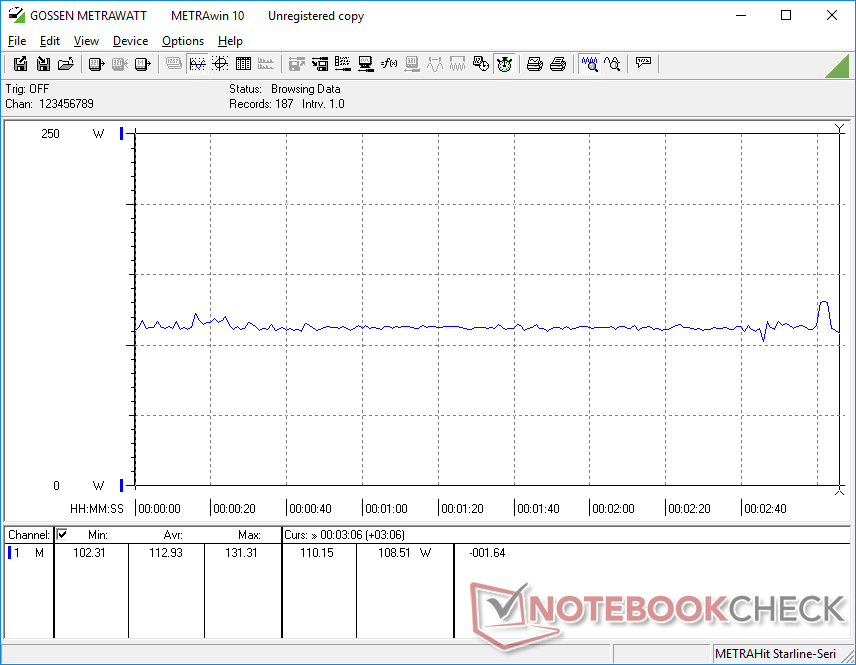
Power consumption when idling on desktop would range between 9 W and 25 W which is not unusual for gaming laptops. What is unusual, however, is the low power consumption when running games. Witcher 3, for example, would demand 113 W compared to 179 W on the Legion Pro 5 16IRX8 equipped with the same RTX 4060 GPU. Granted, the latter comes with a more power-hungry Intel HX CPU, but the power consumption delta between the two models is still unusually wide even after taking into account their processor differences. Furthermore, the Legion Pro 5 16ARX8 with the slower RTX 4050 would draw more power than our Legion Slim 5 when gaming as well (126 W vs. 116 W).
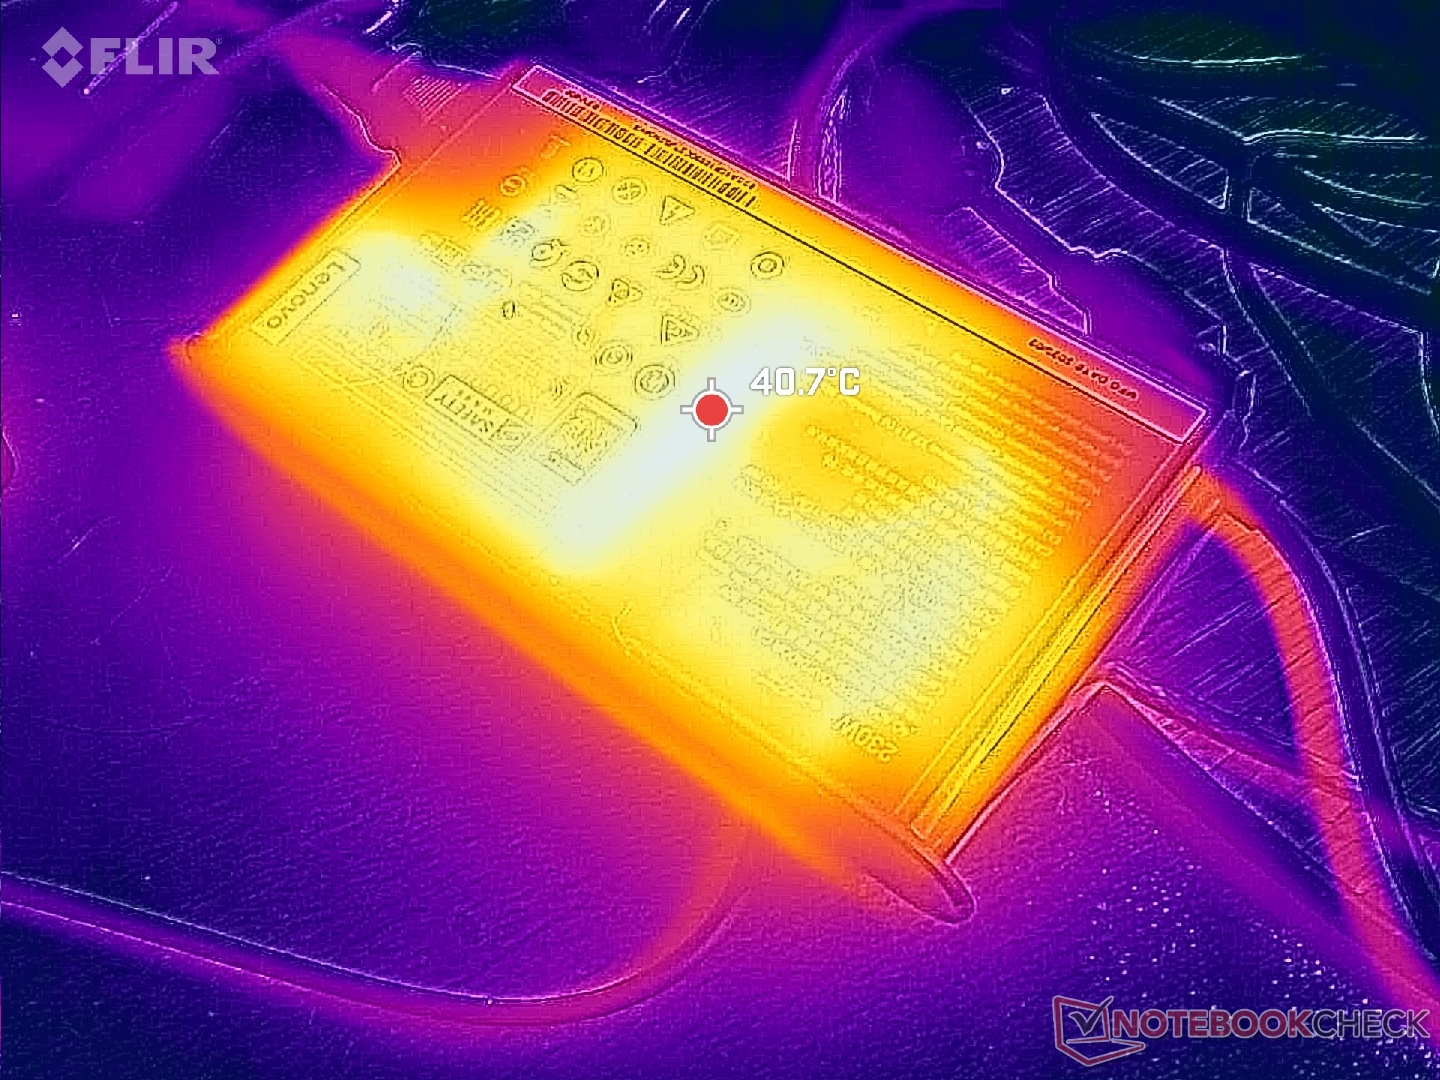
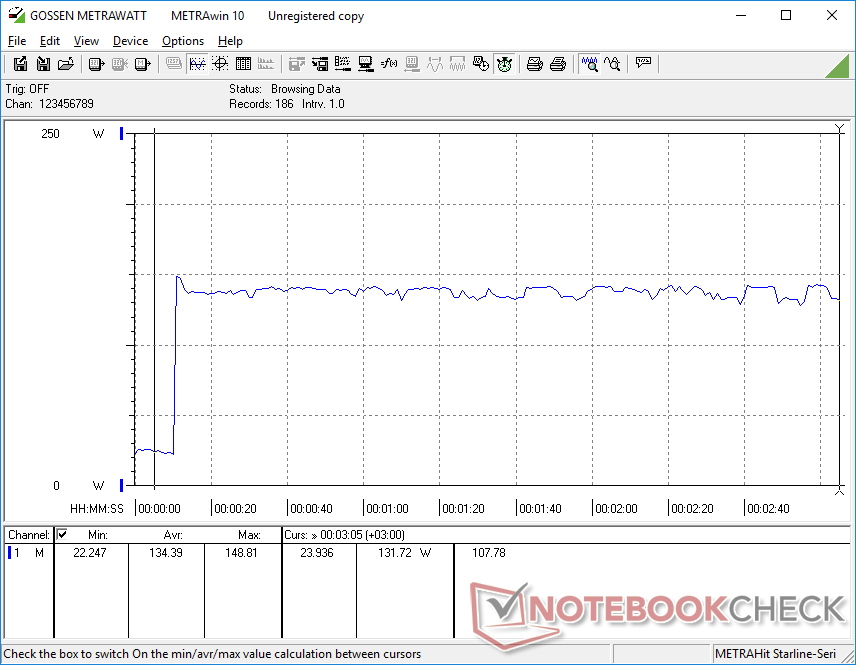
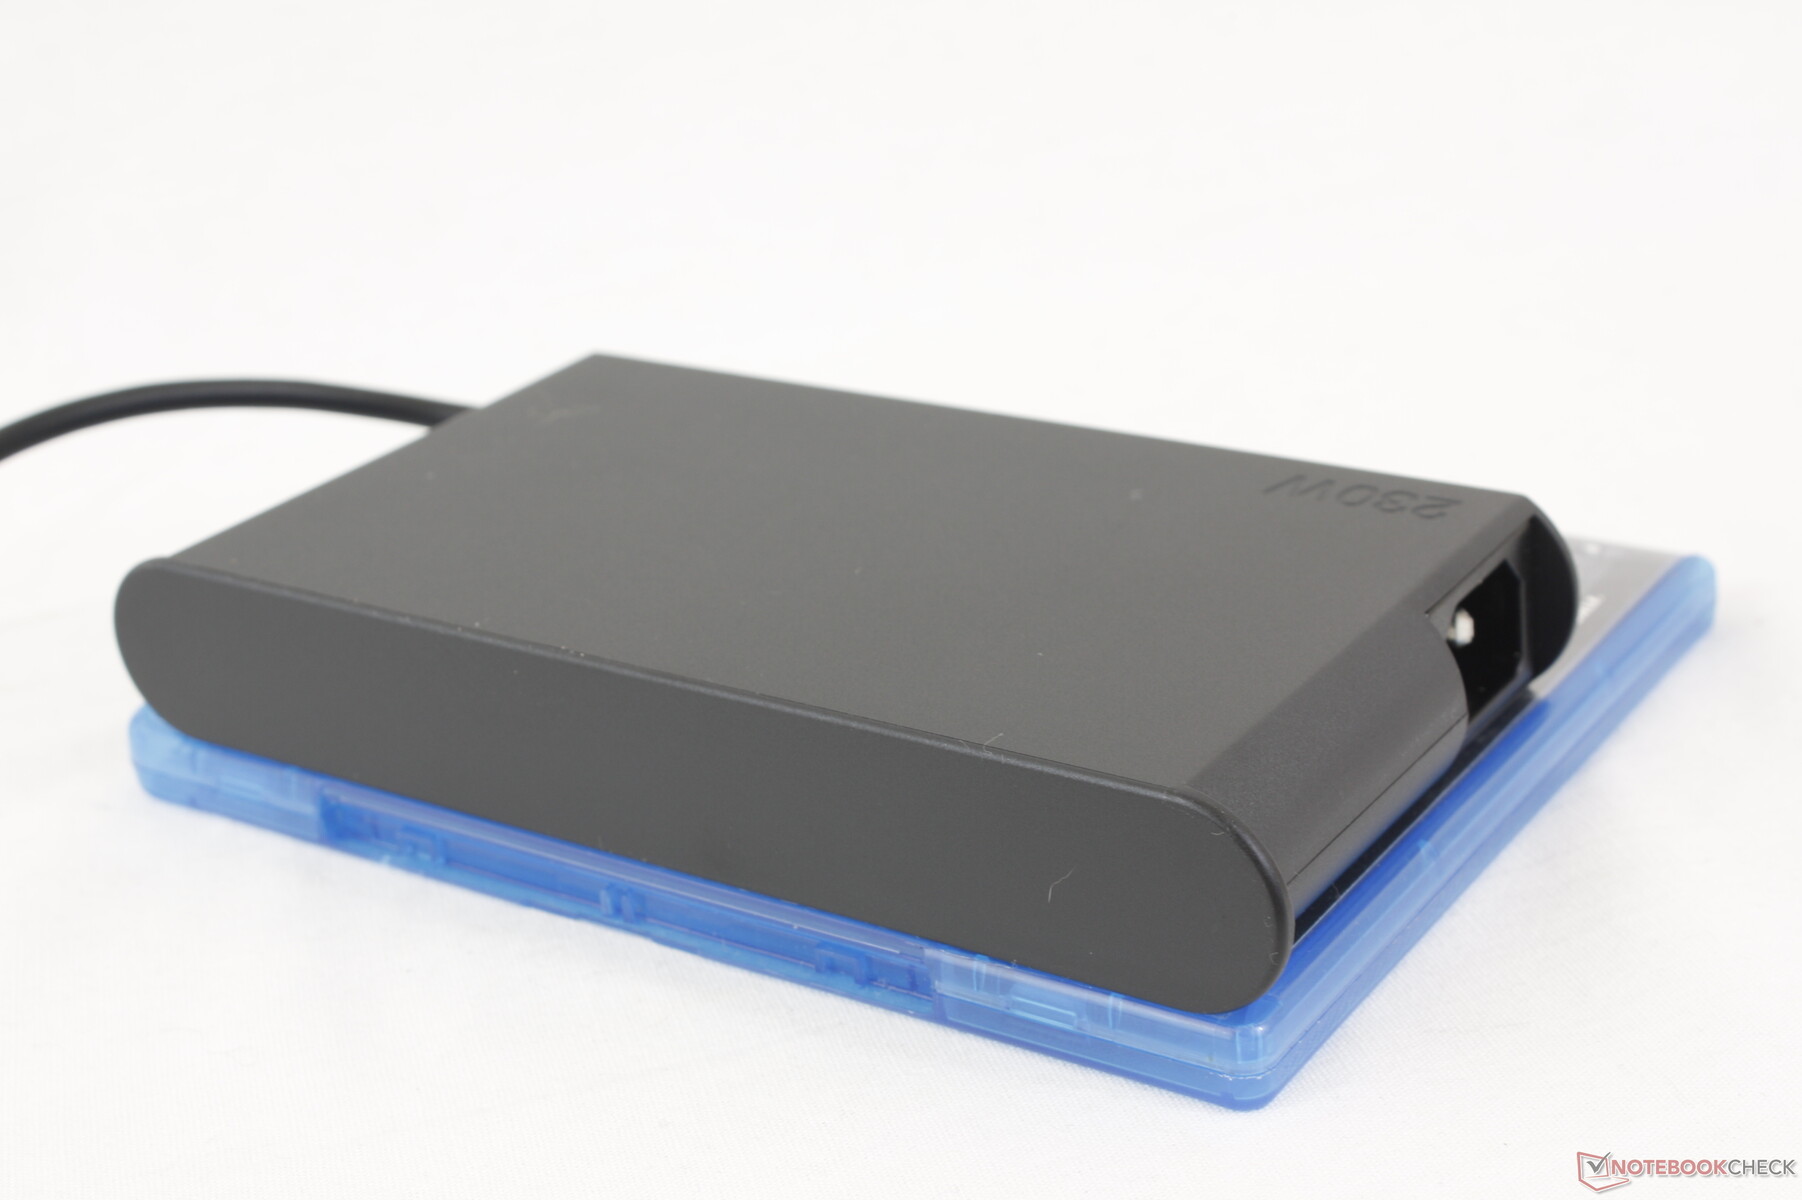
We're able to measure a maximum consumption of 207 W from the medium-sized (~16.8 x 8.6 x 2.5 cm) 230 W AC adapter when the CPU and GPU are each at 100 percent utilization. Consumption would then drop over time before stabilizing at around 180 W.

| Off / Standby | |
| Idle | |
| Load |
|
Key:
min: | |
| Lenovo Legion Slim 5 16APH8 R7 7840HS, GeForce RTX 4060 Laptop GPU, SK hynix PC801 HFS512GEJ9X115N, IPS, 2560x1600, 16" | Acer Nitro 16 AN16-41-R7YE R5 7535HS, GeForce RTX 4050 Laptop GPU, SK hynix HFS512GEJ9X125N, IPS, 1920x1200, 16" | Lenovo Legion Pro 5 16ARX8 (R5 7645HX, RTX 4050) R5 7645HX, GeForce RTX 4050 Laptop GPU, SK hynix PC801 HFS512GEJ9X115N, IPS, 2560x1600, 16" | Dell G16 7620 i7-12700H, GeForce RTX 3060 Laptop GPU, WDC PC SN810 512GB, IPS, 2560x1600, 16" | Asus TUF Gaming A16 FA617XS R9 7940HS, Radeon RX 7600S, Micron 2400 MTFDKBA512QFM, IPS, 1920x1200, 16" | Lenovo Legion Pro 5 16IRX8 i7-13700HX, GeForce RTX 4060 Laptop GPU, SK hynix PC801 HFS512GEJ9X115N, IPS, 2560x1600, 16" | |
|---|---|---|---|---|---|---|
| Power Consumption | -22% | -13% | -35% | 10% | -67% | |
| Idle Minimum * (Watt) | 9.4 | 19 -102% | 13 -38% | 14.4 -53% | 7 26% | 24.5 -161% |
| Idle Average * (Watt) | 15.5 | 20 -29% | 17.4 -12% | 17.8 -15% | 10 35% | 29.2 -88% |
| Idle Maximum * (Watt) | 24.4 | 23 6% | 21.8 11% | 31.5 -29% | 15 39% | 34.3 -41% |
| Load Average * (Watt) | 74.1 | 80 -8% | 96.4 -30% | 101.2 -37% | 86 -16% | 98.7 -33% |
| Witcher 3 ultra * (Watt) | 112.9 | 125.8 -11% | 125 -11% | 176.9 -57% | 160.6 -42% | 178.6 -58% |
| Load Maximum * (Watt) | 206.5 | 184 11% | 204 1% | 242.9 -18% | 172 17% | 249.6 -21% |
* ... smaller is better
Power Consumption Witcher 3 / Stresstest
Power Consumption external Monitor
Battery Life
Battery life is respectable at just over seven hours of real-world WLAN use which is at least one to two hours longer than on the competing Omen 16 or Dell G16 7620. Battery capacity is identical to the Legion Pro 5 despite their size differences.
Charging from empty to full capacity with the included AC adapter is very fast at about 45 minutes compared to 90 minutes on most other laptops. Lenovo Rapid Charge is enabled by default. The system can also be recharged via USB-C, but most USB-C adapters are not compatible; of the handful we tested, only the "official" 140 W USB-C adapter from Lenovo could charge our laptop.
| Lenovo Legion Slim 5 16APH8 R7 7840HS, GeForce RTX 4060 Laptop GPU, 80 Wh | Acer Nitro 16 AN16-41-R7YE R5 7535HS, GeForce RTX 4050 Laptop GPU, 90 Wh | Lenovo Legion Pro 5 16ARX8 (R5 7645HX, RTX 4050) R5 7645HX, GeForce RTX 4050 Laptop GPU, 80 Wh | HP Omen 16-wf000 i7-13700HX, GeForce RTX 4080 Laptop GPU, 83 Wh | Dell G16 7620 i7-12700H, GeForce RTX 3060 Laptop GPU, 84 Wh | Asus TUF Gaming A16 FA617XS R9 7940HS, Radeon RX 7600S, 90 Wh | |
|---|---|---|---|---|---|---|
| Battery runtime | 47% | -21% | -30% | -37% | 41% | |
| Reader / Idle (h) | 11.7 | 12 3% | 5.5 -53% | 7.1 -39% | 20.3 74% | |
| WiFi v1.3 (h) | 7.1 | 11 55% | 5.6 -21% | 5.1 -28% | 5 -30% | 12.4 75% |
| Load (h) | 1.2 | 2.2 83% | 1.1 -8% | 0.7 -42% | 0.9 -25% | |
| H.264 (h) | 10.8 | 5.4 | 12.4 | |||
| Witcher 3 ultra (h) | 0.8 |
Pros
Cons
Verdict — Underperforming GPU With An Otherwise Great Display And Attractive Design
Visually, the Legion Slim 5 is an improvement over the Legion Pro 5 and it's one of the better-looking gaming laptops in the affordable $1000 to $1200 price range. Display quality is also admirable on our 1600p configuration with its excellent calibration, fast response times, fast refresh rates, and full sRGB colors to be fit for most gamers and content editors.
In terms of performance, however, there is potentially a bug on the model preventing it from performing faster on Performance mode versus Balanced mode. The 60 W GPU power ceiling would remain constant between the two power profiles and so the only noticeable differences between the two modes appear to be fan noise and temperature. Such a behavior is counter to what we've observed on other Legion models. We've notified Lenovo of our findings and the page will be updated should anything change.
The Legion Slim 5 16 looks great and its 1600p display is excellent for the price. Its GeForce RTX 4060 option, however, is slower than on most other laptops with the same GPU.
Because of the issue above, we recommend considering the Legion Pro 5 16 G8 for now especially since it can outperform the Legion Slim 5 by 15 to 25 percent even when configured with the same GeForce RTX 4060 GPU. Alternatively, users can still consider the Legion Slim 5 RTX 4050 configuration with the 1600p display since the RTX 4060 option is currently underperforming.
Price and Availability
Lenovo is now shipping its Legion Slim 5 series starting at $1020 USD for the base Ryzen 5/RTX 4050/1200p configuration up to $1220 for the Ryzen 7/RTX 4060/1600p configuration as reviewed.
Lenovo Legion Slim 5 16APH8
- 08/11/2023 v7 (old)
Allen Ngo
