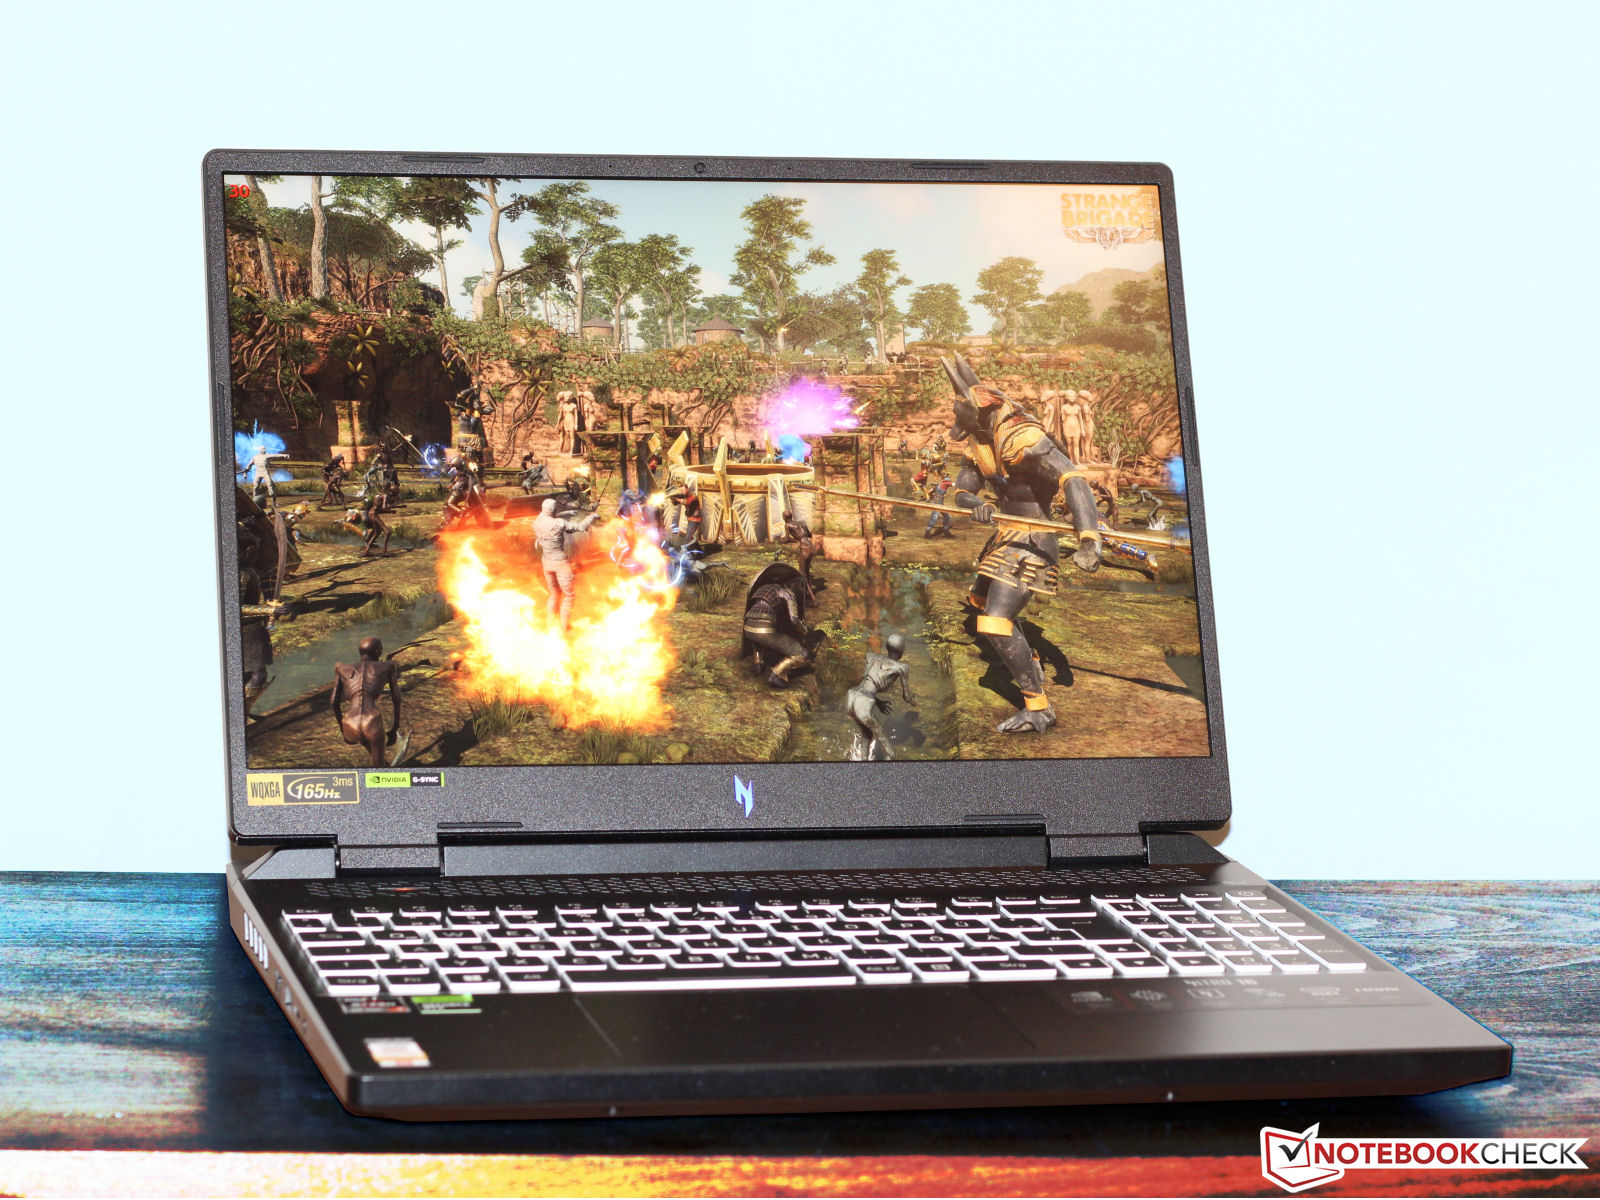
Acer Nitro 16 AN16-41 review: An RTX 4070 gaming laptop with good battery life
The Acer Nitro 16 - a mid-range gaming laptop - is based on a combination of AMD and Nvidia: The machine is powered by Rembrandt and Ada Lovelace. Acer's asking price is around $2000 for the complete package. Competing devices are the Lenovo Legion Pro 5 16ARX8, the Medion Erazer Major X20, the Aorus 15X ASF, the Asus TUF Gaming A16 FA617XS.
Possible competitors compared
Rating | Date | Model | Weight | Height | Size | Resolution | Price |
|---|---|---|---|---|---|---|---|
| 88.1 % v7 (old) | 06 / 2023 | Acer Nitro 16 AN16-41 R7 7735HS, GeForce RTX 4070 Laptop GPU | 2.7 kg | 27.9 mm | 16.00" | 2560x1600 | |
| 86.9 % v7 (old) | 06 / 2023 | Asus TUF Gaming A16 FA617XS R9 7940HS, Radeon RX 7600S | 2.2 kg | 22.1 mm | 16.00" | 1920x1200 | |
| 88.4 % v7 (old) | 05 / 2023 | Lenovo Legion Pro 5 16ARX8 R7 7745HX, GeForce RTX 4070 Laptop GPU | 2.5 kg | 26.8 mm | 16.00" | 2560x1600 | |
| 89 % v7 (old) | 04 / 2023 | Medion Erazer Major X20 i9-13900HX, GeForce RTX 4070 Laptop GPU | 2.4 kg | 29 mm | 16.00" | 2560x1600 | |
| 86.2 % v7 (old) | 04 / 2023 | Aorus 15X ASF i7-13700HX, GeForce RTX 4070 Laptop GPU | 2.3 kg | 19.7 mm | 15.60" | 2560x1440 |
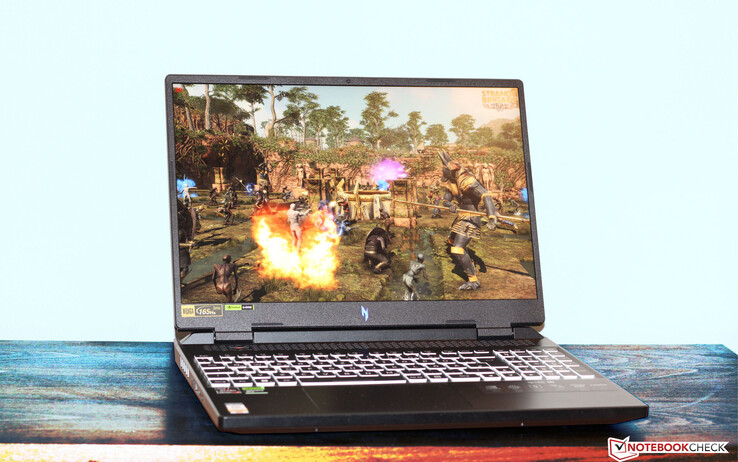
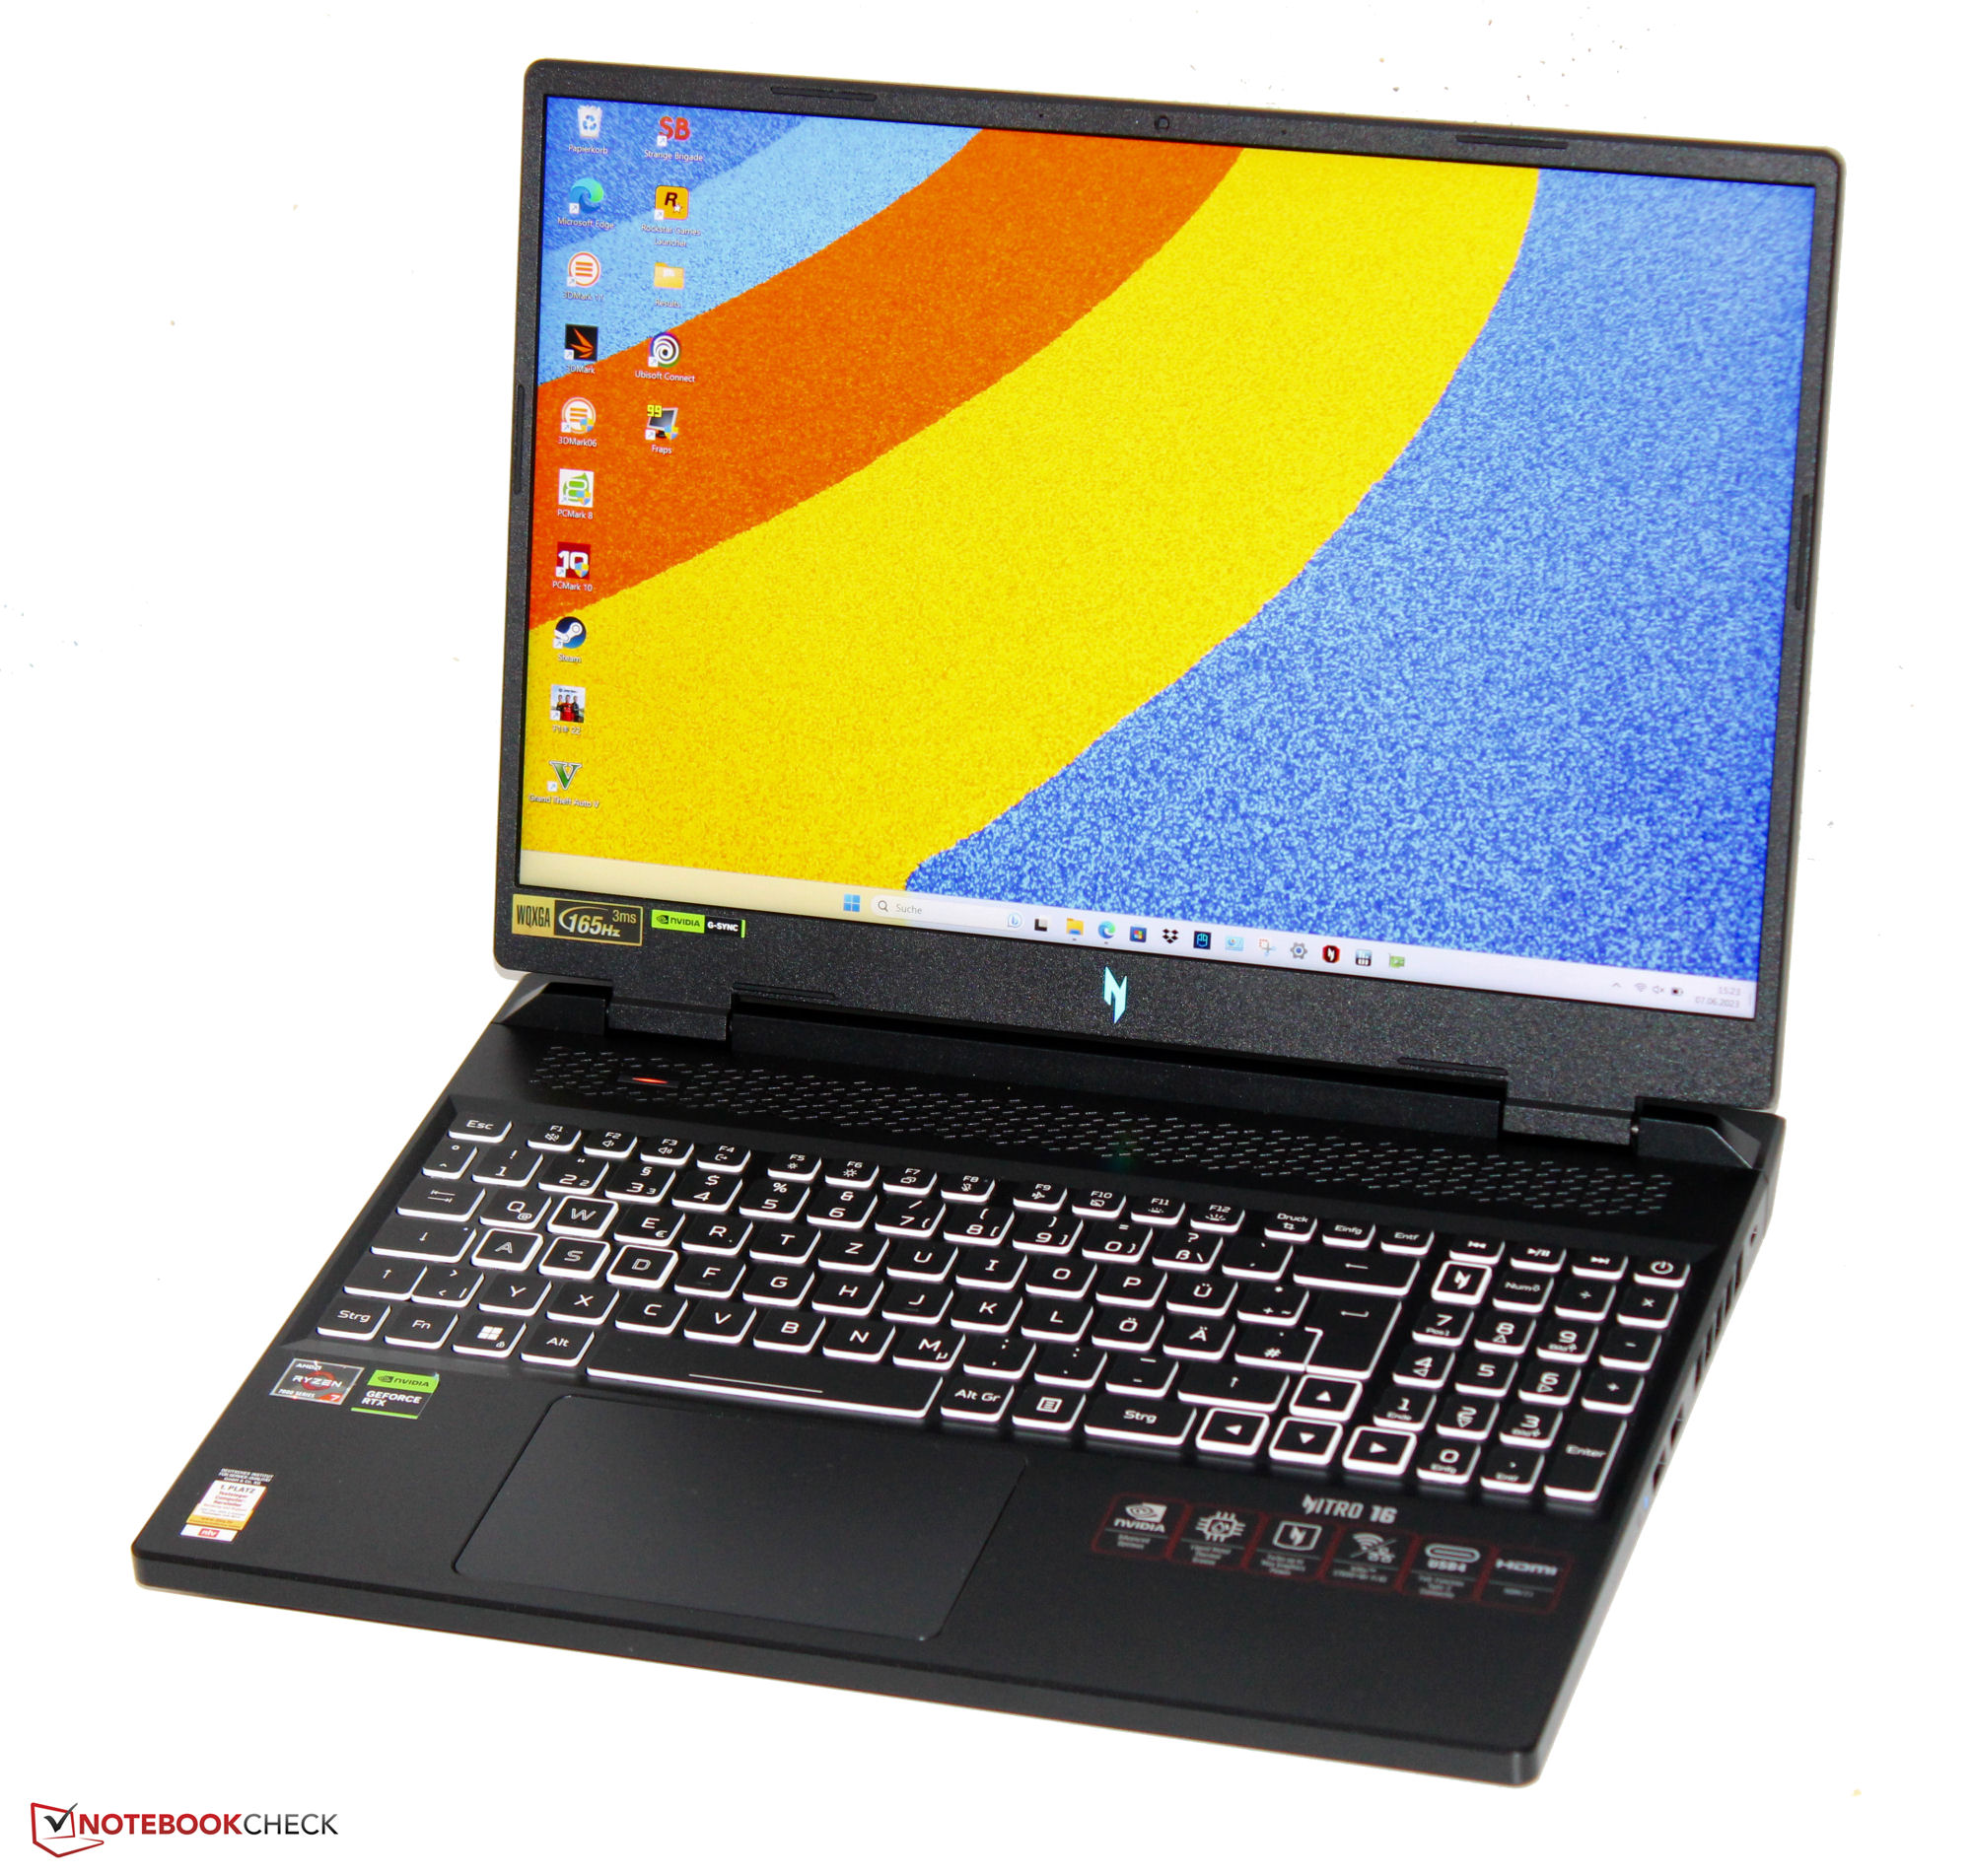
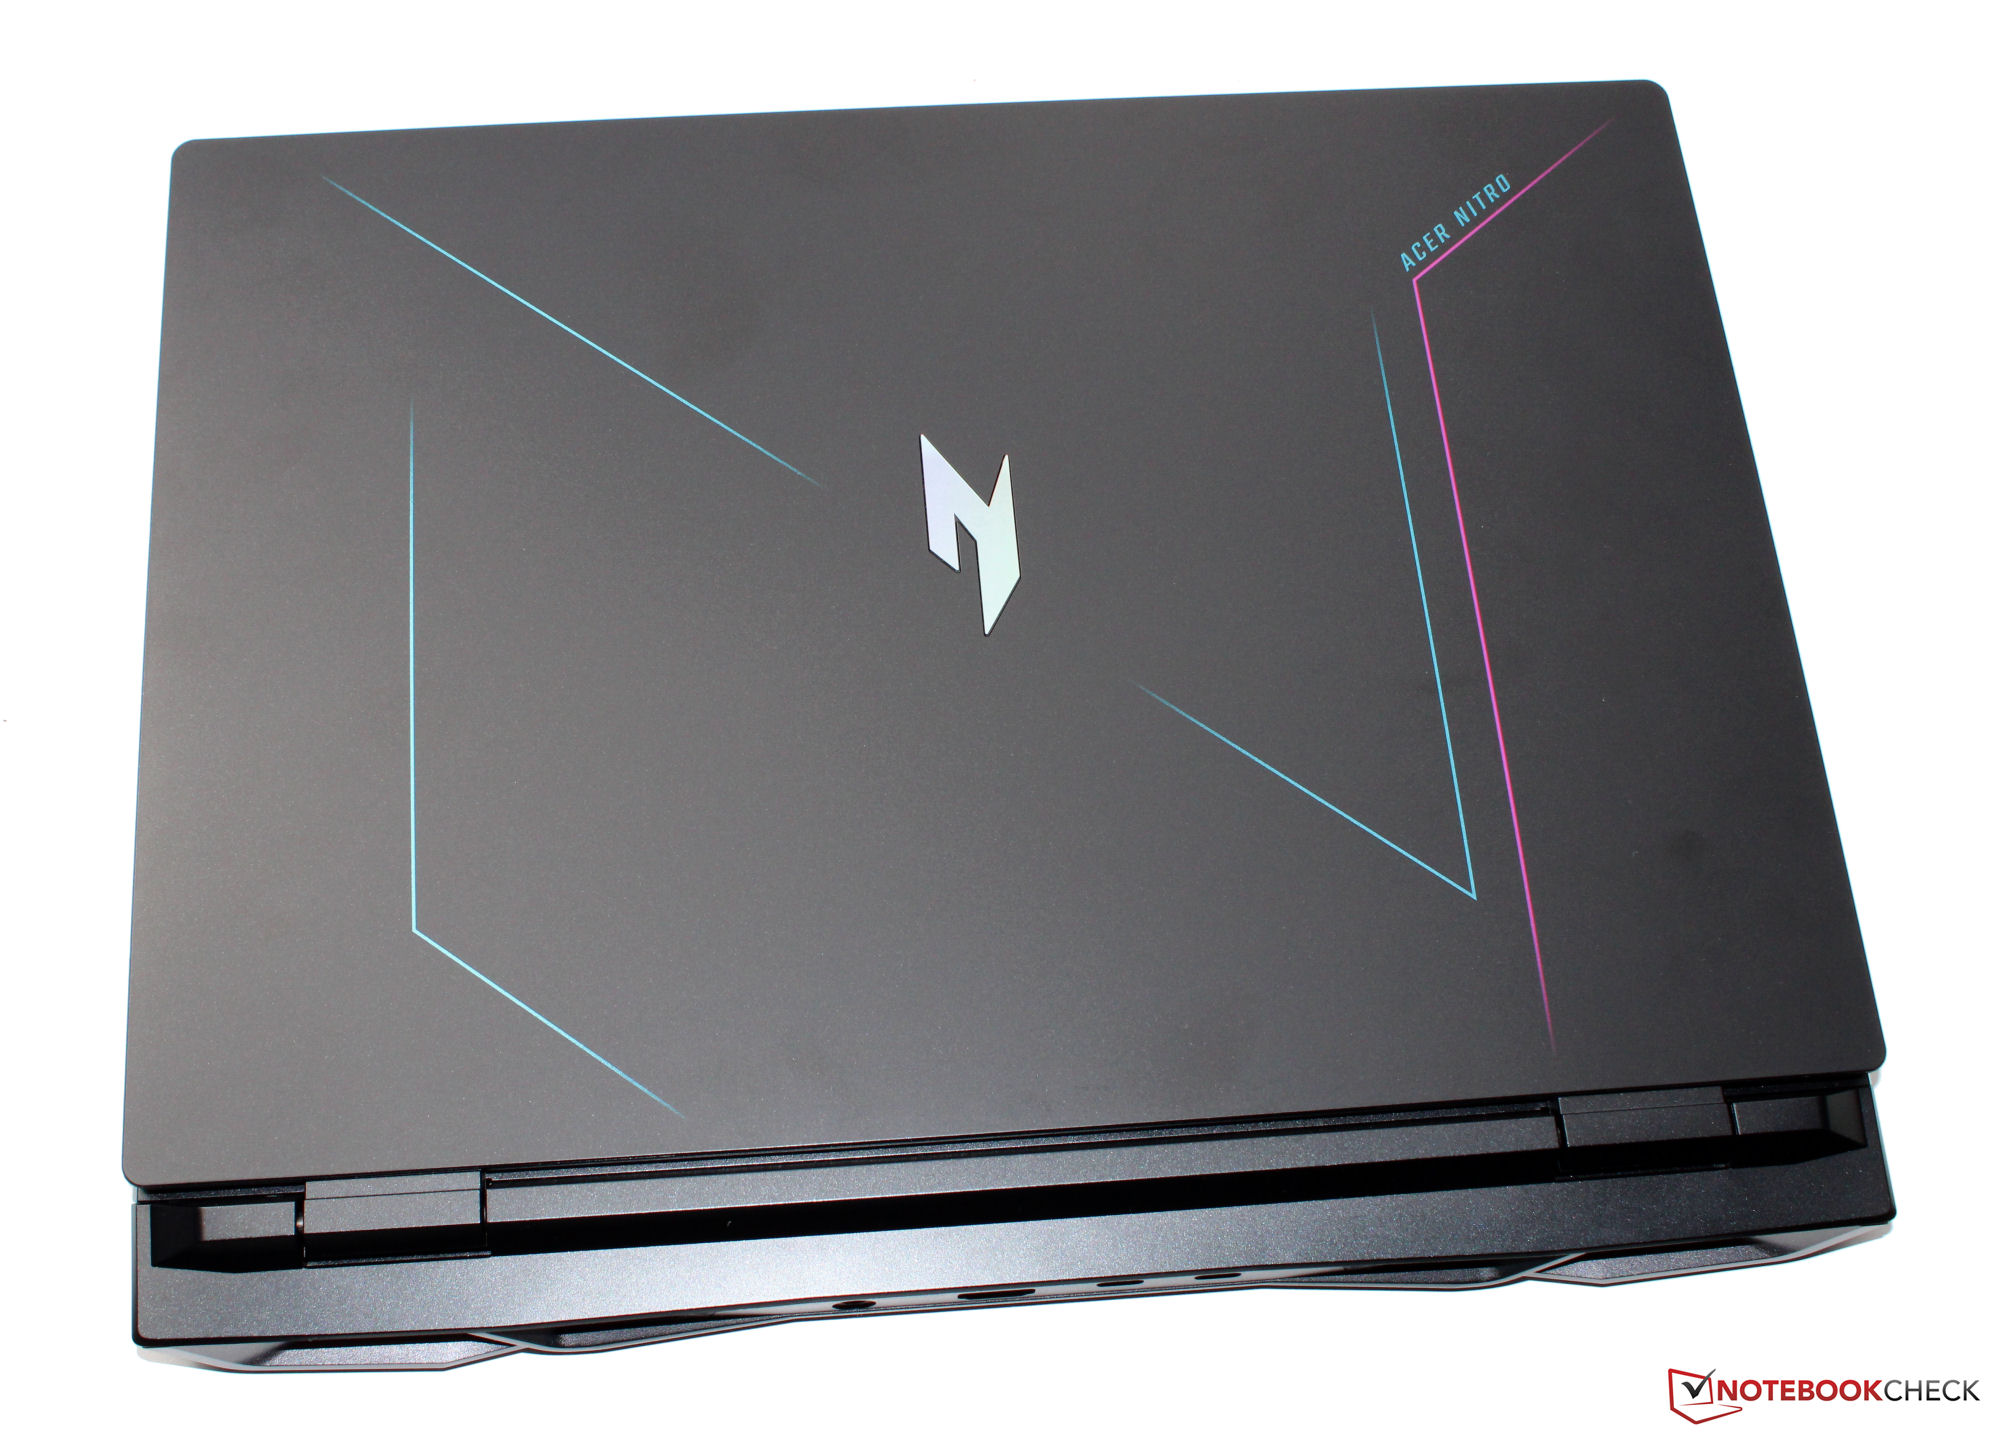
Case - The Nitro is home to a black chassis
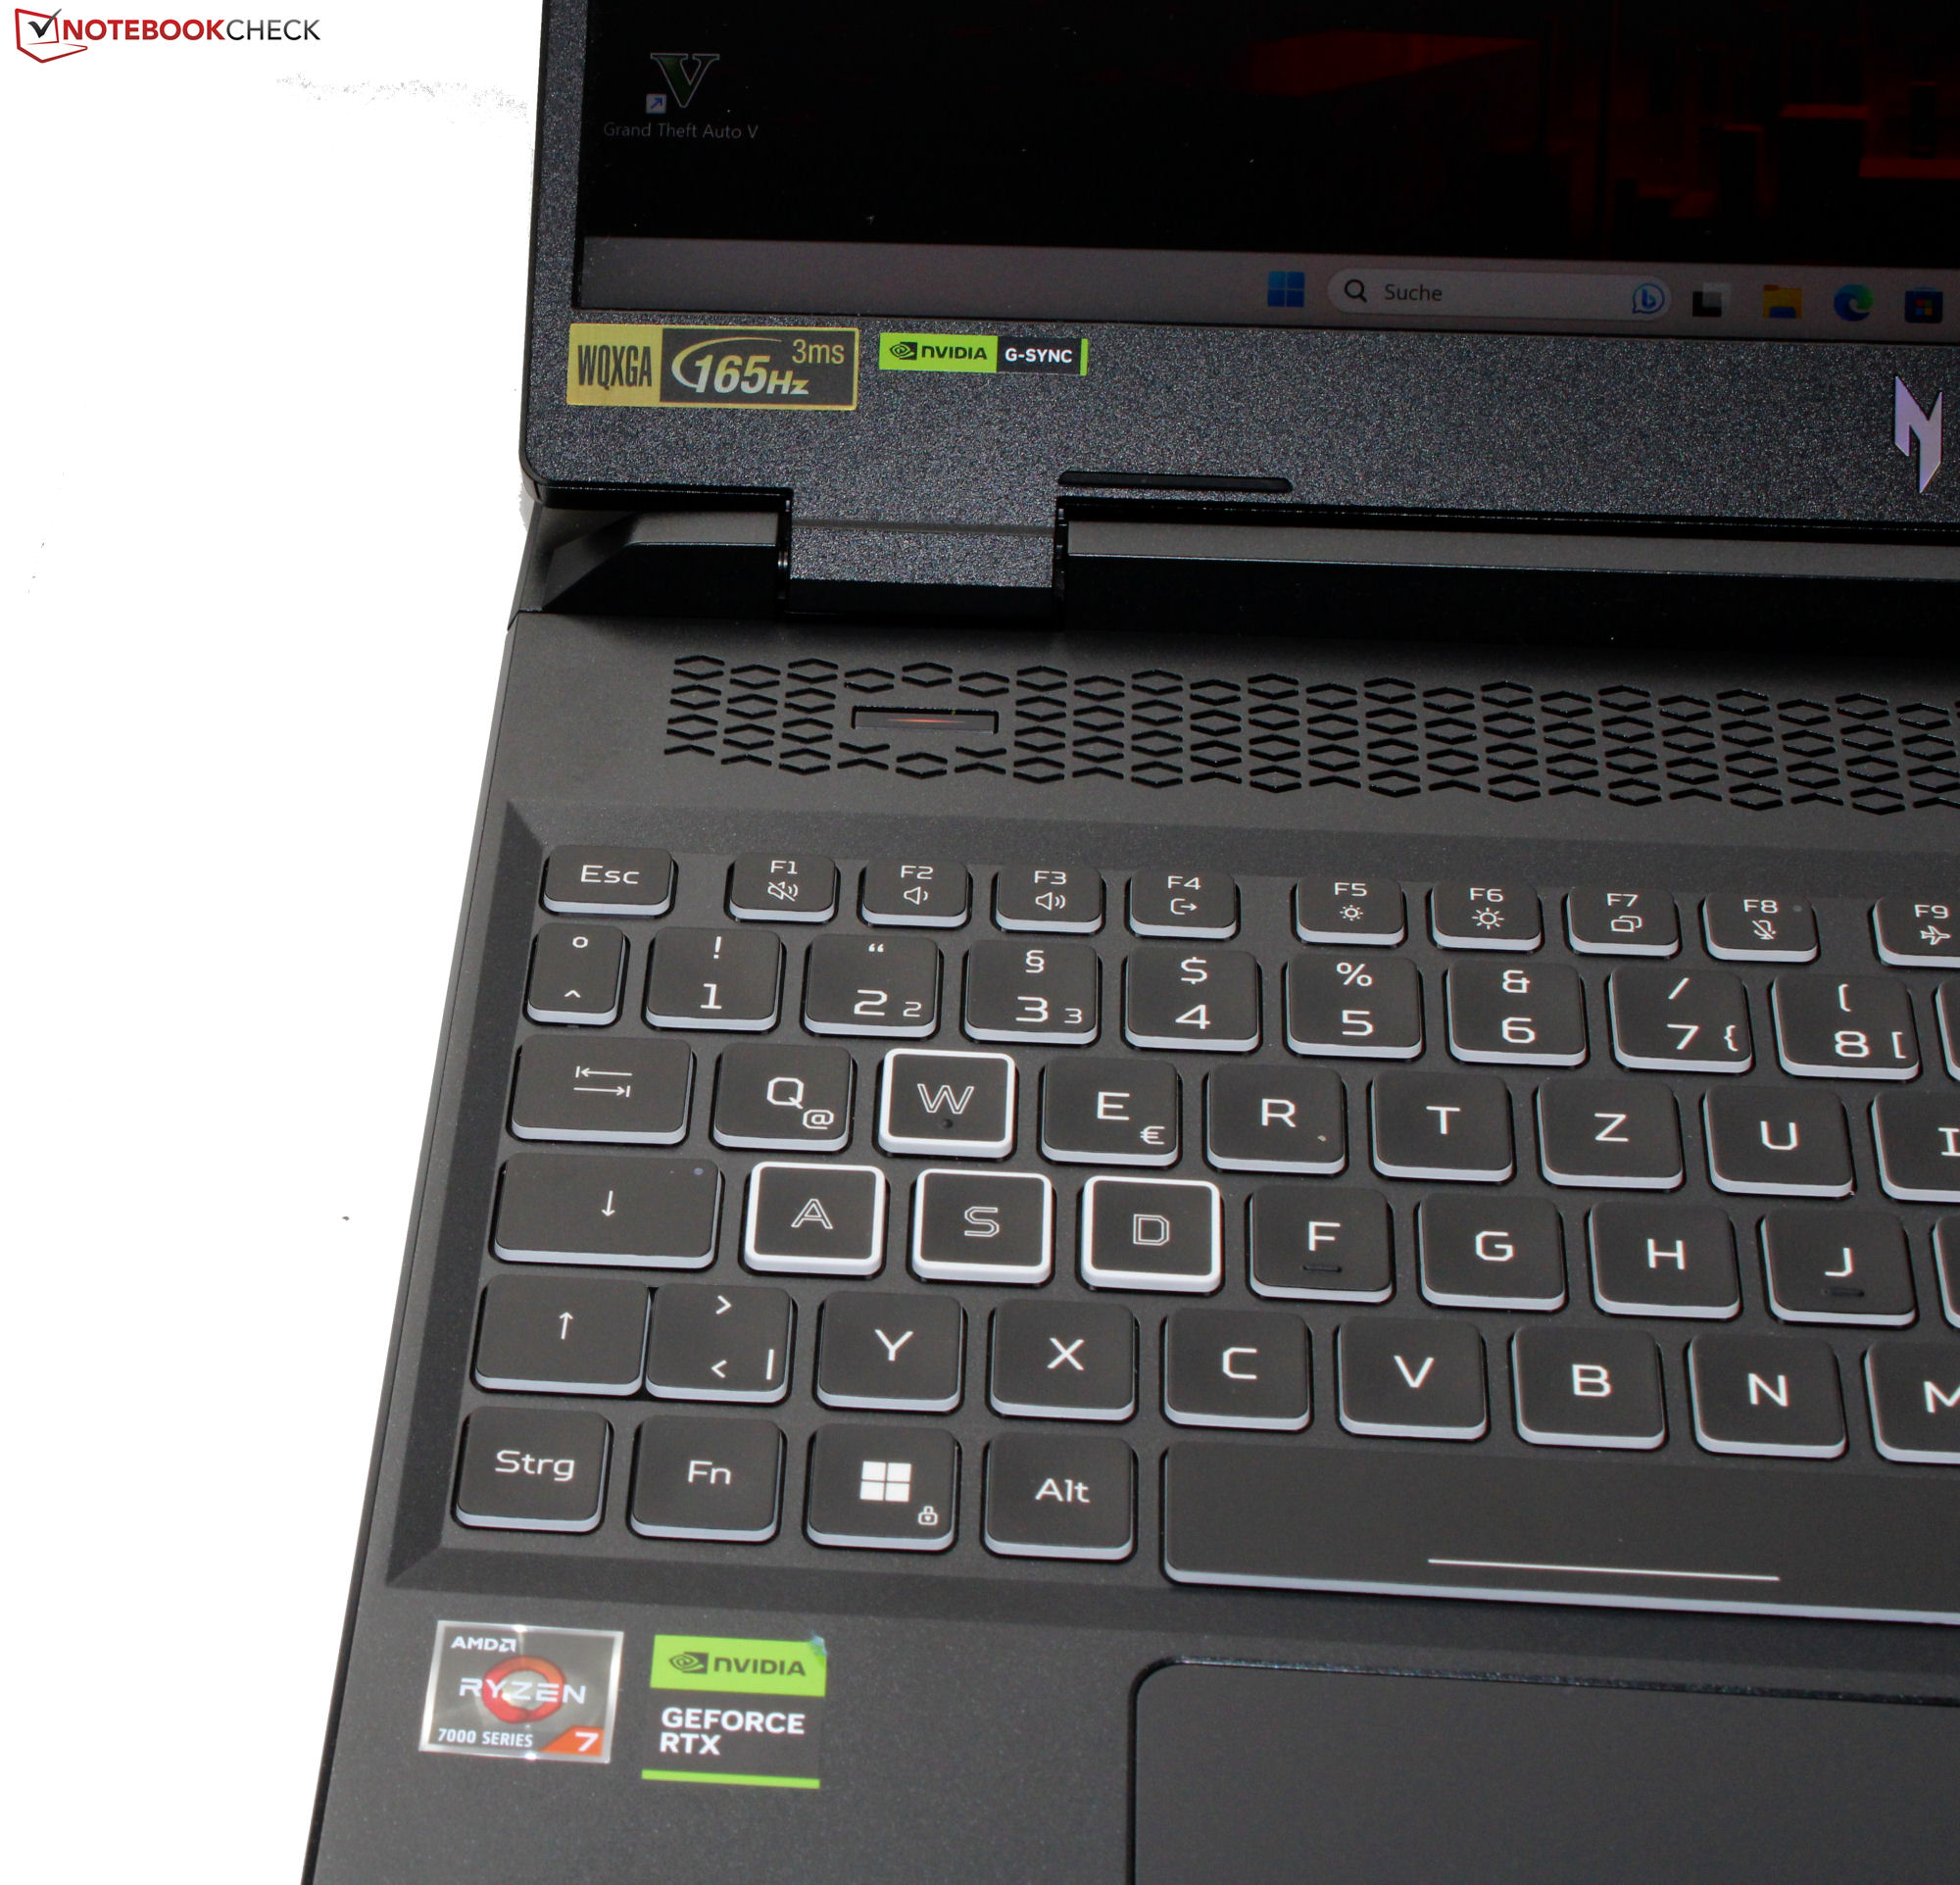
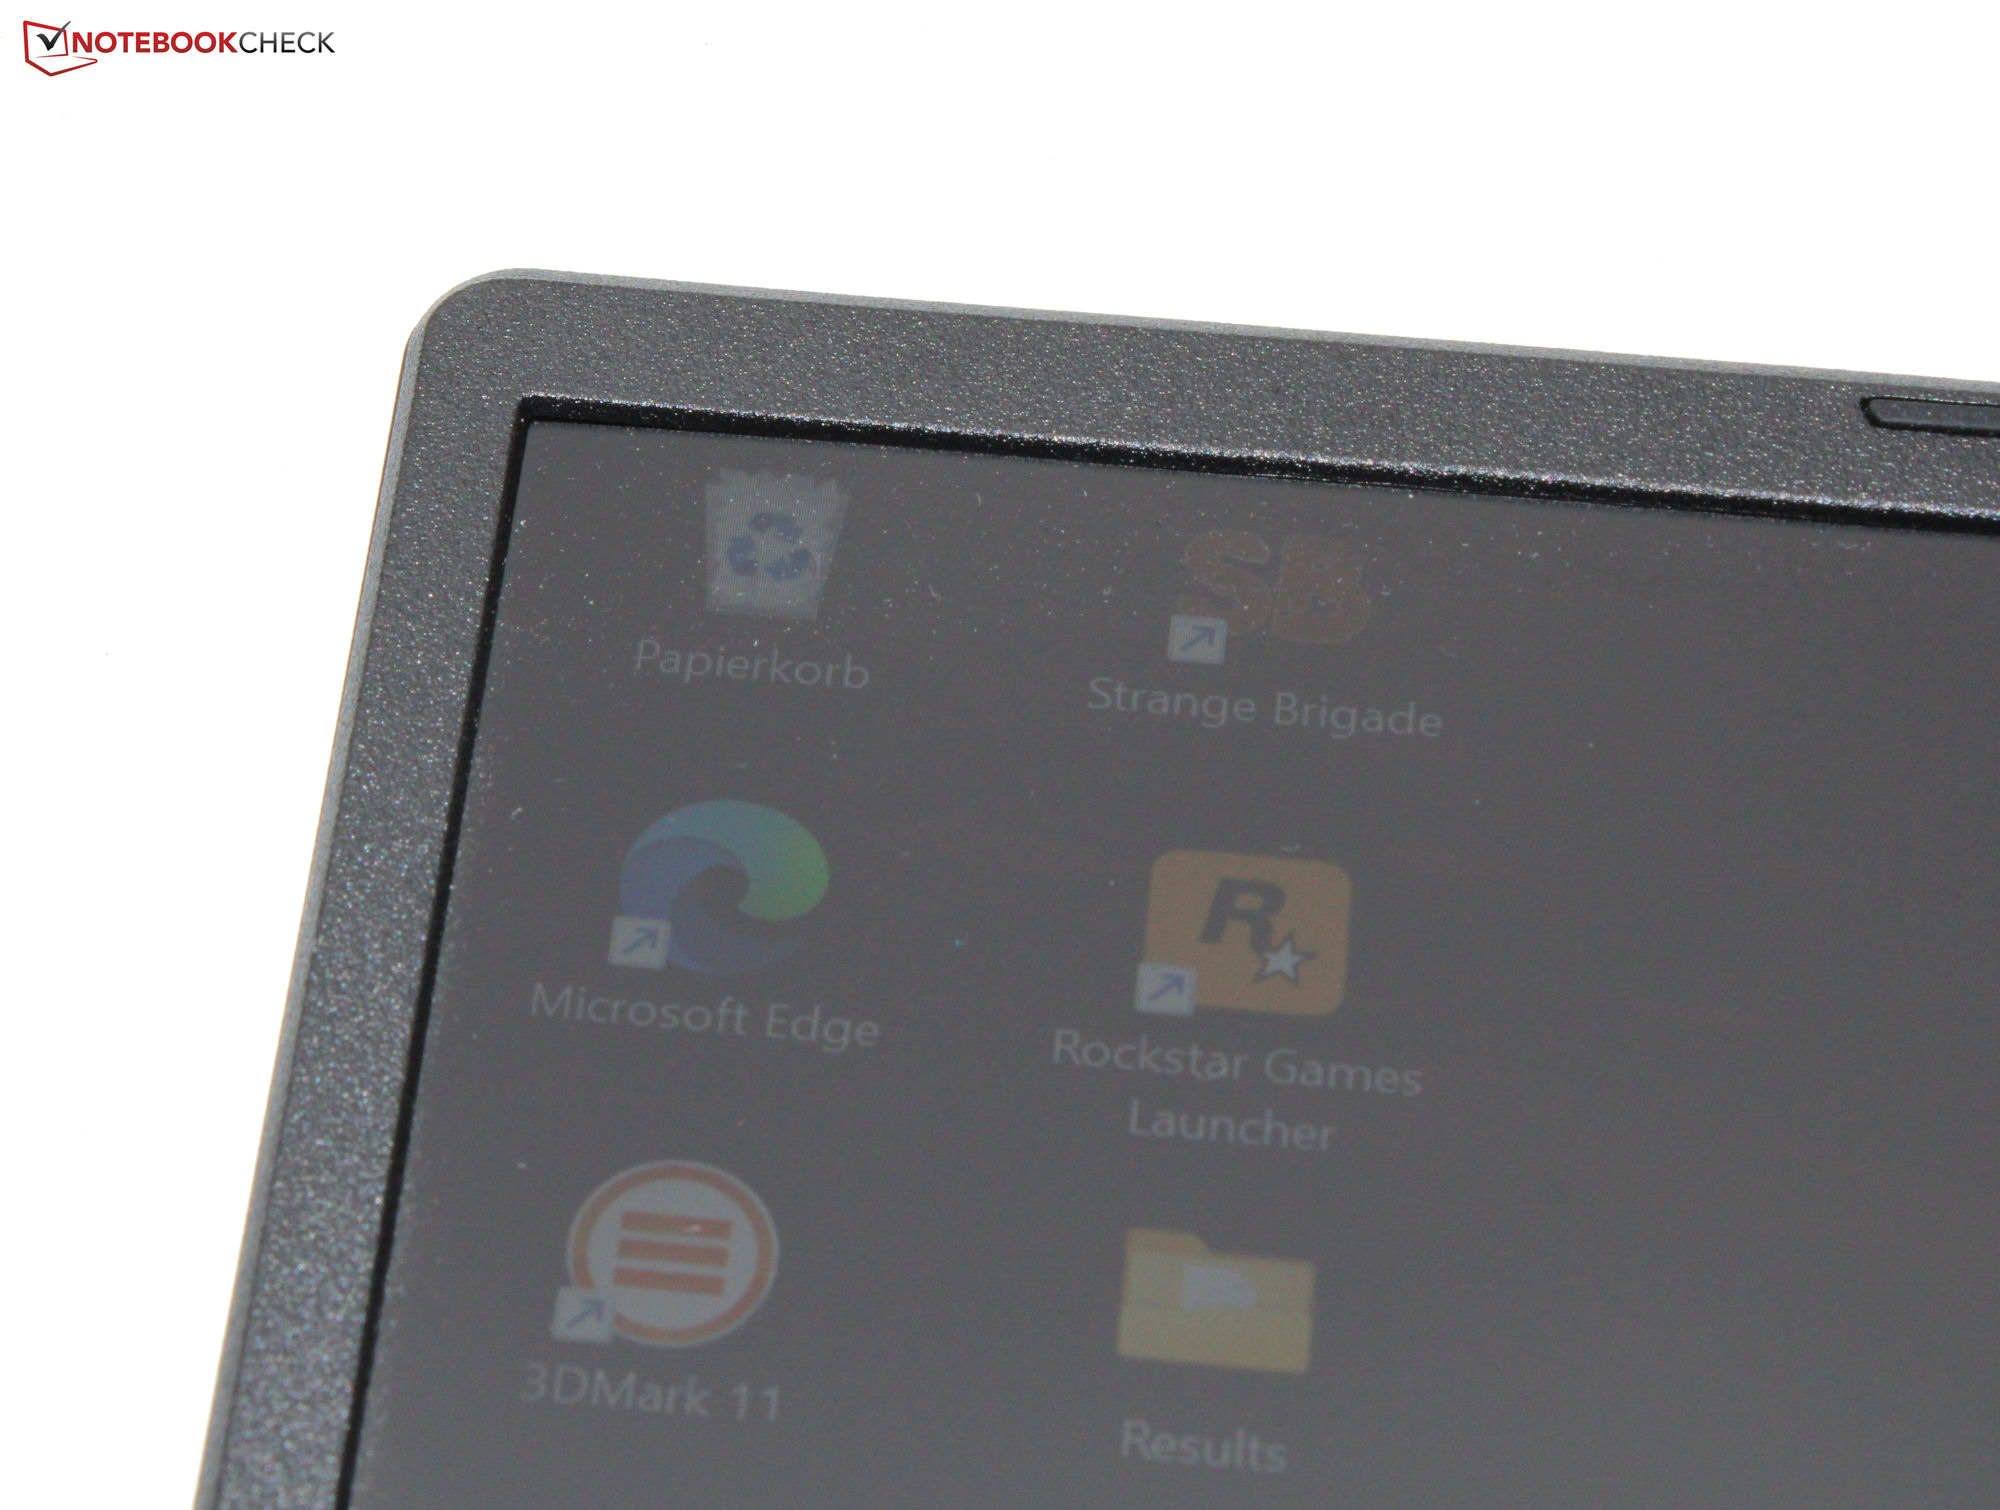
The Nitro 16's chassis doesn't consist of premium case materials such as aluminum or magnesium. The entire case consists of black plastic. Acer has opted for matte, smooth surfaces. In addition to RGB keyboard lighting, some colorful light relief is provided in the form of a few thin, coloured stripes on the back of the case. Acer has decided against emblazoning the computer with some extrovert design elements.
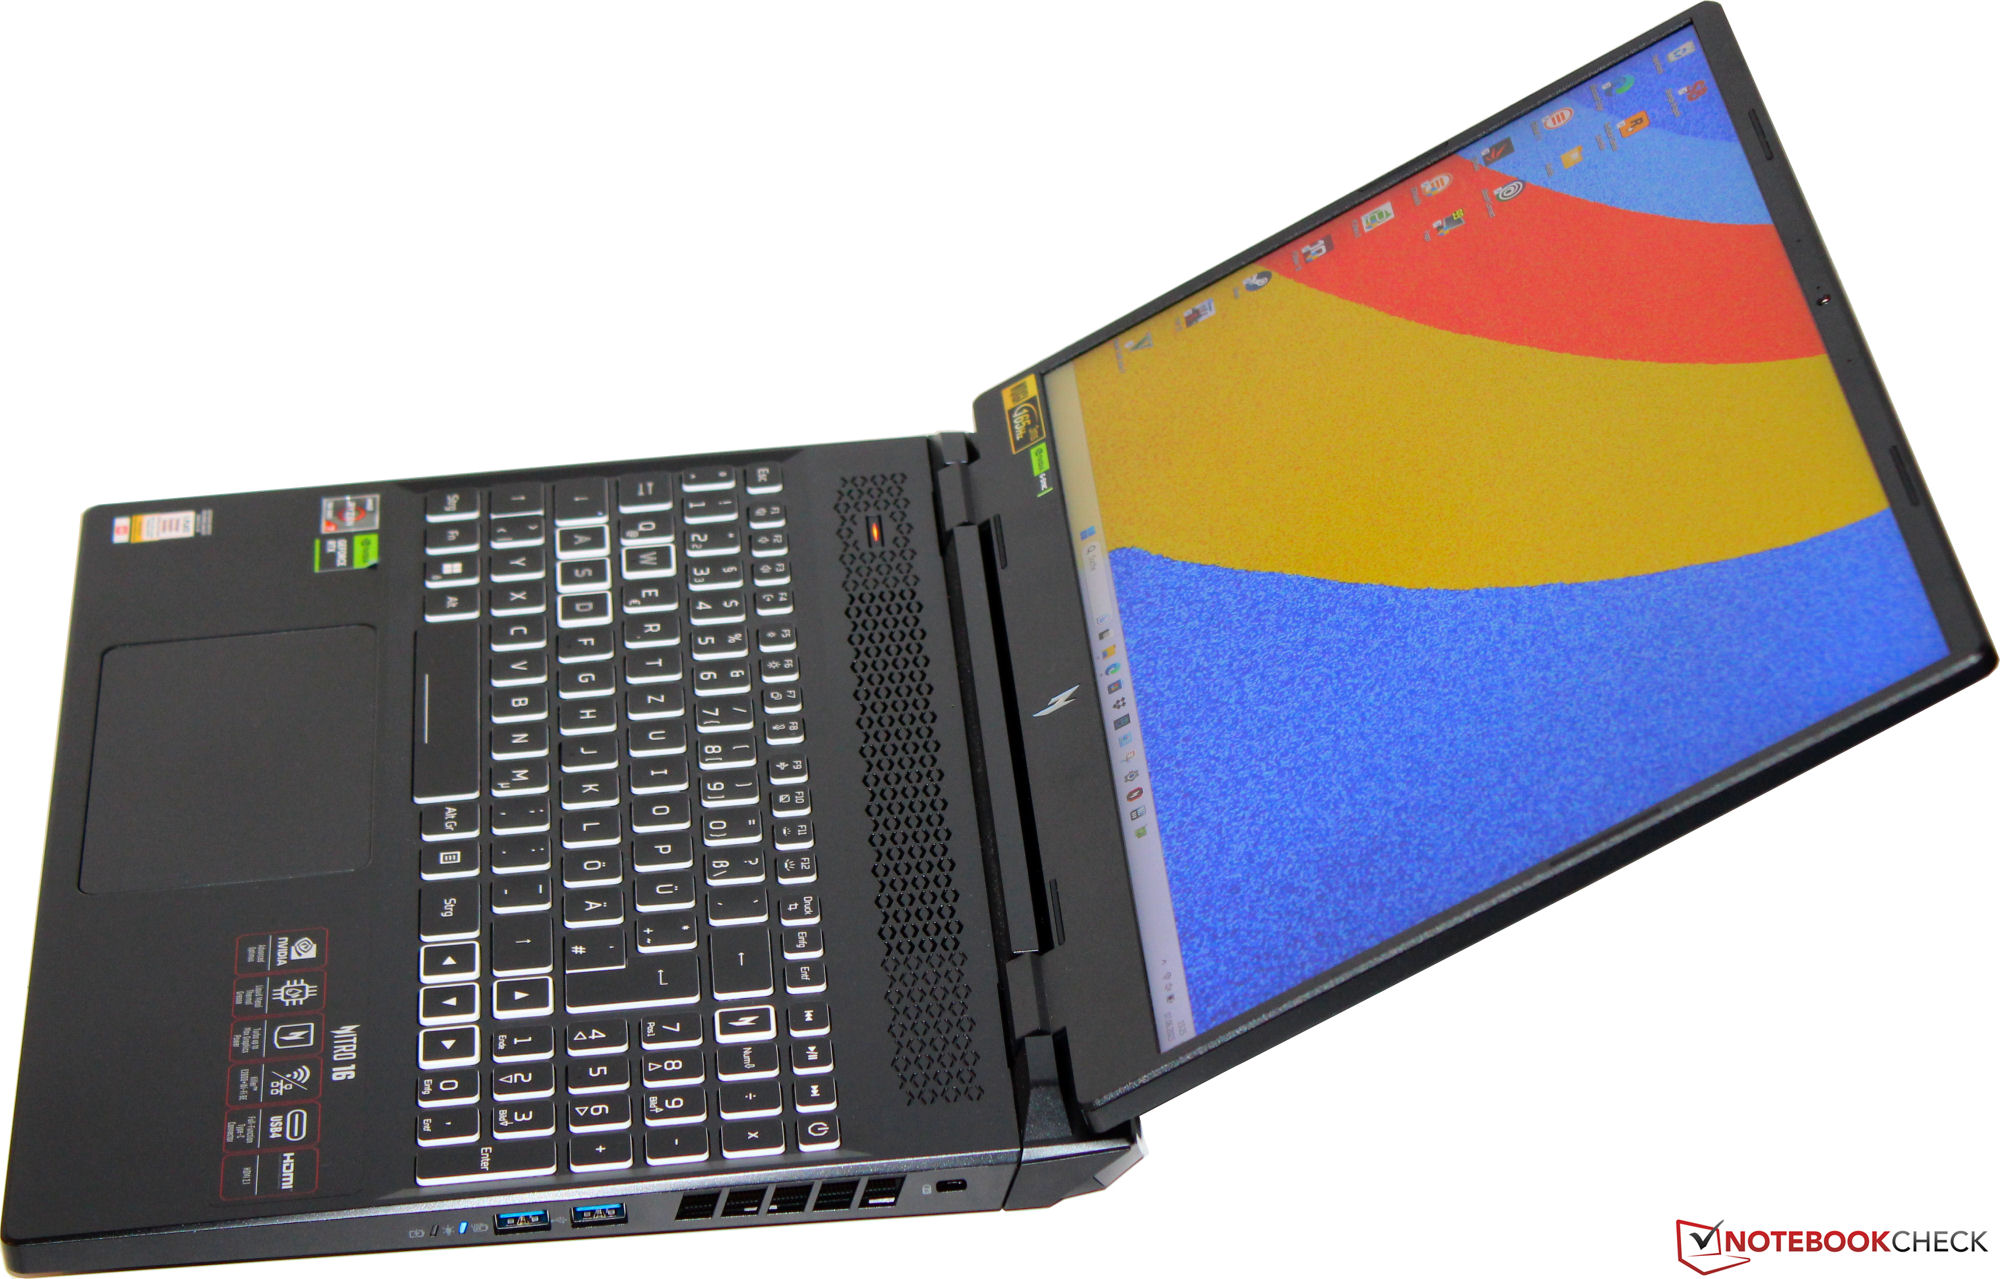
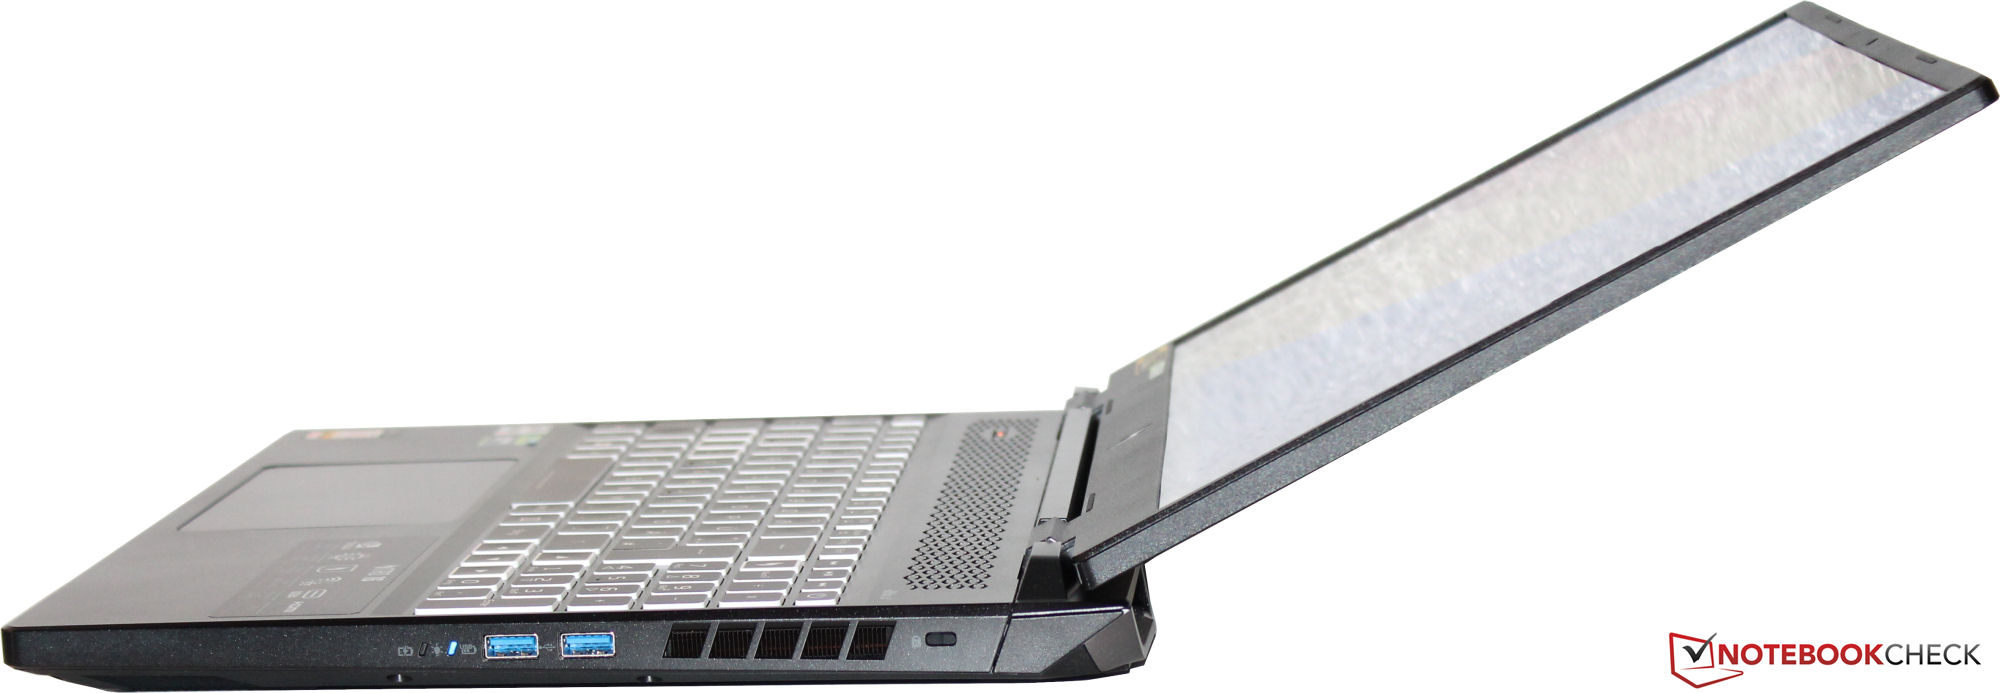
The laptop doesn't appear to suffer from any manufacturing flaws. The gap dimensions are good with no noticeable material protrusions. The base unit can be twisted slightly and the lid considerably more. Applying pressure on the rear of the lid doesn't lead to display image distortion. The hinges hold the lid firmly in place with a maximum opening angle of around 165 degrees. A one-handed opening of the lid is possible.

Acer's computer is the heaviest and bulkiest amongst its peers. The competition tips the scales at a few hundred grams less than our review model.
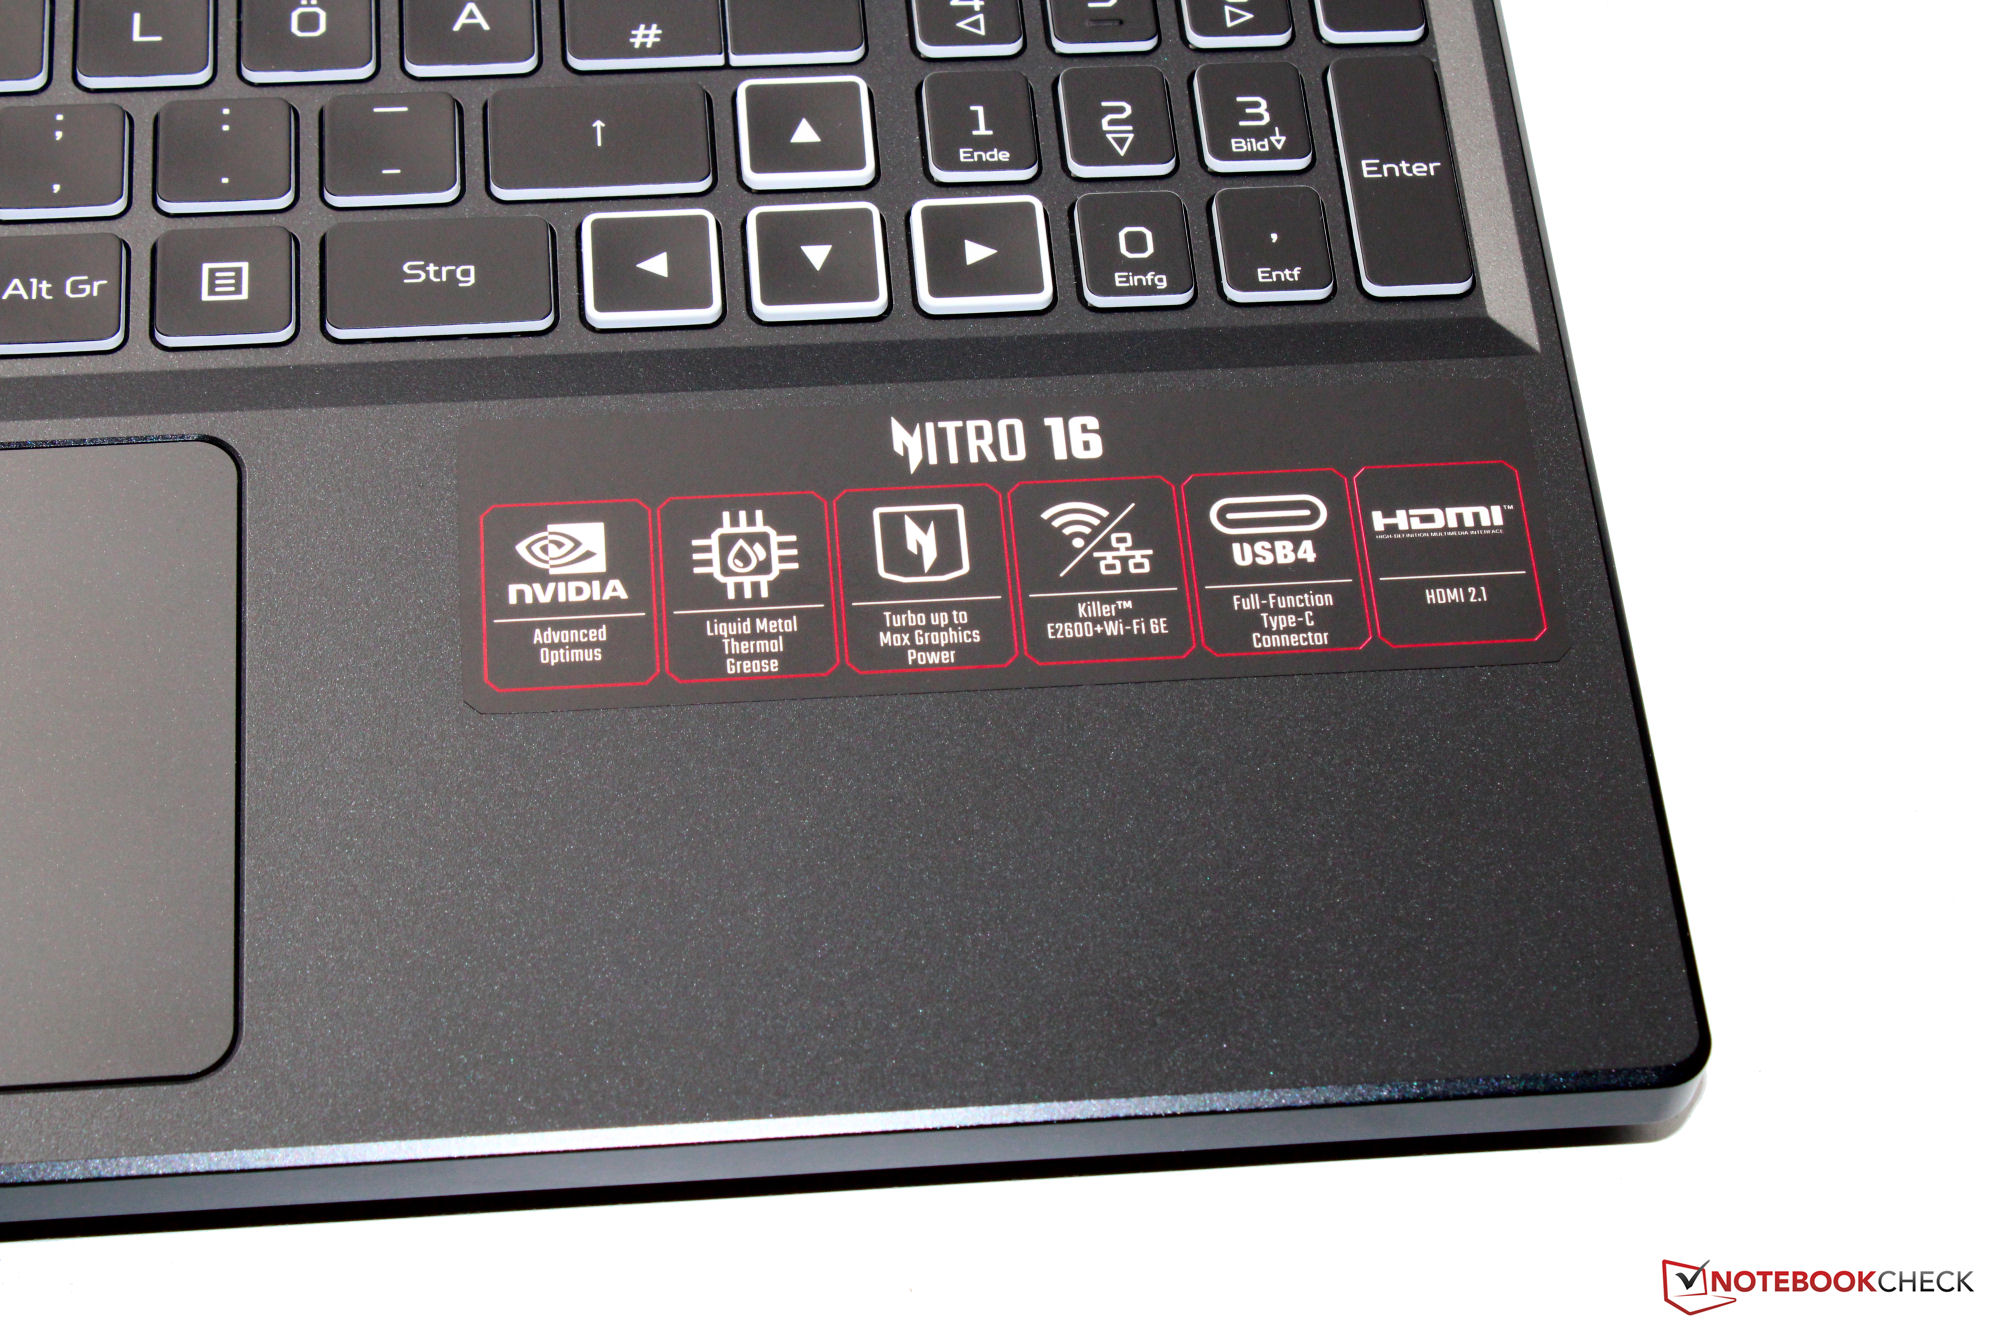
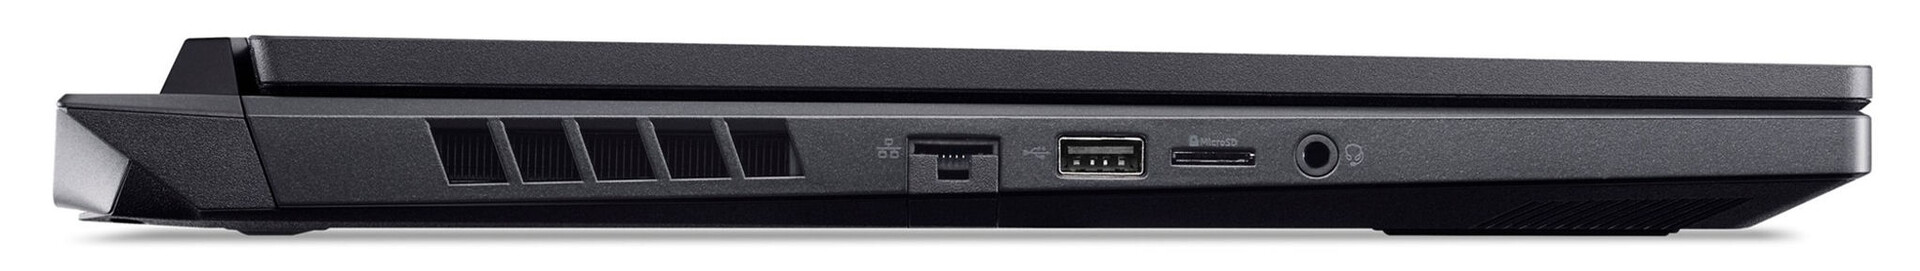
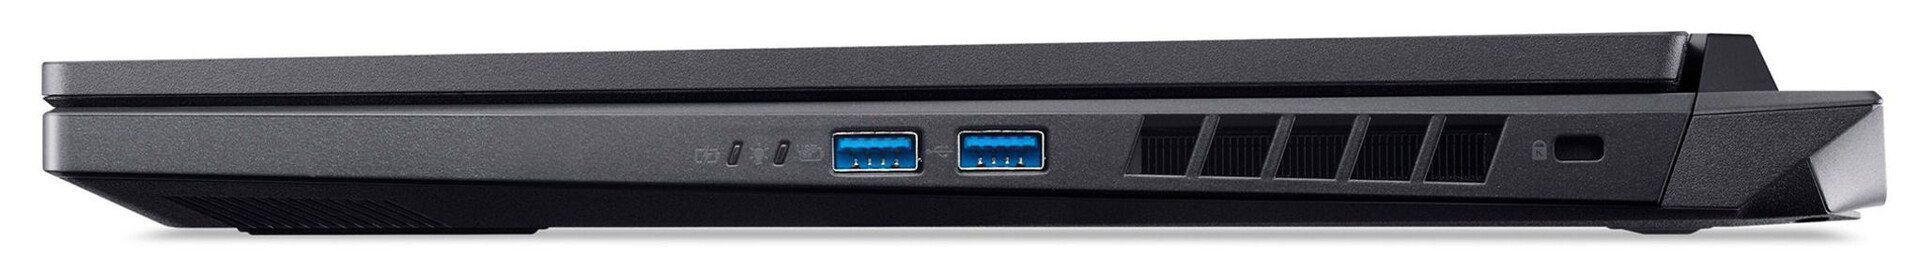
Features - The Acer computer comes with USB 4
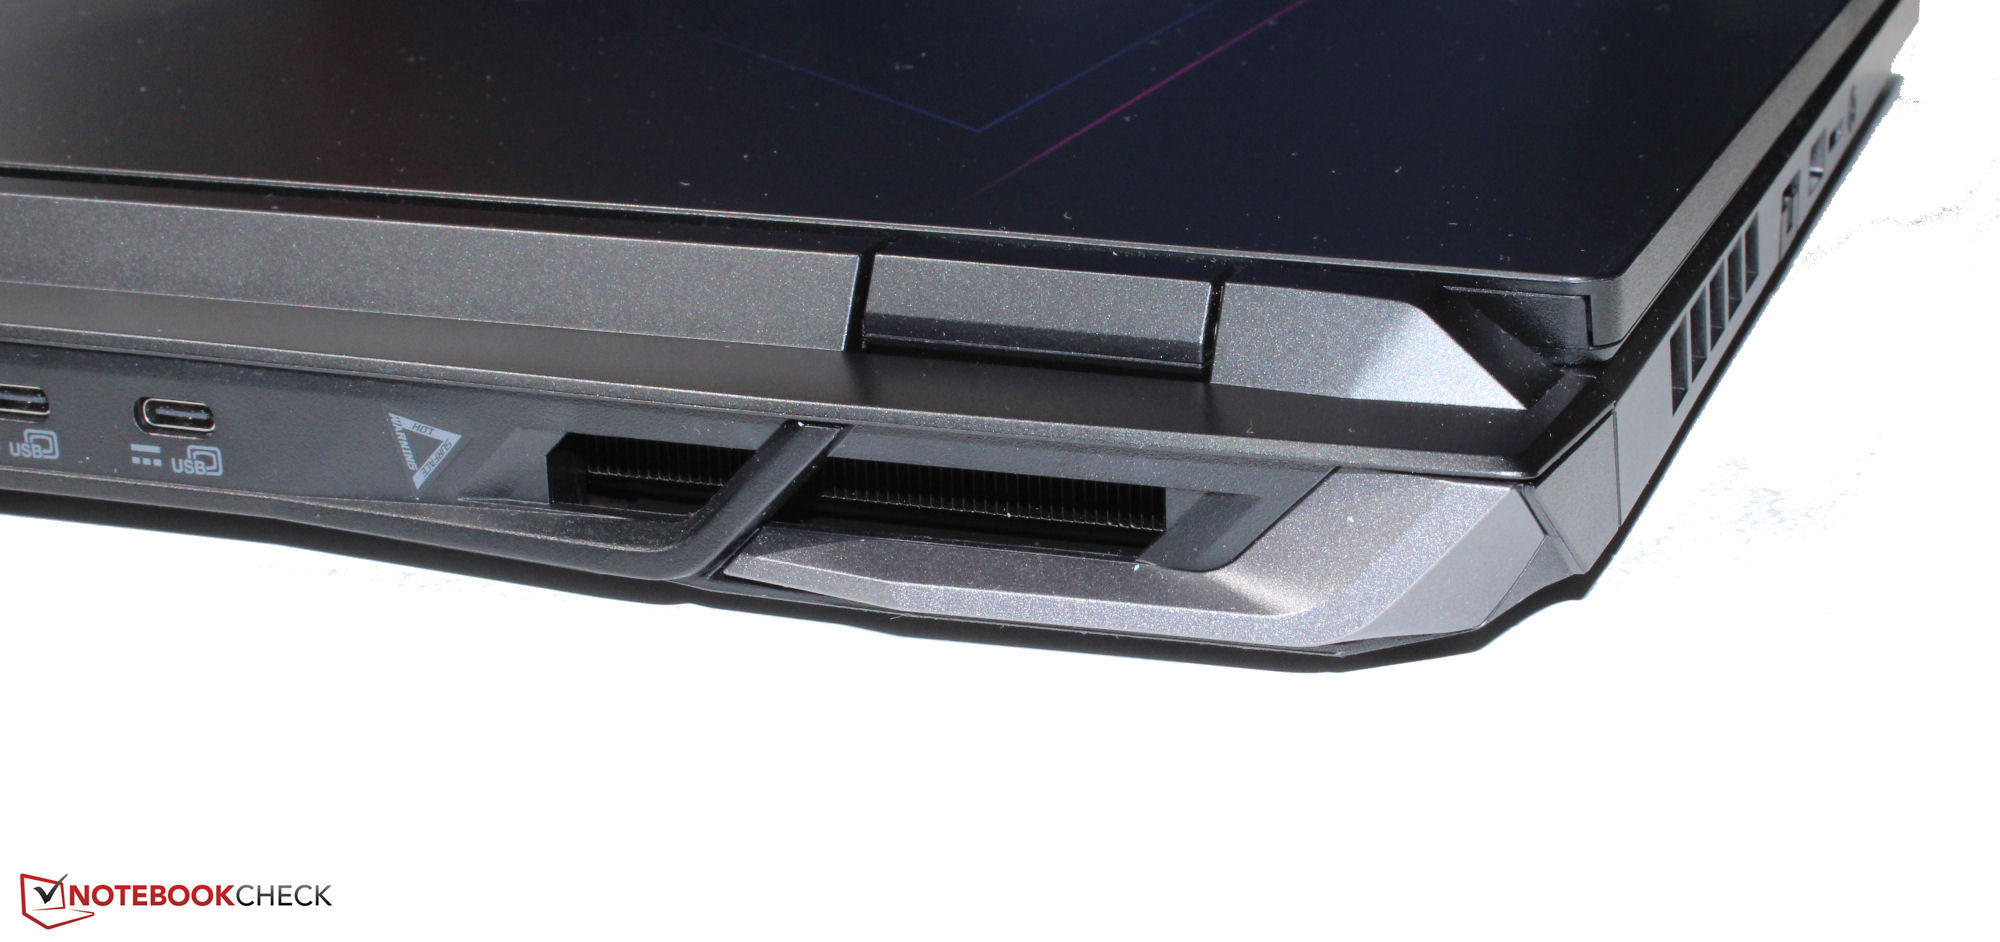
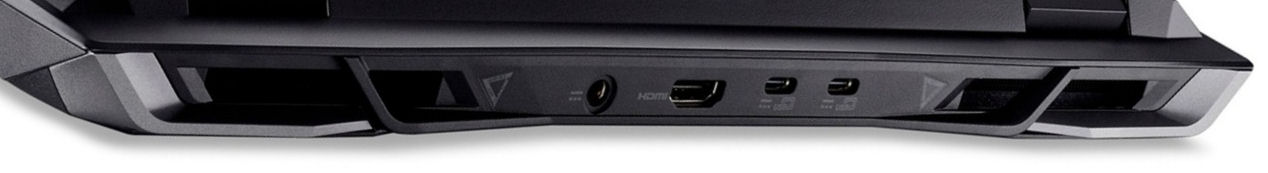
The AN16 has three USB-A ports (1x USB 2.0, 2x USB 3.2 Gen 2) and two USB-C ports (1x USB 3.2 Gen 2, 1x USB 4) at its disposal. The latter supports Power Delivery and can display a DisplayPort signal. The Nitro has a total of three video outputs (HDMI 2.1, 2x DP). These offerings are rounded off by an audio jack and a Gigabit Ethernet port.
The video outputs and power connector can be found on the rear of the device meaning any corresponding cables would run to the back of the laptop and not get in the way.
SD Card Reader
Speed-wise, the SD memory card reader (reference card: AV PRO microSD 128 GB V60) is nestled in the middle of the pack with a maximum transfer rate of 80.3 MB/s (transfer of 250 jpg image files at around 5 MB each) and 87.5 MB/s (copying large blocks of data).
| SD Card Reader | |
| average JPG Copy Test (av. of 3 runs) | |
| Average of class Gaming (20.9 - 210, n=54, last 2 years) | |
| Acer Nitro 16 AN16-41 (AV Pro SD microSD 128 GB V60) | |
| Medion Erazer Major X20 (AV PRO microSD 128 GB V60) | |
| maximum AS SSD Seq Read Test (1GB) | |
| Average of class Gaming (25.5 - 261, n=51, last 2 years) | |
| Medion Erazer Major X20 (AV PRO microSD 128 GB V60) | |
| Acer Nitro 16 AN16-41 (AV Pro SD microSD 128 GB V60) | |
Communication
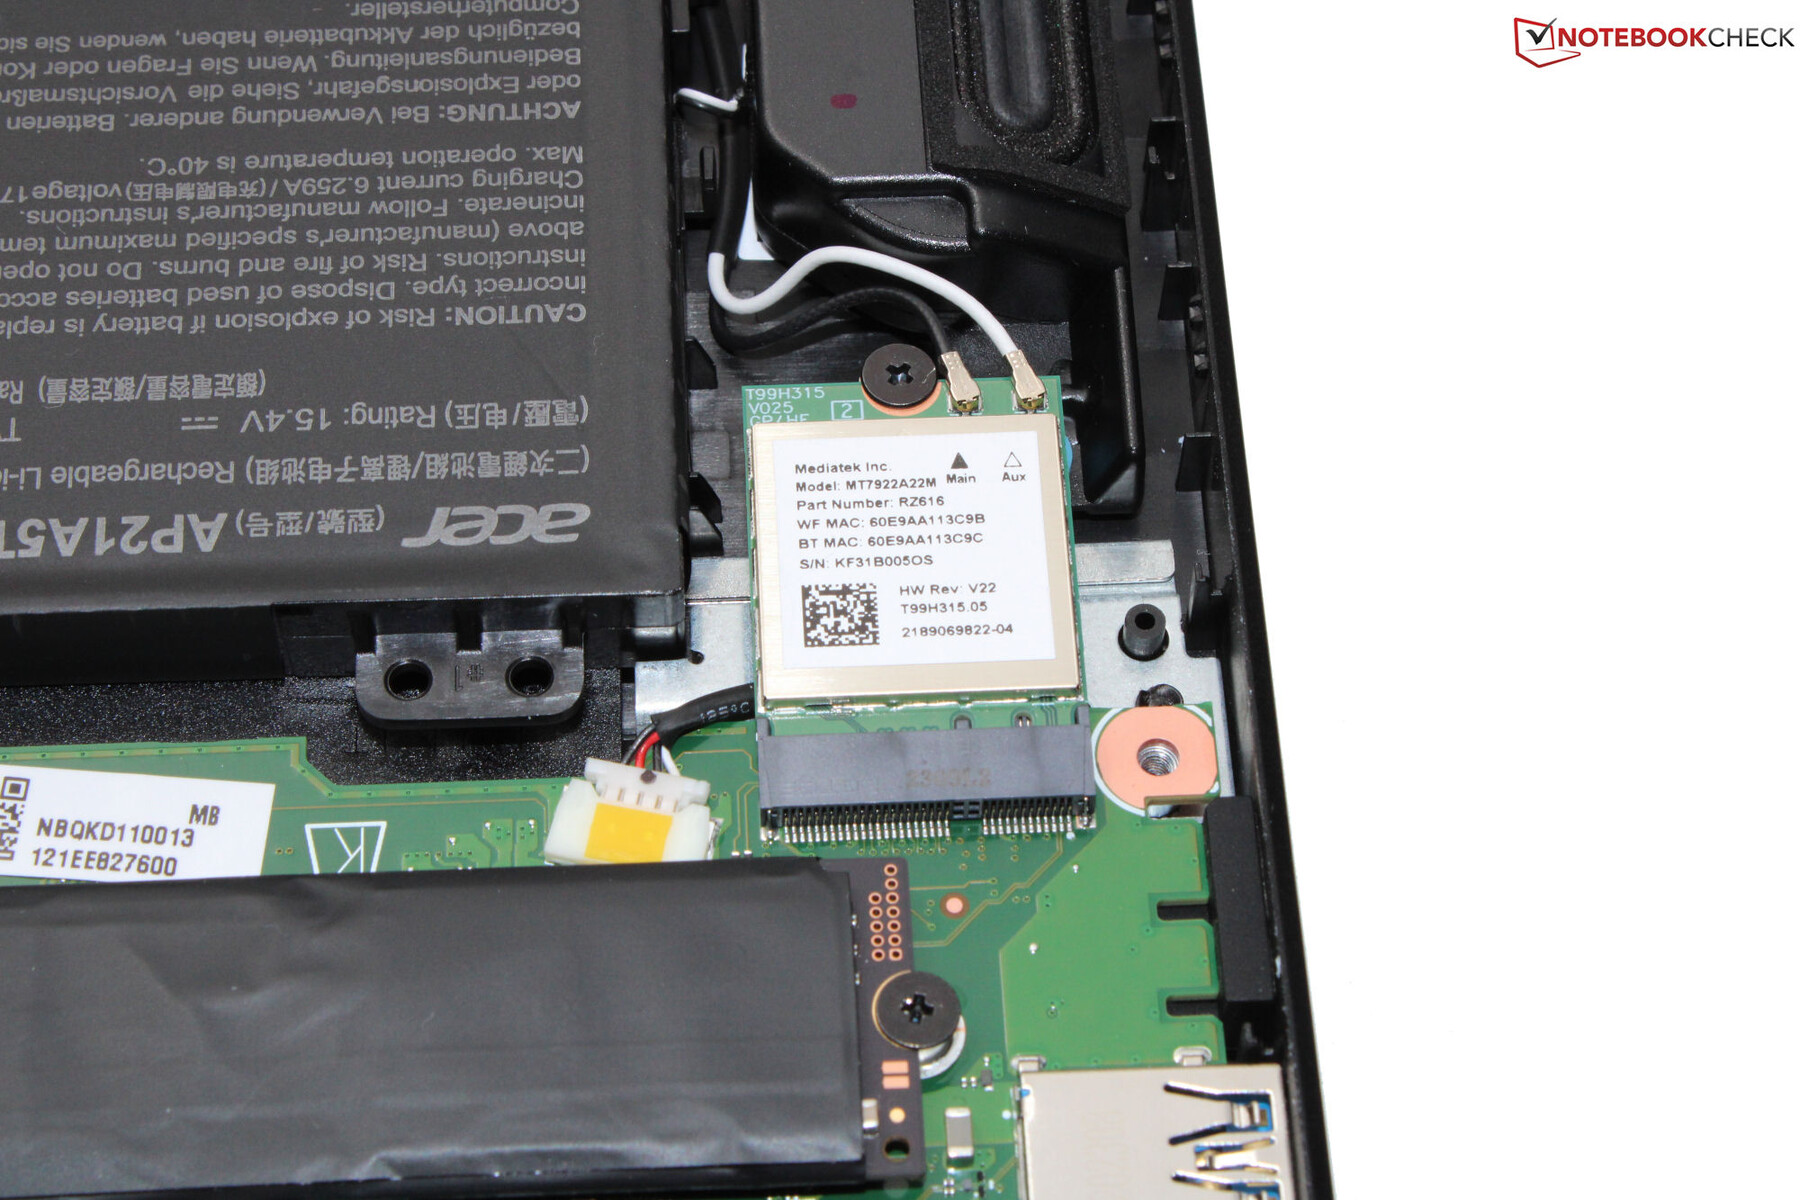
Under optimum conditions (no Wi-Fi devices nearby, short distance between the laptop and server PC) excellent Wi-Fi data transfer rates are possible. The Acer laptop uses a Wi-Fi 6E chip (MediaTek MT7922). Wired connections are handled by a Killer/Intel chip (E2600; 1 GBit/s).
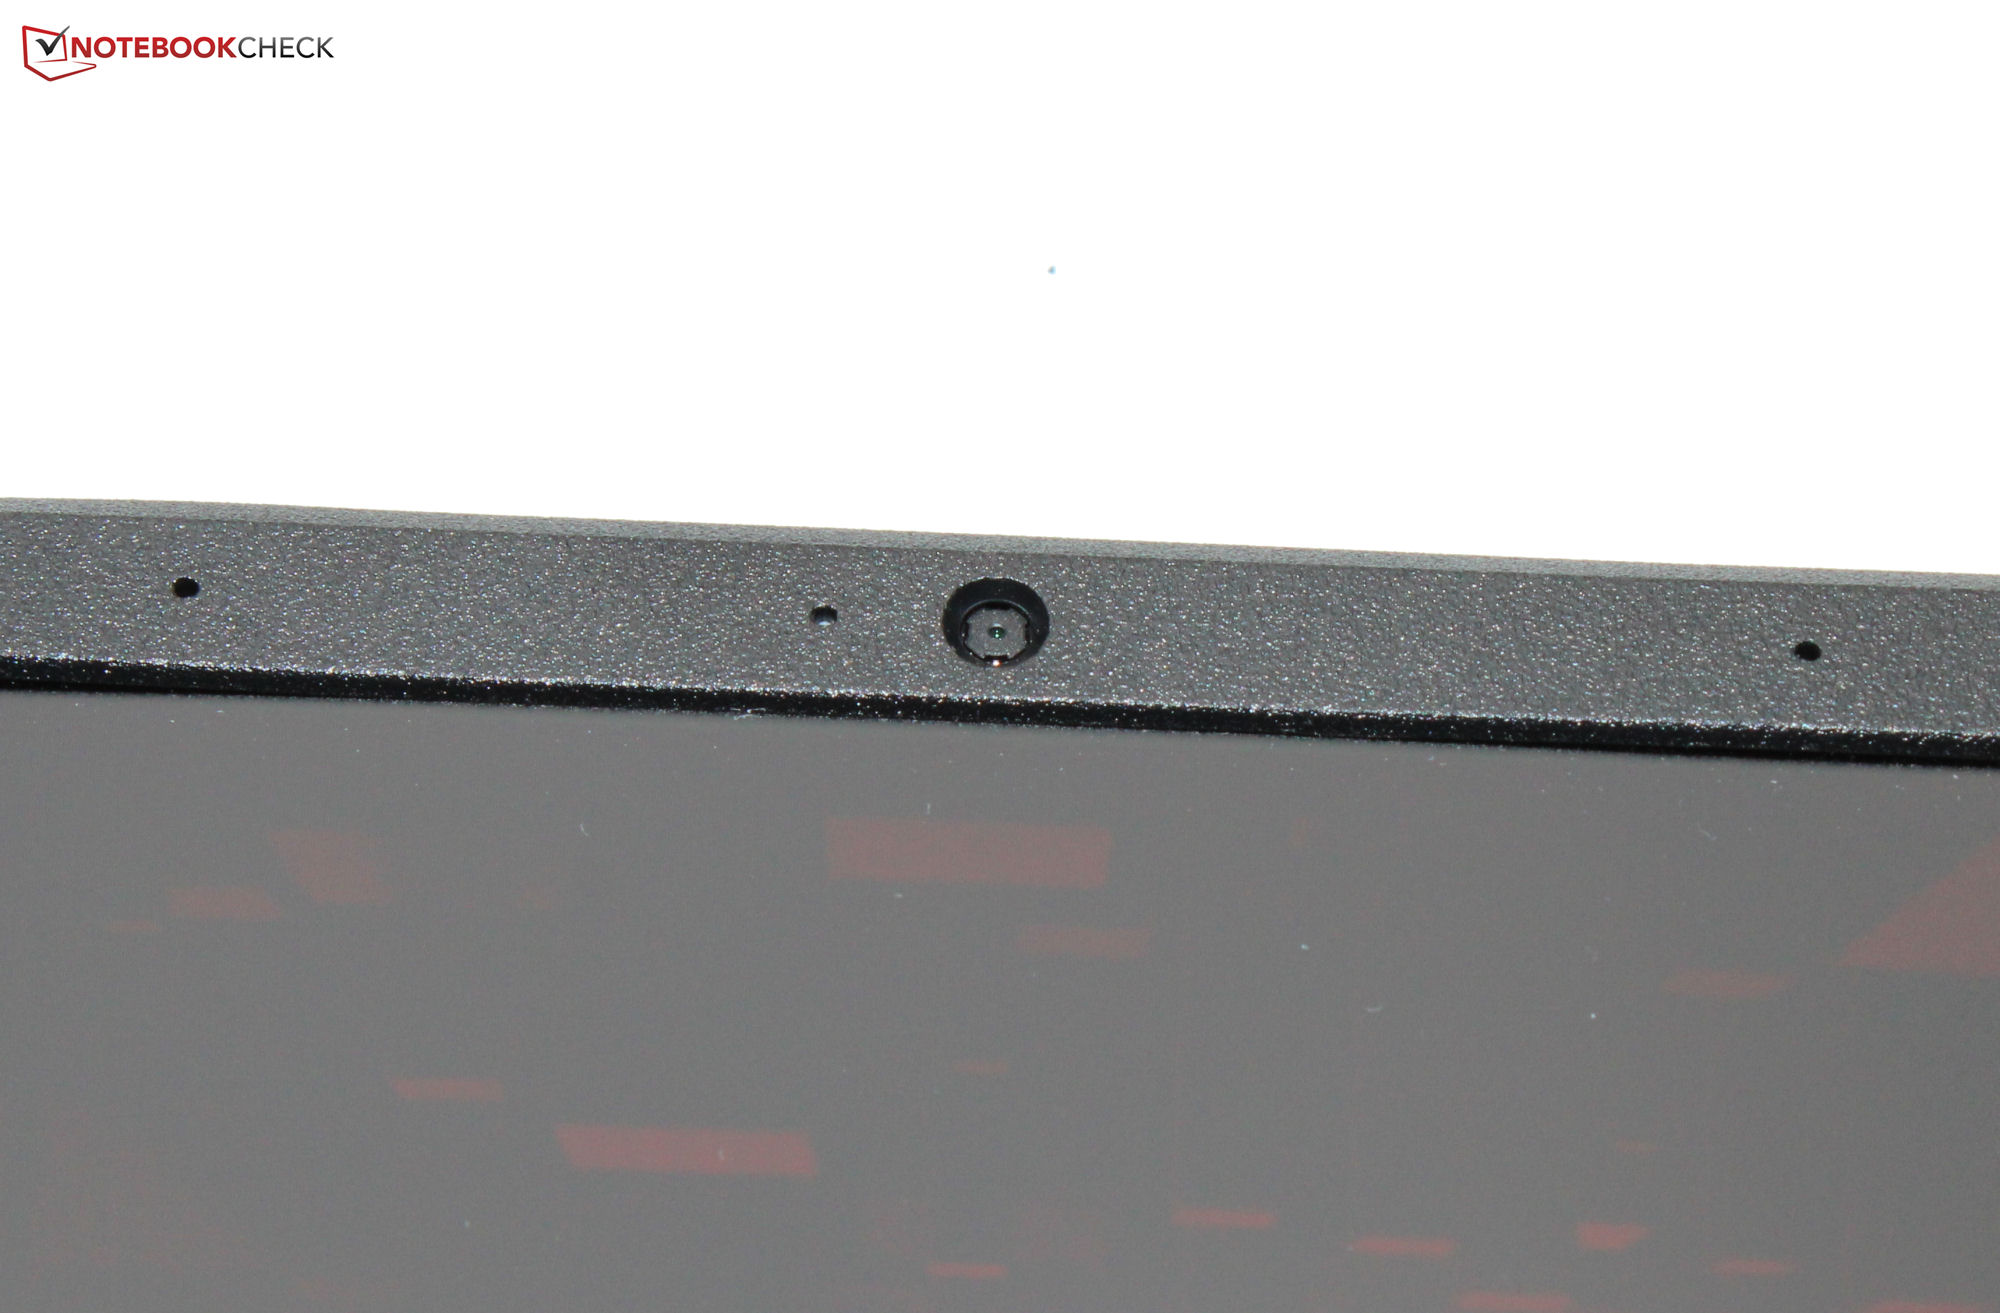
Webcam
The webcam (0.9 MP, max. 1,280 x 720 pixels) comes without a mechanical lens cover. In terms of quality, the camera doesn't deliver convincing results and also falls short regarding color accuracy: The colors deviate greatly from how they should be.


Accessories
In addition to the usual documents (quick start guide and warranty information), no other accessories are included.
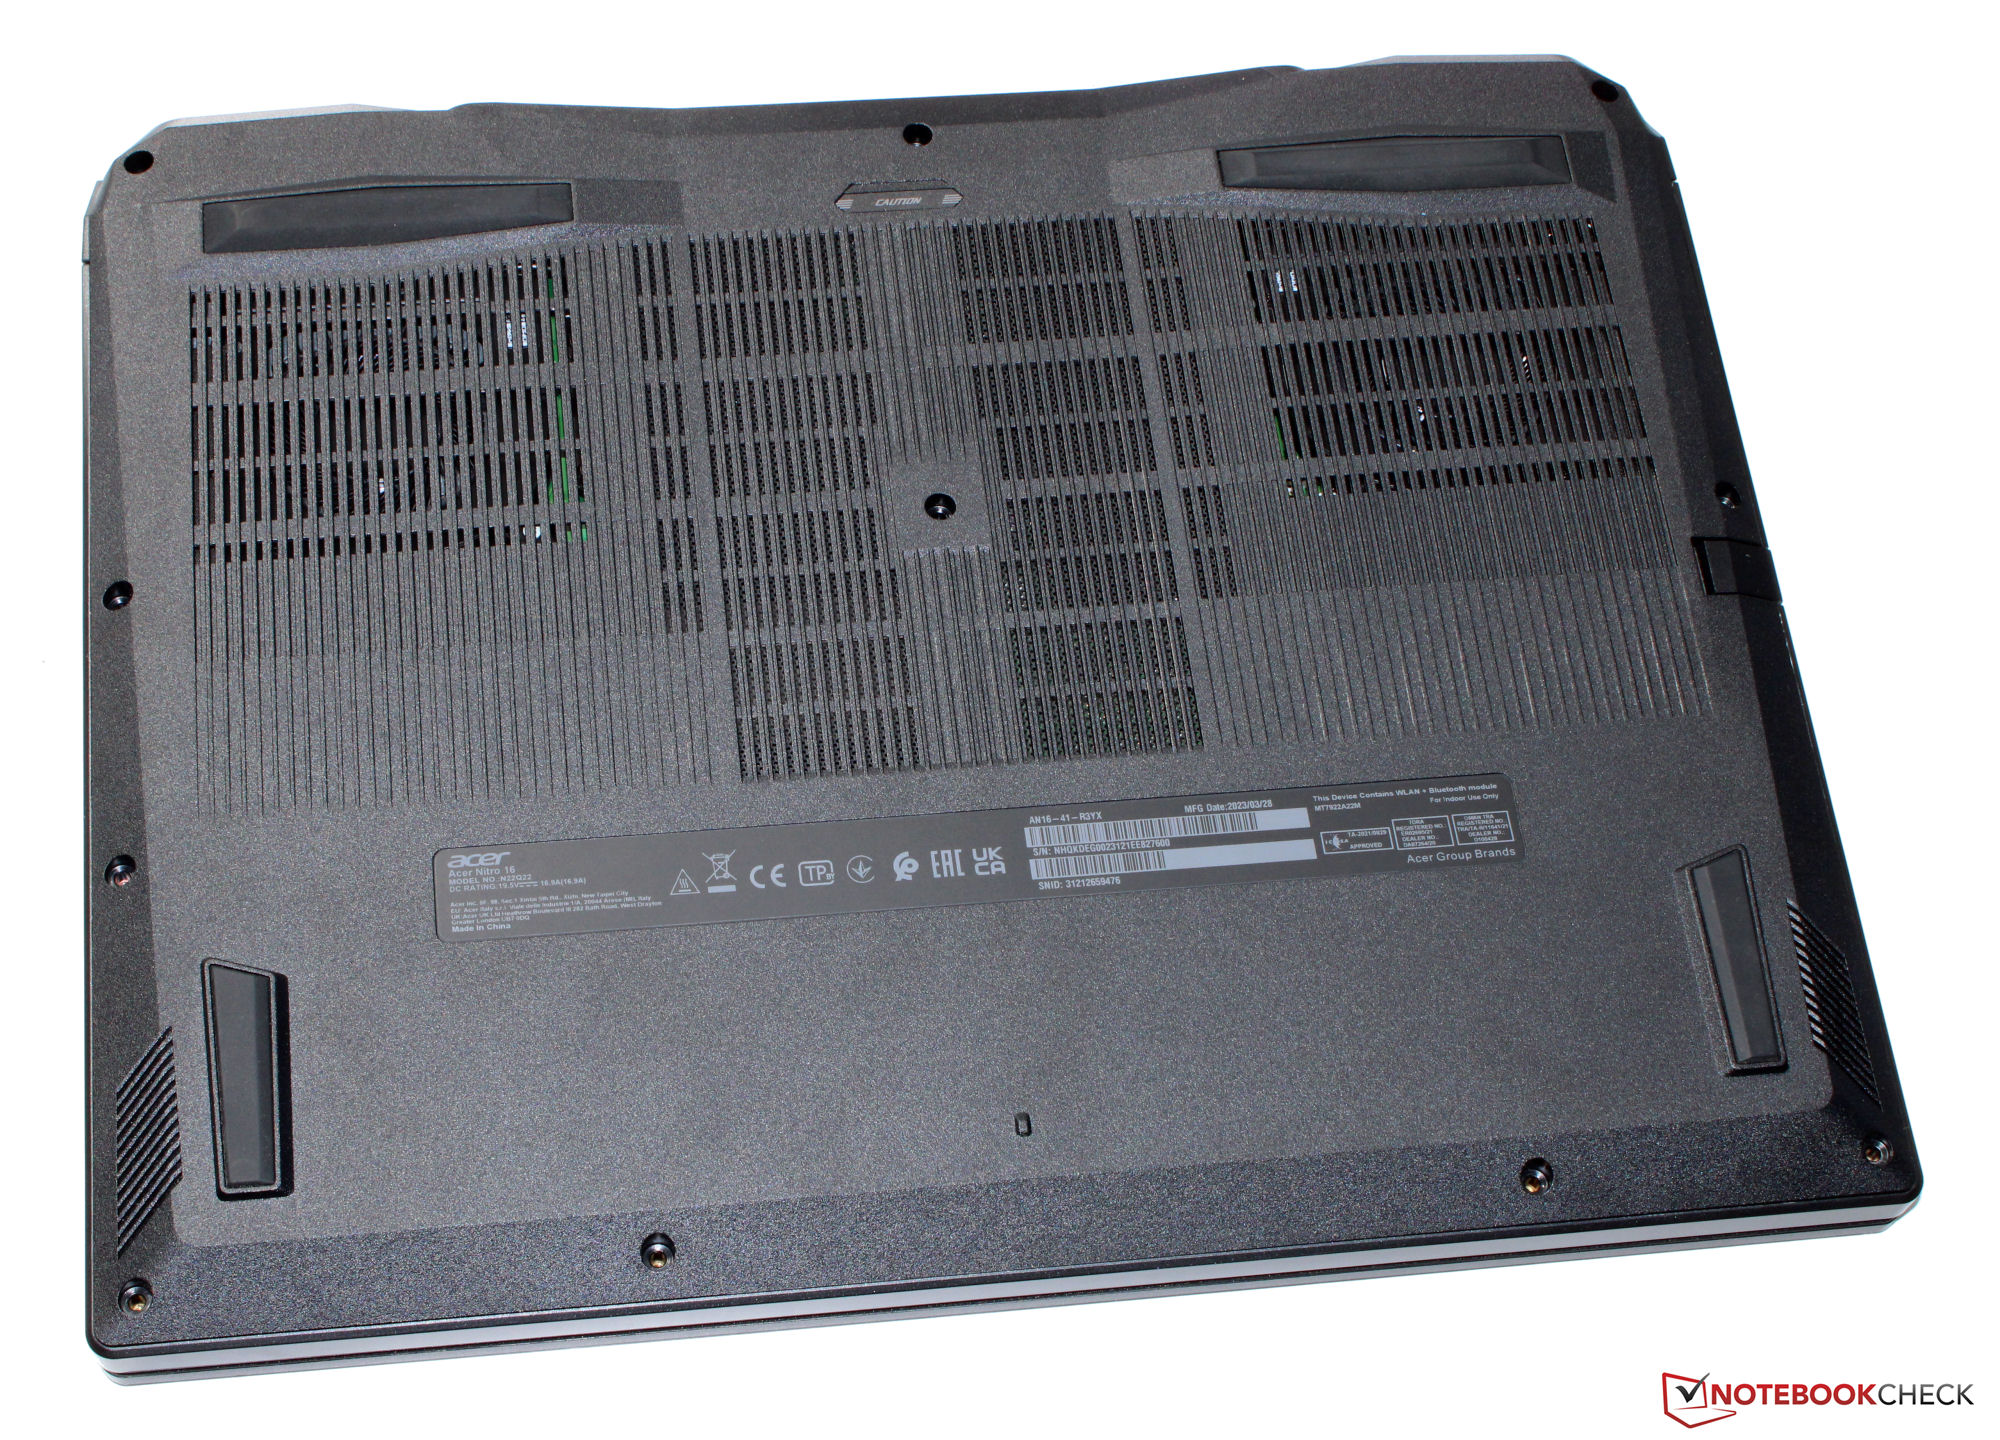
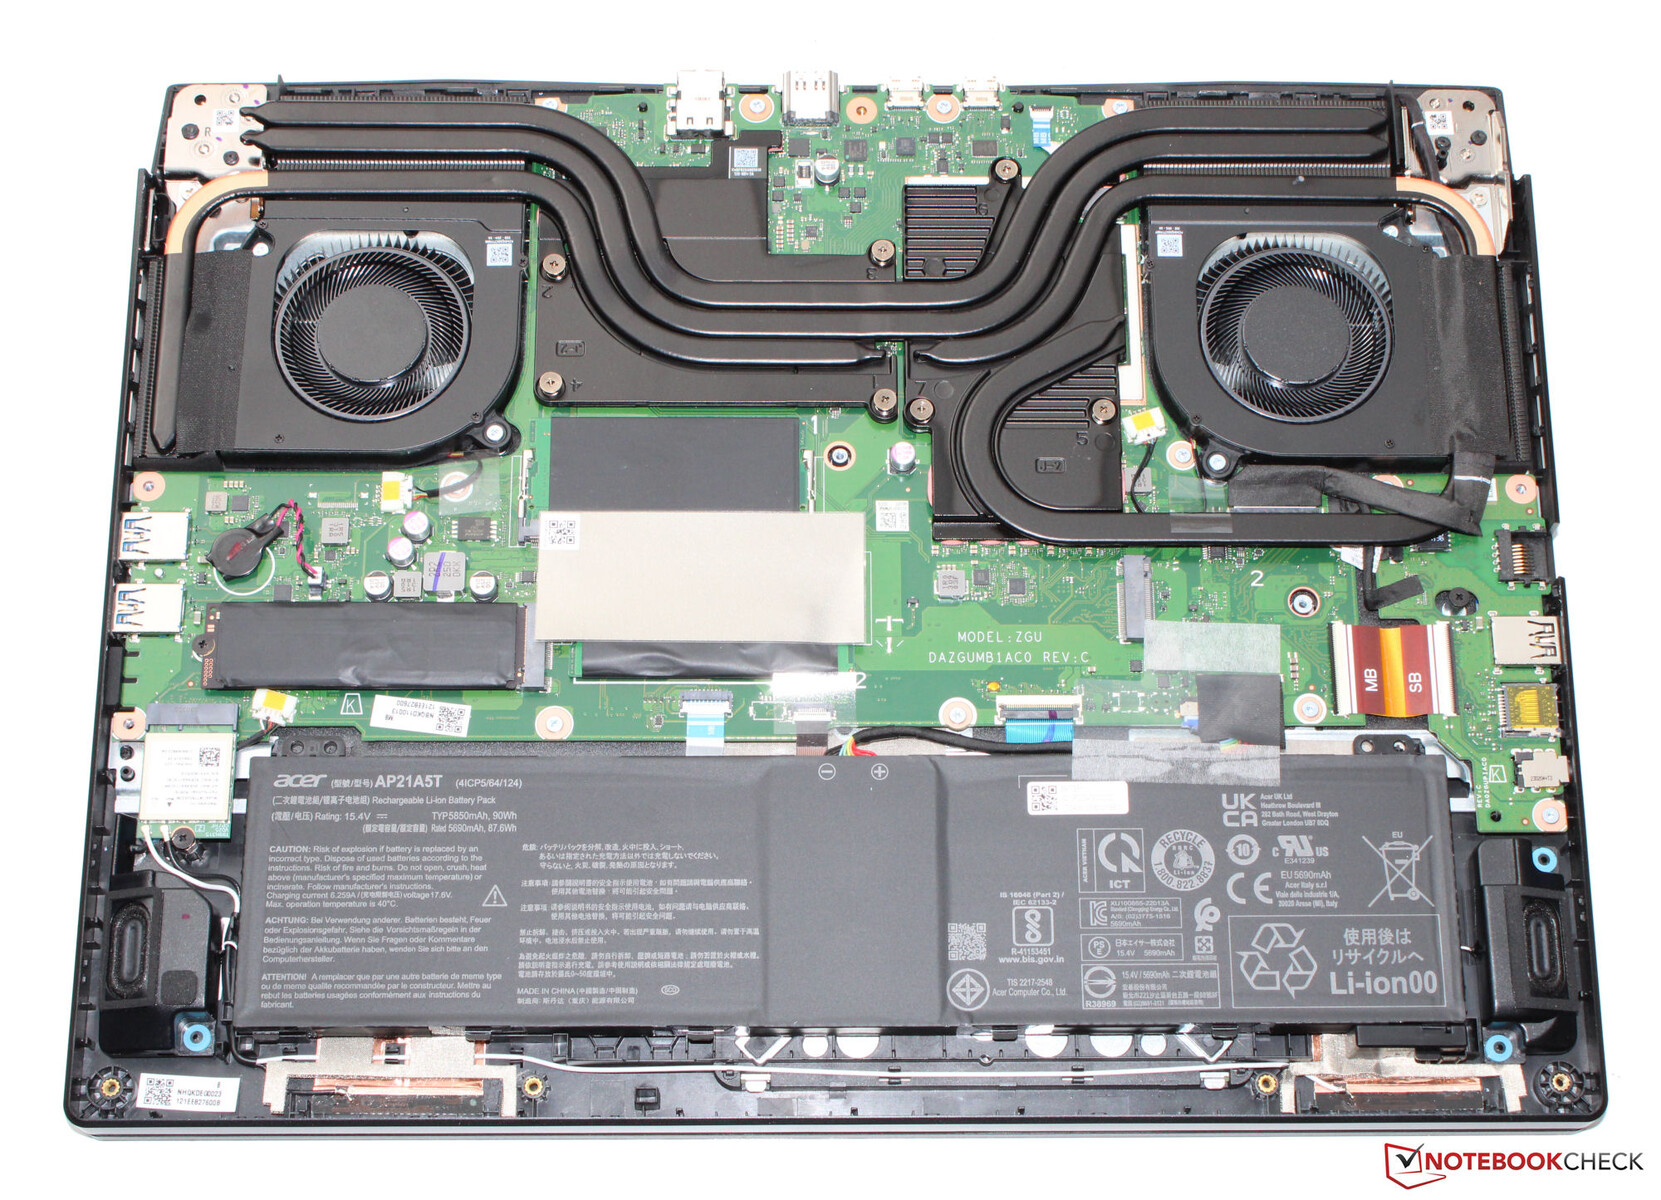
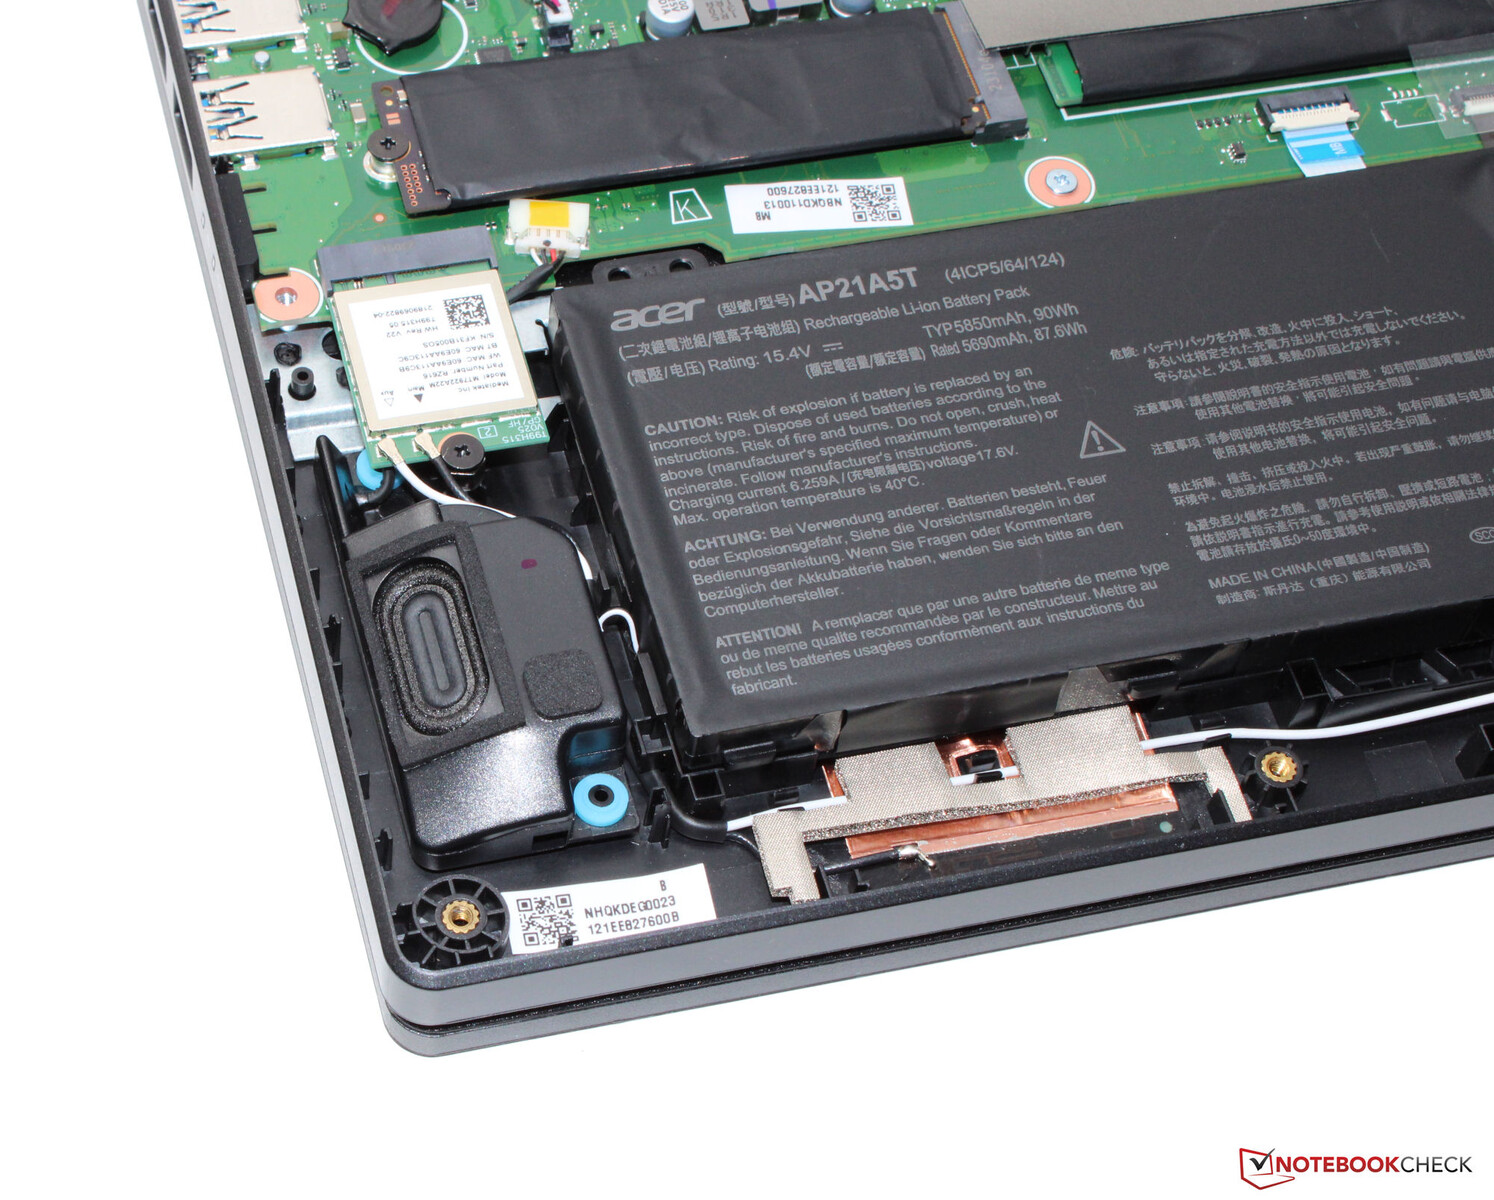
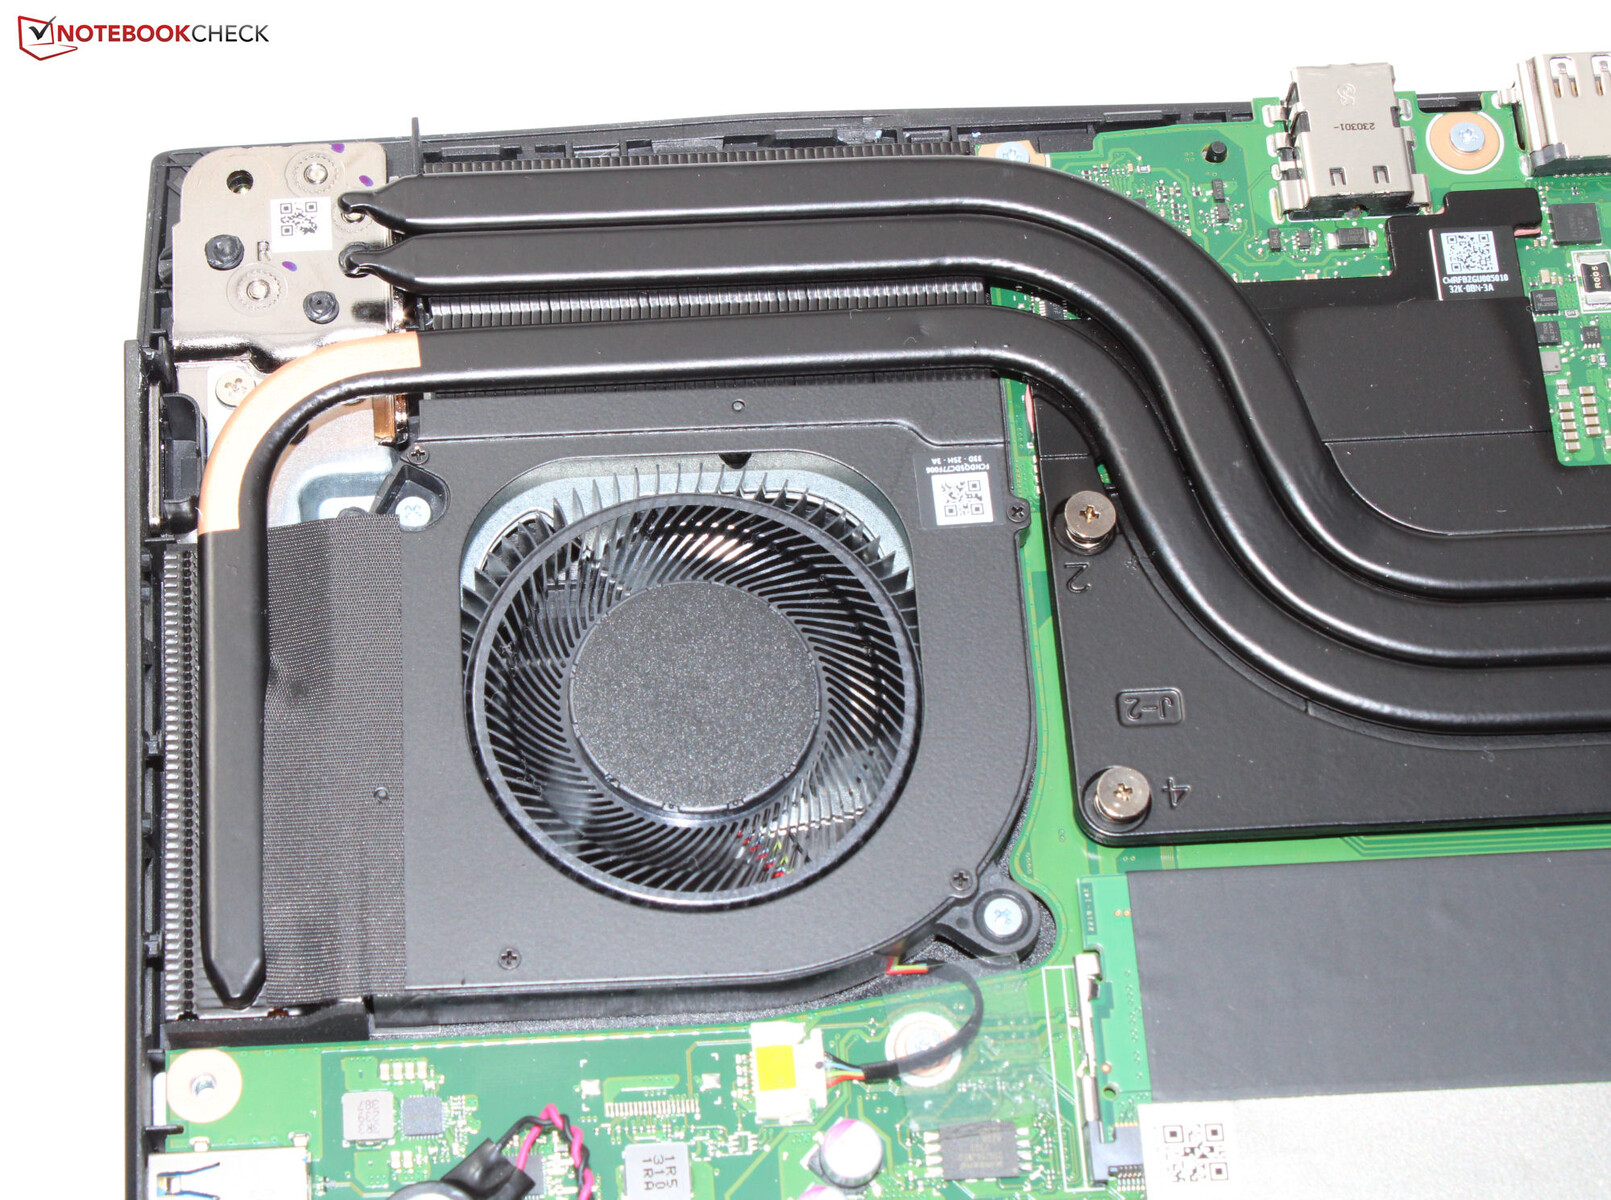
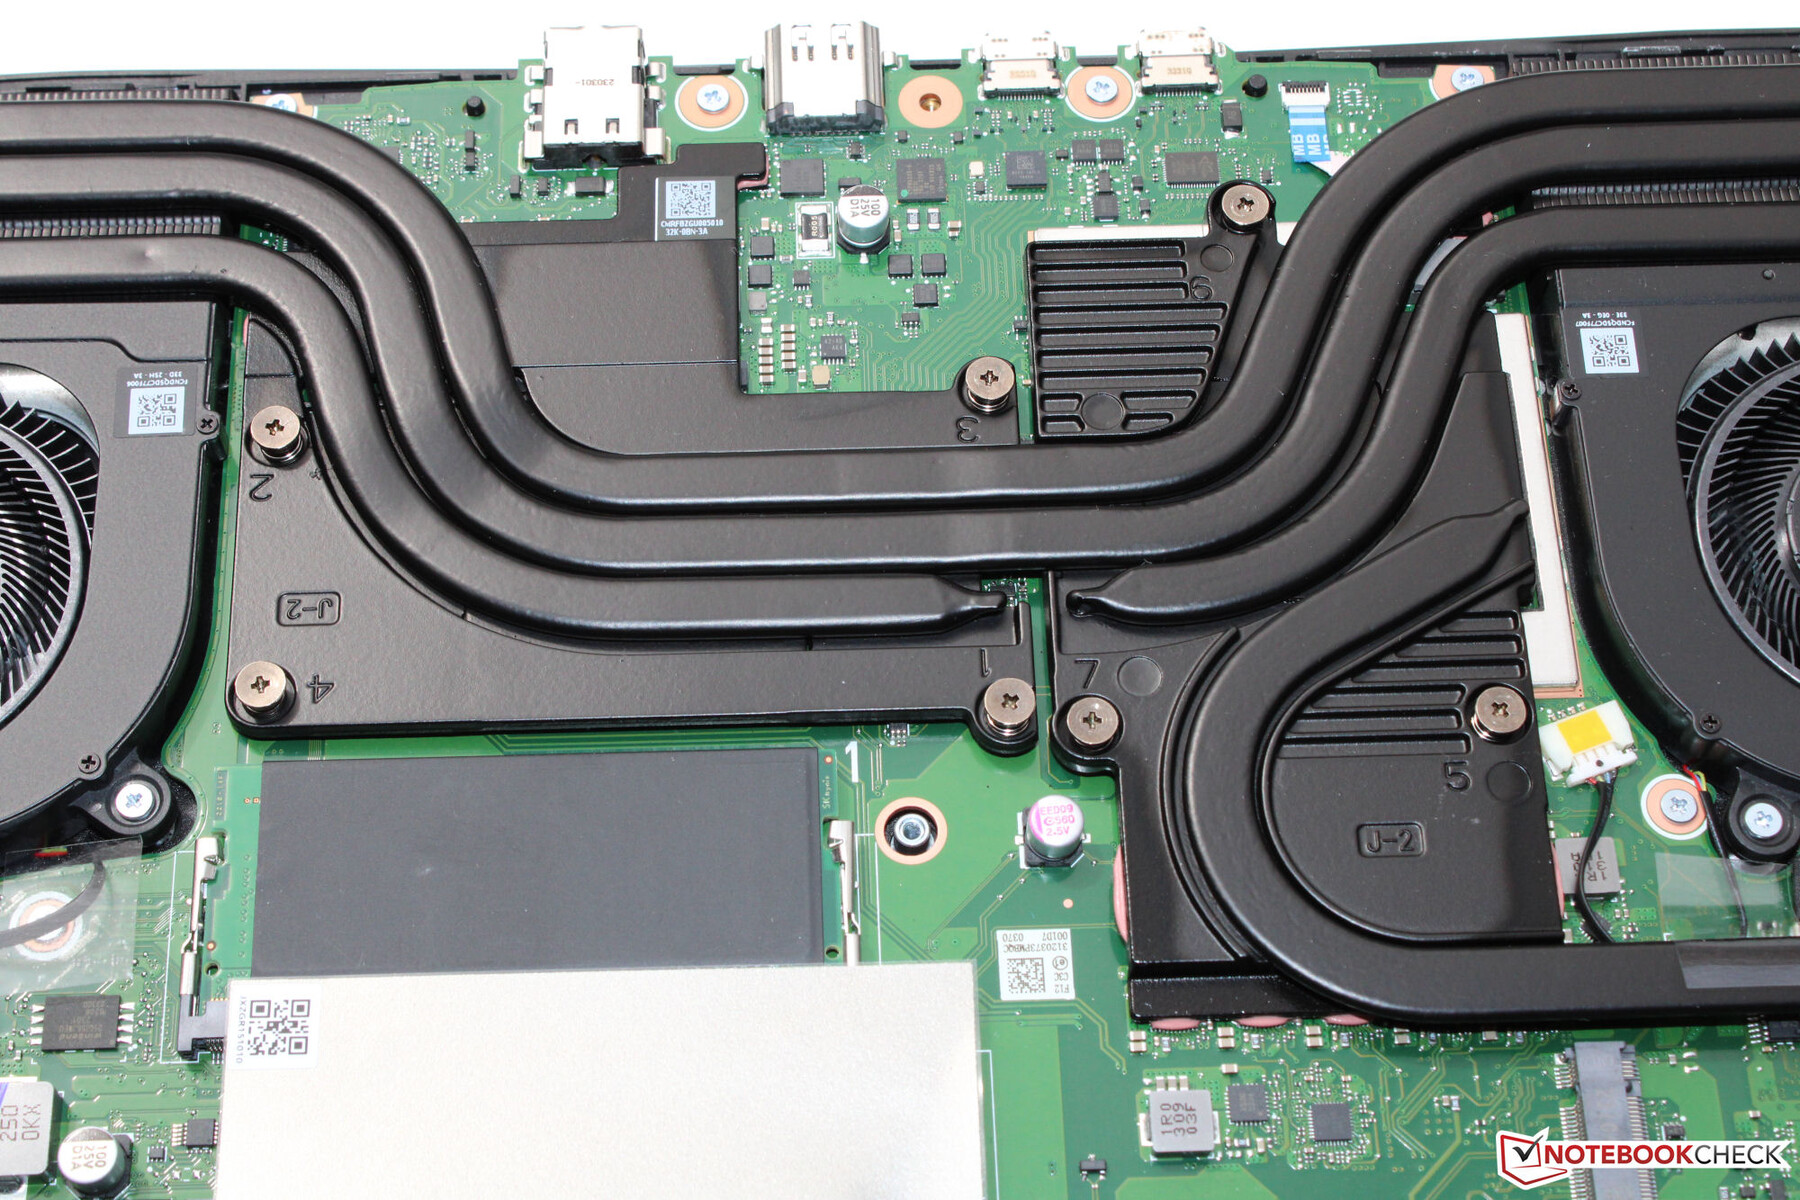
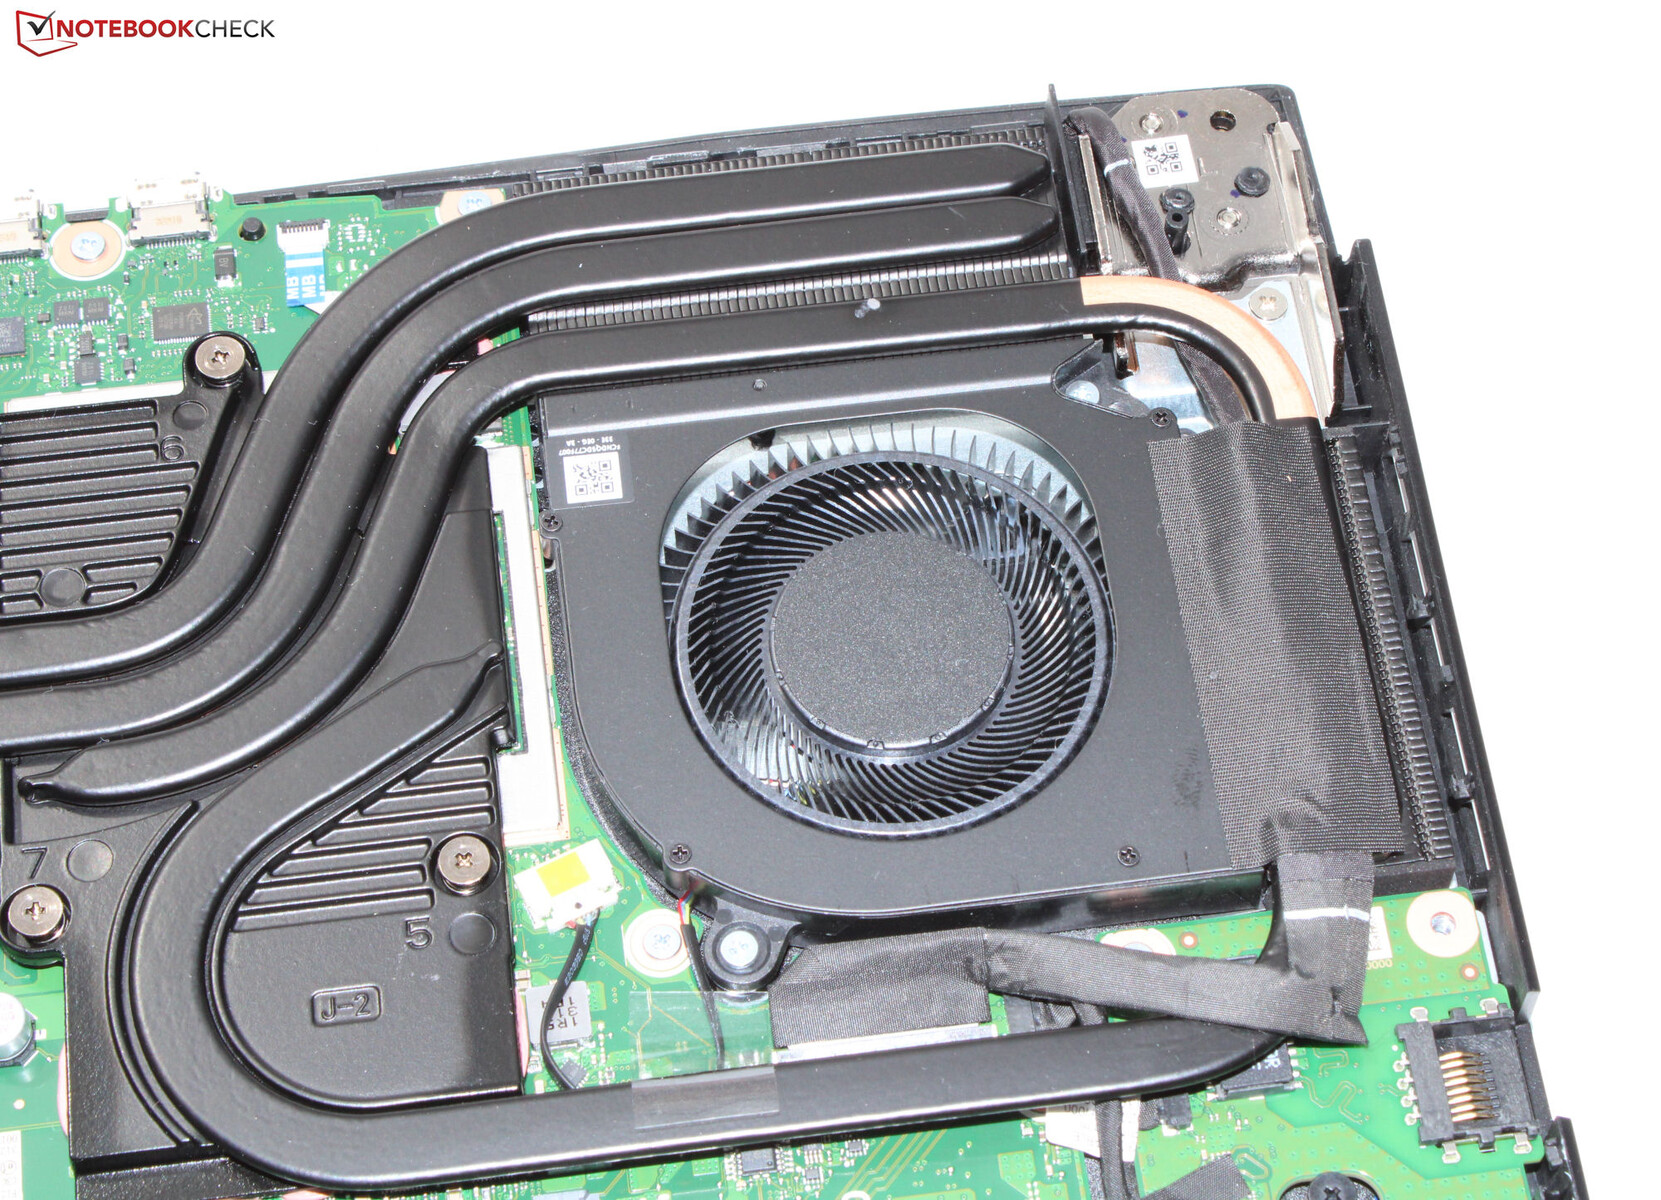
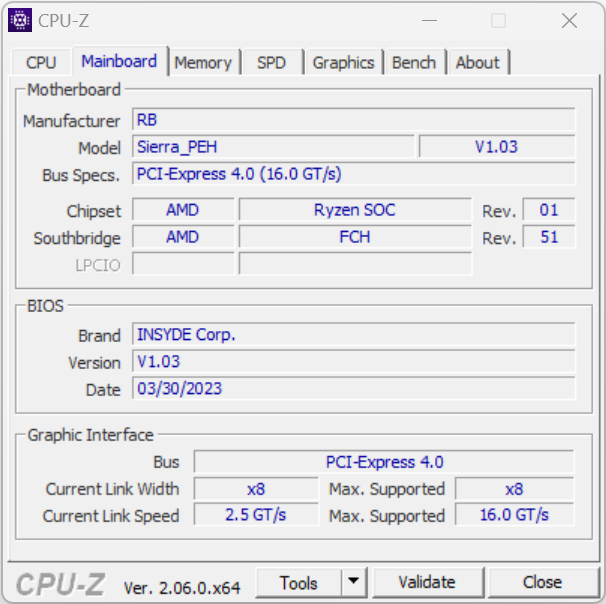
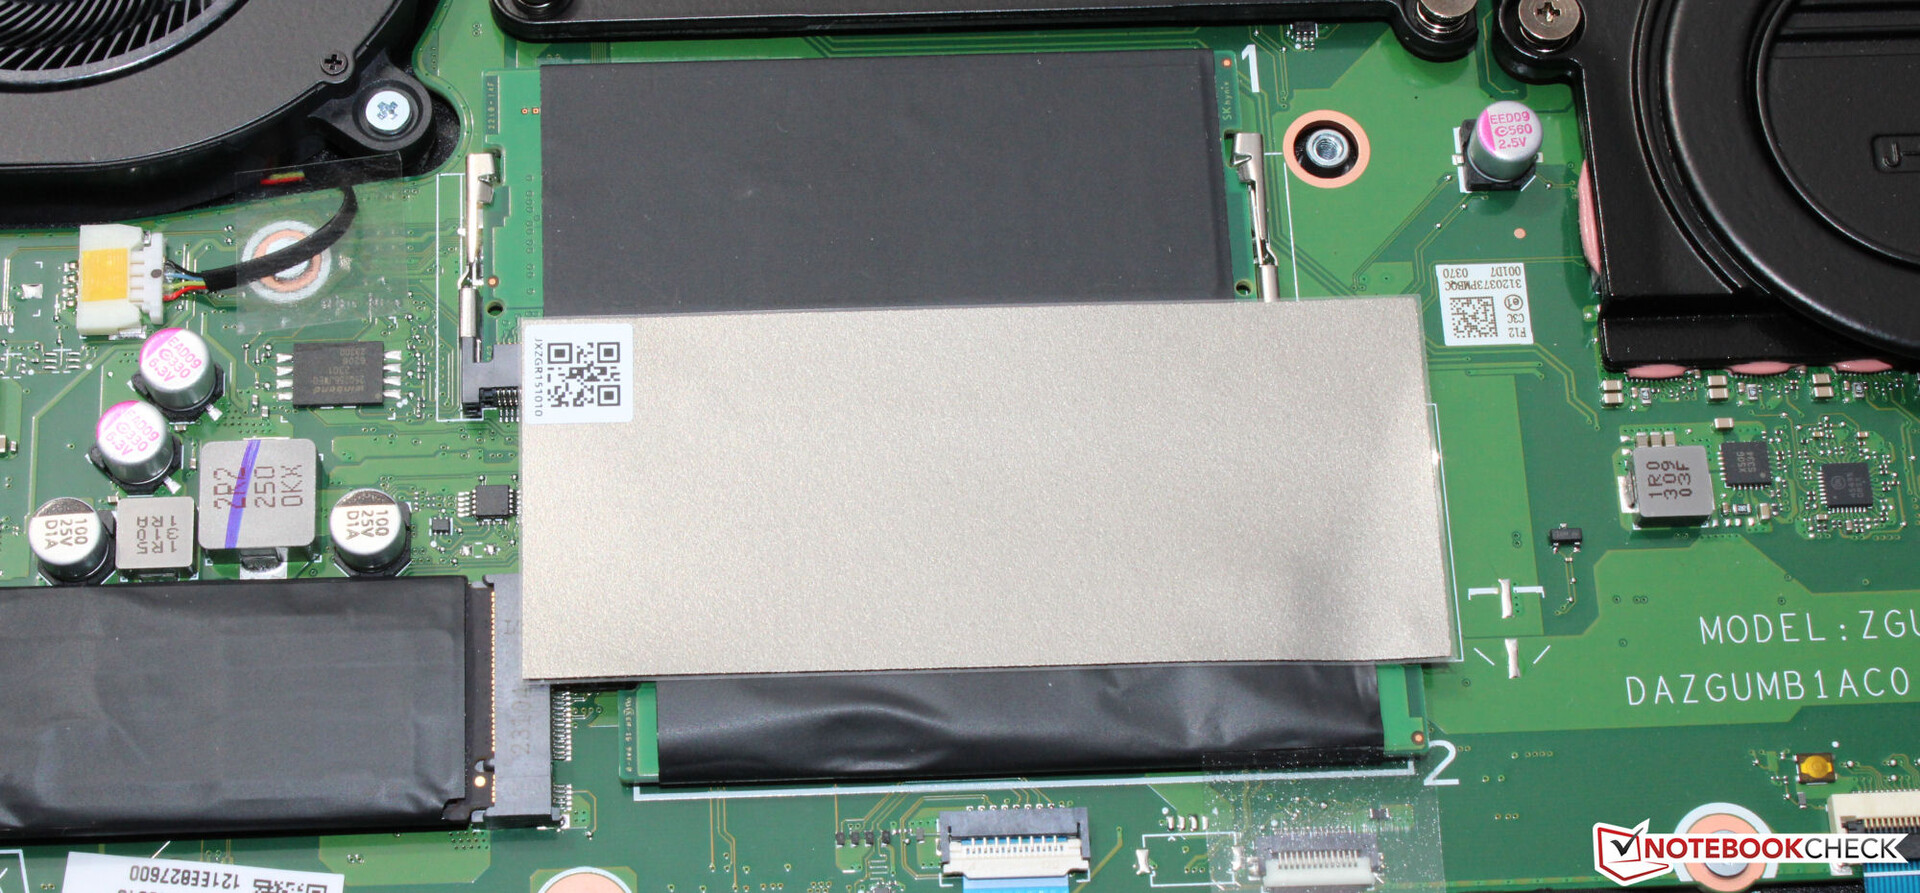
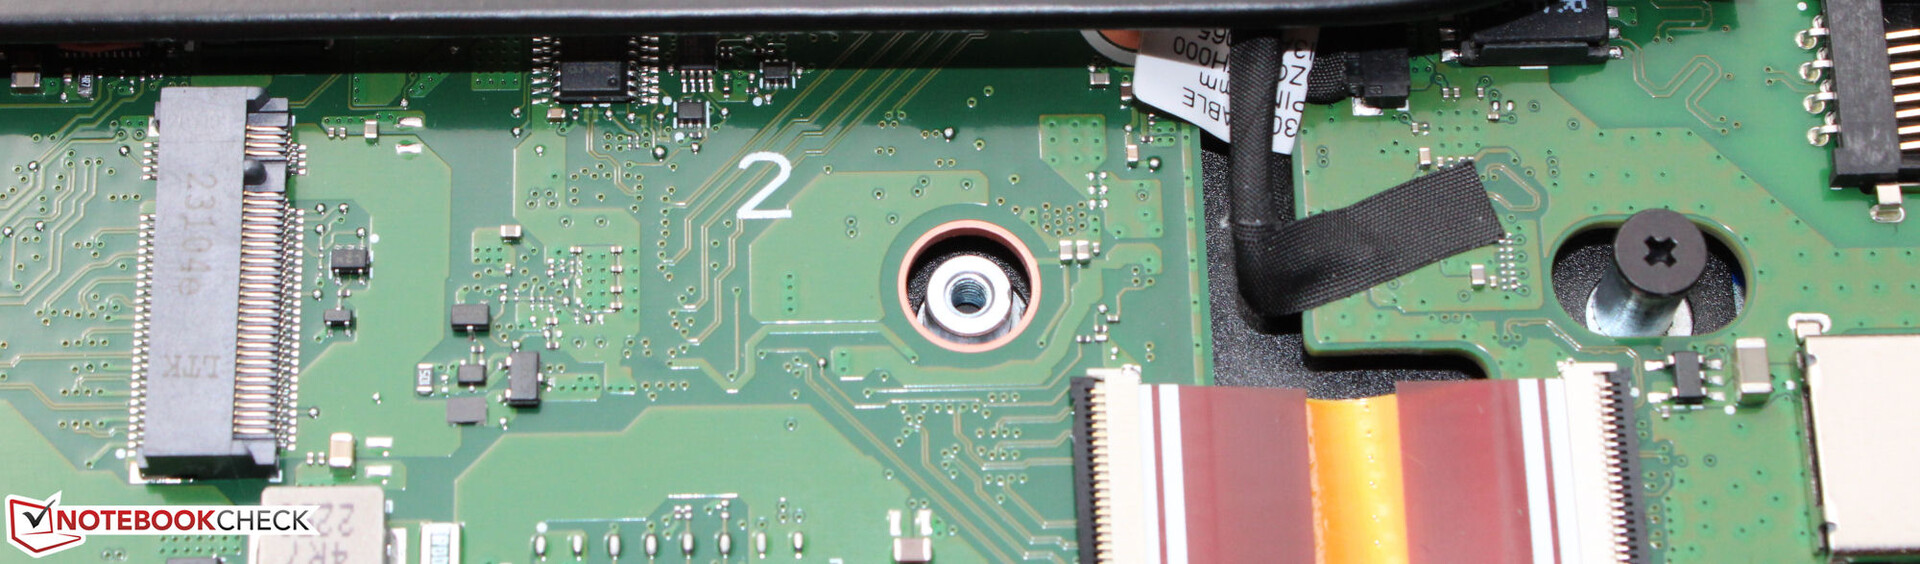
Servicing
After removing the screws on the underside of the case, the base unit can be removed with the help of a flat spatula or plectrum. Be careful: The base unit is secured quite firmly in place. Subsequently, the memory banks can be accessed (both occupied) as well as the SSD (PCIe 4), the second M.2-2280 slot (PCIe 4), the BIOS battery, the Wi-Fi module, the fans, the speakers and the battery.
Warranty
Acer has granted the 16-inch device a two-year guarantee. This can be extended to three years at an additional cost of almost $100.
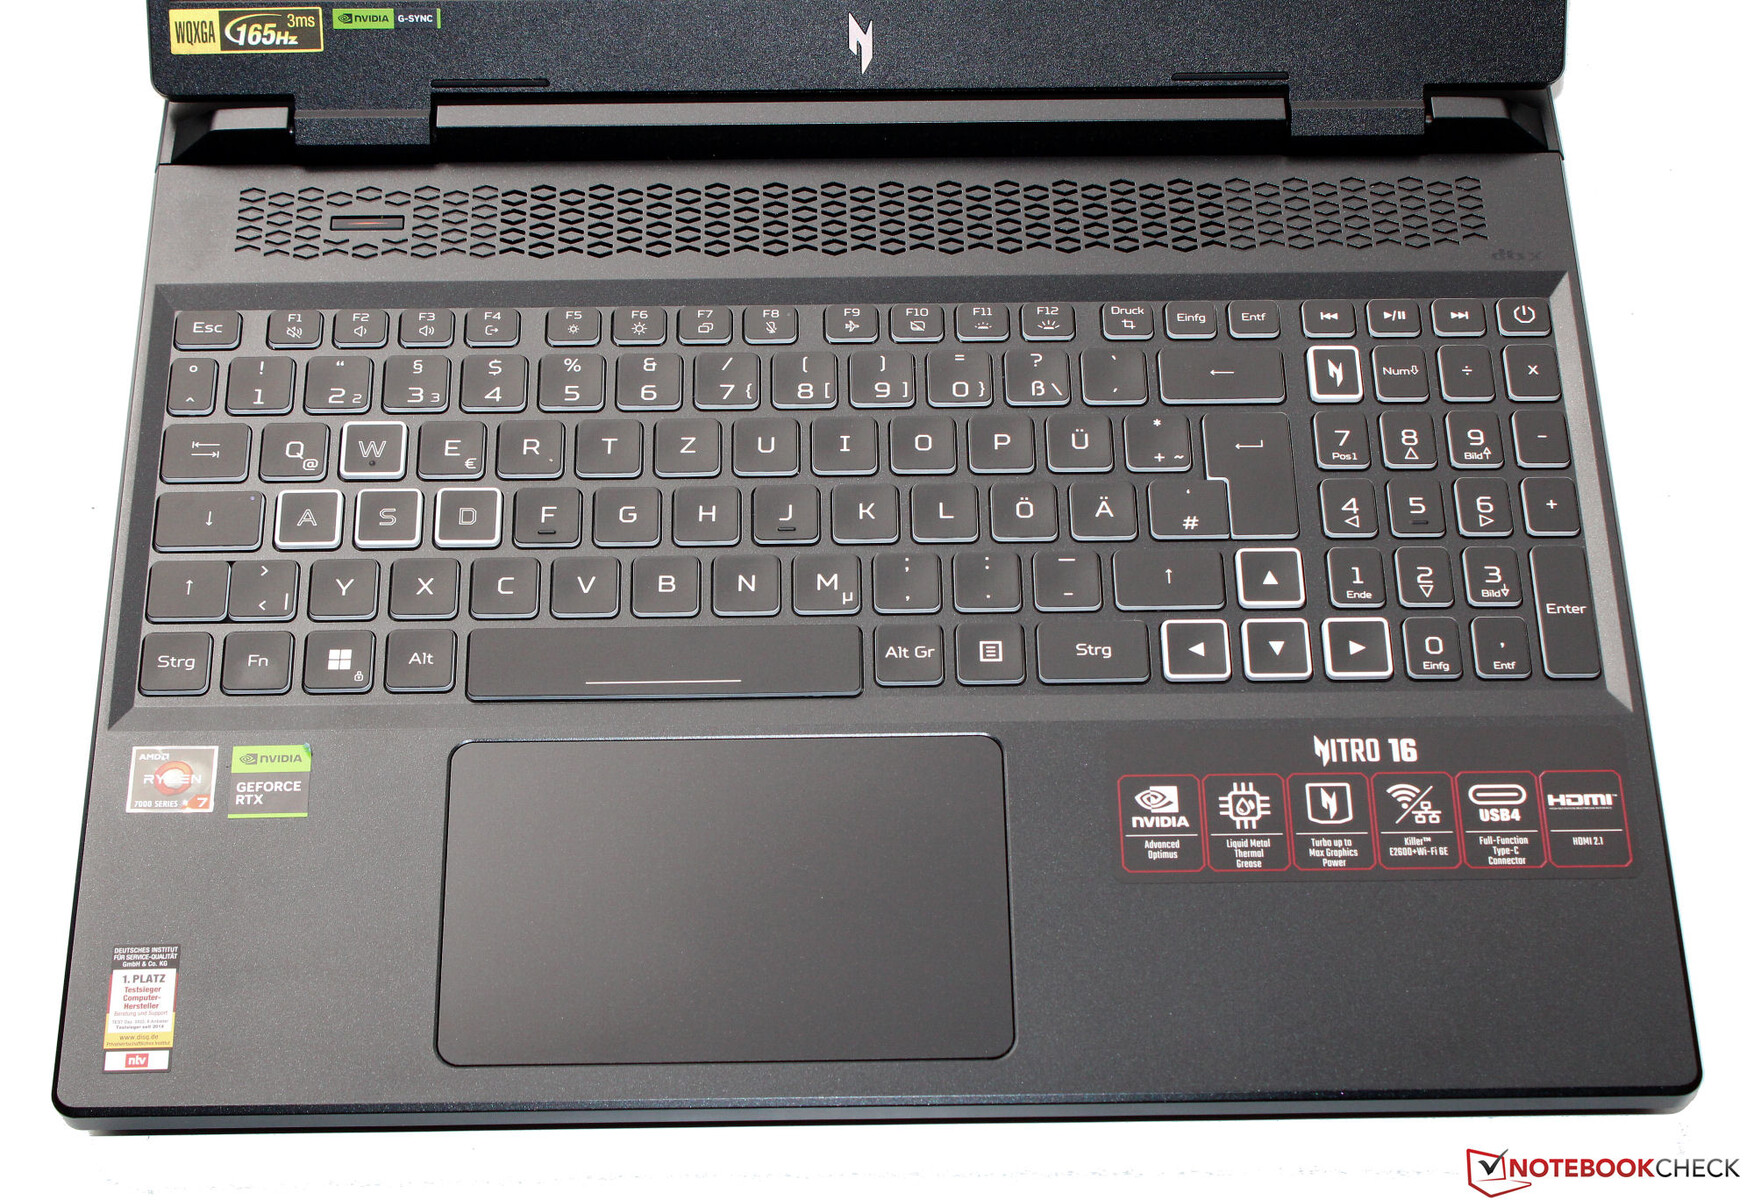
Input devices - The Acer Nitro comes with RGB backlighting
Keyboard
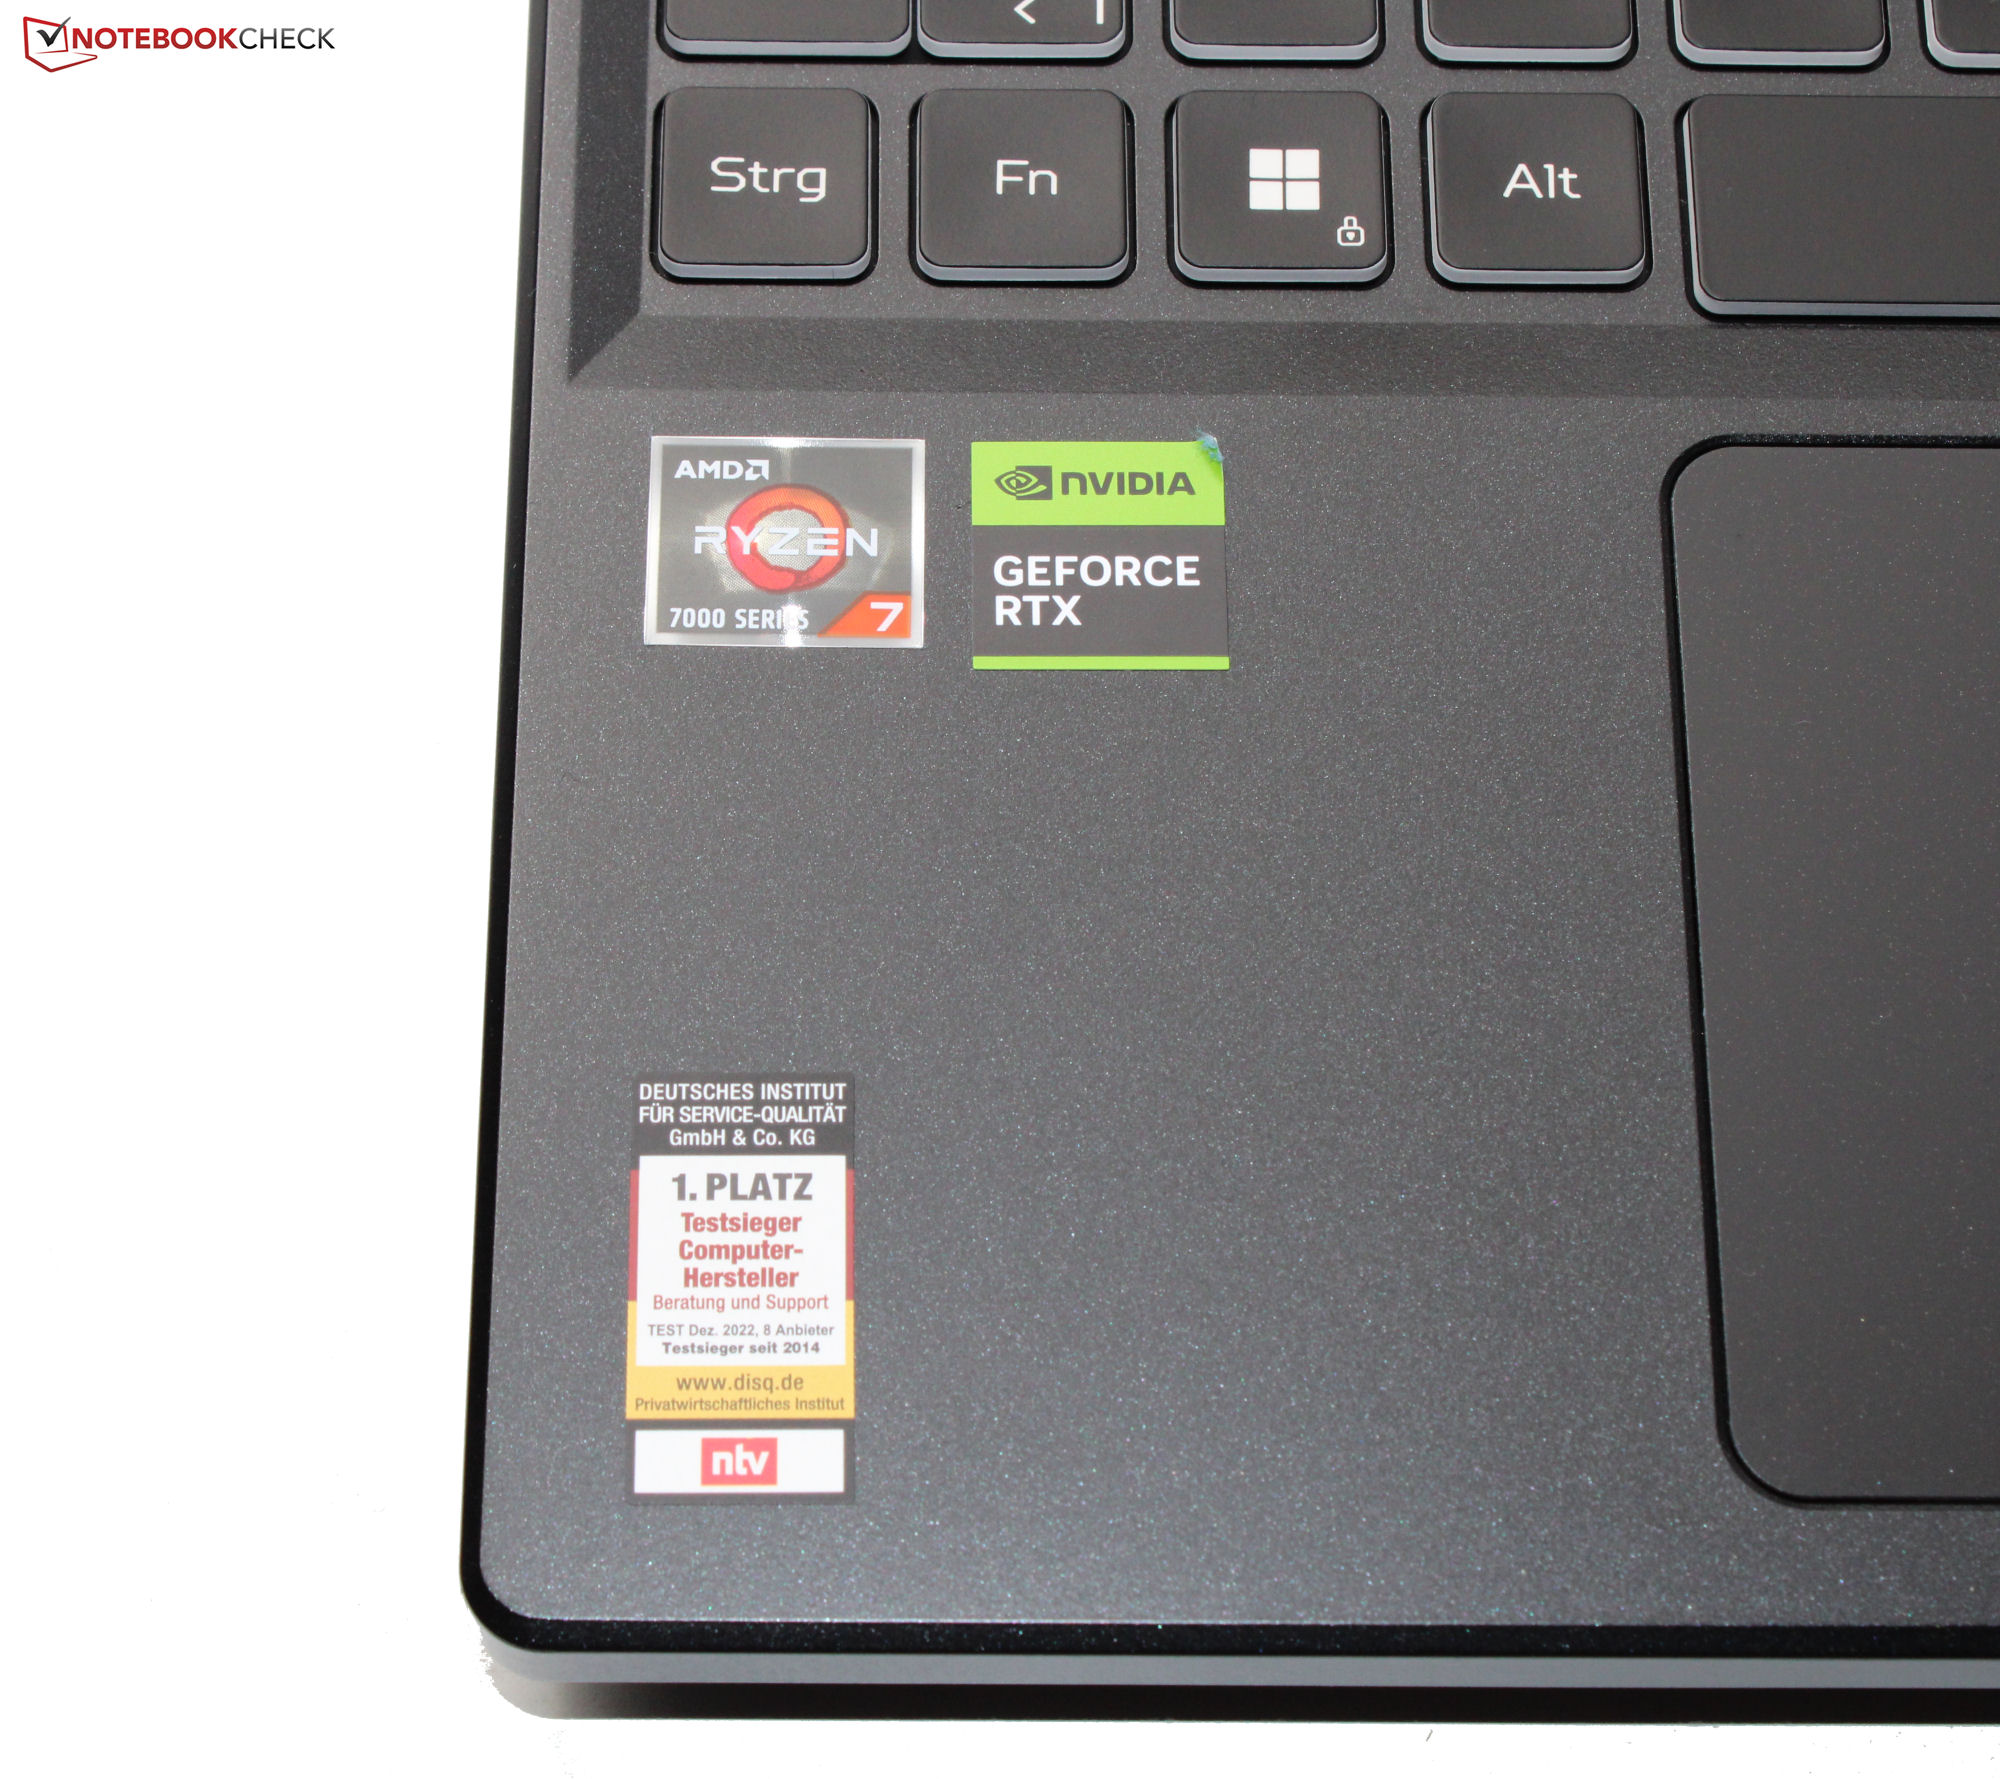
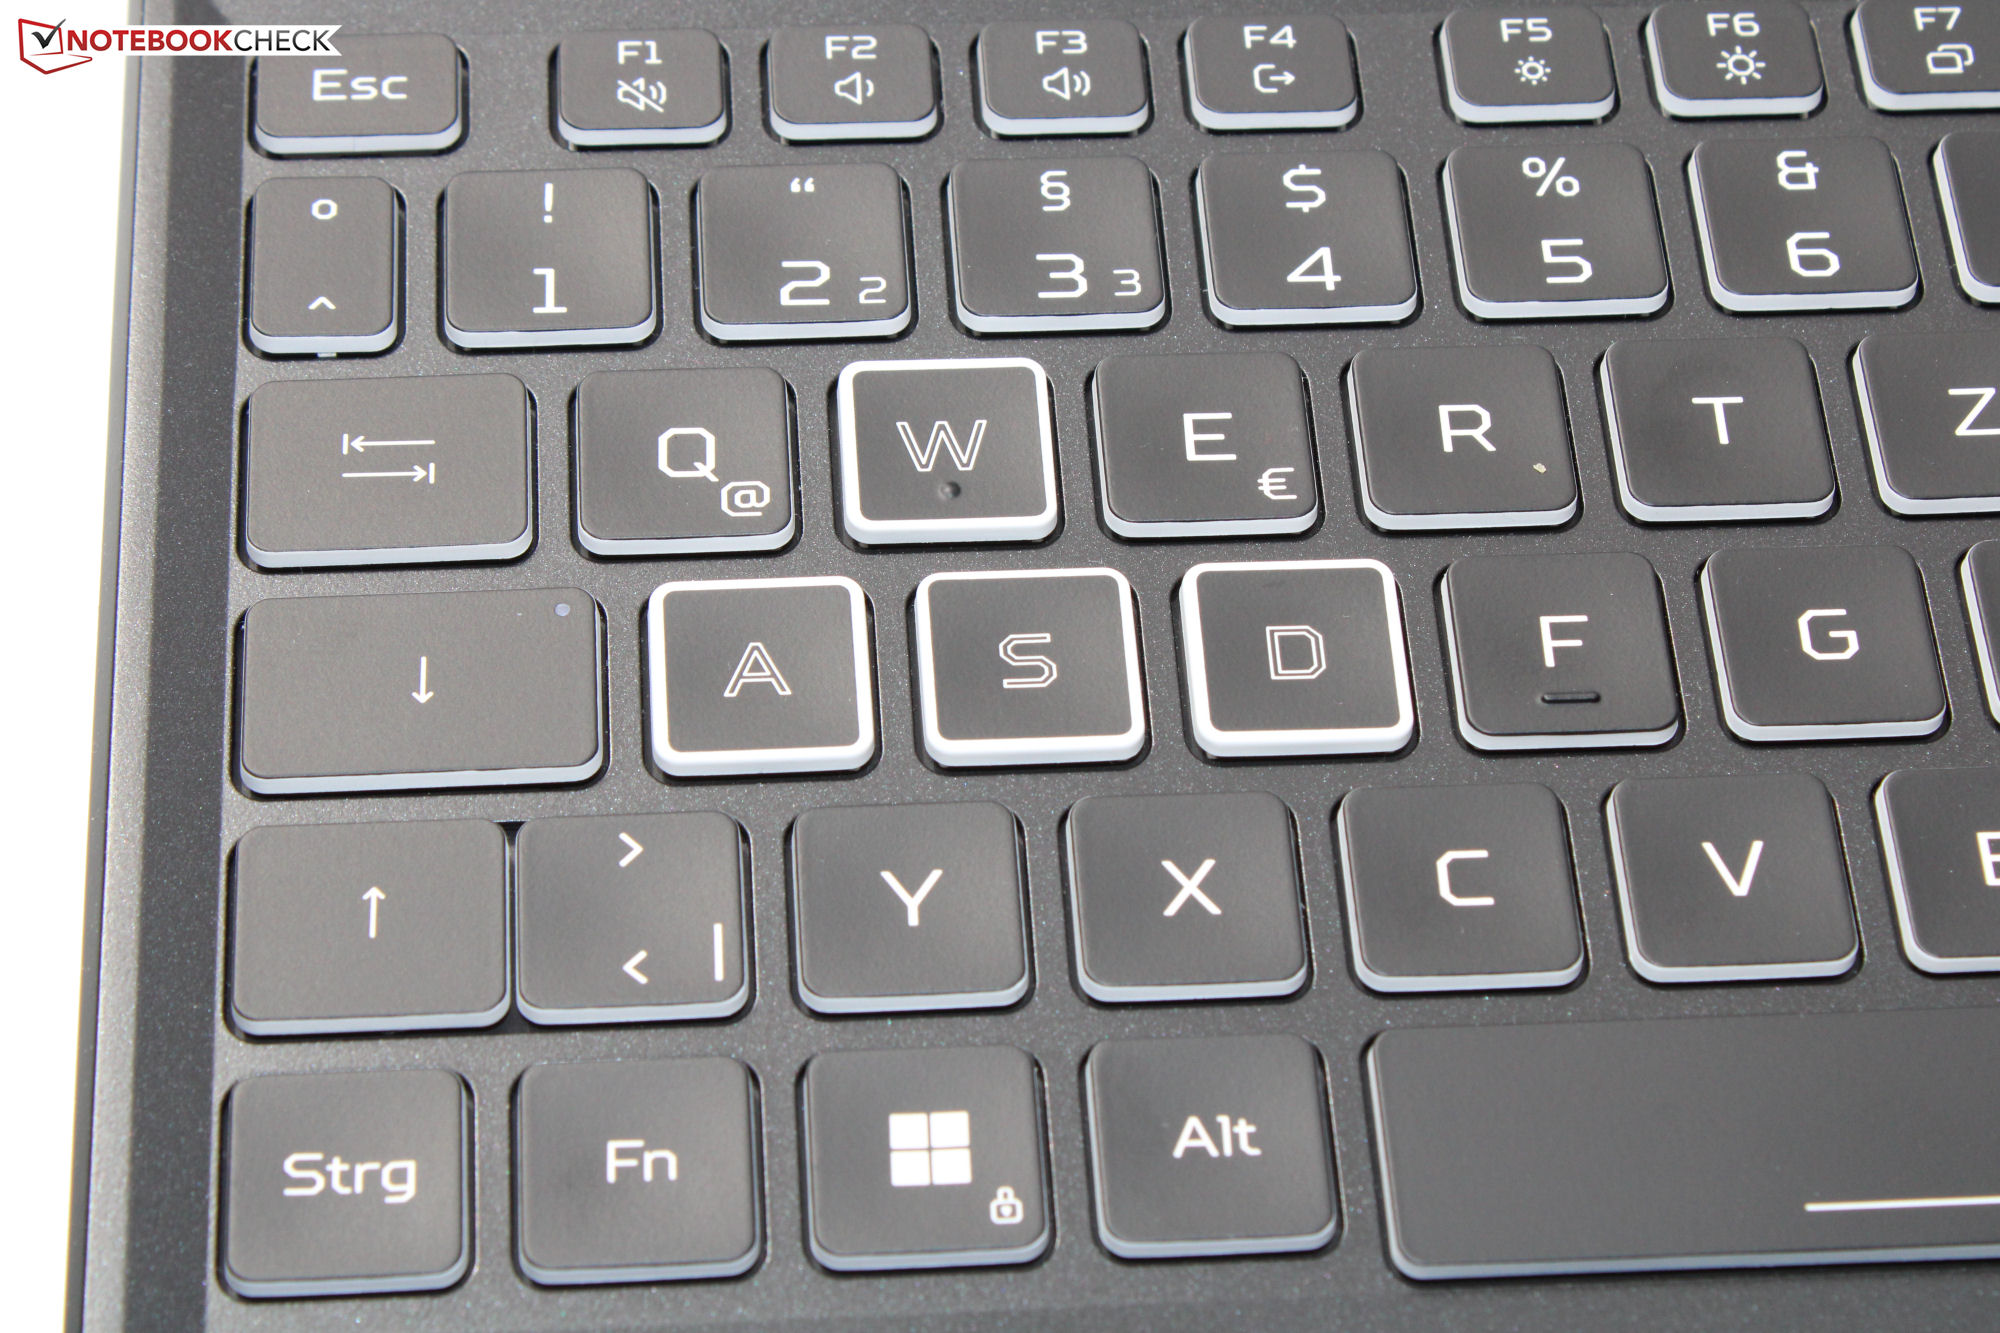
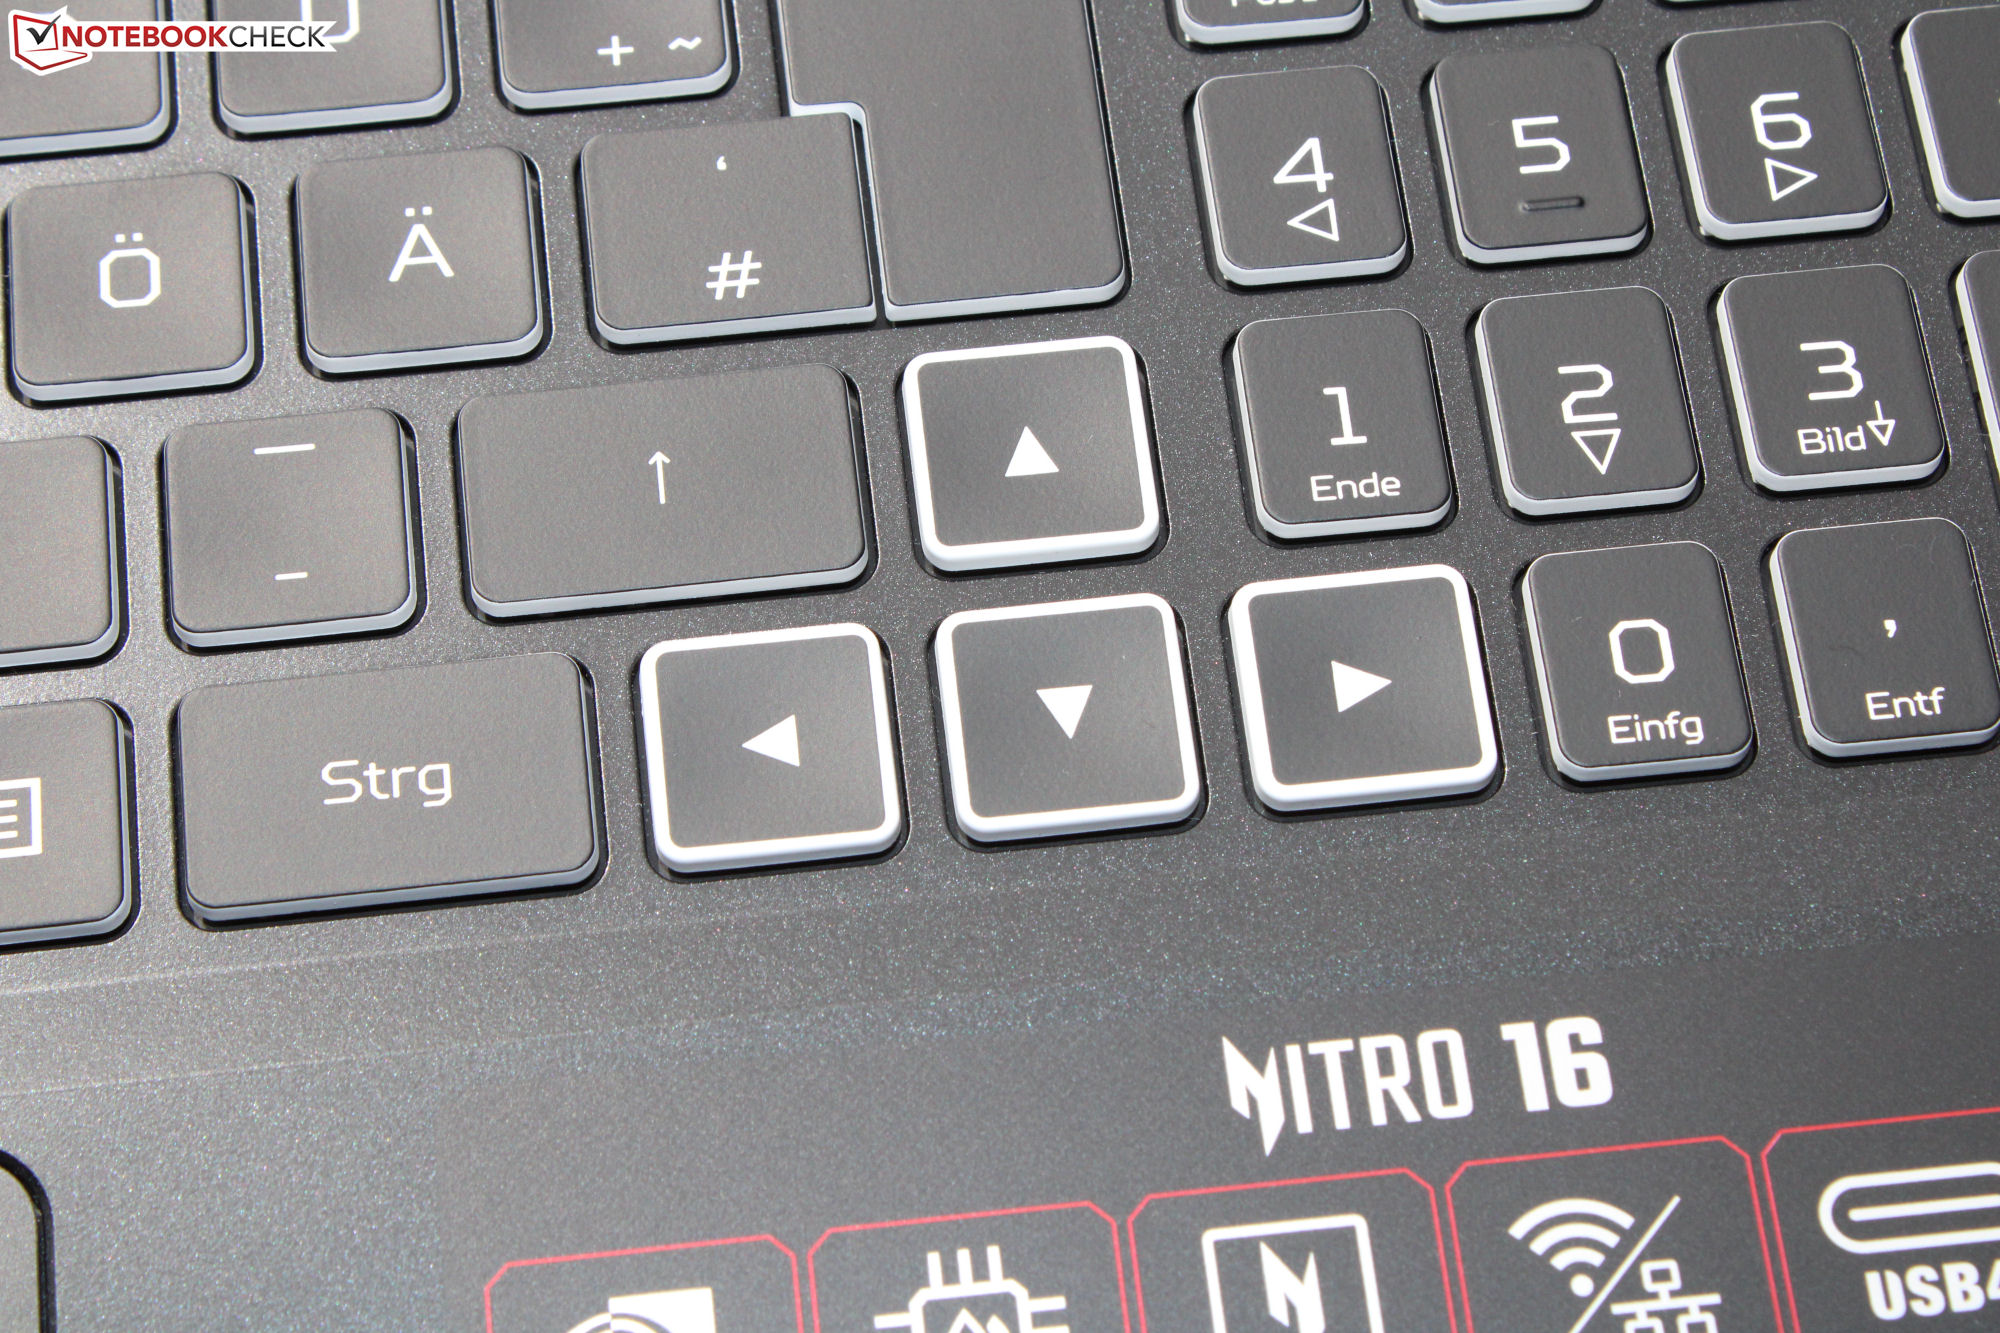
Acer has equipped the AN16 with a chiclet keyboard which includes a numerical keypad as well as RGB lighting and is made from concave keys (letter, number row) and flat keys (function keys, numerical pad). The WASD and arrow keys are visually accentuated. That also applies to the separate NitroSense key which opens the laptop's similarly-named control center.
All the keys have short travel and a clearly defined pressure point. However, their resistance could be a little crisper. When typing, the keyboard flexes slightly but without being particularly annoying. All in all, Acer has delivered a keyboard fit for everyday use.
Touchpad
A multitouch clickpad acts as a mouse replacement (approx. 12.6 x 7.7 cm) with its smooth surface ensuring a pleasant input experience. It possesses short travel and a clear pressure point.
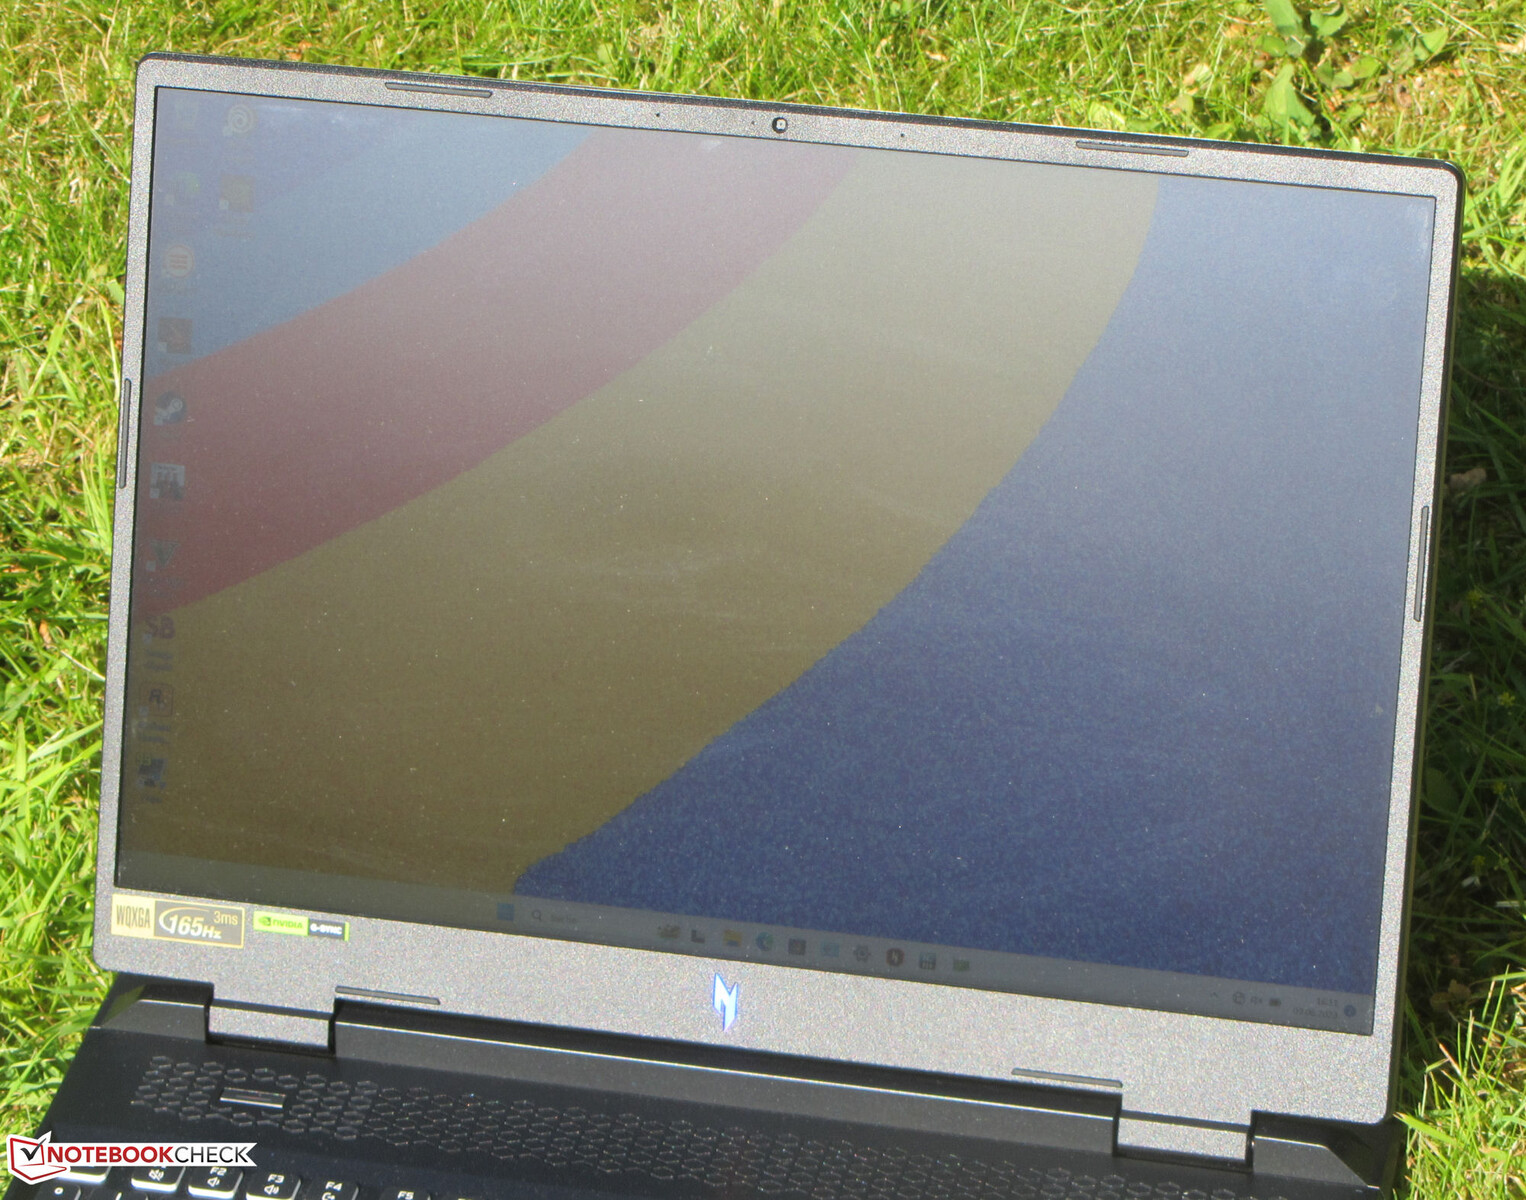
Display - Acer has treated the AN16 to a bright panel

The matte, 16-inch (2,560 x 1,600 pixels, IPS), 16:10 aspect ratio display scores well with G-Sync support, the absence of PWM flickering and fast response times.
The 165 Hz panel's brightness and contrast fulfil their expectations (> 300 cd/m² and 1,000:1, respectively). In particular, the display's brightness is worth highlighting (520 cd/m²).
| |||||||||||||||||||||||||
Brightness Distribution: 91 %
Center on Battery: 520 cd/m²
Contrast: 1333:1 (Black: 0.39 cd/m²)
ΔE ColorChecker Calman: 1.94 | ∀{0.5-29.43 Ø4.71}
calibrated: 0.74
ΔE Greyscale Calman: 2.94 | ∀{0.09-98 Ø4.96}
69.9% AdobeRGB 1998 (Argyll 3D)
99.1% sRGB (Argyll 3D)
67.9% Display P3 (Argyll 3D)
Gamma: 2.37
CCT: 6443 K
| Acer Nitro 16 AN16-41 BOE CQ NE16QDM-NY1, IPS, 2560x1600, 16" | Asus TUF Gaming A16 FA617XS BOE NE160WUM-NX2, IPS, 1920x1200, 16" | Lenovo Legion Pro 5 16ARX8 CSOT T3 MNG007DA1-Q, IPS, 2560x1600, 16" | Medion Erazer Major X20 BOE CQ NE160QDM-NZ1, IPS, 2560x1600, 16" | Aorus 15X ASF BOE CQ NE156QHM-NZ1, IPS, 2560x1440, 15.6" | |
|---|---|---|---|---|---|
| Display | 0% | 3% | 1% | 1% | |
| Display P3 Coverage (%) | 67.9 | 69.3 2% | 70.4 4% | 69.4 2% | 69.3 2% |
| sRGB Coverage (%) | 99.1 | 97.3 -2% | 99.6 1% | 98 -1% | 98.2 -1% |
| AdobeRGB 1998 Coverage (%) | 69.9 | 70.7 1% | 72.6 4% | 70.9 1% | 70.5 1% |
| Response Times | -71% | -23% | -33% | -51% | |
| Response Time Grey 50% / Grey 80% * (ms) | 11 ? | 15.6 ? -42% | 7 ? 36% | 13.1 ? -19% | 12.4 ? -13% |
| Response Time Black / White * (ms) | 5 ? | 10 ? -100% | 9.1 ? -82% | 7.3 ? -46% | 9.4 ? -88% |
| PWM Frequency (Hz) | |||||
| Screen | -3% | 16% | -16% | 0% | |
| Brightness middle (cd/m²) | 520 | 301 -42% | 355.3 -32% | 374 -28% | 316 -39% |
| Brightness (cd/m²) | 494 | 294 -40% | 340 -31% | 357 -28% | 301 -39% |
| Brightness Distribution (%) | 91 | 94 3% | 91 0% | 92 1% | 90 -1% |
| Black Level * (cd/m²) | 0.39 | 0.21 46% | 0.32 18% | 0.33 15% | 0.28 28% |
| Contrast (:1) | 1333 | 1433 8% | 1110 -17% | 1133 -15% | 1129 -15% |
| Colorchecker dE 2000 * | 1.94 | 1.79 8% | 1.13 42% | 2.43 -25% | 1.54 21% |
| Colorchecker dE 2000 max. * | 5.62 | 3.48 38% | 2.78 51% | 3.97 29% | 2.46 56% |
| Colorchecker dE 2000 calibrated * | 0.74 | 1.2 -62% | 0.32 57% | 1.4 -89% | 1.21 -64% |
| Greyscale dE 2000 * | 2.94 | 2.5 15% | 1.4 52% | 3.1 -5% | 1.3 56% |
| Gamma | 2.37 93% | 2.265 97% | 2.24 98% | 2.191 100% | 2.307 95% |
| CCT | 6443 101% | 6157 106% | 6372 102% | 6194 105% | 6456 101% |
| Total Average (Program / Settings) | -25% /
-12% | -1% /
7% | -16% /
-15% | -17% /
-7% |
* ... smaller is better
Out-of-the-box, the display boasts good color reproduction: With a deviation of around 1.9, the panel (DeltaE < 3) meets its requirements. Calibration reduces the deviation to 0.74 and ensures balanced gray scales. The panel completely covers the sRGB color space but, by contrast, not the AdobeRGB and DCI P3 color spaces. However, that is no different to the screens offered by the competition.


Display Response Times
| ↔ Response Time Black to White | ||
|---|---|---|
| 5 ms ... rise ↗ and fall ↘ combined | ↗ 2 ms rise |  |
| ↘ 3 ms fall | ||
| The screen shows very fast response rates in our tests and should be very well suited for fast-paced gaming. In comparison, all tested devices range from 0.1 (minimum) to 240 (maximum) ms. » 18 % of all devices are better. This means that the measured response time is better than the average of all tested devices (19.8 ms). | ||
| ↔ Response Time 50% Grey to 80% Grey | ||
| 11 ms ... rise ↗ and fall ↘ combined | ↗ 5 ms rise |  |
| ↘ 6 ms fall | ||
| The screen shows good response rates in our tests, but may be too slow for competitive gamers. In comparison, all tested devices range from 0.165 (minimum) to 636 (maximum) ms. » 25 % of all devices are better. This means that the measured response time is better than the average of all tested devices (31 ms). | ||
Screen Flickering / PWM (Pulse-Width Modulation)
| Screen flickering / PWM not detected |  | ||
In comparison: 52 % of all tested devices do not use PWM to dim the display. If PWM was detected, an average of 7757 (minimum: 5 - maximum: 343500) Hz was measured. | |||
The IPS panel has stable viewing angles and is legible from any position. The display can even be read outdoors due to its very high brightness.

Performance - AMD and Nvidia power the gaming laptop
Acer has multiple variants of the Nitro 16 - a mid-range gaming laptop - on offer. Ada Lovelace GPUs are combined with Intel or AMD CPUs. Our review model comes with AMD and can be had for around $2,000. Currently, devices in the series start at around $1,450. This gets you a computer consisting of a Ryzen 5 7535HS, an RTX 4050, 16 GB of RAM, a 1TB SSD, and a WUXGA display.
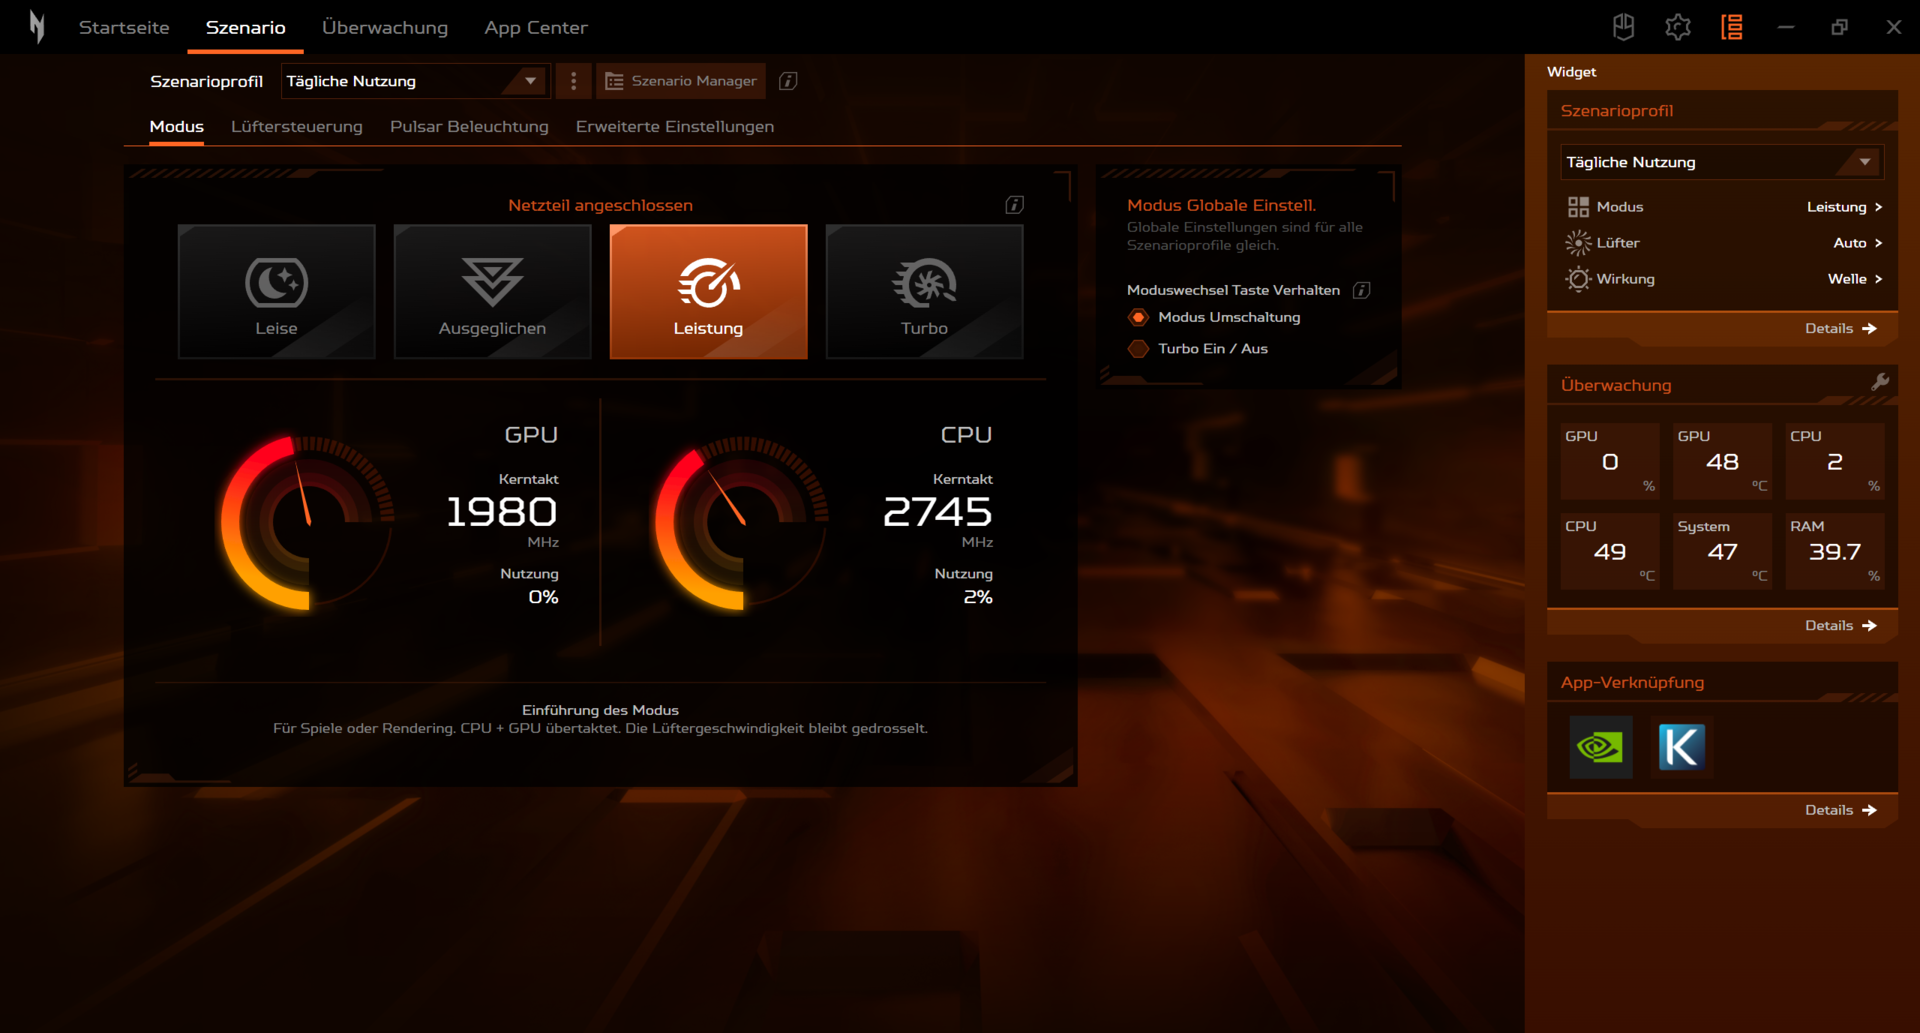
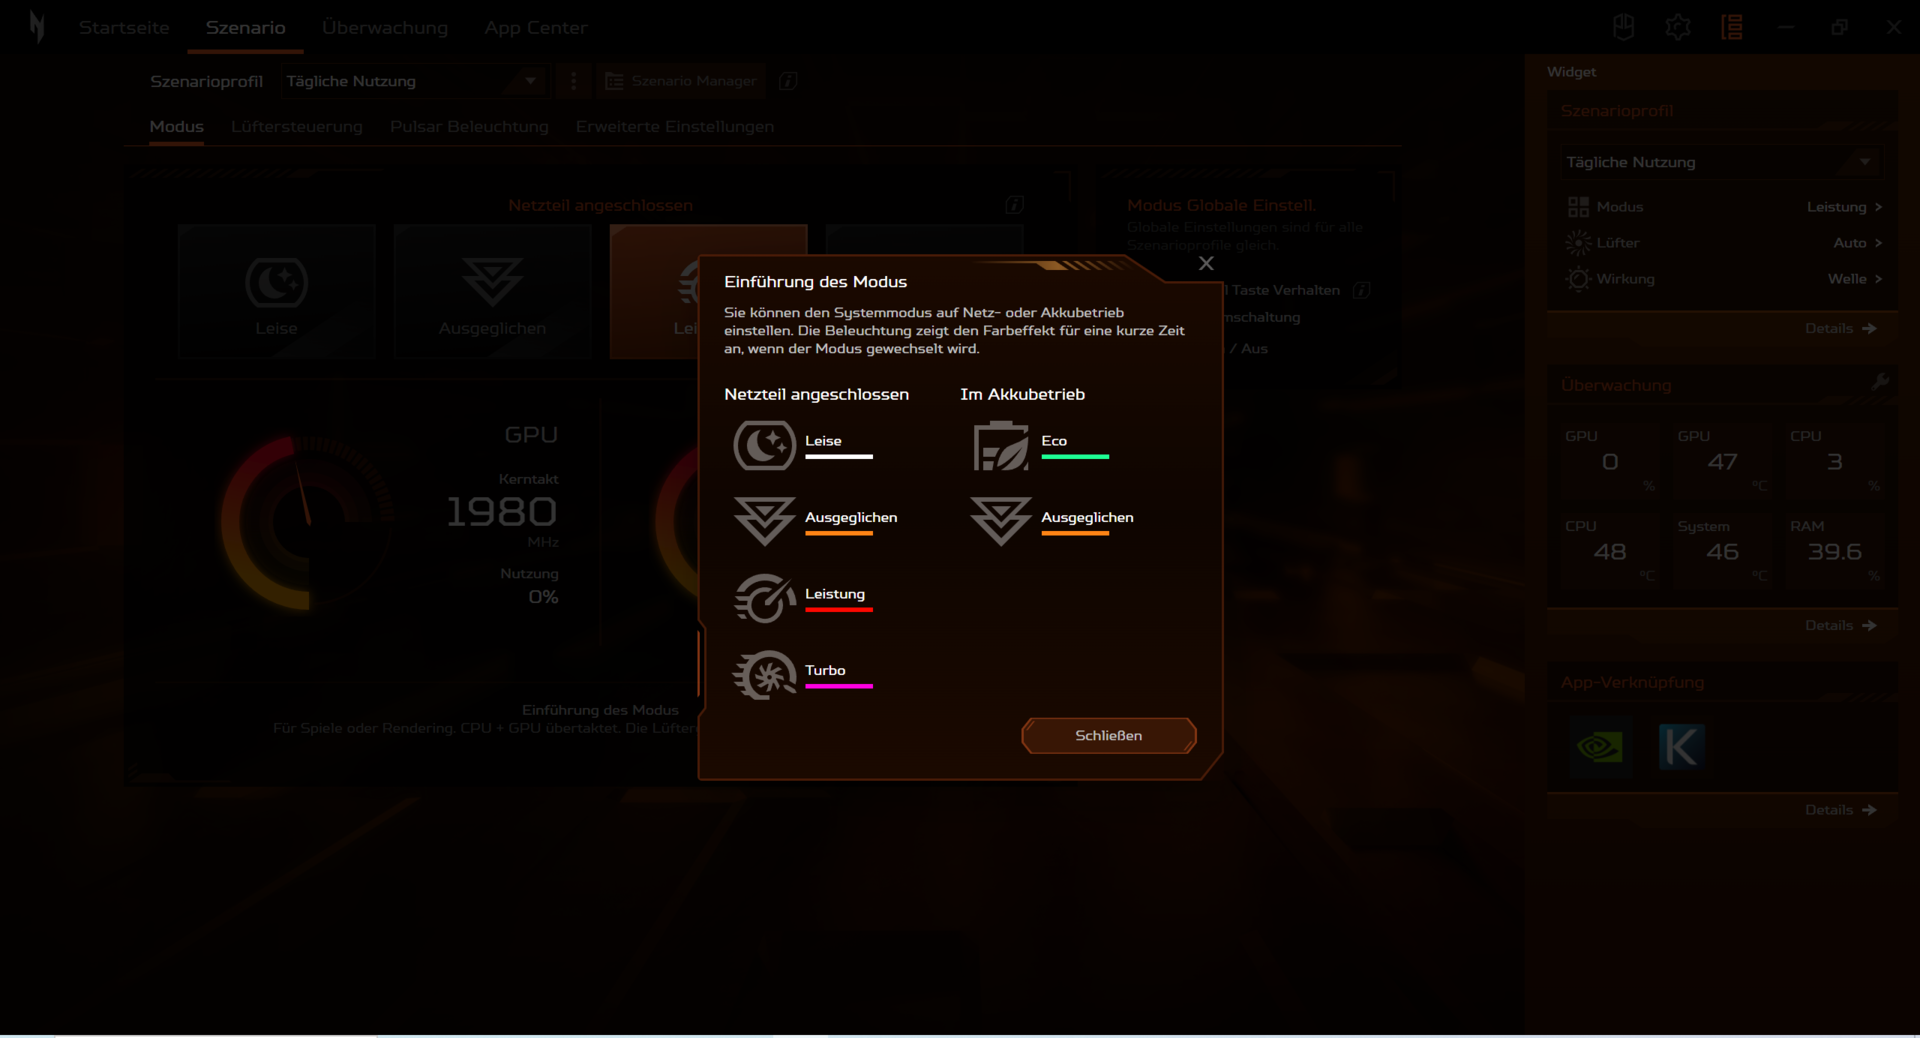
Test conditions
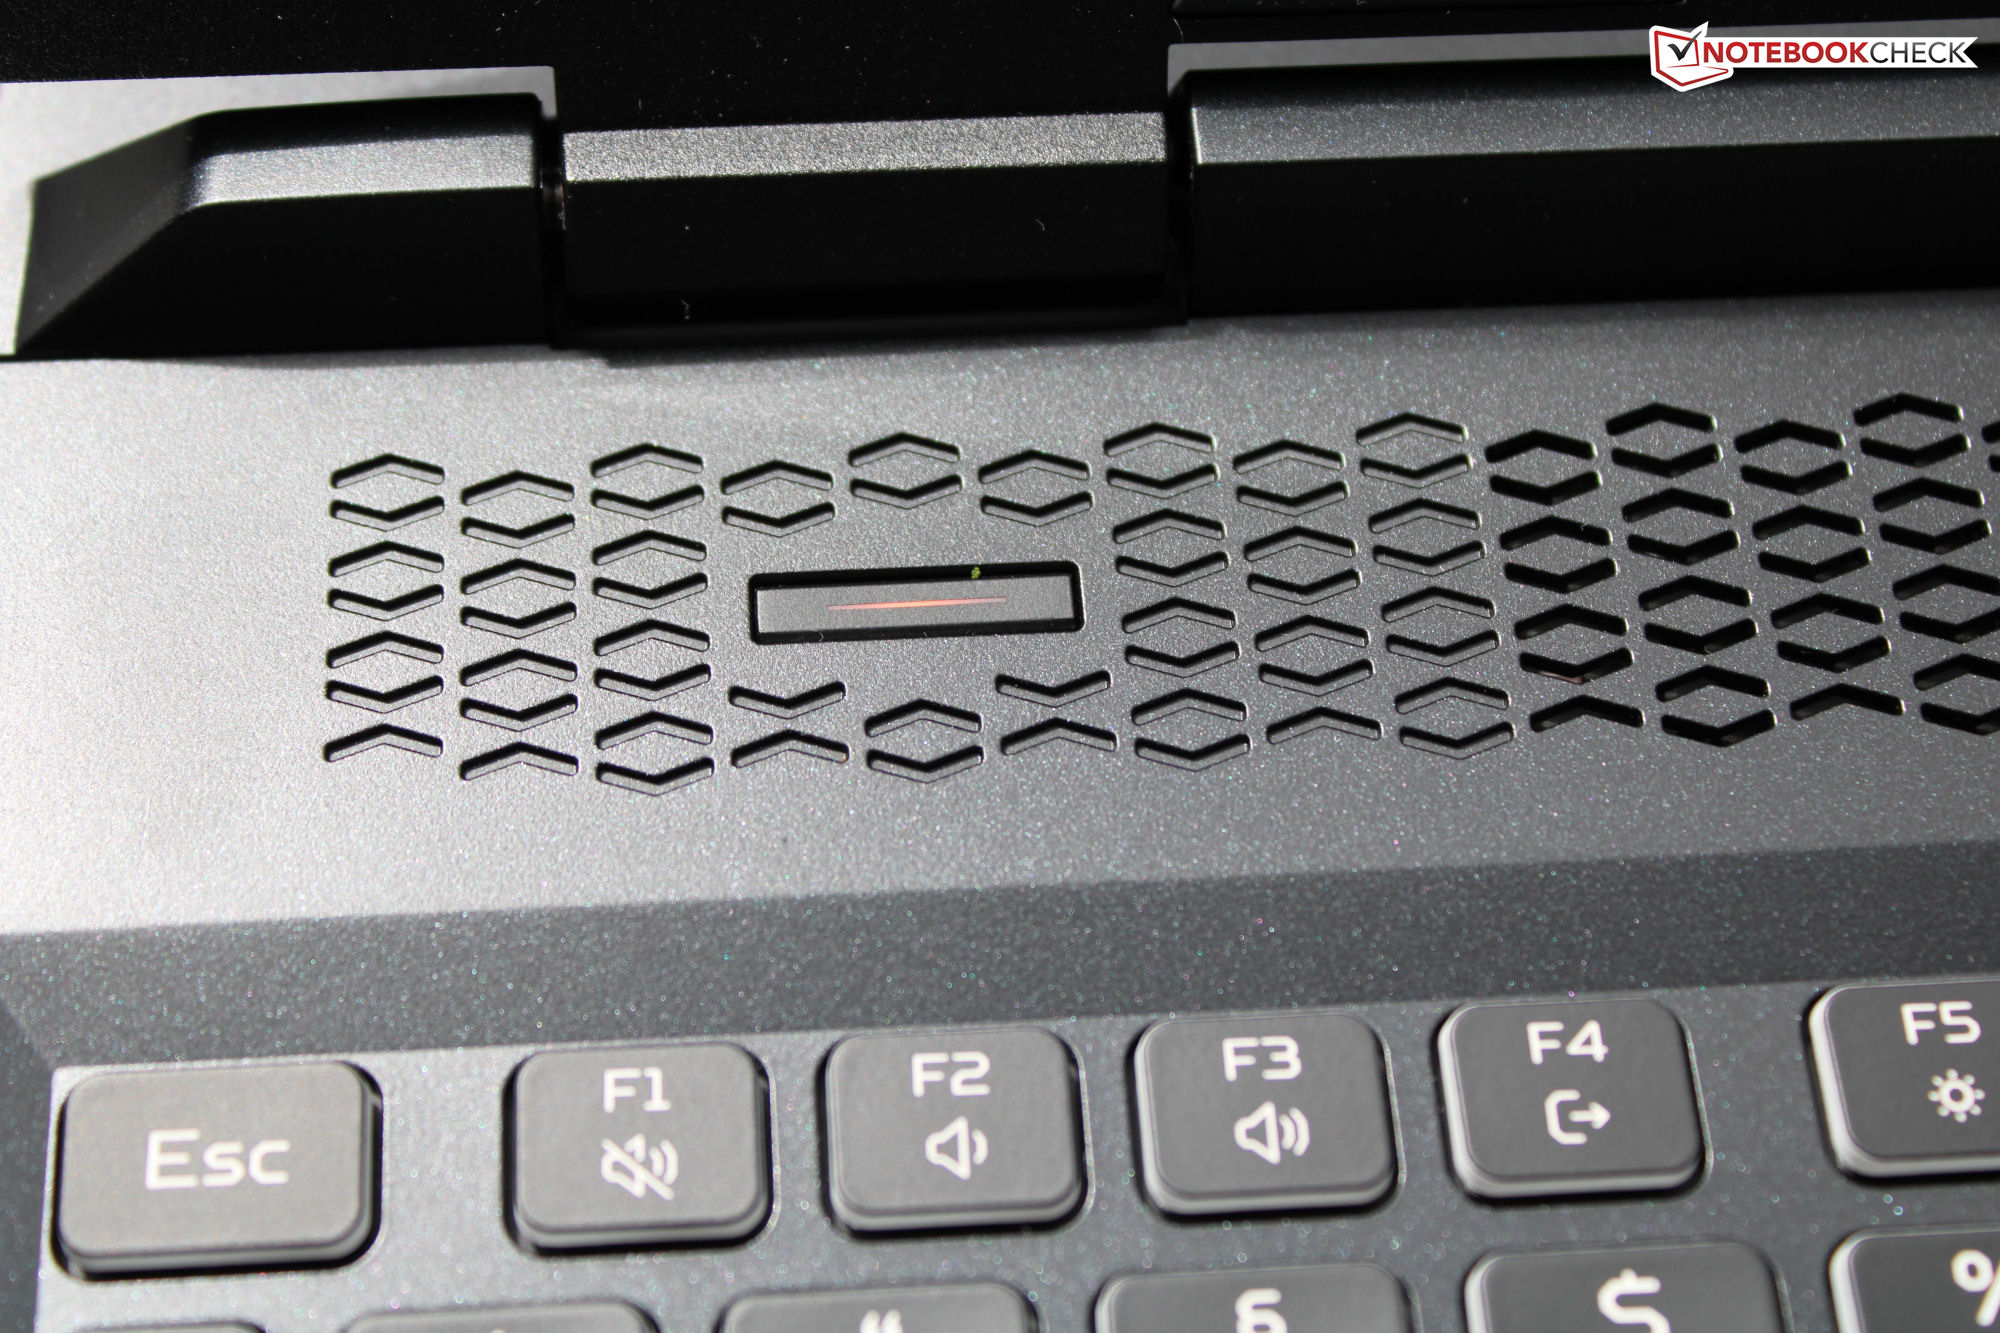
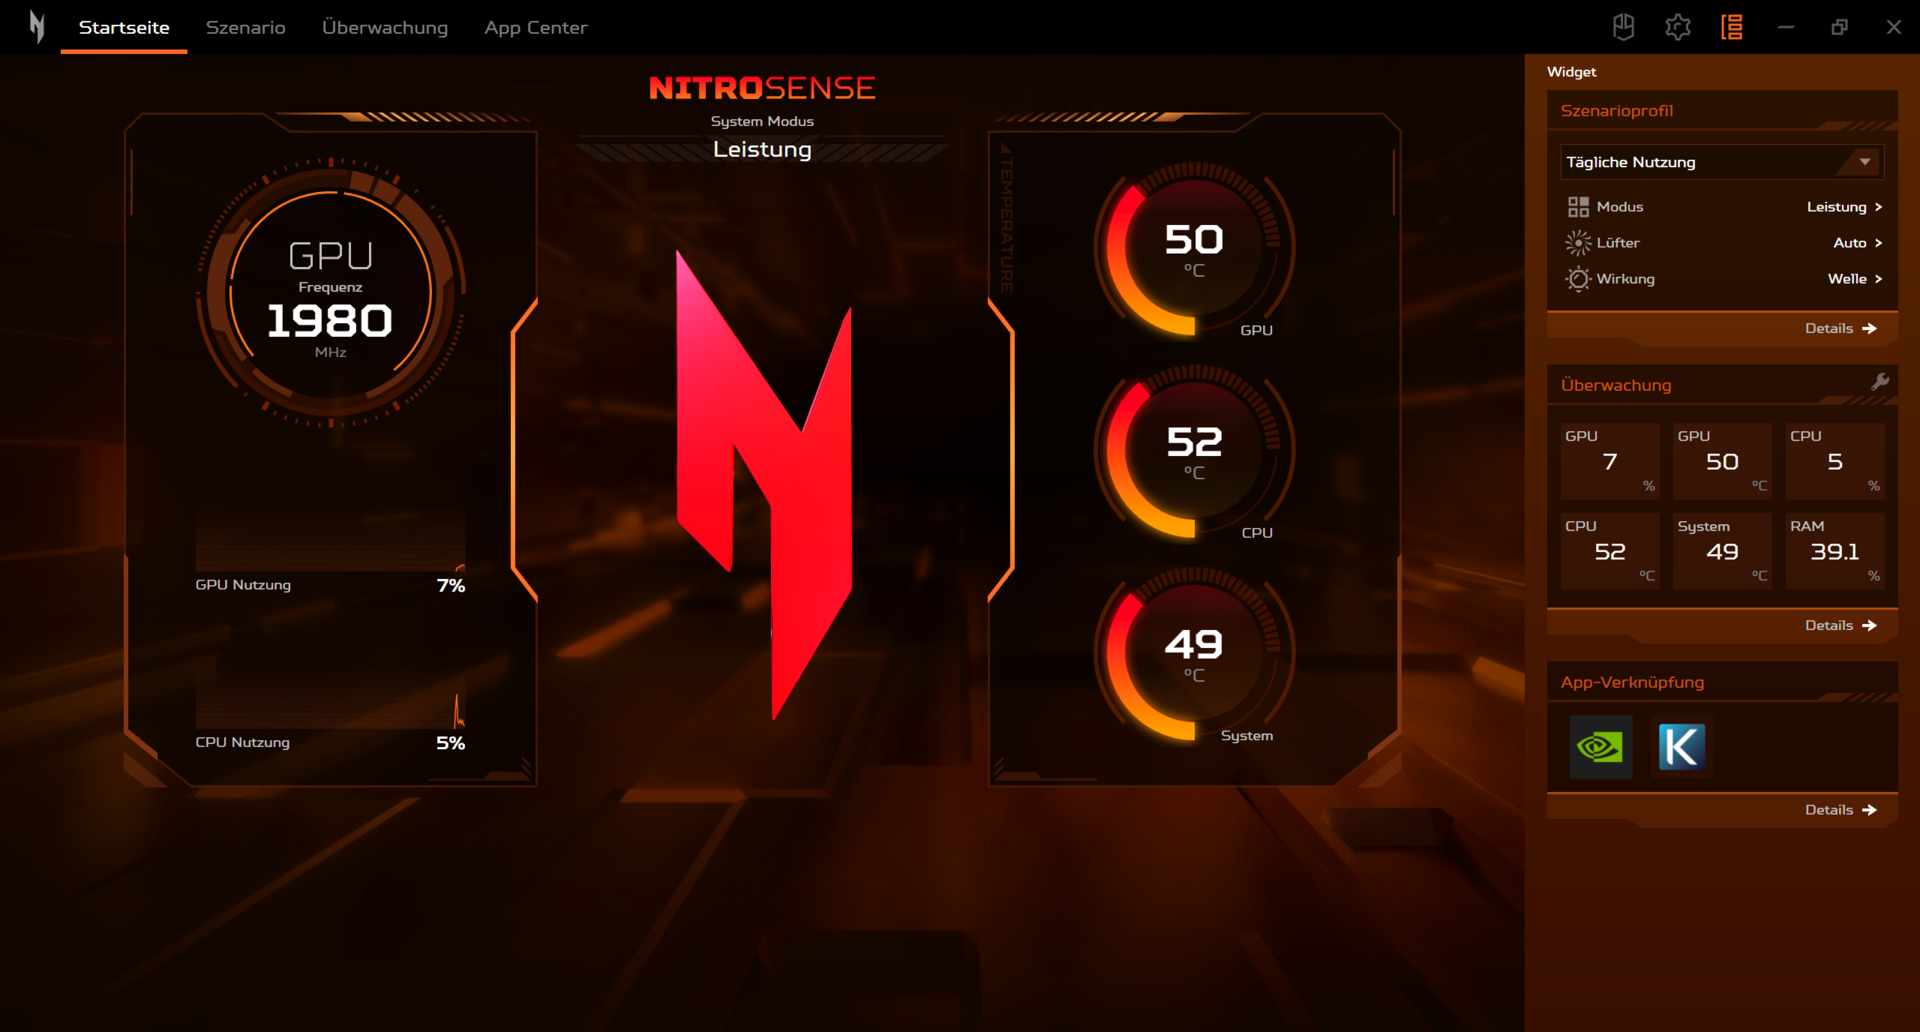
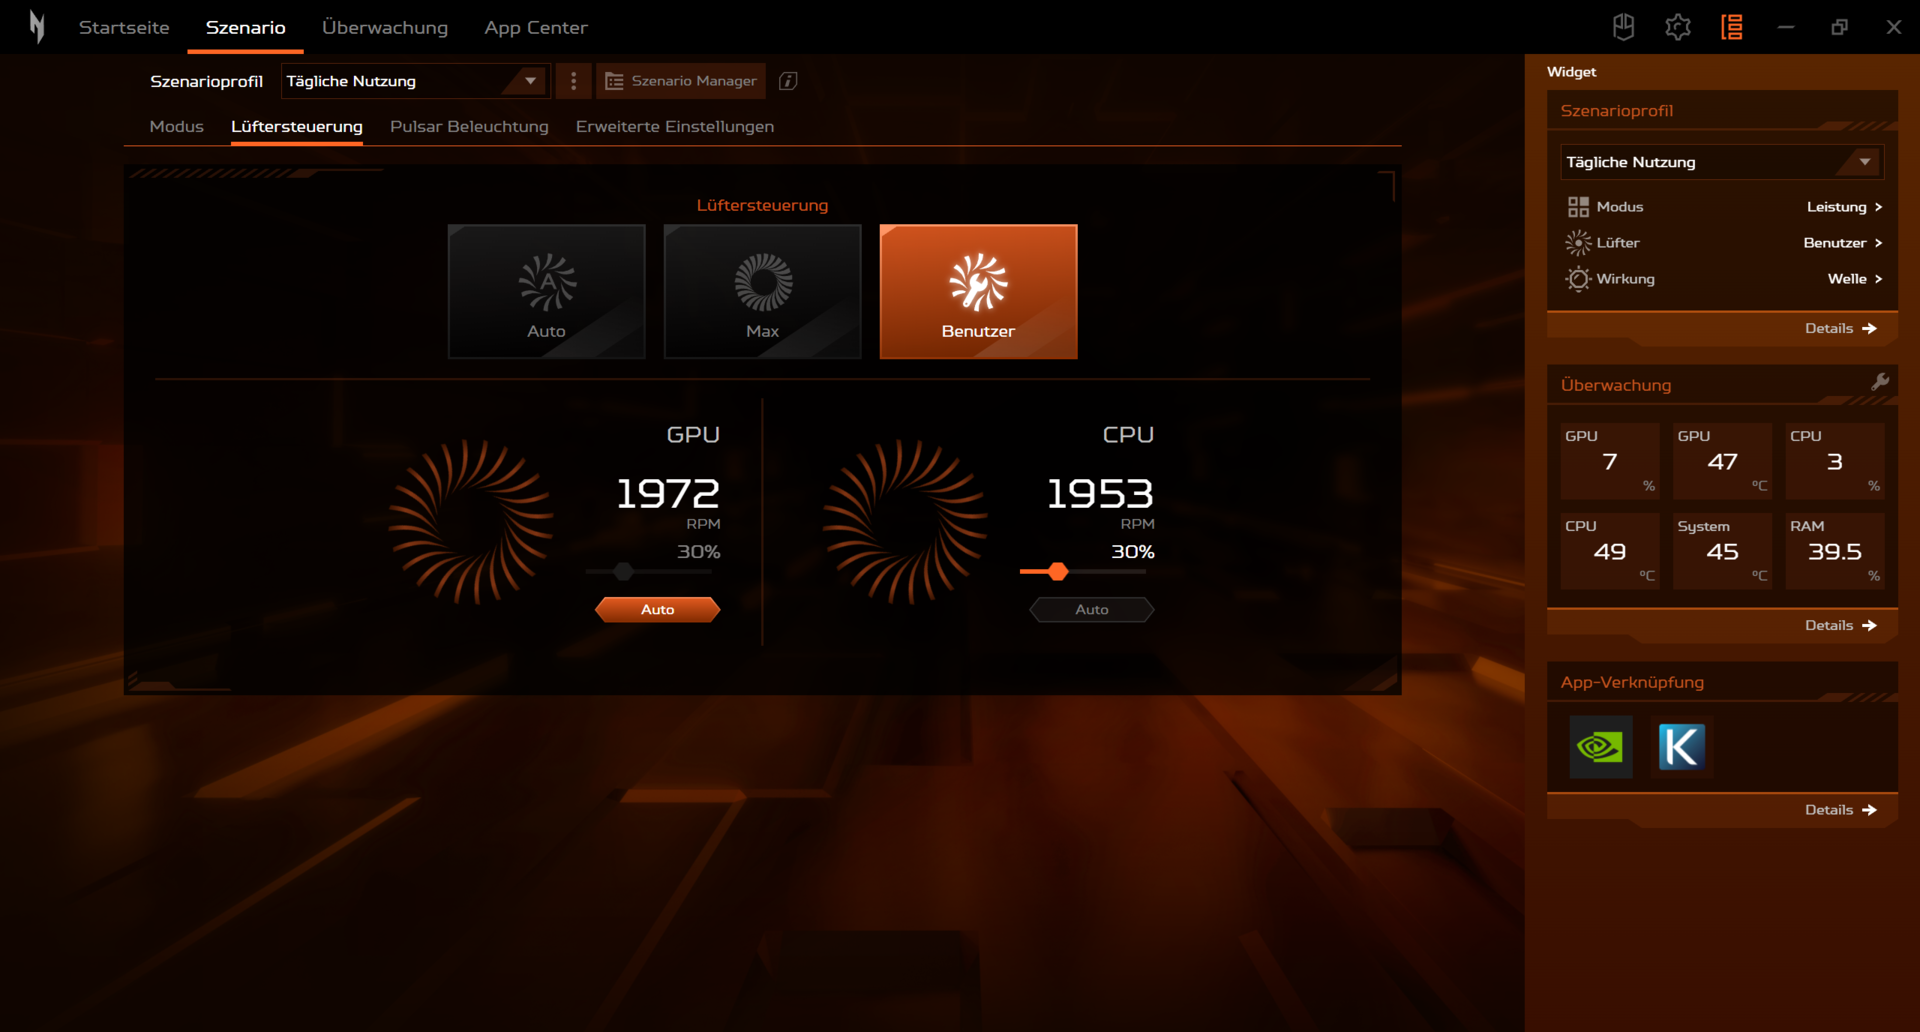
The laptop offers six manufacturer-specific performance modes - four mains, and two battery modes (see table). We used the "Performance" (benchmarks) and "Eco" (battery life testing) modes. "Turbo" and "Performance" are only available in mains operation (battery level > 30 %).
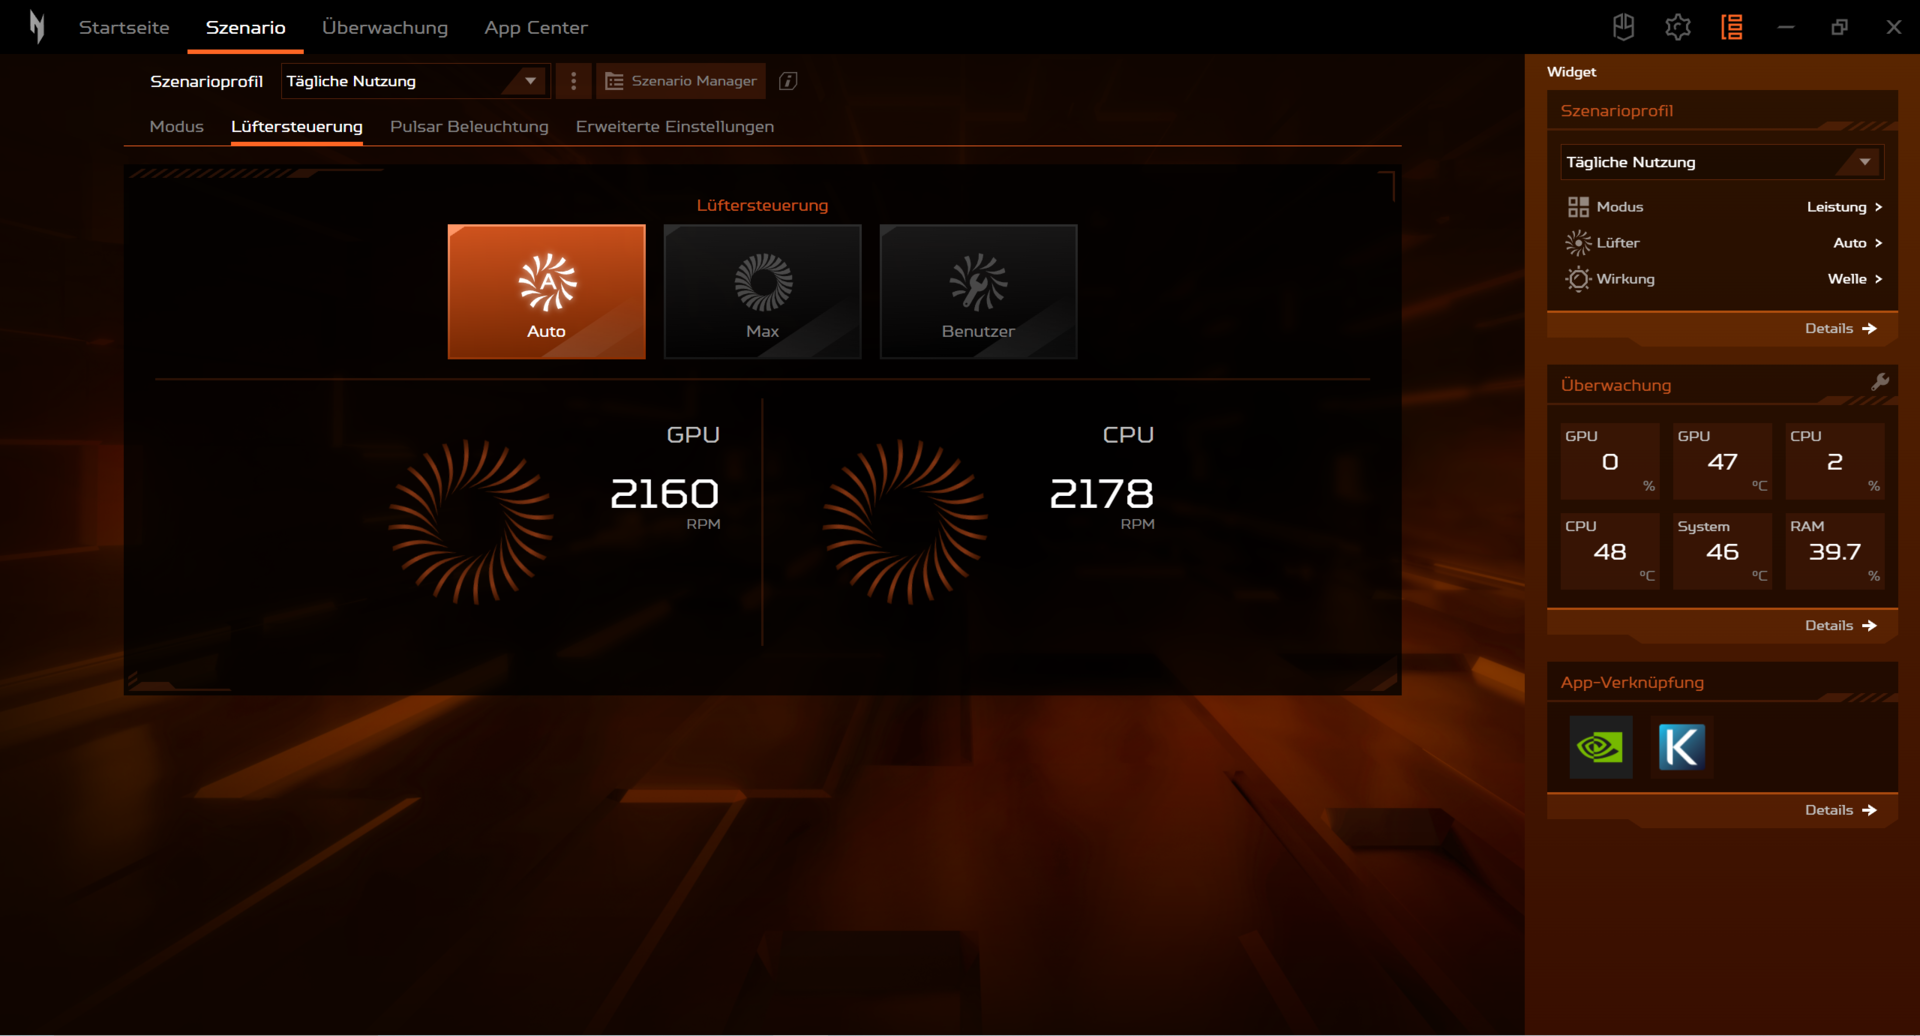
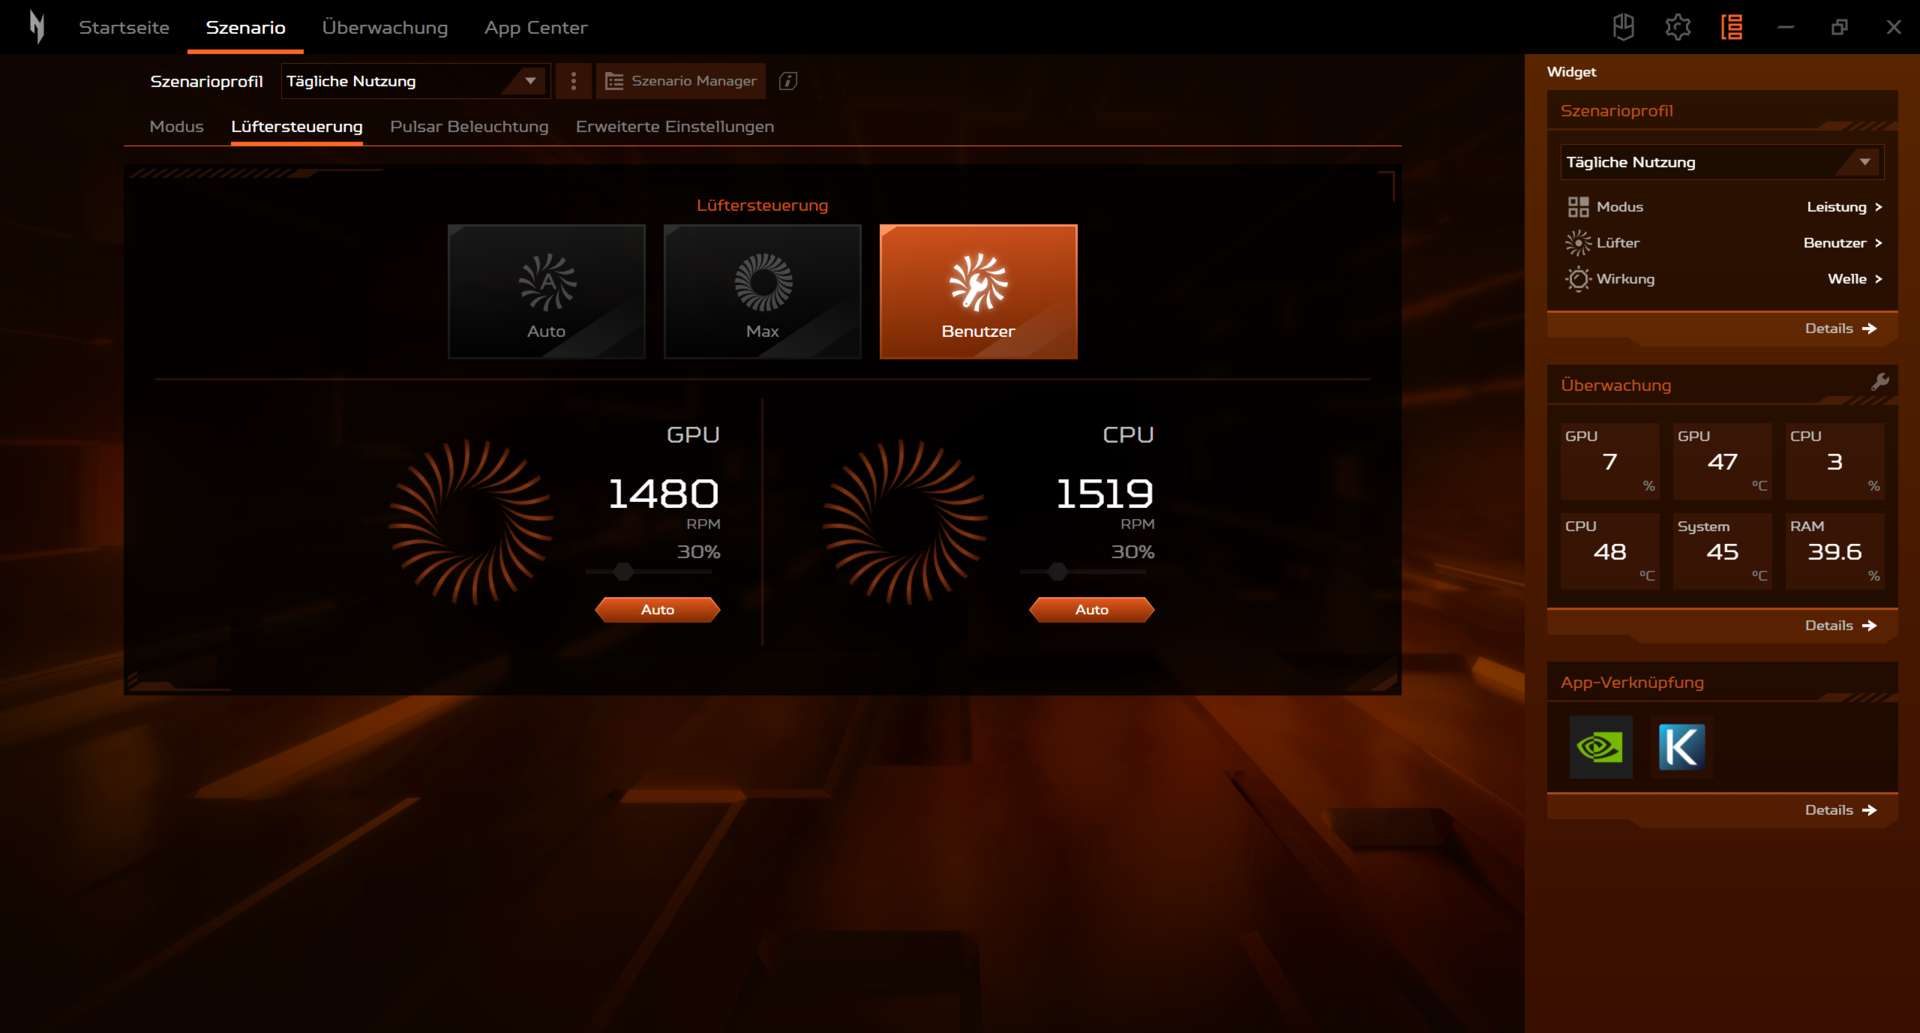
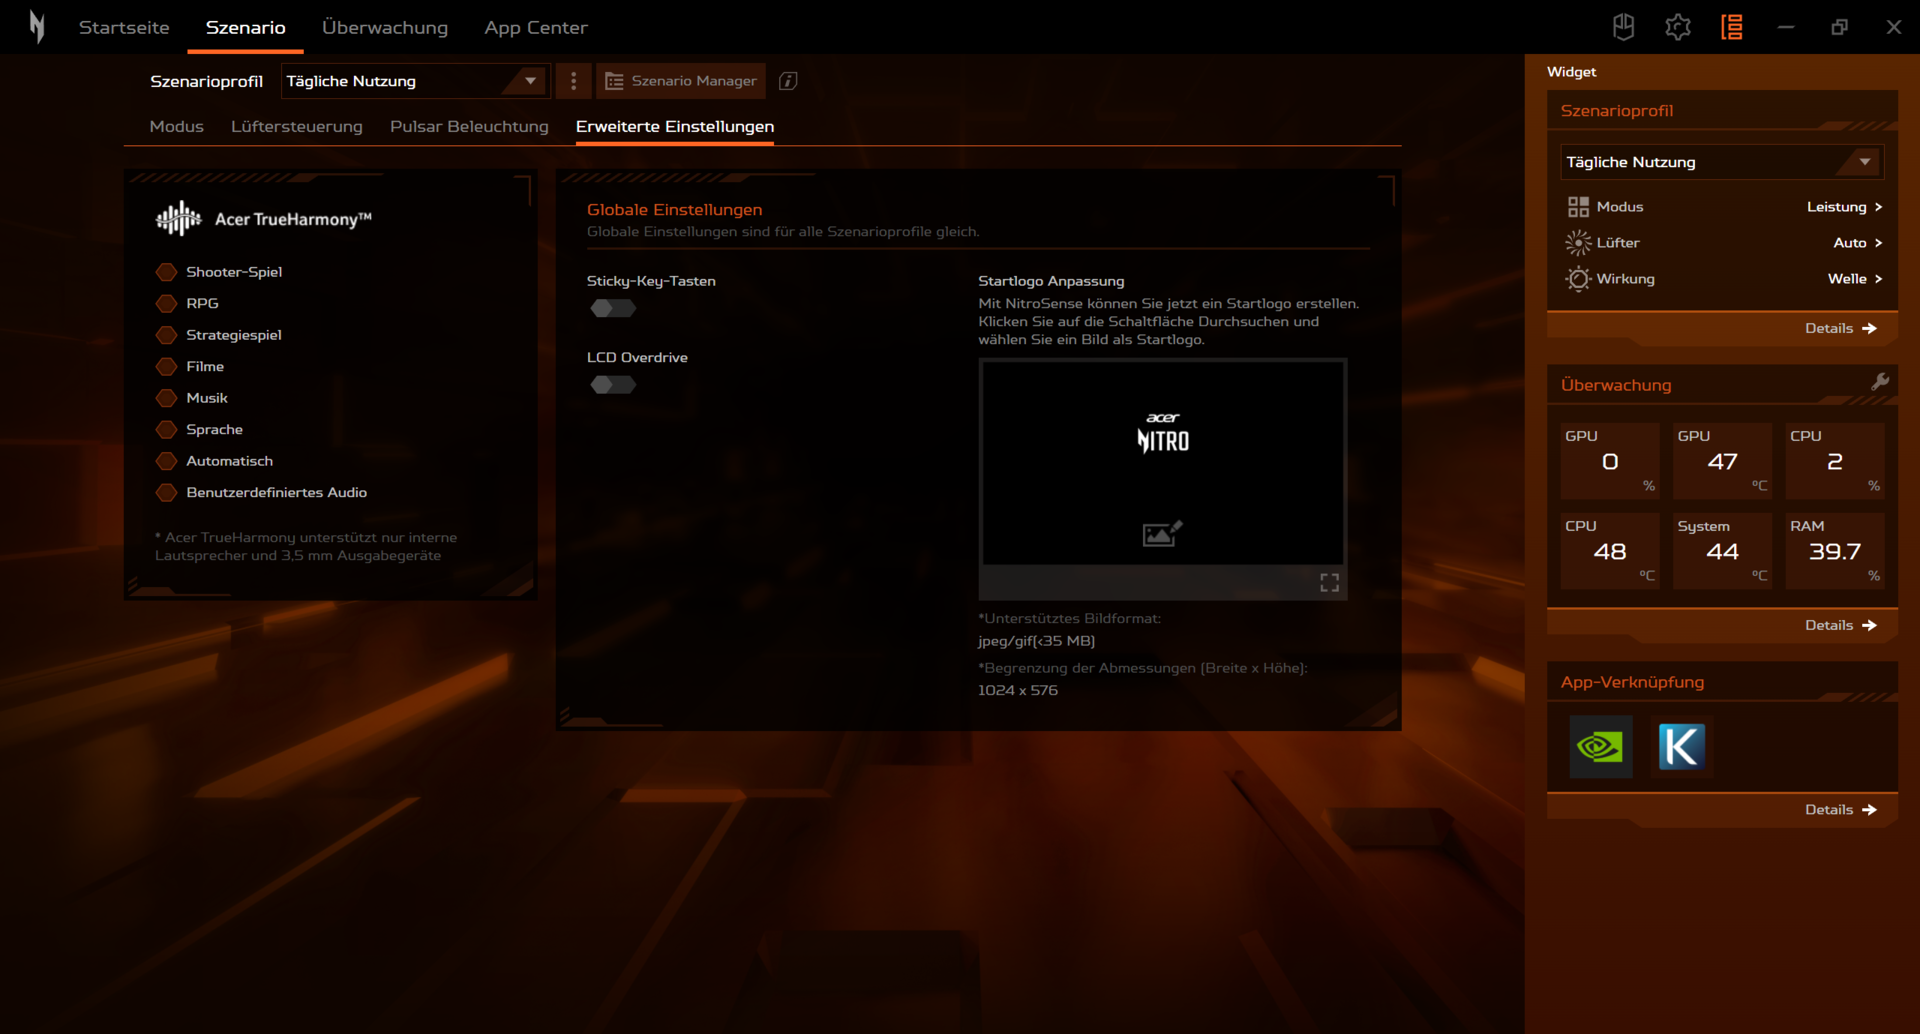
A button above the keyboard allows for quick switching between the modes. Alternatively, this can be done via the laptop's NitroSense software (the laptop's control center). An LED shows which mode is active.
| Turbo | Performance | Balanced | Quiet | Balanced (Battery) | Eco (Battery) | |
|---|---|---|---|---|---|---|
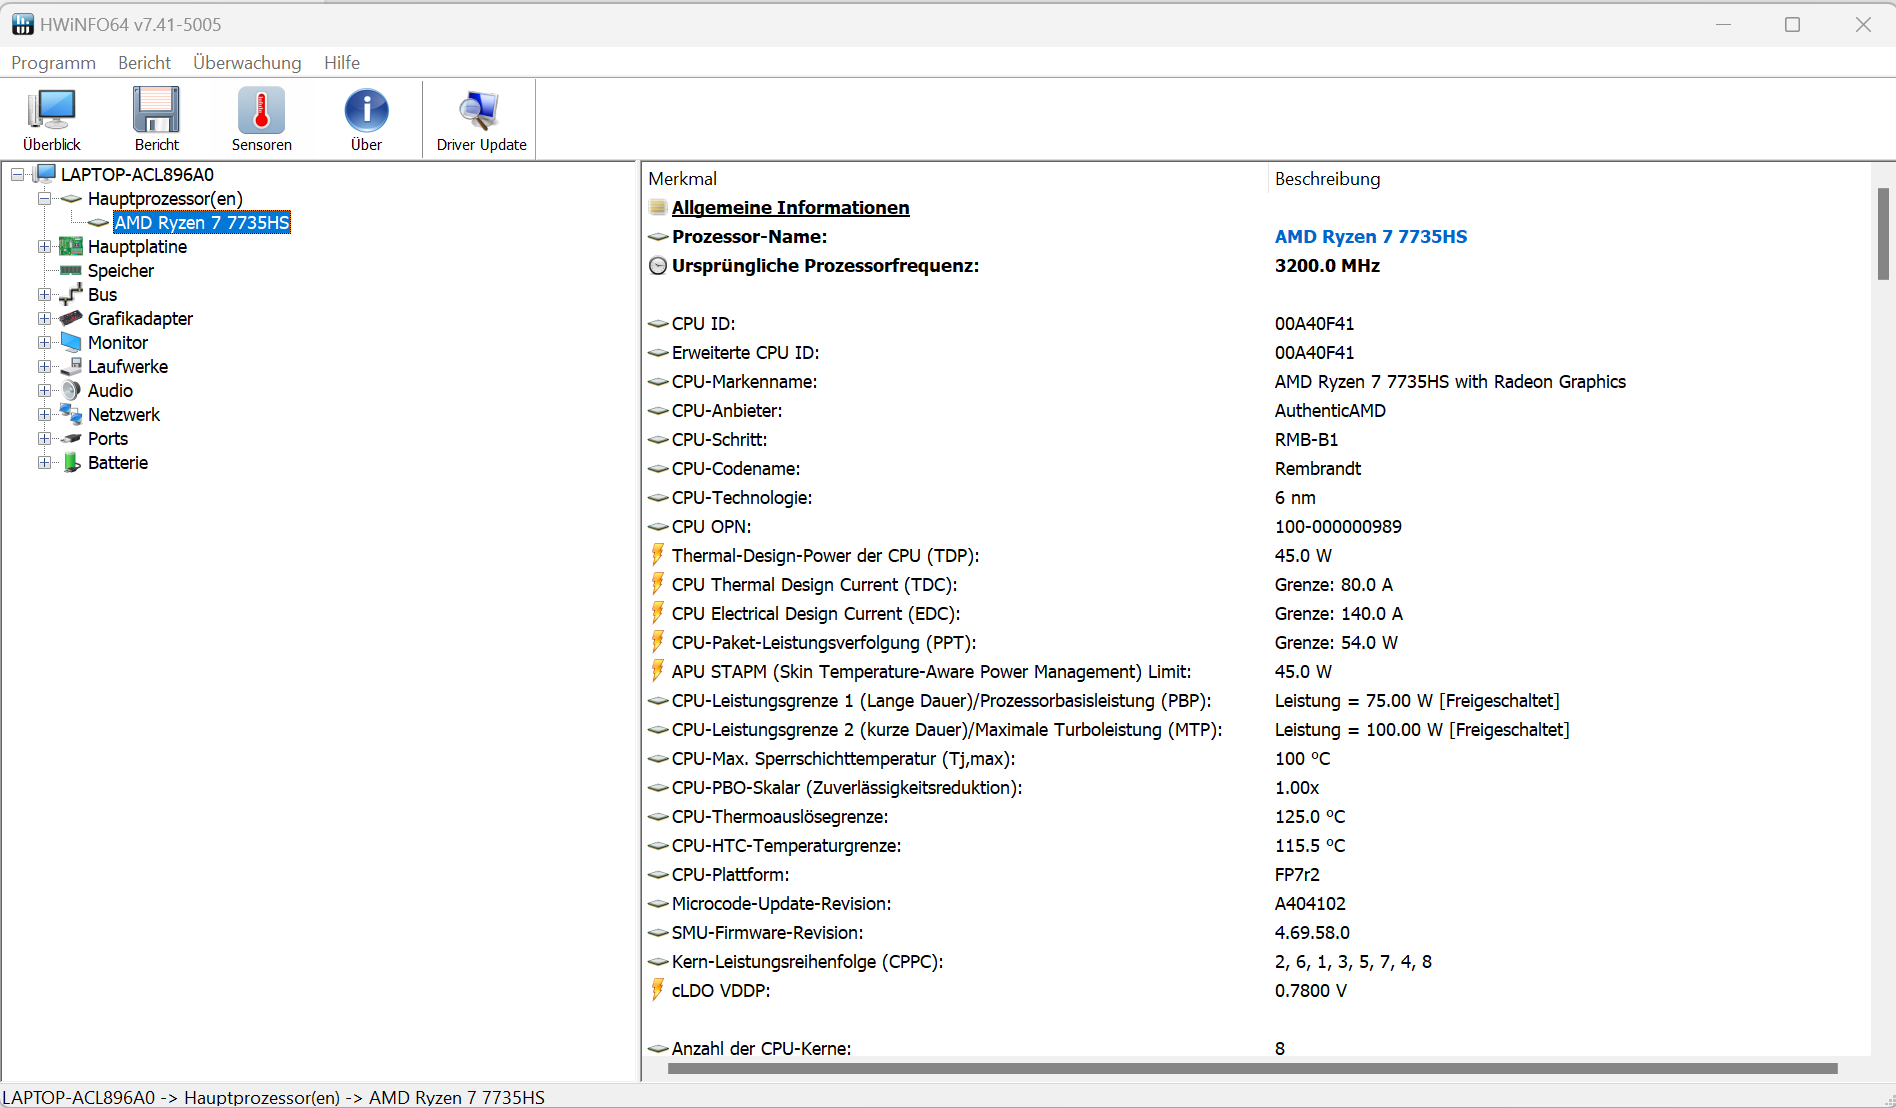
| Power Limit 1 (HWInfo) | 95 watts | 75 watts | 65 watts | 45 watts | 25 watts | 25 watts |
| Power Limit 2 (HWInfo) | 100 watts | 100 watts | 100 watts | 100 watts | 25 watts | 25 watts |

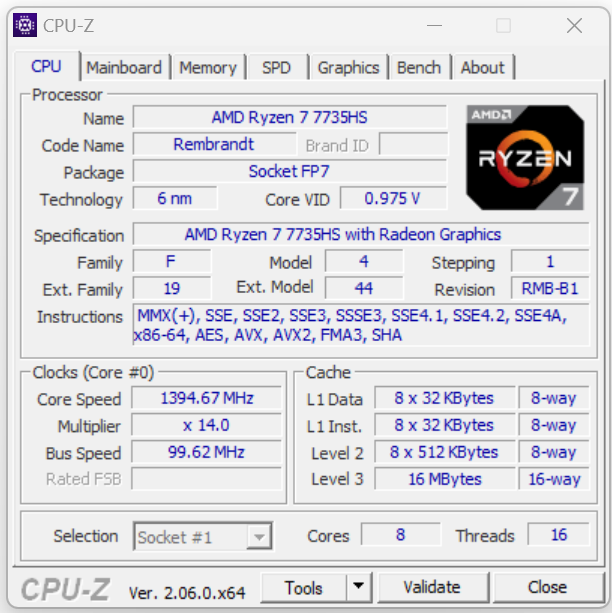
Processor
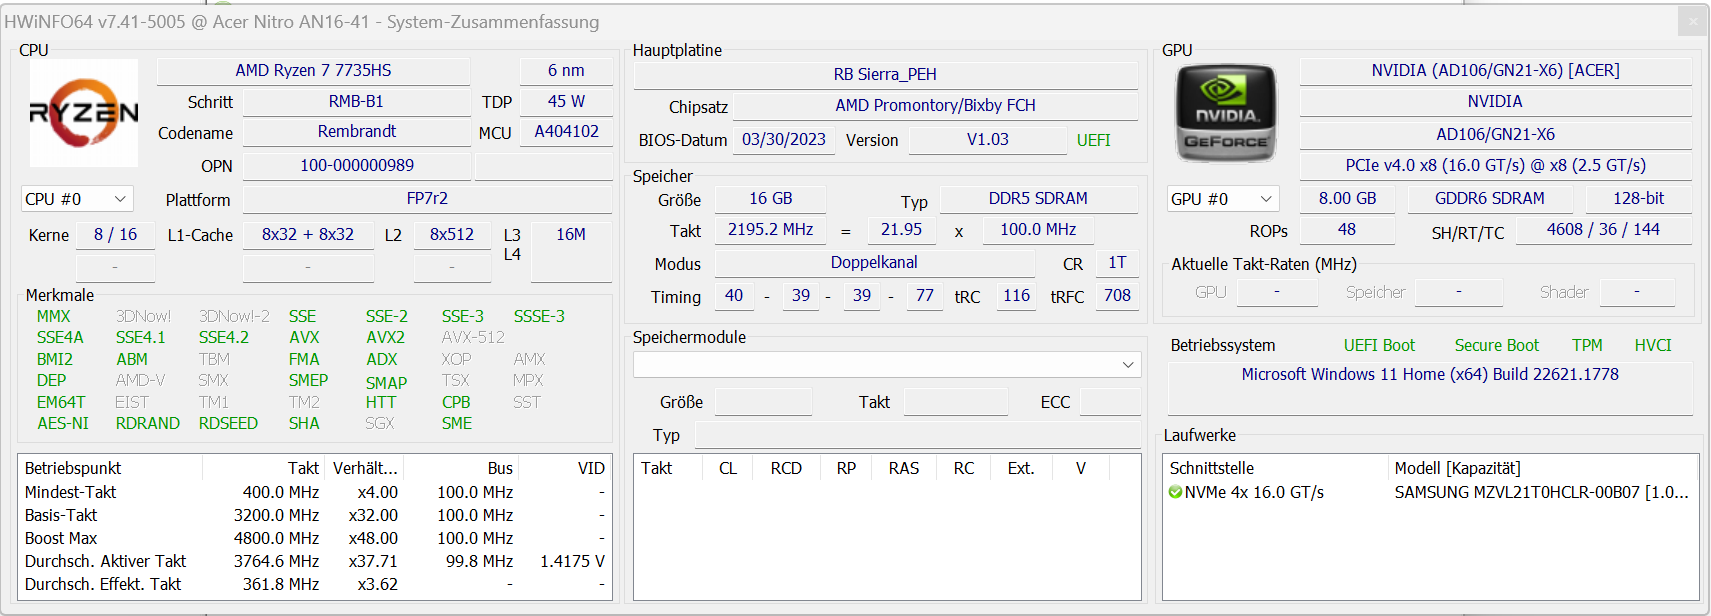
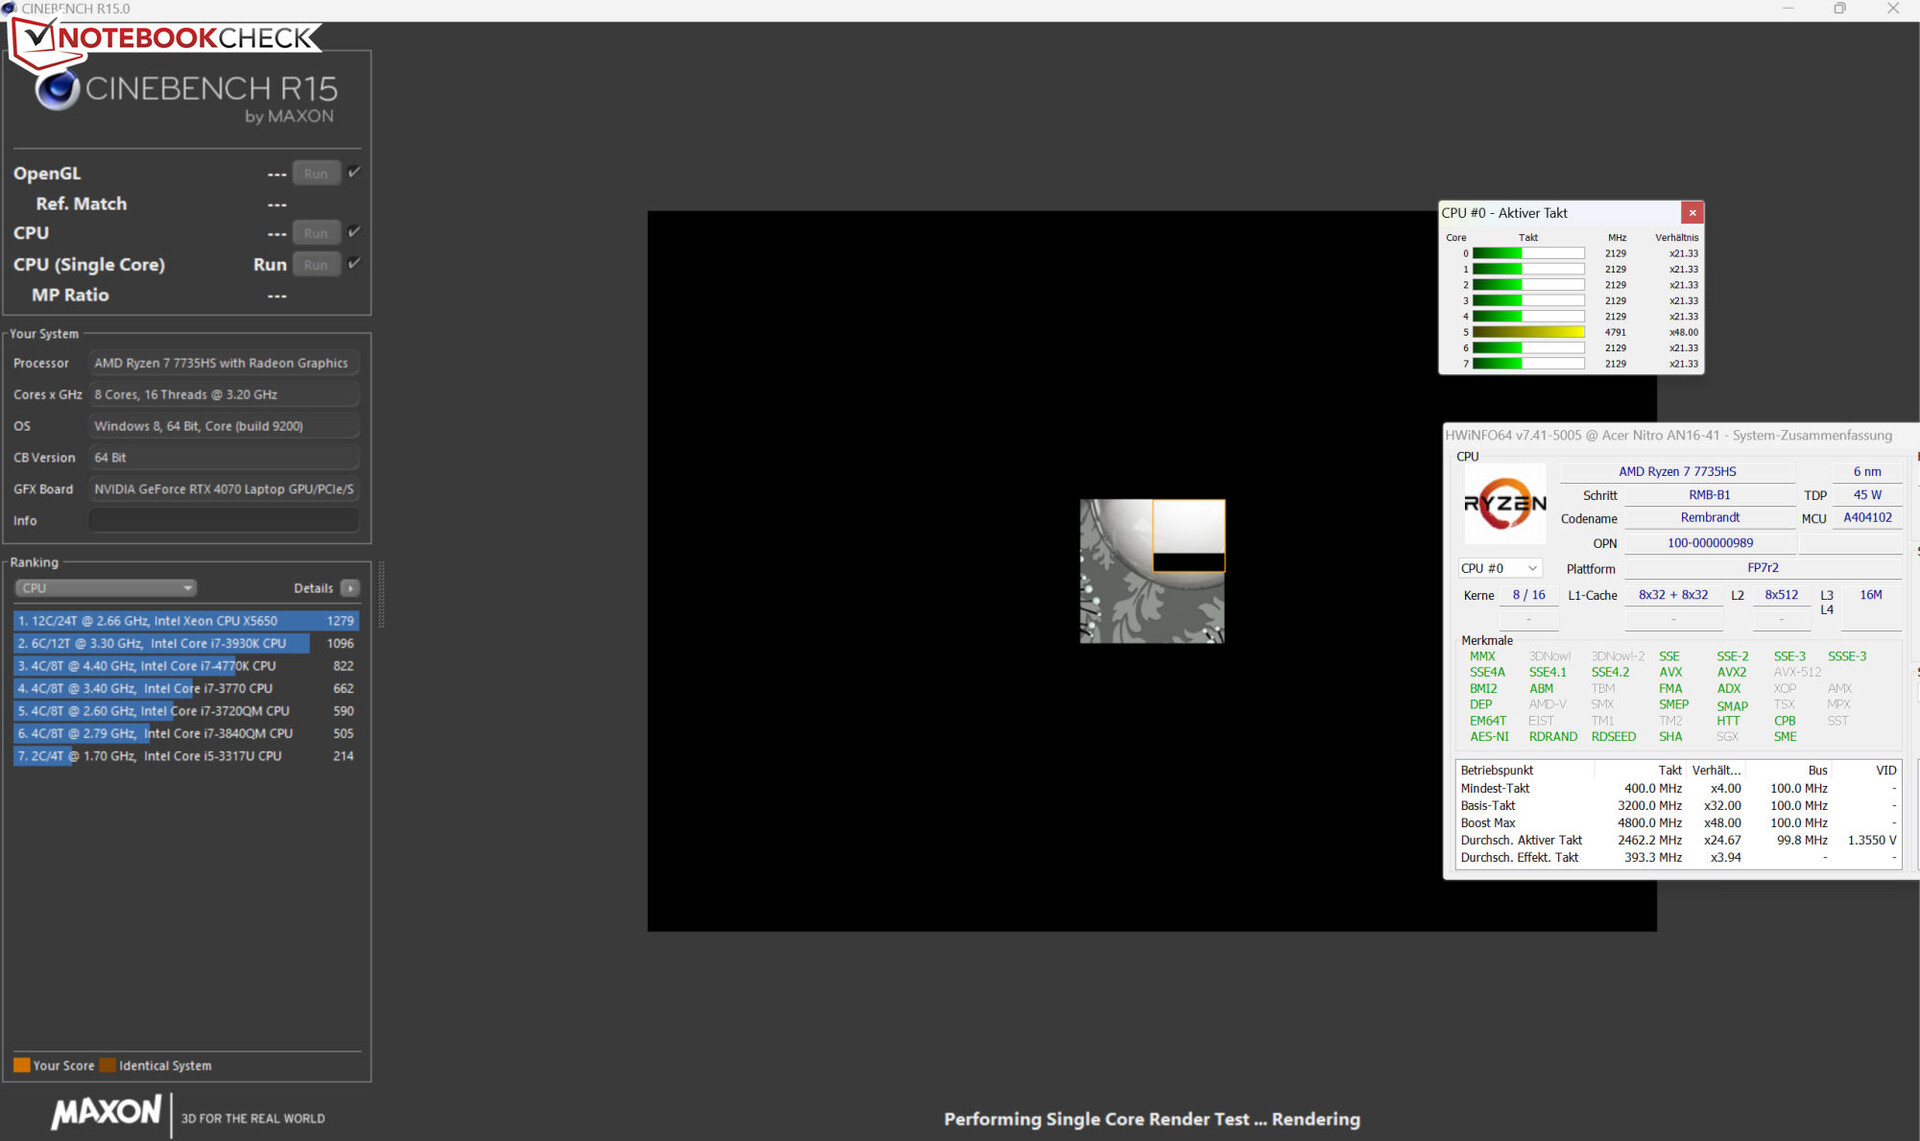
The CPU part of the Ryzen 7 7735HS APU (Rembrandt R, Zen 3+) offers eight processor cores with 16 threads. The base clock speed of 3.2 GHz can be increased up to 4.75 GHz (one core). The benchmark results are a little higher than the 7735HS average seen so far. The differences between the four performance modes (mains) are relatively small.
The Asus TUF Gaming A16 FA617XS and the Lenovo Legion Pro 5 16ARX8's AMD processors can't match our review model. Why? Thanks to improved architecture (Zen 4) and higher clock speeds, both eight-core CPUs have significantly more power - with slightly lower power requirements.
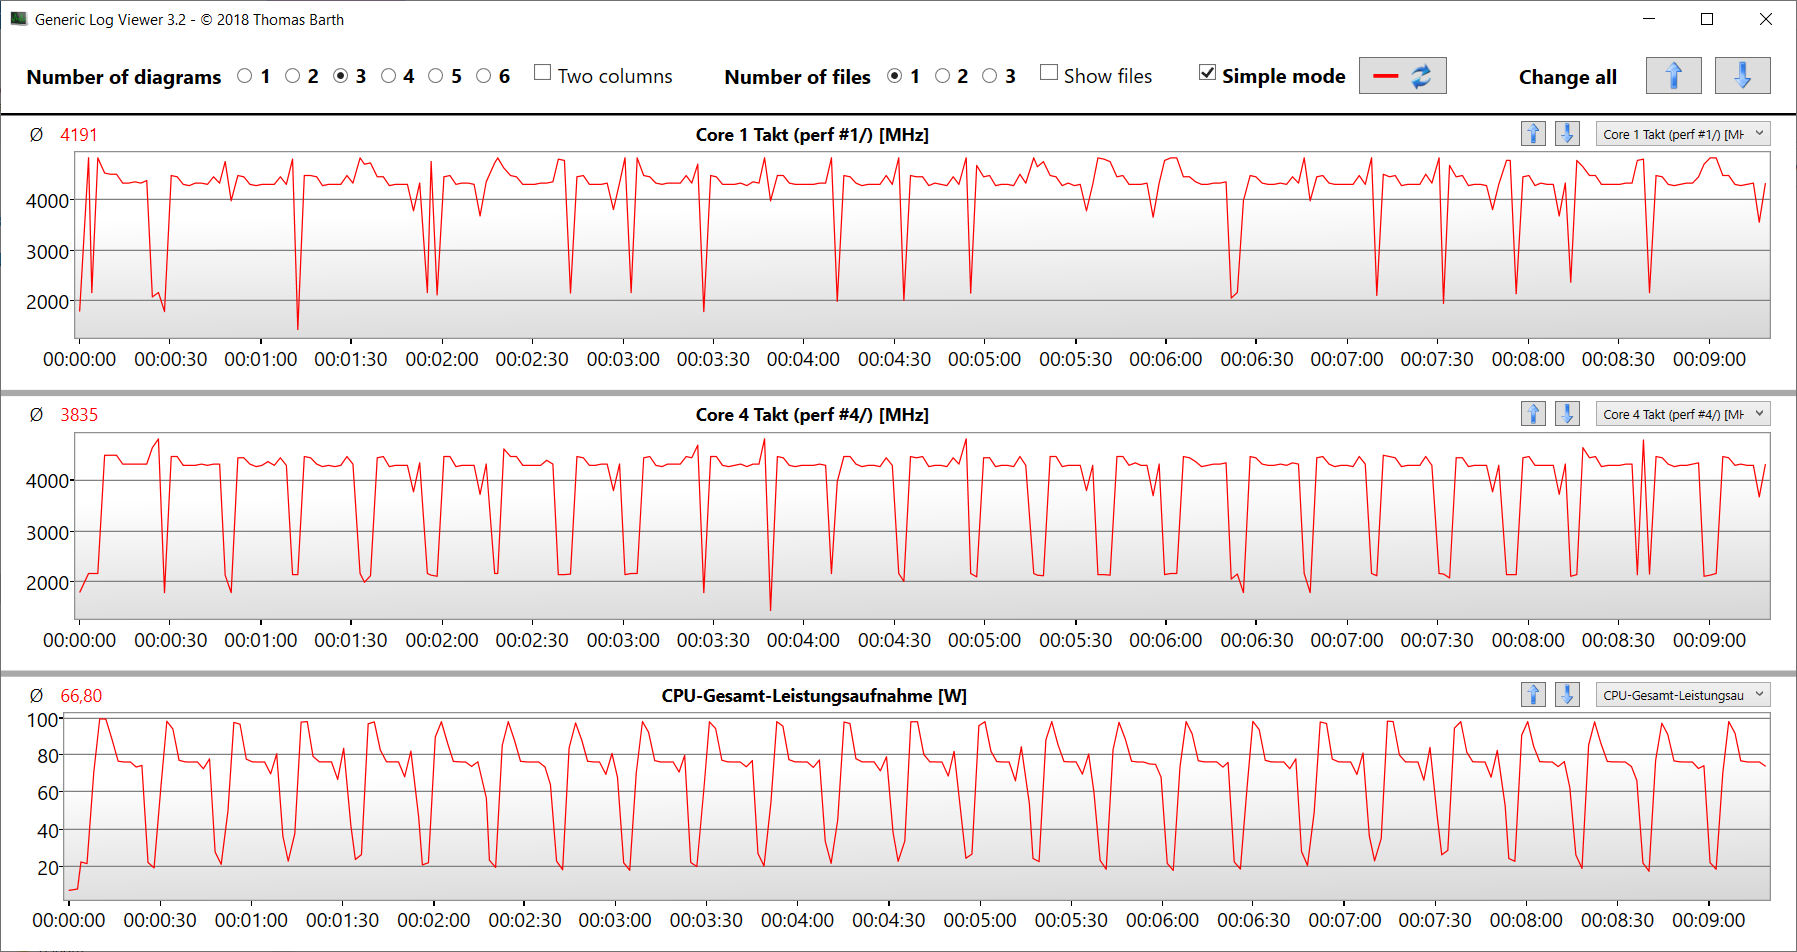
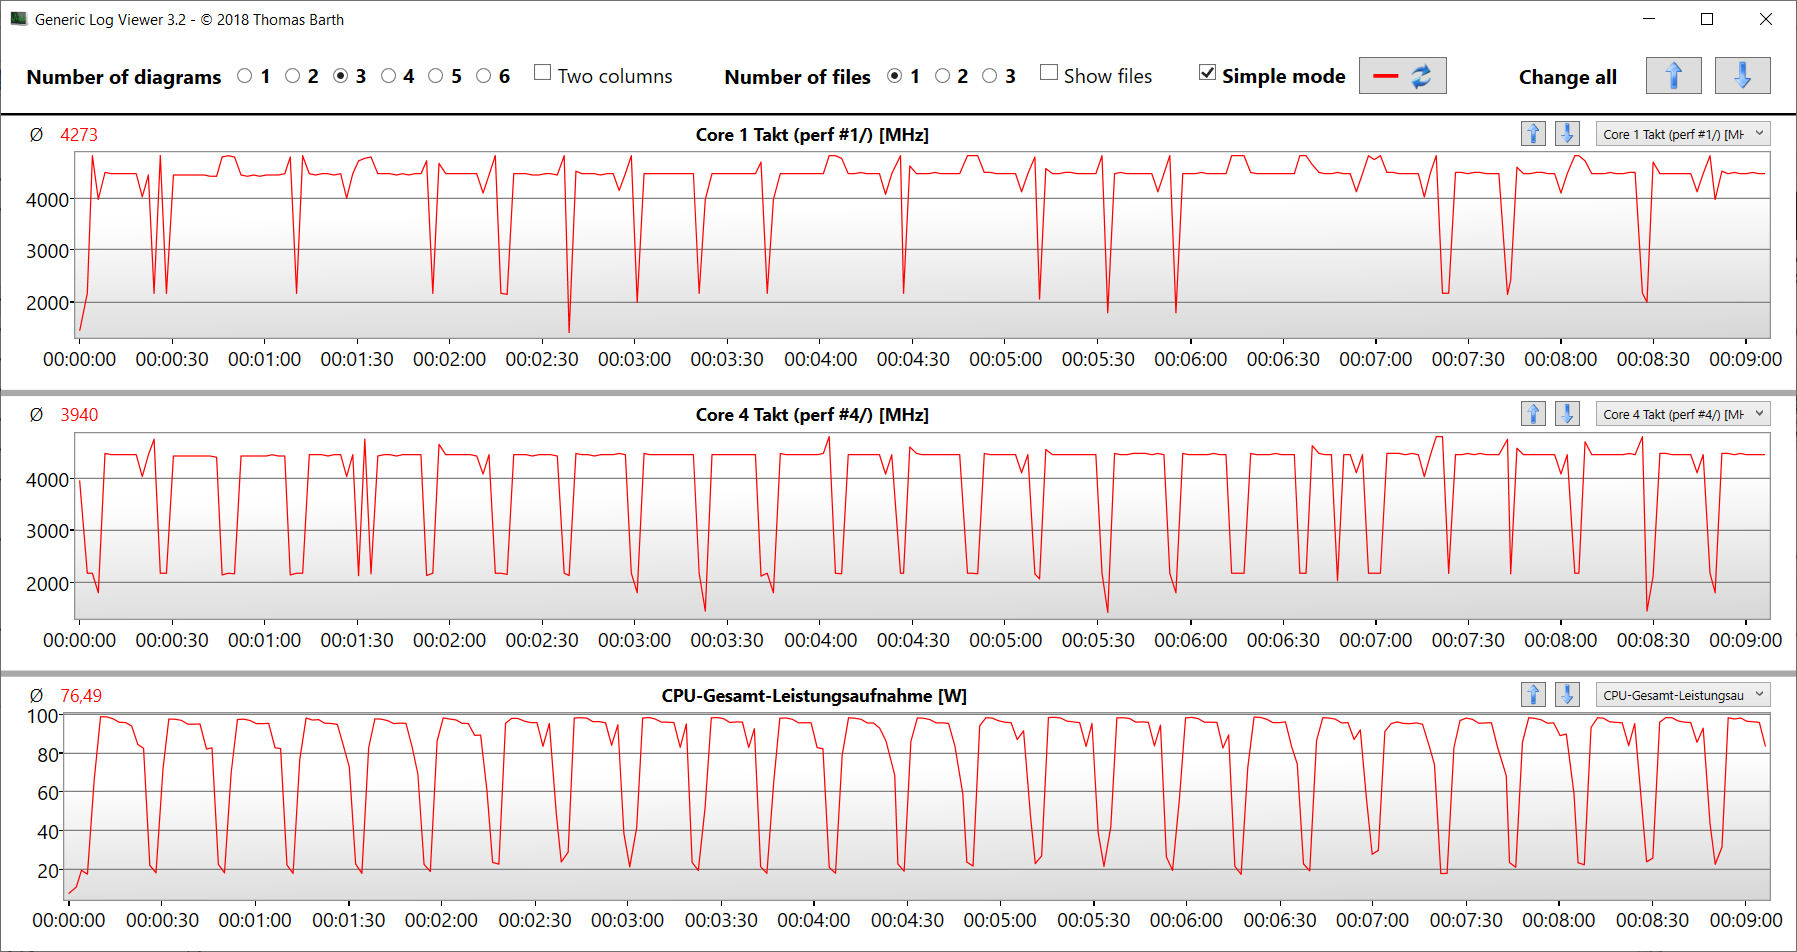
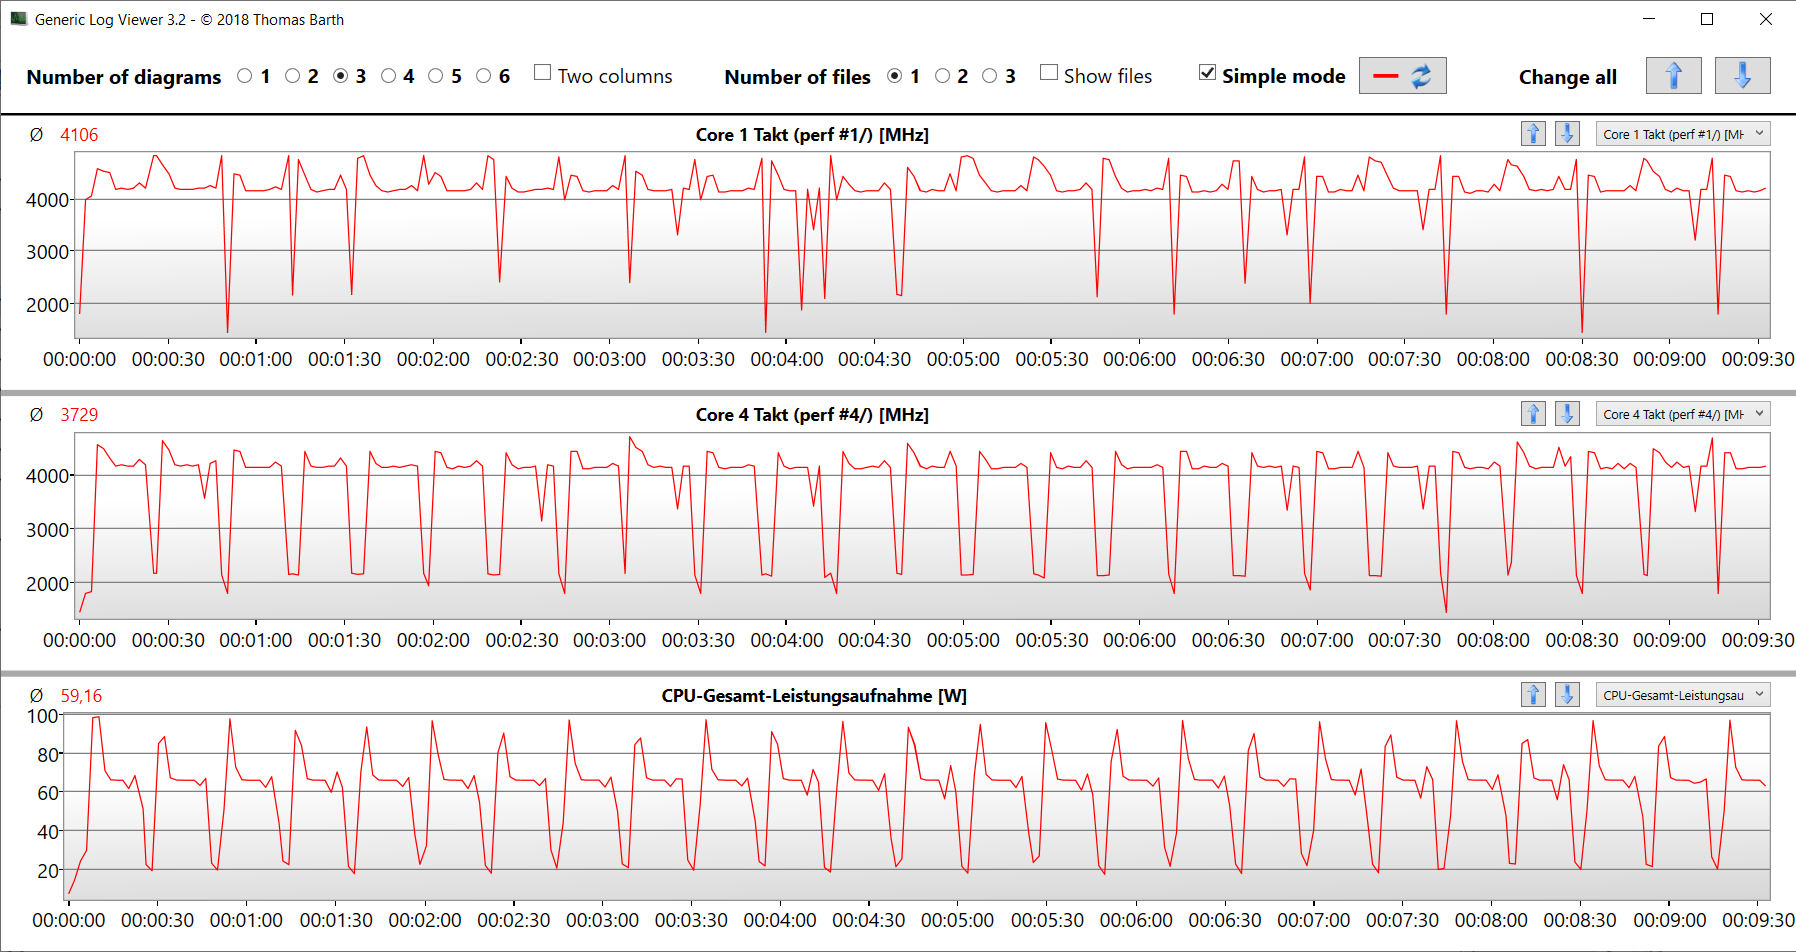
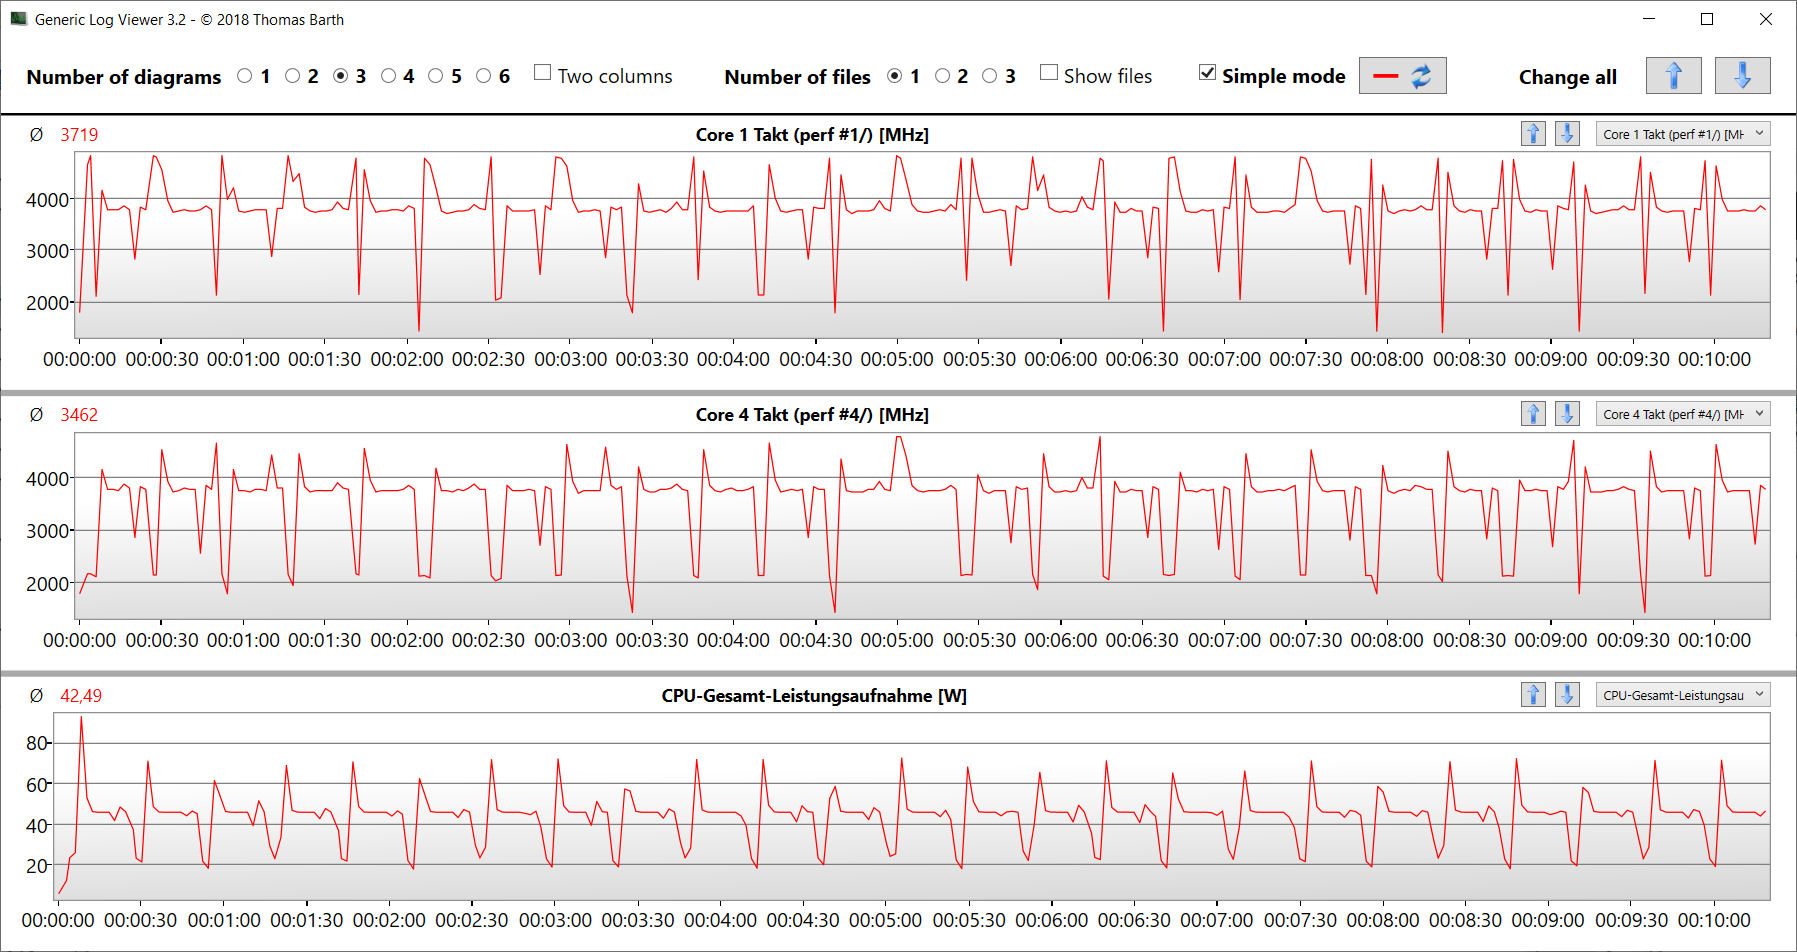
The CB15 loop test shows that the CPU acknowledges continuous multi-thread load with a consistently high-level turbo clock speed - independent of the selected performance mode. The "Turbo" profile ensures minimally higher values.

Cinebench R15 Multi continuous test
* ... smaller is better
AIDA64: FP32 Ray-Trace | FPU Julia | CPU SHA3 | CPU Queen | FPU SinJulia | FPU Mandel | CPU AES | CPU ZLib | FP64 Ray-Trace | CPU PhotoWorxx
| Performance rating | |
| Average of class Gaming | |
| Medion Erazer Major X20 | |
| Lenovo Legion Pro 5 16ARX8 | |
| Asus TUF Gaming A16 FA617XS | |
| Aorus 15X ASF | |
| Acer Nitro 16 AN16-41 | |
| Average AMD Ryzen 7 7735HS | |
| Aorus 15 XE5 | |
| AIDA64 / FP32 Ray-Trace | |
| Average of class Gaming (10227 - 85542, n=105, last 2 years) | |
| Lenovo Legion Pro 5 16ARX8 | |
| Asus TUF Gaming A16 FA617XS | |
| Medion Erazer Major X20 | |
| Aorus 15X ASF | |
| Acer Nitro 16 AN16-41 | |
| Average AMD Ryzen 7 7735HS (11831 - 17161, n=16) | |
| Aorus 15 XE5 | |
| AIDA64 / FPU Julia | |
| Average of class Gaming (51376 - 238426, n=105, last 2 years) | |
| Medion Erazer Major X20 | |
| Asus TUF Gaming A16 FA617XS | |
| Lenovo Legion Pro 5 16ARX8 | |
| Acer Nitro 16 AN16-41 | |
| Average AMD Ryzen 7 7735HS (75370 - 105483, n=16) | |
| Aorus 15X ASF | |
| Aorus 15 XE5 | |
| AIDA64 / CPU SHA3 | |
| Average of class Gaming (2180 - 10115, n=105, last 2 years) | |
| Medion Erazer Major X20 | |
| Lenovo Legion Pro 5 16ARX8 | |
| Asus TUF Gaming A16 FA617XS | |
| Aorus 15X ASF | |
| Acer Nitro 16 AN16-41 | |
| Average AMD Ryzen 7 7735HS (2499 - 3494, n=16) | |
| Aorus 15 XE5 | |
| AIDA64 / CPU Queen | |
| Medion Erazer Major X20 | |
| Lenovo Legion Pro 5 16ARX8 | |
| Asus TUF Gaming A16 FA617XS | |
| Average of class Gaming (49785 - 173351, n=90, last 2 years) | |
| Aorus 15X ASF | |
| Acer Nitro 16 AN16-41 | |
| Aorus 15 XE5 | |
| Average AMD Ryzen 7 7735HS (87486 - 108729, n=15) | |
| AIDA64 / FPU SinJulia | |
| Lenovo Legion Pro 5 16ARX8 | |
| Asus TUF Gaming A16 FA617XS | |
| Medion Erazer Major X20 | |
| Average of class Gaming (4424 - 33636, n=105, last 2 years) | |
| Acer Nitro 16 AN16-41 | |
| Average AMD Ryzen 7 7735HS (11233 - 13097, n=16) | |
| Aorus 15X ASF | |
| Aorus 15 XE5 | |
| AIDA64 / FPU Mandel | |
| Average of class Gaming (25115 - 128721, n=105, last 2 years) | |
| Lenovo Legion Pro 5 16ARX8 | |
| Asus TUF Gaming A16 FA617XS | |
| Medion Erazer Major X20 | |
| Acer Nitro 16 AN16-41 | |
| Average AMD Ryzen 7 7735HS (41400 - 58232, n=16) | |
| Aorus 15X ASF | |
| Aorus 15 XE5 | |
| AIDA64 / CPU AES | |
| Aorus 15X ASF | |
| Medion Erazer Major X20 | |
| Aorus 15 XE5 | |
| Average of class Gaming (39258 - 247074, n=105, last 2 years) | |
| Asus TUF Gaming A16 FA617XS | |
| Average AMD Ryzen 7 7735HS (44013 - 137629, n=16) | |
| Lenovo Legion Pro 5 16ARX8 | |
| Acer Nitro 16 AN16-41 | |
| AIDA64 / CPU ZLib | |
| Medion Erazer Major X20 | |
| Average of class Gaming (574 - 2531, n=105, last 2 years) | |
| Lenovo Legion Pro 5 16ARX8 | |
| Aorus 15X ASF | |
| Asus TUF Gaming A16 FA617XS | |
| Acer Nitro 16 AN16-41 | |
| Aorus 15 XE5 | |
| Average AMD Ryzen 7 7735HS (651 - 906, n=16) | |
| AIDA64 / FP64 Ray-Trace | |
| Average of class Gaming (5509 - 45446, n=105, last 2 years) | |
| Lenovo Legion Pro 5 16ARX8 | |
| Asus TUF Gaming A16 FA617XS | |
| Medion Erazer Major X20 | |
| Aorus 15X ASF | |
| Acer Nitro 16 AN16-41 | |
| Average AMD Ryzen 7 7735HS (1459 - 9094, n=16) | |
| Aorus 15 XE5 | |
| AIDA64 / CPU PhotoWorxx | |
| Average of class Gaming (12271 - 89891, n=105, last 2 years) | |
| Medion Erazer Major X20 | |
| Aorus 15X ASF | |
| Aorus 15 XE5 | |
| Asus TUF Gaming A16 FA617XS | |
| Lenovo Legion Pro 5 16ARX8 | |
| Acer Nitro 16 AN16-41 | |
| Average AMD Ryzen 7 7735HS (17524 - 30542, n=16) | |
System performance
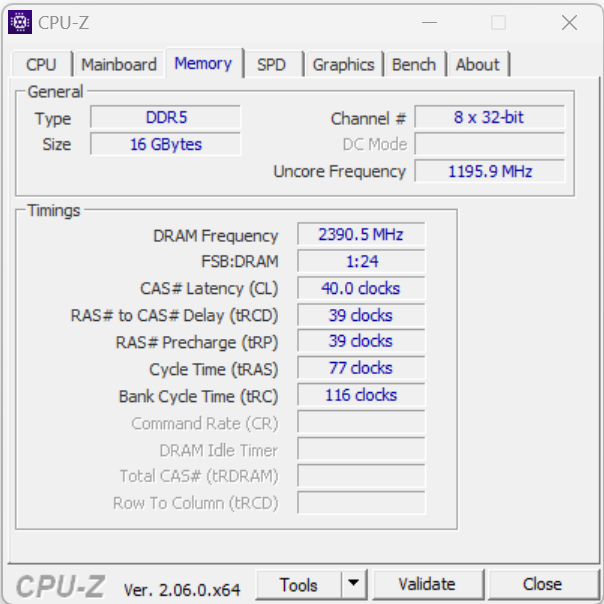
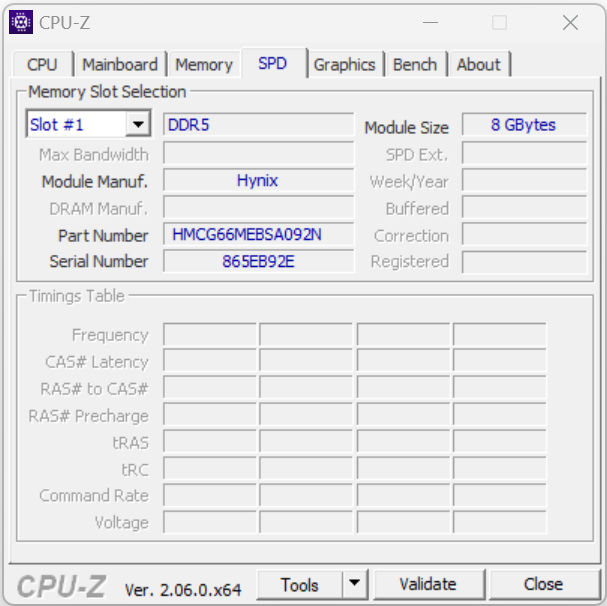
The good PCMark results confirm that the smooth running system delivers sufficient power for demanding applications such as rendering, video editing and gaming. The RAM's transfer rates are considerably lower than what is possible, as shown by the Aorus 15X ASF and Medion Erazer Major X20's comparison values. All three computers have DDR5-4800 RAM on board.
CrossMark: Overall | Productivity | Creativity | Responsiveness
| PCMark 10 / Score | |
| Average of class Gaming (5828 - 12414, n=93, last 2 years) | |
| Lenovo Legion Pro 5 16ARX8 | |
| Asus TUF Gaming A16 FA617XS | |
| Aorus 15 XE5 | |
| Medion Erazer Major X20 | |
| Average AMD Ryzen 7 7735HS, NVIDIA GeForce RTX 4070 Laptop GPU (7220 - 7240, n=2) | |
| Acer Nitro 16 AN16-41 | |
| Aorus 15X ASF | |
| PCMark 10 / Essentials | |
| Medion Erazer Major X20 | |
| Lenovo Legion Pro 5 16ARX8 | |
| Asus TUF Gaming A16 FA617XS | |
| Aorus 15 XE5 | |
| Aorus 15X ASF | |
| Average of class Gaming (8810 - 11935, n=97, last 2 years) | |
| Average AMD Ryzen 7 7735HS, NVIDIA GeForce RTX 4070 Laptop GPU (10579 - 10690, n=2) | |
| Acer Nitro 16 AN16-41 | |
| PCMark 10 / Productivity | |
| Average of class Gaming (6845 - 25323, n=95, last 2 years) | |
| Asus TUF Gaming A16 FA617XS | |
| Aorus 15 XE5 | |
| Lenovo Legion Pro 5 16ARX8 | |
| Medion Erazer Major X20 | |
| Aorus 15X ASF | |
| Acer Nitro 16 AN16-41 | |
| Average AMD Ryzen 7 7735HS, NVIDIA GeForce RTX 4070 Laptop GPU (8893 - 9146, n=2) | |
| PCMark 10 / Digital Content Creation | |
| Average of class Gaming (7602 - 19954, n=95, last 2 years) | |
| Lenovo Legion Pro 5 16ARX8 | |
| Asus TUF Gaming A16 FA617XS | |
| Aorus 15 XE5 | |
| Average AMD Ryzen 7 7735HS, NVIDIA GeForce RTX 4070 Laptop GPU (10558 - 10834, n=2) | |
| Acer Nitro 16 AN16-41 | |
| Medion Erazer Major X20 | |
| Aorus 15X ASF | |
| CrossMark / Overall | |
| Aorus 15X ASF | |
| Lenovo Legion Pro 5 16ARX8 | |
| Average of class Gaming (1366 - 2409, n=94, last 2 years) | |
| Aorus 15 XE5 | |
| Medion Erazer Major X20 | |
| Asus TUF Gaming A16 FA617XS | |
| Acer Nitro 16 AN16-41 | |
| Average AMD Ryzen 7 7735HS, NVIDIA GeForce RTX 4070 Laptop GPU (n=1) | |
| CrossMark / Productivity | |
| Aorus 15X ASF | |
| Lenovo Legion Pro 5 16ARX8 | |
| Aorus 15 XE5 | |
| Average of class Gaming (1386 - 2254, n=94, last 2 years) | |
| Asus TUF Gaming A16 FA617XS | |
| Medion Erazer Major X20 | |
| Acer Nitro 16 AN16-41 | |
| Average AMD Ryzen 7 7735HS, NVIDIA GeForce RTX 4070 Laptop GPU (n=1) | |
| CrossMark / Creativity | |
| Average of class Gaming (1343 - 2786, n=94, last 2 years) | |
| Lenovo Legion Pro 5 16ARX8 | |
| Aorus 15X ASF | |
| Medion Erazer Major X20 | |
| Asus TUF Gaming A16 FA617XS | |
| Aorus 15 XE5 | |
| Acer Nitro 16 AN16-41 | |
| Average AMD Ryzen 7 7735HS, NVIDIA GeForce RTX 4070 Laptop GPU (n=1) | |
| CrossMark / Responsiveness | |
| Aorus 15 XE5 | |
| Aorus 15X ASF | |
| Lenovo Legion Pro 5 16ARX8 | |
| Average of class Gaming (1226 - 2334, n=94, last 2 years) | |
| Medion Erazer Major X20 | |
| Asus TUF Gaming A16 FA617XS | |
| Acer Nitro 16 AN16-41 | |
| Average AMD Ryzen 7 7735HS, NVIDIA GeForce RTX 4070 Laptop GPU (n=1) | |
| PCMark 8 Home Score Accelerated v2 | 5174 points | |
| PCMark 8 Work Score Accelerated v2 | 5520 points | |
| PCMark 10 Score | 7220 points | |
Help | ||
| AIDA64 / Memory Copy | |
| Average of class Gaming (21750 - 129946, n=105, last 2 years) | |
| Medion Erazer Major X20 | |
| Asus TUF Gaming A16 FA617XS | |
| Aorus 15X ASF | |
| Aorus 15 XE5 | |
| Lenovo Legion Pro 5 16ARX8 | |
| Acer Nitro 16 AN16-41 | |
| Average AMD Ryzen 7 7735HS (30324 - 52012, n=16) | |
| AIDA64 / Memory Read | |
| Average of class Gaming (22956 - 118858, n=105, last 2 years) | |
| Medion Erazer Major X20 | |
| Aorus 15X ASF | |
| Asus TUF Gaming A16 FA617XS | |
| Aorus 15 XE5 | |
| Lenovo Legion Pro 5 16ARX8 | |
| Acer Nitro 16 AN16-41 | |
| Average AMD Ryzen 7 7735HS (33938 - 51856, n=16) | |
| AIDA64 / Memory Write | |
| Average of class Gaming (22297 - 135096, n=105, last 2 years) | |
| Asus TUF Gaming A16 FA617XS | |
| Medion Erazer Major X20 | |
| Aorus 15 XE5 | |
| Aorus 15X ASF | |
| Acer Nitro 16 AN16-41 | |
| Lenovo Legion Pro 5 16ARX8 | |
| Average AMD Ryzen 7 7735HS (33175 - 55284, n=16) | |
| AIDA64 / Memory Latency | |
| Average of class Gaming (75.3 - 259, n=105, last 2 years) | |
| Aorus 15 XE5 | |
| Acer Nitro 16 AN16-41 | |
| Average AMD Ryzen 7 7735HS (78.2 - 109.8, n=16) | |
| Medion Erazer Major X20 | |
| Asus TUF Gaming A16 FA617XS | |
| Lenovo Legion Pro 5 16ARX8 | |
| Aorus 15X ASF | |
* ... smaller is better
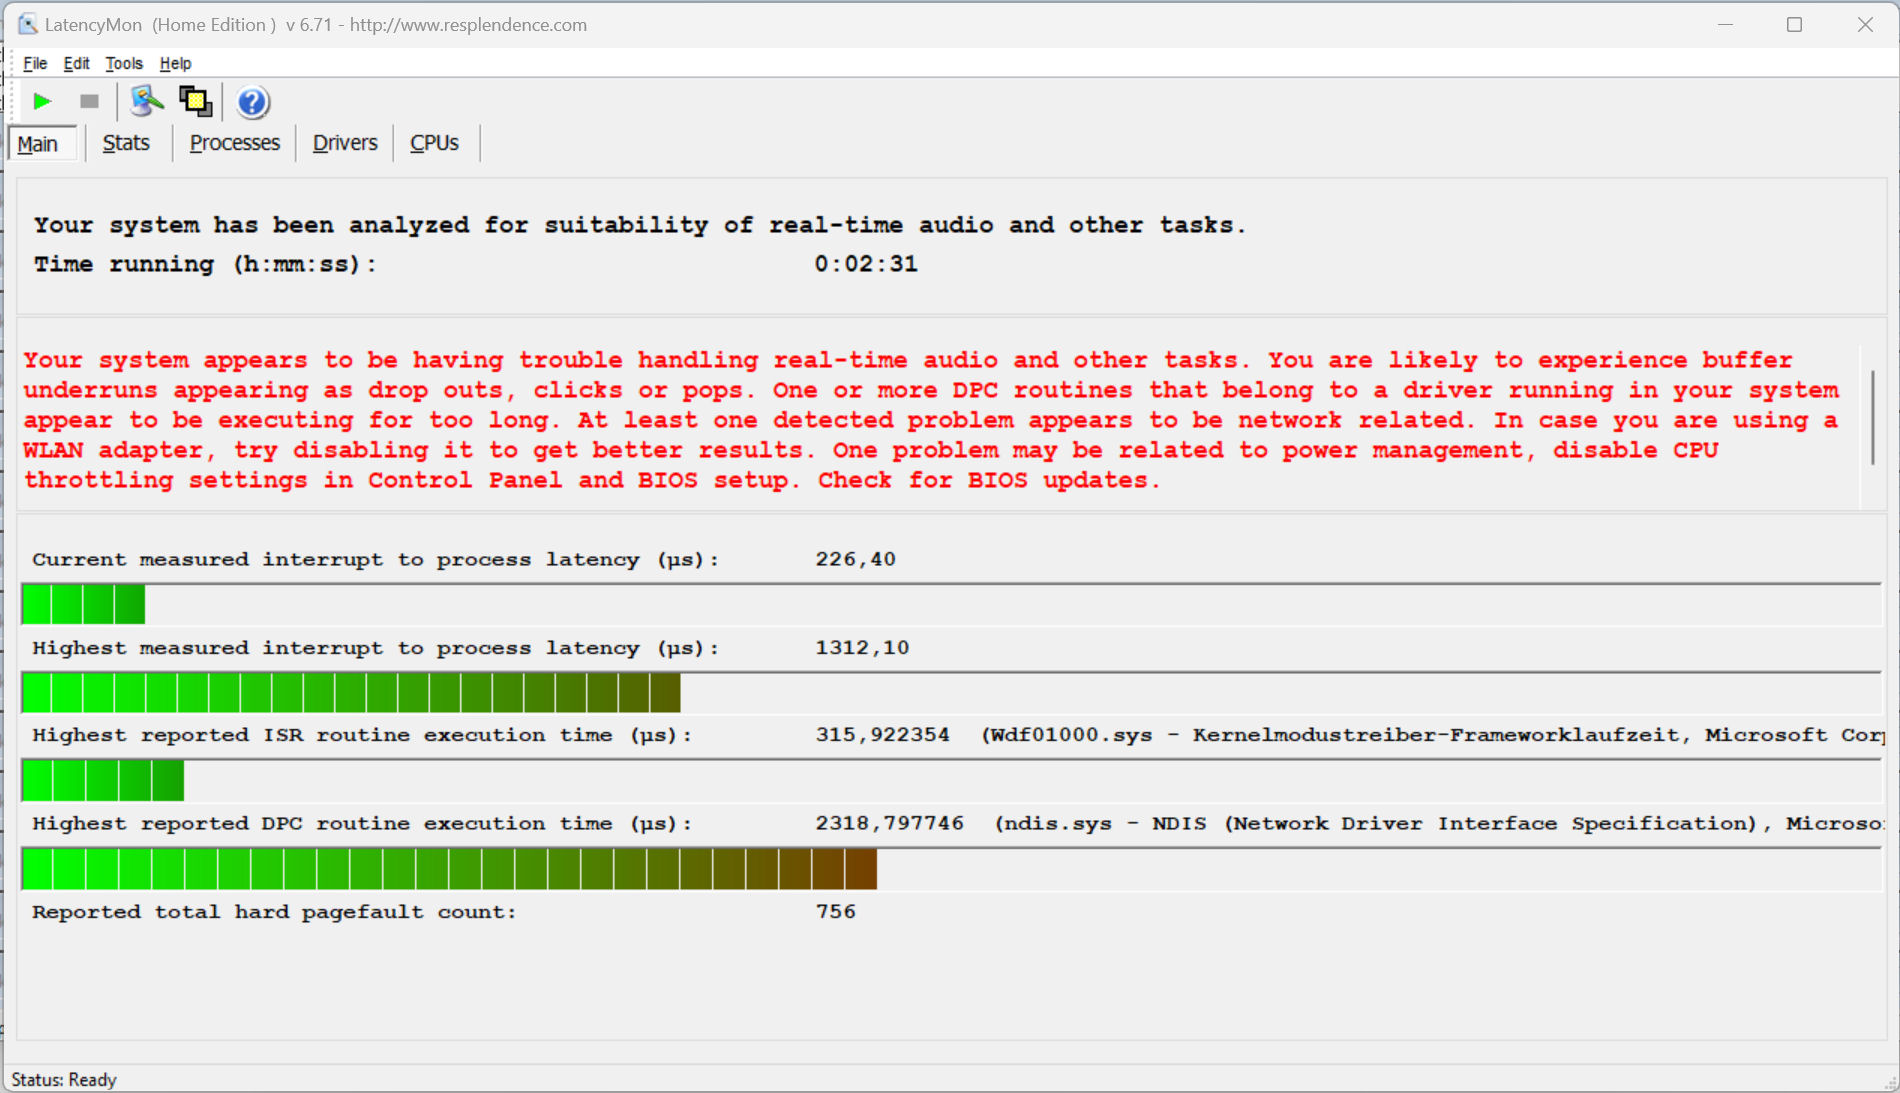
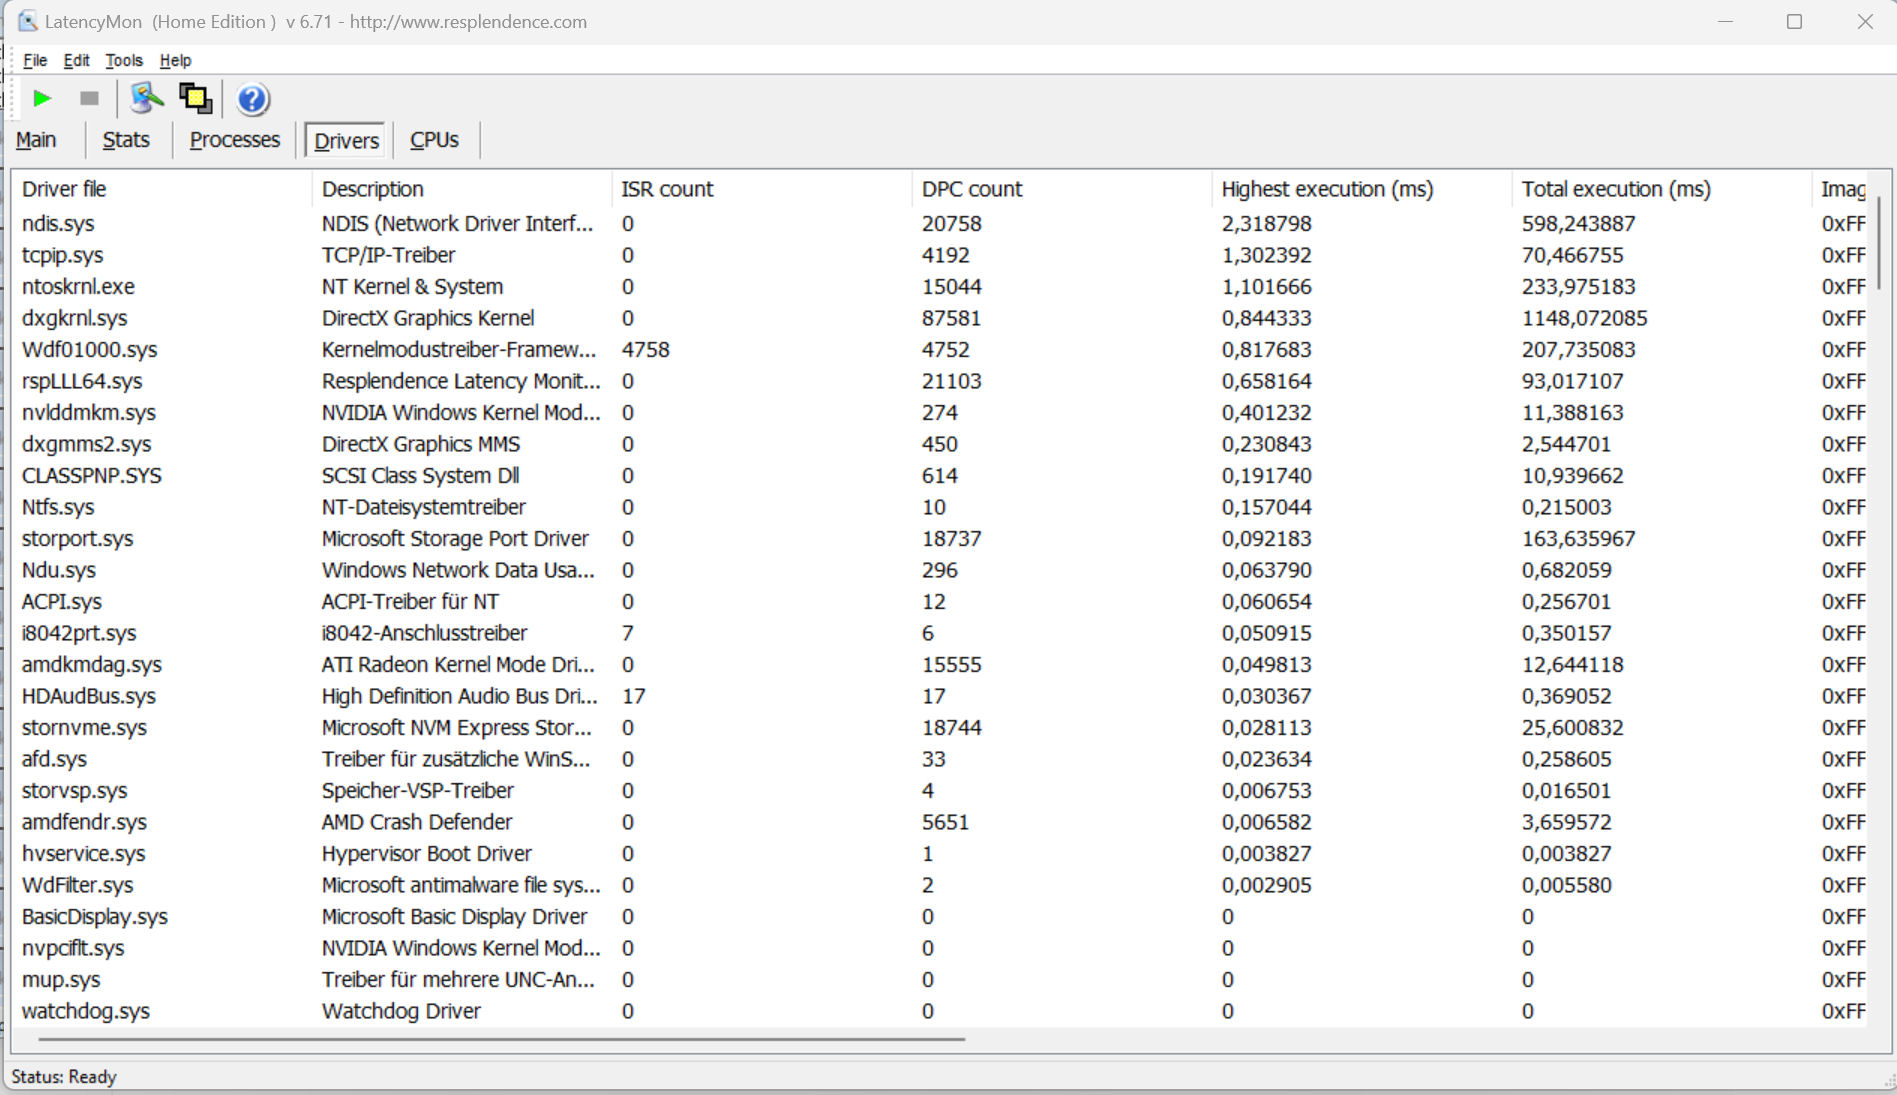
DPC latencies
The standardized Latency Monitor test (internet surfing, 4k video playback, Prime95 high-load) was revealing. The system doesn't appear to be suitable for real-time video and audio editing. Future software updates could either improve or worsen matters.
| DPC Latencies / LatencyMon - interrupt to process latency (max), Web, Youtube, Prime95 | |
| Aorus 15X ASF | |
| Medion Erazer Major X20 | |
| Acer Nitro 16 AN16-41 | |
| Asus TUF Gaming A16 FA617XS | |
| Aorus 15 XE5 | |
| Lenovo Legion Pro 5 16ARX8 | |
* ... smaller is better
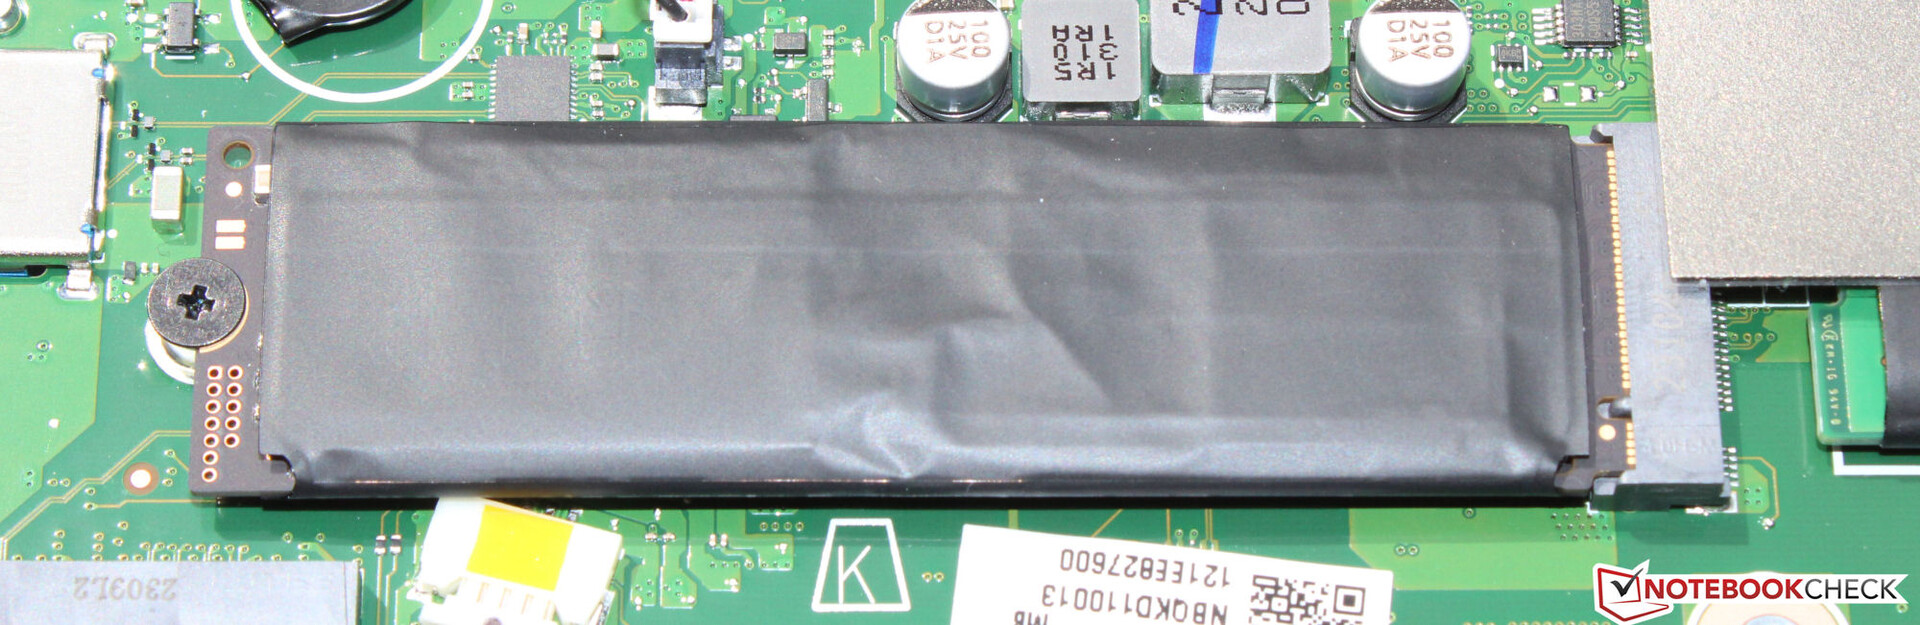
Mass storage
Acer has equipped the Nitro with a 1 TB SSD (PCIe 4, M.2 2280) from Samsung, delivering very good transfer rates. One negative: Dips in performance can happen quickly due to thermal throttling. The laptop has space for a second PCIe 4 SSD.

* ... smaller is better
Continuous performance read: DiskSpd Read Loop, Queue Depth 8
Graphics card
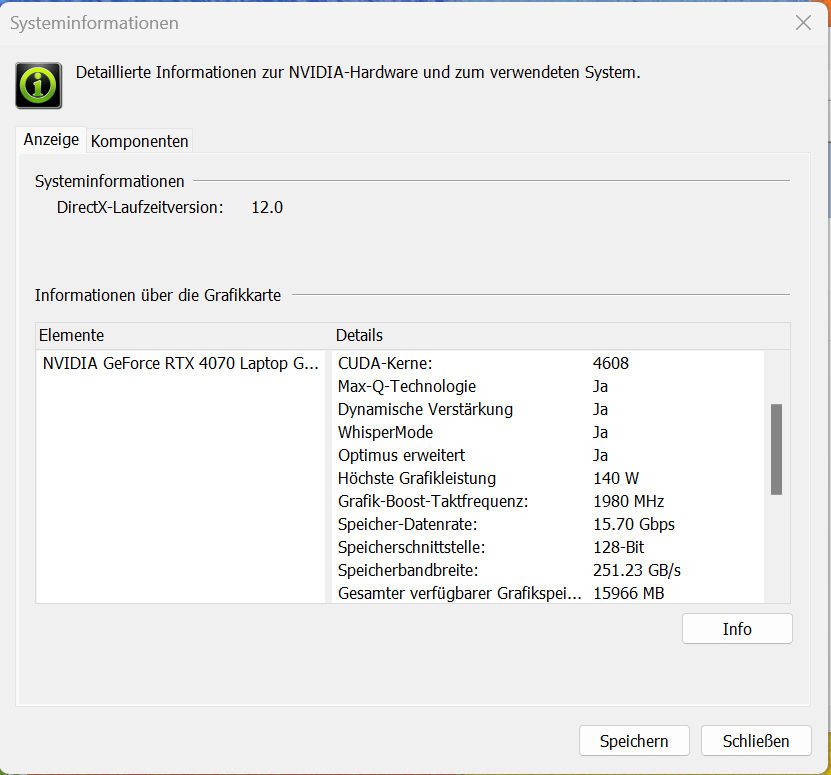
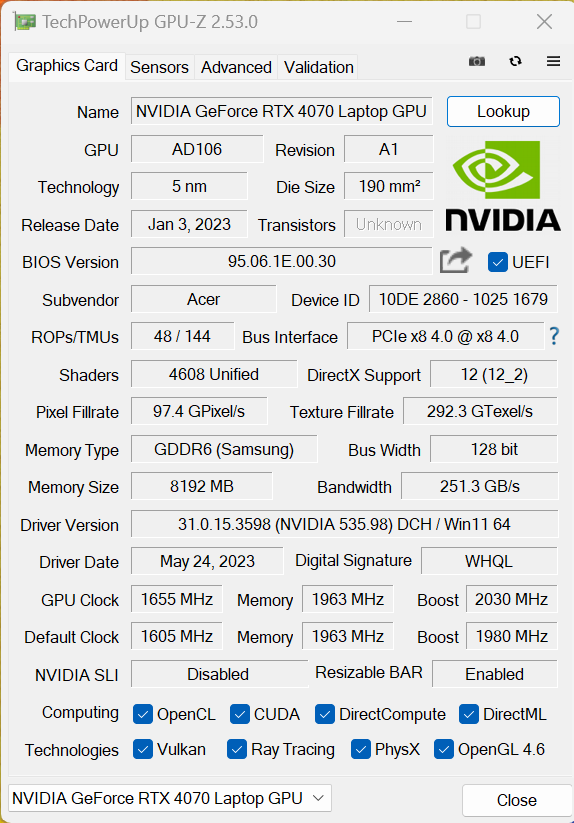
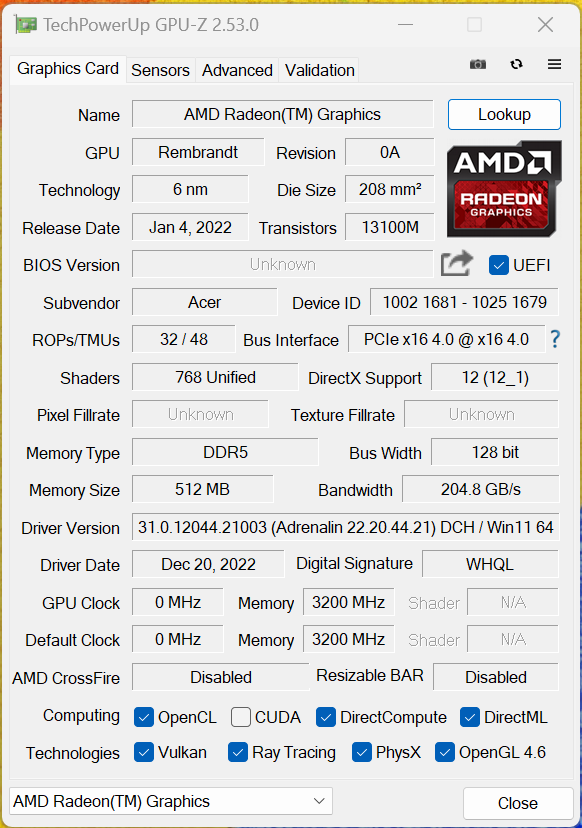
In our review model, Acer has paired its Ryzen 7 APU with a GeForce RTX 4070 laptop GPU and has granted it a maximum TGP of 140 watts - more isn't possible. According to the Witcher 3 test, the TGP isn't completely utilized. The GPU offers 4,608 shaders, a 128 bits bus width and fast GDDR6 RAM (8,192 MB).
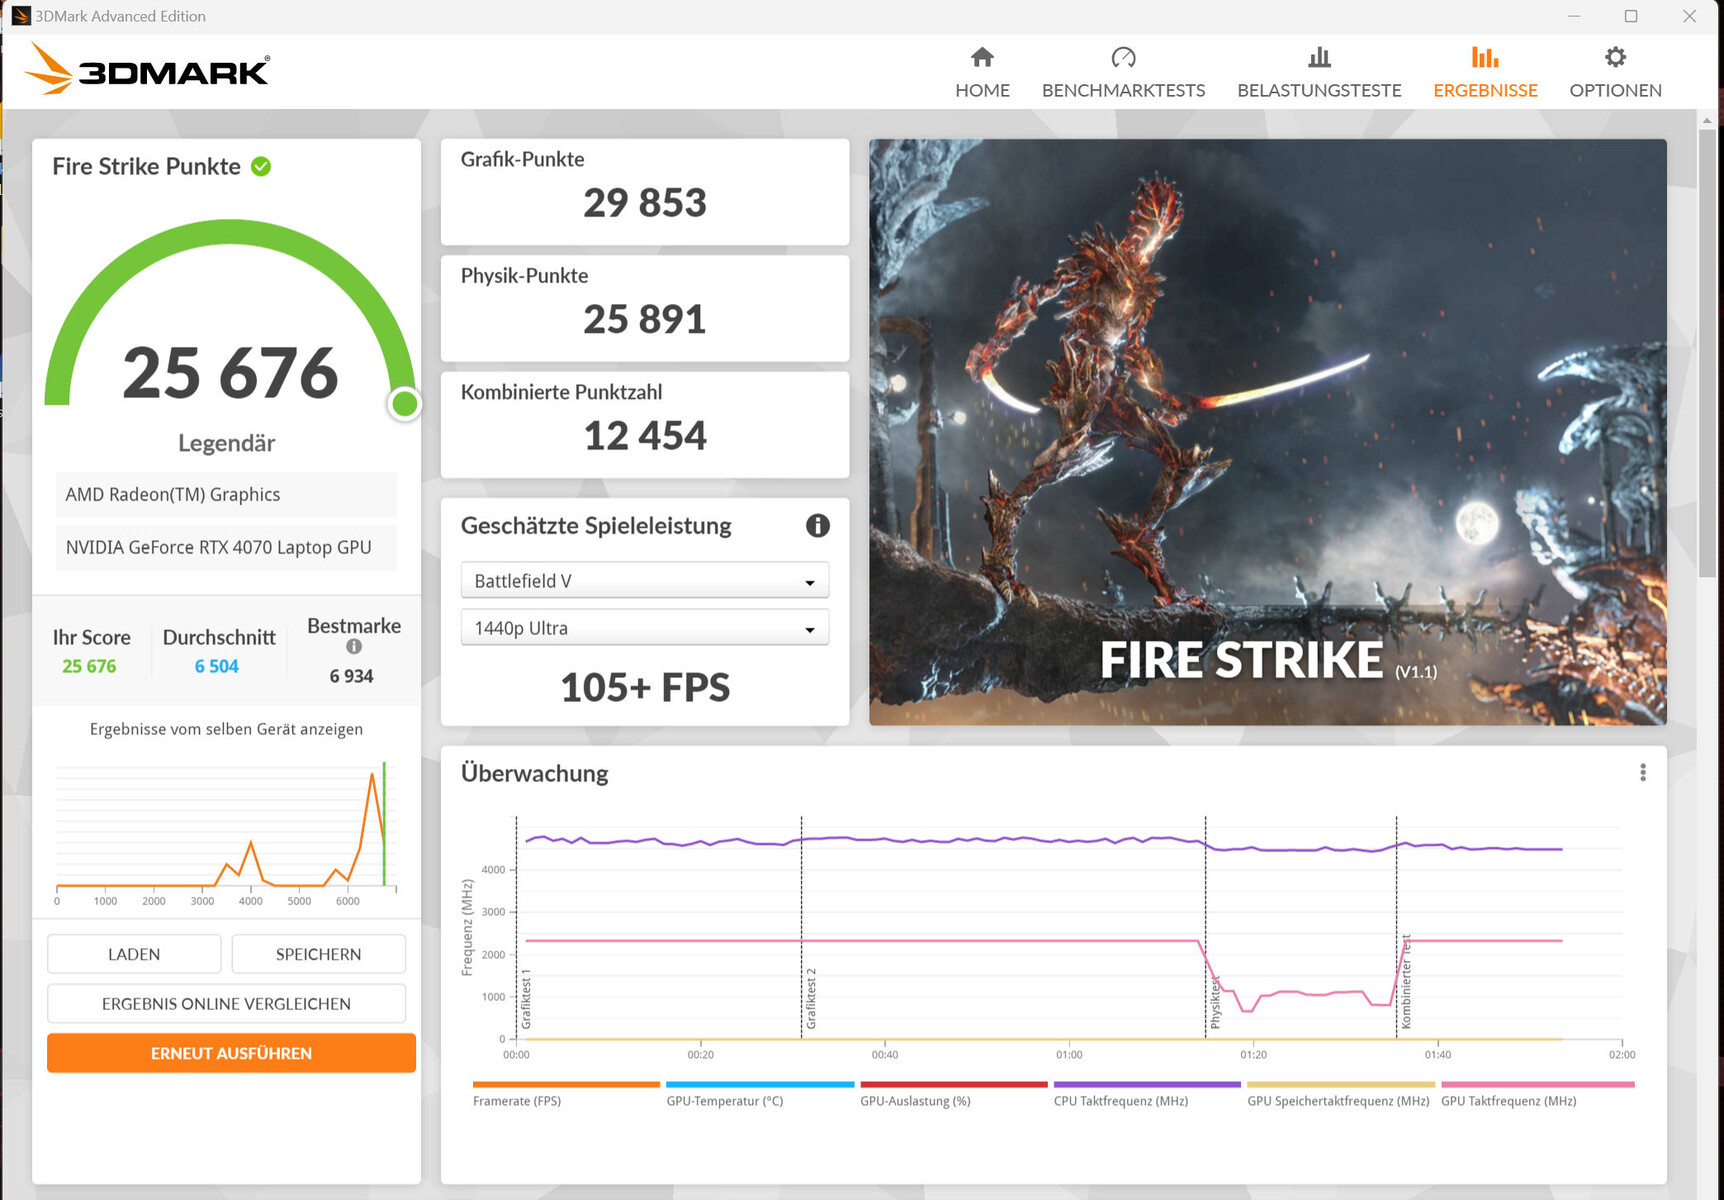
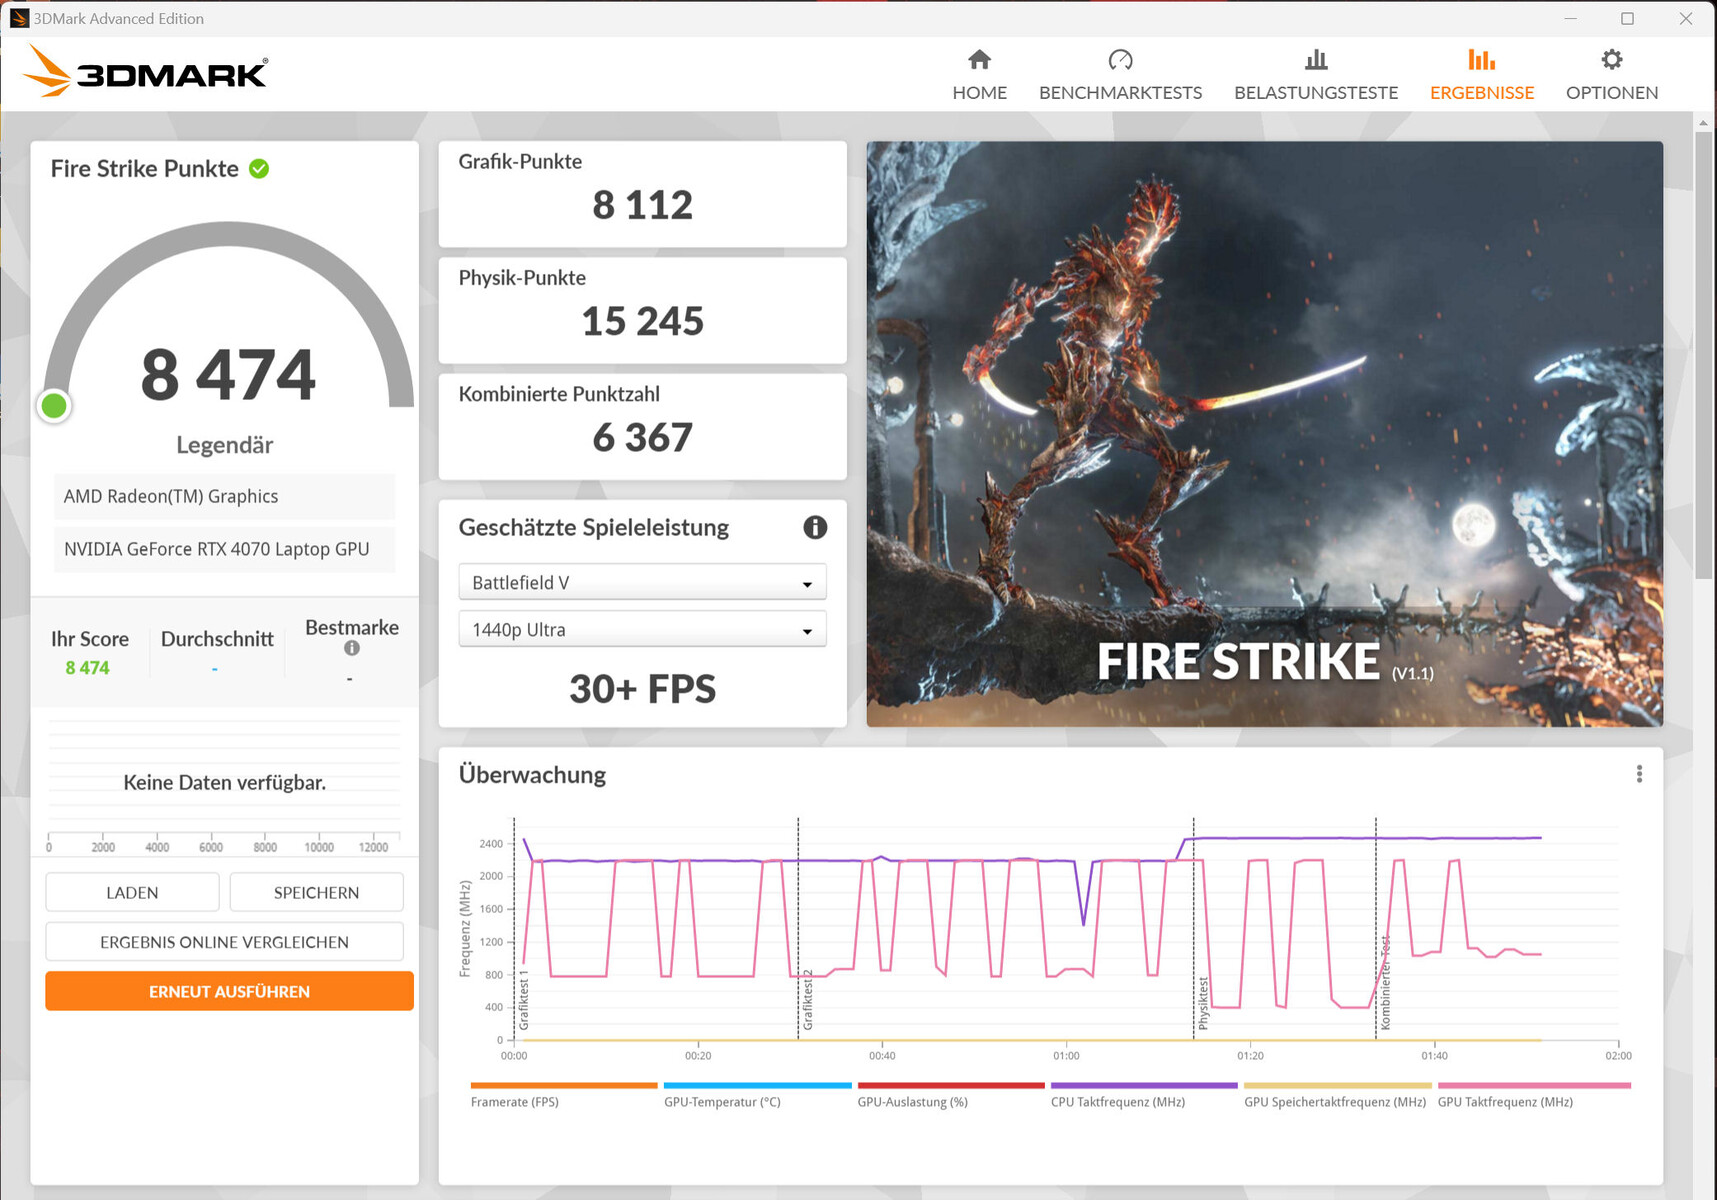
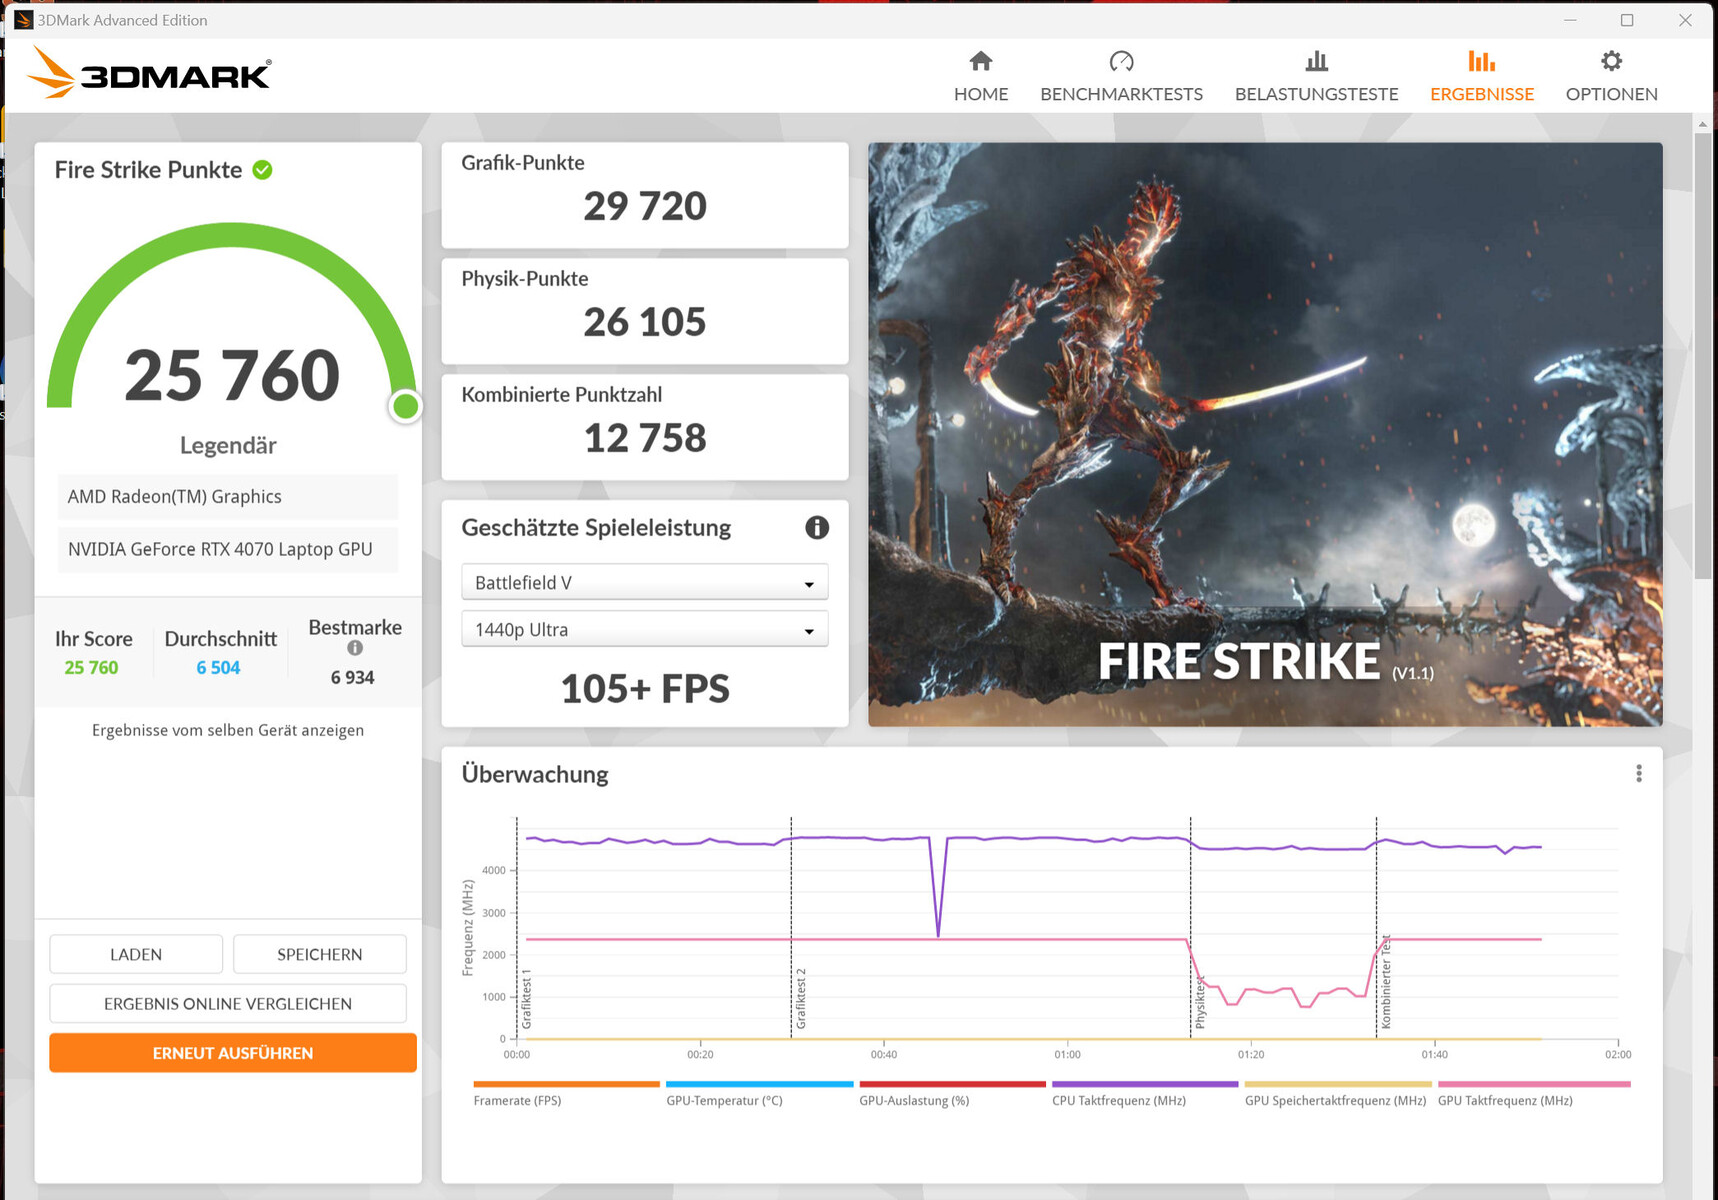
The 3DMark results are above the RTX 4070 average. The performance differences between the four mains and two battery performance modes are very small. The dGPU mode does help matters. Switching between dGPU and Optimus doesn't require rebooting - Advanced Optimus is supported.


| 3DMark 06 Standard Score | 47449 points | |
| 3DMark 11 Performance | 30422 points | |
| 3DMark Cloud Gate Standard Score | 60531 points | |
| 3DMark Fire Strike Score | 25676 points | |
| 3DMark Time Spy Score | 11530 points | |
Help | ||
* ... smaller is better
Gaming performance
The Nitro is designed for WQXGA gaming at high to maximum settings. Higher resolutions would be possible after connecting a corresponding monitor - at slightly reduced settings.
The frame rates are generally just above average for this GPU. Nevertheless, some undemanding titles or settings deliver considerably lower numbers - for example, GTA V and Dota 2 Reborn. This can be traced back to the RTX 4070's "Max Q" feature set: High performance is not the primary goal - the GPU should work as efficiently as possible. That includes not only energy requirements but also temperature levels and/or noise levels. The GTA V Ultra benchmark ran with a TGP average of almost 60 watts (50 to 75 watts).
| The Witcher 3 - 1920x1080 Ultra Graphics & Postprocessing (HBAO+) | |
| Average of class Gaming (104.7 - 240, n=7, last 2 years) | |
| Medion Erazer Major X20 | |
| Lenovo Legion Pro 5 16ARX8 | |
| Aorus 15X ASF | |
| Acer Nitro 16 AN16-41 | |
| Average NVIDIA GeForce RTX 4070 Laptop GPU (69.8 - 133.7, n=57) | |
| Aorus 15 XE5 | |
| Asus TUF Gaming A16 FA617XS | |
| Final Fantasy XV Benchmark - 1920x1080 High Quality | |
| Average of class Gaming (41 - 215, n=95, last 2 years) | |
| Medion Erazer Major X20 | |
| Lenovo Legion Pro 5 16ARX8 | |
| Aorus 15X ASF | |
| Average NVIDIA GeForce RTX 4070 Laptop GPU (41 - 131.9, n=65) | |
| Acer Nitro 16 AN16-41 | |
| Aorus 15 XE5 | |
| Asus TUF Gaming A16 FA617XS | |
| Atomic Heart | |
| 1920x1080 Atomic Preset | |
| Aorus 15X ASF | |
| Acer Nitro 16 AN16-41 | |
| Average NVIDIA GeForce RTX 4070 Laptop GPU (70.4 - 79, n=4) | |
| Asus TUF Gaming A16 FA617XS | |
| 2560x1440 Atomic Preset | |
| Aorus 15X ASF | |
| Acer Nitro 16 AN16-41 | |
| Average NVIDIA GeForce RTX 4070 Laptop GPU (51.6 - 58.9, n=3) | |
| Resident Evil 4 Remake | |
| 1920x1080 Max Preset | |
| Aorus 15X ASF | |
| Average NVIDIA GeForce RTX 4070 Laptop GPU (74.8 - 86.7, n=4) | |
| Acer Nitro 16 AN16-41 | |
| Asus TUF Gaming A16 FA617XS | |
| 2560x1440 Max Preset | |
| Aorus 15X ASF | |
| Average NVIDIA GeForce RTX 4070 Laptop GPU (58.5 - 61.5, n=3) | |
| Acer Nitro 16 AN16-41 | |
| Dead Island 2 | |
| 1920x1080 Ultra Preset AA:High T | |
| Average NVIDIA GeForce RTX 4070 Laptop GPU (130.2 - 178.5, n=3) | |
| Acer Nitro 16 AN16-41 | |
| Asus TUF Gaming A16 FA617XS | |
| 2560x1440 Ultra Preset AA:High T | |
| Acer Nitro 16 AN16-41 | |
| Average NVIDIA GeForce RTX 4070 Laptop GPU (95.6 - 116.7, n=3) | |
| The Last of Us | |
| 1920x1080 Ultra Preset | |
| Acer Nitro 16 AN16-41 | |
| Average NVIDIA GeForce RTX 4070 Laptop GPU (56 - 75, n=4) | |
| Aorus 15X ASF | |
| Asus TUF Gaming A16 FA617XS | |
| 2560x1440 Ultra Preset | |
| Aorus 15X ASF | |
| Average NVIDIA GeForce RTX 4070 Laptop GPU (41.7 - 53.3, n=4) | |
| Acer Nitro 16 AN16-41 | |
| The Callisto Protocol | |
| 1920x1080 Ultra Preset (without FSR Upscaling) | |
| Acer Nitro 16 AN16-41 | |
| Average NVIDIA GeForce RTX 4070 Laptop GPU (78.9 - 88, n=4) | |
| Aorus 15X ASF | |
| 2560x1440 Ultra Preset (without FSR Upscaling) | |
| Acer Nitro 16 AN16-41 | |
| Average NVIDIA GeForce RTX 4070 Laptop GPU (58.4 - 68.3, n=4) | |
| Aorus 15X ASF | |
| 1920x1080 Ultra Preset (without FSR Upscaling) + Full Ray-Tracing | |
| Average NVIDIA GeForce RTX 4070 Laptop GPU (50.8 - 70, n=4) | |
| Aorus 15X ASF | |
| Acer Nitro 16 AN16-41 | |
In order to check whether the frame rates stay stable over longer periods of time, we ran the "The Witcher 3" game for around 60 minutes at Full HD resolution and maximum quality settings. The game characters weren't moved and no dips in frame rate were observed.
Witcher 3 FPS diagram
| low | med. | high | ultra | QHD | |
|---|---|---|---|---|---|
| GTA V (2015) | 180.6 | 158.9 | 97.4 | 86.1 | |
| The Witcher 3 (2015) | 322.5 | 213.3 | 113.2 | ||
| Dota 2 Reborn (2015) | 137.7 | 131.9 | 118.9 | 114.8 | |
| Final Fantasy XV Benchmark (2018) | 186.2 | 147.7 | 109.1 | 81.2 | |
| X-Plane 11.11 (2018) | 107 | 94.2 | 76.3 | ||
| Far Cry 5 (2018) | 141 | 120 | 116 | 109 | 102 |
| Strange Brigade (2018) | 375 | 273 | 221 | 192.6 | 129 |
| Cyberpunk 2077 1.6 (2022) | 86.03 | 53.49 | |||
| F1 22 (2022) | 225 | 222 | 205 | 79.3 | 50.3 |
| Call of Duty Modern Warfare 2 2022 (2022) | 105 | 74 | |||
| The Callisto Protocol (2022) | 122.8 | 113.8 | 111.8 | 83.5 | 66.7 |
| Atomic Heart (2023) | 176.6 | 147.4 | 95.1 | 78 | 58.6 |
| Resident Evil 4 Remake (2023) | 119.3 | 117.6 | 111.5 | 80.5 | 58.5 |
| The Last of Us (2023) | 98.6 | 85.9 | 77.7 | 69.5 | 41.7 |
| Dead Island 2 (2023) | 167.9 | 161.7 | 151.9 | 143.4 | 106.6 |
Emissions - The Acer laptop can run quietly
Noise emissions
Generally, in everyday use (office, internet, etc) the computer runs quietly and sometimes silently. It was possible to achieve a maximum noise level of 62 dB(A) under full load using the "Performance" and "Turbo" modes. "Balanced" delivered its highest but also moderate value of 43.4 dB(A) and, therefore, represents a good compromise between noise and performance. The "Quiet" mode is responsible for maximum silence.
The performance differences between the modes are relatively modest. Therefore, "Balanced" and "Quiet" ensure gaming at moderate to low noise levels.
Noise level
| Idle |
| 25.7 / 25.7 / 26.3 dB(A) |
| Load |
| 33.9 / 62 dB(A) |
 | ||
30 dB silent 40 dB(A) audible 50 dB(A) loud |
||
min: | ||
| Acer Nitro 16 AN16-41 GeForce RTX 4070 Laptop GPU, R7 7735HS, Samsung PM9A1 MZVL21T0HCLR | Asus TUF Gaming A16 FA617XS Radeon RX 7600S, R9 7940HS, Micron 2400 MTFDKBA512QFM | Lenovo Legion Pro 5 16ARX8 GeForce RTX 4070 Laptop GPU, R7 7745HX, Samsung PM9A1 MZVL21T0HCLR | Medion Erazer Major X20 GeForce RTX 4070 Laptop GPU, i9-13900HX, Phison E18-1TB-PHISON-SSD-B47R | Aorus 15X ASF GeForce RTX 4070 Laptop GPU, i7-13700HX, Gigabyte AG470S1TB-SI B10 | Aorus 15 XE5 GeForce RTX 3070 Ti Laptop GPU, i7-12700H, Gigabyte AG470S1TB-SI B10 | |
|---|---|---|---|---|---|---|
| Noise | -2% | 8% | -10% | -16% | -7% | |
| off / environment * (dB) | 25.7 | 25 3% | 23.2 10% | 24 7% | 25 3% | 24 7% |
| Idle Minimum * (dB) | 25.7 | 25 3% | 23.2 10% | 25 3% | 28 -9% | 26 -1% |
| Idle Average * (dB) | 25.7 | 26 -1% | 23.2 10% | 29 -13% | 29 -13% | 28 -9% |
| Idle Maximum * (dB) | 26.3 | 28 -6% | 26.2 -0% | 31 -18% | 36 -37% | 30 -14% |
| Load Average * (dB) | 33.9 | 43 -27% | 31.4 7% | 50 -47% | 50 -47% | 48 -42% |
| Load Maximum * (dB) | 62 | 53 15% | 53.8 13% | 57 8% | 58 6% | 52 16% |
| Witcher 3 ultra * (dB) | 51 | 48.4 | 53 | 54 | 52 |
* ... smaller is better
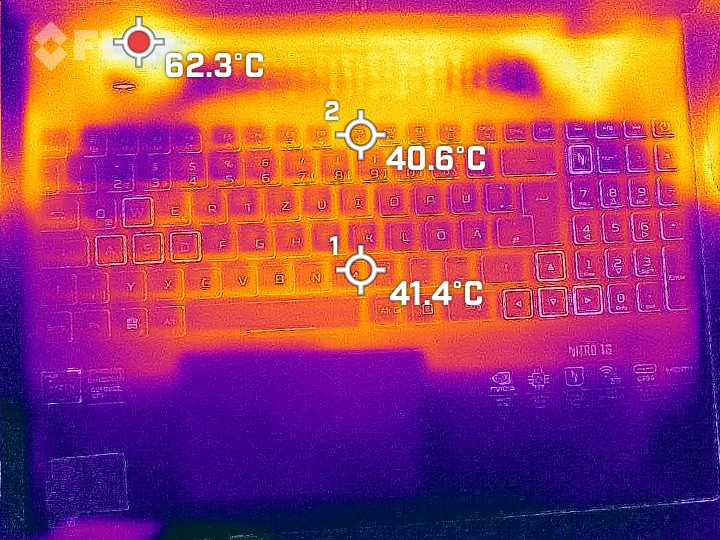
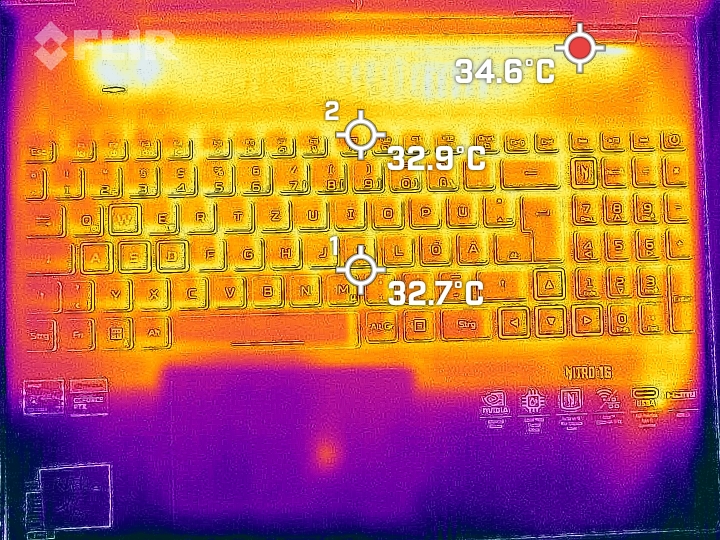
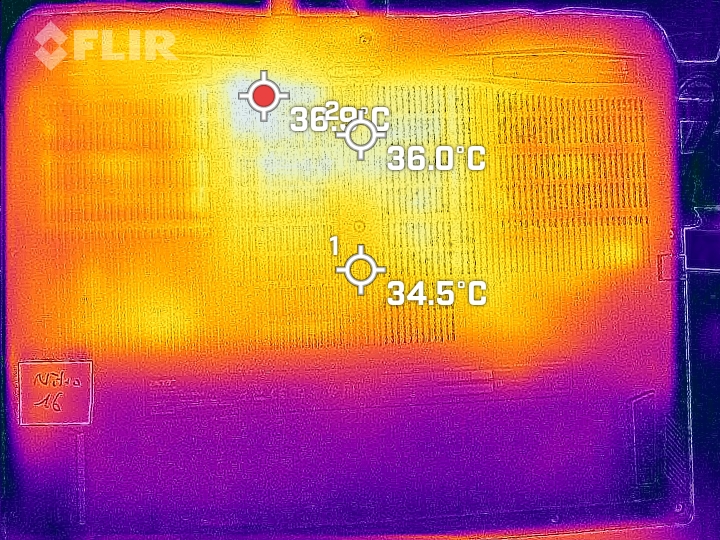
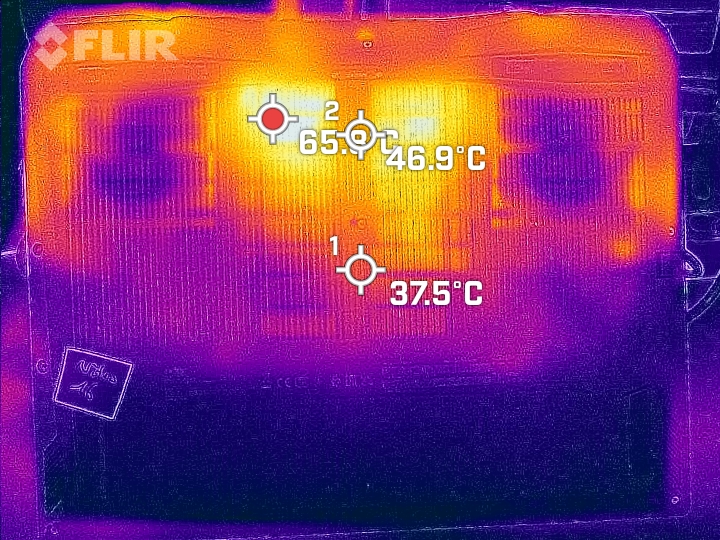
Temperature
Heat dissipation is acceptable: The laptop gets noticeably warm under load but, overall, only moderately. In everyday use, the temperatures remain in the green zone.
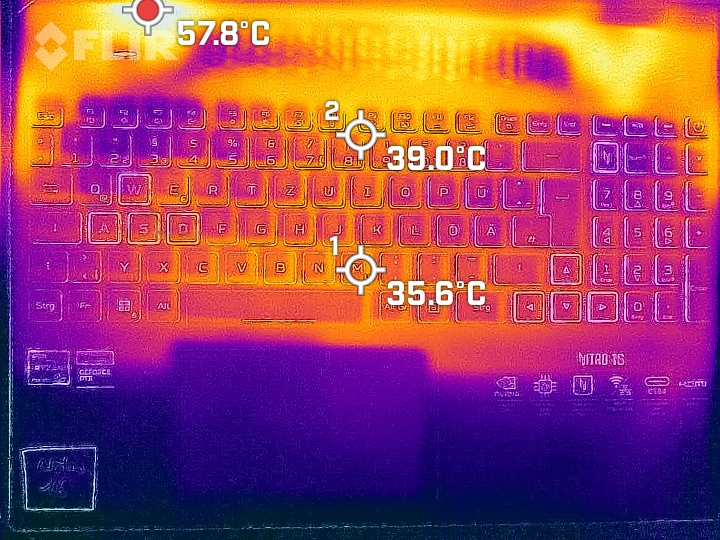
(±) The maximum temperature on the upper side is 41.5 °C / 107 F, compared to the average of 40.4 °C / 105 F, ranging from 21.2 to 68.8 °C for the class Gaming.
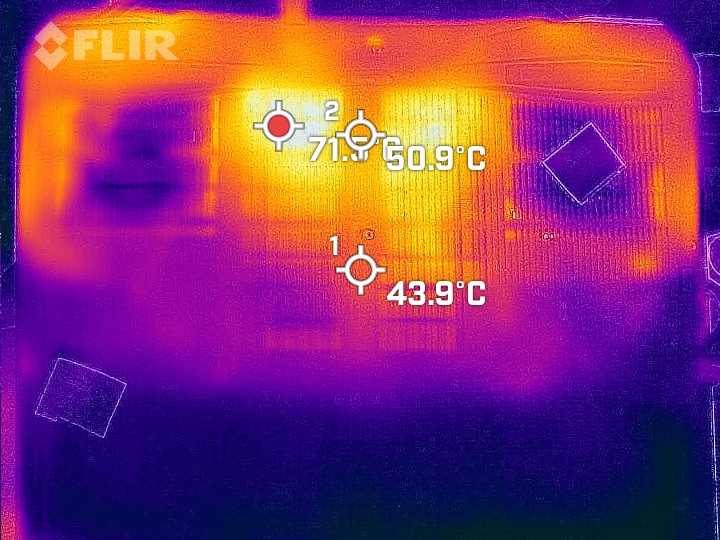
(-) The bottom heats up to a maximum of 51.8 °C / 125 F, compared to the average of 43.2 °C / 110 F
(+) In idle usage, the average temperature for the upper side is 29.5 °C / 85 F, compared to the device average of 33.9 °C / 93 F.
(±) Playing The Witcher 3, the average temperature for the upper side is 33.6 °C / 92 F, compared to the device average of 33.9 °C / 93 F.
(+) The palmrests and touchpad are cooler than skin temperature with a maximum of 29.4 °C / 84.9 F and are therefore cool to the touch.
(±) The average temperature of the palmrest area of similar devices was 28.8 °C / 83.8 F (-0.6 °C / -1.1 F).
| Acer Nitro 16 AN16-41 AMD Ryzen 7 7735HS, NVIDIA GeForce RTX 4070 Laptop GPU | Asus TUF Gaming A16 FA617XS AMD Ryzen 9 7940HS, AMD Radeon RX 7600S | Lenovo Legion Pro 5 16ARX8 AMD Ryzen 7 7745HX, NVIDIA GeForce RTX 4070 Laptop GPU | Medion Erazer Major X20 Intel Core i9-13900HX, NVIDIA GeForce RTX 4070 Laptop GPU | Aorus 15X ASF Intel Core i7-13700HX, NVIDIA GeForce RTX 4070 Laptop GPU | Aorus 15 XE5 Intel Core i7-12700H, NVIDIA GeForce RTX 3070 Ti Laptop GPU | |
|---|---|---|---|---|---|---|
| Heat | -1% | 10% | -8% | 10% | -16% | |
| Maximum Upper Side * (°C) | 41.5 | 53 -28% | 41.8 -1% | 46 -11% | 42 -1% | 46 -11% |
| Maximum Bottom * (°C) | 51.8 | 48 7% | 41.4 20% | 49 5% | 51 2% | 57 -10% |
| Idle Upper Side * (°C) | 31.6 | 30 5% | 29 8% | 37 -17% | 27 15% | 38 -20% |
| Idle Bottom * (°C) | 34.5 | 30 13% | 30.4 12% | 38 -10% | 26 25% | 42 -22% |
* ... smaller is better
Stress test
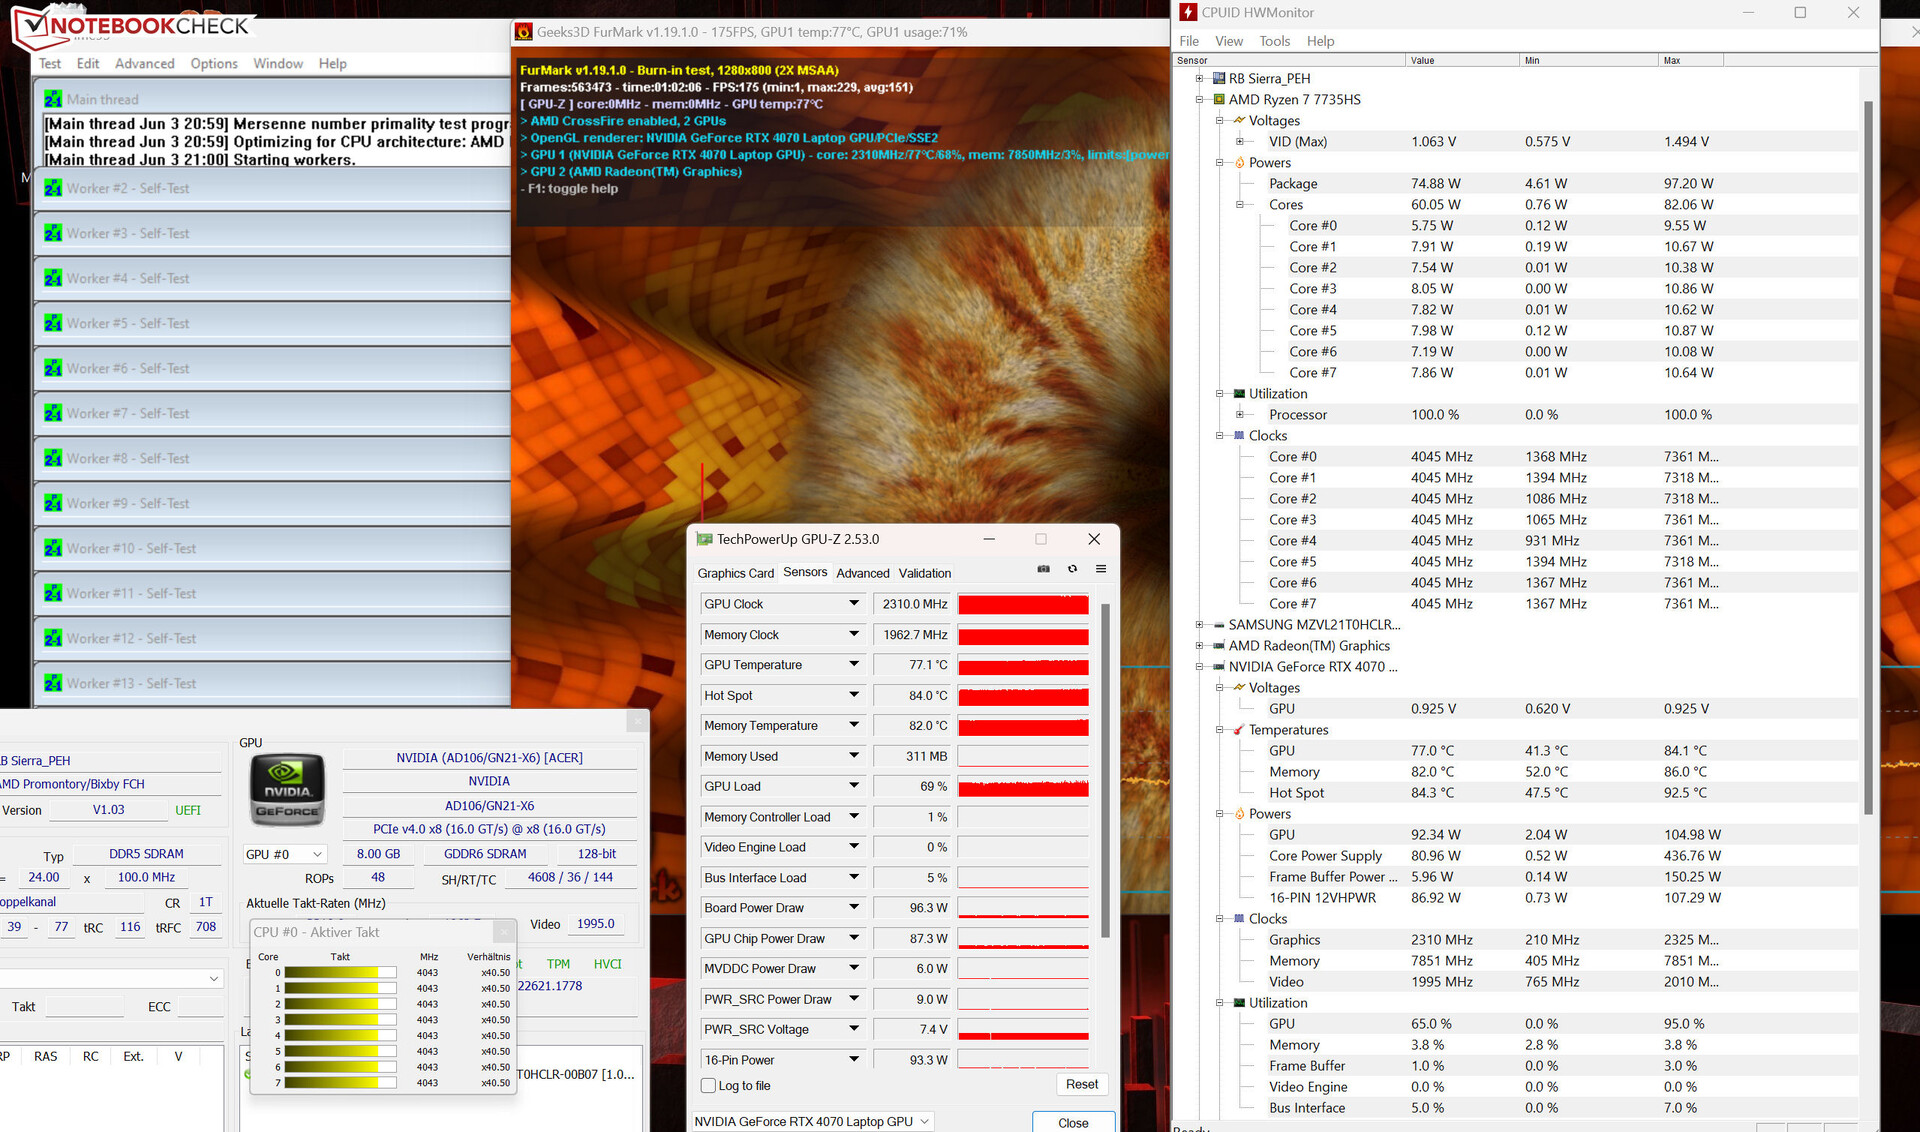
The stress test (Prime95 and Furmark in continuous operation) is an extreme scenario helping to check the system's stability under full load. CPU (4 to 4.1 GHz) and GPU (2,310 MHz) ran throughout the test at a high clock speed.
Speakers
The stereo speakers produce decent sound but are largely free of bass. A better audio experience could be achieved by connecting headphones or external speakers.
Acer Nitro 16 AN16-41 audio analysis
(+) | speakers can play relatively loud (83.9 dB)
Bass 100 - 315 Hz
(-) | nearly no bass - on average 33.5% lower than median
(±) | linearity of bass is average (13.2% delta to prev. frequency)
Mids 400 - 2000 Hz
(+) | balanced mids - only 2.4% away from median
(+) | mids are linear (4.9% delta to prev. frequency)
Highs 2 - 16 kHz
(+) | balanced highs - only 3.6% away from median
(+) | highs are linear (4.2% delta to prev. frequency)
Overall 100 - 16.000 Hz
(±) | linearity of overall sound is average (19.6% difference to median)
Compared to same class
» 68% of all tested devices in this class were better, 6% similar, 25% worse
» The best had a delta of 6%, average was 18%, worst was 132%
Compared to all devices tested
» 49% of all tested devices were better, 7% similar, 44% worse
» The best had a delta of 4%, average was 23%, worst was 134%
Asus TUF Gaming A16 FA617XS audio analysis
(±) | speaker loudness is average but good (79 dB)
Bass 100 - 315 Hz
(±) | reduced bass - on average 11.6% lower than median
(±) | linearity of bass is average (7% delta to prev. frequency)
Mids 400 - 2000 Hz
(±) | higher mids - on average 5.7% higher than median
(+) | mids are linear (3.8% delta to prev. frequency)
Highs 2 - 16 kHz
(+) | balanced highs - only 2.6% away from median
(+) | highs are linear (6.5% delta to prev. frequency)
Overall 100 - 16.000 Hz
(±) | linearity of overall sound is average (15.4% difference to median)
Compared to same class
» 34% of all tested devices in this class were better, 7% similar, 59% worse
» The best had a delta of 6%, average was 18%, worst was 132%
Compared to all devices tested
» 23% of all tested devices were better, 4% similar, 73% worse
» The best had a delta of 4%, average was 23%, worst was 134%
Energy management - No stamina complaints with the Acer computer
Power consumption
There are no particular abnormalities to report when it comes to energy requirements. The values are on a normal level considering the hardware at hand. The stress test and Witcher 3 test ran with slightly falling or constant power consumption. The PSU (330 watts) is more than suitably sized.
| Off / Standby | |
| Idle | |
| Load |
|
Key:
min: | |
| Acer Nitro 16 AN16-41 R7 7735HS, GeForce RTX 4070 Laptop GPU, Samsung PM9A1 MZVL21T0HCLR, IPS, 2560x1600, 16" | Asus TUF Gaming A16 FA617XS R9 7940HS, Radeon RX 7600S, Micron 2400 MTFDKBA512QFM, IPS, 1920x1200, 16" | Lenovo Legion Pro 5 16ARX8 R7 7745HX, GeForce RTX 4070 Laptop GPU, Samsung PM9A1 MZVL21T0HCLR, IPS, 2560x1600, 16" | Medion Erazer Major X20 i9-13900HX, GeForce RTX 4070 Laptop GPU, Phison E18-1TB-PHISON-SSD-B47R, IPS, 2560x1600, 16" | Aorus 15X ASF i7-13700HX, GeForce RTX 4070 Laptop GPU, Gigabyte AG470S1TB-SI B10, IPS, 2560x1440, 15.6" | Aorus 15 XE5 i7-12700H, GeForce RTX 3070 Ti Laptop GPU, Gigabyte AG470S1TB-SI B10, IPS, 2560x1440, 15.6" | Average NVIDIA GeForce RTX 4070 Laptop GPU | Average of class Gaming | |
|---|---|---|---|---|---|---|---|---|
| Power Consumption | 24% | -18% | -20% | -11% | -85% | -10% | -15% | |
| Idle Minimum * (Watt) | 11.6 | 7 40% | 8.1 30% | 12 -3% | 11 5% | 31 -167% | 13.2 ? -14% | 13 ? -12% |
| Idle Average * (Watt) | 15.6 | 10 36% | 15.9 -2% | 16 -3% | 16 -3% | 35 -124% | 18.2 ? -17% | 18.7 ? -20% |
| Idle Maximum * (Watt) | 16.5 | 15 9% | 37.2 -125% | 26 -58% | 24 -45% | 46 -179% | 24.6 ? -49% | 24.3 ? -47% |
| Load Average * (Watt) | 155 | 86 45% | 90.9 41% | 115 26% | 104 33% | 120 23% | 97 ? 37% | 110.2 ? 29% |
| Witcher 3 ultra * (Watt) | 154.8 | 160.6 -4% | 189.6 -22% | 191.6 -24% | 185.4 -20% | 202 -30% | ||
| Load Maximum * (Watt) | 205 | 172 16% | 263.5 -29% | 319 -56% | 272 -33% | 268 -31% | 221 ? -8% | 258 ? -26% |
* ... smaller is better
Power consumption Witcher 3 / stress test
Power consumption with an external monitor
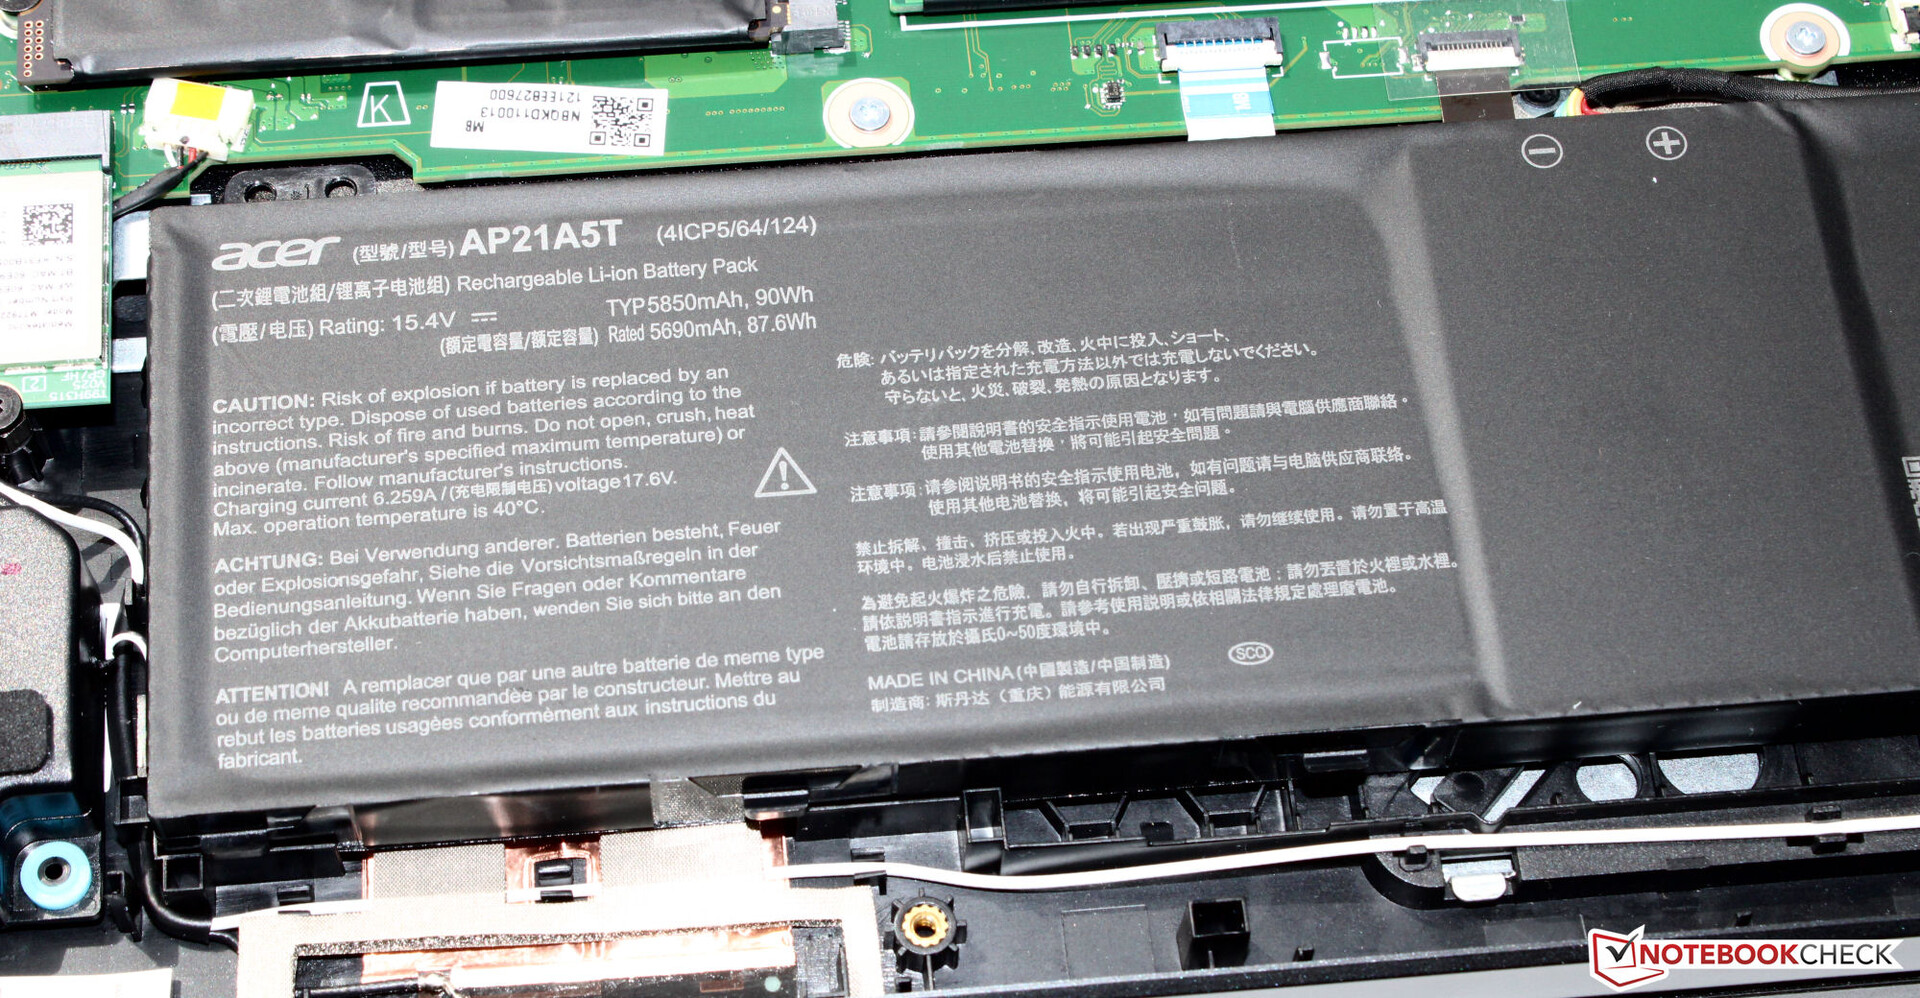
Battery life
In the Wi-Fi (using a script to load a website) and video tests (Big Buck Bunny short film (H.264 coding, FHD) in a loop), the 16-inch machine achieved run times of 9 and 10 hours 14 minutes, respectively. The laptop's energy-saving functions were deactivated and the display brightness was set to 150 cd/m² during both tests. Additionally, the radio module was switched off during the video tests.
The AN16-41 delivered very good runtimes, leaving most of the competition in its tracks. However, it can't quite manage the excellent values seen in the Asus TUF Gaming A16. The latter benefits from the more energy-efficient Zen 4 APU.
| Acer Nitro 16 AN16-41 R7 7735HS, GeForce RTX 4070 Laptop GPU, 90 Wh | Asus TUF Gaming A16 FA617XS R9 7940HS, Radeon RX 7600S, 90 Wh | Lenovo Legion Pro 5 16ARX8 R7 7745HX, GeForce RTX 4070 Laptop GPU, 80 Wh | Medion Erazer Major X20 i9-13900HX, GeForce RTX 4070 Laptop GPU, 62.3 Wh | Aorus 15X ASF i7-13700HX, GeForce RTX 4070 Laptop GPU, 99 Wh | Aorus 15 XE5 i7-12700H, GeForce RTX 3070 Ti Laptop GPU, 99 Wh | Average of class Gaming | |
|---|---|---|---|---|---|---|---|
| Battery runtime | 19% | -49% | -45% | -7% | -19% | -22% | |
| Reader / Idle (h) | 12.2 | 20.3 66% | 6.5 -47% | 5.8 -52% | 11.3 -7% | 10 -18% | 8.16 ? -33% |
| H.264 (h) | 10.2 | 12.4 22% | 4.2 -59% | 7.9 -23% | 6.2 -39% | 8.32 ? -18% | |
| WiFi v1.3 (h) | 9 | 12.4 38% | 4 -56% | 3.9 -57% | 8.2 -9% | 6.8 -24% | 7.11 ? -21% |
| Load (h) | 1.8 | 0.9 -50% | 1 -44% | 1.6 -11% | 2 11% | 1.9 6% | 1.502 ? -17% |
Pros
Cons
Verdict - A bright panel, long battery life
Video editing, rendering and, of course, gaming represent the Nitro 16's core competencies with a Ryzen 7 7735HS and GeForce RTX 4070 providing the necessary power. Both chips run at consistently high clock speeds. A fast PCIe 4 SSD (1 TB) provides the required storage space and ensures short loading times.
With the Nitro 16 AN16-41, Acer has a well-specced, mid-range gaming laptop in its portfolio.
The laptop doesn't get overly warm and produces - with the right settings - a moderate level of background noise. The built-in IPS display (16 inch, 2560 x 1600 pixels, 165 Hz), with its work-friendly, 16:10 aspect ratio, left us impressed. In particular, it scores well with great brightness levels.
A full battery charge (90 Wh) provides real-life run times of around 9 to 10 hours - very good numbers. Another positive: The battery can be charged via the USB-C adapter (min. 65 watts, 20 V) - both USB-C ports support Power Delivery meaning you don't always have to have the hefty, proprietary PSU (330 watts) nearby.
An alternative comes in the form of the Legion Pro 5 16IRX8. It offers more computational power than the Nitro but with significantly worse battery life. The Aorus 15 XE5 would be the budget alternative: Conversely, a somewhat lower performance level is reflected by the considerably lower price ($1599).
Price and availability
A variant of the Acer Nitro 16 AN16-41 with a Ryzen 9 7940HS CPU and an RTX 4070 is available on Amazon for $1696.
Acer Nitro 16 AN16-41
- 06/11/2023 v7 (old)
Sascha Mölck
Transparency
The selection of devices to be reviewed is made by our editorial team. The test sample was provided to the author as a loan by the manufacturer or retailer for the purpose of this review. The lender had no influence on this review, nor did the manufacturer receive a copy of this review before publication. There was no obligation to publish this review. As an independent media company, Notebookcheck is not subjected to the authority of manufacturers, retailers or publishers.
This is how Notebookcheck is testing
Every year, Notebookcheck independently reviews hundreds of laptops and smartphones using standardized procedures to ensure that all results are comparable. We have continuously developed our test methods for around 20 years and set industry standards in the process. In our test labs, high-quality measuring equipment is utilized by experienced technicians and editors. These tests involve a multi-stage validation process. Our complex rating system is based on hundreds of well-founded measurements and benchmarks, which maintains objectivity. Further information on our test methods can be found here.
Price comparison

