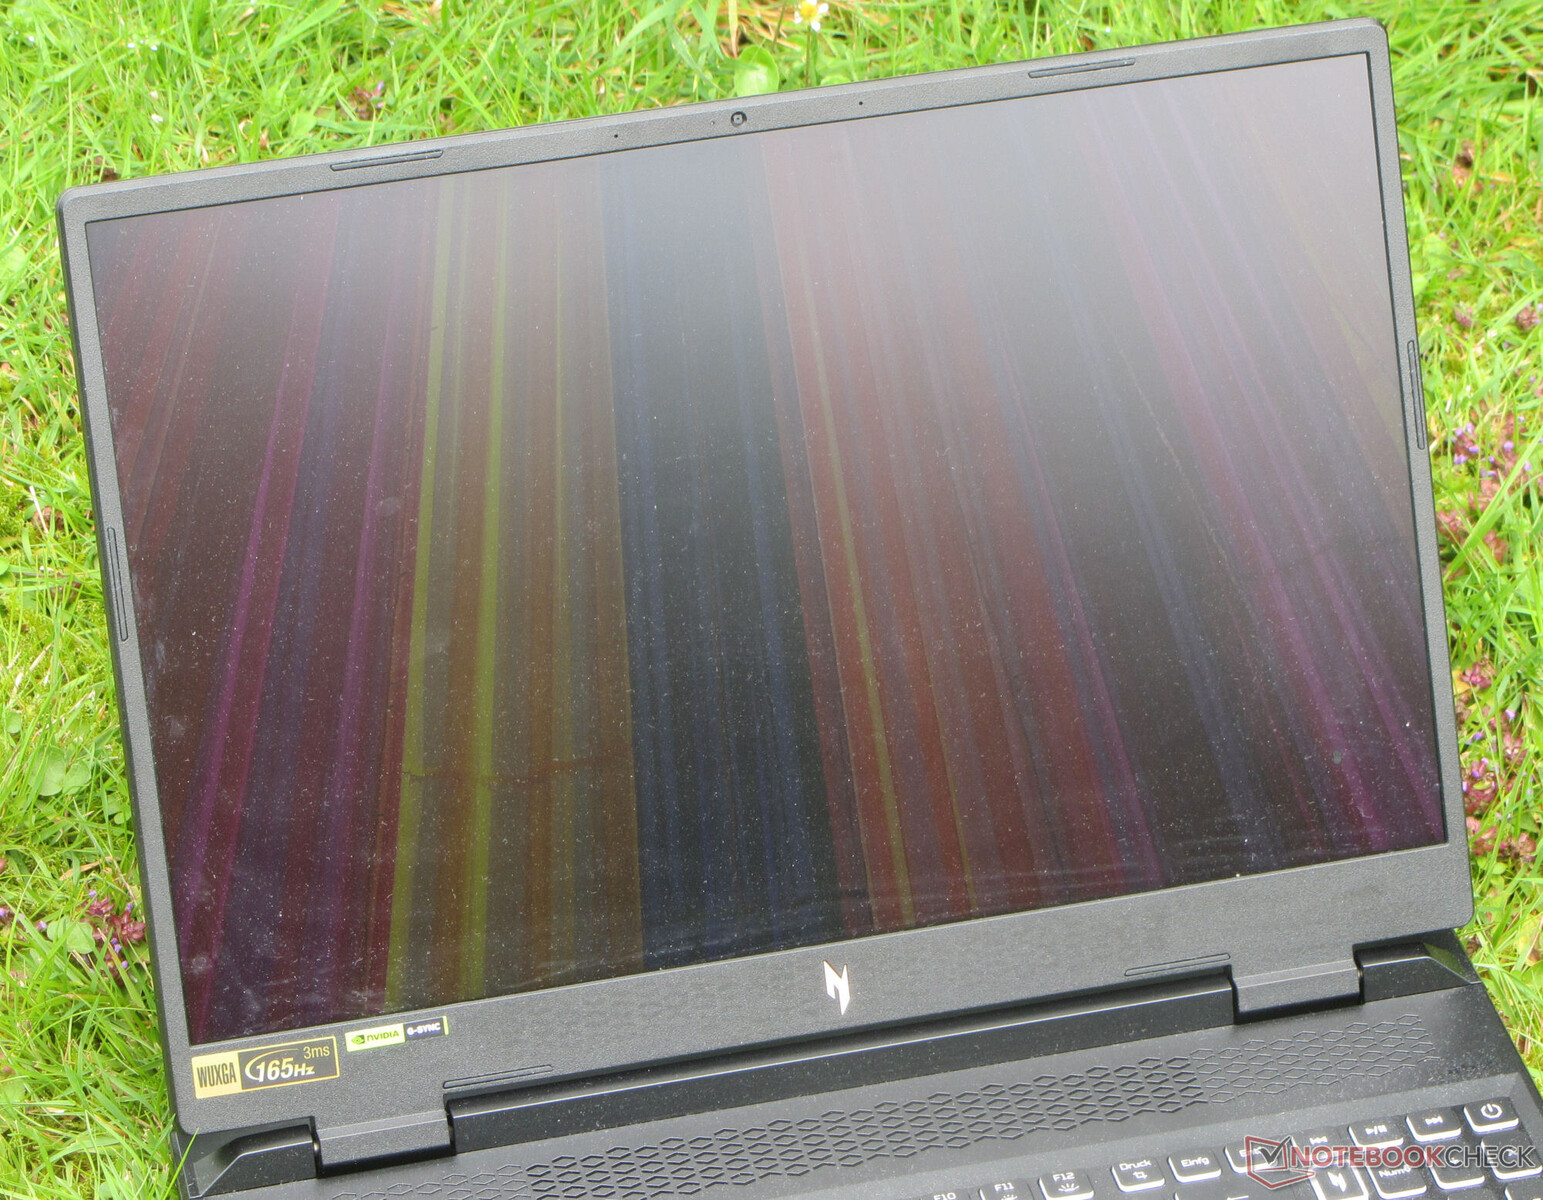
Acer Nitro 16 AN16-41 Review: Affordable gaming laptop with RTX 4050 and long run times
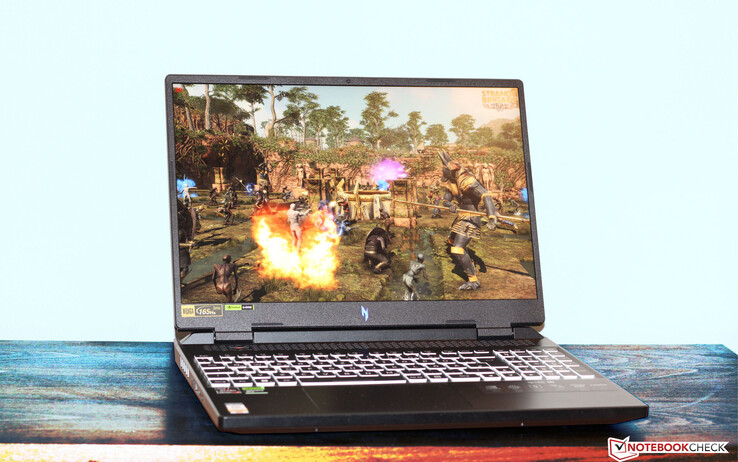
With a price of just under €1,250, the current configuration of the Acer Nitro 16 belongs to the lower price segment gaming laptops. Our Nitro 16 unit is powered by an AMD Ryzen 5 7535HS APU and an Nvidia GeForce RTX 4050 Laptop GPU.
The competition includes devices like the Asus TUF Gaming A16 FA617XS, Schenker XMG Focus 15 (E23), Gigabyte G7 KE, Asus TUF A15 FA507, and the Medion Erazer Scout E20.
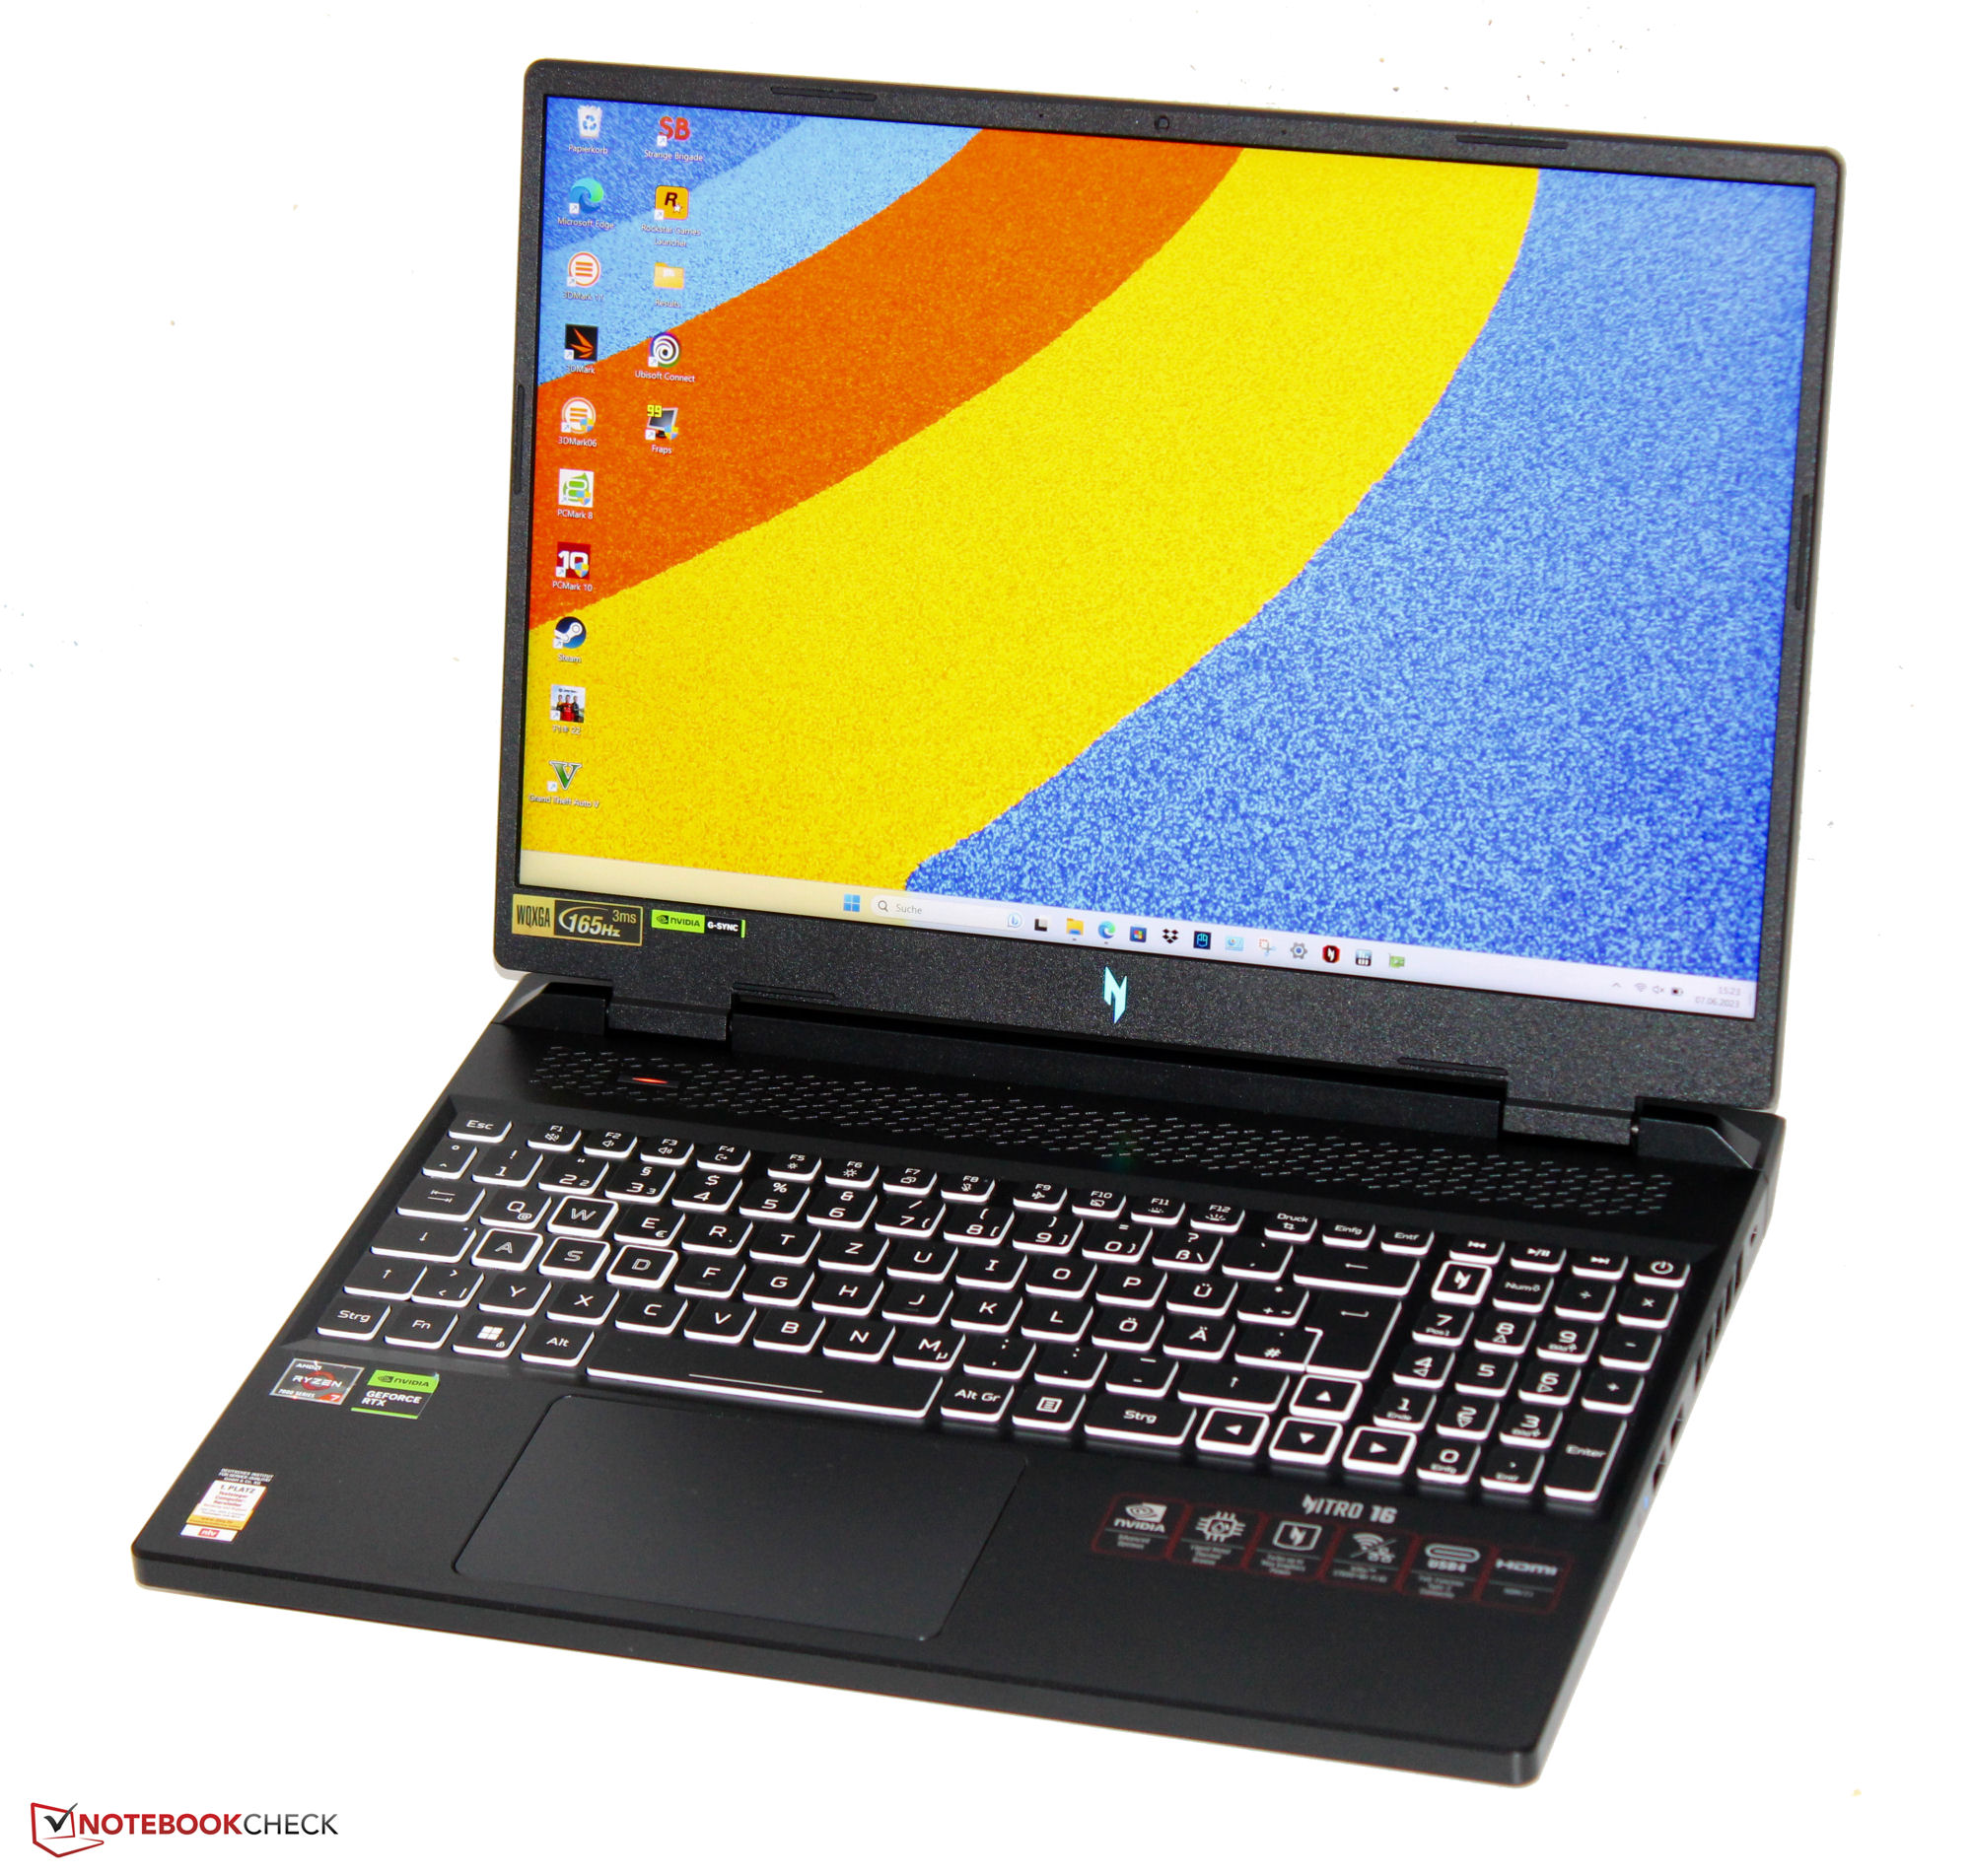
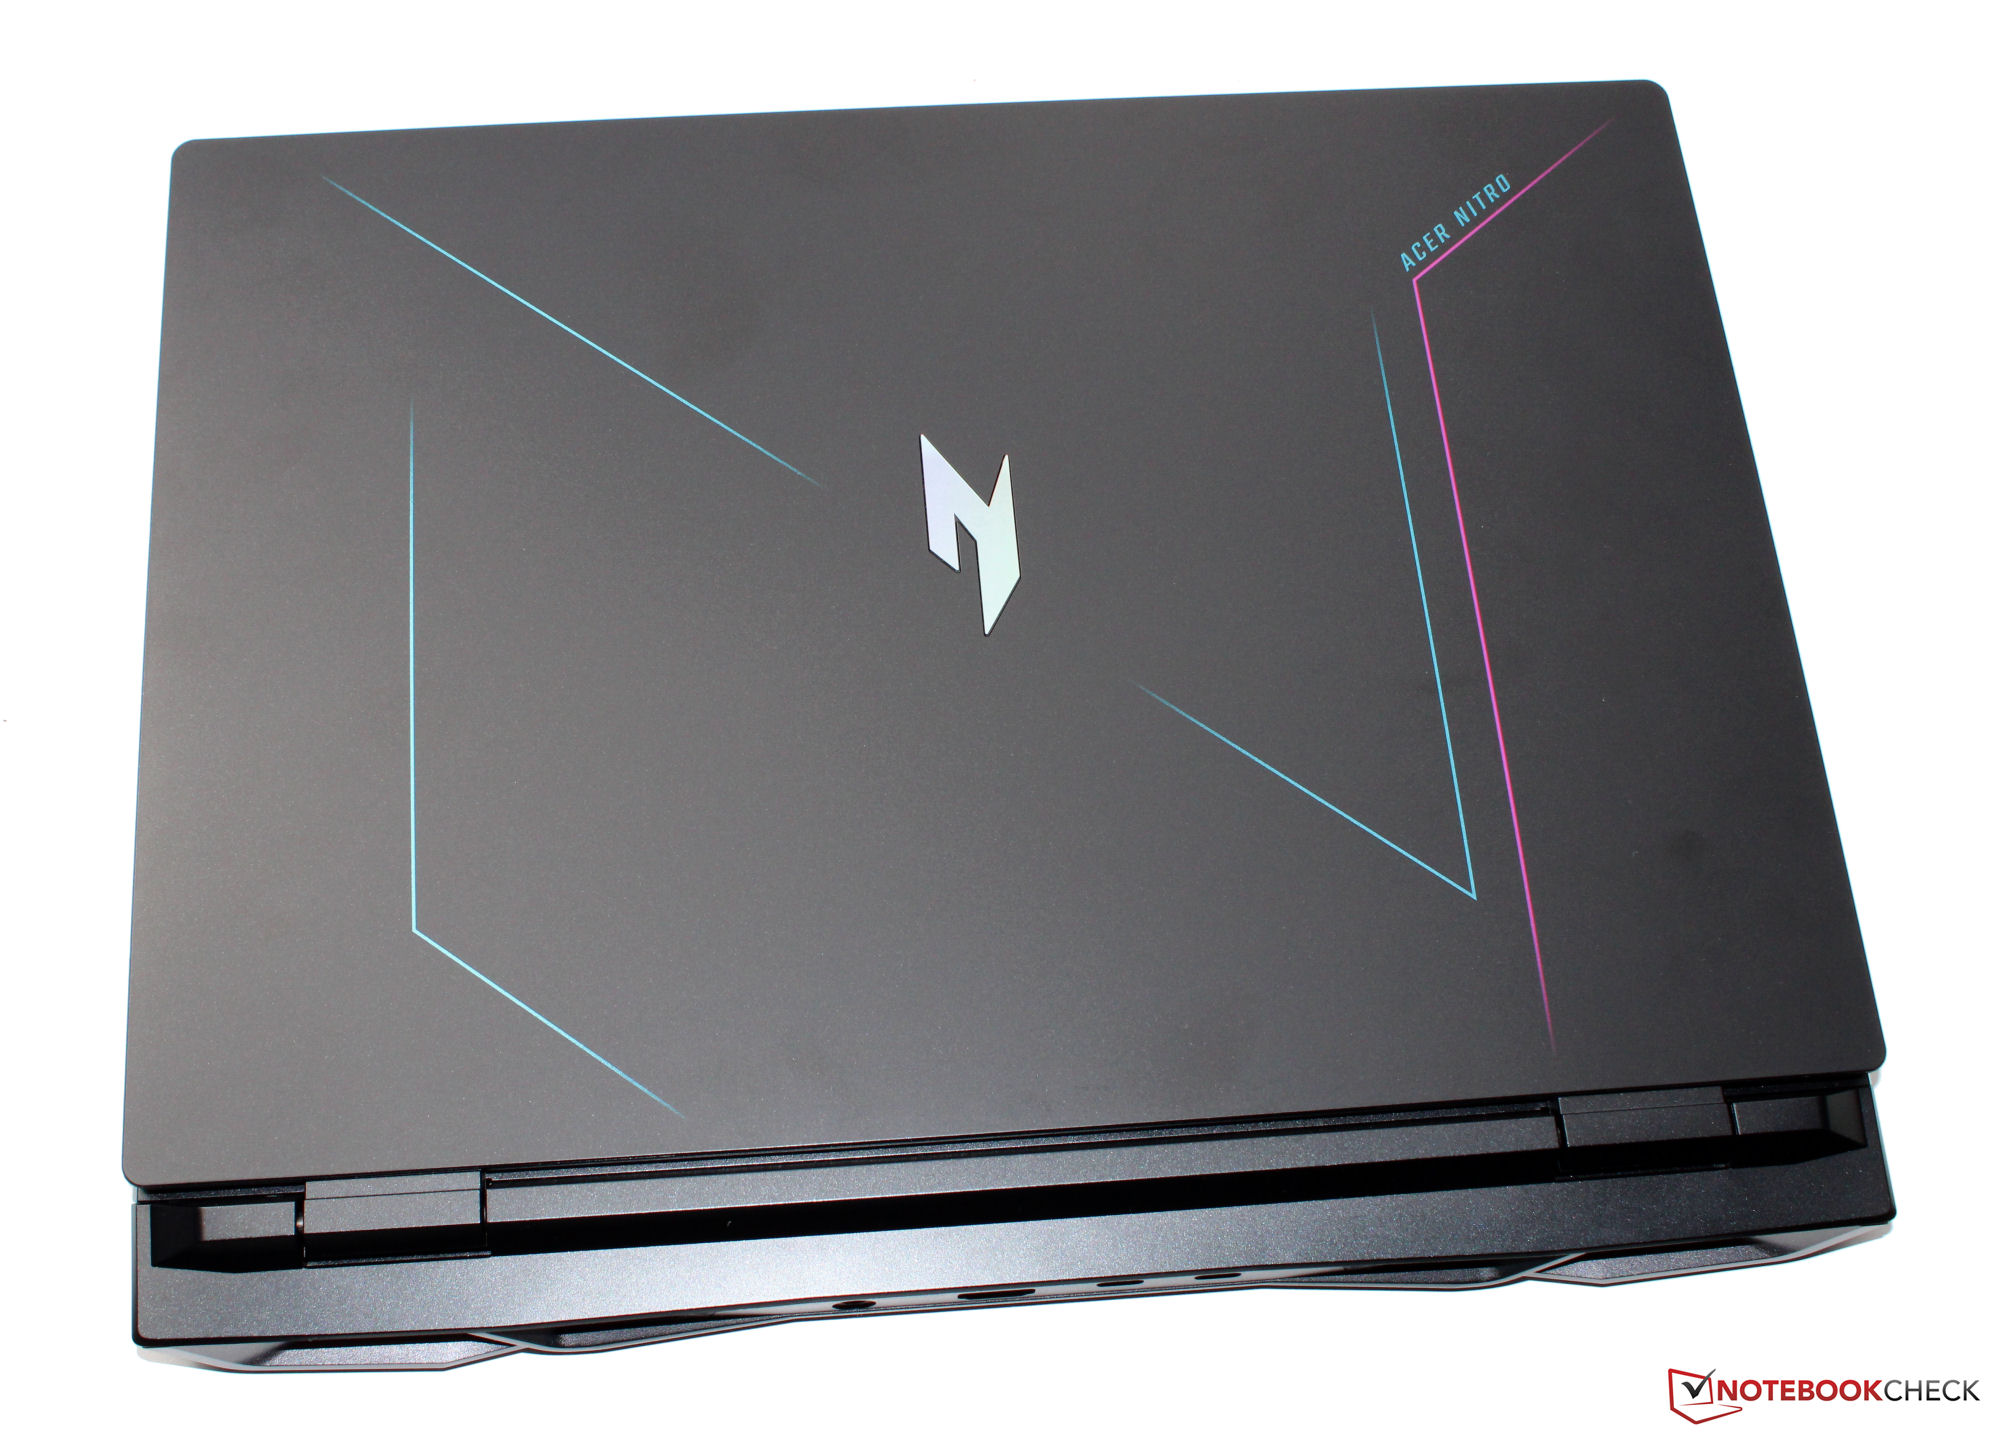
Information about the case, equipment and input devices can be found in our review of the identically built sister model that features a Ryzen 7 7735HS and an RTX 4070 Laptop GPU.
Possible competitors in comparison
Rating | Date | Model | Weight | Height | Size | Resolution | Price |
|---|---|---|---|---|---|---|---|
| 86.7 % v7 (old) | 08 / 2023 | Acer Nitro 16 AN16-41-R7YE R5 7535HS, GeForce RTX 4050 Laptop GPU | 2.6 kg | 27.9 mm | 16.00" | 1920x1200 | |
| 86.9 % v7 (old) | 06 / 2023 | Asus TUF Gaming A16 FA617XS R9 7940HS, Radeon RX 7600S | 2.2 kg | 22.1 mm | 16.00" | 1920x1200 | |
| 85.1 % v7 (old) | 07 / 2023 | Schenker XMG Focus 15 (E23) i9-13900HX, GeForce RTX 4050 Laptop GPU | 2.4 kg | 26.9 mm | 15.60" | 2569x1440 | |
| 83.3 % v7 (old) | 01 / 2023 | Gigabyte G7 KE i5-12500H, GeForce RTX 3060 Laptop GPU | 2.6 kg | 25 mm | 17.30" | 1920x1080 | |
| 86.3 % v7 (old) | 06 / 2023 | Asus TUF A15 FA507 R7 7735HS, GeForce RTX 4050 Laptop GPU | 2.2 kg | 24.9 mm | 15.60" | 1920x1080 | |
| 83 % v7 (old) | 05 / 2023 | Medion Erazer Scout E20 i7-13700H, GeForce RTX 4050 Laptop GPU | 2.8 kg | 29 mm | 17.30" | 1920x1080 |

| SD Card Reader | |
| average JPG Copy Test (av. of 3 runs) | |
| Average of class Gaming (20.9 - 210, n=54, last 2 years) | |
| Acer Nitro 16 AN16-41-R7YE (AV PRO microSD 128 GB V60) | |
| Acer Nitro 16 AN16-41 (AV Pro SD microSD 128 GB V60) | |
| maximum AS SSD Seq Read Test (1GB) | |
| Average of class Gaming (25.5 - 261, n=51, last 2 years) | |
| Schenker XMG Focus 15 (E23) | |
| Gigabyte G7 KE (AV PRO microSD 128 GB V60) | |
| Acer Nitro 16 AN16-41 (AV Pro SD microSD 128 GB V60) | |
| Acer Nitro 16 AN16-41-R7YE (AV PRO microSD 128 GB V60) | |


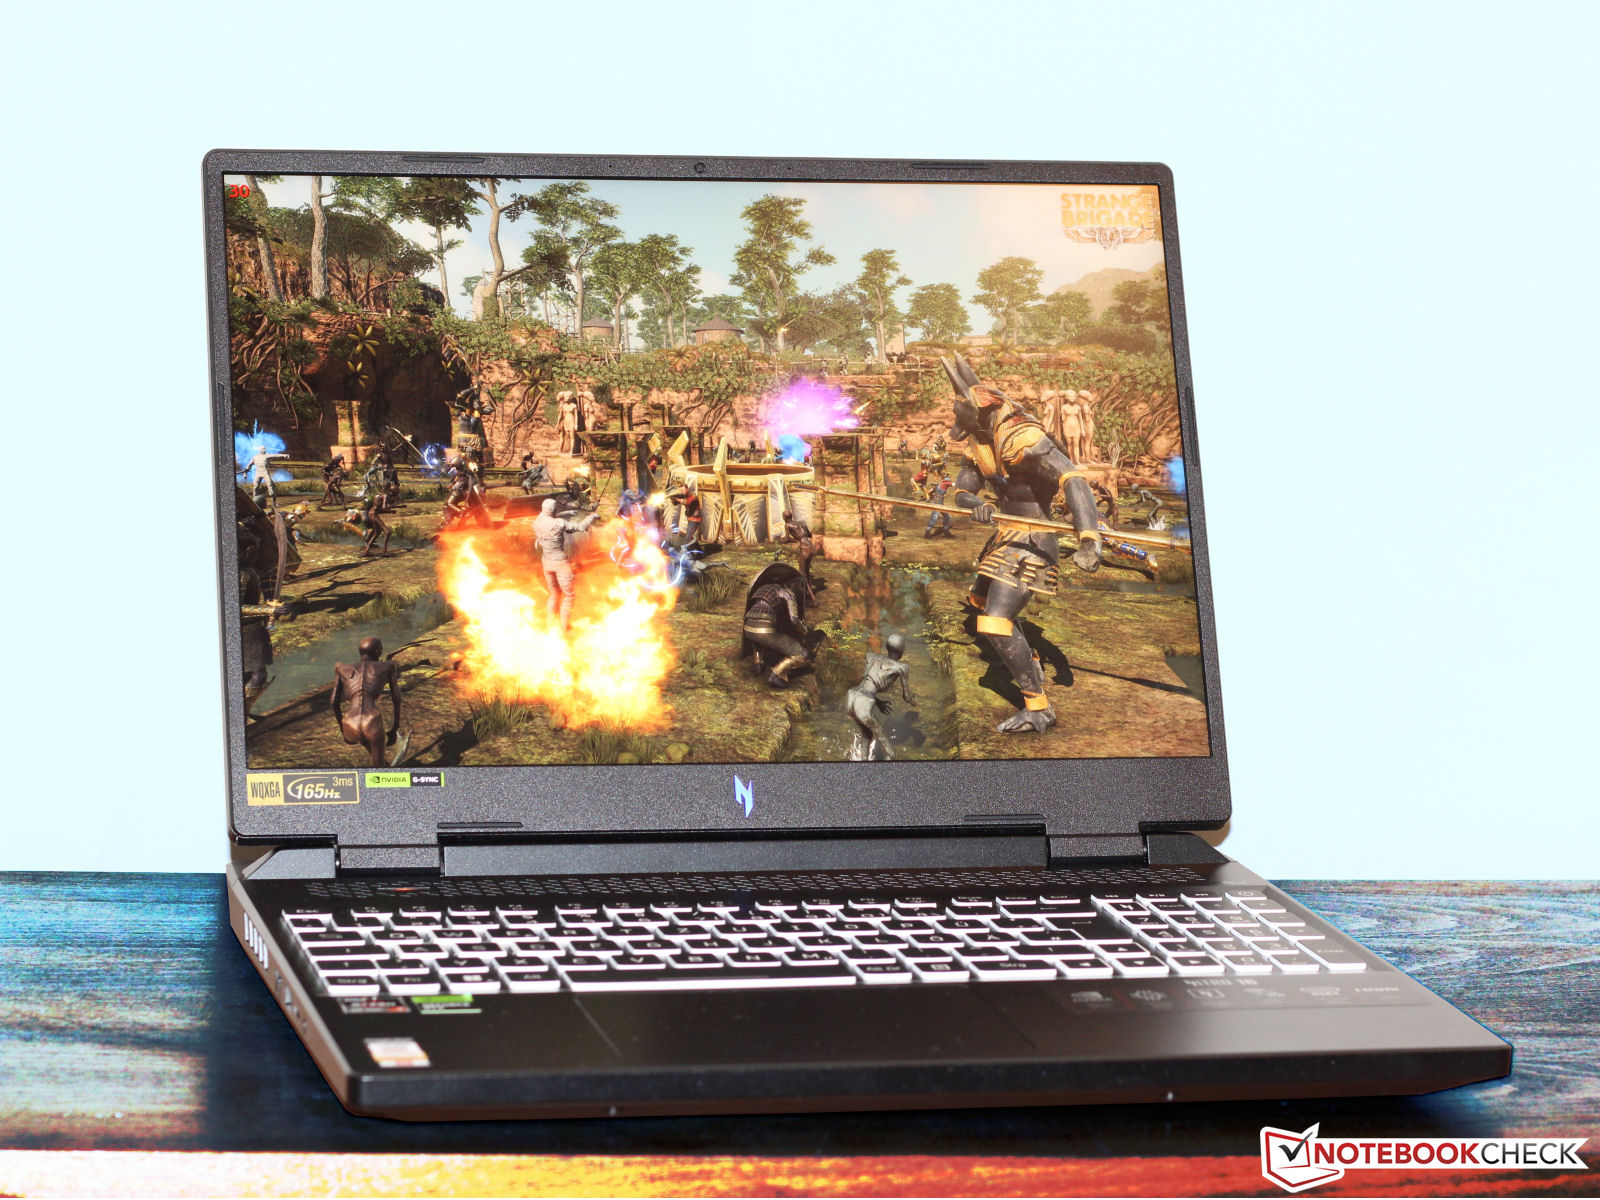
Display - 16:10 panel with sRGB coverage
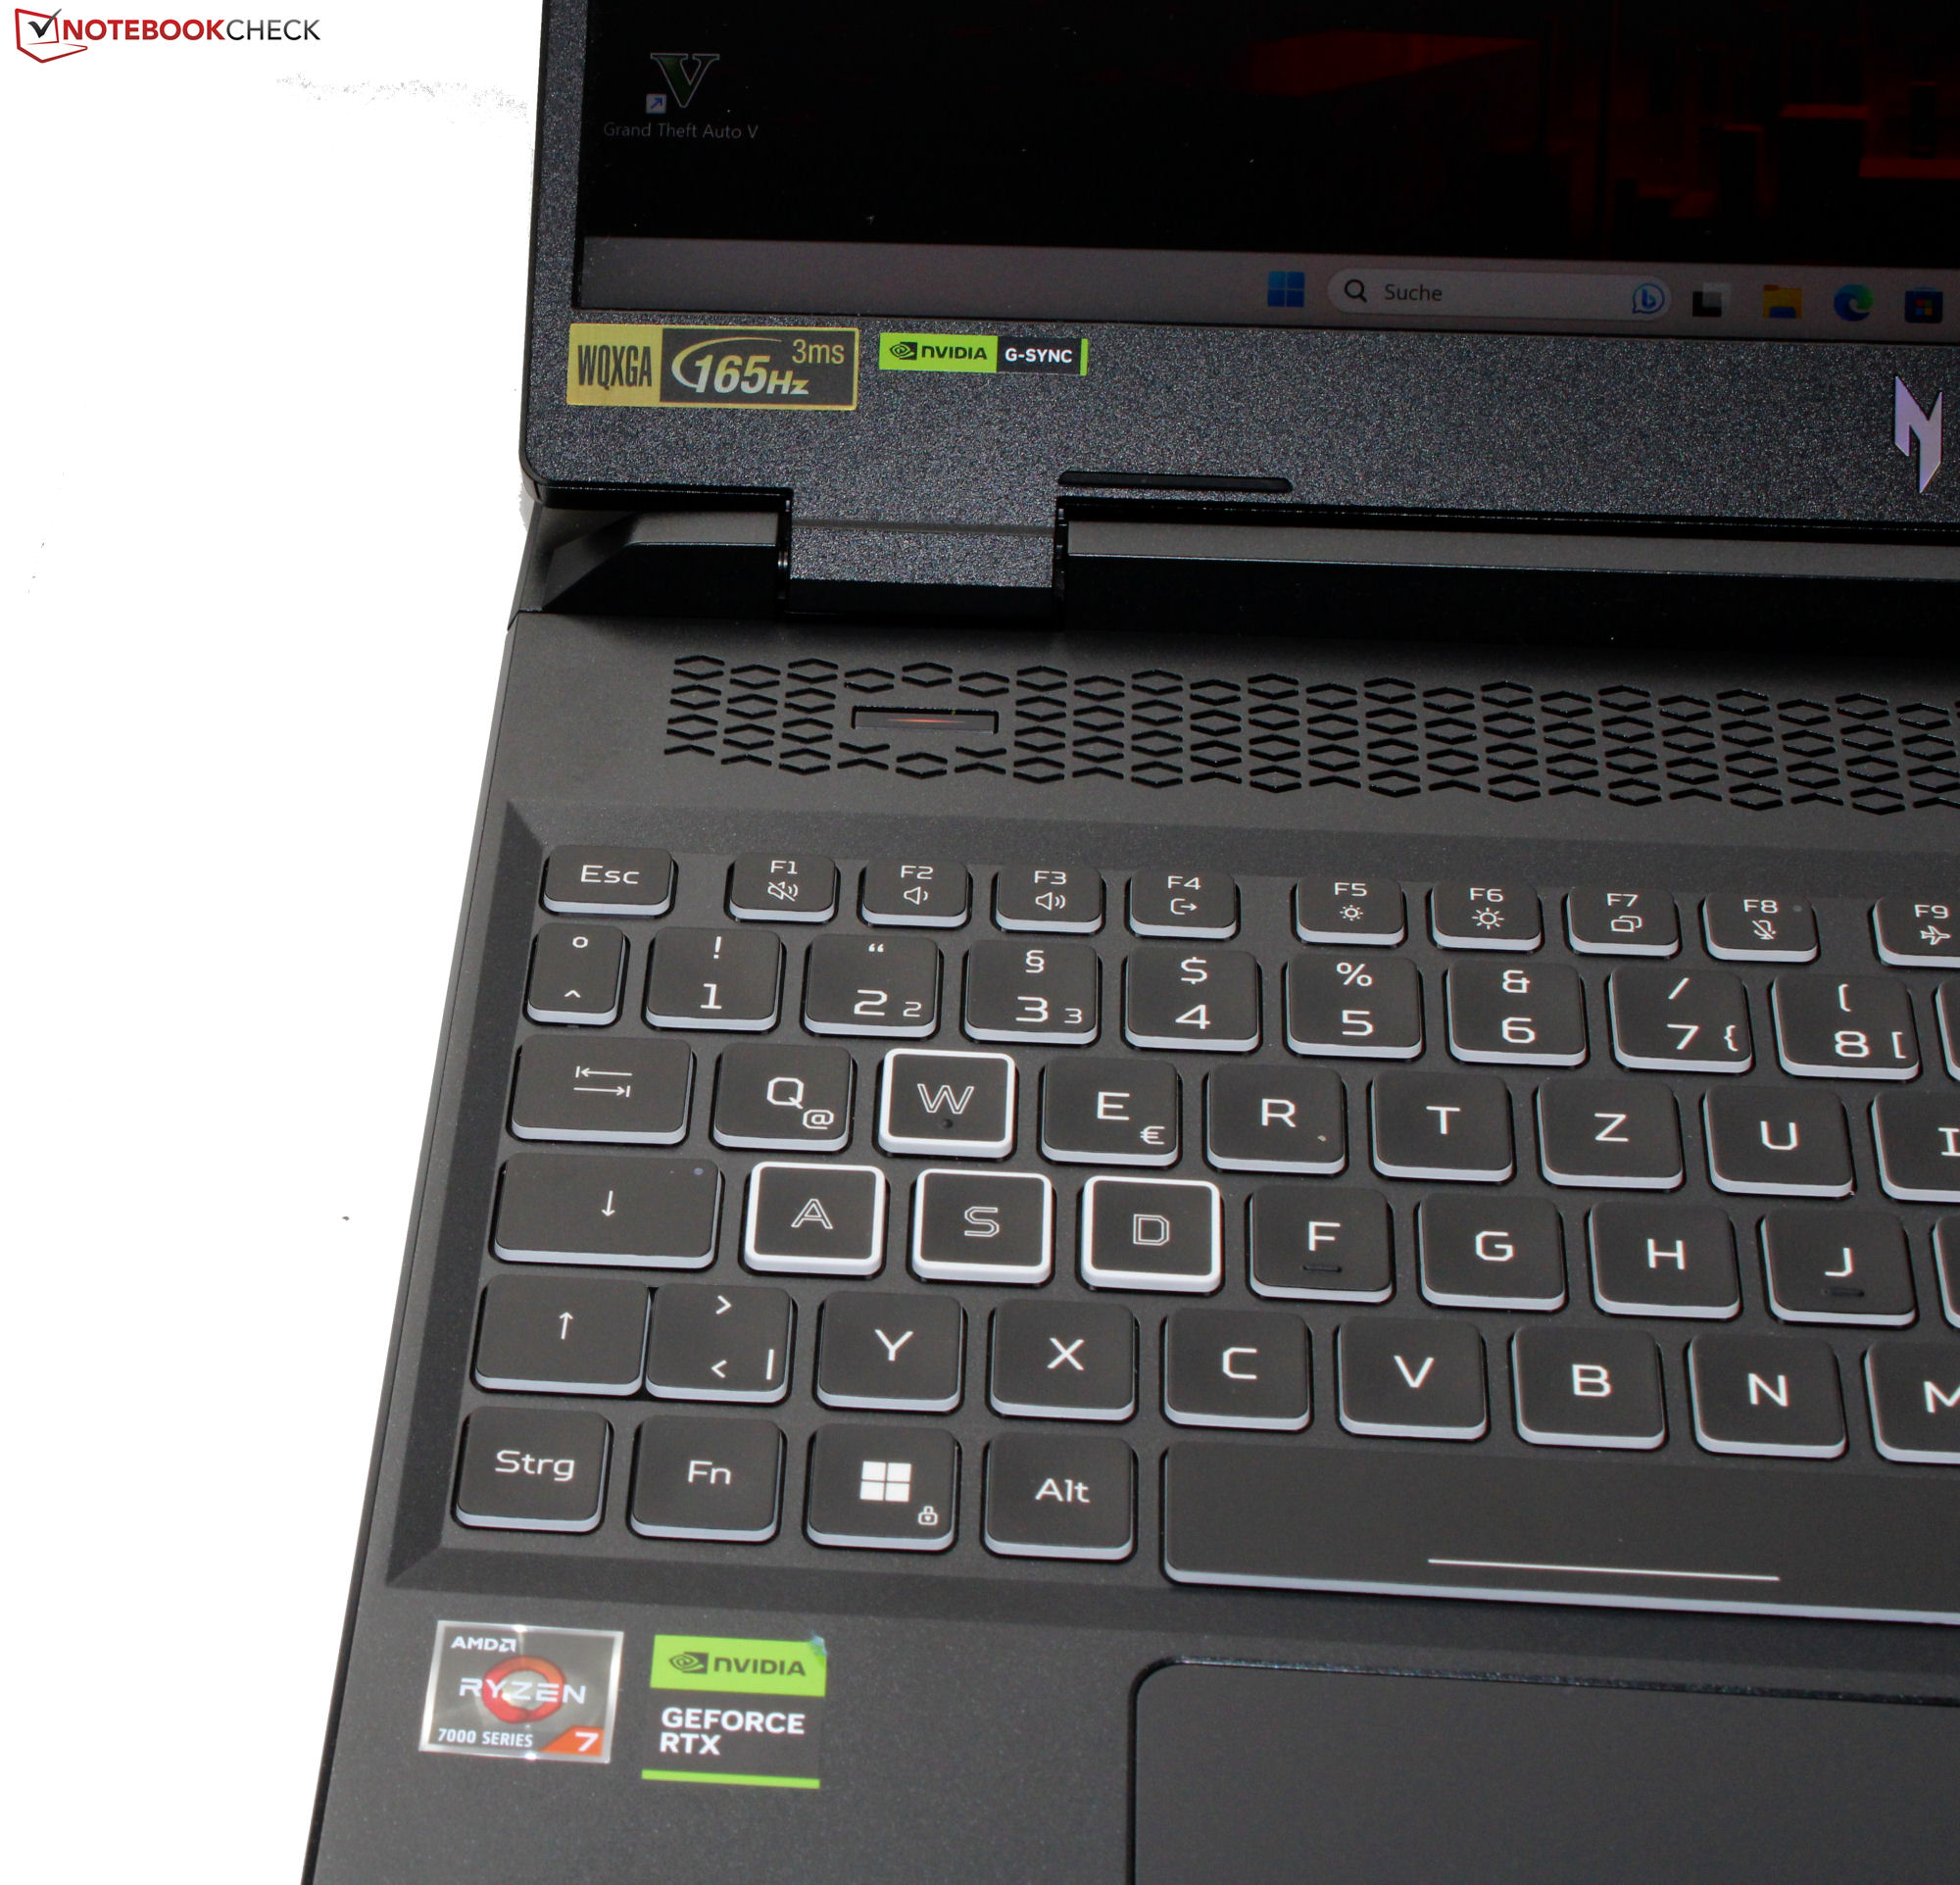
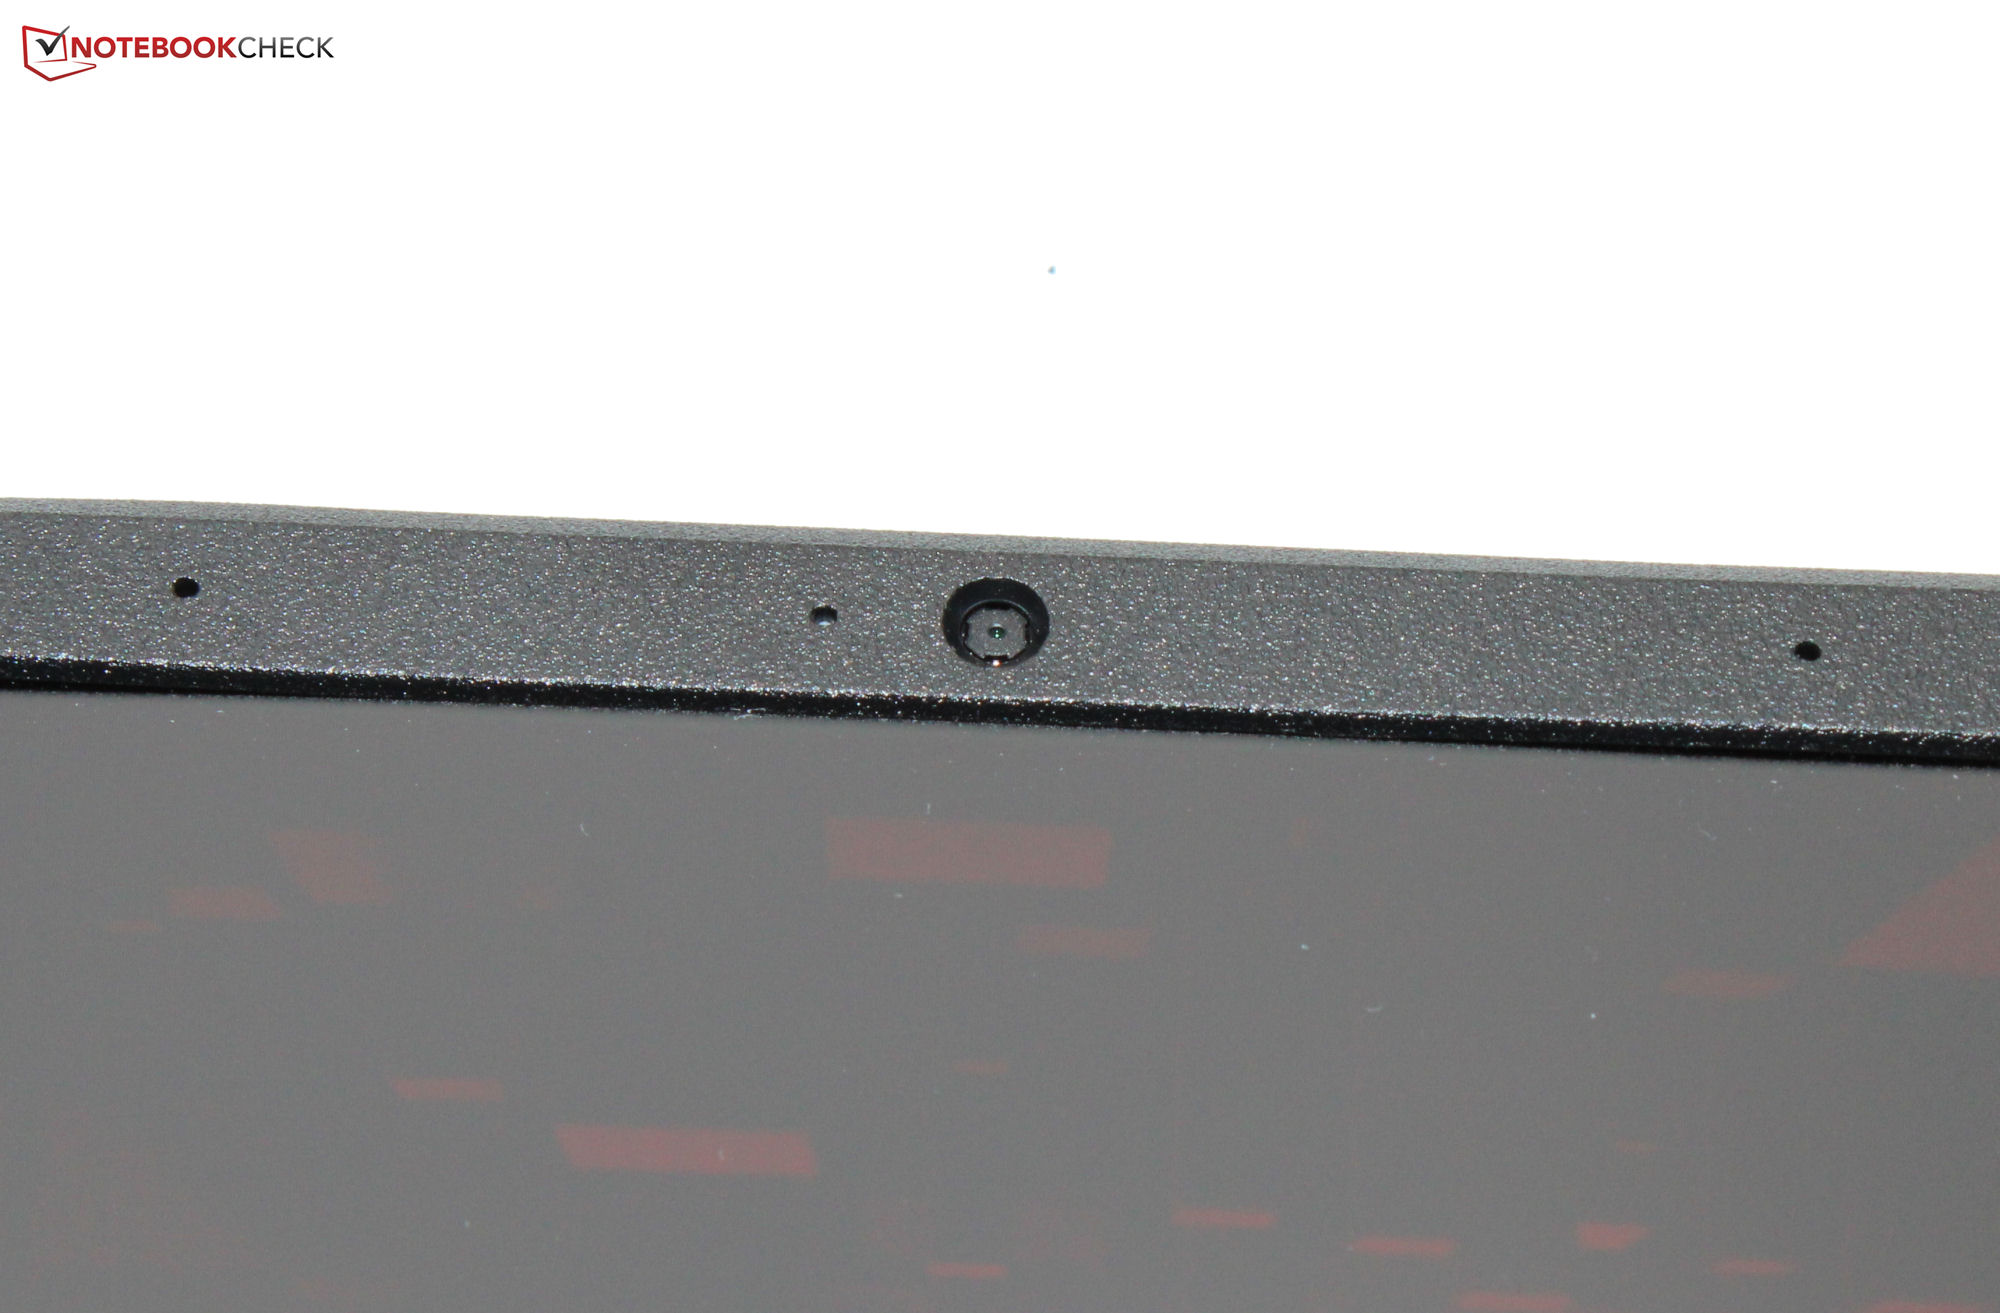
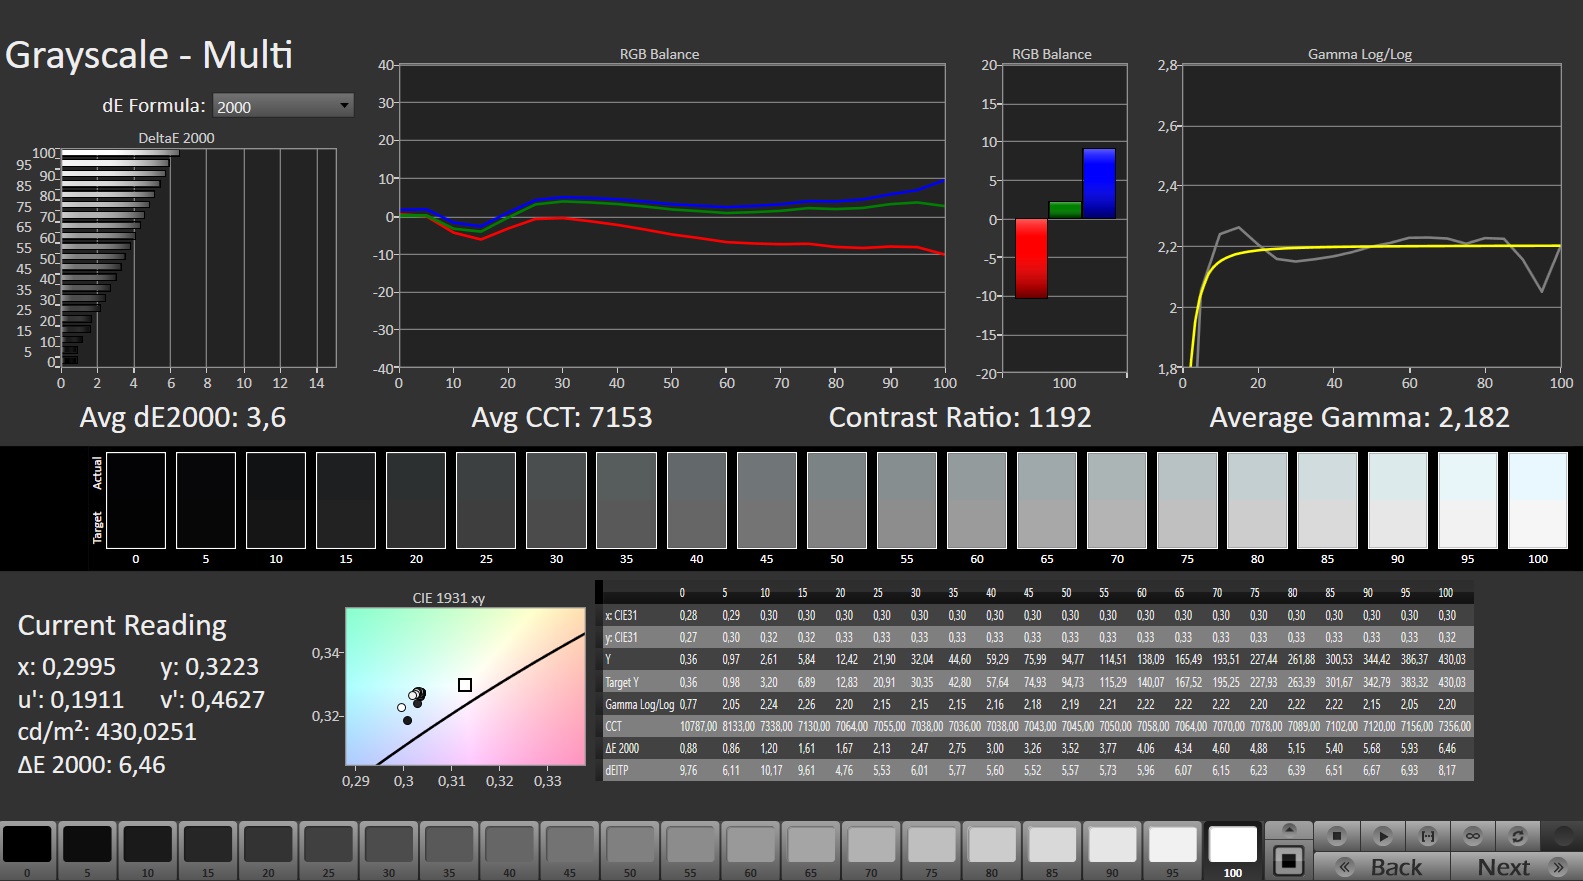
Positives for the matte 16-inch 1,920 x 1,200 IPS screen in 16:10 format include G-Sync support, the absence of PWM flickering, and short response times. Brightness and contrast of the 165 Hz panel meet the respective targets (> 300 cd/m² and 1,000:1, respectively).
There are not many differences apart from these when compared to the WQXGA panel (2,560 x 1,600 pixels) of the sister model, although the latter offers a higher maximum brightness (almost 500 cd/m²).
| |||||||||||||||||||||||||
Brightness Distribution: 84 %
Center on Battery: 415 cd/m²
Contrast: 1153:1 (Black: 0.36 cd/m²)
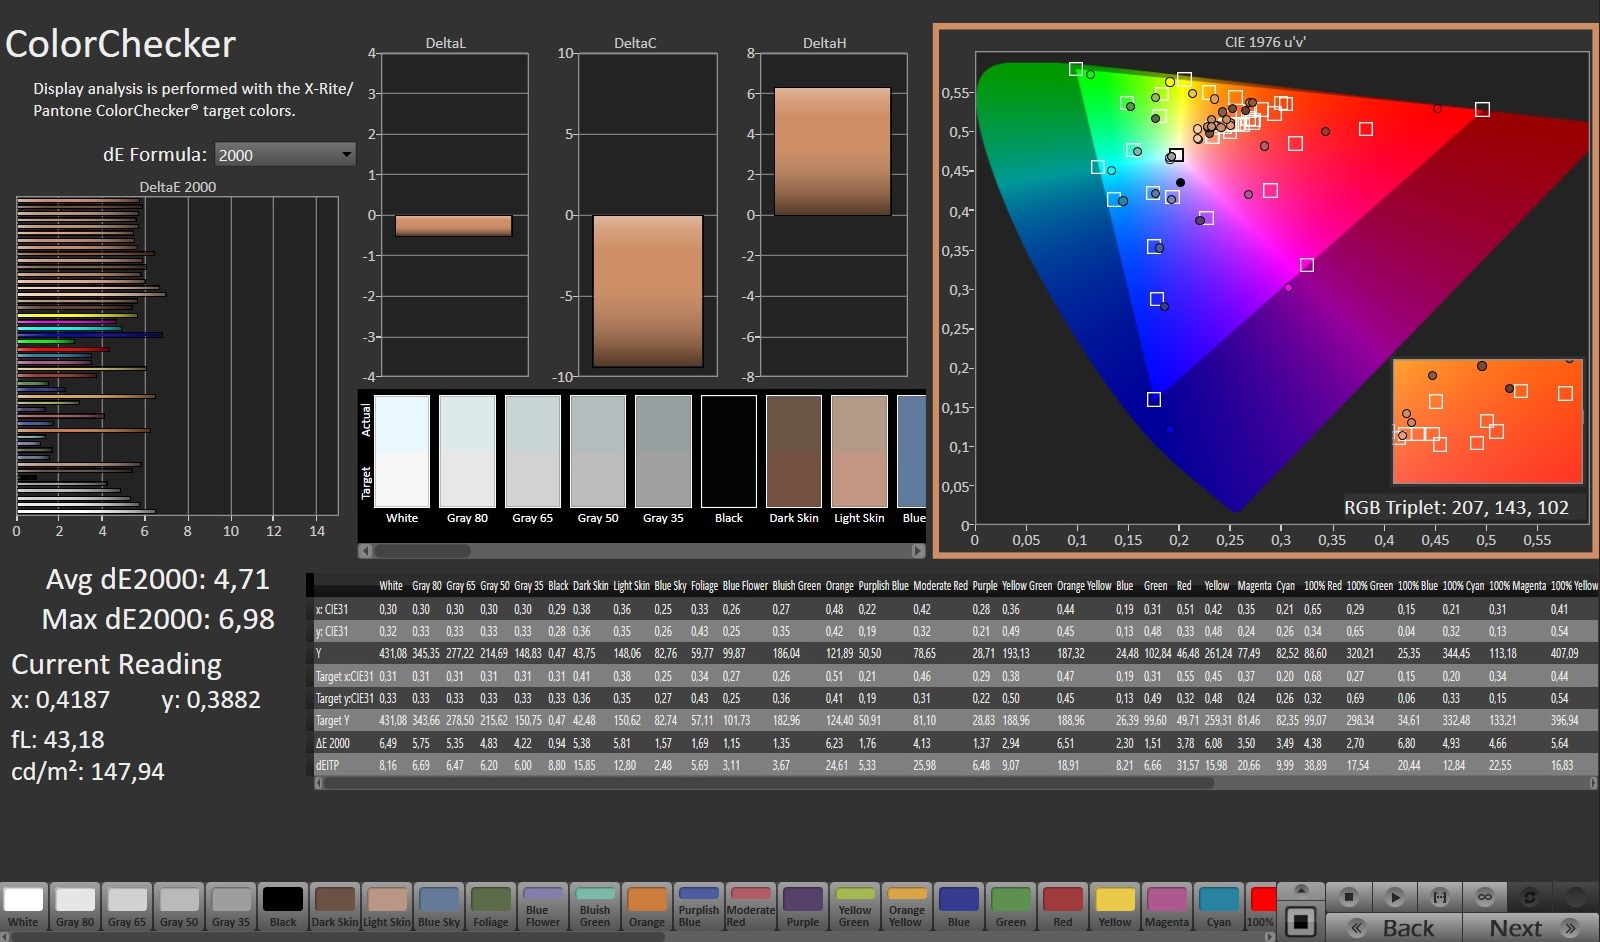
ΔE ColorChecker Calman: 4.71 | ∀{0.5-29.43 Ø4.73}
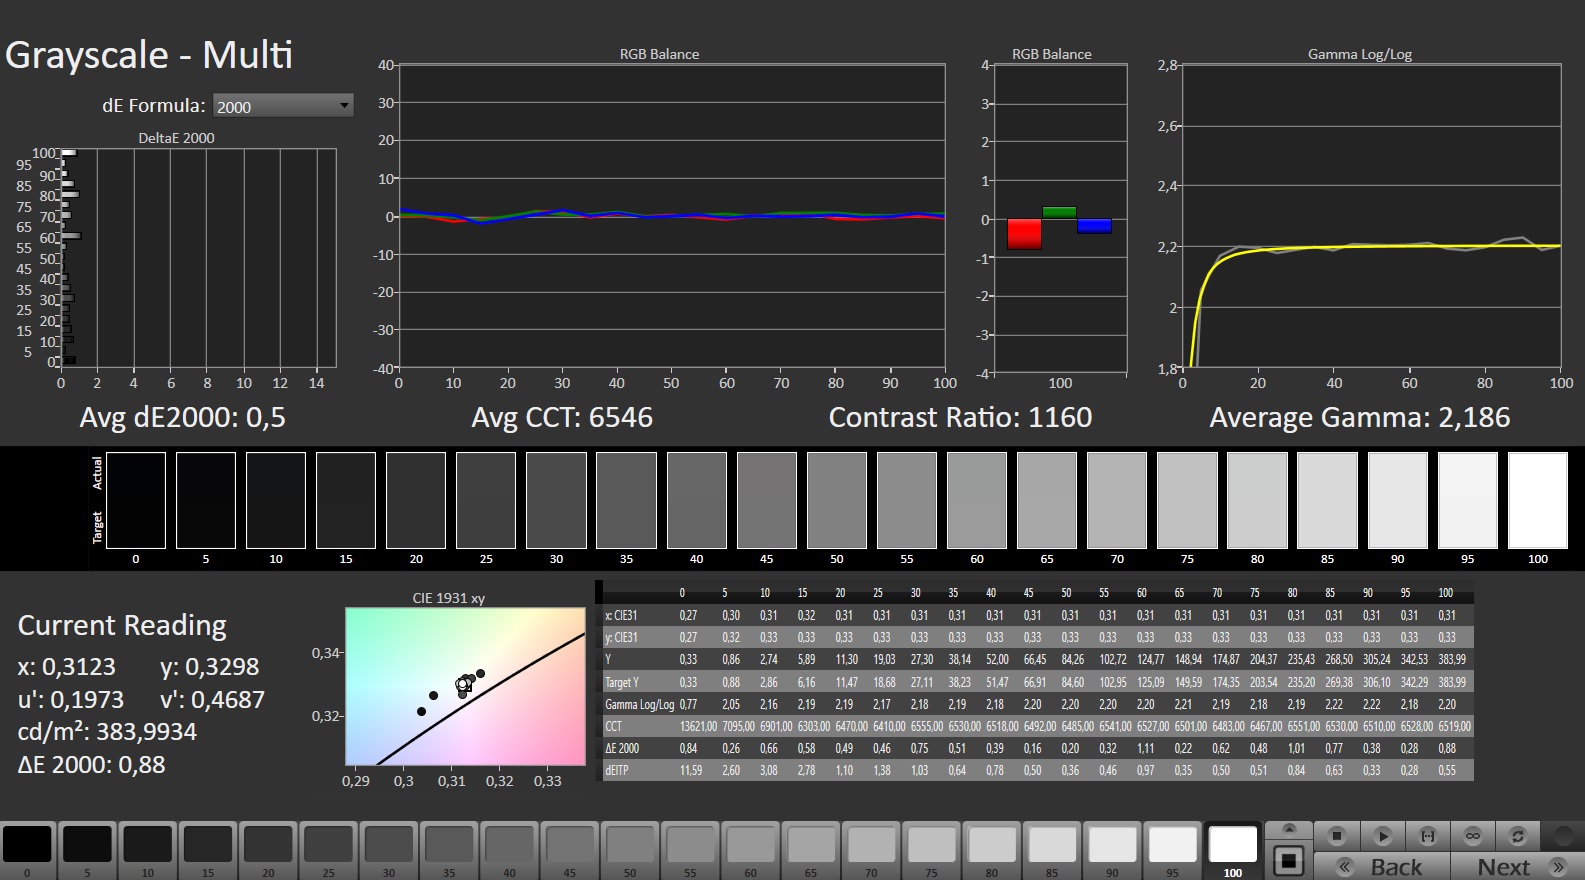
calibrated: 2.68
ΔE Greyscale Calman: 3.6 | ∀{0.09-98 Ø4.97}
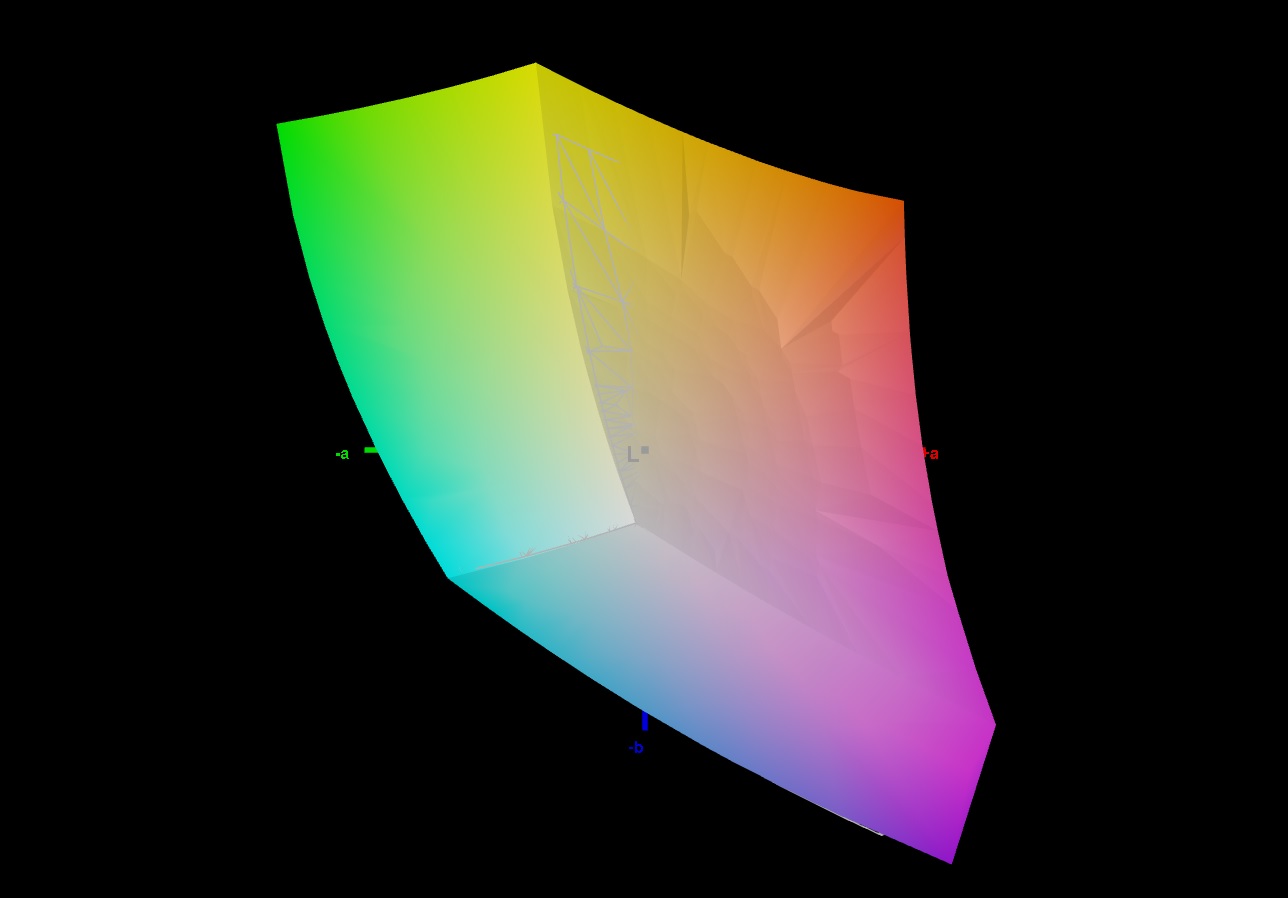
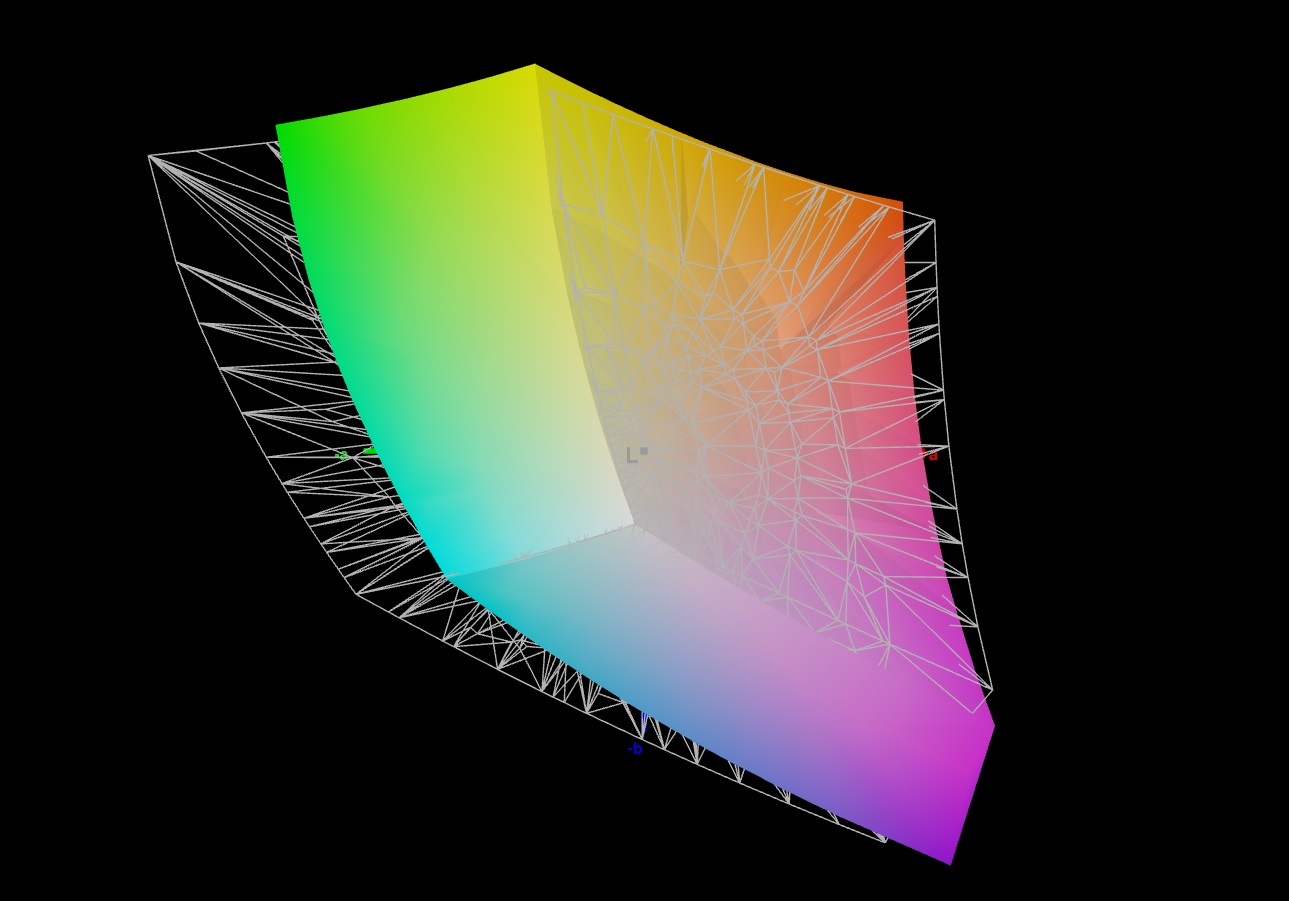
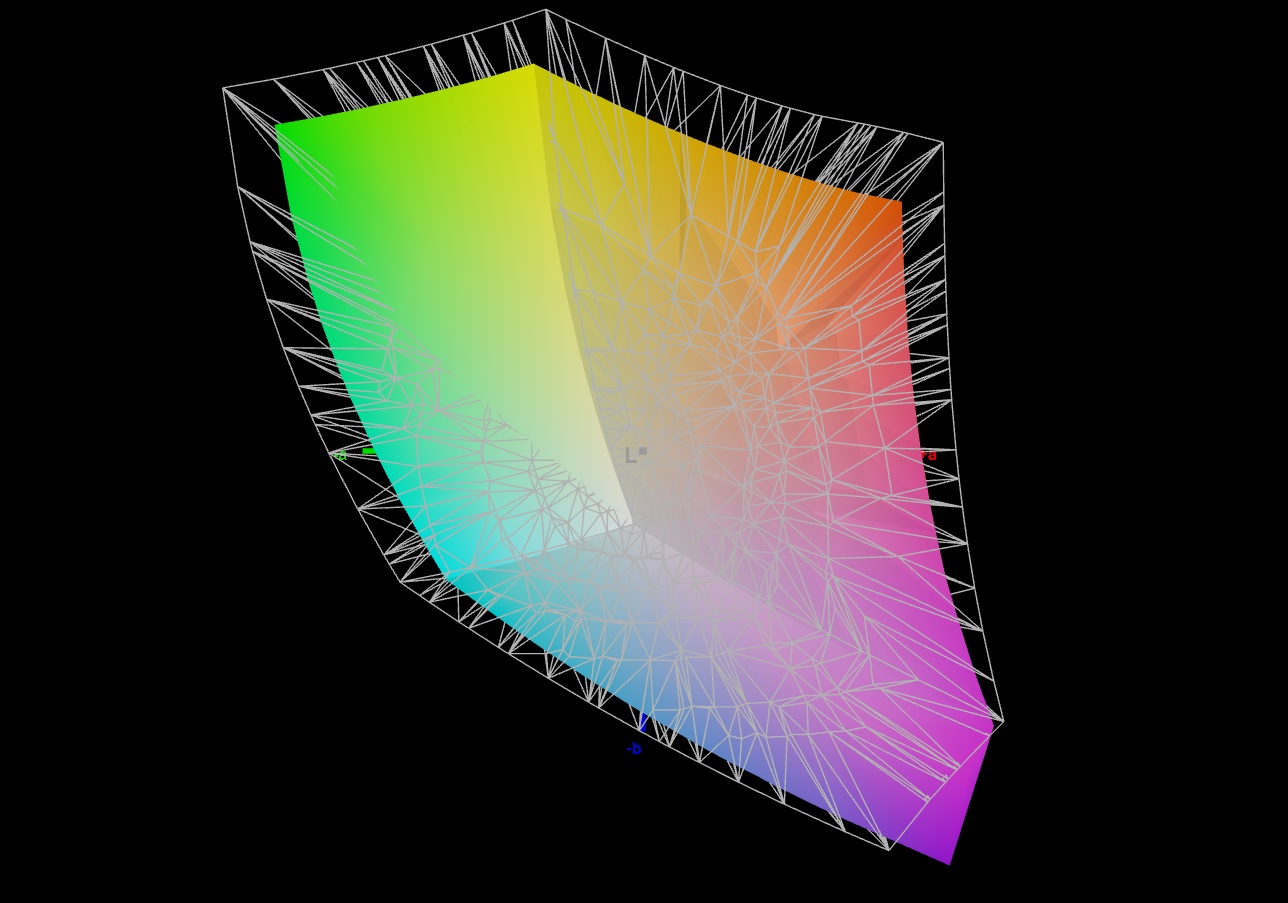
77.4% AdobeRGB 1998 (Argyll 3D)
99.4% sRGB (Argyll 3D)
80% Display P3 (Argyll 3D)
Gamma: 2.182
CCT: 7153 K
| Acer Nitro 16 AN16-41-R7YE AU Optronics B160UAN01.Q, IPS, 1920x1200, 16" | Asus TUF Gaming A16 FA617XS BOE NE160WUM-NX2, IPS, 1920x1200, 16" | Schenker XMG Focus 15 (E23) BOE0AD1, IPS, 2569x1440, 15.6" | Gigabyte G7 KE AU Optronics B173HAN05.1, IPS, 1920x1080, 17.3" | Asus TUF A15 FA507 N156HMA-GA1, IPS, 1920x1080, 15.6" | Medion Erazer Scout E20 LG Philips LGD0611, IPS, 1920x1080, 17.3" | Acer Nitro 16 AN16-41 BOE CQ NE16QDM-NY1, IPS, 2560x1600, 16" | |
|---|---|---|---|---|---|---|---|
| Display | -8% | 12% | -6% | -12% | -12% | -8% | |
| Display P3 Coverage (%) | 80 | 69.3 -13% | 98.6 23% | 70.4 -12% | 64.9 -19% | 65.1 -19% | 67.9 -15% |
| sRGB Coverage (%) | 99.4 | 97.3 -2% | 99.9 1% | 99.8 0% | 96.5 -3% | 96.7 -3% | 99.1 0% |
| AdobeRGB 1998 Coverage (%) | 77.4 | 70.7 -9% | 86.3 11% | 71.7 -7% | 66.6 -14% | 66.5 -14% | 69.9 -10% |
| Response Times | -66% | -81% | -3% | -236% | -66% | 3% | |
| Response Time Grey 50% / Grey 80% * (ms) | 11.2 ? | 15.6 ? -39% | 15.6 ? -39% | 5 ? 55% | 30.4 ? -171% | 14.8 ? -32% | 11 ? 2% |
| Response Time Black / White * (ms) | 5.2 ? | 10 ? -92% | 11.6 ? -123% | 8.3 ? -60% | 20.8 ? -300% | 10.4 ? -100% | 5 ? 4% |
| PWM Frequency (Hz) | |||||||
| Screen | 25% | -2% | 28% | 28% | 14% | 27% | |
| Brightness middle (cd/m²) | 415 | 301 -27% | 302 -27% | 307 -26% | 288 -31% | 312 -25% | 520 25% |
| Brightness (cd/m²) | 380 | 294 -23% | 278 -27% | 301 -21% | 271 -29% | 303 -20% | 494 30% |
| Brightness Distribution (%) | 84 | 94 12% | 85 1% | 93 11% | 91 8% | 91 8% | 91 8% |
| Black Level * (cd/m²) | 0.36 | 0.21 42% | 0.36 -0% | 0.2 44% | 0.17 53% | 0.25 31% | 0.39 -8% |
| Contrast (:1) | 1153 | 1433 24% | 839 -27% | 1535 33% | 1694 47% | 1248 8% | 1333 16% |
| Colorchecker dE 2000 * | 4.71 | 1.79 62% | 2.24 52% | 1.32 72% | 1.9 60% | 2.65 44% | 1.94 59% |
| Colorchecker dE 2000 max. * | 6.98 | 3.48 50% | 5.52 21% | 4.6 34% | 3.3 53% | 6.44 8% | 5.62 19% |
| Colorchecker dE 2000 calibrated * | 2.68 | 1.2 55% | 1.03 62% | 0.9 66% | 0.96 64% | 0.74 72% | |
| Greyscale dE 2000 * | 3.6 | 2.5 31% | 3.87 -8% | 2.1 42% | 2.7 25% | 3.2 11% | 2.94 18% |
| Gamma | 2.182 101% | 2.265 97% | 2.42 91% | 2.247 98% | 2.32 95% | 2.246 98% | 2.37 93% |
| CCT | 7153 91% | 6157 106% | 6936 94% | 6815 95% | 6535 99% | 7258 90% | 6443 101% |
| Total Average (Program / Settings) | -16% /
5% | -24% /
-11% | 6% /
16% | -73% /
-18% | -21% /
-3% | 7% /
16% |
* ... smaller is better
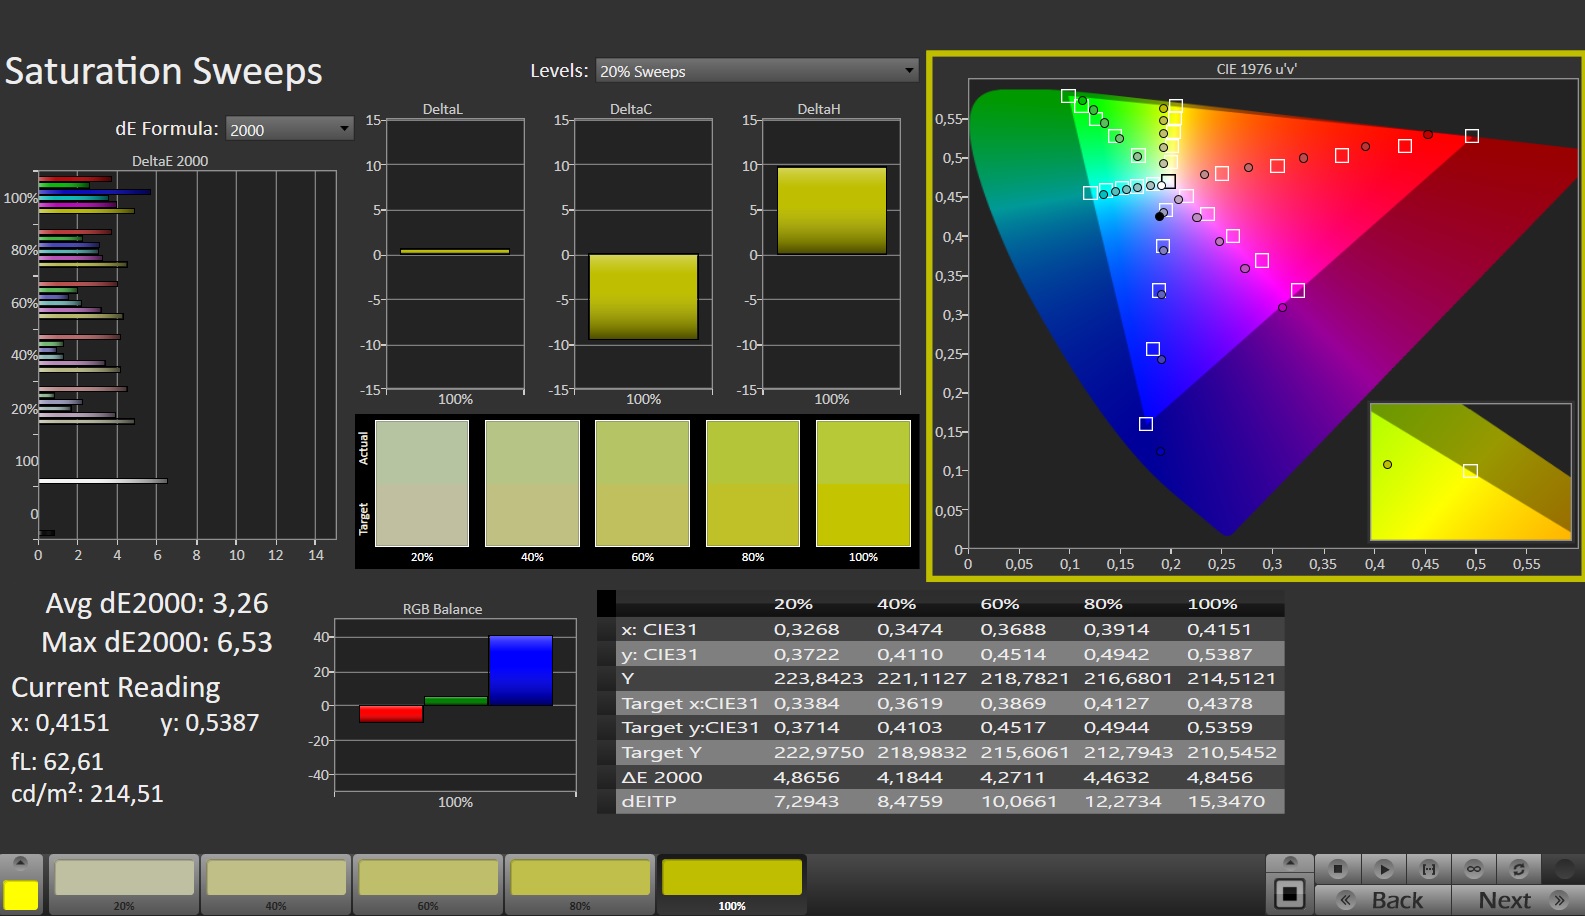
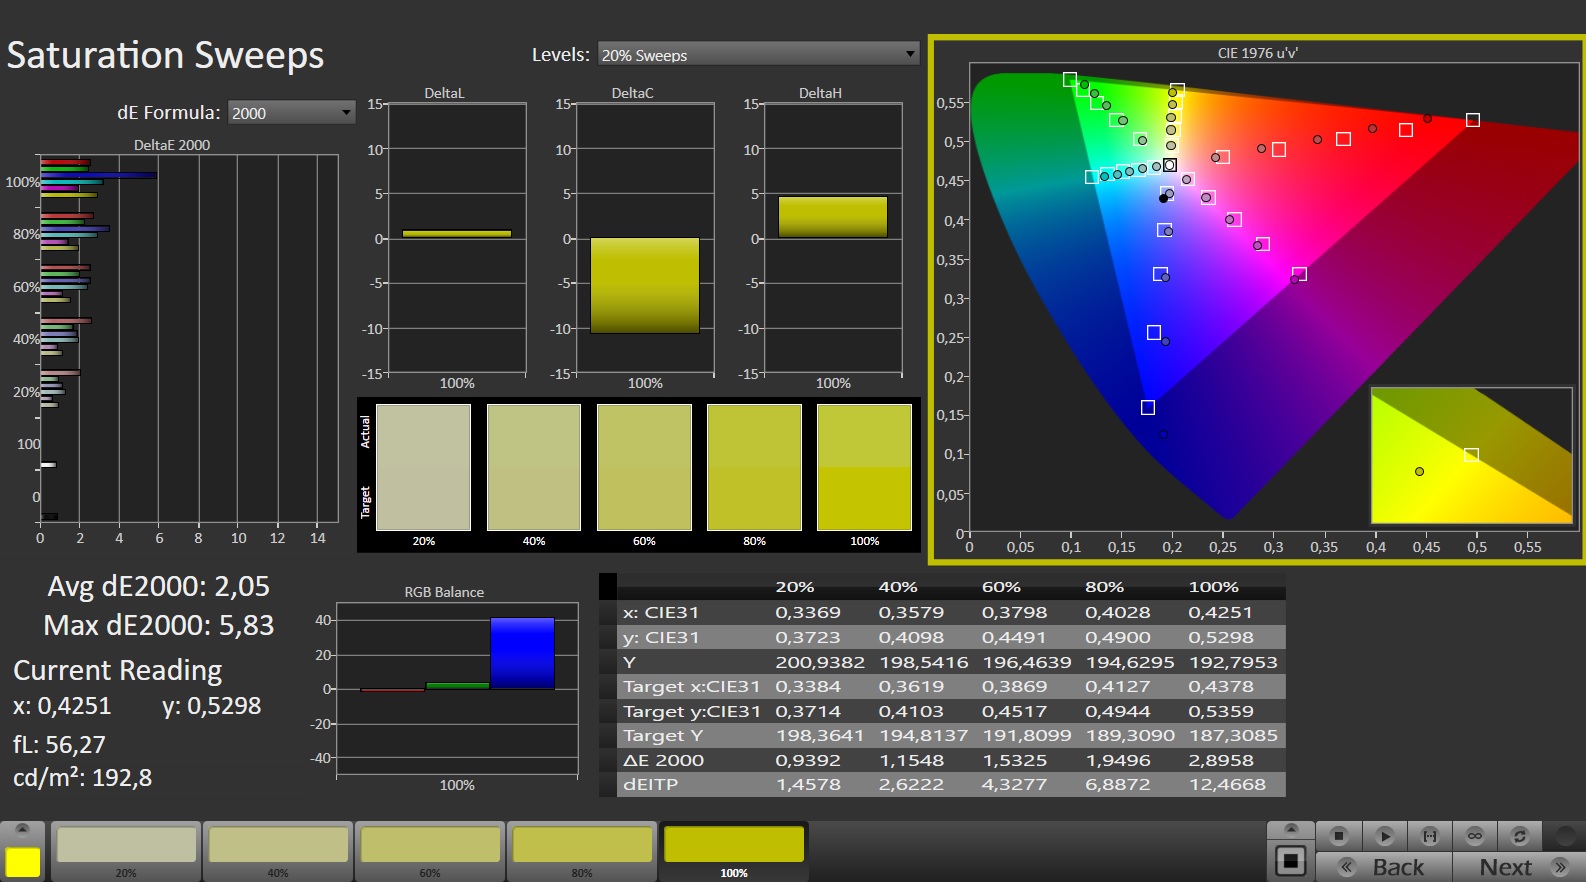
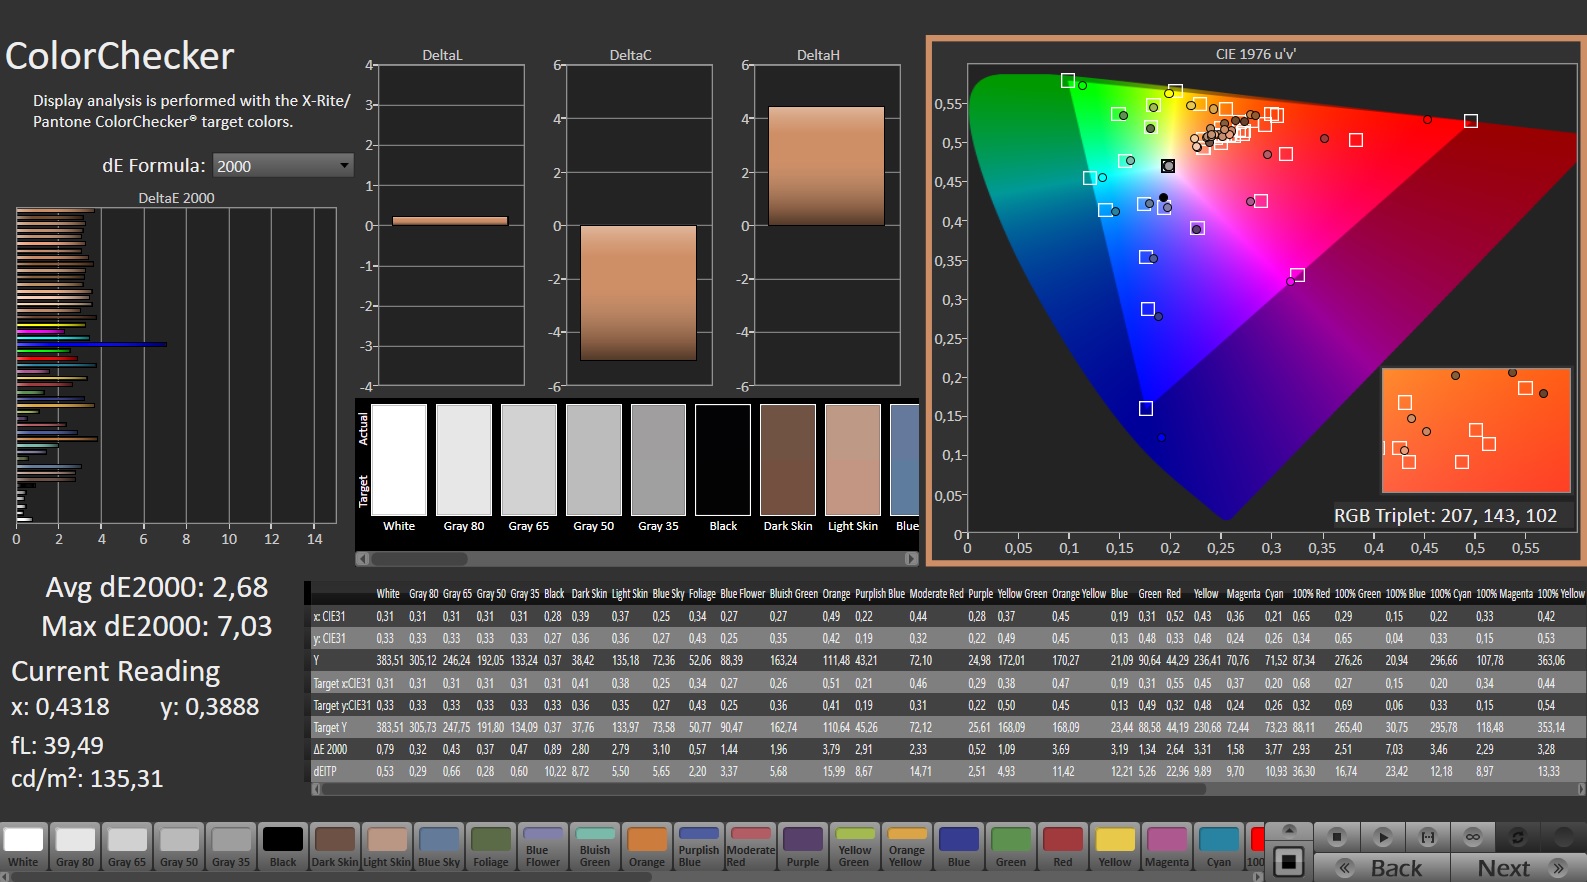
The screen shows a decent color reproduction ex-factory — with a deviation of about 4.7, the target (DeltaE < 3) is not exactly matched. A calibration reduces the deviation to 2.68 and ensures more balanced grayscale levels. The panel can completely reproduce the sRGB color gamut but not the Adobe RGB and Display P3 color spaces.
This is the case for the WQXGA panel in the other Nitro 16 variant, as well as the screens of most competitors. Only the display of the XMG Focus 15 offers good DCI-P3 coverage.
Display Response Times
| ↔ Response Time Black to White | ||
|---|---|---|
| 5.2 ms ... rise ↗ and fall ↘ combined | ↗ 1.9 ms rise | 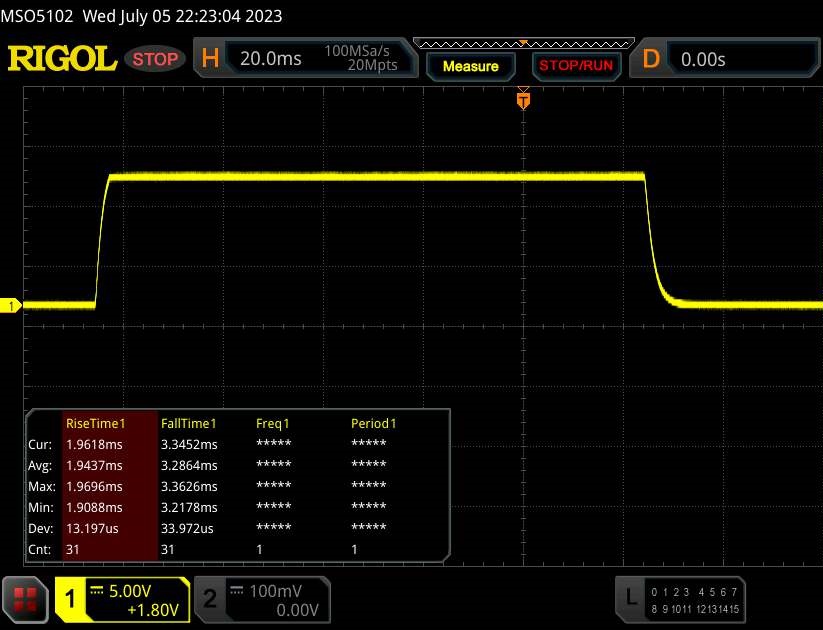 |
| ↘ 3.3 ms fall | ||
| The screen shows very fast response rates in our tests and should be very well suited for fast-paced gaming. In comparison, all tested devices range from 0.1 (minimum) to 240 (maximum) ms. » 18 % of all devices are better. This means that the measured response time is better than the average of all tested devices (19.9 ms). | ||
| ↔ Response Time 50% Grey to 80% Grey | ||
| 11.2 ms ... rise ↗ and fall ↘ combined | ↗ 5.3 ms rise | 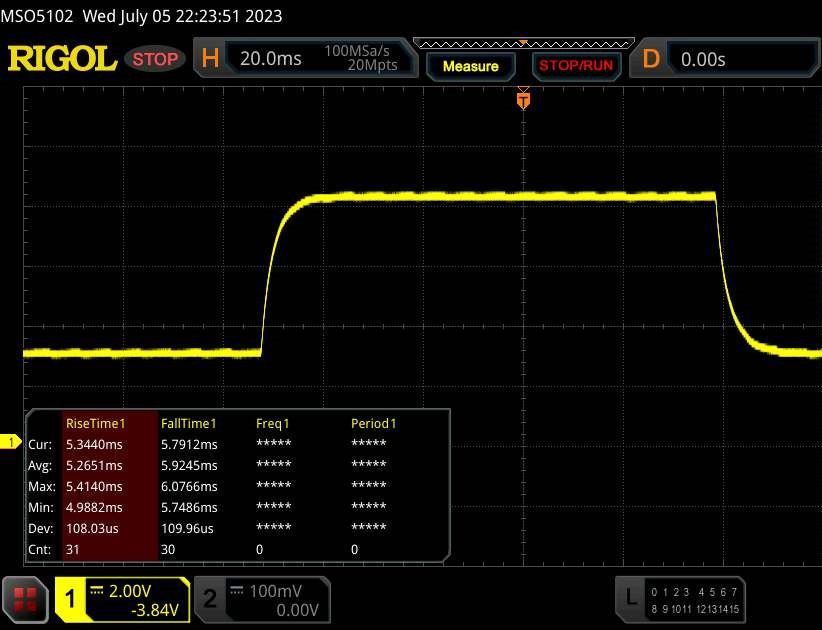 |
| ↘ 5.9 ms fall | ||
| The screen shows good response rates in our tests, but may be too slow for competitive gamers. In comparison, all tested devices range from 0.165 (minimum) to 636 (maximum) ms. » 25 % of all devices are better. This means that the measured response time is better than the average of all tested devices (31.1 ms). | ||
Screen Flickering / PWM (Pulse-Width Modulation)
| Screen flickering / PWM not detected | 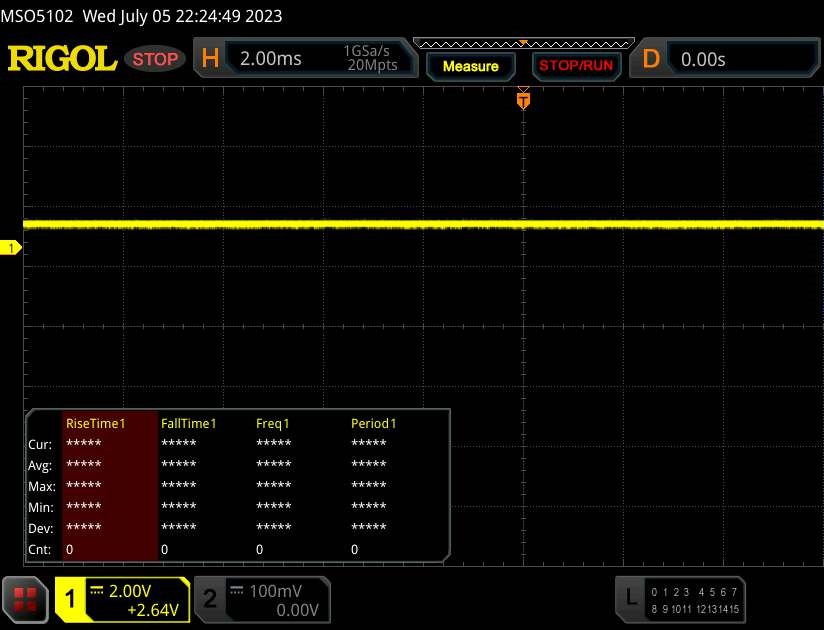 | ||
In comparison: 52 % of all tested devices do not use PWM to dim the display. If PWM was detected, an average of 7791 (minimum: 5 - maximum: 343500) Hz was measured. | |||
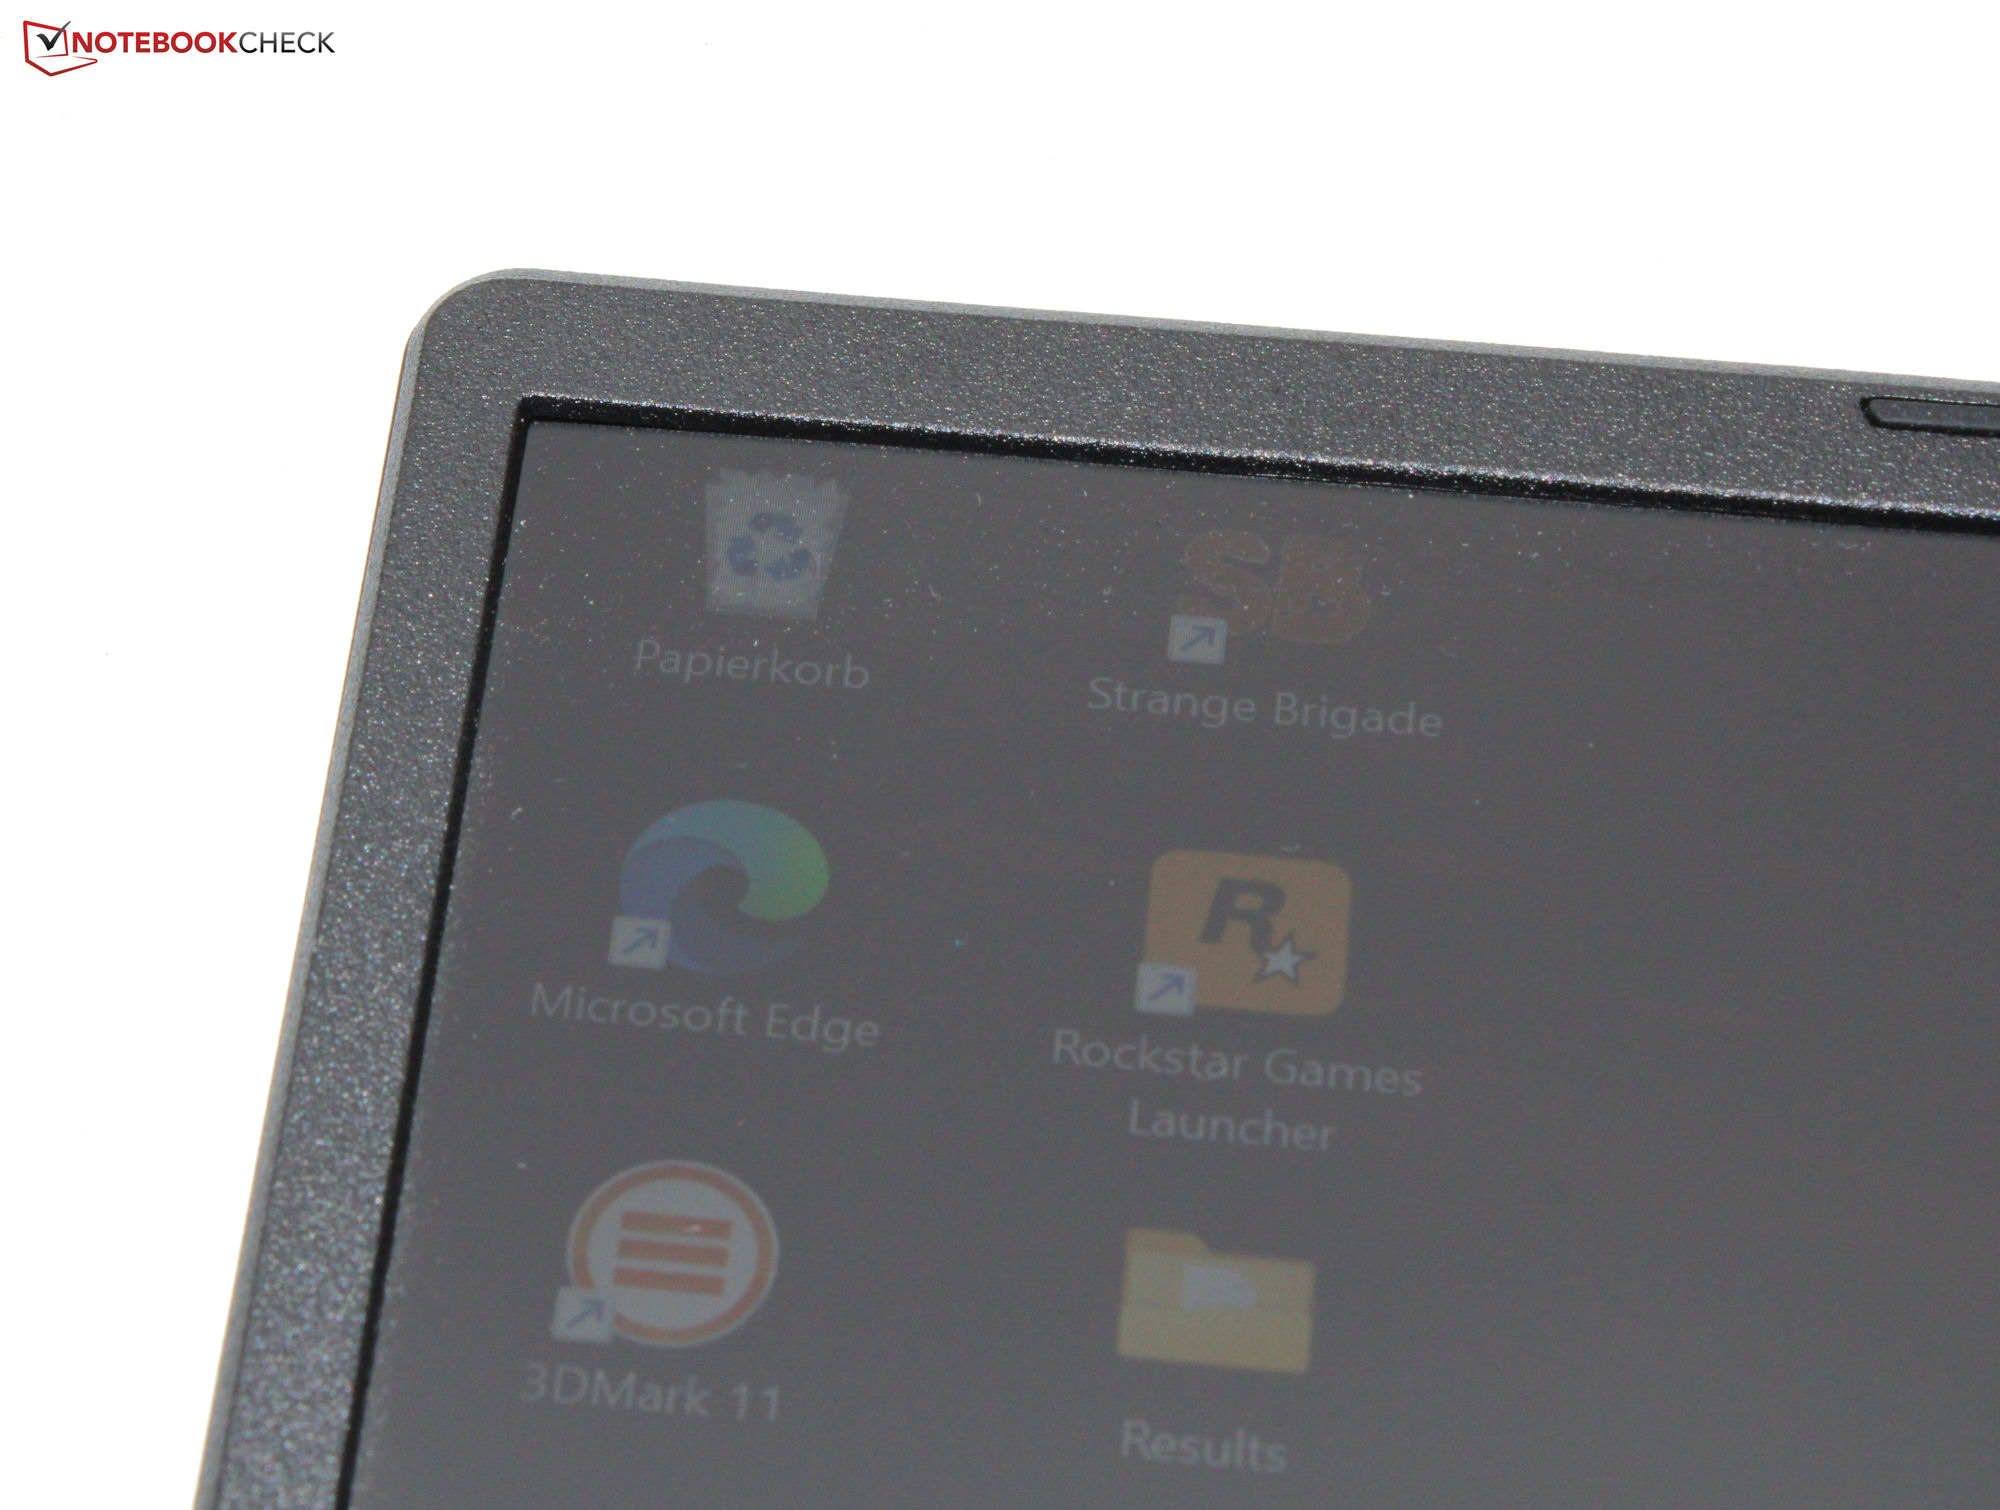
The IPS panel offers stable viewing angles that can be read from any position. The panel's brightness is good-enough for outdoor legibility if the sun does not shine too brightly.

Performance: Acer focuses on Rembrandt and Ada Lovelace
The Nitro 16 series combines Ada-Lovelace GPUs with CPUs from Intel or AMD. The present model relies on AMD and is available for about €1,250 (~US$1,500). Thus, it is currently the cheapest representative of the series.
Test conditions
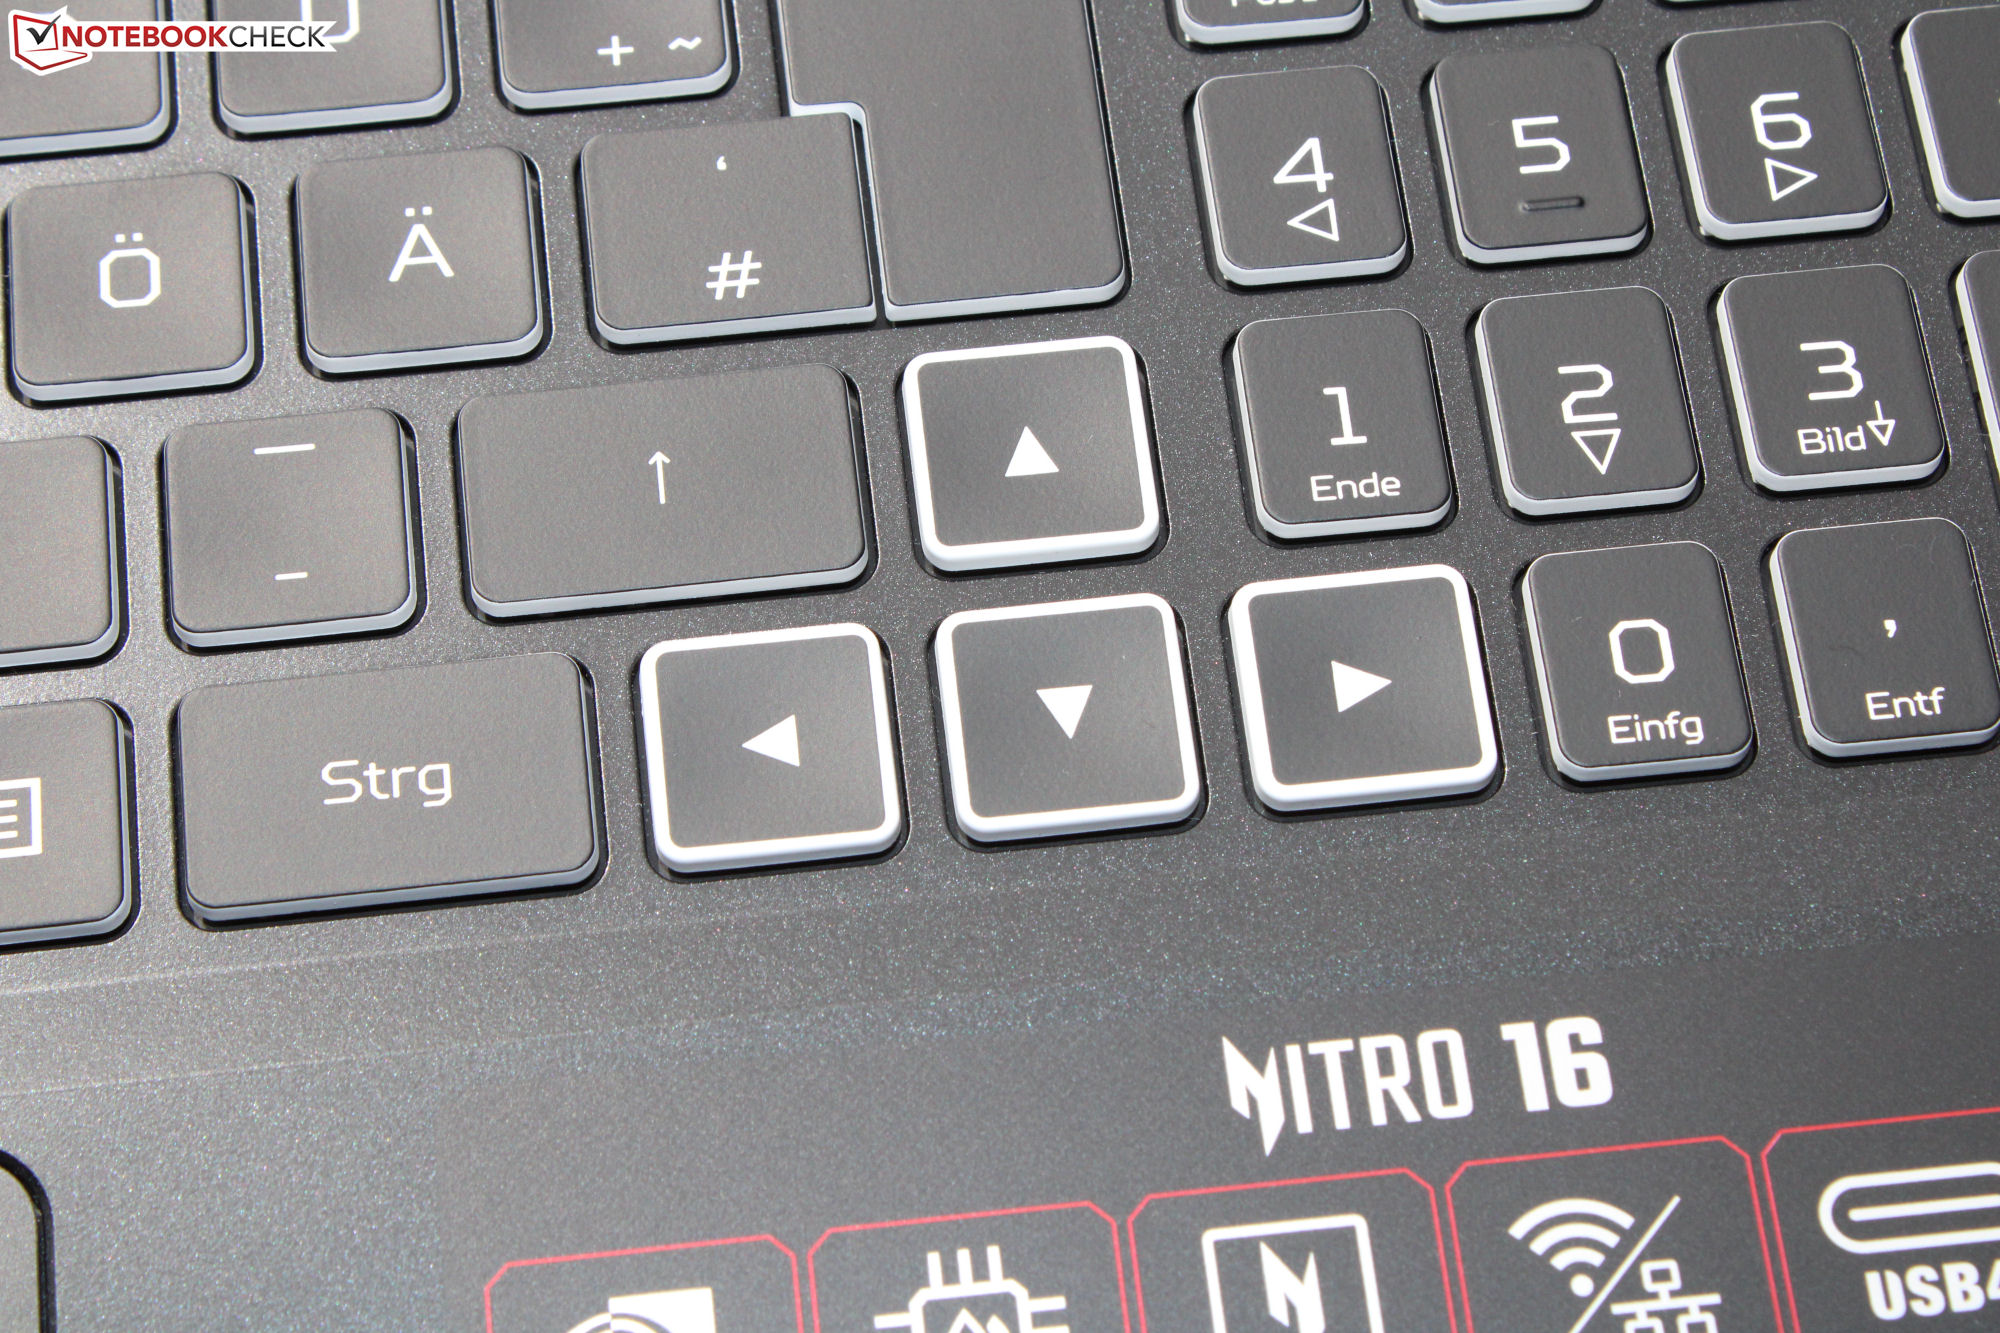
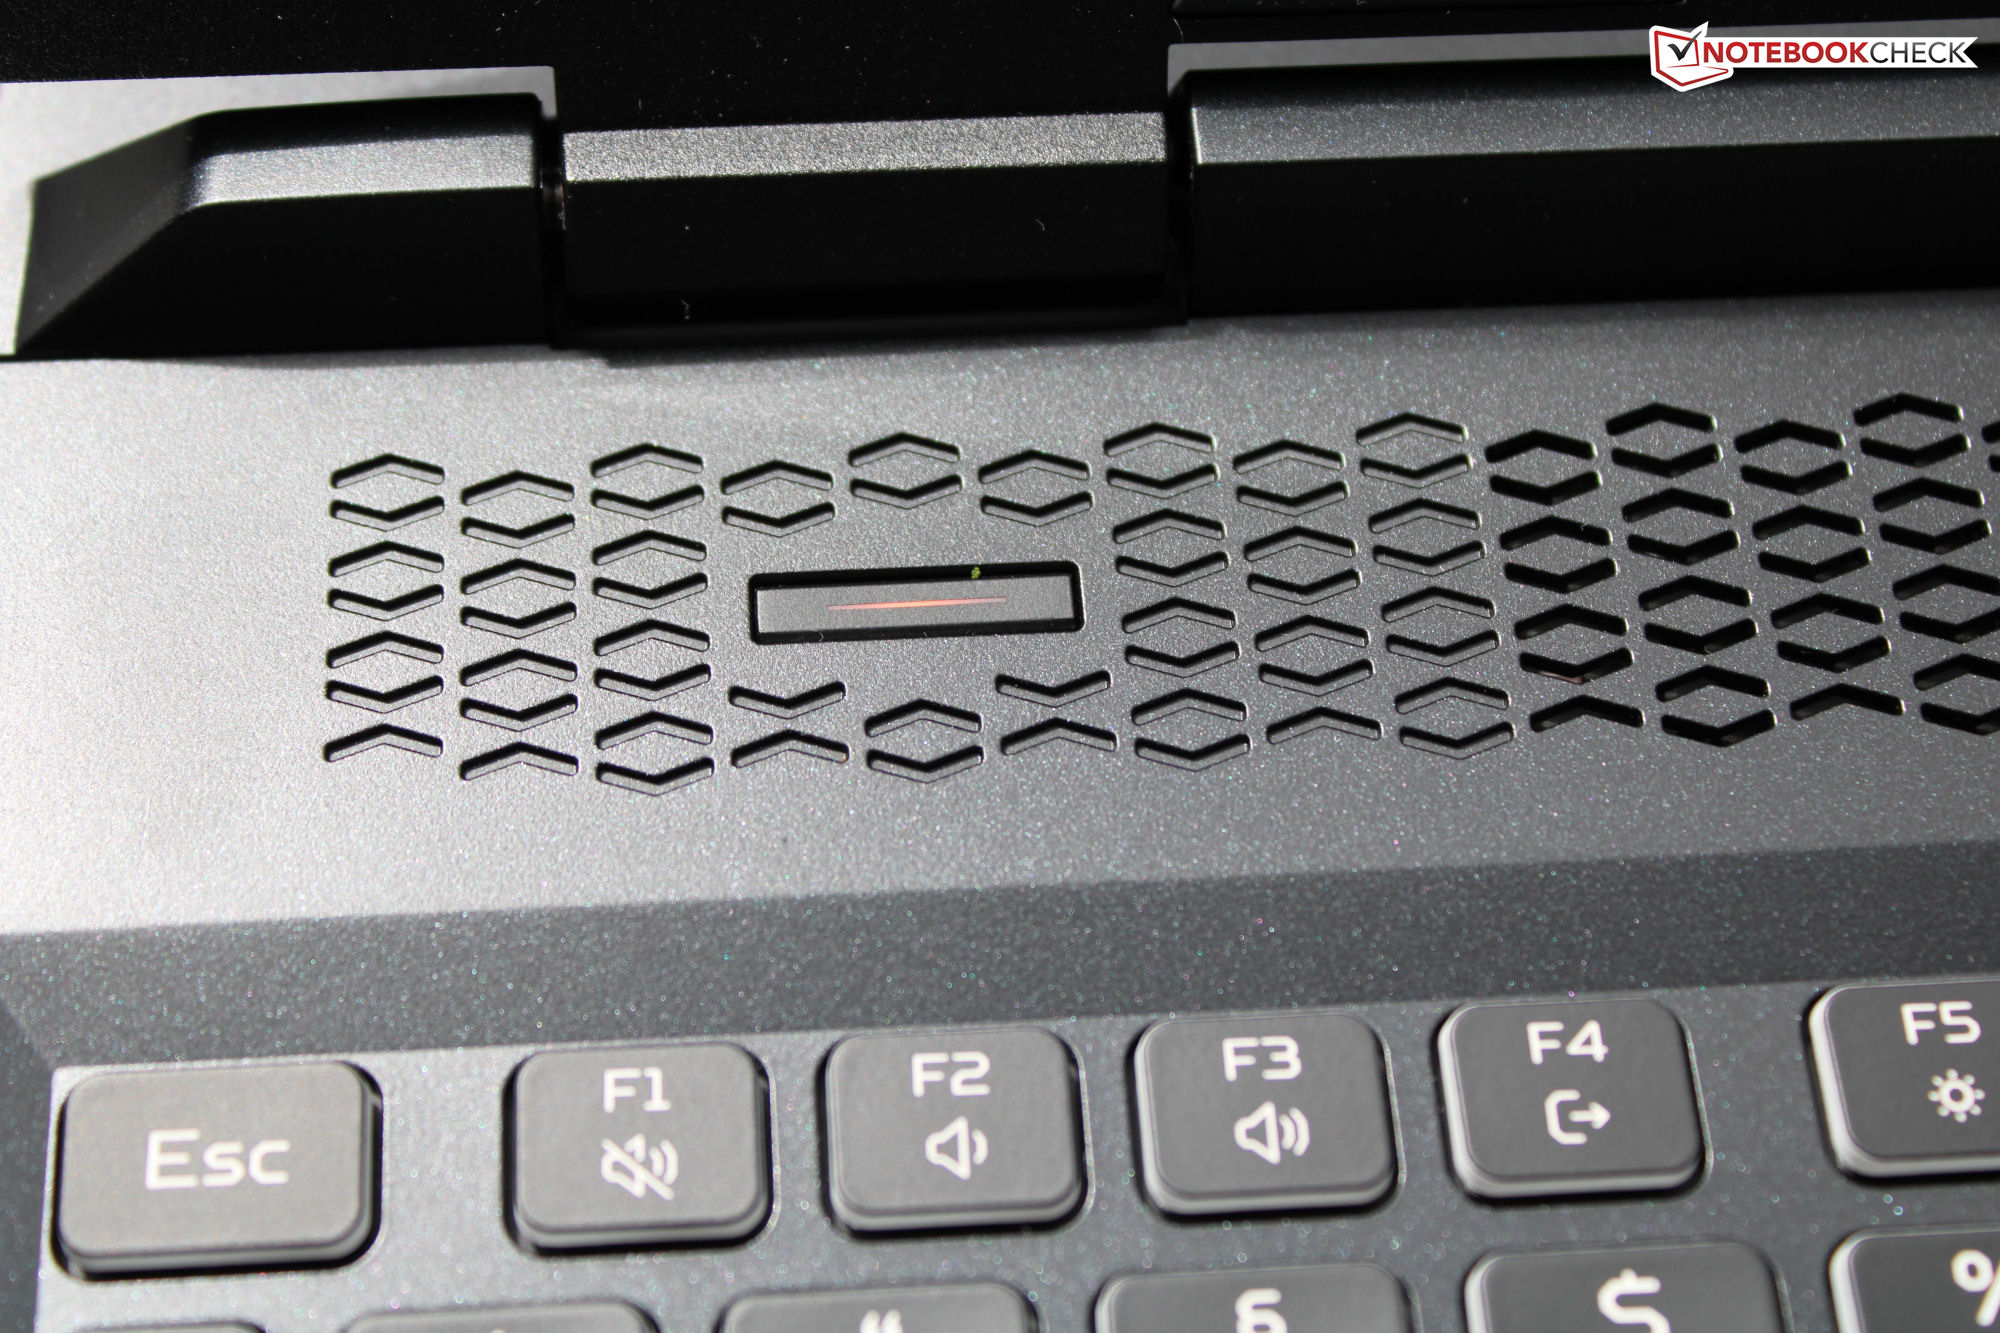
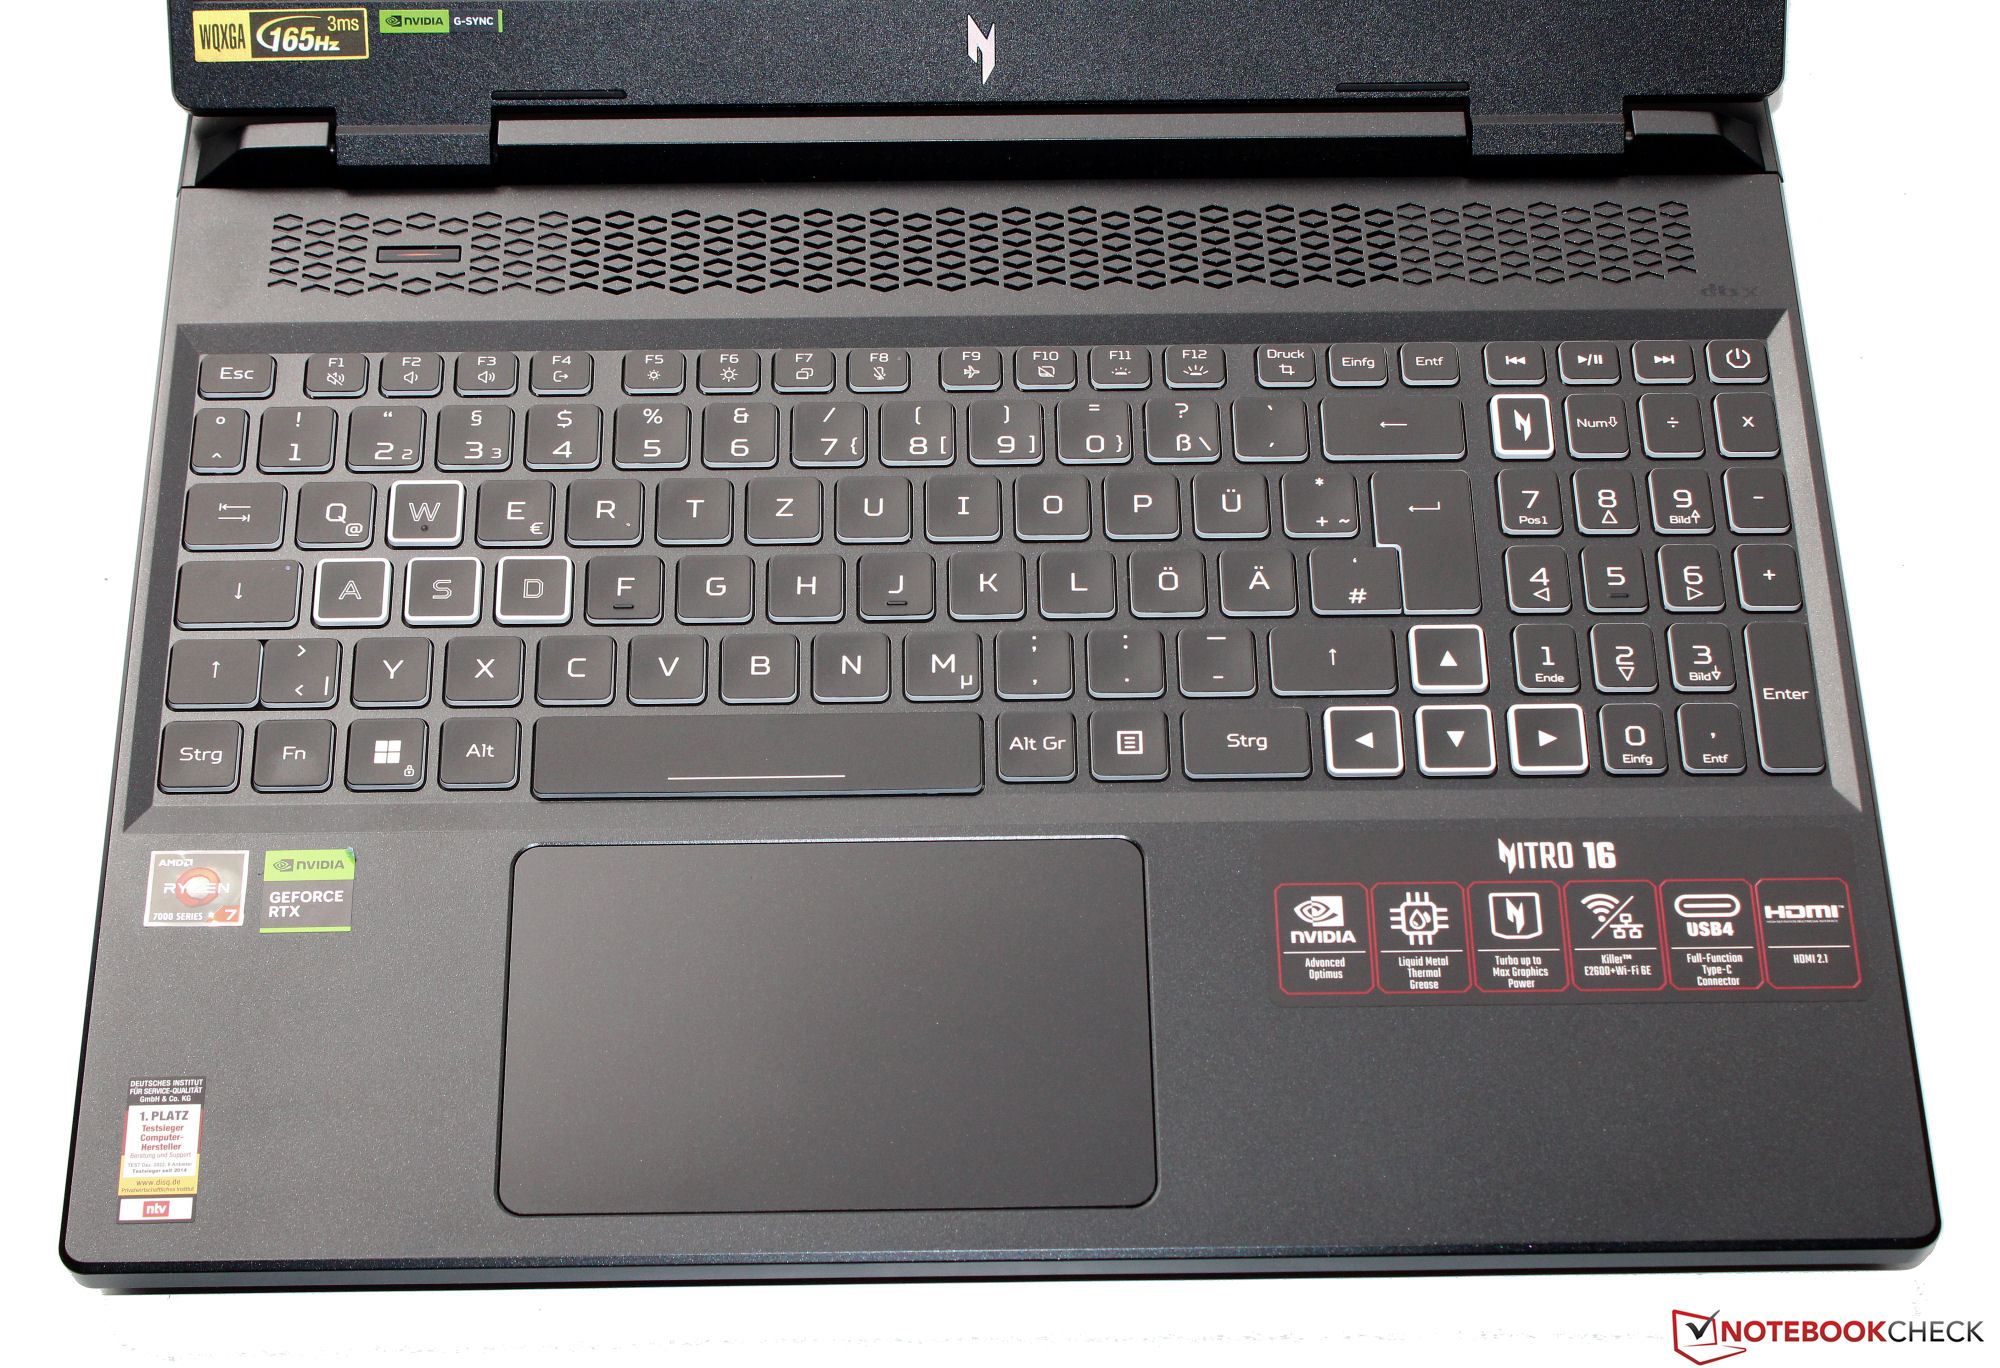
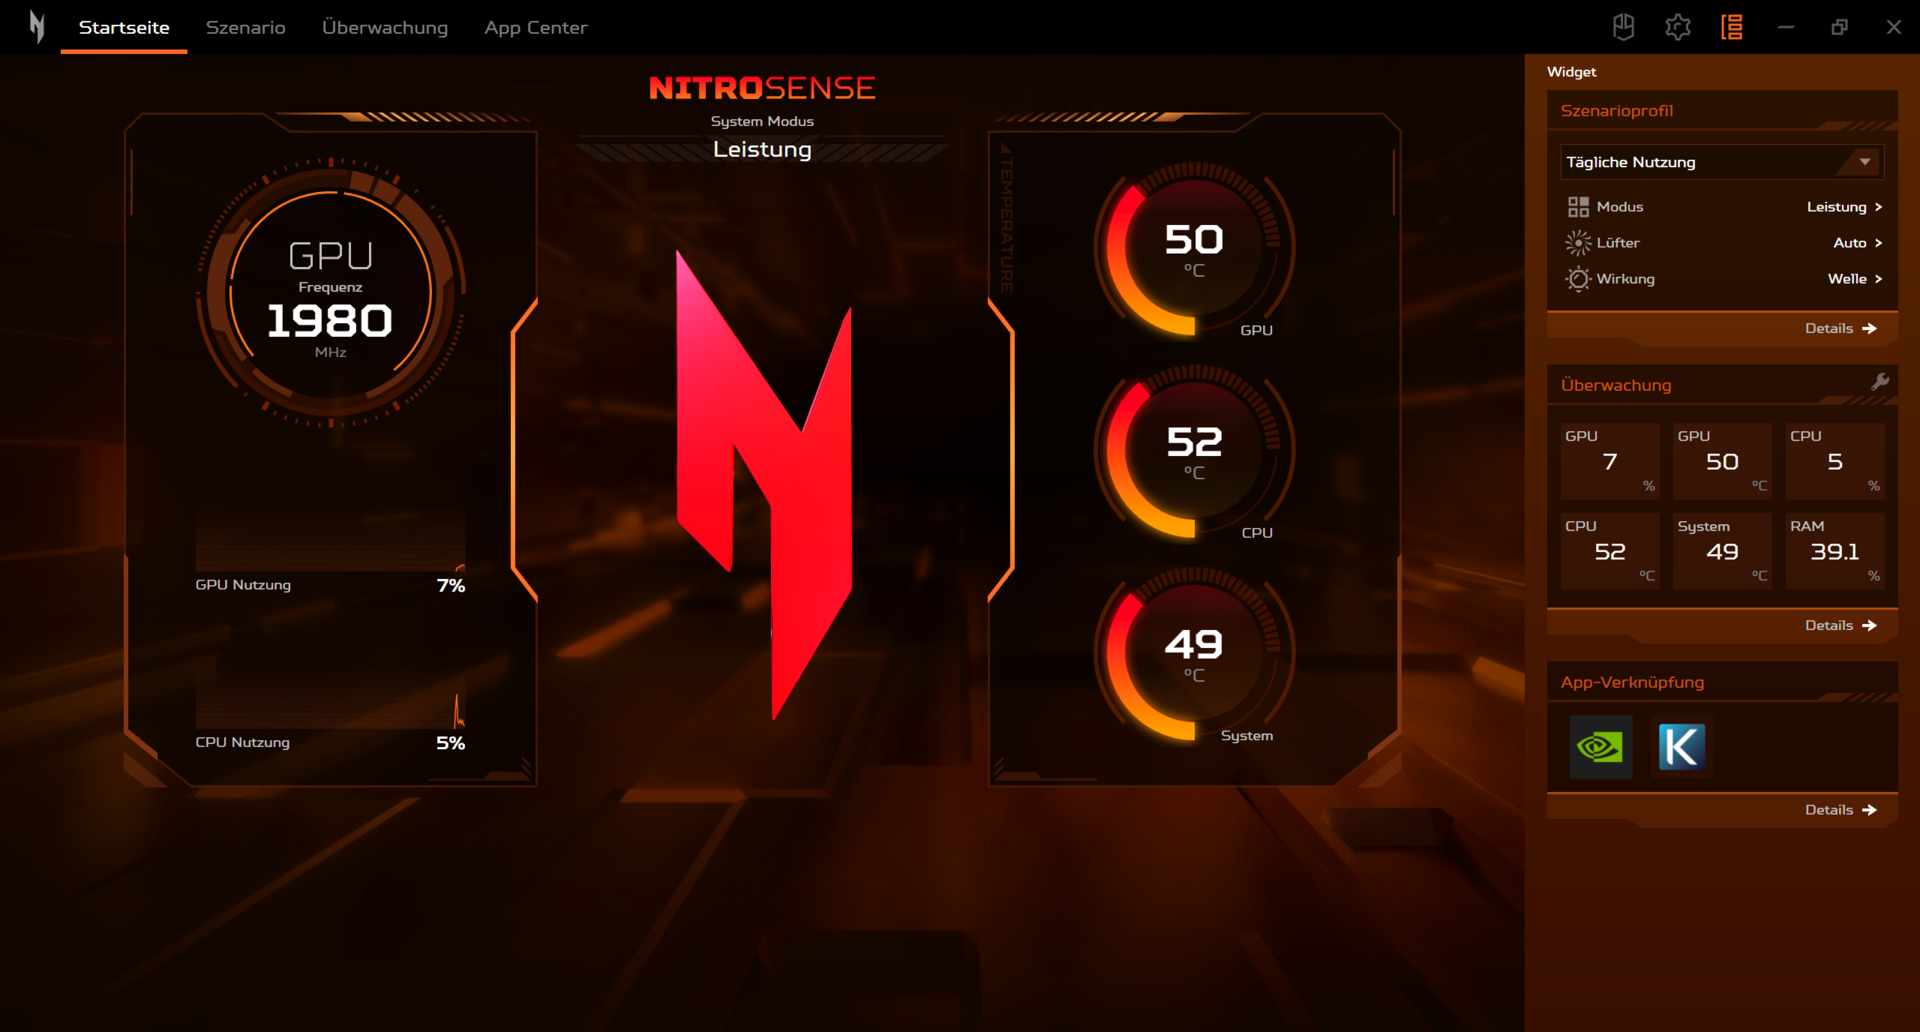
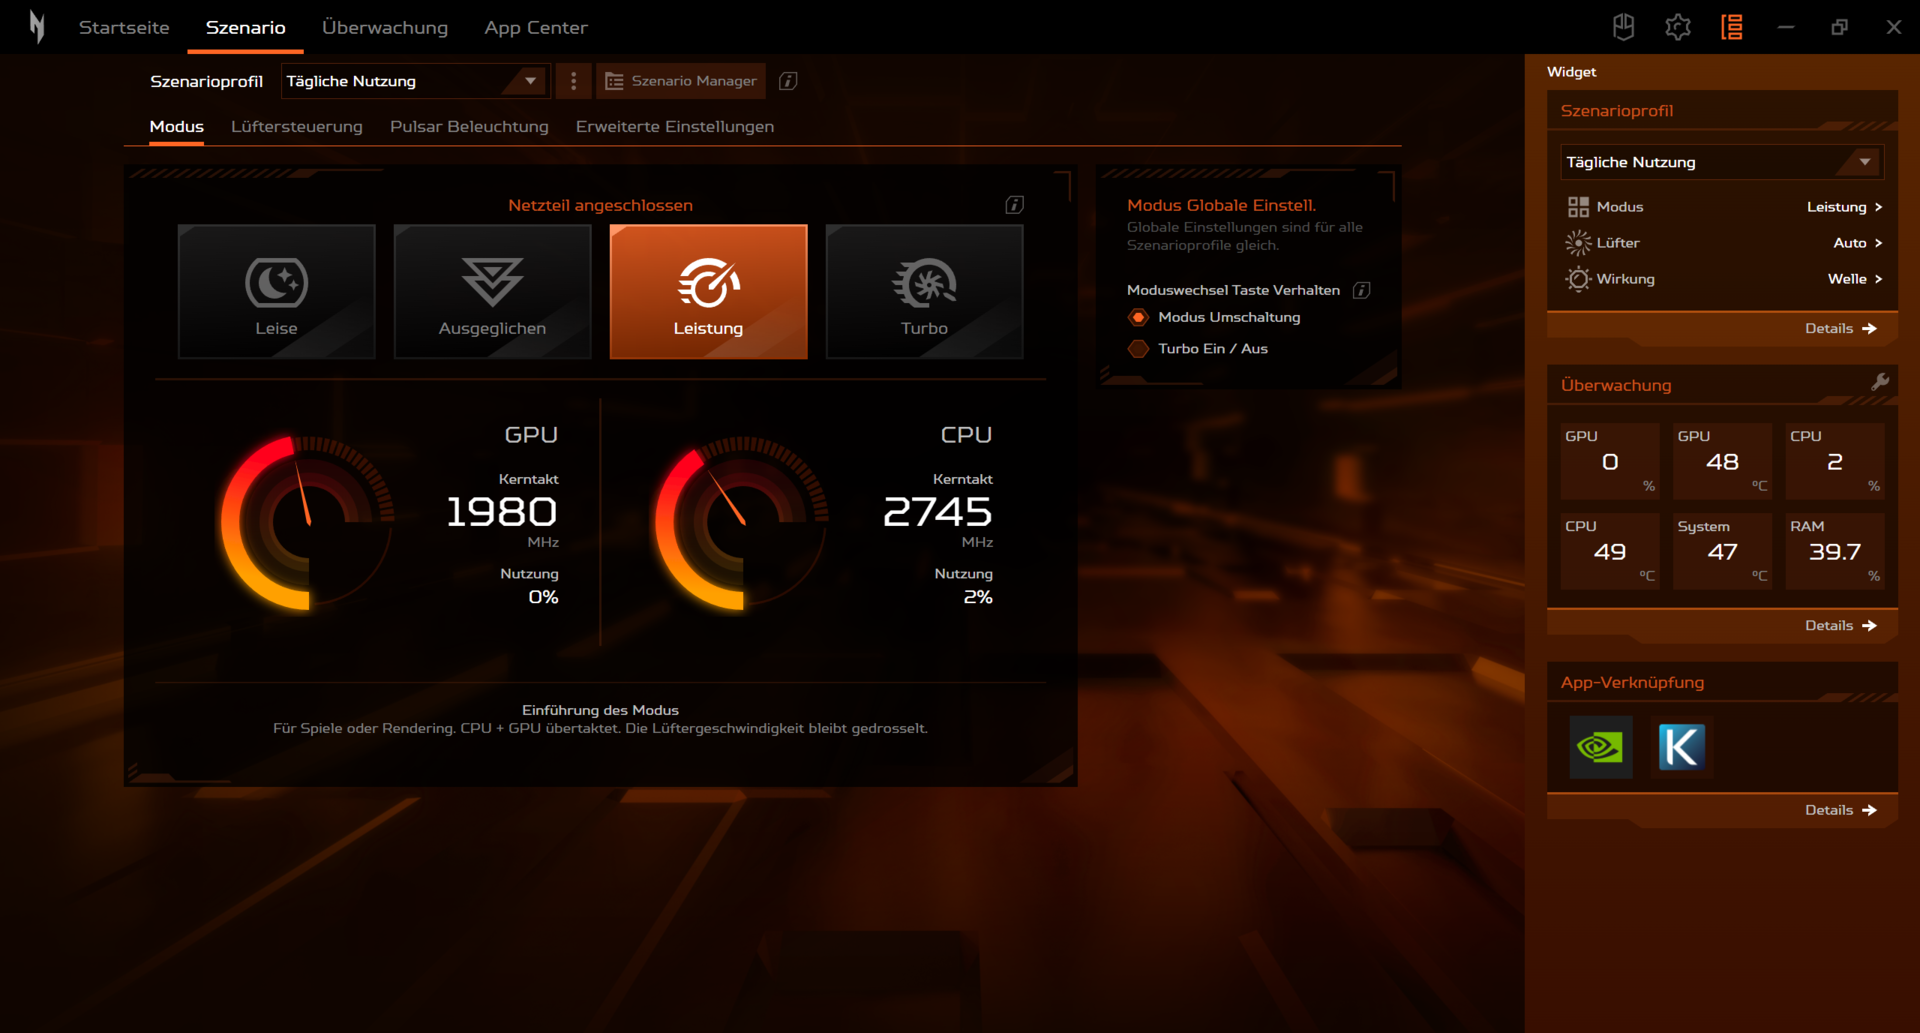
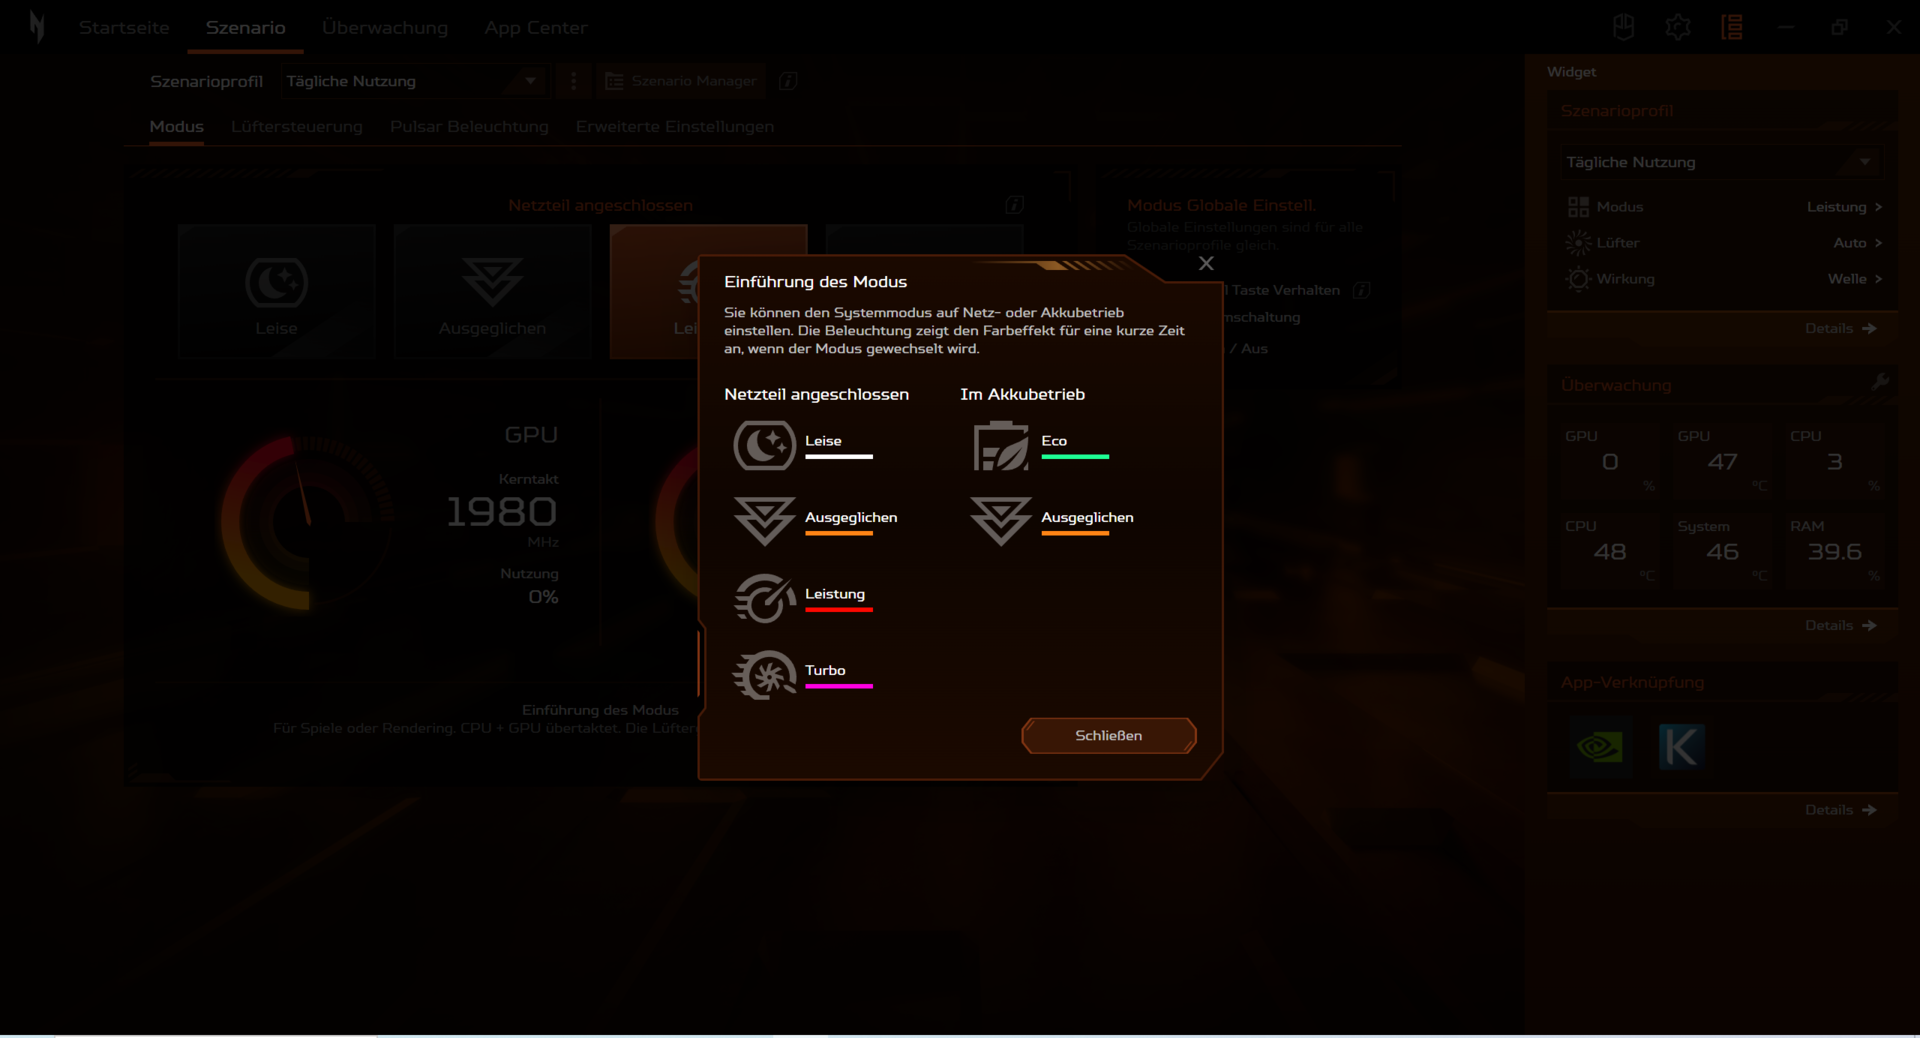
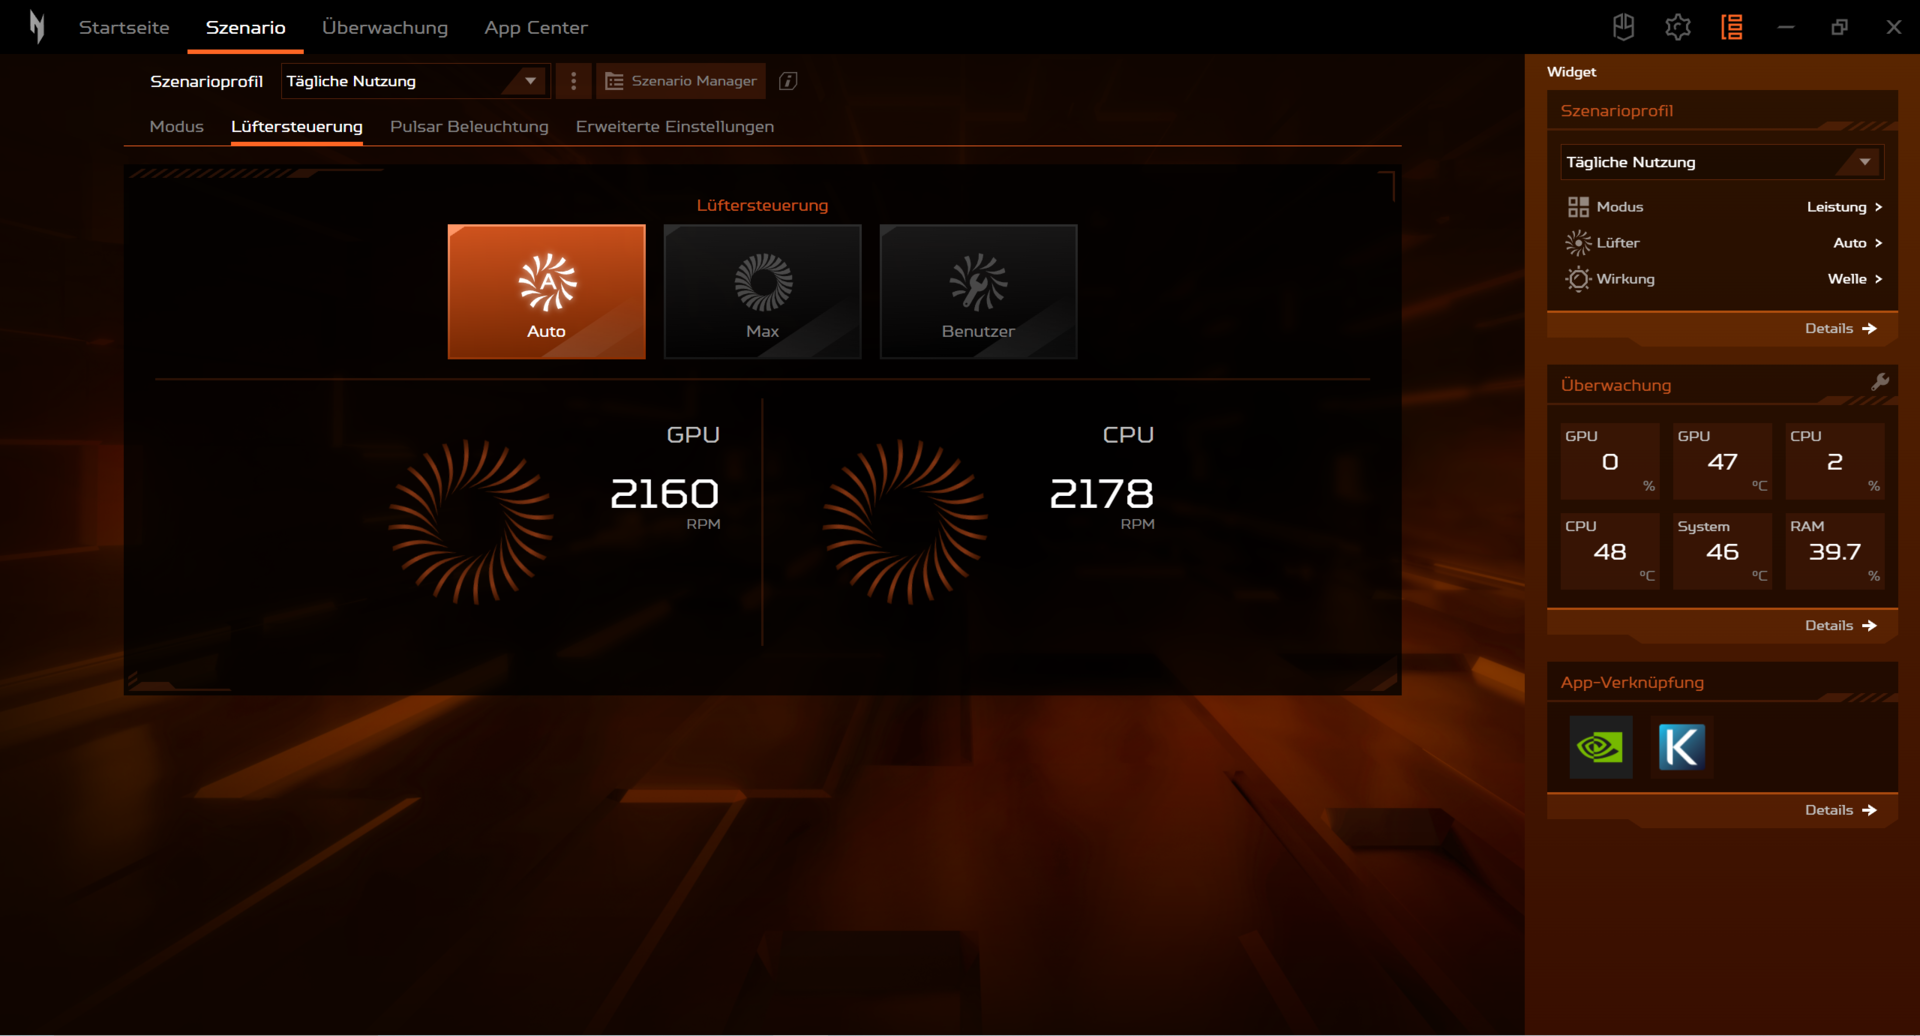
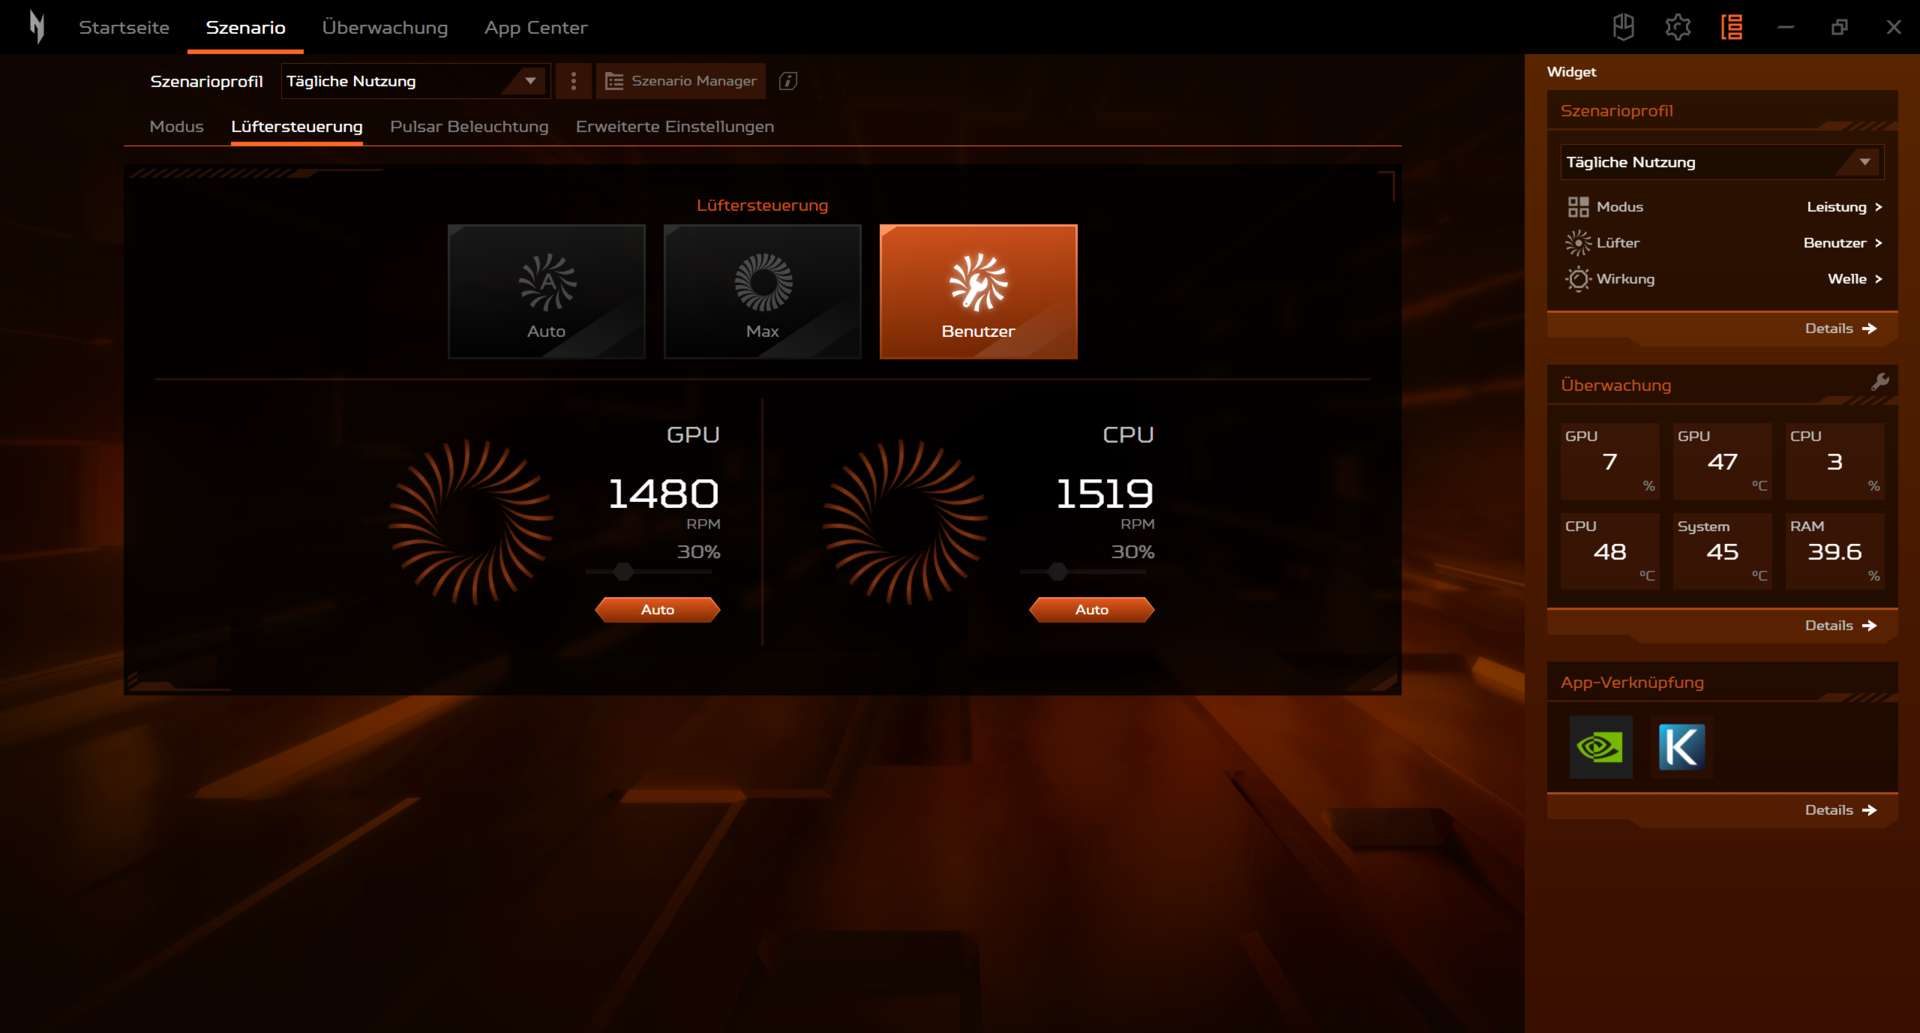
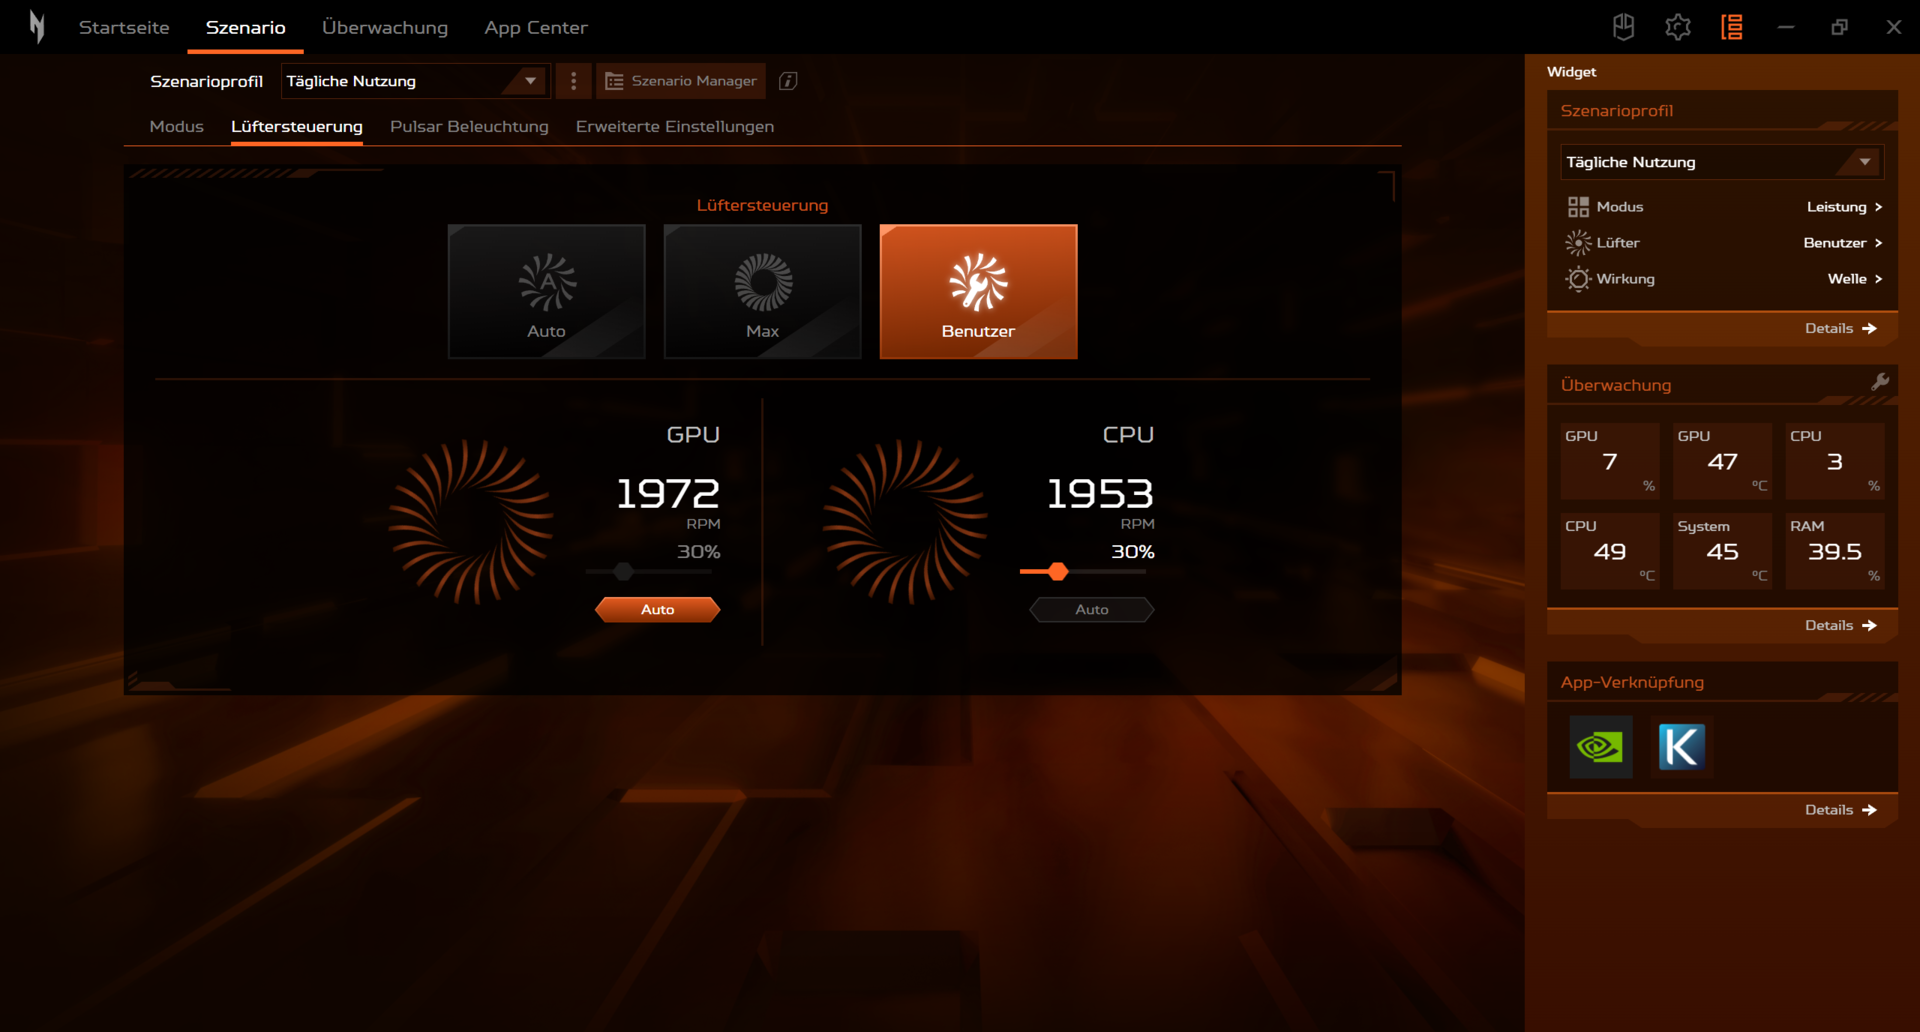
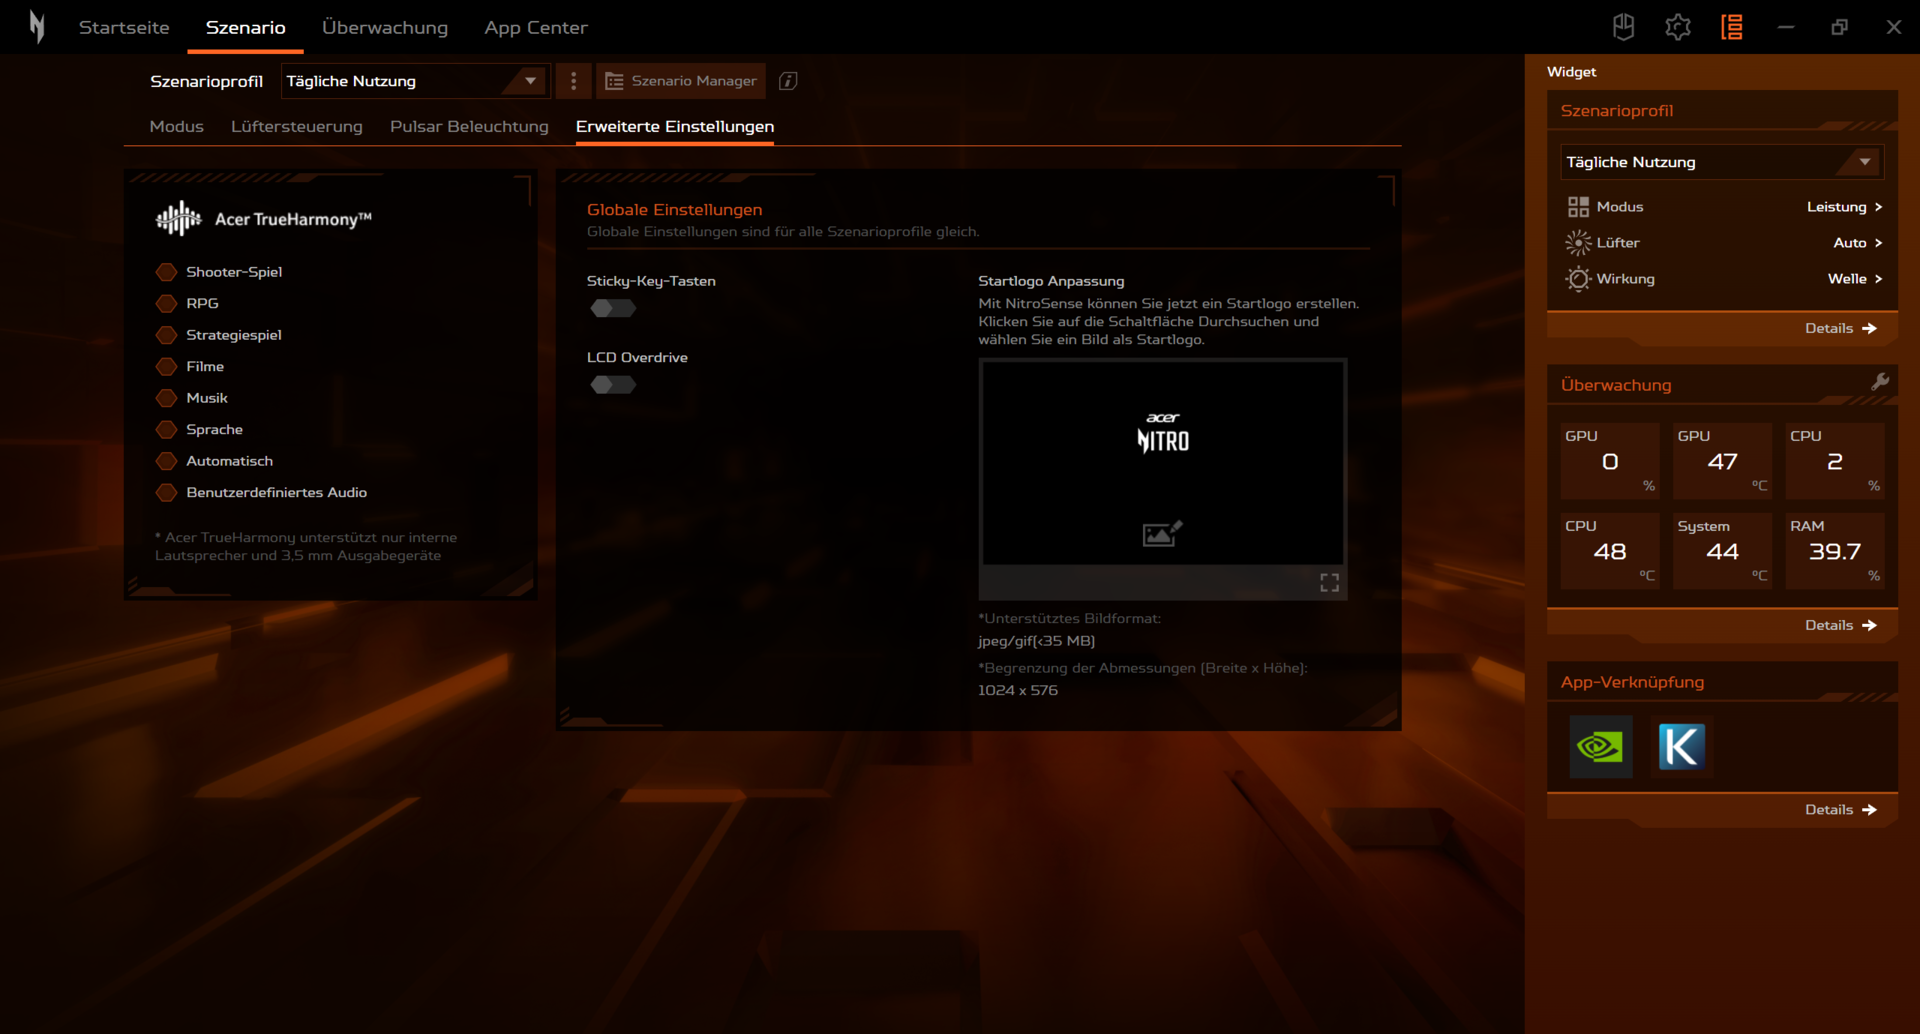
Of the six manufacturer-specific performance modes (see table below), the modes "Balanced" (for benchmarks) and "Eco" (for battery tests) were used. "Turbo" and "Performance" are only available in mains operation (battery level > 30%). A button above the keyboard allows switching between the modes. Alternatively, this can be done via NitroSense software (control center of the laptop). An LED indicates the active mode.
Note: While the other Nitro 16 model was tested with Optimus mode active, the dGPU mode (= the iGPU is disabled) is used on the current test device. The battery tests are an exception, however. Thus, the benchmark results are not always directly comparable.
| Turbo | Power | Balanced | Quiet | Balanced (battery) | Eco (battery) | |
|---|---|---|---|---|---|---|
| PowerLimit 1 (HWInfo) | 95 Watt | 75 Watt | 65 Watt | 45 Watt | 25 Watt | 25 Watt |
| Power Limit 2 (HWInfo) | 100 Watt | 100 Watt | 100 Watt | 100 Watt | 25 Watt | 25 Watt |
| Performance (Witcher 3 ) | ~84 fps | ~83 fps | ~82 fps | ~74 fps | - | - |
| Noise (Witcher 3 ) | 61 dB(A) | 56 dB(A) | 45 dB(A) | 35 dB(A) | - | - |


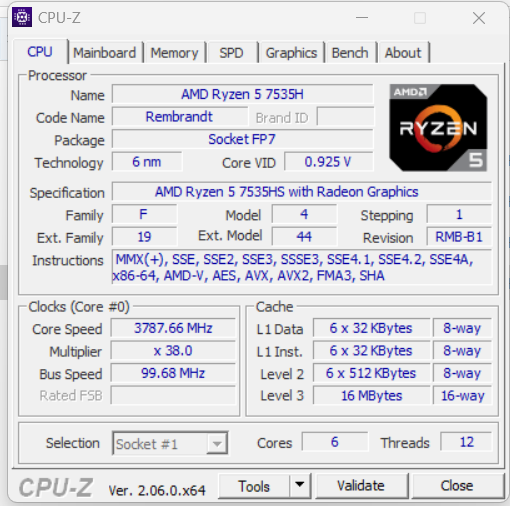
Processor
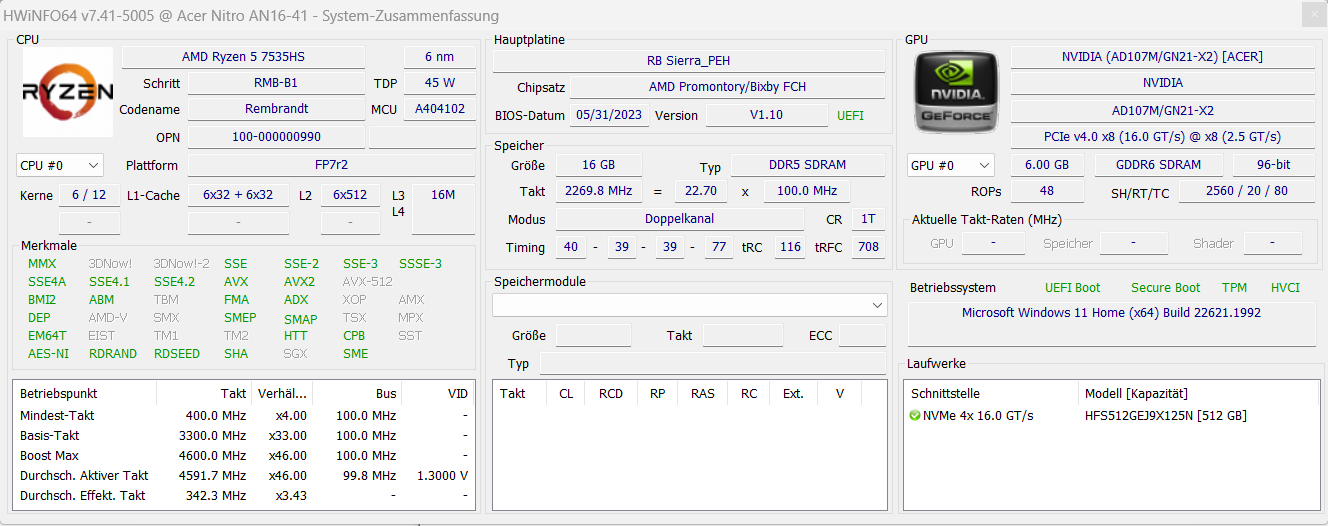
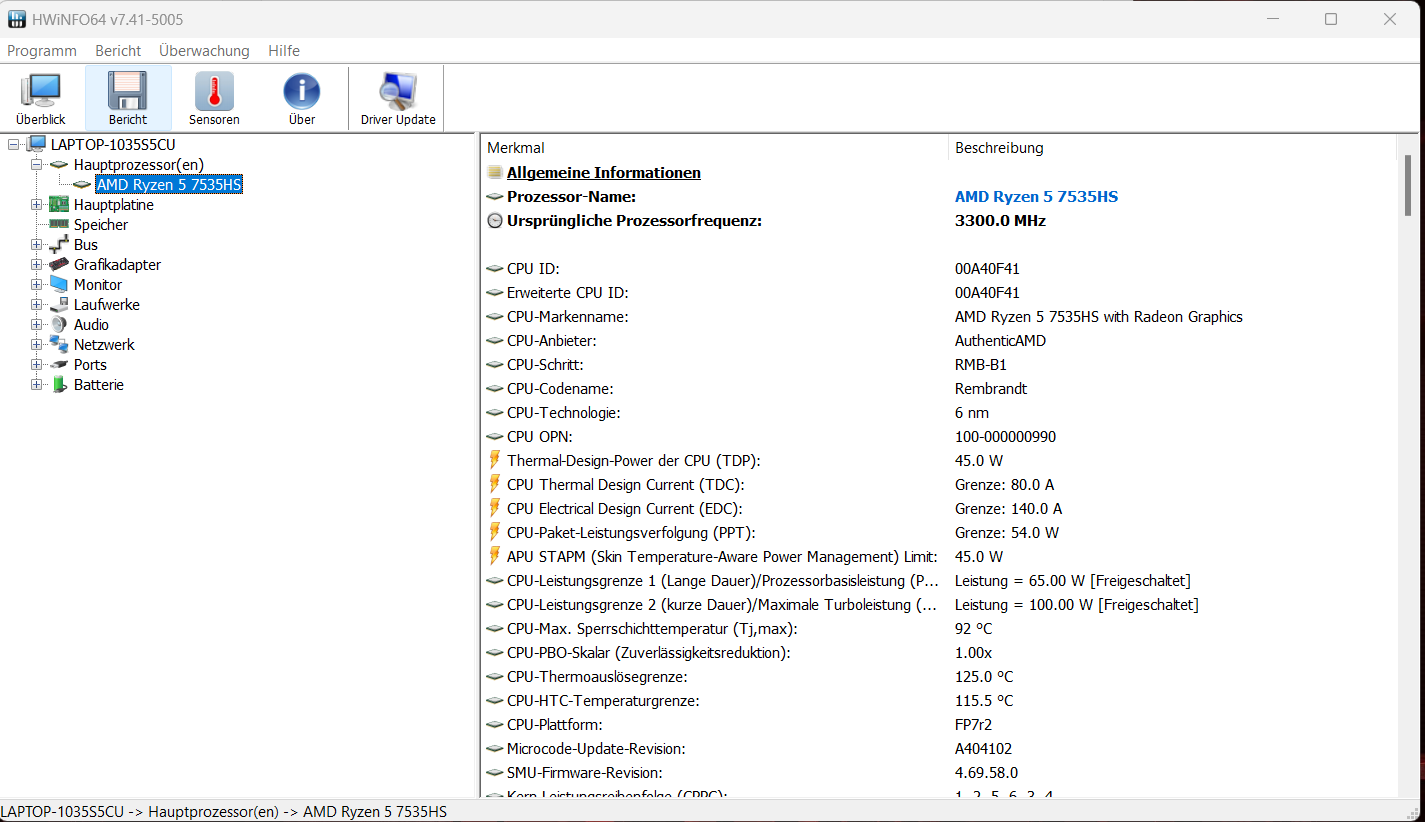
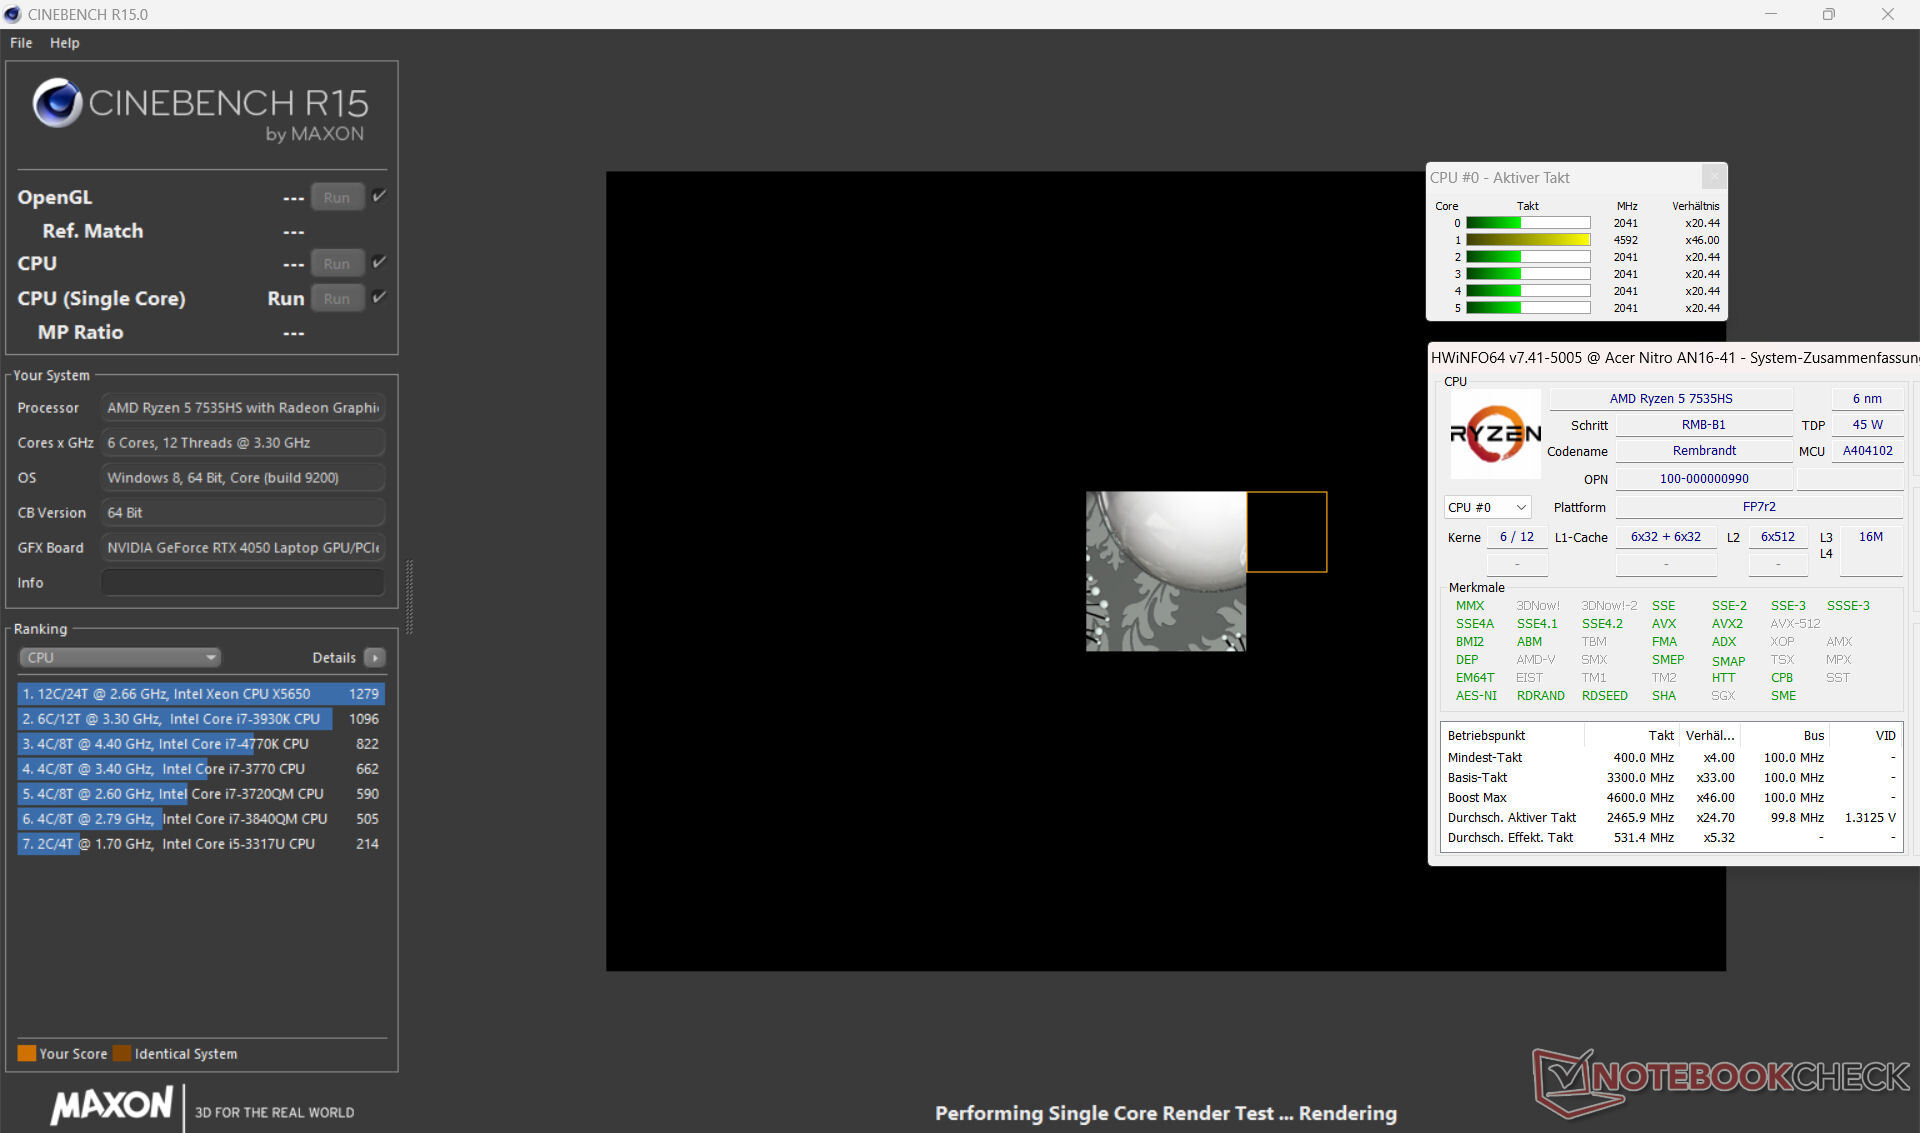
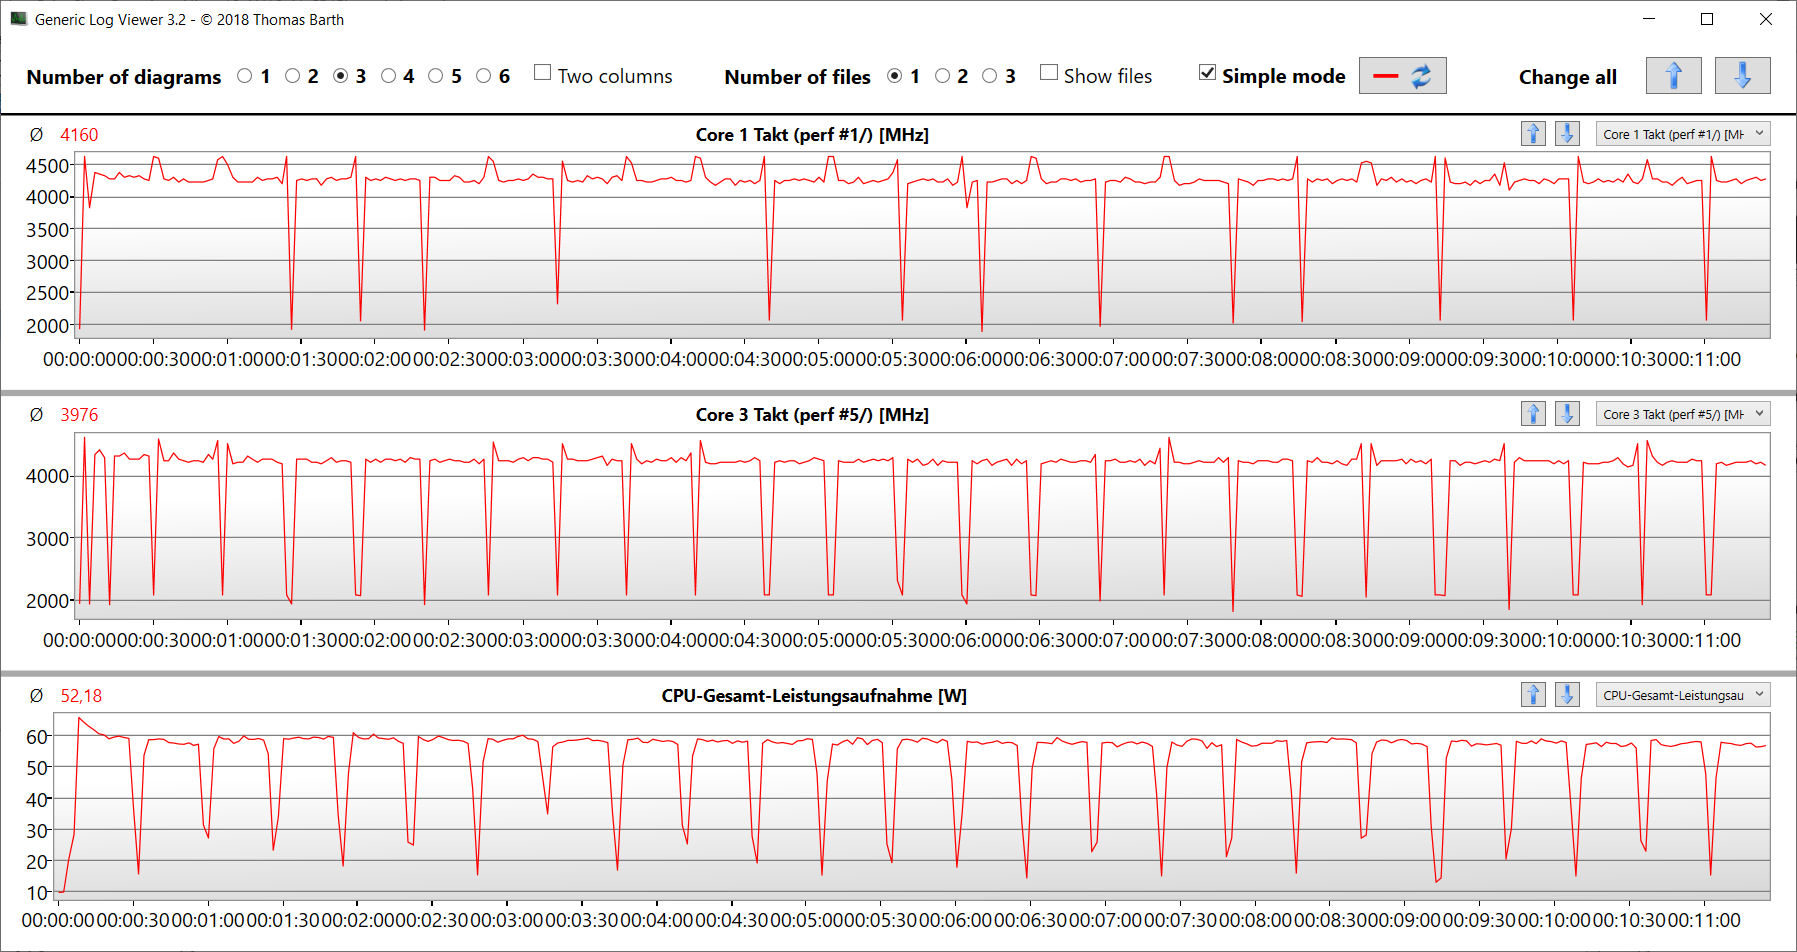
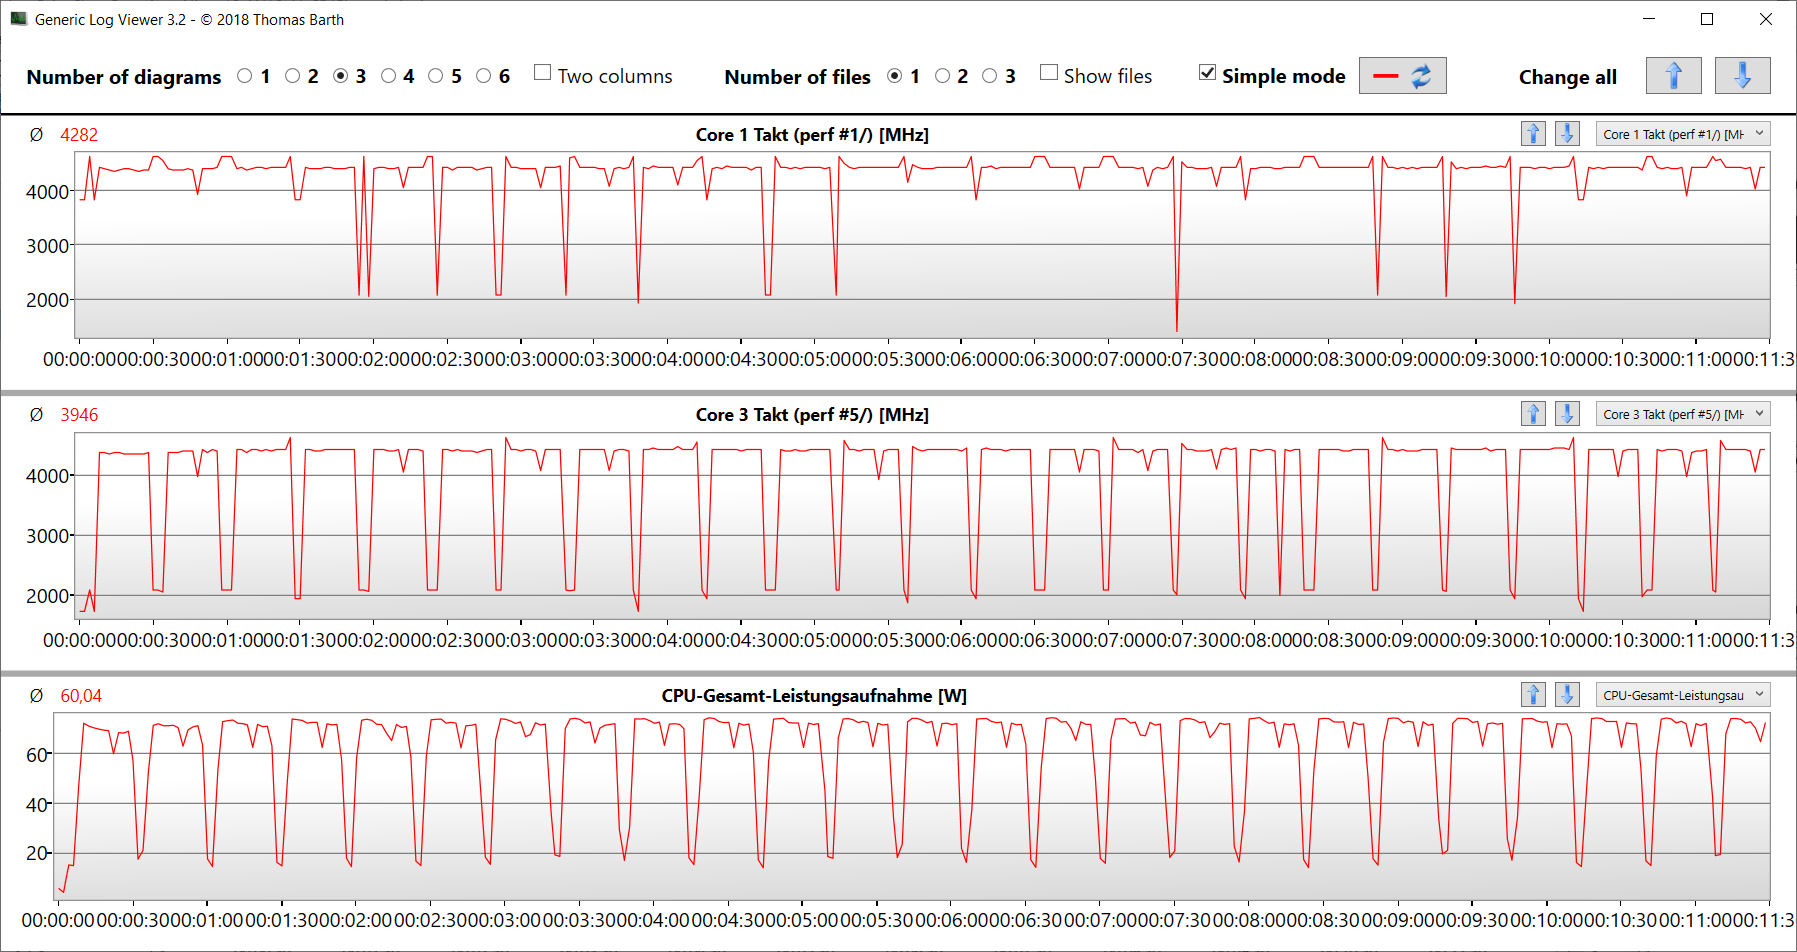
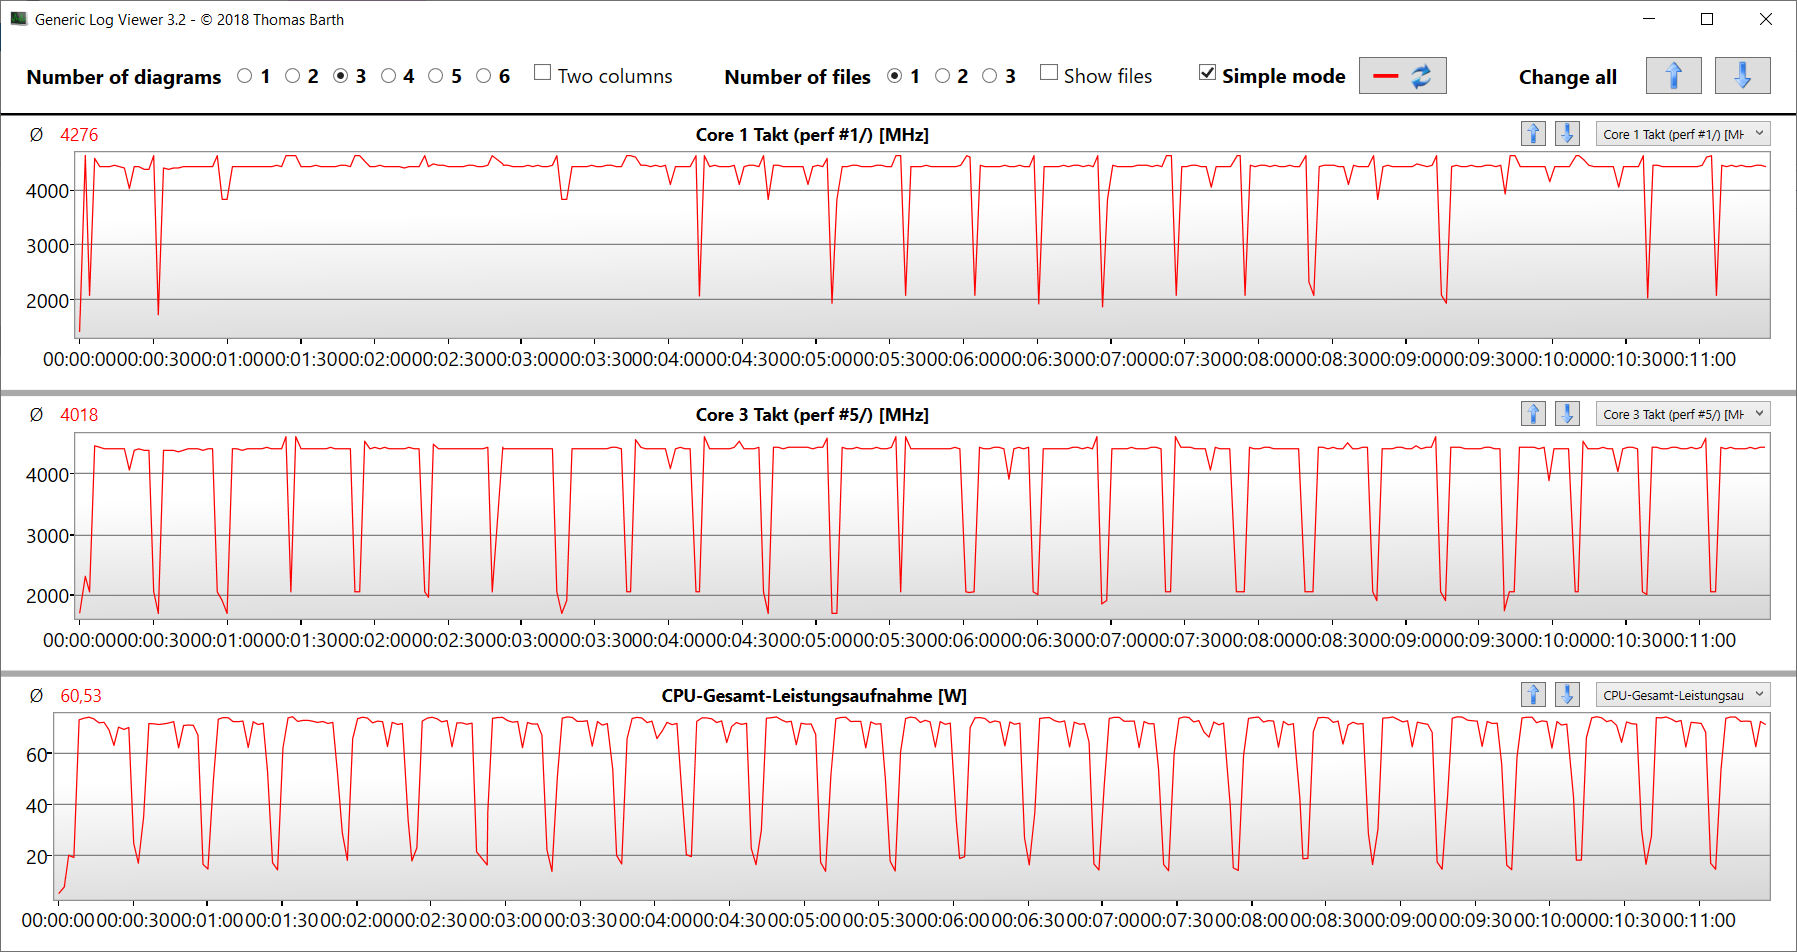
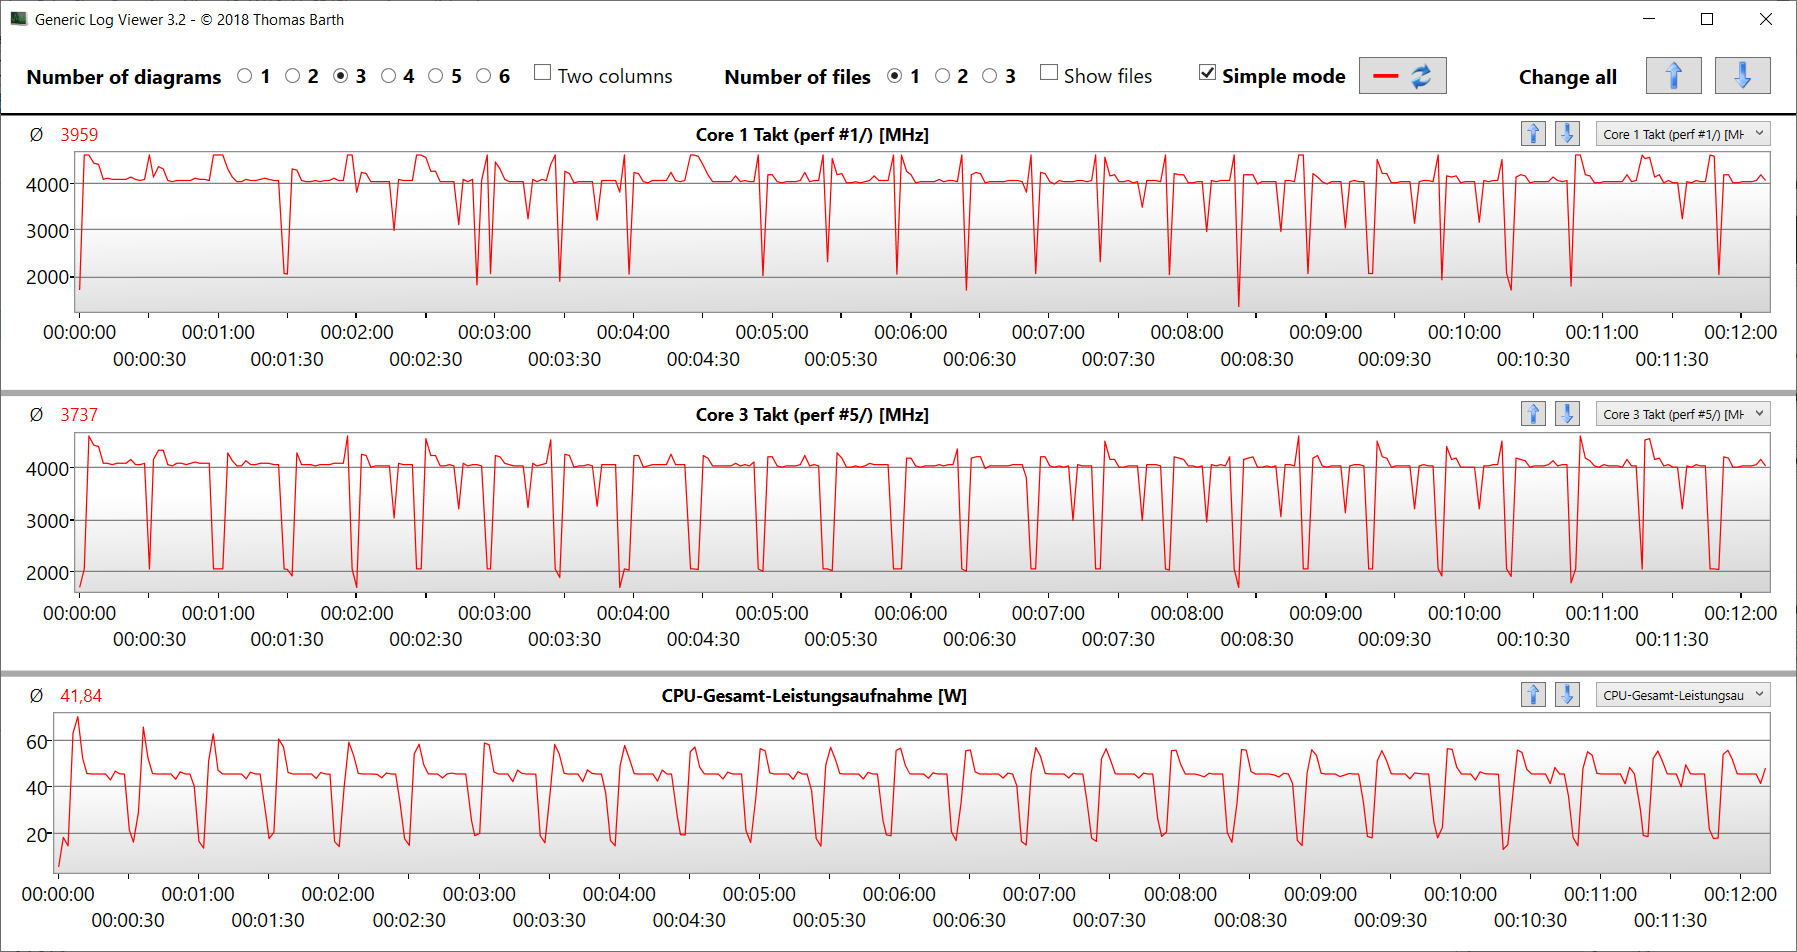
The Ryzen 5 7535HS APU (Zen 3+, Rembrandt-R) offers six CPU cores with a total of 12 threads at a maximum single-core boost of 4.55 GHz. The CPU acknowledges permanent multi-thread load (CB15 Loop) with a constantly high Turbo clock - regardless of the selected system mode. The differences between the modes are small.
Not surprisingly, the Ryzen 7 APU of the sister model offers greater multi-thread performance — after all, it has 8 CPU cores. In terms of the single-thread performance, which is more relevant in everyday use, the APUs are almost on par.
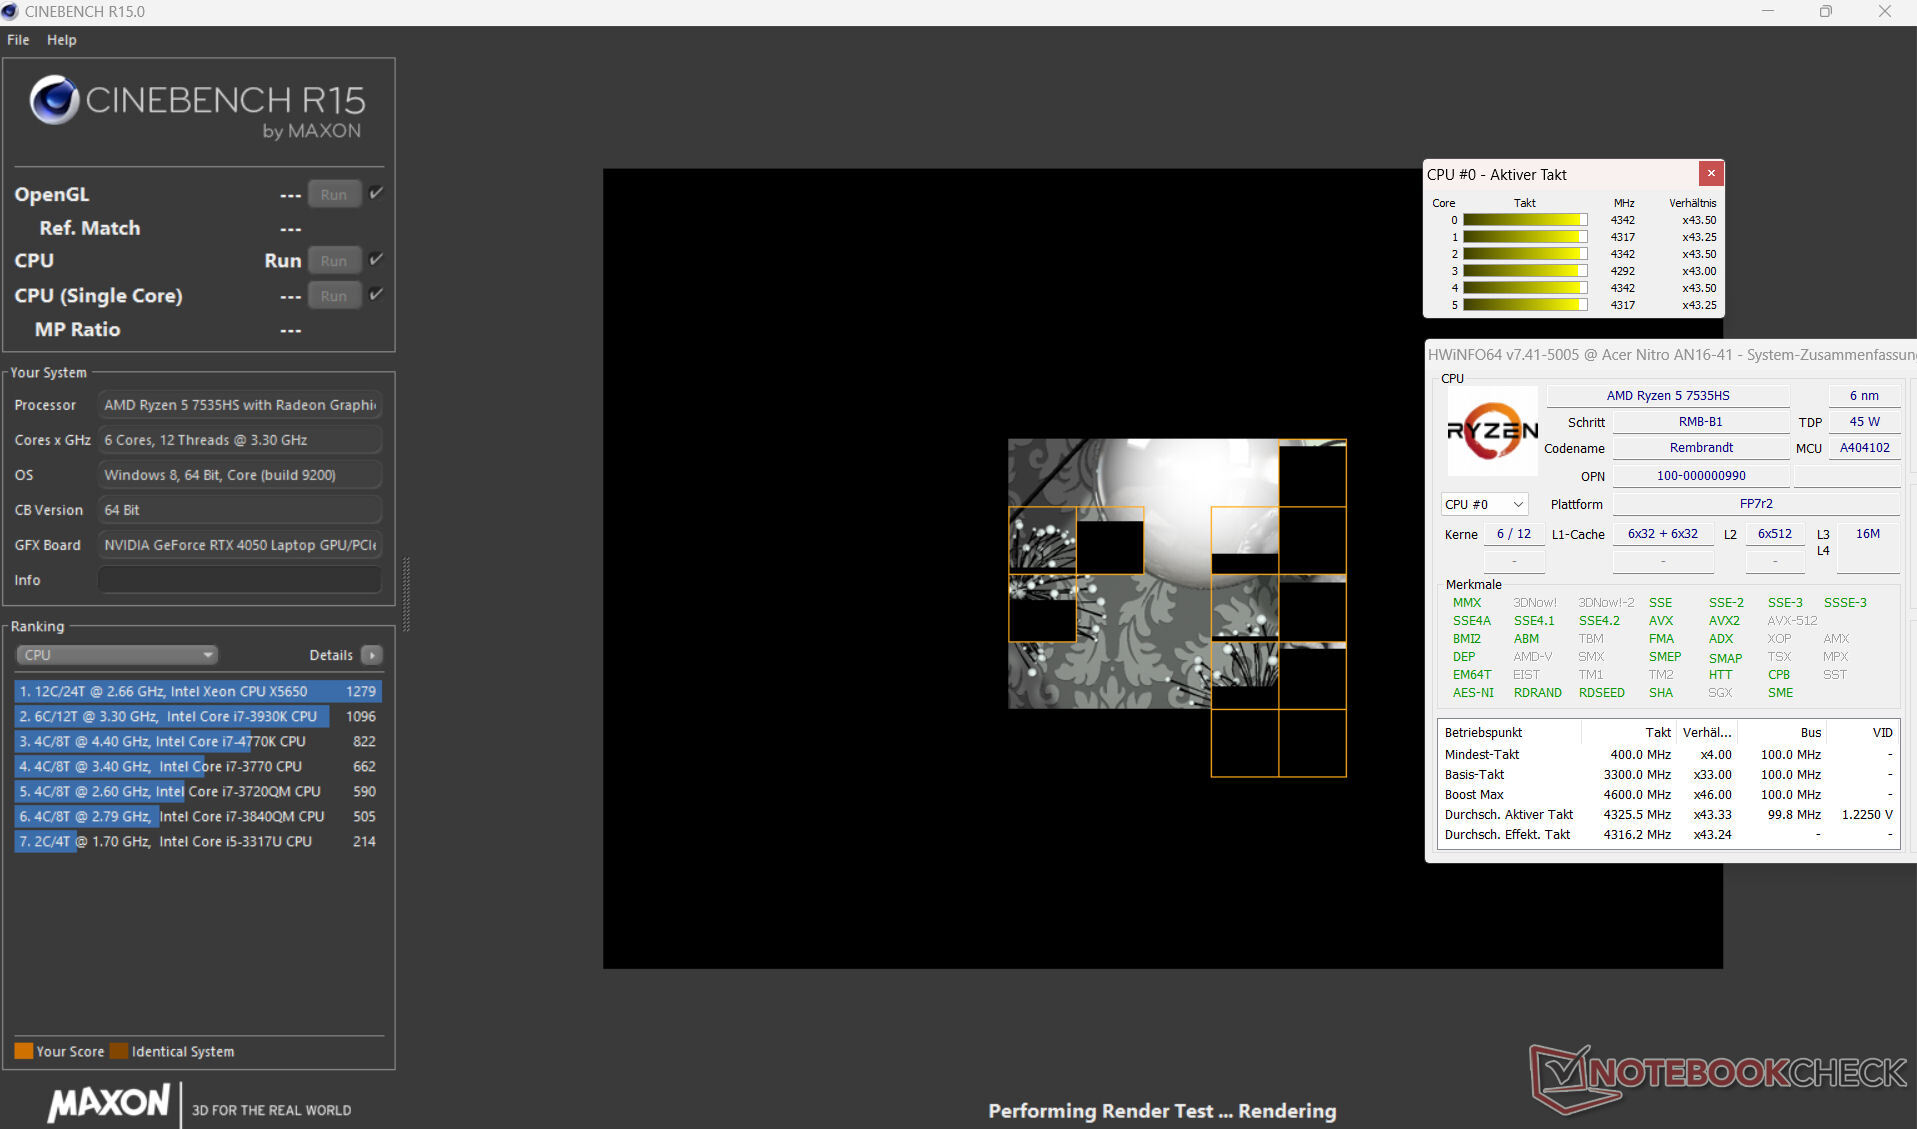
Cinebench R15 multi-core loop
* ... smaller is better
AIDA64: FP32 Ray-Trace | FPU Julia | CPU SHA3 | CPU Queen | FPU SinJulia | FPU Mandel | CPU AES | CPU ZLib | FP64 Ray-Trace | CPU PhotoWorxx
| Performance rating | |
| Average of class Gaming | |
| Schenker XMG Focus 15 (E23) | |
| Asus TUF Gaming A16 FA617XS | |
| Acer Nitro 16 AN16-41 | |
| Asus TUF A15 FA507 | |
| Medion Erazer Scout E20 | |
| Acer Nitro 16 AN16-41-R7YE | |
| Gigabyte G7 KE | |
| Average AMD Ryzen 5 7535HS | |
| AIDA64 / FP32 Ray-Trace | |
| Average of class Gaming (10227 - 85542, n=107, last 2 years) | |
| Asus TUF Gaming A16 FA617XS | |
| Schenker XMG Focus 15 (E23) | |
| Acer Nitro 16 AN16-41 | |
| Asus TUF A15 FA507 | |
| Medion Erazer Scout E20 | |
| Gigabyte G7 KE | |
| Acer Nitro 16 AN16-41-R7YE | |
| Average AMD Ryzen 5 7535HS (9617 - 12945, n=3) | |
| AIDA64 / FPU Julia | |
| Average of class Gaming (51376 - 238426, n=107, last 2 years) | |
| Asus TUF Gaming A16 FA617XS | |
| Schenker XMG Focus 15 (E23) | |
| Acer Nitro 16 AN16-41 | |
| Asus TUF A15 FA507 | |
| Acer Nitro 16 AN16-41-R7YE | |
| Medion Erazer Scout E20 | |
| Average AMD Ryzen 5 7535HS (61244 - 79252, n=3) | |
| Gigabyte G7 KE | |
| AIDA64 / CPU SHA3 | |
| Average of class Gaming (2180 - 9817, n=107, last 2 years) | |
| Schenker XMG Focus 15 (E23) | |
| Asus TUF Gaming A16 FA617XS | |
| Acer Nitro 16 AN16-41 | |
| Asus TUF A15 FA507 | |
| Gigabyte G7 KE | |
| Medion Erazer Scout E20 | |
| Acer Nitro 16 AN16-41-R7YE | |
| Average AMD Ryzen 5 7535HS (2075 - 2679, n=3) | |
| AIDA64 / CPU Queen | |
| Schenker XMG Focus 15 (E23) | |
| Asus TUF Gaming A16 FA617XS | |
| Average of class Gaming (49785 - 173351, n=98, last 2 years) | |
| Acer Nitro 16 AN16-41 | |
| Medion Erazer Scout E20 | |
| Asus TUF A15 FA507 | |
| Acer Nitro 16 AN16-41-R7YE | |
| Gigabyte G7 KE | |
| Average AMD Ryzen 5 7535HS (73548 - 82540, n=3) | |
| AIDA64 / FPU SinJulia | |
| Asus TUF Gaming A16 FA617XS | |
| Average of class Gaming (4424 - 33636, n=107, last 2 years) | |
| Schenker XMG Focus 15 (E23) | |
| Acer Nitro 16 AN16-41 | |
| Asus TUF A15 FA507 | |
| Acer Nitro 16 AN16-41-R7YE | |
| Medion Erazer Scout E20 | |
| Average AMD Ryzen 5 7535HS (8792 - 9786, n=3) | |
| Gigabyte G7 KE | |
| AIDA64 / FPU Mandel | |
| Average of class Gaming (25115 - 128721, n=107, last 2 years) | |
| Asus TUF Gaming A16 FA617XS | |
| Acer Nitro 16 AN16-41 | |
| Asus TUF A15 FA507 | |
| Schenker XMG Focus 15 (E23) | |
| Acer Nitro 16 AN16-41-R7YE | |
| Average AMD Ryzen 5 7535HS (34054 - 43495, n=3) | |
| Medion Erazer Scout E20 | |
| Gigabyte G7 KE | |
| AIDA64 / CPU AES | |
| Gigabyte G7 KE | |
| Average of class Gaming (39258 - 247074, n=107, last 2 years) | |
| Acer Nitro 16 AN16-41-R7YE | |
| Schenker XMG Focus 15 (E23) | |
| Asus TUF Gaming A16 FA617XS | |
| Medion Erazer Scout E20 | |
| Asus TUF A15 FA507 | |
| Average AMD Ryzen 5 7535HS (35651 - 105083, n=3) | |
| Acer Nitro 16 AN16-41 | |
| AIDA64 / CPU ZLib | |
| Schenker XMG Focus 15 (E23) | |
| Average of class Gaming (574 - 2531, n=107, last 2 years) | |
| Asus TUF Gaming A16 FA617XS | |
| Medion Erazer Scout E20 | |
| Gigabyte G7 KE | |
| Acer Nitro 16 AN16-41 | |
| Acer Nitro 16 AN16-41-R7YE | |
| Asus TUF A15 FA507 | |
| Average AMD Ryzen 5 7535HS (545 - 665, n=3) | |
| AIDA64 / FP64 Ray-Trace | |
| Average of class Gaming (5509 - 45446, n=107, last 2 years) | |
| Asus TUF Gaming A16 FA617XS | |
| Schenker XMG Focus 15 (E23) | |
| Acer Nitro 16 AN16-41 | |
| Asus TUF A15 FA507 | |
| Medion Erazer Scout E20 | |
| Gigabyte G7 KE | |
| Acer Nitro 16 AN16-41-R7YE | |
| Average AMD Ryzen 5 7535HS (5170 - 6899, n=3) | |
| AIDA64 / CPU PhotoWorxx | |
| Schenker XMG Focus 15 (E23) | |
| Average of class Gaming (12271 - 89891, n=107, last 2 years) | |
| Medion Erazer Scout E20 | |
| Asus TUF Gaming A16 FA617XS | |
| Gigabyte G7 KE | |
| Acer Nitro 16 AN16-41-R7YE | |
| Asus TUF A15 FA507 | |
| Acer Nitro 16 AN16-41 | |
| Average AMD Ryzen 5 7535HS (24728 - 28865, n=3) | |
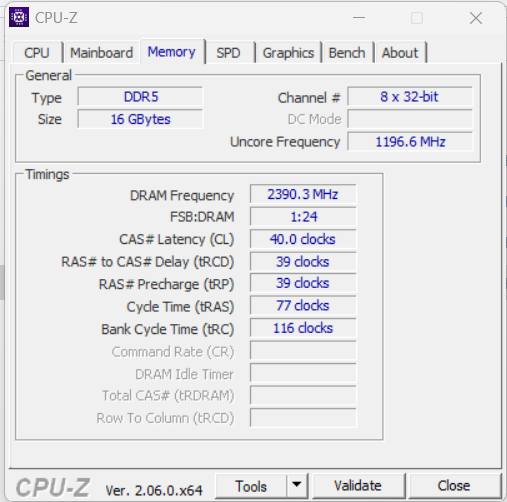
System performance
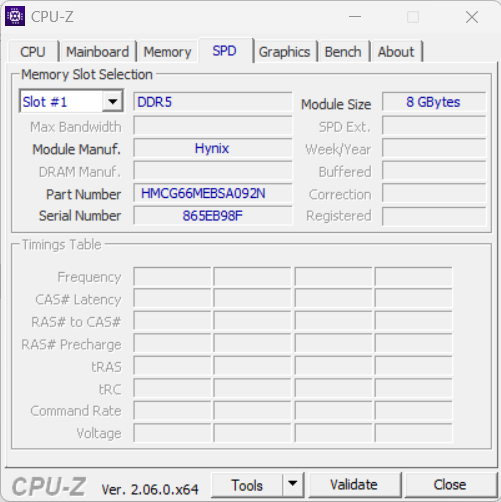
The smoothly running system provides enough computing power for demanding applications like rendering, video editing, and gaming. The transfer rates of the working memory (DDR5-4800) remain below potential, as a comparison with the values of the Asus TUF Gaming A16 shows.
CrossMark: Overall | Productivity | Creativity | Responsiveness
| PCMark 10 / Score | |
| Average of class Gaming (5828 - 11574, n=94, last 2 years) | |
| Asus TUF Gaming A16 FA617XS | |
| Medion Erazer Scout E20 | |
| Acer Nitro 16 AN16-41 | |
| Asus TUF A15 FA507 | |
| Schenker XMG Focus 15 (E23) | |
| Acer Nitro 16 AN16-41-R7YE | |
| Average AMD Ryzen 5 7535HS, NVIDIA GeForce RTX 4050 Laptop GPU (n=1) | |
| Gigabyte G7 KE | |
| PCMark 10 / Essentials | |
| Medion Erazer Scout E20 | |
| Asus TUF Gaming A16 FA617XS | |
| Average of class Gaming (8810 - 12600, n=98, last 2 years) | |
| Acer Nitro 16 AN16-41 | |
| Asus TUF A15 FA507 | |
| Gigabyte G7 KE | |
| Acer Nitro 16 AN16-41-R7YE | |
| Average AMD Ryzen 5 7535HS, NVIDIA GeForce RTX 4050 Laptop GPU (n=1) | |
| Schenker XMG Focus 15 (E23) | |
| PCMark 10 / Productivity | |
| Average of class Gaming (6845 - 18766, n=96, last 2 years) | |
| Asus TUF Gaming A16 FA617XS | |
| Medion Erazer Scout E20 | |
| Schenker XMG Focus 15 (E23) | |
| Asus TUF A15 FA507 | |
| Acer Nitro 16 AN16-41 | |
| Gigabyte G7 KE | |
| Acer Nitro 16 AN16-41-R7YE | |
| Average AMD Ryzen 5 7535HS, NVIDIA GeForce RTX 4050 Laptop GPU (n=1) | |
| PCMark 10 / Digital Content Creation | |
| Average of class Gaming (7602 - 19657, n=96, last 2 years) | |
| Asus TUF Gaming A16 FA617XS | |
| Medion Erazer Scout E20 | |
| Acer Nitro 16 AN16-41 | |
| Asus TUF A15 FA507 | |
| Acer Nitro 16 AN16-41-R7YE | |
| Average AMD Ryzen 5 7535HS, NVIDIA GeForce RTX 4050 Laptop GPU (n=1) | |
| Schenker XMG Focus 15 (E23) | |
| Gigabyte G7 KE | |
| CrossMark / Overall | |
| Schenker XMG Focus 15 (E23) | |
| Average of class Gaming (1366 - 2409, n=96, last 2 years) | |
| Medion Erazer Scout E20 | |
| Gigabyte G7 KE | |
| Asus TUF Gaming A16 FA617XS | |
| Asus TUF A15 FA507 | |
| Acer Nitro 16 AN16-41 | |
| Acer Nitro 16 AN16-41-R7YE | |
| Average AMD Ryzen 5 7535HS, NVIDIA GeForce RTX 4050 Laptop GPU (n=1) | |
| CrossMark / Productivity | |
| Schenker XMG Focus 15 (E23) | |
| Medion Erazer Scout E20 | |
| Average of class Gaming (1386 - 2254, n=96, last 2 years) | |
| Gigabyte G7 KE | |
| Asus TUF Gaming A16 FA617XS | |
| Asus TUF A15 FA507 | |
| Acer Nitro 16 AN16-41 | |
| Acer Nitro 16 AN16-41-R7YE | |
| Average AMD Ryzen 5 7535HS, NVIDIA GeForce RTX 4050 Laptop GPU (n=1) | |
| CrossMark / Creativity | |
| Schenker XMG Focus 15 (E23) | |
| Average of class Gaming (1343 - 2729, n=96, last 2 years) | |
| Medion Erazer Scout E20 | |
| Asus TUF Gaming A16 FA617XS | |
| Gigabyte G7 KE | |
| Asus TUF A15 FA507 | |
| Acer Nitro 16 AN16-41 | |
| Acer Nitro 16 AN16-41-R7YE | |
| Average AMD Ryzen 5 7535HS, NVIDIA GeForce RTX 4050 Laptop GPU (n=1) | |
| CrossMark / Responsiveness | |
| Gigabyte G7 KE | |
| Medion Erazer Scout E20 | |
| Schenker XMG Focus 15 (E23) | |
| Average of class Gaming (1226 - 2334, n=96, last 2 years) | |
| Asus TUF Gaming A16 FA617XS | |
| Acer Nitro 16 AN16-41-R7YE | |
| Average AMD Ryzen 5 7535HS, NVIDIA GeForce RTX 4050 Laptop GPU (n=1) | |
| Acer Nitro 16 AN16-41 | |
| Asus TUF A15 FA507 | |
| PCMark 8 Home Score Accelerated v2 | 5548 points | |
| PCMark 8 Work Score Accelerated v2 | 5810 points | |
| PCMark 10 Score | 6690 points | |
Help | ||
| AIDA64 / Memory Copy | |
| Schenker XMG Focus 15 (E23) | |
| Average of class Gaming (21750 - 129946, n=107, last 2 years) | |
| Asus TUF Gaming A16 FA617XS | |
| Medion Erazer Scout E20 | |
| Average AMD Ryzen 5 7535HS (48040 - 49119, n=3) | |
| Acer Nitro 16 AN16-41-R7YE | |
| Asus TUF A15 FA507 | |
| Acer Nitro 16 AN16-41 | |
| Gigabyte G7 KE | |
| AIDA64 / Memory Read | |
| Schenker XMG Focus 15 (E23) | |
| Average of class Gaming (22956 - 118858, n=107, last 2 years) | |
| Medion Erazer Scout E20 | |
| Asus TUF Gaming A16 FA617XS | |
| Acer Nitro 16 AN16-41-R7YE | |
| Acer Nitro 16 AN16-41 | |
| Asus TUF A15 FA507 | |
| Gigabyte G7 KE | |
| Average AMD Ryzen 5 7535HS (40044 - 50259, n=3) | |
| AIDA64 / Memory Write | |
| Average of class Gaming (22297 - 135096, n=107, last 2 years) | |
| Schenker XMG Focus 15 (E23) | |
| Asus TUF Gaming A16 FA617XS | |
| Medion Erazer Scout E20 | |
| Asus TUF A15 FA507 | |
| Acer Nitro 16 AN16-41-R7YE | |
| Acer Nitro 16 AN16-41 | |
| Average AMD Ryzen 5 7535HS (48854 - 54982, n=3) | |
| Gigabyte G7 KE | |
| AIDA64 / Memory Latency | |
| Average of class Gaming (75.3 - 259, n=107, last 2 years) | |
| Average AMD Ryzen 5 7535HS (87.7 - 110.3, n=3) | |
| Medion Erazer Scout E20 | |
| Acer Nitro 16 AN16-41 | |
| Asus TUF Gaming A16 FA617XS | |
| Gigabyte G7 KE | |
| Acer Nitro 16 AN16-41-R7YE | |
| Schenker XMG Focus 15 (E23) | |
| Asus TUF A15 FA507 | |
* ... smaller is better
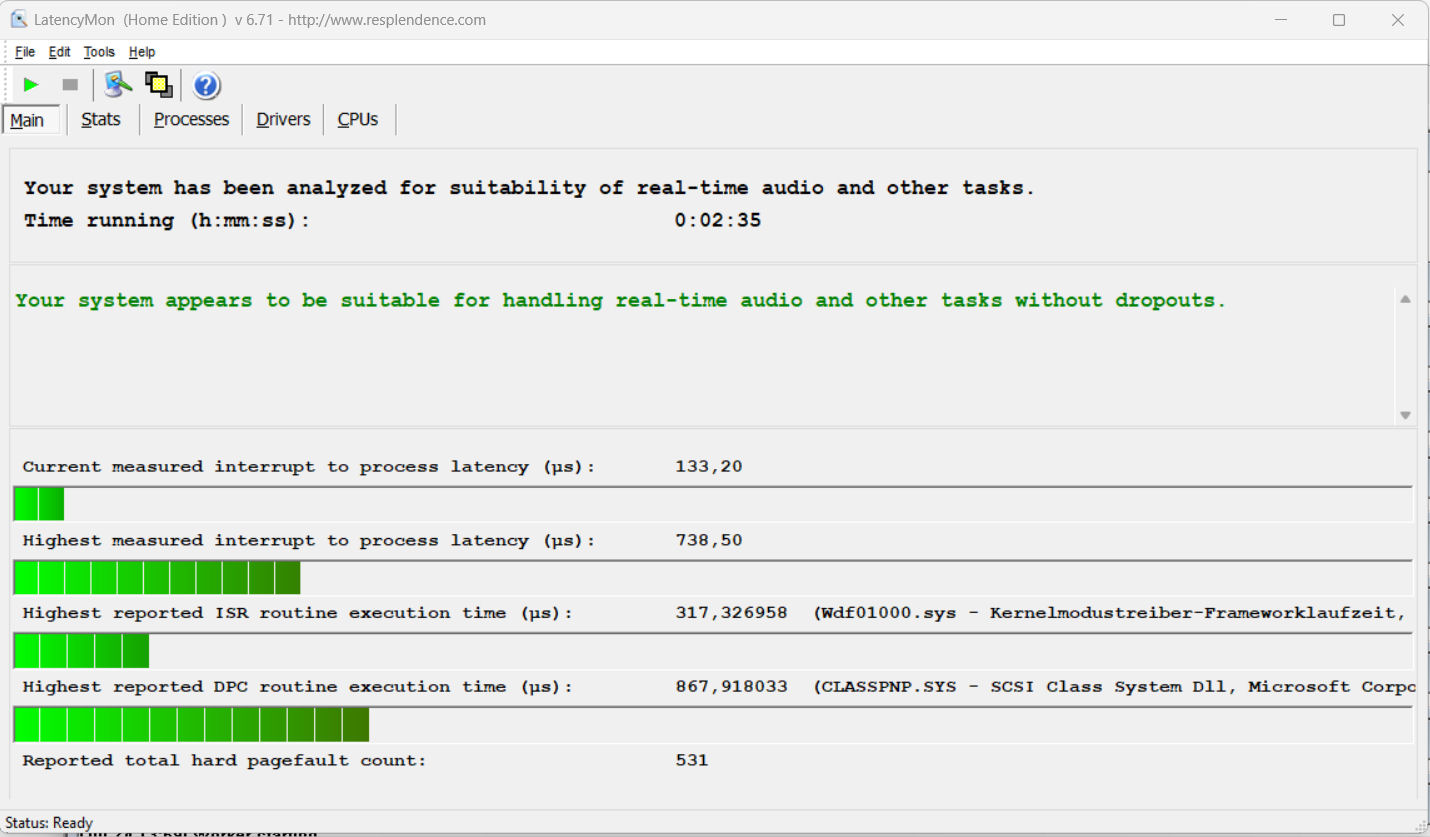
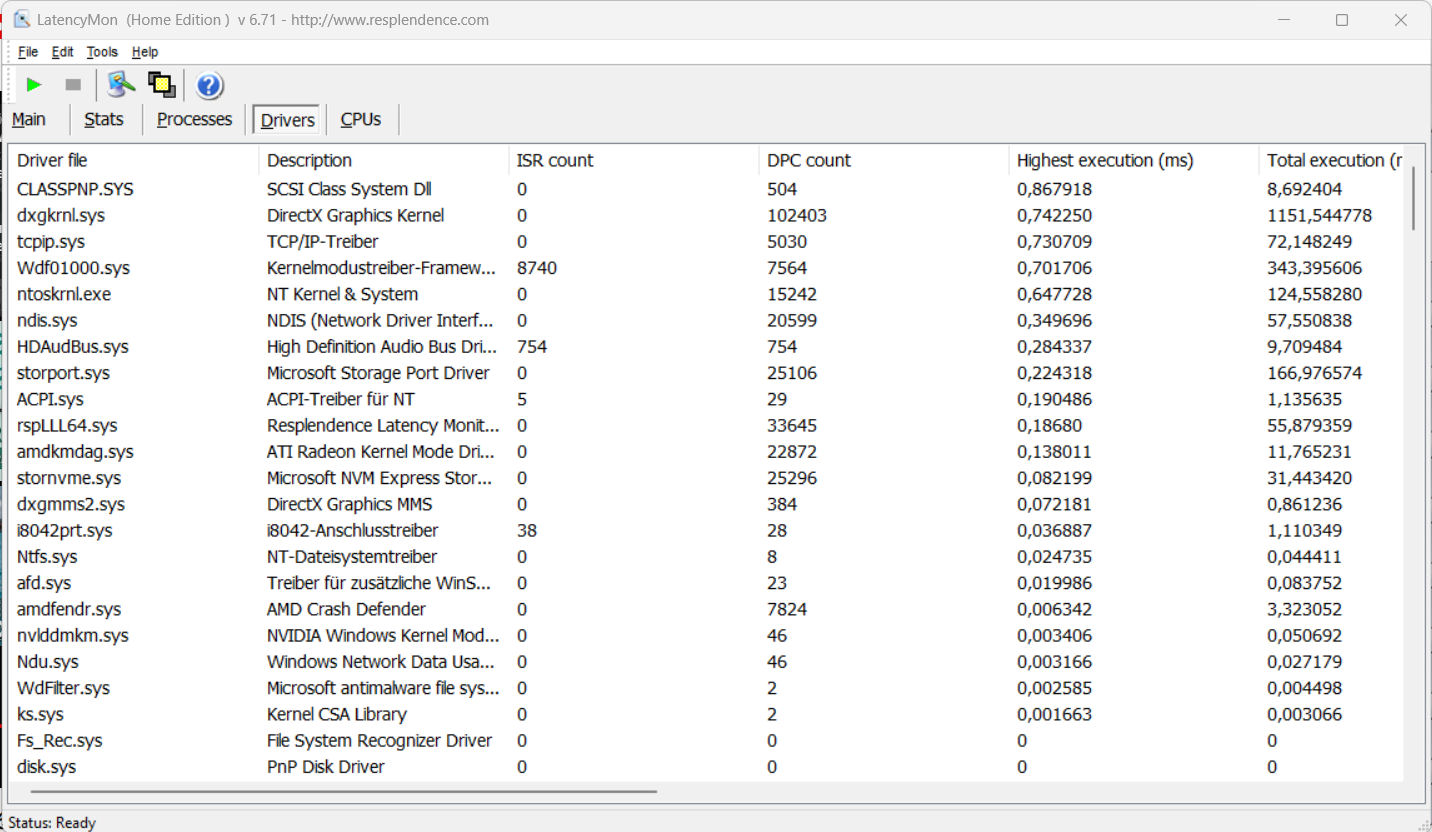
DPC latency
The standardized latency monitor test (web surfing, 4k video playback, Prime95 in-place large FFTs) did not reveal any abnormalities. The system seems to be suitable for real-time video and audio editing. Future software updates could lead to improvements or even degradations.
| DPC Latencies / LatencyMon - interrupt to process latency (max), Web, Youtube, Prime95 | |
| Schenker XMG Focus 15 (E23) | |
| Medion Erazer Scout E20 | |
| Gigabyte G7 KE | |
| Acer Nitro 16 AN16-41 | |
| Asus TUF Gaming A16 FA617XS | |
| Acer Nitro 16 AN16-41-R7YE | |
* ... smaller is better
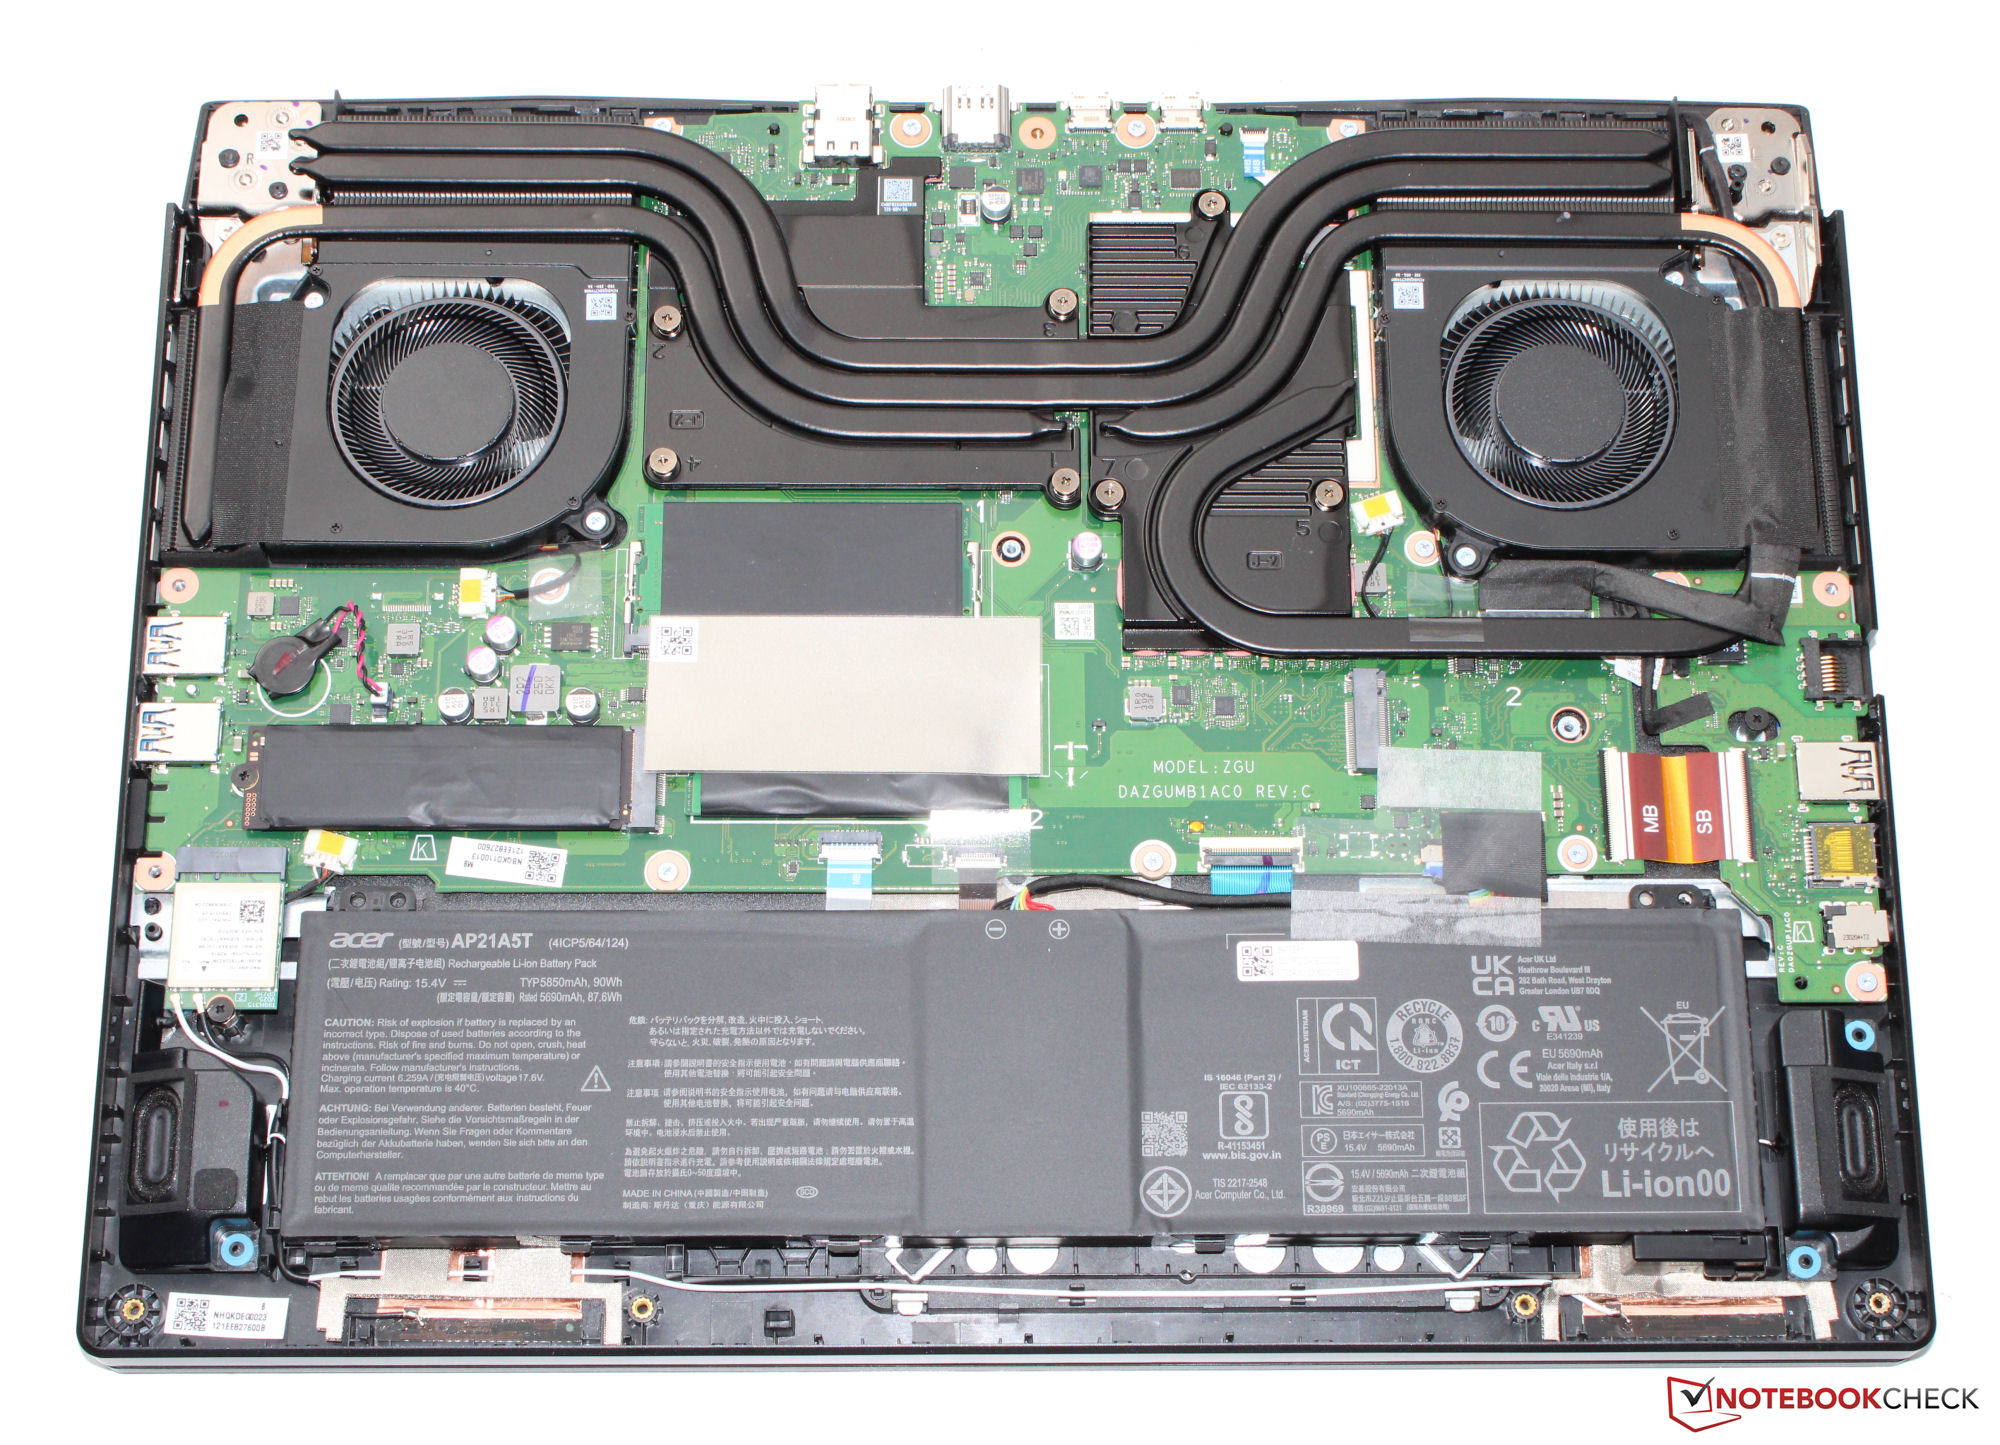
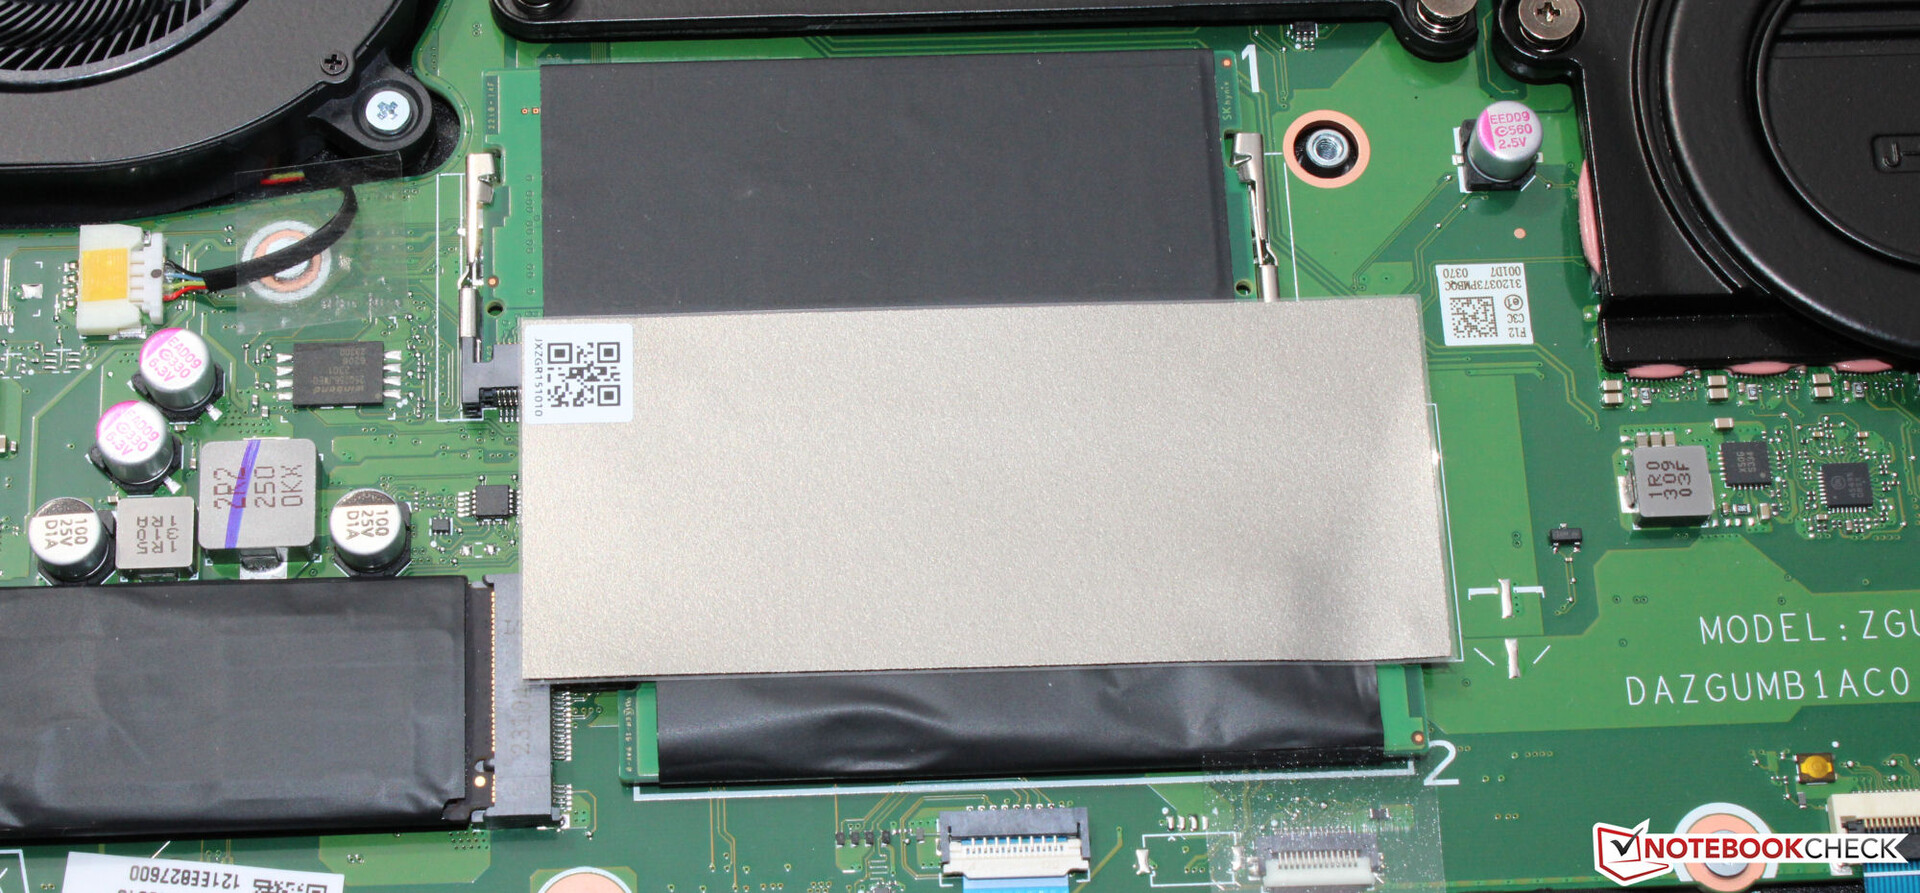
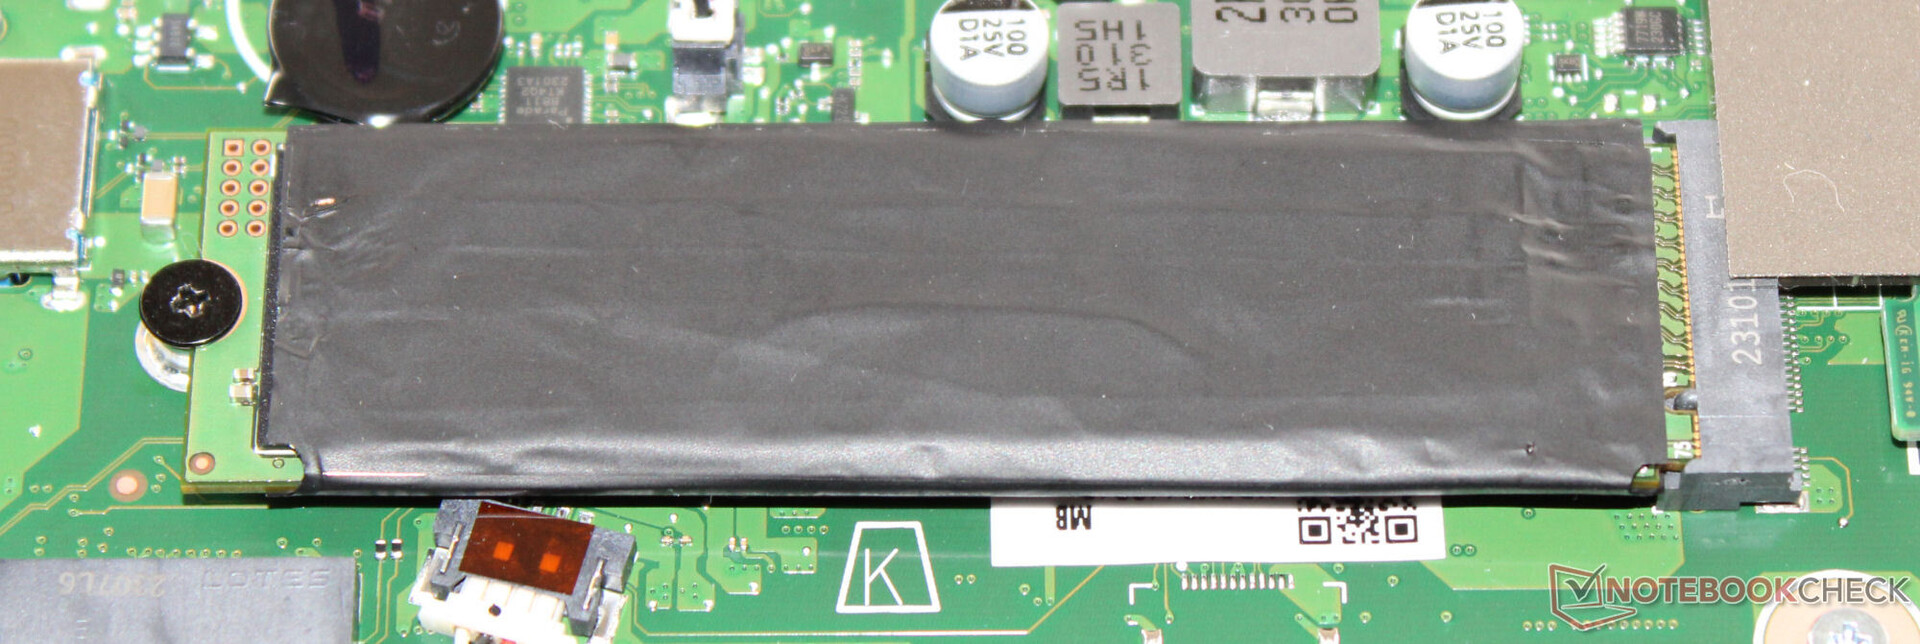
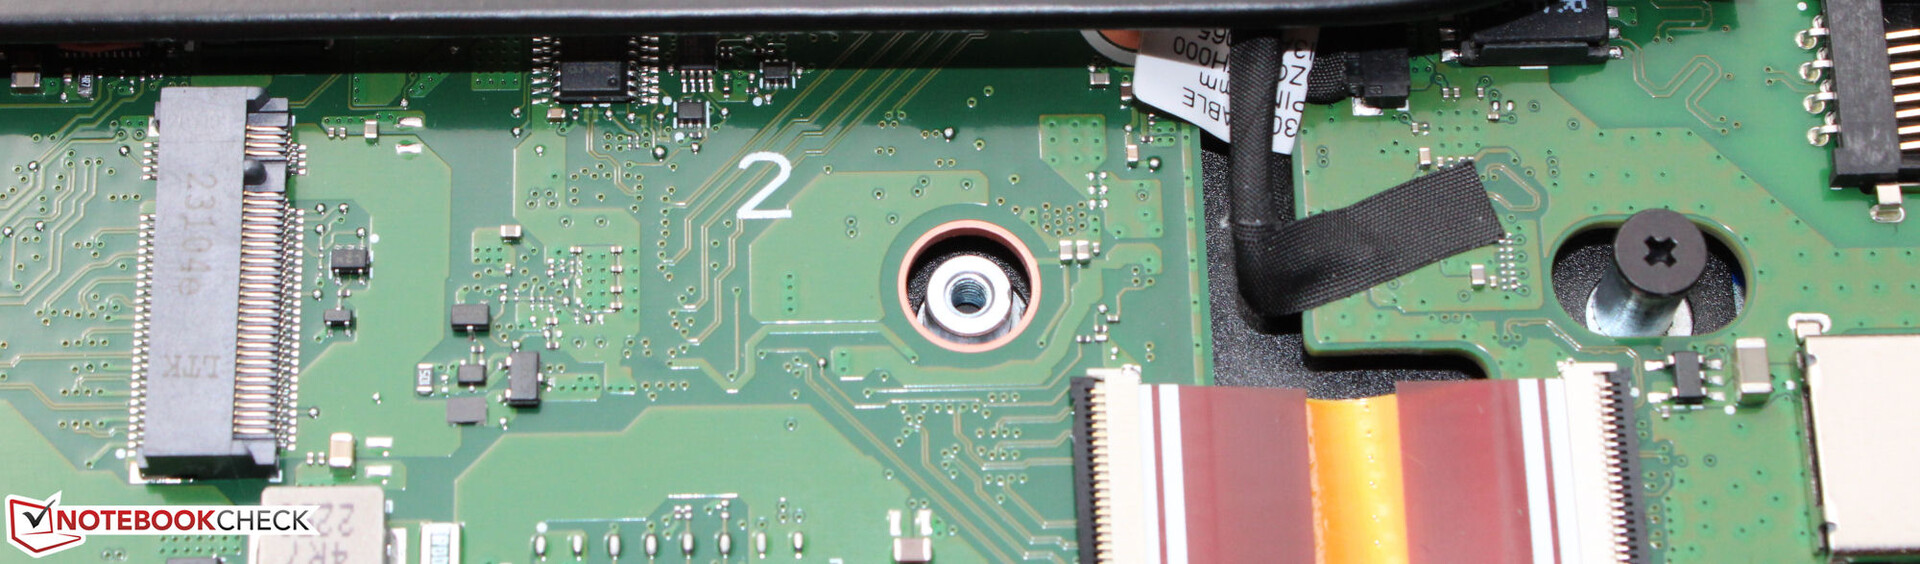
Mass storage
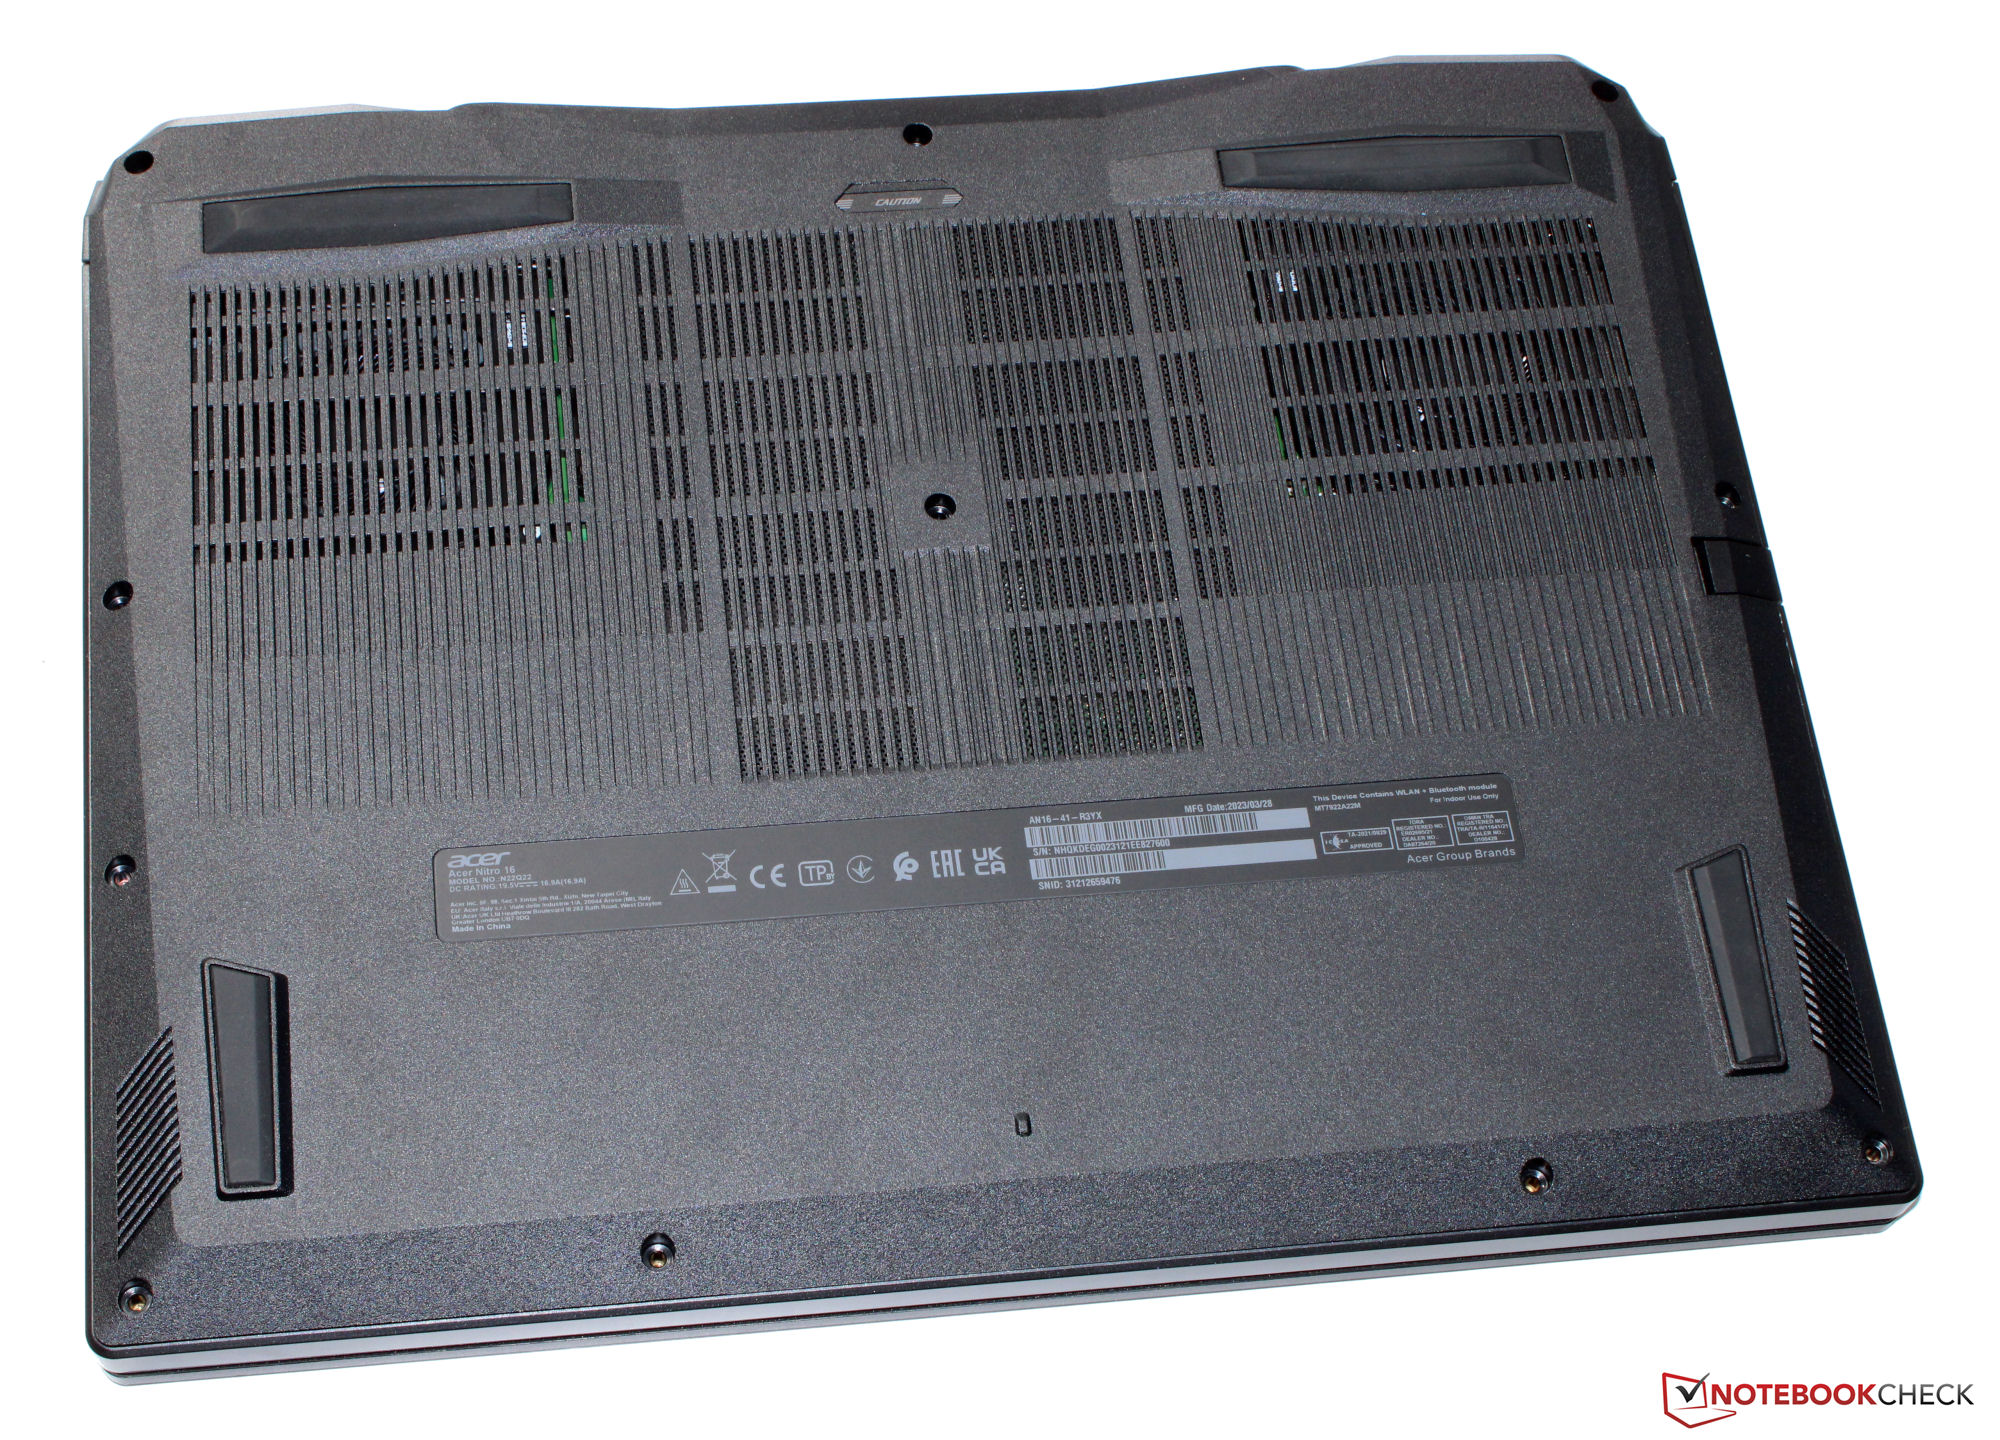
Acer equips the Nitro 16 with a 512 GB SSD (PCIe 4, M.2-2280) from SK Hynix. It delivers good data rates but is not among the top-performing SSD models. A negative aspect is that performance drops occur due to thermal throttling. The notebook has room for a second PCIe Gen 4 SSD.

* ... smaller is better
Drive throttling: DiskSpd Read Loop, Queue Depth 8
Graphics card
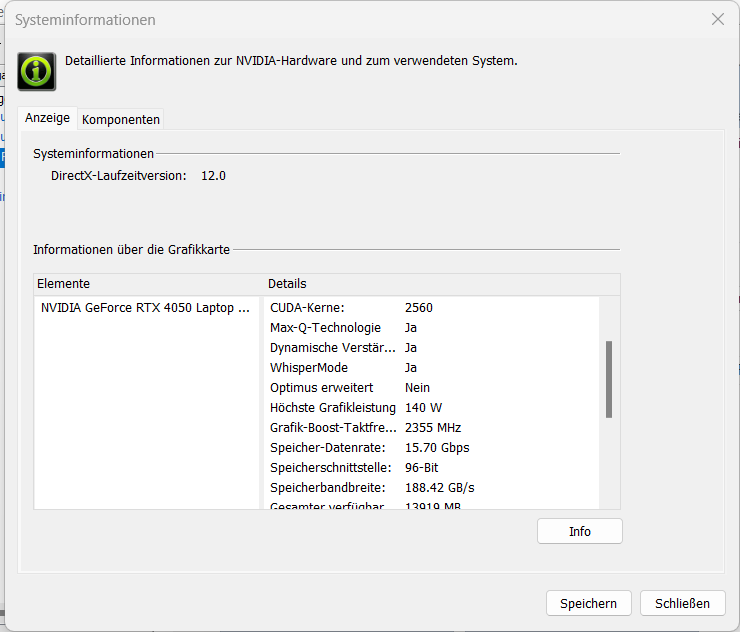
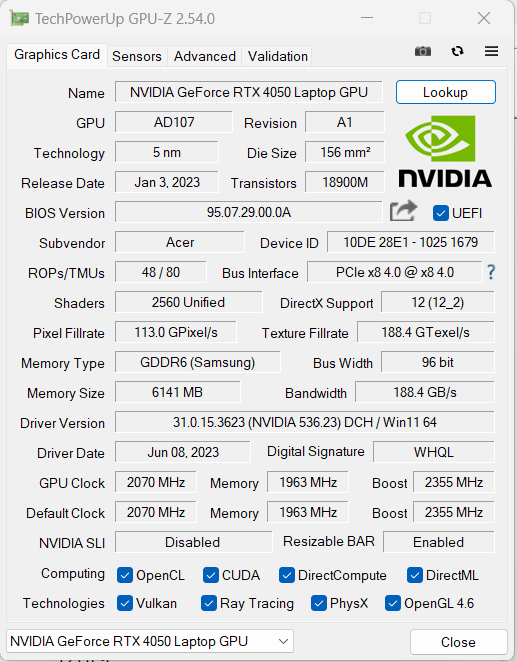
The benchmark results of the GeForce RTX 4050 are above that of the average results for the RTX 4050 ("Balanced"). "Performance" and "Turbo" modes result in a minimal performance increase at best.
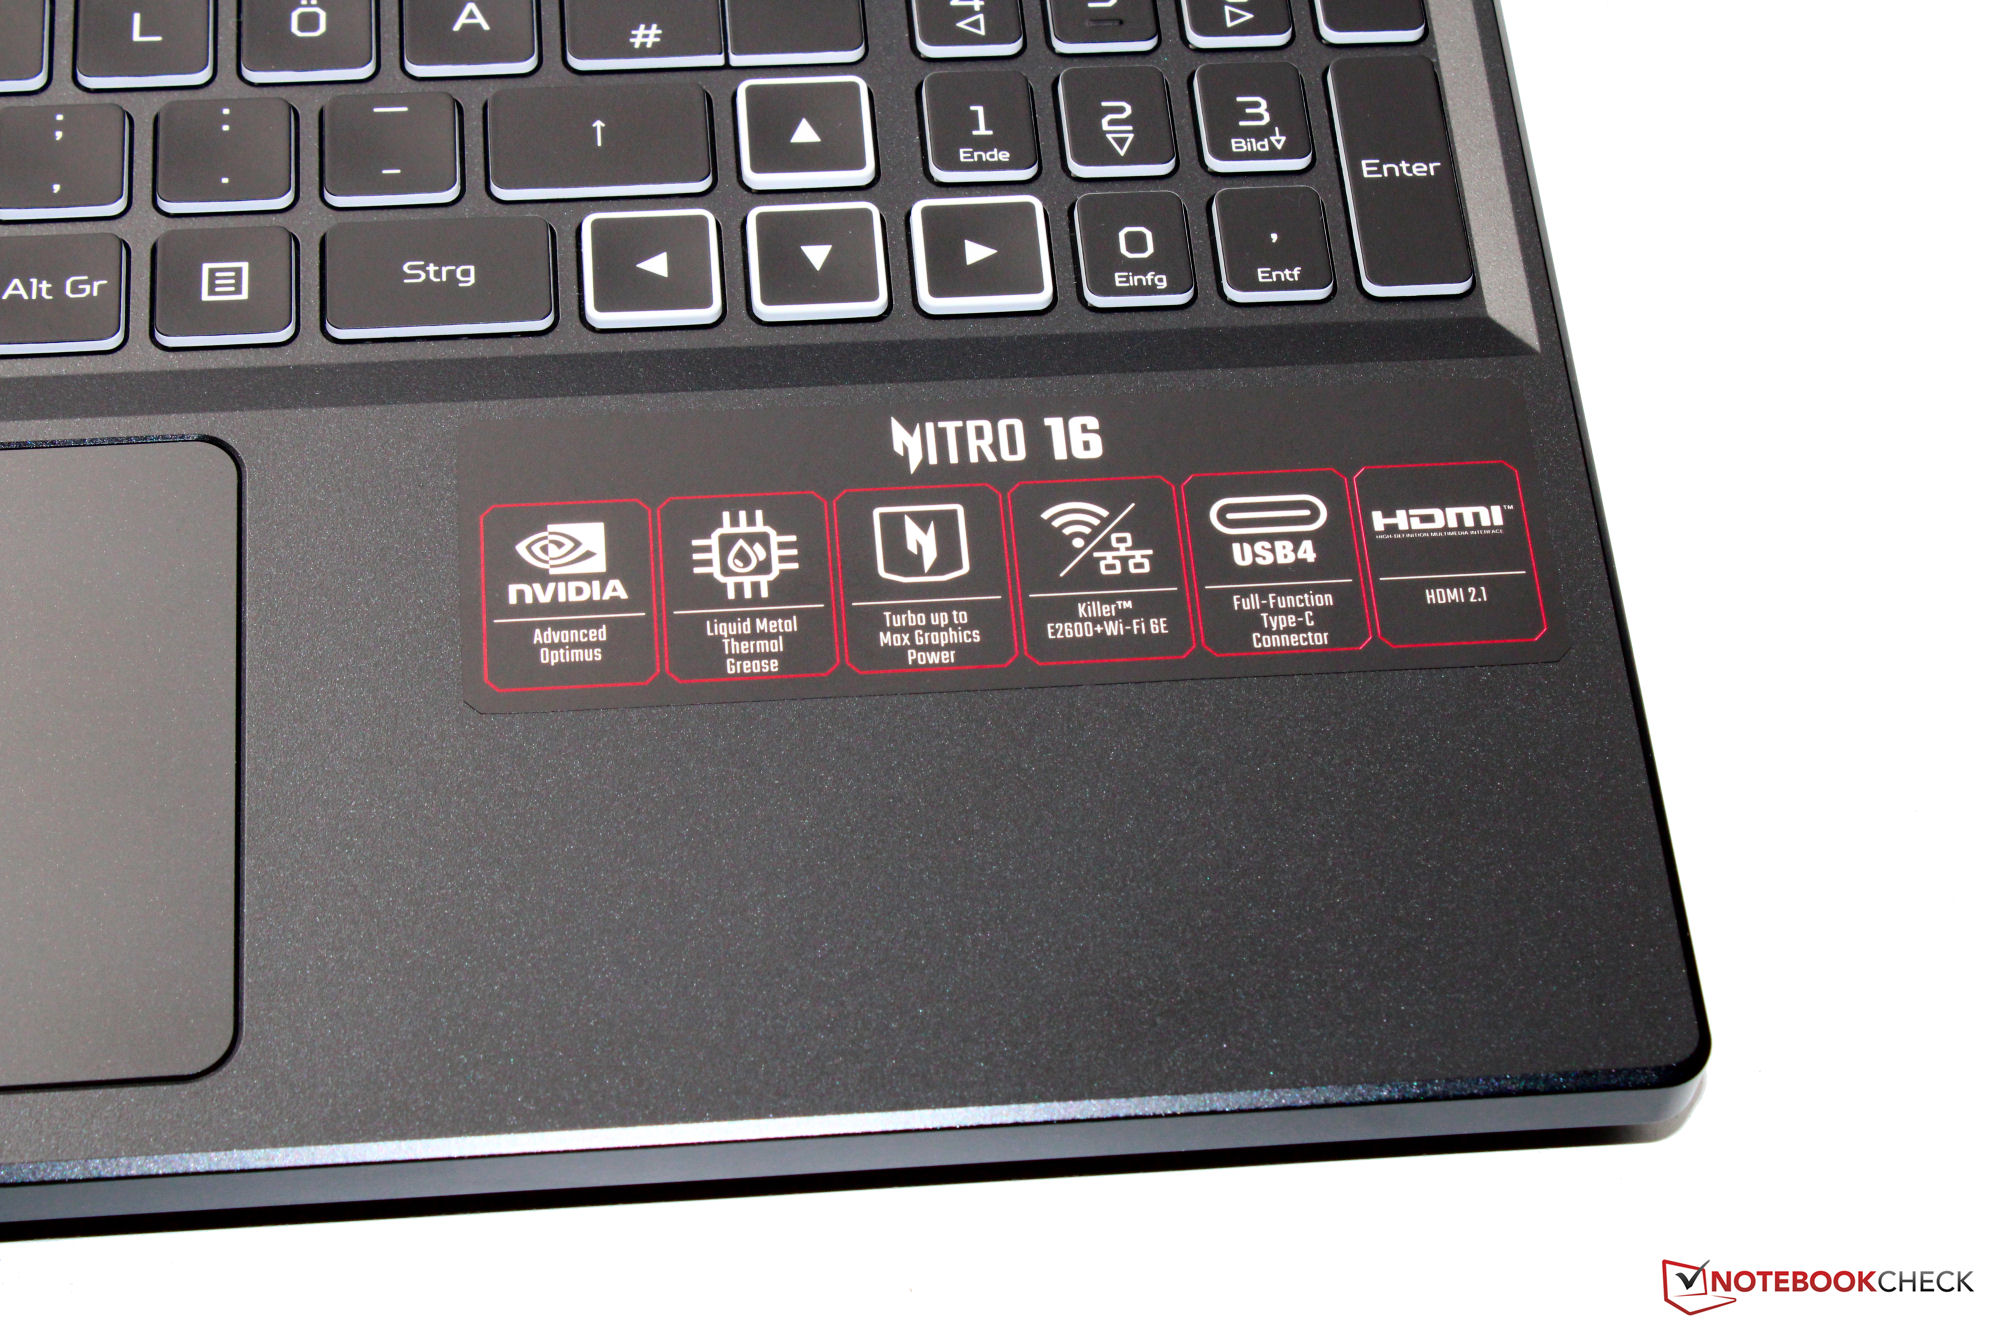
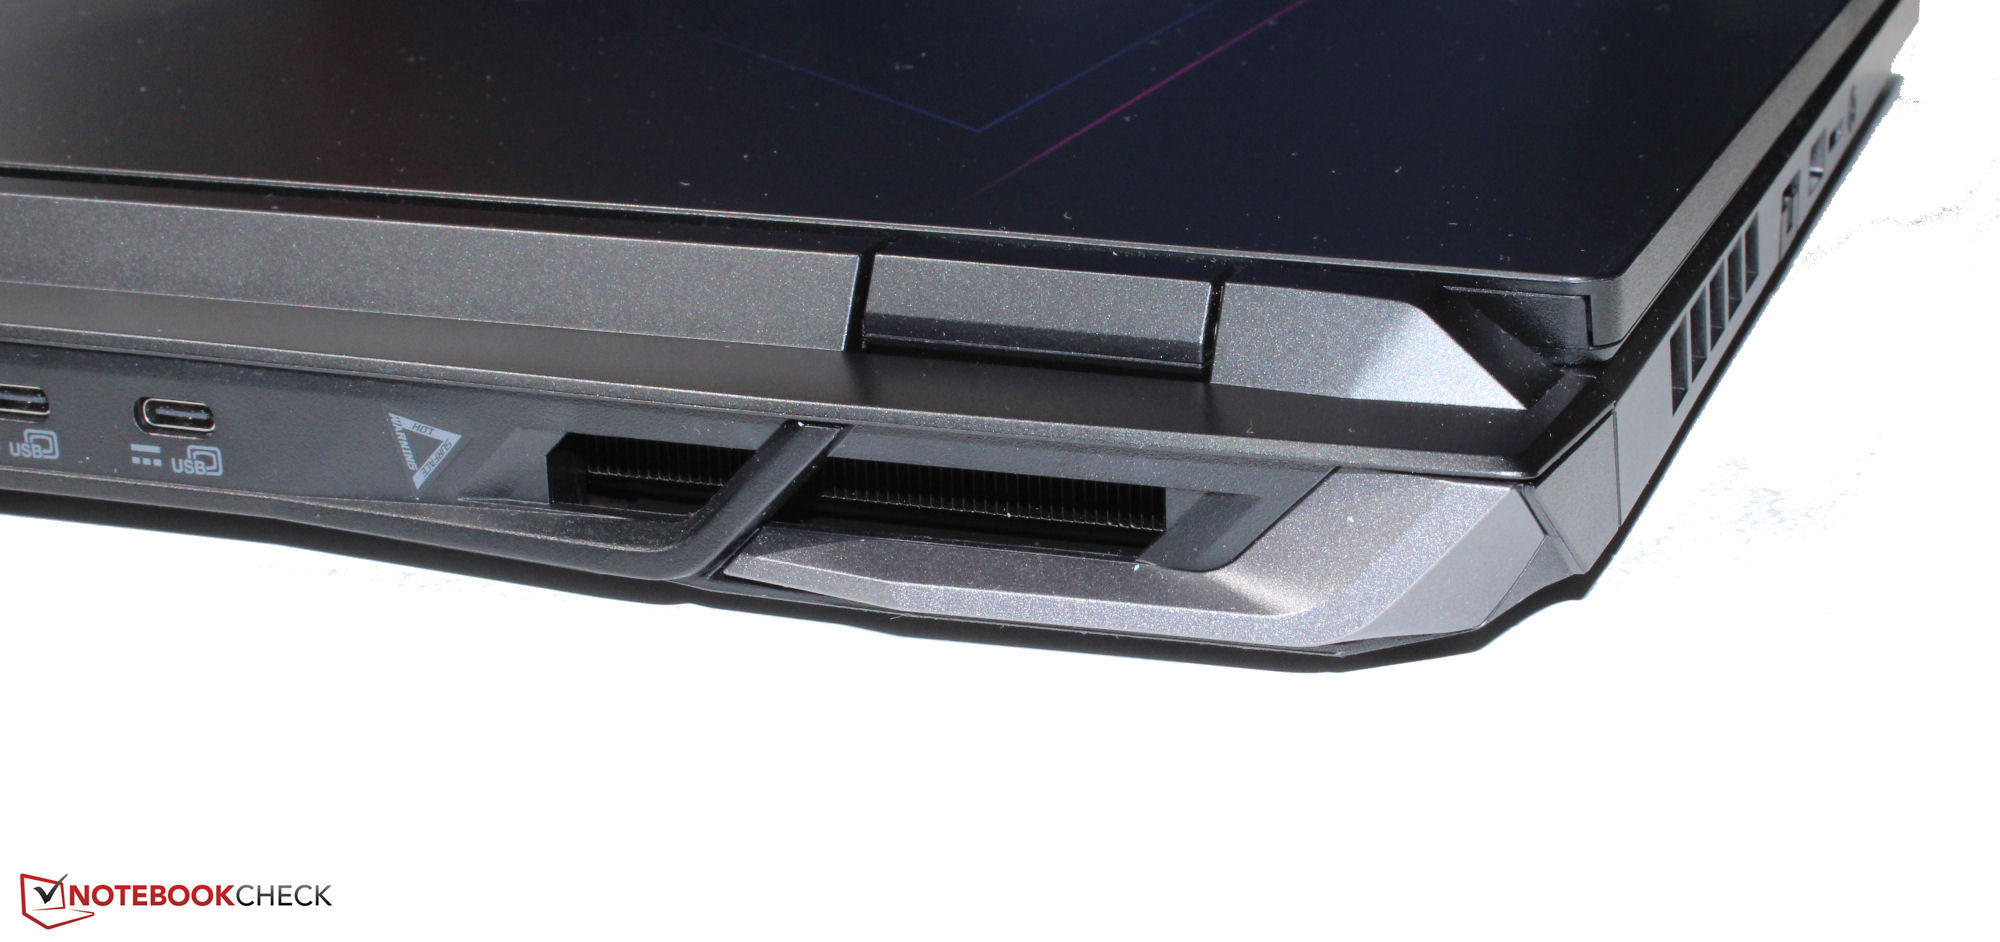
Acer has set the maximum TGP to 140 W — a higher wattage is not possible. According to The Witcher 3 test, it is not even close to being exhausted. Switching between dGPU and Optimus does not require a restart as Advanced Optimus is supported.

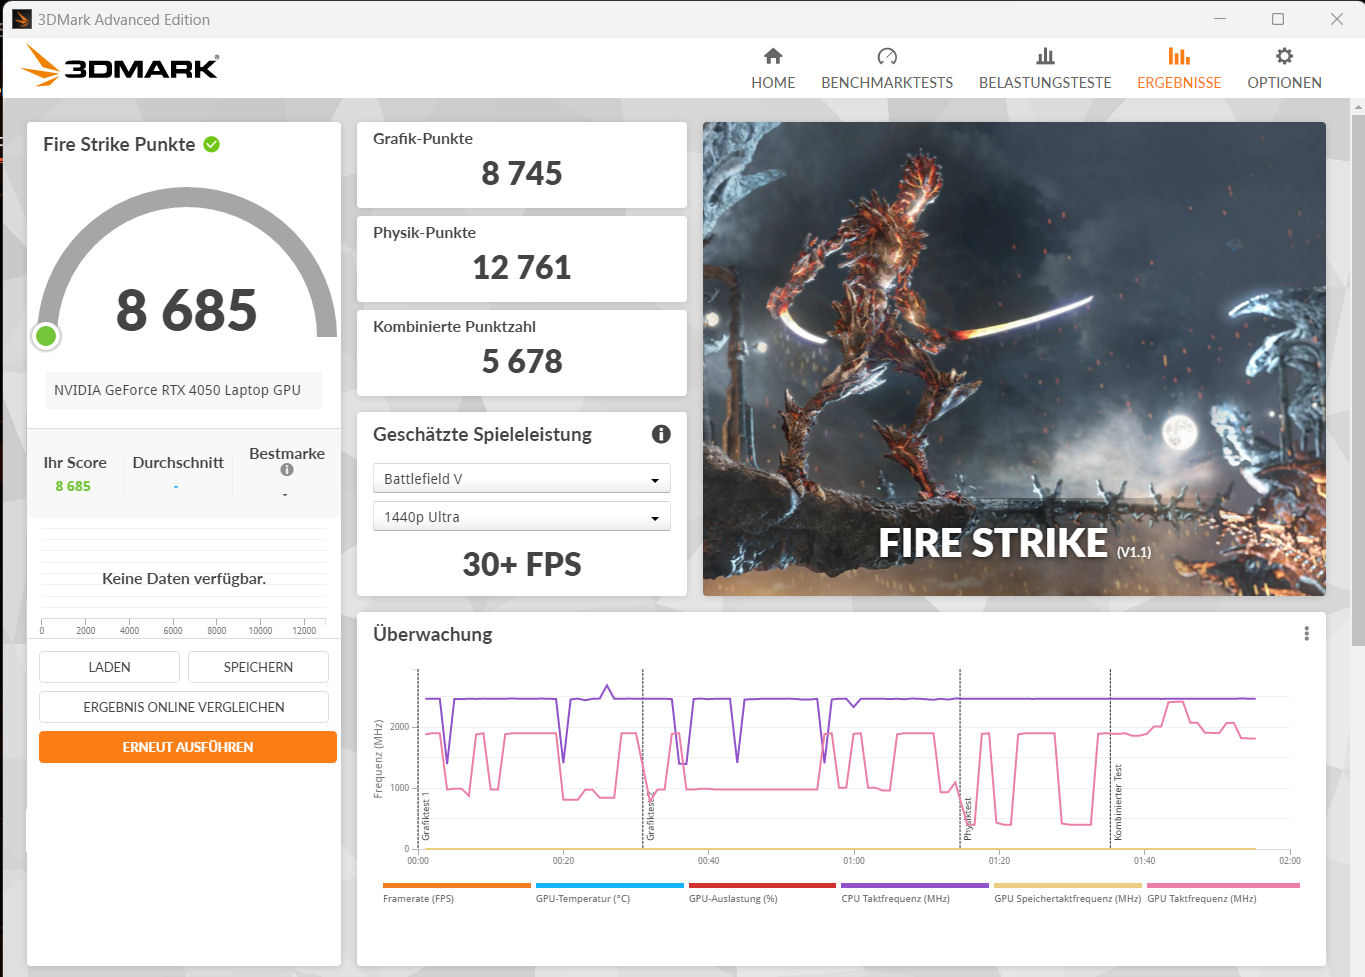
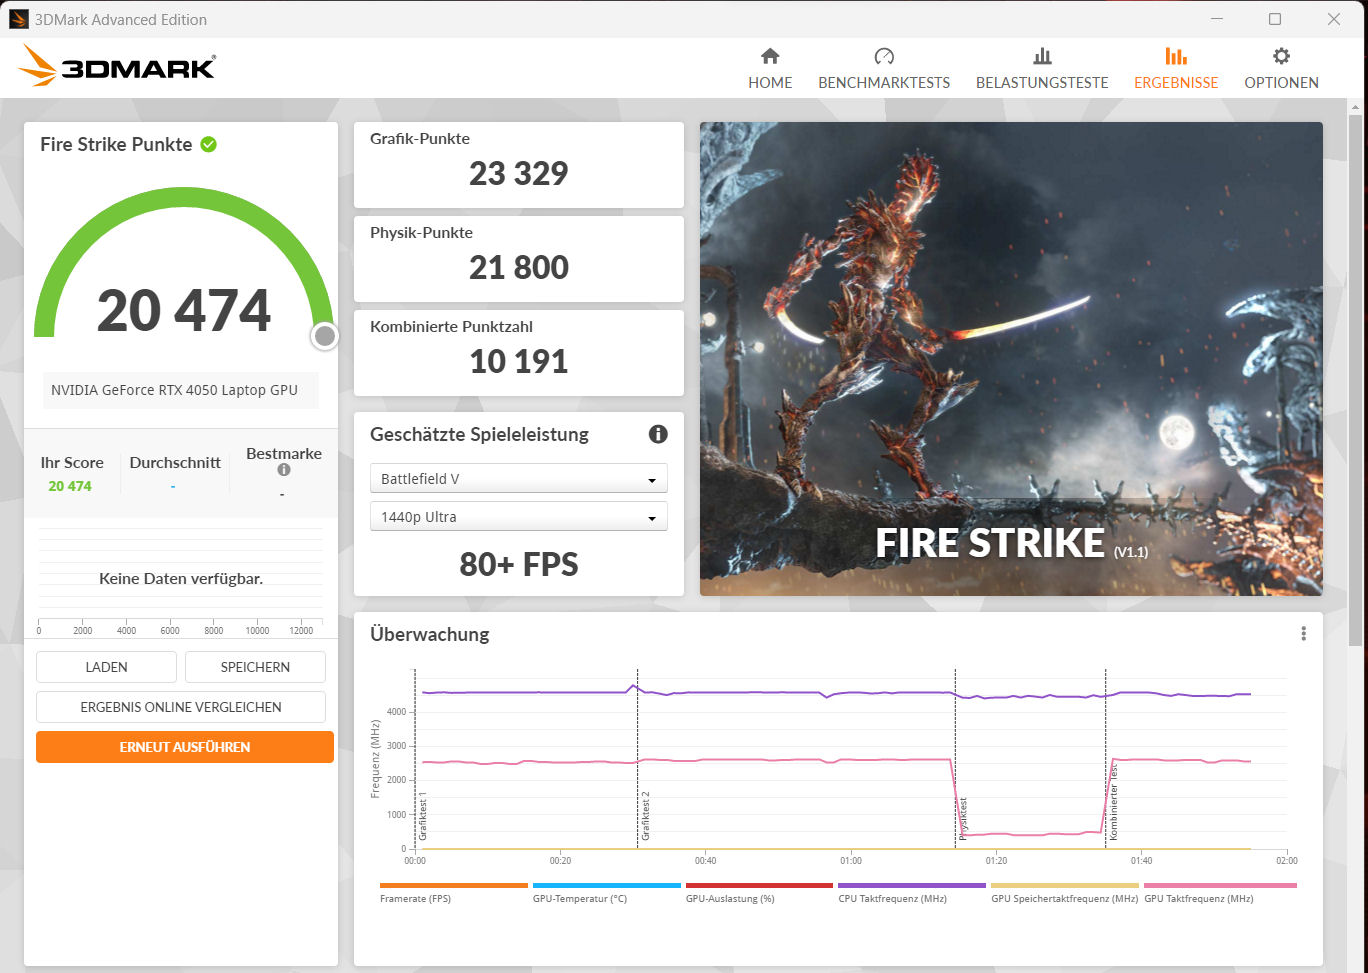
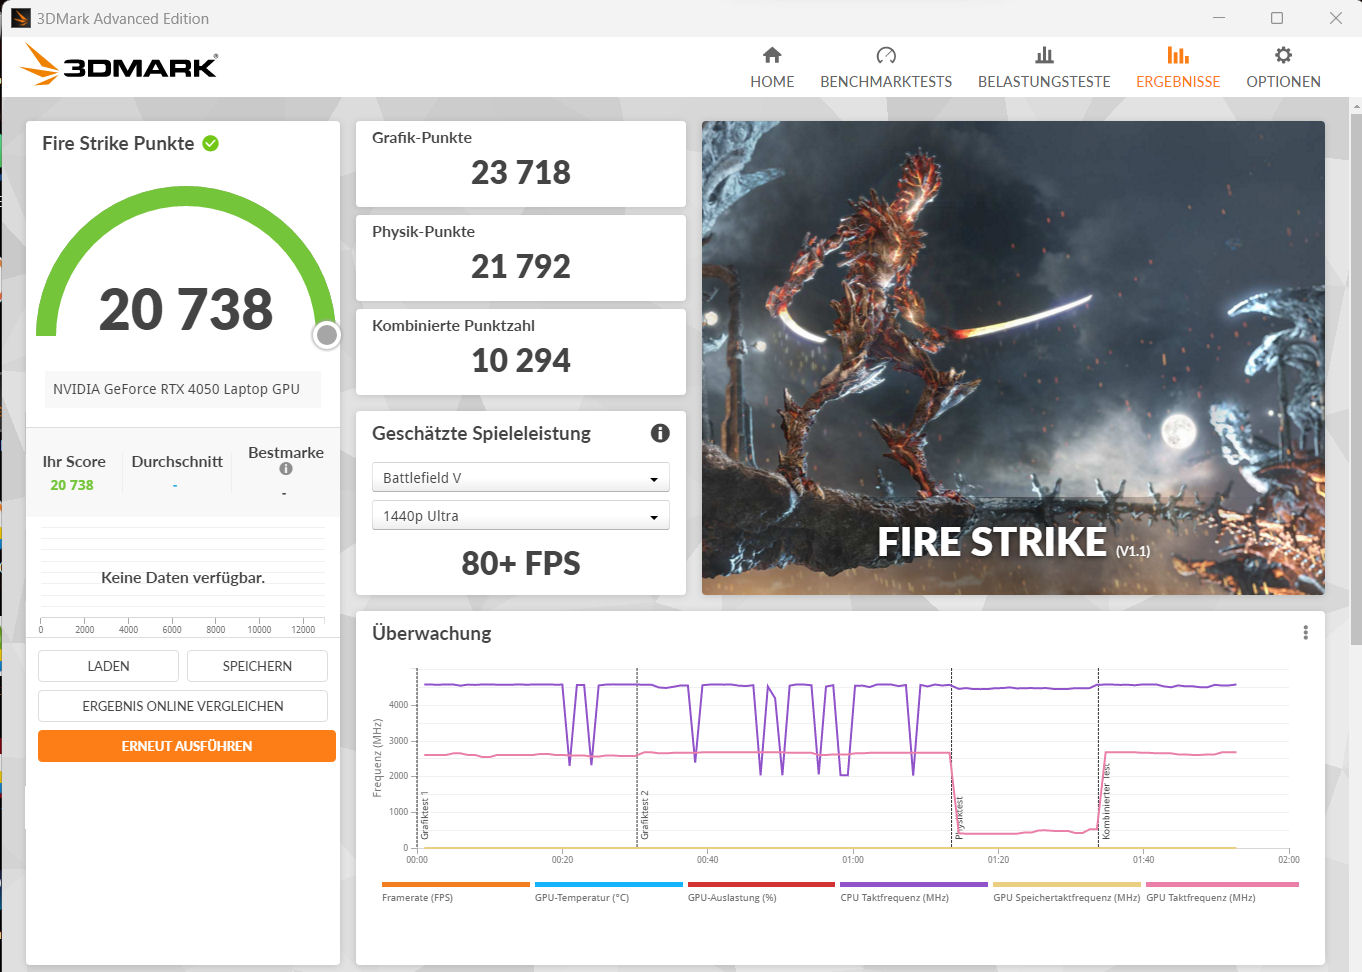
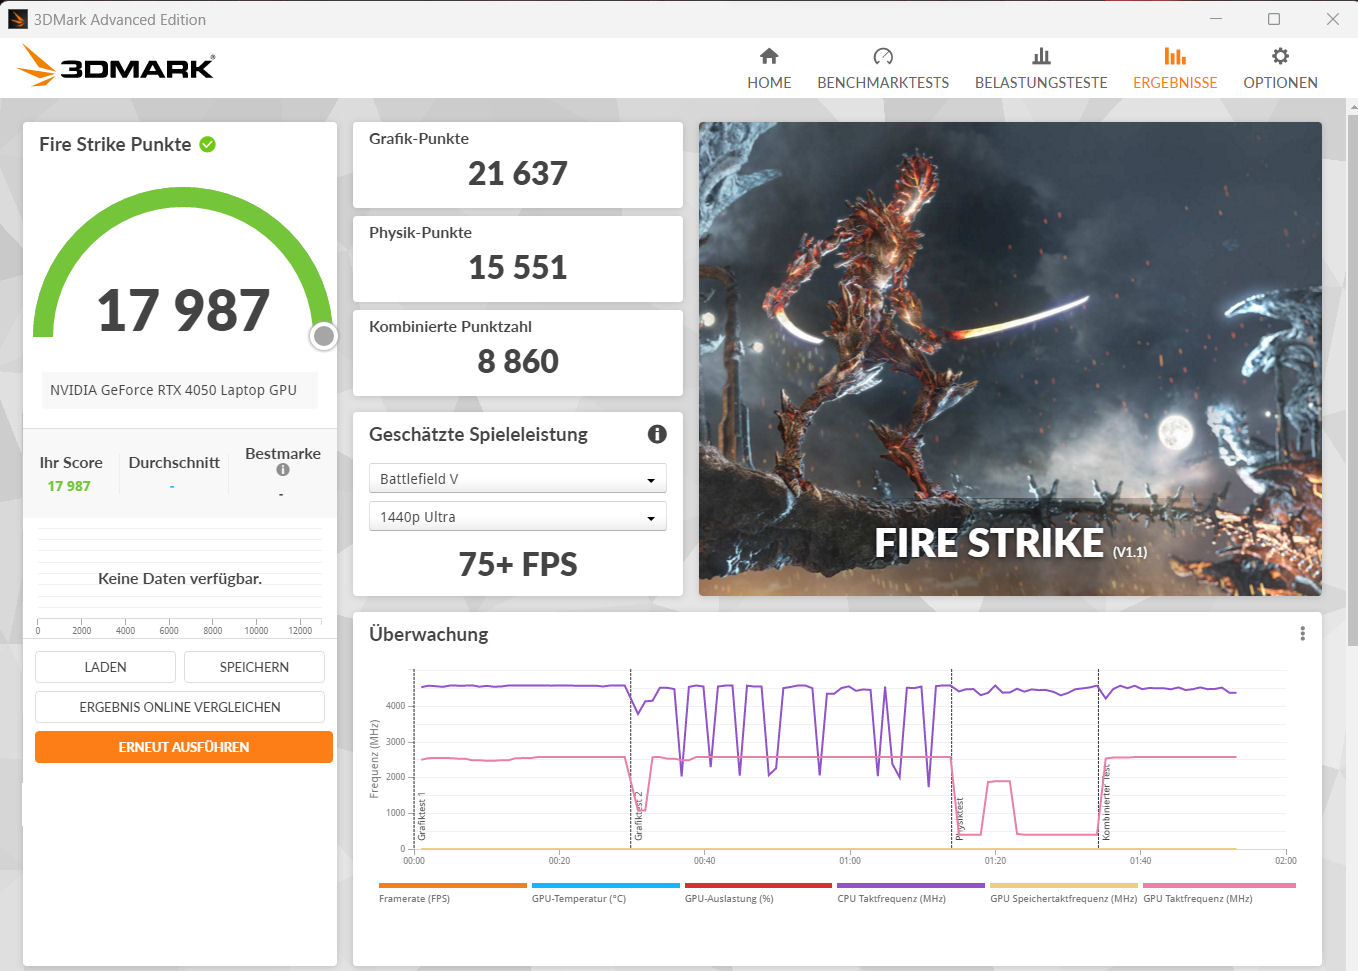
| 3DMark 06 Standard Score | 43233 points | |
| 3DMark 11 Performance | 24596 points | |
| 3DMark Cloud Gate Standard Score | 47710 points | |
| 3DMark Fire Strike Score | 20291 points | |
| 3DMark Time Spy Score | 8227 points | |
Help | ||
* ... smaller is better
Gaming performance
The hardware is designed for FHD gaming at high to maximum settings. High frame rates at the screen's FHD resolution can thus be fully utilized, and frame rates above the determined RTX 4050 average are achieved.
Nvidia's DLSS technology can provide an increase in frame rates. If it is active, the GPU calculates a game in a lower resolution and then scales it up to the desired resolution via AI. DLSS has to be explicitly supported by a game. We tested a few corresponding titles on a trial basis.
| Raytracing (FHD, Ultra) | Raytracing (FHD, Ultra) + DLSS (Quality) | Raytracing (FHD, Ultra) + DLSS (Balanced) | Raytracing (FHD, Ultra) + DLSS (Performance) | |
|---|---|---|---|---|
| Cyberpunk 2077 V1.6 | ||||
| Spider-Man: Miles Morales | ||||
| The Witcher 3 V4.00 | ||||
| Hogwarts Legacy | ||||
| Returnal |
| The Witcher 3 - 1920x1080 Ultra Graphics & Postprocessing (HBAO+) | |
| Average of class Gaming (95 - 240, n=8, last 2 years) | |
| Acer Nitro 16 AN16-41 | |
| Asus TUF Gaming A16 FA617XS | |
| Acer Nitro 16 AN16-41-R7YE | |
| Medion Erazer Scout E20 | |
| Gigabyte G7 KE | |
| Asus TUF A15 FA507 | |
| Average NVIDIA GeForce RTX 4050 Laptop GPU (18.5 - 94.7, n=40) | |
| Schenker XMG Focus 15 (E23) | |
To check whether the frame rates remain largely constant over a longer period, we run The Witcher 3 for about 60 minutes with Full HD resolution and maximum quality settings. The game character is not moved. A drop in the frame rates is not noticed.
The Witcher 3 FPS Chart
| low | med. | high | ultra | |
|---|---|---|---|---|
| The Witcher 3 (2015) | 307.8 | 262.4 | 156.2 | 83.9 |
| Dota 2 Reborn (2015) | 151 | 136.5 | 132.1 | 125.2 |
| Final Fantasy XV Benchmark (2018) | 187.4 | 116.2 | 83.5 | |
| X-Plane 11.11 (2018) | 115.3 | 101.6 | 81.4 | |
| Far Cry 5 (2018) | 131 | 114 | 108 | 102 |
| Strange Brigade (2018) | 355 | 209 | 169.3 | 146.8 |
| F1 22 (2022) | 207 | 198.1 | 166.8 | 52.9 |
Emissions: The Acer Nitro 16 heats up significantly
Noise emissions
Despite the permanently active dGPU, the notebook is quiet in everyday use (office, Internet, etc.). As expected, this looks different in gaming mode.
Sound pressure levels of up to 61 dB(A) ("Turbo") or 56 dB(A) ("Performance") require the use of headphones. The "Balanced" mode we used leaves at 45 dB(A). An overall lower noise development can be achieved by using the "Quiet" mode, but at the expense of the computing performance of course.
Noise level
| Idle |
| 25 / 26 / 27 dB(A) |
| Load |
| 42 / 45 dB(A) |
 | ||
30 dB silent 40 dB(A) audible 50 dB(A) loud |
||
min: | ||
| Acer Nitro 16 AN16-41-R7YE R5 7535HS, GeForce RTX 4050 Laptop GPU | Asus TUF Gaming A16 FA617XS R9 7940HS, Radeon RX 7600S | Schenker XMG Focus 15 (E23) i9-13900HX, GeForce RTX 4050 Laptop GPU | Gigabyte G7 KE i5-12500H, GeForce RTX 3060 Laptop GPU | Asus TUF A15 FA507 R7 7735HS, GeForce RTX 4050 Laptop GPU | Medion Erazer Scout E20 i7-13700H, GeForce RTX 4050 Laptop GPU | Acer Nitro 16 AN16-41 R7 7735HS, GeForce RTX 4070 Laptop GPU | |
|---|---|---|---|---|---|---|---|
| Noise | -7% | -15% | -26% | 10% | -16% | -4% | |
| off / environment * (dB) | 24 | 25 -4% | 24 -0% | 27 -13% | 23.3 3% | 25 -4% | 25.7 -7% |
| Idle Minimum * (dB) | 25 | 25 -0% | 24 4% | 27 -8% | 23.3 7% | 26 -4% | 25.7 -3% |
| Idle Average * (dB) | 26 | 26 -0% | 25.14 3% | 35 -35% | 23.3 10% | 27 -4% | 25.7 1% |
| Idle Maximum * (dB) | 27 | 28 -4% | 35.14 -30% | 38 -41% | 23.3 14% | 32 -19% | 26.3 3% |
| Load Average * (dB) | 42 | 43 -2% | 55.93 -33% | 52 -24% | 29.6 30% | 57 -36% | 33.9 19% |
| Witcher 3 ultra * (dB) | 43 | 51 -19% | 54.62 -27% | 56 -30% | 43 -0% | 50 -16% | |
| Load Maximum * (dB) | 45 | 53 -18% | 56.34 -25% | 59 -31% | 43 4% | 57 -27% | 62 -38% |
* ... smaller is better
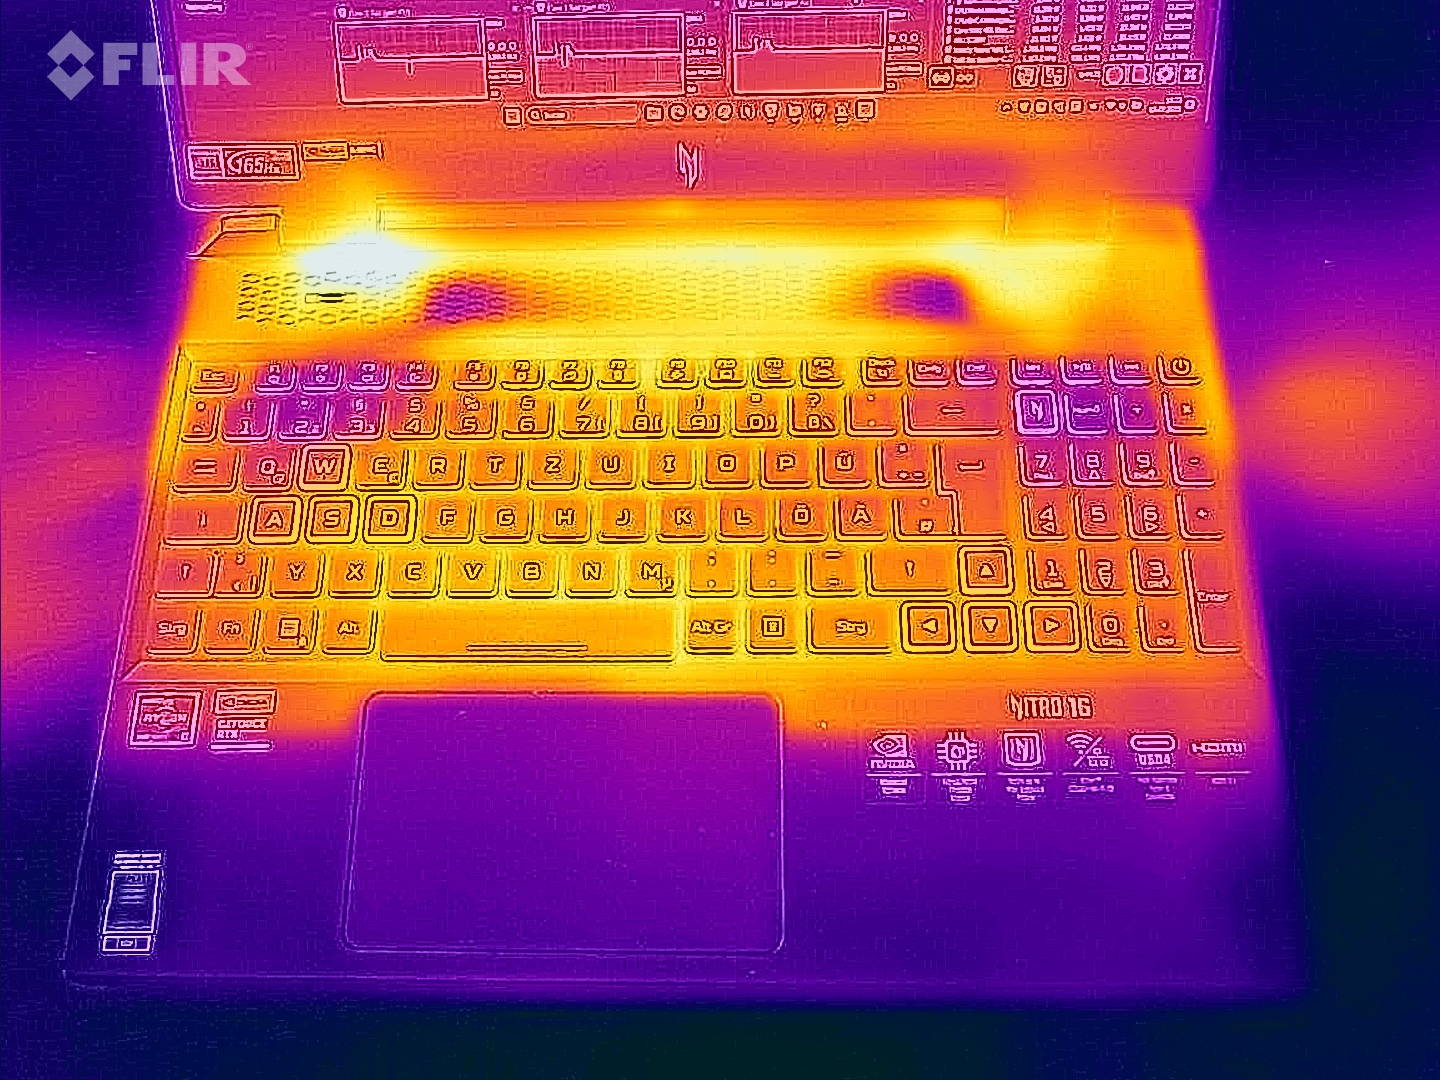
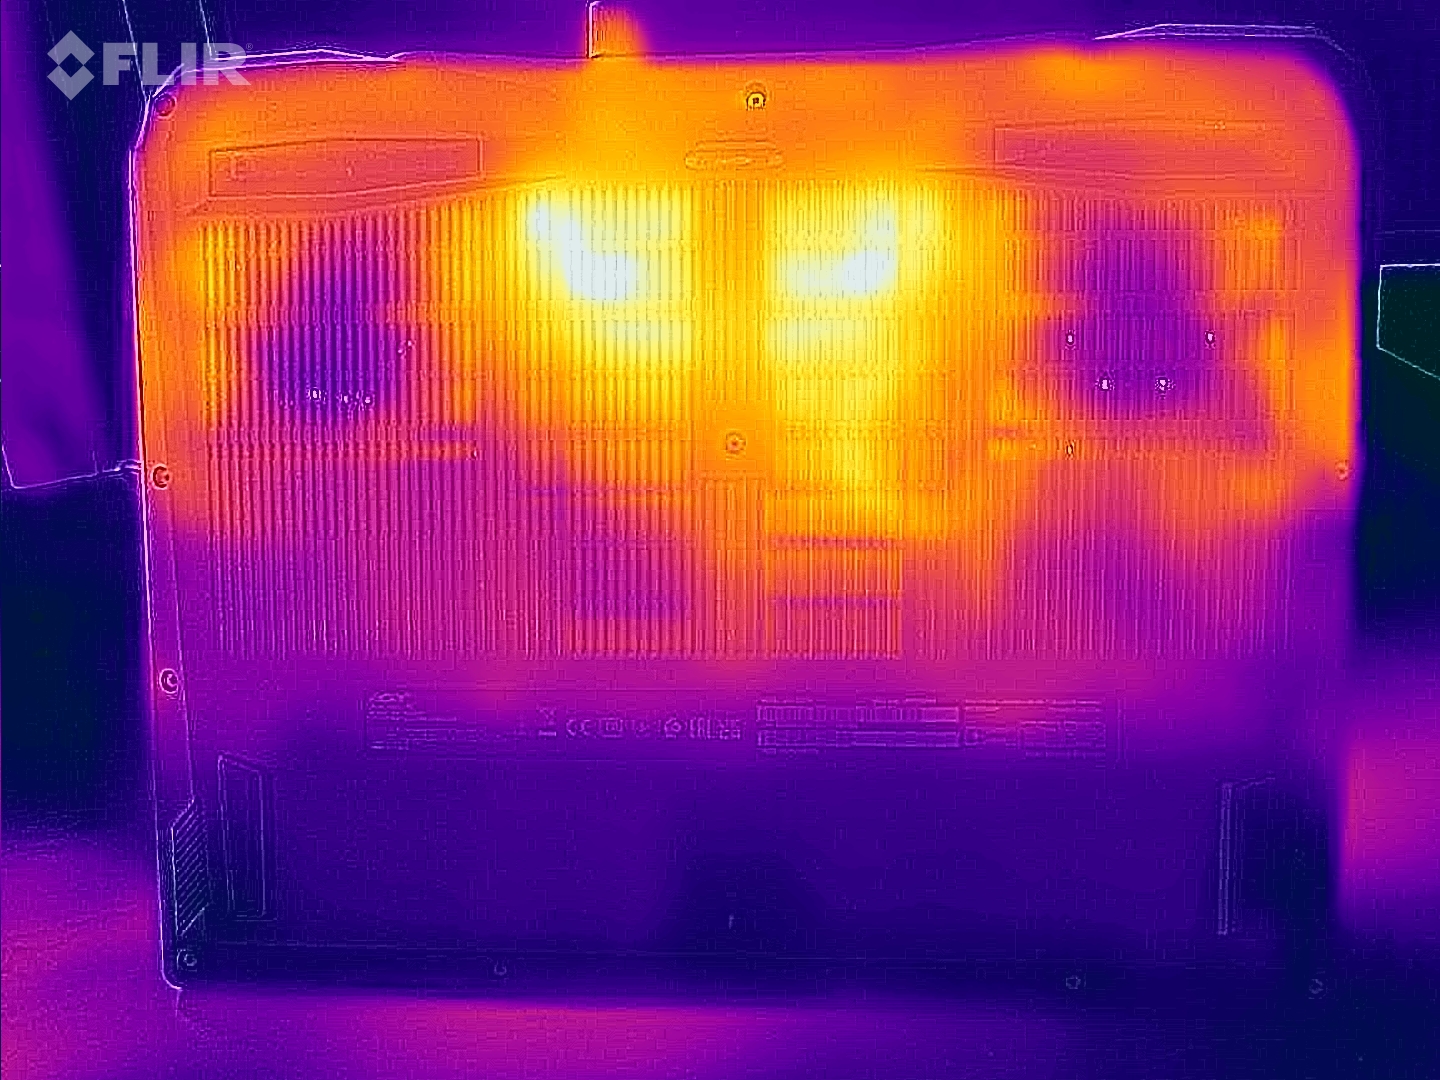
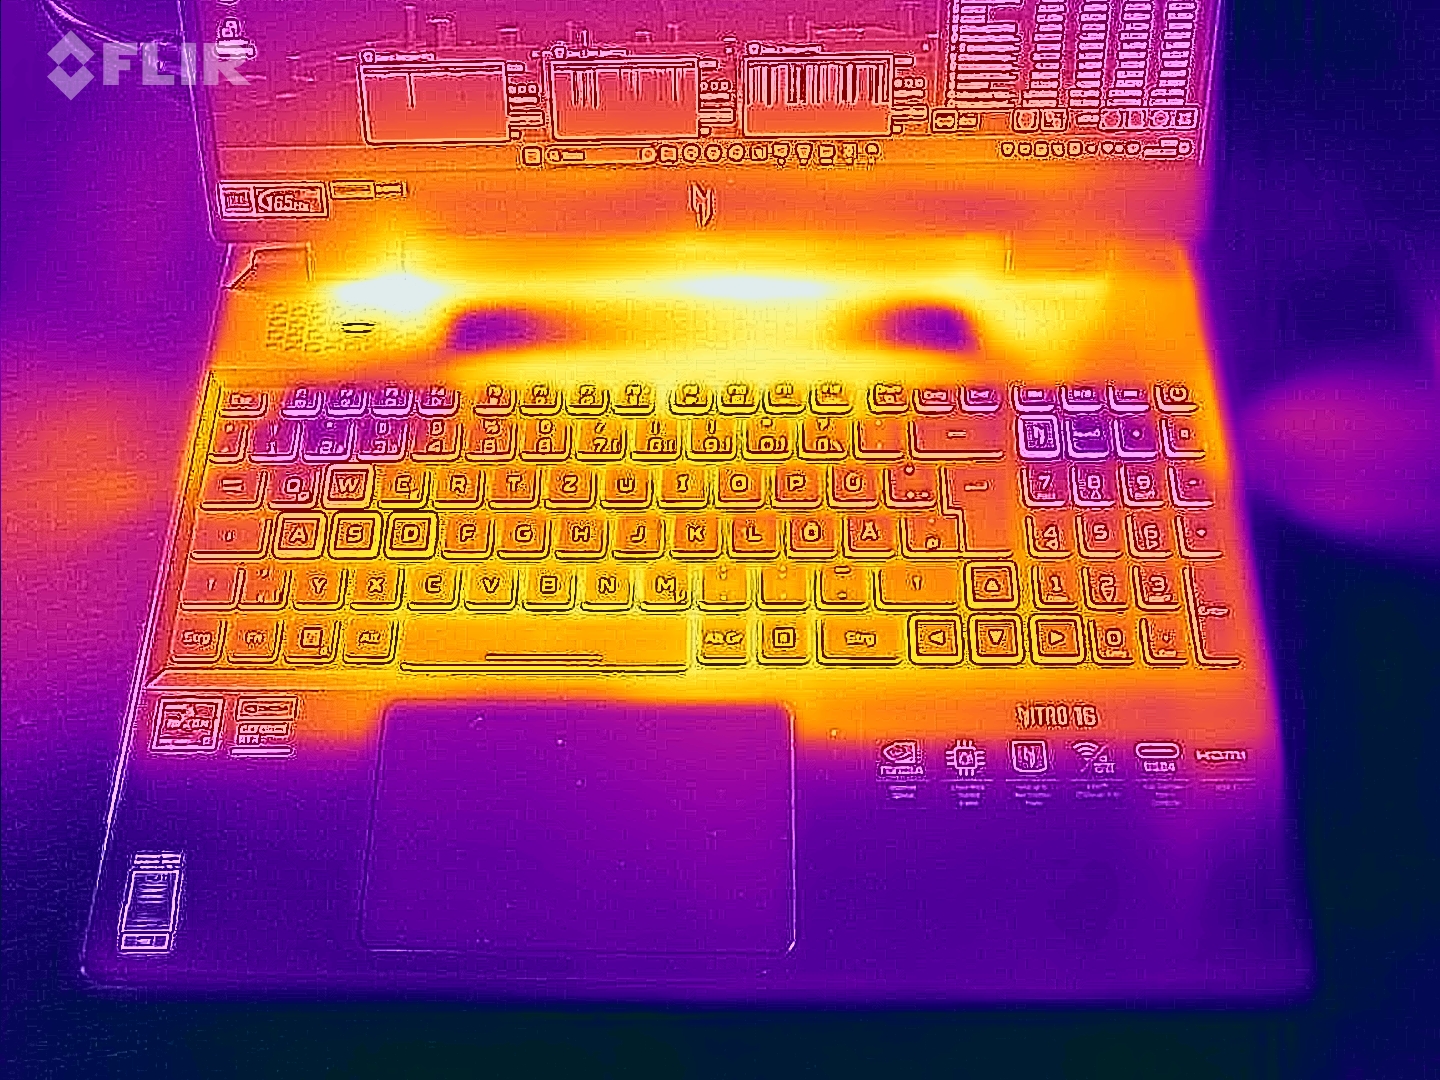
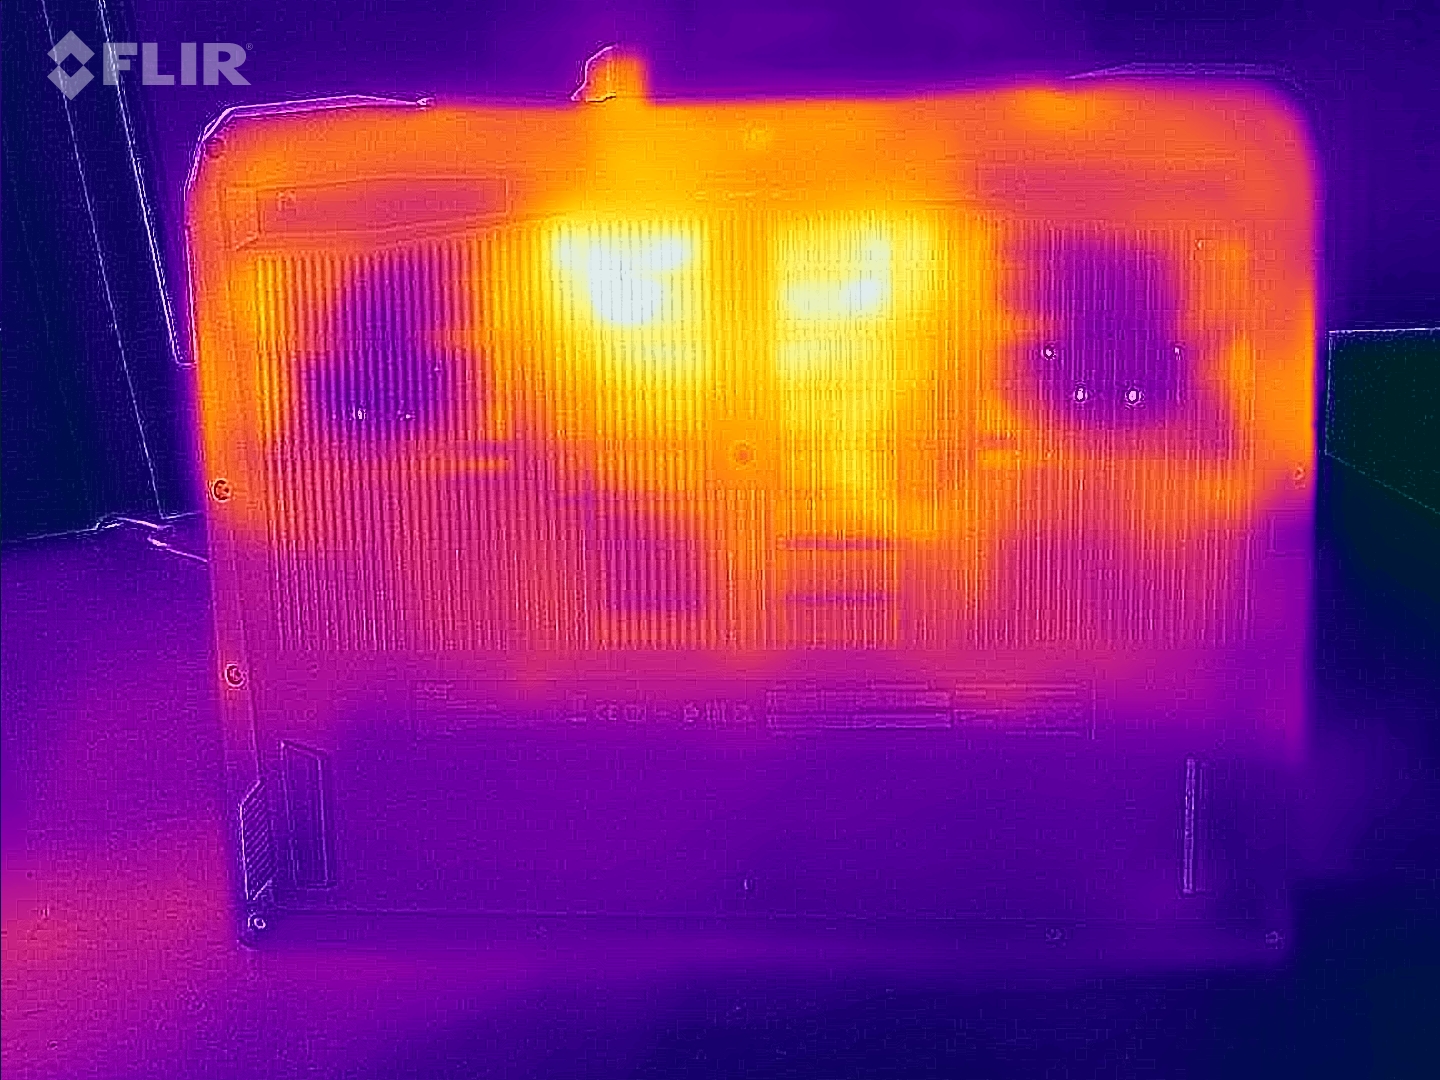
Temperature
The Nitro 16 heats up noticeably under load. A temperature of more than 60 °C is reached at one measuring point.
The temperatures are within the green zone in everyday use, but they are higher than in the sister model due to the active dGPU mode.
(-) The maximum temperature on the upper side is 51 °C / 124 F, compared to the average of 40.4 °C / 105 F, ranging from 21.2 to 68.8 °C for the class Gaming.
(-) The bottom heats up to a maximum of 63 °C / 145 F, compared to the average of 43.2 °C / 110 F
(+) In idle usage, the average temperature for the upper side is 31.6 °C / 89 F, compared to the device average of 33.9 °C / 93 F.
(-) Playing The Witcher 3, the average temperature for the upper side is 42.8 °C / 109 F, compared to the device average of 33.9 °C / 93 F.
(-) The palmrests and touchpad can get very hot to the touch with a maximum of 42 °C / 107.6 F.
(-) The average temperature of the palmrest area of similar devices was 28.8 °C / 83.8 F (-13.2 °C / -23.8 F).
| Acer Nitro 16 AN16-41-R7YE AMD Ryzen 5 7535HS, NVIDIA GeForce RTX 4050 Laptop GPU | Asus TUF Gaming A16 FA617XS AMD Ryzen 9 7940HS, AMD Radeon RX 7600S | Schenker XMG Focus 15 (E23) Intel Core i9-13900HX, NVIDIA GeForce RTX 4050 Laptop GPU | Gigabyte G7 KE Intel Core i5-12500H, NVIDIA GeForce RTX 3060 Laptop GPU | Asus TUF A15 FA507 AMD Ryzen 7 7735HS, NVIDIA GeForce RTX 4050 Laptop GPU | Medion Erazer Scout E20 Intel Core i7-13700H, NVIDIA GeForce RTX 4050 Laptop GPU | Acer Nitro 16 AN16-41 AMD Ryzen 7 7735HS, NVIDIA GeForce RTX 4070 Laptop GPU | |
|---|---|---|---|---|---|---|---|
| Heat | 10% | 9% | 8% | 17% | 19% | 9% | |
| Maximum Upper Side * (°C) | 51 | 53 -4% | 51 -0% | 52 -2% | 48.9 4% | 41 20% | 41.5 19% |
| Maximum Bottom * (°C) | 63 | 48 24% | 53 16% | 54 14% | 44.6 29% | 39 38% | 51.8 18% |
| Idle Upper Side * (°C) | 34 | 30 12% | 29 15% | 28 18% | 27.1 20% | 31 9% | 31.6 7% |
| Idle Bottom * (°C) | 32 | 30 6% | 30 6% | 32 -0% | 27.5 14% | 29 9% | 34.5 -8% |
* ... smaller is better
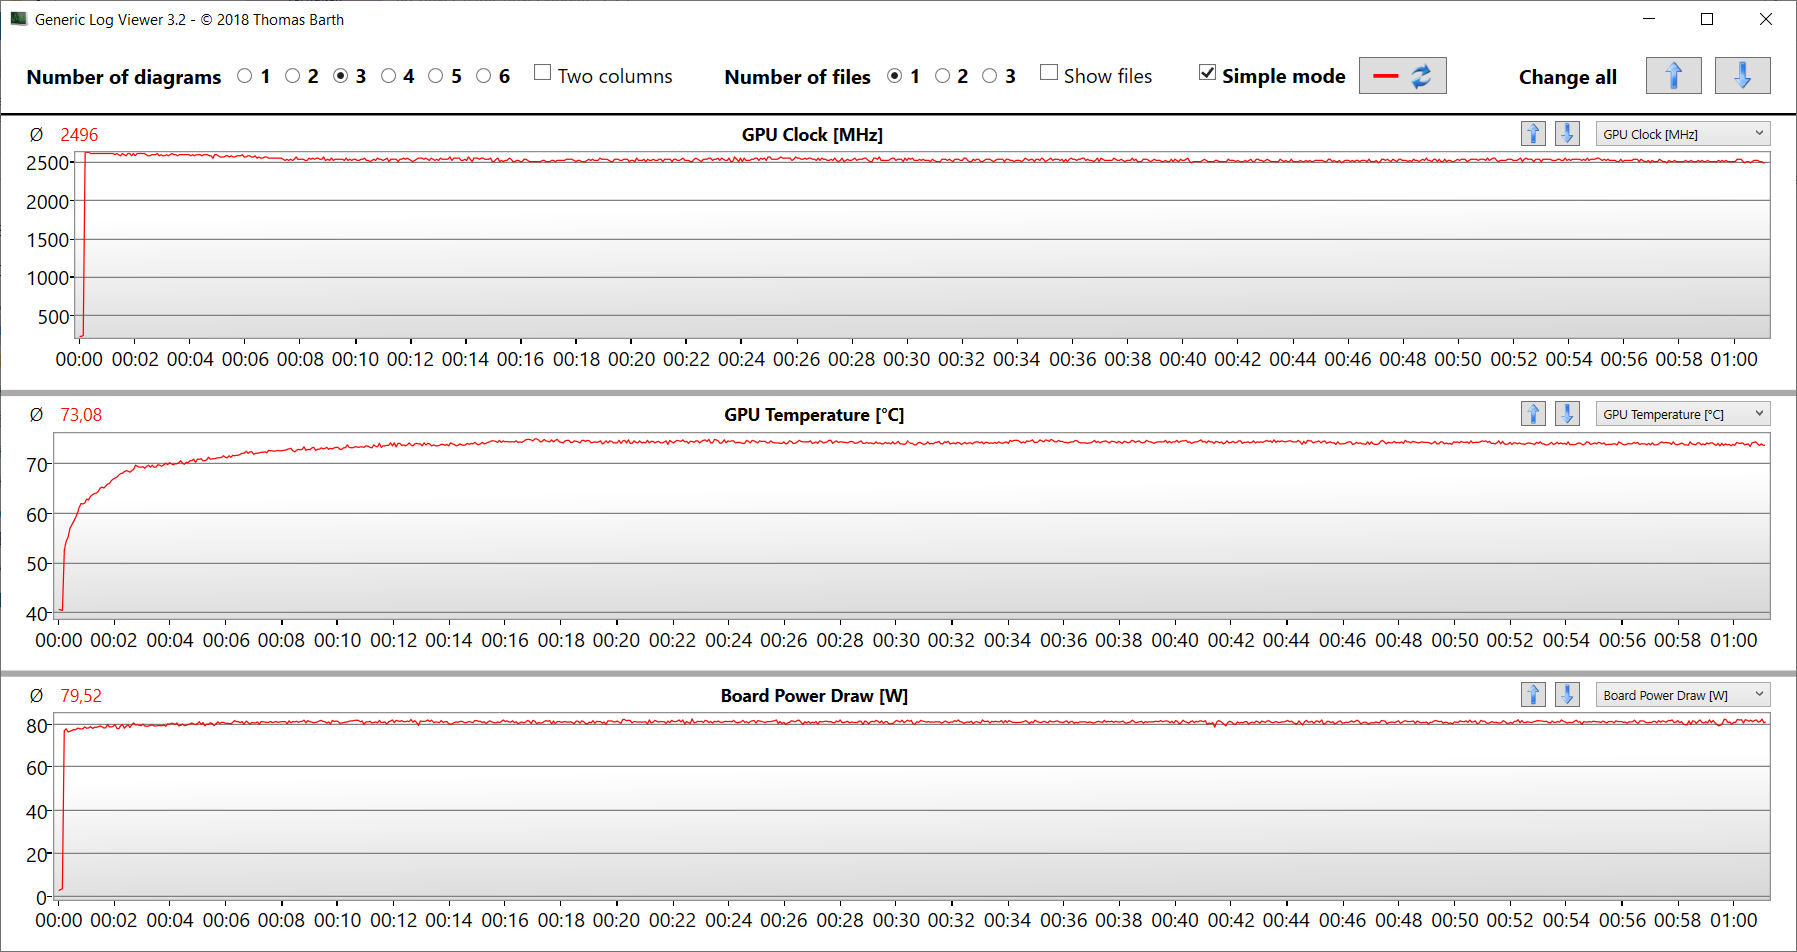
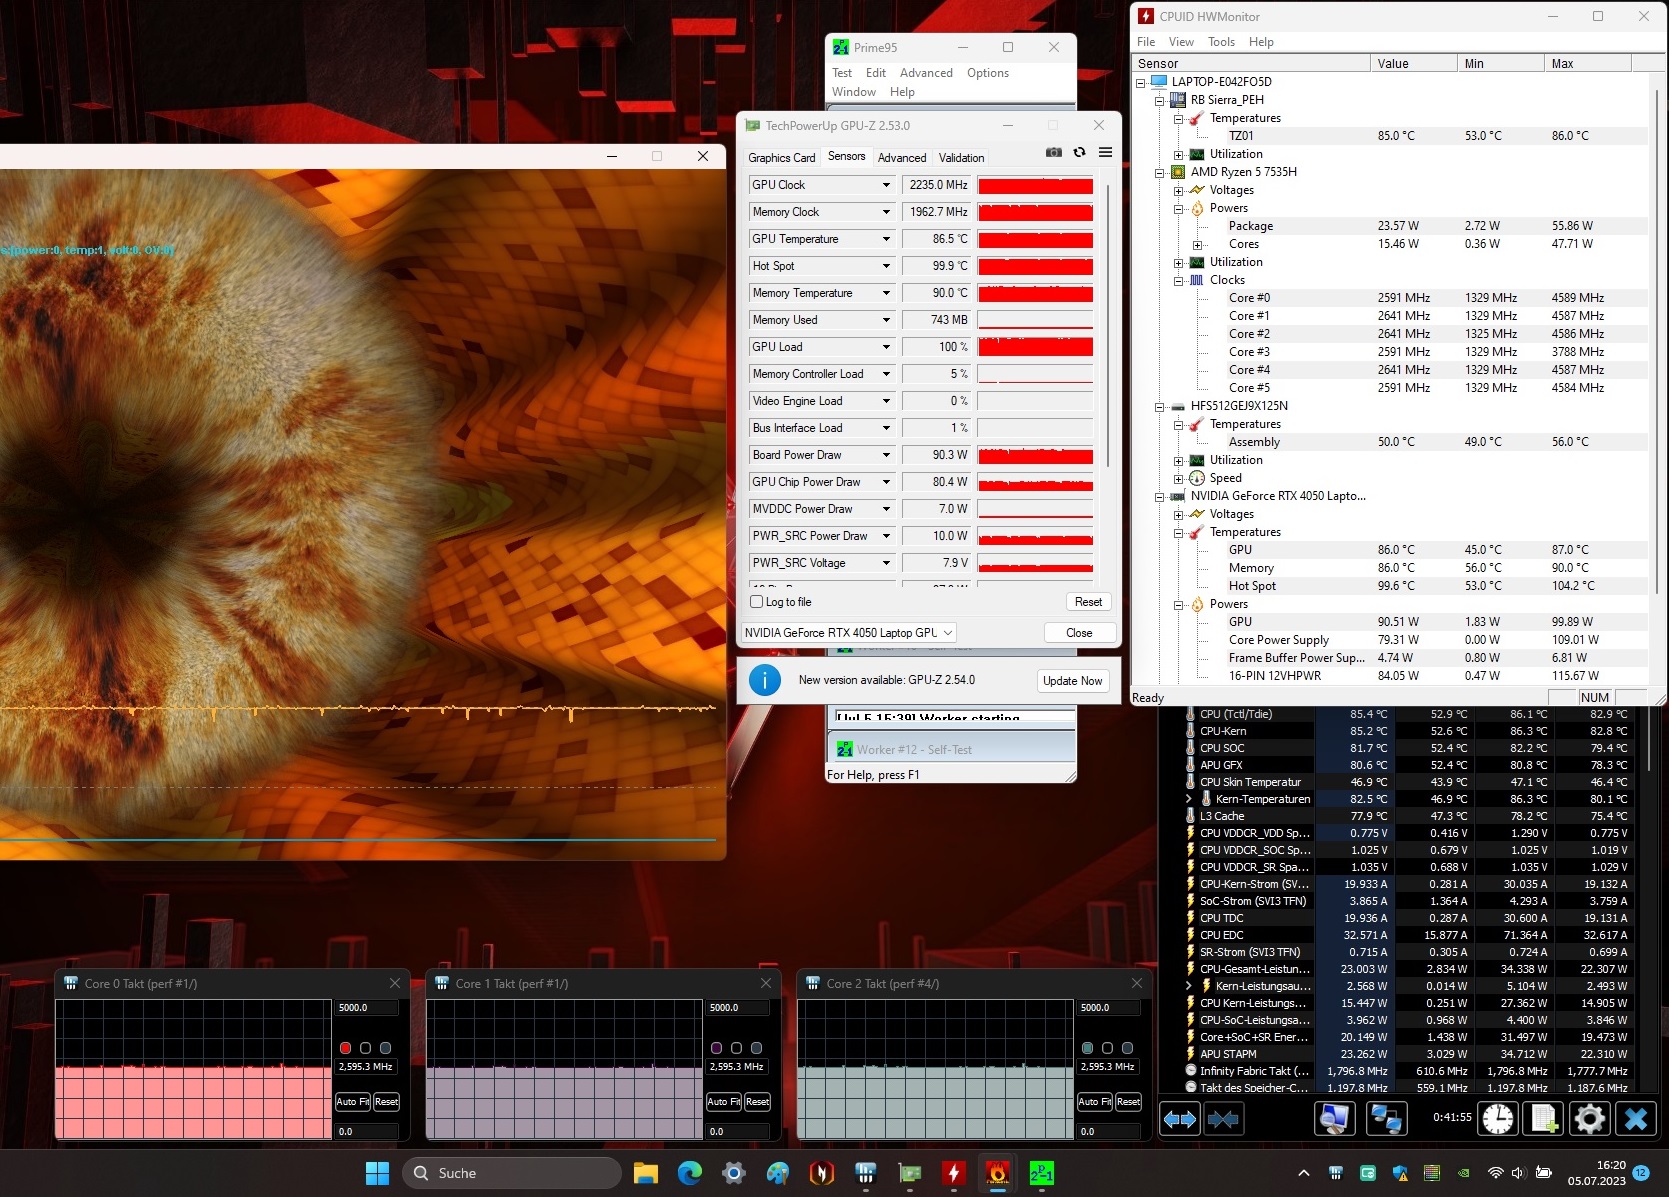
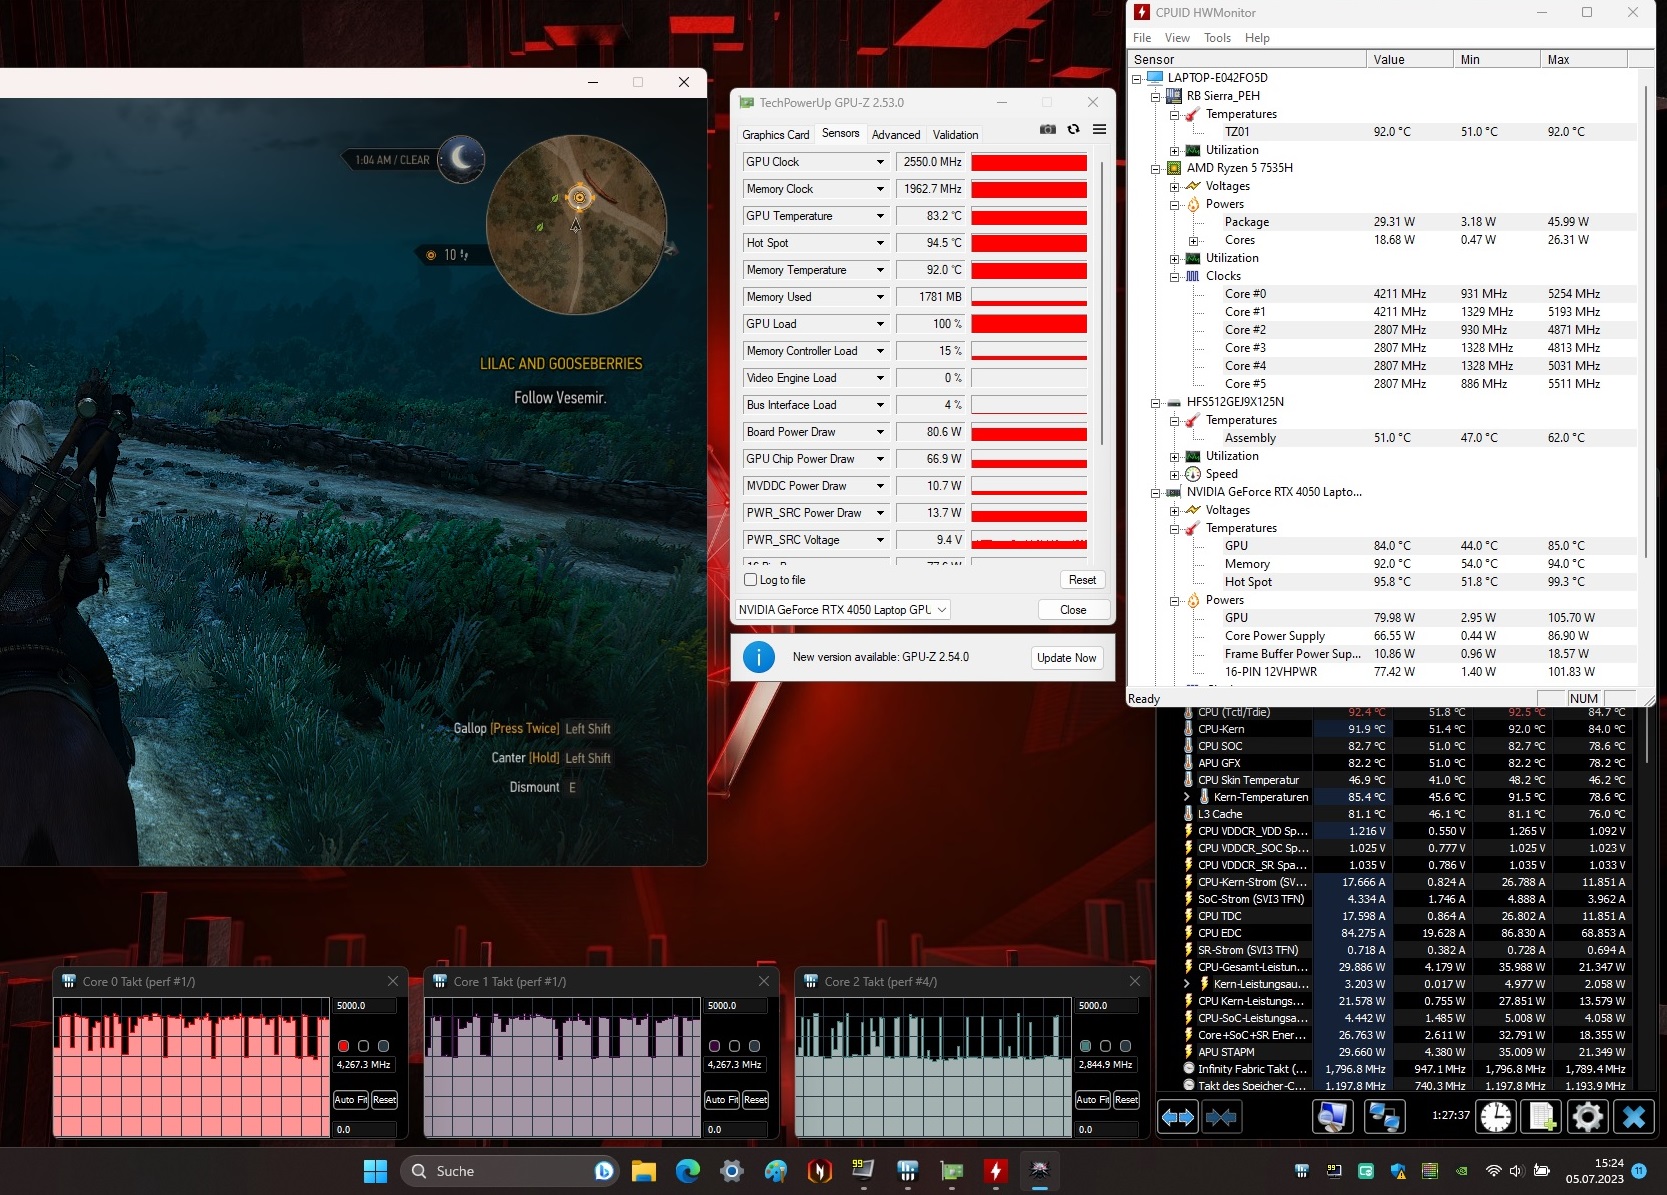
Stress test
The stress test (Prime95 and Furmark in continuous operation) is an extreme scenario for testing the system stability under full load. The CPU starts the stress test with clock rates of 4.1 to 4.2 GHz, the graphics core runs at 2.3 to 2.4 GHz. The rates drop to 2.6 GHz (processor) and 2.2 GHz (graphics core) in the further course of the test.
Loudspeaker
The stereo speakers produce a decent, largely bass-free sound. A better sound experience would be achievable with headphones or external speakers.
Acer Nitro 16 AN16-41-R7YE audio analysis
(+) | speakers can play relatively loud (82 dB)
Bass 100 - 315 Hz
(-) | nearly no bass - on average 28.2% lower than median
(±) | linearity of bass is average (12.9% delta to prev. frequency)
Mids 400 - 2000 Hz
(+) | balanced mids - only 2.2% away from median
(+) | mids are linear (3.8% delta to prev. frequency)
Highs 2 - 16 kHz
(+) | balanced highs - only 3.5% away from median
(+) | highs are linear (4.6% delta to prev. frequency)
Overall 100 - 16.000 Hz
(±) | linearity of overall sound is average (17.3% difference to median)
Compared to same class
» 47% of all tested devices in this class were better, 12% similar, 41% worse
» The best had a delta of 6%, average was 18%, worst was 132%
Compared to all devices tested
» 32% of all tested devices were better, 8% similar, 59% worse
» The best had a delta of 4%, average was 24%, worst was 134%
Asus TUF Gaming A16 FA617XS audio analysis
(±) | speaker loudness is average but good (79 dB)
Bass 100 - 315 Hz
(±) | reduced bass - on average 11.6% lower than median
(±) | linearity of bass is average (7% delta to prev. frequency)
Mids 400 - 2000 Hz
(±) | higher mids - on average 5.7% higher than median
(+) | mids are linear (3.8% delta to prev. frequency)
Highs 2 - 16 kHz
(+) | balanced highs - only 2.6% away from median
(+) | highs are linear (6.5% delta to prev. frequency)
Overall 100 - 16.000 Hz
(±) | linearity of overall sound is average (15.4% difference to median)
Compared to same class
» 34% of all tested devices in this class were better, 7% similar, 59% worse
» The best had a delta of 6%, average was 18%, worst was 132%
Compared to all devices tested
» 22% of all tested devices were better, 4% similar, 73% worse
» The best had a delta of 4%, average was 24%, worst was 134%
Power management: The Nitro 16 can achieve very good runtimes
Energy consumption
The power consumption is at a normal level for the installed hardware. The dGPU mode is responsible for the higher idle consumption when compared to the sister model. The stress test and The Witcher 3 test are run with constant power consumption. The supplied power supply (230 W) can fully power the laptop under load.
| Off / Standby | |
| Idle | |
| Load |
|
Key:
min: | |
| Acer Nitro 16 AN16-41-R7YE R5 7535HS, GeForce RTX 4050 Laptop GPU | Asus TUF Gaming A16 FA617XS R9 7940HS, Radeon RX 7600S | Schenker XMG Focus 15 (E23) i9-13900HX, GeForce RTX 4050 Laptop GPU | Gigabyte G7 KE i5-12500H, GeForce RTX 3060 Laptop GPU | Asus TUF A15 FA507 R7 7735HS, GeForce RTX 4050 Laptop GPU | Medion Erazer Scout E20 i7-13700H, GeForce RTX 4050 Laptop GPU | Acer Nitro 16 AN16-41 R7 7735HS, GeForce RTX 4070 Laptop GPU | Average of class Gaming | |
|---|---|---|---|---|---|---|---|---|
| Power Consumption | 20% | -32% | -10% | 23% | 13% | -7% | -9% | |
| Idle Minimum * (Watt) | 19 | 7 63% | 11.4 40% | 15 21% | 8 58% | 5 74% | 11.6 39% | 13.2 ? 31% |
| Idle Average * (Watt) | 20 | 10 50% | 16.7 16% | 17 15% | 12.1 39% | 11 45% | 15.6 22% | 18.9 ? 5% |
| Idle Maximum * (Watt) | 23 | 15 35% | 25.8 -12% | 24 -4% | 12.5 46% | 22 4% | 16.5 28% | 24.3 ? -6% |
| Load Average * (Watt) | 80 | 86 -8% | 139 -74% | 111 -39% | 74.9 6% | 96 -20% | 155 -94% | 108.3 ? -35% |
| Witcher 3 ultra * (Watt) | 125.8 | 160.6 -28% | 265 -111% | 174.1 -38% | 136.6 -9% | 145.2 -15% | 154.8 -23% | |
| Load Maximum * (Watt) | 184 | 172 7% | 280 -52% | 208 -13% | 185 -1% | 201 -9% | 205 -11% | 254 ? -38% |
* ... smaller is better
Power consumption: The Witcher 3 / Stress test
Power consumption: External monitor
Battery life
The Nitro 16 achieves runtimes of 11:00 h and 10:50 h in the WLAN test (calling up websites via a script) and video test (short movie Big Buck Bunny FHD H.264 encoding in a loop), respectively. During both tests, the notebook's energy-saving features are disabled, and the display brightness is set to about 150 cd/m². The wireless modules are also disabled for the video test.
Note: The Nitro shows an increased power consumption in battery mode under Windows 11 (Acer installation, own installation). Consequently, the run times lag behind the rates of the sister model (WLAN: 5.5 vs. 9 h) with the same battery capacities. Therefore, the run times were determined under Windows 10. The problem does not occur here.
We cannot name a reason for the increased energy consumption. It might be a problem of our test device.
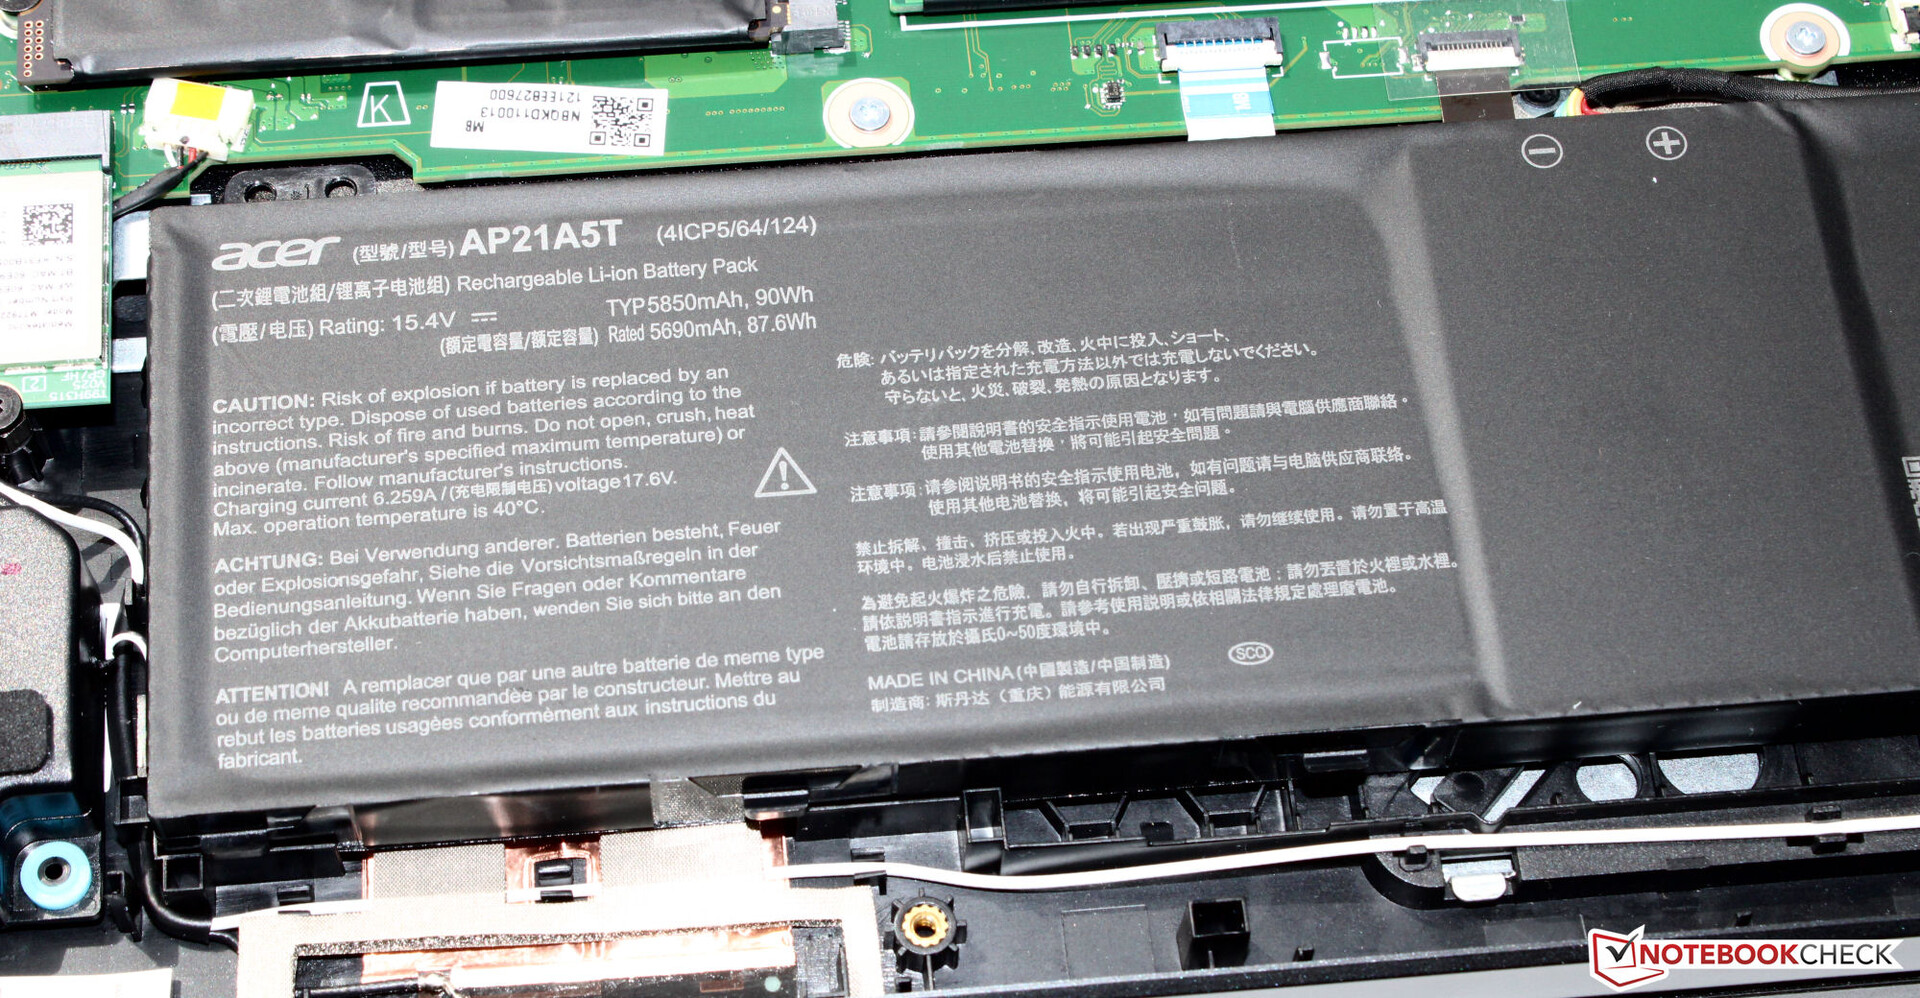
| Acer Nitro 16 AN16-41-R7YE R5 7535HS, GeForce RTX 4050 Laptop GPU, 90 Wh | Asus TUF Gaming A16 FA617XS R9 7940HS, Radeon RX 7600S, 90 Wh | Schenker XMG Focus 15 (E23) i9-13900HX, GeForce RTX 4050 Laptop GPU, 73 Wh | Gigabyte G7 KE i5-12500H, GeForce RTX 3060 Laptop GPU, 54 Wh | Asus TUF A15 FA507 R7 7735HS, GeForce RTX 4050 Laptop GPU, 90 Wh | Medion Erazer Scout E20 i7-13700H, GeForce RTX 4050 Laptop GPU, 53.35 Wh | Acer Nitro 16 AN16-41 R7 7735HS, GeForce RTX 4070 Laptop GPU, 90 Wh | Average of class Gaming | |
|---|---|---|---|---|---|---|---|---|
| Battery runtime | 10% | -44% | -54% | -11% | -48% | -10% | -30% | |
| Reader / Idle (h) | 12 | 20.3 69% | 7.1 -41% | 6.7 -44% | 12.2 2% | 8.71 ? -27% | ||
| H.264 (h) | 10.8 | 12.4 15% | 2.2 -80% | 12.5 16% | 4.6 -57% | 10.2 -6% | 8.26 ? -24% | |
| WiFi v1.3 (h) | 11 | 12.4 13% | 5.9 -46% | 5.3 -52% | 11.7 6% | 4.7 -57% | 9 -18% | 7.04 ? -36% |
| Load (h) | 2.2 | 0.9 -59% | 1.3 -41% | 1.3 -41% | 1 -55% | 1.5 -32% | 1.8 -18% | 1.47 ? -33% |
Pros
Cons
Verdict: Inexpensive entry into the gaming world
The Acer Nitro 16 is designed for FHD gaming at high to maximum settings but also cuts a good figure in other areas (video editing, rendering). The Ryzen 5 7535HS and GeForce RTX 4050 combo delivers the necessary performance, and the CPU and GPU can work with constantly high clock rates.
Acer presents a well-rounded gaming laptop in the entry-level segment with the Nitro 16.
Surprisingly, the laptop heats up more under load than its sister model equipped with more powerful hardware. The Nitro models do not have much in common in terms of noise development. The "Balanced" mode provides a moderate background noise.
The 16-inch display (WUXGA) is hardly inferior to the panel (WQXGA) of the sister model. The latter offers a higher maximum brightness (400 nits vs. 500 nits). The already good runtimes of the Ryzen 7 Nitro are surpassed by the current model, even if only under Windows 10. The storage capacity (512 GB) is meager for a gaming notebook.
An alternative can be found in the Asus TUF A15 FA507. It offers more CPU performance with slightly better battery run times. The Gigabyte G7 KE would be the budget alternative wherein a lower performance level would be countered by a lower purchase price (€1,050). However, a Windows operating system is not included in the scope of delivery.
Price and availability
In the USA, users can order some variants of Acer Nitro 16 AN16-41 on Amazon, which have more powerful configurations than the one we have reviewed.
Acer Nitro 16 AN16-41-R7YE
- 08/01/2023 v7 (old)
Sascha Mölck
Transparency
The selection of devices to be reviewed is made by our editorial team. The test sample was provided to the author as a loan by the manufacturer or retailer for the purpose of this review. The lender had no influence on this review, nor did the manufacturer receive a copy of this review before publication. There was no obligation to publish this review. As an independent media company, Notebookcheck is not subjected to the authority of manufacturers, retailers or publishers.
This is how Notebookcheck is testing
Every year, Notebookcheck independently reviews hundreds of laptops and smartphones using standardized procedures to ensure that all results are comparable. We have continuously developed our test methods for around 20 years and set industry standards in the process. In our test labs, high-quality measuring equipment is utilized by experienced technicians and editors. These tests involve a multi-stage validation process. Our complex rating system is based on hundreds of well-founded measurements and benchmarks, which maintains objectivity. Further information on our test methods can be found here.
Price comparison

