Asus TUF Gaming A15 laptop review - A budget gamer with an RTX 4050 and a 144 Hz screen
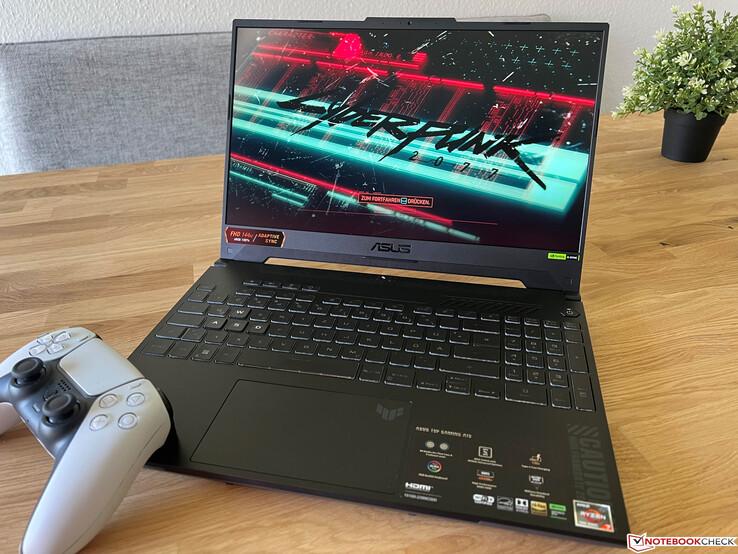
Situated below the ROG series, Asus' TUF Gaming series sets out to provide a cheaper laptop option for gamers. We recently tested the 16-inch model with AMD hardware, and now it is time to take a look at the 15-inch version: the TUF Gaming A15 with an AMD processor (Ryzen 7 7735HS) and current Nvidia graphics card (GeForce RTX 4050 Laptop). It has an MRSP of around $1,300 and can currently be found online for $1,169. Furthermore, the device has a matte IPS panel with a refresh rate of 144 Hz, 16 GB RAM and a 512 GB NVMe SSD. The retail version of the FA507NU-LP031 comes without an operating system, but ours already had Windows 11 Home installed when we received it.
possible competitors compared
Rating | Date | Model | Weight | Height | Size | Resolution | Price |
|---|---|---|---|---|---|---|---|
| 86.3 % v7 (old) | 06 / 2023 | Asus TUF A15 FA507 R7 7735HS, GeForce RTX 4050 Laptop GPU | 2.2 kg | 24.9 mm | 15.60" | 1920x1080 | |
| 81.8 % v7 (old) | 04 / 2023 | Gigabyte G5 KE i5-12500H, GeForce RTX 3060 Laptop GPU | 2 kg | 23.9 mm | 15.60" | 1920x1080 | |
| 87.9 % v7 (old) | 01 / 2023 | Schenker XMG Core 15 (M22) R7 6800H, GeForce RTX 3060 Laptop GPU | 2.1 kg | 23 mm | 15.60" | 2560x1440 | |
| 82.9 % v7 (old) | 03 / 2023 | MSI Katana 15 B12VEK i7-12650H, GeForce RTX 4050 Laptop GPU | 2.3 kg | 24.9 mm | 15.60" | 1920x1080 | |
| 81 % v7 (old) | 12 / 2022 | HP Victus 15 fa0020nr i7-12700H, GeForce RTX 3050 Ti Laptop GPU | 2.3 kg | 23.6 mm | 15.60" | 1920x1080 | |
| 82.8 % v7 (old) | 10 / 2022 | Lenovo IdeaPad Gaming 3 15IAH7 i5-12500H, GeForce RTX 3050 Ti Laptop GPU | 2.4 kg | 26 mm | 15.60" | 1920x1080 | |
| 87.2 % v7 (old) | 03 / 2022 | Asus TUF Gaming F15 FX507ZM i7-12700H, GeForce RTX 3060 Laptop GPU | 2.1 kg | 24.95 mm | 15.60" | 1920x1080 |
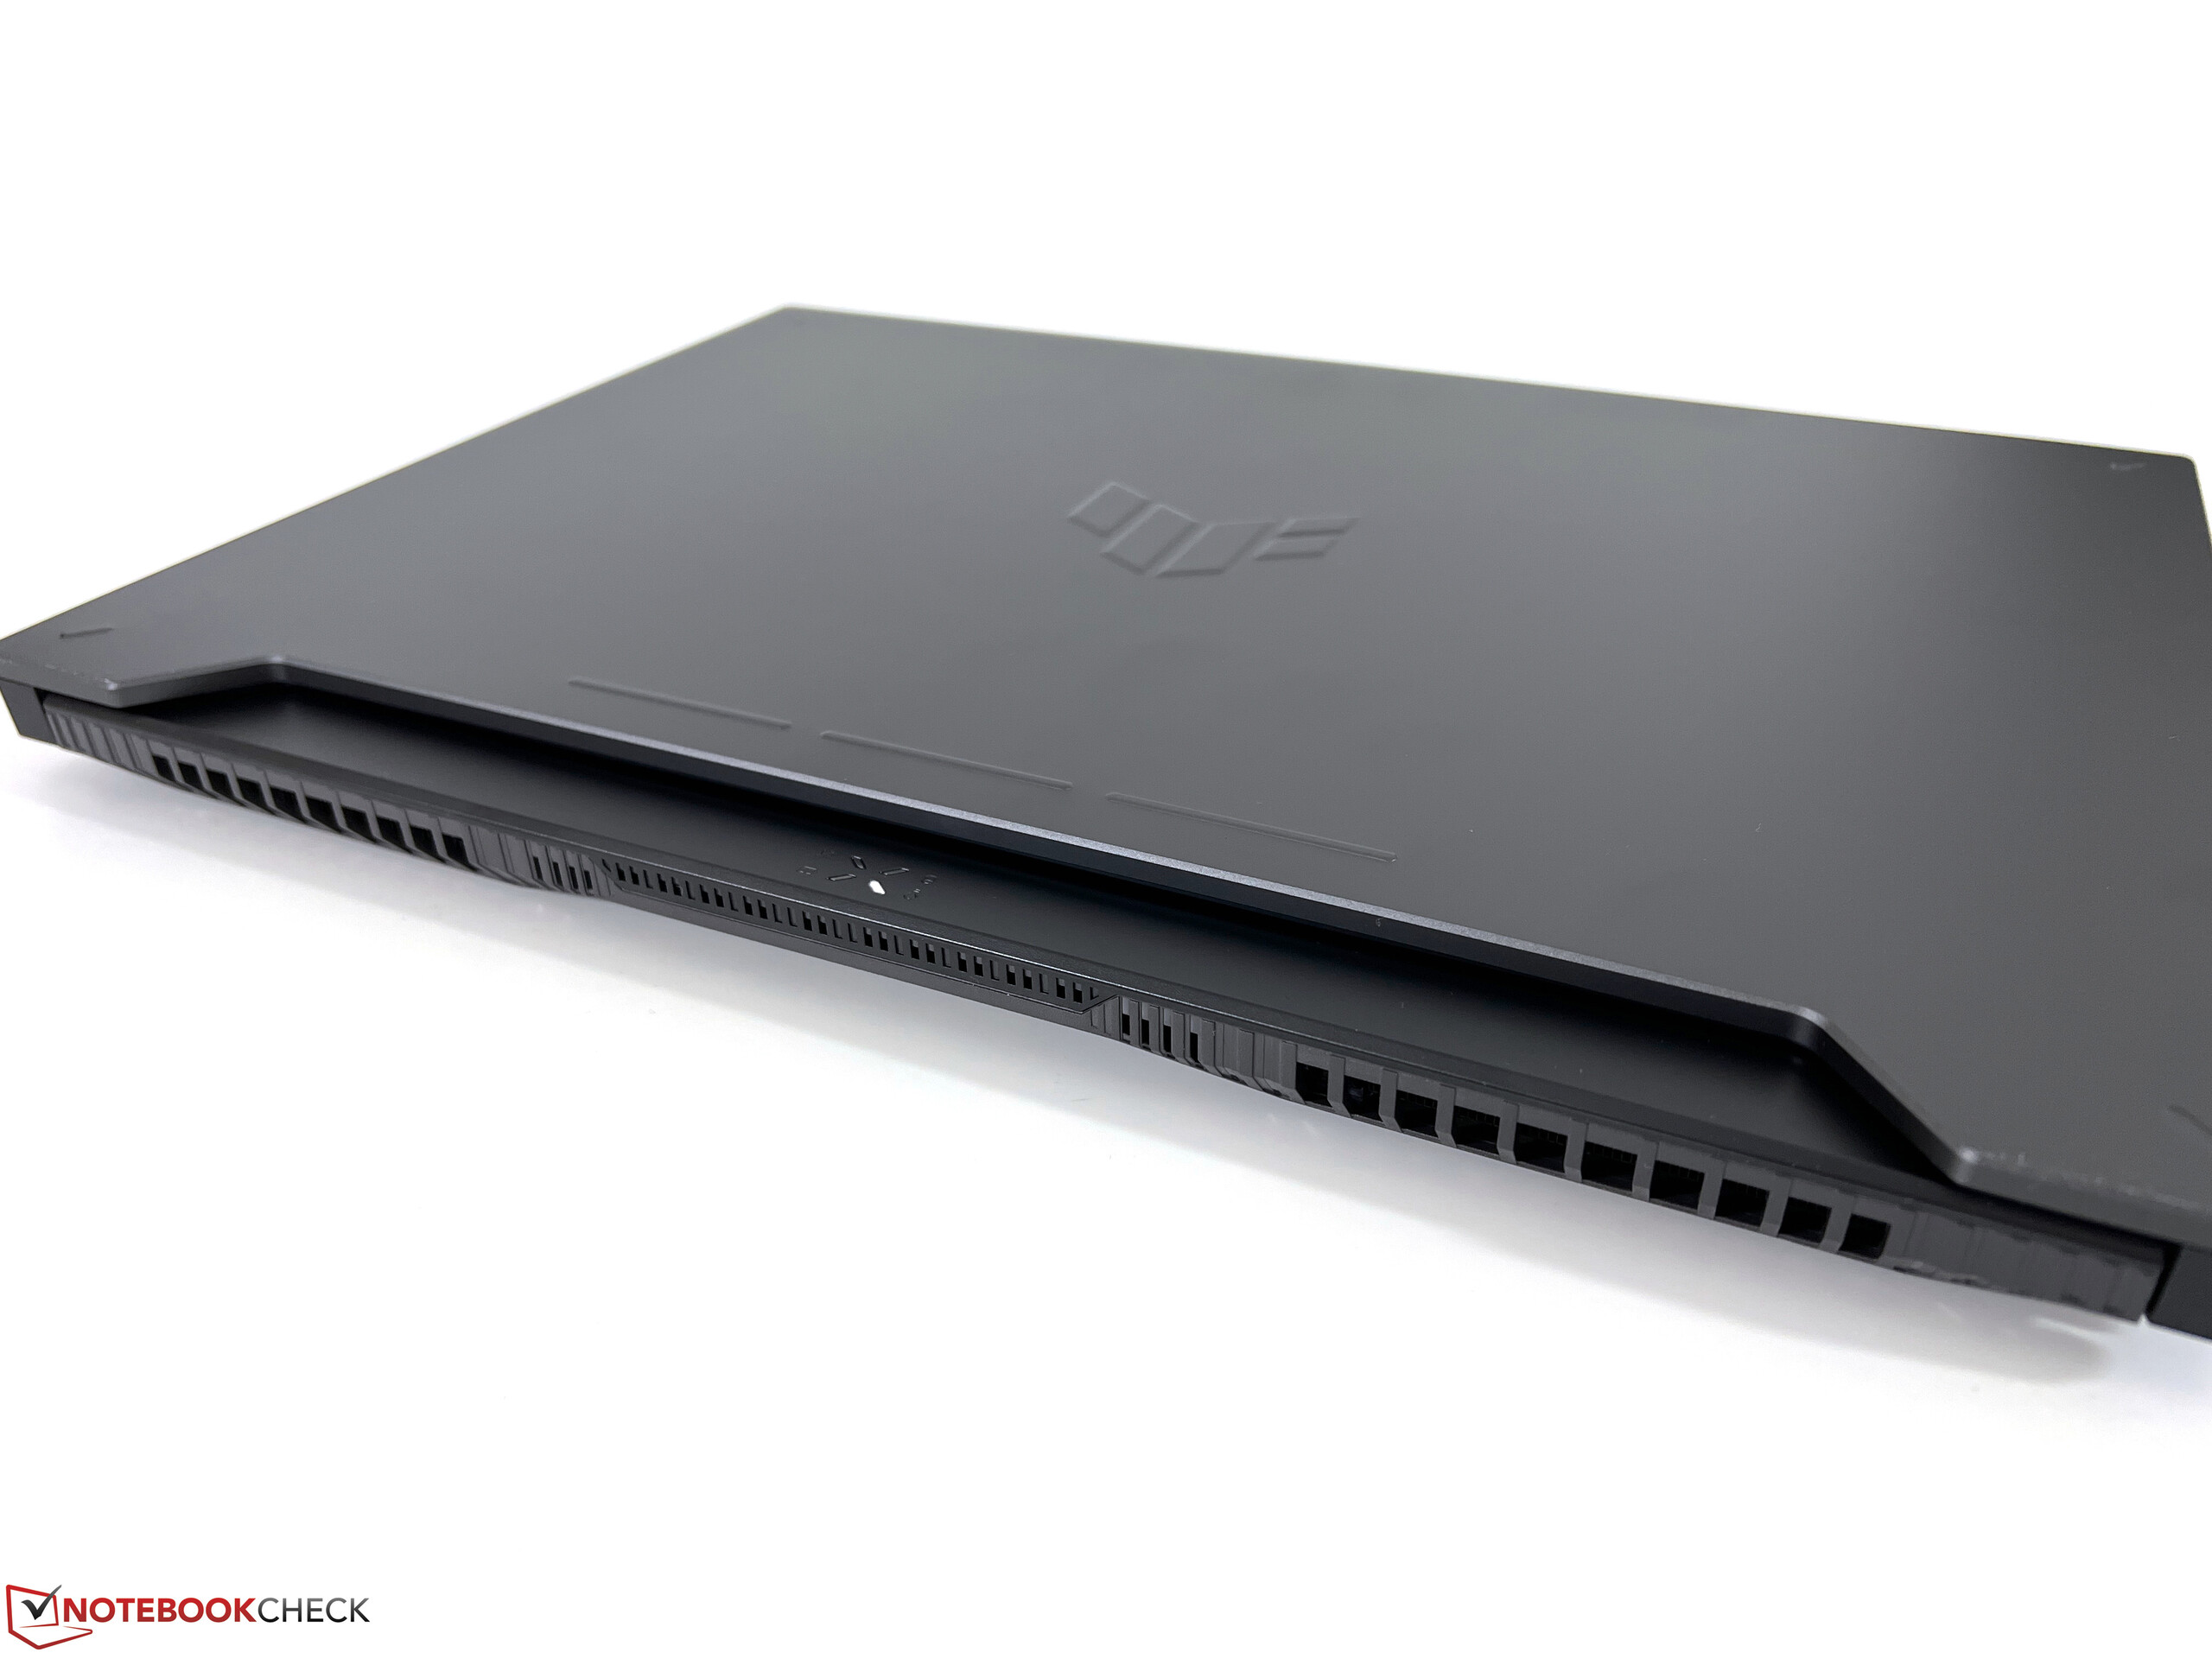
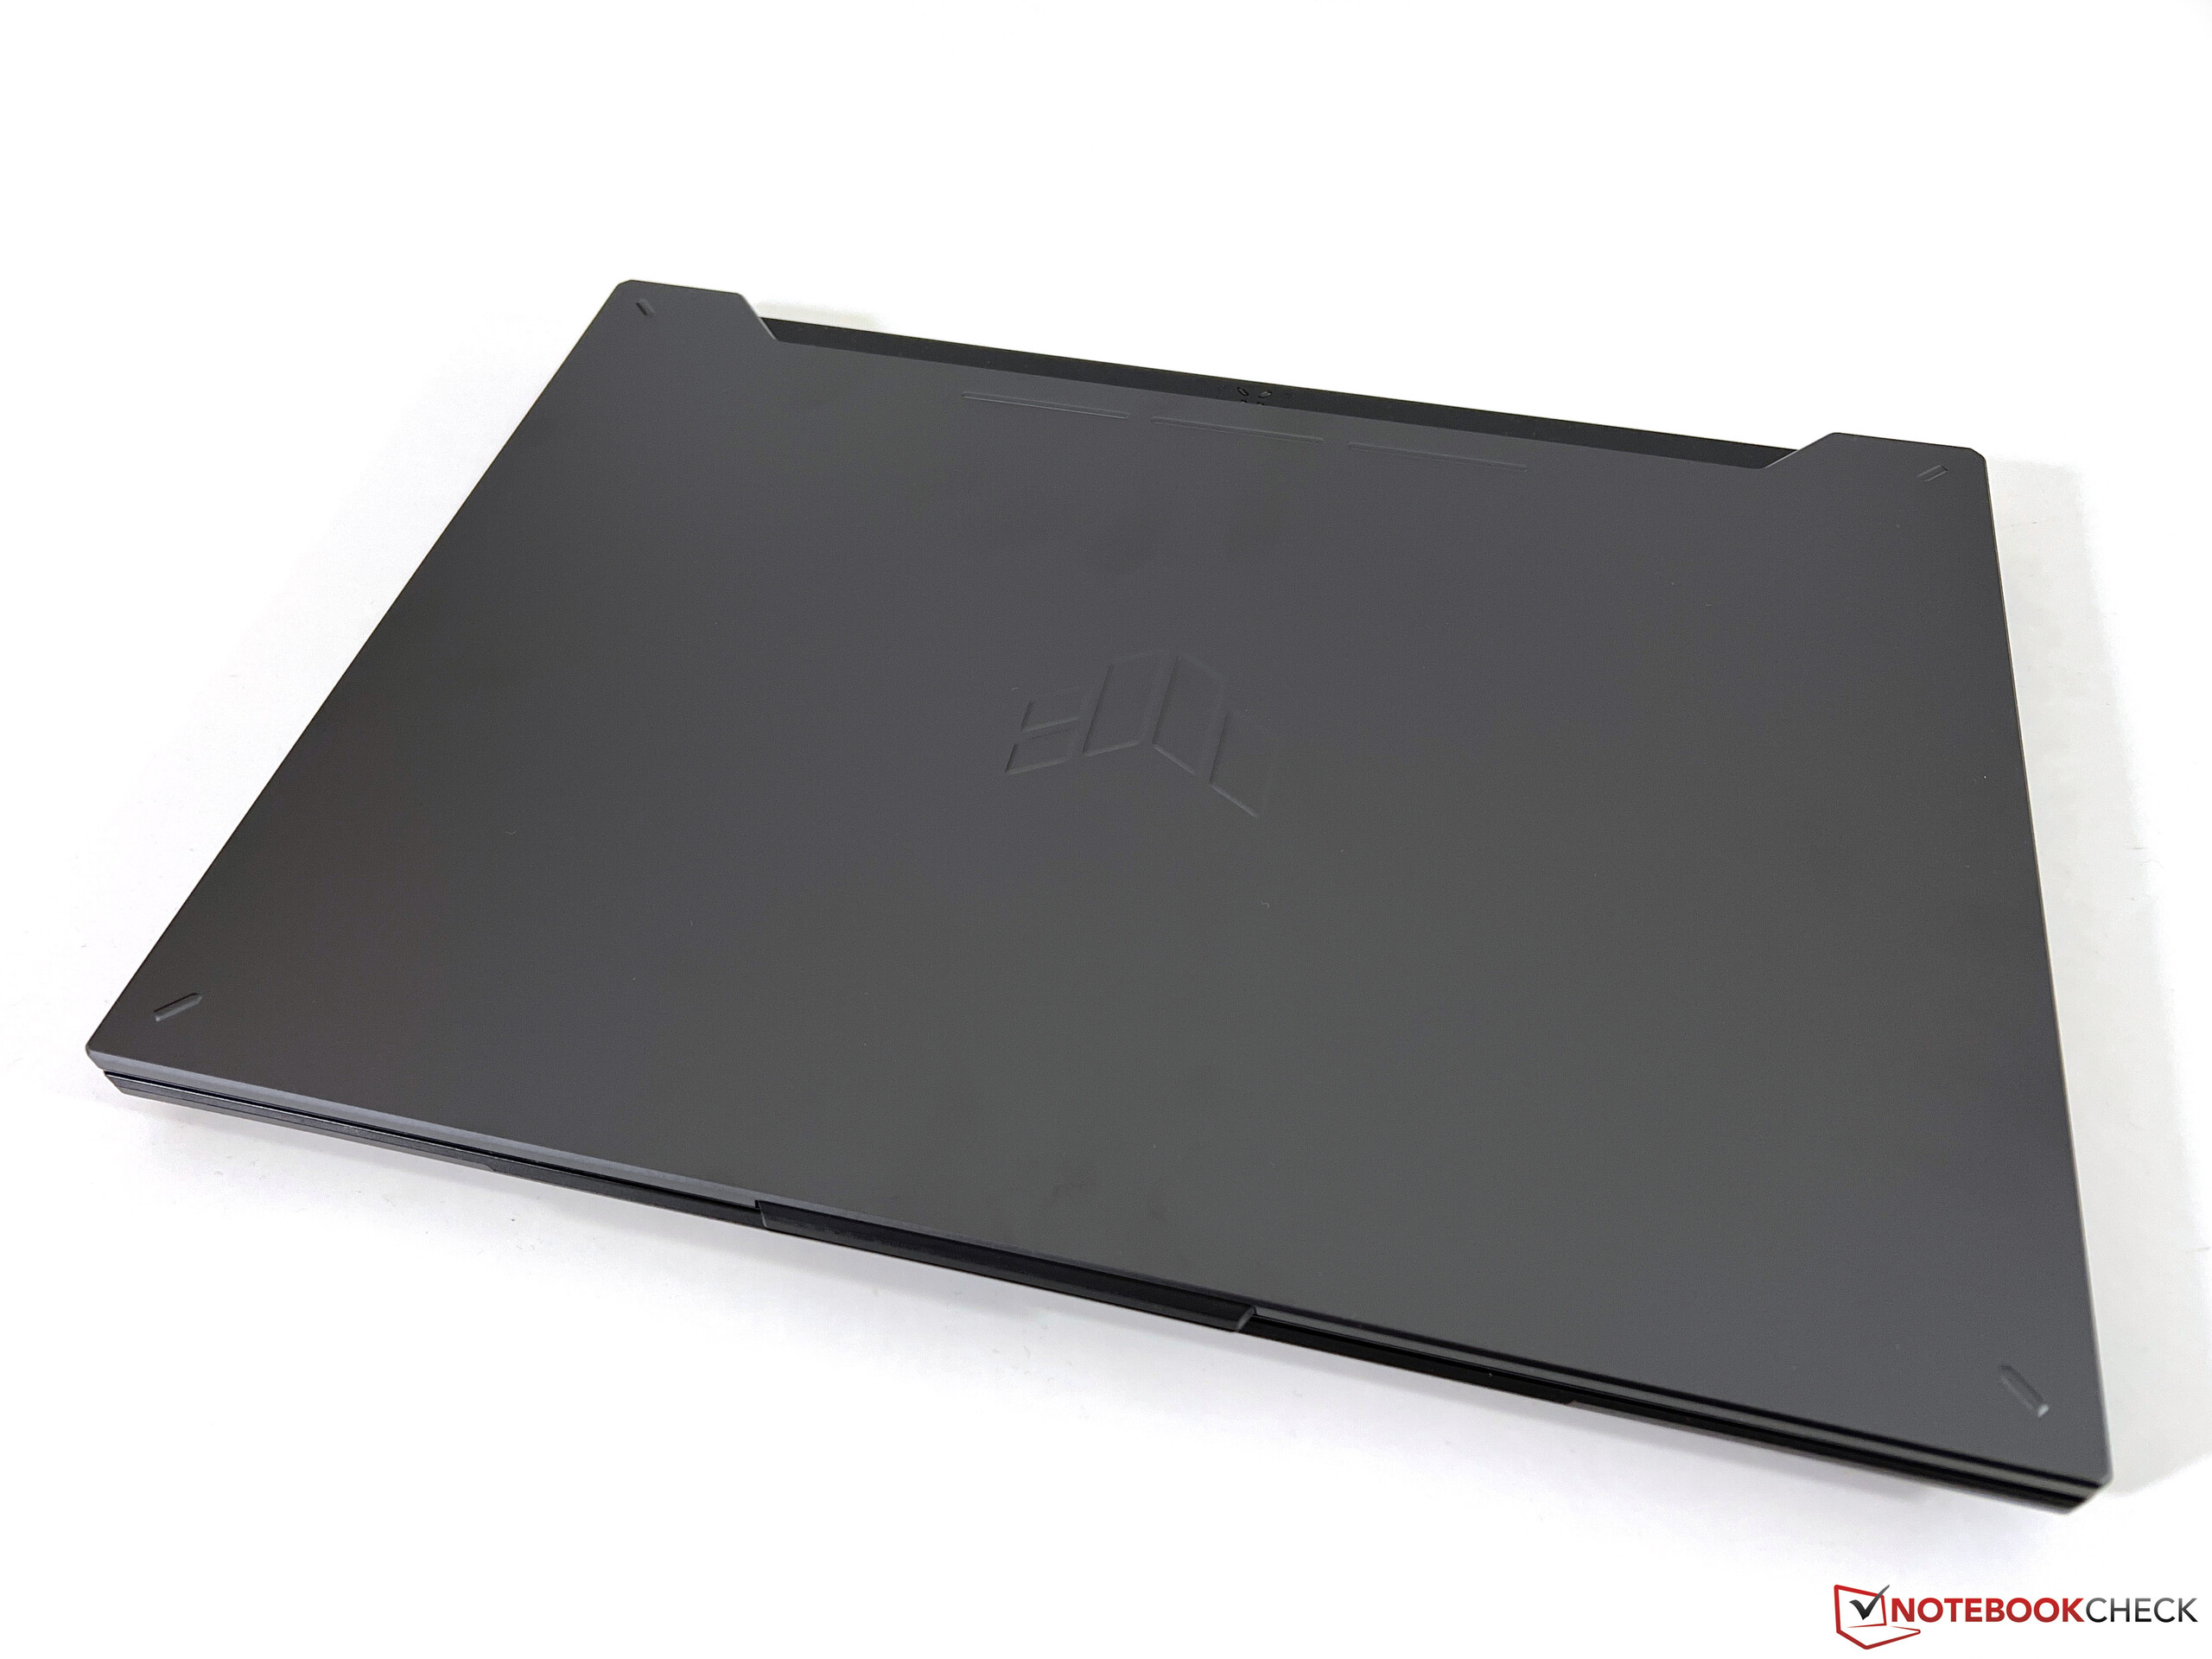
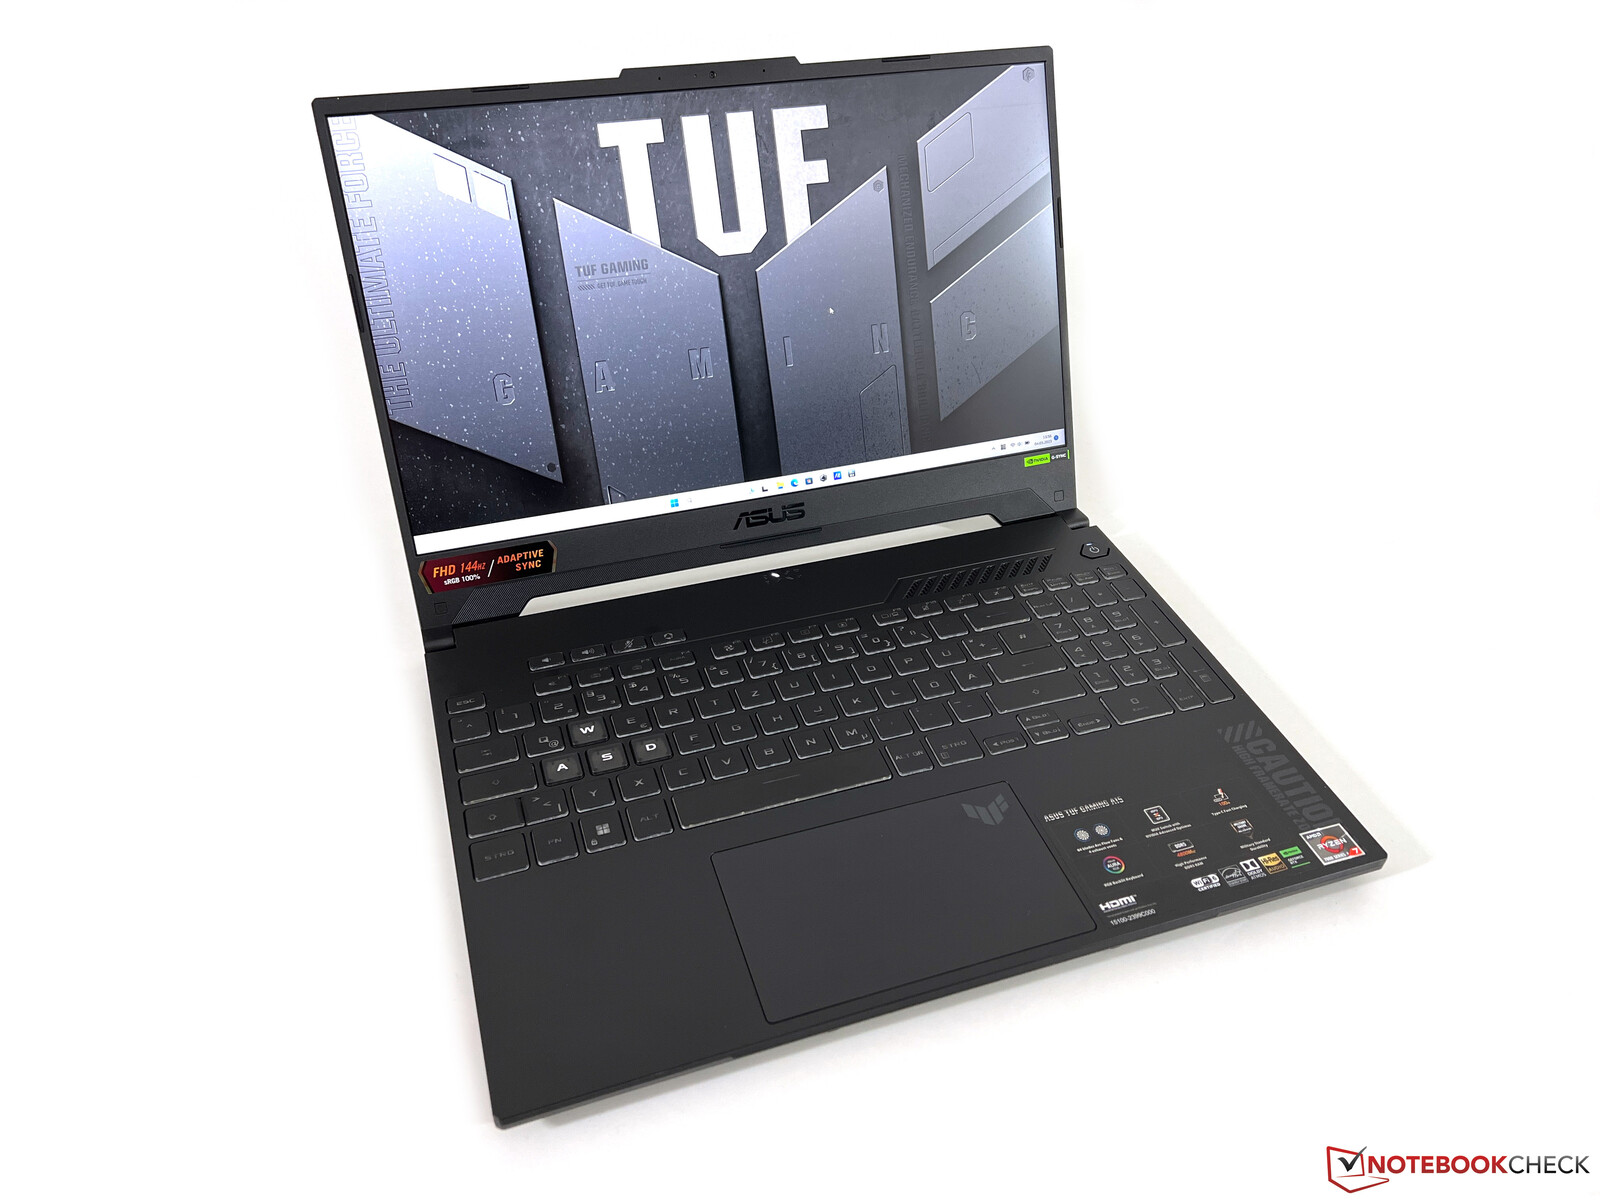
Case - An understated gaming laptop without lighting
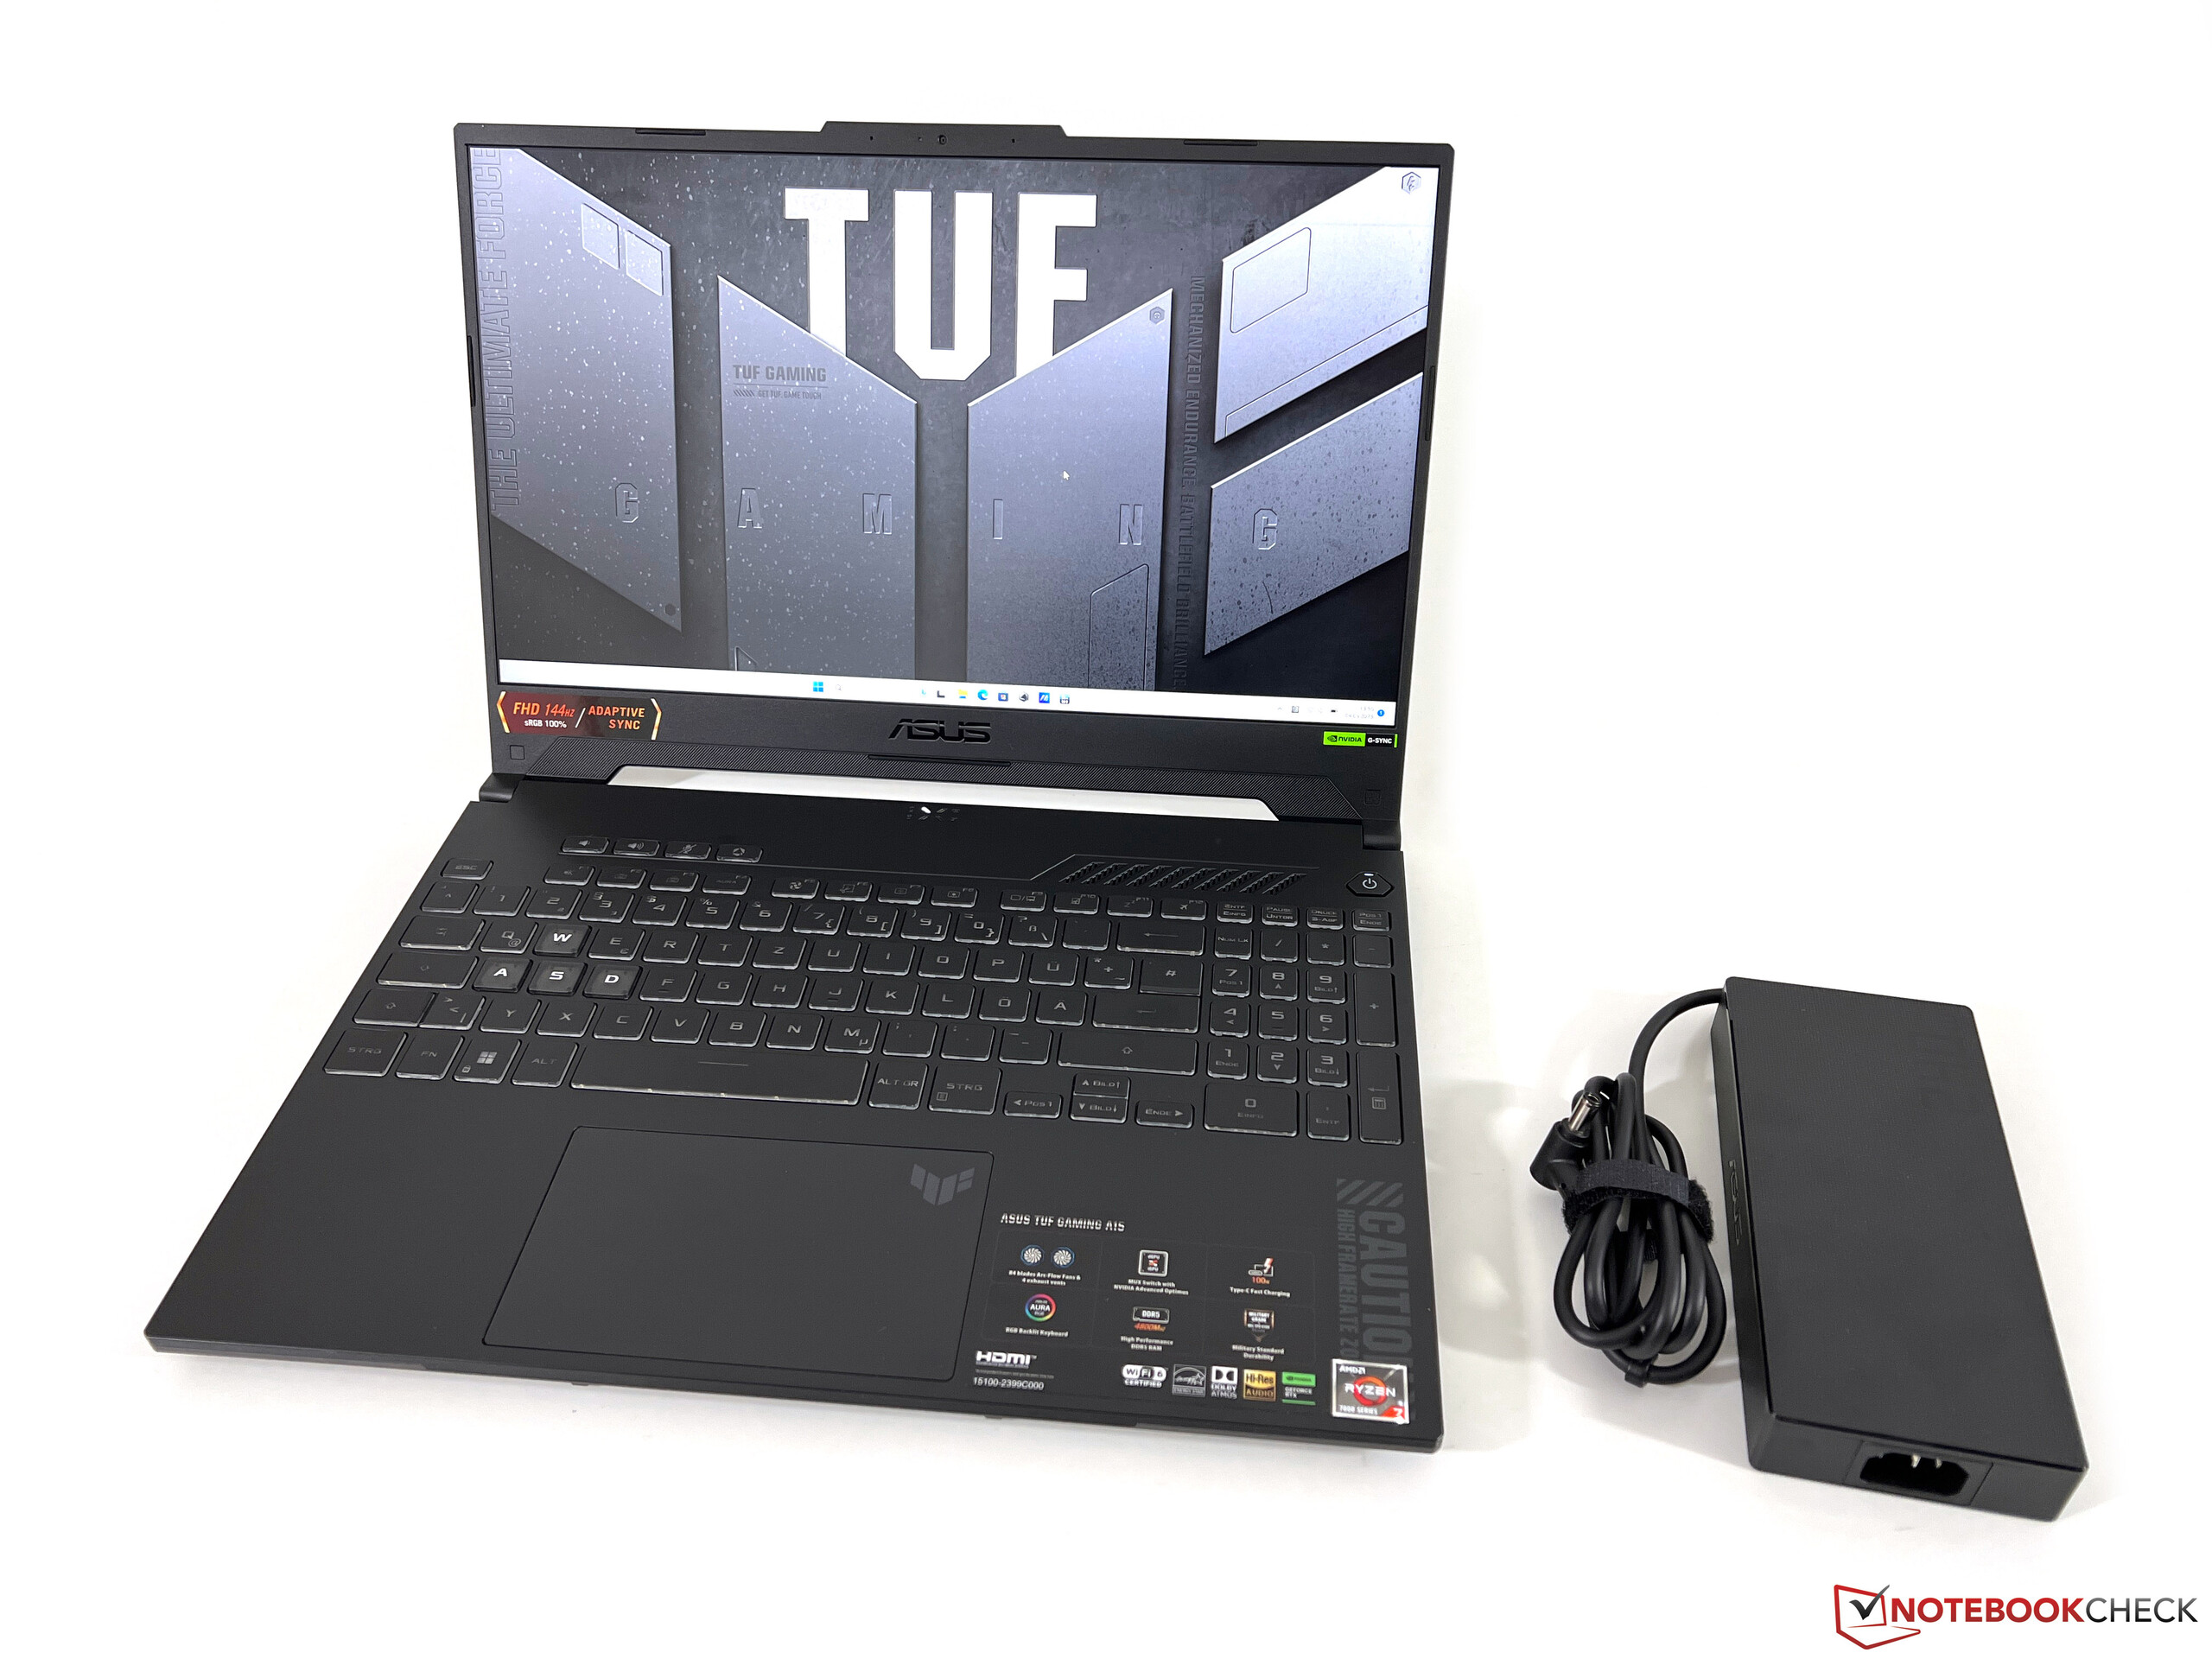
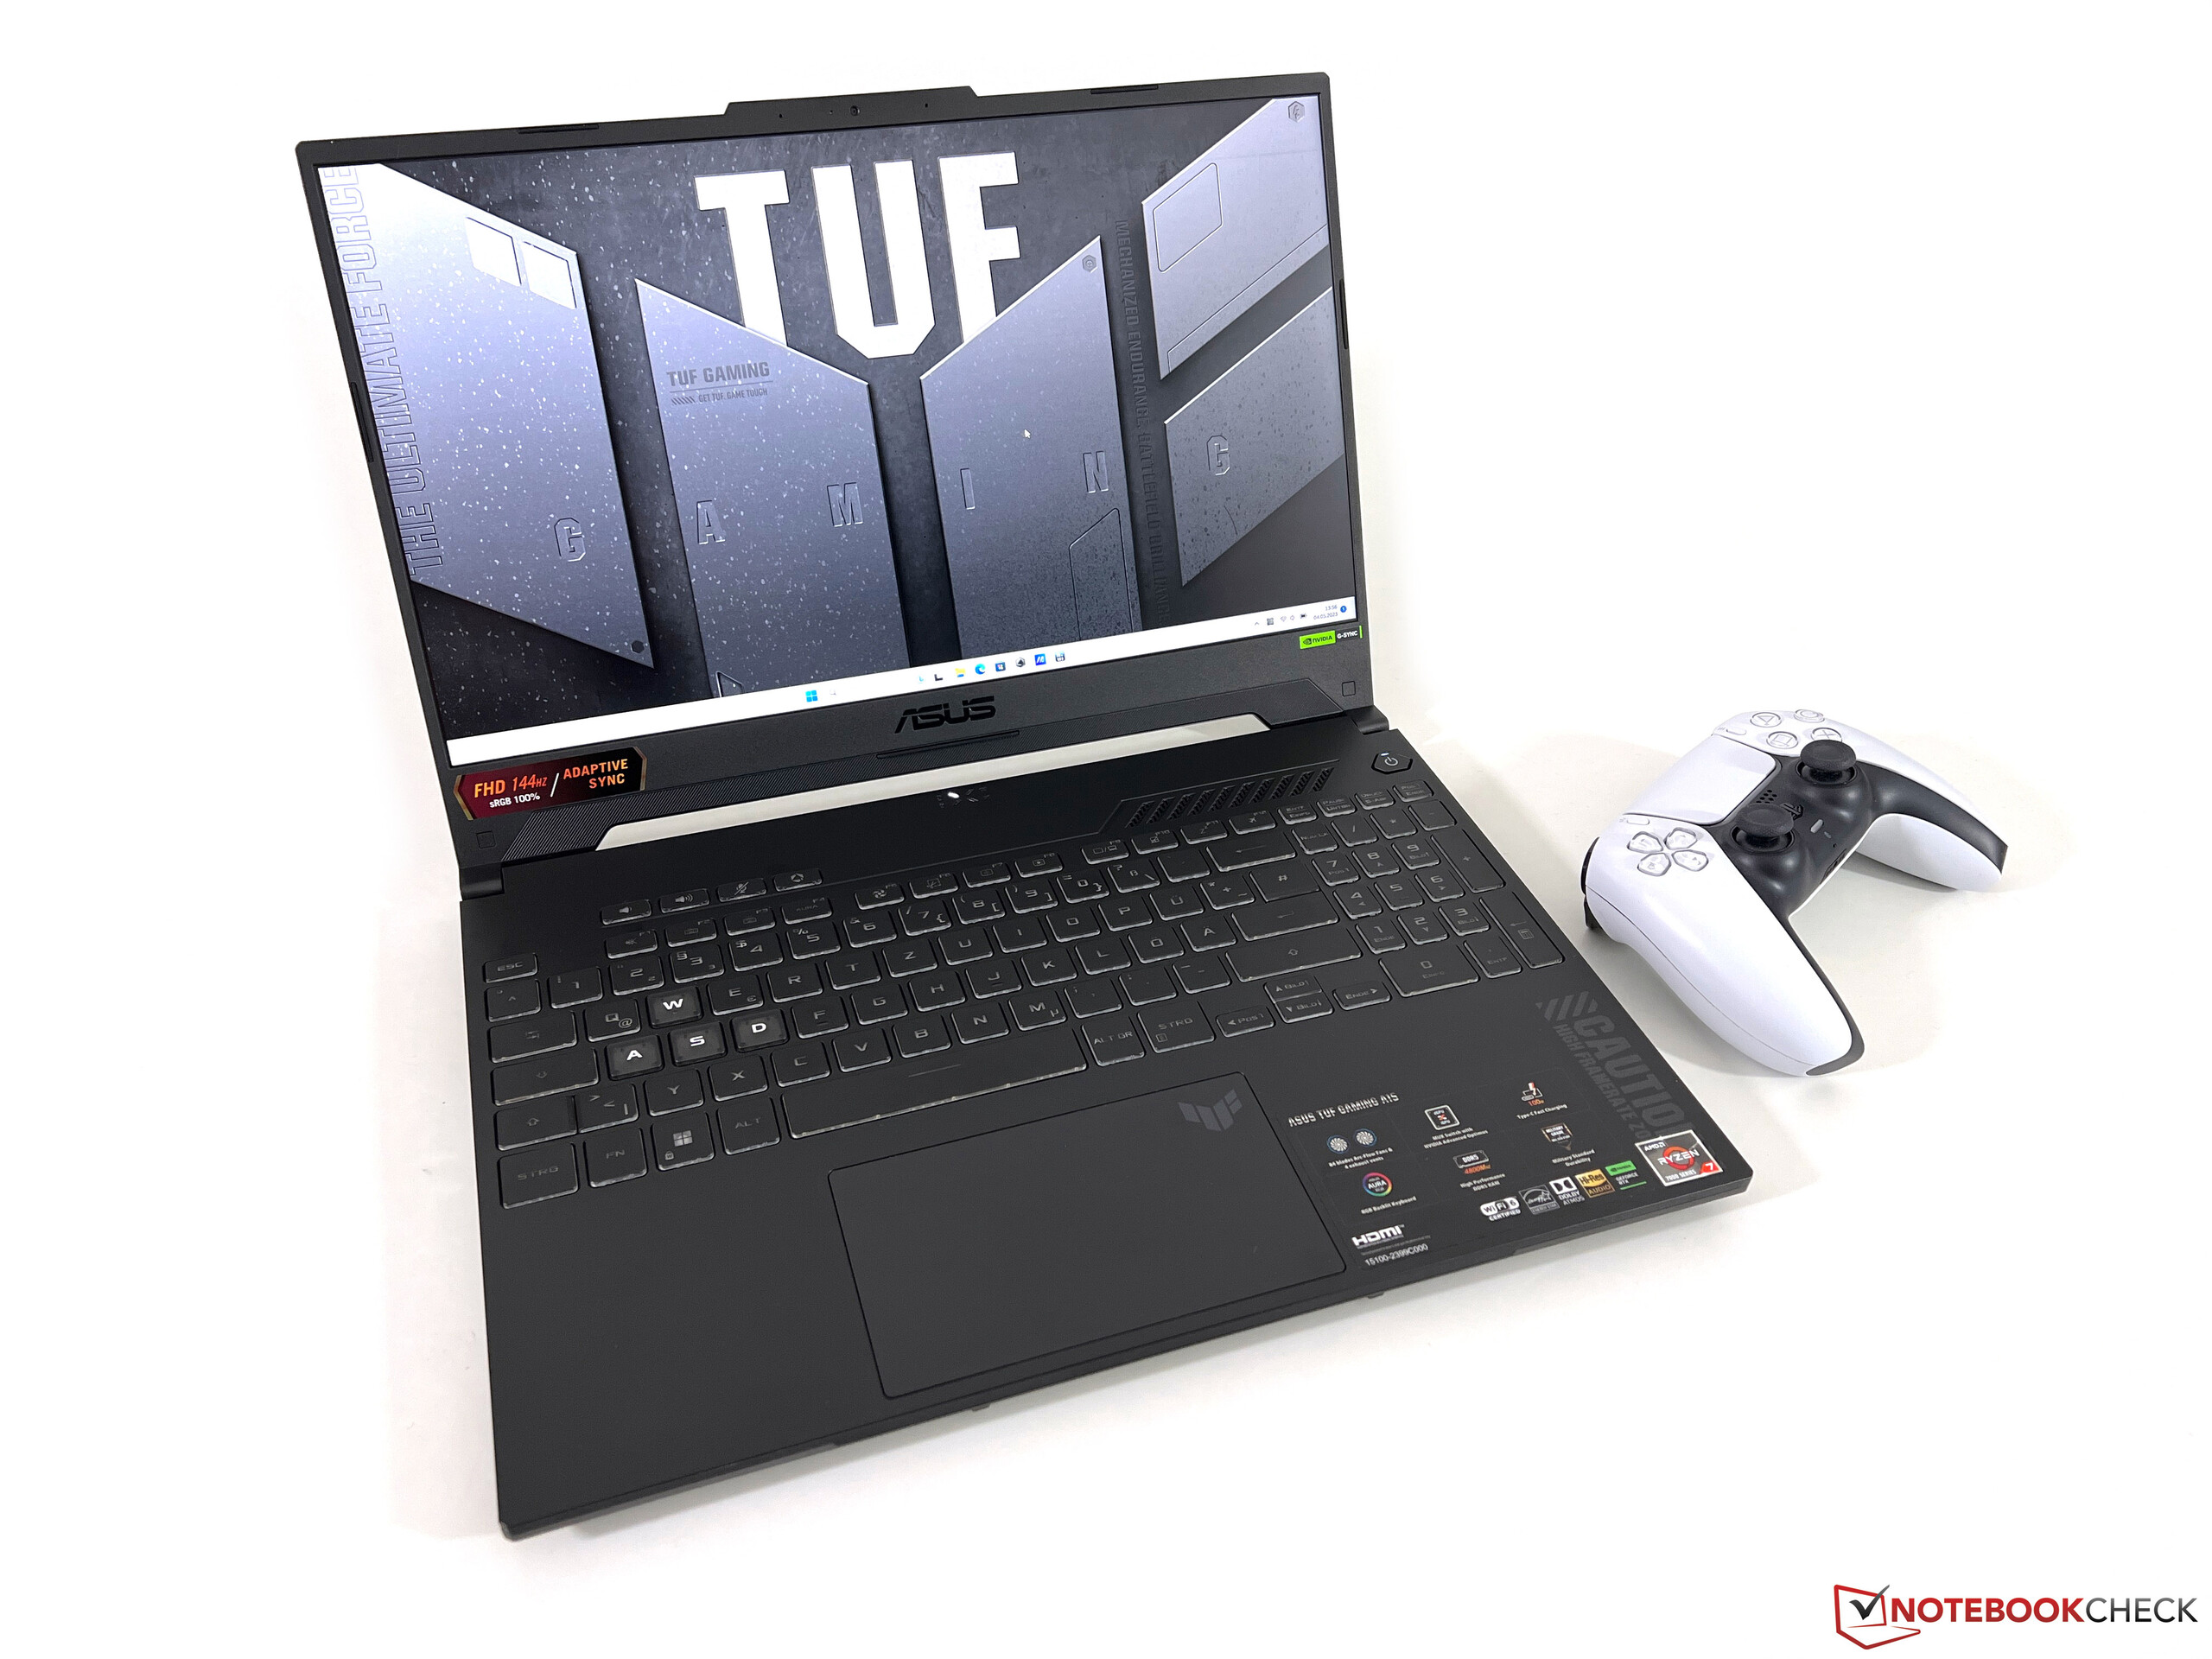
Compared to its predecessor with an Intel processor, the TUF Gaming F15, this laptop's case design remains practically unchanged. There are only small differences, such as the WASD keys no longer being white and the four corners of the lid now featuring little bars instead of circles. The current model still doesn't feature any fancy lighting features and in general, the laptop has taken on quite an understated look with its dark gray color. Especially the bottom edge along the screen is quite big, as the laptop still uses a 16:9 ratio. You will likely need to clean its dark surfaces quite frequently, as they are prone to collecting fingerprint marks.
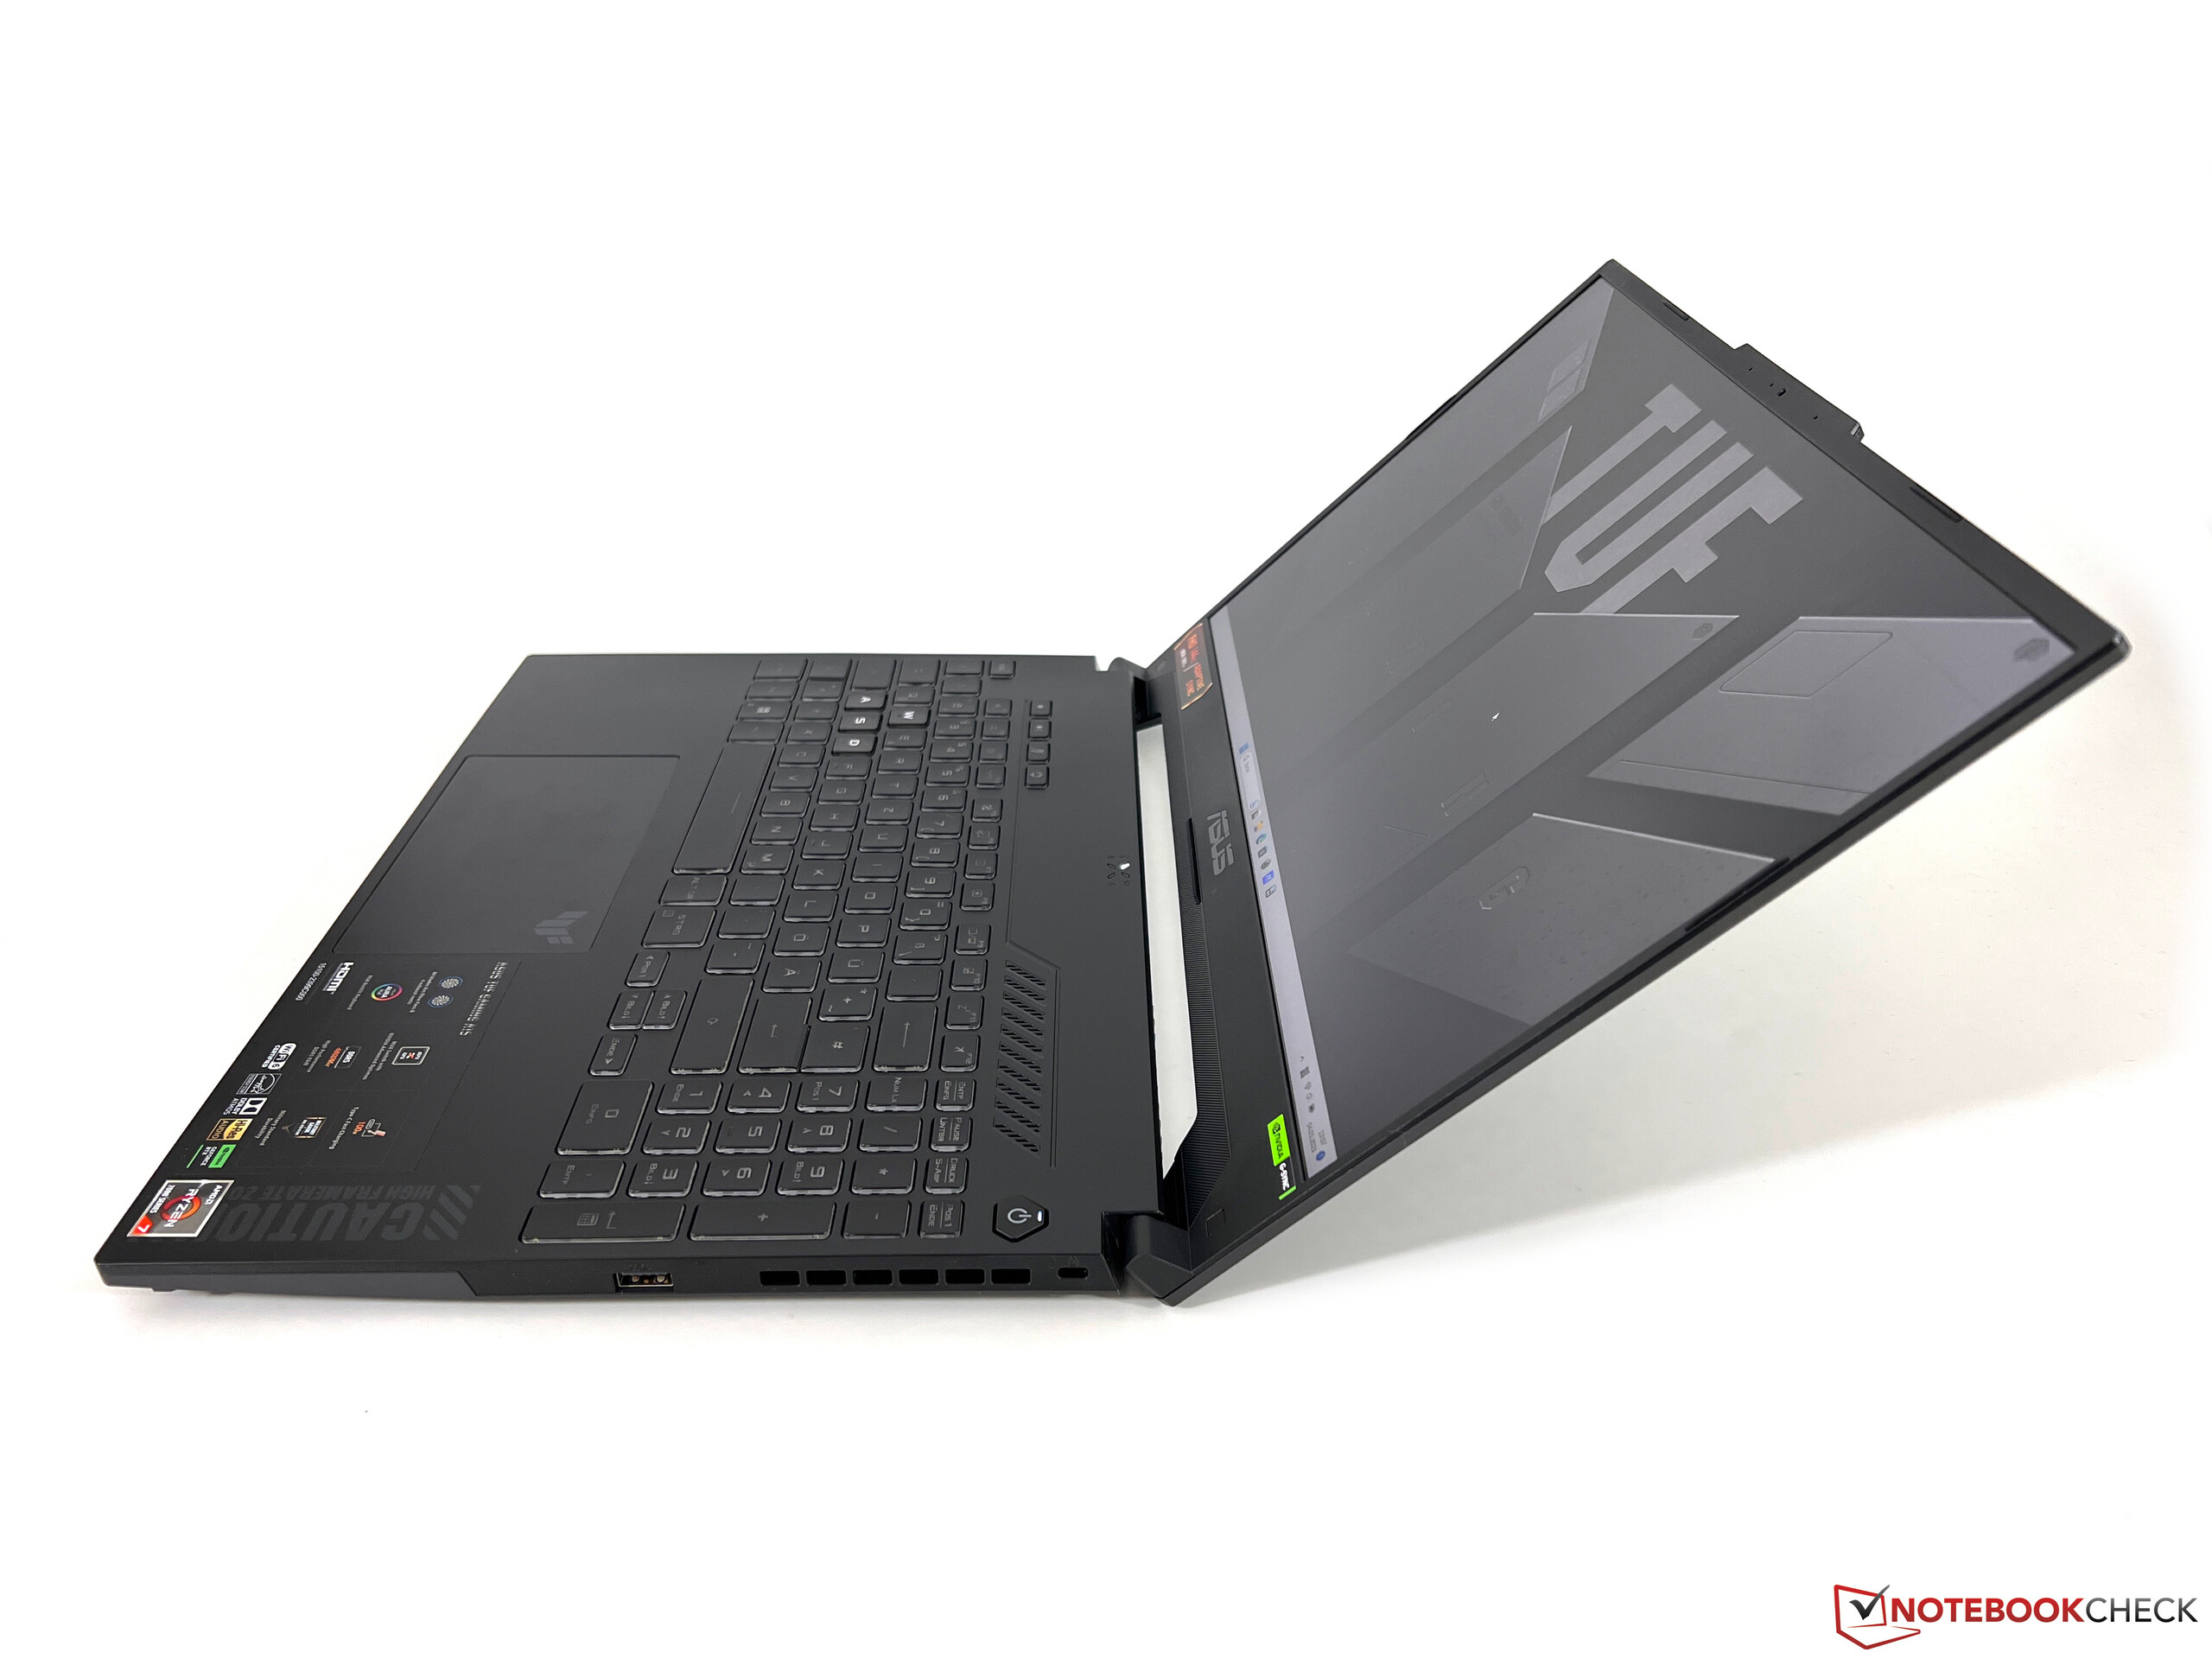
The laptop's lid is made of metal and the rest of the case is plastic. The base unit is stable enough but you can push in the middle of the keyboard quite easily. Although, it doesn't make any creaking noises when you try to twist and bend the device. Its thin lid isn't the best, as the screen already starts to show disturbances when you press down on it with little pressure or try to change the opening angle (max. ~ 135 degrees).
Size-wise, all the competitors are quite similar - but the TUF Gaming A15 has the smallest blueprint. It weighs just over 2.1 kg, making the laptop relatively portable and you will most likely be able to fit it into most backpacks or bags. The included 240-watt power supply weighs an additional 735 grams.
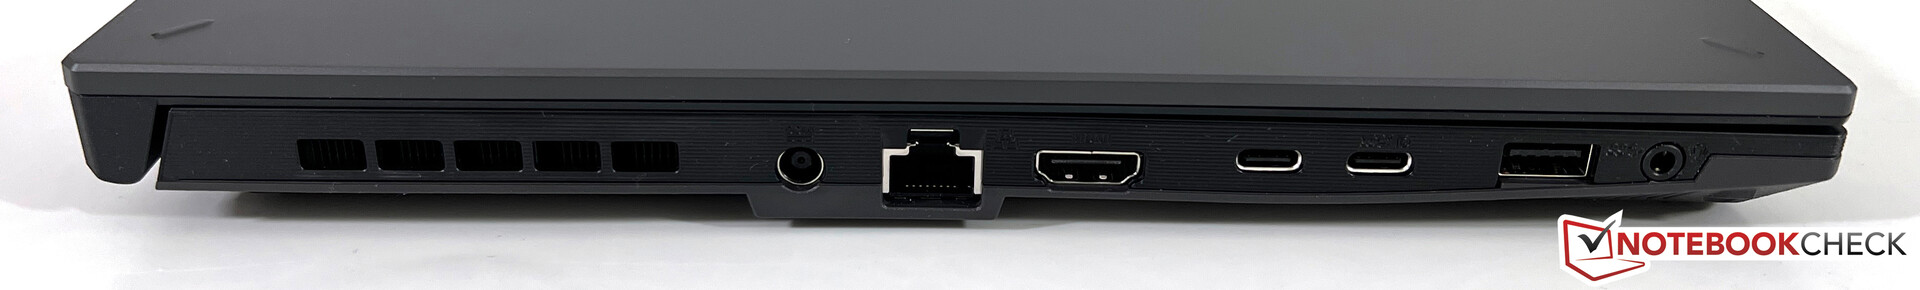
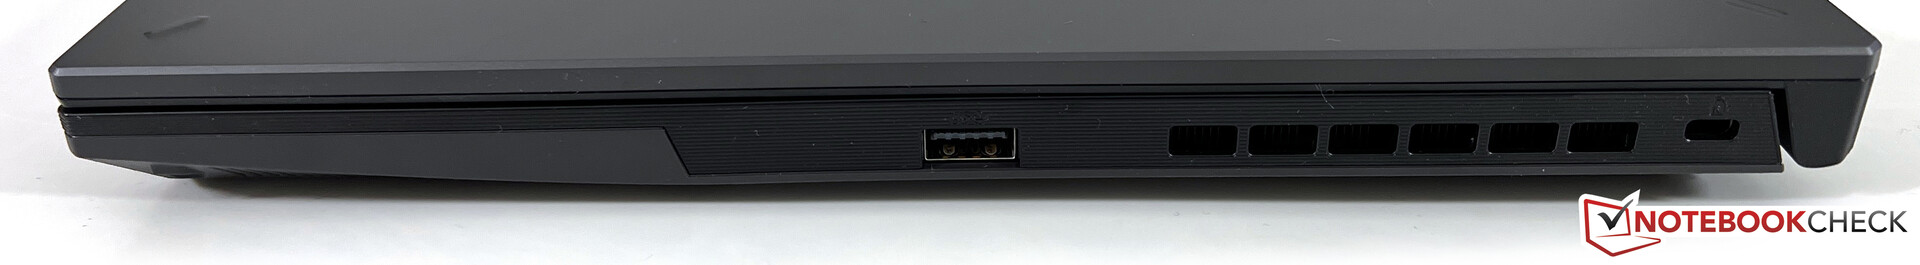
Connectivity - Asus have included USB 4
The back part of the base unit is occupied by the cooling unit and almost all ports are situated on the left side of the device. Only one USB port is on the right side. If you are using all the ports, the space might get a bit tight. There are two USB-C ports of which one supports USB 4.0 and the other supports G-Sync if you connect a corresponding monitor.
Communication
Aside from a Gigabit Ethernet port, the laptop also uses a MediaTek MT7921 WLAN module which supports Wi-Fi 6 and 160-MHz band connections. However, its maximum transfer rates are 1,200 Bit/s. In our test using a reference router from Asus, these rates were confirmed and although they are decent, there are definitely faster WLAN modules on the market. At the end of the day, this shouldn't cause any issues in everyday use (e.g. when downloading content).
| Networking | |
| Asus TUF A15 FA507 | |
| iperf3 transmit AXE11000 | |
| iperf3 receive AXE11000 | |
| Gigabyte G5 KE | |
| iperf3 transmit AXE11000 | |
| iperf3 receive AXE11000 | |
| Schenker XMG Core 15 (M22) | |
| iperf3 transmit AXE11000 | |
| iperf3 receive AXE11000 | |
| iperf3 transmit AXE11000 6GHz | |
| iperf3 receive AXE11000 6GHz | |
| MSI Katana 15 B12VEK | |
| iperf3 transmit AXE11000 | |
| iperf3 receive AXE11000 | |
| HP Victus 15 fa0020nr | |
| iperf3 transmit AXE11000 | |
| iperf3 receive AXE11000 | |
| Lenovo IdeaPad Gaming 3 15IAH7 | |
| iperf3 receive AXE11000 | |
| Asus TUF Gaming F15 FX507ZM | |
| iperf3 transmit AX12 | |
| iperf3 receive AX12 | |
Webcam
Despite the TUF Gaming A15's camera having a bump, it is only capable of 720p which struggles to take decent photos even in good lighting conditions. Its sharpness is minimal and colors aren't depicted very accurately, either.


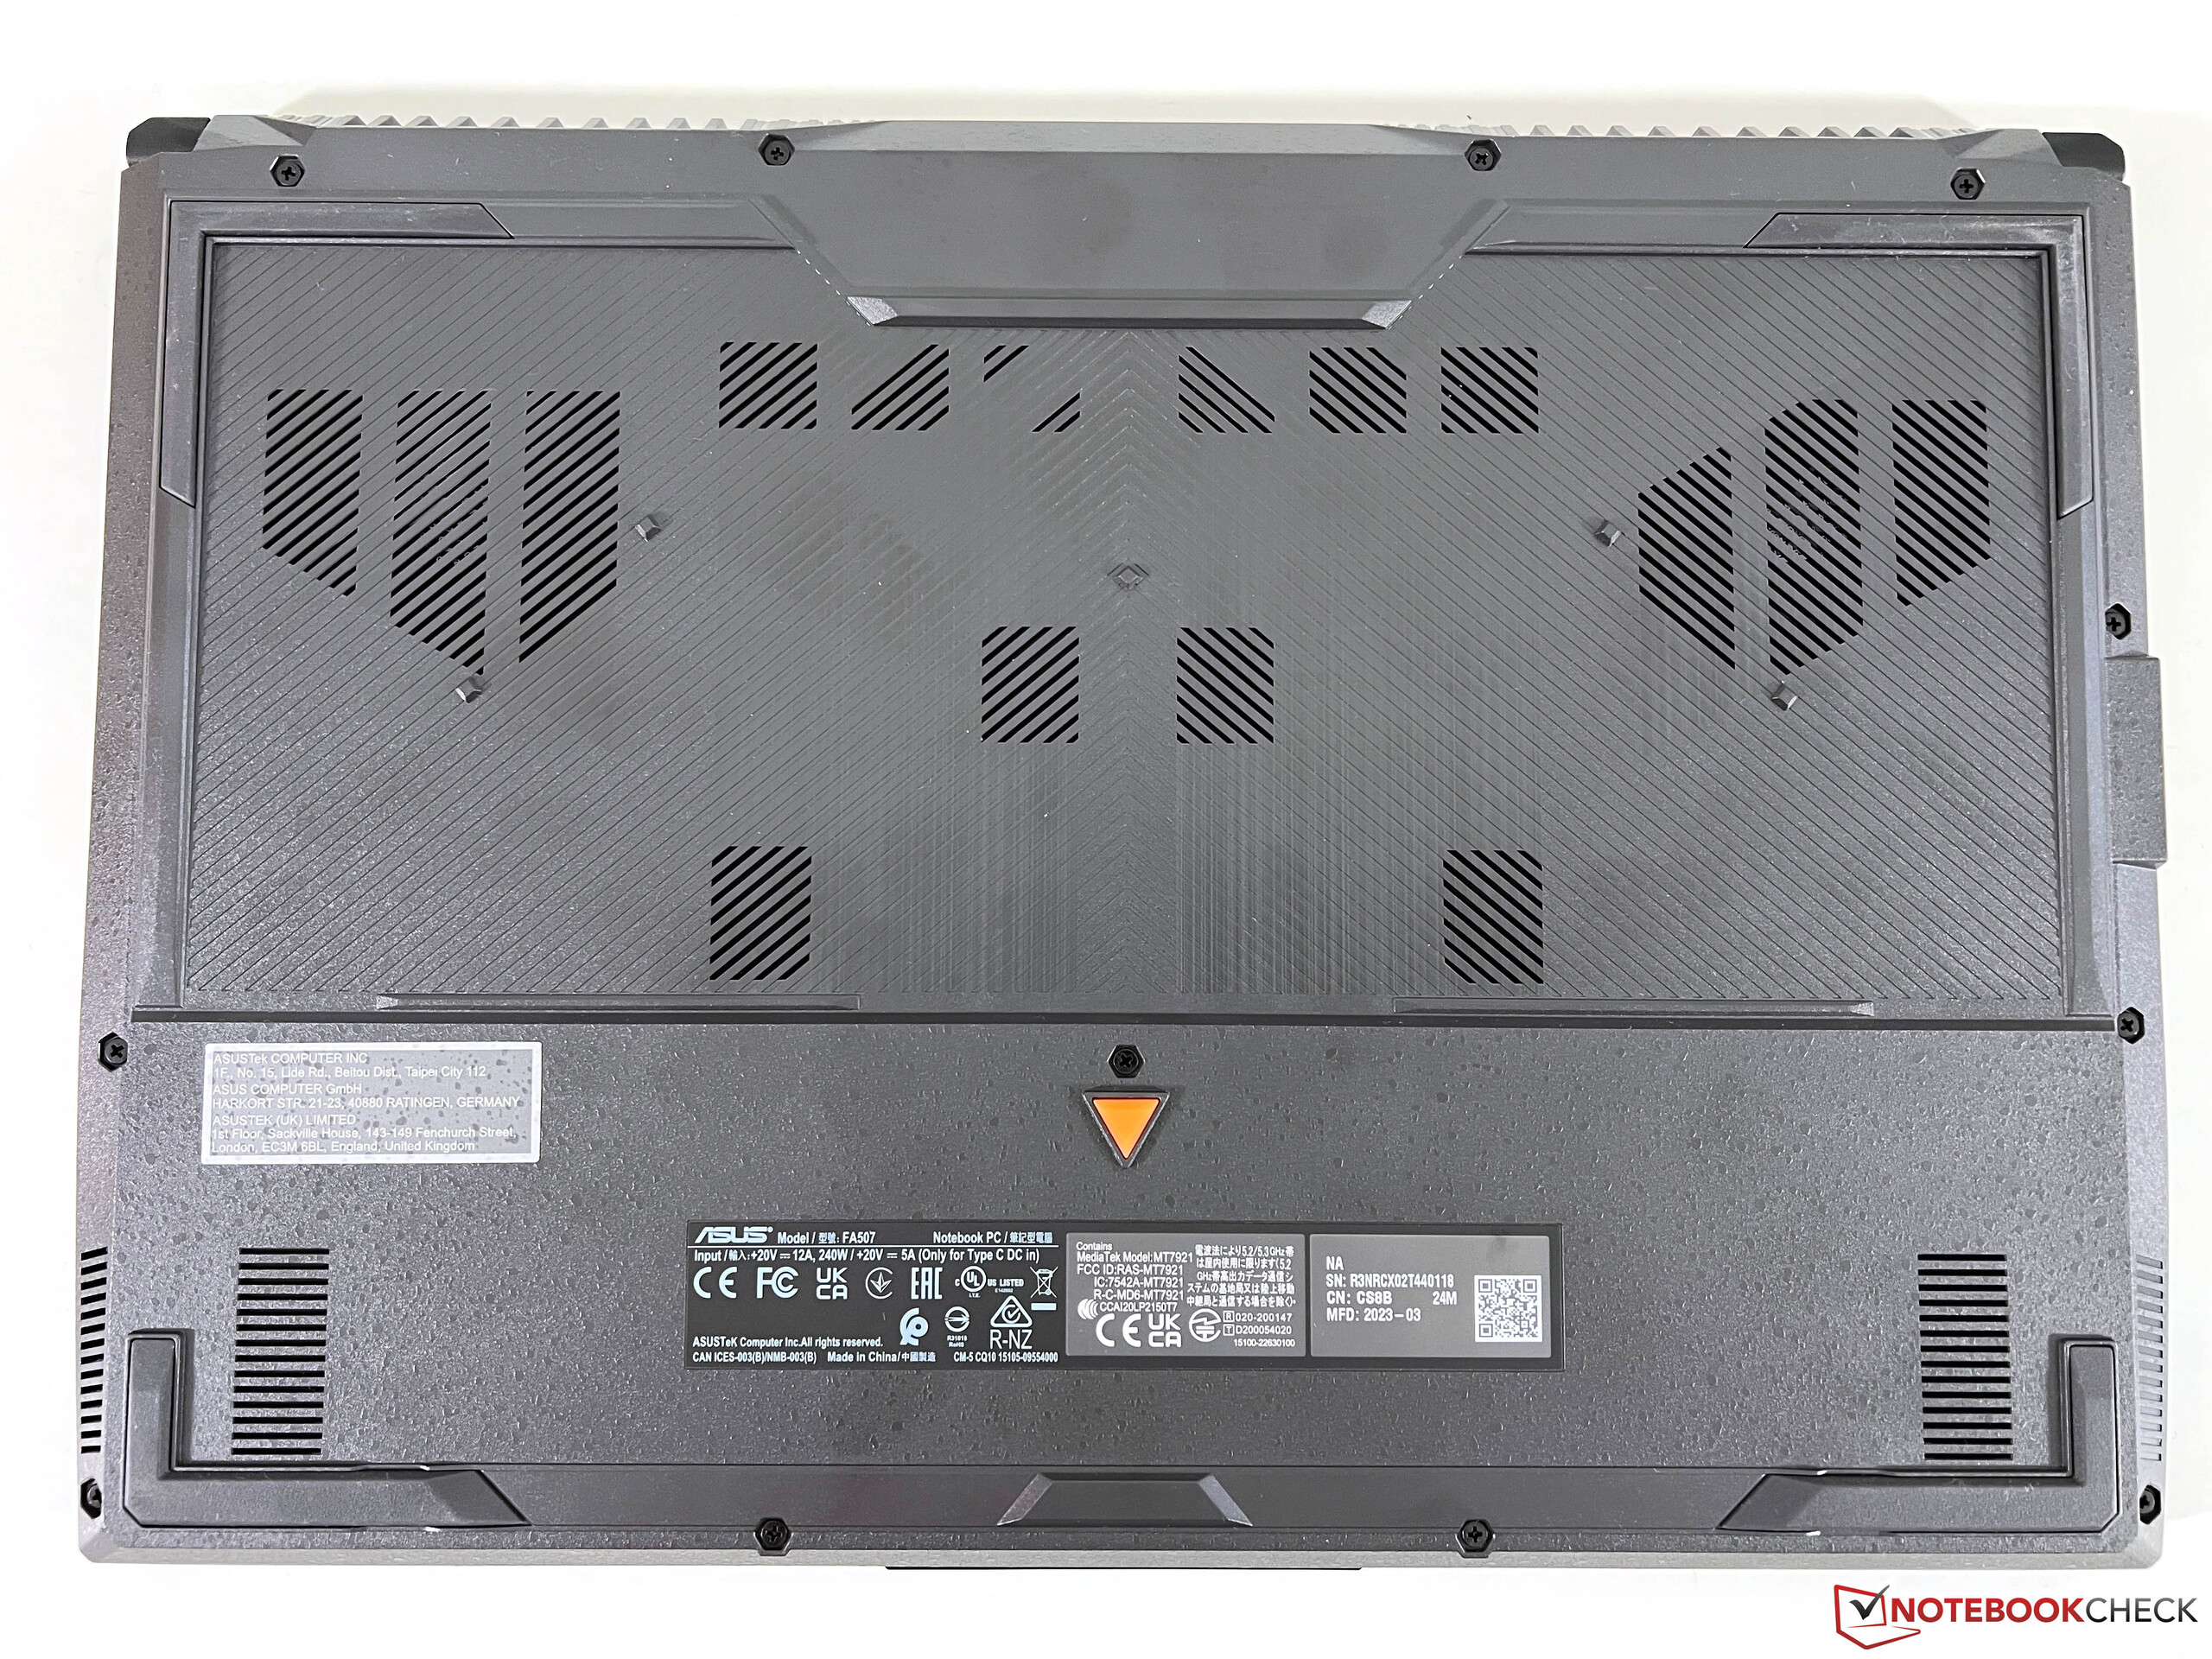
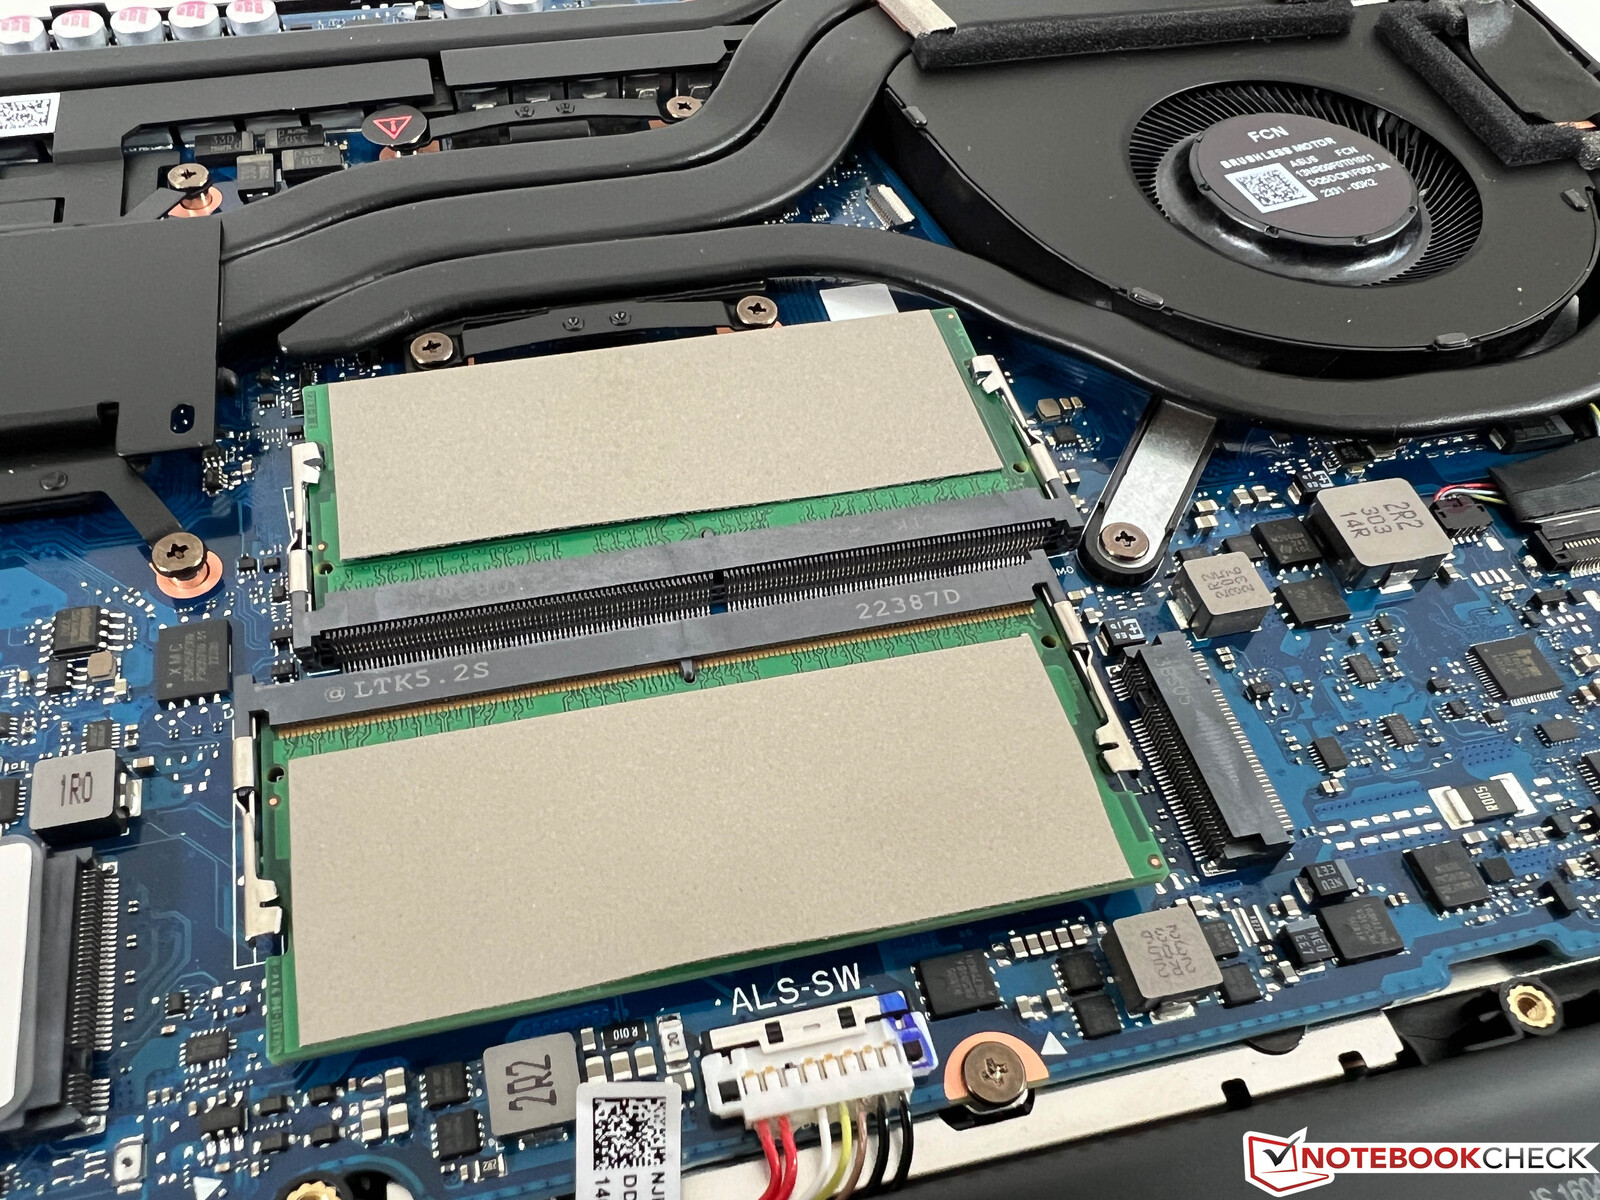
Maintenance
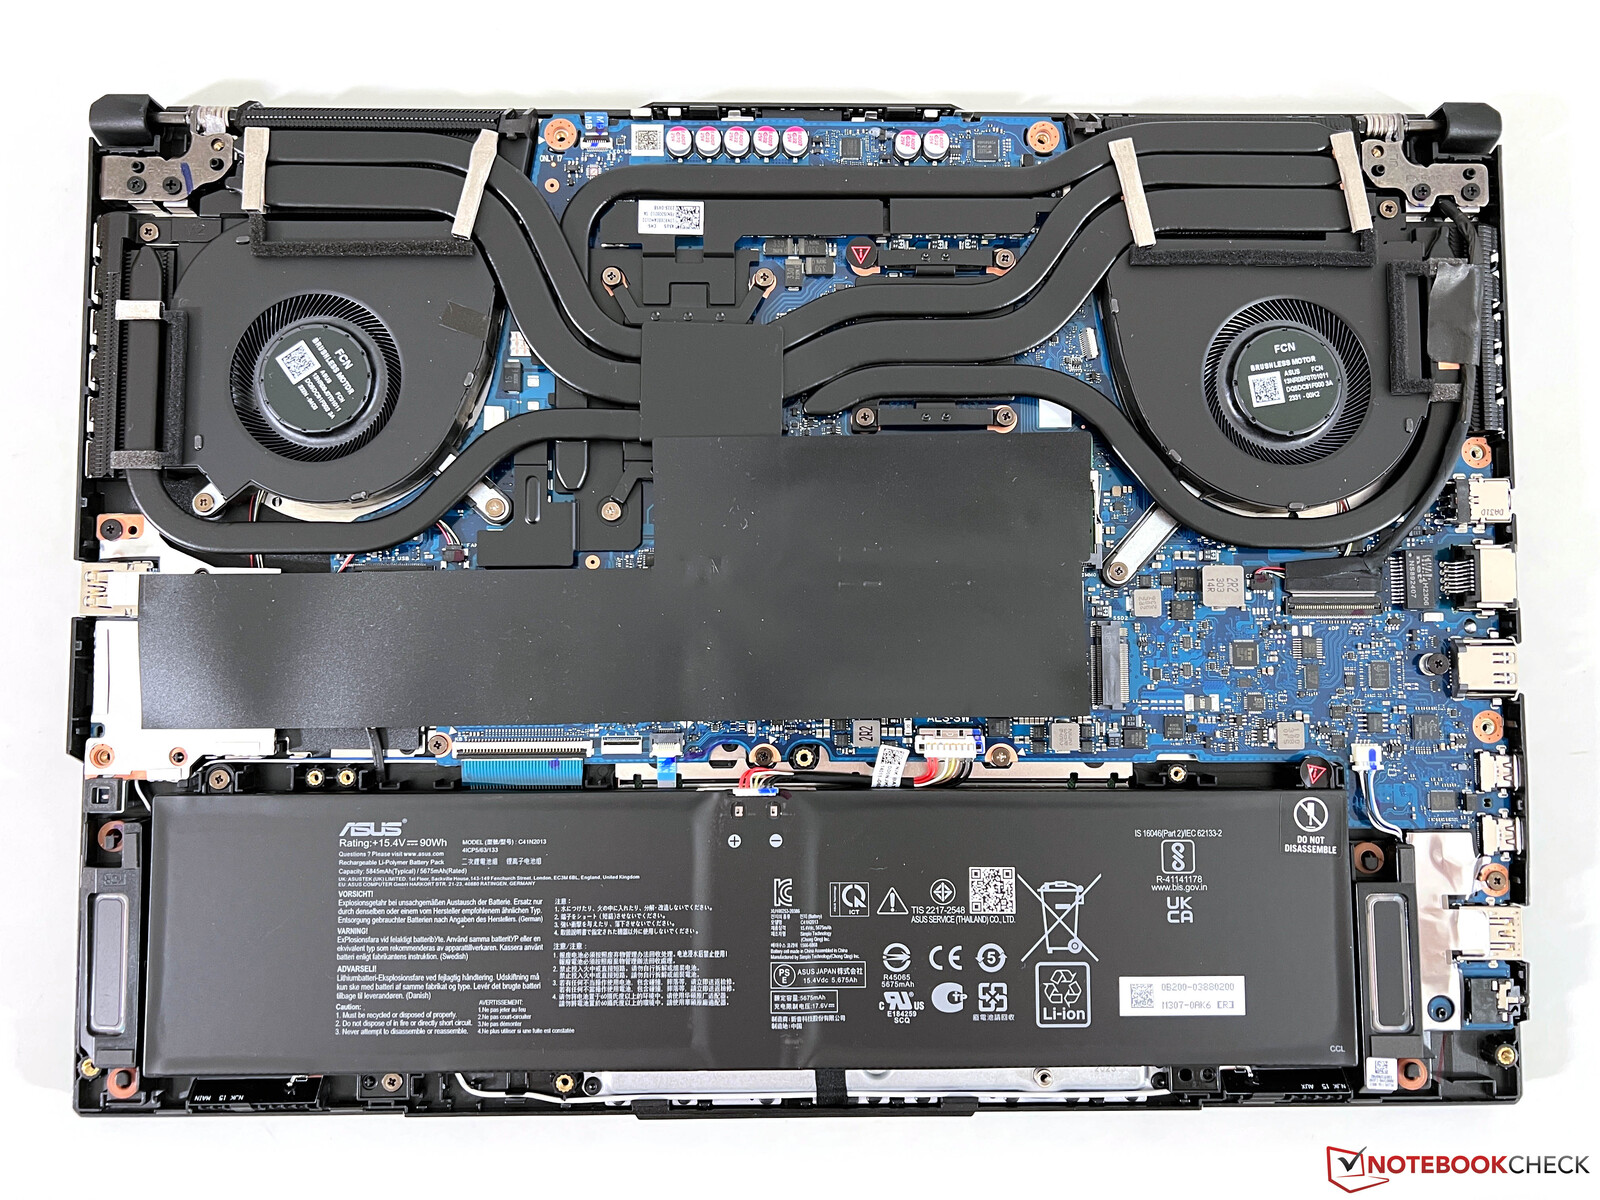
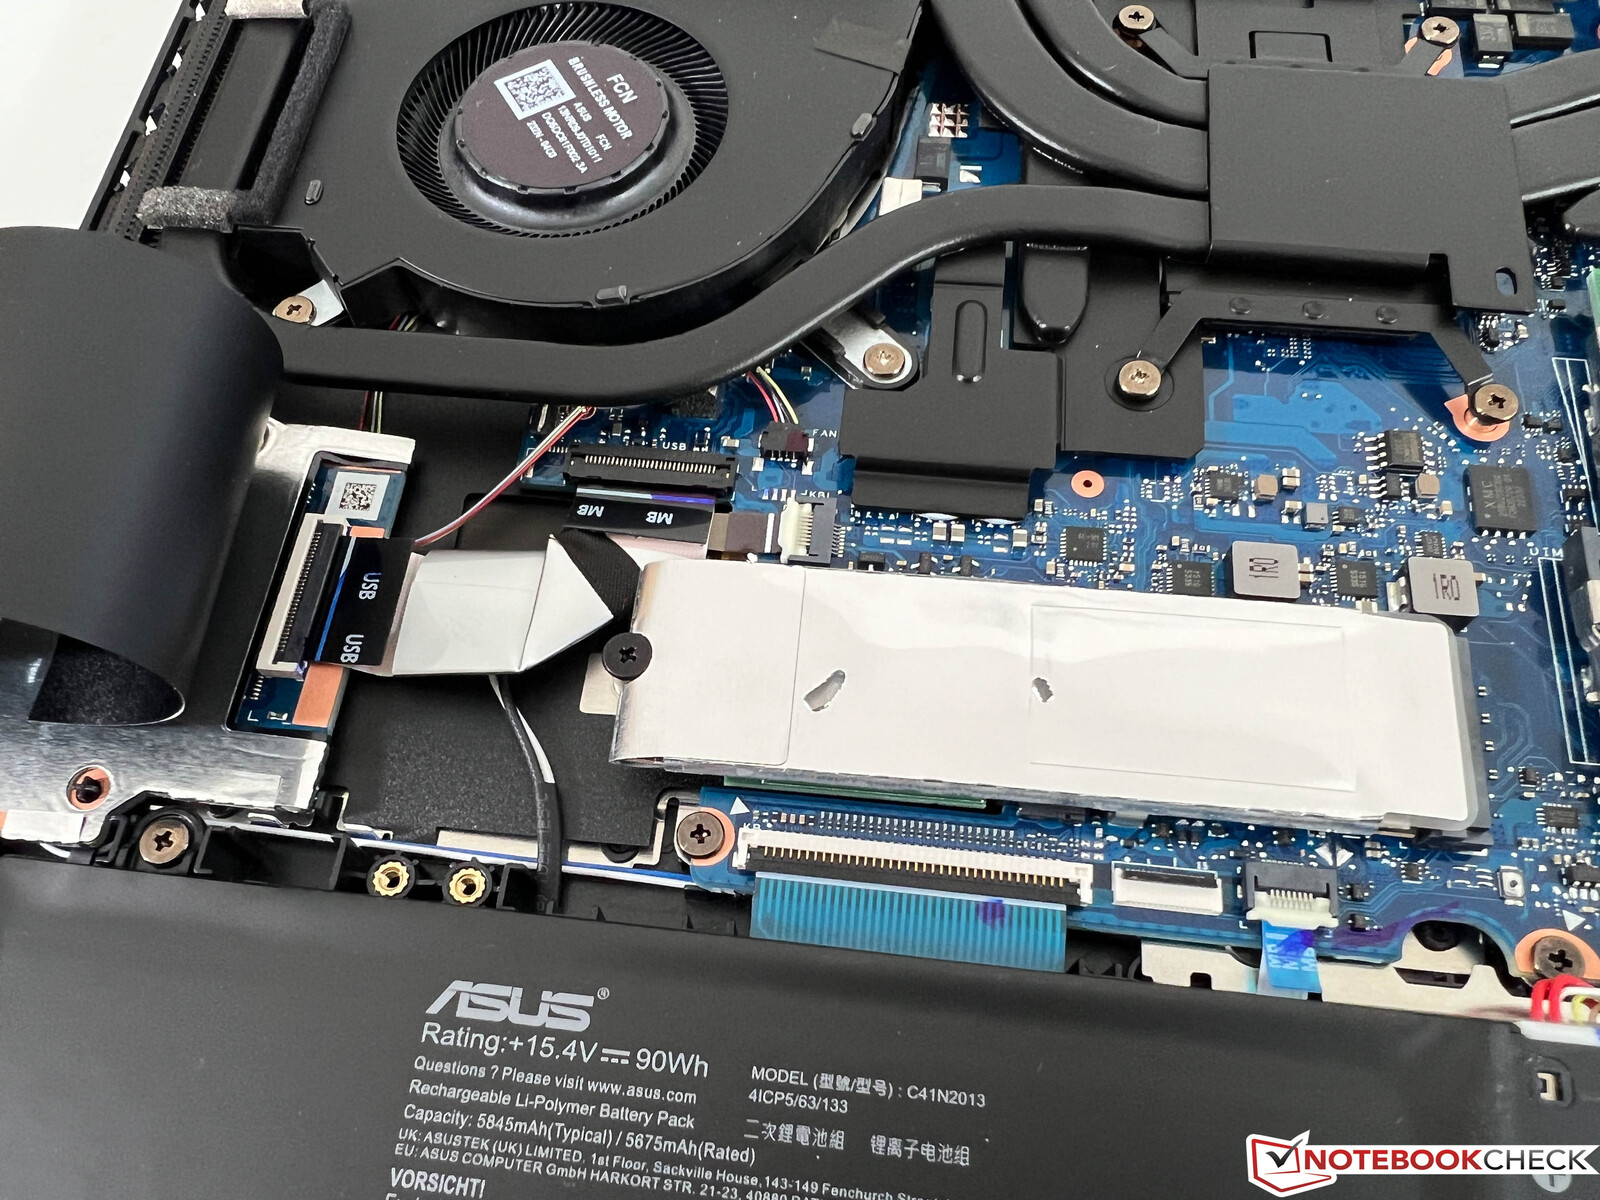
The bottom case lid is quite tightly attached to the rest of the device - even after releasing the screws. Removing this part of the case proves to be a little fiddly. Once you have done so, you can access both of the RAM slots, the battery, the fans and the M.2 2280 SSD.
Input devices - Large keyboard with a numeric keypad
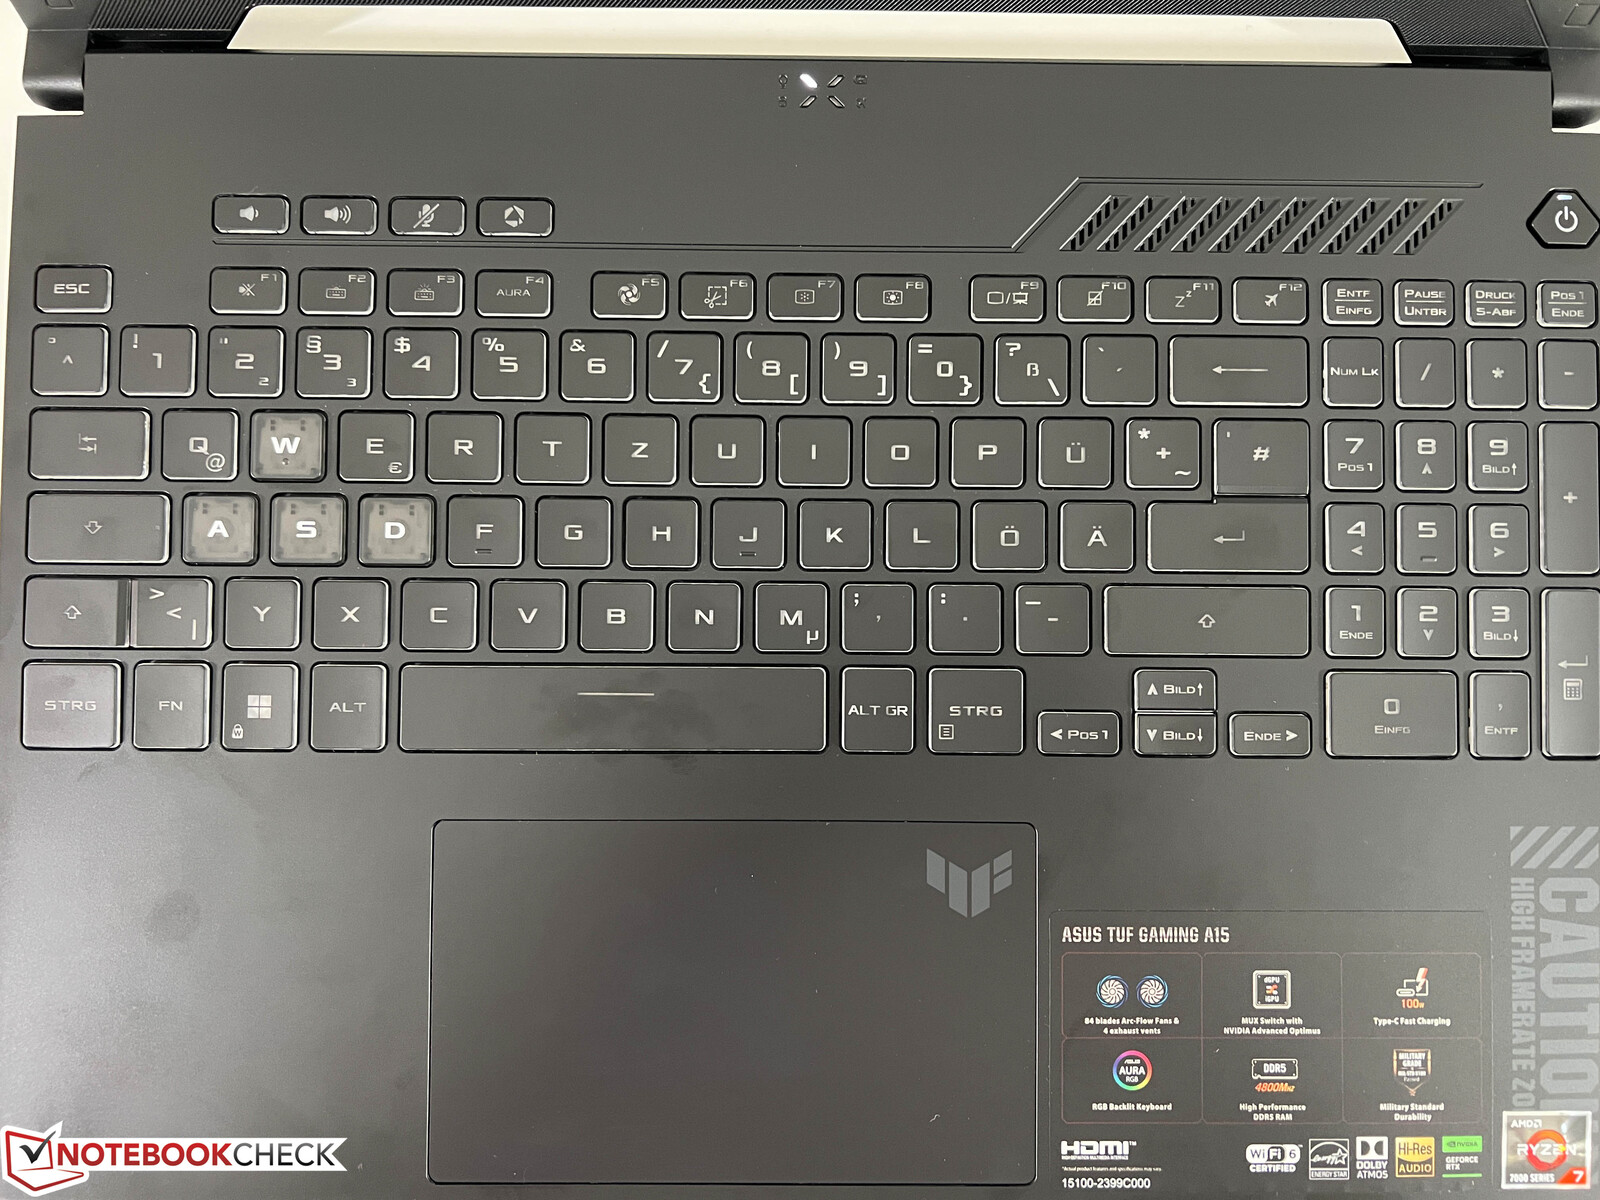
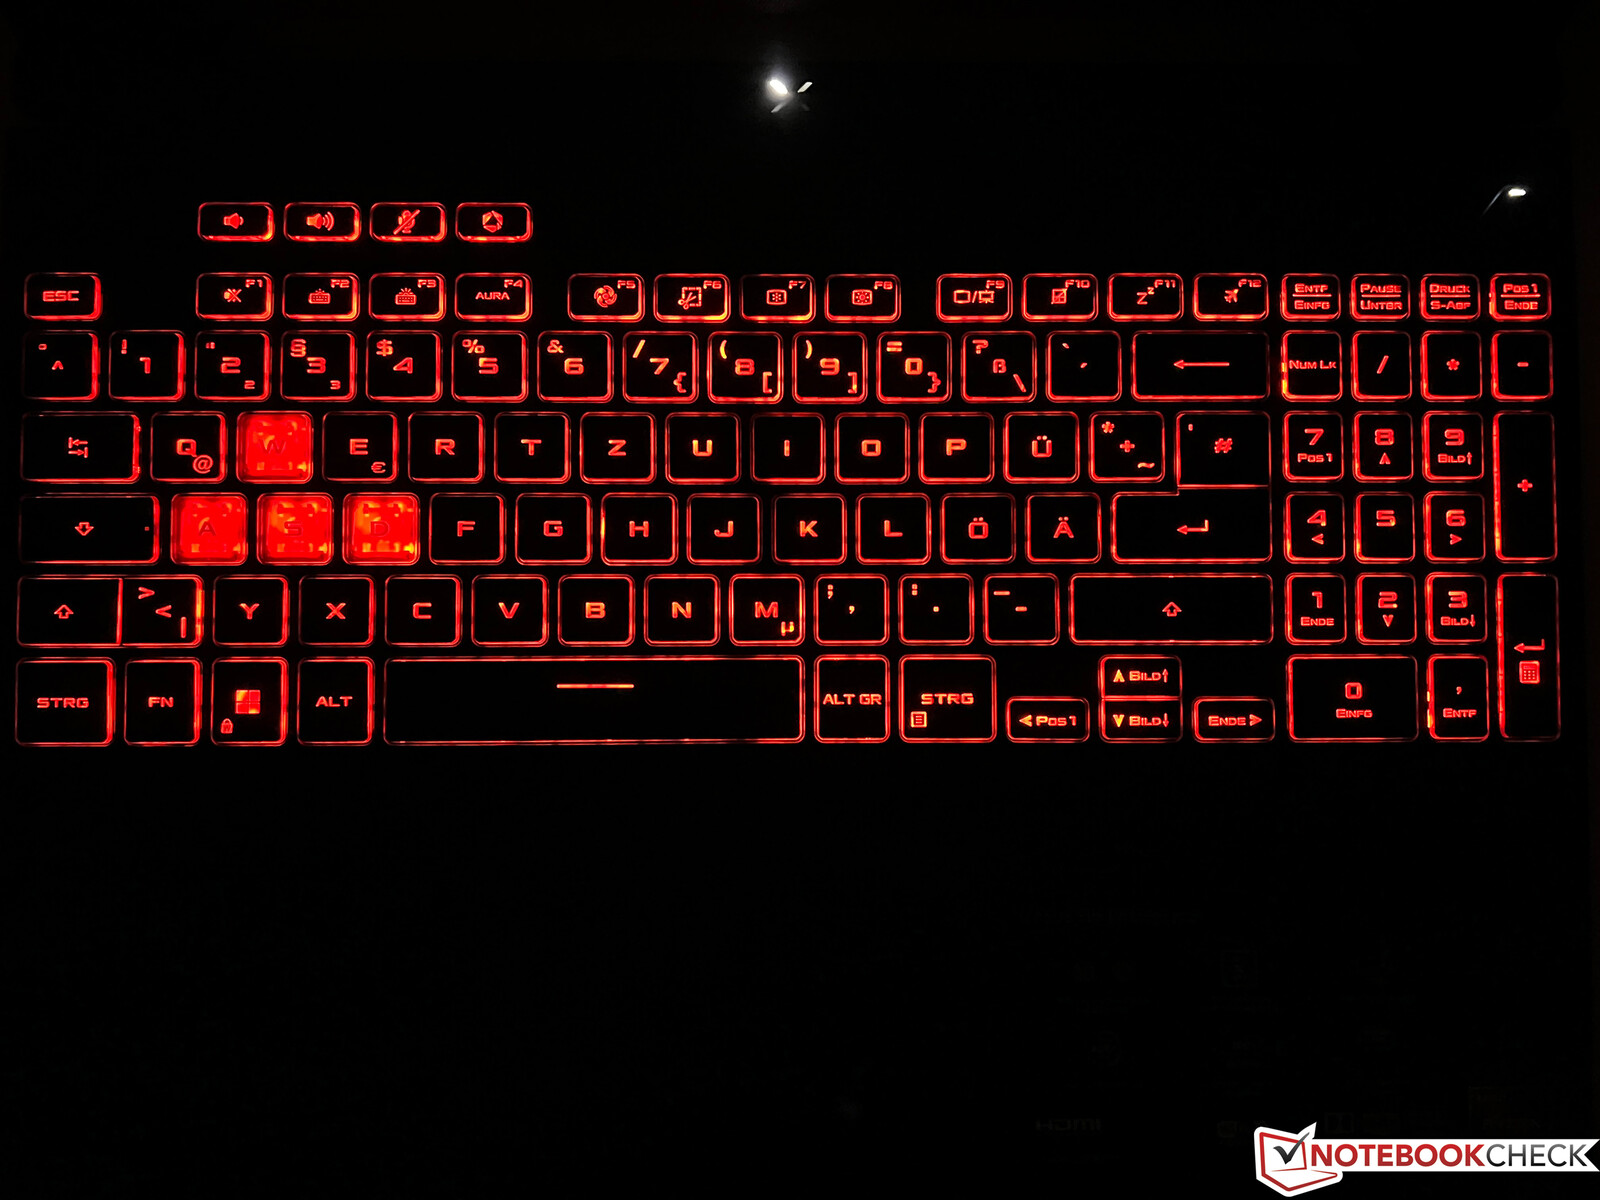
The keyboard features a dedicated numerical keypad and it is comfortable to type on it. The problem, however, lies in the keyboard labelling. Apart from the WASD keys which are white, all the other keys have transparent labelling. Even in decent lighting conditions, it is therefore often more comfortable to just activate the back-lighting. There are three lighting levels and you can also choose your own color - within one zone. Its layout is fine but you have to get used to the single-row enter key. Above the regular keyboard, there are also four special keys: Three are used to control the volume and one can be personally assigned. It must be said, the arrow keys are particularly small for a gaming laptop.
The touchpad works well - regular finger movements are input smoothly and its surface has a nice feel to it. Its click noise is nice and quiet. In total, a solid performance and of course, most users will turn to using an external mouse or a controller, anyway.
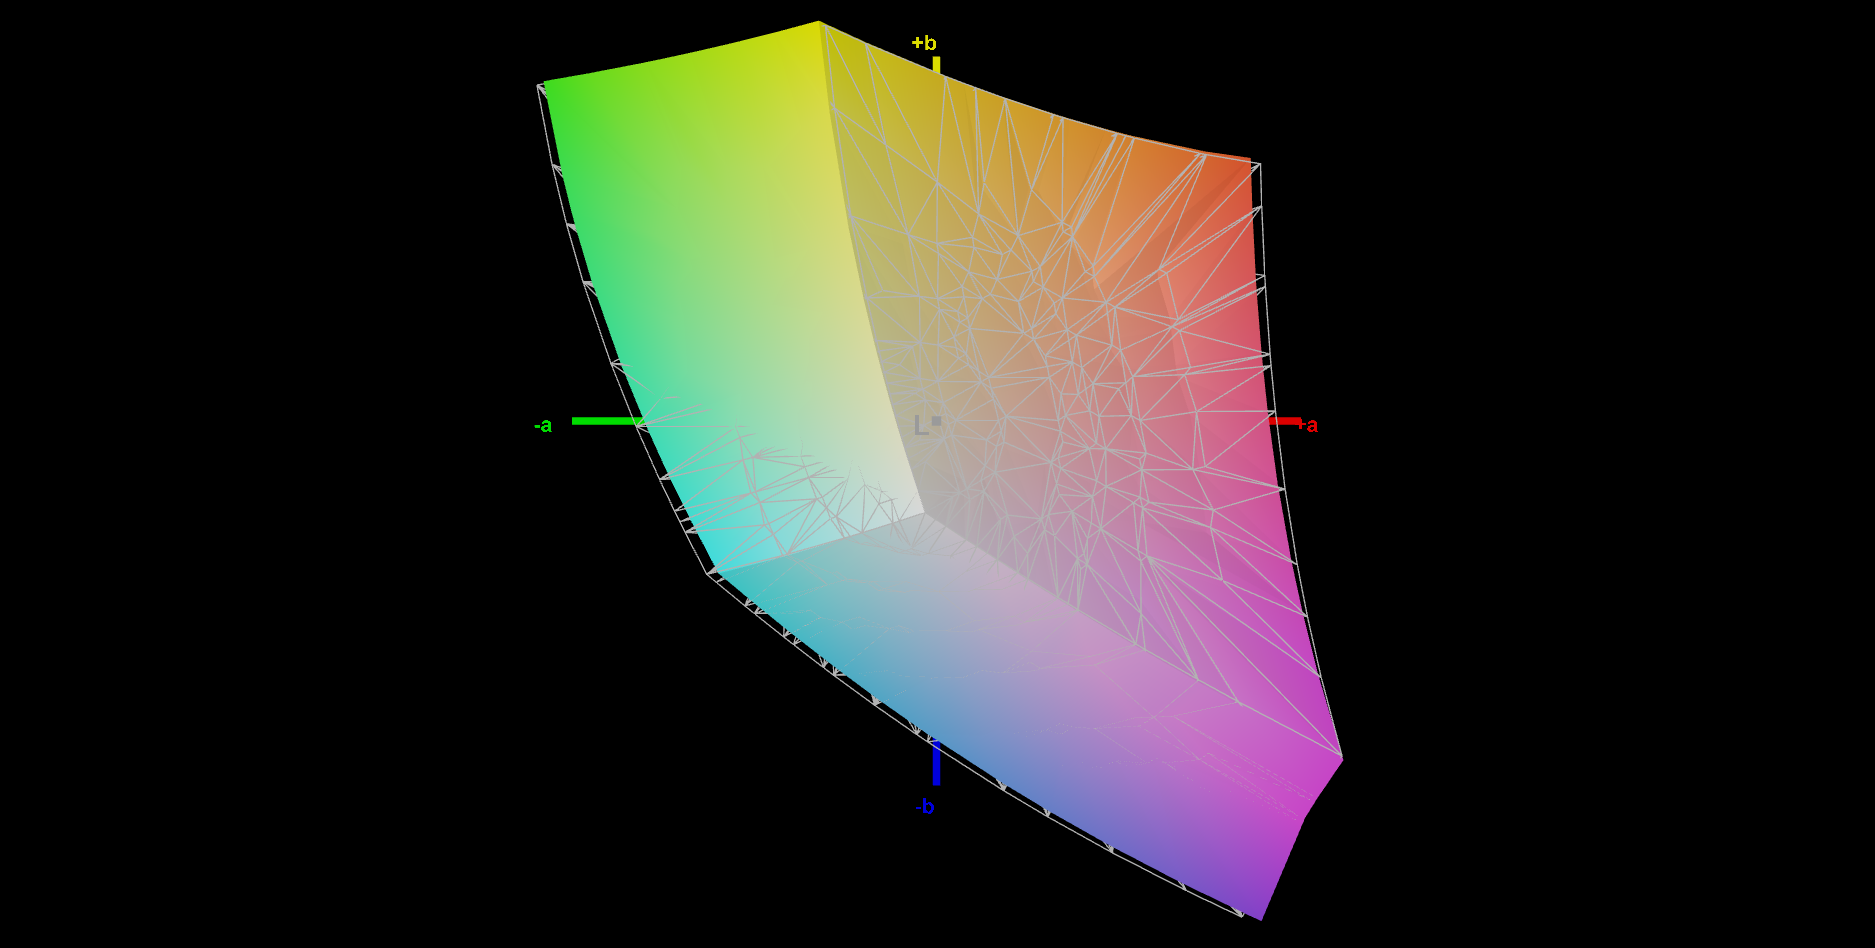
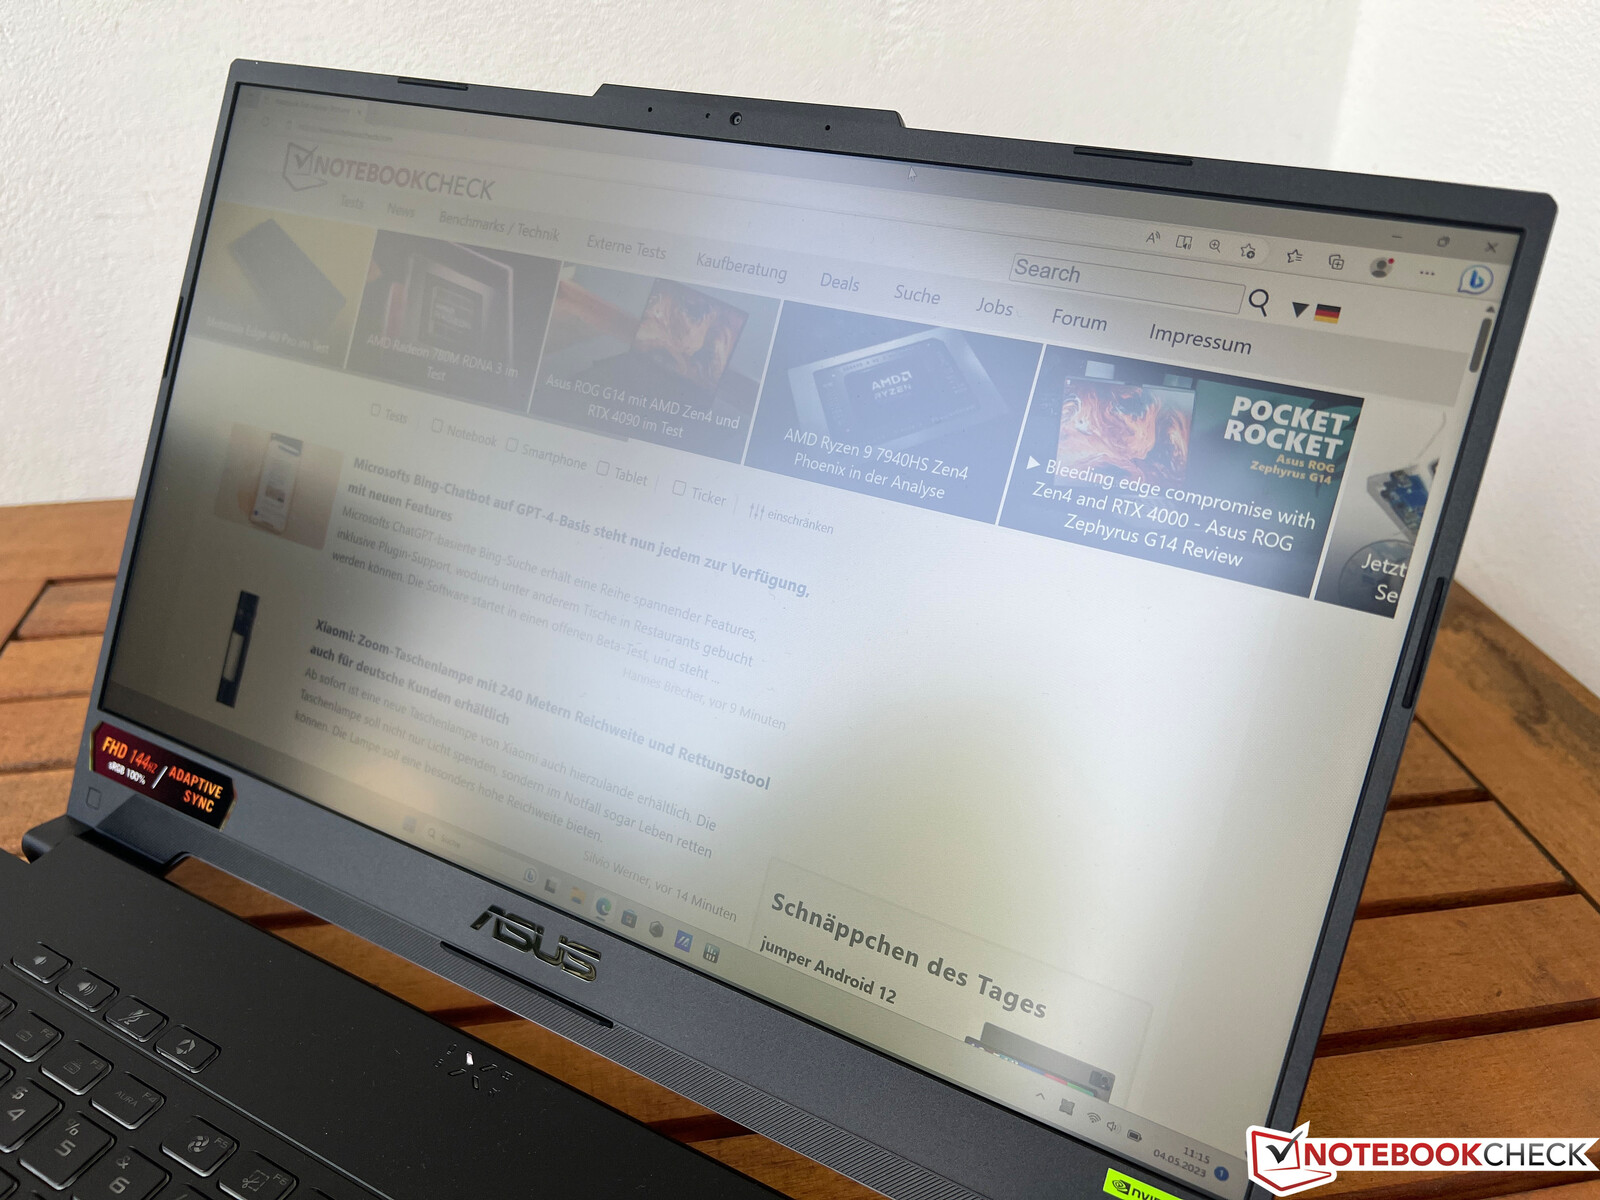
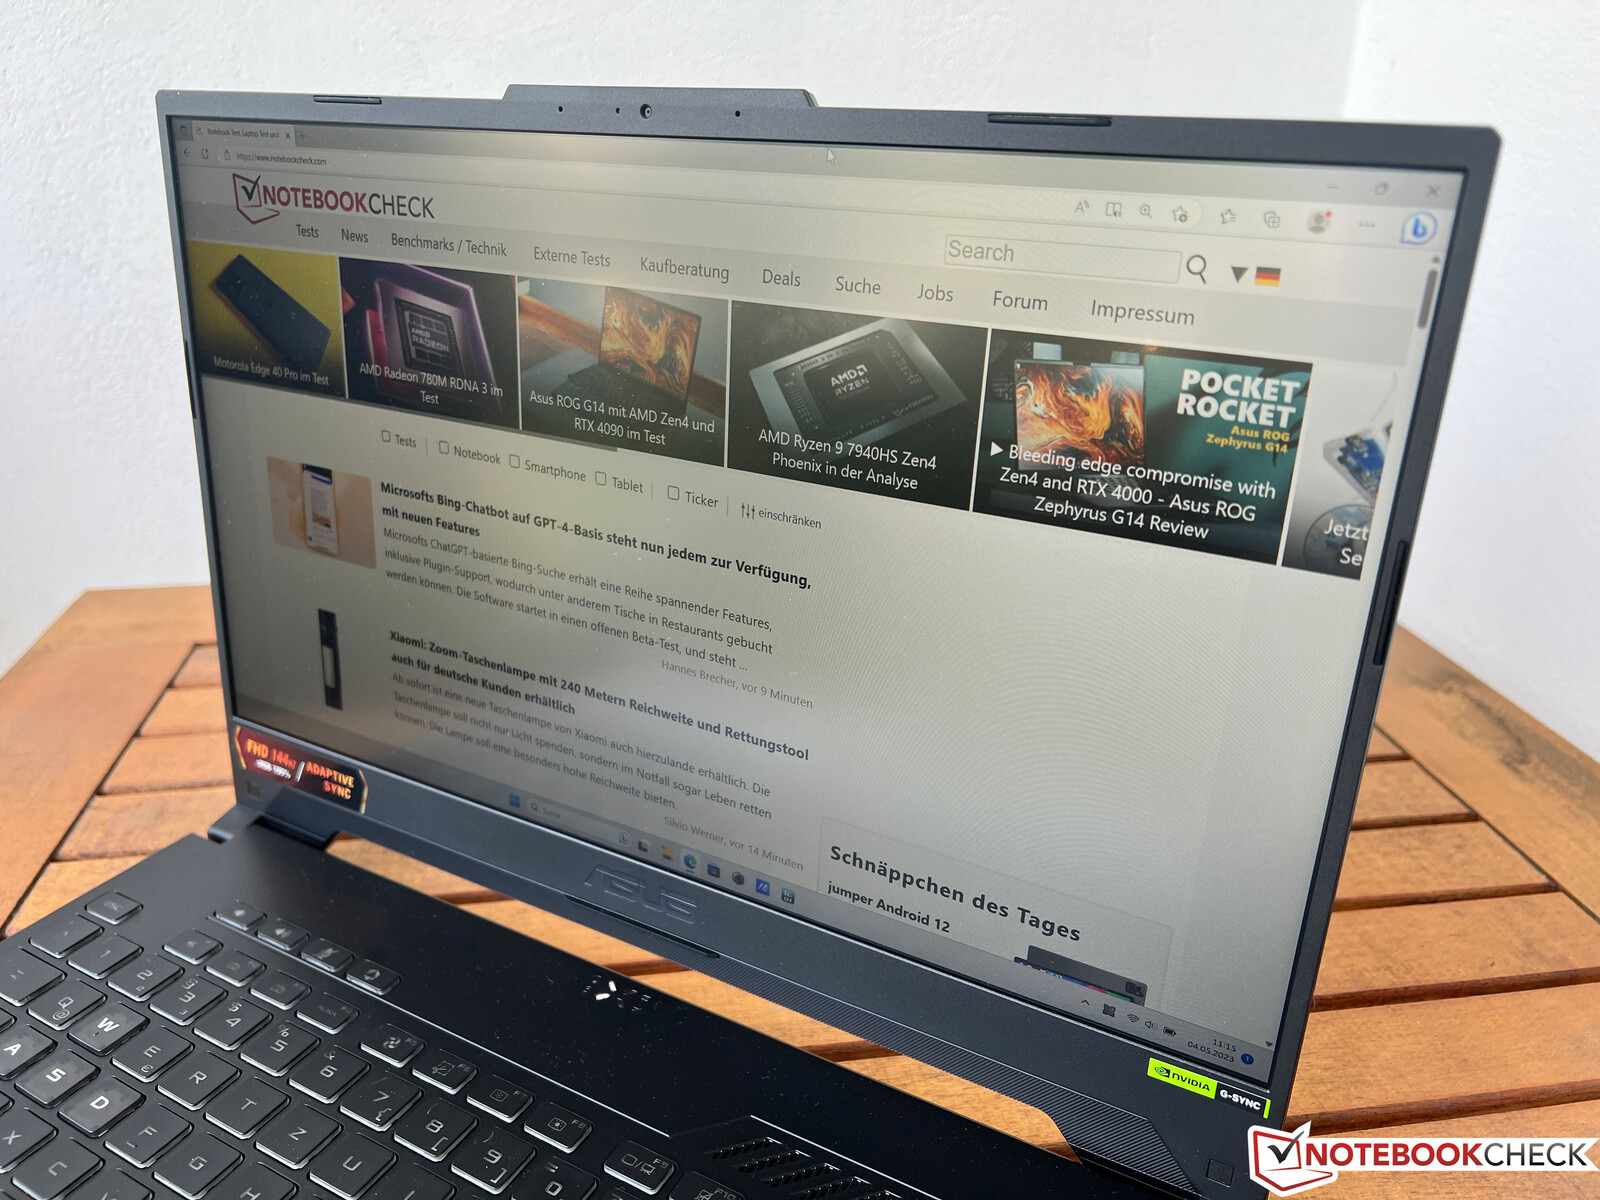
Display - a 144-Hz IPS panel

The laptop has a relatively simple matte IPS panel in Full HD resolution (1,920 x 1,080 pixels) and in a 16:9 format. Subjectively, it left quite a good impression on us - contents were depicted sharp enough and lighter areas didn't look grainy. Its 144 Hz refresh rate helps with fast movements and there is no PWM flickering but in total, the screen doesn't really have anything to shout about too much.
The advertized screen brightness is 250 cd/m² but we measured 270 cd/m² (on average). Of course, this isn't the best, but it is sufficient for indoor use and outdoors if it isn't too sunny. In turn, its black value is mediocre, which means its contrast levels only measure ~1.700:1 at best. The device's reaction speeds are a little slow for a gaming laptop and when the screen is completely dark, you can see some visible backlight bleeding. In everyday use, this shouldn't be too big an annoyance.
| |||||||||||||||||||||||||
Brightness Distribution: 91 %
Center on Battery: 288 cd/m²
Contrast: 1694:1 (Black: 0.17 cd/m²)
ΔE ColorChecker Calman: 1.9 | ∀{0.5-29.43 Ø4.71}
calibrated: 0.9
ΔE Greyscale Calman: 2.7 | ∀{0.09-98 Ø4.96}
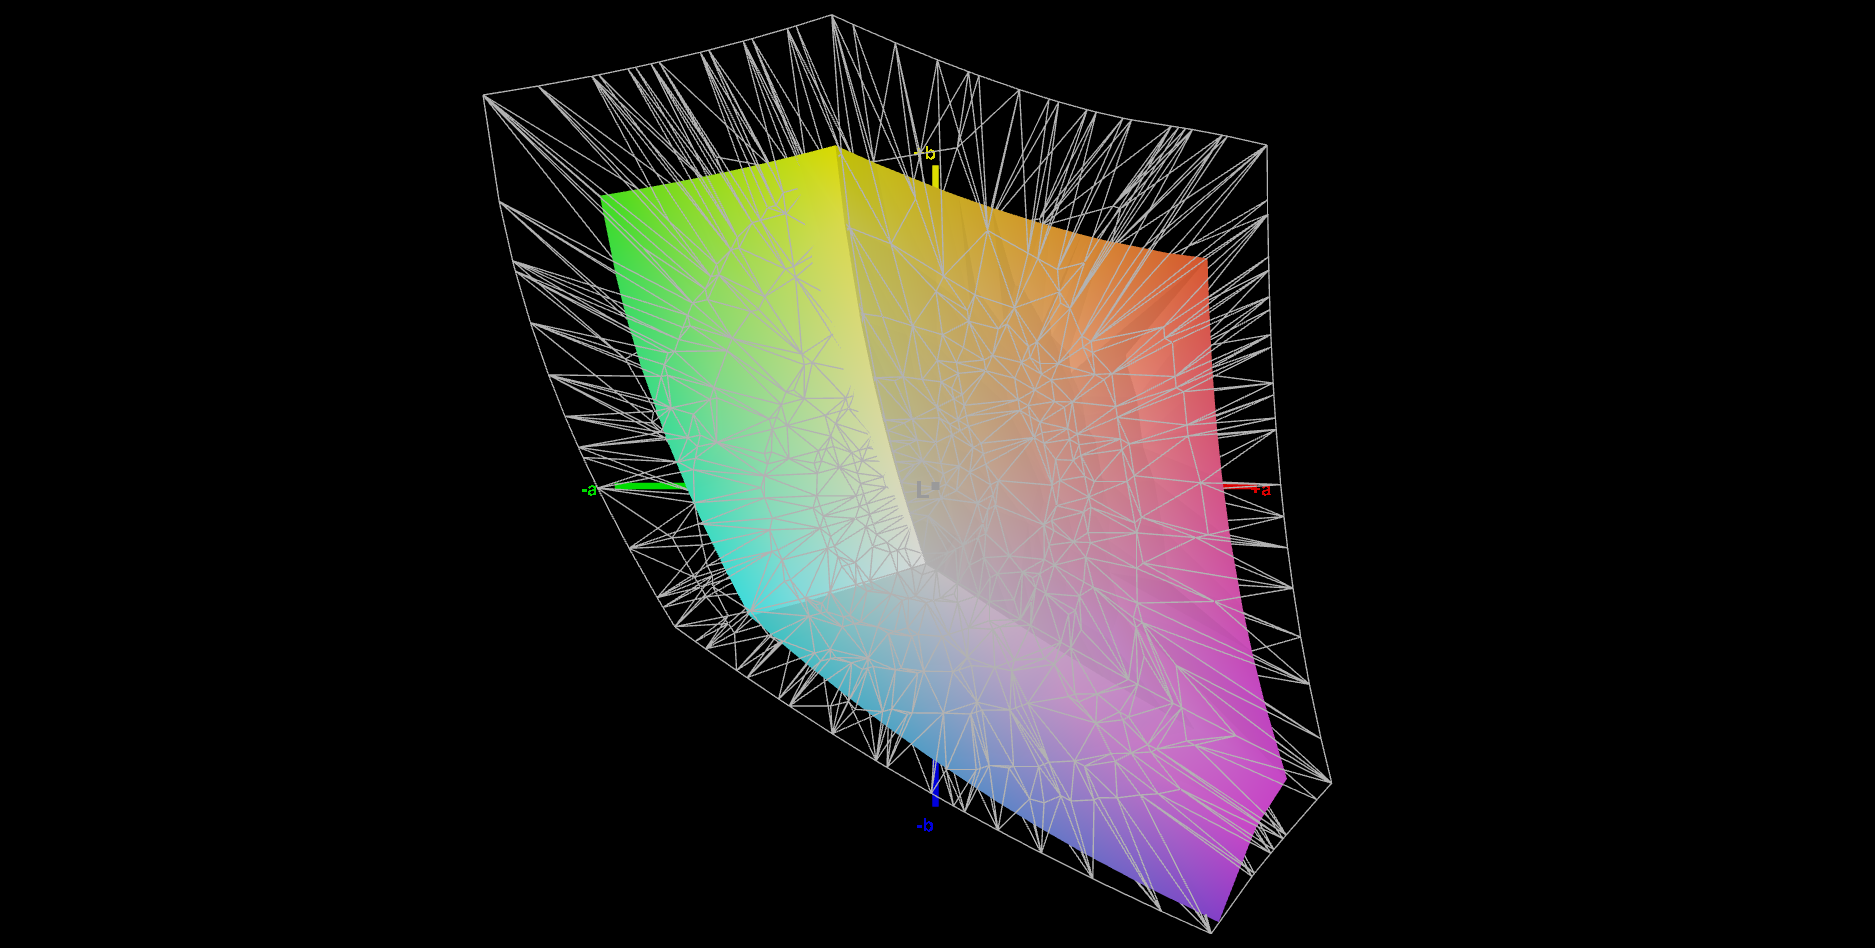
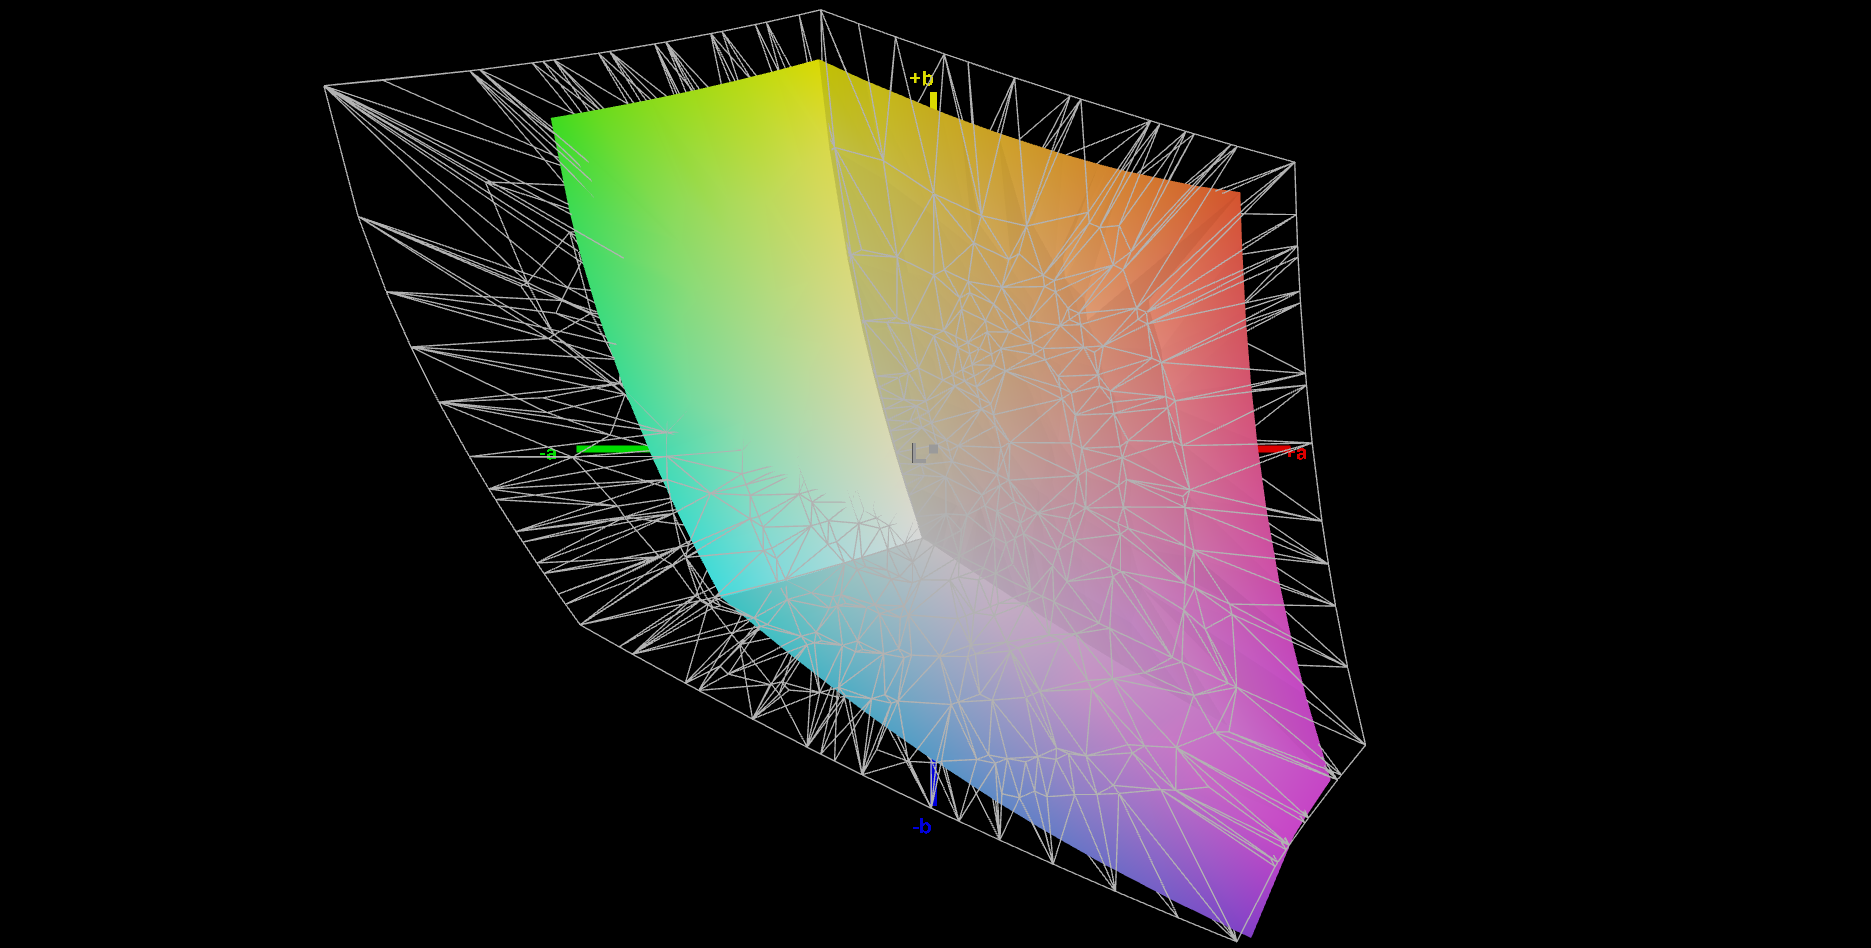
66.6% AdobeRGB 1998 (Argyll 3D)
96.5% sRGB (Argyll 3D)
64.9% Display P3 (Argyll 3D)
Gamma: 2.32
CCT: 6535 K
| Asus TUF A15 FA507 N156HMA-GA1, IPS, 1920x1080, 15.6" | Gigabyte G5 KE Chi Mei N156HRA-EA1, IPS, 1920x1080, 15.6" | Schenker XMG Core 15 (M22) CSOT MNF601CA1-1, IPS, 2560x1440, 15.6" | MSI Katana 15 B12VEK AUOAF90 (B156HAN08.4), IPS, 1920x1080, 15.6" | HP Victus 15 fa0020nr CMN1521, IPS, 1920x1080, 15.6" | Lenovo IdeaPad Gaming 3 15IAH7 Lenovo LEN156FHD, IPS, 1920x1080, 15.6" | Asus TUF Gaming F15 FX507ZM TL156VDXP0101, IPS, 1920x1080, 15.6" | |
|---|---|---|---|---|---|---|---|
| Display | -37% | 5% | -41% | -35% | 5% | 2% | |
| Display P3 Coverage (%) | 64.9 | 40.7 -37% | 68.8 6% | 38.1 -41% | 42 -35% | 69.1 6% | 66.4 2% |
| sRGB Coverage (%) | 96.5 | 61 -37% | 99.3 3% | 56.8 -41% | 62.7 -35% | 99.2 3% | 97 1% |
| AdobeRGB 1998 Coverage (%) | 66.6 | 42.1 -37% | 69.9 5% | 39.3 -41% | 43.4 -35% | 69.9 5% | 68.5 3% |
| Response Times | 11% | 55% | -29% | -24% | 59% | 60% | |
| Response Time Grey 50% / Grey 80% * (ms) | 30.4 ? | 26.64 ? 12% | 16 ? 47% | 38.8 ? -28% | 35.2 ? -16% | 13 ? 57% | 5.6 ? 82% |
| Response Time Black / White * (ms) | 20.8 ? | 18.65 ? 10% | 7.6 ? 63% | 26.8 ? -29% | 27.2 ? -31% | 8.4 ? 60% | 12.8 ? 38% |
| PWM Frequency (Hz) | |||||||
| Screen | -129% | -48% | -133% | -82% | -45% | -3% | |
| Brightness middle (cd/m²) | 288 | 269 -7% | 378 31% | 261 -9% | 284.3 -1% | 338 17% | 353.7 23% |
| Brightness (cd/m²) | 271 | 248 -8% | 371 37% | 258 -5% | 262 -3% | 329 21% | 340 25% |
| Brightness Distribution (%) | 91 | 85 -7% | 93 2% | 92 1% | 87 -4% | 92 1% | 89 -2% |
| Black Level * (cd/m²) | 0.17 | 0.5 -194% | 0.33 -94% | 0.19 -12% | 0.17 -0% | 0.27 -59% | 0.34 -100% |
| Contrast (:1) | 1694 | 538 -68% | 1145 -32% | 1374 -19% | 1672 -1% | 1252 -26% | 1040 -39% |
| Colorchecker dE 2000 * | 1.9 | 4.54 -139% | 2.84 -49% | 5.57 -193% | 4.52 -138% | 2.88 -52% | 1.74 8% |
| Colorchecker dE 2000 max. * | 3.3 | 17.28 -424% | 5.51 -67% | 20.6 -524% | 18.67 -466% | 9.35 -183% | 3.63 -10% |
| Colorchecker dE 2000 calibrated * | 0.9 | 3.34 -271% | 2.75 -206% | 4.63 -414% | 1.55 -72% | 1.22 -36% | 0.5 44% |
| Greyscale dE 2000 * | 2.7 | 3.8 -41% | 4.08 -51% | 3.19 -18% | 4.1 -52% | 5 -85% | 2.1 22% |
| Gamma | 2.32 95% | 2.17 101% | 2.4 92% | 2.45 90% | 2.3 96% | 2.162 102% | 2.3 96% |
| CCT | 6535 99% | 7408 88% | 5841 111% | 6146 106% | 6529 100% | 7497 87% | 6257 104% |
| Total Average (Program / Settings) | -52% /
-89% | 4% /
-22% | -68% /
-98% | -47% /
-64% | 6% /
-19% | 20% /
7% |
* ... smaller is better
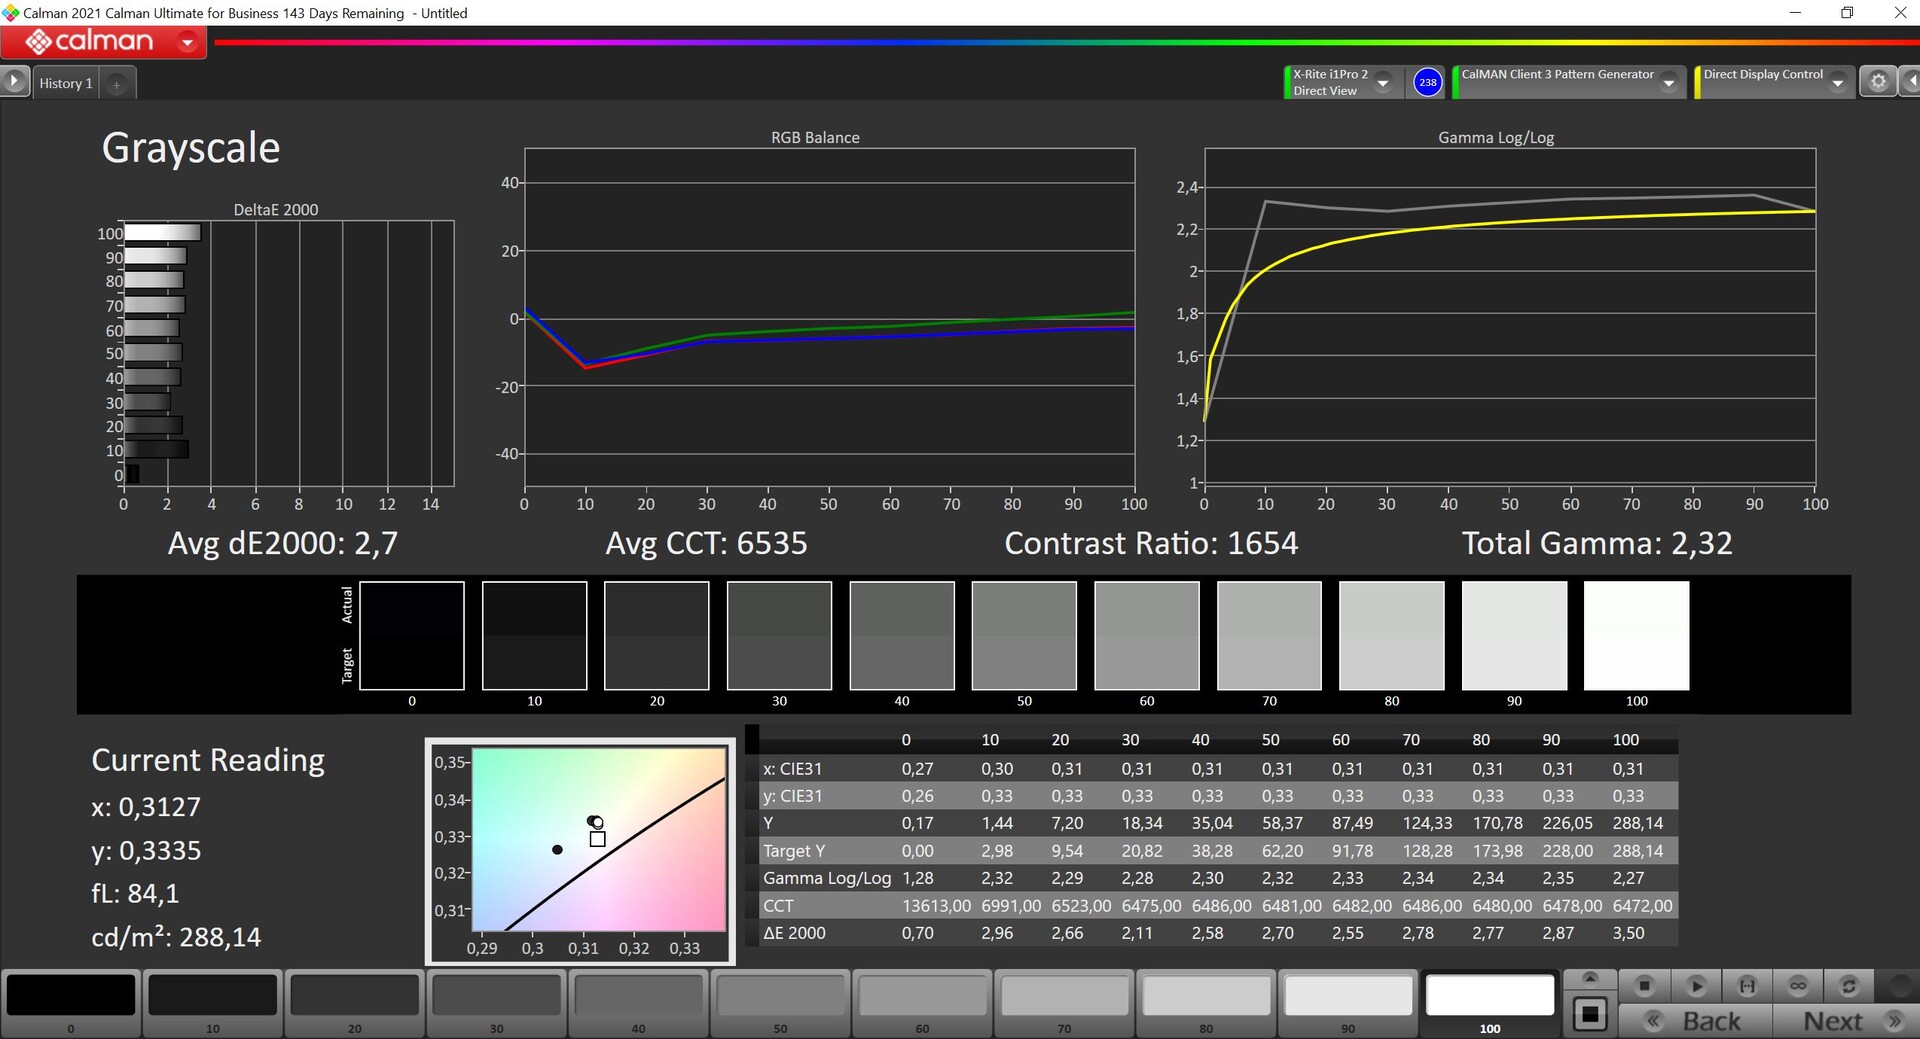
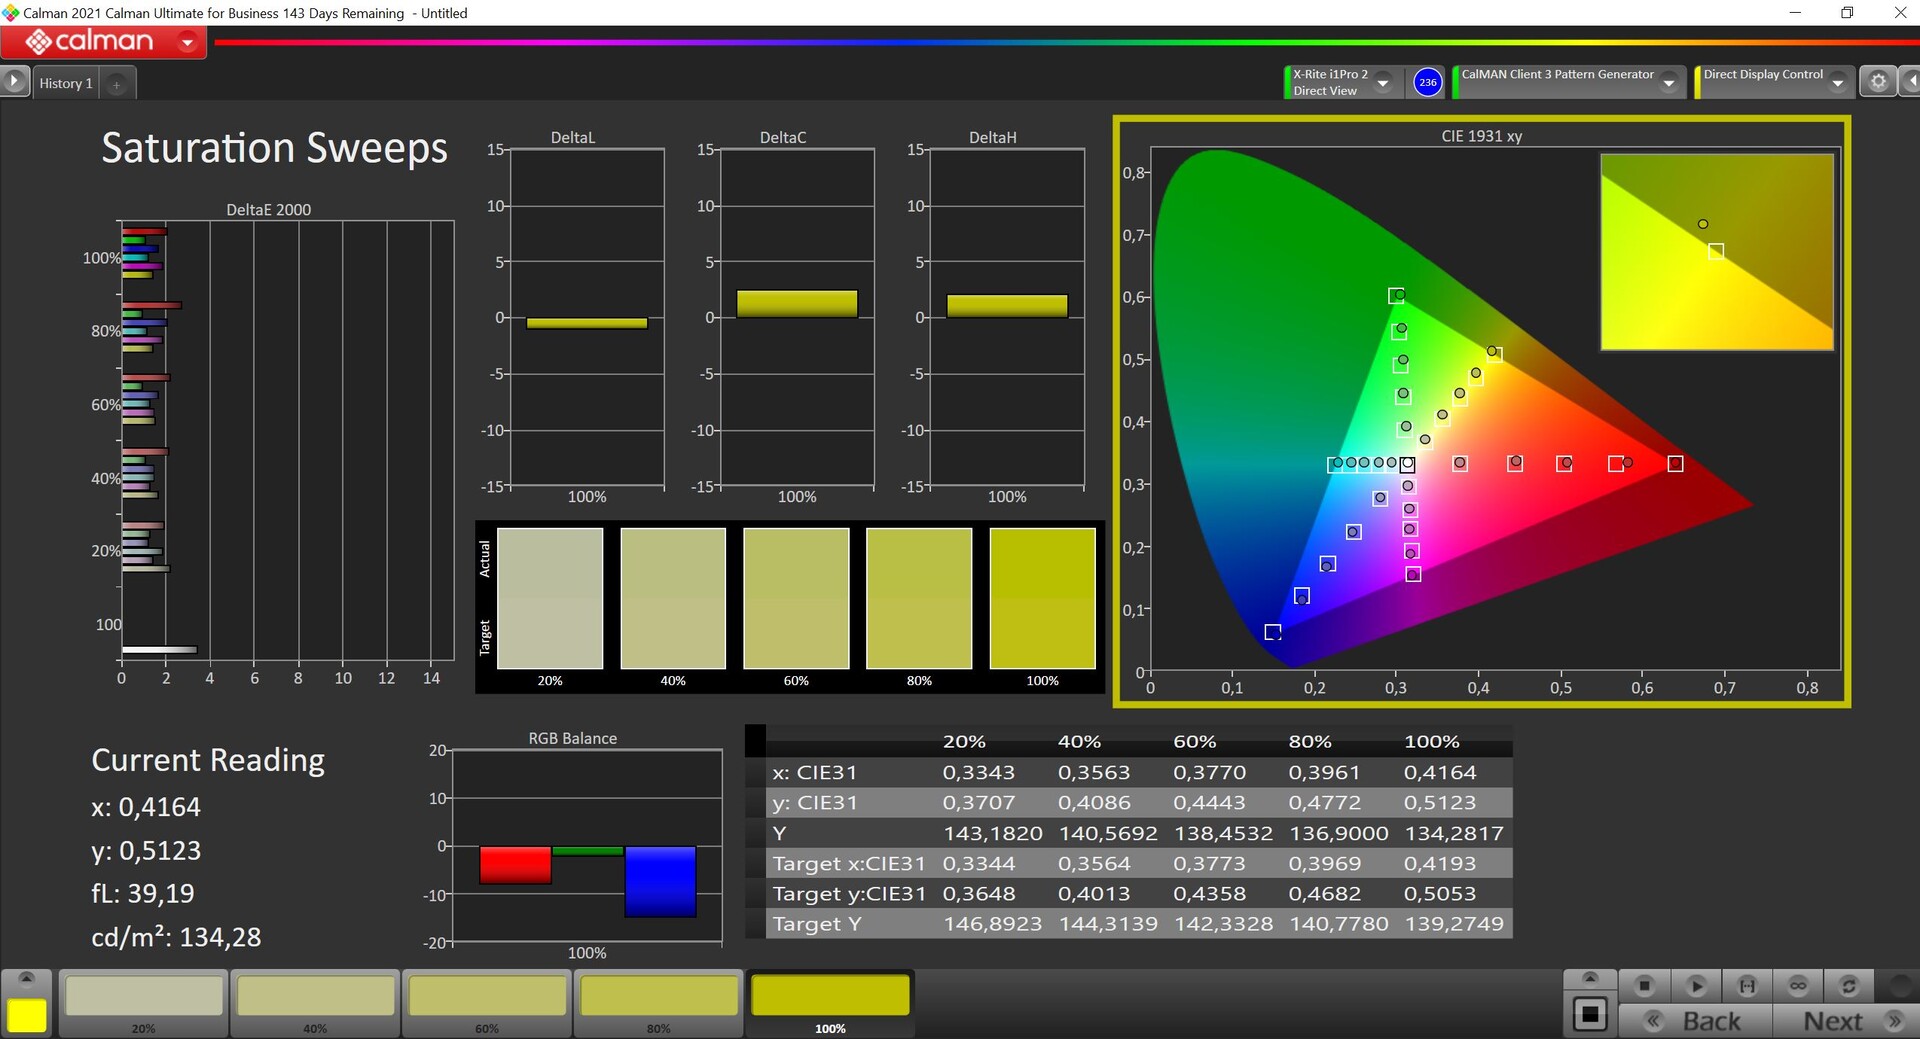
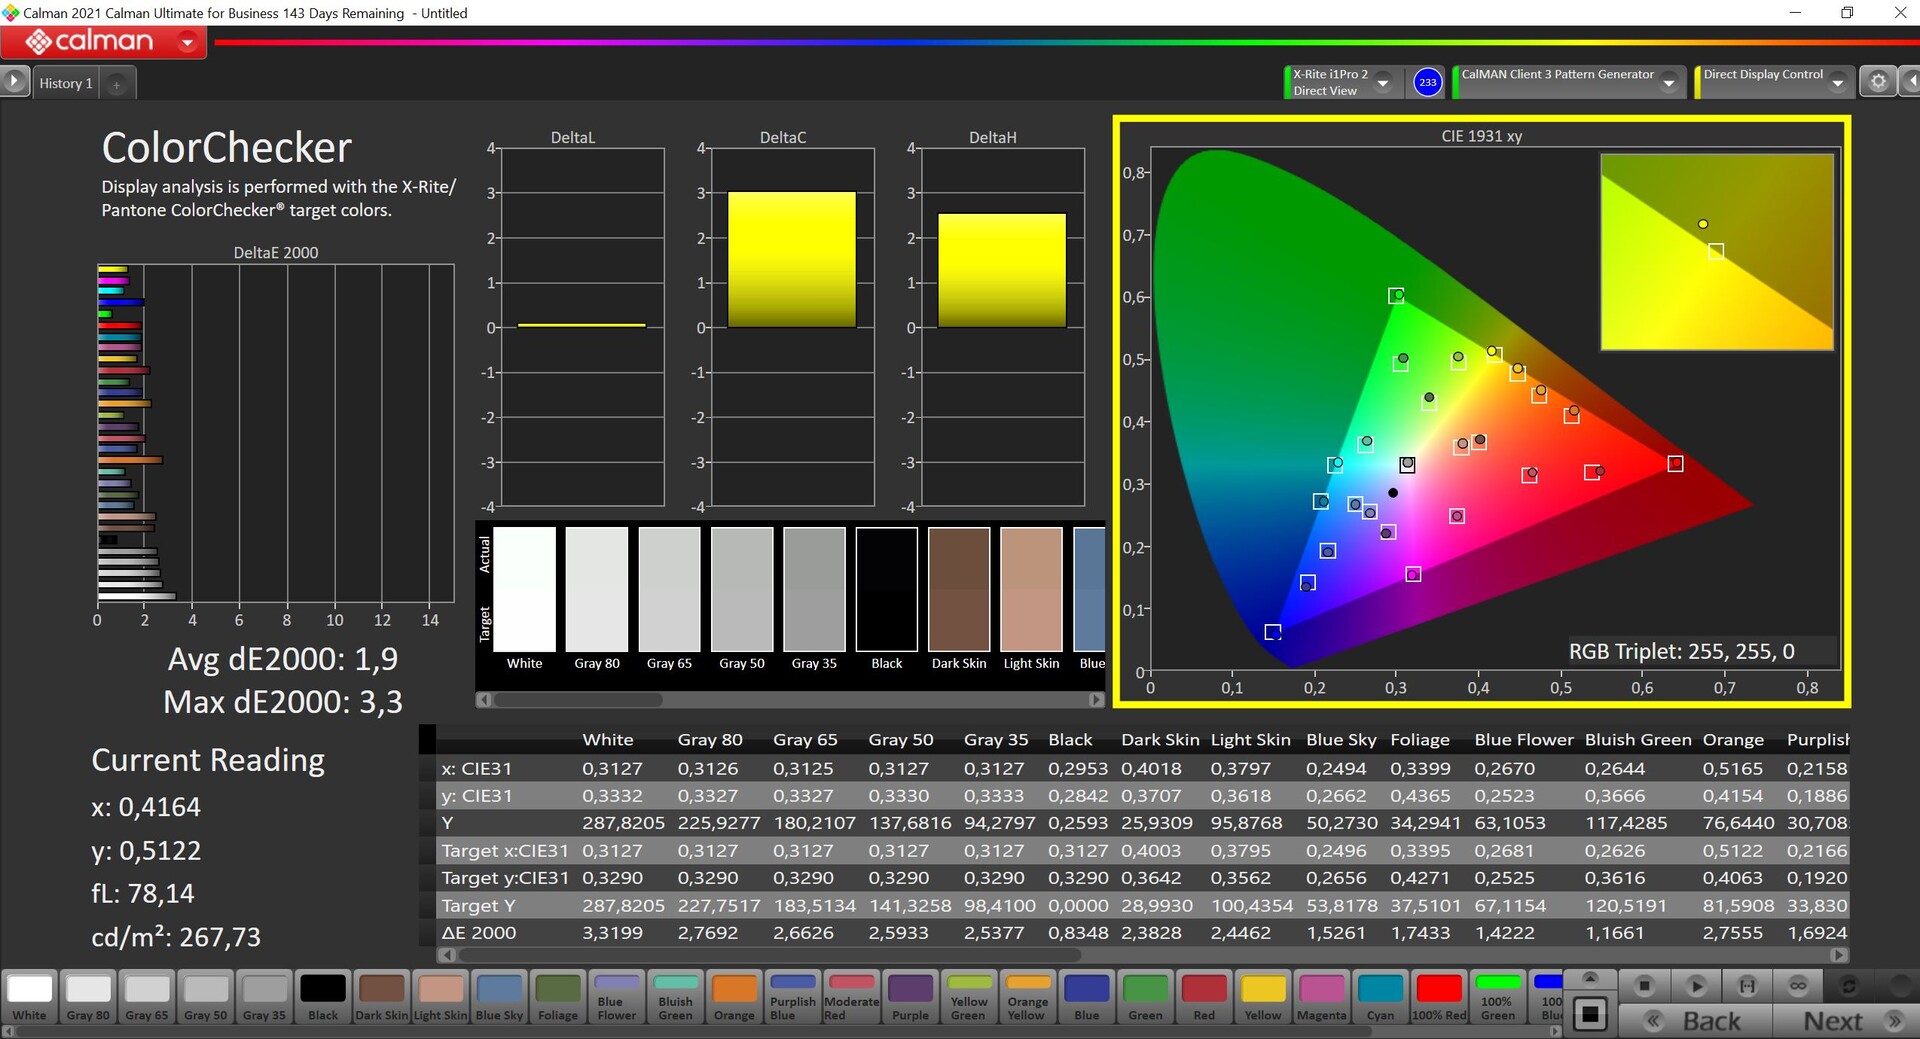
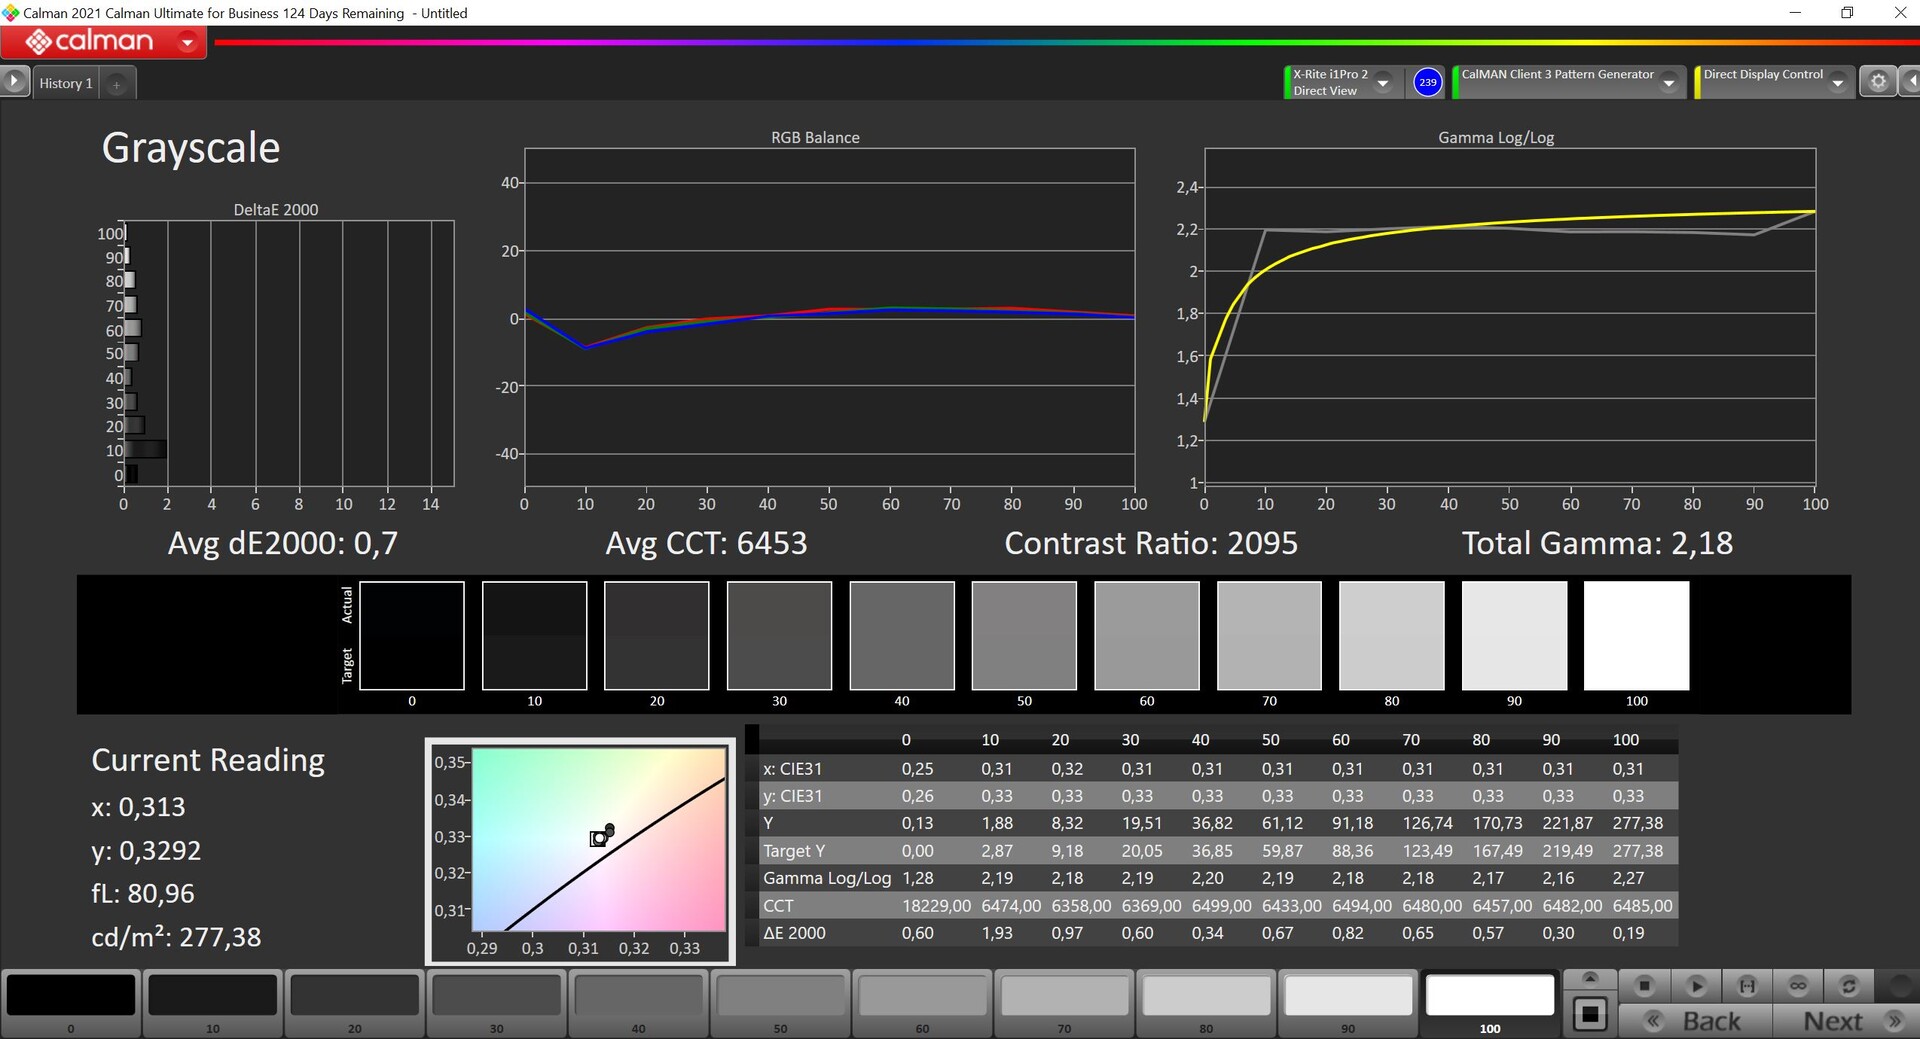


Using the professional CalMAN software (X-Rite i1 Pro 2), we measured the panel and its performance was great straight out of the box. There was no color tint and its color depiction was already very accurate, meaning you can get to work on image editing straight away (at least within the smaller sRGB color space). After our own calibration (you can download this profile above for free), we were able to improve on this ever so slightly, but this isn't really necessary - especially for gaming.
Display Response Times
| ↔ Response Time Black to White | ||
|---|---|---|
| 20.8 ms ... rise ↗ and fall ↘ combined | ↗ 11.7 ms rise | 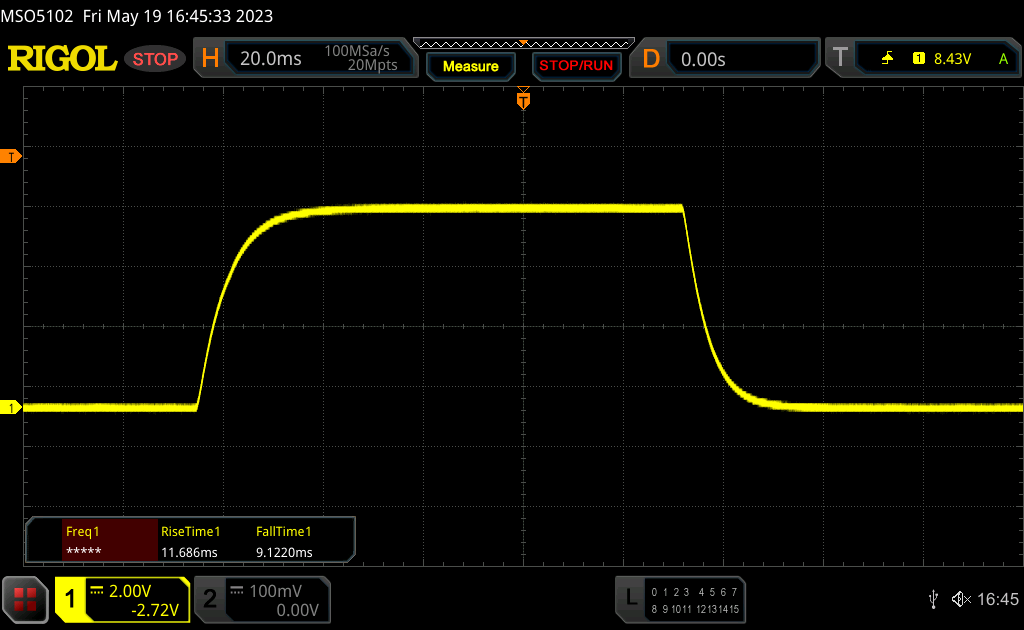 |
| ↘ 9.1 ms fall | ||
| The screen shows good response rates in our tests, but may be too slow for competitive gamers. In comparison, all tested devices range from 0.1 (minimum) to 240 (maximum) ms. » 46 % of all devices are better. This means that the measured response time is similar to the average of all tested devices (19.8 ms). | ||
| ↔ Response Time 50% Grey to 80% Grey | ||
| 30.4 ms ... rise ↗ and fall ↘ combined | ↗ 14.8 ms rise | 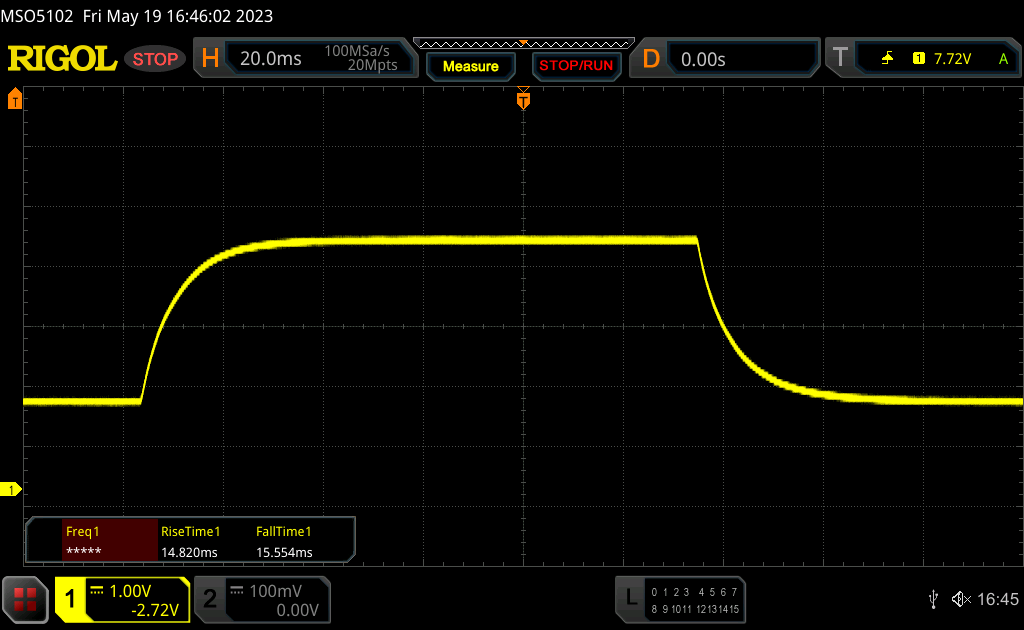 |
| ↘ 15.6 ms fall | ||
| The screen shows slow response rates in our tests and will be unsatisfactory for gamers. In comparison, all tested devices range from 0.165 (minimum) to 636 (maximum) ms. » 41 % of all devices are better. This means that the measured response time is similar to the average of all tested devices (31 ms). | ||
Screen Flickering / PWM (Pulse-Width Modulation)
| Screen flickering / PWM not detected | 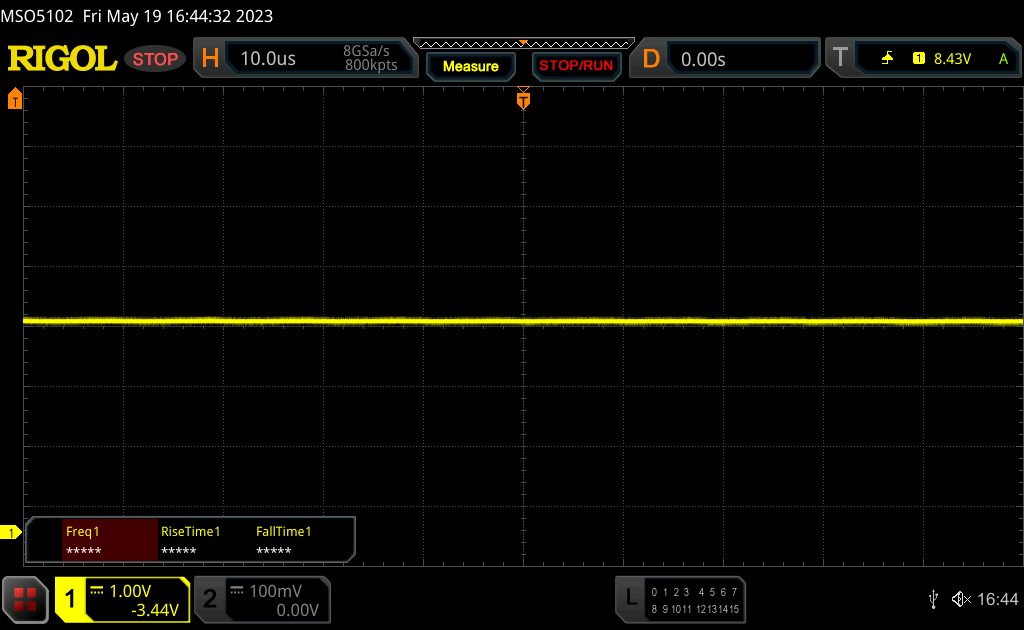 | ||
In comparison: 52 % of all tested devices do not use PWM to dim the display. If PWM was detected, an average of 7751 (minimum: 5 - maximum: 343500) Hz was measured. | |||

Outdoors, you definitely profit form the screen being matte, but if it is too bright, you will still struggle to see contents on the screen. The screen brightness could do with being brighter. The IPS panel's viewing angle stability is fine - however, from certain angles, the screen sometimes appears too lightened (especially from the top and side).

Performance - The TUF Gaming combines a Ryzen 7 with an RTX 4050
Our test configuration is the weakest model of the series - optionally, the Asus TUF Gaming A15 can be fitted with a newer Ryzen 9 7940HS and a GeForce RTX 4070 Laptop at best. Of course, the laptop will cost considerably more in this configuration.
Testing conditions
Asus uses the Armoury Crate software for its gaming laptops, in which there are also different energy profiles. However, the optional Turbo mode does not lead to a performance increase in our configuration, which is why we performed all measurements and benchmarks in Performance mode. Additionally, Advanced Optimus was active, which, however, leads to slight stutters when switching graphics (for example, when starting games). If you do not want this, you can deactivate the iGPU permanently or use the normal Optimus function.
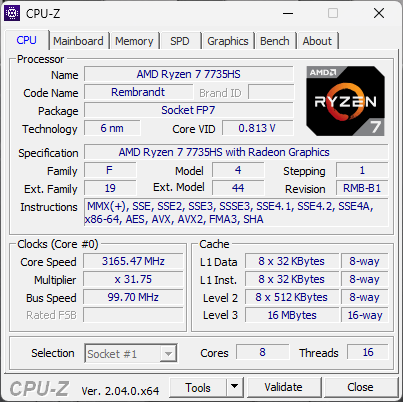
Processor - Ryzen 7 7735HS
The AMD Ryzen 7 7735HS is used as the laptop's processor, which is basically the old Ryzen 7 6800HS but with a 50 MHz higher maximum clock. The Zen3+ chip has 8 cores and can process 16 threads simultaneously. The TUF Gaming A15's power limits are 80/65 watts, which allows for decent multi-core performance that often lies ahead of competitors with Alder Lake CPUs. In the single-core tests, however, the Intel chips with the performance cores had a clear advantage. Unsurprisingly, the 7735HS is on par with the Schenker XMG Core 15's Ryzen 7 6800H. Overall, the CPU is a decent choice for a budget gaming laptop. On battery power, the CPU briefly consumes 45 watts and then drops back to 32 watts, which is why the multi-core performance drops by 20%. More CPU benchmarks are available here.
Cinebench R15 Multi continuous test
Cinebench R23: Multi Core | Single Core
Cinebench R20: CPU (Multi Core) | CPU (Single Core)
Cinebench R15: CPU Multi 64Bit | CPU Single 64Bit
Blender: v2.79 BMW27 CPU
7-Zip 18.03: 7z b 4 | 7z b 4 -mmt1
Geekbench 5.5: Multi-Core | Single-Core
HWBOT x265 Benchmark v2.2: 4k Preset
LibreOffice : 20 Documents To PDF
R Benchmark 2.5: Overall mean
| CPU Performance rating | |
| Average of class Gaming | |
| Asus TUF Gaming F15 FX507ZM | |
| HP Victus 15 fa0020nr | |
| MSI Katana 15 B12VEK | |
| Asus TUF A15 FA507 | |
| Schenker XMG Core 15 (M22) | |
| Lenovo IdeaPad Gaming 3 15IAH7 | |
| Gigabyte G5 KE | |
| Average AMD Ryzen 7 7735HS | |
| Cinebench R23 / Multi Core | |
| Average of class Gaming (10488 - 42661, n=108, last 2 years) | |
| Asus TUF Gaming F15 FX507ZM | |
| MSI Katana 15 B12VEK | |
| HP Victus 15 fa0020nr | |
| Lenovo IdeaPad Gaming 3 15IAH7 | |
| Schenker XMG Core 15 (M22) | |
| Asus TUF A15 FA507 | |
| Gigabyte G5 KE | |
| Average AMD Ryzen 7 7735HS (10283 - 14131, n=15) | |
| Cinebench R23 / Single Core | |
| Average of class Gaming (1166 - 2415, n=108, last 2 years) | |
| Asus TUF Gaming F15 FX507ZM | |
| HP Victus 15 fa0020nr | |
| MSI Katana 15 B12VEK | |
| Lenovo IdeaPad Gaming 3 15IAH7 | |
| Gigabyte G5 KE | |
| Schenker XMG Core 15 (M22) | |
| Asus TUF A15 FA507 | |
| Average AMD Ryzen 7 7735HS (1288 - 1570, n=15) | |
| Cinebench R20 / CPU (Multi Core) | |
| Average of class Gaming (4029 - 16433, n=107, last 2 years) | |
| Asus TUF Gaming F15 FX507ZM | |
| MSI Katana 15 B12VEK | |
| HP Victus 15 fa0020nr | |
| Lenovo IdeaPad Gaming 3 15IAH7 | |
| Schenker XMG Core 15 (M22) | |
| Asus TUF A15 FA507 | |
| Gigabyte G5 KE | |
| Average AMD Ryzen 7 7735HS (3968 - 5502, n=15) | |
| Cinebench R20 / CPU (Single Core) | |
| Average of class Gaming (442 - 913, n=107, last 2 years) | |
| HP Victus 15 fa0020nr | |
| Asus TUF Gaming F15 FX507ZM | |
| Lenovo IdeaPad Gaming 3 15IAH7 | |
| MSI Katana 15 B12VEK | |
| Gigabyte G5 KE | |
| Schenker XMG Core 15 (M22) | |
| Asus TUF A15 FA507 | |
| Average AMD Ryzen 7 7735HS (502 - 613, n=15) | |
| Cinebench R15 / CPU Multi 64Bit | |
| Average of class Gaming (1578 - 6330, n=106, last 2 years) | |
| Asus TUF Gaming F15 FX507ZM | |
| HP Victus 15 fa0020nr | |
| Schenker XMG Core 15 (M22) | |
| Asus TUF A15 FA507 | |
| Lenovo IdeaPad Gaming 3 15IAH7 | |
| MSI Katana 15 B12VEK | |
| Average AMD Ryzen 7 7735HS (1758 - 2355, n=17) | |
| Gigabyte G5 KE | |
| Cinebench R15 / CPU Single 64Bit | |
| Average of class Gaming (188.8 - 350, n=107, last 2 years) | |
| HP Victus 15 fa0020nr | |
| Asus TUF Gaming F15 FX507ZM | |
| Schenker XMG Core 15 (M22) | |
| Asus TUF A15 FA507 | |
| Lenovo IdeaPad Gaming 3 15IAH7 | |
| MSI Katana 15 B12VEK | |
| Average AMD Ryzen 7 7735HS (206 - 255, n=16) | |
| Gigabyte G5 KE | |
| Blender / v2.79 BMW27 CPU | |
| Average AMD Ryzen 7 7735HS (214 - 351, n=15) | |
| HP Victus 15 fa0020nr | |
| MSI Katana 15 B12VEK | |
| Gigabyte G5 KE | |
| Lenovo IdeaPad Gaming 3 15IAH7 | |
| Asus TUF A15 FA507 | |
| Schenker XMG Core 15 (M22) | |
| Asus TUF Gaming F15 FX507ZM | |
| Average of class Gaming (79 - 330, n=105, last 2 years) | |
| 7-Zip 18.03 / 7z b 4 | |
| Average of class Gaming (33491 - 148086, n=106, last 2 years) | |
| Asus TUF Gaming F15 FX507ZM | |
| Schenker XMG Core 15 (M22) | |
| Asus TUF A15 FA507 | |
| MSI Katana 15 B12VEK | |
| Average AMD Ryzen 7 7735HS (43455 - 63698, n=15) | |
| Gigabyte G5 KE | |
| HP Victus 15 fa0020nr | |
| Lenovo IdeaPad Gaming 3 15IAH7 | |
| 7-Zip 18.03 / 7z b 4 -mmt1 | |
| Average of class Gaming (4199 - 7436, n=106, last 2 years) | |
| HP Victus 15 fa0020nr | |
| Asus TUF A15 FA507 | |
| Schenker XMG Core 15 (M22) | |
| Average AMD Ryzen 7 7735HS (4779 - 5849, n=15) | |
| MSI Katana 15 B12VEK | |
| Lenovo IdeaPad Gaming 3 15IAH7 | |
| Gigabyte G5 KE | |
| Asus TUF Gaming F15 FX507ZM | |
| Geekbench 5.5 / Multi-Core | |
| Average of class Gaming (6460 - 28263, n=106, last 2 years) | |
| Asus TUF Gaming F15 FX507ZM | |
| MSI Katana 15 B12VEK | |
| HP Victus 15 fa0020nr | |
| Gigabyte G5 KE | |
| Schenker XMG Core 15 (M22) | |
| Asus TUF A15 FA507 | |
| Average AMD Ryzen 7 7735HS (7151 - 10258, n=15) | |
| Lenovo IdeaPad Gaming 3 15IAH7 | |
| Geekbench 5.5 / Single-Core | |
| Average of class Gaming (986 - 2474, n=106, last 2 years) | |
| HP Victus 15 fa0020nr | |
| Asus TUF Gaming F15 FX507ZM | |
| MSI Katana 15 B12VEK | |
| Gigabyte G5 KE | |
| Lenovo IdeaPad Gaming 3 15IAH7 | |
| Schenker XMG Core 15 (M22) | |
| Average AMD Ryzen 7 7735HS (1327 - 1615, n=15) | |
| Asus TUF A15 FA507 | |
| HWBOT x265 Benchmark v2.2 / 4k Preset | |
| Average of class Gaming (11.5 - 44.4, n=106, last 2 years) | |
| Asus TUF Gaming F15 FX507ZM | |
| Schenker XMG Core 15 (M22) | |
| MSI Katana 15 B12VEK | |
| Asus TUF A15 FA507 | |
| Gigabyte G5 KE | |
| HP Victus 15 fa0020nr | |
| Lenovo IdeaPad Gaming 3 15IAH7 | |
| Average AMD Ryzen 7 7735HS (10.8 - 17.9, n=15) | |
| LibreOffice / 20 Documents To PDF | |
| Schenker XMG Core 15 (M22) | |
| Gigabyte G5 KE | |
| Average AMD Ryzen 7 7735HS (44.3 - 63.9, n=15) | |
| Asus TUF A15 FA507 | |
| Asus TUF Gaming F15 FX507ZM | |
| Average of class Gaming (33.2 - 88.8, n=106, last 2 years) | |
| HP Victus 15 fa0020nr | |
| Lenovo IdeaPad Gaming 3 15IAH7 | |
| MSI Katana 15 B12VEK | |
| R Benchmark 2.5 / Overall mean | |
| Lenovo IdeaPad Gaming 3 15IAH7 | |
| Average AMD Ryzen 7 7735HS (0.4822 - 0.585, n=15) | |
| Asus TUF A15 FA507 | |
| MSI Katana 15 B12VEK | |
| Gigabyte G5 KE | |
| Schenker XMG Core 15 (M22) | |
| HP Victus 15 fa0020nr | |
| Asus TUF Gaming F15 FX507ZM | |
| Average of class Gaming (0.3439 - 0.759, n=107, last 2 years) | |
* ... smaller is better
AIDA64: FP32 Ray-Trace | FPU Julia | CPU SHA3 | CPU Queen | FPU SinJulia | FPU Mandel | CPU AES | CPU ZLib | FP64 Ray-Trace | CPU PhotoWorxx
| Performance rating | |
| Average of class Gaming | |
| Schenker XMG Core 15 (M22) | |
| Asus TUF A15 FA507 | |
| Average AMD Ryzen 7 7735HS | |
| MSI Katana 15 B12VEK | |
| Gigabyte G5 KE | |
| Asus TUF Gaming F15 FX507ZM | |
| Lenovo IdeaPad Gaming 3 15IAH7 | |
| HP Victus 15 fa0020nr | |
| AIDA64 / FP32 Ray-Trace | |
| Average of class Gaming (10227 - 85542, n=106, last 2 years) | |
| Schenker XMG Core 15 (M22) | |
| Asus TUF A15 FA507 | |
| MSI Katana 15 B12VEK | |
| Average AMD Ryzen 7 7735HS (11831 - 17161, n=16) | |
| Lenovo IdeaPad Gaming 3 15IAH7 | |
| HP Victus 15 fa0020nr | |
| Gigabyte G5 KE | |
| Asus TUF Gaming F15 FX507ZM | |
| AIDA64 / FPU Julia | |
| Average of class Gaming (51376 - 372155, n=106, last 2 years) | |
| Schenker XMG Core 15 (M22) | |
| Asus TUF A15 FA507 | |
| Average AMD Ryzen 7 7735HS (75370 - 105483, n=16) | |
| MSI Katana 15 B12VEK | |
| Lenovo IdeaPad Gaming 3 15IAH7 | |
| Gigabyte G5 KE | |
| HP Victus 15 fa0020nr | |
| Asus TUF Gaming F15 FX507ZM | |
| AIDA64 / CPU SHA3 | |
| Average of class Gaming (2180 - 10115, n=106, last 2 years) | |
| Schenker XMG Core 15 (M22) | |
| Asus TUF A15 FA507 | |
| Lenovo IdeaPad Gaming 3 15IAH7 | |
| Asus TUF Gaming F15 FX507ZM | |
| MSI Katana 15 B12VEK | |
| Gigabyte G5 KE | |
| Average AMD Ryzen 7 7735HS (2499 - 3494, n=16) | |
| HP Victus 15 fa0020nr | |
| AIDA64 / CPU Queen | |
| Average of class Gaming (49785 - 173351, n=90, last 2 years) | |
| Asus TUF A15 FA507 | |
| HP Victus 15 fa0020nr | |
| Average AMD Ryzen 7 7735HS (87486 - 108729, n=15) | |
| Asus TUF Gaming F15 FX507ZM | |
| Schenker XMG Core 15 (M22) | |
| MSI Katana 15 B12VEK | |
| Lenovo IdeaPad Gaming 3 15IAH7 | |
| Gigabyte G5 KE | |
| AIDA64 / FPU SinJulia | |
| Average of class Gaming (4424 - 33636, n=106, last 2 years) | |
| Schenker XMG Core 15 (M22) | |
| Asus TUF A15 FA507 | |
| Average AMD Ryzen 7 7735HS (11233 - 13097, n=16) | |
| Asus TUF Gaming F15 FX507ZM | |
| MSI Katana 15 B12VEK | |
| HP Victus 15 fa0020nr | |
| Gigabyte G5 KE | |
| Lenovo IdeaPad Gaming 3 15IAH7 | |
| AIDA64 / FPU Mandel | |
| Average of class Gaming (25115 - 196829, n=106, last 2 years) | |
| Schenker XMG Core 15 (M22) | |
| Asus TUF A15 FA507 | |
| Average AMD Ryzen 7 7735HS (41400 - 58232, n=16) | |
| MSI Katana 15 B12VEK | |
| Lenovo IdeaPad Gaming 3 15IAH7 | |
| Gigabyte G5 KE | |
| HP Victus 15 fa0020nr | |
| Asus TUF Gaming F15 FX507ZM | |
| AIDA64 / CPU AES | |
| Lenovo IdeaPad Gaming 3 15IAH7 | |
| Gigabyte G5 KE | |
| Average of class Gaming (39258 - 247074, n=106, last 2 years) | |
| Average AMD Ryzen 7 7735HS (44013 - 137629, n=16) | |
| Schenker XMG Core 15 (M22) | |
| MSI Katana 15 B12VEK | |
| Asus TUF Gaming F15 FX507ZM | |
| Asus TUF A15 FA507 | |
| HP Victus 15 fa0020nr | |
| AIDA64 / CPU ZLib | |
| Average of class Gaming (574 - 2531, n=106, last 2 years) | |
| Asus TUF Gaming F15 FX507ZM | |
| Gigabyte G5 KE | |
| Lenovo IdeaPad Gaming 3 15IAH7 | |
| Schenker XMG Core 15 (M22) | |
| MSI Katana 15 B12VEK | |
| HP Victus 15 fa0020nr | |
| Average AMD Ryzen 7 7735HS (651 - 906, n=16) | |
| Asus TUF A15 FA507 | |
| AIDA64 / FP64 Ray-Trace | |
| Average of class Gaming (5509 - 45446, n=106, last 2 years) | |
| Schenker XMG Core 15 (M22) | |
| Asus TUF A15 FA507 | |
| MSI Katana 15 B12VEK | |
| Average AMD Ryzen 7 7735HS (1459 - 9094, n=16) | |
| Lenovo IdeaPad Gaming 3 15IAH7 | |
| Gigabyte G5 KE | |
| HP Victus 15 fa0020nr | |
| Asus TUF Gaming F15 FX507ZM | |
| AIDA64 / CPU PhotoWorxx | |
| Average of class Gaming (12271 - 89891, n=106, last 2 years) | |
| MSI Katana 15 B12VEK | |
| Asus TUF Gaming F15 FX507ZM | |
| Schenker XMG Core 15 (M22) | |
| Gigabyte G5 KE | |
| Asus TUF A15 FA507 | |
| Average AMD Ryzen 7 7735HS (17524 - 30542, n=16) | |
| HP Victus 15 fa0020nr | |
| Lenovo IdeaPad Gaming 3 15IAH7 | |
System performance
The TUF Gaming A15 performed well in the synthetic system benchmarks and was able to place itself in the upper midfield during the PCMark 10 test. Overall, there was not that much between the contenders and subjectively, they all left a good impression on us when it came to performance. Apart from the aforementioned slight stutters during GPU switching (which are normal), the system always ran smoothly in the test.
CrossMark: Overall | Productivity | Creativity | Responsiveness
| PCMark 10 / Score | |
| Average of class Gaming (5828 - 12414, n=94, last 2 years) | |
| Asus TUF Gaming F15 FX507ZM | |
| Schenker XMG Core 15 (M22) | |
| Asus TUF A15 FA507 | |
| Average AMD Ryzen 7 7735HS, NVIDIA GeForce RTX 4050 Laptop GPU (n=1) | |
| Gigabyte G5 KE | |
| HP Victus 15 fa0020nr | |
| MSI Katana 15 B12VEK | |
| Lenovo IdeaPad Gaming 3 15IAH7 | |
| PCMark 10 / Essentials | |
| Gigabyte G5 KE | |
| Schenker XMG Core 15 (M22) | |
| Average of class Gaming (8810 - 11935, n=98, last 2 years) | |
| Asus TUF A15 FA507 | |
| Average AMD Ryzen 7 7735HS, NVIDIA GeForce RTX 4050 Laptop GPU (n=1) | |
| Asus TUF Gaming F15 FX507ZM | |
| HP Victus 15 fa0020nr | |
| MSI Katana 15 B12VEK | |
| Lenovo IdeaPad Gaming 3 15IAH7 | |
| PCMark 10 / Productivity | |
| Average of class Gaming (6845 - 25323, n=96, last 2 years) | |
| MSI Katana 15 B12VEK | |
| Schenker XMG Core 15 (M22) | |
| Lenovo IdeaPad Gaming 3 15IAH7 | |
| Gigabyte G5 KE | |
| Asus TUF A15 FA507 | |
| Average AMD Ryzen 7 7735HS, NVIDIA GeForce RTX 4050 Laptop GPU (n=1) | |
| Asus TUF Gaming F15 FX507ZM | |
| HP Victus 15 fa0020nr | |
| PCMark 10 / Digital Content Creation | |
| Average of class Gaming (7602 - 19954, n=96, last 2 years) | |
| Asus TUF Gaming F15 FX507ZM | |
| Asus TUF A15 FA507 | |
| Average AMD Ryzen 7 7735HS, NVIDIA GeForce RTX 4050 Laptop GPU (n=1) | |
| Schenker XMG Core 15 (M22) | |
| Gigabyte G5 KE | |
| HP Victus 15 fa0020nr | |
| MSI Katana 15 B12VEK | |
| Lenovo IdeaPad Gaming 3 15IAH7 | |
| CrossMark / Overall | |
| Average of class Gaming (1366 - 2409, n=95, last 2 years) | |
| Gigabyte G5 KE | |
| MSI Katana 15 B12VEK | |
| HP Victus 15 fa0020nr | |
| Schenker XMG Core 15 (M22) | |
| Asus TUF A15 FA507 | |
| Average AMD Ryzen 7 7735HS, NVIDIA GeForce RTX 4050 Laptop GPU (n=1) | |
| CrossMark / Productivity | |
| Average of class Gaming (1386 - 2254, n=95, last 2 years) | |
| Gigabyte G5 KE | |
| MSI Katana 15 B12VEK | |
| HP Victus 15 fa0020nr | |
| Schenker XMG Core 15 (M22) | |
| Asus TUF A15 FA507 | |
| Average AMD Ryzen 7 7735HS, NVIDIA GeForce RTX 4050 Laptop GPU (n=1) | |
| CrossMark / Creativity | |
| Average of class Gaming (1343 - 2786, n=95, last 2 years) | |
| MSI Katana 15 B12VEK | |
| HP Victus 15 fa0020nr | |
| Gigabyte G5 KE | |
| Schenker XMG Core 15 (M22) | |
| Asus TUF A15 FA507 | |
| Average AMD Ryzen 7 7735HS, NVIDIA GeForce RTX 4050 Laptop GPU (n=1) | |
| CrossMark / Responsiveness | |
| Gigabyte G5 KE | |
| Average of class Gaming (1226 - 2334, n=95, last 2 years) | |
| MSI Katana 15 B12VEK | |
| HP Victus 15 fa0020nr | |
| Schenker XMG Core 15 (M22) | |
| Asus TUF A15 FA507 | |
| Average AMD Ryzen 7 7735HS, NVIDIA GeForce RTX 4050 Laptop GPU (n=1) | |
| PCMark 10 Score | 7210 points | |
Help | ||
| AIDA64 / Memory Copy | |
| Average of class Gaming (21750 - 129946, n=106, last 2 years) | |
| MSI Katana 15 B12VEK | |
| Asus TUF Gaming F15 FX507ZM | |
| Schenker XMG Core 15 (M22) | |
| Asus TUF A15 FA507 | |
| Average AMD Ryzen 7 7735HS (30324 - 52012, n=16) | |
| Gigabyte G5 KE | |
| HP Victus 15 fa0020nr | |
| Lenovo IdeaPad Gaming 3 15IAH7 | |
| AIDA64 / Memory Read | |
| Average of class Gaming (22956 - 118858, n=106, last 2 years) | |
| MSI Katana 15 B12VEK | |
| Asus TUF Gaming F15 FX507ZM | |
| Schenker XMG Core 15 (M22) | |
| Asus TUF A15 FA507 | |
| Gigabyte G5 KE | |
| HP Victus 15 fa0020nr | |
| Average AMD Ryzen 7 7735HS (33938 - 51856, n=16) | |
| Lenovo IdeaPad Gaming 3 15IAH7 | |
| AIDA64 / Memory Write | |
| Average of class Gaming (22297 - 135096, n=106, last 2 years) | |
| Asus TUF Gaming F15 FX507ZM | |
| MSI Katana 15 B12VEK | |
| Schenker XMG Core 15 (M22) | |
| Asus TUF A15 FA507 | |
| Average AMD Ryzen 7 7735HS (33175 - 55284, n=16) | |
| Gigabyte G5 KE | |
| HP Victus 15 fa0020nr | |
| Lenovo IdeaPad Gaming 3 15IAH7 | |
| AIDA64 / Memory Latency | |
| Average of class Gaming (75.3 - 259, n=106, last 2 years) | |
| Gigabyte G5 KE | |
| MSI Katana 15 B12VEK | |
| Lenovo IdeaPad Gaming 3 15IAH7 | |
| Average AMD Ryzen 7 7735HS (78.2 - 109.8, n=16) | |
| Schenker XMG Core 15 (M22) | |
| Asus TUF A15 FA507 | |
| HP Victus 15 fa0020nr | |
| Asus TUF Gaming F15 FX507ZM | |
* ... smaller is better
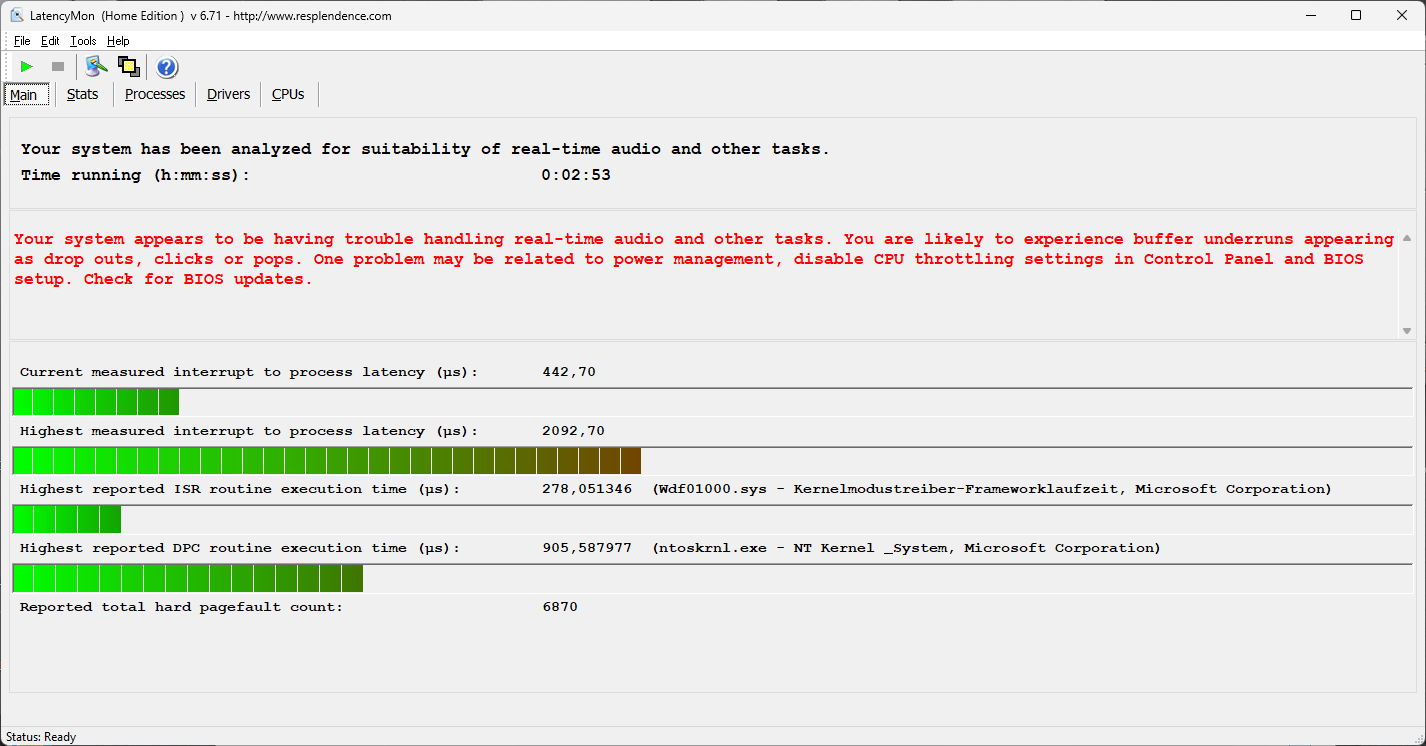
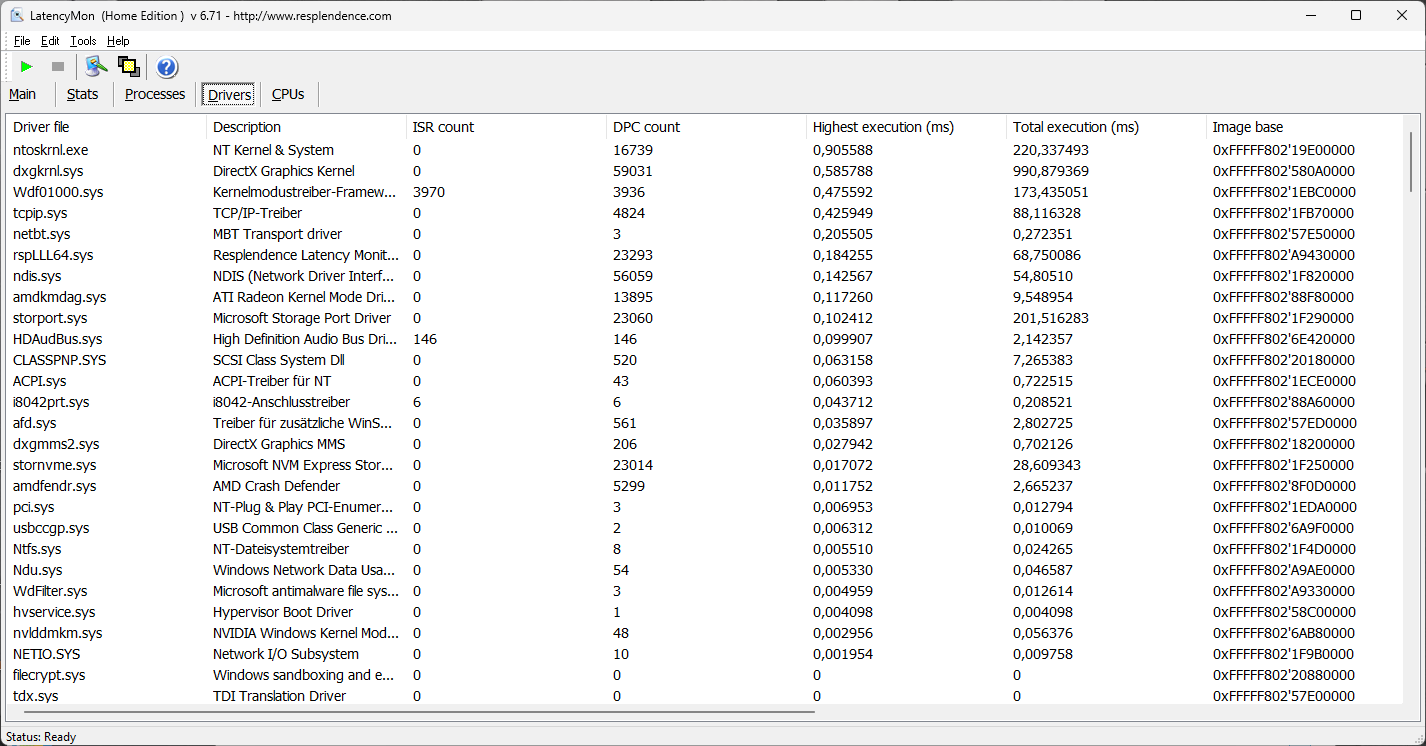
DPC latency
In our standardized latency test (web browsing, 4K YouTube playback, CPU load), the test device showed some limitations with the present BIOS version and is therefore not suitable for unrestricted real-time audio software.
| DPC Latencies / LatencyMon - interrupt to process latency (max), Web, Youtube, Prime95 | |
| MSI Katana 15 B12VEK | |
| Schenker XMG Core 15 (M22) | |
| HP Victus 15 fa0020nr | |
| Lenovo IdeaPad Gaming 3 15IAH7 | |
| Gigabyte G5 KE | |
| Asus TUF Gaming F15 FX507ZM | |
* ... smaller is better
Storage devices
The installed SSD is a PCIe 4.0 drive from Micron (2400). The M.2 2280 drive has a storage capacity of 512 GB, with 420 GB available after the first startup. The maximum transfer rate of the QLC-SSD is 4,200 MB/s, which also matches the rates in our benchmarks. Overall, its performance is good and stable even under longer load. More SSD benchmarks are listed here.

* ... smaller is better
reading continuous performance: DiskSpd Read Loop, Queue Depth 8
Graphics card - GeForce RTX 4050 Laptop
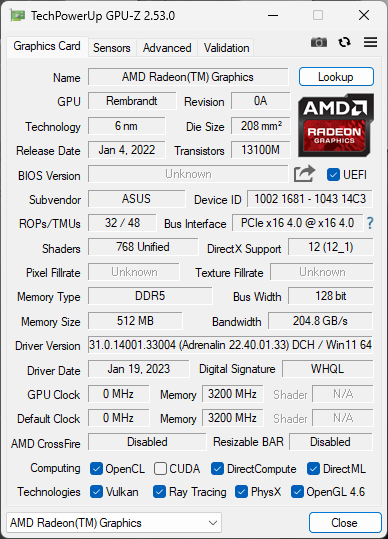
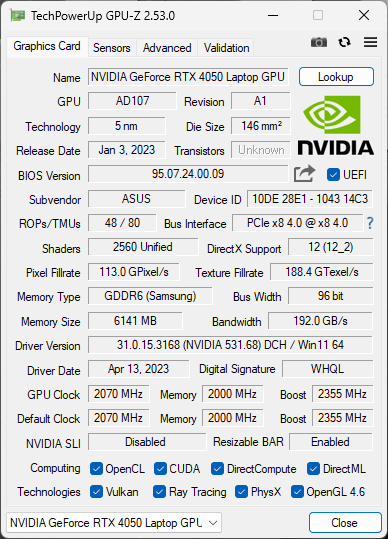
In everyday use, graphics computing is taken care of by the integrated AMD Radeon 680M - for bigger exertions, it automatically switches to the dedicated Nvidia GeForce RTX 4050 Laptop. The latter has 6 GB RAM and according to the driver, this is the 140-watt version. However, this specification is a little misleading since the new GPU consumes a maximum of ~95 watts while gaming anyway. So, it is the fastest version of the RTX 4050 laptop. This is also reflected in the benchmarks, where the TUF Gaming A15 performed about 10% faster on average than the average values we have for this GPU in our database.
This means the RTX 4050 laptop also comes very close to the old RTX 3060, which also consumes significantly more power within the comparison devices (between 115 and 140 watts TGP). Overall, its performance is very good and there was no performance drop even under permanent load - the Time Spy stress test was run without any problems with a pass rate of 99.3%. In battery mode, the GPU's power consumption is limited to around 50 watts, which is why the graphics performance drops by about 30%. More GPU benchmarks are listed in our technology section.
| 3DMark Performance rating - Percent | |
| Average of class Gaming | |
| Asus TUF Gaming F15 FX507ZM -4! | |
| MSI Katana 15 B12VEK -3! | |
| Gigabyte G5 KE -3! | |
| Asus TUF A15 FA507 | |
| Schenker XMG Core 15 (M22) -1! | |
| Average NVIDIA GeForce RTX 4050 Laptop GPU | |
| Lenovo IdeaPad Gaming 3 15IAH7 -3! | |
| HP Victus 15 fa0020nr -2! | |
| Geekbench 6.0 - GPU OpenCL 6.0 | |
| Average of class Gaming (155885 - 241981, n=3, last 2 years) | |
| Asus TUF A15 FA507 | |
| Average NVIDIA GeForce RTX 4050 Laptop GPU (66574 - 84452, n=13) | |
| 3DMark 11 Performance | 26692 points | |
| 3DMark Fire Strike Score | 20183 points | |
| 3DMark Time Spy Score | 8902 points | |
Help | ||
| Blender / v3.3 Classroom HIP/AMD | |
| Schenker XMG Core 15 (M22) | |
| Asus TUF A15 FA507 | |
| Asus TUF A15 FA507 | |
| Average NVIDIA GeForce RTX 4050 Laptop GPU (345 - 345, n=2) | |
| Blender / v3.3 Classroom OPTIX/RTX | |
| Lenovo IdeaPad Gaming 3 15IAH7 | |
| HP Victus 15 fa0020nr | |
| Schenker XMG Core 15 (M22) | |
| Gigabyte G5 KE | |
| Average NVIDIA GeForce RTX 4050 Laptop GPU (25 - 37, n=40) | |
| MSI Katana 15 B12VEK | |
| Asus TUF A15 FA507 | |
| Asus TUF A15 FA507 | |
| Average of class Gaming (9 - 32, n=107, last 2 years) | |
| Blender / v3.3 Classroom CUDA | |
| Lenovo IdeaPad Gaming 3 15IAH7 | |
| HP Victus 15 fa0020nr | |
| Average NVIDIA GeForce RTX 4050 Laptop GPU (47 - 68, n=39) | |
| Schenker XMG Core 15 (M22) | |
| MSI Katana 15 B12VEK | |
| Gigabyte G5 KE | |
| Asus TUF A15 FA507 | |
| Asus TUF A15 FA507 | |
| Average of class Gaming (15 - 228, n=107, last 2 years) | |
| Blender / v3.3 Classroom CPU | |
| MSI Katana 15 B12VEK | |
| Gigabyte G5 KE | |
| HP Victus 15 fa0020nr | |
| Average NVIDIA GeForce RTX 4050 Laptop GPU (243 - 907, n=40) | |
| Lenovo IdeaPad Gaming 3 15IAH7 | |
| Asus TUF A15 FA507 | |
| Asus TUF A15 FA507 | |
| Schenker XMG Core 15 (M22) | |
| Average of class Gaming (122 - 565, n=103, last 2 years) | |
* ... smaller is better
Gaming performance
Our base variant of the TUF Gaming A15's gaming performance was very good - more than sufficient for the native 1080p resolution even when playing modern games like Hogwarts Legacy or Cyberpunk 2077 with maximum detail settings. If you want to use ray tracing, however, you have to use DLSS upscaling. For example, Cyberpunk 2077 only ran at 24 FPS in 1080p with ray tracing on Ultra, whereas it ran at 74 FPS with DLSS. However, the difference can be less in other games. Basically, all modern games are able to be run and the 6 GB VRAM is currently completely sufficient for 1080p. The Witcher 3 test also shows that the gaming performance remains stable even during longer sessions.
| The Witcher 3 - 1920x1080 Ultra Graphics & Postprocessing (HBAO+) | |
| Average of class Gaming (104.7 - 240, n=7, last 2 years) | |
| Asus TUF Gaming F15 FX507ZM | |
| Gigabyte G5 KE | |
| MSI Katana 15 B12VEK | |
| Asus TUF A15 FA507 | |
| Schenker XMG Core 15 (M22) | |
| Lenovo IdeaPad Gaming 3 15IAH7 | |
| HP Victus 15 fa0020nr | |
| Final Fantasy XV Benchmark - 1920x1080 High Quality | |
| Average of class Gaming (41 - 215, n=95, last 2 years) | |
| Asus TUF Gaming F15 FX507ZM | |
| Schenker XMG Core 15 (M22) | |
| Gigabyte G5 KE | |
| MSI Katana 15 B12VEK | |
| Asus TUF A15 FA507 | |
| Lenovo IdeaPad Gaming 3 15IAH7 | |
| HP Victus 15 fa0020nr | |
| Dota 2 Reborn - 1920x1080 ultra (3/3) best looking | |
| Average of class Gaming (84.8 - 252, n=108, last 2 years) | |
| Asus TUF Gaming F15 FX507ZM | |
| MSI Katana 15 B12VEK | |
| Gigabyte G5 KE | |
| HP Victus 15 fa0020nr | |
| Asus TUF A15 FA507 | |
| Schenker XMG Core 15 (M22) | |
| Lenovo IdeaPad Gaming 3 15IAH7 | |
| The Witcher 3 - 1920x1080 Ultra Graphics & Postprocessing (HBAO+) | |
| Average of class Gaming (104.7 - 240, n=7, last 2 years) | |
| Asus TUF Gaming F15 FX507ZM | |
| Gigabyte G5 KE | |
| MSI Katana 15 B12VEK | |
| Asus TUF A15 FA507 | |
| Schenker XMG Core 15 (M22) | |
| Average NVIDIA GeForce RTX 4050 Laptop GPU (18.5 - 94.7, n=40) | |
| Lenovo IdeaPad Gaming 3 15IAH7 | |
| HP Victus 15 fa0020nr | |
| F1 22 | |
| 1920x1080 High Preset AA:T AF:16x | |
| Average of class Gaming (99.3 - 271, n=4, last 2 years) | |
| Asus TUF A15 FA507 | |
| Gigabyte G5 KE | |
| Average NVIDIA GeForce RTX 4050 Laptop GPU (94.4 - 174.7, n=22) | |
| Lenovo IdeaPad Gaming 3 15IAH7 | |
| 1920x1080 Ultra High Preset AA:T AF:16x | |
| Average of class Gaming (40.1 - 121.2, n=4, last 2 years) | |
| Asus TUF A15 FA507 | |
| Gigabyte G5 KE | |
| Average NVIDIA GeForce RTX 4050 Laptop GPU (10.9 - 56.4, n=24) | |
| Lenovo IdeaPad Gaming 3 15IAH7 | |
| Cyberpunk 2077 1.6 | |
| 1920x1080 High Preset | |
| Gigabyte G5 KE | |
| Asus TUF A15 FA507 | |
| Average NVIDIA GeForce RTX 4050 Laptop GPU (48 - 91.3, n=14) | |
| HP Victus 15 fa0020nr | |
| 1920x1080 Ultra Preset | |
| Gigabyte G5 KE | |
| Asus TUF A15 FA507 | |
| Average NVIDIA GeForce RTX 4050 Laptop GPU (44.4 - 79.4, n=14) | |
| HP Victus 15 fa0020nr | |
| Hogwarts Legacy | |
| 1920x1080 High Preset AA:High T | |
| Asus TUF A15 FA507 | |
| Average NVIDIA GeForce RTX 4050 Laptop GPU (44.8 - 93.6, n=8) | |
| 1920x1080 Ultra Preset AA:High T | |
| Average of class Gaming (n=1last 2 years) | |
| Average NVIDIA GeForce RTX 4050 Laptop GPU (39 - 77.3, n=8) | |
| Asus TUF A15 FA507 | |
Witcher 3 FPS diagram
| low | med. | high | ultra | |
|---|---|---|---|---|
| GTA V (2015) | 168.6 | 153.1 | 83.5 | |
| The Witcher 3 (2015) | 171 | 82.2 | ||
| Dota 2 Reborn (2015) | 137.4 | 127.2 | 115.8 | |
| Final Fantasy XV Benchmark (2018) | 178.9 | 115.5 | 81.5 | |
| X-Plane 11.11 (2018) | 103.5 | 97 | 77.8 | |
| Far Cry 5 (2018) | 111 | 105 | 99 | |
| Strange Brigade (2018) | 211 | 171 | 147 | |
| F1 2021 (2021) | 283 | 260 | 209 | 110.3 |
| Cyberpunk 2077 1.6 (2022) | 103 | 82 | 71 | 66 |
| F1 22 (2022) | 192.7 | 191.4 | 161.2 | 56.4 |
| Hogwarts Legacy (2023) | 122 | 109 | 89 | 49 |
Emissions - A gaming laptop with a cool keyboard
Noise emissions
For a gaming laptop, our test device was comparatively quiet. During simple tasks, the cooler was often completely silent and even under load, we were positively surprised: During the stress test, the fans reached a maximum noise level of 43 dB(A). While gaming, we measured between 40-43 dB(A), meaning the TUF Gaming A15 is still quieter than its competitors. We assume the stronger configurations will have slightly louder fans. We didn't note any other electronic noises.
Noise level
| Idle |
| 23.3 / 23.3 / 23.3 dB(A) |
| Load |
| 29.6 / 43 dB(A) |
 | ||
30 dB silent 40 dB(A) audible 50 dB(A) loud |
||
min: | ||
| Asus TUF A15 FA507 GeForce RTX 4050 Laptop GPU, R7 7735HS, Micron 2400 MTFDKBA512QFM | Gigabyte G5 KE GeForce RTX 3060 Laptop GPU, i5-12500H, Gigabyte AG4512G-SI B10 | Schenker XMG Core 15 (M22) GeForce RTX 3060 Laptop GPU, R7 6800H, Samsung SSD 980 Pro 1TB MZ-V8P1T0BW | MSI Katana 15 B12VEK GeForce RTX 4050 Laptop GPU, i7-12650H, Micron 2400 MTFDKBA1T0QFM | HP Victus 15 fa0020nr GeForce RTX 3050 Ti Laptop GPU, i7-12700H, Samsung PM9A1 MZVL2512HCJQ | Lenovo IdeaPad Gaming 3 15IAH7 GeForce RTX 3050 Ti Laptop GPU, i5-12500H, Intel SSD 660p SSDPEKNW512G8 | Asus TUF Gaming F15 FX507ZM GeForce RTX 3060 Laptop GPU, i7-12700H, SK Hynix HFM001TD3JX013N | |
|---|---|---|---|---|---|---|---|
| Noise | -33% | -13% | -10% | -10% | -25% | -14% | |
| off / environment * (dB) | 23.3 | 19.52 16% | 23 1% | 24 -3% | 24.8 -6% | 25 -7% | 23.2 -0% |
| Idle Minimum * (dB) | 23.3 | 31.05 -33% | 23 1% | 24 -3% | 26.2 -12% | 29 -24% | 23.6 -1% |
| Idle Average * (dB) | 23.3 | 31.05 -33% | 23 1% | 24 -3% | 29.2 -25% | 30 -29% | 23.6 -1% |
| Idle Maximum * (dB) | 23.3 | 31.05 -33% | 23 1% | 24 -3% | 29.4 -26% | 32 -37% | 25.4 -9% |
| Load Average * (dB) | 29.6 | 55.66 -88% | 42.41 -43% | 37.71 -27% | 29.9 -1% | 42 -42% | 38 -28% |
| Witcher 3 ultra * (dB) | 43 | 55.7 -30% | 54.71 -27% | 45.75 -6% | 41.1 4% | 46 -7% | 54.1 -26% |
| Load Maximum * (dB) | 43 | 55.51 -29% | 55.05 -28% | 54.55 -27% | 45.5 -6% | 54 -26% | 57.2 -33% |
* ... smaller is better
Temperature
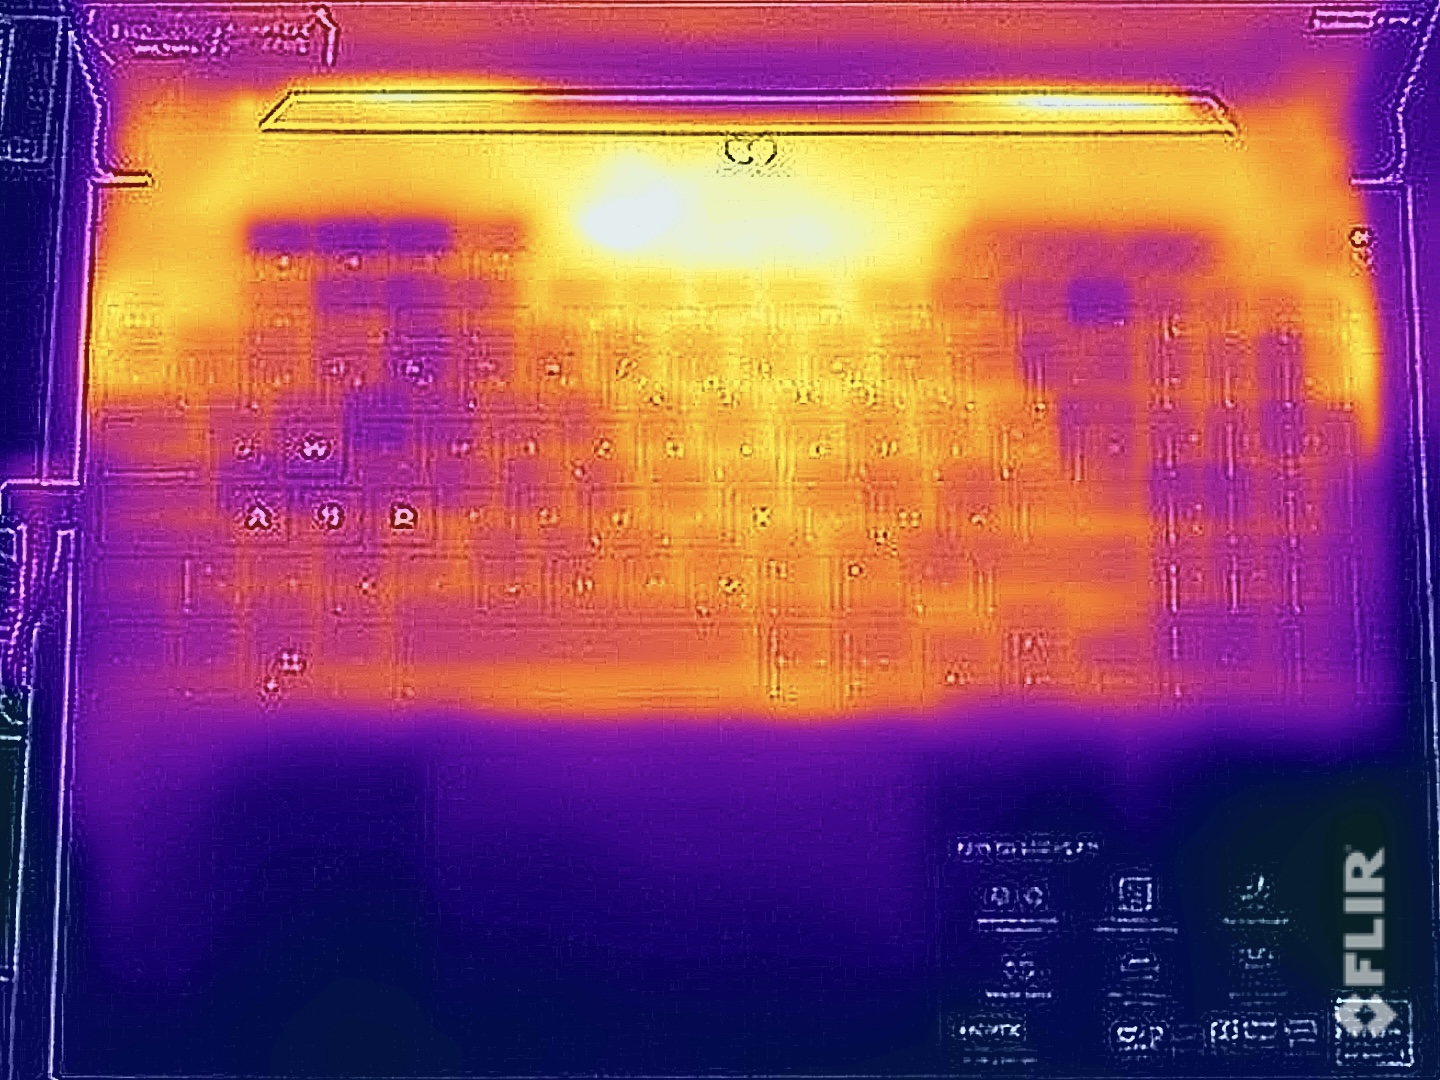
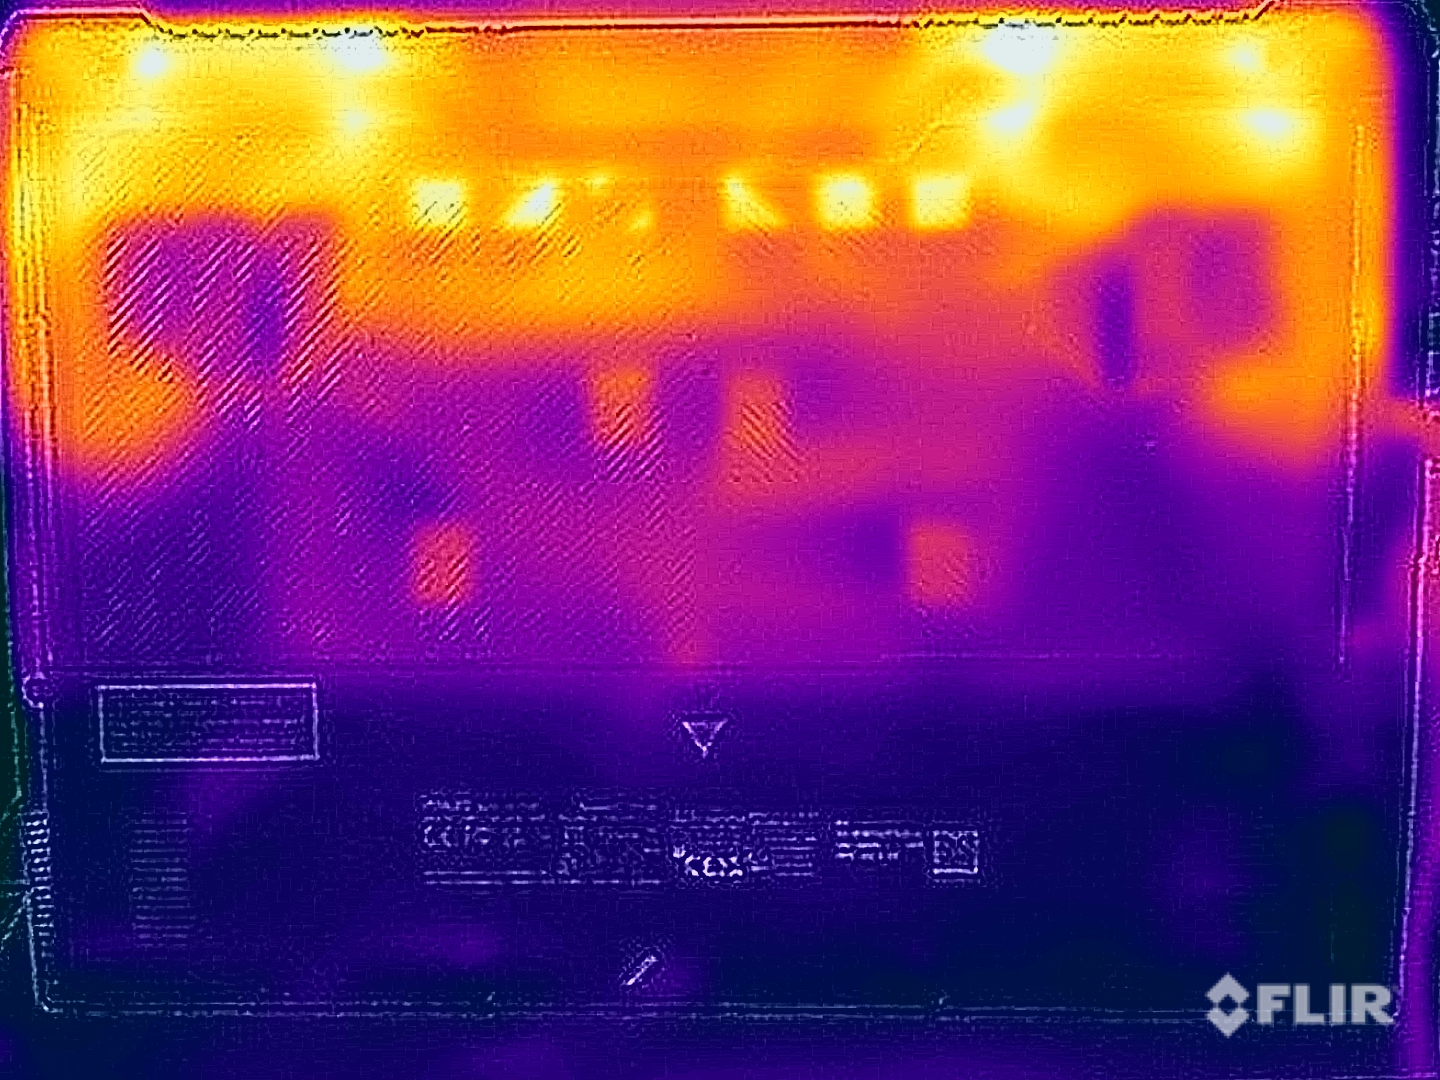
There were no temperature issues during everyday tasks and even under load, the Asus laptop had its surface temperatures well under control. The upper center area of the base unit got very warm at almost 50 °C, but this hotspot is above the keyboard and especially the WASD key area stayed very cool, which is important when gaming. On the underside, we measured a maximum of 44 °C in the rear area, and you can even place the laptop on your thighs without any problems.
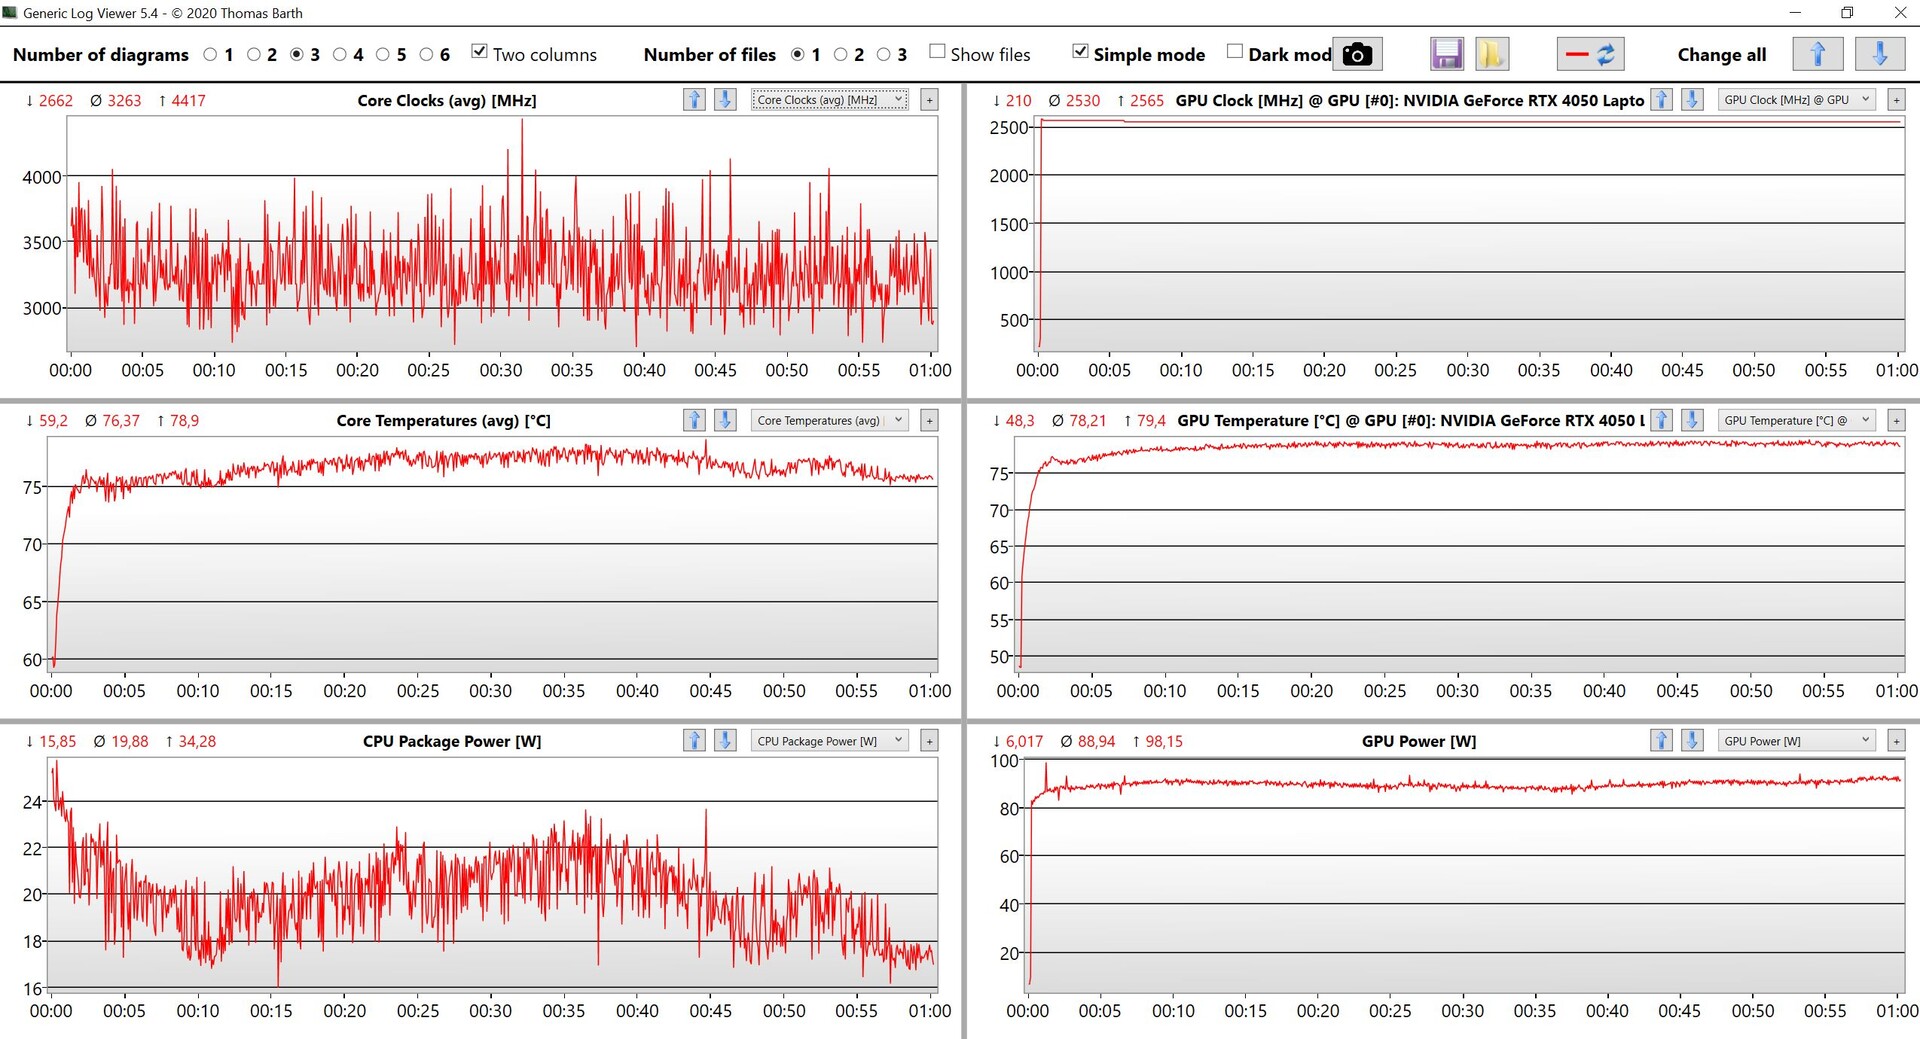
As expected, the dGPU was favored during the stress test. There were still slight fluctuations in the first 15 minutes before the processor and graphics card then settled at a stable 35 and 80 watts, respectively.
(-) The maximum temperature on the upper side is 48.9 °C / 120 F, compared to the average of 40.4 °C / 105 F, ranging from 21.2 to 68.8 °C for the class Gaming.
(±) The bottom heats up to a maximum of 44.6 °C / 112 F, compared to the average of 43.2 °C / 110 F
(+) In idle usage, the average temperature for the upper side is 26.2 °C / 79 F, compared to the device average of 33.9 °C / 93 F.
(±) Playing The Witcher 3, the average temperature for the upper side is 36.9 °C / 98 F, compared to the device average of 33.9 °C / 93 F.
(+) The palmrests and touchpad are cooler than skin temperature with a maximum of 30.6 °C / 87.1 F and are therefore cool to the touch.
(±) The average temperature of the palmrest area of similar devices was 28.8 °C / 83.8 F (-1.8 °C / -3.3 F).
| Asus TUF A15 FA507 AMD Ryzen 7 7735HS, NVIDIA GeForce RTX 4050 Laptop GPU | Gigabyte G5 KE Intel Core i5-12500H, NVIDIA GeForce RTX 3060 Laptop GPU | Schenker XMG Core 15 (M22) AMD Ryzen 7 6800H, NVIDIA GeForce RTX 3060 Laptop GPU | MSI Katana 15 B12VEK Intel Core i7-12650H, NVIDIA GeForce RTX 4050 Laptop GPU | HP Victus 15 fa0020nr Intel Core i7-12700H, NVIDIA GeForce RTX 3050 Ti Laptop GPU | Lenovo IdeaPad Gaming 3 15IAH7 Intel Core i5-12500H, NVIDIA GeForce RTX 3050 Ti Laptop GPU | Asus TUF Gaming F15 FX507ZM Intel Core i7-12700H, NVIDIA GeForce RTX 3060 Laptop GPU | |
|---|---|---|---|---|---|---|---|
| Heat | -25% | -9% | -18% | 20% | 2% | -21% | |
| Maximum Upper Side * (°C) | 48.9 | 52.6 -8% | 48 2% | 47 4% | 37.2 24% | 47 4% | 44.4 9% |
| Maximum Bottom * (°C) | 44.6 | 62.4 -40% | 51 -14% | 48 -8% | 35.4 21% | 52 -17% | 48.8 -9% |
| Idle Upper Side * (°C) | 27.1 | 33.6 -24% | 28 -3% | 35 -29% | 22.4 17% | 25 8% | 37.8 -39% |
| Idle Bottom * (°C) | 27.5 | 34.8 -27% | 33 -20% | 38 -38% | 22.6 18% | 24 13% | 39.6 -44% |
* ... smaller is better
Speakers
The TUF Gaming A15 certainly can't boast amazing sound and the two stereo speakers are pretty average - but this is often the case with inexpensive gaming laptops. Music and movies are not really fun to listen to and watch - we would recommend using a headset when gaming anyway, since the fans can be annoying otherwise.
Asus TUF A15 FA507 audio analysis
(±) | speaker loudness is average but good (79.3 dB)
Bass 100 - 315 Hz
(±) | reduced bass - on average 13.7% lower than median
(+) | bass is linear (6.2% delta to prev. frequency)
Mids 400 - 2000 Hz
(±) | higher mids - on average 7.6% higher than median
(±) | linearity of mids is average (7.3% delta to prev. frequency)
Highs 2 - 16 kHz
(+) | balanced highs - only 2.1% away from median
(±) | linearity of highs is average (7.5% delta to prev. frequency)
Overall 100 - 16.000 Hz
(±) | linearity of overall sound is average (17.2% difference to median)
Compared to same class
» 47% of all tested devices in this class were better, 11% similar, 42% worse
» The best had a delta of 6%, average was 18%, worst was 132%
Compared to all devices tested
» 32% of all tested devices were better, 8% similar, 60% worse
» The best had a delta of 4%, average was 23%, worst was 134%
Schenker XMG Core 15 (M22) audio analysis
(±) | speaker loudness is average but good (81.28 dB)
Bass 100 - 315 Hz
(-) | nearly no bass - on average 19.8% lower than median
(+) | bass is linear (6.4% delta to prev. frequency)
Mids 400 - 2000 Hz
(±) | higher mids - on average 6.2% higher than median
(±) | linearity of mids is average (7.9% delta to prev. frequency)
Highs 2 - 16 kHz
(+) | balanced highs - only 1.8% away from median
(+) | highs are linear (4.8% delta to prev. frequency)
Overall 100 - 16.000 Hz
(±) | linearity of overall sound is average (17.1% difference to median)
Compared to same class
» 46% of all tested devices in this class were better, 12% similar, 43% worse
» The best had a delta of 6%, average was 18%, worst was 132%
Compared to all devices tested
» 31% of all tested devices were better, 8% similar, 61% worse
» The best had a delta of 4%, average was 23%, worst was 134%
Power management - Long runtimes thanks to a big battery
Power consumption
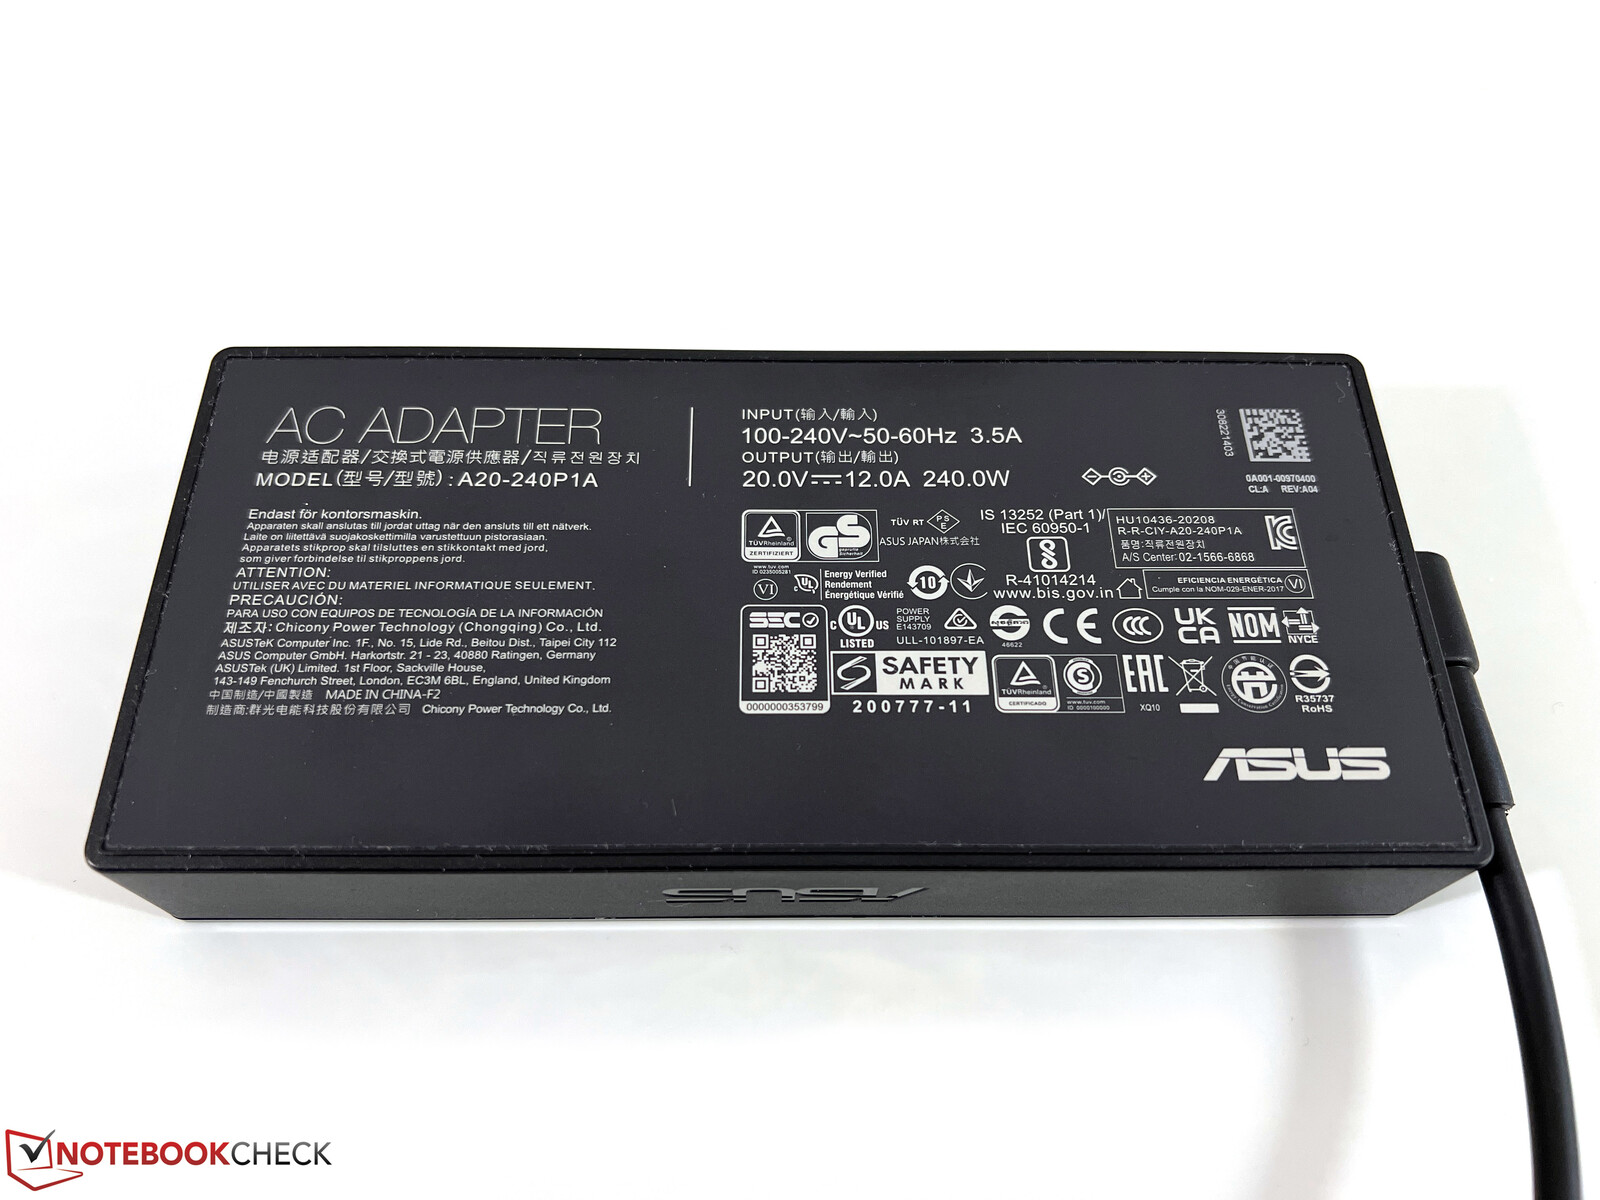
In our consumption measurements, the review sample remained very frugal and even when gaming, the A15 remained much more efficient than the RTX-3060 laptops, which don't offer much more power, either. We determined a maximum of 185 watts in the stress test, which then quickly settled at around 155 watts. In view of these rates, the included 240-watt power supply is almost oversized for the base variant and the more compact 200-watt module of the current Zenbook Pro 14 would have been perfectly sufficient.
| Off / Standby | |
| Idle | |
| Load |
|
Key:
min: | |
| Asus TUF A15 FA507 R7 7735HS, GeForce RTX 4050 Laptop GPU, Micron 2400 MTFDKBA512QFM, IPS, 1920x1080, 15.6" | Gigabyte G5 KE i5-12500H, GeForce RTX 3060 Laptop GPU, Gigabyte AG4512G-SI B10, IPS, 1920x1080, 15.6" | Schenker XMG Core 15 (M22) R7 6800H, GeForce RTX 3060 Laptop GPU, Samsung SSD 980 Pro 1TB MZ-V8P1T0BW, IPS, 2560x1440, 15.6" | MSI Katana 15 B12VEK i7-12650H, GeForce RTX 4050 Laptop GPU, Micron 2400 MTFDKBA1T0QFM, IPS, 1920x1080, 15.6" | HP Victus 15 fa0020nr i7-12700H, GeForce RTX 3050 Ti Laptop GPU, Samsung PM9A1 MZVL2512HCJQ, IPS, 1920x1080, 15.6" | Lenovo IdeaPad Gaming 3 15IAH7 i5-12500H, GeForce RTX 3050 Ti Laptop GPU, Intel SSD 660p SSDPEKNW512G8, IPS, 1920x1080, 15.6" | Asus TUF Gaming F15 FX507ZM i7-12700H, GeForce RTX 3060 Laptop GPU, SK Hynix HFM001TD3JX013N, IPS, 1920x1080, 15.6" | Average NVIDIA GeForce RTX 4050 Laptop GPU | Average of class Gaming | |
|---|---|---|---|---|---|---|---|---|---|
| Power Consumption | -19% | -31% | 2% | -11% | -7% | -30% | -26% | -61% | |
| Idle Minimum * (Watt) | 8 | 7.66 4% | 11.8 -48% | 8.5 -6% | 5.1 36% | 8 -0% | 6.3 21% | 9.95 ? -24% | 13 ? -63% |
| Idle Average * (Watt) | 12.1 | 10.3 15% | 14.7 -21% | 10.2 16% | 15.1 -25% | 10 17% | 9.8 19% | 15.8 ? -31% | 19 ? -57% |
| Idle Maximum * (Watt) | 12.5 | 16.05 -28% | 15 -20% | 11.3 10% | 18.9 -51% | 16 -28% | 26.5 -112% | 20.1 ? -61% | 24.6 ? -97% |
| Load Average * (Watt) | 74.9 | 115.8 -55% | 100 -34% | 84 -12% | 114.5 -53% | 99 -32% | 103.8 -39% | 88 ? -17% | 110.7 ? -48% |
| Witcher 3 ultra * (Watt) | 136.6 | 168.7 -23% | 184 -35% | 128 6% | 113.9 17% | 144.6 -6% | 189 -38% | ||
| Load Maximum * (Watt) | 185 | 234.6 -27% | 237 -28% | 189 -2% | 165.8 10% | 168 9% | 241.9 -31% | 176.3 ? 5% | 259 ? -40% |
* ... smaller is better
power consumption Witcher 3 / stress test
power consumption with external monitor
Runtimes
The laptop's 90 Wh battery leads to very good battery runtimes. Except for a few minutes, it did not make a difference in our tests whether the display was in 60 Hz or 144 Hz mode. In the WLAN test at 150 cd/m² (which corresponds to 73% of maximum brightness), we noted just over 11.5 hours and at full brightness still a bit more than 9.5 hours. In the video test at 150 cd/m², we measured more than 12.5 hours. A complete charging process takes 106 minutes when the device is turned on. The charging curve only levels off at 70%, which is the case after ~44 minutes.
| Asus TUF A15 FA507 R7 7735HS, GeForce RTX 4050 Laptop GPU, 90 Wh | Gigabyte G5 KE i5-12500H, GeForce RTX 3060 Laptop GPU, 54 Wh | Schenker XMG Core 15 (M22) R7 6800H, GeForce RTX 3060 Laptop GPU, 62 Wh | MSI Katana 15 B12VEK i7-12650H, GeForce RTX 4050 Laptop GPU, 53.5 Wh | HP Victus 15 fa0020nr i7-12700H, GeForce RTX 3050 Ti Laptop GPU, 70 Wh | Lenovo IdeaPad Gaming 3 15IAH7 i5-12500H, GeForce RTX 3050 Ti Laptop GPU, 60 Wh | Asus TUF Gaming F15 FX507ZM i7-12700H, GeForce RTX 3060 Laptop GPU, 90 Wh | Average of class Gaming | |
|---|---|---|---|---|---|---|---|---|
| Battery runtime | -44% | -12% | -26% | -36% | -50% | -25% | -7% | |
| H.264 (h) | 12.5 | 2.2 -82% | 4.4 -65% | 8.32 ? -33% | ||||
| WiFi v1.3 (h) | 11.7 | 5.7 -51% | 7.8 -33% | 4.3 -63% | 2.1 -82% | 5.9 -50% | 4.8 -59% | 7.11 ? -39% |
| Load (h) | 1 | 1 0% | 1.1 10% | 1.5 50% | 1.1 10% | 1.1 10% | 1.502 ? 50% | |
| Witcher 3 ultra (h) | 1.3 | |||||||
| Reader / Idle (h) | 2.6 | 15.8 | 8.27 ? |
Pros
Cons
Verdict - A good gaming laptop for 1080p gaming
With the release of the TUF Gaming A15, Asos have concentrated on the essentials: gaming performance. Our base version, which can be had for around $1,169, already provided enough power to play current games smoothly in a native resolution of 1080p and with maximum details - thanks to its new Nvidia GeForce RTX 4050 Laptop. If you utilize upscaling, then you can even manage to run ray tracing. Its Zen3+ processor is an old friend, but even still, it manages to offer solid performance. RAM and SSD can be expanded - although, 16 GB and 512 GB should be fine to start with.
The laptop's case quality is fine; it doesn't feature any sort of fancy lighting (which doesn't necessarily have to be a bad thing). The labels on the keyboard are a little low in contrast and you often have to rely on the backlighting to be able to see them clearly. But, the keyboard manages to stay nice and cool while you are gaming and the fans don't get too loud.
The base version of the new Asus TUF Gaming A15 is a good gaming laptop and its RTX 4050 Laptop delivers enough performance for the 1080p display.
The screen does what it is supposed to do. Its 16:9 matte IPS panel has refresh rates of 144 Hz and good color accuracy, but its reaction times and brightness could do with being a little better. We measured 300 cd/m² for the latter. Its connectivity options even include USB 4.0 and you can connect a G-Sync monitor. The only issue is the fact that almost all of the laptop's ports are on the front left and middle of the device.
The laptop didn't really flag up any proper weaknesses, but you have to keep in mind that the base version comes without an operating system installed. In many areas, the device delivers standard features (WLAN, speakers, webcam) - but in all the core areas, its performance is satisfactory. Its price of around $1,169 is also quite competitive.
Price and availability
The device we tested can be found for around $1,169 on Amazon.
Asus TUF A15 FA507
- 06/13/2023 v7 (old)
Andreas Osthoff
Transparency
The selection of devices to be reviewed is made by our editorial team. The test sample was provided to the author as a loan by the manufacturer or retailer for the purpose of this review. The lender had no influence on this review, nor did the manufacturer receive a copy of this review before publication. There was no obligation to publish this review. As an independent media company, Notebookcheck is not subjected to the authority of manufacturers, retailers or publishers.
This is how Notebookcheck is testing
Every year, Notebookcheck independently reviews hundreds of laptops and smartphones using standardized procedures to ensure that all results are comparable. We have continuously developed our test methods for around 20 years and set industry standards in the process. In our test labs, high-quality measuring equipment is utilized by experienced technicians and editors. These tests involve a multi-stage validation process. Our complex rating system is based on hundreds of well-founded measurements and benchmarks, which maintains objectivity. Further information on our test methods can be found here.
Price comparison

