Asus Zenbook Pro 14 OLED laptop review: MacBook Pro rival with 120 Hz OLED display
With its new Zenbook Pro 14, Asus is offering a powerful multimedia notebook for content creators, thus putting it in direct competition with the Apple MacBook Pro 14. In addition to the current Raptor Lake processors from Intel, Asus installs the new RTX GPUs from Nvidia, whereby our test device even has the GeForce RTX 4070 Laptop installed. One special feature is the screen, which is a 2.8K OLED touchscreen with 120 Hz.
However, all this hardware comes at a price - our test device with a Core i9 13900H, an RTX 4070, 32 GB RAM and a 2 TB SSD costs a whopping EUR 3,500 (~US$3,750) and is therefore priced directly against the MacBook Pro 14 (M2 Max). 14-inch devices with these performance values are rare, which is why we also list some 15-inch models as comparison devices.
Possible competitors in comparison
Rating | Date | Model | Weight | Height | Size | Resolution | Price |
|---|---|---|---|---|---|---|---|
| 89.3 % v7 (old) | 06 / 2023 | Asus Zenbook Pro 14 OLED UX6404VI i9-13900H, GeForce RTX 4070 Laptop GPU | 1.7 kg | 17.9 mm | 14.50" | 2880x1800 | |
| 87 % v7 (old) | 06 / 2023 | Asus ZenBook Pro 14 Duo UX8402VV-P1021W i9-13900H, GeForce RTX 4060 Laptop GPU | 1.8 kg | 21 mm | 14.50" | 2880x1800 | |
| 93.9 % v7 (old) | 03 / 2023 | Apple MacBook Pro 14 2023 M2 Pro M2 Pro, M2 Pro 19-Core GPU | 1.6 kg | 15.5 mm | 14.20" | 3024x1964 | |
| 90 % v7 (old) | 04 / 2023 | Asus ROG Zephyrus G14 GA402XY R9 7940HS, GeForce RTX 4090 Laptop GPU | 1.7 kg | 20.5 mm | 14.00" | 2560x1600 | |
| 90.3 % v7 (old) | 04 / 2023 | Dell XPS 15 9530 RTX 4070 i7-13700H, GeForce RTX 4070 Laptop GPU | 1.9 kg | 18 mm | 15.60" | 3456x2160 | |
| 89.9 % v7 (old) | 03 / 2023 | Razer Blade 15 OLED (Early 2022) i9-12900H, GeForce RTX 3070 Ti Laptop GPU | 2 kg | 16.99 mm | 15.60" | 2560x1440 |
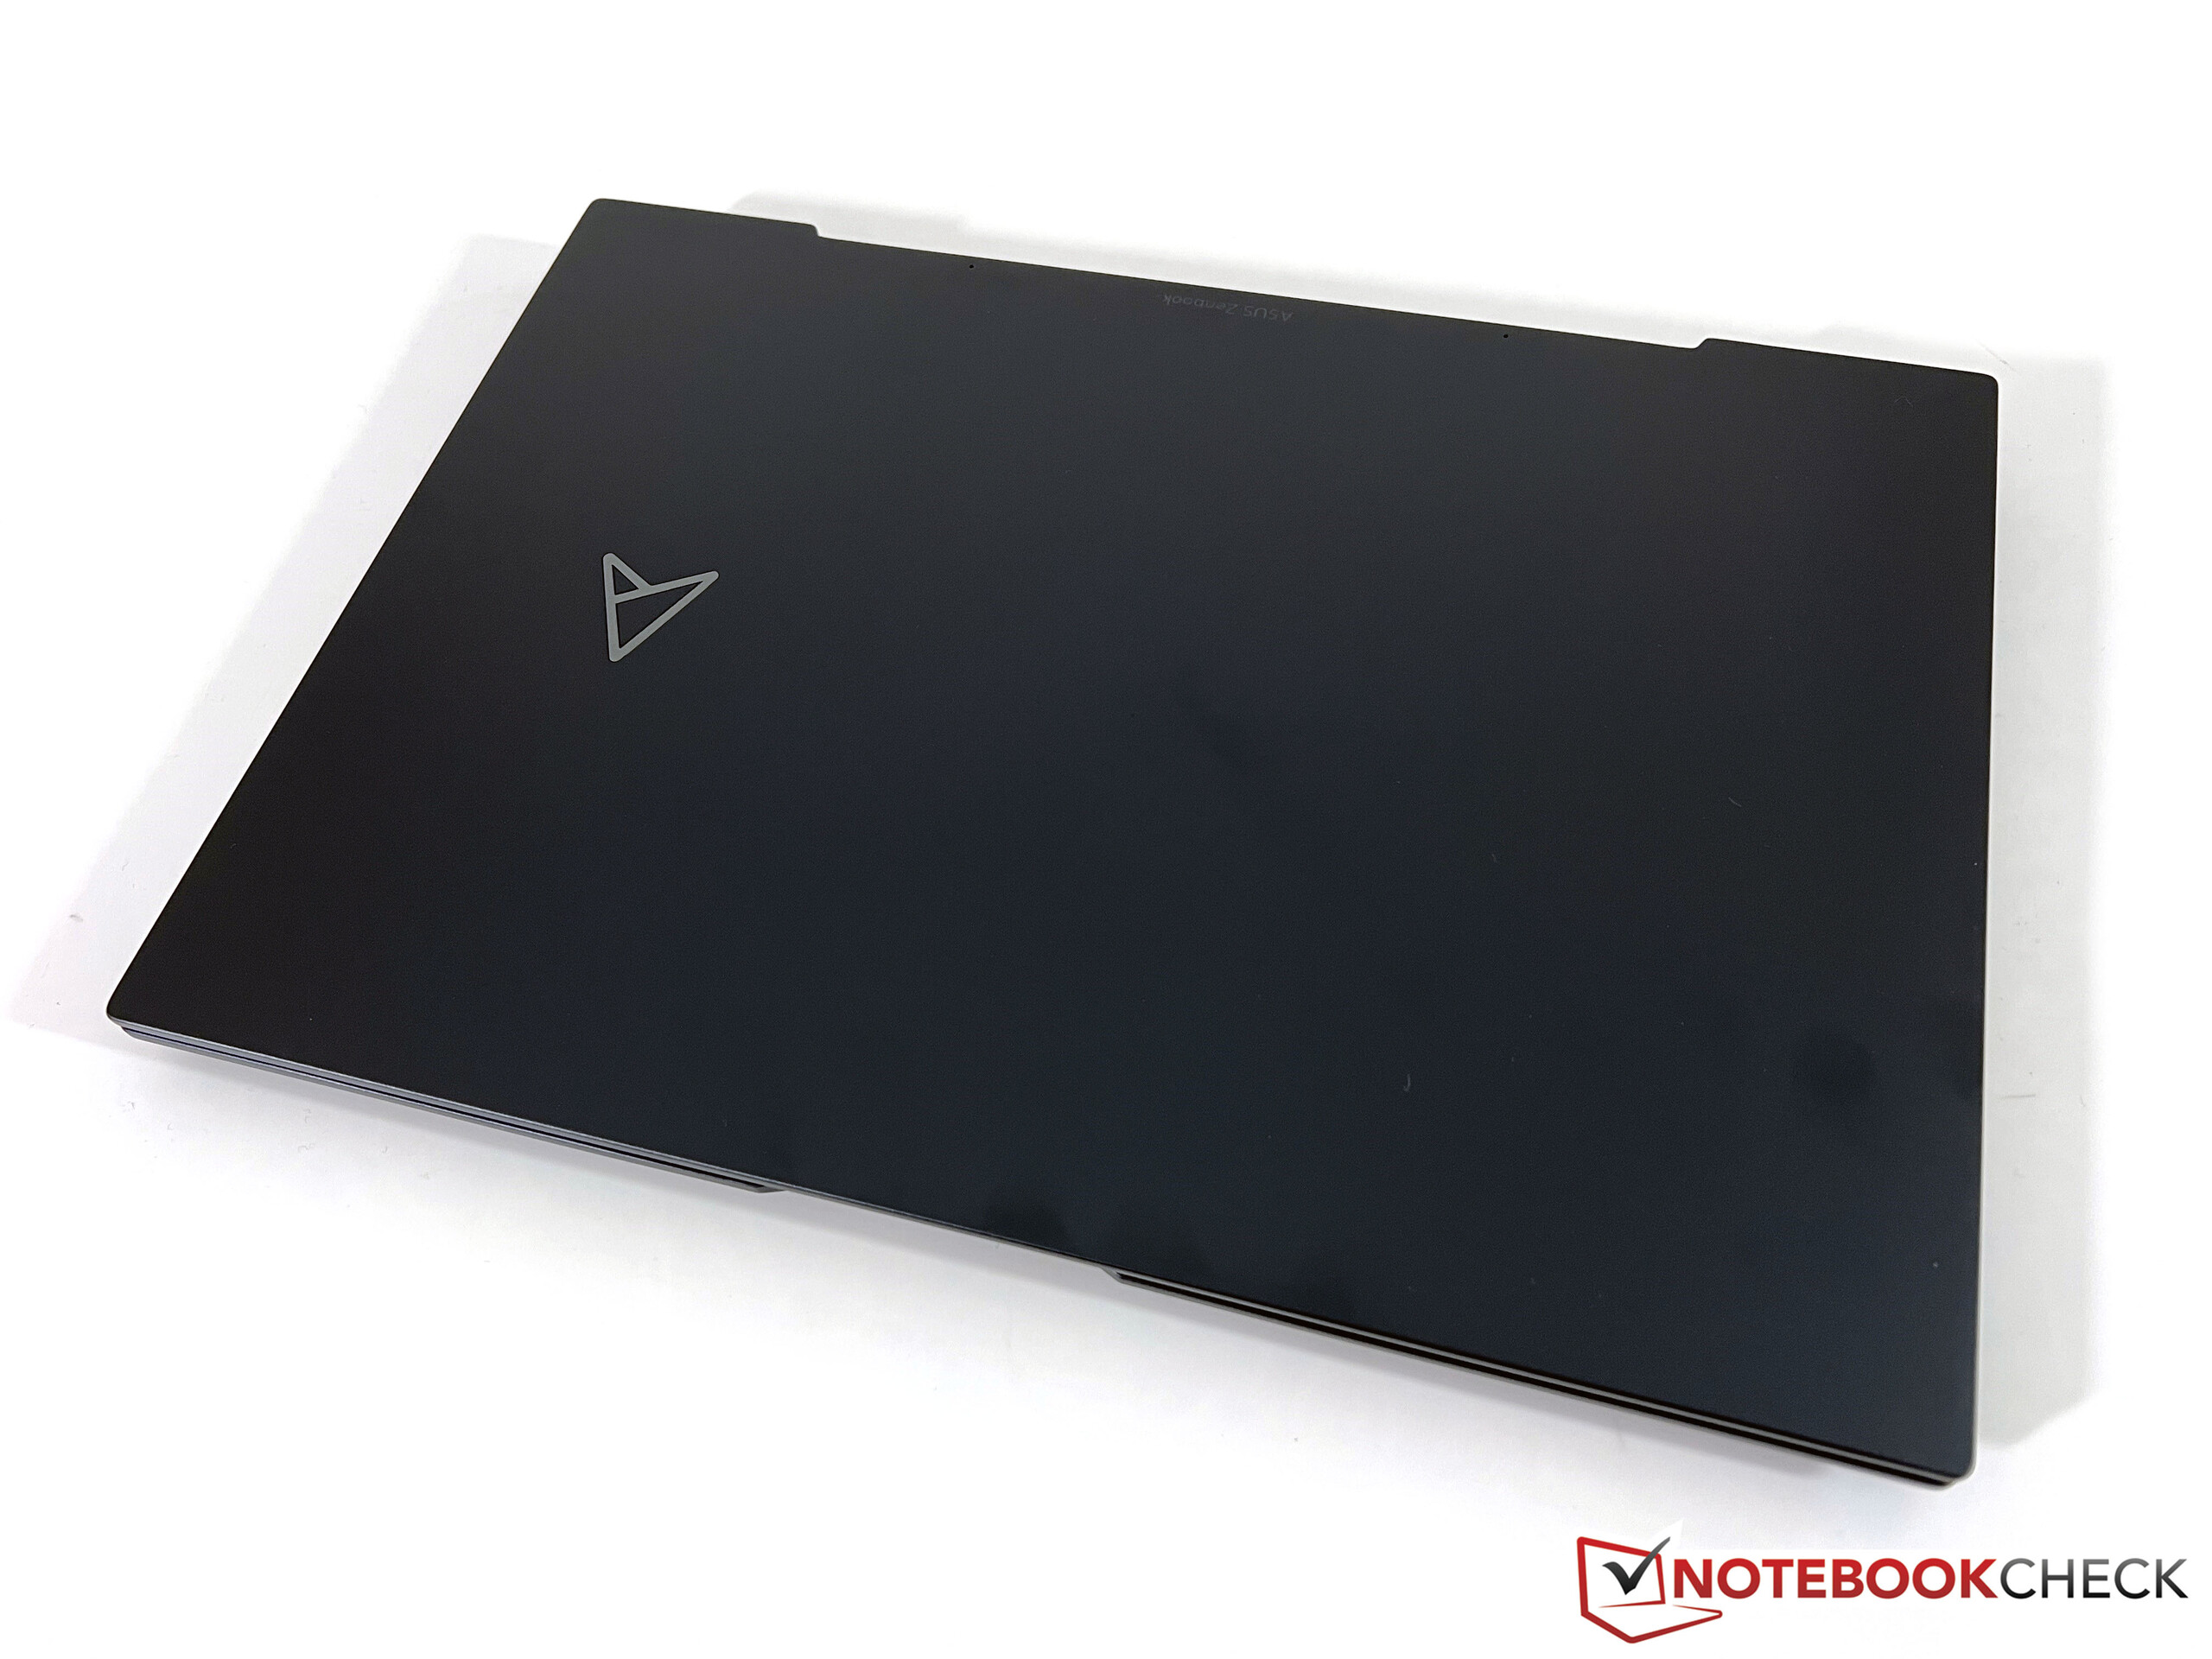
Case - Zenbook with sturdy metal chassis
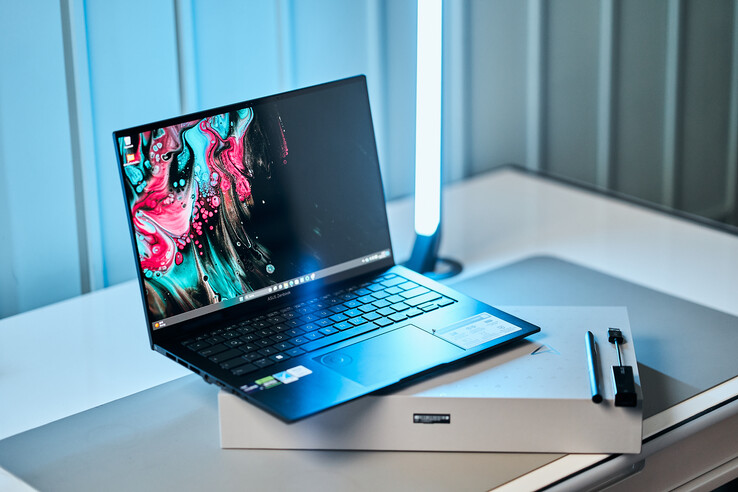
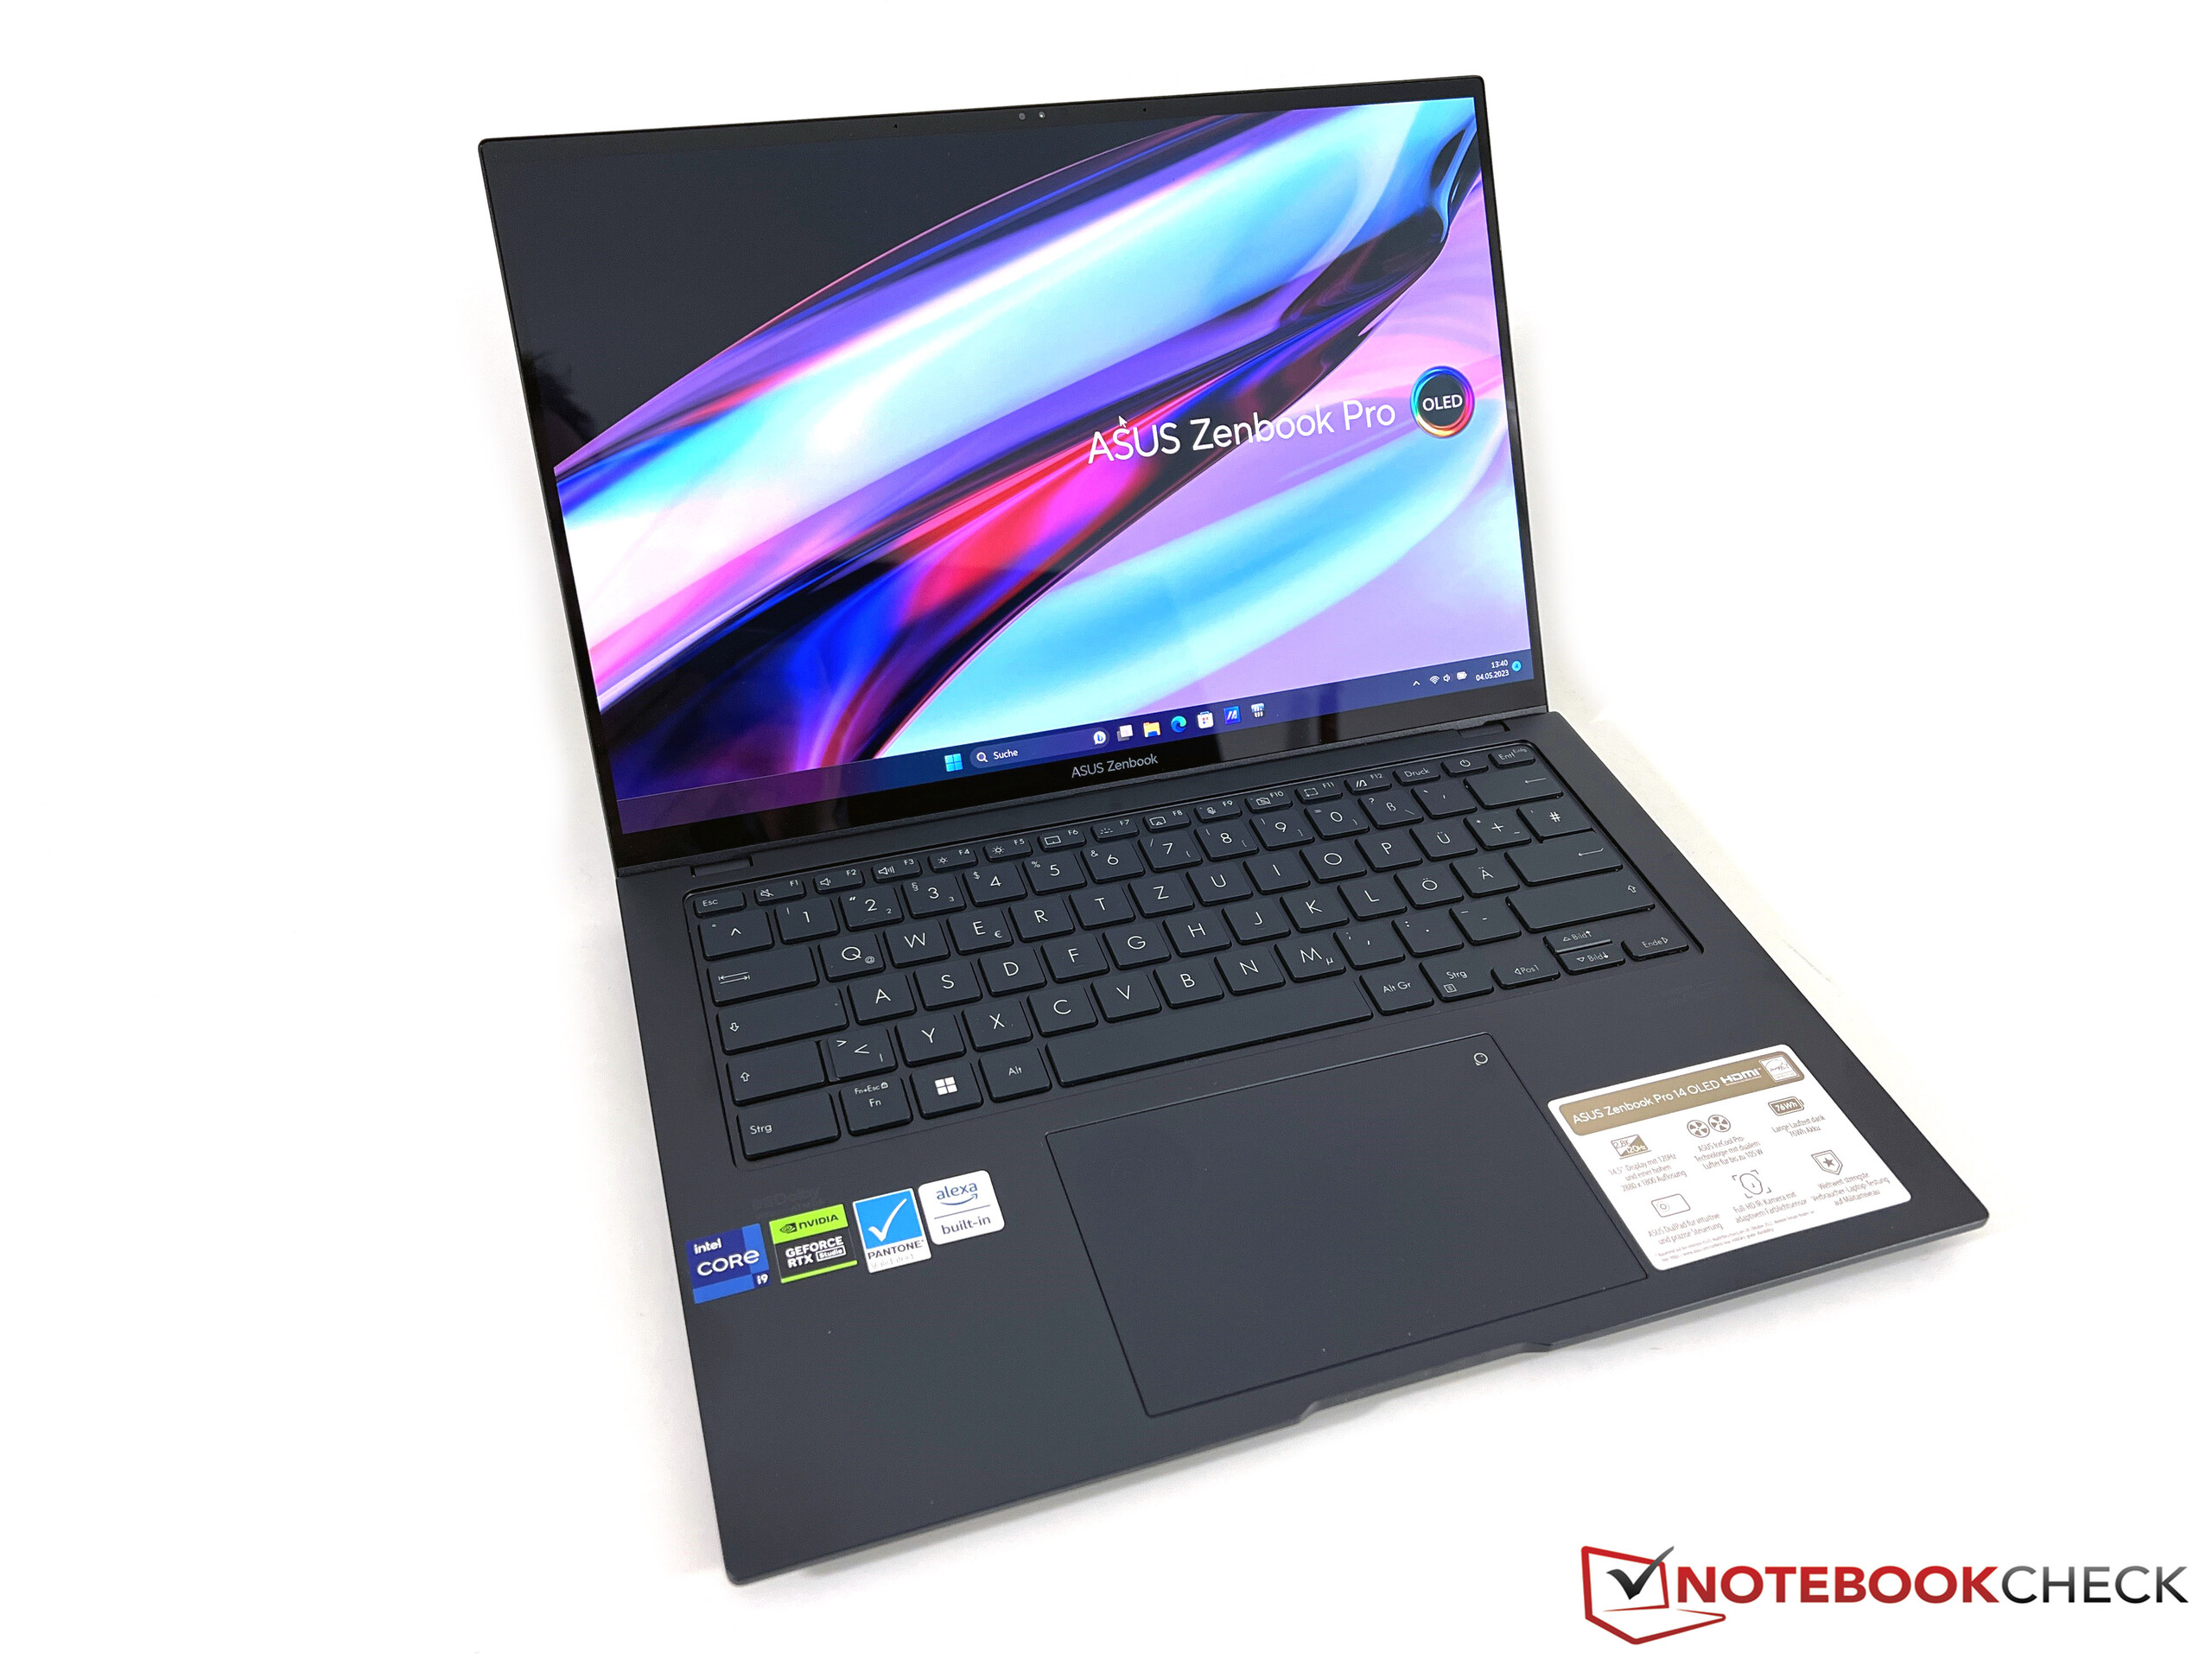
Visually, the new Zenbook Pro 14 looks quite restrained and there is only a small ProArt logo on the display lid. Asus does not add any other visual elements otherwise. The surfaces are smooth, which quickly results in fingerprint smudges and the regular wiping away of these. The notebook appears very elegant in the dark color Tech Black, but the manufacturer stickers on the palm rest are massively annoying. The large sticker with the laptop's features on the right side can be easily removed, but the four smaller stickers on the left side cannot. Who wants an Amazon Alexa sticker on their device when you've paid EUR 3,500 (~US$3,750) for it?
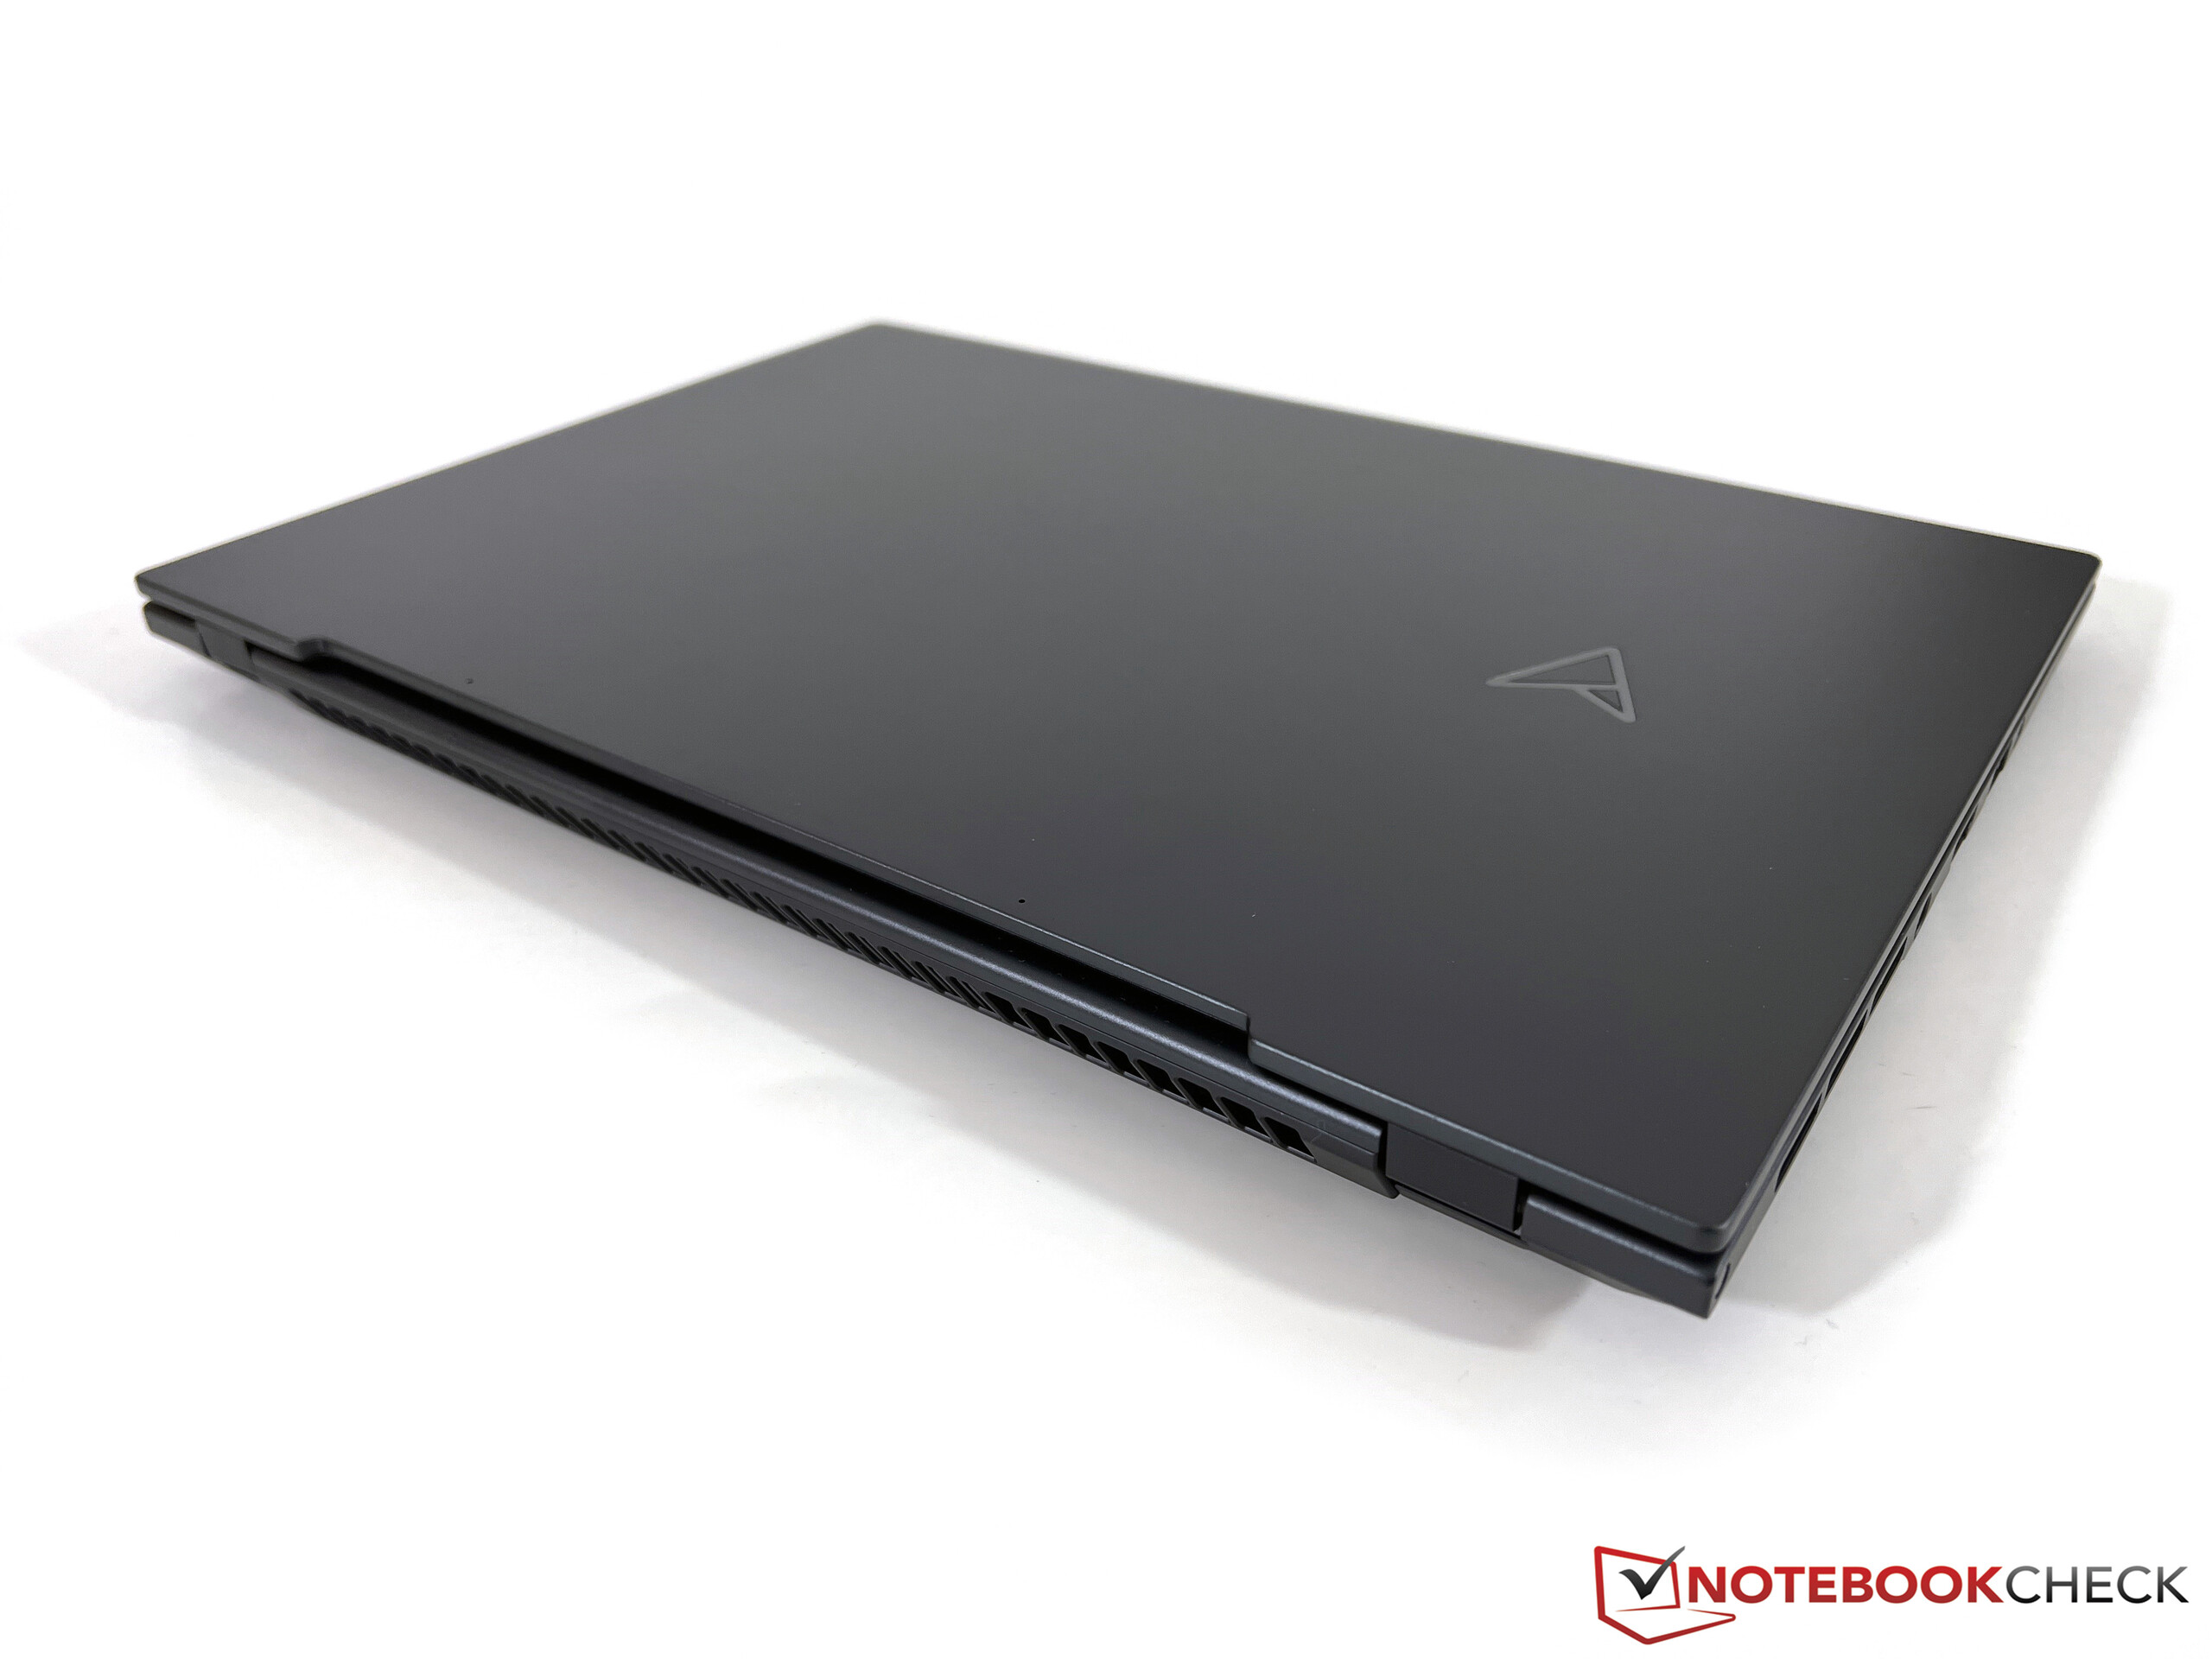
Asus uses a metal chassis and both the base unit and the display lid are extremely stable and torsion-resistant. The base unit also looks quite slim, which is made possible by the tapered sides. This is in stark contrast to the Apple MacBook Pro 14, for example, in which the base unit appears very bulky, although it is actually thinner than the Zenbook. This is definitely not an extremely thin notebook, but this is not a point of criticism in view of the powerful components.
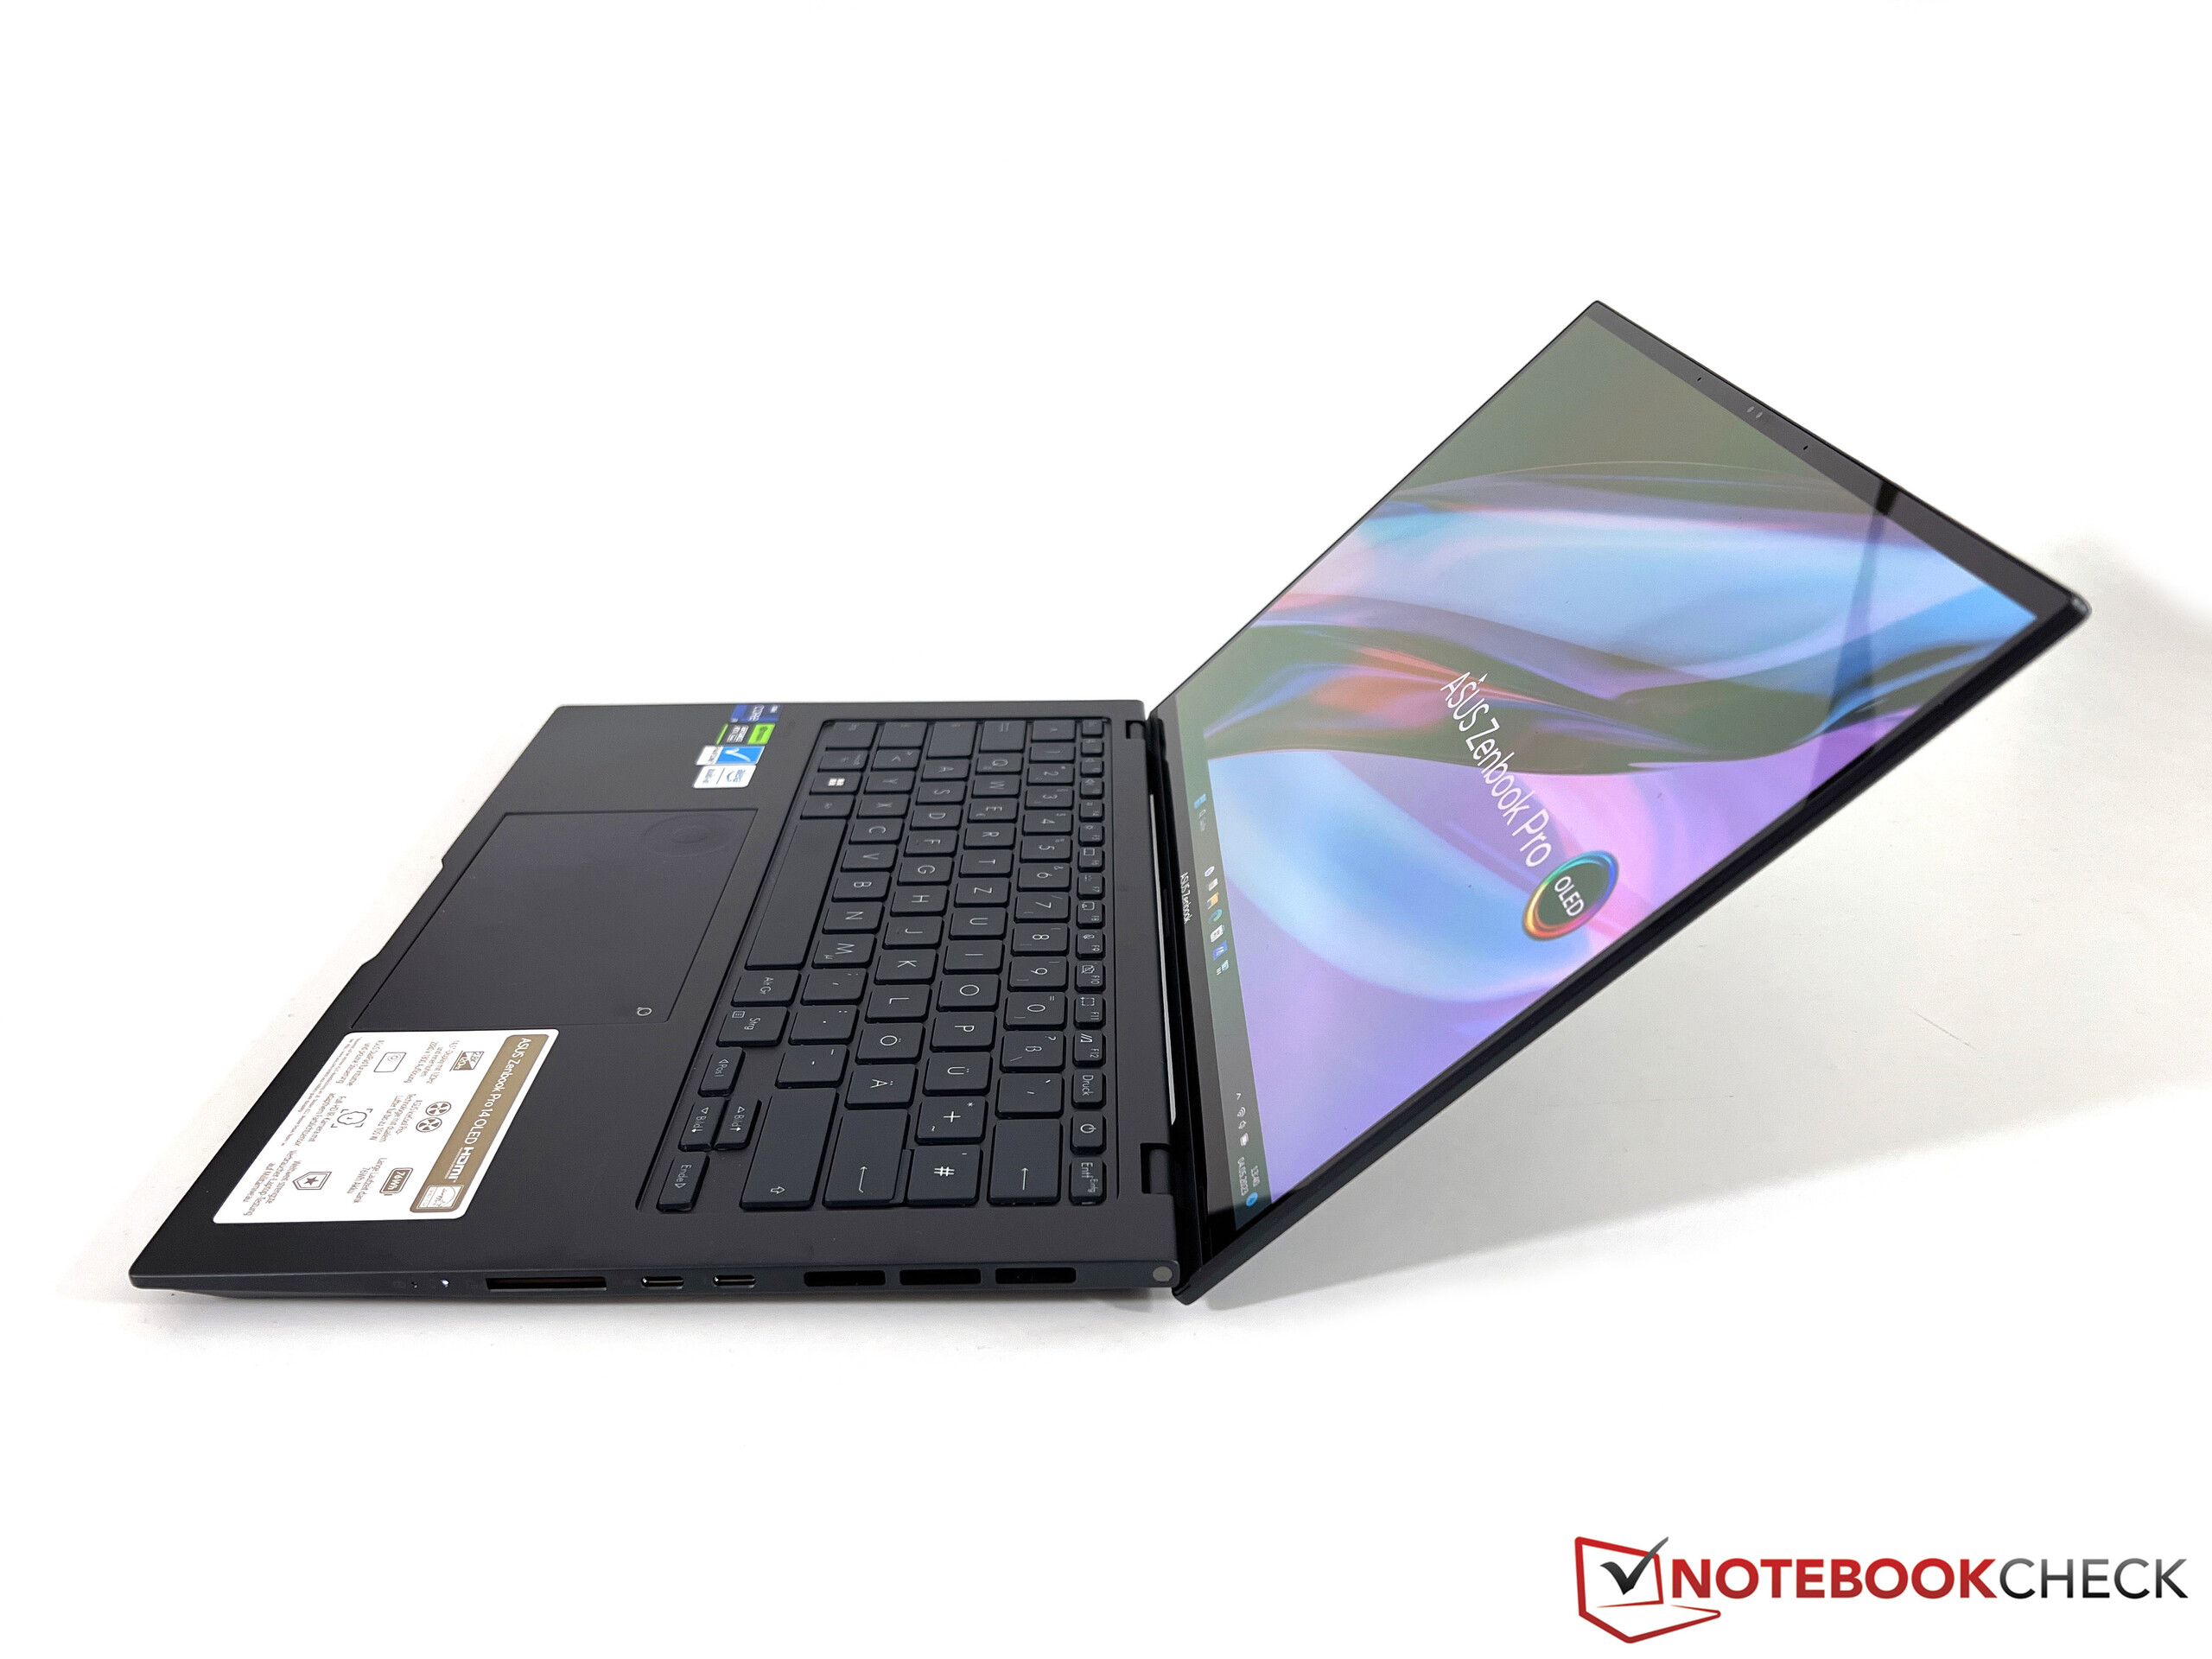
The two display hinges are well adjusted, but cannot completely prevent a certain teetering when changing the opening angle. The maximum opening angle is ~135 degrees. The screen edges of the 16:10 panel are very narrow, especially on the sides, and the overall screen-to-body ratio is a good 85%.
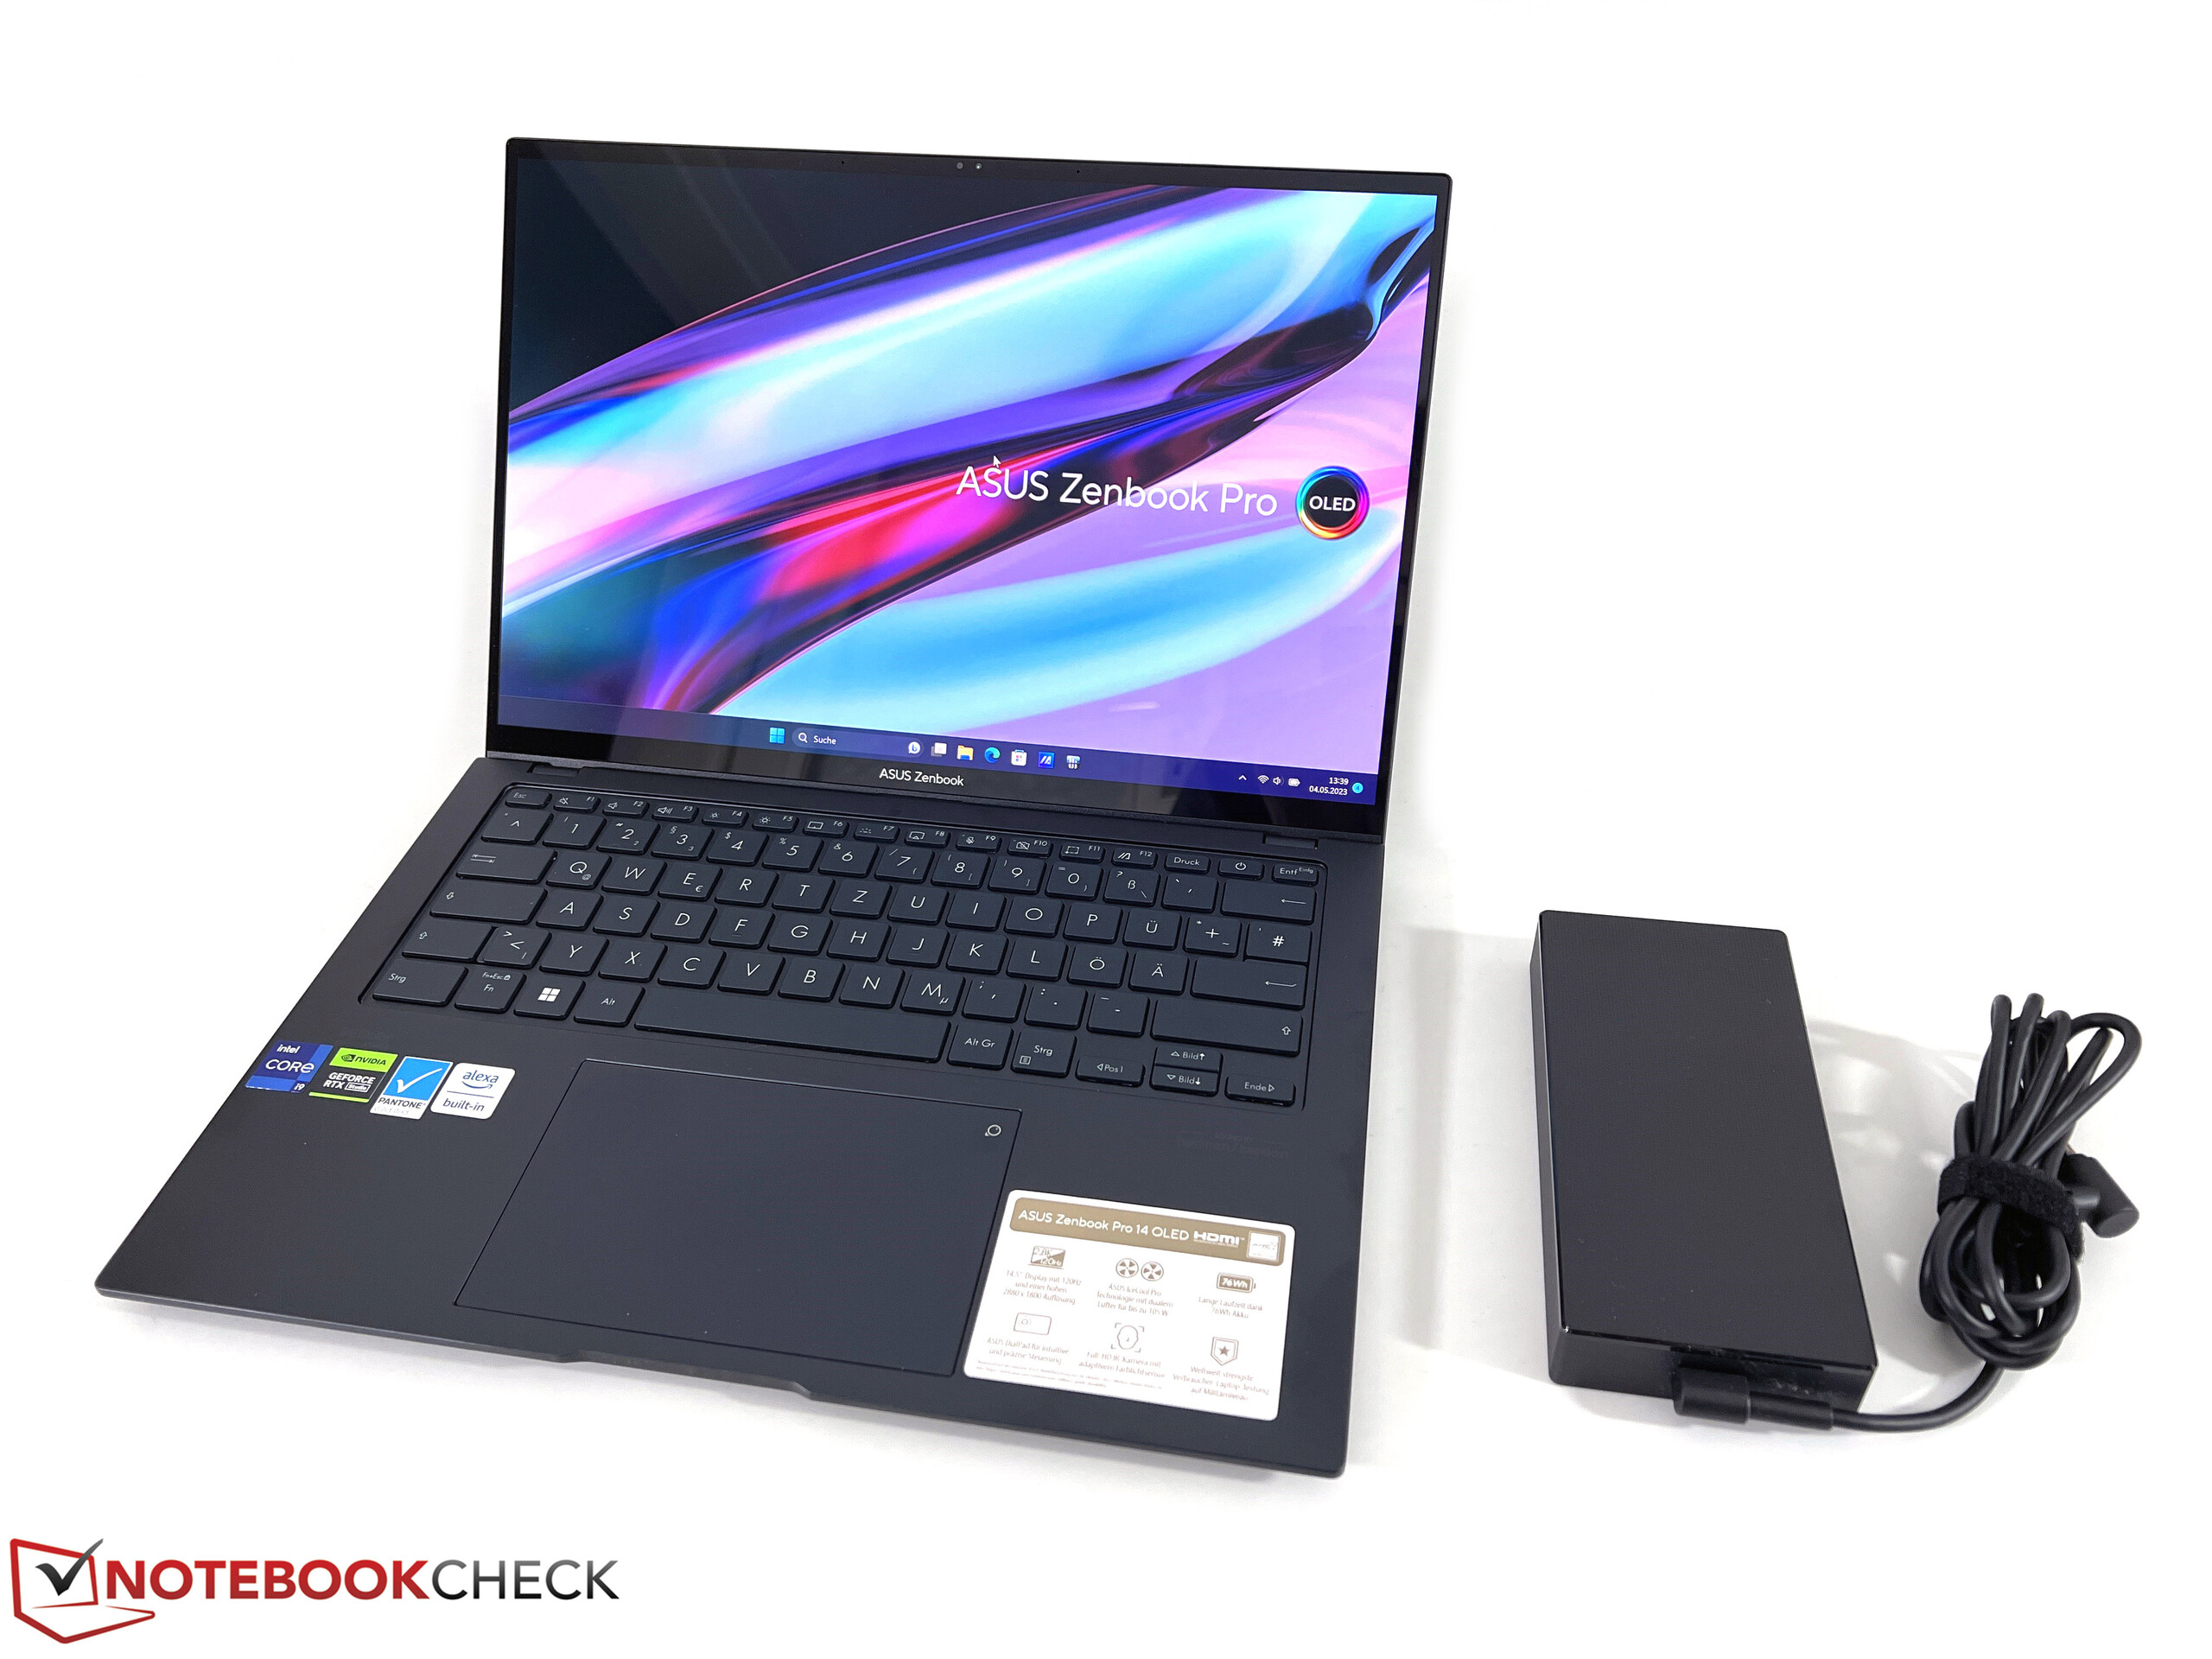
In a direct comparison, the MacBook Pro 14 in particular is somewhat more compact in all areas, but there are no large differences in weight. Due to the high-performance hardware, some 15-inch devices in our comparison field naturally require a little more desk space. The included 200-watt power supply adds an additional 556 grams to the scales.
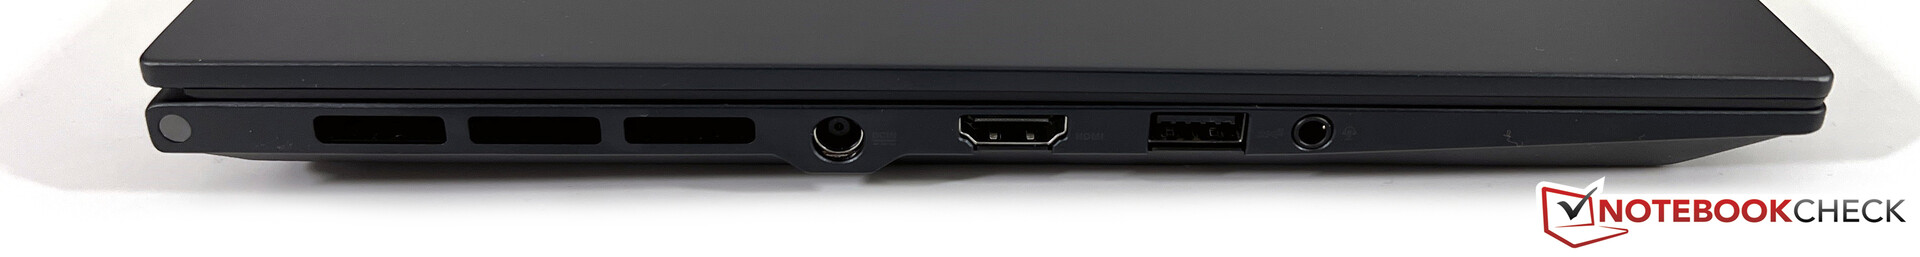
Equipment - Asus installs all important ports
Since the rear area of the base unit is occupied by the cooling, the connections are distributed over the middle of both sides. Using all ports at the same time may result in a workplace that appears very cramped. Nevertheless, Asus provides all the important ports, including USB-A, USB-C and HDMI. The rear USB-C port also supports Thunderbolt and should also be used if you want to work on an external monitor, since this is the only way to use the iGPU on the external monitor. The other USB-C port and the HDMI output always use the dedicated GPU, which consumes unnecessary power, especially in simple tasks.
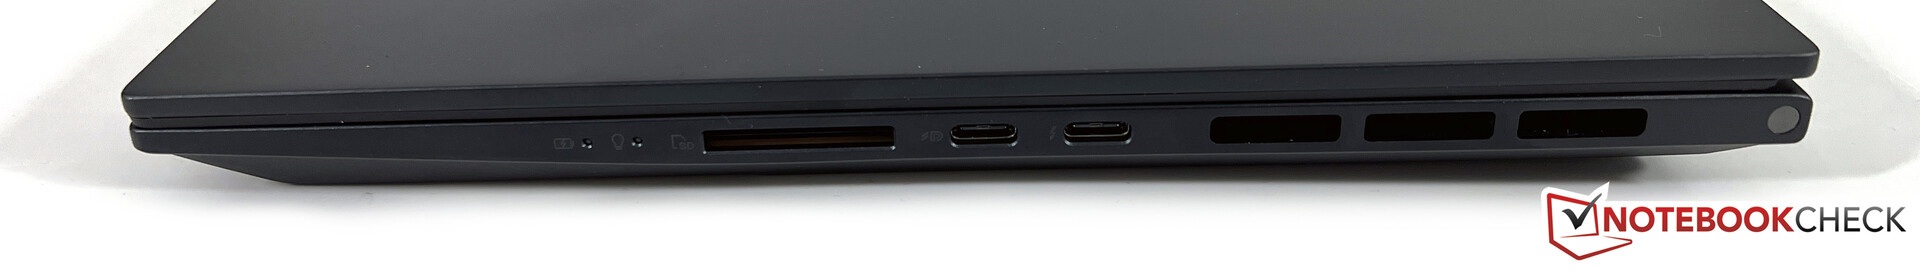
SD Card Reader
The Zenbook offers a fully-fledged SD card reader that also achieves very high transfer rates. In conjunction with our reference card (Angelbird AV Pro V60), we recorded maximum transfer rates of more than 250 MB/s and a little over 100 MB/s when copying image files.
| SD Card Reader | |
| average JPG Copy Test (av. of 3 runs) | |
| Apple MacBook Pro 14 2023 M2 Pro (AV Pro V60) | |
| Dell XPS 15 9530 RTX 4070 (Toshiba Exceria Pro SDXC 64 GB UHS-II) | |
| Asus ROG Zephyrus G14 GA402XY (Angelibrid AV Pro V60) | |
| Average of class Multimedia (23 - 531, n=37, last 2 years) | |
| Asus Zenbook Pro 14 OLED UX6404VI (Angelbird AV Pro V60) | |
| Razer Blade 15 OLED (Early 2022) (AV Pro SD microSD 128 GB V60) | |
| Asus ZenBook Pro 14 Duo UX8402VV-P1021W (AV Pro SD microSD 128 GB V60) | |
| maximum AS SSD Seq Read Test (1GB) | |
| Asus ROG Zephyrus G14 GA402XY (Angelibrid AV Pro V60) | |
| Asus Zenbook Pro 14 OLED UX6404VI (Angelbird AV Pro V60) | |
| Apple MacBook Pro 14 2023 M2 Pro (AV Pro V60) | |
| Average of class Multimedia (37.3 - 1455, n=36, last 2 years) | |
| Dell XPS 15 9530 RTX 4070 (Toshiba Exceria Pro SDXC 64 GB UHS-II) | |
| Razer Blade 15 OLED (Early 2022) (AV Pro SD microSD 128 GB V60) | |
| Asus ZenBook Pro 14 Duo UX8402VV-P1021W (AV Pro SD microSD 128 GB V60) | |
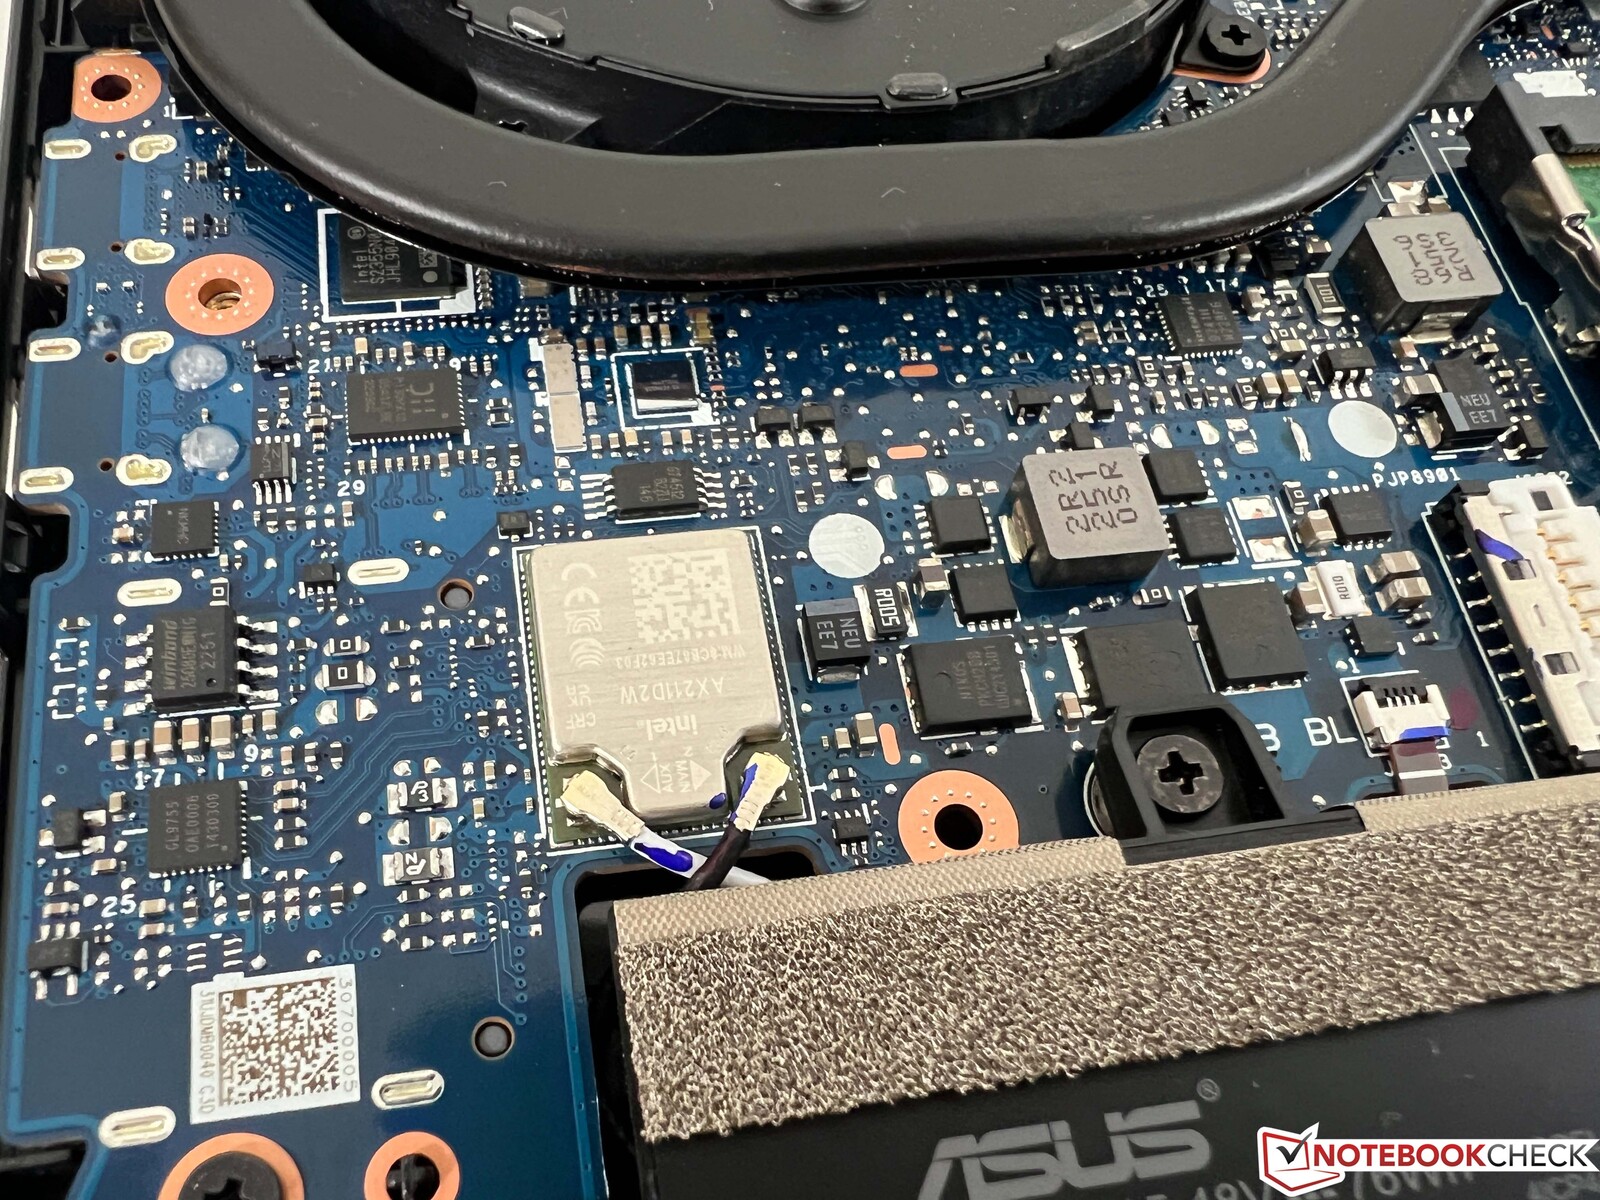
Communication
Wireless network connections are handled by Intel's AX211 module, which supports Bluetooth 5.2 in addition to the current Wi-Fi 6E standard. We were unable to connect to the corresponding 6 GHz network of our Asus reference router, but performance in the 5 GHz network was very good and we had no issues with WLAN. A USB Ethernet adapter for wired networks is also included in the scope of delivery.
| Networking | |
| Asus Zenbook Pro 14 OLED UX6404VI | |
| iperf3 transmit AXE11000 | |
| iperf3 receive AXE11000 | |
| Asus ZenBook Pro 14 Duo UX8402VV-P1021W | |
| iperf3 transmit AXE11000 | |
| iperf3 receive AXE11000 | |
| iperf3 transmit AXE11000 6GHz | |
| iperf3 receive AXE11000 6GHz | |
| Apple MacBook Pro 14 2023 M2 Pro | |
| iperf3 transmit AXE11000 6GHz | |
| iperf3 receive AXE11000 6GHz | |
| Asus ROG Zephyrus G14 GA402XY | |
| iperf3 transmit AXE11000 | |
| iperf3 receive AXE11000 | |
| Dell XPS 15 9530 RTX 4070 | |
| iperf3 transmit AXE11000 | |
| iperf3 receive AXE11000 | |
| Razer Blade 15 OLED (Early 2022) | |
| iperf3 transmit AXE11000 | |
| iperf3 receive AXE11000 | |
| iperf3 transmit AXE11000 6GHz | |
| iperf3 receive AXE11000 6GHz | |
Webcam
Asus installs a 1080p sensor in the upper screen bezel for the webcam. The picture quality is a little better than the old 720p models, but you should not expect miracles. An IR module is also installed, which enables facial recognition via Windows Hello.


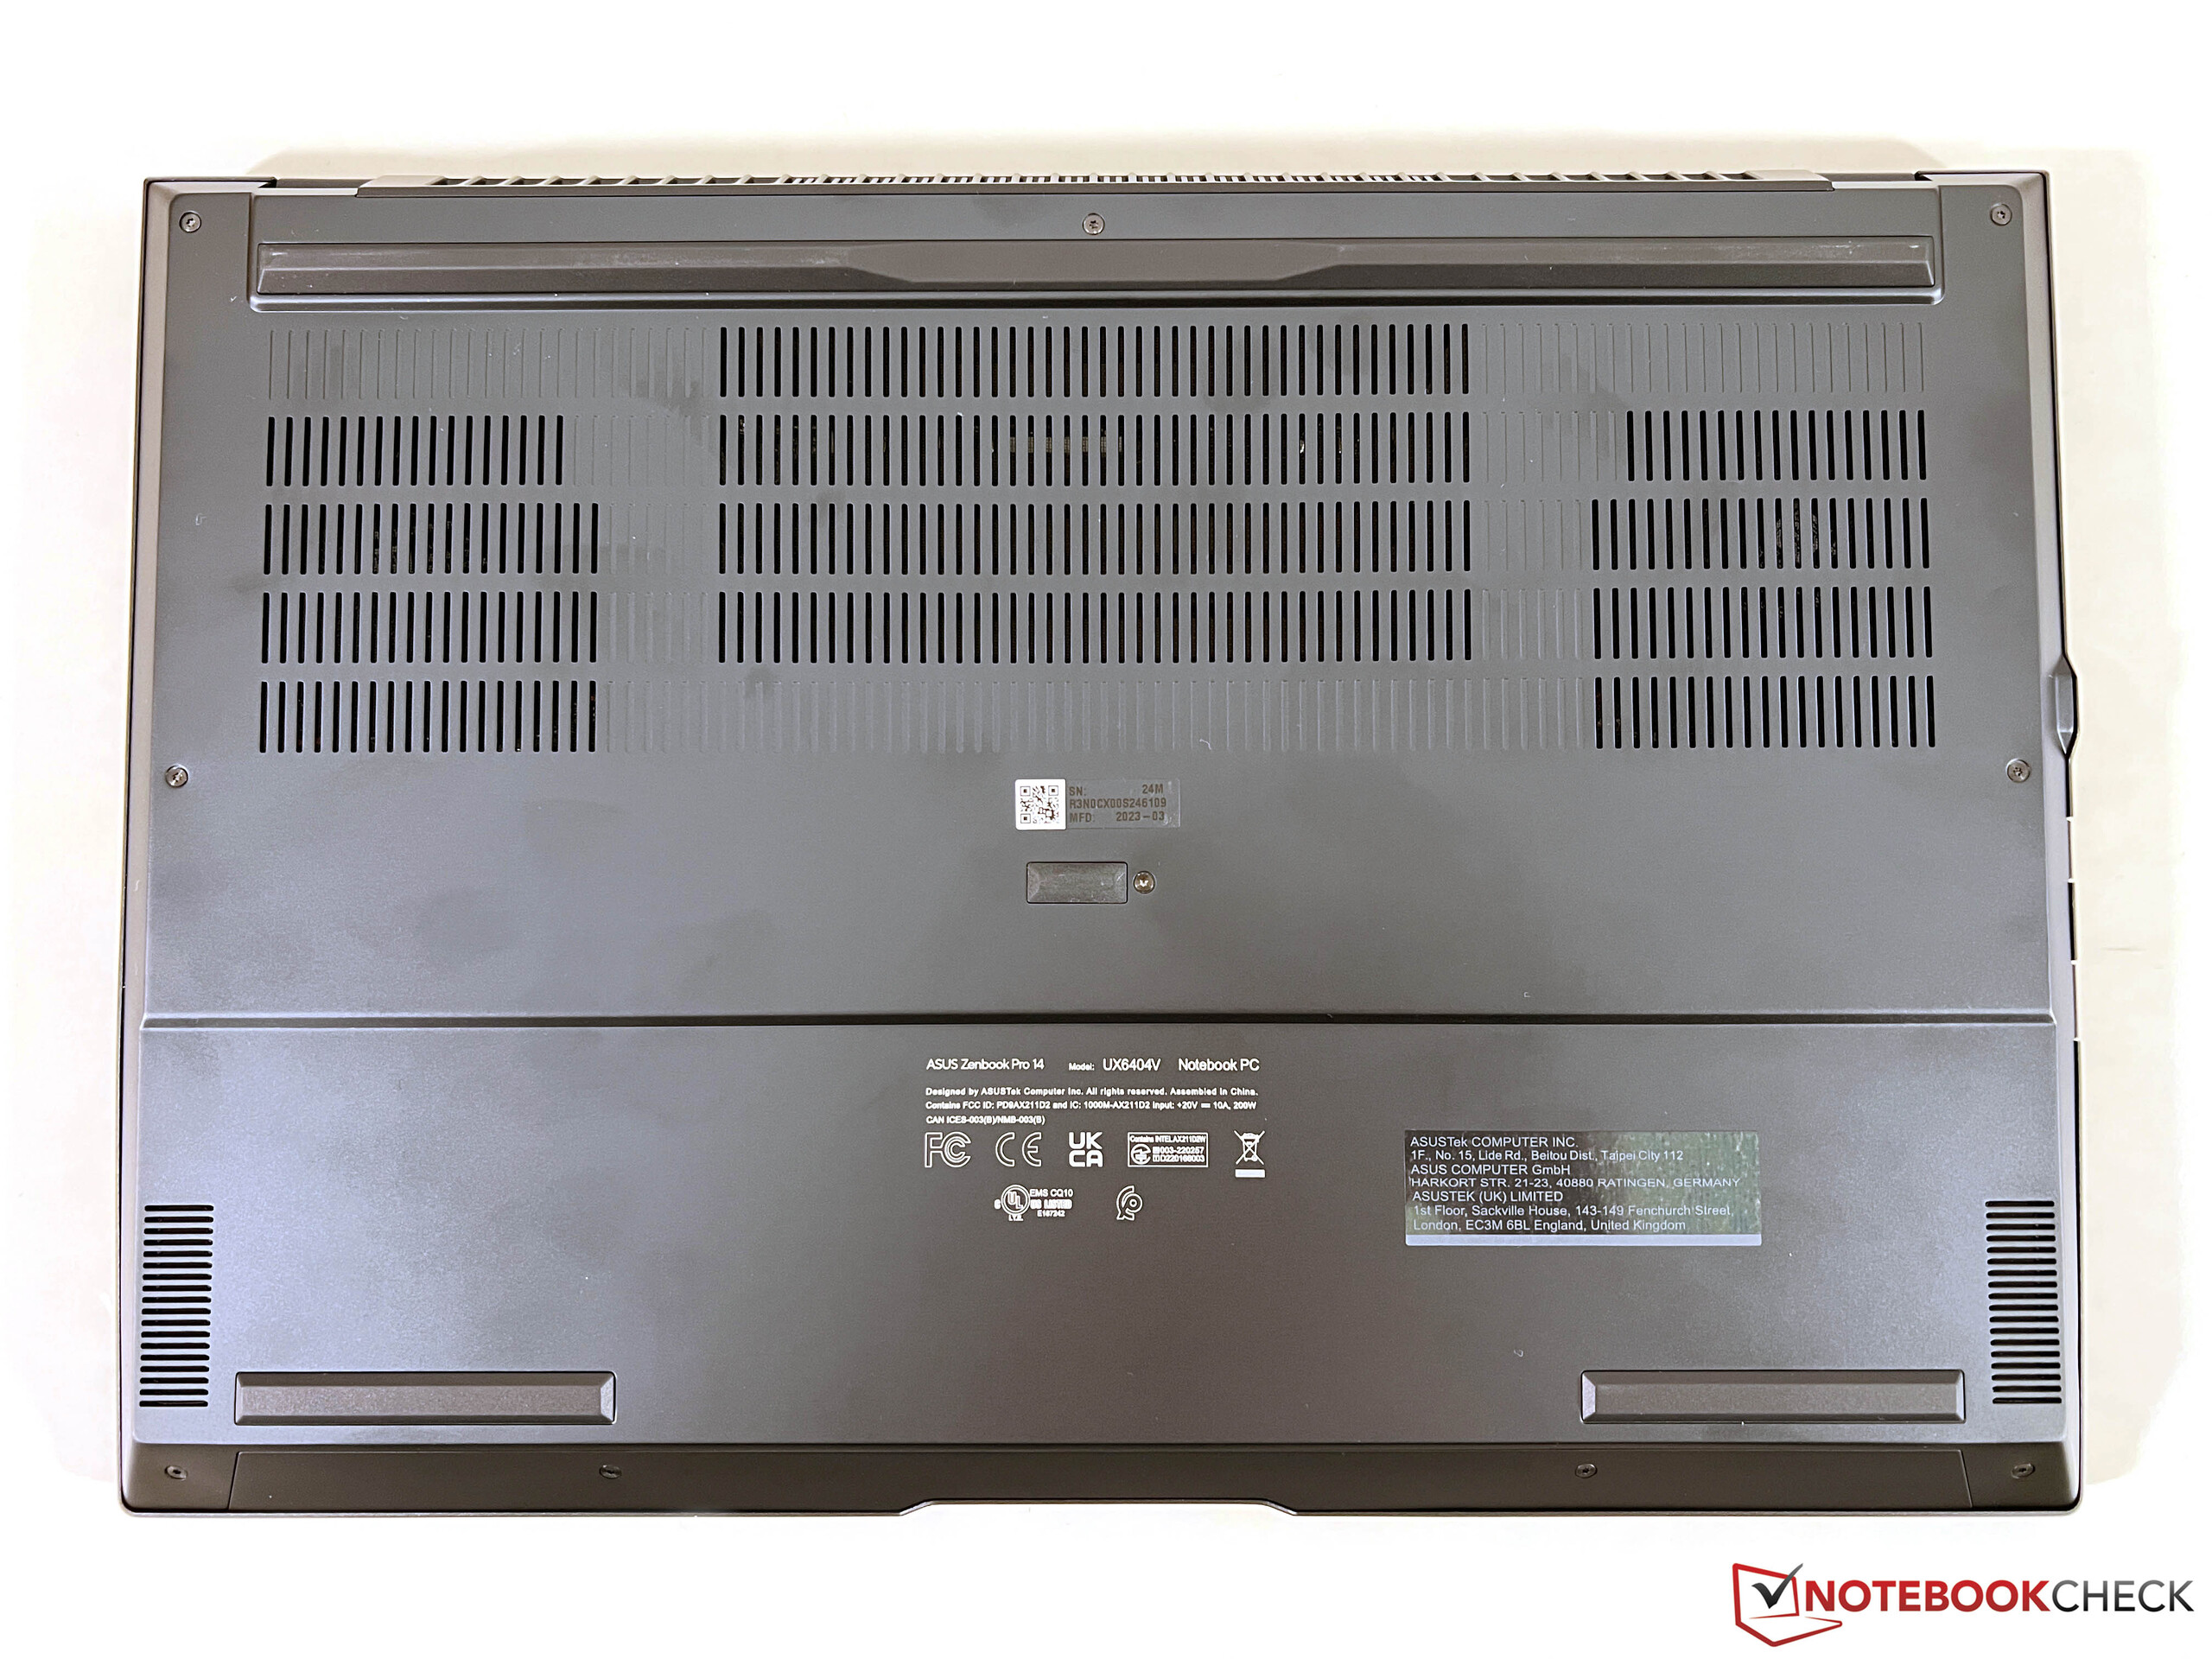
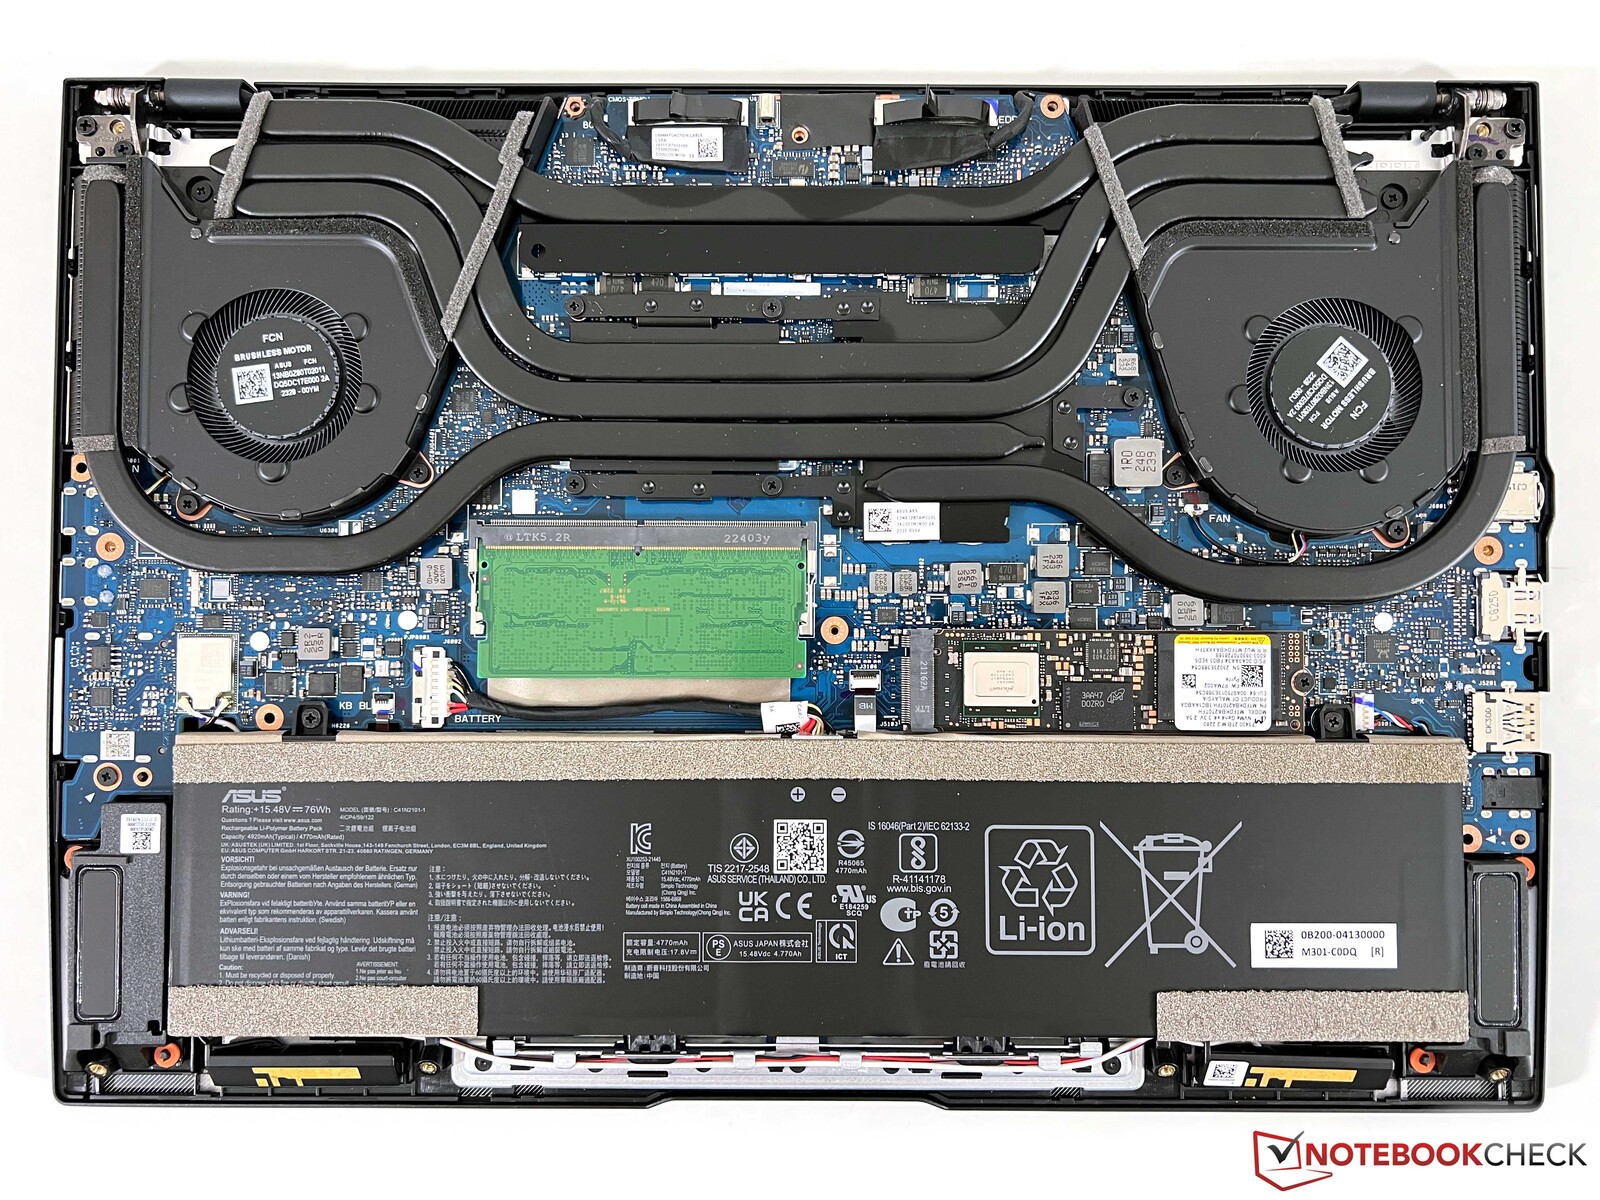
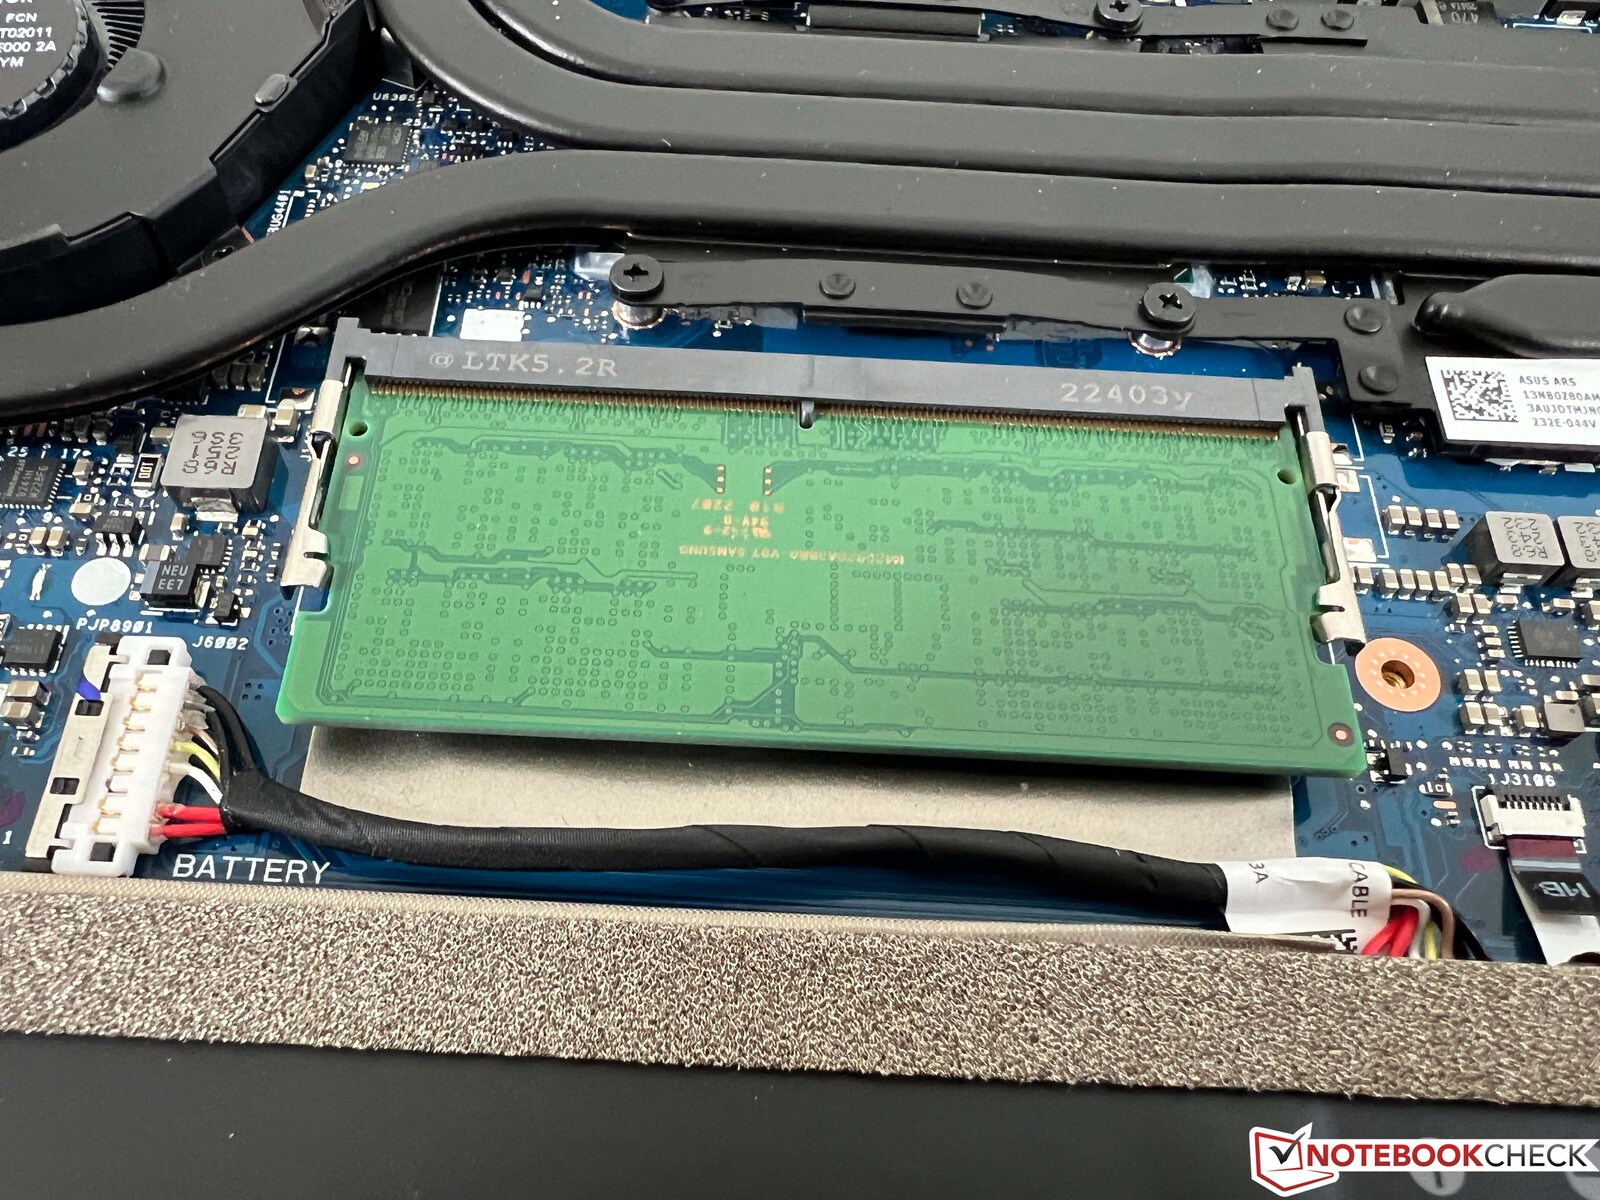
Maintenance
The lower case cover is fixed in place with a total of nine Torx screws (T5) and can be removed easily. You then have access to the two fans, the battery and the single SODIMM slot for a RAM module. However, the WLAN module and one RAM module are soldered.
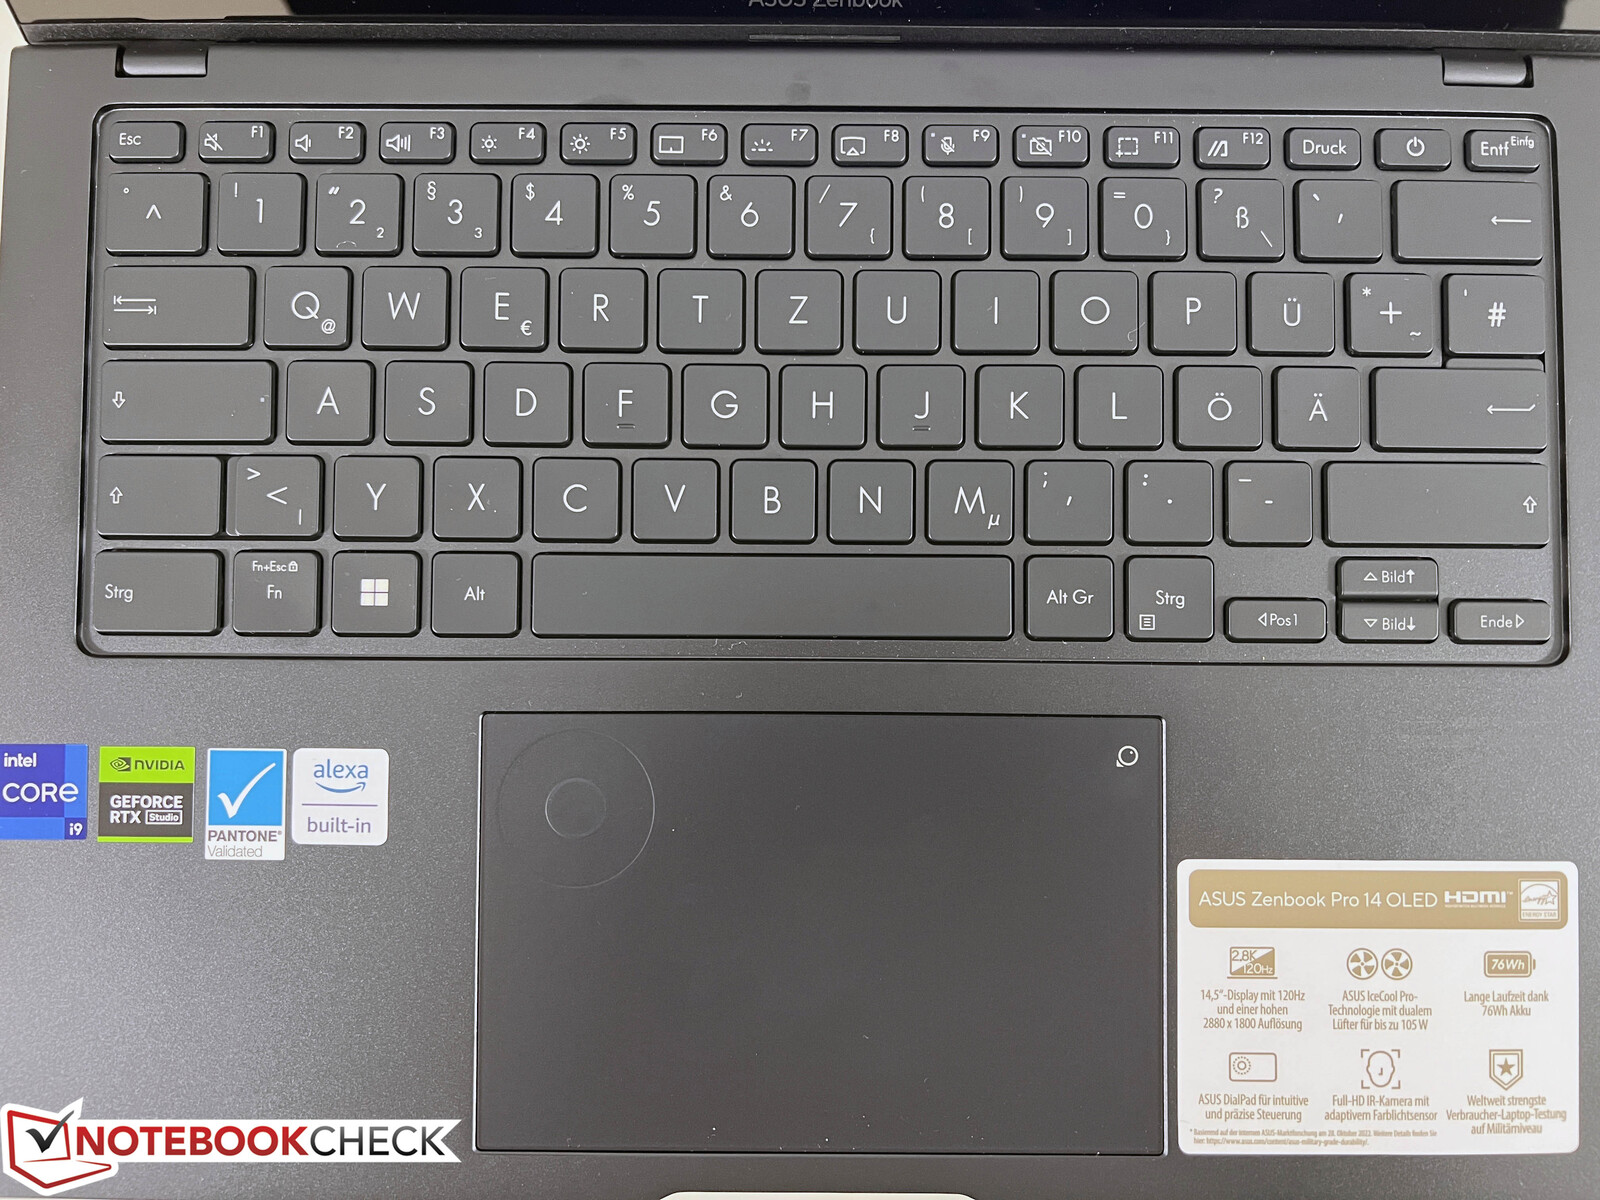
Input Devices - Touchpad with DialPad
Keyboard
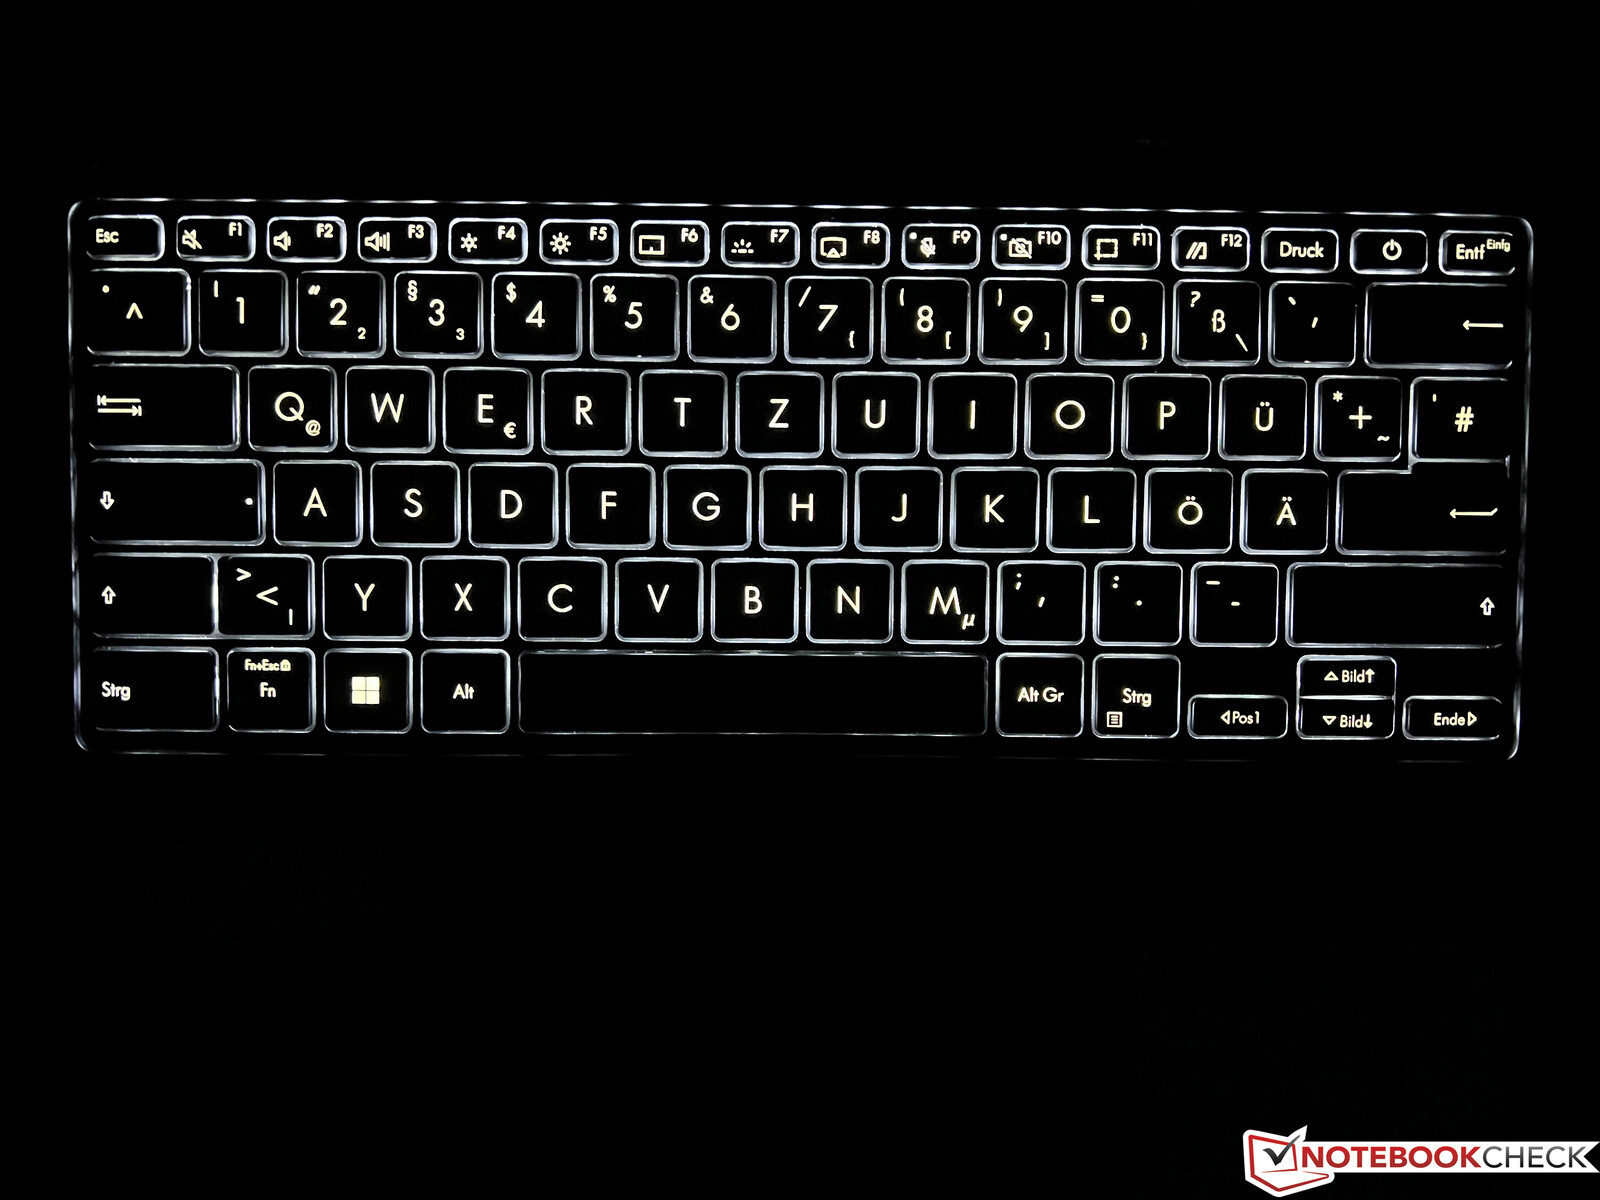
The keyboard offers a key travel of 1.4 mm and offers average input overall. Considering the thickness of the case and also the price, more could have been done here, especially since the keys tend to rattle a little overall. For example, we liked the keyboard of the ROG Zephyrus G14 (1.7 mm travel) better. In terms of layout, you also have to get used to the single-row Enter key as well as the small arrow keys. Lastly, there is a three-stage white backlight that can be activated via sensor.
Touchpad & Stylus

Asus has devised a special feature for the touchpad, namely the so-called DialPad, which is installed in the upper left corner. This ring gives the user additional options and the integration with Adobe apps works very well. In everyday use, for example, the brightness and volume can be adjusted here. This all works well, but the dedicated special keys and shortcuts in creative apps usually work faster.
Moreover, you notice the raised ring during simple operation of the pad, which works well overall, but clicks a little loudly. Of course, the capacitive touchscreen can also be used as an option, and an active stylus is also included, which also made a good impression, especially when editing images.
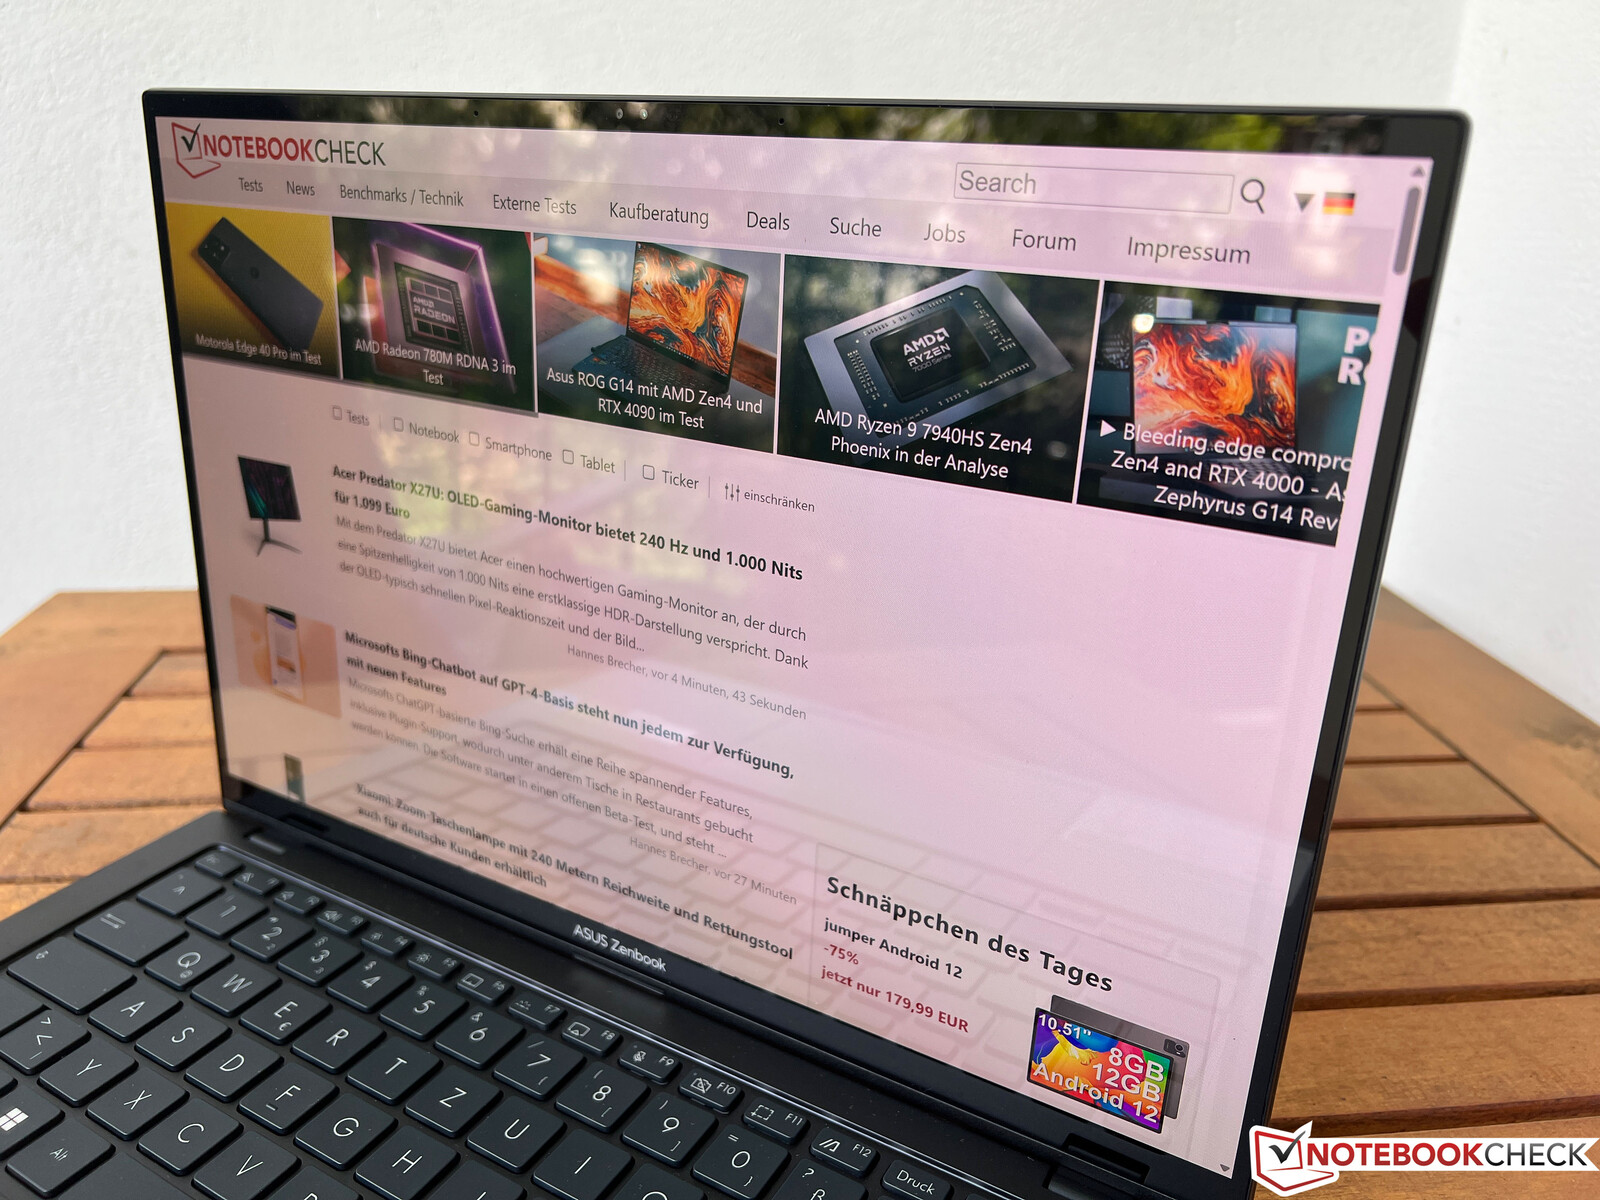
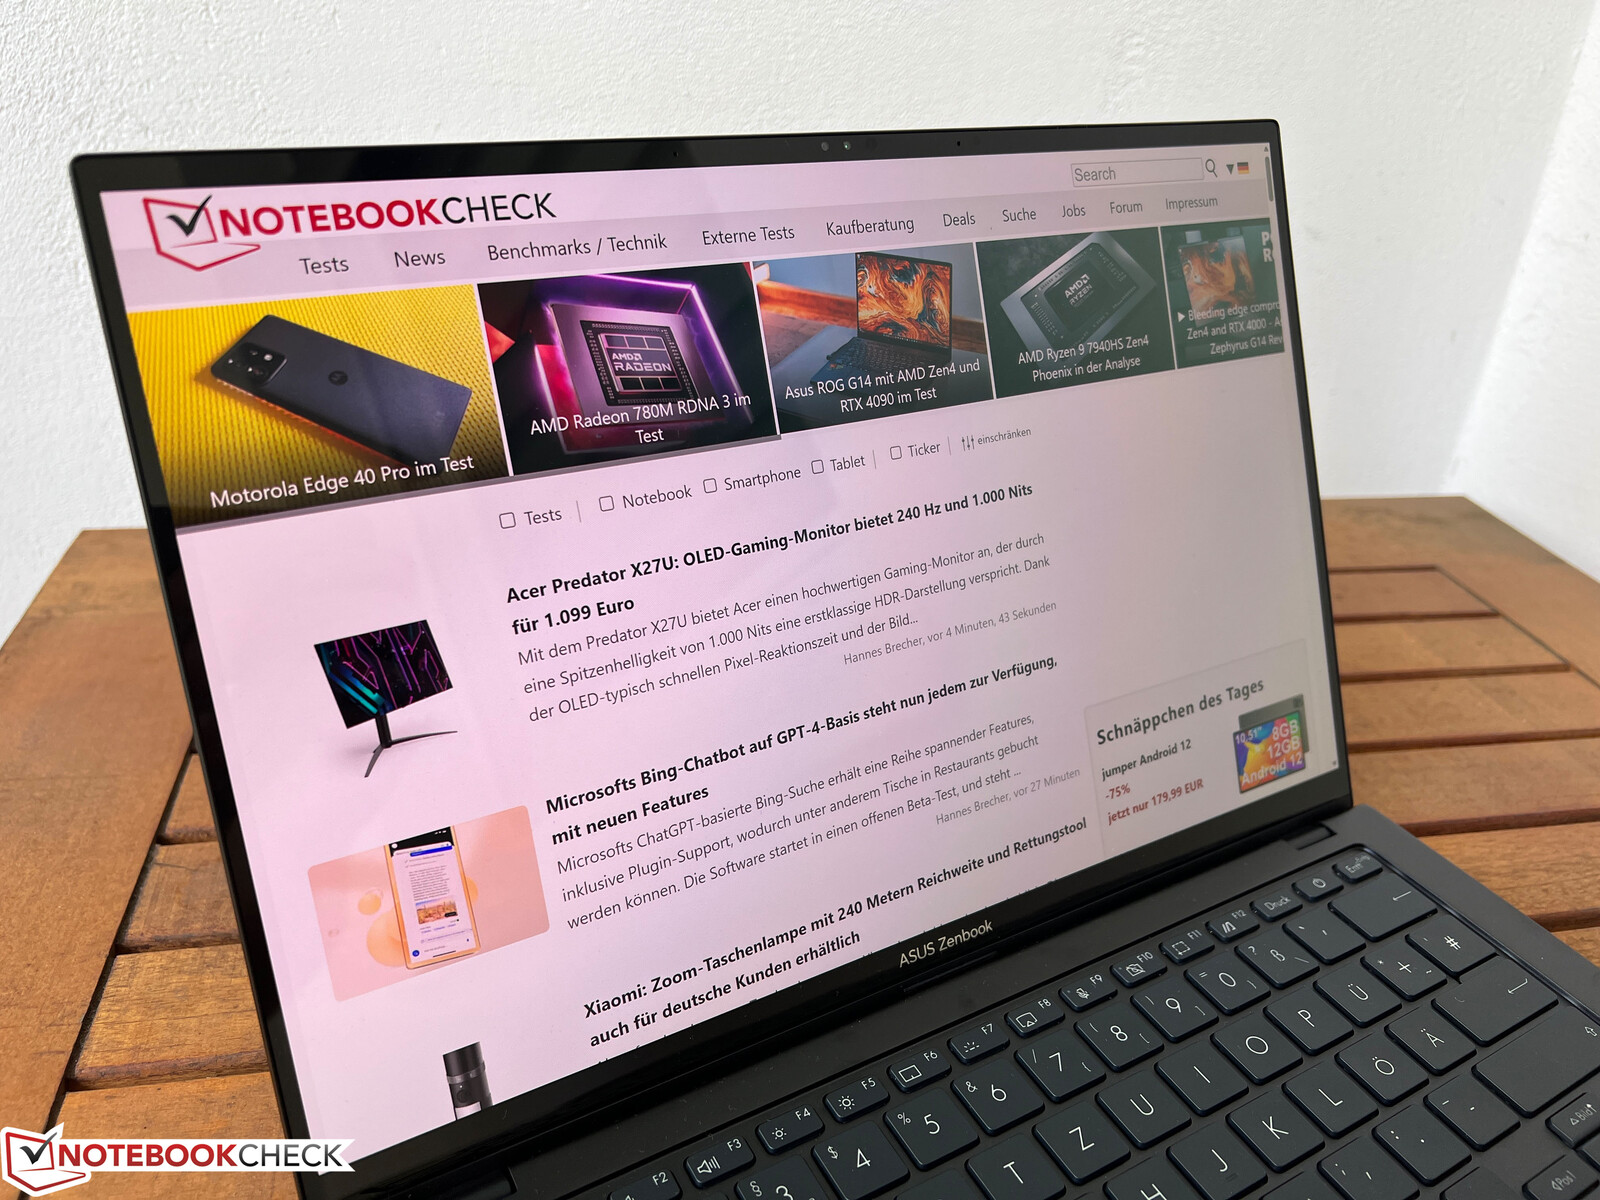
Display - 120 Hz OLED touchscreen

Asus equips the Zenbook Pro 14 with a high-resolution OLED touchscreen. The resolution of the 14.5-inch panel (16:10) is 2880x1800 and the subjective picture impression fundamentally very good, but the picture quality is slightly grainy due to the touchscreen. Screen activity is very smooth thanks to the high frequency.
In the technical data, the manufacturer specifies a brightness of 400 cd/m² or a maximum of 550 cd/m² for HDR content. However, the panel does not quite reach that in our measurements, as we determined an average of almost 360 cd/m² for normal SDR content (i.e. everyday things). The contrast ratio is extremely high, which is due to the low black level. In terms of HDR content, we recorded a maximum of 584 cd/m² with a small bright image section and around 460 cd/m² with an almost completely white image.
Windows' HDR settings are deserving of criticism, because in order for HDR content to be really shown, HDR must first be activated in the settings. However, all color profiles are then discarded altogether and the various color profiles of the MyAsus software are no longer available. Apple's implementation of HDR in the MacBook Pro 14's mini-LED panel is clearly superior here and much higher brightness values are also reached.
| |||||||||||||||||||||||||
Brightness Distribution: 99 %
Center on Battery: 356 cd/m²
Contrast: ∞:1 (Black: 0 cd/m²)
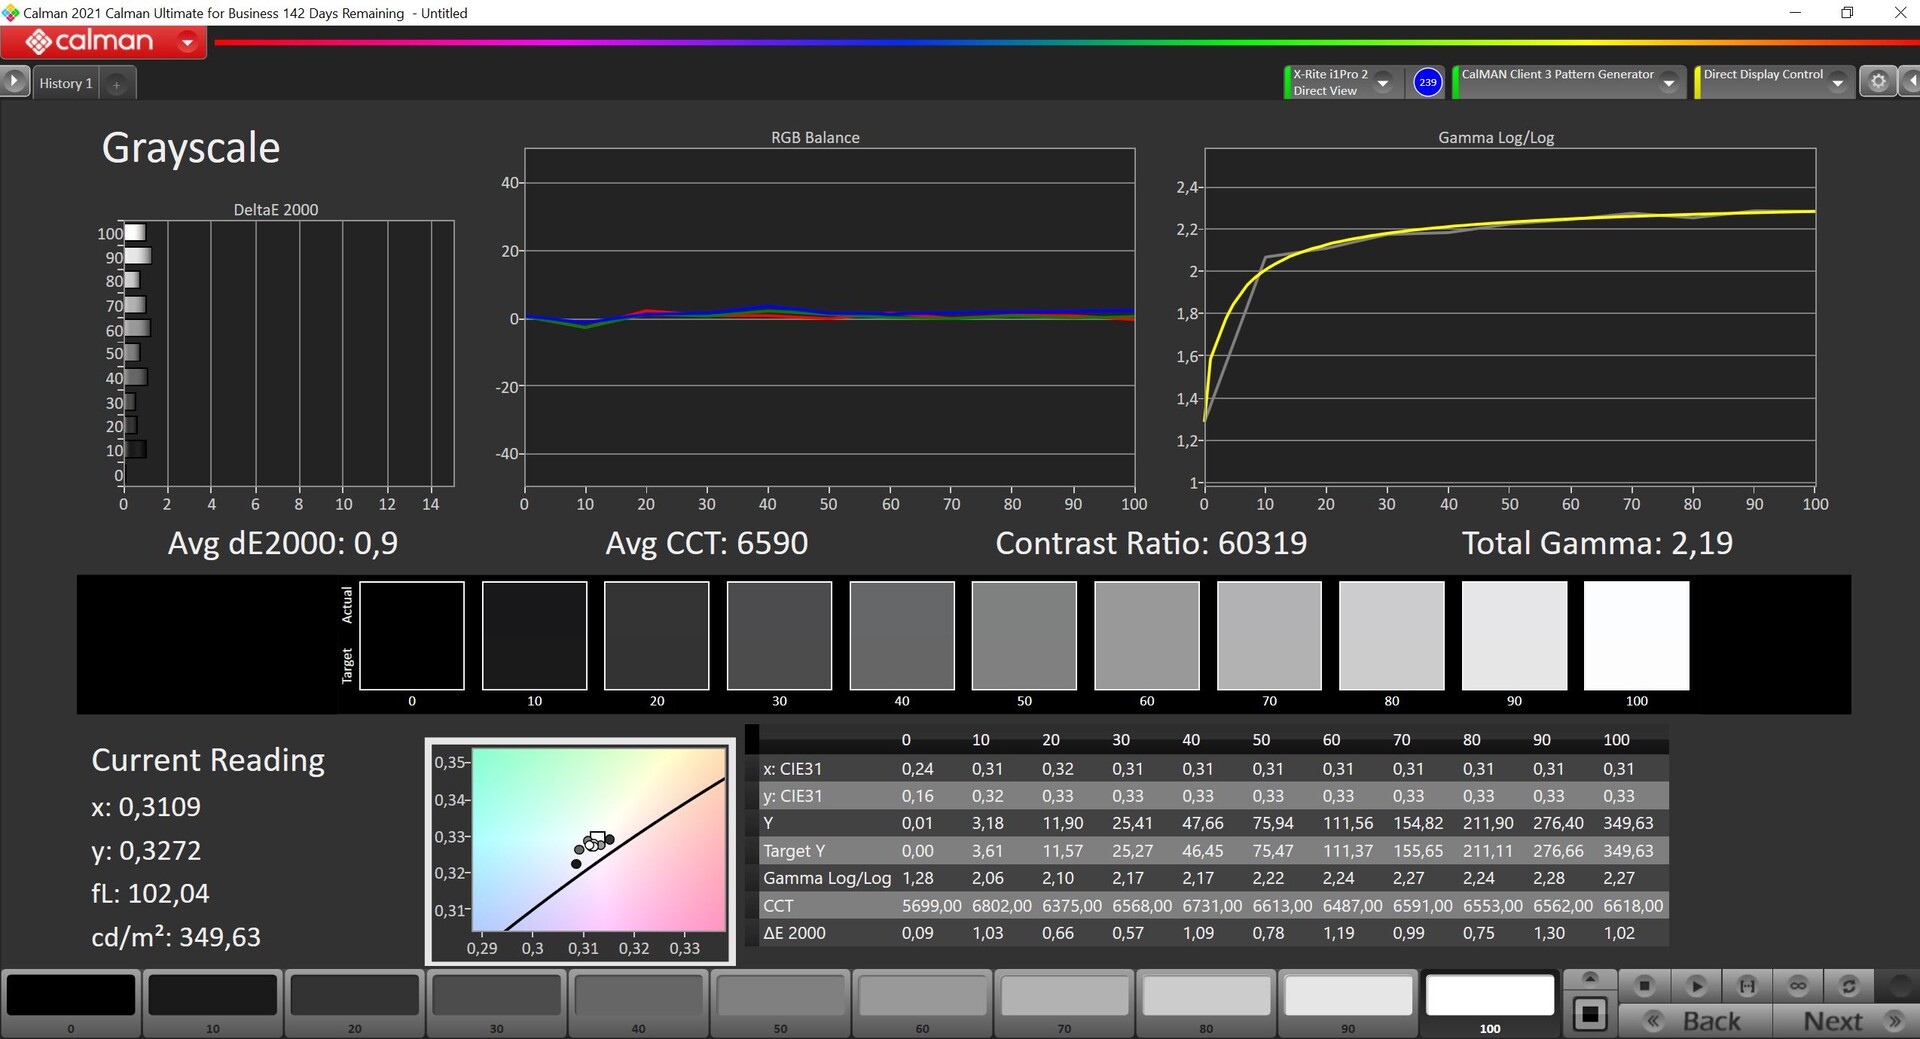
ΔE ColorChecker Calman: 0.8 | ∀{0.5-29.43 Ø4.71}
ΔE Greyscale Calman: 0.9 | ∀{0.09-98 Ø4.96}
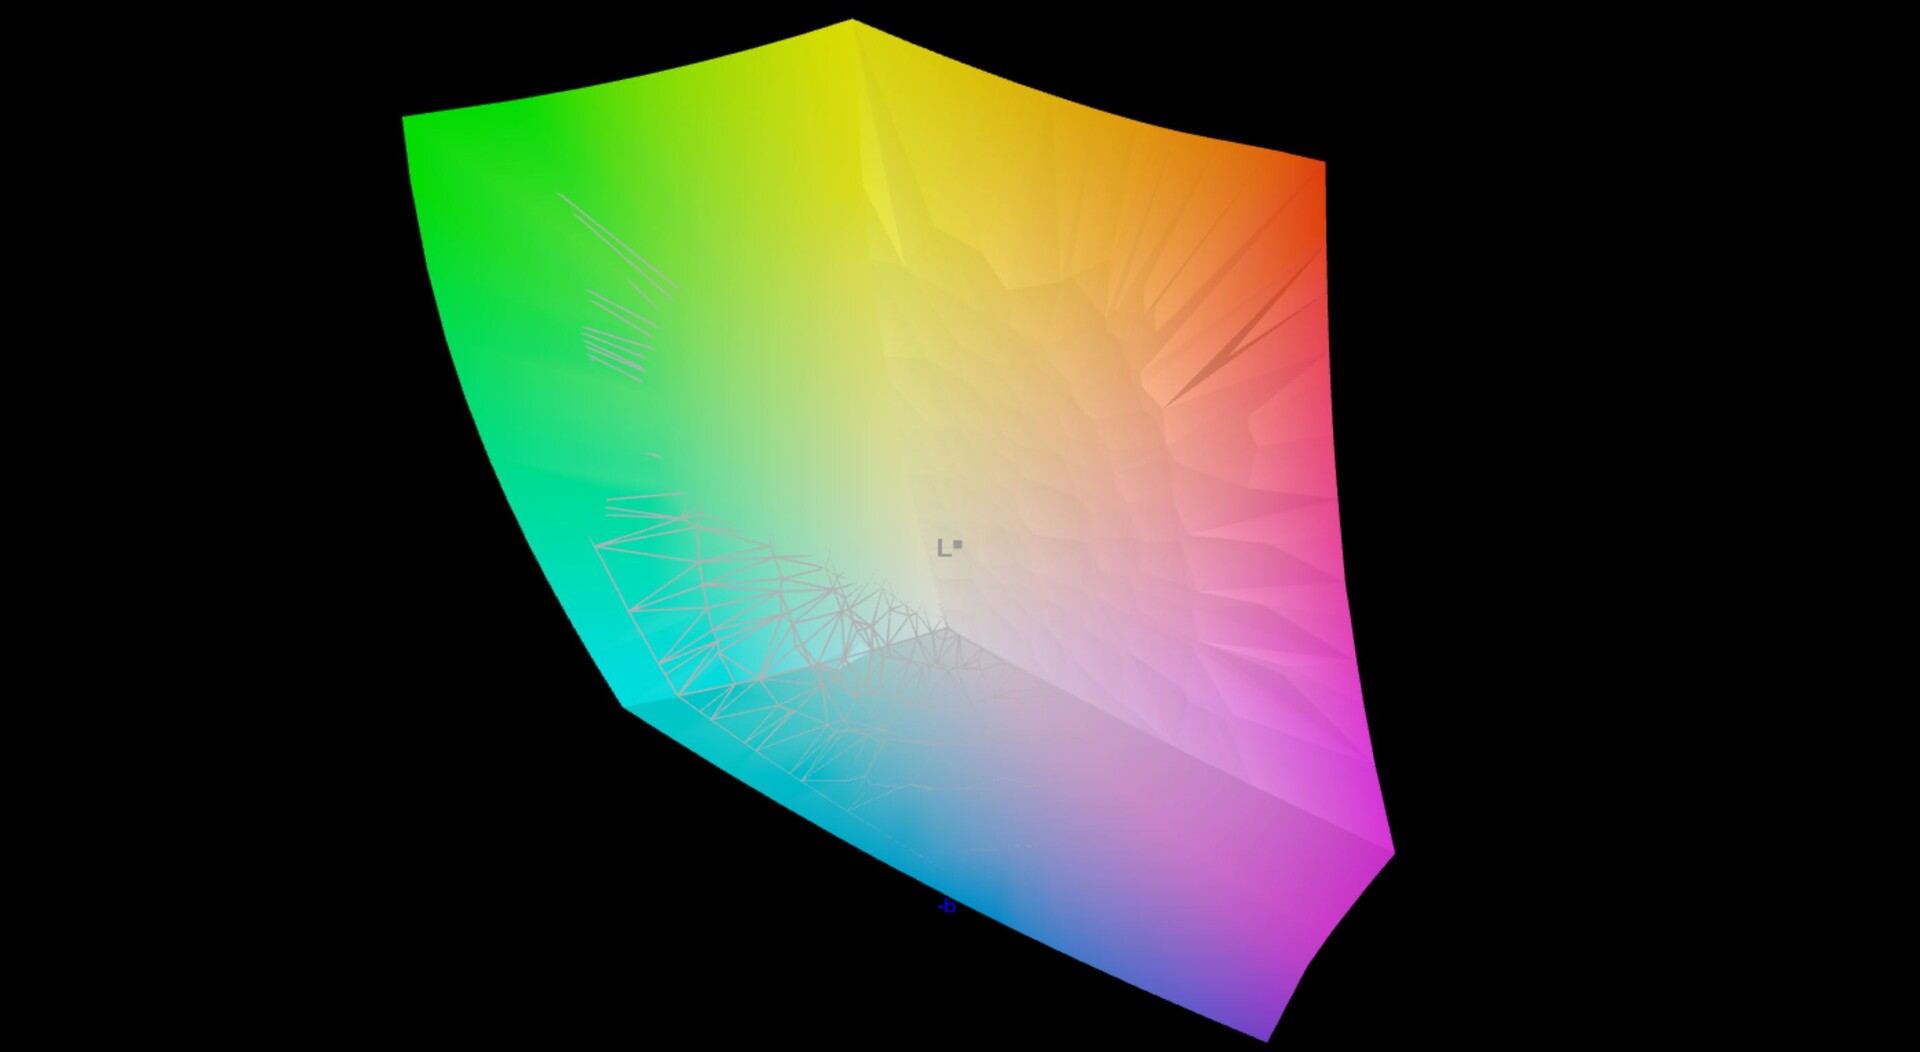
97.5% AdobeRGB 1998 (Argyll 3D)
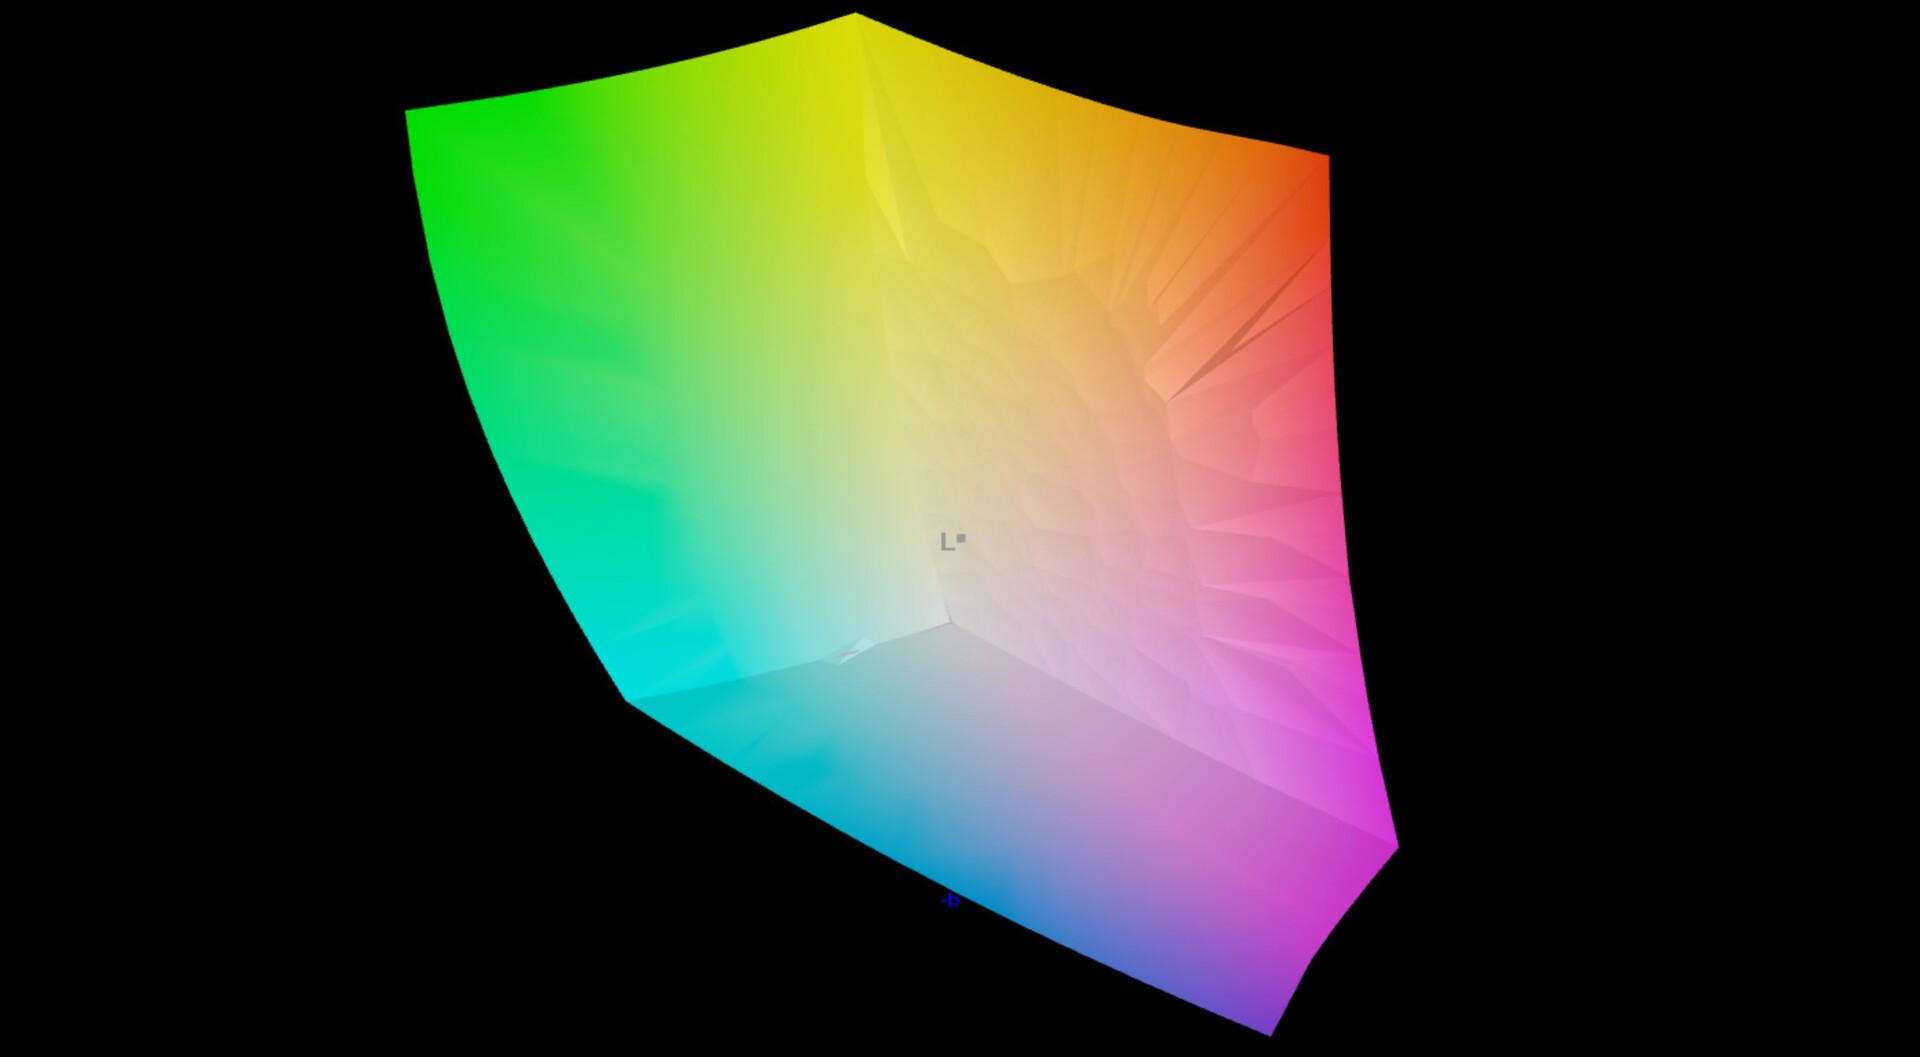
100% sRGB (Argyll 3D)
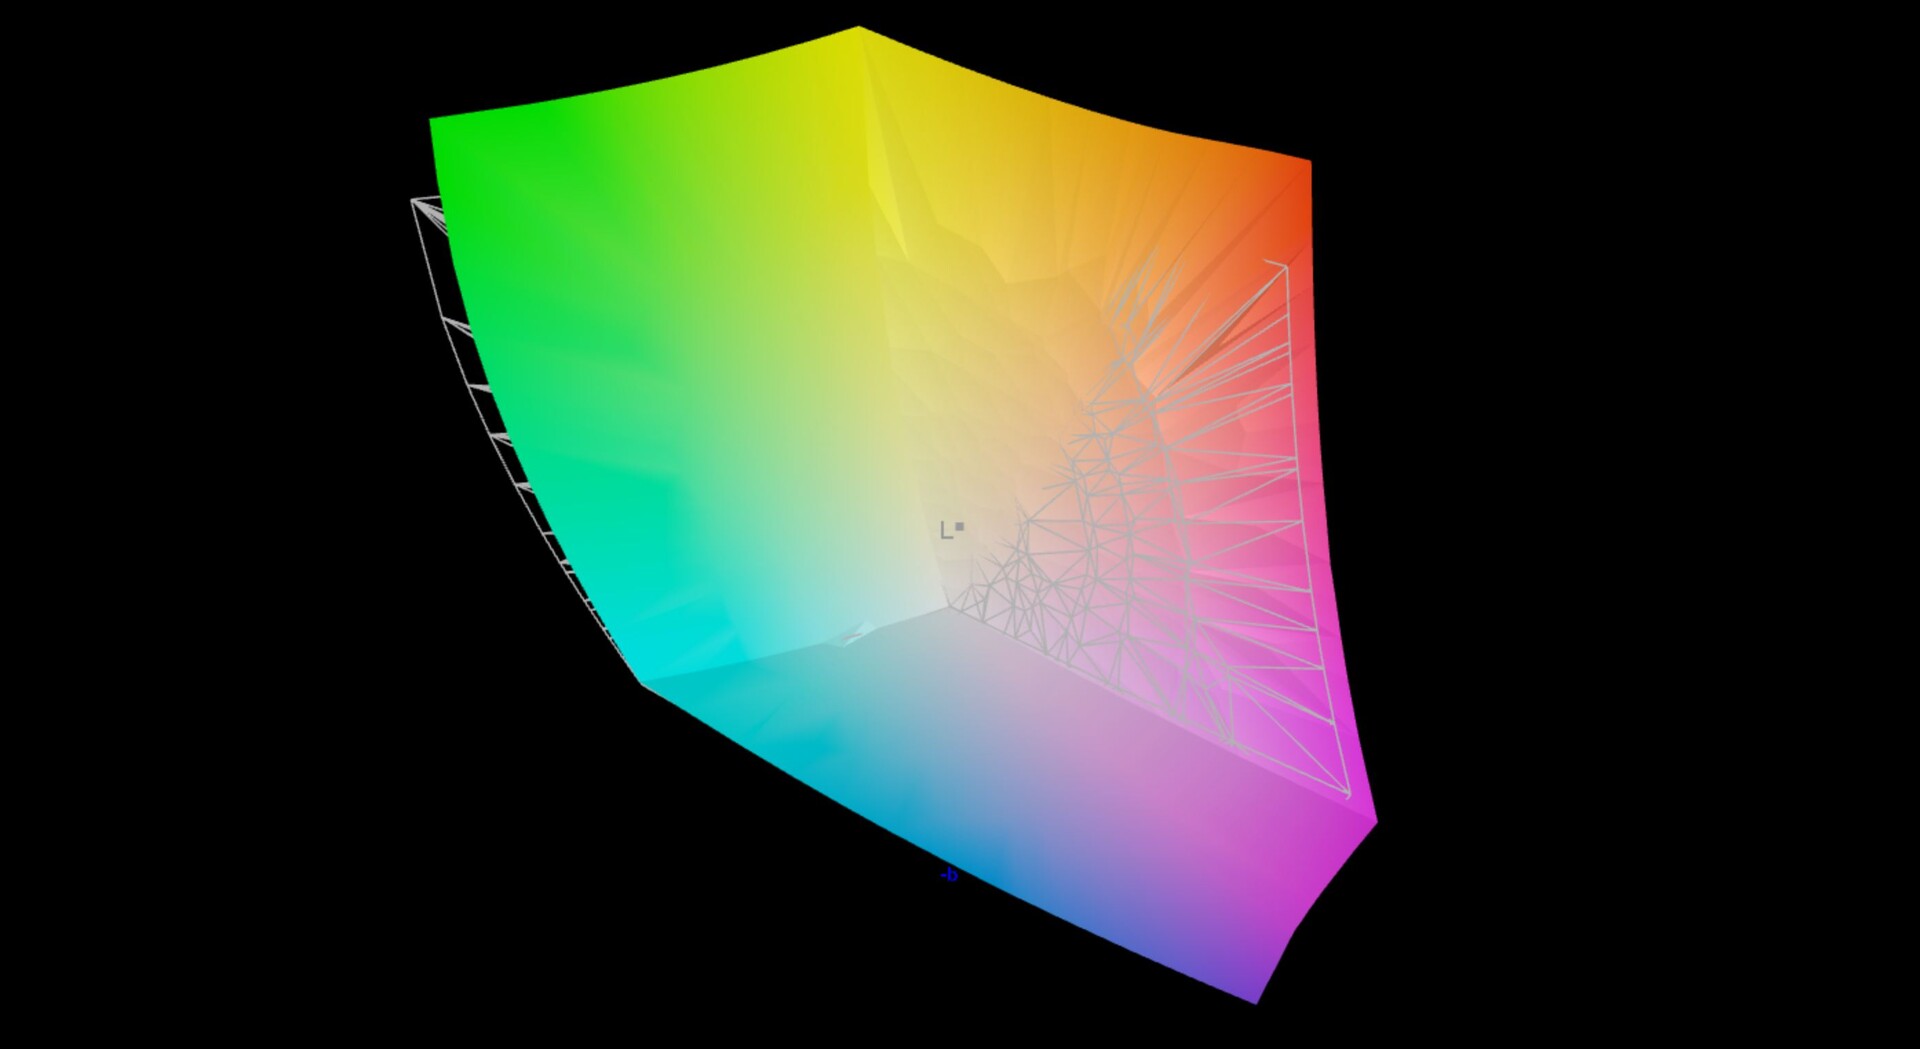
99.6% Display P3 (Argyll 3D)
Gamma: 2.19
CCT: 6590 K
| Asus Zenbook Pro 14 OLED UX6404VI SDC4190, OLED, 2880x1800, 14.5" | Asus ZenBook Pro 14 Duo UX8402VV-P1021W ATNA45AF04-0 , OLED, 2880x1800, 14.5" | Apple MacBook Pro 14 2023 M2 Pro Mini-LED, 3024x1964, 14.2" | Asus ROG Zephyrus G14 GA402XY B140QAN06.S, Mini-LED, 2560x1600, 14" | Dell XPS 15 9530 RTX 4070 Samsung 156XG01, OLED, 3456x2160, 15.6" | Razer Blade 15 OLED (Early 2022) Samsung ATNA562P02-0, OLED, 2560x1440, 15.6" | |
|---|---|---|---|---|---|---|
| Display | -1% | 0% | -1% | 0% | -2% | |
| Display P3 Coverage (%) | 99.6 | 99.91 0% | 99.2 0% | 99.6 0% | 99.8 0% | 97.6 -2% |
| sRGB Coverage (%) | 100 | 100 0% | 100 0% | 100 0% | 99.4 -1% | |
| AdobeRGB 1998 Coverage (%) | 97.5 | 95.35 -2% | 93.4 -4% | 98.4 1% | 94 -4% | |
| Response Times | -161% | -3994% | -1734% | -134% | -161% | |
| Response Time Grey 50% / Grey 80% * (ms) | 0.67 ? | 2 ? -199% | 35.2 ? -5154% | 17.2 ? -2467% | 1.68 ? -151% | 2 ? -199% |
| Response Time Black / White * (ms) | 0.9 ? | 2 ? -122% | 26.4 ? -2833% | 9.9 ? -1000% | 1.94 ? -116% | 2 ? -122% |
| PWM Frequency (Hz) | 240 | 240 | 14880 ? | 5430 | 239 | 500 ? |
| Screen | -43% | -22% | -17% | -178% | -49% | |
| Brightness middle (cd/m²) | 356 | 340 -4% | 500 40% | 535 50% | 389.5 9% | 383 8% |
| Brightness (cd/m²) | 358 | 340 -5% | 489 37% | 563 57% | 392 9% | 384 7% |
| Brightness Distribution (%) | 99 | 99 0% | 94 -5% | 91 -8% | 98 -1% | 99 0% |
| Black Level * (cd/m²) | 0.002 | 0.02 | 0.03 | |||
| Colorchecker dE 2000 * | 0.8 | 1.76 -120% | 1.2 -50% | 1 -25% | 4.95 -519% | 1.89 -136% |
| Colorchecker dE 2000 max. * | 1.6 | 3.2 -100% | 2.6 -63% | 2.8 -75% | 8.65 -441% | 3.76 -135% |
| Greyscale dE 2000 * | 0.9 | 1.16 -29% | 1.7 -89% | 1.8 -100% | 2 -122% | 1.26 -40% |
| Gamma | 2.19 100% | 2.43 91% | 2.24 98% | 2.24 98% | 2.27 97% | 2.41 91% |
| CCT | 6590 99% | 6418 101% | 6791 96% | 6337 103% | 6265 104% | 6386 102% |
| Contrast (:1) | 170000 | 25000 | 12767 | |||
| Colorchecker dE 2000 calibrated * | 1.62 | 1.53 | 2.67 | |||
| Total Average (Program / Settings) | -68% /
-53% | -1339% /
-902% | -584% /
-325% | -104% /
-121% | -71% /
-57% |
* ... smaller is better

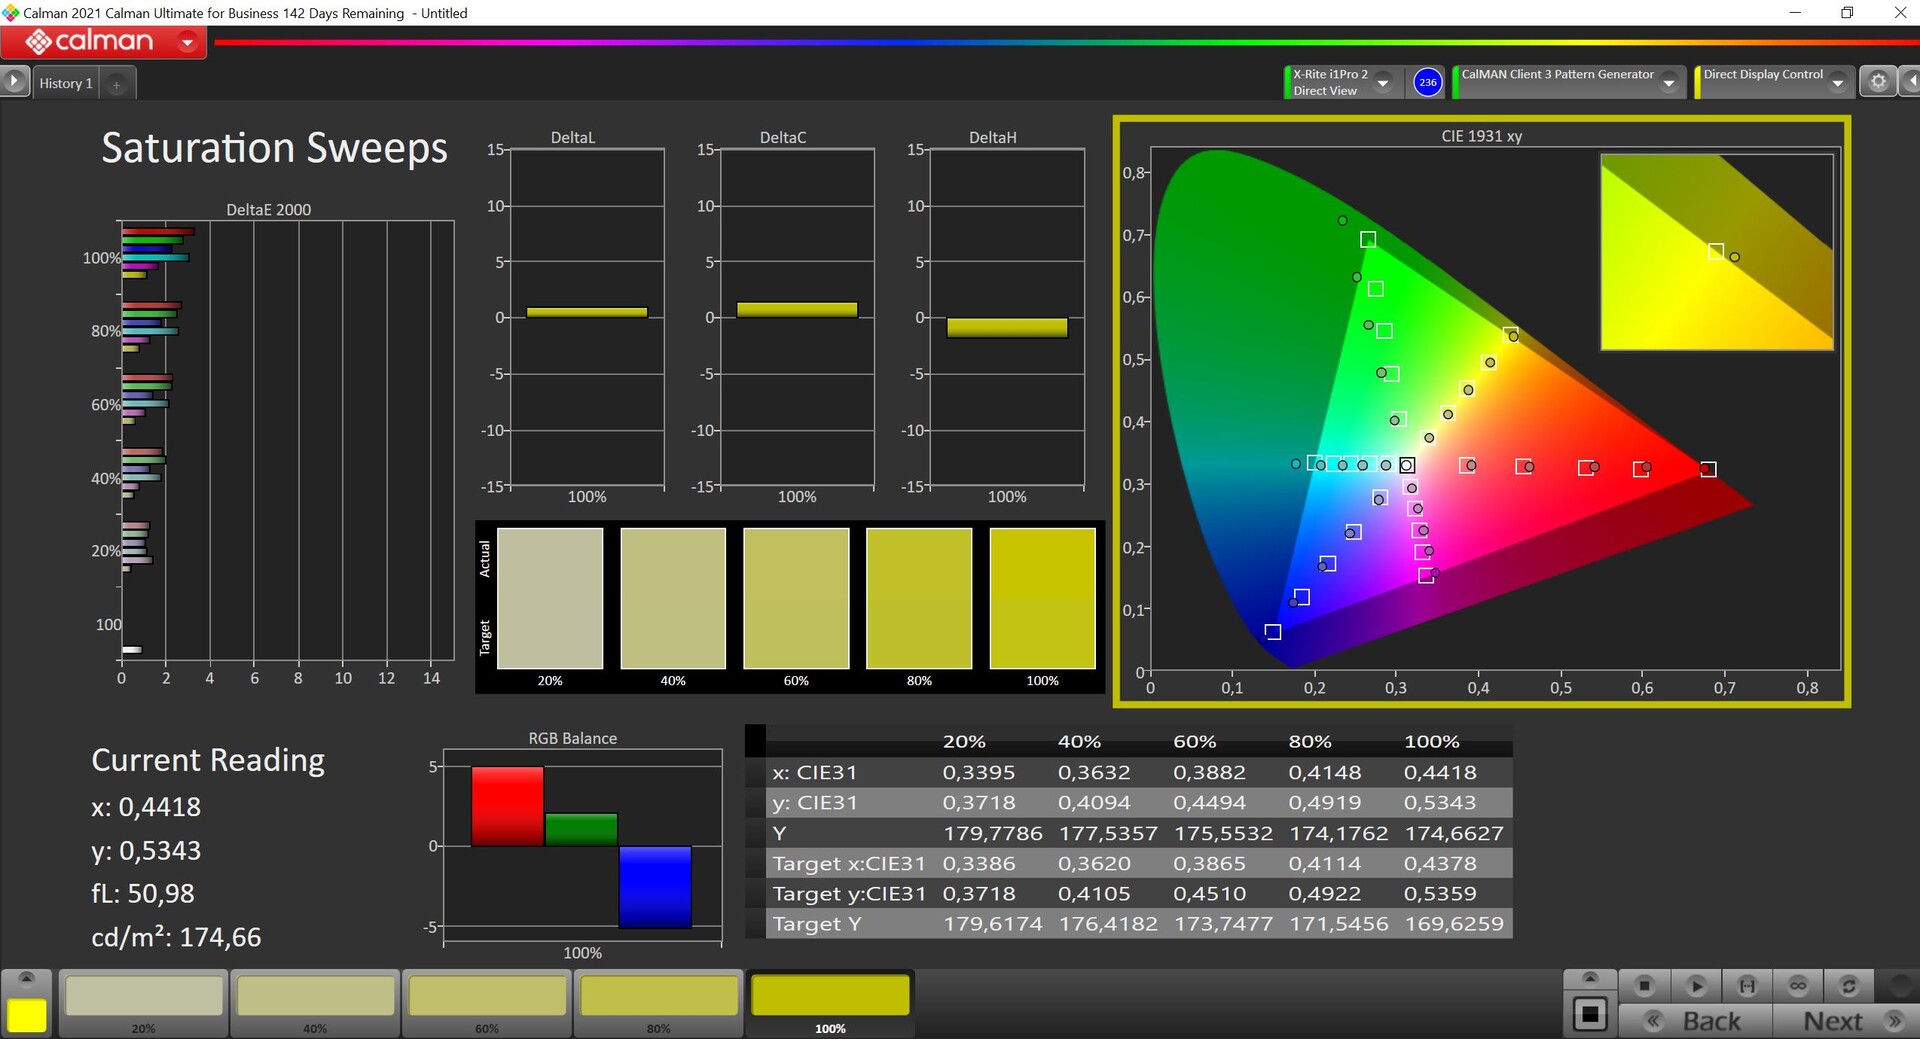

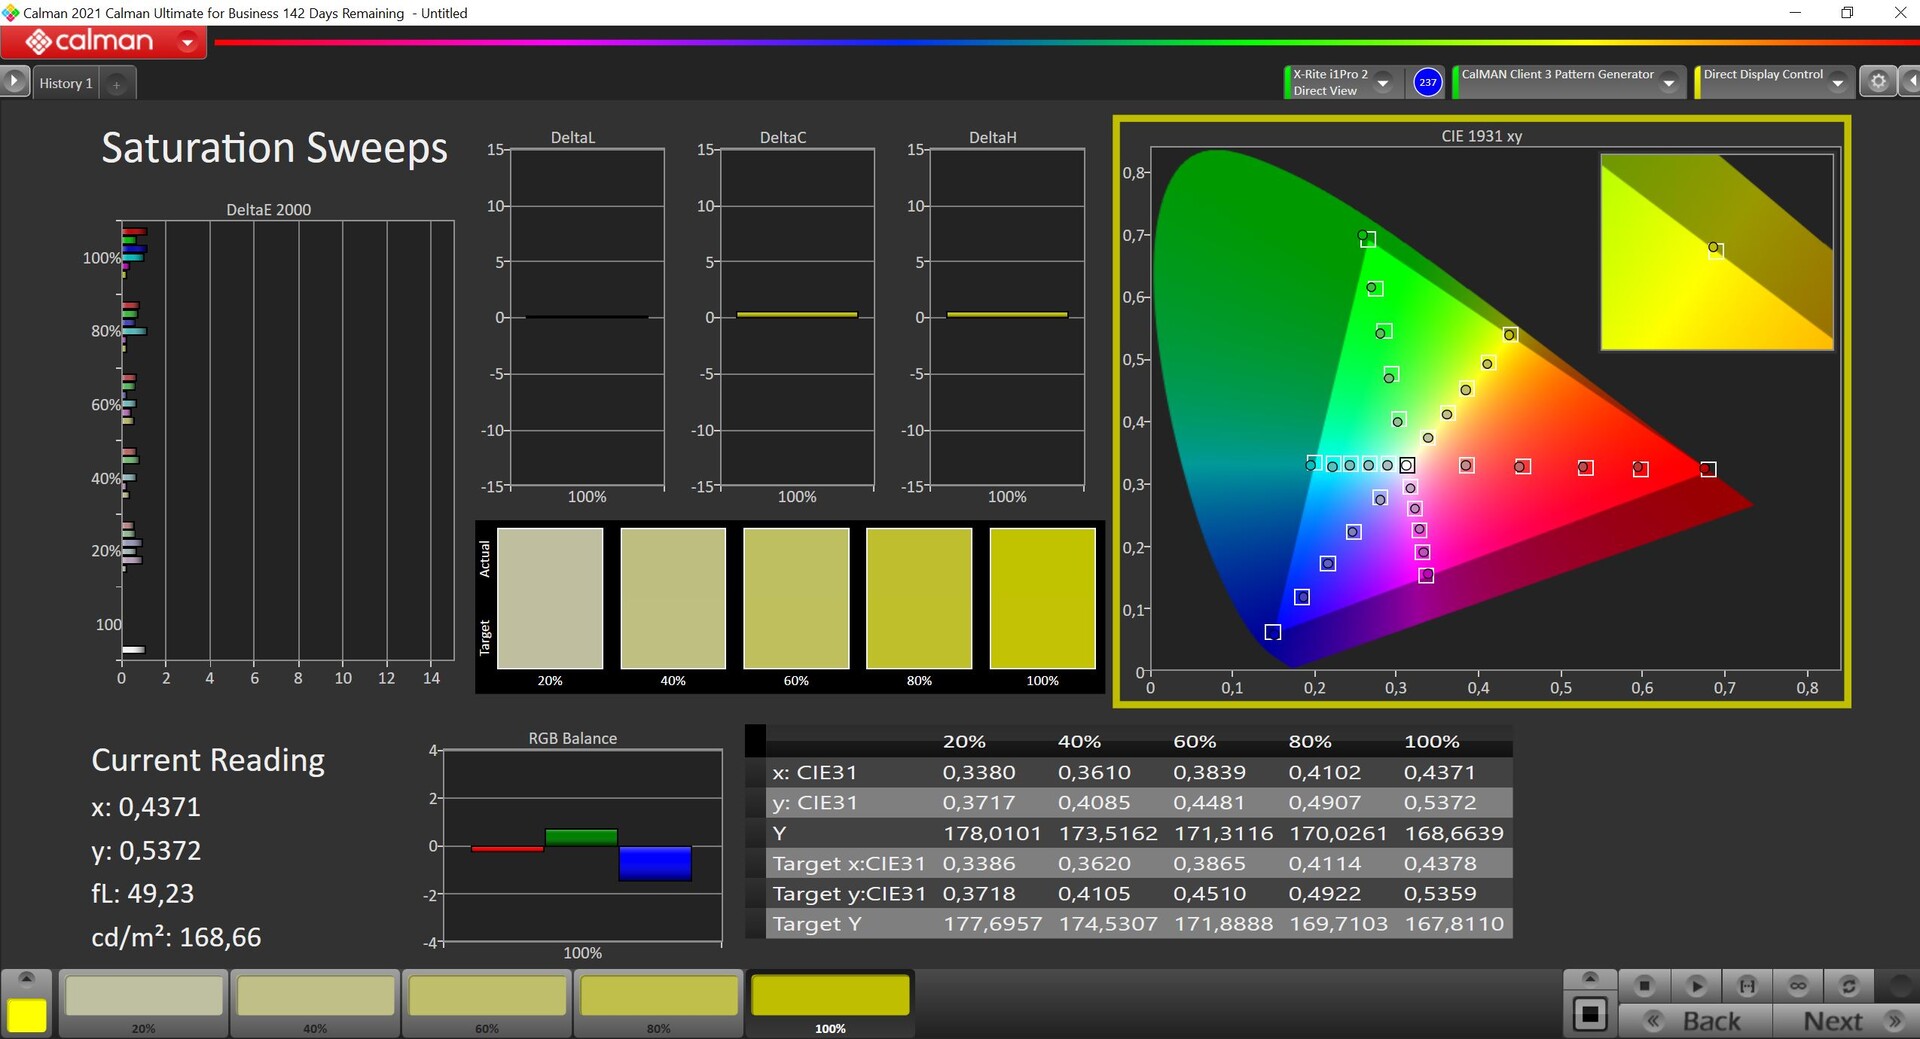

We measured the OLED panel with professional CalMAN software (i.e. X-Rite i1 Pro 2) using the default Native profile as well as Display P3. Colors appear a little oversaturated in the Native profile, which results in even more vivid image quality, but some colors overshoot the important limit of 3. The Display P3 profile, on the other hand, provides extremely accurate colors and allows for direct image/video editing. We were unable to improve the display further with our own calibration, which is why the corresponding profile for download is not provided here. An sRGB profile is also available. The P3 color space is completely covered.
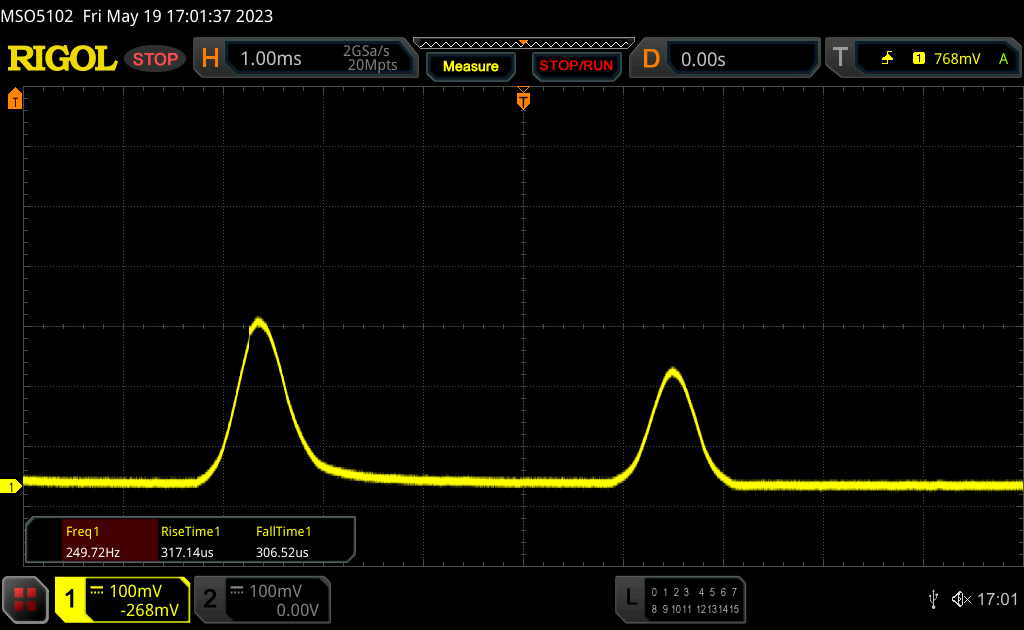
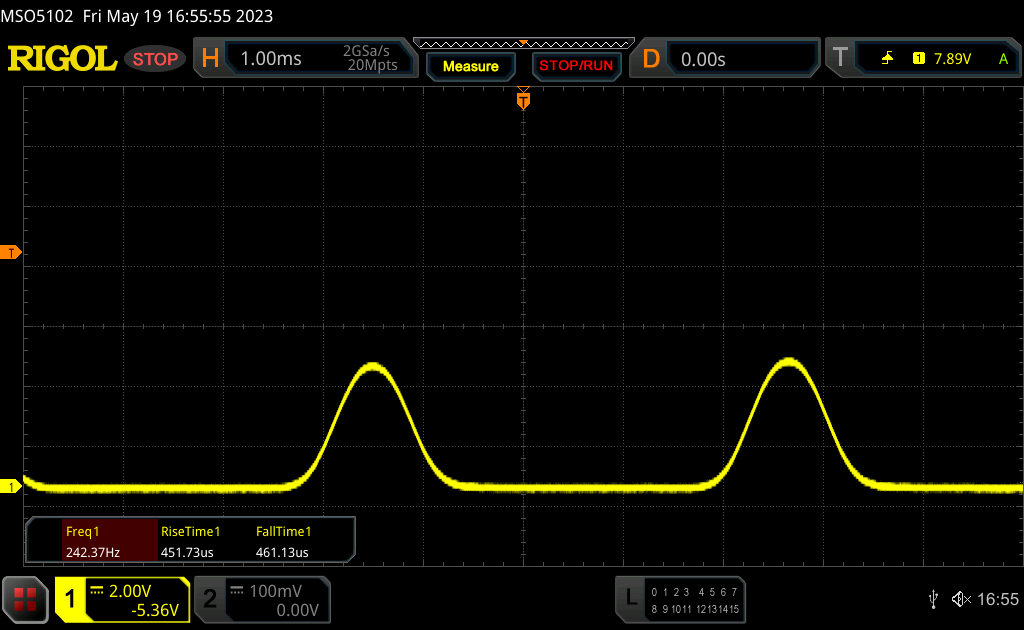
Display Response Times
| ↔ Response Time Black to White | ||
|---|---|---|
| 0.9 ms ... rise ↗ and fall ↘ combined | ↗ 0.4 ms rise | 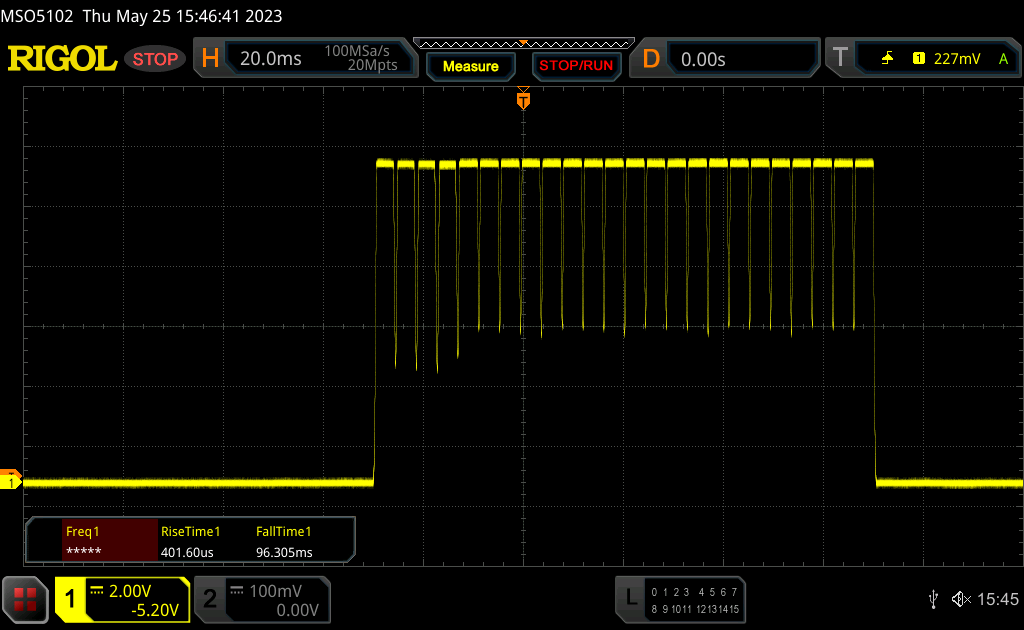 |
| ↘ 0.5 ms fall | ||
| The screen shows very fast response rates in our tests and should be very well suited for fast-paced gaming. In comparison, all tested devices range from 0.1 (minimum) to 240 (maximum) ms. » 3 % of all devices are better. This means that the measured response time is better than the average of all tested devices (19.8 ms). | ||
| ↔ Response Time 50% Grey to 80% Grey | ||
| 0.67 ms ... rise ↗ and fall ↘ combined | ↗ 0.33 ms rise | 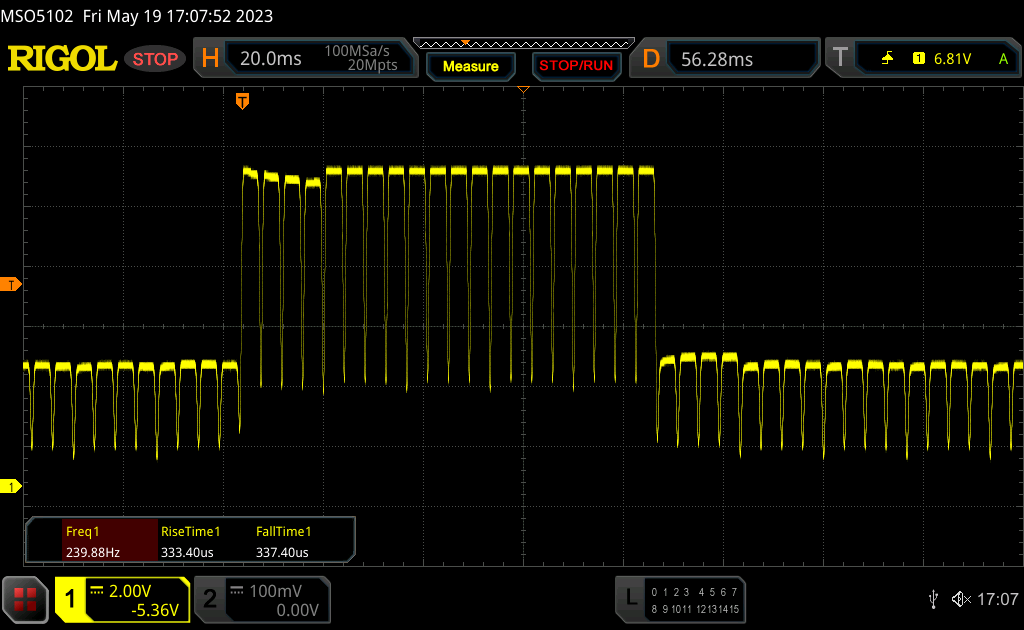 |
| ↘ 0.34 ms fall | ||
| The screen shows very fast response rates in our tests and should be very well suited for fast-paced gaming. In comparison, all tested devices range from 0.165 (minimum) to 636 (maximum) ms. » 2 % of all devices are better. This means that the measured response time is better than the average of all tested devices (31 ms). | ||
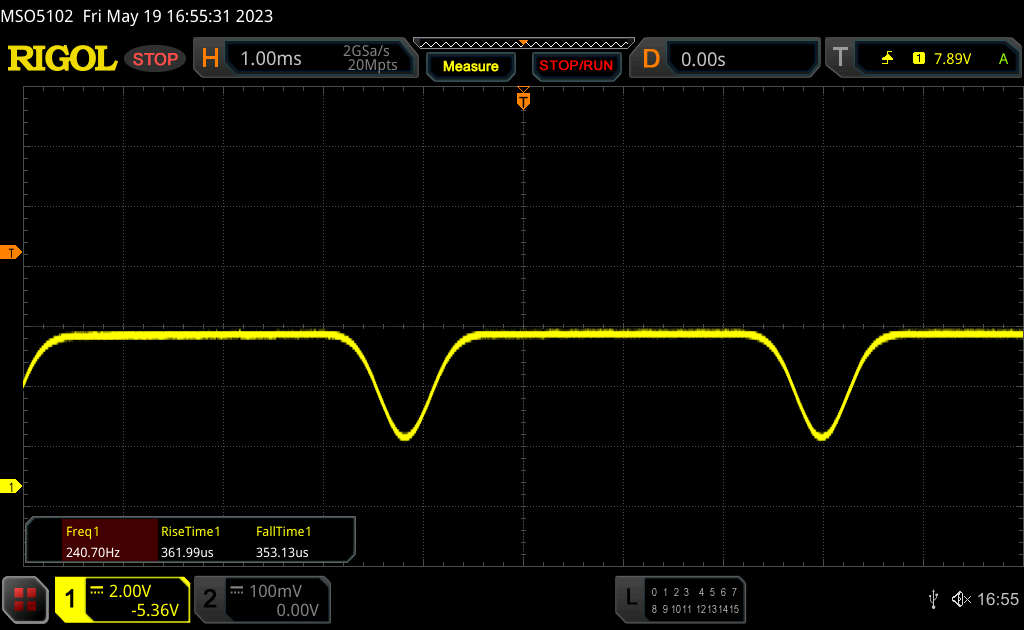
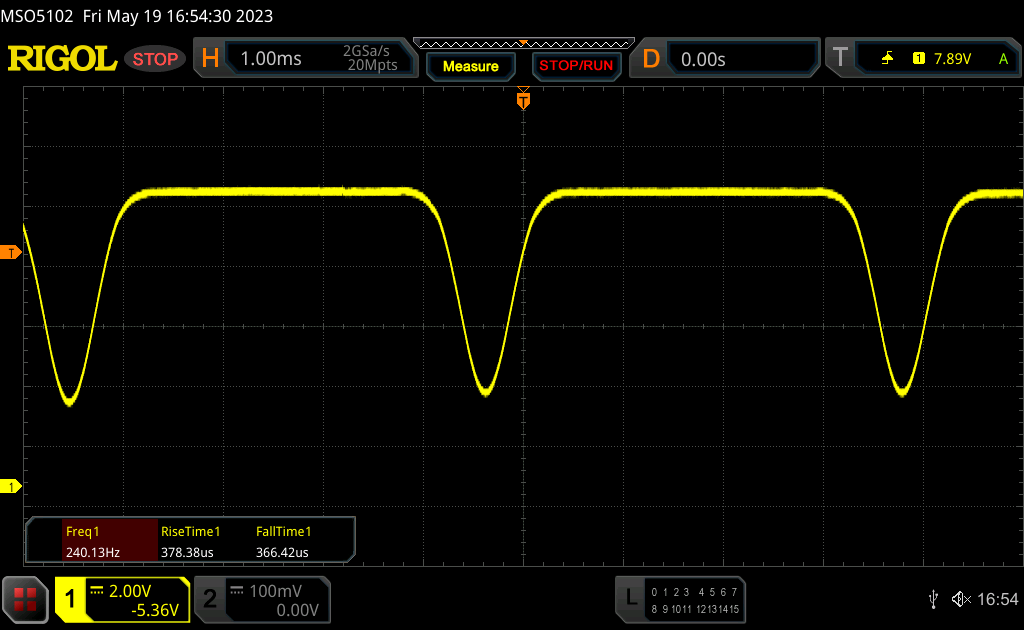
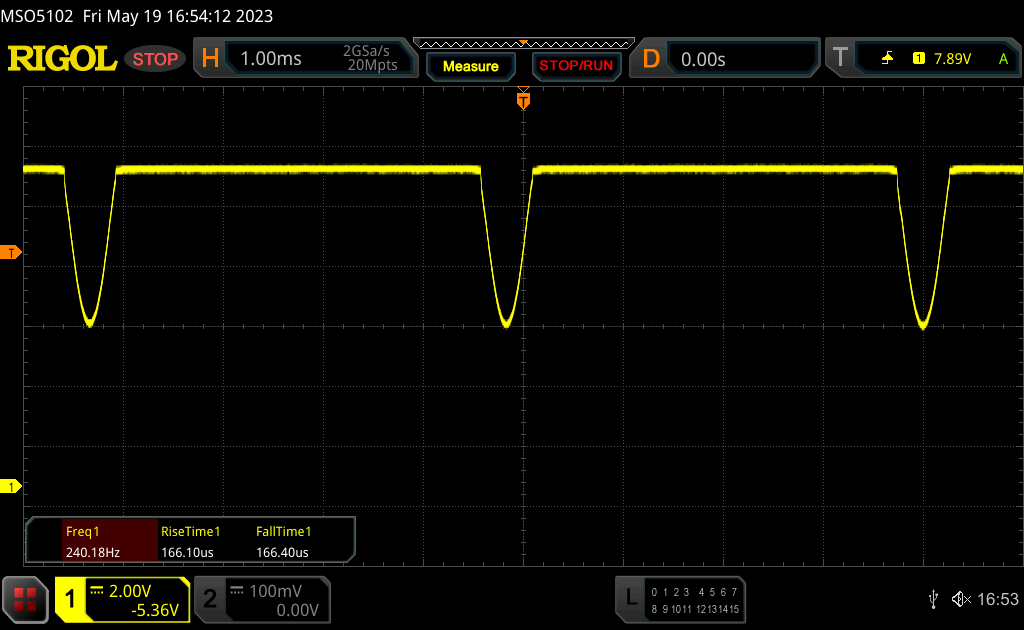
Screen Flickering / PWM (Pulse-Width Modulation)
| Screen flickering / PWM detected | 240 Hz |  | |
The display backlight flickers at 240 Hz (worst case, e.g., utilizing PWM) . The frequency of 240 Hz is relatively low, so sensitive users will likely notice flickering and experience eyestrain at the stated brightness setting and below. In comparison: 52 % of all tested devices do not use PWM to dim the display. If PWM was detected, an average of 7757 (minimum: 5 - maximum: 343500) Hz was measured. | |||
The OLED panel's response times are very fast, but we detected PWM flickering at all brightness levels. DC dimming is used down to a brightness level of 50%, and classic PWM with a frequency of 240 Hz is used below that. Asus itself advises not to go below this brightness and to use the flicker-free OLED dimming function in the MyAsus software instead. We discussed this in detail in the review of the Zenbook S 13 OLED and the functionality is identical here.
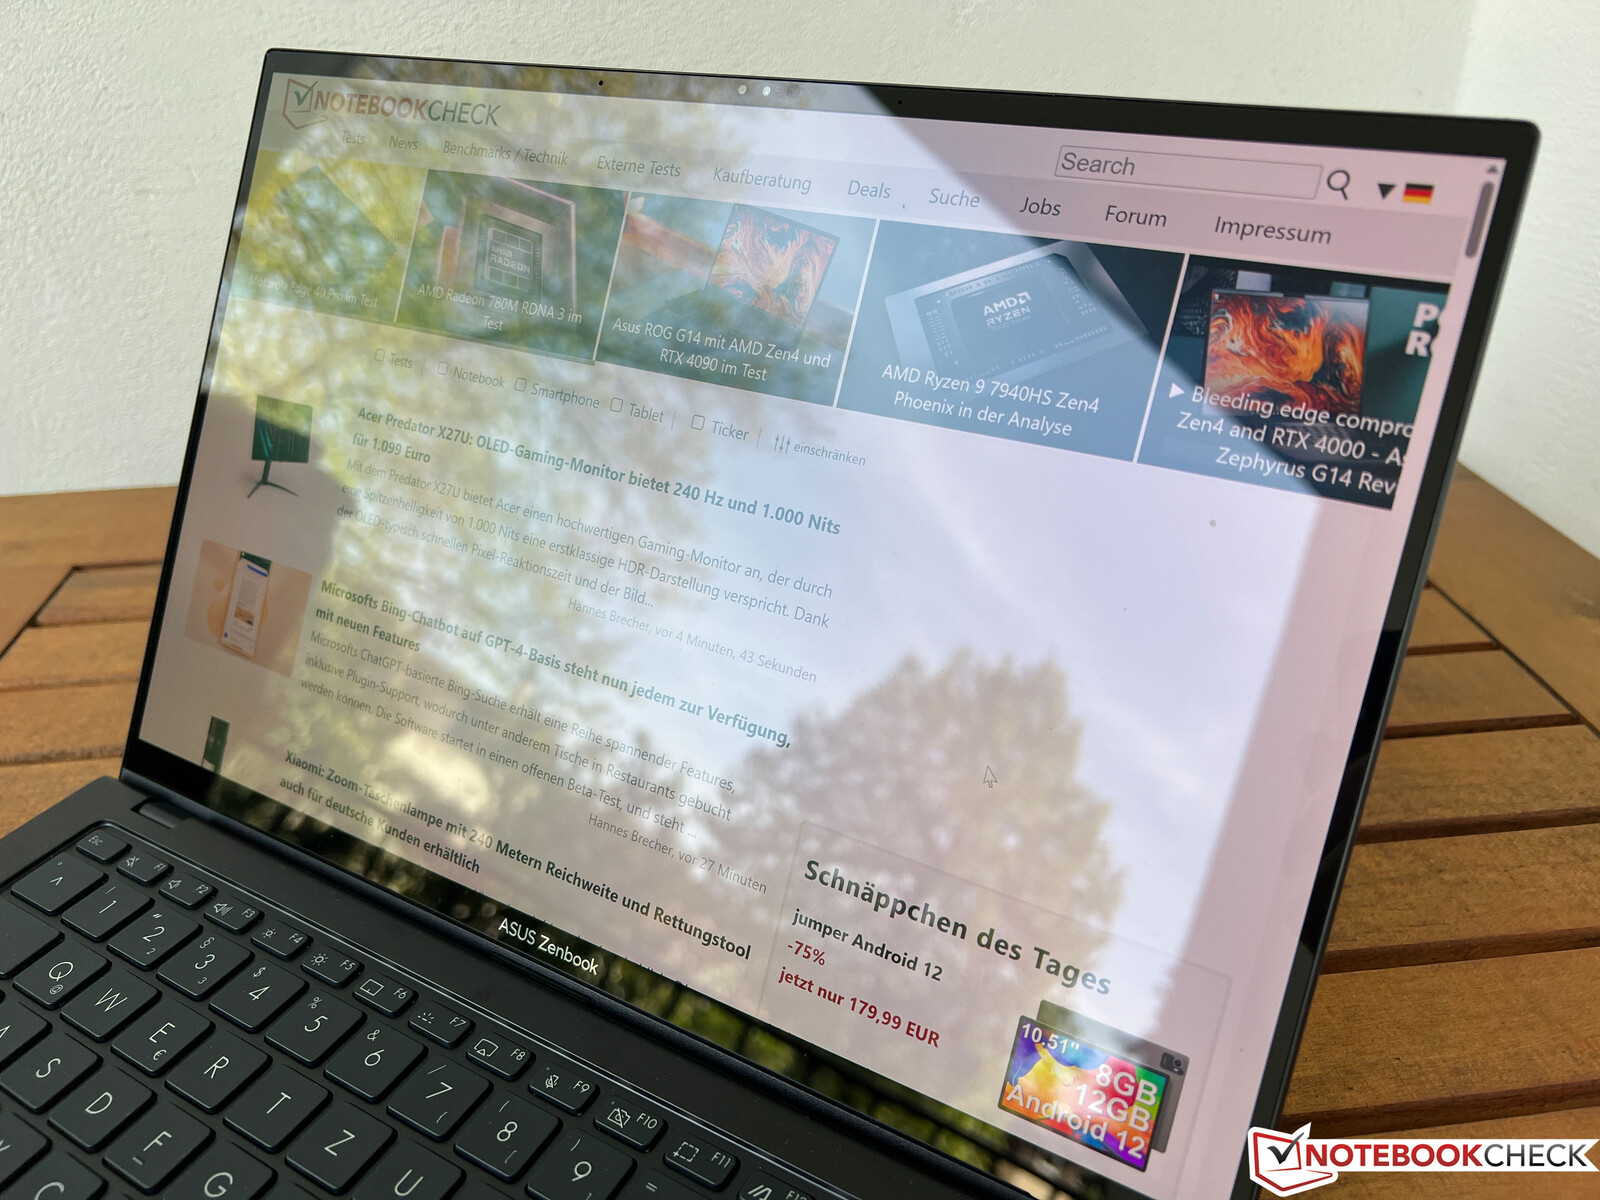
Outdoors, the highly reflective touchscreen is problematic because you always have to deal with reflections, even on cloudy days. The viewing-angle stability is very good overall. Only from certain (wide) angles do you notice a blue cast, which is typical for OLED panels.

Performance - Core i9 & RTX 4070 Laptop GPU
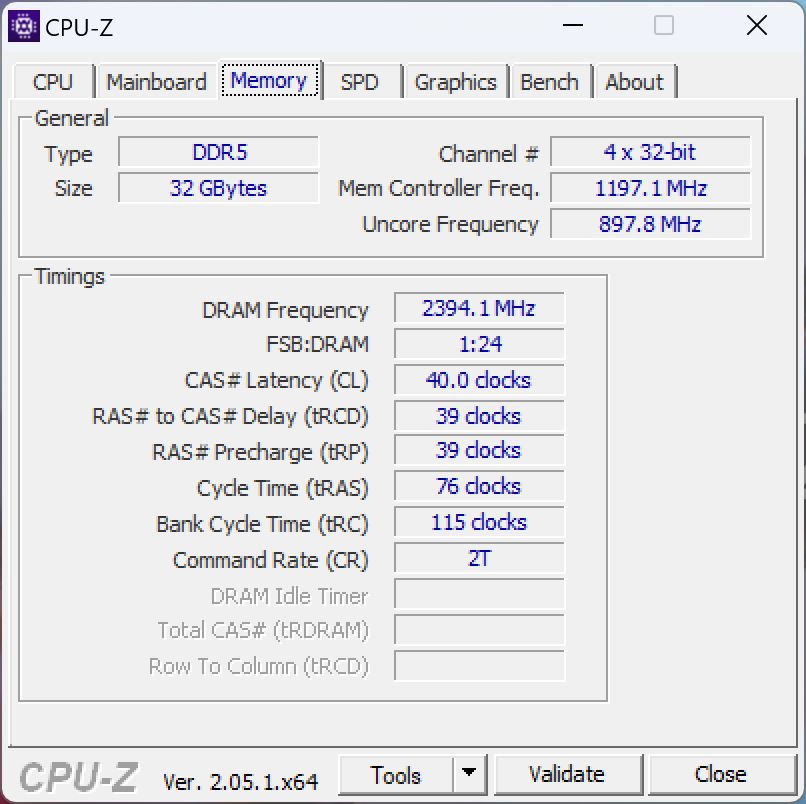
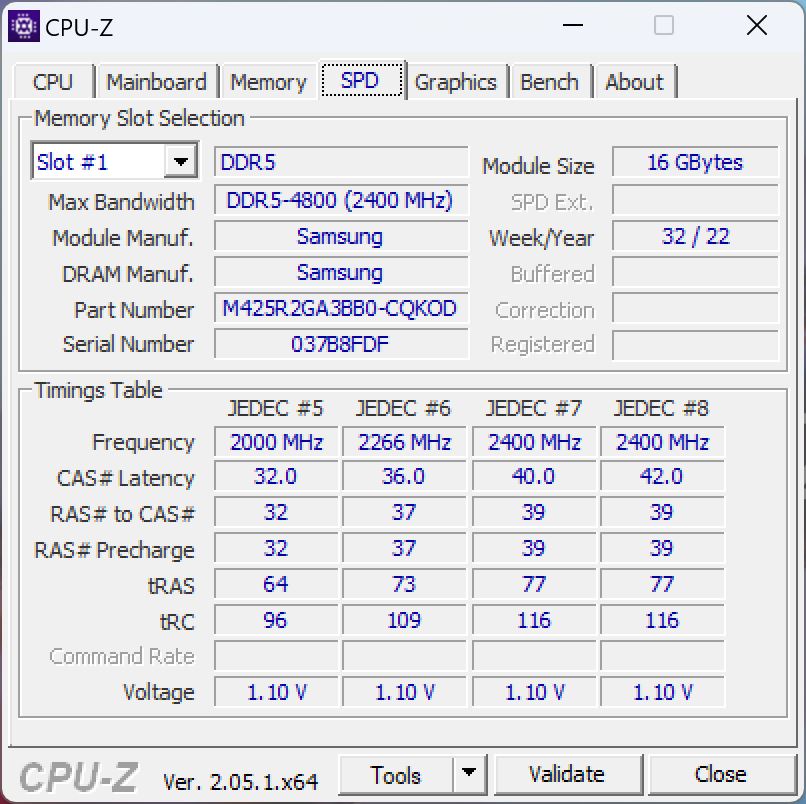
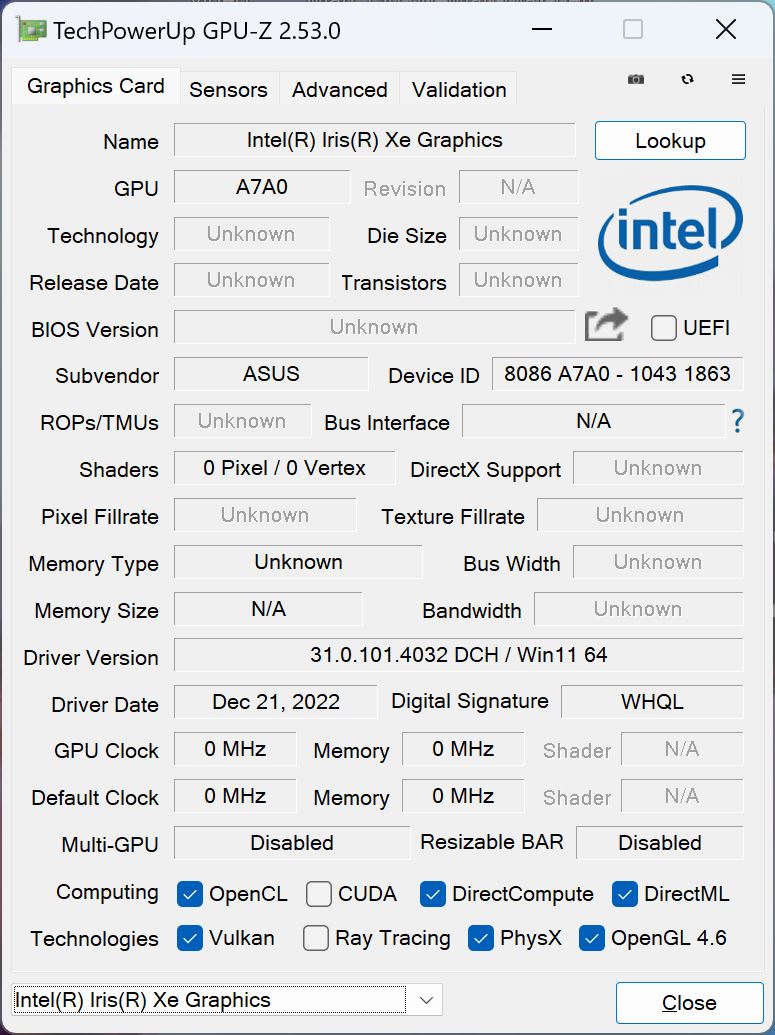
The Zenbook Pro 14 is only available with the Intel Core i9-13900H and 16 GB of RAM is soldered. A SODIMM slot is available, which is equipped with either 16 or 32 GB of RAM, depending on the model. As for the graphics card, you have the choice between the GeForce RTX 4060 Laptop and the RTX 4070 Laptop, of which the latter is installed in our test device.

Testing Conditions
There are three different performance modes in the MyAsus software: Whisper, Standard and Performance. The table below shows the TDP/TGP values of the modes. We used Performance mode for the following benchmarks and measurements, since the graphics performance of the GeForce GPU in particular is otherwise significantly lower. In everyday life, however, you can easily use one of the other two modes without issue. The Zenbook also has a MUX switch that can be used to completely disable the integrated GPU. However, switching requires a system reboot.
| Mode | CPU | GPU | Stress Test | CB R23 Multi | Time Spy Graphics |
|---|---|---|---|---|---|
| Whisper | 45 watts | 35 watts | CPU: 25 watts GPU: 35 watts |
13.453 points | 7.252 points |
| Standard | 120 -> 80 watts | 45 watts | CPU: 25 watts GPU: 35 watts |
18.576 points | 8.218 points |
| Performance | 120 -> 90 watts | 90 watts | CPU: 30 watts GPU: 75 watts |
19.014 points | 11.398 points |
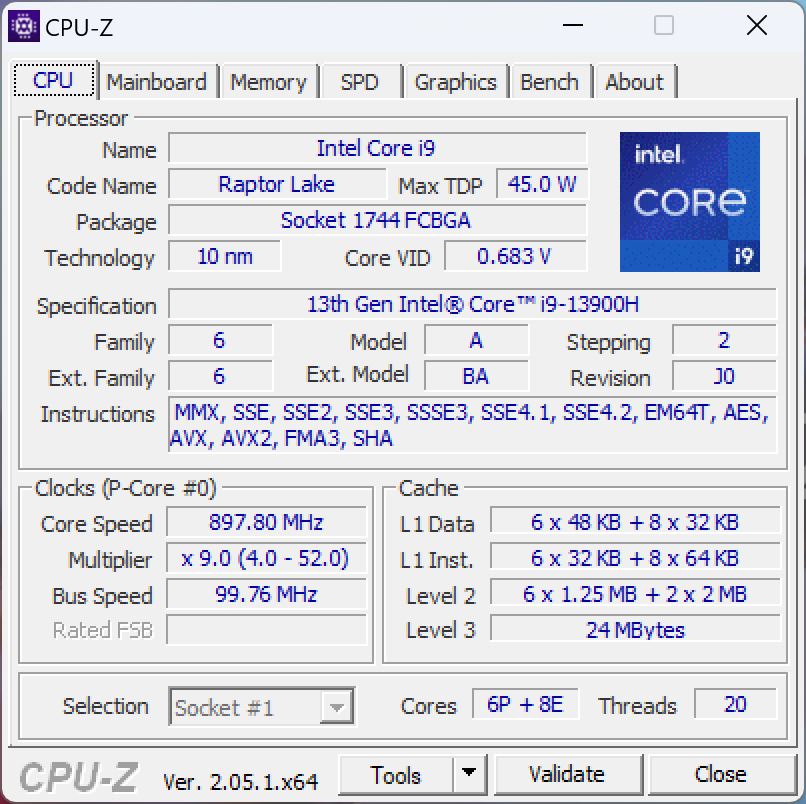
Processor - Intel Core i9 13900H
The Intel Core i9-13900H is a high-end mobile processor with 6 performance cores and 8 efficiency cores, which is why a total of 20 threads can be processed at any given time. Apart from the slightly higher clock rate, however, there are no differences to the Core i9-12900H. The performance in the Zenbook Pro 14 is very good thanks to the high power limits, although it must also be stated here that the Intel chip is only marginally faster than the new AMD Ryzen 9 7940HS with 80 watts, despite the significantly higher power consumption. In our CB R15 multi-loop, the i9-13900H drops to 90 watts after a few runs, where it is also slower than the 7940HS.
Cinebench R15 Multi Sustained Load
On the other hand, the single-core performance of the performance cores is still very good: we see an advantage of around 15% over the current AMD Ryzen 9 7940HS here. The main rival Apple MacBook Pro 14 is clearly at a disadvantage in terms of raw CPU performance, but the power consumption of 34 watts is also significantly lower. The MacBook also has the advantage that performance remains constant in battery mode. The Zenbook's CPU, however, drops to a meager 30 watts without the power supply, resulting in a performance loss of around 45% in multi-core tests. More CPU benchmarks are listed in our tech section.
Cinebench R23: Multi Core | Single Core
Cinebench R20: CPU (Multi Core) | CPU (Single Core)
Cinebench R15: CPU Multi 64Bit | CPU Single 64Bit
Blender: v2.79 BMW27 CPU
7-Zip 18.03: 7z b 4 | 7z b 4 -mmt1
Geekbench 5.5: Multi-Core | Single-Core
HWBOT x265 Benchmark v2.2: 4k Preset
LibreOffice : 20 Documents To PDF
R Benchmark 2.5: Overall mean
| CPU Performance rating | |
| Asus Zenbook Pro 14 OLED UX6404VI | |
| Asus ROG Zephyrus G14 GA402XY | |
| Apple MacBook Pro 14 2023 M2 Pro -6! | |
| Asus ZenBook Pro 14 Duo UX8402VV-P1021W | |
| Average Intel Core i9-13900H | |
| Dell XPS 15 9530 RTX 4070 | |
| Average of class Multimedia | |
| Razer Blade 15 OLED (Early 2022) | |
| Cinebench R23 / Multi Core | |
| Asus Zenbook Pro 14 OLED UX6404VI | |
| Asus ROG Zephyrus G14 GA402XY | |
| Asus ZenBook Pro 14 Duo UX8402VV-P1021W | |
| Average Intel Core i9-13900H (11997 - 20385, n=28) | |
| Average of class Multimedia (4861 - 33362, n=74, last 2 years) | |
| Razer Blade 15 OLED (Early 2022) | |
| Dell XPS 15 9530 RTX 4070 | |
| Apple MacBook Pro 14 2023 M2 Pro | |
| Cinebench R23 / Single Core | |
| Asus Zenbook Pro 14 OLED UX6404VI | |
| Asus ZenBook Pro 14 Duo UX8402VV-P1021W | |
| Average of class Multimedia (1128 - 2459, n=66, last 2 years) | |
| Average Intel Core i9-13900H (1297 - 2054, n=26) | |
| Dell XPS 15 9530 RTX 4070 | |
| Asus ROG Zephyrus G14 GA402XY | |
| Razer Blade 15 OLED (Early 2022) | |
| Apple MacBook Pro 14 2023 M2 Pro | |
| Cinebench R20 / CPU (Multi Core) | |
| Asus Zenbook Pro 14 OLED UX6404VI | |
| Asus ROG Zephyrus G14 GA402XY | |
| Asus ZenBook Pro 14 Duo UX8402VV-P1021W | |
| Average Intel Core i9-13900H (4935 - 7716, n=25) | |
| Average of class Multimedia (1887 - 12912, n=57, last 2 years) | |
| Razer Blade 15 OLED (Early 2022) | |
| Dell XPS 15 9530 RTX 4070 | |
| Apple MacBook Pro 14 2023 M2 Pro | |
| Cinebench R20 / CPU (Single Core) | |
| Asus Zenbook Pro 14 OLED UX6404VI | |
| Asus ZenBook Pro 14 Duo UX8402VV-P1021W | |
| Average of class Multimedia (425 - 853, n=57, last 2 years) | |
| Average Intel Core i9-13900H (428 - 792, n=25) | |
| Asus ROG Zephyrus G14 GA402XY | |
| Dell XPS 15 9530 RTX 4070 | |
| Razer Blade 15 OLED (Early 2022) | |
| Apple MacBook Pro 14 2023 M2 Pro | |
| Cinebench R15 / CPU Multi 64Bit | |
| Asus Zenbook Pro 14 OLED UX6404VI | |
| Asus ROG Zephyrus G14 GA402XY | |
| Asus ZenBook Pro 14 Duo UX8402VV-P1021W | |
| Average Intel Core i9-13900H (2061 - 3100, n=26) | |
| Dell XPS 15 9530 RTX 4070 | |
| Average of class Multimedia (856 - 5224, n=61, last 2 years) | |
| Razer Blade 15 OLED (Early 2022) | |
| Apple MacBook Pro 14 2023 M2 Pro | |
| Cinebench R15 / CPU Single 64Bit | |
| Asus Zenbook Pro 14 OLED UX6404VI | |
| Asus ZenBook Pro 14 Duo UX8402VV-P1021W | |
| Asus ROG Zephyrus G14 GA402XY | |
| Average of class Multimedia (184.8 - 326, n=59, last 2 years) | |
| Dell XPS 15 9530 RTX 4070 | |
| Average Intel Core i9-13900H (211 - 297, n=26) | |
| Razer Blade 15 OLED (Early 2022) | |
| Apple MacBook Pro 14 2023 M2 Pro | |
| Blender / v2.79 BMW27 CPU | |
| Average of class Multimedia (100 - 557, n=58, last 2 years) | |
| Razer Blade 15 OLED (Early 2022) | |
| Dell XPS 15 9530 RTX 4070 | |
| Average Intel Core i9-13900H (166 - 268, n=24) | |
| Asus ZenBook Pro 14 Duo UX8402VV-P1021W | |
| Asus ROG Zephyrus G14 GA402XY | |
| Asus Zenbook Pro 14 OLED UX6404VI | |
| 7-Zip 18.03 / 7z b 4 | |
| Asus Zenbook Pro 14 OLED UX6404VI | |
| Asus ROG Zephyrus G14 GA402XY | |
| Asus ZenBook Pro 14 Duo UX8402VV-P1021W | |
| Average Intel Core i9-13900H (45045 - 79032, n=25) | |
| Razer Blade 15 OLED (Early 2022) | |
| Dell XPS 15 9530 RTX 4070 | |
| Average of class Multimedia (26062 - 130368, n=55, last 2 years) | |
| 7-Zip 18.03 / 7z b 4 -mmt1 | |
| Asus ROG Zephyrus G14 GA402XY | |
| Asus Zenbook Pro 14 OLED UX6404VI | |
| Asus ZenBook Pro 14 Duo UX8402VV-P1021W | |
| Dell XPS 15 9530 RTX 4070 | |
| Average Intel Core i9-13900H (3665 - 6600, n=25) | |
| Average of class Multimedia (3666 - 7545, n=56, last 2 years) | |
| Razer Blade 15 OLED (Early 2022) | |
| Geekbench 5.5 / Multi-Core | |
| Apple MacBook Pro 14 2023 M2 Pro | |
| Asus Zenbook Pro 14 OLED UX6404VI | |
| Dell XPS 15 9530 RTX 4070 | |
| Average of class Multimedia (4652 - 20422, n=56, last 2 years) | |
| Asus ZenBook Pro 14 Duo UX8402VV-P1021W | |
| Average Intel Core i9-13900H (9094 - 15410, n=26) | |
| Razer Blade 15 OLED (Early 2022) | |
| Asus ROG Zephyrus G14 GA402XY | |
| Geekbench 5.5 / Single-Core | |
| Asus ROG Zephyrus G14 GA402XY | |
| Asus Zenbook Pro 14 OLED UX6404VI | |
| Average of class Multimedia (805 - 2974, n=56, last 2 years) | |
| Apple MacBook Pro 14 2023 M2 Pro | |
| Asus ZenBook Pro 14 Duo UX8402VV-P1021W | |
| Dell XPS 15 9530 RTX 4070 | |
| Average Intel Core i9-13900H (1140 - 2043, n=26) | |
| Razer Blade 15 OLED (Early 2022) | |
| HWBOT x265 Benchmark v2.2 / 4k Preset | |
| Asus ROG Zephyrus G14 GA402XY | |
| Asus Zenbook Pro 14 OLED UX6404VI | |
| Average of class Multimedia (5.26 - 36.1, n=56, last 2 years) | |
| Average Intel Core i9-13900H (14.1 - 22.3, n=25) | |
| Asus ZenBook Pro 14 Duo UX8402VV-P1021W | |
| Dell XPS 15 9530 RTX 4070 | |
| Razer Blade 15 OLED (Early 2022) | |
| LibreOffice / 20 Documents To PDF | |
| Razer Blade 15 OLED (Early 2022) | |
| Average of class Multimedia (23.9 - 146.7, n=57, last 2 years) | |
| Average Intel Core i9-13900H (34.4 - 82.8, n=25) | |
| Asus Zenbook Pro 14 OLED UX6404VI | |
| Dell XPS 15 9530 RTX 4070 | |
| Asus ZenBook Pro 14 Duo UX8402VV-P1021W | |
| Asus ROG Zephyrus G14 GA402XY | |
| R Benchmark 2.5 / Overall mean | |
| Razer Blade 15 OLED (Early 2022) | |
| Average of class Multimedia (0.3604 - 0.947, n=56, last 2 years) | |
| Average Intel Core i9-13900H (0.4052 - 0.723, n=25) | |
| Asus ZenBook Pro 14 Duo UX8402VV-P1021W | |
| Dell XPS 15 9530 RTX 4070 | |
| Asus ROG Zephyrus G14 GA402XY | |
| Asus Zenbook Pro 14 OLED UX6404VI | |
* ... smaller is better
AIDA64: FP32 Ray-Trace | FPU Julia | CPU SHA3 | CPU Queen | FPU SinJulia | FPU Mandel | CPU AES | CPU ZLib | FP64 Ray-Trace | CPU PhotoWorxx
| Performance rating | |
| Asus Zenbook Pro 14 OLED UX6404VI | |
| Average of class Multimedia | |
| Average Intel Core i9-13900H | |
| Razer Blade 15 OLED (Early 2022) | |
| Asus ZenBook Pro 14 Duo UX8402VV-P1021W | |
| Dell XPS 15 9530 RTX 4070 | |
| AIDA64 / FP32 Ray-Trace | |
| Average of class Multimedia (2214 - 50388, n=53, last 2 years) | |
| Asus Zenbook Pro 14 OLED UX6404VI | |
| Average Intel Core i9-13900H (6788 - 19557, n=25) | |
| Asus ZenBook Pro 14 Duo UX8402VV-P1021W | |
| Dell XPS 15 9530 RTX 4070 | |
| Razer Blade 15 OLED (Early 2022) | |
| AIDA64 / FPU Julia | |
| Asus Zenbook Pro 14 OLED UX6404VI | |
| Average of class Multimedia (12867 - 201874, n=54, last 2 years) | |
| Average Intel Core i9-13900H (22551 - 95579, n=25) | |
| Razer Blade 15 OLED (Early 2022) | |
| Asus ZenBook Pro 14 Duo UX8402VV-P1021W | |
| Dell XPS 15 9530 RTX 4070 | |
| AIDA64 / CPU SHA3 | |
| Asus Zenbook Pro 14 OLED UX6404VI | |
| Average of class Multimedia (626 - 8623, n=54, last 2 years) | |
| Average Intel Core i9-13900H (2491 - 4270, n=25) | |
| Razer Blade 15 OLED (Early 2022) | |
| Asus ZenBook Pro 14 Duo UX8402VV-P1021W | |
| Dell XPS 15 9530 RTX 4070 | |
| AIDA64 / CPU Queen | |
| Asus Zenbook Pro 14 OLED UX6404VI | |
| Asus ZenBook Pro 14 Duo UX8402VV-P1021W | |
| Razer Blade 15 OLED (Early 2022) | |
| Average Intel Core i9-13900H (65121 - 120936, n=25) | |
| Dell XPS 15 9530 RTX 4070 | |
| Average of class Multimedia (13483 - 181505, n=41, last 2 years) | |
| AIDA64 / FPU SinJulia | |
| Asus Zenbook Pro 14 OLED UX6404VI | |
| Razer Blade 15 OLED (Early 2022) | |
| Average Intel Core i9-13900H (6108 - 11631, n=25) | |
| Asus ZenBook Pro 14 Duo UX8402VV-P1021W | |
| Average of class Multimedia (886 - 28794, n=54, last 2 years) | |
| Dell XPS 15 9530 RTX 4070 | |
| AIDA64 / FPU Mandel | |
| Average of class Multimedia (6395 - 105740, n=53, last 2 years) | |
| Asus Zenbook Pro 14 OLED UX6404VI | |
| Average Intel Core i9-13900H (11283 - 48474, n=25) | |
| Asus ZenBook Pro 14 Duo UX8402VV-P1021W | |
| Razer Blade 15 OLED (Early 2022) | |
| Dell XPS 15 9530 RTX 4070 | |
| AIDA64 / CPU AES | |
| Razer Blade 15 OLED (Early 2022) | |
| Average Intel Core i9-13900H (3691 - 149377, n=25) | |
| Asus Zenbook Pro 14 OLED UX6404VI | |
| Average of class Multimedia (8171 - 126790, n=54, last 2 years) | |
| Asus ZenBook Pro 14 Duo UX8402VV-P1021W | |
| Dell XPS 15 9530 RTX 4070 | |
| AIDA64 / CPU ZLib | |
| Asus Zenbook Pro 14 OLED UX6404VI | |
| Razer Blade 15 OLED (Early 2022) | |
| Average Intel Core i9-13900H (789 - 1254, n=25) | |
| Average of class Multimedia (143.8 - 2022, n=54, last 2 years) | |
| Dell XPS 15 9530 RTX 4070 | |
| Asus ZenBook Pro 14 Duo UX8402VV-P1021W | |
| AIDA64 / FP64 Ray-Trace | |
| Average of class Multimedia (1014 - 26875, n=54, last 2 years) | |
| Asus Zenbook Pro 14 OLED UX6404VI | |
| Average Intel Core i9-13900H (3655 - 10716, n=25) | |
| Asus ZenBook Pro 14 Duo UX8402VV-P1021W | |
| Dell XPS 15 9530 RTX 4070 | |
| Razer Blade 15 OLED (Early 2022) | |
| AIDA64 / CPU PhotoWorxx | |
| Average of class Multimedia (8187 - 88154, n=54, last 2 years) | |
| Dell XPS 15 9530 RTX 4070 | |
| Asus Zenbook Pro 14 OLED UX6404VI | |
| Asus ZenBook Pro 14 Duo UX8402VV-P1021W | |
| Average Intel Core i9-13900H (10871 - 50488, n=25) | |
| Razer Blade 15 OLED (Early 2022) | |
| Razer Blade 15 OLED (Early 2022) | |
System Performance
System performance is excellent, which is confirmed by both the good benchmark results and our subjective performance impression. We experienced no issues with the Zenbook Pro during testing.
CrossMark: Overall | Productivity | Creativity | Responsiveness
| PCMark 10 / Score | |
| Asus ROG Zephyrus G14 GA402XY | |
| Average of class Multimedia (4325 - 10386, n=52, last 2 years) | |
| Average Intel Core i9-13900H, NVIDIA GeForce RTX 4070 Laptop GPU (5855 - 8538, n=8) | |
| Asus ZenBook Pro 14 Duo UX8402VV-P1021W | |
| Asus Zenbook Pro 14 OLED UX6404VI | |
| Razer Blade 15 OLED (Early 2022) | |
| Dell XPS 15 9530 RTX 4070 | |
| PCMark 10 / Essentials | |
| Dell XPS 15 9530 RTX 4070 | |
| Asus ZenBook Pro 14 Duo UX8402VV-P1021W | |
| Asus Zenbook Pro 14 OLED UX6404VI | |
| Average Intel Core i9-13900H, NVIDIA GeForce RTX 4070 Laptop GPU (8835 - 11940, n=8) | |
| Asus ROG Zephyrus G14 GA402XY | |
| Average of class Multimedia (8025 - 11664, n=51, last 2 years) | |
| Razer Blade 15 OLED (Early 2022) | |
| PCMark 10 / Productivity | |
| Average of class Multimedia (7323 - 18233, n=51, last 2 years) | |
| Asus ROG Zephyrus G14 GA402XY | |
| Razer Blade 15 OLED (Early 2022) | |
| Asus ZenBook Pro 14 Duo UX8402VV-P1021W | |
| Average Intel Core i9-13900H, NVIDIA GeForce RTX 4070 Laptop GPU (7967 - 10991, n=8) | |
| Asus Zenbook Pro 14 OLED UX6404VI | |
| Dell XPS 15 9530 RTX 4070 | |
| PCMark 10 / Digital Content Creation | |
| Asus ROG Zephyrus G14 GA402XY | |
| Average Intel Core i9-13900H, NVIDIA GeForce RTX 4070 Laptop GPU (7738 - 13575, n=8) | |
| Asus Zenbook Pro 14 OLED UX6404VI | |
| Dell XPS 15 9530 RTX 4070 | |
| Asus ZenBook Pro 14 Duo UX8402VV-P1021W | |
| Average of class Multimedia (3651 - 16240, n=51, last 2 years) | |
| Razer Blade 15 OLED (Early 2022) | |
| CrossMark / Overall | |
| Asus Zenbook Pro 14 OLED UX6404VI | |
| Dell XPS 15 9530 RTX 4070 | |
| Average of class Multimedia (866 - 2728, n=60, last 2 years) | |
| Asus ZenBook Pro 14 Duo UX8402VV-P1021W | |
| Asus ROG Zephyrus G14 GA402XY | |
| Average Intel Core i9-13900H, NVIDIA GeForce RTX 4070 Laptop GPU (1104 - 1974, n=7) | |
| Apple MacBook Pro 14 2023 M2 Pro | |
| Razer Blade 15 OLED (Early 2022) | |
| CrossMark / Productivity | |
| Asus Zenbook Pro 14 OLED UX6404VI | |
| Asus ZenBook Pro 14 Duo UX8402VV-P1021W | |
| Average of class Multimedia (931 - 2489, n=60, last 2 years) | |
| Asus ROG Zephyrus G14 GA402XY | |
| Dell XPS 15 9530 RTX 4070 | |
| Average Intel Core i9-13900H, NVIDIA GeForce RTX 4070 Laptop GPU (1058 - 1914, n=7) | |
| Razer Blade 15 OLED (Early 2022) | |
| Apple MacBook Pro 14 2023 M2 Pro | |
| CrossMark / Creativity | |
| Apple MacBook Pro 14 2023 M2 Pro | |
| Asus Zenbook Pro 14 OLED UX6404VI | |
| Average of class Multimedia (907 - 3465, n=60, last 2 years) | |
| Dell XPS 15 9530 RTX 4070 | |
| Asus ZenBook Pro 14 Duo UX8402VV-P1021W | |
| Asus ROG Zephyrus G14 GA402XY | |
| Average Intel Core i9-13900H, NVIDIA GeForce RTX 4070 Laptop GPU (1178 - 2254, n=7) | |
| Razer Blade 15 OLED (Early 2022) | |
| CrossMark / Responsiveness | |
| Average Intel Core i9-13900H, NVIDIA GeForce RTX 4070 Laptop GPU (1037 - 1952, n=7) | |
| Dell XPS 15 9530 RTX 4070 | |
| Asus Zenbook Pro 14 OLED UX6404VI | |
| Razer Blade 15 OLED (Early 2022) | |
| Asus ZenBook Pro 14 Duo UX8402VV-P1021W | |
| Average of class Multimedia (605 - 2024, n=60, last 2 years) | |
| Asus ROG Zephyrus G14 GA402XY | |
| Apple MacBook Pro 14 2023 M2 Pro | |
| PCMark 10 Score | 7534 points | |
Help | ||
| AIDA64 / Memory Copy | |
| Average of class Multimedia (11299 - 132135, n=54, last 2 years) | |
| Dell XPS 15 9530 RTX 4070 | |
| Asus Zenbook Pro 14 OLED UX6404VI | |
| Average Intel Core i9-13900H (37448 - 74486, n=25) | |
| Asus ZenBook Pro 14 Duo UX8402VV-P1021W | |
| Razer Blade 15 OLED (Early 2022) | |
| AIDA64 / Memory Read | |
| Average of class Multimedia (11624 - 174586, n=54, last 2 years) | |
| Dell XPS 15 9530 RTX 4070 | |
| Asus Zenbook Pro 14 OLED UX6404VI | |
| Average Intel Core i9-13900H (41599 - 75433, n=25) | |
| Razer Blade 15 OLED (Early 2022) | |
| Asus ZenBook Pro 14 Duo UX8402VV-P1021W | |
| AIDA64 / Memory Write | |
| Average of class Multimedia (11755 - 134998, n=54, last 2 years) | |
| Asus ZenBook Pro 14 Duo UX8402VV-P1021W | |
| Dell XPS 15 9530 RTX 4070 | |
| Average Intel Core i9-13900H (36152 - 88505, n=25) | |
| Asus Zenbook Pro 14 OLED UX6404VI | |
| Razer Blade 15 OLED (Early 2022) | |
| AIDA64 / Memory Latency | |
| Average of class Multimedia (7 - 535, n=53, last 2 years) | |
| Razer Blade 15 OLED (Early 2022) | |
| Asus ZenBook Pro 14 Duo UX8402VV-P1021W | |
| Average Intel Core i9-13900H (75.8 - 102.3, n=25) | |
| Dell XPS 15 9530 RTX 4070 | |
| Asus Zenbook Pro 14 OLED UX6404VI | |
* ... smaller is better
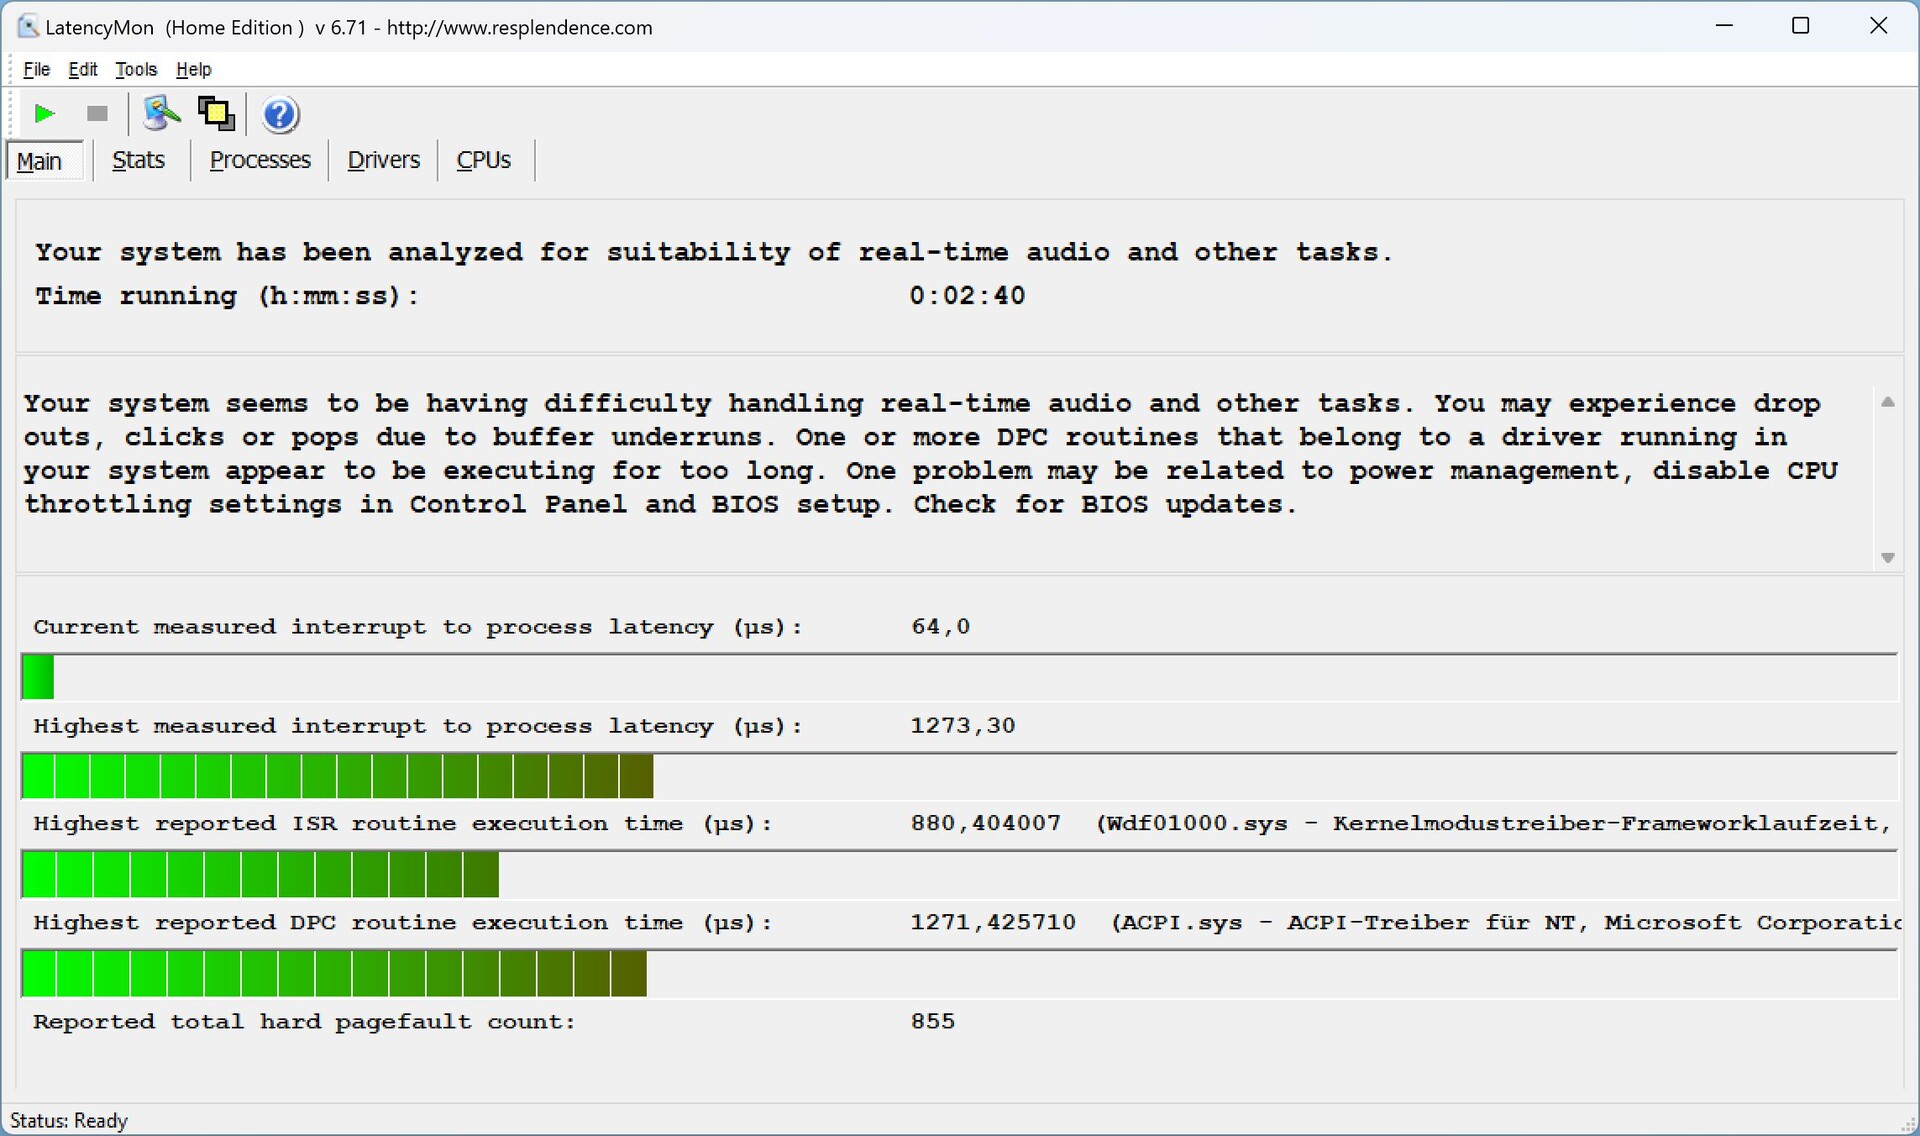
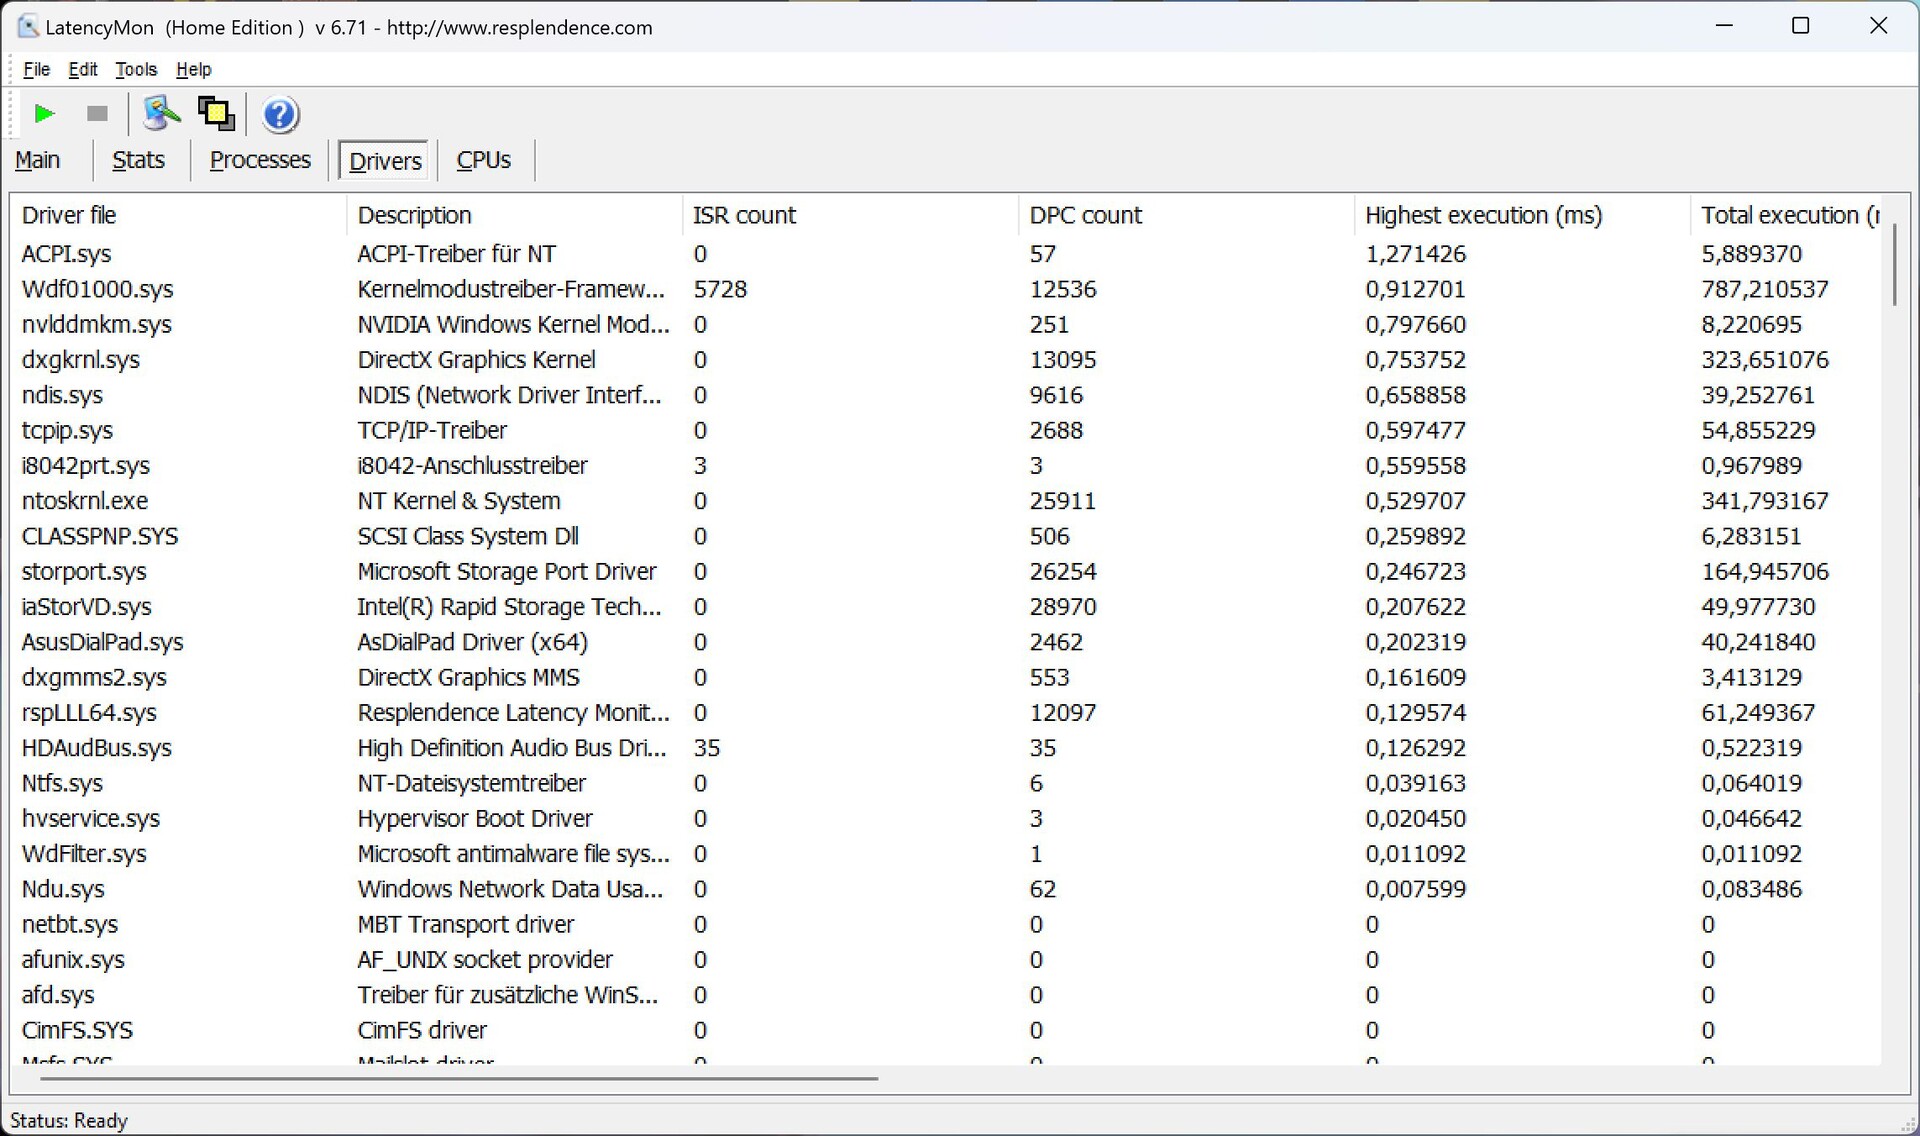
DPC Latency
In our standardized latency test (web browsing, YouTube 4K playback, CPU load), the test device shows slight limitations when using real-time audio applications under the present BIOS version.
| DPC Latencies / LatencyMon - interrupt to process latency (max), Web, Youtube, Prime95 | |
| Asus Zenbook Pro 14 OLED UX6404VI | |
| Dell XPS 15 9530 RTX 4070 | |
| Asus ZenBook Pro 14 Duo UX8402VV-P1021W | |
| Razer Blade 15 OLED (Early 2022) | |
| Asus ROG Zephyrus G14 GA402XY | |
* ... smaller is better
Storage Devices
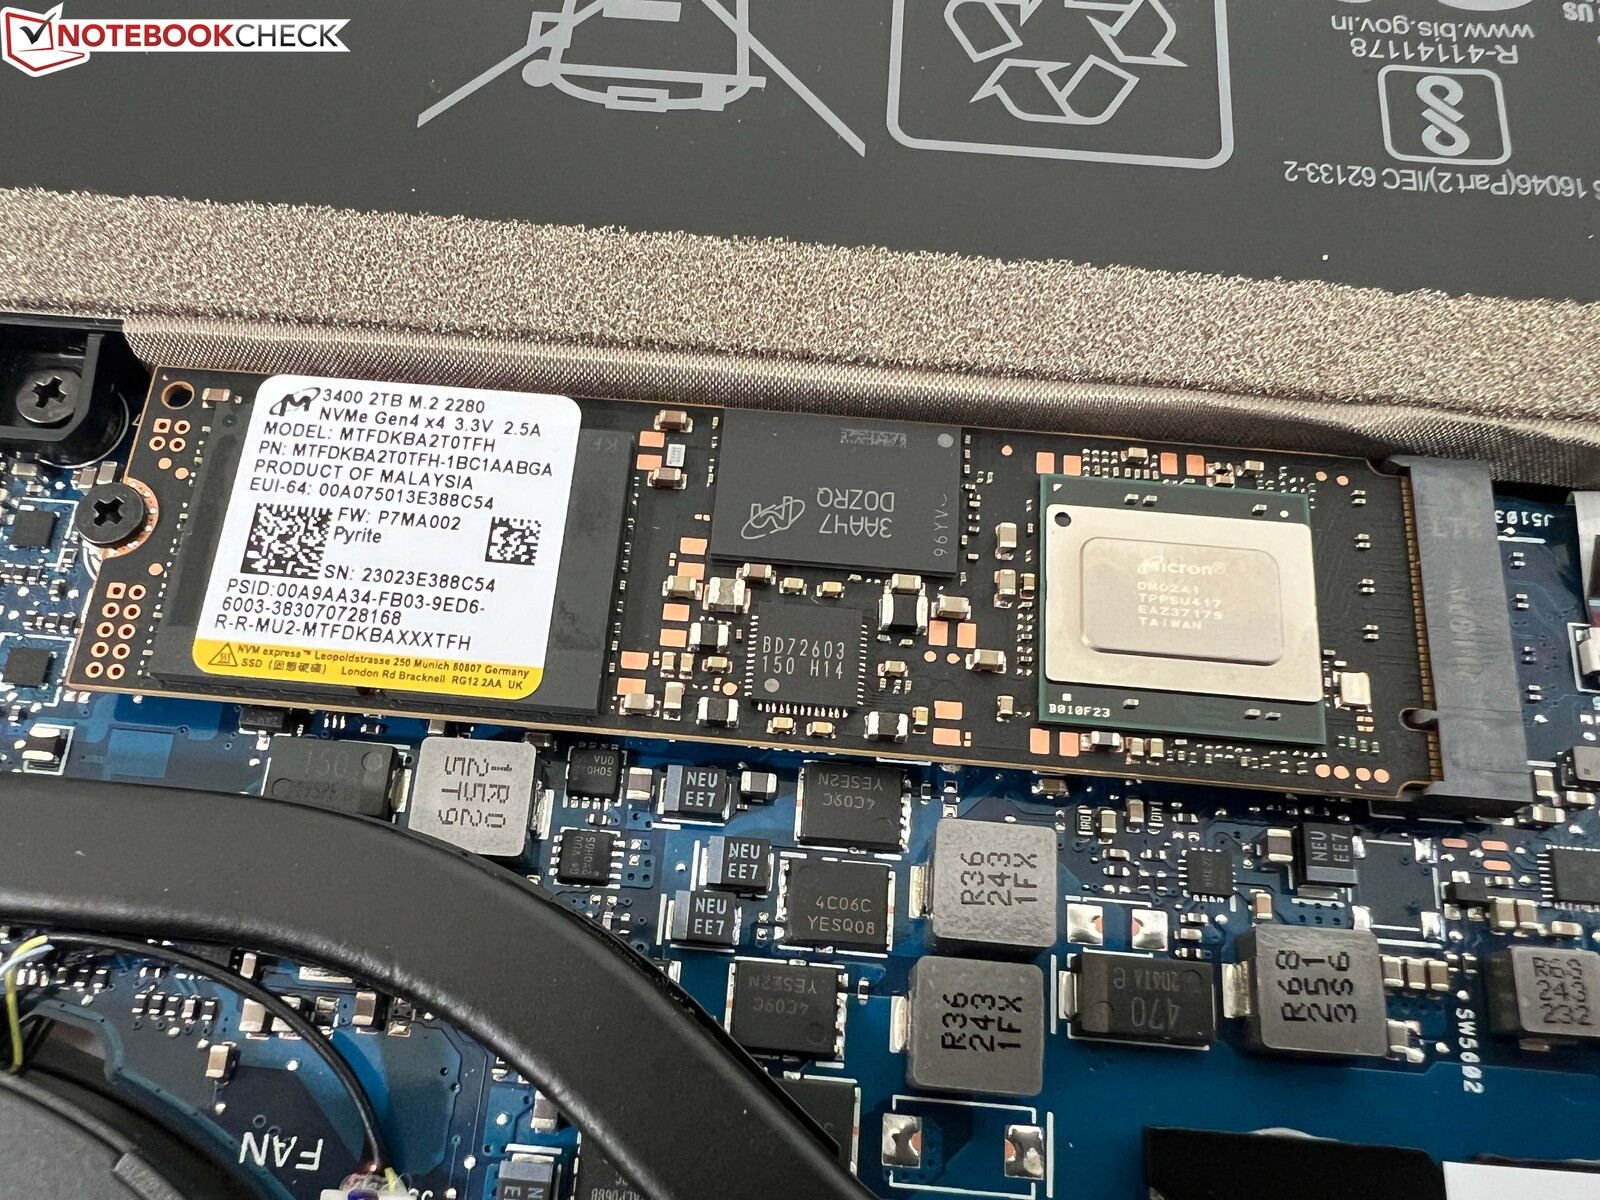
Our test device is equipped with the Micron 3400 NVMe SSD, which offers a storage capacity of 2 TB (of which 1.79 TB is available after the first start-up). It is a fast PCIe 4.0 SSD, although the devices from Samsung and SK Hynix achieve slightly higher transfer rates. But this does not play a major role in everyday use; it is much more important that performance remains stable under sustained load. More SSD benchmarks are listed here.

* ... smaller is better
Sustained Read Performance: DiskSpd Read Loop, Queue Depth 8
Graphics Card
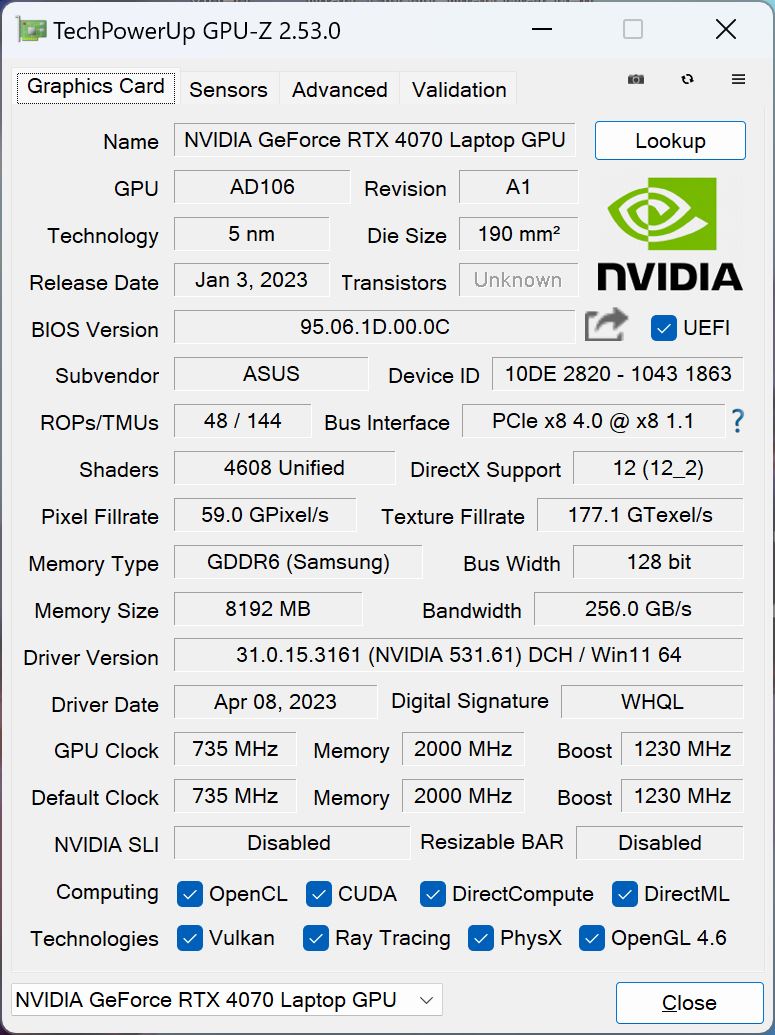
Nvidia's new GeForce RTX 4070 Laptop CPU with 8 GB VRAM is used as the dedicated graphics card. According to the driver, we have the 120-watt variant installed, but we were only able to draw a maximum of 95 watts from the GPU (120 watts briefly in the stress test). Since the GPU only consumes a maximum of ~105-110 watts during gaming, this matters little and overall performance is very good, especially in view of the compact 14-inch chassis. Hybrid mode is active by default, but the integrated GPU can also be deactivated completely if required (which requires a reboot).
In the synthetic benchmarks, for example, the Zenbook Pro 14 is also significantly faster (60-80%) than the 50-watt variant of the RTX 4070 Laptop in the new Dell XPS 15 and overall also noticeably faster than the old RTX 3070 Ti in the Razer Blade 15.
GPU performance also remains completely stable under sustained load, as it easily passes the Time Spy stress test at 99.5%. On battery power, however, GPU performance is limited to 60 watts, which reduces the performance by about 23%. More GPU benchmarks are available here.
| 3DMark 11 Performance | 34341 points | |
| 3DMark Fire Strike Score | 25794 points | |
| 3DMark Time Spy Score | 11666 points | |
Help | ||
| Blender / v3.3 Classroom OPTIX/RTX | |
| Average of class Multimedia (12 - 105, n=22, last 2 years) | |
| Dell XPS 15 9530 RTX 4070 | |
| Asus ZenBook Pro 14 Duo UX8402VV-P1021W | |
| Razer Blade 15 OLED (Early 2022) | |
| Asus Zenbook Pro 14 OLED UX6404VI | |
| Average NVIDIA GeForce RTX 4070 Laptop GPU (18 - 30, n=68) | |
| Asus ROG Zephyrus G14 GA402XY | |
| Blender / v3.3 Classroom CUDA | |
| Average of class Multimedia (20 - 186, n=22, last 2 years) | |
| Asus ZenBook Pro 14 Duo UX8402VV-P1021W | |
| Dell XPS 15 9530 RTX 4070 | |
| Razer Blade 15 OLED (Early 2022) | |
| Asus Zenbook Pro 14 OLED UX6404VI | |
| Average NVIDIA GeForce RTX 4070 Laptop GPU (32 - 50, n=67) | |
| Asus ROG Zephyrus G14 GA402XY | |
| Blender / v3.3 Classroom METAL | |
| Apple MacBook Pro 14 2023 M2 Pro | |
| Average of class Multimedia (17.8 - 68, n=5, last 2 years) | |
* ... smaller is better
Gaming Performance
Even though Asus advertises the Zenbook Pro 14 as a creator laptop, it's also great for gaming. The performance of the RTX 4070 Laptop is completely adequate for smooth gameplay in QHD resolution, even in the latest gaming titles. Gaming performance also remains completely stable during longer sessions. More GPU benchmarks are listed in our tech section.
| The Witcher 3 - 1920x1080 Ultra Graphics & Postprocessing (HBAO+) | |
| Asus ROG Zephyrus G14 GA402XY | |
| Asus ZenBook Pro 14 Duo UX8402VV-P1021W | |
| Asus Zenbook Pro 14 OLED UX6404VI | |
| Razer Blade 15 OLED (Early 2022) | |
| Dell XPS 15 9530 RTX 4070 | |
| Average of class Multimedia (11 - 121, n=7, last 2 years) | |
| Final Fantasy XV Benchmark - 1920x1080 High Quality | |
| Asus ROG Zephyrus G14 GA402XY | |
| Asus Zenbook Pro 14 OLED UX6404VI | |
| Razer Blade 15 OLED (Early 2022) | |
| Asus ZenBook Pro 14 Duo UX8402VV-P1021W | |
| Dell XPS 15 9530 RTX 4070 | |
| Average of class Multimedia (7.61 - 144.4, n=57, last 2 years) | |
| Dota 2 Reborn - 1920x1080 ultra (3/3) best looking | |
| Asus Zenbook Pro 14 OLED UX6404VI | |
| Asus ZenBook Pro 14 Duo UX8402VV-P1021W | |
| Dell XPS 15 9530 RTX 4070 | |
| Asus ROG Zephyrus G14 GA402XY | |
| Razer Blade 15 OLED (Early 2022) | |
| Average of class Multimedia (29 - 179.9, n=59, last 2 years) | |
Witcher 3 FPS Chart

| low | med. | high | ultra | QHD | |
|---|---|---|---|---|---|
| GTA V (2015) | 184.5 | 179.4 | 117.7 | 86.8 | |
| The Witcher 3 (2015) | 223 | 105.3 | |||
| Dota 2 Reborn (2015) | 199.2 | 182.3 | 171.5 | 162.2 | |
| Final Fantasy XV Benchmark (2018) | 121.8 | 108.3 | 79.5 | ||
| X-Plane 11.11 (2018) | 162.3 | 143.3 | 113.4 | ||
| Far Cry 5 (2018) | 119 | 118 | 116 | 95 | |
| Strange Brigade (2018) | 249 | 215 | 194 | 132 | |
| F1 2021 (2021) | 182.6 | 162.5 | 118.4 | 88.6 | |
| Cyberpunk 2077 1.6 (2022) | 130 | 104 | 89 | 82 | 61 |
| F1 22 (2022) | 242 | 182 | 71.8 | 47.1 |
Emissions - Good speakers
Noise
For everyday tasks (or as long as you do not need GPU performance), you should use Whisper or Standard mode if possible, since the Zenbook Pro 14 then often remains silent. You should also test out Standard mode for gaming, as performance will still be sufficient in many cases and the device is much more pleasant at just under 41 dB(A) compared to just under 49 dB(A) in Performance mode. No other electronic noises, such as coil whine, were detected.
Noise level
| Idle |
| 23.3 / 23.3 / 23.3 dB(A) |
| Load |
| 39.3 / 48.8 dB(A) |
 | ||
30 dB silent 40 dB(A) audible 50 dB(A) loud |
||
min: | ||
| Asus Zenbook Pro 14 OLED UX6404VI GeForce RTX 4070 Laptop GPU, i9-13900H, Micron 3400 2TB MTFDKBA2T0TFH | Asus ZenBook Pro 14 Duo UX8402VV-P1021W GeForce RTX 4060 Laptop GPU, i9-13900H, Samsung PM9A1 MZVL22T0HBLB | Apple MacBook Pro 14 2023 M2 Pro M2 Pro 19-Core GPU, M2 Pro, Apple SSD AP2048Z | Asus ROG Zephyrus G14 GA402XY GeForce RTX 4090 Laptop GPU, R9 7940HS, Samsung PM9A1 MZVL21T0HCLR | Dell XPS 15 9530 RTX 4070 GeForce RTX 4070 Laptop GPU, i7-13700H, SK hynix PC801 HFS001TEJ9X101N | Razer Blade 15 OLED (Early 2022) GeForce RTX 3070 Ti Laptop GPU, i9-12900H, Samsung PM9A1 MZVL21T0HCLR | |
|---|---|---|---|---|---|---|
| Noise | -23% | 6% | -12% | 8% | -10% | |
| off / environment * (dB) | 23.3 | 25.2 -8% | 23.9 -3% | 23.3 -0% | 23.1 1% | 26 -12% |
| Idle Minimum * (dB) | 23.3 | 25.2 -8% | 23.9 -3% | 23.6 -1% | 23.1 1% | 28 -20% |
| Idle Average * (dB) | 23.3 | 25.2 -8% | 23.9 -3% | 23.6 -1% | 23.1 1% | 28 -20% |
| Idle Maximum * (dB) | 23.3 | 32.5 -39% | 23.9 -3% | 33 -42% | 24.2 -4% | 28 -20% |
| Load Average * (dB) | 39.3 | 59.7 -52% | 26 34% | 49.5 -26% | 27.1 31% | 38.5 2% |
| Witcher 3 ultra * (dB) | 48.8 | 52.2 -7% | 40.1 18% | |||
| Load Maximum * (dB) | 48.8 | 60.9 -25% | 43.2 11% | 52.2 -7% | 44.6 9% | 43.9 10% |
* ... smaller is better
Temperature
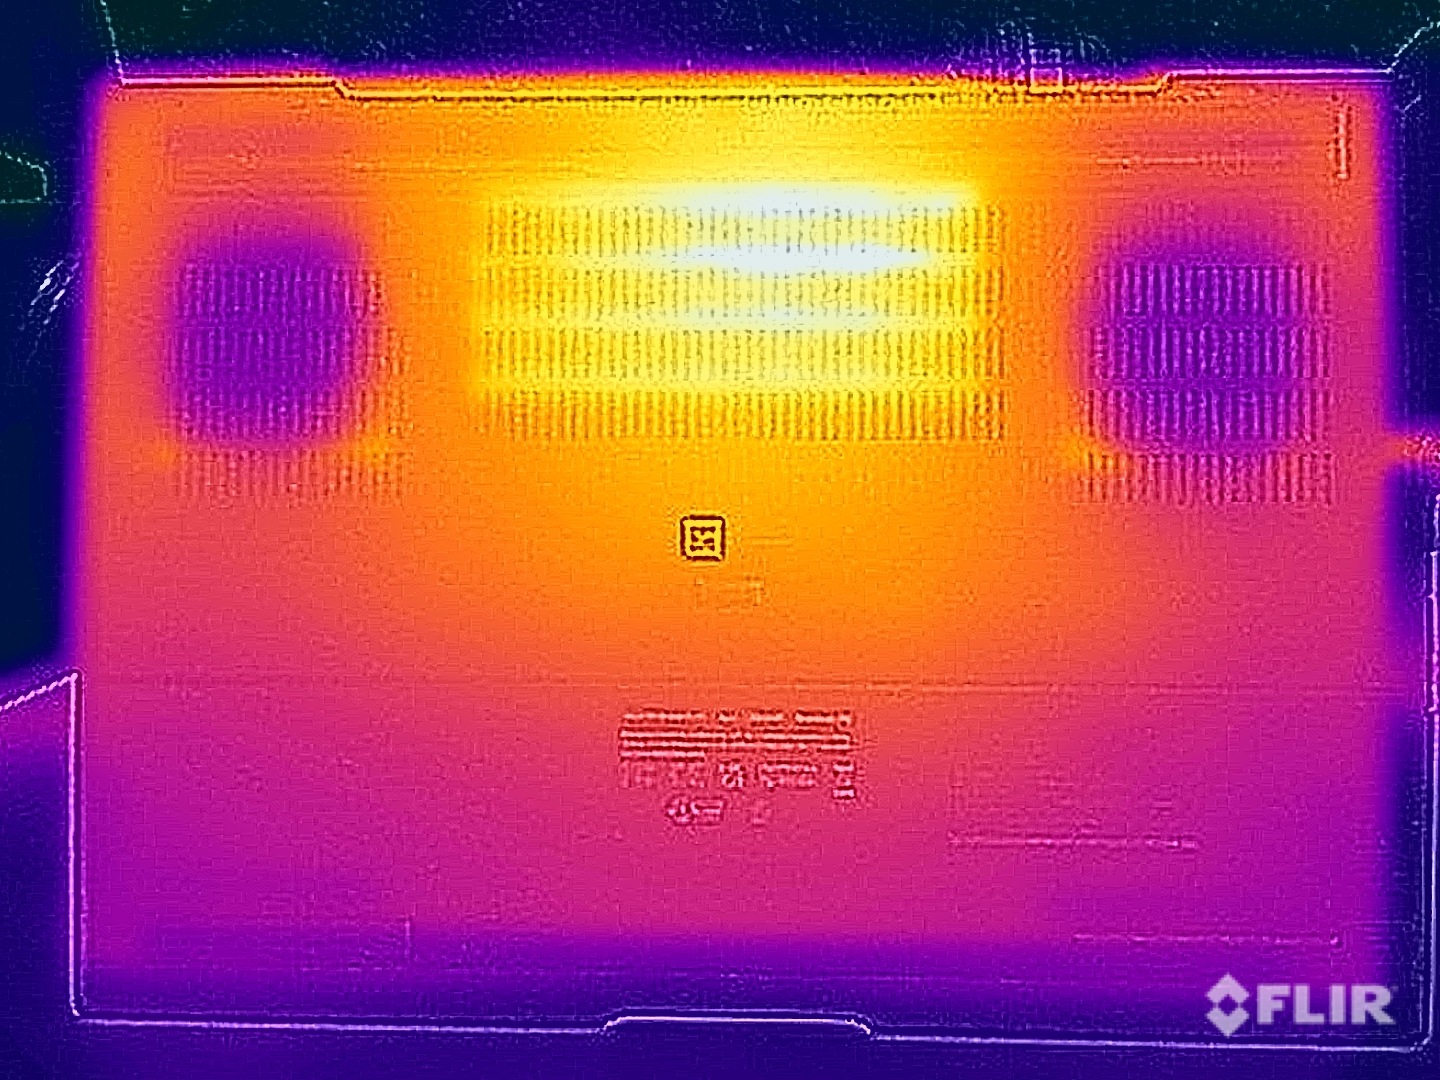
The fans are often deactivated while idling or during light tasks, but the case does get a little warmer at around 30 °C in some places. Nevertheless, Asus has the temperatures under load well under control because the keyboard area remains harmless at a maximum of 42 °C in the stress test and during gaming. On the underside, there is a hotspot that reaches a maximum of 51 °C in the rear center area, so you should avoid direct skin contact here.
The graphics card levels off at around 75 watts in the stress test and remains at this value. The processor is a bit more erratic and is usually around 35 watts with constant short upward spikes.

(±) The maximum temperature on the upper side is 40.6 °C / 105 F, compared to the average of 36.8 °C / 98 F, ranging from 21 to 71 °C for the class Multimedia.
(-) The bottom heats up to a maximum of 49.5 °C / 121 F, compared to the average of 39.1 °C / 102 F
(+) In idle usage, the average temperature for the upper side is 27.1 °C / 81 F, compared to the device average of 31.3 °C / 88 F.
(±) Playing The Witcher 3, the average temperature for the upper side is 36.3 °C / 97 F, compared to the device average of 31.3 °C / 88 F.
(+) The palmrests and touchpad are cooler than skin temperature with a maximum of 30.5 °C / 86.9 F and are therefore cool to the touch.
(±) The average temperature of the palmrest area of similar devices was 28.7 °C / 83.7 F (-1.8 °C / -3.2 F).

| Asus Zenbook Pro 14 OLED UX6404VI Intel Core i9-13900H, NVIDIA GeForce RTX 4070 Laptop GPU | Asus ZenBook Pro 14 Duo UX8402VV-P1021W Intel Core i9-13900H, NVIDIA GeForce RTX 4060 Laptop GPU | Apple MacBook Pro 14 2023 M2 Pro Apple M2 Pro, Apple M2 Pro 19-Core GPU | Asus ROG Zephyrus G14 GA402XY AMD Ryzen 9 7940HS, NVIDIA GeForce RTX 4090 Laptop GPU | Dell XPS 15 9530 RTX 4070 Intel Core i7-13700H, NVIDIA GeForce RTX 4070 Laptop GPU | Razer Blade 15 OLED (Early 2022) Intel Core i9-12900H, NVIDIA GeForce RTX 3070 Ti Laptop GPU | |
|---|---|---|---|---|---|---|
| Heat | -1% | 14% | 2% | -7% | -13% | |
| Maximum Upper Side * (°C) | 40.6 | 37.1 9% | 46.9 -16% | 47 -16% | 45.6 -12% | 49.5 -22% |
| Maximum Bottom * (°C) | 49.5 | 49.4 -0% | 41.7 16% | 46.5 6% | 42 15% | 47.5 4% |
| Idle Upper Side * (°C) | 28.2 | 30 -6% | 21.4 24% | 25.9 8% | 34.4 -22% | 33.4 -18% |
| Idle Bottom * (°C) | 30.6 | 32.4 -6% | 21.4 30% | 28 8% | 33.2 -8% | 35 -14% |
* ... smaller is better
Speakers
The speakers deliver good sound quality overall. Only the bass could be a bit stronger. While definitely adequate for occasional videos and some music, you should preferably use a headset for gaming due to the fans.
Asus Zenbook Pro 14 OLED UX6404VI audio analysis
(±) | speaker loudness is average but good (78.9 dB)
Bass 100 - 315 Hz
(±) | reduced bass - on average 10.7% lower than median
(±) | linearity of bass is average (9.4% delta to prev. frequency)
Mids 400 - 2000 Hz
(+) | balanced mids - only 1.2% away from median
(+) | mids are linear (4.1% delta to prev. frequency)
Highs 2 - 16 kHz
(+) | balanced highs - only 4.3% away from median
(+) | highs are linear (4.8% delta to prev. frequency)
Overall 100 - 16.000 Hz
(+) | overall sound is linear (11.4% difference to median)
Compared to same class
» 18% of all tested devices in this class were better, 4% similar, 78% worse
» The best had a delta of 5%, average was 17%, worst was 45%
Compared to all devices tested
» 7% of all tested devices were better, 2% similar, 90% worse
» The best had a delta of 4%, average was 23%, worst was 134%
Apple MacBook Pro 14 2023 M2 Pro audio analysis
(+) | speakers can play relatively loud (84.3 dB)
Bass 100 - 315 Hz
(+) | good bass - only 3.8% away from median
(+) | bass is linear (6.9% delta to prev. frequency)
Mids 400 - 2000 Hz
(+) | balanced mids - only 2.1% away from median
(+) | mids are linear (2.2% delta to prev. frequency)
Highs 2 - 16 kHz
(+) | balanced highs - only 2.7% away from median
(+) | highs are linear (4.8% delta to prev. frequency)
Overall 100 - 16.000 Hz
(+) | overall sound is linear (6% difference to median)
Compared to same class
» 3% of all tested devices in this class were better, 0% similar, 97% worse
» The best had a delta of 5%, average was 17%, worst was 45%
Compared to all devices tested
» 0% of all tested devices were better, 0% similar, 100% worse
» The best had a delta of 4%, average was 23%, worst was 134%
Energy Management - 120Hz OLED consumes a lot of power
Power Consumption

The power consumption of OLED screens depends largely on the displayed content. We measured a maximum of just under 12 watts in idle with the dark standard background, but this can increase further in the presence of bright pictures. As soon as you watch HDR content, consumption rates increase to up to 28 watts. We registered up to 208 watts for a short time in the stress test, but this quickly leveled off at ~140 watts (also applies to games). Overall, the 200-watt power supply is sufficient.
| Off / Standby | |
| Idle | |
| Load |
|
Key:
min: | |
| Asus Zenbook Pro 14 OLED UX6404VI i9-13900H, GeForce RTX 4070 Laptop GPU, Micron 3400 2TB MTFDKBA2T0TFH, OLED, 2880x1800, 14.5" | Asus ZenBook Pro 14 Duo UX8402VV-P1021W i9-13900H, GeForce RTX 4060 Laptop GPU, Samsung PM9A1 MZVL22T0HBLB, OLED, 2880x1800, 14.5" | Apple MacBook Pro 14 2023 M2 Pro M2 Pro, M2 Pro 19-Core GPU, Apple SSD AP2048Z, Mini-LED, 3024x1964, 14.2" | Asus ROG Zephyrus G14 GA402XY R9 7940HS, GeForce RTX 4090 Laptop GPU, Samsung PM9A1 MZVL21T0HCLR, Mini-LED, 2560x1600, 14" | Dell XPS 15 9530 RTX 4070 i7-13700H, GeForce RTX 4070 Laptop GPU, SK hynix PC801 HFS001TEJ9X101N, OLED, 3456x2160, 15.6" | Razer Blade 15 OLED (Early 2022) i9-12900H, GeForce RTX 3070 Ti Laptop GPU, Samsung PM9A1 MZVL21T0HCLR, OLED, 2560x1440, 15.6" | Average NVIDIA GeForce RTX 4070 Laptop GPU | Average of class Multimedia | |
|---|---|---|---|---|---|---|---|---|
| Power Consumption | 2% | 35% | -17% | -44% | -134% | -53% | 20% | |
| Idle Minimum * (Watt) | 7.5 | 8.5 -13% | 2.4 68% | 9.4 -25% | 20 -167% | 31.6 -321% | 13.2 ? -76% | 5.66 ? 25% |
| Idle Average * (Watt) | 11.1 | 8.8 21% | 11.3 -2% | 14.2 -28% | 20.7 -86% | 33.3 -200% | 18.2 ? -64% | 10.2 ? 8% |
| Idle Maximum * (Watt) | 11.6 | 16.5 -42% | 11.5 1% | 14.5 -25% | 22.4 -93% | 38.6 -233% | 24.6 ? -112% | 12.5 ? -8% |
| Load Average * (Watt) | 91.9 | 102 -11% | 59.6 35% | 79 14% | 77.1 16% | 149 -62% | 97 ? -6% | 65.2 ? 29% |
| Witcher 3 ultra * (Watt) | 132.2 | 101.2 23% | 55.9 58% | 172 -30% | 95.4 28% | 149.6 -13% | ||
| Load Maximum * (Watt) | 208 | 140 33% | 100 52% | 220.8 -6% | 133.4 36% | 160 23% | 221 ? -6% | 113.5 ? 45% |
* ... smaller is better
Power consumption Witcher 3 / Stress test
Power consumption with an external monitor
Battery Life
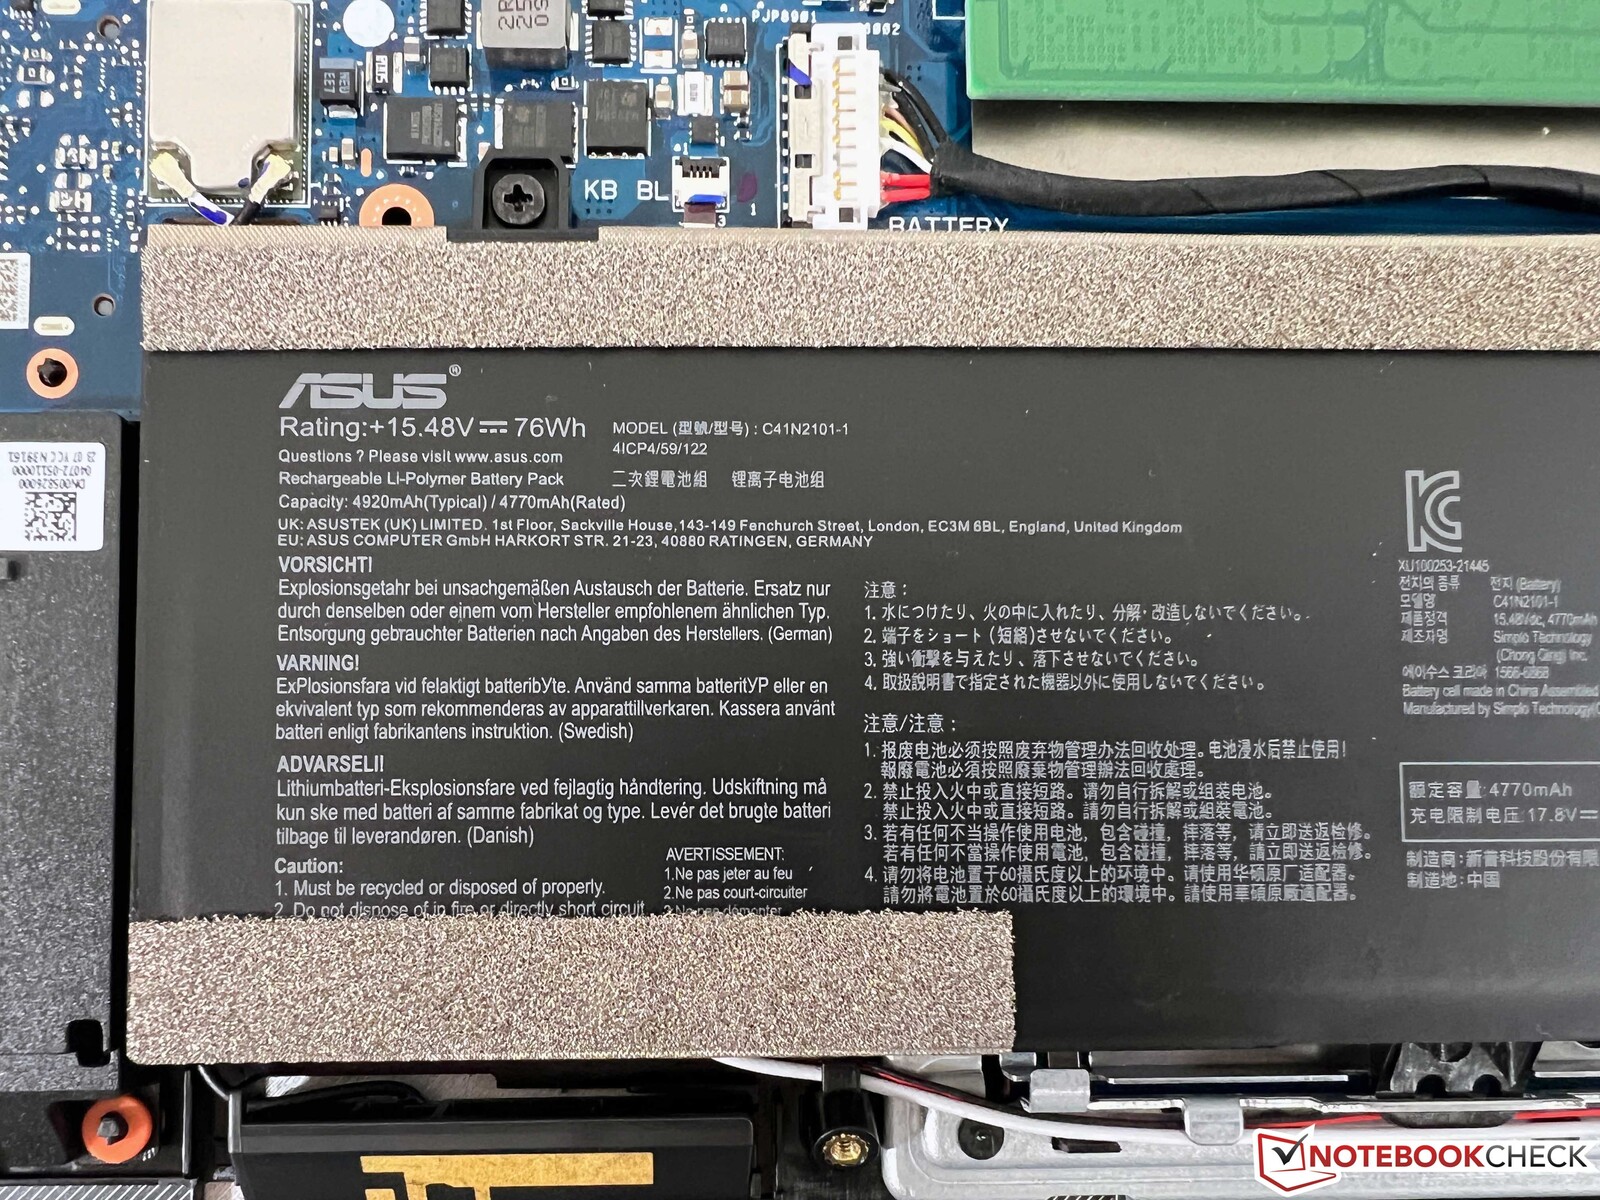
The 76 Wh battery only delivers average battery runtimes because the OLED screen needs a lot of power. We carried out the tests at 60 Hz (for 120 Hz you can subtract around half an hour). Video playback at 150 cd/m² (corresponding to 73% of the maximum SDR brightness in the test device) ran for a decent 8.5 hours, but only 7.5 hours in the WLAN test or just under 6 hours at full brightness. An HDR YouTube video at maximum brightness drains the battery in 3.5 hours. The MacBook Pro 14 lasts considerably longer in all aspects.
A full charge takes around 105 minutes when the device is switched on; 50% of the capacity is available after less than half an hour.
| Asus Zenbook Pro 14 OLED UX6404VI i9-13900H, GeForce RTX 4070 Laptop GPU, 76 Wh | Apple MacBook Pro 14 2023 M2 Pro M2 Pro, M2 Pro 19-Core GPU, 70 Wh | Asus ROG Zephyrus G14 GA402XY R9 7940HS, GeForce RTX 4090 Laptop GPU, 76 Wh | Dell XPS 15 9530 RTX 4070 i7-13700H, GeForce RTX 4070 Laptop GPU, 86 Wh | Razer Blade 15 OLED (Early 2022) i9-12900H, GeForce RTX 3070 Ti Laptop GPU, 80 Wh | Average of class Multimedia | |
|---|---|---|---|---|---|---|
| Battery runtime | 59% | -5% | 28% | 13% | 76% | |
| H.264 (h) | 8.5 | 15.3 80% | 7.2 -15% | 5.9 -31% | 17.1 ? 101% | |
| WiFi v1.3 (h) | 7.6 | 13.5 78% | 7.5 -1% | 8 5% | 4.6 -39% | 12.2 ? 61% |
| Load (h) | 1 | 1.2 20% | 1 0% | 1.5 50% | 2.1 110% | 1.664 ? 66% |
Pros
Cons
Verdict - The Zenbook Pro 14 offers a lot of performance, but has to make some compromises

Asus' new Zenbook Pro 14 is a powerful 14-inch device aimed at creative users and thus competes directly with the Apple MacBook Pro 14. Hence, the manufacturer installs the latest components from Intel and Nvidia: both the Core i9-13900H and the GeForce RTX 4070 Laptop offer lots of performance for such a compact device. The Zenbook also offers significantly more performance than larger multimedia laptops such as the new XPS 15 von Dell from Dell.
An OLED screen with 120 Hz is used as the display. The subjective image quality is very good overall, but bright areas appear slightly grainy due to the touchscreen. In addition, PMW is used from a brightness of 50% and below. As on other Asus OLED laptops, there is a software feature that allows the OLED to be dimmed without PWM, but users have to activate this via the software each time. The various color profiles are very good; the Display P3 in particular is extremely accurate and requires no subsequent calibration. However, the color profiles are not available in HDR mode, and the HDR function simply works much better in the Apple MacBook Pro and its mini-LED panel also achieves significantly higher brightness values.
The focus is on performance: Thanks to the Intel Core i9-13900H and the Nvidia GeForce RTX 4070 Laptop GPU, the new Zenbook Pro is a very fast 14-inch notebook. However, the OLED screen struggles with a minimally grainy picture quality and compromises also have to be made in terms of battery life.
The device is noticeably bulkier than many other 14-inch laptops, but the components are cooled well enough and there are enough ports. The manufacturer also hides the thickness of the case very well thanks to the tapered base unit. However, for the full performance of the GeForce RTX 4070, users need to activate Performance mode, where the fans become noticeably louder.
The keyboard is also only average, which is a little disappointing in view of the high purchase price. The additional DialPad on the top left of the touchpad is also more of a gimmick. The implementation of the Adobe apps works very well, but in the end, shortcuts and key combinations work faster. By default, the screen brightness and volume can also be adjusted using the DialPad, but this also works much faster with the dedicated special keys. Another drawback is the battery life (especially with 120 Hz activated), not to mention the price, which in our case amounts to a whopping EUR 3,500 (~US$3,750.00).
A big competitor is of course the Apple MacBook Pro 14, which has disadvantages in terms of raw CPU & GPU performance, but is the better laptop overall. Furthermore, the MacBook is not an ideal choice if you also want to use the laptop for current games. Another interesting competitor comes from Asus itself: Although the ROG Zephyrus G14 is primarily a gaming machine, it can also be used just as well for creative purposes (also available with the RTX 4070 laptop GPU). The matte mini-LED or IPS panel (depending on the configuration) even confers some advantages over the OLED screen.
Price and Availability
Global availability of the Asus Zenbook Pro 14 OLED appears limited. The laptop is priced at $1,799.99 on Asus' estore, but is currently out of stock.
Prices and availability are as of 12.06.2023 and are subject to change.
Asus Zenbook Pro 14 OLED UX6404VI
- 06/09/2023 v7 (old)
Andreas Osthoff
Transparency
The selection of devices to be reviewed is made by our editorial team. The test sample was provided to the author as a loan by the manufacturer or retailer for the purpose of this review. The lender had no influence on this review, nor did the manufacturer receive a copy of this review before publication. There was no obligation to publish this review. As an independent media company, Notebookcheck is not subjected to the authority of manufacturers, retailers or publishers.
This is how Notebookcheck is testing
Every year, Notebookcheck independently reviews hundreds of laptops and smartphones using standardized procedures to ensure that all results are comparable. We have continuously developed our test methods for around 20 years and set industry standards in the process. In our test labs, high-quality measuring equipment is utilized by experienced technicians and editors. These tests involve a multi-stage validation process. Our complex rating system is based on hundreds of well-founded measurements and benchmarks, which maintains objectivity. Further information on our test methods can be found here.
Price comparison

