Apple MacBook Pro 14 2023 review: The M2 Pro is slowed down in the small MacBook Pro
After the launch was postponed last fall, Apple has now finally presented the upgraded versions of the MacBook Pro models. At the heart of the new models are, of course, Apple's own M2 Pro and M2 Max SoCs, which are said to offer significantly more performance in terms of both the processor and the graphics card. At the same time, fast 6 GHz WLAN networks (Wi-Fi 6E) are now supported and, according to Apple, battery runtimes are better than before. The prices have also increased by around US$150.
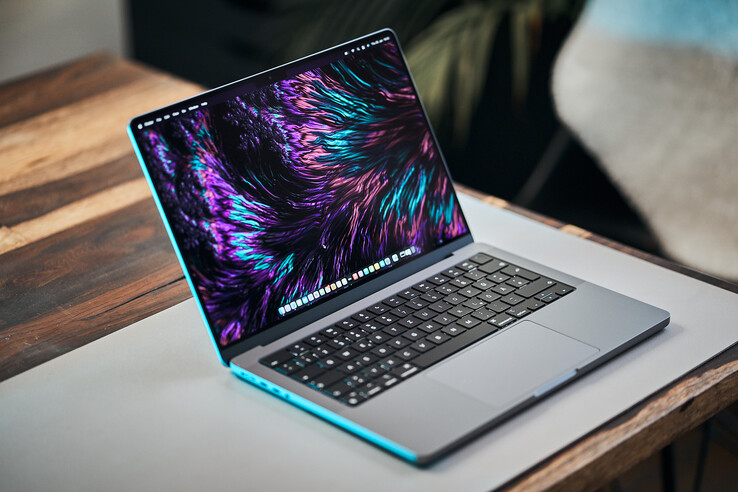
Our review device is the MacBook Pro 14 with the fast M2 Pro (12 CPU cores & 19 GPU cores), which is available with 16 GB of RAM and a 1 TB SSD from US$2,499.00. Our model even has 32 GB of RAM and a 2 TB SSD installed, which is why the price here rises to US$3,299.00. As Apple only introduced the basic design in the 2021 models, no changes to the case or the input devices have been made. For more information, we refer to our previous reviews:
Possible Competitors in Comparison
Rating | Date | Model | Weight | Height | Size | Resolution | Price |
|---|---|---|---|---|---|---|---|
| 93.9 % v7 (old) | 03 / 2023 | Apple MacBook Pro 14 2023 M2 Pro M2 Pro, M2 Pro 19-Core GPU | 1.6 kg | 15.5 mm | 14.20" | 3024x1964 | |
| 91.9 % v7 (old) | 06 / 2022 | Apple MacBook Pro 13 2022 M2 M2, M2 10-Core GPU | 1.4 kg | 15.6 mm | 13.30" | 2560x1600 | |
| 92.1 % v7 (old) | 04 / 2022 | Apple MacBook Pro 14 2021 M1 Max 24-Core GPU M1 Max, M1 Max 24-Core GPU | 1.6 kg | 15.5 mm | 14.20" | 3024x1964 | |
| 87.7 % v7 (old) | 12 / 2022 | Lenovo Yoga Slim 7 Pro X 14IAH7 82TK006CGE i7-12700H, GeForce RTX 3050 4GB Laptop GPU | 1.5 kg | 18 mm | 14.50" | 3072x1920 | |
| 89 % v7 (old) | 03 / 2022 | Microsoft Surface Laptop Studio i7 RTX 3050 Ti i7-11370H, GeForce RTX 3050 Ti Laptop GPU | 1.8 kg | 19 mm | 14.40" | 2400x1600 | |
| 89.4 % v7 (old) | 05 / 2022 | Razer Blade 14 Ryzen 9 6900HX R9 6900HX, GeForce RTX 3070 Ti Laptop GPU | 1.8 kg | 16.8 mm | 14.00" | 2560x1440 | |
| 88.8 % v7 (old) | 10 / 2022 | Schenker Vision 14 2022 RTX 3050 Ti i7-12700H, GeForce RTX 3050 Ti Laptop GPU | 1.3 kg | 16.6 mm | 14.00" | 2880x1800 |
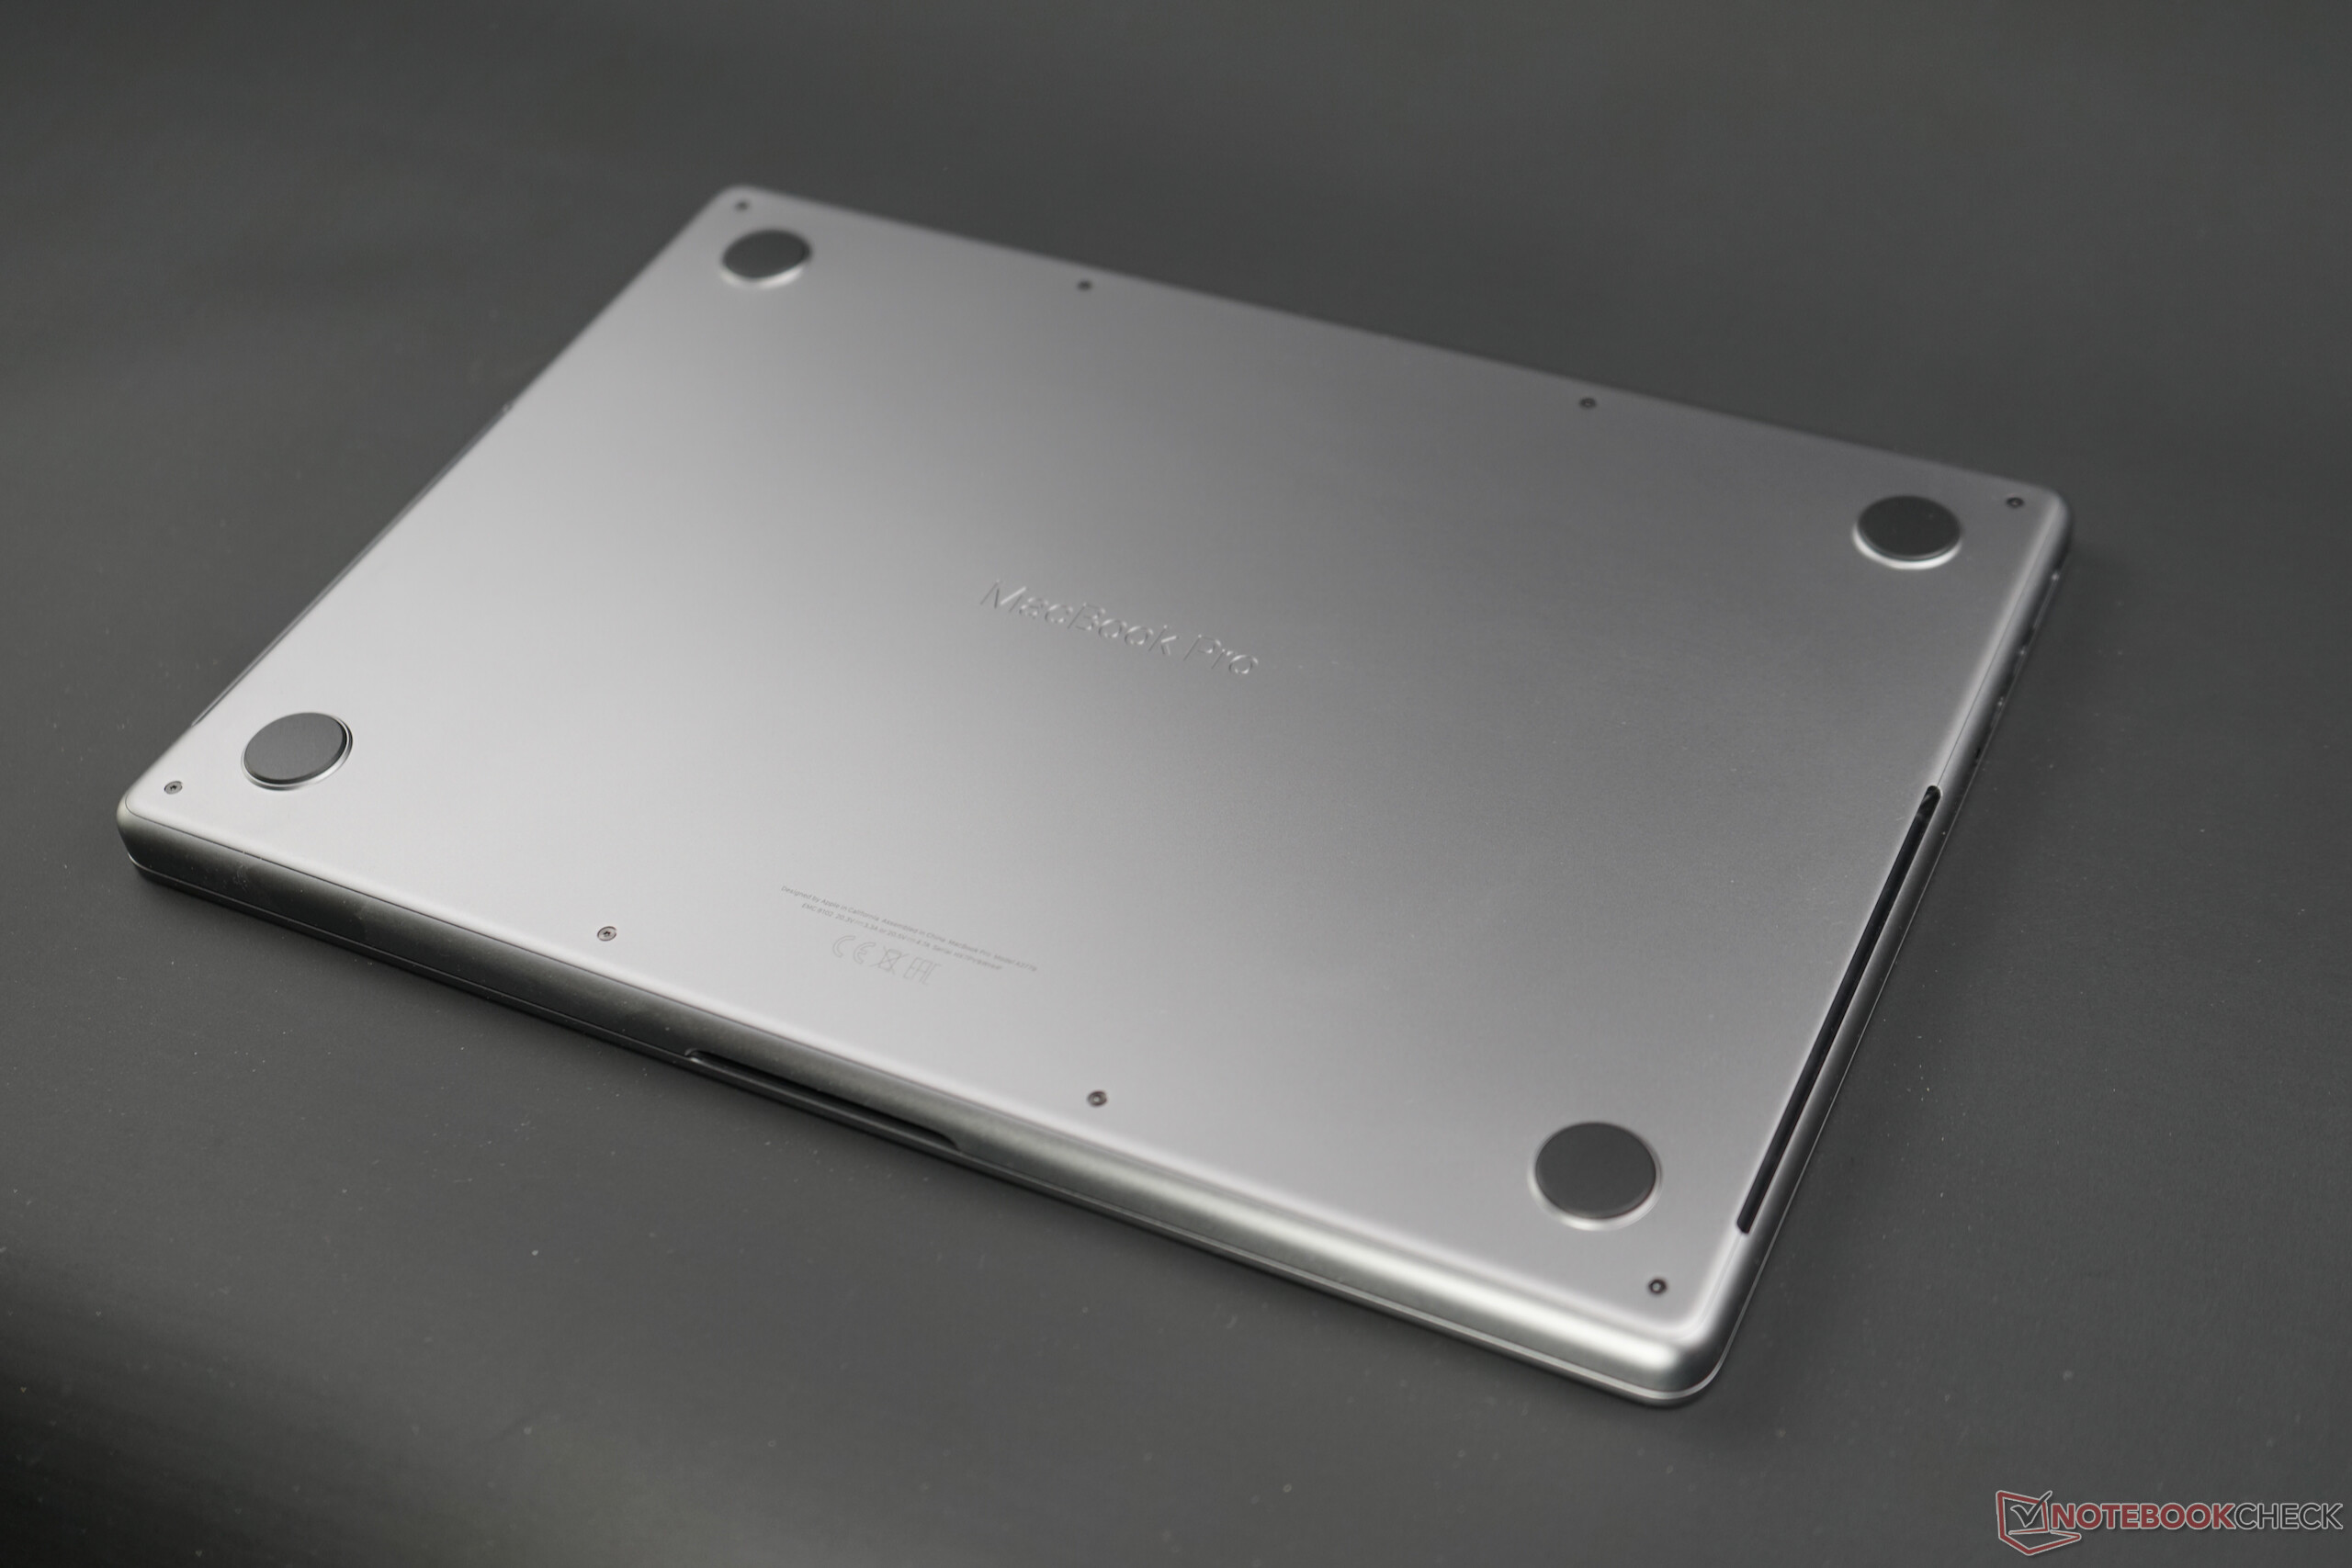
Case - Apple makes no changes
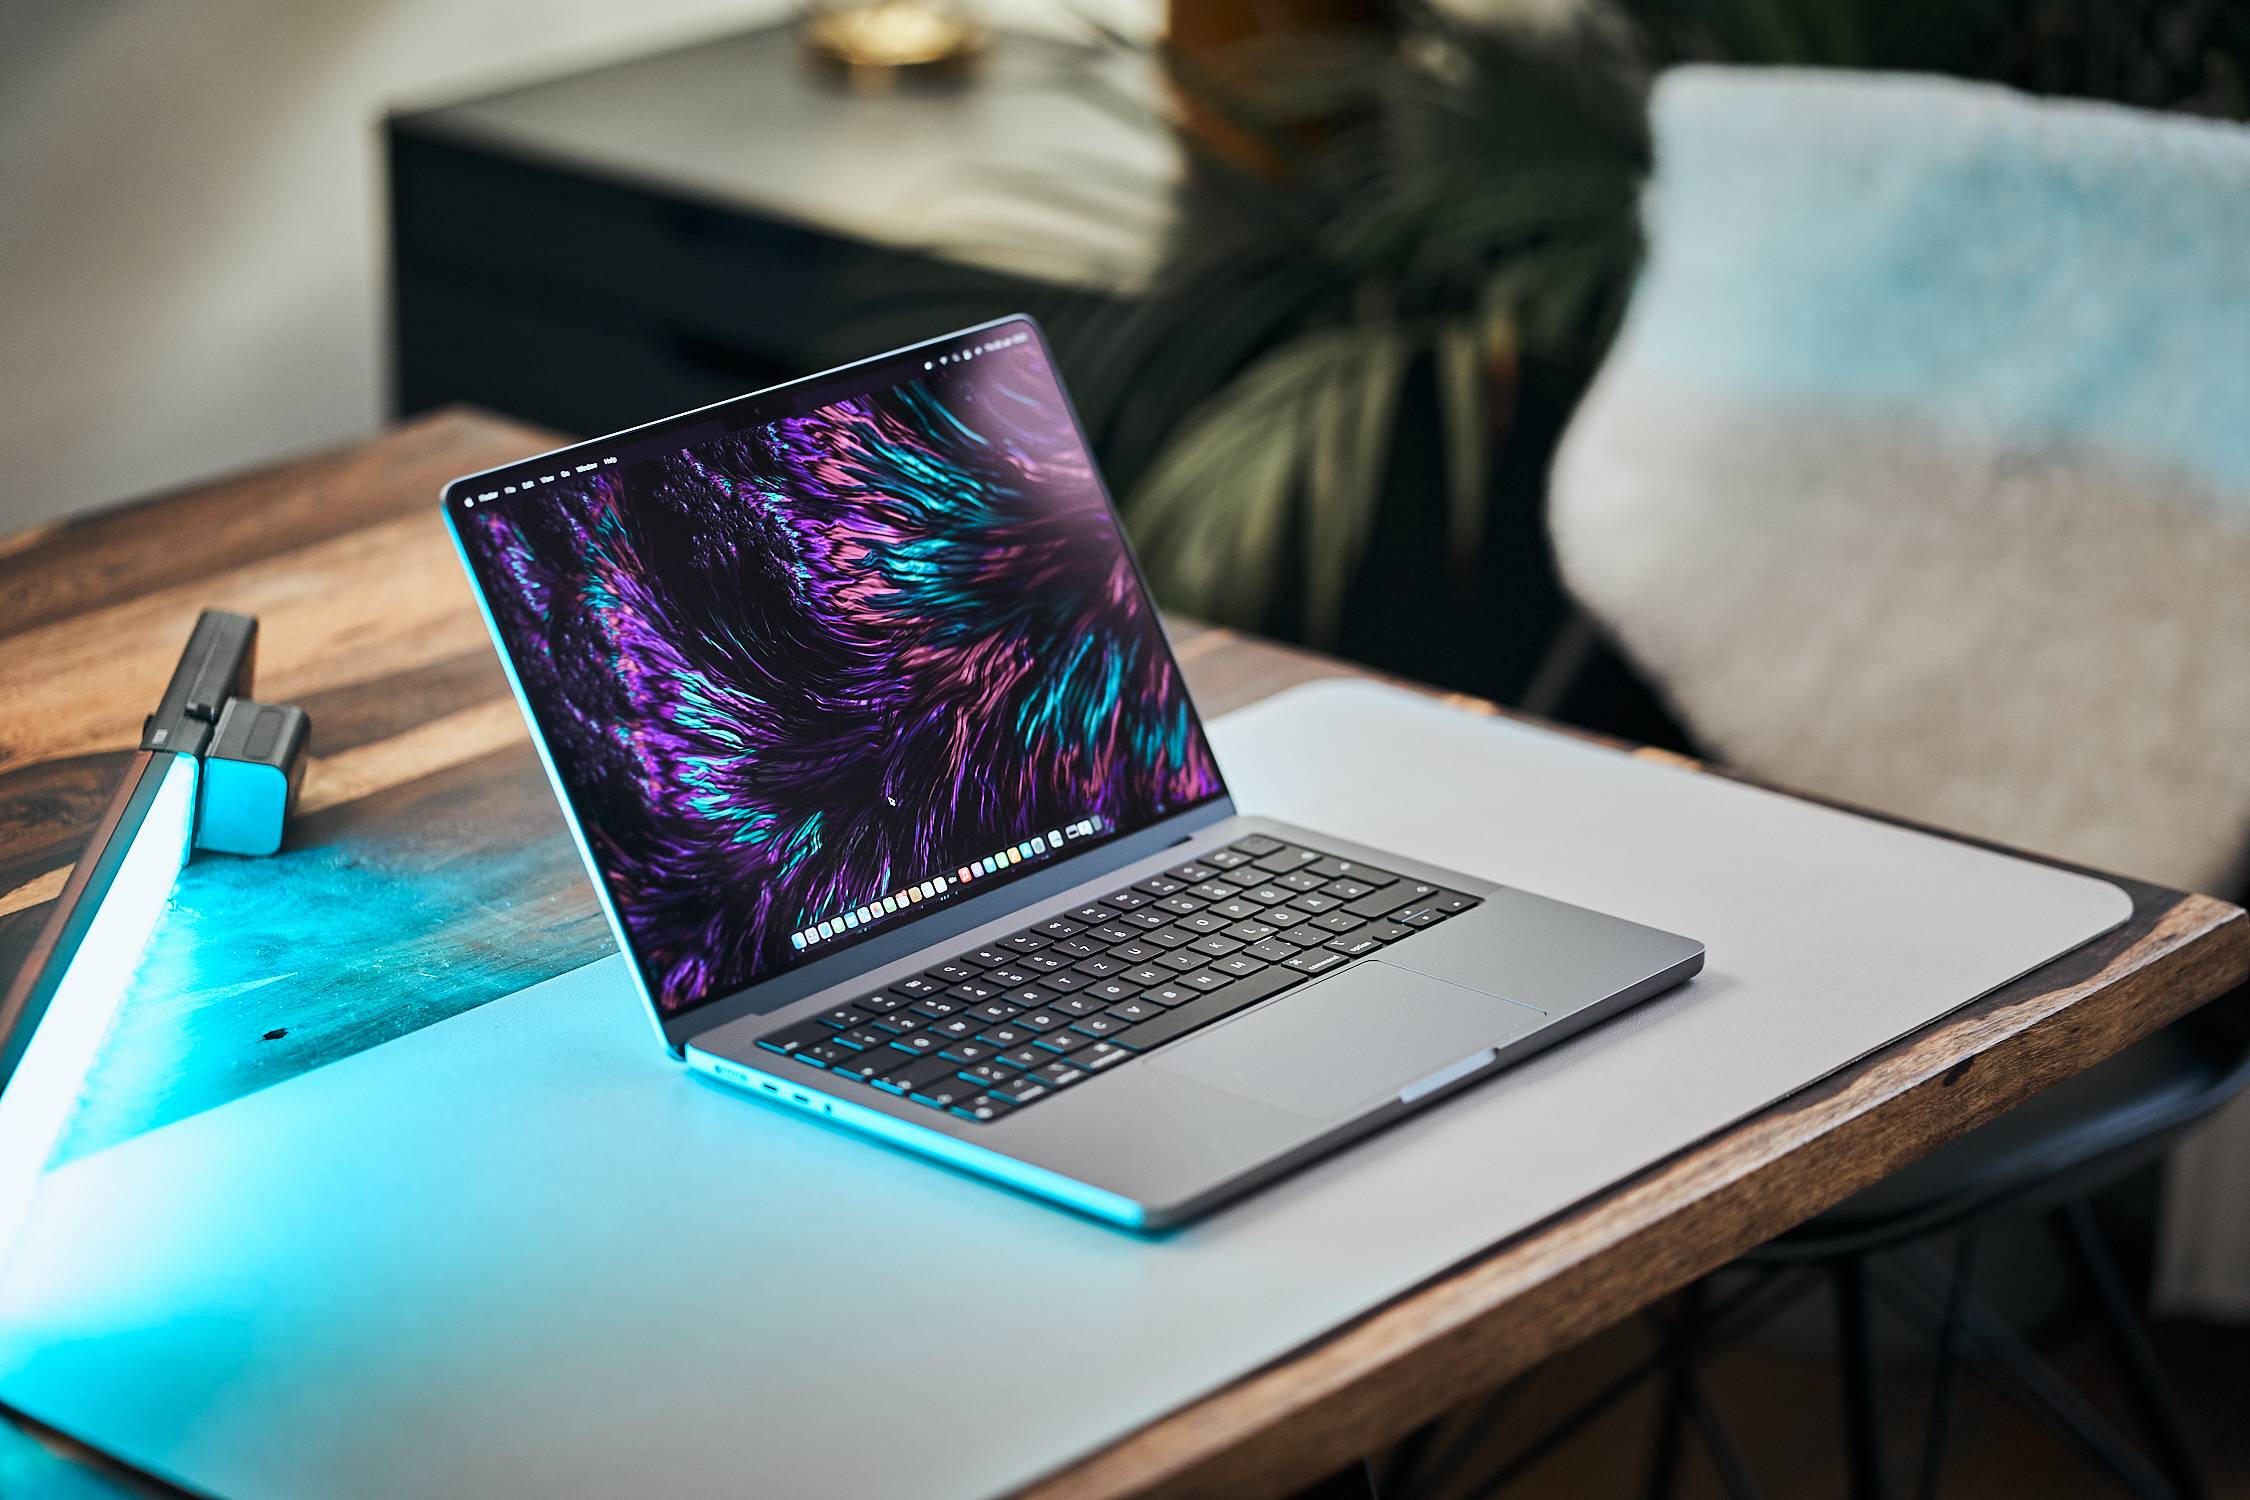
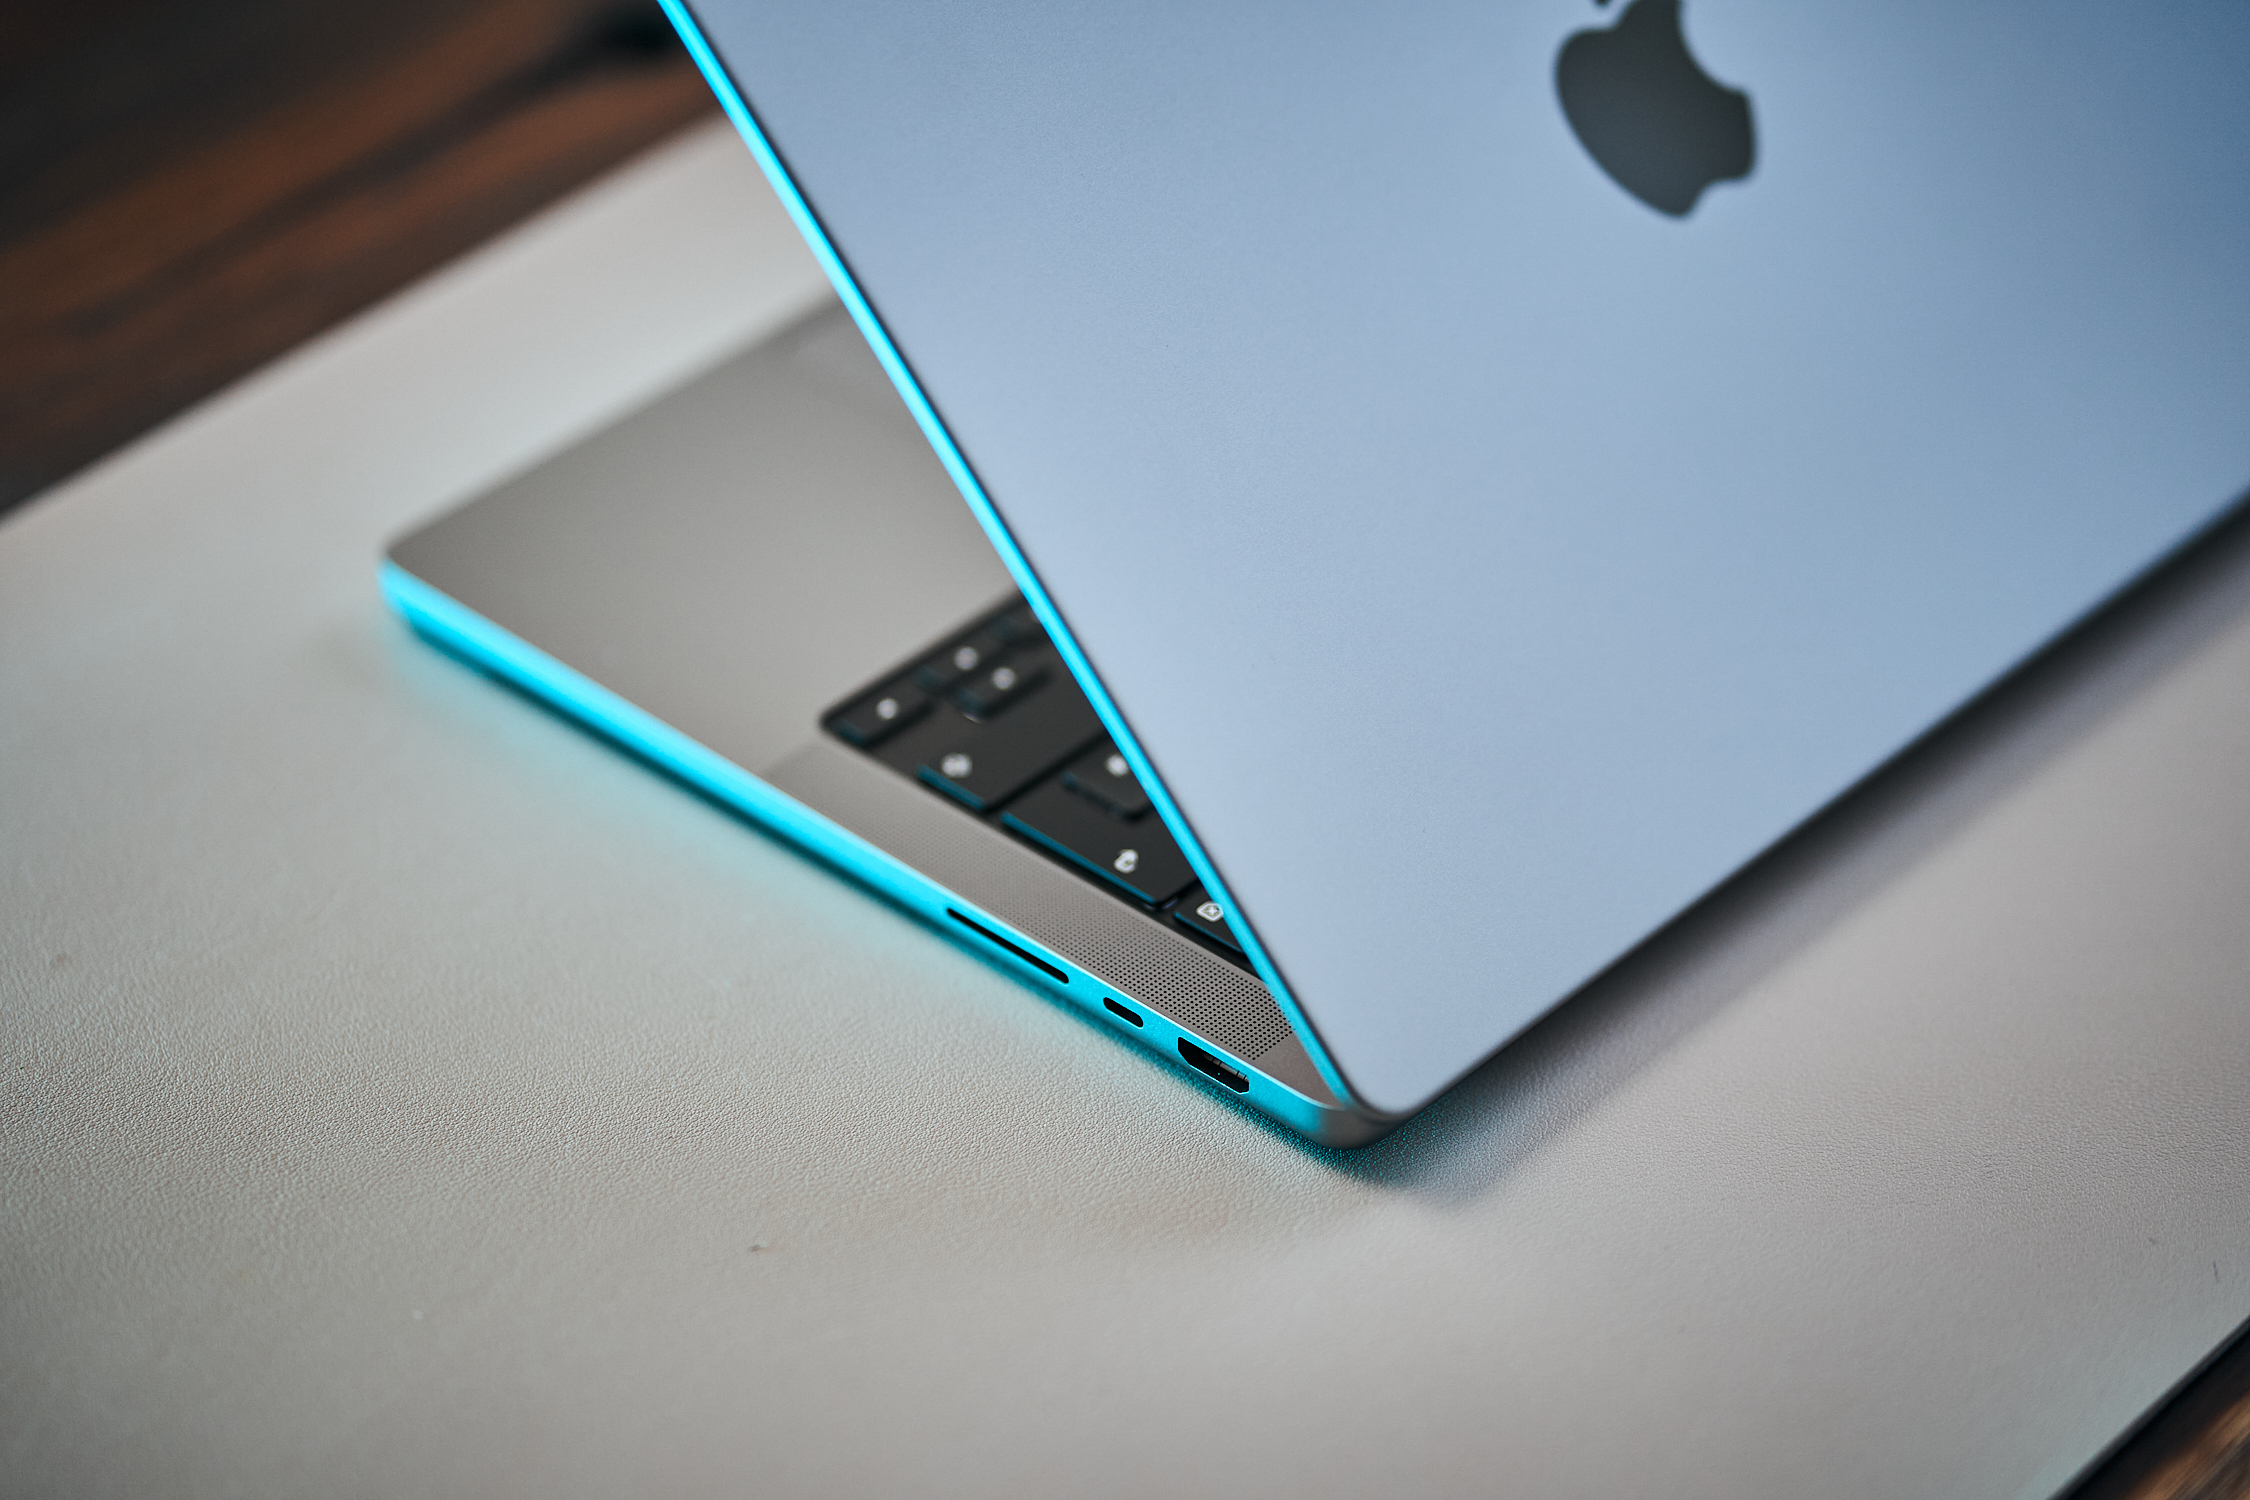
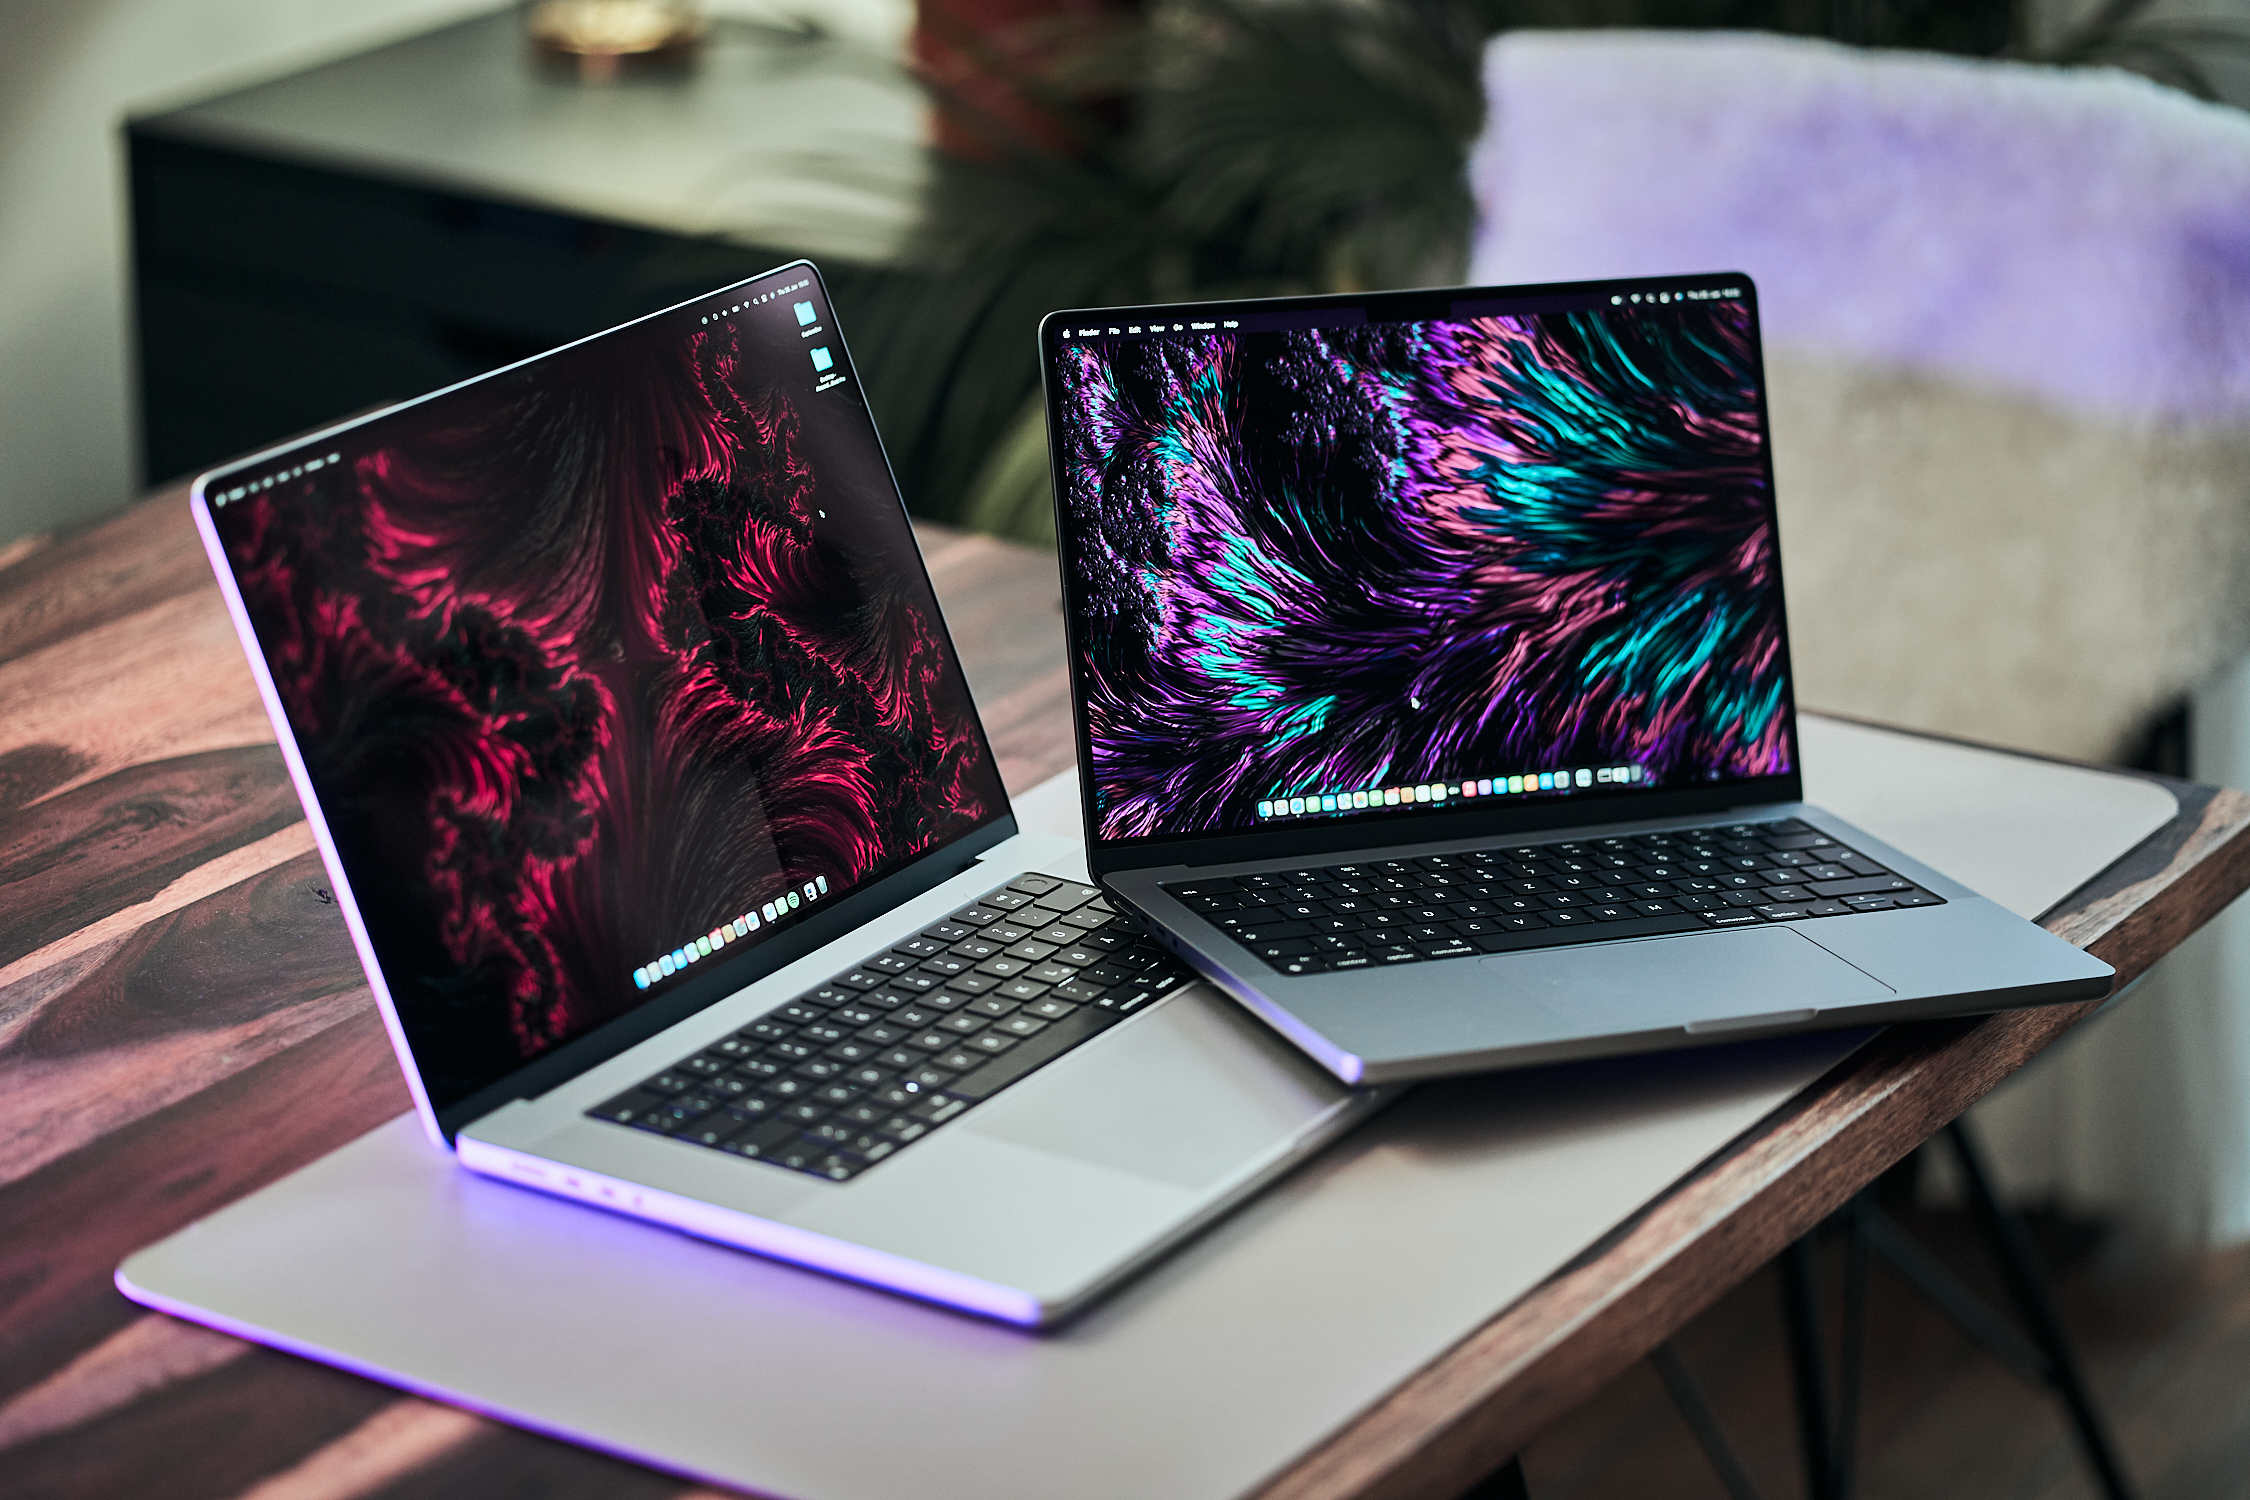
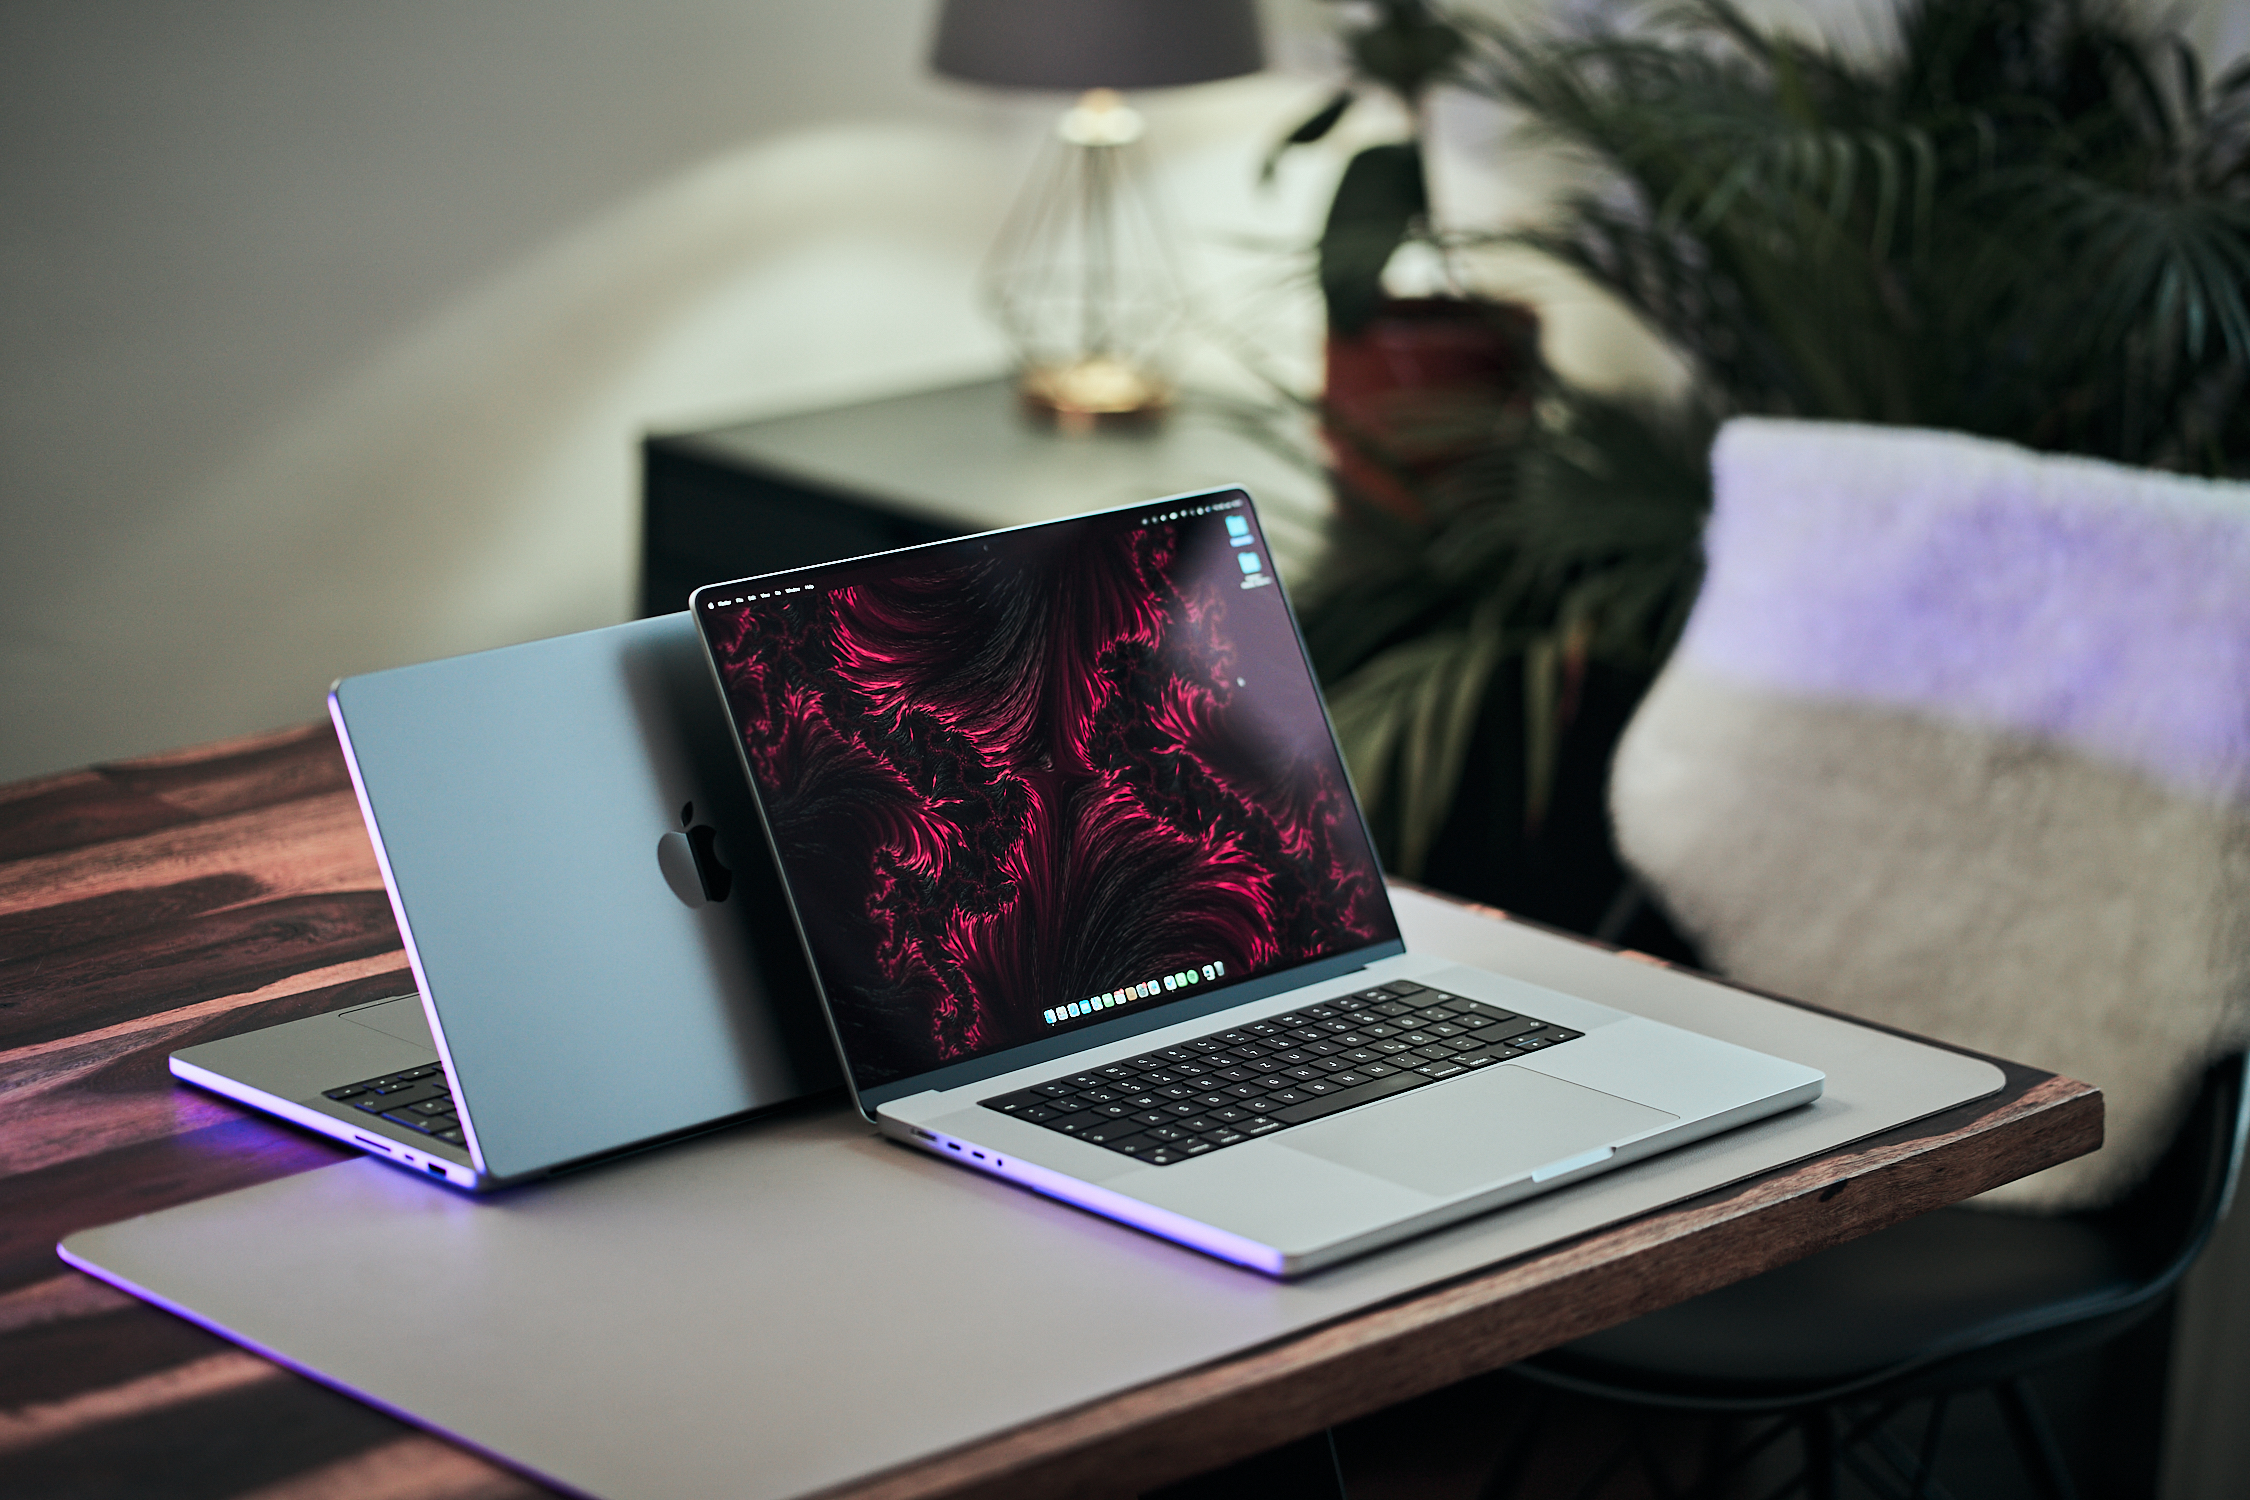
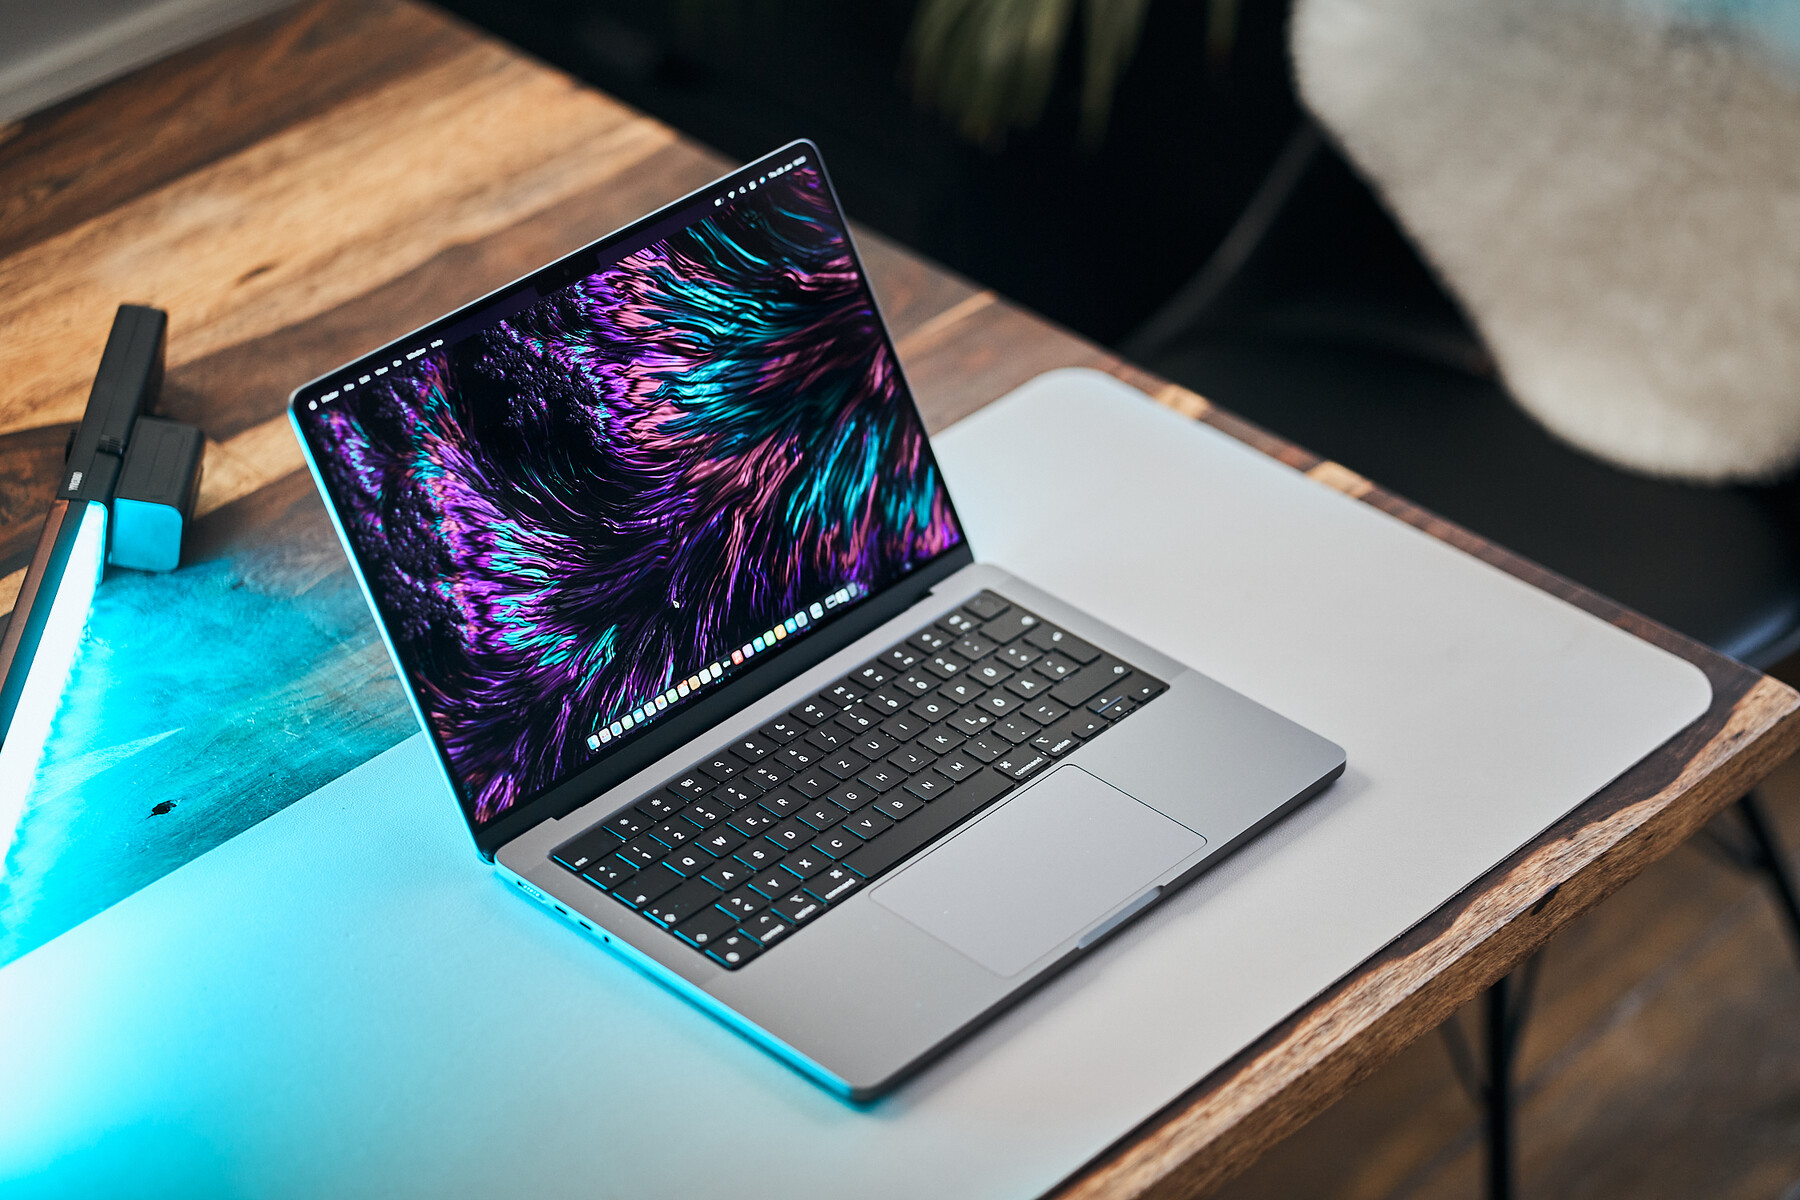
We can keep things short in regard to the case, as there have been no changes since the 2021 model. The aluminum case is still of extremely high quality, but the shape of the case makes the 14-inch model (in particular) look very bulky, although it isn't any higher in direct comparison with the tapered units of the competition. Depending on the position, the raised front edge may prove to be problematic when typing, as the edge quickly presses into the wrists. The MacBook Pro 14 is once again available in Silver or Space Gray and both variants are not particularly sensitive to dirt.
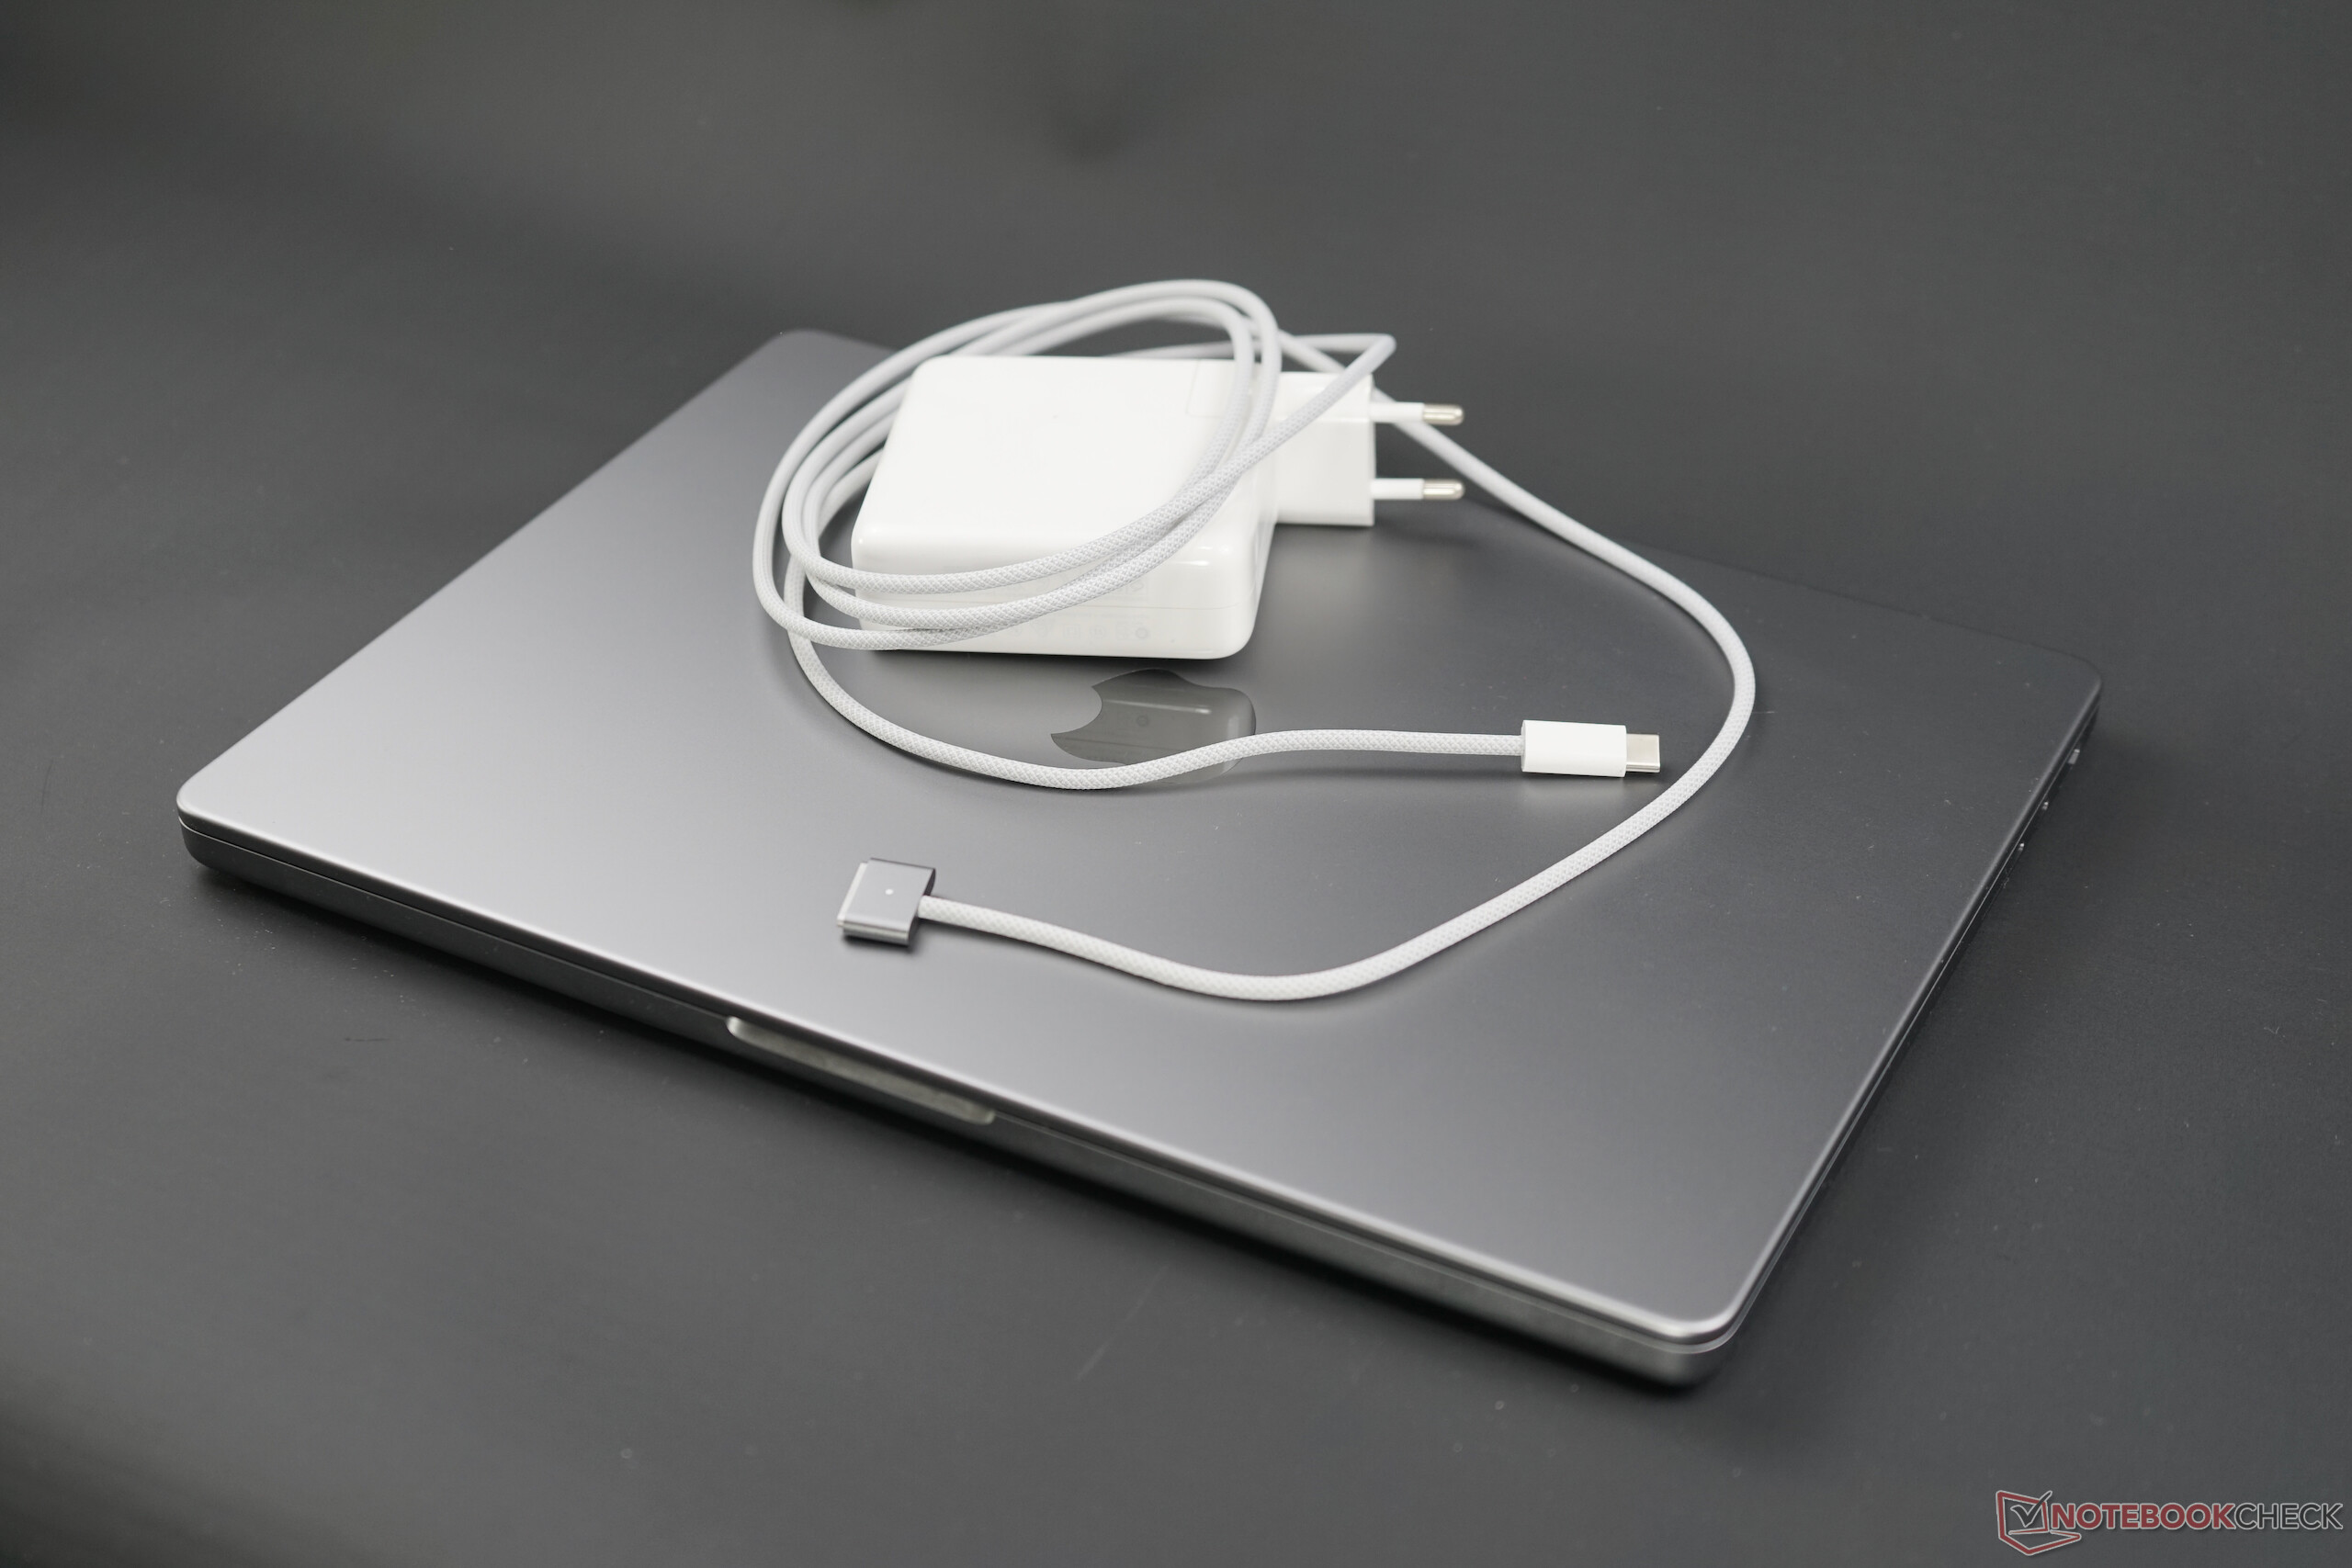
The only visual change concerns the MagSafe cable, where the connector is now in the same color as the case. But the cable itself is still white, even in the Space Gray version.

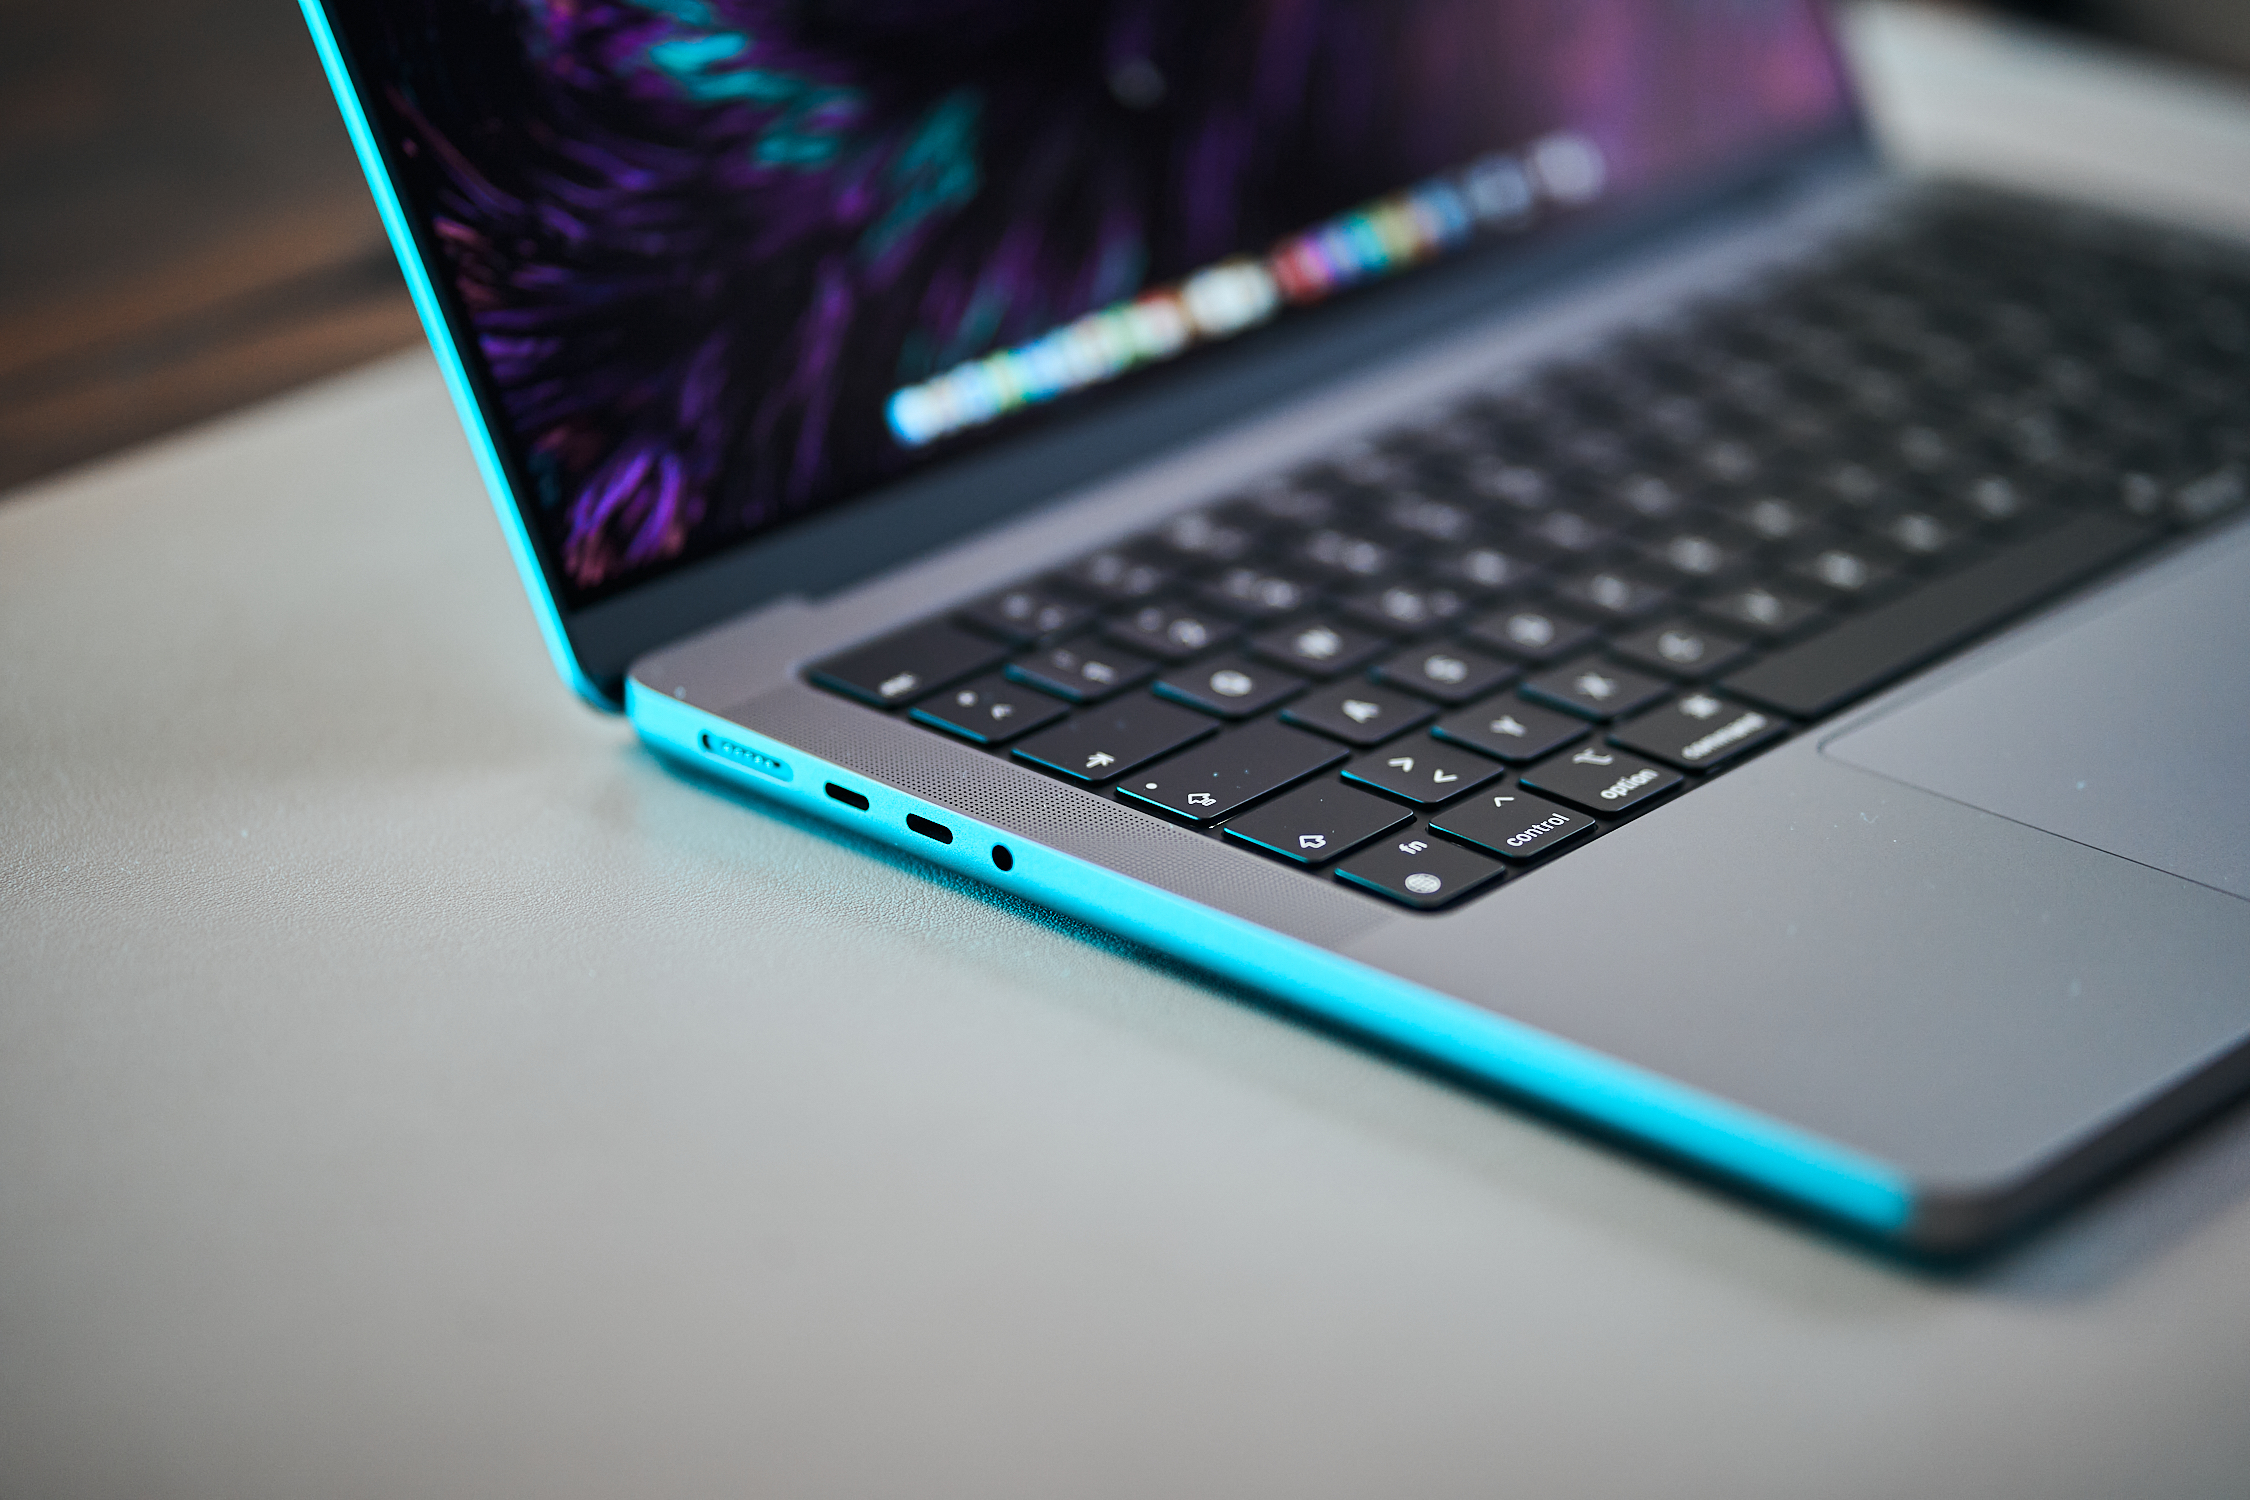
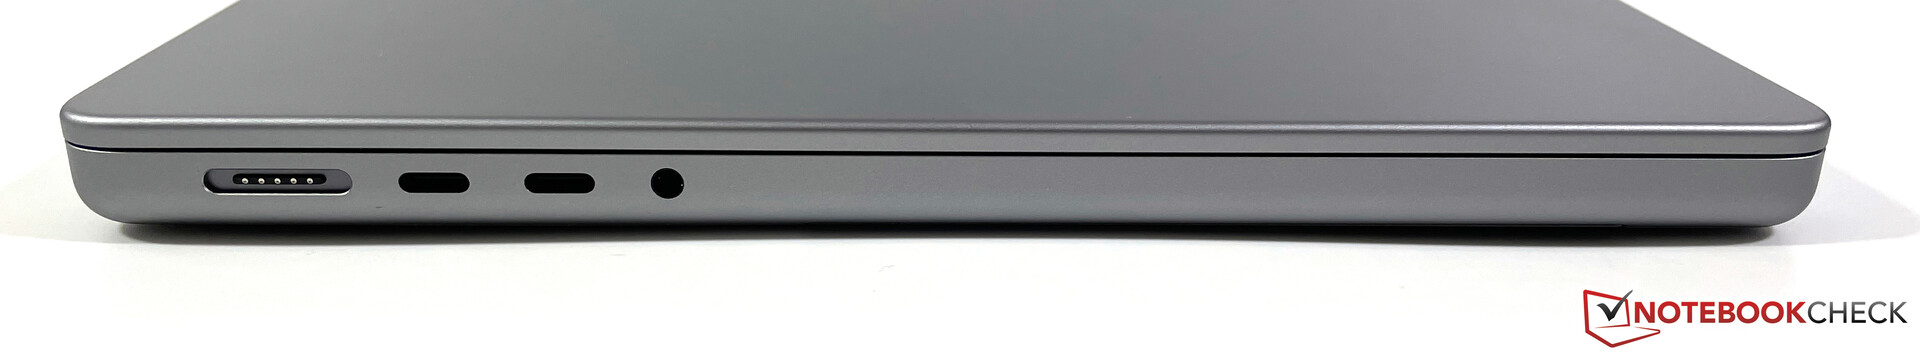
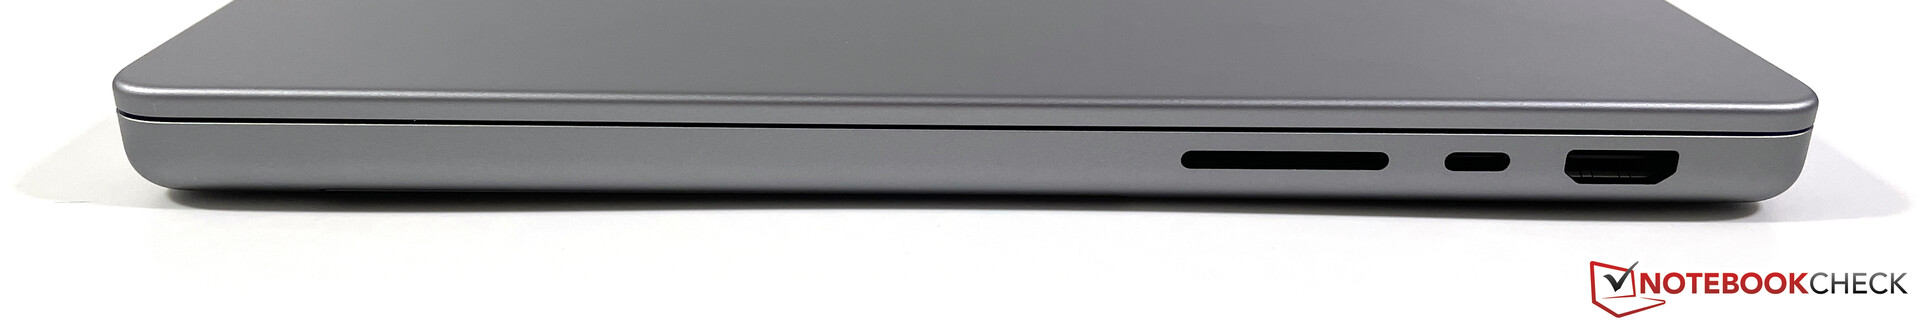
Equipment - MacBook Pro now with HDMI 2.1
There are also only minor changes to the connections - the HMDI output now supports HDMI 2.1 instead of 2.0. Apple even goes a little beyond the standard here and allows users to connect a 4K display at up to 240 Hz (8K with 60 Hz). With the M2 Pro, a maximum of two external monitors can be connected alongside the integrated display (2x 6K 60 Hz via Thunderbolt or 1x 6K 60 Hz via Thunderbolt and 1x 4K 144 Hz via HDMI). With the M2 Max, up to four external monitors can be connected.
SD Card Reader
According to our measurements, the card reader is now slightly faster when copying, achieving a transfer rate of 181 MB/s with our Angelbird AV Pro V60 reference card. According to AmorphousDiskMark, the maximum read speed is 208 MB/s.
| SD Card Reader - average JPG Copy Test (av. of 3 runs) | |
| Apple MacBook Pro 14 2023 M2 Pro (AV Pro V60) | |
| Average of class Multimedia (23 - 531, n=43, last 2 years) | |
| Apple MacBook Pro 14 2021 M1 Pro Entry (AV PRO V60) | |
| Apple MacBook Pro 16 2021 M1 Pro (Angelbird AV Pro V60) | |
| Schenker Vision 14 2022 RTX 3050 Ti | |
Communication
A disadvantage of the 2021 MacBook Pro models was the comparatively slow WLAN connection, as only 80 MHz connections were supported. The new 2023 models now finally support Wi-Fi 6E in addition to Bluetooth 5.3, and we were also able to connect to the 6 GHz network of our Asus reference router without issue. The transfer rates are among the best we've seen so far, so the new MacBook Pro 14 is more than twice as fast as its predecessor (provided a suitable router is used).
| Networking | |
| Apple MacBook Pro 14 2023 M2 Pro | |
| iperf3 receive AXE11000 6GHz | |
| iperf3 transmit AXE11000 6GHz | |
| Apple MacBook Pro 14 2021 M1 Pro Entry | |
| iperf3 transmit AX12 | |
| iperf3 receive AX12 | |
| Apple MacBook Pro 16 2021 M1 Pro | |
| iperf3 transmit AX12 | |
| iperf3 receive AX12 | |
| iperf3 receive AXE11000 | |
| iperf3 transmit AXE11000 | |
| Apple MacBook Pro 13 2022 M2 | |
| iperf3 receive AXE11000 | |
| iperf3 transmit AXE11000 | |
| Lenovo Yoga Slim 7 Pro X 14IAH7 82TK006CGE | |
| iperf3 receive AXE11000 6GHz | |
| iperf3 receive AXE11000 | |
| iperf3 transmit AXE11000 6GHz | |
| iperf3 transmit AXE11000 | |
| Microsoft Surface Laptop Studio i7 RTX 3050 Ti | |
| iperf3 transmit AX12 | |
| iperf3 receive AX12 | |
| Razer Blade 14 Ryzen 9 6900HX | |
| iperf3 transmit AX12 | |
| iperf3 receive AX12 | |
| Schenker Vision 14 2022 RTX 3050 Ti | |
| iperf3 receive AXE11000 | |
| iperf3 transmit AXE11000 | |
Webcam

Apple continues to install its well-known 1080p webcam, but the quality of recordings has increased slightly in some scenarios thanks to the improved image processing of the M2 Pro. A pity, however, that the MacBooks still do not support Face ID or Center Stage.


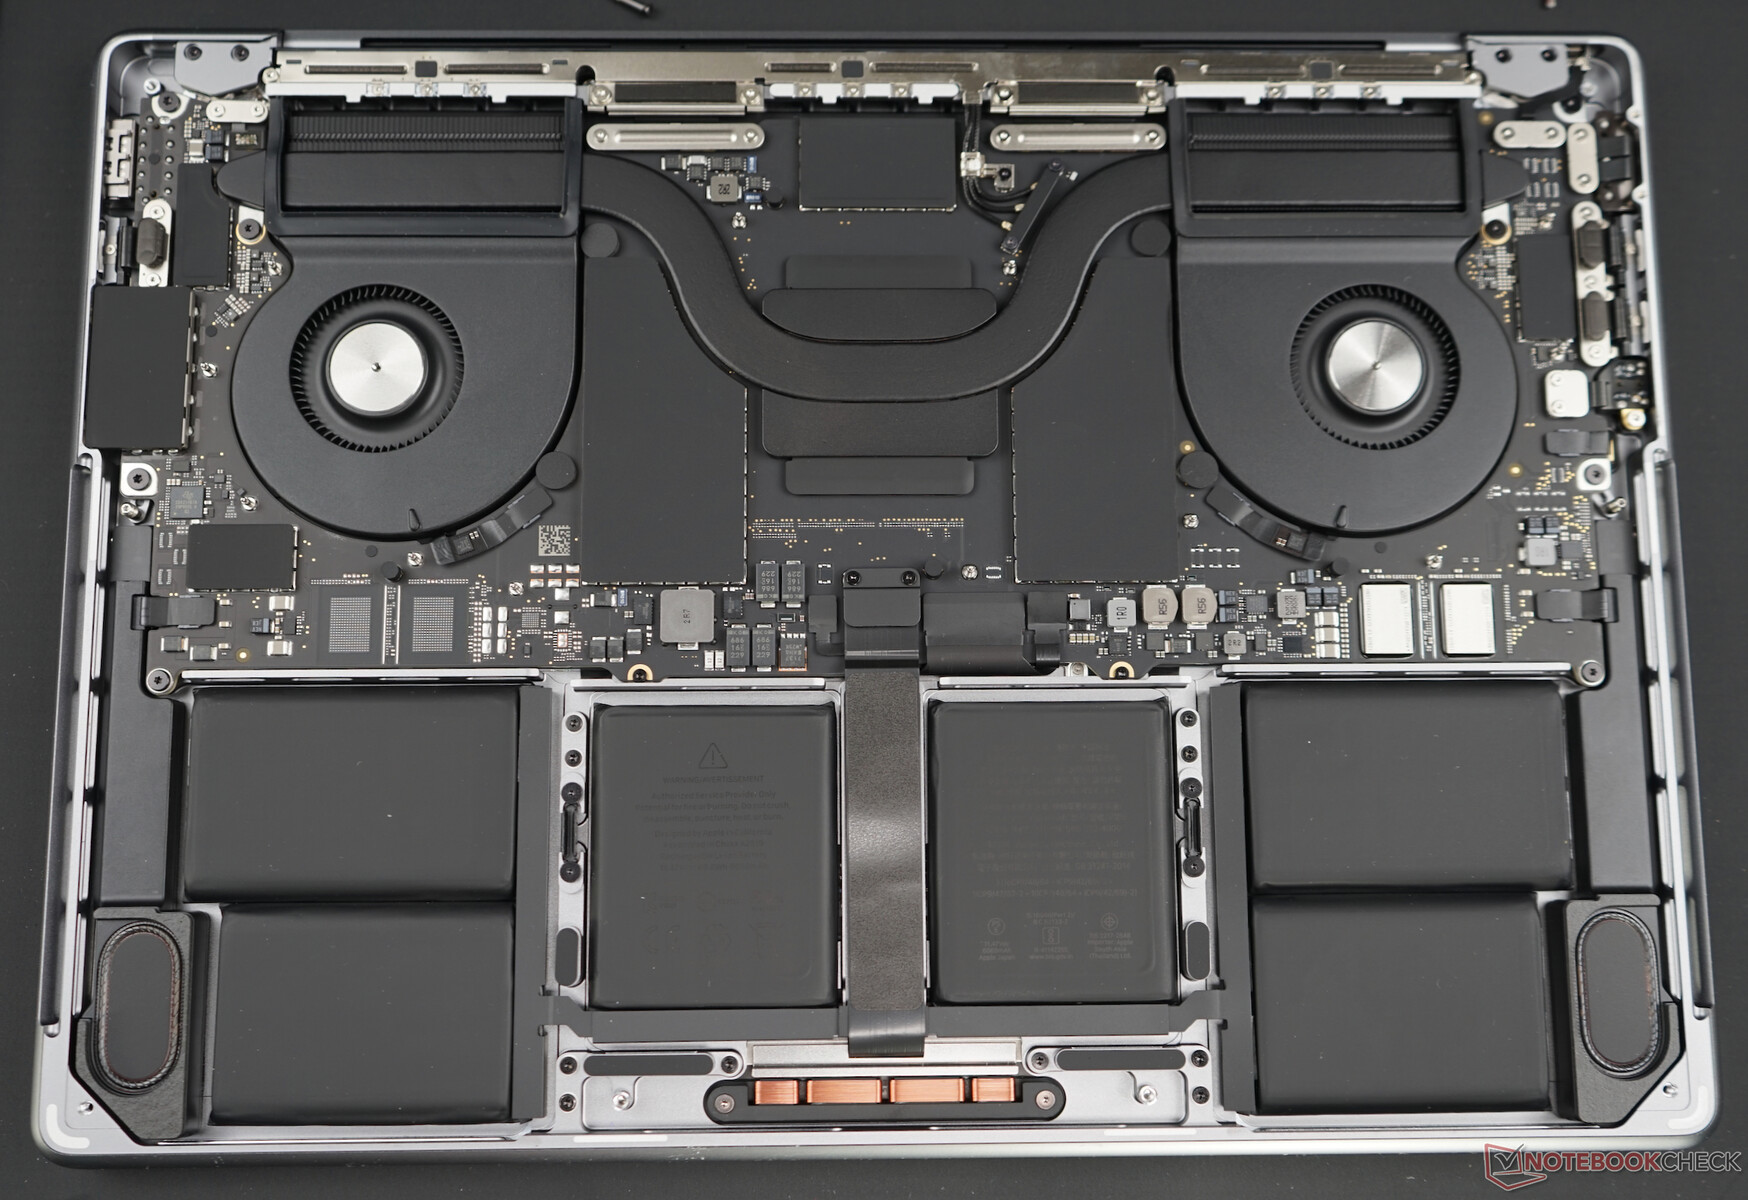
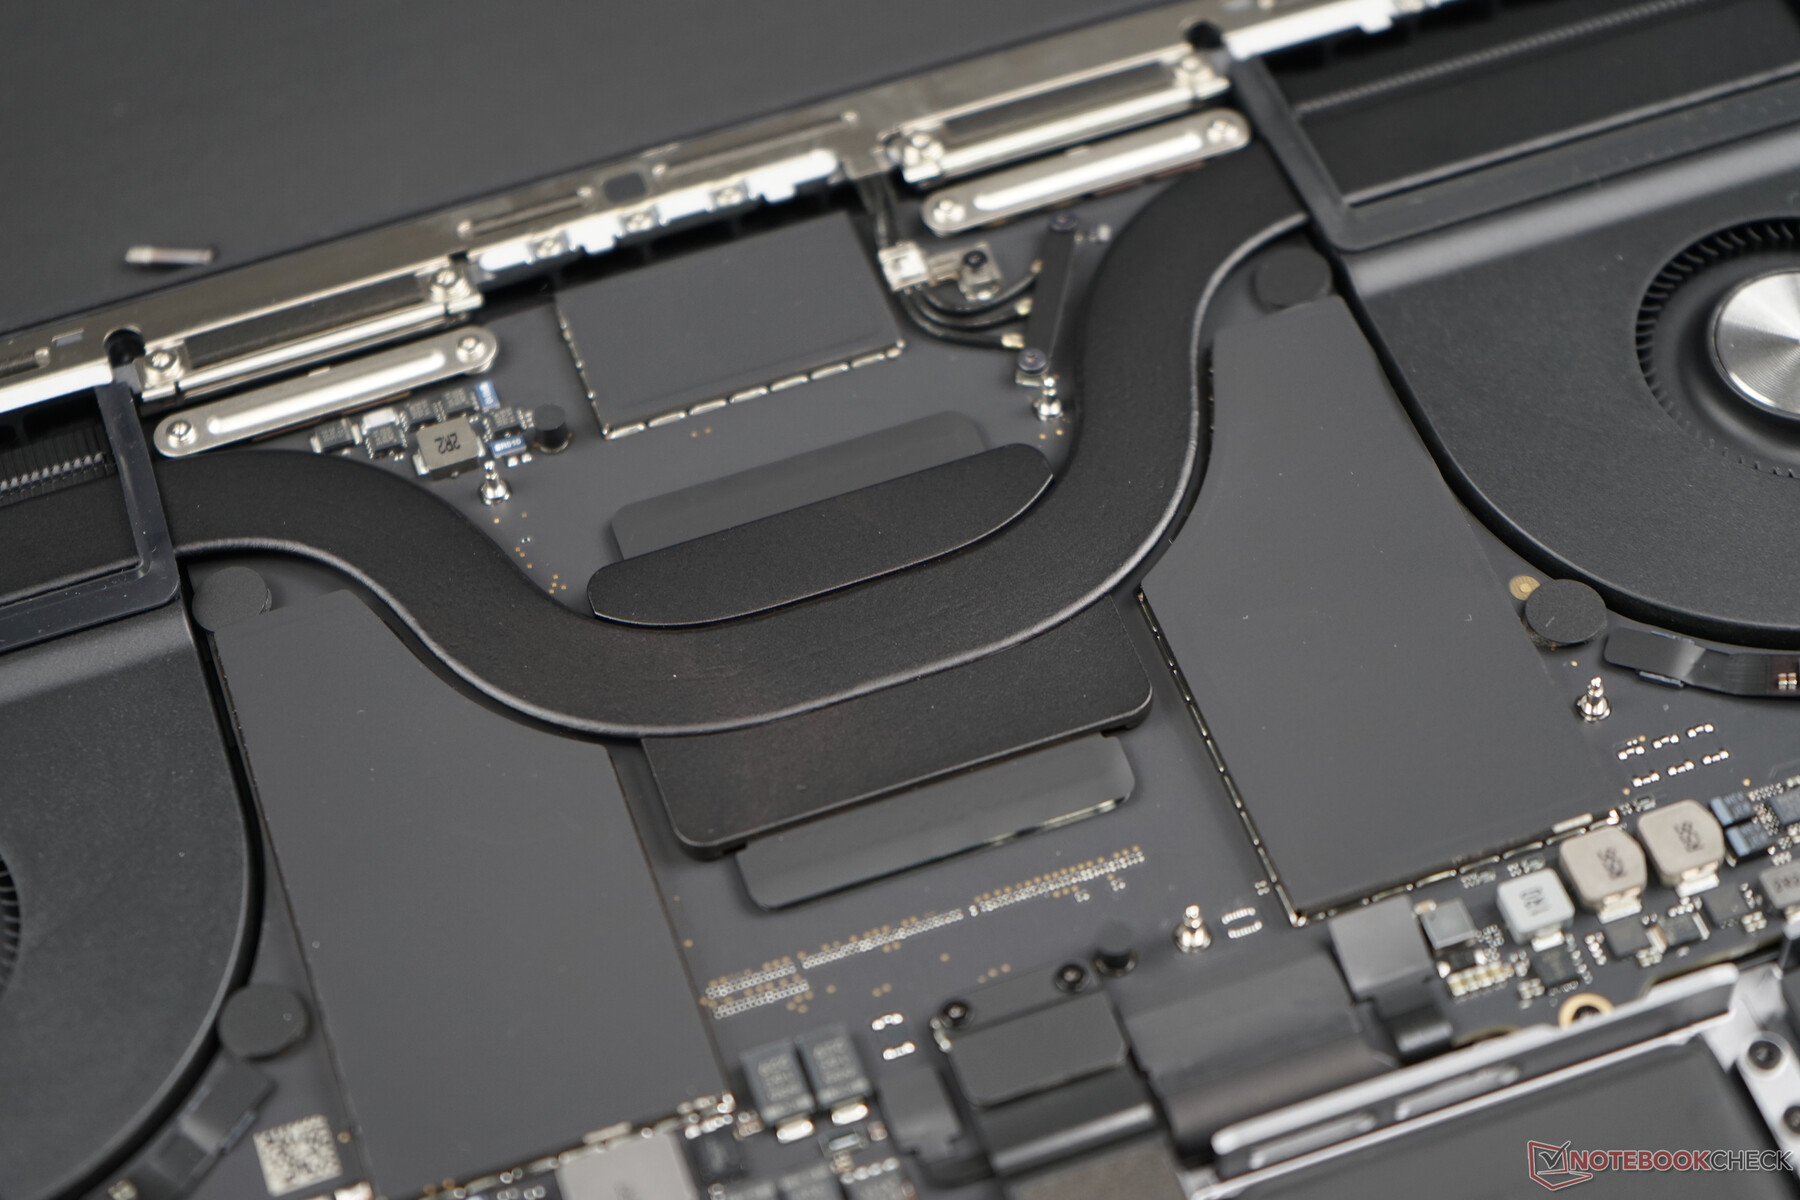
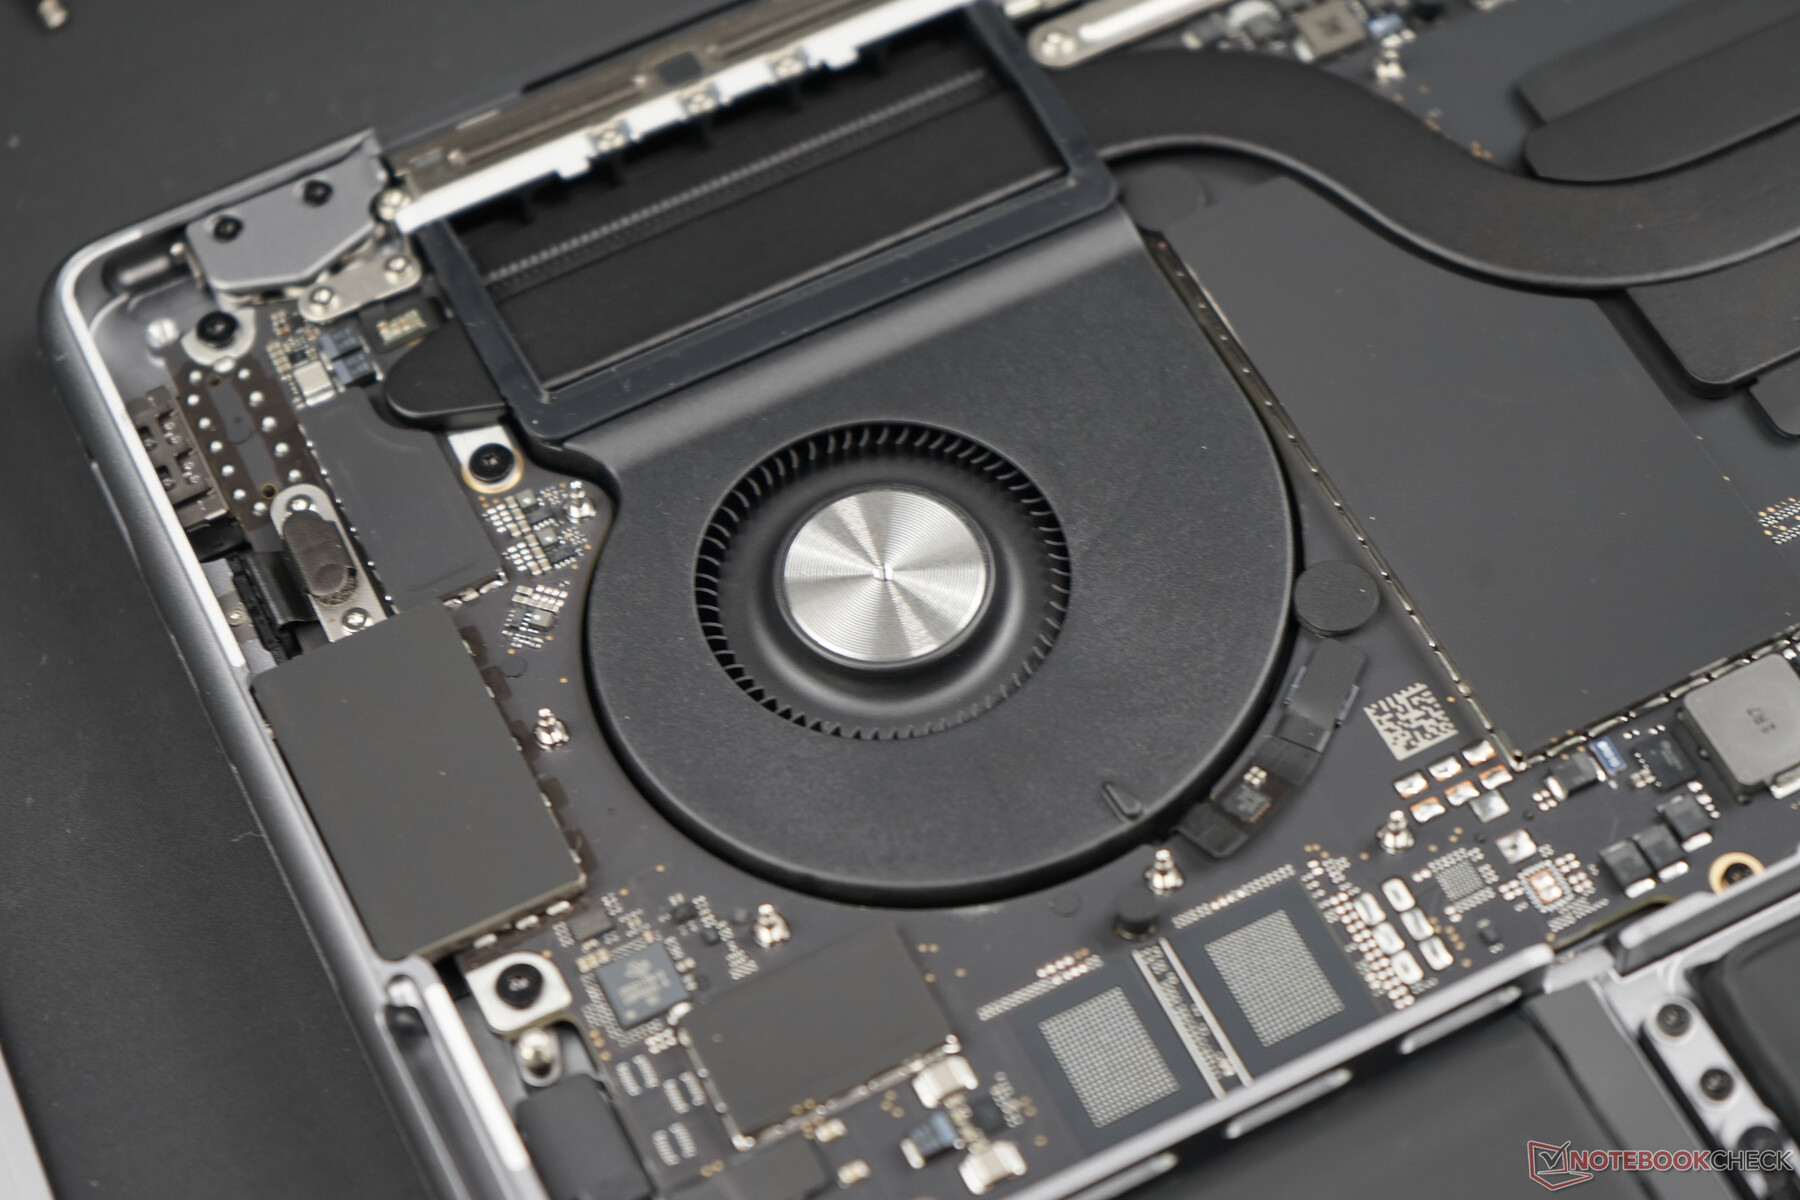
Maintenance
Maintenance options are still very limited. Ultimately, only the two fans can be cleaned. All components are soldered and can neither be upgraded nor individually replaced (in case of a defect). Compared to the predecessor, the heat sink has become somewhat smaller.
Warranty
Apple continues to deliver the MacBook Pro 14 2023 with a one-year warranty, but in Germany, of course, the statutory warranty of 24 months applies. This may differ in other countries, so buyers should double-check before purchasing.
Optionally, the warranty can be extended with Apple Care+. In the US, for example, buyers have the choice between annual coverage (unlimited until cancelled) at US$99.99/yr or three years of coverage at US$279.00. These prices may also differ in other countries and other currencies.
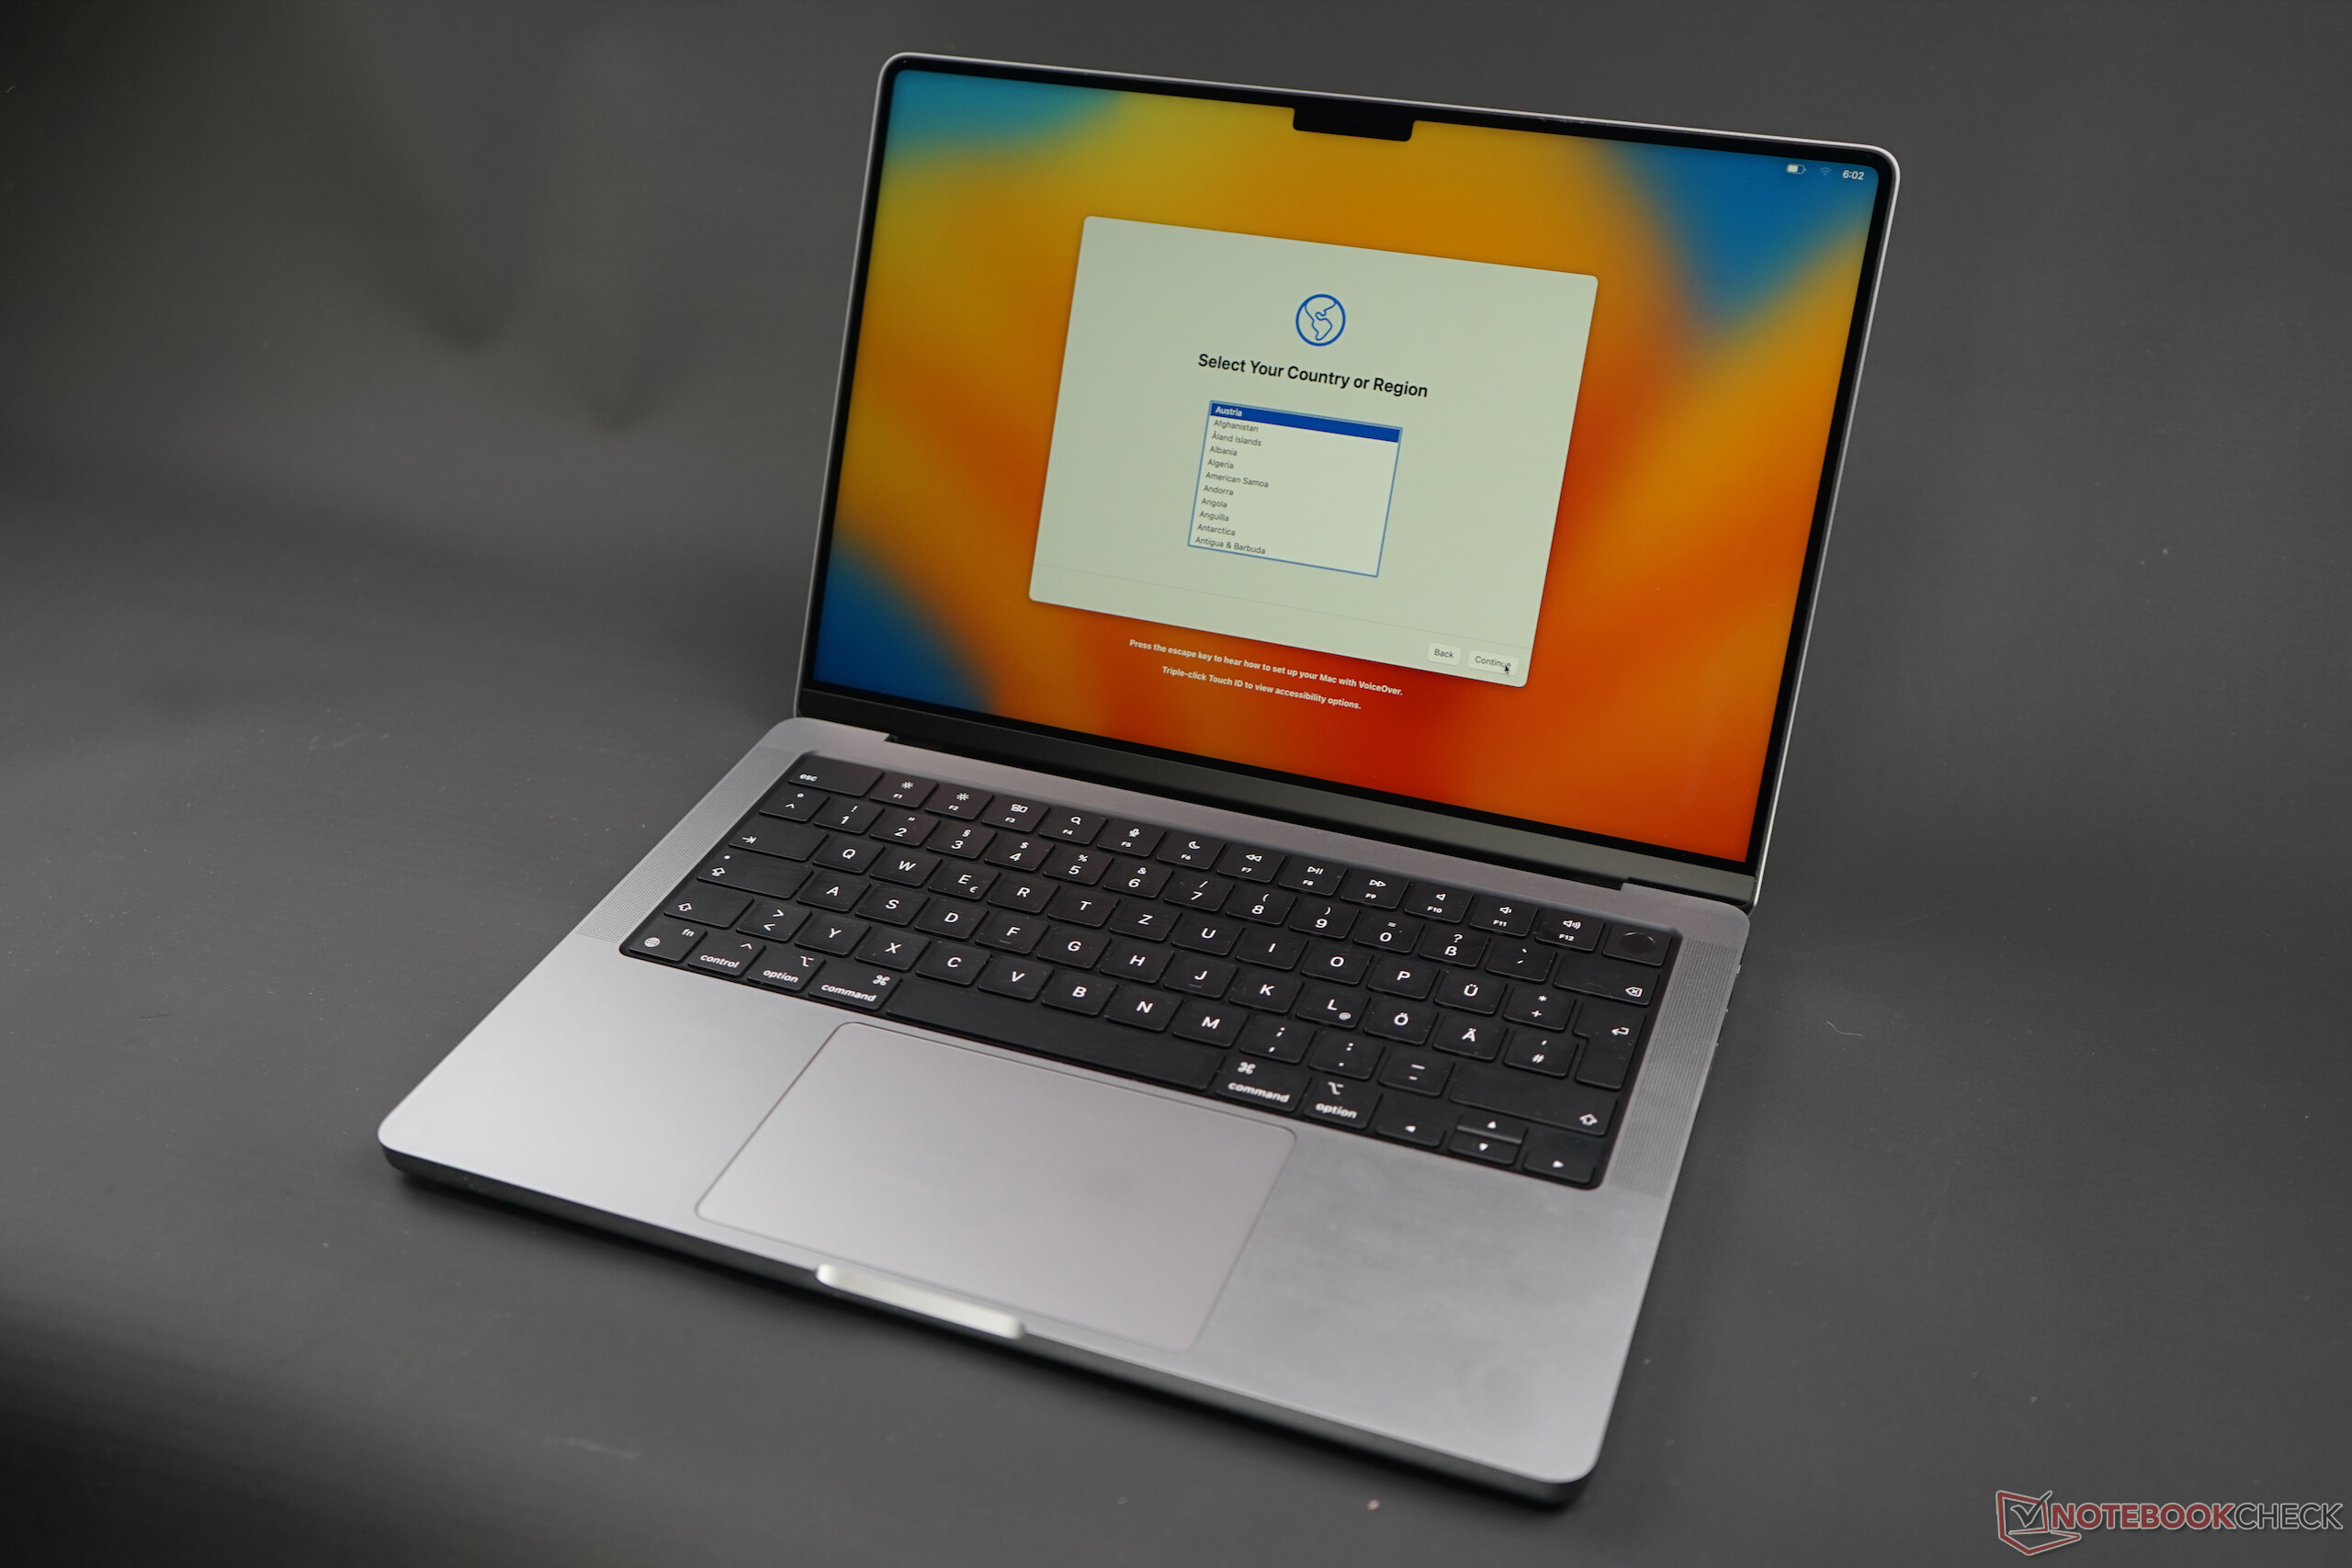
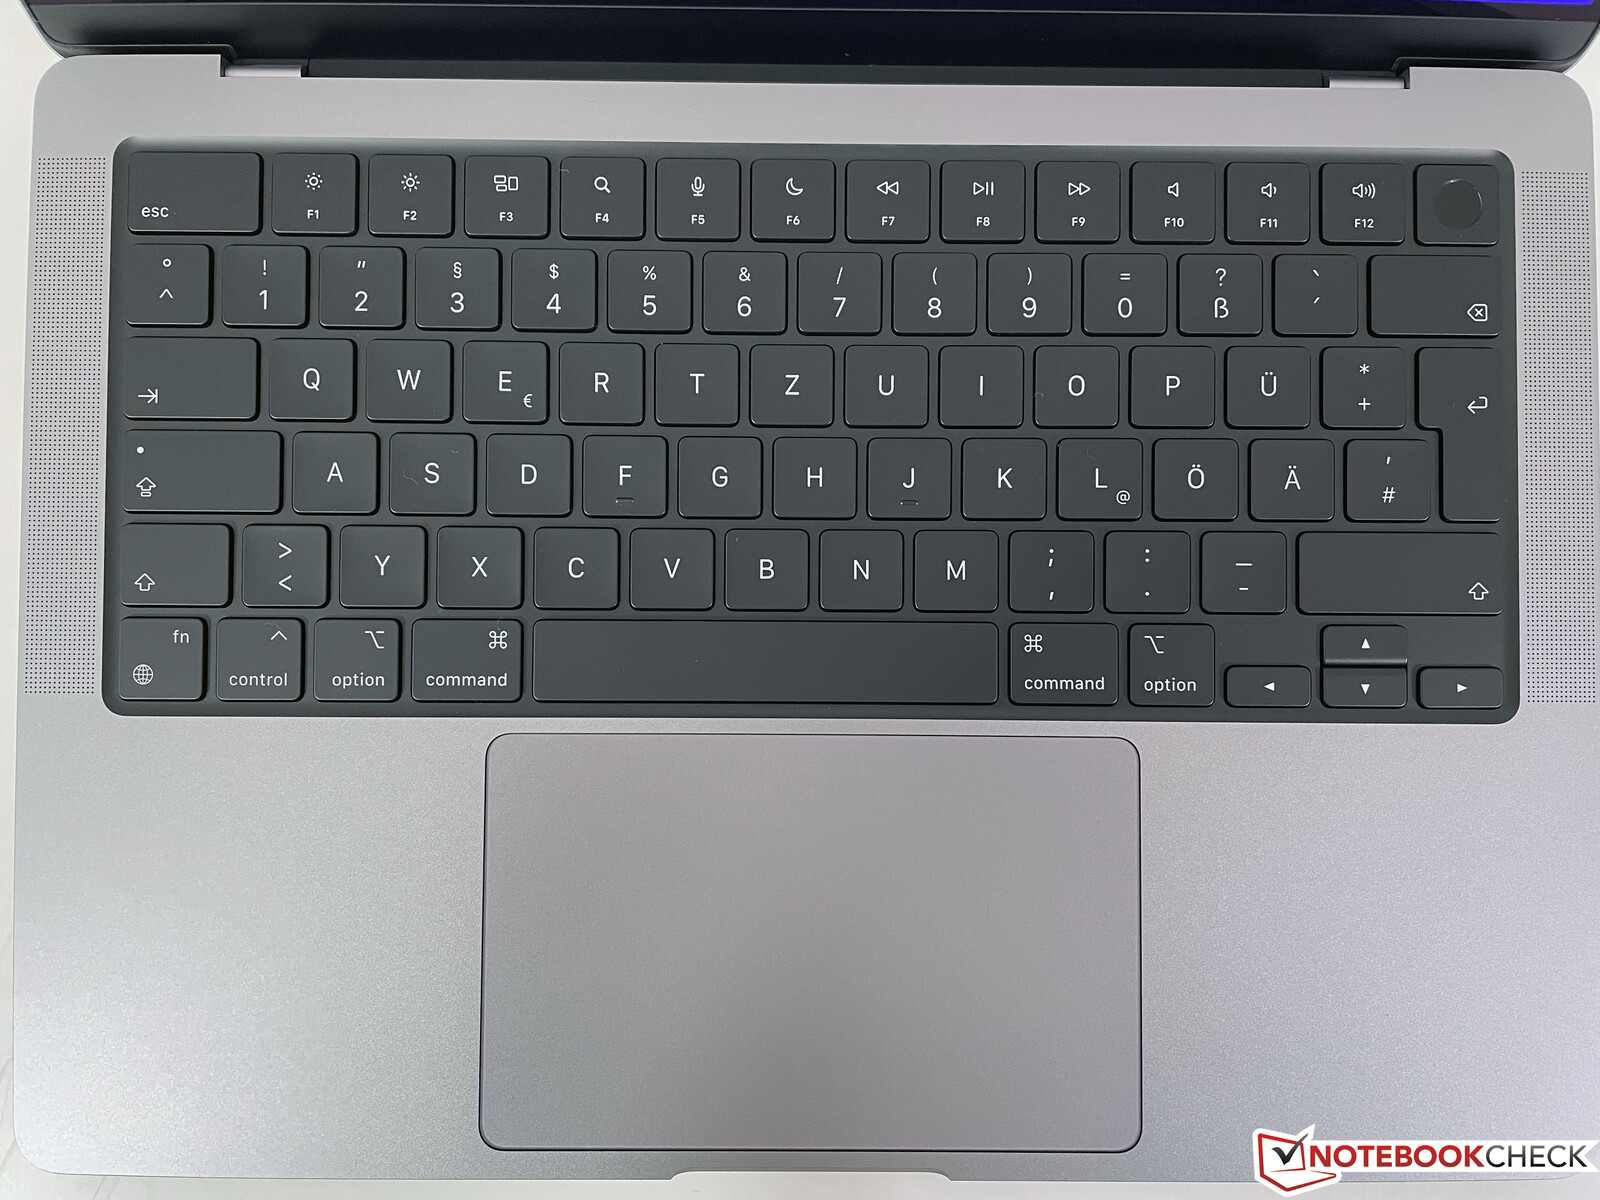
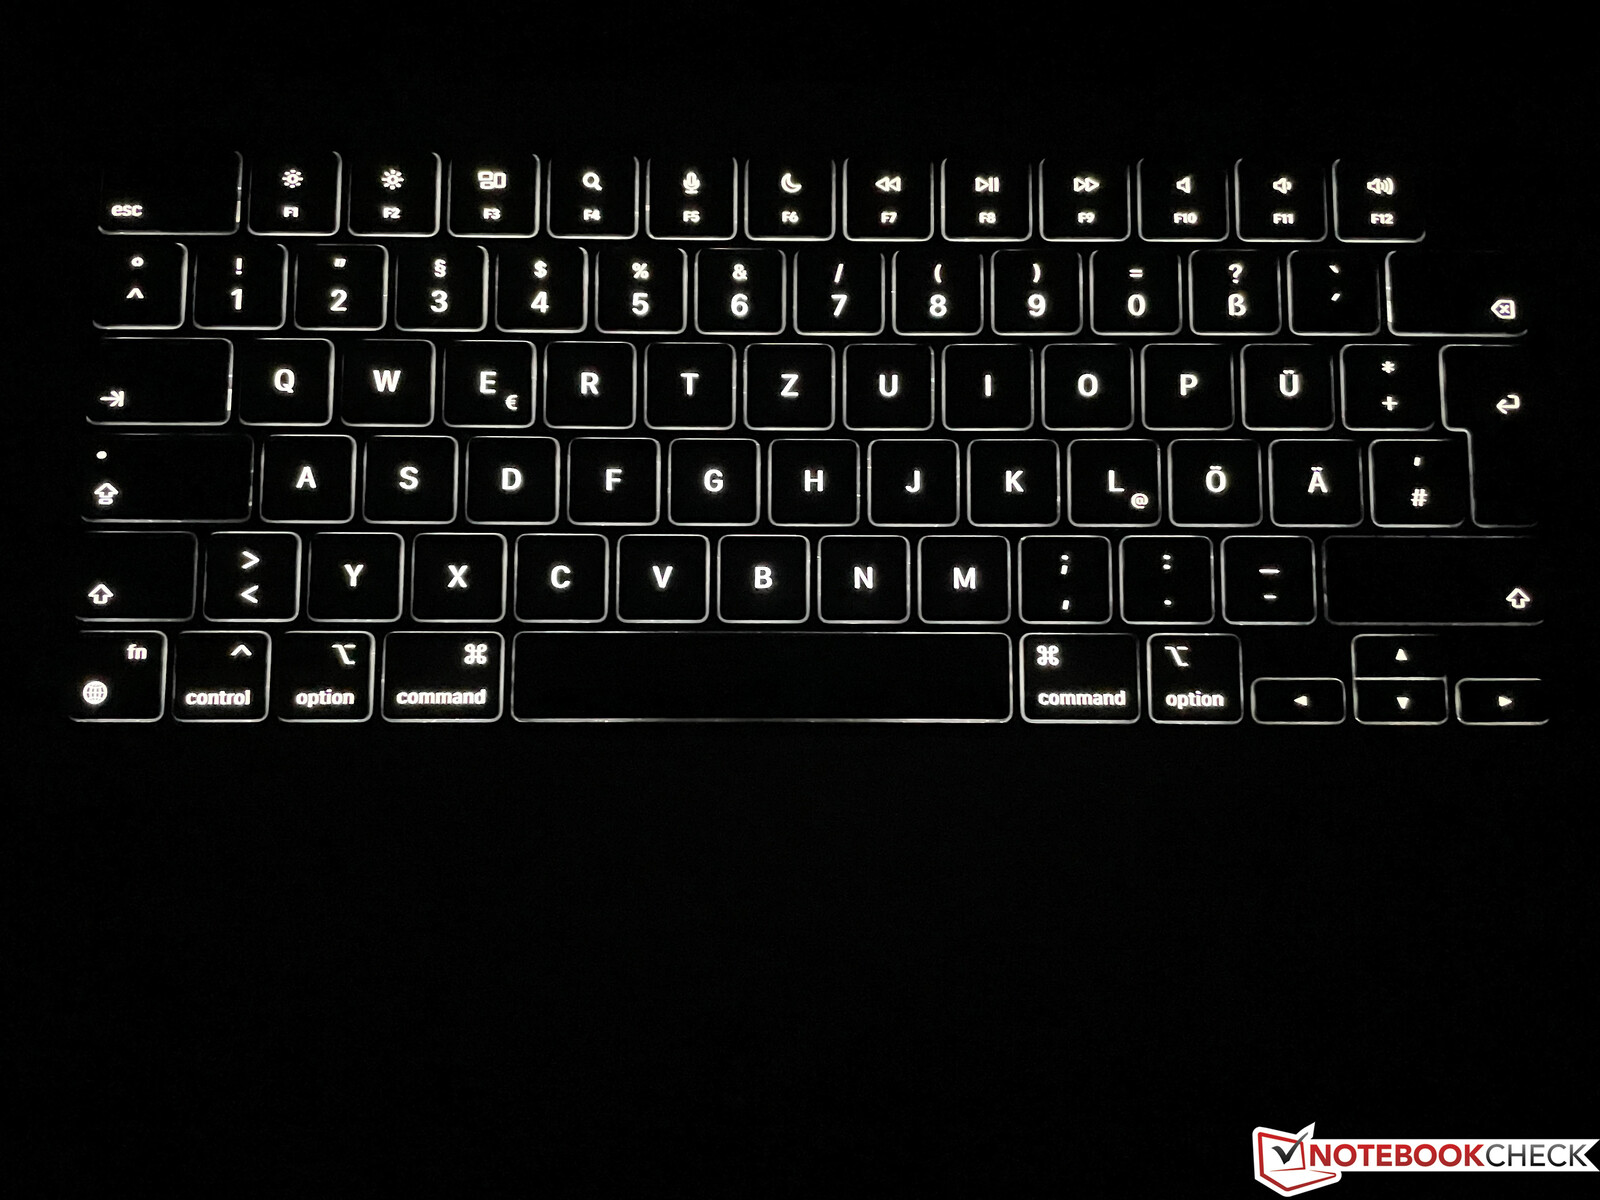
Input Devices - Good keyboard, perfect trackpad
As for the input devices, we also refer to our review of the predecessor. The keyboard offers a good typing feel, but in comparison with high-end business laptops, there is room for improvement here. On the other hand, Apple still offers the best keyboard backlighting, which is regulated automatically and very well by a sensor. No Windows laptop can match this.
The large trackpad continues to set standards in terms of functionality and operation, as the implementation in macOS also works excellently.
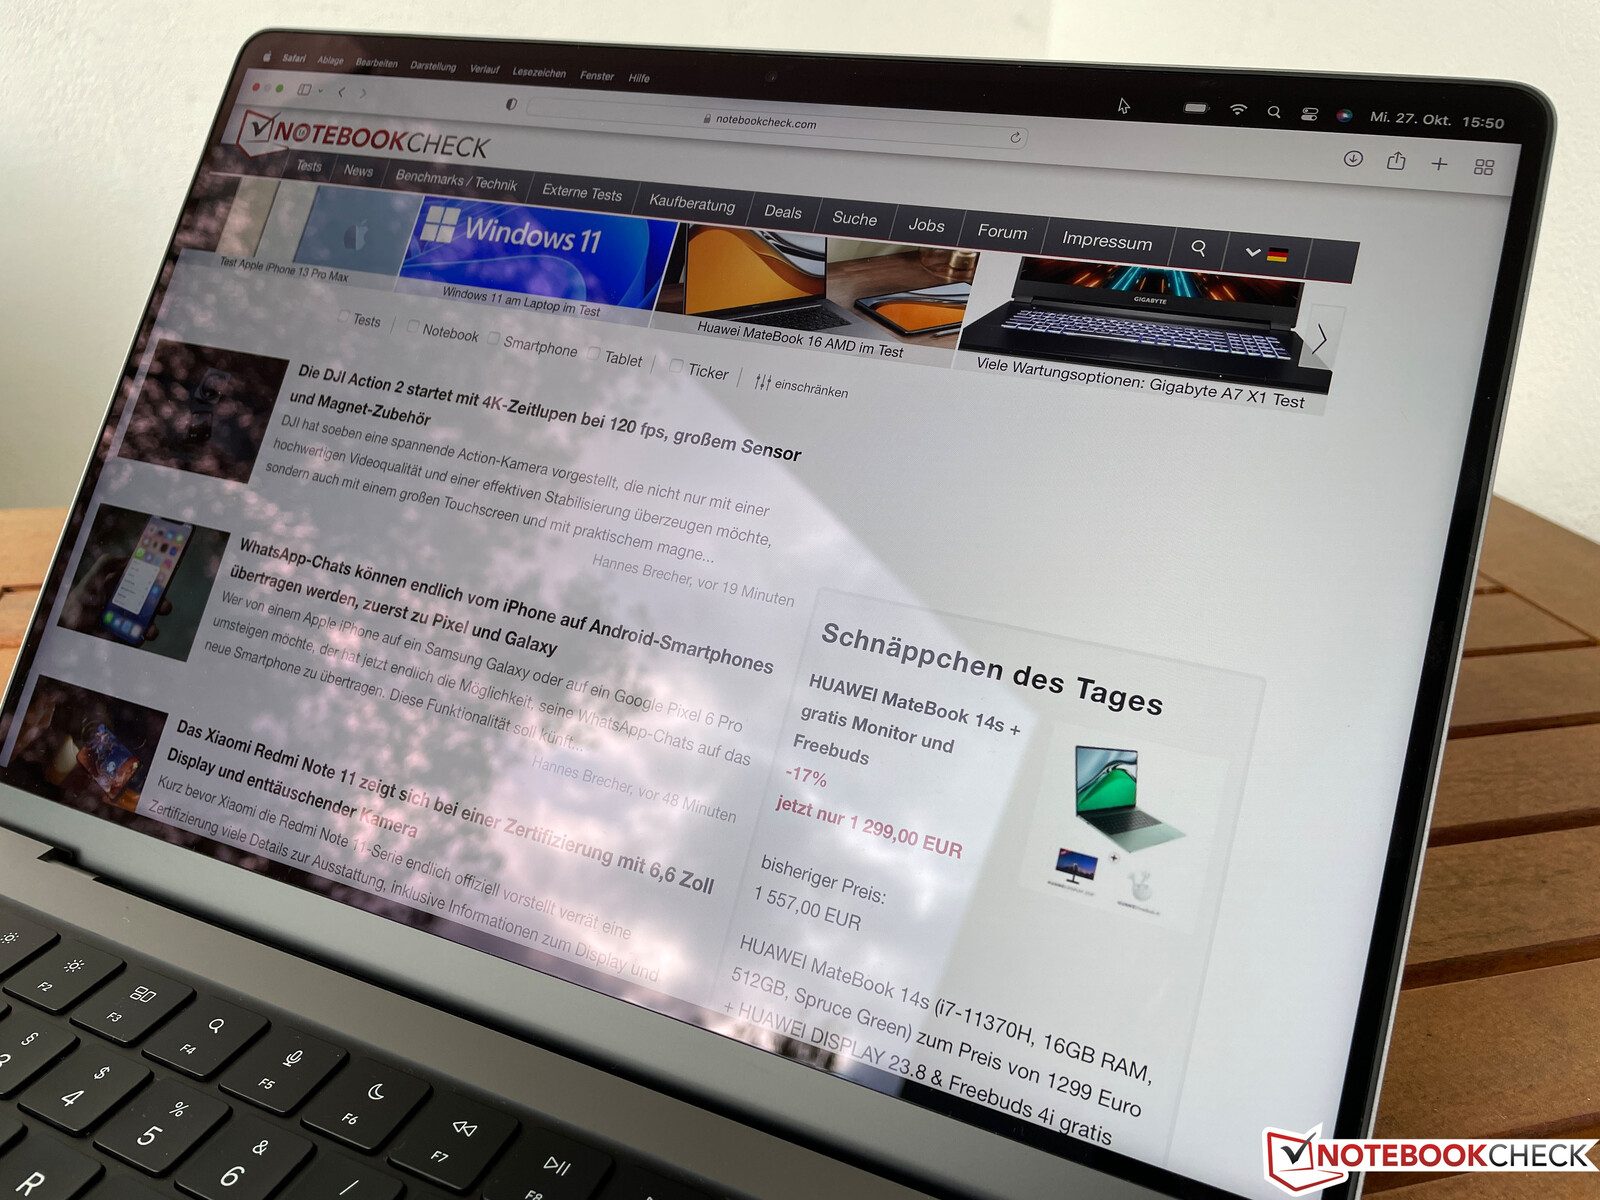
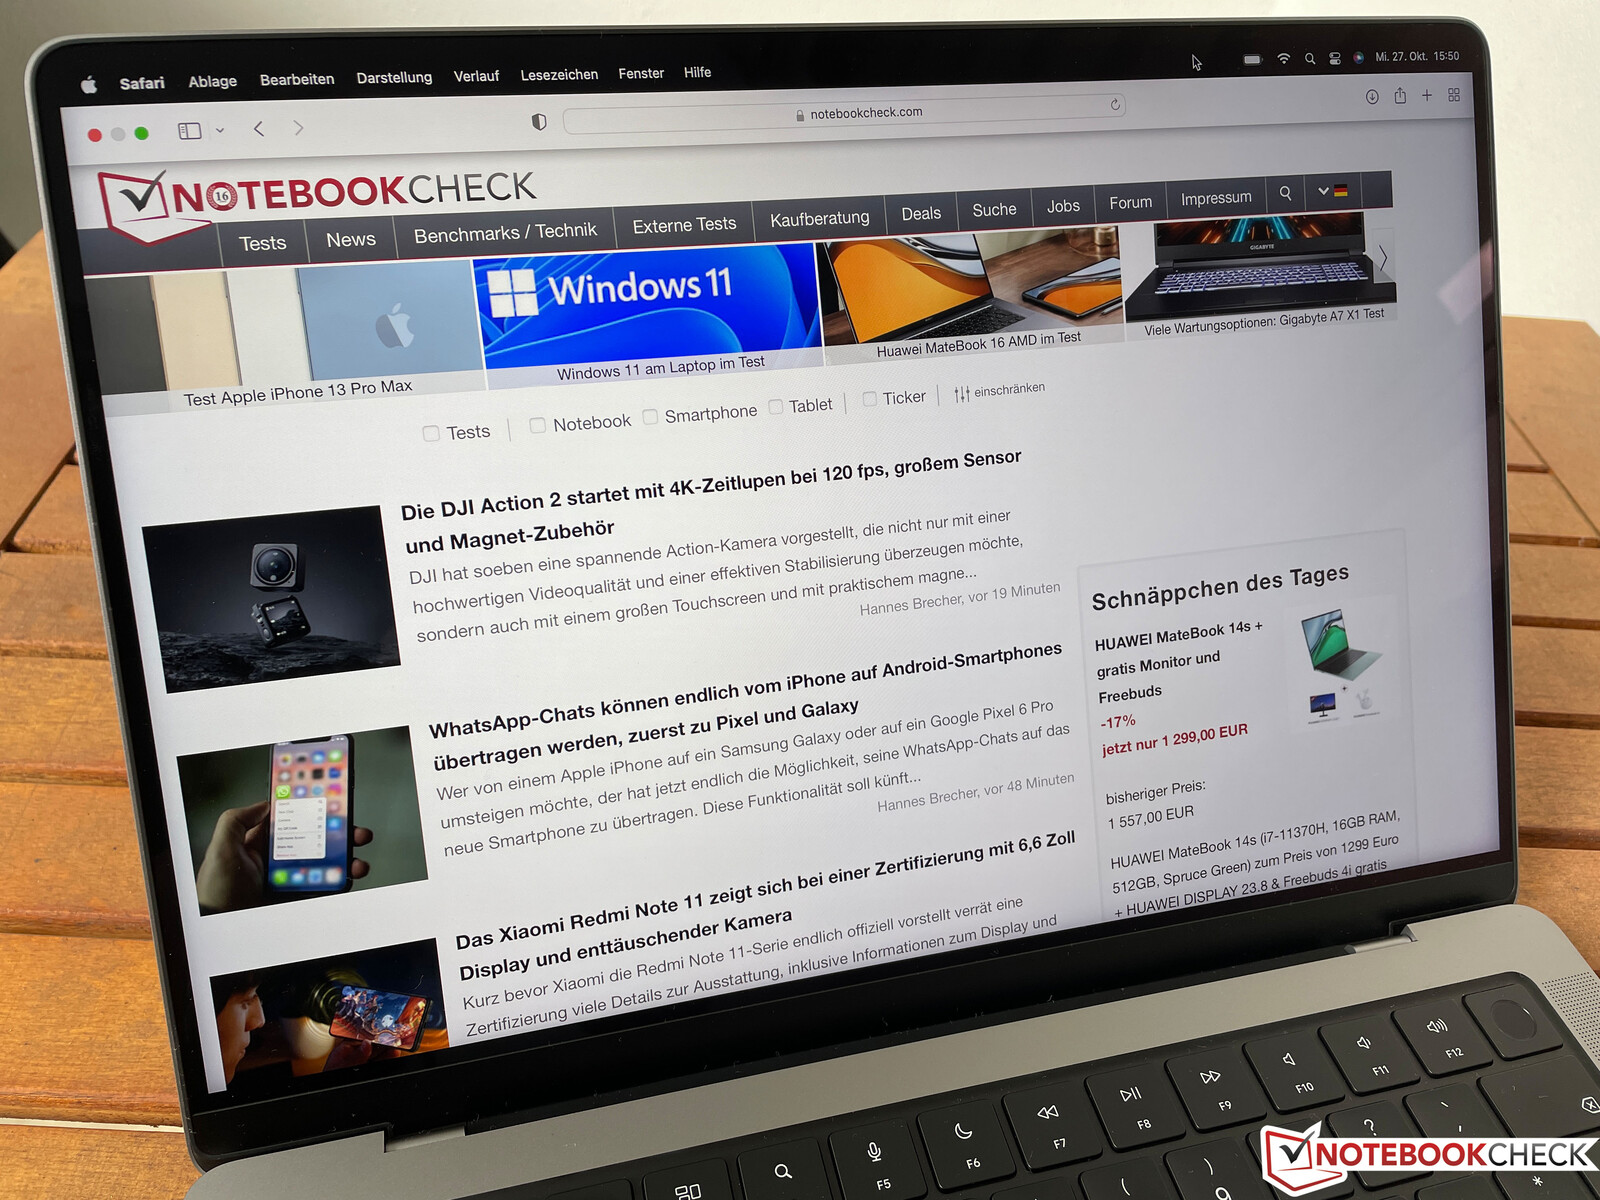
Display - Mini LED panel at 120 Hz
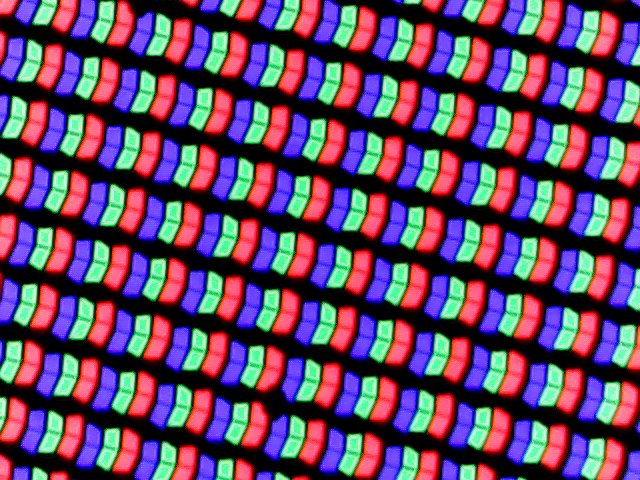
The mini LED panel also remains unchanged, but this is not a problem either. The subjective picture quality is simply outstanding and thanks to 120 Hz, moving images are displayed very smoothly. Furthermore, Apple is clearly the pioneer when it comes to implementing HDR. While you usually have to activate HDR mode manually on Windows devices, it works automatically here. For example, as soon as a corresponding YouTube video starts, the panel then benefits from the higher brightness.
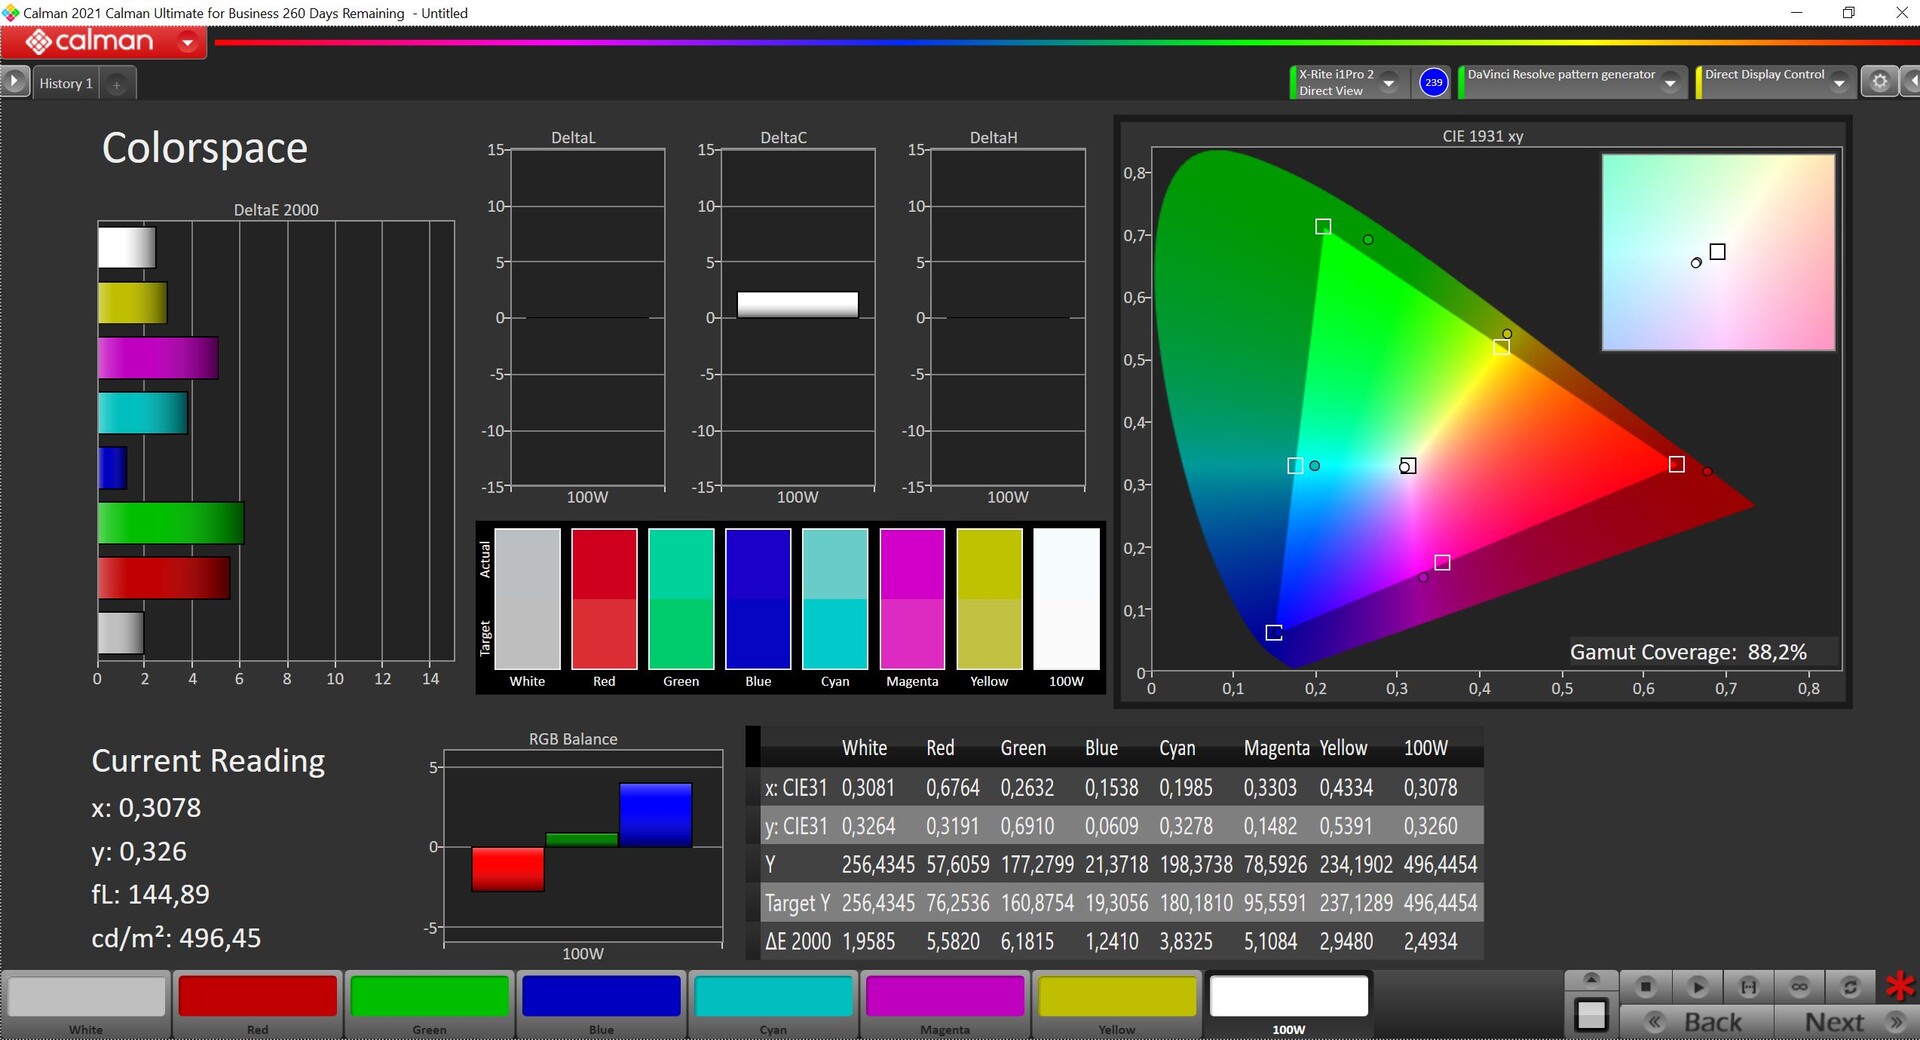
In normal SDR mode, the brightness in the center of the screen is exactly 500 cd/m², so Apple has calibrated it very well. The black level of the mini-LED panel is just 0.02, which results in an extremely high contrast. In practice, the automatic regulation of brightness and color temperature is extremely practical. The notch above the display is still not particularly pretty, but functionally there are no more problems here and the display area next to the notch is superimposed on the normal 16:10, so you have more space for menu elements compared to other 16:10 panels.
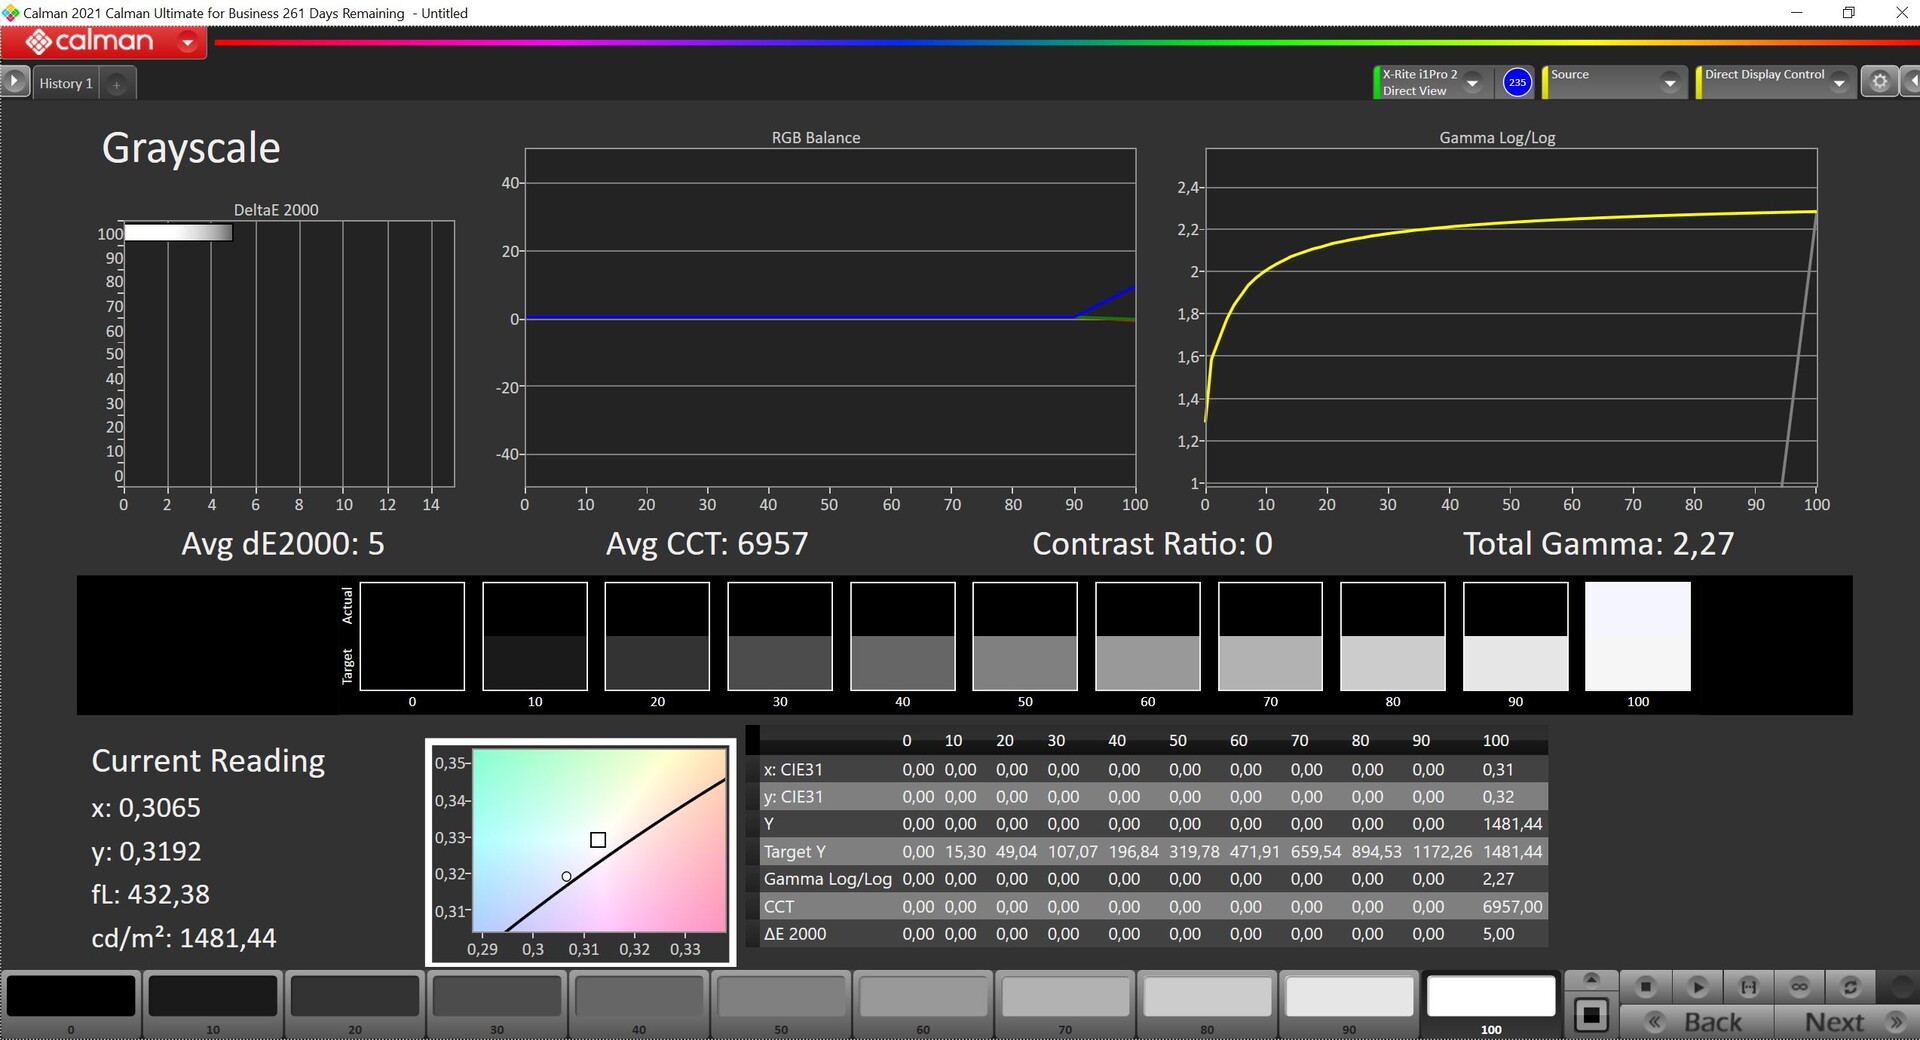
After we criticized Apple for only specifying the HDR brightness in the technical data for the last model, this has now been corrected. The HDR brightness is still specified as 1,600 cd/m² or 1,000 cd/m² for full-screen images. We measured a maximum of 1,481 cd/m² on the new MacBook Pro 14 2023 and 1,082 cd/m² on an almost completely white image.
While Apple's technology prevents backlight bleeding or halos, you can still see clear blooming on dark backgrounds with bright objects, such as the mouse pointer. A small bright cloud appears around the bright object.
| |||||||||||||||||||||||||
Brightness Distribution: 94 %
Center on Battery: 500 cd/m²
Contrast: 25000:1 (Black: 0.02 cd/m²)
ΔE ColorChecker Calman: 1.2 | ∀{0.5-29.43 Ø4.73}
ΔE Greyscale Calman: 1.7 | ∀{0.09-98 Ø4.97}
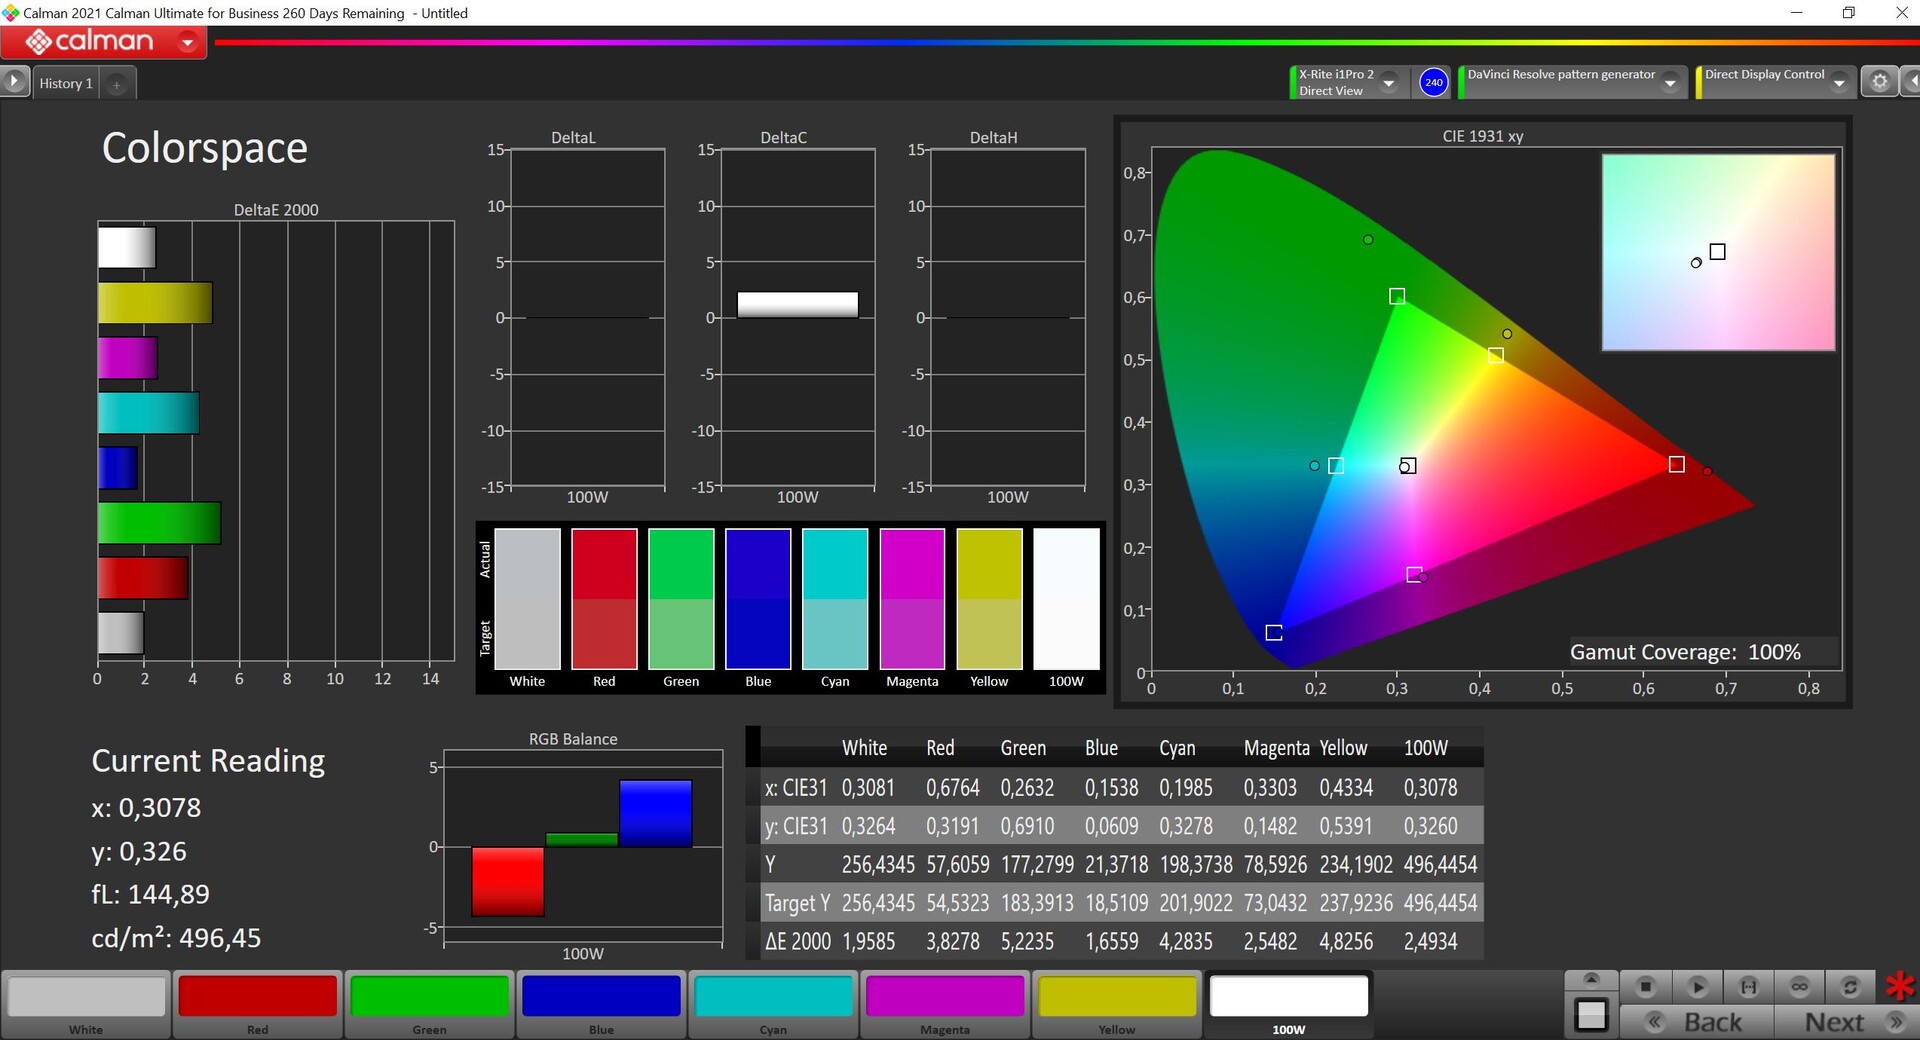
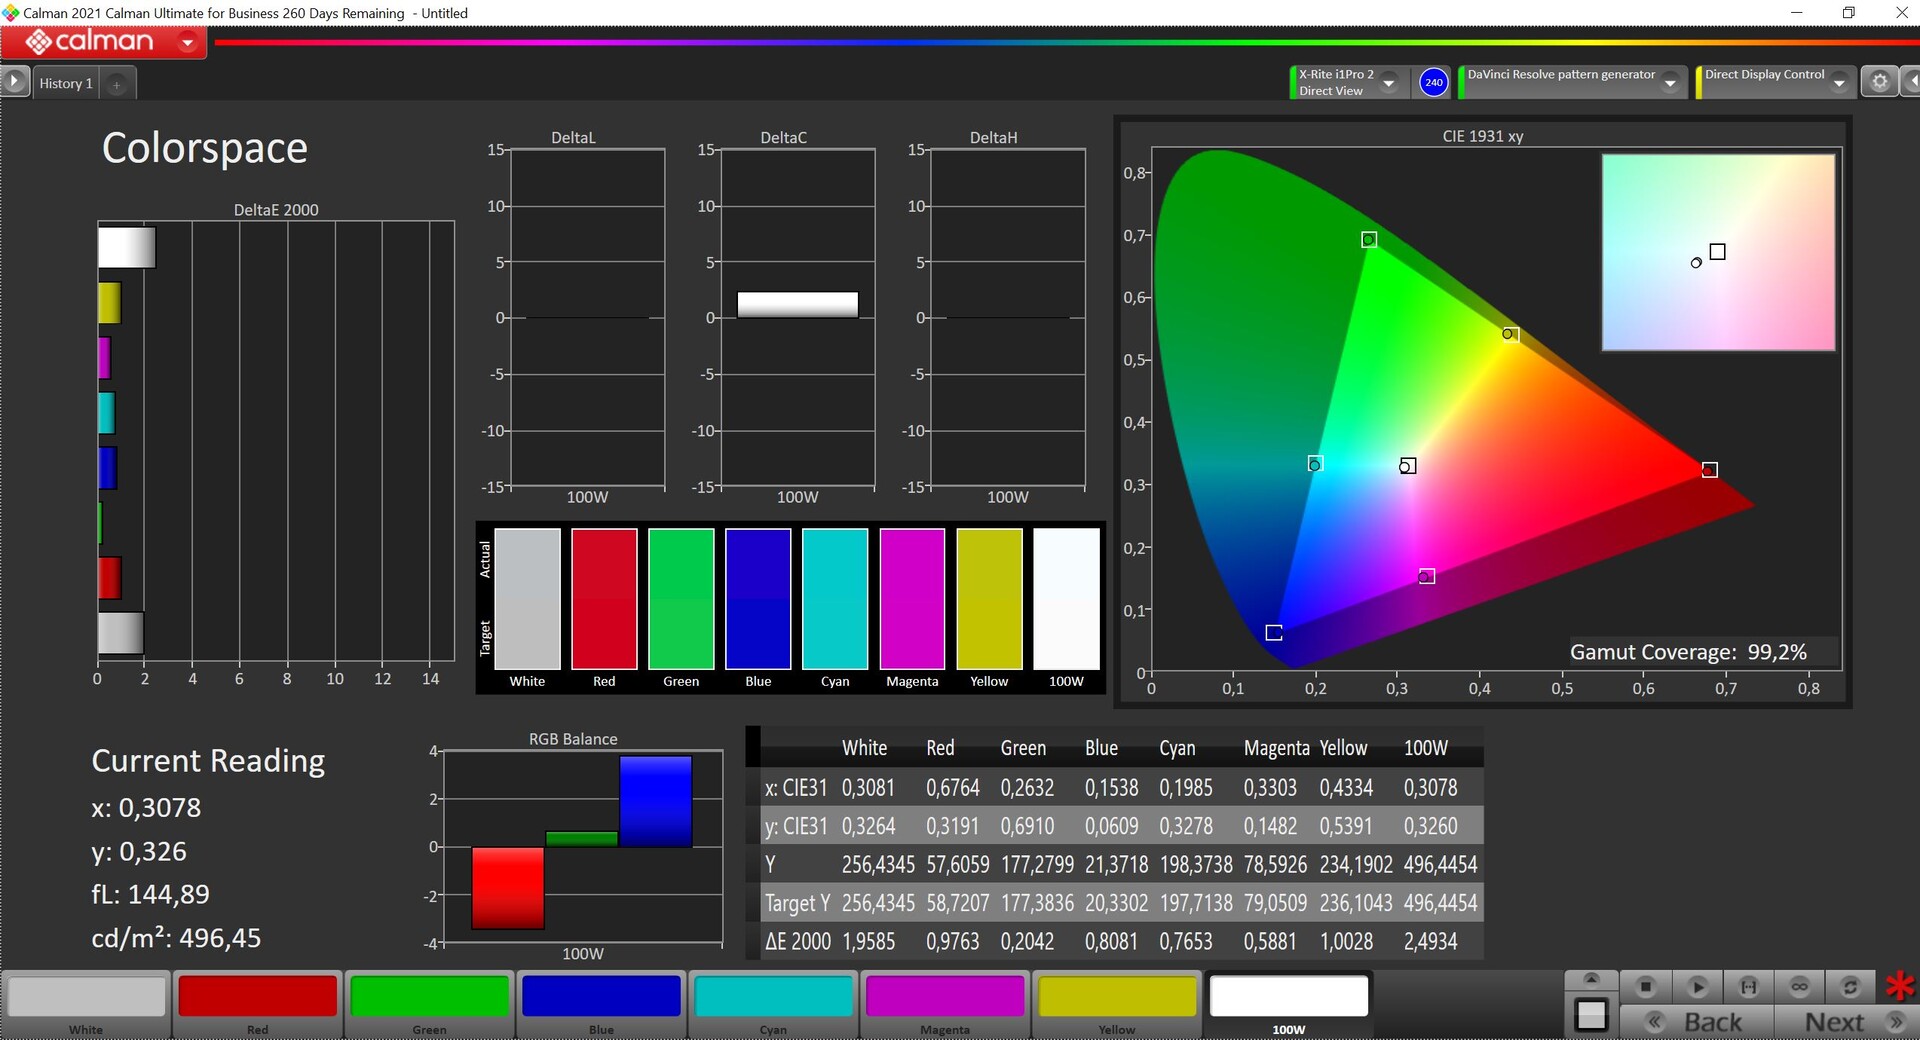
99.2% Display P3 (Argyll 3D)
Gamma: 2.24
CCT: 6791 K
| Apple MacBook Pro 14 2023 M2 Pro Mini-LED, 3024x1964, 14.2" | Apple MacBook Pro 14 2021 M1 Pro Entry Mini-LED, 3024x1964, 14.2" | Apple MacBook Pro 13 2022 M2 IPS, 2560x1600, 13.3" | Lenovo Yoga Slim 7 Pro X 14IAH7 82TK006CGE MNE507ZA1-1, IPS, 3072x1920, 14.5" | Microsoft Surface Laptop Studio i7 RTX 3050 Ti LQ144P1JX01, IPS, 2400x1600, 14.4" | Razer Blade 14 Ryzen 9 6900HX TL140BDXP02-0, IPS, 2560x1440, 14" | Schenker Vision 14 2022 RTX 3050 Ti MNE007ZA1-1, IPS, 2880x1800, 14" | |
|---|---|---|---|---|---|---|---|
| Display | 0% | 0% | -34% | -19% | -2% | -25% | |
| Display P3 Coverage (%) | 99.2 | 99.3 0% | 98.8 0% | 65.7 -34% | 80.6 -19% | 97.2 -2% | 74.1 -25% |
| sRGB Coverage (%) | 100 | 92.1 | 99.9 | 99.9 | 97.4 | ||
| AdobeRGB 1998 Coverage (%) | 87.9 | 67.7 | 78.5 | 85.7 | 75.3 | ||
| Response Times | -60% | -12% | 9% | -29% | 47% | 28% | |
| Response Time Grey 50% / Grey 80% * (ms) | 35.2 ? | 58.4 ? -66% | 42 ? -19% | 35 ? 1% | 58.4 ? -66% | 16.8 ? 52% | 31.5 ? 11% |
| Response Time Black / White * (ms) | 26.4 ? | 40.4 ? -53% | 27.8 ? -5% | 22 ? 17% | 24 ? 9% | 15.2 ? 42% | 14.5 ? 45% |
| PWM Frequency (Hz) | 14880 ? | 14880 | 117780 ? | 5000 ? | |||
| Screen | 33% | -191% | -171% | -183% | -250% | -234% | |
| Brightness middle (cd/m²) | 500 | 489 -2% | 514 3% | 430 -14% | 497 -1% | 354 -29% | 421 -16% |
| Brightness (cd/m²) | 489 | 479 -2% | 497 2% | 408 -17% | 491 0% | 328 -33% | 416 -15% |
| Brightness Distribution (%) | 94 | 94 0% | 93 -1% | 85 -10% | 92 -2% | 86 -9% | 89 -5% |
| Black Level * (cd/m²) | 0.02 | 0.01 50% | 0.31 -1450% | 0.29 -1350% | 0.29 -1350% | 0.37 -1750% | 0.28 -1300% |
| Contrast (:1) | 25000 | 48900 96% | 1658 -93% | 1483 -94% | 1714 -93% | 957 -96% | 1504 -94% |
| Colorchecker dE 2000 * | 1.2 | 0.8 33% | 1.1 8% | 0.7 42% | 1.2 -0% | 1.66 -38% | 3.2 -167% |
| Colorchecker dE 2000 max. * | 2.6 | 1.3 50% | 2.3 12% | 1.3 50% | 2.8 -8% | 3.83 -47% | 5.5 -112% |
| Greyscale dE 2000 * | 1.7 | 1.1 35% | 1.8 -6% | 1.3 24% | 1.9 -12% | 1.6 6% | 4.4 -159% |
| Gamma | 2.24 98% | 2.24 98% | 2.23 99% | 2.22 99% | 2.14 103% | 2.23 99% | 2.22 99% |
| CCT | 6791 96% | 6764 96% | 6526 100% | 6821 95% | 6542 99% | 6384 102% | |
| Colorchecker dE 2000 calibrated * | 0.6 | 0.4 | 0.8 | 2 | |||
| Total Average (Program / Settings) | -9% /
13% | -68% /
-141% | -65% /
-126% | -77% /
-140% | -68% /
-173% | -77% /
-167% |
* ... smaller is better
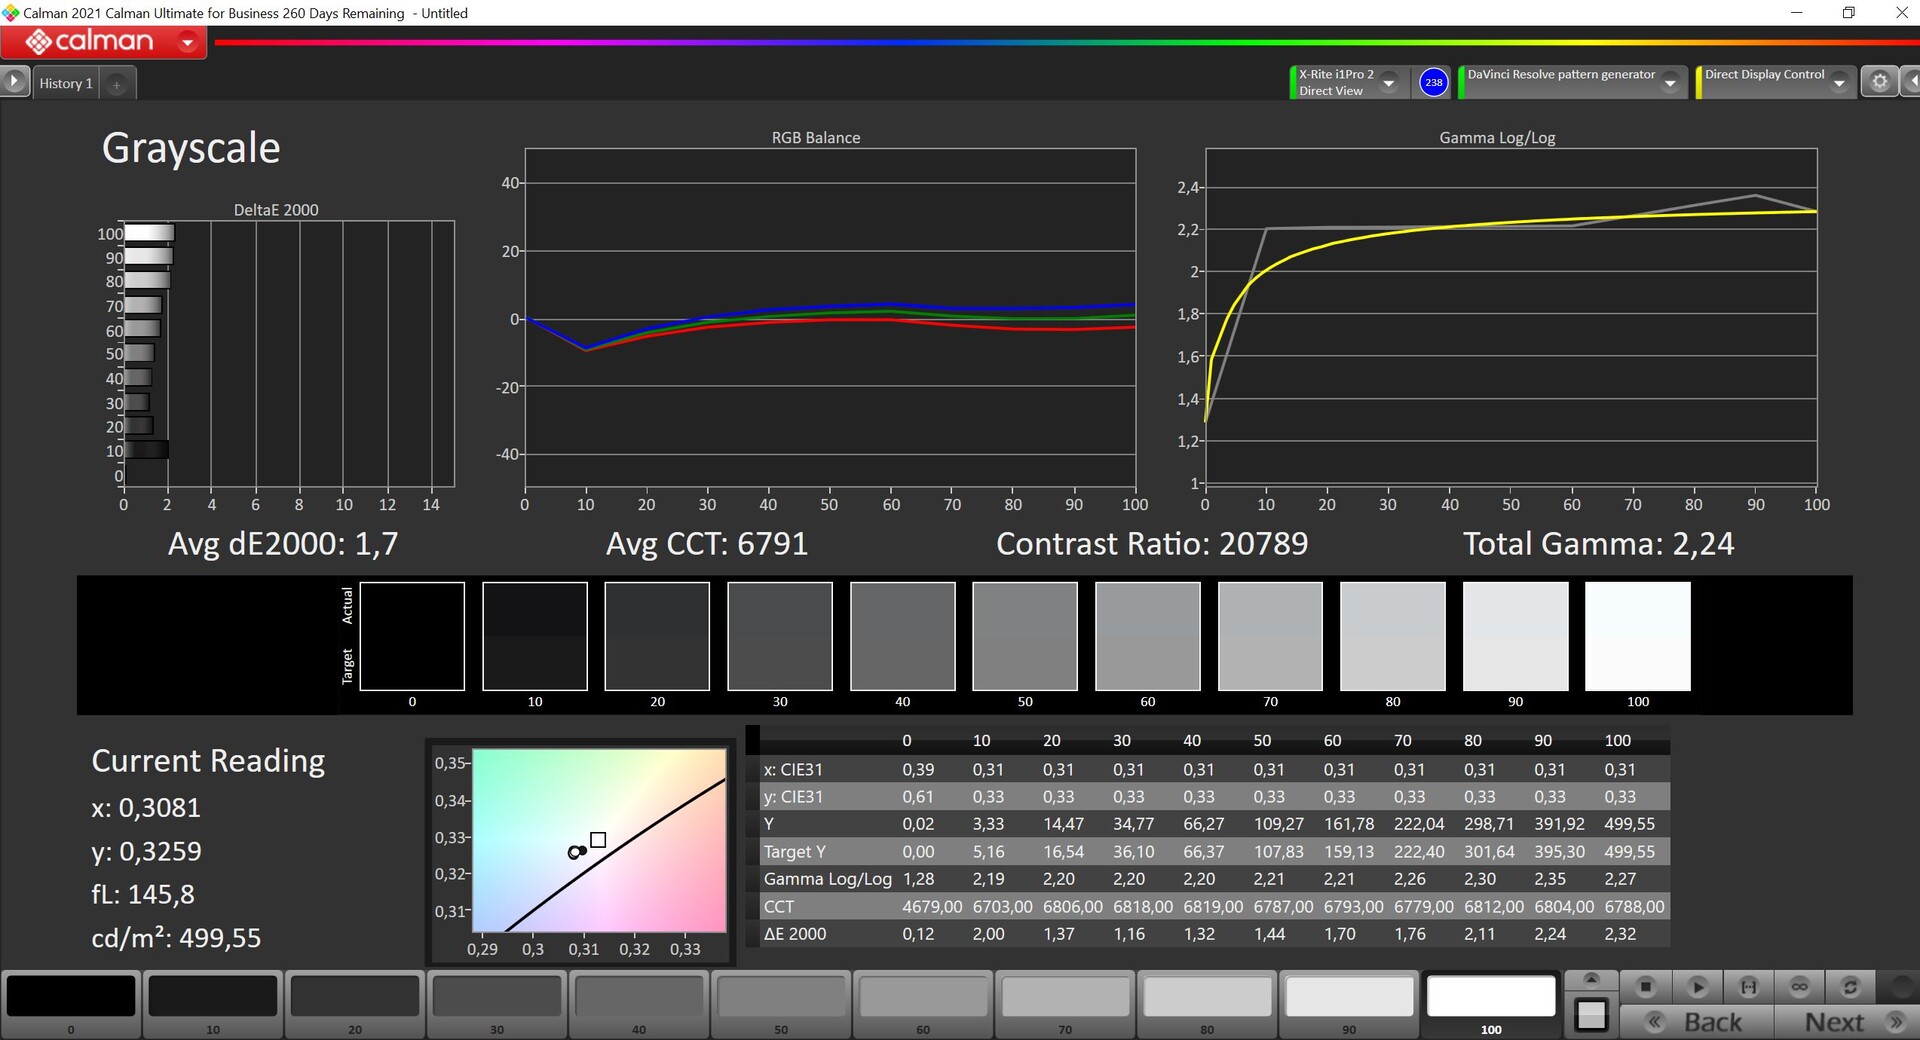
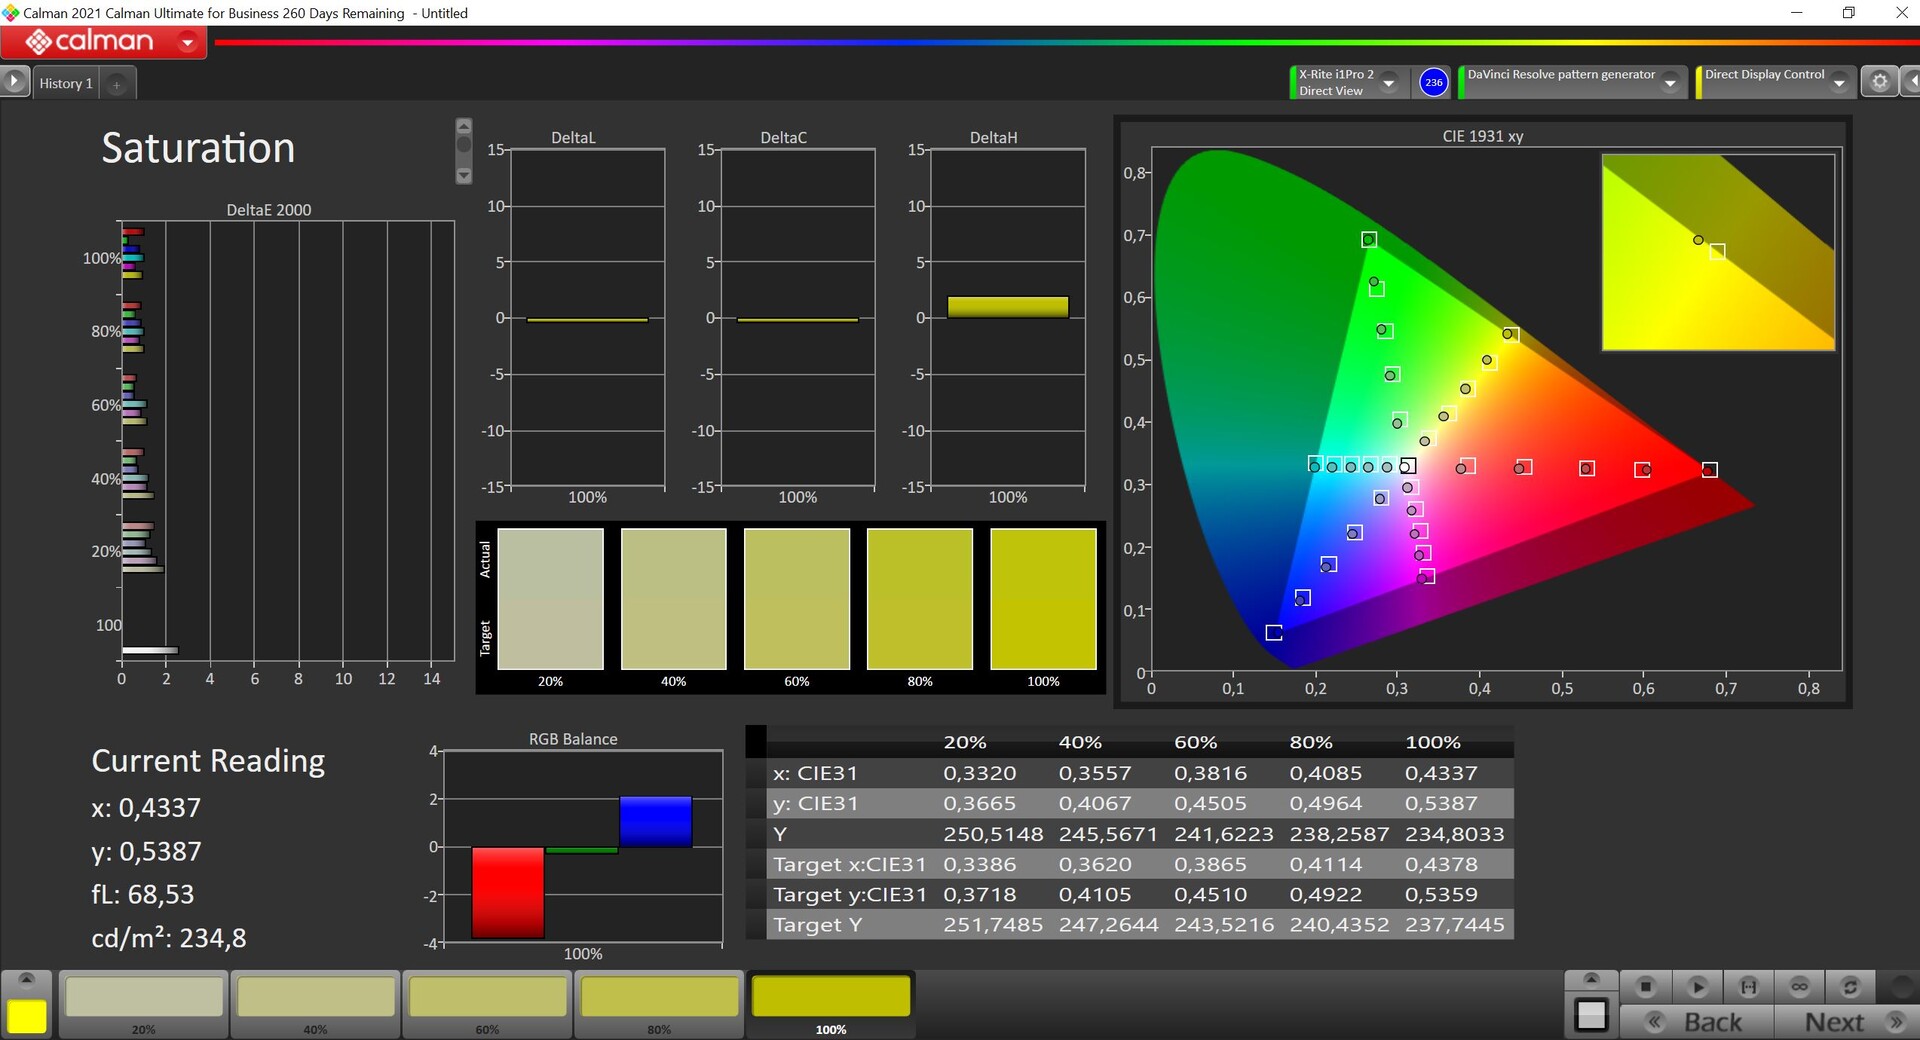
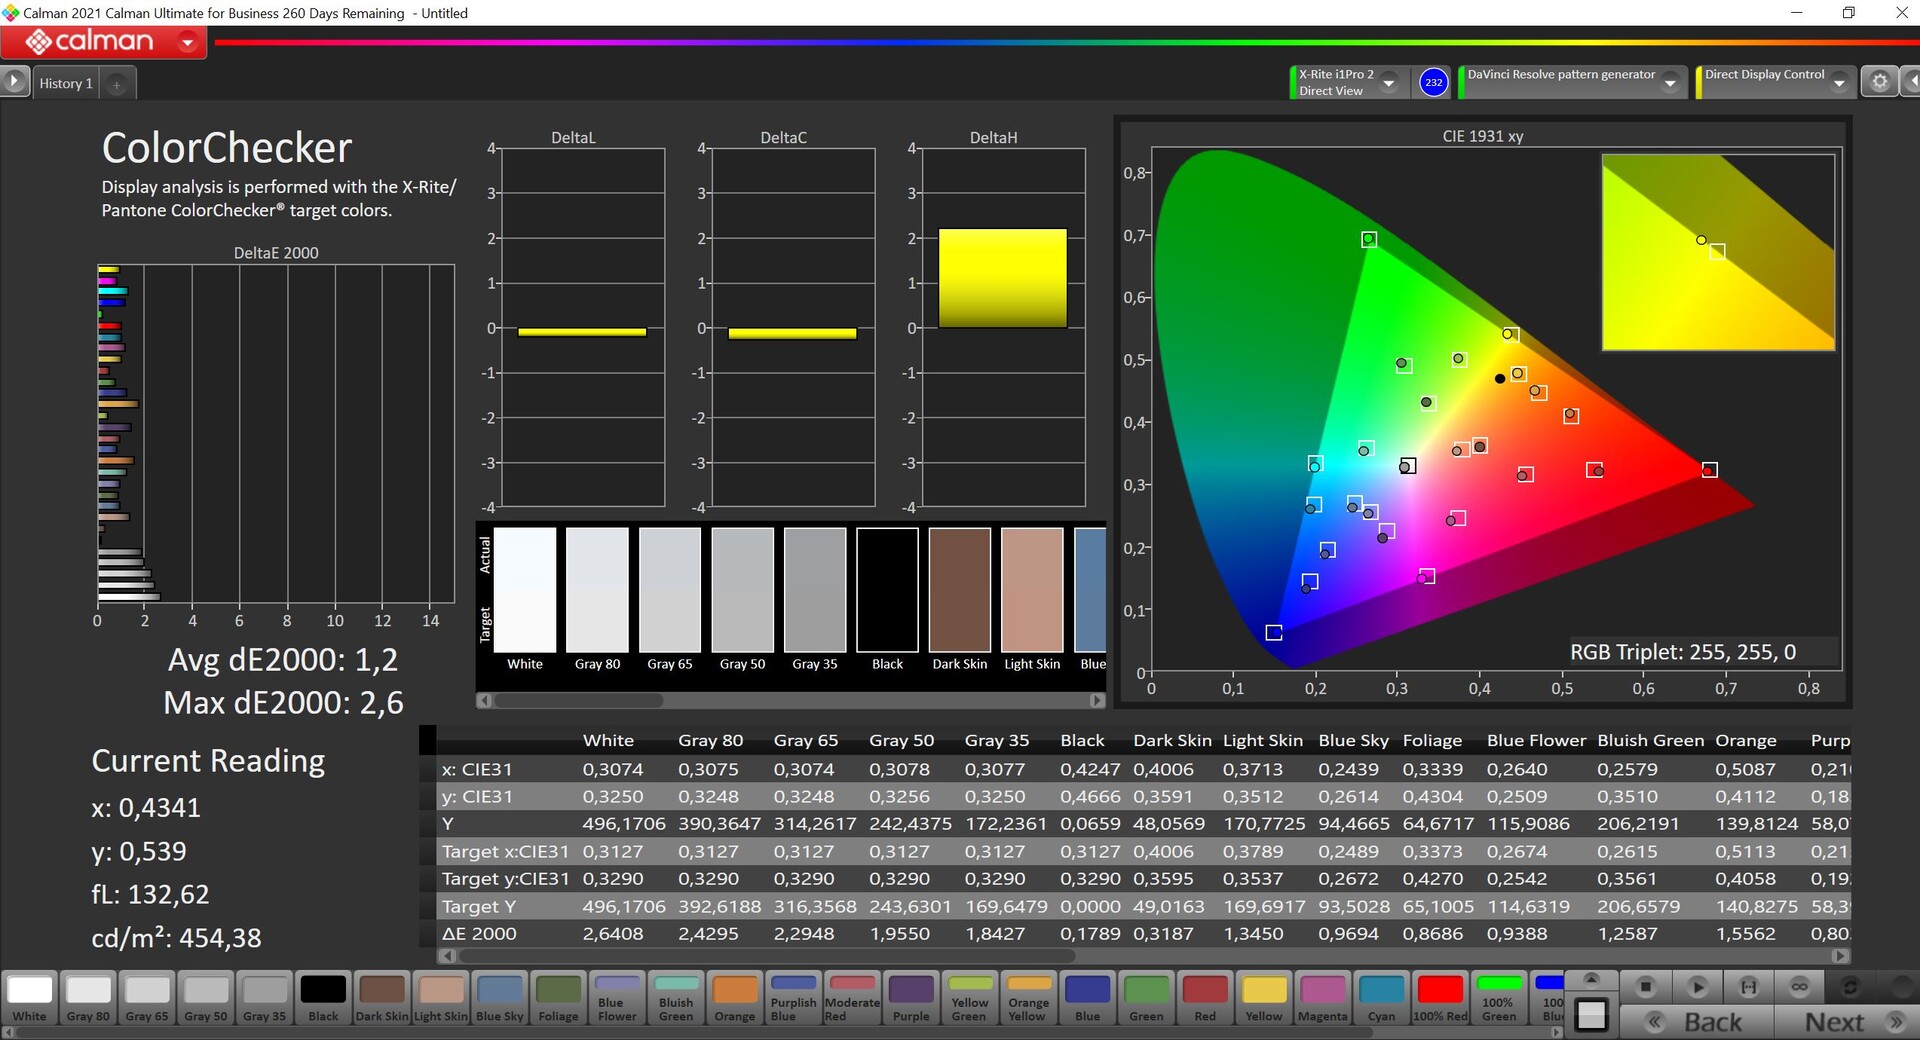
The display's factory calibration is very good and there are no major deviations from the P3 reference color space, neither in grayscale nor in color. A subsequent calibration is therefore not absolutely necessary, even if the color temperature is slightly too cool. As with the previous Pro models, we were unable to calibrate the display and thus cannot provide a profile at this point. The P3 color space is completely covered.
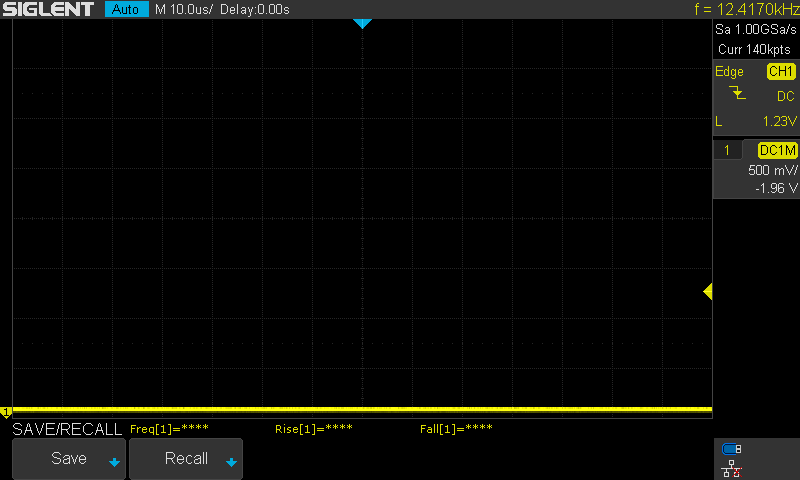
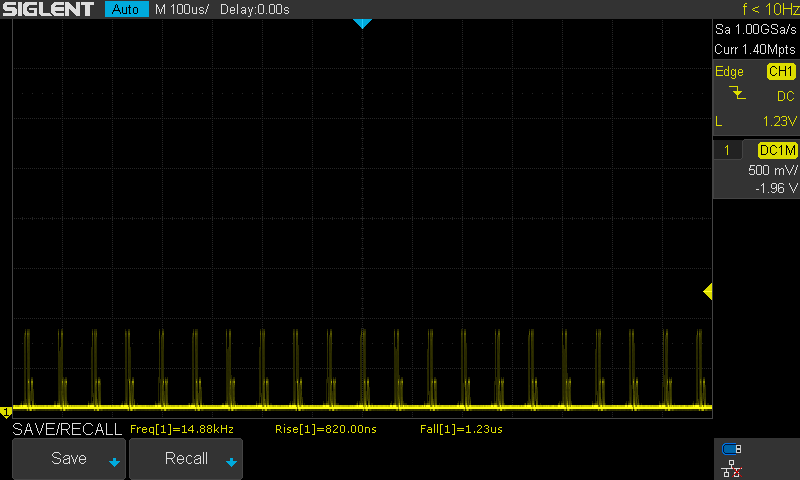
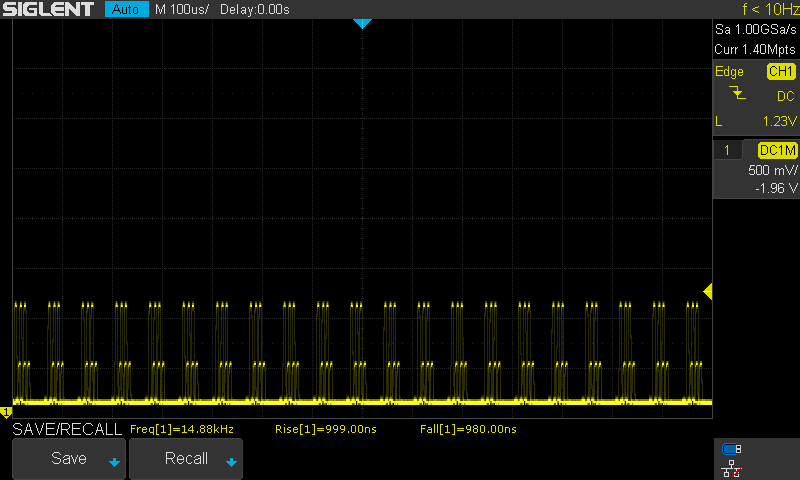
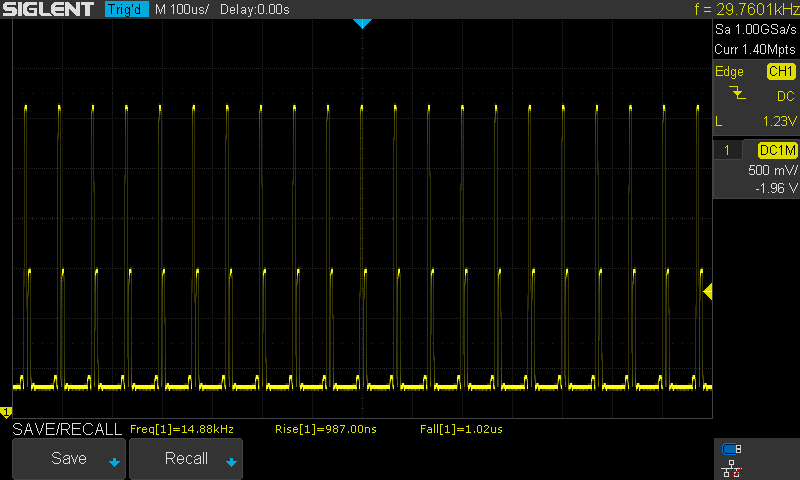
The mini LED display continues to use PWM for regulating brightness. This is measurable over the entire brightness range in normal SDR mode and uses a very high frequency of 14.88 kHz. This should reduce the amount of people affected by flickering. Even if we increase the brightness via the Vivid app, the brightness is controlled through PWM. At maximum brightness with Vivid, on the other hand, the frequency shifts to an even higher 40 KHz. The amplitude (i.e. differences in brightness) per change is relatively high.
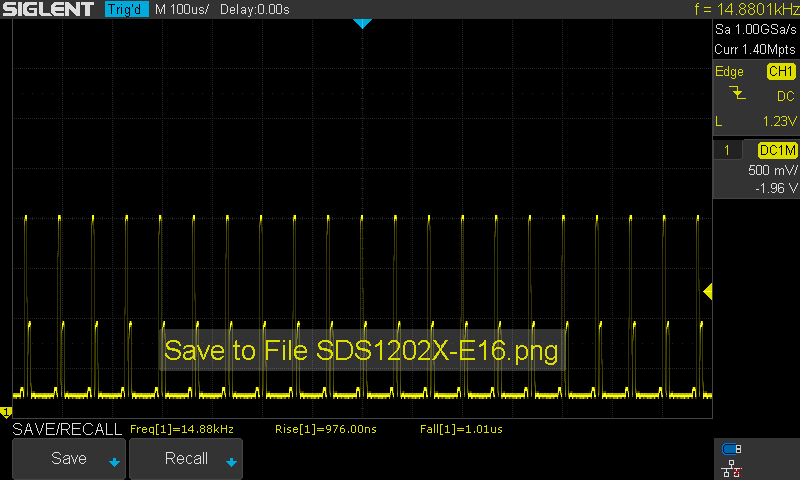
Screen Flickering / PWM (Pulse-Width Modulation)
| Screen flickering / PWM detected | 14880 Hz | ≤ 100 % brightness setting | 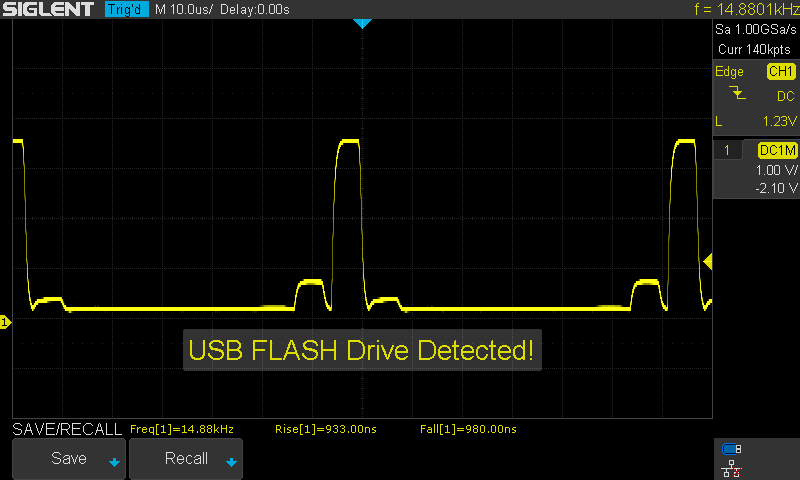 |
| ≤ 500 cd/m² brightness | |||
The display backlight flickers at 14880 Hz (worst case, e.g., utilizing PWM) Flickering detected at a brightness setting of 100 % (500 cd/m²) and below. There should be no flickering or PWM above this brightness setting. The frequency of 14880 Hz is quite high, so most users sensitive to PWM should not notice any flickering. Flickering occurs even at high brightness setting and may have an effect on the user during everyday use. In comparison: 52 % of all tested devices do not use PWM to dim the display. If PWM was detected, an average of 7794 (minimum: 5 - maximum: 343500) Hz was measured. | |||
Measuring the exact times of the display's response times is difficult due to the PWM control and we can only thus give an approximation. The progress curve in the black-on-white test is curiously odd. Here, the brightness increases in several steps and is only "normal" at reduced brightness. The measured values are more in the lower midfield and cannot keep up with fast OLED displays.
Display Response Times
| ↔ Response Time Black to White | ||
|---|---|---|
| 26.4 ms ... rise ↗ and fall ↘ combined | ↗ 11.2 ms rise | 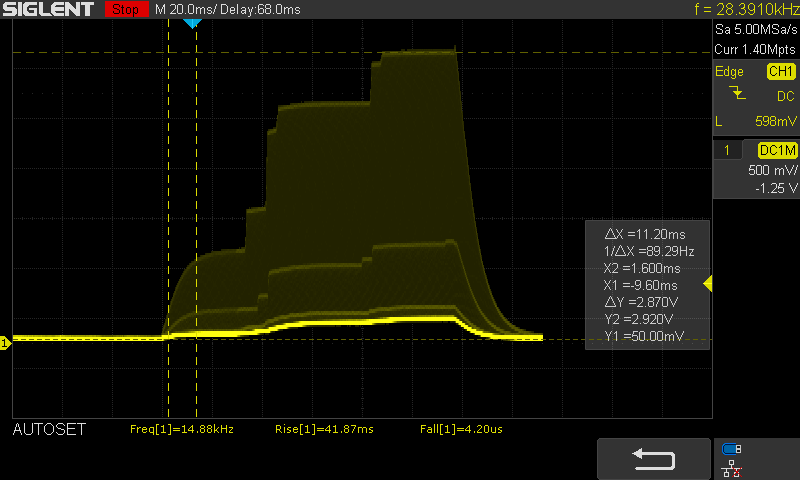 |
| ↘ 15.2 ms fall | ||
| The screen shows relatively slow response rates in our tests and may be too slow for gamers. In comparison, all tested devices range from 0.1 (minimum) to 240 (maximum) ms. » 66 % of all devices are better. This means that the measured response time is worse than the average of all tested devices (19.9 ms). | ||
| ↔ Response Time 50% Grey to 80% Grey | ||
| 35.2 ms ... rise ↗ and fall ↘ combined | ↗ 12.8 ms rise | 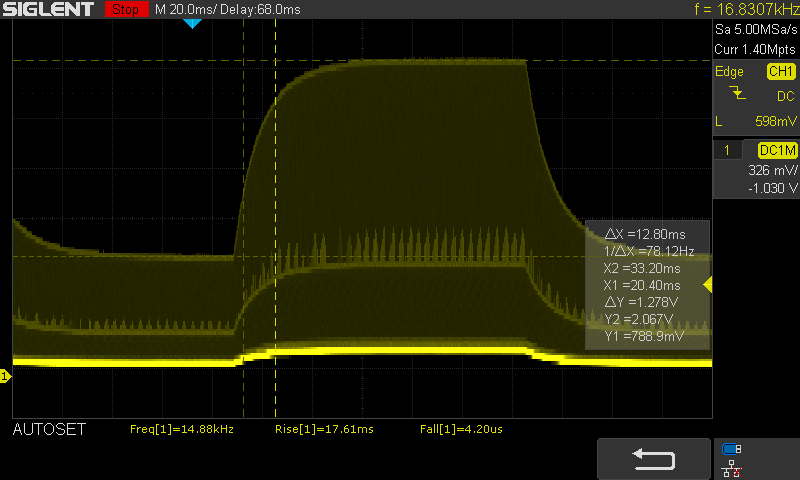 |
| ↘ 22.4 ms fall | ||
| The screen shows slow response rates in our tests and will be unsatisfactory for gamers. In comparison, all tested devices range from 0.165 (minimum) to 636 (maximum) ms. » 49 % of all devices are better. This means that the measured response time is worse than the average of all tested devices (31.1 ms). | ||
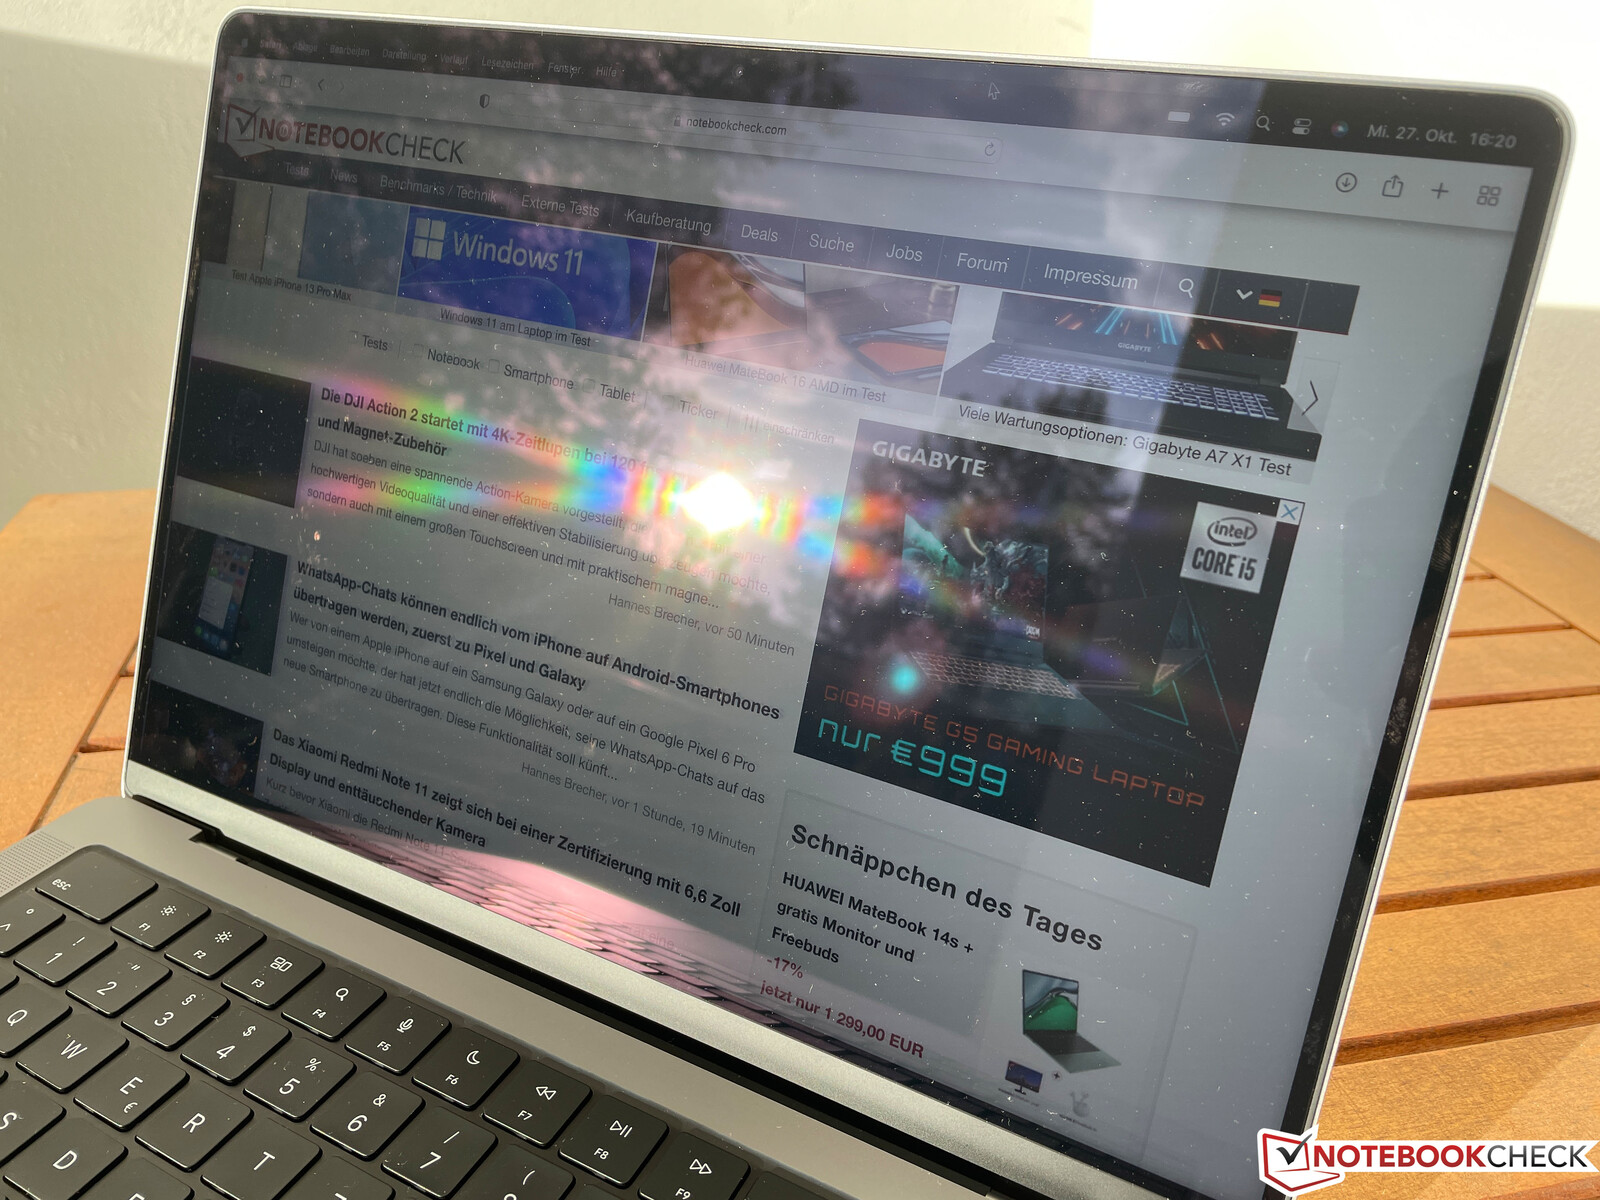
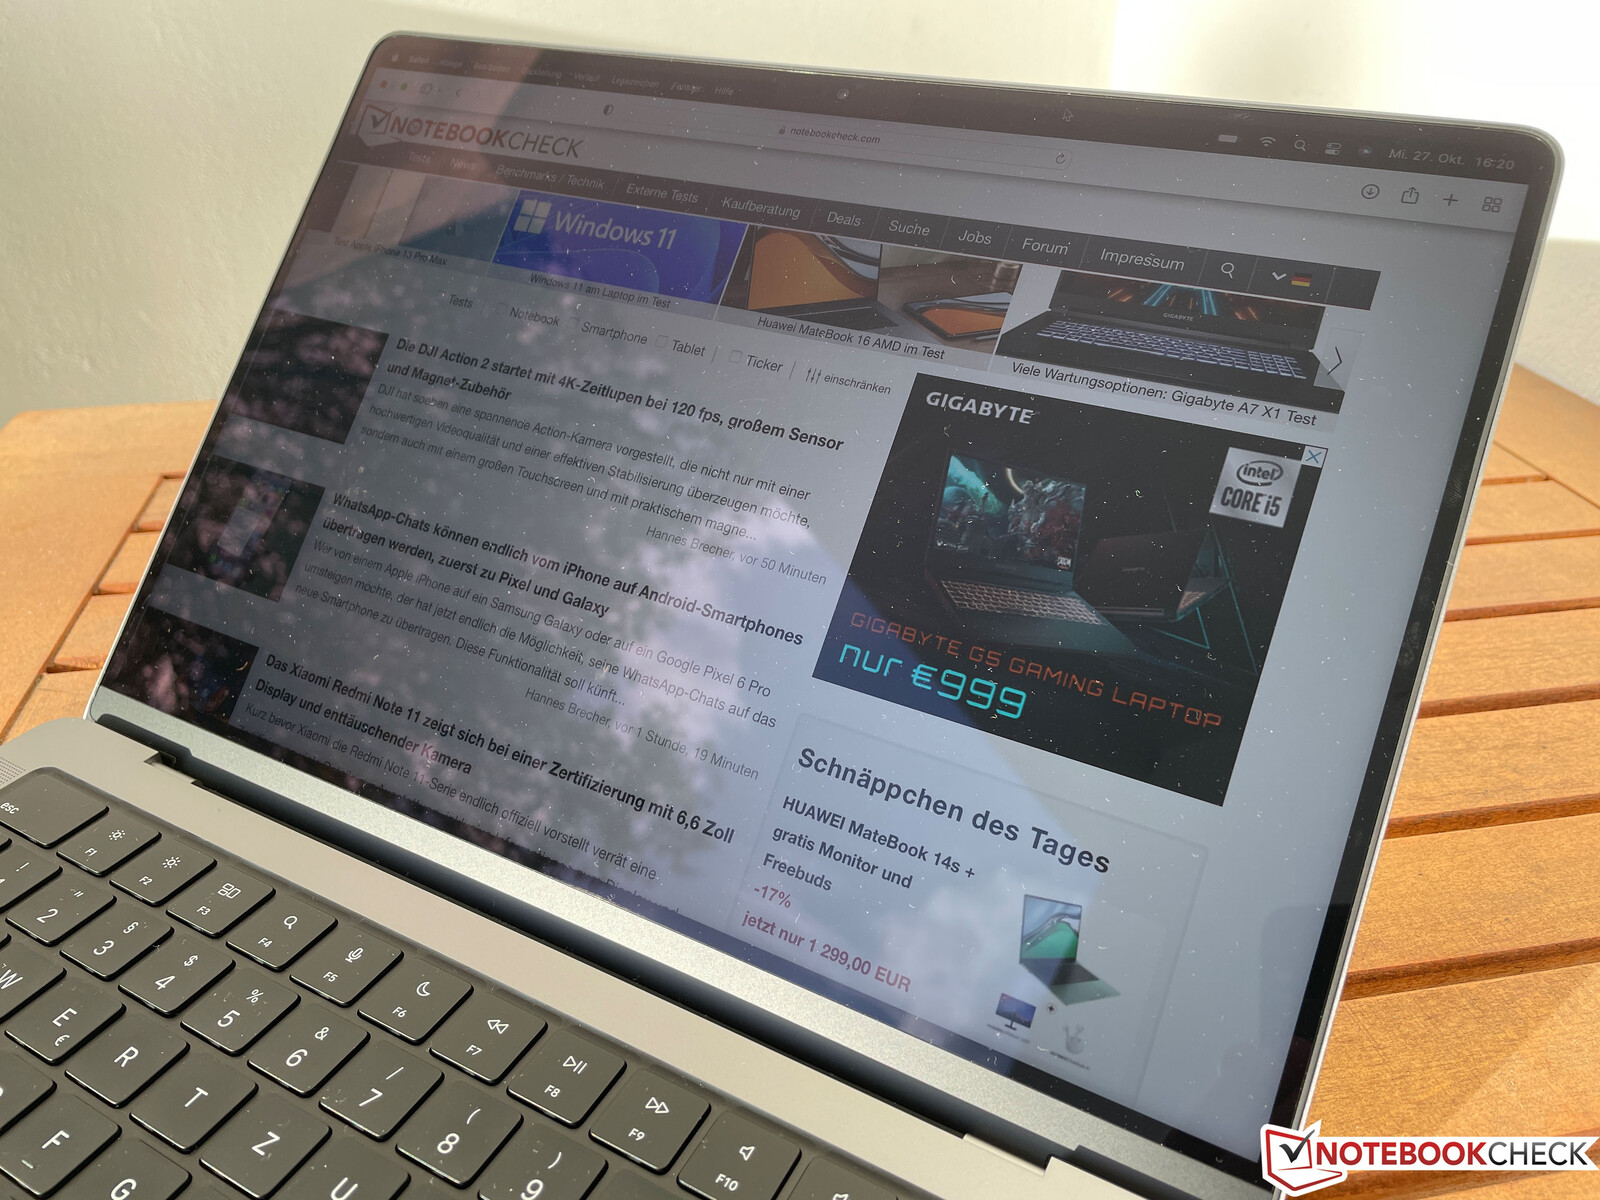
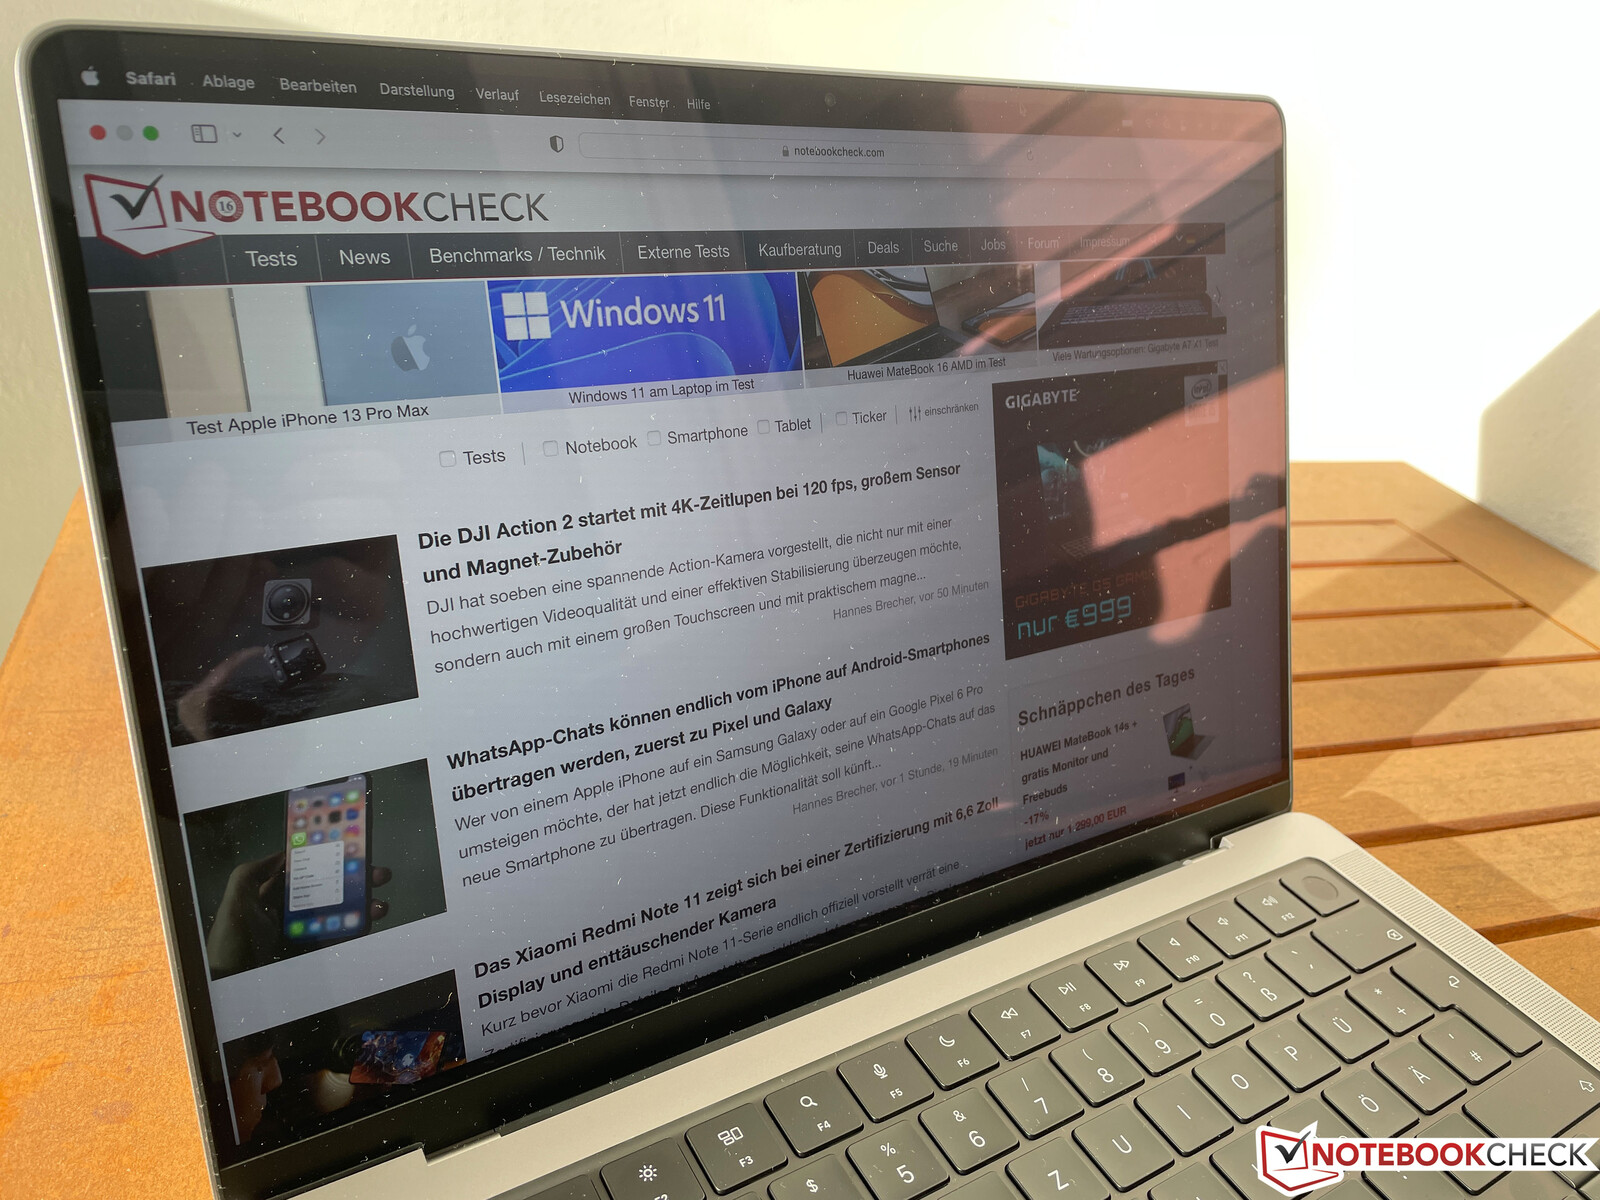
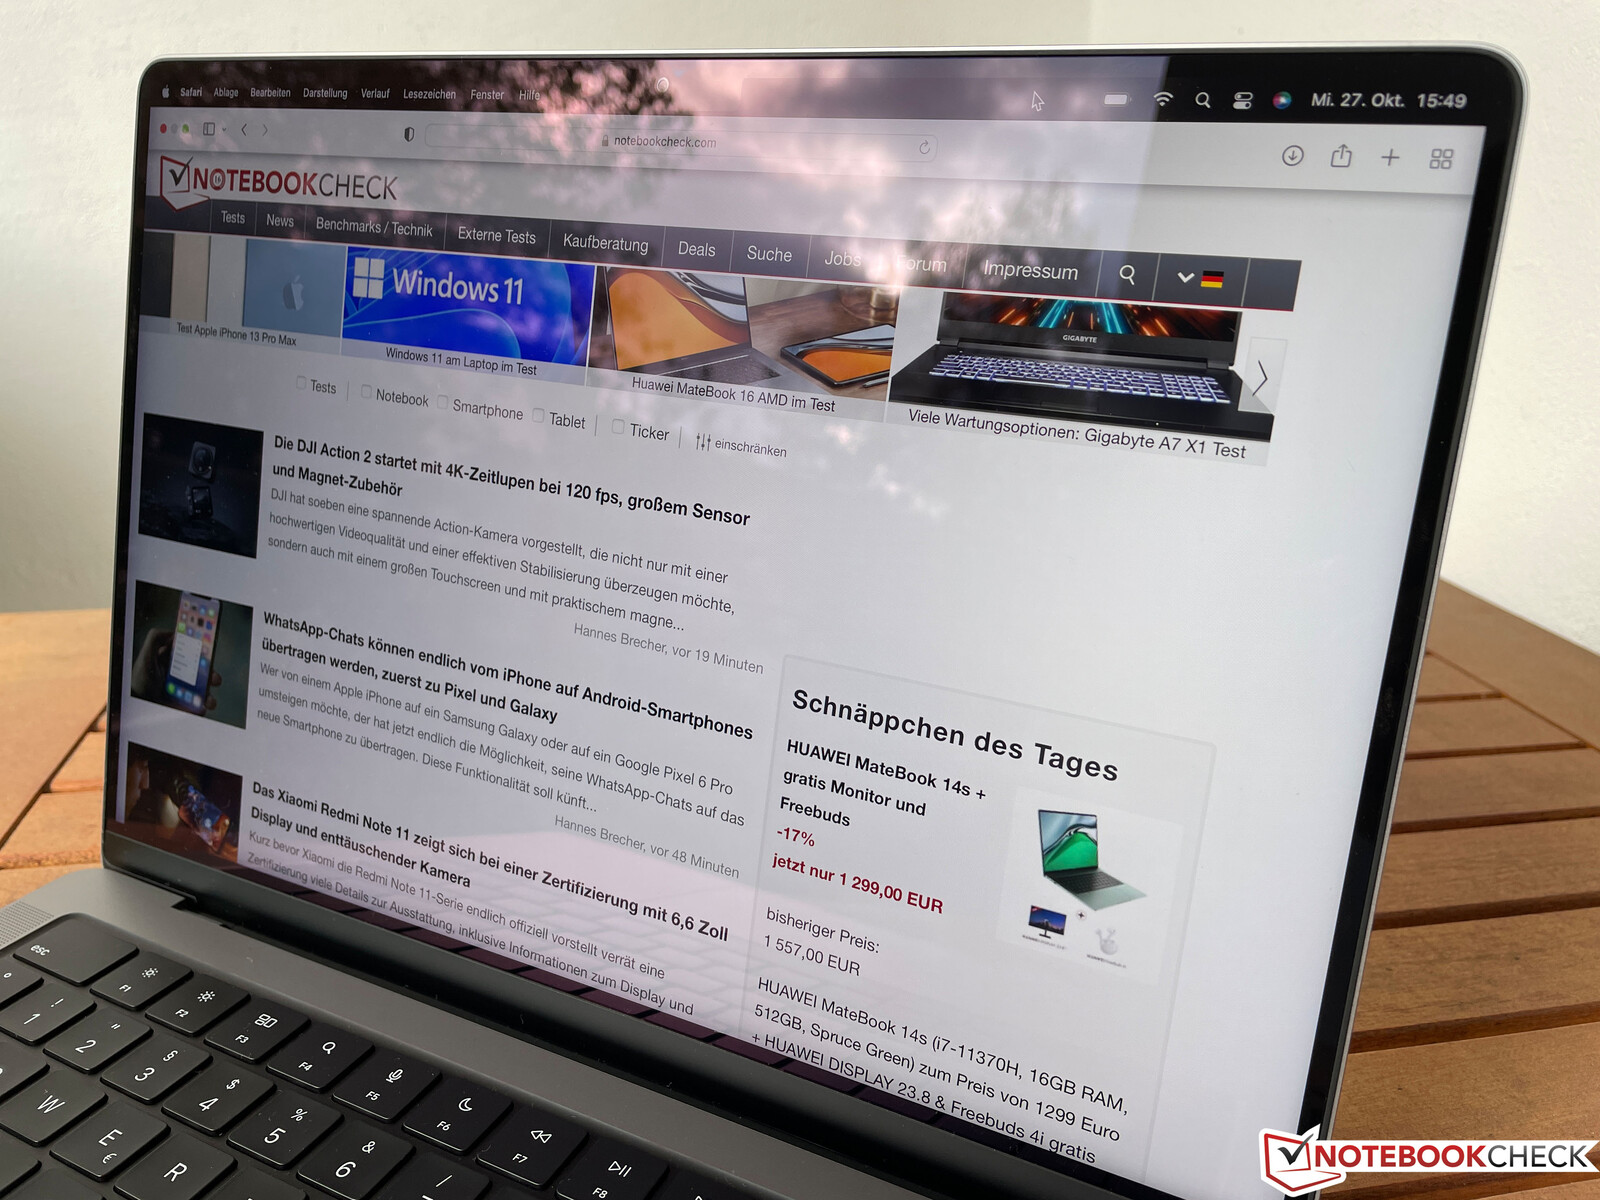
Unfortunately, the weather forbids us from take outdoor photos under bright skies or in sunshine at present, which is why we are using previous photos from the MacBook Pro 14 2021 for the time being. Basically, the MBP's display is not as reflective as most Windows devices, and the good brightness and extremely high contrast ratio naturally also help here. As long as you can avoid direct reflections, the MacBook works well in bright environments. If you need more than 500 nits of brightness, you can also use the Vivid app, for example, which allows you to achieve ~1,000-1,100 nits in full-screen mode, even in SDR mode. The viewing angle stability of the mini LED panel is also very good.

Performance - M2 Pro with more efficiency cores

The new M2 Pro- and M2 Max SoCs are improved iterations of the previous chips and are manufactured in an improved 5 nm process (N5P), but nothing has changed in the basic architecture. The M2 chip, introduced together with the MacBook Air last year, already hinted as to where things were going. The number of performance cores is the same, but there are two additional efficiency cores (4 in total). The MacBook Pro 14 also continues to be offered as a slimmed-down model with 6 performance cores and a 16-core GPU, while the full M2 Pro with 12 CPU cores (8P + 4E) is standard only in the large MacBook Pro 16.
The following increases in surcharge from the basic model (US$1999.00) were calculated according to the official prices listed in Apple's online store in the USA. Differences in price (and thus surcharge) may be smaller or greater in other countries or at other online retailers.
| SoC | CPU cores | GPU cores | RAM | surcharge |
|---|---|---|---|---|
| M2 Pro | 4 efficiency cores & 6 performance cores | 16 | 16 or 32 GB | |
| M2 Pro | 4 efficiency cores & 8 performance cores | 19 | 16 or 32 GB | US$500 |
| M2 Max | 4 efficiency cores & 8 performance cores | 30 | 32, 64 or 96 GB | US$1,100 |
| M2 Max | 4 efficiency cores & 8 performance cores | 38 | 32, 64 or 96 GB | US$1,500 |
As with the last generation, CPU performance is almost identical, but the new M2 chips now support single-core boost. The efficiency cores reach a maximum of 2,424 MHz and the performance cores a maximum of 3,264 MHz in multi-core operation. In single-core operation, the P-cores are able to reach up to 3,504 MHz on the M2 Pro and even up to 3,696 MHz on the M2 Max.
The big difference between the M2 Pro and M2 Max is once again the integrated graphics card, which now also has significantly more cores. Moreover, Apple has increased the maximum possible size of the shared RAM to 96 GB. Despite the increased base price, the upgrades have also become more expensive. The RAM prices in particular are considerable: an upgrade from 16 to 32 GB RAM will set you back US$400. So if you want the M2 Max, you'll have to pay US$1,100 more than the basic model. The surcharges for the SSDs also remain extremely high (for example, US$200 from 512 GB to 1 TB), considering that a fast PCIe 4.0 SSD in M.2 format is already available for around US$120. For a MacBook Pro 14 2023 in maximum configuration with the M2 Max, 96 GB RAM and 8 TB SSD storage, the final price is US$6,798.98.
Processor - M2 Pro with 12 CPU cores
The M2 Pro in our review device offers an efficiency cluster of 4 cores and two performance clusters of 4 cores each, so a total of 12 cores and 12 threads. In the old M1 Pro with 8 P cores, we measured a consumption of 27 watts and 31 watts for the CPU cores at full load. In the new M2 Pro, the CPU now consumes 34 watts, although the internal powermetrics utility no longer displays the package power. Based on pure CPU consumption, we see a 25% higher consumption under maximum load. The efficiency of the new SoCs will be discussed in further detail in a separate article.
In short, Apple has been able to increase performance. In native benchmarks such as Cinebench R23, single-core performance is now around 7% faster than the old M1 Pro/M1 Max and 4% faster than the M2 in the MacBook Pro 13. Geekbench shows an 11% lead over the M1 Pro, while the M2 is practically on par. Single-core consumption has increased from around 4 watts to around 6-7 watts.
In the multi-core tests, we see a 20% lead over the M1 Pro, which Apple also advertises. The lead over the normal M2 processor even almost reaches 70% here.
In native Cinebench R23 tests, the new M2 Pro also easily keeps the Intel Core i7-12700H in check when running at 64 watts, like in the Lenovo Yoga Slim 7i Pro. However, the Core i7 still has a slight advantage in the single-core test, but when you consider that the performance core of the Core i7 needs around 23 watts for this and the M2 Pro just a little more than 6-7 watts, this is very impressive. The new MacBook Pro 14 also clearly outshines the AMD Ryzen 9 6900HX processor in the Razer Blade 14.
Cinebench R15 Multi Sustained Load
Although the results in Cinebench R15 are not representative, since the benchmark has to be emulated, the multi-loop still gives a good indication of CPU performance under sustained load. Here, the MacBook Pro 14 does not show any weaknesses and can easily maintain its performance without issue.
This also applies to battery operation, where CPU performance remains completely stable (even at low battery levels, consumption only drops to 3 watts at 3%). More CPU benchmarks are available in our tech section.
Cinebench R20: CPU (Multi Core) | CPU (Single Core)
Cinebench R15: CPU Multi 64Bit | CPU Single 64Bit
Geekbench 5.5: Multi-Core | Single-Core
LibreOffice : 20 Documents To PDF
Blender: v3.3 Classroom CPU
| Cinebench R20 / CPU (Multi Core) | |
| Average of class Multimedia (1887 - 12912, n=64, last 2 years) | |
| Schenker Vision 14 2022 RTX 3050 Ti | |
| Razer Blade 14 Ryzen 9 6900HX | |
| Lenovo Yoga Slim 7 Pro X 14IAH7 82TK006CGE | |
| Apple MacBook Pro 14 2023 M2 Pro | |
| Average Apple M2 Pro (4018 - 4044, n=2) | |
| Apple MacBook Pro 14 2021 M1 Max 24-Core GPU | |
| Apple MacBook Pro 16 2021 M1 Pro | |
| Microsoft Surface Laptop Studio i7 RTX 3050 Ti | |
| Apple MacBook Pro 13 2022 M2 | |
| Cinebench R20 / CPU (Single Core) | |
| Average of class Multimedia (425 - 853, n=64, last 2 years) | |
| Schenker Vision 14 2022 RTX 3050 Ti | |
| Lenovo Yoga Slim 7 Pro X 14IAH7 82TK006CGE | |
| Razer Blade 14 Ryzen 9 6900HX | |
| Microsoft Surface Laptop Studio i7 RTX 3050 Ti | |
| Apple MacBook Pro 14 2023 M2 Pro | |
| Average Apple M2 Pro (446 - 447, n=2) | |
| Apple MacBook Pro 14 2021 M1 Max 24-Core GPU | |
| Apple MacBook Pro 16 2021 M1 Pro | |
| Apple MacBook Pro 13 2022 M2 | |
| Cinebench R15 / CPU Multi 64Bit | |
| Average of class Multimedia (856 - 5224, n=68, last 2 years) | |
| Lenovo Yoga Slim 7 Pro X 14IAH7 82TK006CGE | |
| Razer Blade 14 Ryzen 9 6900HX | |
| Schenker Vision 14 2022 RTX 3050 Ti | |
| Apple MacBook Pro 14 2023 M2 Pro | |
| Average Apple M2 Pro (n=1) | |
| Apple MacBook Pro 16 2021 M1 Pro | |
| Apple MacBook Pro 14 2021 M1 Max 24-Core GPU | |
| Apple MacBook Pro 13 2022 M2 | |
| Microsoft Surface Laptop Studio i7 RTX 3050 Ti | |
| Cinebench R15 / CPU Single 64Bit | |
| Average of class Multimedia (184.8 - 326, n=66, last 2 years) | |
| Schenker Vision 14 2022 RTX 3050 Ti | |
| Razer Blade 14 Ryzen 9 6900HX | |
| Lenovo Yoga Slim 7 Pro X 14IAH7 82TK006CGE | |
| Apple MacBook Pro 14 2023 M2 Pro | |
| Average Apple M2 Pro (n=1) | |
| Microsoft Surface Laptop Studio i7 RTX 3050 Ti | |
| Apple MacBook Pro 13 2022 M2 | |
| Apple MacBook Pro 14 2021 M1 Max 24-Core GPU | |
| Apple MacBook Pro 16 2021 M1 Pro | |
| LibreOffice / 20 Documents To PDF | |
| Microsoft Surface Laptop Studio i7 RTX 3050 Ti | |
| Razer Blade 14 Ryzen 9 6900HX | |
| Average of class Multimedia (23.9 - 146.7, n=64, last 2 years) | |
| Lenovo Yoga Slim 7 Pro X 14IAH7 82TK006CGE | |
| Schenker Vision 14 2022 RTX 3050 Ti | |
| Average Apple M2 Pro (n=1) | |
| Blender / v3.3 Classroom CPU | |
| Schenker Vision 14 2022 RTX 3050 Ti | |
| Average of class Multimedia (134.5 - 1042, n=68, last 2 years) | |
| Lenovo Yoga Slim 7 Pro X 14IAH7 82TK006CGE | |
| Apple MacBook Pro 14 2023 M2 Pro | |
| Average Apple M2 Pro (n=1) | |
* ... smaller is better
System Performance
The new MacBook Pro 14 M2 is an extremely fast and responsive machine, but this was also the case with the predecessor and you won't notice any difference between the two versions in everyday use. Performance is about 12% faster in the cross-platform CrossMark test, and performance is also excellent in the browser benchmarks.
For the sake of completeness, we again include the results of the PudgetBench tests for Adobe Photoshop and Premiere Pro, but the tests only run with the emulated Intel version of the applications. But if you start the applications for Apple Silicon, the speed advantage is immense and the Adobe apps run really well on the MacBooks. Basically, the Apple SoCs do an excellent job in image and video editing.
Blackmagic RAW Speed Test: 12:1 8K Metal | 12:1 8K CPU
Jetstream 2: 2.0 Total
Speedometer 2.0: Result 2.0
Mozilla Kraken 1.1: Total
WebXPRT 3: Overall
WebXPRT 4: Overall
Premiere Pro PugetBench: Overall Score 0.9
Photoshop PugetBench: Overall Score
| CrossMark / Overall | |
| Average of class Multimedia (866 - 2728, n=67, last 2 years) | |
| Apple MacBook Pro 14 2023 M2 Pro | |
| Average Apple M2 Pro, Apple M2 Pro 19-Core GPU (1797 - 1812, n=2) | |
| Lenovo Yoga Slim 7 Pro X 14IAH7 82TK006CGE | |
| Schenker Vision 14 2022 RTX 3050 Ti | |
| Apple MacBook Pro 14 2021 M1 Max 24-Core GPU | |
| Apple MacBook Pro 13 2022 M2 | |
| Microsoft Surface Laptop Studio i7 RTX 3050 Ti | |
| CrossMark / Productivity | |
| Average of class Multimedia (931 - 2489, n=67, last 2 years) | |
| Lenovo Yoga Slim 7 Pro X 14IAH7 82TK006CGE | |
| Schenker Vision 14 2022 RTX 3050 Ti | |
| Apple MacBook Pro 14 2023 M2 Pro | |
| Average Apple M2 Pro, Apple M2 Pro 19-Core GPU (1537 - 1562, n=2) | |
| Microsoft Surface Laptop Studio i7 RTX 3050 Ti | |
| Apple MacBook Pro 13 2022 M2 | |
| Apple MacBook Pro 14 2021 M1 Max 24-Core GPU | |
| CrossMark / Creativity | |
| Average Apple M2 Pro, Apple M2 Pro 19-Core GPU (2330 - 2338, n=2) | |
| Apple MacBook Pro 14 2023 M2 Pro | |
| Apple MacBook Pro 14 2021 M1 Max 24-Core GPU | |
| Average of class Multimedia (907 - 3465, n=67, last 2 years) | |
| Lenovo Yoga Slim 7 Pro X 14IAH7 82TK006CGE | |
| Apple MacBook Pro 13 2022 M2 | |
| Schenker Vision 14 2022 RTX 3050 Ti | |
| Microsoft Surface Laptop Studio i7 RTX 3050 Ti | |
| CrossMark / Responsiveness | |
| Schenker Vision 14 2022 RTX 3050 Ti | |
| Average of class Multimedia (605 - 2024, n=67, last 2 years) | |
| Lenovo Yoga Slim 7 Pro X 14IAH7 82TK006CGE | |
| Apple MacBook Pro 14 2023 M2 Pro | |
| Average Apple M2 Pro, Apple M2 Pro 19-Core GPU (1306 - 1333, n=2) | |
| Microsoft Surface Laptop Studio i7 RTX 3050 Ti | |
| Apple MacBook Pro 14 2021 M1 Max 24-Core GPU | |
| Apple MacBook Pro 13 2022 M2 | |
| Blackmagic RAW Speed Test / 12:1 8K Metal | |
| Average of class Multimedia (78 - 430, n=7, last 2 years) | |
| Apple MacBook Pro 14 2021 M1 Max 24-Core GPU | |
| Apple MacBook Pro 14 2023 M2 Pro | |
| Average Apple M2 Pro, Apple M2 Pro 19-Core GPU (n=1) | |
| Apple MacBook Pro 13 2022 M2 | |
| Blackmagic RAW Speed Test / 12:1 8K CPU | |
| Average of class Multimedia (44 - 102, n=7, last 2 years) | |
| Apple MacBook Pro 14 2023 M2 Pro | |
| Average Apple M2 Pro, Apple M2 Pro 19-Core GPU (n=1) | |
| Apple MacBook Pro 14 2021 M1 Max 24-Core GPU | |
| Apple MacBook Pro 13 2022 M2 | |
| Jetstream 2 / 2.0 Total | |
| Average of class Multimedia (261 - 481, n=36, last 2 years) | |
| Schenker Vision 14 2022 RTX 3050 Ti | |
| Apple MacBook Pro 14 2023 M2 Pro | |
| Average Apple M2 Pro, Apple M2 Pro 19-Core GPU (n=1) | |
| Apple MacBook Pro 13 2022 M2 | |
| Razer Blade 14 Ryzen 9 6900HX | |
| Apple MacBook Pro 14 2021 M1 Max 24-Core GPU | |
| Microsoft Surface Laptop Studio i7 RTX 3050 Ti | |
| Speedometer 2.0 / Result 2.0 | |
| Average of class Multimedia (337 - 946, n=35, last 2 years) | |
| Apple MacBook Pro 13 2022 M2 | |
| Apple MacBook Pro 14 2023 M2 Pro | |
| Average Apple M2 Pro, Apple M2 Pro 19-Core GPU (n=1) | |
| Schenker Vision 14 2022 RTX 3050 Ti | |
| Apple MacBook Pro 14 2021 M1 Max 24-Core GPU | |
| Microsoft Surface Laptop Studio i7 RTX 3050 Ti | |
| Mozilla Kraken 1.1 / Total | |
| Microsoft Surface Laptop Studio i7 RTX 3050 Ti | |
| Razer Blade 14 Ryzen 9 6900HX | |
| Lenovo Yoga Slim 7 Pro X 14IAH7 82TK006CGE | |
| Schenker Vision 14 2022 RTX 3050 Ti | |
| Apple MacBook Pro 14 2021 M1 Max 24-Core GPU | |
| Average of class Multimedia (228 - 835, n=74, last 2 years) | |
| Apple MacBook Pro 13 2022 M2 | |
| Average Apple M2 Pro, Apple M2 Pro 19-Core GPU (n=1) | |
| Apple MacBook Pro 14 2023 M2 Pro | |
| WebXPRT 3 / Overall | |
| Apple MacBook Pro 14 2023 M2 Pro | |
| Average Apple M2 Pro, Apple M2 Pro 19-Core GPU (n=1) | |
| Apple MacBook Pro 13 2022 M2 | |
| Apple MacBook Pro 14 2021 M1 Max 24-Core GPU | |
| Average of class Multimedia (136.4 - 596, n=70, last 2 years) | |
| Schenker Vision 14 2022 RTX 3050 Ti | |
| Razer Blade 14 Ryzen 9 6900HX | |
| Microsoft Surface Laptop Studio i7 RTX 3050 Ti | |
| WebXPRT 4 / Overall | |
| Average of class Multimedia (167.3 - 402, n=71, last 2 years) | |
| Schenker Vision 14 2022 RTX 3050 Ti | |
| Apple MacBook Pro 14 2023 M2 Pro | |
| Average Apple M2 Pro, Apple M2 Pro 19-Core GPU (n=1) | |
| Lenovo Yoga Slim 7 Pro X 14IAH7 82TK006CGE | |
| Premiere Pro PugetBench / Overall Score 0.9 | |
| Apple MacBook Pro 14 2021 M1 Max 24-Core GPU | |
| Apple MacBook Pro 14 2023 M2 Pro | |
| Average Apple M2 Pro, Apple M2 Pro 19-Core GPU (n=1) | |
| Apple MacBook Pro 13 2022 M2 | |
| Microsoft Surface Laptop Studio i7 RTX 3050 Ti | |
| Photoshop PugetBench / Overall Score | |
| Apple MacBook Pro 14 2023 M2 Pro | |
| Average Apple M2 Pro, Apple M2 Pro 19-Core GPU (951 - 1075, n=2) | |
| Apple MacBook Pro 13 2022 M2 | |
| Apple MacBook Pro 14 2021 M1 Max 24-Core GPU | |
| Microsoft Surface Laptop Studio i7 RTX 3050 Ti | |
* ... smaller is better
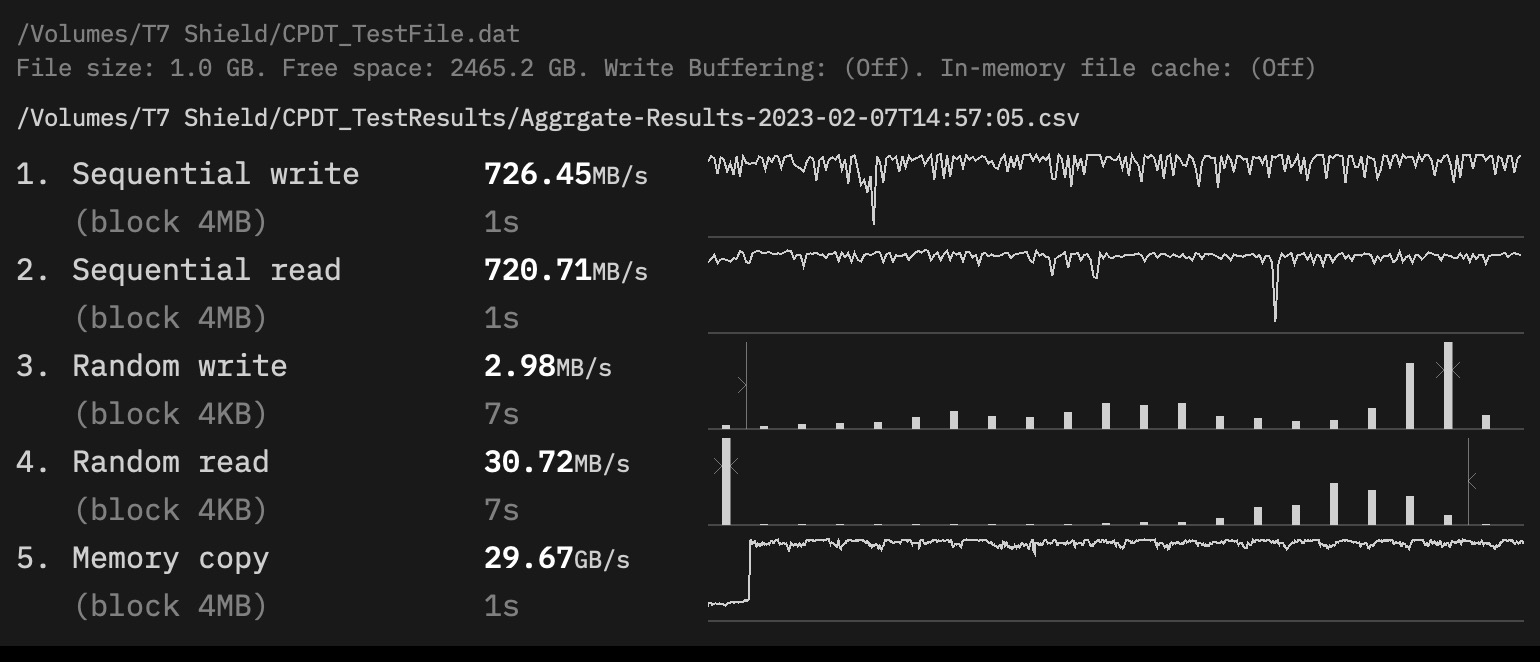
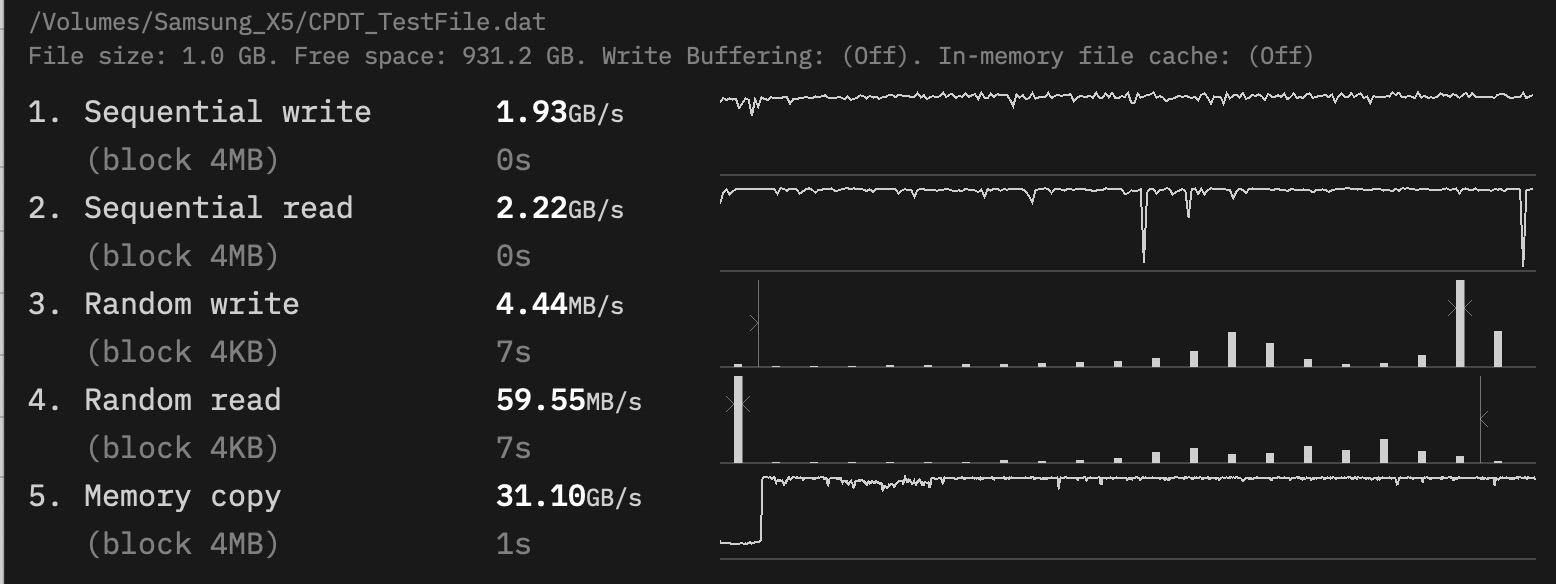
Storage Devices
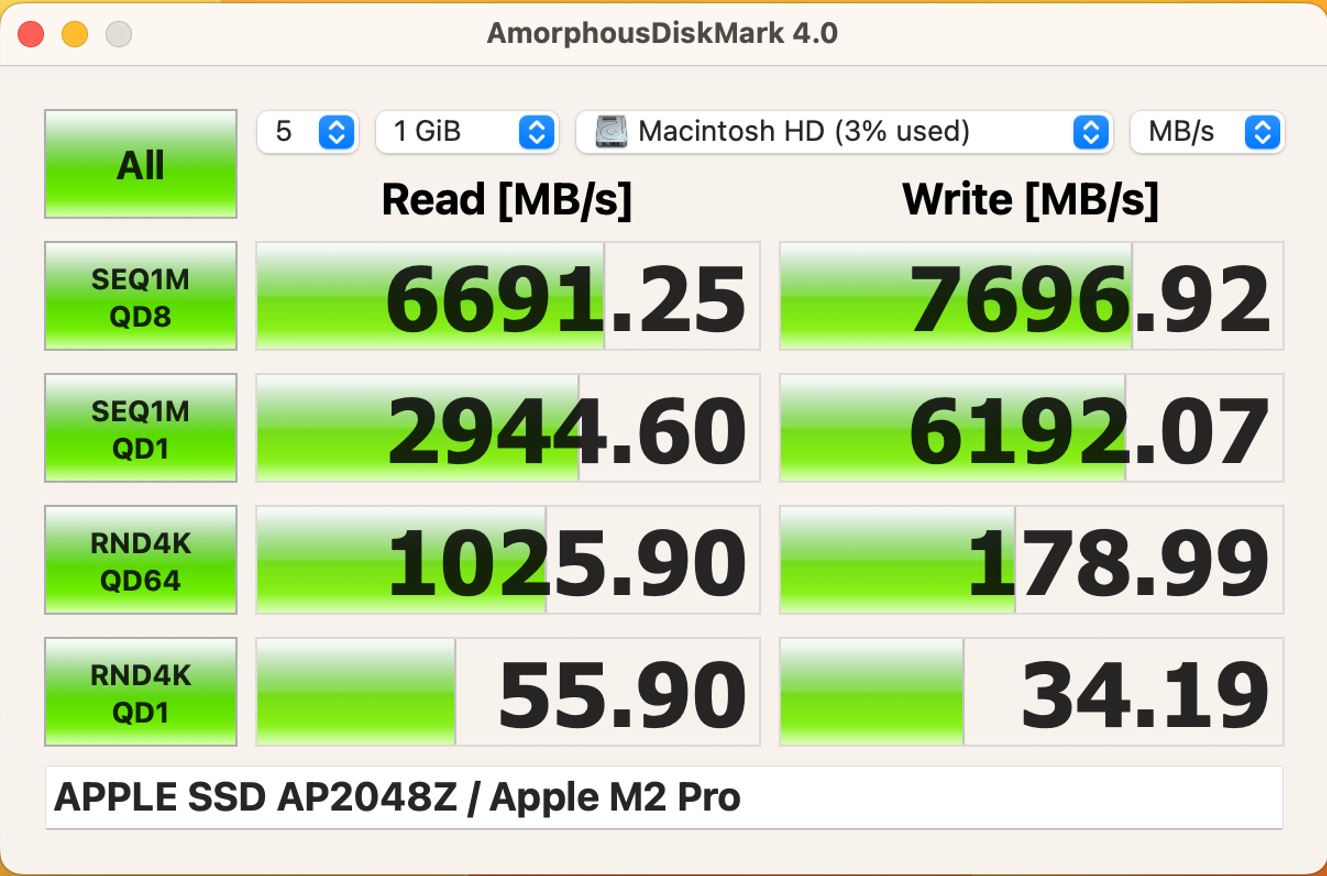
The 2021 models of the MacBook Pro were already equipped with fast PCIe 4.0 SSDs, but the new base model with 512 GB memory is said to be equipped with only one storage device, which has a negative impact on performance. We will test this ourselves shortly, but the 2 TB model of our review device has no speed problems whatsoever: at over 6.5 GB/s in reading and around 7.7 GB/s in writing, the drive is extremely fast. After the first start-up, the user still has 1.97 TB available. Further SSD benchmarks are listed here.
| Drive Performance rating - Percent | |
| Average of class Multimedia | |
| Average Apple SSD AP2048Z | |
| Apple MacBook Pro 14 2023 M2 Pro | |
| Apple MacBook Pro 14 2021 M1 Max 24-Core GPU | |
| Apple MacBook Pro 13 2022 M2 | |
Graphics Card
The new graphics unit of the M2 Pro offers either 16 or 19 GPU cores clocked at a maximum of 1.4 GHz. The power consumption of the GPU also increases somewhat, but the difference is significantly lower at 25 watts compared to the previous 22 watts (M1 Pro 16C GPU). As with the normal M2 processor, the GPU has once again become more efficient: the performance increase in the benchmarks is around 25% compared to the M1 Pro, while the gap to the M1 Max with 24 GPU cores is just 11-18% (depending on the test).
Compared to Nvidia GPUs, the M2 Pro GPU with 19 cores falls very much between an RTX 3050 Ti (50 watts) and an RTX 3060 (95W) and is on par with the Radeon RX 6600M (80W), which again is an excellent result given the low consumption of 25 watts. Graphics performance remains completely stable both under sustained load and in battery mode.
| Blender / v3.3 Classroom METAL | |
| Apple MacBook Pro 14 2023 M2 Pro | |
| Average Apple M2 Pro 19-Core GPU (n=1) | |
| Average of class Multimedia (17.8 - 68, n=5, last 2 years) | |
| Blender / v3.3 Classroom OPTIX/RTX | |
| Lenovo Yoga Slim 7 Pro X 14IAH7 82TK006CGE | |
| Schenker Vision 14 2022 RTX 3050 Ti | |
| Average of class Multimedia (12 - 105, n=24, last 2 years) | |
| Blender / v3.3 Classroom CUDA | |
| Lenovo Yoga Slim 7 Pro X 14IAH7 82TK006CGE | |
| Schenker Vision 14 2022 RTX 3050 Ti | |
| Average of class Multimedia (20 - 186, n=24, last 2 years) | |
| Blender / v3.3 Classroom CPU | |
| Schenker Vision 14 2022 RTX 3050 Ti | |
| Average of class Multimedia (134.5 - 1042, n=68, last 2 years) | |
| Lenovo Yoga Slim 7 Pro X 14IAH7 82TK006CGE | |
| Apple MacBook Pro 14 2023 M2 Pro | |
| Average Apple M2 Pro 19-Core GPU (n=1) | |
* ... smaller is better
Gaming Performance
Gaming is slowly becoming more interesting on the Mac as there are now more games that run natively on the M1 and now M2. This includes, for example, Resident Evil Village, which runs perfectly smoothly on the MacBook Pro 14 with the M2 Pro in 1080p at maximum details (between 60-90 FPS), which can be clearly seen from the demo sequence in the following video. In addition, we carried out the usual benchmarks of emulated games, which also ran properly. However, we had some difficulties with the Crossover programme (which can be used to run Windows games) in connection with Steam, and so we have not been able to run Witcher 3 or GTA V so far.
In the emulated games Shadow of the Tomb Raider and Total War: Three Kingdoms, the new M2 Pro is also about 25% ahead of the old M1 Pro and around 15% behind the M1 Max with 24 cores. In Borderlands 3, the lead is slightly smaller at 11-16%.
| low | med. | high | ultra | QHD | |
|---|---|---|---|---|---|
| The Witcher 3 (2015) | 57 | 51 | |||
| Shadow of the Tomb Raider (2018) | 169 | 80 | 72 | 63 | 40 |
| Total War: Three Kingdoms (2019) | 269 | 84 | 54 | 40 | 25 |
| Borderlands 3 (2019) | 79 | 54 | 40 | 29 |
Emissions - MacBook always quiet in everyday use
Noise
The 2023 model of the MacBook Pro 14 is also an extremely quiet device in everyday use and the two fans are often completely deactivated. Apple continues to use a very defensive fan curve, allowing the chip to reach 100 °C before the fans kick in. As a rule, this is more than sufficient for withstanding long load peaks without fan use. Under load, however, fan speeds always fluctuate a little. We would have preferred an steady noise here.
The first two fan speeds (up to 2,800 rpm) are practically inaudible at a maximum of 26 dB(A) at normal sitting distance. We measured between 33-36 dB(A) both under pure CPU load (multi-core) as well as during gaming (RE Village) and a maximum of 43.2 dB(A) in the stress test, whereby the value quickly leveled off at 39-40 dB(A). The maximum fan speed of 6,800 rpm is now higher than in the predecessor and at this level the fans roar at a loud 52 dB(A), which we could only trigger manually. No other electronic noises were detected.
Noise level
| Idle |
| 23.9 / 23.9 / 23.9 dB(A) |
| Load |
| 26 / 43.2 dB(A) |
 | ||
30 dB silent 40 dB(A) audible 50 dB(A) loud |
||
min: | ||
| Apple MacBook Pro 14 2023 M2 Pro M2 Pro 19-Core GPU, M2 Pro, Apple SSD AP2048Z | Apple MacBook Pro 13 2022 M2 M2 10-Core GPU, M2, Apple SSD AP1024Z | Apple MacBook Pro 14 2021 M1 Max 24-Core GPU M1 Max 24-Core GPU, M1 Max, Apple SSD AP0512 | Lenovo Yoga Slim 7 Pro X 14IAH7 82TK006CGE GeForce RTX 3050 4GB Laptop GPU, i7-12700H, Micron 3400 1TB MTFDKBA1T0TFH | Microsoft Surface Laptop Studio i7 RTX 3050 Ti GeForce RTX 3050 Ti Laptop GPU, i7-11370H, SK Hynix PC711 1TB HFS001TDE9X084N | Razer Blade 14 Ryzen 9 6900HX GeForce RTX 3070 Ti Laptop GPU, R9 6900HX, Samsung PM9A1 MZVL21T0HCLR | Schenker Vision 14 2022 RTX 3050 Ti GeForce RTX 3050 Ti Laptop GPU, i7-12700H, Samsung SSD 980 Pro 1TB MZ-V8P1T0BW | |
|---|---|---|---|---|---|---|---|
| Noise | -1% | -8% | -17% | -8% | -3% | -17% | |
| off / environment * (dB) | 23.9 | 23.9 -0% | 24.8 -4% | 24.6 -3% | 24.7 -3% | 23.3 3% | 24.4 -2% |
| Idle Minimum * (dB) | 23.9 | 23.9 -0% | 24.8 -4% | 24.6 -3% | 24.7 -3% | 23.3 3% | 24.4 -2% |
| Idle Average * (dB) | 23.9 | 23.9 -0% | 24.8 -4% | 24.6 -3% | 24.7 -3% | 23.3 3% | 24.4 -2% |
| Idle Maximum * (dB) | 23.9 | 23.9 -0% | 24.8 -4% | 24.6 -3% | 24.7 -3% | 23.3 3% | 27.8 -16% |
| Load Average * (dB) | 26 | 23.9 8% | 30.4 -17% | 45.1 -73% | 33.2 -28% | 34.7 -33% | 43.3 -67% |
| Load Maximum * (dB) | 43.2 | 49 -13% | 49.5 -15% | 50.4 -17% | 46.7 -8% | 42.1 3% | 48.8 -13% |
| Witcher 3 ultra * (dB) | 34.6 | 35.8 | 49.1 | 44.5 | 42.1 | 48.2 |
* ... smaller is better
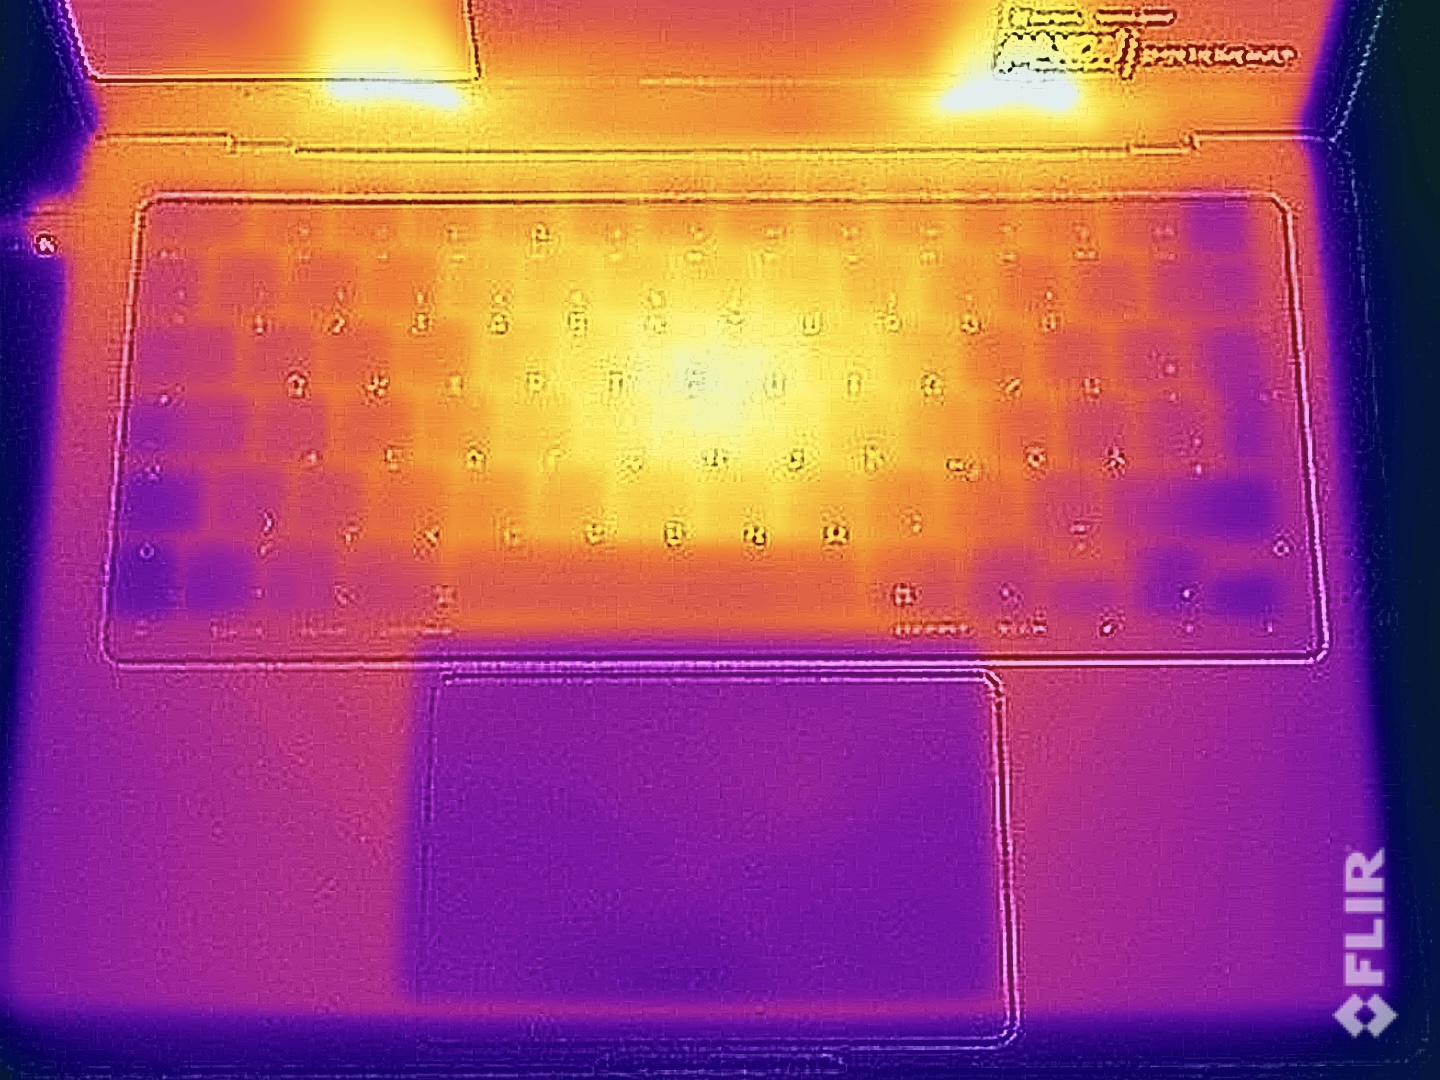
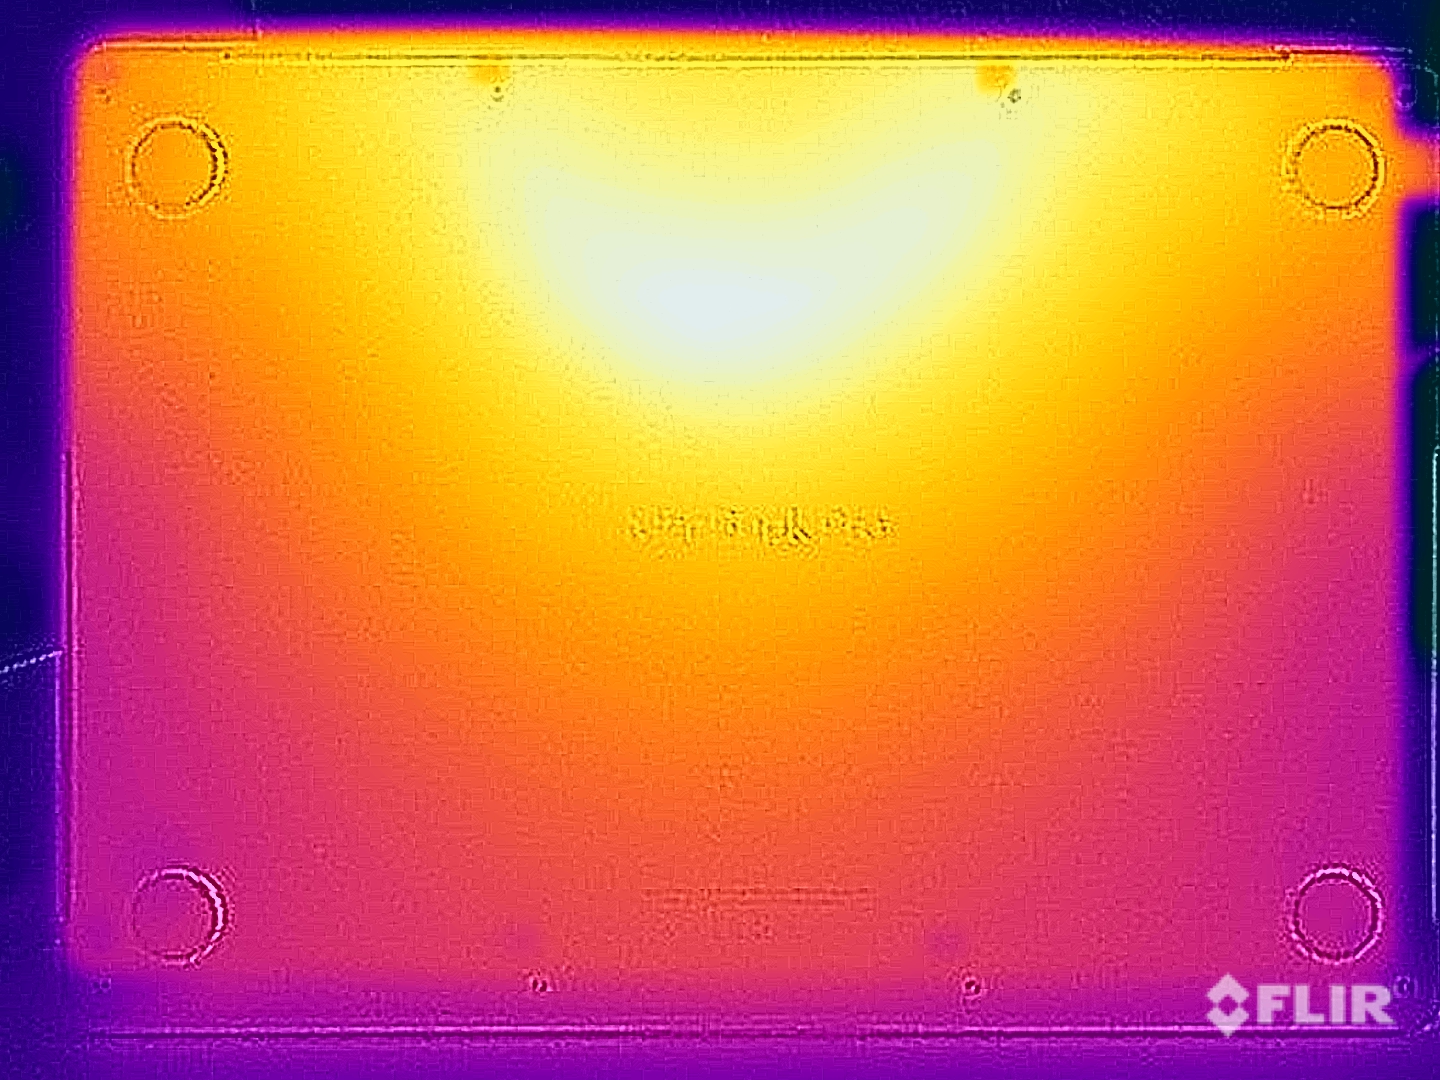
Temperature
The metal case practically does not heat up at all when idling and under low load. Under load, however, it remains the case that the central keyboard area in particular gets very warm at more than 45 °C and this is also noticeable, for example, when gaming (the temperatures here are comparable to the stress test). On the underside, the metal case remains noticeably cooler at just over 40 °C and you can place the MBP 14 on your lap under load free of concern.
(-) The maximum temperature on the upper side is 46.9 °C / 116 F, compared to the average of 36.8 °C / 98 F, ranging from 21 to 71 °C for the class Multimedia.
(±) The bottom heats up to a maximum of 41.7 °C / 107 F, compared to the average of 39.1 °C / 102 F
(+) In idle usage, the average temperature for the upper side is 21 °C / 70 F, compared to the device average of 31.3 °C / 88 F.
(+) The palmrests and touchpad are cooler than skin temperature with a maximum of 30.5 °C / 86.9 F and are therefore cool to the touch.
(±) The average temperature of the palmrest area of similar devices was 28.7 °C / 83.7 F (-1.8 °C / -3.2 F).
| Apple MacBook Pro 14 2023 M2 Pro Apple M2 Pro, Apple M2 Pro 19-Core GPU | Apple MacBook Pro 13 2022 M2 Apple M2, Apple M2 10-Core GPU | Apple MacBook Pro 14 2021 M1 Max 24-Core GPU Apple M1 Max, Apple M1 Max 24-Core GPU | Lenovo Yoga Slim 7 Pro X 14IAH7 82TK006CGE Intel Core i7-12700H, NVIDIA GeForce RTX 3050 4GB Laptop GPU | Microsoft Surface Laptop Studio i7 RTX 3050 Ti Intel Core i7-11370H, NVIDIA GeForce RTX 3050 Ti Laptop GPU | Razer Blade 14 Ryzen 9 6900HX AMD Ryzen 9 6900HX, NVIDIA GeForce RTX 3070 Ti Laptop GPU | Schenker Vision 14 2022 RTX 3050 Ti Intel Core i7-12700H, NVIDIA GeForce RTX 3050 Ti Laptop GPU | |
|---|---|---|---|---|---|---|---|
| Heat | -9% | -8% | -23% | -0% | -35% | -27% | |
| Maximum Upper Side * (°C) | 46.9 | 45.1 4% | 49.2 -5% | 48 -2% | 42.3 10% | 40.6 13% | 48.4 -3% |
| Maximum Bottom * (°C) | 41.7 | 43 -3% | 44.1 -6% | 50.2 -20% | 38.2 8% | 42.6 -2% | 57.1 -37% |
| Idle Upper Side * (°C) | 21.4 | 25.2 -18% | 23.5 -10% | 27.7 -29% | 23.4 -9% | 38 -78% | 28.1 -31% |
| Idle Bottom * (°C) | 21.4 | 25.4 -19% | 23.6 -10% | 30.1 -41% | 23.5 -10% | 37 -73% | 29 -36% |
* ... smaller is better
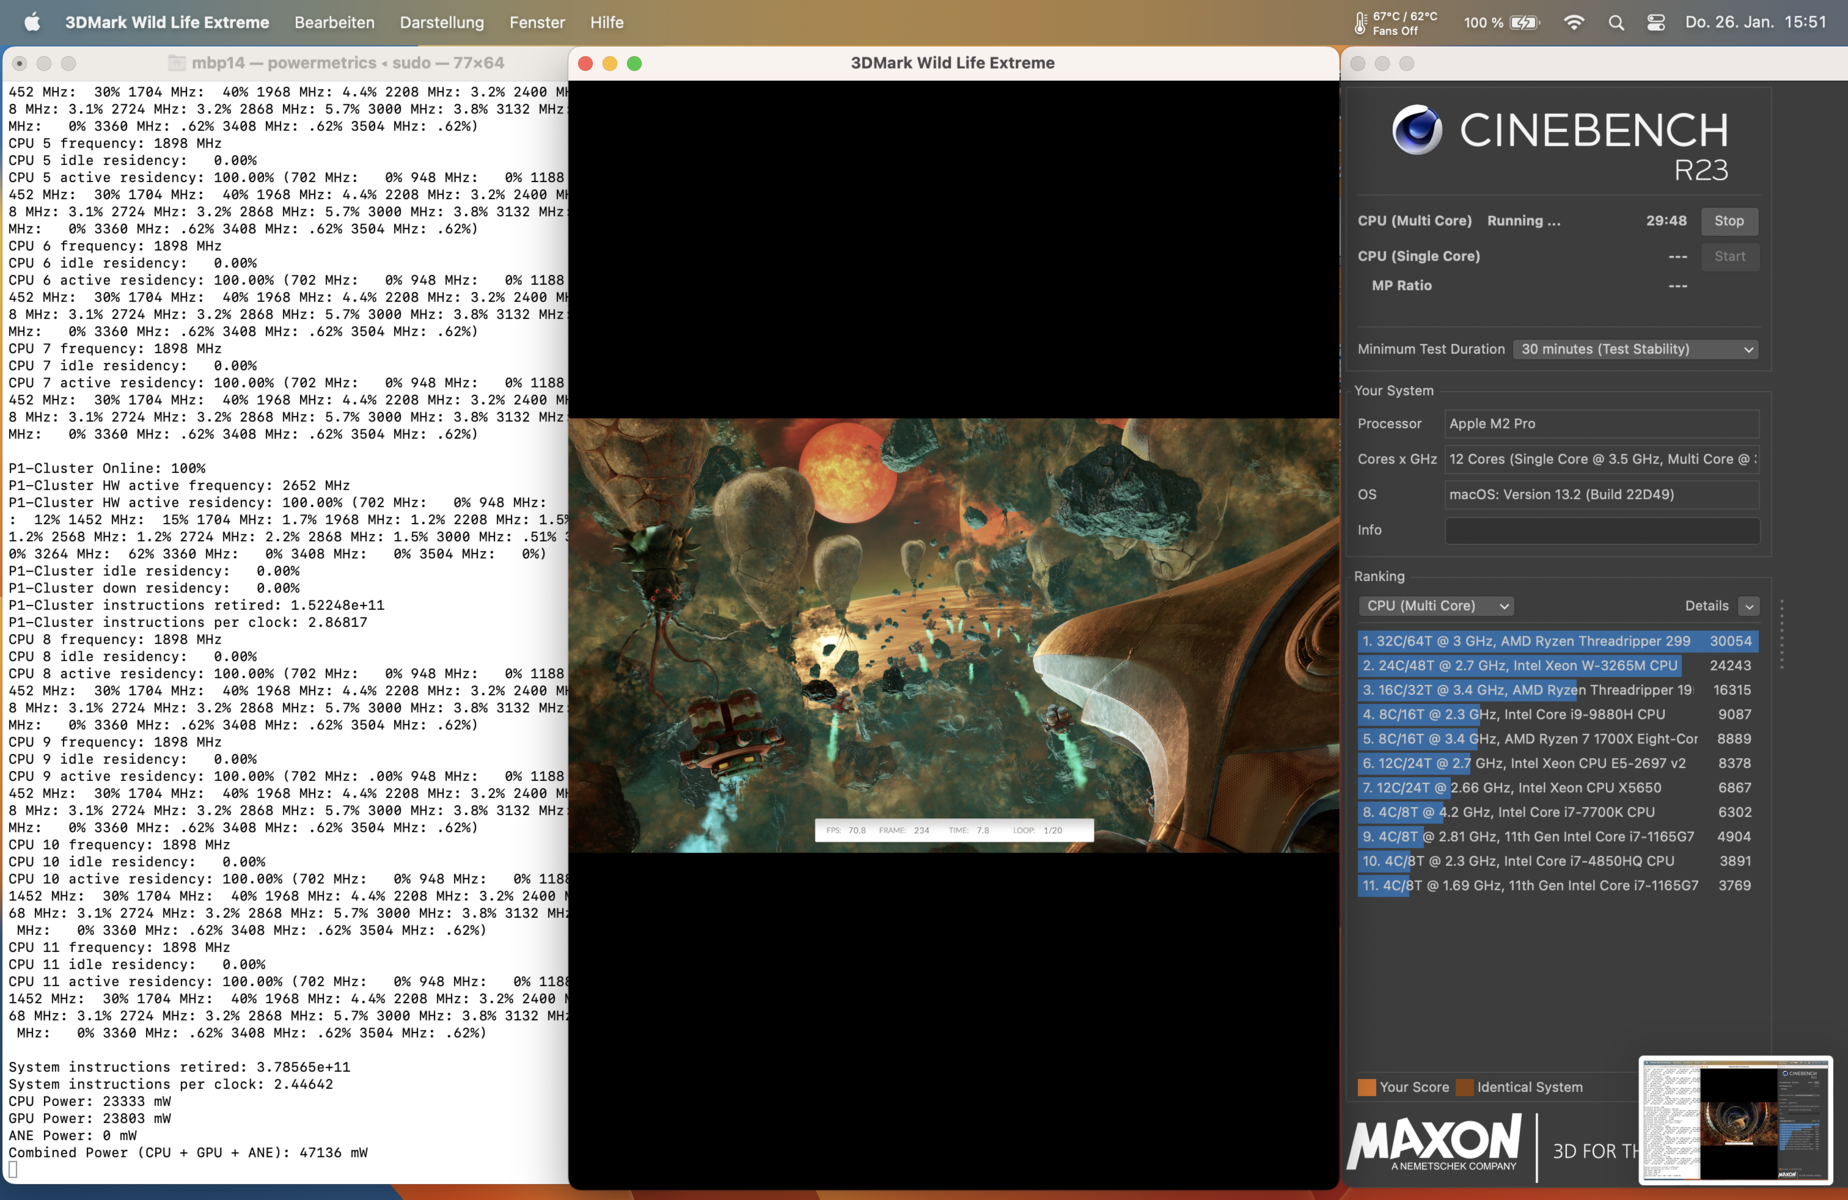
Stress Testing
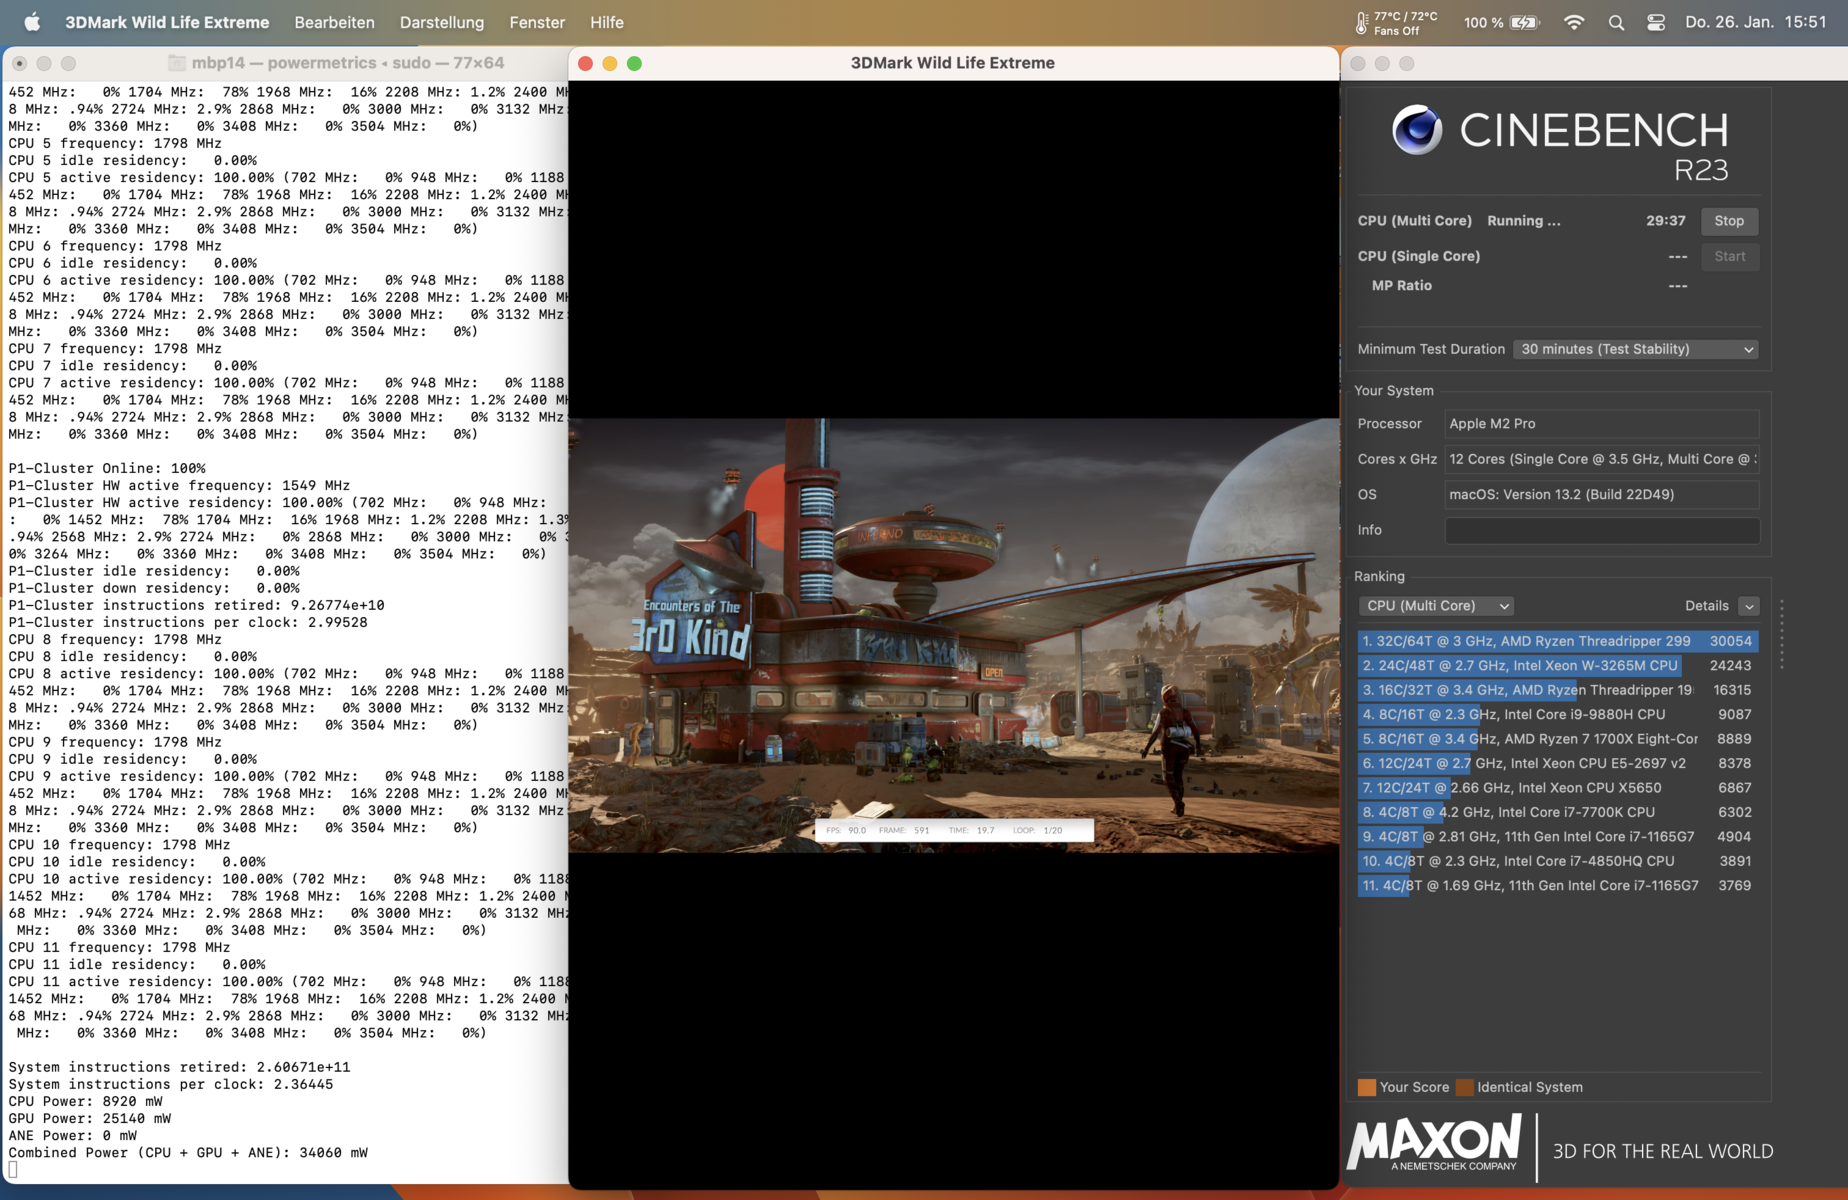
The results of the stress test surprised us a little because CPU performance is throttled significantly when the CPU and GPU are simultaneously placed under load. For stress testing, we used the native applications 3DMark Wild Life Extreme Stress Test and Cinebench R23. At the beginning of stress testing, the total consumption of the M2 Pro jumped to 47 watts and both components had ~23 watts at their disposal, but after only 1-2 seconds, total consumption was limited to 34 watts. Here the GPU is clearly favored and works with a full 25 watts, while the processor only works with about 8 watts.
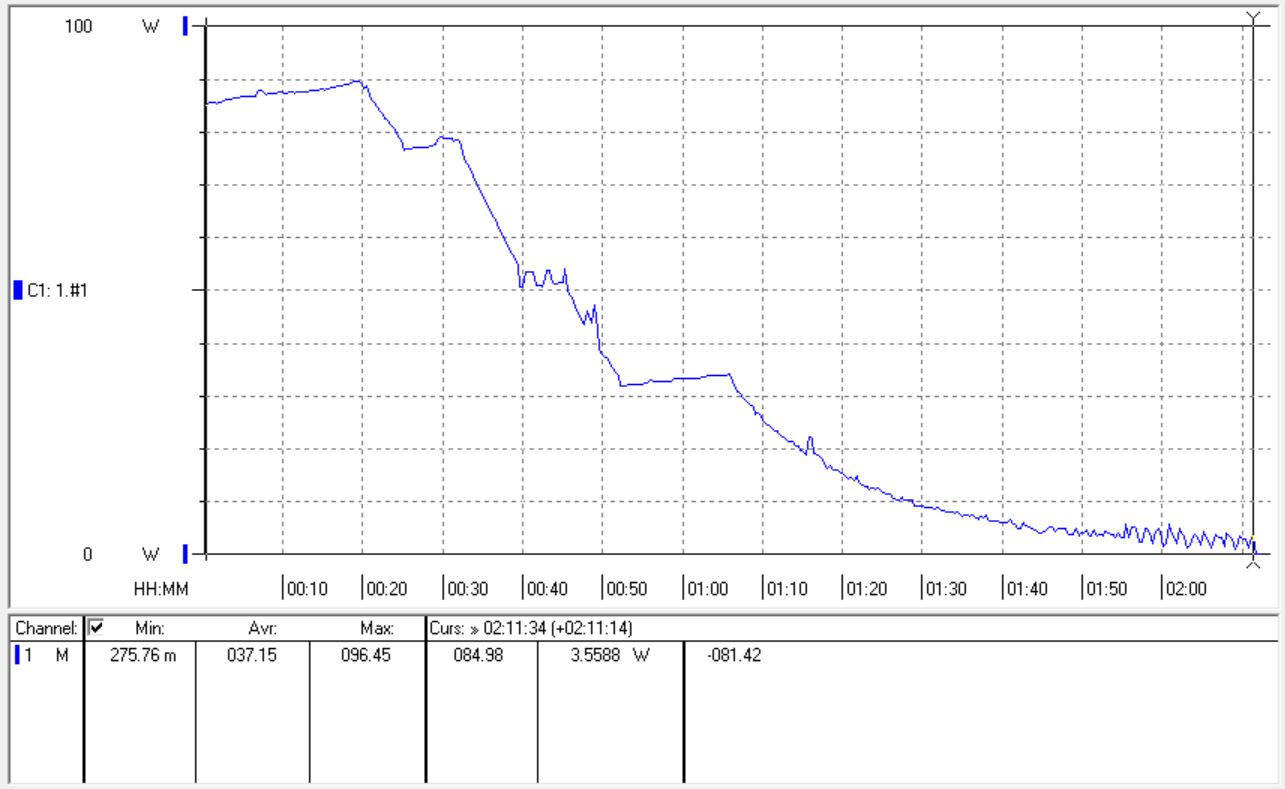
We suspect that Apple has put this restriction in place so that performance on mains and battery power is identical. As we will see later, our review device consumes around 100 watts at the beginning of the stress test and a little more than 70 watts later on. Of course, the 70-Wh battery is unable to provide 100 watts.
Speakers
The MacBook Pro 14 continues to use 6 speakers that produce very good sound. In our analysis, the 2023 model performs slightly worse than its predecessor, but you can't tell the difference without a direct comparison to the old one. Perhaps this is simply due to a small change in the software. Nevertheless, the MBP 14 remains the 14-inch notebook with the best speakers, and is only just surpassed by the larger MacBook Pro 16.
Apple MacBook Pro 14 2023 M2 Pro audio analysis
(+) | speakers can play relatively loud (84.3 dB)
Bass 100 - 315 Hz
(+) | good bass - only 3.8% away from median
(+) | bass is linear (6.9% delta to prev. frequency)
Mids 400 - 2000 Hz
(+) | balanced mids - only 2.1% away from median
(+) | mids are linear (2.2% delta to prev. frequency)
Highs 2 - 16 kHz
(+) | balanced highs - only 2.7% away from median
(+) | highs are linear (4.8% delta to prev. frequency)
Overall 100 - 16.000 Hz
(+) | overall sound is linear (6% difference to median)
Compared to same class
» 3% of all tested devices in this class were better, 0% similar, 97% worse
» The best had a delta of 5%, average was 17%, worst was 45%
Compared to all devices tested
» 0% of all tested devices were better, 0% similar, 100% worse
» The best had a delta of 4%, average was 24%, worst was 134%
Apple MacBook Pro 14 2021 M1 Pro Entry audio analysis
(+) | speakers can play relatively loud (84.9 dB)
Bass 100 - 315 Hz
(+) | good bass - only 4.3% away from median
(+) | bass is linear (5.9% delta to prev. frequency)
Mids 400 - 2000 Hz
(+) | balanced mids - only 1.1% away from median
(+) | mids are linear (1.9% delta to prev. frequency)
Highs 2 - 16 kHz
(+) | balanced highs - only 2.9% away from median
(+) | highs are linear (3% delta to prev. frequency)
Overall 100 - 16.000 Hz
(+) | overall sound is linear (5.6% difference to median)
Compared to same class
» 2% of all tested devices in this class were better, 1% similar, 97% worse
» The best had a delta of 5%, average was 17%, worst was 45%
Compared to all devices tested
» 0% of all tested devices were better, 0% similar, 100% worse
» The best had a delta of 4%, average was 24%, worst was 134%
Power Management - MBP 2023 with more stamina
Power Consumption
Compared to its predecessor with the M1 Pro, Apple has been able to reduce the idle consumption slightly. In view of the high resolution and the brightness of 500 cd/m², the maximum value of 11.5 watts is very good. However, we measured up to 24 watts in HDR mode. Under load, on the other hand, not much has changed - we measured a short-term maximum of just under 100 watts, which quickly leveled off at 72 watts. The supplied 96 watt power adapter is therefore sufficiently sized.
| Off / Standby | |
| Idle | |
| Load |
|
Key:
min: | |
| Apple MacBook Pro 14 2023 M2 Pro M2 Pro, M2 Pro 19-Core GPU, Apple SSD AP2048Z, Mini-LED, 3024x1964, 14.2" | Apple MacBook Pro 14 2021 M1 Pro Entry M1 Pro 8-Core, M1 Pro 14-Core GPU, Apple SSD AP0512, Mini-LED, 3024x1964, 14.2" | Apple MacBook Pro 14 2021 M1 Max 24-Core GPU M1 Max, M1 Max 24-Core GPU, Apple SSD AP0512, Mini-LED, 3024x1964, 14.2" | Apple MacBook Pro 13 2022 M2 M2, M2 10-Core GPU, Apple SSD AP1024Z, IPS, 2560x1600, 13.3" | Lenovo Yoga Slim 7 Pro X 14IAH7 82TK006CGE i7-12700H, GeForce RTX 3050 4GB Laptop GPU, Micron 3400 1TB MTFDKBA1T0TFH, IPS, 3072x1920, 14.5" | Microsoft Surface Laptop Studio i7 RTX 3050 Ti i7-11370H, GeForce RTX 3050 Ti Laptop GPU, SK Hynix PC711 1TB HFS001TDE9X084N, IPS, 2400x1600, 14.4" | Razer Blade 14 Ryzen 9 6900HX R9 6900HX, GeForce RTX 3070 Ti Laptop GPU, Samsung PM9A1 MZVL21T0HCLR, IPS, 2560x1440, 14" | Schenker Vision 14 2022 RTX 3050 Ti i7-12700H, GeForce RTX 3050 Ti Laptop GPU, Samsung SSD 980 Pro 1TB MZ-V8P1T0BW, IPS, 2880x1800, 14" | Average Apple M2 Pro 19-Core GPU | Average of class Multimedia | |
|---|---|---|---|---|---|---|---|---|---|---|
| Power Consumption | 3% | -15% | 38% | -50% | -2% | -158% | -53% | 0% | -31% | |
| Idle Minimum * (Watt) | 2.4 | 2.9 -21% | 3.2 -33% | 1.77 26% | 7.1 -196% | 2.6 -8% | 10.2 -325% | 7.5 -213% | 2.4 ? -0% | 5.71 ? -138% |
| Idle Average * (Watt) | 11.3 | 11.6 -3% | 12.6 -12% | 6.7 41% | 10.8 4% | 7.1 37% | 26 -130% | 10.4 8% | 11.3 ? -0% | 10.1 ? 11% |
| Idle Maximum * (Watt) | 11.5 | 11.9 -3% | 13 -13% | 6.9 40% | 11.6 -1% | 7.9 31% | 26.7 -132% | 11.4 1% | 11.5 ? -0% | 12.4 ? -8% |
| Load Average * (Watt) | 59.6 | 49.5 17% | 57.9 3% | 30.9 48% | 84.8 -42% | 76.8 -29% | 89.3 -50% | 83.3 -40% | 59.6 ? -0% | 65 ? -9% |
| Witcher 3 ultra * (Watt) | 55.9 | 58.2 -4% | 76.3 -36% | 38.9 30% | 91.3 -63% | 83 -48% | 158.7 -184% | 92.7 -66% | ||
| Load Maximum * (Watt) | 100 | 68.5 31% | 97.7 2% | 56 44% | 100.8 -1% | 97.3 3% | 227.5 -128% | 110.3 -10% | 100 ? -0% | 112.2 ? -12% |
* ... smaller is better
Power Consumption Witcher 3 / Stress Test
Power Consumption with an External Monitor
Battery Life
Overall, the battery life has improved. The results are practically identical to the predecessor in the load test (70 minutes), the video test, and the WLAN test (13.5 hours) at 150 cd/m² (the brightness is reduced in 7 large and 2 small steps). At full brightness, the WLAN test runs for little more than 7 hours, over half an hour longer. The additional efficiency cores certainly pay off here. However, video playback in HDR can still drain the battery quite quickly, because a YouTube video in 4K and HDR ran for 4:33 hours, which again is slightly longer than the predecessor.
A complete charging process with the 96-watt power supply takes almost exactly two hours with the device switched on, whereby 50% of the capacity is available again after just over 30 minutes and 80% after one hour.
| Apple MacBook Pro 14 2023 M2 Pro M2 Pro, M2 Pro 19-Core GPU, 70 Wh | Apple MacBook Pro 14 2021 M1 Pro Entry M1 Pro 8-Core, M1 Pro 14-Core GPU, 69.9 Wh | Apple MacBook Pro 14 2021 M1 Max 24-Core GPU M1 Max, M1 Max 24-Core GPU, 69.9 Wh | Apple MacBook Pro 13 2022 M2 M2, M2 10-Core GPU, 58.2 Wh | Lenovo Yoga Slim 7 Pro X 14IAH7 82TK006CGE i7-12700H, GeForce RTX 3050 4GB Laptop GPU, 70 Wh | Microsoft Surface Laptop Studio i7 RTX 3050 Ti i7-11370H, GeForce RTX 3050 Ti Laptop GPU, 58 Wh | Razer Blade 14 Ryzen 9 6900HX R9 6900HX, GeForce RTX 3070 Ti Laptop GPU, 62 Wh | Schenker Vision 14 2022 RTX 3050 Ti i7-12700H, GeForce RTX 3050 Ti Laptop GPU, 99.8 Wh | Average of class Multimedia | |
|---|---|---|---|---|---|---|---|---|---|
| Battery runtime | -0% | -18% | 33% | -21% | -26% | 2% | 8% | 12% | |
| H.264 (h) | 15.3 | 15 -2% | 12.1 -21% | 19.2 25% | 8.9 -42% | 12.3 -20% | 11.1 -27% | 16.4 ? 7% | |
| WiFi v1.3 (h) | 13.5 | 13.6 1% | 11.6 -14% | 19.1 41% | 7.2 -47% | 8 -41% | 9.5 -30% | 10.1 -25% | 12 ? -11% |
| Load (h) | 1.2 | 1.2 0% | 1.5 25% | 1 -17% | 1.6 33% | 2.1 75% | 1.675 ? 40% |
Pros
Cons
Verdict - MacBook Pro 14 is expensive but extremely good
A lot of people (including us) were expecting 3nm SoCs in the new MacBook Pro models. Despite the improved 5nm process, the new M2 Pro is a very solid upgrade. Graphics performance has increased by about 25% in tandem with a clear improvement in efficiency. The processor has also seen a performance leap of up to 20%, but this is accompanied by an increase in consumption of up to 25%. We plan to analyze the efficiency of the new M2 SoCs in more detail soon. In everyday use, the new chips are definitely more efficient, which is simply due to the two additional efficiency cores that are able to take on more work.
Fundamentally, Apple its maintaining its advantage over AMD and Intel, particularly in optimized applications where the results are very good in view of the comparatively low power consumption. Moreover, another significant advantage is the fact that performance control can also be fully accessed in battery mode. However, Apple also slows down the M2 Pro a little here, because the processor is throttled significantly when CPU and GPU are simultaneously stressed. The M2 Pro could offer more performance in this case (the cooling could handle it, since there is also room for improvement here), but Apple appears to have decided otherwise. There are two possible reasons for this: either battery performance shouldn't differ from mains operation, even in this extreme case, or the MacBook Pro simply shouldn't get too loud. In any case, potential is being wasted here and since the graphics unit of the new M2 Max (38 GPU cores) alone is able consume more than 50 watts in the MacBook Pro 16, the large M2 Max in the smaller MBP 14 is hardly worth it.
Elsewhere, Apple has addressed some points of criticism, finally installing HDMI 2.1 and fast Wi-Fi 6E for modern 6 GHz networks. Battery life has also improved in some situations and both the mini LED display and sound system remain worthy of reference.
The MacBook Pro 2023 just got better with the M2 Pro, now offering even more performance. In addition, customers now get fast Wi-Fi and improved HDMI output. The price may be high, but the new MacBook Pro 14 is also a damn good machine. However, switching from the predecessor with the M1 Pro is not really worth it.
Of course, there are still a few points of criticism, and here one only has to mention the non-existent maintenance or upgrade options. If these criteria are decisive for purchase, the MacBook Pro 14 immediately disqualifies itself despite its objectively excellent performance values. Furthermore, the surcharges for additional RAM and SSD storage remain extremely high. To be fair, it should be kept in mind that many other manufacturers are increasingly relying on soldered components and have also limited the maintenance and/or upgrade options for their premium devices.
In the 14-inch segment, it is not easy to find a comparable competitor. Microsoft's Surface Laptop Studio is weaker with its old Tiger Lake processor and also falls behind in graphics performance. The most interesting competitor in the Windows camp at present is probably the Schenker Vision 14, which can keep up in terms of performance despite its noticeably lower weight and is also very modular. The old MacBook Pro 14 M1 Pro also remains a worthy choice. Compared to the basic model with the fast M2 Pro, 16 GB RAM and a 1 TB SSD for an RRP of EUR 2,999, you save around EUR 600-700 with an identically equipped MacBook Pro 14 M1 Pro. The performance is a little lower here, but still very competitive.
Price and Availability
The new MacBook Pro 14 appears to be widely available around the world. Interested buyers should compare (where possible) prices between Apple's official website and via typical retailers such as Amazon. In the US, for example, our reviewed configuration (M2 Pro (12C CPU), 16 GB RAM and a 1 TB SSD) is available via Apple for US$2,499.00. At Amazon, this is not much cheaper at US$2.489,00. Differences at other retailers may be greater.
Prices are as of 28.01.2023 and subject to change.
Apple MacBook Pro 14 2023 M2 Pro
- 01/27/2023 v7 (old)
Andreas Osthoff
Transparency
The selection of devices to be reviewed is made by our editorial team. The test sample was provided to the author as a loan by the manufacturer or retailer for the purpose of this review. The lender had no influence on this review, nor did the manufacturer receive a copy of this review before publication. There was no obligation to publish this review. As an independent media company, Notebookcheck is not subjected to the authority of manufacturers, retailers or publishers.
This is how Notebookcheck is testing
Every year, Notebookcheck independently reviews hundreds of laptops and smartphones using standardized procedures to ensure that all results are comparable. We have continuously developed our test methods for around 20 years and set industry standards in the process. In our test labs, high-quality measuring equipment is utilized by experienced technicians and editors. These tests involve a multi-stage validation process. Our complex rating system is based on hundreds of well-founded measurements and benchmarks, which maintains objectivity. Further information on our test methods can be found here.
Price comparison

