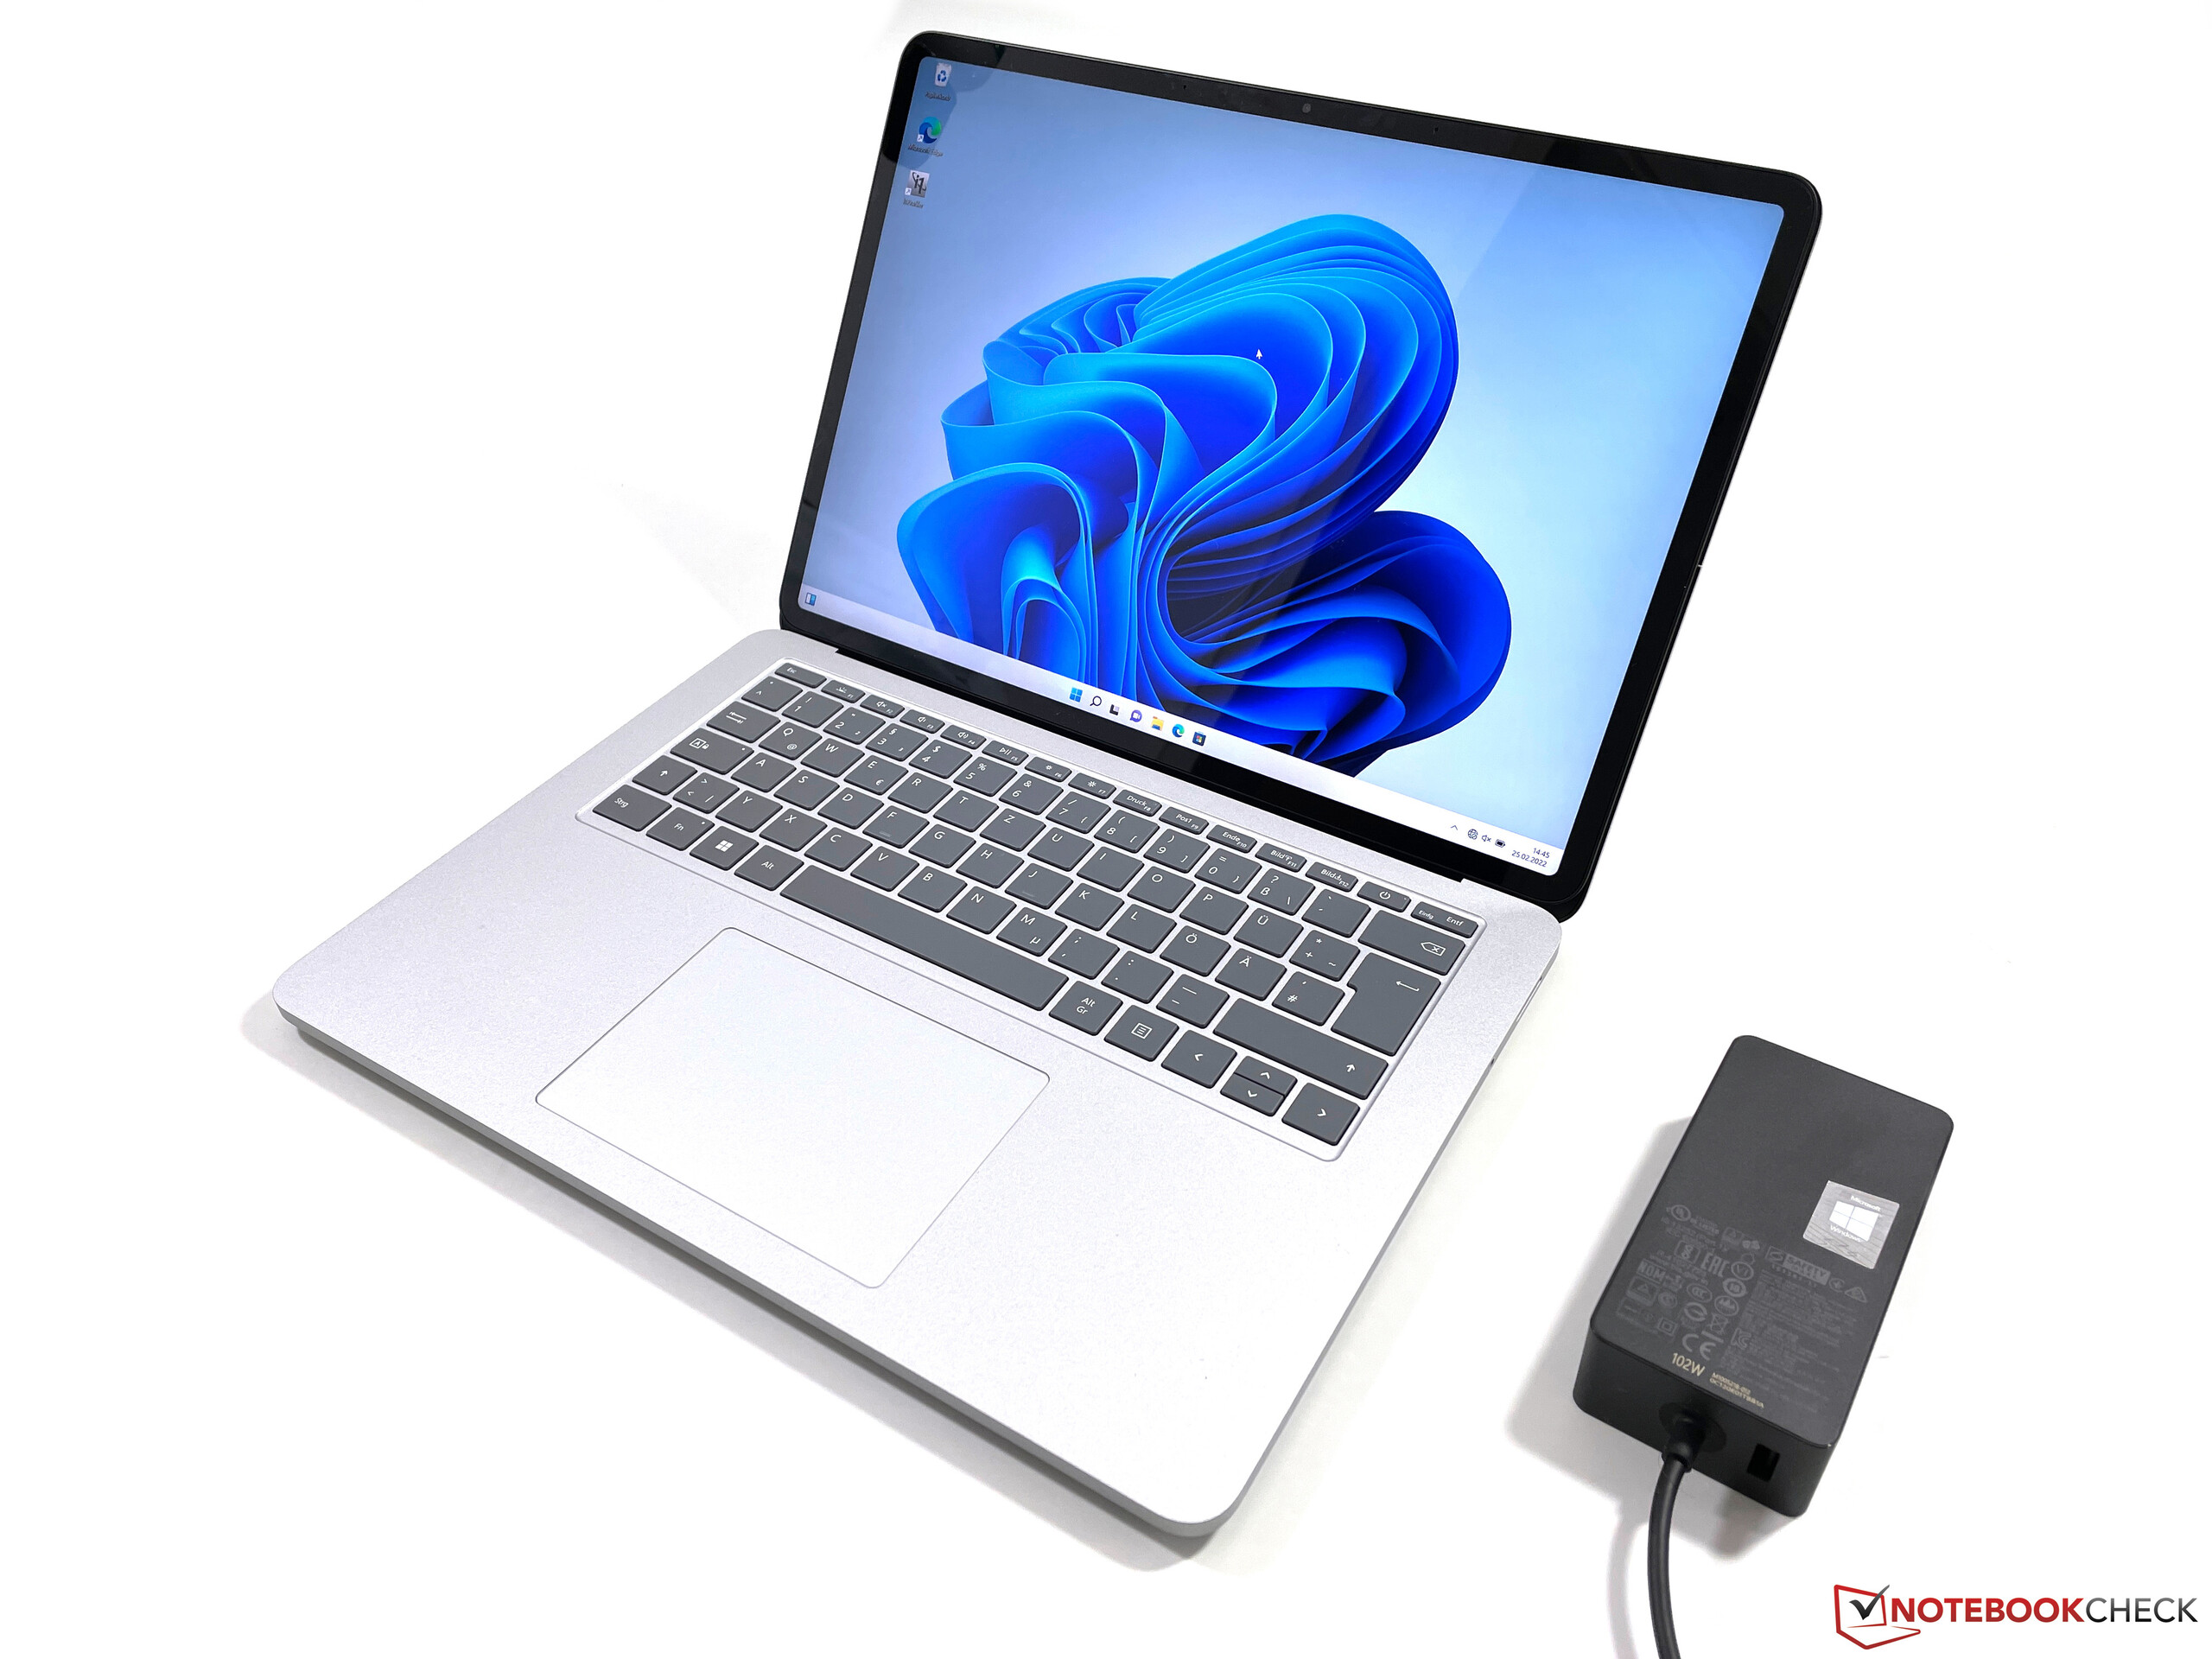
Microsoft Surface Laptop Studio Review: Interesting concept with slow Intel CPU
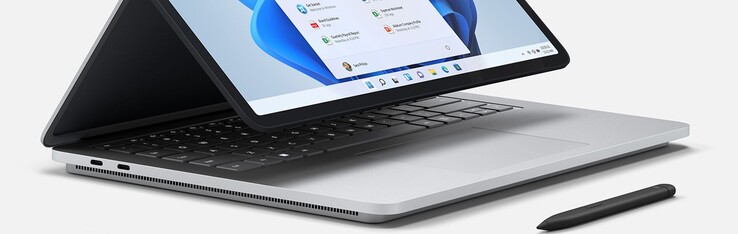
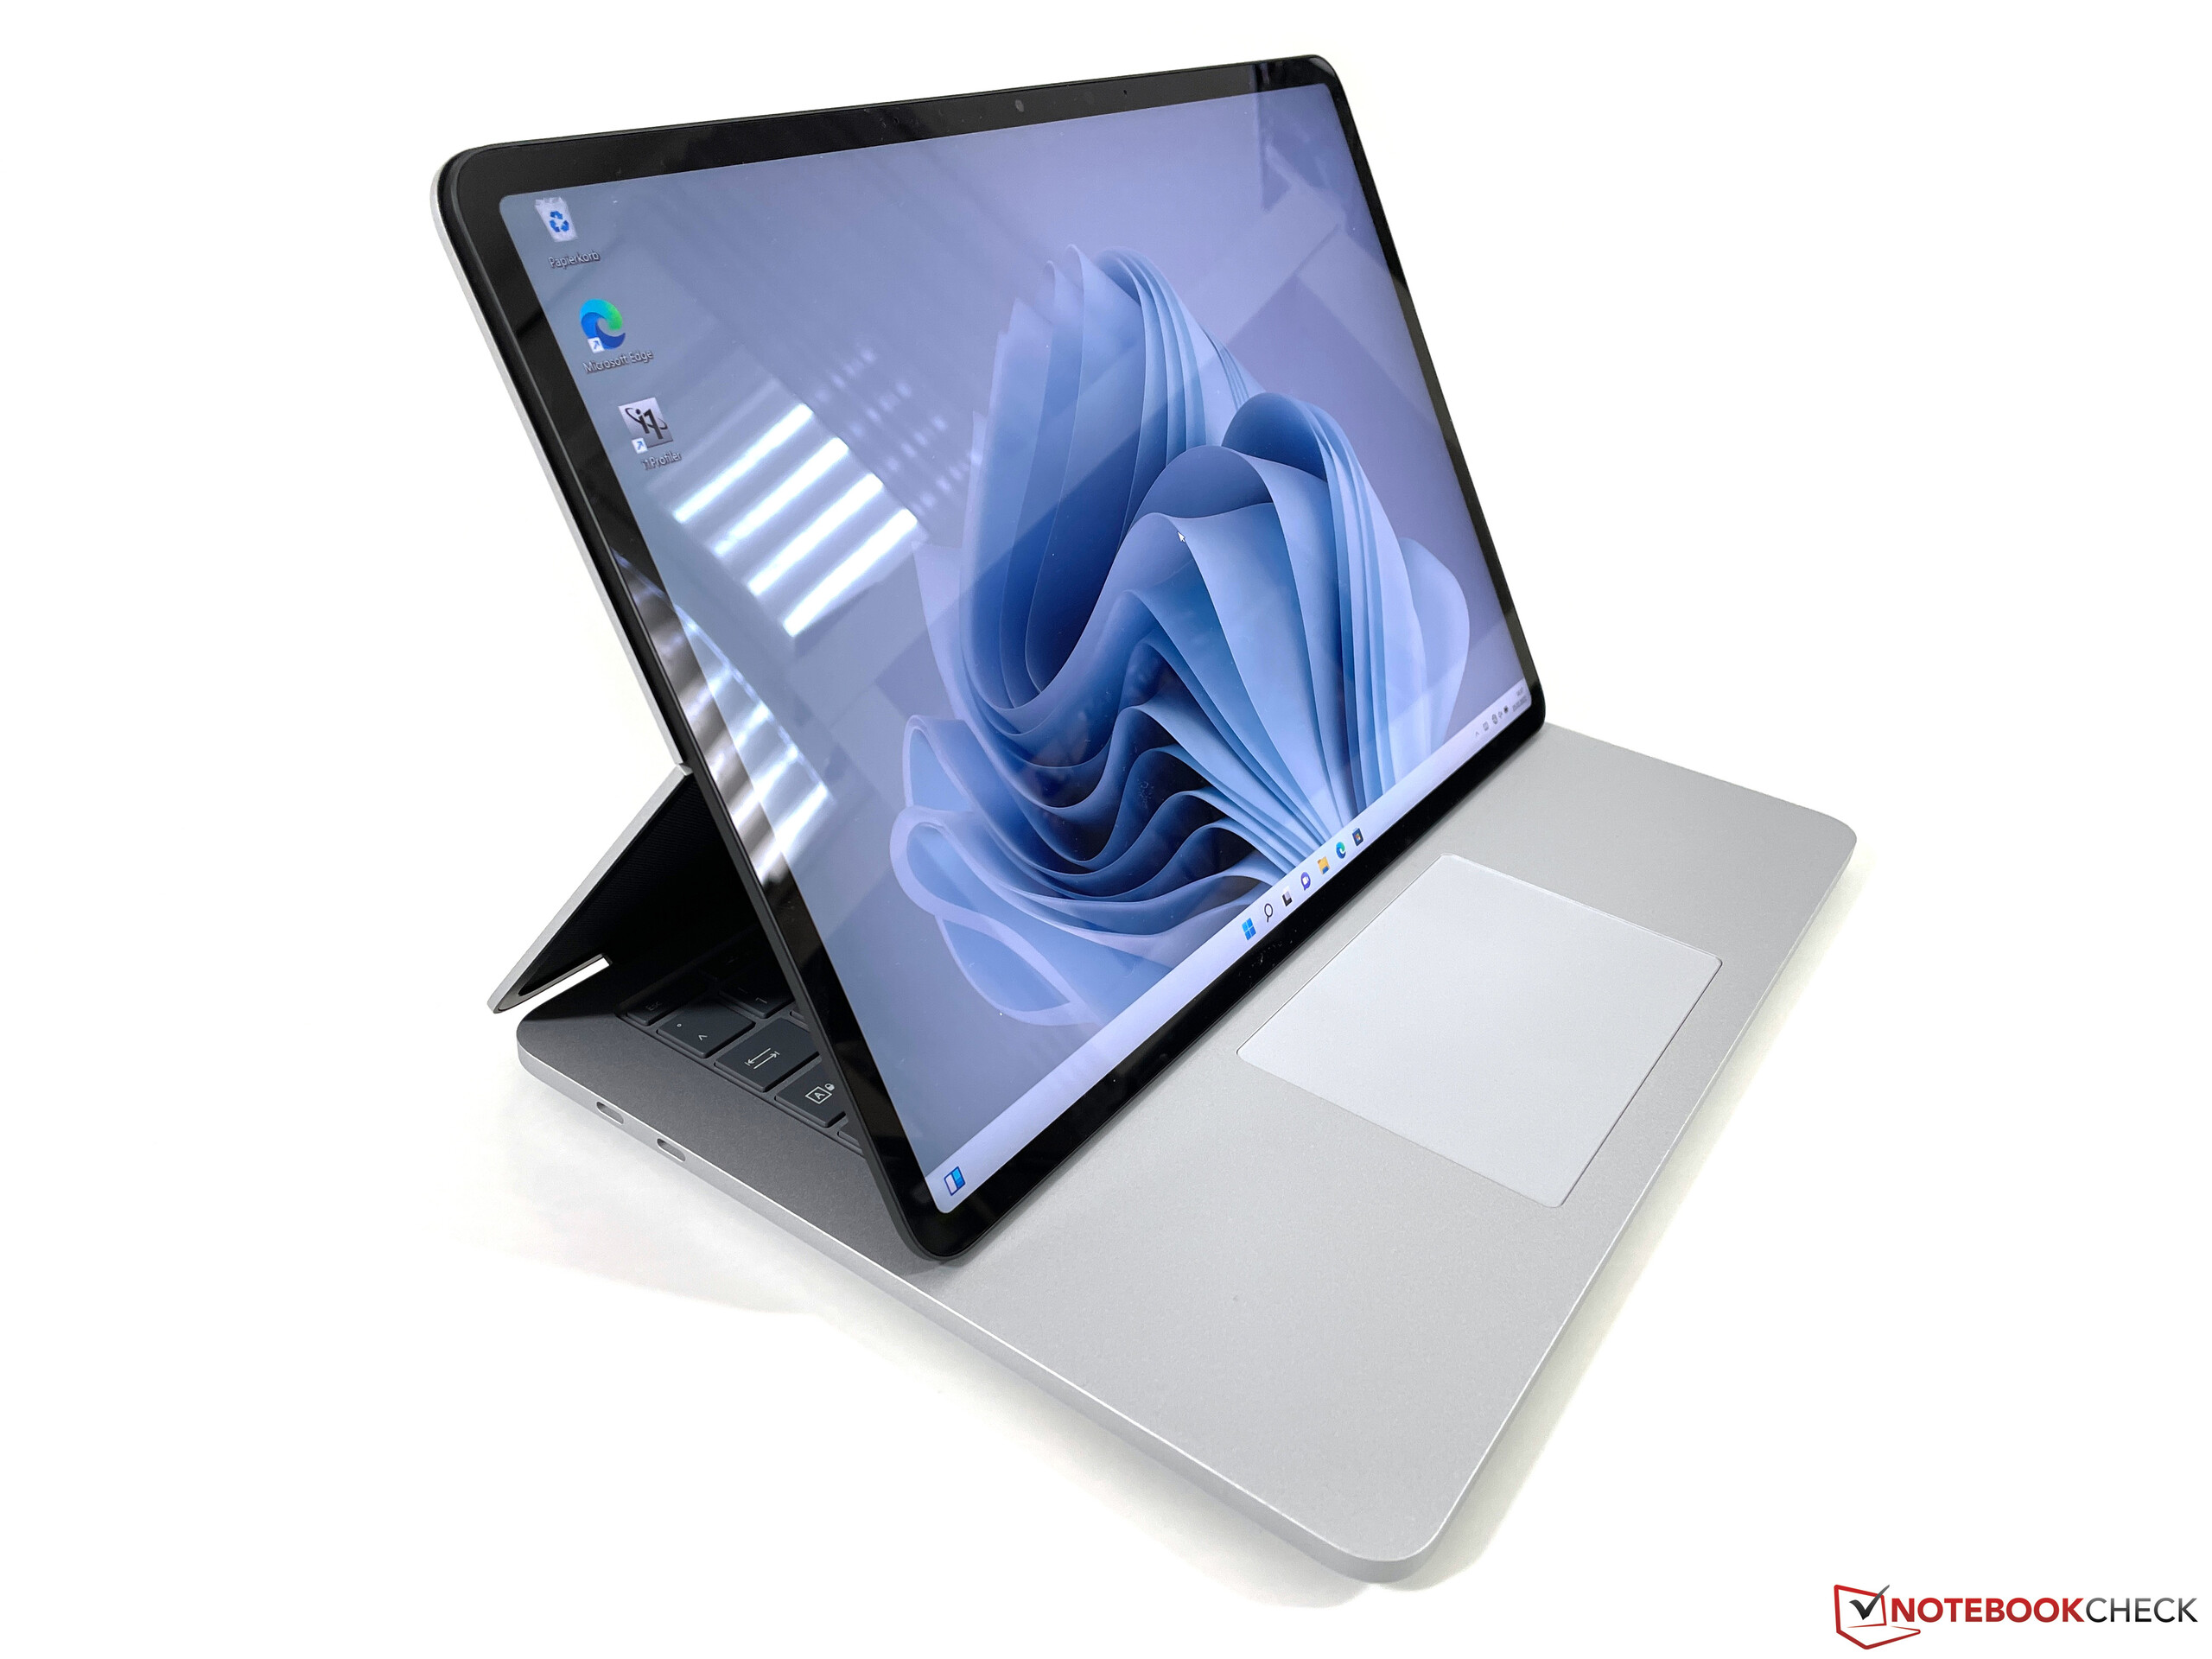
The Surface Laptop Studio is a completely new design from Microsoft and complements the regular Surface Laptop. The Surface Book (13 and 15-inch) with the detachable display unit on the other hand is discontinued and the new Surface Laptop Studio with the 14.4-inch screen is pretty much the replacement. The display is not detachable anymore, but it can be tilted forwards thanks to a new hinge or used as a tablet.
Microsoft uses Intel’s Tiger Lake-H35 processors, so they are still quad-cores with the integrated Iris Xe Graphics G7. Prices start at 1699 Euros for the Core i5-11300H SKU with 16 GB RAM and 256 GB SSD storage. If you need more GPU power, you can get a version with the Core i7-11370H and the dedicated GeForce RTX 3050 Ti, which starts at 2199 Euros. Our review unit is the high-end model with the i7/RTX 3050 Ti, 32 GB RAM as well as 1 TB SSD storage for 2799 Euros. All models get the same 14.4-inch IPS screen with a 3:2 aspect ratio, which offers a high resolution of 2400 x 1600 pixels as well as a refresh rate of 120 Hz. The Surface Slim Pen 2 is not part of the package and has to be purchased separately for 130 Euros.
Possible competitors
Rating | Date | Model | Weight | Height | Size | Resolution | Price |
|---|---|---|---|---|---|---|---|
| 89 % v7 (old) | 03 / 2022 | Microsoft Surface Laptop Studio i7 RTX 3050 Ti i7-11370H, GeForce RTX 3050 Ti Laptop GPU | 1.8 kg | 19 mm | 14.40" | 2400x1600 | |
| 87.4 % v7 (old) | 03 / 2021 | Acer ConceptD 3 Ezel CC314-72G-7513 i7-10750H, GeForce GTX 1650 Ti Max-Q | 1.8 kg | 23.9 mm | 14.00" | 1920x1080 | |
| 92.7 % v7 (old) | 11 / 2021 | Apple MacBook Pro 14 2021 M1 Pro Entry M1 Pro 8-Core, M1 Pro 14-Core GPU | 1.6 kg | 15.5 mm | 14.20" | 3024x1964 | |
| 86.9 % v7 (old) | 06 / 2020 | Microsoft Surface Book 3 13.5 i7-1065G7, GeForce GTX 1650 Max-Q | 1.6 kg | 23 mm | 13.50" | 3000x2000 | |
| 87.7 % v7 (old) | 01 / 2022 | Schenker Vision 14 i7-11370H, GeForce RTX 3050 Ti Laptop GPU | 1.1 kg | 15.6 mm | 14.00" | 2880x1800 | |
| 87.5 % v7 (old) | 06 / 2021 | Razer Blade 14 Ryzen 9 RTX 3070 R9 5900HX, GeForce RTX 3070 Laptop GPU | 1.8 kg | 16.8 mm | 14.00" | 2560x1440 | |
| 82.3 % v7 (old) | 07 / 2021 | MSI Summit E14 A11SCS i7-1185G7, GeForce GTX 1650 Ti Max-Q | 1.3 kg | 16 mm | 14.00" | 3840x2160 |
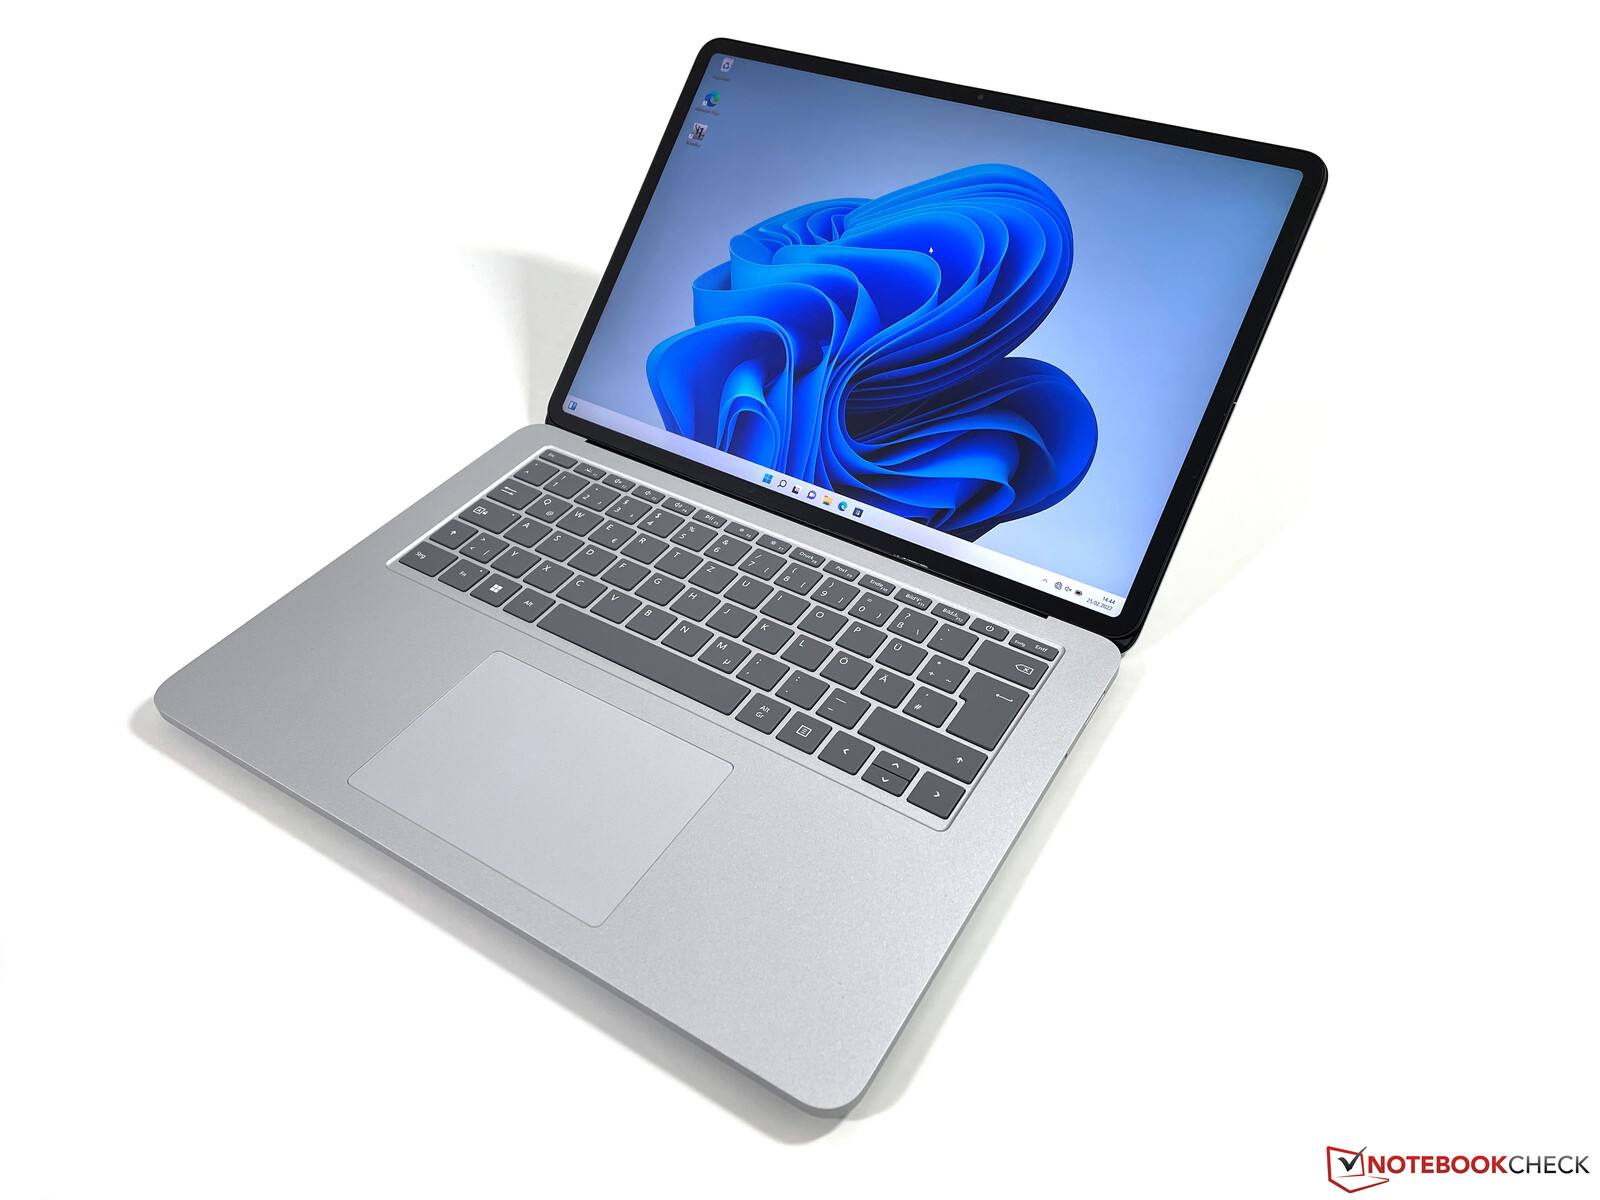
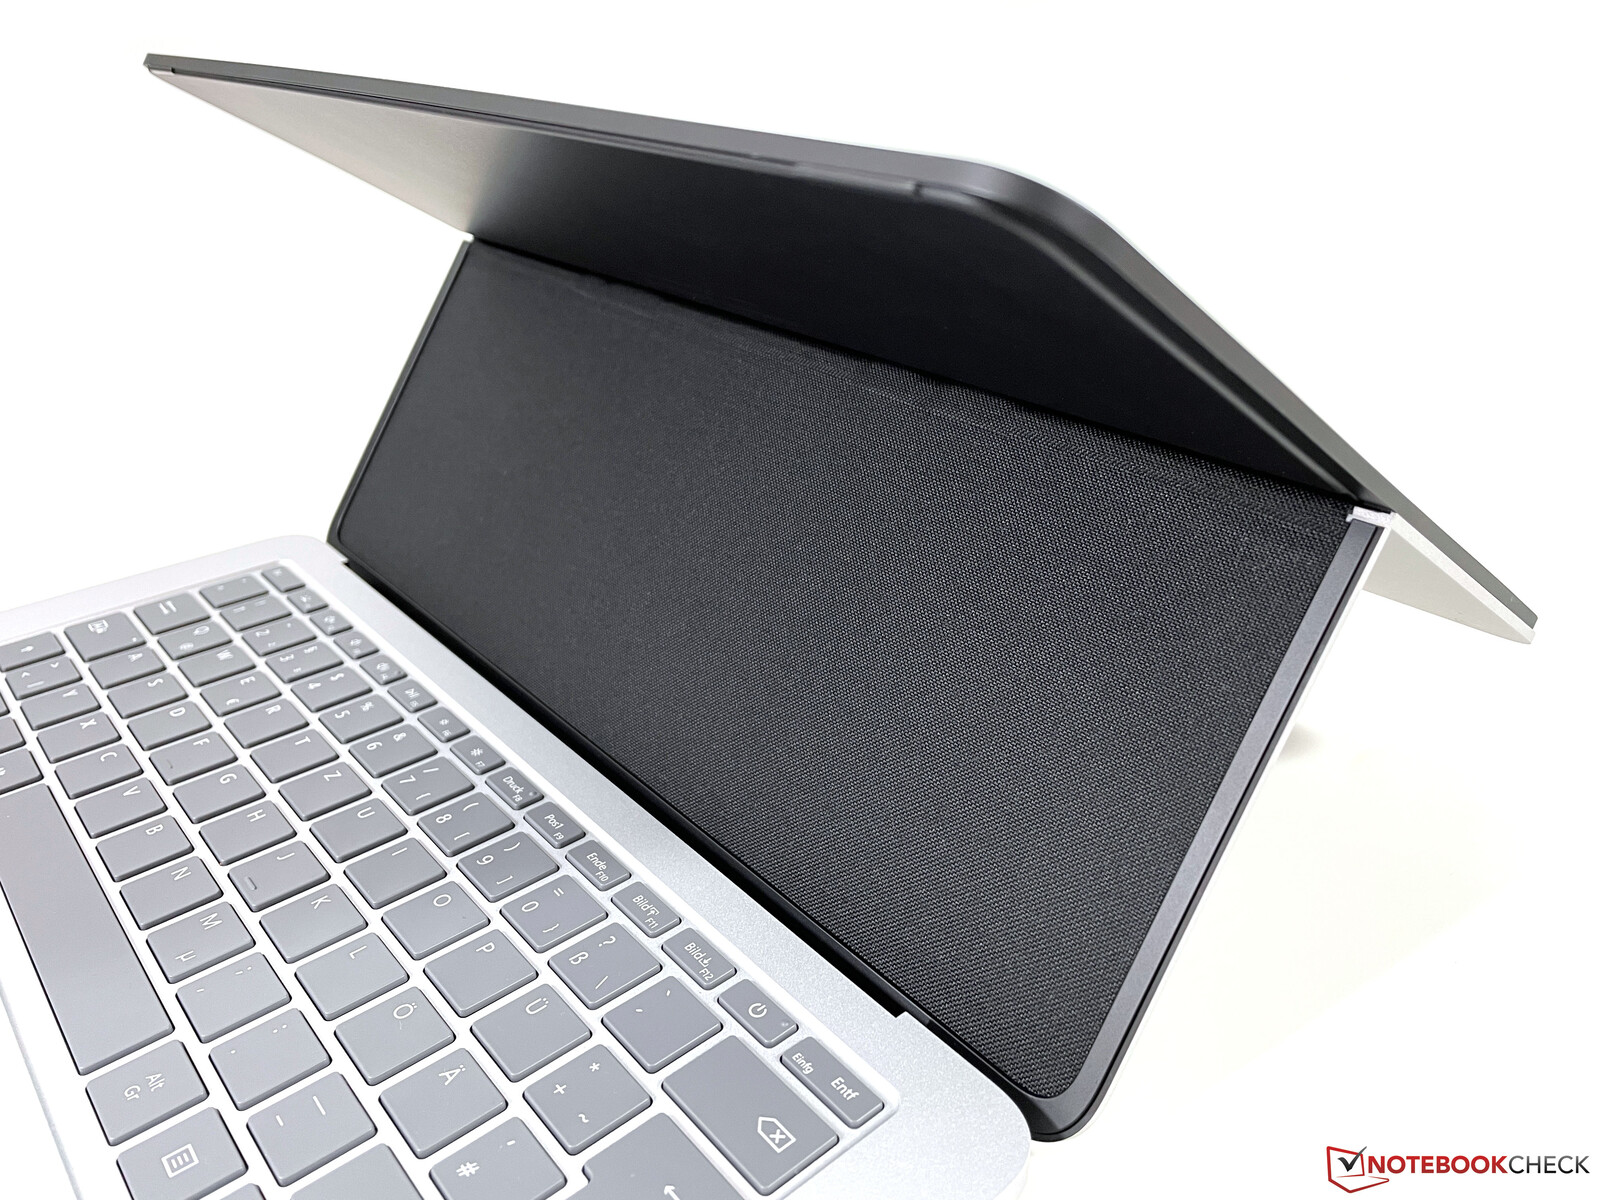
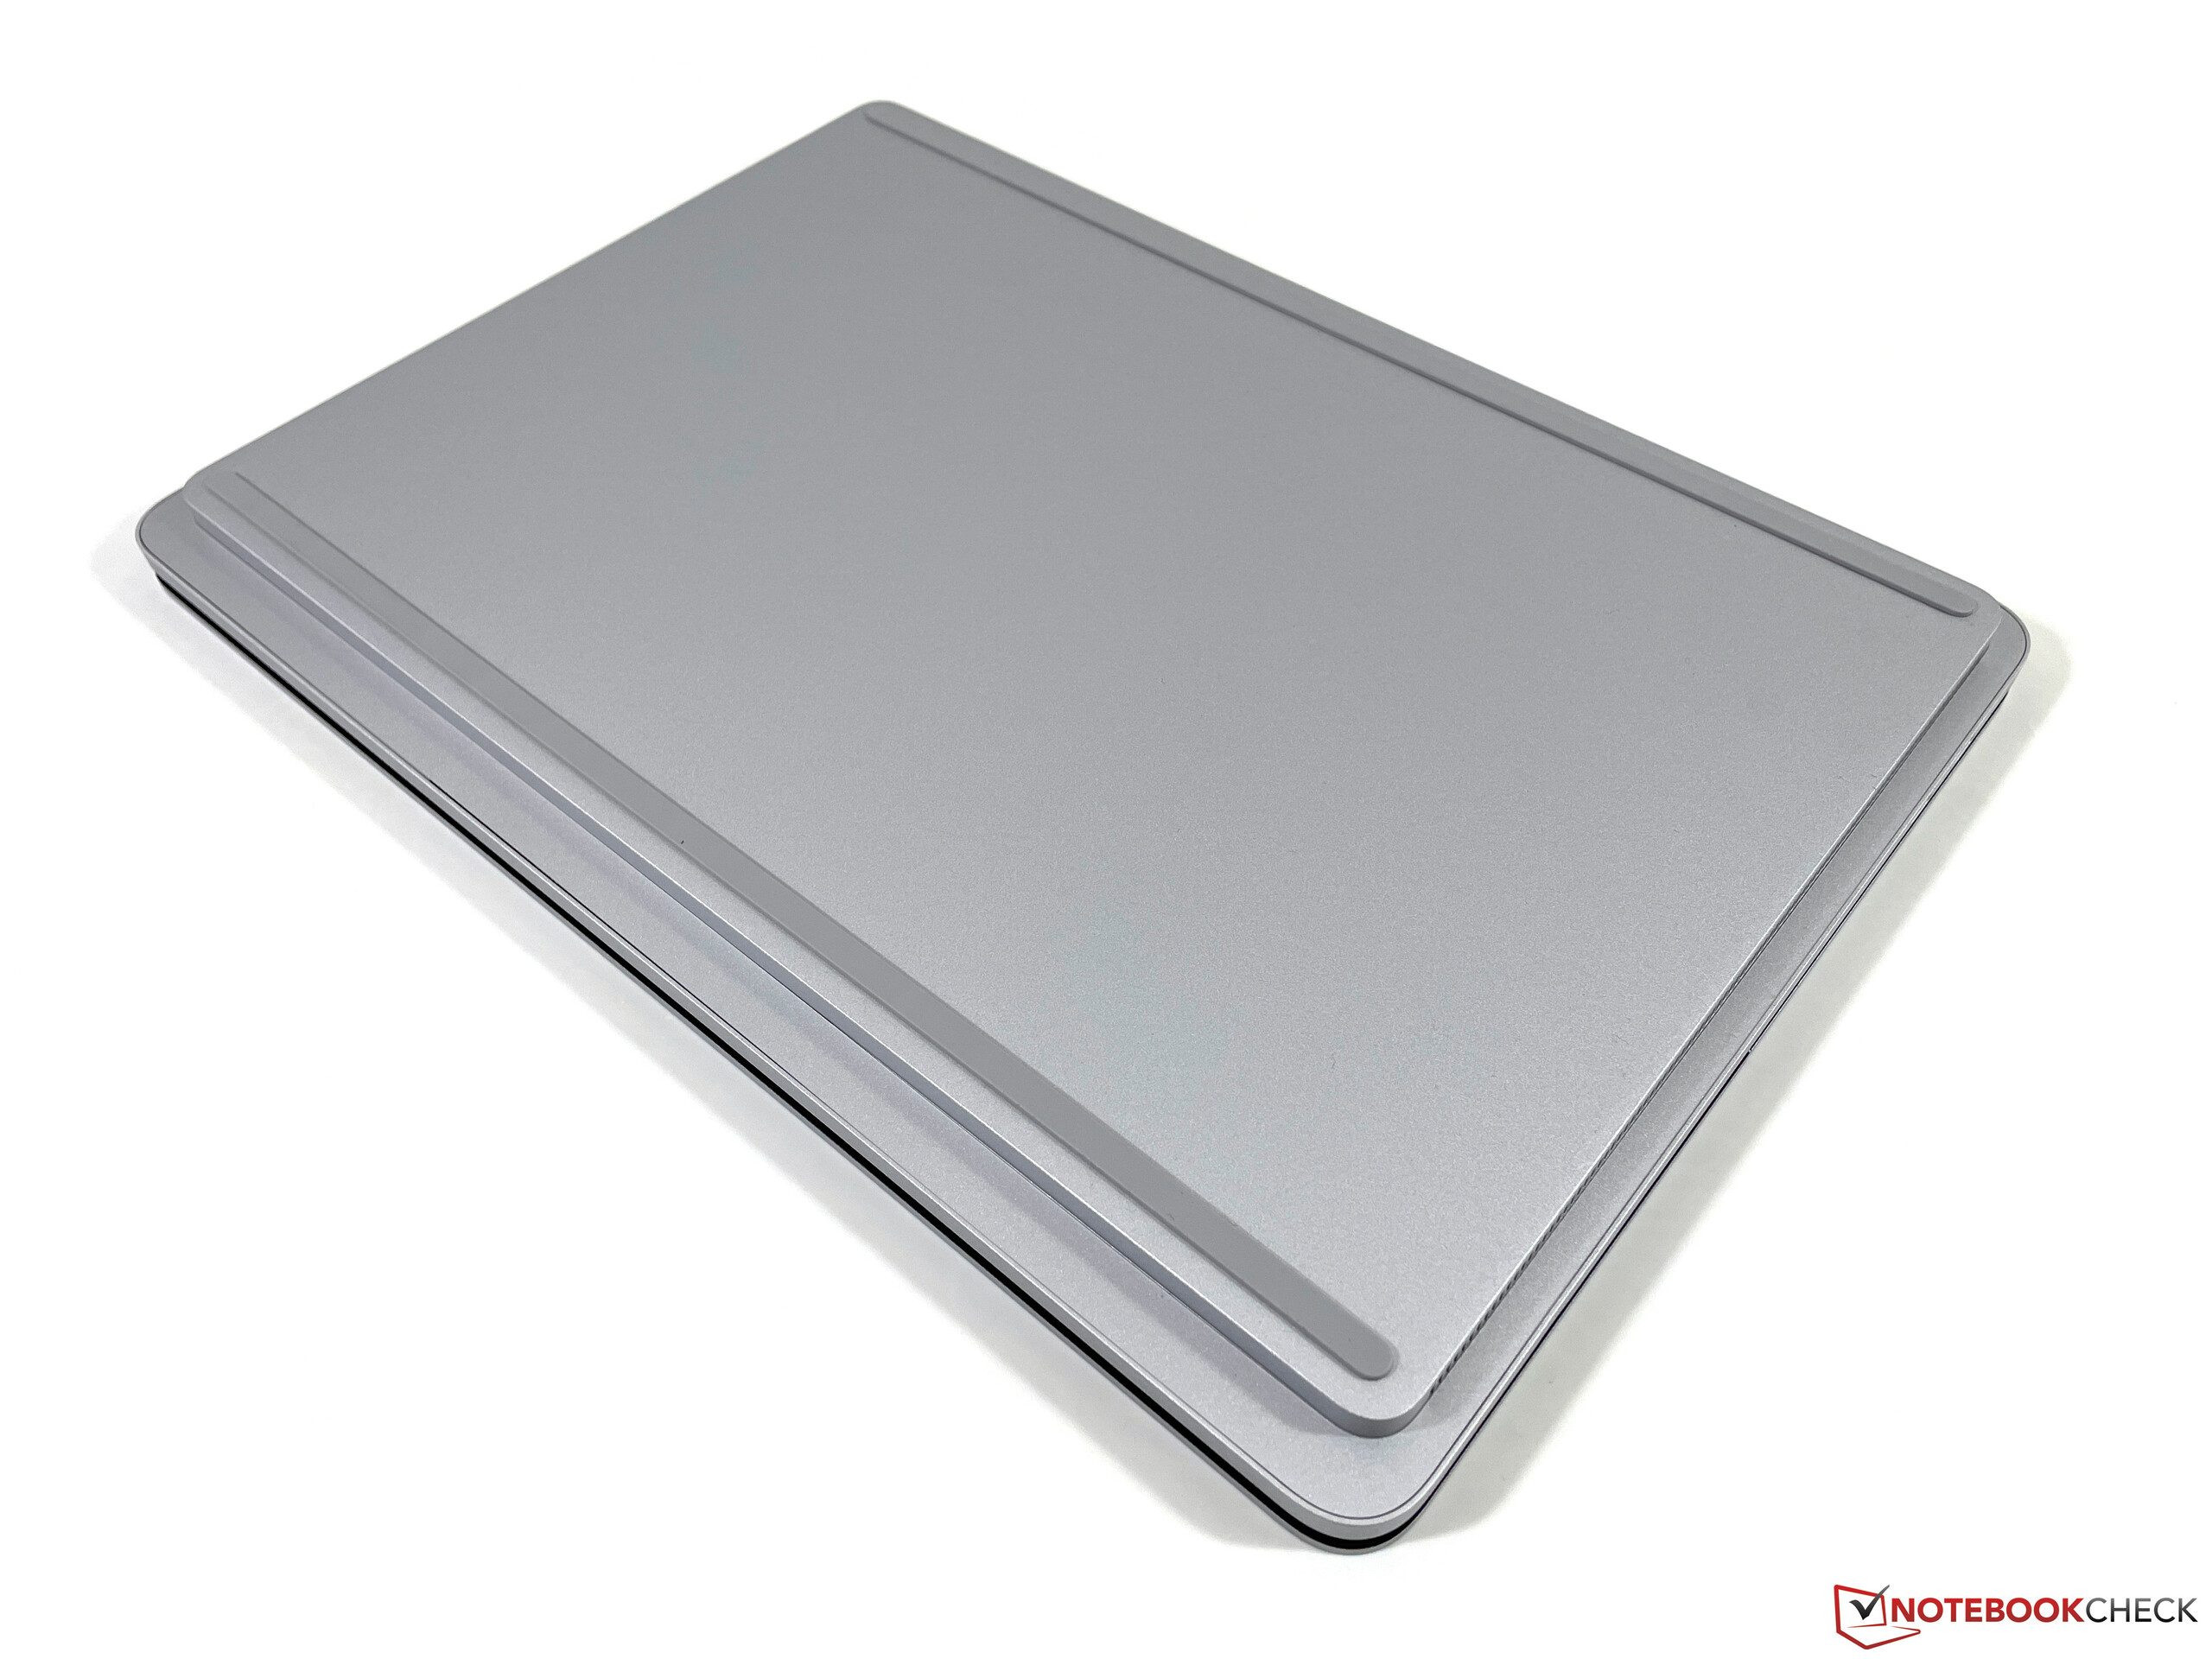
Case - Surface Laptop Studio with foldable display
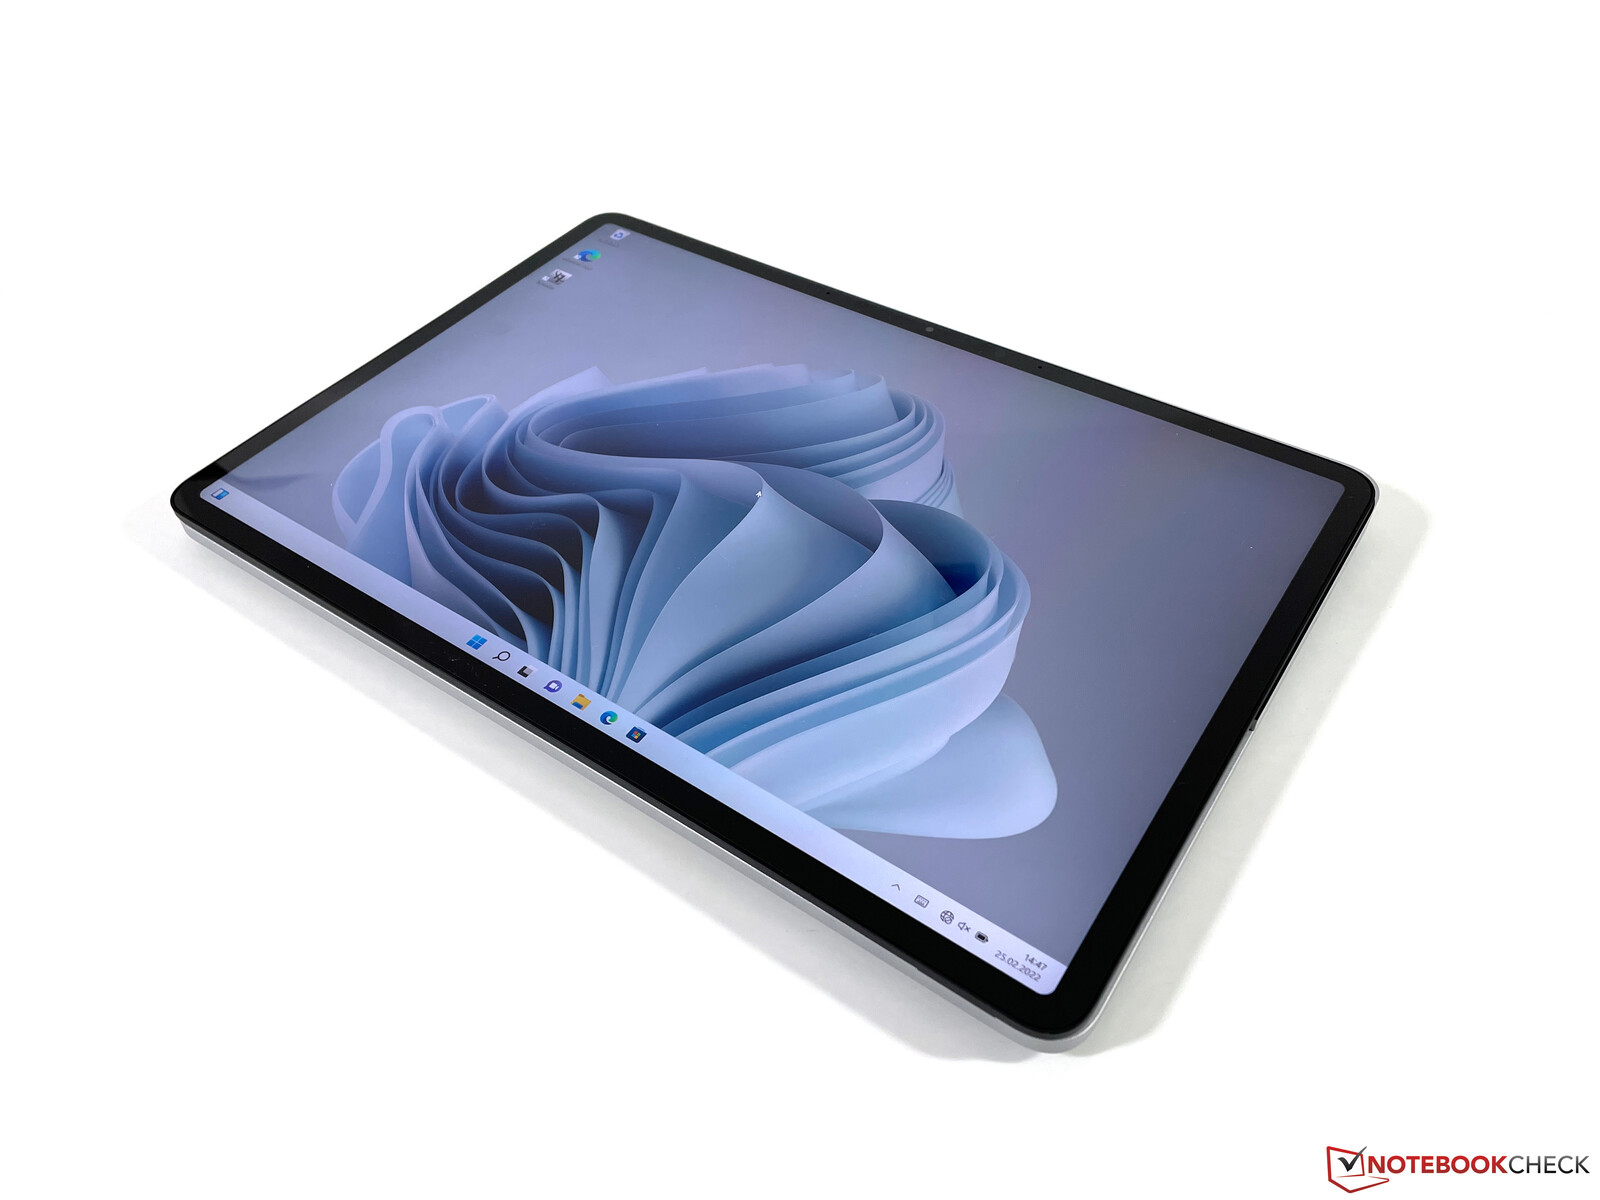
We have already reported about a new folding mechanism patent in combination with a potential Surface Book 4. We now know that Microsoft uses this hinge for the new Surface Laptop Studio. The device is basically a regular laptop with an additional hinge in the middle of the screen. This means you can tilt the screen forwards in two positions, one position in front of the keyboard (seems to be held magnetically) or you can put it down onto the keyboard and use the Surface Laptop Studio as a tablet. We are already familiar with this concept from the Acer ConceptD 3 Ezel, where the mechanism with the additional hinge was a bit bulkier though.
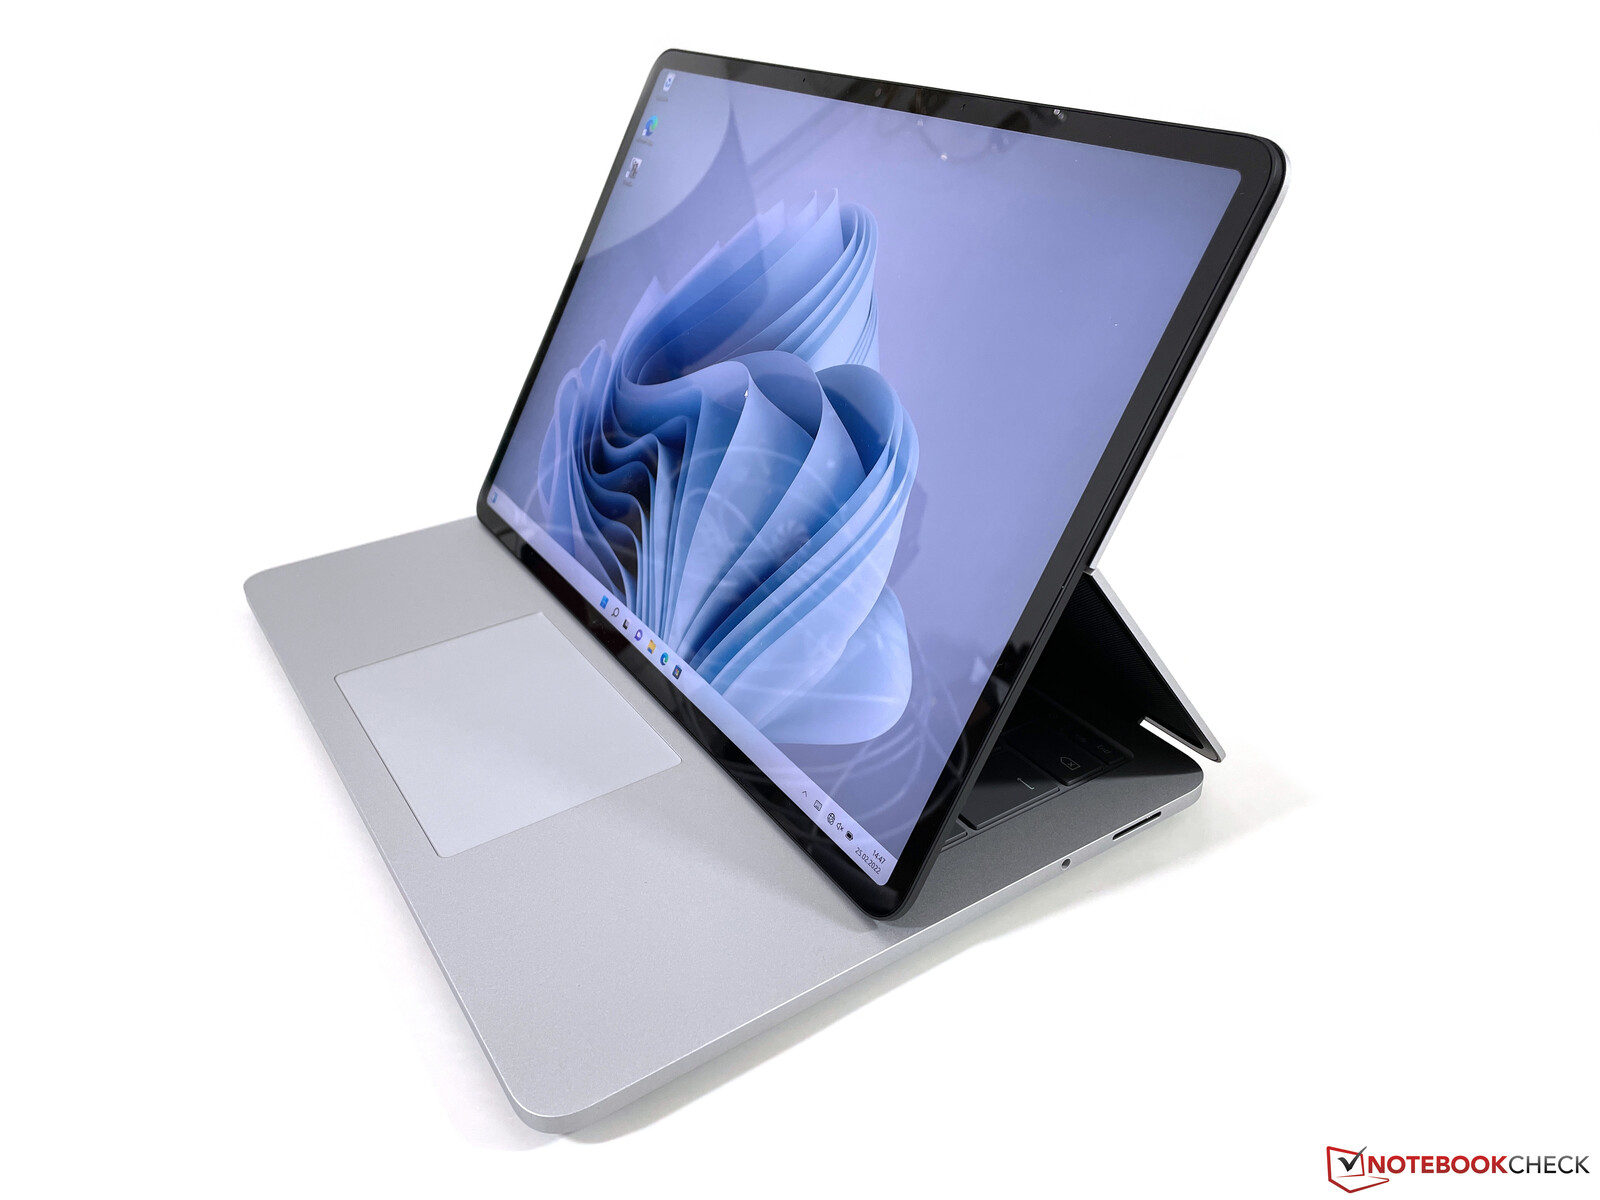
The "middle" position can be used to watch videos or play games with a game pad. You can obviously use the touchscreen for inputs or with the optional pen as well, but the hidden keyboard in this case is definitely not ideal and you have no access to the volume or brightness controls.
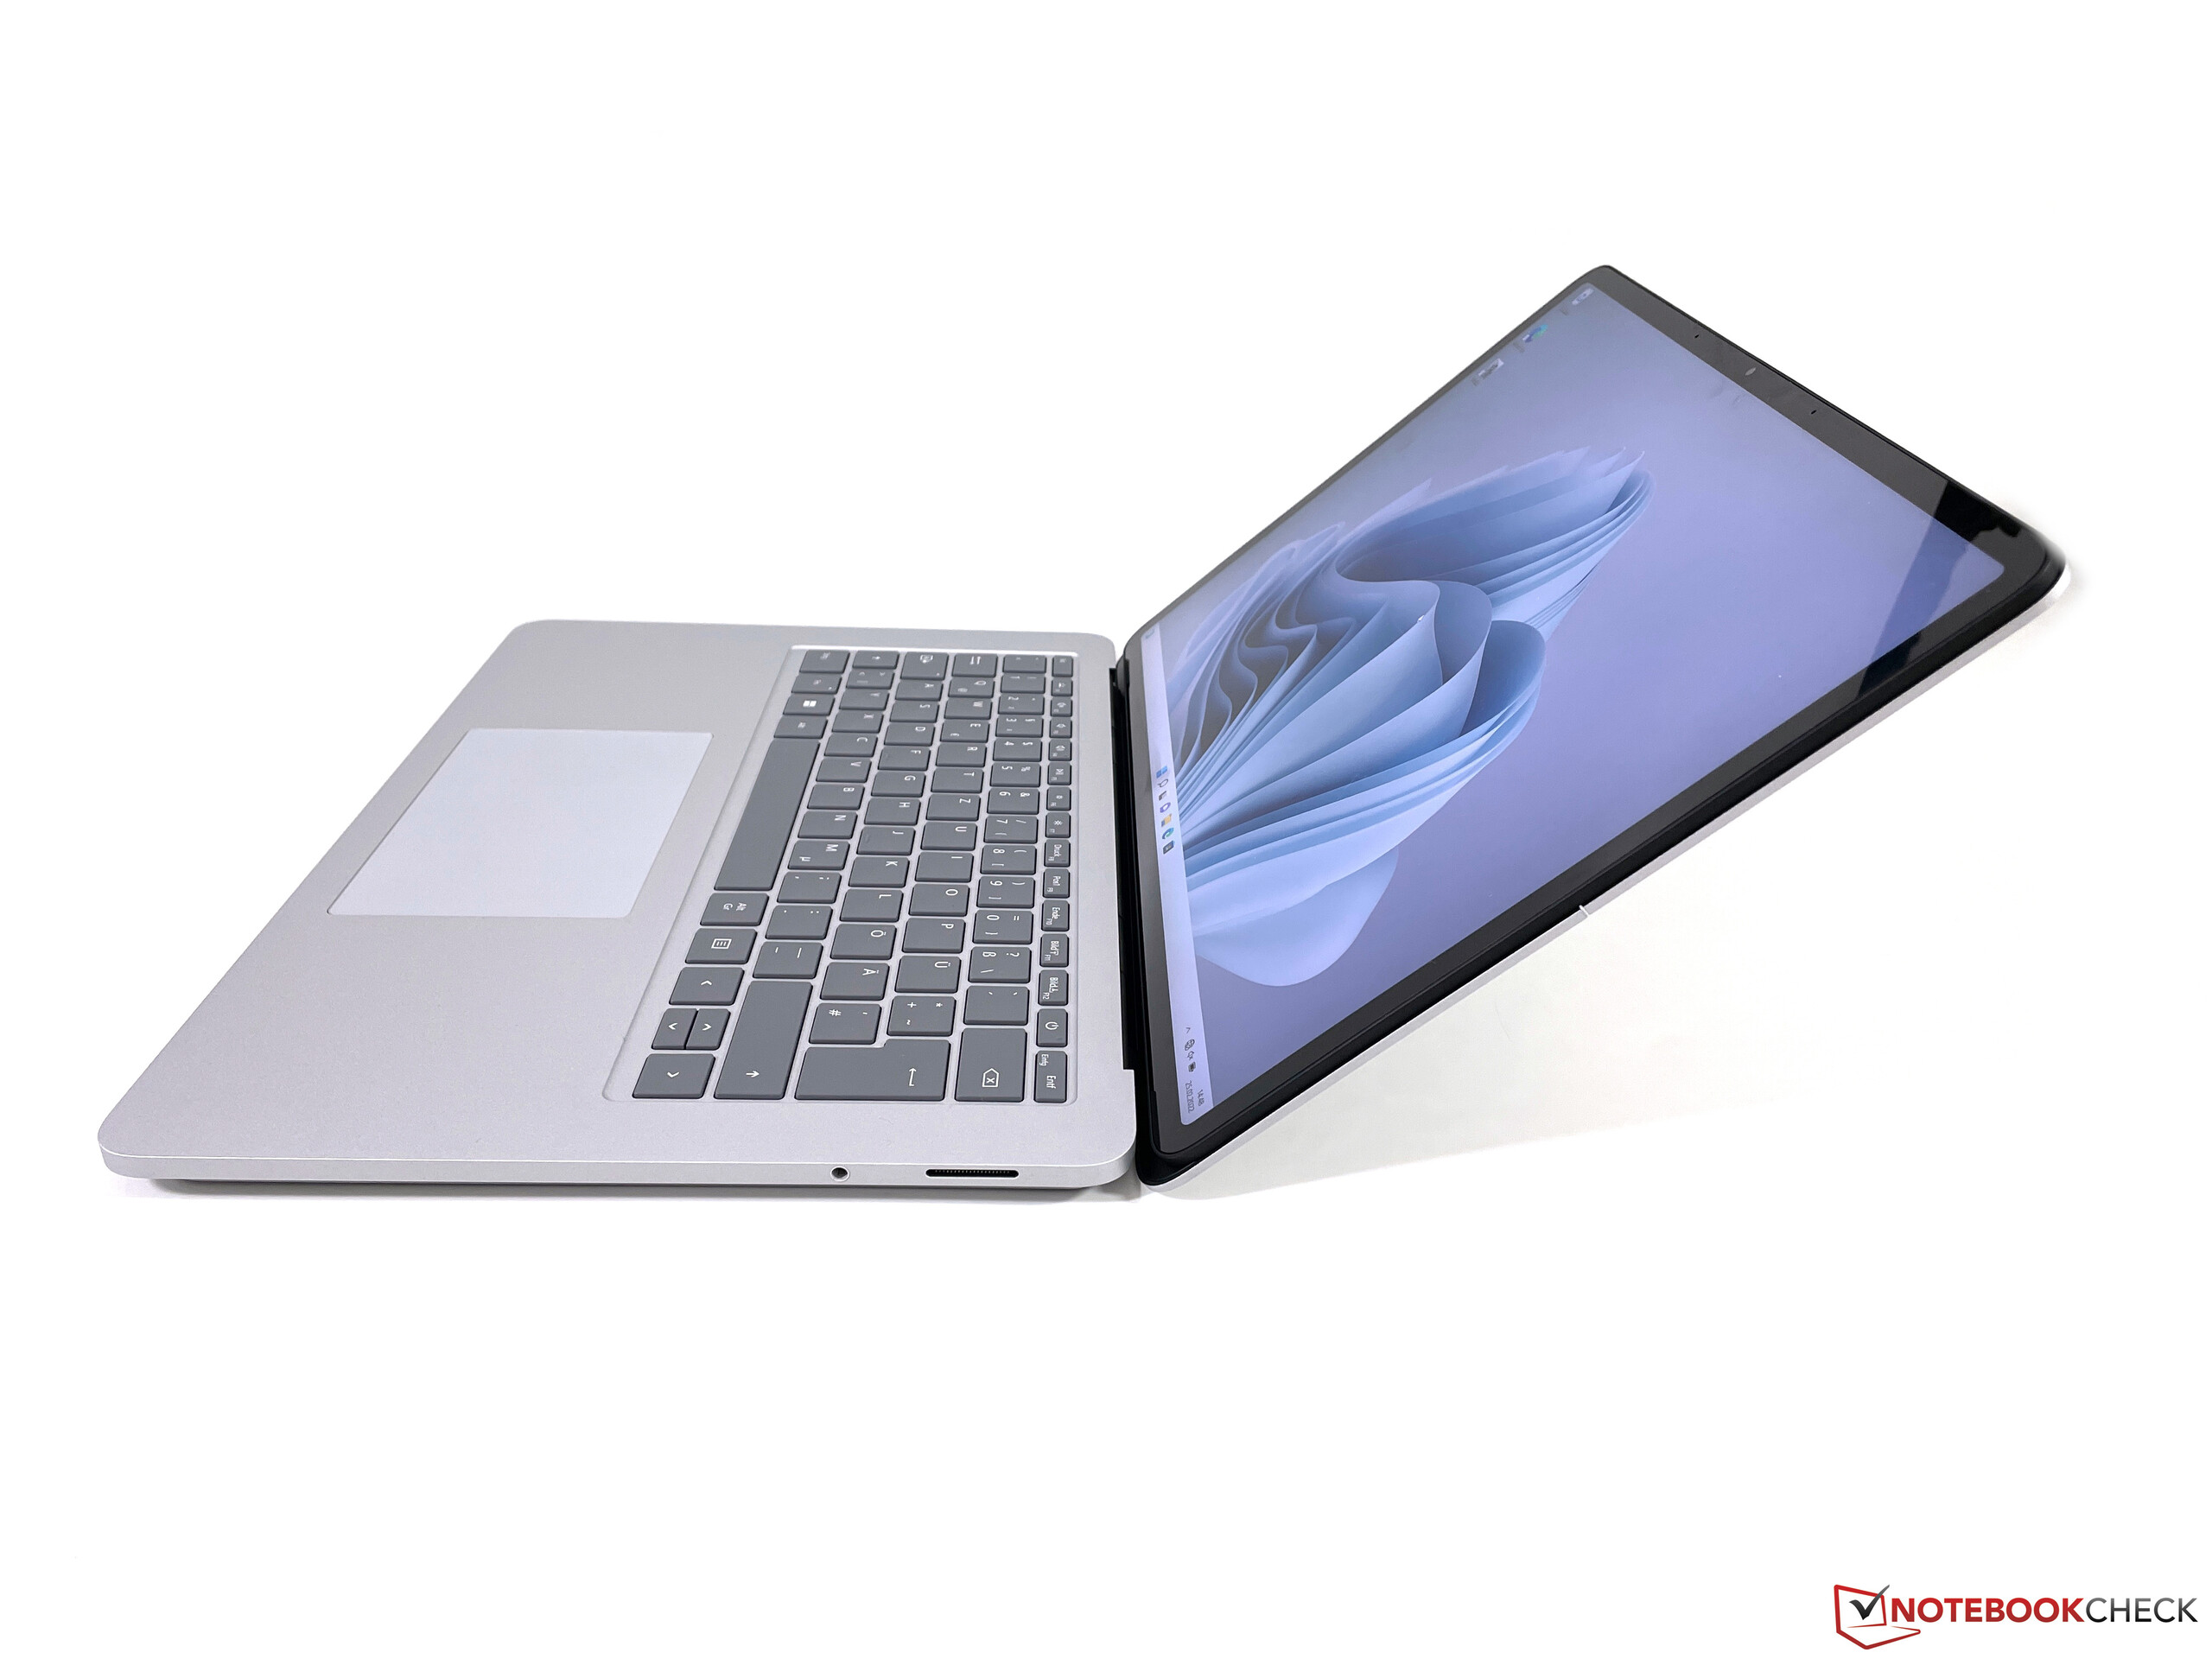
The hinge mechanism itself leaves a solid impression and does not appear wobbly or fragile, but the question is how it will endure over time especially considering the cables. Microsoft advertises that the cables can be folded by 180 degrees. The lower half behind the display is covered by cloth and feels sophisticated. The regular display hinges are also well-adjusted, but there is some bouncing when you adjust the opening angle of the screen and the maximum opening angle is limited to 135 degrees.
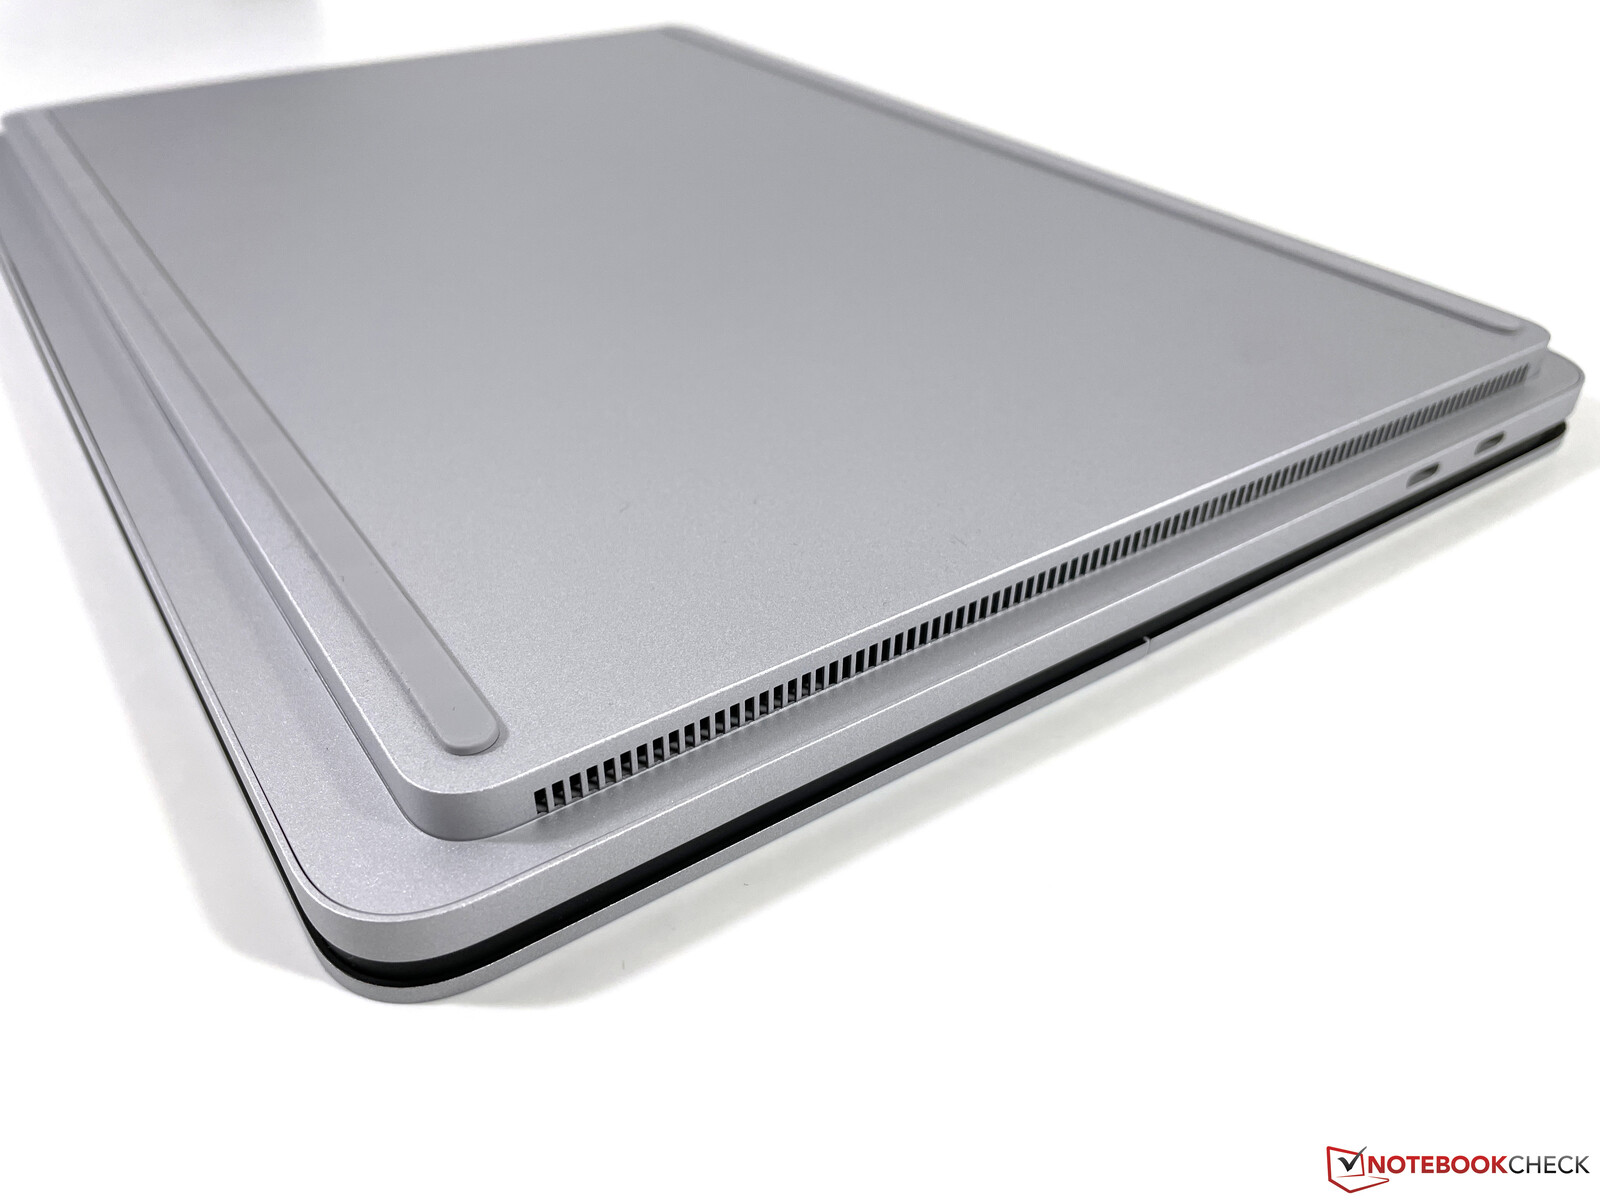
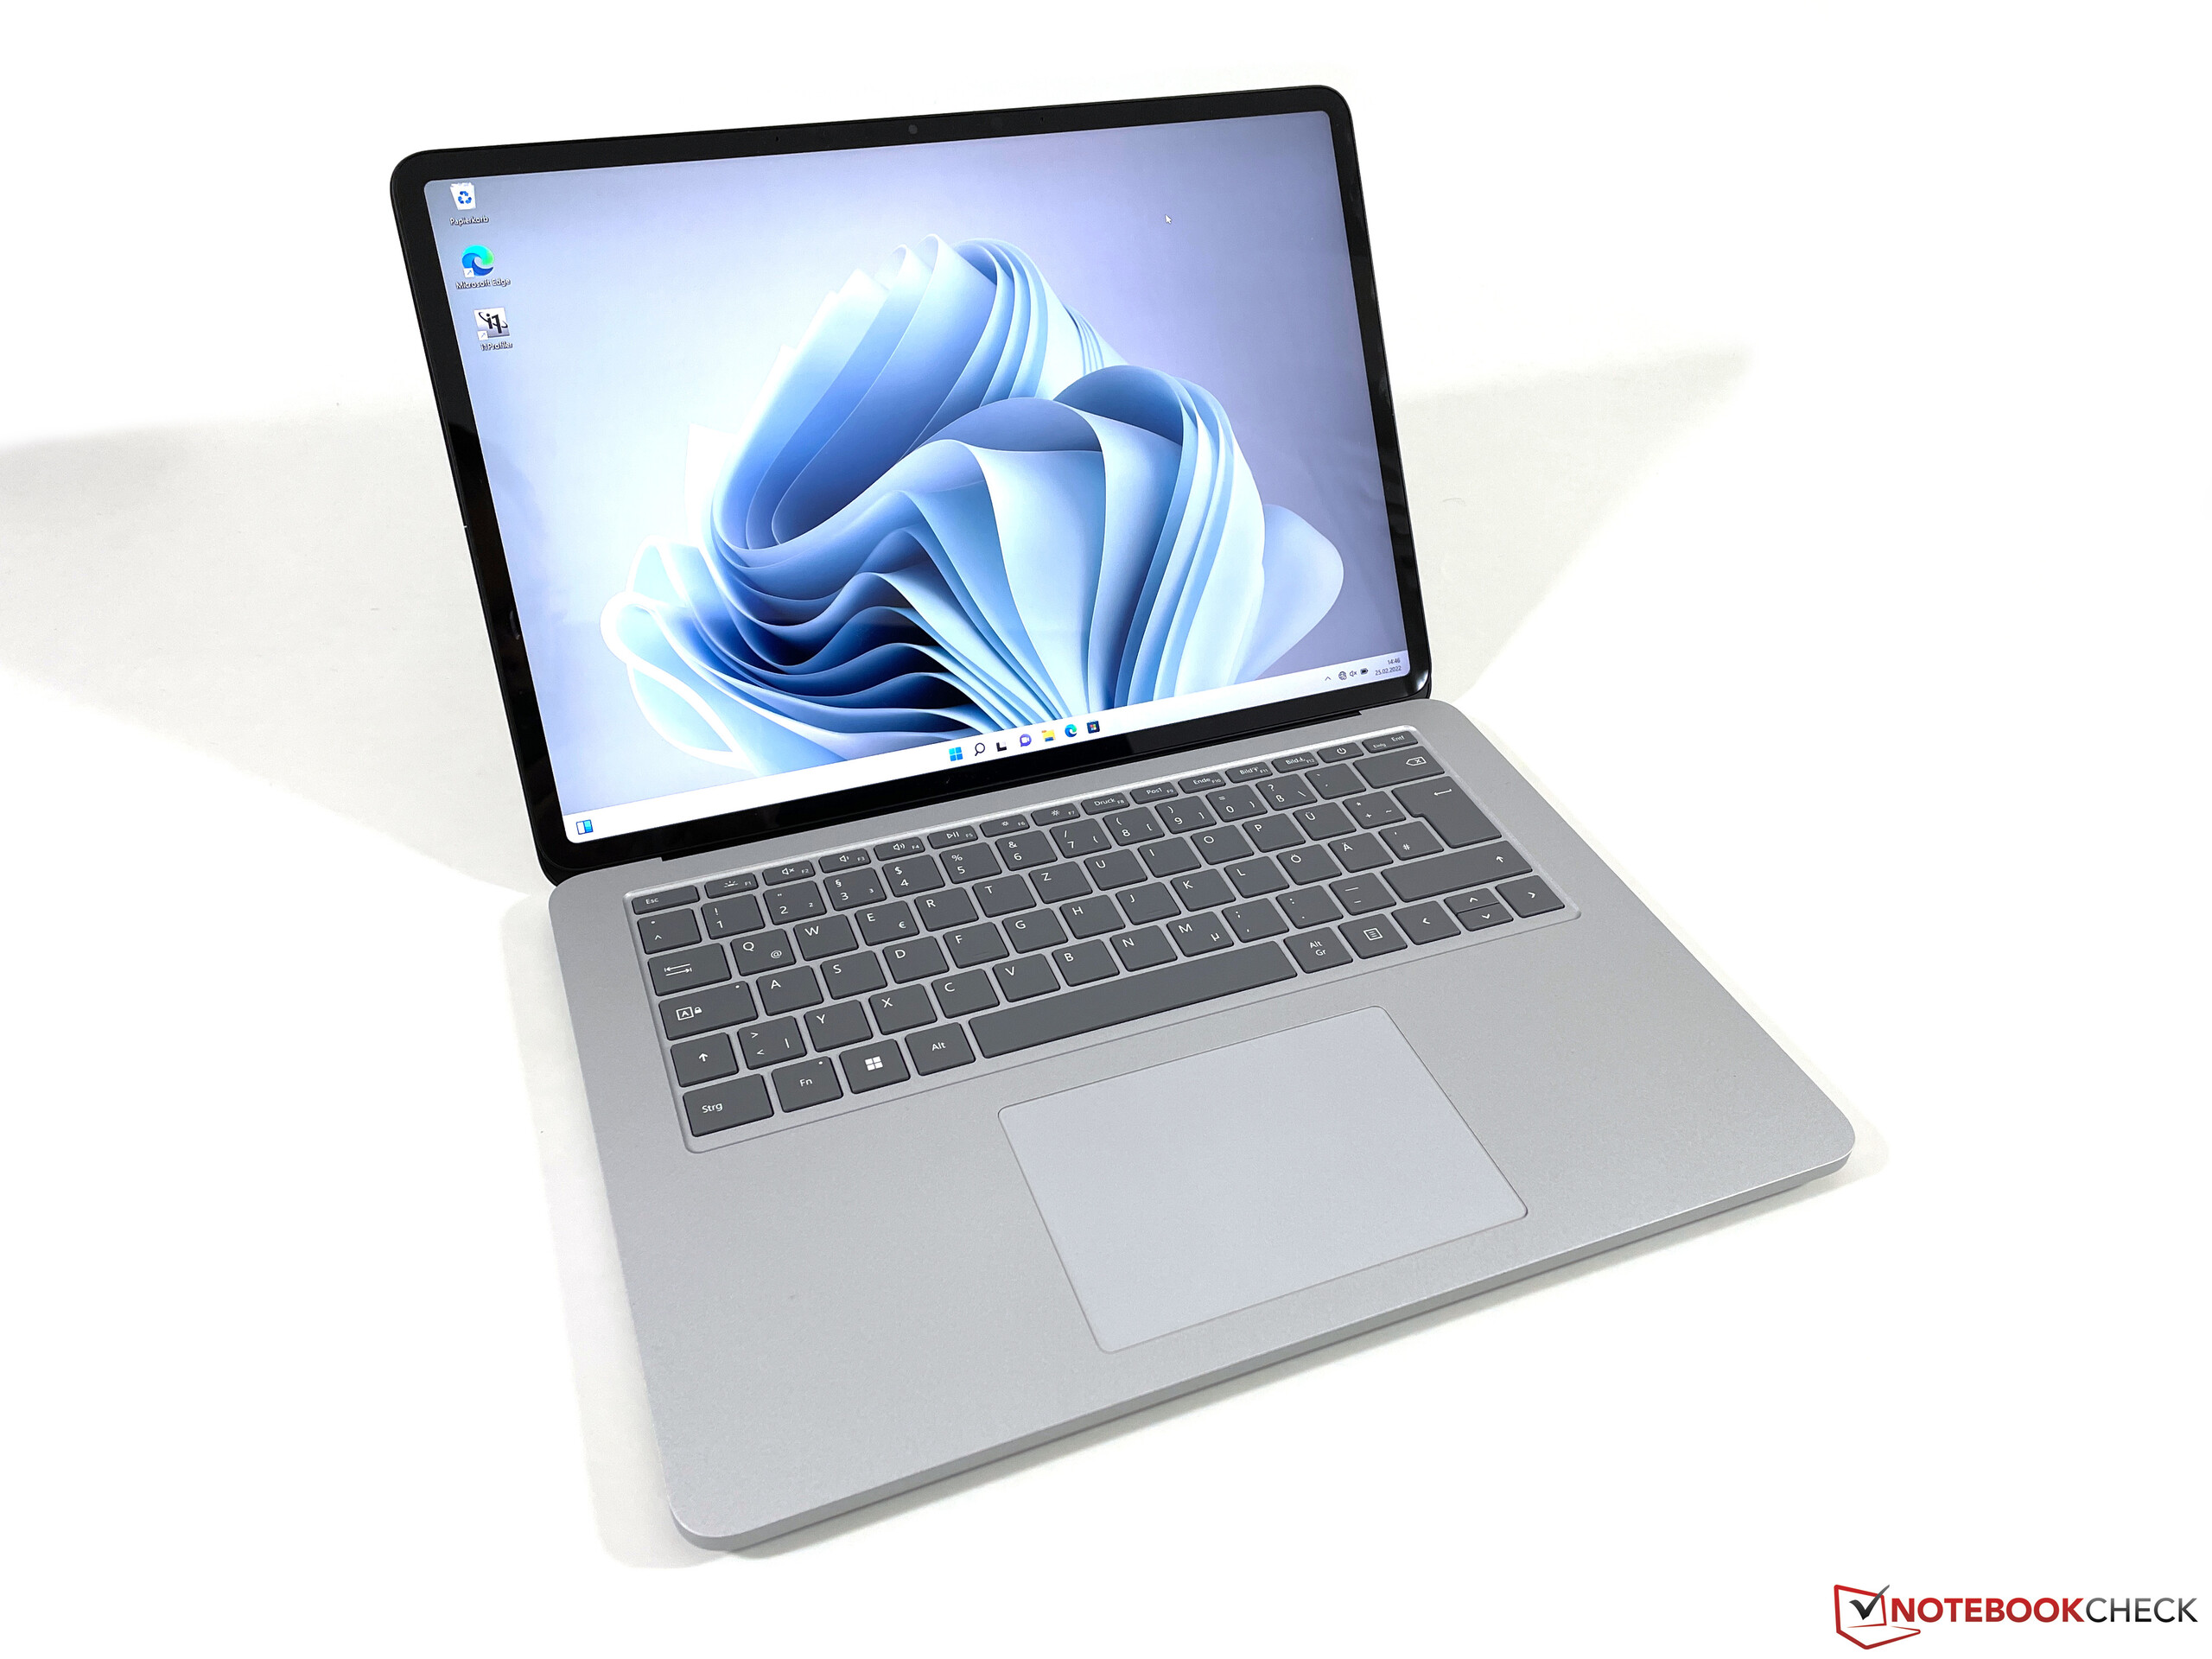
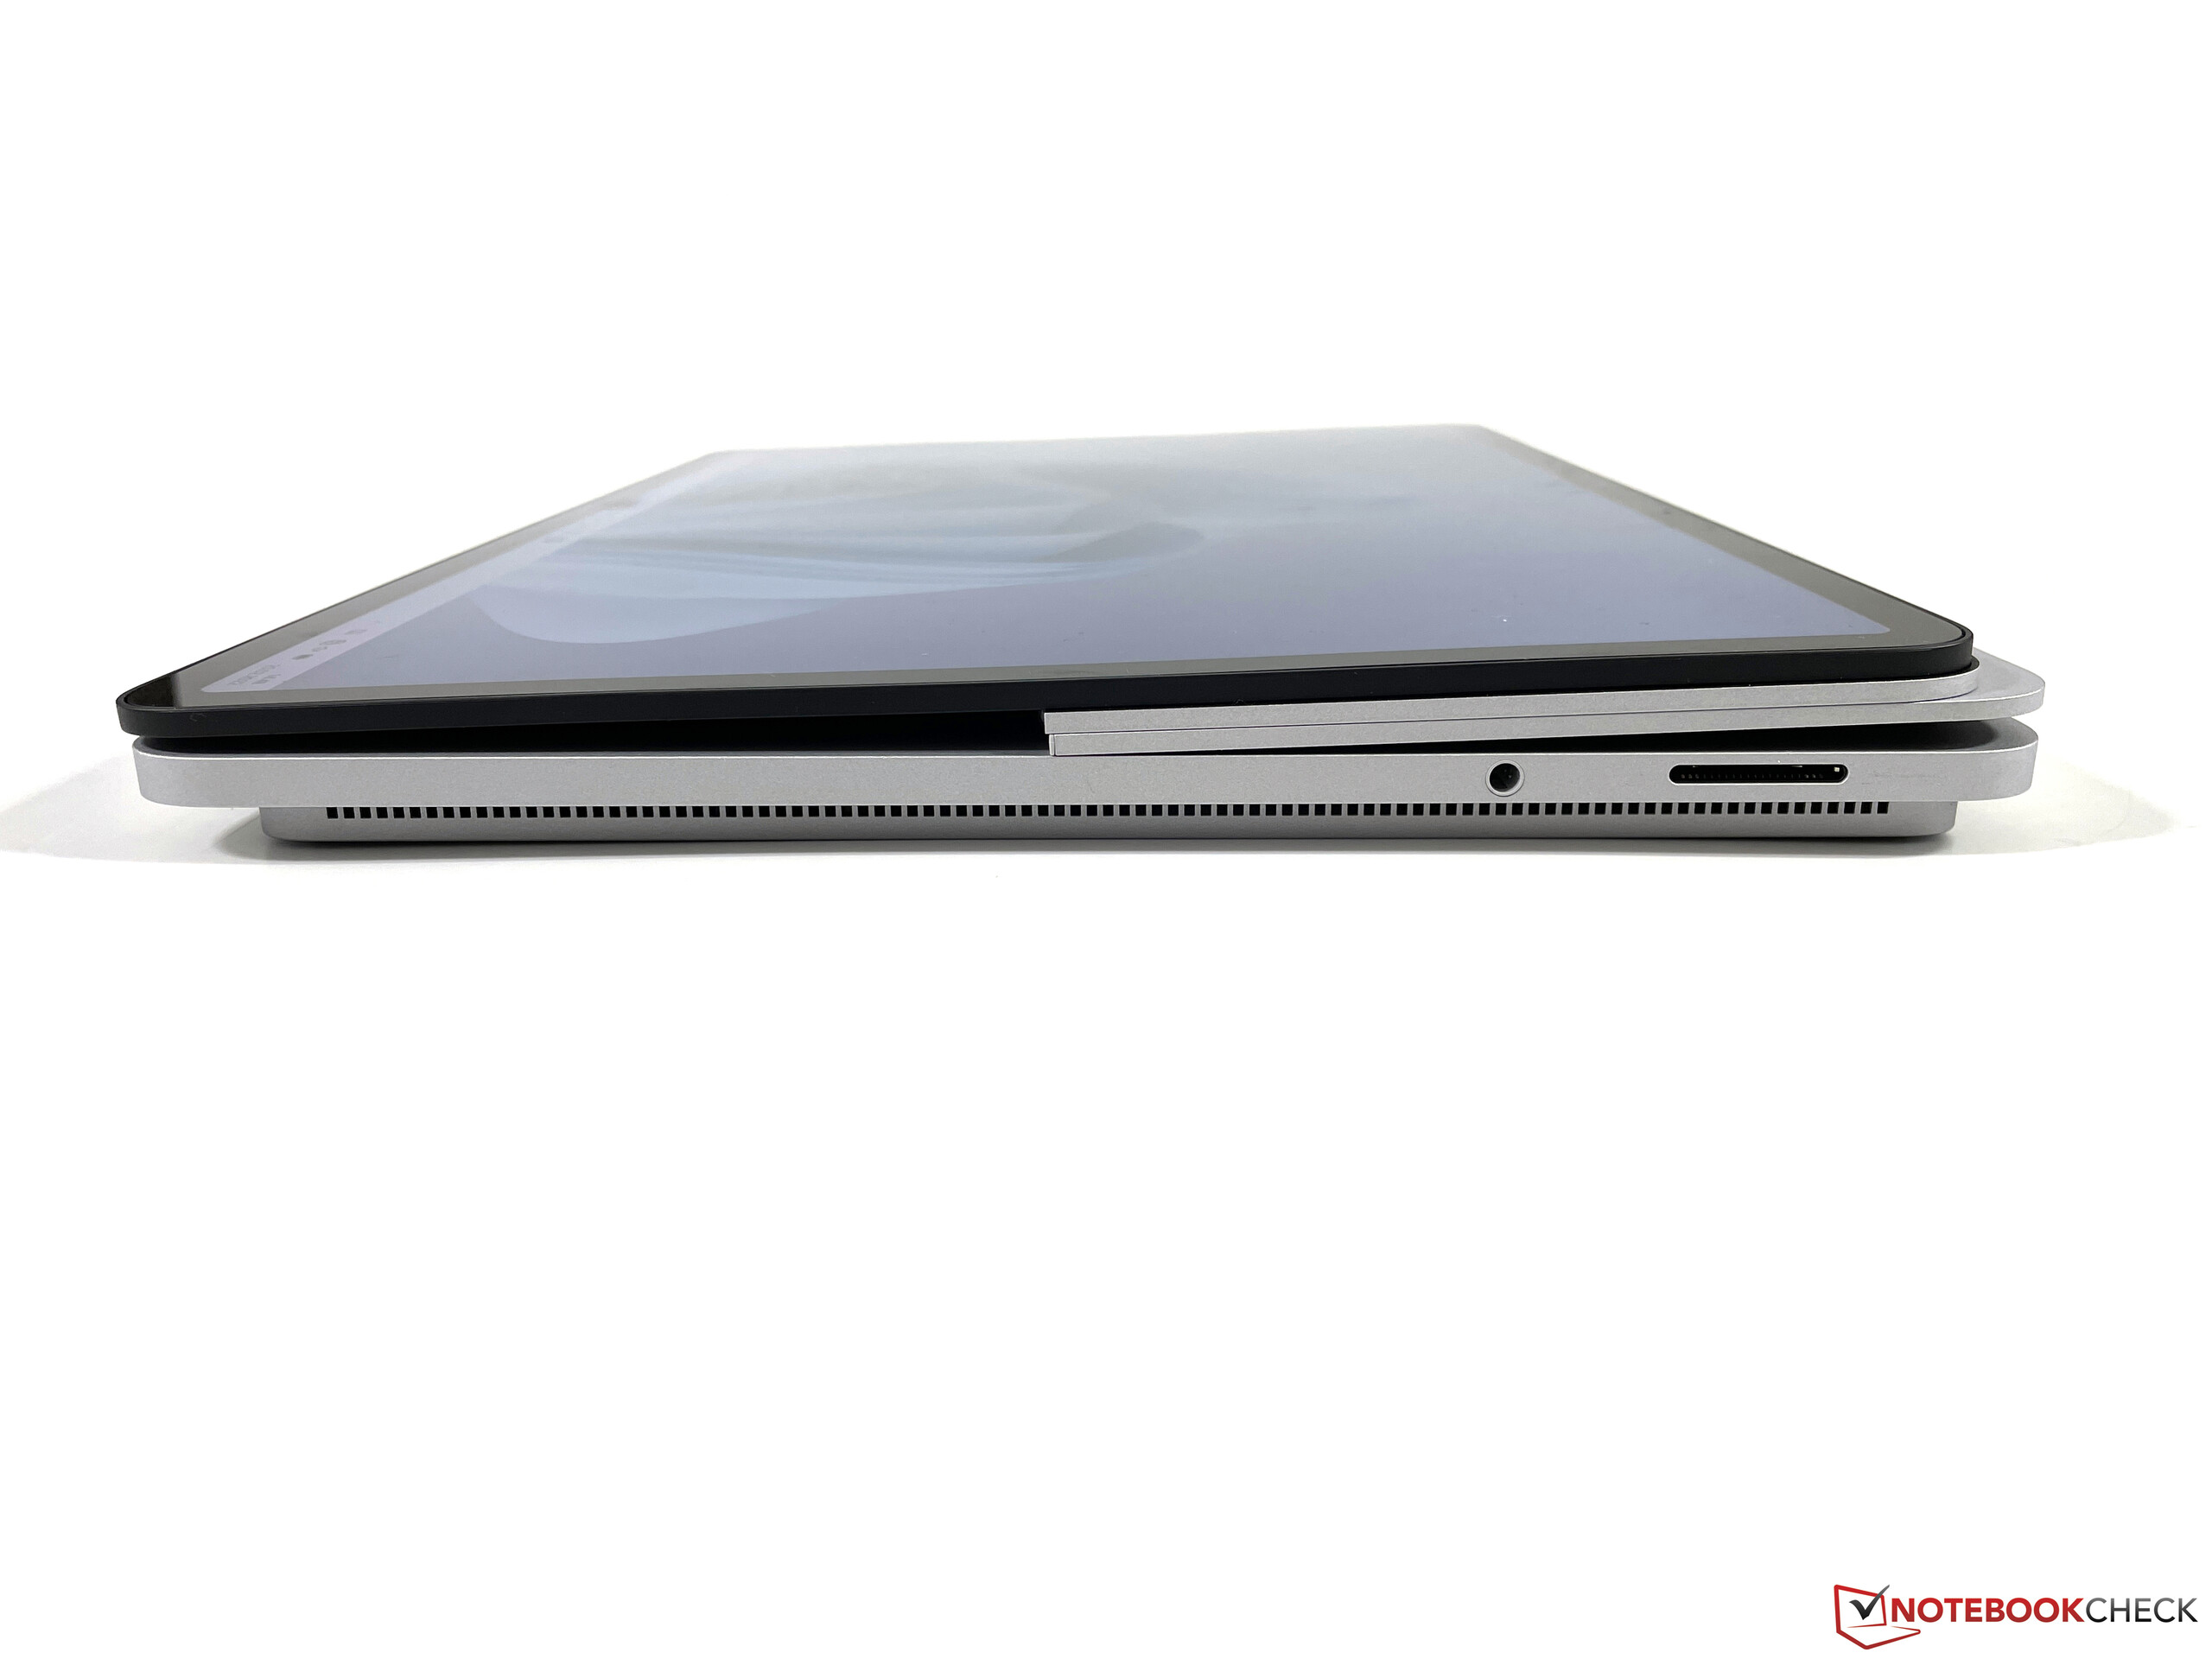
The unusual design continues with the base unit, which consist of two layers. The lower part and the upper part, which is wider on all sides. We are familiar with this basic approach from other manufacturers and device with tapered design appear slimmer than they really are, but the transition is usually much smoother and not as angled as on the Surface Laptop Studio. It is very easy to lift the device, but the design itself is (as per usual) definitely a matter of taste. The screen bezels are comparatively wide for a modern device at around 10 mm (screen to body ratio: 84 %).
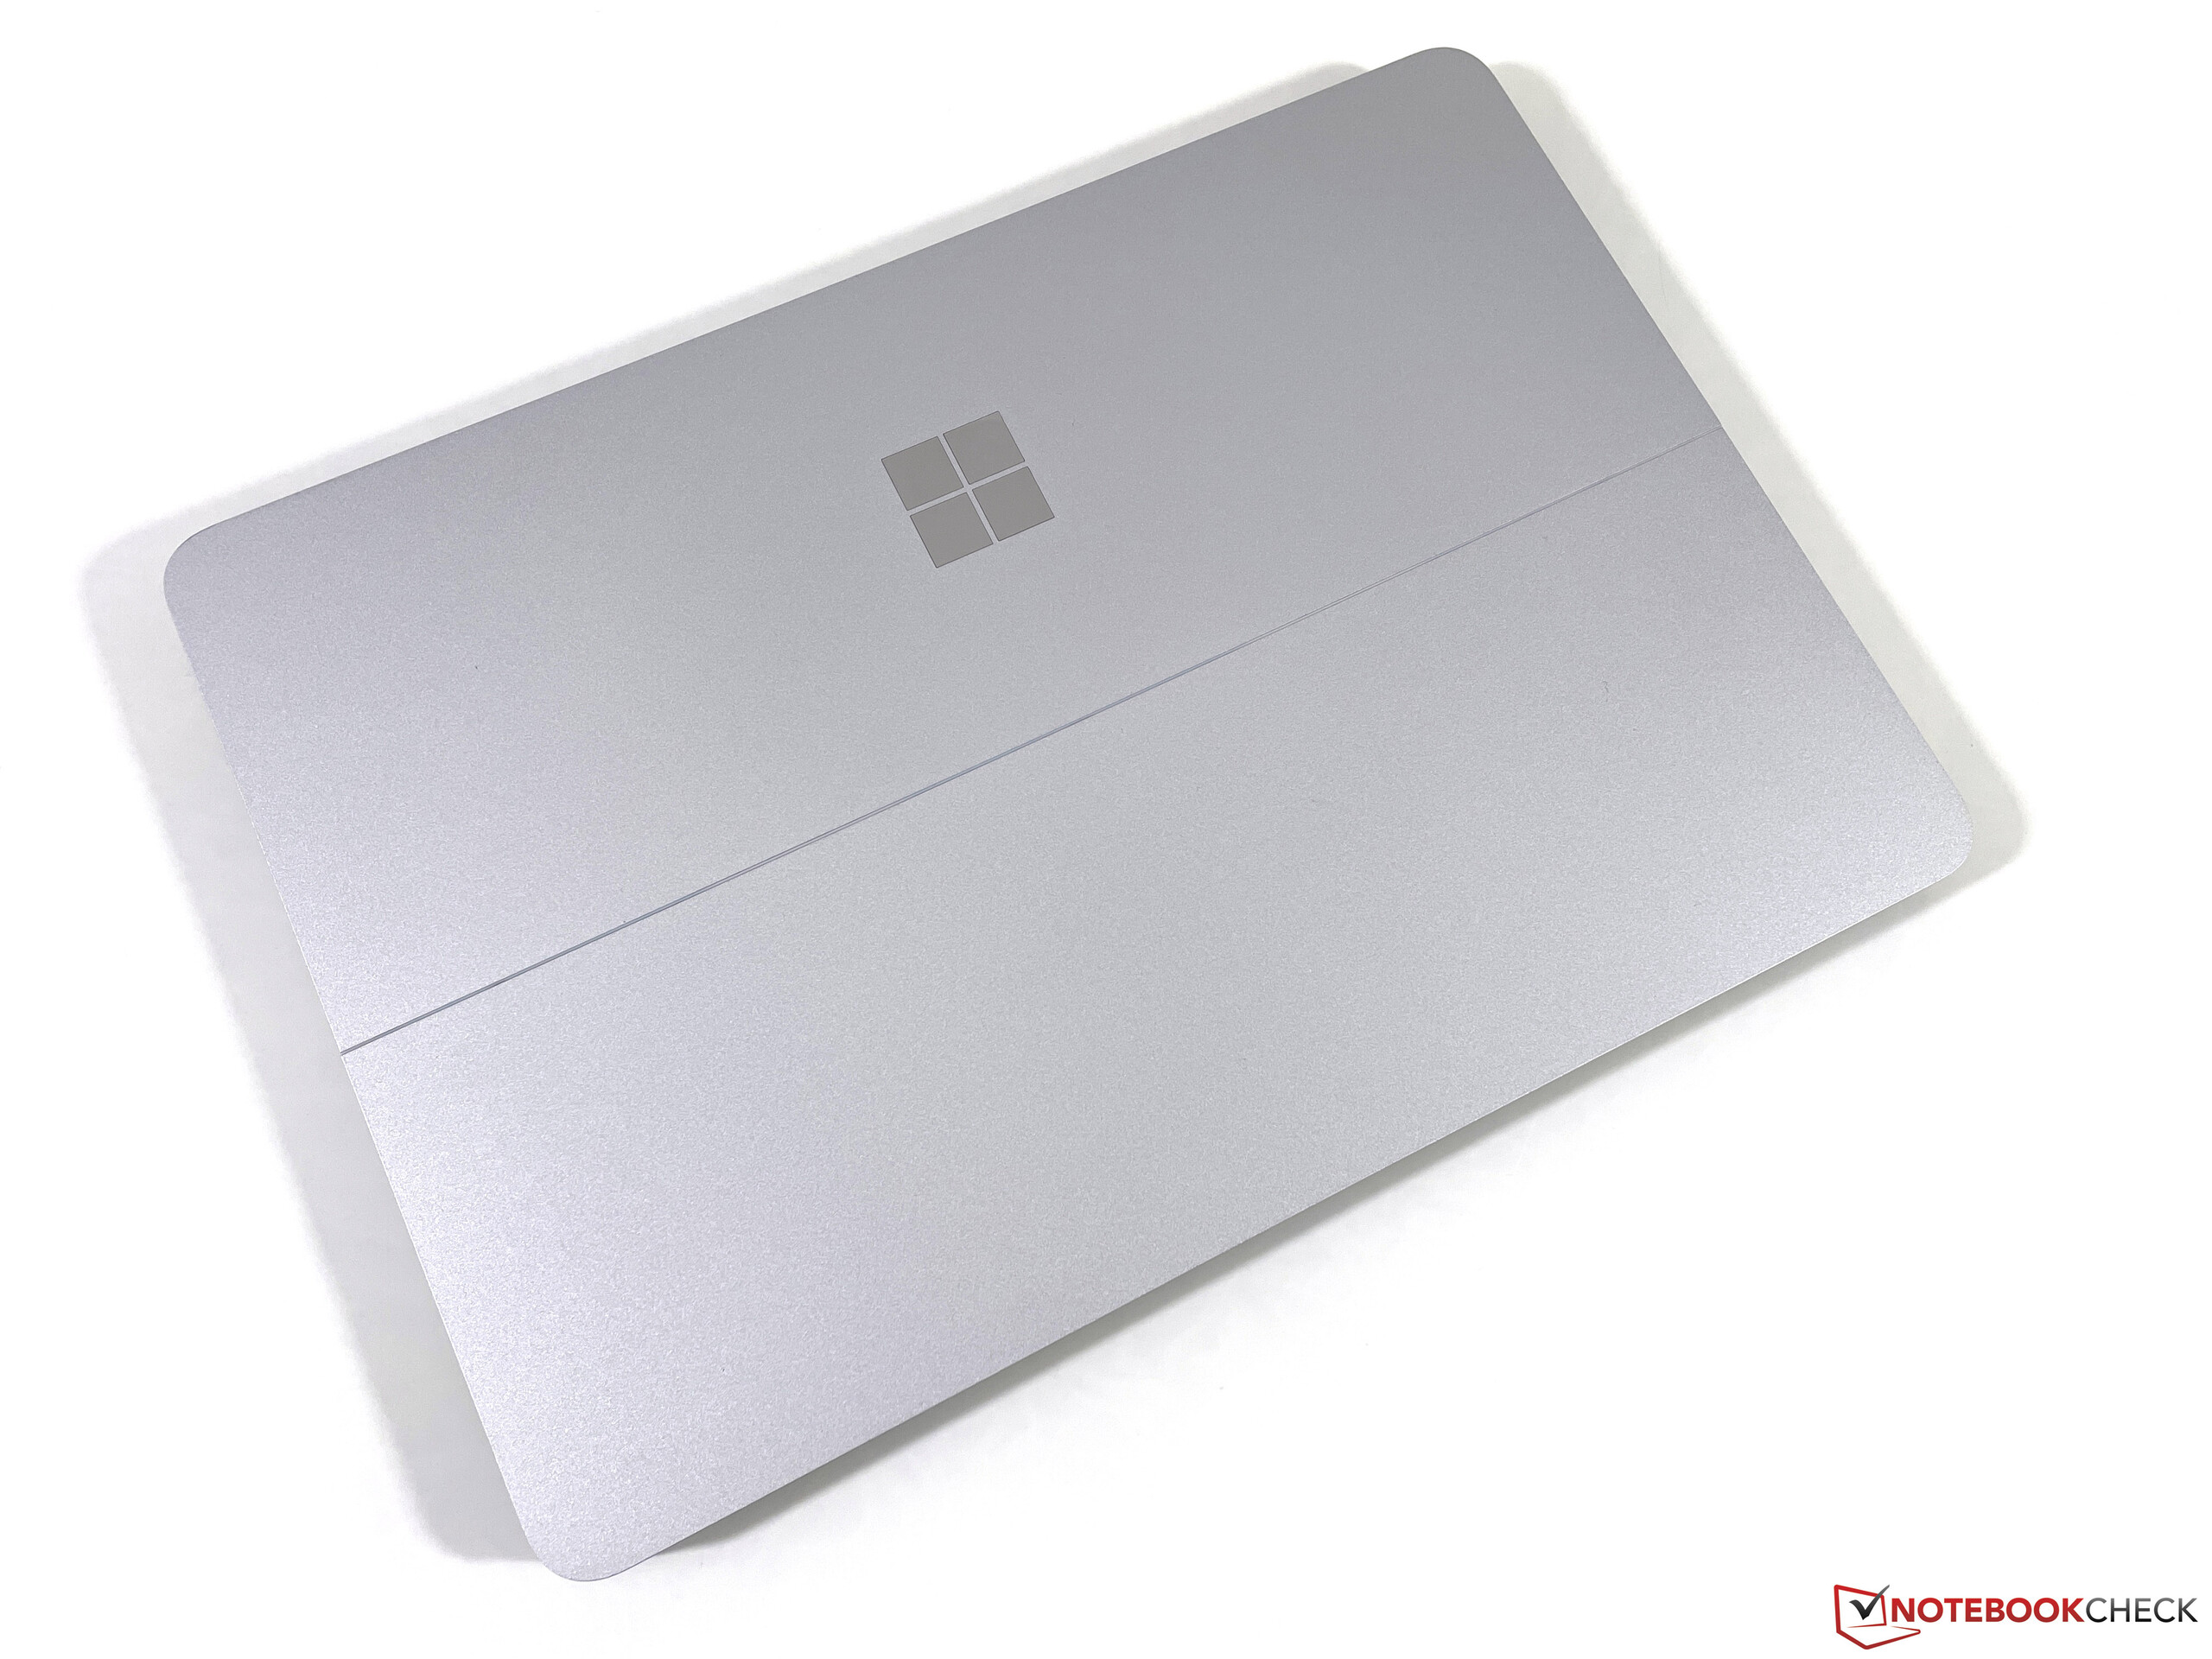
Microsoft’s Surface devices always had great build quality and the new Surface Laptop Studio is no exception. The build quality is flawless and the matte surfaces of the chassis, which is made of aluminum and magnesium, are nice to touch and they are not very susceptible to dirt, either. We are completely happy with the stability of the review unit as well.
The new design approach results in a rather large chassis and the Surface Laptop Studio is one of the biggest and at more than 1.8 kg also one of the heaviest devices within the comparison group. The 102W power adapter tips the scale at 379 grams. If you go for the Core i5 SKU without the GeForce dGPU, you get a more compact 65W power adapter (309 grams).
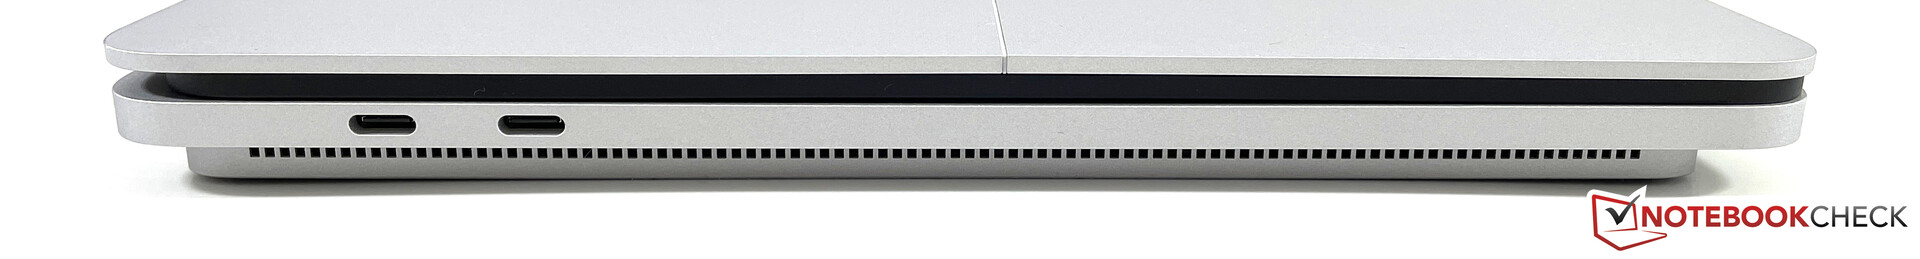
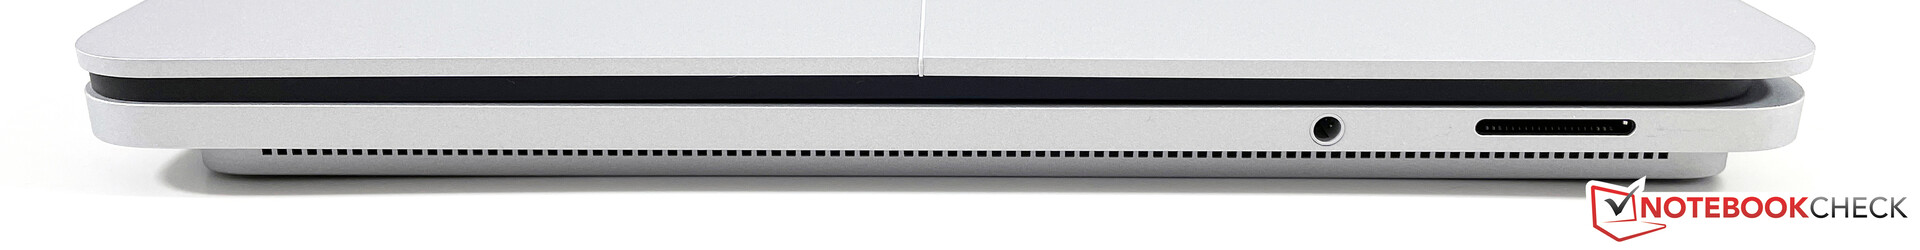
Connectivity - Thunderbolt 4 and Surface Connect
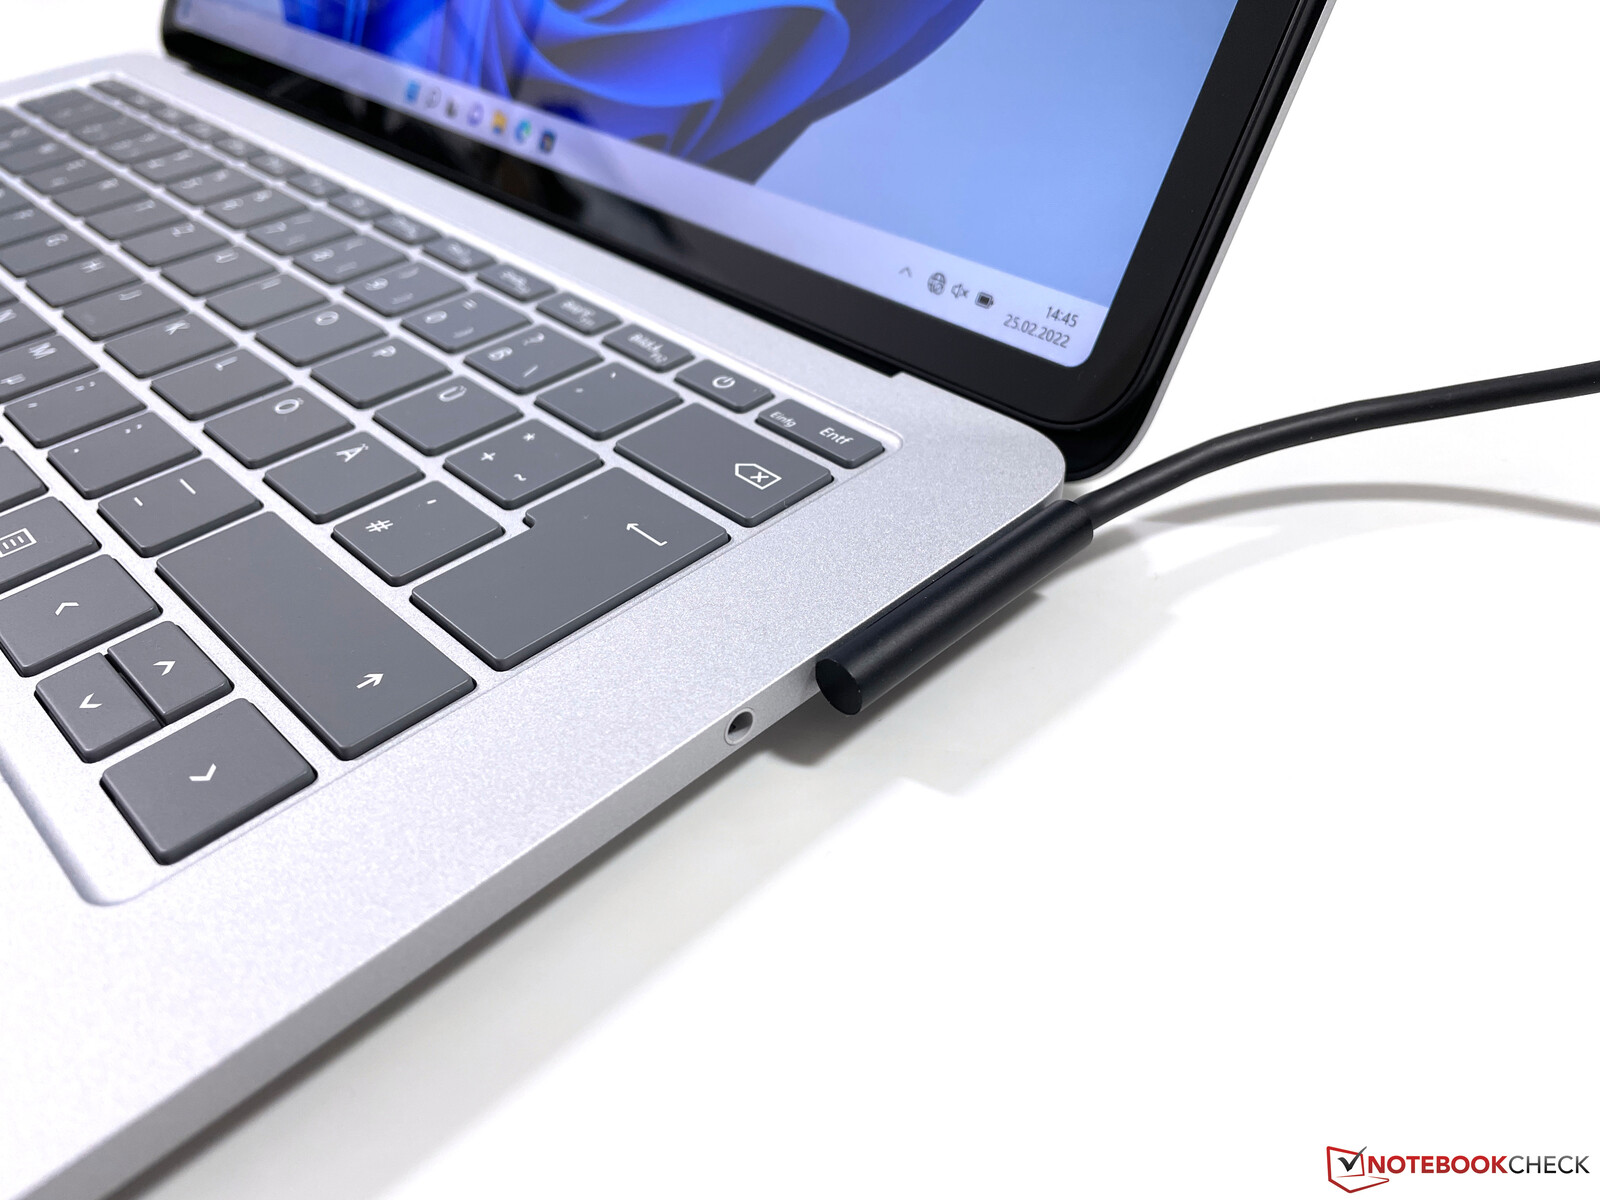
Microsoft still uses its own Surface Connect port and offers some corresponding accessories like docking stations. The connector itself is still not ideal, though. Thanks to the straight side wall, it is easier to attach the connector compared to the angled side wall of the Surface Laptop, for example, but the cable will block the 3.5 mm stereo jack depending on the orientation. You also get two USB-C ports with Thunderbolt 4 support, so they can be used for third-party docking stations as well. You do not get any other ports like regular USB-A or an SD-card reader.
Communication
The communication modules are limited to the basic requirements, because the Intel AX200 module from Intel supports Wi-Fi 6 (802.11ax) and Bluetooth 5.1, but is has been around for more than two years and there are already more modern models like the AX210E. Both the signal quality and the transfer rates, however, were very good during our test with the reference router from Netgear (Nighthawk AX12) and there are no limitations in practice, either. There is no option for an LTE or 5G modem.
Webcam
Microsoft uses a 1080p webcam and the picture quality is okay in good lighting conditions, but the manufacturer offers better modules in the Surface Pro and Surface Go models. In addition to the webcam, there is also an infrared camera that supports facial recognition via Windows Hello.


Accessories
We already mentioned that the Surface Slim Pen 2 has to be purchased separately for 130 Euros. It can be stored at the front underneath the base unit and it is also charged there. Microsoft also offers other accessories like input devices or docking stations.
Maintenance
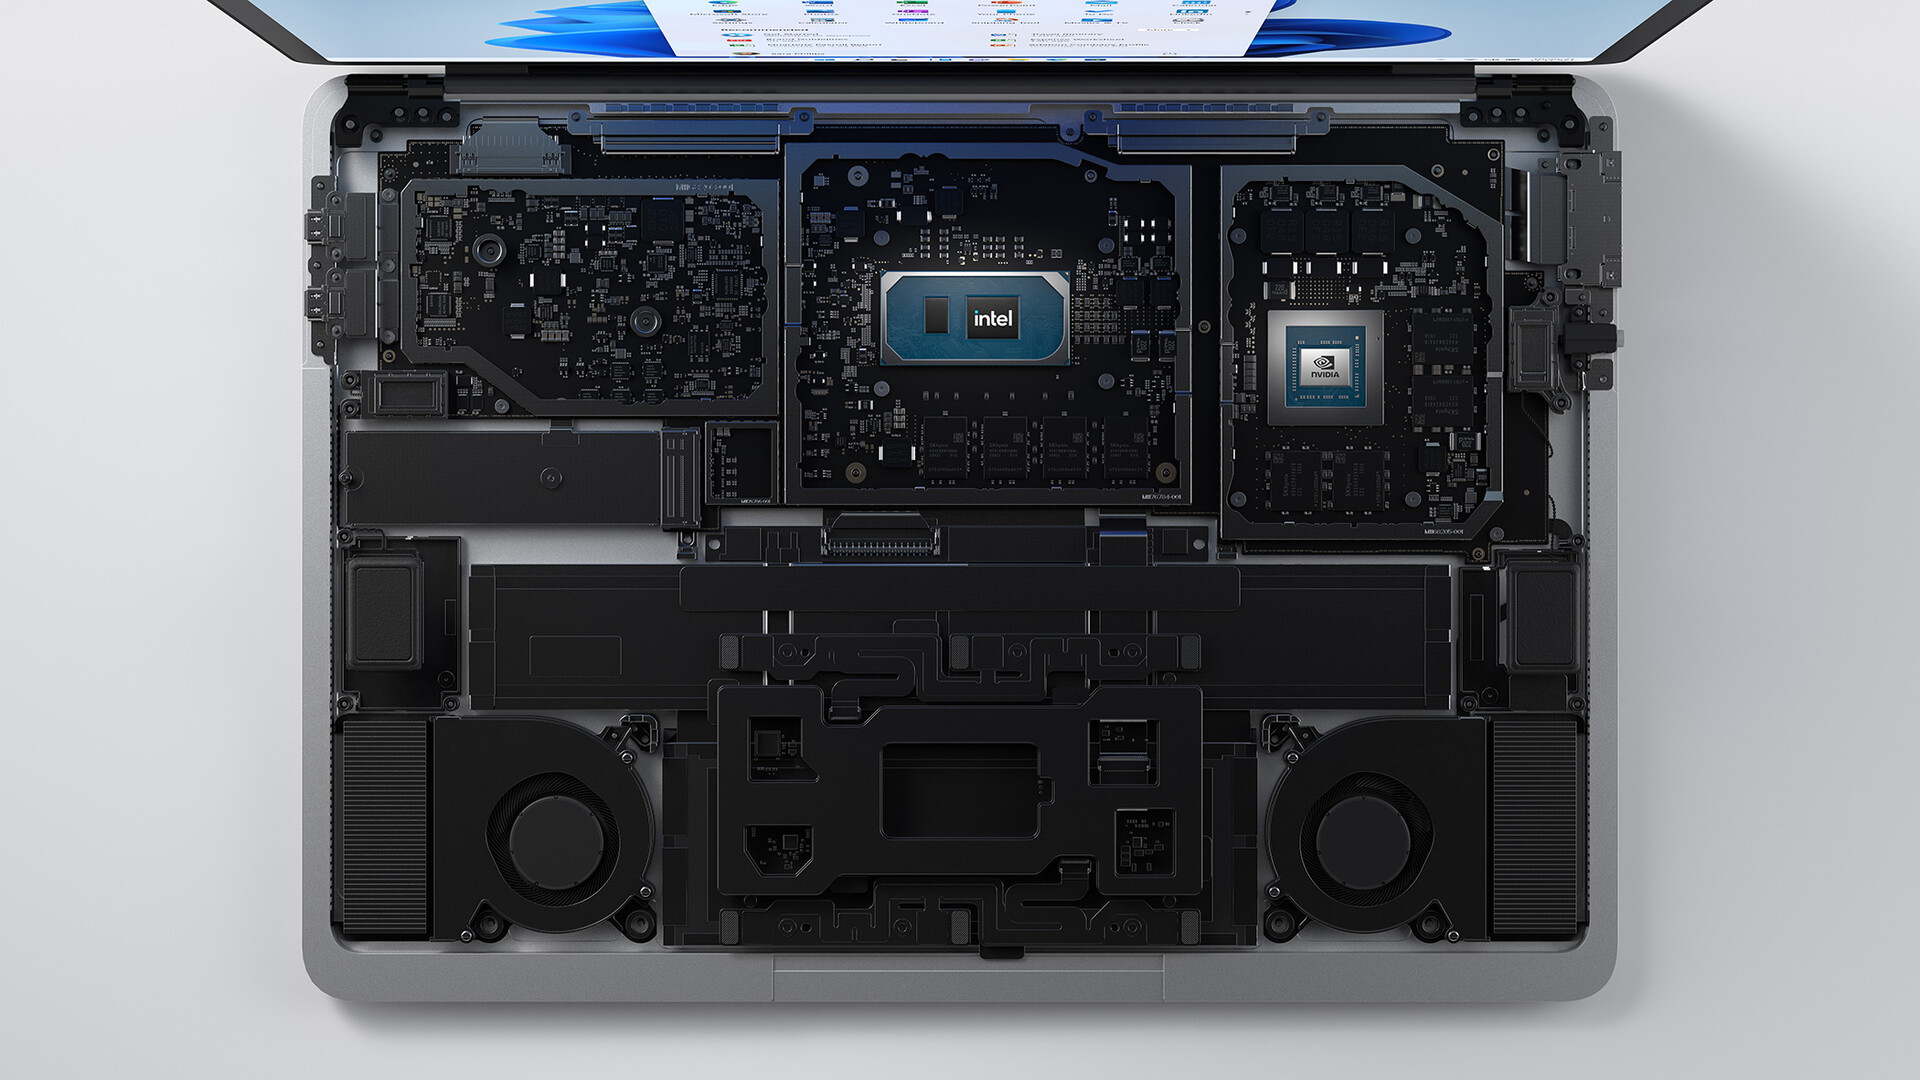
The new Surface Laptop Studio does not offer any maintenance options. Microsoft says the M.2-SSD can be replaced and you can also recognize the M.2-2280 slot in Microsoft’s press image below, but there are no visible screws and the user cannot access the internals. The official technical specs also state that the SSD must not be replaced by the user (only by authorized technicians). You cannot even clean the fans.
Input Devices - Microsoft uses Force Touchpad
Keyboard
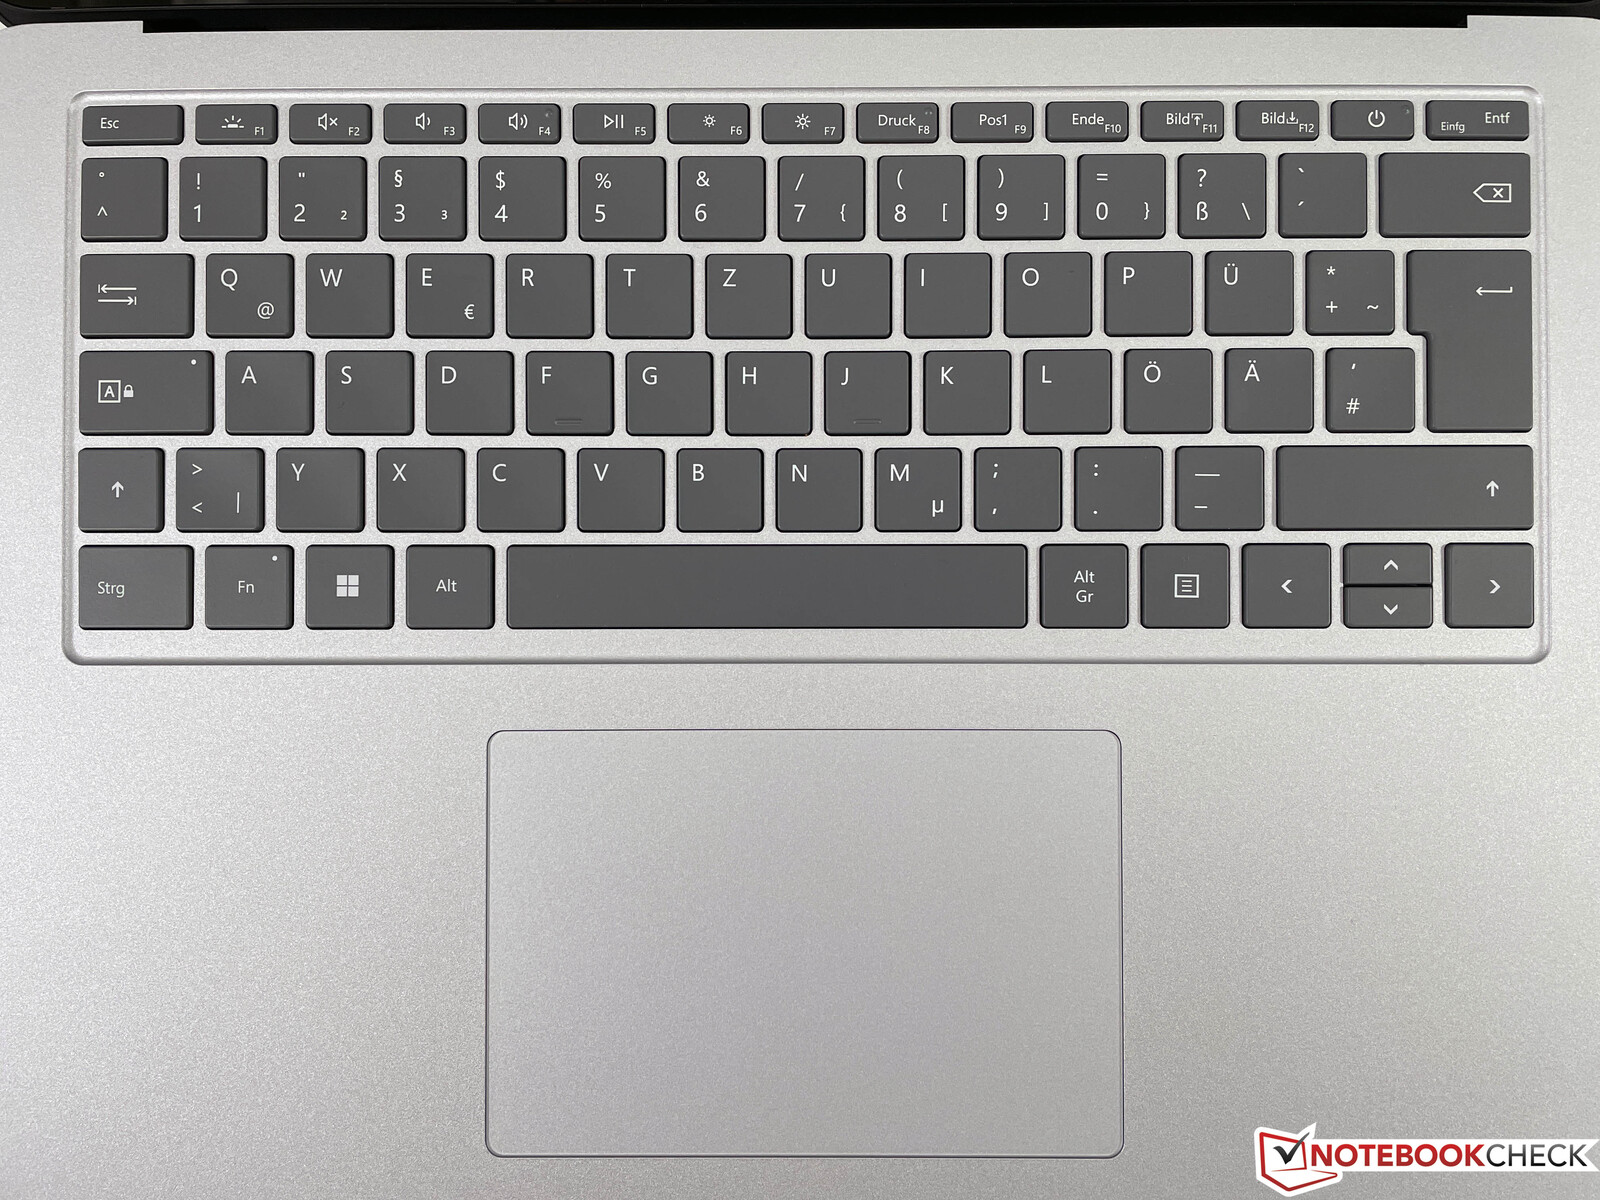
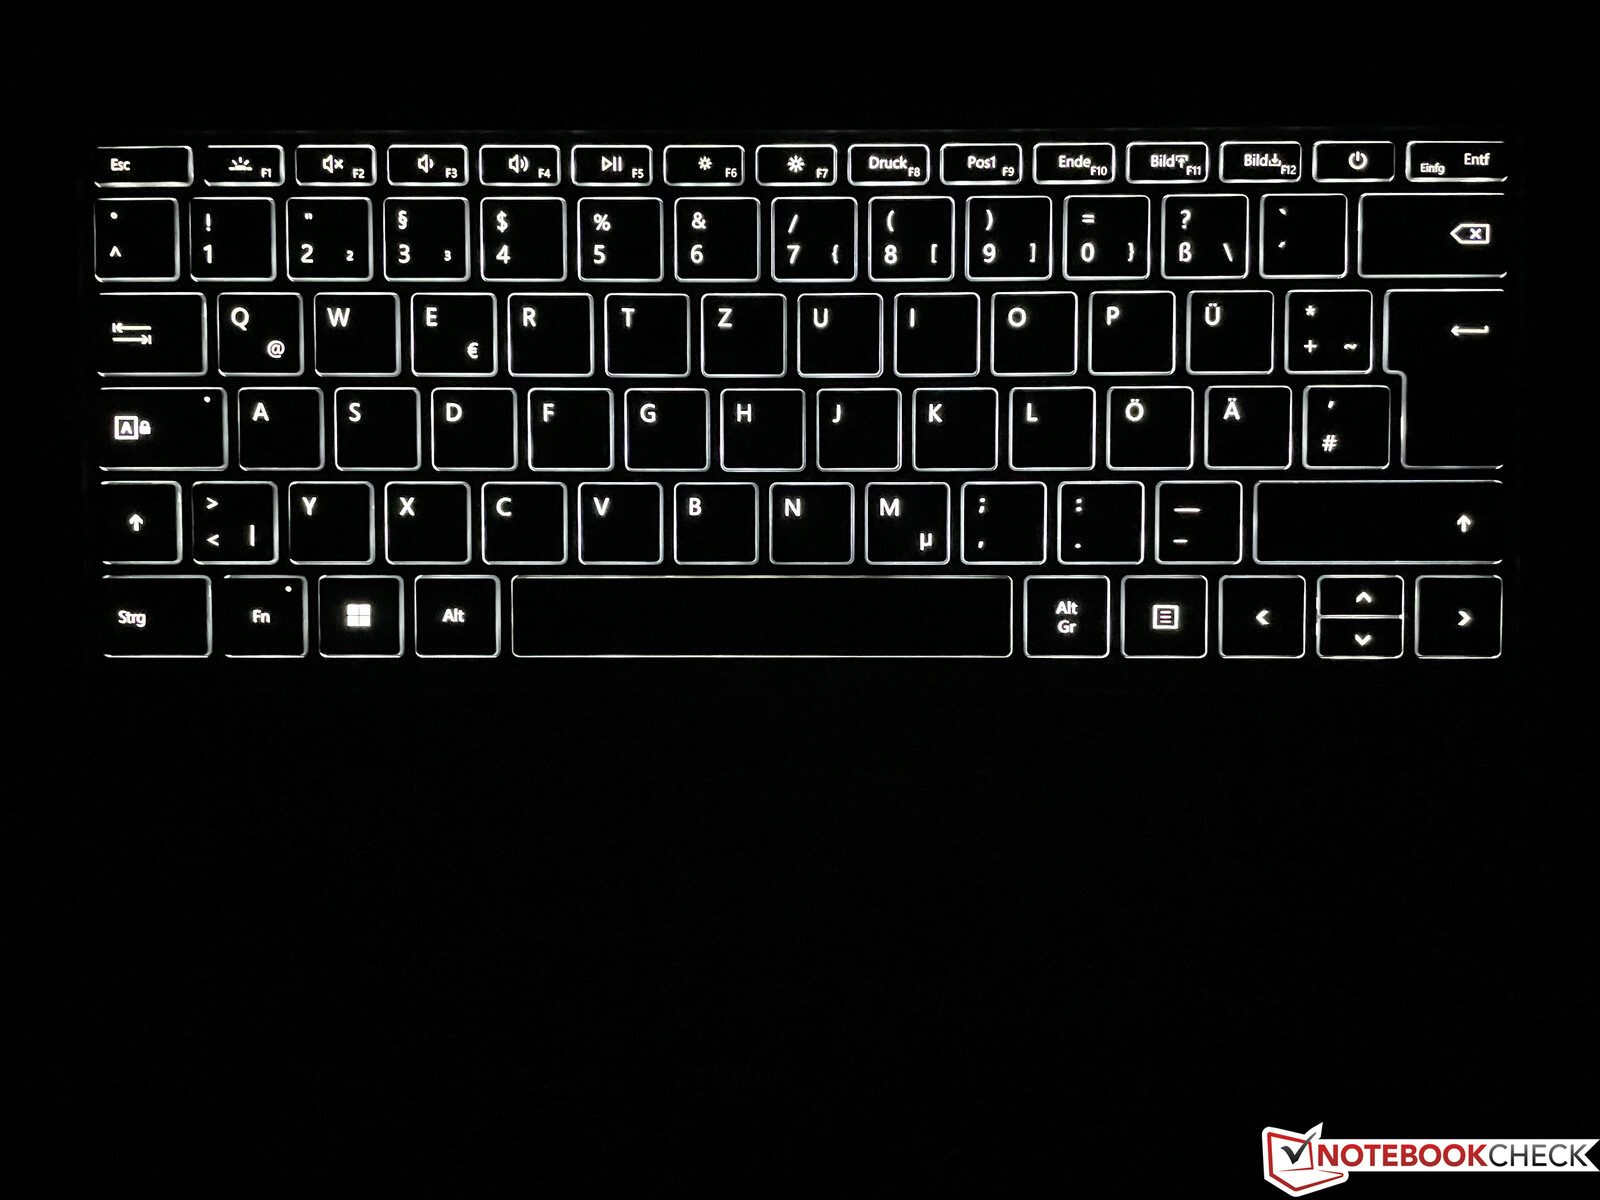
A look at the keyboard shows a difference compared to previous models, because the keys are now colored in a darker grey tone and not the color of the base unit anymore. The good mechanism on the other hand did not change and the typing experience is very comfortable. Thanks to the sufficient key travel and the precise key strokes, it is no problem to type longer texts and a three-stage white illumination helps in darker environments.
Touchpad & Touchscreen
Microsoft follows Apple’s example and equips the Surface Laptop Studio with a force touchpad (we did not find any official designation from Microsoft), so you cannot depress the pad physically. The haptic feedback is instead produced by a vibration motor, which results in an even feedback across the whole touchpad surface (12 x 8 cm) and the cursor controls work well. We only encountered some issues after standby where the pad seemed to be too sensitive. However, we only noticed it two times and some driver optimizations should solve the issue.
The capacitive touchscreen works as well as expected. Microsoft advertises the support for haptic feedback in combination with the Surface Slim Pen 2, but we did not have the pen to test it.
Display - Pixel Sense with 120 Hz

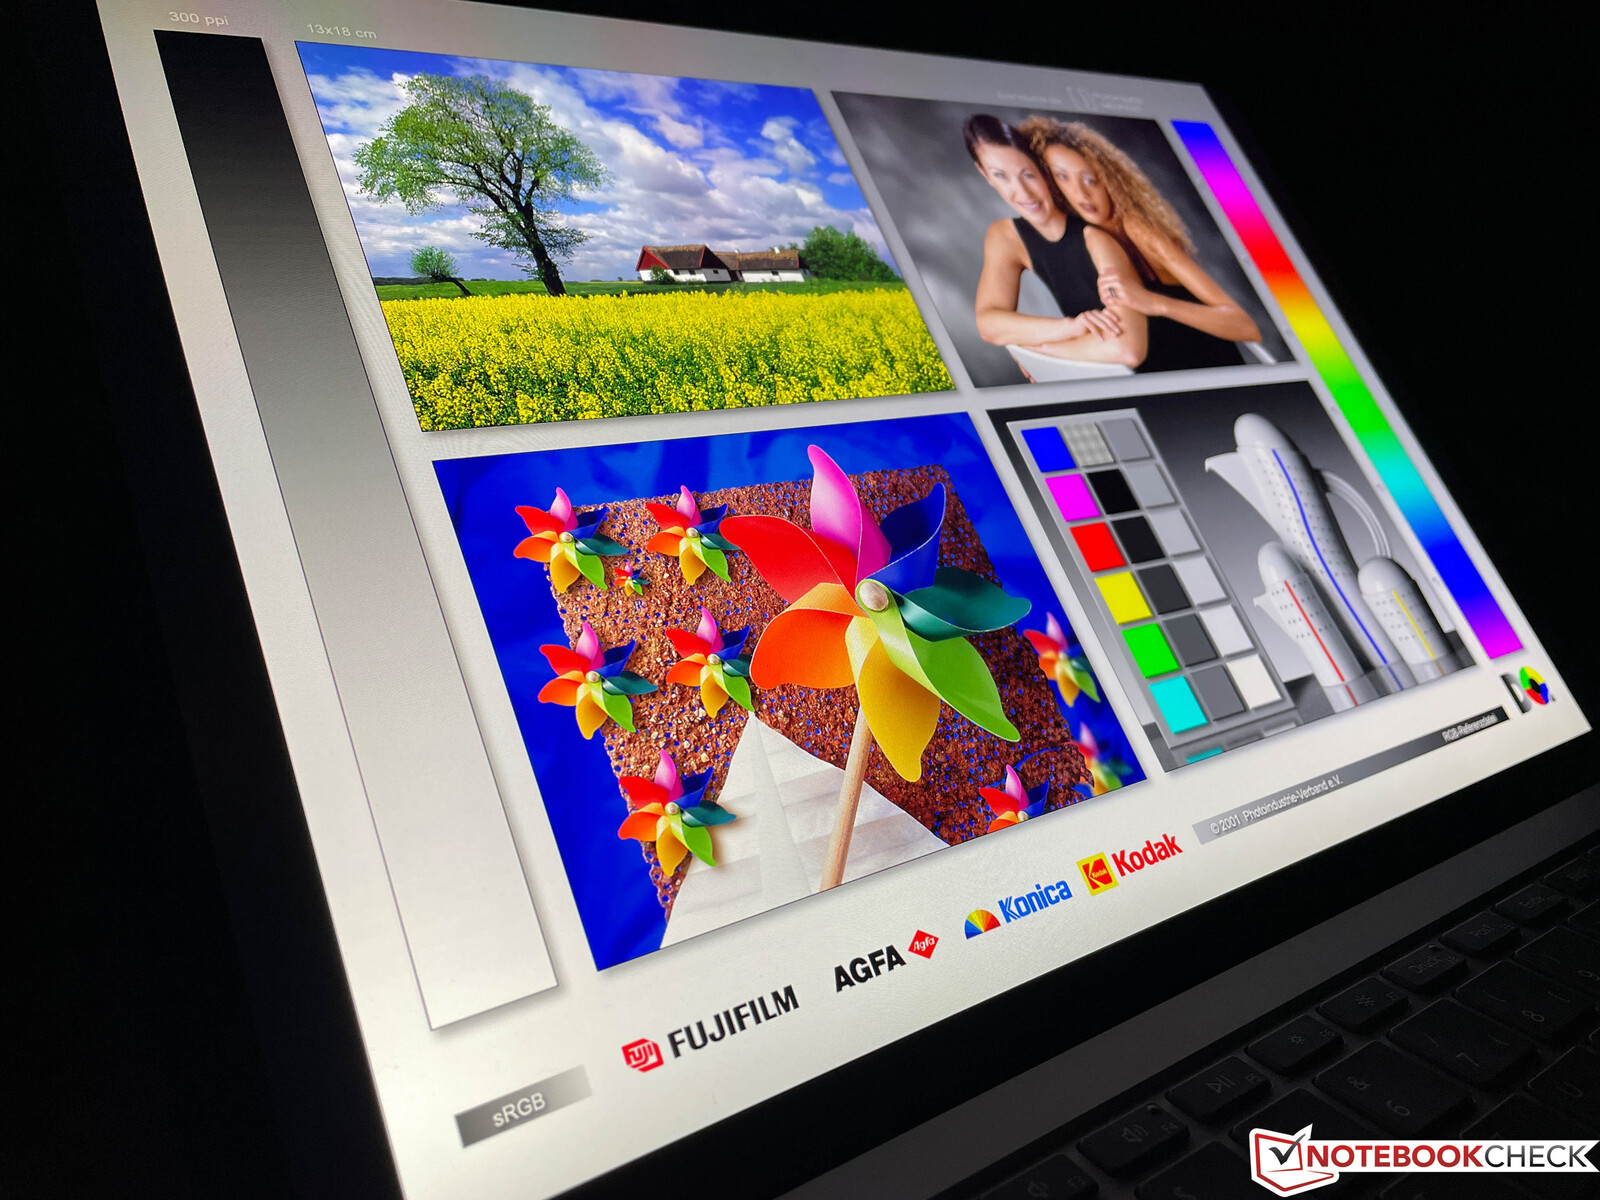
The display of the Surface Laptop Studio uses a 14.4-inch IPS panel with the resolution of 2400 x 1600 pixels and an aspect ratio of 3:2. The bezels are rounded like the rest of the case, so the contents in the display corners are slightly cut off. It does not really hide any contents, but you notice it in practice. The subjective picture impression is very good, which is also a result of the high contrast ratio of more than 1700:1. We determine an average brightness of almost 500 nits and a decent black value of 0.29 cd/m².
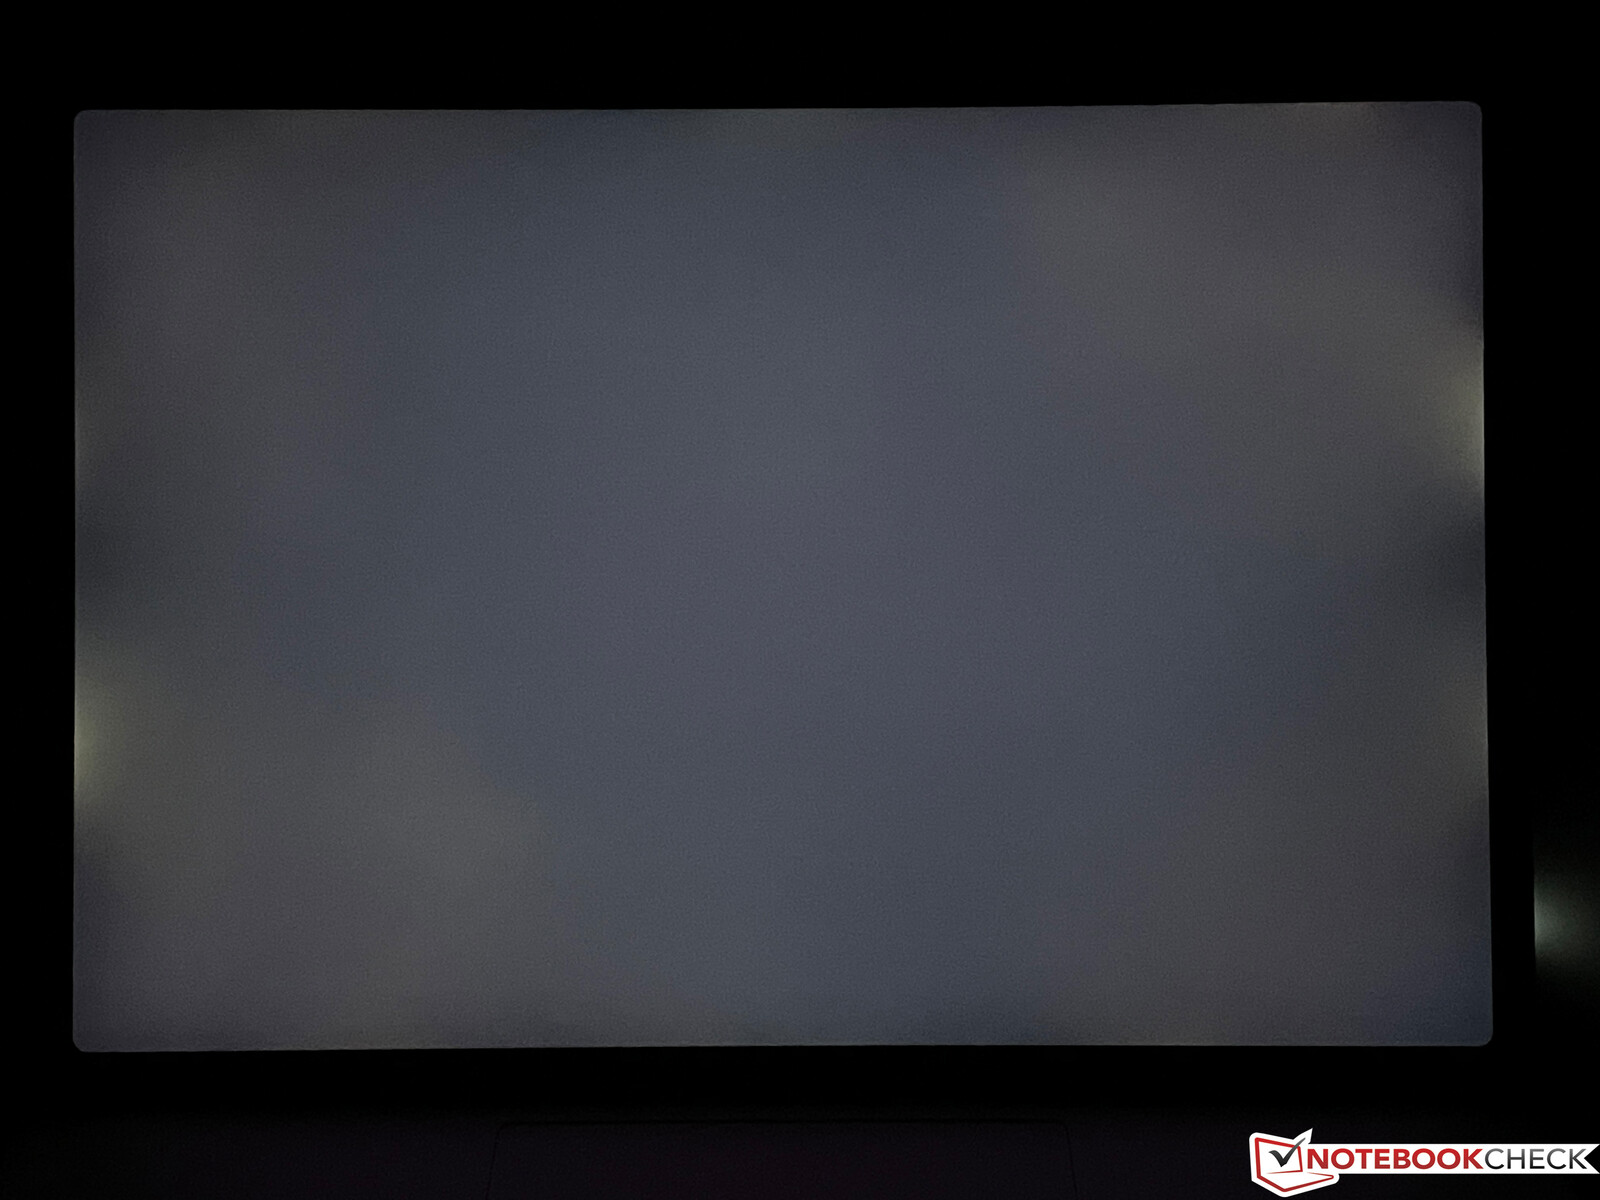
You can see backlight bleeding at the side edges on a dark background at high brightness levels, but they are no problem in daily scenarios. We can detect PWM flickering at a brightness level of 98 % or lower, but the frequency is very high at 5 kHz and the majority of users should not notice any issues. The response times are not among the fastest and there are visible ghosting effects when you move the cursor, for example. The 120 Hz refresh rate cannot fix this issue and mainly creates a smoother picture impression when you scroll through documents or websites. The display brightness can be adjusted automatically thanks to the ambient light sensor and Dolby Vision contents are supported as well, but the effect is much smaller compared to good TVs due to the limited HDR capabilities.
| |||||||||||||||||||||||||
Brightness Distribution: 92 %
Center on Battery: 496 cd/m²
Contrast: 1714:1 (Black: 0.29 cd/m²)
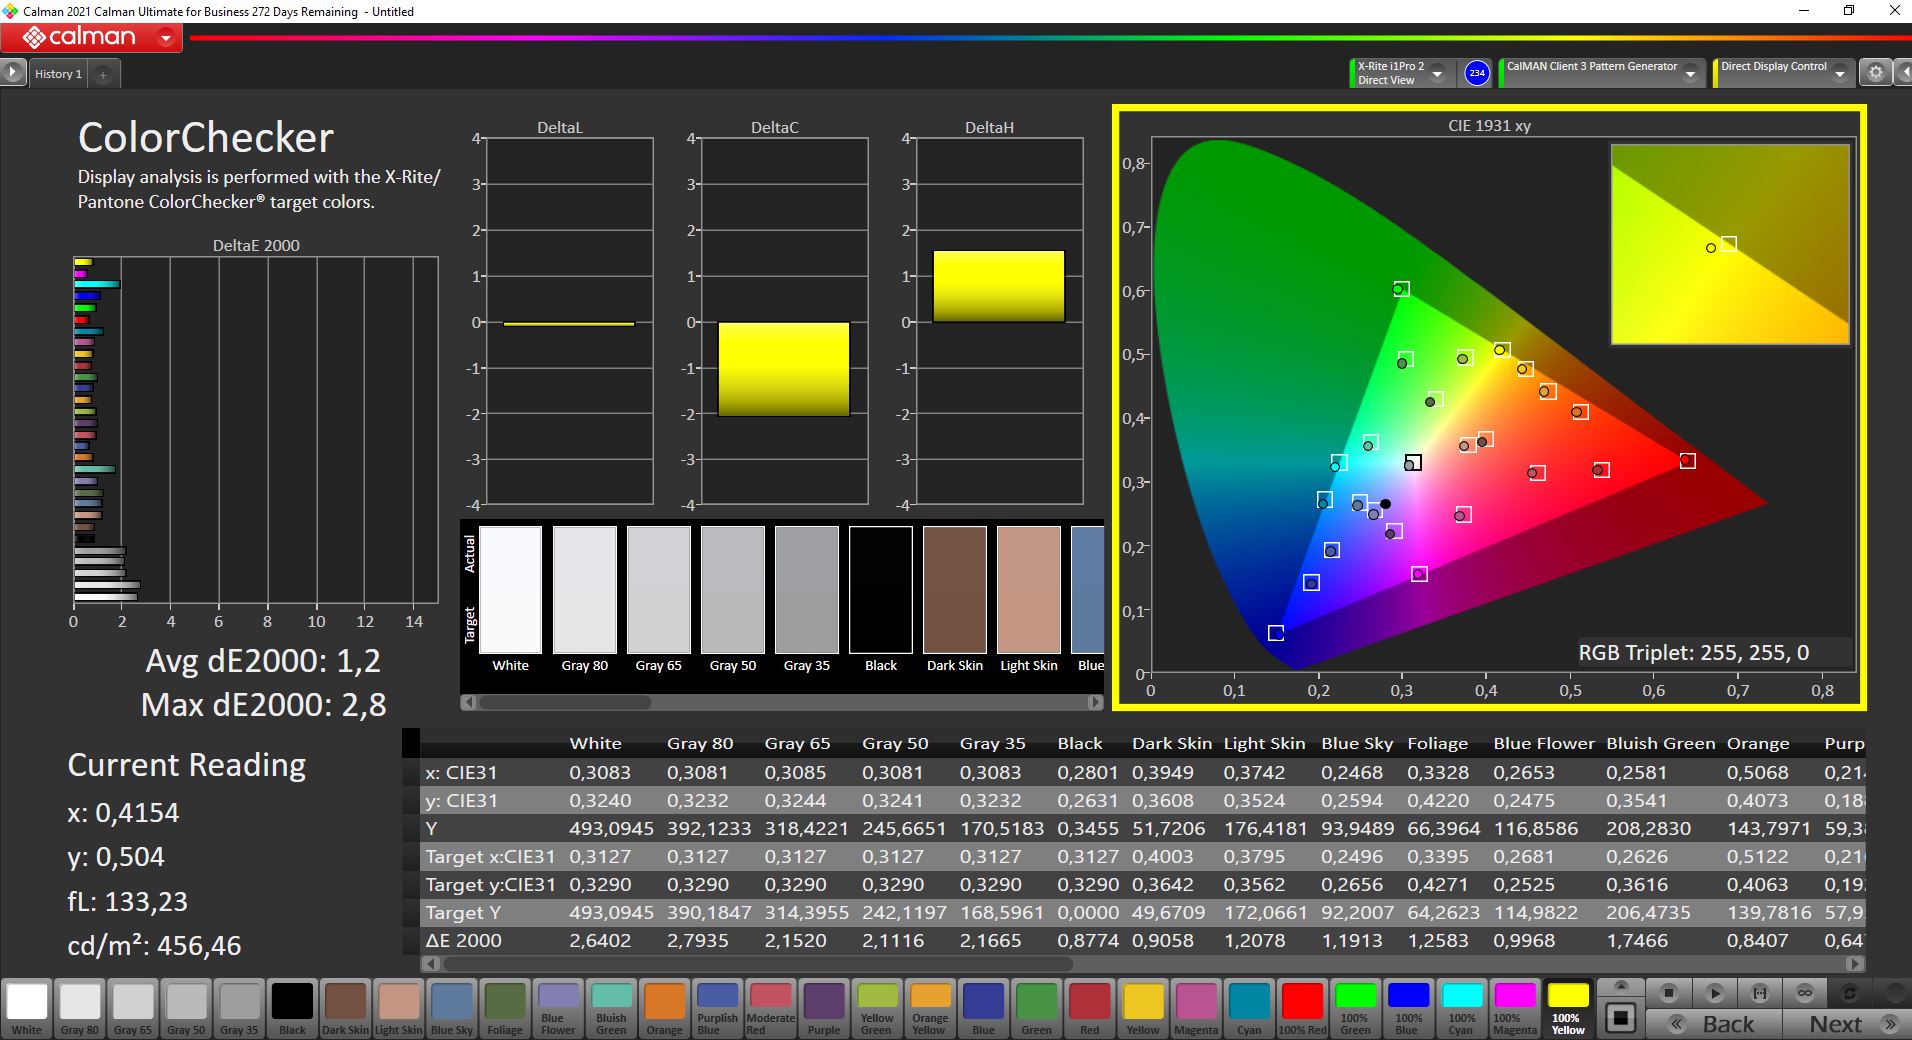
ΔE ColorChecker Calman: 1.2 | ∀{0.5-29.43 Ø4.73}
calibrated: 0.8
ΔE Greyscale Calman: 1.9 | ∀{0.09-98 Ø4.98}
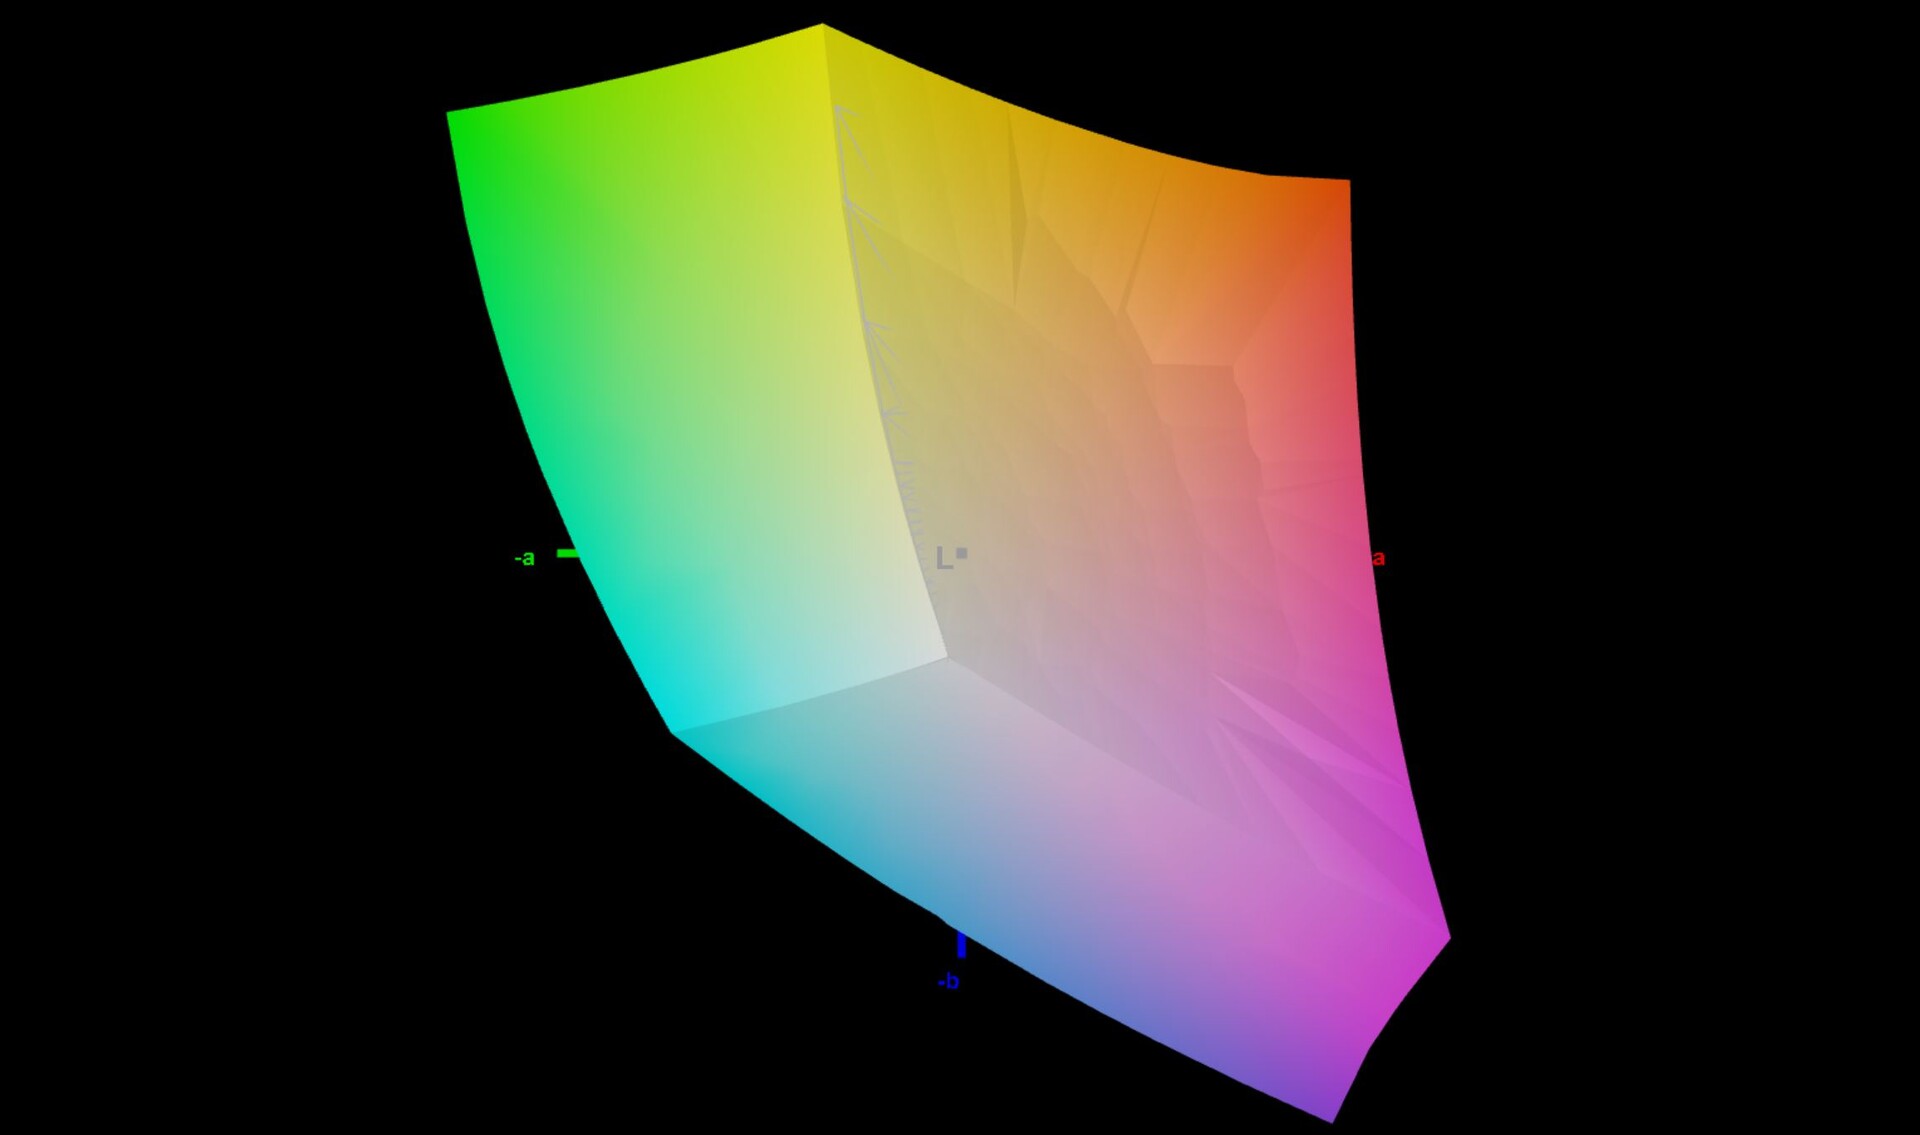
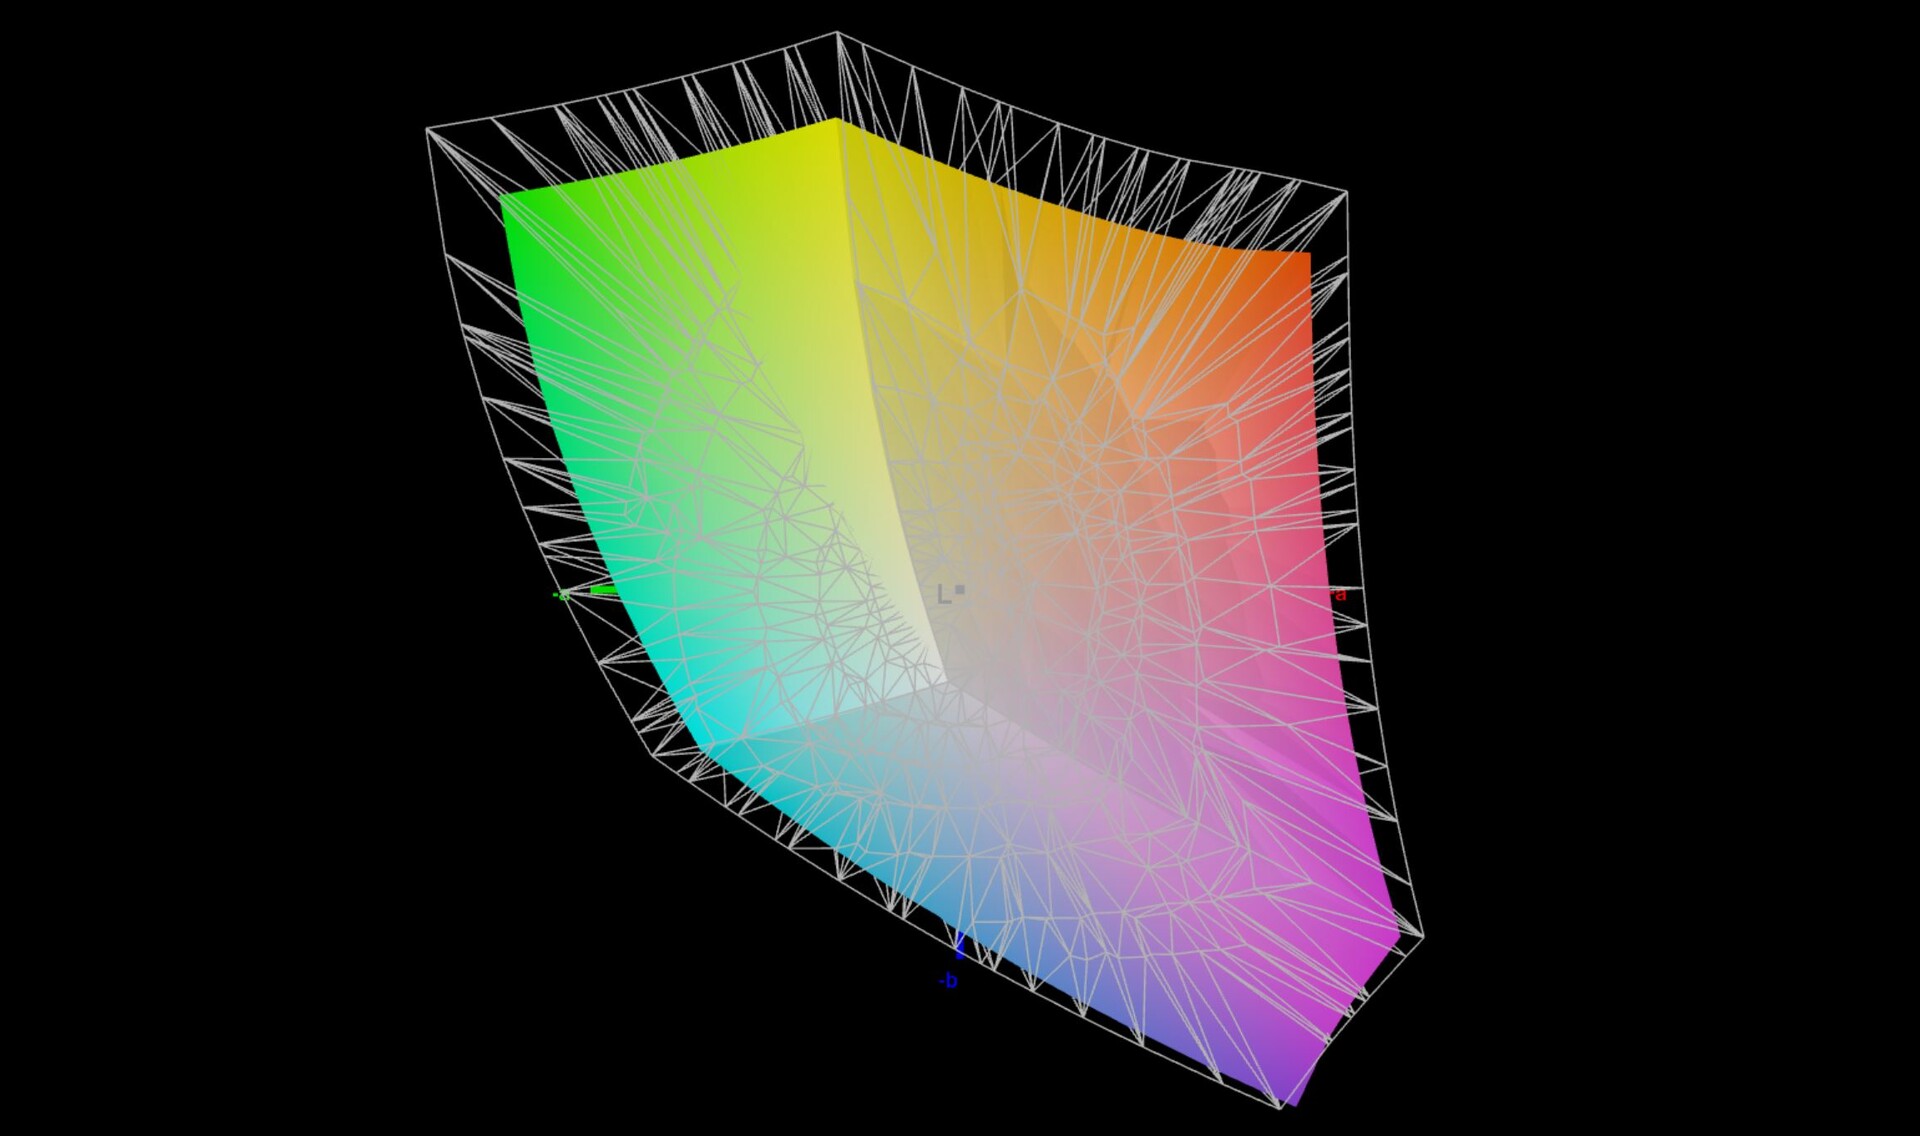
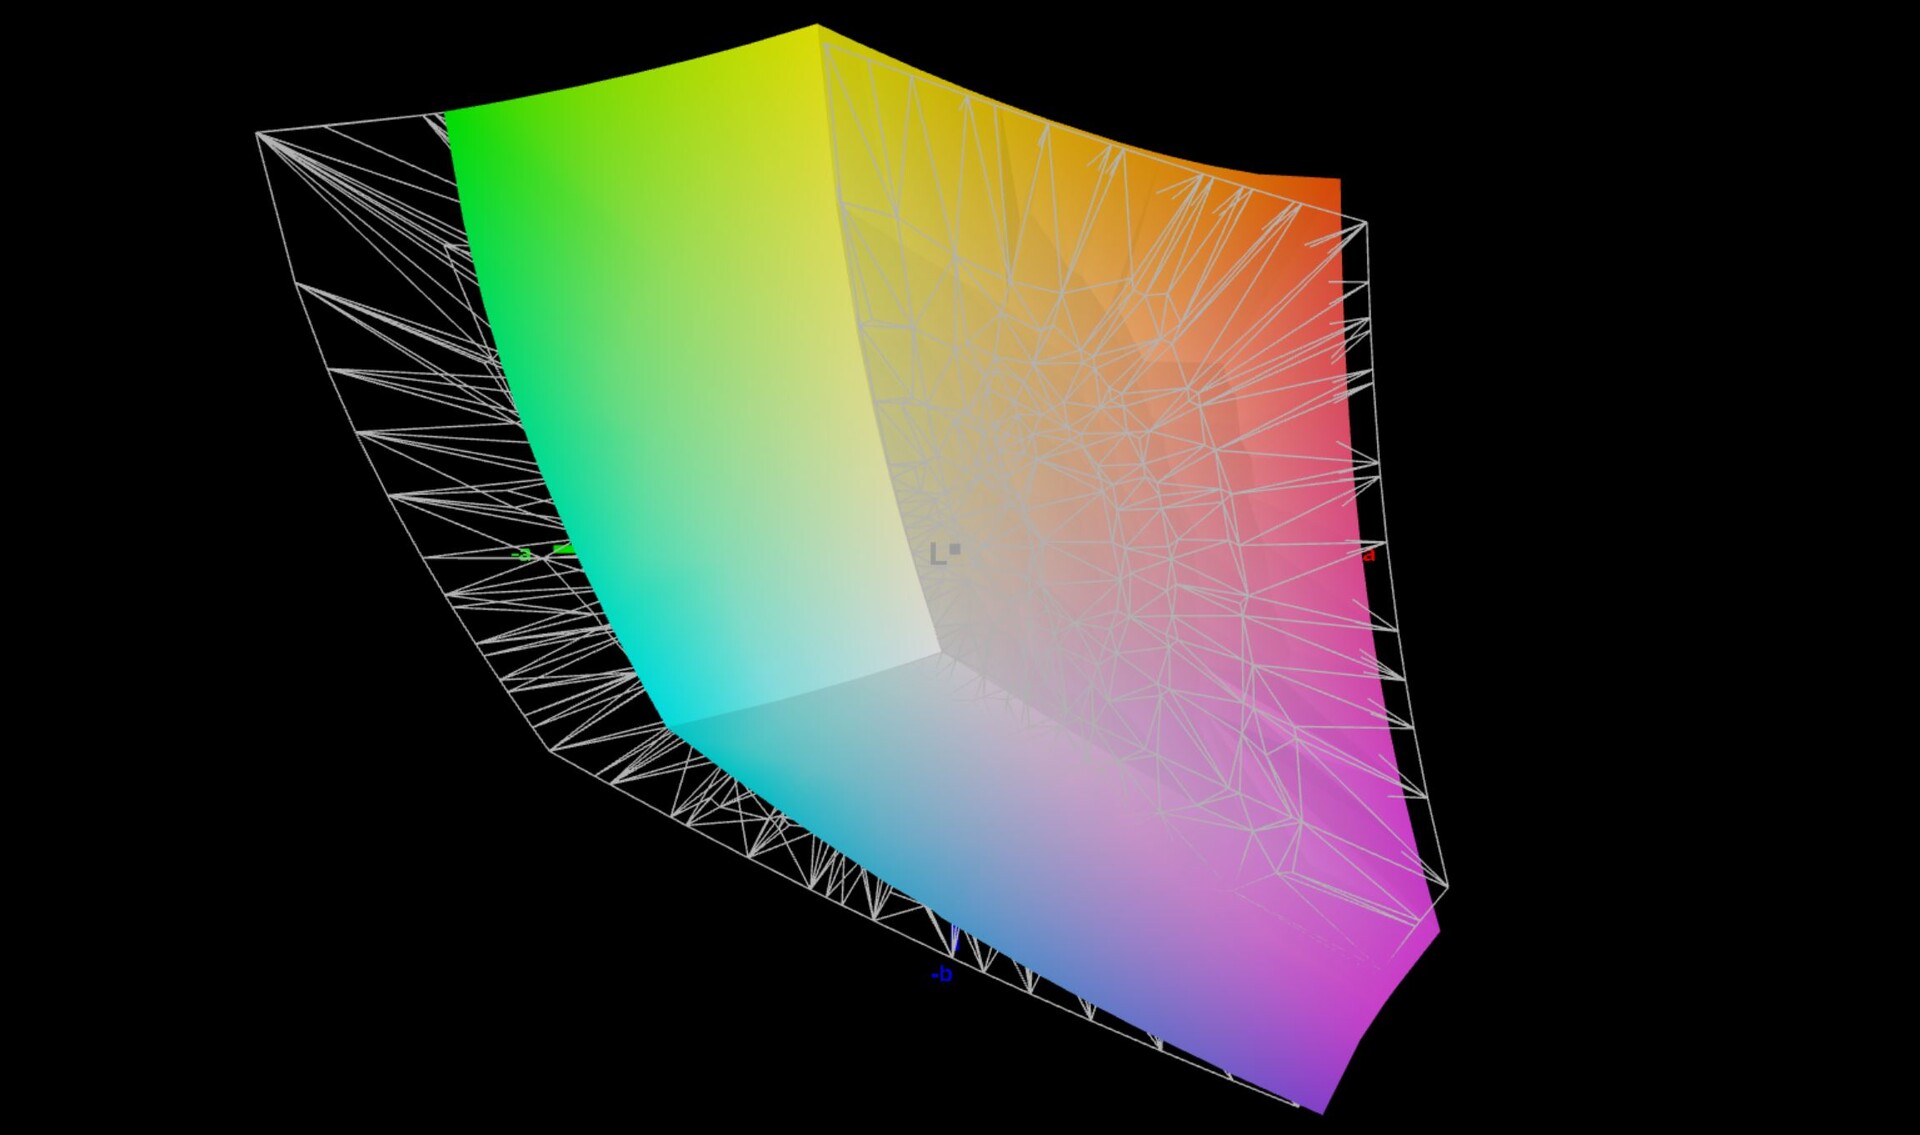
78.5% AdobeRGB 1998 (Argyll 3D)
99.9% sRGB (Argyll 3D)
80.6% Display P3 (Argyll 3D)
Gamma: 2.14
CCT: 6821 K
| Microsoft Surface Laptop Studio i7 RTX 3050 Ti LQ144P1JX01, IPS, 2400x1600, 14.4" | Acer ConceptD 3 Ezel CC314-72G-7513 B140HAN06.D, IPS LED, 1920x1080, 14" | Apple MacBook Pro 14 2021 M1 Pro Entry Mini-LED, 3024x1964, 14.2" | Microsoft Surface Book 3 13.5 Panasonic MEI96A2, IPS, 3000x2000, 13.5" | Schenker Vision 14 MNE007ZA1, IPS, 2880x1800, 14" | Razer Blade 14 Ryzen 9 RTX 3070 TL140BDXP02-2, IPS, 2560x1440, 14" | MSI Summit E14 A11SCS AU Optronics AUO123B, IPS, 3840x2160, 14" | |
|---|---|---|---|---|---|---|---|
| Display | -10% | 23% | -14% | -5% | 10% | 12% | |
| Display P3 Coverage (%) | 80.6 | 67.2 -17% | 99.3 23% | 63.5 -21% | 74.3 -8% | 97.2 21% | 87.5 9% |
| sRGB Coverage (%) | 99.9 | 98.2 -2% | 95.1 -5% | 97.6 -2% | 99.9 0% | 100 0% | |
| AdobeRGB 1998 Coverage (%) | 78.5 | 68.7 -12% | 65.7 -16% | 75.7 -4% | 85.4 9% | 99.4 27% | |
| Response Times | 22% | -34% | -28% | 27% | 64% | -9% | |
| Response Time Grey 50% / Grey 80% * (ms) | 58.4 ? | 43 ? 26% | 58.4 ? -0% | 57 ? 2% | 40.4 ? 31% | 16.4 ? 72% | 52 ? 11% |
| Response Time Black / White * (ms) | 24 ? | 20 ? 17% | 40.4 ? -68% | 38 ? -58% | 18.4 ? 23% | 10.8 ? 55% | 30.8 ? -28% |
| PWM Frequency (Hz) | 5000 ? | 14880 | |||||
| Screen | 1% | 372% | -45% | -43% | -35% | -113% | |
| Brightness middle (cd/m²) | 497 | 367 -26% | 489 -2% | 391 -21% | 407 -18% | 331.1 -33% | 593.3 19% |
| Brightness (cd/m²) | 491 | 354 -28% | 479 -2% | 367 -25% | 407 -17% | 318 -35% | 571 16% |
| Brightness Distribution (%) | 92 | 83 -10% | 94 2% | 86 -7% | 94 2% | 91 -1% | 87 -5% |
| Black Level * (cd/m²) | 0.29 | 0.19 34% | 0.01 97% | 0.19 34% | 0.25 14% | 0.36 -24% | 0.53 -83% |
| Contrast (:1) | 1714 | 1932 13% | 48900 2753% | 2058 20% | 1628 -5% | 920 -46% | 1119 -35% |
| Colorchecker dE 2000 * | 1.2 | 1.09 9% | 0.8 33% | 3.07 -156% | 2.6 -117% | 2.25 -88% | 4.42 -268% |
| Colorchecker dE 2000 max. * | 2.8 | 2.61 7% | 1.3 54% | 4.74 -69% | 4.4 -57% | 4.62 -65% | 7.16 -156% |
| Colorchecker dE 2000 calibrated * | 0.8 | 0.99 -24% | 1.52 -90% | 2 -150% | 4.3 -437% | ||
| Greyscale dE 2000 * | 1.9 | 1.2 37% | 1.1 42% | 3.6 -89% | 2.7 -42% | 1.7 11% | 3.2 -68% |
| Gamma | 2.14 103% | 2.4 92% | 2.24 98% | 2.29 96% | 2.18 101% | 2.3 96% | 2.04 108% |
| CCT | 6821 95% | 6563 99% | 6330 103% | 6316 103% | 6751 96% | 6737 96% | |
| Color Space (Percent of AdobeRGB 1998) (%) | 63 | 61 | |||||
| Color Space (Percent of sRGB) (%) | 98 | 95 | |||||
| Total Average (Program / Settings) | 4% /
2% | 120% /
267% | -29% /
-36% | -7% /
-25% | 13% /
-10% | -37% /
-71% |
* ... smaller is better
Displays of Surface devices are traditionally very accurate out of the box and we can confirm the same for the Surface Laptop Studio after our calibration with the professional CalMAN software and the X-Rite i1 Pro 2 spectrophotometer. There is a minor blue case in the grayscale, but it is hardly visible with the naked eye. The DeltaE-2000 deviations of the grayscale as well as the ColorChecker are already smaller 3.
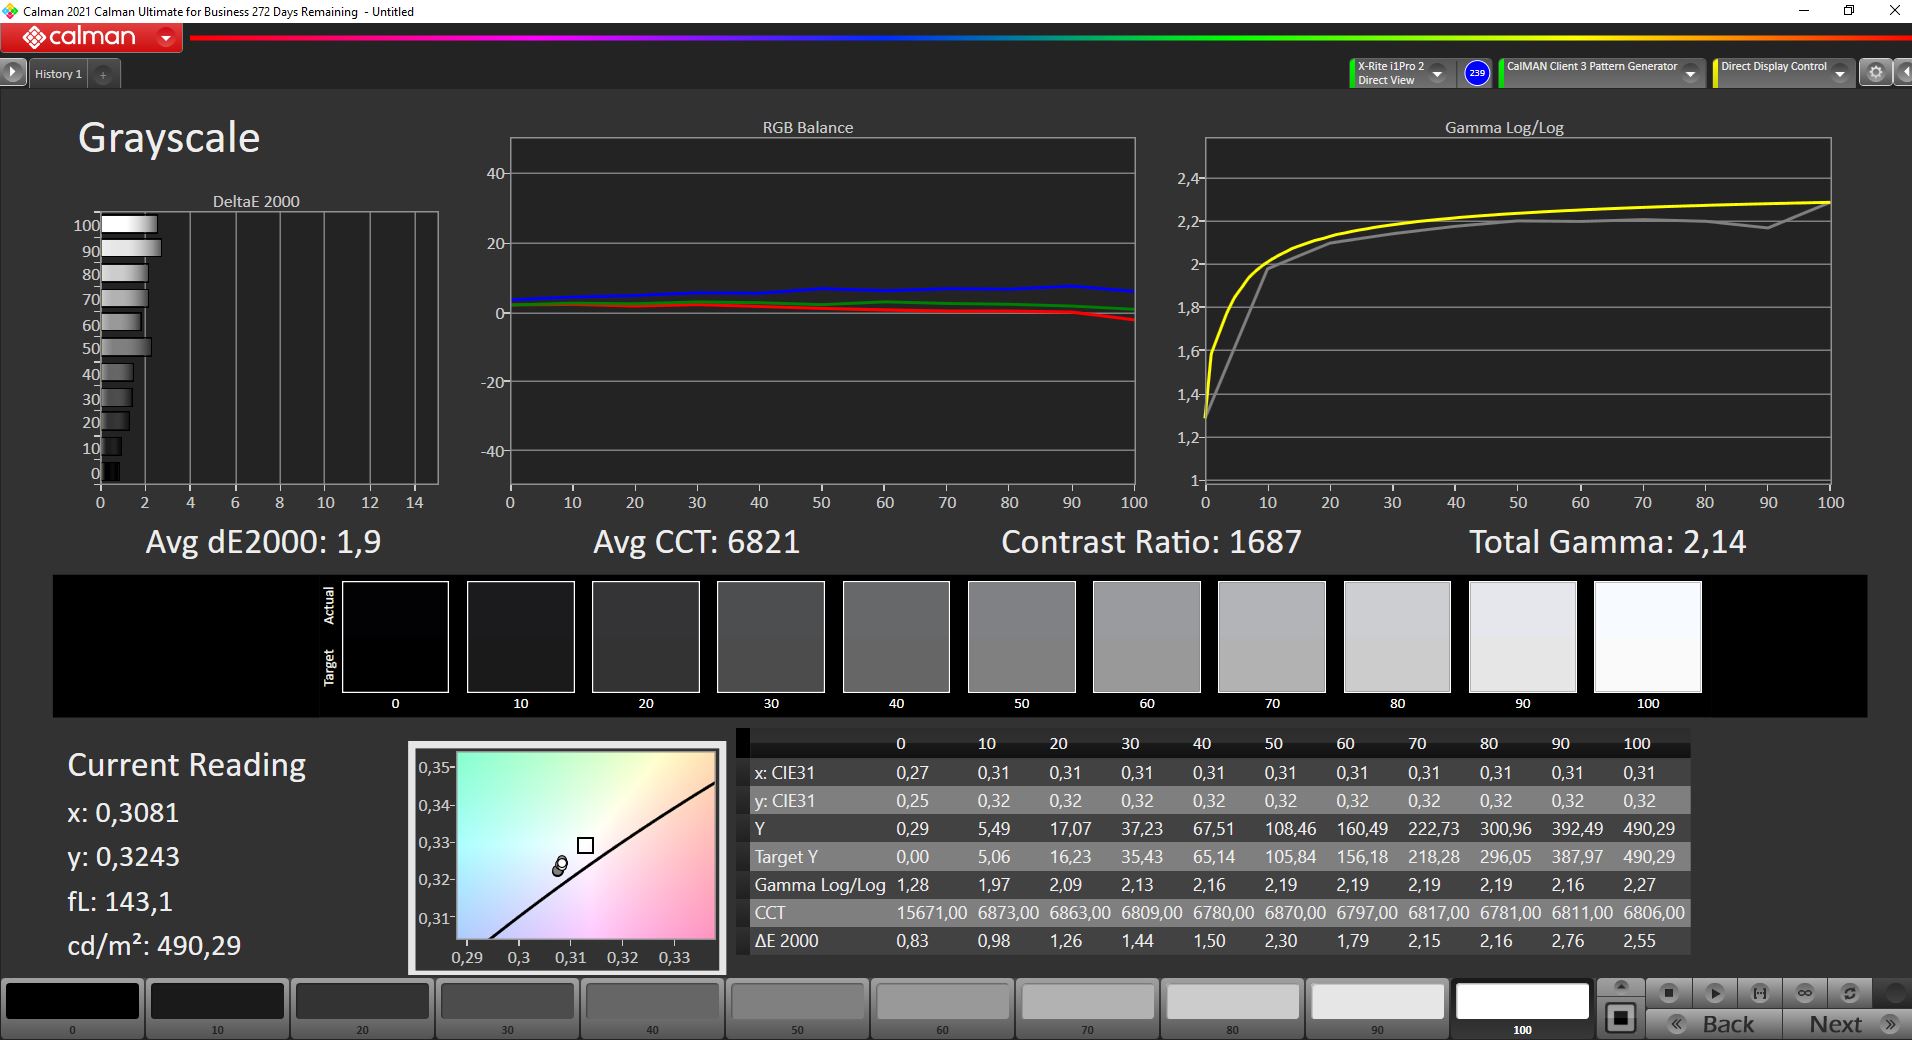
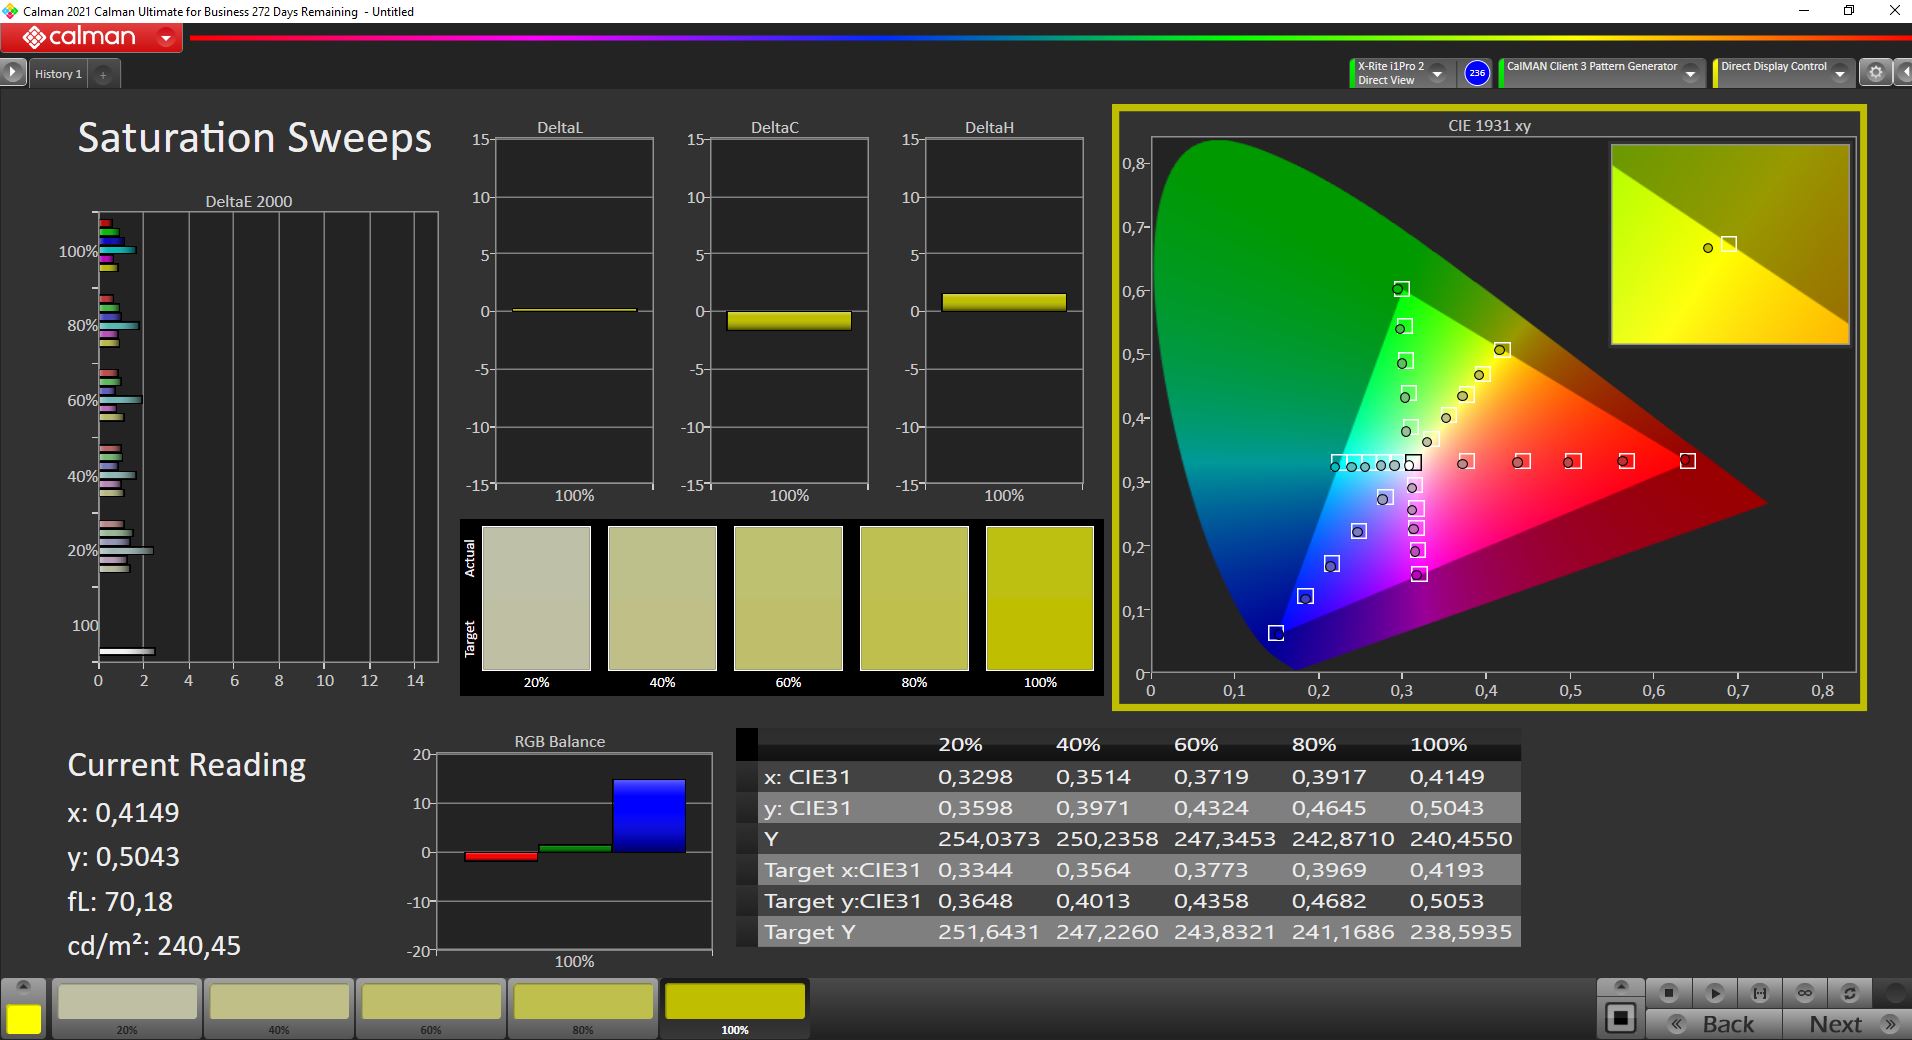
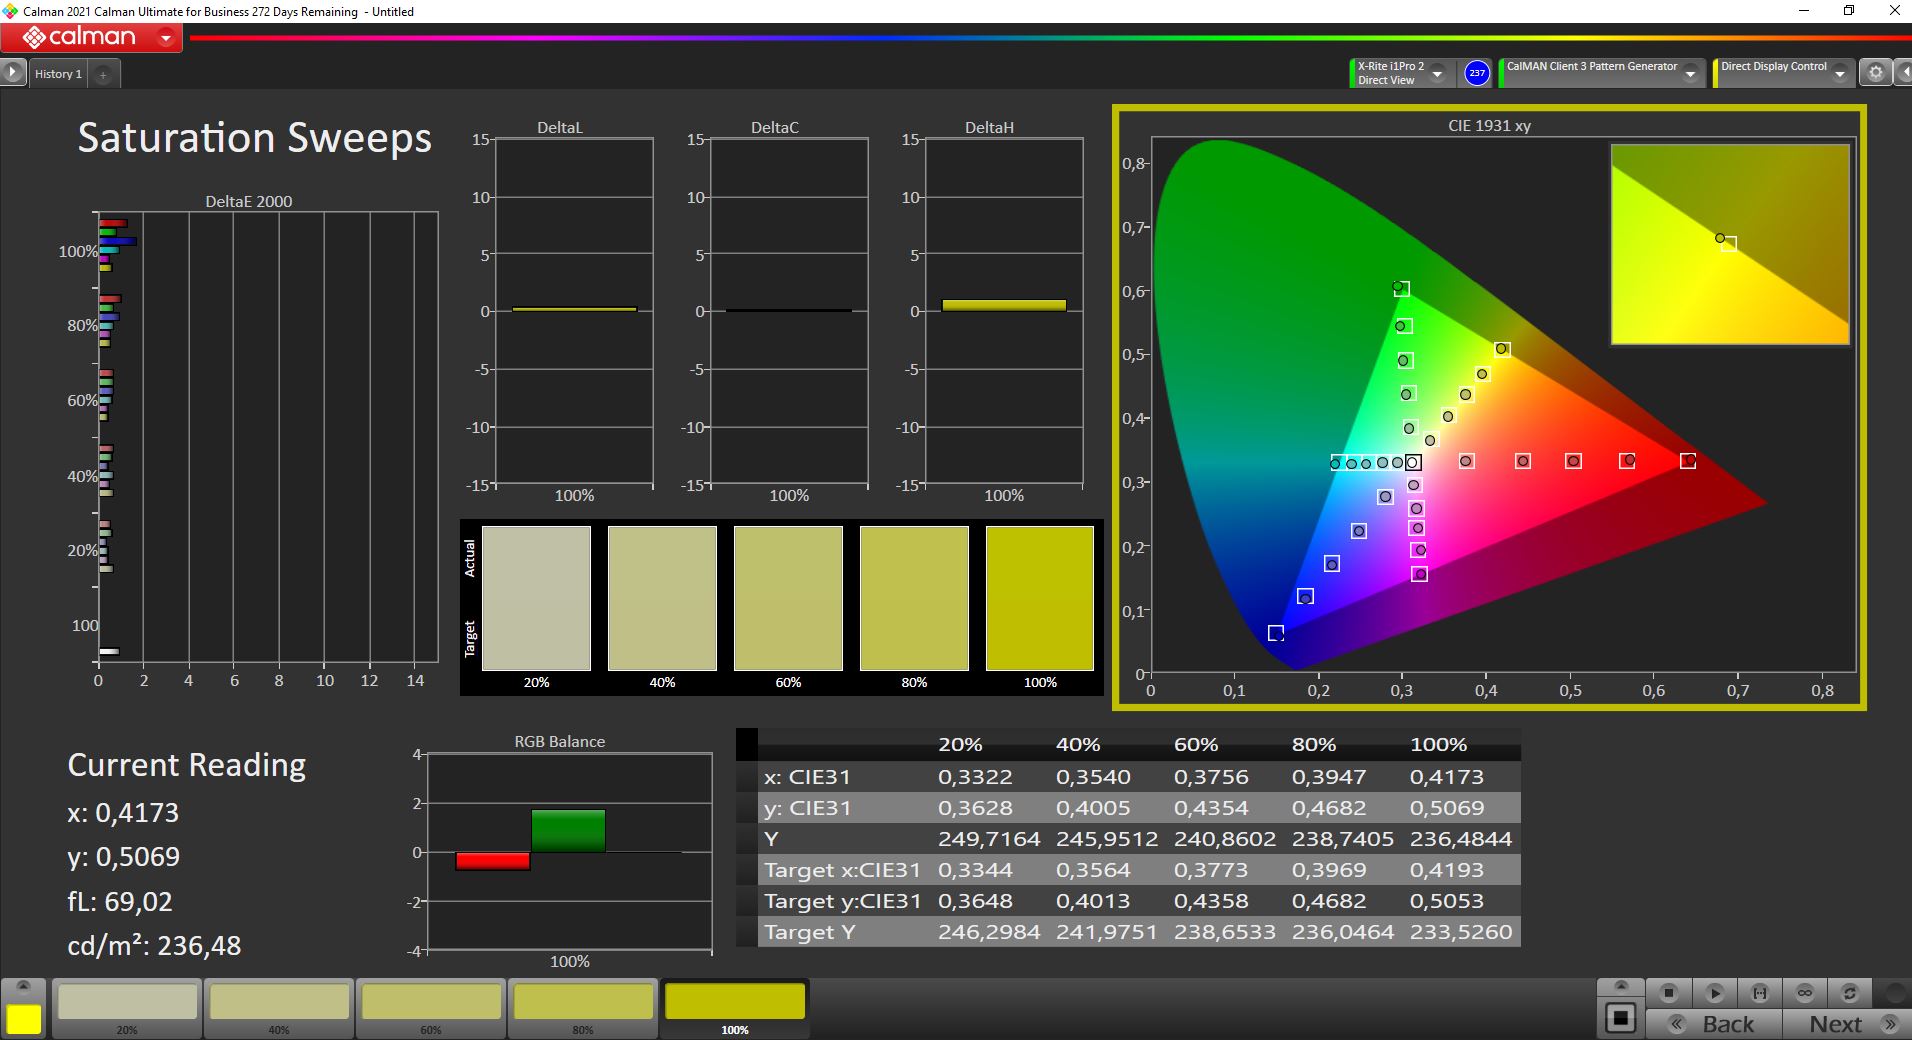
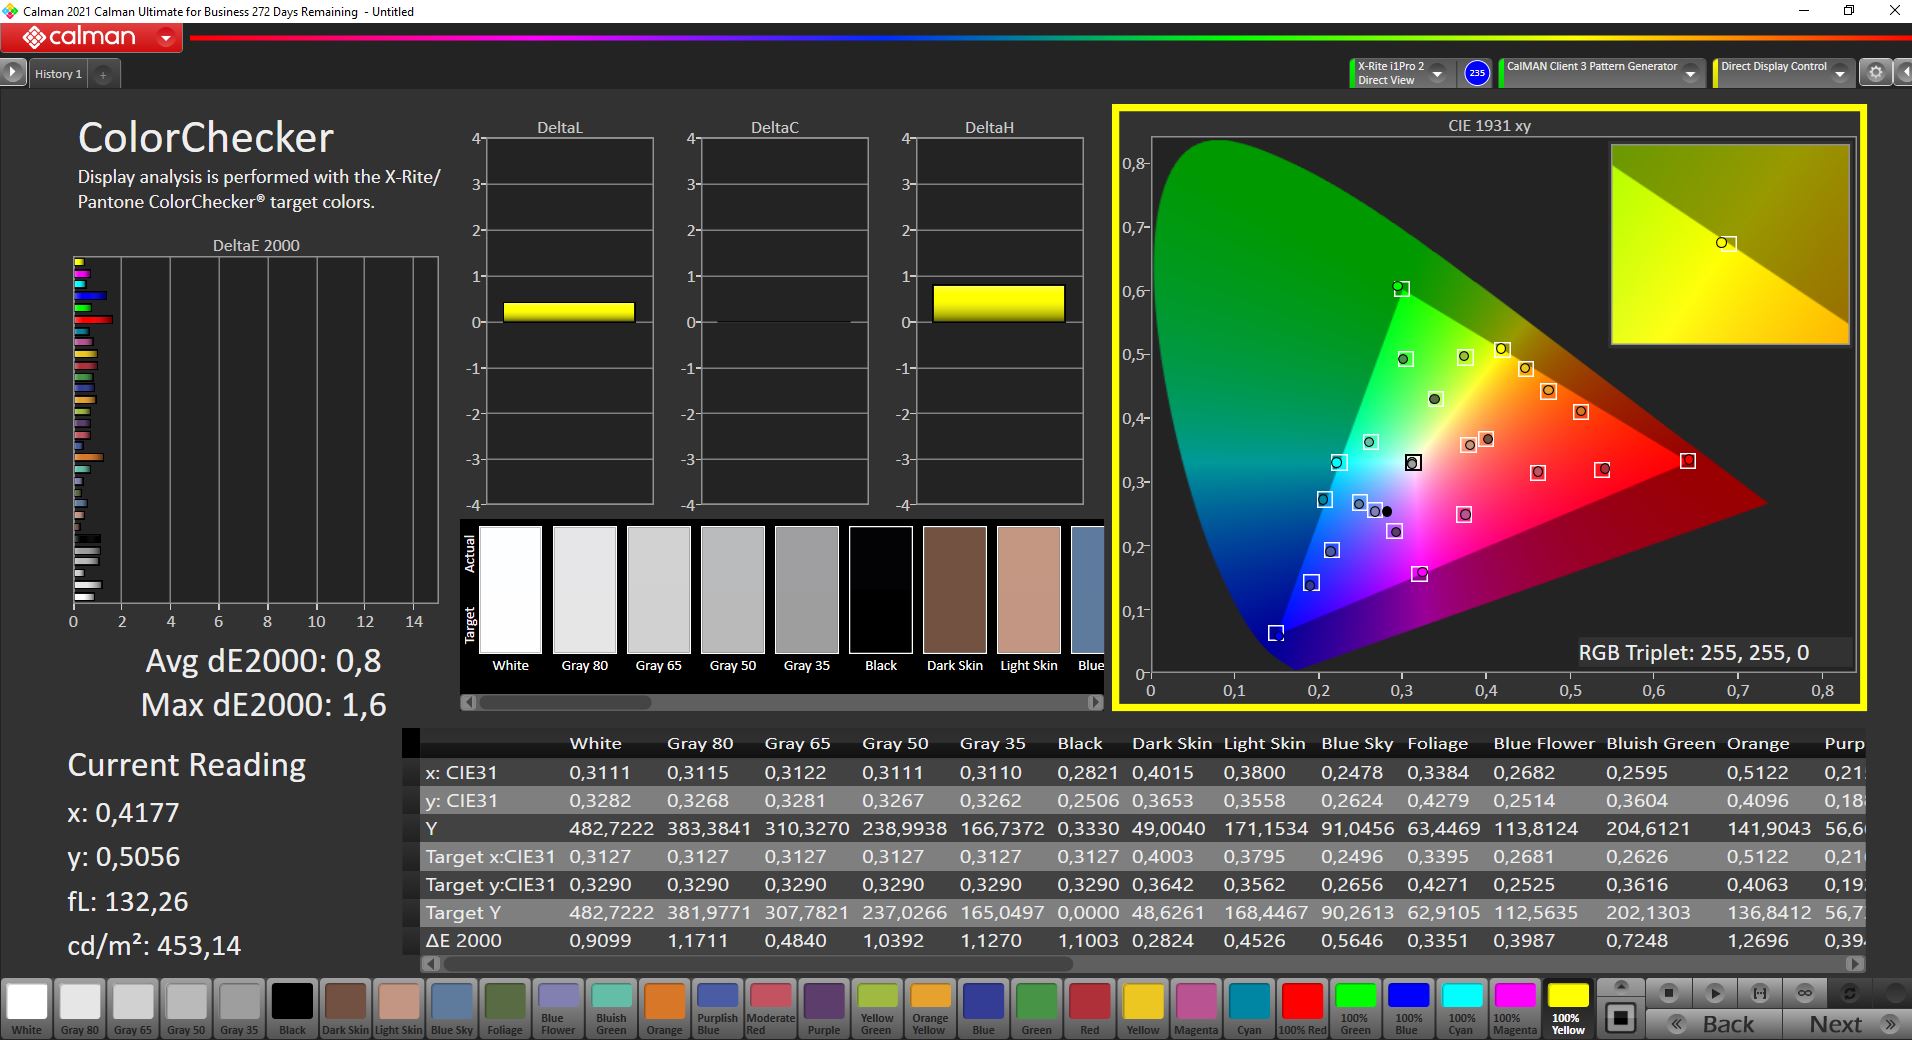
However, the new Surface device once again only covers the small sRGB gamut, which is a bit surprising considering the designation Studio and the high price. Most high-quality laptops for content creators now cover the P3 reference, which is also a result of the increased use of OLED screens.
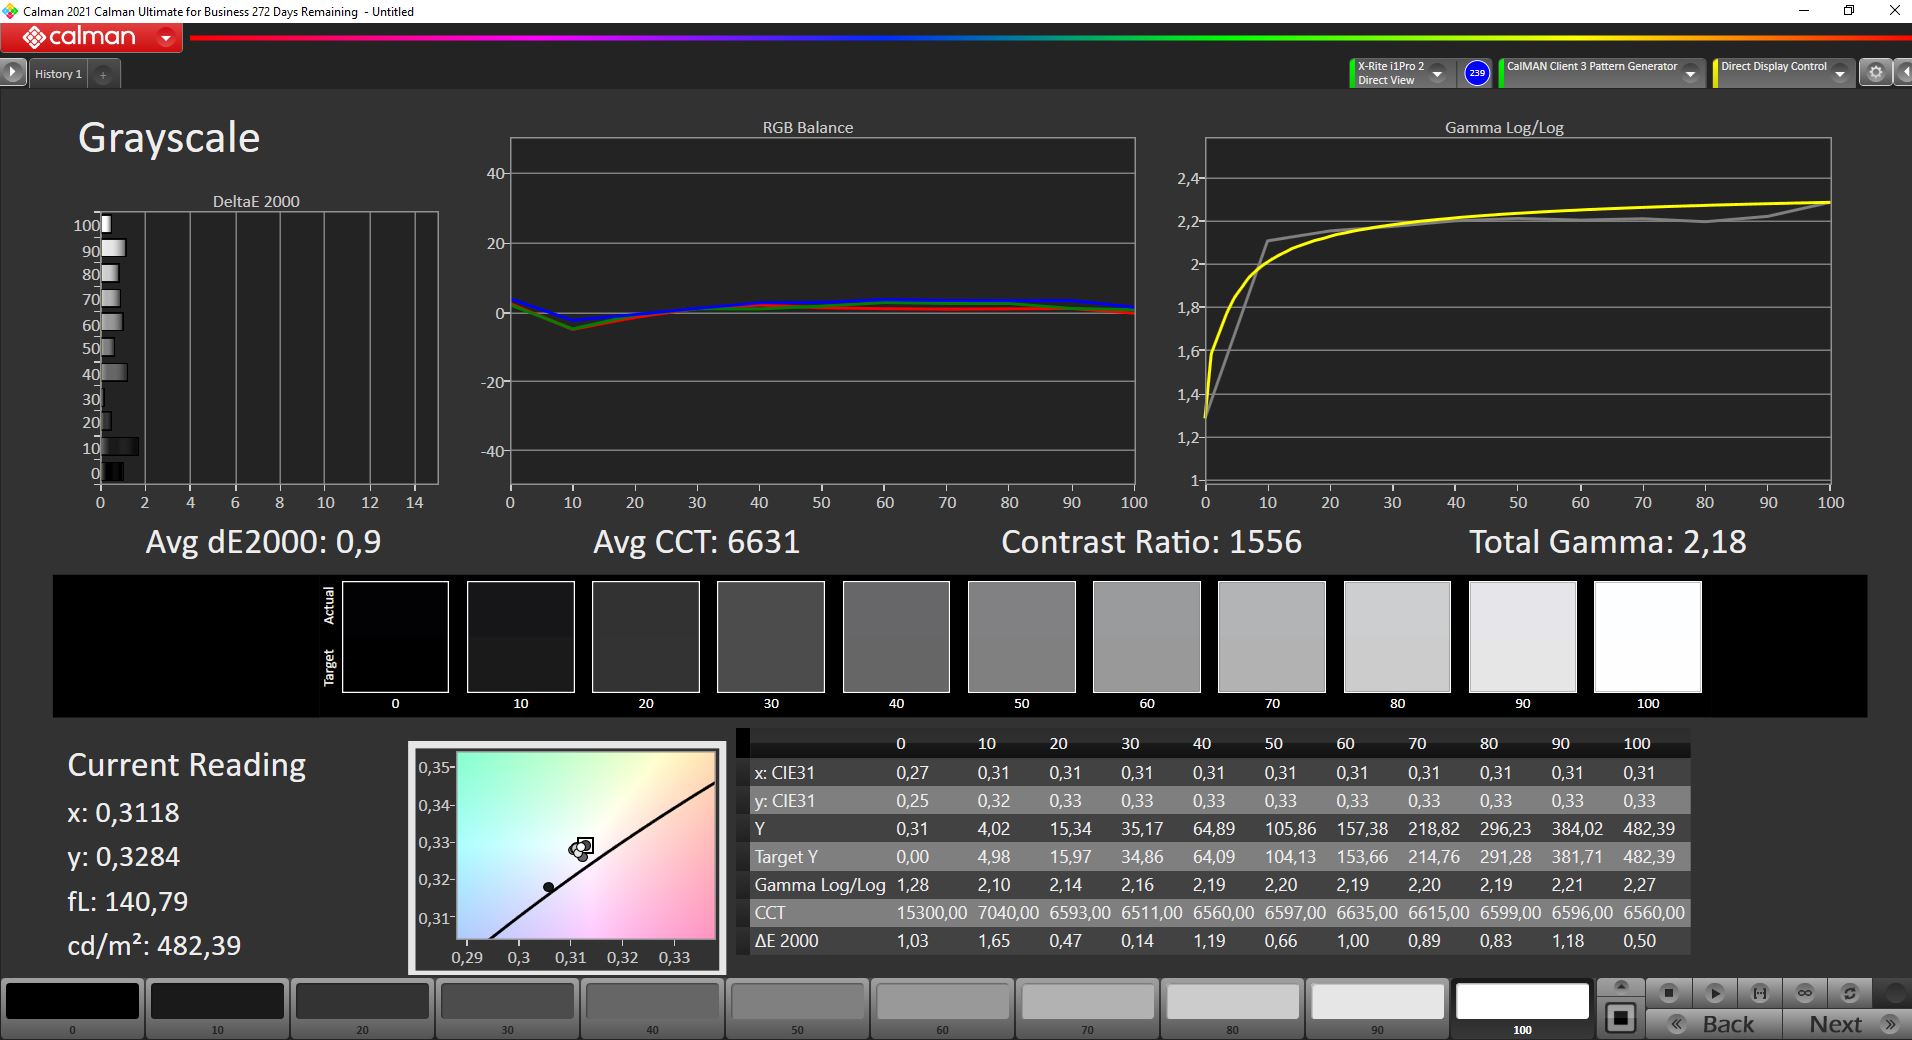
We managed to improve the picture quality a bit with our own calibration and the minor blue cast is gone as well. The corresponding profile ca be downloaded for free in the display box above.
Display Response Times
| ↔ Response Time Black to White | ||
|---|---|---|
| 24 ms ... rise ↗ and fall ↘ combined | ↗ 8.4 ms rise | 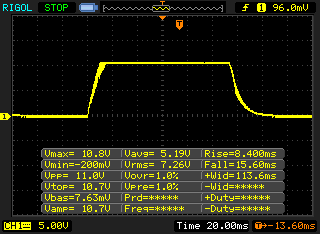 |
| ↘ 15.6 ms fall | ||
| The screen shows good response rates in our tests, but may be too slow for competitive gamers. In comparison, all tested devices range from 0.1 (minimum) to 240 (maximum) ms. » 54 % of all devices are better. This means that the measured response time is worse than the average of all tested devices (19.9 ms). | ||
| ↔ Response Time 50% Grey to 80% Grey | ||
| 58.4 ms ... rise ↗ and fall ↘ combined | ↗ 26.8 ms rise | 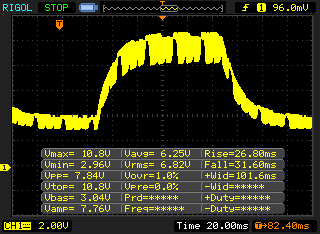 |
| ↘ 31.6 ms fall | ||
| The screen shows slow response rates in our tests and will be unsatisfactory for gamers. In comparison, all tested devices range from 0.165 (minimum) to 636 (maximum) ms. » 95 % of all devices are better. This means that the measured response time is worse than the average of all tested devices (31.1 ms). | ||
Screen Flickering / PWM (Pulse-Width Modulation)
| Screen flickering / PWM detected | 5000 Hz | ≤ 98 % brightness setting | 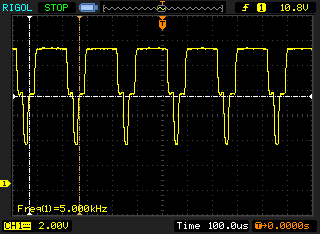 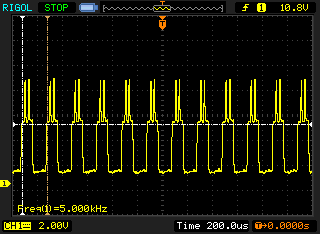 |
The display backlight flickers at 5000 Hz (worst case, e.g., utilizing PWM) Flickering detected at a brightness setting of 98 % and below. There should be no flickering or PWM above this brightness setting. The frequency of 5000 Hz is quite high, so most users sensitive to PWM should not notice any flickering. In comparison: 52 % of all tested devices do not use PWM to dim the display. If PWM was detected, an average of 7822 (minimum: 1.31 - maximum: 343500) Hz was measured. | |||
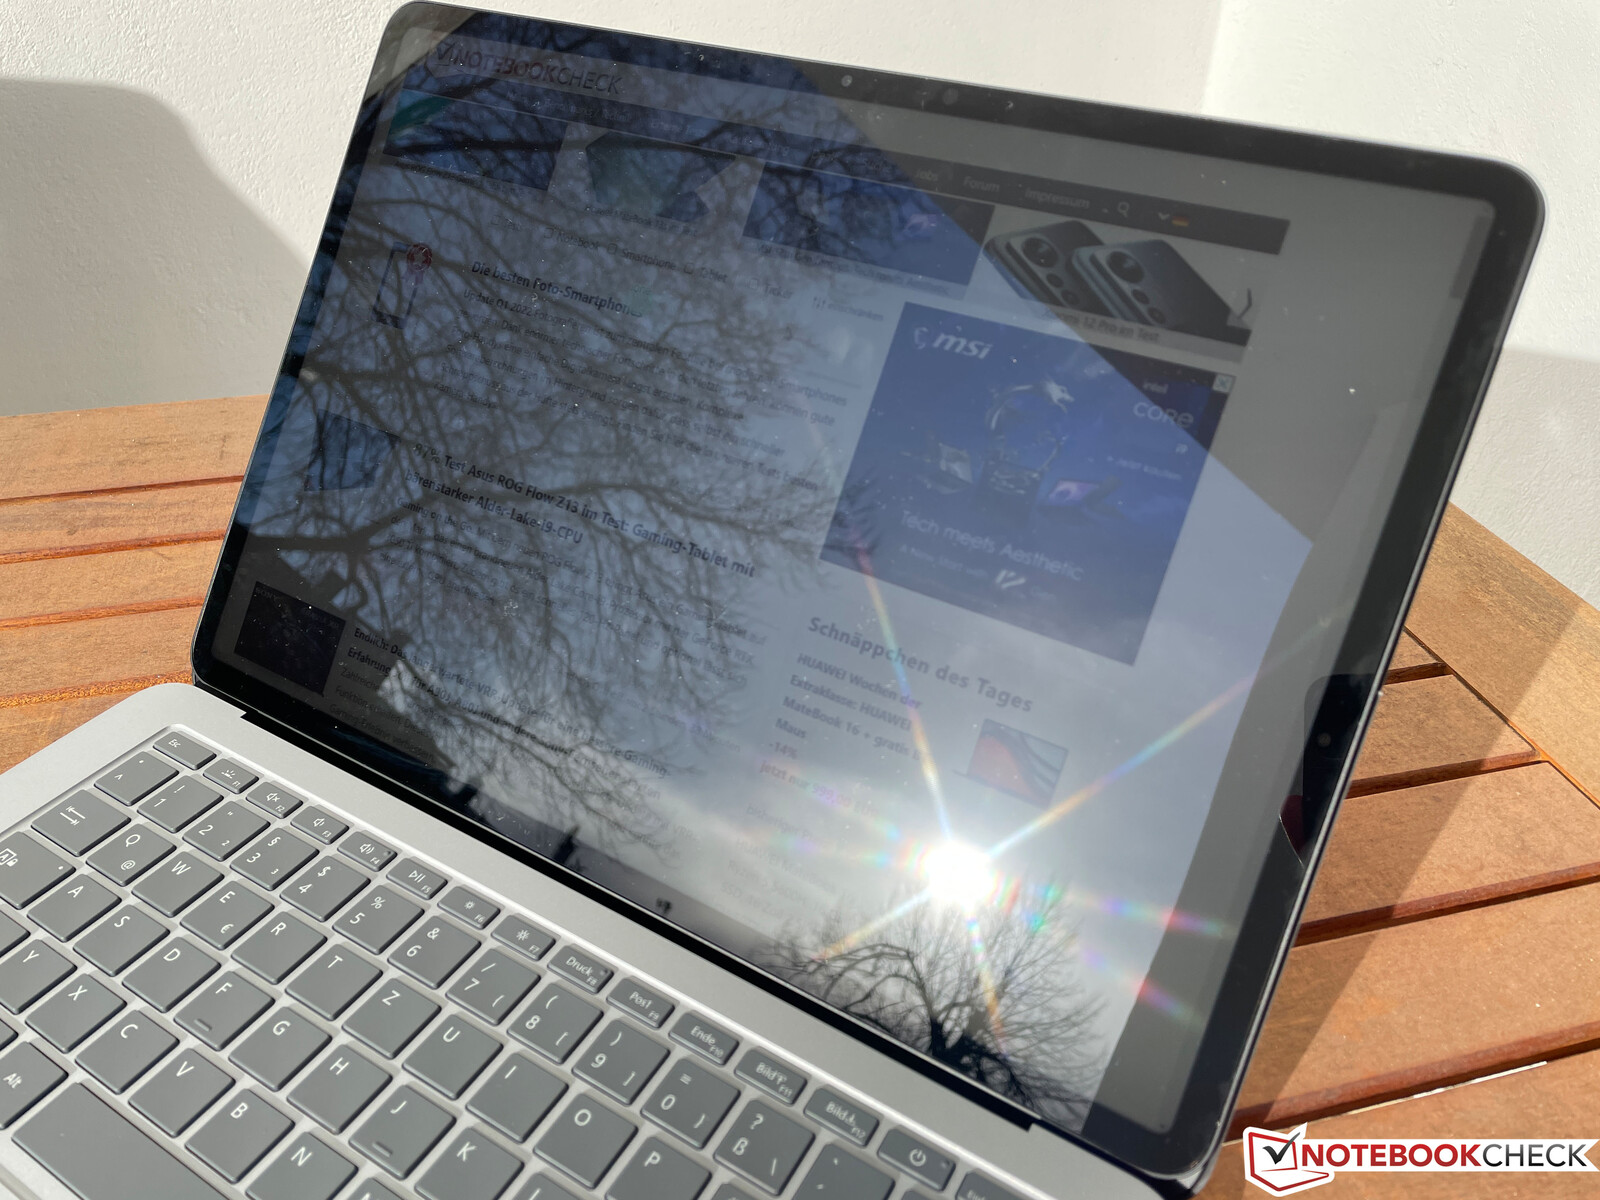
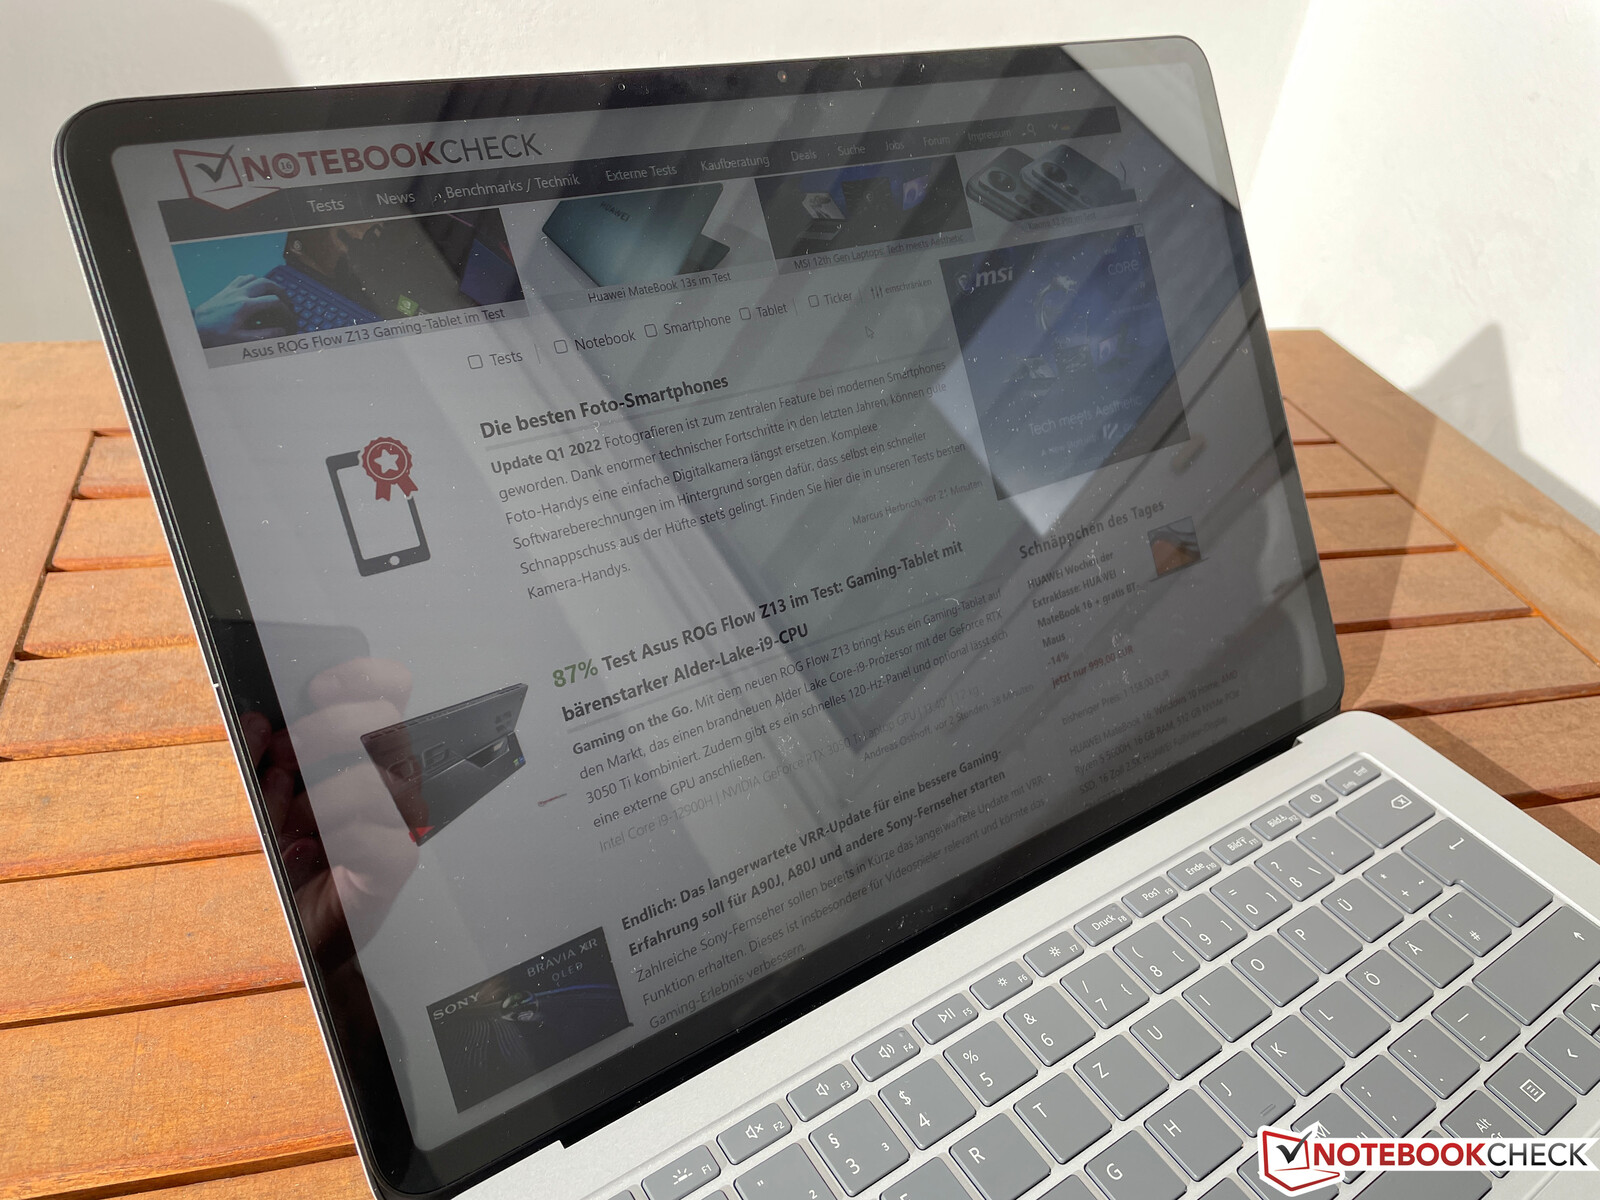
Thanks to the high brightness, you can use the Surface Laptop Studio outdoors, but will face reflections on very bright or sunny days to see the display contents comfortably. The viewing angles of the IPS screen are very wide and you can still see the contents without distortions from every angle when you use the Surface Laptop Studio as a tablet.
Performance - Surface Laptop Studio still with Tiger Lake
The new Surface Laptop Studio still uses Intel’s Tiger Lake processors. One aspect here is definitely that corresponding Alder Lake chips were not yet available, but we are still surprised about the selection of Tiger Lake-H35 chips. We have covered this topic a few times already, these chips are basically regular Tiger Lake-U CPUs like the Core i7-1165G7, which is used in many ultrabooks for around two years now and the H35 models are just operated with higher TDP figures. This means you only get four CPU cores and the faster iGPU Iris Xe Graphics G7, so the CPUs do not make much sense when you combine them with dedicated graphics cards.
Review Settings
Microsoft does not implement any additional energy profiles and all the settings are controlled with the Windows performance slider. All the following benchmarks and measurements were performed with the setting "Best Performance".
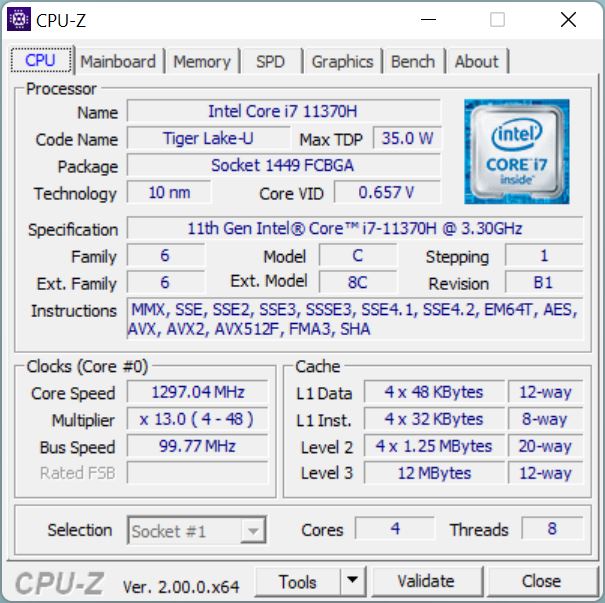
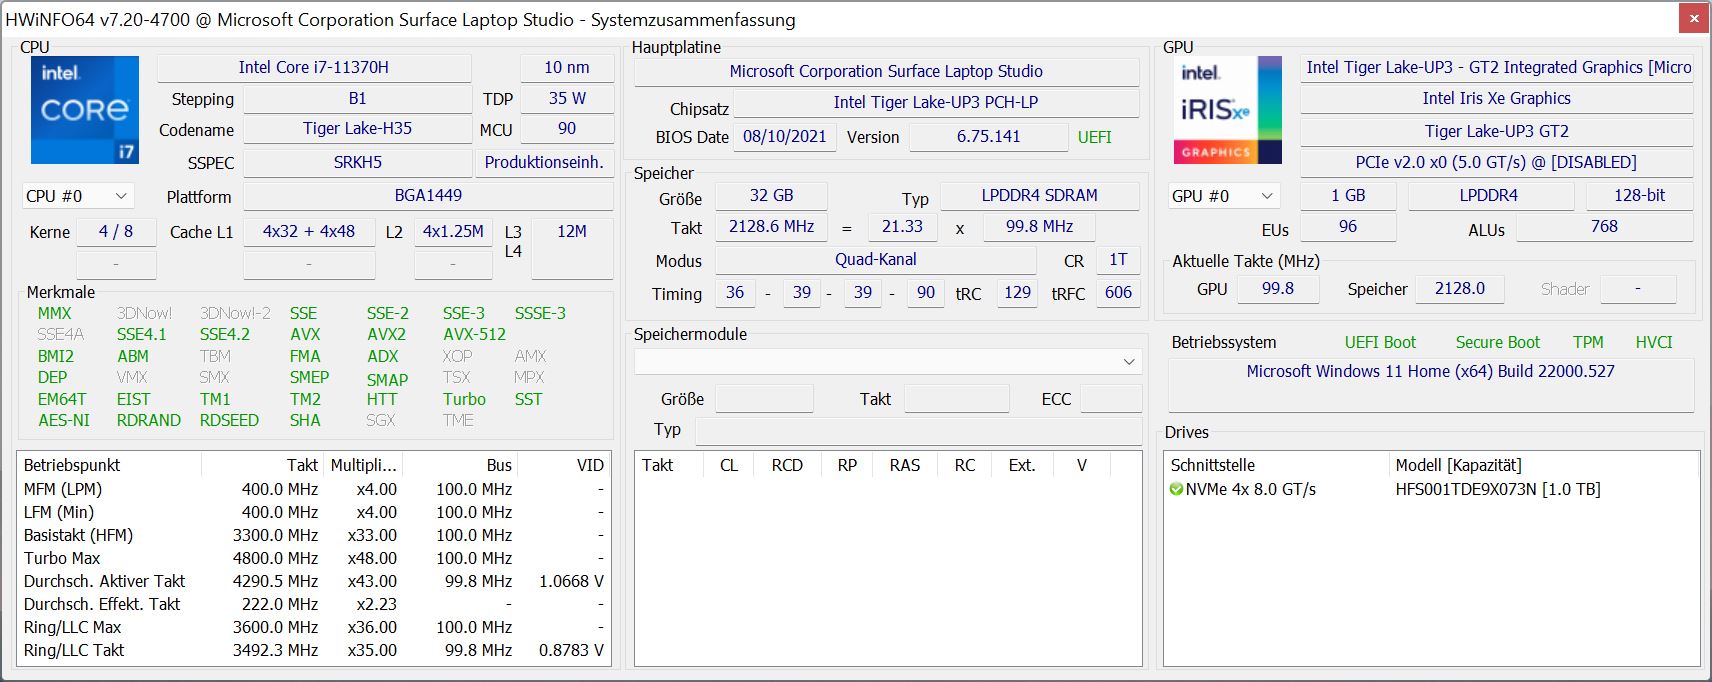
Processor - Core i7-11370H
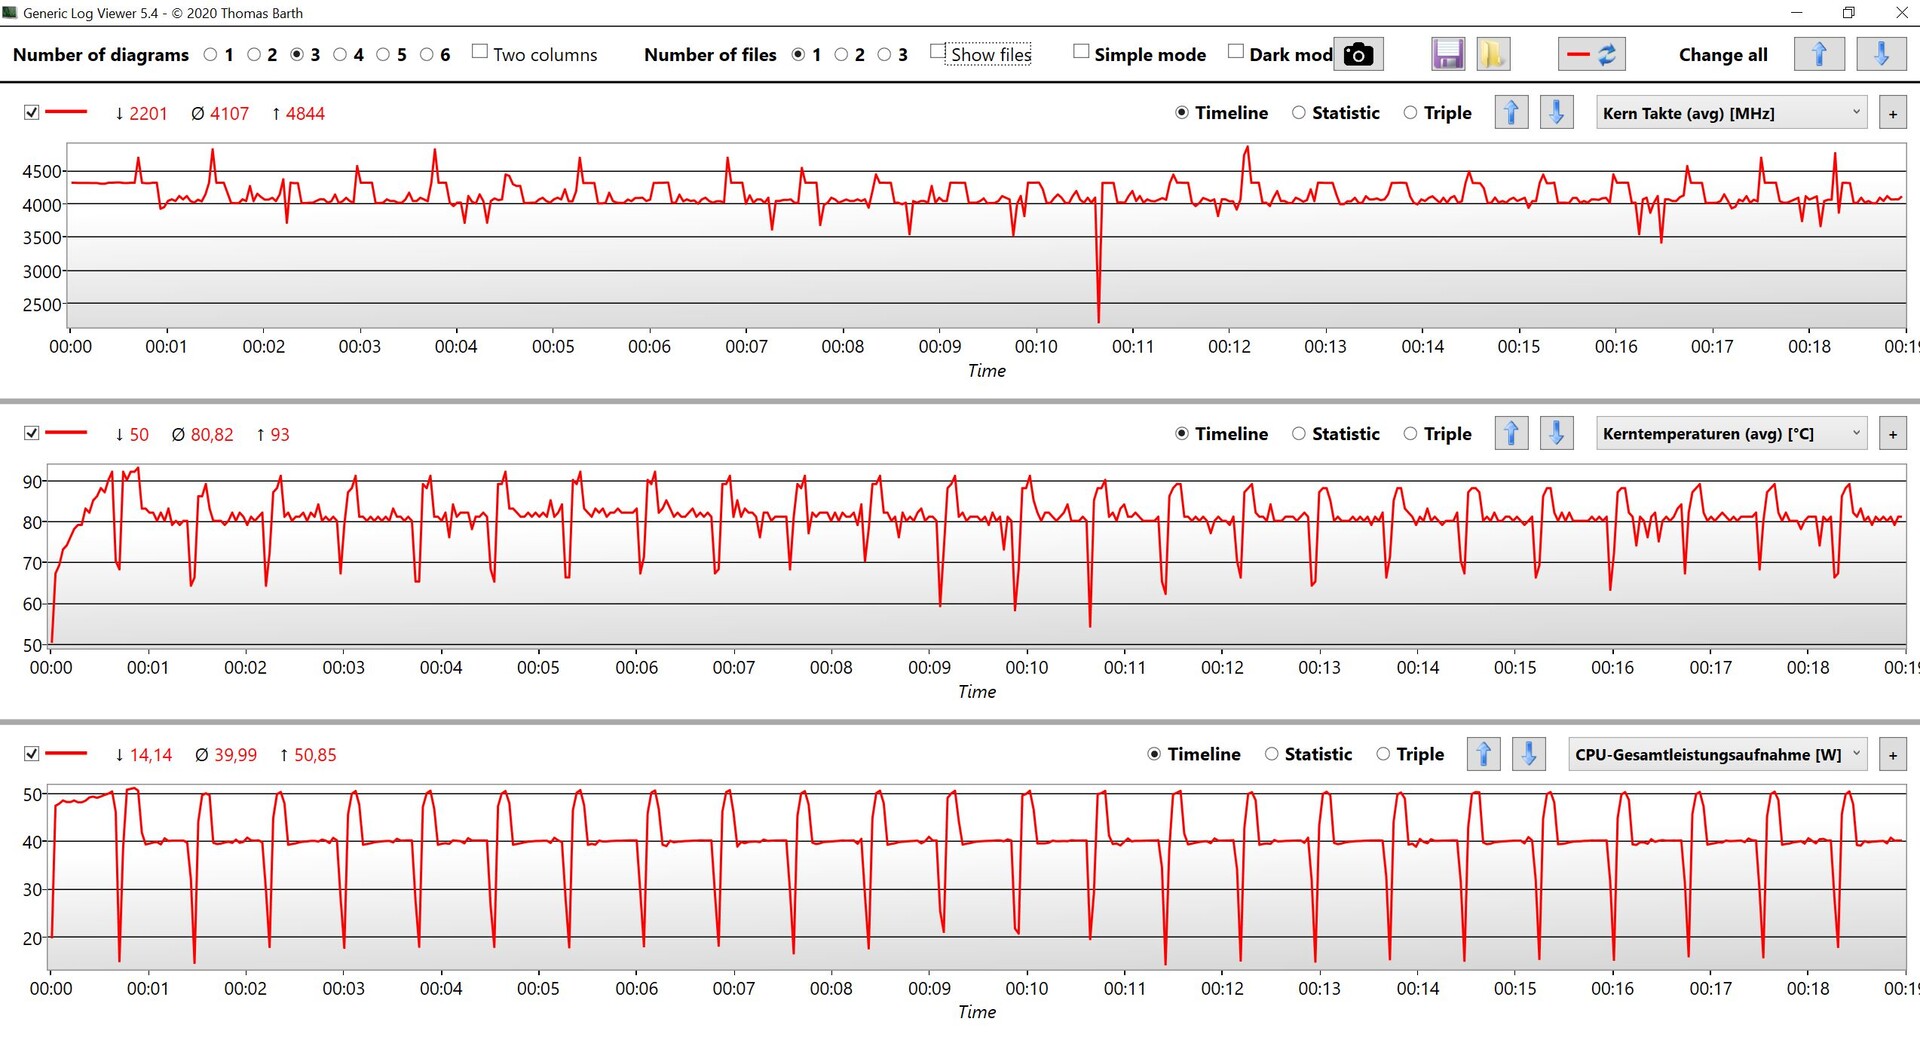
Intel’s Core i7-11370H is a Tiger Lake-H35 processor with four cores (eight threads) running at up to 4.8 GHz or 4.3 GHz on all active cores, respectively. The CPU can consume slightly more than 50W for a short time here and quickly levels off at 40W. The benchmarks results confirm that it is basically just a regular Tiger Lake-U processor with a little more power. The Core i7-1185G7 in the MSI Summit E14, for example, is not much slower (~15%).
The Intel quad-core does not stand a chance against the competition from AMD and their current CPUs are almost twice as fast and Intel’s new Alder Lake chips also have a big advantage thanks to the increased number of cores. But even considering that the Alder Lake chips just were not ready, we do not understand why Microsoft did not use Tiger Lake H45 CPUs like the Core i7-11800H. We selected an early review unit of the ThinkPad P1 G4 with similar TDP values for comparison, and the multi-core performance is still around 40% better. Even the Core i5-11400H in the Dell XPS 15 is faster despite the lower TDP value of 35 Watts.
The new Surface laptop Studio does not look particularly good compared to Apple’s M1 Pro CPU. Even the slowest model with 8 cores is about 30% faster in Cinebench R15, even though this app has to be emulated. The advantage is increased to around 50% in native benchmarks like Cinebench R23 Multi.
Don’t get us wrong here, the performance of the Core i7-11370H is more than sufficient for everyday tasks and the single-core performance is still competitive with current rivals from Apple and AMD, but the new Alder Lake chips once again offer a big improvement of more than 20% thanks to their new performance cores. Al in all, the CPU performance could have been so much better. We expect comparable performance figures for the entry-level SKU of the Surface Laptop Studio with the Core i5-11300H, where the chip makes more sense since you will actually use the faster iGPU.
The CPU performance is not reduced on battery power. More CPU benchmarks are listed in our Tech section.
Cinebench R15 Multi Loop
Cinebench R23: Multi Core | Single Core
Cinebench R20: CPU (Multi Core) | CPU (Single Core)
Cinebench R15: CPU Multi 64Bit | CPU Single 64Bit
Blender: v2.79 BMW27 CPU
7-Zip 18.03: 7z b 4 | 7z b 4 -mmt1
Geekbench 5.5: Multi-Core | Single-Core
HWBOT x265 Benchmark v2.2: 4k Preset
LibreOffice : 20 Documents To PDF
R Benchmark 2.5: Overall mean
| CPU Performance rating | |
| Asus ROG Flow Z13 GZ301ZE | |
| Average of class Multimedia | |
| Apple MacBook Pro 14 2021 M1 Pro Entry -8! | |
| Razer Blade 14 Ryzen 9 RTX 3070 -2! | |
| Schenker Vision 14 | |
| Microsoft Surface Laptop Studio i7 RTX 3050 Ti | |
| Average Intel Core i7-11370H | |
| MSI Summit E14 A11SCS -2! | |
| Acer ConceptD 3 Ezel CC314-72G-7513 | |
| Microsoft Surface Book 3 13.5 -2! | |
| Cinebench R23 / Multi Core | |
| Average of class Multimedia (4861 - 33362, n=82, last 2 years) | |
| Asus ROG Flow Z13 GZ301ZE | |
| Razer Blade 14 Ryzen 9 RTX 3070 | |
| Apple MacBook Pro 14 2021 M1 Pro Entry | |
| Microsoft Surface Laptop Studio i7 RTX 3050 Ti | |
| Schenker Vision 14 | |
| Acer ConceptD 3 Ezel CC314-72G-7513 | |
| MSI Summit E14 A11SCS | |
| Average Intel Core i7-11370H (3696 - 6646, n=12) | |
| Cinebench R23 / Single Core | |
| Asus ROG Flow Z13 GZ301ZE | |
| Average of class Multimedia (1128 - 2459, n=74, last 2 years) | |
| Apple MacBook Pro 14 2021 M1 Pro Entry | |
| Microsoft Surface Laptop Studio i7 RTX 3050 Ti | |
| MSI Summit E14 A11SCS | |
| Average Intel Core i7-11370H (1081 - 1556, n=11) | |
| Schenker Vision 14 | |
| Razer Blade 14 Ryzen 9 RTX 3070 | |
| Acer ConceptD 3 Ezel CC314-72G-7513 | |
| Cinebench R20 / CPU (Multi Core) | |
| Average of class Multimedia (1887 - 12912, n=65, last 2 years) | |
| Asus ROG Flow Z13 GZ301ZE | |
| Razer Blade 14 Ryzen 9 RTX 3070 | |
| Microsoft Surface Laptop Studio i7 RTX 3050 Ti | |
| Schenker Vision 14 | |
| MSI Summit E14 A11SCS | |
| Average Intel Core i7-11370H (1438 - 2578, n=11) | |
| Acer ConceptD 3 Ezel CC314-72G-7513 | |
| Microsoft Surface Book 3 13.5 | |
| Cinebench R20 / CPU (Single Core) | |
| Asus ROG Flow Z13 GZ301ZE | |
| Average of class Multimedia (420 - 853, n=65, last 2 years) | |
| Schenker Vision 14 | |
| MSI Summit E14 A11SCS | |
| Microsoft Surface Laptop Studio i7 RTX 3050 Ti | |
| Average Intel Core i7-11370H (475 - 601, n=11) | |
| Razer Blade 14 Ryzen 9 RTX 3070 | |
| Acer ConceptD 3 Ezel CC314-72G-7513 | |
| Microsoft Surface Book 3 13.5 | |
| Cinebench R15 / CPU Multi 64Bit | |
| Asus ROG Flow Z13 GZ301ZE | |
| Average of class Multimedia (856 - 5224, n=69, last 2 years) | |
| Razer Blade 14 Ryzen 9 RTX 3070 | |
| Apple MacBook Pro 14 2021 M1 Pro Entry | |
| Acer ConceptD 3 Ezel CC314-72G-7513 | |
| Schenker Vision 14 | |
| Schenker Vision 14 | |
| Microsoft Surface Laptop Studio i7 RTX 3050 Ti | |
| Average Intel Core i7-11370H (606 - 1086, n=17) | |
| MSI Summit E14 A11SCS | |
| Microsoft Surface Book 3 13.5 | |
| Cinebench R15 / CPU Single 64Bit | |
| Average of class Multimedia (184.8 - 326, n=67, last 2 years) | |
| Asus ROG Flow Z13 GZ301ZE | |
| Schenker Vision 14 | |
| MSI Summit E14 A11SCS | |
| Microsoft Surface Laptop Studio i7 RTX 3050 Ti | |
| Average Intel Core i7-11370H (162.9 - 233, n=15) | |
| Apple MacBook Pro 14 2021 M1 Pro Entry | |
| Acer ConceptD 3 Ezel CC314-72G-7513 | |
| Razer Blade 14 Ryzen 9 RTX 3070 | |
| Microsoft Surface Book 3 13.5 | |
| Blender / v2.79 BMW27 CPU | |
| Microsoft Surface Book 3 13.5 | |
| Average Intel Core i7-11370H (432 - 762, n=11) | |
| MSI Summit E14 A11SCS | |
| Microsoft Surface Laptop Studio i7 RTX 3050 Ti | |
| Acer ConceptD 3 Ezel CC314-72G-7513 | |
| Schenker Vision 14 | |
| Razer Blade 14 Ryzen 9 RTX 3070 | |
| Average of class Multimedia (100 - 557, n=66, last 2 years) | |
| Asus ROG Flow Z13 GZ301ZE | |
| 7-Zip 18.03 / 7z b 4 | |
| Asus ROG Flow Z13 GZ301ZE | |
| Average of class Multimedia (29095 - 130368, n=63, last 2 years) | |
| Razer Blade 14 Ryzen 9 RTX 3070 | |
| Schenker Vision 14 | |
| Microsoft Surface Laptop Studio i7 RTX 3050 Ti | |
| Acer ConceptD 3 Ezel CC314-72G-7513 | |
| Average Intel Core i7-11370H (18961 - 28520, n=11) | |
| MSI Summit E14 A11SCS | |
| Microsoft Surface Book 3 13.5 | |
| 7-Zip 18.03 / 7z b 4 -mmt1 | |
| Asus ROG Flow Z13 GZ301ZE | |
| Average of class Multimedia (3666 - 7545, n=64, last 2 years) | |
| Schenker Vision 14 | |
| Average Intel Core i7-11370H (5074 - 5550, n=11) | |
| Microsoft Surface Laptop Studio i7 RTX 3050 Ti | |
| Acer ConceptD 3 Ezel CC314-72G-7513 | |
| MSI Summit E14 A11SCS | |
| Razer Blade 14 Ryzen 9 RTX 3070 | |
| Microsoft Surface Book 3 13.5 | |
| Geekbench 5.5 / Multi-Core | |
| Asus ROG Flow Z13 GZ301ZE | |
| Average of class Multimedia (4652 - 20422, n=63, last 2 years) | |
| Apple MacBook Pro 14 2021 M1 Pro Entry | |
| Acer ConceptD 3 Ezel CC314-72G-7513 | |
| Schenker Vision 14 | |
| Microsoft Surface Laptop Studio i7 RTX 3050 Ti | |
| Average Intel Core i7-11370H (3828 - 6115, n=10) | |
| Microsoft Surface Book 3 13.5 | |
| Geekbench 5.5 / Single-Core | |
| Average of class Multimedia (805 - 2974, n=63, last 2 years) | |
| Asus ROG Flow Z13 GZ301ZE | |
| Apple MacBook Pro 14 2021 M1 Pro Entry | |
| Schenker Vision 14 | |
| Microsoft Surface Laptop Studio i7 RTX 3050 Ti | |
| Average Intel Core i7-11370H (1376 - 1607, n=10) | |
| Microsoft Surface Book 3 13.5 | |
| Acer ConceptD 3 Ezel CC314-72G-7513 | |
| HWBOT x265 Benchmark v2.2 / 4k Preset | |
| Average of class Multimedia (5.26 - 36.1, n=64, last 2 years) | |
| Asus ROG Flow Z13 GZ301ZE | |
| Razer Blade 14 Ryzen 9 RTX 3070 | |
| Schenker Vision 14 | |
| Microsoft Surface Laptop Studio i7 RTX 3050 Ti | |
| Acer ConceptD 3 Ezel CC314-72G-7513 | |
| Average Intel Core i7-11370H (4.98 - 8.82, n=11) | |
| MSI Summit E14 A11SCS | |
| Microsoft Surface Book 3 13.5 | |
| LibreOffice / 20 Documents To PDF | |
| Microsoft Surface Book 3 13.5 | |
| MSI Summit E14 A11SCS | |
| Razer Blade 14 Ryzen 9 RTX 3070 | |
| Acer ConceptD 3 Ezel CC314-72G-7513 | |
| Microsoft Surface Laptop Studio i7 RTX 3050 Ti | |
| Average of class Multimedia (23.9 - 146.7, n=65, last 2 years) | |
| Schenker Vision 14 | |
| Average Intel Core i7-11370H (23.6 - 56.5, n=11) | |
| Asus ROG Flow Z13 GZ301ZE | |
| R Benchmark 2.5 / Overall mean | |
| Microsoft Surface Book 3 13.5 | |
| Acer ConceptD 3 Ezel CC314-72G-7513 | |
| Razer Blade 14 Ryzen 9 RTX 3070 | |
| Microsoft Surface Laptop Studio i7 RTX 3050 Ti | |
| MSI Summit E14 A11SCS | |
| Average Intel Core i7-11370H (0.544 - 0.596, n=11) | |
| Schenker Vision 14 | |
| Average of class Multimedia (0.3604 - 0.947, n=64, last 2 years) | |
| Asus ROG Flow Z13 GZ301ZE | |
* ... smaller is better
AIDA64: FP32 Ray-Trace | FPU Julia | CPU SHA3 | CPU Queen | FPU SinJulia | FPU Mandel | CPU AES | CPU ZLib | FP64 Ray-Trace | CPU PhotoWorxx
| Performance rating | |
| Average of class Multimedia | |
| Razer Blade 14 Ryzen 9 RTX 3070 | |
| Schenker Vision 14 | |
| Acer ConceptD 3 Ezel CC314-72G-7513 | |
| Average Intel Core i7-11370H | |
| MSI Summit E14 A11SCS | |
| Microsoft Surface Laptop Studio i7 RTX 3050 Ti | |
| Microsoft Surface Book 3 13.5 | |
| AIDA64 / FP32 Ray-Trace | |
| Average of class Multimedia (2214 - 50388, n=61, last 2 years) | |
| Razer Blade 14 Ryzen 9 RTX 3070 | |
| Schenker Vision 14 | |
| Acer ConceptD 3 Ezel CC314-72G-7513 | |
| Microsoft Surface Laptop Studio i7 RTX 3050 Ti | |
| Average Intel Core i7-11370H (5204 - 8413, n=10) | |
| MSI Summit E14 A11SCS | |
| Microsoft Surface Book 3 13.5 | |
| AIDA64 / FPU Julia | |
| Razer Blade 14 Ryzen 9 RTX 3070 | |
| Average of class Multimedia (12867 - 201874, n=62, last 2 years) | |
| Acer ConceptD 3 Ezel CC314-72G-7513 | |
| Schenker Vision 14 | |
| Microsoft Surface Laptop Studio i7 RTX 3050 Ti | |
| Average Intel Core i7-11370H (23958 - 34020, n=10) | |
| MSI Summit E14 A11SCS | |
| Microsoft Surface Book 3 13.5 | |
| AIDA64 / CPU SHA3 | |
| Average of class Multimedia (653 - 8623, n=62, last 2 years) | |
| Razer Blade 14 Ryzen 9 RTX 3070 | |
| Schenker Vision 14 | |
| Acer ConceptD 3 Ezel CC314-72G-7513 | |
| Average Intel Core i7-11370H (1656 - 2297, n=10) | |
| Microsoft Surface Laptop Studio i7 RTX 3050 Ti | |
| MSI Summit E14 A11SCS | |
| Microsoft Surface Book 3 13.5 | |
| AIDA64 / CPU Queen | |
| Razer Blade 14 Ryzen 9 RTX 3070 | |
| Average of class Multimedia (13483 - 181505, n=51, last 2 years) | |
| Acer ConceptD 3 Ezel CC314-72G-7513 | |
| Schenker Vision 14 | |
| Average Intel Core i7-11370H (42086 - 52930, n=10) | |
| MSI Summit E14 A11SCS | |
| Microsoft Surface Laptop Studio i7 RTX 3050 Ti | |
| Microsoft Surface Book 3 13.5 | |
| AIDA64 / FPU SinJulia | |
| Razer Blade 14 Ryzen 9 RTX 3070 | |
| Average of class Multimedia (1240 - 28794, n=62, last 2 years) | |
| Acer ConceptD 3 Ezel CC314-72G-7513 | |
| Schenker Vision 14 | |
| Average Intel Core i7-11370H (3755 - 5027, n=10) | |
| MSI Summit E14 A11SCS | |
| Microsoft Surface Laptop Studio i7 RTX 3050 Ti | |
| Microsoft Surface Book 3 13.5 | |
| AIDA64 / FPU Mandel | |
| Razer Blade 14 Ryzen 9 RTX 3070 | |
| Average of class Multimedia (6395 - 105740, n=61, last 2 years) | |
| Acer ConceptD 3 Ezel CC314-72G-7513 | |
| Schenker Vision 14 | |
| MSI Summit E14 A11SCS | |
| Average Intel Core i7-11370H (14433 - 20417, n=10) | |
| Microsoft Surface Laptop Studio i7 RTX 3050 Ti | |
| Microsoft Surface Book 3 13.5 | |
| AIDA64 / CPU AES | |
| Razer Blade 14 Ryzen 9 RTX 3070 | |
| Schenker Vision 14 | |
| Average Intel Core i7-11370H (44267 - 76866, n=10) | |
| Average of class Multimedia (13243 - 126790, n=62, last 2 years) | |
| Microsoft Surface Laptop Studio i7 RTX 3050 Ti | |
| MSI Summit E14 A11SCS | |
| Microsoft Surface Book 3 13.5 | |
| Acer ConceptD 3 Ezel CC314-72G-7513 | |
| AIDA64 / CPU ZLib | |
| Average of class Multimedia (167.2 - 2022, n=62, last 2 years) | |
| Razer Blade 14 Ryzen 9 RTX 3070 | |
| Acer ConceptD 3 Ezel CC314-72G-7513 | |
| Schenker Vision 14 | |
| Average Intel Core i7-11370H (289 - 422, n=10) | |
| MSI Summit E14 A11SCS | |
| Microsoft Surface Laptop Studio i7 RTX 3050 Ti | |
| Microsoft Surface Book 3 13.5 | |
| AIDA64 / FP64 Ray-Trace | |
| Average of class Multimedia (1014 - 26875, n=62, last 2 years) | |
| Razer Blade 14 Ryzen 9 RTX 3070 | |
| Schenker Vision 14 | |
| Acer ConceptD 3 Ezel CC314-72G-7513 | |
| Average Intel Core i7-11370H (2756 - 4551, n=10) | |
| Microsoft Surface Laptop Studio i7 RTX 3050 Ti | |
| MSI Summit E14 A11SCS | |
| Microsoft Surface Book 3 13.5 | |
| AIDA64 / CPU PhotoWorxx | |
| Average of class Multimedia (12860 - 88154, n=62, last 2 years) | |
| MSI Summit E14 A11SCS | |
| Microsoft Surface Laptop Studio i7 RTX 3050 Ti | |
| Microsoft Surface Book 3 13.5 | |
| Average Intel Core i7-11370H (15892 - 40069, n=10) | |
| Schenker Vision 14 | |
| Acer ConceptD 3 Ezel CC314-72G-7513 | |
| Razer Blade 14 Ryzen 9 RTX 3070 | |
System Performance
The subjective performance impression of the review unit is very good since the processor is powerful enough for everyday tasks and the fast PCIe-SSD ensures that inputs are quickly executed and loading times are very short when you launch applications. The synthetic benchmark scores are average within the comparison group. We did not experience any issues or crashes during our review period.
CrossMark: Overall | Productivity | Creativity | Responsiveness
| PCMark 10 / Score | |
| Average of class Multimedia (4325 - 10386, n=58, last 2 years) | |
| Razer Blade 14 Ryzen 9 RTX 3070 | |
| Schenker Vision 14 | |
| Average Intel Core i7-11370H, NVIDIA GeForce RTX 3050 Ti Laptop GPU (5538 - 5838, n=2) | |
| Microsoft Surface Laptop Studio i7 RTX 3050 Ti | |
| MSI Summit E14 A11SCS | |
| Acer ConceptD 3 Ezel CC314-72G-7513 | |
| Microsoft Surface Book 3 13.5 | |
| PCMark 10 / Essentials | |
| Average of class Multimedia (8025 - 11664, n=57, last 2 years) | |
| Razer Blade 14 Ryzen 9 RTX 3070 | |
| Acer ConceptD 3 Ezel CC314-72G-7513 | |
| Schenker Vision 14 | |
| MSI Summit E14 A11SCS | |
| Average Intel Core i7-11370H, NVIDIA GeForce RTX 3050 Ti Laptop GPU (8715 - 9234, n=2) | |
| Microsoft Surface Laptop Studio i7 RTX 3050 Ti | |
| Microsoft Surface Book 3 13.5 | |
| PCMark 10 / Productivity | |
| Average of class Multimedia (7323 - 18233, n=57, last 2 years) | |
| Razer Blade 14 Ryzen 9 RTX 3070 | |
| Schenker Vision 14 | |
| Average Intel Core i7-11370H, NVIDIA GeForce RTX 3050 Ti Laptop GPU (8342 - 8806, n=2) | |
| Microsoft Surface Laptop Studio i7 RTX 3050 Ti | |
| MSI Summit E14 A11SCS | |
| Acer ConceptD 3 Ezel CC314-72G-7513 | |
| Microsoft Surface Book 3 13.5 | |
| PCMark 10 / Digital Content Creation | |
| Average of class Multimedia (3651 - 16240, n=57, last 2 years) | |
| Razer Blade 14 Ryzen 9 RTX 3070 | |
| Schenker Vision 14 | |
| Average Intel Core i7-11370H, NVIDIA GeForce RTX 3050 Ti Laptop GPU (6343 - 6641, n=2) | |
| Microsoft Surface Laptop Studio i7 RTX 3050 Ti | |
| MSI Summit E14 A11SCS | |
| Microsoft Surface Book 3 13.5 | |
| Acer ConceptD 3 Ezel CC314-72G-7513 | |
| CrossMark / Overall | |
| Average of class Multimedia (866 - 2728, n=68, last 2 years) | |
| Schenker Vision 14 | |
| Apple MacBook Pro 14 2021 M1 Pro Entry | |
| Average Intel Core i7-11370H, NVIDIA GeForce RTX 3050 Ti Laptop GPU (1407 - 1502, n=2) | |
| Microsoft Surface Laptop Studio i7 RTX 3050 Ti | |
| CrossMark / Productivity | |
| Average of class Multimedia (913 - 2489, n=68, last 2 years) | |
| Schenker Vision 14 | |
| Average Intel Core i7-11370H, NVIDIA GeForce RTX 3050 Ti Laptop GPU (1417 - 1555, n=2) | |
| Microsoft Surface Laptop Studio i7 RTX 3050 Ti | |
| Apple MacBook Pro 14 2021 M1 Pro Entry | |
| CrossMark / Creativity | |
| Average of class Multimedia (907 - 3465, n=68, last 2 years) | |
| Apple MacBook Pro 14 2021 M1 Pro Entry | |
| Microsoft Surface Laptop Studio i7 RTX 3050 Ti | |
| Average Intel Core i7-11370H, NVIDIA GeForce RTX 3050 Ti Laptop GPU (1452 - 1472, n=2) | |
| Schenker Vision 14 | |
| CrossMark / Responsiveness | |
| Schenker Vision 14 | |
| Average of class Multimedia (605 - 2024, n=68, last 2 years) | |
| Average Intel Core i7-11370H, NVIDIA GeForce RTX 3050 Ti Laptop GPU (1202 - 1501, n=2) | |
| Microsoft Surface Laptop Studio i7 RTX 3050 Ti | |
| Apple MacBook Pro 14 2021 M1 Pro Entry | |
| PCMark 10 Score | 5538 points | |
Help | ||
| AIDA64 / Memory Copy | |
| Average of class Multimedia (21158 - 132135, n=62, last 2 years) | |
| MSI Summit E14 A11SCS | |
| Microsoft Surface Laptop Studio i7 RTX 3050 Ti | |
| Microsoft Surface Book 3 13.5 | |
| Average Intel Core i7-11370H (32035 - 64524, n=10) | |
| Schenker Vision 14 | |
| Razer Blade 14 Ryzen 9 RTX 3070 | |
| Acer ConceptD 3 Ezel CC314-72G-7513 | |
| AIDA64 / Memory Read | |
| Average of class Multimedia (19699 - 174586, n=62, last 2 years) | |
| MSI Summit E14 A11SCS | |
| Microsoft Surface Laptop Studio i7 RTX 3050 Ti | |
| Microsoft Surface Book 3 13.5 | |
| Average Intel Core i7-11370H (37216 - 62417, n=10) | |
| Schenker Vision 14 | |
| Razer Blade 14 Ryzen 9 RTX 3070 | |
| Acer ConceptD 3 Ezel CC314-72G-7513 | |
| AIDA64 / Memory Write | |
| Average of class Multimedia (17733 - 134998, n=62, last 2 years) | |
| MSI Summit E14 A11SCS | |
| Microsoft Surface Laptop Studio i7 RTX 3050 Ti | |
| Microsoft Surface Book 3 13.5 | |
| Average Intel Core i7-11370H (36920 - 65610, n=10) | |
| Schenker Vision 14 | |
| Acer ConceptD 3 Ezel CC314-72G-7513 | |
| Razer Blade 14 Ryzen 9 RTX 3070 | |
| AIDA64 / Memory Latency | |
| Average of class Multimedia (7 - 535, n=61, last 2 years) | |
| Microsoft Surface Book 3 13.5 | |
| Microsoft Surface Laptop Studio i7 RTX 3050 Ti | |
| MSI Summit E14 A11SCS | |
| Average Intel Core i7-11370H (73.4 - 103, n=10) | |
| Razer Blade 14 Ryzen 9 RTX 3070 | |
| Schenker Vision 14 | |
| Acer ConceptD 3 Ezel CC314-72G-7513 | |
* ... smaller is better
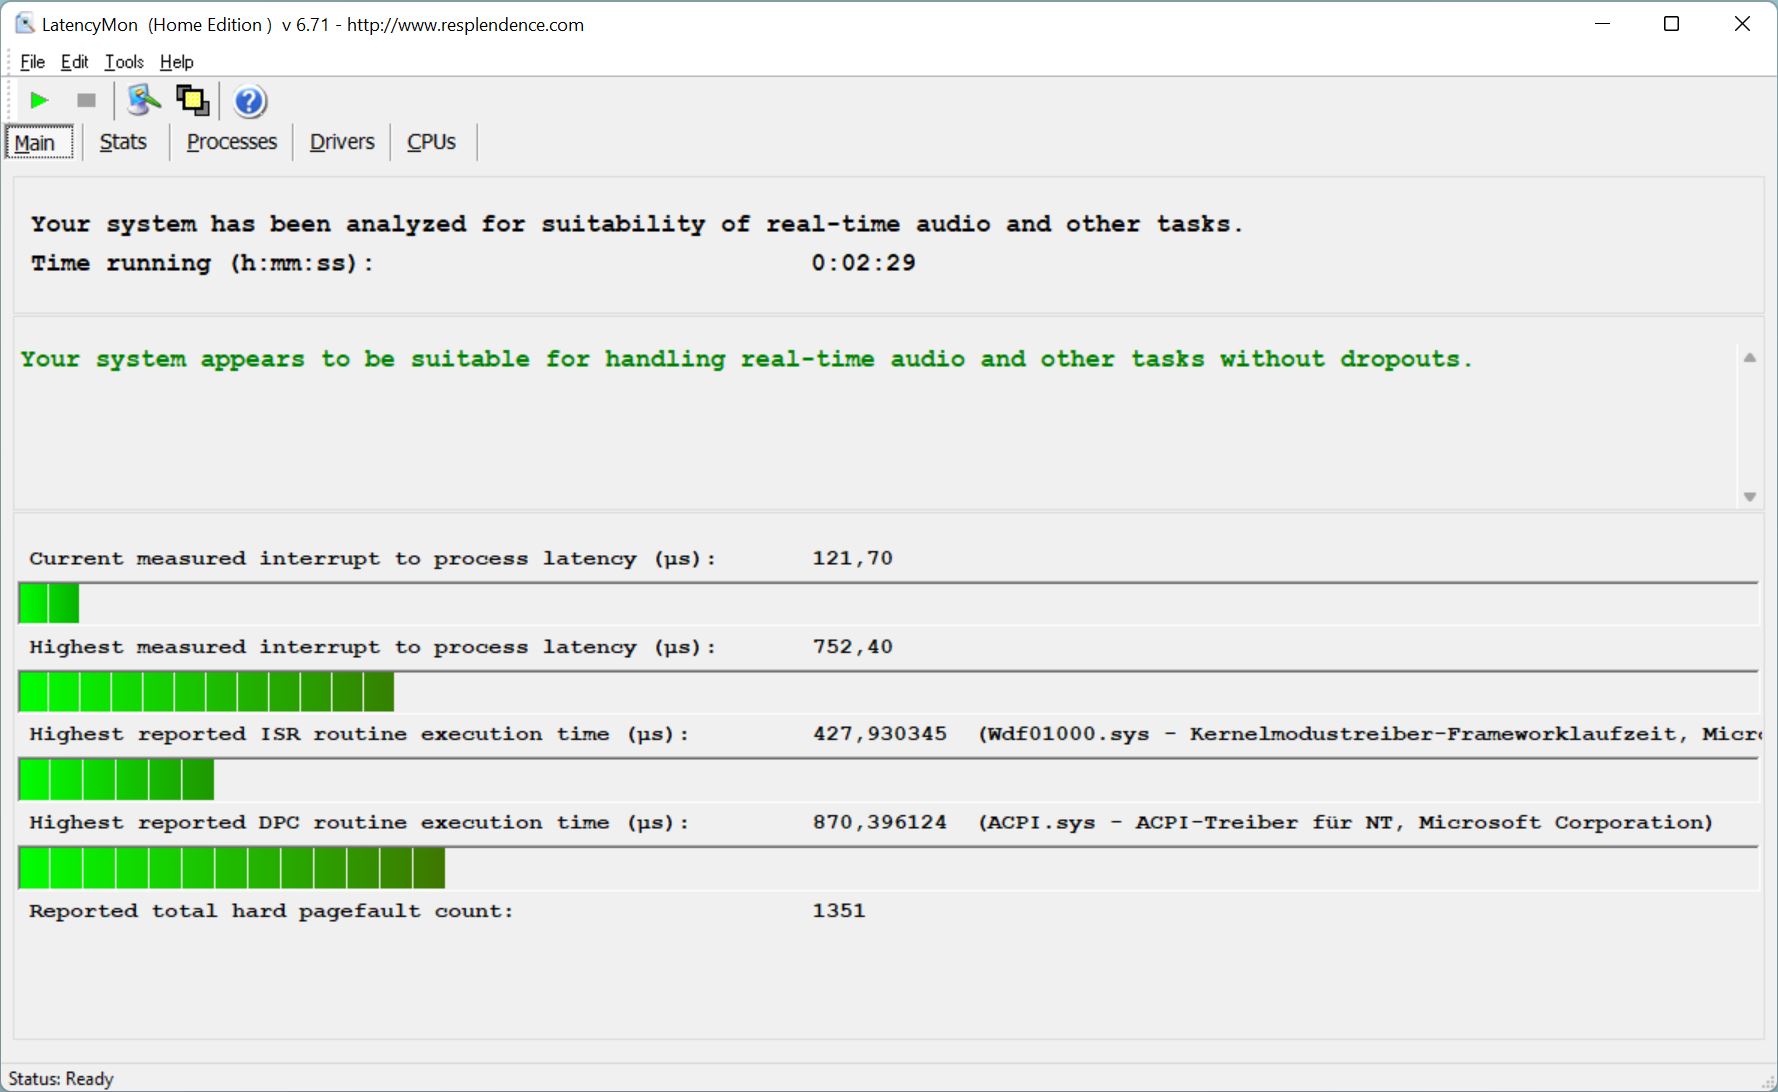
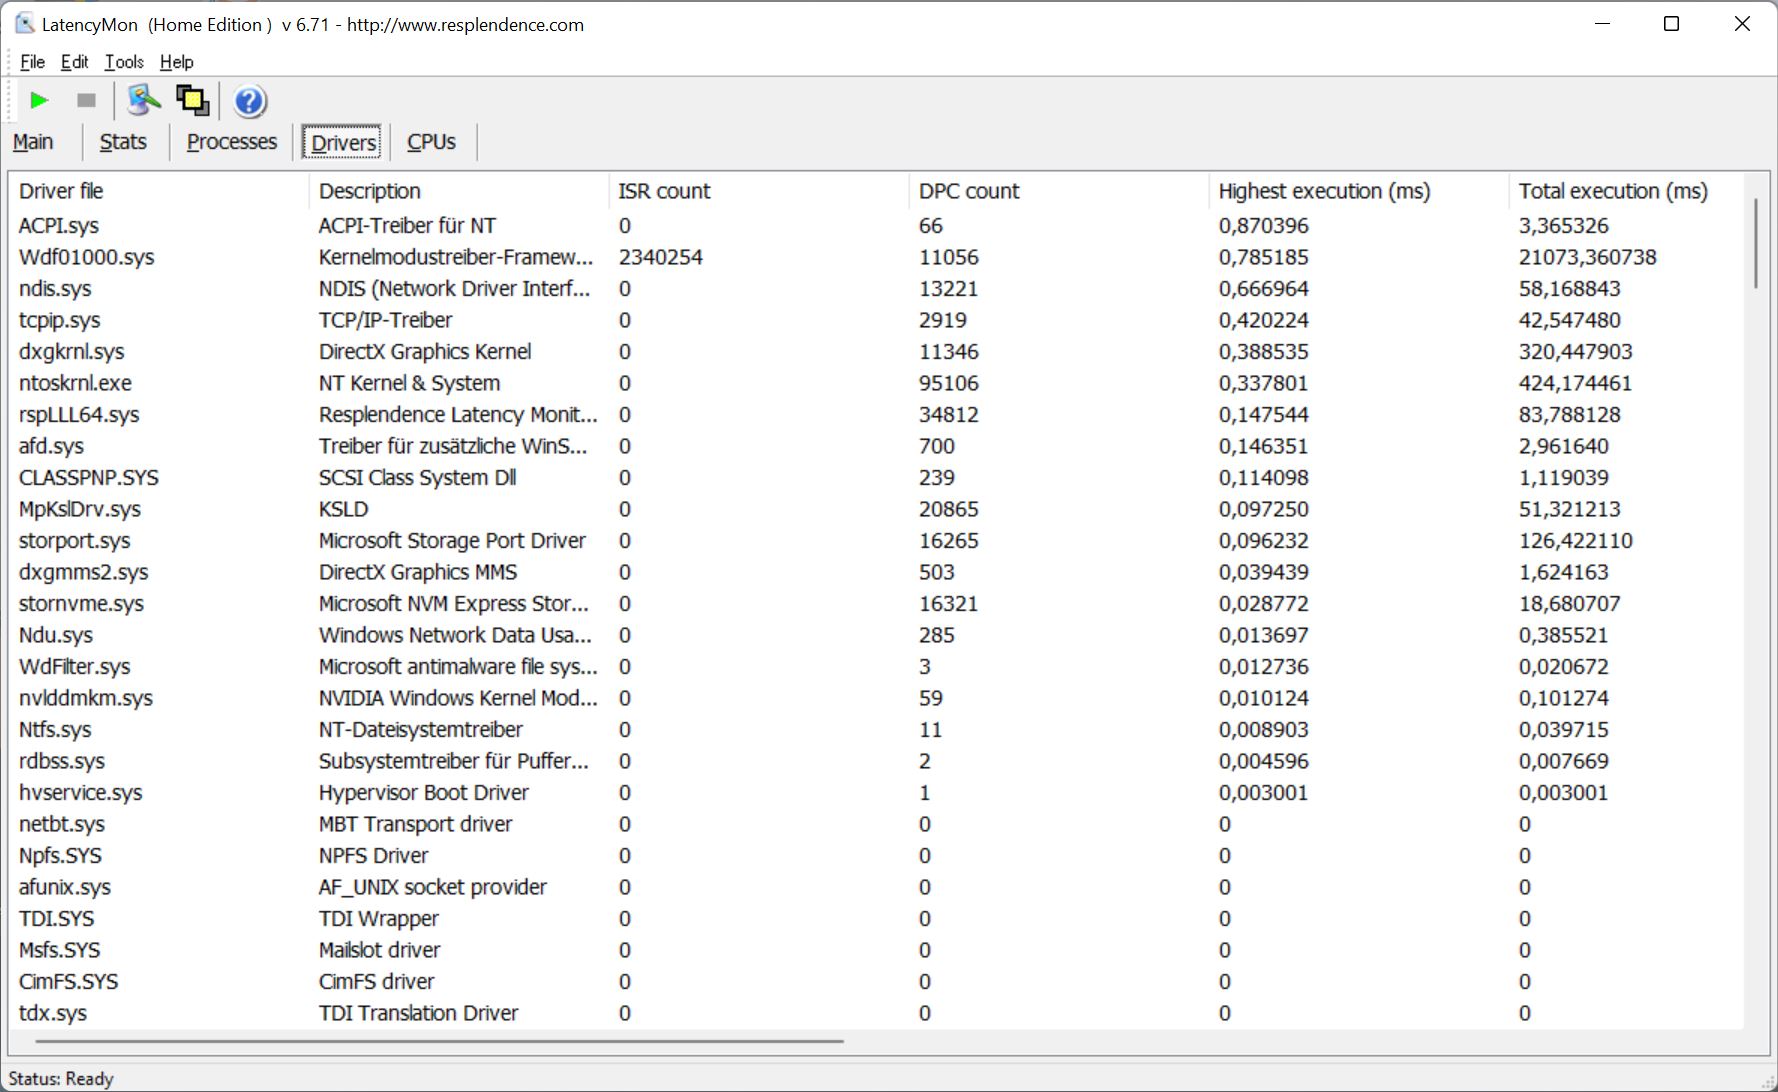
DPC Latency
Our standardized latency test (web browsing, YouTube 4K, CPU load) did not show any problems for the Surface laptop Studio and there were no dropped frames during the video playback.
| DPC Latencies / LatencyMon - interrupt to process latency (max), Web, Youtube, Prime95 | |
| Acer ConceptD 3 Ezel CC314-72G-7513 | |
| Schenker Vision 14 | |
| MSI Summit E14 A11SCS | |
| Microsoft Surface Laptop Studio i7 RTX 3050 Ti | |
| Microsoft Surface Book 3 13.5 | |
| Razer Blade 14 Ryzen 9 RTX 3070 | |
* ... smaller is better
Storage Devices
Microsoft uses a regular M.2-2280 SSD, but the device does not support the latest PCIe 4.0 standard. The transfer rates of the PCIe 3.0 x4 SSD from SK Hynix (BC711) are still very good and there will be no limitations. Our review unit offers a storage capacity of 1 TB and you can use 894 GB for your own files and apps after the initial set-up.
As mentioned before, users cannot replace the SSD, so you should consider how much storage you will need before you purchase the device. More SSD benchmarks are available in our Tech section.

* ... smaller is better
Disk Throttling: DiskSpd Read Loop, Queue Depth 8
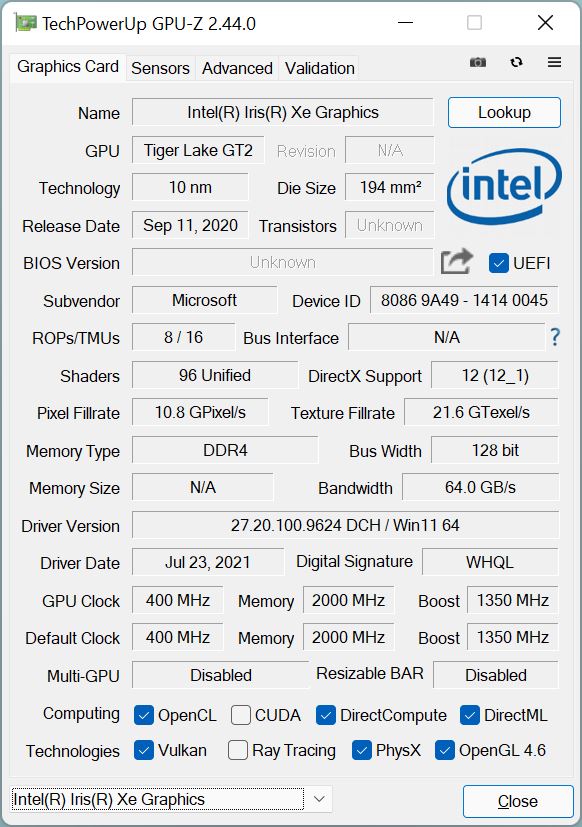
GPU Performance - GeForce RTX 3050 Ti with 50W TGP
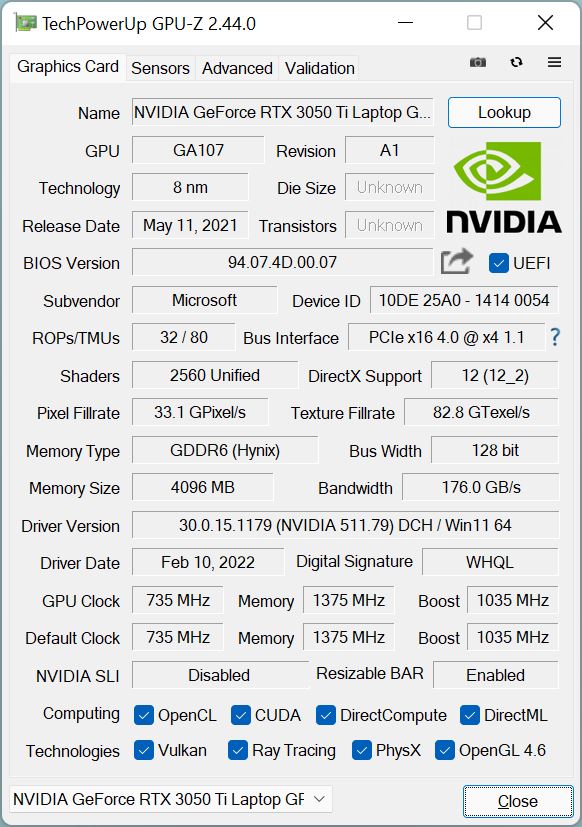
Light workloads including the playback of high-resolution videos will mostly be handled by the integrated Iris Xe Graphics G7 of the processor. The dedicated GeForce RTX 3050 Ti with 4 GB GDDR6-VRAM is automatically activated via Nvidia’s Optimus technology when you need more performance during gaming, for example. It is the version with a TGP of 50W and a maximum core clock of 1455 MHz. There are faster versions of the RTX 3050 Ti (up to 80W TGP), so the benchmark results are a bit lower compared to the average results for this GPU in our database. Compared to the old GTX 1650 Max-Q of the Surface Book 3, however, the RTX 3050 Ti offers noticeable more performance.
The GPU performance is completely stable under sustained workloads and the demanding 3DMark Time Spy stress test is easily passed at 99.3%. The power consumption of the GPU is limited to 35W on battery power, which results in a performance deficit of around 20% (4893 vs. 3944 points @Time Spy Graphics). More GPU benchmarks are available here.
Business customers can also get the Surface Laptop Studio with the RTX A2000 instead of the RTX 3050 Ti, which offers special driver certifications for professional applications. The basic level of performance, however, is similar to the RTX 3050 Ti.
| 3DMark 11 Performance | 15393 points | |
| 3DMark Cloud Gate Standard Score | 25704 points | |
| 3DMark Fire Strike Score | 10493 points | |
| 3DMark Time Spy Score | 4987 points | |
Help | ||
Gaming Performance
The RTX 3050 Ti is powerful enough for smooth 1080p gameplay with high details in many titles, but you will usually not reach the 120 Hz of the display. The gaming performance is once again stable in longer sessions, but the performance is a bit lower on battery power. However, the difference is not as big as in the synthetic tests. Witcher 3 Ultra, for example, was still smooth at more than 35 fps. Please see our tech section for more gaming benchmarks
| F1 2021 | |
| 1920x1080 High Preset AA:T AF:16x | |
| Average NVIDIA GeForce RTX 3050 Ti Laptop GPU (68 - 131, n=11) | |
| Microsoft Surface Laptop Studio i7 RTX 3050 Ti | |
| Schenker Vision 14 | |
| 1920x1080 Ultra High Preset + Raytracing AA:T AF:16x | |
| Average NVIDIA GeForce RTX 3050 Ti Laptop GPU (44.4 - 69, n=11) | |
| Schenker Vision 14 | |
| Microsoft Surface Laptop Studio i7 RTX 3050 Ti | |
| GTA V | |
| 1920x1080 High/On (Advanced Graphics Off) AA:2xMSAA + FX AF:8x | |
| Razer Blade 14 Ryzen 9 RTX 3070 | |
| Average NVIDIA GeForce RTX 3050 Ti Laptop GPU (53.8 - 149, n=25) | |
| Microsoft Surface Laptop Studio i7 RTX 3050 Ti | |
| Schenker Vision 14 | |
| Average of class Multimedia (19.5 - 186.1, n=57, last 2 years) | |
| MSI Summit E14 A11SCS | |
| 1920x1080 Highest AA:4xMSAA + FX AF:16x | |
| Razer Blade 14 Ryzen 9 RTX 3070 | |
| Average NVIDIA GeForce RTX 3050 Ti Laptop GPU (27.8 - 75.6, n=26) | |
| Microsoft Surface Laptop Studio i7 RTX 3050 Ti | |
| Average of class Multimedia (7.92 - 141.6, n=63, last 2 years) | |
| Schenker Vision 14 | |
| MSI Summit E14 A11SCS | |
Witcher 3 FPS Chart
| low | med. | high | ultra | |
|---|---|---|---|---|
| GTA V (2015) | 170 | 163 | 111 | 63.2 |
| The Witcher 3 (2015) | 212 | 145 | 85 | 41.6 |
| Dota 2 Reborn (2015) | 137 | 121 | 115 | 111 |
| Final Fantasy XV Benchmark (2018) | 101 | 63.8 | 45 | |
| X-Plane 11.11 (2018) | 101 | 89.8 | 75.2 | |
| Far Cry 5 (2018) | 117 | 81 | 75 | 70 |
| Strange Brigade (2018) | 256 | 119 | 96.2 | 82.3 |
| Shadow of the Tomb Raider (2018) | 102 | 78 | 60 | 49 |
| Total War: Three Kingdoms (2019) | 178 | 77 | 52 | 37 |
| Borderlands 3 (2019) | 97 | 76 | 55 | 45 |
| F1 2021 (2021) | 224 | 136 | 103 | 45.8 |
| Cyberpunk 2077 1.6 (2022) | 62 | 60 | 42 | 40 |
Emissions - Surface is often silent
System Noise
Microsoft uses two fans located in the front area of the base unit. The fan profile is very defensive in general and the fans speed is slowly increased under load. This means the device is usually very quiet when you perform basic tasks or the fan murmur will be very quiet. There are also no annoying electronic sounds like coil whine, for example. The fan noise will reach around 45 dB(A) during gaming after a couple of minutes, which is definitely audible and we also recommend headphones for gaming.
Noise level
| Idle |
| 24.7 / 24.7 / 24.7 dB(A) |
| Load |
| 33.2 / 46.7 dB(A) |
 | ||
30 dB silent 40 dB(A) audible 50 dB(A) loud |
||
min: | ||
| Microsoft Surface Laptop Studio i7 RTX 3050 Ti GeForce RTX 3050 Ti Laptop GPU, i7-11370H, SK Hynix PC711 1TB HFS001TDE9X084N | Acer ConceptD 3 Ezel CC314-72G-7513 GeForce GTX 1650 Ti Max-Q, i7-10750H, WDC PC SN730 SDBQNTY-1T00 | Apple MacBook Pro 14 2021 M1 Pro Entry M1 Pro 14-Core GPU, M1 Pro 8-Core, Apple SSD AP0512 | Microsoft Surface Book 3 13.5 GeForce GTX 1650 Max-Q, i7-1065G7, SK Hynix BC501 HFM512GDJTNG | Schenker Vision 14 GeForce RTX 3050 Ti Laptop GPU, i7-11370H, Samsung SSD 980 Pro 1TB MZ-V8P1T0BW | Razer Blade 14 Ryzen 9 RTX 3070 GeForce RTX 3070 Laptop GPU, R9 5900HX, Samsung PM981a MZVLB1T0HBLR | MSI Summit E14 A11SCS GeForce GTX 1650 Ti Max-Q, i7-1185G7, Phison 1TB SM2801T24GKBB4S-E162 | |
|---|---|---|---|---|---|---|---|
| Noise | -3% | 7% | -2% | -5% | -2% | -8% | |
| off / environment * (dB) | 24.7 | 25 -1% | 24.8 -0% | 30.2 -22% | 24.3 2% | 25.1 -2% | 23.9 3% |
| Idle Minimum * (dB) | 24.7 | 25 -1% | 24.8 -0% | 30.2 -22% | 24.3 2% | 25.2 -2% | 24.2 2% |
| Idle Average * (dB) | 24.7 | 25 -1% | 24.8 -0% | 30.2 -22% | 24.3 2% | 25.2 -2% | 24.2 2% |
| Idle Maximum * (dB) | 24.7 | 31.5 -28% | 24.8 -0% | 30.2 -22% | 25.9 -5% | 25.2 -2% | 24.2 2% |
| Load Average * (dB) | 33.2 | 36.7 -11% | 27.8 16% | 32.4 2% | 43.3 -30% | 31 7% | 50.2 -51% |
| Witcher 3 ultra * (dB) | 44.5 | 43.2 3% | 27.8 38% | 25.2 43% | 44.6 -0% | 44 1% | 47 -6% |
| Load Maximum * (dB) | 46.7 | 36.7 21% | 49.5 -6% | 33.6 28% | 49.5 -6% | 51.7 -11% | 51.7 -11% |
* ... smaller is better
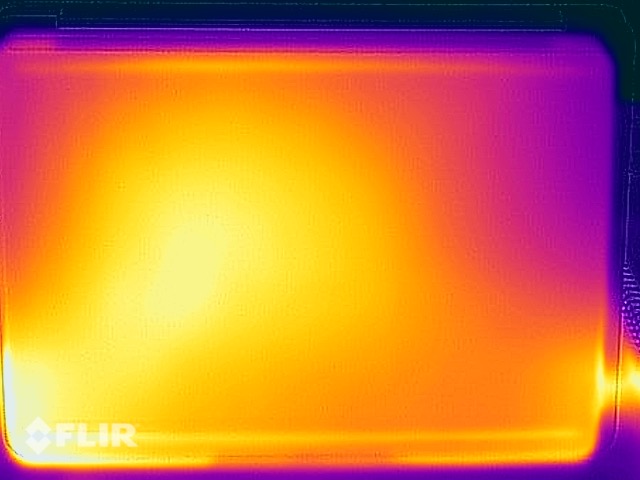
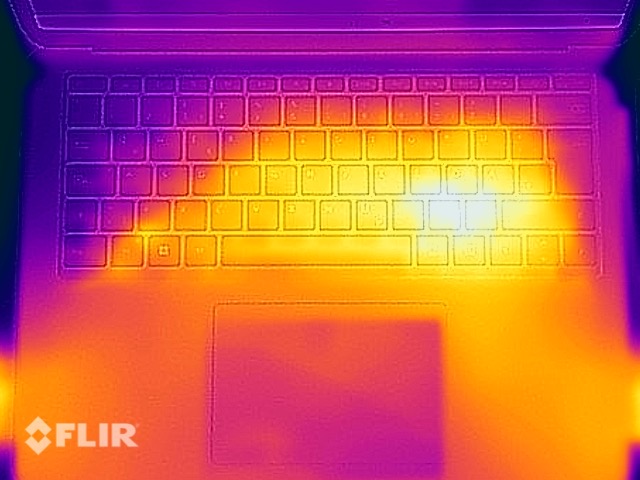
Temperature
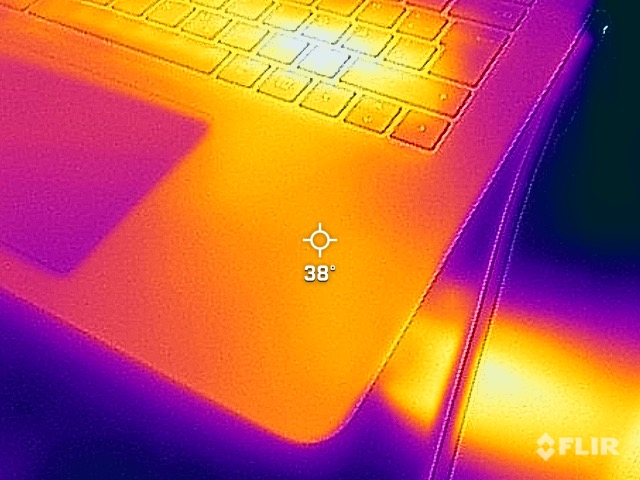
Although we cannot look inside the chassis, Microsoft’s press image gives us a nice overview and shows a rather unconventional approach. The processors are located the upper right area of the base unit, but the two fans are located in the bottom corners. This means the warm air is dissipated at the front side areas of the chassis, which is definitely noticeable when you use an external mouse. The palm rests also get much warmer compared to more traditional cooling systems.
Microsoft controls the surface temperatures very well with this cooling solution and we can only determine a few spots with temperatures above 40 °C, even during the stress test. We believe the fan speed could be a bit lower with slightly warmer temperatures. The chassis hardly warms up at all during light workloads.
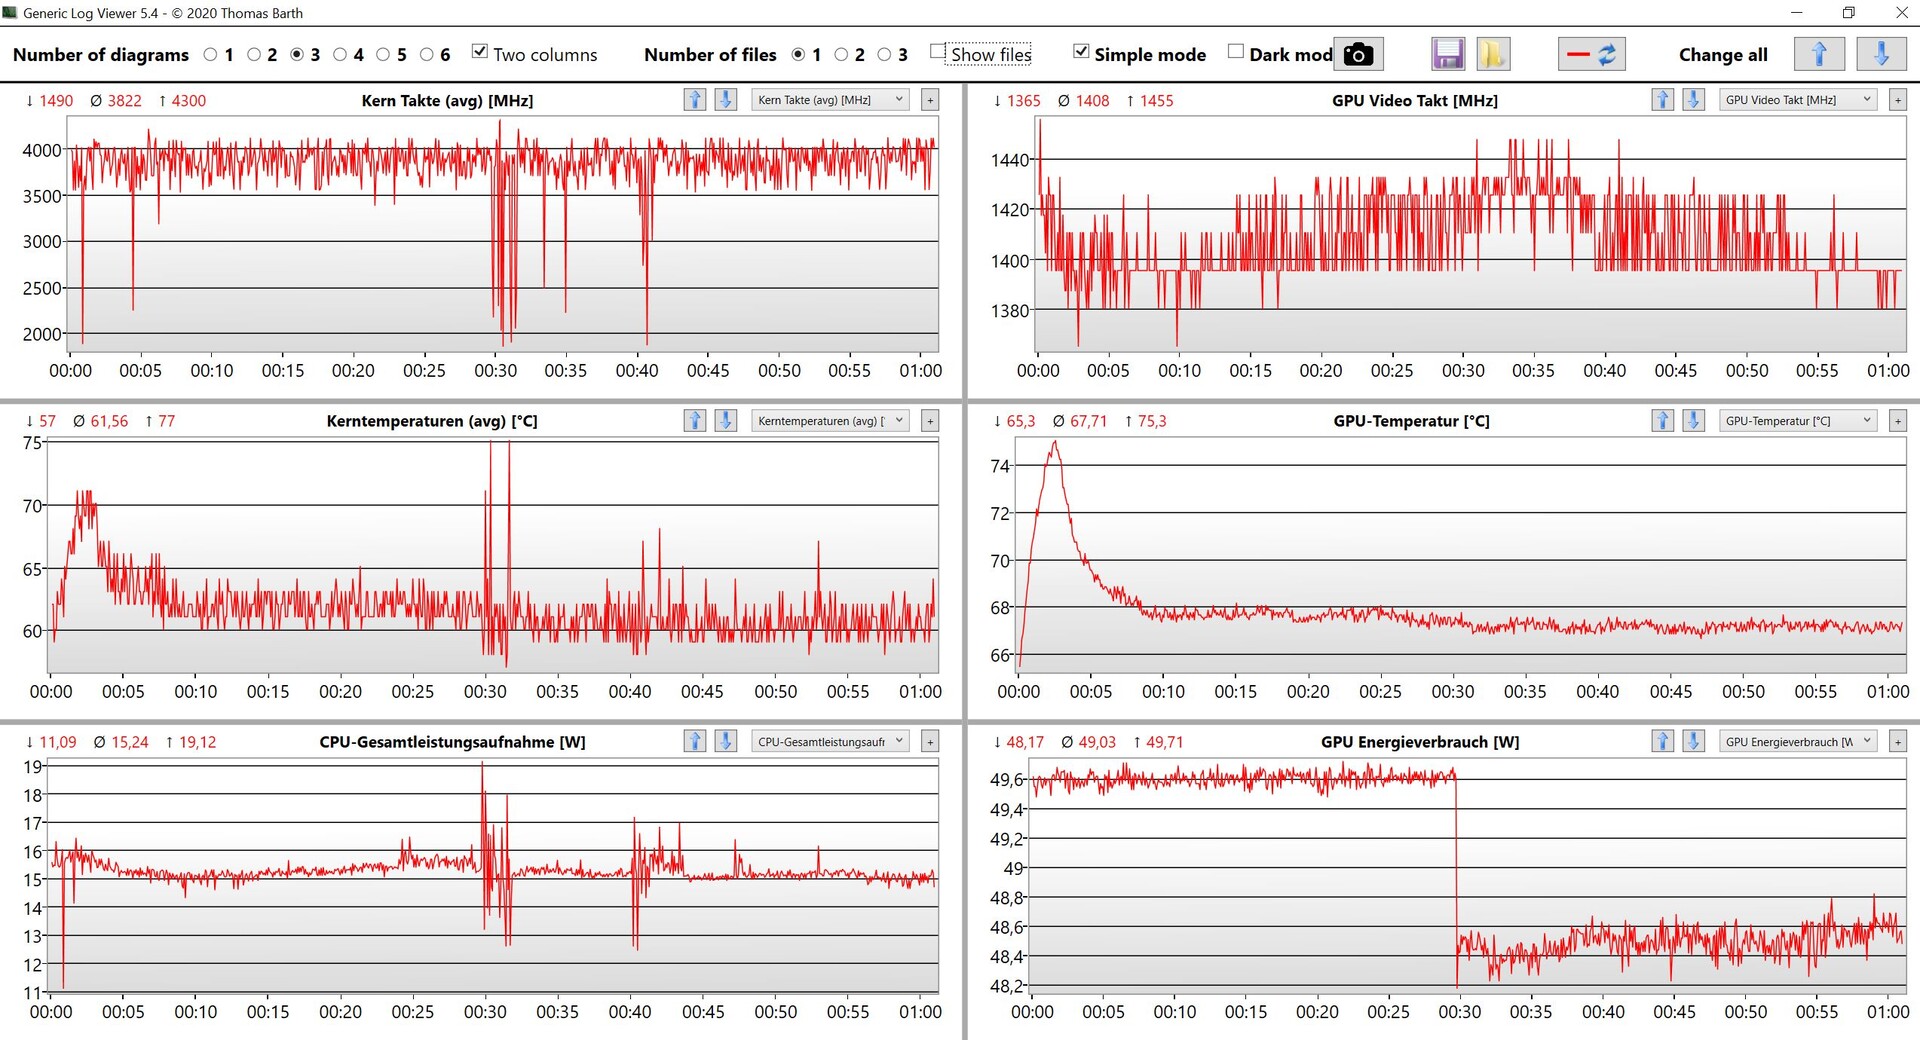
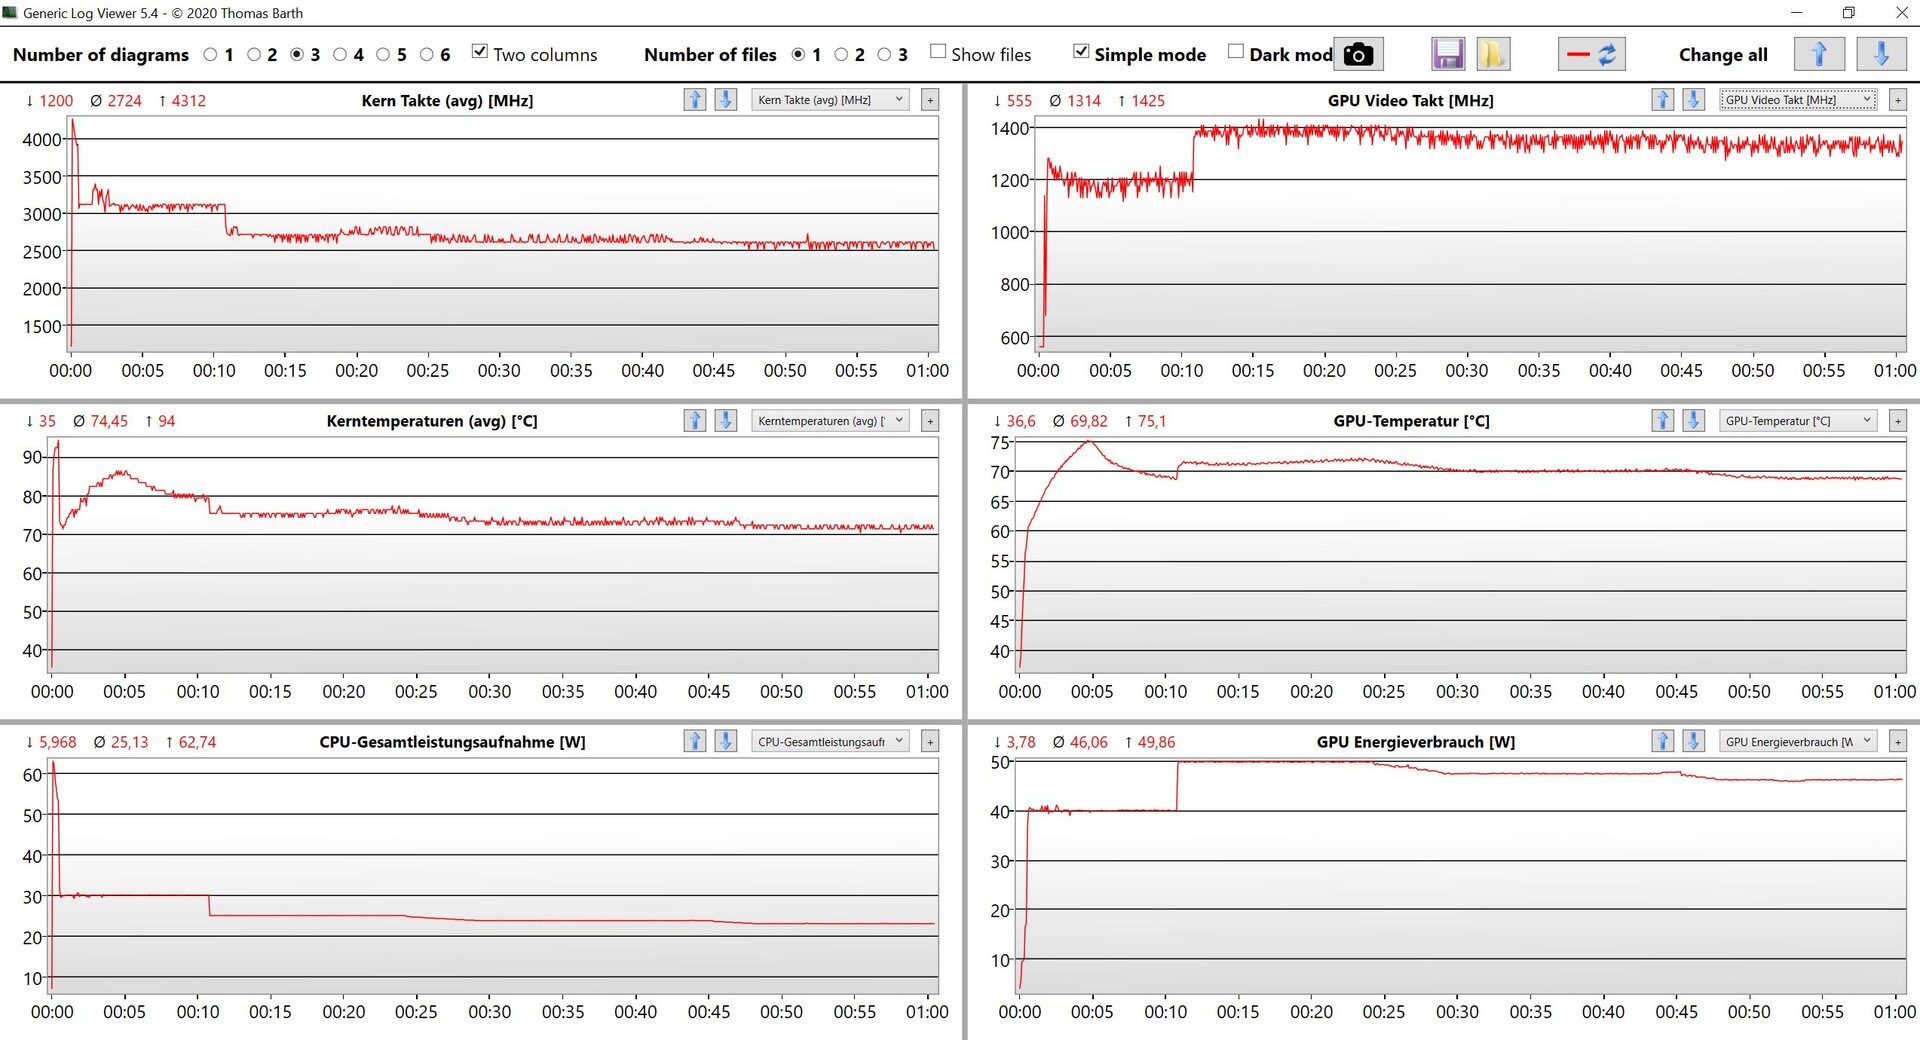
The CPU and GPU behavior during the stress test is quite interesting. The GPU is operated at 40W during the first 10 minutes and only jumps to 50W after the CPU drops from 30 to 23W. The GPU cannot maintain this value, however, and slightly drops again over the course of the test. The Surface laptop Studio generally favors the GPU in combined workloads, which makes sense, especially when you play games. We did not notice any performance deficits immediately after the stress test.
(±) The maximum temperature on the upper side is 42.3 °C / 108 F, compared to the average of 36.8 °C / 98 F, ranging from 21 to 71 °C for the class Multimedia.
(+) The bottom heats up to a maximum of 38.2 °C / 101 F, compared to the average of 39.1 °C / 102 F
(+) In idle usage, the average temperature for the upper side is 23.2 °C / 74 F, compared to the device average of 31.3 °C / 88 F.
(±) Playing The Witcher 3, the average temperature for the upper side is 36.1 °C / 97 F, compared to the device average of 31.3 °C / 88 F.
(+) The palmrests and touchpad are reaching skin temperature as a maximum (35.7 °C / 96.3 F) and are therefore not hot.
(-) The average temperature of the palmrest area of similar devices was 28.7 °C / 83.7 F (-7 °C / -12.6 F).
| Microsoft Surface Laptop Studio i7 RTX 3050 Ti Intel Core i7-11370H, NVIDIA GeForce RTX 3050 Ti Laptop GPU | Acer ConceptD 3 Ezel CC314-72G-7513 Intel Core i7-10750H, NVIDIA GeForce GTX 1650 Ti Max-Q | Apple MacBook Pro 14 2021 M1 Pro Entry Apple M1 Pro 8-Core, Apple M1 Pro 14-Core GPU | Microsoft Surface Book 3 13.5 Intel Core i7-1065G7, NVIDIA GeForce GTX 1650 Max-Q | Schenker Vision 14 Intel Core i7-11370H, NVIDIA GeForce RTX 3050 Ti Laptop GPU | Razer Blade 14 Ryzen 9 RTX 3070 AMD Ryzen 9 5900HX, NVIDIA GeForce RTX 3070 Laptop GPU | MSI Summit E14 A11SCS Intel Core i7-1185G7, NVIDIA GeForce GTX 1650 Ti Max-Q | |
|---|---|---|---|---|---|---|---|
| Heat | -10% | -6% | -13% | -29% | -40% | -42% | |
| Maximum Upper Side * (°C) | 42.3 | 46 -9% | 46.8 -11% | 41 3% | 49.7 -17% | 45 -6% | 49.4 -17% |
| Maximum Bottom * (°C) | 38.2 | 46 -20% | 40.9 -7% | 43.7 -14% | 56 -47% | 44.4 -16% | 60.6 -59% |
| Idle Upper Side * (°C) | 23.4 | 24.4 -4% | 24.2 -3% | 29.2 -25% | 28.8 -23% | 40.2 -72% | 30.6 -31% |
| Idle Bottom * (°C) | 23.5 | 24.8 -6% | 24.2 -3% | 27.6 -17% | 30.6 -30% | 39.2 -67% | 37.4 -59% |
* ... smaller is better
Speakers
Microsoft uses a four-speaker system and you can clearly see them on the press image we included in the Maintenance section. The quality of the speakers is very good and they even create a spatial effect. The bass is a bit below average according to our analysis and the MacBook Pro 14 is a bit better overall in this respect, but the Surface Laptop Studio definitely does not have to hide behind the rivals.
Microsoft Surface Laptop Studio i7 RTX 3050 Ti audio analysis
(+) | speakers can play relatively loud (82.9 dB)
Bass 100 - 315 Hz
(±) | reduced bass - on average 12.5% lower than median
(±) | linearity of bass is average (7.3% delta to prev. frequency)
Mids 400 - 2000 Hz
(+) | balanced mids - only 3.2% away from median
(+) | mids are linear (2.1% delta to prev. frequency)
Highs 2 - 16 kHz
(+) | balanced highs - only 1.2% away from median
(+) | highs are linear (2.4% delta to prev. frequency)
Overall 100 - 16.000 Hz
(+) | overall sound is linear (10.8% difference to median)
Compared to same class
» 16% of all tested devices in this class were better, 2% similar, 82% worse
» The best had a delta of 5%, average was 17%, worst was 45%
Compared to all devices tested
» 6% of all tested devices were better, 2% similar, 93% worse
» The best had a delta of 4%, average was 24%, worst was 134%
Apple MacBook Pro 14 2021 M1 Pro Entry audio analysis
(+) | speakers can play relatively loud (84.9 dB)
Bass 100 - 315 Hz
(+) | good bass - only 4.3% away from median
(+) | bass is linear (5.9% delta to prev. frequency)
Mids 400 - 2000 Hz
(+) | balanced mids - only 1.1% away from median
(+) | mids are linear (1.9% delta to prev. frequency)
Highs 2 - 16 kHz
(+) | balanced highs - only 2.9% away from median
(+) | highs are linear (3% delta to prev. frequency)
Overall 100 - 16.000 Hz
(+) | overall sound is linear (5.6% difference to median)
Compared to same class
» 2% of all tested devices in this class were better, 1% similar, 97% worse
» The best had a delta of 5%, average was 17%, worst was 45%
Compared to all devices tested
» 0% of all tested devices were better, 0% similar, 100% worse
» The best had a delta of 4%, average was 24%, worst was 134%
Energy Management - Runtime is much shorter than advertised
Power Consumption
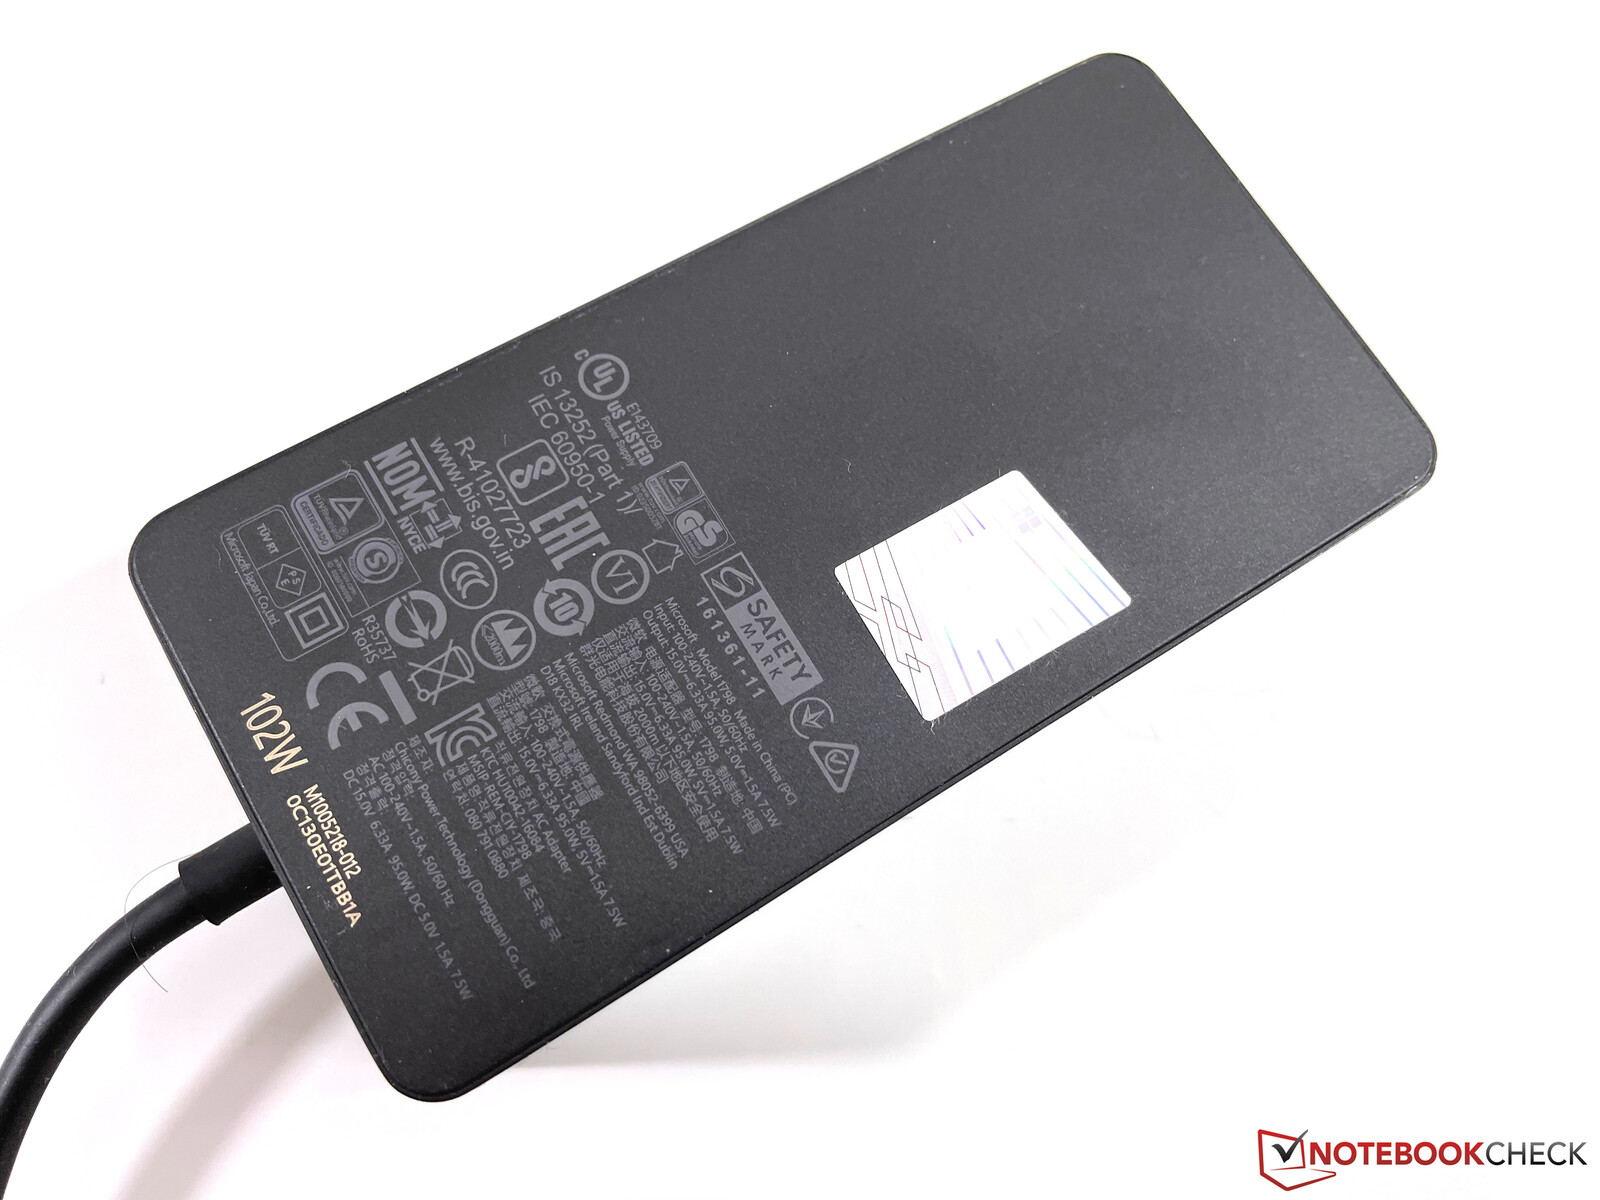
Our idle measurements are very low, despite the high resolution and the good brightness, so the Surface Laptop Studio is the most efficient device here. However, Microsoft should have another look at the standby consumption, which is just too high at 2.6W. You can expect around 80W during gaming and we recorded up to 97W during the stress test, which quickly leveled off at 92W. The included 102W power adapter, which offers an additional USB-A port for charging, is therefore completely sufficient.
| Off / Standby | |
| Idle | |
| Load |
|
Key:
min: | |
| Microsoft Surface Laptop Studio i7 RTX 3050 Ti i7-11370H, GeForce RTX 3050 Ti Laptop GPU, SK Hynix PC711 1TB HFS001TDE9X084N, IPS, 2400x1600, 14.4" | Acer ConceptD 3 Ezel CC314-72G-7513 i7-10750H, GeForce GTX 1650 Ti Max-Q, WDC PC SN730 SDBQNTY-1T00, IPS LED, 1920x1080, 14" | Apple MacBook Pro 14 2021 M1 Pro Entry M1 Pro 8-Core, M1 Pro 14-Core GPU, Apple SSD AP0512, Mini-LED, 3024x1964, 14.2" | Microsoft Surface Book 3 13.5 i7-1065G7, GeForce GTX 1650 Max-Q, SK Hynix BC501 HFM512GDJTNG, IPS, 3000x2000, 13.5" | Schenker Vision 14 i7-11370H, GeForce RTX 3050 Ti Laptop GPU, Samsung SSD 980 Pro 1TB MZ-V8P1T0BW, IPS, 2880x1800, 14" | Razer Blade 14 Ryzen 9 RTX 3070 R9 5900HX, GeForce RTX 3070 Laptop GPU, Samsung PM981a MZVLB1T0HBLR, IPS, 2560x1440, 14" | MSI Summit E14 A11SCS i7-1185G7, GeForce GTX 1650 Ti Max-Q, Phison 1TB SM2801T24GKBB4S-E162, IPS, 3840x2160, 14" | Average NVIDIA GeForce RTX 3050 Ti Laptop GPU | Average of class Multimedia | |
|---|---|---|---|---|---|---|---|---|---|
| Power Consumption | -158% | -5% | -29% | -59% | -129% | -100% | -95% | -43% | |
| Idle Minimum * (Watt) | 2.6 | 18.6 -615% | 2.9 -12% | 4.8 -85% | 6.7 -158% | 9.4 -262% | 9.9 -281% | 8.2 ? -215% | 5.67 ? -118% |
| Idle Average * (Watt) | 7.1 | 20.6 -190% | 11.6 -63% | 9.4 -32% | 12.6 -77% | 15.8 -123% | 17.4 -145% | 12.6 ? -77% | 9.99 ? -41% |
| Idle Maximum * (Watt) | 7.9 | 22.6 -186% | 11.9 -51% | 11.2 -42% | 15.4 -95% | 24.1 -205% | 22.5 -185% | 17.2 ? -118% | 12.4 ? -57% |
| Load Average * (Watt) | 76.8 | 66 14% | 49.5 36% | 72 6% | 85.7 -12% | 76.8 -0% | 85.6 -11% | 92 ? -20% | 64.7 ? 16% |
| Witcher 3 ultra * (Watt) | 83 | 67 19% | 58.2 30% | 83 -0% | 154 -86% | 70.9 15% | |||
| Load Maximum * (Watt) | 97.3 | 86 12% | 68.5 30% | 90 8% | 110.9 -14% | 189.7 -95% | 91.1 6% | 139.1 ? -43% | 112 ? -15% |
* ... smaller is better
Power Consumption Witcher 3 / Stress test
Power Consumption external screen
Battery Runtime
Microsoft advertises a runtime of up to 18 hours with the 58 WH battery at a brightness level of 150 nits and a typical Surface usage scenario, but these tests also include standby times. Our tests with continuous use, which are also performed at 150 nits (in this case 62% of the maximum brightness), determine much shorter results. Video playback is possible for more than 12 hours, but our Wi-Fi test only runs for 8 hours and just 6 when we repeat it at the maximum display brightness. These results are not bad within the comparison group, only Apple's MacBook Pro 14 has an advantage.
A full charge of the battery takes little more than two hours when the device is turned on and 50% of the capacity is available after little more than 37 minutes.
| Microsoft Surface Laptop Studio i7 RTX 3050 Ti i7-11370H, GeForce RTX 3050 Ti Laptop GPU, 58 Wh | Acer ConceptD 3 Ezel CC314-72G-7513 i7-10750H, GeForce GTX 1650 Ti Max-Q, 56 Wh | Apple MacBook Pro 14 2021 M1 Pro Entry M1 Pro 8-Core, M1 Pro 14-Core GPU, 69.9 Wh | Microsoft Surface Book 3 13.5 i7-1065G7, GeForce GTX 1650 Max-Q, 69 Wh | Schenker Vision 14 i7-11370H, GeForce RTX 3050 Ti Laptop GPU, 53 Wh | Razer Blade 14 Ryzen 9 RTX 3070 R9 5900HX, GeForce RTX 3070 Laptop GPU, 62 Wh | MSI Summit E14 A11SCS i7-1185G7, GeForce GTX 1650 Ti Max-Q, 52 Wh | Average of class Multimedia | |
|---|---|---|---|---|---|---|---|---|
| Battery runtime | 14% | 37% | 97% | -12% | 11% | -22% | 50% | |
| H.264 (h) | 12.3 | 10.8 -12% | 15 22% | 6.8 -45% | 16.3 ? 33% | |||
| WiFi v1.3 (h) | 8 | 8.4 5% | 13.6 70% | 6.6 -17% | 5.5 -31% | 7.3 -9% | 4.5 -44% | 12 ? 50% |
| Load (h) | 1 | 1.5 50% | 1.2 20% | 3.1 210% | 1.4 40% | 1.3 30% | 1 0% | 1.672 ? 67% |
| Reader / Idle (h) | 16.5 | 13.8 | 6.6 | 25.2 ? |
Pros
Cons
Verdict - Surface Laptop Studio is not "Pro"
The new Surface Laptop Studio with its foldable display is supposed to replace the old Surface Book and the overall impression is good after our review. The build quality and the materials are top-notch, the performance utilization of the two components is solid and the device does not show any major flaws in terms of display or speakers, either. The folding mechanism leaves a sold impression as well, but it remains to be seen how it will hold up over the years. The so-called presentation mode is also not ideal since it covers the whole keyboard.
We were surprised about the CPU choice. Intel’s Tiger Lake quad-core certainly offers sufficient performance for everyday tasks, but current-gen mobile chips from AMD and Apple are already faster and the new models will be launched in the next couple of weeks. The Core i5 with the faster iGPU makes a bit more sense for the entry-level SKU, but you cannot utilize the faster iGPU when you combine it with a dedicated GPU like the GeForce RTX 3050 Ti. An H45 processor would have required a different mainboard and therefore more development costs, but the performance would have been competitive.
The new Surface Laptop Studio is an interesting product and is a great companion for your daily workloads, but the CPU performance of the Intel quad-core processor is disappointing, especially considering the high price tag, so you pay a lot of money for old technology. Microsoft also says the device is designed for professional users, but we do not think the Surface Laptop Studio meets this claim. We strongly recommend an updated model with Intel’s new Alder Lake CPUs as soon as possible.
You can obviously always recommend for new models, especially in the mobile segment, but the new Alder Lake CPUs are a big step forward in terms of CPU performance we have not seen for years. Microsoft should quickly launch an updated model of the Surface Laptop Studio, because the device is hardly competitive with the slow Tiger Lake quad-core. The display is pretty good, but we are surprised that it once again only covers the small sRGB color gamut, while the competition is mainly focusing on the wider P3 color space. We do not understand the complete lack of maintenance options (you cannot even clean the fans), either.
The new Surface Laptop Studio pretty much offers what you get from the regular Surface Laptops, but with a bit more versatility: A good device for everyday workloads. The problem is the high price and we believe there is plenty of unused potential here. Apple’s MacBook Pro 14 is superior in some respects and is in the same price range. The same hardware equipment is also available in much cheaper systems like Schenker's Vision 14, while the Razer Blade 14 with the Ryzen CPU and RTX 3070 GPU shows the performance potential of a 14-inch system.
Price and Availability
Our review configuration is currently available for $2499 at Best Buy (on stock) and the entry-level model with the Core i5 and the iGPU (16 GB RAM and 256 GB SSD) already starts at $1399.
Microsoft Surface Laptop Studio i7 RTX 3050 Ti
- 03/08/2022 v7 (old)
Andreas Osthoff
Price comparison
