Dell XPS 15 9510 Core i5 laptop review: Basic model with the brakes engaged
We have known the Dell XPS 15 for years as a high-quality multimedia laptop that is usually also equipped with a dedicated graphics card. However, Dell also always offers a model with pure processor graphics, in case you really don't need a fast graphics card. But since you have to pay 1599 Euros (~$1862) for the Core i5-11400H with 8 GB of RAM, a 512 GB PCIe SSD, and the matte FHD panel (16:10), the device is still not affordable.
There are also a few competitors without the dedicated GPUs, and they are often significantly more affordable. With the new Huawei MateBook 16 that we are currently testing, there is already another competitor at the start. For detailed information on the case, input devices, and speakers we refer you to our review of the i7 model:
Possible Competitors in Comparison
Rating | Date | Model | Weight | Height | Size | Resolution | Price |
|---|---|---|---|---|---|---|---|
| 84.2 % v7 (old) | 10 / 2021 | Dell XPS 15 9510 i5 11400H FHD i5-11400H, UHD Graphics Xe 16EUs | 1.8 kg | 18 mm | 15.60" | 1920x1200 | |
| 88.6 % v7 (old) | 10 / 2021 | Huawei MateBook 14s i7 i7-11370H, Iris Xe G7 96EUs | 1.4 kg | 16.7 mm | 14.20" | 2520x1680 | |
| 86.4 % v7 (old) | 10 / 2021 | Acer Swift 3 SF316-51 i7-11370H, Iris Xe G7 96EUs | 1.7 kg | 15.9 mm | 16.10" | 1920x1080 | |
| 87.7 % v7 (old) | 12 / 2020 | Schenker Vision 15 i7-1165G7, Iris Xe G7 96EUs | 1.7 kg | 15 mm | 15.60" | 1920x1080 | |
| 84.5 % v7 (old) | 11 / 2020 | Honor MagicBook Pro (AMD) R5 4600H, Vega 6 | 1.7 kg | 16.9 mm | 16.10" | 1920x1080 | |
| 86.8 % v7 (old) | 05 / 2020 | Dell XPS 15 9500 Core i5 i5-10300H, UHD Graphics 630 | 1.8 kg | 18 mm | 15.60" | 1920x1200 |
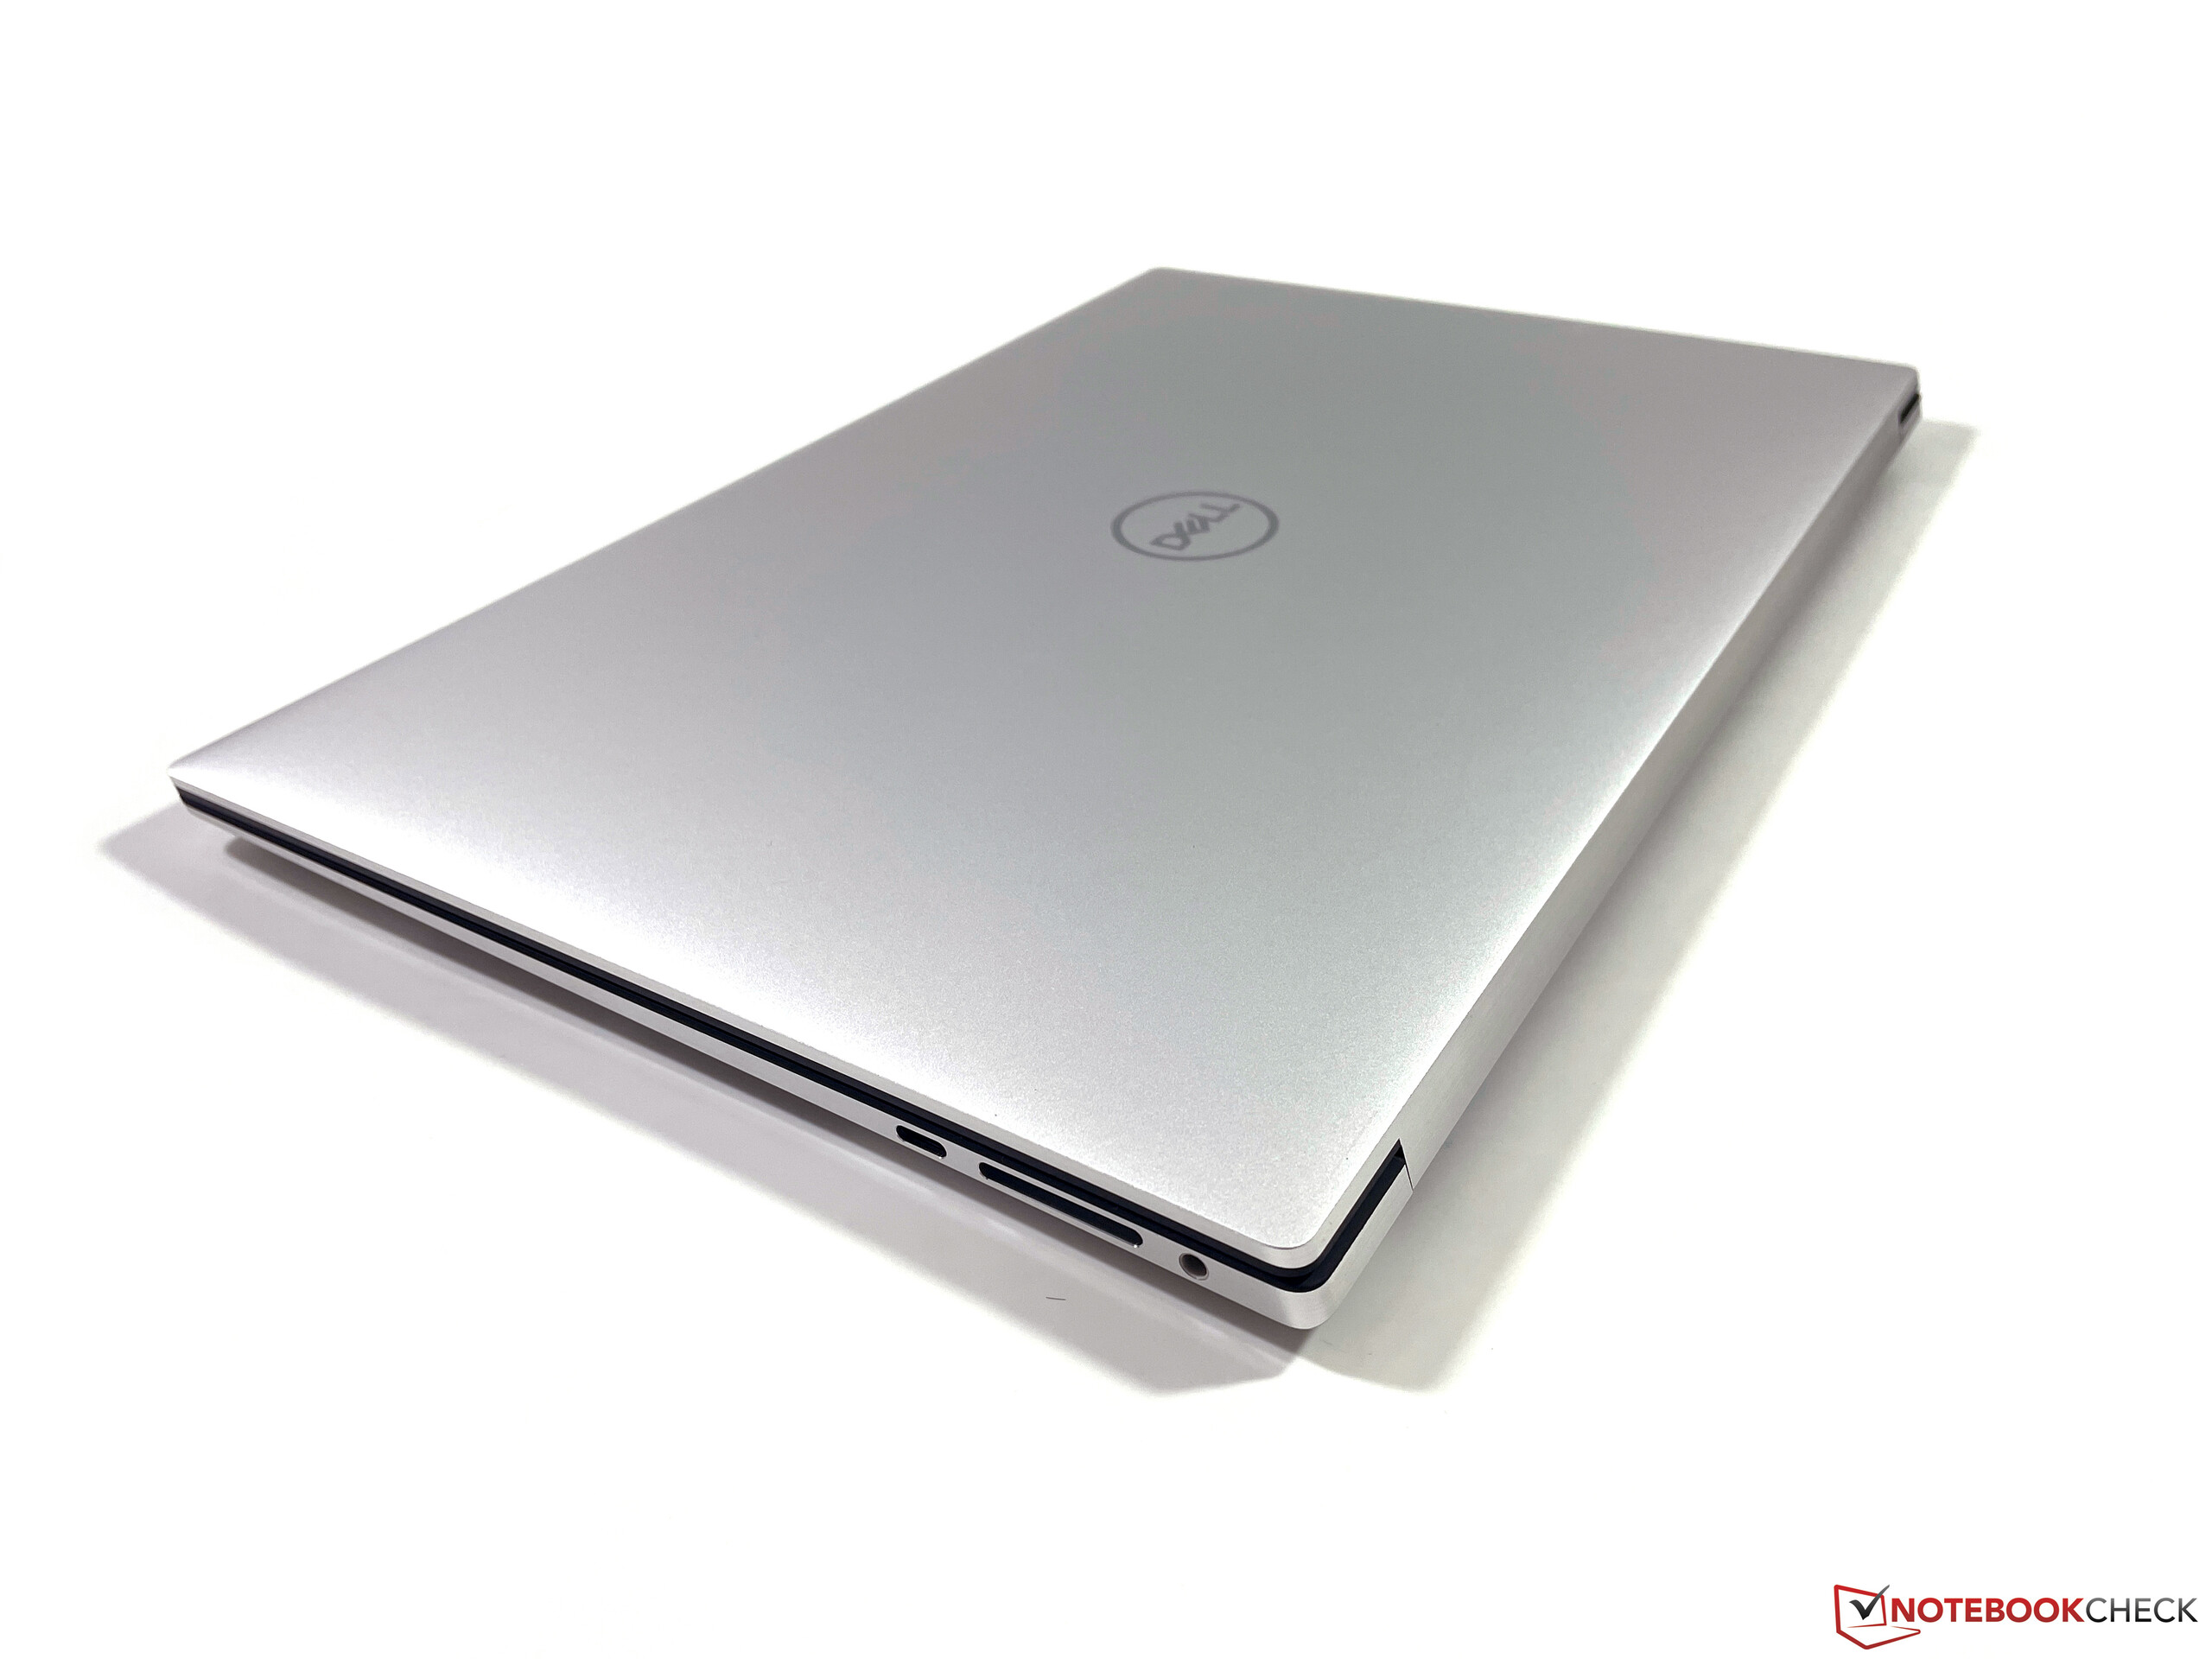
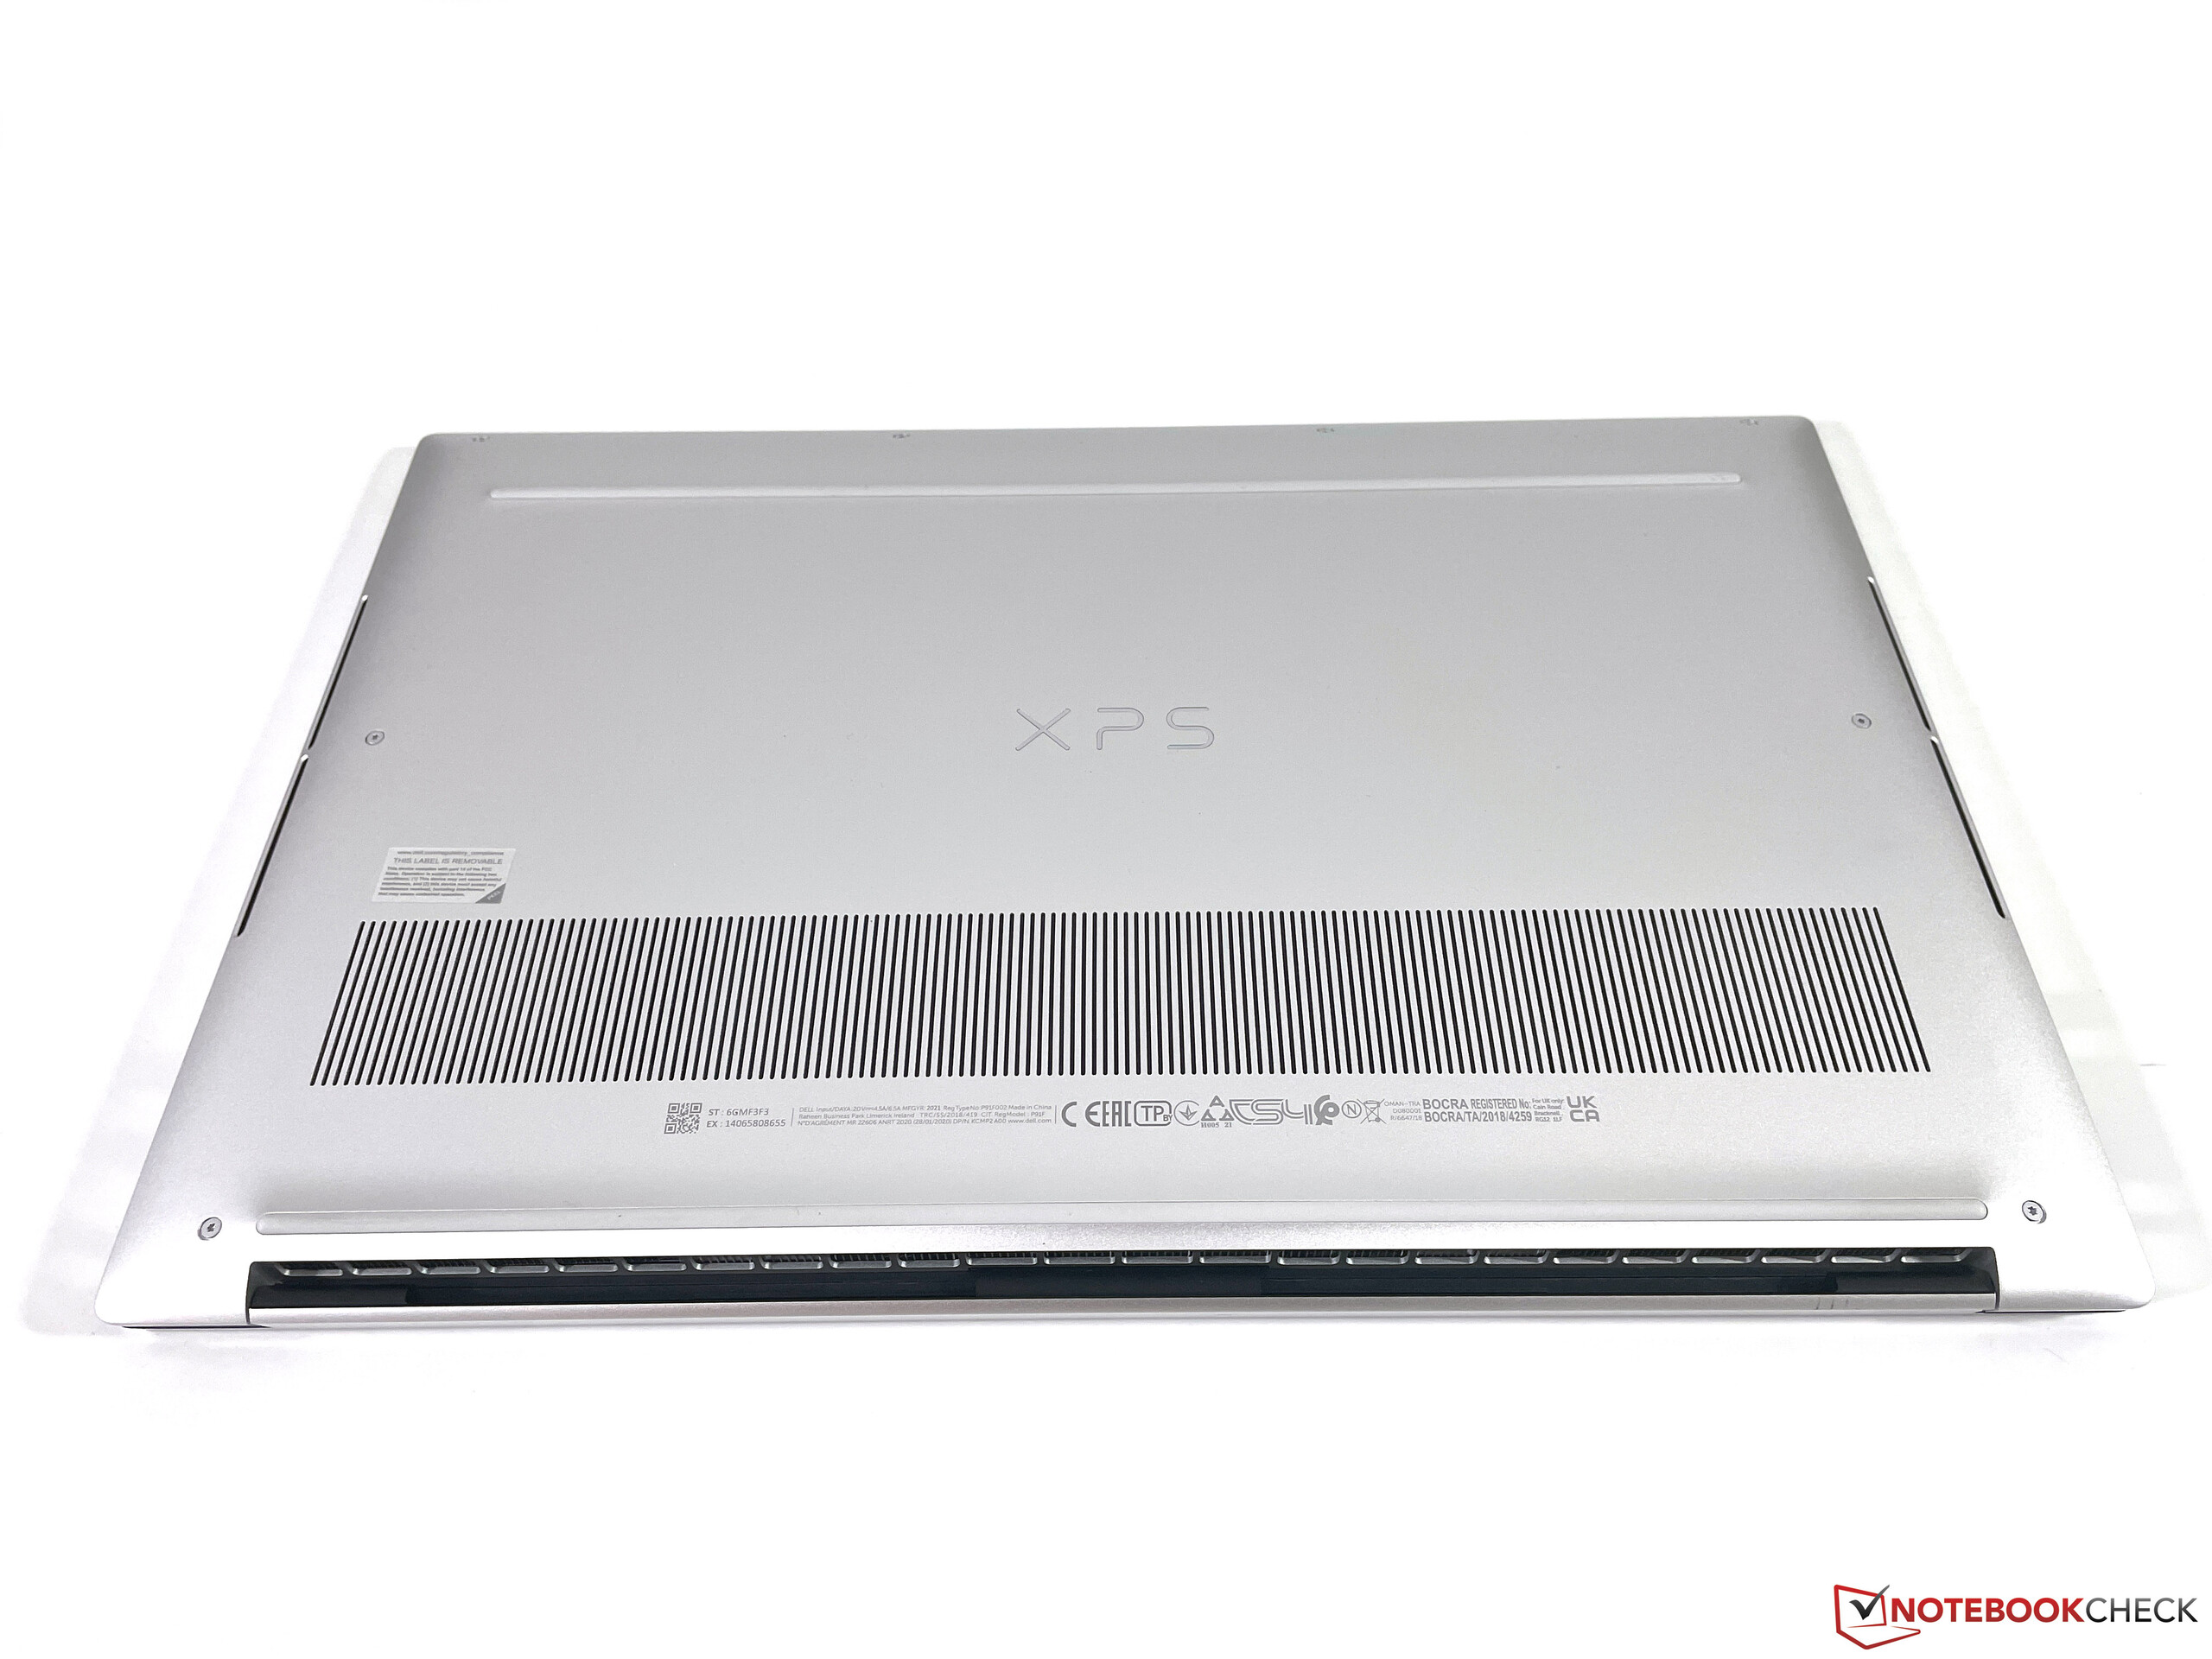
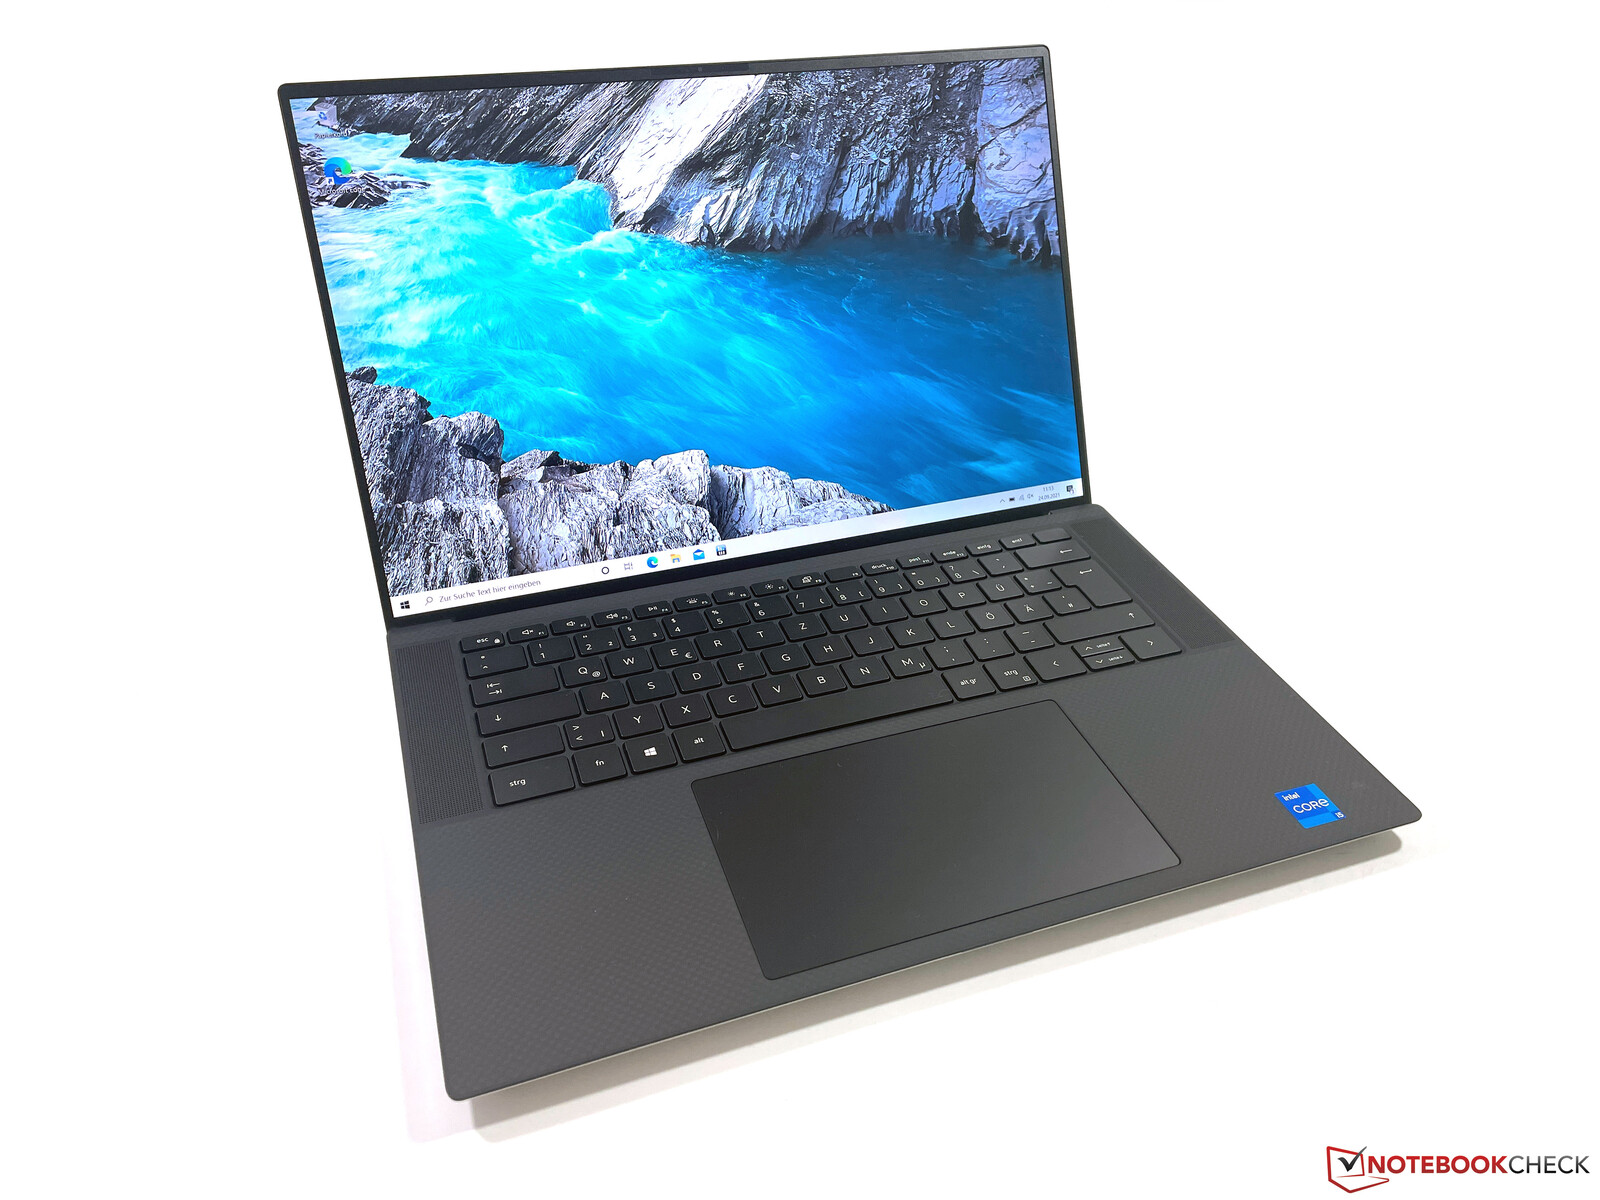
Case and Equipment
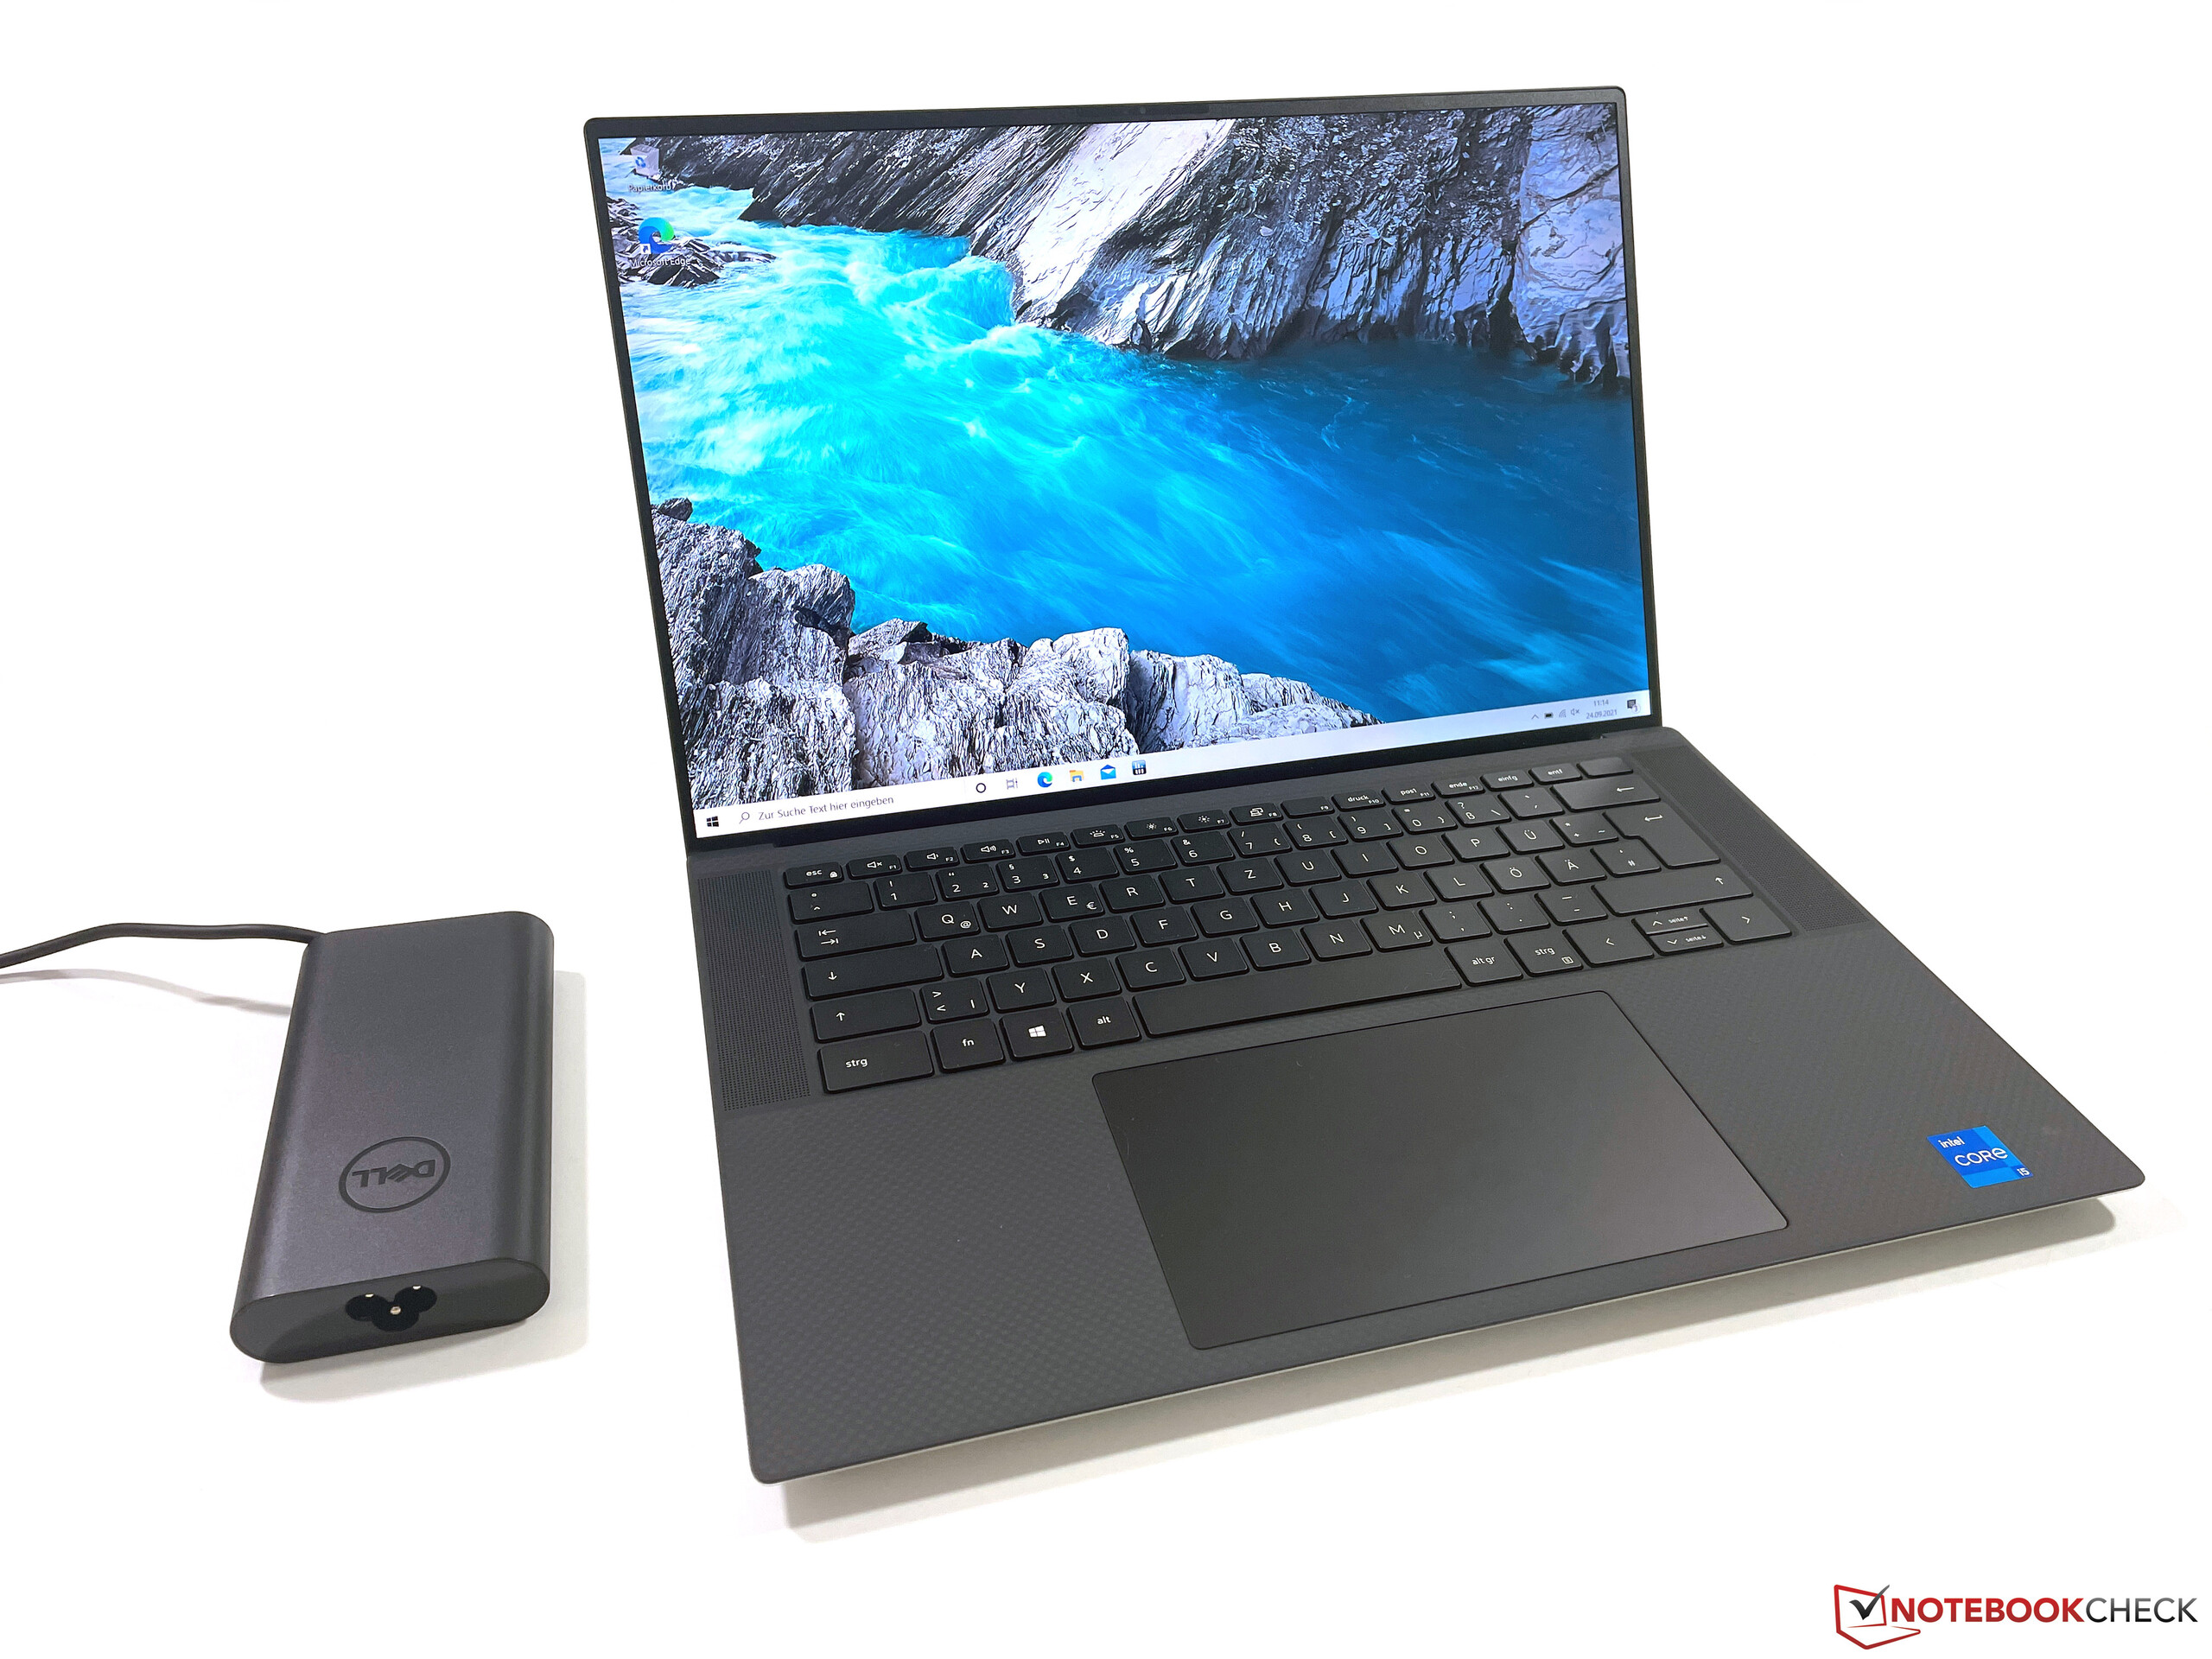
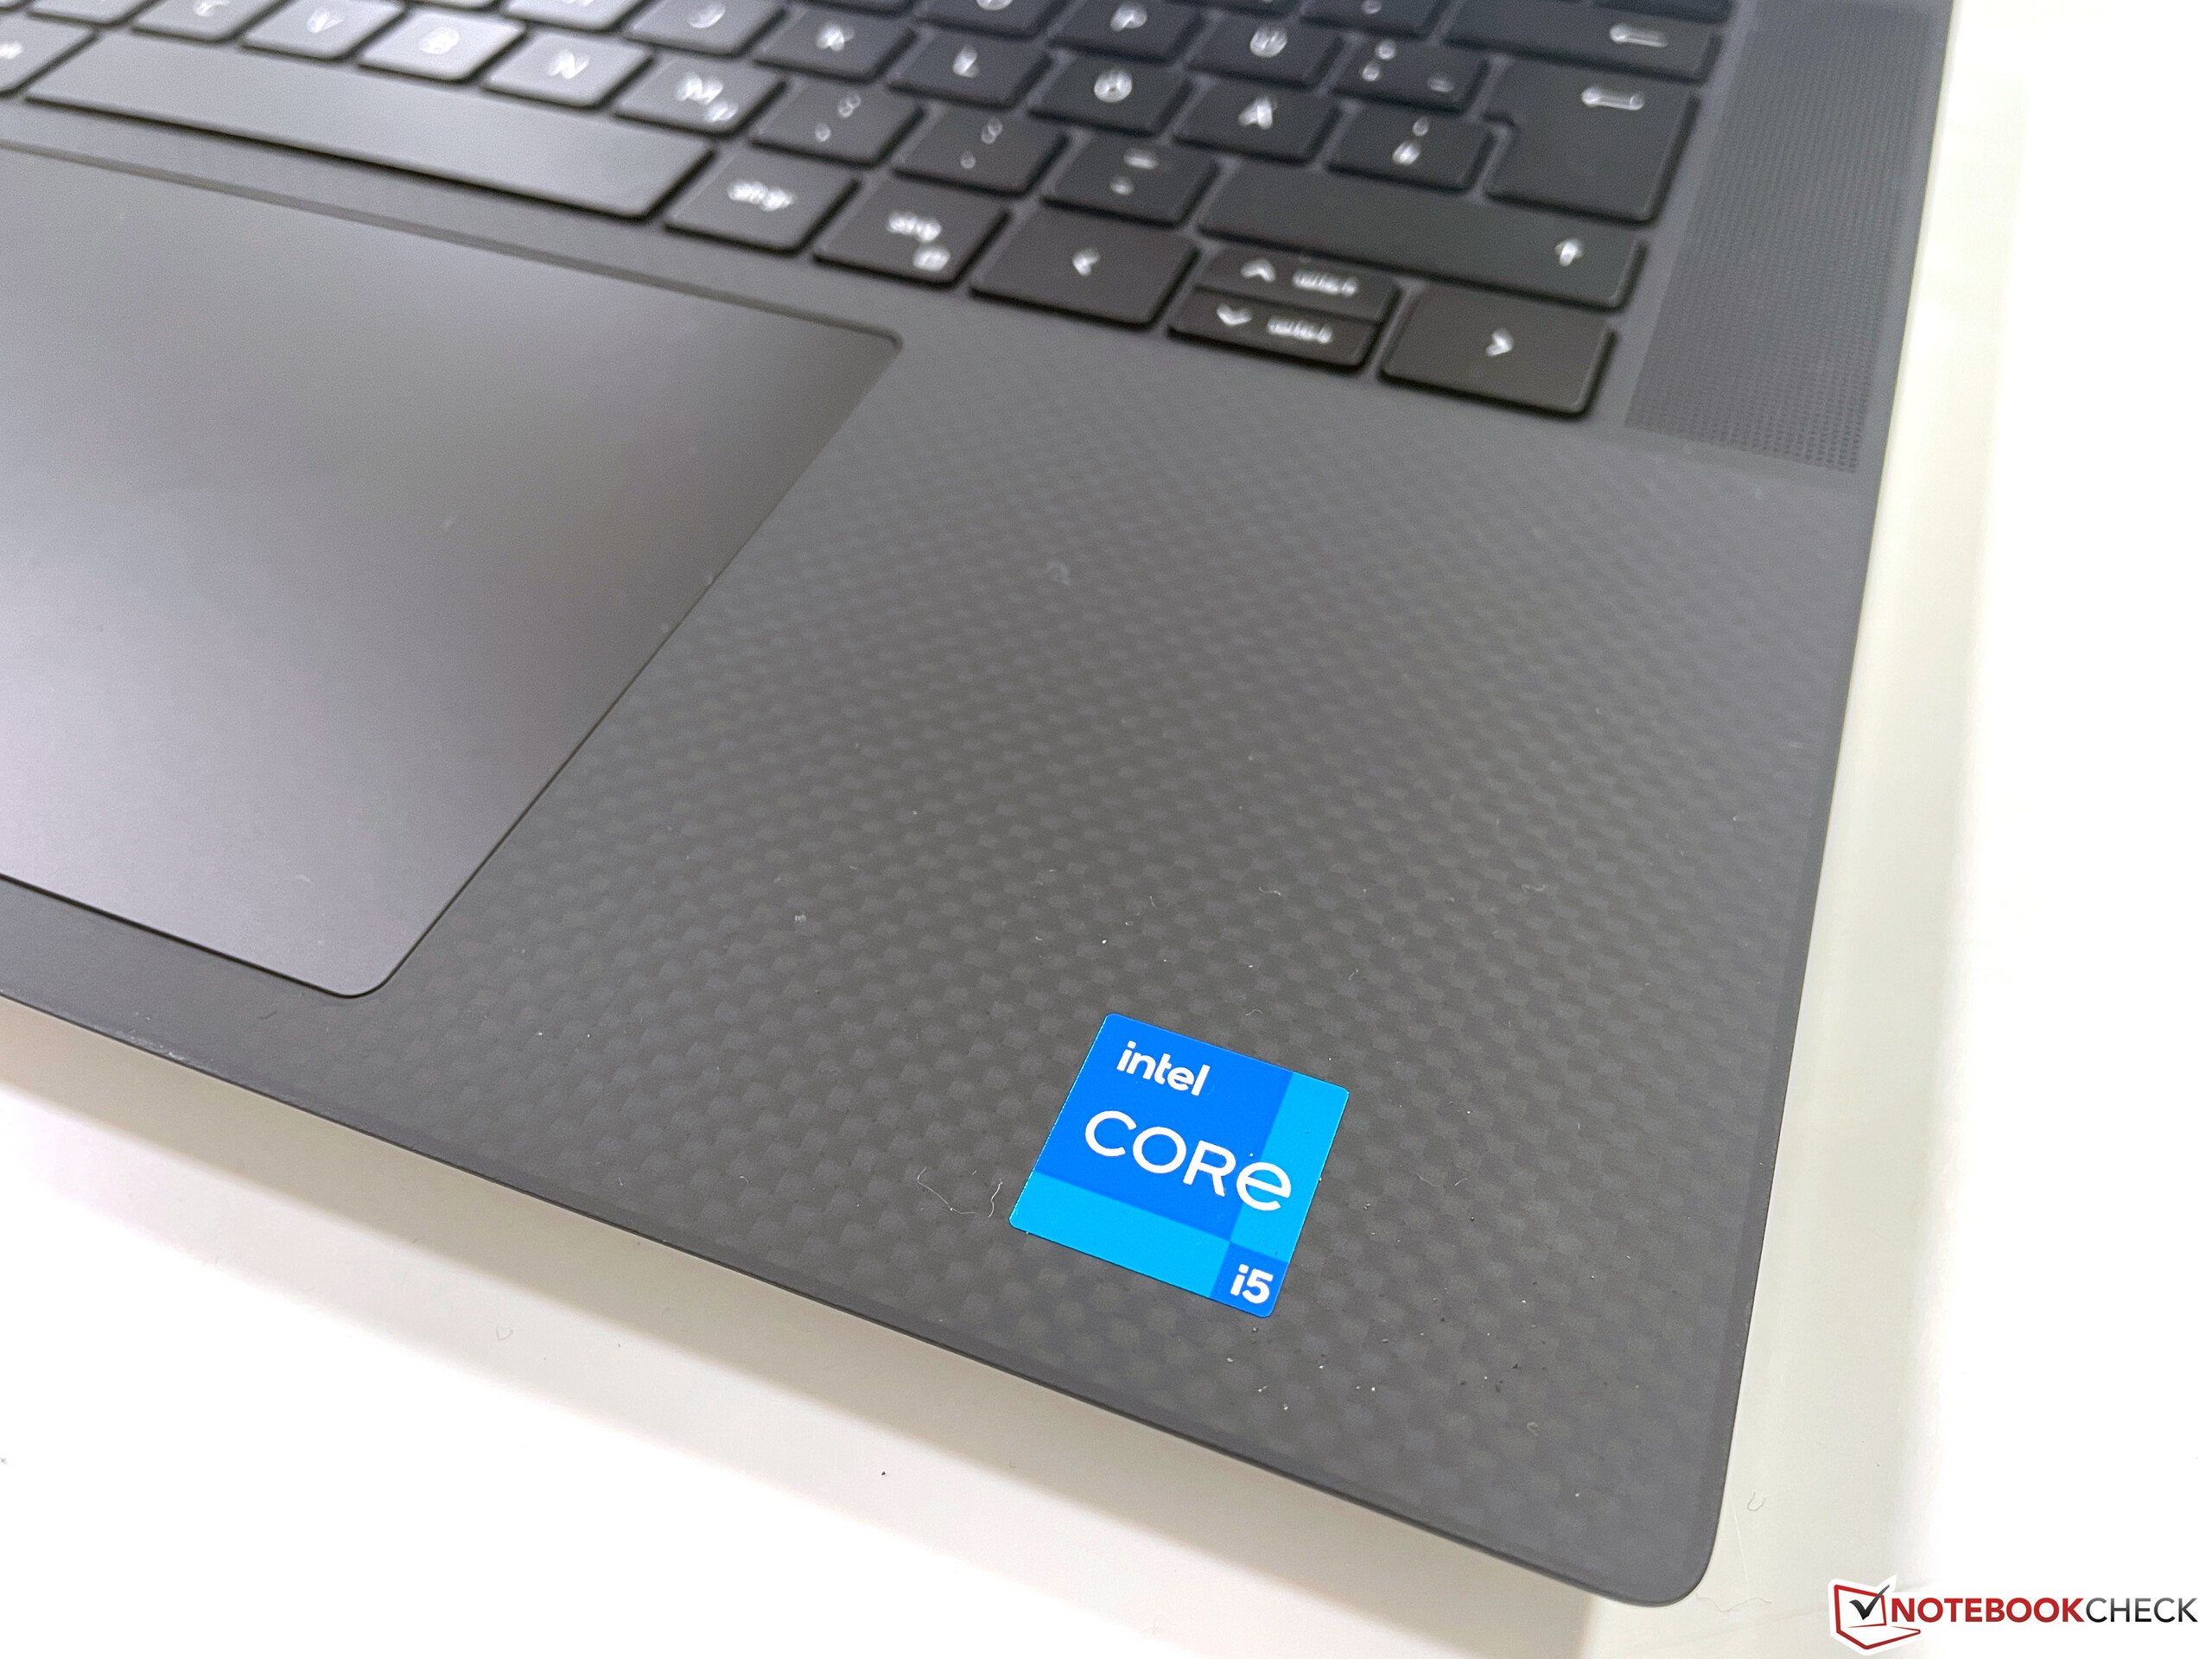
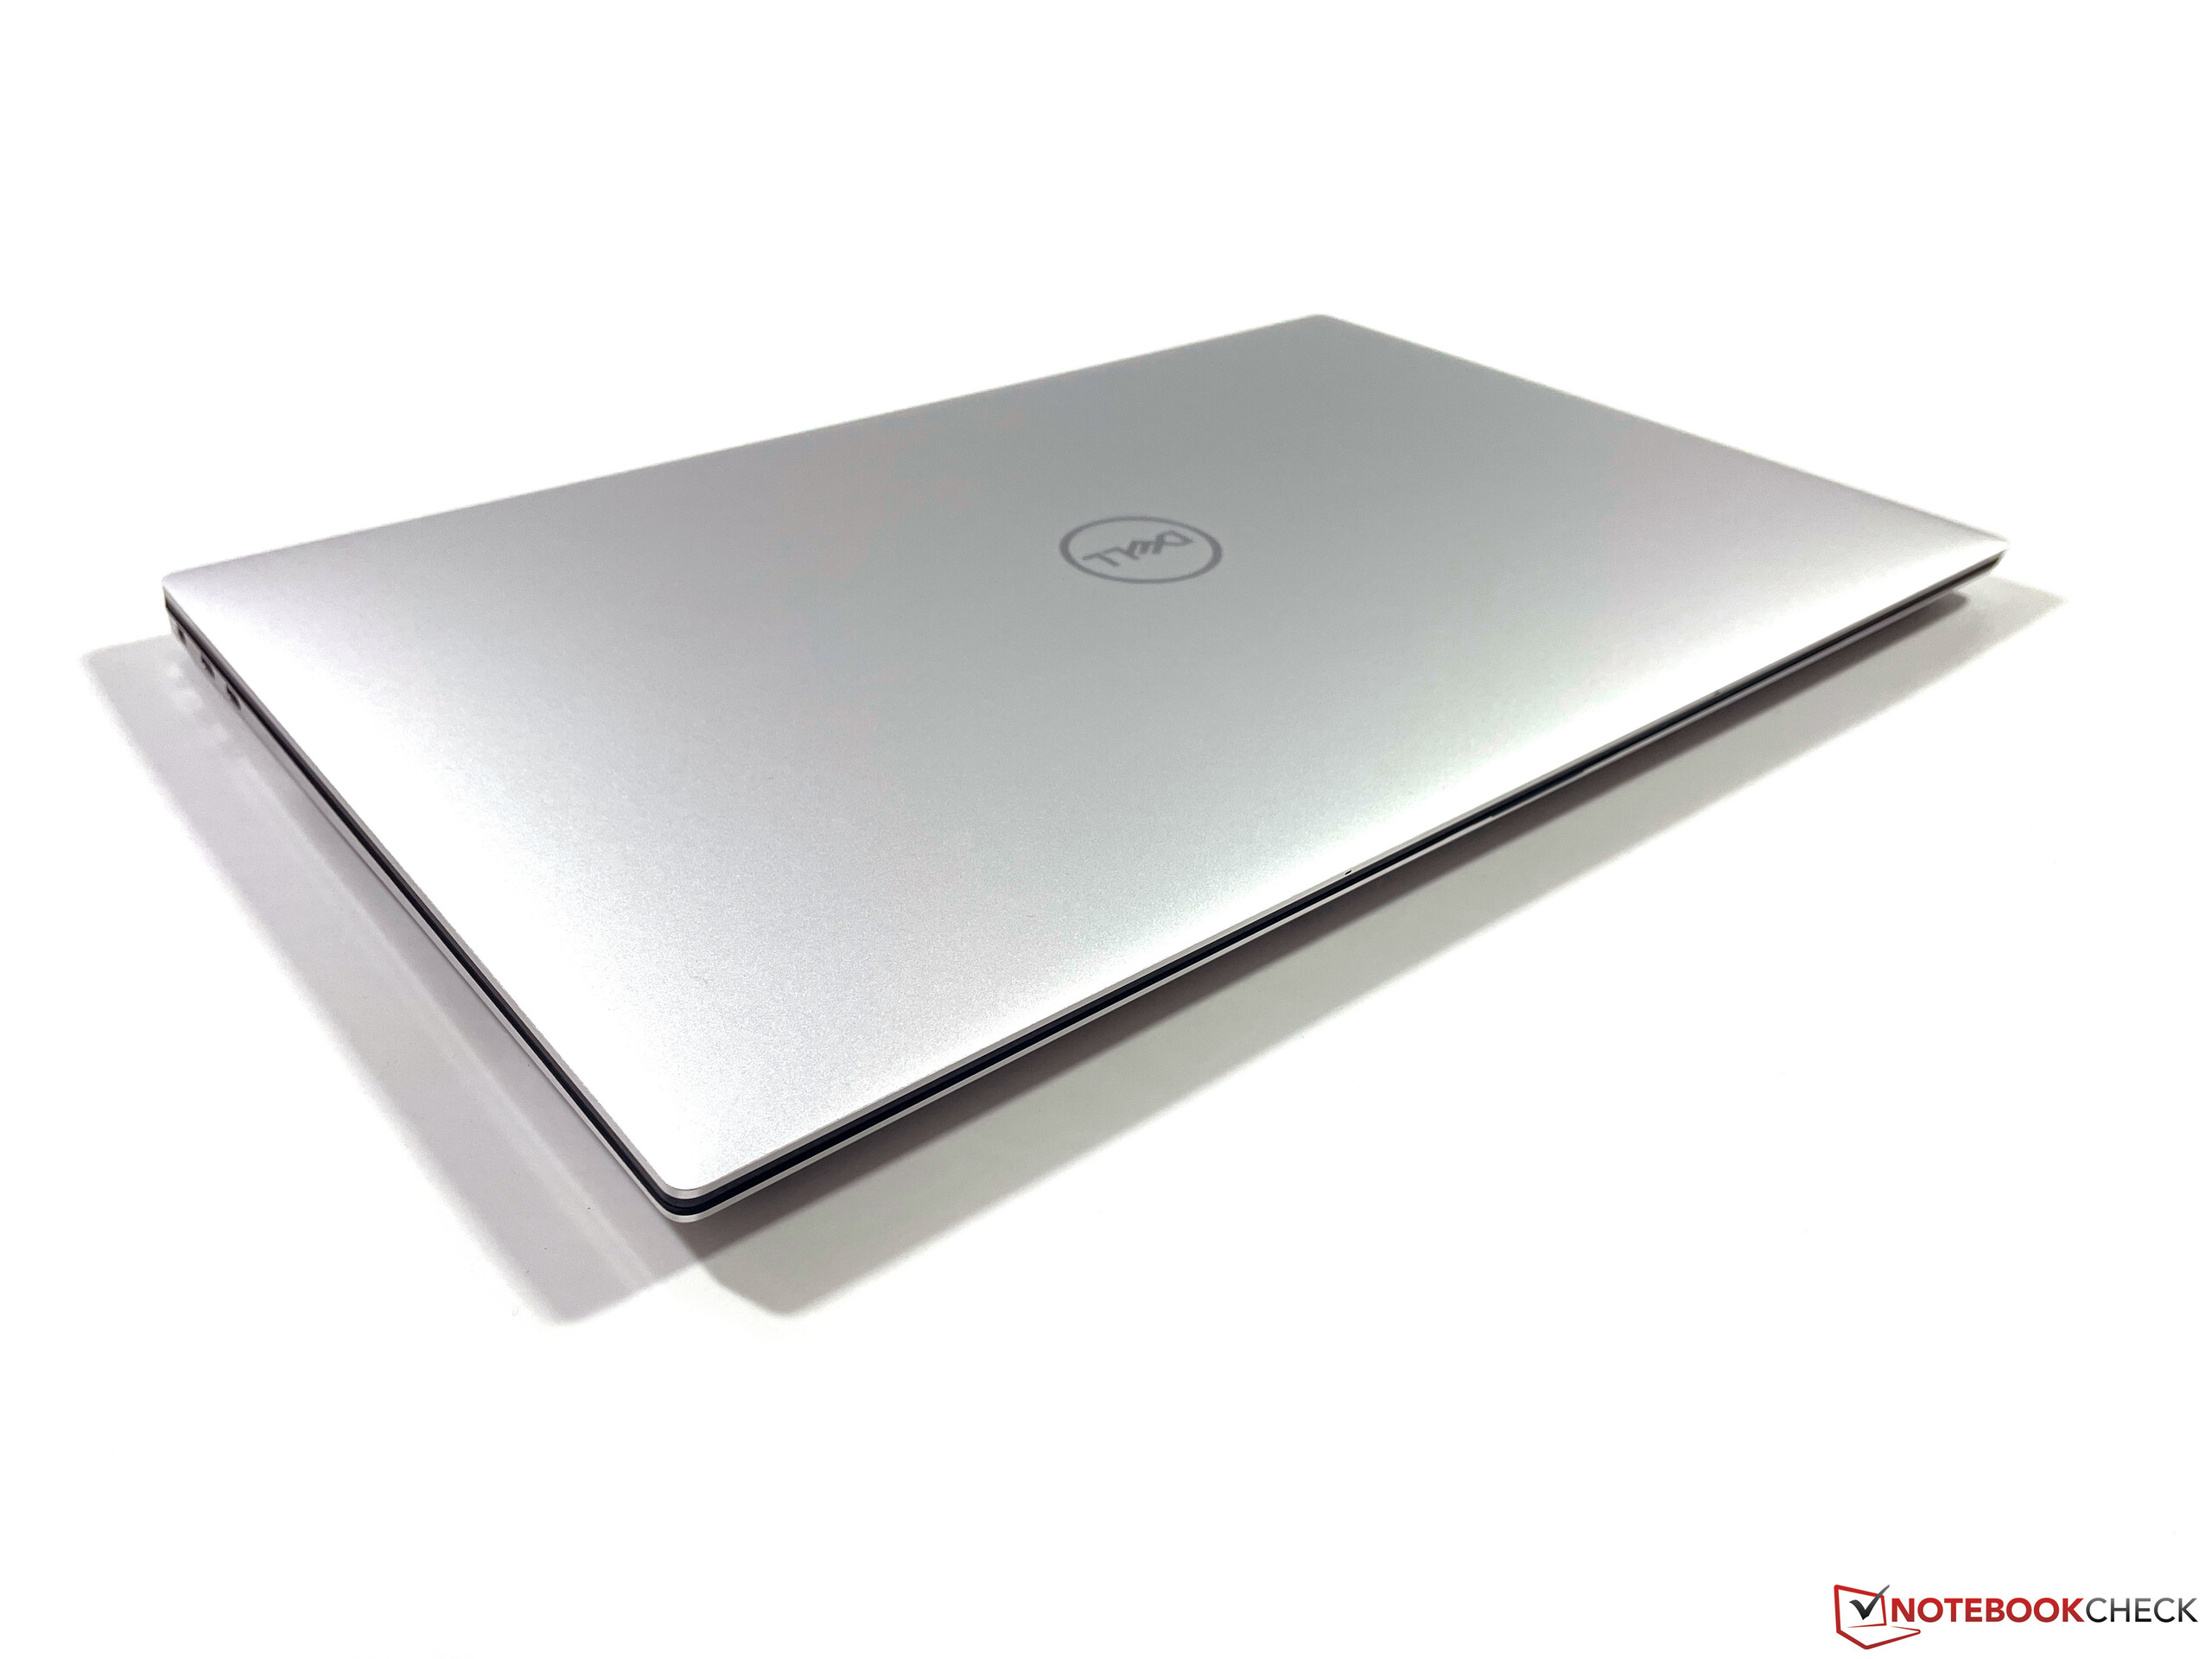
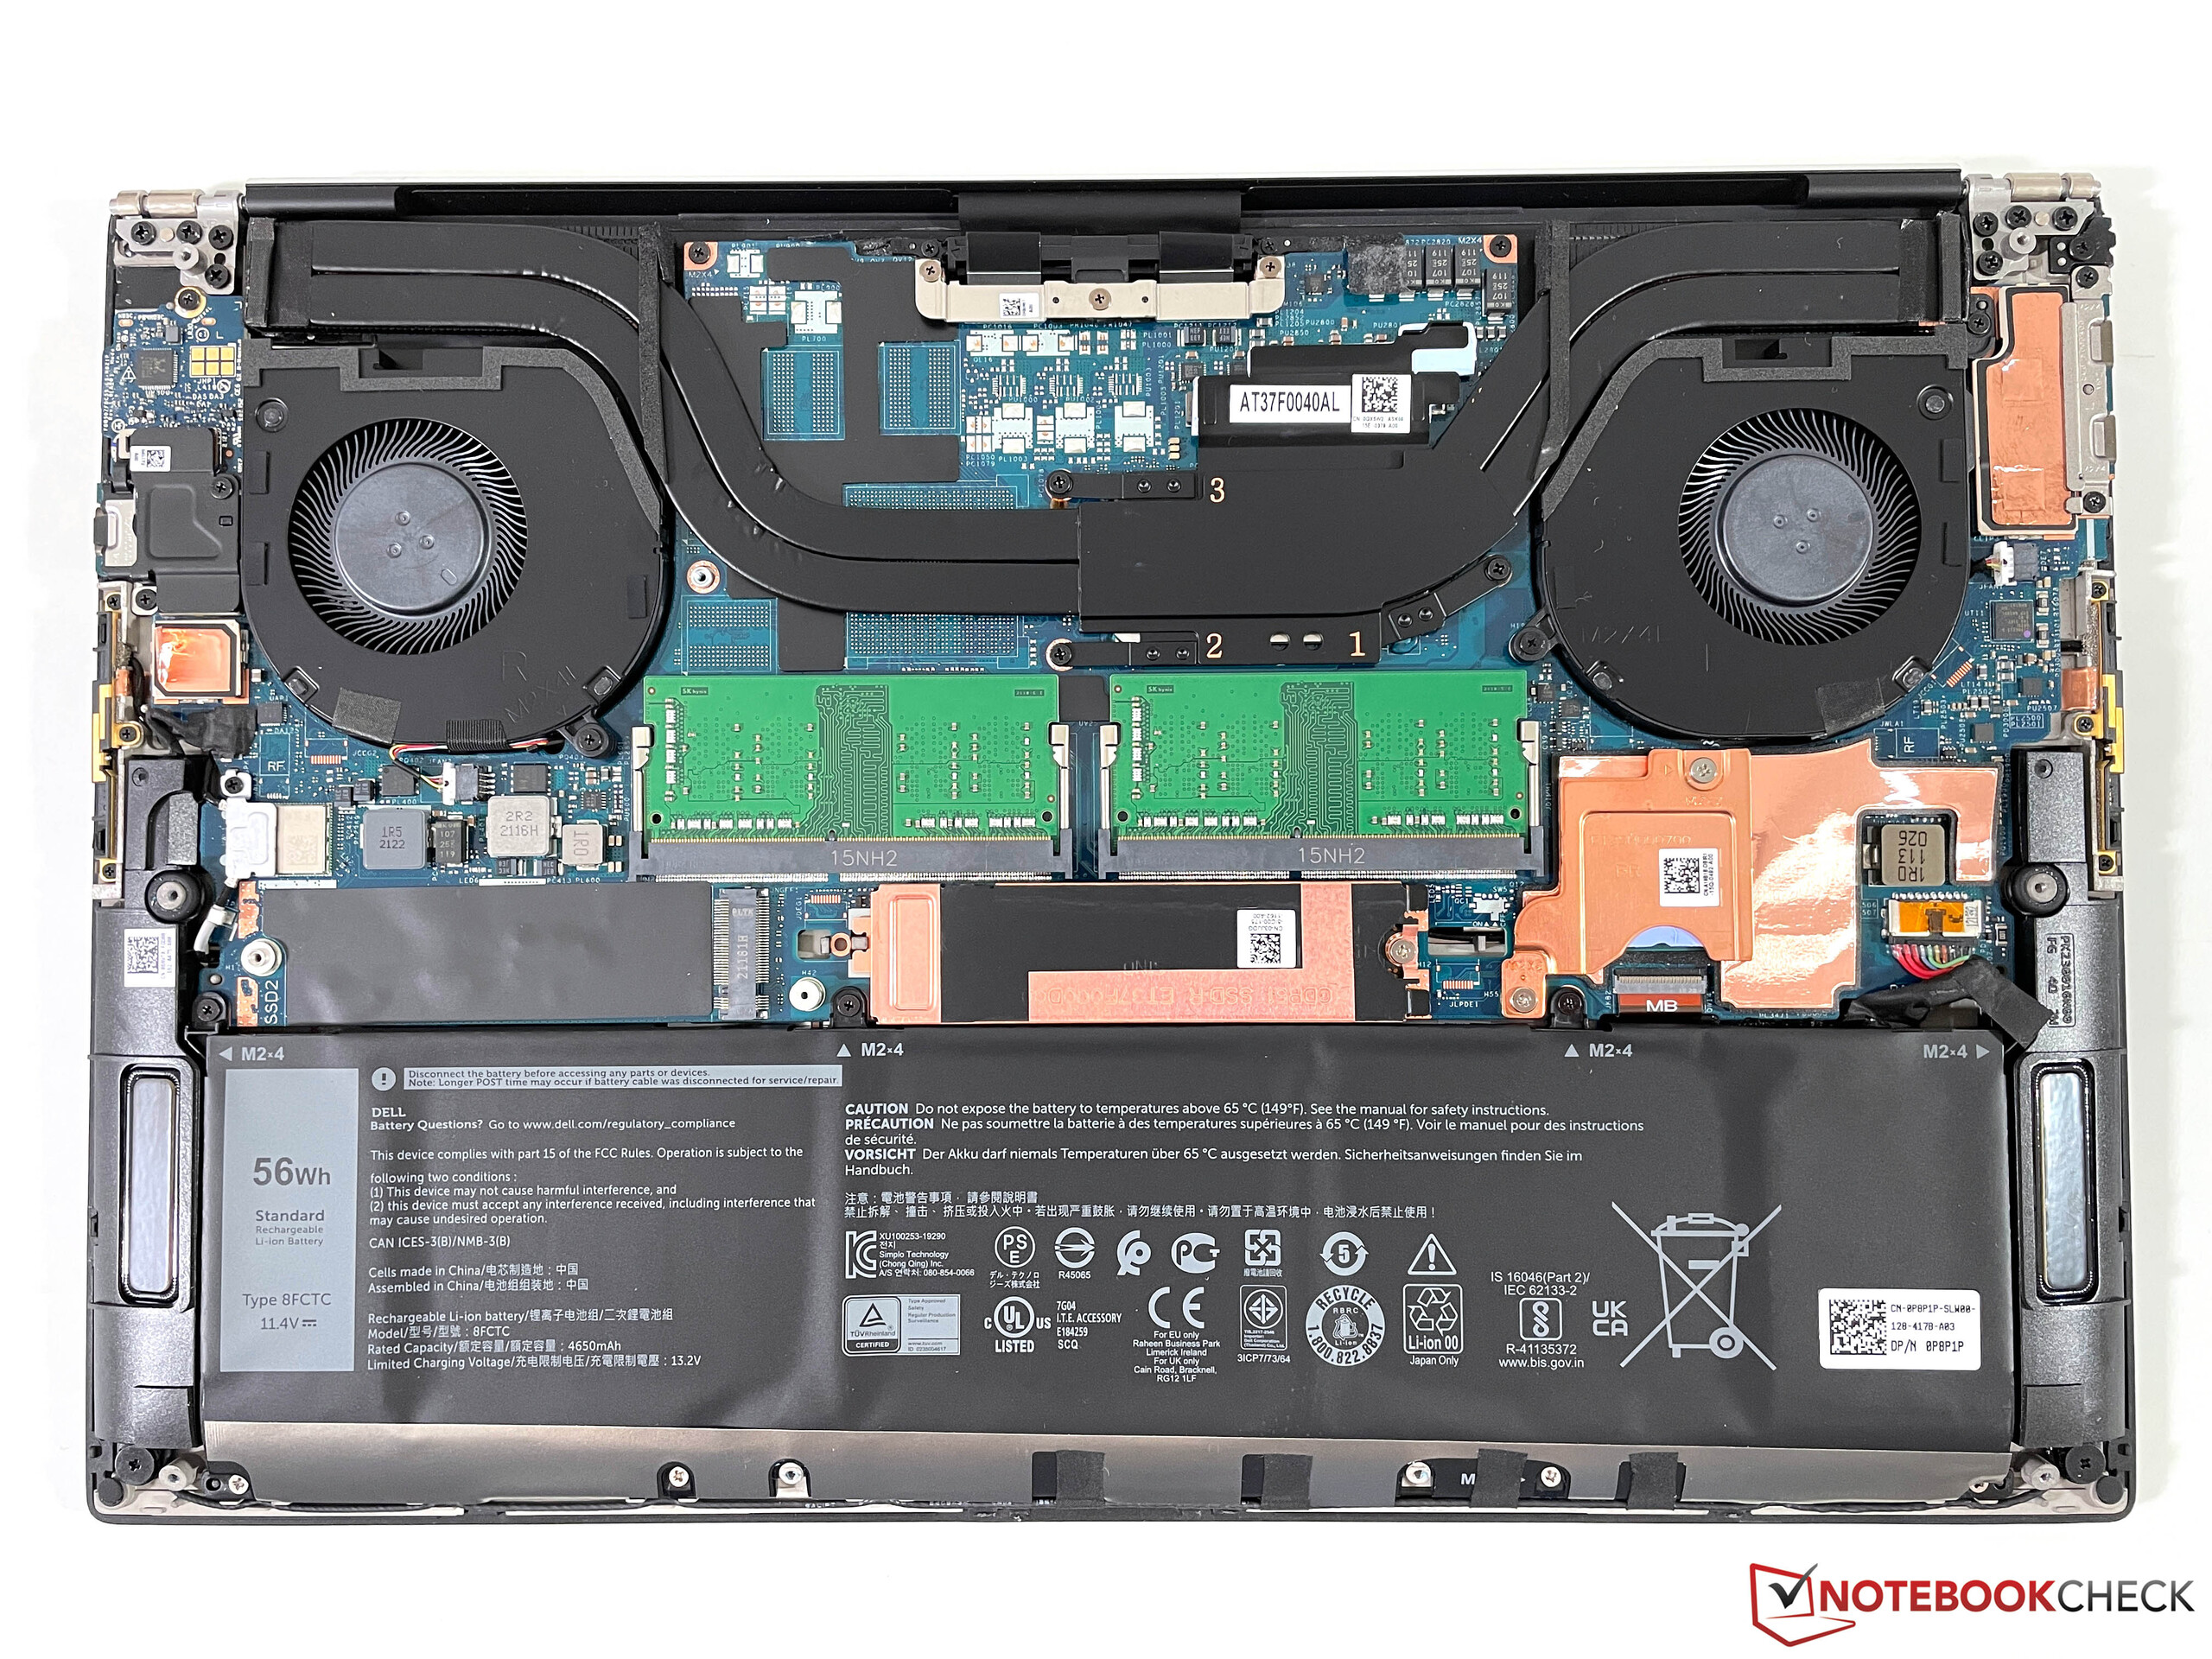
The case is practically identical to the high-end version of the XPS 15 9510 that we already tested. However, this time we are testing the model with a black base unit and silver color lid. As was already the case for the predecessor models, the black surface remains susceptible to dirt and fingerprints. When taking a look inside, you won't see any difference, aside from the lack of the dedicated GPU. The cooling is also identical, and the battery has the same size, even though the capacity is significantly smaller at 56 instead of 86 Wh. At least this becomes noticeable in terms of the weight, since the entry-level model of the XPS 15 without the touchscreen is about 200 grams (~7 oz) lighter.
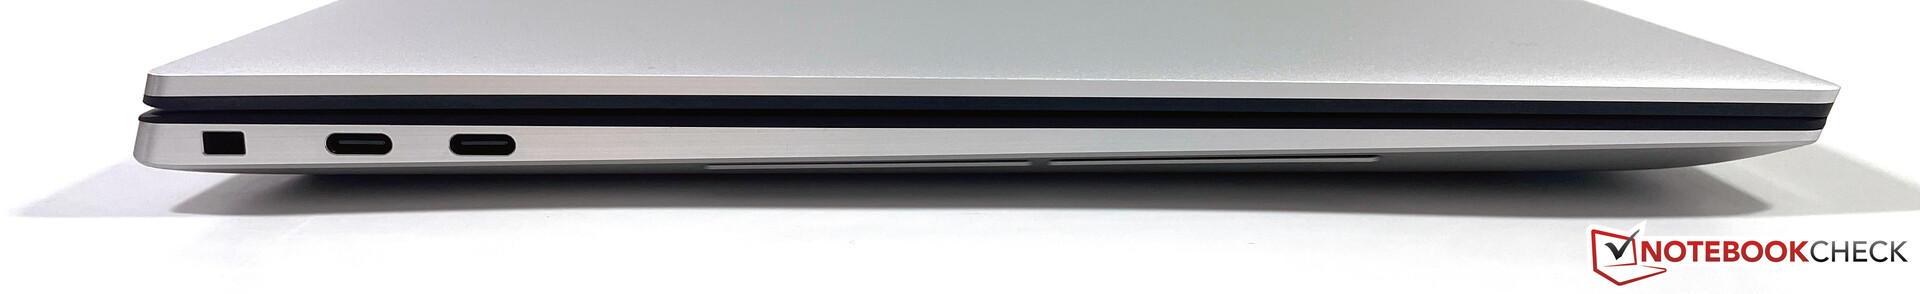
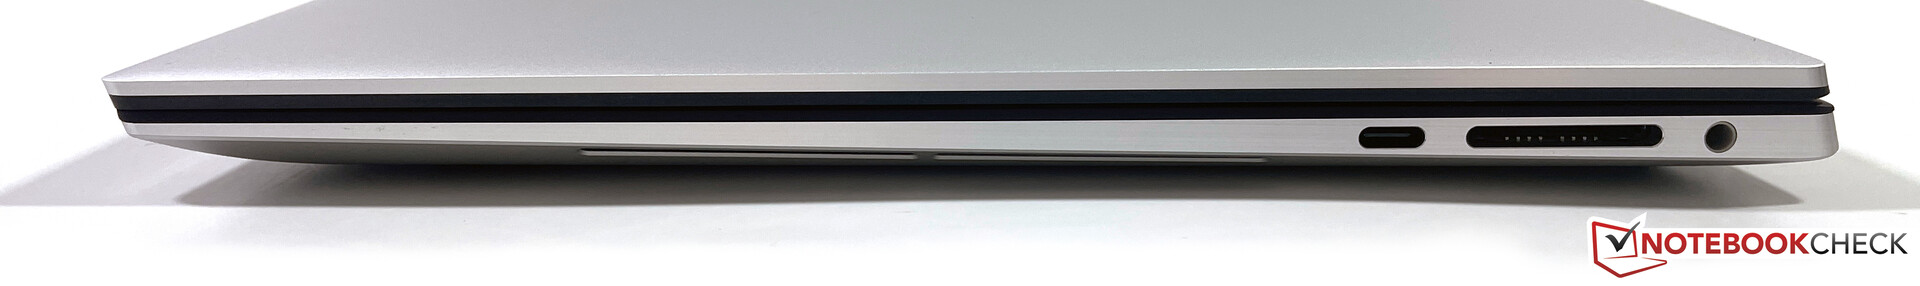
The rest of the equipment with the Thunderbolt 4 connections, the fast WLAN module from Killer, and the SD card reader is identical to the high-end XPS 15 9510.
Connection Equipment
| SD Card Reader | |
| average JPG Copy Test (av. of 3 runs) | |
| Dell XPS 15 9500 Core i5 (Toshiba Exceria Pro SDXC 64 GB UHS-II) | |
| Dell XPS 15 9510 i5 11400H FHD (AV Pro V60) | |
| Average of class Multimedia (23 - 531, n=43, last 2 years) | |
| maximum AS SSD Seq Read Test (1GB) | |
| Dell XPS 15 9510 i5 11400H FHD (AV Pro V60) | |
| Dell XPS 15 9500 Core i5 (Toshiba Exceria Pro SDXC 64 GB UHS-II) | |
| Average of class Multimedia (27.9 - 1455, n=42, last 2 years) | |


Display - A matte 1080p display in the 16:10 format
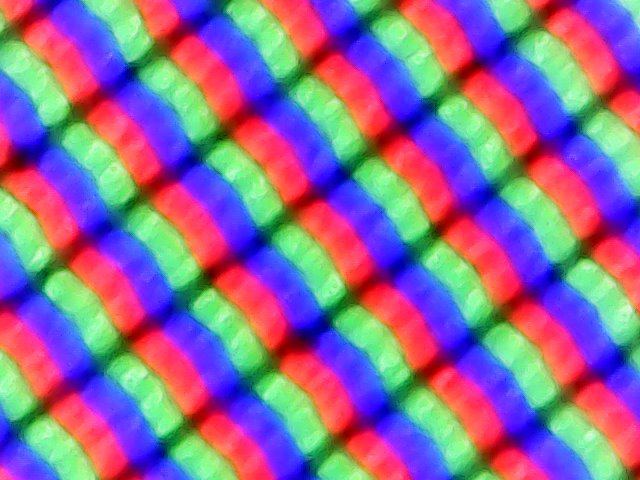
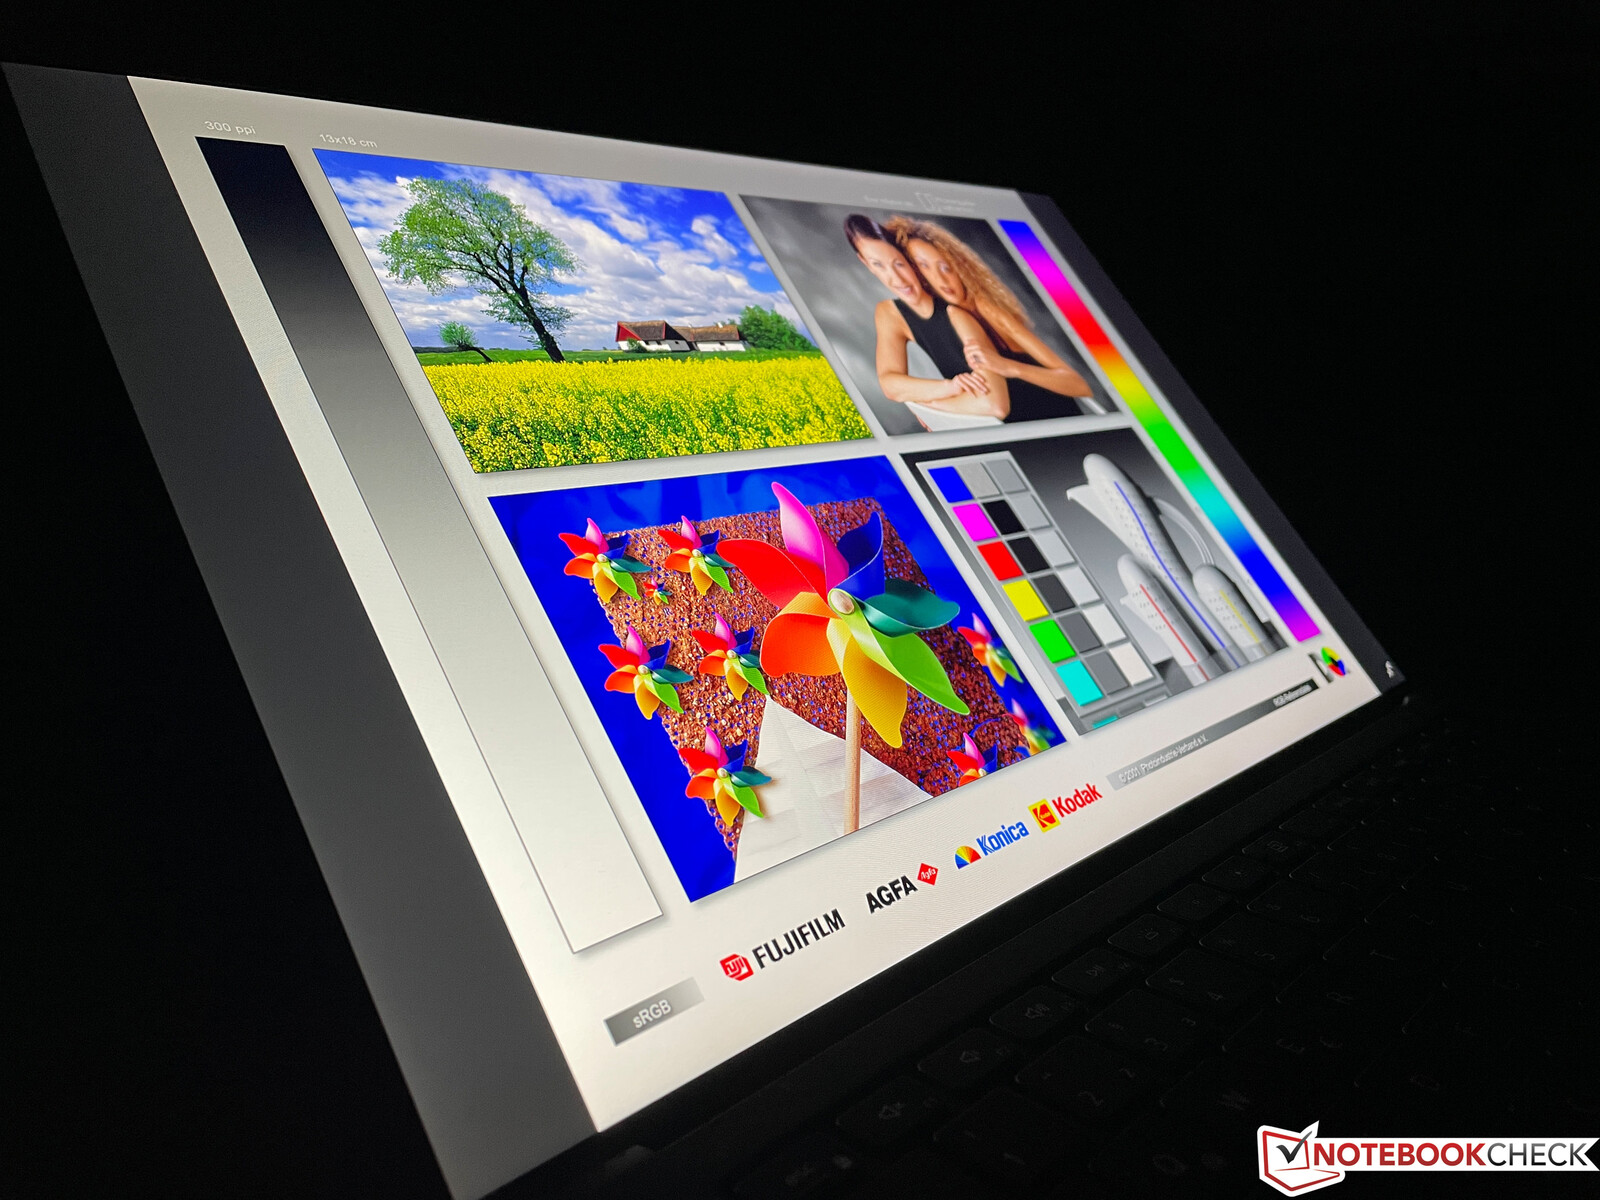
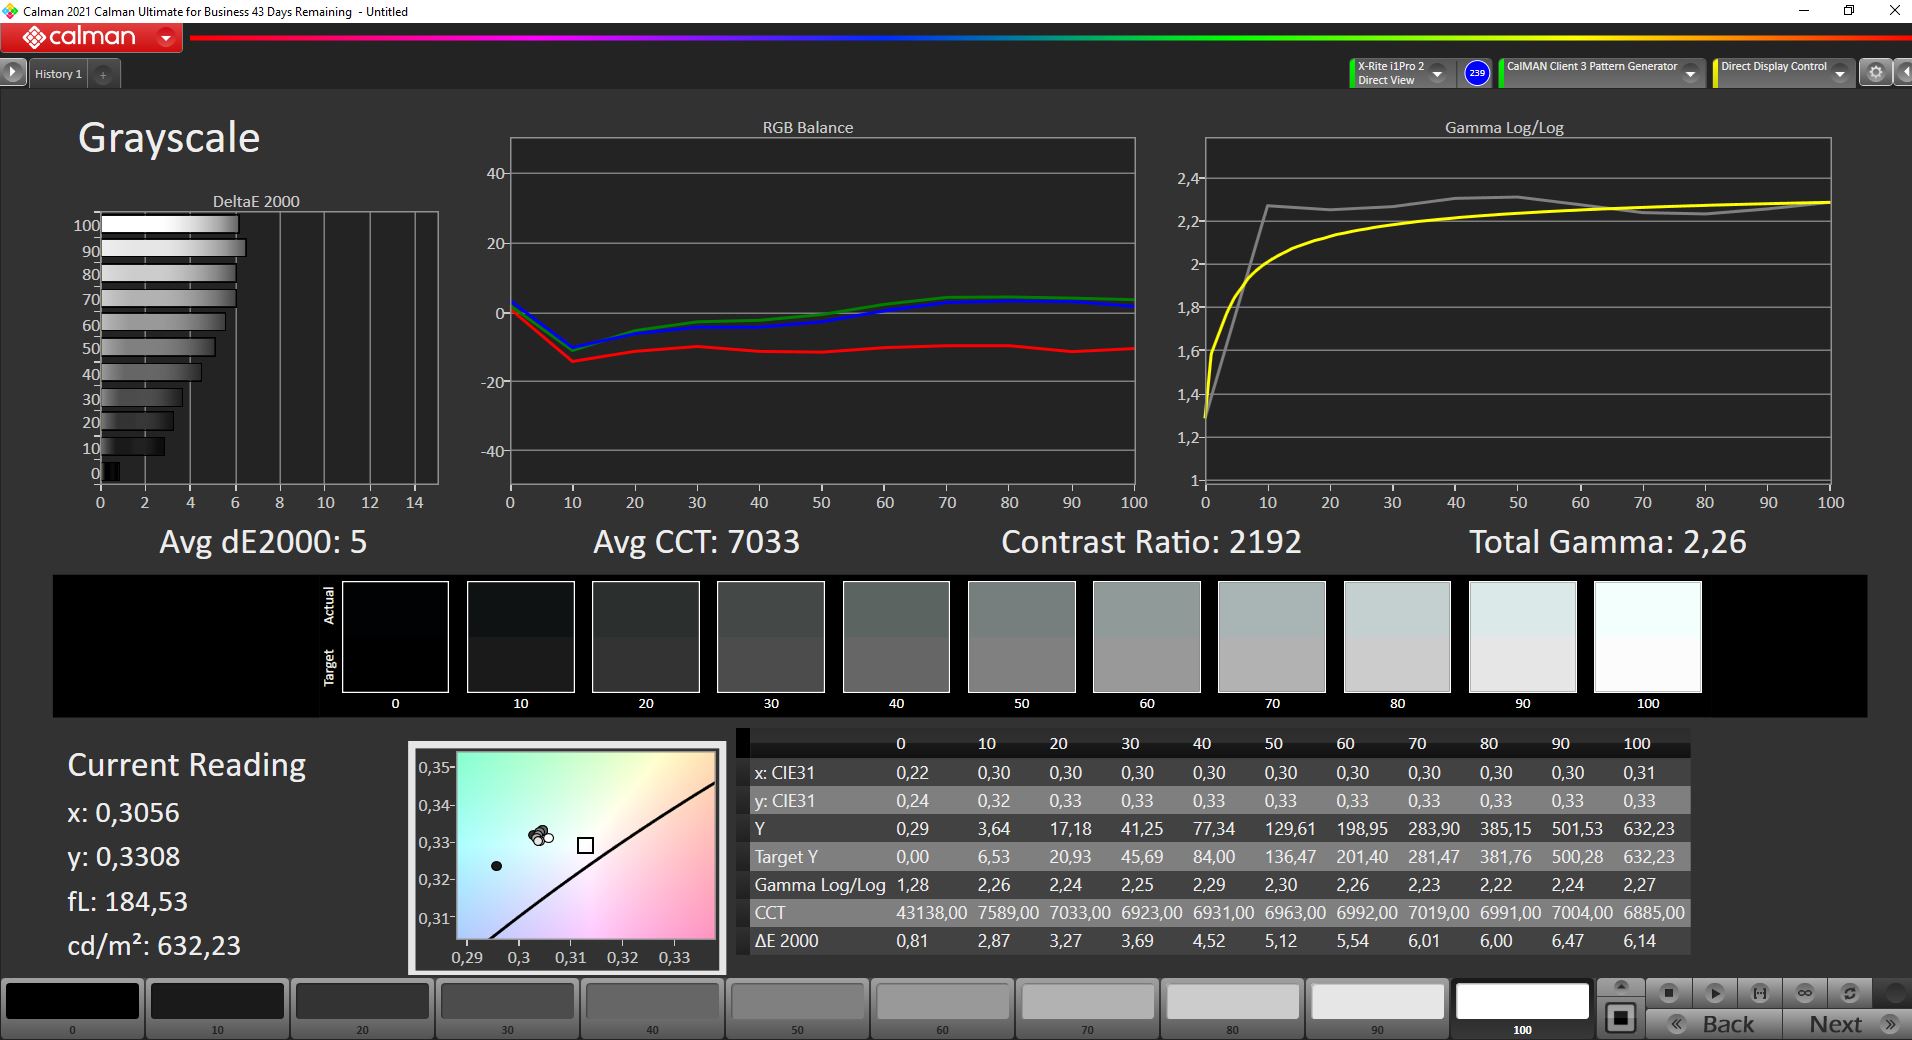
We already know the matte Full-HD panel from Sharp with a 1920 x 1200 pixel resolution from the old XPS 15 9500. With an average brightness of more than 600 cd/m², the panel continues to be one of the brightest on the market. The black value is relatively low, leading to the extremely high contrast ratio of more than 2000:1.
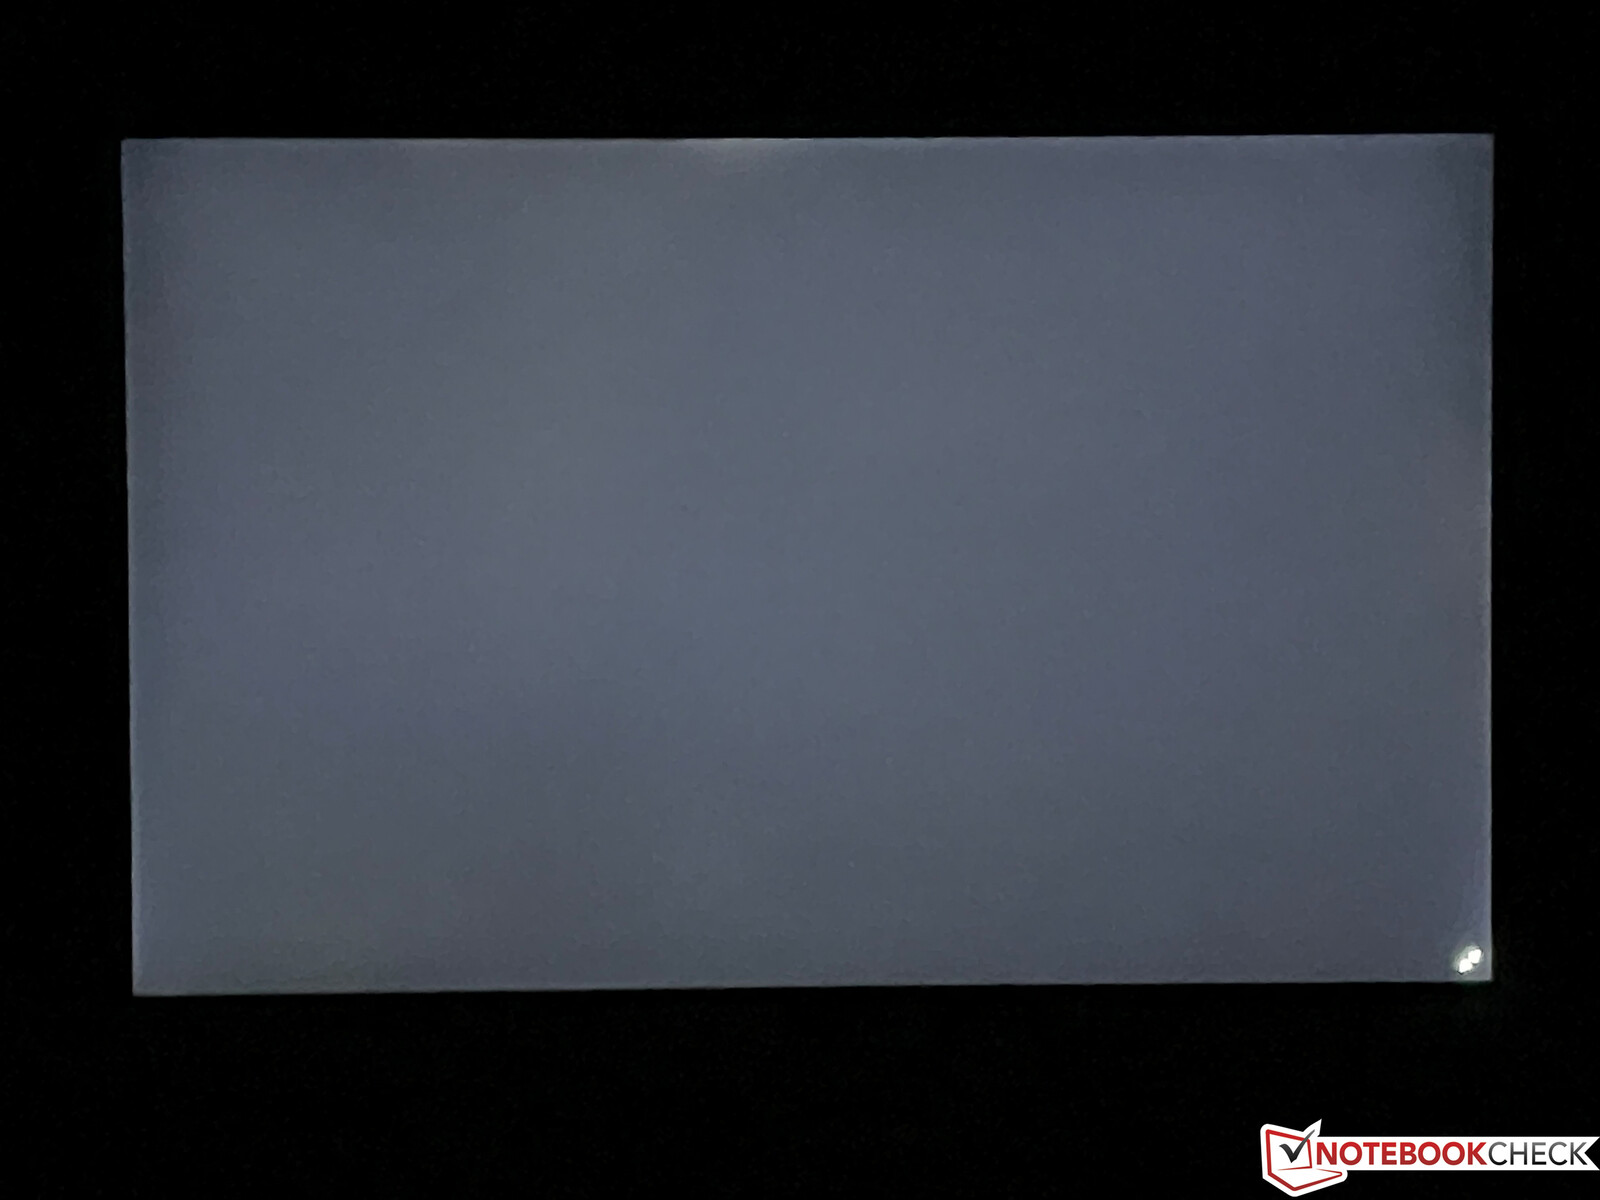
The subjective image impression is very good, and even bright areas don't appear very grainy. The predecessor was slightly more problematic in this regard (see the subpixel images for comparison). There is no PWM flickering and despite the high brightness, screen bleeding is also not a problem. We only notice a minimally brighter area at the top edge. In practice, the brightness can be controlled comfortably by the automatic brightness sensor. The viewing angle stability of the IPS panel is very good. What is problematic is the slow response time that can also lead to visible ghosting in practice.
| |||||||||||||||||||||||||
Brightness Distribution: 91 %
Center on Battery: 634 cd/m²
Contrast: 2179:1 (Black: 0.29 cd/m²)
ΔE ColorChecker Calman: 3.5 | ∀{0.5-29.43 Ø4.73}
calibrated: 2
ΔE Greyscale Calman: 5 | ∀{0.09-98 Ø4.97}
79.1% AdobeRGB 1998 (Argyll 3D)
100% sRGB (Argyll 3D)
80.9% Display P3 (Argyll 3D)
Gamma: 2.26
CCT: 7033 K
| Dell XPS 15 9510 i5 11400H FHD Sharp LQ156N1, IPS, 1920x1200, 15.6" | Huawei MateBook 14s i7 CSOTT3 U17B MNE208ZA1-3, LTPS, 2520x1680, 14.2" | Acer Swift 3 SF316-51 Chi Mei CMN160B, IPS, 1920x1080, 16.1" | Honor MagicBook Pro (AMD) N161HCA-EA3, IPS, 1920x1080, 16.1" | Dell XPS 15 9500 Core i5 Sharp LQ156N1, IPS, 1920x1200, 15.6" | Dell XPS 15 9510 11800H RTX 3050 Ti OLED SDC414D, OLED, 3456x2160, 15.6" | Schenker Vision 15 BOE08F5, IPS, 1920x1080, 15.6" | |
|---|---|---|---|---|---|---|---|
| Display | -10% | -10% | -20% | 1% | 16% | -10% | |
| Display P3 Coverage (%) | 80.9 | 67.8 -16% | 66.6 -18% | 67.5 -17% | 81.5 1% | 99.9 23% | 69.3 -14% |
| sRGB Coverage (%) | 100 | 98.3 -2% | 99.5 0% | 69.7 -30% | 100 0% | 100 0% | 94 -6% |
| AdobeRGB 1998 Coverage (%) | 79.1 | 70.1 -11% | 68.5 -13% | 69.7 -12% | 79.6 1% | 98.1 24% | 70.8 -10% |
| Response Times | 42% | 49% | 37% | 30% | 94% | 2% | |
| Response Time Grey 50% / Grey 80% * (ms) | 62.4 ? | 37.6 ? 40% | 32 ? 49% | 37.6 ? 40% | 42 ? 33% | 3.6 ? 94% | 60 ? 4% |
| Response Time Black / White * (ms) | 38.8 ? | 21.6 ? 44% | 20 ? 48% | 25.6 ? 34% | 28.8 ? 26% | 2.8 ? 93% | 39 ? -1% |
| PWM Frequency (Hz) | 27780 ? | 2500 ? | 25250 ? | 59.5 ? | |||
| Screen | 14% | 9% | 24% | -8% | 34% | -8% | |
| Brightness middle (cd/m²) | 632 | 419 -34% | 304 -52% | 337 -47% | 592 -6% | 362 -43% | 478 -24% |
| Brightness (cd/m²) | 606 | 407 -33% | 284 -53% | 312 -49% | 565 -7% | 367 -39% | 462 -24% |
| Brightness Distribution (%) | 91 | 93 2% | 88 -3% | 89 -2% | 85 -7% | 97 7% | 94 3% |
| Black Level * (cd/m²) | 0.29 | 0.23 21% | 0.165 43% | 0.2 31% | 0.46 -59% | 0.06 79% | 0.27 7% |
| Contrast (:1) | 2179 | 1822 -16% | 1842 -15% | 1685 -23% | 1287 -41% | 6033 177% | 1770 -19% |
| Colorchecker dE 2000 * | 3.5 | 1.9 46% | 1.44 59% | 0.8 77% | 3.19 9% | 2.1 40% | 3.2 9% |
| Colorchecker dE 2000 max. * | 6.4 | 3.6 44% | 3.62 43% | 1.1 83% | 5.45 15% | 4.1 36% | 8.4 -31% |
| Colorchecker dE 2000 calibrated * | 2 | 0.9 55% | 0.7 65% | 2.03 -1% | 2.5 -25% | 2 -0% | |
| Greyscale dE 2000 * | 5 | 2.9 42% | 2.6 48% | 1 80% | 3.9 22% | 1.4 72% | 4.5 10% |
| Gamma | 2.26 97% | 2.14 103% | 2.41 91% | 2.2 100% | 2.25 98% | 2.18 101% | 2.16 102% |
| CCT | 7033 92% | 6733 97% | 6527 100% | 6538 99% | 6522 100% | 6608 98% | 6788 96% |
| Color Space (Percent of AdobeRGB 1998) (%) | 68.5 | 63.8 | 71.6 | 63.1 | |||
| Color Space (Percent of sRGB) (%) | 99.5 | 99.5 | 100 | 93.6 | |||
| Total Average (Program / Settings) | 15% /
13% | 16% /
10% | 14% /
16% | 8% /
-1% | 48% /
38% | -5% /
-7% |
* ... smaller is better
Display Response Times
| ↔ Response Time Black to White | ||
|---|---|---|
| 38.8 ms ... rise ↗ and fall ↘ combined | ↗ 20.8 ms rise | 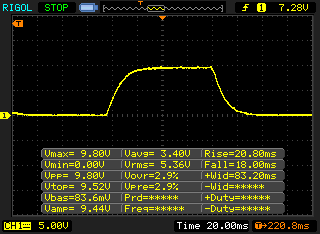 |
| ↘ 18 ms fall | ||
| The screen shows slow response rates in our tests and will be unsatisfactory for gamers. In comparison, all tested devices range from 0.1 (minimum) to 240 (maximum) ms. » 96 % of all devices are better. This means that the measured response time is worse than the average of all tested devices (19.9 ms). | ||
| ↔ Response Time 50% Grey to 80% Grey | ||
| 62.4 ms ... rise ↗ and fall ↘ combined | ↗ 31.6 ms rise | 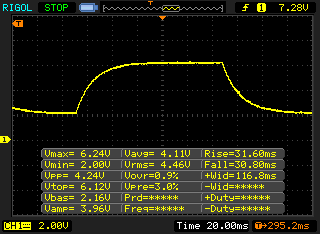 |
| ↘ 30.8 ms fall | ||
| The screen shows slow response rates in our tests and will be unsatisfactory for gamers. In comparison, all tested devices range from 0.165 (minimum) to 636 (maximum) ms. » 97 % of all devices are better. This means that the measured response time is worse than the average of all tested devices (31.1 ms). | ||
Screen Flickering / PWM (Pulse-Width Modulation)
| Screen flickering / PWM not detected | 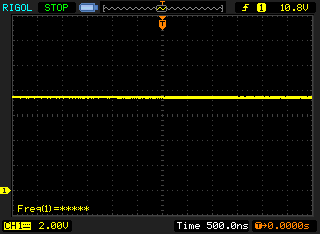 | ||
In comparison: 52 % of all tested devices do not use PWM to dim the display. If PWM was detected, an average of 7798 (minimum: 5 - maximum: 343500) Hz was measured. | |||
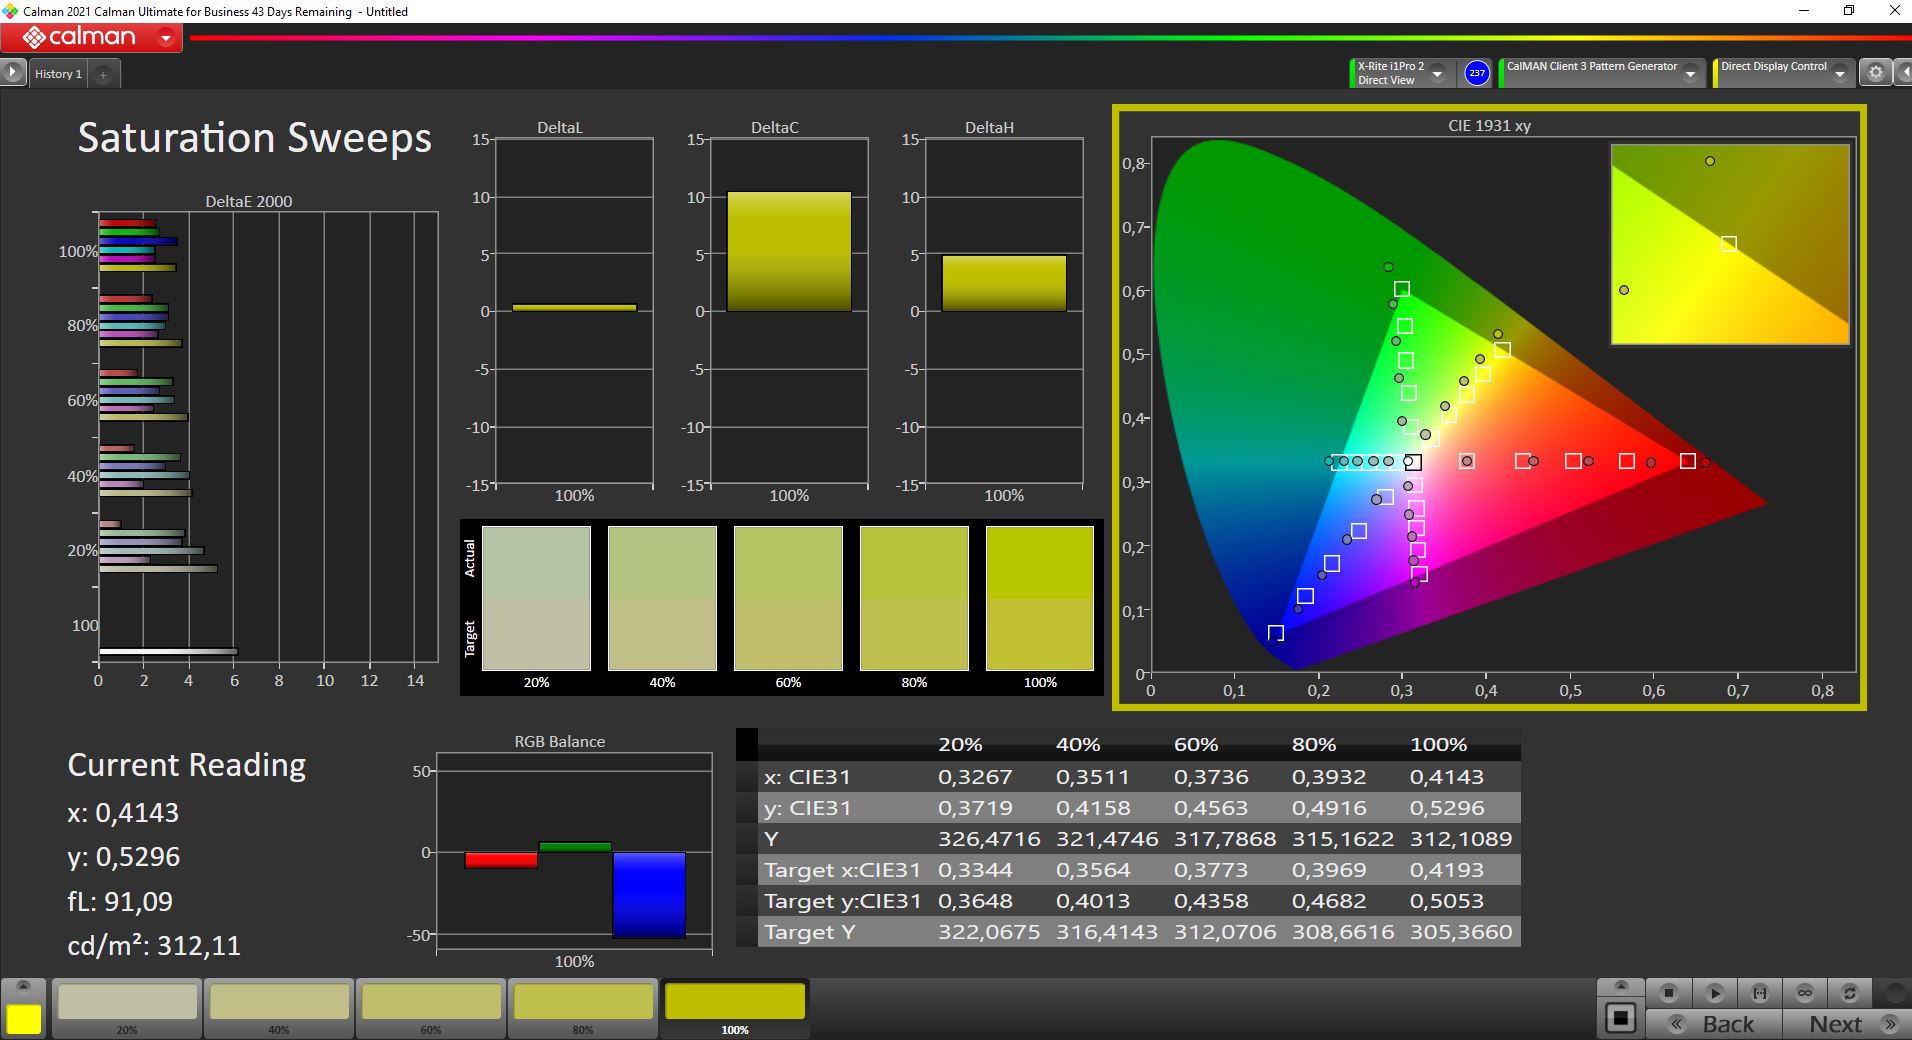
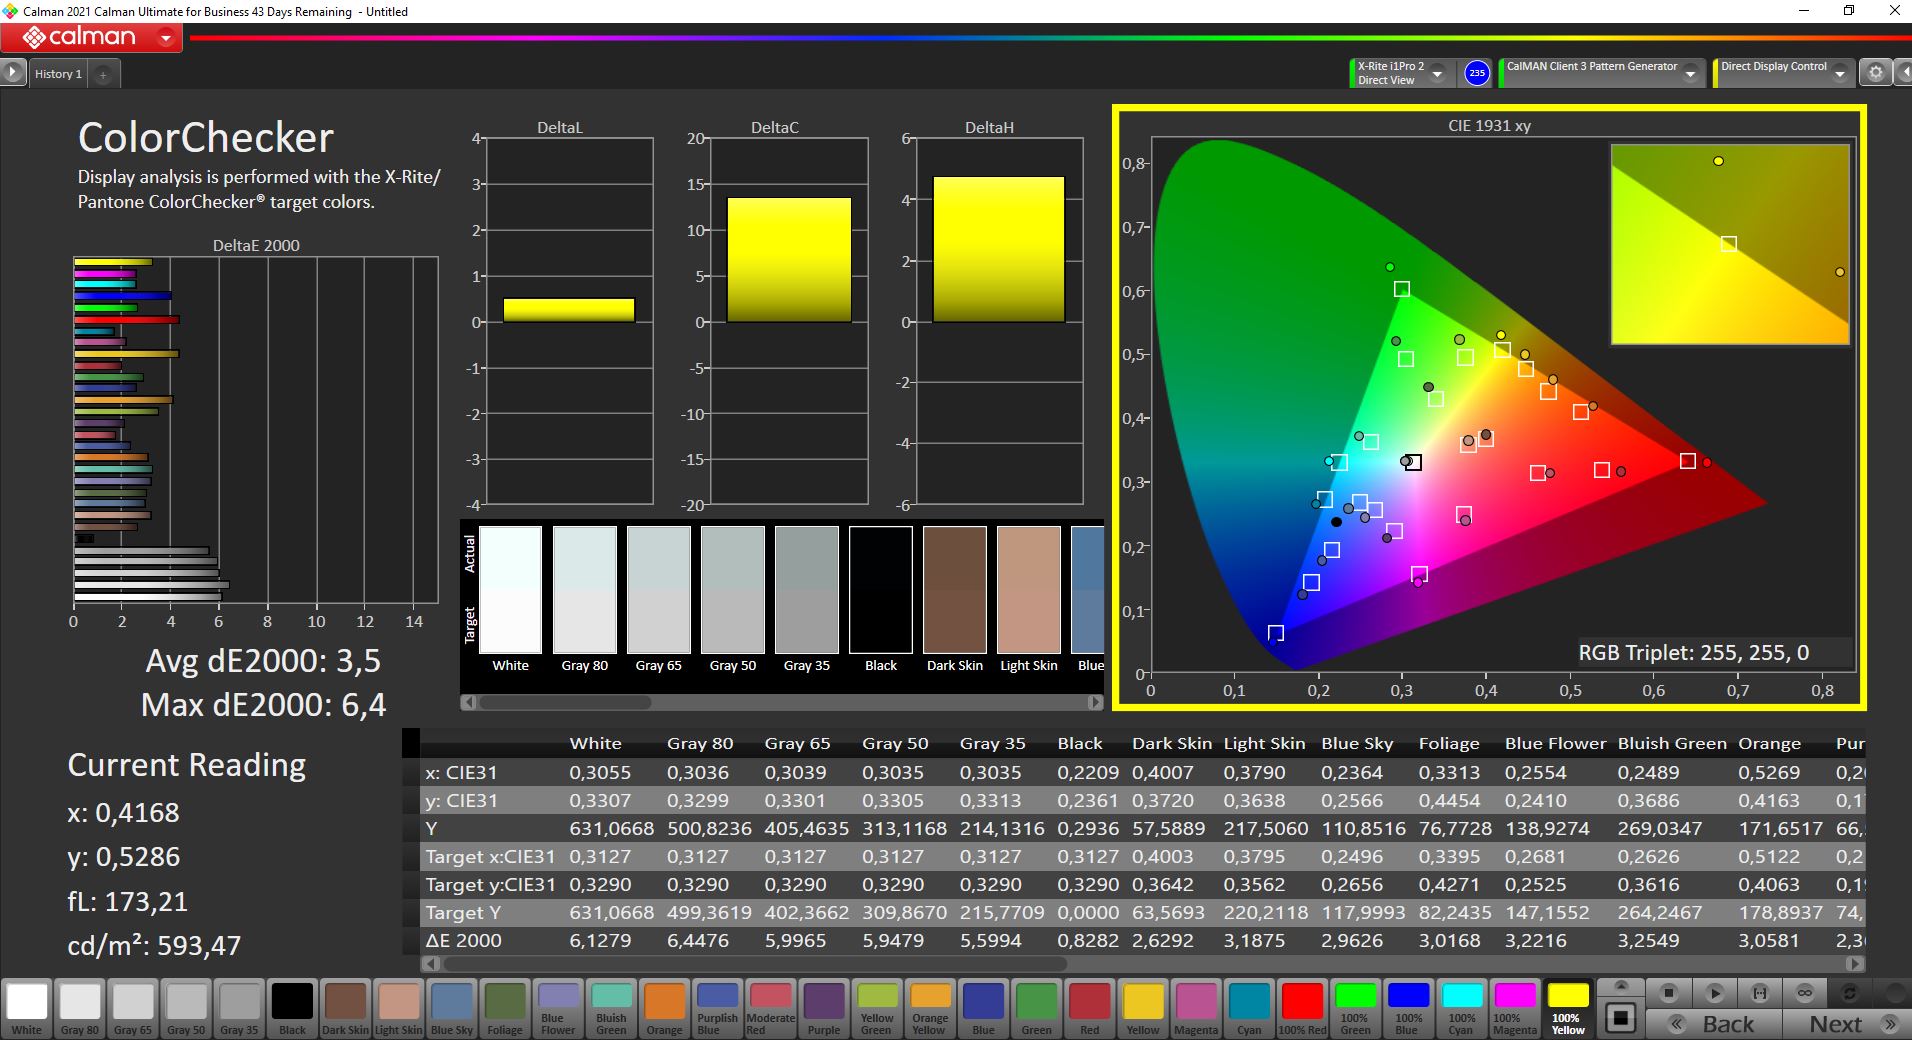
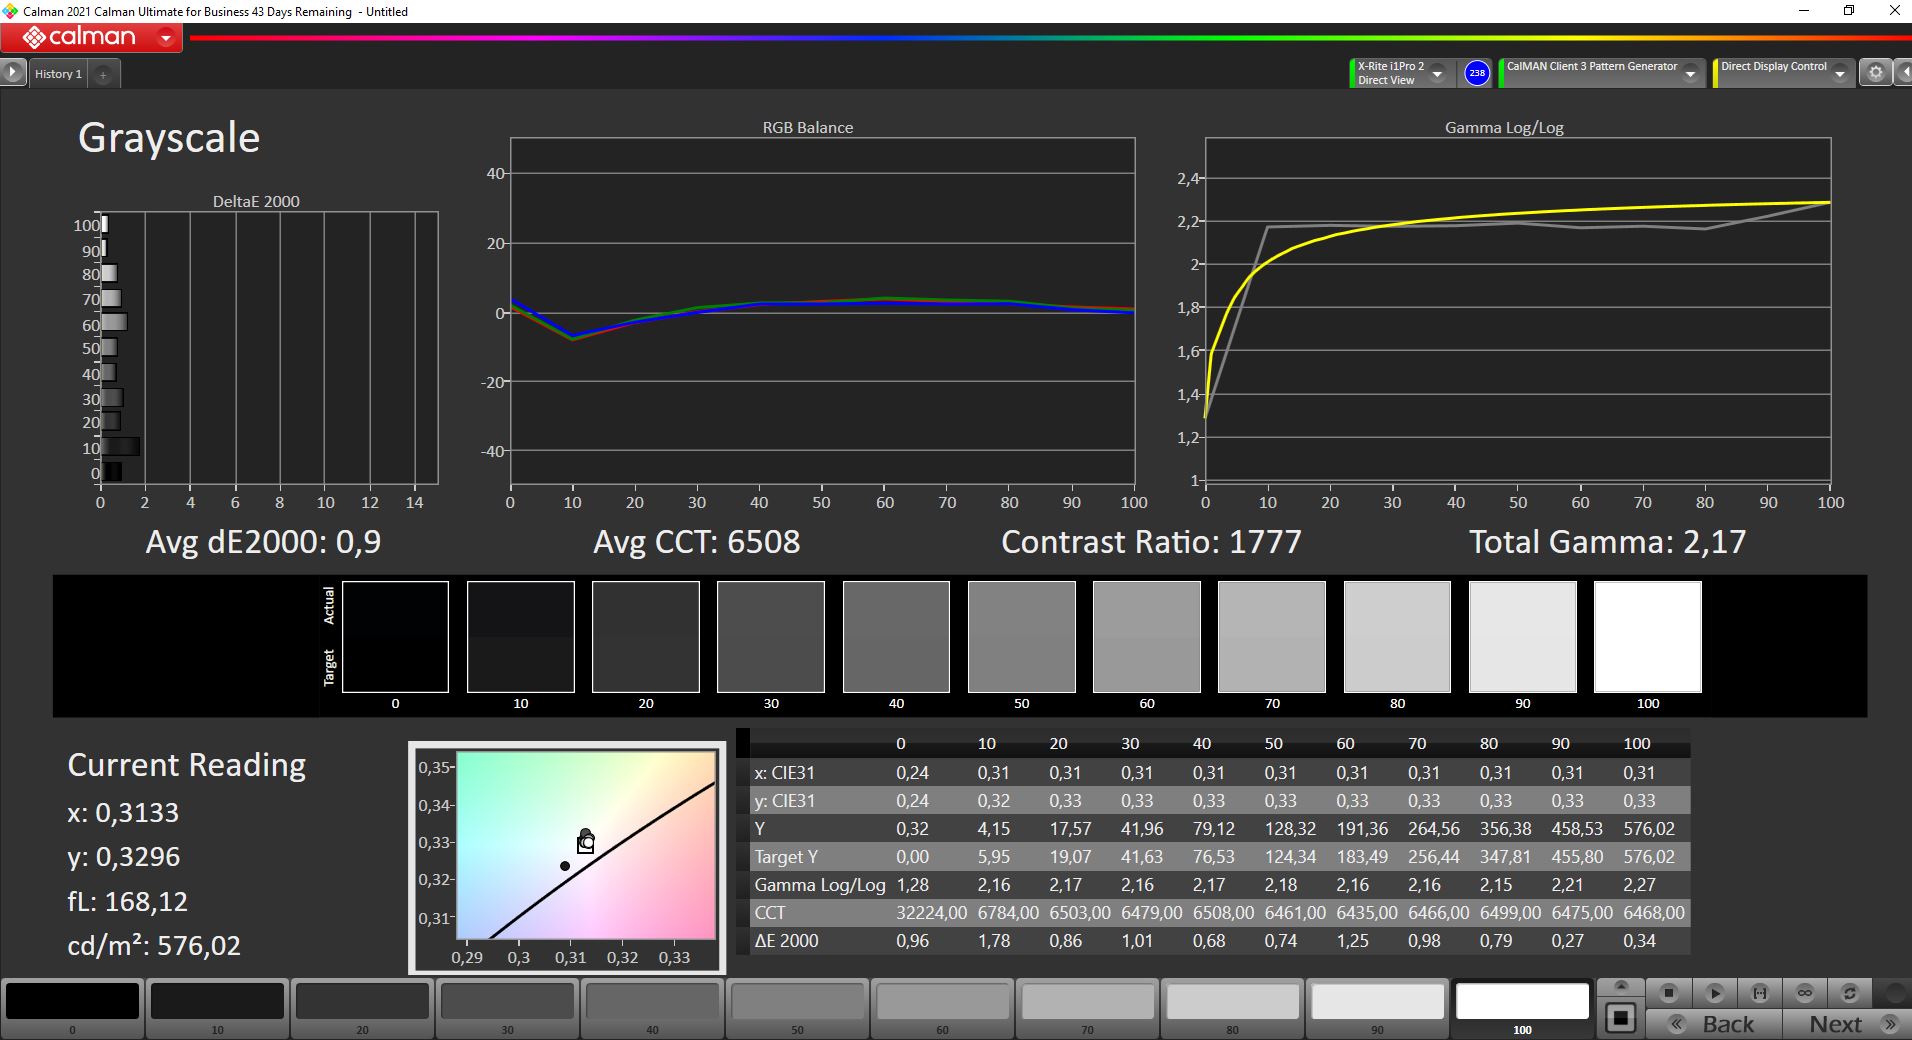
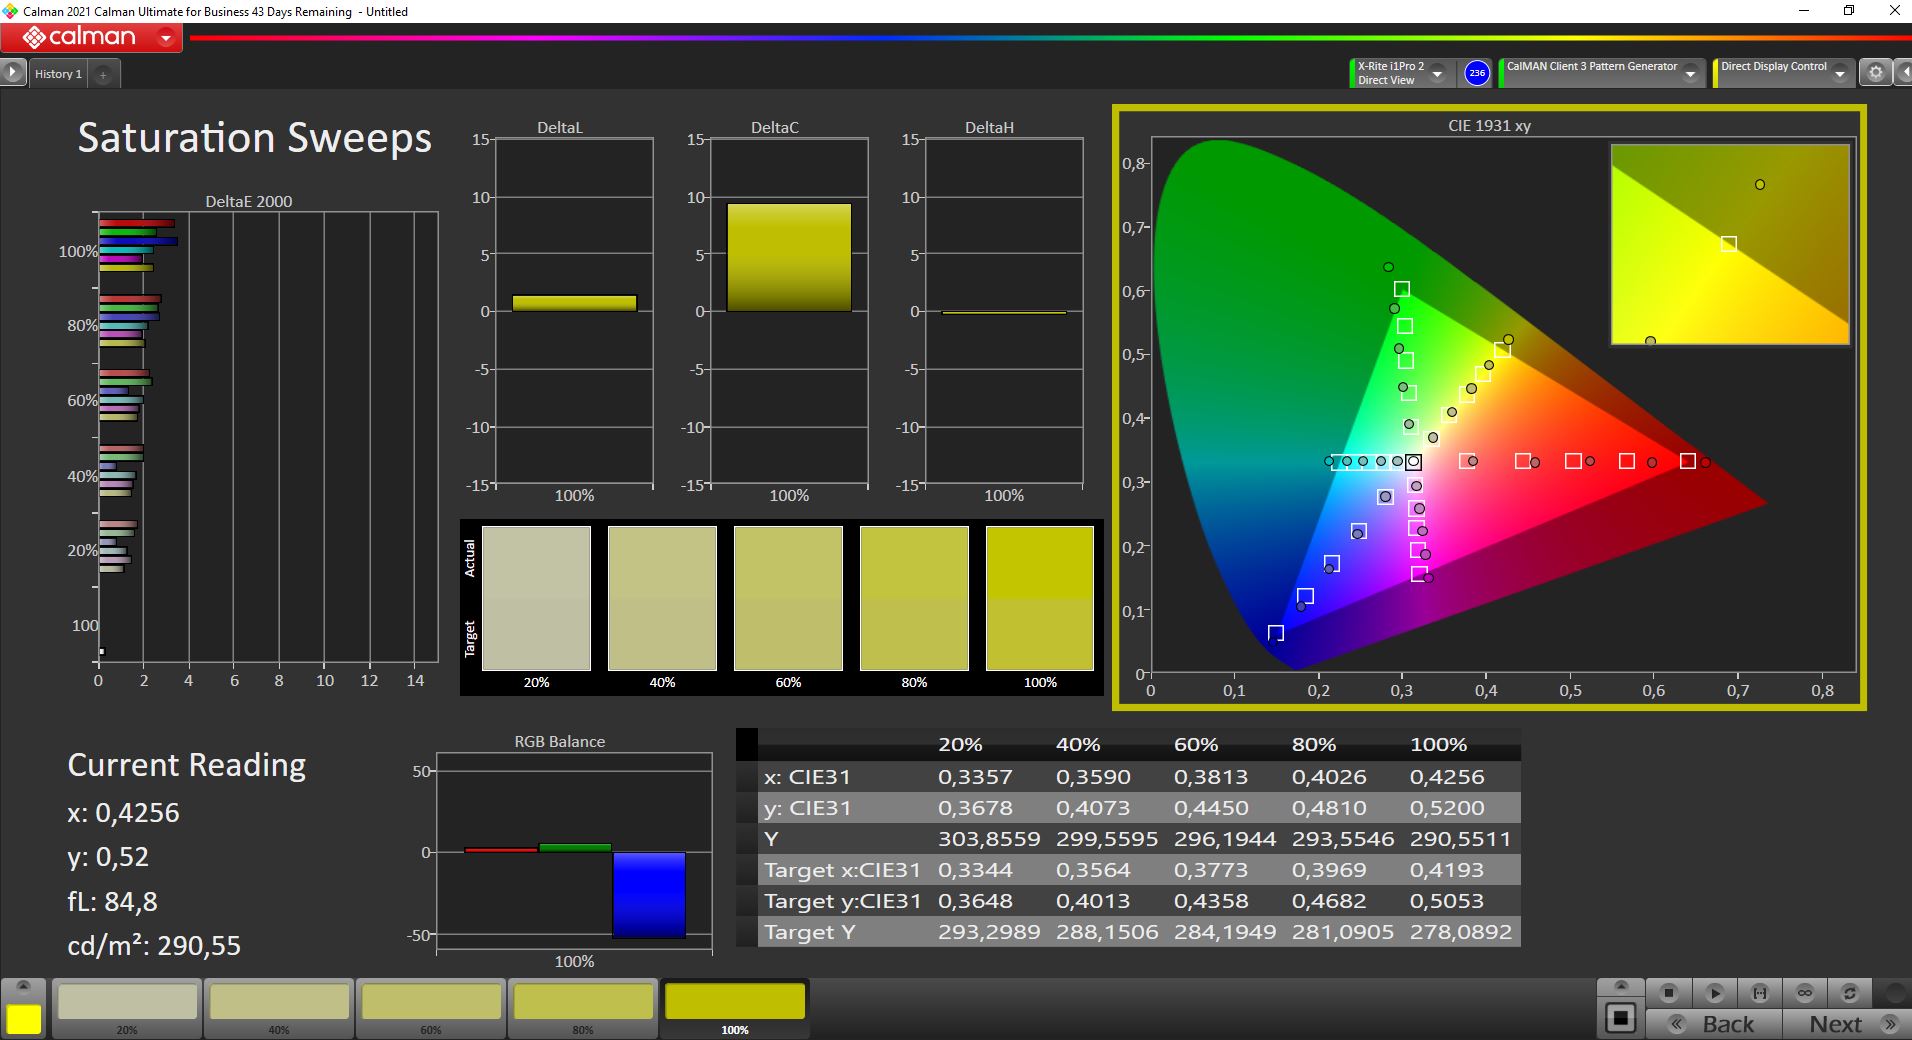
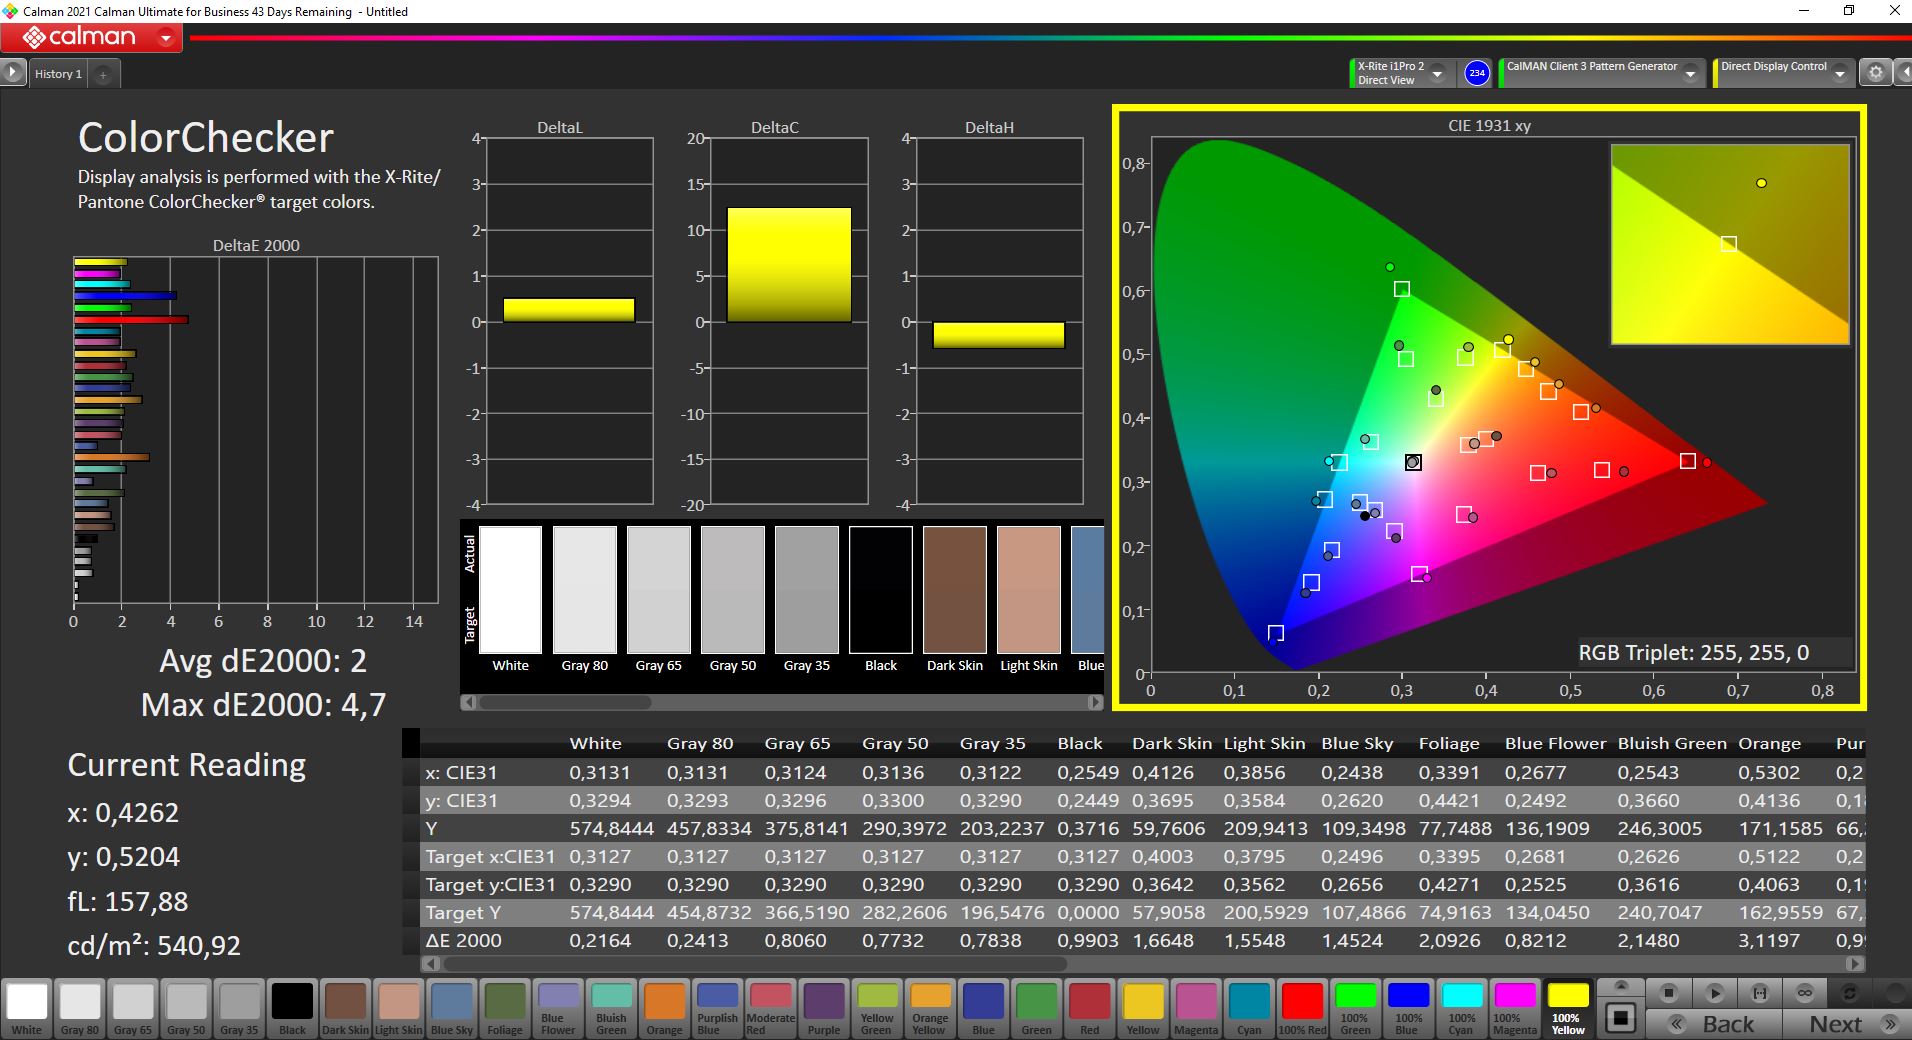
In the state of delivery, the panel isn't calibrated particularly well, and there is a slight green tint in combination with the color temperature being too cool. Our analysis with the professional CalMAN software and the X-Rite i1 Pro 2 Colorimeter also shows color deviations that are slightly too high. With our calibration (profile available for free download in the info box above), we are able to improve the reproduction of the grayscale in particular and also eliminate the color tint. The color deviations from the sRGB reference color space (which is completely covered by the panel) are also reduced. There are only two colors (100% red and blue) that are still minimally above the important target value of 3. However, the panel is still suitable for image processing.
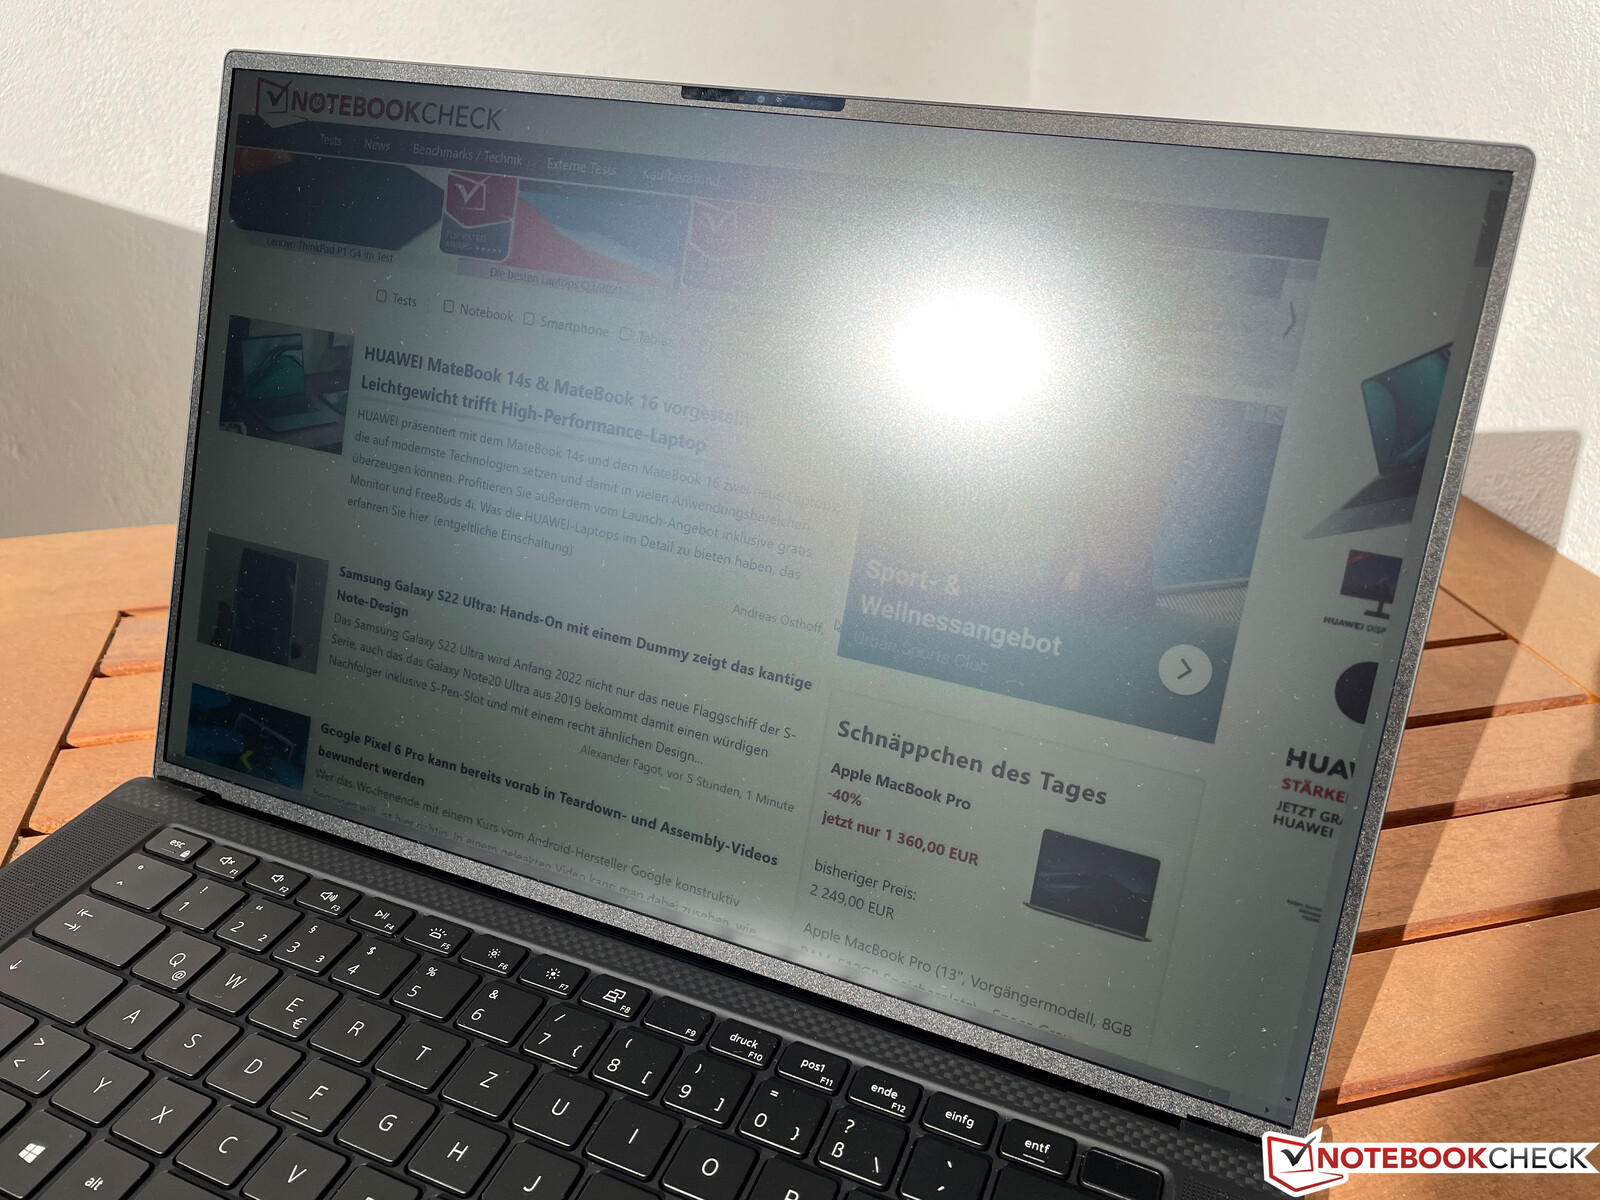
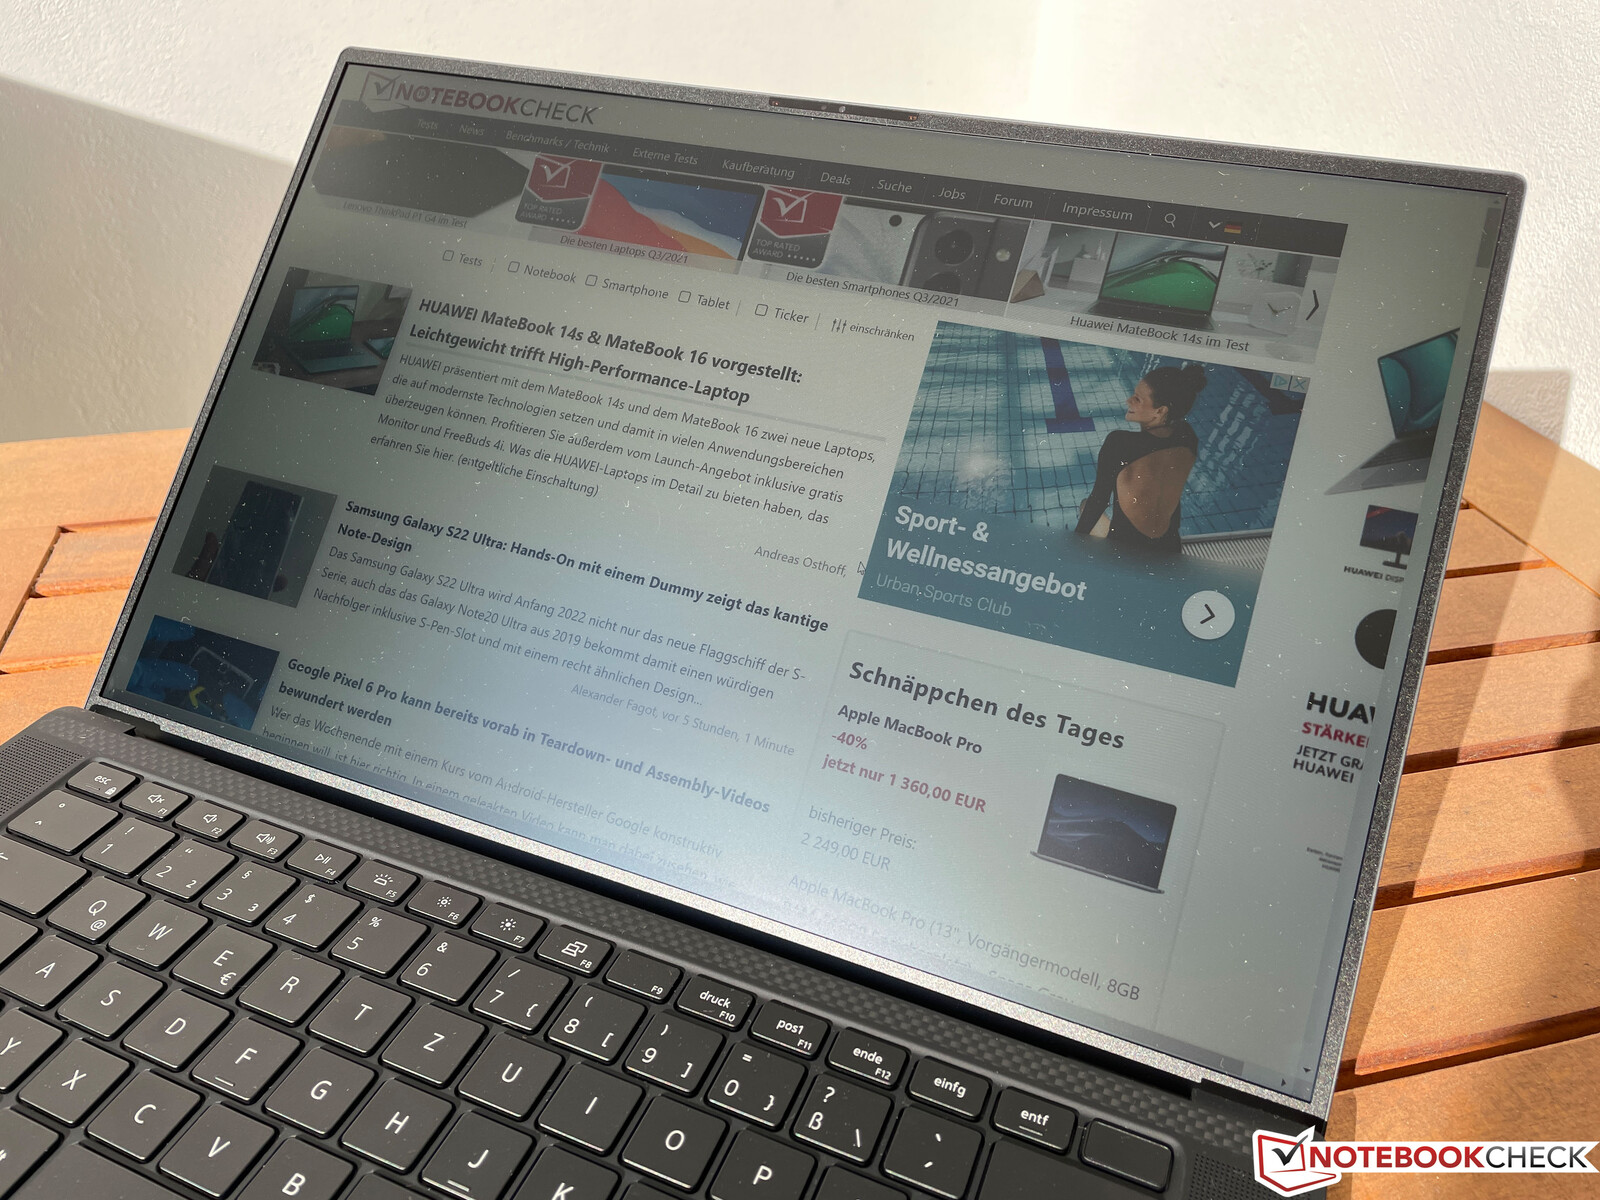
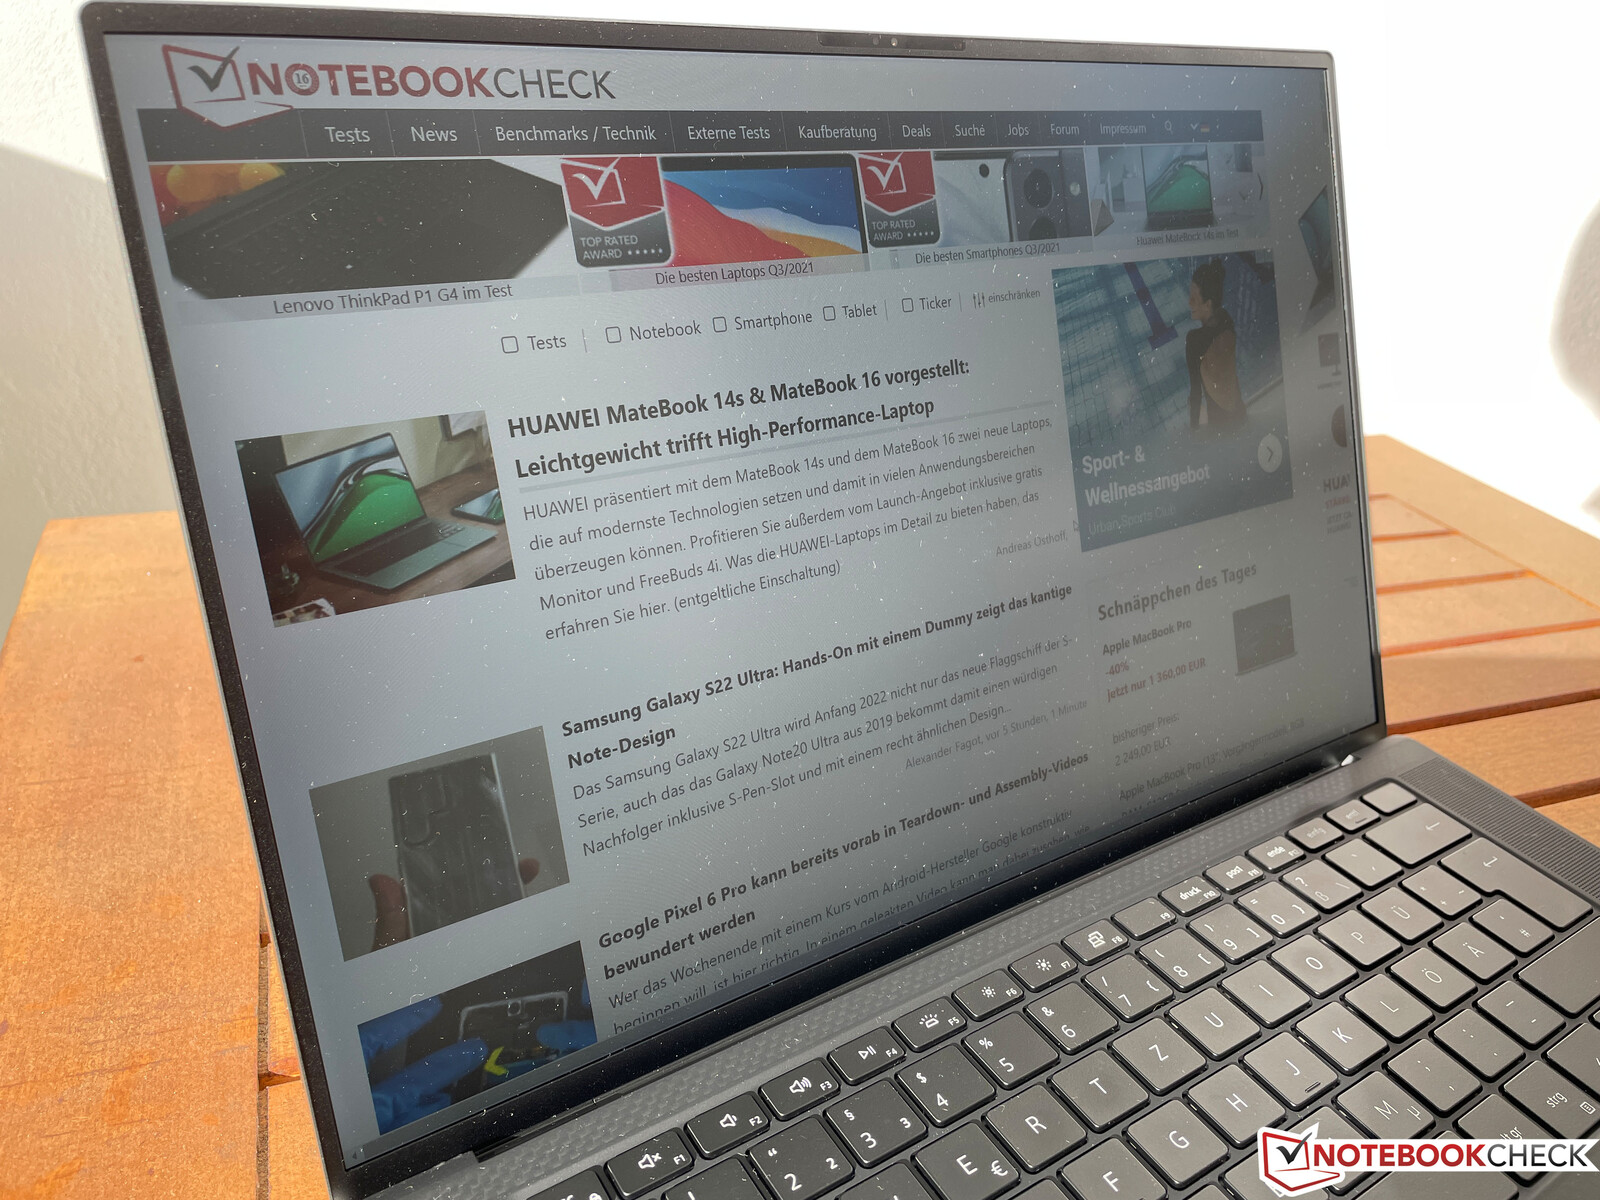
Thanks to its high brightness, the display is completely in its element outdoors. If you avoid direct reflections of light sources, you can also use the XPS 15 without any problems in very bright surroundings.
Performance - Tiger Lake H with 6 cores
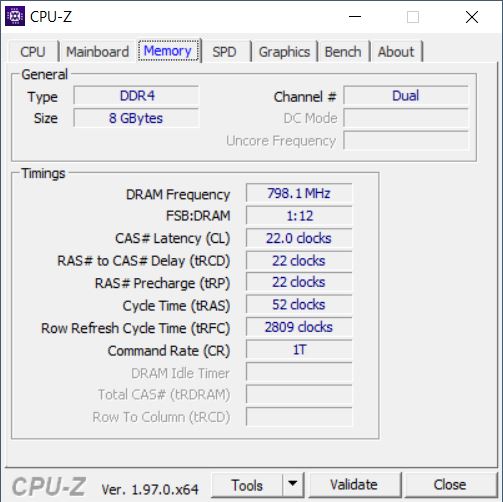
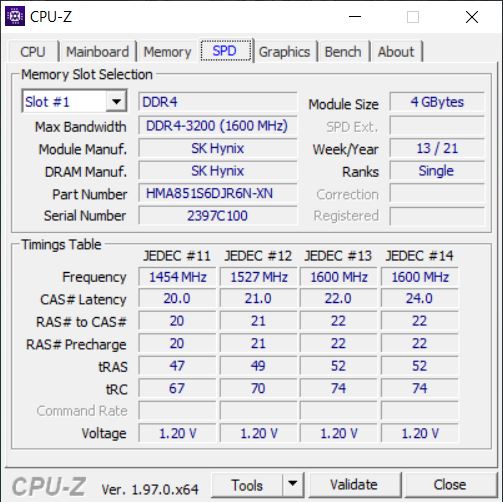
The entry-level model is primarily suitable for users who are looking for a large multimedia laptop and don't want to use it for gaming. Dell has equipped it with a current Intel Tiger Lake-H processor that is usually run at a TDP of 45 watts. Since the cooling is identical to the high-end model, this shouldn't really create any problems. However, Dell still decided for running the processor at only about 40 watts, which we are unable to explain. At 8 GB, the amount of working memory is also on the small side. While you can easily upgrade it with the availability of two SODIMM slots, since Dell uses two 4 GB modules, you have to pay more money to replace them with 16 GB, for example.
The preinstalled Dell Power Manager also offers the option to activate the Ultra Performance mode, but we will see in a moment why this does not have much of an effect. The following benchmarks and measurements were performed with the standard Optimized setting.
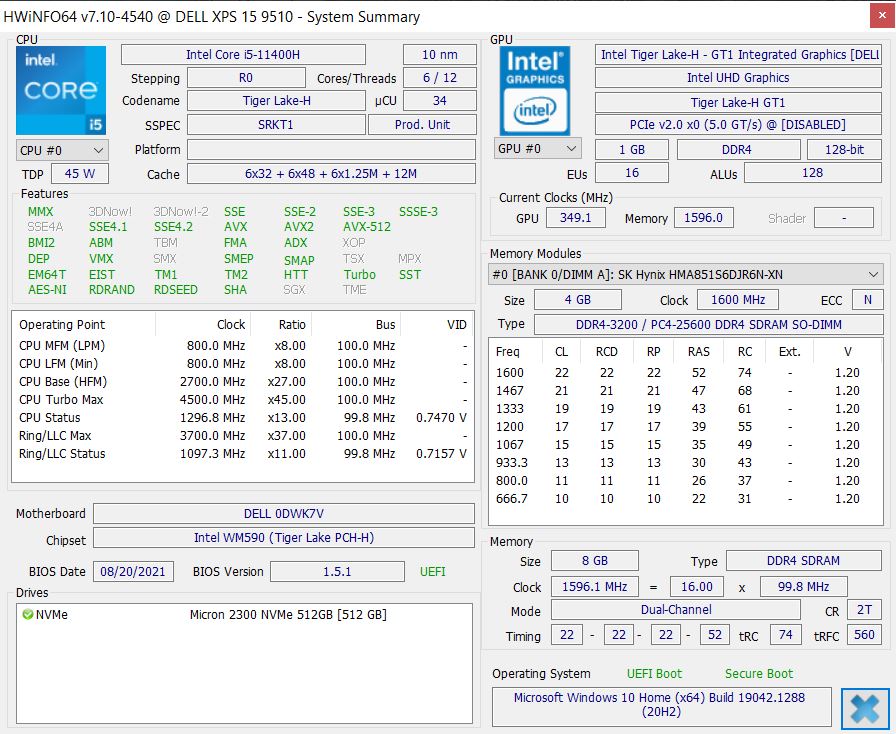
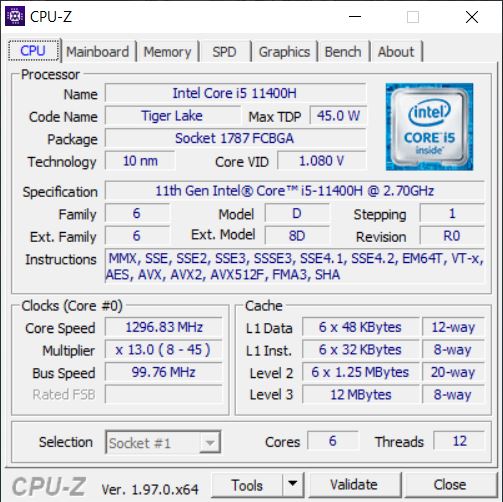
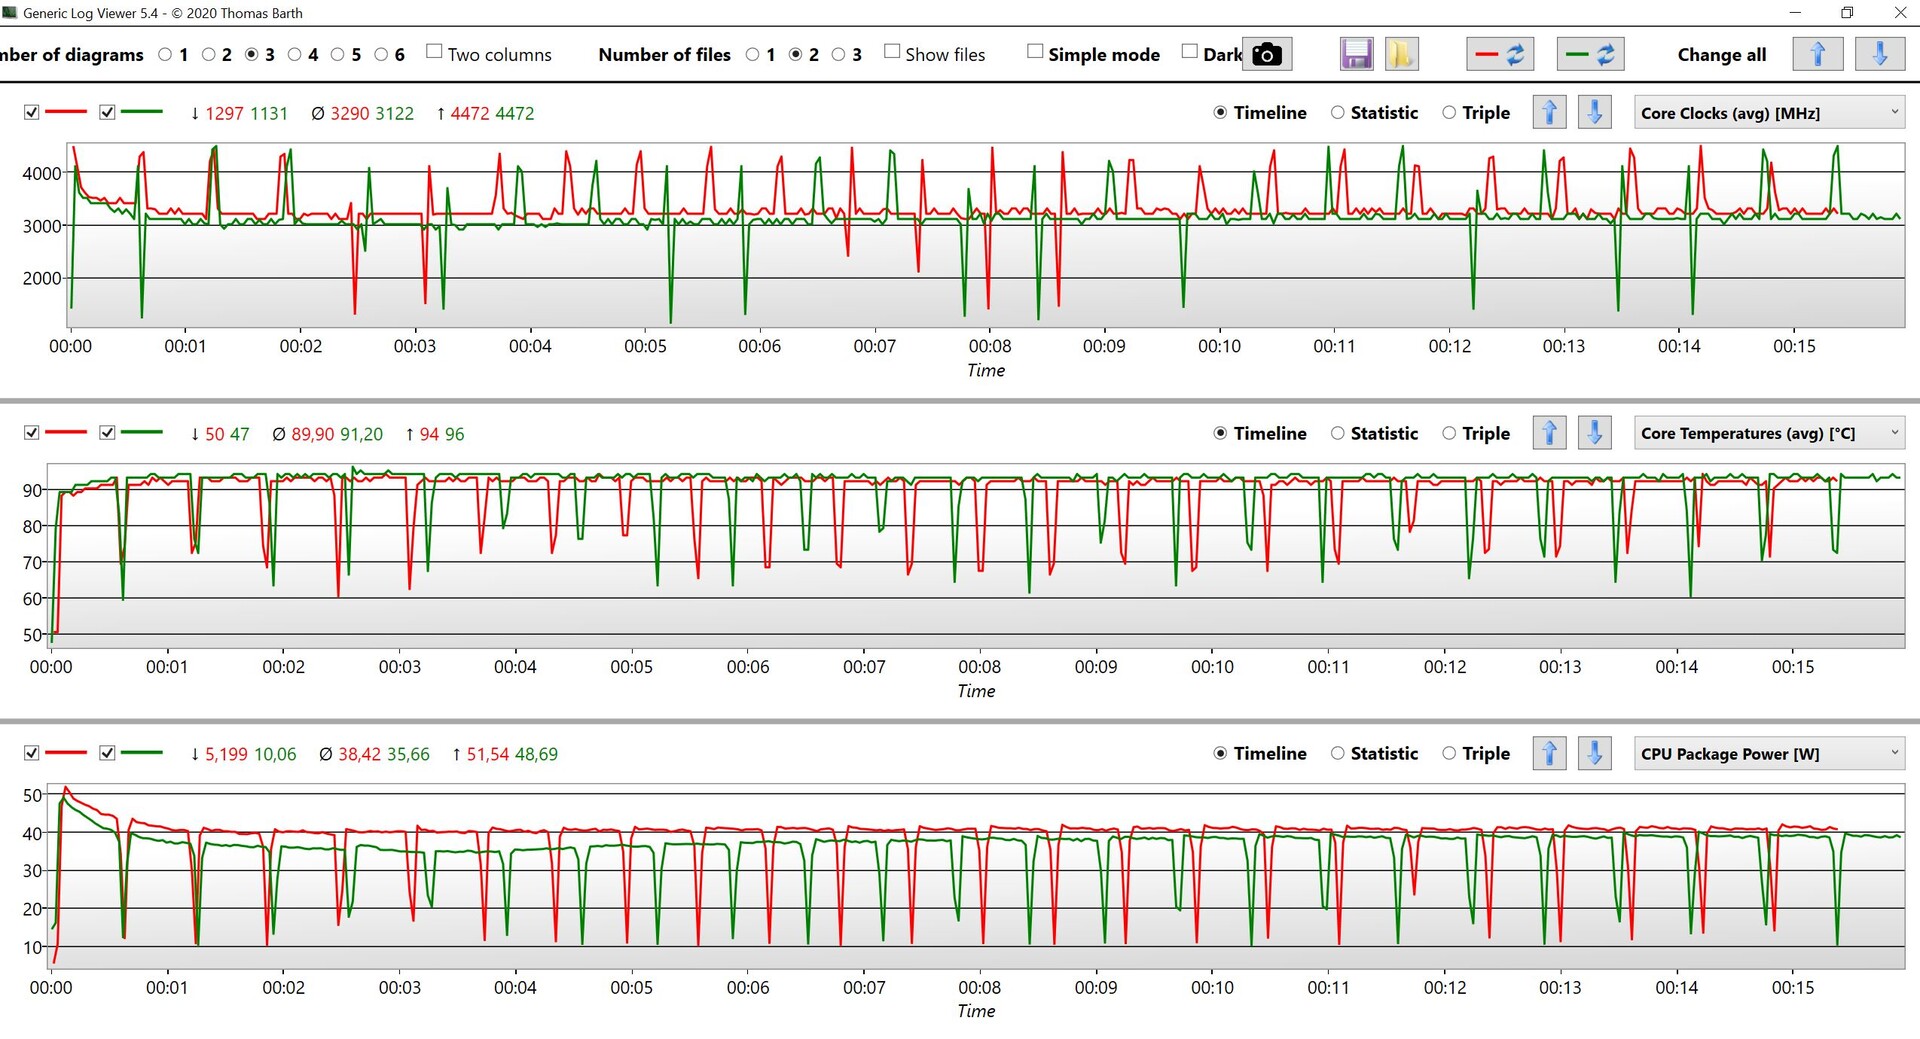
Processor - Core i5-11400H
The Core i5-11400H is a hexacore processor that is able to reach a maximum speed of 4.5 GHz on a single core and 4.1 GHz on all cores. In the beginning, the processor comes close to the 50-watt mark, but then it quickly levels out below 40 watts (or at 40 watts in the Ultra Performance mode). Due the powerful cooling, we would have expected it to be able to use the full potential of the Core i5-11400H.
Compared to the old Core i5-10300H (quadcore) in the XPS 15 9500, there is a performance advantage of about 30%, but the new hexacore processor is hardly any faster than the Core i7-11370H quadcore processor in the MateBook 14s. The new Huawei MateBook 16 also shows impressively what is possible with a current 45-Watt Ryzen processor from AMD (~70% faster on average in the multi tests @54 watts). While the performance is of course completely sufficient for everyday tasks, there is clearly some wasted potential here.
In battery operation, the TDP is lowered to only 15 watts, causing the CPU performance to drop by about 50% in the multi-core tests (579 points @ CB R15 Multi). You can find additional benchmarks in our technical section.
Cinebench R15 Multi Constant Load Test
Cinebench R20: CPU (Multi Core) | CPU (Single Core)
Cinebench R15: CPU Multi 64Bit | CPU Single 64Bit
Blender: v2.79 BMW27 CPU
7-Zip 18.03: 7z b 4 | 7z b 4 -mmt1
Geekbench 5.5: Multi-Core | Single-Core
HWBOT x265 Benchmark v2.2: 4k Preset
LibreOffice : 20 Documents To PDF
R Benchmark 2.5: Overall mean
| Cinebench R23 / Multi Core | |
| Average of class Multimedia (4861 - 33362, n=81, last 2 years) | |
| Dell XPS 15 9510 11800H RTX 3050 Ti OLED | |
| Average Intel Core i5-11400H (6674 - 9406, n=7) | |
| Dell XPS 15 9510 i5 11400H FHD | |
| Huawei MateBook 14s i7 | |
| Acer Swift 3 SF316-51 | |
| Schenker Vision 15 | |
| Cinebench R23 / Single Core | |
| Average of class Multimedia (1128 - 2459, n=73, last 2 years) | |
| Acer Swift 3 SF316-51 | |
| Huawei MateBook 14s i7 | |
| Dell XPS 15 9510 11800H RTX 3050 Ti OLED | |
| Average Intel Core i5-11400H (1349 - 1472, n=6) | |
| Dell XPS 15 9510 i5 11400H FHD | |
| Schenker Vision 15 | |
| Cinebench R20 / CPU (Multi Core) | |
| Average of class Multimedia (1887 - 12912, n=64, last 2 years) | |
| Dell XPS 15 9510 11800H RTX 3050 Ti OLED | |
| Honor MagicBook Pro (AMD) | |
| Average Intel Core i5-11400H (2550 - 3740, n=7) | |
| Dell XPS 15 9510 i5 11400H FHD | |
| Huawei MateBook 14s i7 | |
| Acer Swift 3 SF316-51 | |
| Dell XPS 15 9500 Core i5 | |
| Schenker Vision 15 | |
| Cinebench R20 / CPU (Single Core) | |
| Average of class Multimedia (425 - 853, n=64, last 2 years) | |
| Acer Swift 3 SF316-51 | |
| Huawei MateBook 14s i7 | |
| Dell XPS 15 9510 11800H RTX 3050 Ti OLED | |
| Dell XPS 15 9510 i5 11400H FHD | |
| Average Intel Core i5-11400H (522 - 569, n=6) | |
| Schenker Vision 15 | |
| Honor MagicBook Pro (AMD) | |
| Dell XPS 15 9500 Core i5 | |
| Cinebench R15 / CPU Multi 64Bit | |
| Average of class Multimedia (856 - 5224, n=68, last 2 years) | |
| Dell XPS 15 9510 11800H RTX 3050 Ti OLED | |
| Dell XPS 15 9510 11800H RTX 3050 Ti OLED | |
| Honor MagicBook Pro (AMD) | |
| Average Intel Core i5-11400H (1014 - 1532, n=7) | |
| Dell XPS 15 9510 i5 11400H FHD | |
| Dell XPS 15 9510 i5 11400H FHD | |
| Huawei MateBook 14s i7 | |
| Schenker Vision 15 | |
| Acer Swift 3 SF316-51 | |
| Dell XPS 15 9500 Core i5 | |
| Cinebench R15 / CPU Single 64Bit | |
| Average of class Multimedia (184.8 - 326, n=66, last 2 years) | |
| Huawei MateBook 14s i7 | |
| Acer Swift 3 SF316-51 | |
| Schenker Vision 15 | |
| Dell XPS 15 9510 11800H RTX 3050 Ti OLED | |
| Average Intel Core i5-11400H (202 - 219, n=6) | |
| Dell XPS 15 9510 i5 11400H FHD | |
| Dell XPS 15 9500 Core i5 | |
| Honor MagicBook Pro (AMD) | |
| Blender / v2.79 BMW27 CPU | |
| Schenker Vision 15 | |
| Dell XPS 15 9500 Core i5 | |
| Acer Swift 3 SF316-51 | |
| Huawei MateBook 14s i7 | |
| Dell XPS 15 9510 i5 11400H FHD | |
| Average Intel Core i5-11400H (340 - 483, n=6) | |
| Honor MagicBook Pro (AMD) | |
| Dell XPS 15 9510 11800H RTX 3050 Ti OLED | |
| Average of class Multimedia (100 - 557, n=65, last 2 years) | |
| 7-Zip 18.03 / 7z b 4 | |
| Average of class Multimedia (29095 - 130368, n=62, last 2 years) | |
| Dell XPS 15 9510 11800H RTX 3050 Ti OLED | |
| Honor MagicBook Pro (AMD) | |
| Average Intel Core i5-11400H (27615 - 40268, n=6) | |
| Dell XPS 15 9510 i5 11400H FHD | |
| Huawei MateBook 14s i7 | |
| Acer Swift 3 SF316-51 | |
| Schenker Vision 15 | |
| Dell XPS 15 9500 Core i5 | |
| 7-Zip 18.03 / 7z b 4 -mmt1 | |
| Average of class Multimedia (3666 - 7545, n=63, last 2 years) | |
| Dell XPS 15 9510 11800H RTX 3050 Ti OLED | |
| Acer Swift 3 SF316-51 | |
| Huawei MateBook 14s i7 | |
| Average Intel Core i5-11400H (4802 - 5343, n=6) | |
| Schenker Vision 15 | |
| Dell XPS 15 9510 i5 11400H FHD | |
| Dell XPS 15 9500 Core i5 | |
| Honor MagicBook Pro (AMD) | |
| Geekbench 5.5 / Multi-Core | |
| Average of class Multimedia (4652 - 20422, n=62, last 2 years) | |
| Dell XPS 15 9510 11800H RTX 3050 Ti OLED | |
| Average Intel Core i5-11400H (4679 - 7018, n=7) | |
| Acer Swift 3 SF316-51 | |
| Honor MagicBook Pro (AMD) | |
| Huawei MateBook 14s i7 | |
| Dell XPS 15 9510 i5 11400H FHD | |
| Schenker Vision 15 | |
| Dell XPS 15 9500 Core i5 | |
| Geekbench 5.5 / Single-Core | |
| Average of class Multimedia (805 - 2974, n=62, last 2 years) | |
| Acer Swift 3 SF316-51 | |
| Huawei MateBook 14s i7 | |
| Schenker Vision 15 | |
| Dell XPS 15 9510 11800H RTX 3050 Ti OLED | |
| Dell XPS 15 9510 i5 11400H FHD | |
| Average Intel Core i5-11400H (1396 - 1528, n=7) | |
| Dell XPS 15 9500 Core i5 | |
| Honor MagicBook Pro (AMD) | |
| HWBOT x265 Benchmark v2.2 / 4k Preset | |
| Average of class Multimedia (5.26 - 36.1, n=63, last 2 years) | |
| Dell XPS 15 9510 11800H RTX 3050 Ti OLED | |
| Honor MagicBook Pro (AMD) | |
| Average Intel Core i5-11400H (8.19 - 11.3, n=6) | |
| Dell XPS 15 9510 i5 11400H FHD | |
| Huawei MateBook 14s i7 | |
| Acer Swift 3 SF316-51 | |
| Schenker Vision 15 | |
| Dell XPS 15 9500 Core i5 | |
| LibreOffice / 20 Documents To PDF | |
| Dell XPS 15 9500 Core i5 | |
| Honor MagicBook Pro (AMD) | |
| Average of class Multimedia (23.9 - 146.7, n=64, last 2 years) | |
| Dell XPS 15 9510 11800H RTX 3050 Ti OLED | |
| Average Intel Core i5-11400H (41.4 - 53, n=6) | |
| Dell XPS 15 9510 i5 11400H FHD | |
| Schenker Vision 15 | |
| Huawei MateBook 14s i7 | |
| Acer Swift 3 SF316-51 | |
| R Benchmark 2.5 / Overall mean | |
| Dell XPS 15 9500 Core i5 | |
| Honor MagicBook Pro (AMD) | |
| Average Intel Core i5-11400H (0.581 - 0.644, n=6) | |
| Dell XPS 15 9510 i5 11400H FHD | |
| Schenker Vision 15 | |
| Dell XPS 15 9510 11800H RTX 3050 Ti OLED | |
| Huawei MateBook 14s i7 | |
| Acer Swift 3 SF316-51 | |
| Average of class Multimedia (0.3604 - 0.947, n=63, last 2 years) | |
* ... smaller is better
System Performance
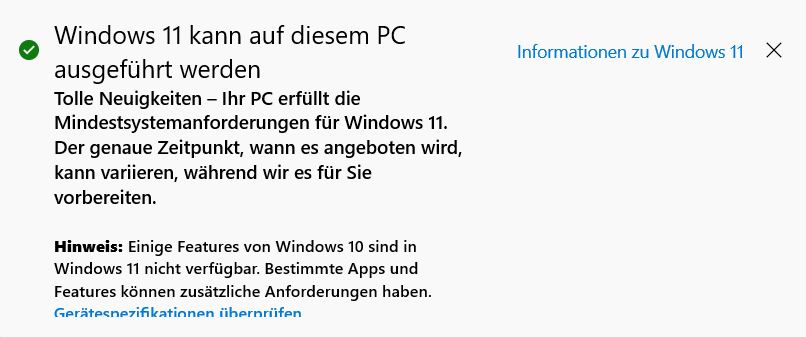
Due to the relatively weak CPU/iGPU combination, the XPS 15 9510 only barely places ahead of the old XPS 15 at the end of the comparison group in the synthetic PCMark 10 benchmarks. However, in everyday tasks this is not noticeable, and the XPS 15 is simply a very responsive computer, which is of course also due to the fast PCIe SSD. The XPS 15 9510 is compatible with Windows 11.
| PCMark 10 / Score | |
| Average of class Multimedia (4325 - 10386, n=58, last 2 years) | |
| Dell XPS 15 9510 11800H RTX 3050 Ti OLED | |
| Acer Swift 3 SF316-51 | |
| Huawei MateBook 14s i7 | |
| Schenker Vision 15 | |
| Honor MagicBook Pro (AMD) | |
| Average Intel Core i5-11400H, Intel UHD Graphics Xe 16EUs (4502 - 4525, n=2) | |
| Dell XPS 15 9510 i5 11400H FHD | |
| Dell XPS 15 9500 Core i5 | |
| PCMark 10 / Essentials | |
| Huawei MateBook 14s i7 | |
| Schenker Vision 15 | |
| Average of class Multimedia (8025 - 11664, n=57, last 2 years) | |
| Acer Swift 3 SF316-51 | |
| Dell XPS 15 9500 Core i5 | |
| Dell XPS 15 9510 11800H RTX 3050 Ti OLED | |
| Average Intel Core i5-11400H, Intel UHD Graphics Xe 16EUs (9463 - 9513, n=2) | |
| Dell XPS 15 9510 i5 11400H FHD | |
| Honor MagicBook Pro (AMD) | |
| PCMark 10 / Productivity | |
| Average of class Multimedia (7323 - 18233, n=57, last 2 years) | |
| Dell XPS 15 9510 11800H RTX 3050 Ti OLED | |
| Acer Swift 3 SF316-51 | |
| Honor MagicBook Pro (AMD) | |
| Huawei MateBook 14s i7 | |
| Dell XPS 15 9500 Core i5 | |
| Schenker Vision 15 | |
| Average Intel Core i5-11400H, Intel UHD Graphics Xe 16EUs (6466 - 6495, n=2) | |
| Dell XPS 15 9510 i5 11400H FHD | |
| PCMark 10 / Digital Content Creation | |
| Average of class Multimedia (3651 - 16240, n=57, last 2 years) | |
| Dell XPS 15 9510 11800H RTX 3050 Ti OLED | |
| Acer Swift 3 SF316-51 | |
| Huawei MateBook 14s i7 | |
| Honor MagicBook Pro (AMD) | |
| Schenker Vision 15 | |
| Average Intel Core i5-11400H, Intel UHD Graphics Xe 16EUs (4047 - 4072, n=2) | |
| Dell XPS 15 9510 i5 11400H FHD | |
| Dell XPS 15 9500 Core i5 | |
| PCMark 10 Score | 4502 points | |
Help | ||
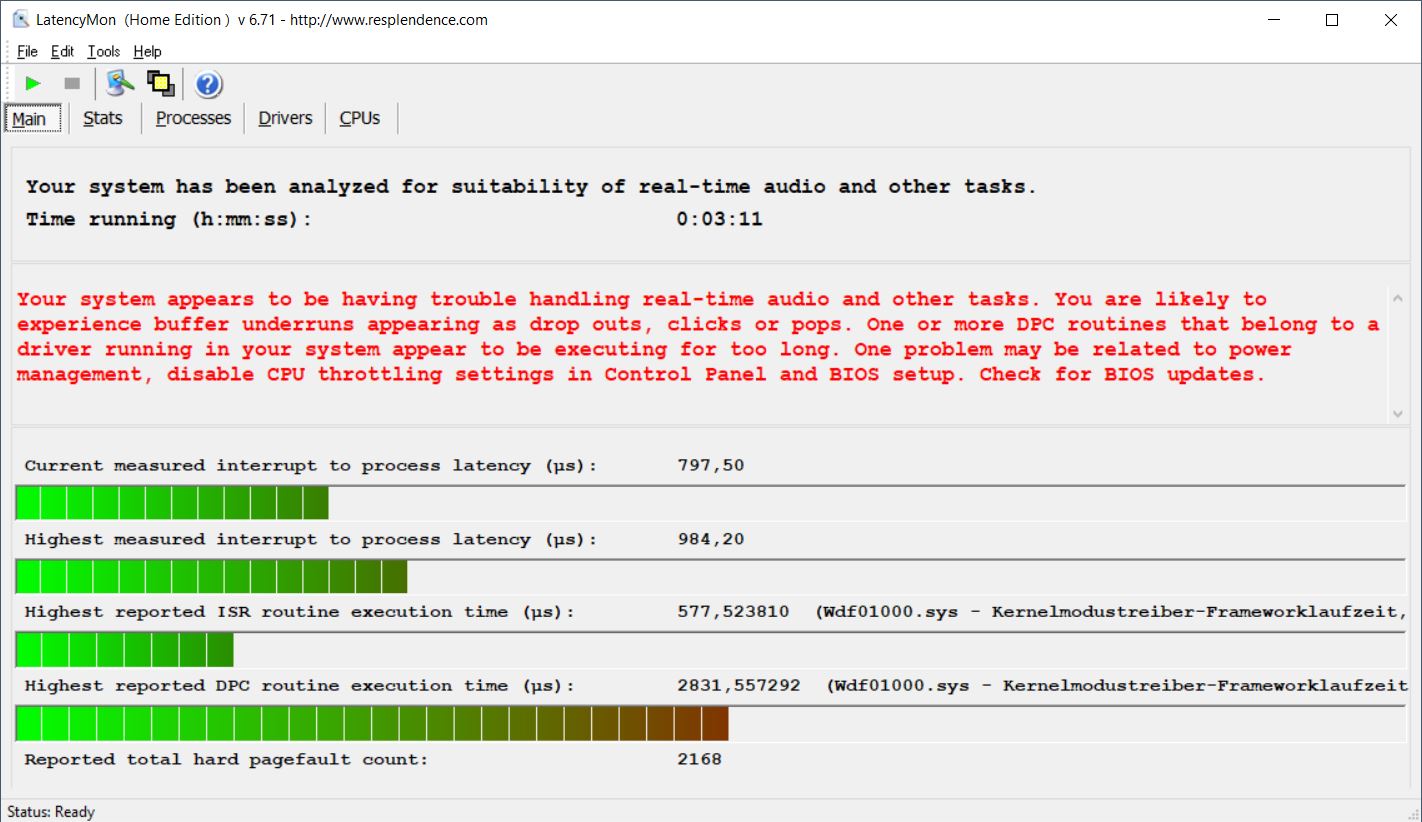
DPC Latencies
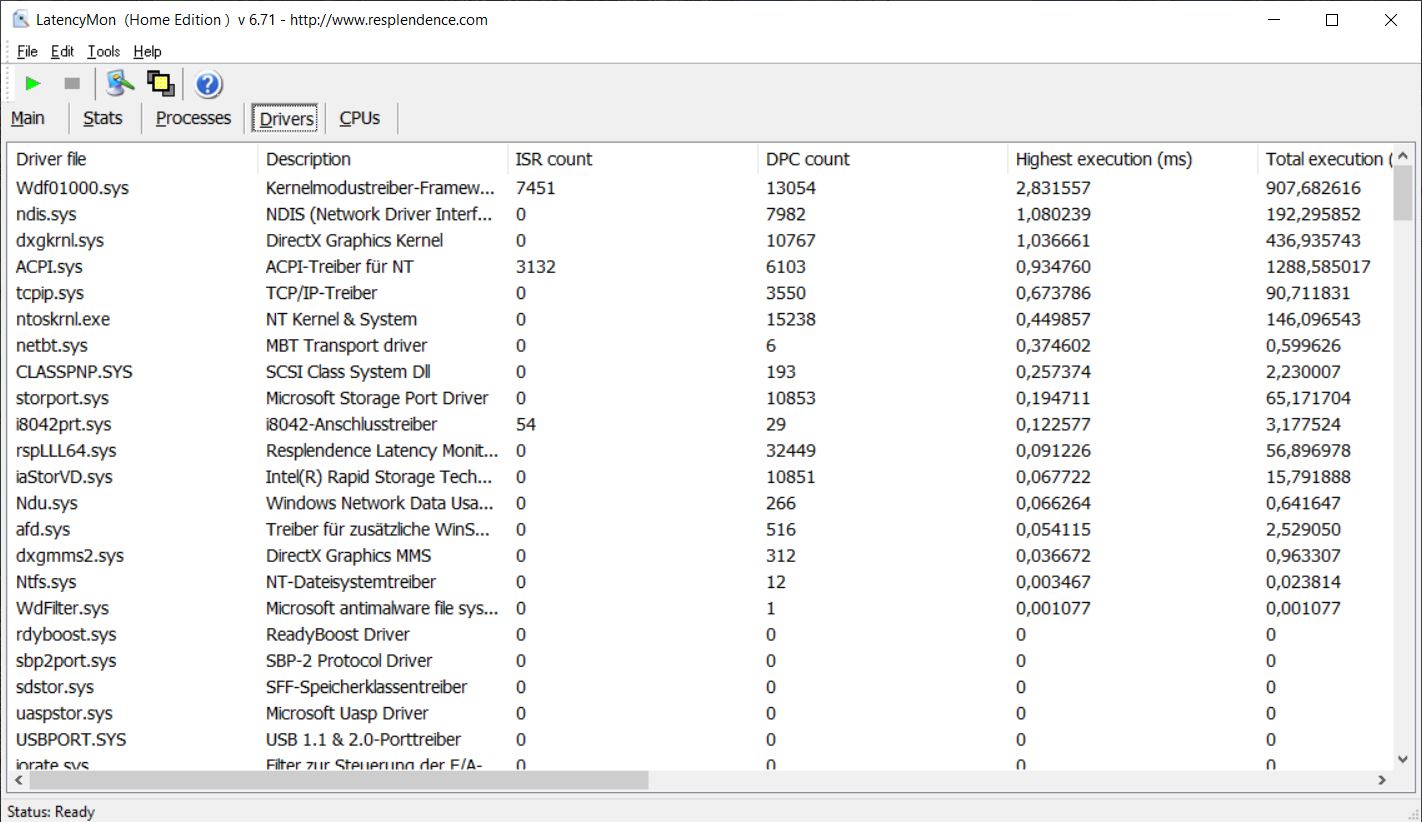
| DPC Latencies / LatencyMon - interrupt to process latency (max), Web, Youtube, Prime95 | |
| Schenker Vision 15 | |
| Dell XPS 15 9510 11800H RTX 3050 Ti OLED | |
| Dell XPS 15 9500 Core i5 | |
| Honor MagicBook Pro (AMD) | |
| Dell XPS 15 9510 i5 11400H FHD | |
| Huawei MateBook 14s i7 | |
| Acer Swift 3 SF316-51 | |
* ... smaller is better
Storage Solution
Our test unit is equipped with a fast PCIe 3.0 SSD from Micron, which offers a 512 GB storage capacity (411 GB available after turning it on for the first time). Thanks to the second M.2 2280 slot, the storage capacity can easily be expanded if necessary. You can find additional SSD benchmarks here.
| Dell XPS 15 9510 i5 11400H FHD Micron 2300 512GB MTFDHBA512TDV | Huawei MateBook 14s i7 Toshiba XG6 KXG60ZNV512G | Acer Swift 3 SF316-51 Micron 2210 MTFDHBA512QFD | Honor MagicBook Pro (AMD) WDC PC SN730 SDBPNTY-512G | Dell XPS 15 9500 Core i5 Toshiba KBG40ZNS256G NVMe | Dell XPS 15 9510 11800H RTX 3050 Ti OLED Micron 2300 512GB MTFDHBA512TDV | Schenker Vision 15 Samsung SSD 980 Pro 1TB MZ-V8P1T0BW | Average Micron 2300 512GB MTFDHBA512TDV | Average of class Multimedia | |
|---|---|---|---|---|---|---|---|---|---|
| CrystalDiskMark 5.2 / 6 | 28% | -2% | -6% | -30% | -2% | 88% | -1% | 42% | |
| Write 4K (MB/s) | 110.3 | 209.4 90% | 171.8 56% | 156.9 42% | 93.3 -15% | 109.3 -1% | 238.1 116% | 105.5 ? -4% | 163.8 ? 49% |
| Read 4K (MB/s) | 57.1 | 56.8 -1% | 79.4 39% | 48.81 -15% | 45.9 -20% | 53.9 -6% | 79.2 39% | 51.2 ? -10% | 67.5 ? 18% |
| Write Seq (MB/s) | 1958 | 1099 -44% | 1050 -46% | 1211 -38% | 1991 2% | 4139 111% | 2041 ? 4% | 2715 ? 39% | |
| Read Seq (MB/s) | 1781 | 1847 4% | 2517 41% | 1633 -8% | 1759 -1% | 4133 132% | 1845 ? 4% | 3120 ? 75% | |
| Write 4K Q32T1 (MB/s) | 495.7 | 606 22% | 539 9% | 408.7 -18% | 273.1 -45% | 499.8 1% | 697 41% | 494 ? 0% | 454 ? -8% |
| Read 4K Q32T1 (MB/s) | 474.4 | 792 67% | 555 17% | 504 6% | 356 -25% | 438.8 -8% | 758 60% | 445 ? -6% | 581 ? 22% |
| Write Seq Q32T1 (MB/s) | 2839 | 2322 -18% | 1095 -61% | 1087 -62% | 1198 -58% | 2835 0% | 5187 83% | 2867 ? 1% | 4593 ? 62% |
| Read Seq Q32T1 (MB/s) | 3243 | 3511 8% | 1988 -39% | 3407 5% | 2269 -30% | 3235 0% | 7117 119% | 3272 ? 1% | 5776 ? 78% |
| Write 4K Q8T8 (MB/s) | 1573 | 1077 ? | |||||||
| Read 4K Q8T8 (MB/s) | 1202 | 1365 ? | |||||||
| AS SSD | 46% | 11% | 74% | -55% | -8% | 135% | 10% | 75% | |
| Seq Read (MB/s) | 2602 | 2961 14% | 2015 -23% | 2749 6% | 1423 -45% | 1362 -48% | 5427 109% | 2300 ? -12% | 4442 ? 71% |
| Seq Write (MB/s) | 976 | 2098 115% | 1055 8% | 2348 141% | 766 -22% | 1440 48% | 3886 298% | 1550 ? 59% | 3060 ? 214% |
| 4K Read (MB/s) | 42.99 | 53 23% | 73.9 72% | 44.22 3% | 42.21 -2% | 38.43 -11% | 72.9 70% | 45 ? 5% | 61.2 ? 42% |
| 4K Write (MB/s) | 127.1 | 186.9 47% | 223.2 76% | 140.5 11% | 74.8 -41% | 121.4 -4% | 219.3 73% | 106.6 ? -16% | 185.6 ? 46% |
| 4K-64 Read (MB/s) | 383.3 | 1131 195% | 589 54% | 1450 278% | 973 154% | 370.5 -3% | 2209 476% | 676 ? 76% | 1085 ? 183% |
| 4K-64 Write (MB/s) | 1346 | 1502 12% | 1029 -24% | 2346 74% | 218.8 -84% | 1054 -22% | 2265 68% | 1616 ? 20% | 2213 ? 64% |
| Access Time Read * (ms) | 0.037 | 0.029 22% | 0.056 -51% | 0.079 -114% | 0.125 -238% | 0.042 -14% | 0.033 11% | 0.059 ? -59% | 0.05759 ? -56% |
| Access Time Write * (ms) | 0.117 | 0.026 78% | 0.039 67% | 0.027 77% | 0.552 -372% | 0.135 -15% | 0.02 83% | 0.1807 ? -54% | 0.07513 ? 36% |
| Score Read (Points) | 687 | 1480 115% | 865 26% | 1769 157% | 1157 68% | 545 -21% | 2825 311% | 952 ? 39% | 1590 ? 131% |
| Score Write (Points) | 1571 | 1899 21% | 1358 -14% | 2721 73% | 370 -76% | 1319 -16% | 2873 83% | 1877 ? 19% | 2705 ? 72% |
| Score Total (Points) | 2541 | 4102 61% | 2644 4% | 5376 112% | 2094 -18% | 2160 -15% | 7069 178% | 3290 ? 29% | 5052 ? 99% |
| Copy ISO MB/s (MB/s) | 1074 | 1512 41% | 1186 10% | 1151 7% | 1406 31% | 2775 158% | 1603 ? 49% | 2777 ? 159% | |
| Copy Program MB/s (MB/s) | 874 | 376.3 -57% | 782 -11% | 499.4 -43% | 844 -3% | 662 -24% | 843 ? -4% | 852 ? -3% | |
| Copy Game MB/s (MB/s) | 1805 | 1115 -38% | 1028 -43% | 733 -59% | 1353 -25% | 1655 -8% | 1570 ? -13% | 1723 ? -5% | |
| Total Average (Program / Settings) | 37% /
41% | 5% /
6% | 34% /
41% | -43% /
-46% | -5% /
-6% | 112% /
118% | 5% /
6% | 59% /
63% |
* ... smaller is better

Constant Performance Reading: DiskSpd Read Loop, Queue Depth 8
Graphics Card
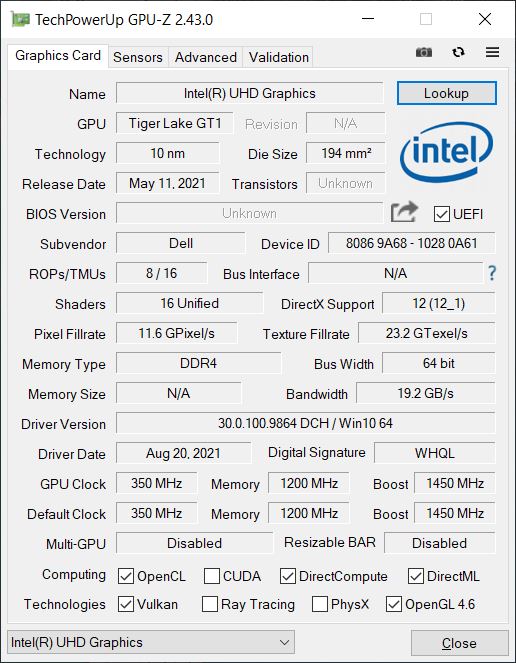
The largest difference between the i5-11400H and other Tiger Lake H45 CPUs is the integrated GPU, since there is only a slimmed down UHD Graphics Xe graphics chip with 16 EUs (Core i7-11800H: 32 EUs, Core i7-11370H: 96 EUs). The pure graphics performance is therefore only at the level of the old XPS 15 9500 with the UHD Graphics 630, even though dual-channel RAM is already used. The only advantage of the new iGPU is the improved video decoder of the Tiger Lake generation, which significantly reduces the GPU load during 4K video reproduction (~30% vs. 60% for the old UHD Graphics 630).
With this configuration, the XPS 15 is hardly suited for gaming, and many games don't run smoothly even at minimal detail settings. Those who still want to game should concentrate on simple games from the Windows store.
The graphics performance remains stable under constant load, as well as during battery operation. You can find additional benchmarks here.
| 3DMark 06 Standard Score | 12803 points | |
| 3DMark Vantage P Result | 7609 points | |
| 3DMark 11 Performance | 1979 points | |
| 3DMark Ice Storm Standard Score | 57212 points | |
| 3DMark Cloud Gate Standard Score | 10288 points | |
| 3DMark Fire Strike Score | 1298 points | |
| 3DMark Time Spy Score | 433 points | |
Help | ||
| low | med. | high | ultra | |
|---|---|---|---|---|
| GTA V (2015) | 62.8 | 50 | 9.2 | |
| The Witcher 3 (2015) | 27 | 17 | 9 | 5 |
| Dota 2 Reborn (2015) | 108 | 57 | 23.1 | 21.5 |
| Final Fantasy XV Benchmark (2018) | 14.6 | 6.87 | 4.79 | |
| X-Plane 11.11 (2018) | 18.4 | 16.8 | 15.4 | |
| Strange Brigade (2018) | 31 | 12 | 11 | 7 |
| F1 2020 (2020) | 26 | 12 | ||
| F1 2021 (2021) | 34 |
Emissions and Power
Noise Emissions
The advantage of the low performance lies in the quiet fans that you practically never hear in everyday operation (surfing the Internet, video streaming). Even under full load, it takes a few minutes before the maximum level of almost 38 dB(A) is reached. We did not notice any other electronic noises such as coil whine.
Noise level
| Idle |
| 24.4 / 24.4 / 24.4 dB(A) |
| Load |
| 26.1 / 37.7 dB(A) |
 | ||
30 dB silent 40 dB(A) audible 50 dB(A) loud |
||
min: | ||
| Dell XPS 15 9510 i5 11400H FHD UHD Graphics Xe 16EUs, i5-11400H, Micron 2300 512GB MTFDHBA512TDV | Huawei MateBook 14s i7 Iris Xe G7 96EUs, i7-11370H, Toshiba XG6 KXG60ZNV512G | Acer Swift 3 SF316-51 Iris Xe G7 96EUs, i7-11370H, Micron 2210 MTFDHBA512QFD | Honor MagicBook Pro (AMD) Vega 6, R5 4600H, WDC PC SN730 SDBPNTY-512G | Dell XPS 15 9500 Core i5 UHD Graphics 630, i5-10300H, Toshiba KBG40ZNS256G NVMe | Dell XPS 15 9510 11800H RTX 3050 Ti OLED GeForce RTX 3050 Ti Laptop GPU, i7-11800H, Micron 2300 512GB MTFDHBA512TDV | Schenker Vision 15 Iris Xe G7 96EUs, i7-1165G7, Samsung SSD 980 Pro 1TB MZ-V8P1T0BW | |
|---|---|---|---|---|---|---|---|
| Noise | -8% | -11% | -14% | -13% | -6% | -25% | |
| off / environment * (dB) | 24.4 | 24.3 -0% | 26 -7% | 29.7 -22% | 28 -15% | 23.8 2% | 29.8 -22% |
| Idle Minimum * (dB) | 24.4 | 24.3 -0% | 26 -7% | 29.7 -22% | 28 -15% | 23.8 2% | 29.8 -22% |
| Idle Average * (dB) | 24.4 | 24.3 -0% | 26 -7% | 29.7 -22% | 28 -15% | 23.8 2% | 29.8 -22% |
| Idle Maximum * (dB) | 24.4 | 28.4 -16% | 27.7 -14% | 30.5 -25% | 28 -15% | 23.8 2% | 31.1 -27% |
| Load Average * (dB) | 26.1 | 31.7 -21% | 32.7 -25% | 31 -19% | 28 -7% | 36 -38% | 40.5 -55% |
| Witcher 3 ultra * (dB) | 33.2 | 31.7 5% | 31.3 6% | 36 -8% | 40.5 -22% | ||
| Load Maximum * (dB) | 37.7 | 46.8 -24% | 39 -3% | 36.7 3% | 41.9 -11% | 38.2 -1% | 40.5 -7% |
* ... smaller is better
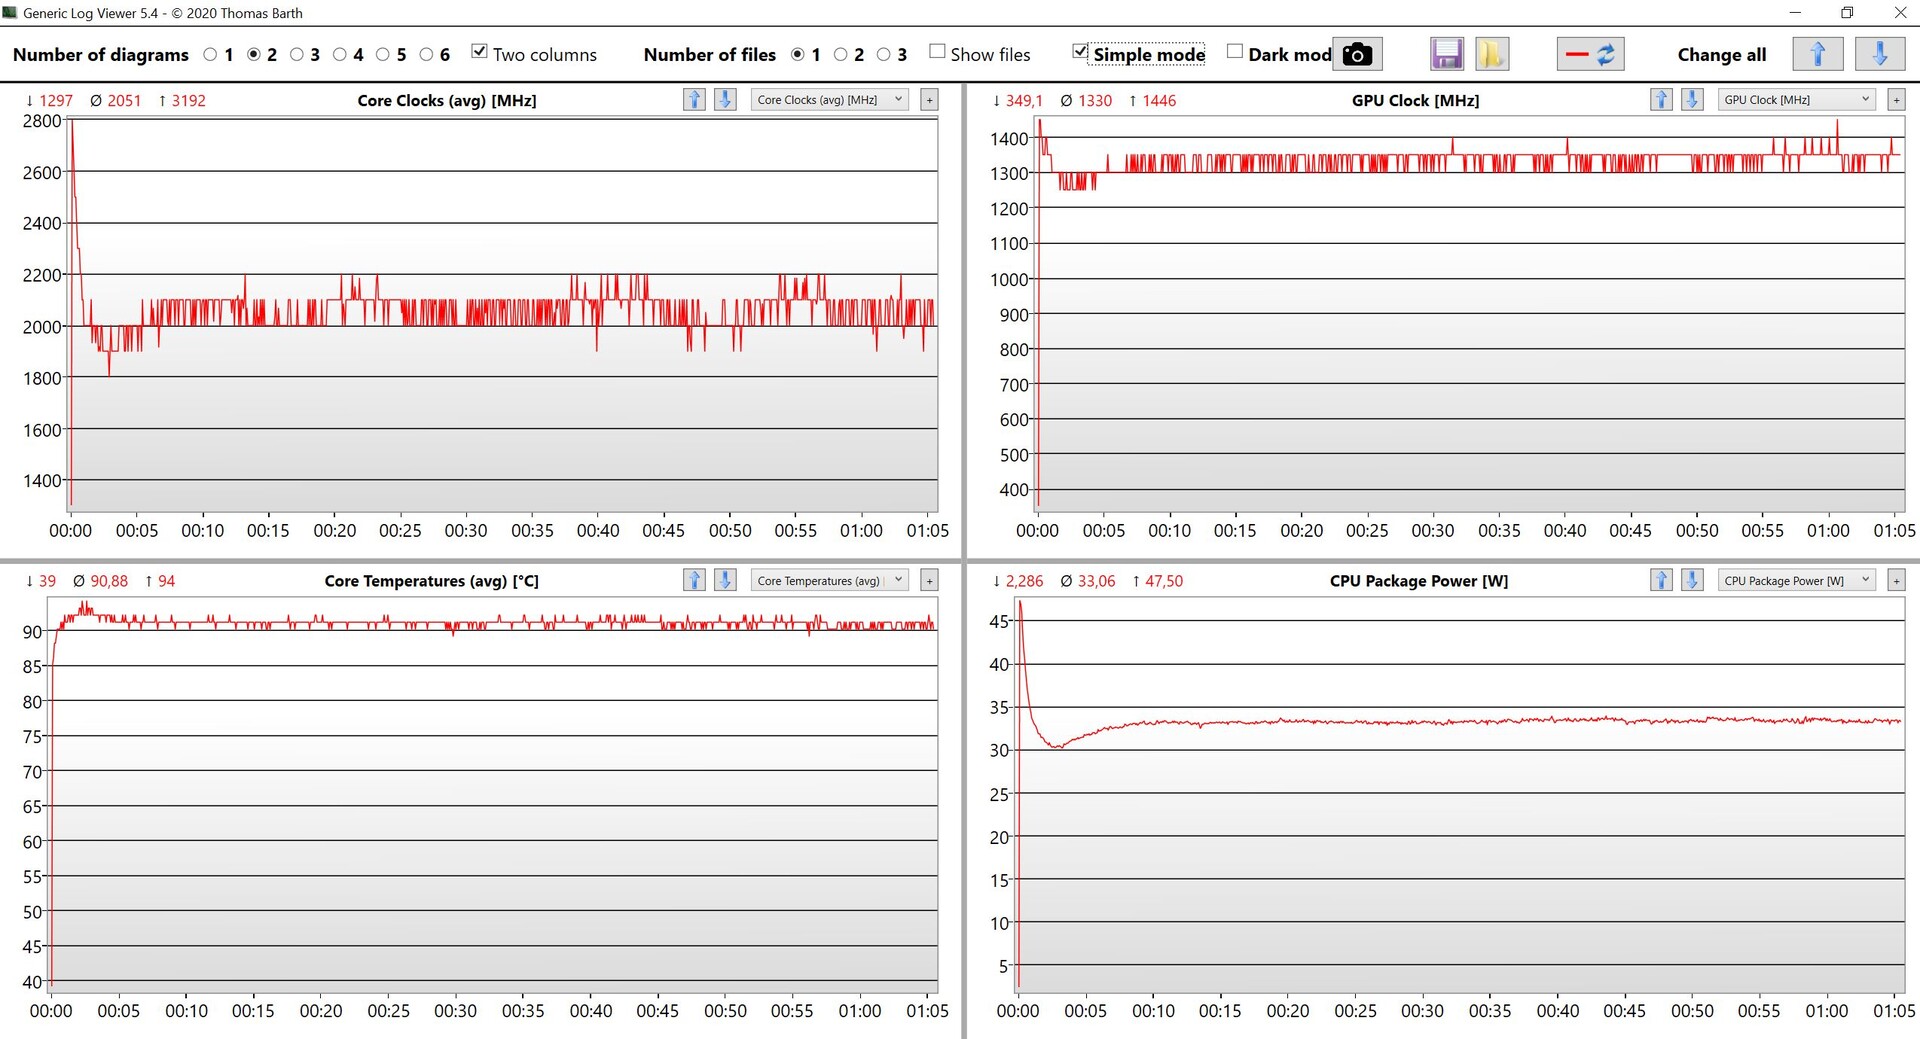
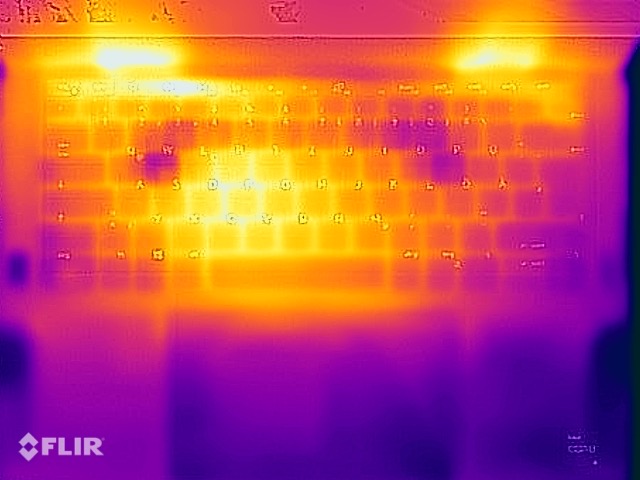
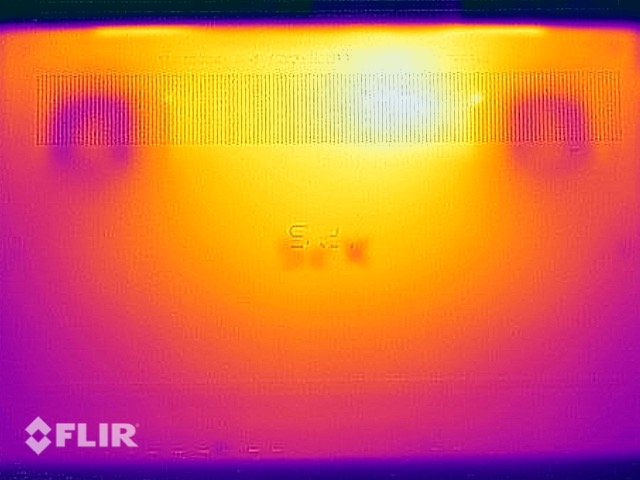
Temperature
The surface temperatures give no reason for concern in any situation, and you can place your computer on your lap even under load. During the stress test, the performance is even reduced further, and it levels out at only 34 watts (CPU: ~2 GHz, iGPU: ~1.3 GHz), which is again very little.
(±) The maximum temperature on the upper side is 42.8 °C / 109 F, compared to the average of 36.8 °C / 98 F, ranging from 21 to 71 °C for the class Multimedia.
(±) The bottom heats up to a maximum of 41.2 °C / 106 F, compared to the average of 39.1 °C / 102 F
(+) In idle usage, the average temperature for the upper side is 25.2 °C / 77 F, compared to the device average of 31.3 °C / 88 F.
(±) Playing The Witcher 3, the average temperature for the upper side is 34.5 °C / 94 F, compared to the device average of 31.3 °C / 88 F.
(+) The palmrests and touchpad are cooler than skin temperature with a maximum of 31.5 °C / 88.7 F and are therefore cool to the touch.
(-) The average temperature of the palmrest area of similar devices was 28.7 °C / 83.7 F (-2.8 °C / -5 F).
Speakers
Dell XPS 15 9510 i5 11400H FHD audio analysis
(+) | speakers can play relatively loud (88.8 dB)
Bass 100 - 315 Hz
(±) | reduced bass - on average 5.6% lower than median
(+) | bass is linear (4.3% delta to prev. frequency)
Mids 400 - 2000 Hz
(+) | balanced mids - only 3.9% away from median
(+) | mids are linear (4.1% delta to prev. frequency)
Highs 2 - 16 kHz
(+) | balanced highs - only 2.4% away from median
(+) | highs are linear (4.9% delta to prev. frequency)
Overall 100 - 16.000 Hz
(+) | overall sound is linear (8.4% difference to median)
Compared to same class
» 9% of all tested devices in this class were better, 2% similar, 89% worse
» The best had a delta of 5%, average was 17%, worst was 45%
Compared to all devices tested
» 2% of all tested devices were better, 1% similar, 97% worse
» The best had a delta of 4%, average was 24%, worst was 134%
Acer Swift 3 SF316-51 audio analysis
(±) | speaker loudness is average but good (75.2 dB)
Bass 100 - 315 Hz
(-) | nearly no bass - on average 25.5% lower than median
(±) | linearity of bass is average (12.1% delta to prev. frequency)
Mids 400 - 2000 Hz
(+) | balanced mids - only 2.7% away from median
(+) | mids are linear (5.2% delta to prev. frequency)
Highs 2 - 16 kHz
(+) | balanced highs - only 3.8% away from median
(+) | highs are linear (2.9% delta to prev. frequency)
Overall 100 - 16.000 Hz
(±) | linearity of overall sound is average (17.7% difference to median)
Compared to same class
» 51% of all tested devices in this class were better, 7% similar, 42% worse
» The best had a delta of 5%, average was 17%, worst was 45%
Compared to all devices tested
» 35% of all tested devices were better, 8% similar, 57% worse
» The best had a delta of 4%, average was 24%, worst was 134%
Power Consumption
Considering the large and very bright display, the idle consumption of the XPS 15 is very low. By the way, the basic model is delivered with a weaker 90 Watt power supply (USB-C), while the high-end XPS 15 includes a 130 Watt power supply. However, since the maximum consumption during the stress test is only 76 watts and then quickly levels out at 57 watts, the 90-Watt power supply is completely sufficient.
| Off / Standby | |
| Idle | |
| Load |
|
Key:
min: | |
Power Consumption Witcher 3 / Stress Test
Battery Life
The efficient FHD panel also becomes noticeable in terms of the battery life, and despite the smaller battery, in practice a battery life of 6.5 to 7.5 hours are possible in our WLAN test (depending on the brightness; 150 cd/m² @24%). However, there is also some wasted potential here, since with the larger 86-Wh battery, 10-11 hours would probably be possible here. Even though the i5 XPS still places ahead of its OLED sibling, it ends up last of our comparison group overall.
Pros
Cons
Verdict - The XPS 15 9510 with the Core i5 & iGPU is too expensive
In principle, the concept of offering a high-quality multimedia laptop without a dedicated graphics card definitely makes sense, because not everyone also wants to play games with their laptop. However, the new XPS 15 9510 does not appear to be well-thought-out in this regard, and the i5-11400H used is unsuitable. It is known that Dell does not use AMD CPUs for the XPS 15, but it would have been better to use the Core i7-11370H. Despite having two CPU cores less, the CPU performance in everyday operation is not noticeably worse, but the integrated GPU is significantly faster.
Overall, the actual performance of the test unit is very disappointing. Despite having the same cooling as the high-end model, the TDP is limited to 40 watts already after several seconds. The graphics performance also did not improve compared to the old XPS 15 9500 iGPU. But at least the XPS 15 remains almost always silent in everyday operation with this, and the fans remain very quiet even under load. While this is probably positive in everyday operation, at least in the optional Ultra Performance mode, we would have liked the maximum CPU performance, even if the fans are louder then.
The iGPU model of the new XPS 15 9510 is simply too expensive for the offered performance. For those who are interested in an XPS 15 without a dedicated GPU, we recommend the old XPS 15 9500, which continues to be available from Dell for 1250 Euros (~$1456) and is hardly any slower.
The matte Full-HD display continues to be extremely bright and is therefore very well suited for using it outdoors. The power consumption also remains within limits, but unfortunately Dell also uses a smaller battery in its entry-level model, meaning that the battery life is also not particularly good. There is definitely some wasted potential here. Overall, the Schenker Vision 15 is a better alternative, and there are also many multimedia laptops with a much better price-performance ratio, such as the Honor MagicBook Pro, the Acer Swift 3 16, and also the Huawei MateBook 14s with its great 3:2 display. In addition, another competitor is introduced with the MateBook 16, which offers significantly more performance thanks to the Ryzen 7-5800H processor. But if it absolutely must be the XPS 15 with the bright FHD panel, we recommend the XPS 15 9500 predecessor, which offers hardly any less CPU performance for everyday tasks and continues to be available from Dell for 1250 Euros (~$1456).
Price and Availability
Our test configuration is available from Dell for about $1300, with many other configurations also being available. For example, the model with the Core i7-11800H, dedicated GeForce RTX 3050, 16 GB of RAM, the matte FHD panel, and the larger battery costs about $1900.
Dell XPS 15 9510 i5 11400H FHD
- 10/20/2021 v7 (old)
Andreas Osthoff
Price comparison

