Dell XPS 15 9500 Core i5 Review: Now Even More Like a MacBook Pro

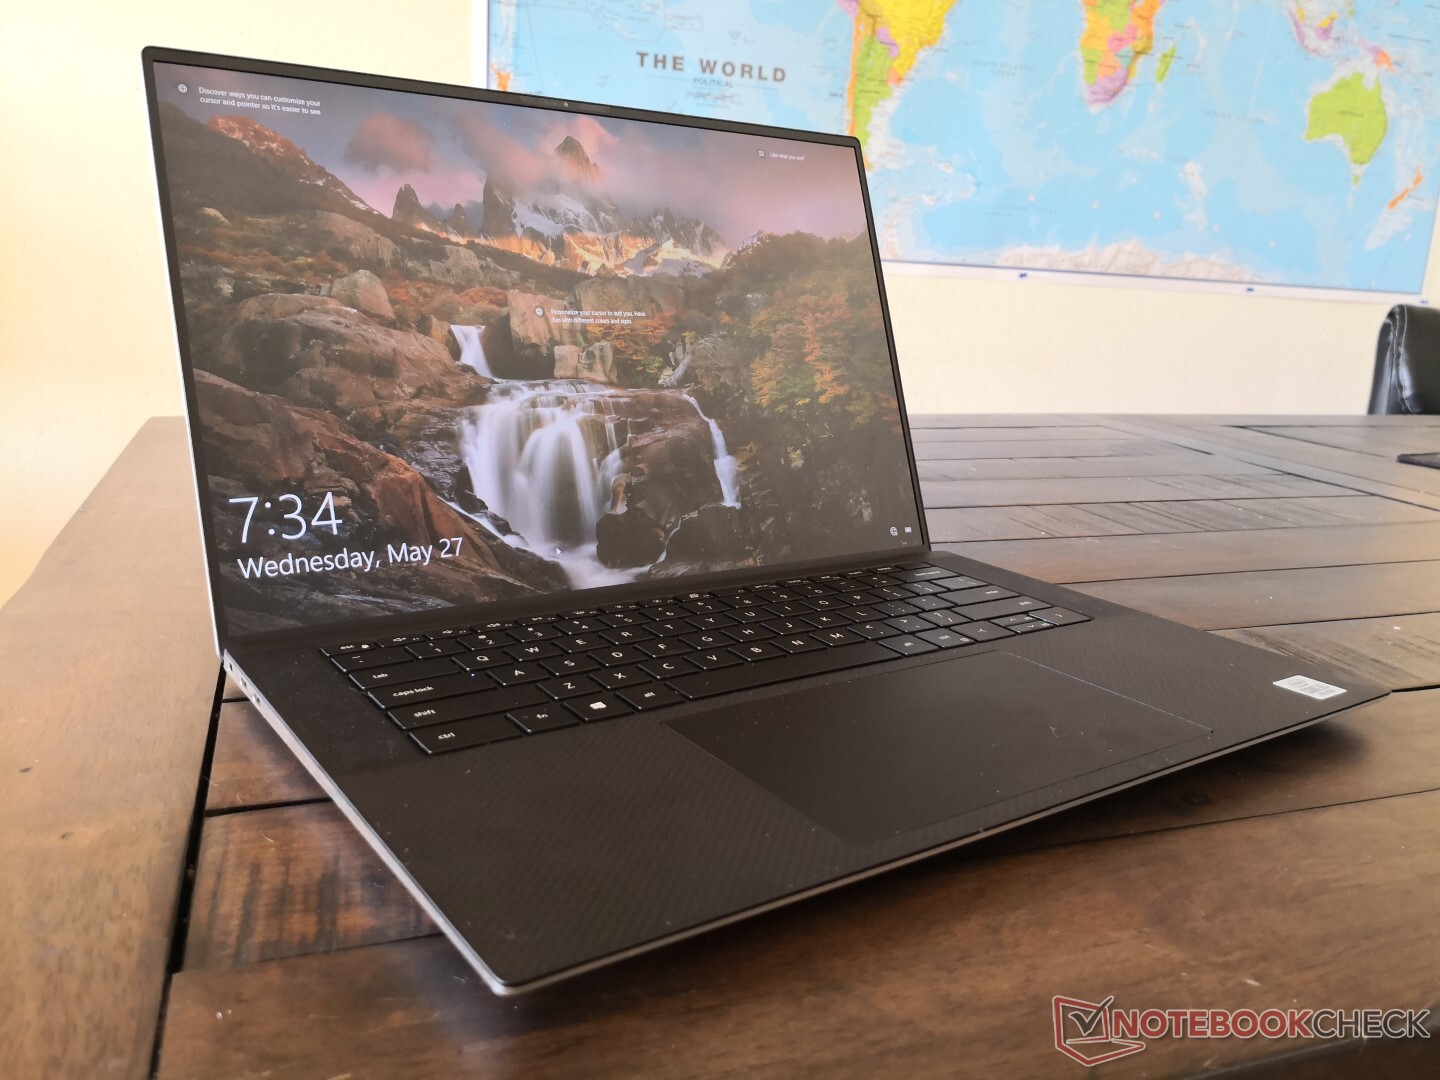
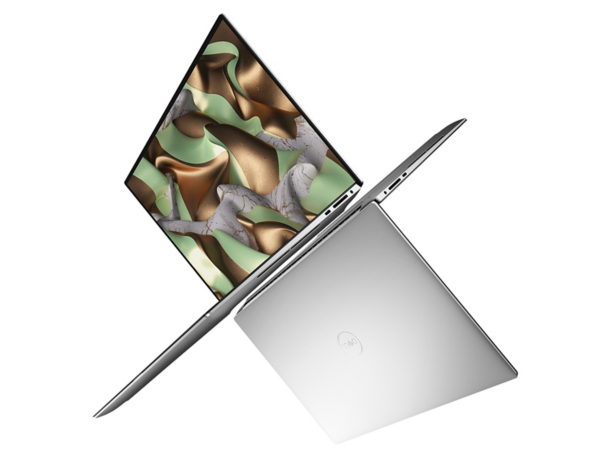
After almost five years of using the exact same chassis from the XPS 15 9550 all the way up to the XPS 15 7590, the Dell XPS 15 9500 is the complete redesign that the series sorely needed. The system brings a host of gen-to-gen changes both inside and out with the new 16:10 aspect ratio display being the most prominent.
Internally, the CPU and GPU have been updated to the Intel 10th gen Comet Lake-H series and the optional GeForce GTX 1650 Ti, respectively, alongside faster DDR4-2933 RAM and new display options. Launch prices range from $1300 USD all the way up to $2300 or more. The system we'll be checking out today is the least expensive configuration with the Core i5-10300H CPU, 8 GB of RAM, 256 GB NVMe SSD, and 1200p display. Expect a second review on a higher-end Core i7 and GeForce configuration at a future date so we can properly compare how the two SKUs will differ.
Direct competitors to the XPS 15 include other 15.6-inch flagship Ultrabooks like the HP Spectre x360 15, Asus ZenBook 15, MSI Prestige 15, Lenovo Yoga C940-15, Microsoft Surface Laptop 3 15, and the Apple MacBook Pro series.
More Dell reviews:
Rating | Date | Model | Weight | Height | Size | Resolution | Price |
|---|---|---|---|---|---|---|---|
| 86.8 % v7 (old) | 05 / 2020 | Dell XPS 15 9500 Core i5 i5-10300H, UHD Graphics 630 | 1.8 kg | 18 mm | 15.60" | 1920x1200 | |
| 85.2 % v7 (old) | 03 / 2020 | Asus ZenBook 15 UX534FTC-A8190T i7-10510U, GeForce GTX 1650 Max-Q | 1.6 kg | 18.9 mm | 15.60" | 1920x1080 | |
| 86 % v7 (old) | 12 / 2019 | Lenovo Yoga C940-15IRH i7-9750H, GeForce GTX 1650 Max-Q | 2 kg | 19.7 mm | 15.60" | 1920x1080 | |
| 85 % v7 (old) | 01 / 2020 | HP Spectre X360 15-5ZV31AV i7-10510U, GeForce MX250 | 2.1 kg | 19.3 mm | 15.60" | 3840x2160 | |
| 89.7 % v7 (old) | 12 / 2019 | Apple MacBook Pro 16 2019 i9 5500M i9-9880H, Radeon Pro 5500M | 2 kg | 16.2 mm | 16.00" | 3072x1920 |
Case
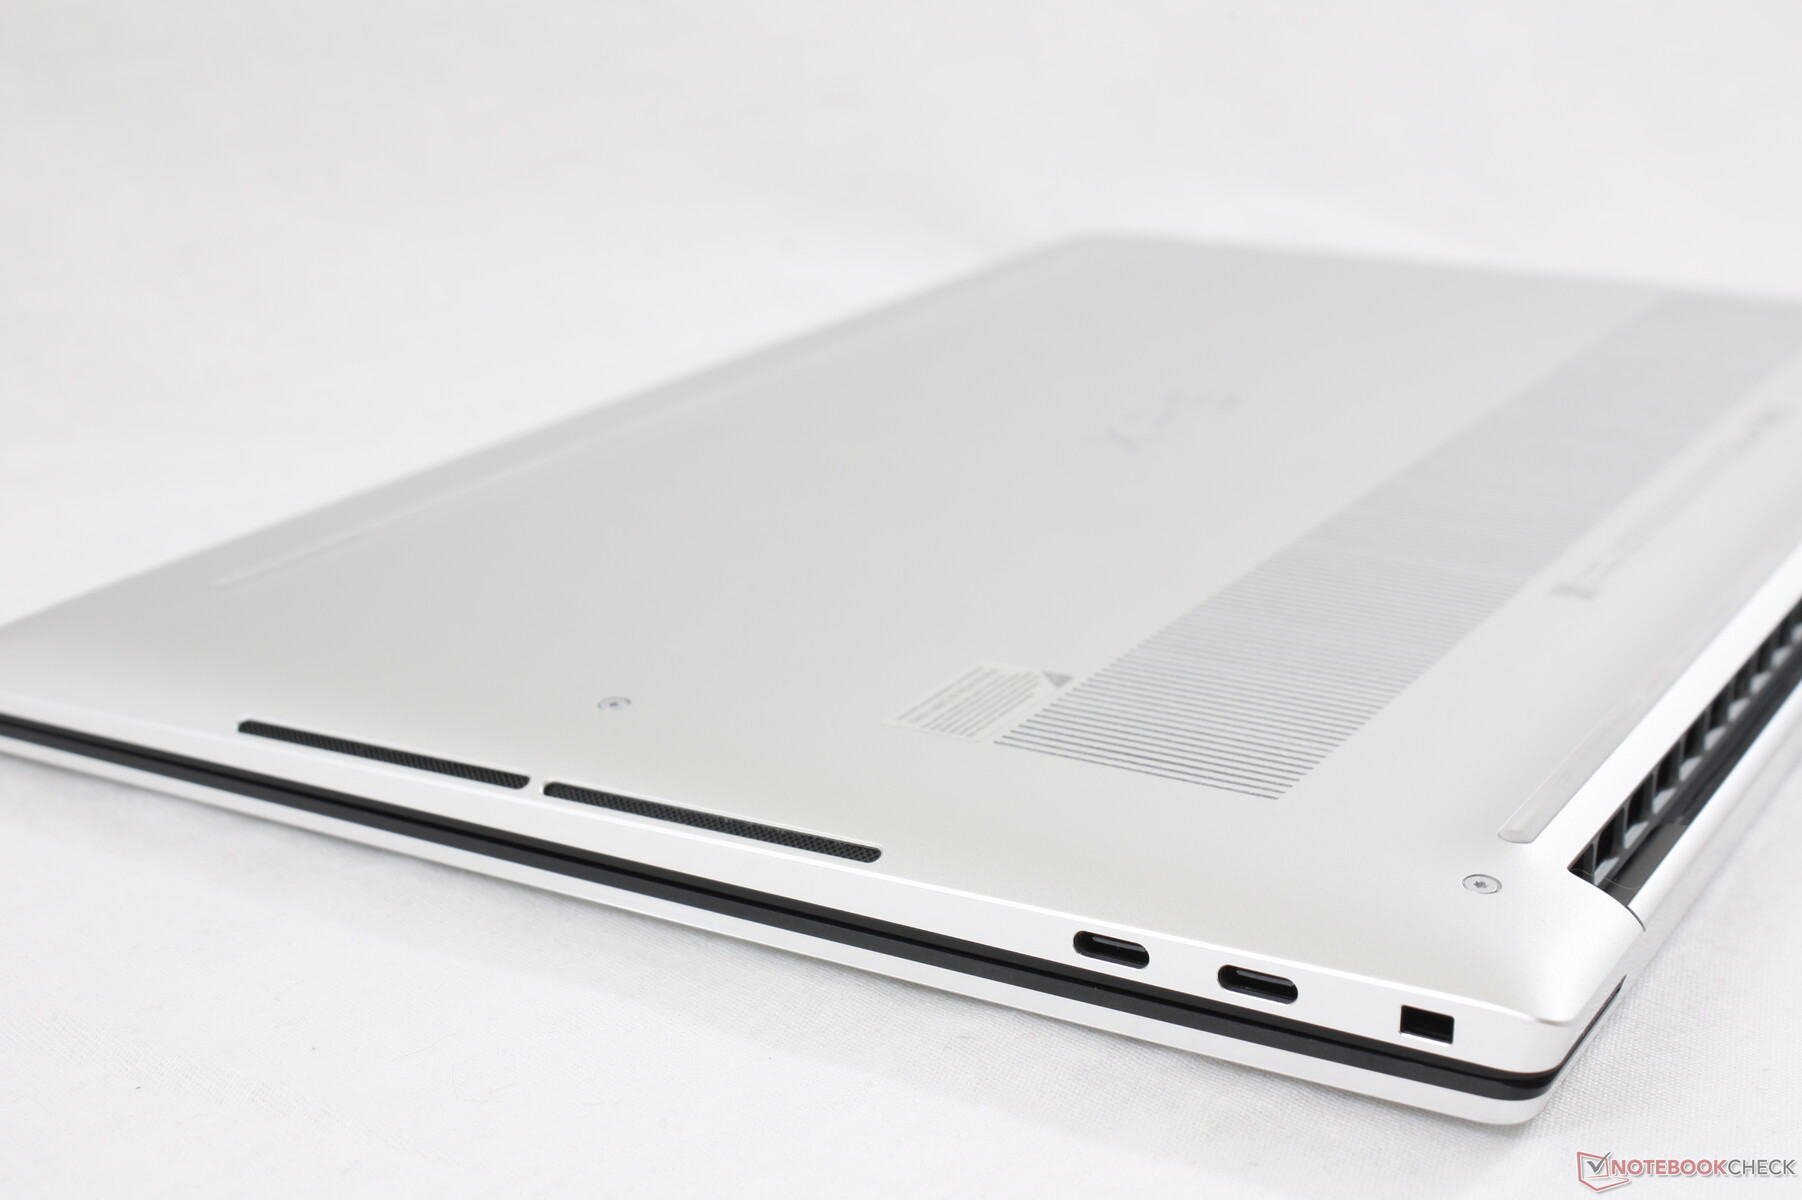
Externally, Dell has made several changes to the XPS 15 chassis with many that are similar to the jump from the XPS 13 7390 to the XPS 13 9300. The bottom metal plate, for example, now rises to cover the edges and corners whereas last year's model had black carbon fiber instead. Dell says this will create a stronger chassis that's more resistant to bumps and bruises without deviating too far from the visual design of the previous generation. From what we can tell, attempting to twist the base or lid doesn't show any more or less flexing than on the XPS 15 7590.
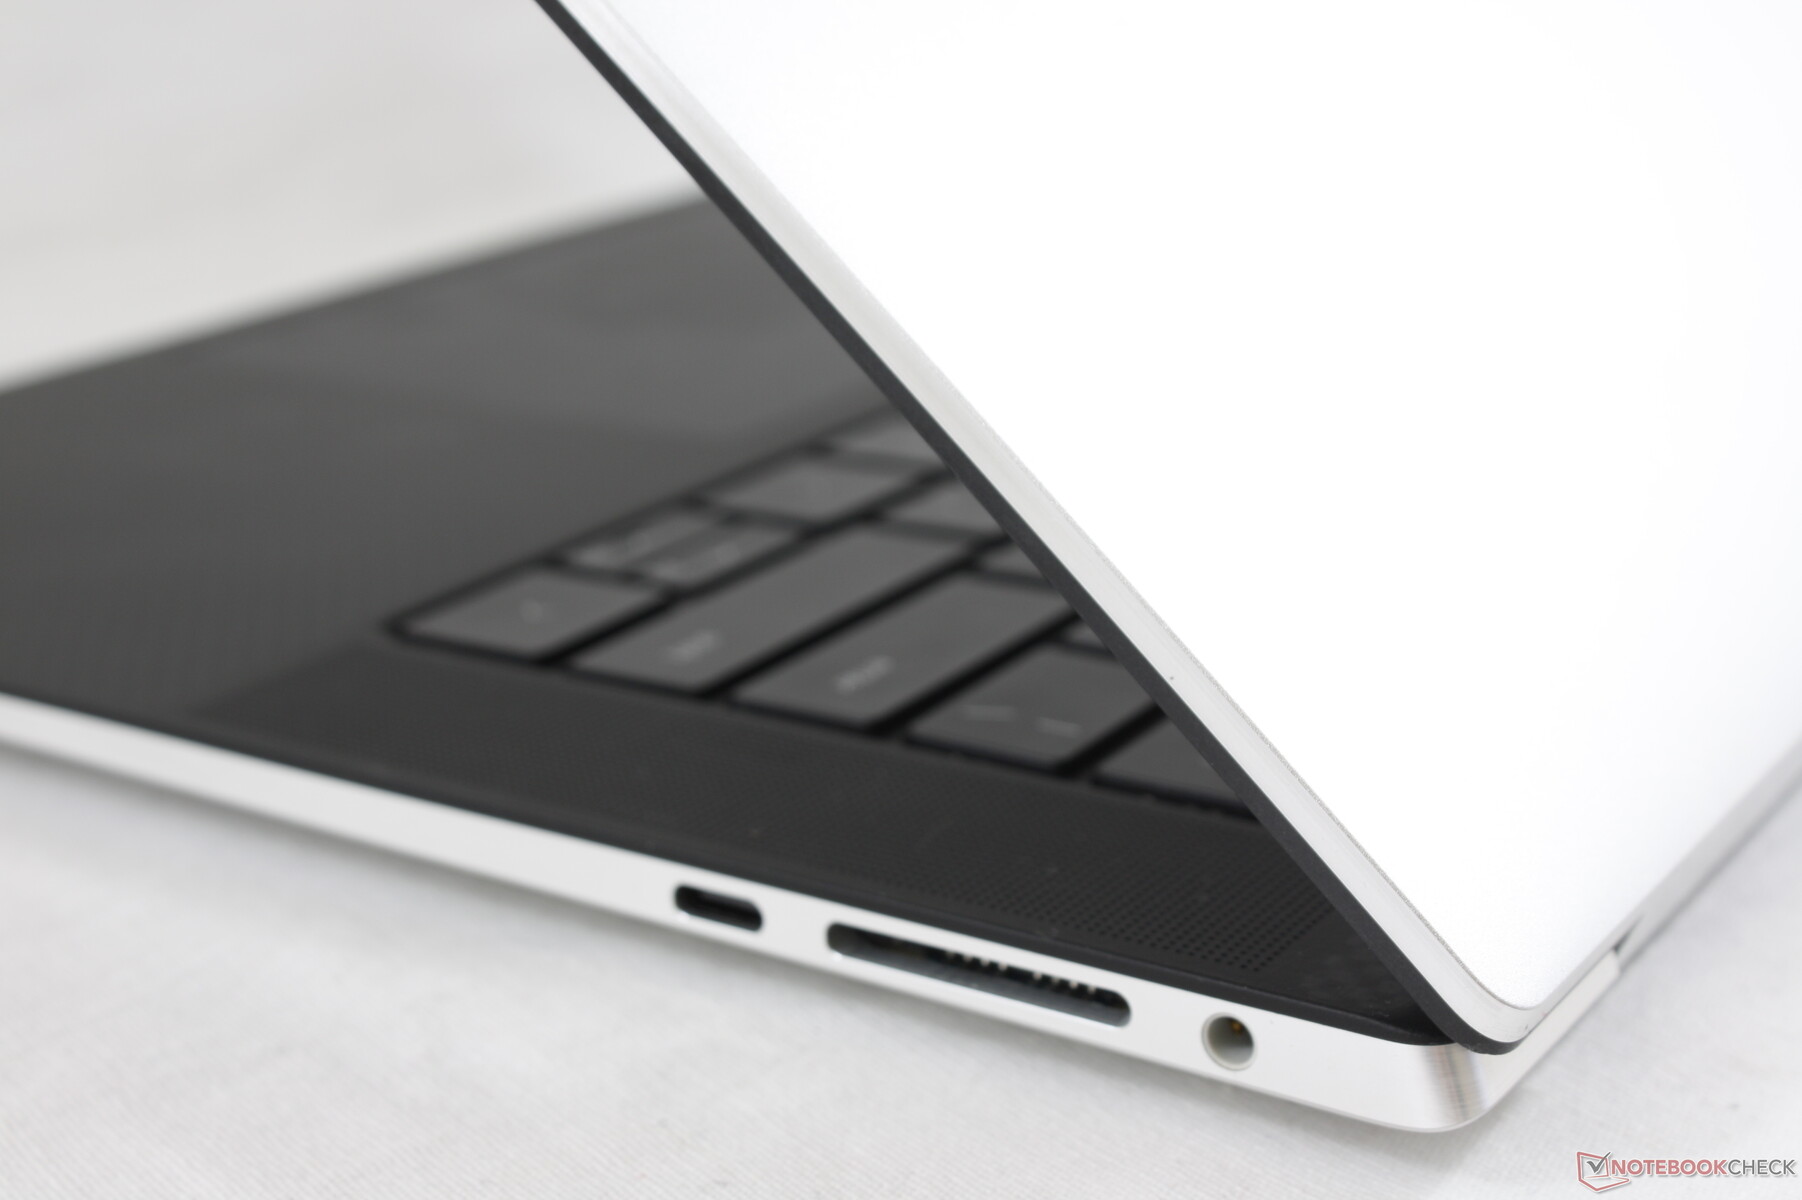
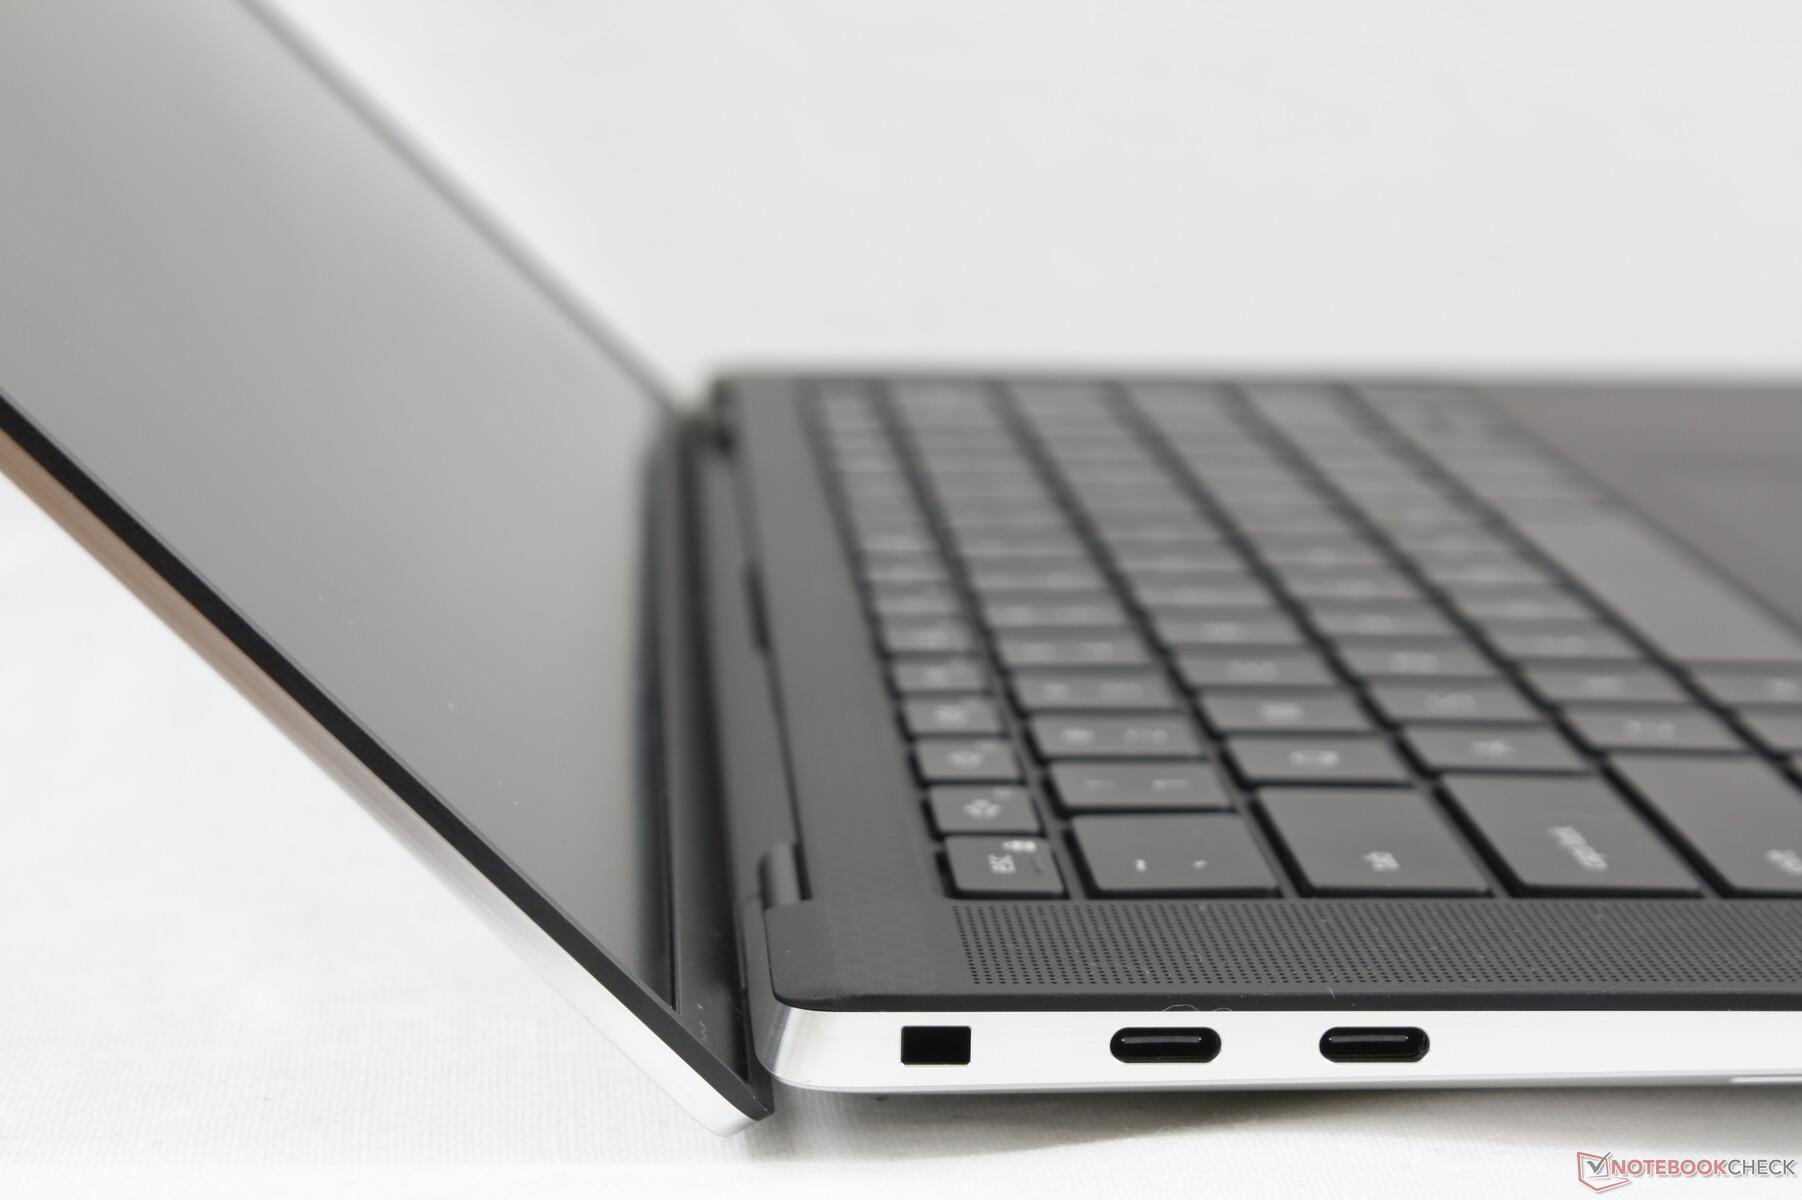
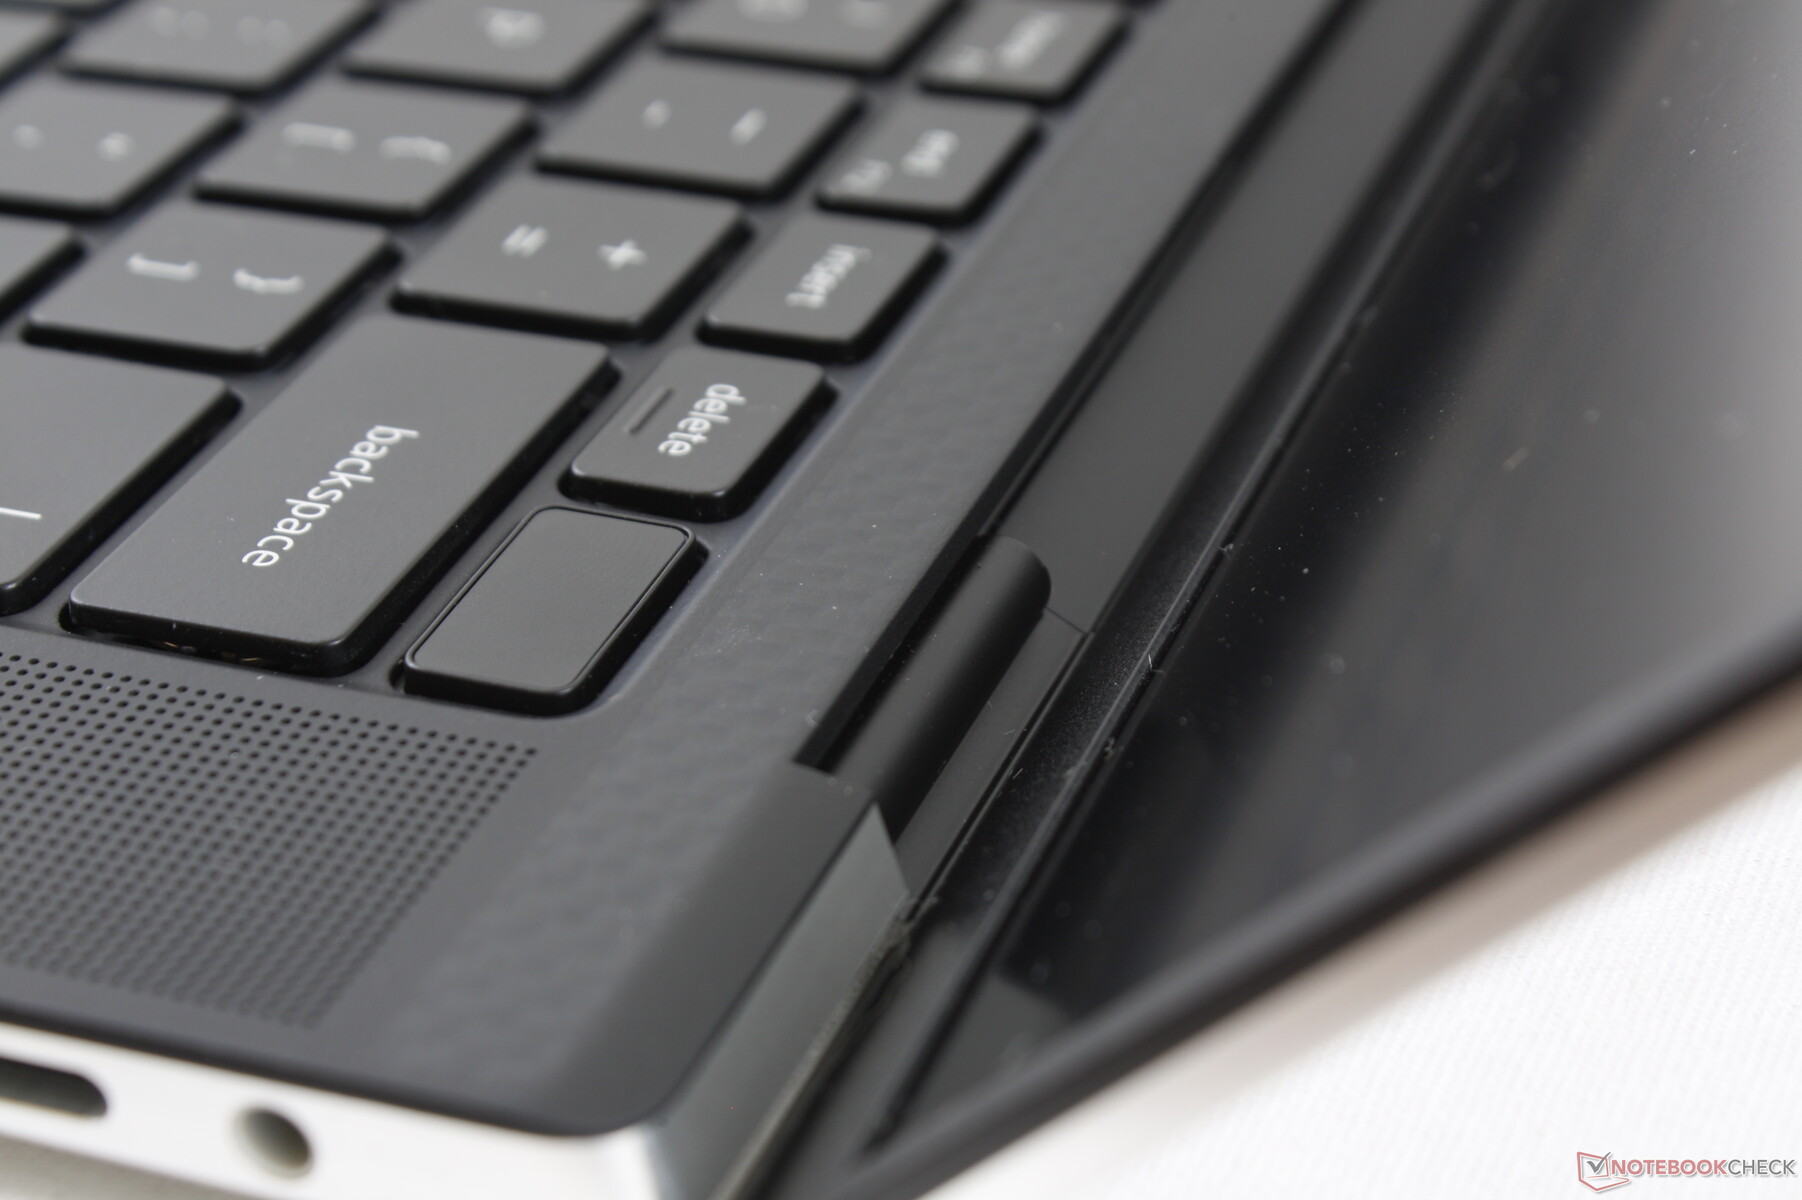
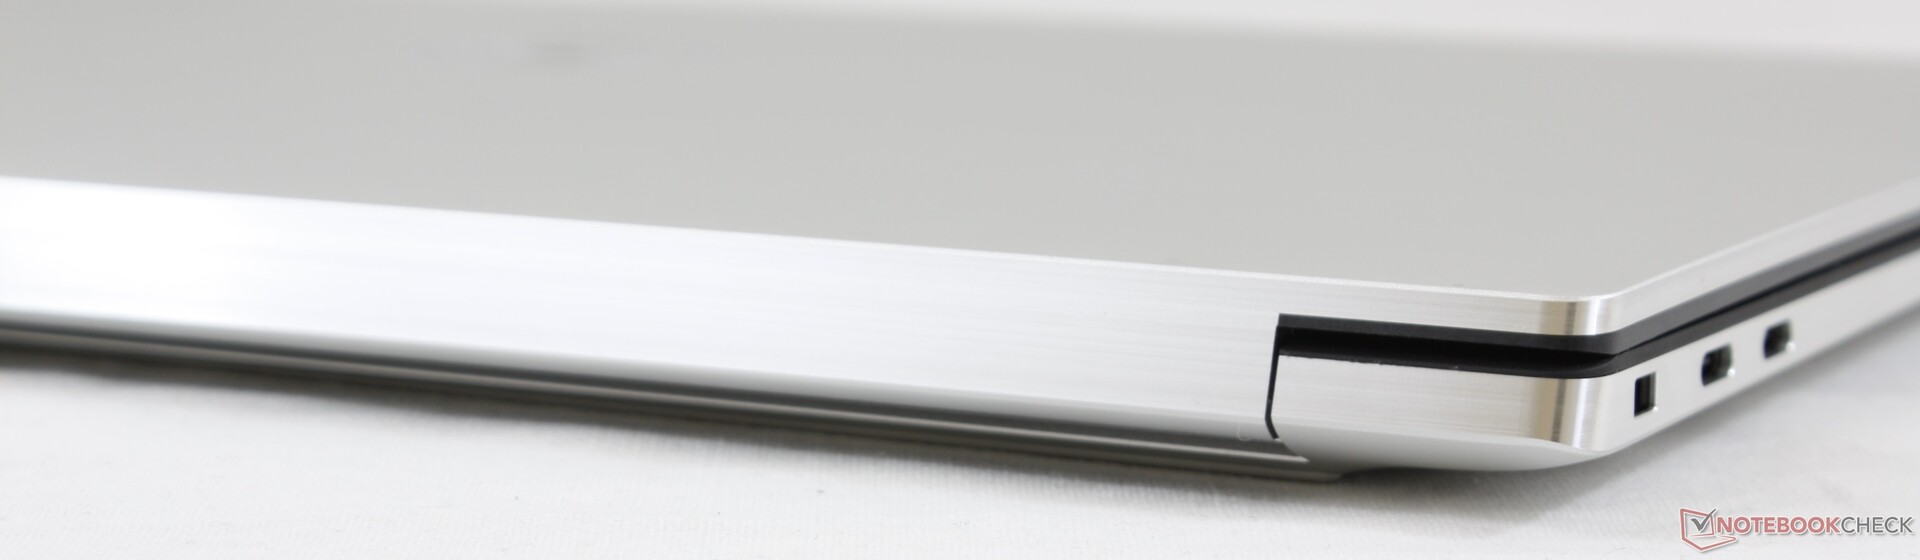
The next most noticeable change involves the redesigned hinges. Dell has ditched the long bar hinge of the previous design in favor of smaller and more inconscpicuous dual hinges. This approach has allowed for a very narrow bottom bezel and an even higher screen-to-body ratio as a result. Hinge rigidity remains satisfactory with no creaking or teetering when adjusting angles.
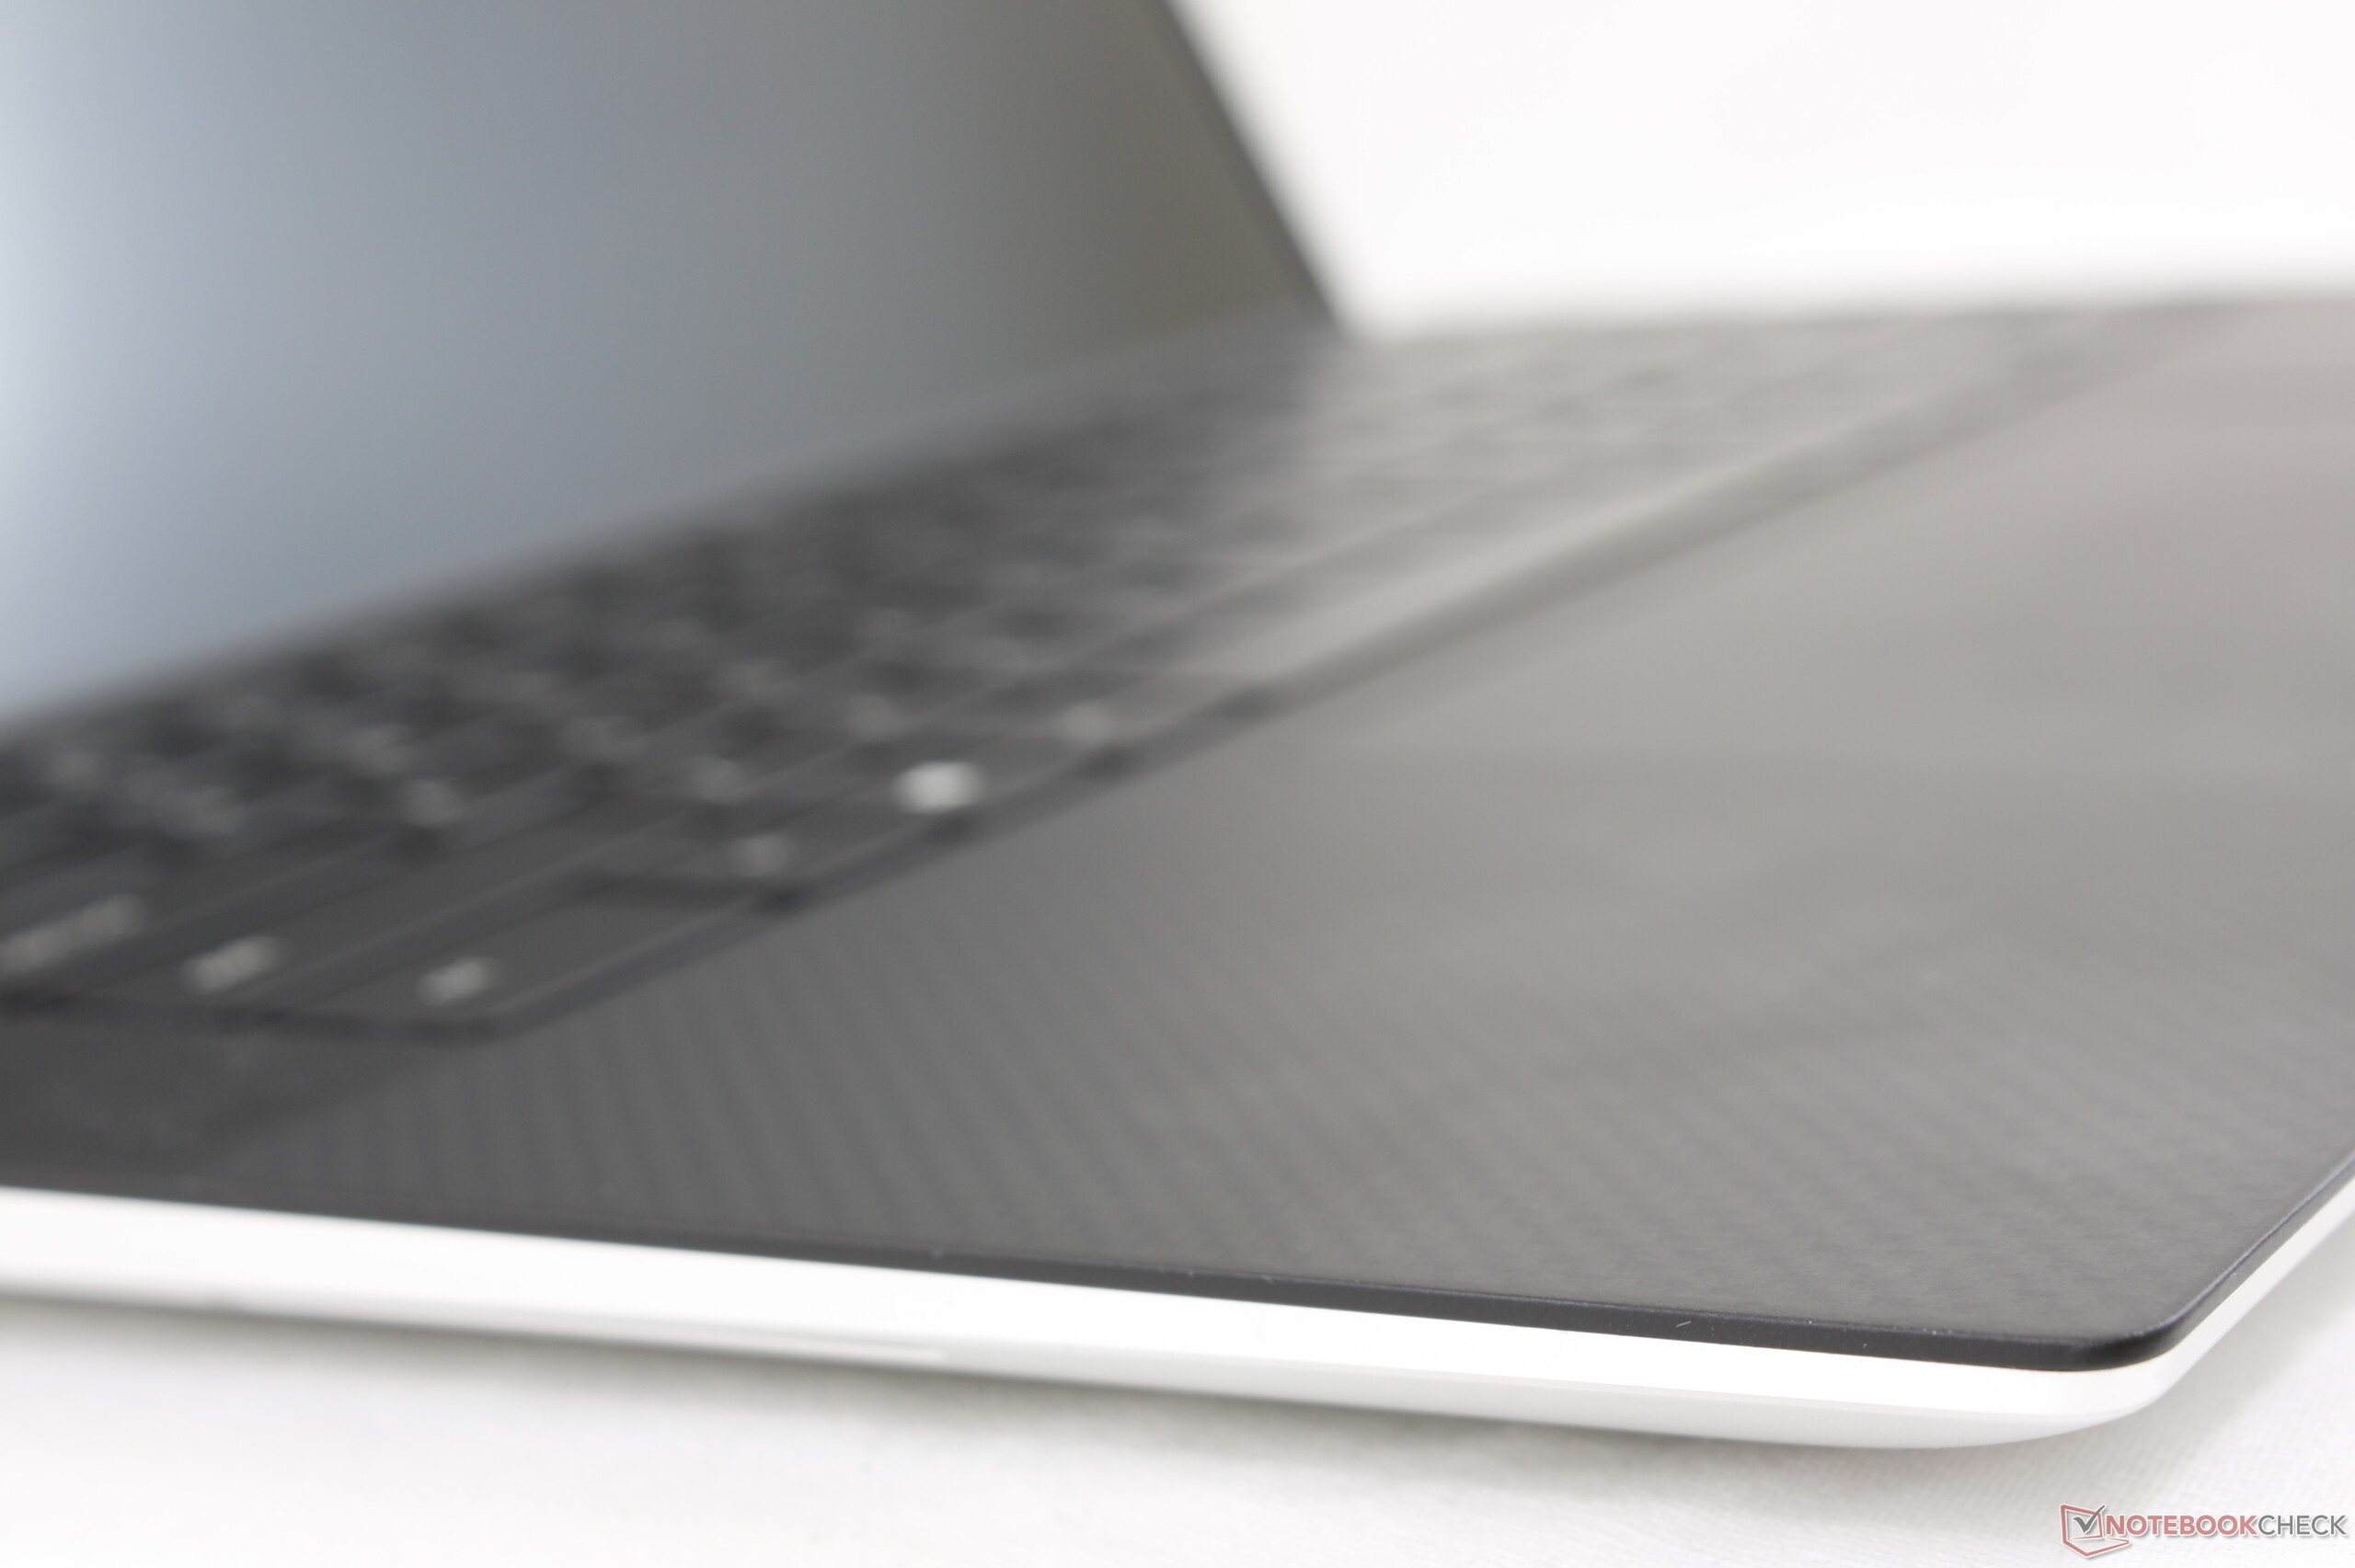
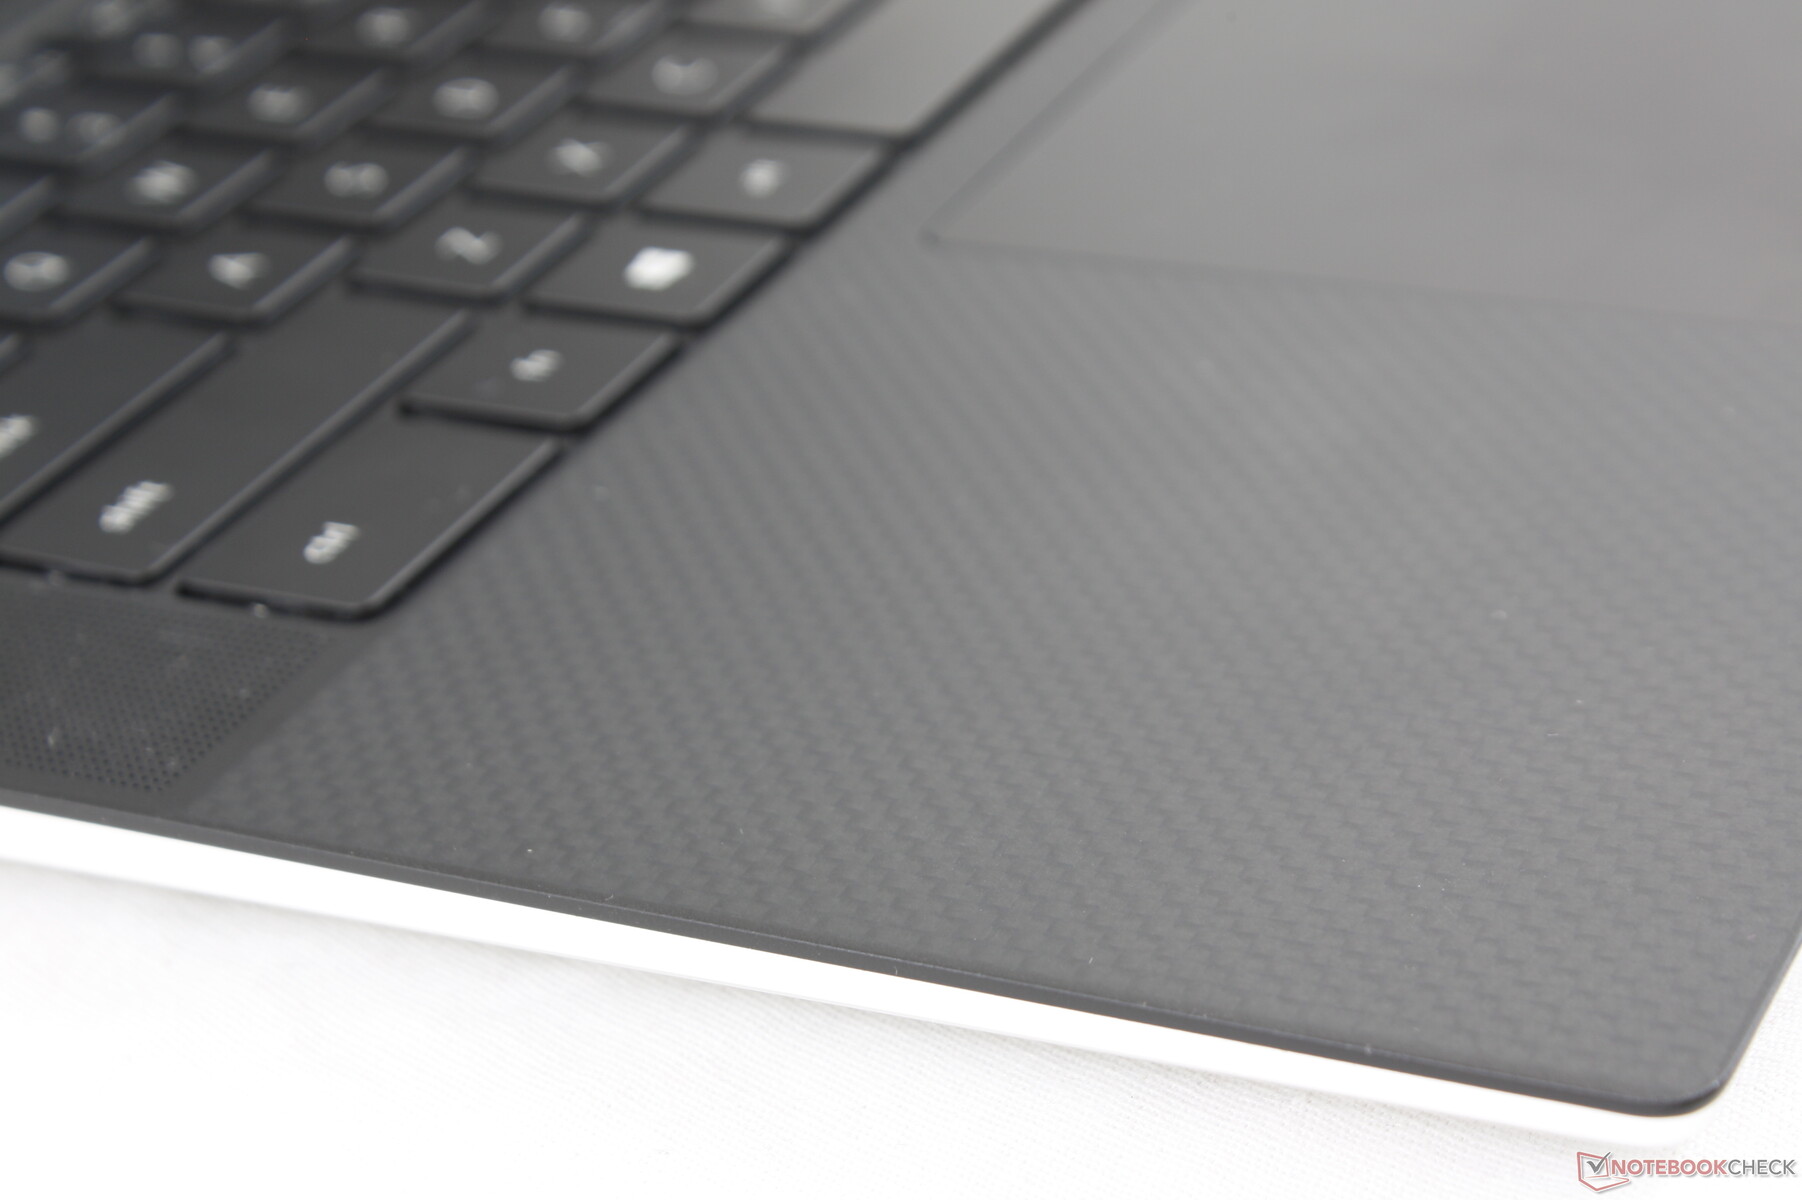
And lastly, the empty space down the two sides of the keyboard now have speaker grilles not unlike on the Razer Blade Pro 17. These visual changes make it easy to tell the difference between an XPS 15 9500 from earlier models.
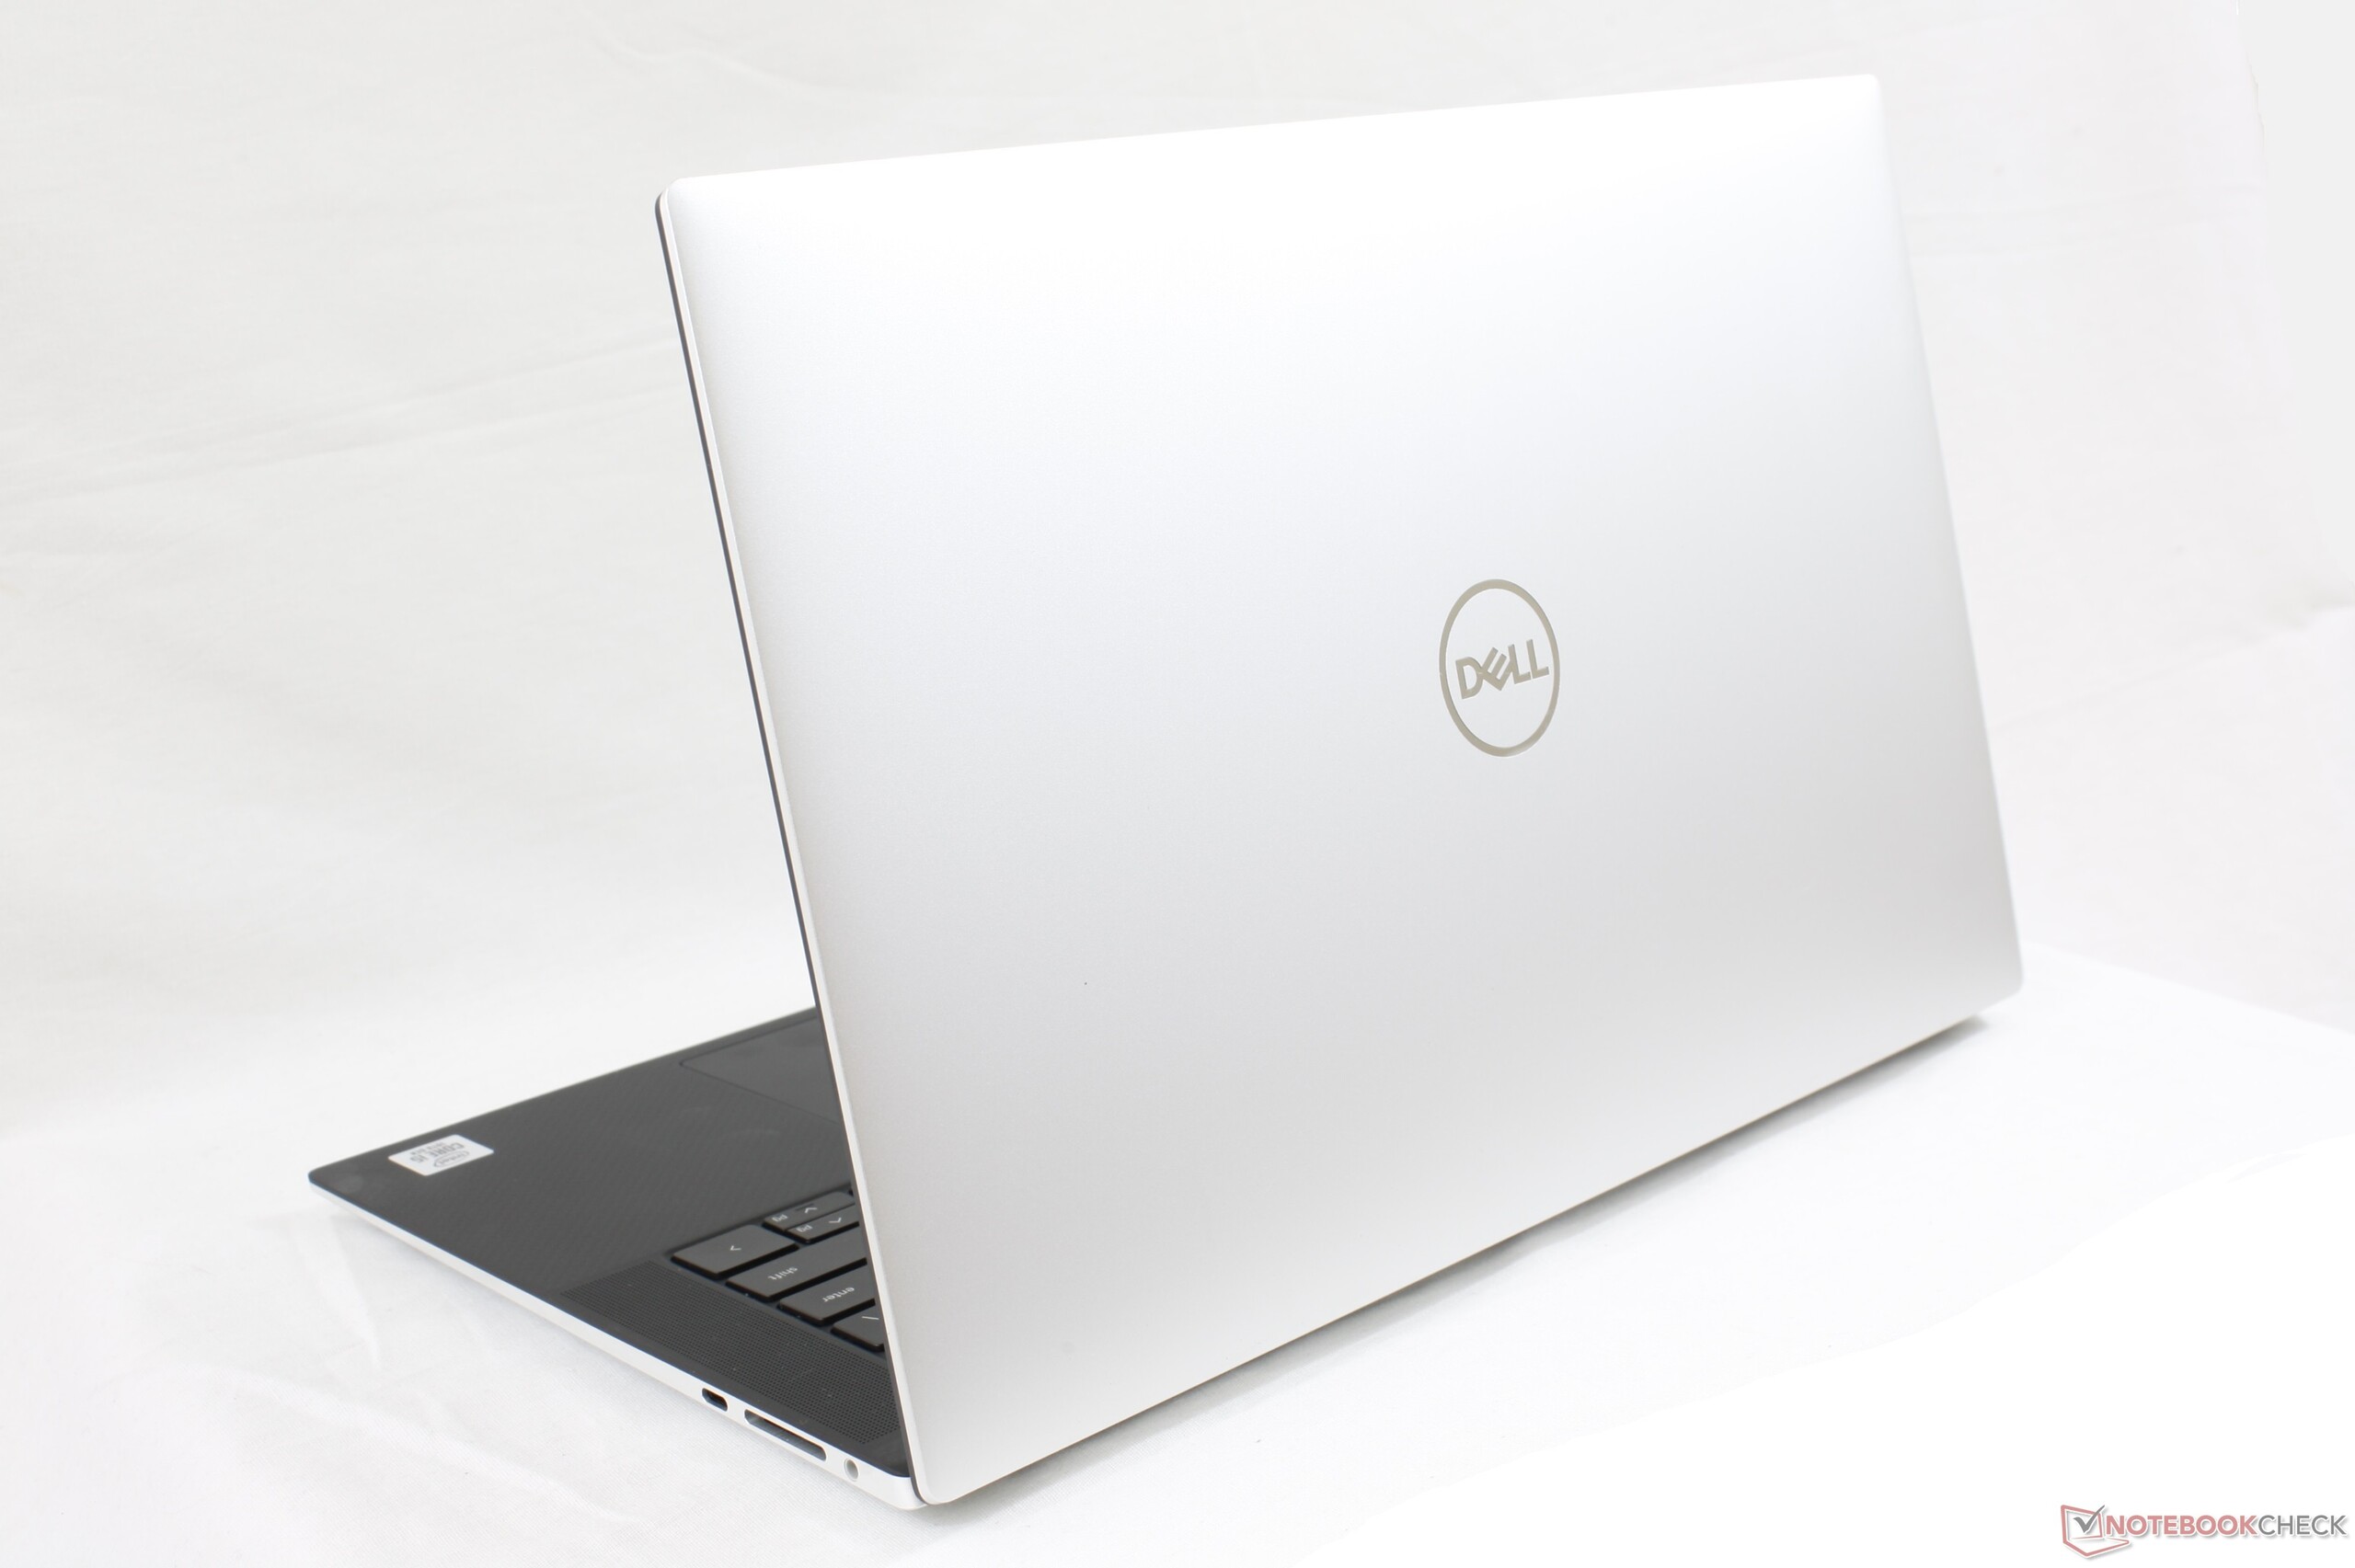
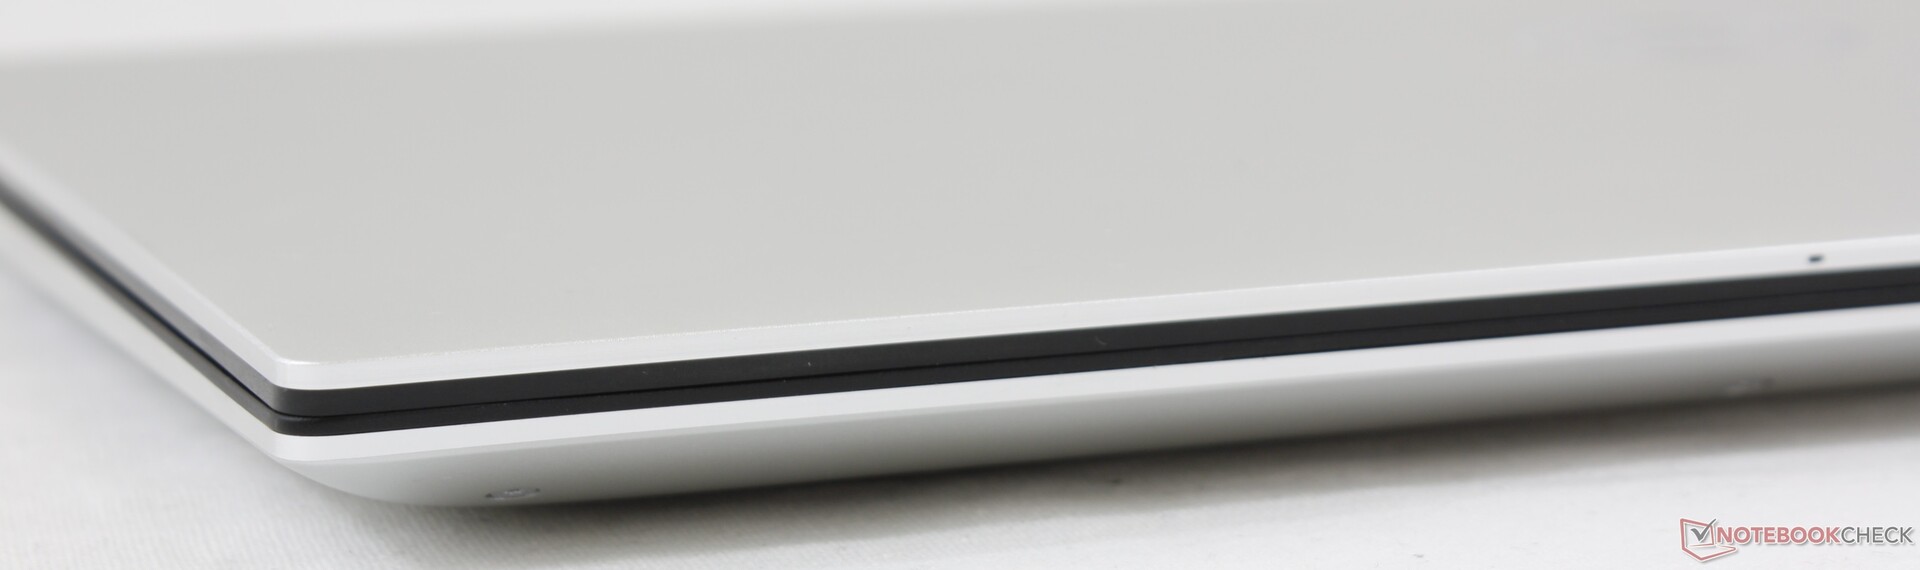
Chassis materials are otherwise the same as the generation and so the textures of the black carbon fiber palm rests and silver magnesium alloy outer lid will be instantly familiar to any XPS owner.
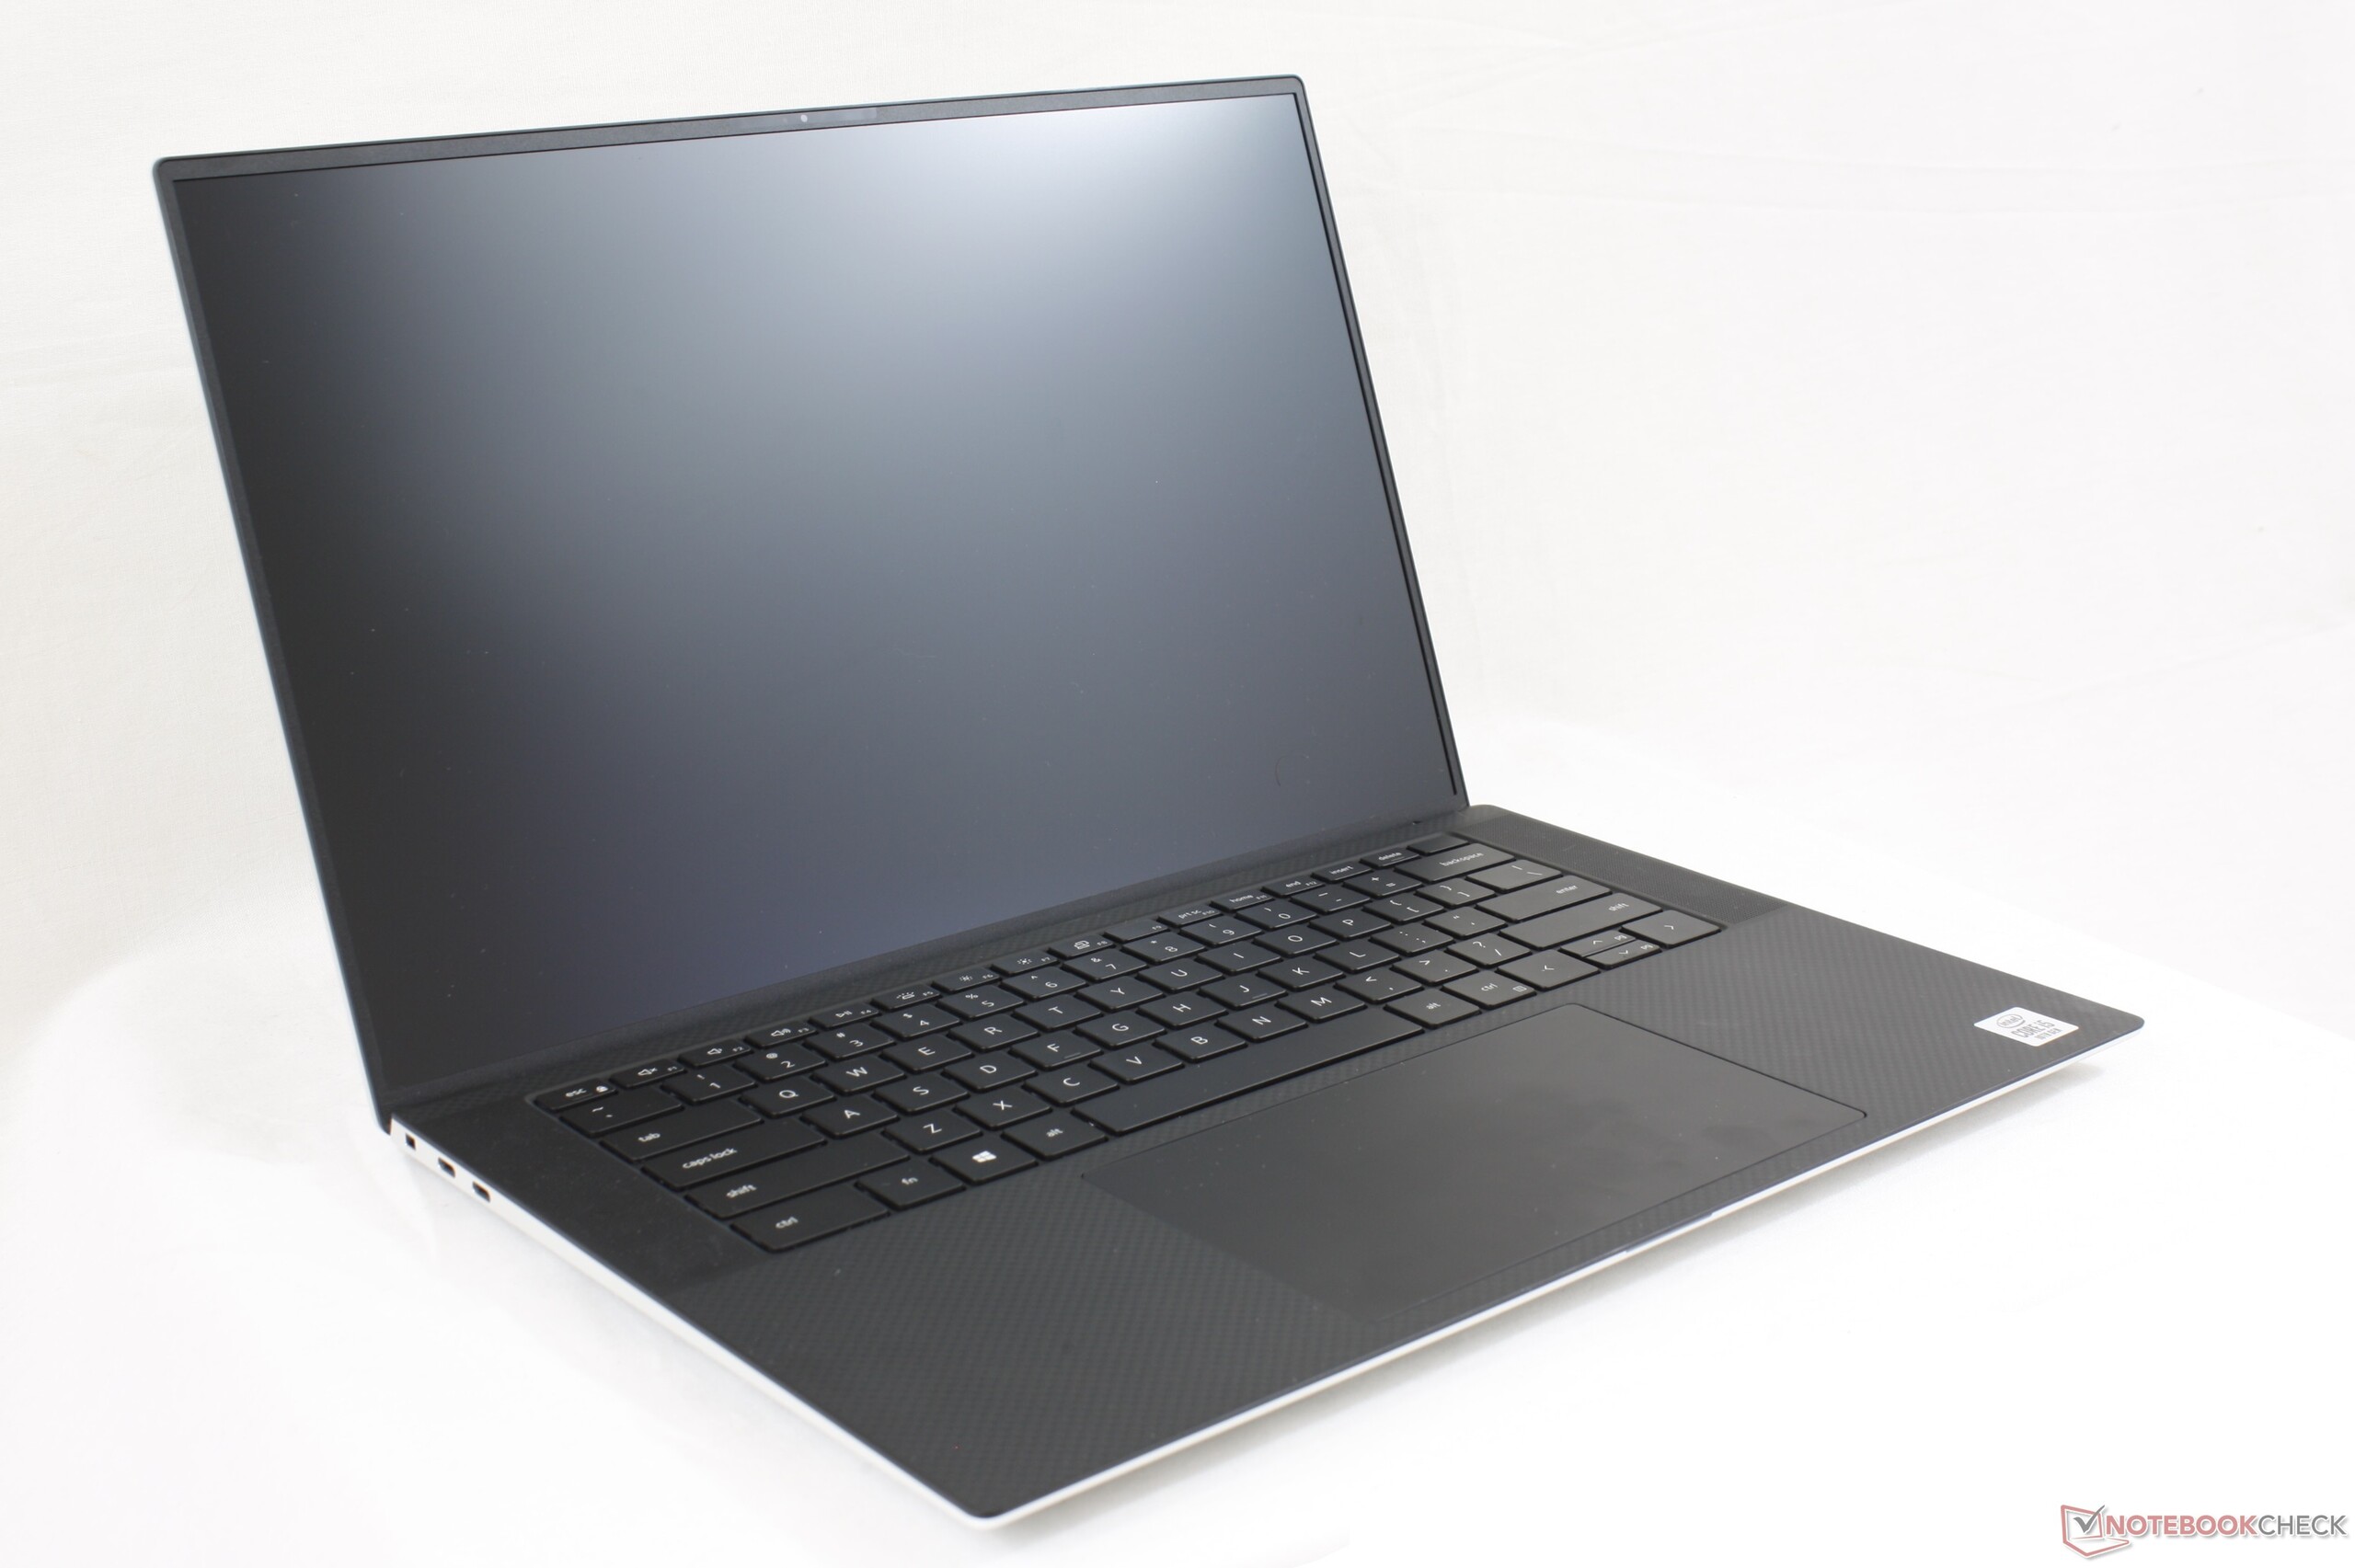
As if the XPS 15 7590 wasn't small enough, the XPS 15 9500 is even smaller and lighter as shown by our comparison tool below. The newer design is about 1 mm thicker, however, which is a fair trade-off when considering the more significant savings in weight and footprint.

Connectivity
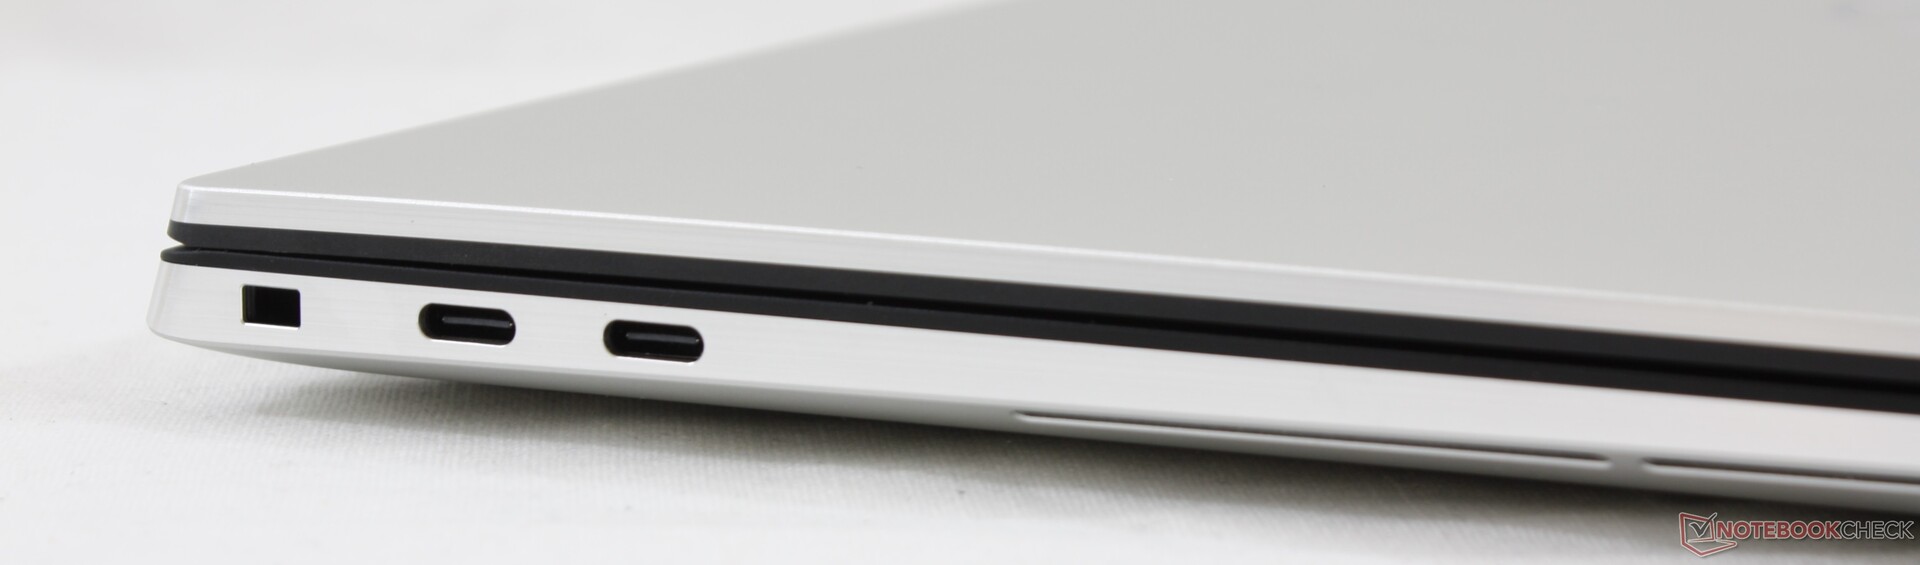
Three USB Type-C ports are available and all are capable of both recharging the laptop and outputting to an external monitor. Only the two along the left edge, however, are compatible with Thunderbolt 3 accessories.
When compared to the outgoing XPS 15 7590 model, the XPS 15 9500 has dropped all USB Type-A ports, the HDMI port, the proprietary AC barrel charging port, and the battery checker button. Users will have to rely on USB Type-C adapters moving forward not unlike most MacBook Pro owners.
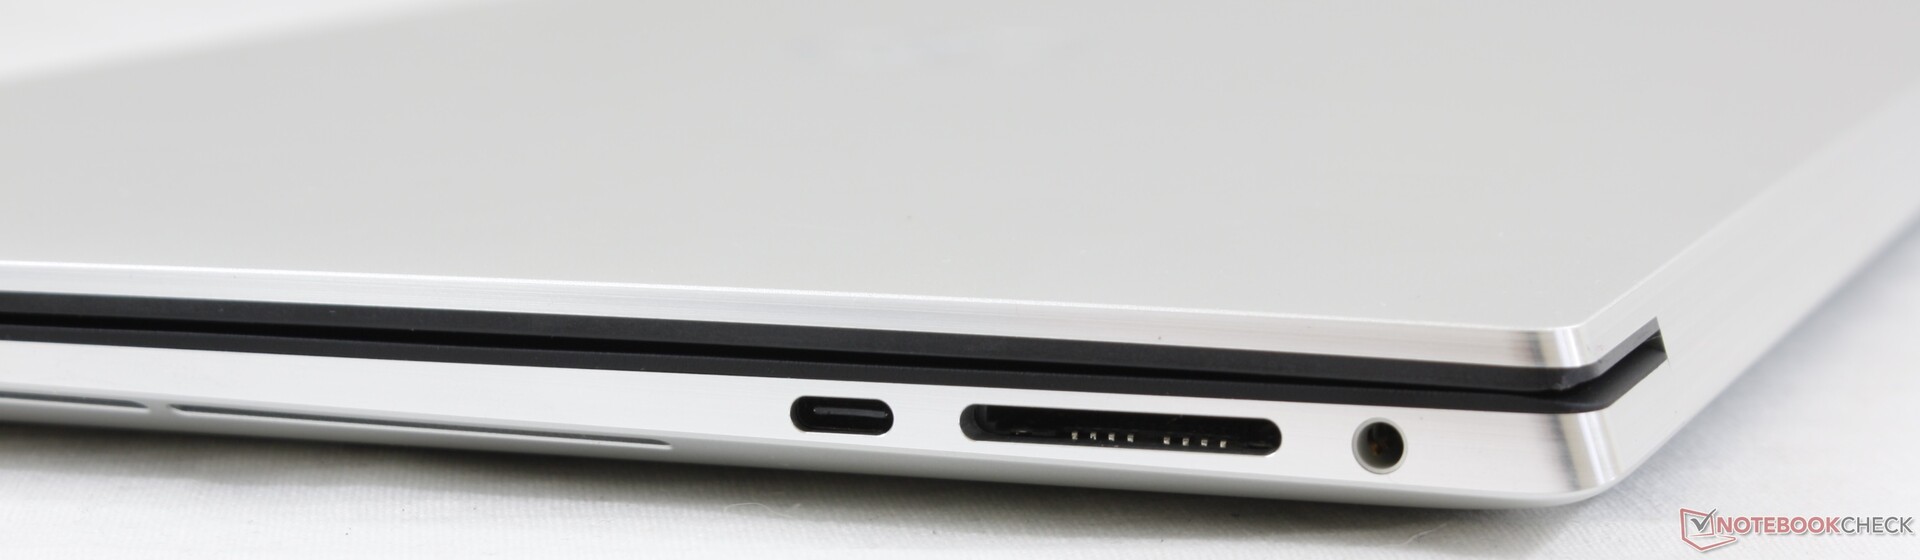
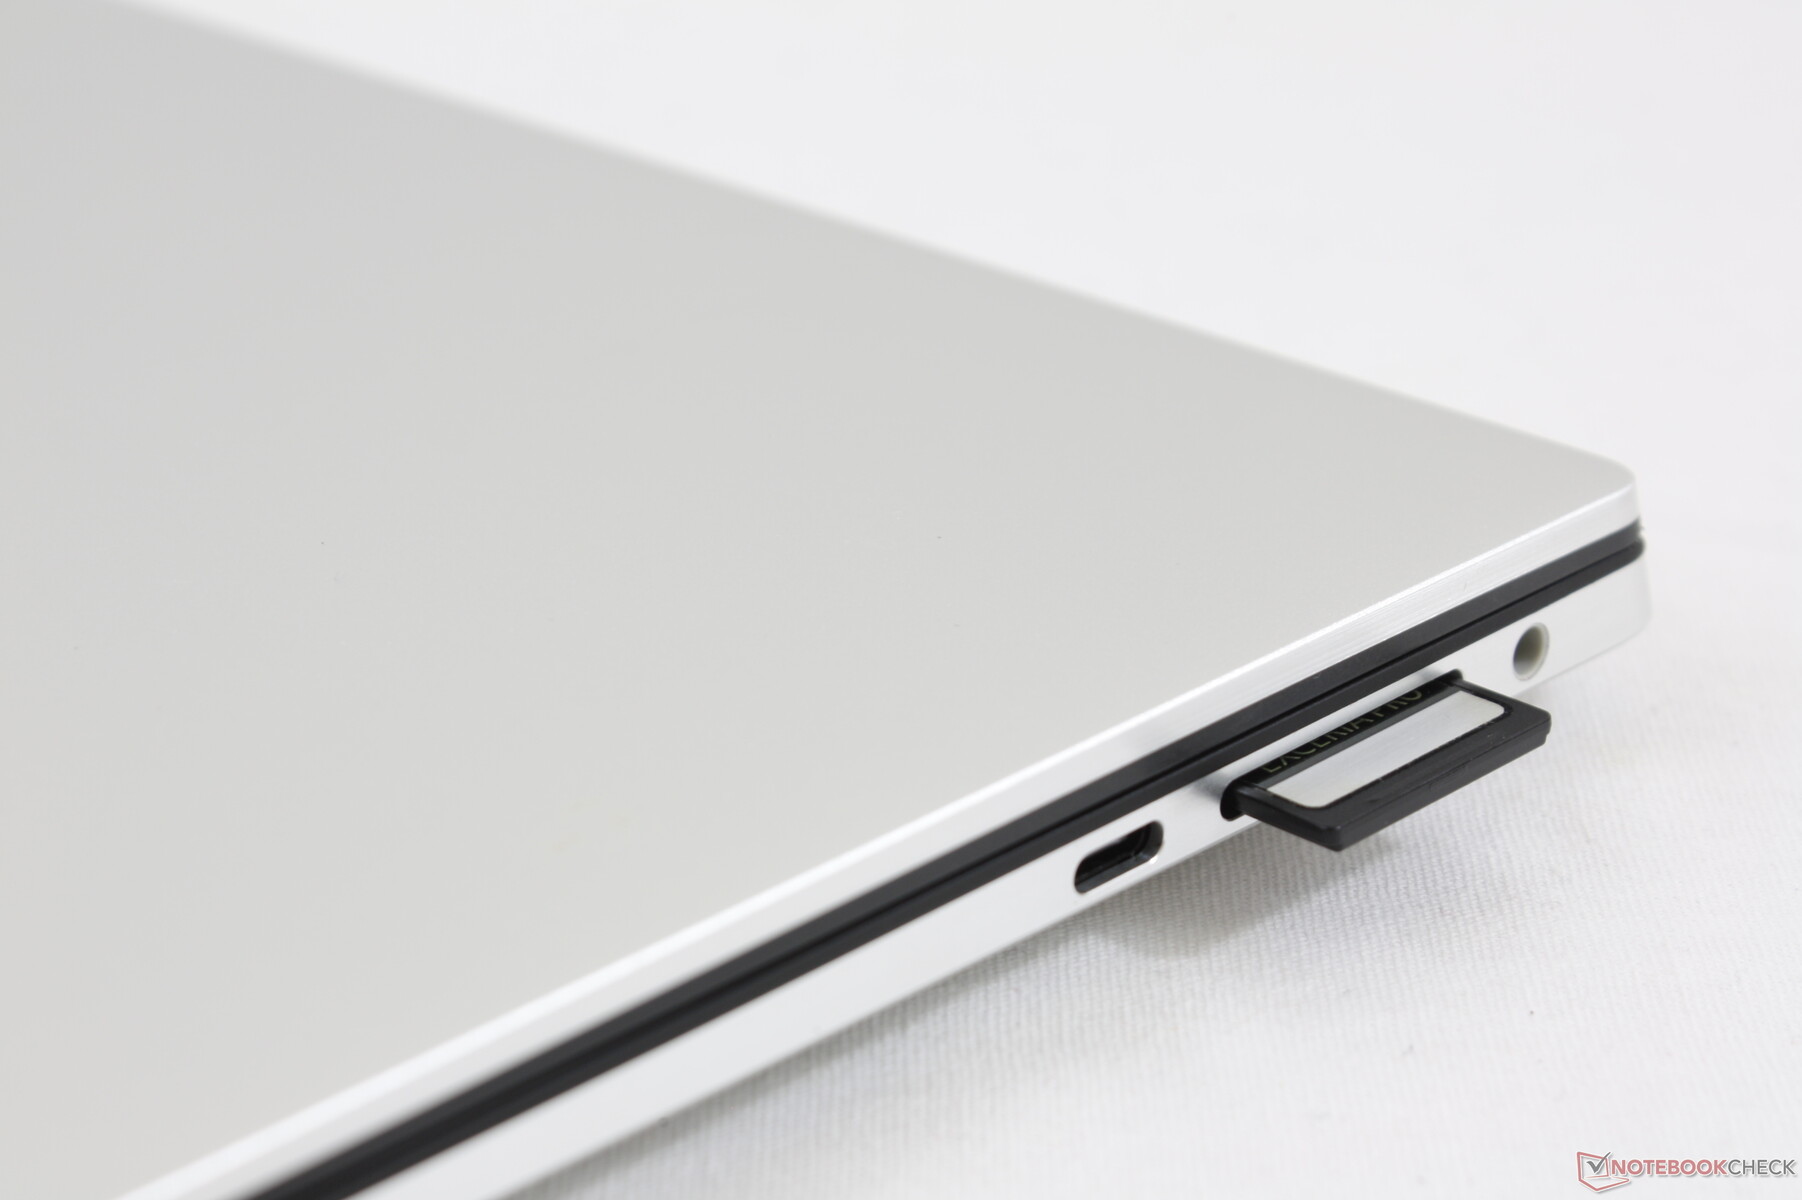
SD Card Reader
XPS laptops have some of the fastest SD card readers for any consumer-class laptop and the new XPS 15 is no different. Moving 1 GB of pictures from our UHS-II test card to desktop only takes about 5 to 6 seconds.
| SD Card Reader | |
| average JPG Copy Test (av. of 3 runs) | |
| Dell XPS 15 9500 Core i5 (Toshiba Exceria Pro SDXC 64 GB UHS-II) | |
| Razer Blade Pro 17 4K UHD 120 Hz (Toshiba Exceria Pro SDXC 64 GB UHS-II) | |
| Dell XPS 15 7590 i5 iGPU FHD (Toshiba Exceria Pro SDXC 64 GB UHS-II) | |
| HP Spectre X360 15-5ZV31AV (Toshiba Exceria Pro M501 UHS-II) | |
| maximum AS SSD Seq Read Test (1GB) | |
| Dell XPS 15 9500 Core i5 (Toshiba Exceria Pro SDXC 64 GB UHS-II) | |
| Razer Blade Pro 17 4K UHD 120 Hz (Toshiba Exceria Pro SDXC 64 GB UHS-II) | |
| Dell XPS 15 7590 i5 iGPU FHD (Toshiba Exceria Pro SDXC 64 GB UHS-II) | |
| HP Spectre X360 15-5ZV31AV (Toshiba Exceria Pro M501 UHS-II) | |
Communication
The Killer 1650s comes standard across all SKUs for Wi-Fi 6 and Bluetooth 5.1 compatibility. Though we experienced no issues when connected to our Netgear RAX200 test router, transfer rates could have been more stable.
Webcam


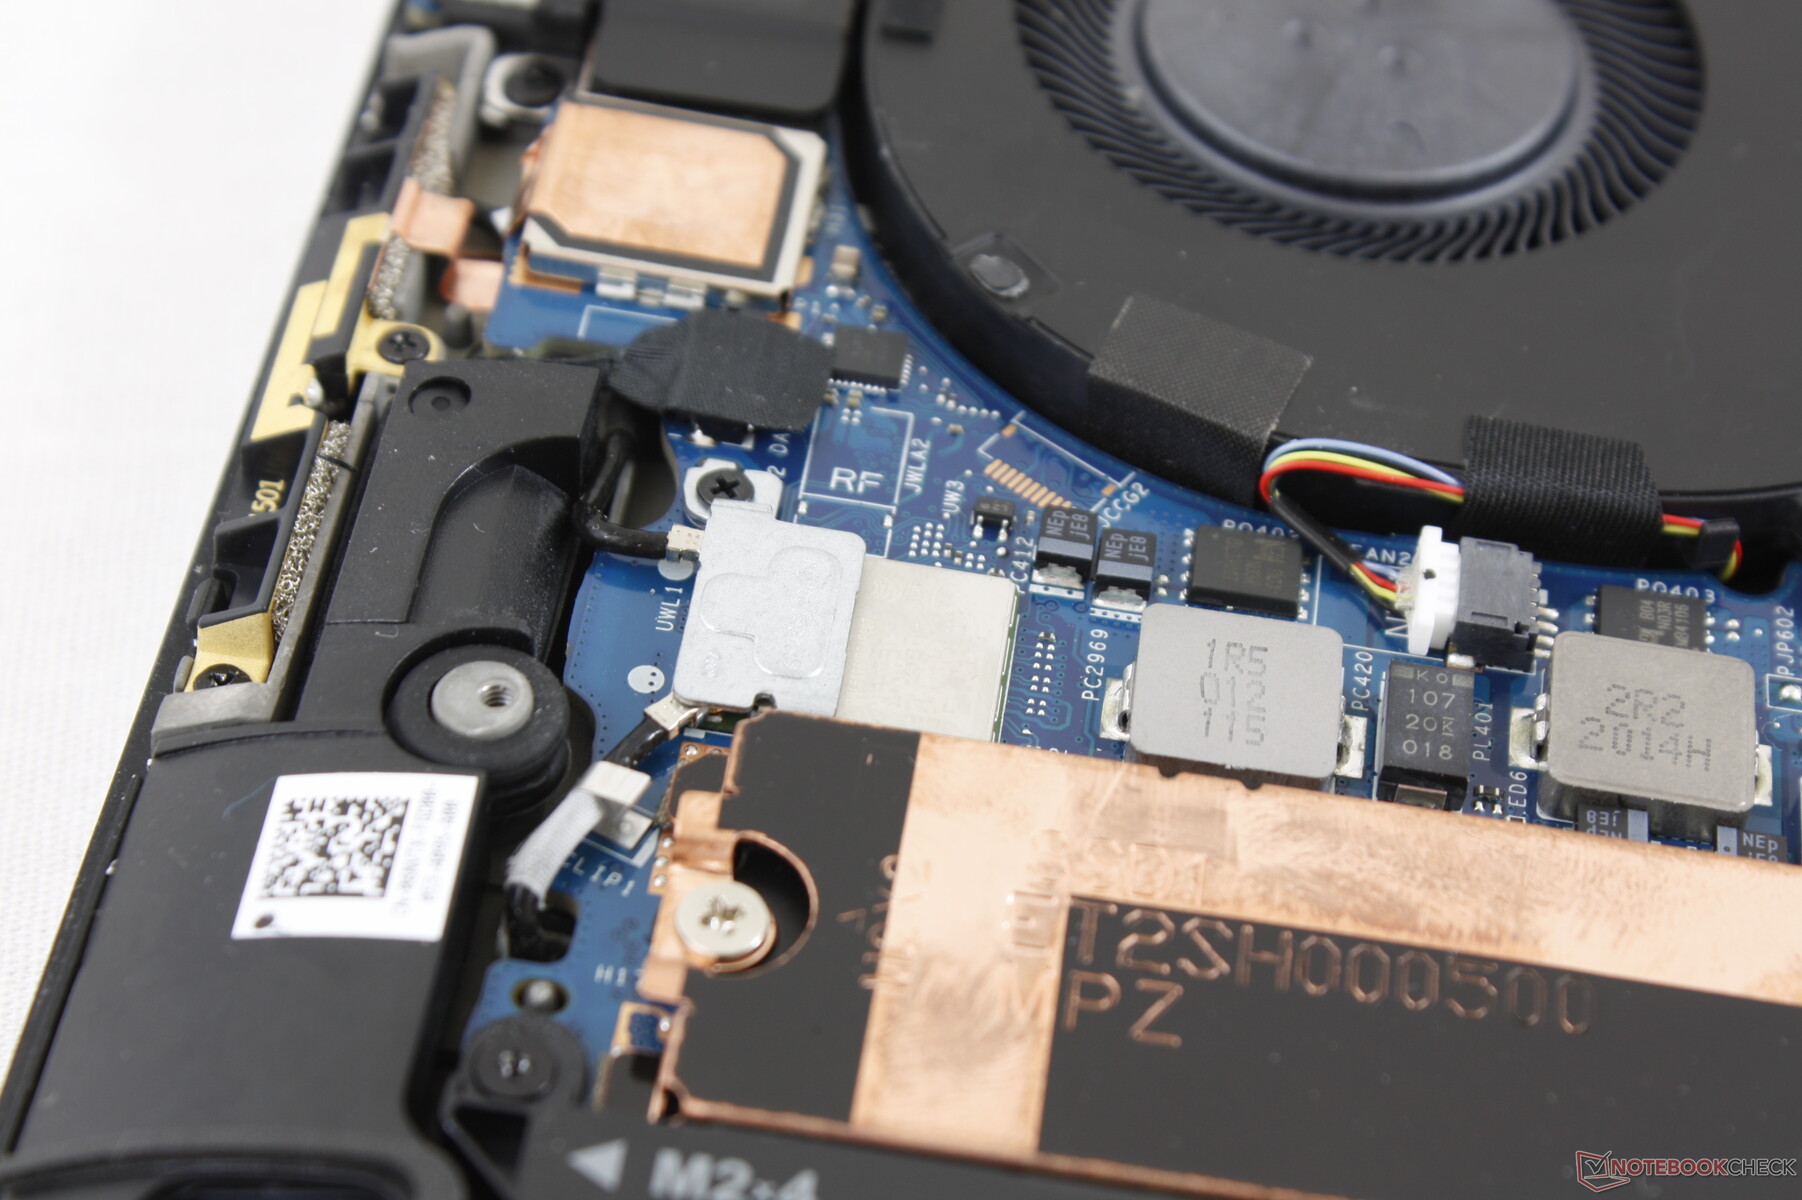
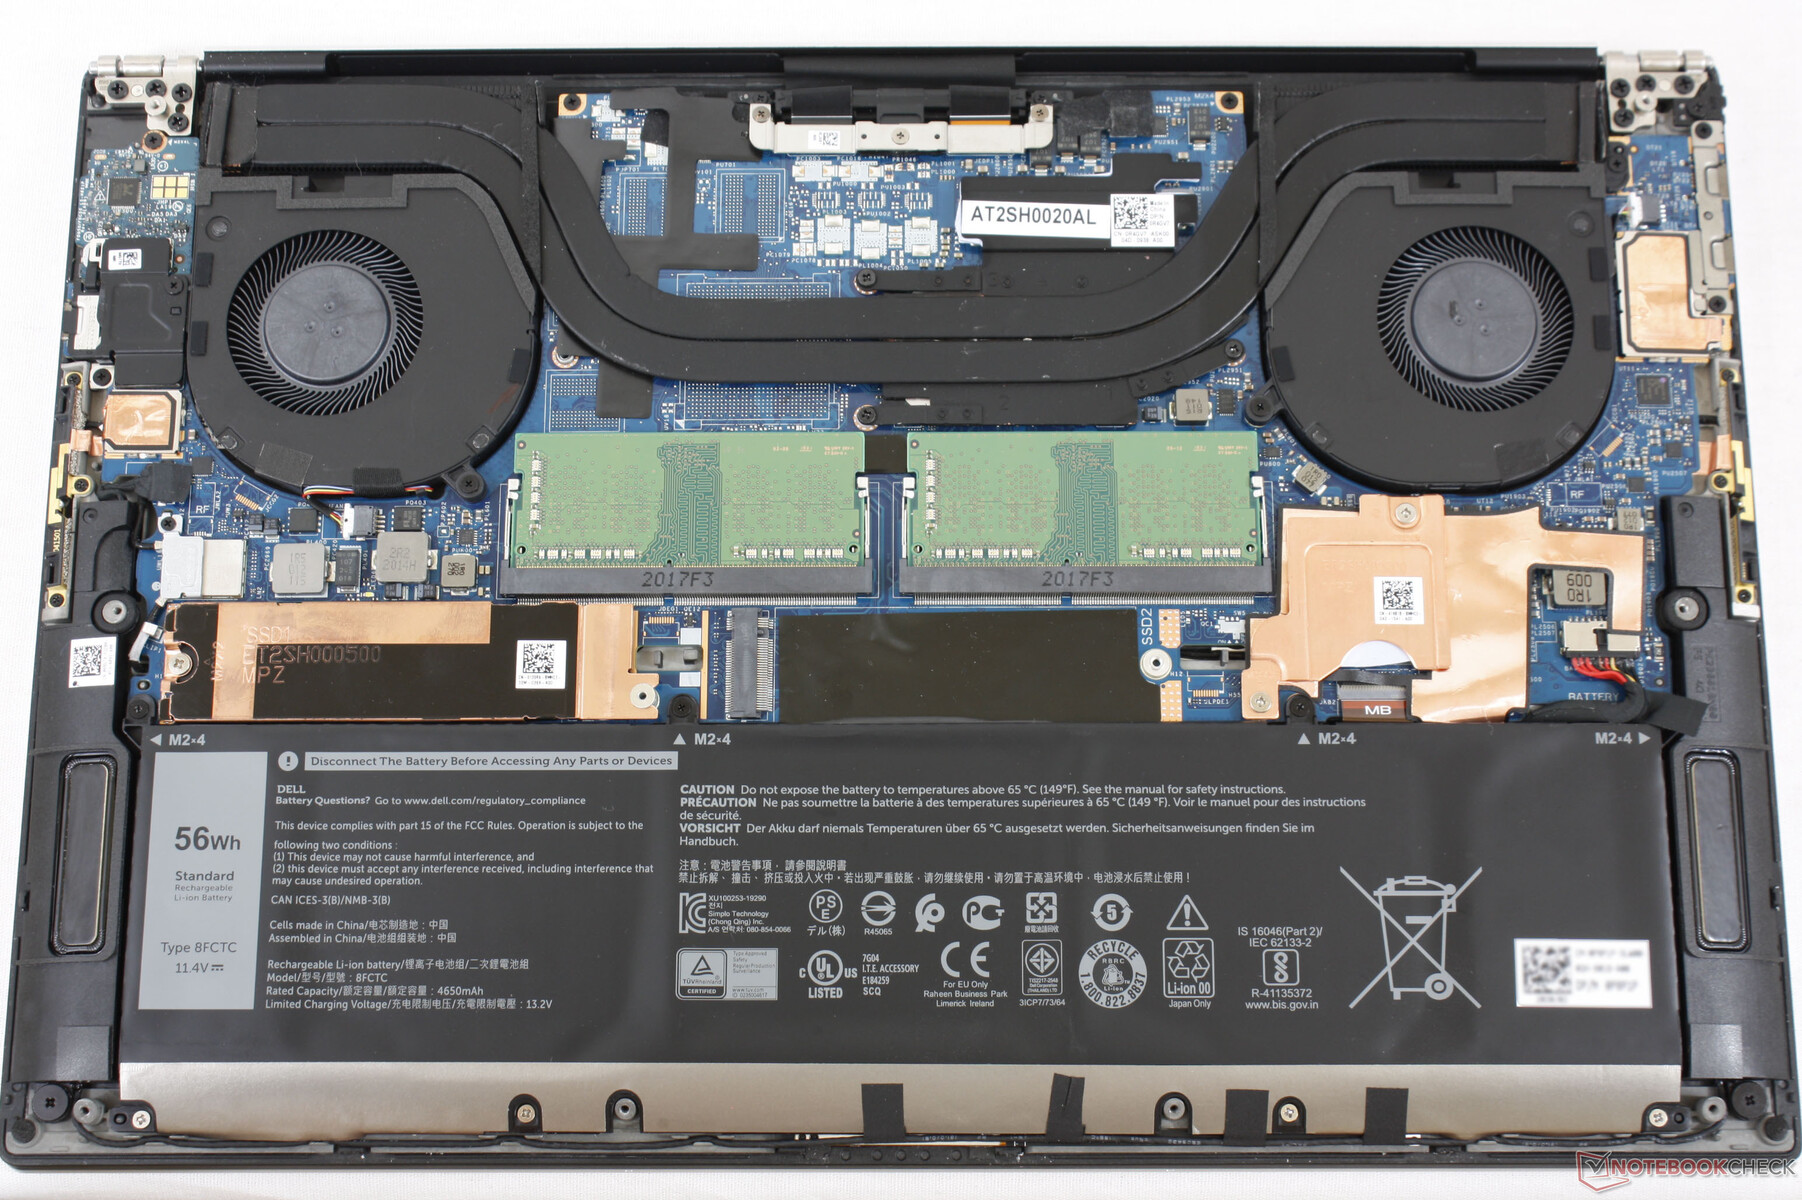
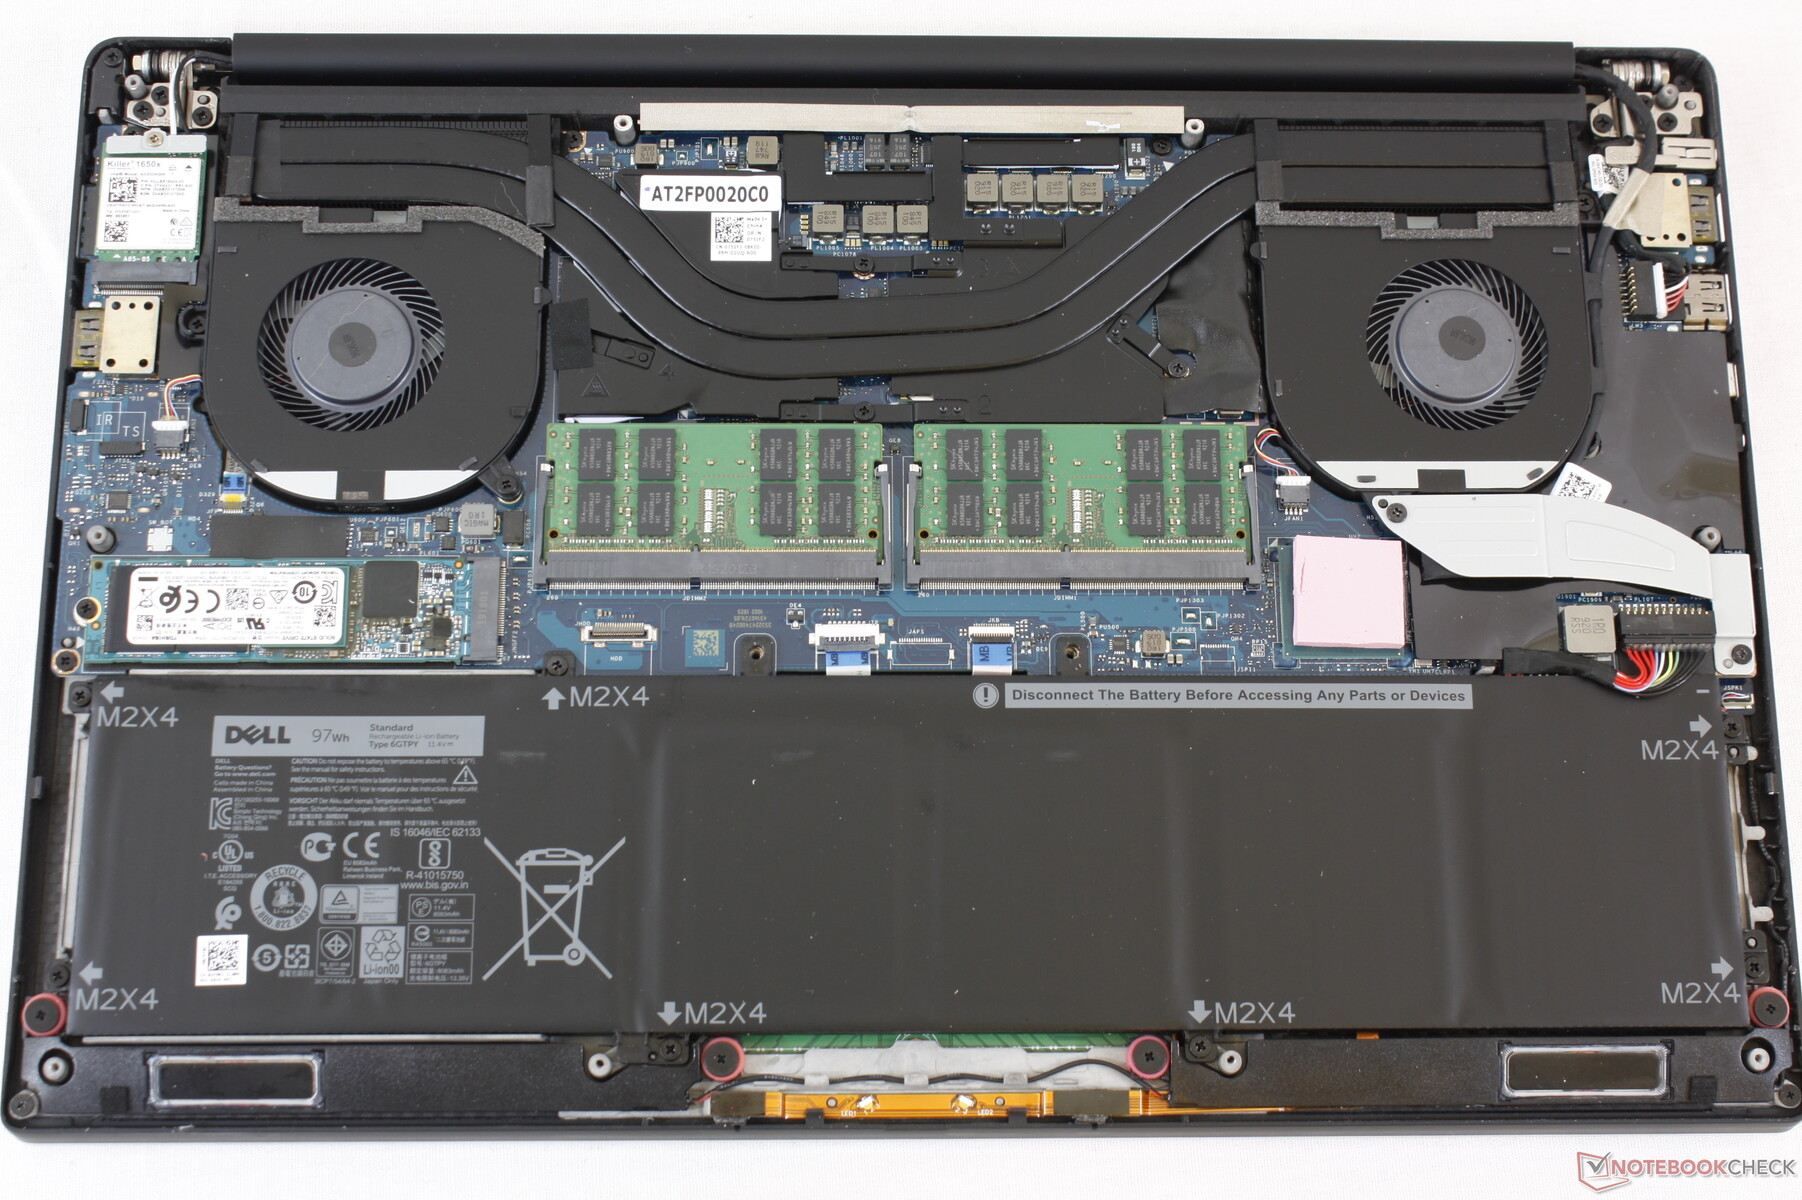
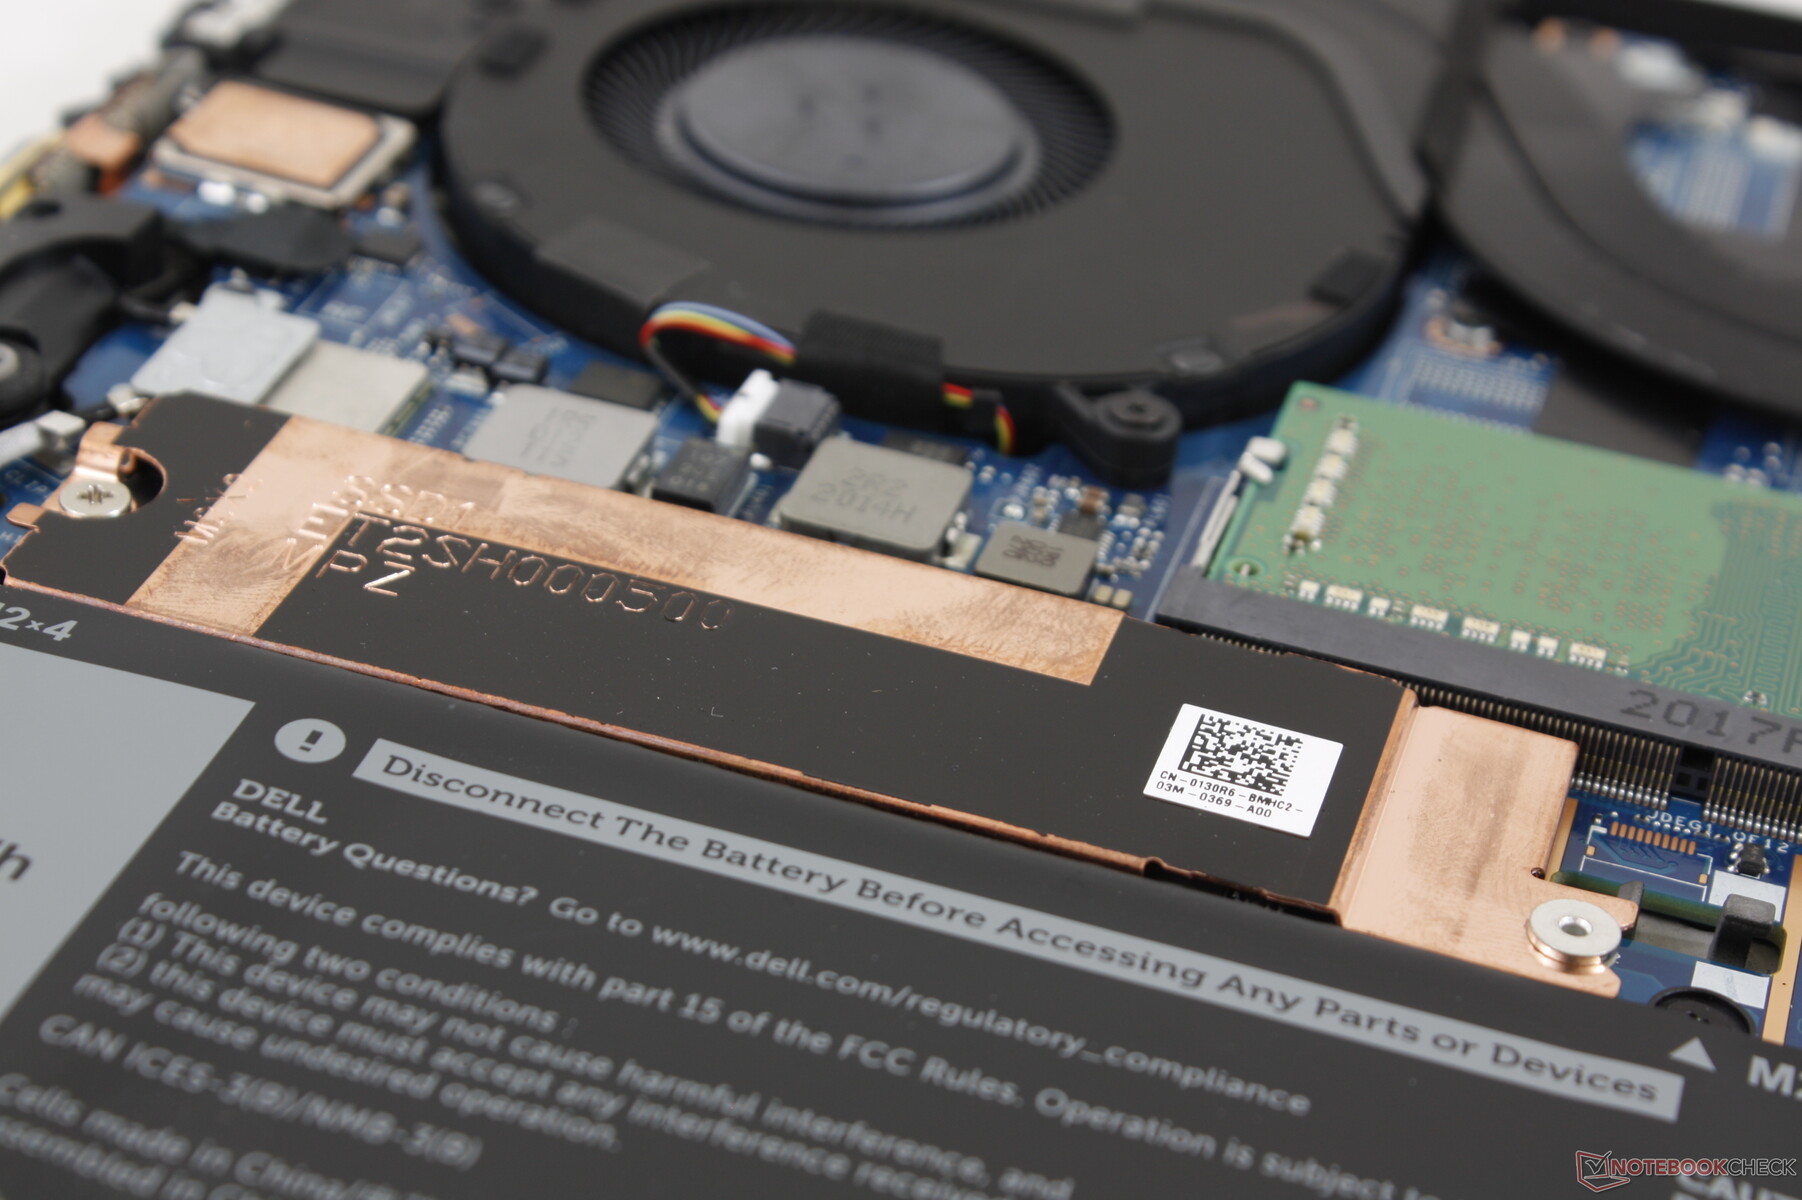
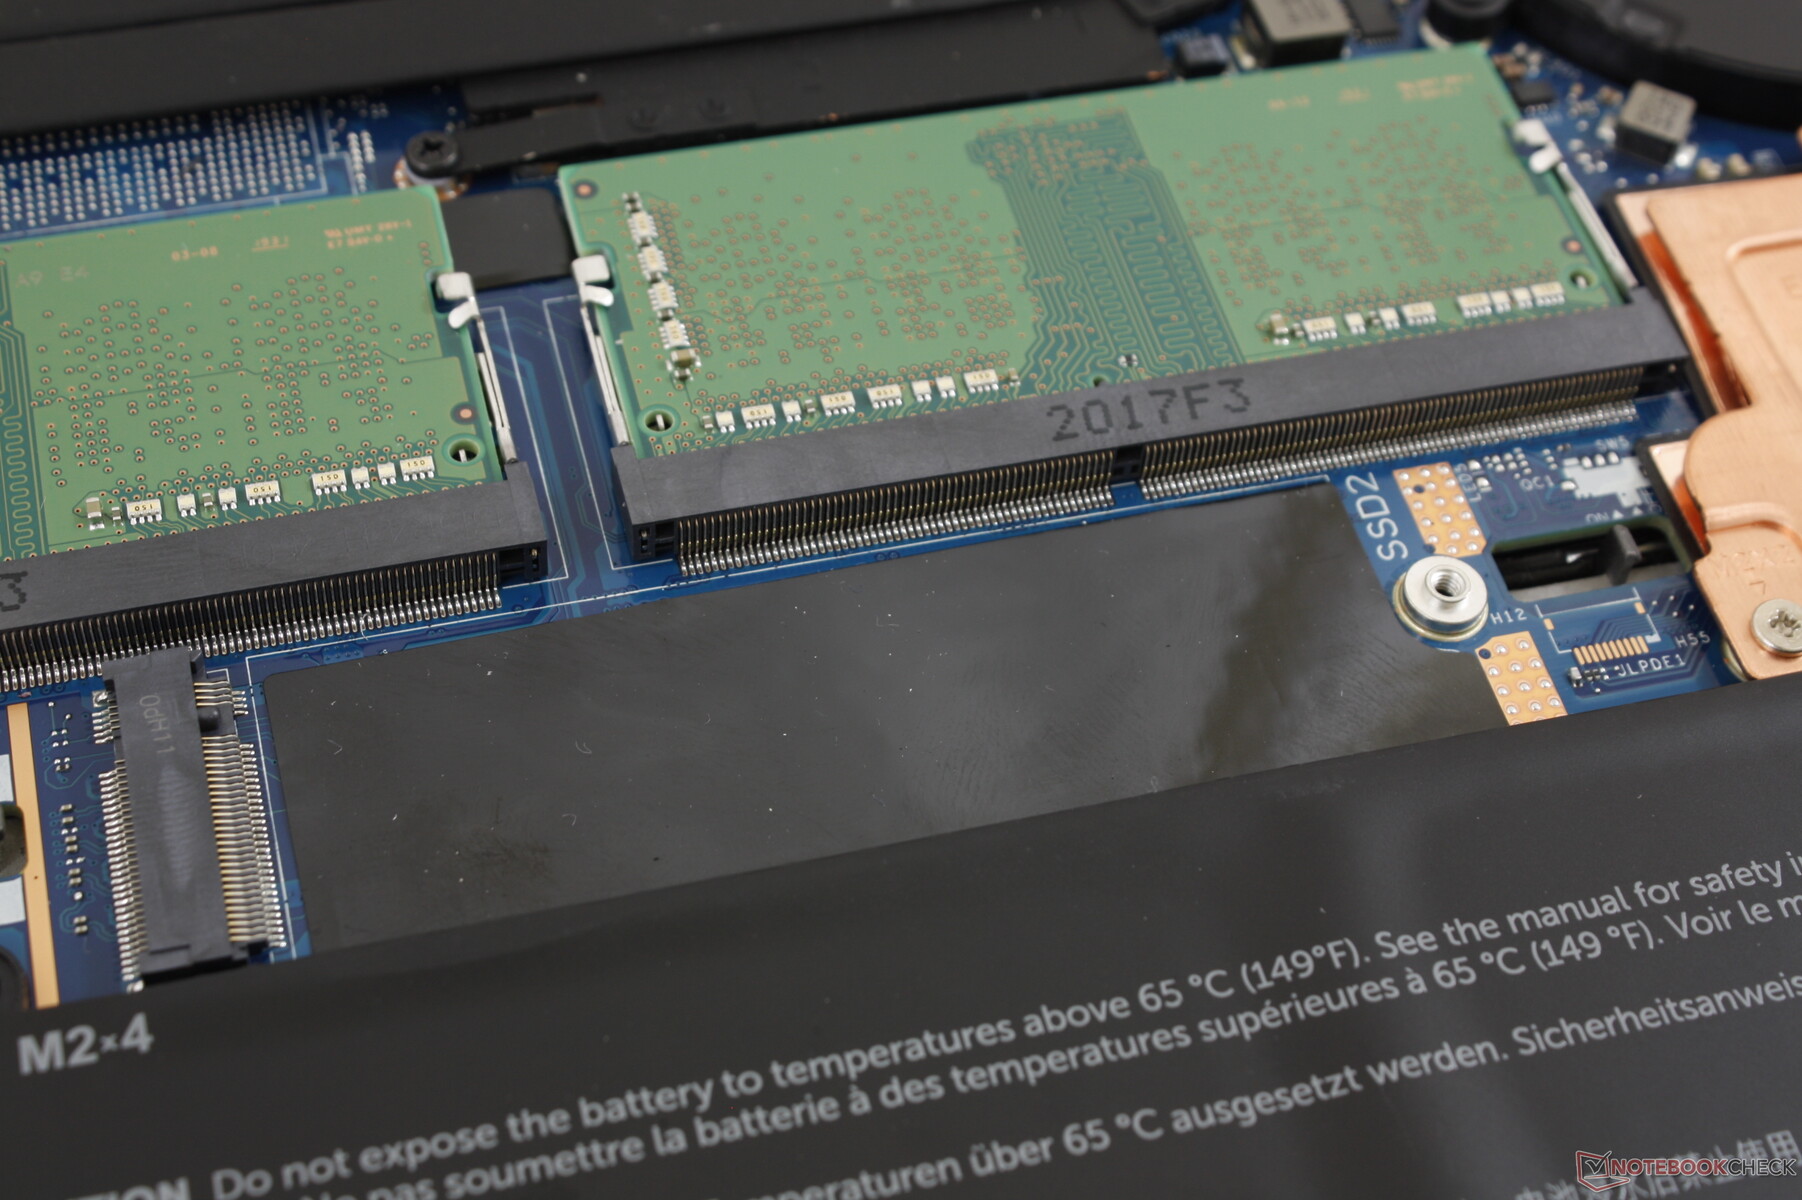
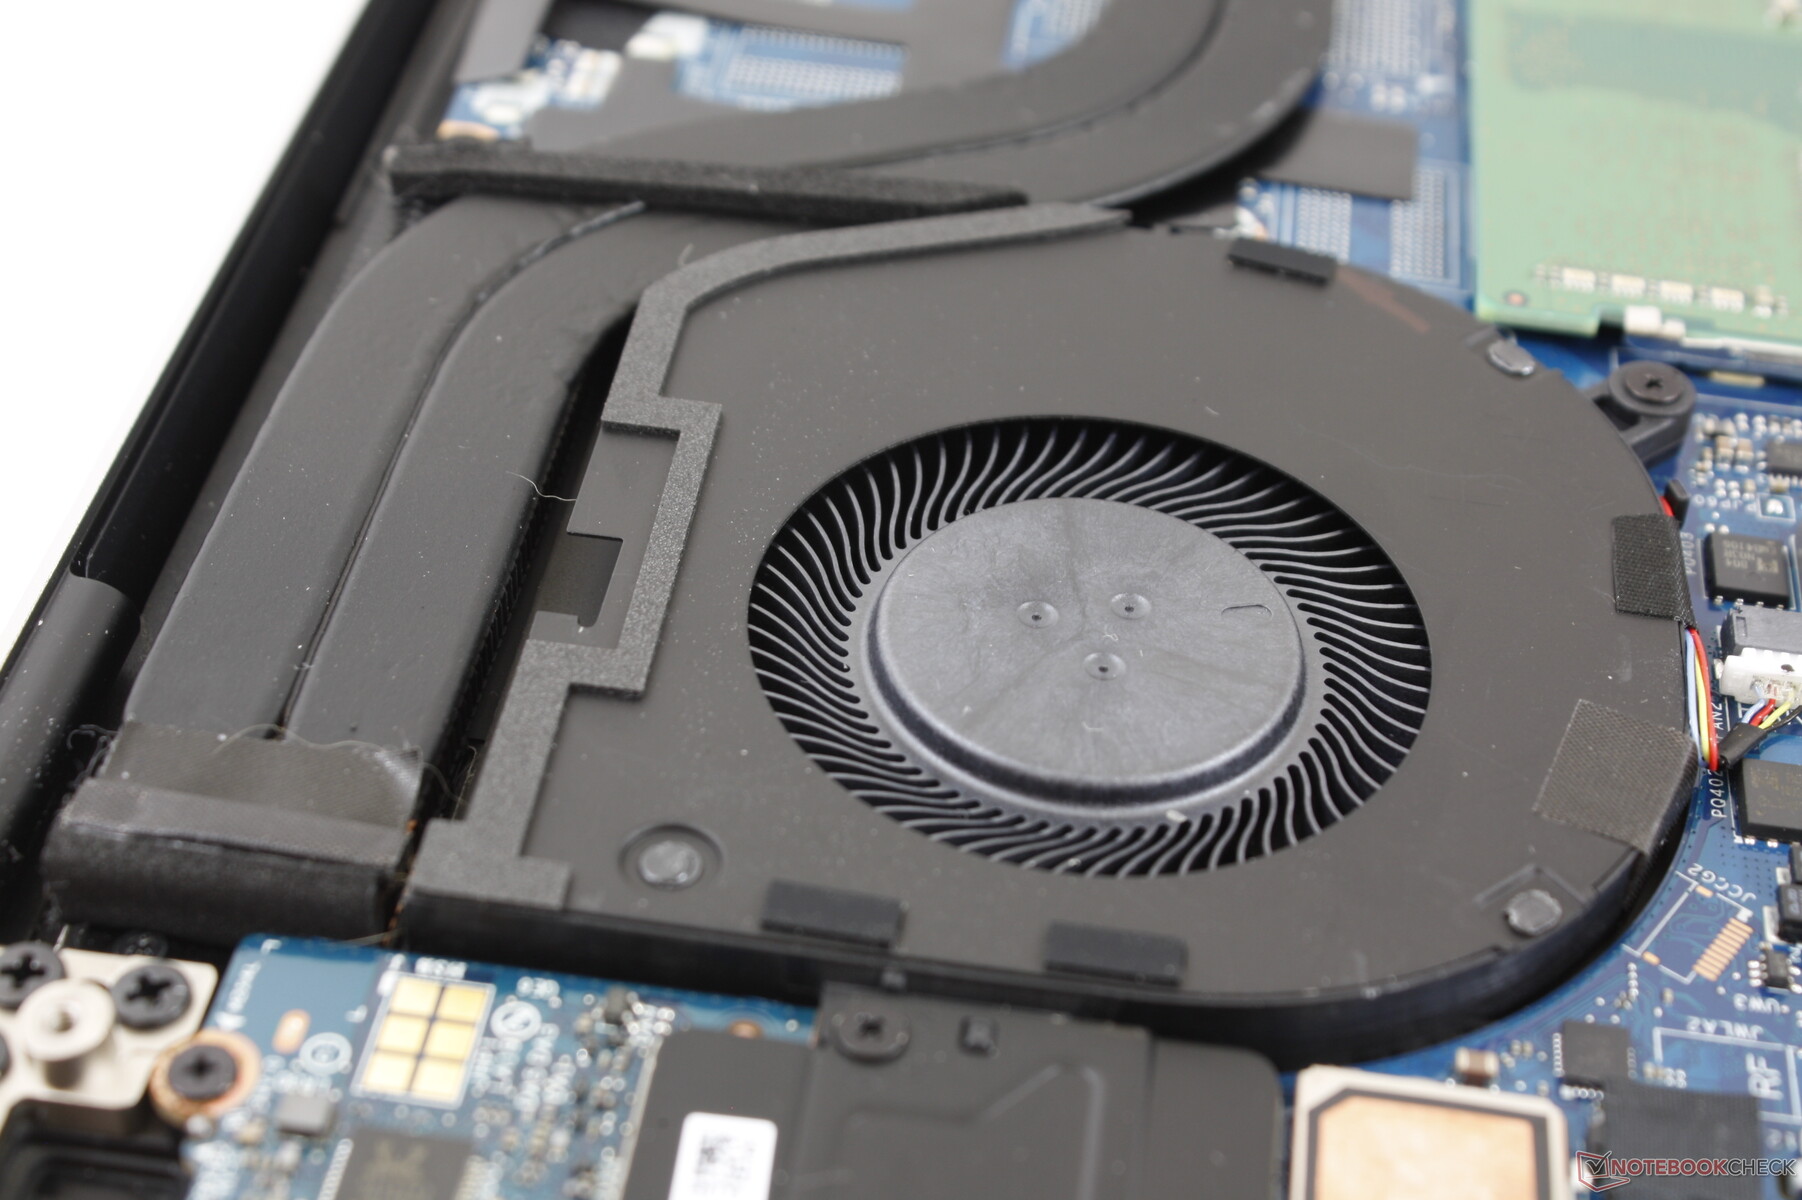
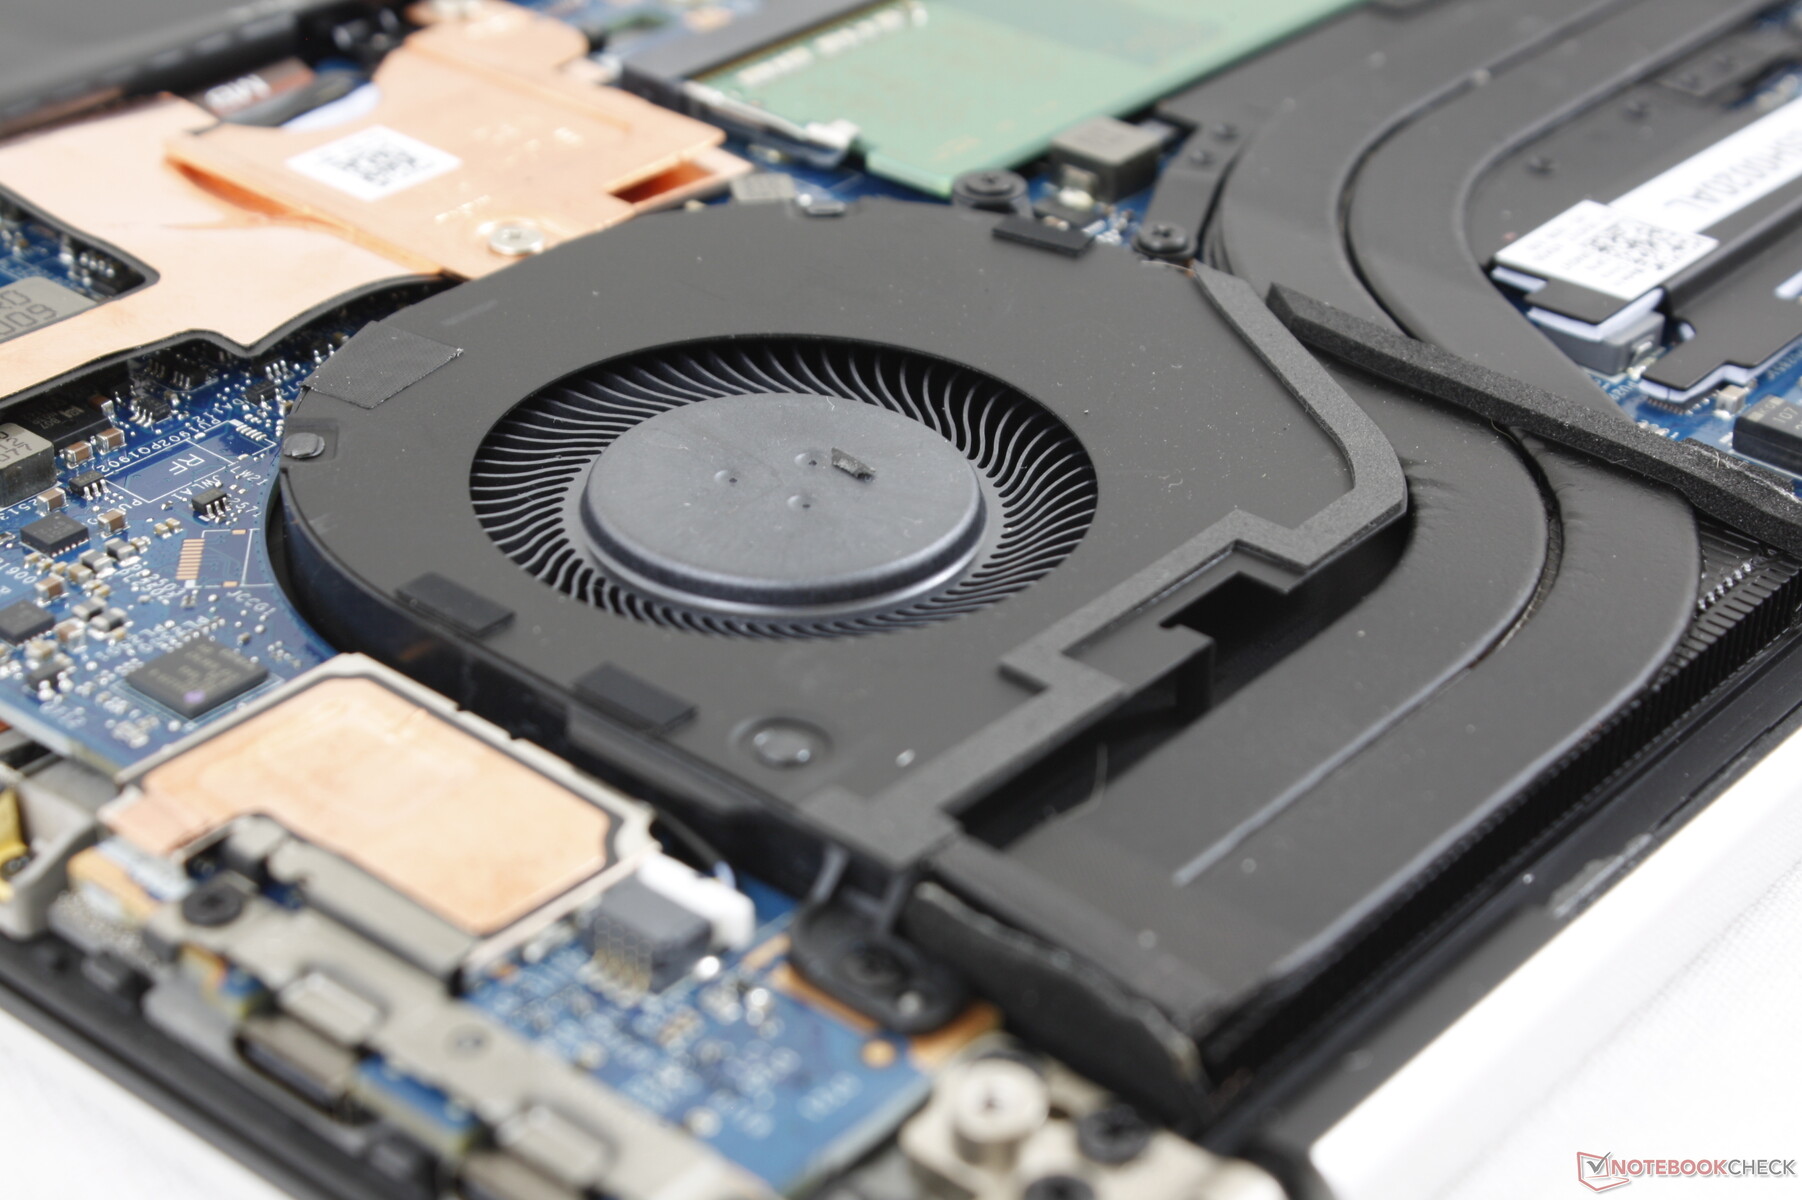
Maintenance
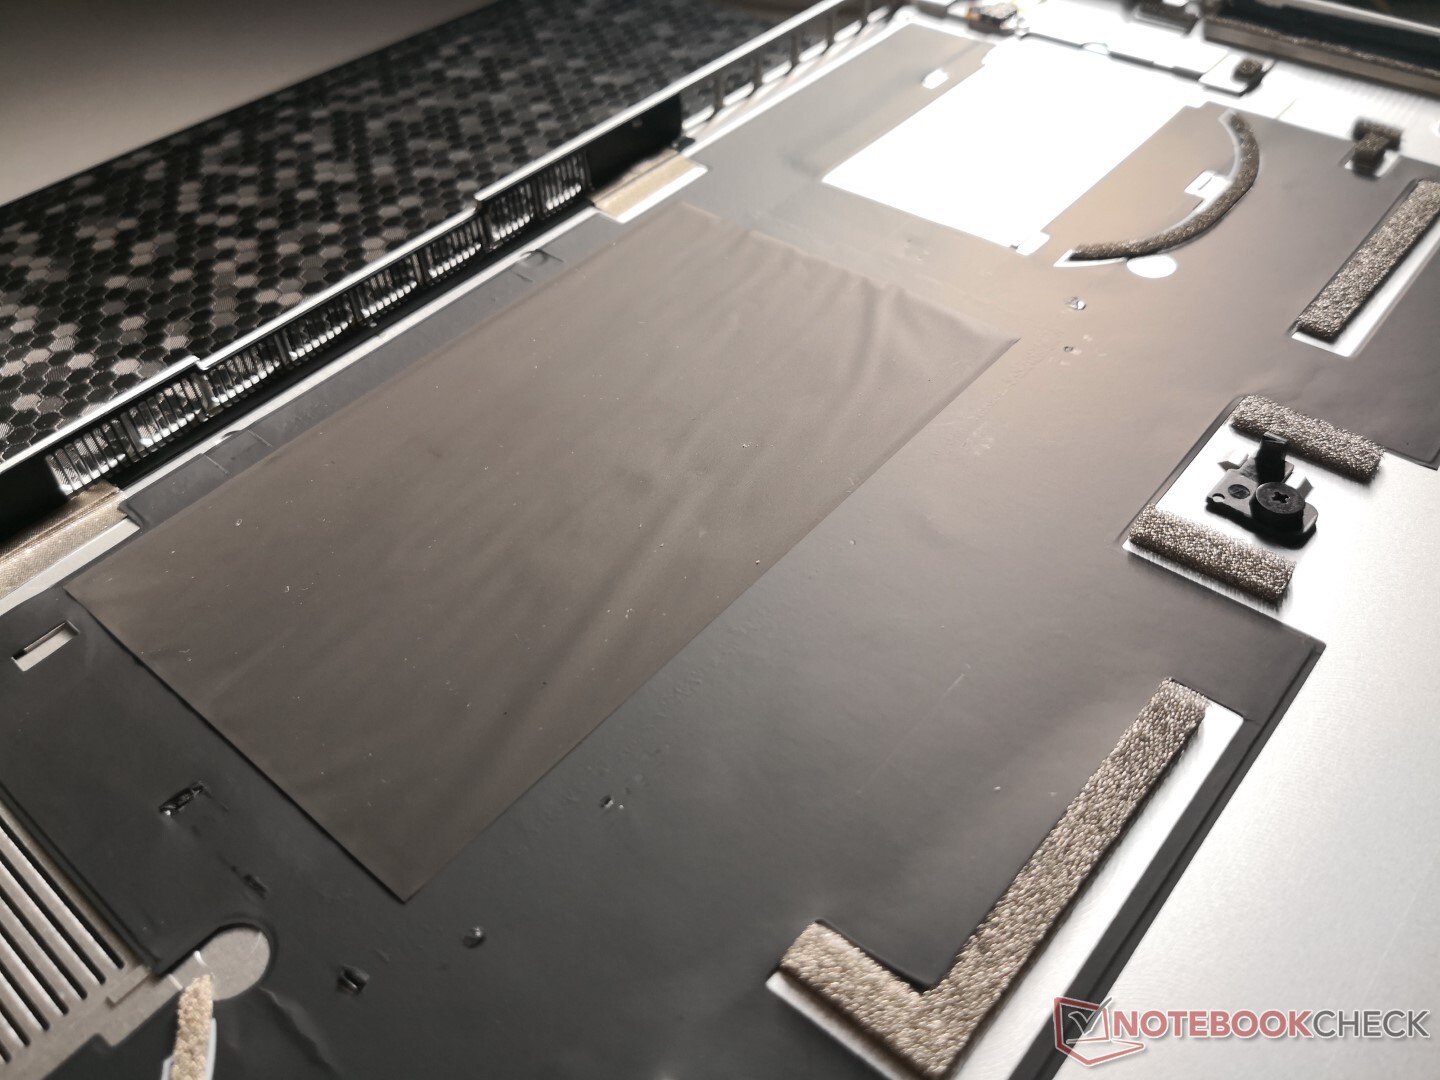
Servicing requires a T5 Torx wrench and a sharp edge to pry open the edges. The metal panel is very sharp and so this should be done carefully.
Once removed, users will have direct access to the storage bays, RAM modules, and battery.
Accessories and Warranty
Dell throws in two useful adapters in the box: USB Type-C to HDMI and USB Type-C to USB Type-A. You'll definitely want to keep them around since port variety is more limited compared to last year's model.
The standard one-year limited warranty applies with plenty of extension options of up to four years.
Input Devices
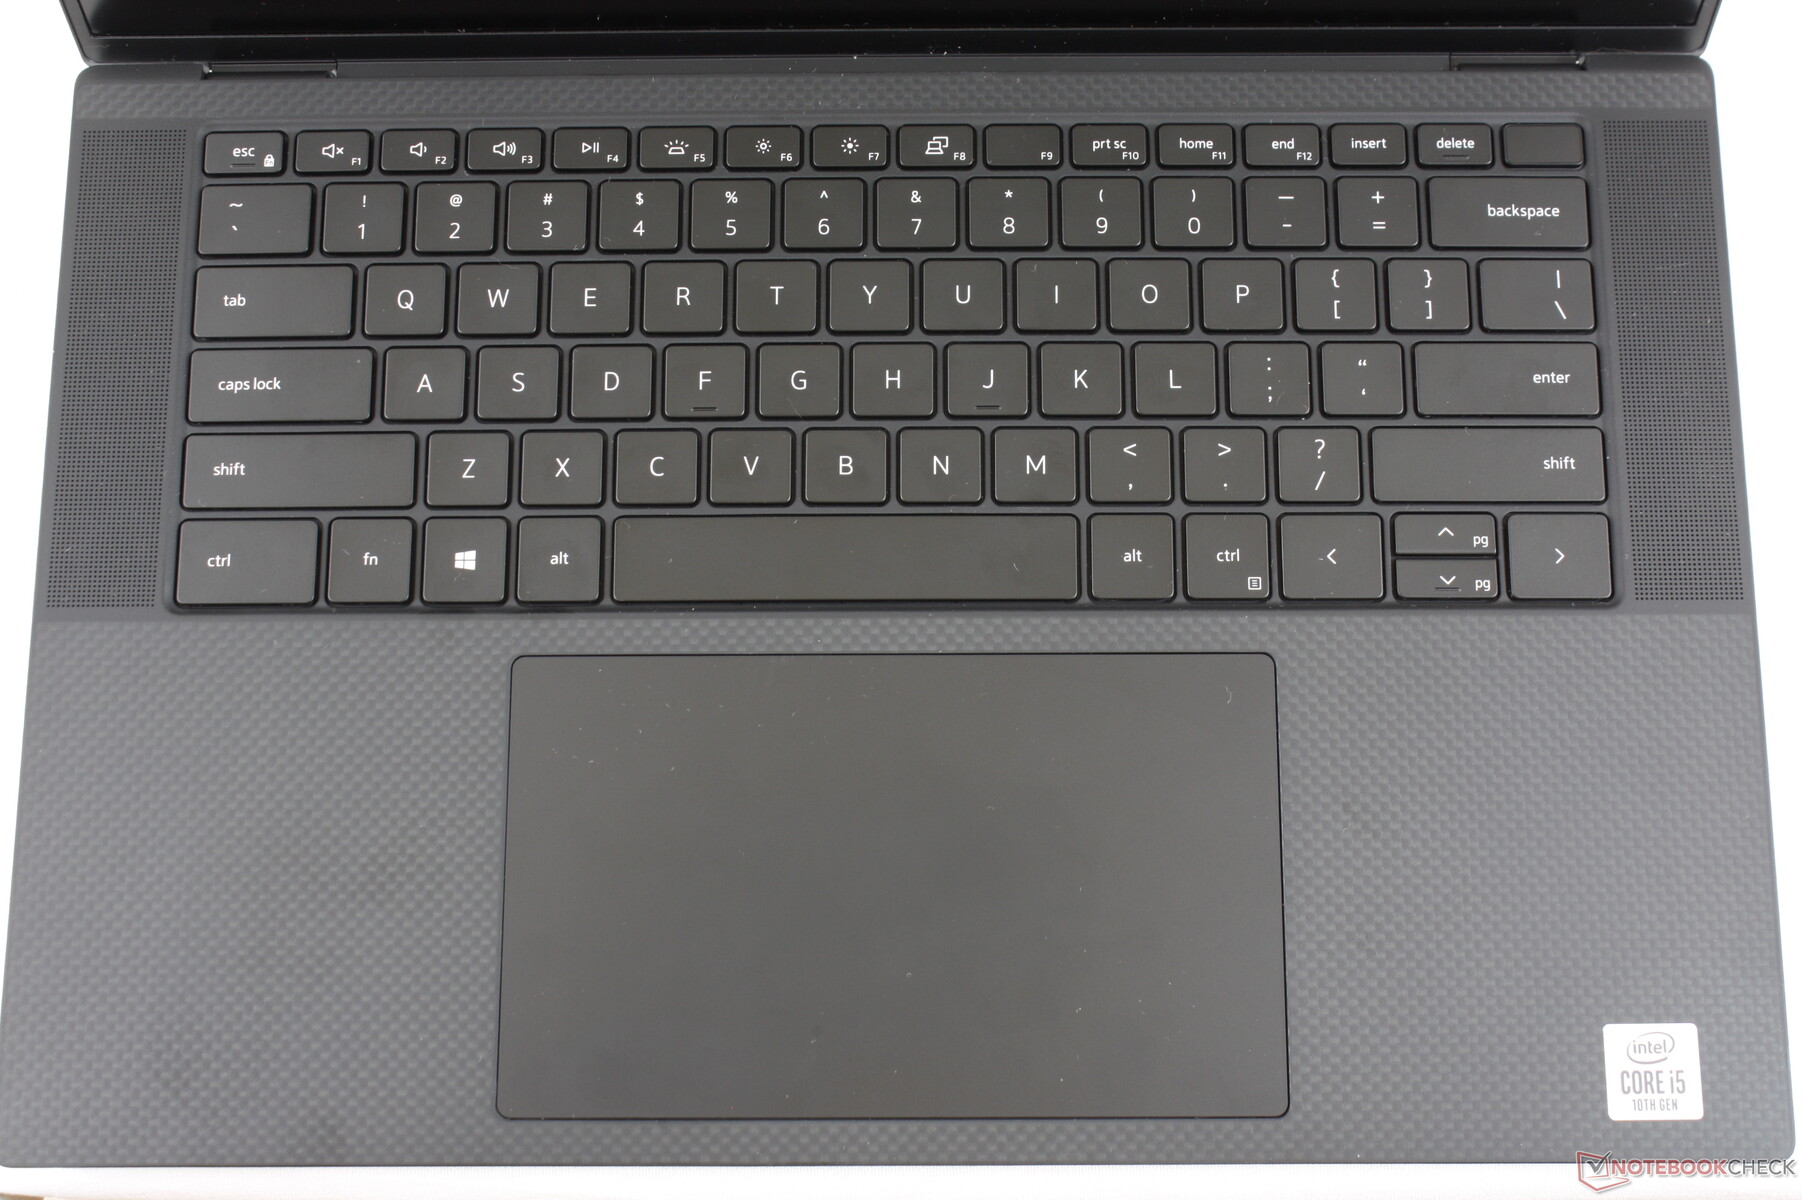
Keyboard
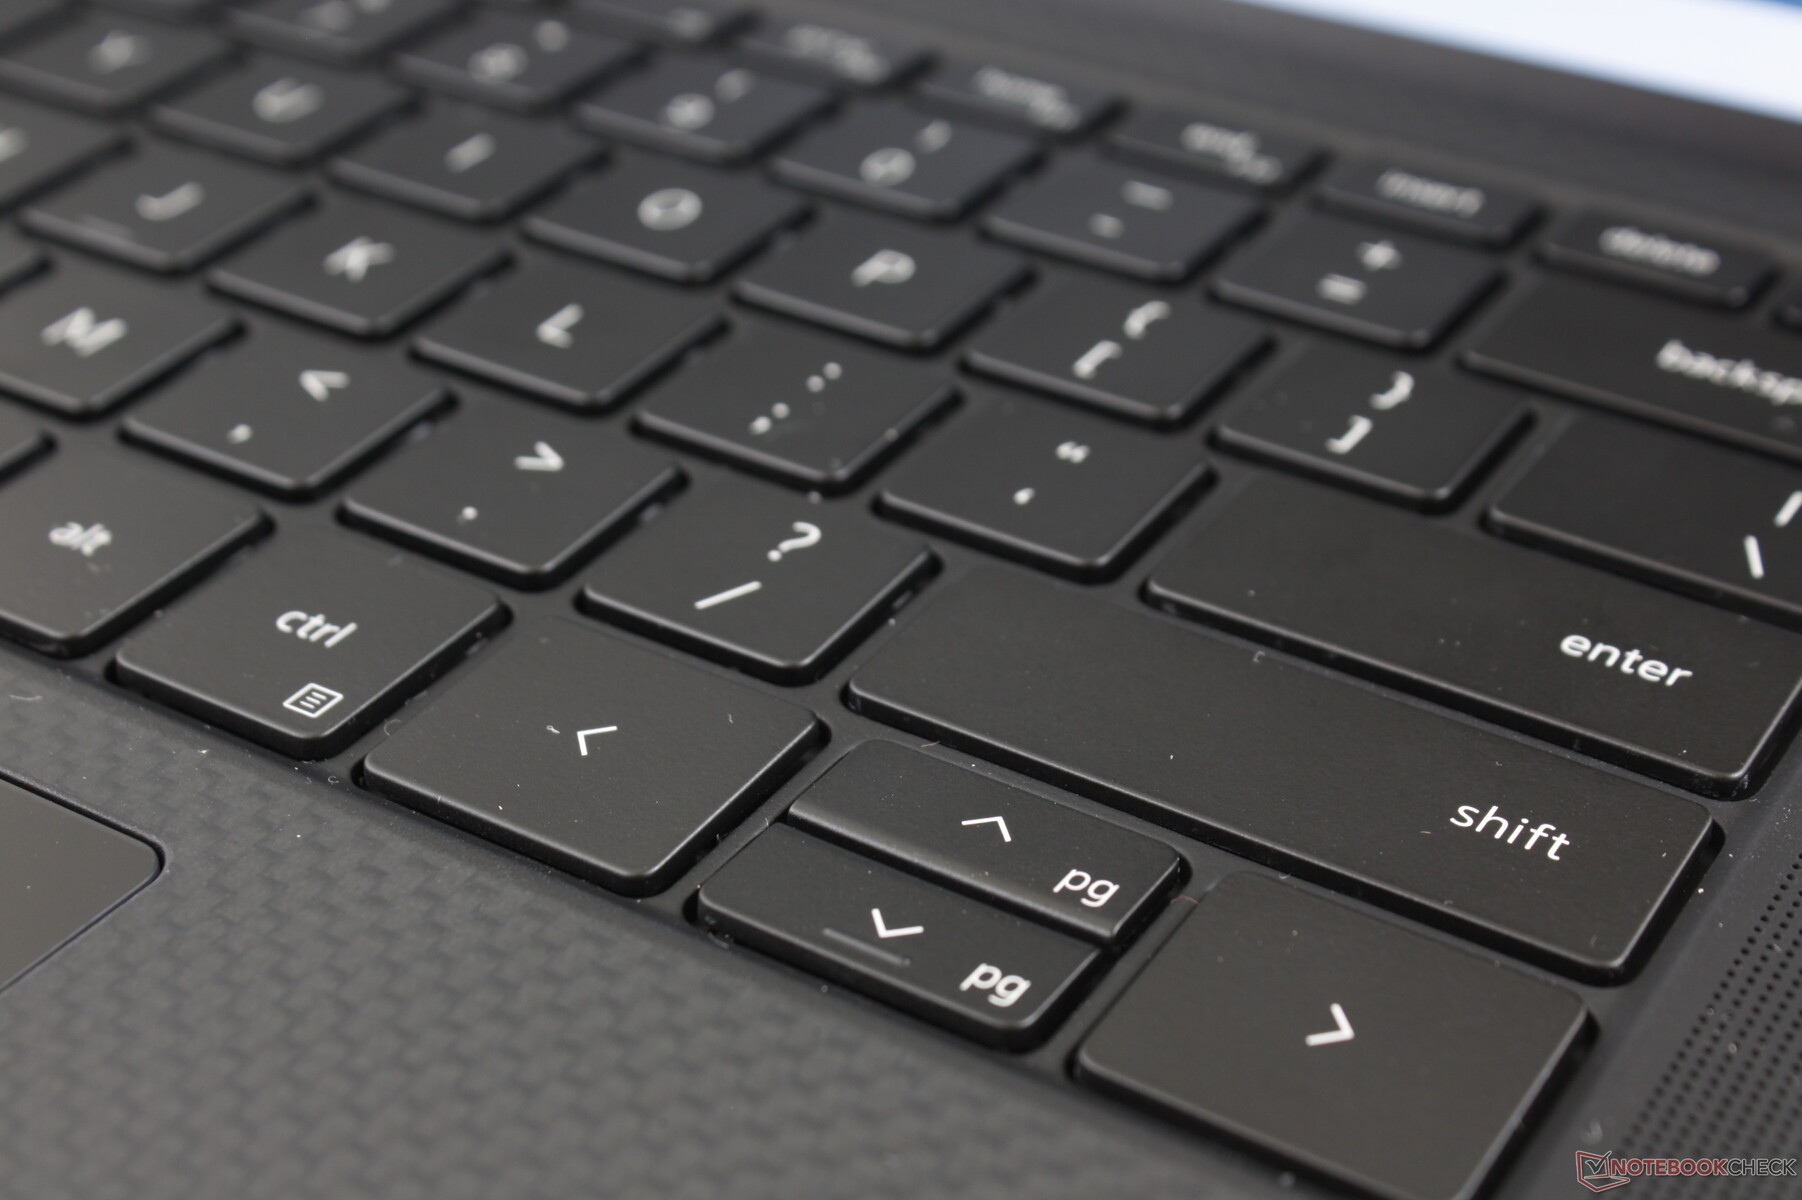
Dell has revamped the keyboard for the XPS 15 9500. Keys are now larger than they were on the XPS 15 7590 with slightly crisper feedback when pressed for a better typing experience. Travel hasn't changed significantly and it is still shallower than the keys on the HP Spectre x360 15. We had expected a keyboard more alike the MagLev keys of the XPS 15 9575, but Dell seems content with refining the standard membrane keys instead and we can't really complain about the results.
Touchpad
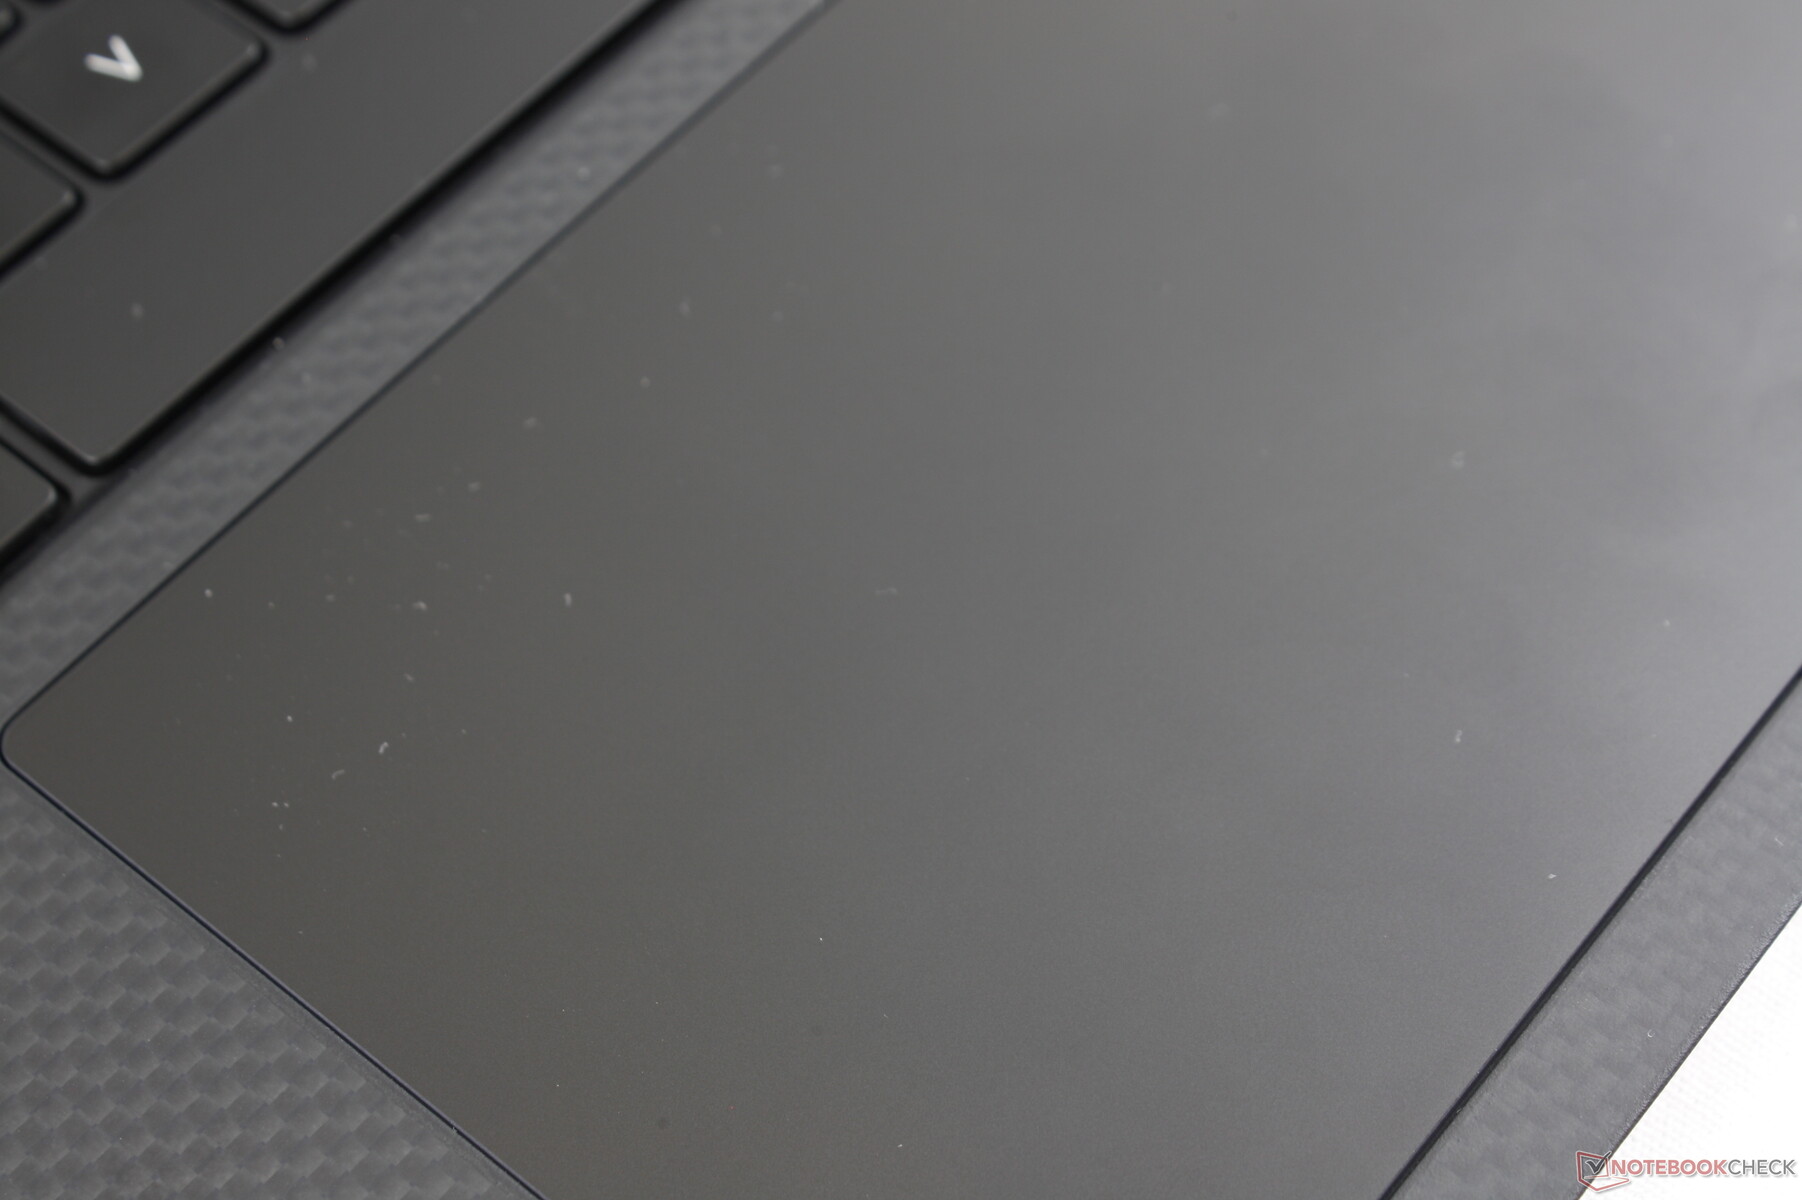
At 15.1 x 9 cm, the Precision-enabled clickpad is 52 percent larger than the clickpad on the XPS 15 7590 (10.5 x 8.5 cm) to be one of the largest we've seen on any Windows laptop. It's difficult to go back to smaller clickpads after spending time with the XPS 15 9500. Gliding is smooth and reliable with no cursor jumping and very little sticking if moving at slower speeds.
No matter how large the clickpad may be, however, the lack of dedicated mouse keys makes precision clicks difficult. Dragging and dropping is still easier on a traditional ThinkPad like the T490 where firm mouse keys are available. The integrated clickpad keys on the XPS 15 9500 are soft, quiet, and shallow with weak feedback when pressed.

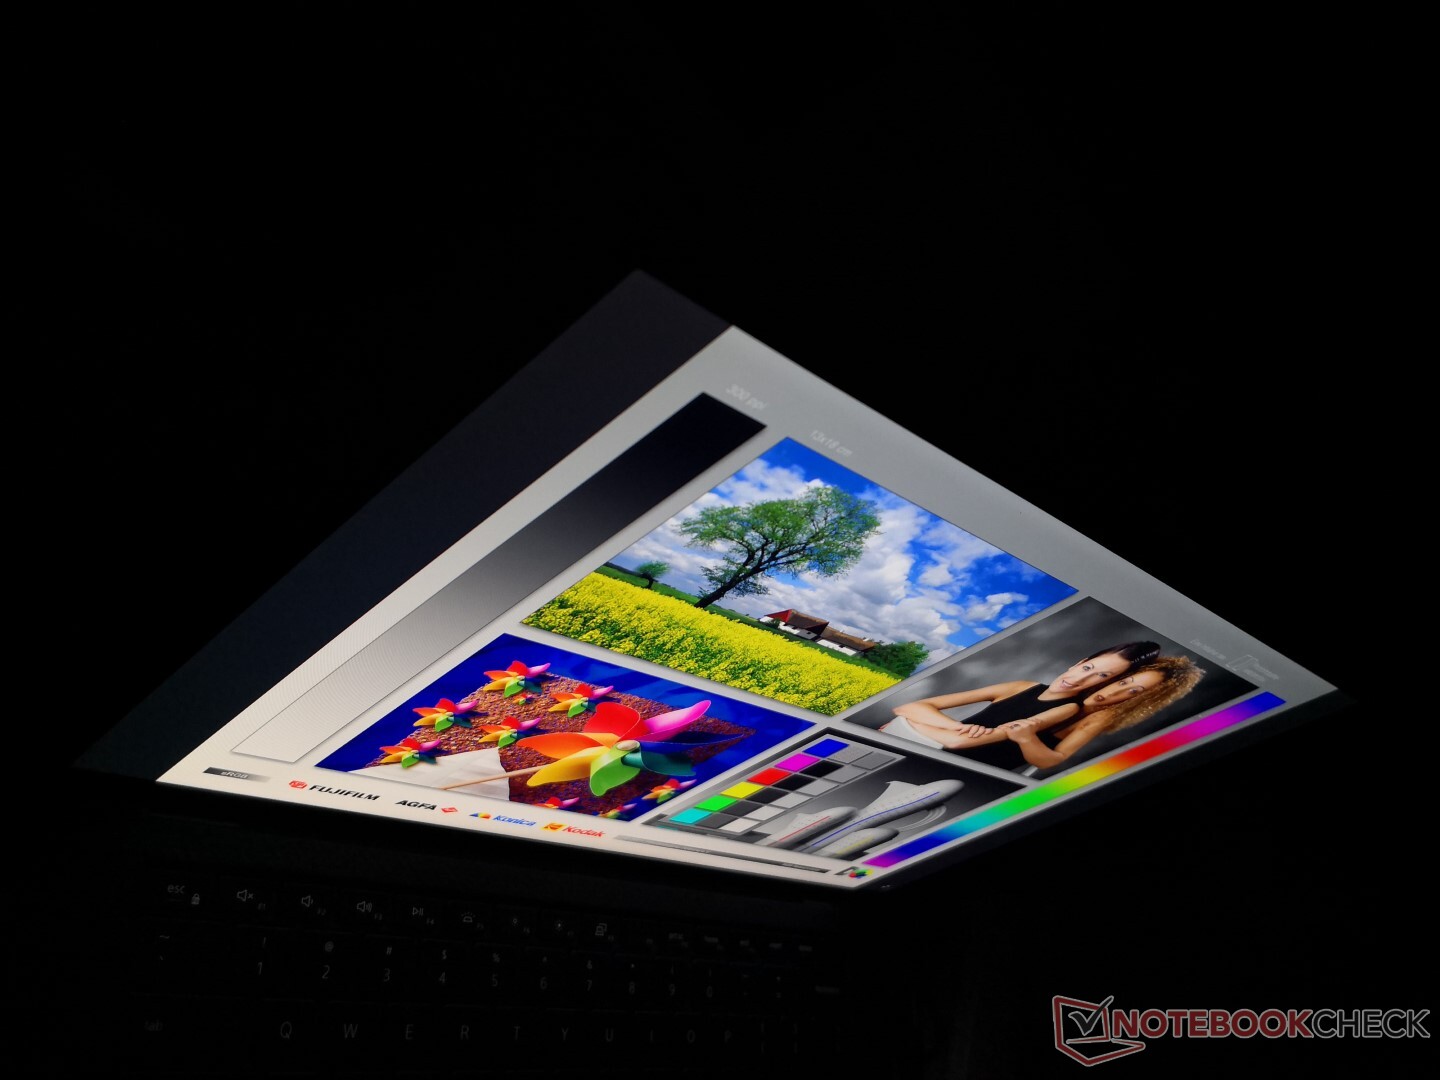
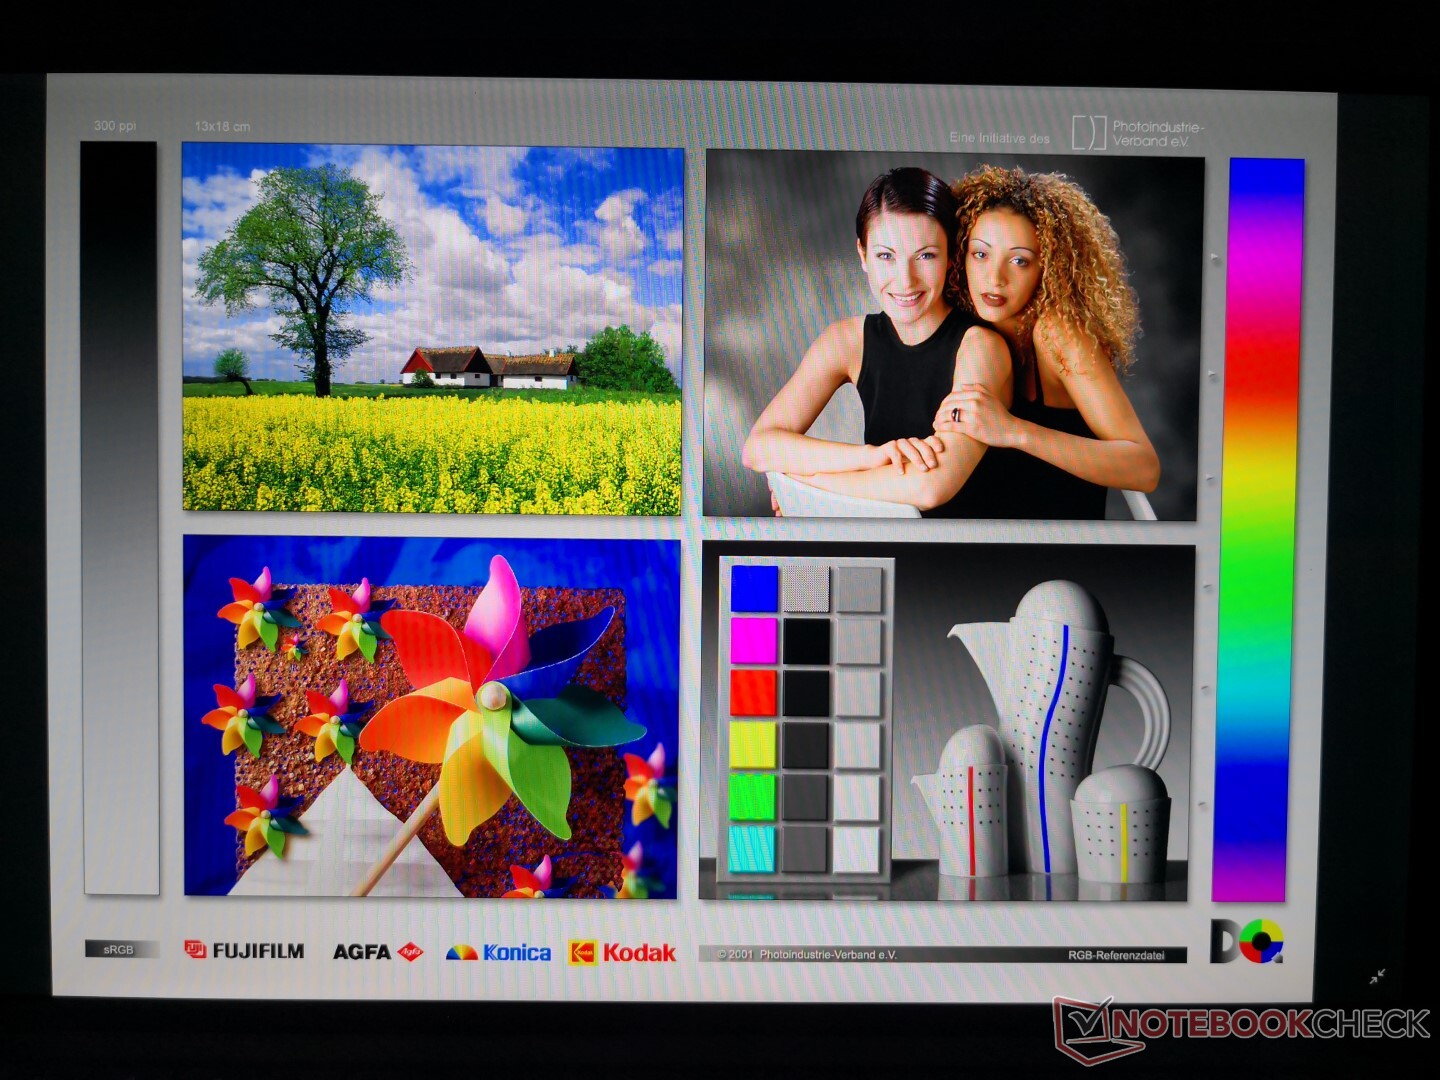
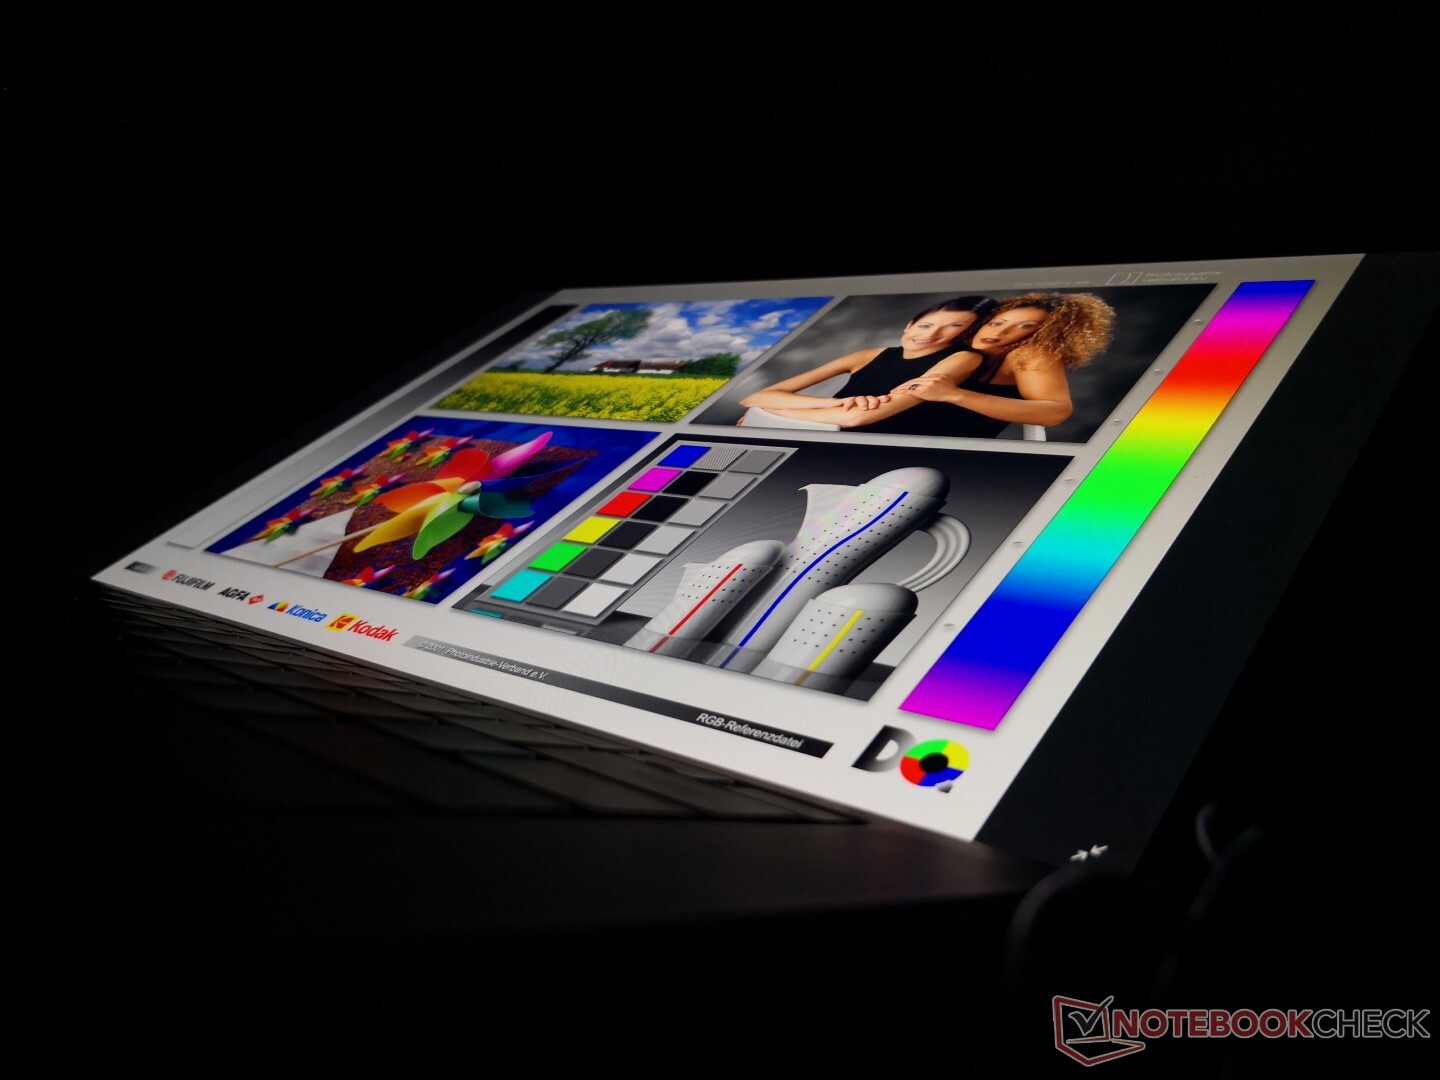
Display
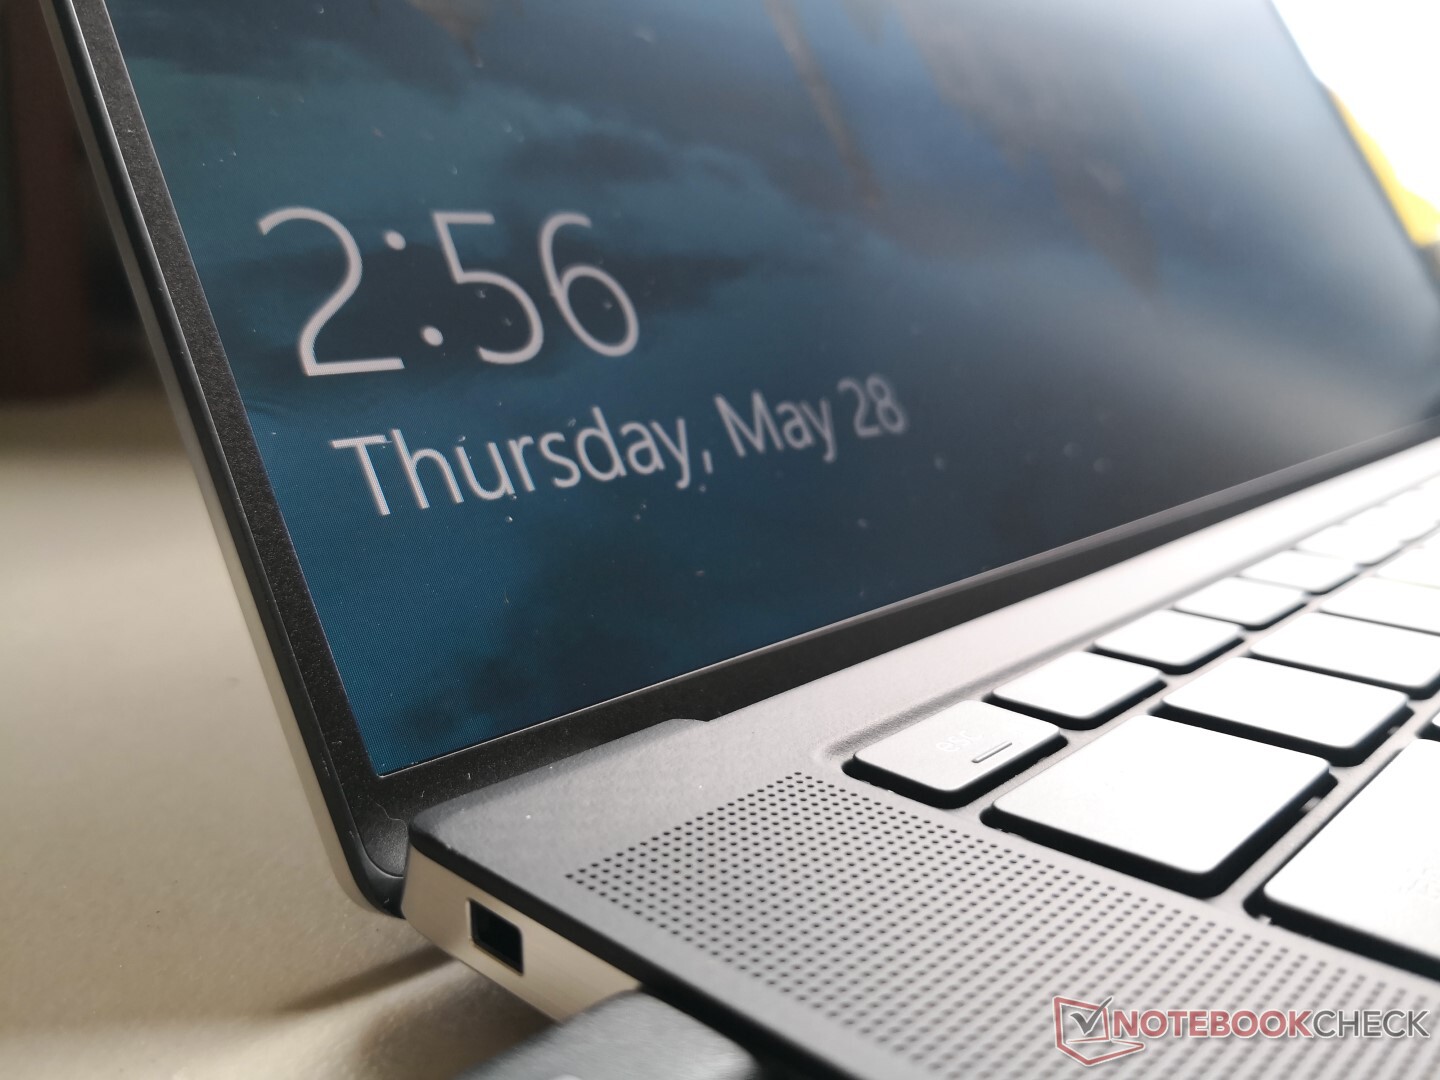
The display is easily the highlight of the XPS 15 9500. Even the baseline configuration we have here comes with one of the brightest displays we've seen on any 15.6-inch consumer laptop. When compared to the XPS 15 7590 FHD panel, the XPS 15 9500 manages to offer both marginally faster response times and wider color coverage without impacting brightness or contrast. Pulse-width modulation is completely gone as well for a flicker-free experience.
The 16:10 aspect ratio is immediately apparent for a noticeably larger screen area when compared to the typical 16:9 laptop. The Sharp LQ156N1 IPS panel can be found on no other laptop in our database since Dell is one of the first to offer a 16:10 Ultrabook for mass adoption.
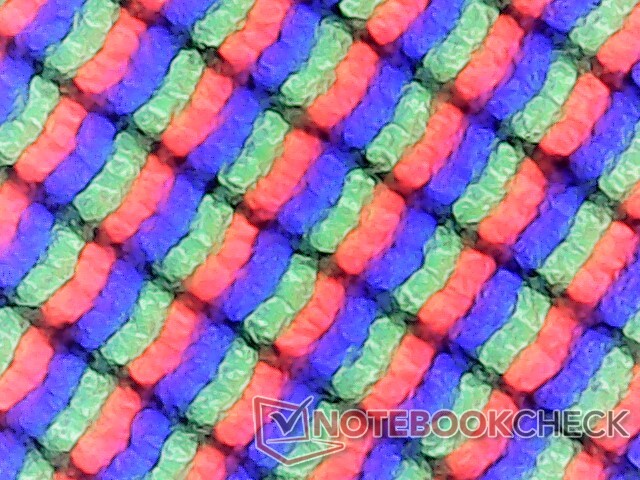
Our main gripe is that the screen is ever-so-slightly grainy which is to be expected from a matte overlay. Luckily, Dell offers glossy options to alleviate this. Note that OLED is no longer available likely because there is no sufficient supply of 16:10 OLED panels in the market.

| |||||||||||||||||||||||||
Brightness Distribution: 85 %
Center on Battery: 592 cd/m²
Contrast: 1287:1 (Black: 0.46 cd/m²)
ΔE ColorChecker Calman: 3.19 | ∀{0.5-29.43 Ø4.73}
calibrated: 2.03
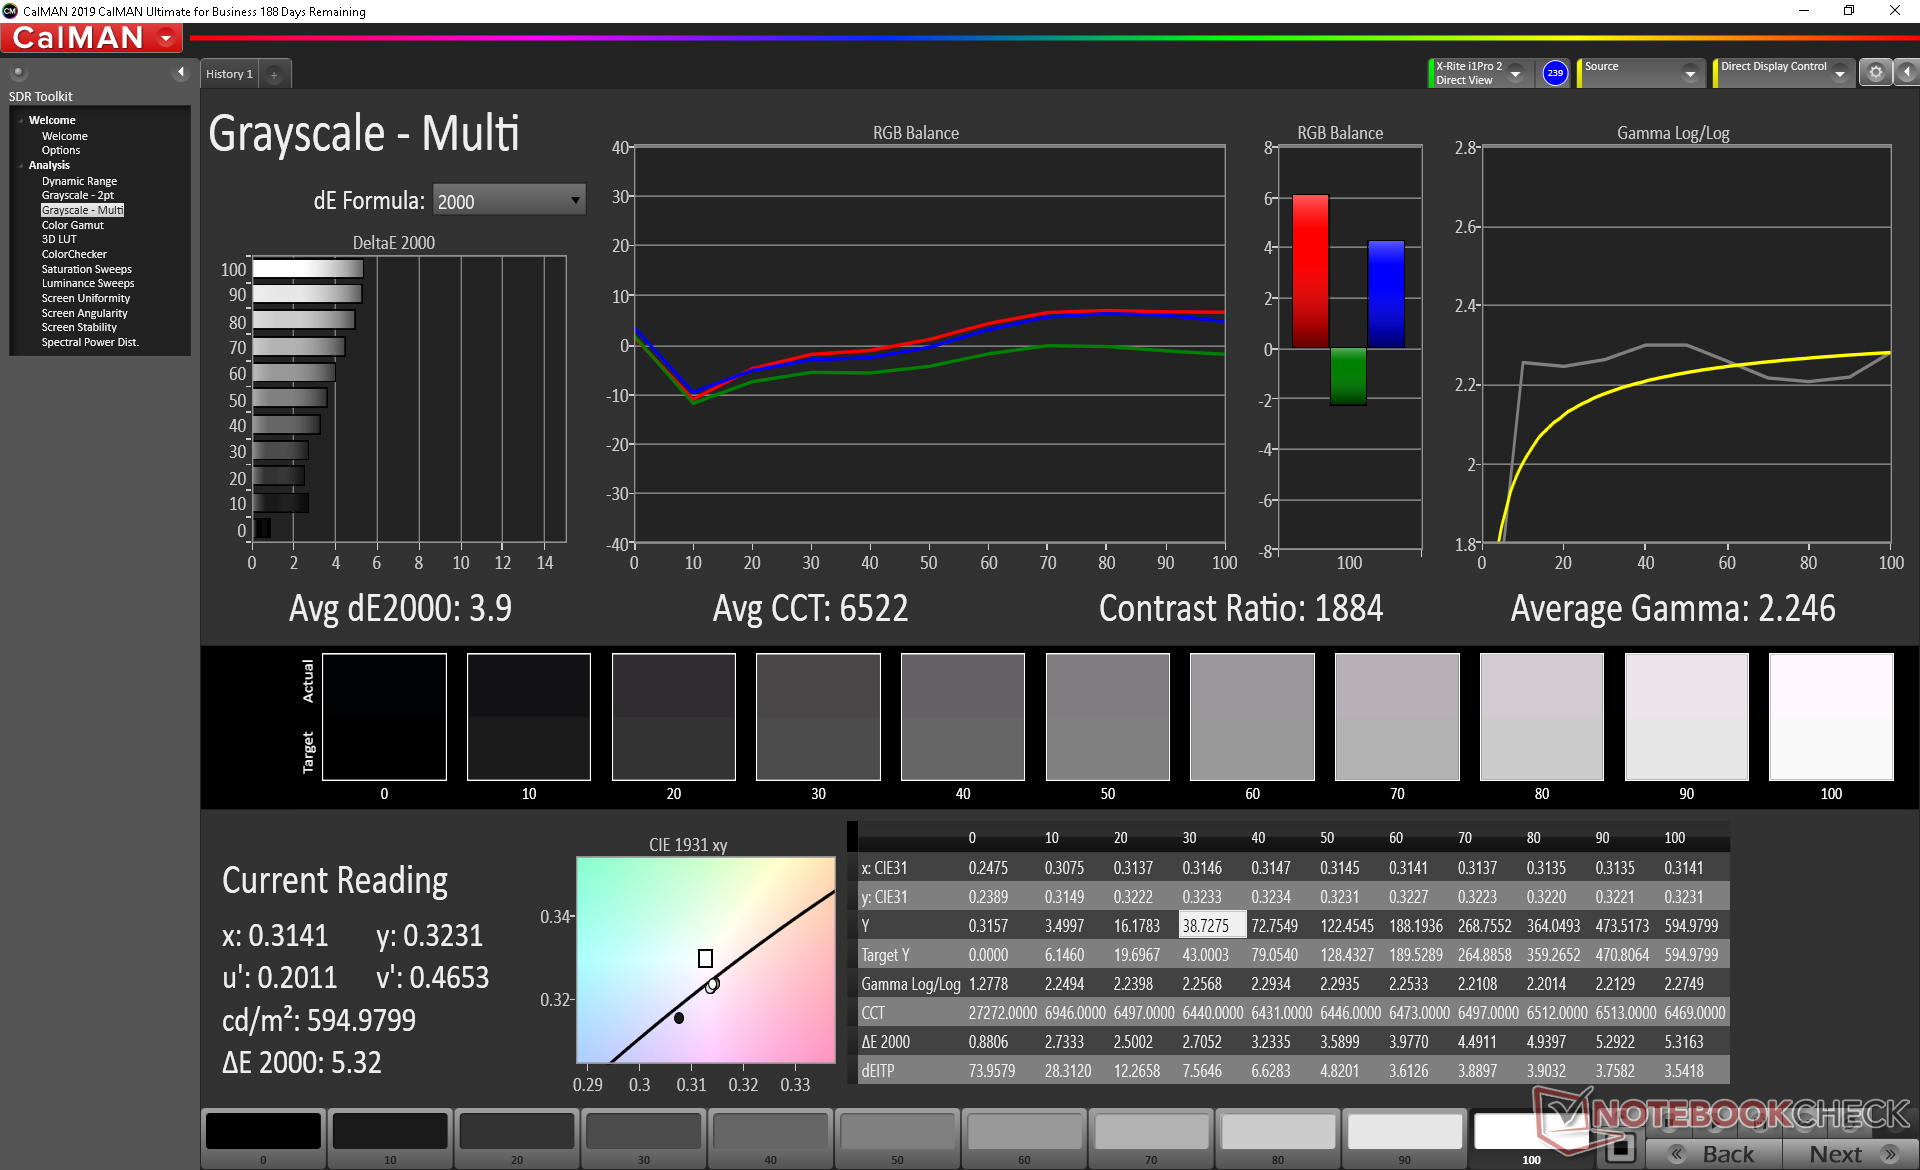
ΔE Greyscale Calman: 3.9 | ∀{0.09-98 Ø4.97}
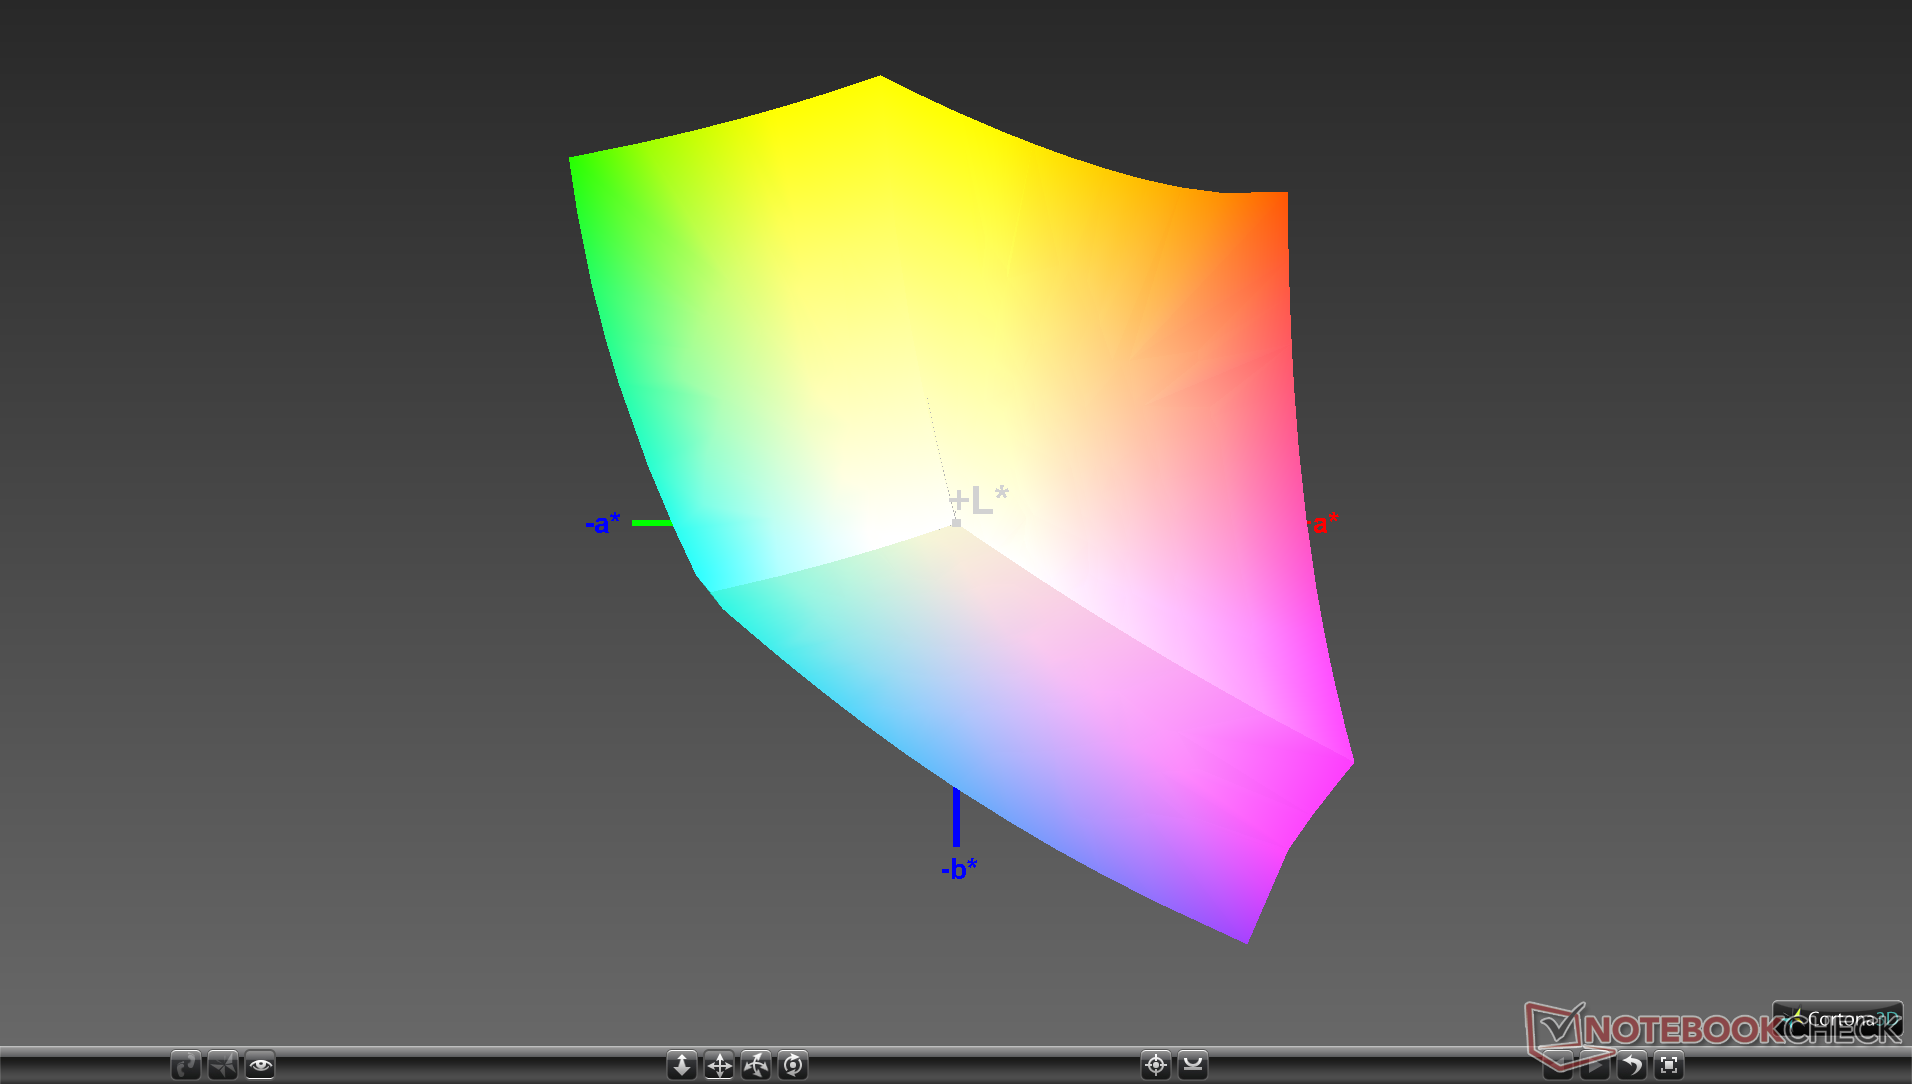
100% sRGB (Argyll 1.6.3 3D)
71.6% AdobeRGB 1998 (Argyll 1.6.3 3D)
79.6% AdobeRGB 1998 (Argyll 3D)
100% sRGB (Argyll 3D)
81.5% Display P3 (Argyll 3D)
Gamma: 2.25
CCT: 6522 K
| Dell XPS 15 9500 Core i5 Sharp LQ156N1, IPS, 15.6", 1920x1200 | Dell XPS 15 7590 i5 iGPU FHD LQ156M1, IPS, 15.6", 1920x1080 | Asus ZenBook 15 UX534FTC-A8190T BOE CQ NV156FHM-N63, IPS, 15.6", 1920x1080 | Lenovo Yoga C940-15IRH LG Philips LP156WFC-SPU1, IPS, 15.6", 1920x1080 | HP Spectre X360 15-5ZV31AV AU Optronics AUO30EB, IPS, 15.6", 3840x2160 | Apple MacBook Pro 16 2019 i9 5500M APPA044, IPS, 16", 3072x1920 | |
|---|---|---|---|---|---|---|
| Display | -11% | -18% | -17% | -12% | ||
| Display P3 Coverage (%) | 81.5 | 66.5 -18% | 65 -20% | 61.5 -25% | 68.3 -16% | |
| sRGB Coverage (%) | 100 | 98 -2% | 86.2 -14% | 92.7 -7% | 94.3 -6% | |
| AdobeRGB 1998 Coverage (%) | 79.6 | 68.4 -14% | 62.9 -21% | 63.6 -20% | 68.4 -14% | |
| Response Times | -19% | -9% | -21% | -39% | -23% | |
| Response Time Grey 50% / Grey 80% * (ms) | 42 ? | 52.8 ? -26% | 45 ? -7% | 48.4 ? -15% | 56.8 ? -35% | 52.4 ? -25% |
| Response Time Black / White * (ms) | 28.8 ? | 32 ? -11% | 32 ? -11% | 36.4 ? -26% | 40.8 ? -42% | 34.9 ? -21% |
| PWM Frequency (Hz) | 1020 ? | 131700 | ||||
| Screen | 7% | -17% | -6% | -12% | 14% | |
| Brightness middle (cd/m²) | 592 | 588 -1% | 299 -49% | 484.8 -18% | 284.6 -52% | 519 -12% |
| Brightness (cd/m²) | 565 | 555 -2% | 280 -50% | 463 -18% | 285 -50% | 477 -16% |
| Brightness Distribution (%) | 85 | 89 5% | 89 5% | 82 -4% | 85 0% | 86 1% |
| Black Level * (cd/m²) | 0.46 | 0.4 13% | 0.21 54% | 0.26 43% | 0.25 46% | 0.39 15% |
| Contrast (:1) | 1287 | 1470 14% | 1424 11% | 1865 45% | 1138 -12% | 1331 3% |
| Colorchecker dE 2000 * | 3.19 | 2.5 22% | 4.76 -49% | 4.5 -41% | 3.52 -10% | 2.28 29% |
| Colorchecker dE 2000 max. * | 5.45 | 6.3 -16% | 9 -65% | 7.55 -39% | 5.56 -2% | 6.54 -20% |
| Colorchecker dE 2000 calibrated * | 2.03 | 0.6 70% | 1.19 41% | 3 -48% | 0.86 58% | |
| Greyscale dE 2000 * | 3.9 | 4.5 -15% | 3.53 9% | 5.7 -46% | 3.2 18% | 0.9 77% |
| Gamma | 2.25 98% | 2.2 100% | 2.3 96% | 2.45 90% | 2.28 96% | 2145 0% |
| CCT | 6522 100% | 6836 95% | 7228 90% | 6101 107% | 7070 92% | 6572 99% |
| Color Space (Percent of AdobeRGB 1998) (%) | 71.6 | 63.2 -12% | 56 -22% | 58.7 -18% | 61.1 -15% | 78 9% |
| Color Space (Percent of sRGB) (%) | 100 | 98 -2% | 86 -14% | 92.8 -7% | 93.8 -6% | |
| Total Average (Program / Settings) | -8% /
0% | -15% /
-16% | -15% /
-10% | -21% /
-15% | -5% /
8% |
* ... smaller is better
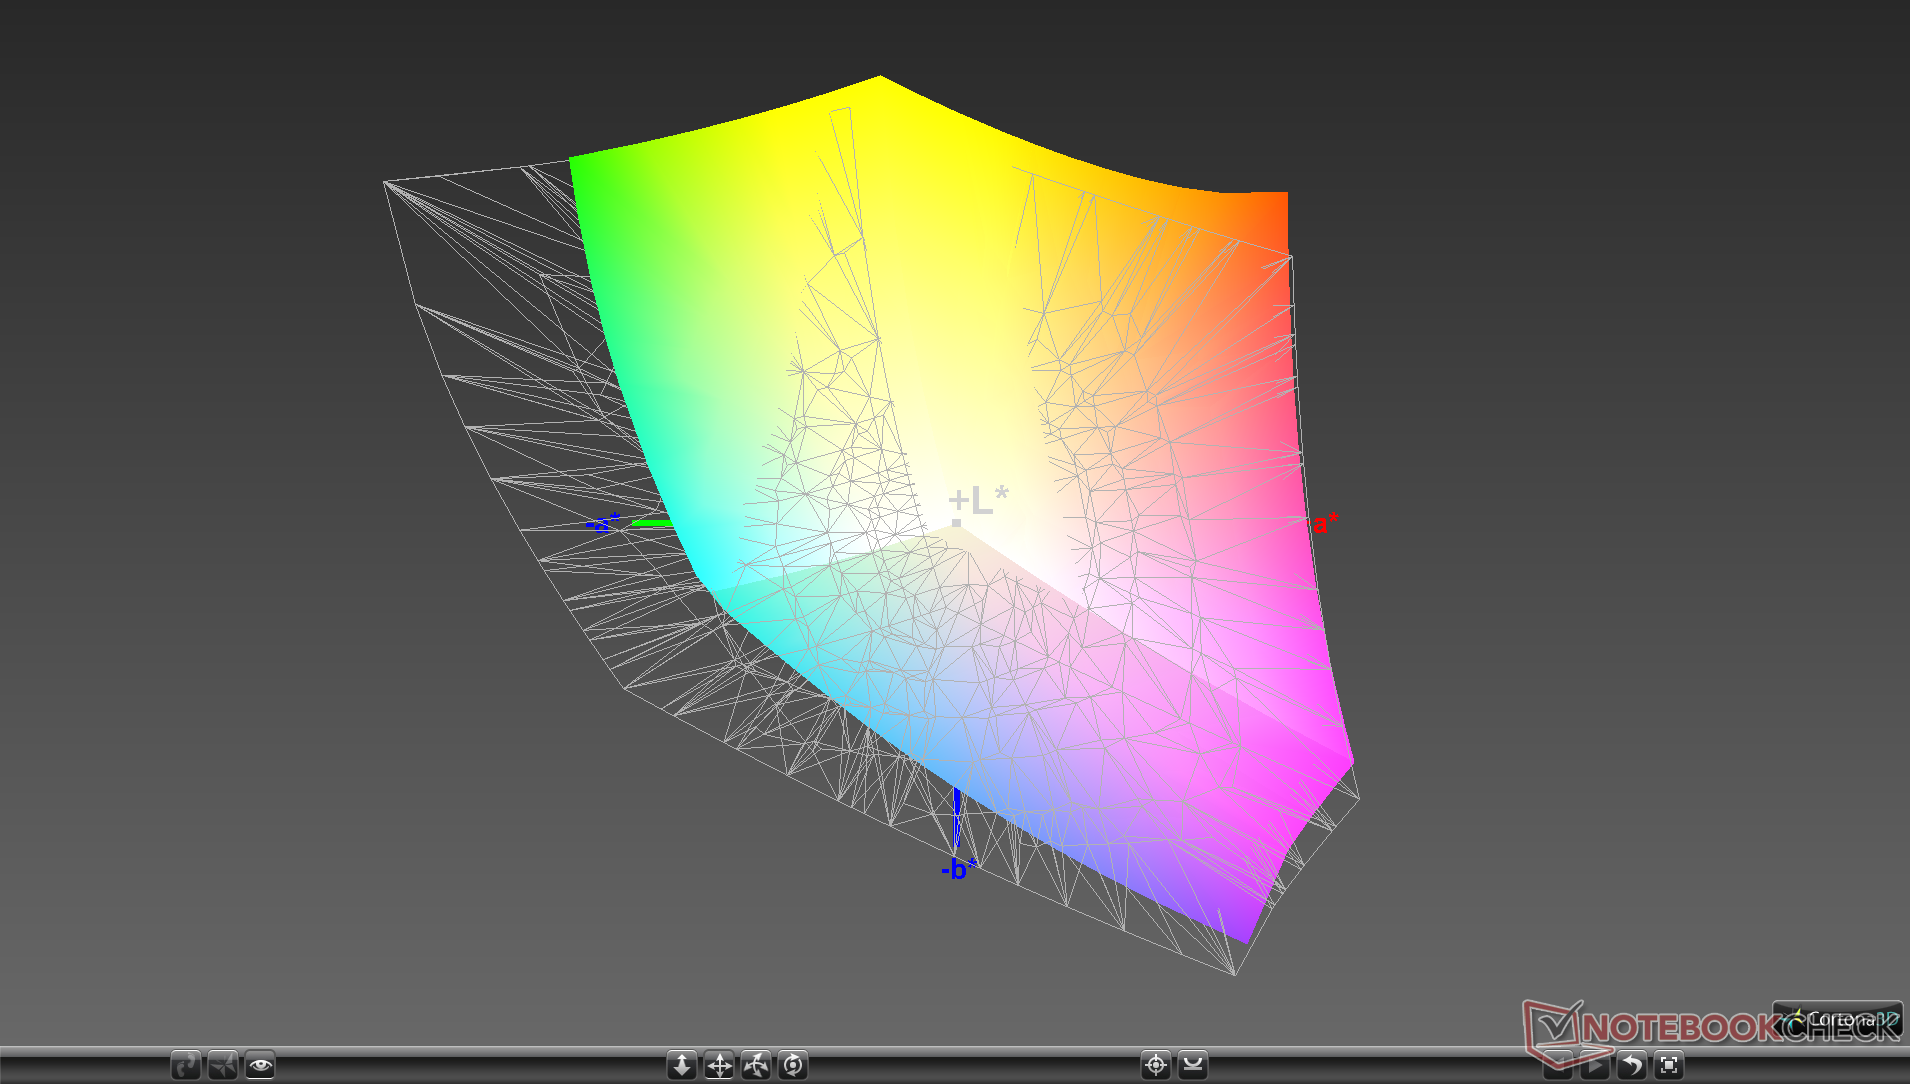
Color space is at an interesting spot as it is measurably wider than sRGB while being smaller than AdobeRGB. In fact, just 80 percent of the XPS 15 9500 3D color space is enough to cover sRGB in its entirety. The 72 percent AdobeRGB coverage is also wider than on most other Ultrabooks where the 60 percent range is more common, but users will have to upgrade to Dell's pricier 4K UHD+ configuration for full AdobeRGB coverage.
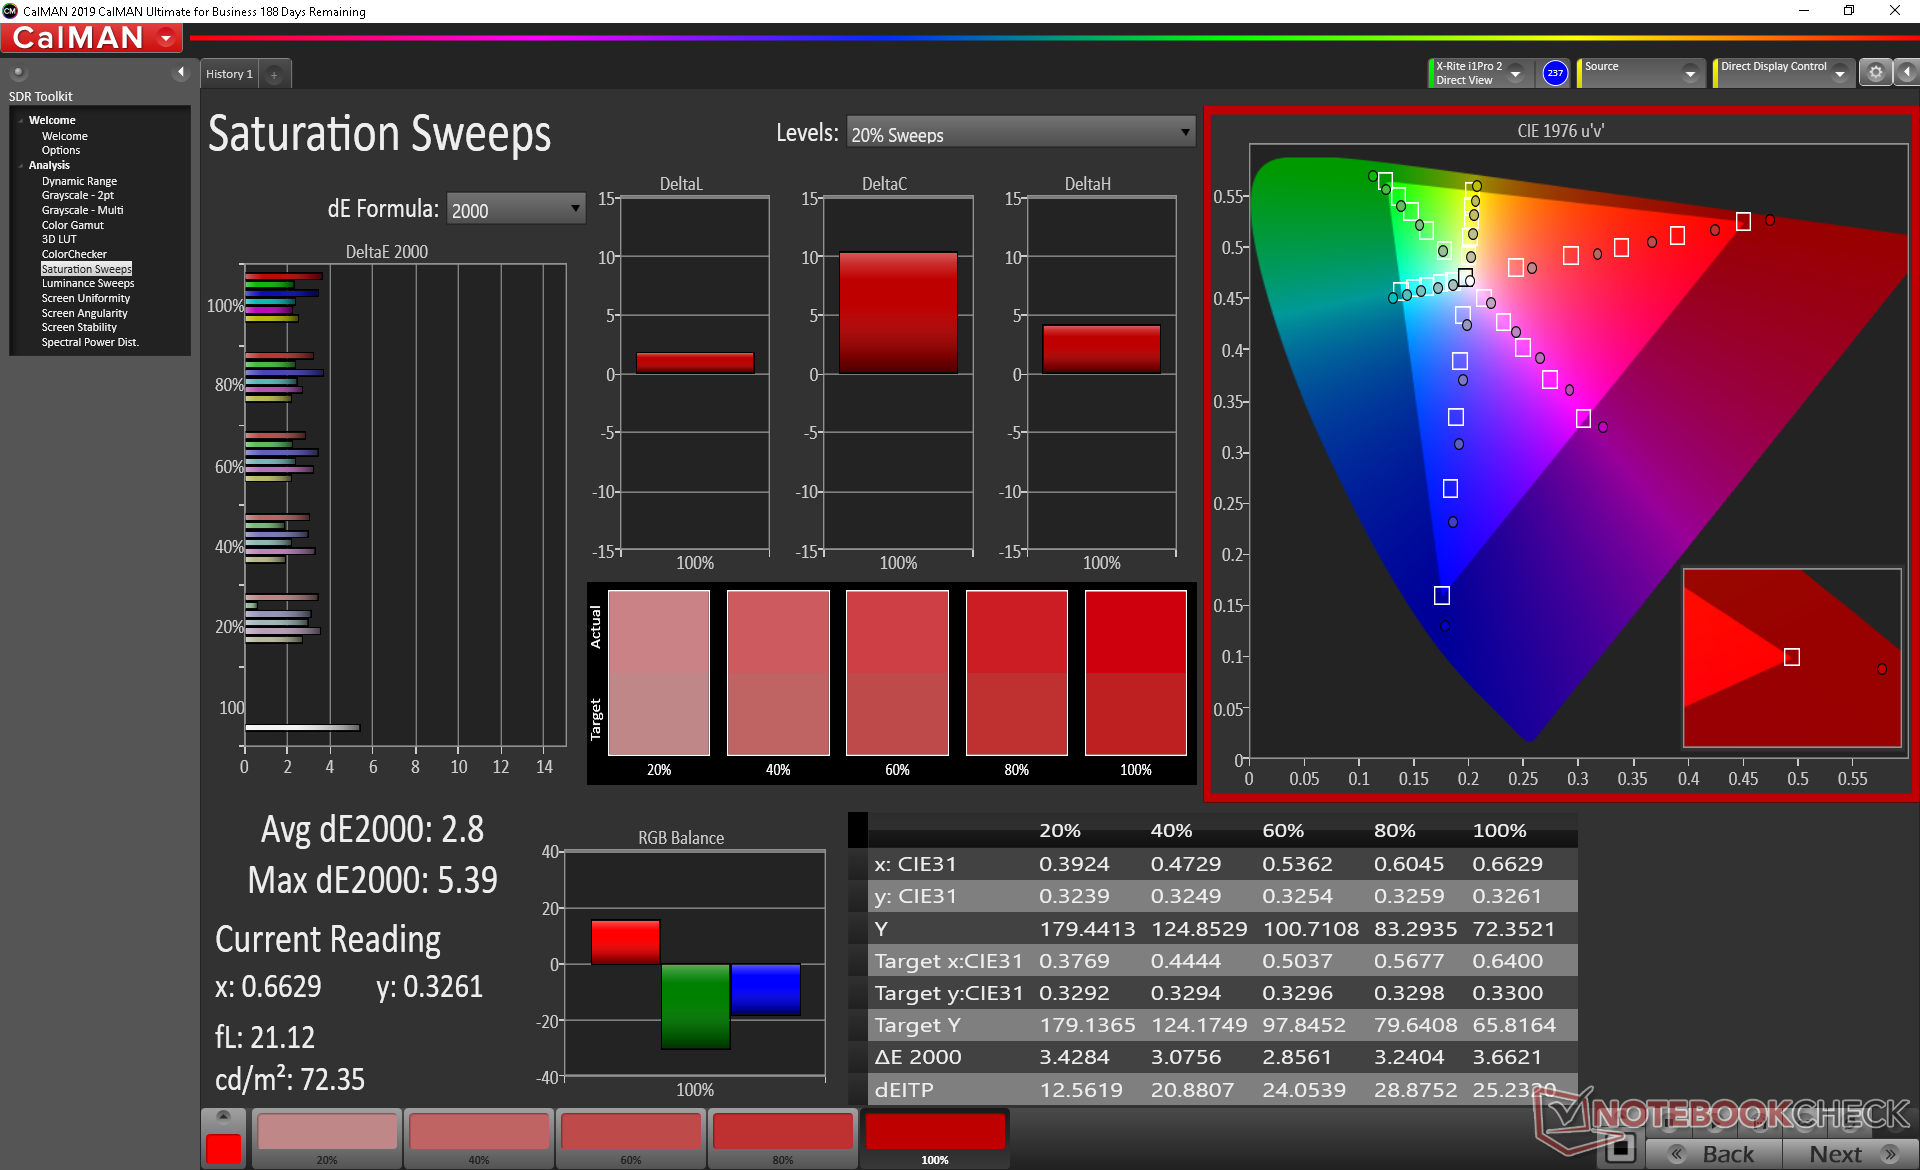
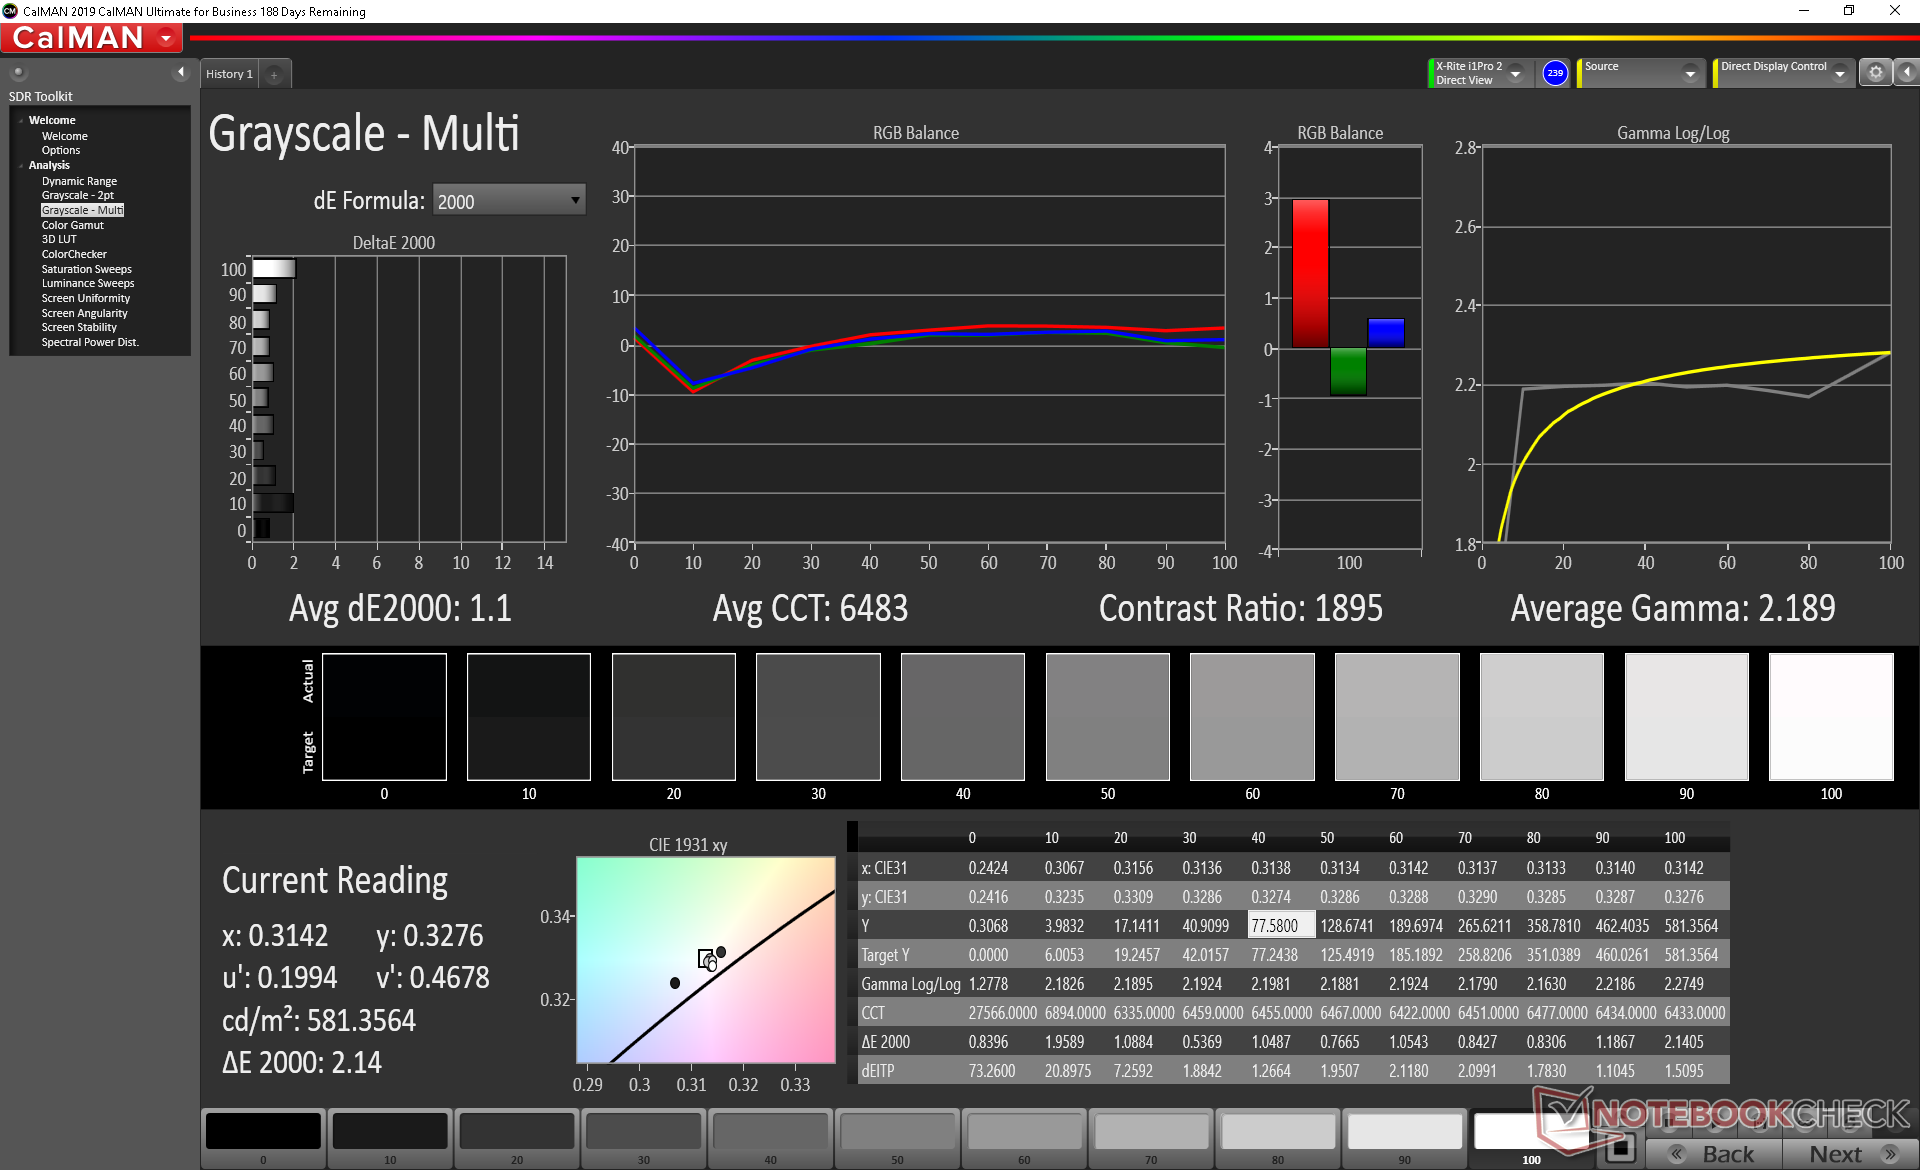
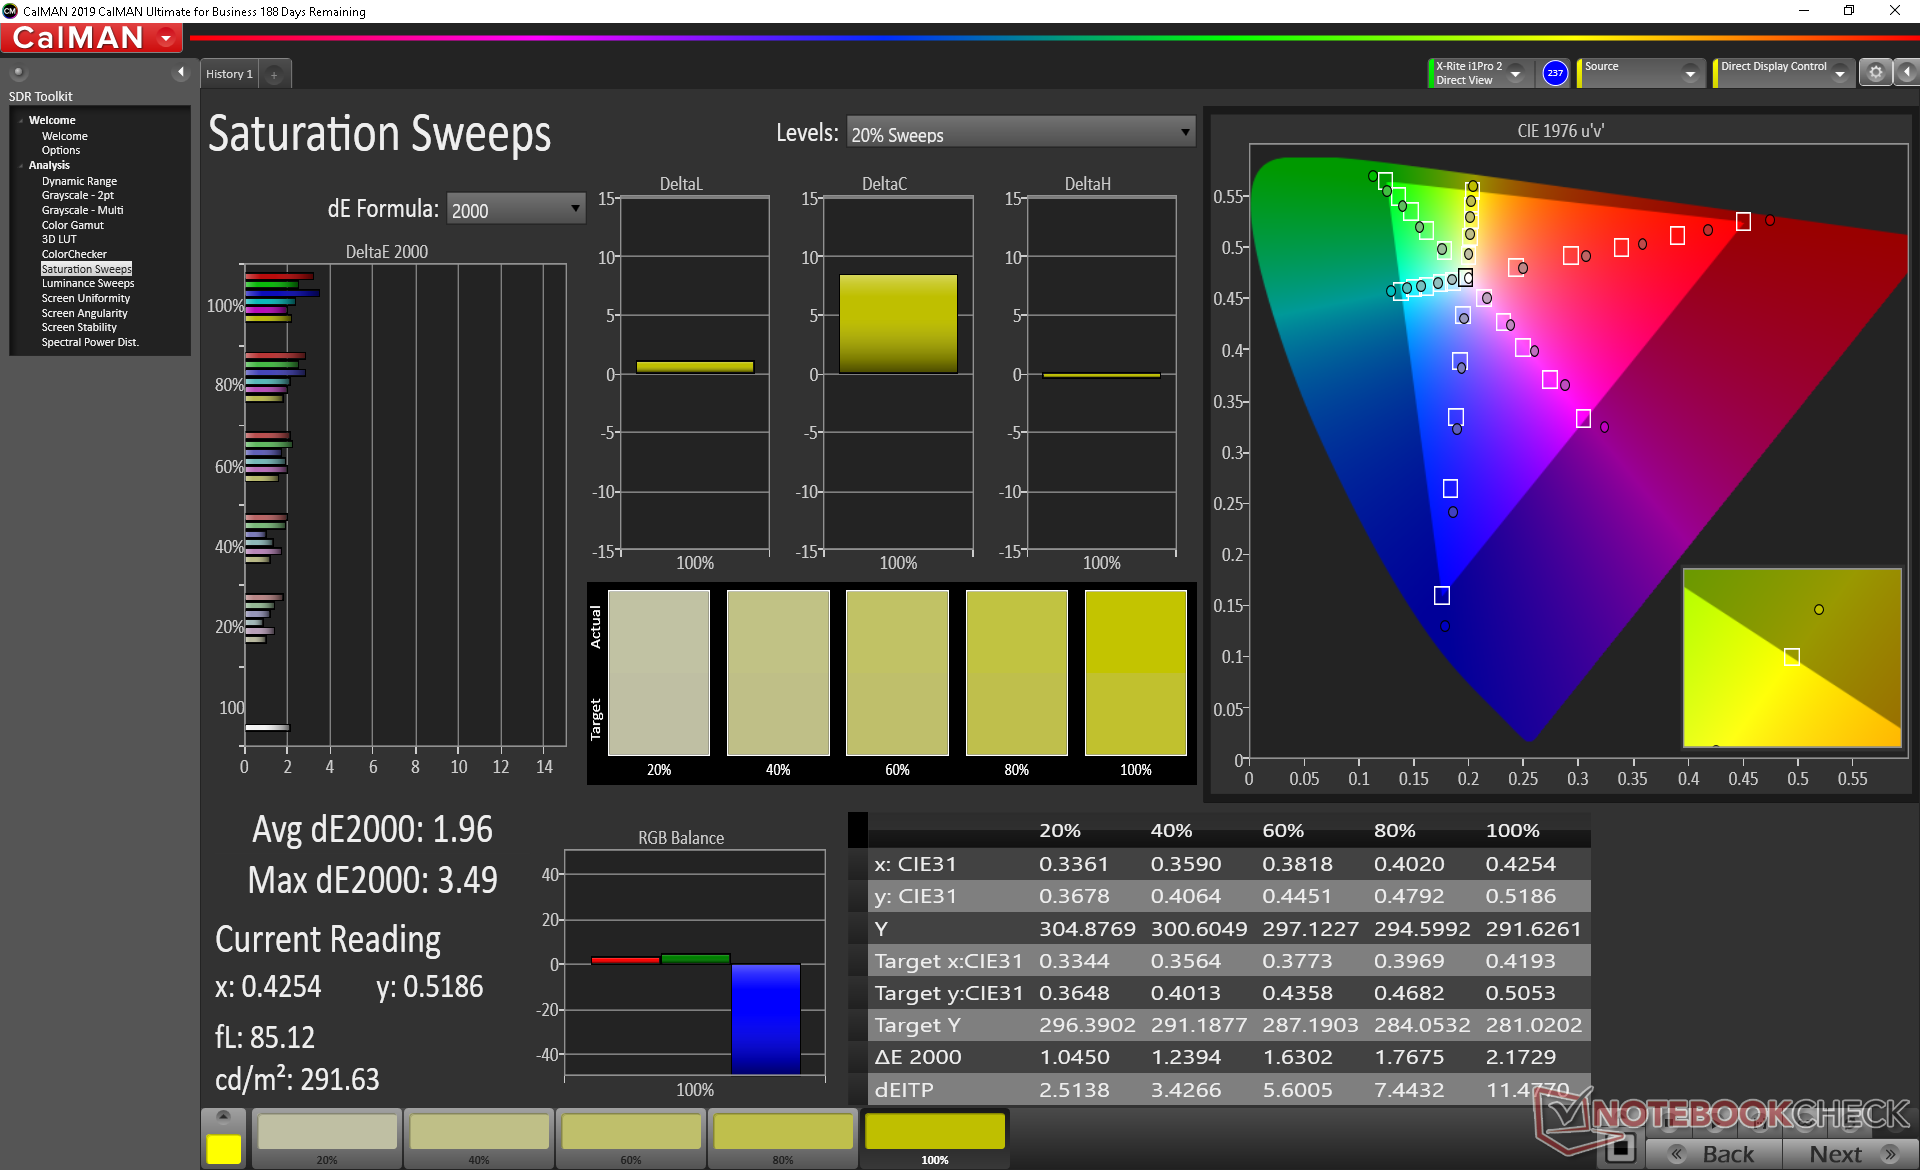
Further measurements with an X-Rite colorimeter show a decently calibrated panel out of the box. Colors and grayscale would improve just marginally from average DeltaE values of 3.9 to 1.1 and 2.9 to 1.96, respectively, after calibrating the panel ourselves. It should be possible to get even better results with more fine-tuning if calibrating against the sRGB spectrum since the panel is capable of reproducing the space completely.


Display Response Times
| ↔ Response Time Black to White | ||
|---|---|---|
| 28.8 ms ... rise ↗ and fall ↘ combined | ↗ 15.2 ms rise | 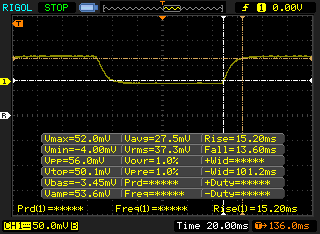 |
| ↘ 13.6 ms fall | ||
| The screen shows relatively slow response rates in our tests and may be too slow for gamers. In comparison, all tested devices range from 0.1 (minimum) to 240 (maximum) ms. » 76 % of all devices are better. This means that the measured response time is worse than the average of all tested devices (19.9 ms). | ||
| ↔ Response Time 50% Grey to 80% Grey | ||
| 42 ms ... rise ↗ and fall ↘ combined | ↗ 20 ms rise | 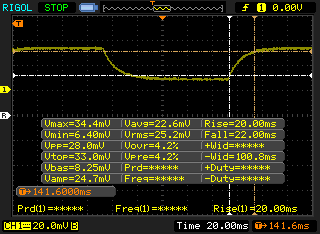 |
| ↘ 22 ms fall | ||
| The screen shows slow response rates in our tests and will be unsatisfactory for gamers. In comparison, all tested devices range from 0.165 (minimum) to 636 (maximum) ms. » 67 % of all devices are better. This means that the measured response time is worse than the average of all tested devices (31.1 ms). | ||
Screen Flickering / PWM (Pulse-Width Modulation)
| Screen flickering / PWM not detected | 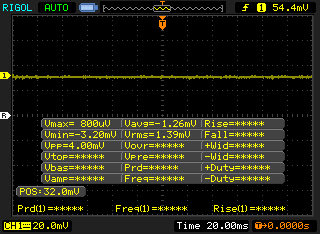 | ||
In comparison: 52 % of all tested devices do not use PWM to dim the display. If PWM was detected, an average of 7791 (minimum: 5 - maximum: 343500) Hz was measured. | |||
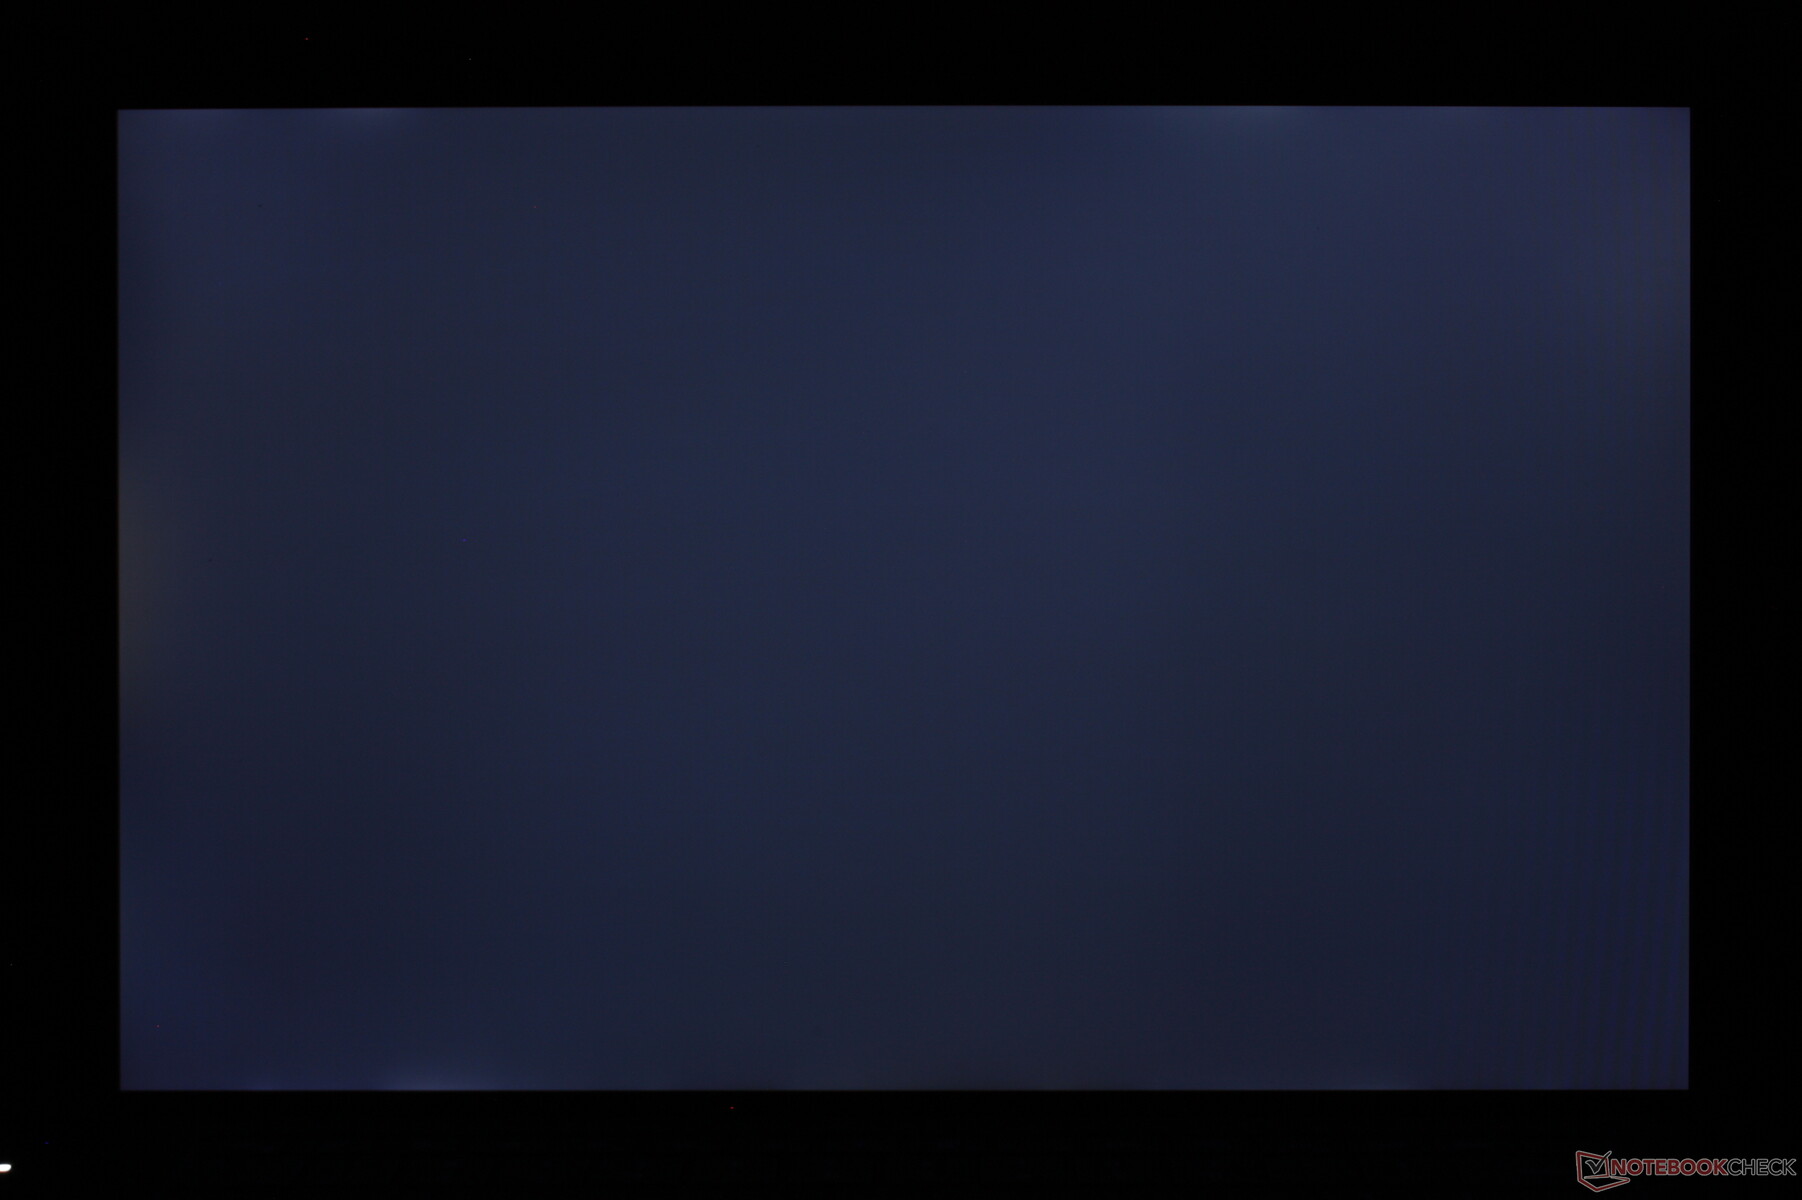
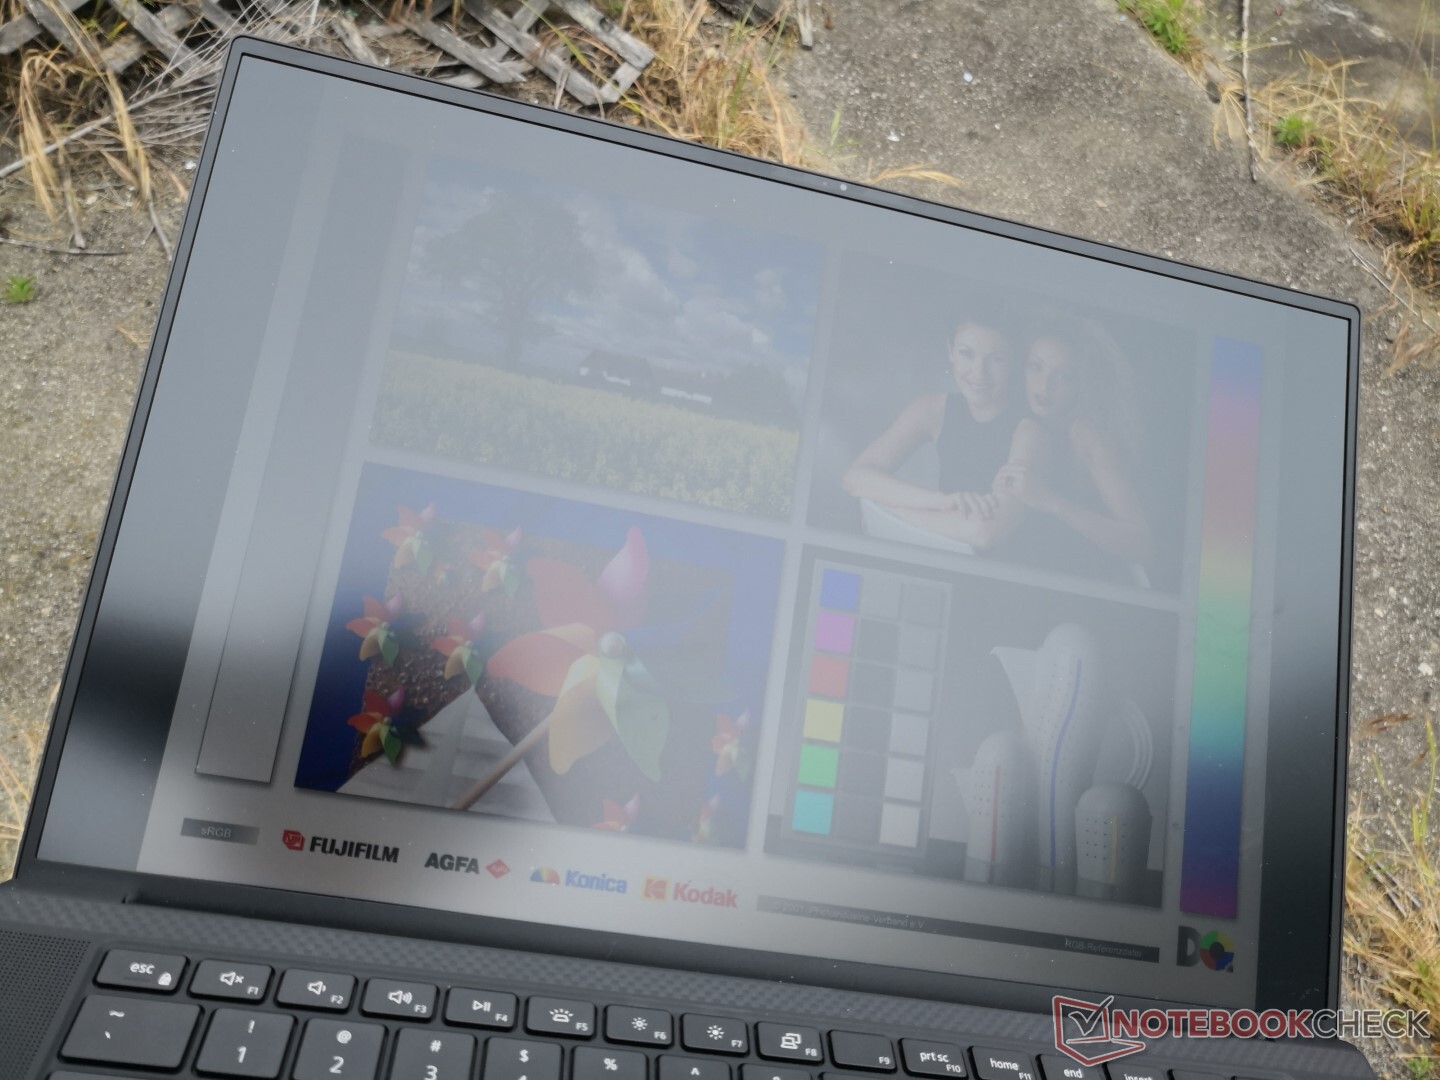
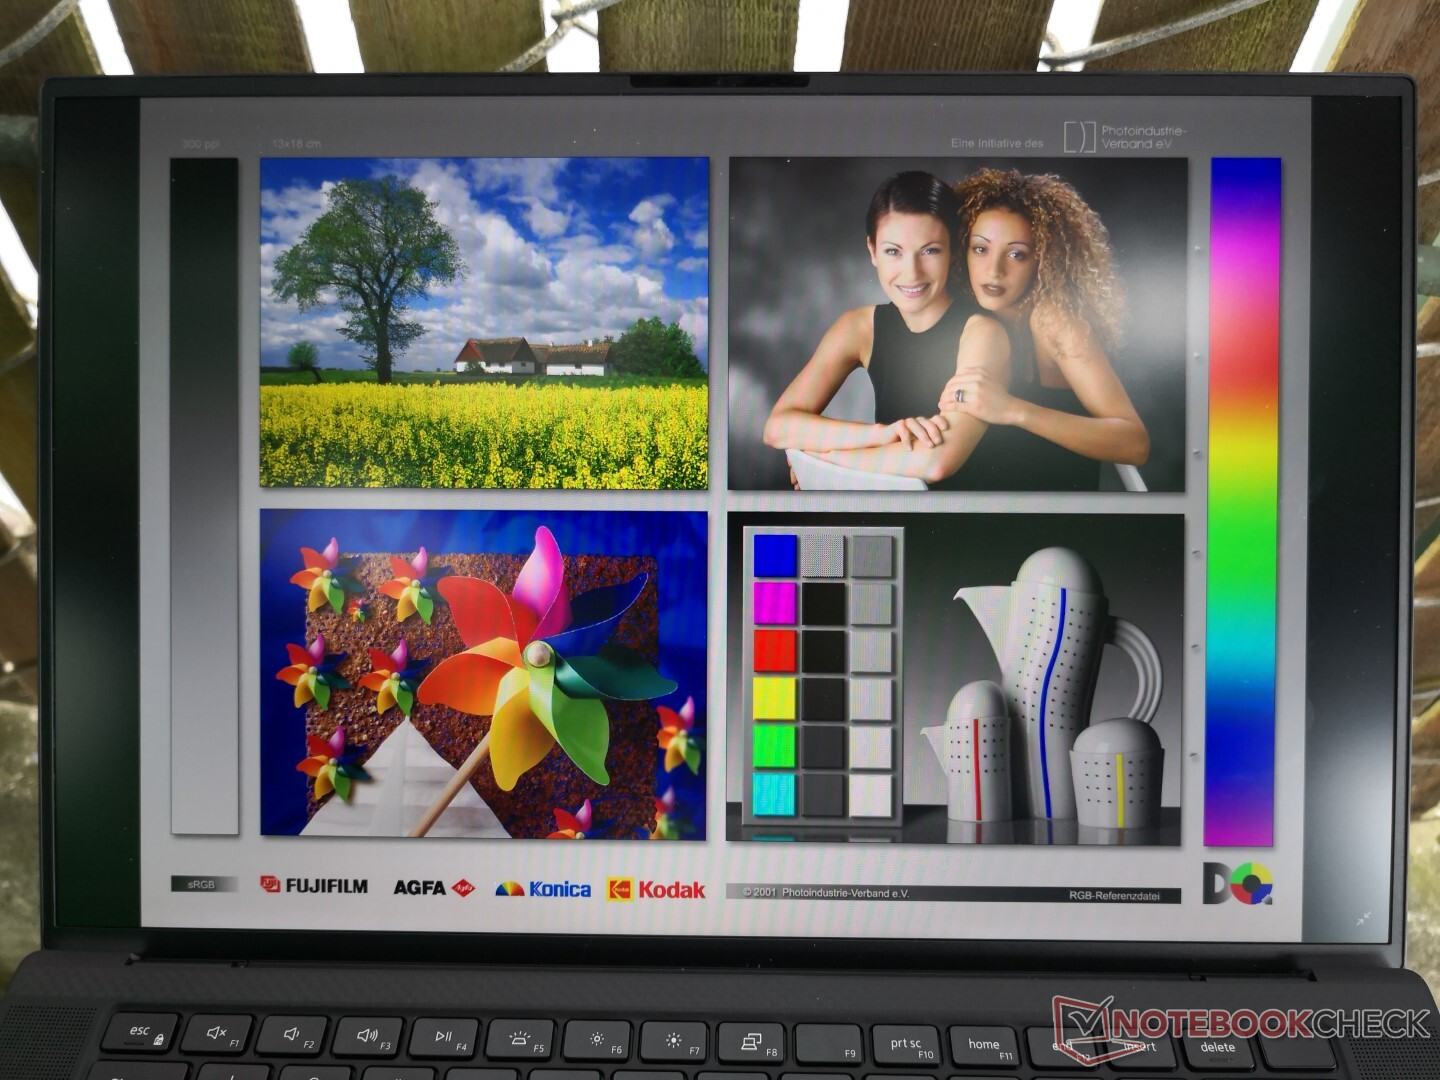
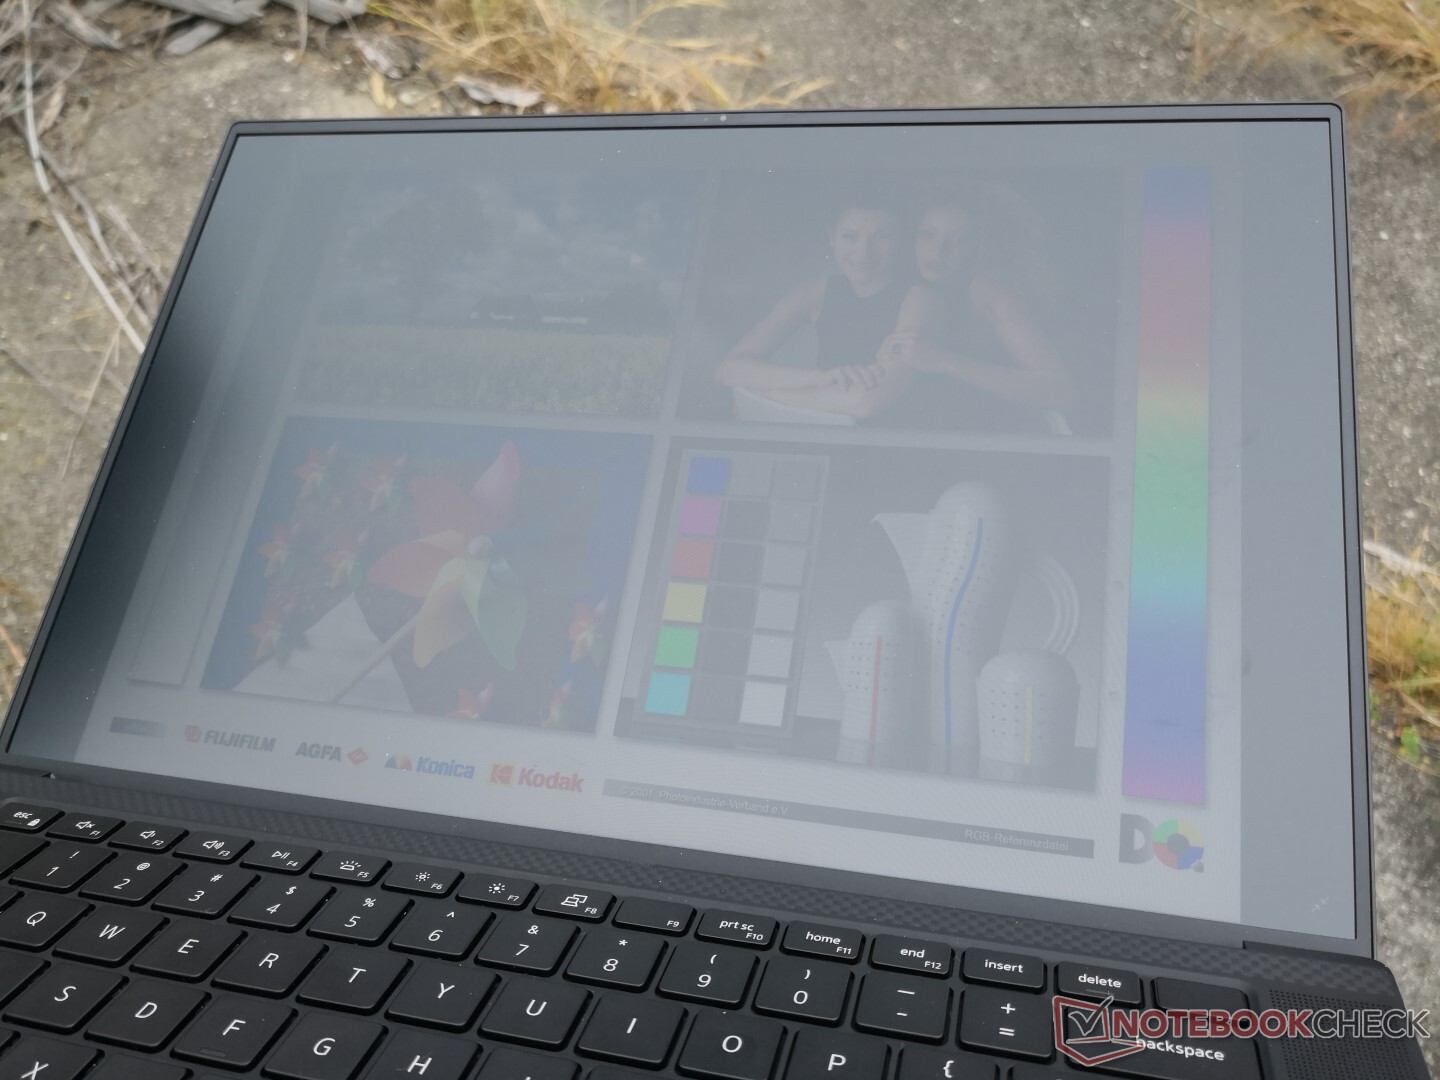
Outdoor visibiity is better than most other Ultrabooks simply due to how bright the display is on the XPS 15. The matte panel helps to reduce glare as well which makes it preferable over the glossy option when outdoors. Keep in mind that the maximum brightness of the display will automatically drop from 592 nits to 504 nits when running on battery power unless if you take these steps.
Performance
All SKUs come with either the quad-core Core i5-10300H, hexa-core Core i7-10750H, or octa-core Core i7-10875H. There are no Core i9 options as of this writing and we're definitely not complaining given the lackluster Core i9 performance on the XPS 15 7590.
The only discrete GPU option is the GeForce GTX 1650 Ti which we will test at a later date. It's a shame that no AMD options are available.
(June 3, 2020 update: We previously stated that the Nvidia GeForce option is a Max-Q GPU, but that is not correct. This has been amended.)
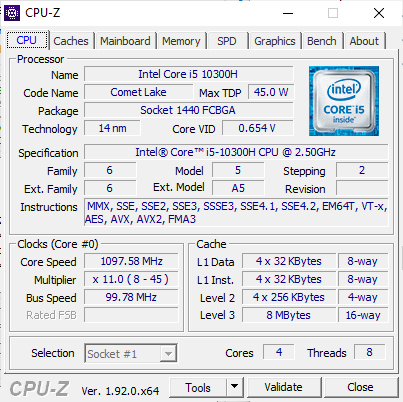
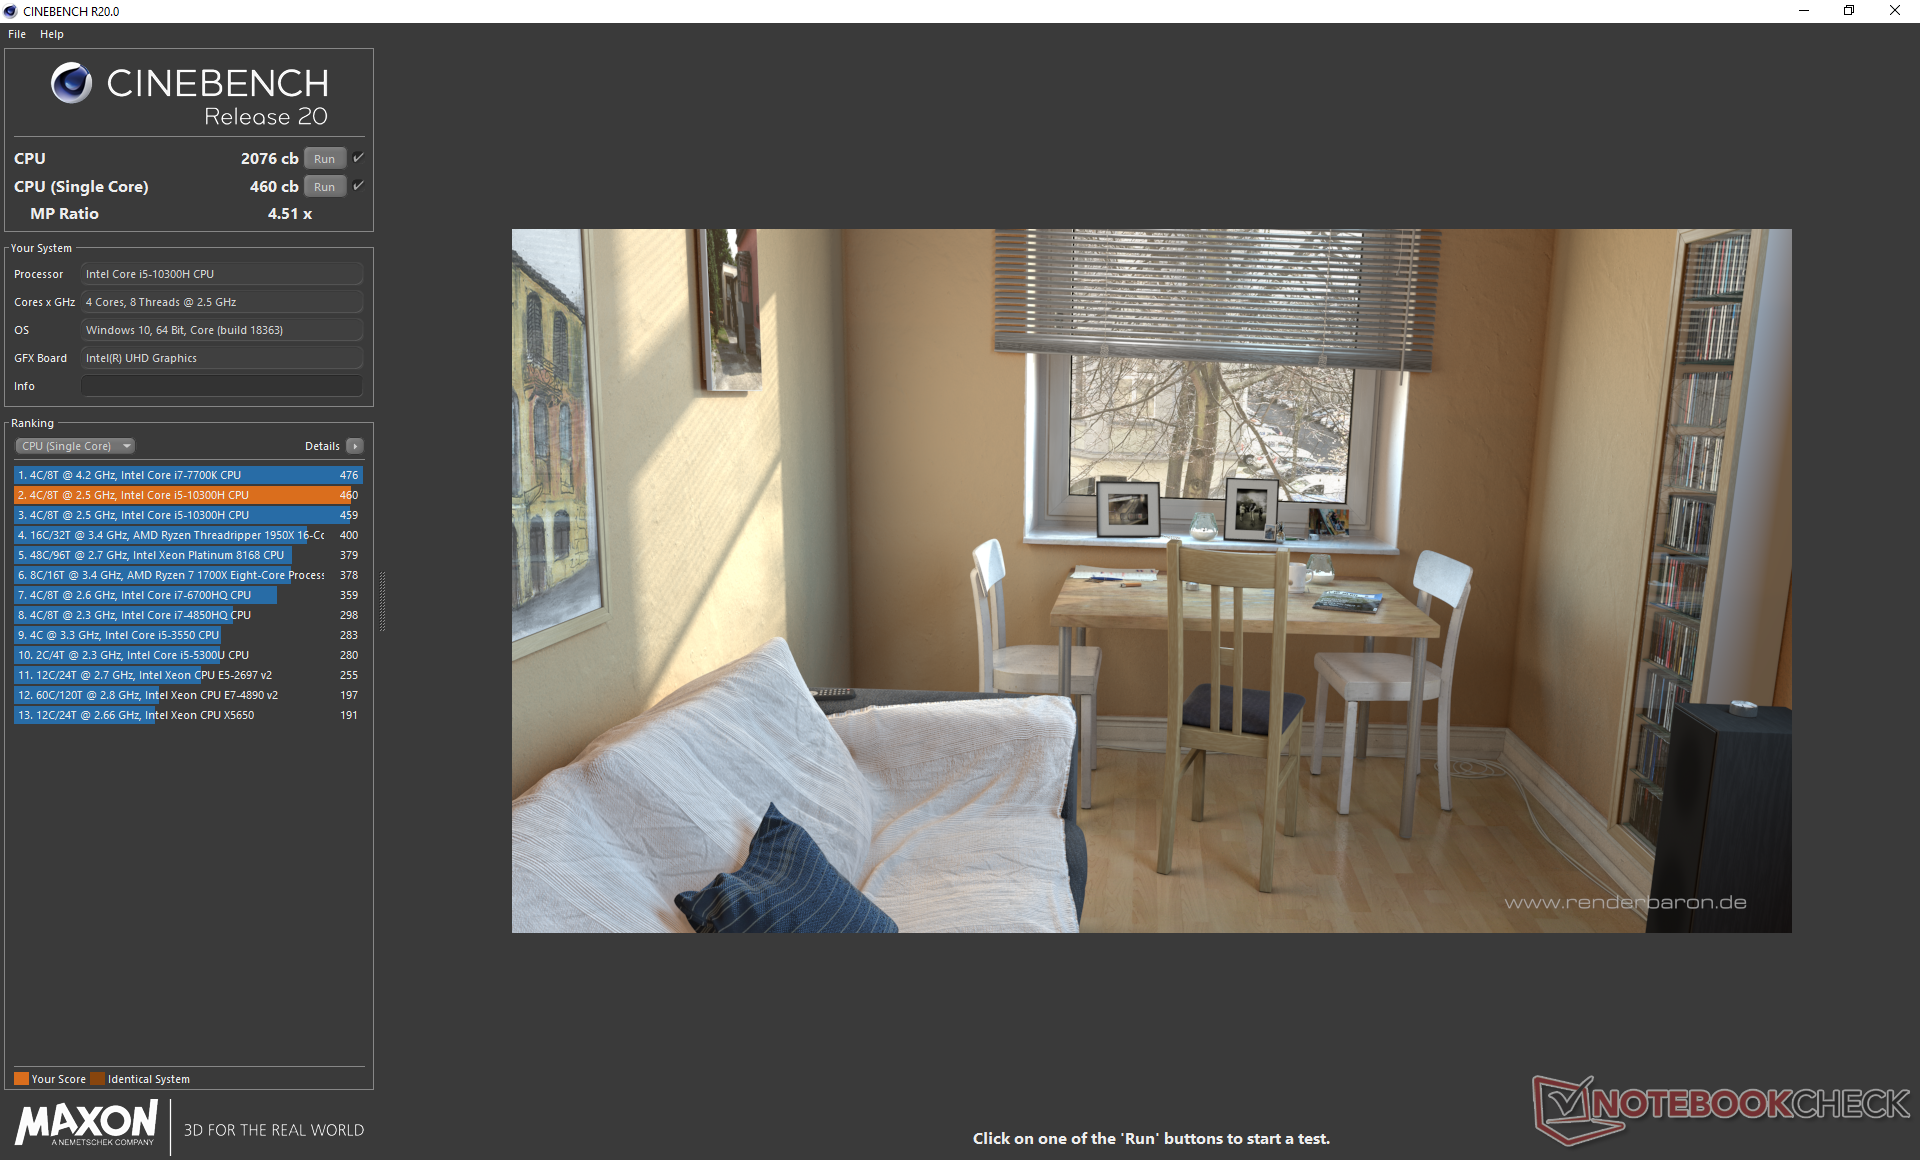
Processor
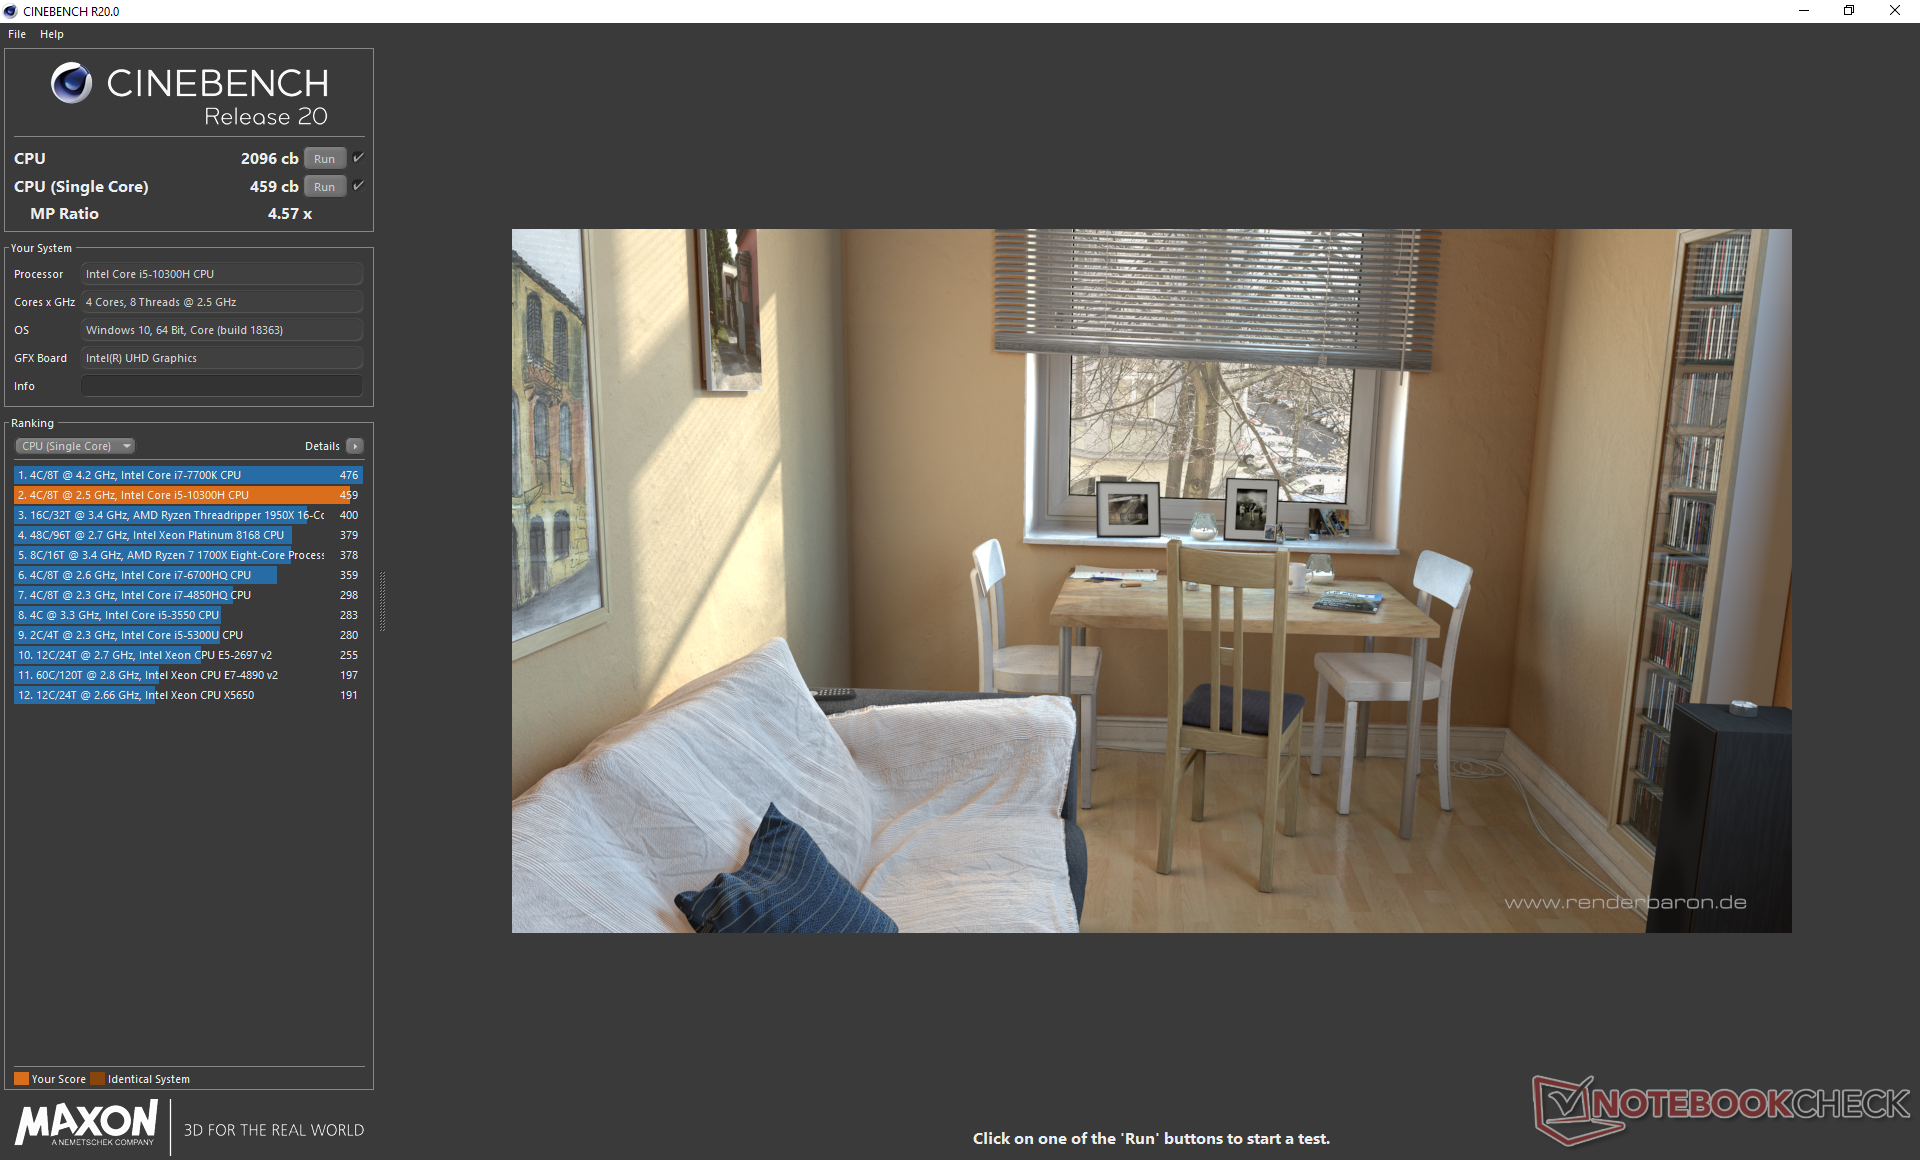
The Core i5-10300H is performing where we expect it to be relative to other Core i5-10300H laptops in our database. In fact, sustained performance when running CineBench R15 Multi-Thread in a loop is about 13 percent faster than the MSI GF75 equipped with the same CPU. We wouldn't expect any less especially since our XPS 15 configuration omits the discrete Nvidia GPU. Had the system struggled to run the Core i5-10300H, then we would have been worried for the more demanding higher-end SKUs.
See our dedicated page on the Core i5-10300H for more technical information and benchmark comparisons. Upgrading to the Core i7-10750H or Core i7-10875H option will net users roughly 40 percent and 80 percent more multi-thread performance, respectively. The CPU performance difference between the Dell Optimized and Ultra Performance power profiles appears to be minimal according to CineBench R20.
Cinebench R15: CPU Multi 64Bit | CPU Single 64Bit
Blender: v2.79 BMW27 CPU
7-Zip 18.03: 7z b 4 -mmt1 | 7z b 4
Geekbench 5.5: Single-Core | Multi-Core
HWBOT x265 Benchmark v2.2: 4k Preset
LibreOffice : 20 Documents To PDF
R Benchmark 2.5: Overall mean
| Cinebench R15 / CPU Multi 64Bit | |
| Eluktronics RP-15 | |
| Gigabyte Aero 15 OLED XB-8DE51B0SP | |
| Dell XPS 15 7590 9980HK GTX 1650 | |
| Acer Predator Triton 500 PT515-52-70N3 | |
| Gigabyte Aero 15-Y9 | |
| Dell G5 15 5590 | |
| Lenovo IdeaPad S740-15IRH | |
| Dell XPS 15 9500 Core i5 | |
| Average Intel Core i5-10300H (536 - 921, n=17) | |
| Dell G5 15 5590-PCNJJ | |
| Asus TUF FX505DT-EB73 | |
| HP Pavilion Gaming 15-ec0002ng | |
| Lenovo IdeaPad 330-15ICH | |
| Cinebench R15 / CPU Single 64Bit | |
| Gigabyte Aero 15 OLED XB-8DE51B0SP | |
| Dell XPS 15 7590 9980HK GTX 1650 | |
| Gigabyte Aero 15-Y9 | |
| Acer Predator Triton 500 PT515-52-70N3 | |
| Lenovo IdeaPad S740-15IRH | |
| Eluktronics RP-15 | |
| Dell XPS 15 9500 Core i5 | |
| Average Intel Core i5-10300H (108 - 194, n=17) | |
| Lenovo IdeaPad 330-15ICH | |
| Dell G5 15 5590-PCNJJ | |
| Dell G5 15 5590 | |
| Asus TUF FX505DT-EB73 | |
| HP Pavilion Gaming 15-ec0002ng | |
| Blender / v2.79 BMW27 CPU | |
| Average Intel Core i5-10300H (479 - 555, n=14) | |
| Dell XPS 15 9500 Core i5 | |
| Acer Predator Triton 500 PT515-52-70N3 | |
| Gigabyte Aero 15 OLED XB-8DE51B0SP | |
| Eluktronics RP-15 | |
| 7-Zip 18.03 / 7z b 4 -mmt1 | |
| Gigabyte Aero 15 OLED XB-8DE51B0SP | |
| Acer Predator Triton 500 PT515-52-70N3 | |
| Dell XPS 15 9500 Core i5 | |
| Eluktronics RP-15 | |
| Average Intel Core i5-10300H (2945 - 4956, n=14) | |
| 7-Zip 18.03 / 7z b 4 | |
| Eluktronics RP-15 | |
| Gigabyte Aero 15 OLED XB-8DE51B0SP | |
| Acer Predator Triton 500 PT515-52-70N3 | |
| Dell XPS 15 9500 Core i5 | |
| Average Intel Core i5-10300H (15146 - 24841, n=14) | |
| Geekbench 5.5 / Single-Core | |
| Gigabyte Aero 15 OLED XB-8DE51B0SP | |
| Acer Predator Triton 500 PT515-52-70N3 | |
| Eluktronics RP-15 | |
| Dell XPS 15 9500 Core i5 | |
| Average Intel Core i5-10300H (703 - 1241, n=16) | |
| HP Pavilion Gaming 15-ec0002ng | |
| Geekbench 5.5 / Multi-Core | |
| Eluktronics RP-15 | |
| Gigabyte Aero 15 OLED XB-8DE51B0SP | |
| Acer Predator Triton 500 PT515-52-70N3 | |
| Dell XPS 15 9500 Core i5 | |
| Average Intel Core i5-10300H (2783 - 4728, n=16) | |
| HP Pavilion Gaming 15-ec0002ng | |
| HWBOT x265 Benchmark v2.2 / 4k Preset | |
| Eluktronics RP-15 | |
| Gigabyte Aero 15 OLED XB-8DE51B0SP | |
| Acer Predator Triton 500 PT515-52-70N3 | |
| Dell XPS 15 9500 Core i5 | |
| Average Intel Core i5-10300H (6.13 - 7.78, n=14) | |
| LibreOffice / 20 Documents To PDF | |
| Dell XPS 15 9500 Core i5 | |
| Eluktronics RP-15 | |
| Average Intel Core i5-10300H (23.9 - 94, n=14) | |
| Gigabyte Aero 15 OLED XB-8DE51B0SP | |
| Acer Predator Triton 500 PT515-52-70N3 | |
| R Benchmark 2.5 / Overall mean | |
| Average Intel Core i5-10300H (0.625 - 1.088, n=14) | |
| Dell XPS 15 9500 Core i5 | |
| Acer Predator Triton 500 PT515-52-70N3 | |
| Eluktronics RP-15 | |
| Gigabyte Aero 15 OLED XB-8DE51B0SP | |
Cinebench R15: CPU Multi 64Bit | CPU Single 64Bit
Blender: v2.79 BMW27 CPU
7-Zip 18.03: 7z b 4 -mmt1 | 7z b 4
Geekbench 5.5: Single-Core | Multi-Core
HWBOT x265 Benchmark v2.2: 4k Preset
LibreOffice : 20 Documents To PDF
R Benchmark 2.5: Overall mean
* ... smaller is better
System Performance
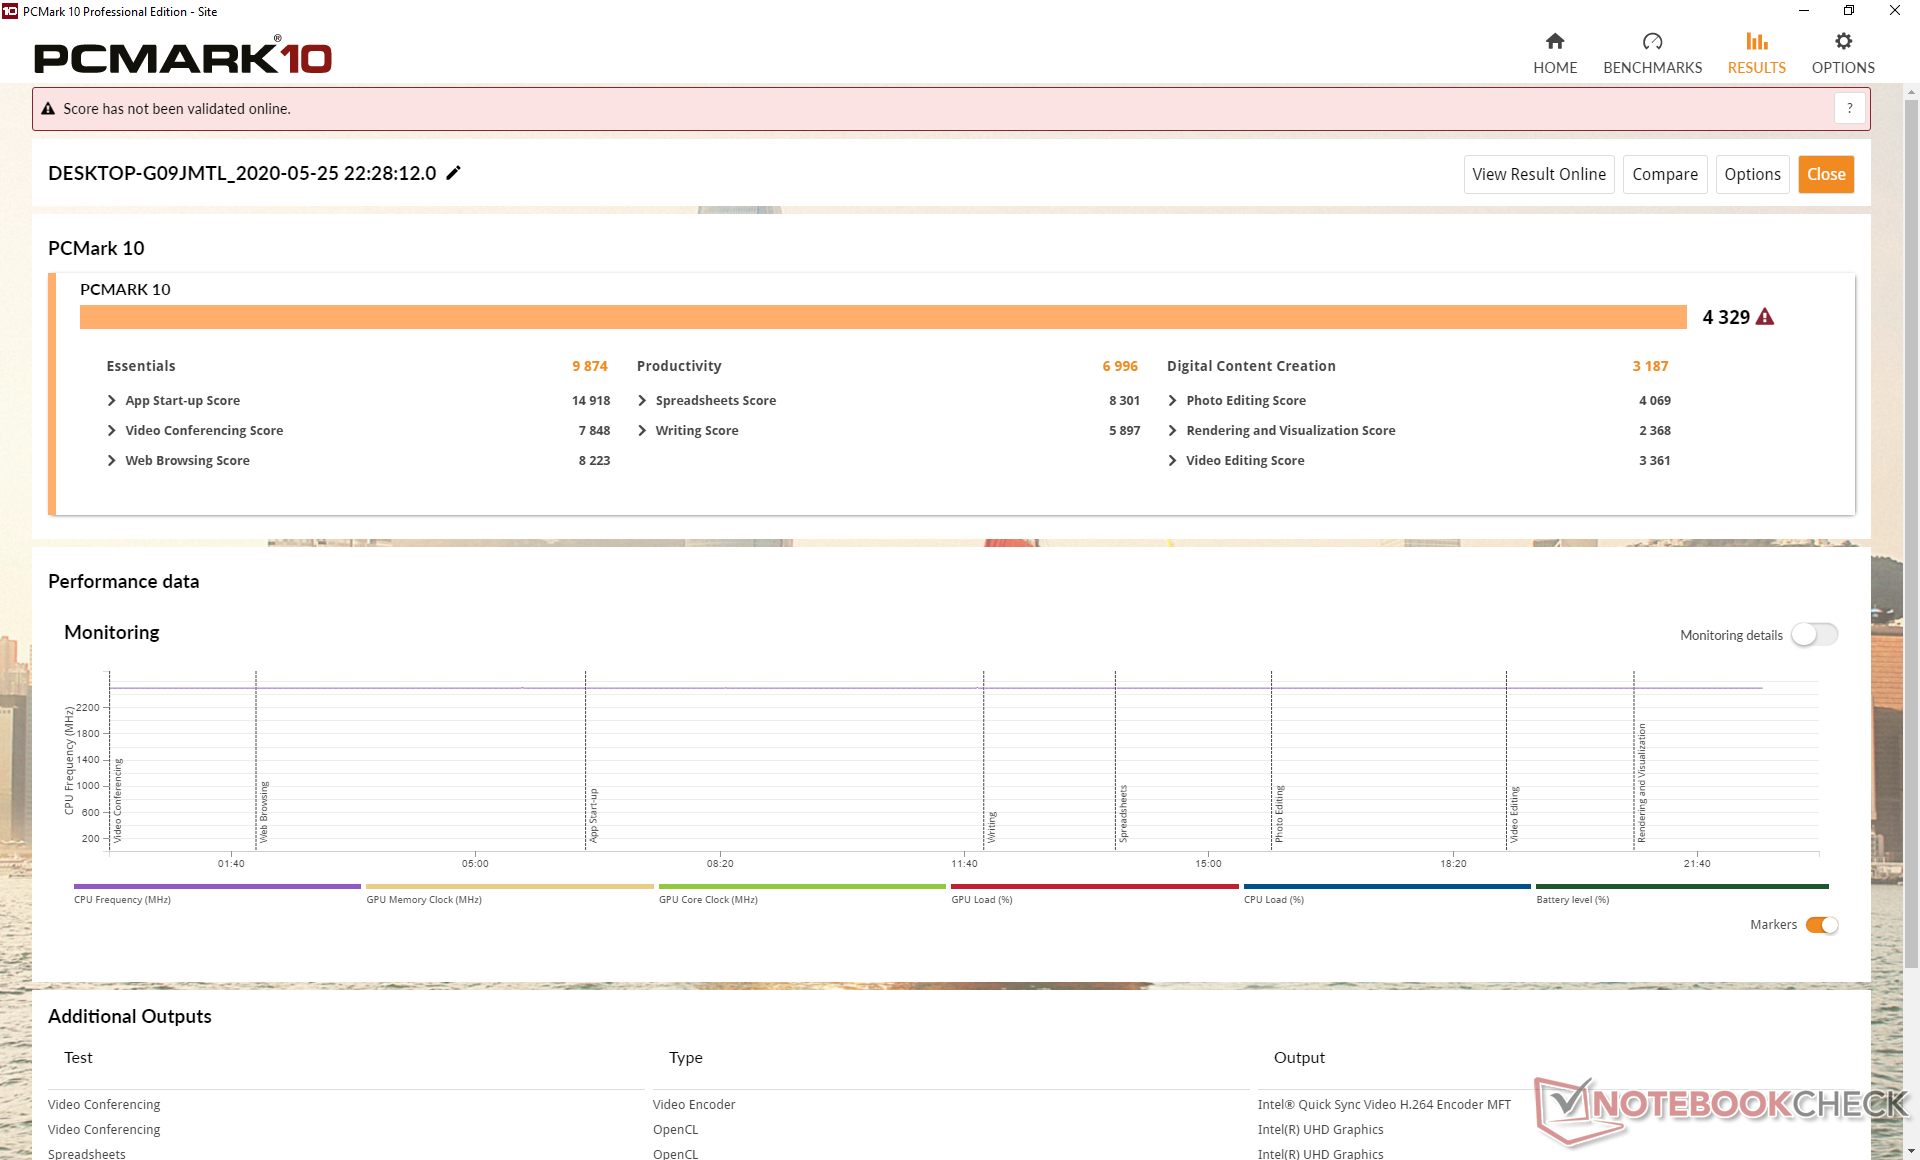
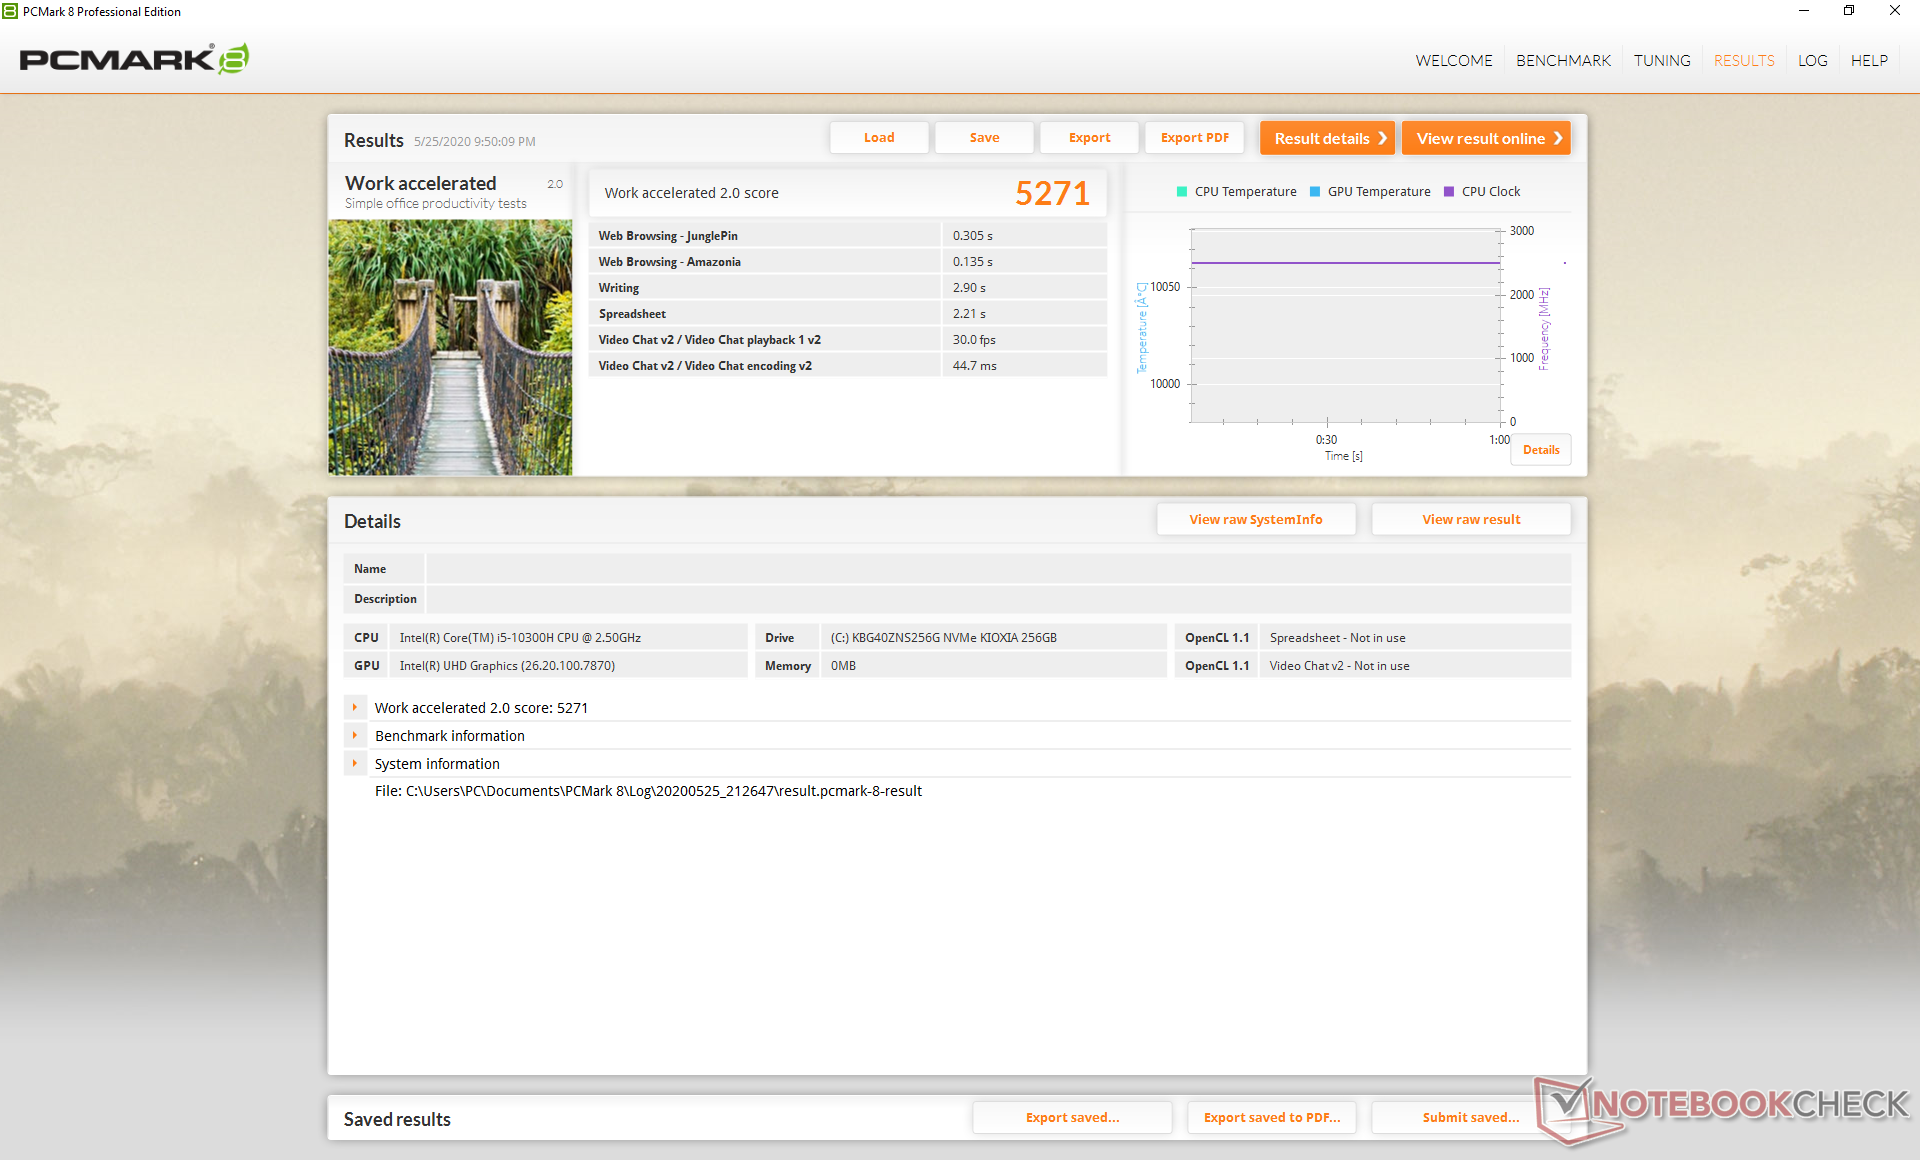
PCMark benchmarks are consistently ahead of last year's XPS 15 7590 Core i5 — if just barely. It's recommended to run Dell updates as soon as possible since the manufacturer is notorious for releasing hotfixes for its XPS lineup.
Strangely, our test unit would sometimes not recognize our Logitech USB receiver when plugging it into one of the three USB Type-C ports. Unplugging and re-plugging would solve the issue, but it's an annoyance nonetheless. We don't know for sure if it's just an issue specific to our unit or if it's something greater.
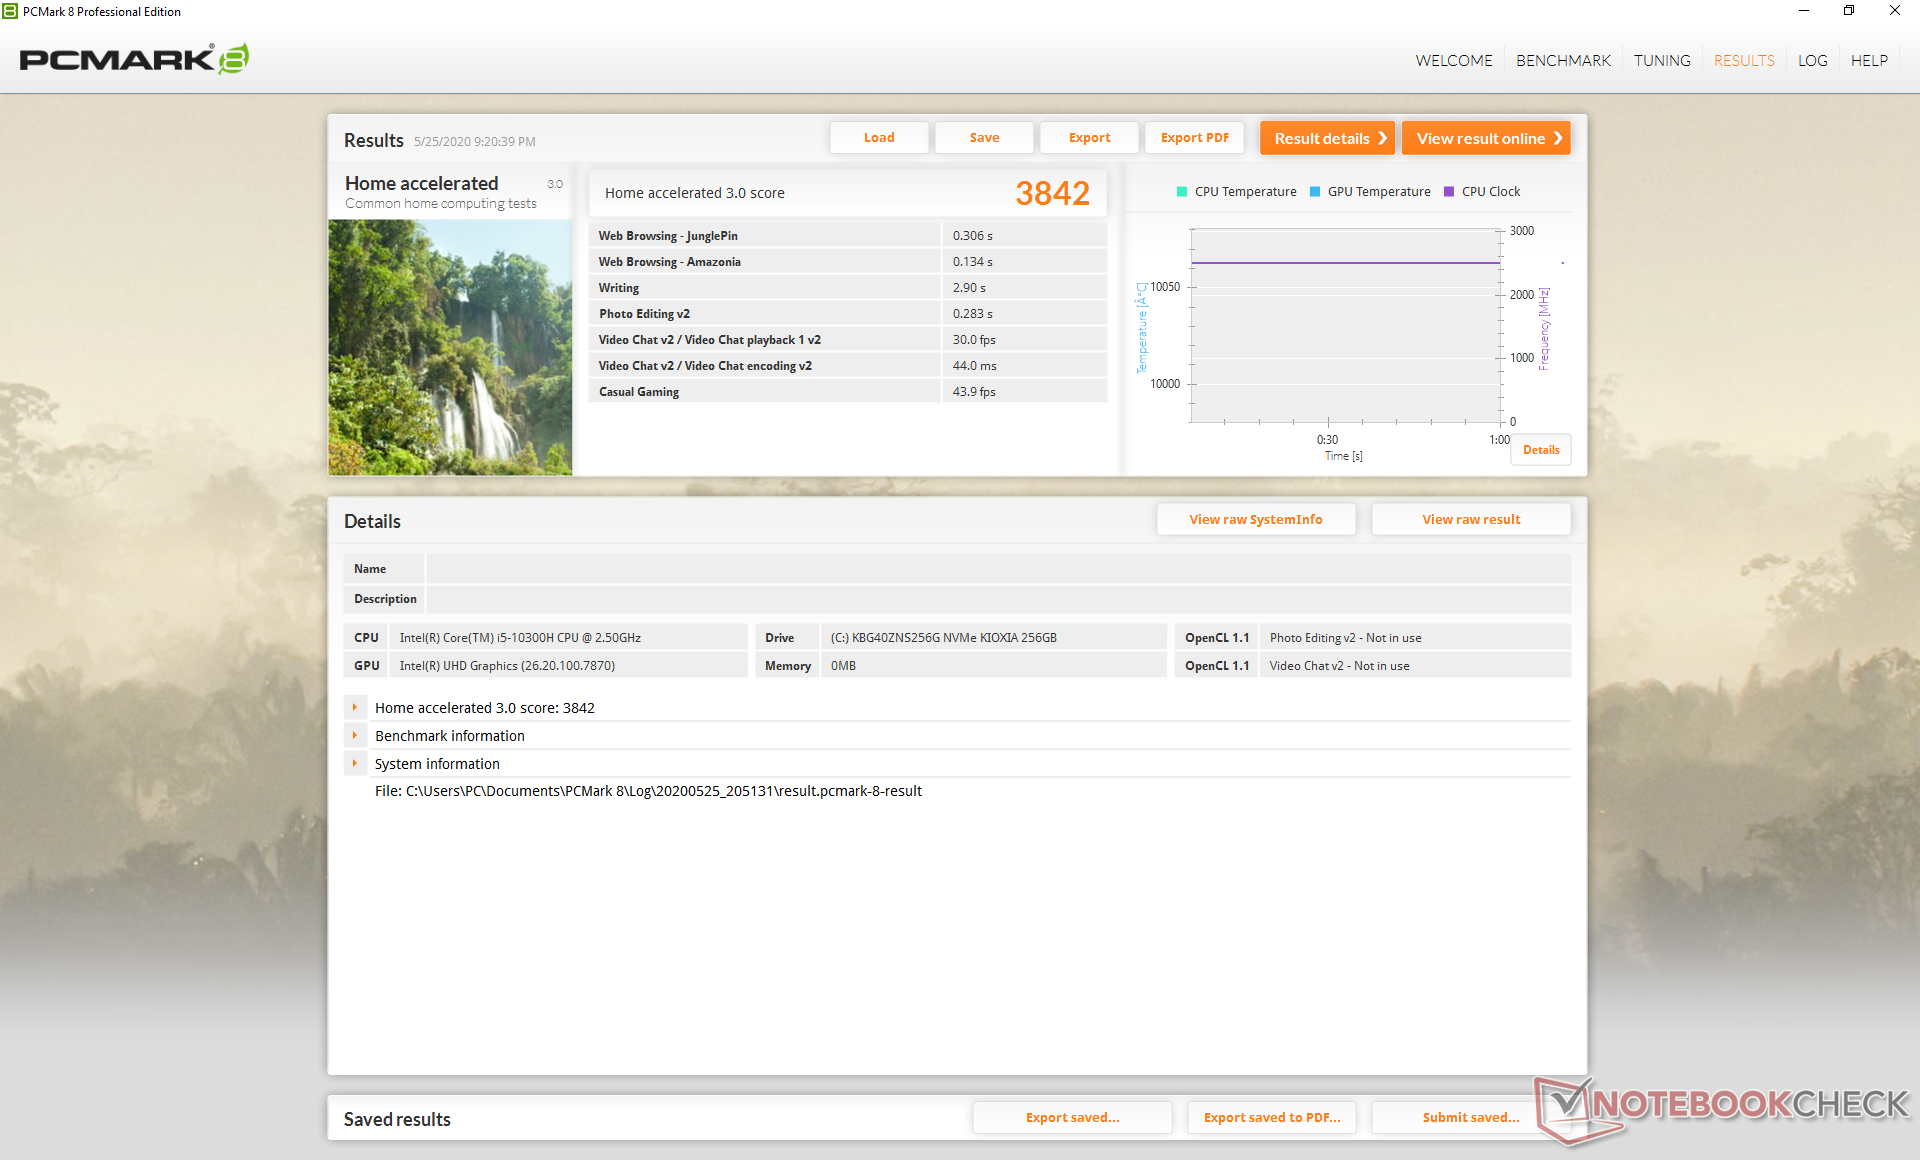
| PCMark 8 Home Score Accelerated v2 | 3842 points | |
| PCMark 8 Work Score Accelerated v2 | 5271 points | |
| PCMark 10 Score | 4329 points | |
Help | ||
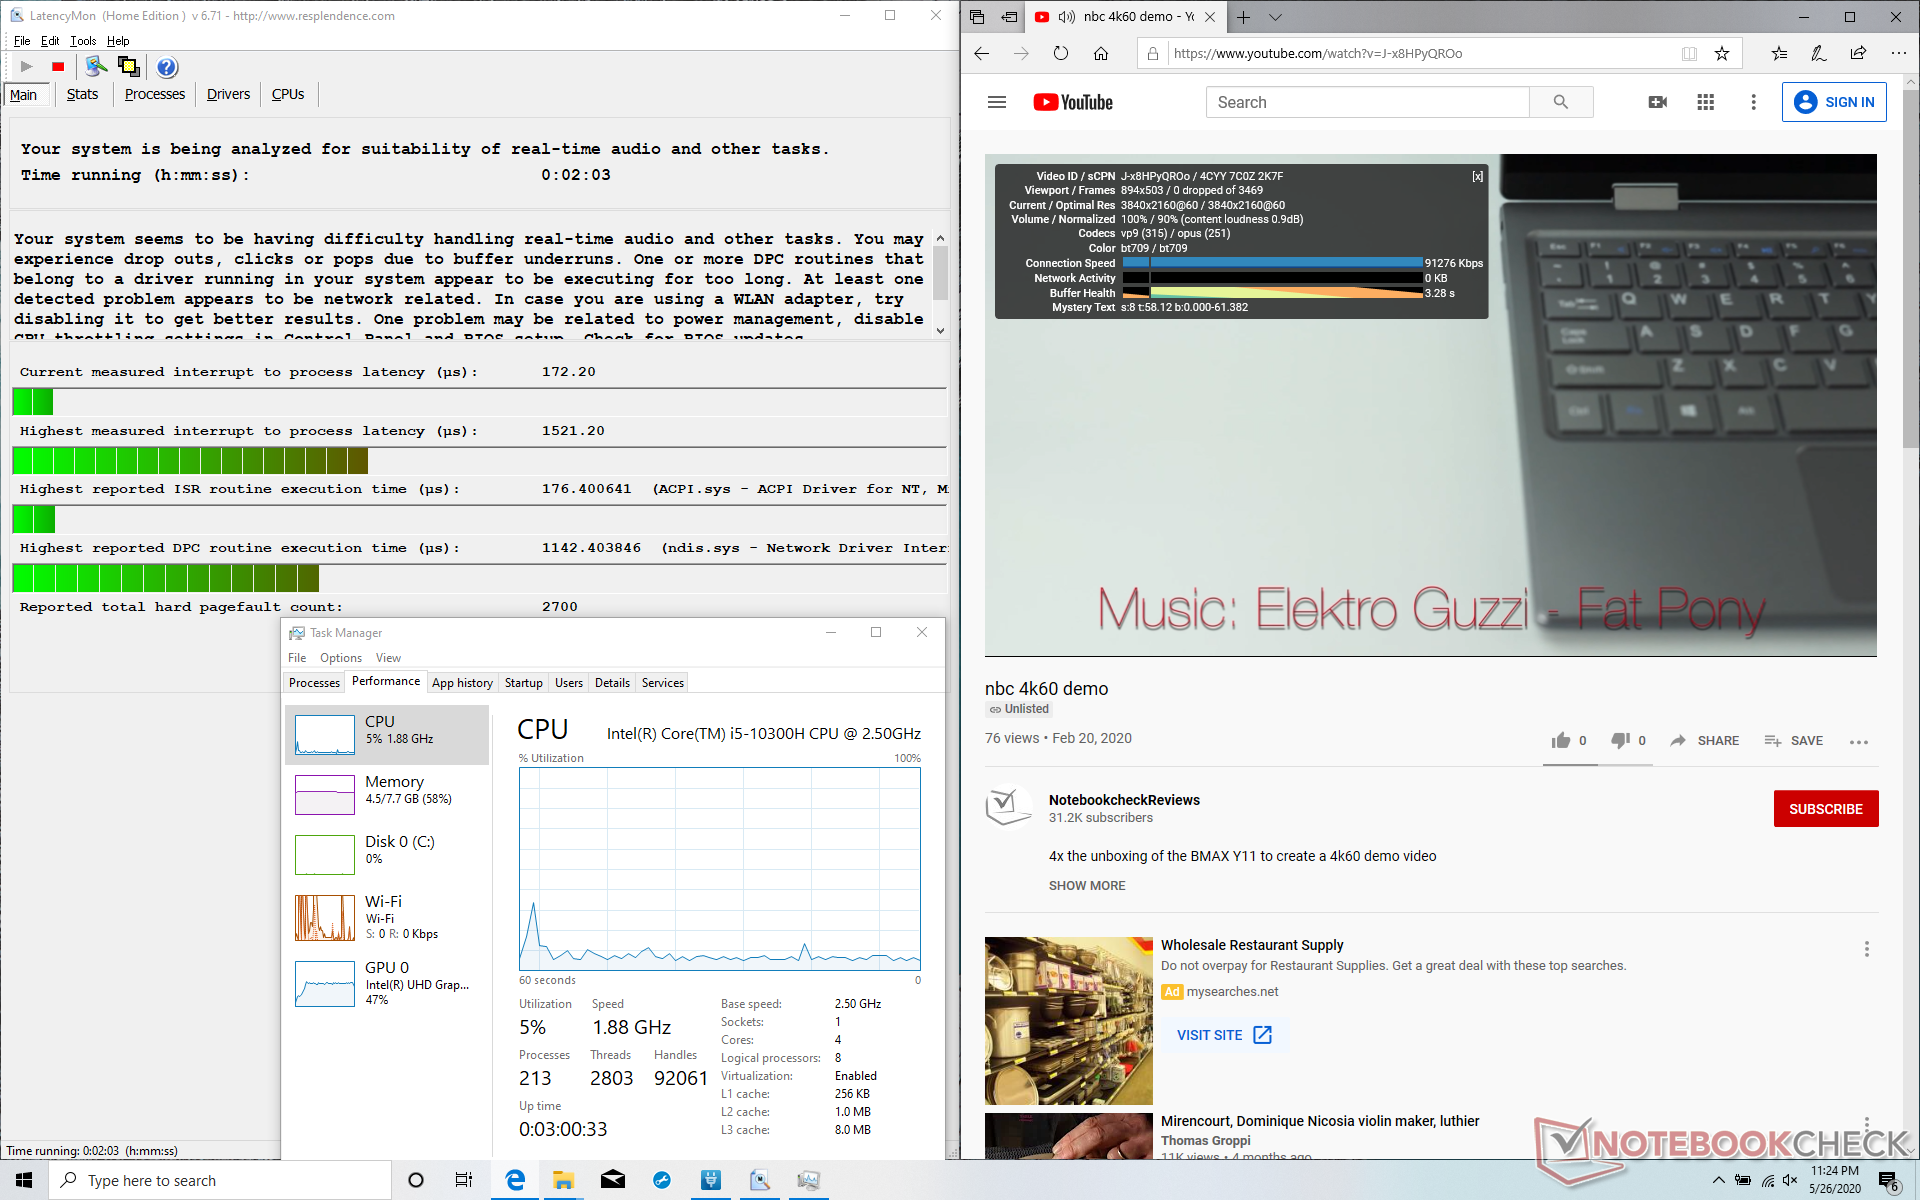
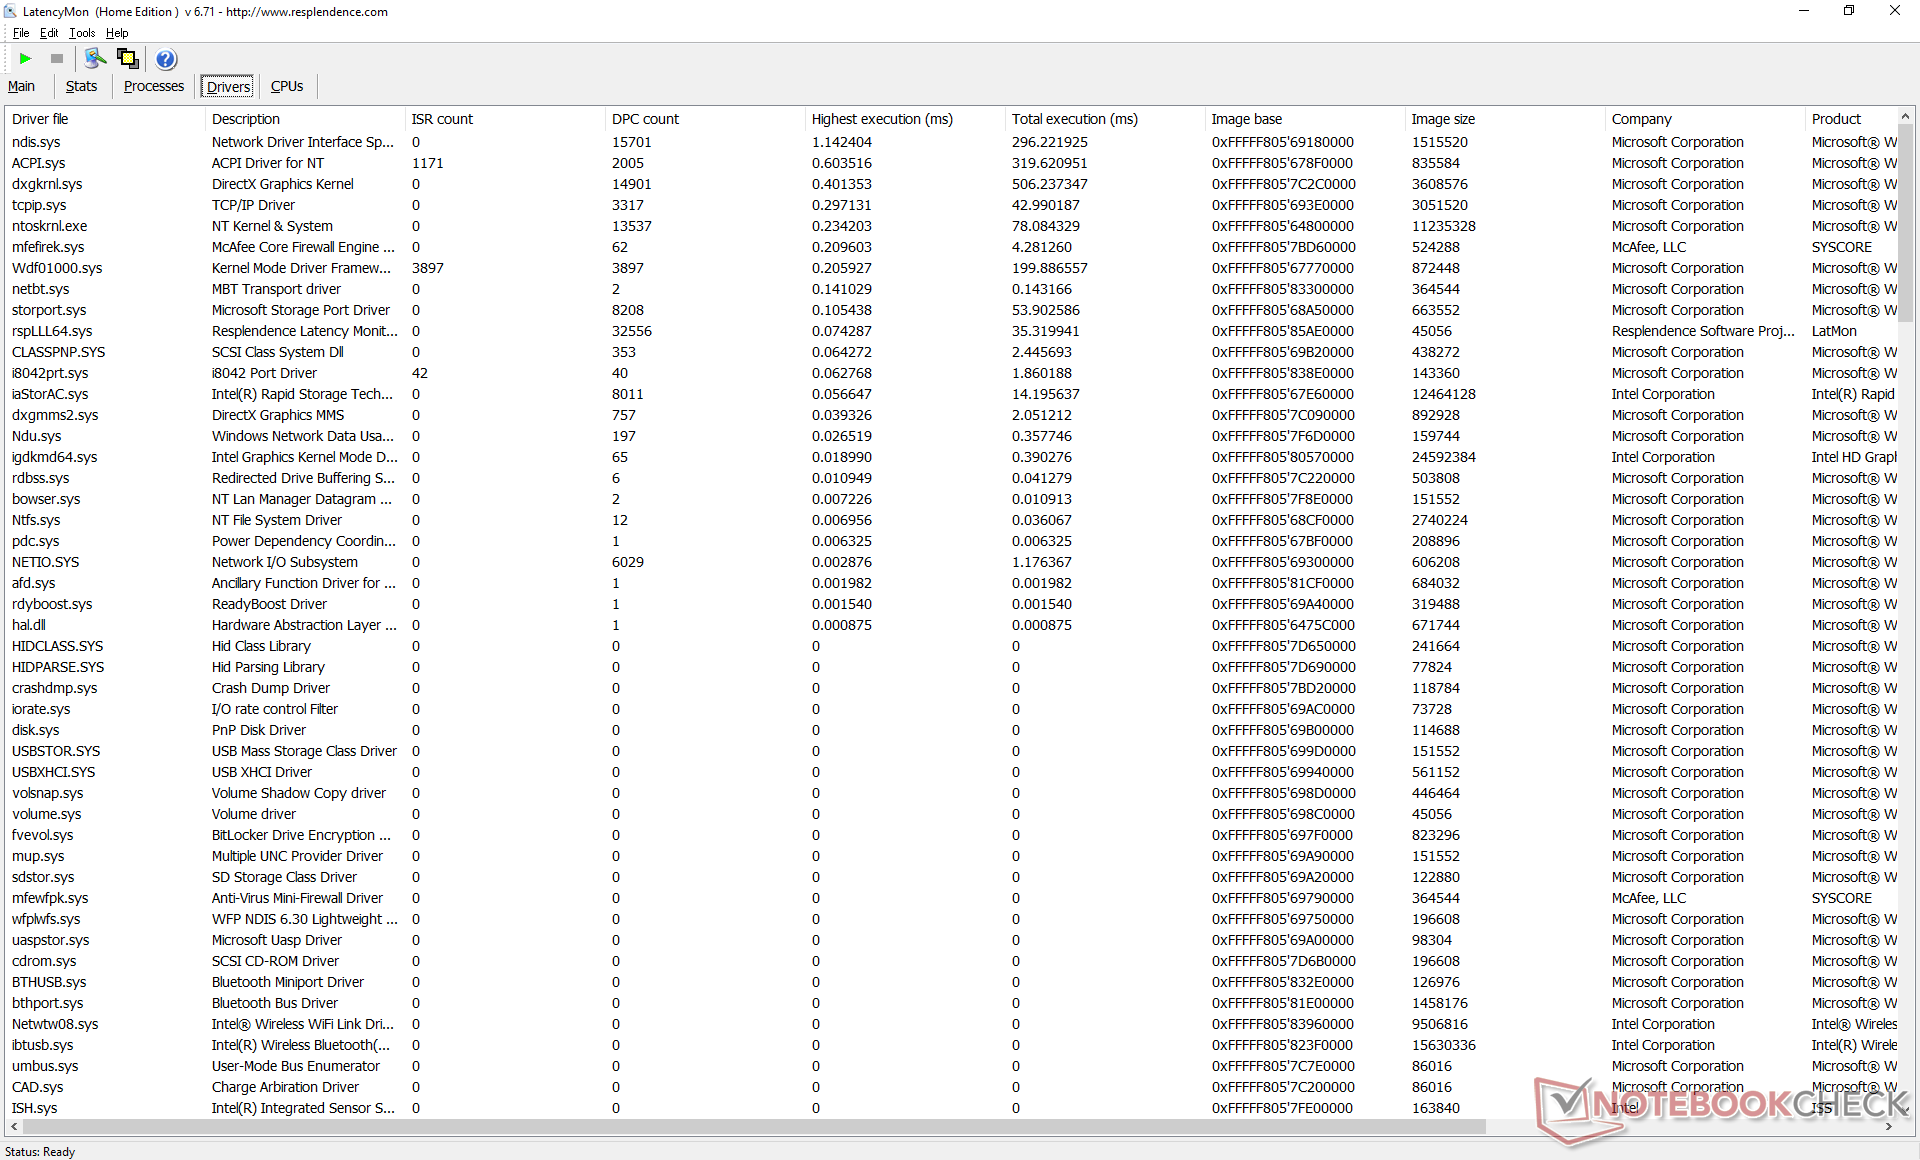
DPC Latency
LatencyMon shows DPC latency issues when opening multiple tabs on our homepage. 4K video playback on YouTube is otherwise smooth with no dropped frames.
| DPC Latencies / LatencyMon - interrupt to process latency (max), Web, Youtube, Prime95 | |
| HP ProBook 430 G7-8VU53EA | |
| Dell XPS 15 9500 Core i5 | |
| Razer Blade 15 RZ09-0328 | |
| Asus ZenBook Flip 14 UX463FA-AI039T | |
* ... smaller is better
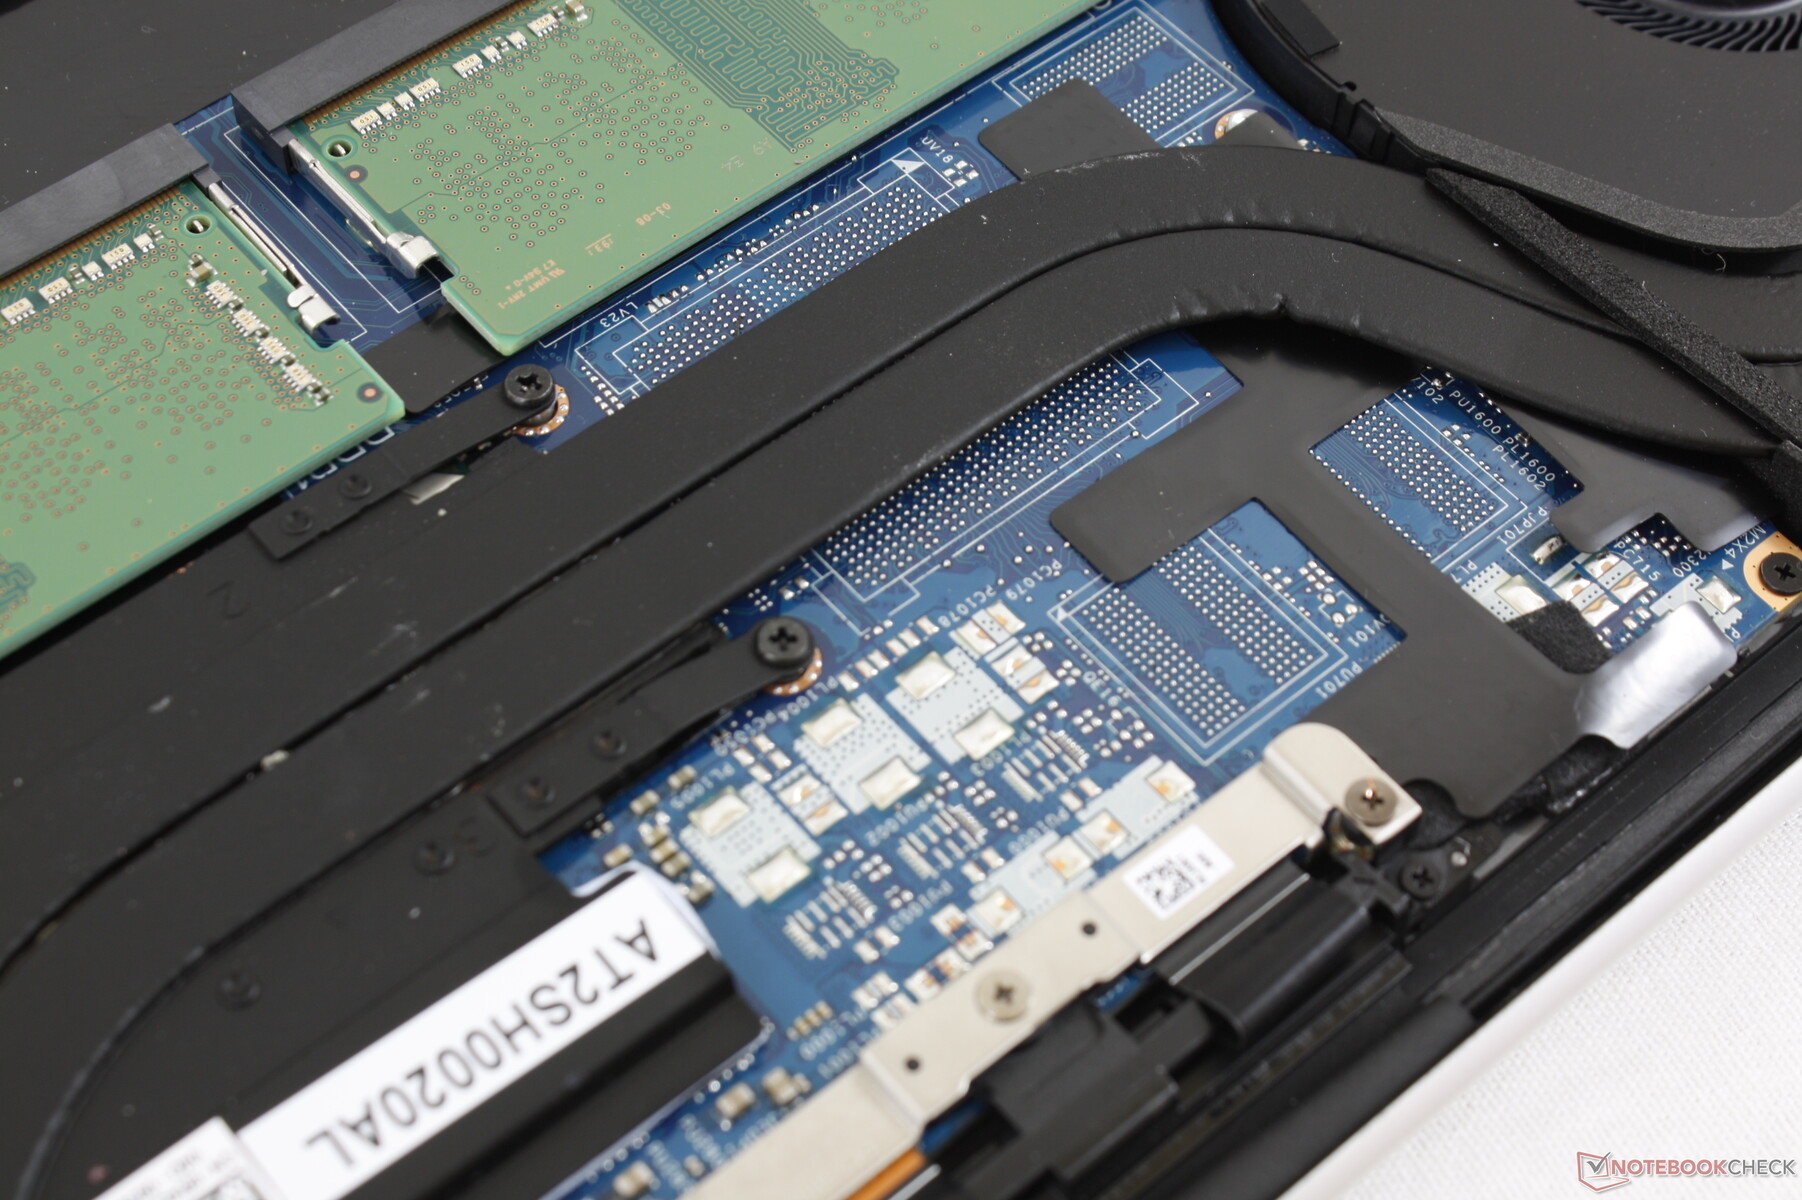
Storage Devices
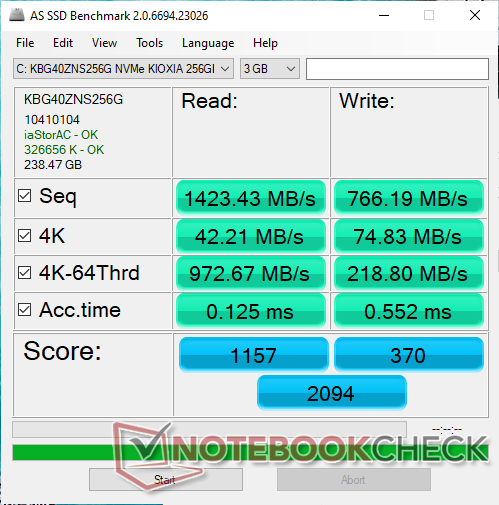
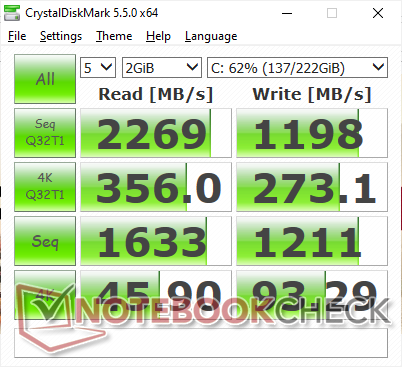
Two M.2 2280 PCIe x4 slots are available with no 2.5-inch SATA III options on any configuration level. Like last year's XPS 15 7590 base model, Dell is once again using a slower budget 256 GB Toshiba NVMe SSD. Higher-end XPS 15 9500 configurations with higher capacities will come with faster drives much like what we observed on the XPS 15 7590 series.
See our table of SSDs and HDDs for more benchmark comparisons.
| Dell XPS 15 9500 Core i5 Toshiba KBG40ZNS256G NVMe | Dell XPS 15 7590 i5 iGPU FHD Toshiba XG6 KXG60ZNV512G | Asus ZenBook 15 UX534FTC-A8190T Samsung SSD PM981 MZVLB1T0HALR | Lenovo Yoga C940-15IRH Intel Optane Memory H10 with Solid State Storage 32GB + 512GB HBRPEKNX0202A(L/H) | HP Spectre X360 15-5ZV31AV Intel SSD 660p 2TB SSDPEKNW020T8 | Apple MacBook Pro 16 2019 i9 5500M Apple SSD AP1024 7171 | |
|---|---|---|---|---|---|---|
| AS SSD | 109% | 112% | 38% | 62% | 122% | |
| Seq Read (MB/s) | 1423 | 2357 66% | 2643 86% | 769 -46% | 1220 -14% | 2531 78% |
| Seq Write (MB/s) | 766 | 1235 61% | 1533 100% | 351.1 -54% | 1152 50% | 2289 199% |
| 4K Read (MB/s) | 42.21 | 43.29 3% | 49.12 16% | 69.1 64% | 52.3 24% | 15.85 -62% |
| 4K Write (MB/s) | 74.8 | 99.7 33% | 134.7 80% | 100.9 35% | 146.6 96% | 39.88 -47% |
| 4K-64 Read (MB/s) | 973 | 1020 5% | 1028 6% | 472 -51% | 652 -33% | 1267 30% |
| 4K-64 Write (MB/s) | 218.8 | 1502 586% | 1353 518% | 948 333% | 847 287% | 1749 699% |
| Access Time Read * (ms) | 0.125 | 0.07 44% | 0.033 74% | 0.071 43% | 0.077 38% | 0.122 2% |
| Access Time Write * (ms) | 0.552 | 0.039 93% | 0.028 95% | 0.137 75% | 0.106 81% | 0.095 83% |
| Score Read (Points) | 1157 | 1299 12% | 1342 16% | 618 -47% | 826 -29% | 1536 33% |
| Score Write (Points) | 370 | 1726 366% | 1641 344% | 1084 193% | 1109 200% | 2018 445% |
| Score Total (Points) | 2094 | 3640 74% | 3622 73% | 2024 -3% | 2371 13% | 4317 106% |
| Copy ISO MB/s (MB/s) | 1151 | 2145 86% | 2226 93% | 839 -27% | 2070 80% | 1995 73% |
| Copy Program MB/s (MB/s) | 499.4 | 565 13% | 506 1% | 455.8 -9% | 571 14% | 584 17% |
| Copy Game MB/s (MB/s) | 733 | 1320 80% | 1230 68% | 969 32% | 1219 66% | 1135 55% |
| CrystalDiskMark 5.2 / 6 | 32% | 48% | 25% | 25% | 33% | |
| Write 4K (MB/s) | 93.3 | 93.6 0% | 138.1 48% | 102.2 10% | 151.5 62% | 55.5 -41% |
| Read 4K (MB/s) | 45.9 | 41.87 -9% | 45.89 0% | 114.3 149% | 59.3 29% | 16.21 -65% |
| Write Seq (MB/s) | 1211 | 1698 40% | 2147 77% | 468.3 -61% | 1424 18% | 1959 62% |
| Read Seq (MB/s) | 1633 | 1978 21% | 2188 34% | 1236 -24% | 1609 -1% | 1763 8% |
| Write 4K Q32T1 (MB/s) | 273.1 | 383.1 40% | 427.8 57% | 556 104% | 393.6 44% | 398.5 46% |
| Read 4K Q32T1 (MB/s) | 356 | 326.9 -8% | 404 13% | 421.6 18% | 369.4 4% | 648 82% |
| Write Seq Q32T1 (MB/s) | 1198 | 2778 132% | 2396 100% | 1264 6% | 1946 62% | 2727 128% |
| Read Seq Q32T1 (MB/s) | 2269 | 3119 37% | 3454 52% | 2239 -1% | 1934 -15% | 3242 43% |
| Total Average (Program / Settings) | 71% /
81% | 80% /
89% | 32% /
34% | 44% /
49% | 78% /
90% |
* ... smaller is better

Disk Throttling: DiskSpd Read Loop, Queue Depth 8
GPU Performance
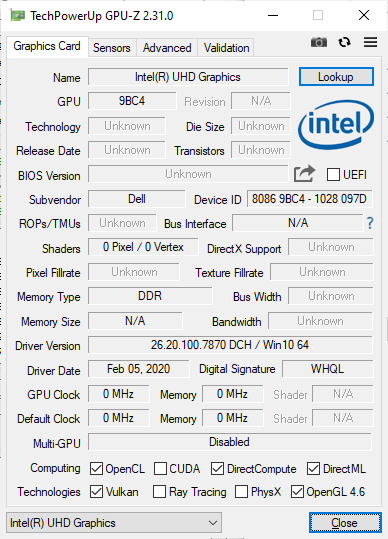
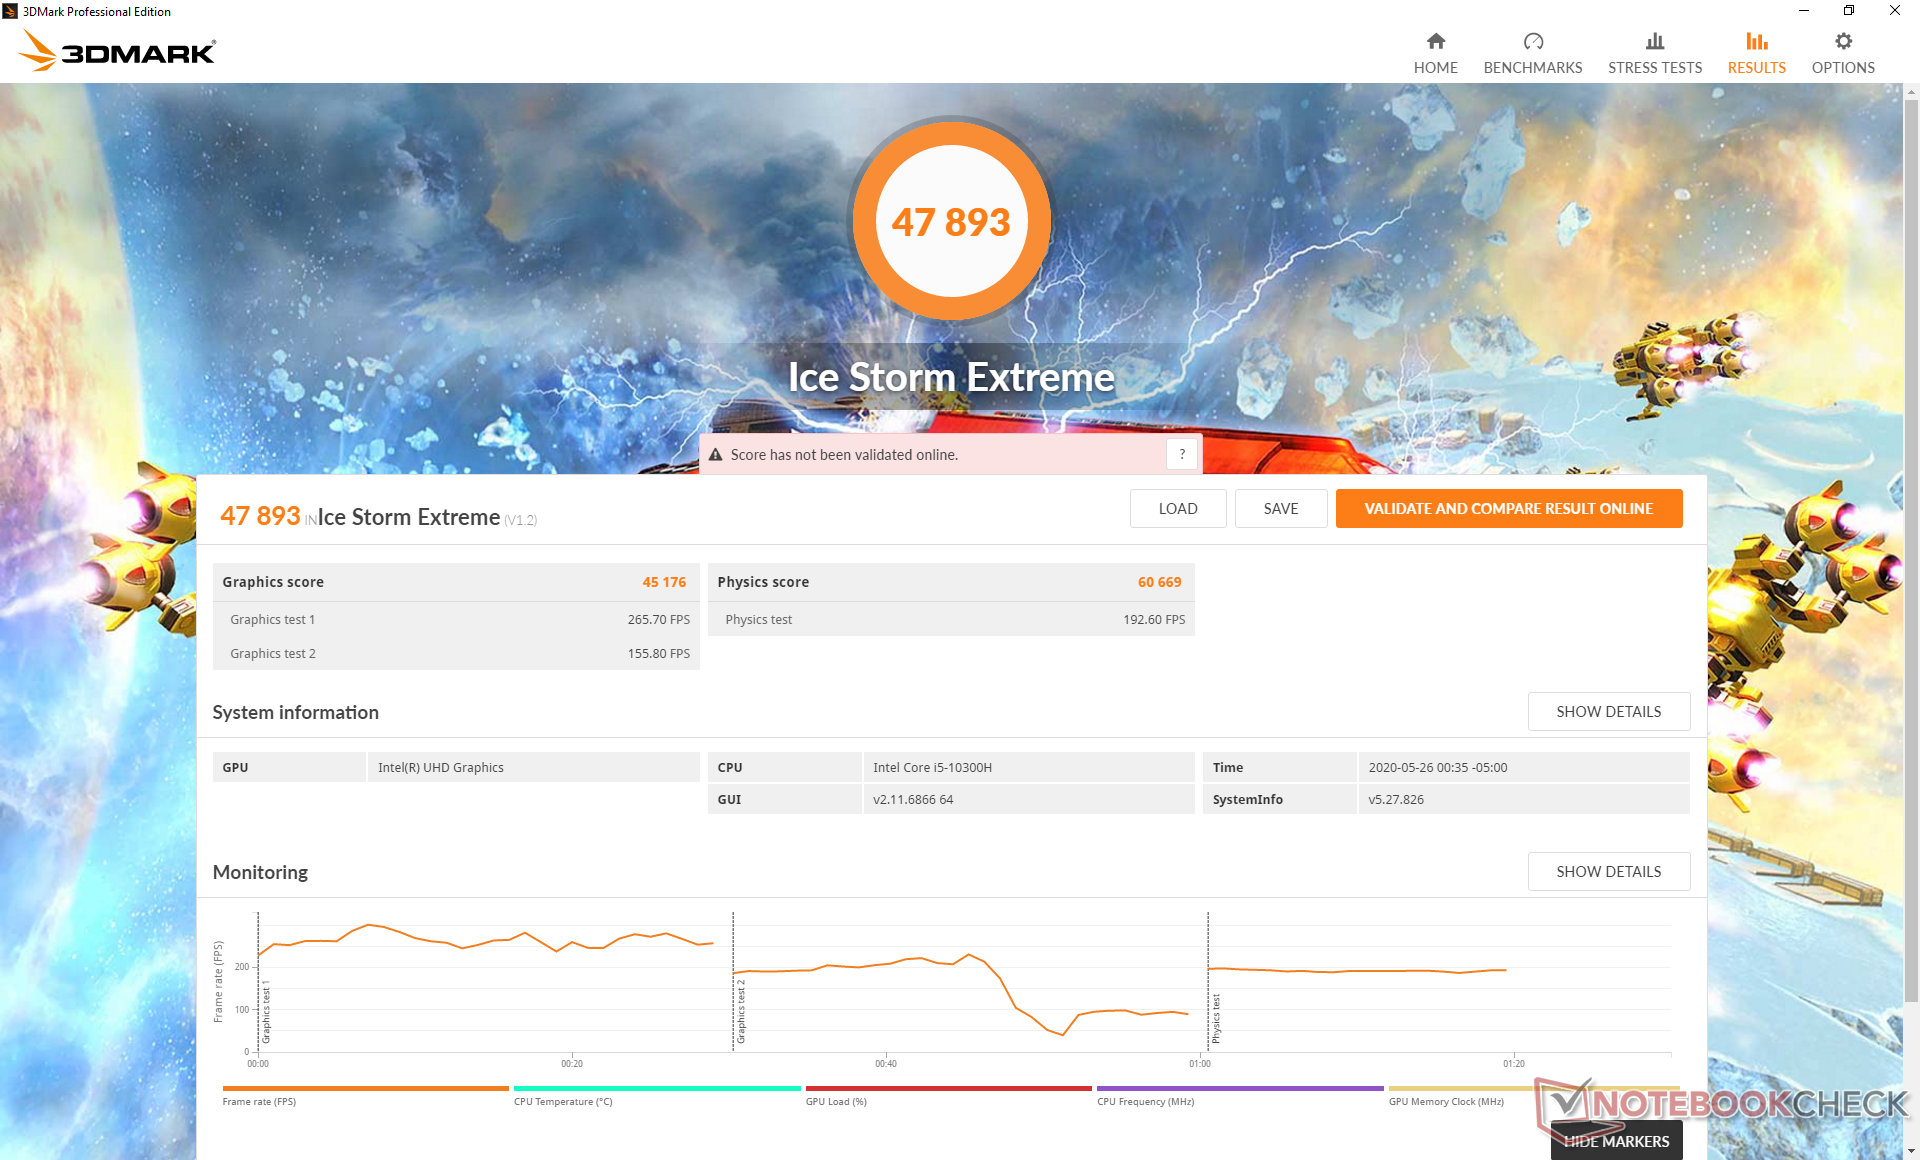
The UHD Graphics 630 is barely any faster than the aging UHD Graphics 620 as found on most other Ultrabooks. If you plan on doing lots of GPU-heavy workloads, then you should absolutely consider upgrading to the GTX 1650 Ti Max-Q option.
See our dedicated page on the UHD Graphics 630 for more technical information and benchmark comparisons.
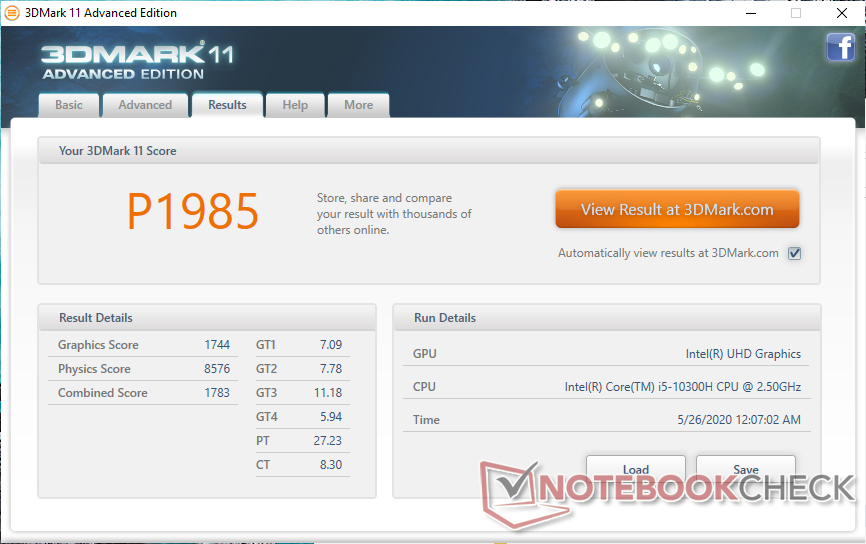
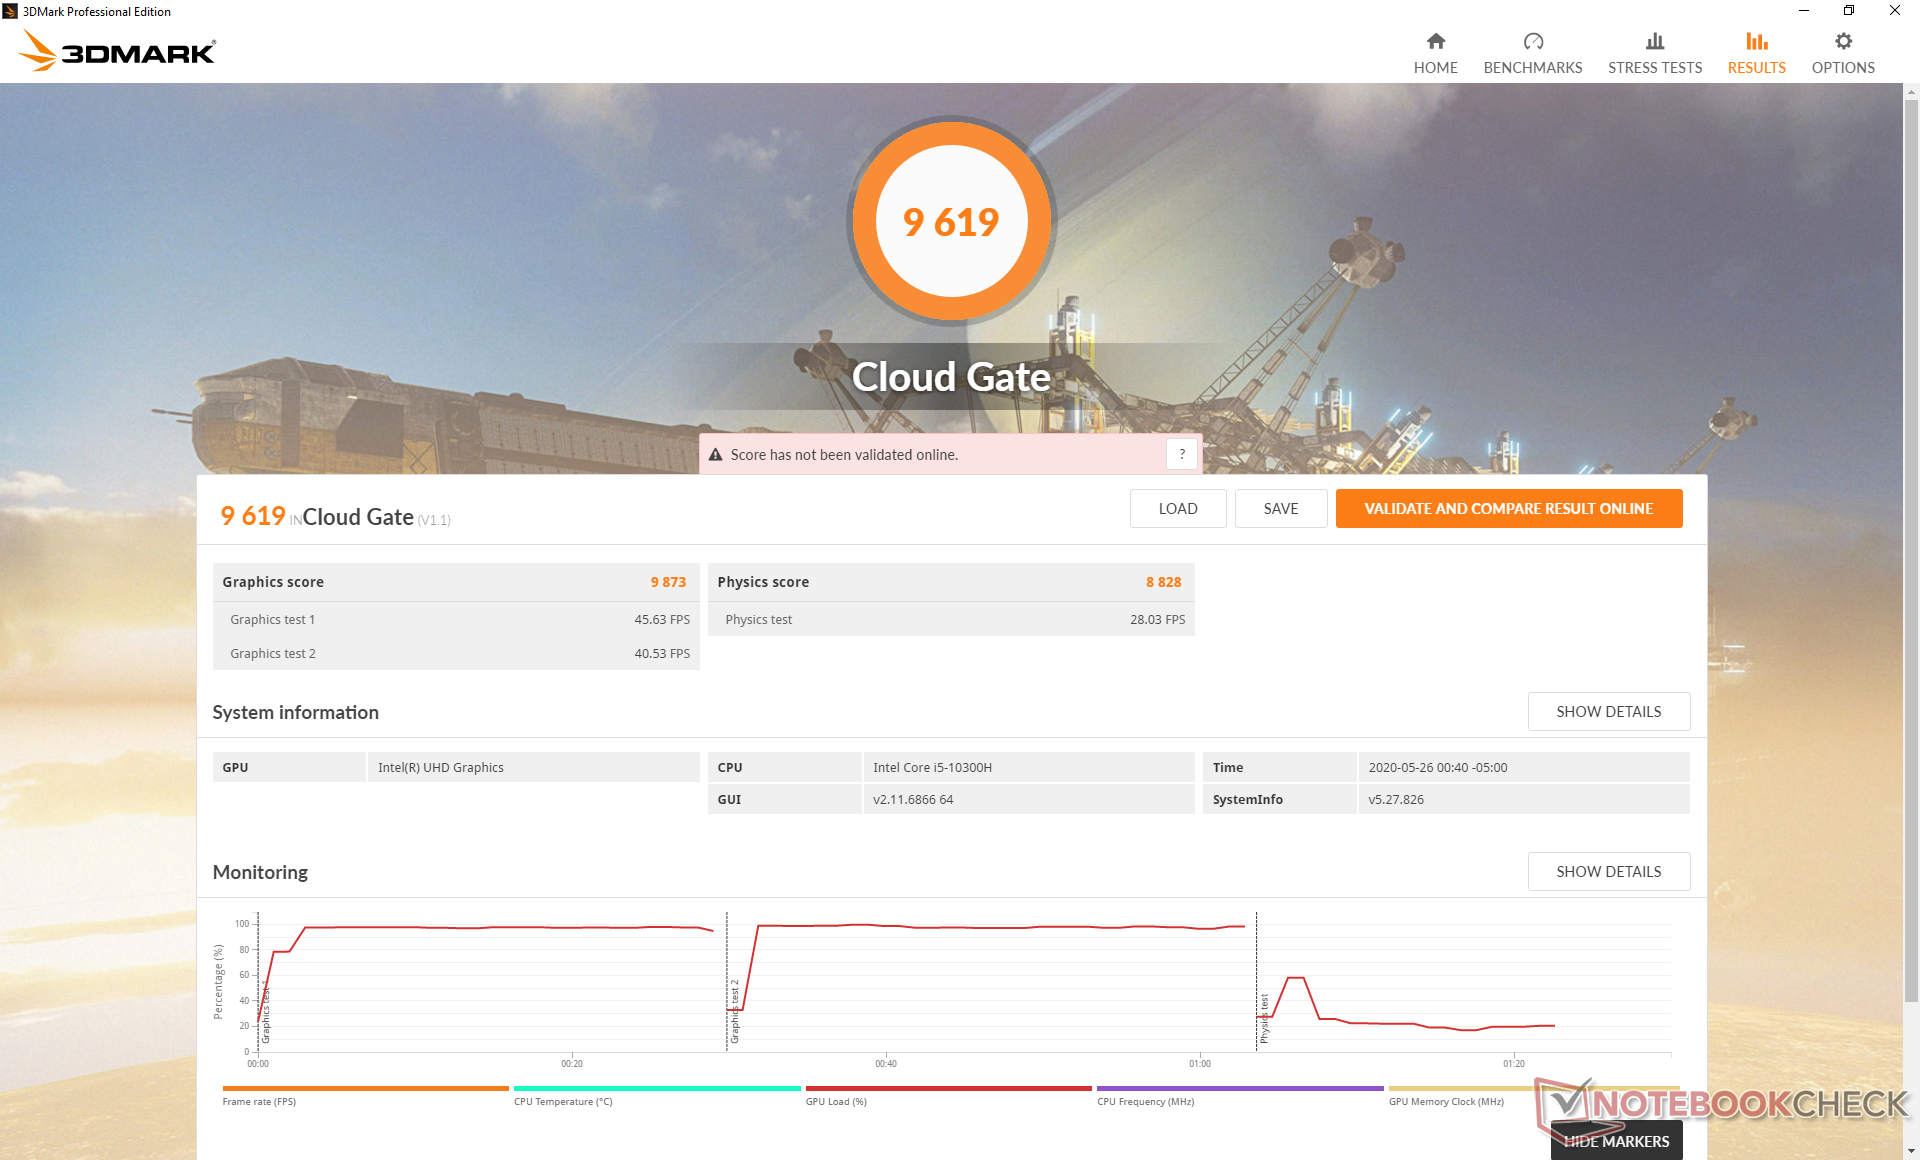
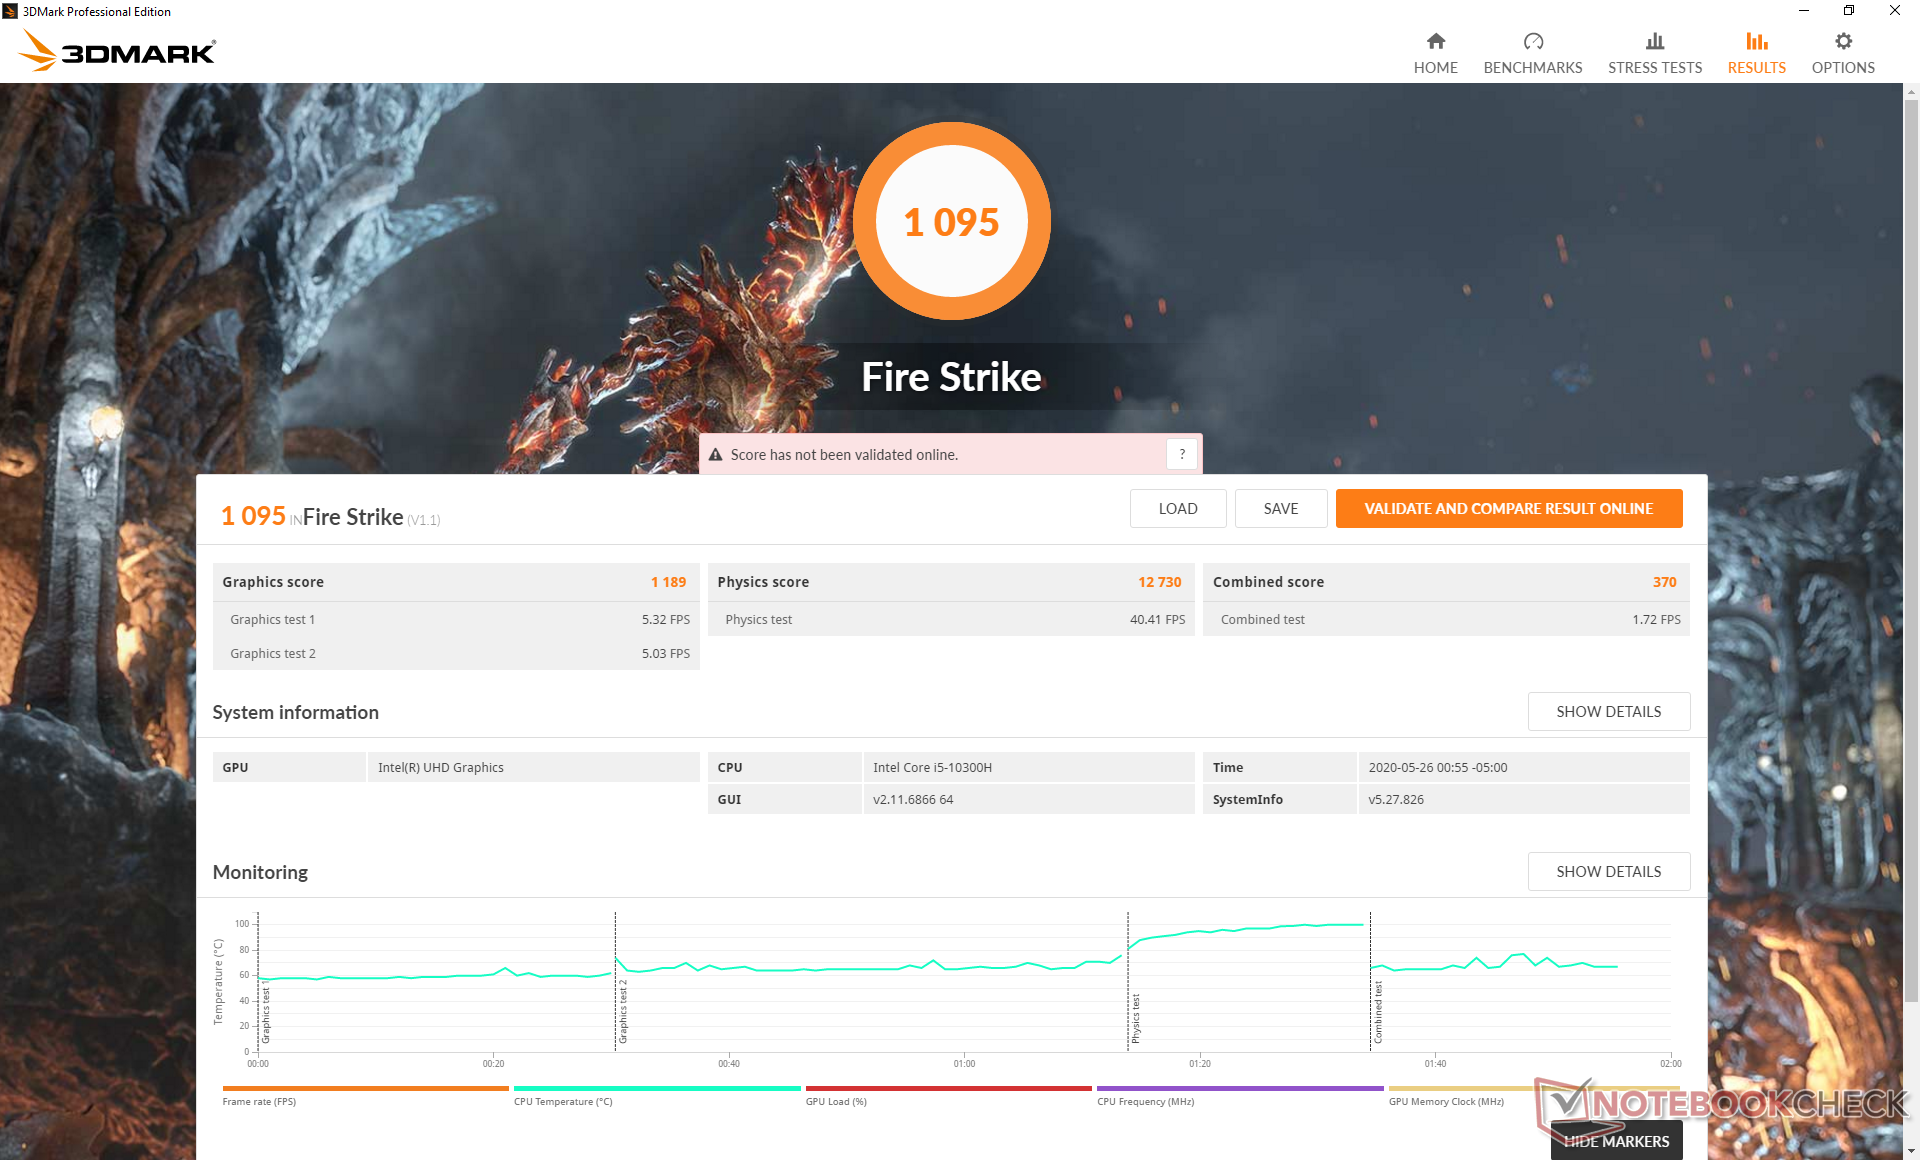
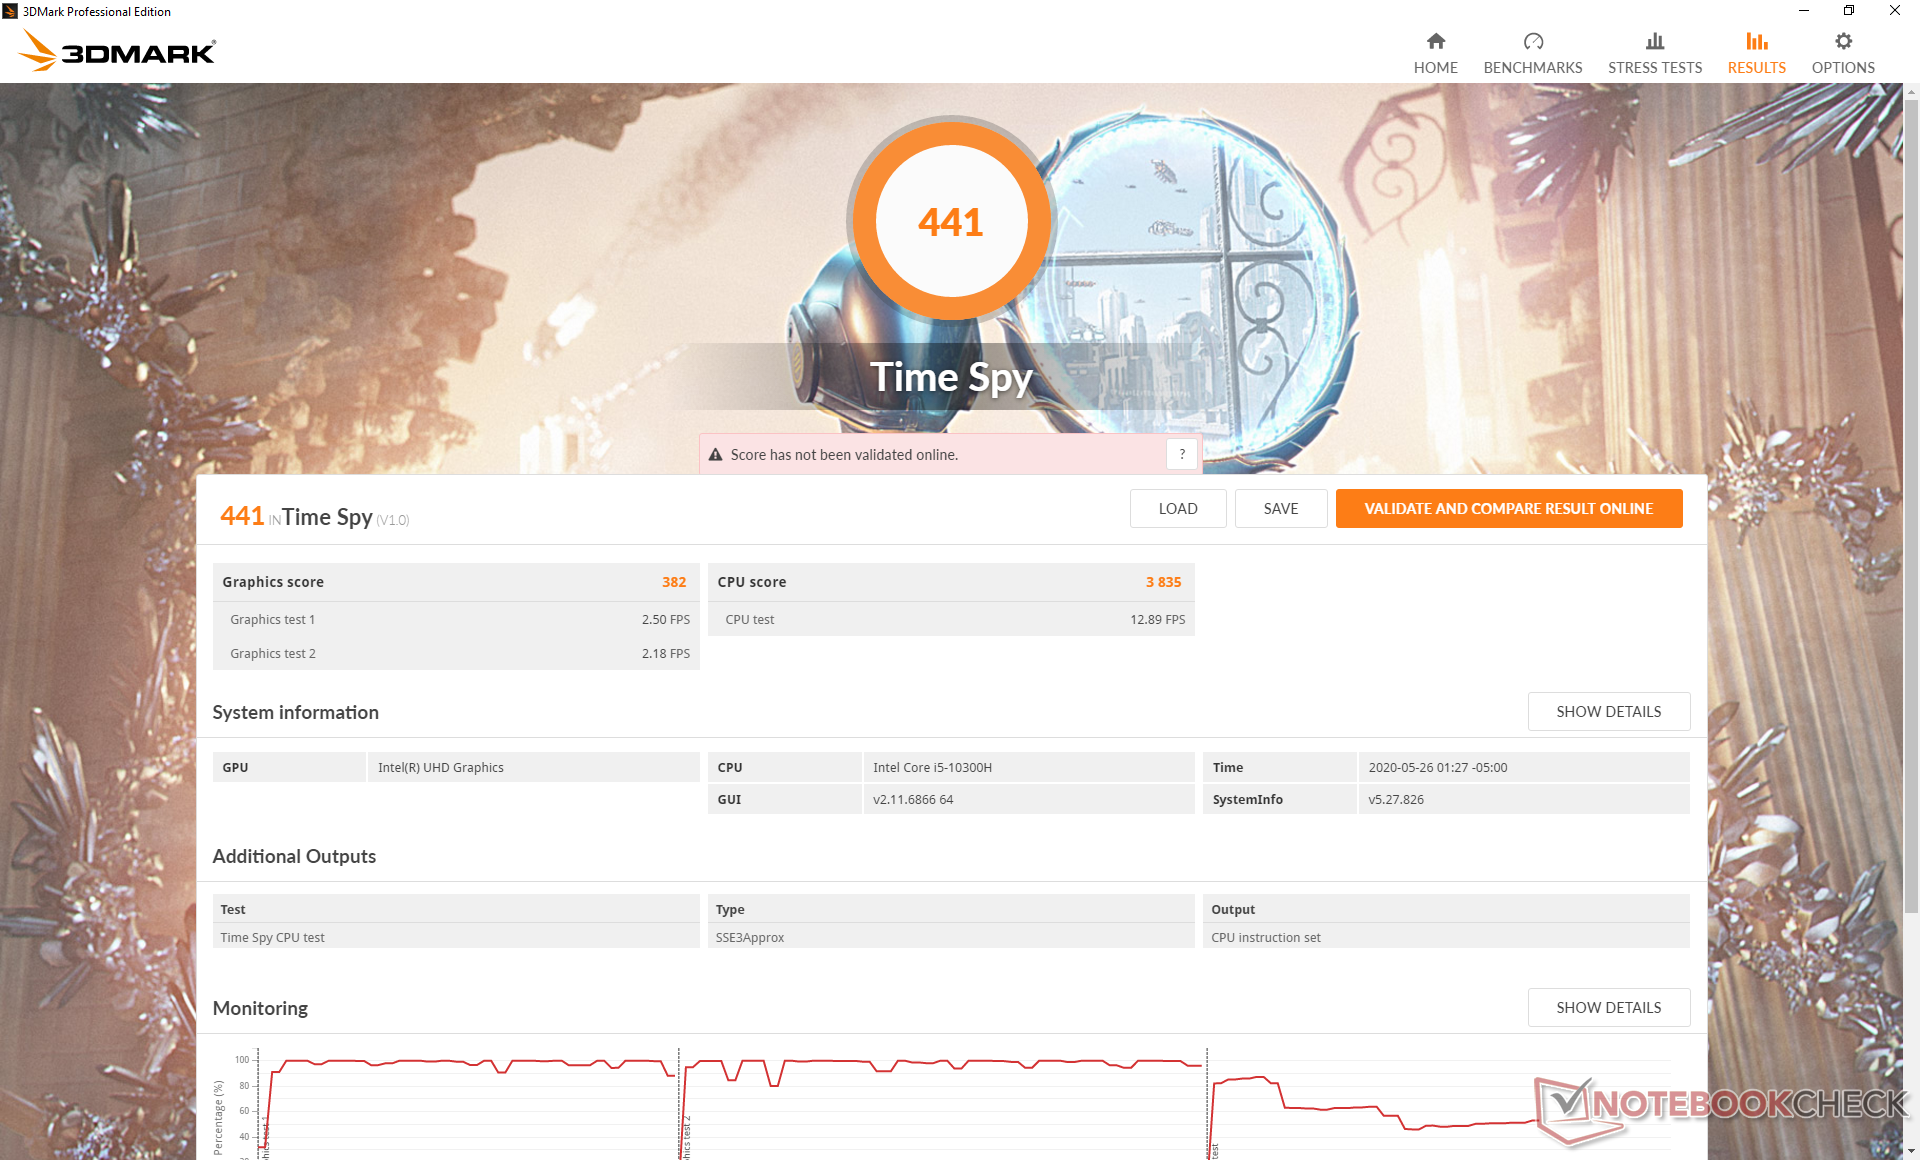
| 3DMark 11 Performance | 1985 points | |
| 3DMark Cloud Gate Standard Score | 9619 points | |
| 3DMark Fire Strike Score | 1095 points | |
| 3DMark Time Spy Score | 441 points | |
Help | ||
| low | med. | high | ultra | |
|---|---|---|---|---|
| The Witcher 3 (2015) | 17.3 | 10.8 | ||
| Dota 2 Reborn (2015) | 79 | 50 | 19.7 | 17.4 |
| X-Plane 11.11 (2018) | 22.4 | 14.3 | 12.8 |
Emissions
System Noise
The system is able to remain silent for much longer than most other laptops. When running the 90-second benchmark scene in 3DMark 06, for example, the fans in the XPS 15 wouldn't pulse at all. This may change when we test the higher-end Core i7 SKUs with GeForce GTX graphics, but at least base model users can rest easy knowing that they can browse, email, and play videos without a hint of fan noise.
At worst, we're able to record a fan noise of 41.9 dB(A) when running both Prime95 and FurMark simultaneously which is louder than what we recorded on last year's Core i5 base model. For most users, fan noise will generally remain well below 32 or 36 dB(A).
| Dell XPS 15 9500 Core i5 UHD Graphics 630, i5-10300H, Toshiba KBG40ZNS256G NVMe | Dell XPS 15 7590 i5 iGPU FHD UHD Graphics 630, i5-9300H, Toshiba XG6 KXG60ZNV512G | Asus ZenBook 15 UX534FTC-A8190T GeForce GTX 1650 Max-Q, i7-10510U, Samsung SSD PM981 MZVLB1T0HALR | Lenovo Yoga C940-15IRH GeForce GTX 1650 Max-Q, i7-9750H, Intel Optane Memory H10 with Solid State Storage 32GB + 512GB HBRPEKNX0202A(L/H) | HP Spectre X360 15-5ZV31AV GeForce MX250, i7-10510U, Intel SSD 660p 2TB SSDPEKNW020T8 | Apple MacBook Pro 16 2019 i9 5500M Radeon Pro 5500M, i9-9880H, Apple SSD AP1024 7171 | |
|---|---|---|---|---|---|---|
| Noise | -4% | -6% | -13% | -7% | -15% | |
| off / environment * (dB) | 28 | 29.3 -5% | 30.3 -8% | 28.7 -2% | 30.1 -8% | 29.8 -6% |
| Idle Minimum * (dB) | 28 | 29.3 -5% | 30.3 -8% | 28.7 -2% | 30.1 -8% | 29.9 -7% |
| Idle Average * (dB) | 28 | 29.3 -5% | 30.3 -8% | 28.8 -3% | 30.1 -8% | 29.9 -7% |
| Idle Maximum * (dB) | 28 | 29.8 -6% | 30.9 -10% | 28.8 -3% | 30.1 -8% | 29.9 -7% |
| Load Average * (dB) | 28 | 32.4 -16% | 31.3 -12% | 45 -61% | 30.1 -8% | 43 -54% |
| Load Maximum * (dB) | 41.9 | 37.2 11% | 38.2 9% | 44.7 -7% | 42 -0% | 46.1 -10% |
| Witcher 3 ultra * (dB) | 38.1 | 44.7 | 39.7 | 45.4 |
* ... smaller is better
Noise level
| Idle |
| 28 / 28 / 28 dB(A) |
| Load |
| 28 / 41.9 dB(A) |
 | ||
30 dB silent 40 dB(A) audible 50 dB(A) loud |
||
min: | ||
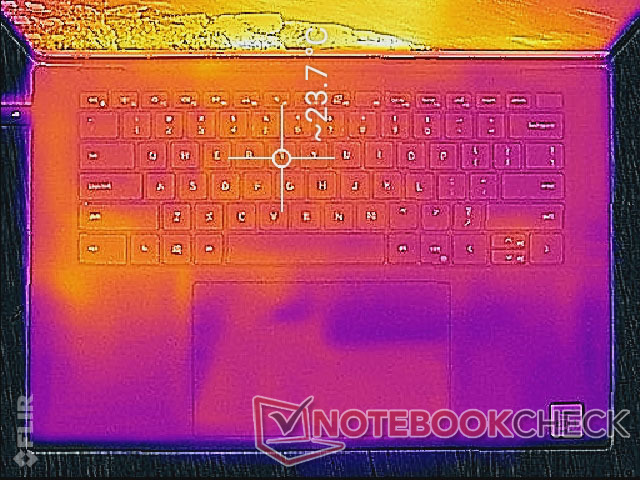
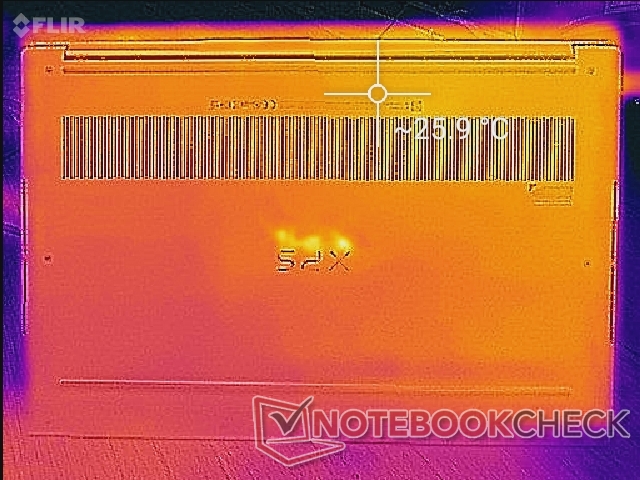
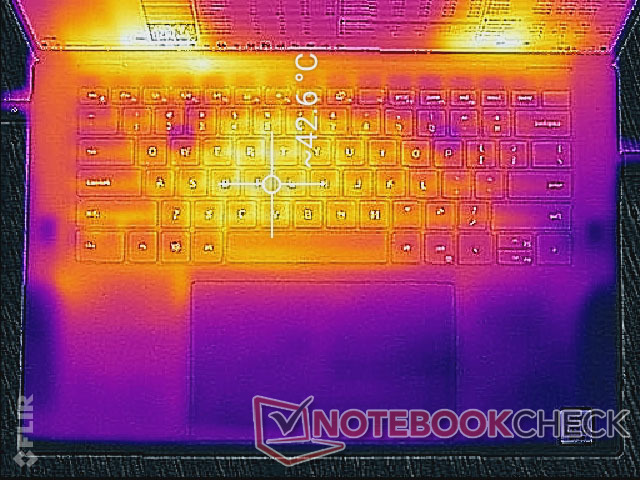
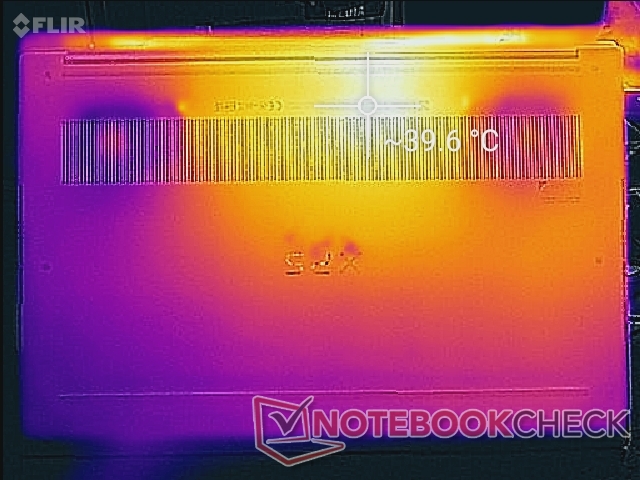
Temperature
Surface temperatures are almost the same as what we recorded on the XPS 15 7590 Core i5 base model. When under extreme loads, the center of the keyboard can become as warm as 43 C while the bottom can approach 40 C. You'll want the system on a flat desk if running demanding applications since the metal bottom will heat up noticeably.
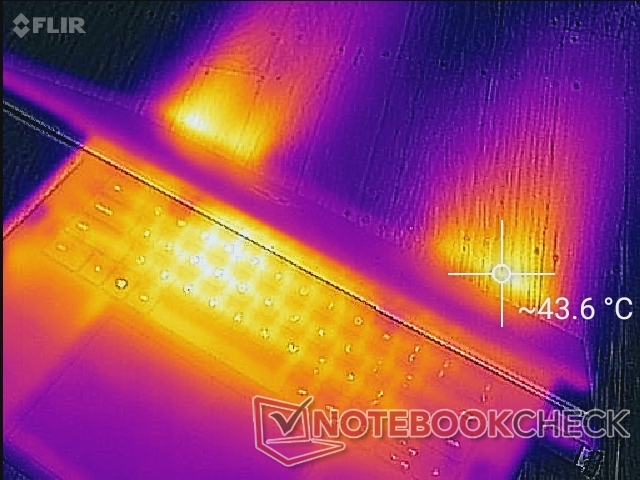

(±) The maximum temperature on the upper side is 42.4 °C / 108 F, compared to the average of 36.8 °C / 98 F, ranging from 21 to 71 °C for the class Multimedia.
(+) The bottom heats up to a maximum of 39.6 °C / 103 F, compared to the average of 39.1 °C / 102 F
(+) In idle usage, the average temperature for the upper side is 23.2 °C / 74 F, compared to the device average of 31.3 °C / 88 F.
(+) The palmrests and touchpad are cooler than skin temperature with a maximum of 28.4 °C / 83.1 F and are therefore cool to the touch.
(±) The average temperature of the palmrest area of similar devices was 28.7 °C / 83.7 F (+0.3 °C / 0.6 F).
Stress Test
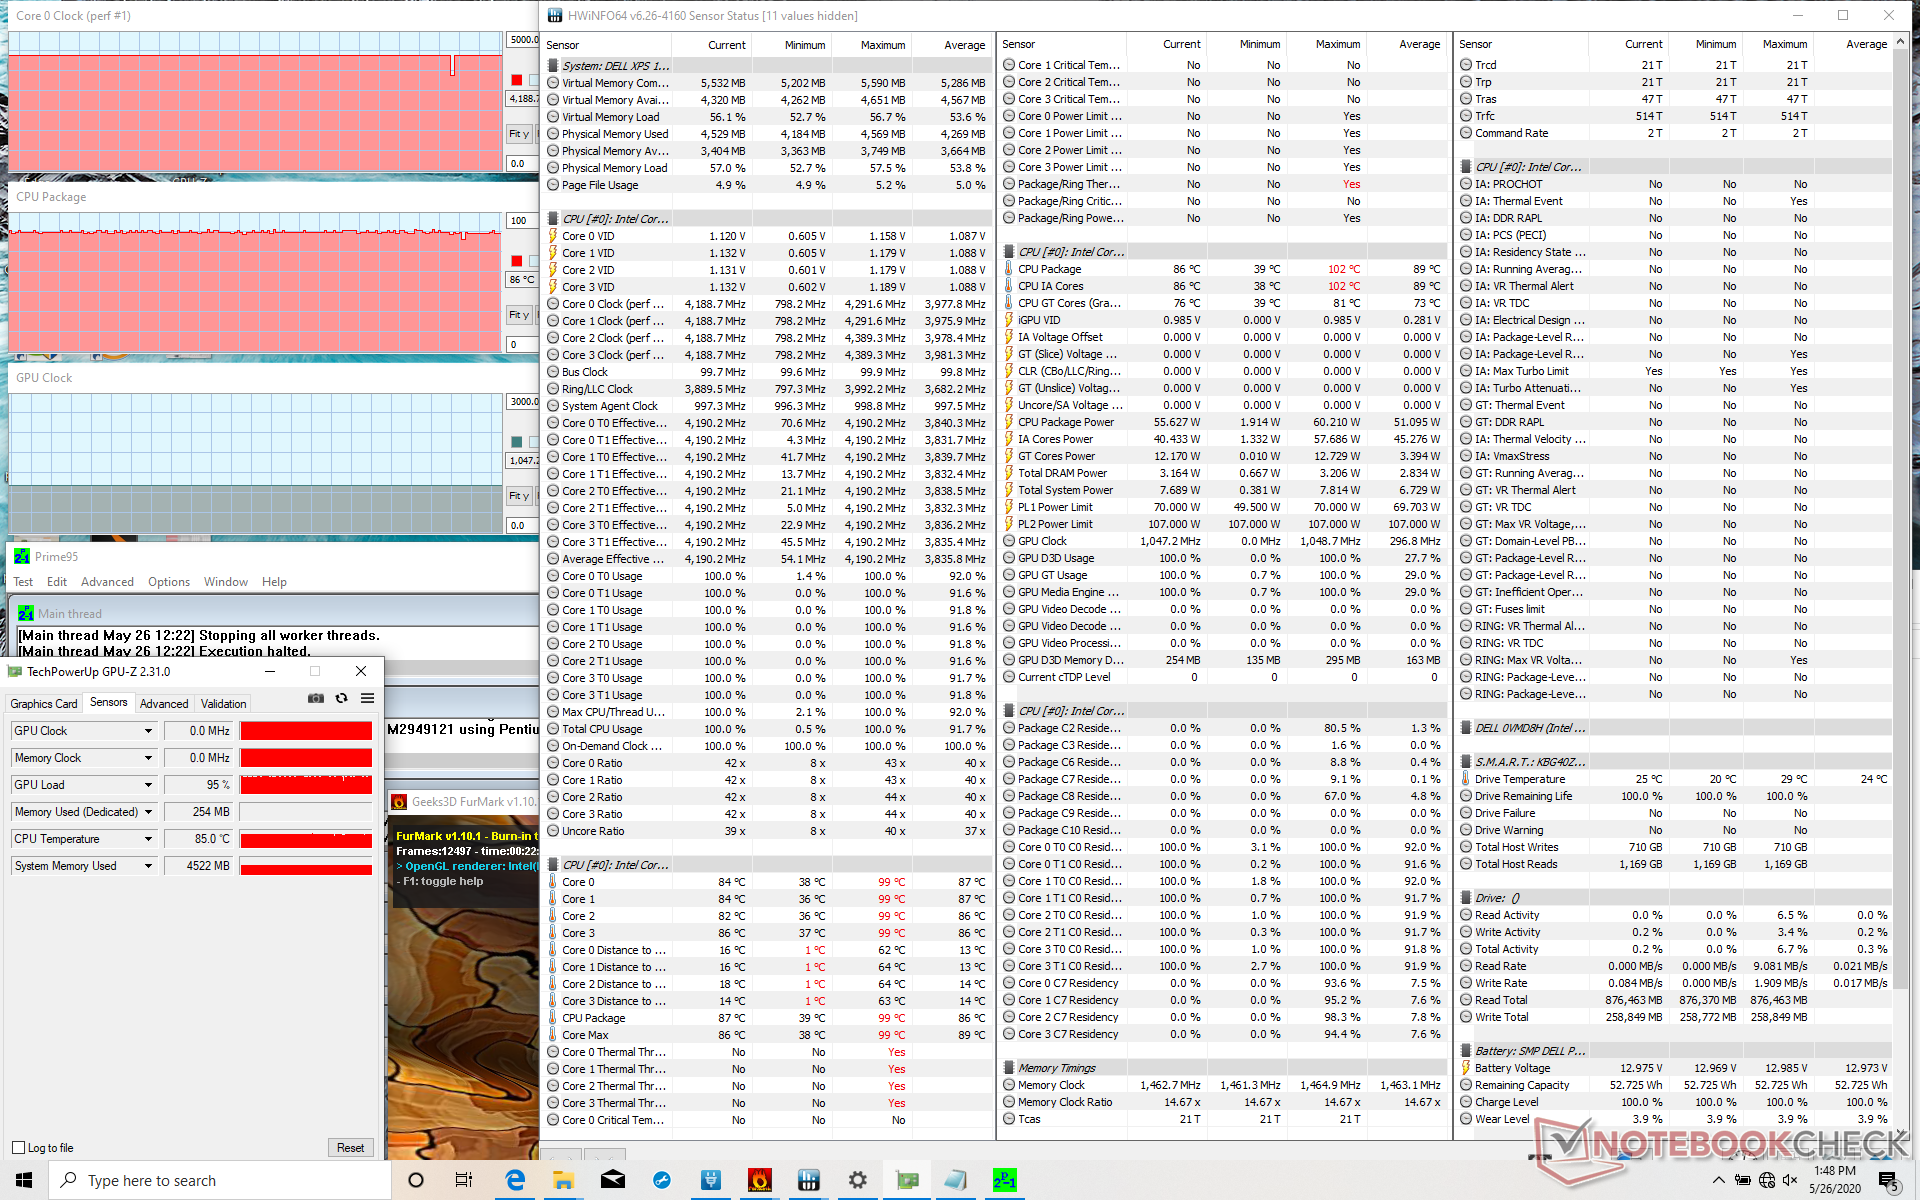
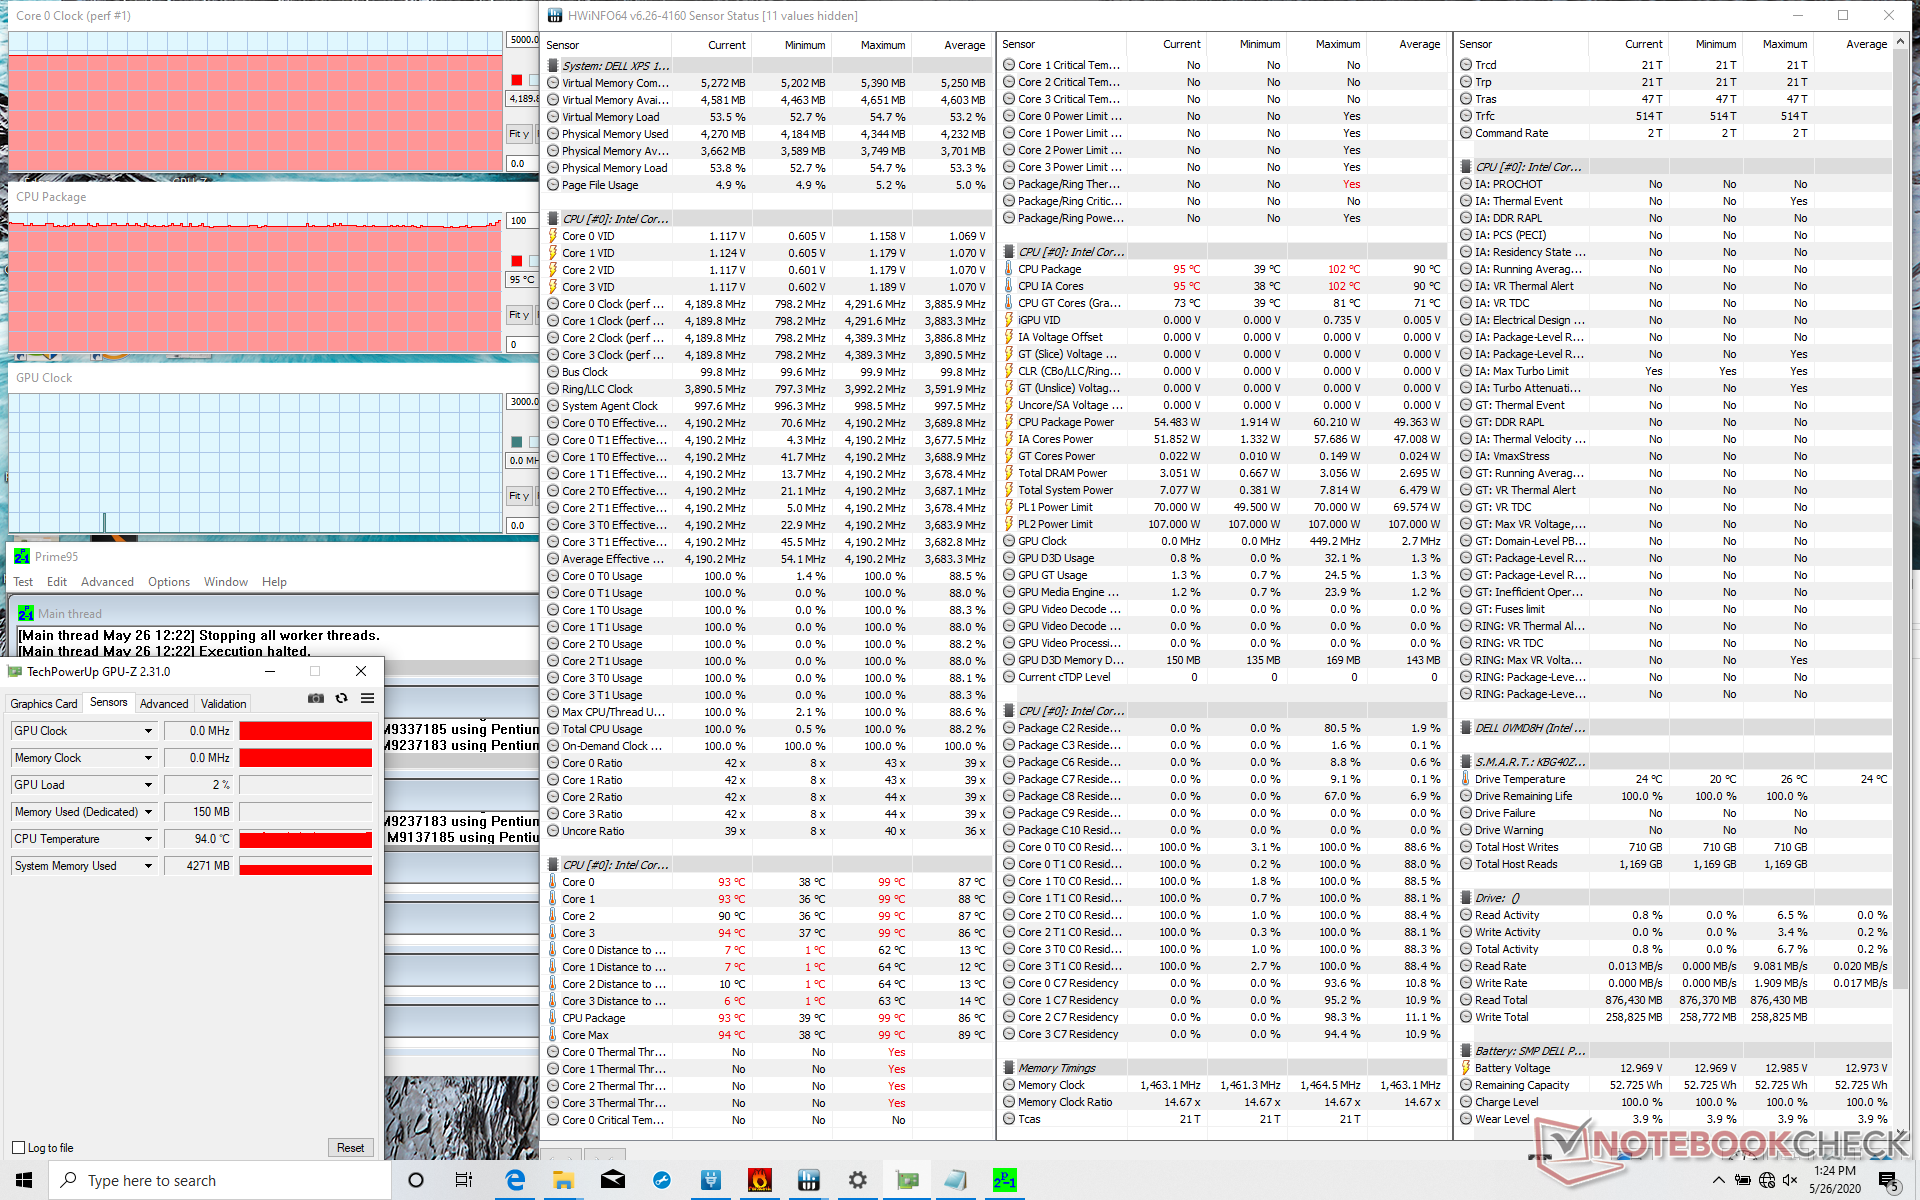
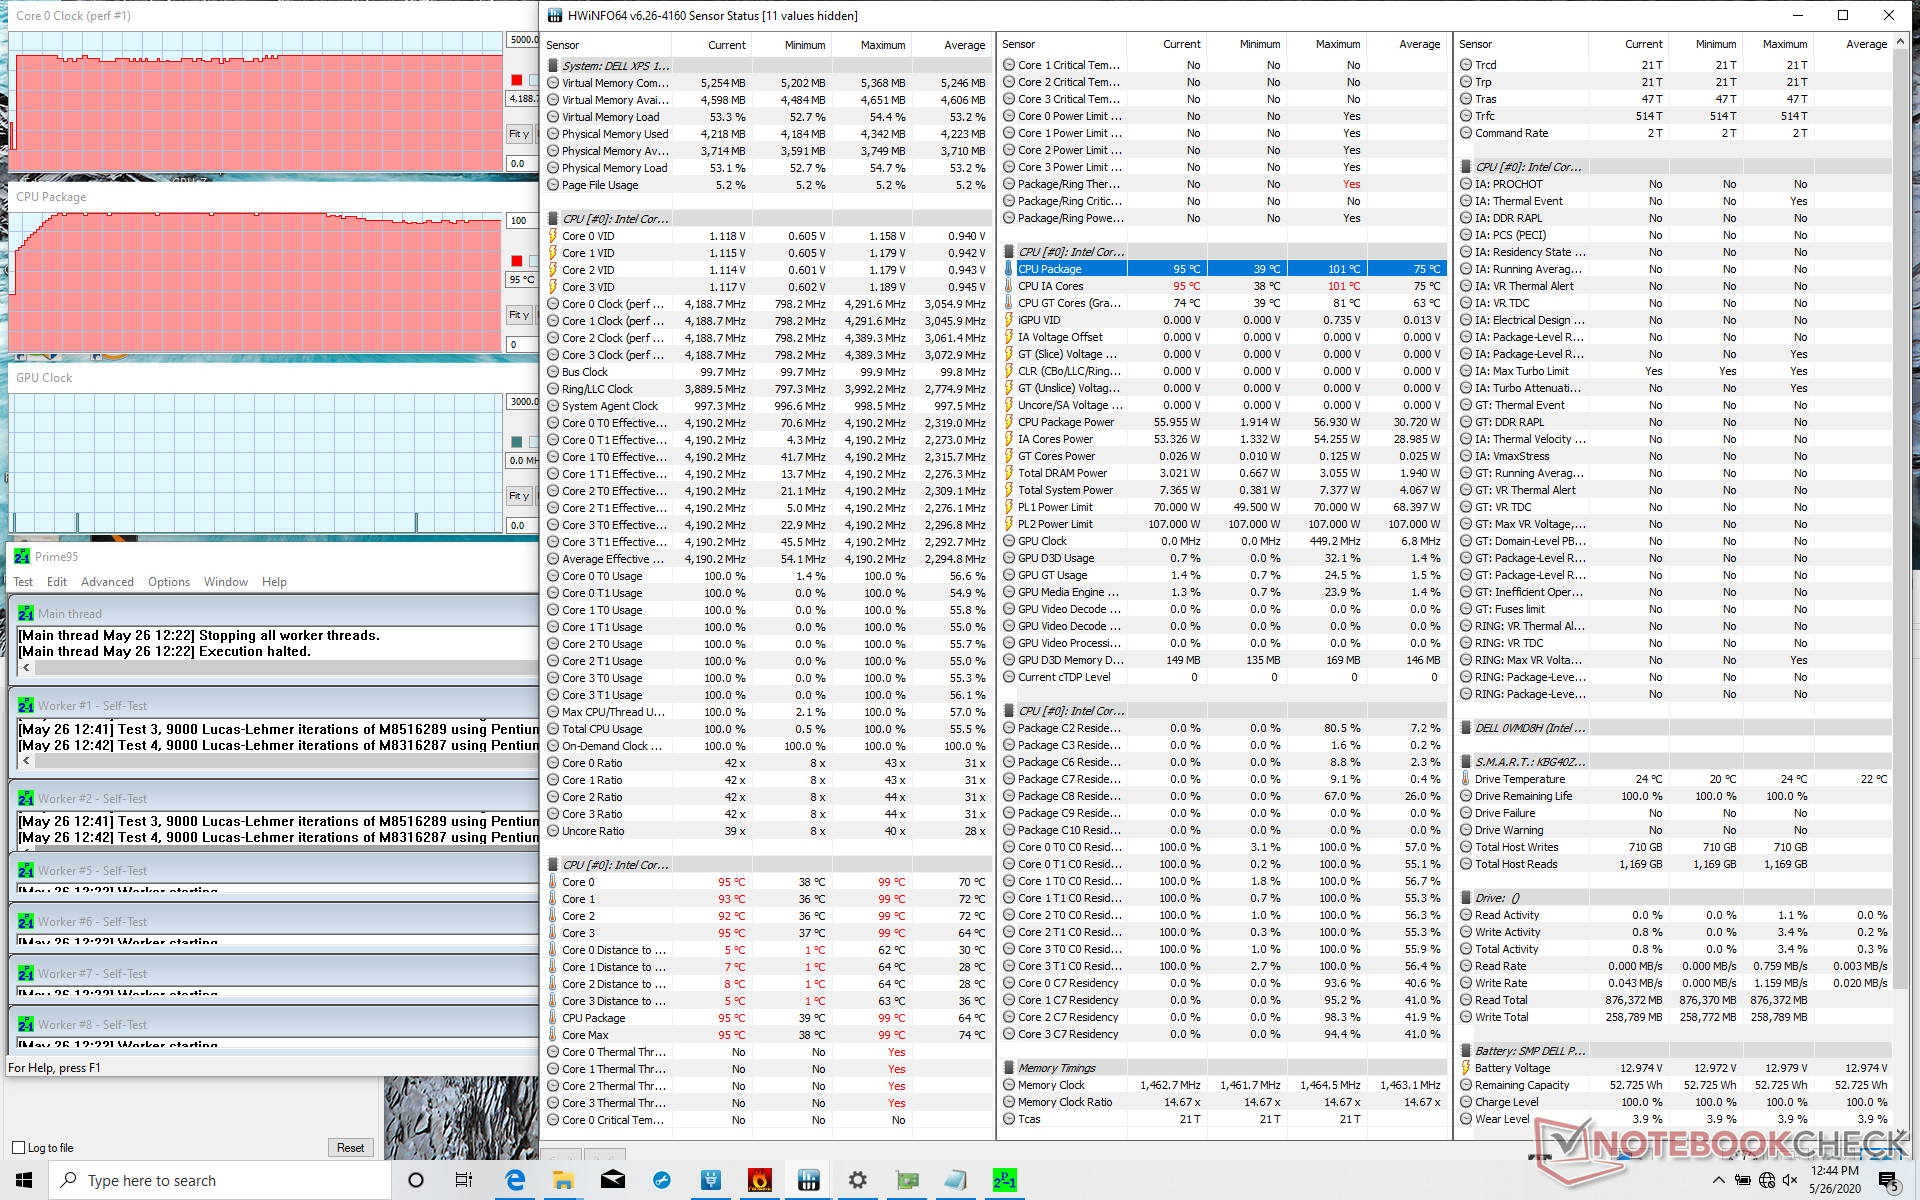
Unlike most other laptops, Dell XPS and Alienware laptops like to run their processors warmer than 90 C and the XPS 15 9500 continues the trend. When running Prime95, core temperature would rise to 100 C and then remain at 100 C for the first few minutes to maintain a high clock rate of 4.2 GHz. Fan noise would then pick up considerably for a slightly cooler core temperature of 95 C. We applaud the system for not throttling the CPU even when under 100 percent utilization, but this comes at the cost of very warm core temperatures and loud fan noise.
Running on battery power will not impact performance. A 3DMark 11 run on batteries returns Physics and Graphics scores of 8389 and 1751 points, respectively, compared to 8576 and 1744 points when on mains.
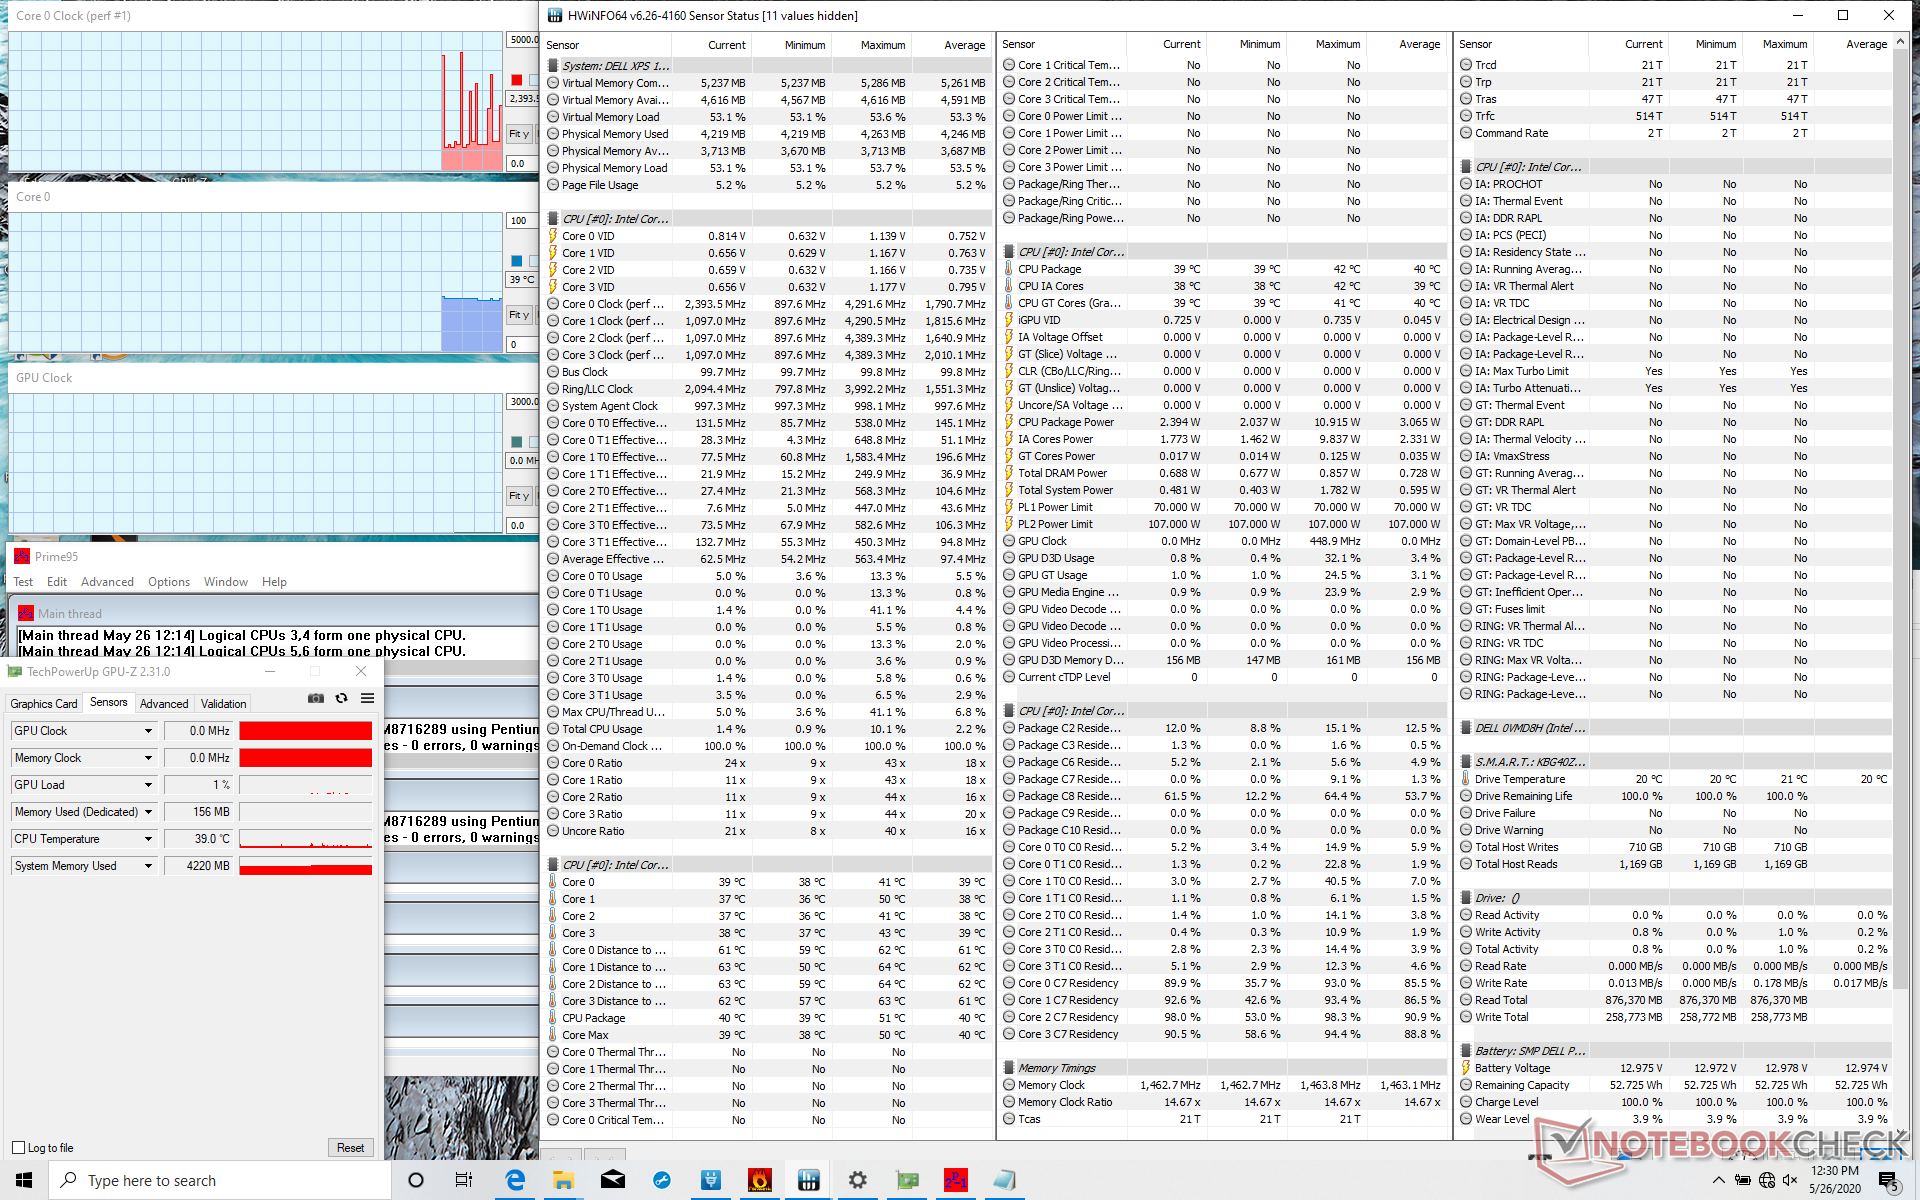
| CPU Clock (GHz) | GPU Clock (MHz) | Average CPU Temperature (°C) | |
| System Idle | -- | -- | 39 |
| Prime95 Stress | 4.2 | -- | 95 |
| Prime95 + FurMark Stress | 4.2 | 1047 | 86 |
Speakers
Dell has revamped the internal speakers to include both subwoofers and tweeters and the resulting audio quality is very well balanced especially for an Ultrabook. Pink noise measurements show roll-off beginning at the 200 Hz range compared to 300 Hz or greater on most cheaper laptops. The major downside is that the keyboard deck will vibrate to the touch much more than expected even when at 50 percent volume. We find the vibration to the distracting when word processing since your palms will be resting on the palm rests.


Dell XPS 15 9500 Core i5 audio analysis
(+) | speakers can play relatively loud (84.2 dB)
Bass 100 - 315 Hz
(+) | good bass - only 4.6% away from median
(±) | linearity of bass is average (10% delta to prev. frequency)
Mids 400 - 2000 Hz
(+) | balanced mids - only 3.3% away from median
(+) | mids are linear (4.5% delta to prev. frequency)
Highs 2 - 16 kHz
(+) | balanced highs - only 2.4% away from median
(+) | highs are linear (4.3% delta to prev. frequency)
Overall 100 - 16.000 Hz
(+) | overall sound is linear (7.7% difference to median)
Compared to same class
» 6% of all tested devices in this class were better, 2% similar, 91% worse
» The best had a delta of 5%, average was 17%, worst was 45%
Compared to all devices tested
» 1% of all tested devices were better, 0% similar, 98% worse
» The best had a delta of 4%, average was 24%, worst was 134%
Apple MacBook 12 (Early 2016) 1.1 GHz audio analysis
(+) | speakers can play relatively loud (83.6 dB)
Bass 100 - 315 Hz
(±) | reduced bass - on average 11.3% lower than median
(±) | linearity of bass is average (14.2% delta to prev. frequency)
Mids 400 - 2000 Hz
(+) | balanced mids - only 2.4% away from median
(+) | mids are linear (5.5% delta to prev. frequency)
Highs 2 - 16 kHz
(+) | balanced highs - only 2% away from median
(+) | highs are linear (4.5% delta to prev. frequency)
Overall 100 - 16.000 Hz
(+) | overall sound is linear (10.2% difference to median)
Compared to same class
» 7% of all tested devices in this class were better, 2% similar, 91% worse
» The best had a delta of 5%, average was 18%, worst was 53%
Compared to all devices tested
» 5% of all tested devices were better, 1% similar, 94% worse
» The best had a delta of 4%, average was 24%, worst was 134%
Energy Management
Power Consumption
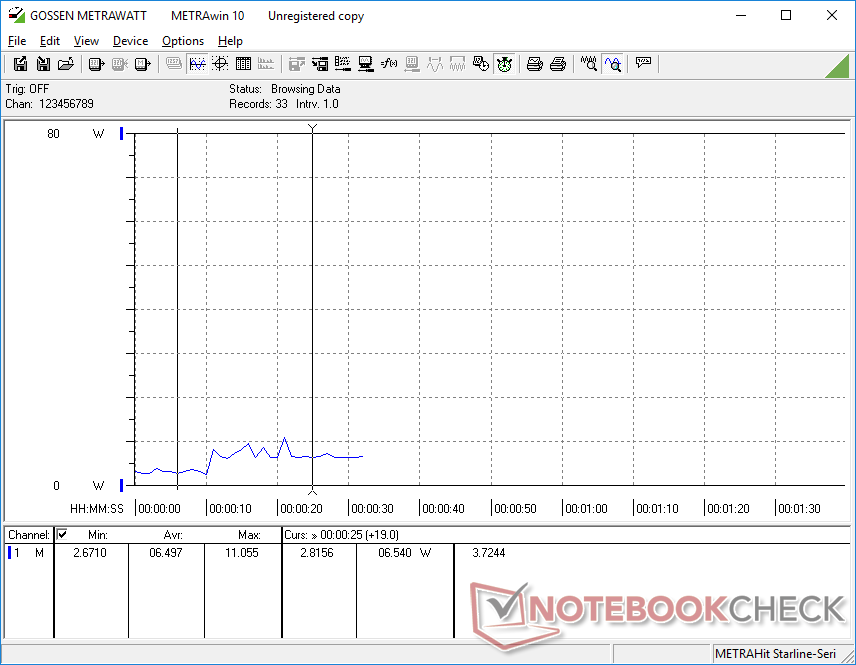
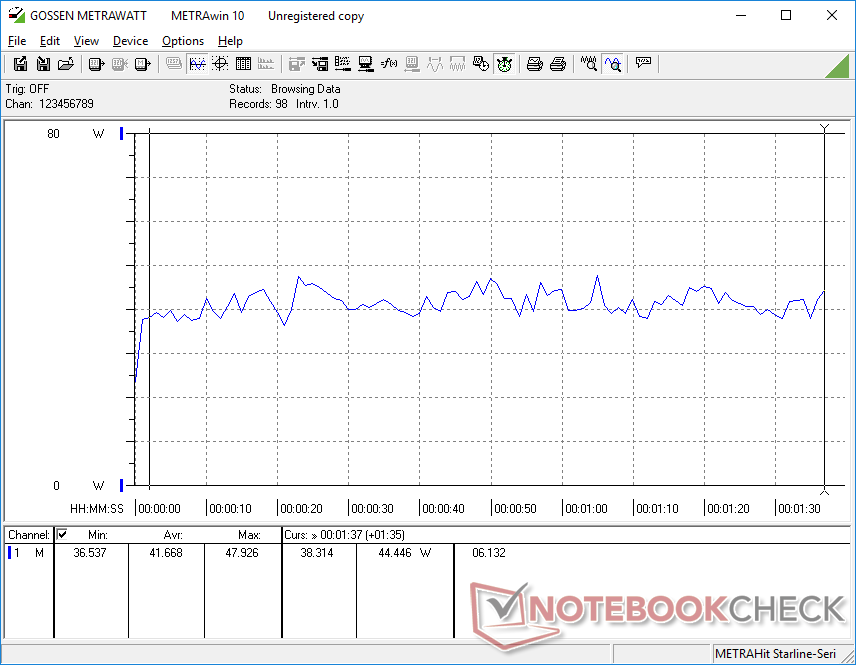
Despite the slightly higher resolution display, the XPS 15 9500 doesn't appear to be more demanding than the last generation XPS 15 7590. Running the first benchmark scene of 3DMark 06 consumes an average of 42 W compared to 62 W on last year's base Core i5 model.
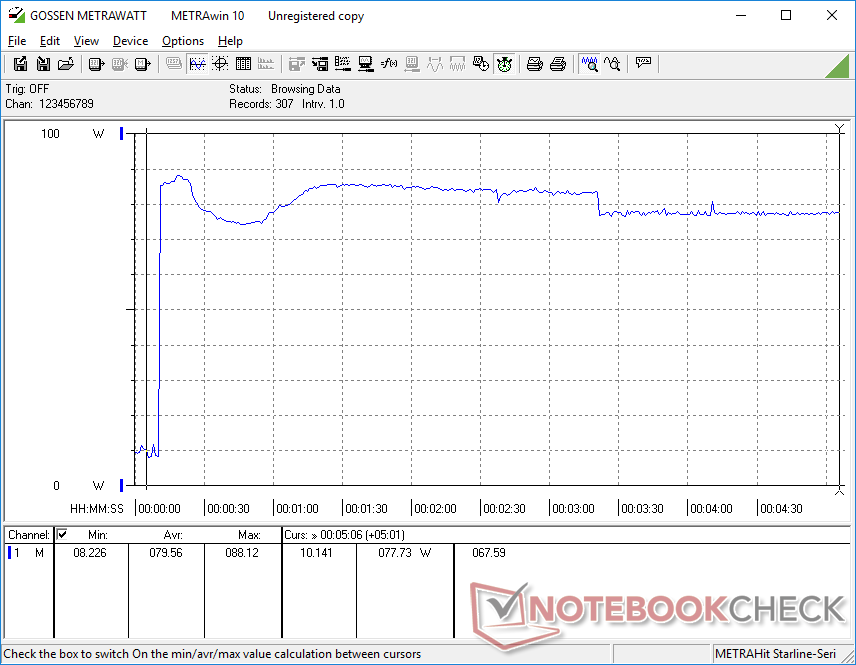
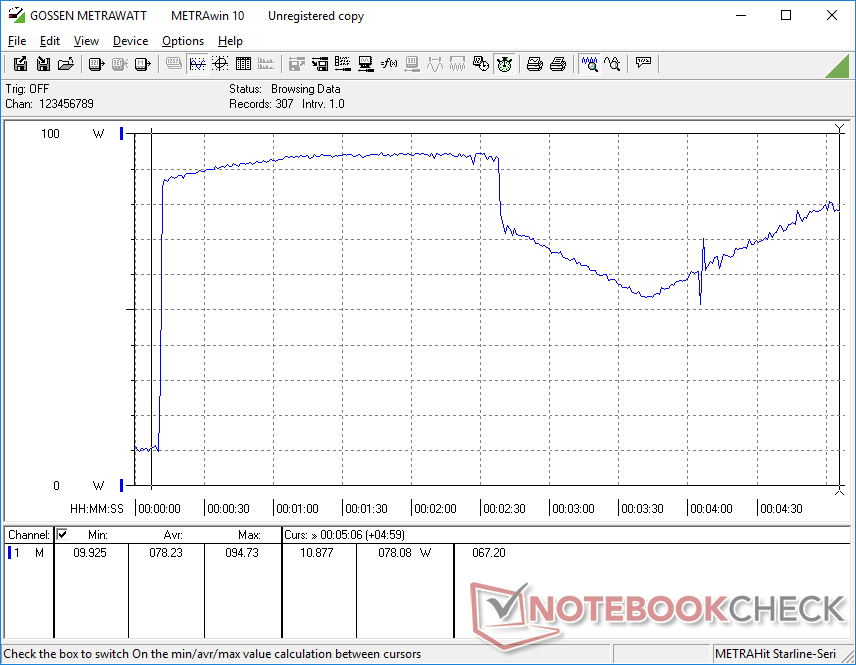
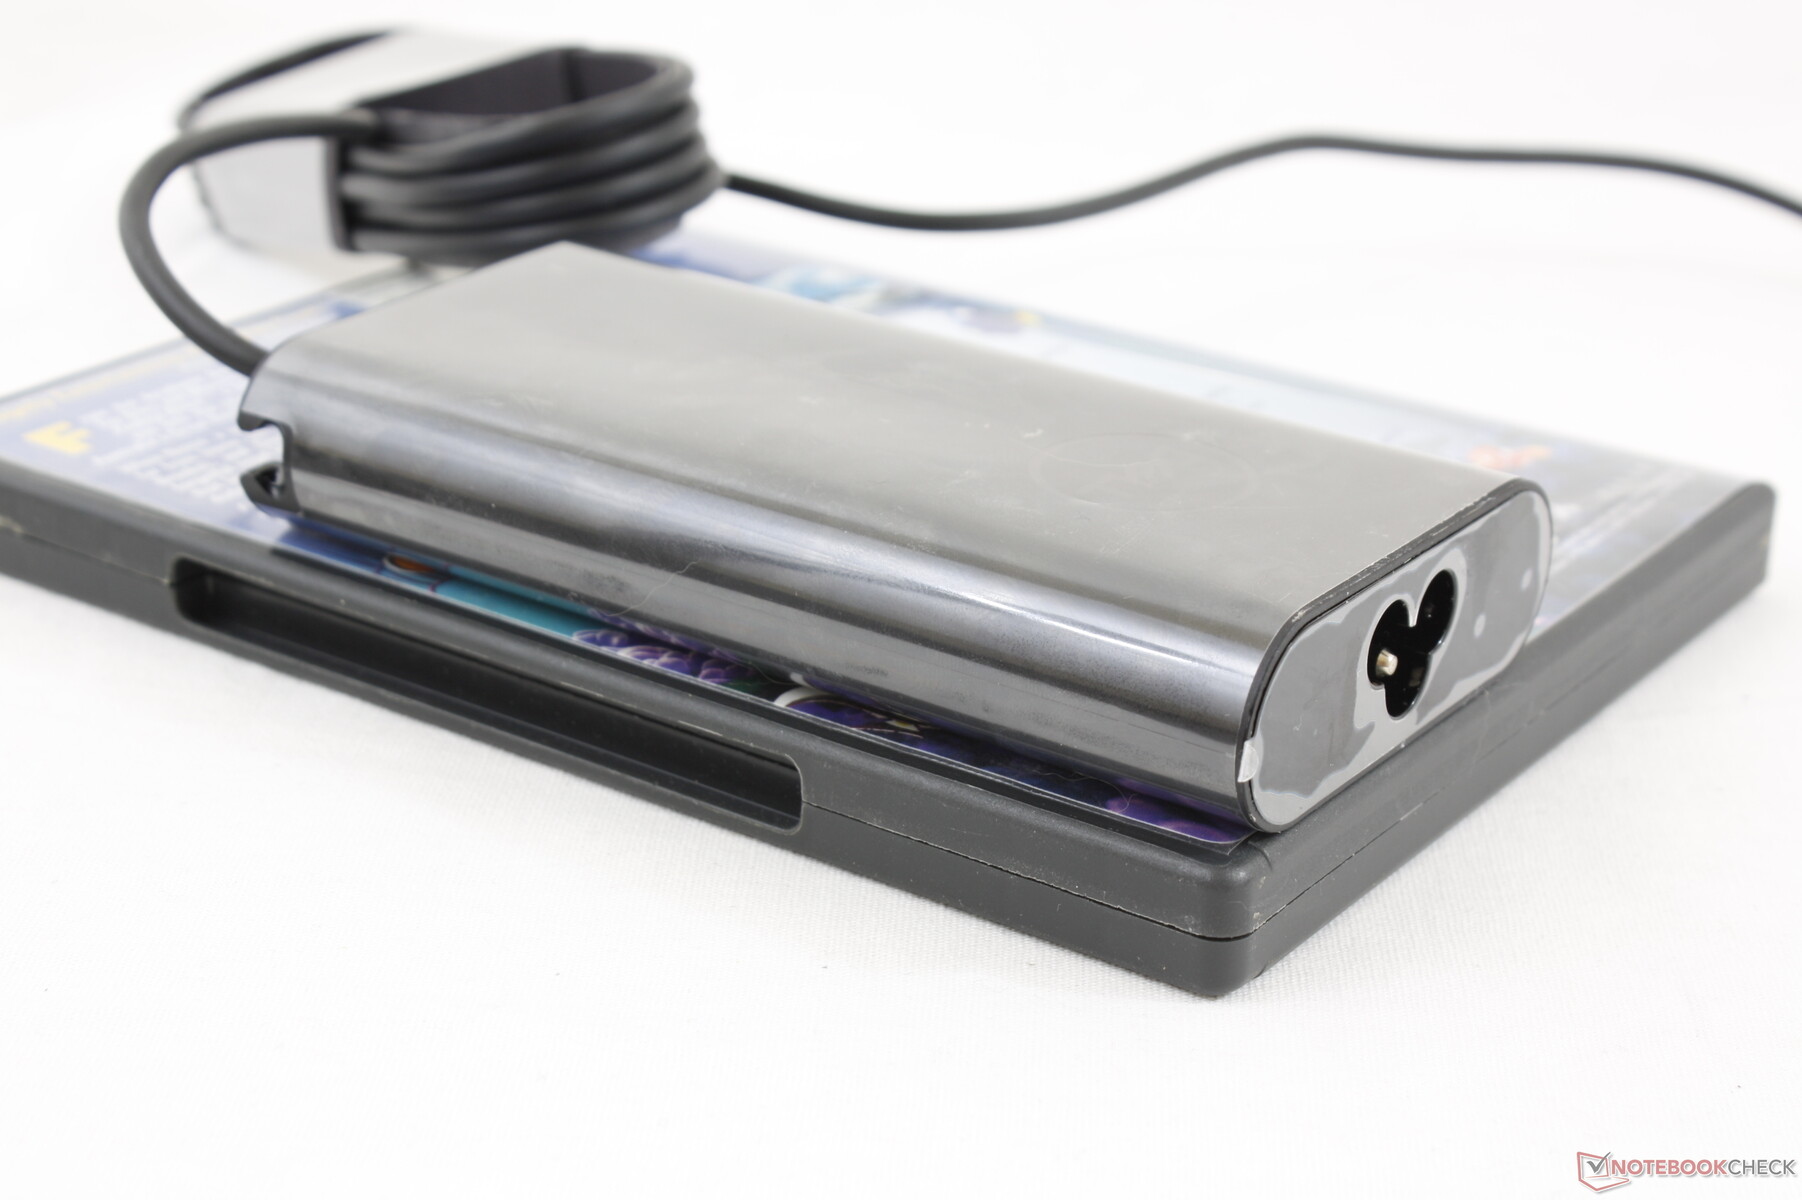
Running both Prime95 and FurMark simultaneously consumes a maximum of 94.8 W from the compact (~13 x 6.5 x 2.3 cm) 90 W AC adapter. The system is only able to maintain a draw of ~77 W after extended periods of extreme stress due to throttling limits.
| Off / Standby | |
| Idle | |
| Load |
|
Key:
min: | |
| Dell XPS 15 9500 Core i5 i5-10300H, UHD Graphics 630, Toshiba KBG40ZNS256G NVMe, IPS, 1920x1200, 15.6" | Dell XPS 15 7590 i5 iGPU FHD i5-9300H, UHD Graphics 630, Toshiba XG6 KXG60ZNV512G, IPS, 1920x1080, 15.6" | Asus ZenBook 15 UX534FTC-A8190T i7-10510U, GeForce GTX 1650 Max-Q, Samsung SSD PM981 MZVLB1T0HALR, IPS, 1920x1080, 15.6" | Lenovo Yoga C940-15IRH i7-9750H, GeForce GTX 1650 Max-Q, Intel Optane Memory H10 with Solid State Storage 32GB + 512GB HBRPEKNX0202A(L/H), IPS, 1920x1080, 15.6" | HP Spectre X360 15-5ZV31AV i7-10510U, GeForce MX250, Intel SSD 660p 2TB SSDPEKNW020T8, IPS, 3840x2160, 15.6" | Apple MacBook Pro 16 2019 i9 5500M i9-9880H, Radeon Pro 5500M, Apple SSD AP1024 7171, IPS, 3072x1920, 16" | |
|---|---|---|---|---|---|---|
| Power Consumption | -20% | -15% | -95% | -31% | -65% | |
| Idle Minimum * (Watt) | 2.9 | 3.79 -31% | 2.8 3% | 5.2 -79% | 5.2 -79% | 3.7 -28% |
| Idle Average * (Watt) | 7.6 | 6.9 9% | 7.7 -1% | 10.7 -41% | 8.5 -12% | 12.1 -59% |
| Idle Maximum * (Watt) | 8 | 9.2 -15% | 9.4 -18% | 24.3 -204% | 8.7 -9% | 17 -113% |
| Load Average * (Watt) | 41.7 | 62 -49% | 57 -37% | 84.4 -102% | 65.6 -57% | 91.5 -119% |
| Load Maximum * (Watt) | 94.8 | 108 -14% | 116 -22% | 142.8 -51% | 92.4 3% | 102.3 -8% |
| Witcher 3 ultra * (Watt) | 62 | 83.9 | 56.5 | 103 |
* ... smaller is better
Battery Life
Two battery options are available depending on the SKU: 56 Wh and 86 Wh. Even though we have the lesser 56 Wh option, runtimes are still very long at almost 9.5 hours of real-world WLAN use and the 86 Wh option will indubitably last for even longer. Note that older XPS 15 systems have larger 97 Wh battery options meaning battery capacity has dropped gen-to-gen.
Charging from empty to full capacity is relatively fast at 1 to 1.5 hours. Of course, the 86 Wh option will likely take a little longer to charge.
| Dell XPS 15 9500 Core i5 i5-10300H, UHD Graphics 630, 56 Wh | Dell XPS 15 7590 i5 iGPU FHD i5-9300H, UHD Graphics 630, 97 Wh | Asus ZenBook 15 UX534FTC-A8190T i7-10510U, GeForce GTX 1650 Max-Q, 71 Wh | Lenovo Yoga C940-15IRH i7-9750H, GeForce GTX 1650 Max-Q, 69 Wh | HP Spectre X360 15-5ZV31AV i7-10510U, GeForce MX250, 84 Wh | Apple MacBook Pro 16 2019 i9 5500M i9-9880H, Radeon Pro 5500M, 99.8 Wh | |
|---|---|---|---|---|---|---|
| Battery runtime | 29% | 29% | -21% | 28% | -4% | |
| Reader / Idle (h) | 26.4 | 27.2 3% | 18.2 -31% | 22.6 -14% | ||
| WiFi v1.3 (h) | 9.3 | 14.1 52% | 12.4 33% | 9.7 4% | 10.8 16% | 12 29% |
| Load (h) | 1.6 | 1.7 6% | 2.4 50% | 1 -37% | 2.9 81% | 1 -37% |
| Witcher 3 ultra (h) | 0.9 |
Pros
Cons
Verdict — Bigger Screen in an Even Smaller Footprint
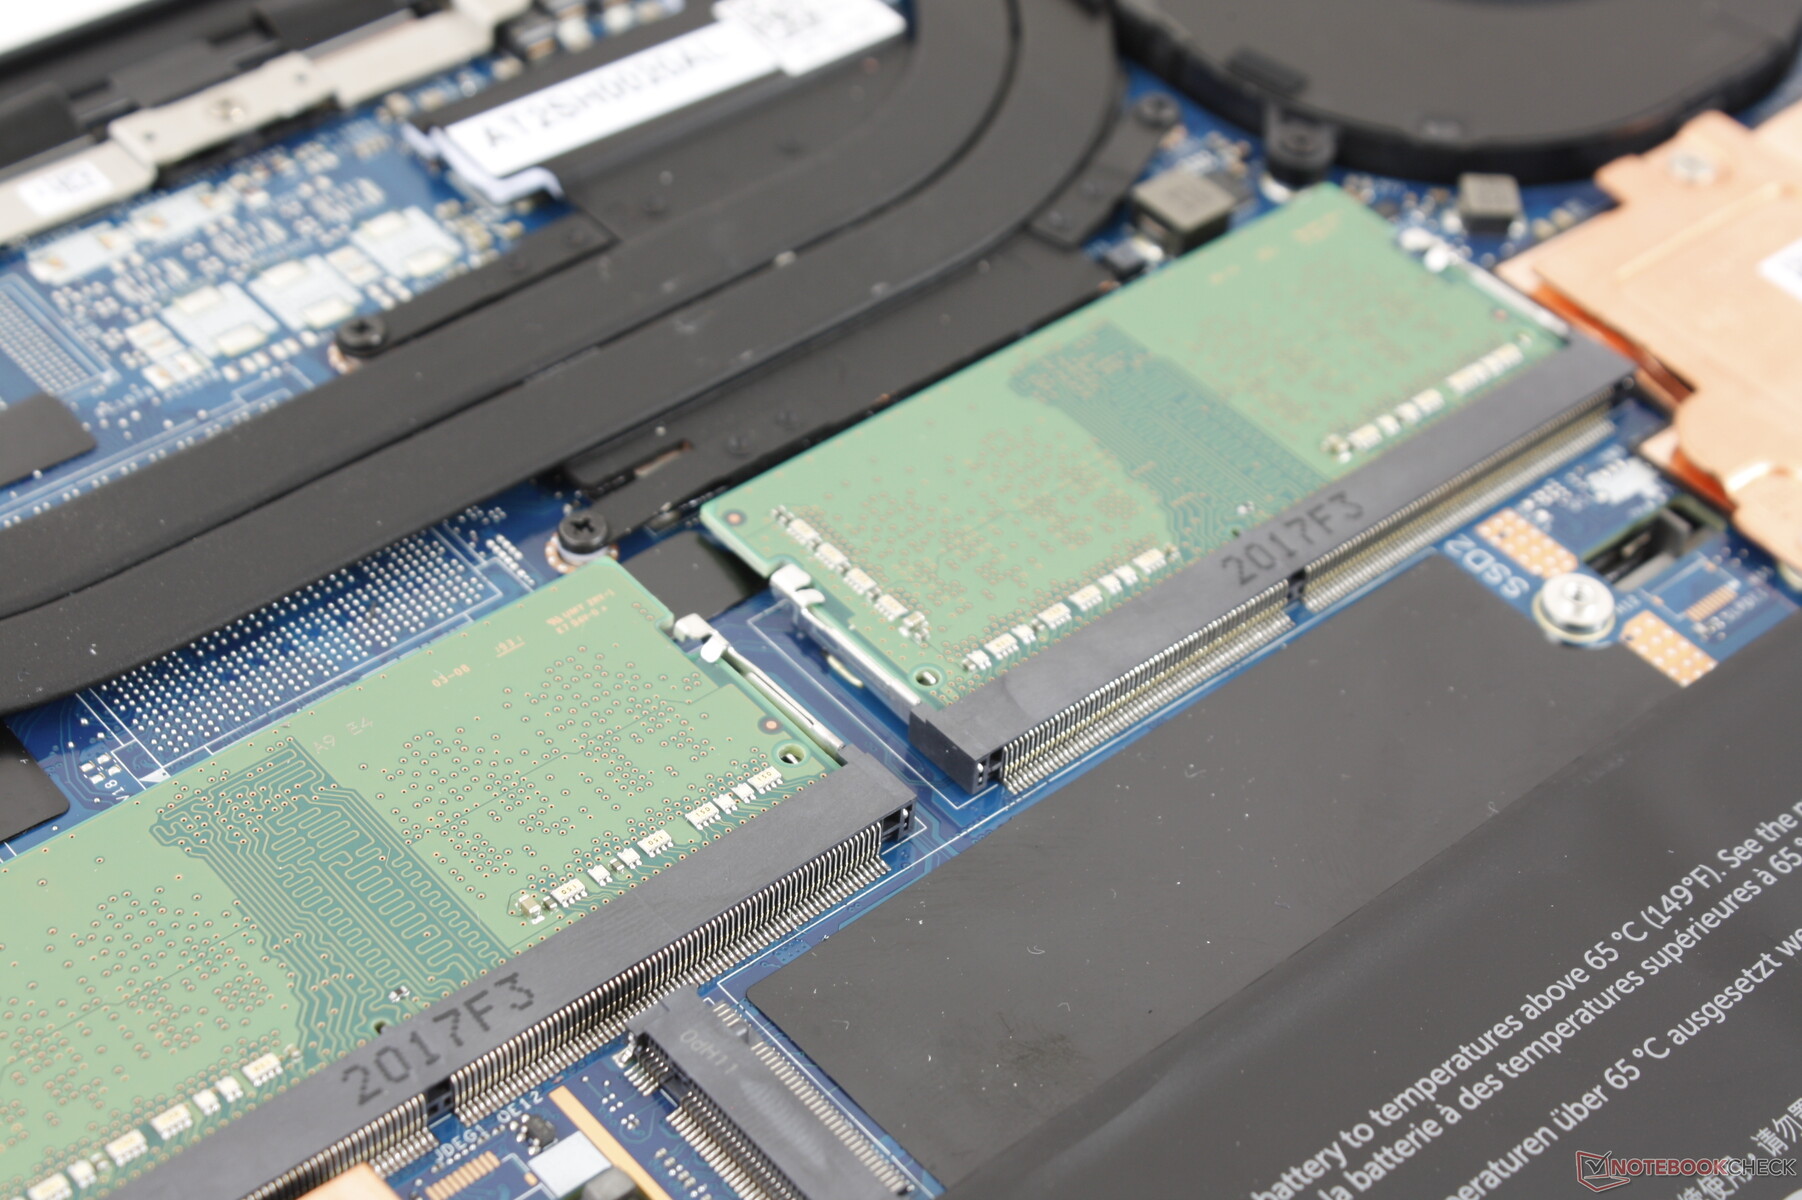
From the point of view of an average consumer, the refreshed XPS 15 checks almost all the right boxes. The bright 16:10 display, improved keyboard feedback, roomy clickpad, expanded audio system, long battery life, quiet fans, upgradeable RAM, and new secondary M.2 slot all help to make the system a joy to use. If you've been holding out on upgrading to an XPS 15, then now would be the time to reconsider because this latest revision improves upon the older design in significant ways. The omission of both HDMI and USB Type-A will inevitably be an annoyance, but at least adapters are included in every box which is more than what we can say for the MacBook Pro.
From an enthusiast's point of view, however, it appears that the cooling solution hasn't improved by all that much. Core temperatures are already reaching over 90 C on our quad-core Core i5 base configuration which means the higher-end octa-core Core i7 GeForce GTX configuration will more than likely run even warmer and louder. If you weren't a fan of the unexceptional cooling solution on the last generation model, then this latest model probably won't change your mind. Furthermore, the WLAN module and keyboard are now more difficult to service than before since their components are more heavily integrated onto the mainboard.
We'll be revisiting the XPS 15 9500 soon with different configurations to get a better picture of the overall model. But for the base price of $1300, Dell's flagship system is making all the right changes in almost all the right places for an admirable first impression.
Dell XPS 15 9500 Core i5
- 06/09/2020 v7 (old)
Allen Ngo
Price comparison
