$1300 Dell XPS 15 9500 vs. $2300 XPS 15 9500: Here is everything the higher-end option will get you
Unlike most smaller OEMs with more limited resources, major OEMs are able to offer far-reaching SKUs ranging from $1000 to $3000 USD all based on the same chassis. The latest Dell XPS 15 9500, for example, currently retails for $1300 to $2400 and more with plenty of options in between.
This page summarizes all the major differences between the least expensive XPS 15 9500 Core i5 option and priciest XPS 15 9500 Core i7 option. We recommend checking out our existing review pages on each of the two configurations to learn more about the 2020 XPS 15 series.
Physical Features
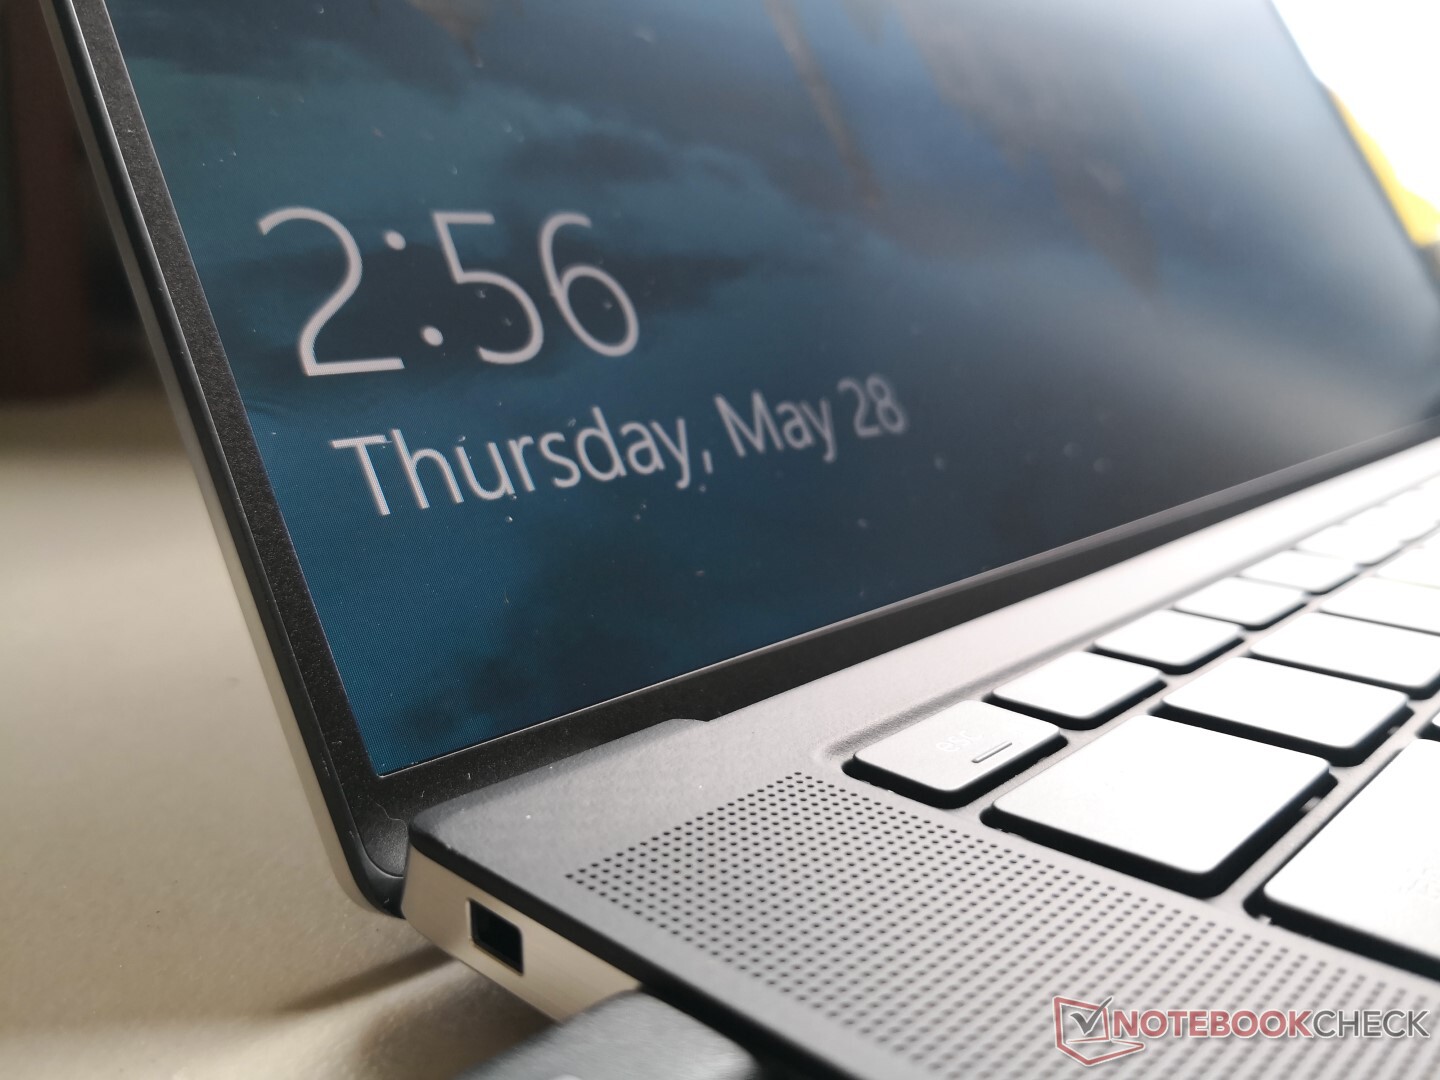
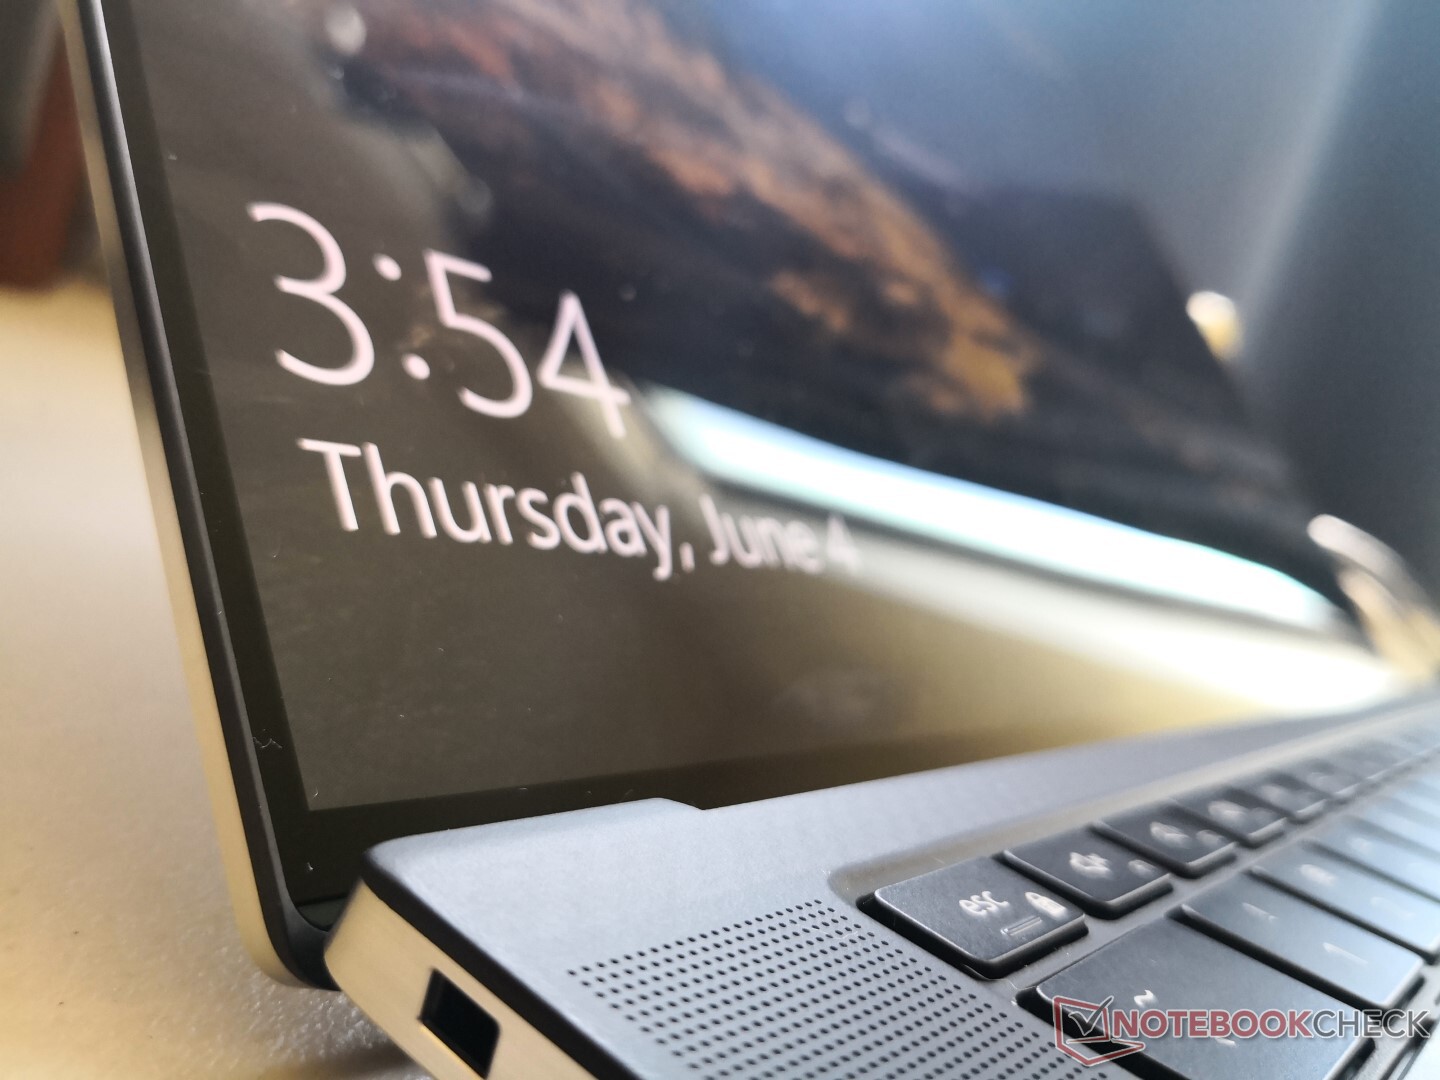
There are no major physical differences between the Core i5 and Core i7 options as they share the same keyboard, clickpad, webcam, chassis materials, speakers, ports, wireless, and others. The edge-to-edge glossy touchscreen on the 4K UHD option is the easiest way to tell it apart from the cheaper Core i5 FHD option.
Display
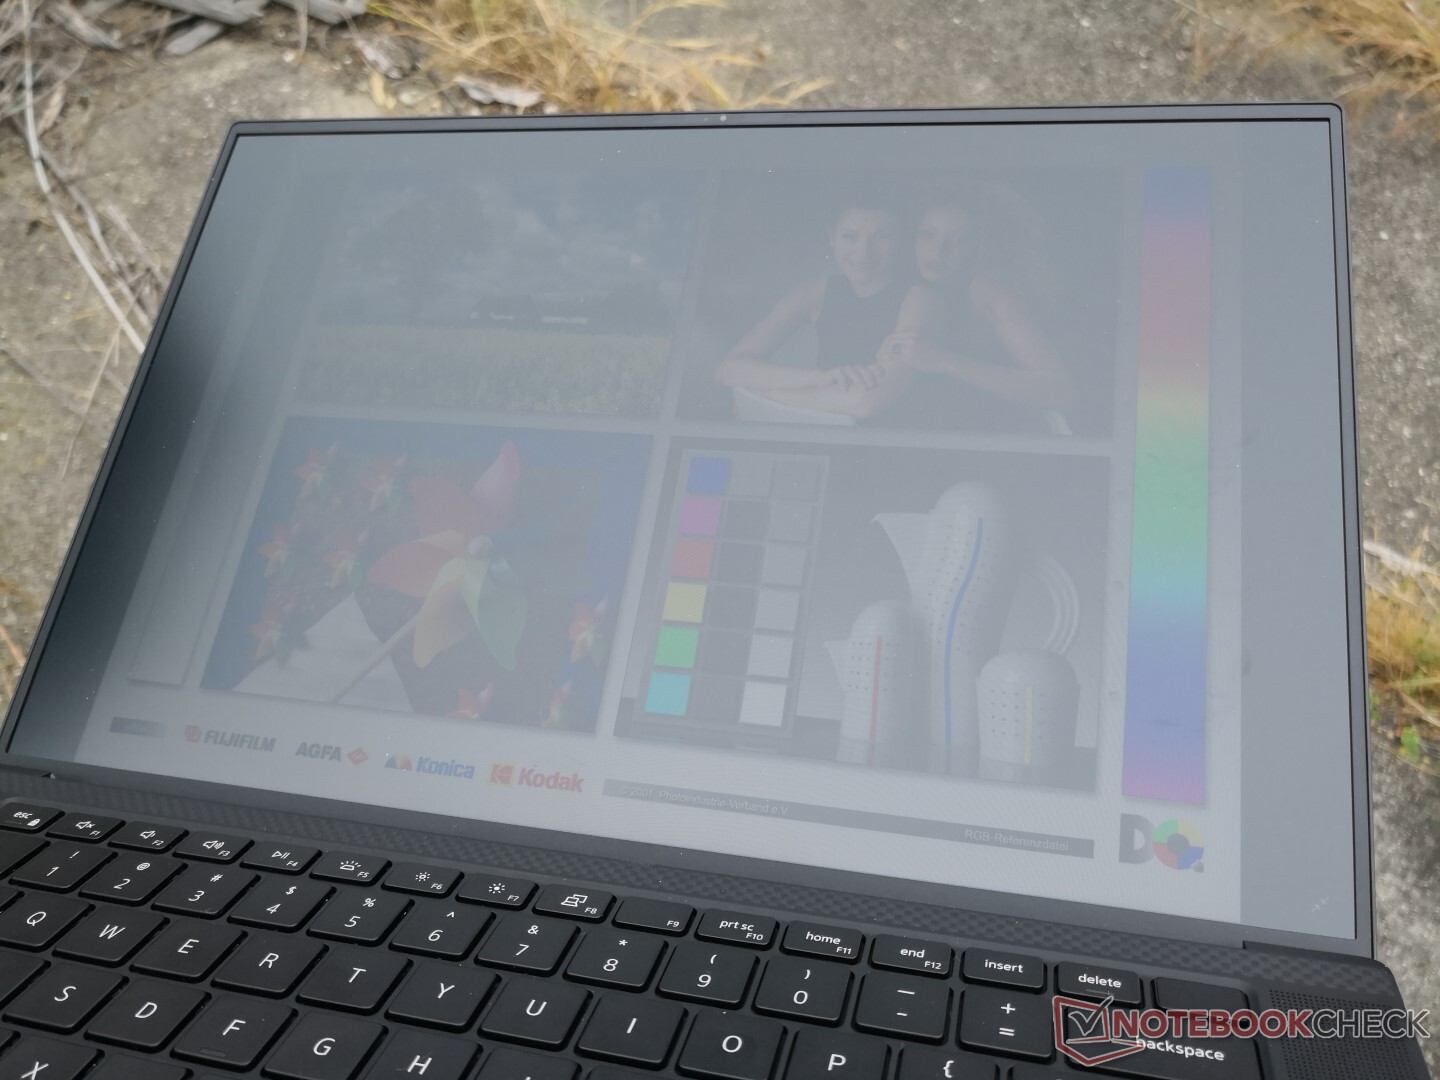
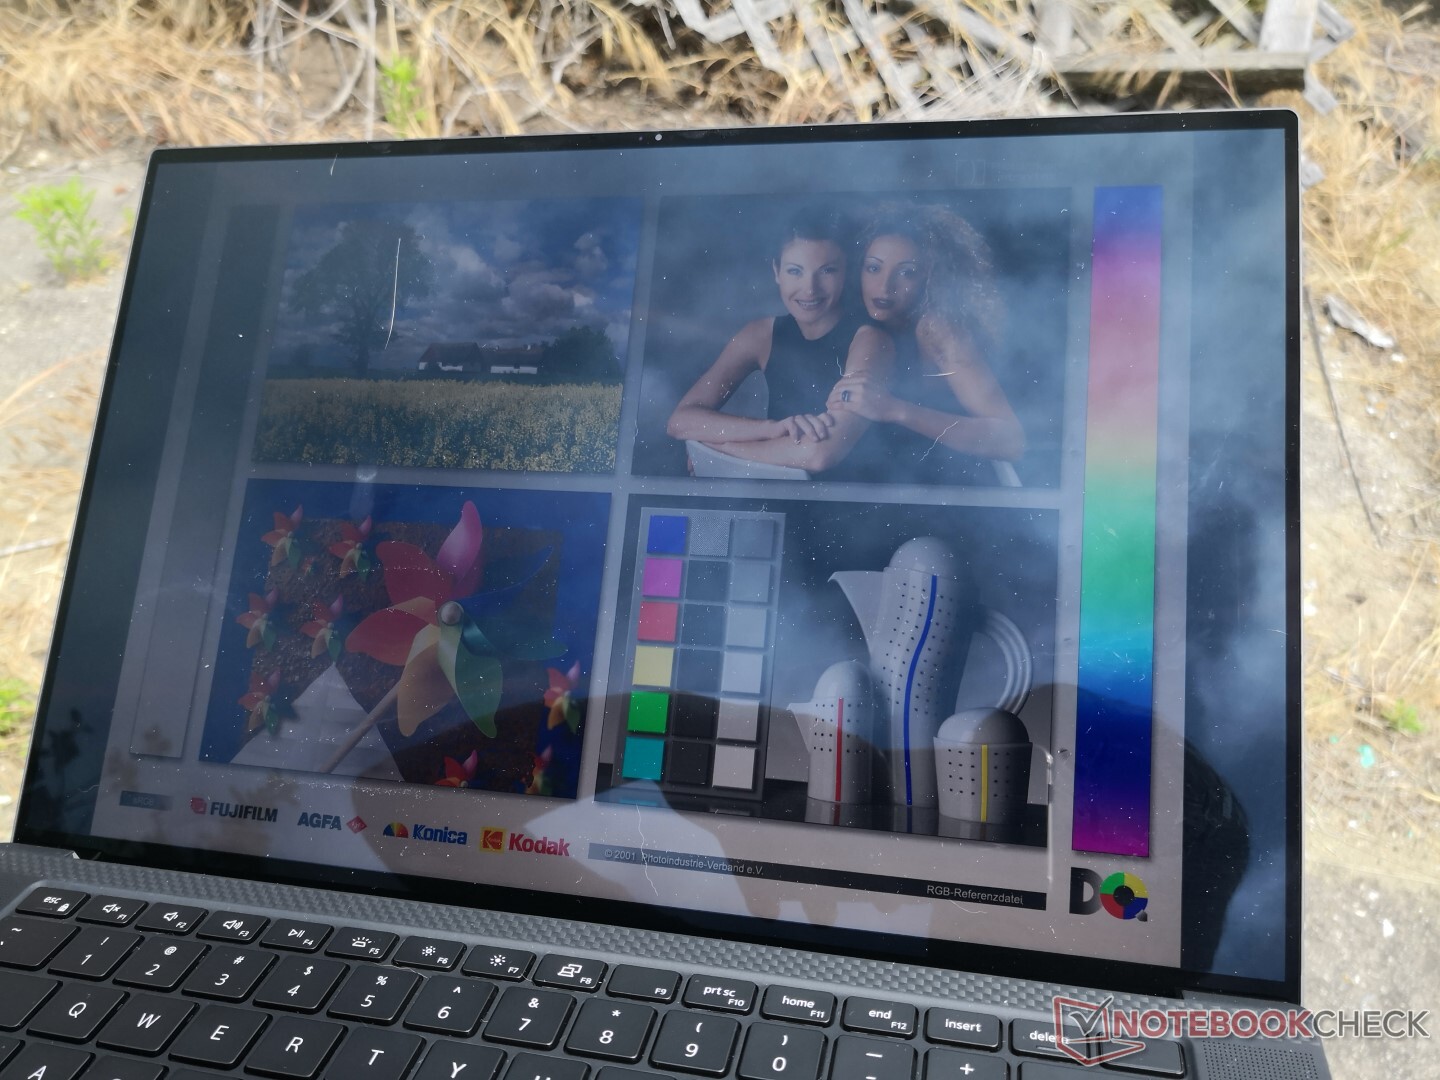
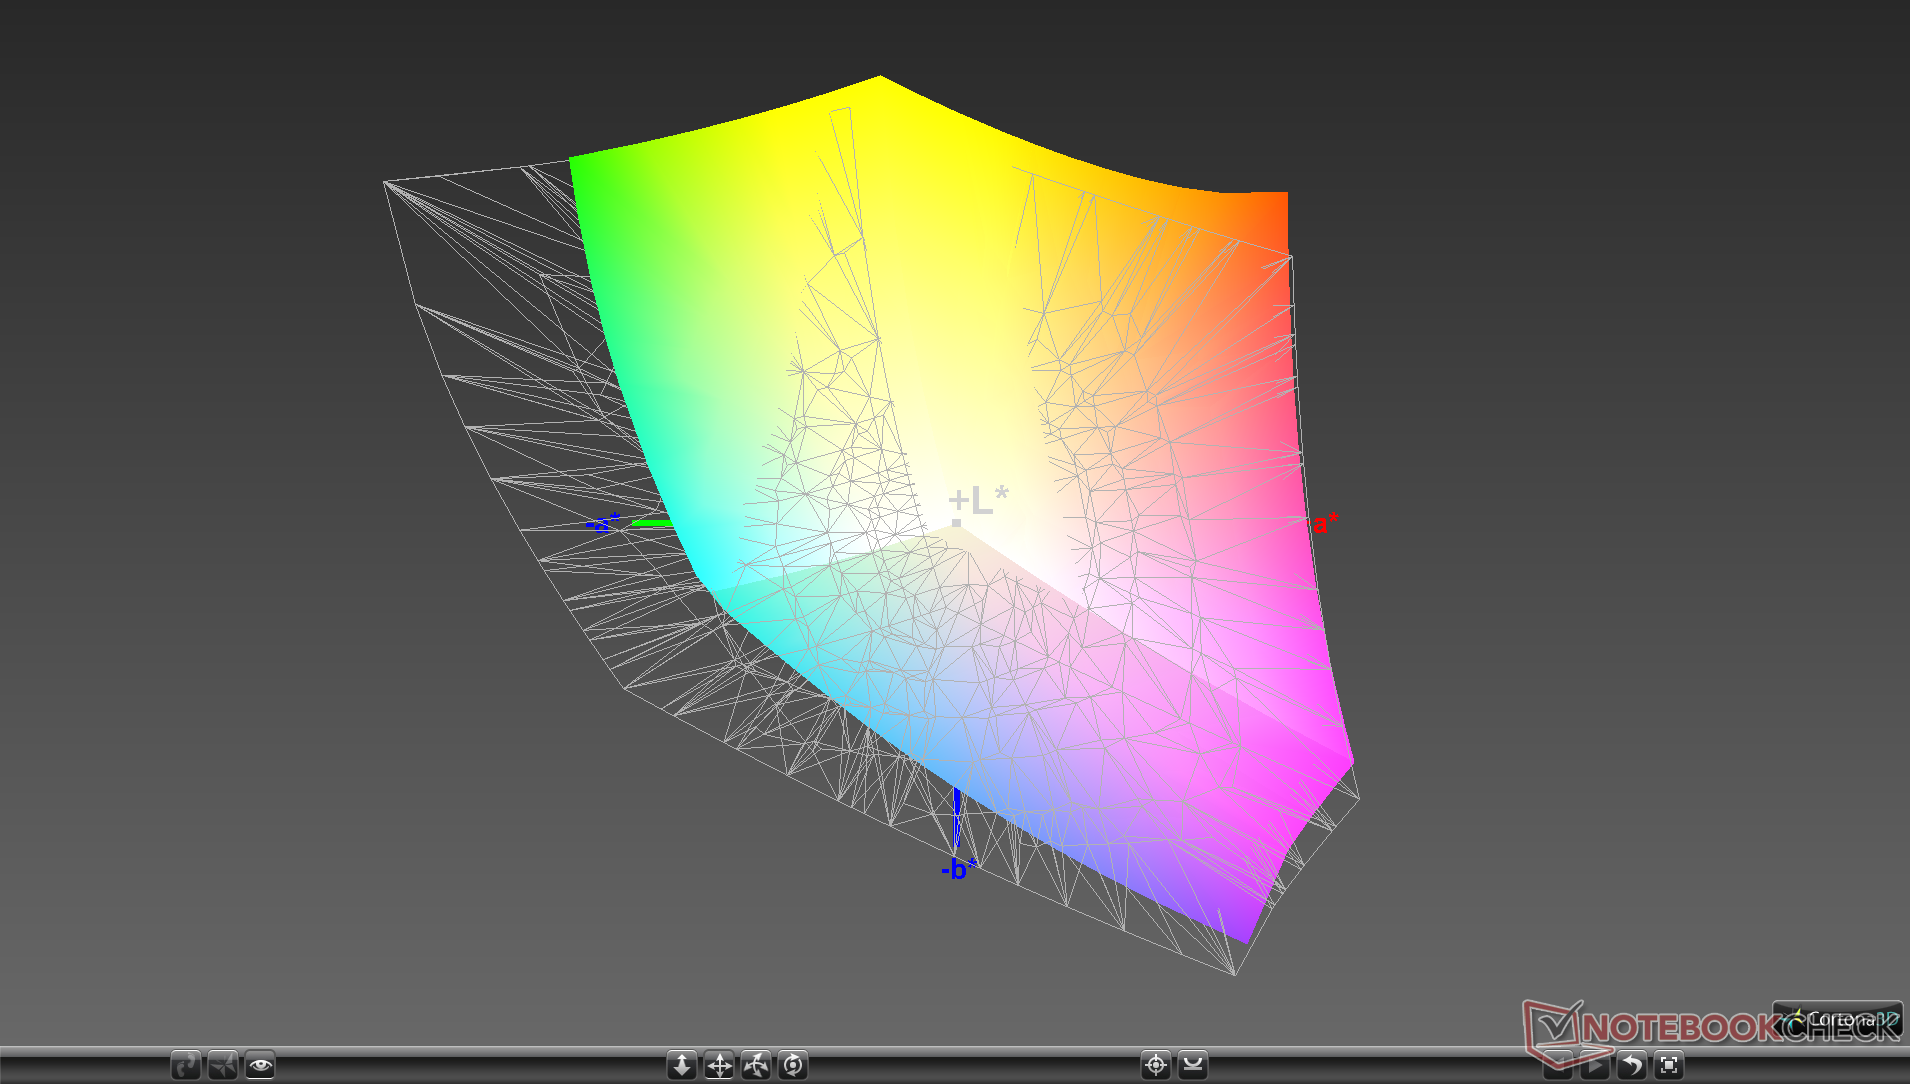
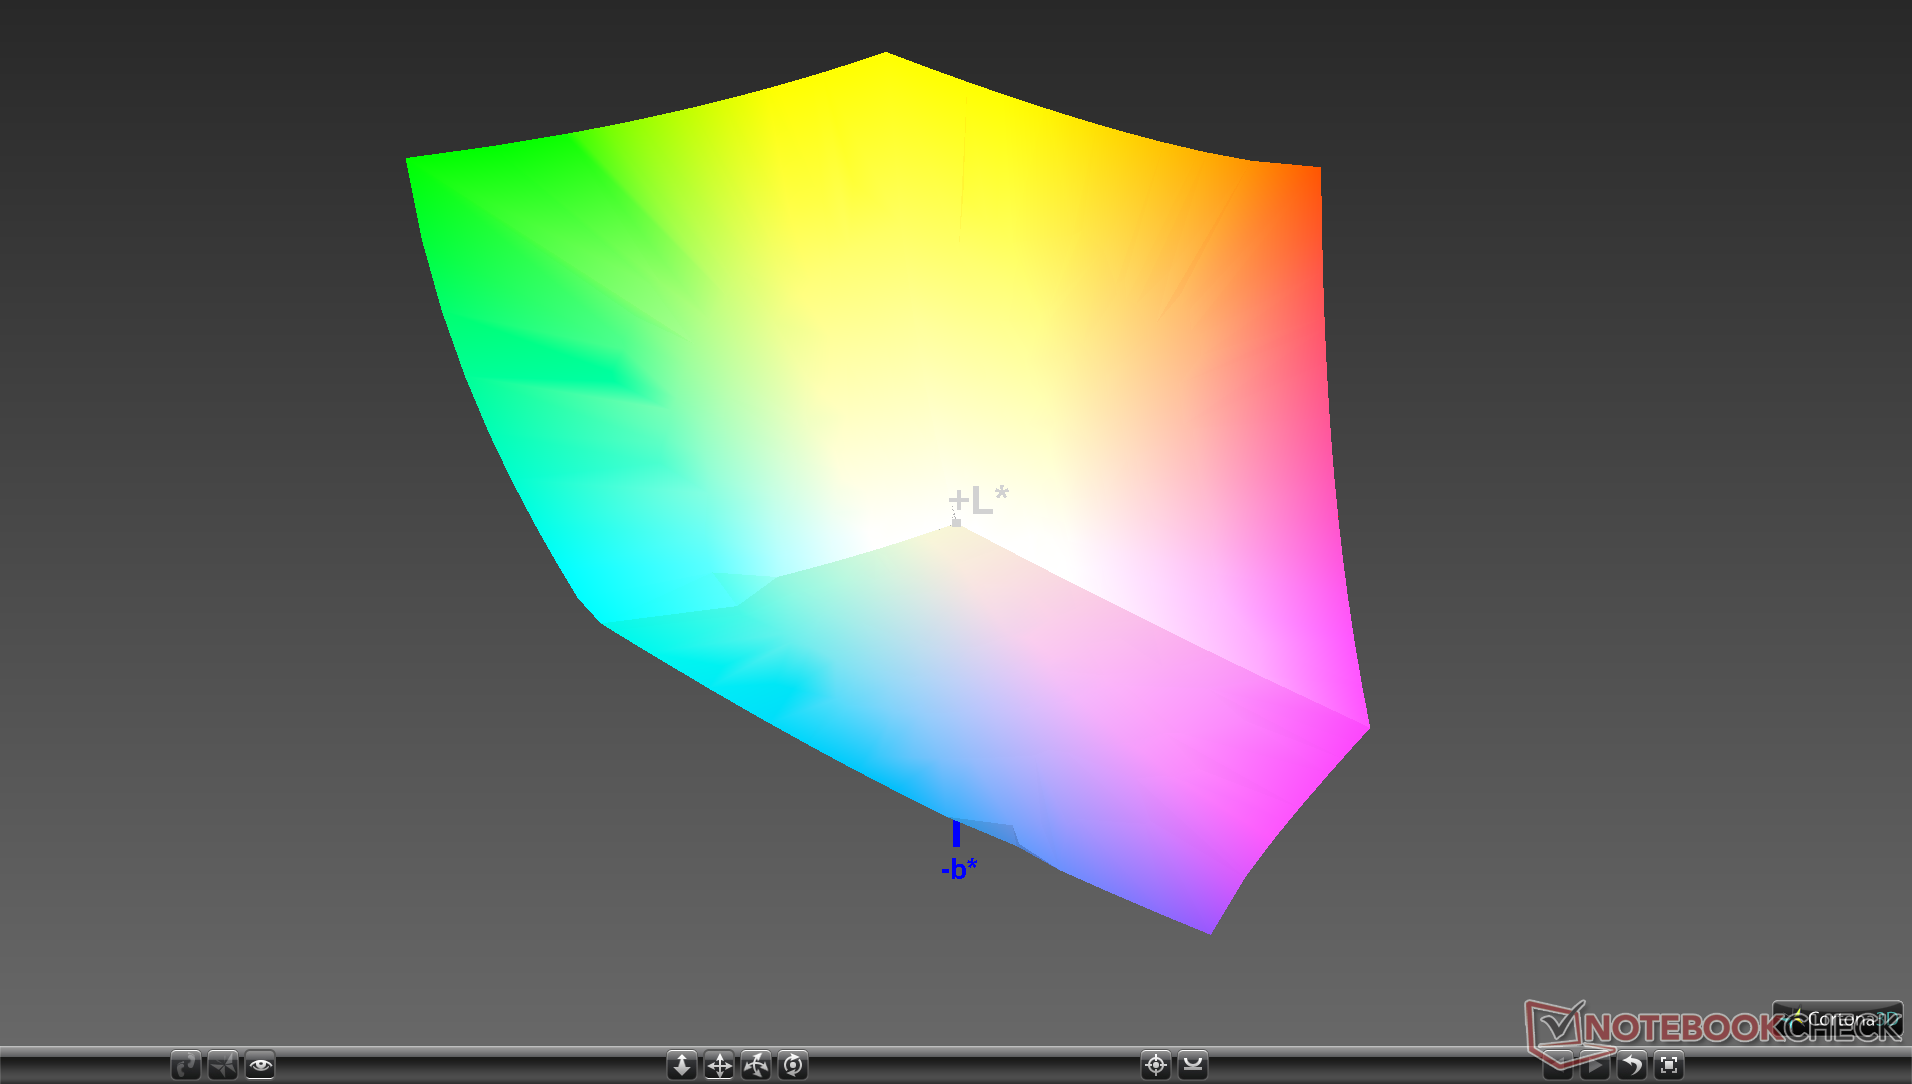
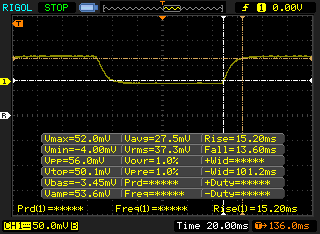
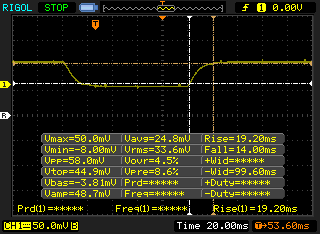
Aside from resolution, the 4K UHD display is ever-so-slightly dimmer with slightly slower response times. Thus, ghosting is more noticeable and it isn't as easy to see when outdoors. To make up for this, the 4K UHD panel covers AdobeRGB almost entirely compared to "only" sRGB on the FHD option.
PWM is not present on either option.
Processor
Jumping from the quad-core Core i5-10300H to the octa-core Core i7-10875H will net roughly 50 percent faster multi-thread performance. Meanwhile, single-thread performance will only be about 10 percent faster.
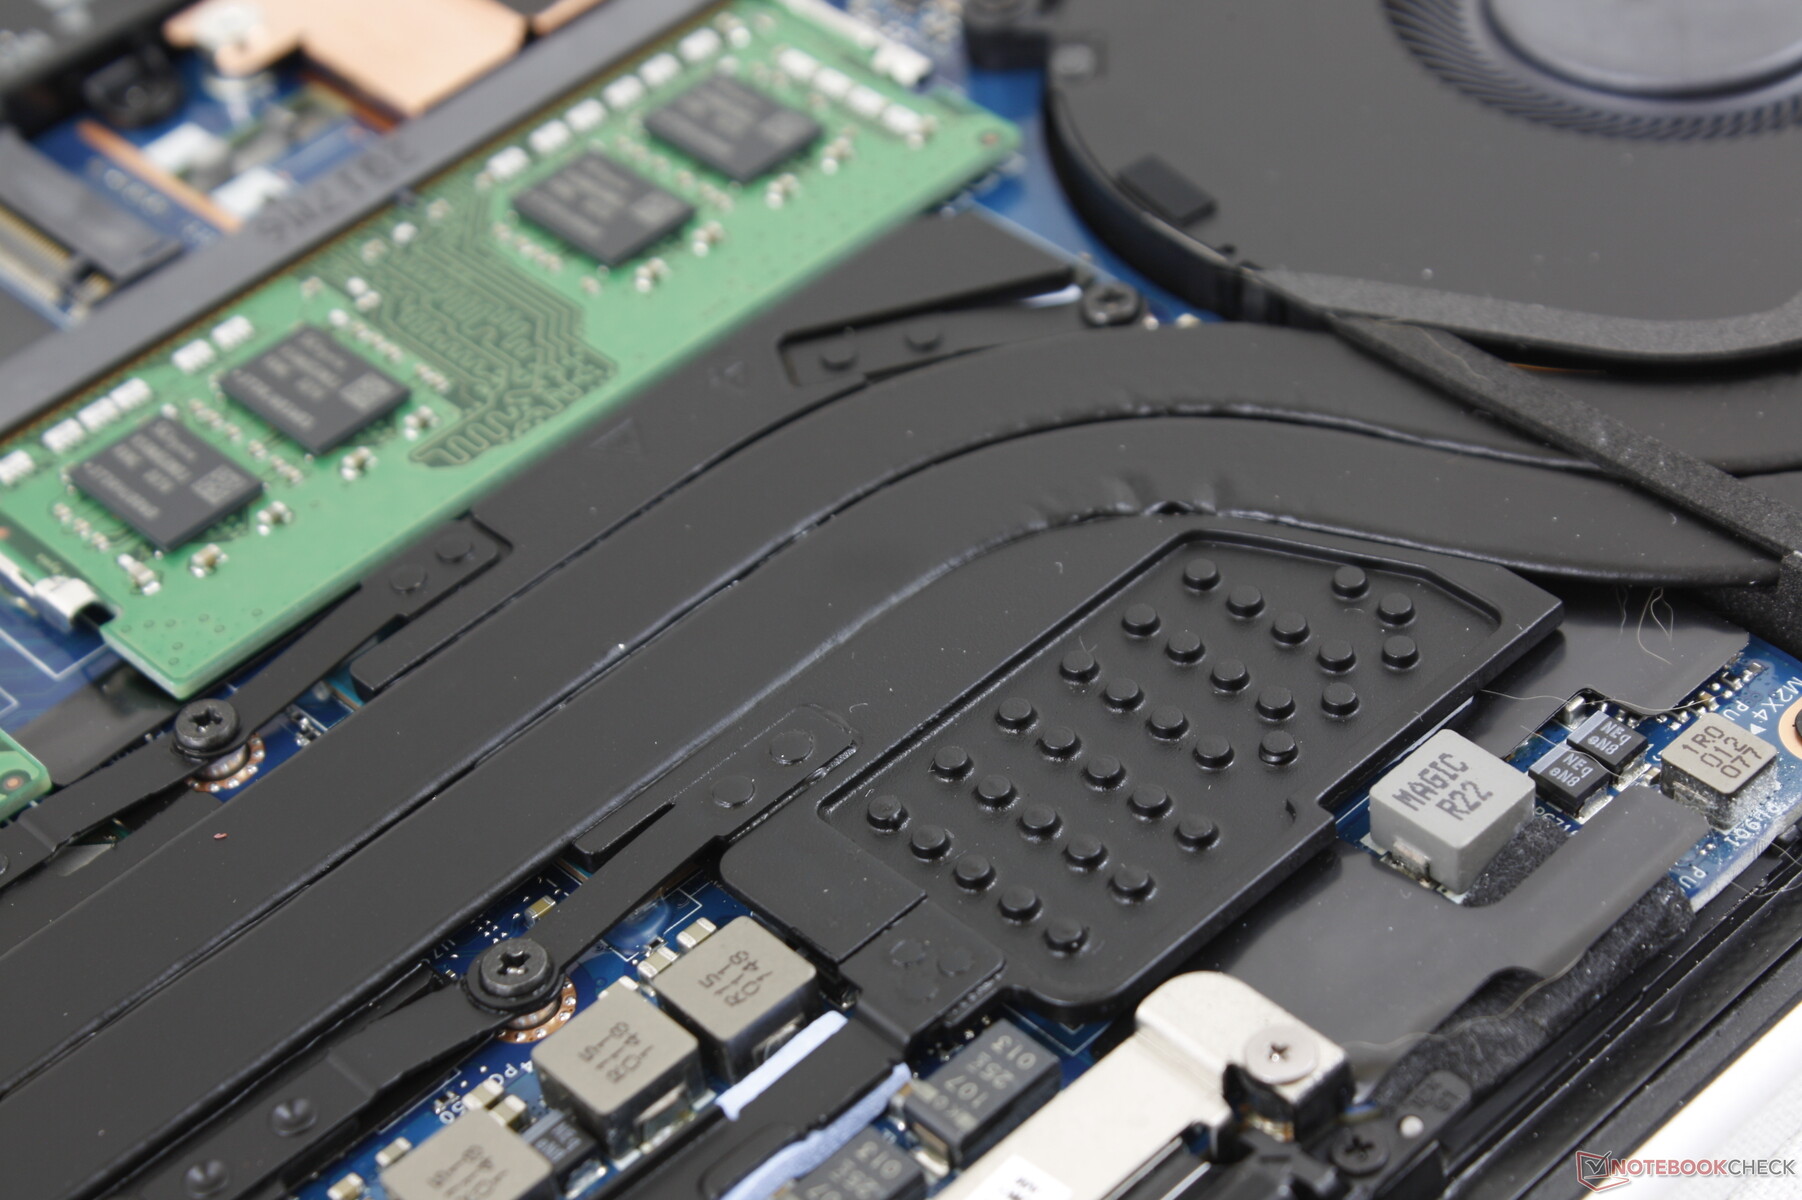
Storage
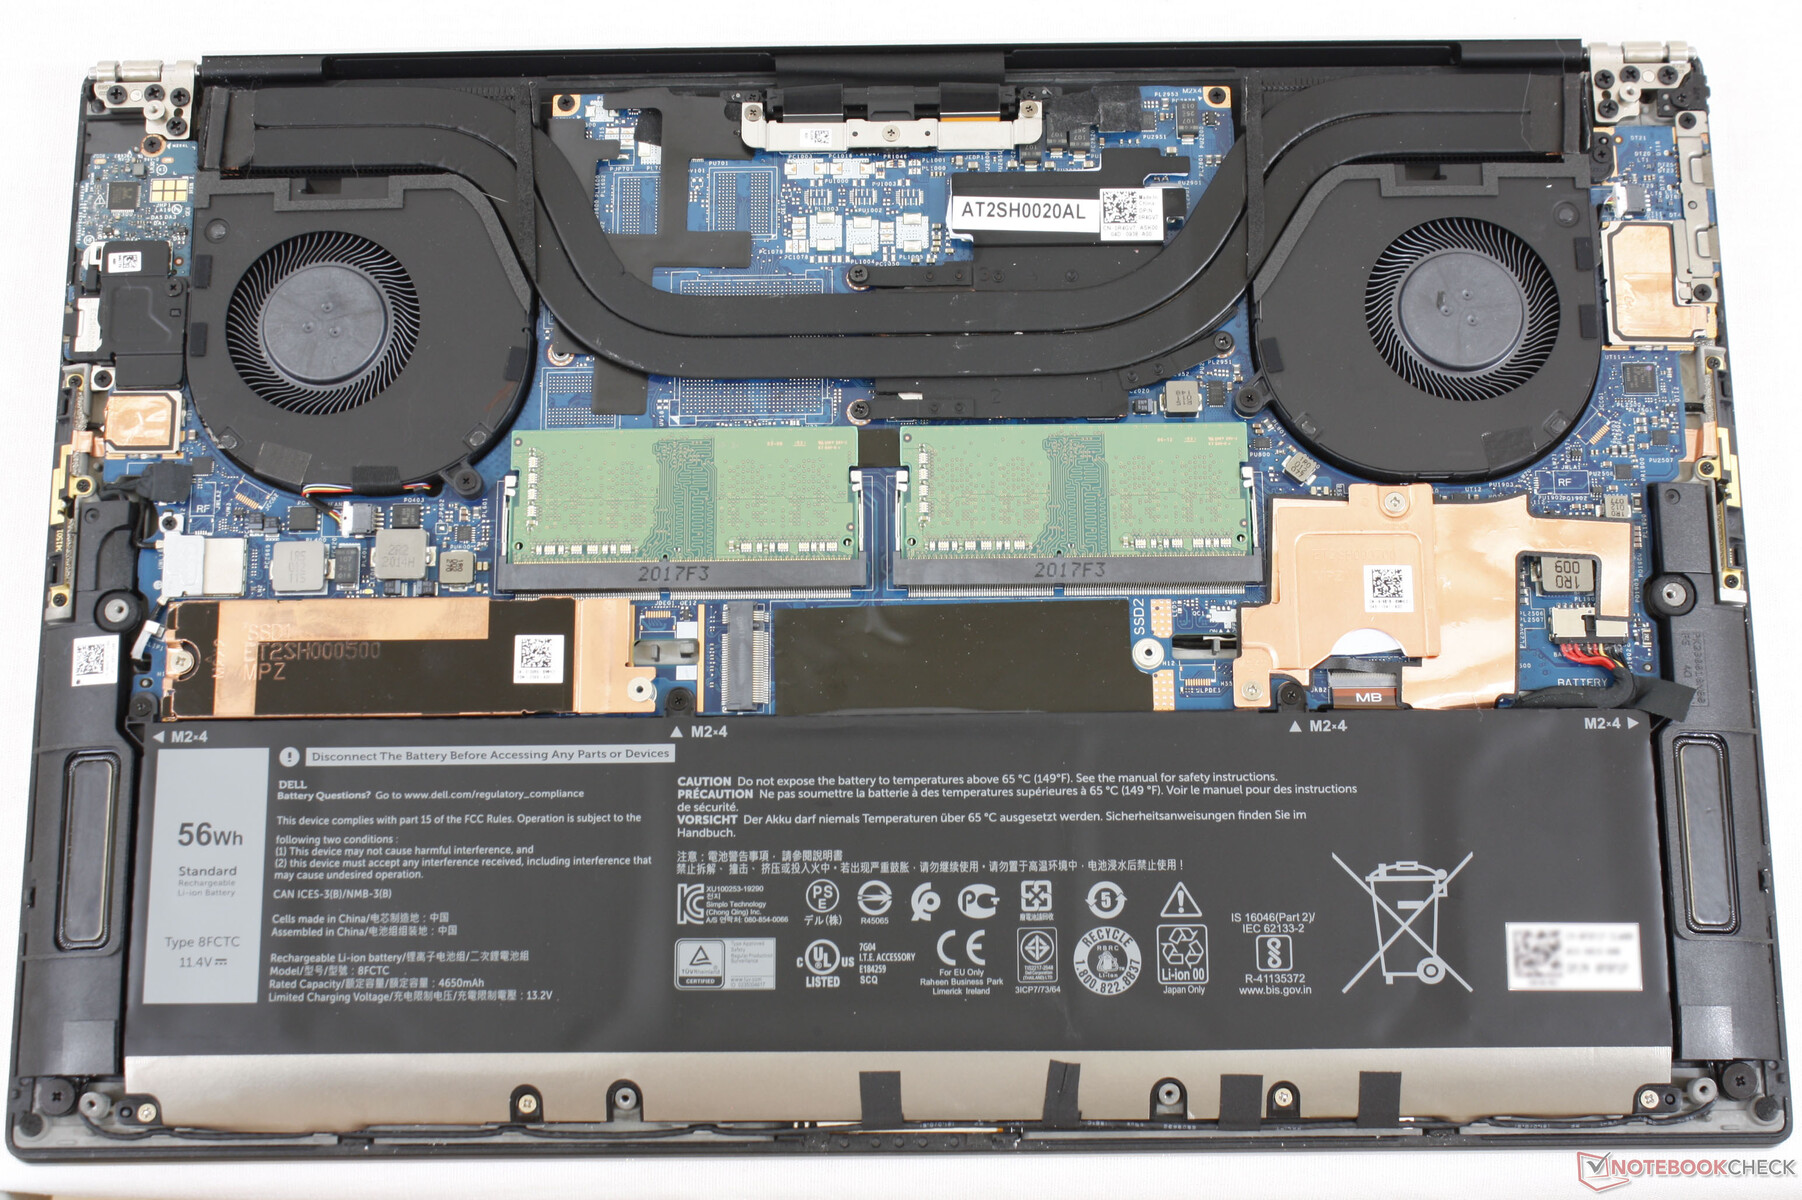
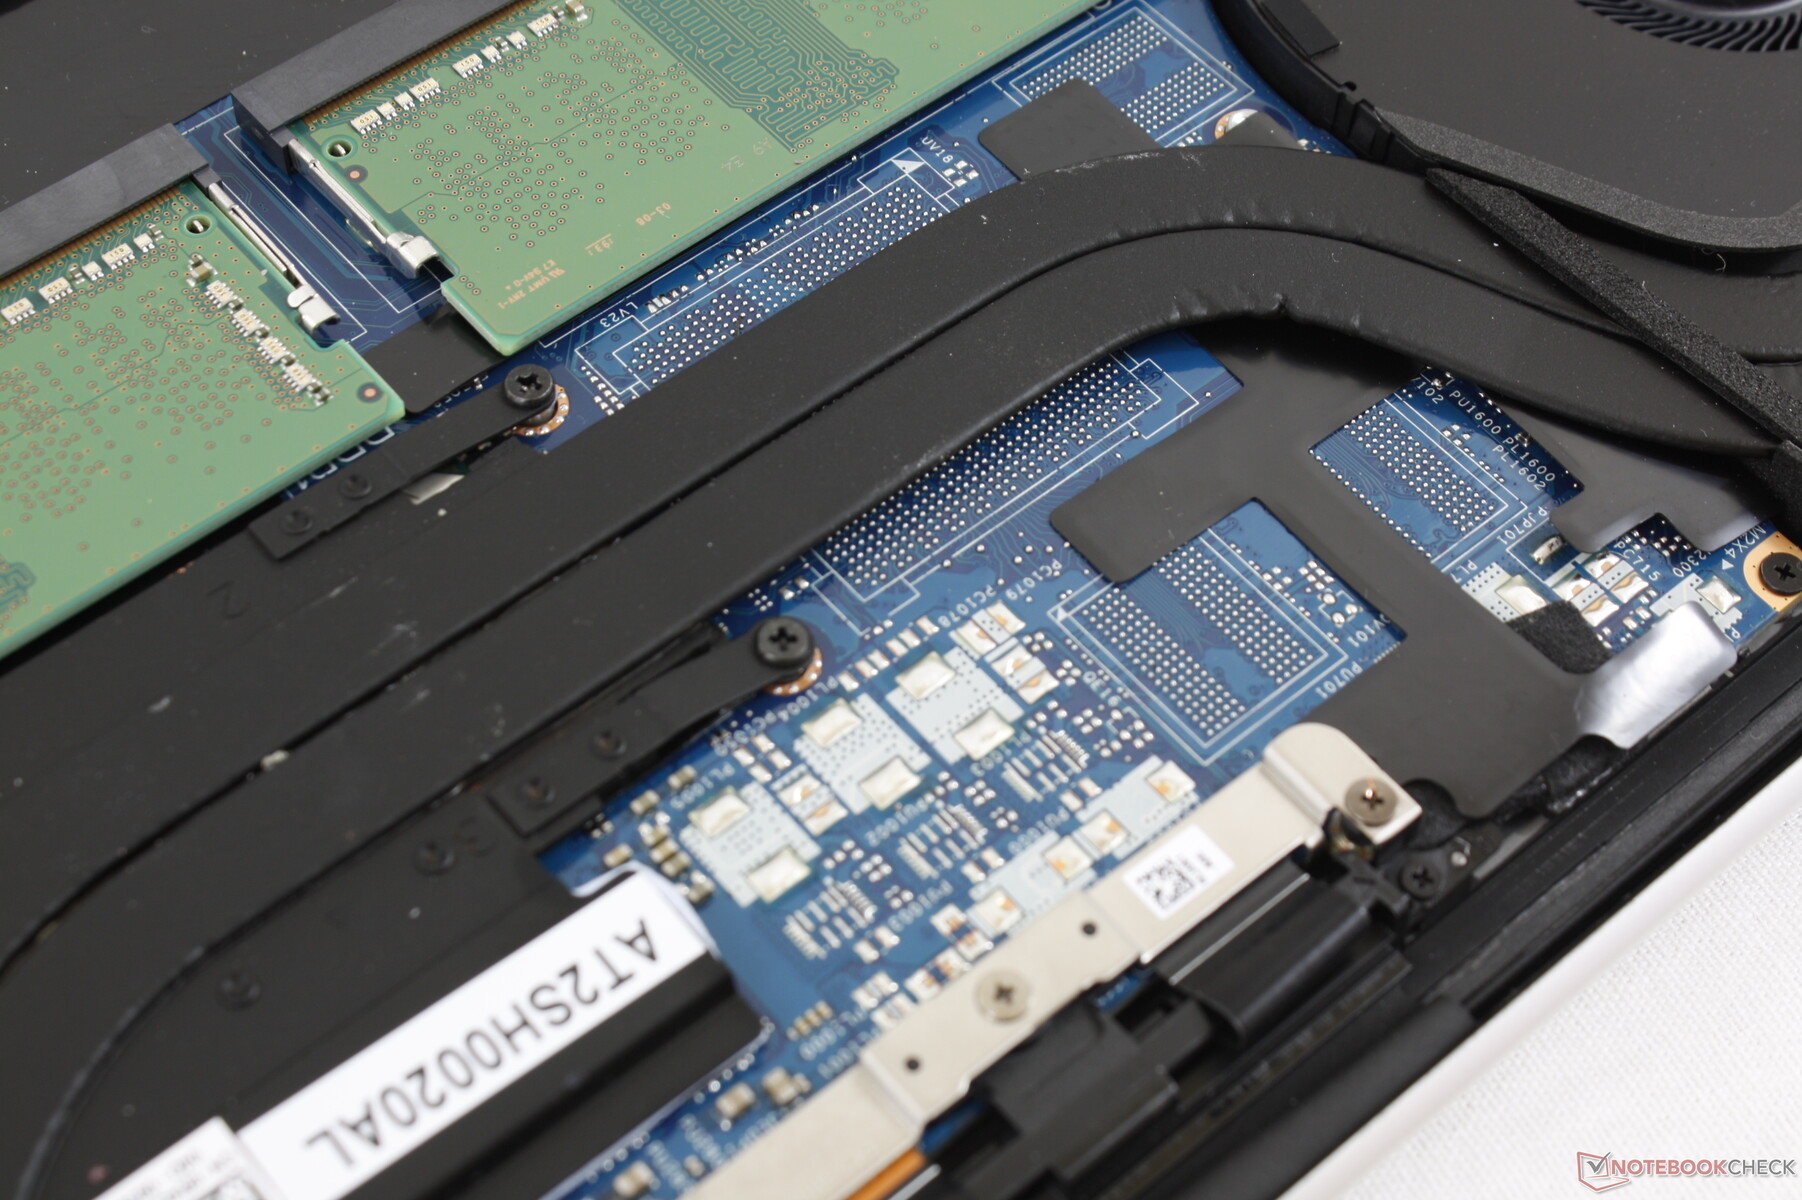
The least expensive SKU comes with only 256 GB of storage compared to 1 TB to 2 TB on the pricier options. Fortunately, it's easy to expand storage yourself via the two accessible M.2 2280 slots.
GPU Performance
This is a key reason for the price gap between the Core i5 and Core i7 SKUs. The latter comes with the uncommon GeForce GTX 1650 Ti to be orders of magnitude faster than the integrated UHD Graphics 630. The GPU is able to run the latest titles at both 1080p and reasonable frame rates.
System Noise
The Core i7 SKU runs louder since it uses the same cooling solution as the less powerful Core i5 SKU. It maxes out at around 47 dB(A) compared to 41 dB(A) on the iGPU-only option.
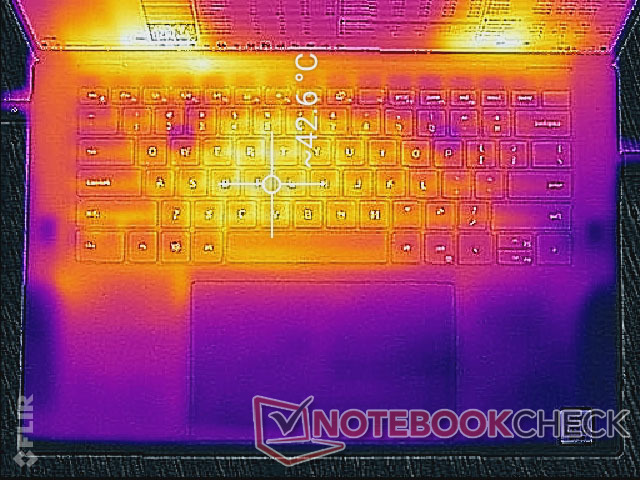
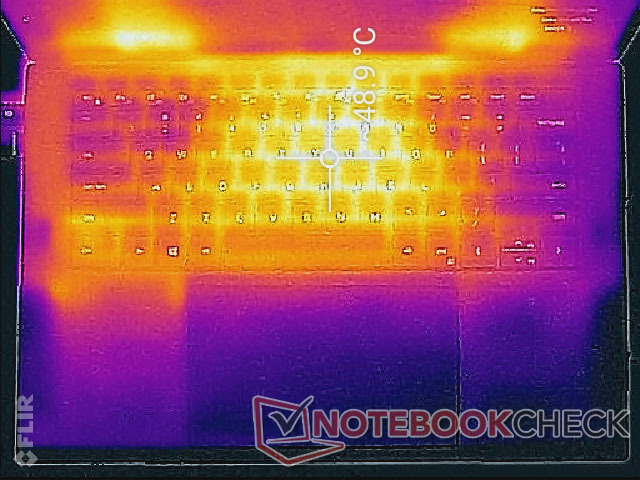
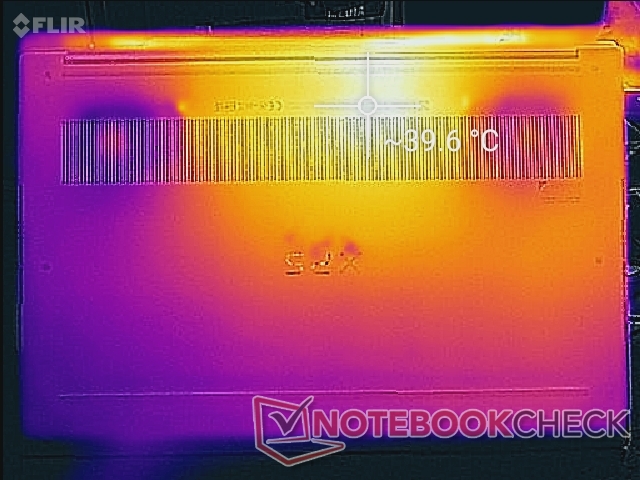
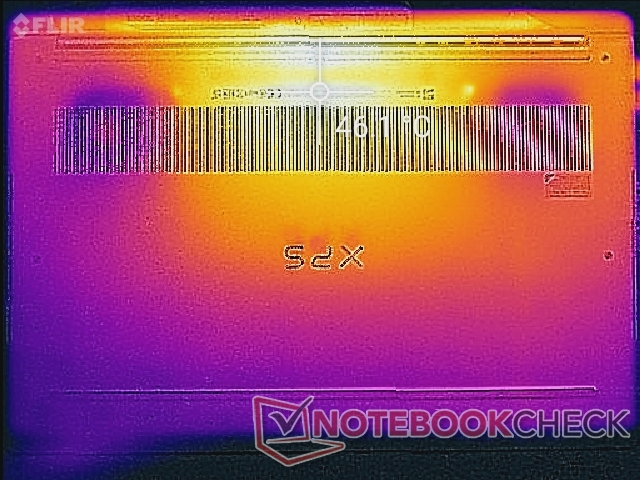
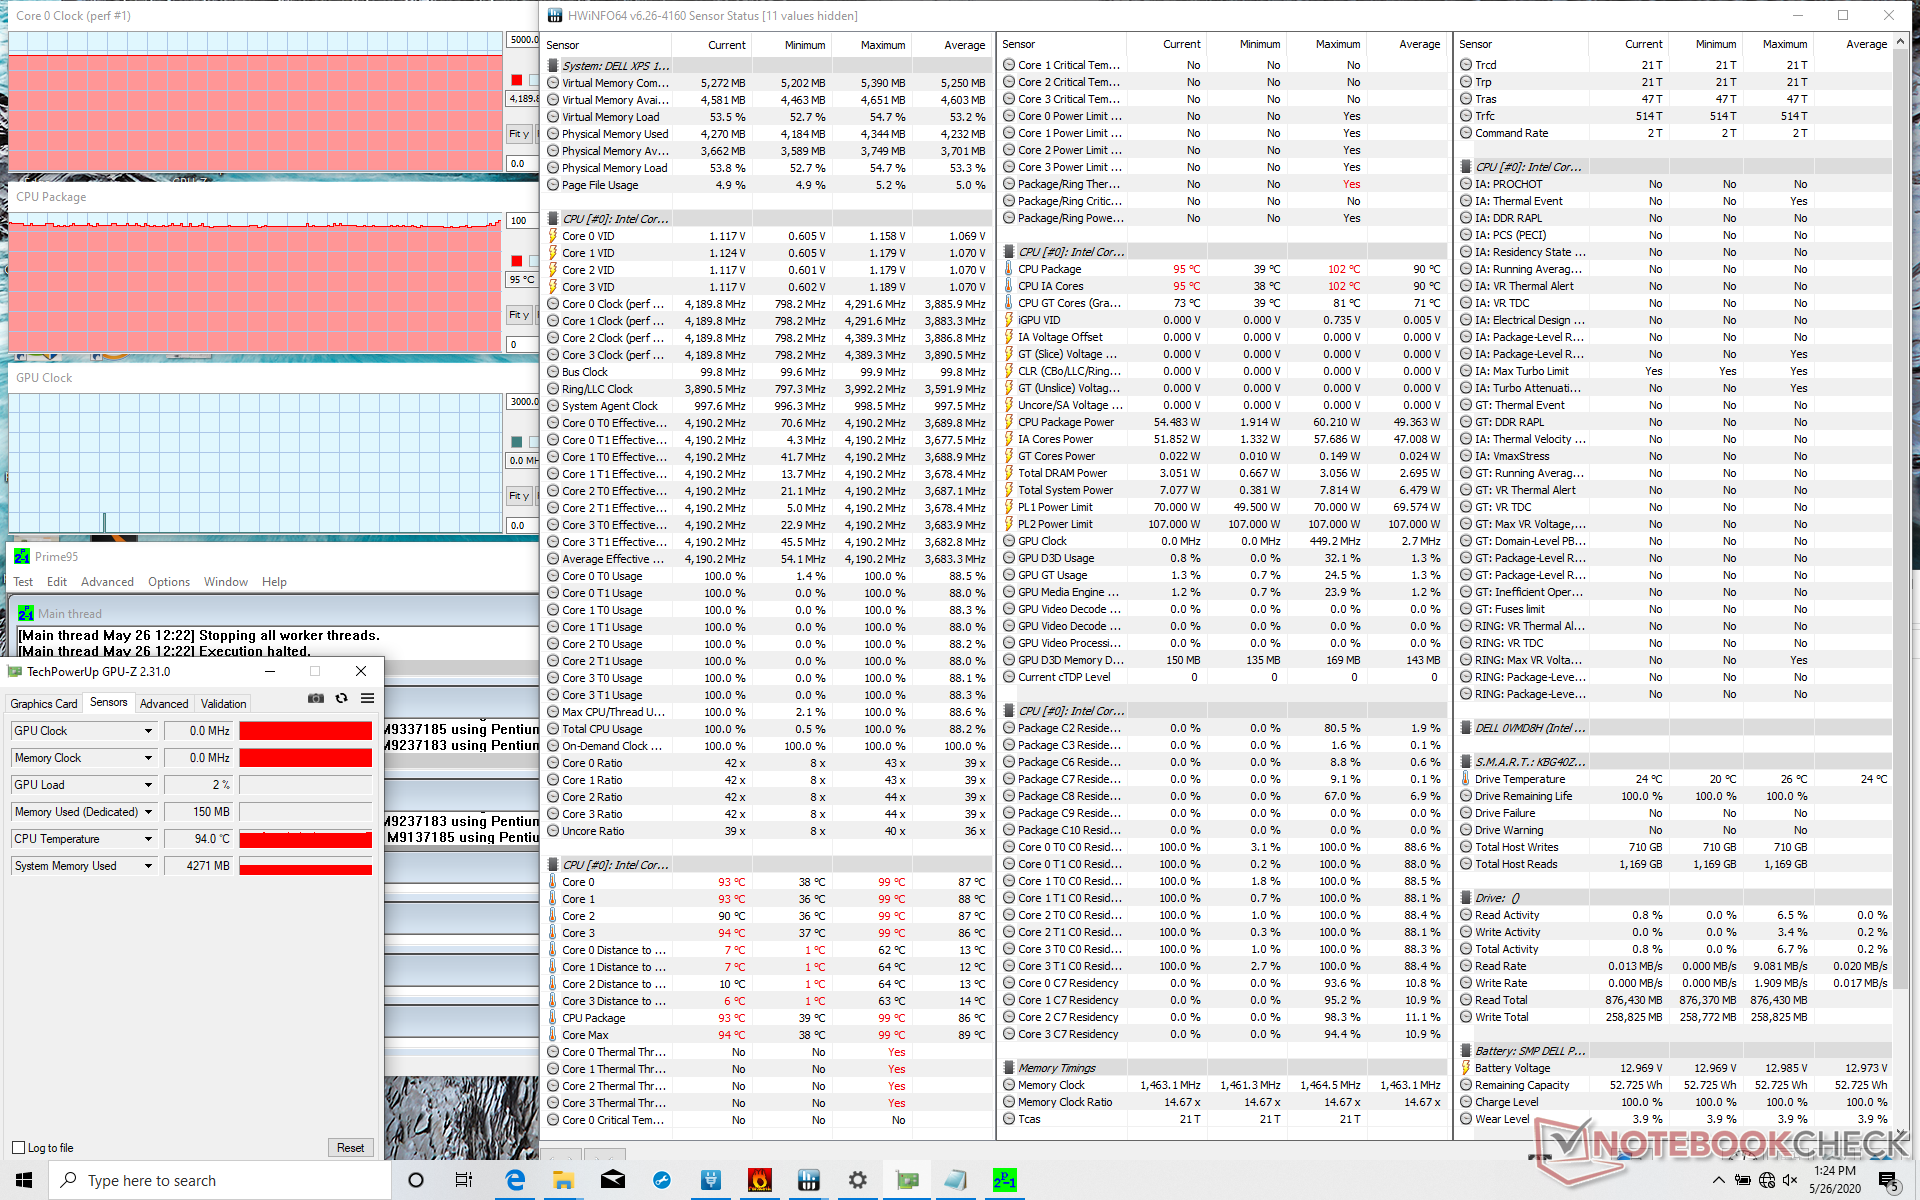
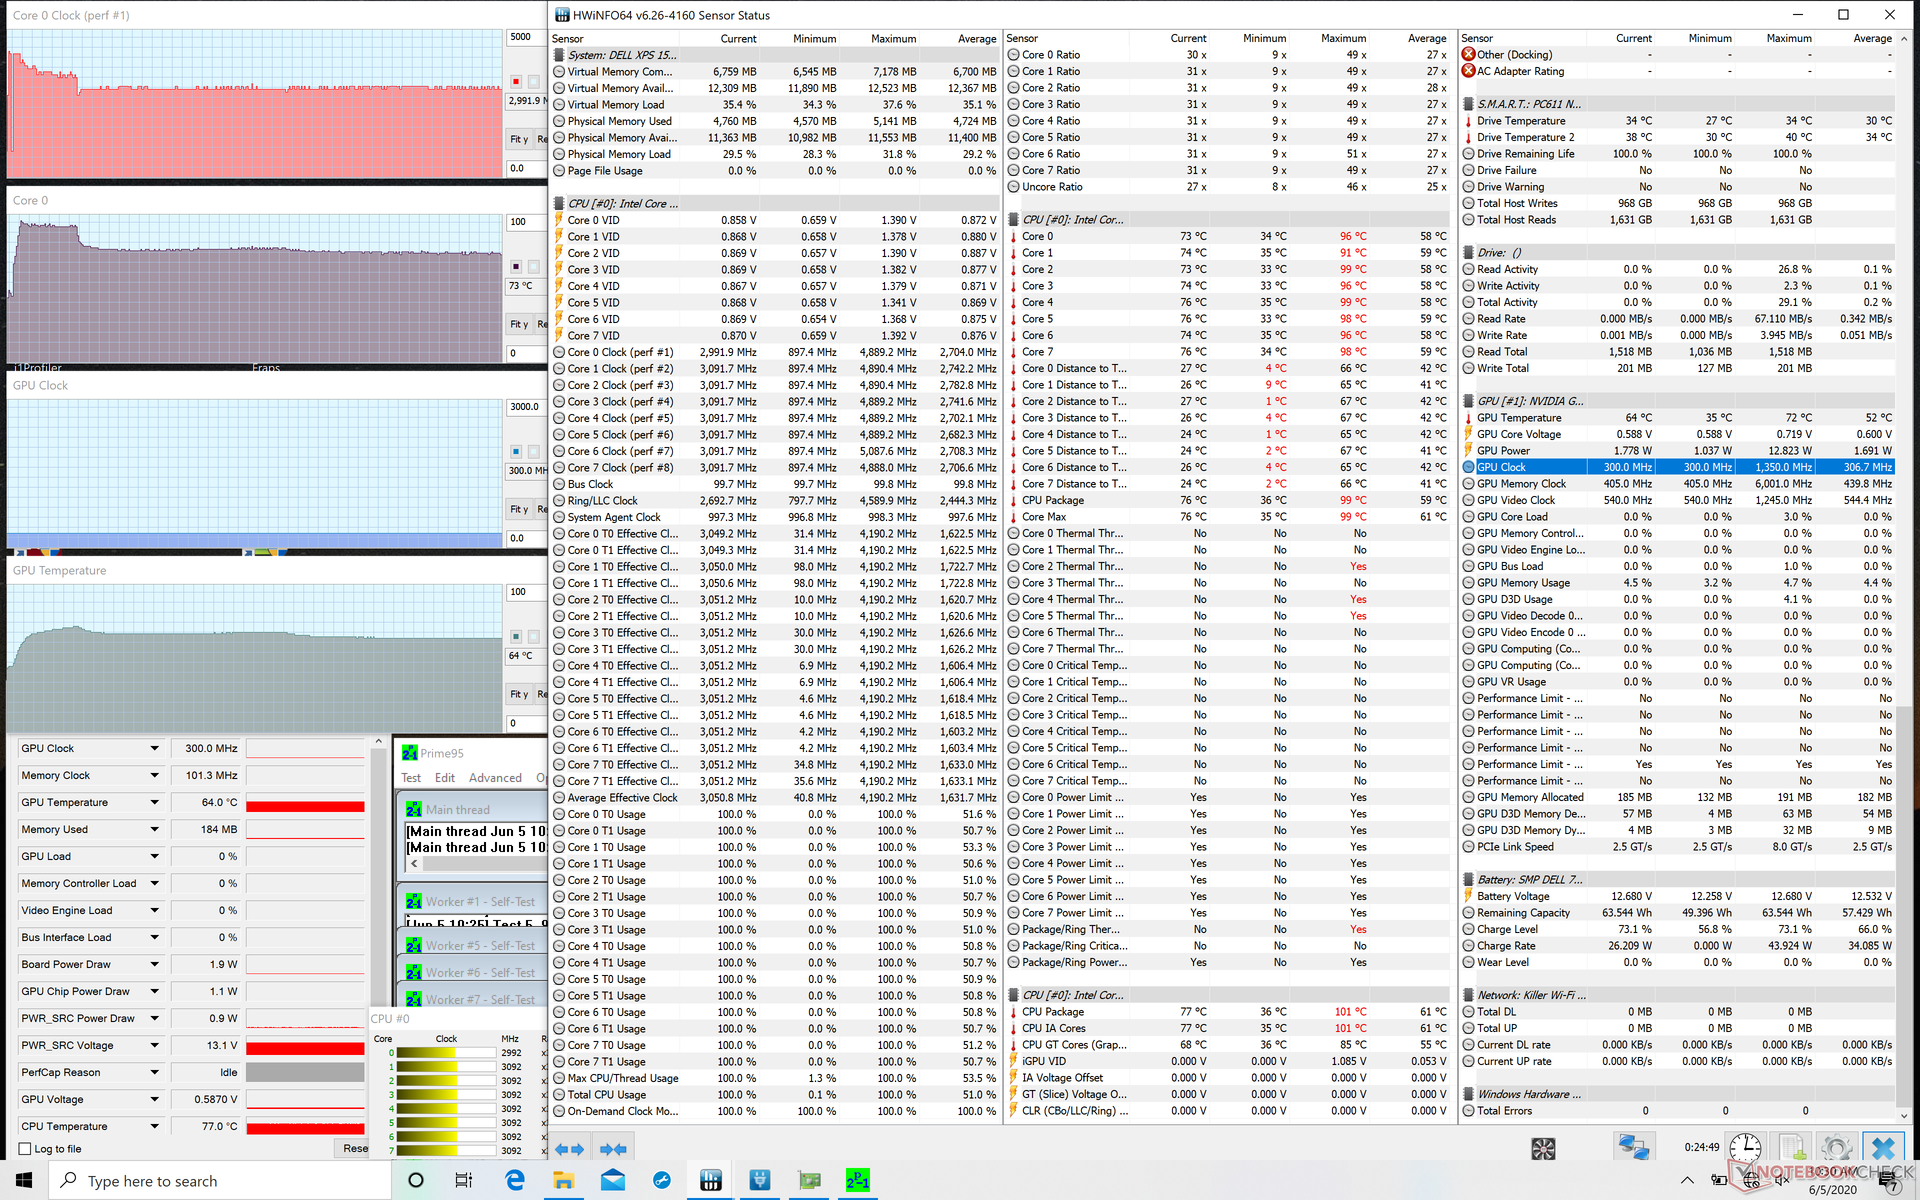
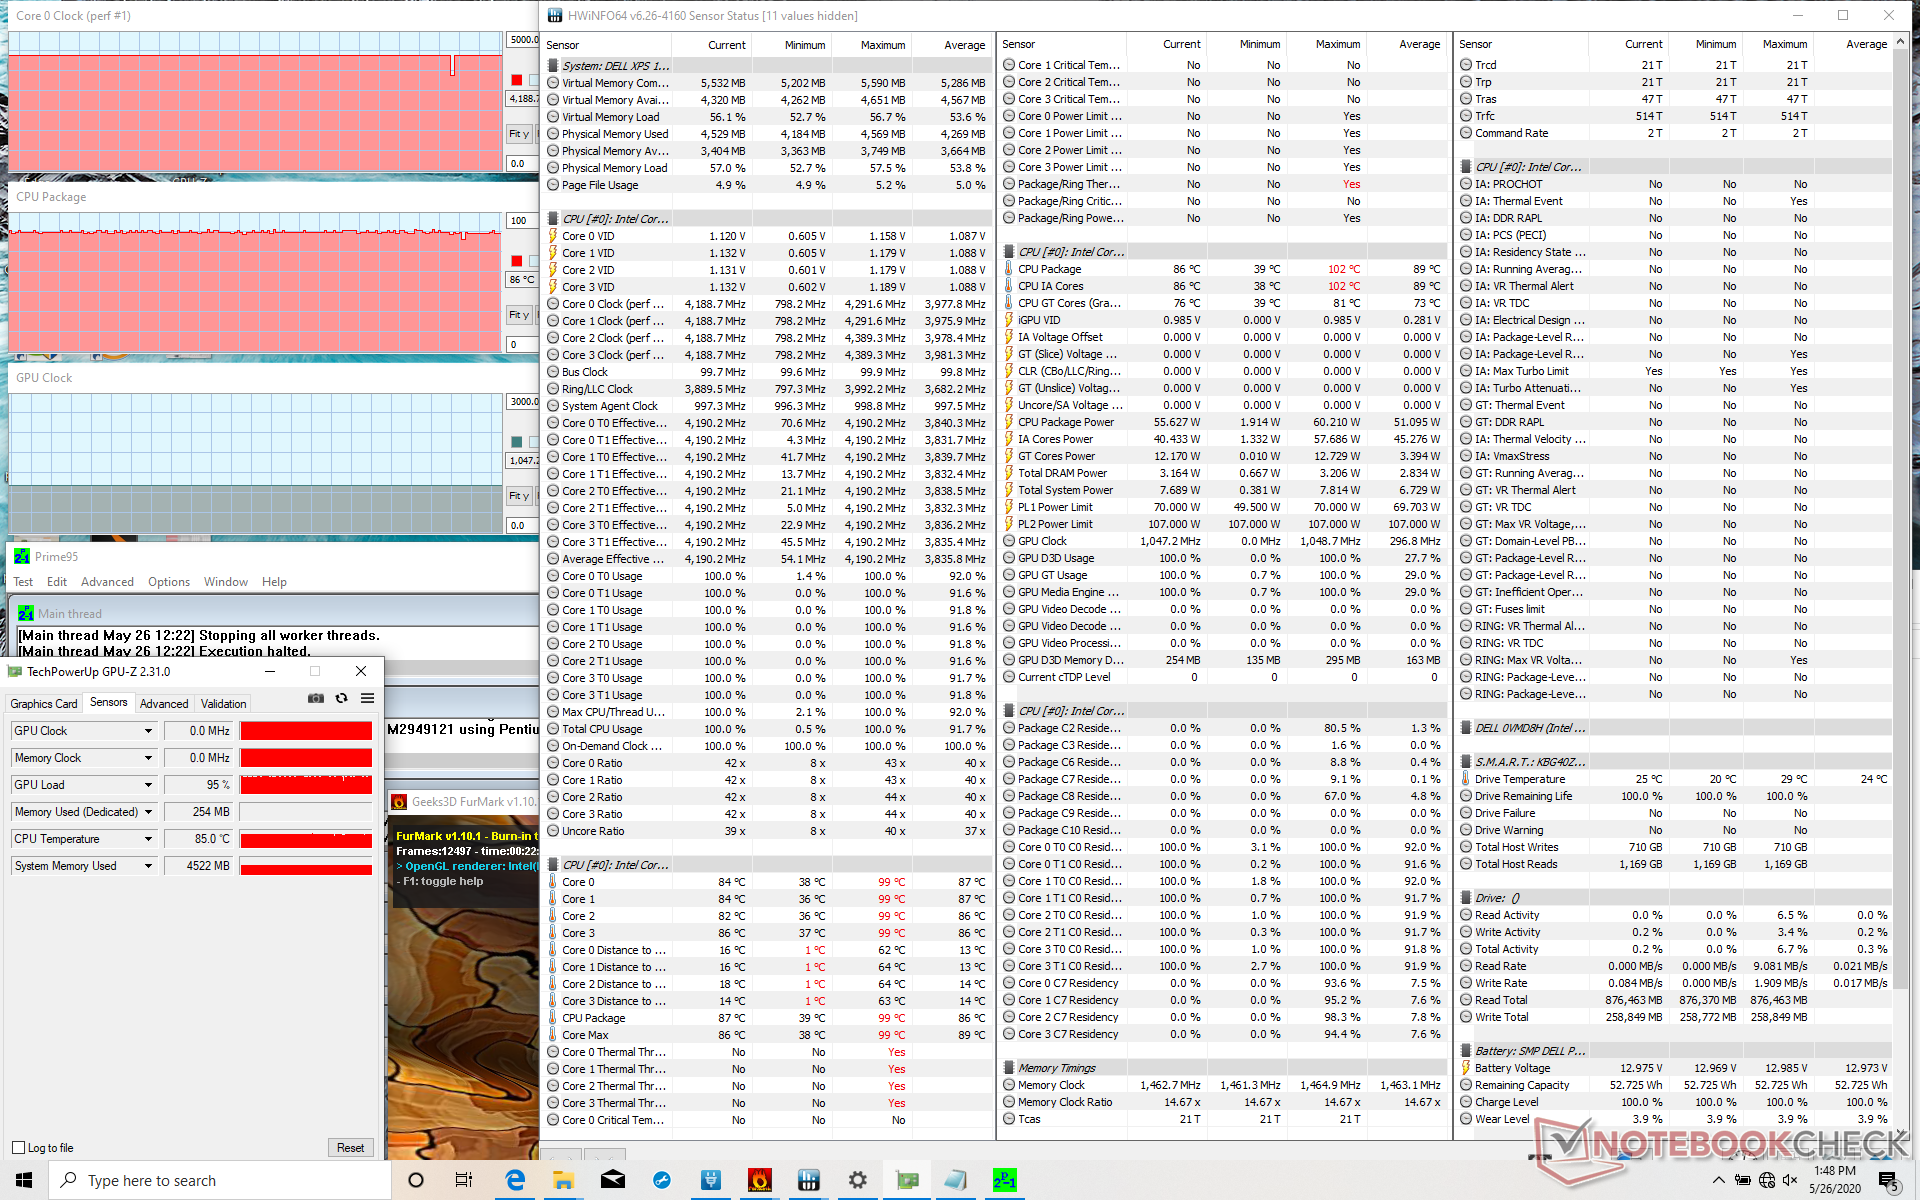
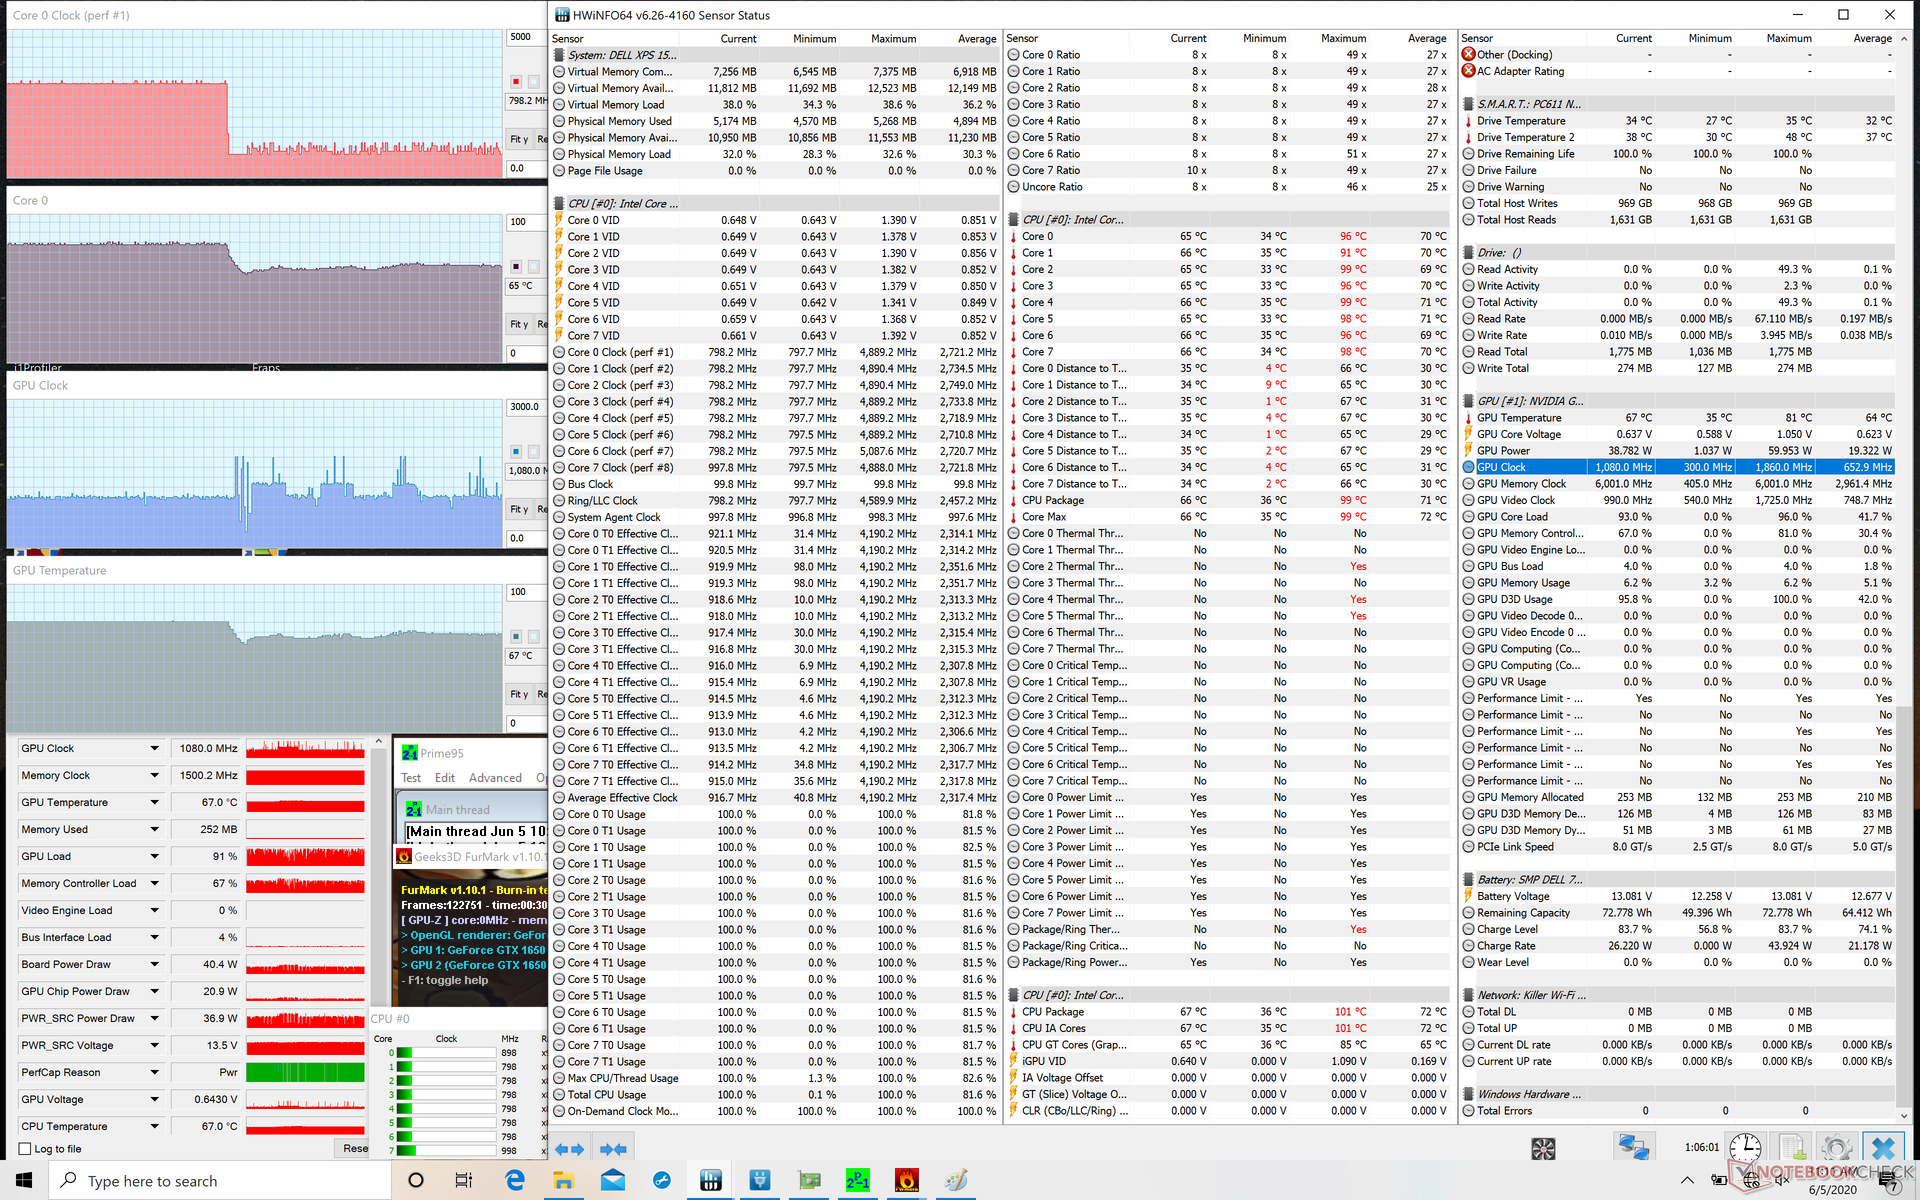
Temperature
Not only does the Core i7 SKU run louder, but it runs warmer as well. Surface temperatures can reach 49 C compared to 42 C on the lesser option.
Battery Life
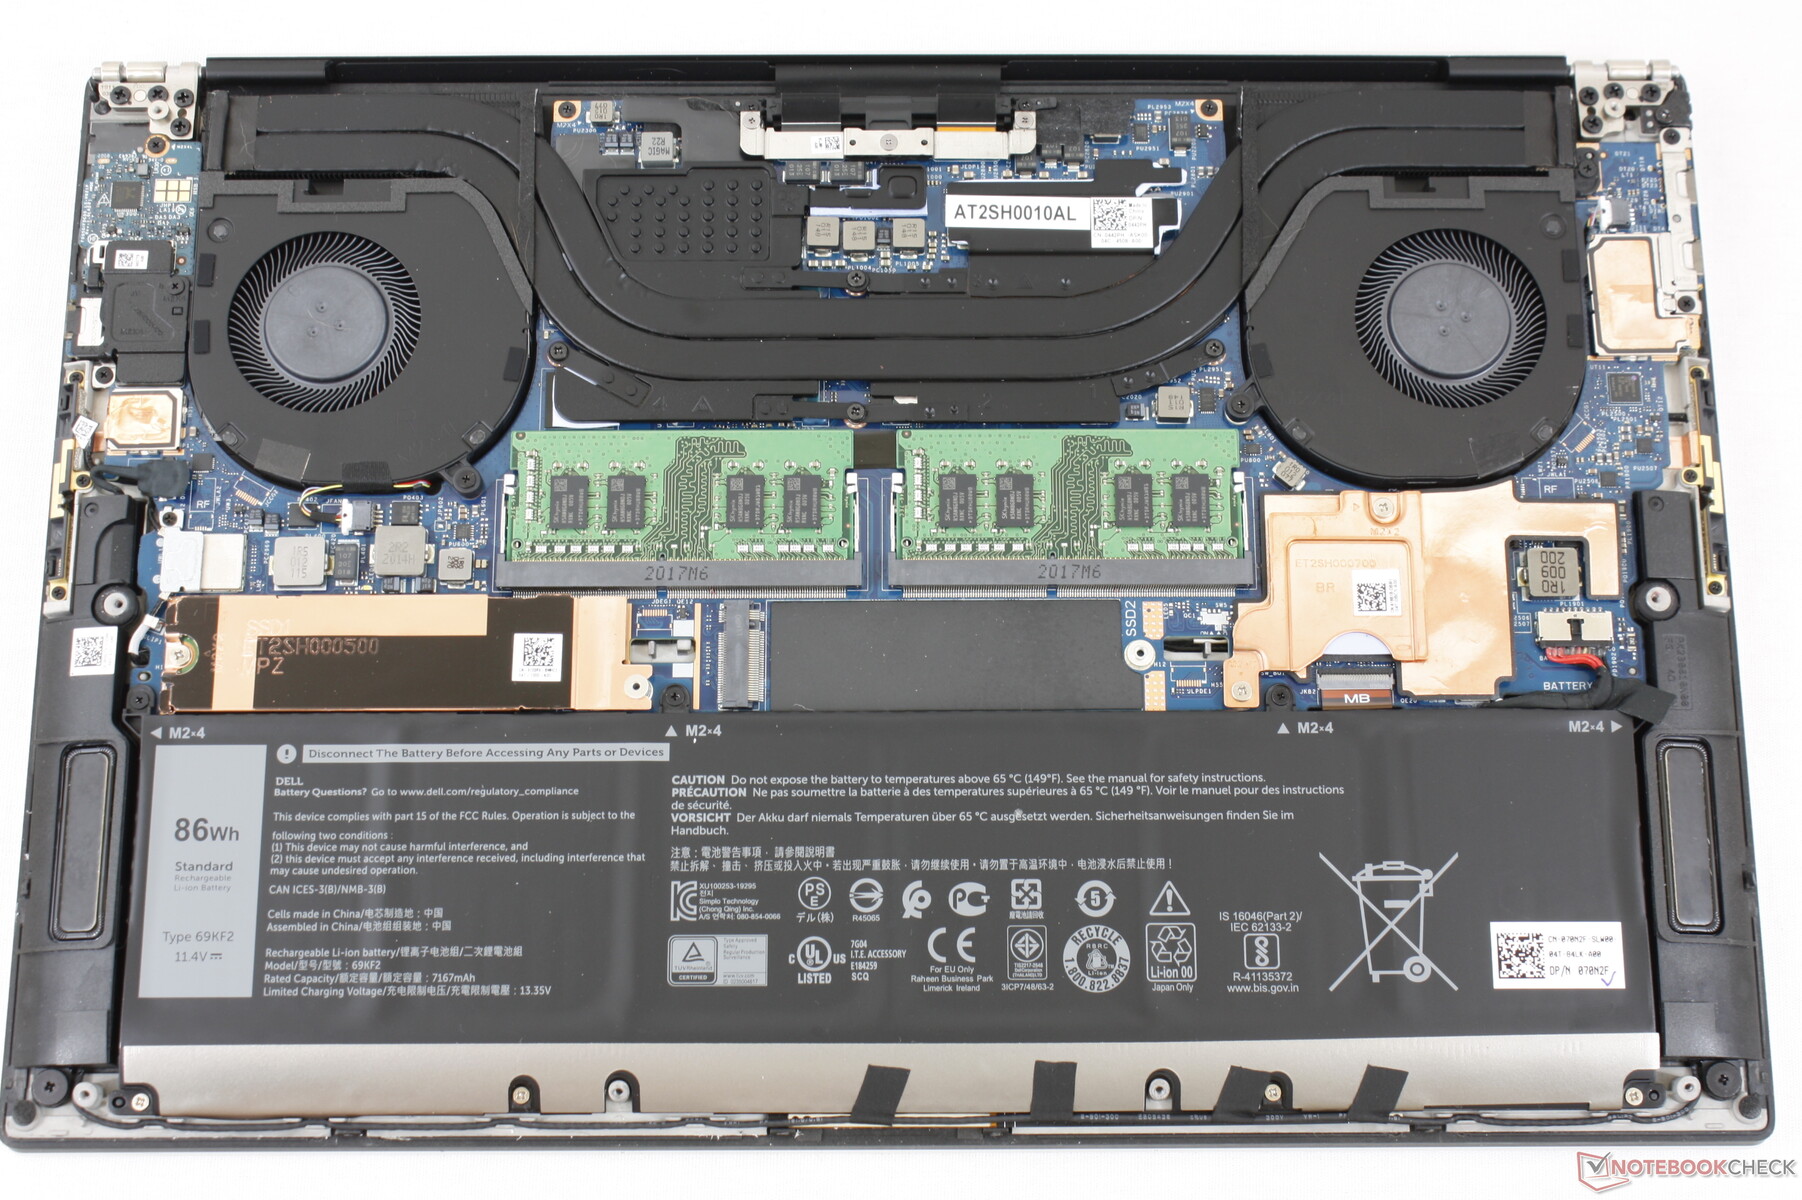
The less demanding Core i5 build comes with a 56 Wh battery while the more powerful Core i7 build comes with an 86 Wh battery. Runtimes are excellent on both and almost identical to one another since the larger capacity on the latter makes up for the more demanding processors.
It's possible to replace the 56 Wh module with the 86 Wh module and vice versa, though this may void the warranty.
| Dell XPS 15 9500 Core i7 4K UHD Sharp LQ156R1, IPS, 15.6", 3840x2400 | Dell XPS 15 9500 Core i5 Sharp LQ156N1, IPS, 15.6", 1920x1200 | |
|---|---|---|
| Display | -10% | |
| Display P3 Coverage (%) | 89.7 | 81.5 -9% |
| sRGB Coverage (%) | 100 | 100 0% |
| AdobeRGB 1998 Coverage (%) | 99.8 | 79.6 -20% |
| Response Times | 18% | |
| Response Time Grey 50% / Grey 80% * (ms) | 54 ? | 42 ? 22% |
| Response Time Black / White * (ms) | 33.2 ? | 28.8 ? 13% |
| PWM Frequency (Hz) | ||
| Screen | 4% | |
| Brightness middle (cd/m²) | 557.9 | 592 6% |
| Brightness (cd/m²) | 541 | 565 4% |
| Brightness Distribution (%) | 91 | 85 -7% |
| Black Level * (cd/m²) | 0.39 | 0.46 -18% |
| Contrast (:1) | 1431 | 1287 -10% |
| Colorchecker dE 2000 * | 4.54 | 3.19 30% |
| Colorchecker dE 2000 max. * | 7.92 | 5.45 31% |
| Colorchecker dE 2000 calibrated * | 3.82 | 2.03 47% |
| Greyscale dE 2000 * | 3.2 | 3.9 -22% |
| Gamma | 1.99 111% | 2.25 98% |
| CCT | 6451 101% | 6522 100% |
| Color Space (Percent of AdobeRGB 1998) (%) | 89.5 | 71.6 -20% |
| Color Space (Percent of sRGB) (%) | 100 | 100 0% |
| Total Average (Program / Settings) | 4% /
3% |
* ... smaller is better
Cinebench R15: CPU Multi 64Bit | CPU Single 64Bit
Blender: v2.79 BMW27 CPU
7-Zip 18.03: 7z b 4 -mmt1 | 7z b 4
Geekbench 5.5: Single-Core | Multi-Core
HWBOT x265 Benchmark v2.2: 4k Preset
LibreOffice : 20 Documents To PDF
R Benchmark 2.5: Overall mean
| Cinebench R20 / CPU (Multi Core) | |
| Dell XPS 15 9500 Core i7 4K UHD | |
| Dell XPS 15 9500 Core i5 | |
| Cinebench R20 / CPU (Single Core) | |
| Dell XPS 15 9500 Core i7 4K UHD | |
| Dell XPS 15 9500 Core i5 | |
| Cinebench R15 / CPU Multi 64Bit | |
| Dell XPS 15 9500 Core i7 4K UHD | |
| Dell XPS 15 9500 Core i5 | |
| Cinebench R15 / CPU Single 64Bit | |
| Dell XPS 15 9500 Core i7 4K UHD | |
| Dell XPS 15 9500 Core i5 | |
| Blender / v2.79 BMW27 CPU | |
| Dell XPS 15 9500 Core i5 | |
| Dell XPS 15 9500 Core i7 4K UHD | |
| 7-Zip 18.03 / 7z b 4 -mmt1 | |
| Dell XPS 15 9500 Core i7 4K UHD | |
| Dell XPS 15 9500 Core i5 | |
| 7-Zip 18.03 / 7z b 4 | |
| Dell XPS 15 9500 Core i7 4K UHD | |
| Dell XPS 15 9500 Core i5 | |
| Geekbench 5.5 / Single-Core | |
| Dell XPS 15 9500 Core i7 4K UHD | |
| Dell XPS 15 9500 Core i5 | |
| Geekbench 5.5 / Multi-Core | |
| Dell XPS 15 9500 Core i7 4K UHD | |
| Dell XPS 15 9500 Core i5 | |
| HWBOT x265 Benchmark v2.2 / 4k Preset | |
| Dell XPS 15 9500 Core i7 4K UHD | |
| Dell XPS 15 9500 Core i5 | |
| LibreOffice / 20 Documents To PDF | |
| Dell XPS 15 9500 Core i5 | |
| Dell XPS 15 9500 Core i7 4K UHD | |
| R Benchmark 2.5 / Overall mean | |
| Dell XPS 15 9500 Core i5 | |
| Dell XPS 15 9500 Core i7 4K UHD | |
* ... smaller is better
| PCMark 10 | |
| Score | |
| Dell XPS 15 9500 Core i7 4K UHD | |
| Dell XPS 15 9500 Core i5 | |
| Essentials | |
| Dell XPS 15 9500 Core i5 | |
| Dell XPS 15 9500 Core i7 4K UHD | |
| Productivity | |
| Dell XPS 15 9500 Core i7 4K UHD | |
| Dell XPS 15 9500 Core i5 | |
| Digital Content Creation | |
| Dell XPS 15 9500 Core i7 4K UHD | |
| Dell XPS 15 9500 Core i5 | |
| PCMark 8 | |
| Home Score Accelerated v2 | |
| Dell XPS 15 9500 Core i5 | |
| Dell XPS 15 9500 Core i7 4K UHD | |
| Work Score Accelerated v2 | |
| Dell XPS 15 9500 Core i5 | |
| Dell XPS 15 9500 Core i7 4K UHD | |
| 3DMark | |
| 1920x1080 Fire Strike Graphics | |
| Dell XPS 15 9500 Core i7 4K UHD | |
| Dell XPS 15 9500 Core i5 | |
| 2560x1440 Time Spy Graphics | |
| Dell XPS 15 9500 Core i7 4K UHD | |
| Dell XPS 15 9500 Core i5 | |
| 2560x1440 Time Spy Score | |
| Dell XPS 15 9500 Core i7 4K UHD | |
| Dell XPS 15 9500 Core i5 | |
| 3DMark 11 | |
| 1280x720 Performance GPU | |
| Dell XPS 15 9500 Core i7 4K UHD | |
| Dell XPS 15 9500 Core i5 | |
| 1280x720 Performance Combined | |
| Dell XPS 15 9500 Core i7 4K UHD | |
| Dell XPS 15 9500 Core i5 | |
| Dell XPS 15 9500 Core i7 4K UHD GeForce GTX 1650 Ti Mobile, i7-10875H, SK Hynix PC611 512GB | Dell XPS 15 9500 Core i5 UHD Graphics 630, i5-10300H, Toshiba KBG40ZNS256G NVMe | |
|---|---|---|
| Noise | 9% | |
| off / environment * (dB) | 28.4 | 28 1% |
| Idle Minimum * (dB) | 28.4 | 28 1% |
| Idle Average * (dB) | 28.4 | 28 1% |
| Idle Maximum * (dB) | 28.4 | 28 1% |
| Load Average * (dB) | 46 | 28 39% |
| Witcher 3 ultra * (dB) | 42 | |
| Load Maximum * (dB) | 47.1 | 41.9 11% |
* ... smaller is better
| Dell XPS 15 9500 Core i7 4K UHD i7-10875H, GeForce GTX 1650 Ti Mobile, SK Hynix PC611 512GB, IPS, 3840x2400, 15.6" | Dell XPS 15 9500 Core i5 i5-10300H, UHD Graphics 630, Toshiba KBG40ZNS256G NVMe, IPS, 1920x1200, 15.6" | |
|---|---|---|
| Power Consumption | 49% | |
| Idle Minimum * (Watt) | 5.7 | 2.9 49% |
| Idle Average * (Watt) | 13.5 | 7.6 44% |
| Idle Maximum * (Watt) | 19.6 | 8 59% |
| Load Average * (Watt) | 114.1 | 41.7 63% |
| Witcher 3 ultra * (Watt) | 93 | |
| Load Maximum * (Watt) | 135.2 | 94.8 30% |
* ... smaller is better
| Dell XPS 15 9500 Core i7 4K UHD i7-10875H, GeForce GTX 1650 Ti Mobile, 86 Wh | Dell XPS 15 9500 Core i5 i5-10300H, UHD Graphics 630, 56 Wh | |
|---|---|---|
| Battery runtime | -1% | |
| Reader / Idle (h) | 23 | 26.4 15% |
| WiFi v1.3 (h) | 9.1 | 9.3 2% |
| Load (h) | 2 | 1.6 -20% |

Price comparison
