Reviews for the Intel Core i5-10300H processor
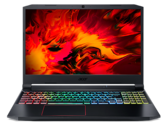
Acer Nitro 5 AN515-55 Laptop Review - Price-to-performance champ with an RTX 3060
While laptops with an RTX 3080 offer a whole lot of performance, they are often chunky and can get really hot, which is not something that everybody wants. The Acer Nitro 5, on the other hand, is for those who are looking for a low-priced portable gaming laptop.
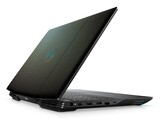
Intel Core i5-10300H, NVIDIA GeForce RTX 3060 Laptop GPU, 15.6", 2.3 kgDell G5 15 5500 Laptop Review: Aspirational mid-ranger let down by a sub-par display
Dell's new G5 15 5500 variant aims to appeal to the mid-range gamer. With a Core i5-10300H, a GTX 1650 Ti, and a 120 Hz display, the G5 15 5500 gets the basics right. However, for the asking price of ₹87,990 (US$1,195), the G5 15 5500 cuts corners, especially with the display. Can the Dell G5 15 5500 make up for these deficits on the performance front? Let's find out.
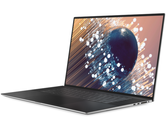
Intel Core i5-10300H, NVIDIA GeForce GTX 1650 Ti Mobile, 15.6", 2.3 kgDell XPS 17 9700 Review - Multimedia laptop with bright matte FHD panel and long battery runtime
Dell is one of the few manufacturers that offer large multimedia laptops without dedicated graphics cards. If you are not interested in gaming, you can still get a high-end multimedia laptop for a lower price. However, even the base model XPS 17 9700 with the small Core i5 is anything but cheap.
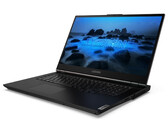
Intel Core i5-10300H, UHD Graphics 630, 17.3", 2.3 kgLenovo Legion 5 17IMH Laptop Review: The battery just won't die
Despite the hardware from the gaming entry-level segment, you don't have to worry about the performance. The Legion 5i brings all the current computer games smoothly to the matte screen (Full-HD, IPS). The highlight of the laptop is the outstanding battery life.
Intel Core i5-10300H, NVIDIA GeForce GTX 1650 Mobile, 17.3", 2.9 kgWalmart Gateway Creator Series 15 Laptop Review: GeForce RTX 2060 For Under $1000 USD
It's one of the cheapest gaming laptops you can find with the GeForce RTX 2060 at the moment, but don't hop onboard just yet. The 8 GB of single-channel RAM and small 256 GB NVMe SSD might hinder your experience.
Intel Core i5-10300H, NVIDIA GeForce RTX 2060 Mobile, 15.6", 2 kgHP Omen 15-ek0456ng: NVIDIA GeForce GTX 1660 Ti Mobile, 15.60", 2.1 kg
Review » HP Omen 15: Gaming laptop with good battery life
Nexoc GH5 515IG: NVIDIA GeForce GTX 1650 Mobile, 15.60", 2.1 kg
Review » Nexoc GH5 515IG (Clevo NH50DB): Entry-level gaming laptop offers room for three storage drives
HP Pavilion Gaming 16-a0242ng: NVIDIA GeForce GTX 1650 Ti Mobile, 16.10", 2.2 kg
Review » HP Pavilion Gaming 16 Laptop Review: Low-priced 16-inch laptop with a GeForce GPU
Lenovo IdeaPad Gaming 3i 15IMH05: NVIDIA GeForce GTX 1650 Mobile, 15.60", 2.2 kg
Review » Lenovo IdeaPad Gaming 3i 15IMH05 in review: Core i5 at full throttle
Lenovo Legion 5 15IMH05H: NVIDIA GeForce RTX 2060 Mobile, 15.60", 2.5 kg
Review » Lenovo Legion 5 15IMH05H Review: Excellent power delivery and good battery life
Dell XPS 15 9500 Core i5: Intel UHD Graphics 630, 15.60", 1.8 kg
Review » Dell XPS 15 9500 Core i5 Review: Now Even More Like a MacBook Pro
MSI GF75 Thin 10SCXR: NVIDIA GeForce GTX 1650 Mobile, 17.30", 2.2 kg
Review » 10th gen Core i5 Comet Lake-H Debut: MSI GF75 Thin 10SCXR Laptop Review
Acer Aspire Nitro 5 AN515-55-57GF: NVIDIA GeForce RTX 3060 Laptop GPU, 15.60", 2.3 kg
External Review » Acer Aspire Nitro 5 AN515-55-57GF
Asus TUF Gaming F15 FX506LHB-HN324: NVIDIA GeForce GTX 1650 Mobile, 15.60", 2.3 kg
External Review » Asus TUF Gaming F15 FX506LHB-HN324
Asus TUF Gaming F15 FX506LH-AS51: NVIDIA GeForce GTX 1650 Mobile, 15.60", 2.3 kg
External Review » Asus TUF Gaming F15 FX506LH-AS51
Acer Nitro 5 AN515-55-5560: NVIDIA GeForce RTX 3060 Laptop GPU, 15.60", 2.3 kg
External Review » Acer Nitro 5 AN515-55-5560
Medion Erazer Deputy P10-MD62132: NVIDIA GeForce GTX 1660 Ti Mobile, 15.60", 2.3 kg
External Review » Medion Erazer Deputy P10-MD62132
Asus TUF Gaming F17 FX706LI-ES53: NVIDIA GeForce GTX 1650 Ti Mobile, 17.30", 2.6 kg
External Review » Asus TUF Gaming F17 FX706LI-ES53
MSI GF75 Thin 10SCXR: NVIDIA GeForce GTX 1650 Mobile, 17.30", 2.2 kg
External Review » MSI GF75 Thin 10SCXR
Acer Nitro 5 AN515-55-53E5: NVIDIA GeForce RTX 3050 4GB Laptop GPU, 15.60", 2.3 kg
External Review » Acer Nitro 5 AN515-55-53E5
Acer Nitro 5 AN515-55-56F5: NVIDIA GeForce GTX 1650 Mobile, 15.60", 2.3 kg
External Review » Acer Nitro 5 AN515-55-56F5
HP Pavilion Gaming 16-a0046ns: NVIDIA GeForce GTX 1650 Ti Mobile, 16.10", 2.4 kg
External Review » HP Pavilion Gaming 16-a0046ns
Acer Nitro 5 AN515-55-524P: NVIDIA GeForce RTX 2060 Mobile, 15.60", 2.3 kg
External Review » Acer Nitro 5 AN515-55-524P
Asus TUF Gaming F15 FX506LH-HN042T: NVIDIA GeForce GTX 1650 Mobile, 15.60", 2.3 kg
External Review » Asus TUF Gaming F15 FX506LH-HN042T
Asus ZenBook Pro 15 UX535LH-BN024T: NVIDIA GeForce GTX 1650 Max-Q, 15.60", 1.8 kg
External Review » Asus ZenBook Pro 15 UX535LH-BN024T
Acer Aspire Nitro 5 AN517-52-58NB: NVIDIA GeForce RTX 3060 Laptop GPU, 17.30", 2.2 kg
External Review » Acer Aspire Nitro 5 AN517-52-58NB
Lenovo ThinkBook 15p IMH-20V30007GE: NVIDIA GeForce GTX 1650 Max-Q, 15.60", 1.9 kg
External Review » Lenovo ThinkBook 15p IMH-20V30007GE
Acer Nitro 5 AN515-55-59KS: NVIDIA GeForce GTX 1650 Ti Mobile, 15.60", 2.3 kg
External Review » Acer Nitro 5 AN515-55-59KS
HP Pavilion Gaming 16-a0044ns: NVIDIA GeForce GTX 1650 Ti Mobile, 16.10", 2.5 kg
External Review » HP Pavilion Gaming 16-a0044ns
Acer Predator Helios 300 PH315-53-527E: NVIDIA GeForce RTX 3060 Laptop GPU, 15.60", 2.3 kg
External Review » Acer Predator Helios 300 PH315-53-527E
Dell G3 15 3500-H5JDG: NVIDIA GeForce GTX 1650 Ti Mobile, 15.60", 2.6 kg
External Review » Dell G3 15 3500-H5JDG
Medion Erazer Crawler E10: NVIDIA GeForce GTX 1650 Mobile, 15.60", 2.2 kg
External Review » Medion Erazer Crawler E10
MSI GF63 Thin 10SC-206: NVIDIA GeForce GTX 1650 Max-Q, 15.60", 1.9 kg
External Review » MSI GF63 Thin 10SC-206
HP Pavilion Gaming 16-a0042ns: NVIDIA GeForce RTX 2060 Max-Q, 16.10", 2.4 kg
External Review » HP Pavilion Gaming 16-a0042ns
Medion Erazer Defender P10 : NVIDIA GeForce RTX 3060 Laptop GPU, 17.30", 2.5 kg
External Review » Medion Erazer Defender P10
Lenovo Legion 5 15IMH05H-81Y60043GE: NVIDIA GeForce RTX 2060 Mobile, 15.60", 2.5 kg
External Review » Lenovo Legion 5 15IMH05H-81Y60043GE
Lenovo IdeaPad 3 15IMH05-81Y400DWMH: NVIDIA GeForce GTX 1650 Mobile, 15.60", 2.2 kg
External Review » Lenovo IdeaPad 3 15IMH05-81Y400DWMH
Lenovo Legion Slim 7i-82BC002FGE: NVIDIA GeForce GTX 1650 Ti Mobile, 15.60", 1.9 kg
External Review » Lenovo Legion Slim 7i-82BC002FGE
HP Pavilion Gaming 16-A0008NS: NVIDIA GeForce GTX 1050 Mobile, 16.10", 2.4 kg
External Review » HP Pavilion Gaming 16-A0008NS
HP Pavilion Gaming 16-A0023NS: NVIDIA GeForce GTX 1050 Mobile, 16.10", 2.4 kg
External Review » HP Pavilion Gaming 16-A0023NS
Lenovo Ideapad Creator 5 15IMH05-82D4003UCK: NVIDIA GeForce GTX 1650 Mobile, 15.60", 2.2 kg
External Review » Lenovo Ideapad Creator 5 15IMH05-82D4003UCK
HP Pavilion Gaming 16-a0031ns: NVIDIA GeForce GTX 1650 Mobile, 16.10", 2.4 kg
External Review » HP Pavilion Gaming 16-a0031ns
Acer Aspire 7 A715-75G-59MG: NVIDIA GeForce GTX 1650 Mobile, 15.60", 2.2 kg
External Review » Acer Aspire 7 A715-75G-59MG
Lenovo Legion 5 17IMH05: NVIDIA GeForce GTX 1650 Mobile, 17.30", 2.9 kg
External Review » Lenovo Legion 5 17IMH05
Gateway Creator Series 15.6 GWTN156-3BK: NVIDIA GeForce RTX 2060 Mobile, 15.60", 2 kg
External Review » Gateway Creator Series 15.6 GWTN156-3BK
MSI GL65 10SER, i5-10300H RTX 2060: NVIDIA GeForce RTX 2060 Mobile, 15.60", 2.3 kg
External Review » MSI GL65 10SER, i5-10300H RTX 2060
Xiaomi Redmi G, i5-10300H 1650Ti: NVIDIA GeForce GTX 1650 Ti Mobile, 16.10", 2.5 kg
External Review » Xiaomi Redmi G, i5-10300H 1650Ti
Acer Predator Helios 300 PH315-53-5507: NVIDIA GeForce GTX 1650 Ti Mobile, 15.60", 2.3 kg
External Review » Acer Predator Helios 300 PH315-53-5507
HP Pavilion Gaming 16-a0006ns: NVIDIA GeForce GTX 1650 Mobile, 15.60", 2.4 kg
External Review » HP Pavilion Gaming 16-a0006ns
HP Pavilion Gaming 16-a0005ns: NVIDIA GeForce GTX 1050 Mobile, 15.60", 2.4 kg
External Review » HP Pavilion Gaming 16-a0005ns
Asus TUF Gaming F15 FX506LH-BQ034: NVIDIA GeForce GTX 1650 Mobile, 15.60", 2.3 kg
External Review » Asus TUF FX506LH-BQ034
HP Pavilion Gaming 16-a0022ns: NVIDIA GeForce GTX 1650 Mobile, 16.10", 2.4 kg
External Review » HP Pavilion Gaming 16-a0022ns
HP Envy 15-ep0003ns: NVIDIA GeForce GTX 1650 Ti Mobile, 15.60", 2.1 kg
External Review » HP Envy 15-ep0003ns
Lenovo Yoga Slim 7 15IMH05-82AB002WMH: NVIDIA GeForce GTX 1650 Mobile, 15.60", 1.8 kg
External Review » Lenovo Yoga Slim 7 15IMH05-82AB002WMH
HP Omen 15-ek0456ng: NVIDIA GeForce GTX 1660 Ti Mobile, 15.60", 2.1 kg
External Review » HP Omen 15-ek0456ng
HP Gaming Pavilion 15-dk1064tx: NVIDIA GeForce RTX 2060 Max-Q, 15.60", 2.2 kg
External Review » HP Gaming Pavilion 15-dk1064tx
Acer Nitro 5 AN517-52: NVIDIA GeForce RTX 2060 Mobile, 17.30", 2.2 kg
External Review » Acer Nitro 5 AN517-52
Lenovo Ideapad Creator 5 15IMH05, i5-10300H GTX 1650 Ti: NVIDIA GeForce GTX 1650 Ti Mobile, 15.60", 2.2 kg
External Review » Lenovo Ideapad Creator 5 15IMH05, i5-10300H GTX 1650 Ti
HP Pavilion Gaming 16-a0000ns: NVIDIA GeForce GTX 1650 Mobile, 16.10", 2.4 kg
External Review » HP Pavilion Gaming 16-a0000ns
Dell XPS 17 9700 i5-10300H: Intel UHD Graphics 630, 17.30", 2.3 kg
External Review » Dell XPS 17 9700 i5-10300H
Acer Nitro 5 AN515-55-52HQ: NVIDIA GeForce GTX 1650 Ti Mobile, 15.60", 2.3 kg
External Review » Acer Nitro 5 AN515-55-52HQ
Acer Nitro 5 AN515-55-598S: NVIDIA GeForce GTX 1650 Mobile, 15.60", 2.3 kg
External Review » Acer Nitro 5 AN515-55-598S
Acer Nitro 7 AN715, i5-10300H: NVIDIA GeForce GTX 1660 Ti Mobile, 15.60", 2.5 kg
External Review » Acer Nitro 7 AN715, i5-10300H
Dell G3 15 3500-3KJ99: NVIDIA GeForce GTX 1650 Mobile, 15.60", 2.6 kg
External Review » Dell G3 15 3500-3KJ99
Dell XPS 15 9500 Core i5: Intel UHD Graphics 630, 15.60", 1.8 kg
External Review » Dell XPS 15 9500 Core i5
Lenovo IdeaPad Gaming 3i 15IMH05: NVIDIA GeForce GTX 1650 Mobile, 15.60", 2.2 kg
External Review » Lenovo IdeaPad Gaming 3i 15IMH05
Dell G5 15 5500-9T6CF: NVIDIA GeForce GTX 1650 Ti Mobile, 15.60", 2.4 kg
External Review » Dell G5 15 5500-9T6CF
Acer Predator Triton 300 PT315-52, i5-10300H GTX 1650 Ti: NVIDIA GeForce GTX 1650 Ti Mobile, 15.60", 2.3 kg
External Review » Acer Predator Triton 300 PT315-52, i5-10300H GTX 1650 Ti
HP Omen 15t-ek000: NVIDIA GeForce GTX 1650 Ti Mobile, 15.60", 2.4 kg
External Review » HP Omen 15t-ek000
Acer Predator Triton 300 PT315-52-51U8: NVIDIA GeForce GTX 1660 Ti Mobile, 15.60", 2.3 kg
External Review » Acer Predator Triton 300 PT315-52-51U8
MSI GL75 10SCSR-003XPL: NVIDIA GeForce GTX 1650 Ti Mobile, 17.30", 2.5 kg
External Review » MSI GL75 10SCSR-003XPL
Acer Nitro 5 AN515-55-53YW: NVIDIA GeForce GTX 1650 Mobile, 15.60", 2.3 kg
External Review » Acer Nitro 5 AN515-55-53YW
Acer Nitro 5 AN515-55-52DV: NVIDIA GeForce GTX 1650 Ti Mobile, 15.60", 2.3 kg
External Review » Acer Nitro 5 AN515-55-52DV
Dell XPS 17 9700 i5-10300H: Intel UHD Graphics 630, 17.30", 2.3 kg
» The base model of the XPS 17 9700 is just too expensive
Lenovo Legion 5 17IMH05: NVIDIA GeForce GTX 1650 Mobile, 17.30", 2.9 kg
» Processor and graphics core of the Lenovo Legion 5 17IMH05 are able to run at constant full power
Gateway Creator Series 15.6 GWTN156-3BK: NVIDIA GeForce RTX 2060 Mobile, 15.60", 2 kg
» Is a $999 Walmart Gateway gaming laptop any good? We try one out ourselves to see
HP Omen 15-ek0456ng: NVIDIA GeForce GTX 1660 Ti Mobile, 15.60", 2.1 kg
» The HP Omen 15 convinces with a good display and long battery life
Nexoc GH5 515IG: NVIDIA GeForce GTX 1650 Mobile, 15.60", 2.1 kg
» The Nexoc GH5 515IG gaming laptop can be individually customized to your own needs
HP Pavilion Gaming 16-a0242ng: NVIDIA GeForce GTX 1650 Ti Mobile, 16.10", 2.2 kg
» Low-priced HP Pavilion Gaming 16 laptop with a 16.1-inch display and GeForce graphics
Lenovo IdeaPad Gaming 3i 15IMH05: NVIDIA GeForce GTX 1650 Mobile, 15.60", 2.2 kg
» The Lenovo IdeaPad Gaming 3i 15IMH05 fully exploits its CPU and GPU
Lenovo Legion 5 15IMH05H: NVIDIA GeForce RTX 2060 Mobile, 15.60", 2.5 kg
» Wish you could turn Nvidia Optimus on and off? The Lenovo Legion 5 15IMH05H lets you do just that
MSI GF75 Thin 10SCXR: NVIDIA GeForce GTX 1650 Mobile, 17.30", 2.2 kg
» The MSI GF75 has a 'Silent mode'. The problem? It's not actually silent
» Intel Core i5-10300H vs. AMD Ryzen 7 3750H: Another sideways step for Intel