Lenovo IdeaPad Gaming 3i 15IMH05 in review: Core i5 at full throttle

Lenovo's IdeaPad Gaming 3i series is aimed at customers who are looking for the cheapest possible gaming laptop. In doing so, the company has opted for mid-range hardware from Intel and Nvidia. The 15.6-inch test device provided to us is powered by a Core i5-10300H processor and a GeForce GTX 1650 graphics core. Competitors include devices such as the Asus TUF FX505DT, the Dell G3 3590, the HP Pavilion Gaming 15, the Acer Nitro 5 AN515-44, and the MSI GF63 Thin 9SC.
Rating | Date | Model | Weight | Height | Size | Resolution | Price |
|---|---|---|---|---|---|---|---|
| 78.4 % v7 (old) | 07 / 2020 | Lenovo IdeaPad Gaming 3i 15IMH05 i5-10300H, GeForce GTX 1650 Mobile | 2.2 kg | 24.9 mm | 15.60" | 1920x1080 | |
| 80.4 % v6 (old) | 07 / 2019 | Asus TUF FX505DT-EB73 R7 3750H, GeForce GTX 1650 Mobile | 2.2 kg | 26.8 mm | 15.60" | 1920x1080 | |
| 79.3 % v7 (old) | 10 / 2019 | Dell G3 3590 i5-9300H, GeForce GTX 1650 Mobile | 2.5 kg | 21.6 mm | 15.60" | 1920x1080 | |
| 77.6 % v7 (old) | 01 / 2020 | MSI GF63 Thin 9SC i5-9300H, GeForce GTX 1650 Max-Q | 1.8 kg | 22 mm | 15.60" | 1920x1080 | |
| 75.4 % v7 (old) | 03 / 2020 | HP Pavilion Gaming 15-ec0002ng R5 3550H, GeForce GTX 1050 Mobile | 2.3 kg | 23.5 mm | 15.60" | 1920x1080 | |
| 78.8 % v7 (old) | 02 / 2020 | MSI Alpha 15 A3DDK-034 R7 3750H, Radeon RX 5500M | 2.3 kg | 27.5 mm | 15.60" | 1920x1080 | |
| 79.8 % v7 (old) | 06 / 2020 | Acer Nitro 5 AN515-44-R5FT R5 4600H, GeForce GTX 1650 Ti Mobile | 2.2 kg | 24 mm | 15.60" | 1920x1080 |
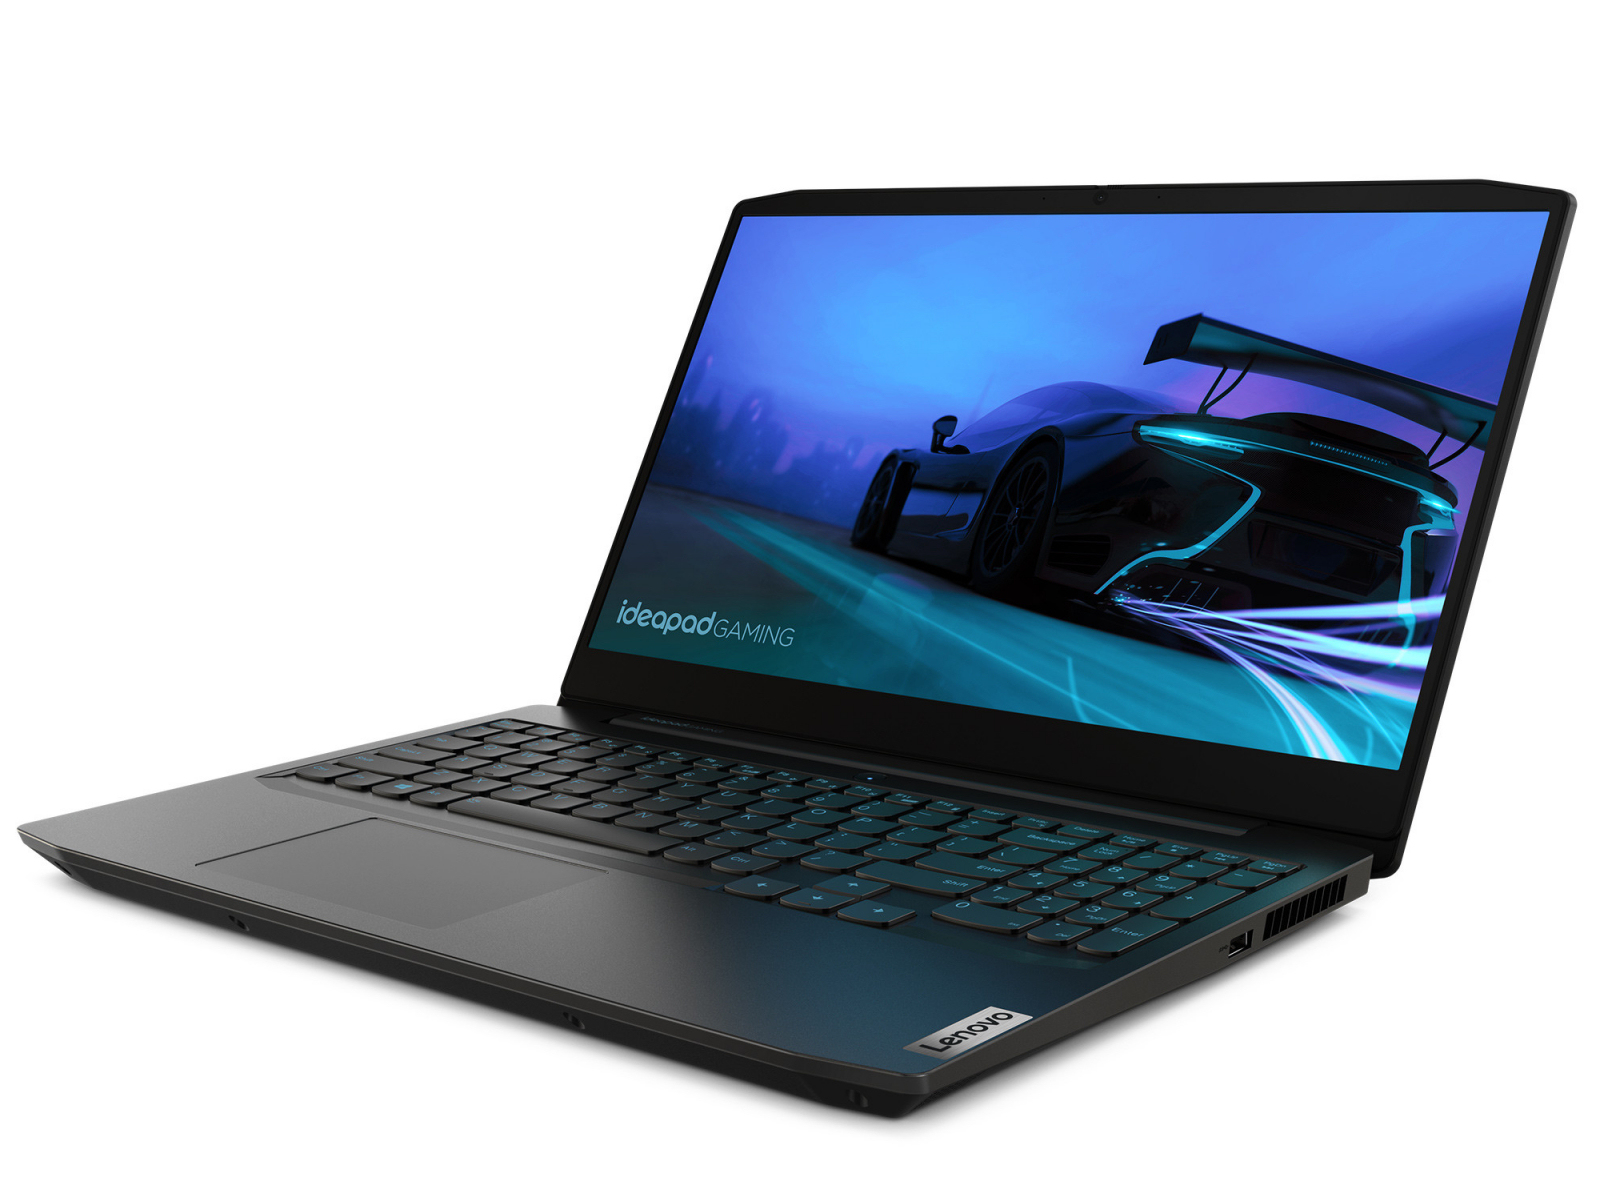
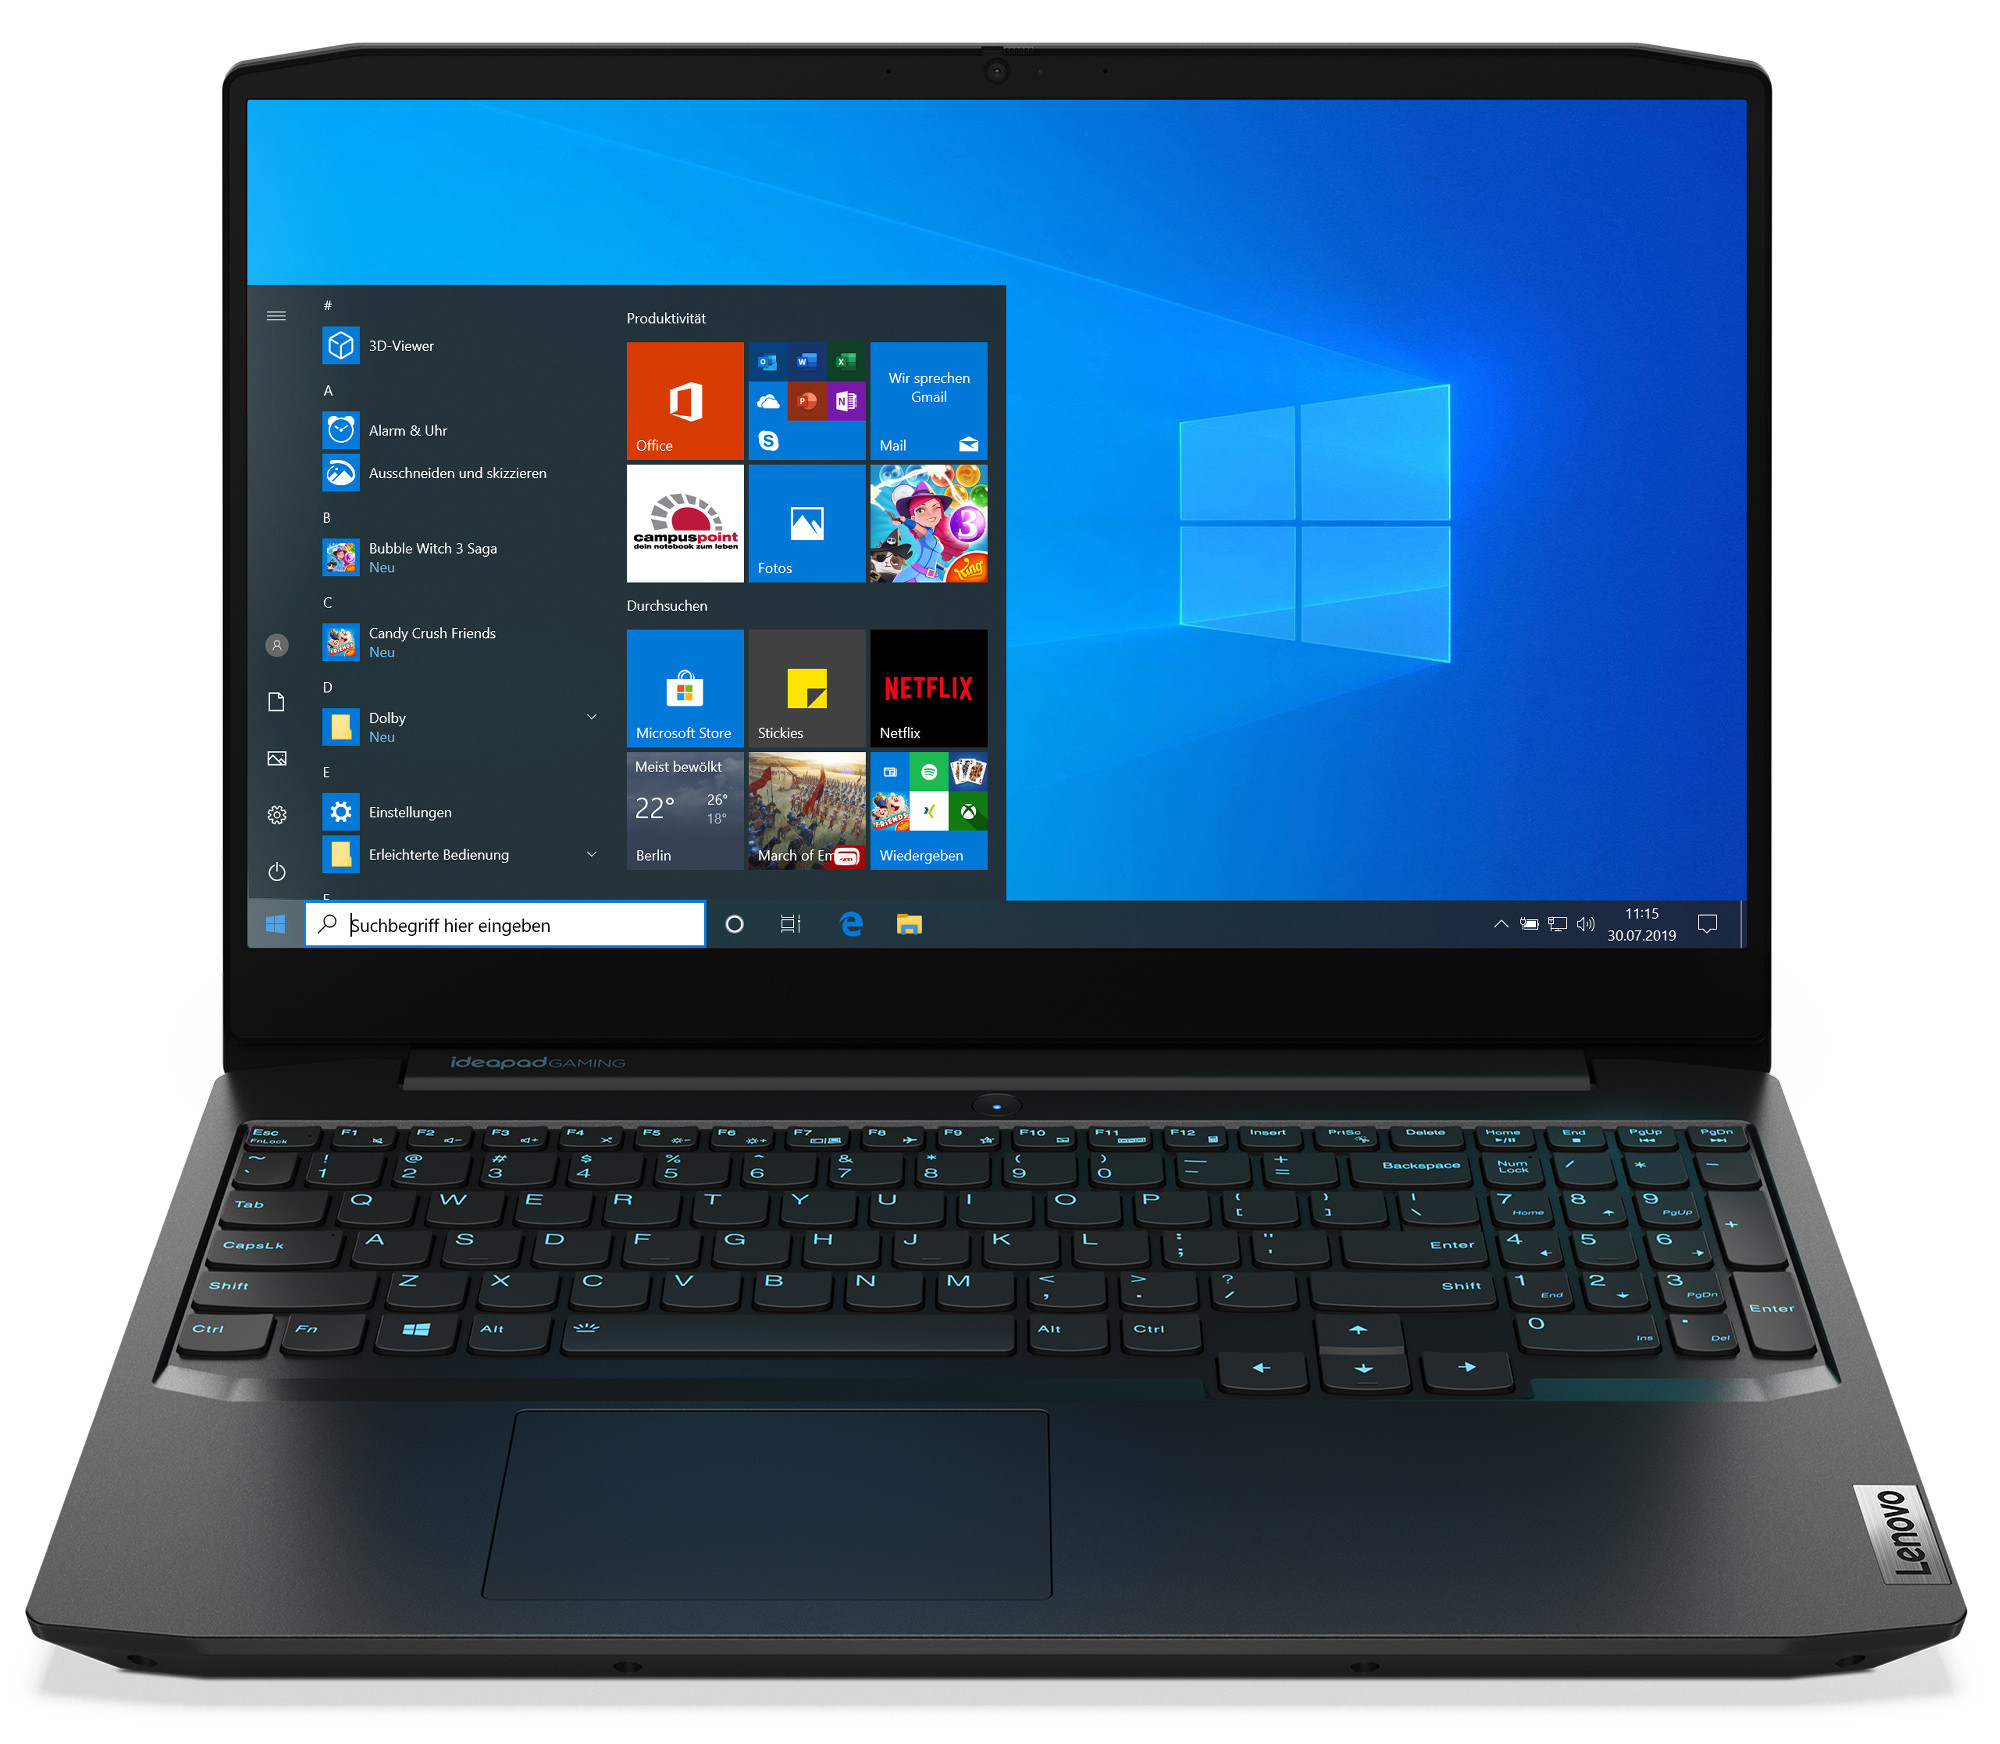
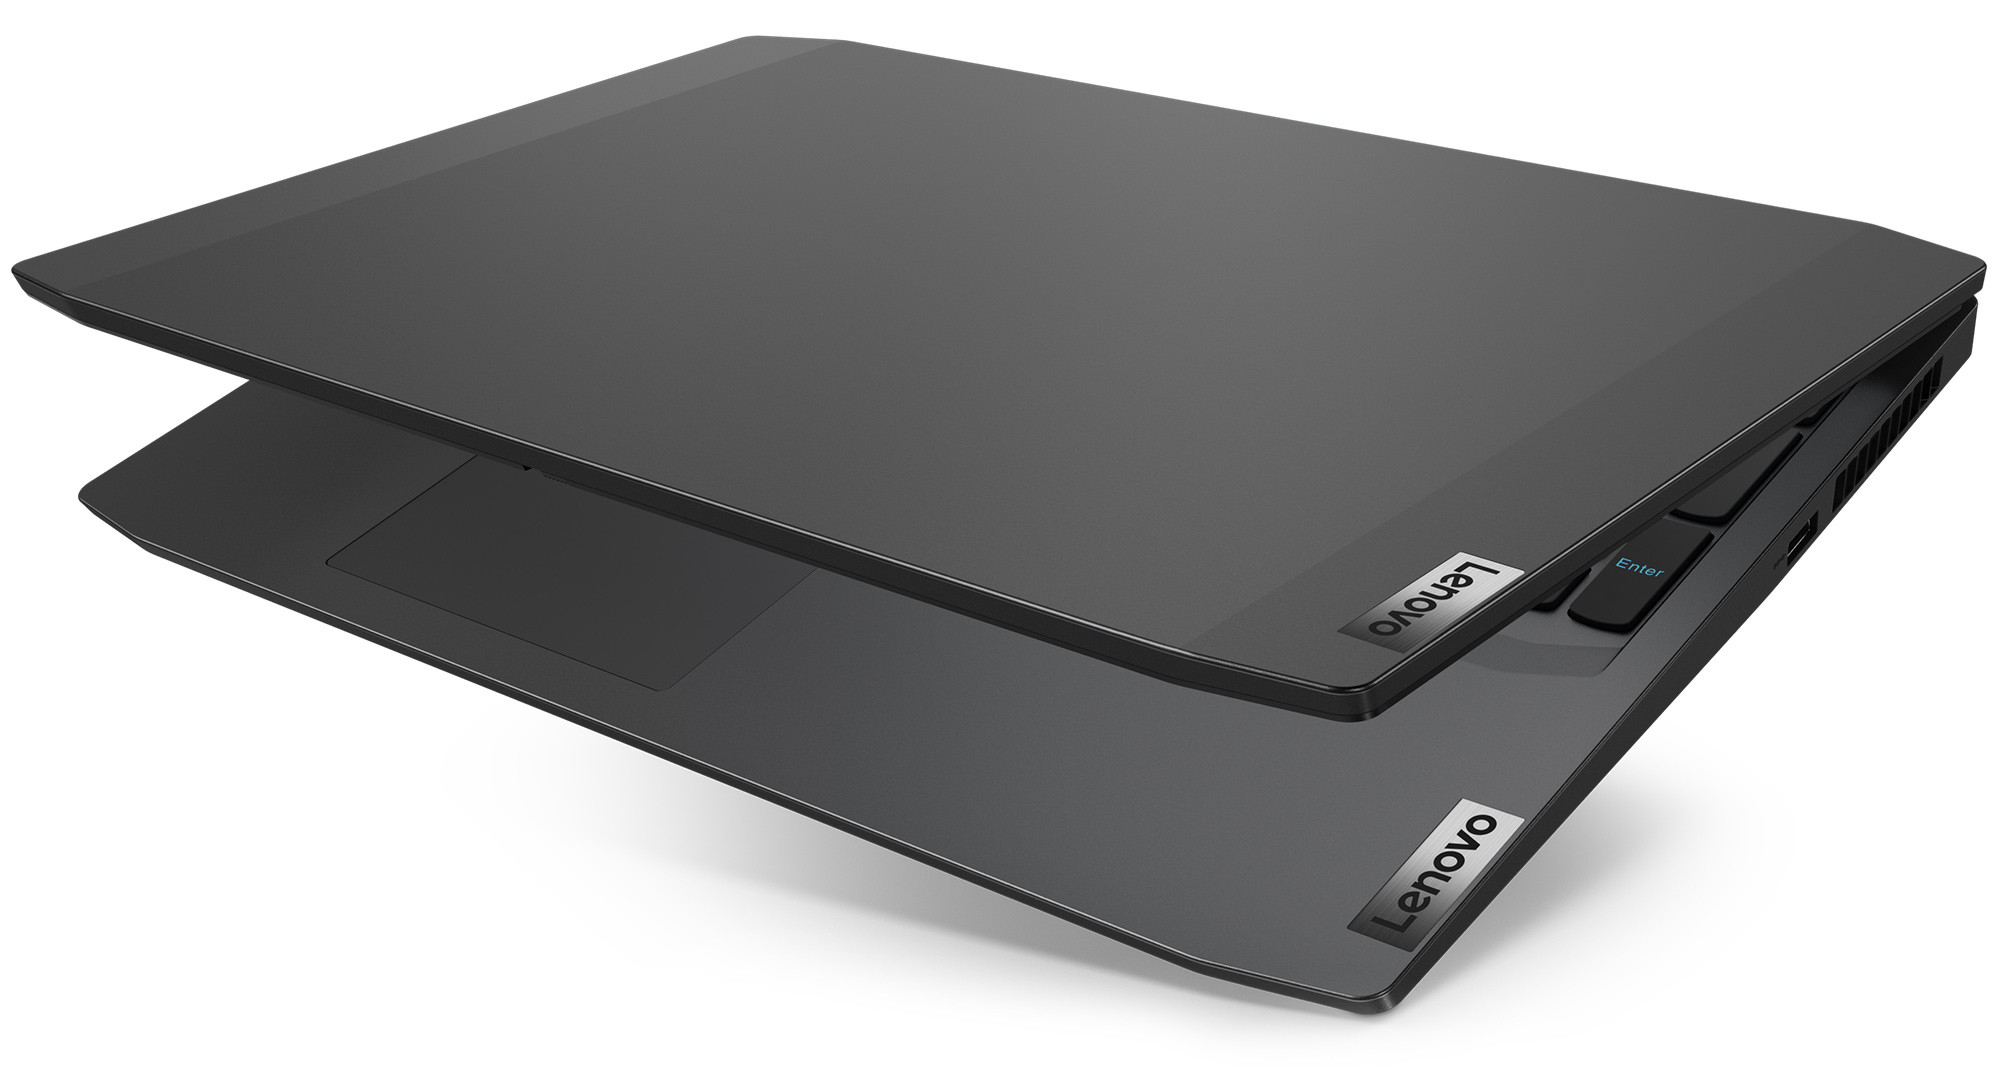
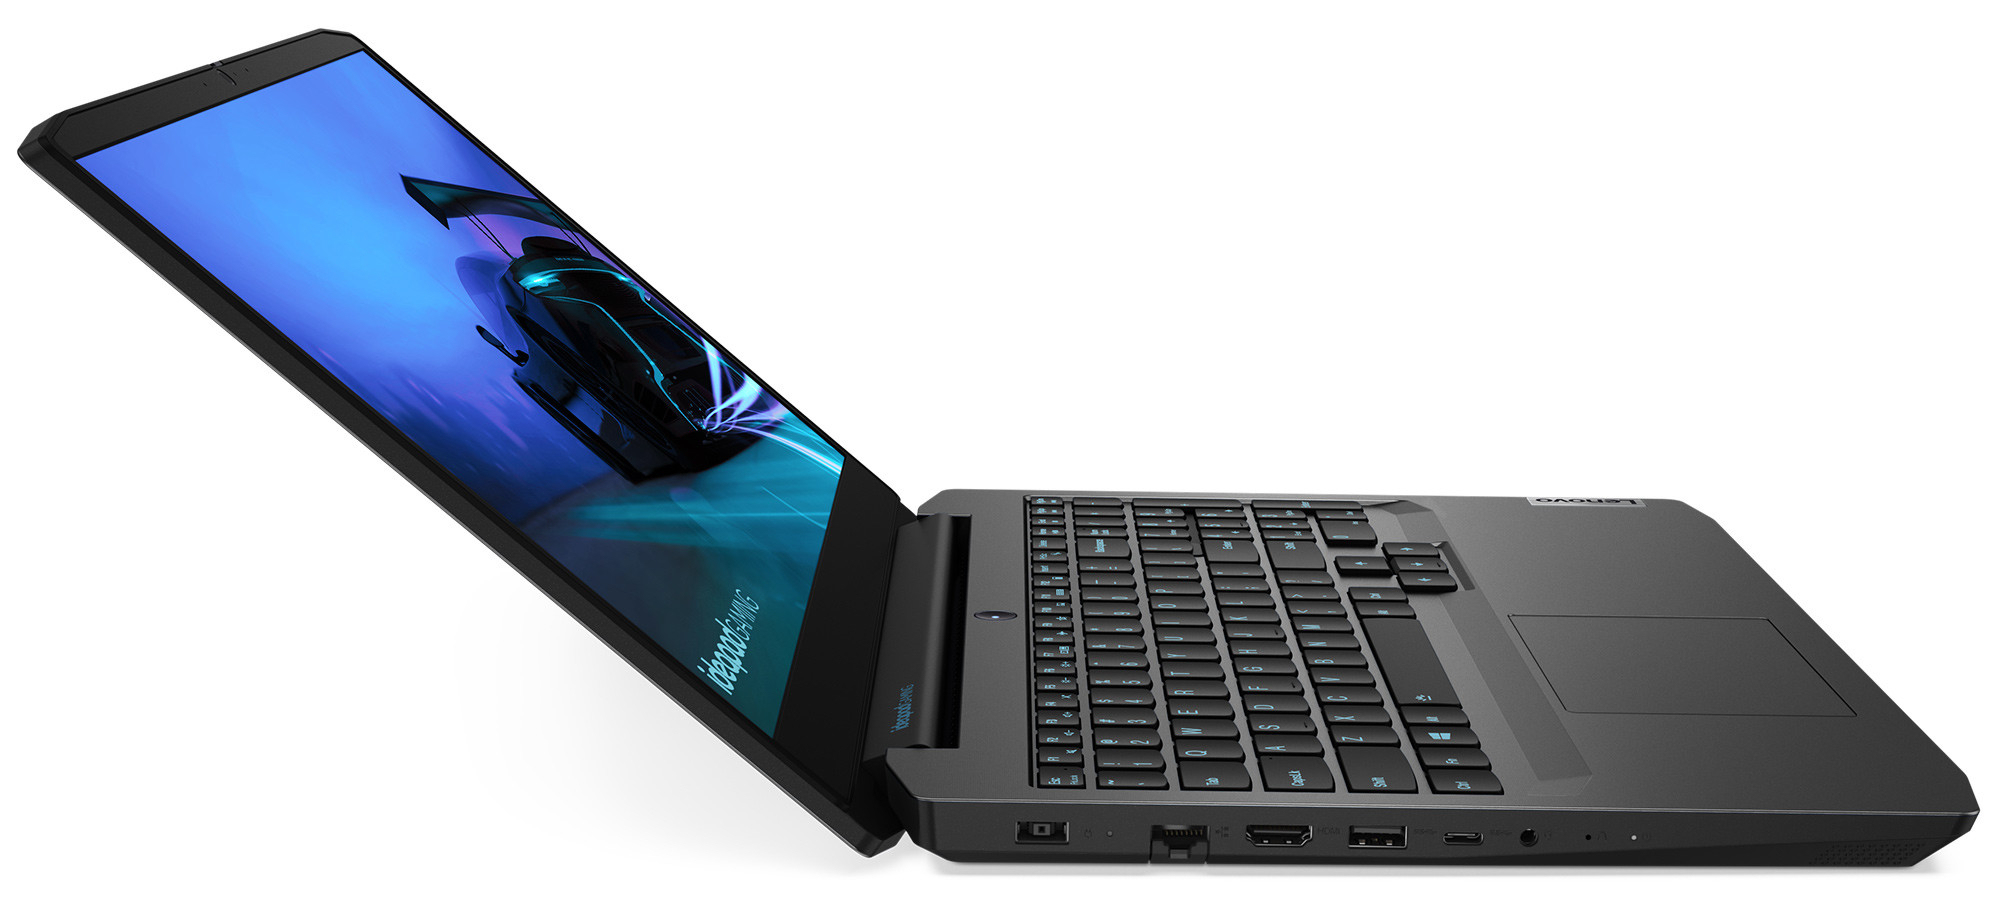
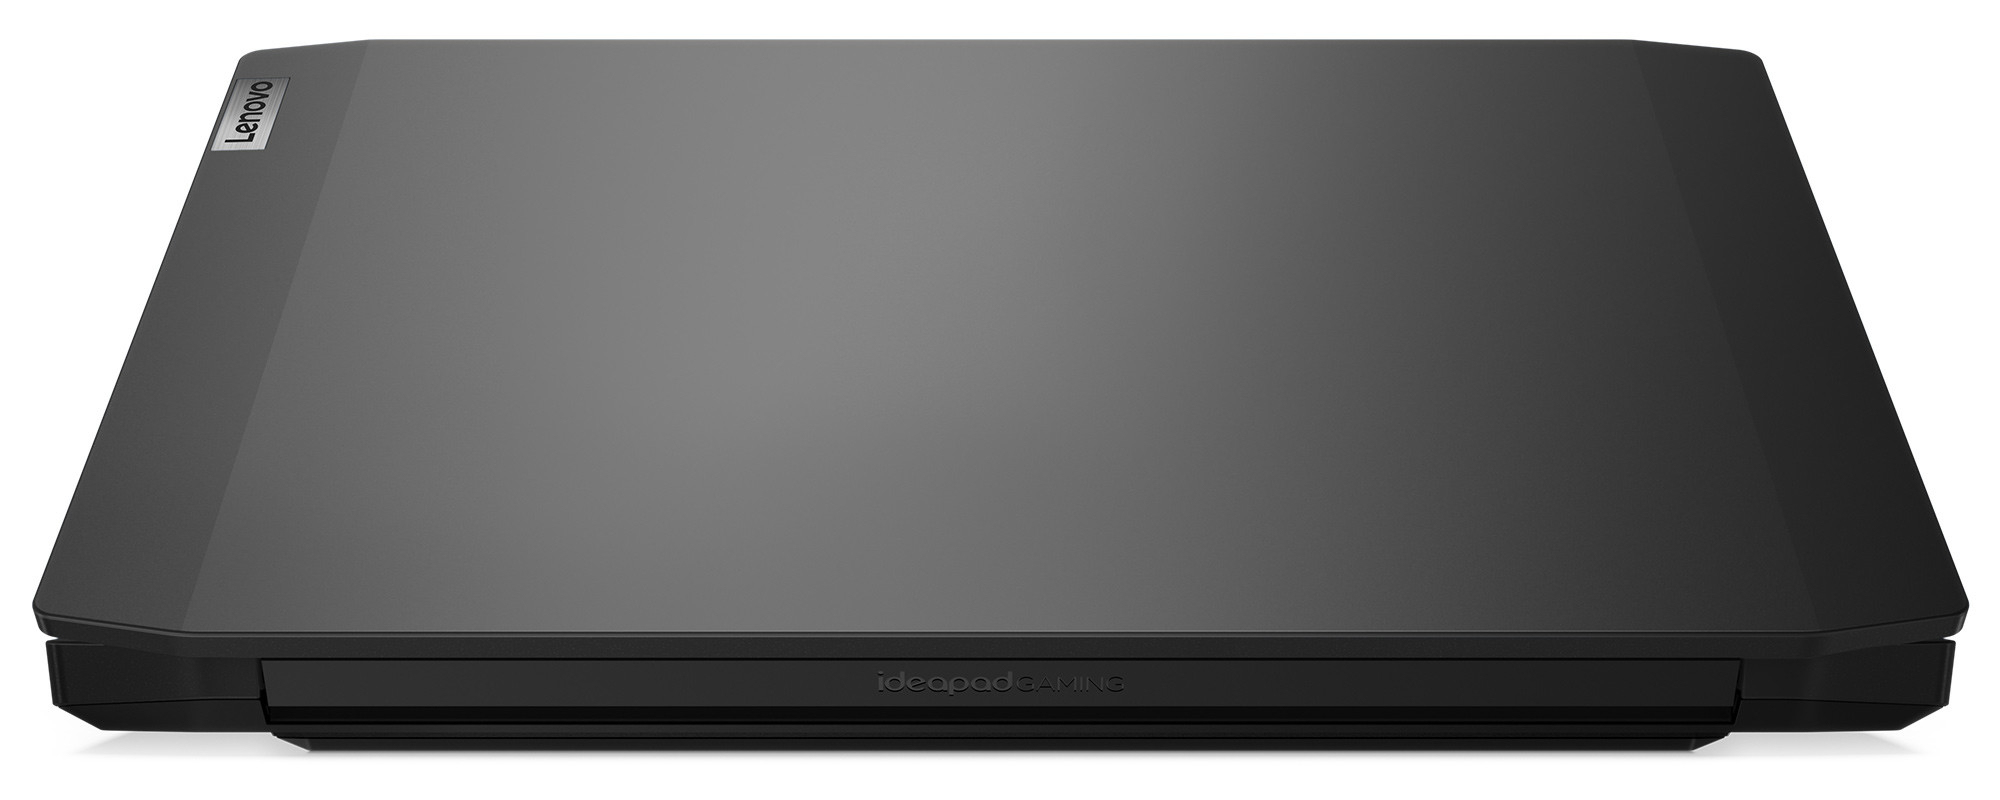
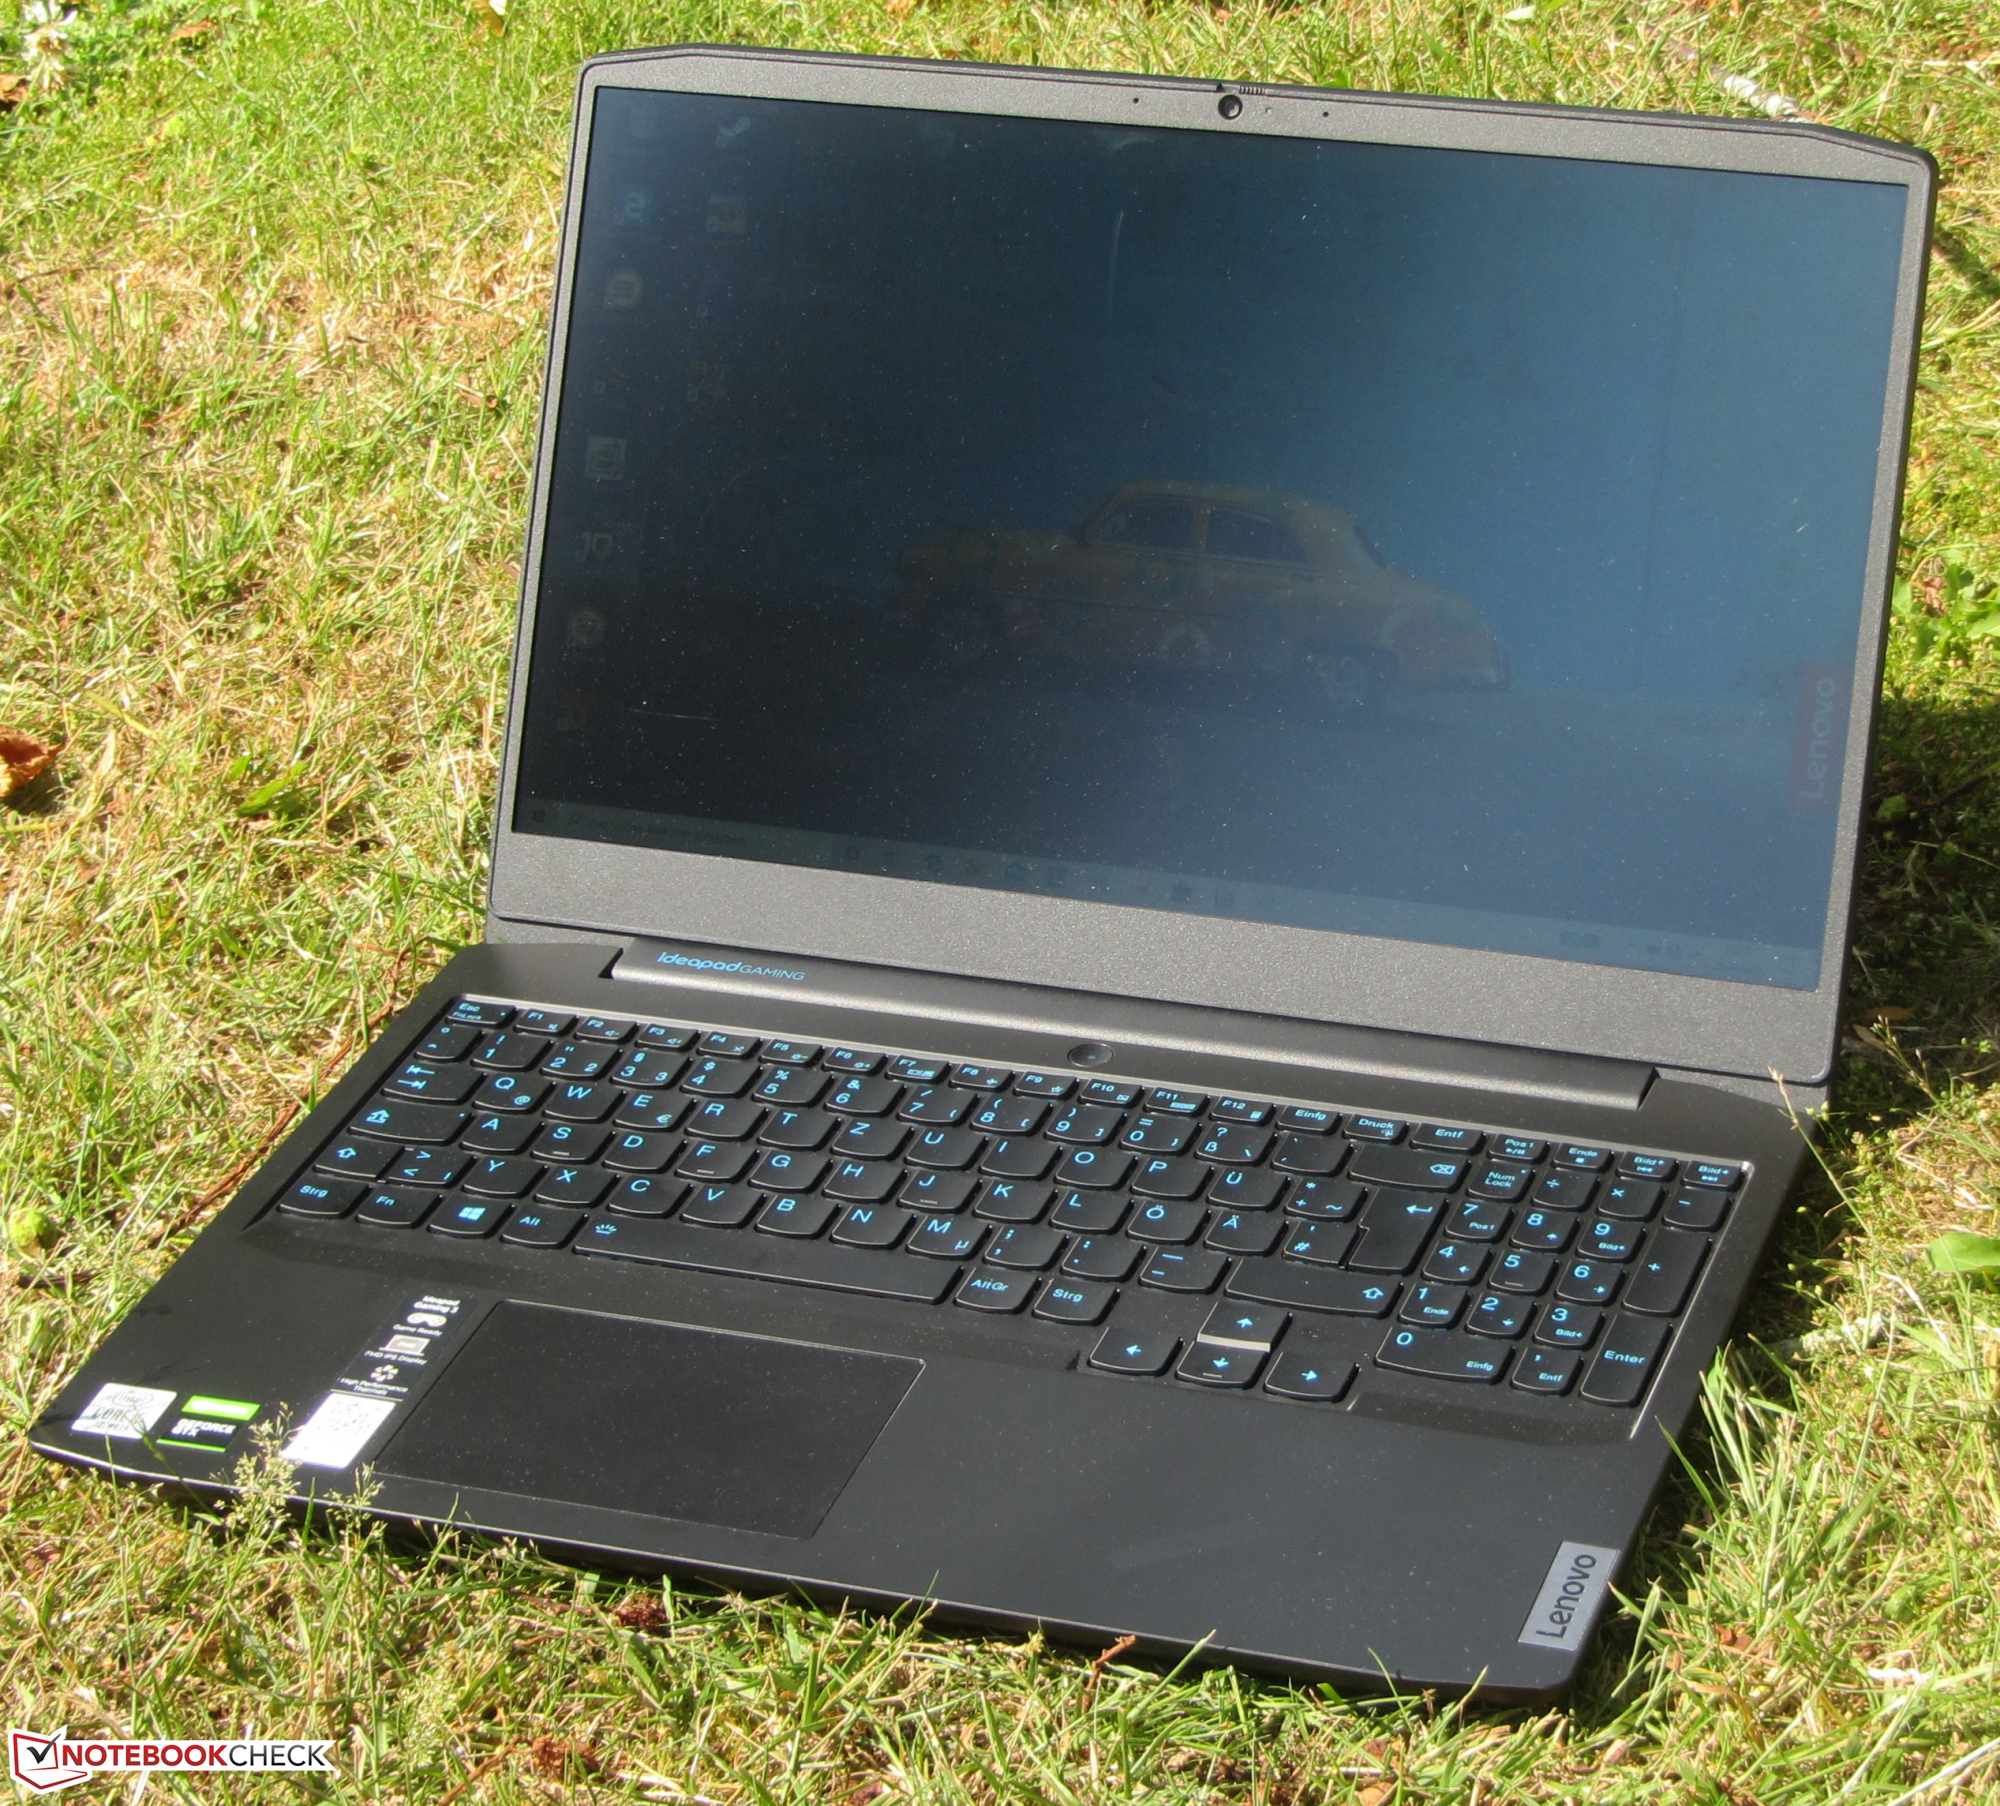
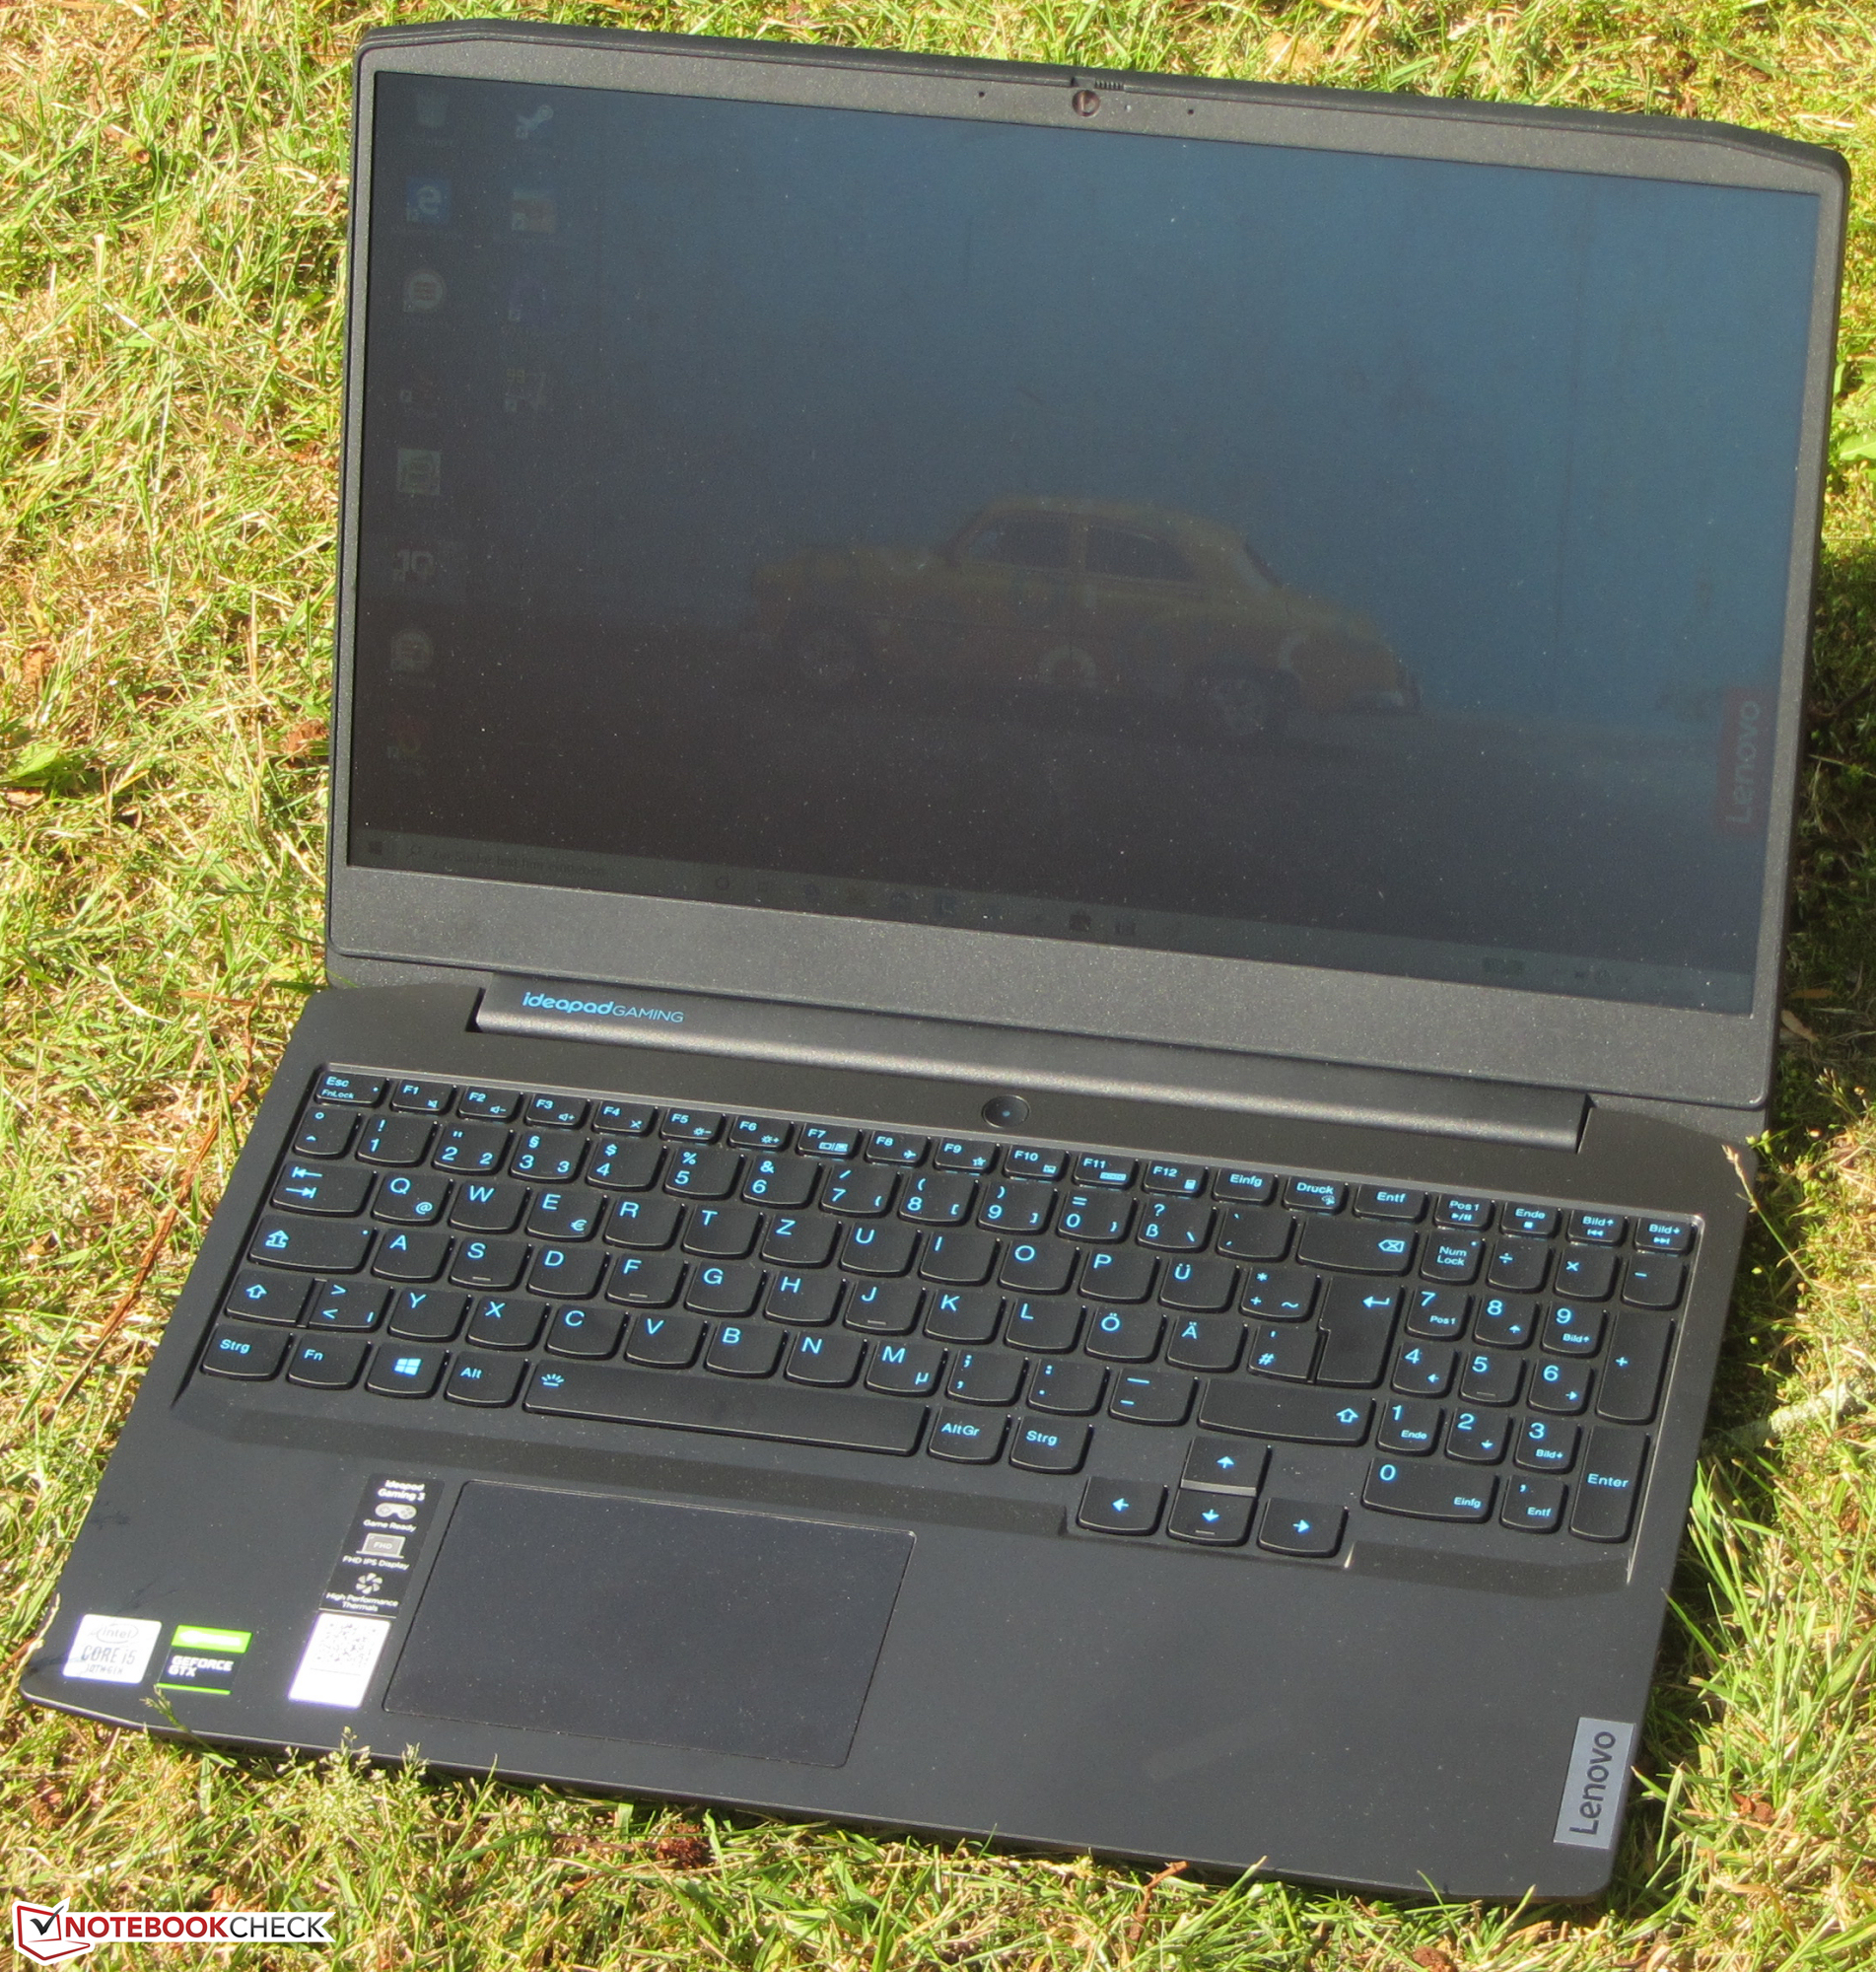
Case - A plastic chassis for the IdeaPad Gaming
The case of the IdeaPad Gaming is made of black plastic ("Onyx Black") throughout. Lenovo uses smooth surfaces on the base unit's top side and the lid's back. The surfaces of the bottom cover and the display bezel are roughened. The battery is firmly built into the device. Furthermore, the gaming laptop doesn't have a maintenance hatch. In order to access the inside, the bottom cover must be removed. More about this later.
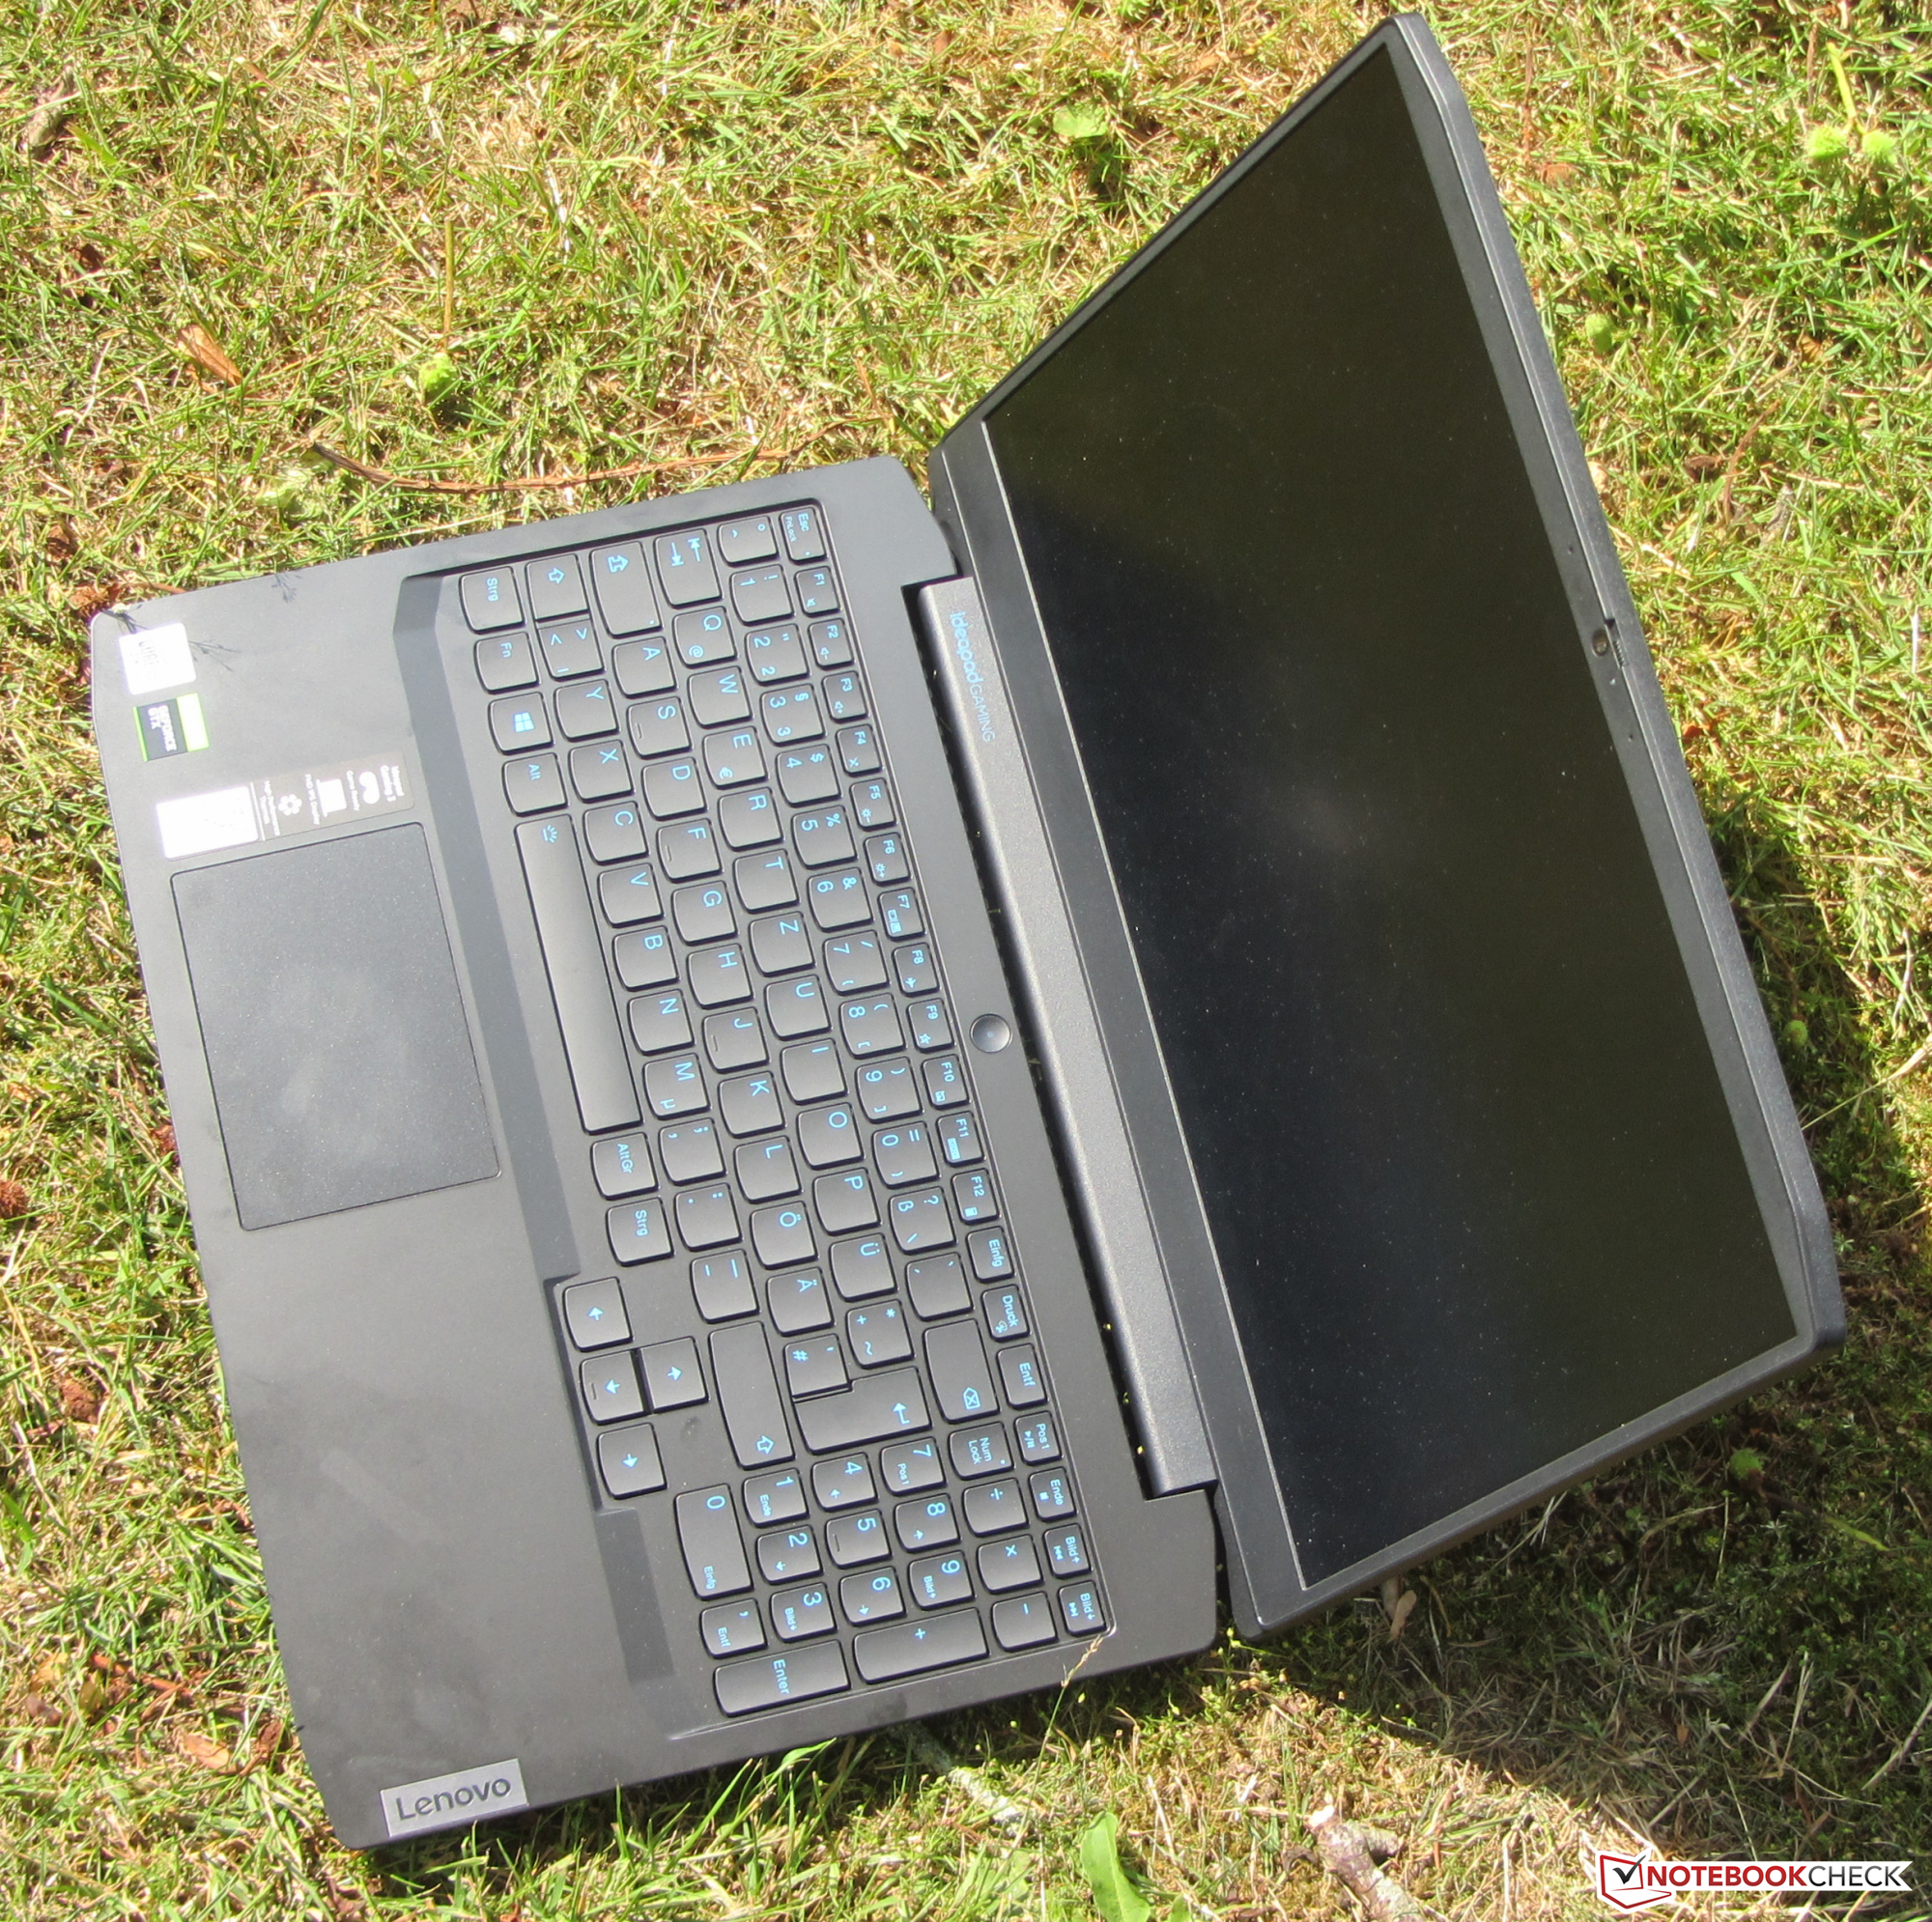
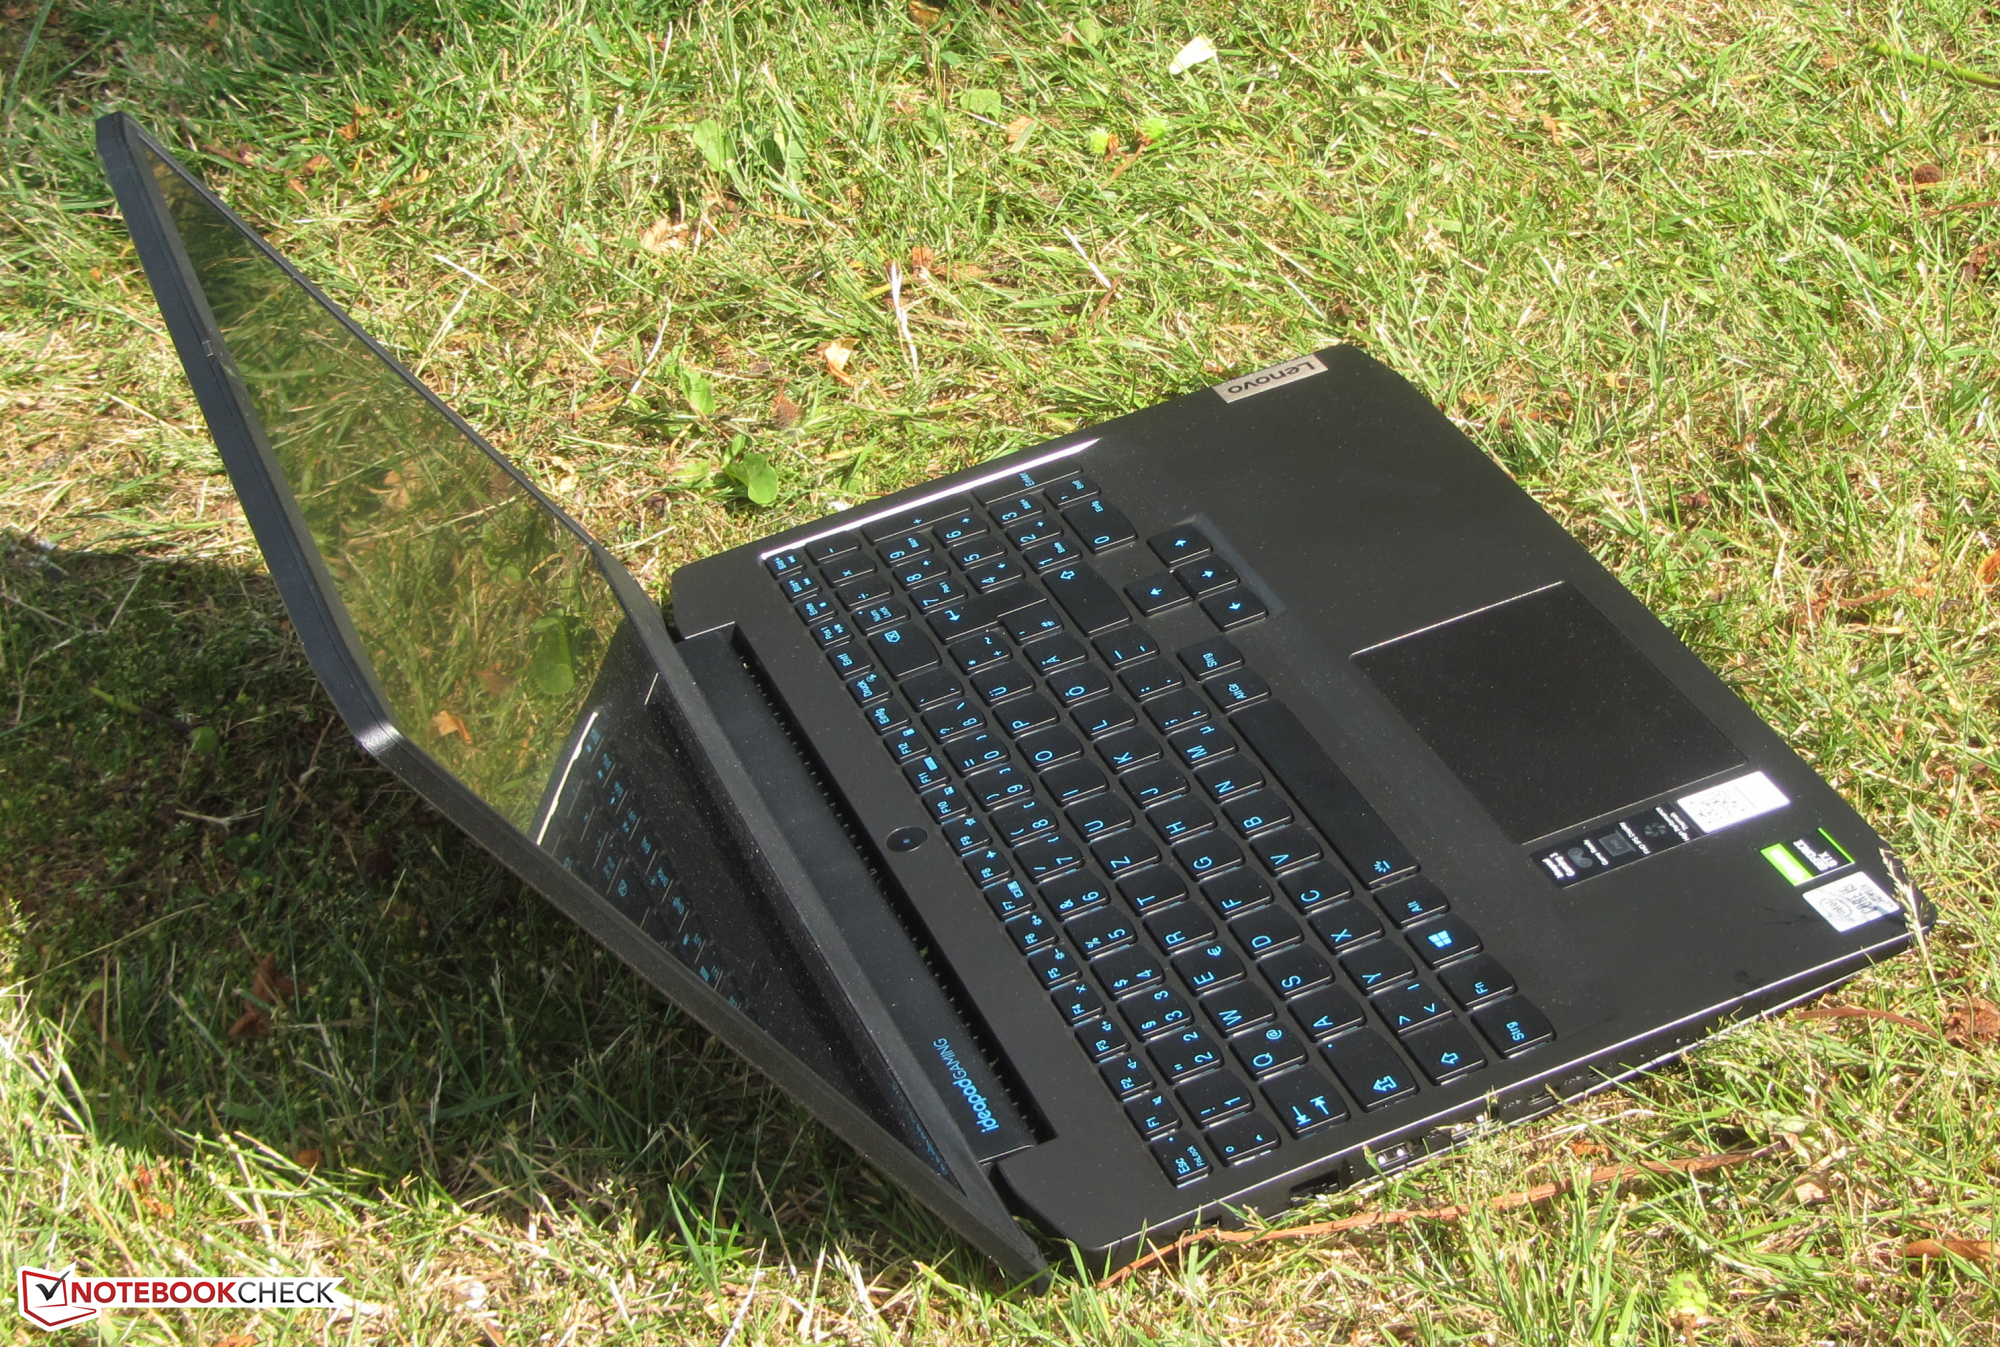
There's nothing to criticize when it comes to the workmanship. The gap dimensions are in order, and sharp edges aren't noticeable. The laptop doesn't reveal any serious stability deficiencies. The base unit can be twisted a bit, but this behavior is still just within the limits. The same applies to the lid. Exerting pressure on the lid's back leads to changes in the image in a few places. The hinges hold the lid firmly in position. Moreover, opening the lid with one hand is possible.
The Lenovo computer is largely on par with most competitors in terms of dimensions and weight. The Dell G3 3590 (2.5 kg) and the MSI GF63 Thin 9SC (1.8 kg) represent outliers at the top and bottom, respectively.
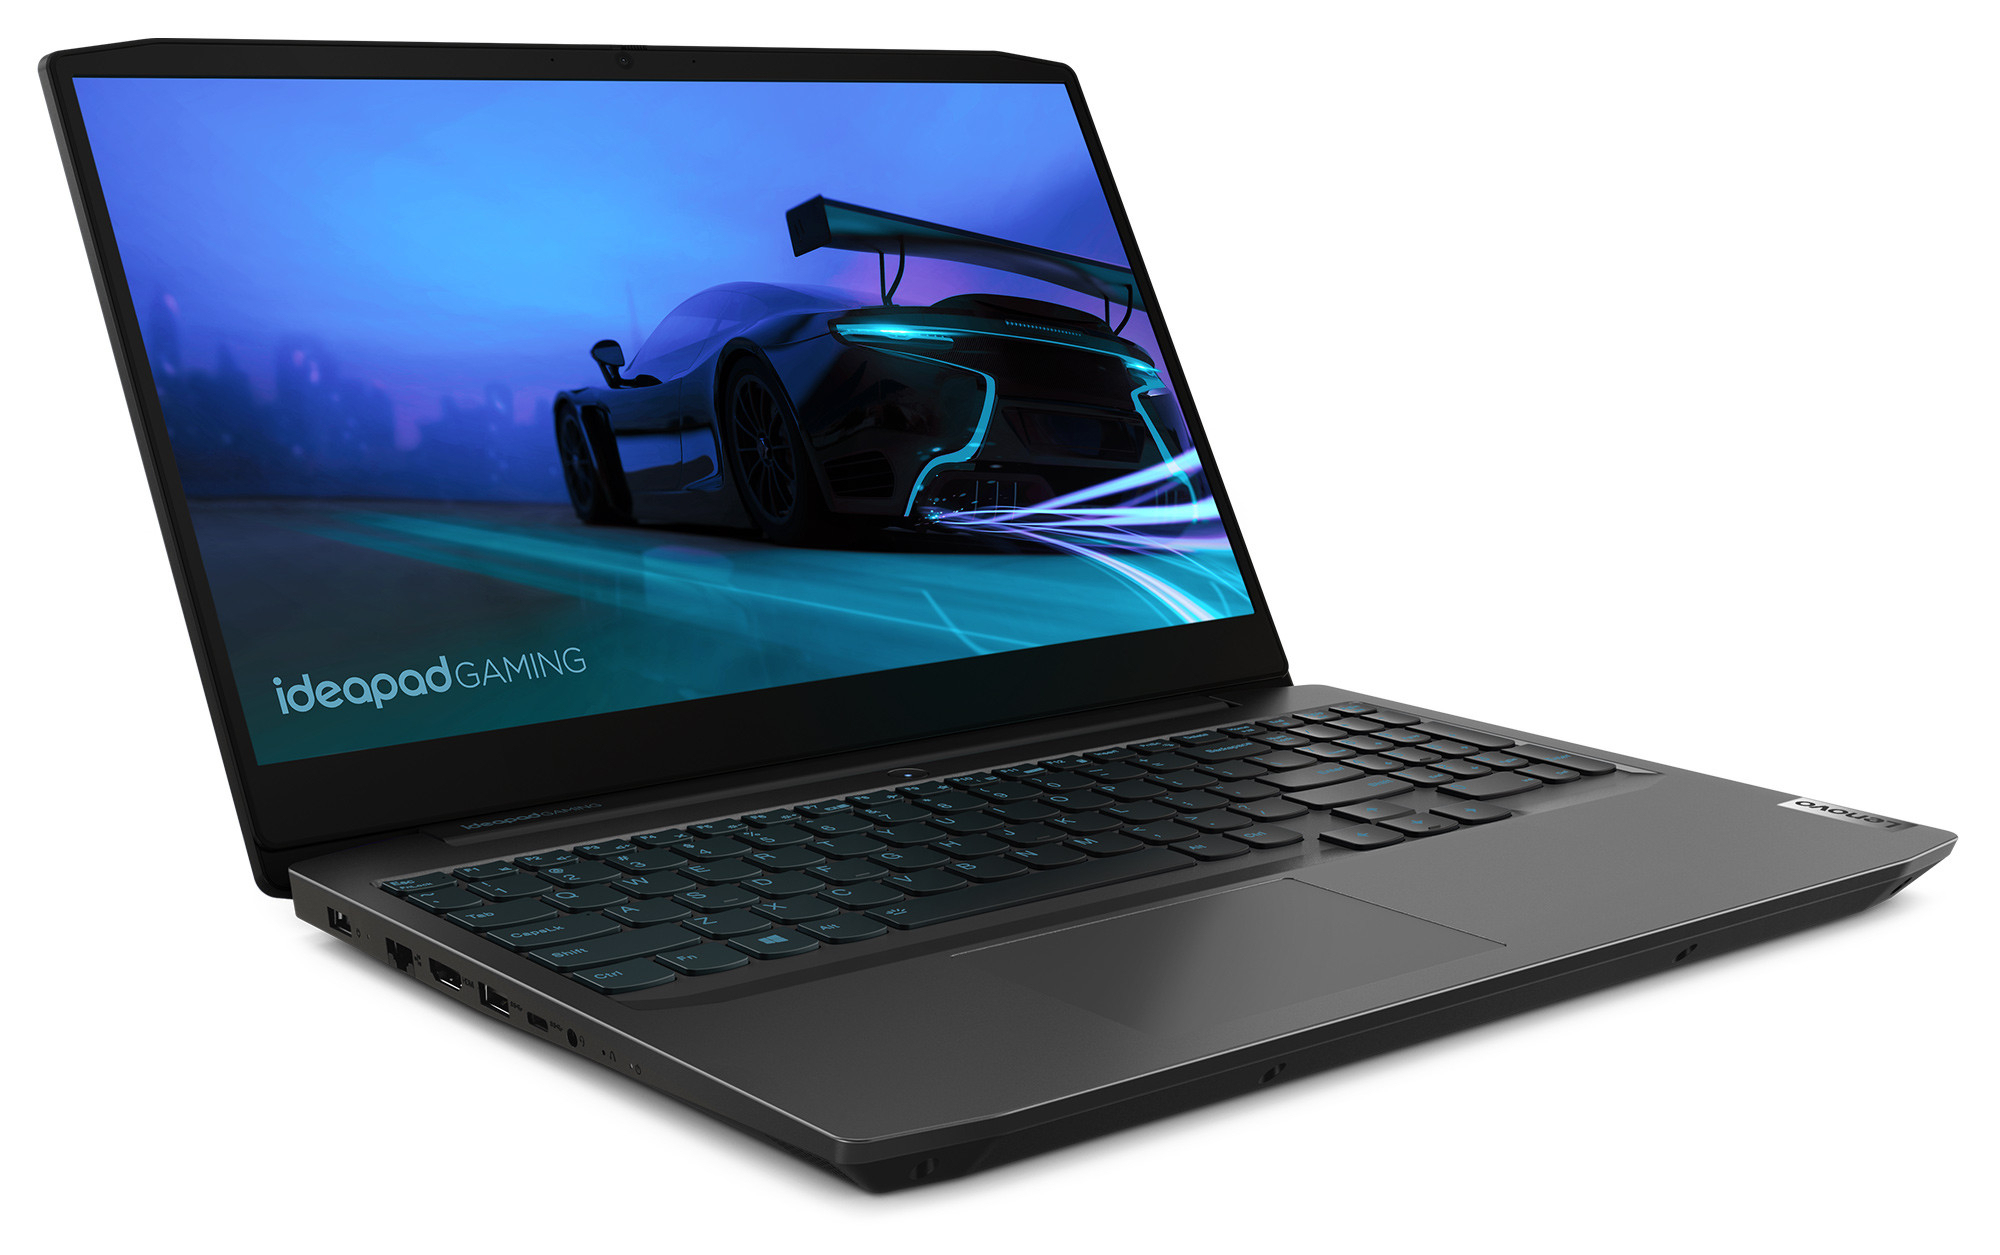
Connectivity - The Lenovo laptop doesn't offer Thunderbolt 3
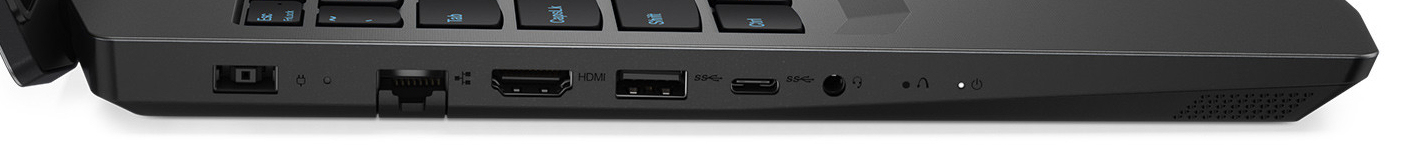
The Lenovo laptop doesn't have any surprises in store in terms of the port configuration. All three USB ports (2x Type-A, 1x Type-C) work according to the USB 3.2 Gen 1 standard. The Type-C port doesn't offer a DisplayPort via USB C functionality. As a result, the HDMI connection is the only video output available. In addition, there is no memory card reader. The ports are located in the rear sections of the right and left sides. The areas next to the palm rest remain free of cables.

Communication
The IdeaPad doesn't offer a Wi-Fi 6 chip. The built-in WLAN chip (Intel Wireless-AC 9560) only supports Wi-Fi 5 (i.e. 802.11ac). The transfer speeds determined under optimal conditions (no other WLAN devices nearby, short distance between laptop and server PC) are good. Wired network connections are handled by a Gigabit Ethernet controller from Realtek's RTL8168/8111 family; the controller performs its tasks without issues.
Webcam
Like most webcams, the model built into the IdeaPad (0.9 MP; max. 1280x720 pixels) doesn't produce convincing images. In addition, there are shortcomings in terms of color accuracy. The target (Delta E less than 3) is clearly missed with a deviation of almost 19.


Accessories
The laptop comes with the usual documents: A quick-start guide and warranty information.
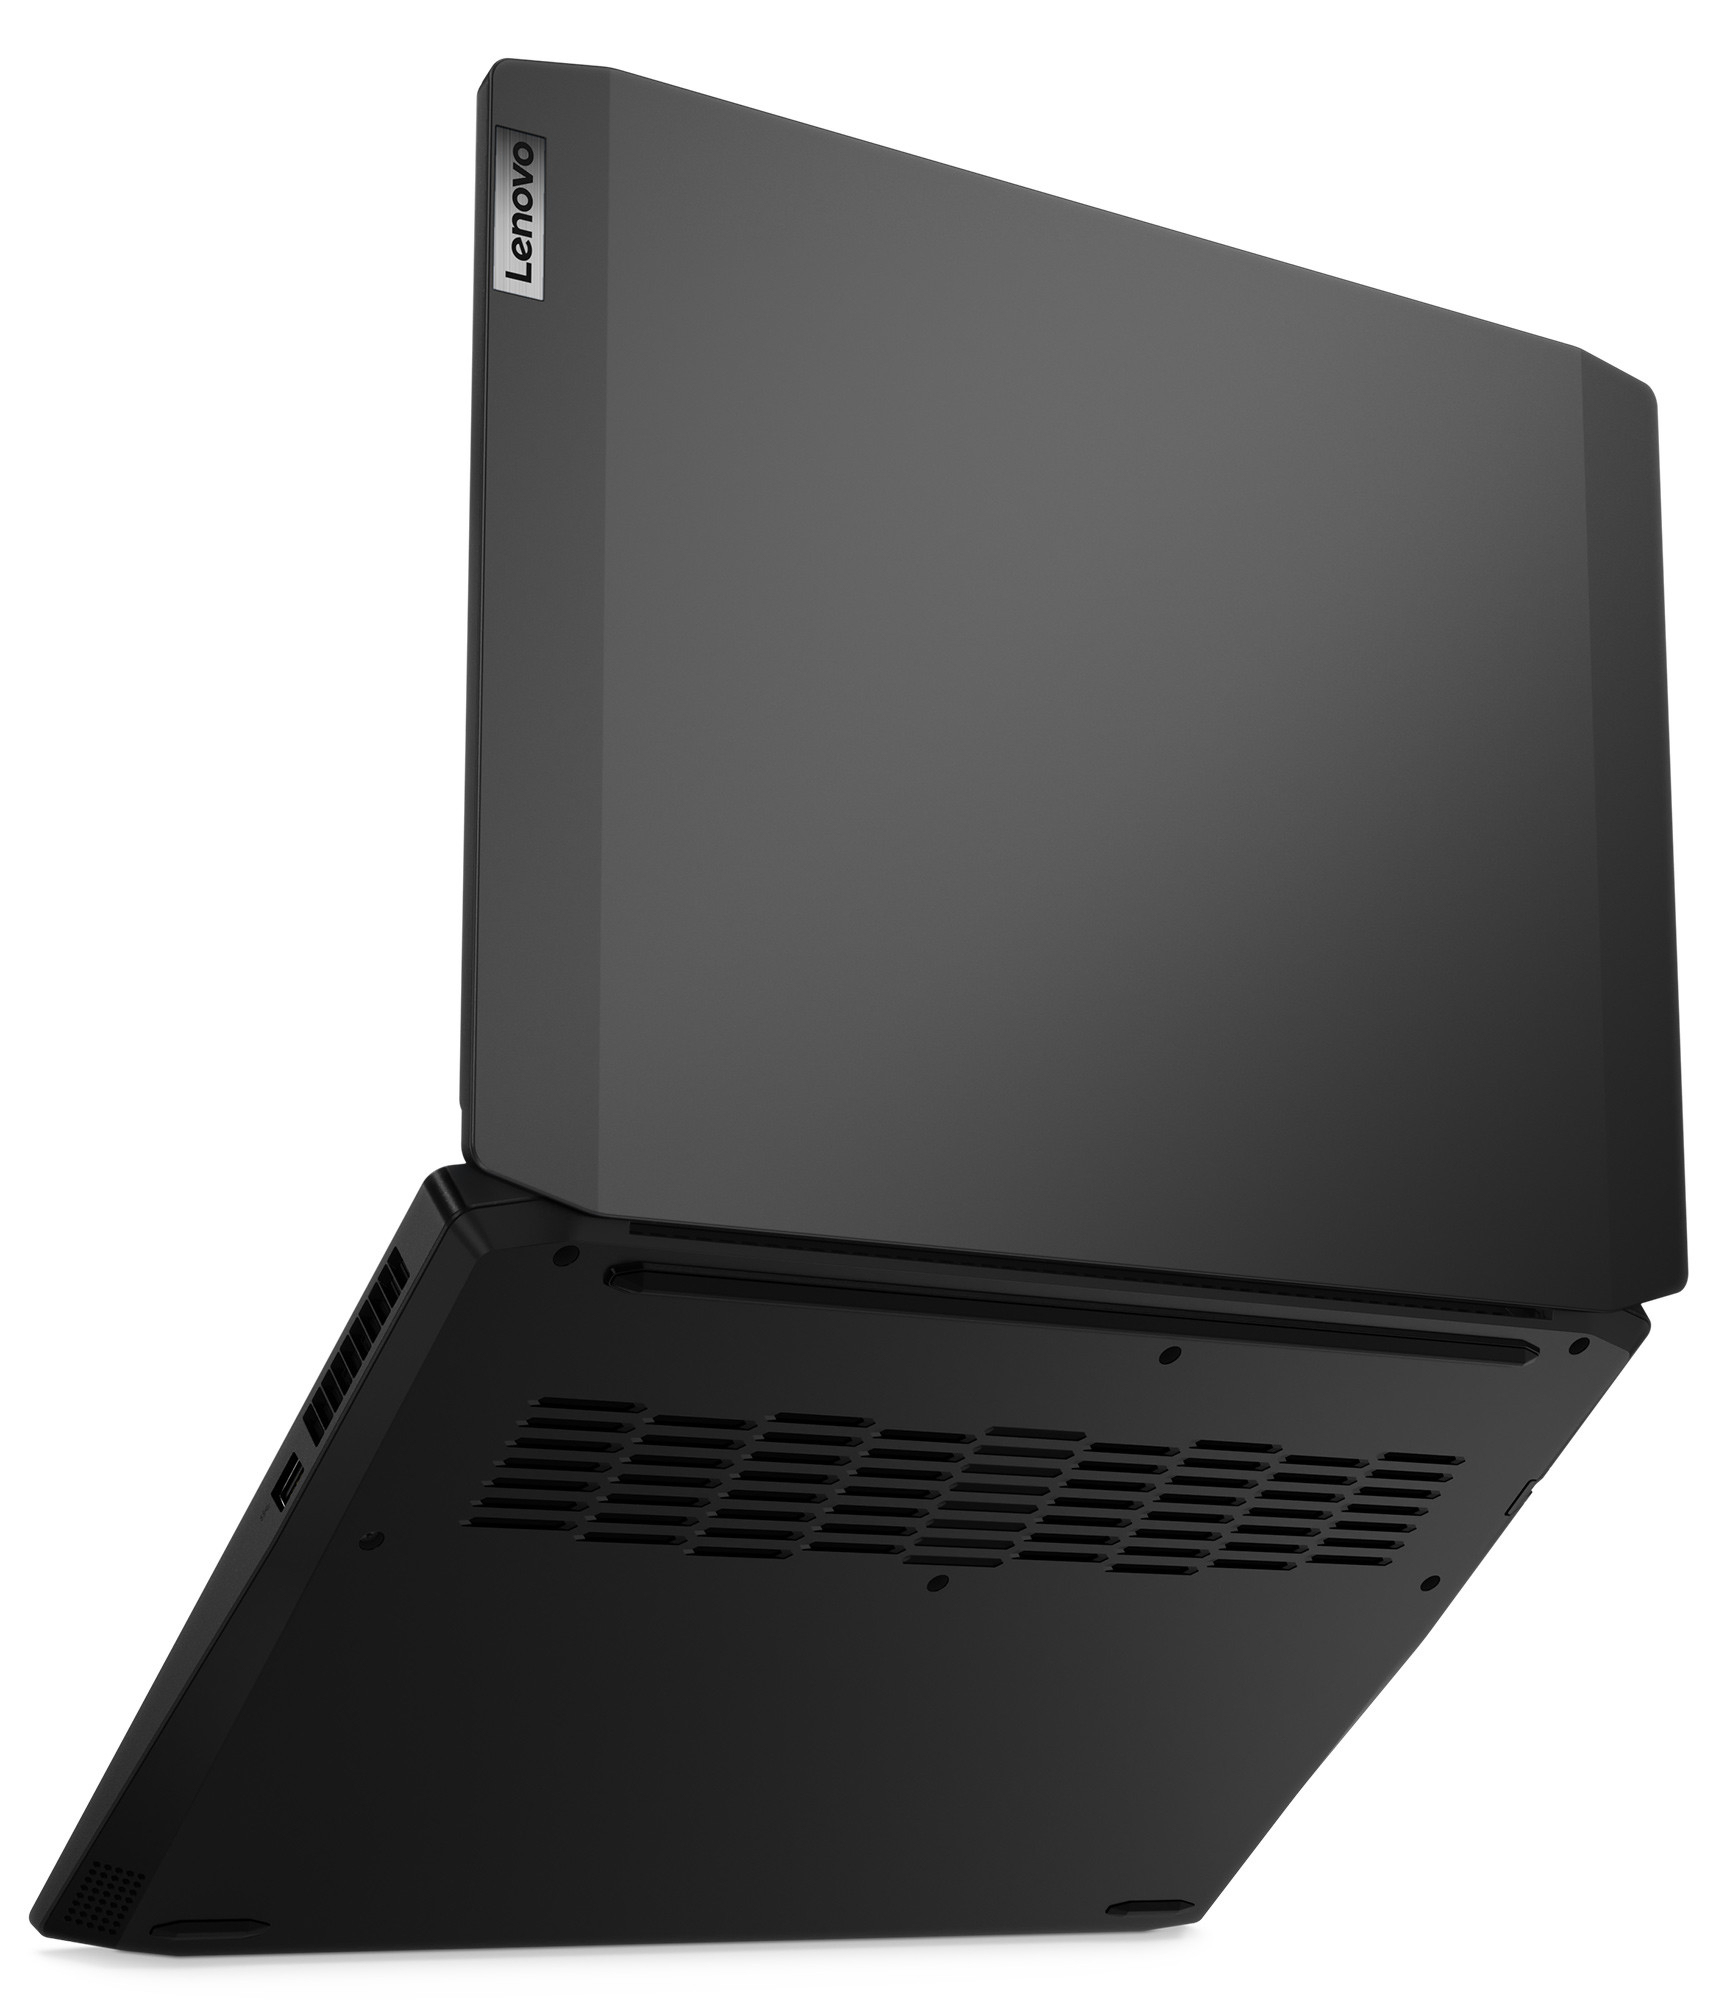
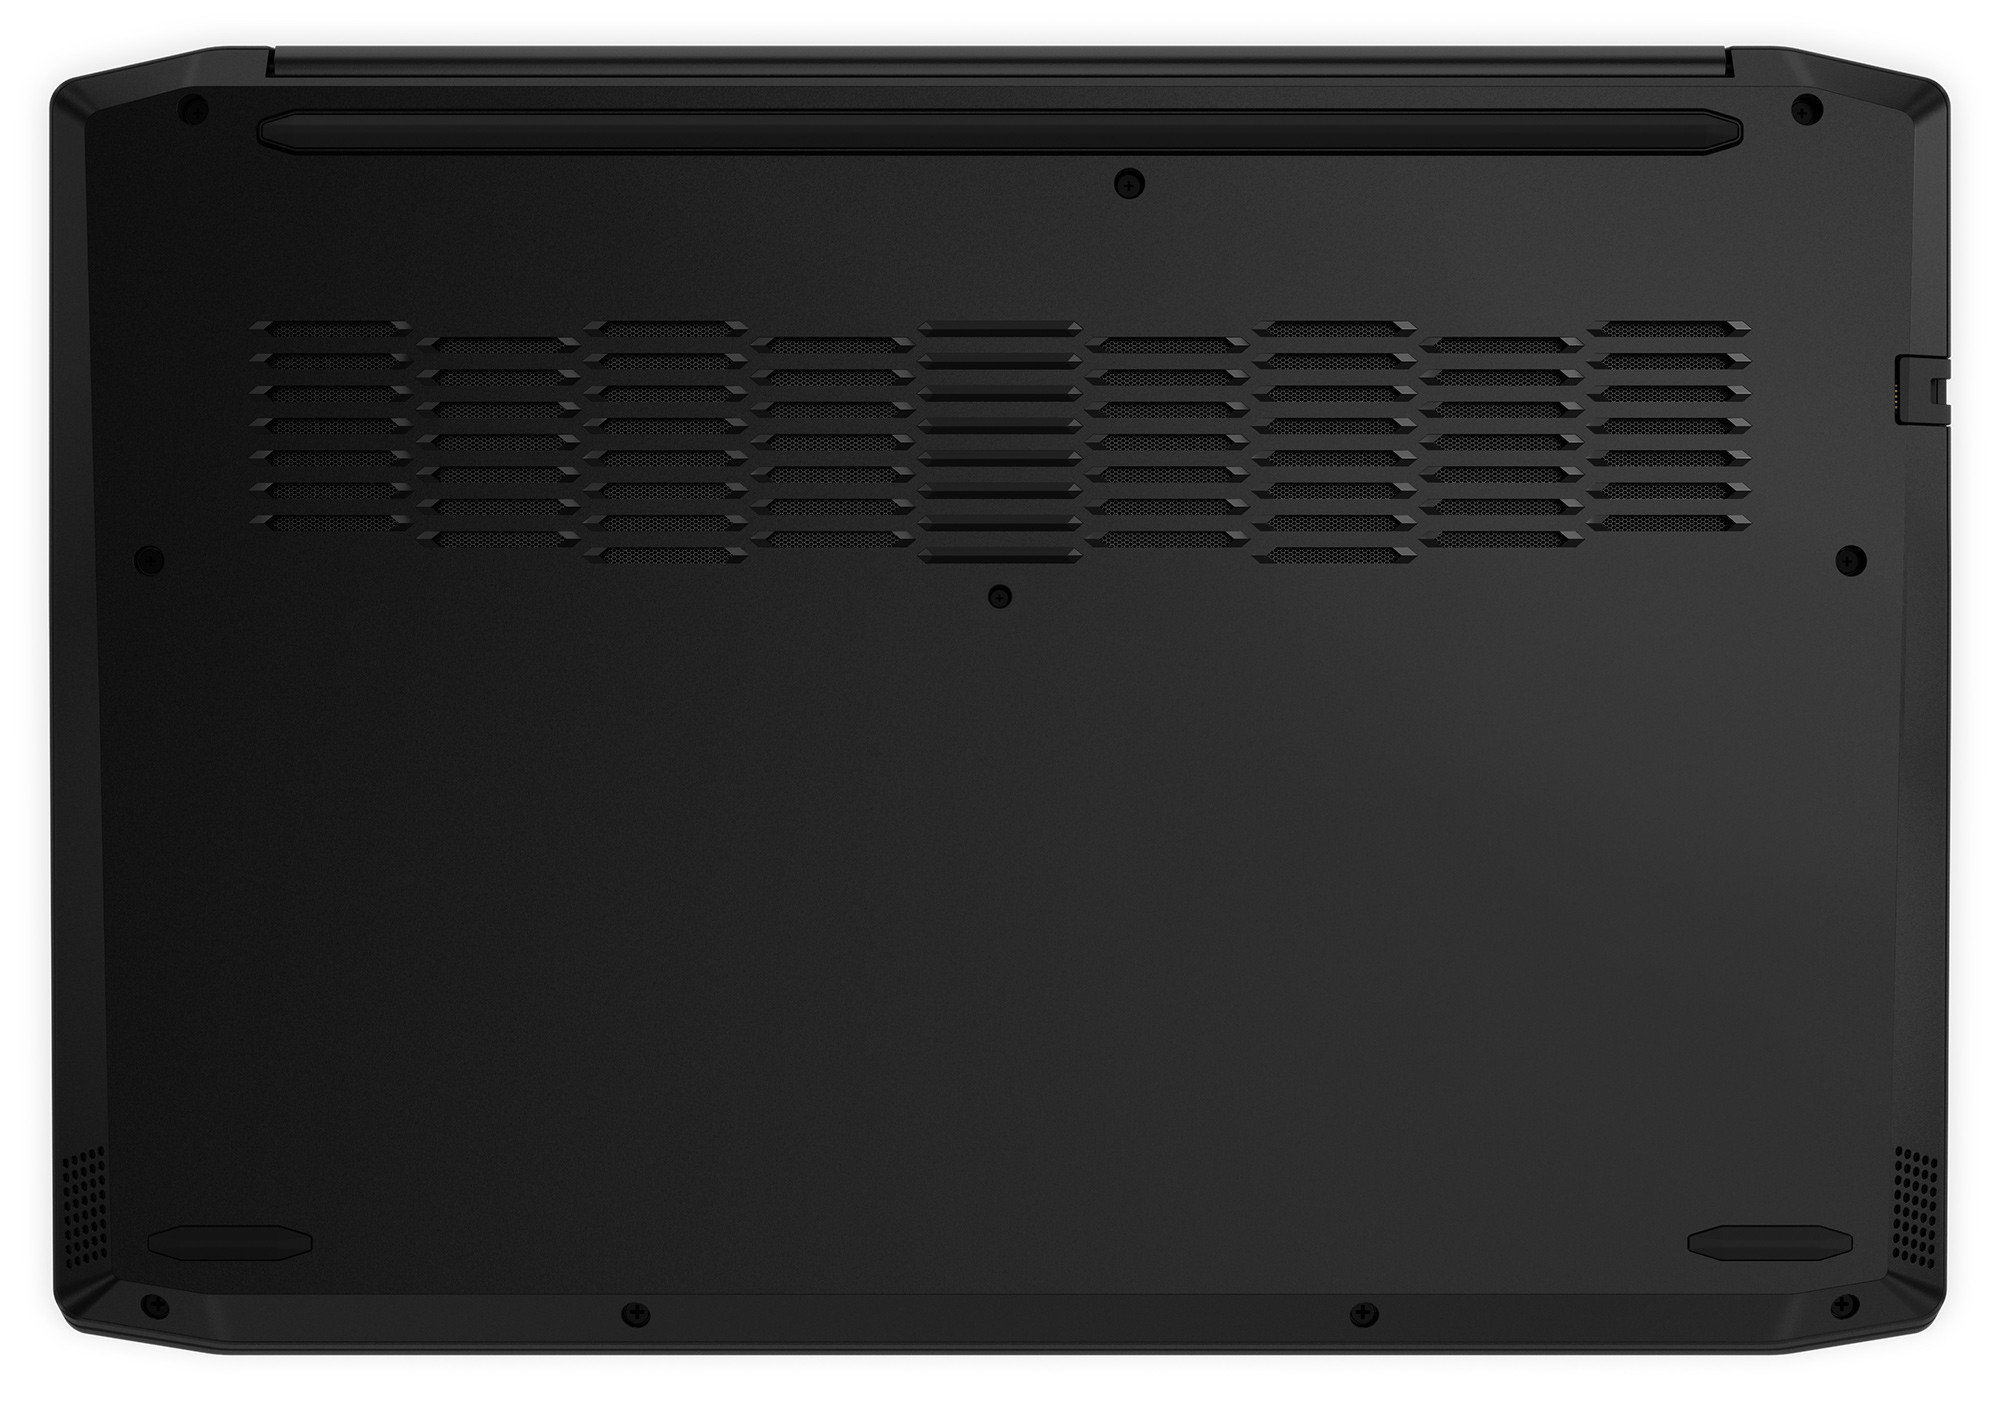
Maintenance
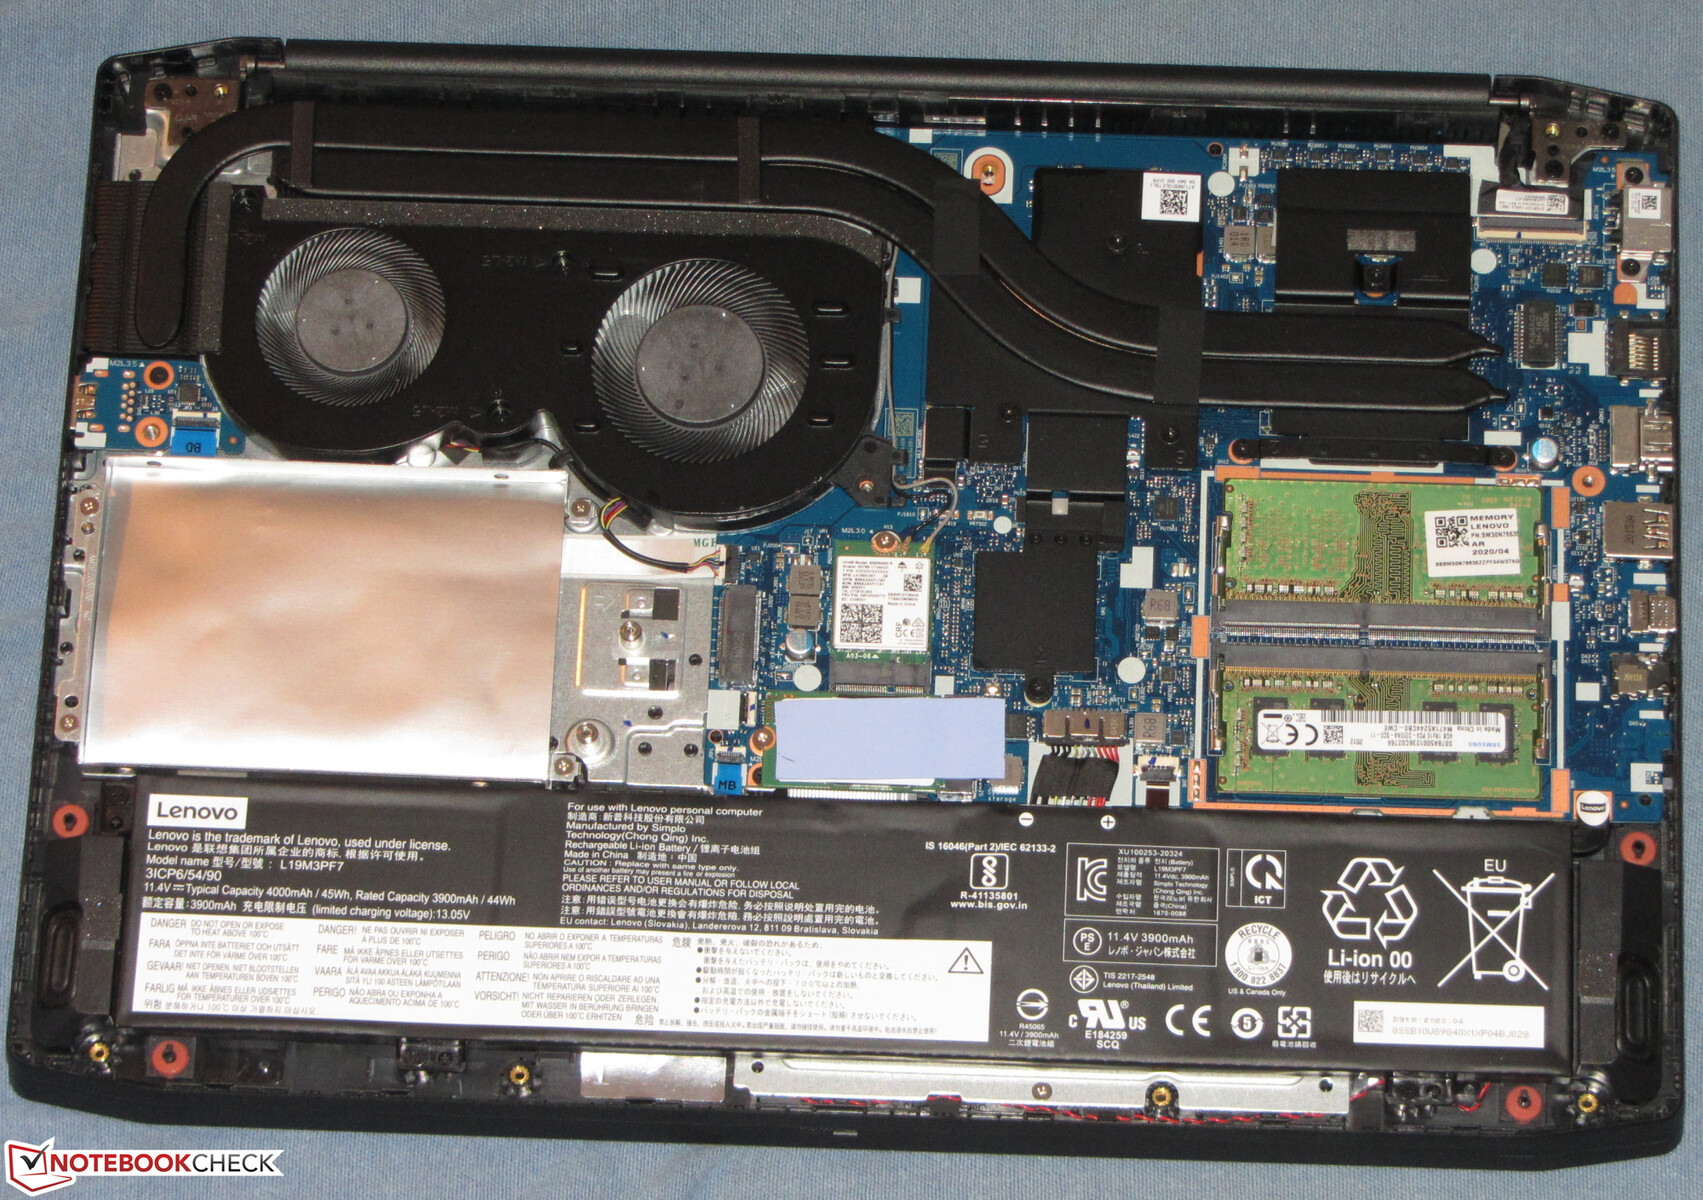
Lenovo didn't include a maintenance hatch in the gaming laptop. In order to get to the inside, the bottom cover needs to be detached. All the screws on the bottom of the device have to be removed for this. The bottom cover can then be lifted with the help of a flat spatula or a grout finishing tool.
Warranty
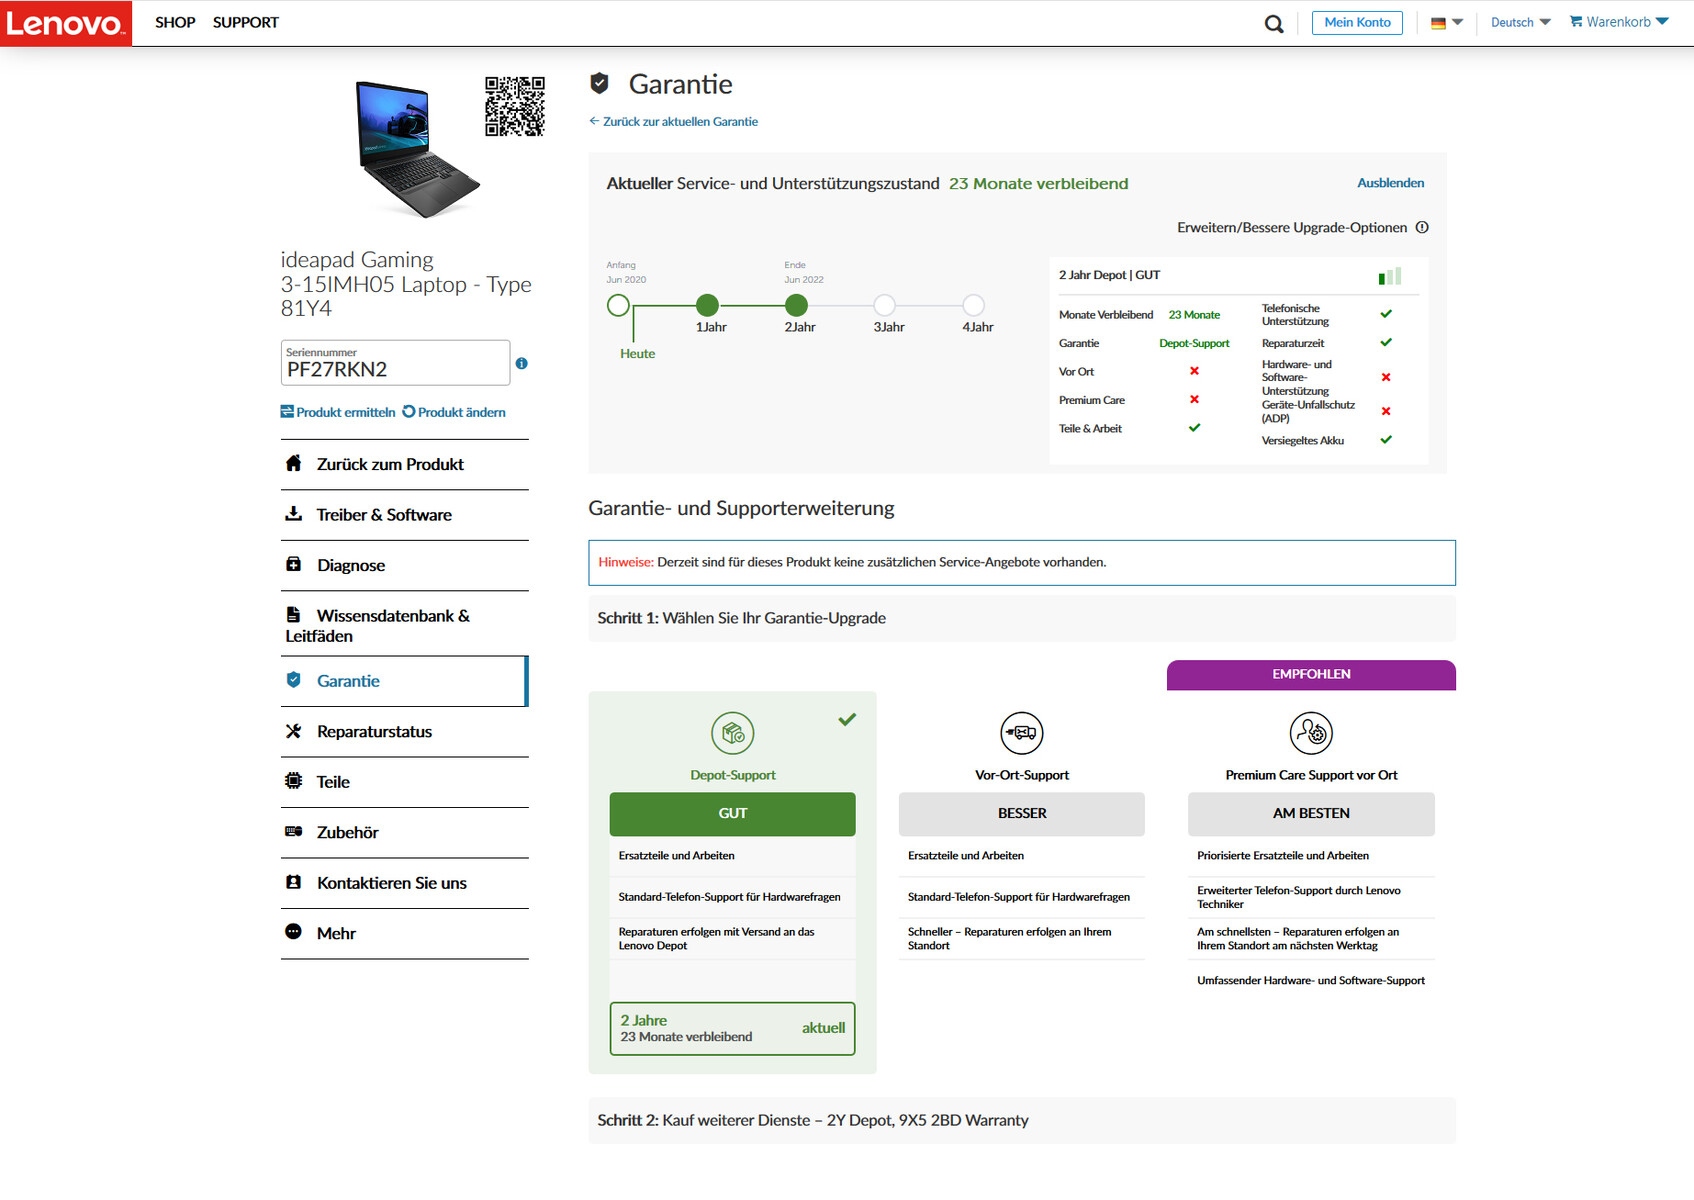
Lenovo honors the 15.6-incher with a two-year warranty. Warranty extensions are not available at the time of conducting our review.
Input devices - Lenovo laptop with blue keyboard backlighting
Keyboard
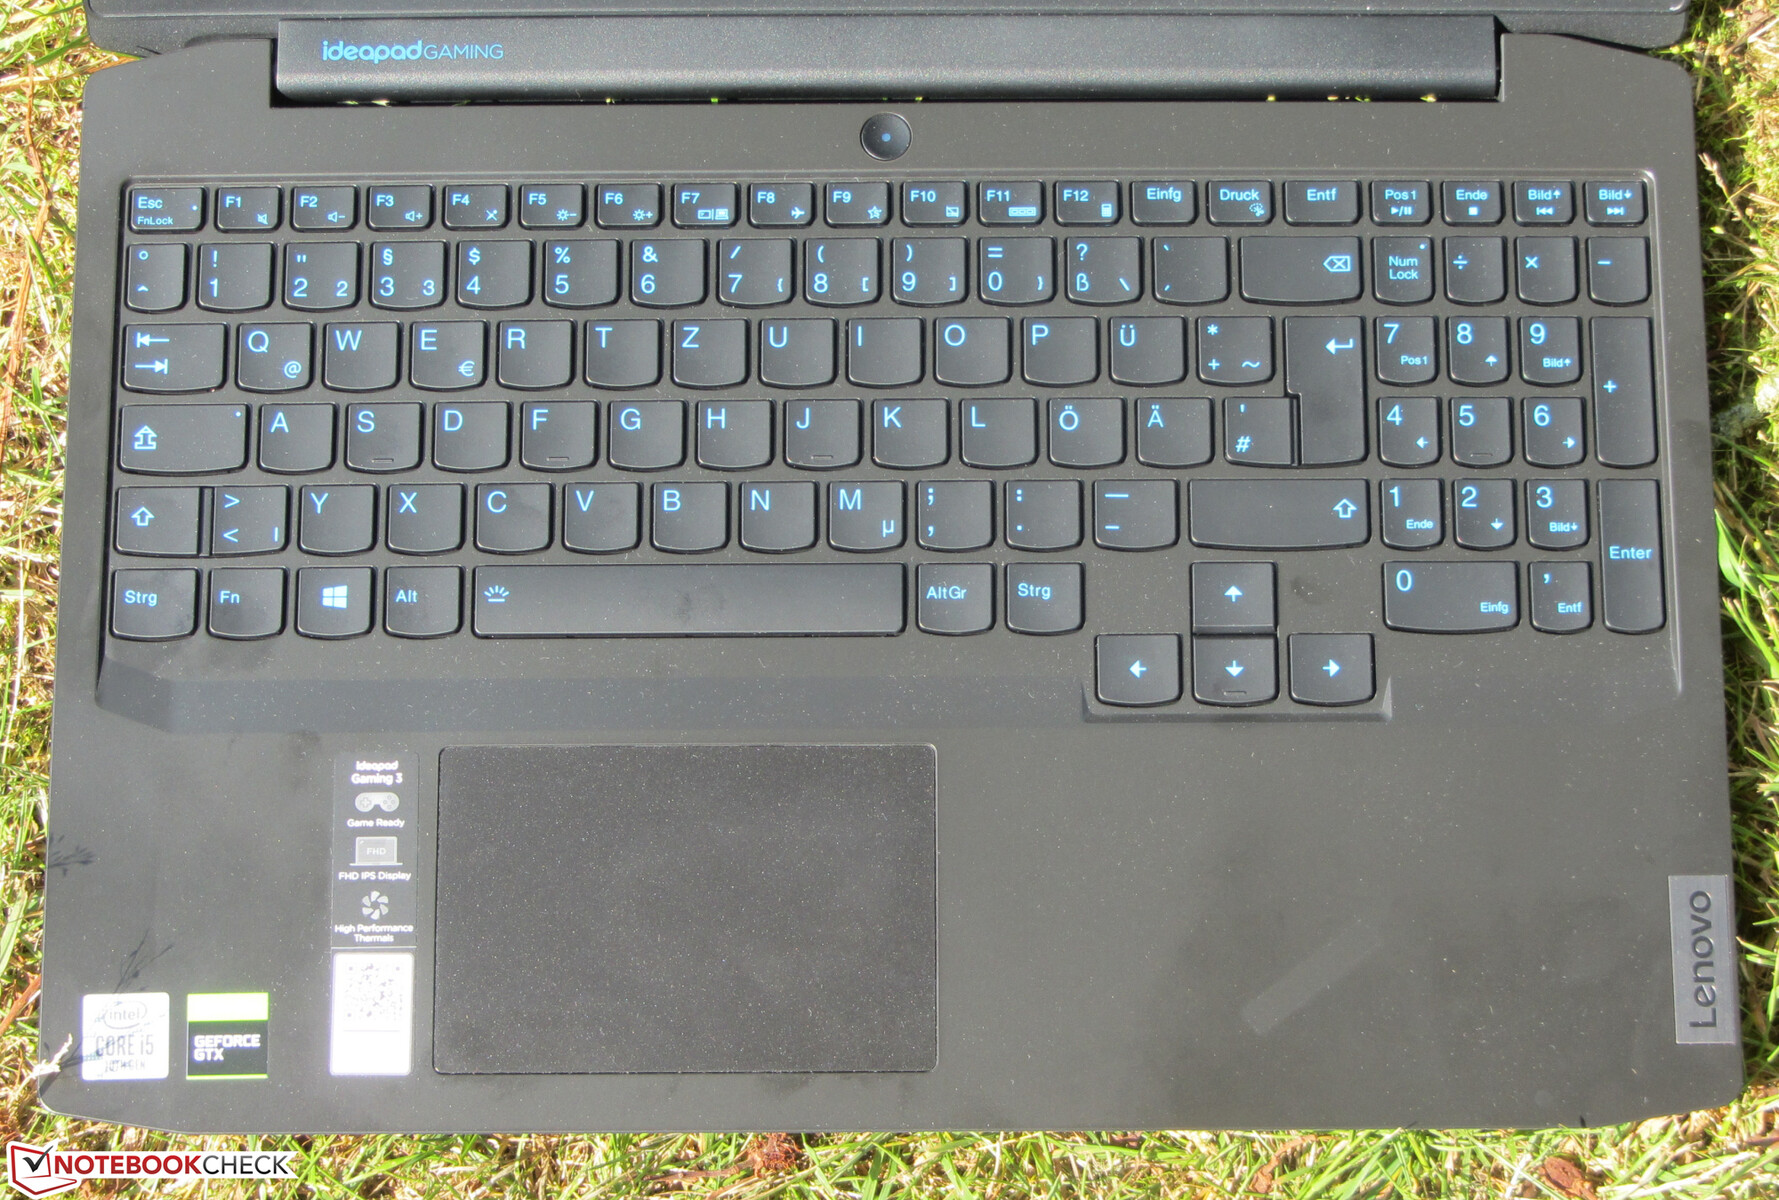
The IdeaPad has a backlit chiclet keyboard on board. The concave keys have a medium travel and a very clear pressure point. We really like the crisp resistance provided by the keys. The number pad looks squashed in because its keys don't have the width of the main field's keys. The blue key backlight (two brightness levels) is controlled by a function key. Overall, Lenovo delivers a keyboard suitable for everyday use here.
Touchpad
The multi-touch capable ClickPad occupies an area of approximately 10.6 x 7 cm. As a result, a lot of space is available for the use of gesture control. The smooth pad surface makes it easy for the fingers to glide. In addition, the pad also reacts to input in the corners. It has a short travel and a clear pressure point.
Display - Gaming laptop with a 120 Hz IPS display
The 15.6-inch display in the Lenovo computer works at a native resolution of 1920x1080 pixels. While the maximum brightness (293.7 cd/m²) can still be described as acceptable, the contrast (753:1) is too low. We consider values beyond 300 cd/m² and 1000:1 to be good, respectively. The response times are in order for a 120 Hz panel. Positive: The display doesn't show any PWM flickering.


| |||||||||||||||||||||||||
Brightness Distribution: 70 %
Center on Battery: 300 cd/m²
Contrast: 753:1 (Black: 0.405 cd/m²)
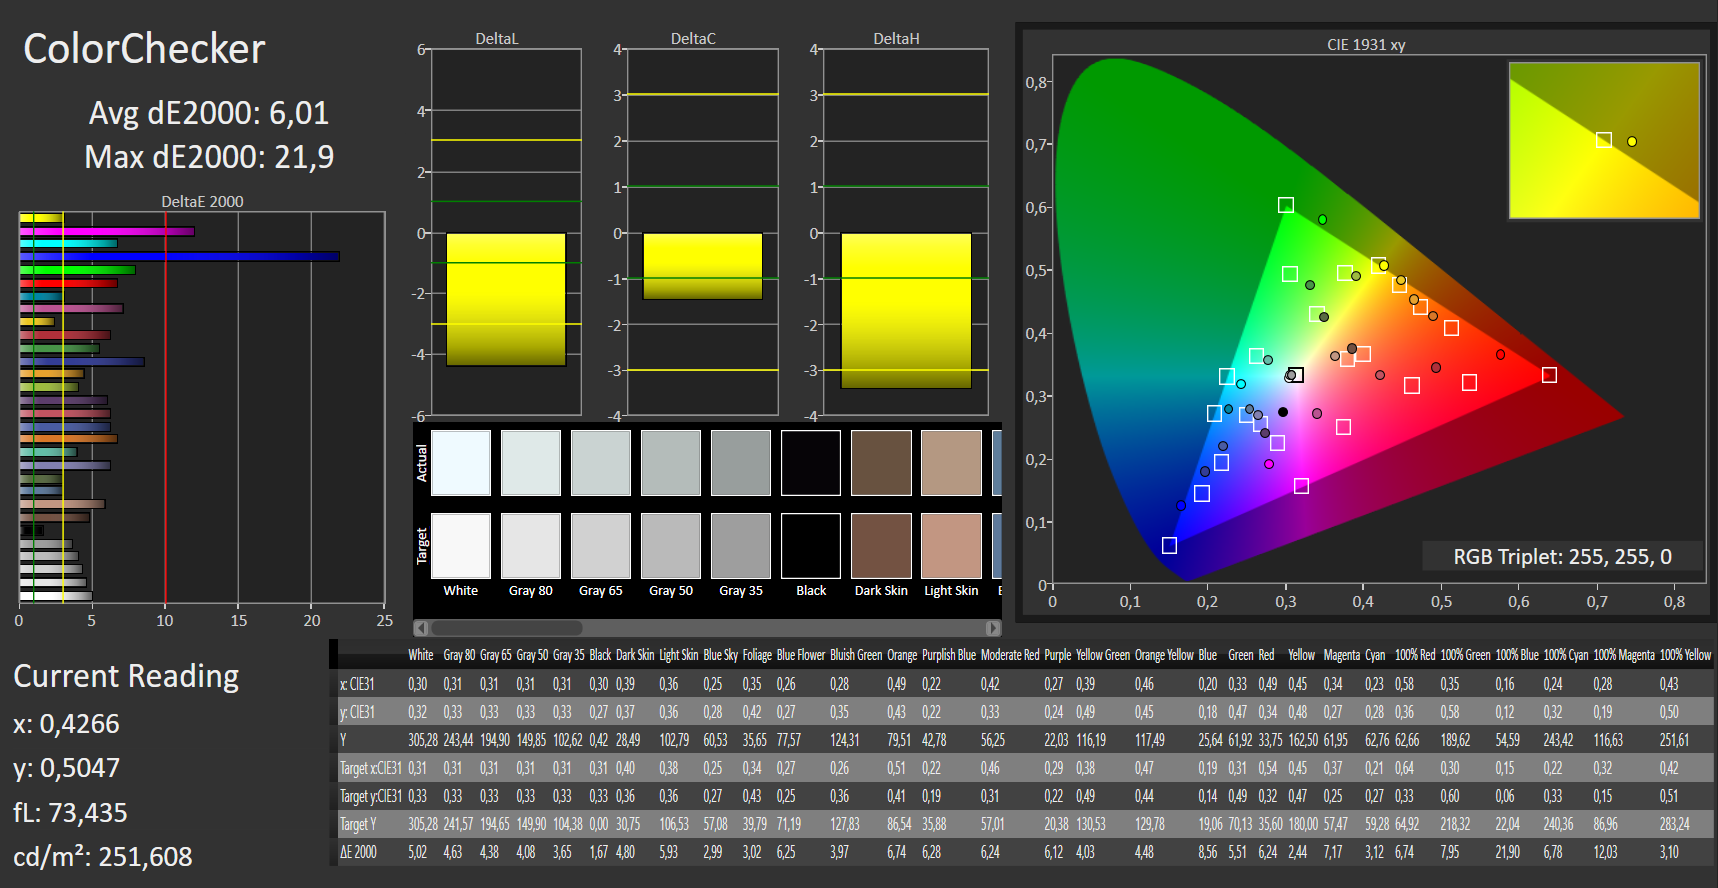
ΔE ColorChecker Calman: 6.01 | ∀{0.5-29.43 Ø4.71}
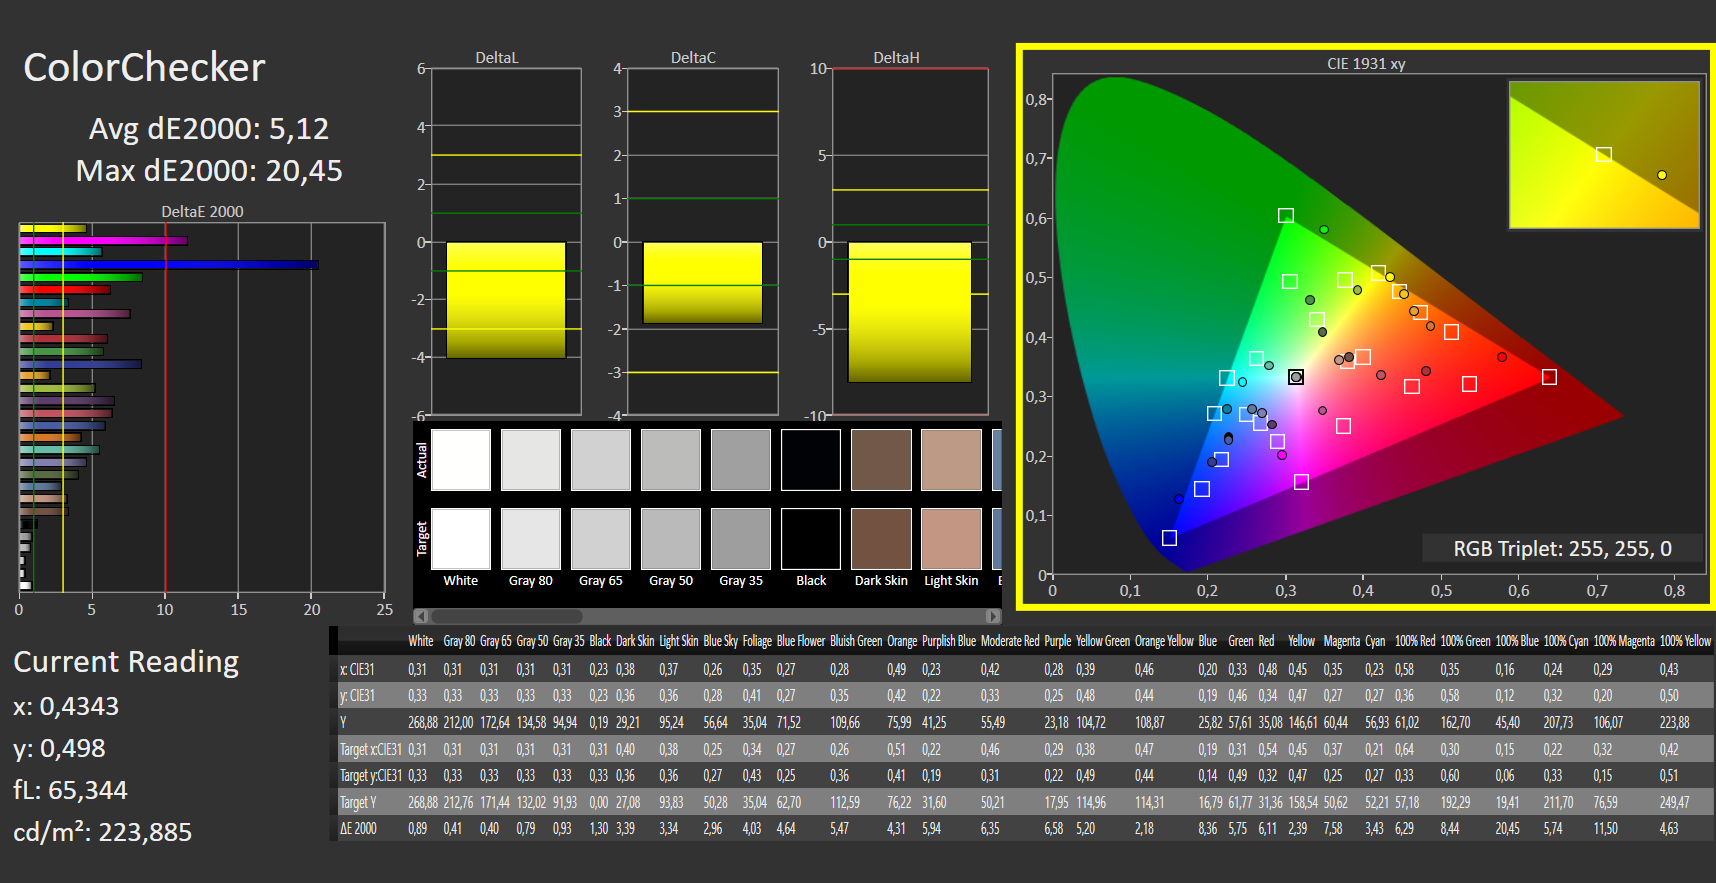
calibrated: 5.12
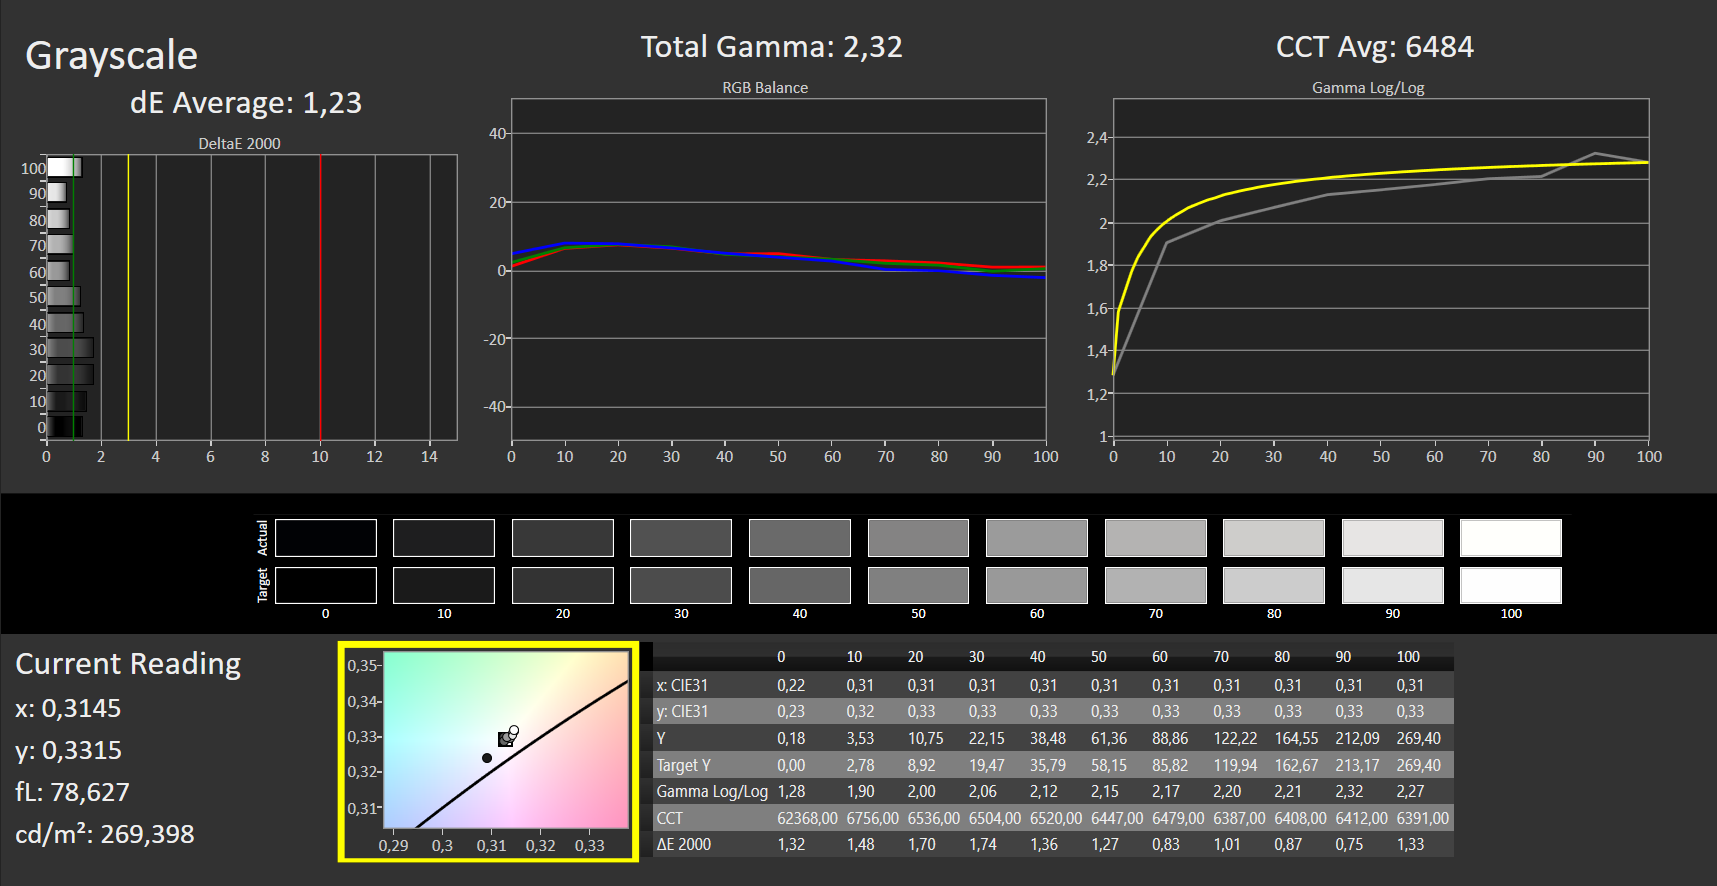
ΔE Greyscale Calman: 3.23 | ∀{0.09-98 Ø4.96}
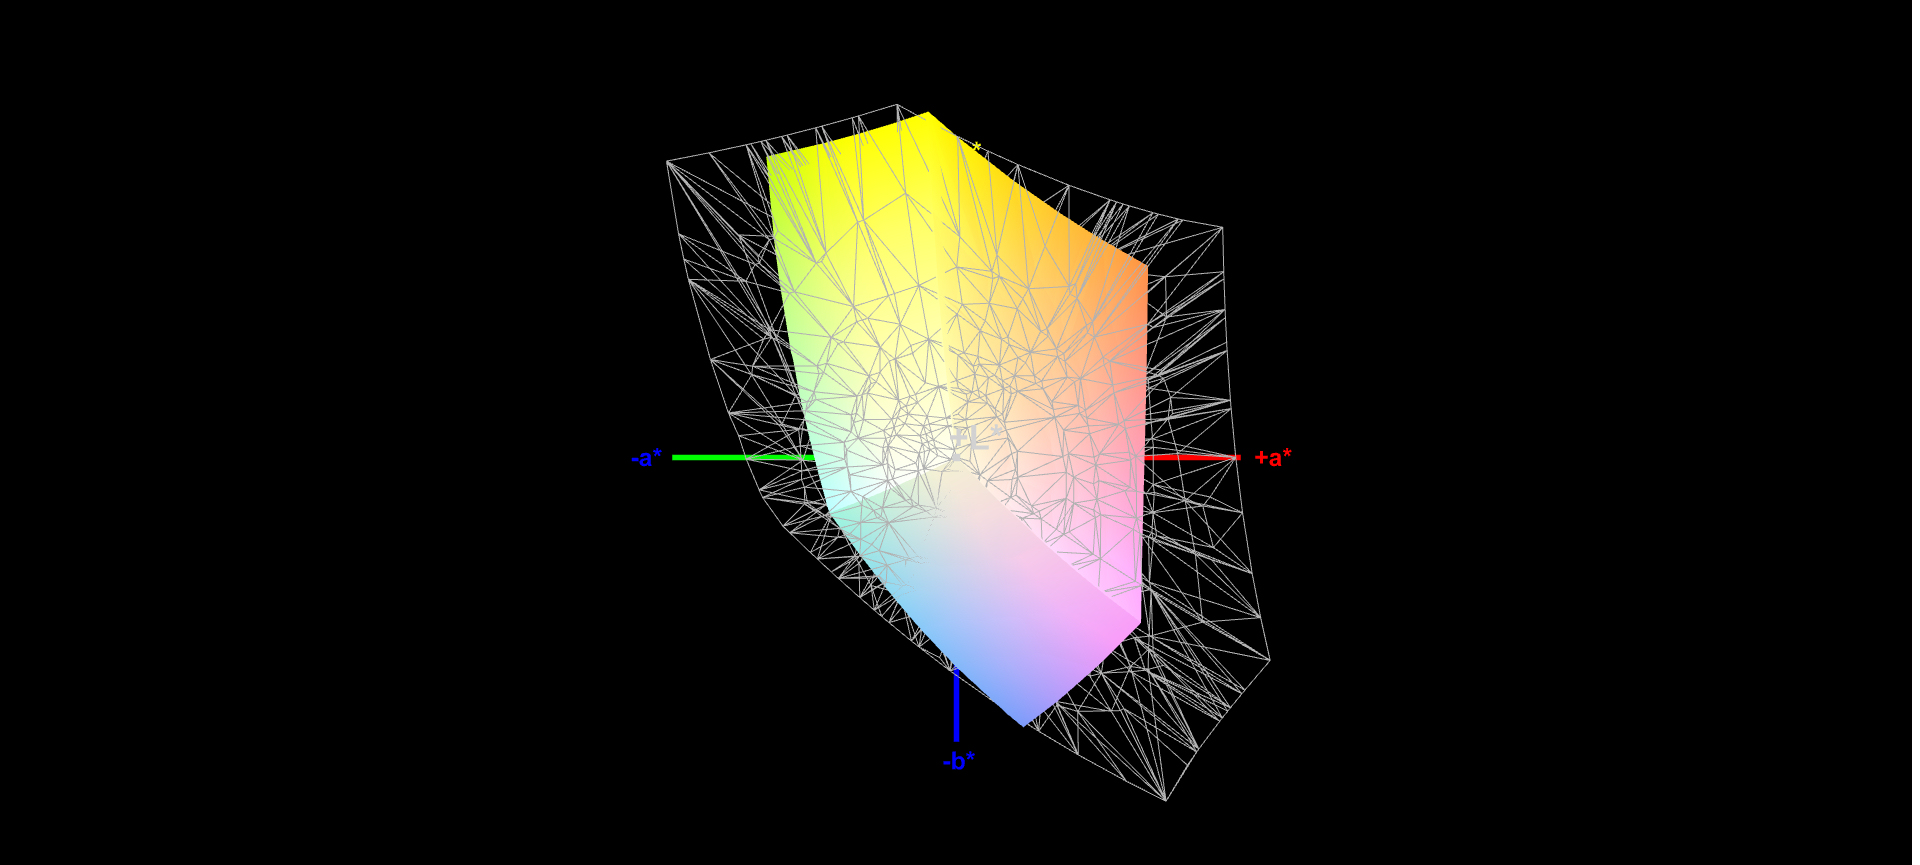
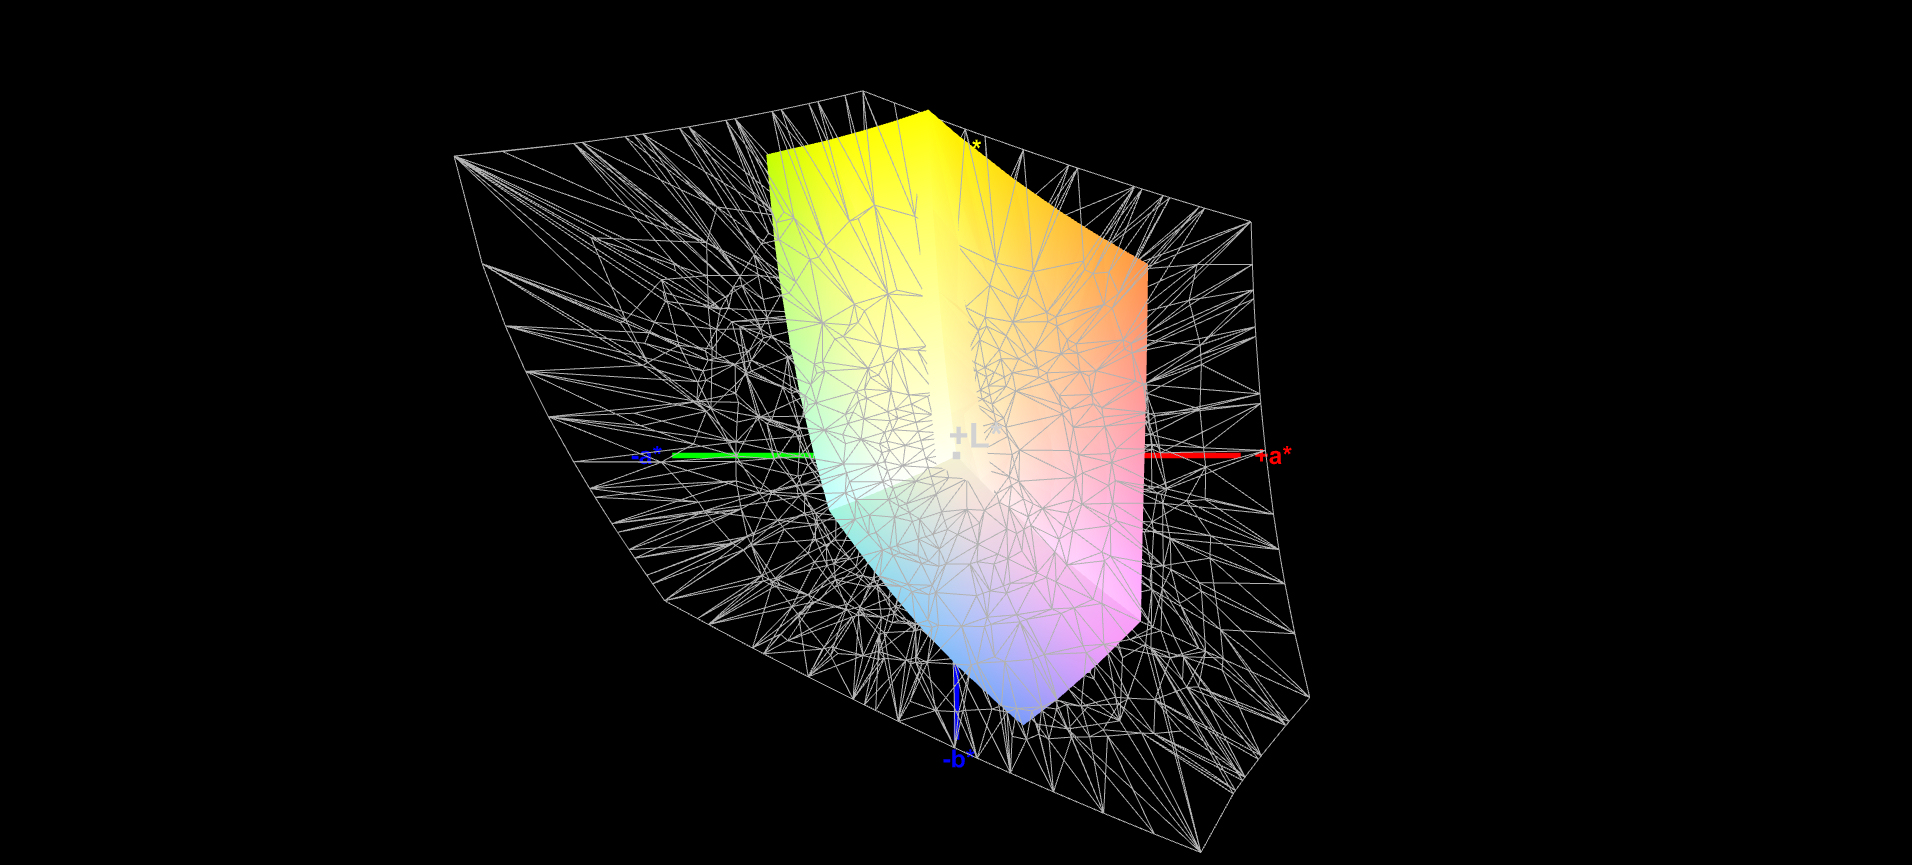
56% sRGB (Argyll 1.6.3 3D)
36% AdobeRGB 1998 (Argyll 1.6.3 3D)
39.3% AdobeRGB 1998 (Argyll 3D)
56.6% sRGB (Argyll 3D)
38.04% Display P3 (Argyll 3D)
Gamma: 2.43
CCT: 6818 K
| Lenovo IdeaPad Gaming 3i 15IMH05 IPS, 1920x1080, 15.6" | Asus TUF FX505DT-EB73 IPS, 1920x1080, 15.6" | Dell G3 3590 IPS, 1920x1080, 15.6" | MSI GF63 Thin 9SC IPS, 1920x1080, 15.6" | HP Pavilion Gaming 15-ec0002ng TN LED, 1920x1080, 15.6" | MSI Alpha 15 A3DDK-034 IPS, 1920x1080, 15.6" | Acer Nitro 5 AN515-44-R5FT IPS, 1920x1080, 15.6" | Lenovo IdeaPad L340-15IRH 81LK00BMGE IPS, 1920x1080, 15.6" | |
|---|---|---|---|---|---|---|---|---|
| Display | 4% | 6% | -1% | 8% | 68% | 8% | 13% | |
| Display P3 Coverage (%) | 38.04 | 39.56 4% | 40.13 5% | 37.76 -1% | 41.22 8% | 66.4 75% | 41.16 8% | 42.81 13% |
| sRGB Coverage (%) | 56.6 | 59.5 5% | 59.8 6% | 56.5 0% | 61.8 9% | 91 61% | 61.8 9% | 63.8 13% |
| AdobeRGB 1998 Coverage (%) | 39.3 | 40.91 4% | 41.47 6% | 39.01 -1% | 42.62 8% | 66.6 69% | 42.56 8% | 44.31 13% |
| Response Times | -42% | -88% | -83% | -32% | 56% | -70% | -82% | |
| Response Time Grey 50% / Grey 80% * (ms) | 25 ? | 30.4 ? -22% | 46 ? -84% | 44.8 ? -79% | 44 ? -76% | 7 ? 72% | 40.8 ? -63% | 45.6 ? -82% |
| Response Time Black / White * (ms) | 17 ? | 27.6 ? -62% | 32.4 ? -91% | 31.6 ? -86% | 15 ? 12% | 10.4 ? 39% | 30 ? -76% | 30.8 ? -81% |
| PWM Frequency (Hz) | 200 ? | 250 ? | 25910 ? | |||||
| Screen | 2% | 11% | 21% | -28% | 29% | 20% | 18% | |
| Brightness middle (cd/m²) | 305 | 286.2 -6% | 276.2 -9% | 260 -15% | 233 -24% | 310 2% | 287 -6% | 275 -10% |
| Brightness (cd/m²) | 294 | 267 -9% | 261 -11% | 249 -15% | 211 -28% | 310 5% | 271 -8% | 253 -14% |
| Brightness Distribution (%) | 70 | 84 20% | 86 23% | 92 31% | 82 17% | 86 23% | 88 26% | 83 19% |
| Black Level * (cd/m²) | 0.405 | 0.33 19% | 0.24 41% | 0.23 43% | 0.405 -0% | 0.29 28% | 0.25 38% | 0.18 56% |
| Contrast (:1) | 753 | 867 15% | 1151 53% | 1130 50% | 575 -24% | 1069 42% | 1148 52% | 1528 103% |
| Colorchecker dE 2000 * | 6.01 | 5.45 9% | 5.56 7% | 4.1 32% | 8.22 -37% | 4.78 20% | 4.77 21% | 5.4 10% |
| Colorchecker dE 2000 max. * | 21.9 | 18.08 17% | 23.45 -7% | 7.93 64% | 18.6 15% | 8.1 63% | 17.15 22% | 21.3 3% |
| Colorchecker dE 2000 calibrated * | 5.12 | 4.47 13% | 5.23 -2% | 3.56 30% | 2.36 54% | 3.73 27% | 4.4 14% | |
| Greyscale dE 2000 * | 3.23 | 5.3 -64% | 2.8 13% | 2.83 12% | 10.13 -214% | 4.78 -48% | 2.7 16% | 3.7 -15% |
| Gamma | 2.43 91% | 2.1 105% | 2.37 93% | 2.53 87% | 2.27 97% | 2.43 91% | 2.115 104% | 2.12 104% |
| CCT | 6818 95% | 7679 85% | 6710 97% | 6158 106% | 11323 57% | 7739 84% | 7187 90% | 6376 102% |
| Color Space (Percent of AdobeRGB 1998) (%) | 36 | 37.6 4% | 37.8 5% | 36 0% | 39 8% | 59 64% | 43 19% | 40.8 13% |
| Color Space (Percent of sRGB) (%) | 56 | 59.1 6% | 59 5% | 56 0% | 62 11% | 91 63% | 61 9% | 63.6 14% |
| Total Average (Program / Settings) | -12% /
-3% | -24% /
-3% | -21% /
4% | -17% /
-21% | 51% /
40% | -14% /
6% | -17% /
4% |
* ... smaller is better
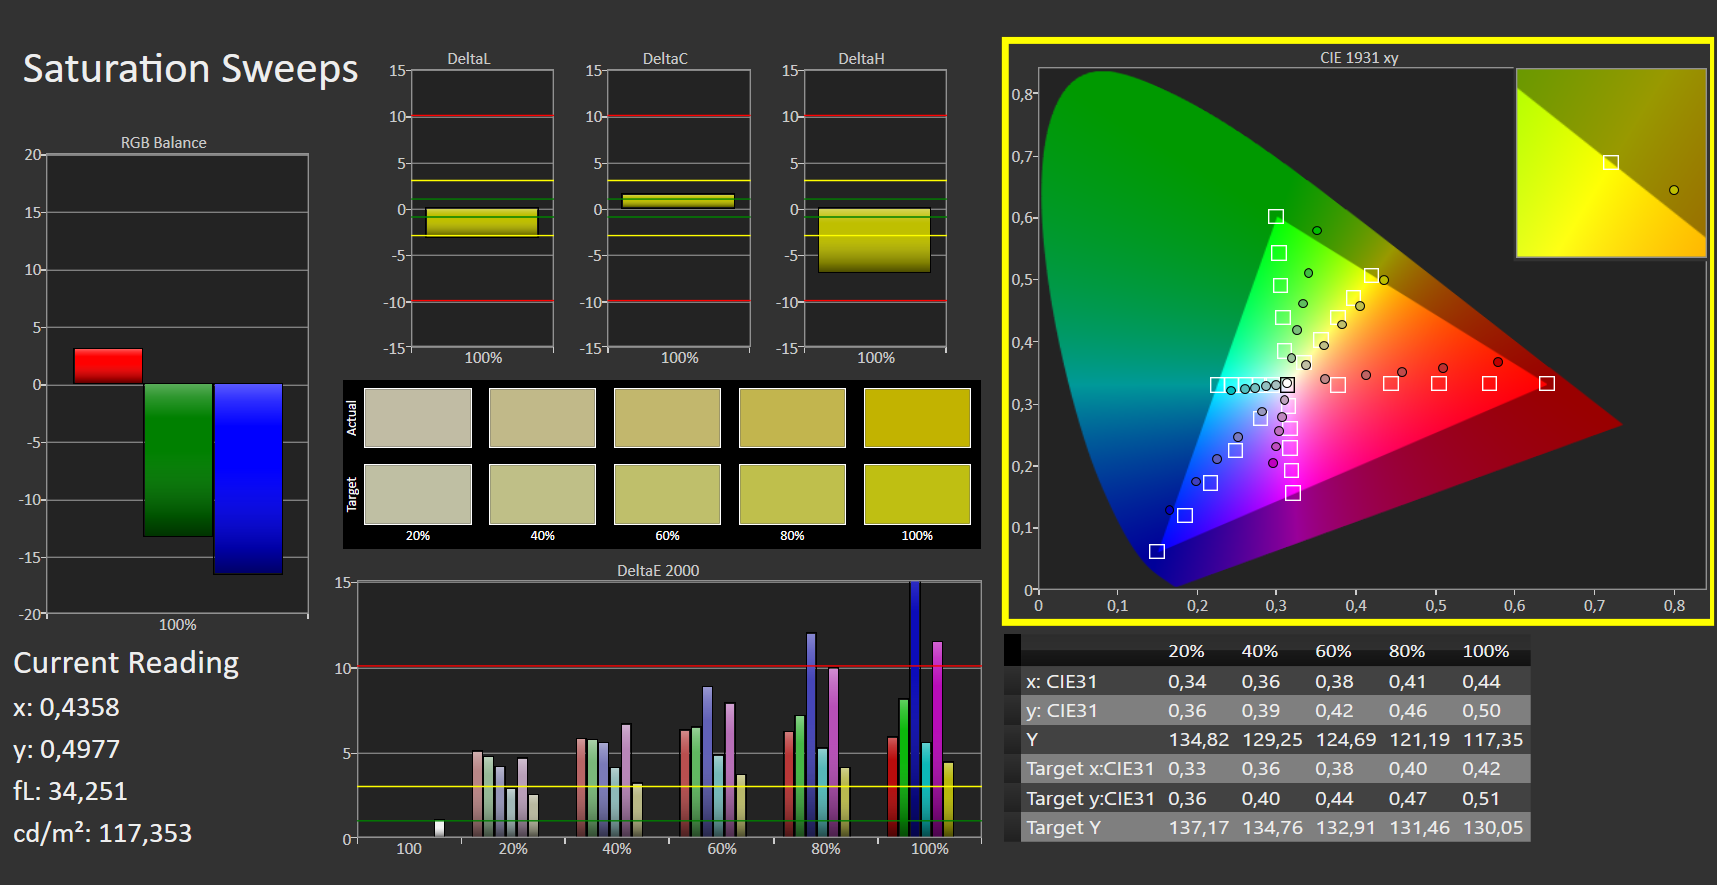
Out of the box, the display shows an acceptable color reproduction. However, with a Delta E 2000 color deviation of just under 6, the target (Delta E less than 3) is missed. The display doesn't suffer from a blue tint. Moreover, calibration only provides minor improvements. The AdobeRGB (36%) and sRGB (56%) color spaces aren't fully reproduced.


Display Response Times
| ↔ Response Time Black to White | ||
|---|---|---|
| 17 ms ... rise ↗ and fall ↘ combined | ↗ 9 ms rise | 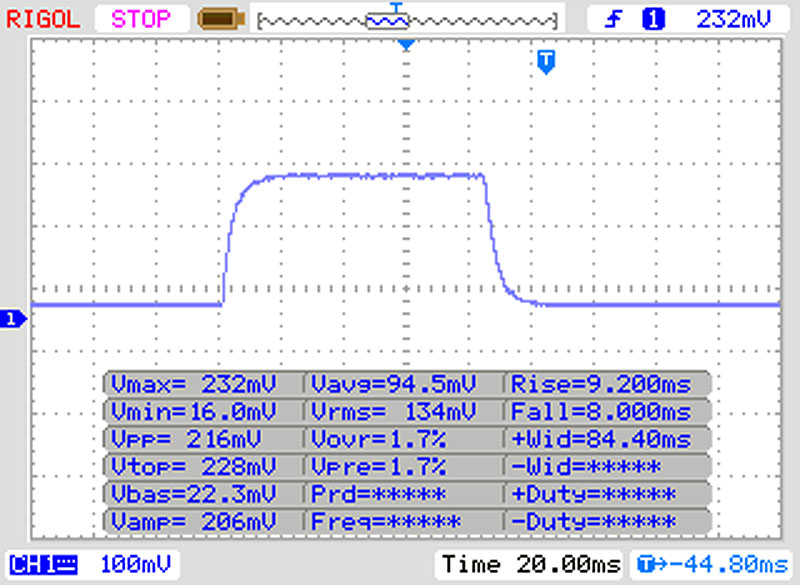 |
| ↘ 8 ms fall | ||
| The screen shows good response rates in our tests, but may be too slow for competitive gamers. In comparison, all tested devices range from 0.1 (minimum) to 240 (maximum) ms. » 39 % of all devices are better. This means that the measured response time is better than the average of all tested devices (19.8 ms). | ||
| ↔ Response Time 50% Grey to 80% Grey | ||
| 25 ms ... rise ↗ and fall ↘ combined | ↗ 13 ms rise | 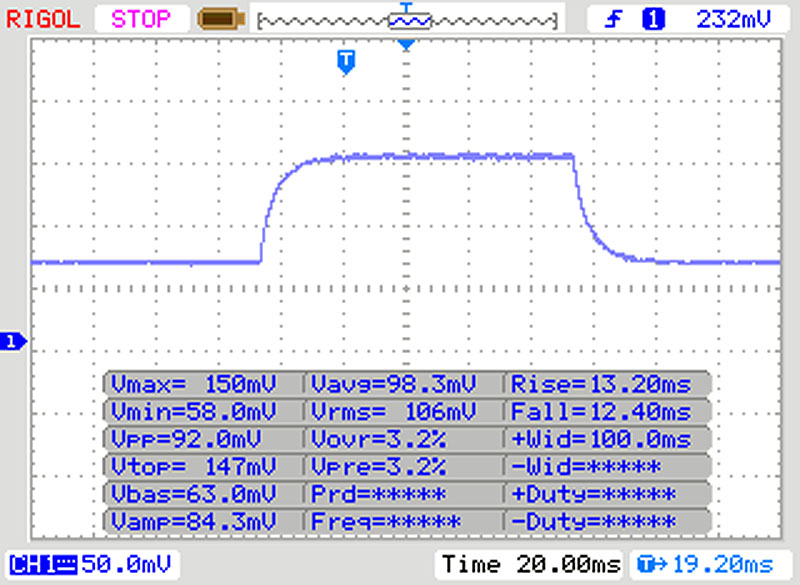 |
| ↘ 12 ms fall | ||
| The screen shows relatively slow response rates in our tests and may be too slow for gamers. In comparison, all tested devices range from 0.165 (minimum) to 636 (maximum) ms. » 35 % of all devices are better. This means that the measured response time is better than the average of all tested devices (31 ms). | ||
Screen Flickering / PWM (Pulse-Width Modulation)
| Screen flickering / PWM not detected | 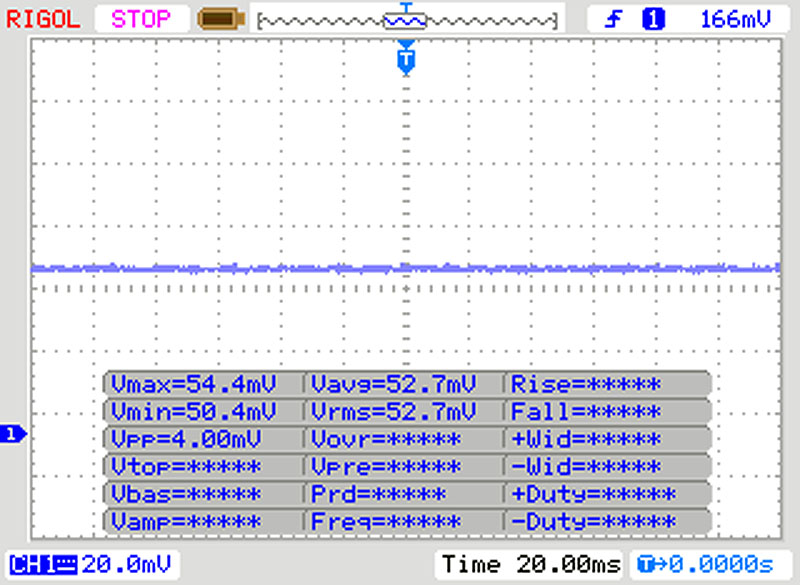 | ||
In comparison: 52 % of all tested devices do not use PWM to dim the display. If PWM was detected, an average of 7754 (minimum: 5 - maximum: 343500) Hz was measured. | |||
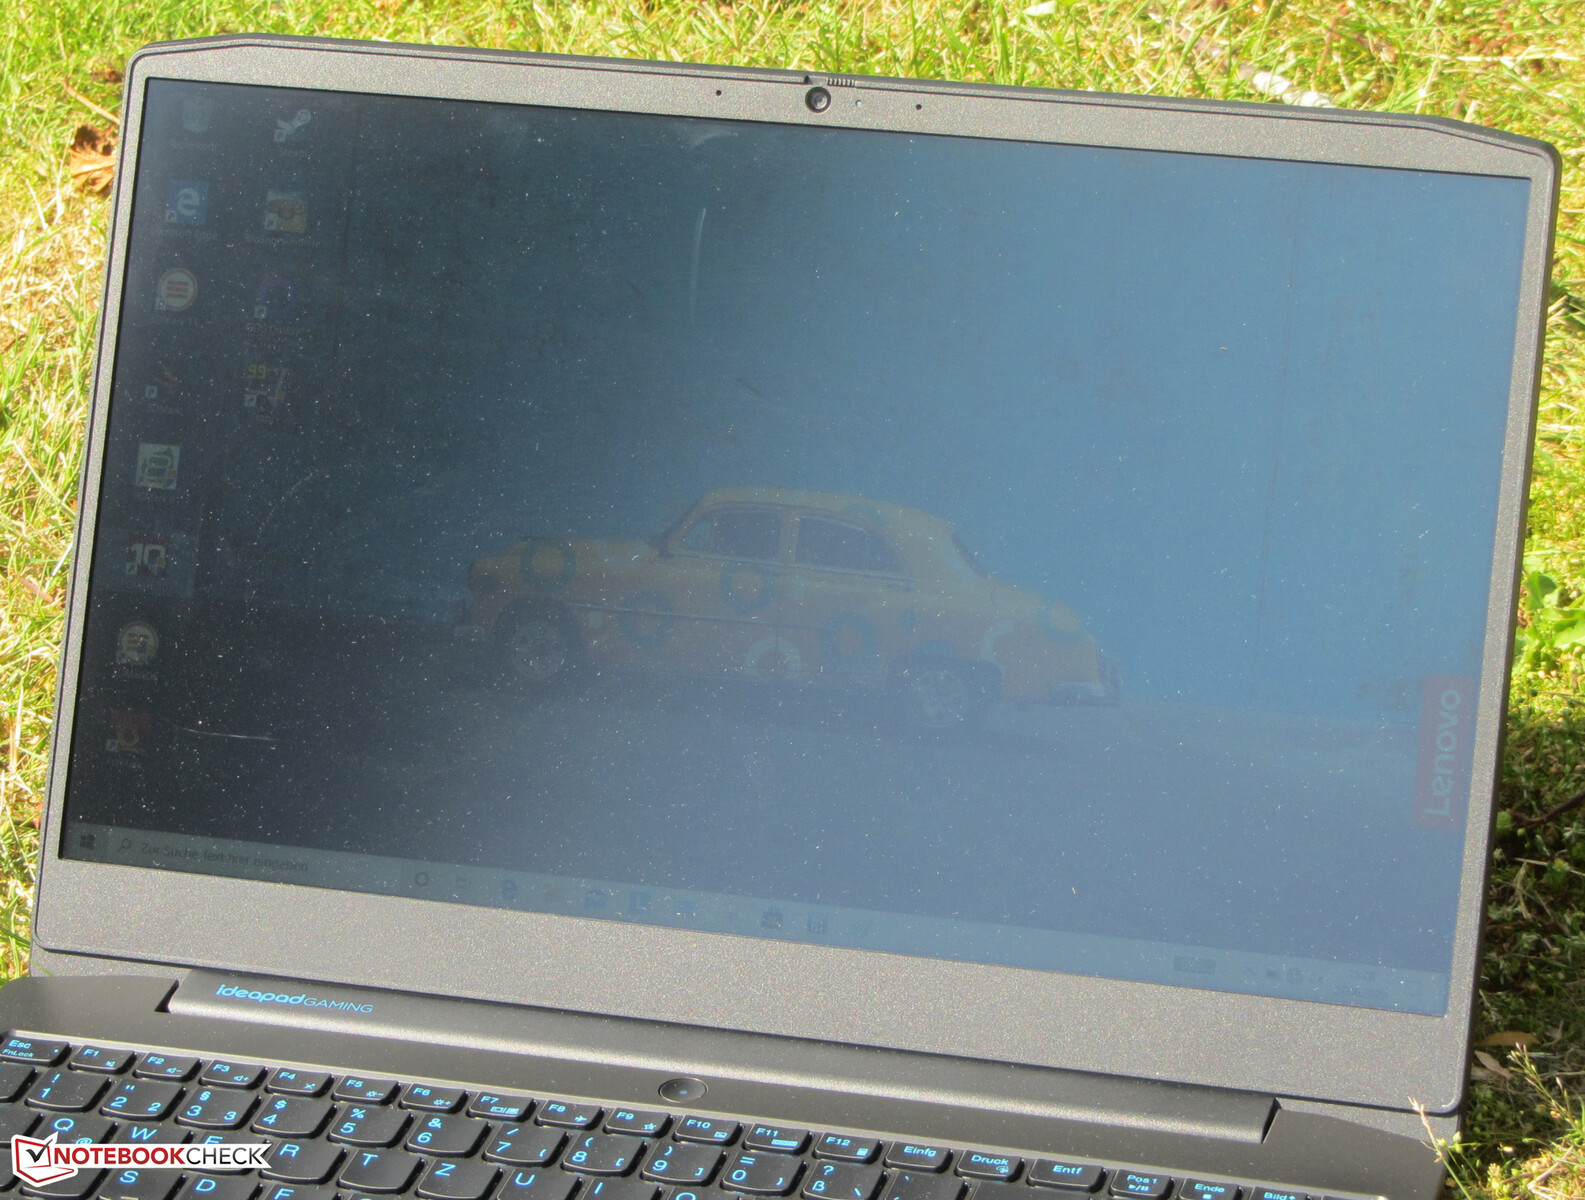
The Lenovo laptop is equipped with a viewing-angle-stable IPS panel. Consequently, the screen can be read from any position. Reading the display outdoors is only possible when the sun isn't too bright.

Performance - Core i5 at full power
With the IdeaPad Gaming 3i 15IMH05, Lenovo carries a 15.6-inch gaming laptop in its product range. It brings every modern game smoothly onto the screen and also cuts a fine figure in all other application areas. Our test device costs about 800 Euros (~$903). Other configuration variants are available.


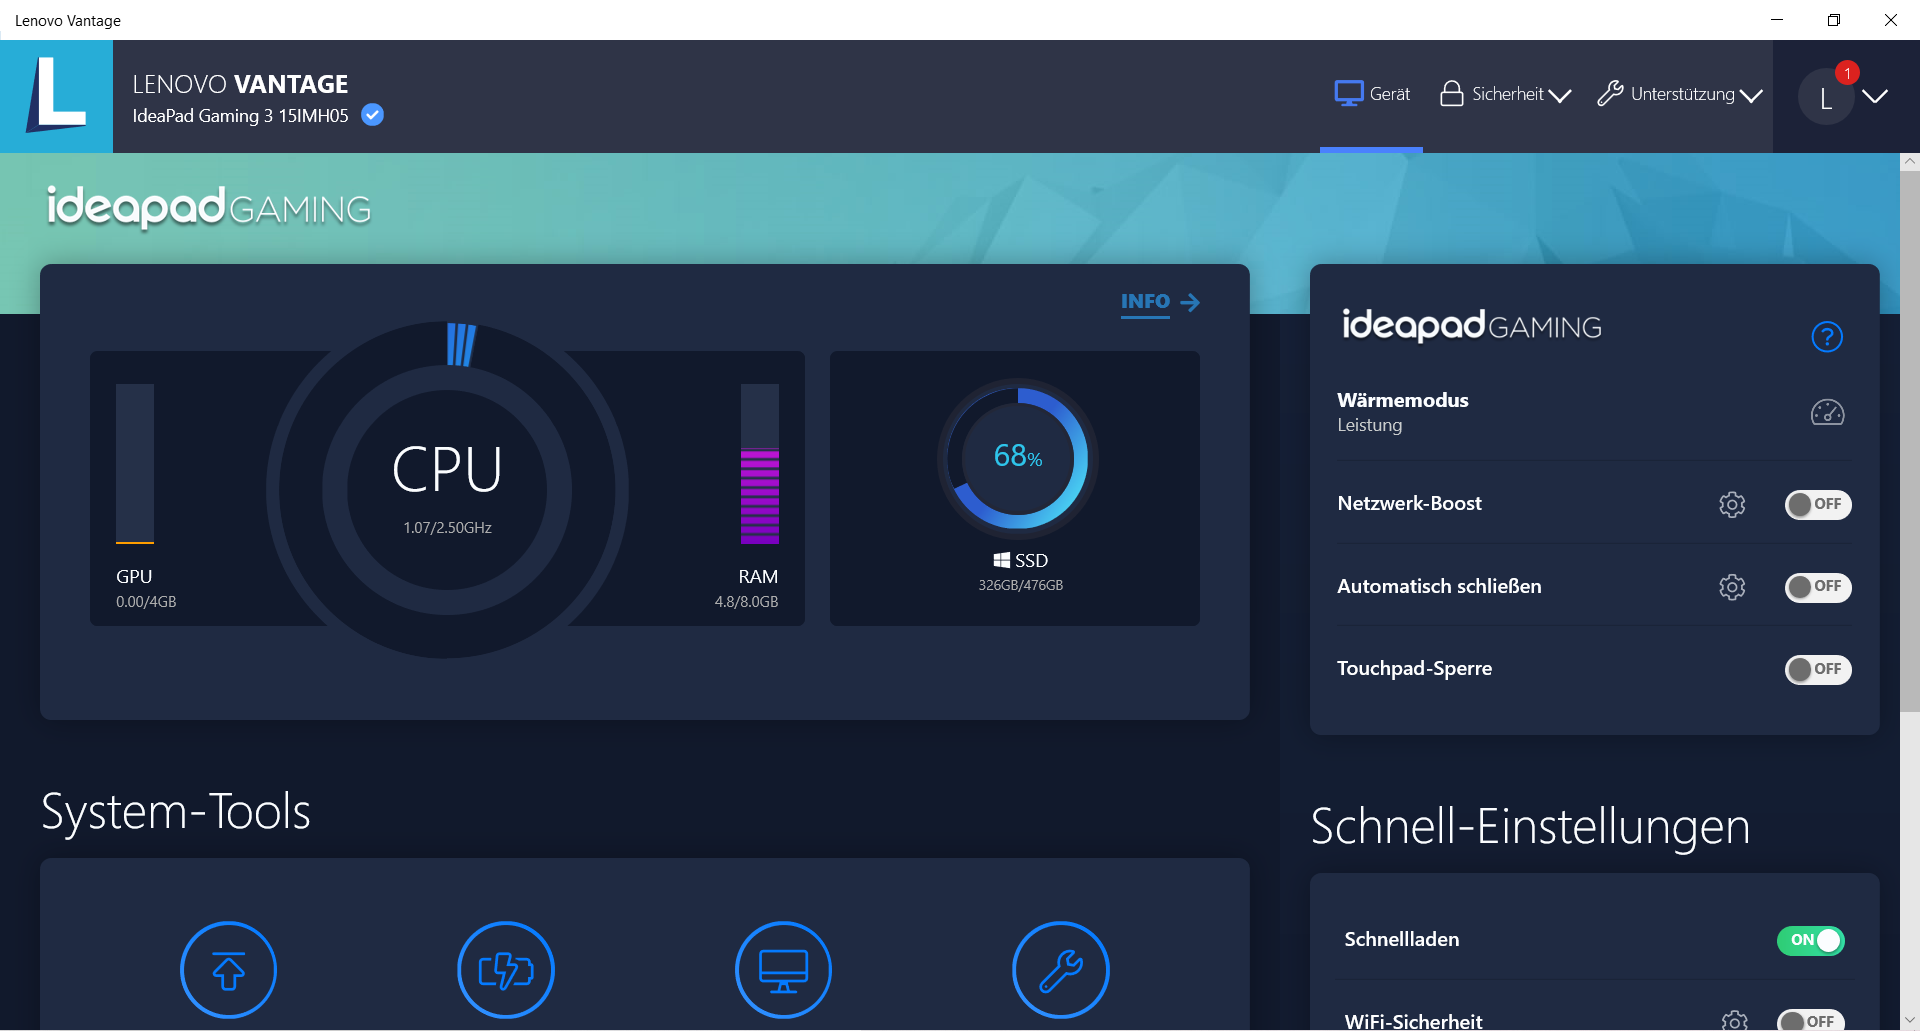
Test conditions
The preinstalled Lenovo Vantage software allows you to set a thermal mode. Three options are available: "Performance mode", "Balanced mode" and "Quiet mode". We conducted all benchmarks with the "Performance mode" active.

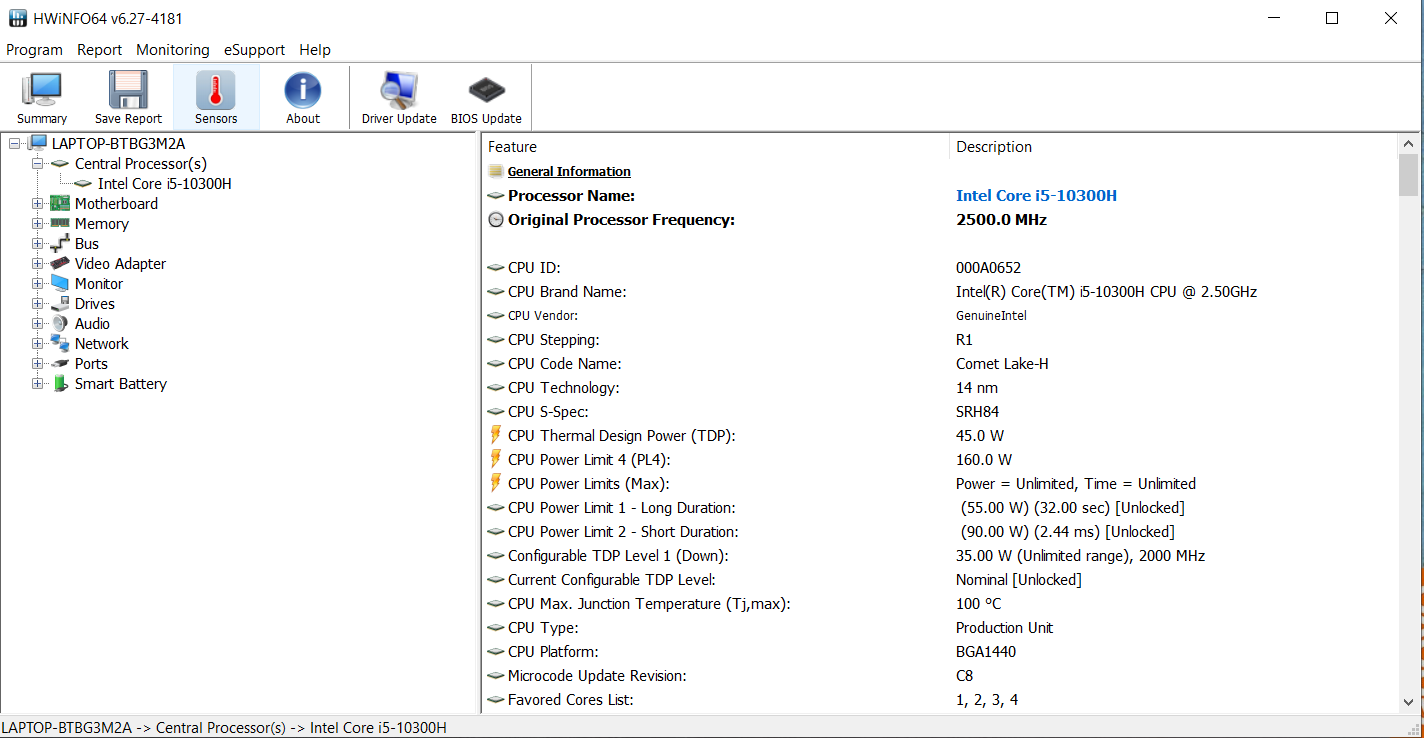
Processor
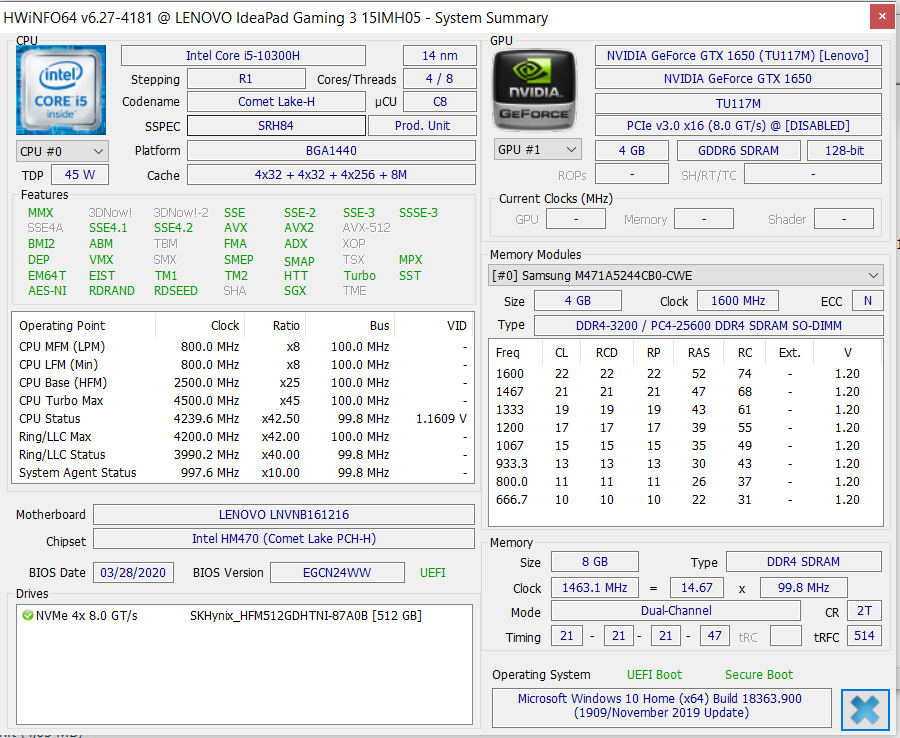
The IdeaPad is powered by a Core i5-10300H quad-core processor (Comet Lake). The CPU operates at a base speed of 2.5 GHz. The clock rate can be increased to 4.2 GHz (four cores) and up to 4.5 GHz (one core) via Turbo. Hyper-Threading (two threads can be processed per core) is supported.
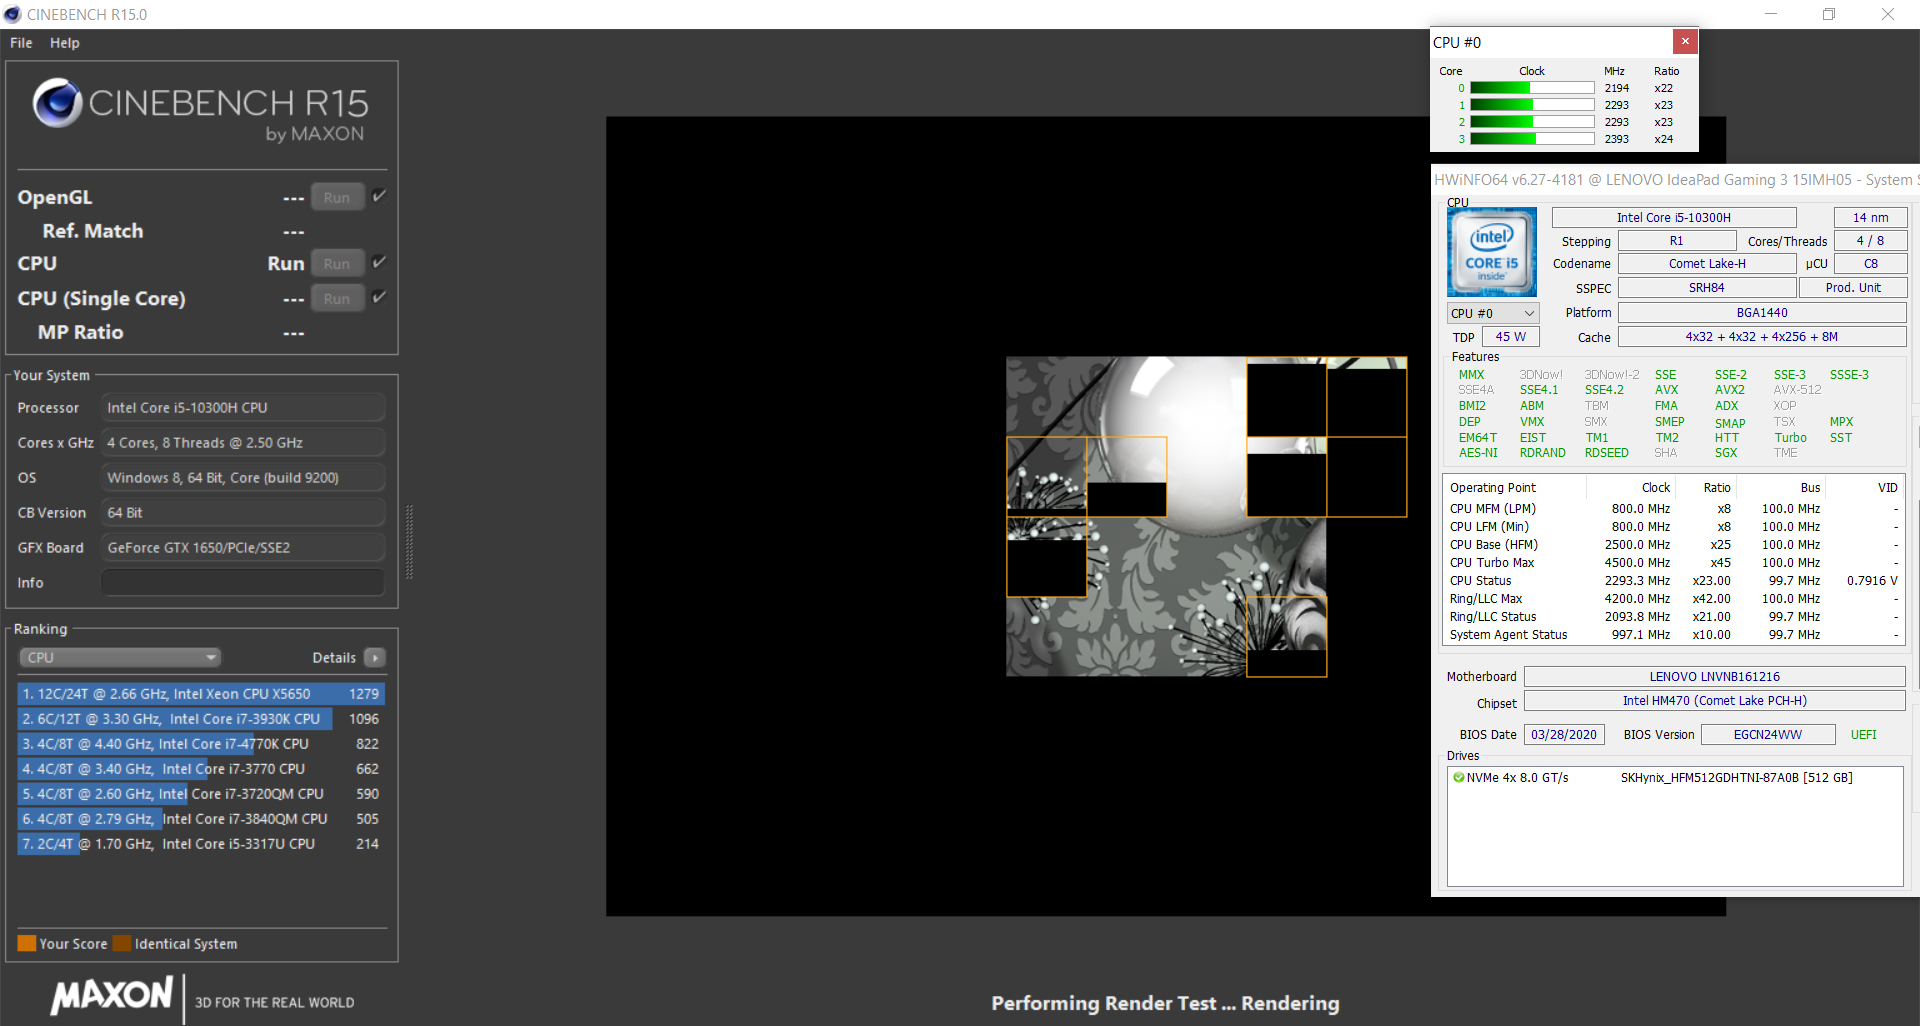
The processor works through the multithread tests of the Cinebench benchmarks at 4.2 GHz (plugged in) and 2.2 to 2.4 GHz (battery power), respectively. Furthermore, the single-thread tests are run at 4.2 to 4.5 GHz (plugged in) and 2.2 to 2.9 GHz (battery power).
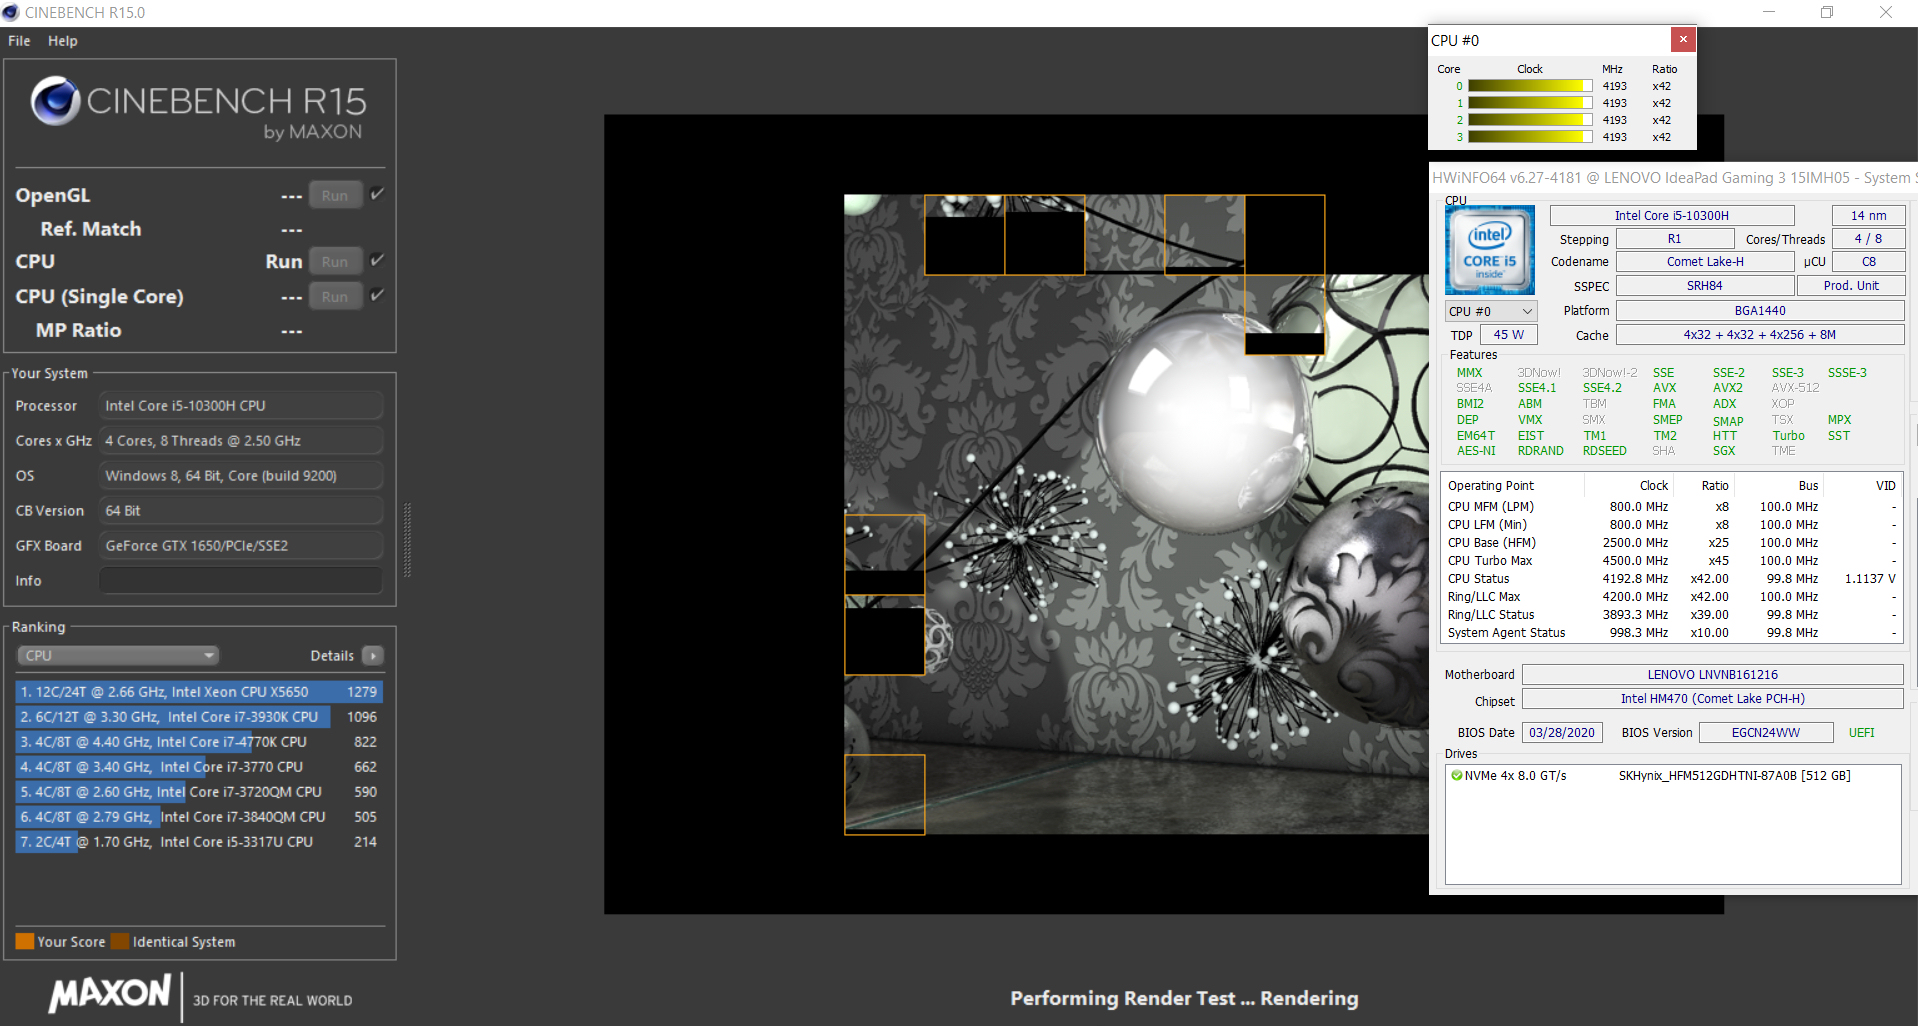
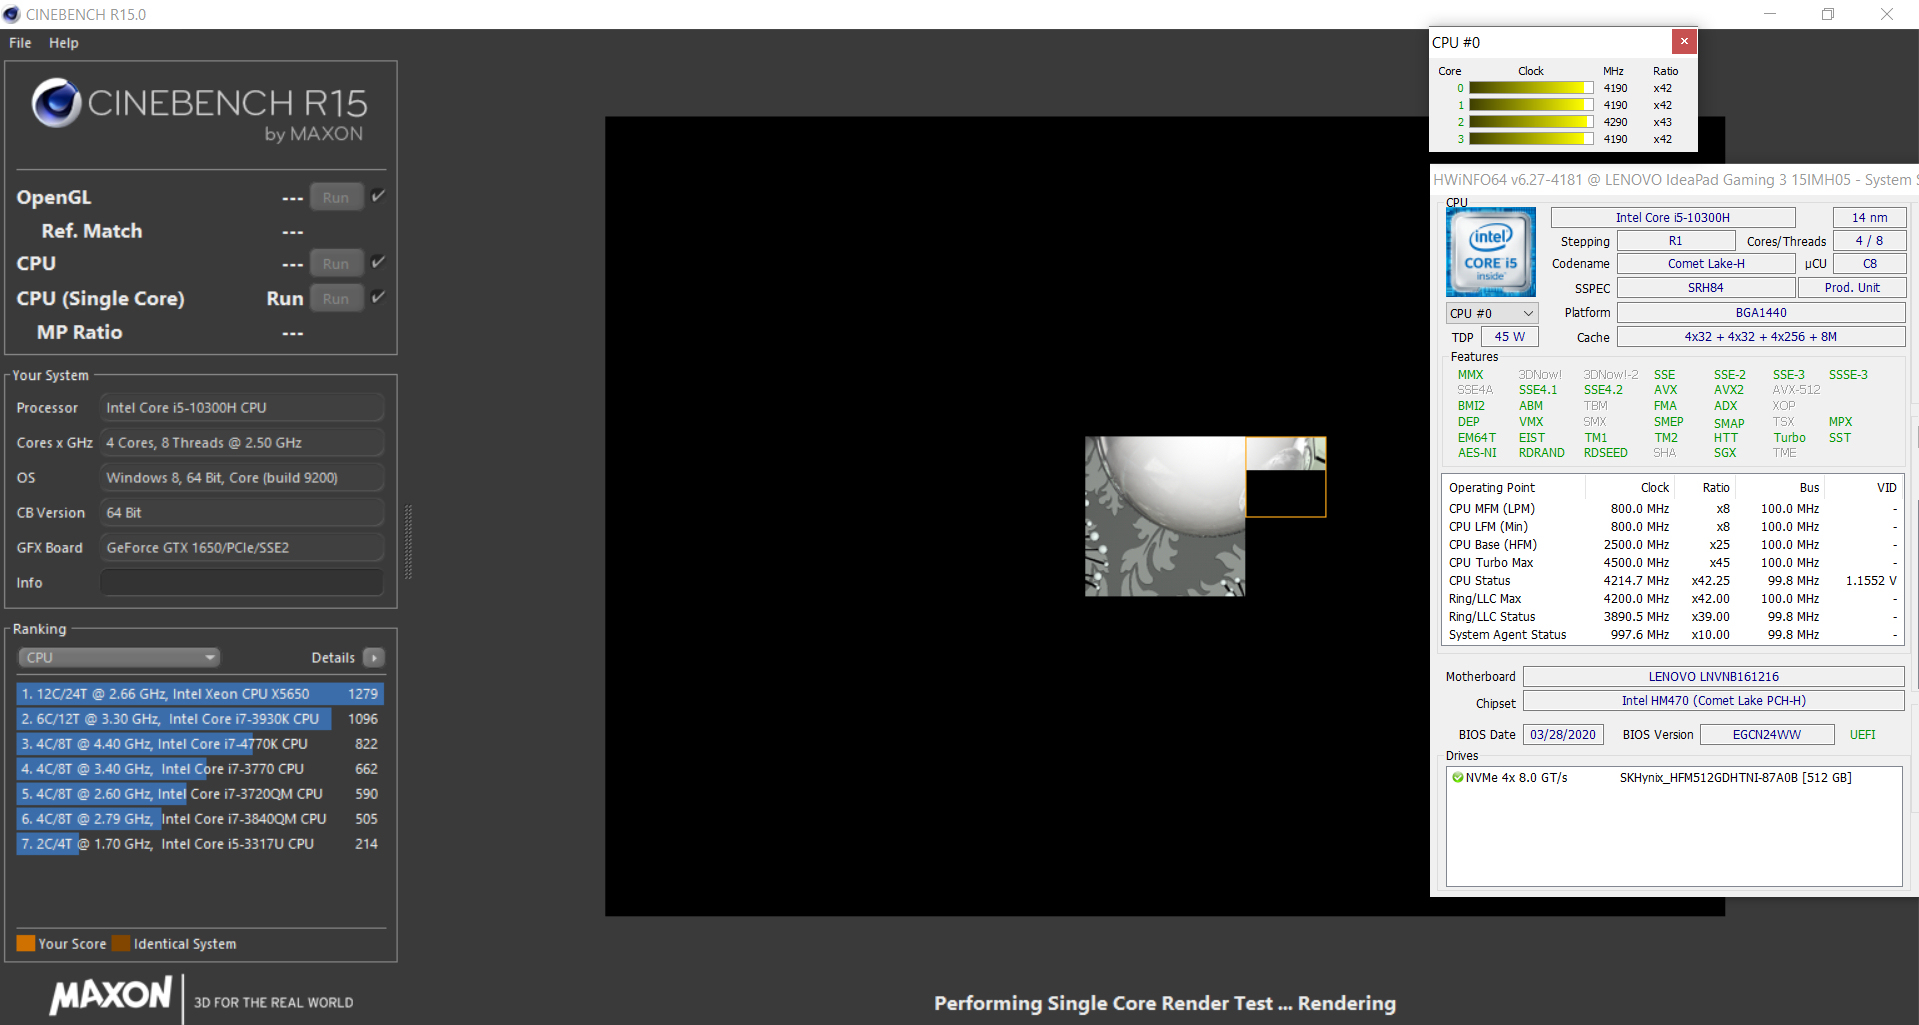
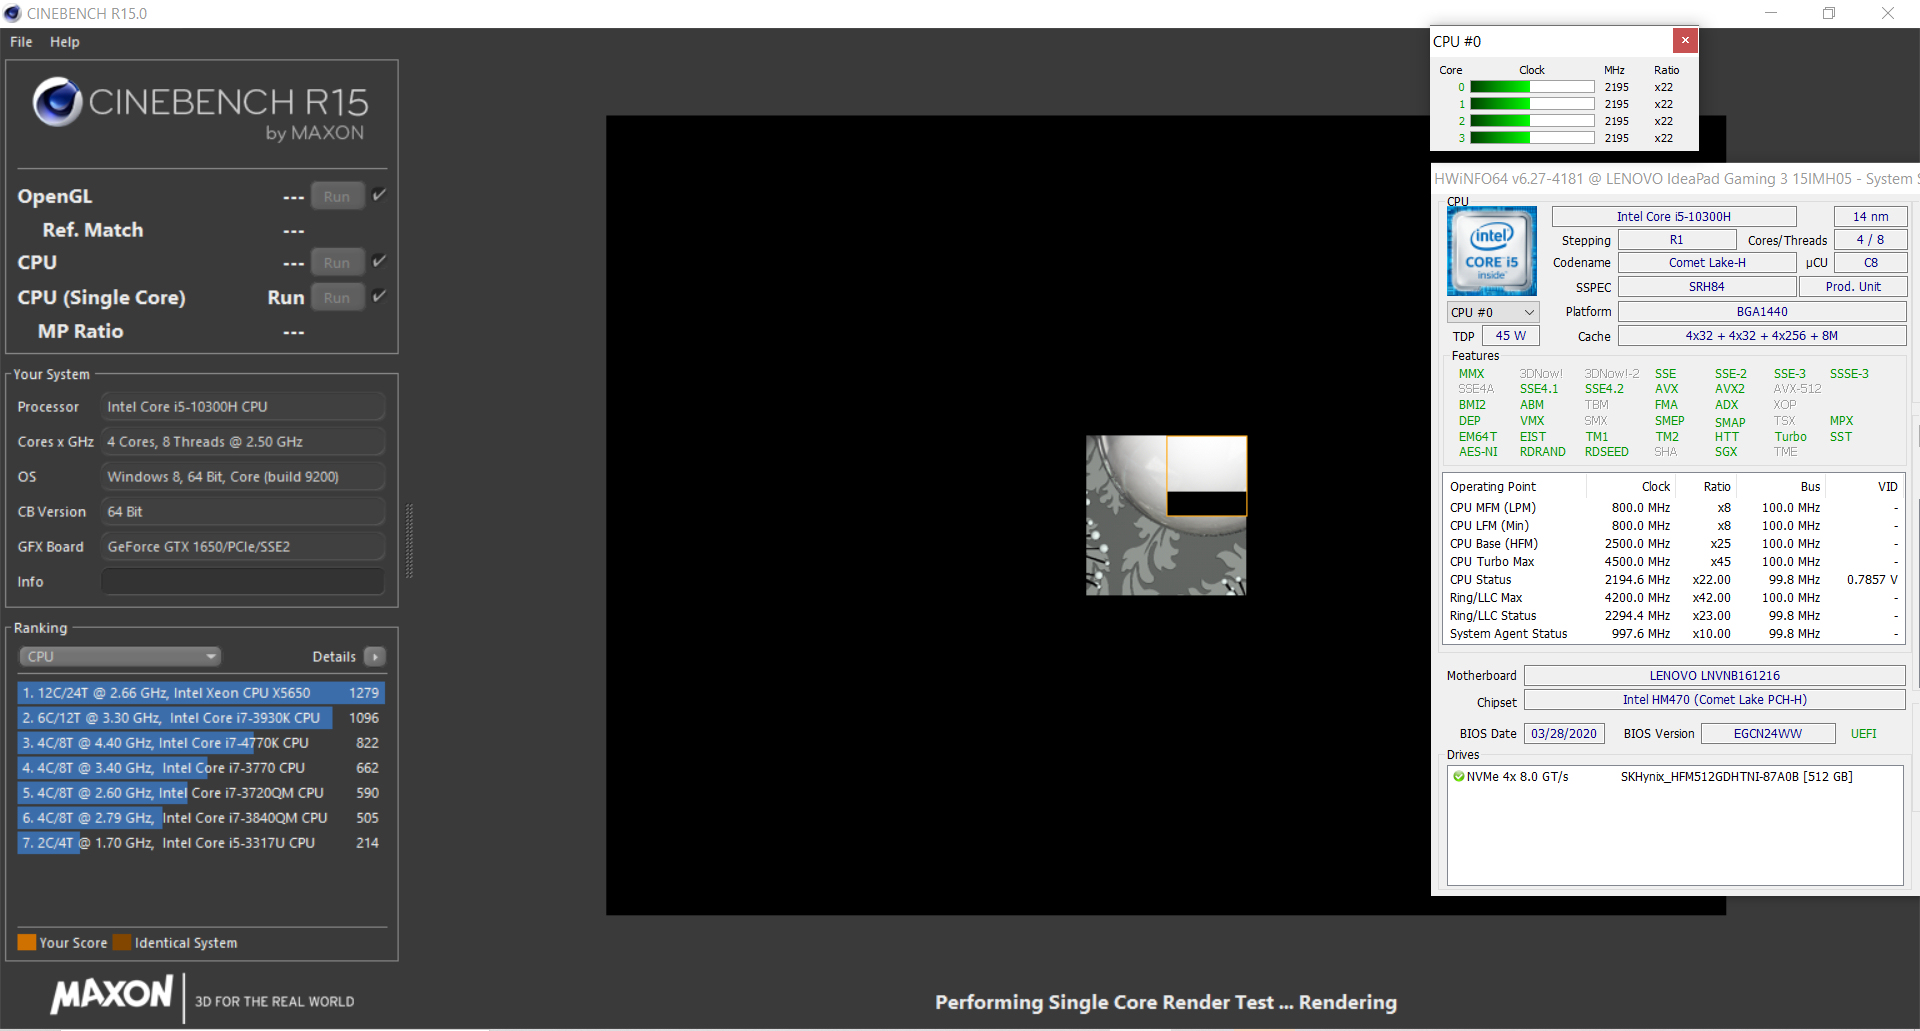
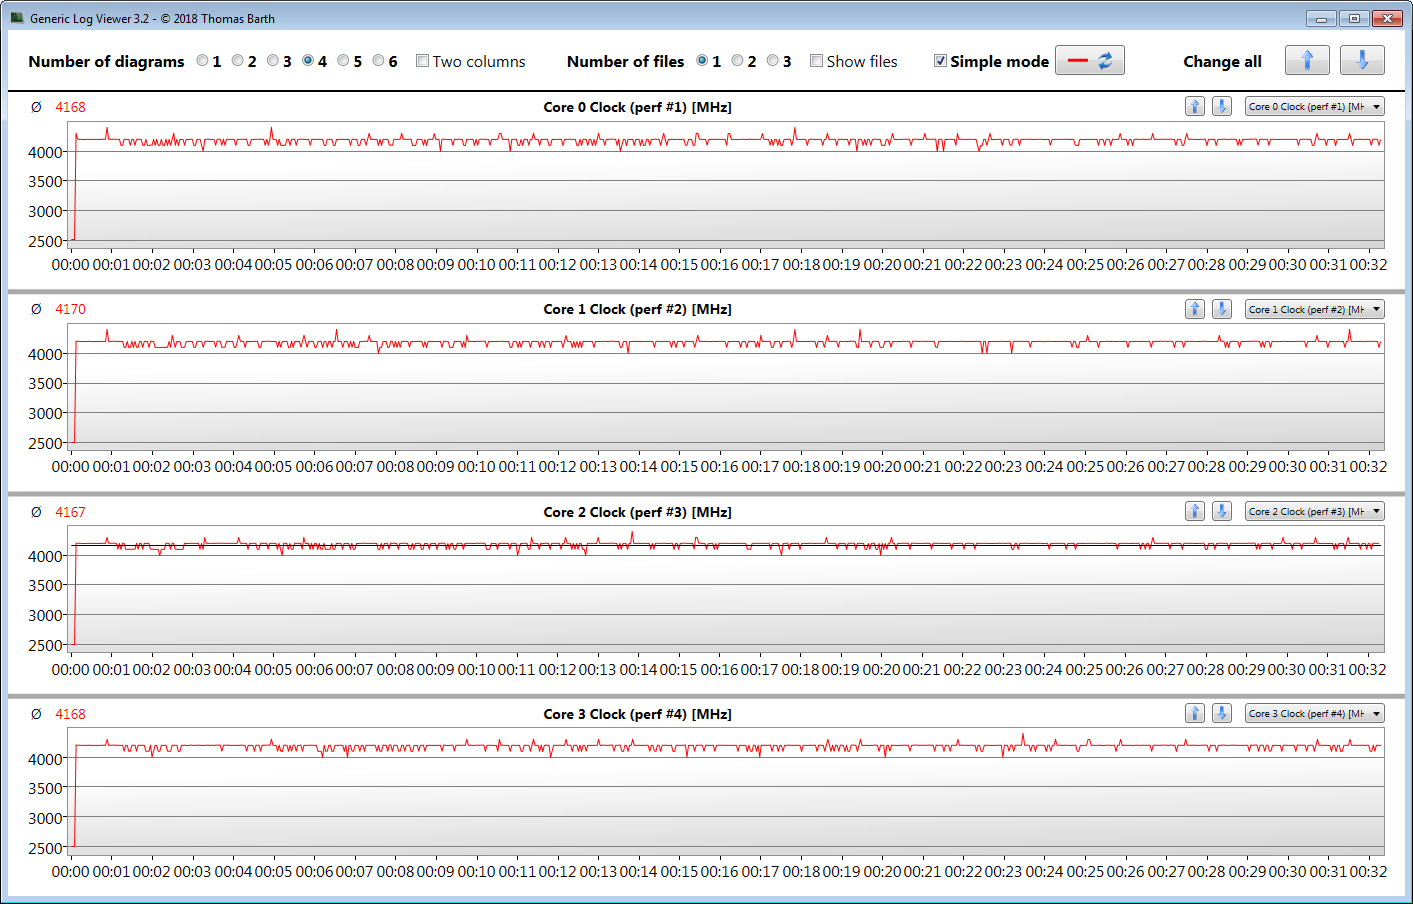
We verify if the CPU Turbo is also consistently used when plugged in by running the Cinebench R15 benchmark's multithread test in a continuous loop for at least 30 minutes. There is a minimal drop in performance from the first to the second run; the values then stabilize at a constant level. Turbo is used continuously at full power.
| LibreOffice - 20 Documents To PDF | |
| Acer Nitro 5 AN515-44-R5FT | |
| Average Intel Core i5-10300H (23.9 - 94, n=14) | |
| Lenovo IdeaPad Gaming 3i 15IMH05 | |
| Average of class Gaming (33.2 - 88.8, n=105, last 2 years) | |
* ... smaller is better
System performance
We didn't encounter any problems. The system works correctly and smoothly. Moreover, the built-in Core i5 processor offers enough computing power for all common applications, while the dedicated graphics core enables playing computer games. This is complemented by good results in the PCMark benchmarks.
| PCMark 8 Home Score Accelerated v2 | 3841 points | |
| PCMark 8 Creative Score Accelerated v2 | 3644 points | |
| PCMark 8 Work Score Accelerated v2 | 5210 points | |
| PCMark 10 Score | 4612 points | |
Help | ||
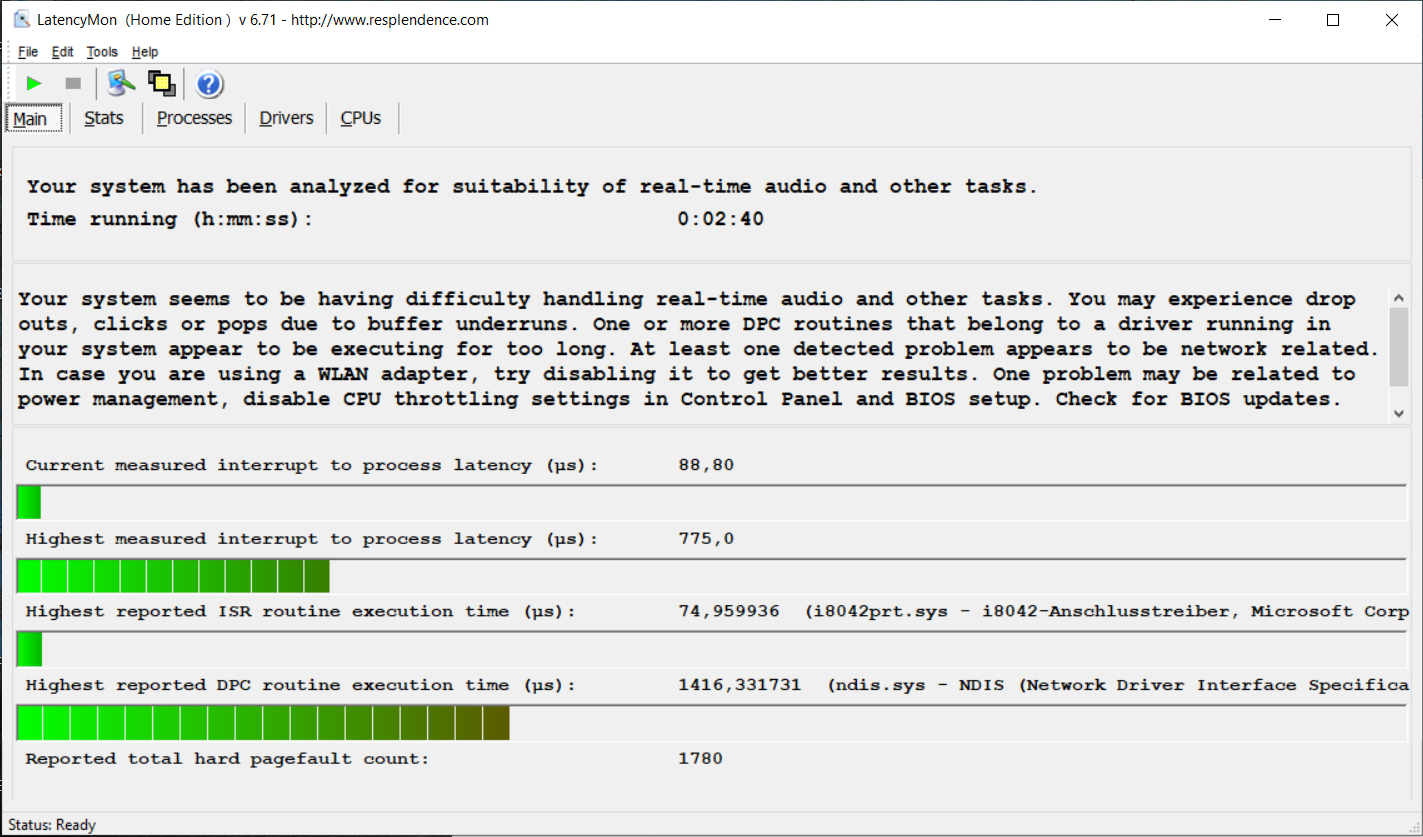
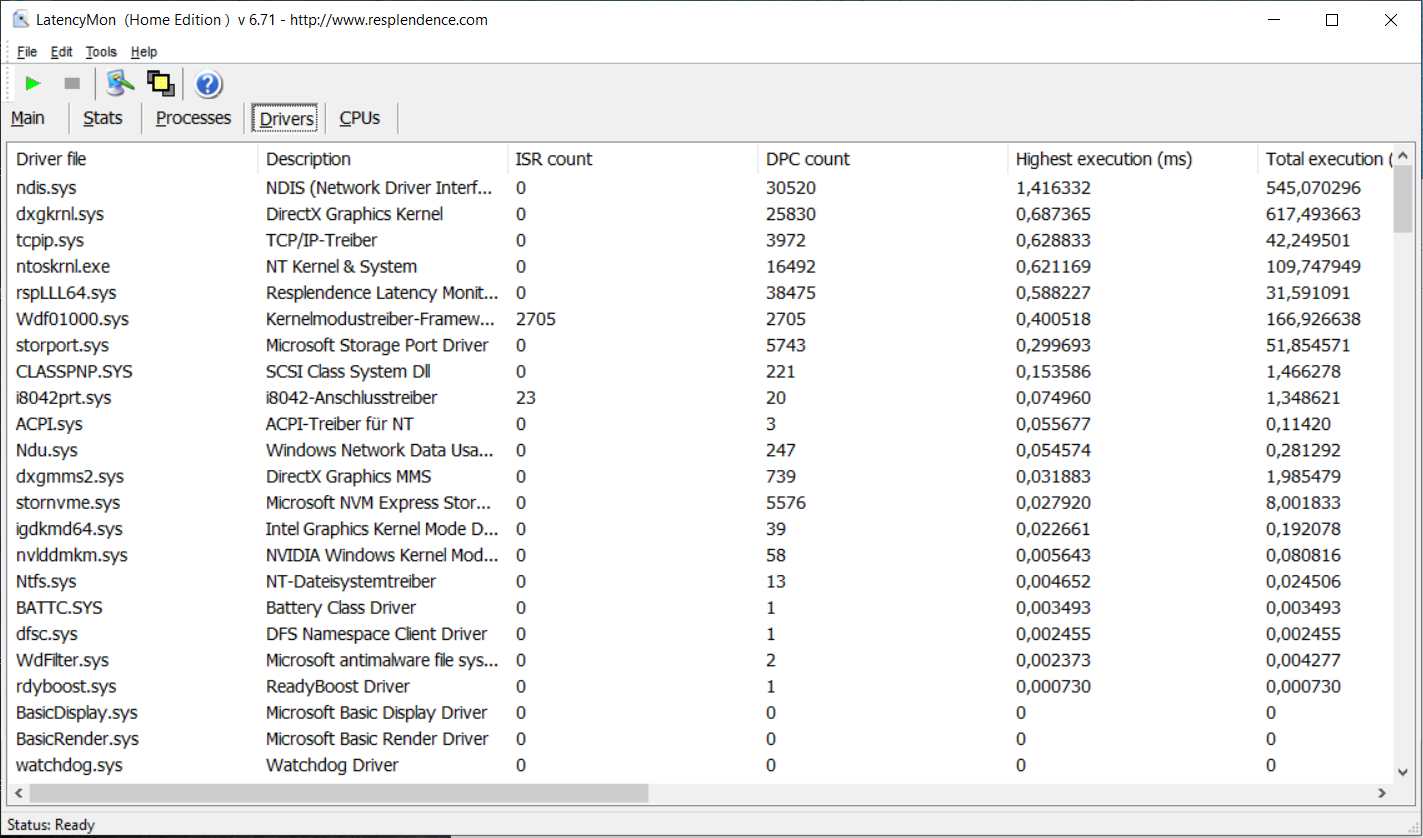
DPC latencies
We could observe high DPC latencies in our standardized latency monitor test (web surfing, 4k video playback, high-load Prime95); therefore, the system is not suitable for real-time video and audio-editing.
| DPC Latencies / LatencyMon - interrupt to process latency (max), Web, Youtube, Prime95 | |
| Acer Nitro 5 AN515-44-R5FT | |
| Lenovo IdeaPad Gaming 3i 15IMH05 | |
* ... smaller is better
Storage
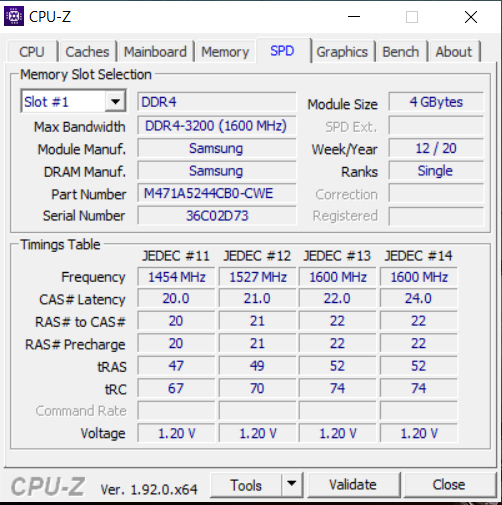
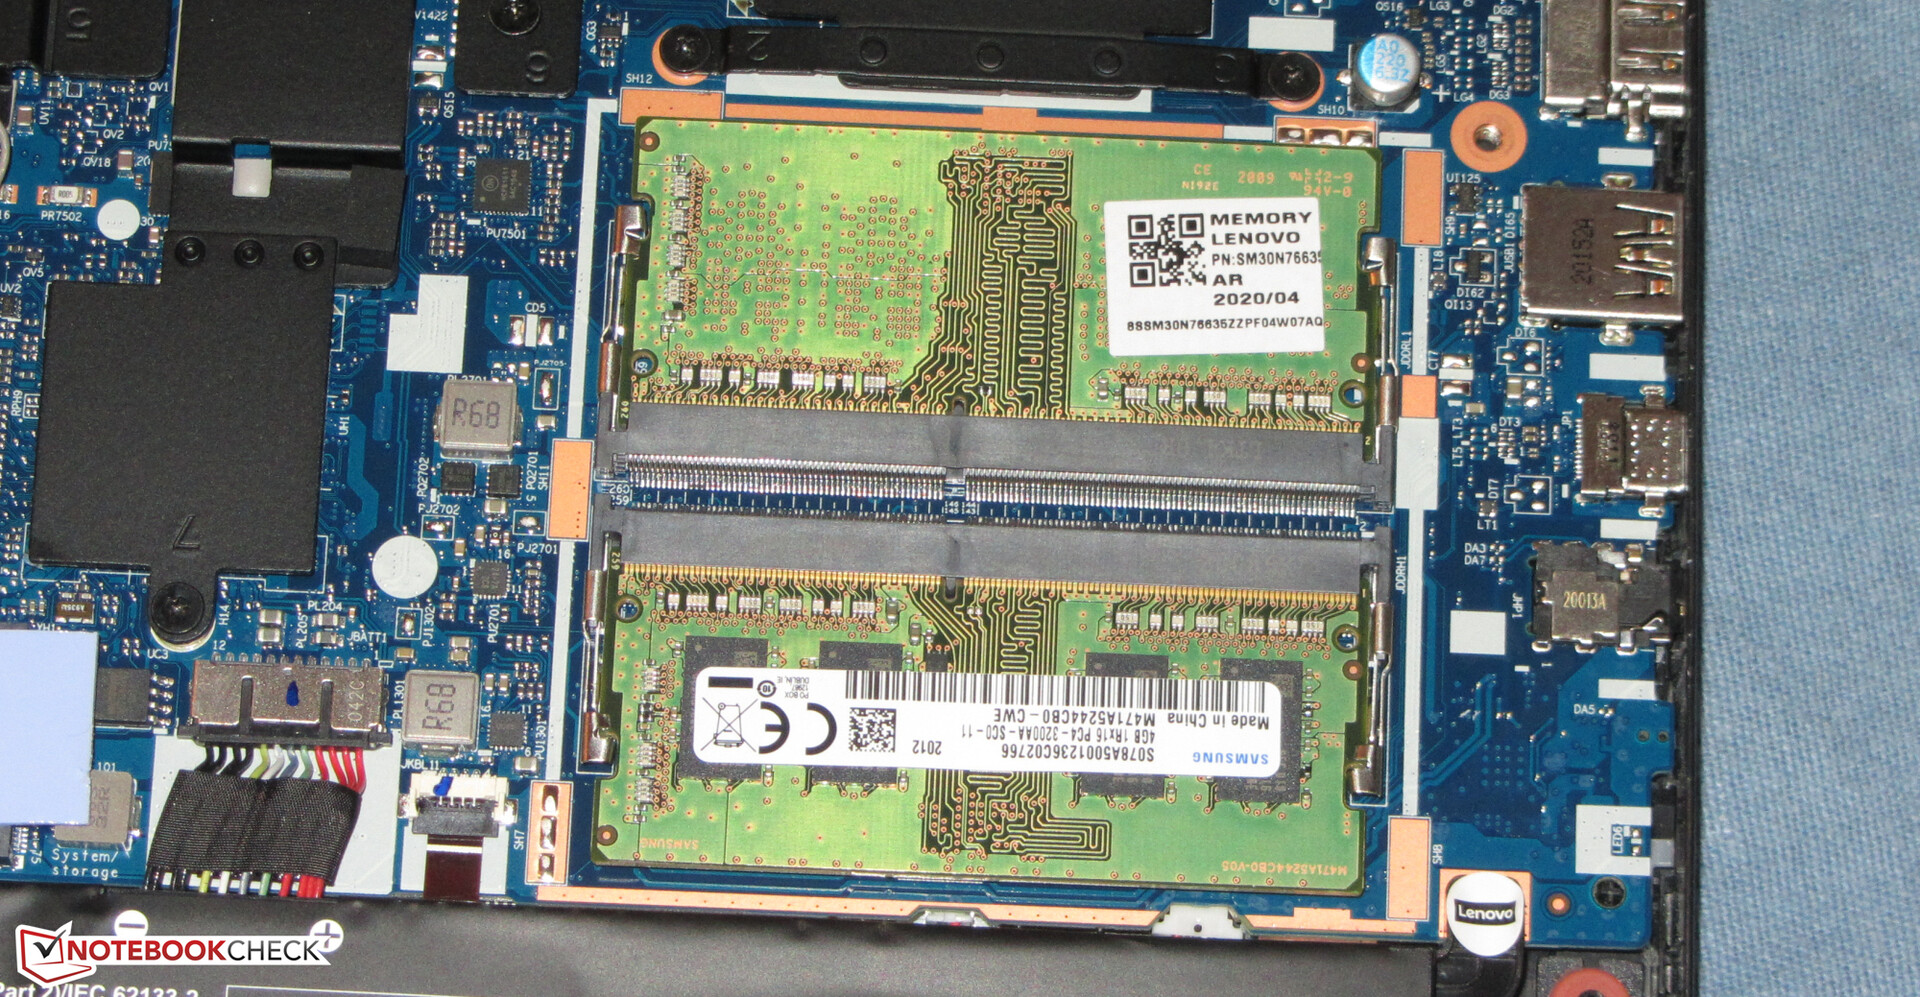
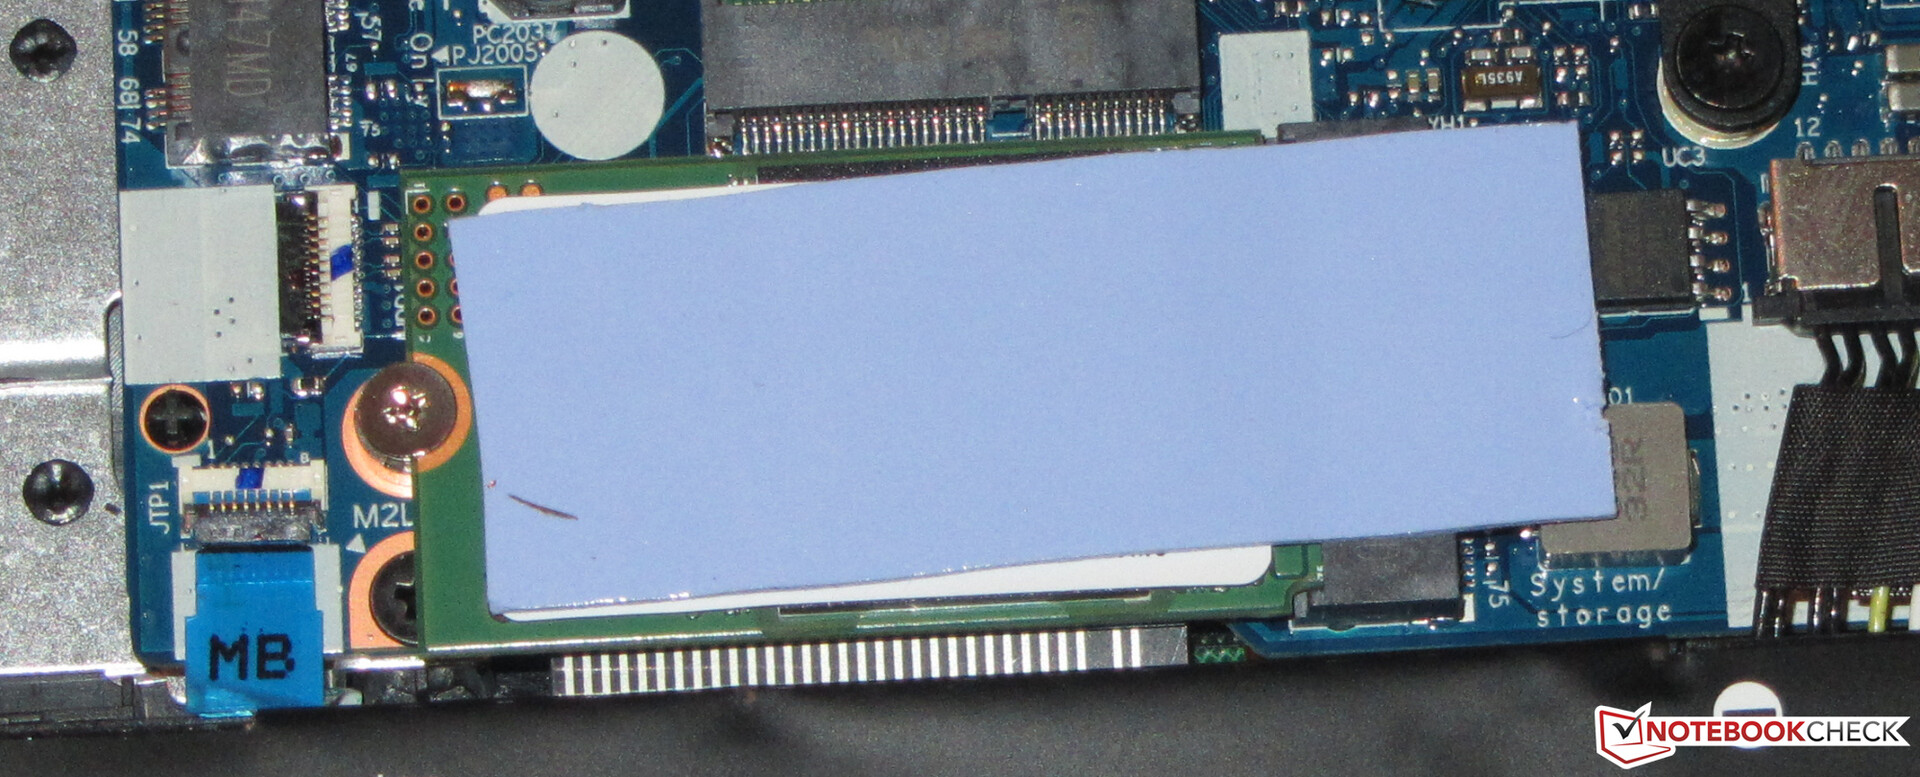
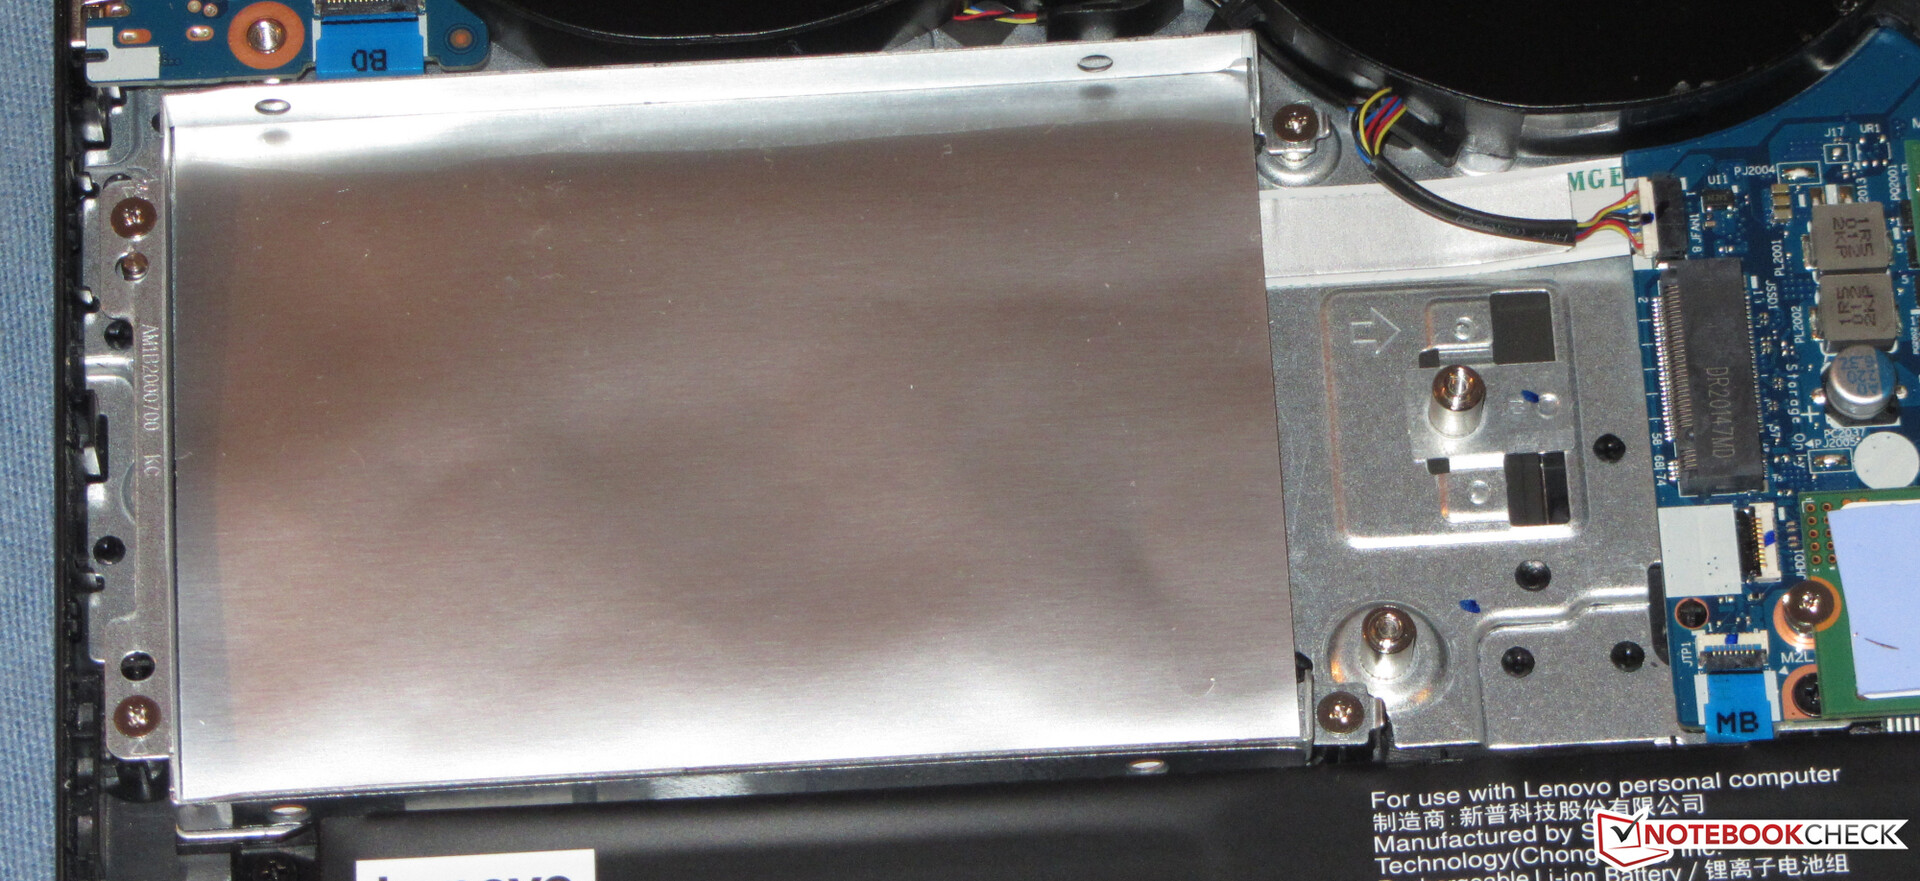
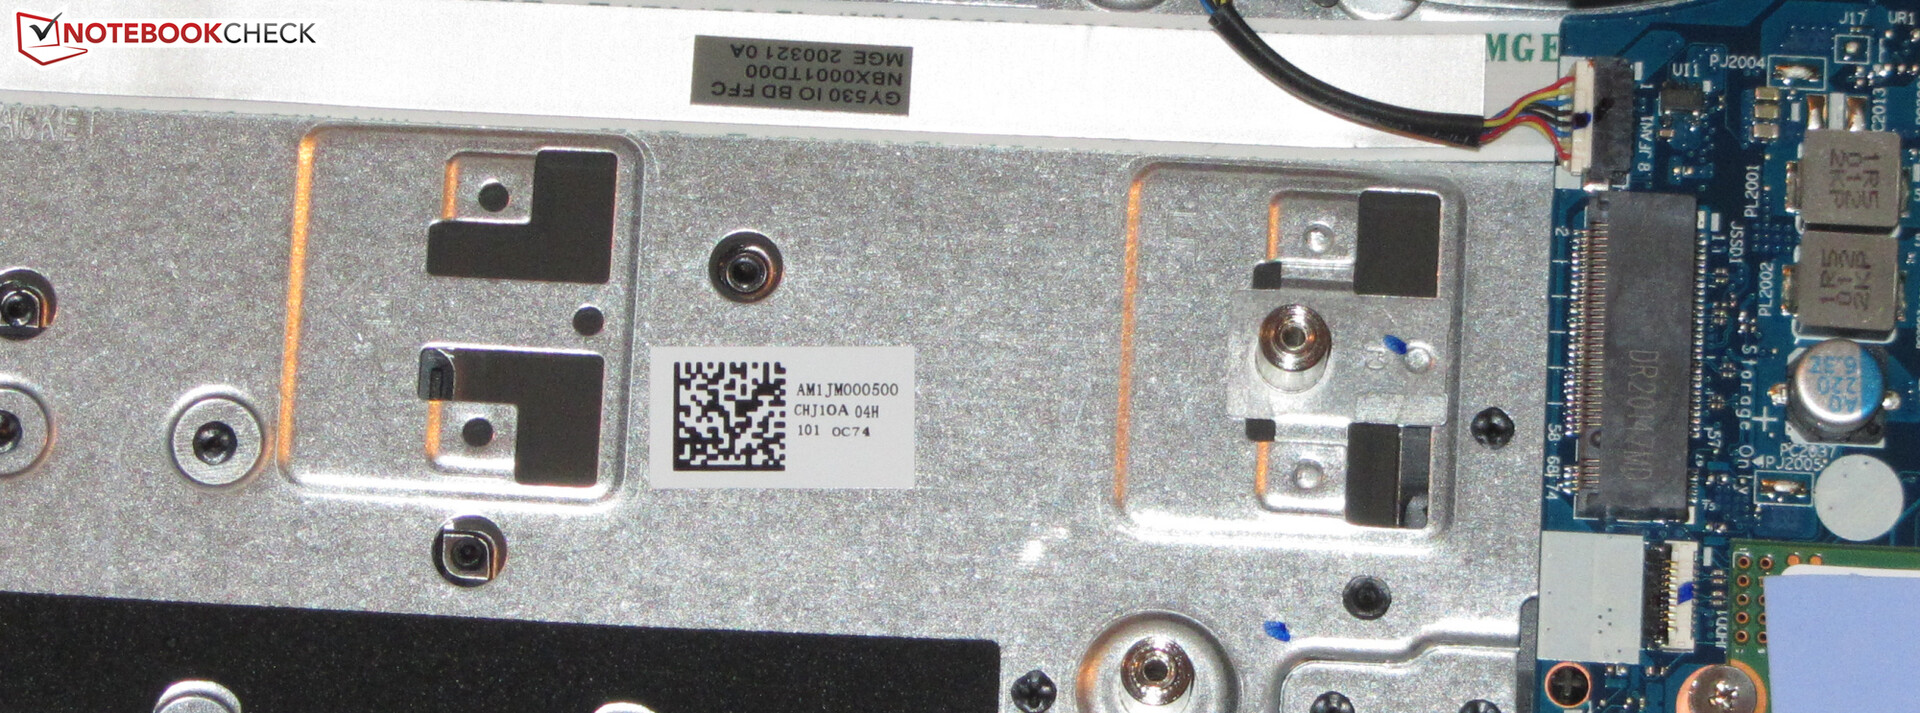
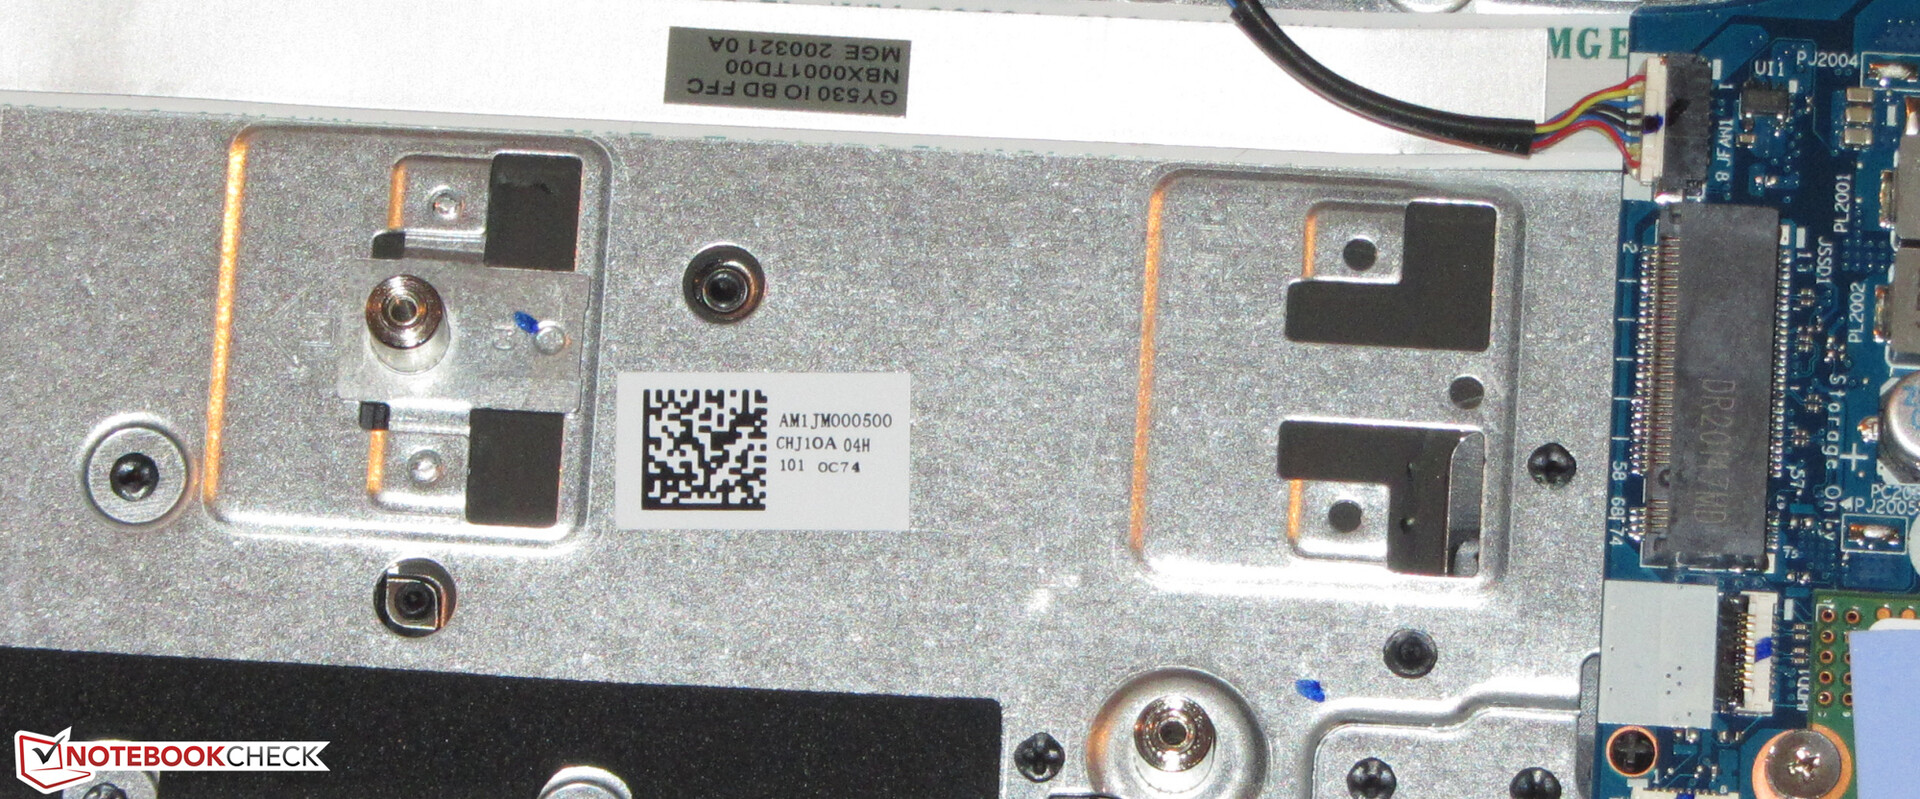
The system drive is an NVMe SSD (M.2 2242) from SK Hynix, which provides 512 GB of storage space. The transfer speeds of the SSD are good.
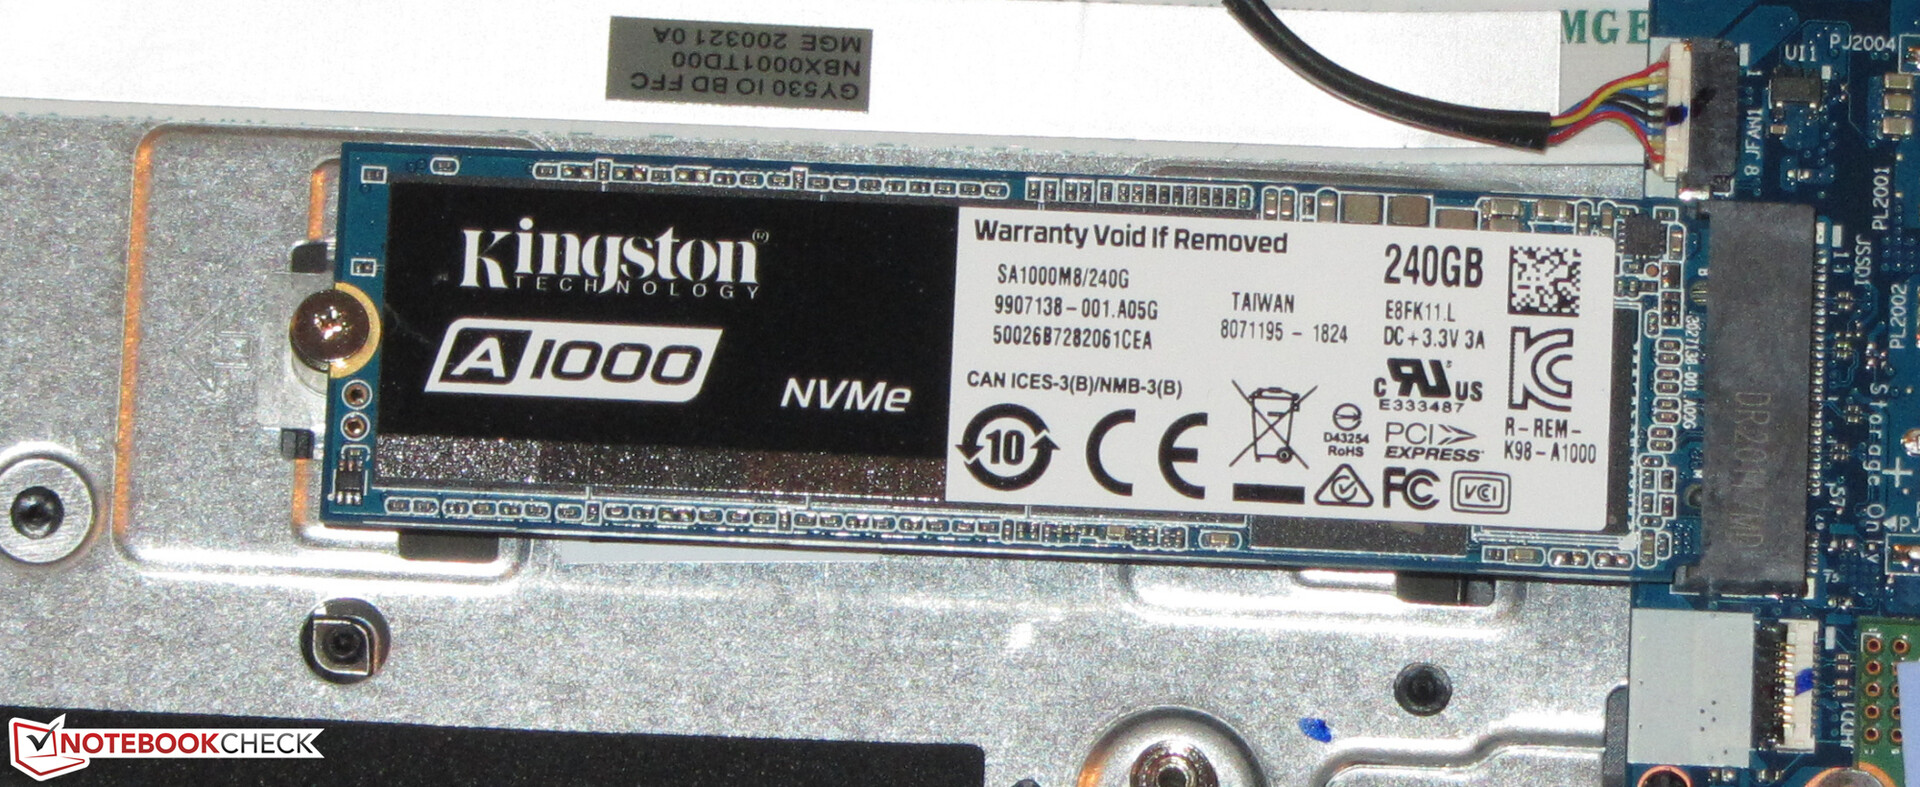
The laptop still has room for a 2.5-inch storage device and a second NVMe SSD. Since our test device doesn't include the SATA slot necessary for the use of a 2.5-inch drive, the only option left is to install a second NVMe SSD. SSDs in the M.2 2230 and M.2 2280 formats can be used. The use of the latter requires the 2.5-inch drive frame to be removed and the retaining screw to be relocated afterwards (see pictures).

| Lenovo IdeaPad Gaming 3i 15IMH05 SK hynix BC511 HFM512GDHTNI-87A0B | Asus TUF FX505DT-EB73 Intel SSD 660p SSDPEKNW512G8 | MSI GF63 Thin 9SC Toshiba KBG30ZMV512G | HP Pavilion Gaming 15-ec0002ng Intel SSD 660p SSDPEKNW512G8 | MSI Alpha 15 A3DDK-034 Kingston RBUSNS8154P3512GJ | Acer Nitro 5 AN515-44-R5FT SK Hynix BC511 HFM512GDJTNI | Lenovo IdeaPad L340-15IRH 81LK00BMGE WDC PC SN520 SDAPMUW-512 | Average SK hynix BC511 HFM512GDHTNI-87A0B | |
|---|---|---|---|---|---|---|---|---|
| CrystalDiskMark 5.2 / 6 | -1% | -25% | 0% | -12% | 1% | -6% | 5% | |
| Write 4K (MB/s) | 130 | 137.5 6% | 80.6 -38% | 136.9 5% | 105.4 -19% | 94.7 -27% | 103.6 -20% | 135.9 ? 5% |
| Read 4K (MB/s) | 44.44 | 57 28% | 41.82 -6% | 57 28% | 33.24 -25% | 38.91 -12% | 39.91 -10% | 45.3 ? 2% |
| Write Seq (MB/s) | 1059 | 984 -7% | 597 -44% | 968 -9% | 1029 -3% | 1056 0% | 1160 10% | 1057 ? 0% |
| Read Seq (MB/s) | 1105 | 1564 42% | 963 -13% | 1631 48% | 1098 -1% | 1183 7% | 990 -10% | 1144 ? 4% |
| Write 4K Q32T1 (MB/s) | 490.3 | 237.4 -52% | 188.8 -61% | 237 -52% | 322.1 -34% | 445.3 -9% | 283.4 -42% | 458 ? -7% |
| Read 4K Q32T1 (MB/s) | 309.2 | 340.7 10% | 403.7 31% | 337.1 9% | 352 14% | 477.7 54% | 344.5 11% | 425 ? 37% |
| Write Seq Q32T1 (MB/s) | 1053 | 959 -9% | 689 -35% | 963 -9% | 1036 -2% | 1063 1% | 1455 38% | 1040 ? -1% |
| Read Seq Q32T1 (MB/s) | 2261 | 1732 -23% | 1583 -30% | 1863 -18% | 1606 -29% | 2154 -5% | 1690 -25% | 2274 ? 1% |
Continuous load read: DiskSpd Read Loop, Queue Depth 8
Graphics card
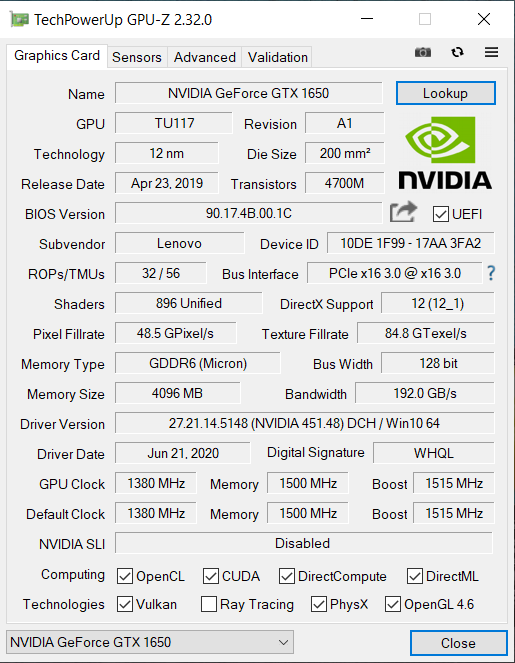
The GeForce GTX 1650 graphics core (Turing) is Nvidia's current mid-range model for laptops. It supports DirectX 12 and runs at a base speed of 1,395 MHz. An increase up to 1,515 MHz is possible when boosted.
Higher clock rates are feasible if the GPU doesn't reach a determined temperature and/or energy threshold. In this way, we register a maximum of 1,787 MHz, which can only be maintained briefly, though. Our The Witcher 3 test is run at an average speed of 1,683 MHz. The GPU is able to access fast GDDR6 graphics memory (4,096 MB).
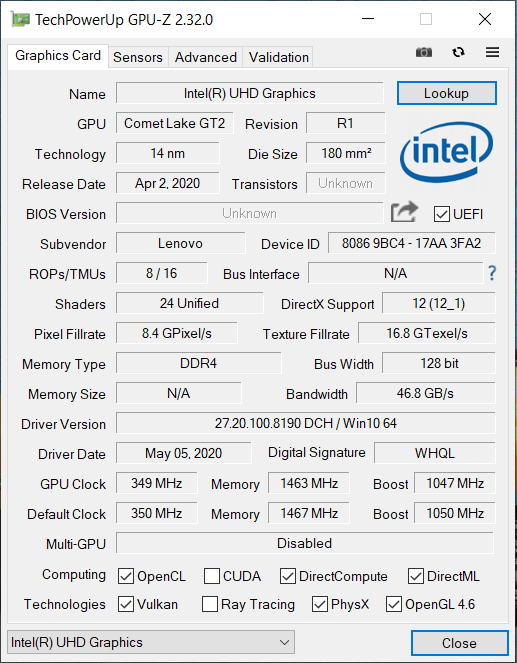
The results in the 3DMark benchmarks are at a normal level for this GPU. The UHD Graphics 630 GPU that's integrated into the processor is active, and the laptop works with Nvidia's Optimus graphics-switching solution.
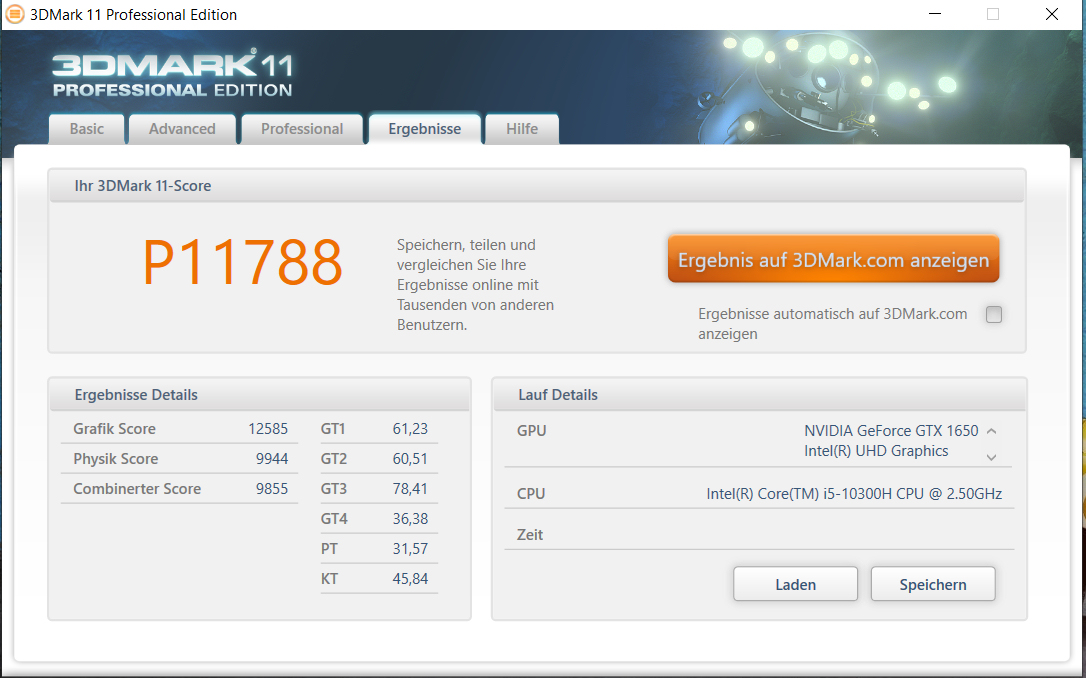
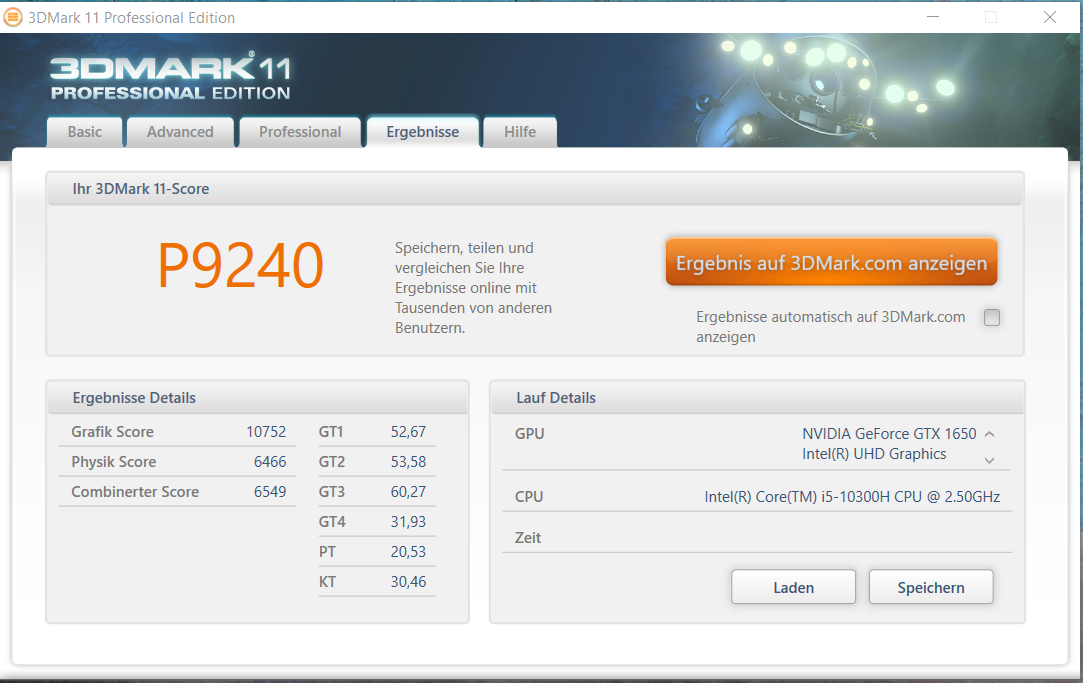
| 3DMark 11 Performance | 11788 points | |
| 3DMark Ice Storm Standard Score | 118141 points | |
| 3DMark Cloud Gate Standard Score | 27773 points | |
| 3DMark Fire Strike Score | 8526 points | |
| 3DMark Time Spy Score | 3621 points | |
Help | ||
Gaming performance
The hardware in the IdeaPad Gaming brings all the games that are in our database onto the screen smoothly. Usually, the Full HD resolution and medium to high quality settings can be used, and in some cases, more is possible.
| BioShock Infinite - 1920x1080 Ultra Preset, DX11 (DDOF) | |
| Lenovo IdeaPad Gaming 3i 15IMH05 | |
| MSI Alpha 15 A3DDK-034 | |
| Average NVIDIA GeForce GTX 1650 Mobile (68.5 - 99.4, n=18) | |
| Dell G3 3590 | |
| Lenovo IdeaPad L340-15IRH 81LK00BMGE | |
| Asus TUF FX505DT-EB73 | |
| HP Pavilion Gaming 15-ec0002ng | |
| Escape from Tarkov - 1920x1080 Ultra Preset | |
| Lenovo IdeaPad Gaming 3i 15IMH05 | |
| Average NVIDIA GeForce GTX 1650 Mobile (45.8 - 62.2, n=2) | |
| Shadow of the Tomb Raider - 1920x1080 Highest Preset AA:T | |
| Average of class Gaming (96 - 116, n=2, last 2 years) | |
| Acer Nitro 5 AN515-44-R5FT | |
| Lenovo IdeaPad Gaming 3i 15IMH05 | |
| Average NVIDIA GeForce GTX 1650 Mobile (34 - 47, n=15) | |
| Asus TUF FX505DT-EB73 | |
| HP Pavilion Gaming 15-ec0002ng | |
| Doom Eternal - 1920x1080 High Preset | |
| Lenovo IdeaPad Gaming 3i 15IMH05 | |
| Average NVIDIA GeForce GTX 1650 Mobile (62.6 - 69.2, n=4) | |
| Gears Tactics - 1920x1080 Ultra Preset | |
| Acer Nitro 5 AN515-44-R5FT | |
| Lenovo IdeaPad Gaming 3i 15IMH05 | |
| Average NVIDIA GeForce GTX 1650 Mobile (41.9 - 48.3, n=5) | |
| Call of Duty Modern Warfare 2019 - 1920x1080 Maximum Settings AA:T2X Filmic SM | |
| Acer Nitro 5 AN515-44-R5FT | |
| Average NVIDIA GeForce GTX 1650 Mobile (43.3 - 53.5, n=4) | |
| Lenovo IdeaPad Gaming 3i 15IMH05 | |
| MSI GF63 Thin 9SC | |
| HP Pavilion Gaming 15-ec0002ng | |
| Far Cry 5 - 1920x1080 Ultra Preset AA:T | |
| Average of class Gaming (70 - 151, n=6, last 2 years) | |
| Lenovo IdeaPad Gaming 3i 15IMH05 | |
| Average NVIDIA GeForce GTX 1650 Mobile (44 - 57, n=9) | |
| HP Pavilion Gaming 15-ec0002ng | |
In order to verify whether the frame rates remain largely constant even over a prolonged period of time, we let the game The Witcher 3 run for about 60 minutes at Full HD resolution and maximum quality settings. The character embodied by the player is not moved during this whole period. A drop in frame rates can't be detected.
| low | med. | high | ultra | |
|---|---|---|---|---|
| BioShock Infinite (2013) | 288.3 | 242.3 | 224.2 | 96.5 |
| The Witcher 3 (2015) | 184.5 | 119.2 | 66 | 37.4 |
| Dota 2 Reborn (2015) | 133.9 | 121.5 | 113.2 | 107.5 |
| X-Plane 11.11 (2018) | 82.8 | 74.1 | 64.8 | |
| Far Cry 5 (2018) | 97 | 66 | 61 | 57 |
| Shadow of the Tomb Raider (2018) | 101 | 63 | 53 | 47 |
| Metro Exodus (2019) | 98.9 | 46.1 | 34.2 | 26.6 |
| Control (2019) | 138.5 | 46 | 33.5 | |
| Borderlands 3 (2019) | 115.7 | 60.1 | 39.2 | 34.6 |
| Call of Duty Modern Warfare 2019 (2019) | 99.6 | 64.3 | 53.3 | 45.4 |
| Need for Speed Heat (2019) | 75.6 | 57.8 | 51 | 48.7 |
| Star Wars Jedi Fallen Order (2019) | 69.6 | 59.8 | 52.1 | |
| Red Dead Redemption 2 (2019) | 93.6 | 50.8 | 33.1 | 21.2 |
| Escape from Tarkov (2020) | 121.2 | 78.6 | 67.9 | 62.2 |
| Hunt Showdown (2020) | 144.4 | 56.8 | 46.4 | |
| Doom Eternal (2020) | 151.5 | 84.6 | 68.1 | |
| Gears Tactics (2020) | 191.1 | 94 | 65.2 | 48.3 |
Emissions - In the green range
Noise emissions
The two fans are often quiet in idle usage, and there is silence. But all this ends under load. In this way, we register sound pressure levels of 50.3 dB(A) (stress test) and 47 dB(A) (The Witcher 3 test), respectively.
Noise level
| Idle |
| 30.7 / 30.7 / 30.7 dB(A) |
| HDD |
| 30.7 dB(A) |
| Load |
| 49.7 / 50.3 dB(A) |
 | ||
30 dB silent 40 dB(A) audible 50 dB(A) loud |
||
min: | ||
| Lenovo IdeaPad Gaming 3i 15IMH05 i5-10300H, GeForce GTX 1650 Mobile | Lenovo IdeaPad L340-15IRH 81LK00BMGE i5-9300H, GeForce GTX 1650 Mobile | Asus TUF FX505DT-EB73 R7 3750H, GeForce GTX 1650 Mobile | Dell G3 3590 i5-9300H, GeForce GTX 1650 Mobile | MSI GF63 Thin 9SC i5-9300H, GeForce GTX 1650 Max-Q | HP Pavilion Gaming 15-ec0002ng R5 3550H, GeForce GTX 1050 Mobile | Acer Nitro 5 AN515-44-R5FT R5 4600H, GeForce GTX 1650 Ti Mobile | MSI Alpha 15 A3DDK-034 R7 3750H, Radeon RX 5500M | Average NVIDIA GeForce GTX 1650 Mobile | Average of class Gaming | |
|---|---|---|---|---|---|---|---|---|---|---|
| Noise | 14% | 6% | 5% | -2% | 7% | -0% | -15% | 8% | 9% | |
| off / environment * (dB) | 30.7 | 28.4 7% | 28.2 8% | 28.4 7% | 30 2% | 30.3 1% | 30 2% | 29 6% | 27.6 ? 10% | 24.1 ? 21% |
| Idle Minimum * (dB) | 30.7 | 28.4 7% | 28.2 8% | 29.2 5% | 35 -14% | 30.3 1% | 30 2% | 36 -17% | 28.1 ? 8% | 26 ? 15% |
| Idle Average * (dB) | 30.7 | 28.4 7% | 28.2 8% | 29.4 4% | 36 -17% | 30.3 1% | 32 -4% | 37 -21% | 28.8 ? 6% | 27.4 ? 11% |
| Idle Maximum * (dB) | 30.7 | 28.4 7% | 31.4 -2% | 29.4 4% | 37 -21% | 31 -1% | 34 -11% | 46 -50% | 31 ? -1% | 30.1 ? 2% |
| Load Average * (dB) | 49.7 | 30.1 39% | 39.8 20% | 39 22% | 44 11% | 39.3 21% | 46 7% | 50 -1% | 41.7 ? 16% | 43.6 ? 12% |
| Witcher 3 ultra * (dB) | 47 | 40.2 14% | 47 -0% | 49.5 -5% | 41 13% | 42.9 9% | 47 -0% | 51 -9% | ||
| Load Maximum * (dB) | 50.3 | 40.2 20% | 50.2 -0% | 49.7 1% | 43 15% | 43.3 14% | 49 3% | 57 -13% | 46.4 ? 8% | 54.2 ? -8% |
* ... smaller is better
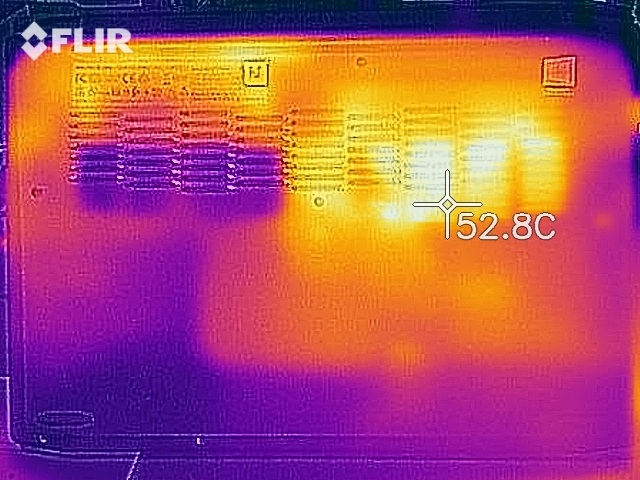
Temperature
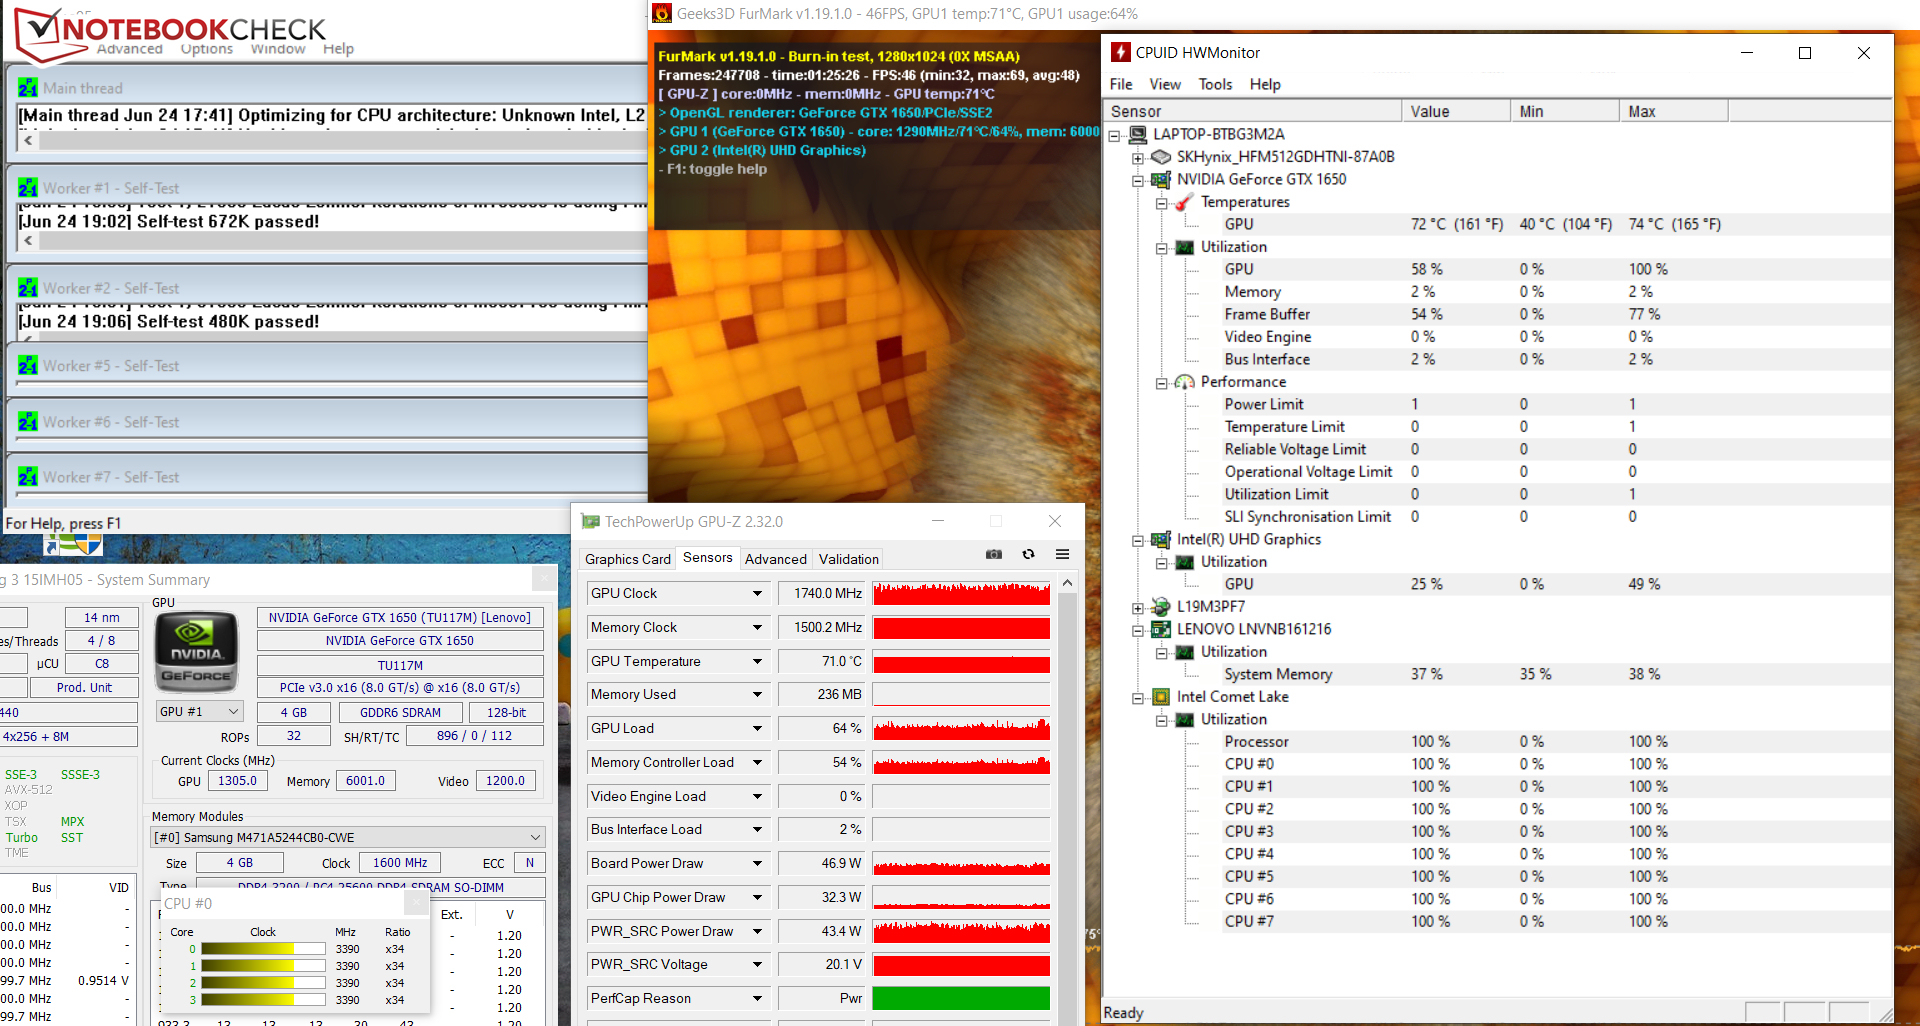
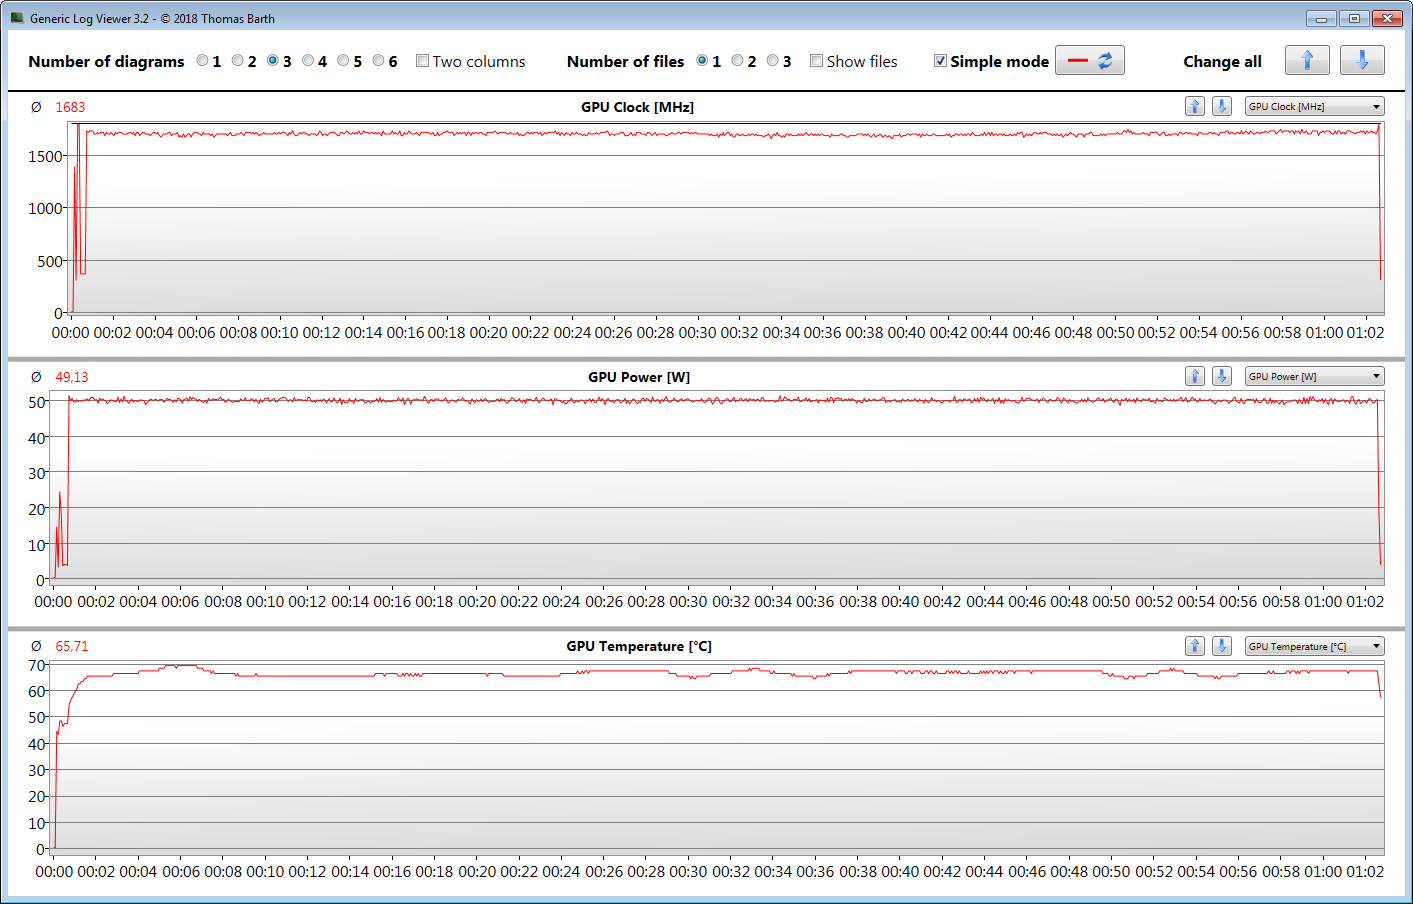
The IdeaPad 3 processes our stress test (Prime95 and FurMark run for at least an hour) in different ways when plugged in and on battery power. In the former case, the processor's clock speed drops from 4.2 GHz to 3.4 to 3.5 GHz after a few seconds and remains at this level. The graphics core reaches speeds between 1,200 and 1,800 MHz. On battery power, the clock rates are 2 to 2.1 GHz (CPU) and 1,000 to 1,200 MHz (GPU), respectively. The stress test represents an extreme scenario that doesn't occur in everyday life. We use this test to check if the system remains stable even under full load.
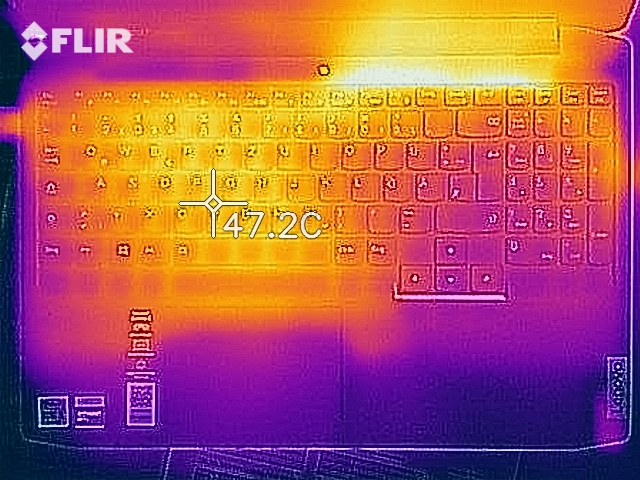
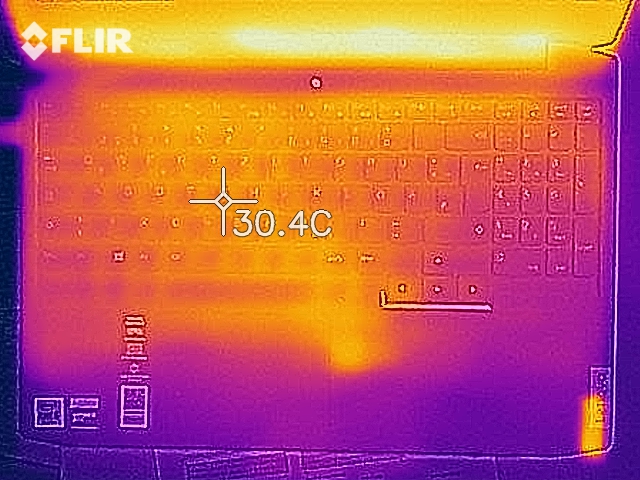
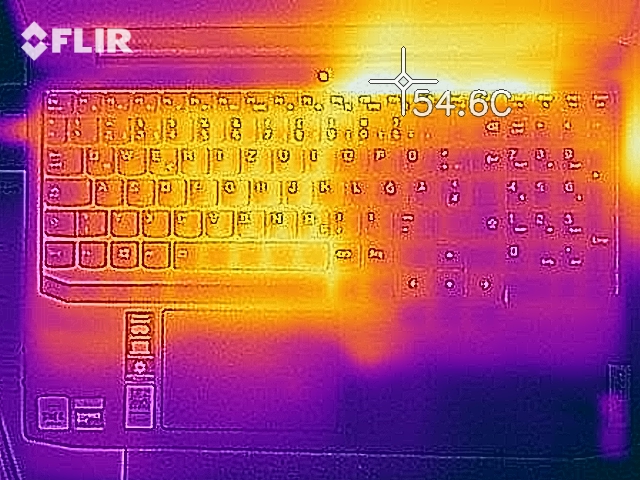
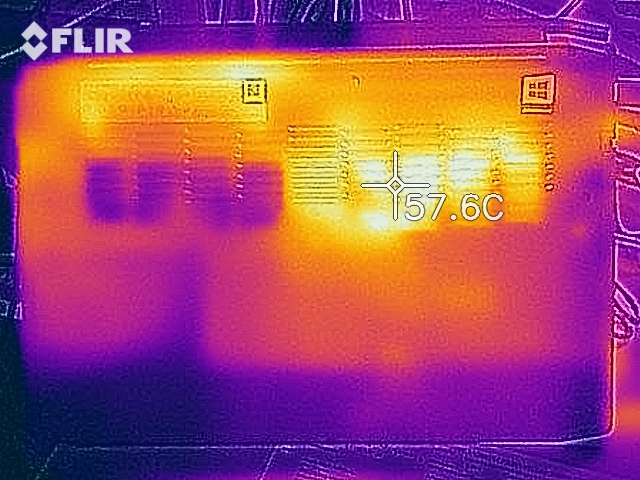
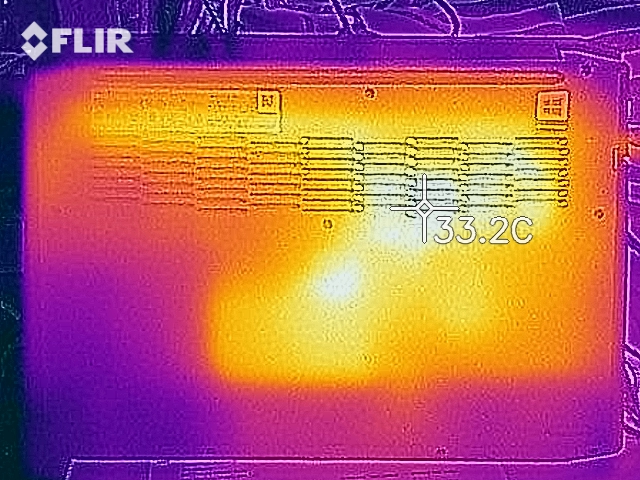
All in all, the laptop warms up moderately. During the stress test, we register a temperature just above 50 °C (~122 °F) at one measuring point. The heat developed is a bit less when performing our The Witcher 3 test. Furthermore, the temperatures remain in the green range in everyday use.
(±) The maximum temperature on the upper side is 43 °C / 109 F, compared to the average of 40.4 °C / 105 F, ranging from 21.2 to 68.8 °C for the class Gaming.
(-) The bottom heats up to a maximum of 50.6 °C / 123 F, compared to the average of 43.2 °C / 110 F
(+) In idle usage, the average temperature for the upper side is 25.7 °C / 78 F, compared to the device average of 33.9 °C / 93 F.
(±) Playing The Witcher 3, the average temperature for the upper side is 34.2 °C / 94 F, compared to the device average of 33.9 °C / 93 F.
(+) The palmrests and touchpad are reaching skin temperature as a maximum (32.4 °C / 90.3 F) and are therefore not hot.
(-) The average temperature of the palmrest area of similar devices was 28.8 °C / 83.8 F (-3.6 °C / -6.5 F).
| Lenovo IdeaPad Gaming 3i 15IMH05 i5-10300H, GeForce GTX 1650 Mobile | Lenovo IdeaPad L340-15IRH 81LK00BMGE i5-9300H, GeForce GTX 1650 Mobile | Asus TUF FX505DT-EB73 R7 3750H, GeForce GTX 1650 Mobile | Dell G3 3590 i5-9300H, GeForce GTX 1650 Mobile | MSI GF63 Thin 9SC i5-9300H, GeForce GTX 1650 Max-Q | HP Pavilion Gaming 15-ec0002ng R5 3550H, GeForce GTX 1050 Mobile | Acer Nitro 5 AN515-44-R5FT R5 4600H, GeForce GTX 1650 Ti Mobile | MSI Alpha 15 A3DDK-034 R7 3750H, Radeon RX 5500M | Average NVIDIA GeForce GTX 1650 Mobile | Average of class Gaming | |
|---|---|---|---|---|---|---|---|---|---|---|
| Heat | -6% | -7% | -15% | 2% | 9% | -5% | 1% | -3% | -10% | |
| Maximum Upper Side * (°C) | 43 | 44.8 -4% | 41.2 4% | 49 -14% | 47 -9% | 41 5% | 49 -14% | 44 -2% | 46 ? -7% | 45.2 ? -5% |
| Maximum Bottom * (°C) | 50.6 | 58.1 -15% | 40 21% | 49.8 2% | 47 7% | 39.1 23% | 50 1% | 49 3% | 49.2 ? 3% | 48.1 ? 5% |
| Idle Upper Side * (°C) | 27.2 | 27.9 -3% | 34.6 -27% | 32.4 -19% | 26 4% | 26 4% | 28 -3% | 26 4% | 28.3 ? -4% | 31 ? -14% |
| Idle Bottom * (°C) | 27.5 | 27.9 -1% | 34.4 -25% | 35.6 -29% | 26 5% | 26.5 4% | 28 -2% | 28 -2% | 28.9 ? -5% | 34.2 ? -24% |
* ... smaller is better
Speakers
The stereo speakers are placed in the front area of the bottom of the device. They produce a decent sound, which is largely lacking in bass. In addition, the speakers only have a low maximum volume.
Lenovo IdeaPad Gaming 3i 15IMH05 audio analysis
(-) | not very loud speakers (70 dB)
Bass 100 - 315 Hz
(-) | nearly no bass - on average 21.8% lower than median
(±) | linearity of bass is average (11.9% delta to prev. frequency)
Mids 400 - 2000 Hz
(±) | higher mids - on average 5.9% higher than median
(±) | linearity of mids is average (9.4% delta to prev. frequency)
Highs 2 - 16 kHz
(+) | balanced highs - only 1.1% away from median
(+) | highs are linear (4.6% delta to prev. frequency)
Overall 100 - 16.000 Hz
(±) | linearity of overall sound is average (22.8% difference to median)
Compared to same class
» 82% of all tested devices in this class were better, 5% similar, 13% worse
» The best had a delta of 6%, average was 18%, worst was 132%
Compared to all devices tested
» 68% of all tested devices were better, 5% similar, 27% worse
» The best had a delta of 4%, average was 23%, worst was 134%
Energy management - The Gaming 3i delivers decent battery life
Energy consumption
The energy requirement remains at a normal level for the hardware installed here over the entire load range. We register a maximum power consumption of 10.6 watts in idle usage. During our stress test, the value increases up to 150 watts. When playing games (The Witcher 3 test), the demand is lower at an average of 109 watts (103 to 111 watts). The power adapter's rated output is 135 watts.
| Off / Standby | |
| Idle | |
| Load |
|
Key:
min: | |
| Lenovo IdeaPad Gaming 3i 15IMH05 i5-10300H, GeForce GTX 1650 Mobile | Lenovo IdeaPad L340-15IRH 81LK00BMGE i5-9300H, GeForce GTX 1650 Mobile | Asus TUF FX505DT-EB73 R7 3750H, GeForce GTX 1650 Mobile | Dell G3 3590 i5-9300H, GeForce GTX 1650 Mobile | MSI GF63 Thin 9SC i5-9300H, GeForce GTX 1650 Max-Q | HP Pavilion Gaming 15-ec0002ng R5 3550H, GeForce GTX 1050 Mobile | Acer Nitro 5 AN515-44-R5FT R5 4600H, GeForce GTX 1650 Ti Mobile | MSI Alpha 15 A3DDK-034 R7 3750H, Radeon RX 5500M | Average NVIDIA GeForce GTX 1650 Mobile | Average of class Gaming | |
|---|---|---|---|---|---|---|---|---|---|---|
| Power Consumption | 24% | 0% | -22% | -1% | 29% | 12% | -82% | 1% | -96% | |
| Idle Minimum * (Watt) | 5.1 | 3.8 25% | 7 -37% | 6.2 -22% | 7 -37% | 1.9 63% | 5 2% | 14 -175% | 4.96 ? 3% | 13 ? -155% |
| Idle Average * (Watt) | 8.2 | 6.6 20% | 9.9 -21% | 8.4 -2% | 9 -10% | 7.2 12% | 8 2% | 18 -120% | 8.61 ? -5% | 19 ? -132% |
| Idle Maximum * (Watt) | 10.6 | 8.9 16% | 12 -13% | 27.7 -161% | 13 -23% | 9.6 9% | 13 -23% | 32 -202% | 14.8 ? -40% | 24.6 ? -132% |
| Load Average * (Watt) | 128 | 78.4 39% | 68.4 47% | 91 29% | 79 38% | 74 42% | 69 46% | 64 50% | 81.7 ? 36% | 110.7 ? 14% |
| Witcher 3 ultra * (Watt) | 109 | 82 25% | 94.9 13% | 94.4 13% | 73 33% | 75 31% | 78 28% | 123 -13% | ||
| Load Maximum * (Watt) | 150 | 124 17% | 130.9 13% | 131.5 12% | 164 -9% | 124 17% | 124 17% | 193 -29% | 131.9 ? 12% | 259 ? -73% |
* ... smaller is better
Battery life
Lenovo's gaming laptop achieves a runtime of 6:19 h in our practical WLAN test (accessing websites with a script; energy profile: balanced). The 15.6-incher completes our video test (energy profile: energy-saving mode) after 7:55 h. We let the short film Big Buck Bunny (H.264 encoding, 1920x1080 pixels) run in a continuous loop here. The energy-saving functions are disabled during both tests, and the display brightness is adjusted to about 150 cd/m². To perform the video test, the wireless modules are also switched off.
| Lenovo IdeaPad Gaming 3i 15IMH05 i5-10300H, GeForce GTX 1650 Mobile, 45 Wh | Asus TUF FX505DT-EB73 R7 3750H, GeForce GTX 1650 Mobile, 48 Wh | Dell G3 3590 i5-9300H, GeForce GTX 1650 Mobile, 51 Wh | MSI GF63 Thin 9SC i5-9300H, GeForce GTX 1650 Max-Q, 51 Wh | HP Pavilion Gaming 15-ec0002ng R5 3550H, GeForce GTX 1050 Mobile, 52.5 Wh | MSI Alpha 15 A3DDK-034 R7 3750H, Radeon RX 5500M, 51 Wh | Acer Nitro 5 AN515-44-R5FT R5 4600H, GeForce GTX 1650 Ti Mobile, 57.48 Wh | Lenovo IdeaPad L340-15IRH 81LK00BMGE i5-9300H, GeForce GTX 1650 Mobile, 45 Wh | Average of class Gaming | |
|---|---|---|---|---|---|---|---|---|---|
| Battery runtime | -26% | -2% | -31% | 33% | -48% | 9% | -28% | -6% | |
| Reader / Idle (h) | 12.4 | 7.8 -37% | 13.5 9% | 8.5 -31% | 5.8 -53% | 13.8 11% | 7.8 -37% | 8.27 ? -33% | |
| H.264 (h) | 7.3 | 3.9 -47% | 8.32 ? 14% | ||||||
| WiFi v1.3 (h) | 6.3 | 4.8 -24% | 6.7 6% | 4.4 -30% | 8.4 33% | 4.1 -35% | 8.7 38% | 6.1 -3% | 7.11 ? 13% |
| Load (h) | 1.8 | 1.5 -17% | 1.4 -22% | 1.2 -33% | 0.8 -56% | 1.4 -22% | 1 -44% | 1.502 ? -17% |
Pros
Cons
Verdict
Lenovo's inexpensive 15.6-inch gaming laptop (about 800 Euros (~$903)) has a Core i5-10300H processor (Comet Lake) on board that provides enough computing power for all common application areas. In combination with the dedicated GeForce GTX 1650 graphics core, the CPU brings all modern computer games smoothly onto the screen. Positive: Both the CPU and the GPU can run at high speeds for prolonged periods of time.
The IdeaPad Gaming 3i 15IMH05 represents a well-rounded gaming laptop in the entry-level segment that offers a good price-performance ratio.
A 512 GB NVMe SSD (M.2 2242) ensures a fast system. Should the storage space run out, it can be expanded without any problems. The laptop comes with a second M.2 slot, which can accommodate an NVMe SSD in either the 2280 or 2230 format. Since the computer doesn't have a maintenance hatch, the case would have to be opened for the installation.
The 120 Hz Full HD IPS display offers stable viewing angles, a matte surface, acceptable response times, and decent color reproduction. While the maximum brightness can still be described as just sufficient, the contrast and color-space coverage are too low. Even an entry-level laptop should deliver more here.
The computer doesn't offer a plethora of connections. As a result, there is neither a memory card reader nor a Thunderbolt 3 port. The USB Type-C 3.2 Gen 1 port available doesn't support the DisplayPort via USB C function. The built-in keyboard (two-stage backlighting) has proven to be suitable for everyday use. In addition, the battery life is good.
Lenovo IdeaPad Gaming 3i 15IMH05
- 07/02/2020 v7 (old)
Sascha Mölck
Price comparison

