Acer Nitro 5 AN515-44 Laptop Review: AMD dating Nvidia

Acer’s Nitro 5 refresh is available in two basic configurations: The AN515-55 equipped with an Intel Comet Lake processor, and the AN515-44 featuring an AMD Renoir processor.
If you want to save some money you might want to opt for the Ryzen 5 4600H. AMD’s hexa-core can easily take it up against Intel’s Core i7-9750H that many more expensive laptops are equipped with. Alternatively, the AN515-44 can also be purchased with a very powerful Ryzen 7 4800H, the same CPU that flexed its muscles in the Bravo not too long ago.
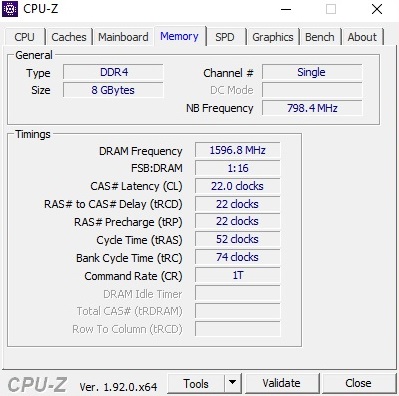
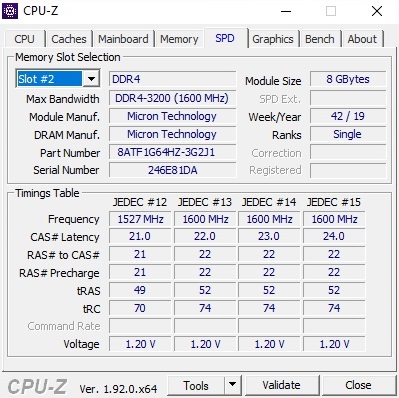
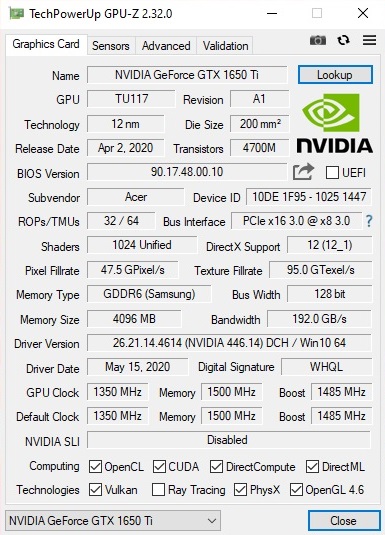
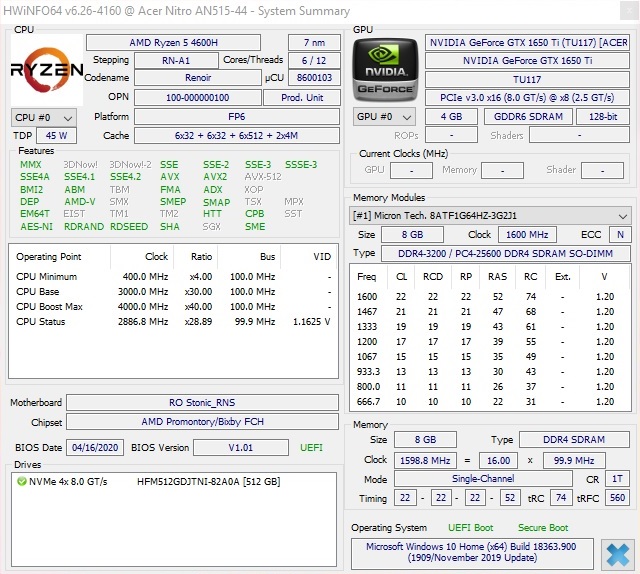
Our review unit was furthermore equipped with a fairly new upper mid-range GeForce GTX 1650 Ti GPU, a 144 Hz display, a 512 GB SSD, and 8 GB of single-channel DDR4 RAM. For reasons of better performance, we would have wished for a dual-channel configuration. In order to purchase this particular configuration, you had to part with around $1,000 at the time of writing.
Its competitors are other 15-inch budget gaming laptops, such as the Dell G5 15 5590, the HP Omen 15, the Lenovo Legion Y540-15, and the Acer Predator Helios 300. Accordingly, our comparison group is comprised of those four devices.
Rating | Date | Model | Weight | Height | Size | Resolution | Price |
|---|---|---|---|---|---|---|---|
| 79.8 % v7 (old) | 06 / 2020 | Acer Nitro 5 AN515-44-R5FT R5 4600H, GeForce GTX 1650 Ti Mobile | 2.2 kg | 24 mm | 15.60" | 1920x1080 | |
| 79.6 % v7 (old) | 10 / 2019 | Dell G5 15 5590-PCNJJ i5-9300H, GeForce GTX 1650 Mobile | 2.7 kg | 23.7 mm | 15.60" | 1920x1080 | |
| 81.5 % v7 (old) | 07 / 2019 | HP Omen 15-dc1020ng i5-9300H, GeForce GTX 1650 Mobile | 2.3 kg | 25 mm | 15.60" | 1920x1080 | |
| 82.3 % v7 (old) | 08 / 2019 | Lenovo Legion Y540-15IRH-81SX00B2GE i7-9750H, GeForce GTX 1660 Ti Mobile | 2.2 kg | 26 mm | 15.60" | 1920x1080 | |
| 82.1 % v7 (old) | 11 / 2019 | Acer Predator Helios 300 PH315-52-79TY i7-9750H, GeForce GTX 1660 Ti Mobile | 2.3 kg | 23.2 mm | 15.60" | 1920x1080 |
Case
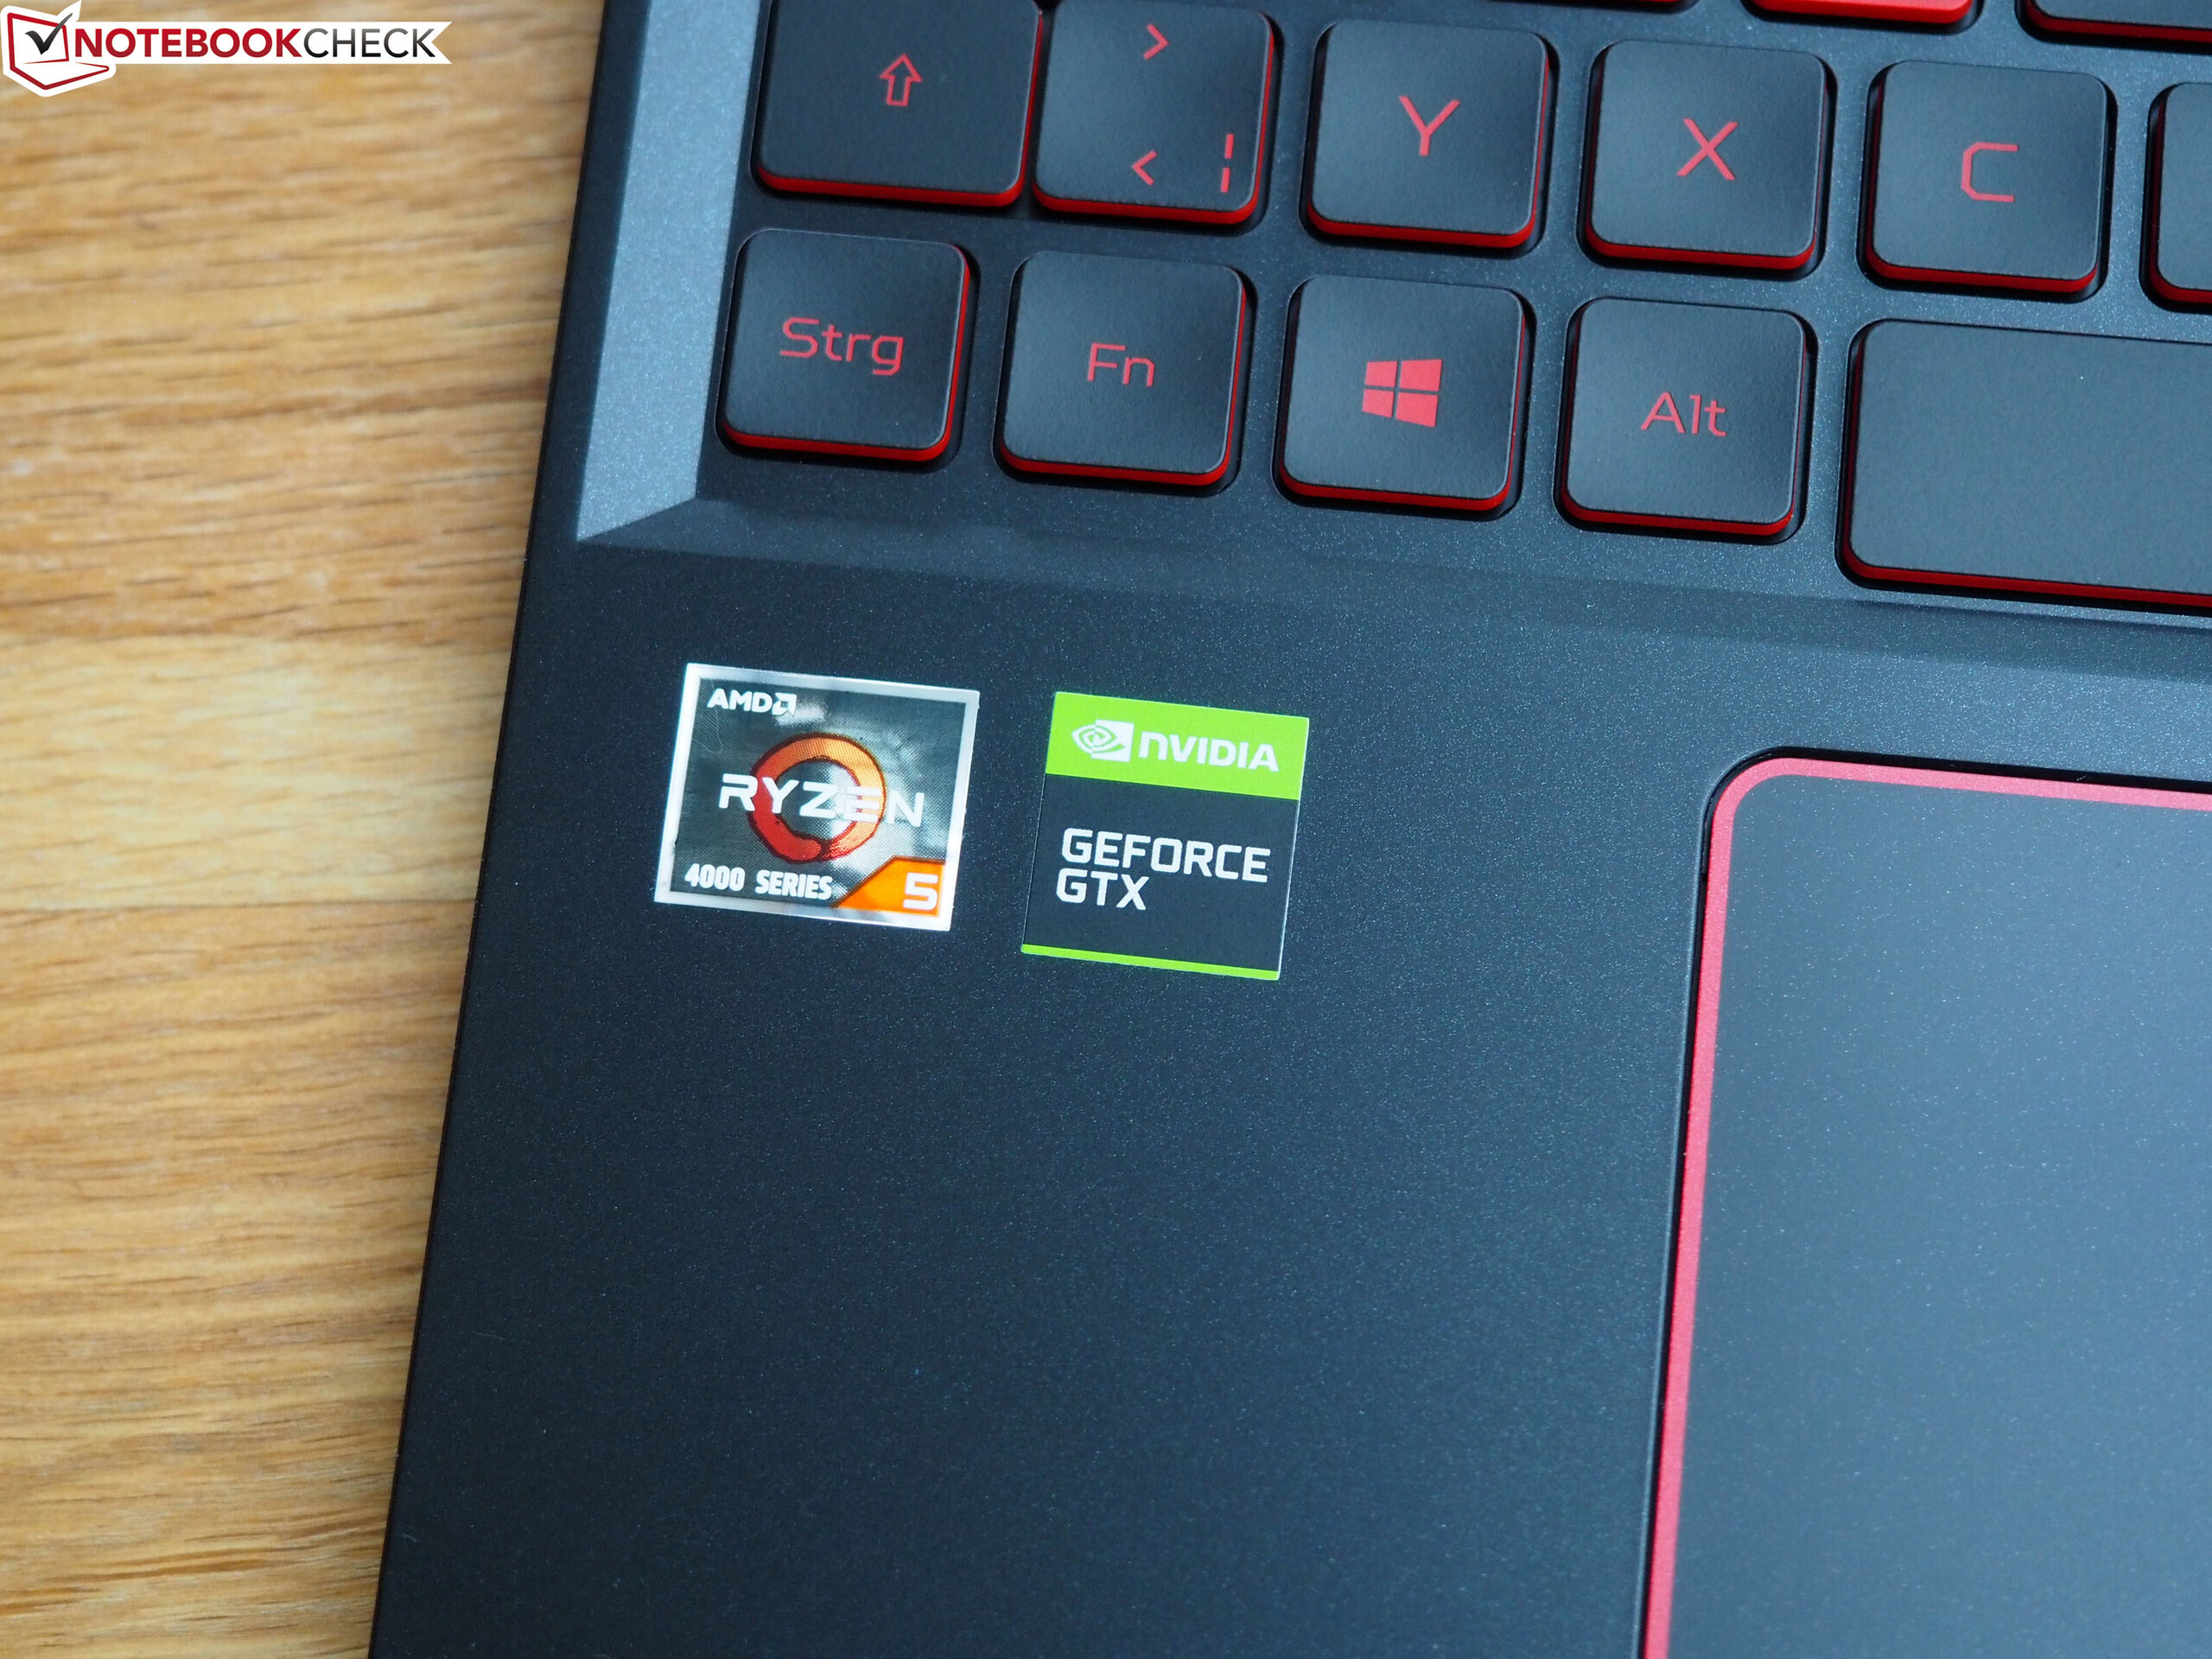
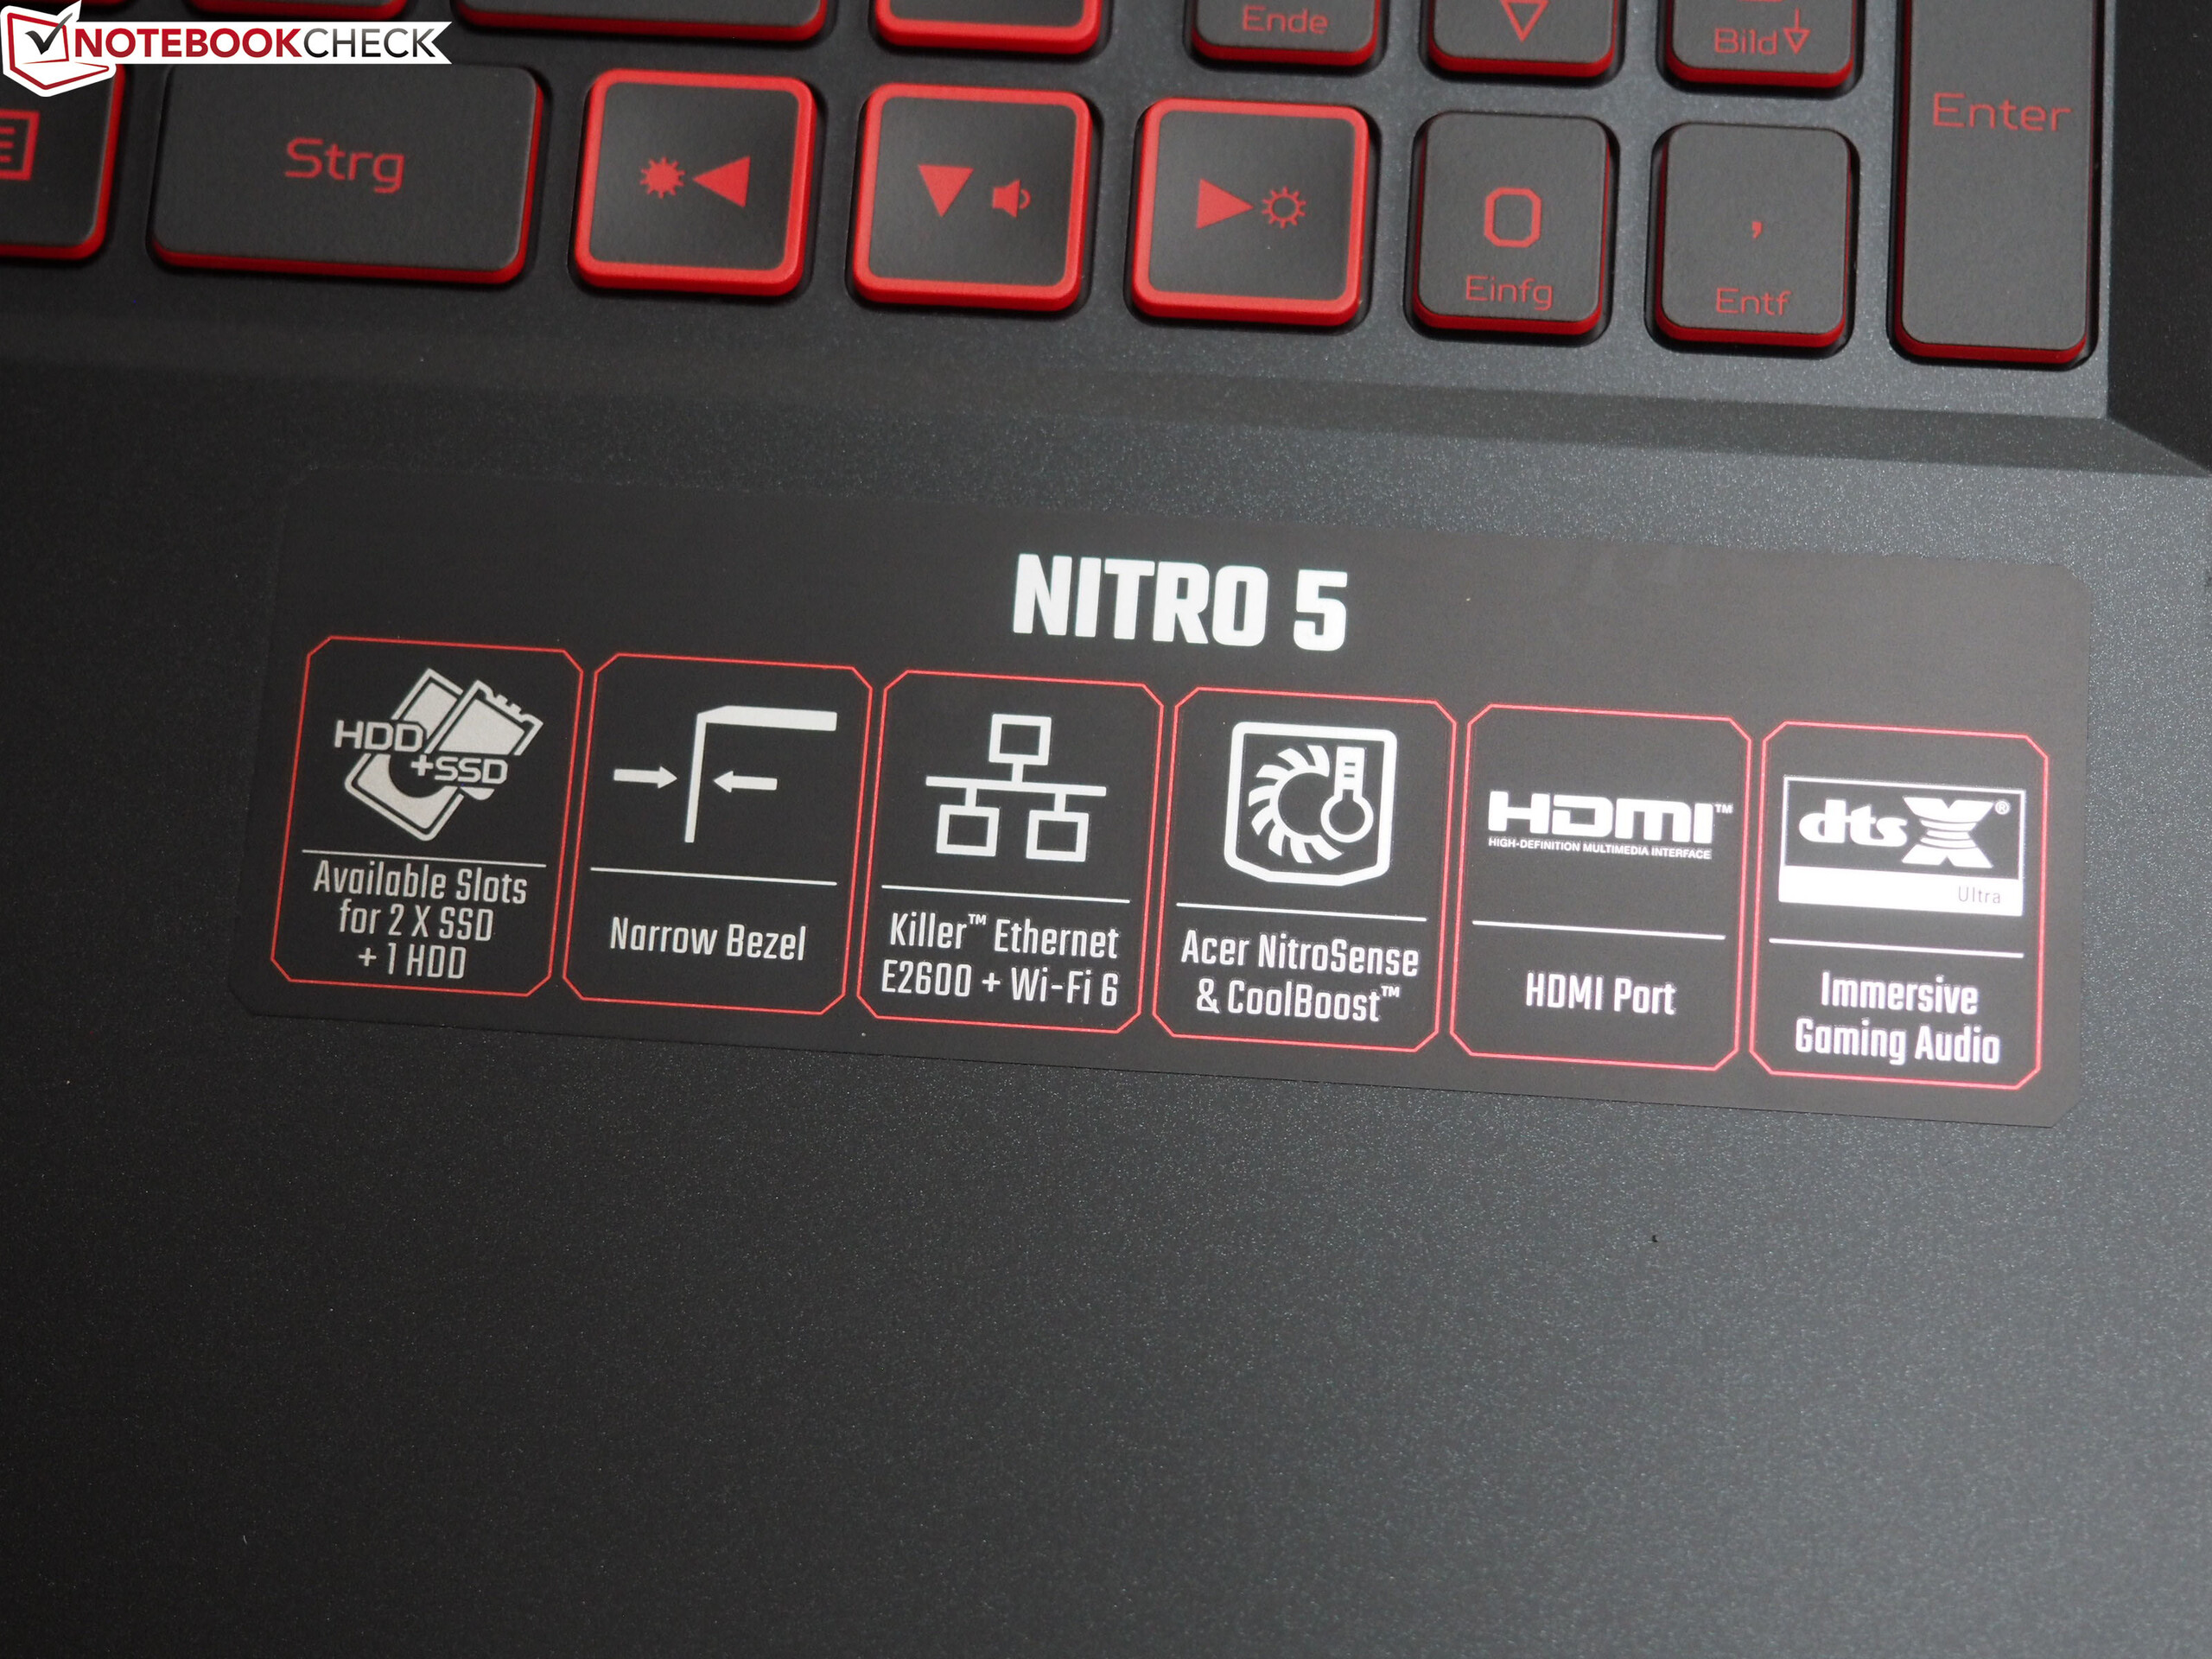
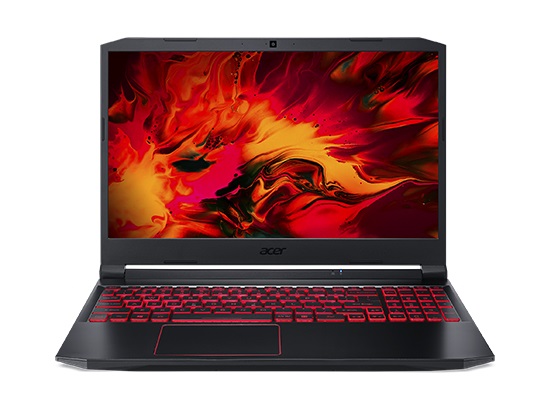
Despite the fact that the case is made almost entirely of plastic, the new Nitro 5 looks and feels fairly premium. The lid in particular looks strikingly similar to real aluminum. The combination of black surfaces with red highlights (keyboard, touchpad, etc…) reminds us of various MSI laptops, and it hits a good balance between boring and playful.
Rigidity was decent except for the not particularly sturdy cover. The base unit only warped after applying a significant amount of force. Build quality was also on a par with its competitors, and thus at a decent level. A maximum display opening angle of 150 degrees should suffice for most users.
As is expected of a modern laptop, Acer opted for narrow albeit slightly wider bezels than those found on some of its competitors. Nevertheless, the Nitro’s footprint of 36.3 x 25.5 cm (14.3 x 10 inches) turned out to be fairly compact for a 15-inch device, as did its maximum height of just 2.4 cm. Thanks to its moderate weight of no more than 2.2 kg it is even portable to a certain degree.
Connectivity
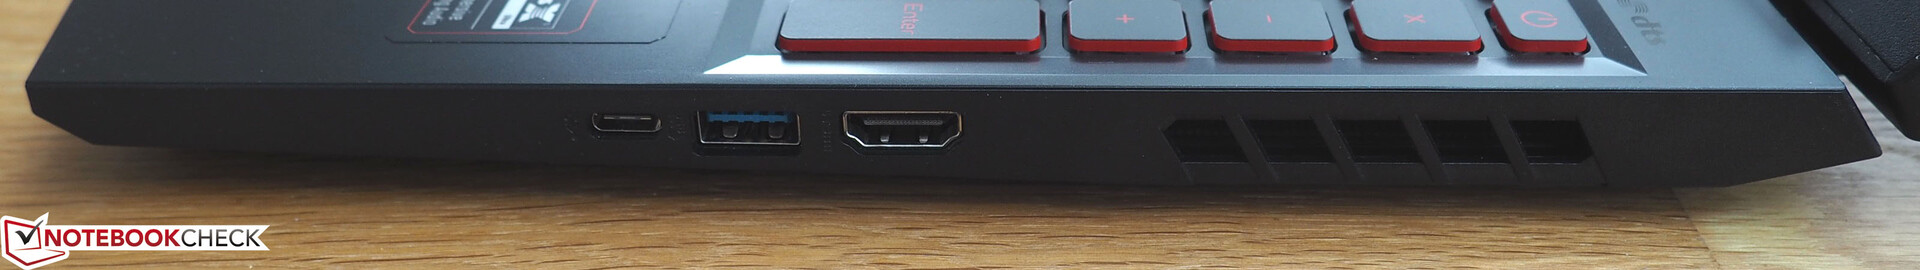
Ports
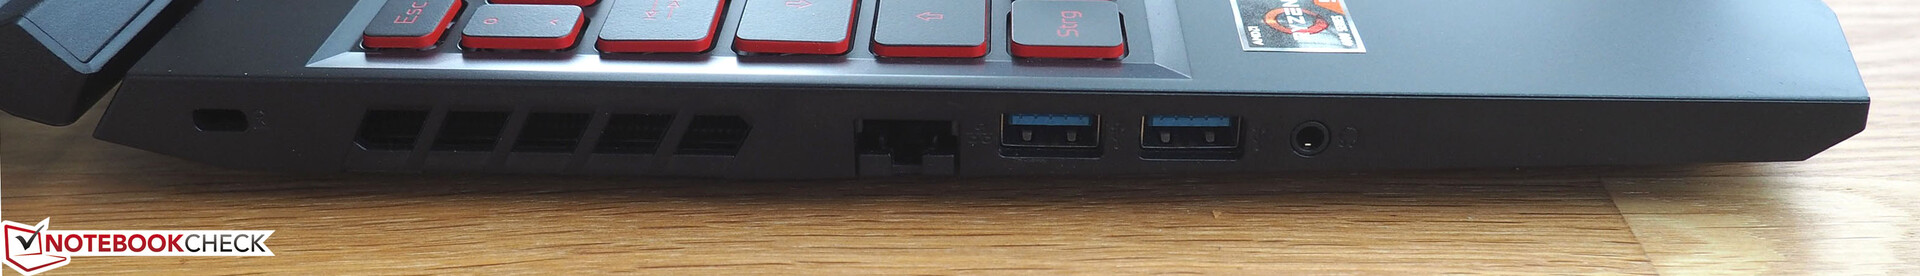
Connectivity, and external ports in particular, is one of the areas where Acer had to cut corners. Neither DisplayPort nor a card reader are available, and Thunderbolt 3 is nowhere to be seen either. On the left-hand side we find a Kensington lock, an RJ45 port, two USB 3.0 Type-A ports, and a 3.5-mm headphone jack. Those are accompanied by a single USB 3.0 Type-C port, a third USB 3.0 Type-A port, and an HDMI port for connecting external displays to at the right-hand side. Given that all ports sit pretty centered on both sides using a mouse can get quite challenging and arduous depending on the amount of cables plugged in.
Communication
Despite its budget price, the Nitro does not require any compromises in regard to communication. While wired connections are handled by a Killer E2600 Ethernet controller, wireless protocol support is plentiful thanks to Intel’s AX200 Wi-Fi 6 modem offering fast Wi-Fi transfer rates of more than 1,300 Mb/s both when transmitting and receiving data. Due to our recently improved test setup those numbers are not comparable to older test results. In order to future-proof our setup we switched from an AC to an AX router (Netgear Nighthawk AX12).
Webcam
Even though the webcam was not as bad in terms of focus as webcams on other gaming laptops, we advise you to lower your video quality expectations and not to expect too much of it.


Accessories
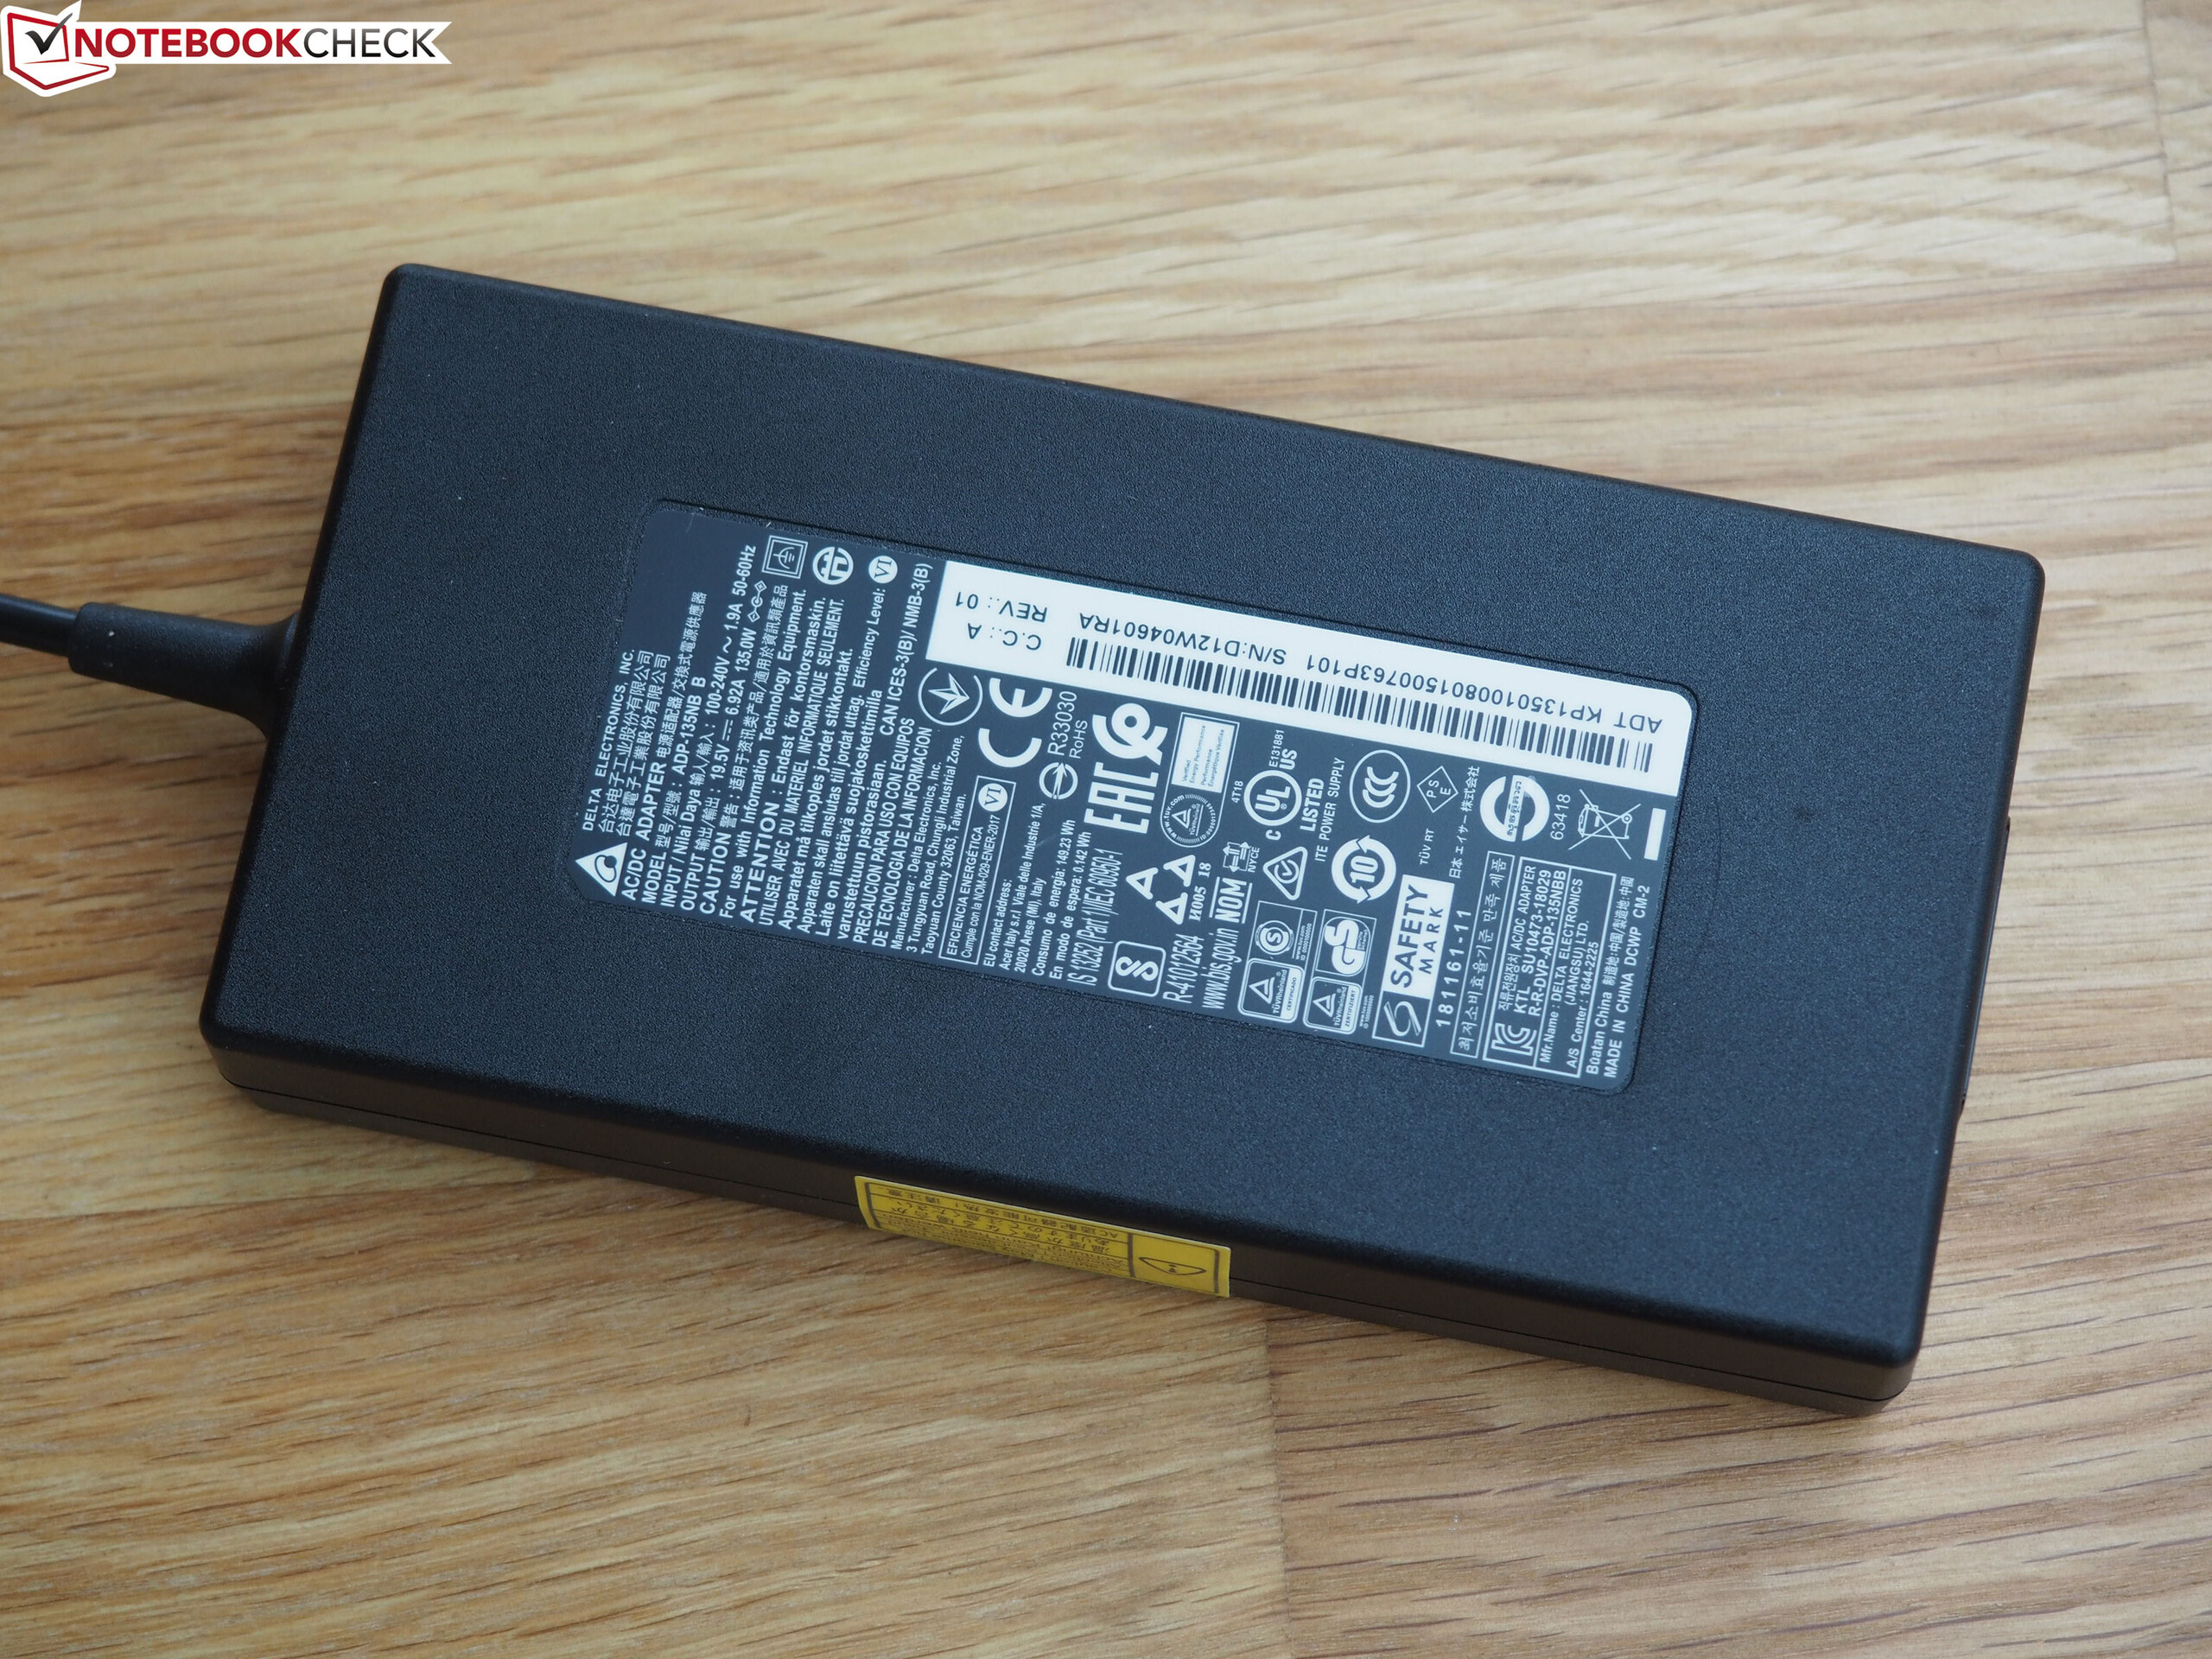
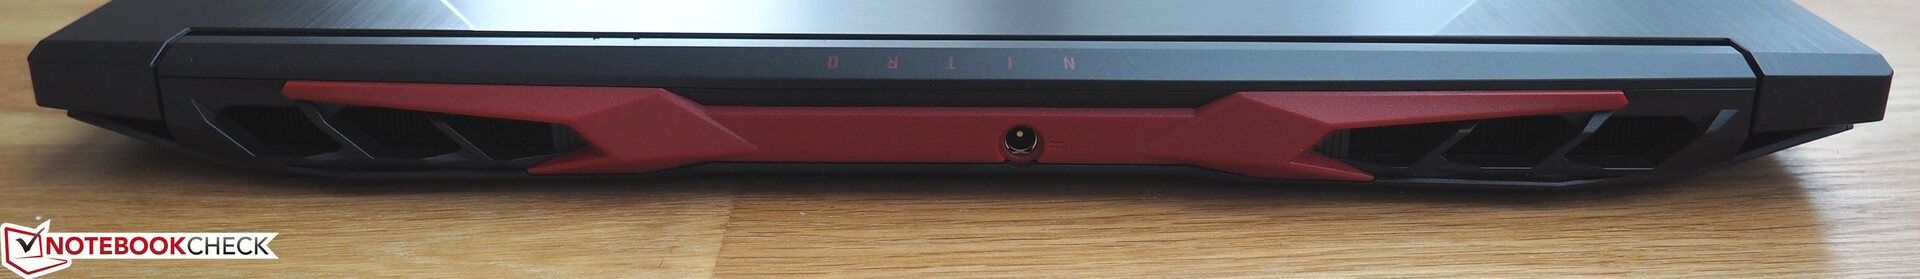
Included in the box are a few leaflets with general information, a mounting frame for the vacant 2.5-inch slot, and a pleasantly lightweight (ca. 340 g / 0.75 lbs) and compact (ca. 13.5 x 7 x 2.5 cm / 5.3 x 2.75 x 1 inches) 135 W power supply.
Maintenance
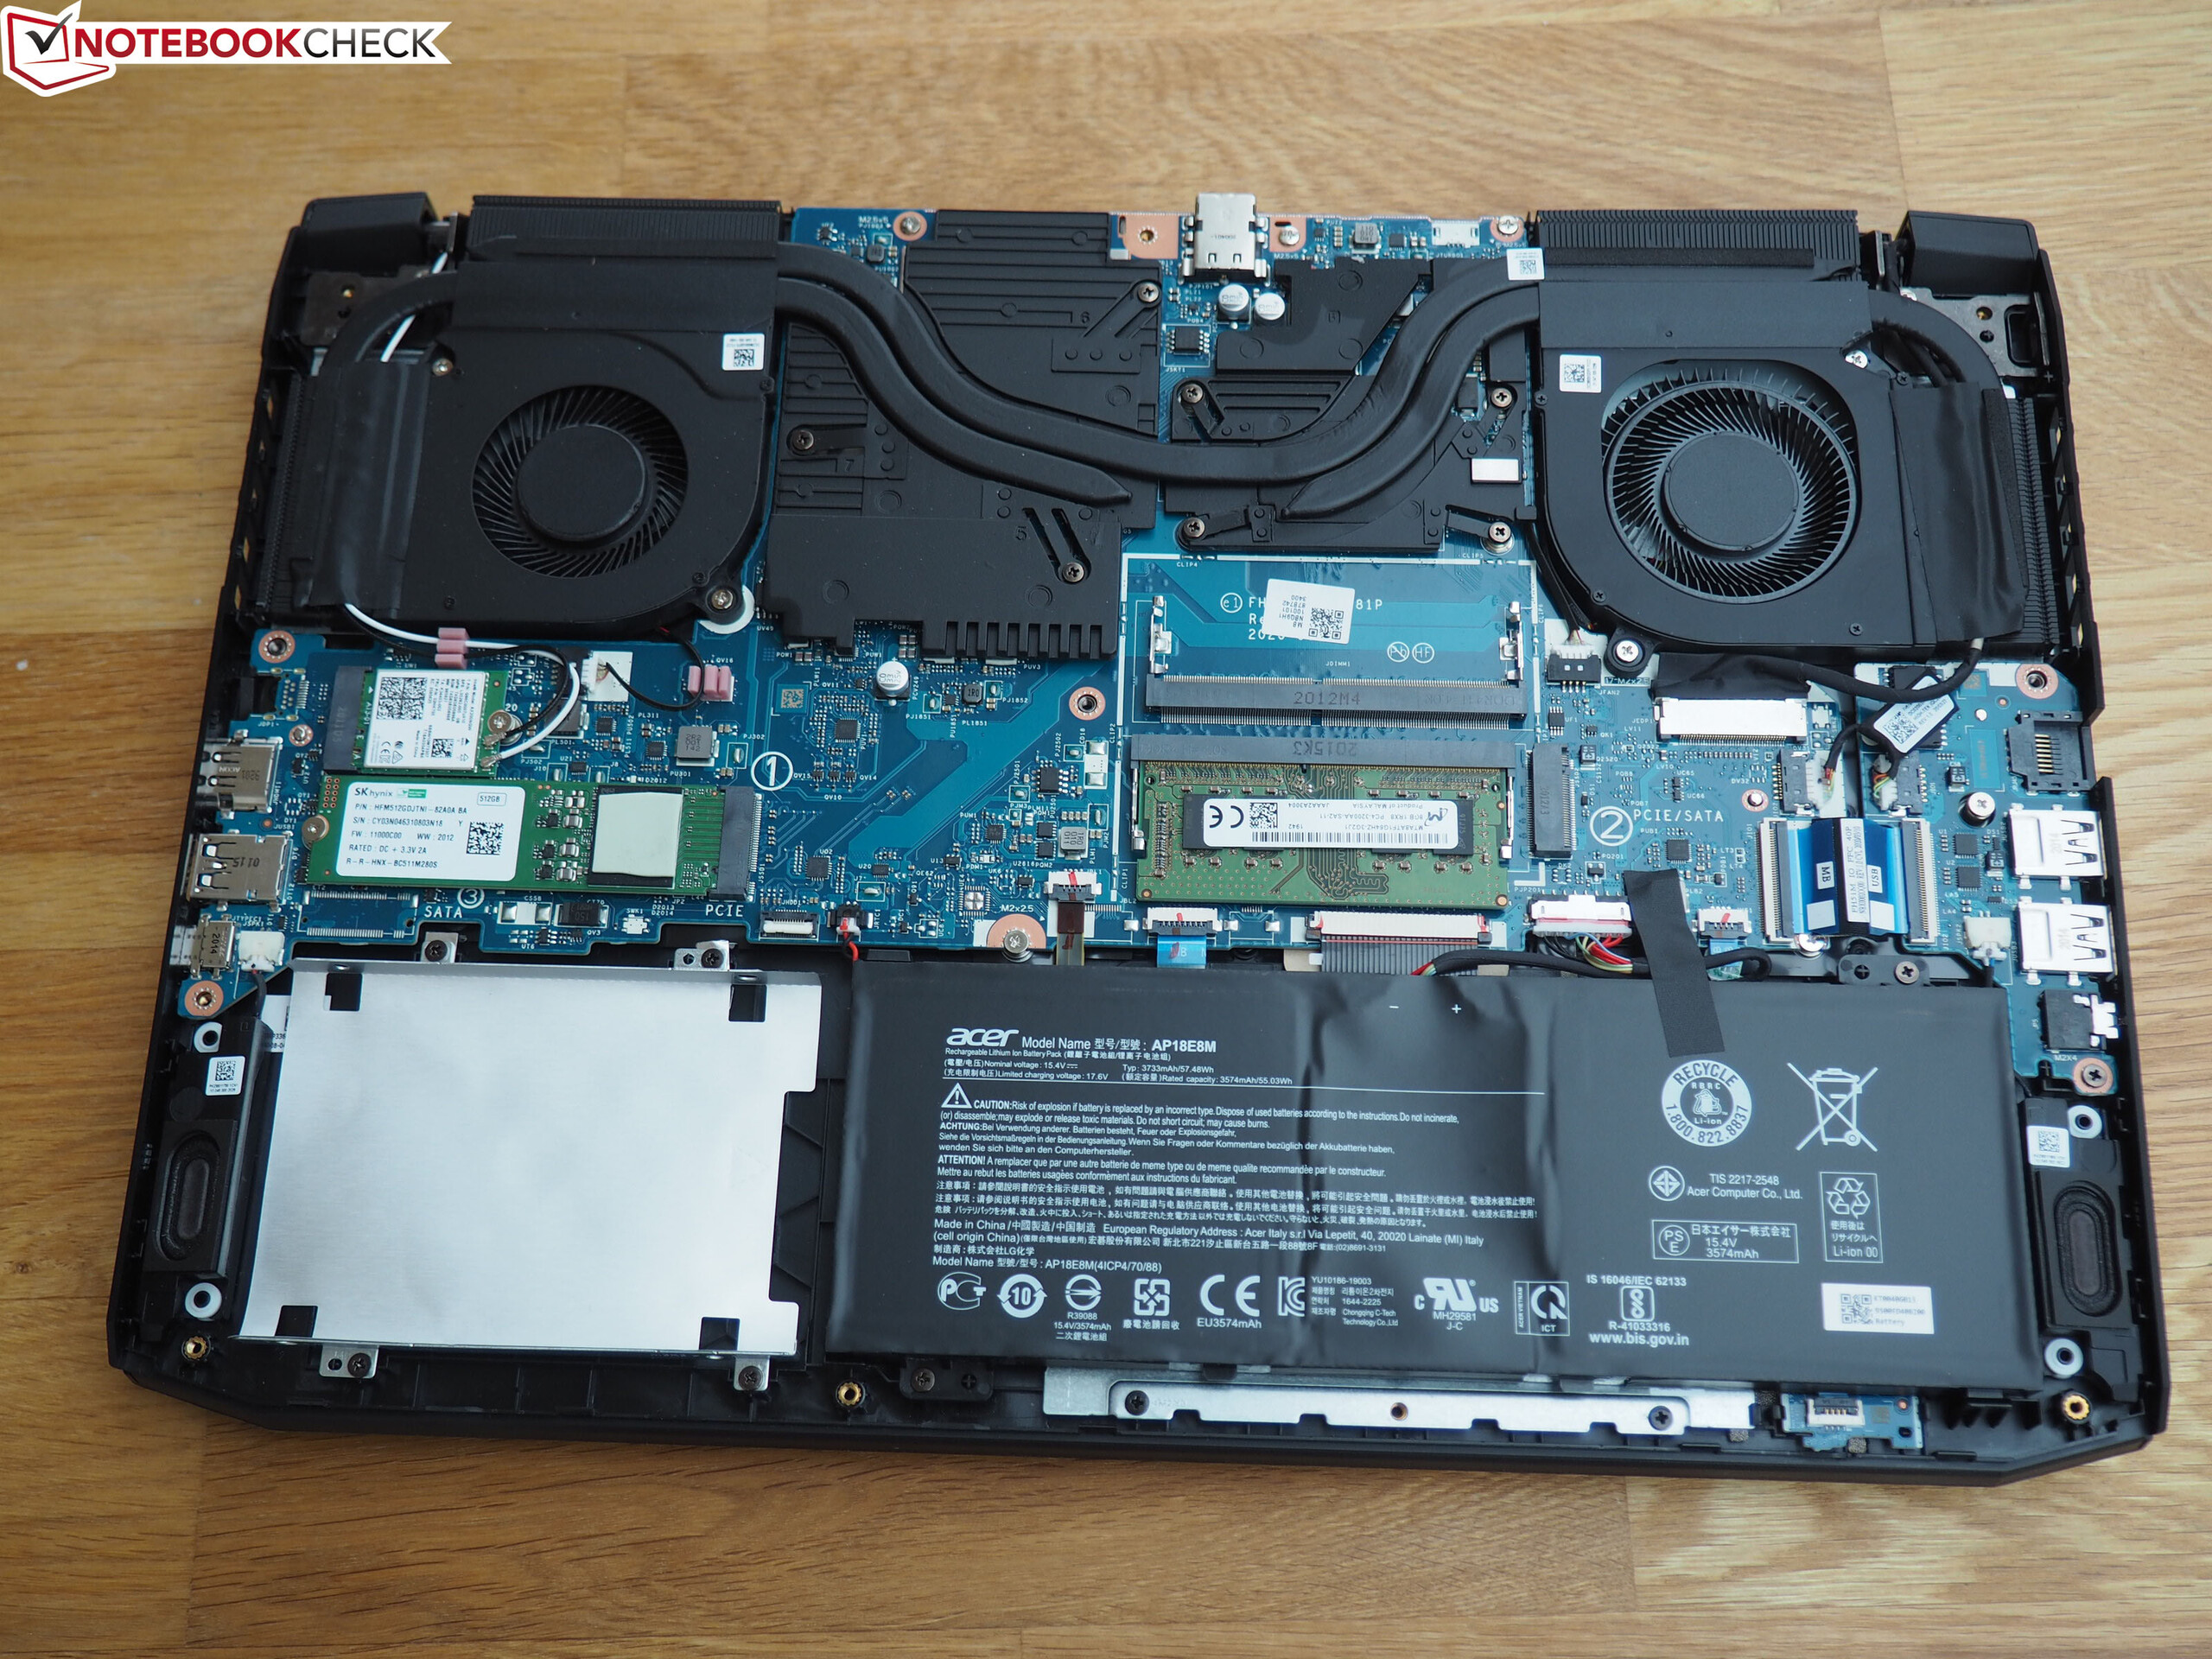
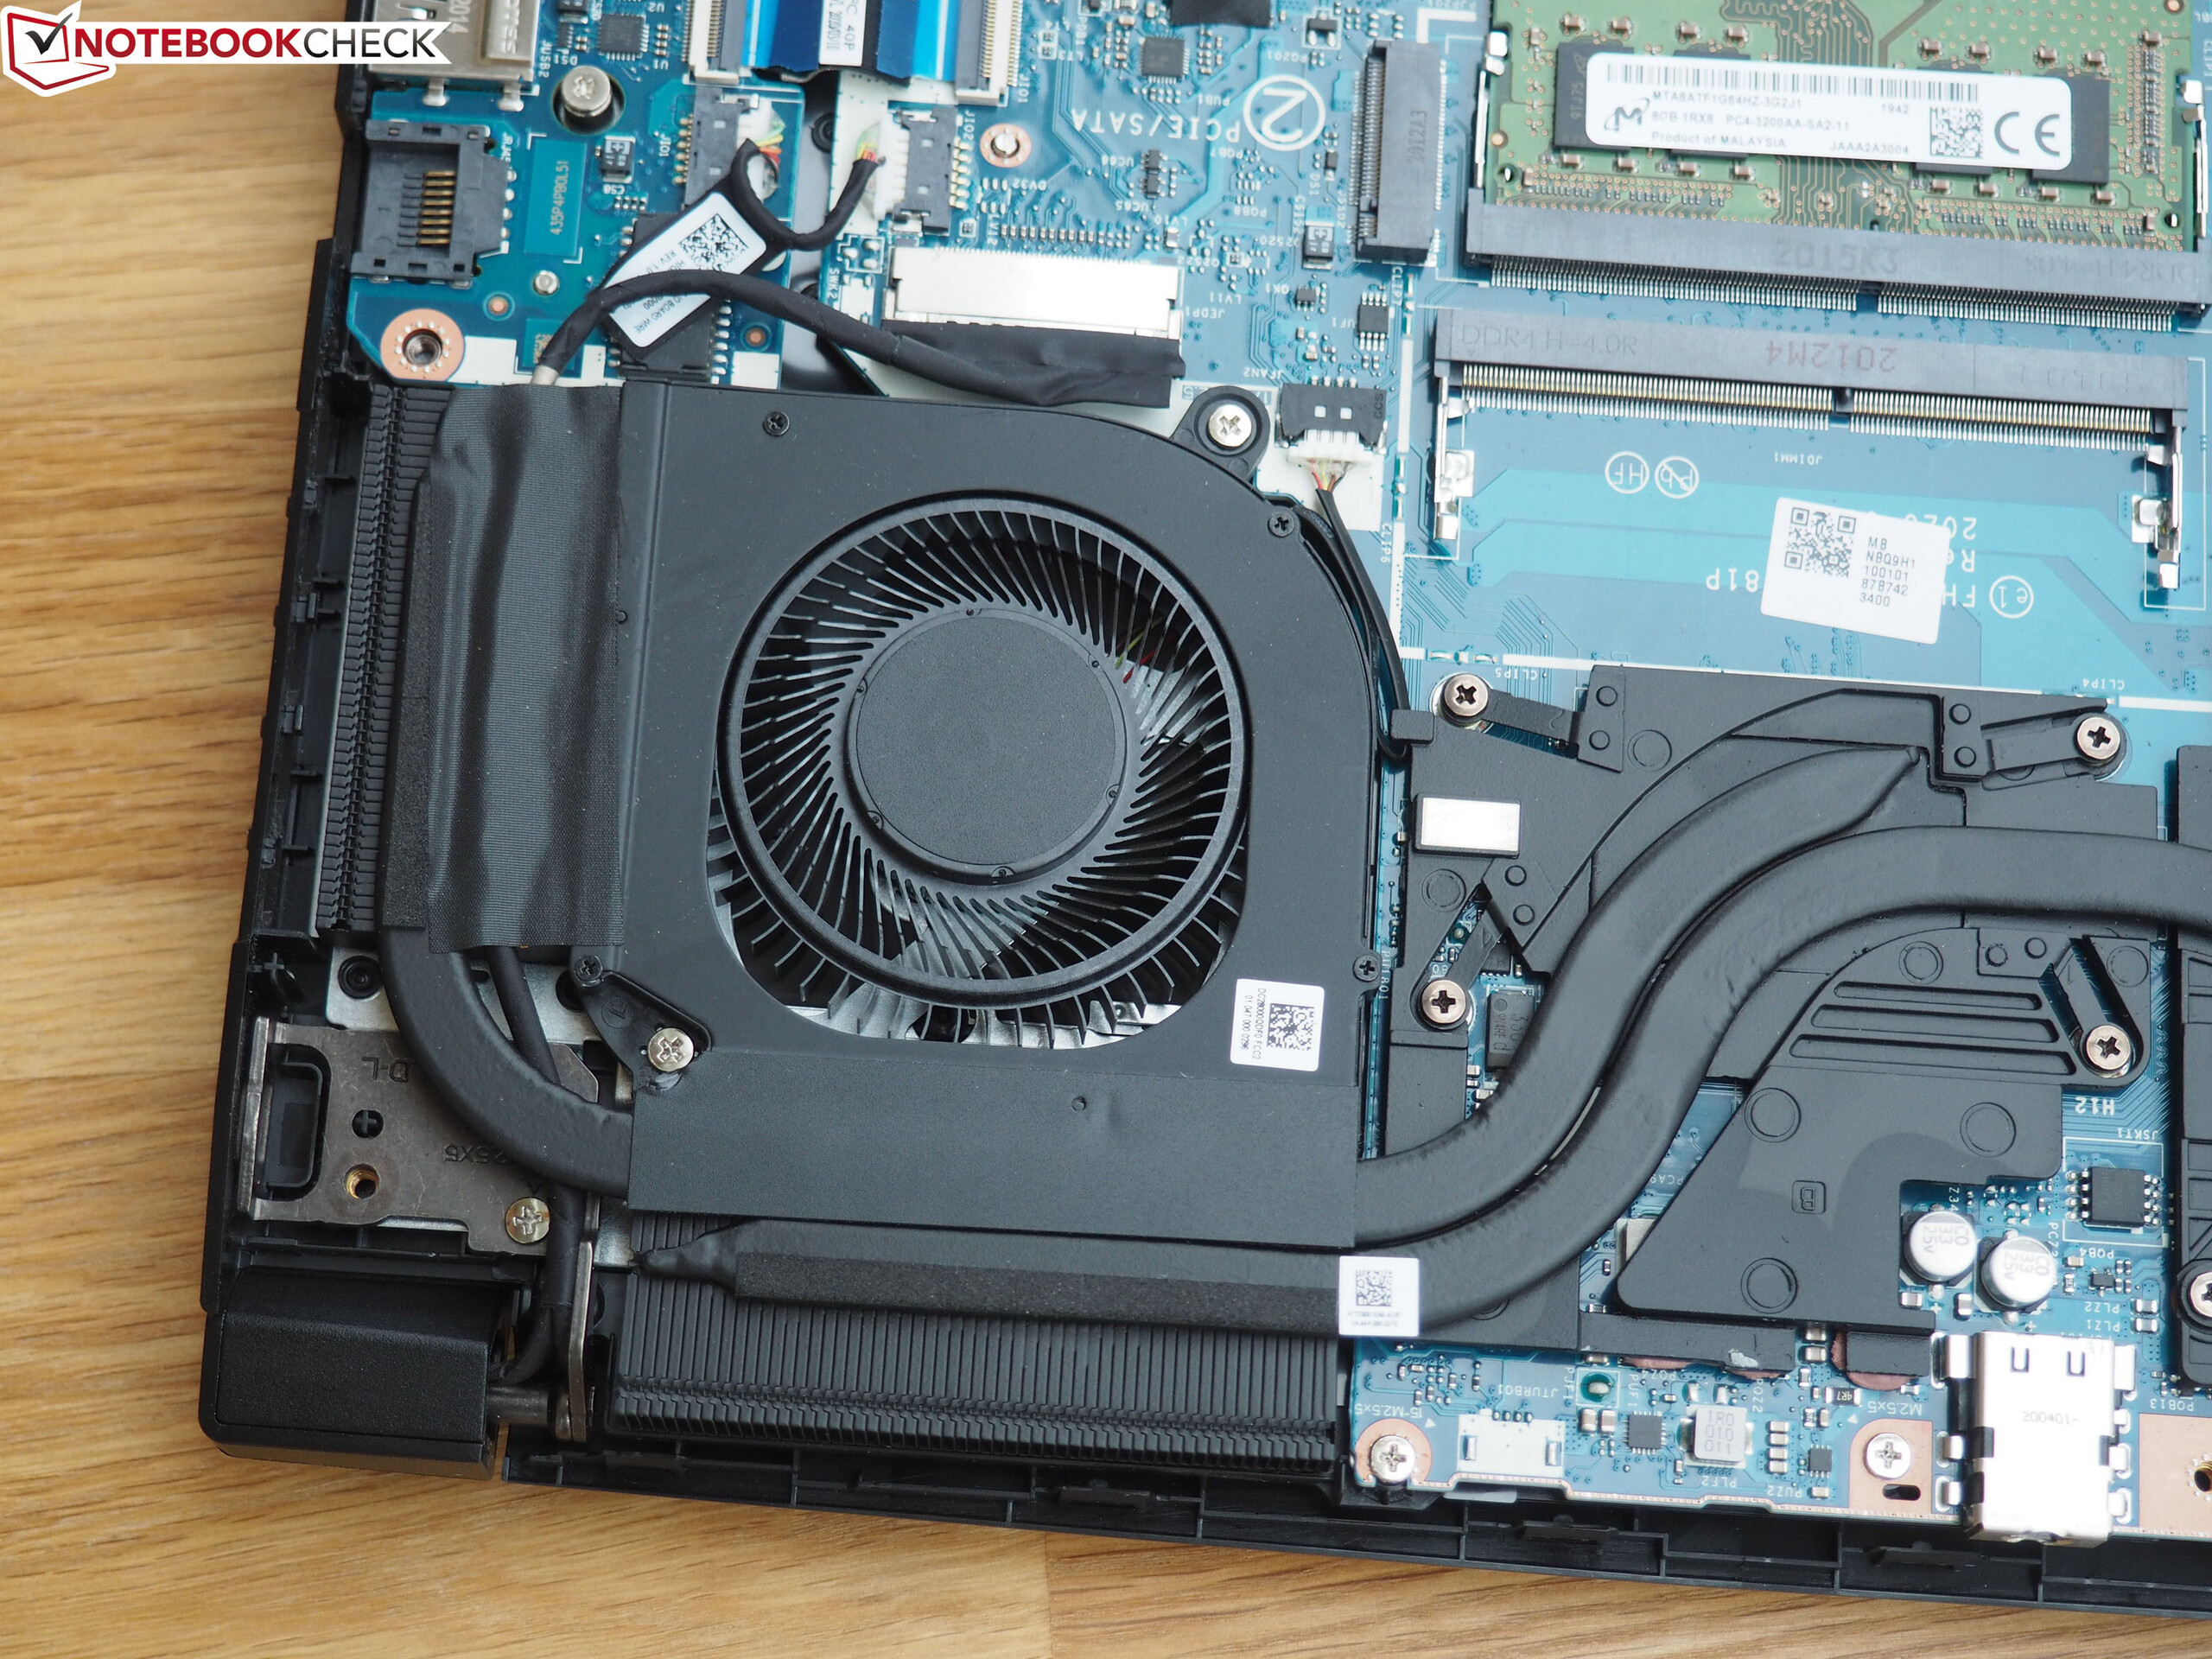
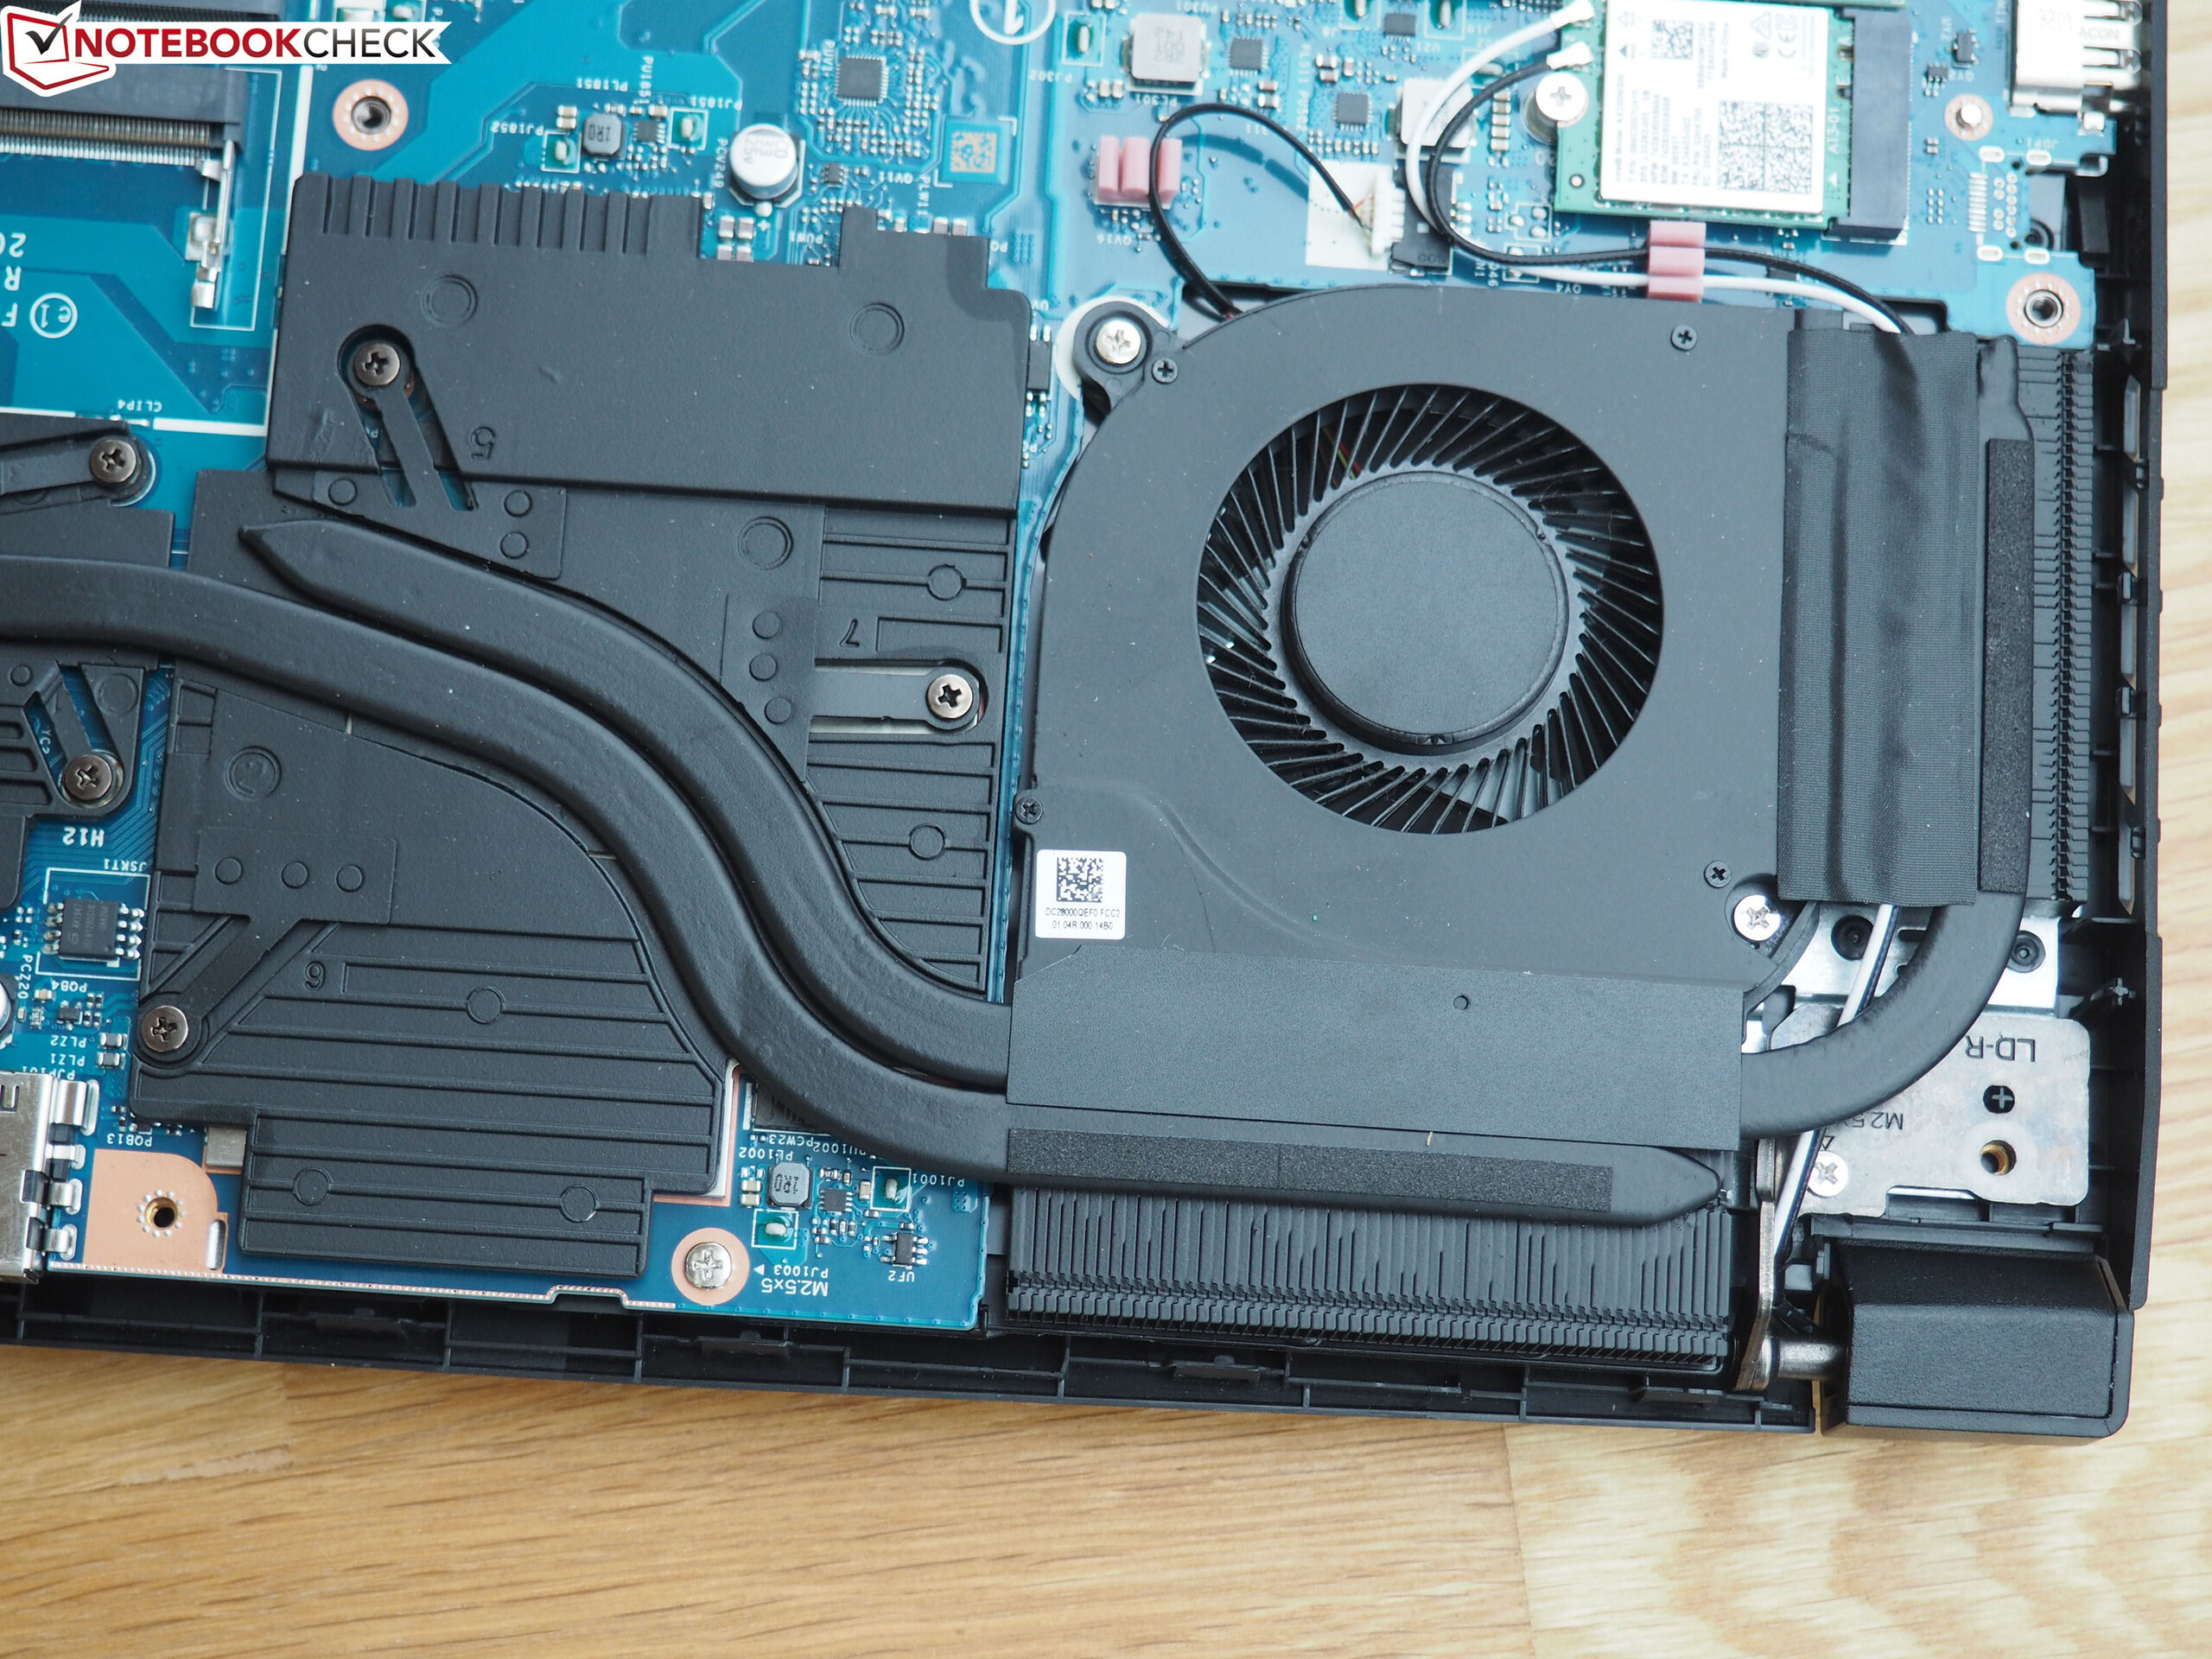
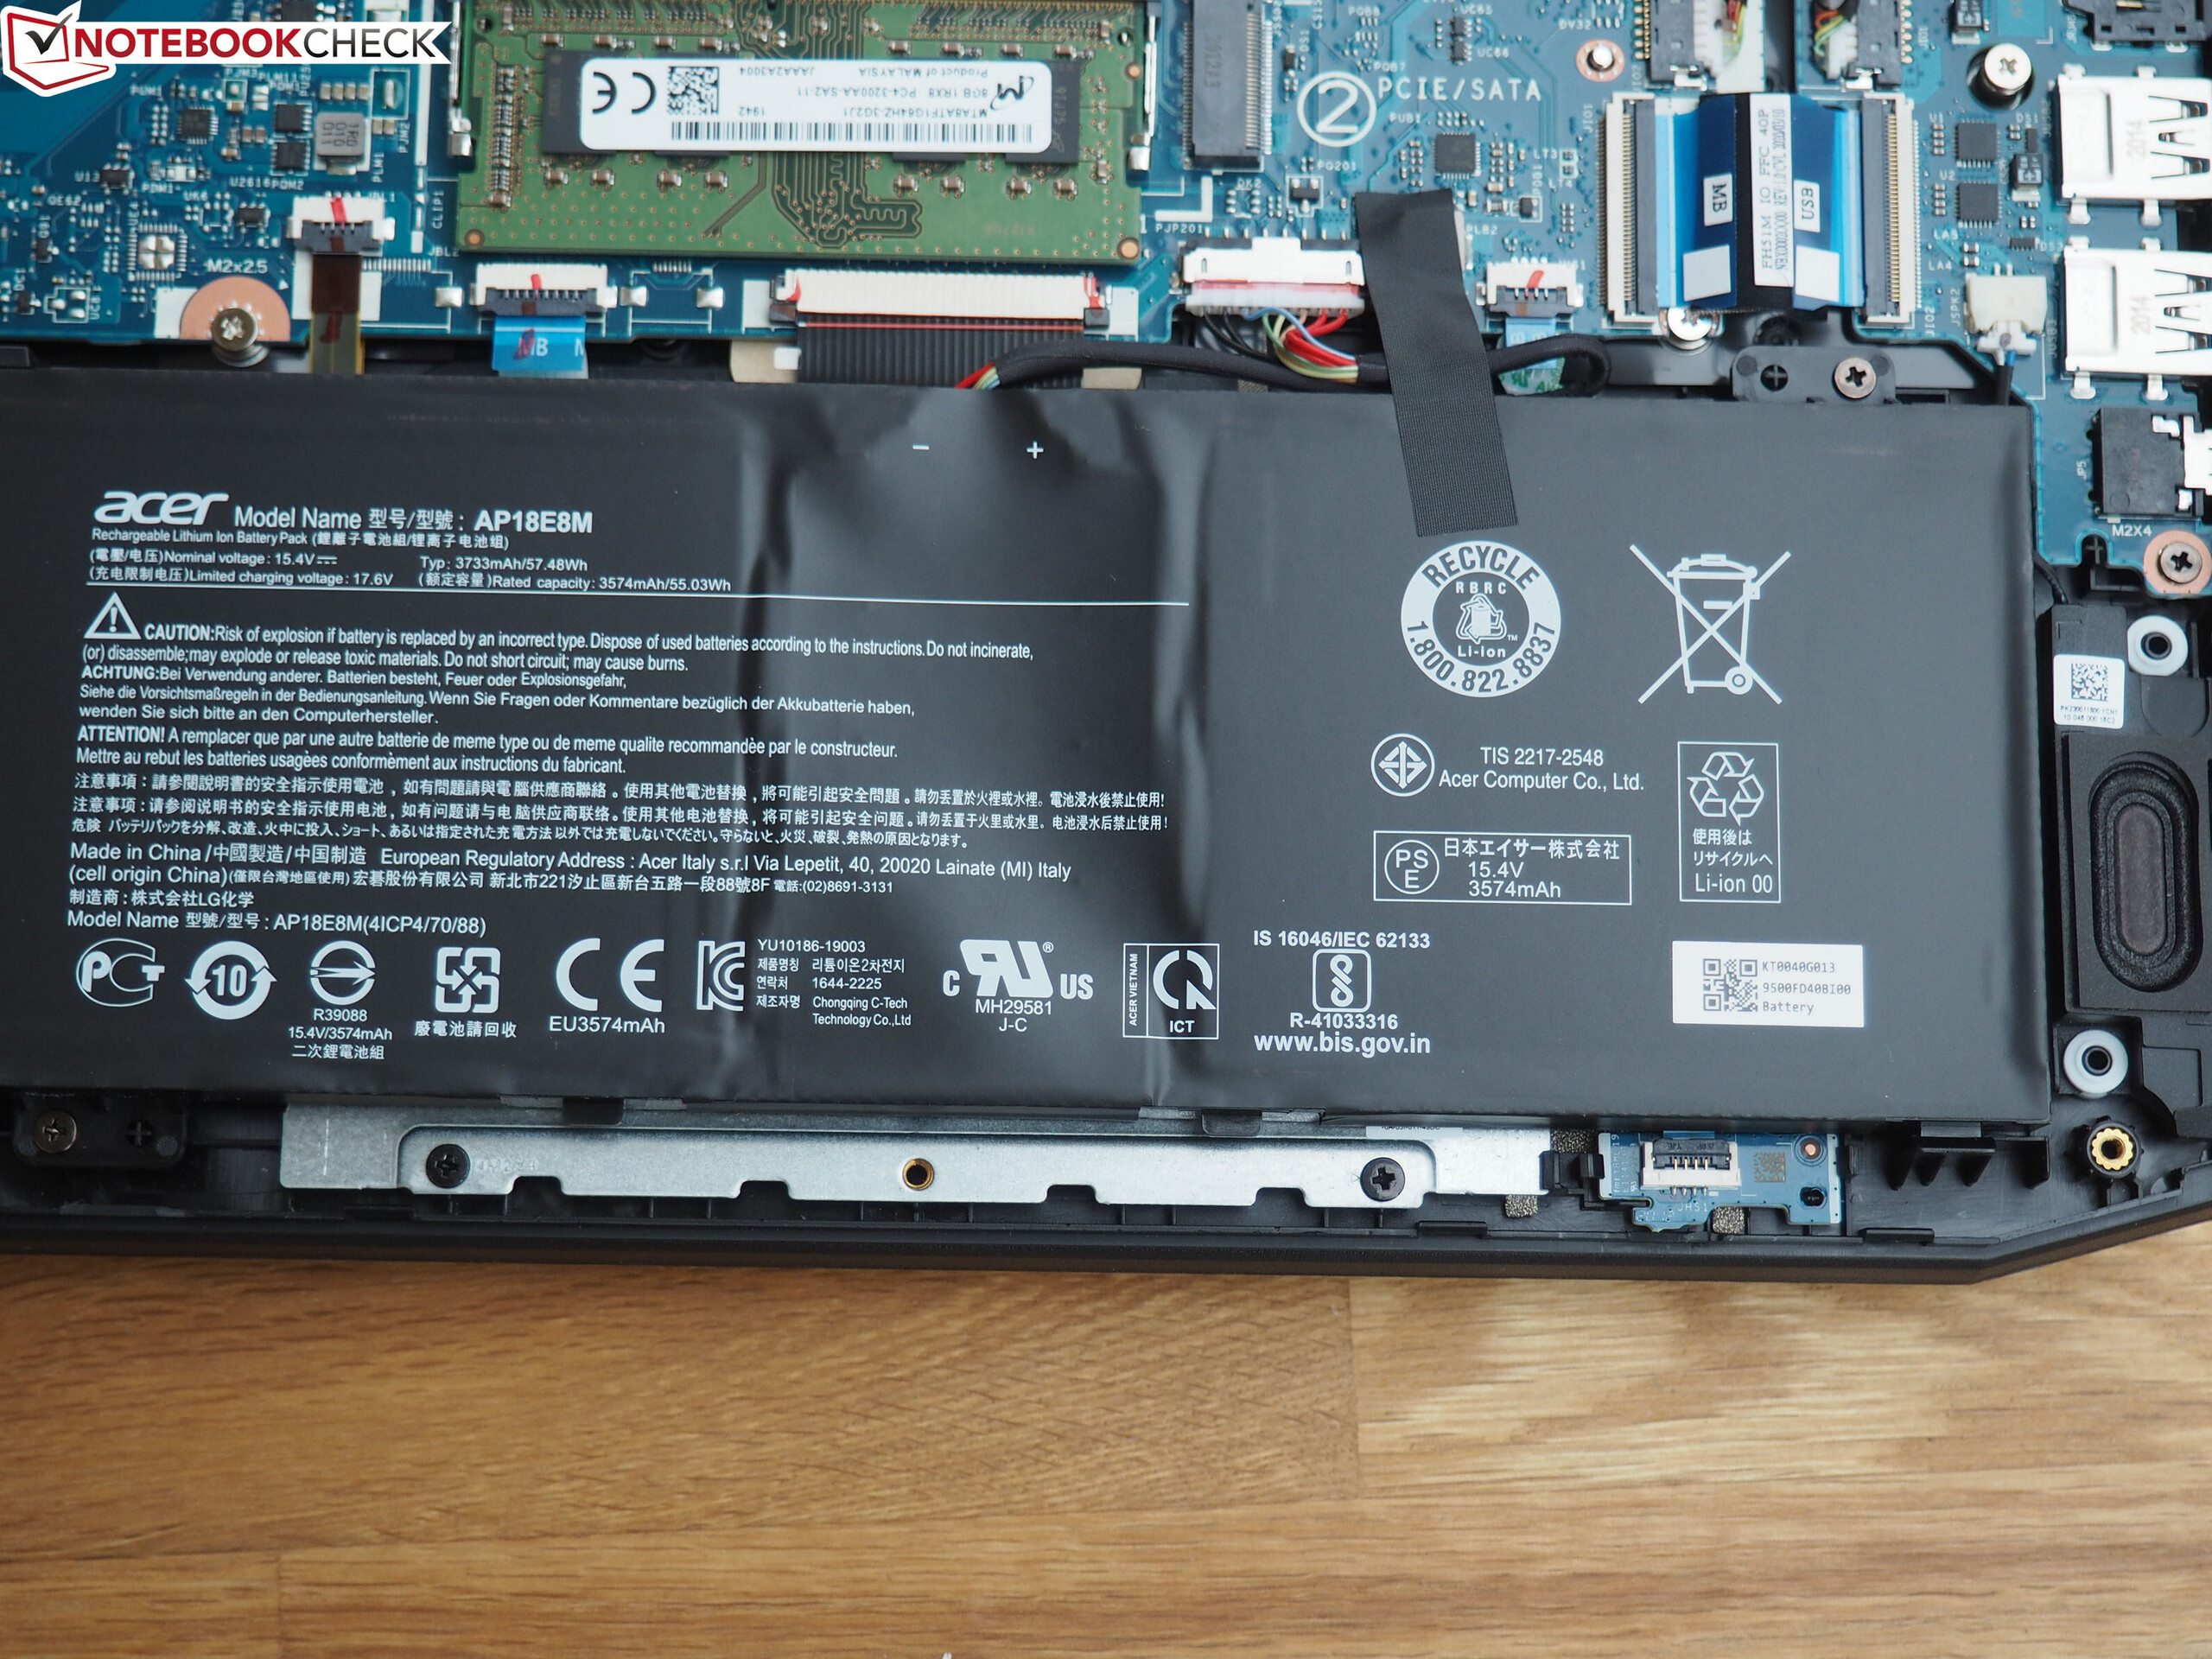
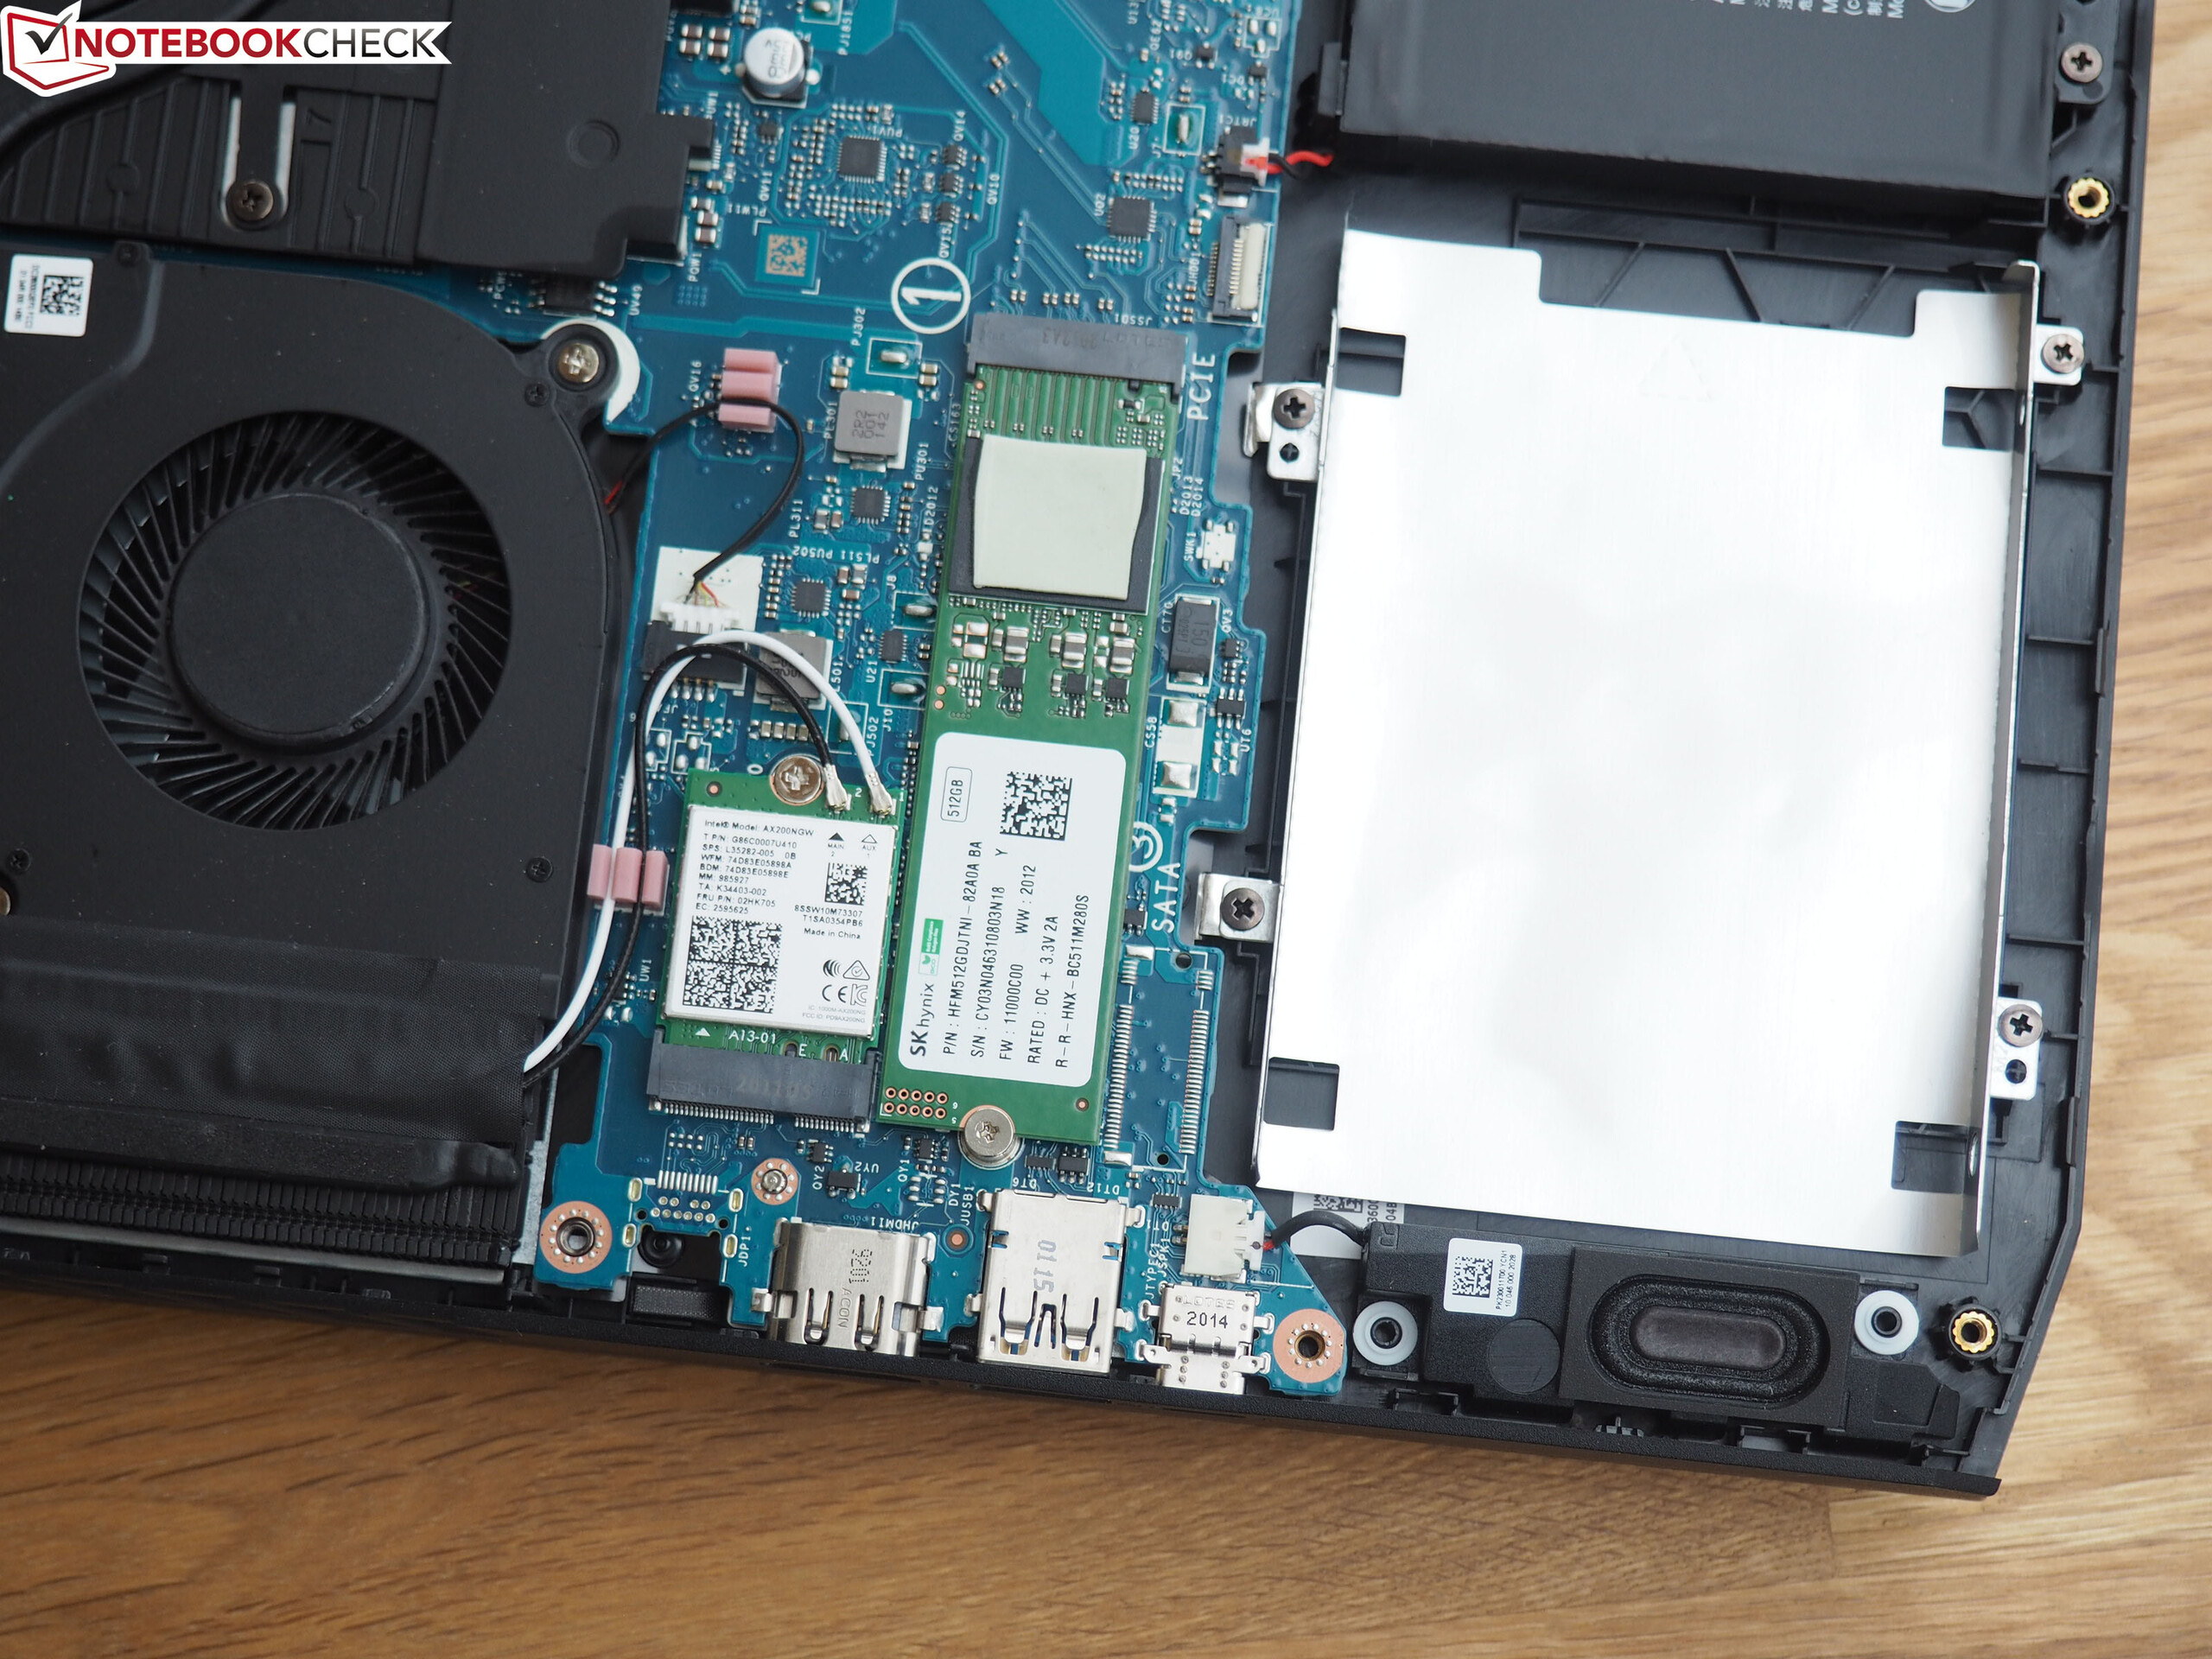
Given the lack of a maintenance opening, the entire bottom case needs to be removed in order to access the internal hardware, which requires the removal of a total of 11 Philips screws. Once removed you get access to the battery, the wireless communication module, two DDR4 SO-DIMM slots, as well as two M.2-2280 slots and one 2.5-inch storage bay. The cooling solution for the soldered CPU and GPU consists of two fans connected by various heat pipes, and it is not completely isolated from each other.
Warranty
Default warranty varies based on country of purchase. For example, our German review unit comes with two full years of pickup & return warranty by default.
Input Devices
Keyboard
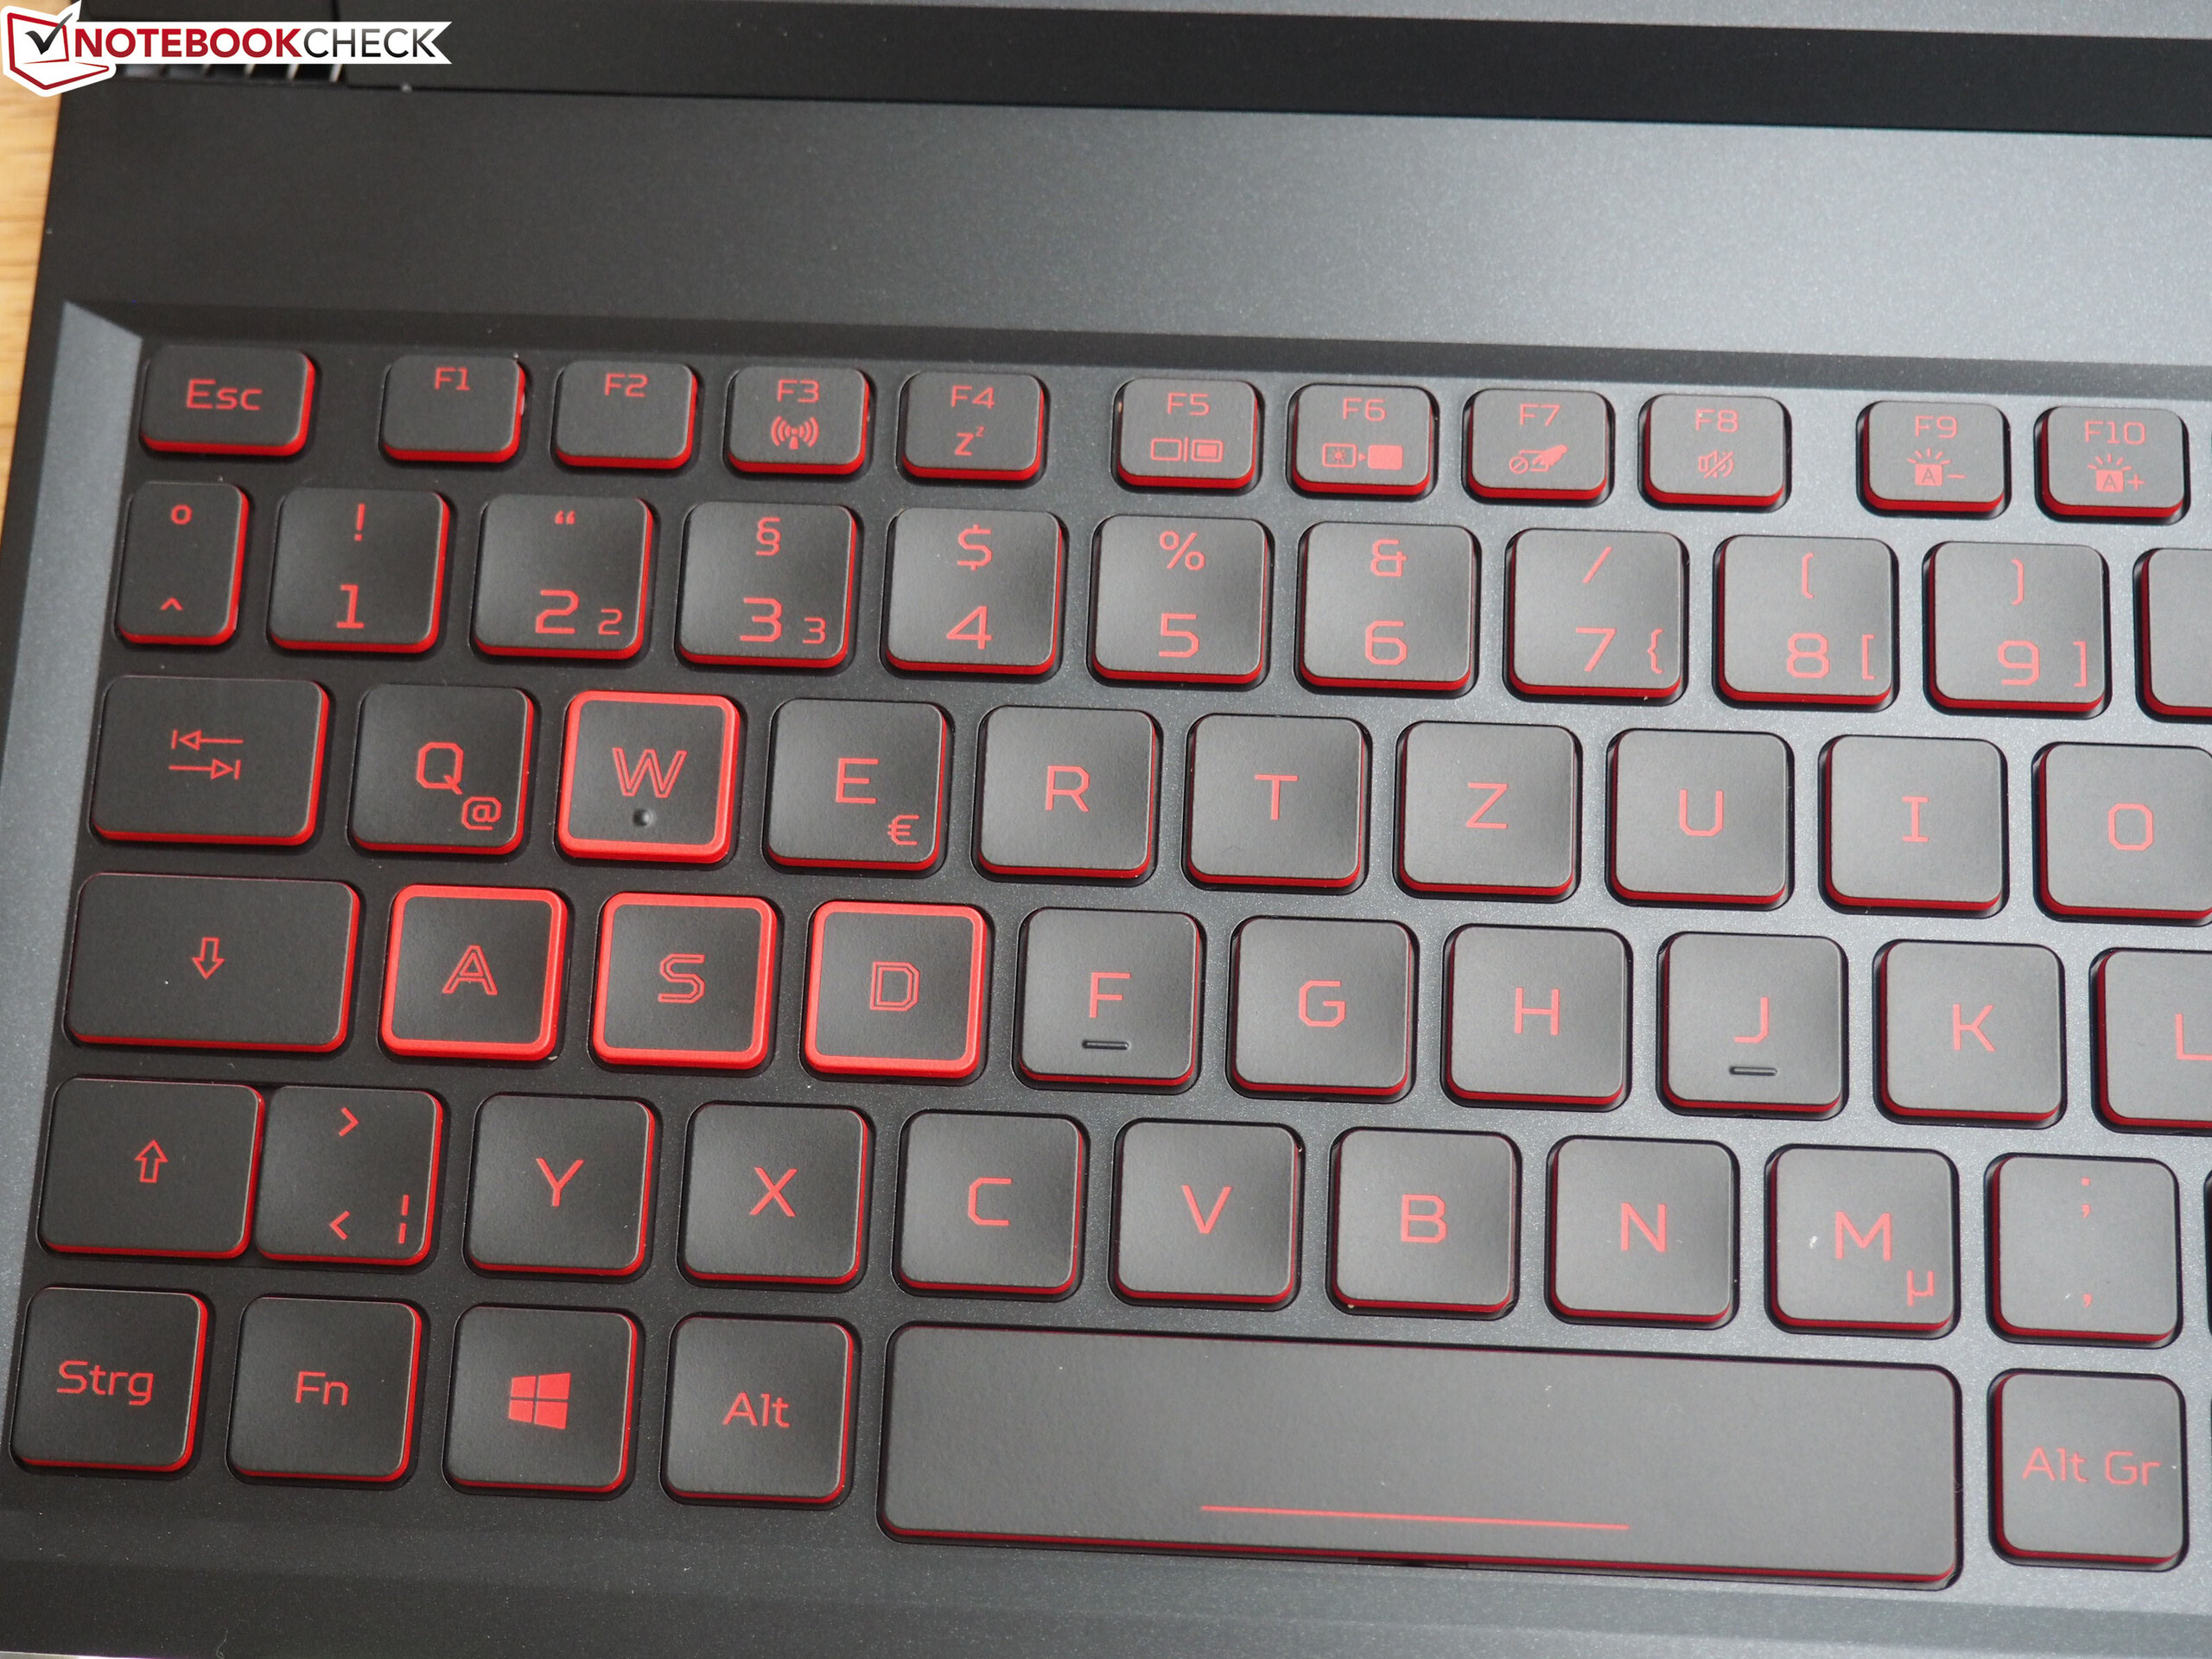
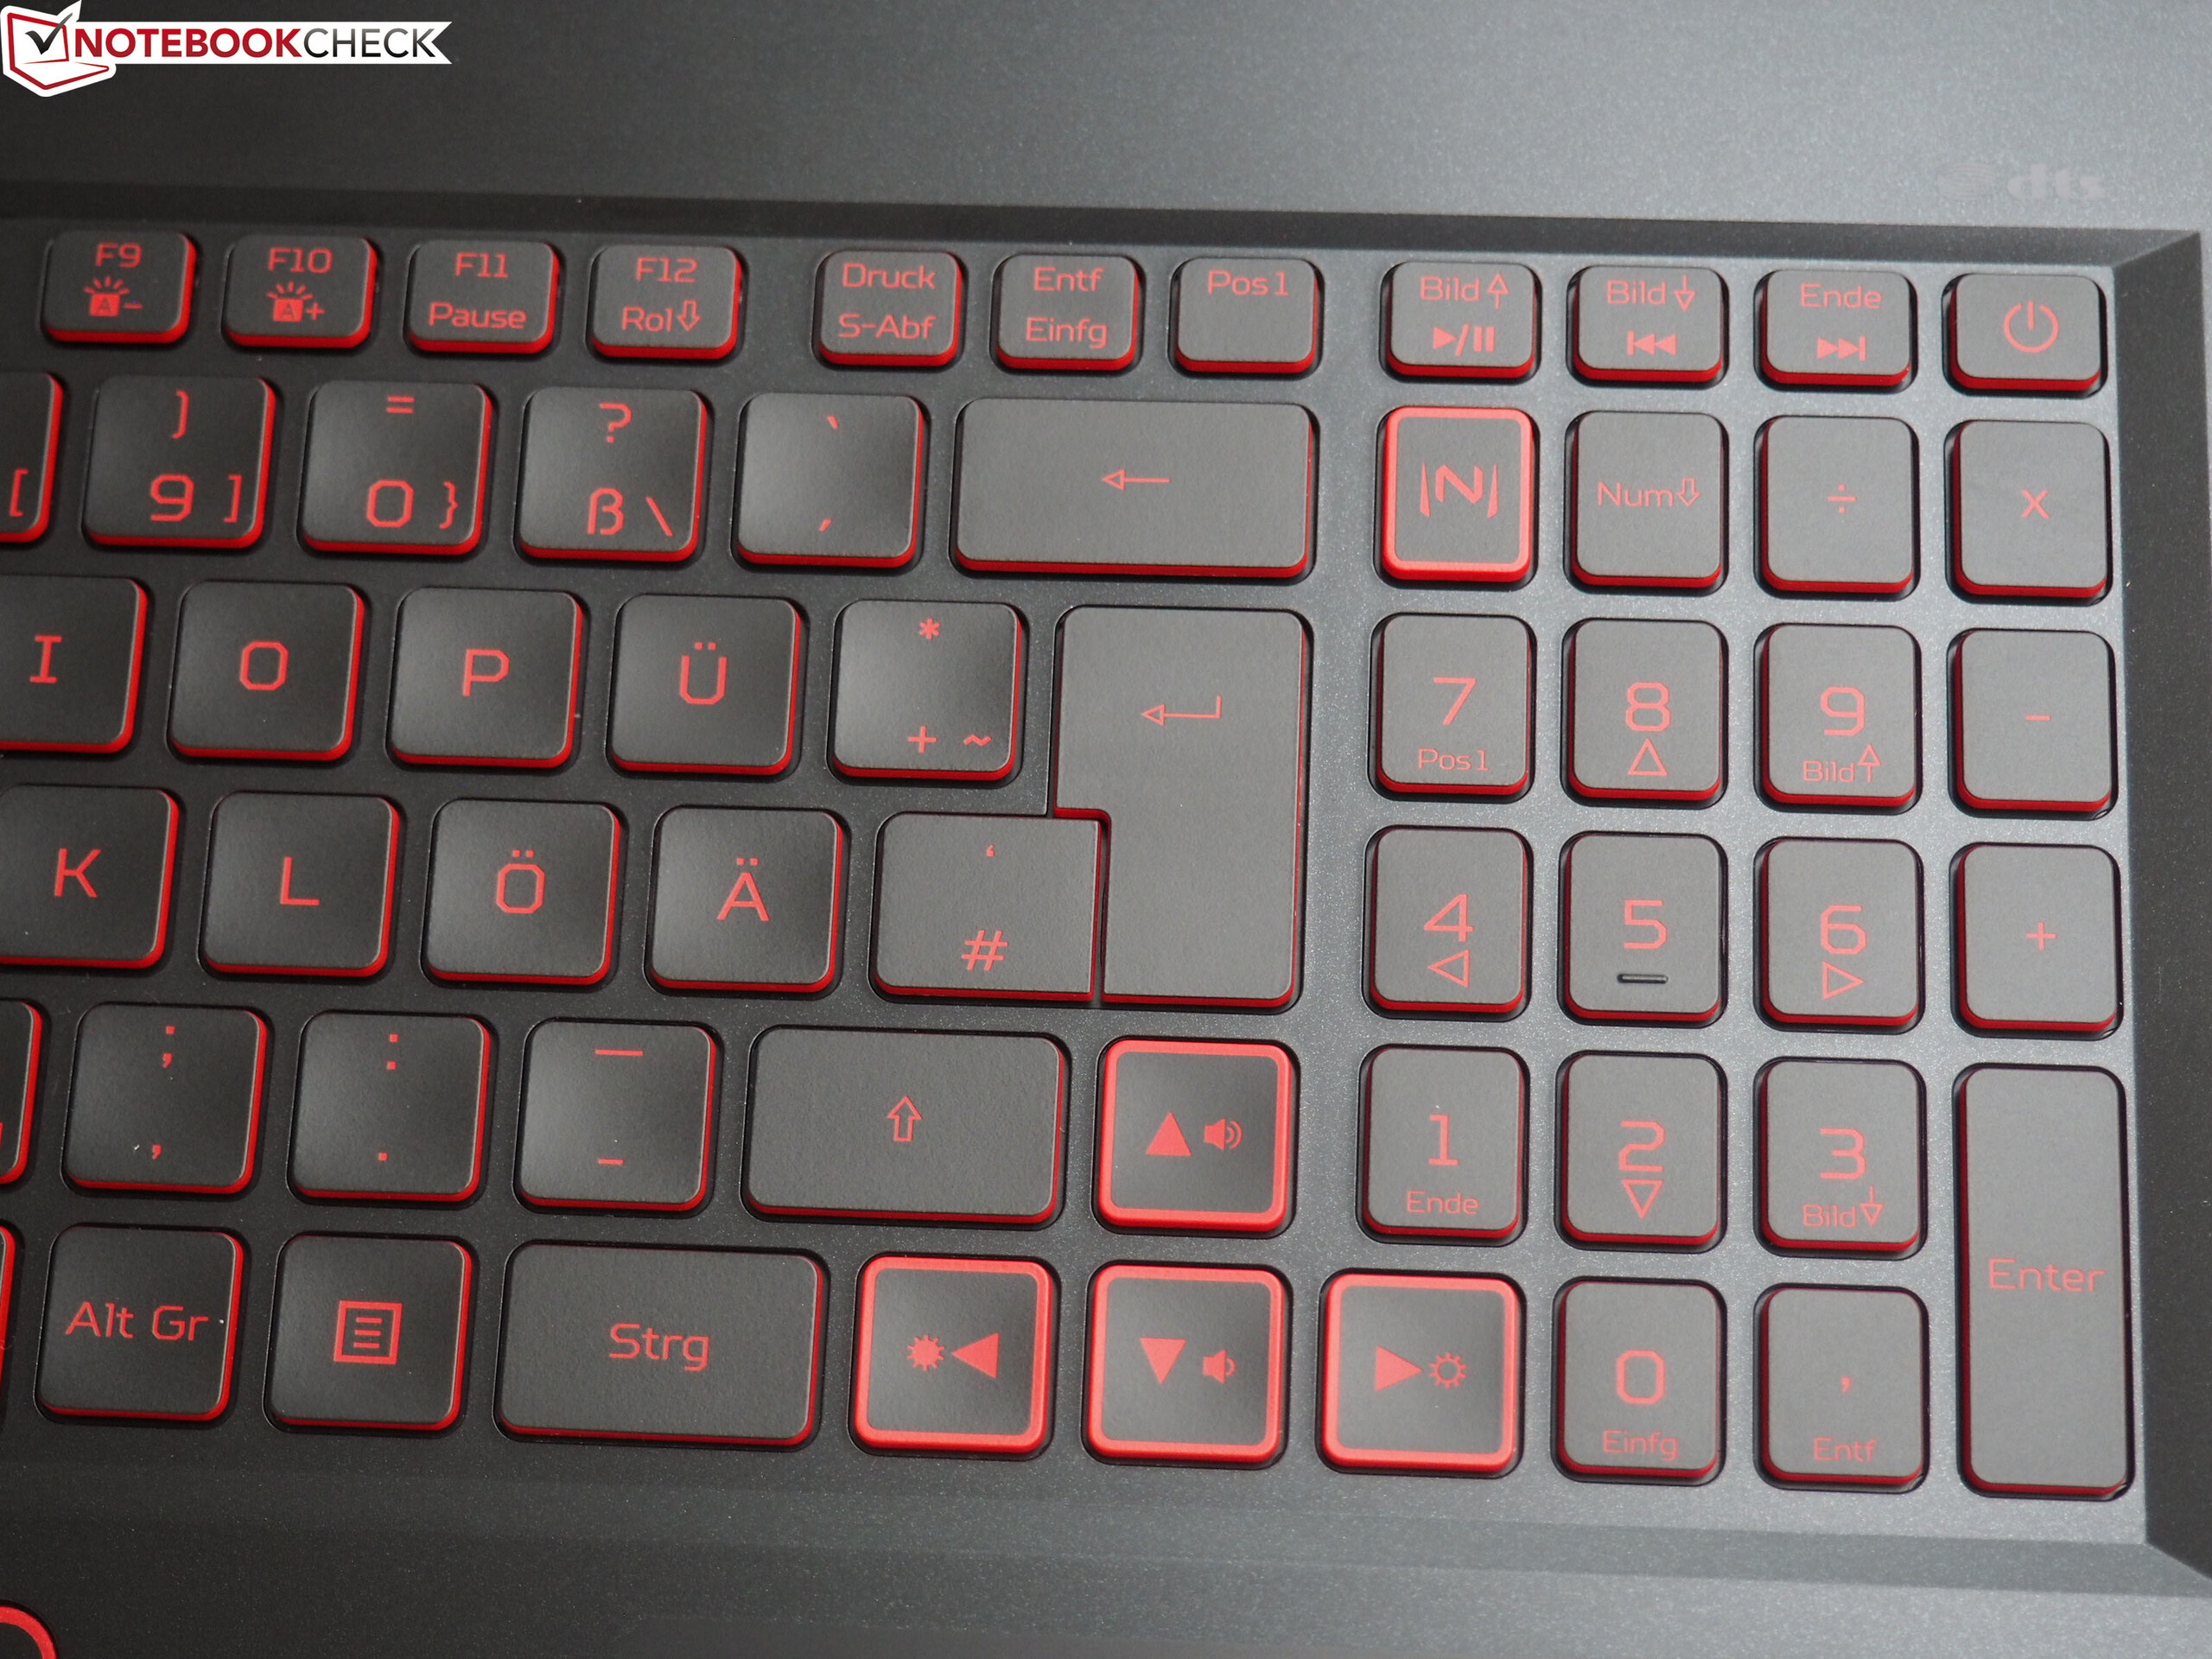
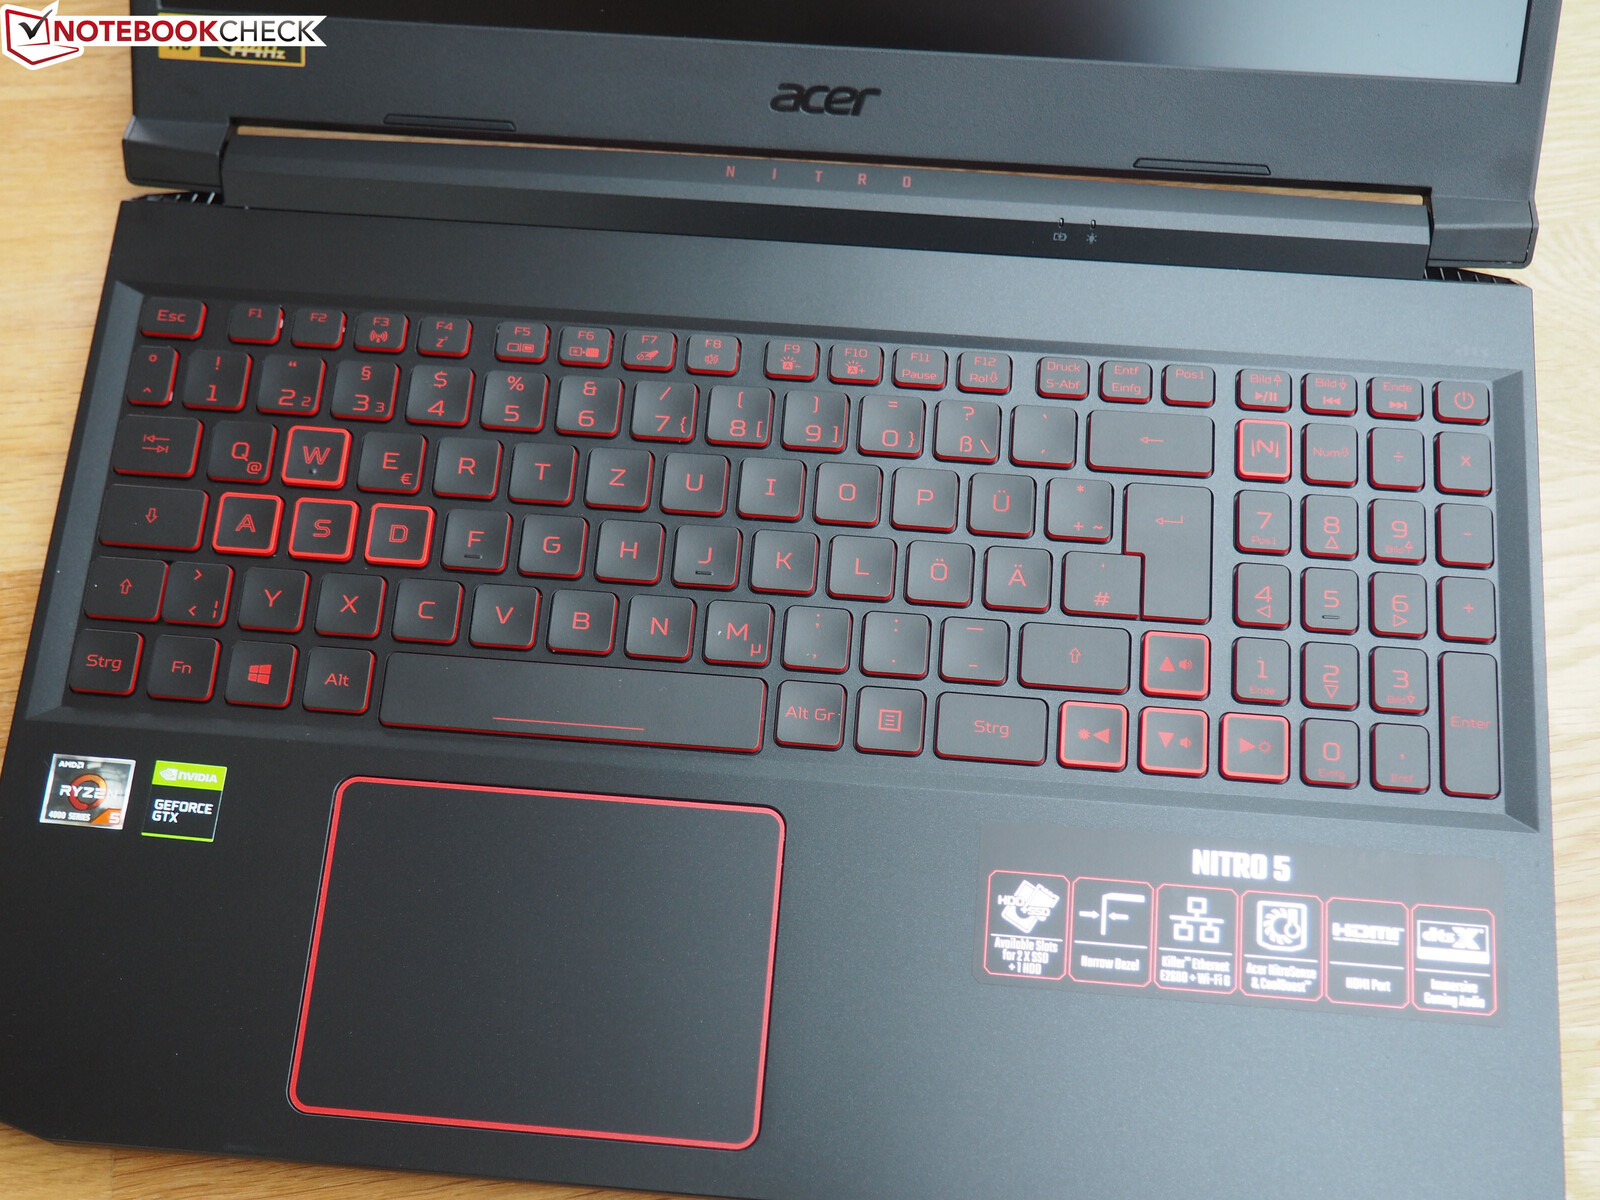
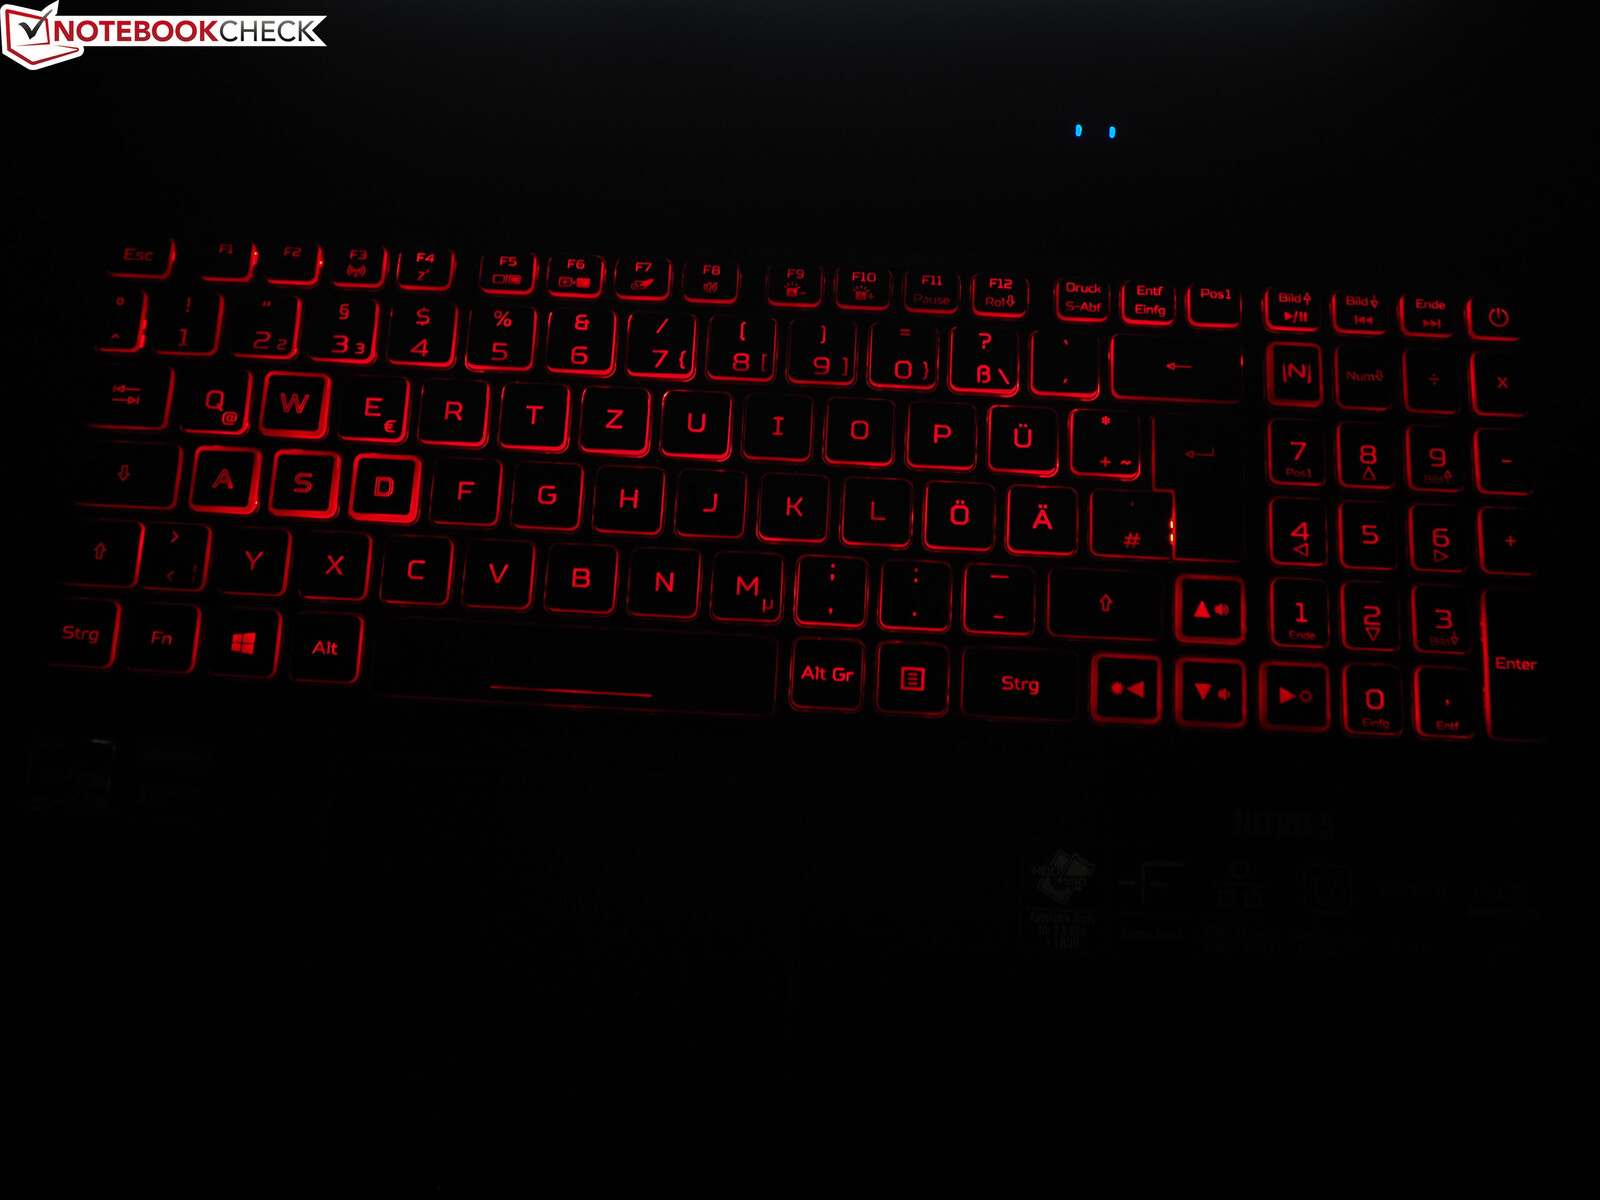
Based on the marketing material on Acer’s website some of the more expensive Nitro 5 models feature an RGB-backlit keyboard. However, the AN515-44 has to make do with a red backlight underneath Acer’s well-established gaming keyboard. It offers a well-defined touch and feel as well as a solid overall layout safe for the combined Insert/Delete key. Furthermore, the German keyboard layout fused the left Shift key with <>| as well as the Return key with #, which while uncommon and confusing at first did not cause any issues after some getting used to.
A very useful feature was the availability of brightness and volume control on the cursor keys, particularly for touch typists. You will need both hands to trigger these functions, though. Some users will also benefit from the dedicated numpad.
Touchpad
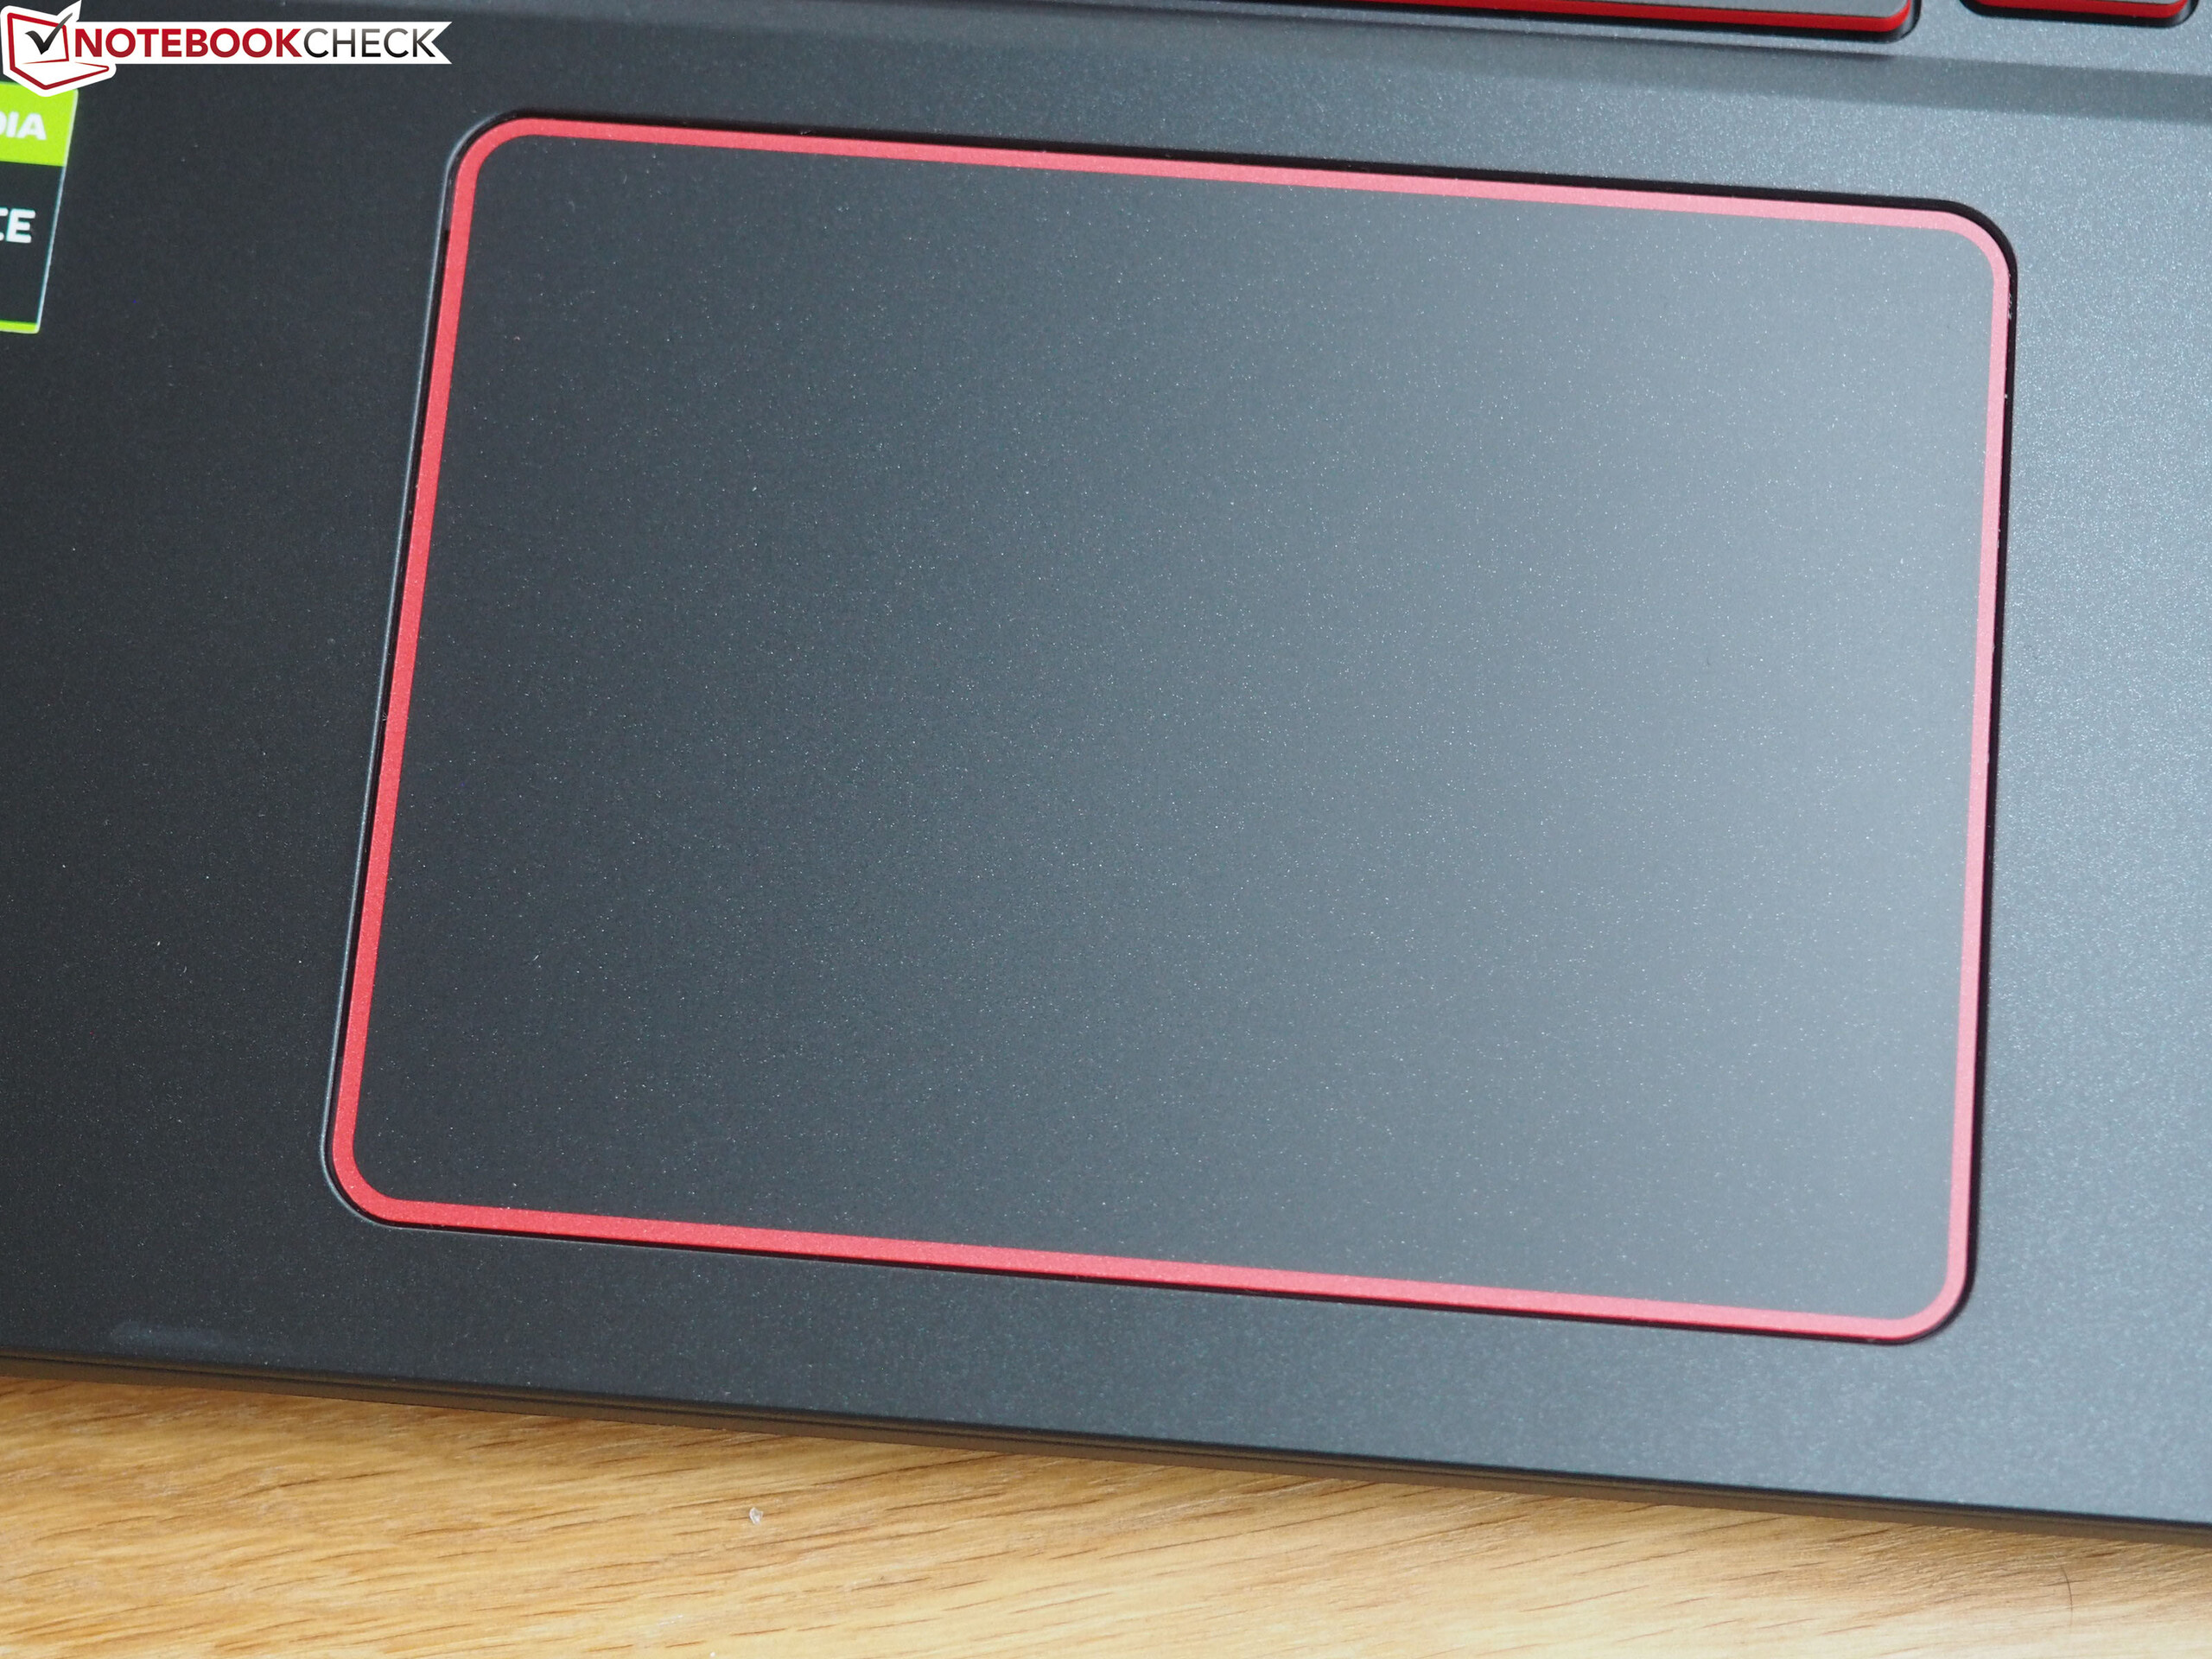
The red-framed touchpad’s footprint of 10.5 x 7.5 cm (4.1 x 3 inches) is more than adequate for a 15-inch laptop. Its smooth surface ensures great gliding capabilities, and its precision was at an acceptable level. As expected, various gestures are supported, for example pinch by zoom or two-finger scrolling. The sound it makes when triggering the buttons is rather loud and clattery, and it could have used some additional fine-tuning, particularly considering that overall keyboard clatter is very low.
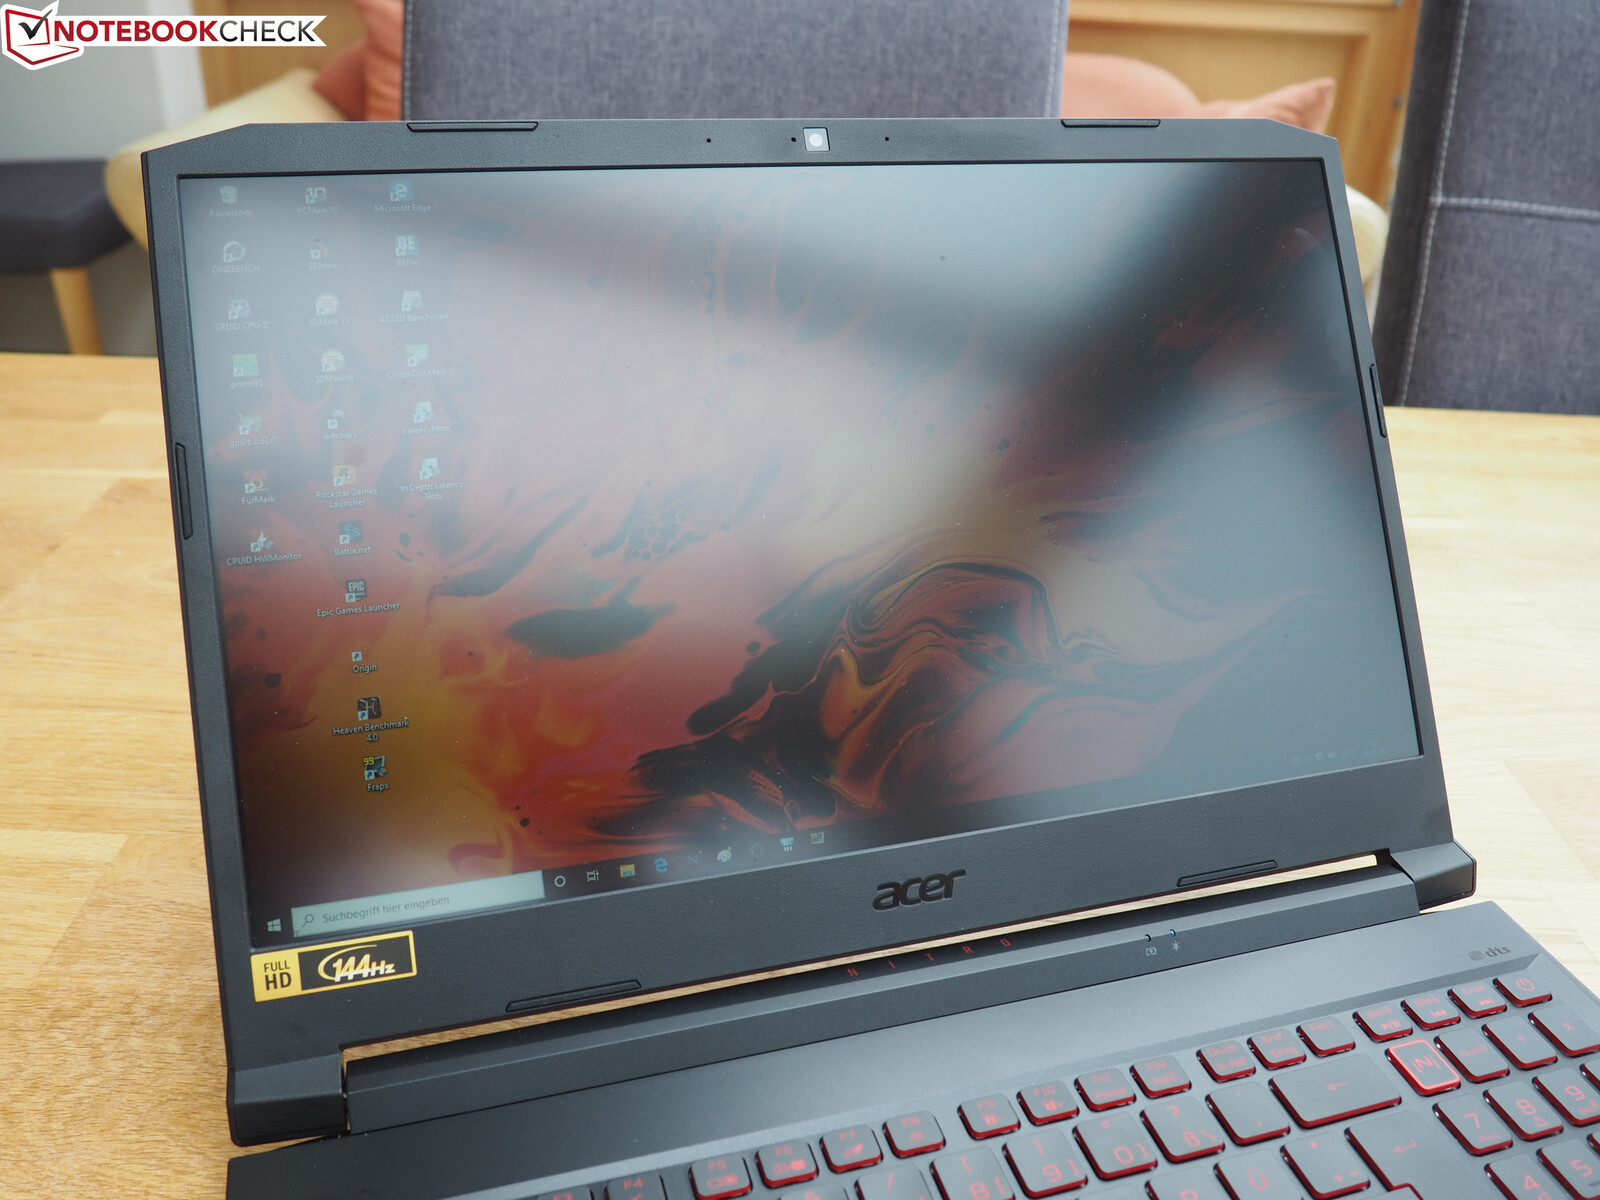
Display
In the past, displays with more than 100 Hz were mostly limited to expensive high-end laptops. Nowadays, more and more budget gamers are equipped with these high-frequency panels.
| |||||||||||||||||||||||||
Brightness Distribution: 88 %
Center on Battery: 287 cd/m²
Contrast: 1148:1 (Black: 0.25 cd/m²)
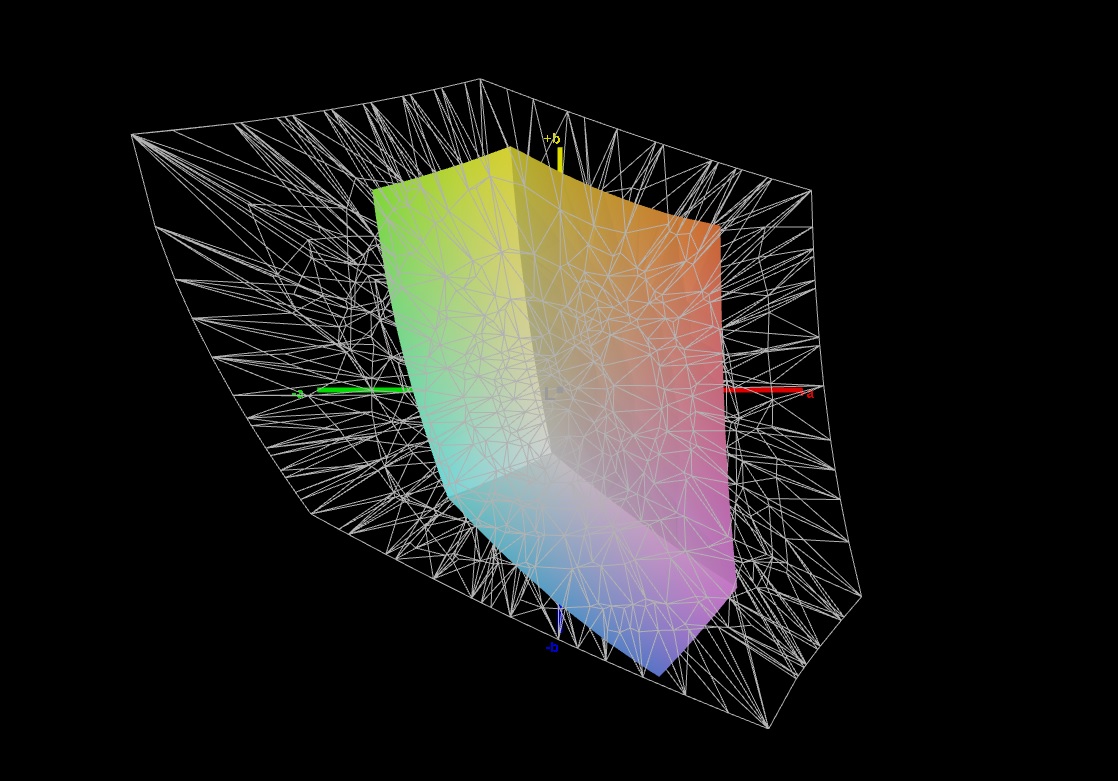
ΔE ColorChecker Calman: 4.77 | ∀{0.5-29.43 Ø4.71}
calibrated: 3.73
ΔE Greyscale Calman: 2.7 | ∀{0.09-98 Ø4.96}
61% sRGB (Argyll 1.6.3 3D)
43% AdobeRGB 1998 (Argyll 1.6.3 3D)
42.56% AdobeRGB 1998 (Argyll 3D)
61.8% sRGB (Argyll 3D)
41.16% Display P3 (Argyll 3D)
Gamma: 2.115
CCT: 7187 K
| Acer Nitro 5 AN515-44-R5FT Panda LM156LF-2F01 (NCP004D), IPS, 1920x1080 | Dell G5 15 5590-PCNJJ AU Optronics B156HAN (AUO23ED), IPS, 1920x1080 | HP Omen 15-dc1020ng LGD05CE, IPS, 1920x1080 | Lenovo Legion Y540-15IRH-81SX00B2GE BOE 084D, IPS, 1920x1080 | Acer Predator Helios 300 PH315-52-79TY AUO, B156HAN08.2, IPS, 1920x1080 | |
|---|---|---|---|---|---|
| Display | 97% | -7% | 52% | 53% | |
| Display P3 Coverage (%) | 41.16 | 83.1 102% | 38.37 -7% | 63.6 55% | 64.1 56% |
| sRGB Coverage (%) | 61.8 | 99.9 62% | 57.6 -7% | 91.7 48% | 93 50% |
| AdobeRGB 1998 Coverage (%) | 42.56 | 96.8 127% | 39.69 -7% | 65.2 53% | 65.7 54% |
| Response Times | -9% | 2% | 69% | 67% | |
| Response Time Grey 50% / Grey 80% * (ms) | 40.8 ? | 48 ? -18% | 40 ? 2% | 8.8 ? 78% | 15 ? 63% |
| Response Time Black / White * (ms) | 30 ? | 30 ? -0% | 29.6 ? 1% | 12 ? 60% | 9 ? 70% |
| PWM Frequency (Hz) | |||||
| Screen | -13% | -11% | 14% | 14% | |
| Brightness middle (cd/m²) | 287 | 234 -18% | 251 -13% | 299 4% | 325 13% |
| Brightness (cd/m²) | 271 | 216 -20% | 232 -14% | 290 7% | 310 14% |
| Brightness Distribution (%) | 88 | 87 -1% | 76 -14% | 89 1% | 82 -7% |
| Black Level * (cd/m²) | 0.25 | 0.22 12% | 0.17 32% | 0.29 -16% | 0.255 -2% |
| Contrast (:1) | 1148 | 1064 -7% | 1476 29% | 1031 -10% | 1275 11% |
| Colorchecker dE 2000 * | 4.77 | 6.52 -37% | 6.2 -30% | 3.7 22% | 4.28 10% |
| Colorchecker dE 2000 max. * | 17.15 | 10.58 38% | 18.6 -8% | 7 59% | 8.42 51% |
| Colorchecker dE 2000 calibrated * | 3.73 | 3.56 5% | 4.8 -29% | 2 46% | 1.45 61% |
| Greyscale dE 2000 * | 2.7 | 5.33 -97% | 4.2 -56% | 4.1 -52% | 5.01 -86% |
| Gamma | 2.115 104% | 2.86 77% | 2.32 95% | 2.19 100% | 2.6 85% |
| CCT | 7187 90% | 5983 109% | 7454 87% | 7166 91% | 7678 85% |
| Color Space (Percent of AdobeRGB 1998) (%) | 43 | 36 -16% | 36.5 -15% | 59.3 38% | 60 40% |
| Color Space (Percent of sRGB) (%) | 61 | 57 -7% | 57.4 -6% | 91.5 50% | 93 52% |
| Total Average (Program / Settings) | 25% /
8% | -5% /
-9% | 45% /
28% | 45% /
28% |
* ... smaller is better
Acer equips its 15-inch Nitro 5 with a 144 Hz IPS panel running at a native resolution of 1920x1080.
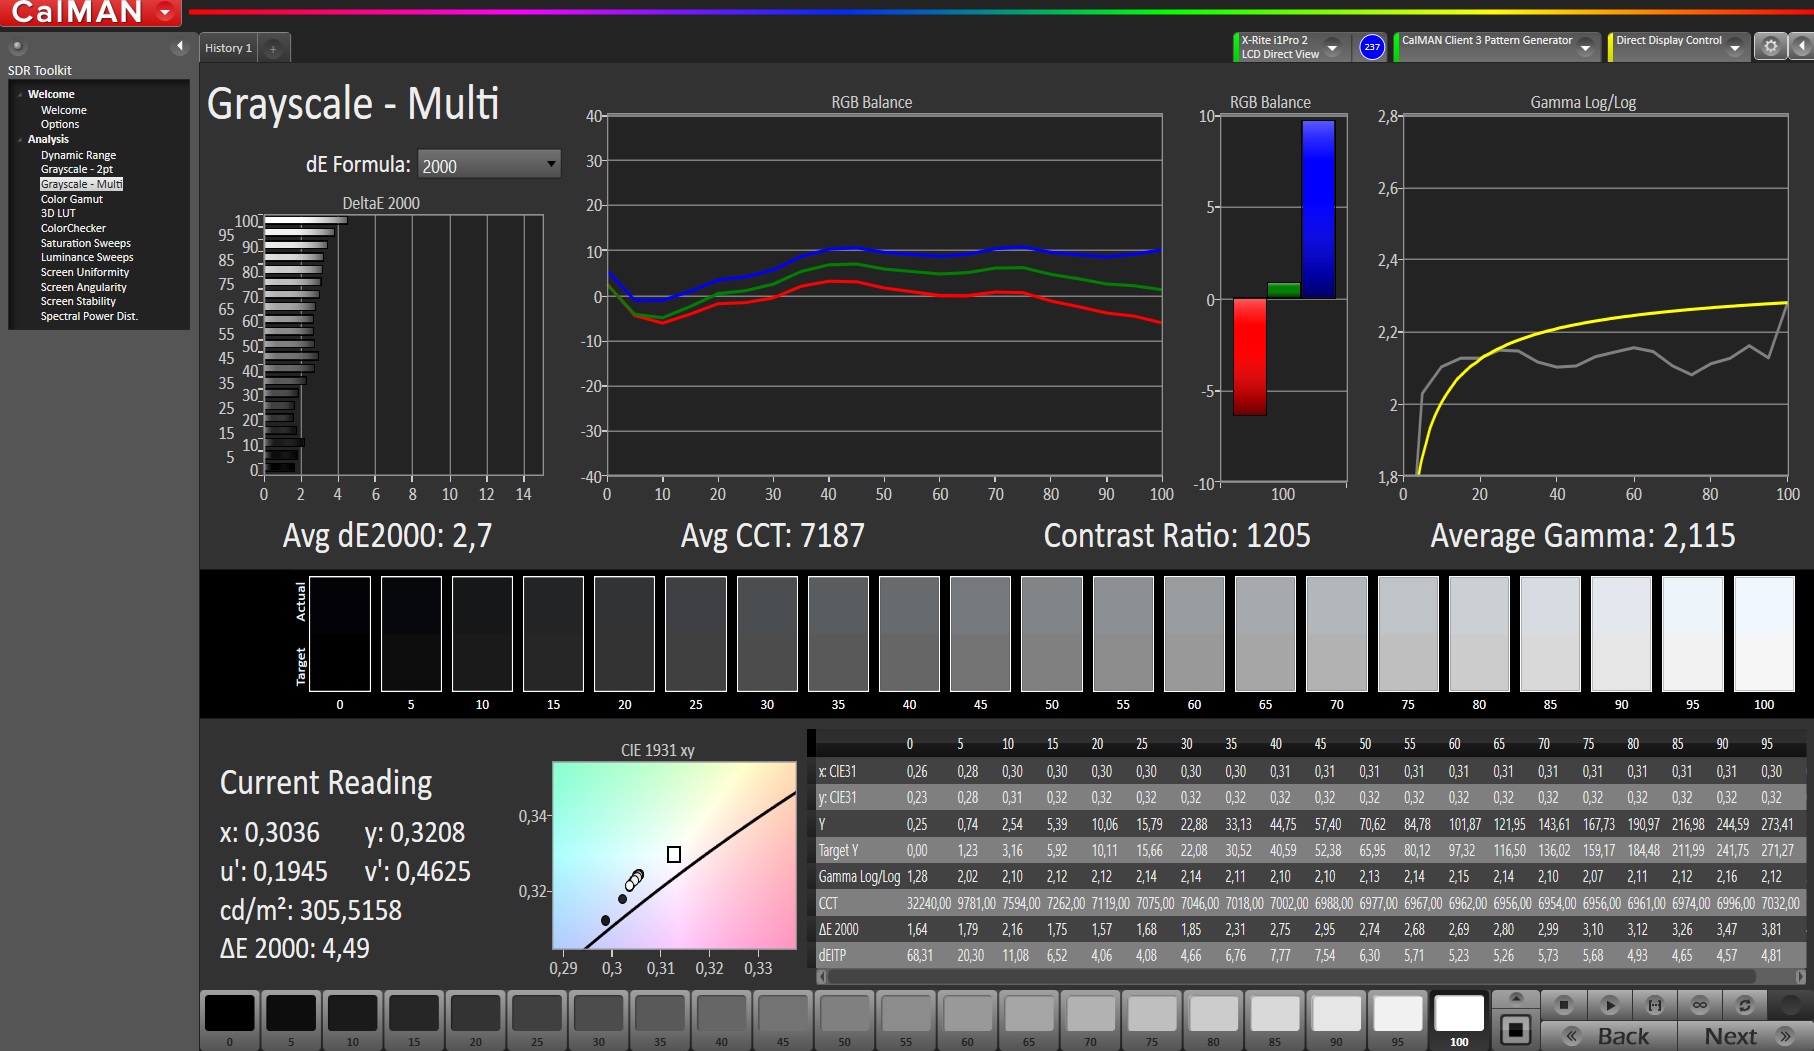
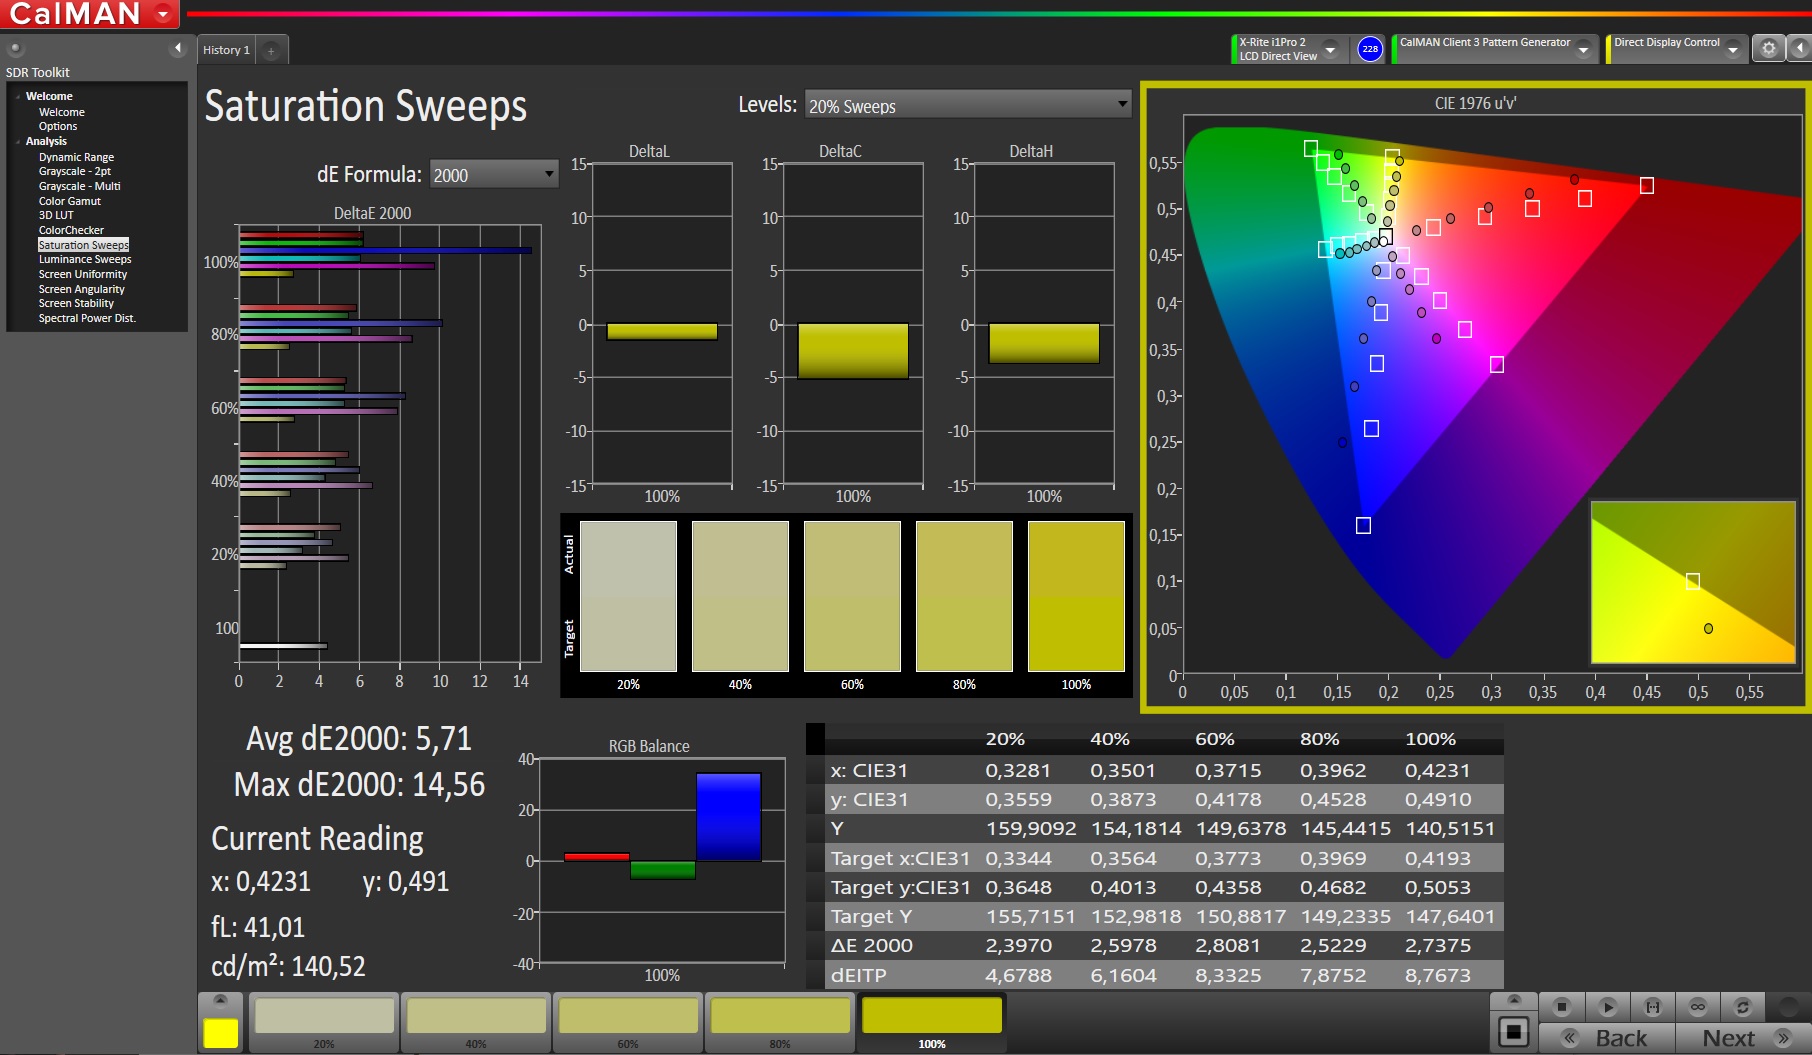
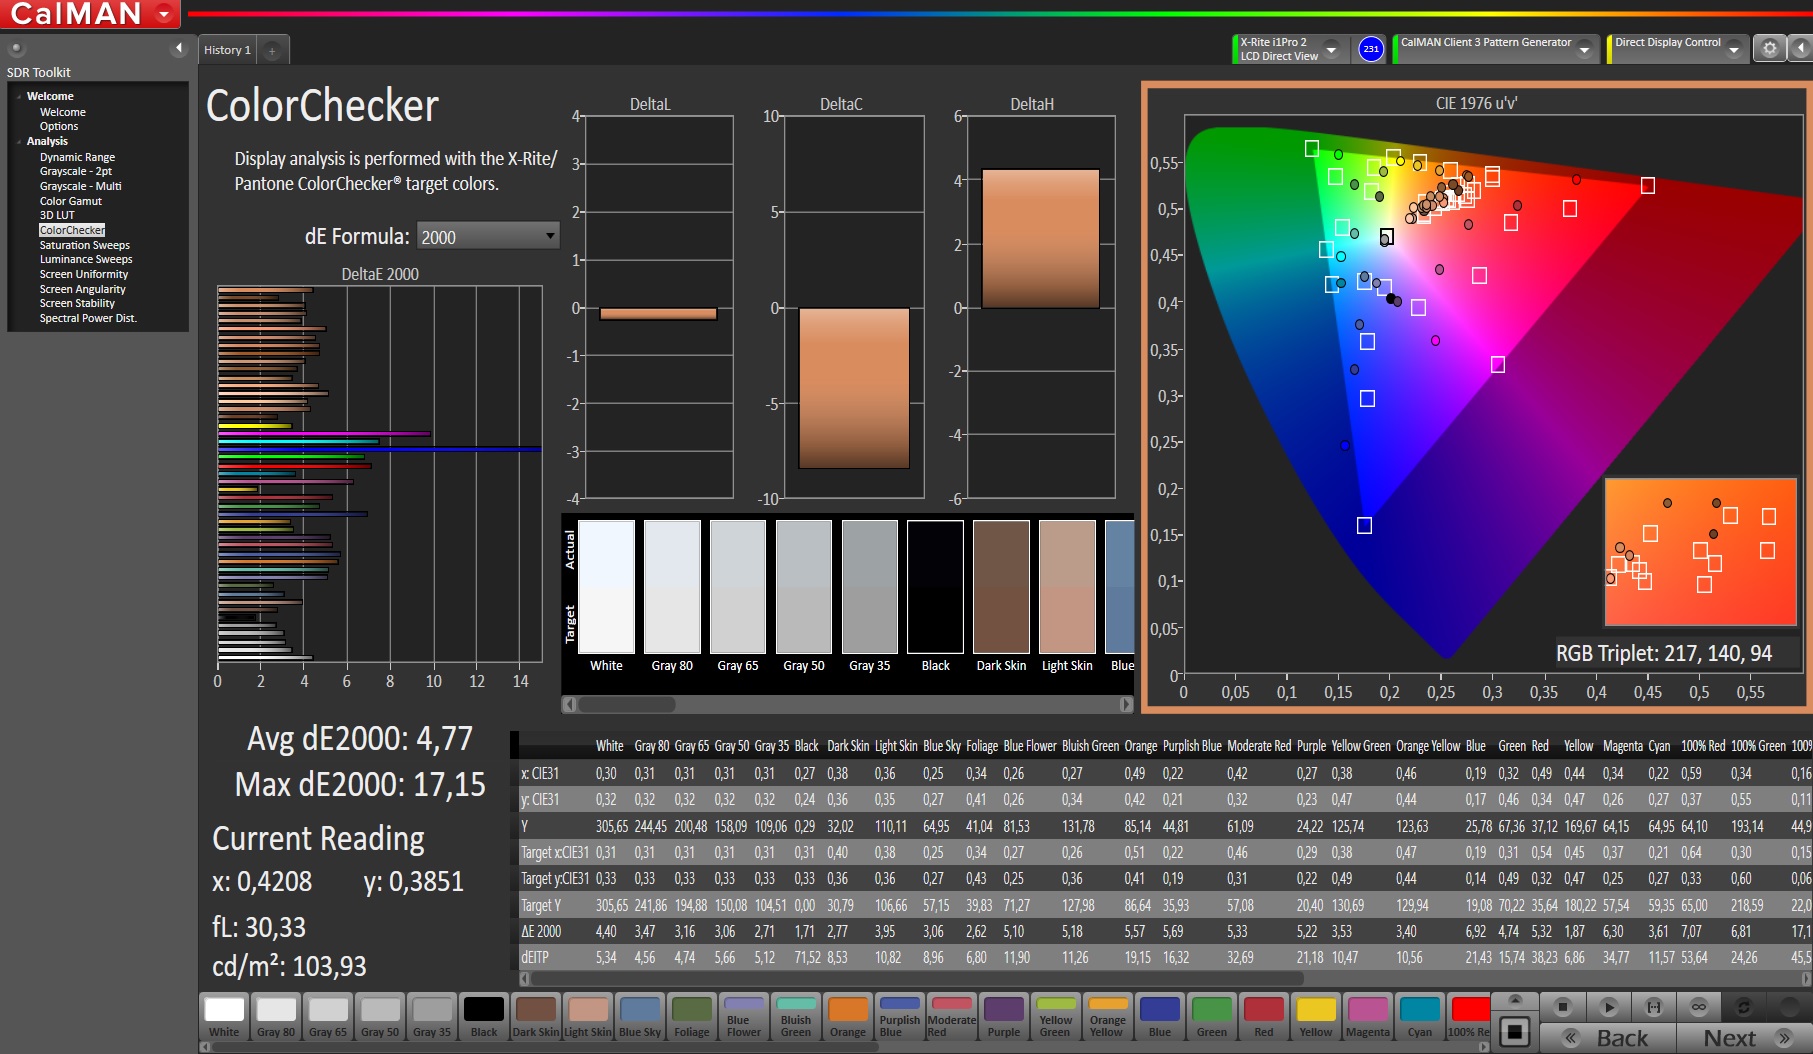
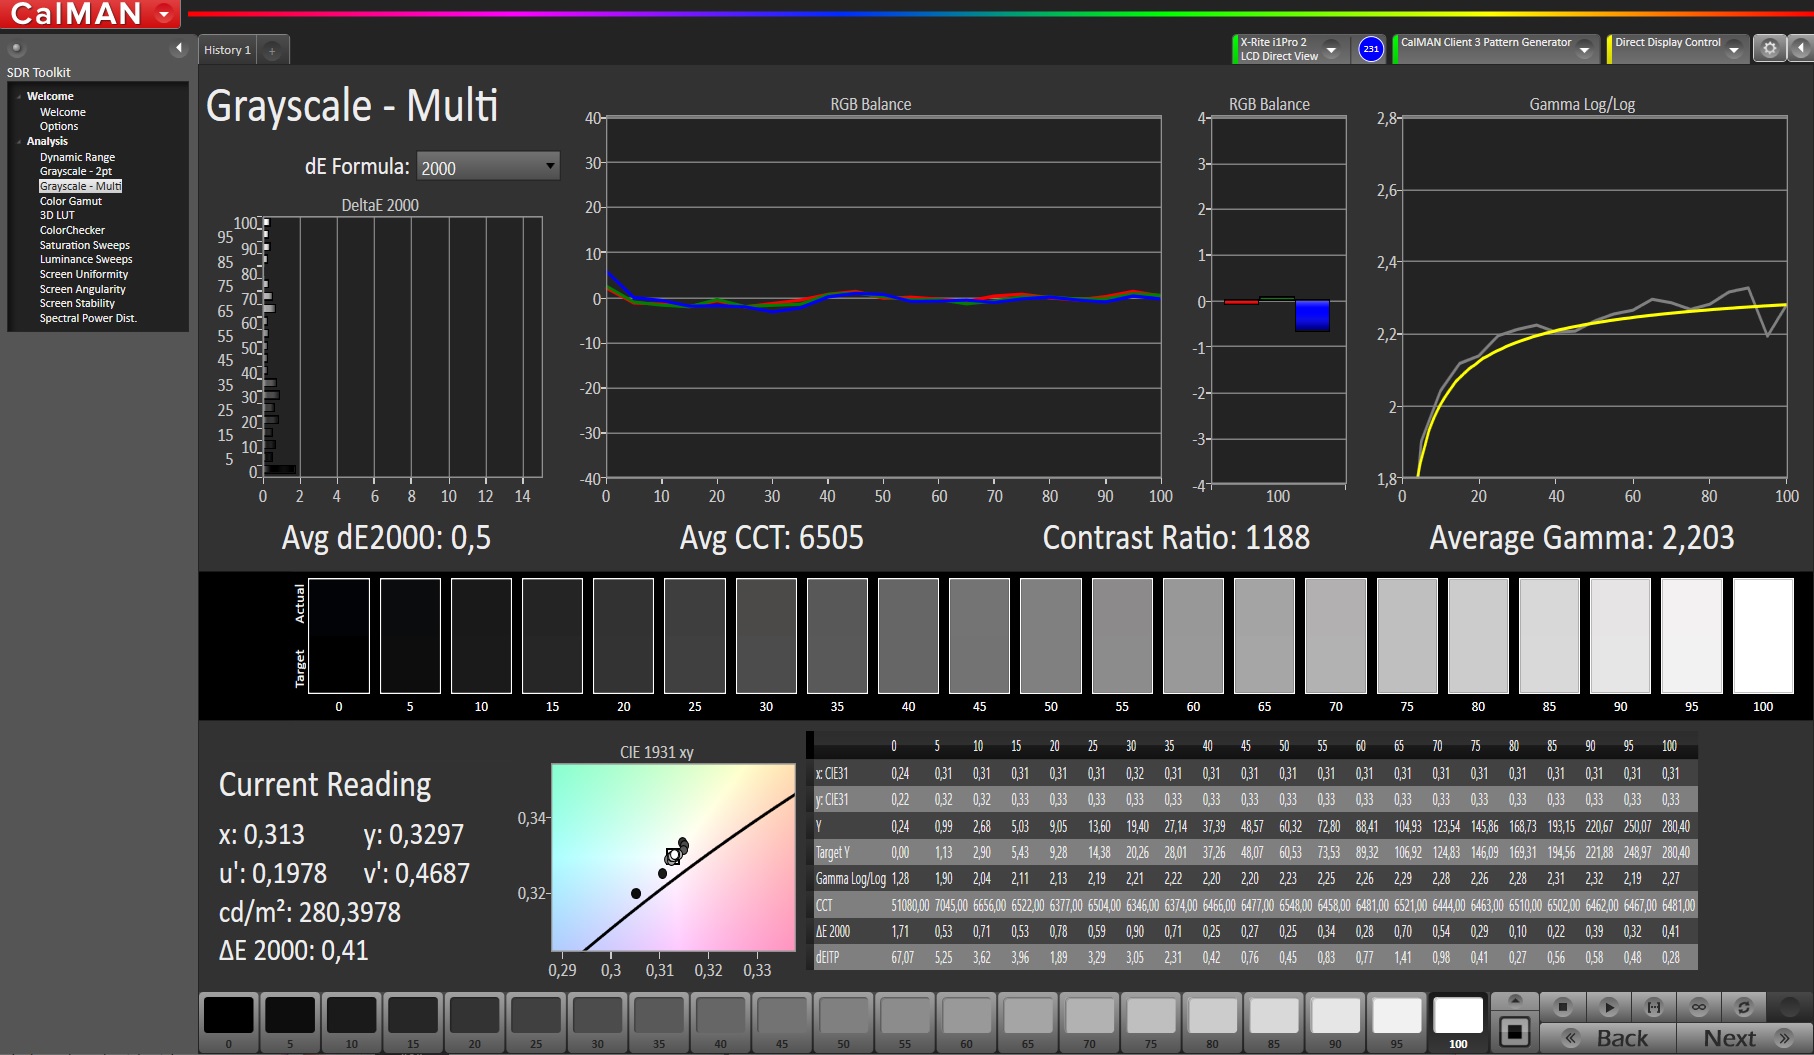
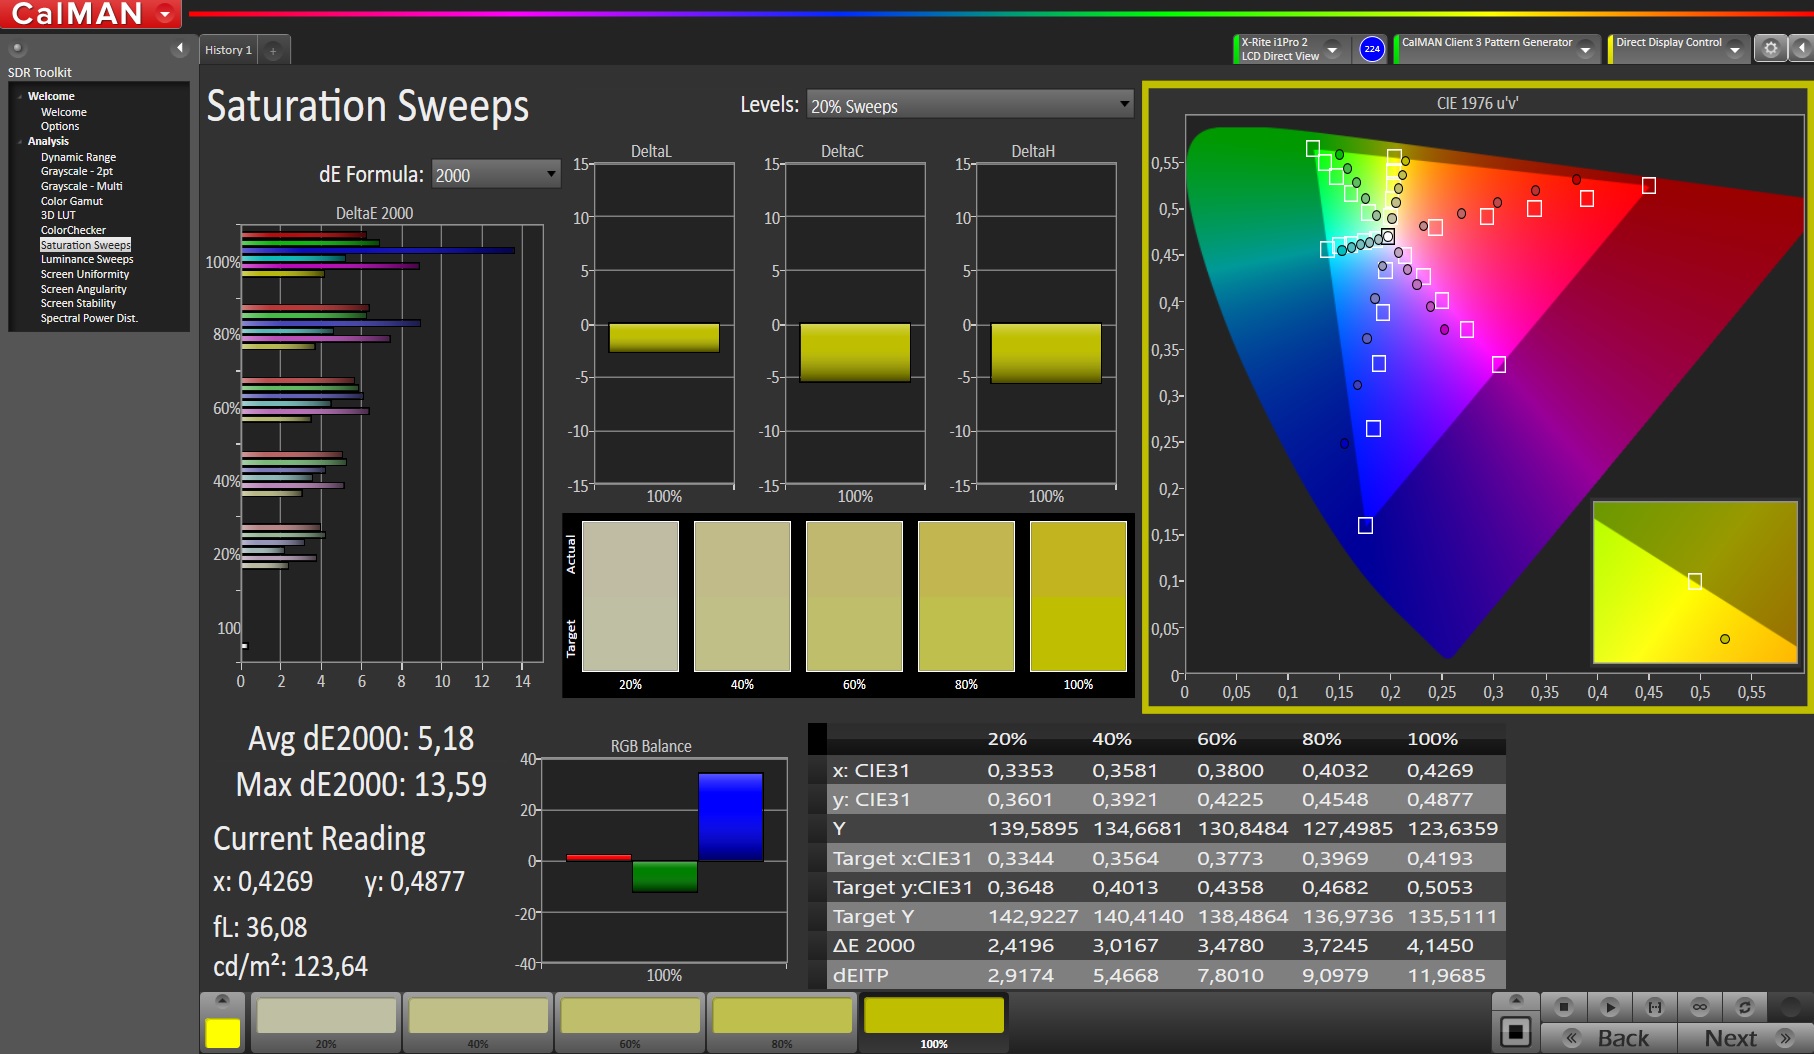
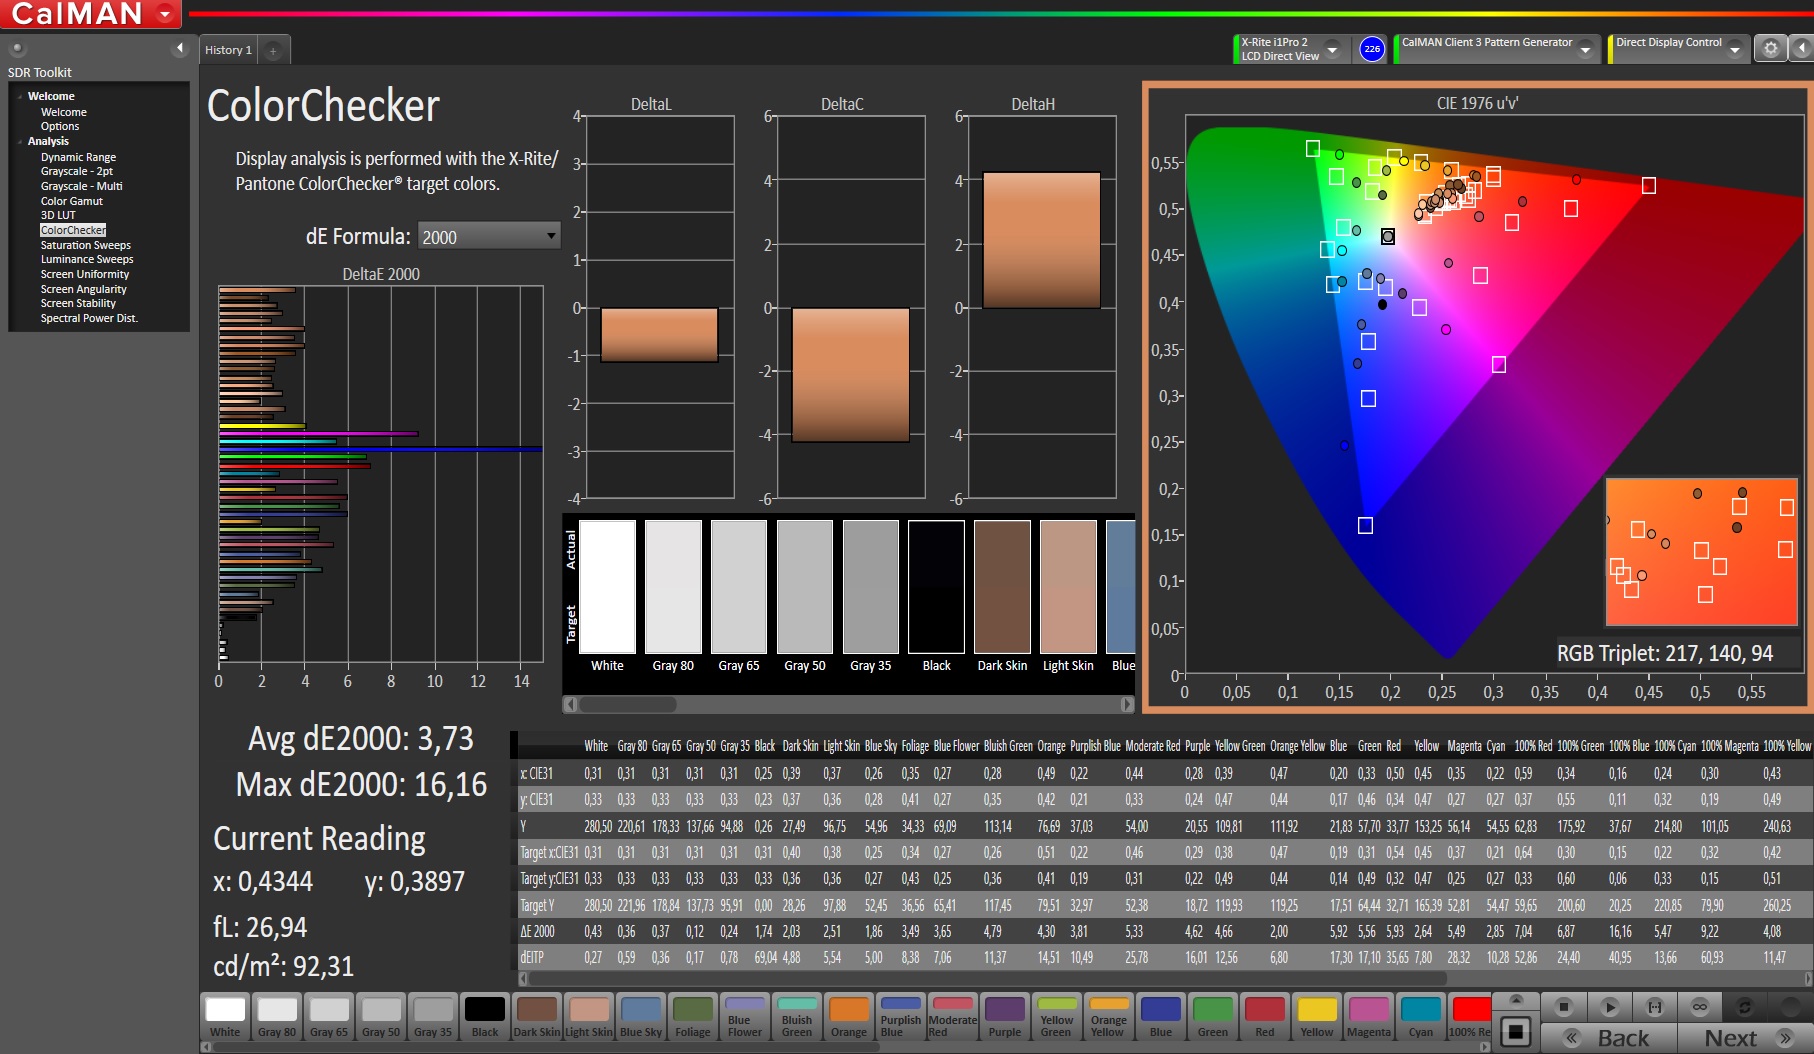
Overall picture quality is rather poor. In addition to a dim backlight (270 nits on average) we also found its color-space coverage (61% sRGB) and its response times to be lacking. In return, its black level of 0.25 nits and resulting contrast ratio of 1,150:1 were adequate.
In order to improve battery life and lower the price Acer opted against Nvidia’s G-Sync and chose the switchable-graphics technology Optimus instead.
Display Response Times
| ↔ Response Time Black to White | ||
|---|---|---|
| 30 ms ... rise ↗ and fall ↘ combined | ↗ 16.8 ms rise | 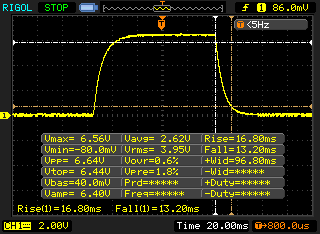 |
| ↘ 13.2 ms fall | ||
| The screen shows slow response rates in our tests and will be unsatisfactory for gamers. In comparison, all tested devices range from 0.1 (minimum) to 240 (maximum) ms. » 80 % of all devices are better. This means that the measured response time is worse than the average of all tested devices (19.8 ms). | ||
| ↔ Response Time 50% Grey to 80% Grey | ||
| 40.8 ms ... rise ↗ and fall ↘ combined | ↗ 19.2 ms rise | 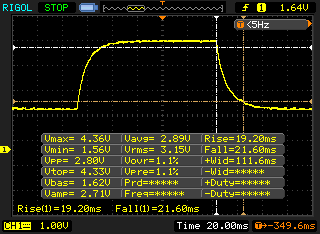 |
| ↘ 21.6 ms fall | ||
| The screen shows slow response rates in our tests and will be unsatisfactory for gamers. In comparison, all tested devices range from 0.165 (minimum) to 636 (maximum) ms. » 64 % of all devices are better. This means that the measured response time is worse than the average of all tested devices (31 ms). | ||
Screen Flickering / PWM (Pulse-Width Modulation)
| Screen flickering / PWM not detected | 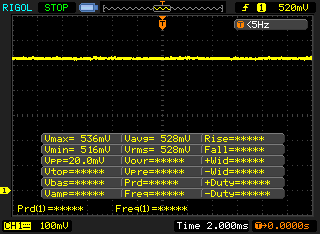 | ||
In comparison: 52 % of all tested devices do not use PWM to dim the display. If PWM was detected, an average of 7754 (minimum: 5 - maximum: 343500) Hz was measured. | |||
Test Conditions
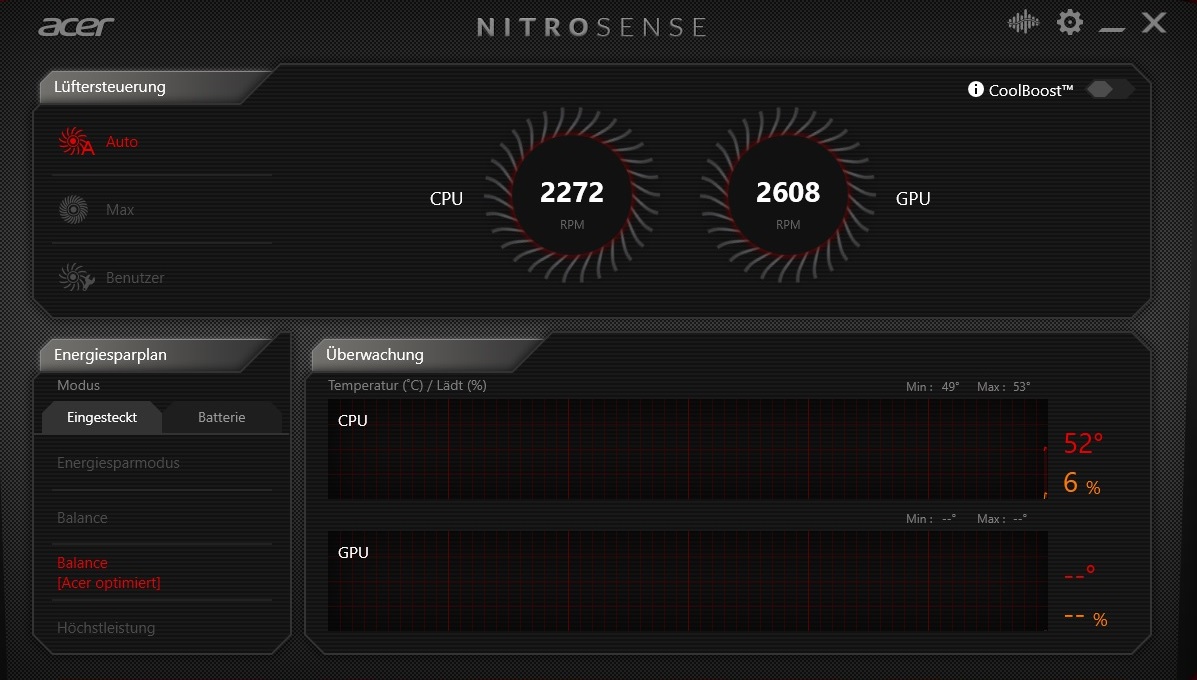
As can be seen on the screenshot below the preinstalled Nitro Sense tool did not offer too many settings or tabs. A well-organized user interface allows you to adjust fan speeds, select a power plan, and monitor CPU as well as GPU temperatures, load, and fan speeds. When running our tests, we left all settings on default resulting in automatic fan speed adjustment and Acer’s optimized Balanced power plan selected.
Performance
Our particular SKU can be found in the upper mid-range segment of gaming laptops, both in terms of price as well as performance. It is worth noting that the CPU offered much more performance headroom than the GPU, which topped out in some of the more-demanding games occasionally already. Unlike the GPU the RAM can be upgraded, and we strongly suggest doubling the RAM from 8 to 16 GB of dual-channel RAM.
Processor
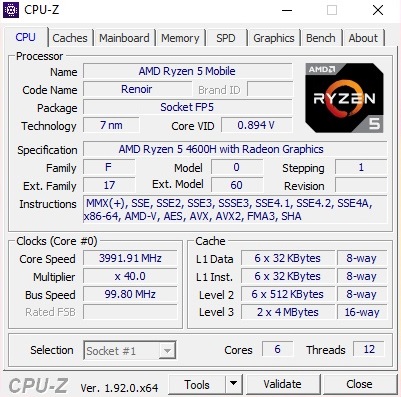
First things first: AMD’s Ryzen 5 4600H offers a breathtaking price-performance ratio. The hexa-core CPU is manufactured in a 7 nm lithography process and supports up to 12 simultaneous threads thanks to SMT.
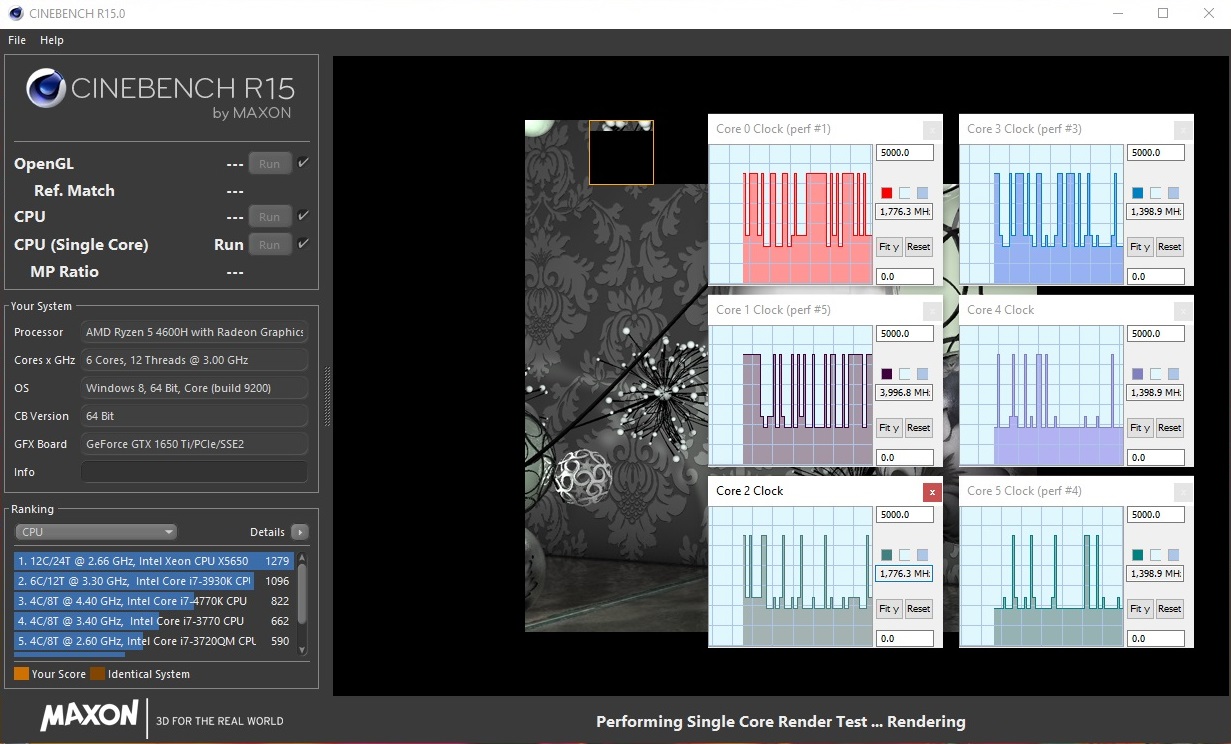
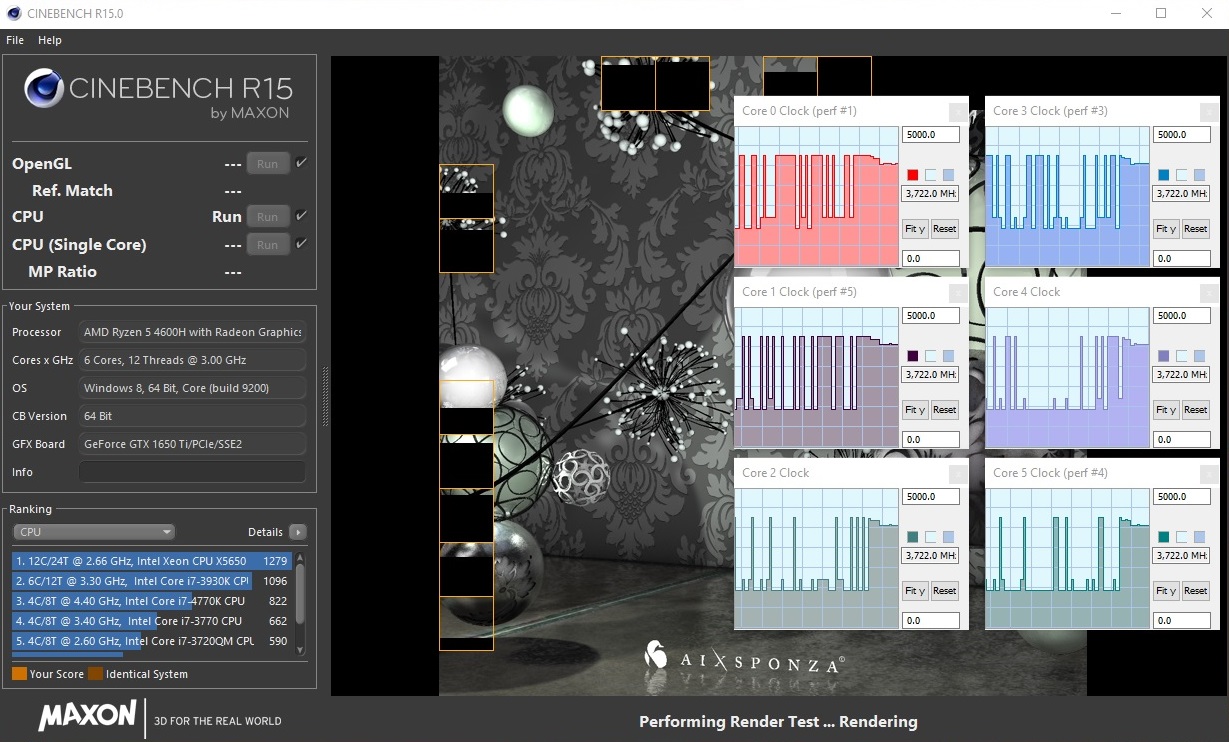
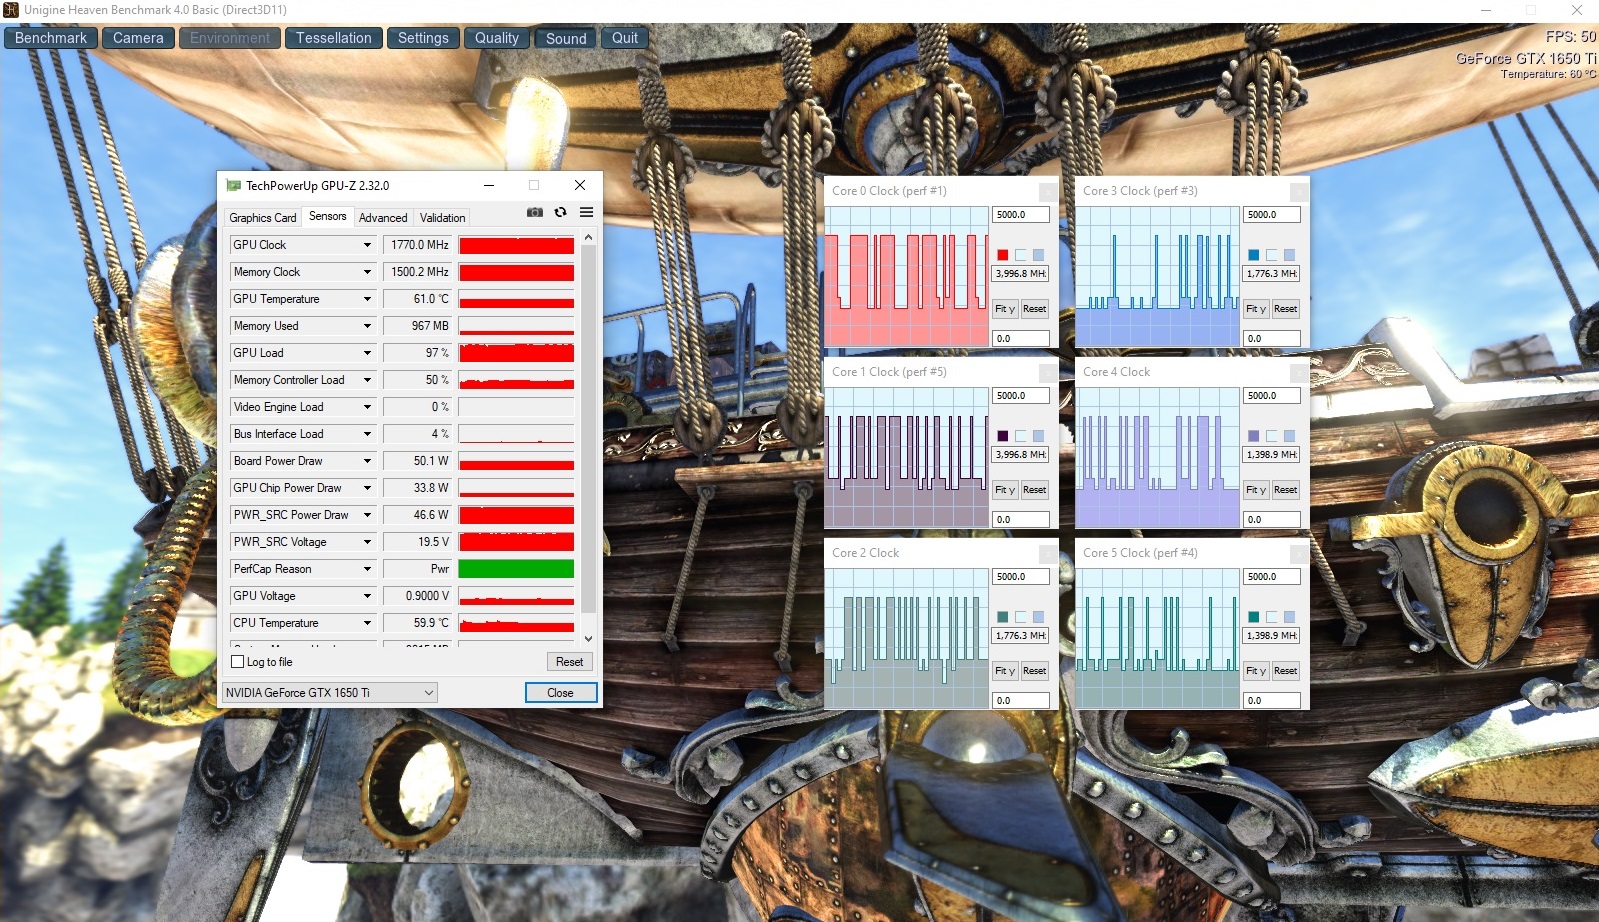
Its clock speeds were pretty impressive overall. While it only achieved its maximum boost of 4.0 GHz under ideal conditions, an average of 3.7 GHz with load on all cores is more than respectable. The fact that performance dropped after a few runs is no exception but rather typical for a laptop.
When running our benchmarks, the Ryzen 5 4600H practically wipes the floor with its Intel competitors. In CineBench R15 multi-thread it scored around 20% faster than a Core i7-9750H. Compared with the Core i5-9300H, a processor very popular with notebooks in the Nitro’s $1,000 range, it was between 70 and 80% faster thanks to its higher core count. Intel definitely has to take note of this.
| Blender - v2.79 BMW27 CPU | |
| HP Omen 15-dc1020ng | |
| Acer Predator Helios 300 PH315-52-79TY | |
| Lenovo Legion Y540-15IRH-81SX00B2GE | |
| Acer Nitro 5 AN515-44-R5FT | |
| Average of class Gaming (79 - 330, n=104, last 2 years) | |
| Geekbench 5.5 | |
| Single-Core | |
| Average of class Gaming (986 - 2474, n=105, last 2 years) | |
| Acer Nitro 5 AN515-44-R5FT | |
| Multi-Core | |
| Average of class Gaming (6460 - 28263, n=105, last 2 years) | |
| Acer Nitro 5 AN515-44-R5FT | |
| LibreOffice - 20 Documents To PDF | |
| Acer Nitro 5 AN515-44-R5FT | |
| Average of class Gaming (33.2 - 88.8, n=105, last 2 years) | |
| R Benchmark 2.5 - Overall mean | |
| Acer Nitro 5 AN515-44-R5FT | |
| Average of class Gaming (0.3439 - 0.759, n=106, last 2 years) | |
* ... smaller is better
System Performance
According to PCMark 10, our review unit scored somewhere between other devices equipped with a GTX 1650 Ti or GTX 1660 Ti, and an i5-9300H or i7-9750H. Subjectively, the 15-inch device felt very fast and snappy at all times, be it application launches, load times, boot times, or file transfers.
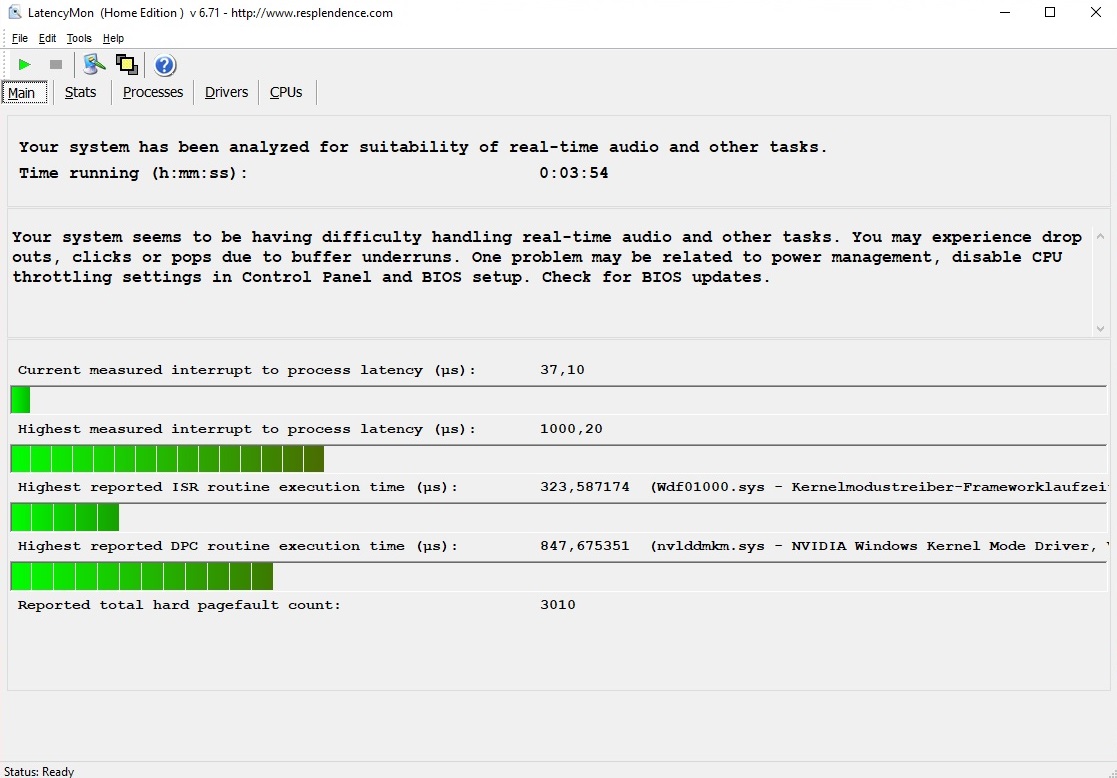
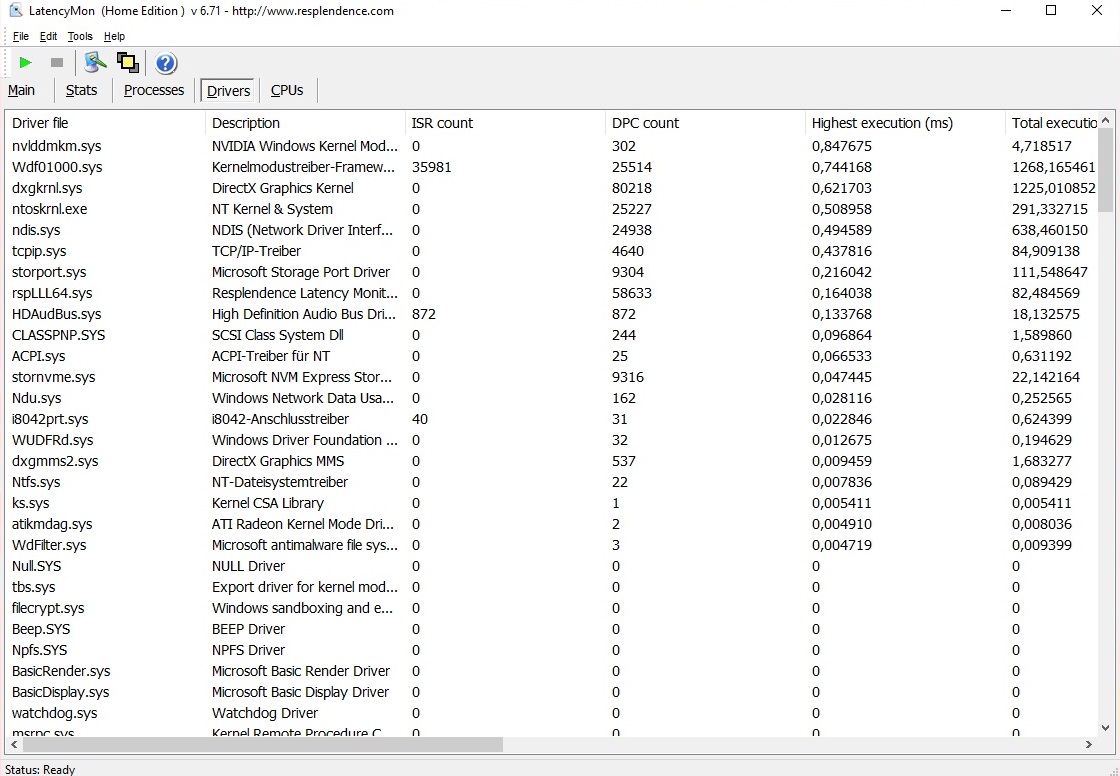
DPC Latencies
Unfortunately, the latencies observed were anything but good. According to LatencyMon you should expect potential difficulties with applications such as real-time audio. Fortunately, most users won’t notice any issues.
| DPC Latencies / LatencyMon - interrupt to process latency (max), Web, Youtube, Prime95 | |
| Acer Nitro 5 AN515-44-R5FT | |
* ... smaller is better
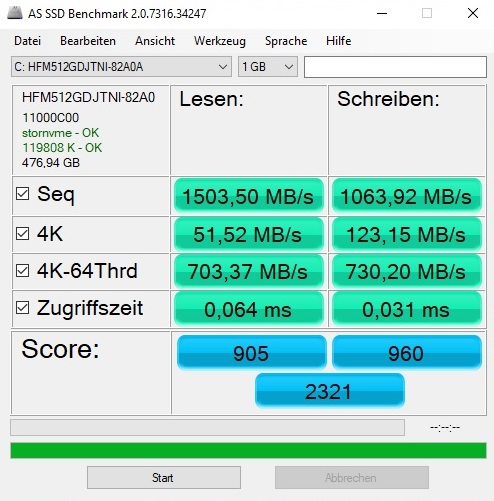
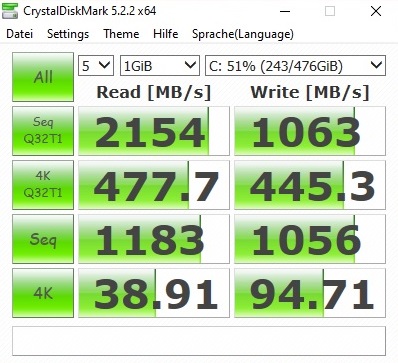
Storage Devices
In order to present the powerful CPU with a worthy storage device Acer opted for a PCIe SSD. Sequential transfer rates north of 1,000 MB/s in both read and write may not be the cream of the crop but still more than enough for everyday use. Our review unit was equipped with a 512 GB large SK Hynix BC511 SSD. If you need more storage space, you can either add a second M.2 SSD or use the included mounting bracket to add a traditional 2.5-inch hard disk drive.
| Acer Nitro 5 AN515-44-R5FT SK Hynix BC511 HFM512GDJTNI | Dell G5 15 5590-PCNJJ KBG30ZMS128G | HP Omen 15-dc1020ng WDC PC SN720 SDAQNTW-512G | Lenovo Legion Y540-15IRH-81SX00B2GE WDC PC SN720 SDAPNTW-512G | Acer Predator Helios 300 PH315-52-79TY WDC PC SN720 SDAPNTW-512G | |
|---|---|---|---|---|---|
| CrystalDiskMark 5.2 / 6 | -55% | 43% | 42% | 48% | |
| Write 4K (MB/s) | 94.7 | 65.3 -31% | 112.1 18% | 158.8 68% | 108.7 15% |
| Read 4K (MB/s) | 38.91 | 29.71 -24% | 42.01 8% | 29.11 -25% | 44.91 15% |
| Write Seq (MB/s) | 1056 | 128.8 -88% | 1964 86% | 1584 50% | 2424 130% |
| Read Seq (MB/s) | 1183 | 859 -27% | 2065 75% | 1694 43% | 1617 37% |
| Write 4K Q32T1 (MB/s) | 445.3 | 95.8 -78% | 318.2 -29% | 536 20% | 356.9 -20% |
| Read 4K Q32T1 (MB/s) | 477.7 | 197.6 -59% | 406.7 -15% | 363.9 -24% | 557 17% |
| Write Seq Q32T1 (MB/s) | 1063 | 132.5 -88% | 2534 138% | 2536 139% | 2542 139% |
| Read Seq Q32T1 (MB/s) | 2154 | 1208 -44% | 3438 60% | 3458 61% | 3218 49% |

GPU Performance
Truth be told we are somewhat disappointed by the GTX 1650 Ti despite its overall decent performance. Looking at the benchmark results reveals that the DirectX 12 GPU can only perform slightly better than a “regular” GTX 1650.
Given the overall very similar specs this does not come as a huge surprise. After all, both Turing GPUs feature 1,024 shaders with access to 4 GB of VRAM and a 128-bit interface. The only difference is that the Ti model features GDDR6 instead of GDDR5 VRAM.
| 3DMark 11 Performance | 12865 points | |
| 3DMark Cloud Gate Standard Score | 28177 points | |
| 3DMark Fire Strike Score | 9374 points | |
| 3DMark Time Spy Score | 4011 points | |
Help | ||
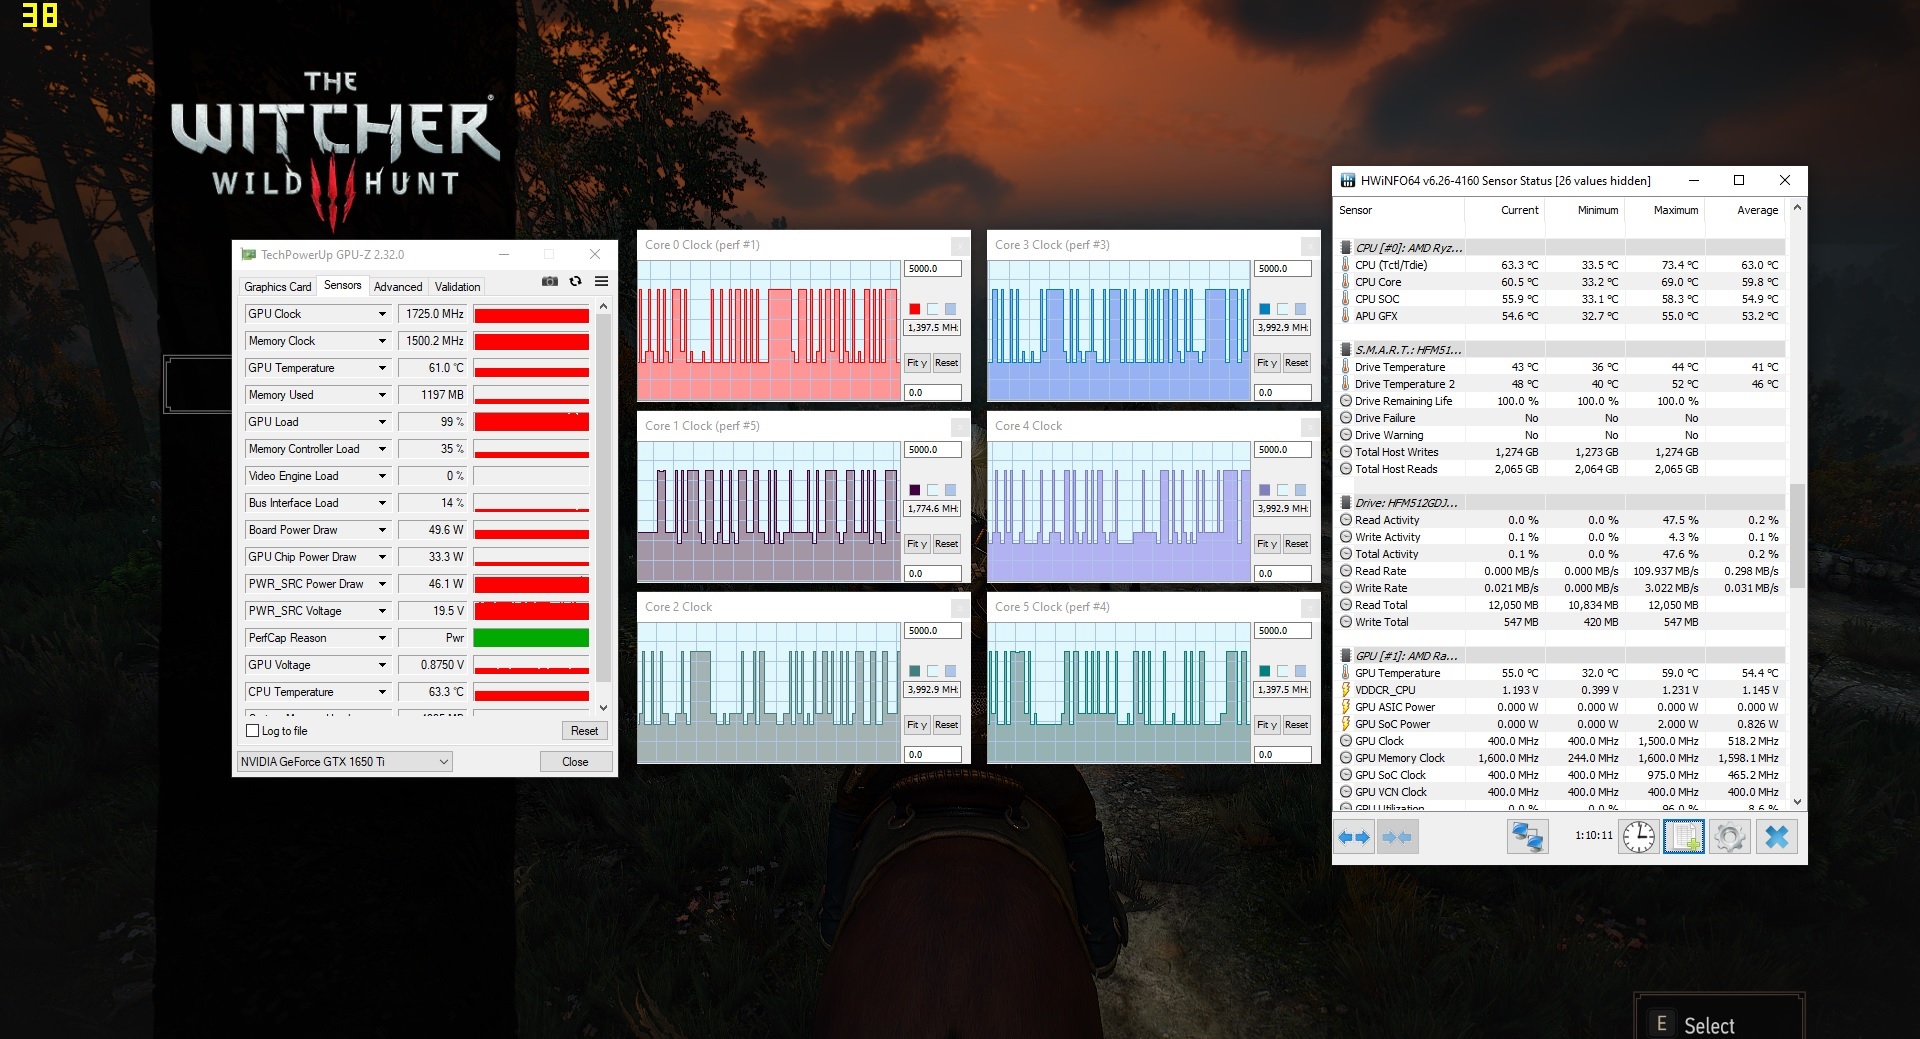
In order to determine sustained load capabilities, we ran The Witcher 3 on FHD/Ultra for at least 60 minutes. The resulting frame rate was consistent throughout the entire test, which hints at a properly sized cooler capable of keeping the GTX 1650 Ti in check. GPU clock speeds settled at more than 1,700 MHz, which is impressive considering the GPU’s base clock speed of no more than 1,350 MHz.
Gaming Performance
The Nitro 5 AN515-44 was developed with price-sensitive gamers in mind that might not necessarily insist on running every single game on the display’s native resolution of 1920x1080 on maximum details. Accordingly, recorded frame rates in less-demanding games such as FIFA 20 get very close to the display’s refresh rate while more-demanding, graphically intense, or poorly optimized games (we are looking at you, Red Dead Redemption 2 and Borderlands 3) tend to skip frames. Things quickly turn ugly when running at even higher resolutions, for example 2560x1440. Generally speaking, a GTX 1650 Ti is not suited for display resolutions higher than QHD.
| The Witcher 3 | |
| 1920x1080 High Graphics & Postprocessing (Nvidia HairWorks Off) | |
| Average of class Gaming (341 - 404, n=2, last 2 years) | |
| Acer Predator Helios 300 PH315-52-79TY | |
| Acer Nitro 5 AN515-44-R5FT | |
| HP Omen 15-dc1020ng | |
| Dell G5 15 5590-PCNJJ | |
| 1920x1080 Ultra Graphics & Postprocessing (HBAO+) | |
| Average of class Gaming (104.7 - 240, n=7, last 2 years) | |
| Acer Predator Helios 300 PH315-52-79TY | |
| Lenovo Legion Y540-15IRH-81SX00B2GE | |
| Acer Nitro 5 AN515-44-R5FT | |
| HP Omen 15-dc1020ng | |
| Dell G5 15 5590-PCNJJ | |
| low | med. | high | ultra | QHD | 4K | |
|---|---|---|---|---|---|---|
| GTA V (2015) | 144 | 93.1 | 51.5 | |||
| The Witcher 3 (2015) | 126 | 67.7 | 38.3 | 24.8 | ||
| Dota 2 Reborn (2015) | 107 | 104 | 91 | 87.1 | ||
| Fortnite (2018) | 121 | 89.9 | 68.6 | 41.1 | 13.1 | |
| Final Fantasy XV Benchmark (2018) | 56.5 | 42 | 14.6 | |||
| Kingdom Come: Deliverance (2018) | 69.3 | 57.7 | 38.7 | 25.9 | 11.7 | |
| X-Plane 11.11 (2018) | 80.2 | 67.6 | 59.1 | |||
| Monster Hunter World (2018) | 63.7 | 55.5 | 45.3 | |||
| Shadow of the Tomb Raider (2018) | 69 | 58 | 51 | 32 | 18 | |
| Hitman 2 (2018) | 59.2 | 53.7 | 51.5 | 40.5 | 21.6 | |
| Battlefield V (2018) | 84.3 | 73.2 | 67.3 | 51.2 | 27.6 | |
| Darksiders III (2018) | 85.9 | 68.6 | 60.8 | 37.9 | 12.7 | |
| Just Cause 4 (2018) | 84.4 | 60.9 | 56.2 | 37.5 | 19.6 | |
| Rage 2 (2019) | 66.9 | 55.5 | 54.7 | 33.7 | 14.9 | |
| Control (2019) | 48.6 | 35.5 | 21.9 | 10.5 | ||
| Borderlands 3 (2019) | 65.9 | 43.2 | 32.3 | 20.1 | 7.1 | |
| FIFA 20 (2019) | 155 | 153 | 148 | 144 | ||
| Call of Duty Modern Warfare 2019 (2019) | 71.1 | 63.5 | 51.7 | 36.6 | 18.9 | |
| Red Dead Redemption 2 (2019) | 53.8 | 35.4 | 21.8 | 17.1 | ||
| Gears Tactics (2020) | 100 | 67.3 | 49.8 | 29.3 | 16.9 |
Emissions
System Noise
Noise-sensitive users might have to look elsewhere. While the fans are either completely off or running at low speeds resulting in a fan noise of 32-34 dB(A) when the device is idle, they quickly rev up to 46-49 dB(A) under load and necessitate the use of a headset. Only the Dell G5 5590 was even louder.
Noise level
| Idle |
| 30 / 32 / 34 dB(A) |
| Load |
| 46 / 49 dB(A) |
 | ||
30 dB silent 40 dB(A) audible 50 dB(A) loud |
||
min: | ||
| Acer Nitro 5 AN515-44-R5FT R5 4600H, GeForce GTX 1650 Ti Mobile | Dell G5 15 5590-PCNJJ i5-9300H, GeForce GTX 1650 Mobile | HP Omen 15-dc1020ng i5-9300H, GeForce GTX 1650 Mobile | Lenovo Legion Y540-15IRH-81SX00B2GE i7-9750H, GeForce GTX 1660 Ti Mobile | Acer Predator Helios 300 PH315-52-79TY i7-9750H, GeForce GTX 1660 Ti Mobile | Average of class Gaming | |
|---|---|---|---|---|---|---|
| Noise | -3% | 13% | 9% | 3% | 9% | |
| off / environment * (dB) | 30 | 30 -0% | 28.8 4% | 29.3 2% | 30.2 -1% | 24.1 ? 20% |
| Idle Minimum * (dB) | 30 | 31 -3% | 28.8 4% | 29.3 2% | 31 -3% | 26 ? 13% |
| Idle Average * (dB) | 32 | 32 -0% | 29.5 8% | 29.3 8% | 31 3% | 27.4 ? 14% |
| Idle Maximum * (dB) | 34 | 35 -3% | 31.1 9% | 29.3 14% | 31 9% | 30.1 ? 11% |
| Load Average * (dB) | 46 | 49 -7% | 35.2 23% | 35.7 22% | 41.5 10% | 43.6 ? 5% |
| Witcher 3 ultra * (dB) | 47 | 47 -0% | 35.2 25% | 44.2 6% | 46.7 1% | |
| Load Maximum * (dB) | 49 | 53 -8% | 41 16% | 45.6 7% | 46.9 4% | 54.2 ? -11% |
* ... smaller is better
Temperature
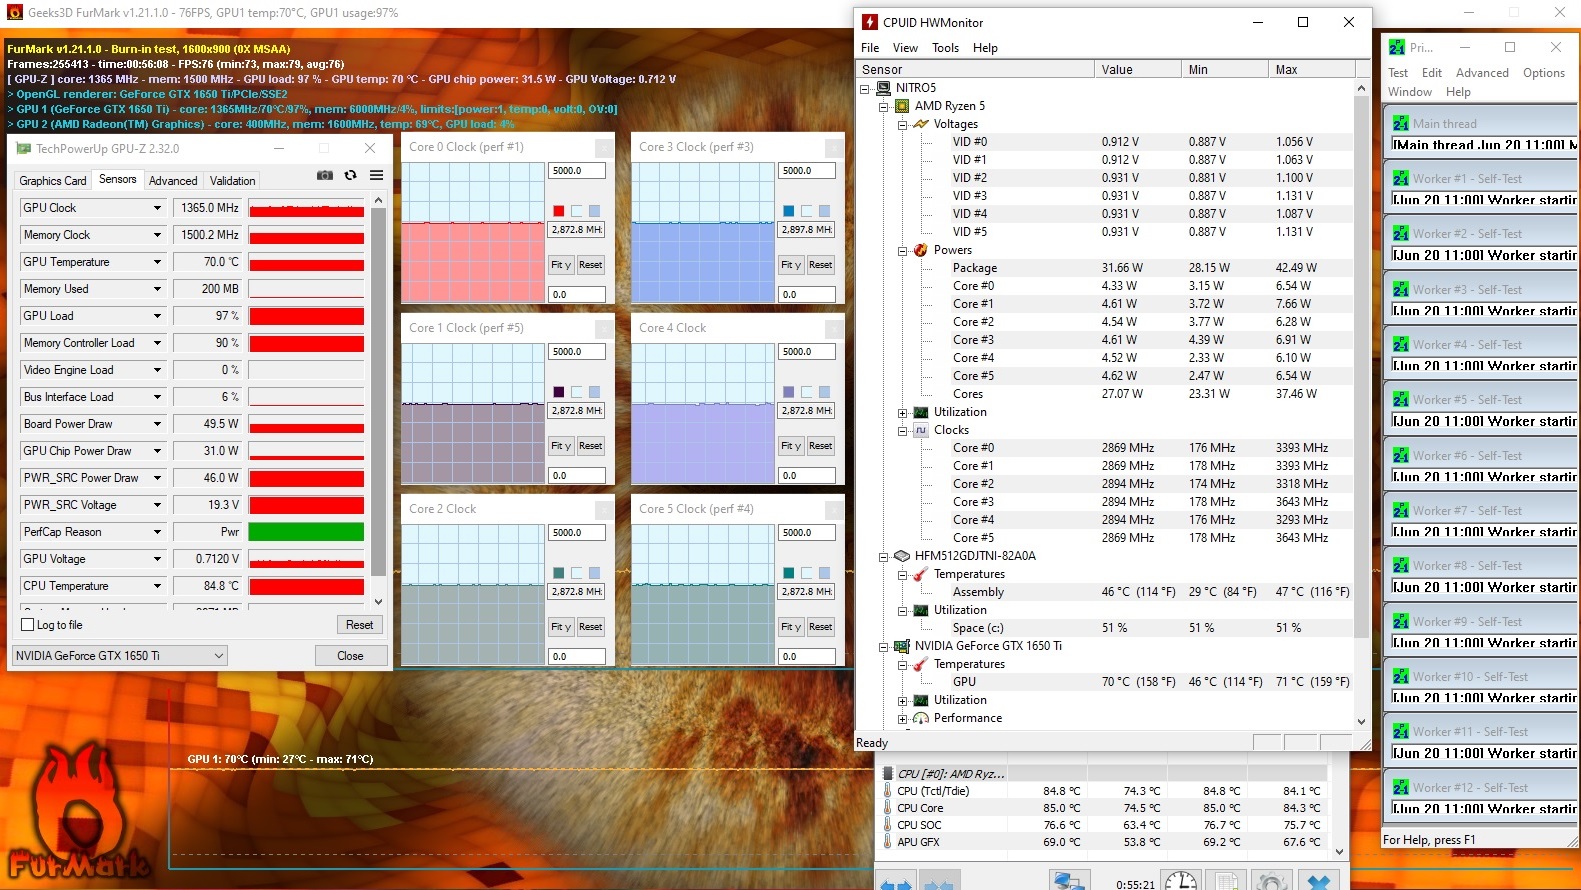
Temperatures recorded during our The Witcher 3 test indicate that the fans could easily be running slower than they are. CPU and GPU temperatures of around 60 °C each hint at quite a lot of thermal headroom. In our unrealistic stress test performed by running FurMark and Prime95 simultaneously we recorded temperatures of up to 71 °C for the GeForce GTX 1650 Ti and 85 °C for the Ryzen 5 4600H, both of which are also more than adequate for this load scenario.
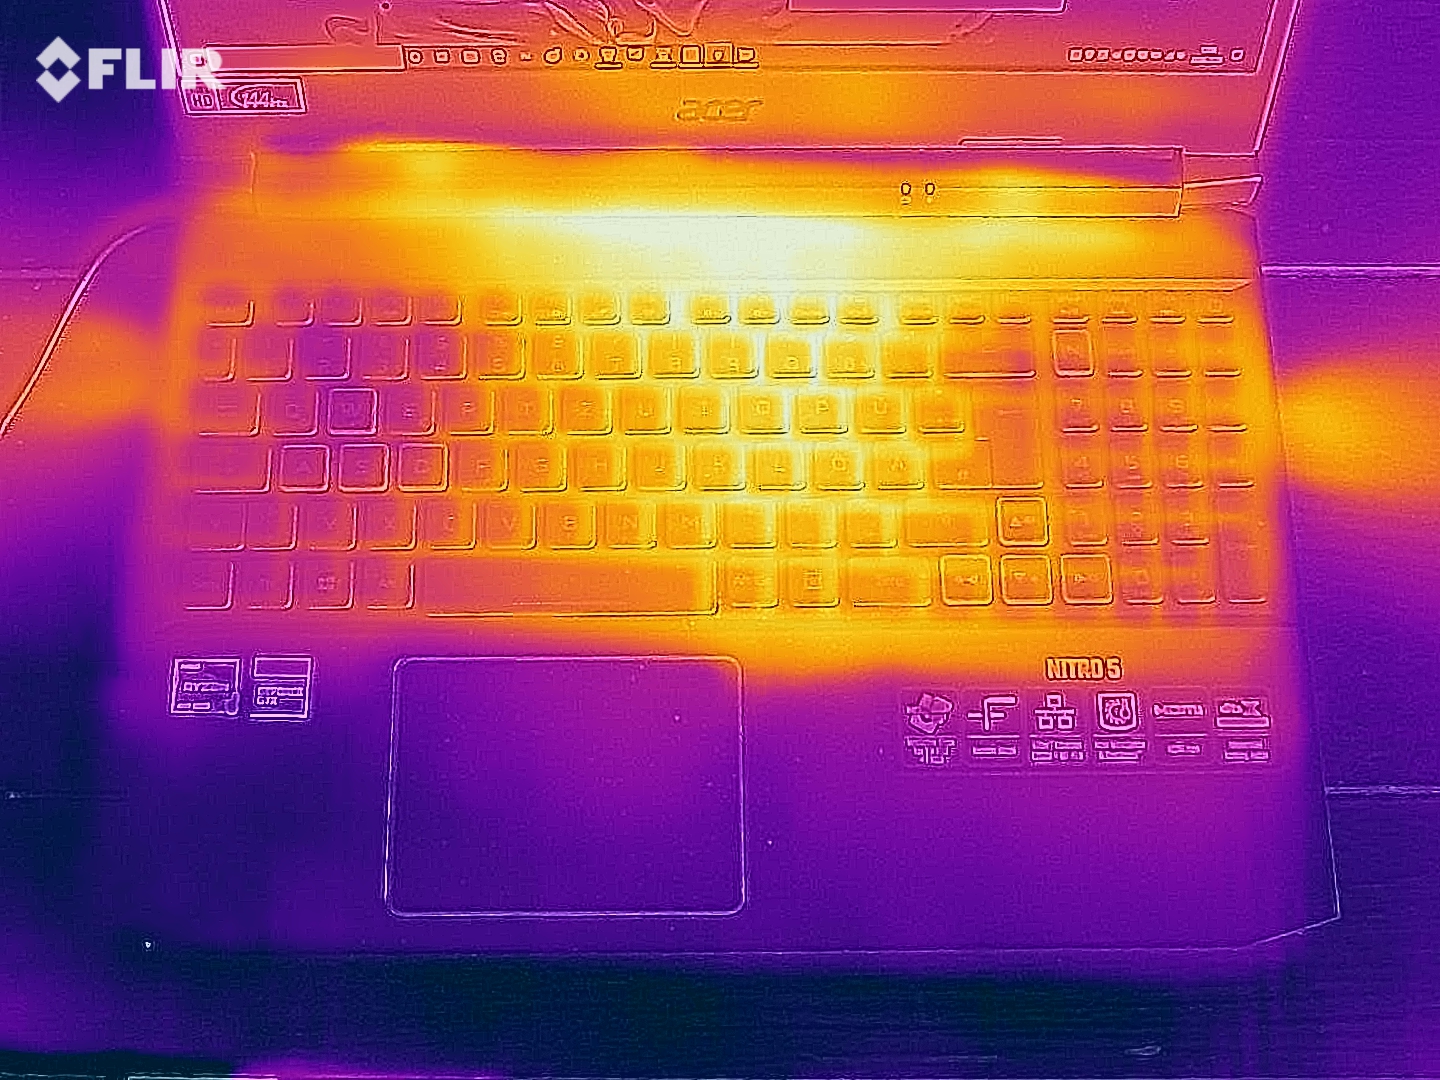
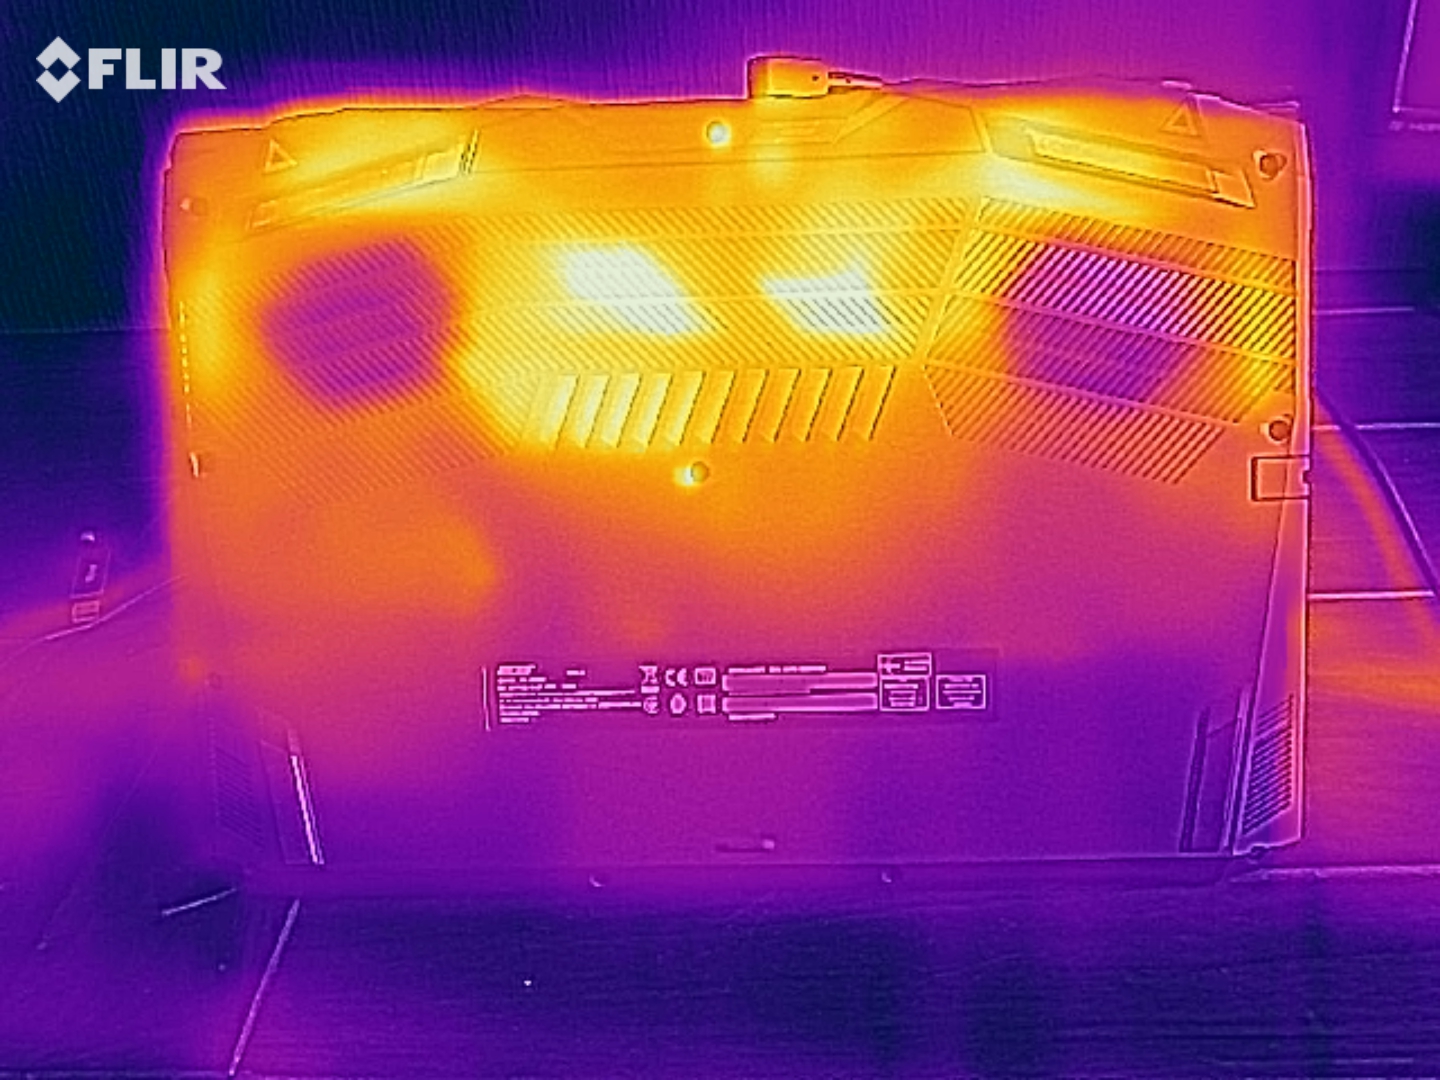
The case peaked at 49 °C at the top and 50 °C at the bottom, which is fairly typical for a gaming laptop. Idle temperatures were very low, and the case did not exceed 30 °C.
(-) The maximum temperature on the upper side is 49 °C / 120 F, compared to the average of 40.4 °C / 105 F, ranging from 21.2 to 68.8 °C for the class Gaming.
(-) The bottom heats up to a maximum of 50 °C / 122 F, compared to the average of 43.2 °C / 110 F
(+) In idle usage, the average temperature for the upper side is 25.9 °C / 79 F, compared to the device average of 33.9 °C / 93 F.
(±) Playing The Witcher 3, the average temperature for the upper side is 37.4 °C / 99 F, compared to the device average of 33.9 °C / 93 F.
(+) The palmrests and touchpad are reaching skin temperature as a maximum (35 °C / 95 F) and are therefore not hot.
(-) The average temperature of the palmrest area of similar devices was 28.8 °C / 83.8 F (-6.2 °C / -11.2 F).
| Acer Nitro 5 AN515-44-R5FT R5 4600H, GeForce GTX 1650 Ti Mobile | Dell G5 15 5590-PCNJJ i5-9300H, GeForce GTX 1650 Mobile | HP Omen 15-dc1020ng i5-9300H, GeForce GTX 1650 Mobile | Lenovo Legion Y540-15IRH-81SX00B2GE i7-9750H, GeForce GTX 1660 Ti Mobile | Acer Predator Helios 300 PH315-52-79TY i7-9750H, GeForce GTX 1660 Ti Mobile | Average of class Gaming | |
|---|---|---|---|---|---|---|
| Heat | 2% | 12% | -14% | 5% | -5% | |
| Maximum Upper Side * (°C) | 49 | 49 -0% | 40.3 18% | 42.7 13% | 52 -6% | 45.2 ? 8% |
| Maximum Bottom * (°C) | 50 | 55 -10% | 48.5 3% | 52.7 -5% | 46.3 7% | 48.1 ? 4% |
| Idle Upper Side * (°C) | 28 | 25 11% | 23.9 15% | 33.1 -18% | 24.8 11% | 31 ? -11% |
| Idle Bottom * (°C) | 28 | 26 7% | 24.6 12% | 41 -46% | 25.4 9% | 34.2 ? -22% |
* ... smaller is better
Speakers
Sound was mediocre at best, and sound quality was pretty comparable overall to the Predator Helios 300, both of which showed a distinct lack of base. At least the Nitro 5 gets significantly louder (79 dB(A) vs. 69 dB(A)).
Acer Nitro 5 AN515-44-R5FT audio analysis
(±) | speaker loudness is average but good (79 dB)
Bass 100 - 315 Hz
(-) | nearly no bass - on average 24% lower than median
(±) | linearity of bass is average (11% delta to prev. frequency)
Mids 400 - 2000 Hz
(±) | higher mids - on average 5% higher than median
(+) | mids are linear (6.9% delta to prev. frequency)
Highs 2 - 16 kHz
(+) | balanced highs - only 2.3% away from median
(+) | highs are linear (3.7% delta to prev. frequency)
Overall 100 - 16.000 Hz
(±) | linearity of overall sound is average (21.5% difference to median)
Compared to same class
» 77% of all tested devices in this class were better, 5% similar, 18% worse
» The best had a delta of 6%, average was 18%, worst was 132%
Compared to all devices tested
» 61% of all tested devices were better, 7% similar, 32% worse
» The best had a delta of 4%, average was 23%, worst was 134%
Acer Predator Helios 300 PH315-52-79TY audio analysis
(-) | not very loud speakers (69.2 dB)
Bass 100 - 315 Hz
(-) | nearly no bass - on average 22.4% lower than median
(±) | linearity of bass is average (12.4% delta to prev. frequency)
Mids 400 - 2000 Hz
(+) | balanced mids - only 3.8% away from median
(±) | linearity of mids is average (9.8% delta to prev. frequency)
Highs 2 - 16 kHz
(+) | balanced highs - only 2% away from median
(+) | highs are linear (6.9% delta to prev. frequency)
Overall 100 - 16.000 Hz
(±) | linearity of overall sound is average (21.4% difference to median)
Compared to same class
» 77% of all tested devices in this class were better, 5% similar, 18% worse
» The best had a delta of 6%, average was 18%, worst was 132%
Compared to all devices tested
» 60% of all tested devices were better, 7% similar, 33% worse
» The best had a delta of 4%, average was 23%, worst was 134%
Energy Management
Power Consumption
Acer’s 15-inch Nitro 5 is living proof that modern gaming laptops can be powerful yet very energy efficient at the same time. Despite its hexa-core CPU, the Nitro 5 only consumed between 5 and 13 W when idle. Both of its 9750H-equipped competitors consumed two to three times as much energy. Under load, it required between 69 and 124 W of energy, which was also excellent.
| Off / Standby | |
| Idle | |
| Load |
|
Key:
min: | |
| Acer Nitro 5 AN515-44-R5FT R5 4600H, GeForce GTX 1650 Ti Mobile | Dell G5 15 5590-PCNJJ i5-9300H, GeForce GTX 1650 Mobile | HP Omen 15-dc1020ng i5-9300H, GeForce GTX 1650 Mobile | Lenovo Legion Y540-15IRH-81SX00B2GE i7-9750H, GeForce GTX 1660 Ti Mobile | Acer Predator Helios 300 PH315-52-79TY i7-9750H, GeForce GTX 1660 Ti Mobile | Average of class Gaming | |
|---|---|---|---|---|---|---|
| Power Consumption | -3% | -2% | -88% | -119% | -111% | |
| Idle Minimum * (Watt) | 5 | 4 20% | 4.04 19% | 14.5 -190% | 17.2 -244% | 13 ? -160% |
| Idle Average * (Watt) | 8 | 7 12% | 7.2 10% | 18.5 -131% | 22.6 -183% | 19 ? -138% |
| Idle Maximum * (Watt) | 13 | 12 8% | 11.4 12% | 20 -54% | 25.5 -96% | 24.6 ? -89% |
| Load Average * (Watt) | 69 | 95 -38% | 80.8 -17% | 81.6 -18% | 88 -28% | 110.7 ? -60% |
| Witcher 3 ultra * (Watt) | 78 | 86 -10% | 93.6 -20% | 132 -69% | ||
| Load Maximum * (Watt) | 124 | 135 -9% | 144.5 -17% | 208.1 -68% | 177 -43% | 259 ? -109% |
* ... smaller is better
Battery Life
Thanks to its combination of switchable graphics and low power consumption the Nitro 5 offers excellent battery life. Despite its comparatively small 57 Wh battery it managed more than 13 hours of runtime in our idle test at minimum display brightness, and close to 9 hours in our Wi-Fi test at medium brightness. The only device capable of keeping up in our comparison group was the Dell G5 5590.
| Acer Nitro 5 AN515-44-R5FT R5 4600H, GeForce GTX 1650 Ti Mobile, 57.48 Wh | Dell G5 15 5590-PCNJJ i5-9300H, GeForce GTX 1650 Mobile, 60 Wh | HP Omen 15-dc1020ng i5-9300H, GeForce GTX 1650 Mobile, 52.5 Wh | Lenovo Legion Y540-15IRH-81SX00B2GE i7-9750H, GeForce GTX 1660 Ti Mobile, 57 Wh | Acer Predator Helios 300 PH315-52-79TY i7-9750H, GeForce GTX 1660 Ti Mobile, 58.75 Wh | Average of class Gaming | |
|---|---|---|---|---|---|---|
| Battery runtime | 18% | -8% | -50% | -46% | -17% | |
| Reader / Idle (h) | 13.8 | 14.5 5% | 15.9 15% | 4 -71% | 5 -64% | 8.27 ? -40% |
| WiFi v1.3 (h) | 8.7 | 8 -8% | 6.4 -26% | 2.4 -72% | 3.5 -60% | 7.11 ? -18% |
| Load (h) | 1.4 | 2.2 57% | 1.2 -14% | 1.3 -7% | 1.2 -14% | 1.502 ? 7% |
| H.264 (h) | 8 | 3.4 | 8.32 ? | |||
| Witcher 3 ultra (h) | 1 |
Pros
Cons
Verdict
Price-conscious users take note: The Acer Nitro 5 AMD edition with Ryzen 5 4600H and GeForce GTX 1650 Ti is a true price-performance recommendation.
While the first RX 5500M and GTX 1660 Ti laptops start making their way into the $1,000 gaming laptop segment, which could potentially offer even better gaming performance, a comparable CPU performance would cost much more in an Intel-equipped device.
Disregarding some of the corners Acer had to cut, such as the dim display with poor color-space coverage or the device’s poor connectivity, the Nitro 5 AN515-44 is a very attractive and versatile budget device. Thanks to long battery life and a comparatively lightweight and compact case it can even be considered somewhat portable.
Acer Nitro 5 AN515-44-R5FT
- 06/27/2020 v7 (old)
Florian Glaser
Price comparison

