Acer Nitro 5 (Ryzen 7 2700U, Radeon RX 560X, FHD) Laptop Review

In addition to various Intel and Nvidia models, the Nitro 5 also exists in several AMD versions. Depending on the model, either the Ryzen 5 2500U or the more powerful Ryzen 7 2700U is used. The mid-range Radeon RX 560X chip, which is used extremely rarely and celebrates its Notebookcheck premiere in this article, serves as the dedicated graphics card. The size of the DDR4 working memory is 8 or 16 GB, while the storage solution consists of either a 1000-GB HDD or a combination of a 128-GB SSD and 1-TB HDD.
The price of the Nitro 5 starts from 629 Euros (~$715; $699 in the US), with the more affordable versions not being equipped with Windows 10 but only with Linux. The model we tested costs almost 900 Euros (~$1023) and is called AN515-42-R6V0.
Since with the exception of its surface texture, the case is identical to that of the predecessor, we will not discuss the case, equipment, and input devices again here. You can find the corresponding information in the review of the AN515-51-788E.
The competitors of the Nitro 5 include other 15-inch laptops from our Budget Top 10, such as the Lenovo IdeaPad 720 (i5-7200U, RX 560), the Xiaomi Mi Pro i5 (i5-8250U, MX150) and the Acer Aspire 5 (i5-8265U, MX150) from the same manufacturer.
| SD Card Reader | |
| average JPG Copy Test (av. of 3 runs) | |
| Average of class Gaming (20.9 - 210, n=53, last 2 years) | |
| Lenovo IdeaPad 720-15IKB (Toshiba Exceria Pro SDXC 64 GB UHS-II) | |
| Acer Aspire 5 A515-52G-53PU (Toshiba Exceria Pro SDXC 64 GB UHS-II) | |
| Acer Nitro 5 AN515-42-R6V0 (Toshiba Exceria Pro SDXC 64 GB UHS-II) | |
| Xiaomi Mi Notebook Pro i5 | |
| maximum AS SSD Seq Read Test (1GB) | |
| Average of class Gaming (25.5 - 261, n=50, last 2 years) | |
| Lenovo IdeaPad 720-15IKB (Toshiba Exceria Pro SDXC 64 GB UHS-II) | |
| Acer Nitro 5 AN515-42-R6V0 (Toshiba Exceria Pro SDXC 64 GB UHS-II) | |
| Acer Aspire 5 A515-52G-53PU (Toshiba Exceria Pro SDXC 64 GB UHS-II) | |
| Xiaomi Mi Notebook Pro i5 | |
| Networking | |
| iperf3 transmit AX12 | |
| Acer Aspire 5 A515-52G-53PU | |
| Acer Nitro 5 AN515-42-R6V0 | |
| Xiaomi Mi Notebook Pro i5 | |
| Lenovo IdeaPad 720-15IKB | |
| iperf3 receive AX12 | |
| Acer Nitro 5 AN515-42-R6V0 | |
| Acer Aspire 5 A515-52G-53PU | |
| Xiaomi Mi Notebook Pro i5 | |
| Lenovo IdeaPad 720-15IKB | |
Display
We got the first surprise with the display. Instead of using the panel from the Intel/Nvidia model (LG Philips LP156WF6-SPK6), Acer has integrated a different Full HD IPS model here (AU Optronics B156HAN06.0). Fortunately this is not a downgrade but more of an upgrade.
| |||||||||||||||||||||||||
Brightness Distribution: 88 %
Center on Battery: 299 cd/m²
Contrast: 1246:1 (Black: 0.24 cd/m²)
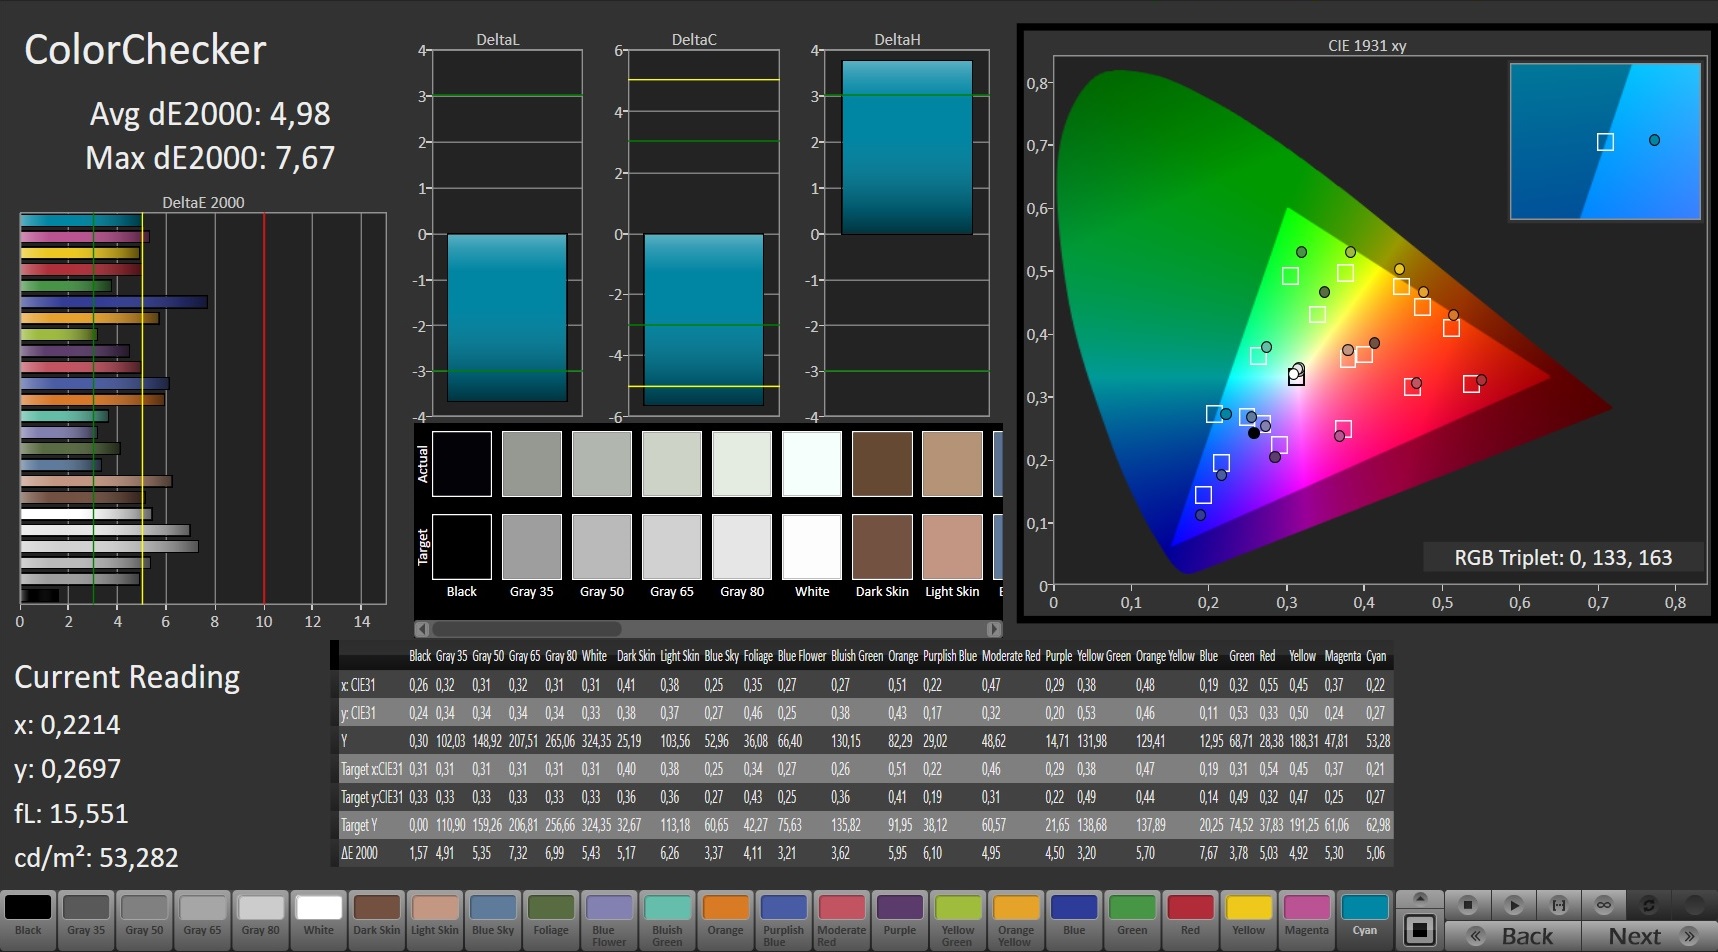
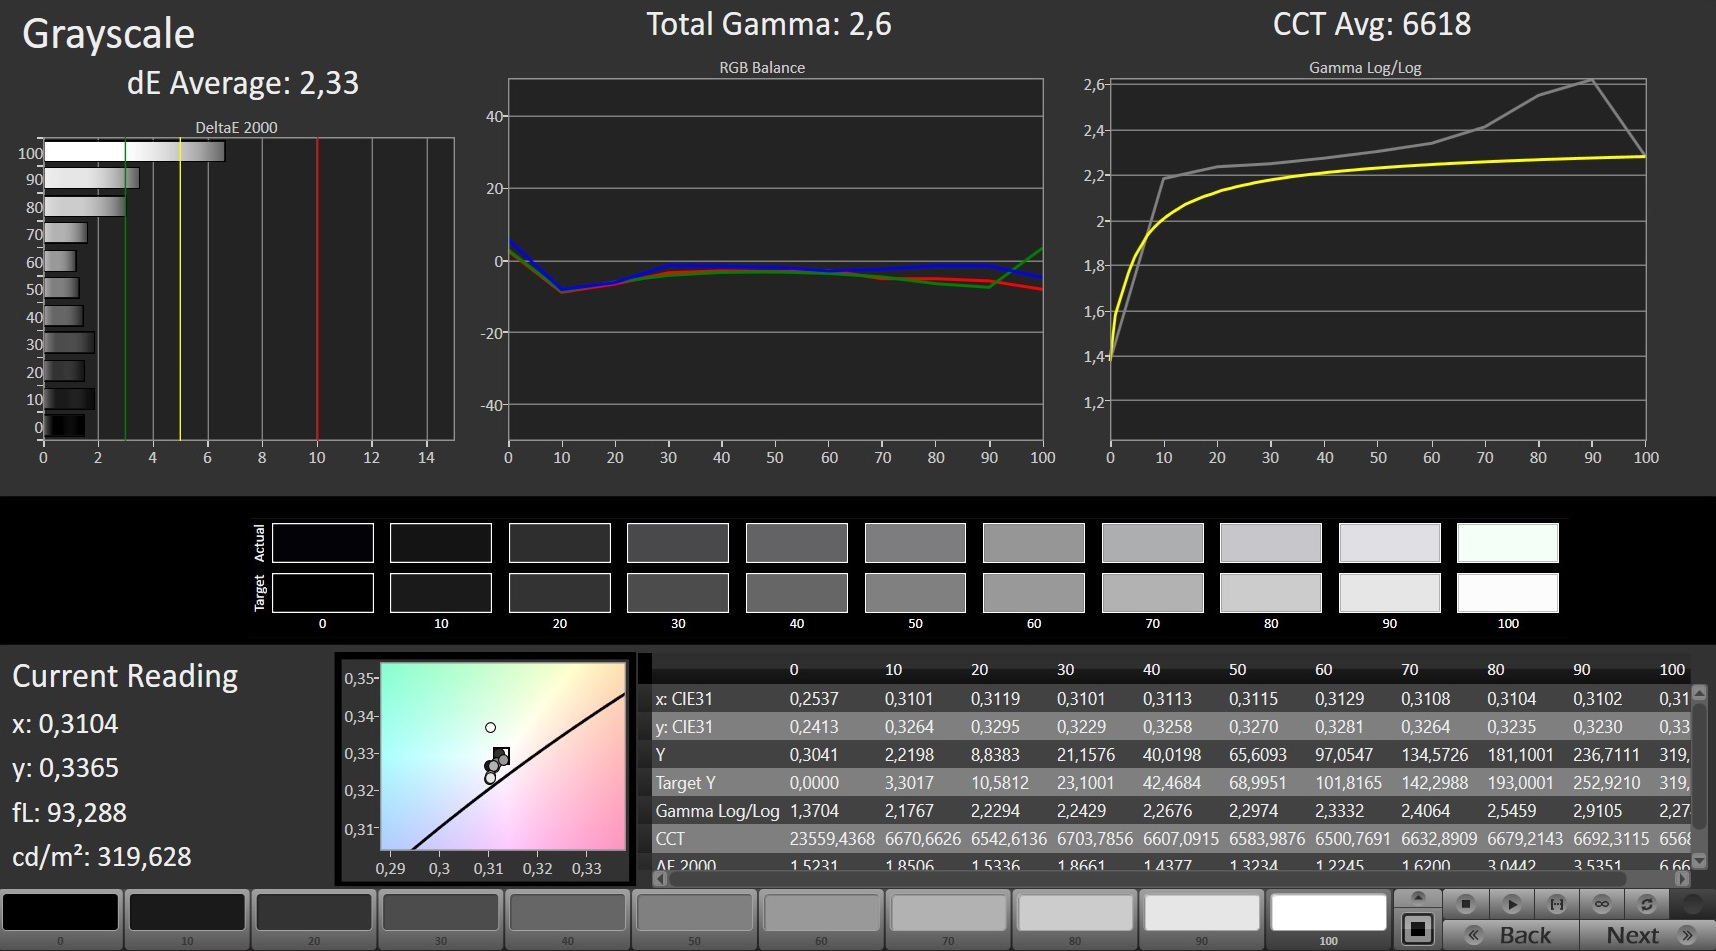
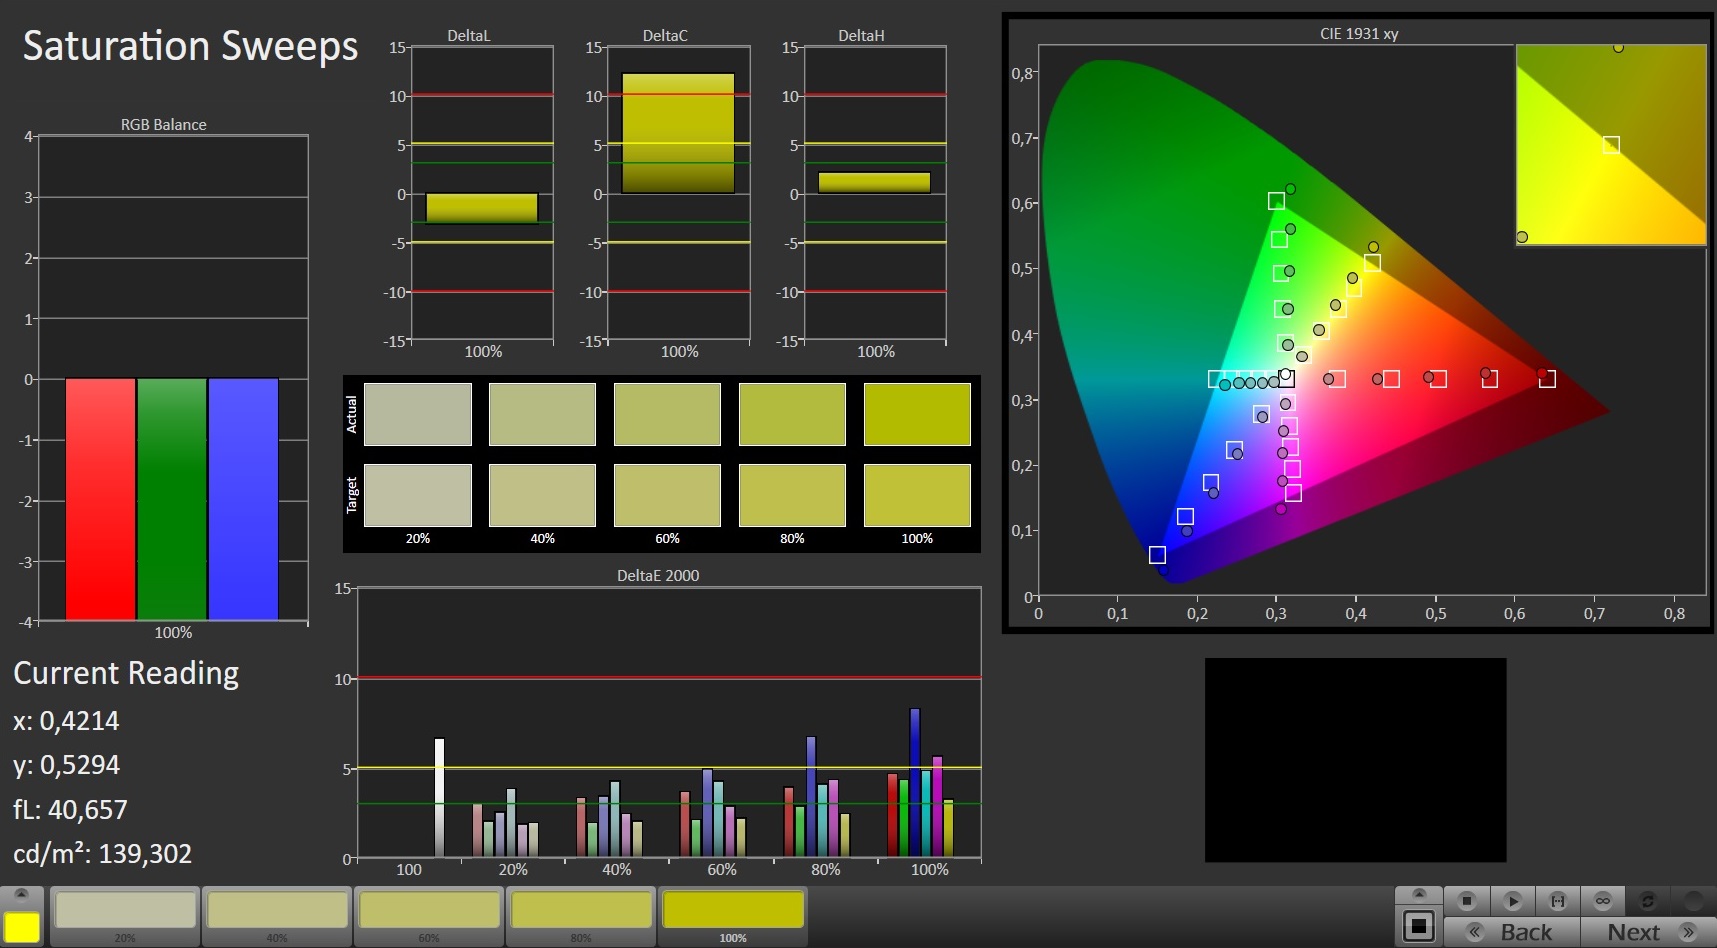
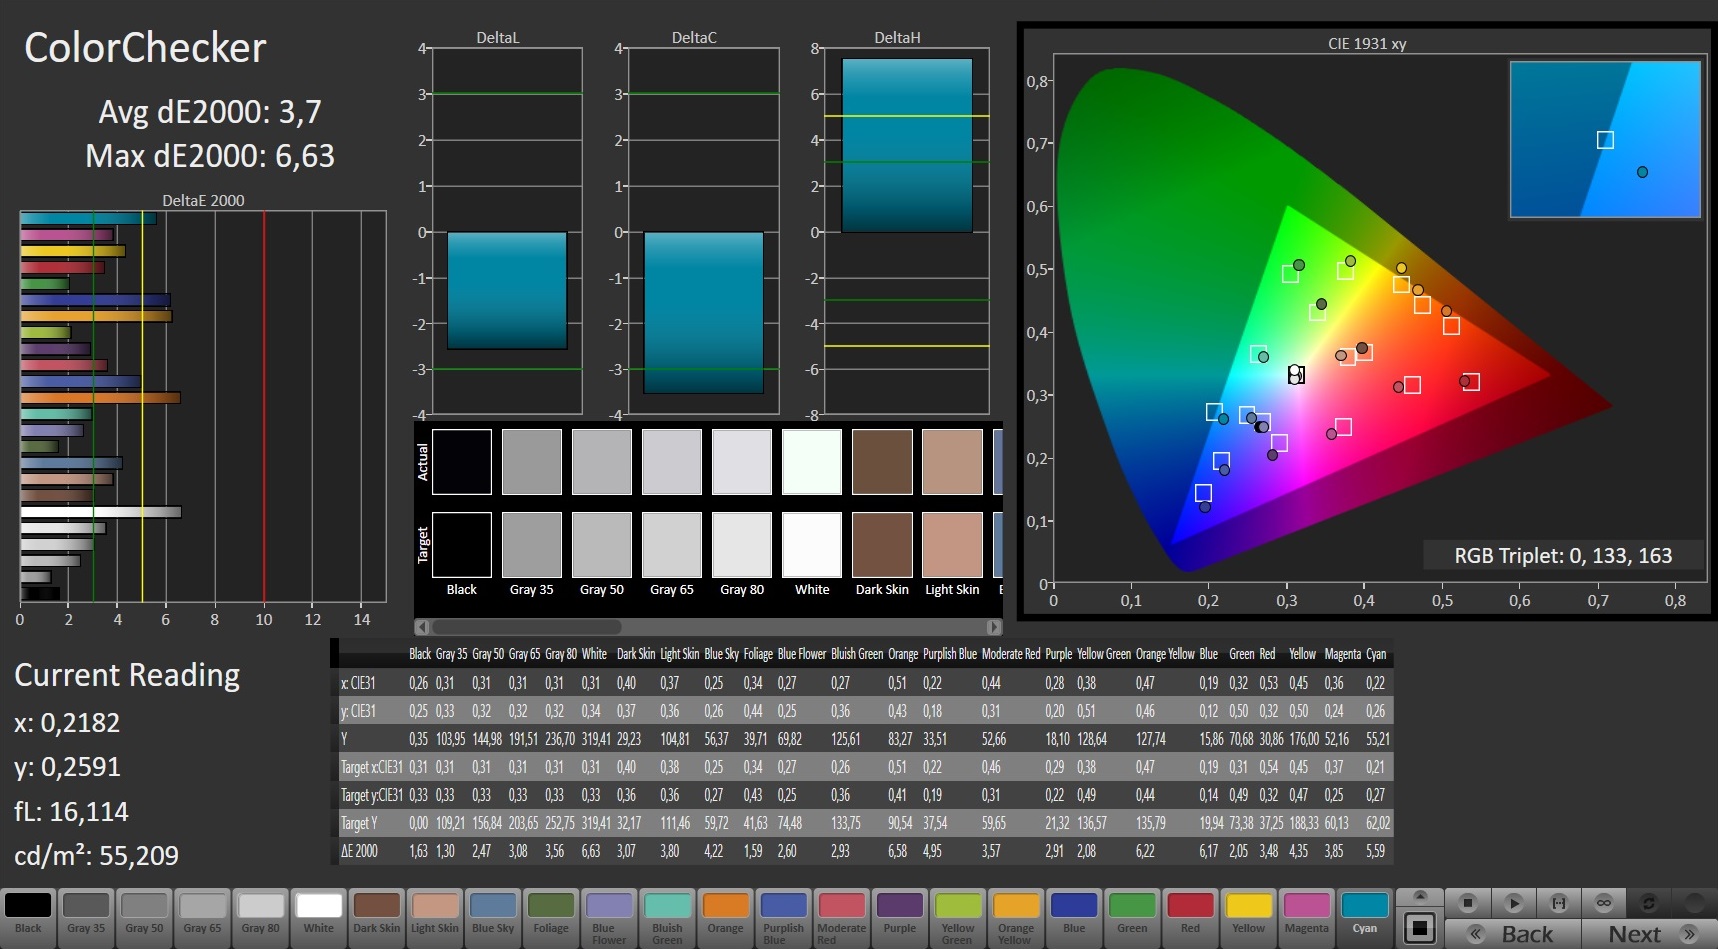
ΔE ColorChecker Calman: 4.98 | ∀{0.5-29.43 Ø4.72}
calibrated: 3.7
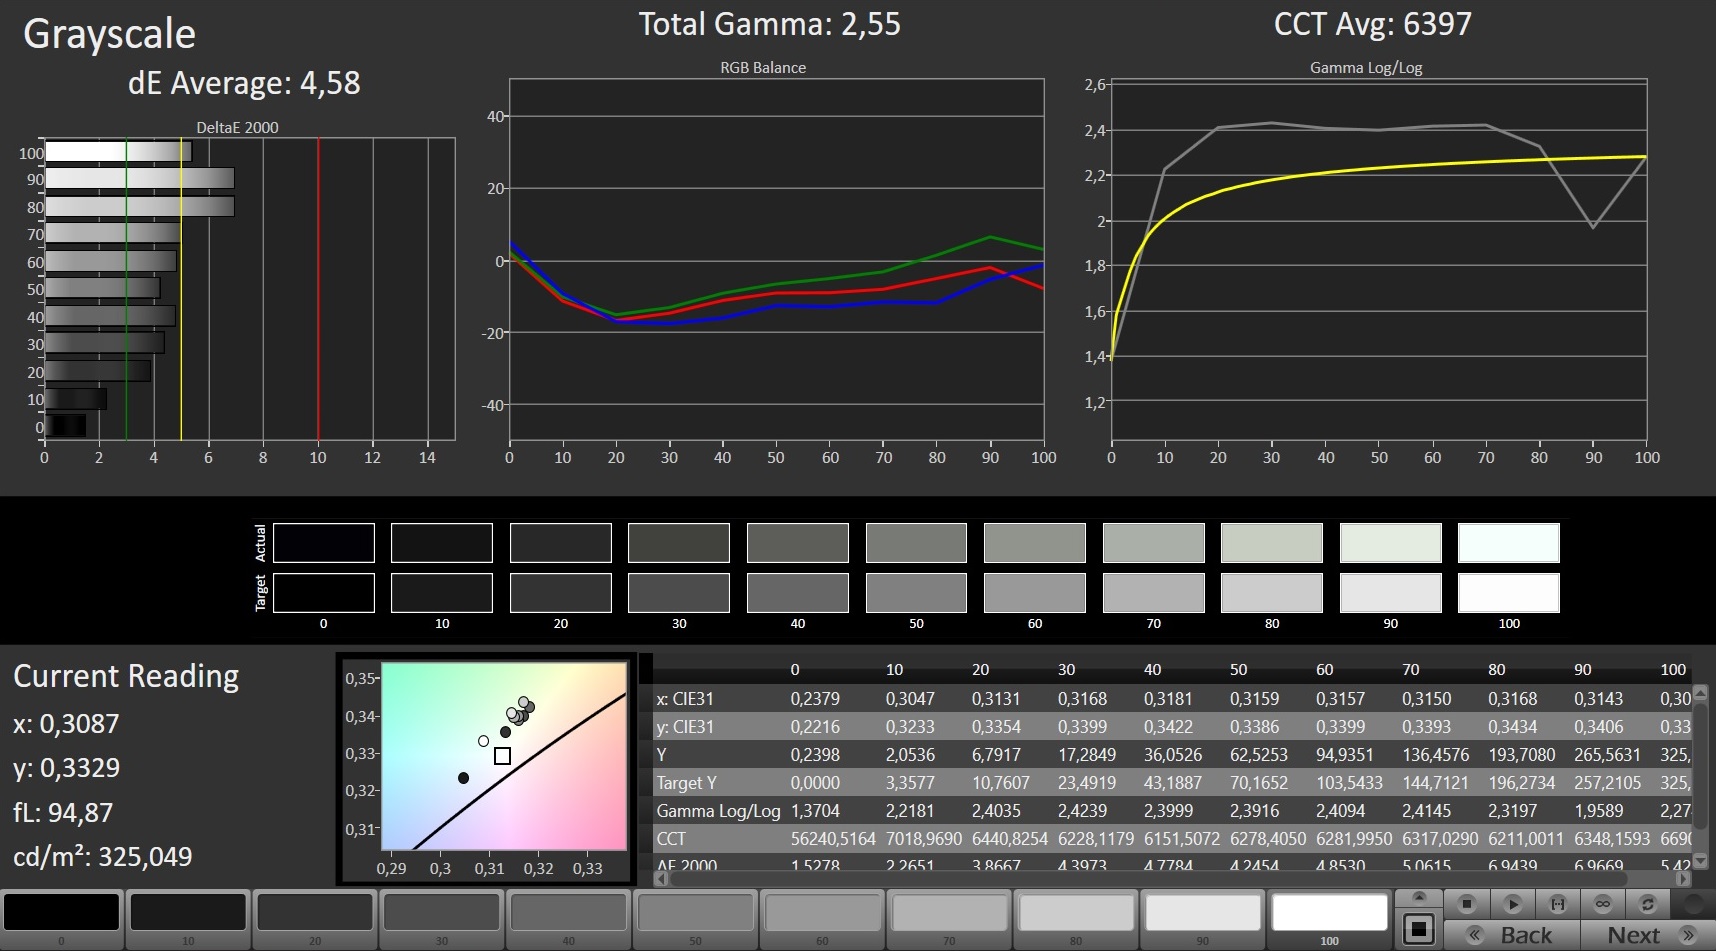
ΔE Greyscale Calman: 4.58 | ∀{0.09-98 Ø4.97}
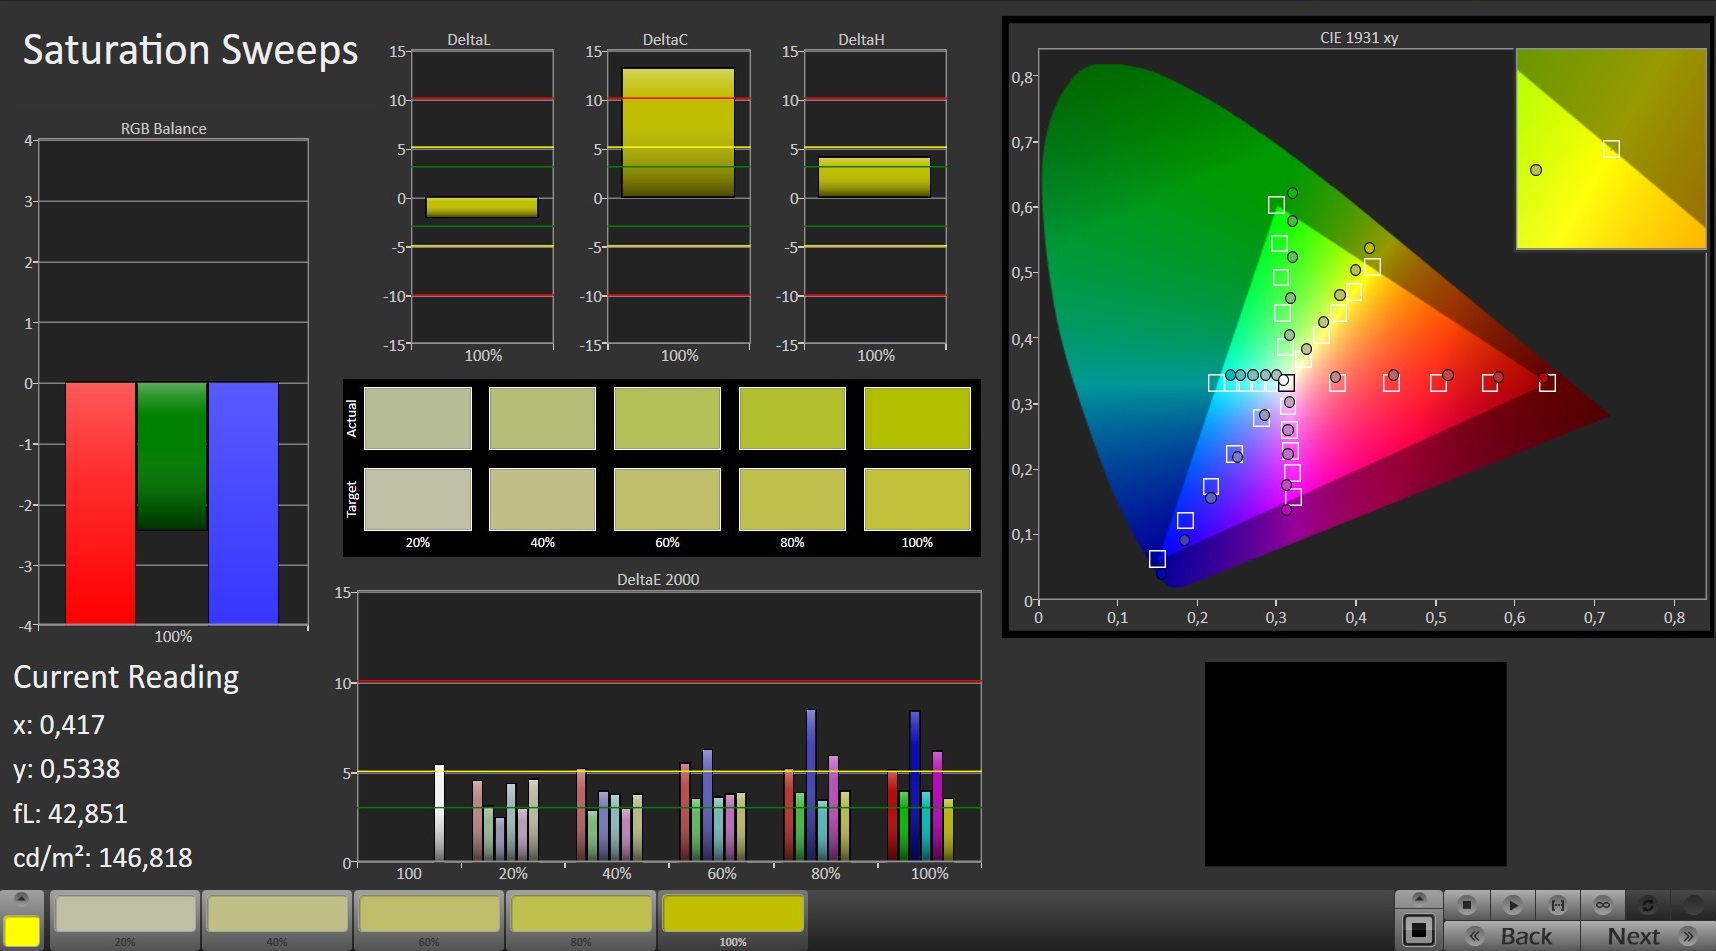
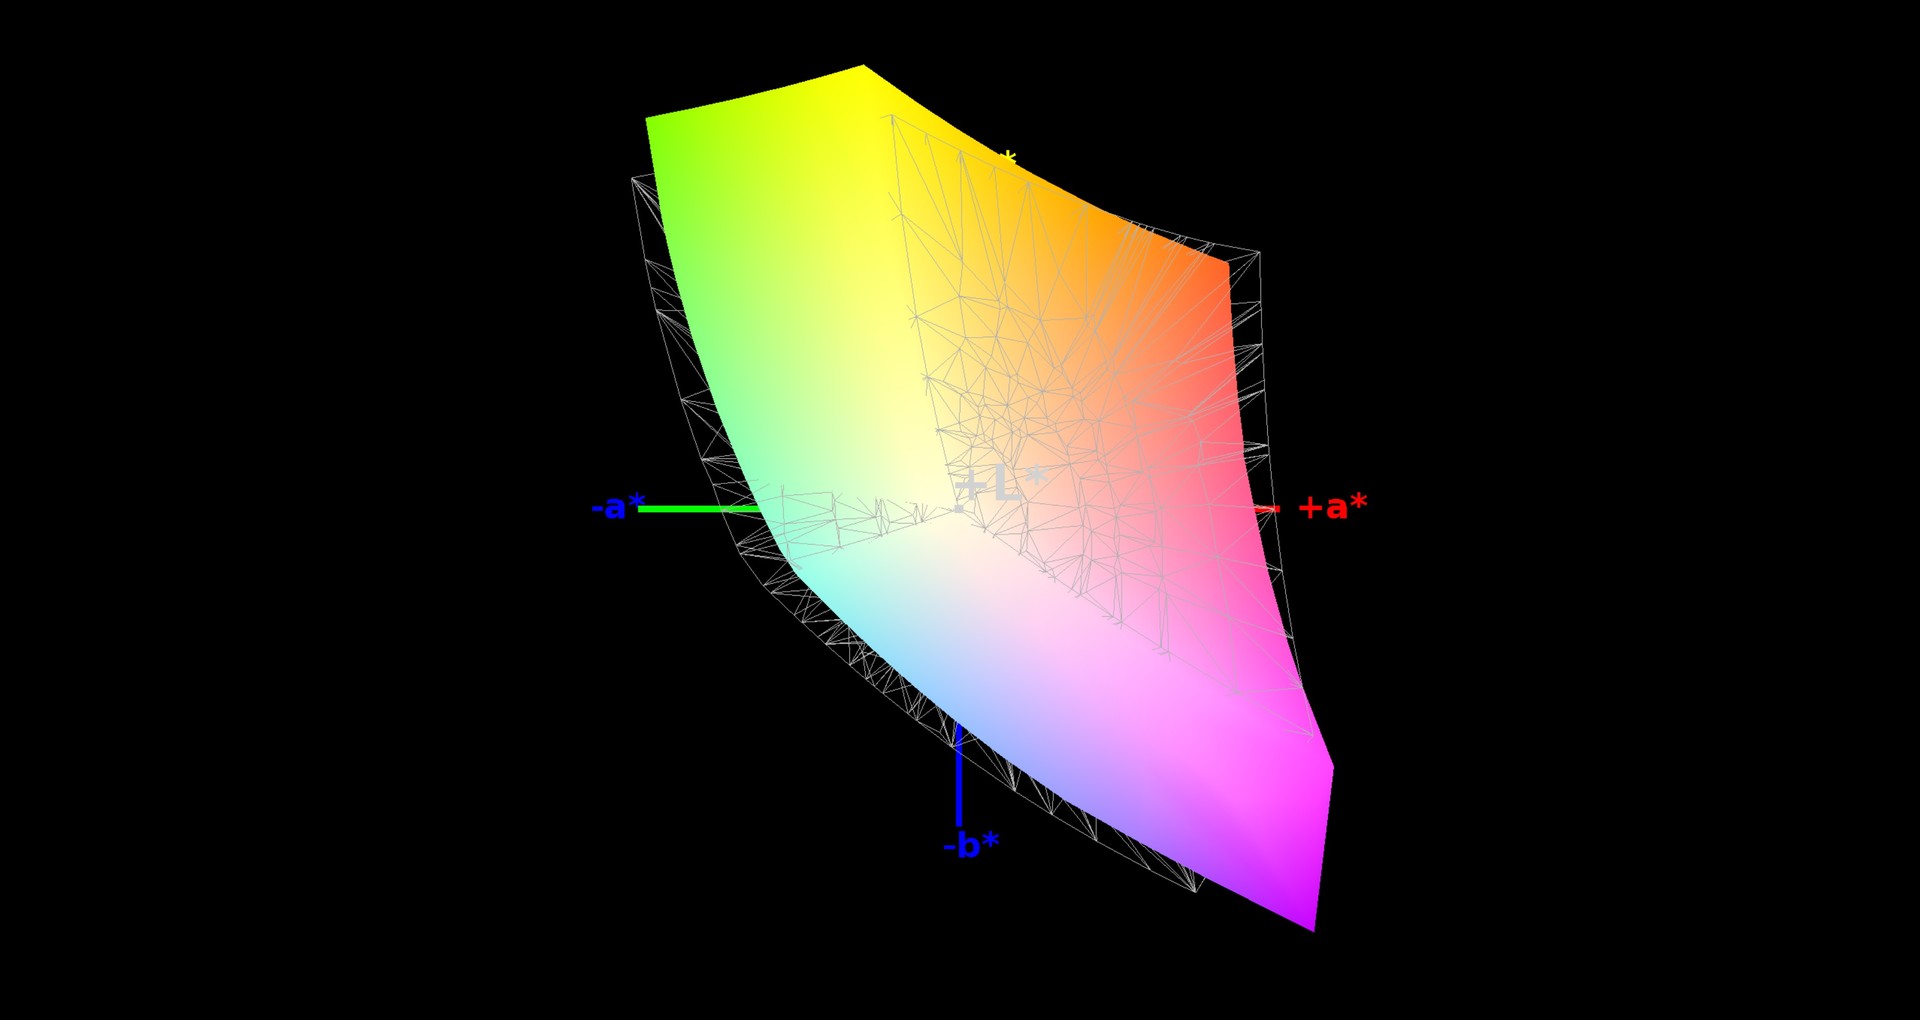
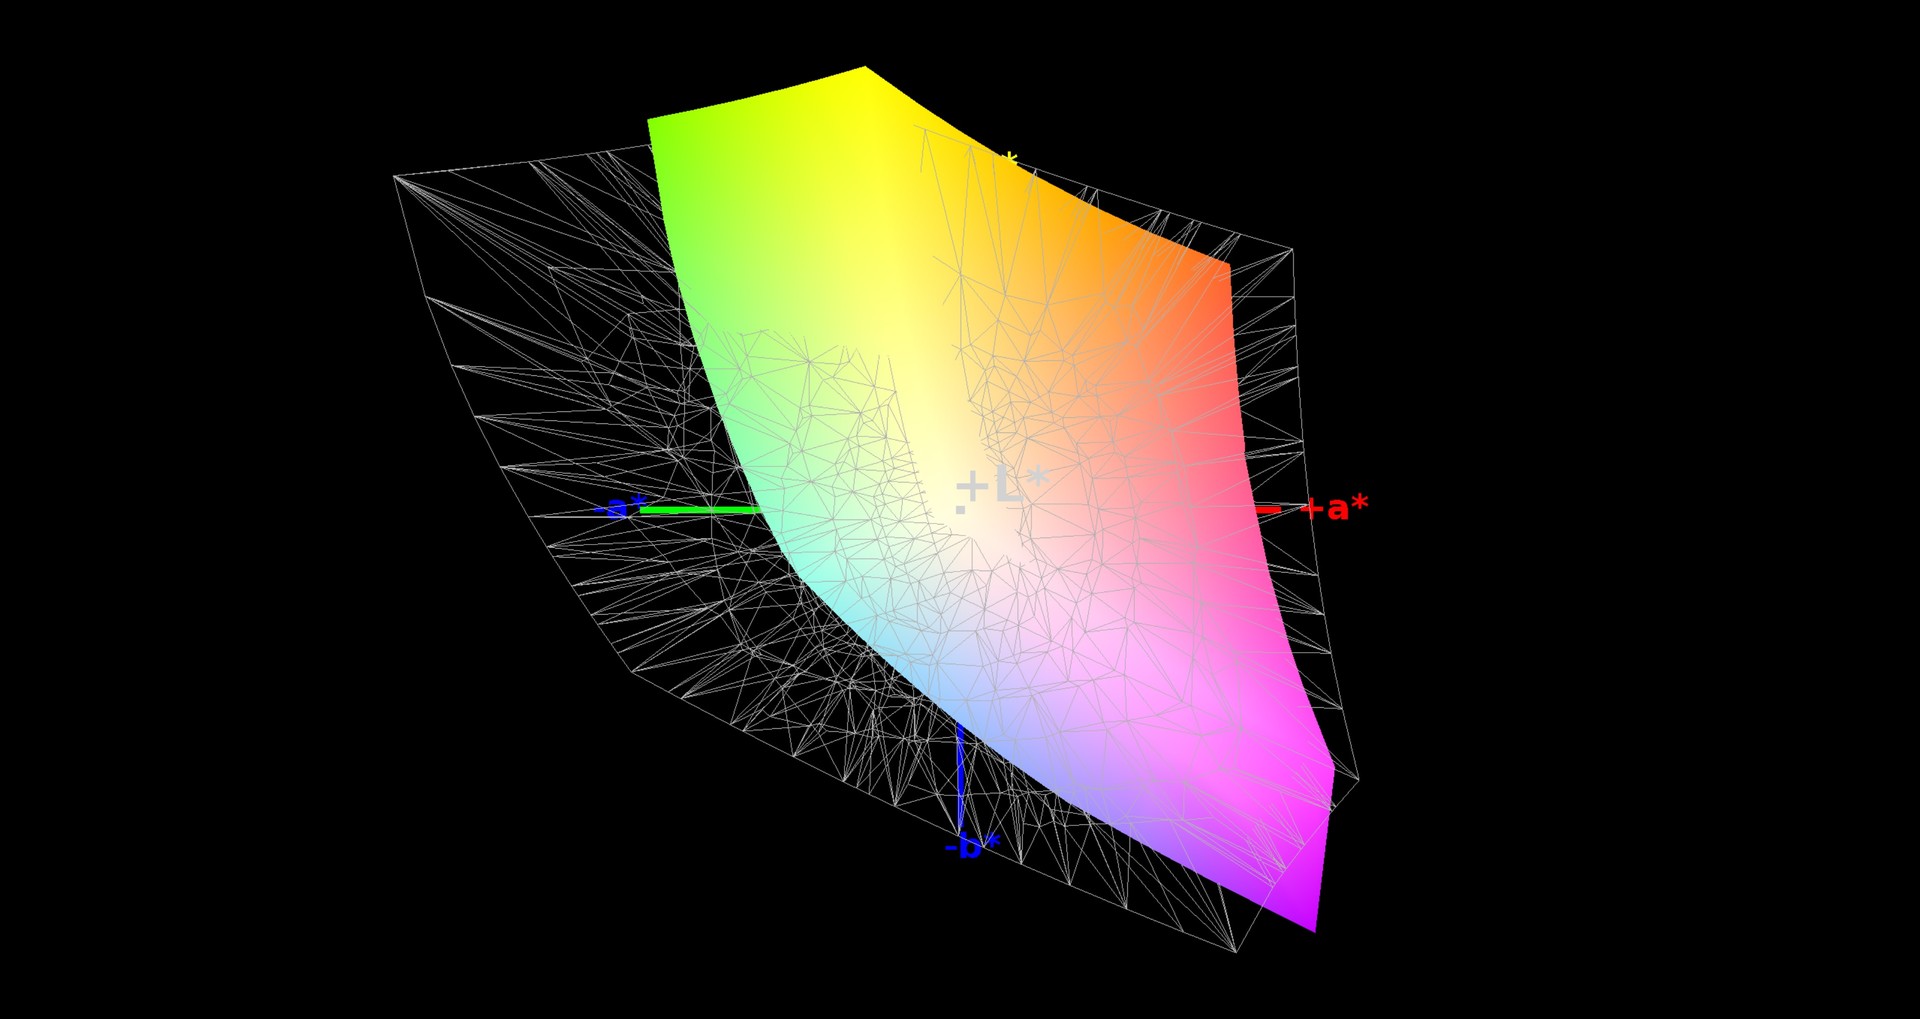
87% sRGB (Argyll 1.6.3 3D)
57% AdobeRGB 1998 (Argyll 1.6.3 3D)
64% AdobeRGB 1998 (Argyll 3D)
87.4% sRGB (Argyll 3D)
63.4% Display P3 (Argyll 3D)
Gamma: 2.55
CCT: 6397 K
| Acer Nitro 5 AN515-42-R6V0 AU Optronics B156HAN06.0 (AUO60ED), IPS, 1920x1080 | Lenovo IdeaPad 720-15IKB LG Philips LGD0573 LP156WF9-SPK2, IPS, 1920x1080 | Acer Aspire 5 A515-52G-53PU BOE CQ NV156FHM-N48, IPS, 1920x1080 | Xiaomi Mi Notebook Pro i5 BOE0747 NV156FHM-N61, IPS LED, 1920x1080 | |
|---|---|---|---|---|
| Display | -37% | -35% | 1% | |
| Display P3 Coverage (%) | 63.4 | 38.62 -39% | 39.85 -37% | 66.5 5% |
| sRGB Coverage (%) | 87.4 | 58.1 -34% | 58.7 -33% | 86.9 -1% |
| AdobeRGB 1998 Coverage (%) | 64 | 39.91 -38% | 41.17 -36% | 63.5 -1% |
| Response Times | 17% | 0% | -1% | |
| Response Time Grey 50% / Grey 80% * (ms) | 48.4 ? | 42 ? 13% | 45 ? 7% | 47.9 ? 1% |
| Response Time Black / White * (ms) | 32.8 ? | 26 ? 21% | 35 ? -7% | 33.7 ? -3% |
| PWM Frequency (Hz) | 20000 ? | 21800 ? | ||
| Screen | -14% | -5% | -2% | |
| Brightness middle (cd/m²) | 299 | 270 -10% | 296 -1% | 296 -1% |
| Brightness (cd/m²) | 284 | 250 -12% | 268 -6% | 288 1% |
| Brightness Distribution (%) | 88 | 87 -1% | 81 -8% | 89 1% |
| Black Level * (cd/m²) | 0.24 | 0.25 -4% | 0.3 -25% | 0.32 -33% |
| Contrast (:1) | 1246 | 1080 -13% | 987 -21% | 925 -26% |
| Colorchecker dE 2000 * | 4.98 | 4.79 4% | 4.01 19% | 4.3 14% |
| Colorchecker dE 2000 max. * | 7.67 | 8.83 -15% | 8.7 -13% | 8.7 -13% |
| Colorchecker dE 2000 calibrated * | 3.7 | 4 -8% | ||
| Greyscale dE 2000 * | 4.58 | 5.66 -24% | 0.98 79% | 3 34% |
| Gamma | 2.55 86% | 2.64 83% | 2.35 94% | 2.1 105% |
| CCT | 6397 102% | 7179 91% | 6408 101% | 7100 92% |
| Color Space (Percent of AdobeRGB 1998) (%) | 57 | 37 -35% | 38 -33% | 56.83 0% |
| Color Space (Percent of sRGB) (%) | 87 | 59 -32% | 58 -33% | 86.86 0% |
| Total Average (Program / Settings) | -11% /
-15% | -13% /
-10% | -1% /
-1% |
* ... smaller is better
While the LG Philips did not offer a good color space (59% sRGB), thanks to an sRGB coverage of 87% the colors of the AU Optronics are much more vibrant in parts. In addition, the AMD model can score with a noticeably higher brightness (284 vs. 237 cd/m²), which becomes particularly noticeable outdoors.
The only bad news is the worse response times. Instead of 22-38 ms, it is only 33-48 ms here. In faster games such as "FIFA 19", this can lead to streaking on the screen.
The rest of the specifications and measured values are hardly any different. Both panels offer a contrast of about 1200:1. The viewing angles, brightness distribution, and black value are also similar.
Display Response Times
| ↔ Response Time Black to White | ||
|---|---|---|
| 32.8 ms ... rise ↗ and fall ↘ combined | ↗ 18 ms rise | 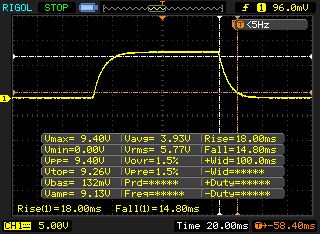 |
| ↘ 14.8 ms fall | ||
| The screen shows slow response rates in our tests and will be unsatisfactory for gamers. In comparison, all tested devices range from 0.1 (minimum) to 240 (maximum) ms. » 88 % of all devices are better. This means that the measured response time is worse than the average of all tested devices (19.8 ms). | ||
| ↔ Response Time 50% Grey to 80% Grey | ||
| 48.4 ms ... rise ↗ and fall ↘ combined | ↗ 24 ms rise | 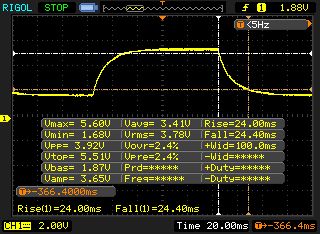 |
| ↘ 24.4 ms fall | ||
| The screen shows slow response rates in our tests and will be unsatisfactory for gamers. In comparison, all tested devices range from 0.165 (minimum) to 636 (maximum) ms. » 84 % of all devices are better. This means that the measured response time is worse than the average of all tested devices (31 ms). | ||
Screen Flickering / PWM (Pulse-Width Modulation)
| Screen flickering / PWM not detected | 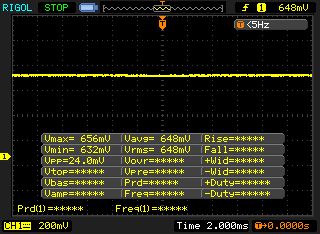 | ||
In comparison: 52 % of all tested devices do not use PWM to dim the display. If PWM was detected, an average of 7750 (minimum: 5 - maximum: 343500) Hz was measured. | |||
Performance
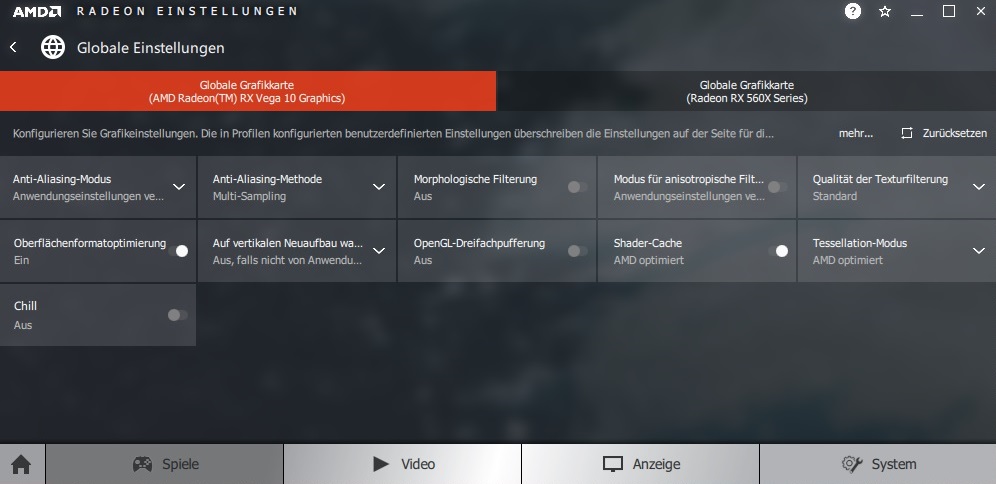
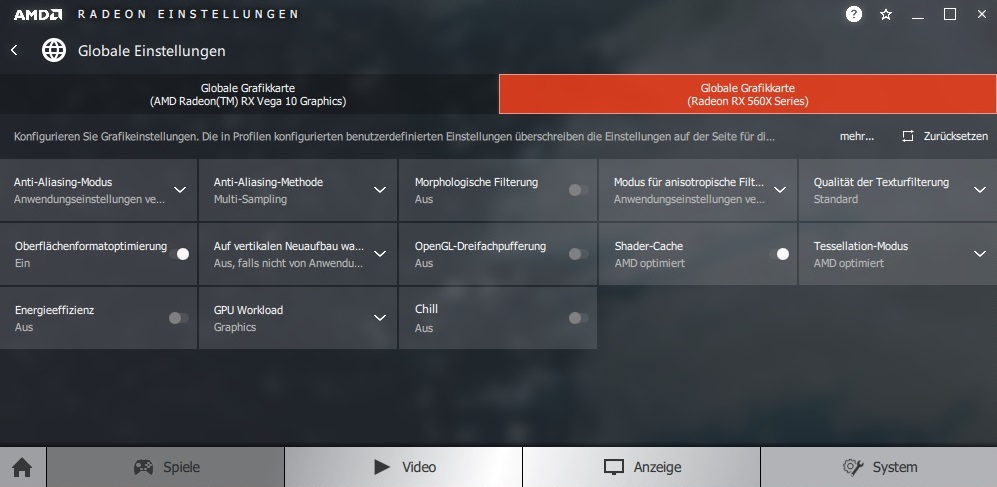
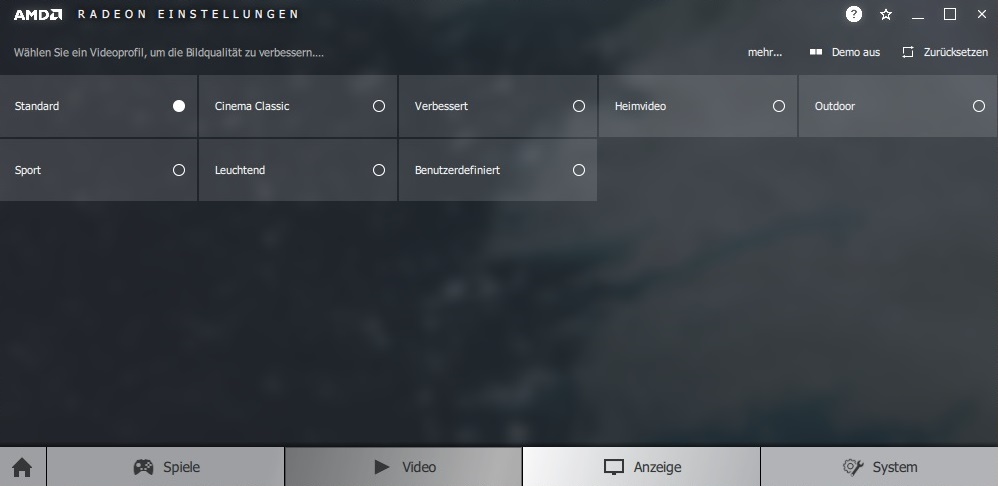
Before we look at the performance, a few words on the preinstalled software: The central point for the management of the 15-incher is the NitroSense tool that not only allows you to adjust the power-saving plan but also the fan control. In addition, it shows the fan speeds, the loads, and the temperatures of CPU and GPU.
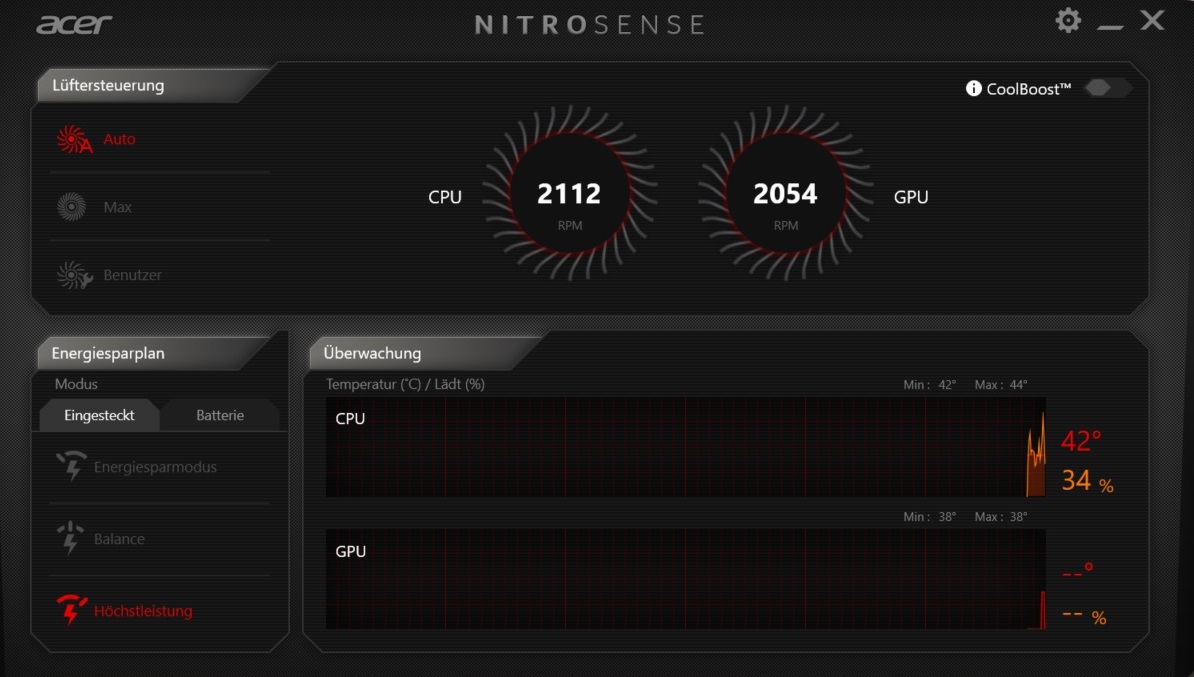
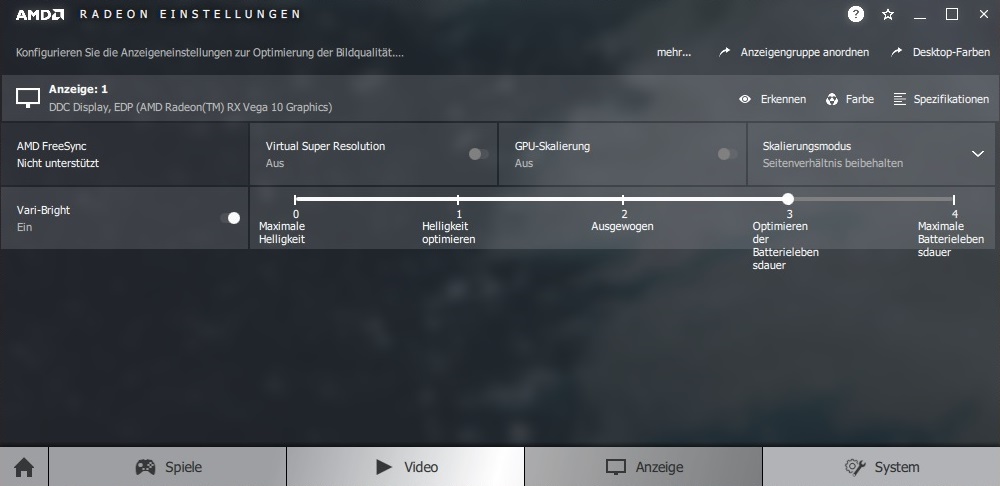
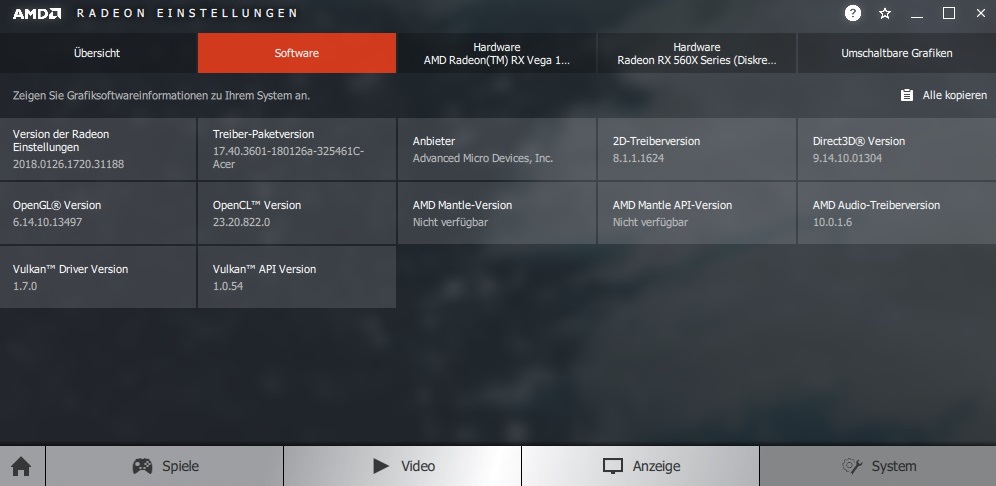
All our tests were run using the standard settings. In terms of the fan control, this means the "Auto" mode.
Processor
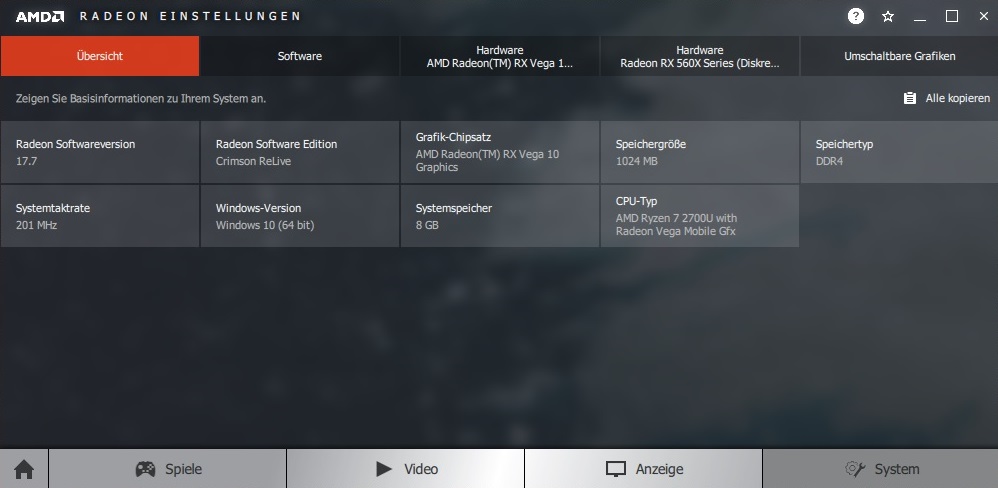
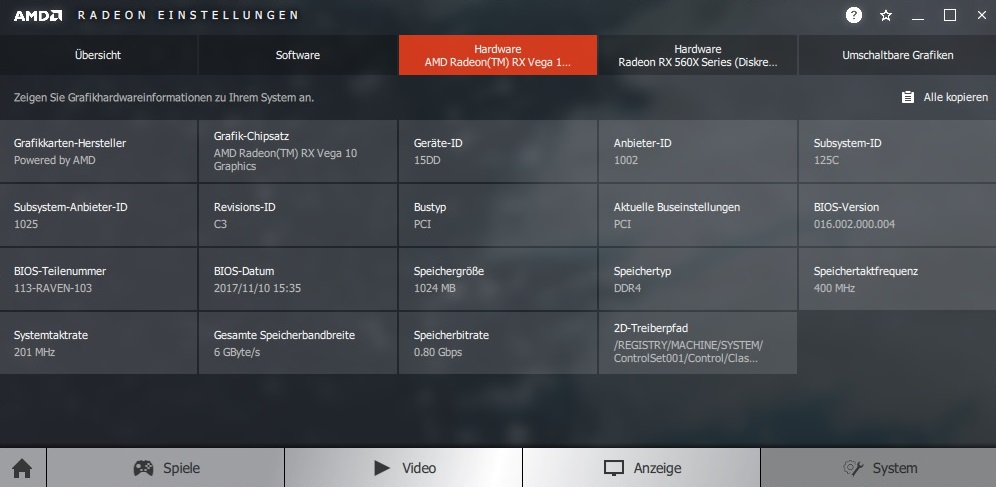
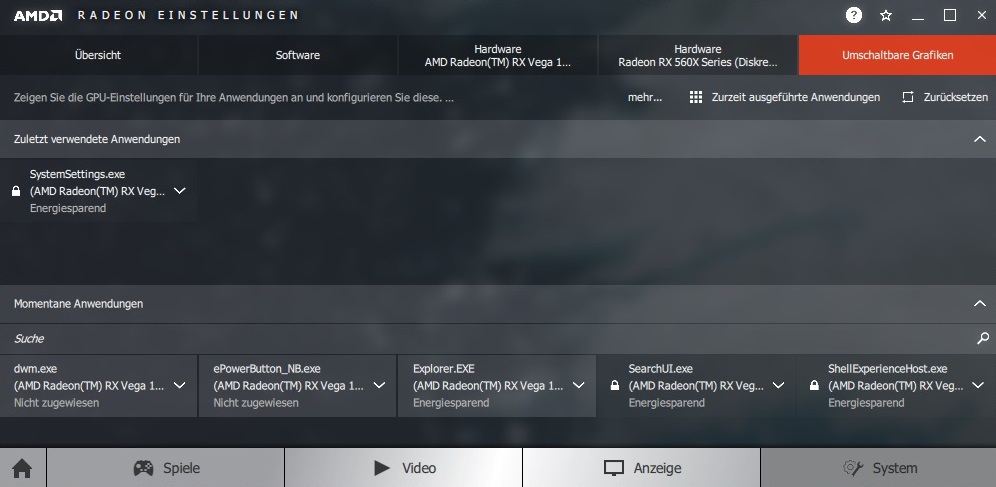
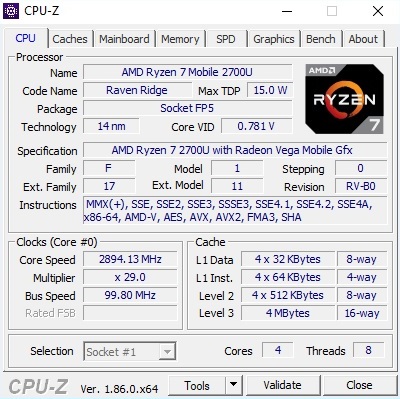
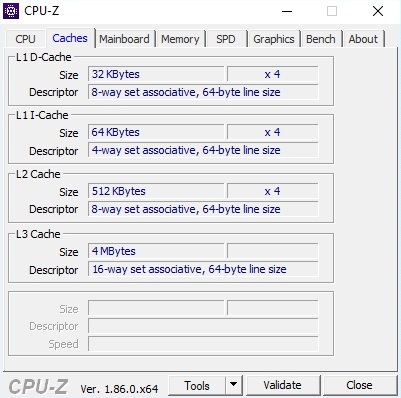
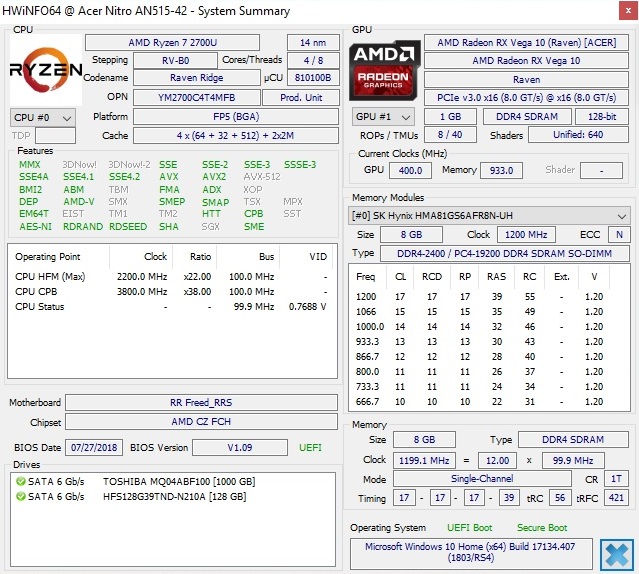
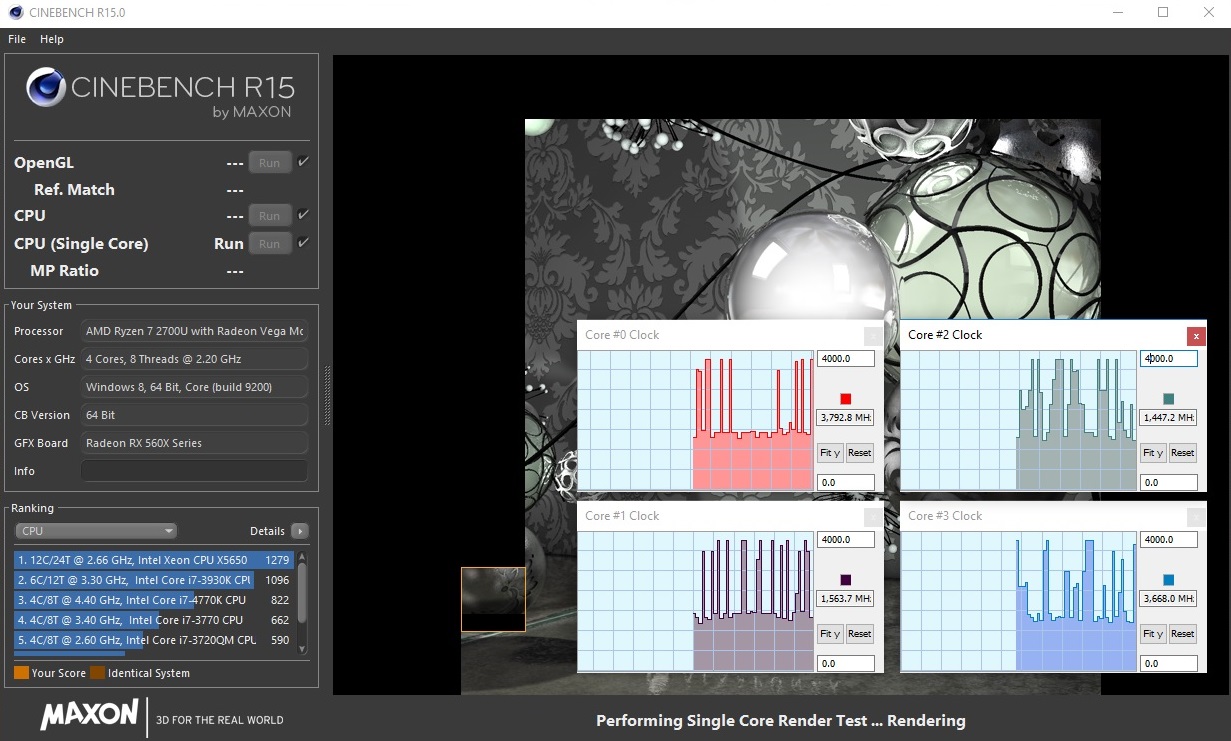
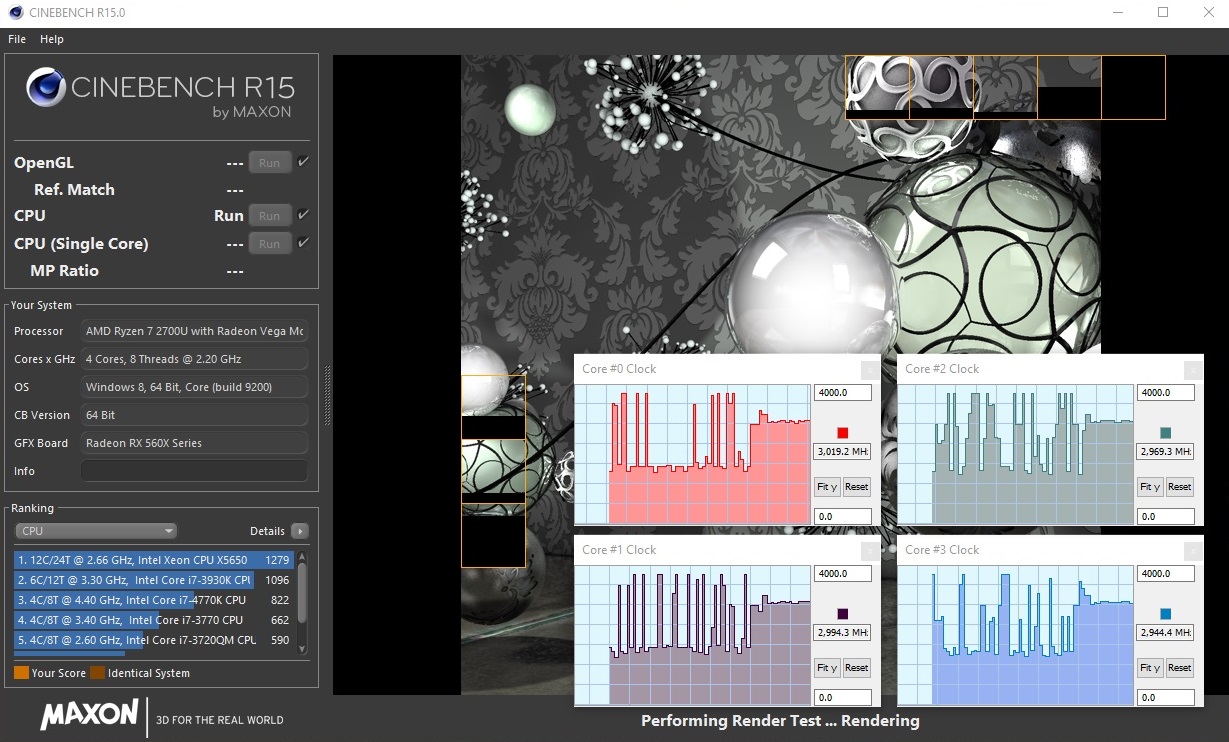
With the Ryzen 7 2700U, AMD offers a power-saving notebook CPU that was designed for energy efficiency. The quad-core model offers 4.5 Billion transistors and a 4 MB L3 cache. Similar to most of Intel's chips, the number of cores is (virtually) doubled via SMT, allowing the 2700U to run up to eight threads simultaneously. At 14 nm, the manufacturing process is also oriented on Intel. It is great that in order to keep the power demands within limits, Acer has equipped the Nitro 5 with graphics switching, which dependent on the load dynamically switches between the graphics chip of the processor (Radeon RX Vega 10) and the dedicated GPU.
In terms of its performance capabilities, we would place the Ryzen 7 in the middle of the field. While the performance of the 2700U is not quite able to reach that of Intel's popular Coffee-Lake Core i5-8300H quad-core processor, the latter is also specified with a TDP of 45 instead of 15 watts and correspondingly needs stronger cooling and more energy. In terms of power-saving CPUs, the AMD model has a very good position. In the multi-core test of Cinebench R15, the Ryzen 7 races ahead of the Xiaomi Mi's Core i5-8250U by about 15% and of the Acer Aspire 5's Core i5-8265U by 26%. The difference compared to the old Core i5-7200U that still has to be content with two cores is 100%.
| Cinebench R11.5 | |
| CPU Single 64Bit | |
| Average of class Gaming (3.3 - 3.98, n=8, last 2 years) | |
| Acer Aspire 5 A515-52G-53PU | |
| Acer Nitro 5 AN515-42-R6V0 | |
| CPU Multi 64Bit | |
| Average of class Gaming (29.8 - 70.7, n=8, last 2 years) | |
| Acer Nitro 5 AN515-42-R6V0 | |
| Acer Aspire 5 A515-52G-53PU | |
As long as there is only load on the processor, the 2700U is able to use its Turbo to the fullest. Maximums of 3.8 GHz during single-core load and between 2.7 and 3.2 GHz during multi-core load are noticeably above the standard clock speed of 2.2 GHz. However, when there is also a parallel demand on the graphics card, the tools report only 1.5 GHz at times, which would mean throttling. In 3D applications, the clock speed levels out at about 2.9 GHz on average. The fact that the Ryzen 7 delivers a consistent performance also over longer time periods deserves some praise. In contrast to many Coffee-Lake notebooks, there is no massive drop in the overall scores of our Cinebench loop in the long run.
System Performance
The system performance ranges on a level that is decent to good. With 3763 points in PCMark 10, the Nitro 5 settles right in the middle of the competitors. In PCMark 8, the situation is similar. Subjectively, the computer primarily benefits from the SSD, which ensures short boot sequences and load times.
| PCMark 10 - Score | |
| Average of class Gaming (5828 - 11574, n=92, last 2 years) | |
| Acer Aspire 5 A515-52G-53PU | |
| Acer Nitro 5 AN515-42-R6V0 | |
| Xiaomi Mi Notebook Pro i5 | |
| PCMark 8 Home Score Accelerated v2 | 3860 points | |
| PCMark 8 Work Score Accelerated v2 | 4810 points | |
| PCMark 10 Score | 3763 points | |
Help | ||
Storage Solution
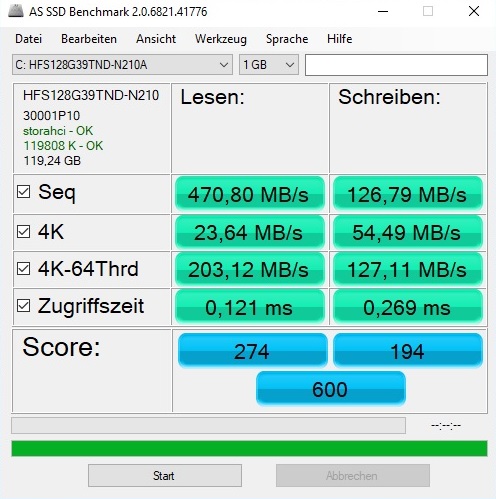
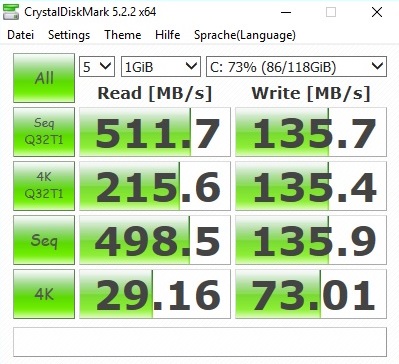
Nonetheless, there would still be some room for improvement in terms of the storage solution. While the integrated solid state drive from SK Hynix comes close to the SATA-III limits during sequential reads (471 MB/s), the Nitro 5 shows weaknesses during sequential writes. 127 MB/s are rather mediocre and are closer to an HDD. With the Micron SSD of the Aspire 5, Acer proves that things can be done better, and the Xiaomi Mi Pro i5 and the Lenovo IdeaPad 720 play in an even higher league, thanks to PCIe technology. Both competing devices easily crack the 1000 MB mark in the sequential test of the AS SSD benchmark.
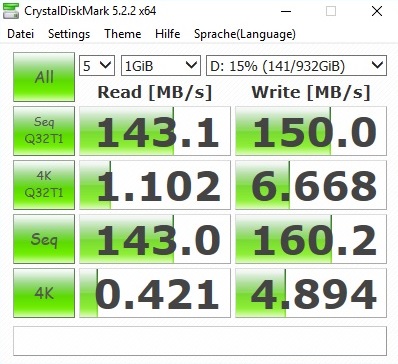
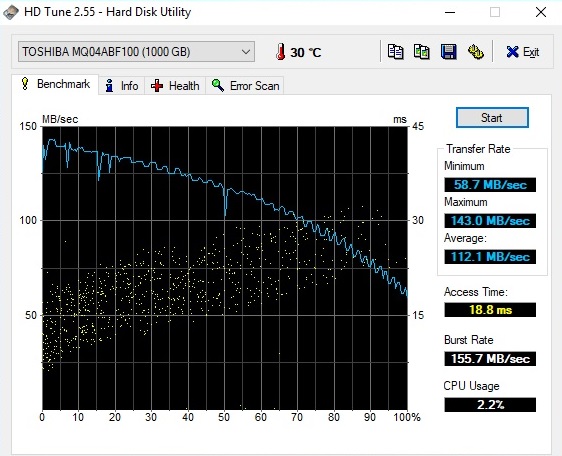
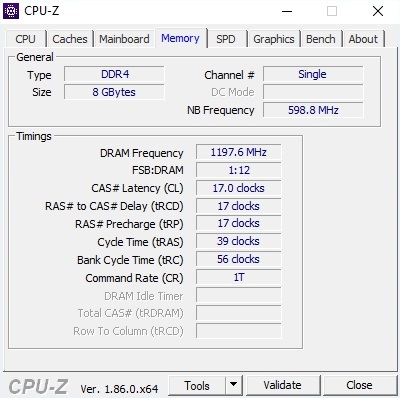
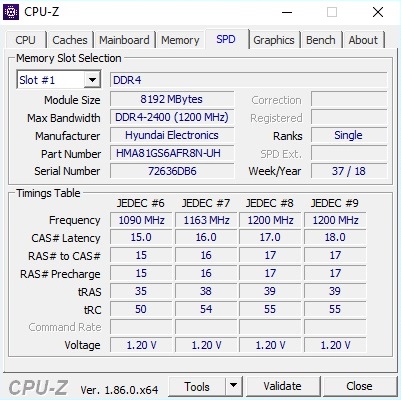
To prevent users from running out of storage space, the Nitro 5 has an additional HDD on board. This 1-TB drive comes from Toshiba and runs at 5400 RPM. While all the storage slots are occupied, since it is accessible via maintenance cover, you could easily expand the working memory by a second module. In the long run this can be recommended, since the graphics unit of the processor demands 1 GB for itself and some games therefore warn of having too little RAM.
| Acer Nitro 5 AN515-42-R6V0 SK Hynix HFS128G39TND | Lenovo IdeaPad 720-15IKB Samsung PM961 MZVLW256HEHP | Acer Aspire 5 A515-52G-53PU Micron 1100 MTFDDAV256TBN | Xiaomi Mi Notebook Pro i5 Samsung PM961 MZVLW256HEHP | |
|---|---|---|---|---|
| AS SSD | 386% | 57% | 353% | |
| Seq Read (MB/s) | 470.8 | 1806 284% | 490.6 4% | 1471 212% |
| Seq Write (MB/s) | 126.8 | 1226 867% | 390.2 208% | 1077 749% |
| 4K Read (MB/s) | 23.64 | 51.4 117% | 19.47 -18% | 49.82 111% |
| 4K Write (MB/s) | 54.5 | 113.9 109% | 72.2 32% | 144.8 166% |
| 4K-64 Read (MB/s) | 203.1 | 485.7 139% | 236.2 16% | 1312 546% |
| 4K-64 Write (MB/s) | 127.1 | 1652 1200% | 276.7 118% | 470.1 270% |
| Score Read (Points) | 274 | 1881 586% | 305 11% | 1509 451% |
| Score Write (Points) | 194 | 710 266% | 388 100% | 723 273% |
| Score Total (Points) | 600 | 35 -94% | 850 42% | 2991 399% |

Graphics Card
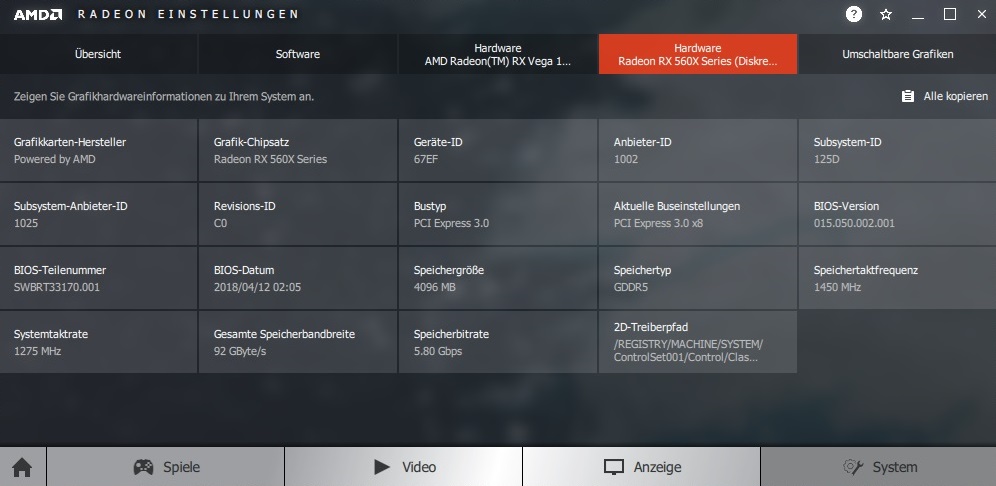
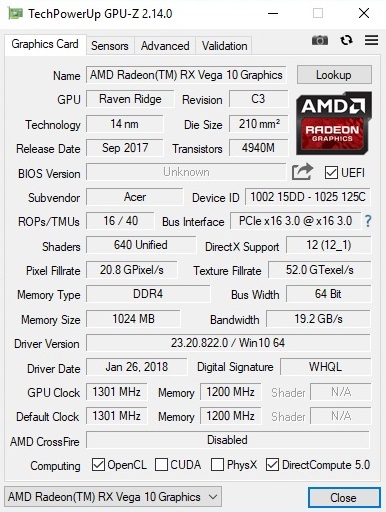
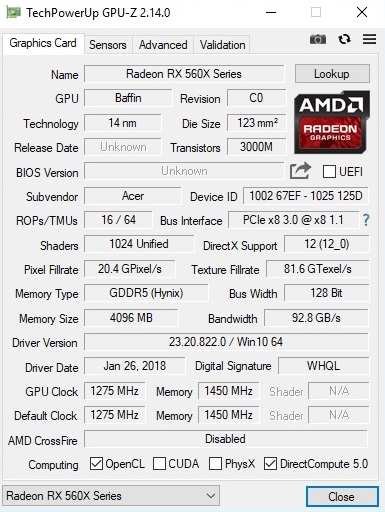
Even though the Radeon RX Vega 10 delivers significantly more than Intel's HD graphics chips in many cases, gamers will be pleased with the presence of a "real" graphics card. AMD's Radeon RX 560X of the Polaris generation contains 3.0 Billion transistors, 1024 shaders, and 4 GB GDDR5 video storage that is connected via 128-bit pipeline. At 14 nm, the manufacturing process follows the Zen cores of the Ryzen 7 2700U.
| 3DMark - 1920x1080 Fire Strike Graphics | |
| Average of class Gaming (12242 - 62849, n=114, last 2 years) | |
| Acer Nitro 5 AN515-42-R6V0 | |
| Lenovo IdeaPad 720-15IKB | |
| Acer Aspire 5 A515-52G-53PU | |
| Xiaomi Mi Notebook Pro i5 | |
| 3DMark 11 - 1280x720 Performance GPU | |
| Average of class Gaming (21841 - 80022, n=103, last 2 years) | |
| Acer Nitro 5 AN515-42-R6V0 | |
| Lenovo IdeaPad 720-15IKB | |
| Acer Aspire 5 A515-52G-53PU | |
| Xiaomi Mi Notebook Pro i5 | |
Considering the price of the notebook, the RX 560X leaves a very good impression in the benchmarks. If we take the Fire-Strike test of 3DMark 13, for example, while the advantage to the regular RX 560 turns out rather low at 10%, Nvidia's low-end GeForce MX150 GPU is beaten by more than 70%. On the other hand, the successful mid-range GeForce GTX 1050 chip performs at the same level.
| 3DMark 06 Standard Score | 22783 points | |
| 3DMark Vantage P Result | 19829 points | |
| 3DMark 11 Performance | 7640 points | |
| 3DMark Ice Storm Standard Score | 56030 points | |
| 3DMark Cloud Gate Standard Score | 13326 points | |
| 3DMark Fire Strike Score | 5316 points | |
Help | ||
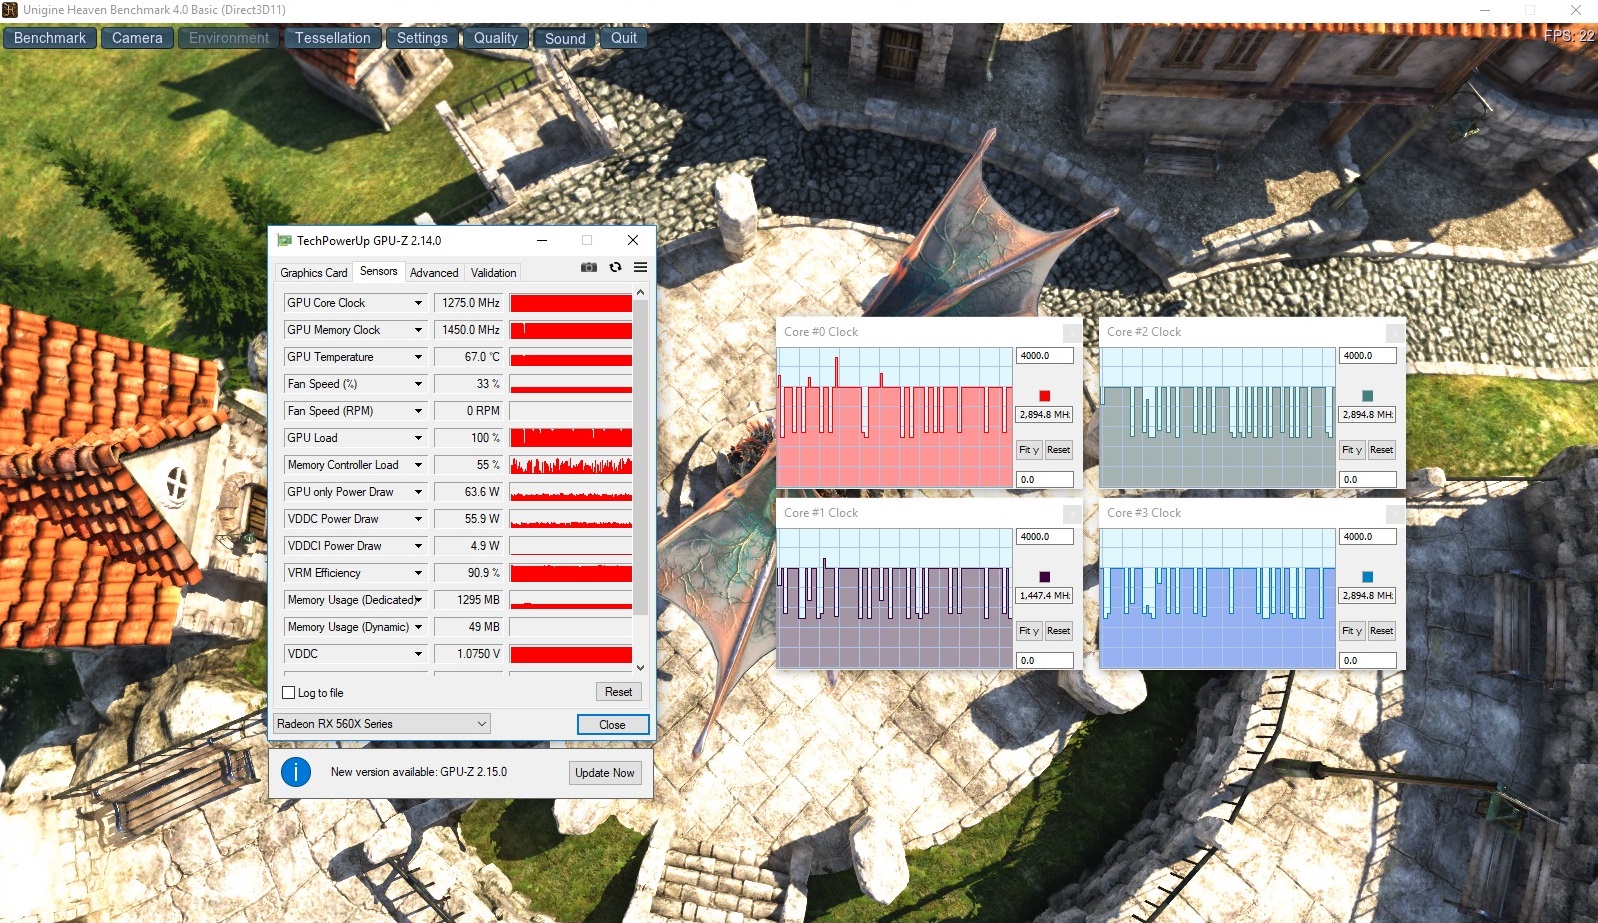
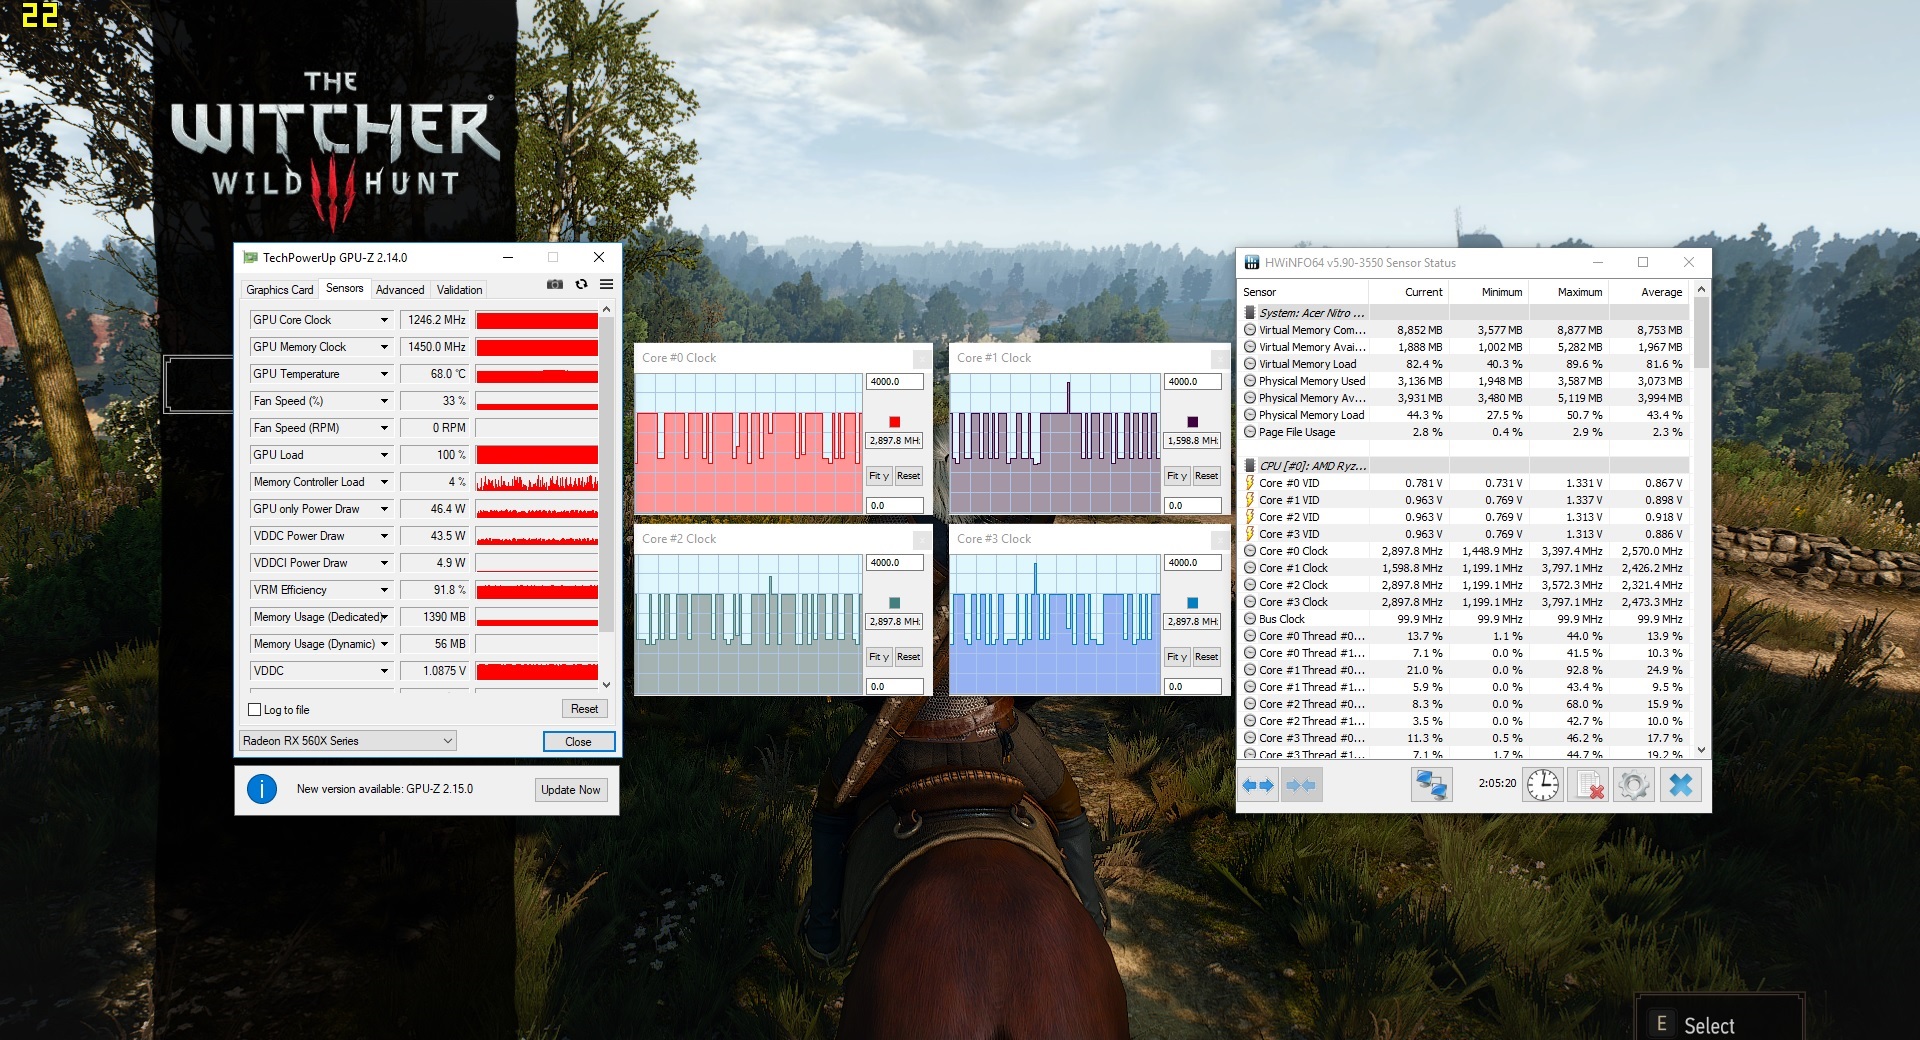
The Radeon RX 560X ran through our endurance test with "The Witcher 3" (at least 60 minutes @Full HD/Ultra) at a rather constant speed without larger fluctuations. According to the GPU-Z tool, the core tends to some discrete throttling down to about 1246 MHz. AMD specifies the standard clock speed as 1275 MHz.
Gaming Performance
Since there have not been any benchmarks on the Radeon RX 560X yet, the gaming tests became very extensive with a total of 36 games. Apart from extremely demanding or poorly optimized games (Assassin‘s Creed Odyssey, Shadow of the Tomb Raider, Monster Hunter World, Final Fantasy 15, The Evil Within 2, Ghost Recon Wildlands, ...) where the performance was only sufficient for minimal settings, the Nitro 5 is almost always able to smoothly reproduce medium to high details in the native Full-HD resolution. However, for the full graphics settings you would often need a GPU from the high-end sector. But for the occasional gamer with a tight budget, the Radeon RX 560X is perfect.
| The Witcher 3 | |
| 1920x1080 High Graphics & Postprocessing (Nvidia HairWorks Off) | |
| Average of class Gaming (n=1last 2 years) | |
| Lenovo IdeaPad 720-15IKB | |
| Acer Nitro 5 AN515-42-R6V0 | |
| Xiaomi Mi Notebook Pro i5 | |
| Acer Aspire 5 A515-52G-53PU | |
| 1920x1080 Ultra Graphics & Postprocessing (HBAO+) | |
| Average of class Gaming (104.7 - 240, n=6, last 2 years) | |
| Acer Nitro 5 AN515-42-R6V0 | |
| Lenovo IdeaPad 720-15IKB | |
| Xiaomi Mi Notebook Pro i5 | |
| Acer Aspire 5 A515-52G-53PU | |
Unfortunately, we had to struggle with the odd problem or two during the course of the test. From time to time we encountered some graphics errors, a crash here and there, stutters or error messages – as is typical for AMD, the driver does not appear to be ideal. In our experience, you get a slightly cleaner gaming experience with Nvidia GPUs – at least on notebooks.
| low | med. | high | ultra | |
|---|---|---|---|---|
| The Witcher 3 (2015) | 97.2 | 68.4 | 33.2 | 20.6 |
| Rainbow Six Siege (2015) | 166 | 145 | 84.1 | 76.6 |
| The Division (2016) | 87.7 | 73.1 | 36.8 | 28.7 |
| Doom (2016) | 54.8 | 53.7 | 34.8 | 32.8 |
| Overwatch (2016) | 205 | 178 | 95 | 46.9 |
| Mirror's Edge Catalyst (2016) | 87.6 | 65 | 37.3 | 32.8 |
| Deus Ex Mankind Divided (2016) | 62.9 | 55.3 | 27.8 | 13.8 |
| Farming Simulator 17 (2016) | 133 | 107 | ||
| Dishonored 2 (2016) | 59.3 | 54.7 | 33.8 | 29.1 |
| Resident Evil 7 (2017) | 184 | 86.1 | 54.6 | 46.2 |
| For Honor (2017) | 122 | 47.4 | 45.3 | 34.9 |
| Ghost Recon Wildlands (2017) | 62.3 | 34.9 | 32.1 | 15.3 |
| Prey (2017) | 90.9 | 65.3 | 51.6 | 43.8 |
| Rocket League (2017) | 182 | 119 | 82.8 | |
| Dirt 4 (2017) | 157 | 83.2 | 50.9 | 28.6 |
| Playerunknown's Battlegrounds (PUBG) (2017) | 110 | 50.3 | 41.8 | 30 |
| Middle-earth: Shadow of War (2017) | 84 | 43 | 31 | 23 |
| The Evil Within 2 (2017) | 35.7 | 25.4 | 23.7 | 23 |
| ELEX (2017) | 49.4 | 41.9 | 34.2 | 25.7 |
| Call of Duty WWII (2017) | 87.3 | 76.7 | 50.1 | 40.9 |
| Need for Speed Payback (2017) | 71.5 | 52.5 | 43.6 | 40.8 |
| Fortnite (2018) | 77.1 | 66.4 | 43.9 | 33 |
| Final Fantasy XV Benchmark (2018) | 49.6 | 27.2 | 11.8 | |
| Kingdom Come: Deliverance (2018) | 64.6 | 35.3 | 29 | 20.7 |
| Far Cry 5 (2018) | 55 | 38 | 35 | 32 |
| The Crew 2 (2018) | 53 | 44.6 | 41.6 | 37.9 |
| Monster Hunter World (2018) | 61.2 | 32.5 | 28.5 | 22.4 |
| F1 2018 (2018) | 94 | 56 | 47 | 31 |
| Shadow of the Tomb Raider (2018) | 54 | 27 | 26 | 23 |
| FIFA 19 (2018) | 127 | 109 | 105 | 100 |
| Forza Horizon 4 (2018) | 90 | 52 | 49 | 38 |
| Assassin´s Creed Odyssey (2018) | 30 | 25 | 21 | 16 |
| Call of Duty Black Ops 4 (2018) | 87 | 49.1 | 42 | 20.3 |
| Hitman 2 (2018) | 40.1 | 35.2 | 32.2 | 31.4 |
| Fallout 76 (2018) | 59.4 | 38.8 | 34.1 | 29.9 |
| Battlefield V (2018) | 95.3 | 49.6 | 41.3 | 36.5 |
| Farming Simulator 19 (2018) | 86.4 | 69.3 | 47.4 | 27 |
Emissions
Noise Emissions
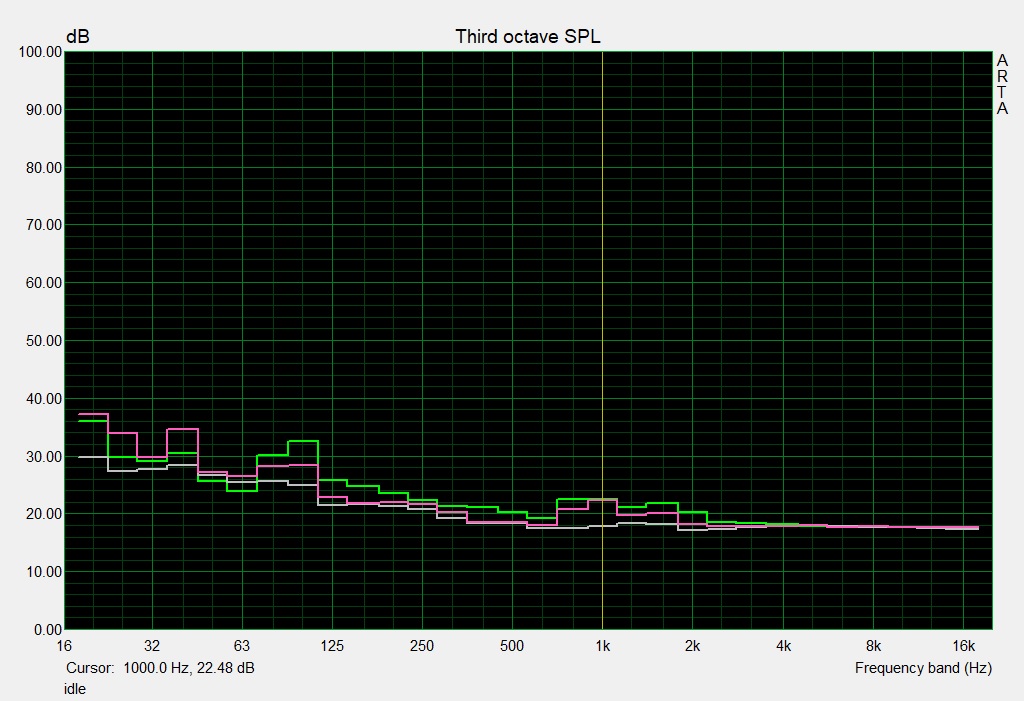
During idle operation, the fan control is surprisingly good. When the notebook has hardly anything to do, the fans are often silent, so that you can only hear the slight whirring of the HDD, and if that is deactivated, the device is completely silent.
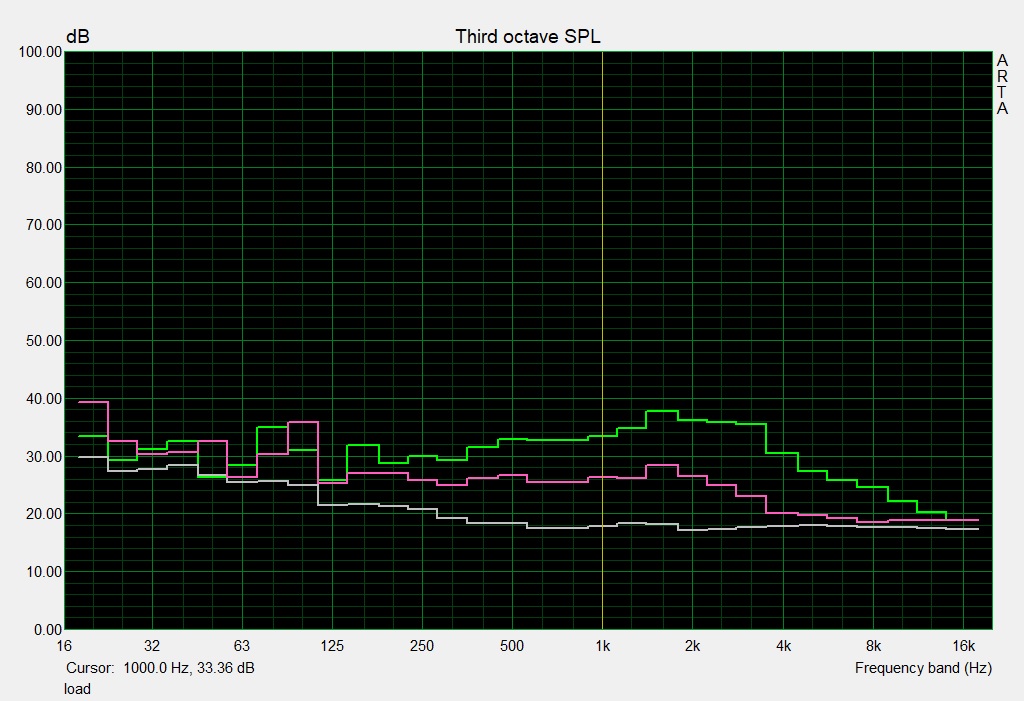
Under load, the Nitro 5 presents a mixed performance. While around 36 dB(A) in 3DMark 06 is relatively little, during current games the 15-incher reaches up to 44 dB(A), which is significantly louder. During the stress test, the system produces up to 46 dB(A), which is also the highest level of our comparison field.
Noise level
| Idle |
| 29 / 31 / 32 dB(A) |
| HDD |
| 31 dB(A) |
| Load |
| 36 / 46 dB(A) |
 | ||
30 dB silent 40 dB(A) audible 50 dB(A) loud |
||
min: | ||
| Acer Nitro 5 AN515-42-R6V0 R7 2700U, Radeon RX 560X (Laptop) | Lenovo IdeaPad 720-15IKB i5-7200U, Radeon RX 560 (Laptop) | Acer Aspire 5 A515-52G-53PU i5-8265U, GeForce MX150 | Xiaomi Mi Notebook Pro i5 i5-8250U, GeForce MX150 | Average of class Gaming | |
|---|---|---|---|---|---|
| Noise | 1% | -2% | -3% | 1% | |
| off / environment * (dB) | 29 | 30.3 -4% | 30.5 -5% | 31 -7% | 24.1 ? 17% |
| Idle Minimum * (dB) | 29 | 30.3 -4% | 30.5 -5% | 31 -7% | 25.9 ? 11% |
| Idle Average * (dB) | 31 | 30.3 2% | 30.5 2% | 31 -0% | 27.4 ? 12% |
| Idle Maximum * (dB) | 32 | 30.3 5% | 30.9 3% | 32.6 -2% | 30 ? 6% |
| Load Average * (dB) | 36 | 39.2 -9% | 41.2 -14% | 41.6 -16% | 43.3 ? -20% |
| Witcher 3 ultra * (dB) | 44 | 41.6 5% | 41.6 5% | ||
| Load Maximum * (dB) | 46 | 39.2 15% | 41.9 9% | 44.7 3% | 54.2 ? -18% |
* ... smaller is better
Temperature
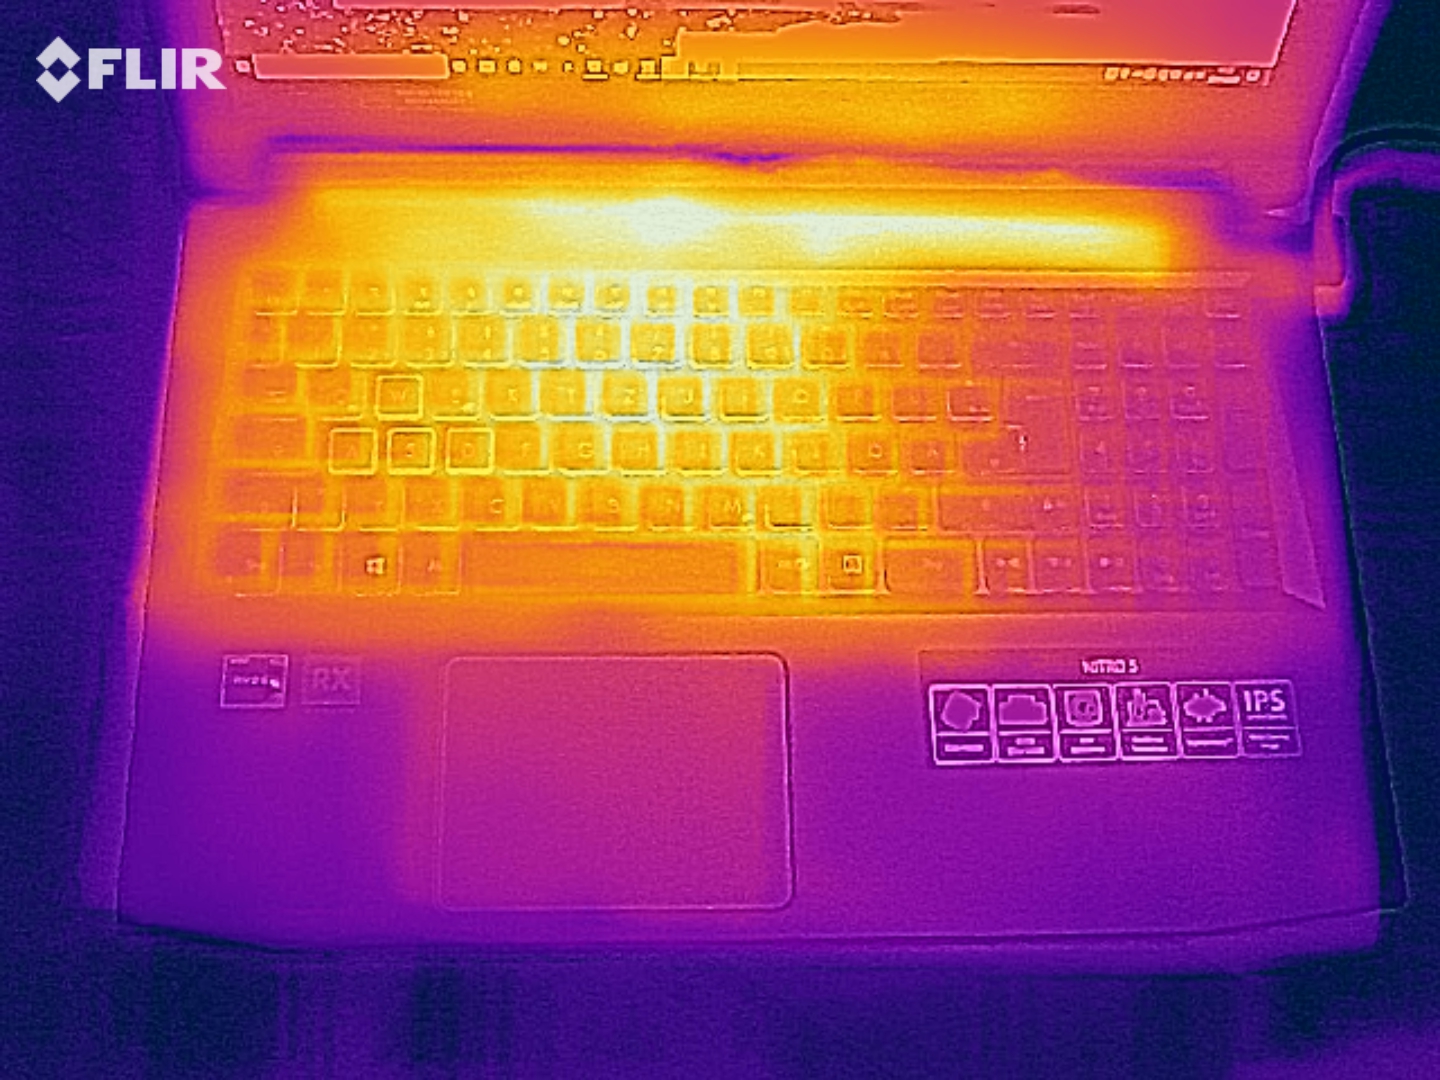
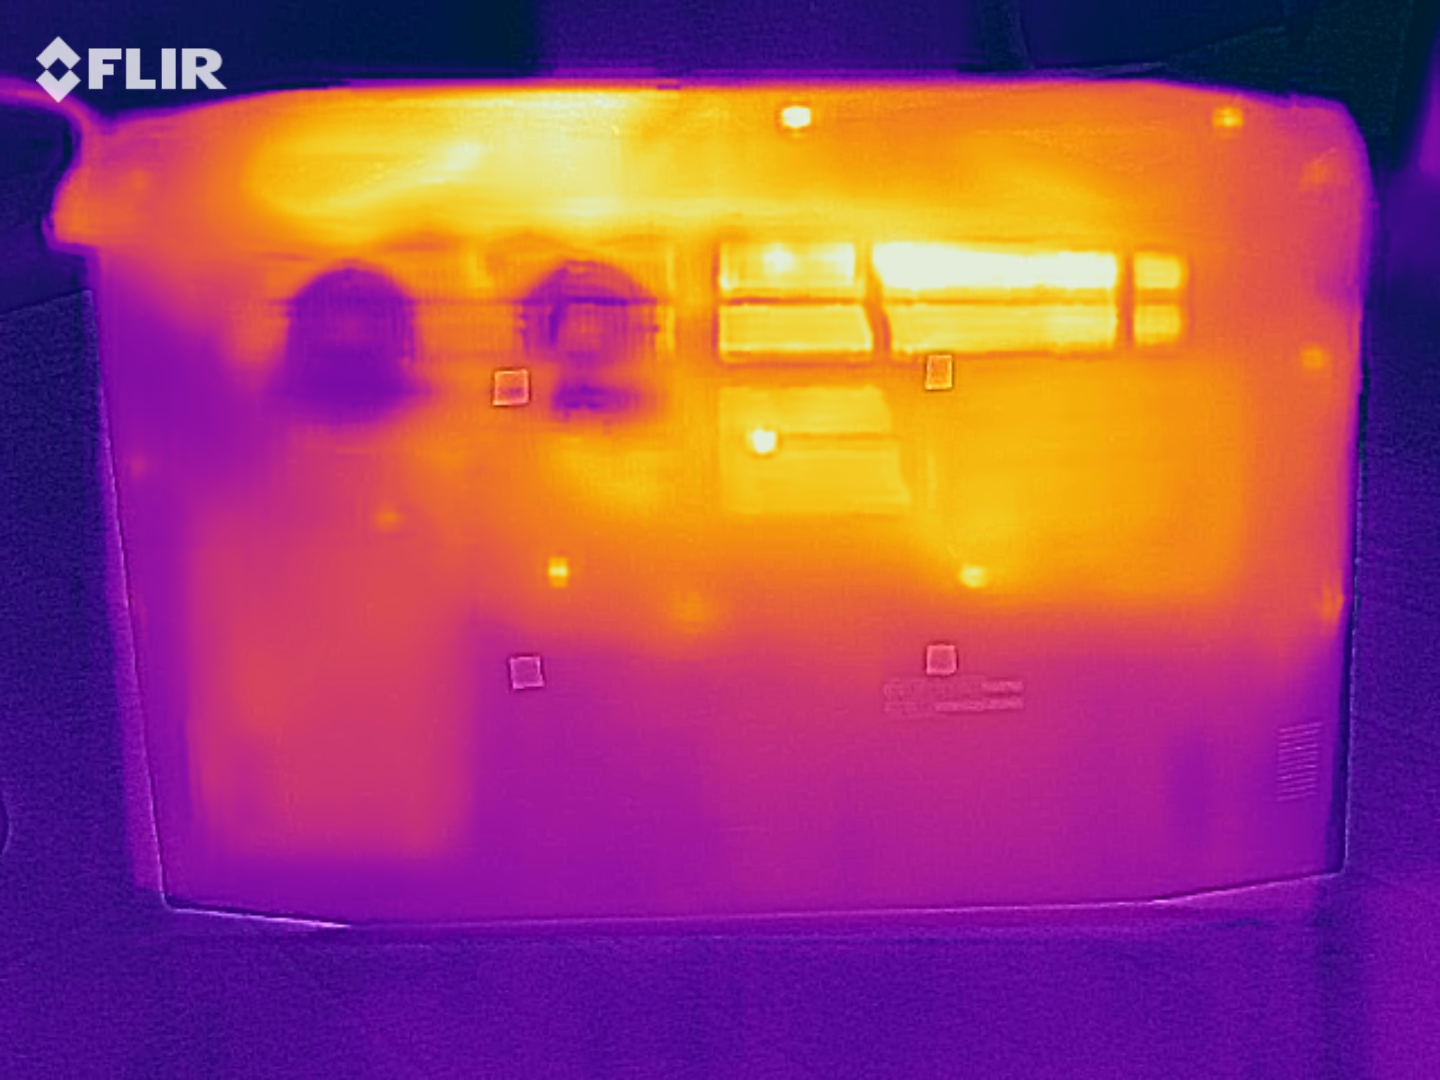
The case does not get excessively warm even in extreme situations. A maximum of 47 °C (117 °F) on top and 44 °C (111 °F) on the bottom are moderate results.
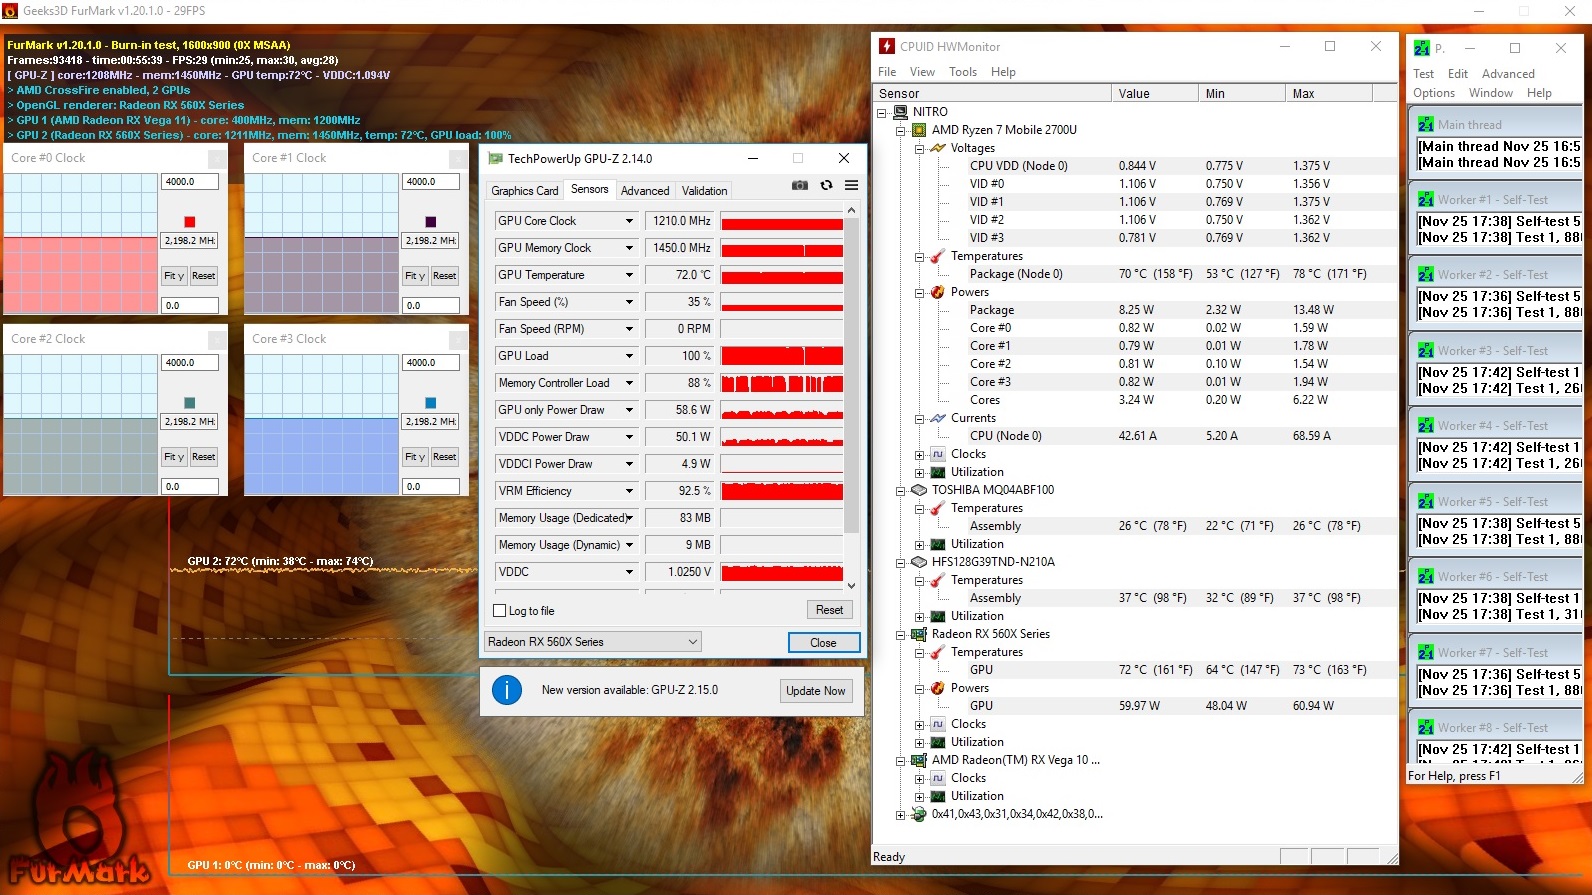
The hardware also gives no reason for complaints. In the 60-minute stress test with the FurMark and Prime95 tools, the Ryzen 7 2700U and the Radeon RX 560X only heated up to barely 70 °C (158 °F), while the processor turned off its Turbo and the graphics card was slightly throttled again.
(-) The maximum temperature on the upper side is 47 °C / 117 F, compared to the average of 40.4 °C / 105 F, ranging from 21.2 to 68.8 °C for the class Gaming.
(±) The bottom heats up to a maximum of 44 °C / 111 F, compared to the average of 43.2 °C / 110 F
(+) In idle usage, the average temperature for the upper side is 26.1 °C / 79 F, compared to the device average of 33.9 °C / 93 F.
(±) Playing The Witcher 3, the average temperature for the upper side is 37.7 °C / 100 F, compared to the device average of 33.9 °C / 93 F.
(+) The palmrests and touchpad are cooler than skin temperature with a maximum of 29 °C / 84.2 F and are therefore cool to the touch.
(±) The average temperature of the palmrest area of similar devices was 28.8 °C / 83.8 F (-0.2 °C / -0.4 F).
| Acer Nitro 5 AN515-42-R6V0 R7 2700U, Radeon RX 560X (Laptop) | Lenovo IdeaPad 720-15IKB i5-7200U, Radeon RX 560 (Laptop) | Acer Aspire 5 A515-52G-53PU i5-8265U, GeForce MX150 | Xiaomi Mi Notebook Pro i5 i5-8250U, GeForce MX150 | Average of class Gaming | |
|---|---|---|---|---|---|
| Heat | 18% | -8% | 6% | -8% | |
| Maximum Upper Side * (°C) | 47 | 41.2 12% | 52.9 -13% | 43.8 7% | 45.2 ? 4% |
| Maximum Bottom * (°C) | 44 | 36.4 17% | 51.5 -17% | 44.9 -2% | 48.2 ? -10% |
| Idle Upper Side * (°C) | 30 | 22 27% | 28.4 5% | 25.9 14% | 31 ? -3% |
| Idle Bottom * (°C) | 28 | 23.6 16% | 29.7 -6% | 26.3 6% | 34.4 ? -23% |
* ... smaller is better
Speaker
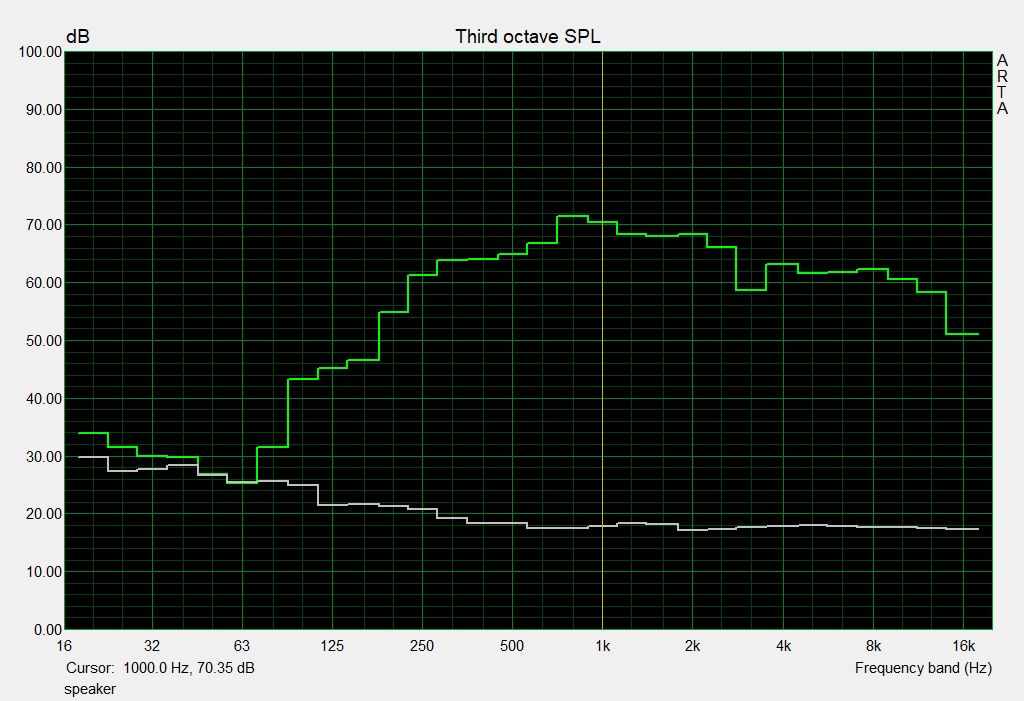
Acer Nitro 5 AN515-42-R6V0 audio analysis
(±) | speaker loudness is average but good (79 dB)
Bass 100 - 315 Hz
(±) | reduced bass - on average 10.3% lower than median
(±) | linearity of bass is average (12.1% delta to prev. frequency)
Mids 400 - 2000 Hz
(±) | higher mids - on average 5.5% higher than median
(+) | mids are linear (3.3% delta to prev. frequency)
Highs 2 - 16 kHz
(+) | balanced highs - only 1.6% away from median
(+) | highs are linear (5.8% delta to prev. frequency)
Overall 100 - 16.000 Hz
(±) | linearity of overall sound is average (15% difference to median)
Compared to same class
» 32% of all tested devices in this class were better, 6% similar, 62% worse
» The best had a delta of 6%, average was 18%, worst was 132%
Compared to all devices tested
» 21% of all tested devices were better, 4% similar, 75% worse
» The best had a delta of 4%, average was 23%, worst was 134%
Lenovo IdeaPad 720-15IKB audio analysis
(-) | not very loud speakers (68.7 dB)
Bass 100 - 315 Hz
(-) | nearly no bass - on average 23% lower than median
(±) | linearity of bass is average (14.6% delta to prev. frequency)
Mids 400 - 2000 Hz
(+) | balanced mids - only 4% away from median
(+) | mids are linear (6% delta to prev. frequency)
Highs 2 - 16 kHz
(+) | balanced highs - only 3.9% away from median
(±) | linearity of highs is average (8.5% delta to prev. frequency)
Overall 100 - 16.000 Hz
(±) | linearity of overall sound is average (23.3% difference to median)
Compared to same class
» 83% of all tested devices in this class were better, 5% similar, 13% worse
» The best had a delta of 5%, average was 17%, worst was 45%
Compared to all devices tested
» 70% of all tested devices were better, 5% similar, 25% worse
» The best had a delta of 4%, average was 23%, worst was 134%
Power Management
Power Consumption
Considering the offered performance, the power consumption is more than acceptable. While 7-18 watts during idle phases and 79-128 watts in 3D operation are undercut by the competitors, those also deliver a poorer performance in terms of CPU as well as GPU.
| Off / Standby | |
| Idle | |
| Load |
|
Key:
min: | |
| Acer Nitro 5 AN515-42-R6V0 R7 2700U, Radeon RX 560X (Laptop) | Lenovo IdeaPad 720-15IKB i5-7200U, Radeon RX 560 (Laptop) | Acer Aspire 5 A515-52G-53PU i5-8265U, GeForce MX150 | Xiaomi Mi Notebook Pro i5 i5-8250U, GeForce MX150 | Average of class Gaming | |
|---|---|---|---|---|---|
| Power Consumption | 12% | 41% | 45% | -69% | |
| Idle Minimum * (Watt) | 7 | 9.9 -41% | 3.8 46% | 3.7 47% | 13 ? -86% |
| Idle Average * (Watt) | 10 | 9.5 5% | 6.3 37% | 7.5 25% | 18.6 ? -86% |
| Idle Maximum * (Watt) | 18 | 10.7 41% | 9.6 47% | 8 56% | 24.2 ? -34% |
| Load Average * (Watt) | 79 | 62 22% | 59.5 25% | 49 38% | 109.2 ? -38% |
| Witcher 3 ultra * (Watt) | 98 | 84 14% | 50.6 48% | ||
| Load Maximum * (Watt) | 128 | 86.7 32% | 64.4 50% | 55.2 57% | 256 ? -100% |
* ... smaller is better
Battery Life
Even though with 48 Wh, the battery is not abundantly sized, the Nitro 5 achieves a decent battery life. Almost 5.5 hours of Internet surfing on the WLAN at medium brightness should satisfy most buyers.
| Acer Nitro 5 AN515-42-R6V0 R7 2700U, Radeon RX 560X (Laptop), 48 Wh | Lenovo IdeaPad 720-15IKB i5-7200U, Radeon RX 560 (Laptop), 40 Wh | Acer Aspire 5 A515-52G-53PU i5-8265U, GeForce MX150, 48 Wh | Xiaomi Mi Notebook Pro i5 i5-8250U, GeForce MX150, 60 Wh | Average of class Gaming | |
|---|---|---|---|---|---|
| Battery runtime | 25% | 32% | 75% | 25% | |
| WiFi v1.3 (h) | 5.7 | 7.1 25% | 7.5 32% | 10 75% | 7.11 ? 25% |
| Reader / Idle (h) | 16.1 | 14.1 | 8.71 ? | ||
| H.264 (h) | 9.2 | 6.7 | 10.5 | 8.64 ? | |
| Load (h) | 0.8 | 1.7 | 2 | 1.502 ? | |
| Witcher 3 ultra (h) | 1.4 |
Verdict
Pros
Cons
AMD enthusiasts who have been yearning for a suitable multimedia notebook with gaming ambitions are exactly at the right address with the Acer Nitro 5 AN515-42-R6V0.
Okay, you can see various cost-cutting measures (small battery, meager connections, weak SSD during writing, only 8 GB of RAM), but for the price of barely 900 Euros (~$1019), the 15-inch notebook is a great deal.
The combination of the Ryzen 7 2700U and Radeon RX 560X brings sufficient power for most applications, although during gaming, your expectations on the graphics quality and frame rates should not be too high.
In summary, with the AMD version of the Nitro 5, Acer offers a beautiful and successful alternative to established notebooks that are based on Intel/Nvidia. Unfortunately, something like this does not happen very often. After all, competition is good for business.
Acer Nitro 5 AN515-42-R6V0
- 05/14/2020 v7 (old)
Florian Glaser
Price comparison

