Acer TravelMate X3410 (i7-8550U, 16 GB RAM, 512 GB SSD) Laptop Review
Acer is a well-known manufacturer, but their name is typically not the first that comes to mind in the business laptop market. Power players like Lenovo, HP, and Dell have ruled the business-class roost for decades. Acer actually has quite a few adequate office machines that are typically priced competitively and offer a good value. Today's review device is a perfect example.
We looked at the TravelMate X3410 earlier this month and found a lot to like about its slim chassis and generally good performance. Today's review device is a variant of that model. The X3410-M-866T we will look at today is mostly the same with two key differences.
Firstly, the 1 TB HDD / 256 GB SSD combo of the earlier model has been swapped for a single 512 GB SSD. Secondly, and perhaps more glaring, the dedicated Nvidia GeForce MX130 GPU is absent; only the onboard Intel UHD Graphics 620 chip is available for graphical workloads. The other specs (Intel Core i7-8550U, 16 GB DDR4 RAM, FHD display) are the same.
We will skip over the external components of the TravelMate X3410, including the case, connectivity, and input devices. You can find details for these features in our original TravelMate X3410 review here.
The TravelMate X3410 faces steep competition in the business laptop arena, including Dell's Latitude 7490; HP's EliteBook 840 G5; Toshiba's Tecra X40-D; and Lenovo's ThinkPad T480, ThinkPad T480s, and ThinkPad X1 Carbon.
| SD Card Reader | |
| average JPG Copy Test (av. of 3 runs) | |
| Dell Latitude 7490 (Toshiba Exceria Pro M501 UHS-II) | |
| Lenovo ThinkPad T480-20L50010US (Toshiba Exceria Pro SDXC 64 GB UHS-II) | |
| Toshiba Tecra X40-D | |
| Lenovo ThinkPad T480s-20L8S02E00 (Toshiba Exceria Pro SDXC 64 GB UHS-II) | |
| Average of class Office (22.4 - 198.5, n=22, last 2 years) | |
| Acer TravelMate X3410-M-866T (Toshiba Exceria Pro SDXC 64 GB UHS-II) | |
| maximum AS SSD Seq Read Test (1GB) | |
| Dell Latitude 7490 (Toshiba Exceria Pro M501 UHS-II) | |
| Lenovo ThinkPad T480s-20L8S02E00 (Toshiba Exceria Pro SDXC 64 GB UHS-II) | |
| Toshiba Tecra X40-D | |
| Lenovo ThinkPad T480-20L50010US (Toshiba Exceria Pro SDXC 64 GB UHS-II) | |
| Average of class Office (27.4 - 249, n=20, last 2 years) | |
| Acer TravelMate X3410-M-866T (Toshiba Exceria Pro SDXC 64 GB UHS-II) | |
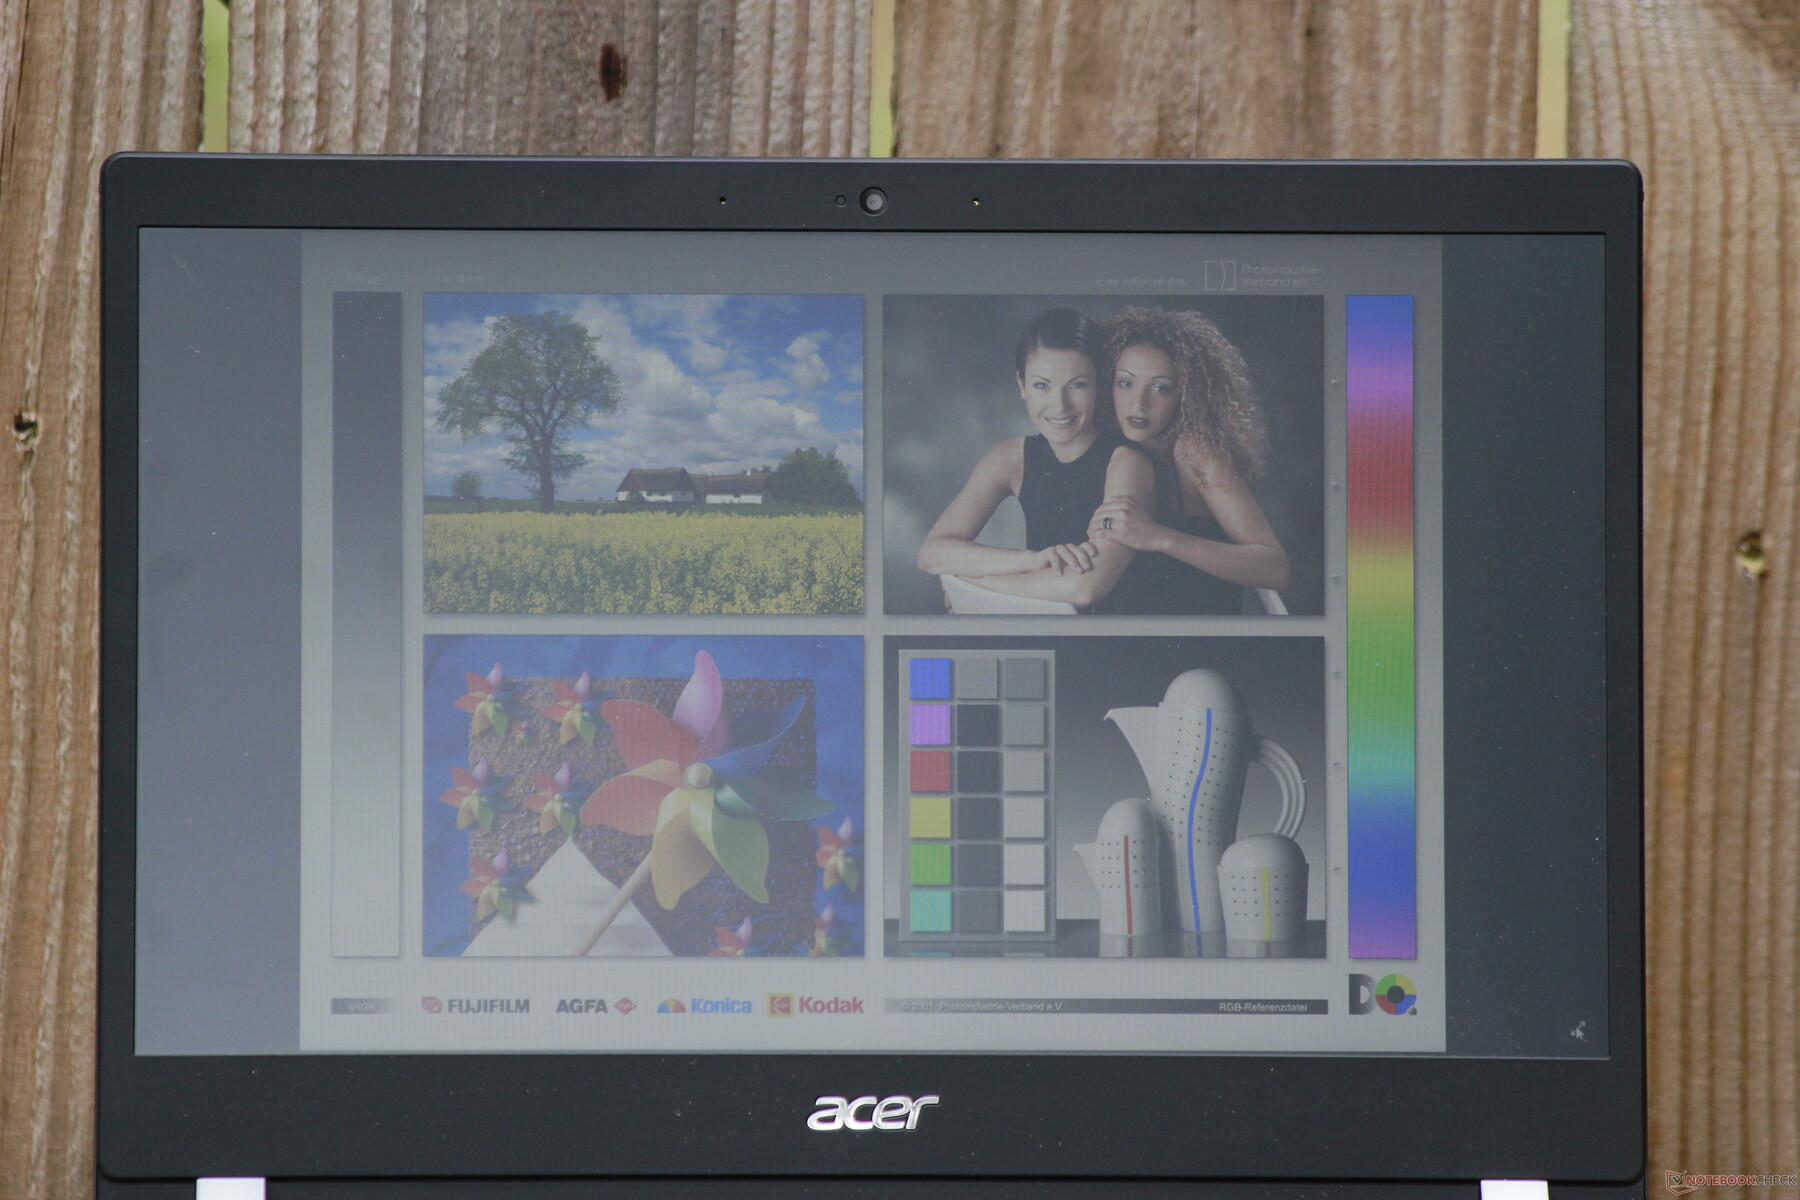
Display
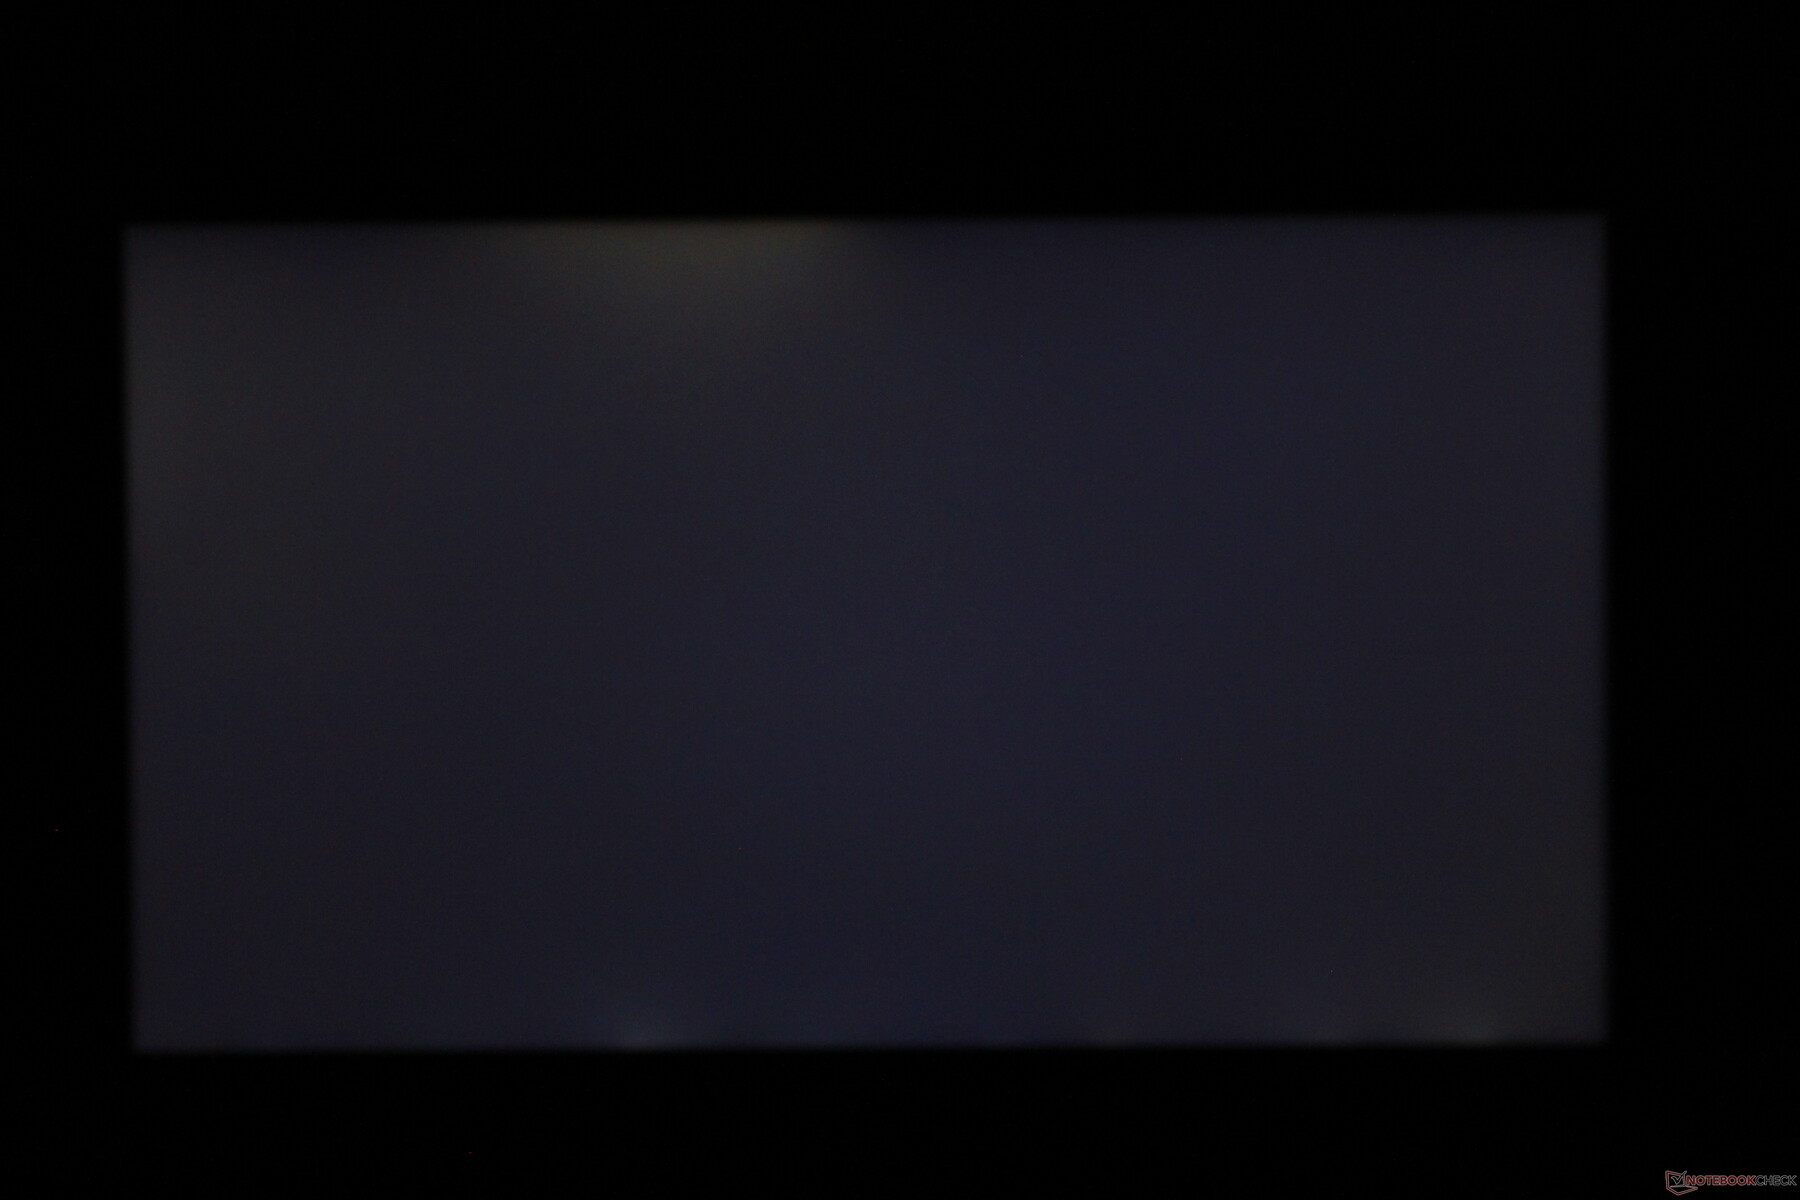
The display on the earlier TravelMate X3410 was a definite weak point, and the newer model doesn't fare much better. This is because Acer offers only one display option. The 14-inch Full HD (1920x1080) IPS panel is more than sharp enough for office work, but the backlight it weak, averaging a measly 210 nits. Most other office laptops hover near or above 300 nits, far outpacing the TravelMate.
Worse still is the Acer's uneven backlight; brightness distribution sits at a modest 77%. The lower corners are noticeably dimmer than the middle, particularly on gray and black backgrounds. The contrast ratio is decent at 844:1 but still falls behind rivals. On the plus side, PWM shouldn't be a problem; we measure 25,000 Hz at brightness levels at or below 21%.
| |||||||||||||||||||||||||
Brightness Distribution: 77 %
Center on Battery: 253.1 cd/m²
Contrast: 844:1 (Black: 0.3 cd/m²)
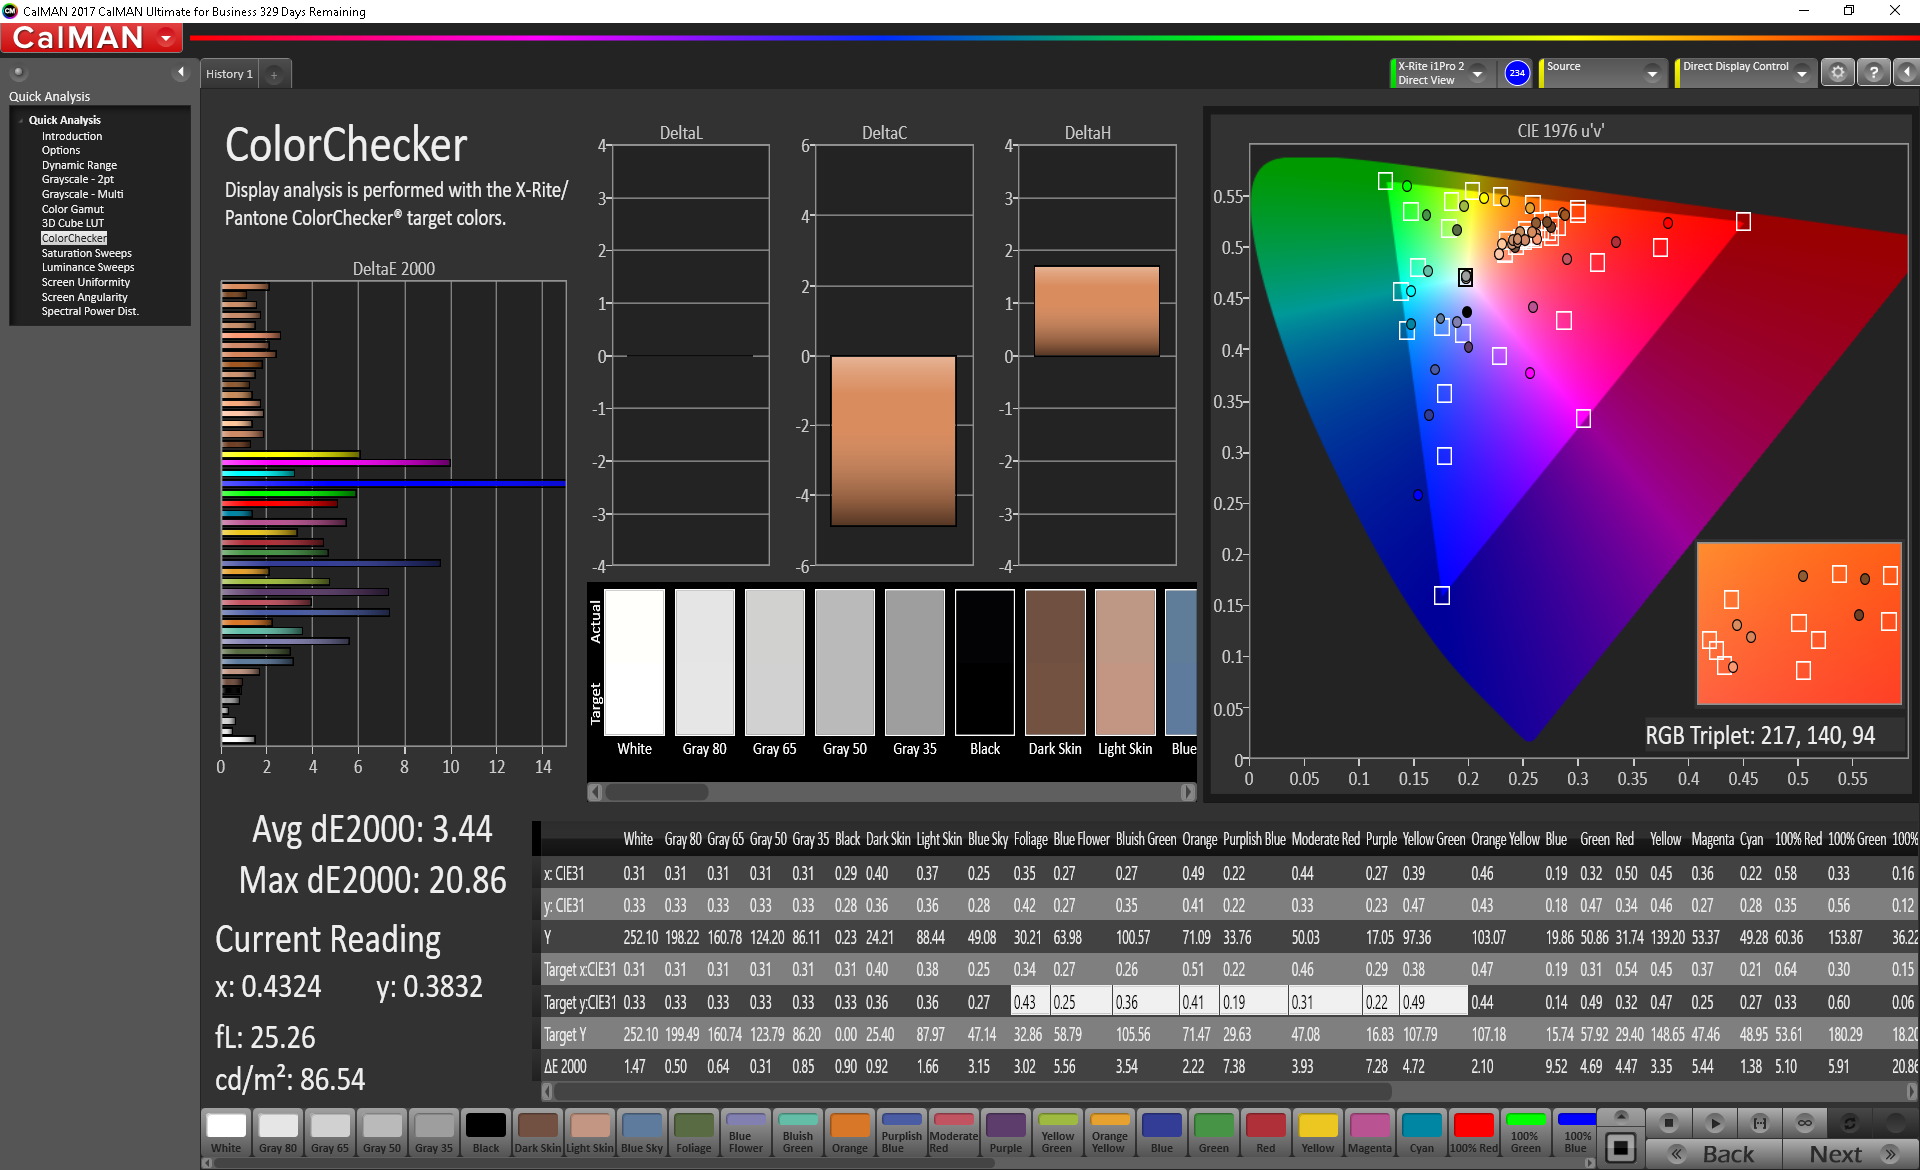
ΔE ColorChecker Calman: 4.71 | ∀{0.5-29.43 Ø4.73}
calibrated: 3.44
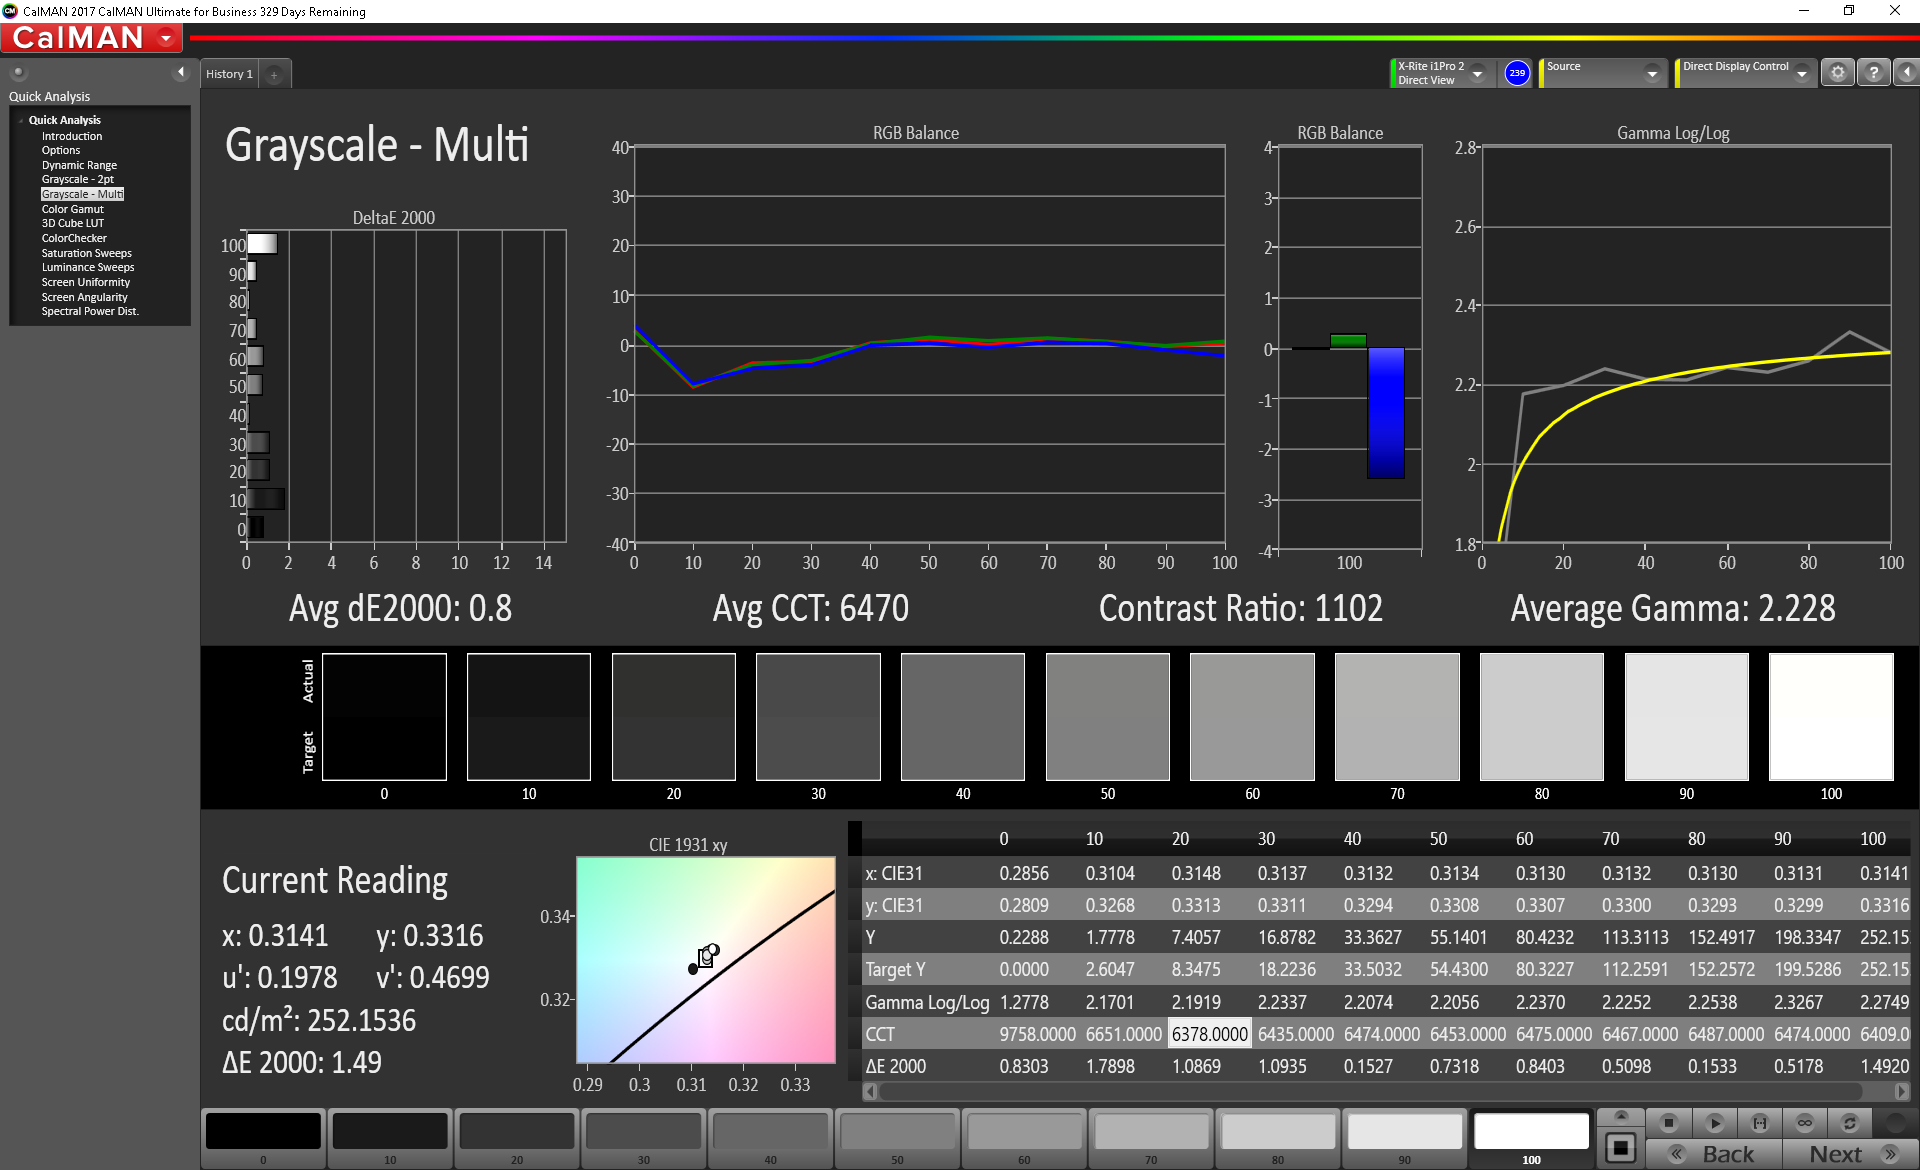
ΔE Greyscale Calman: 3.4 | ∀{0.09-98 Ø4.97}
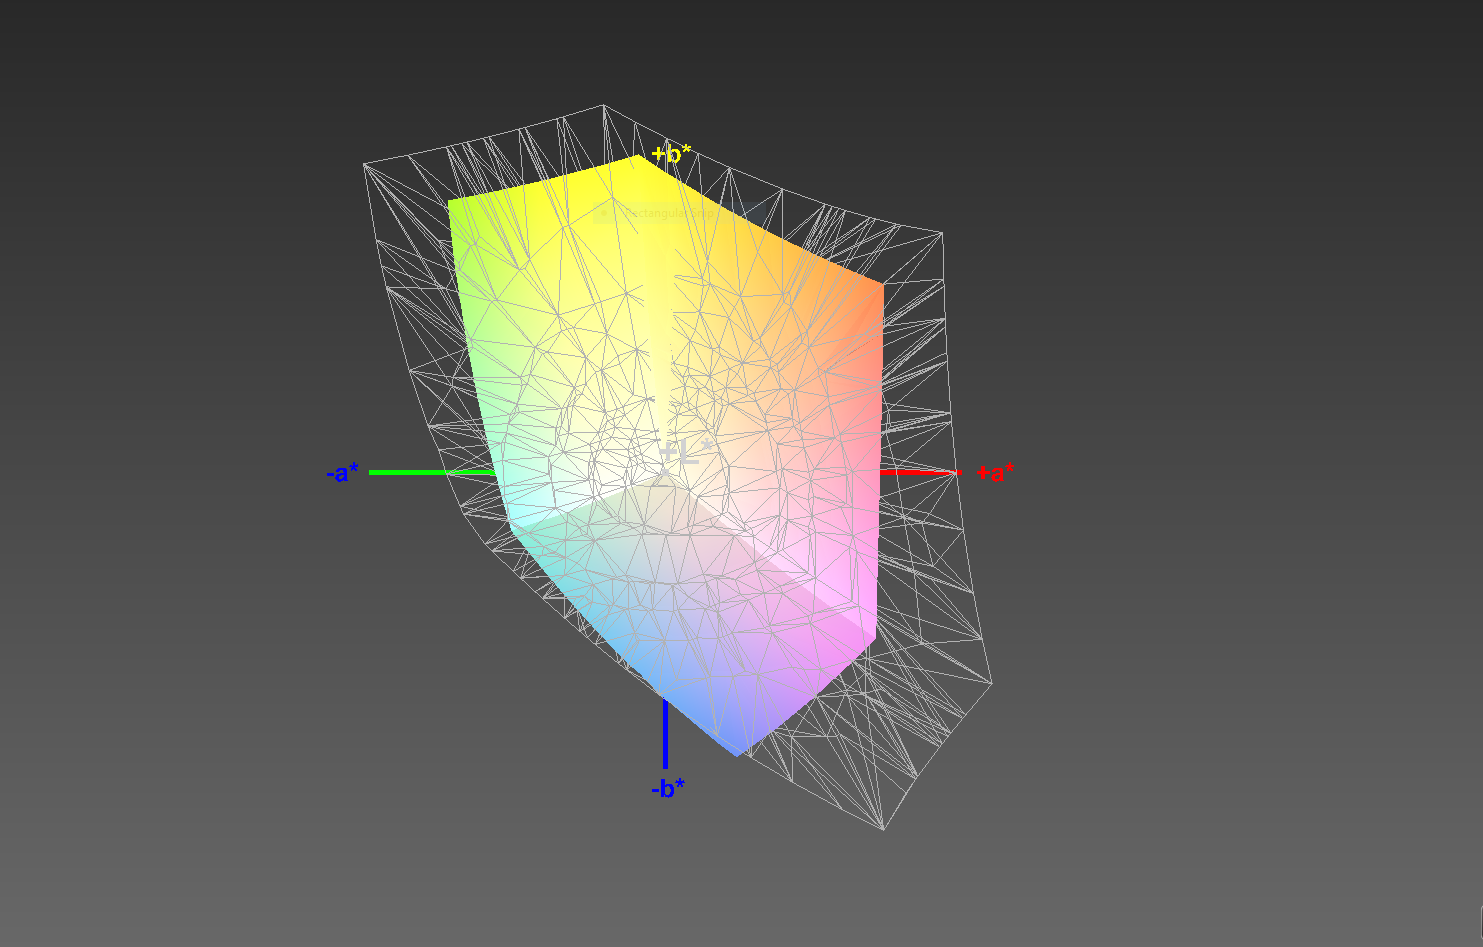
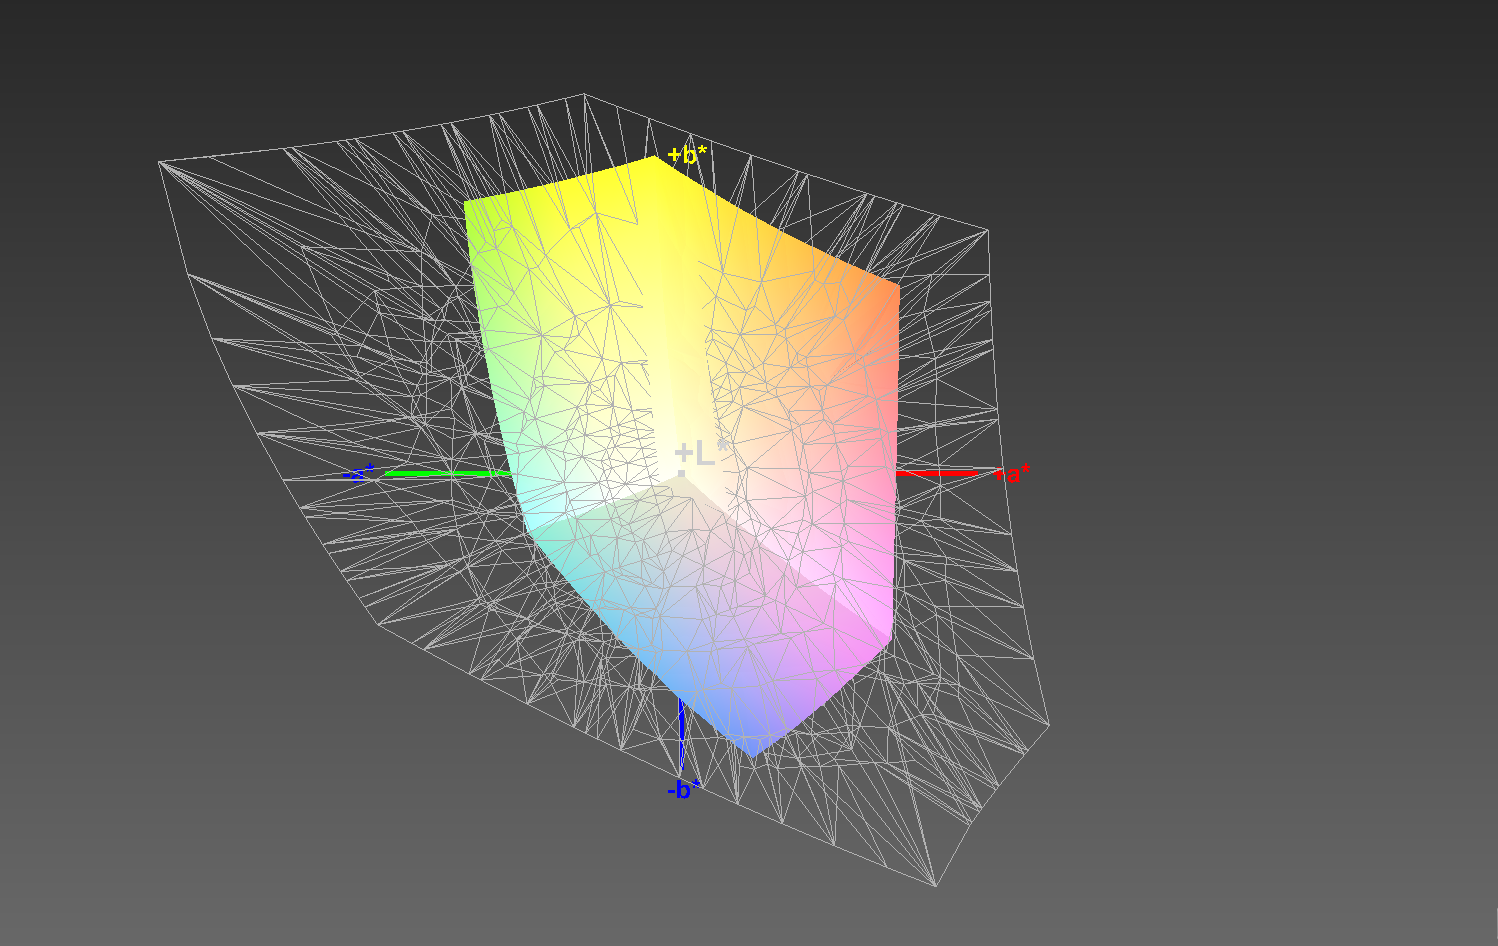
62% sRGB (Argyll 1.6.3 3D)
40% AdobeRGB 1998 (Argyll 1.6.3 3D)
42.99% AdobeRGB 1998 (Argyll 3D)
62.4% sRGB (Argyll 3D)
41.59% Display P3 (Argyll 3D)
Gamma: 1.997
CCT: 6266 K
| Acer TravelMate X3410-M-866T Chi Mei CMN14D4, IPS, 14", 1920x1080 | Lenovo ThinkPad T480-20L50010US B140HAK01.0, TFT-LCD, 14", 1920x1080 | Lenovo ThinkPad T480s-20L8S02E00 LP140QH2-SPB1, IPS LED, 14", 2560x1440 | Lenovo ThinkPad X1 Carbon 2018-20KGS5DU00 LP140QH2-SPB1, IPS, 14", 2560x1440 | Toshiba Portege X30T-E-109 Toshiba TOS508F, IPS, 13.3", 1920x1080 | Toshiba Tecra X40-D Toshiba TOS508F, IPS, 14", 1920x1080 | Dell Latitude 7490 AUO503D (D04YD_B140HAN), IPS, 14", 1920x1080 | HP EliteBook 840 G5-3JX61EA IVO M140NVF7 R0, IPS, 14", 1920x1080 | |
|---|---|---|---|---|---|---|---|---|
| Display | -13% | 65% | 69% | 54% | -3% | 58% | 44% | |
| Display P3 Coverage (%) | 41.59 | 36.31 -13% | 71.4 72% | 72.7 75% | 67.2 62% | 40.55 -3% | 66.6 60% | 61 47% |
| sRGB Coverage (%) | 62.4 | 54.5 -13% | 96.6 55% | 97.9 57% | 90.8 46% | 61 -2% | 96.8 55% | 87.7 41% |
| AdobeRGB 1998 Coverage (%) | 42.99 | 37.51 -13% | 72.1 68% | 74.6 74% | 66.5 55% | 41.89 -3% | 67.9 58% | 62.1 44% |
| Response Times | 8% | 16% | 16% | -5% | 15% | 3% | 22% | |
| Response Time Grey 50% / Grey 80% * (ms) | 40.4 ? | 39.2 ? 3% | 36 ? 11% | 38 ? 6% | 42 ? -4% | 38 ? 6% | 41.6 ? -3% | 33 ? 18% |
| Response Time Black / White * (ms) | 35.2 ? | 30.8 ? 12% | 28 ? 20% | 26 ? 26% | 37 ? -5% | 26.8 ? 24% | 32 ? 9% | 26 ? 26% |
| PWM Frequency (Hz) | 25000 ? | 17000 ? | 20410 ? | 3125 ? | ||||
| Screen | -11% | 29% | 15% | 13% | -3% | 20% | 47% | |
| Brightness middle (cd/m²) | 253.1 | 276.7 9% | 311 23% | 316 25% | 350 38% | 283.9 12% | 308.6 22% | 655 159% |
| Brightness (cd/m²) | 230 | 272 18% | 302 31% | 311 35% | 343 49% | 261 13% | 294 28% | 630 174% |
| Brightness Distribution (%) | 77 | 90 17% | 91 18% | 84 9% | 73 -5% | 85 10% | 89 16% | 93 21% |
| Black Level * (cd/m²) | 0.3 | 0.21 30% | 0.36 -20% | 0.35 -17% | 0.29 3% | 0.25 17% | 0.23 23% | 0.56 -87% |
| Contrast (:1) | 844 | 1318 56% | 864 2% | 903 7% | 1207 43% | 1136 35% | 1342 59% | 1170 39% |
| Colorchecker dE 2000 * | 4.71 | 7.22 -53% | 3 36% | 4.5 4% | 6.36 -35% | 6.4 -36% | 6.07 -29% | 3.27 31% |
| Colorchecker dE 2000 max. * | 20.72 | 25.87 -25% | 6.1 71% | 10.3 50% | 11.63 44% | 18.7 10% | 10.58 49% | 5.92 71% |
| Colorchecker dE 2000 calibrated * | 3.44 | 5.01 -46% | 1.7 51% | 1.6 53% | 1.7 51% | 1.67 51% | 3.22 6% | |
| Greyscale dE 2000 * | 3.4 | 6.7 -97% | 4 -18% | 7.7 -126% | 8.04 -136% | 6.3 -85% | 7.3 -115% | 2.85 16% |
| Gamma | 1.997 110% | 2.321 95% | 2.17 101% | 2.2 100% | 2.47 89% | 2.39 92% | 2.061 107% | 2.45 90% |
| CCT | 6266 104% | 6656 98% | 6961 93% | 6639 98% | 7716 84% | 6511 100% | 7269 89% | 6065 107% |
| Color Space (Percent of AdobeRGB 1998) (%) | 40 | 34 -15% | 66.7 67% | 68.6 72% | 59 48% | 38 -5% | 62 55% | 57 43% |
| Color Space (Percent of sRGB) (%) | 62 | 54 -13% | 96.7 56% | 97.9 58% | 91 47% | 60 -3% | 97 56% | 88 42% |
| Total Average (Program / Settings) | -5% /
-9% | 37% /
34% | 33% /
26% | 21% /
19% | 3% /
-1% | 27% /
25% | 38% /
43% |
* ... smaller is better
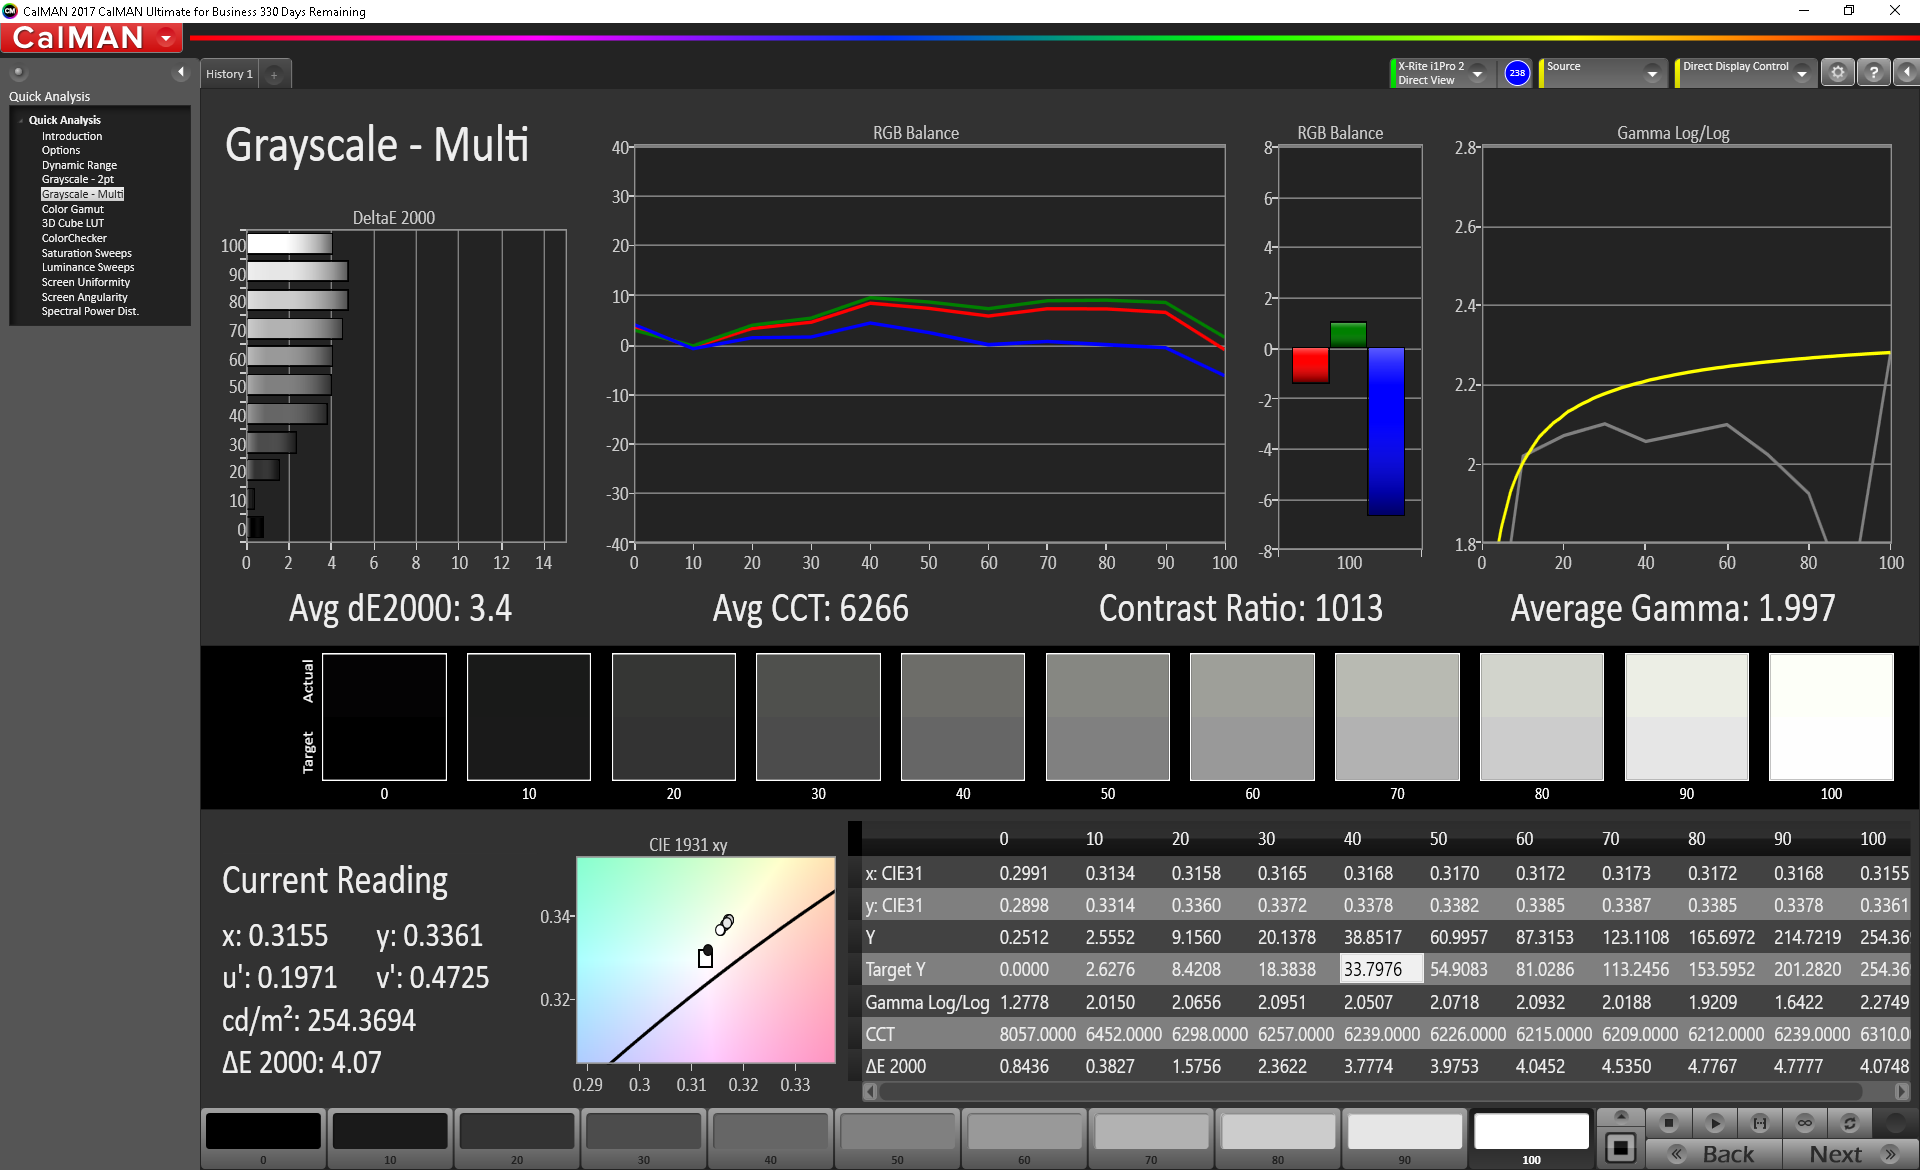
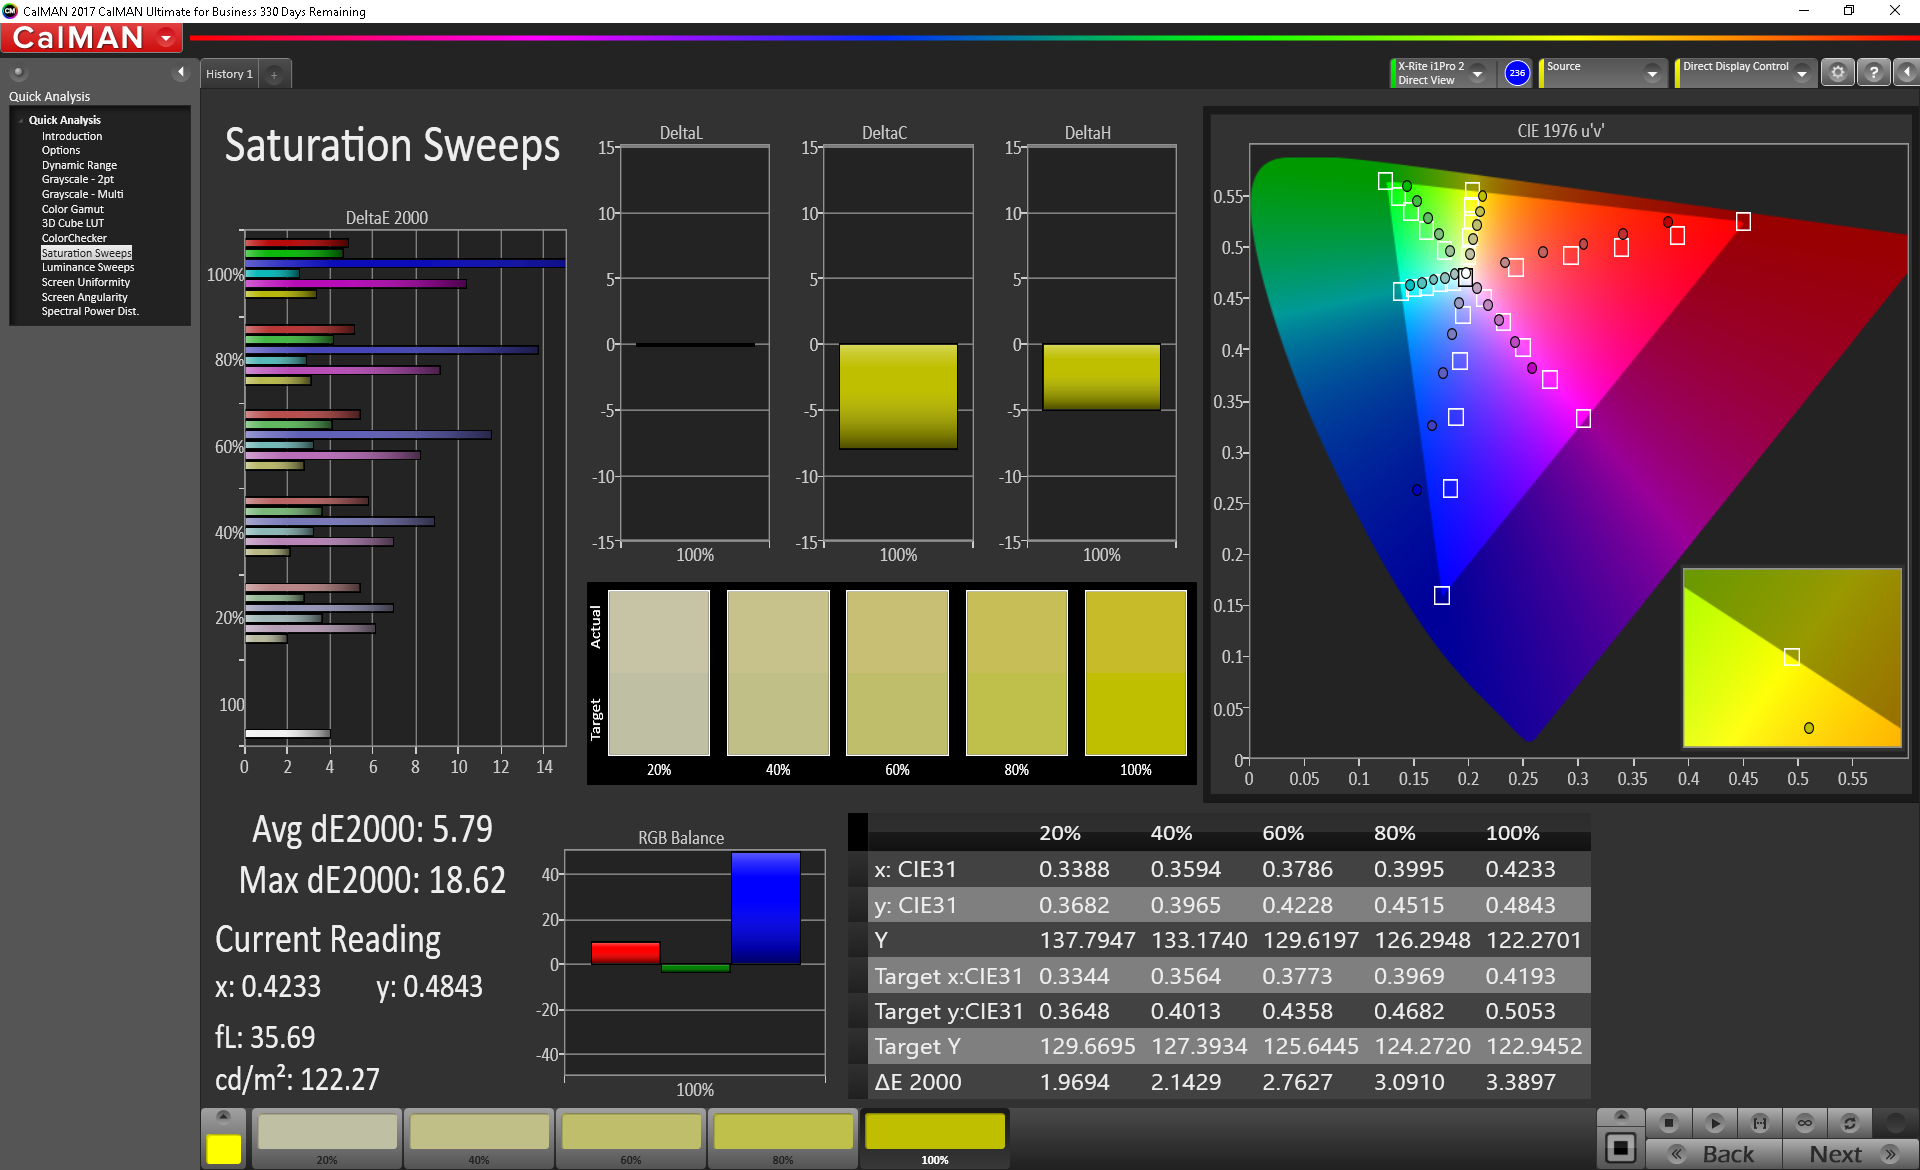
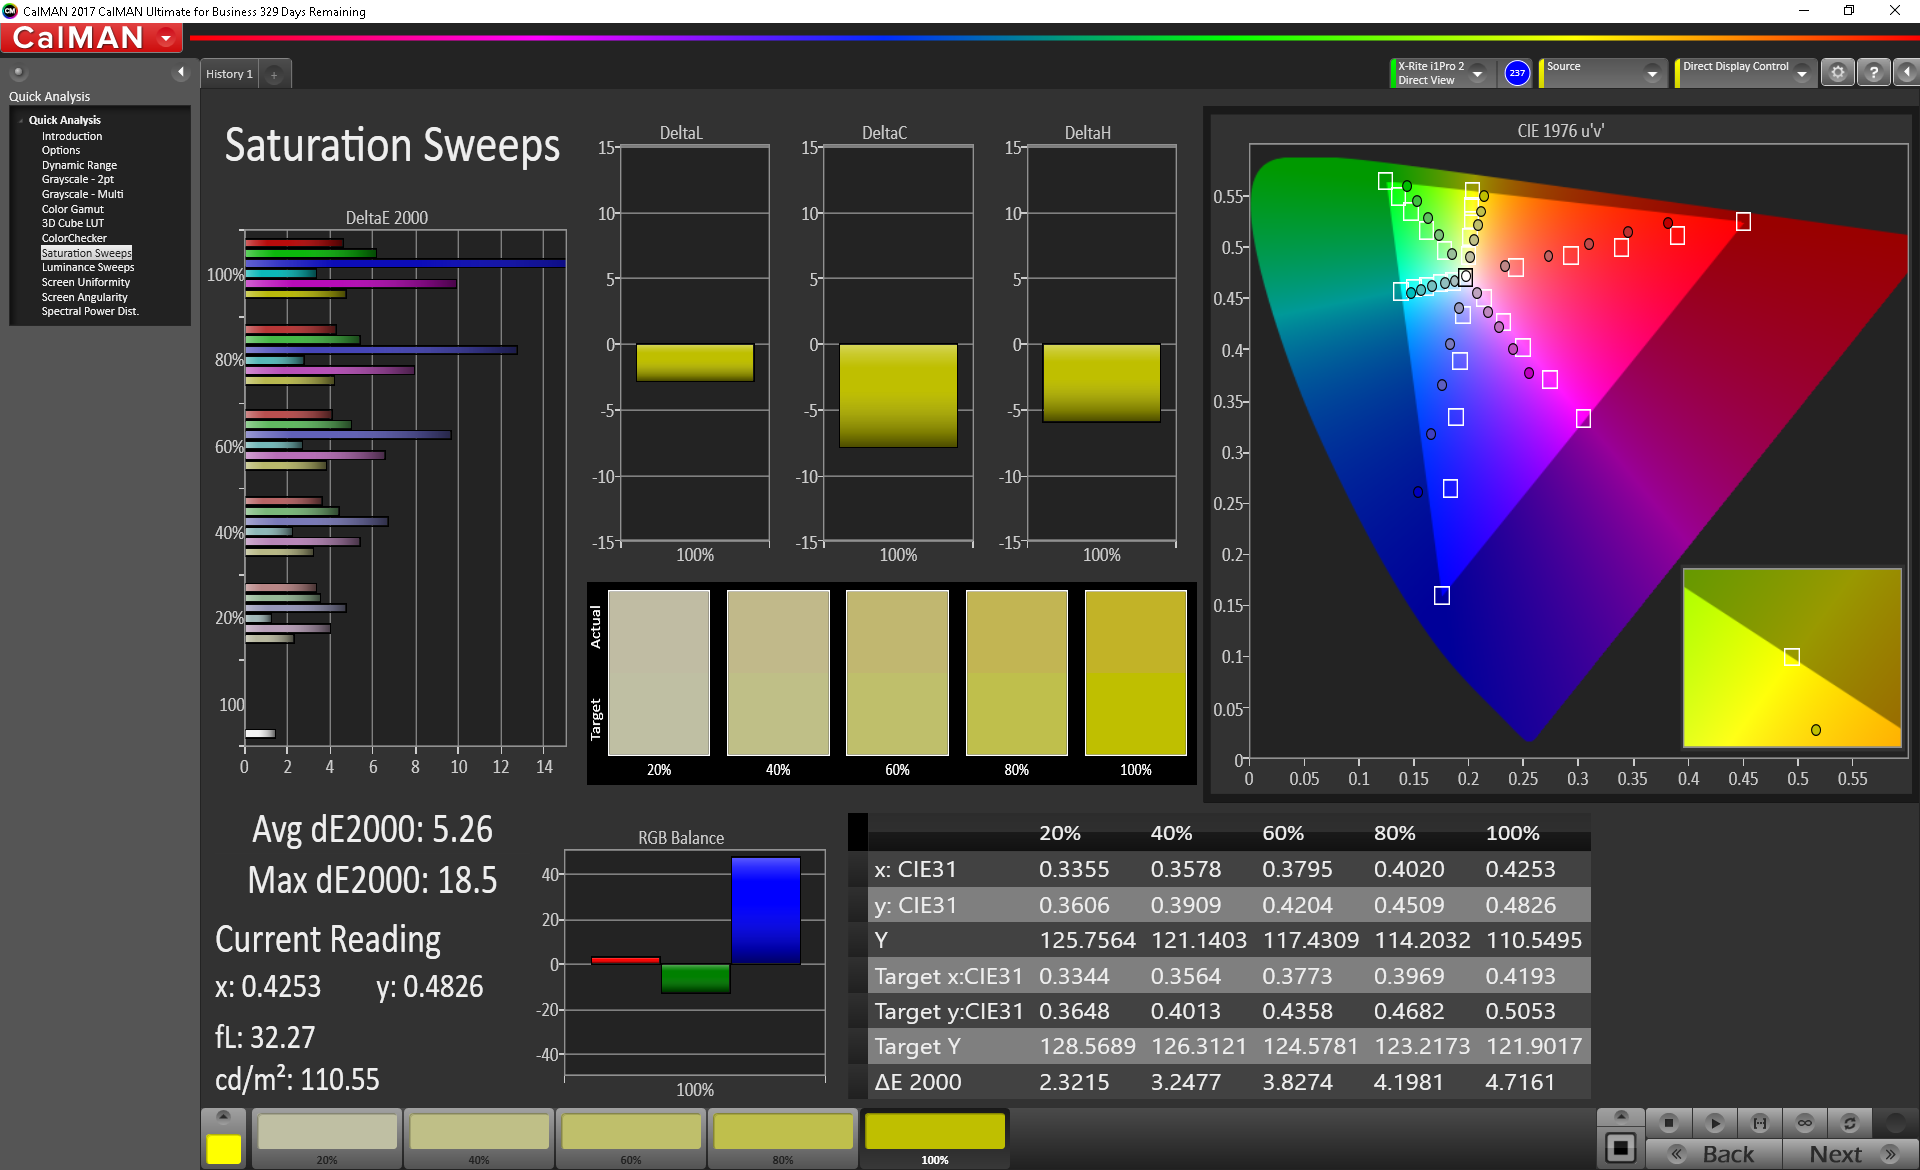
The TravelMate is fairly color accurate. The average DeltaE2000 is 4.71 for colors and 3.4 for grays. These are reasonable numbers, particularly for an office laptop; most business-class notebooks aren't renowned for their color accuracy. (For reference, a DeltaE2000 of 3 or less is generally considered acceptable for professional color work). The primary concern for colors is the wide variance in certain wavelengths, particularly blues and purples. Again, this variance isn't unusual for an office laptop. Gamma is a bit low at 1.997 (ideal is 2.2); grays look a bit lighter as a result. Colors are largely adequate for office work with one exception: color temperature. At 6266 K, the screen is too warm. White backgrounds tend to have a yellow tinge to them which may be distracting to some users, especially those that use an external monitor in addition to the built-in display.
Color coverage is low. The TravelMate covers only 62% of the sRGB color space. This should be adequate for most work, but considering some competitors cover nearly all of the sRGB gamut, there is room for improvement here.

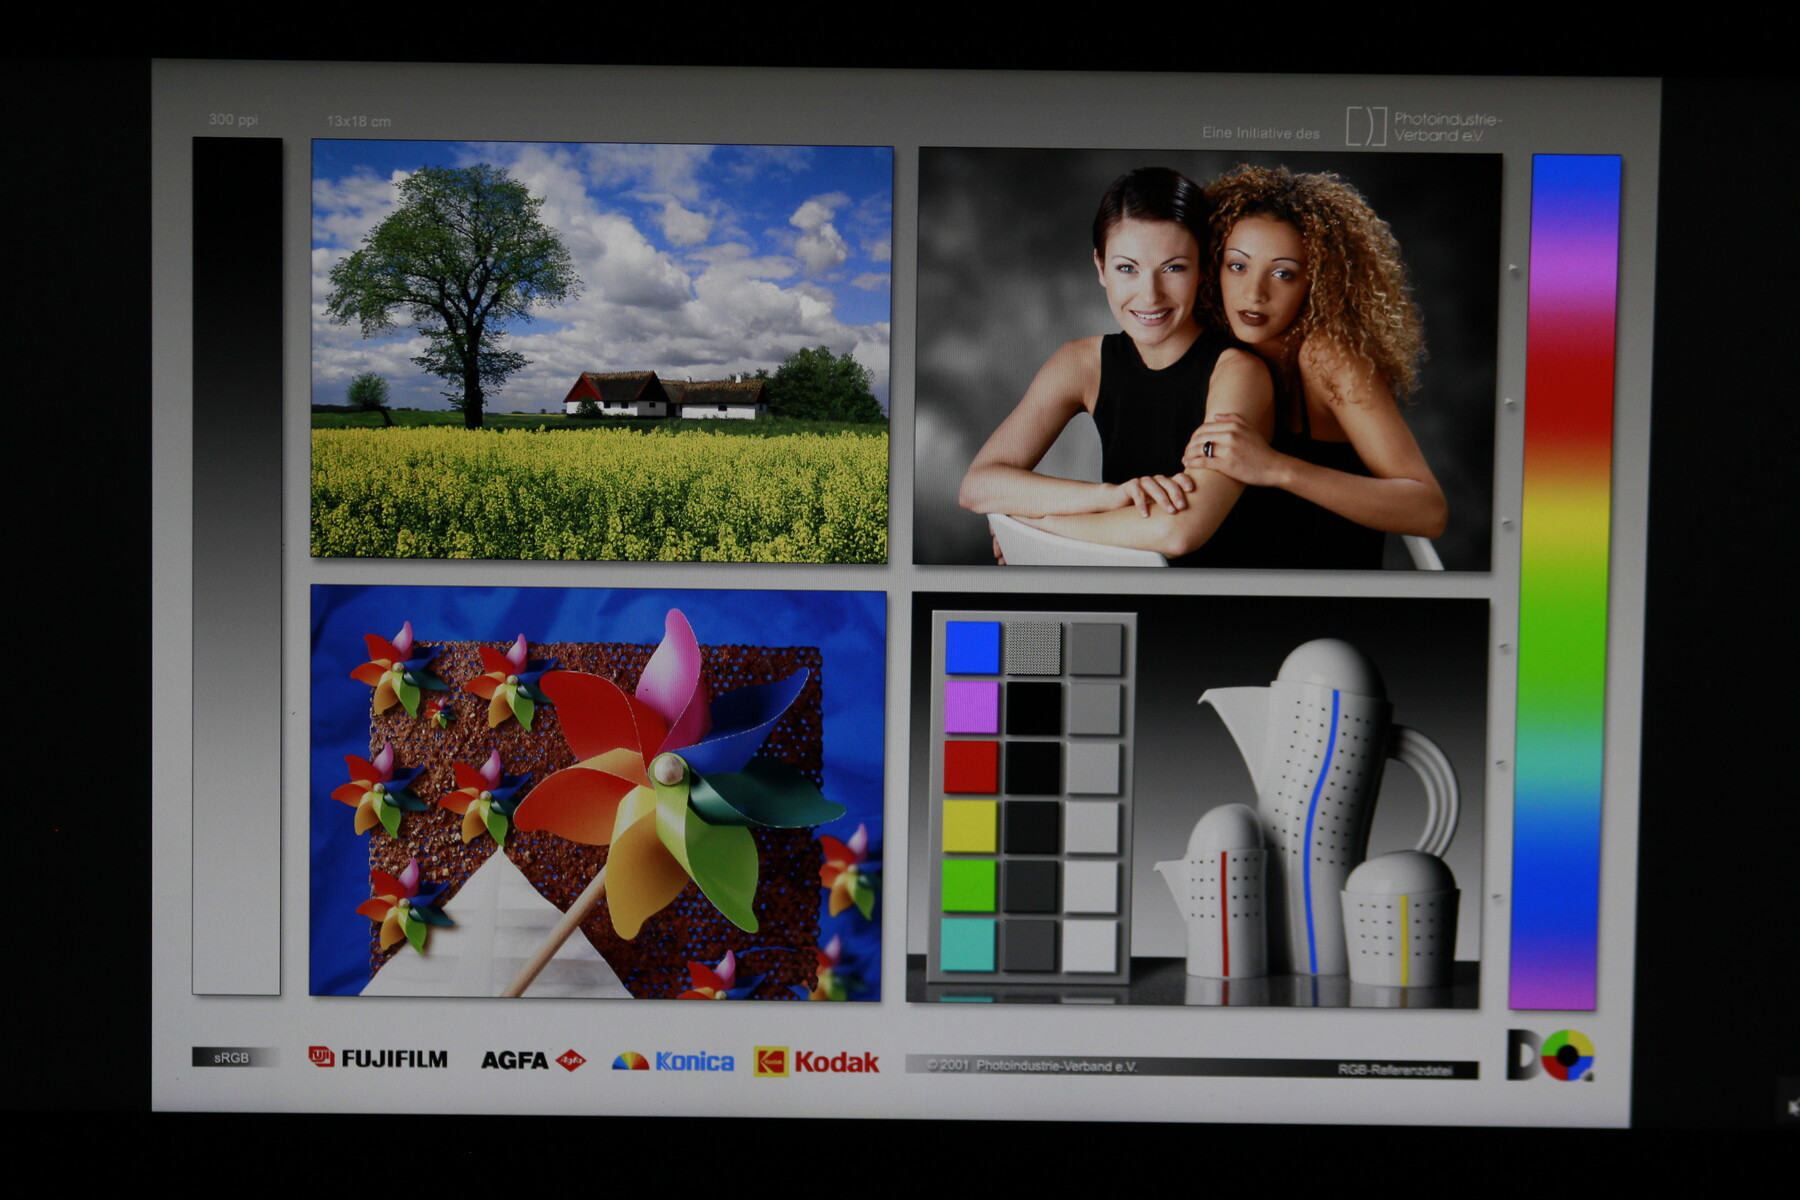
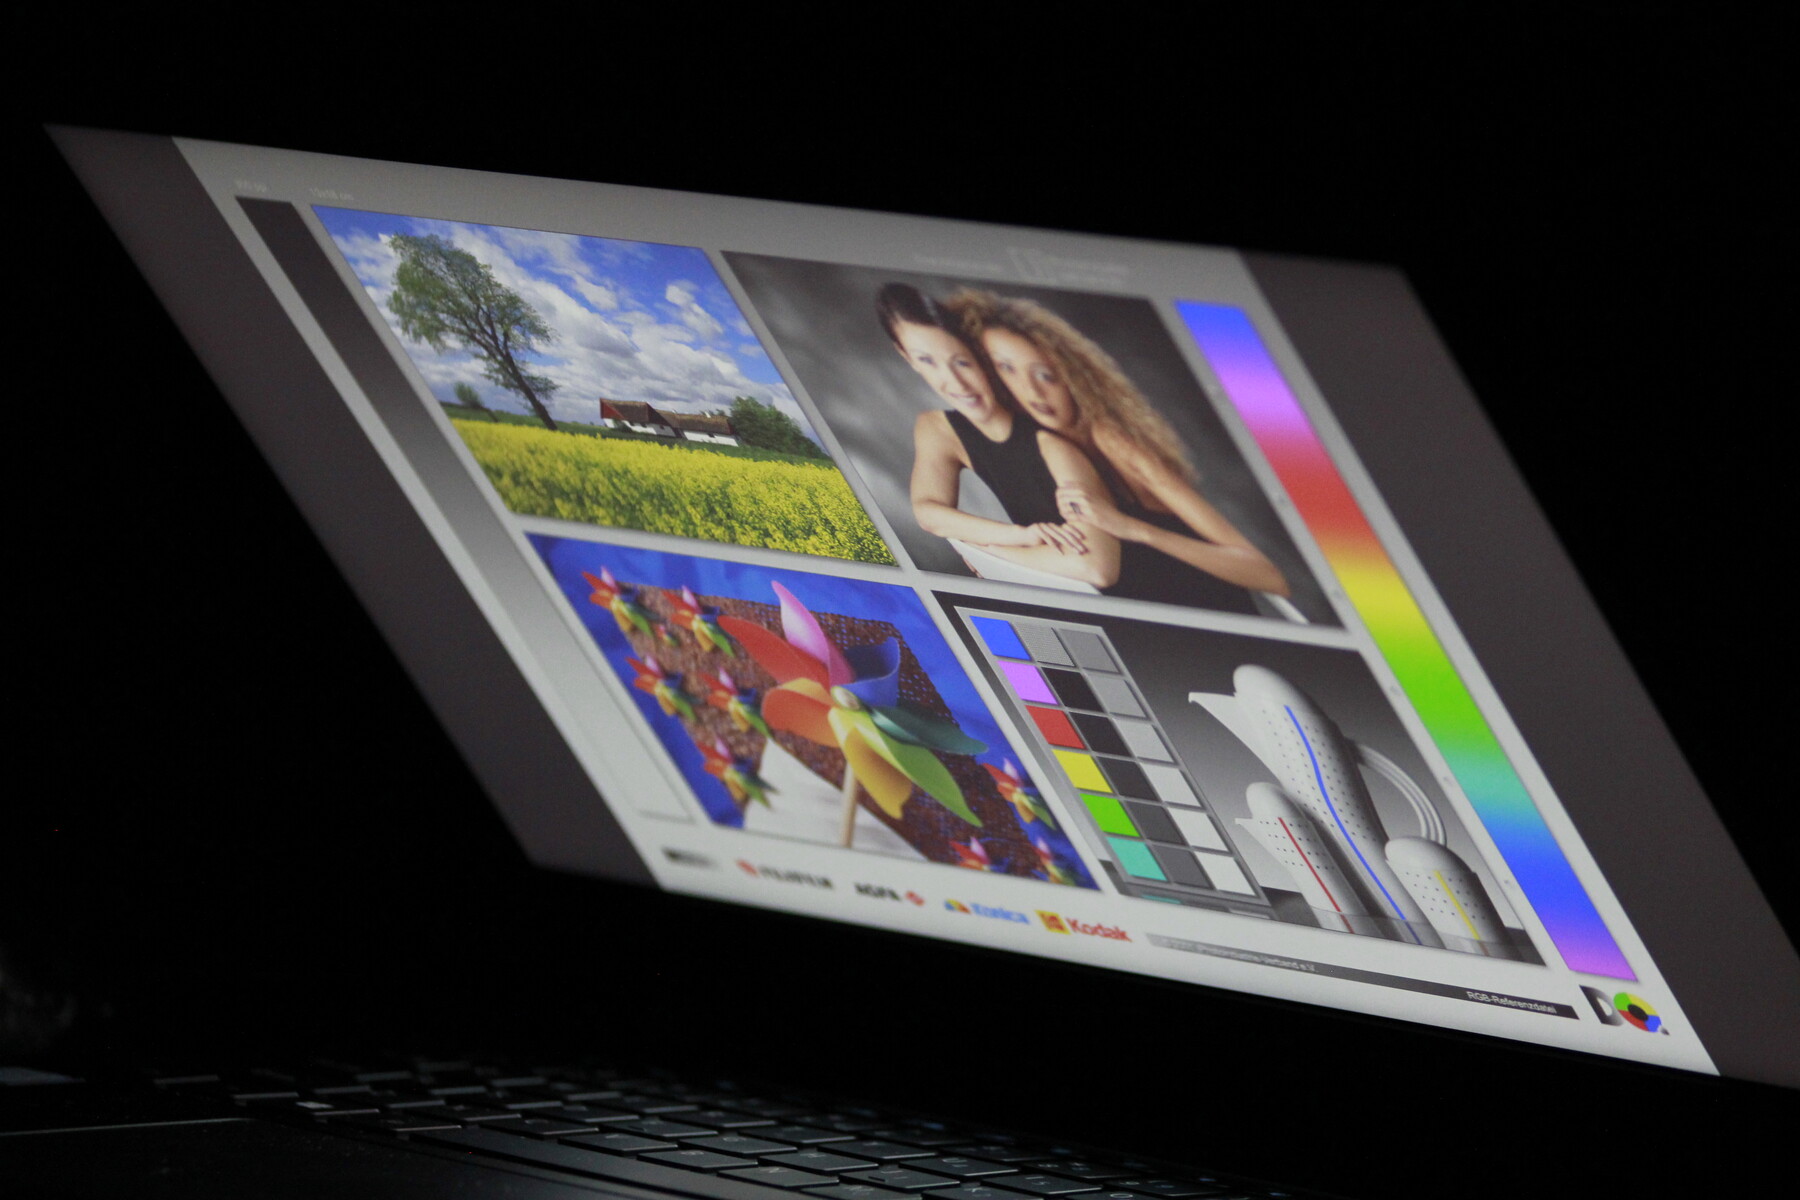
Because of its IPS panel, the TravelMate has good viewing angles. Colors remain stable at almost any angle, and text and images remain clear. The screen noticeably dims when viewed about 20° off-center on the vertical axis; there is an initial drop in perceived luminance, but the display remains stable after this initial shift.
Display Response Times
| ↔ Response Time Black to White | ||
|---|---|---|
| 35.2 ms ... rise ↗ and fall ↘ combined | ↗ 20.8 ms rise | 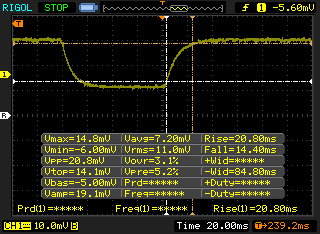 |
| ↘ 14.4 ms fall | ||
| The screen shows slow response rates in our tests and will be unsatisfactory for gamers. In comparison, all tested devices range from 0.1 (minimum) to 240 (maximum) ms. » 93 % of all devices are better. This means that the measured response time is worse than the average of all tested devices (19.9 ms). | ||
| ↔ Response Time 50% Grey to 80% Grey | ||
| 40.4 ms ... rise ↗ and fall ↘ combined | ↗ 23.2 ms rise | 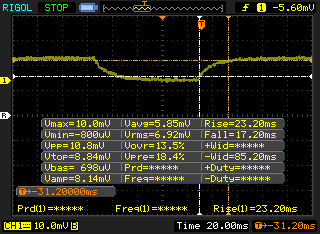 |
| ↘ 17.2 ms fall | ||
| The screen shows slow response rates in our tests and will be unsatisfactory for gamers. In comparison, all tested devices range from 0.165 (minimum) to 636 (maximum) ms. » 63 % of all devices are better. This means that the measured response time is worse than the average of all tested devices (31.1 ms). | ||
Screen Flickering / PWM (Pulse-Width Modulation)
| Screen flickering / PWM detected | 25000 Hz | ≤ 21 % brightness setting | 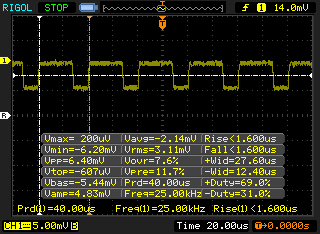 |
The display backlight flickers at 25000 Hz (worst case, e.g., utilizing PWM) Flickering detected at a brightness setting of 21 % and below. There should be no flickering or PWM above this brightness setting. The frequency of 25000 Hz is quite high, so most users sensitive to PWM should not notice any flickering. In comparison: 52 % of all tested devices do not use PWM to dim the display. If PWM was detected, an average of 7798 (minimum: 5 - maximum: 343500) Hz was measured. | |||
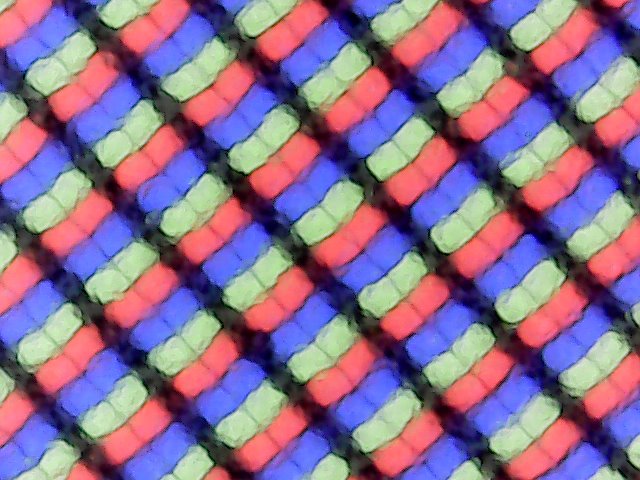
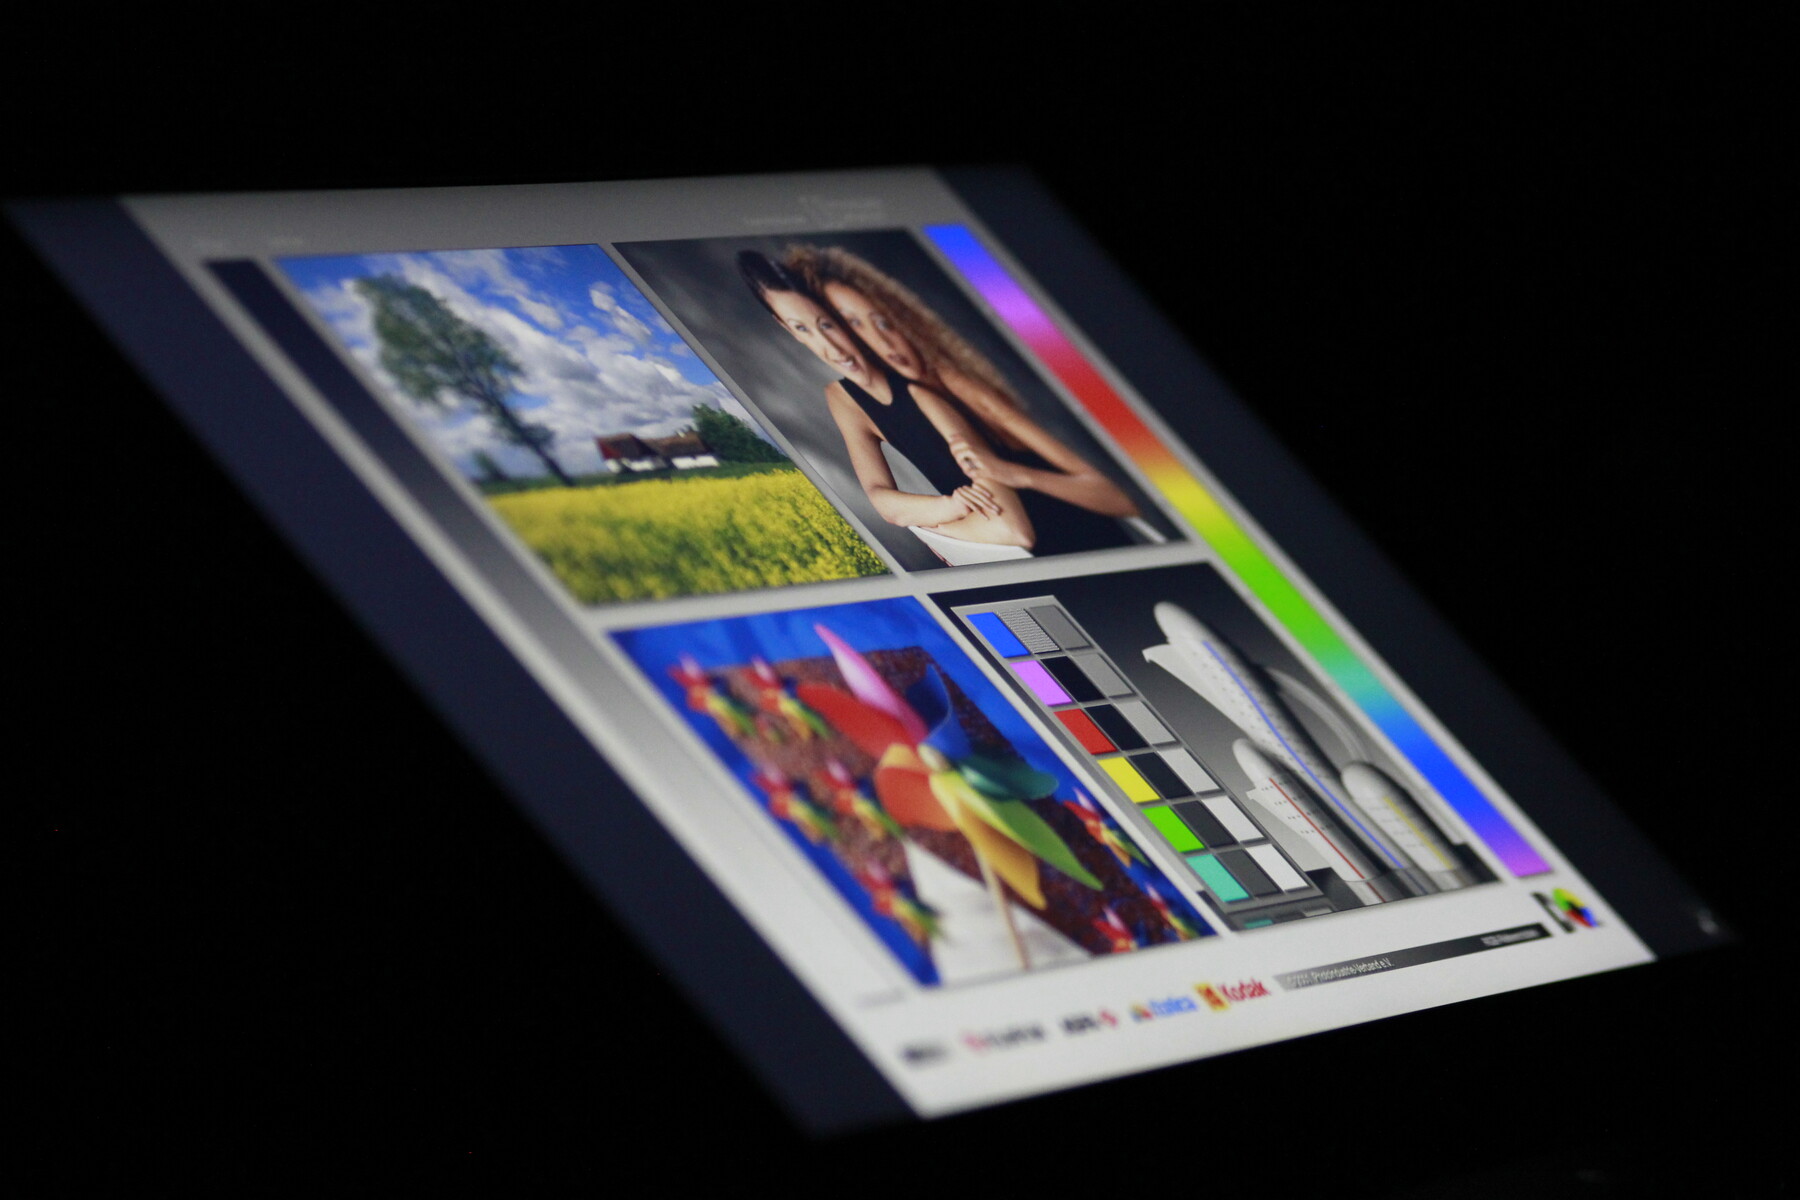
The TravelMate features a matte display, which drastically helps to reduce glare. Still, the weak backlight struggles in bright situations. Even under overcast skies, the screen can be hard to use and may make users squint. Bright lights should be avoided. The matte finish also creates a grainy film that is easily seen.
There is backlight bleed present along the bottom edge of the display, but this largely goes unnoticed. The bleed can be seen in a pitch black room but is otherwise not distracting.
Performance
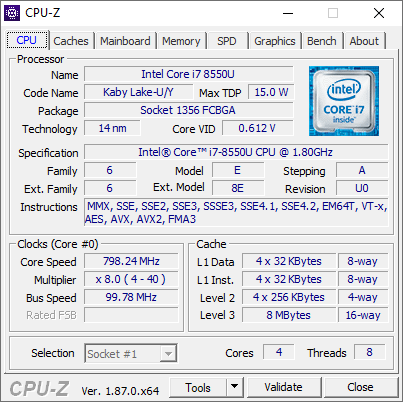
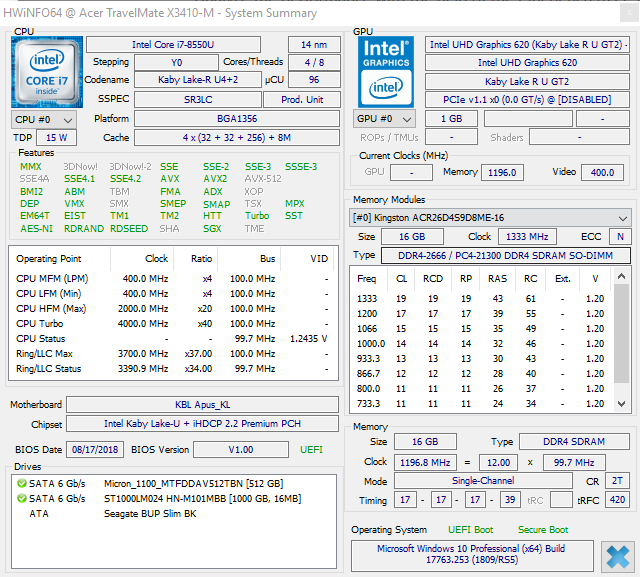
Intel's Core i7-8550U is the de facto CPU for modern premium Ultrabooks. Unfortunately, the TravelMate is not the best example of what an Ultrabook can do in 2019. Performance is decent but falls behind rivals. The gap is wide enough to make us question whether or not Acer intentionally throttles the CPU to keep heat and power consumption low. Add to that a SATA SSD in lieu of an NVMe drive used in most premium laptops and the Acer TravelMate X3410 leaves little question as to why it is cheaper than other business-class notebooks.
Processor
Intel's 8th generation ULV processors bring a much-needed feature to Ultrabooks: Hyperthreading. The Core i7-8550U is one of Intel's top-tier offerings for Ultrabooks; with four cores and eight threads, the CPU packs a lot of performance into a 15 Watt package.
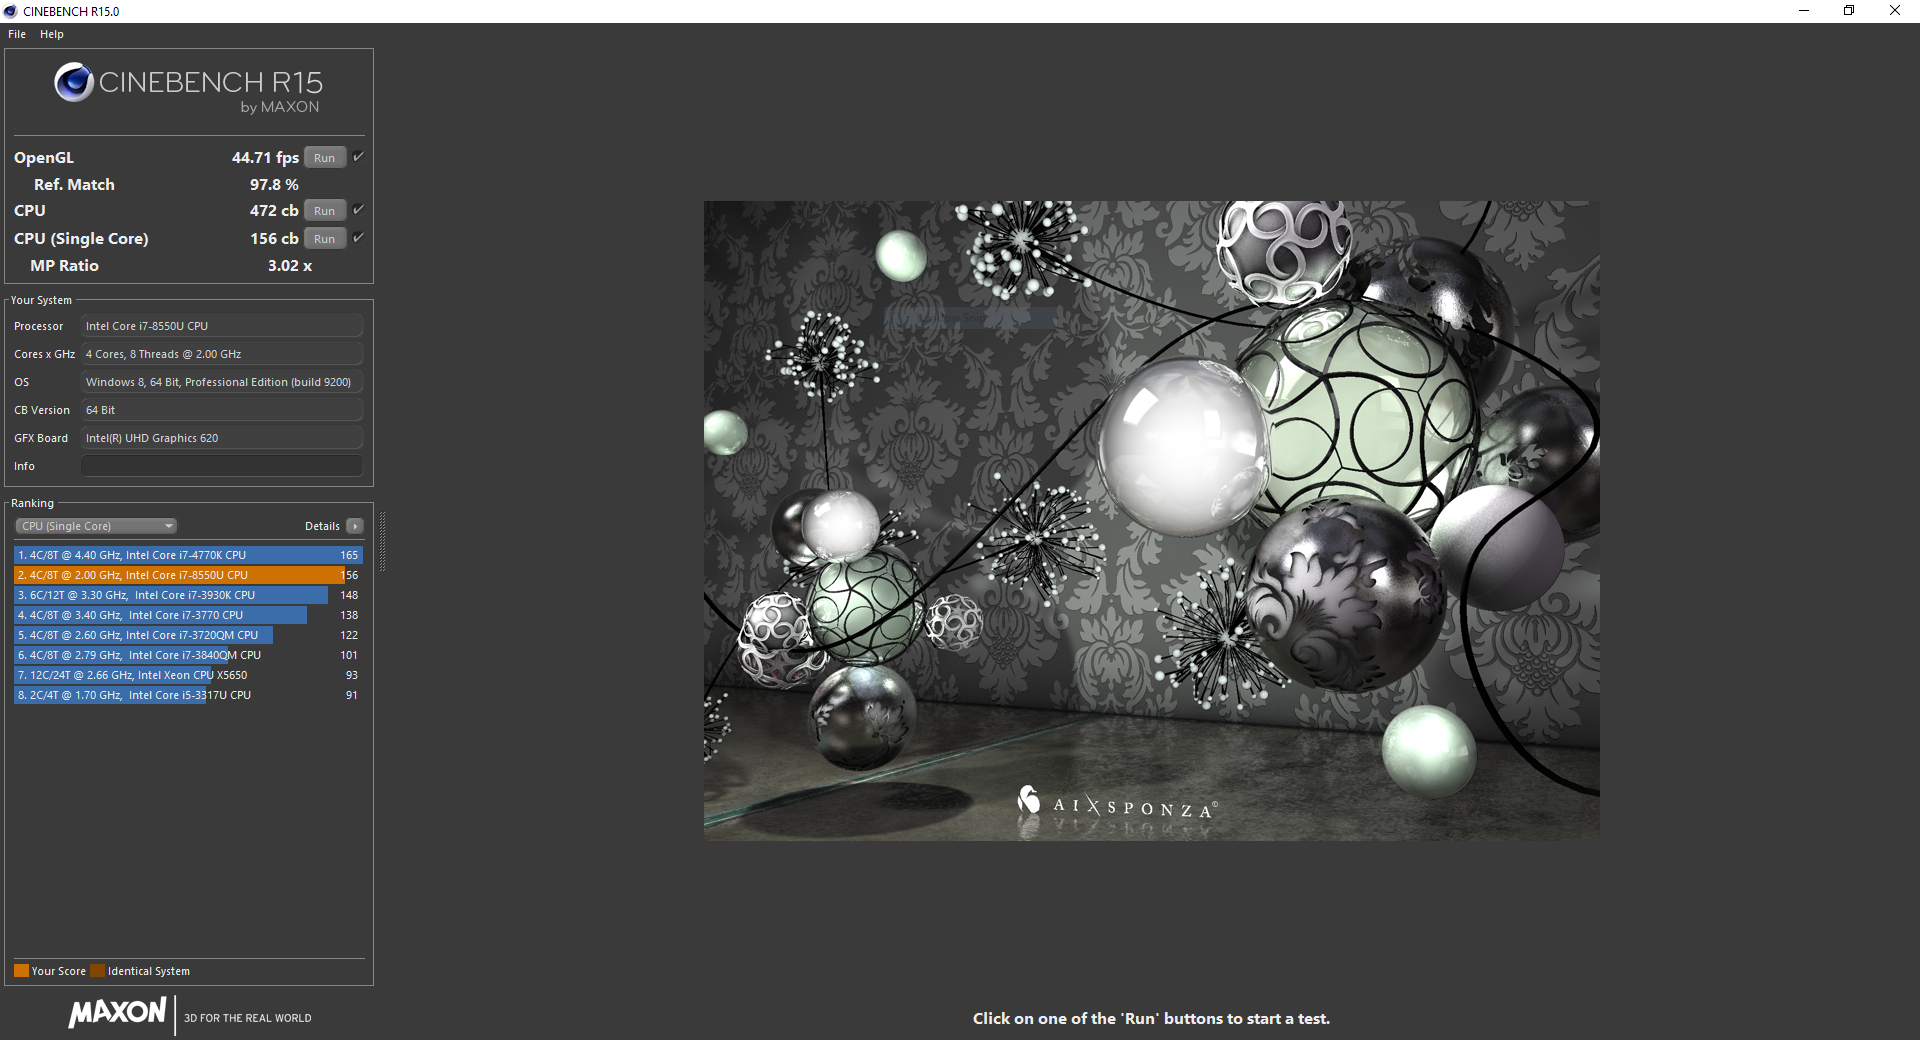
Unfortunately, thee TravelMate X3410 can't keep up with the competition. In Cinebench, the TravelMate shows decent single-core performance. Multi-threaded performance is very weak, though. With a score of 472, the TravelMate falls almost 20% behind other 8550U-equipped Ultrabooks. The culprit is likely intentional throttling by Acer; as we will see in our stress test below, the CPU can't seem to hold on to its rated boost of 4.0 GHz for long.
The lower performance has one benefit: long-term performance is relatively stable. Aside from an odd drop halfway through our Cinebench R15 loop test, the TravelMate manages a consistent score over 30 runs through the benchmark. Performance is unchanged when the TravelMate is on battery power.
For more information about the Intel Core i7-8550U, please see our dedicated processor page here.
| wPrime 2.10 - 1024m | |
| Average of class Office (274 - 675, n=7, last 2 years) | |
| Average Intel Core i7-8550U (258 - 435, n=11) | |
| Lenovo IdeaPad 330-15ICH | |
| MSI P65 8RF-451 - Creator | |
* ... smaller is better
System Performance
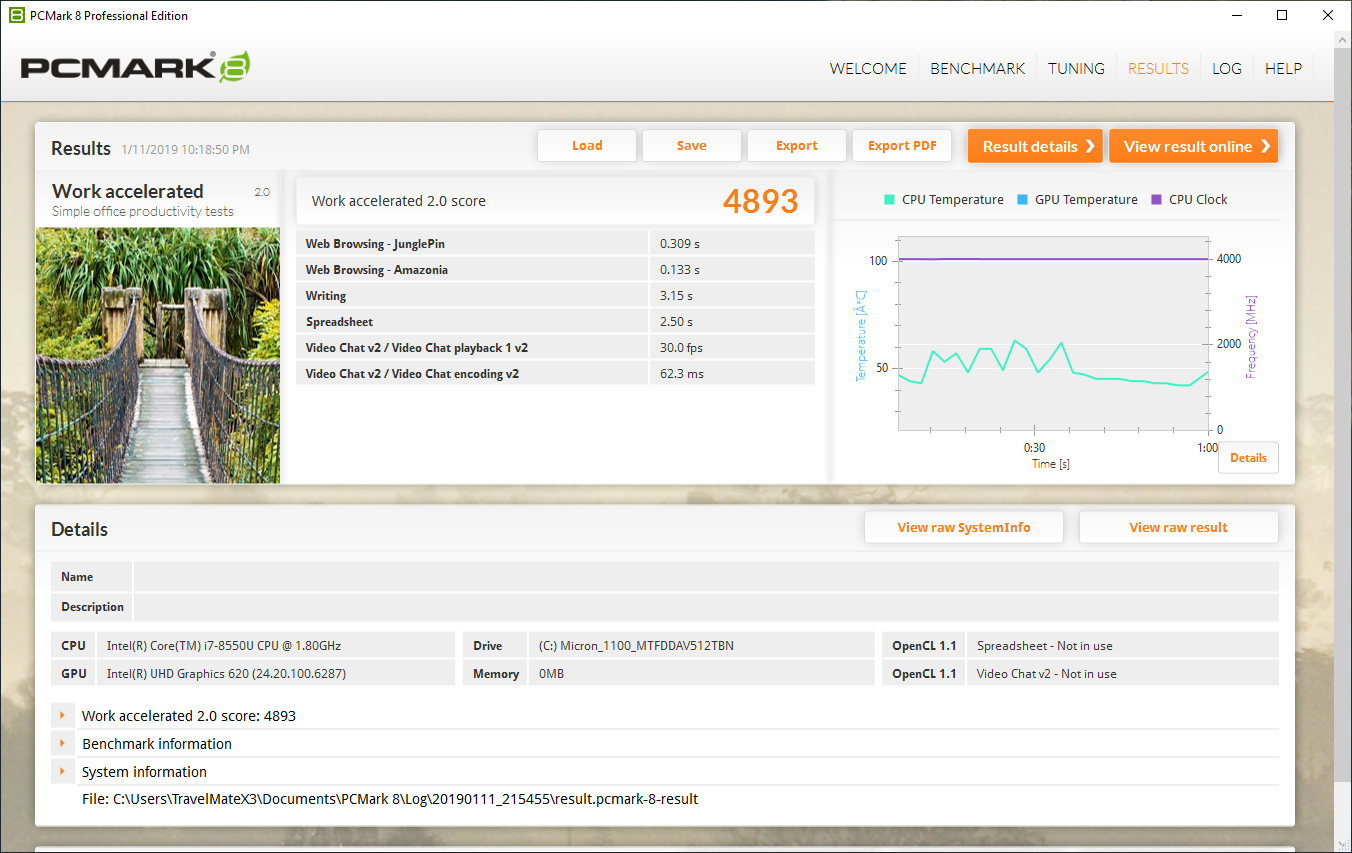
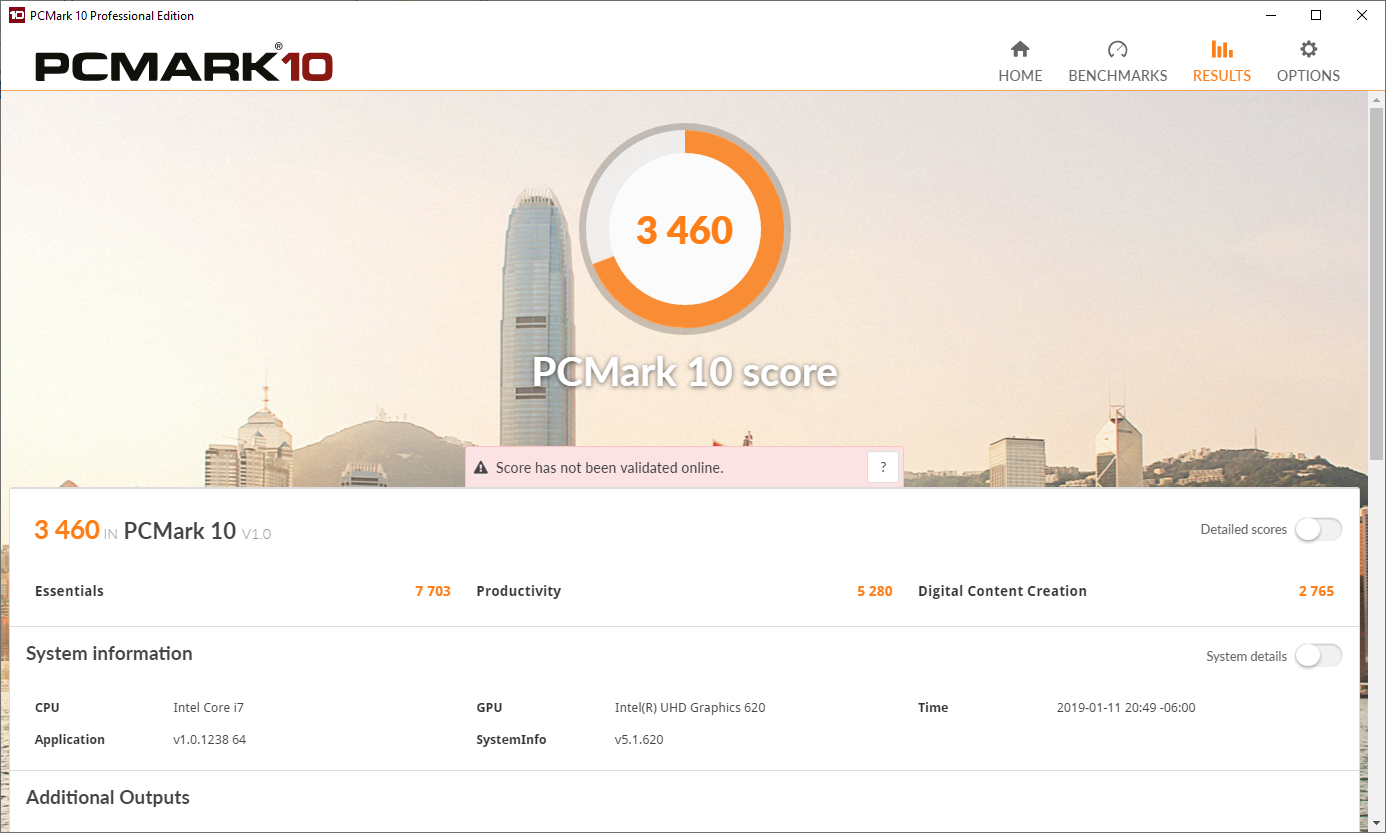
Overall system performance is adequate. In a vacuum, the TravelMate is responsive and quick. The machine can handle any office work or light tasks thrown at it. Heavier workloads will require patience. Compared to other office Ultrabooks, the TravelMate feels much slower. The CPU throttling we observed earlier is partly to blame, but so is the slower SATA SSD. Most modern Ultrabooks use an NVMe drive, which is noticeably faster than the aging SATA standard used by the TravelMate. All said, the TravelMate is perfectly adequate for most office work, but there are quicker devices readily available. Lenovo's ThinkPad line come to mind.
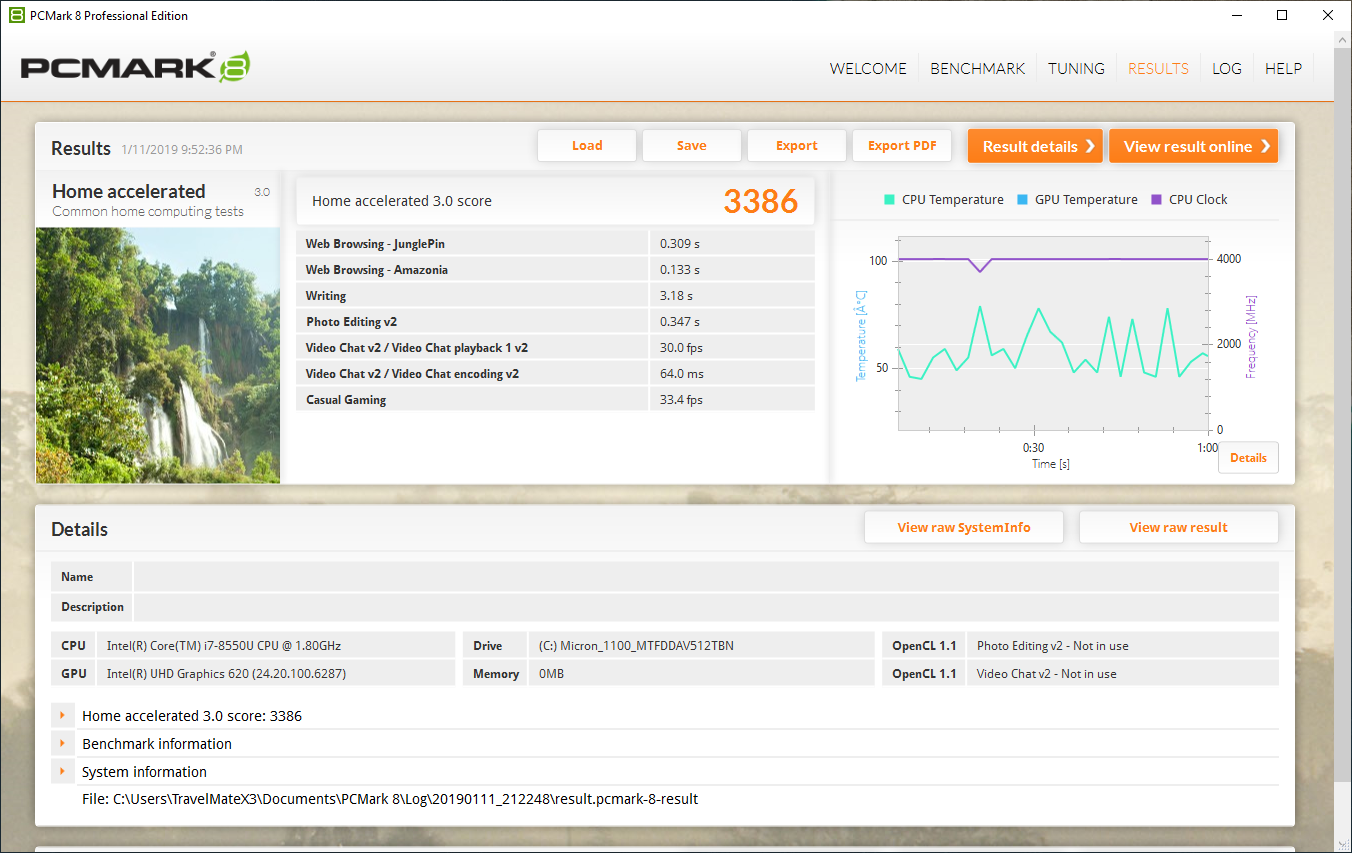
| PCMark 8 Home Score Accelerated v2 | 3386 points | |
| PCMark 8 Work Score Accelerated v2 | 4893 points | |
| PCMark 10 Score | 3460 points | |
Help | ||
Storage Devices
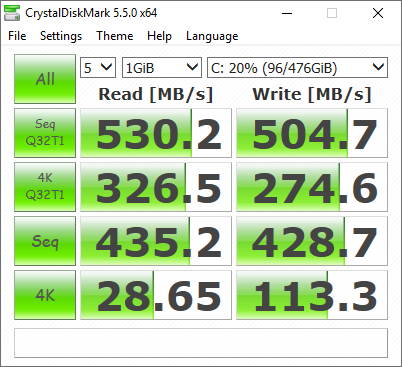
As we mentioned above, the TravelMate X3410 employs a SATA SSD rather than a faster PCIe NVMe drive. The choice of drive was likely made as a cost-cutting measure, but the drive is noticeably slower than those of competitors. The Samsung PM981 NVMe SSD used in Lenovo's latest ThinkPad devices is about four times faster than the Micron 1100 SATA SSD in the TravelMate. In daily use, the TravelMate will feel responsive and apps will load quickly, but those used to NVMe drives may grow impatient with the X3410.
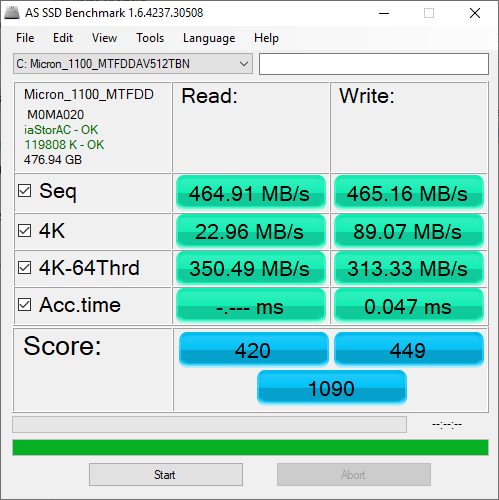
| Acer TravelMate X3410-M-866T Micron SSD 1100 SED 512GB, M.2 (MTFDDAV512TBN) | Lenovo ThinkPad T480-20L50010US Samsung SSD PM981 MZVLB512HAJQ | Lenovo ThinkPad T480s-20L8S02E00 Samsung SSD PM981 MZVLB512HAJQ | Lenovo ThinkPad X1 Carbon 2018-20KGS5DU00 Samsung SSD PM981 MZVLB512HAJQ | Toshiba Portege X30T-E-109 Samsung SSD PM981 MZVLB1T0HALR | Toshiba Tecra X40-D Samsung PM961 MZVLW256HEHP | Dell Latitude 7490 Toshiba KSG60ZMV256G | HP EliteBook 840 G5-3JX61EA Toshiba KXG50ZNV1T02 | Average Micron SSD 1100 SED 512GB, M.2 (MTFDDAV512TBN) | |
|---|---|---|---|---|---|---|---|---|---|
| AS SSD | 225% | 229% | 153% | 255% | 184% | -12% | 124% | -11% | |
| Seq Read (MB/s) | 464.9 | 1420 205% | 2440 425% | 2399 416% | 2276 390% | 2479 433% | 486.2 5% | 2300 395% | 467 ? 0% |
| Seq Write (MB/s) | 465.2 | 1341 188% | 1382 197% | 1343 189% | 2331 401% | 1117 140% | 294.9 -37% | 856 84% | 436 ? -6% |
| 4K Read (MB/s) | 22.96 | 50.5 120% | 49.81 117% | 46.21 101% | 51.4 124% | 51.6 125% | 26.66 16% | 26.75 17% | 22.8 ? -1% |
| 4K Write (MB/s) | 89.1 | 107.4 21% | 114.4 28% | 109.4 23% | 128.6 44% | 124.8 40% | 79.2 -11% | 90 1% | 73.7 ? -17% |
| 4K-64 Read (MB/s) | 350.5 | 1447 313% | 1329 279% | 664 89% | 1561 345% | 1663 374% | 316.1 -10% | 813 132% | 314 ? -10% |
| 4K-64 Write (MB/s) | 313.3 | 1704 444% | 1456 365% | 1020 226% | 1273 306% | 438.4 40% | 248.1 -21% | 908 190% | 254 ? -19% |
| Access Time Read * (ms) | 0.045 | 0.045 | 0.056 | 0.044 | 0.061 | 0.112 | 0.059 | 0.071 ? | |
| Access Time Write * (ms) | 0.047 | 0.035 26% | 0.033 30% | 0.033 30% | 0.03 36% | 0.028 40% | 0.056 -19% | 0.055 -17% | 0.056 ? -19% |
| Score Read (Points) | 420 | 1639 290% | 1623 286% | 950 126% | 1840 338% | 1963 367% | 391 -7% | 1070 155% | 384 ? -9% |
| Score Write (Points) | 449 | 1945 333% | 1708 280% | 1264 182% | 1635 264% | 675 50% | 357 -20% | 1084 141% | 371 ? -17% |
| Score Total (Points) | 1090 | 4425 306% | 4115 278% | 2659 144% | 4424 306% | 3576 228% | 947 -13% | 2630 141% | 956 ? -12% |
| Copy ISO MB/s (MB/s) | 1412 | 1688 | 263 ? | ||||||
| Copy Program MB/s (MB/s) | 387.5 | 326.2 | 174.4 ? | ||||||
| Copy Game MB/s (MB/s) | 1110 | 905 | 222 ? | ||||||
| CrystalDiskMark 5.2 / 6 | 94% | 232% | 171% | 209% | 189% | -18% | 138% | -8% | |
| Write 4K (MB/s) | 113.3 | 123.2 9% | 144.2 27% | 98.6 -13% | 137.6 21% | 195.1 72% | 79.4 -30% | 96.1 -15% | 95.5 ? -16% |
| Read 4K (MB/s) | 28.65 | 44.43 55% | 45.55 59% | 39.75 39% | 47.05 64% | 48.5 69% | 27.37 -4% | 31.12 9% | 27.1 ? -5% |
| Write Seq (MB/s) | 428.7 | 845 97% | 1803 321% | 1757 310% | 2372 453% | 1226 186% | 343.9 -20% | 919 114% | 422 ? -2% |
| Read Seq (MB/s) | 435.2 | 865 99% | 2335 437% | 1169 169% | 1568 260% | 1763 305% | 472.7 9% | 2089 380% | 448 ? 3% |
| Write 4K Q32T1 (MB/s) | 274.6 | 287.3 5% | 701 155% | 333.8 22% | 204.5 -26% | 547 99% | 206 -25% | 425.6 55% | 239 ? -13% |
| Read 4K Q32T1 (MB/s) | 326.5 | 360.9 11% | 442.4 35% | 268 -18% | 350.8 7% | 633 94% | 188.3 -42% | 275.3 -16% | 284 ? -13% |
| Write Seq Q32T1 (MB/s) | 505 | 1718 240% | 1917 280% | 2069 310% | 2395 374% | 1226 143% | 343.3 -32% | 958 90% | 469 ? -7% |
| Read Seq Q32T1 (MB/s) | 530 | 1779 236% | 3399 541% | 3426 546% | 3286 520% | 3421 545% | 533 1% | 3118 488% | 479 ? -10% |
| Total Average (Program / Settings) | 160% /
167% | 231% /
230% | 162% /
161% | 232% /
235% | 187% /
186% | -15% /
-14% | 131% /
130% | -10% /
-10% |
* ... smaller is better

GPU Performance
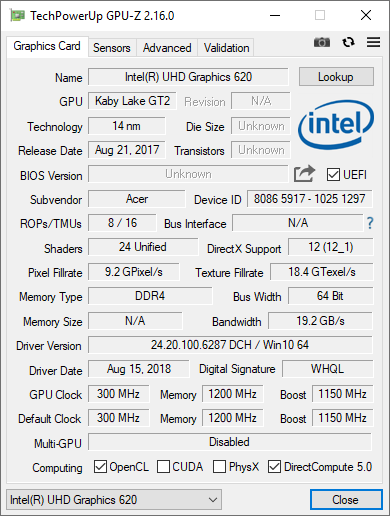
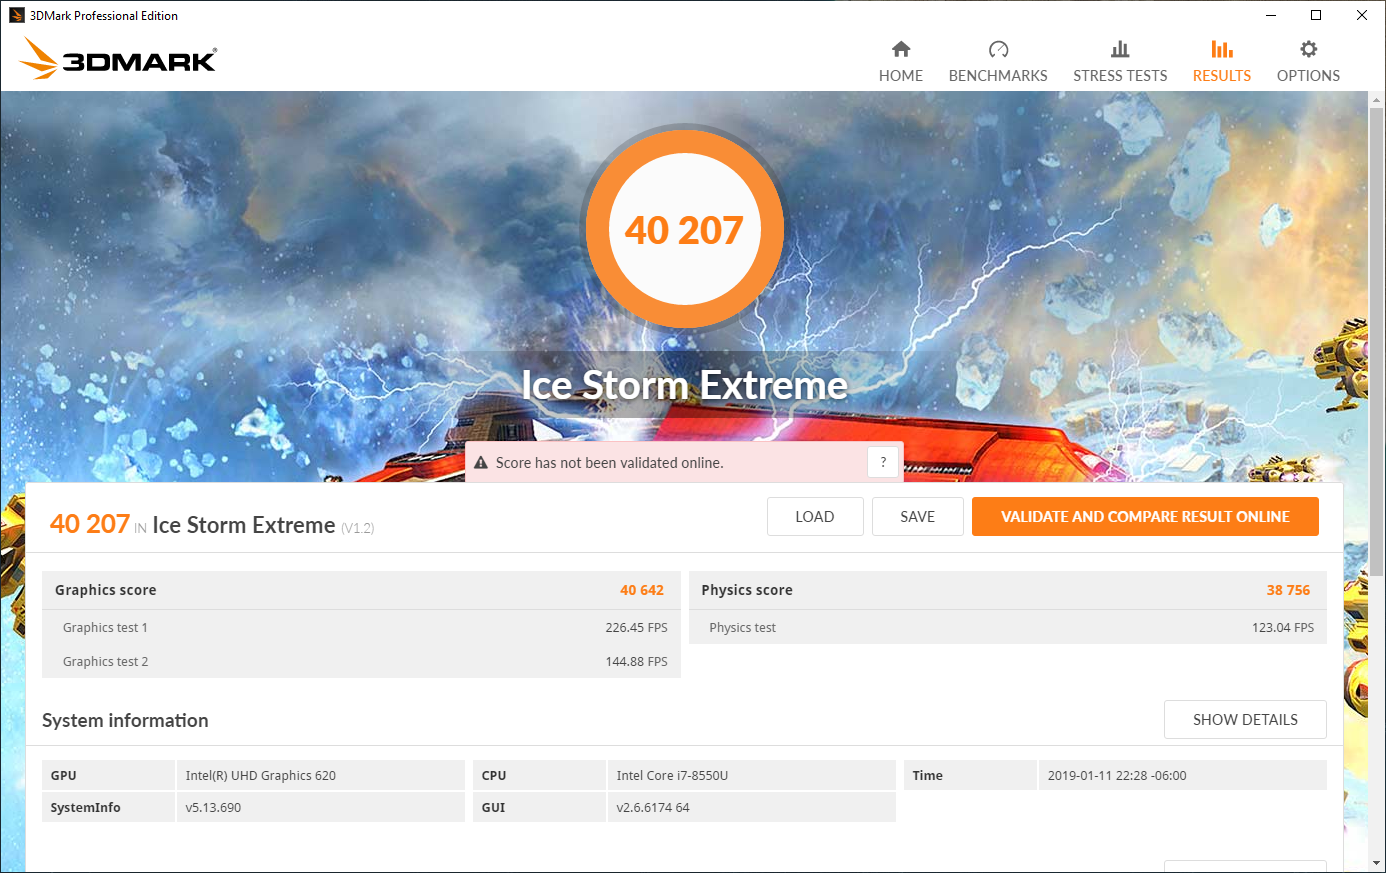
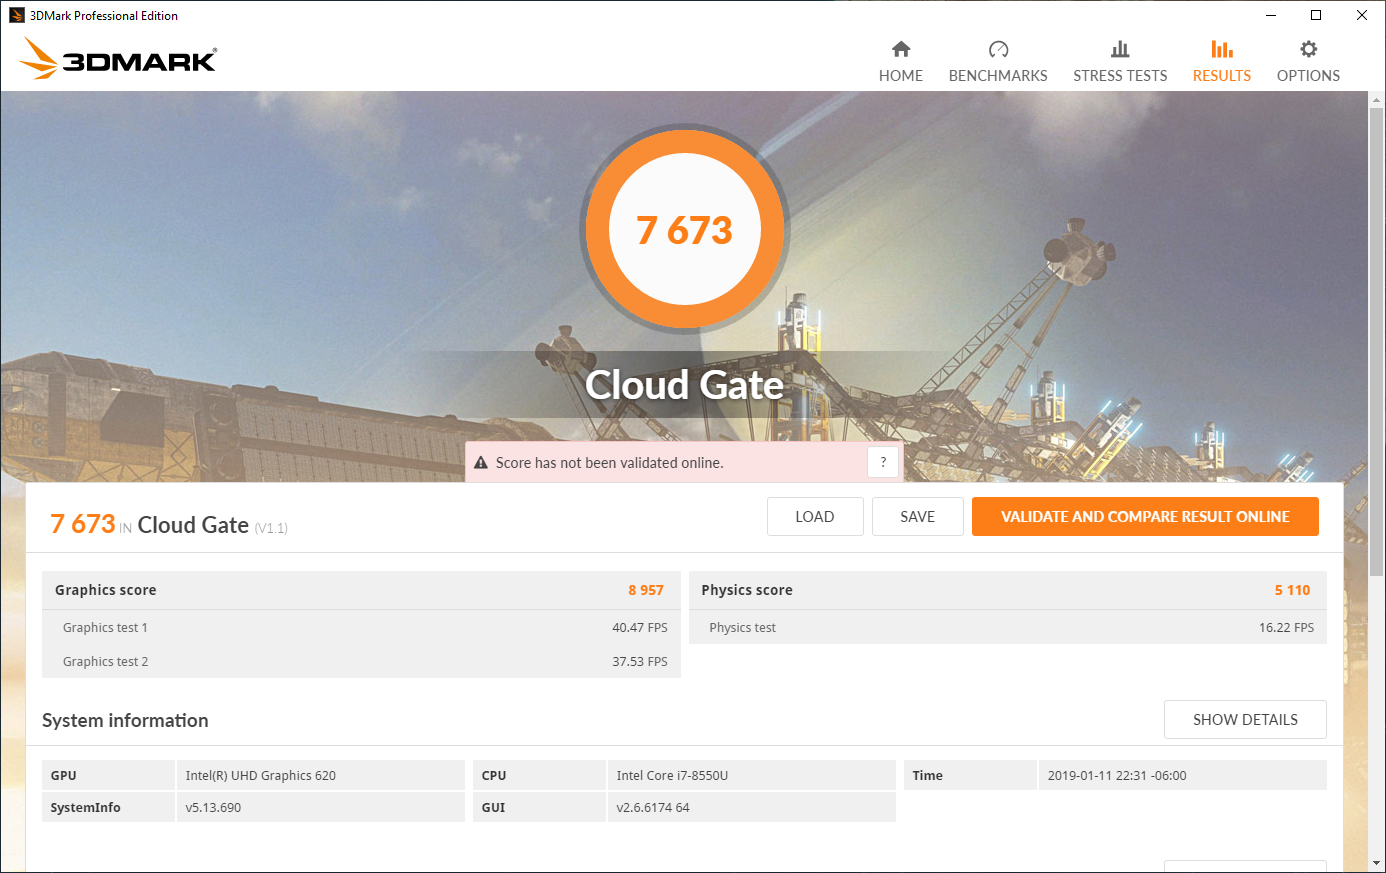
The Intel UHD Graphics 620 is a reasonable integrated GPU for office laptops. Unlike the CPU, the iGPU seems to run at expected speeds and offers expected performance. That said, the UHD Graphics 620 chip is not known as a graphical powerhouse. Its main purpose is to process pre-rendered media (e.g., Netflix streaming at 4K) and support up to two external monitors in addition to the built-in display. The iGPU can support a single 4K monitor at 60 Hz but only through a DisplayPort. As the TravelMate only has an HDMI port and a VGA hookup, 4K at 24 Hz is as high as the device can go.
As far as graphically intense workloads, the Intel UHD Graphics 620 chip performs as well as can be expected. That is to say, the iGPU is not designed for rendering, photo/video editing, or other graphical workloads.
For more about the Intel UHD Graphics 620 iGPU, please see our dedicated GPU page here.
| 3DMark 11 Performance | 1702 points | |
| 3DMark Cloud Gate Standard Score | 7673 points | |
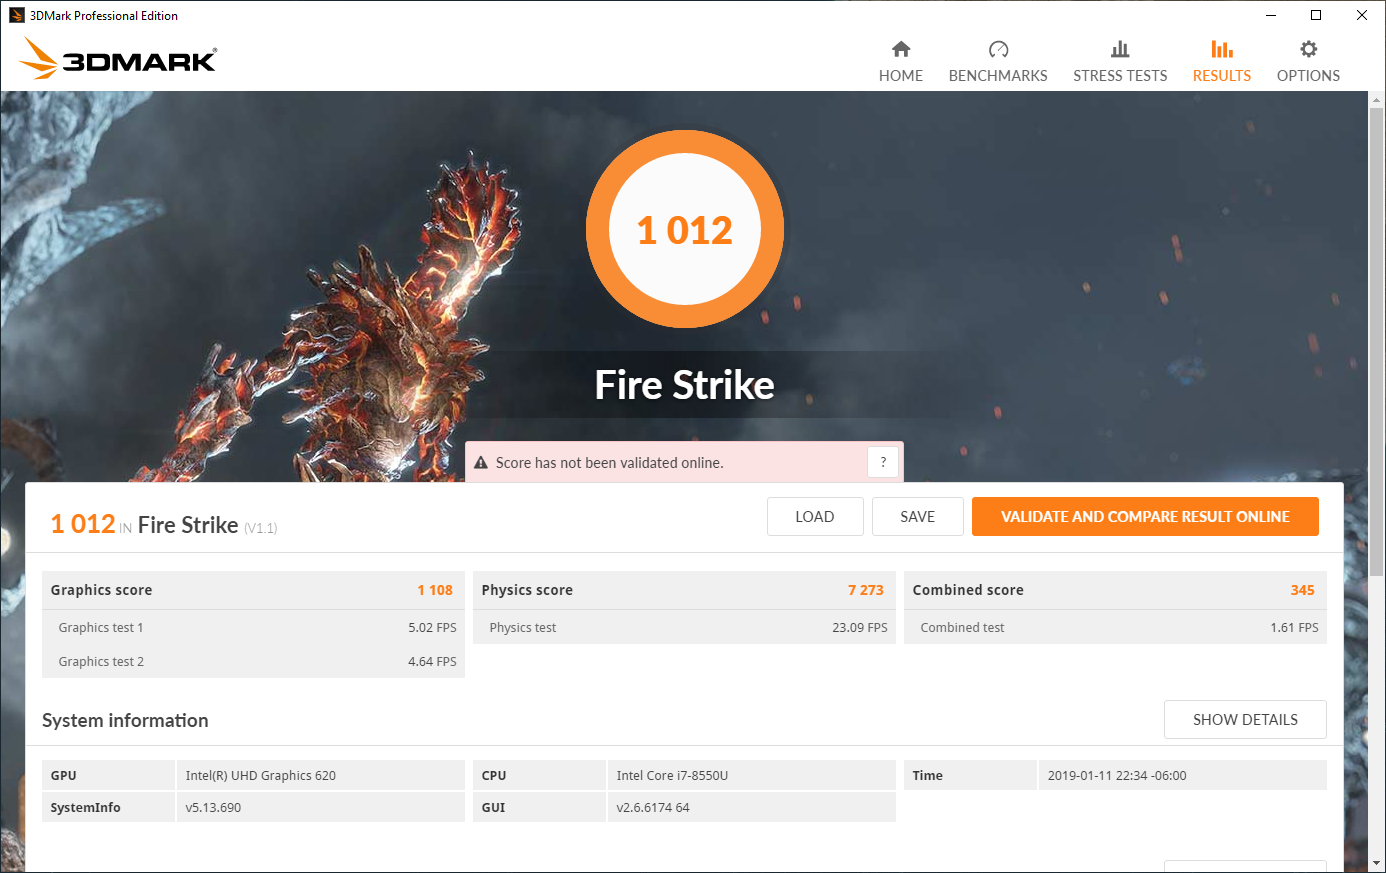
| 3DMark Fire Strike Score | 1012 points | |
Help | ||
Gaming Performance
Gaming is a definite no-go on the TravelMate. Some lighter indie titles like Stardew Valley run well and are smooth, but modern 3D titles are practically unplayable. Even older games like BioShock Infinite strain the iGPU; the game is somewhat playable at low settings and 1024x768 resolution, but pushing the dials any higher results in a bad experience. Stick to light 2D titles.
| low | med. | high | ultra | |
|---|---|---|---|---|
| BioShock Infinite (2013) | 46 | 32 | 26 | 16 |
Emissions
System Noise
The single fan is well-tuned and inoffensive, but the system's fan curve is aggressive. Under light workloads, the fan remains off and the system is silent save for a bit of coil whine (heard from about 1.5 feet away from the device). Under a standard workload, the fan turns on intermittently for about 30 seconds before shutting off for a few minutes.
Heavier workloads cause the fan to stay on permanently and pulse between 33 and 36 dB(A). The fan will burst up to 36 dB(A) for about a half minute before ramping back down to 32-33 dB(A) for a period. Thankfully, the fan has a low pitch that blends in with normal background noise.
Noise level
| Idle |
| 28.2 / 28.2 / 28.2 dB(A) |
| Load |
| 33.2 / 35.6 dB(A) |
 | ||
30 dB silent 40 dB(A) audible 50 dB(A) loud |
||
min: | ||
Temperature
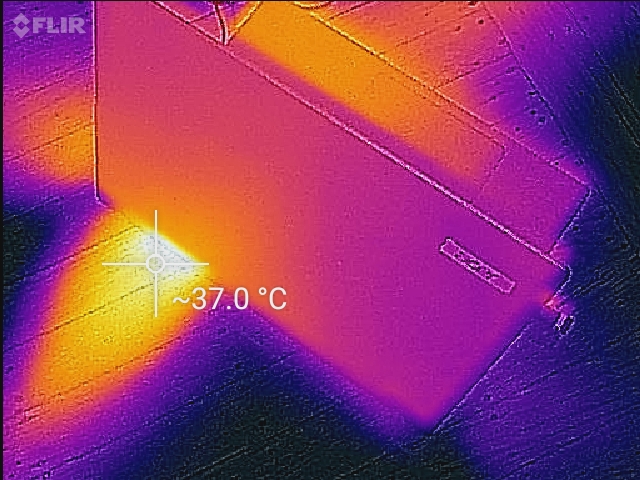
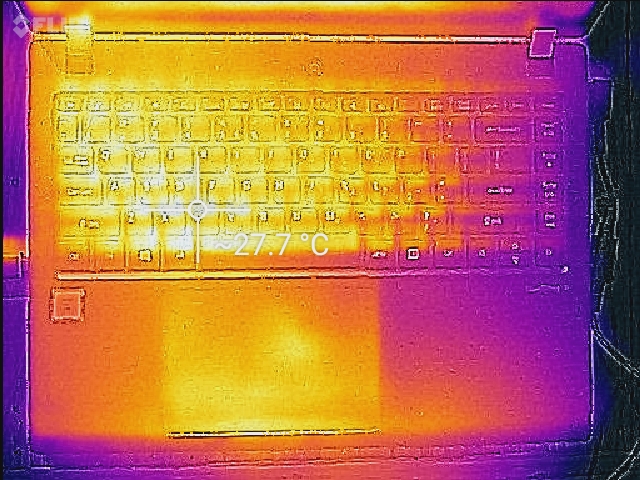
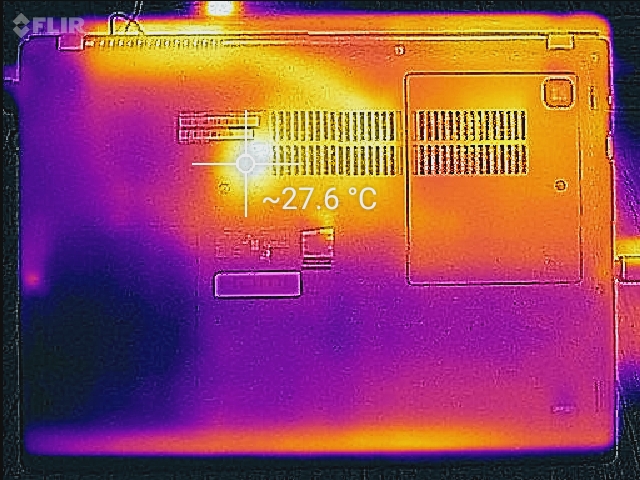
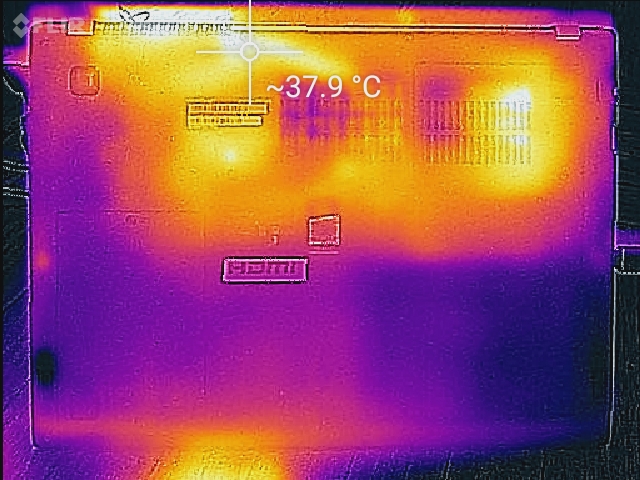
Temperatures across the device are excellent. The outside case never eclipses 40° C, even under full stress. The hottest part of the chassis is on the bottom panel directly over the CPU. This spot only gets warm to the touch. Lap use is thus possible under most workloads, although knees may get a bit clammy.
Internal temperatures are equally well-managed, almost to a fault. Under CPU and GPU stress, the system indeed throttles heavily; Prime95 keeps the CPU near its base clock, while FurMark brings the processor even lower to 1.0-1.2 GHz. Unigine Valley, a more realistic workload, sees better clocks; the CPU hovers between 2.8-3.1 GHz while the GPU sits at its rated boost of 1150 MHz.
The heavy throttling under the synthetic benchmarks (i.e., Prime95 and FurMark) is curious. Temperatures across the CPU die stay between 62-64°C. There is plenty of thermal headroom to push the chip further. Instead, the TravelMate throttles back quite a bit when synthetically stressed. Unigine Valley produces results we would expect from the CPU, but synthetics cripple the system. Acer may have been too aggressive with CPU management.
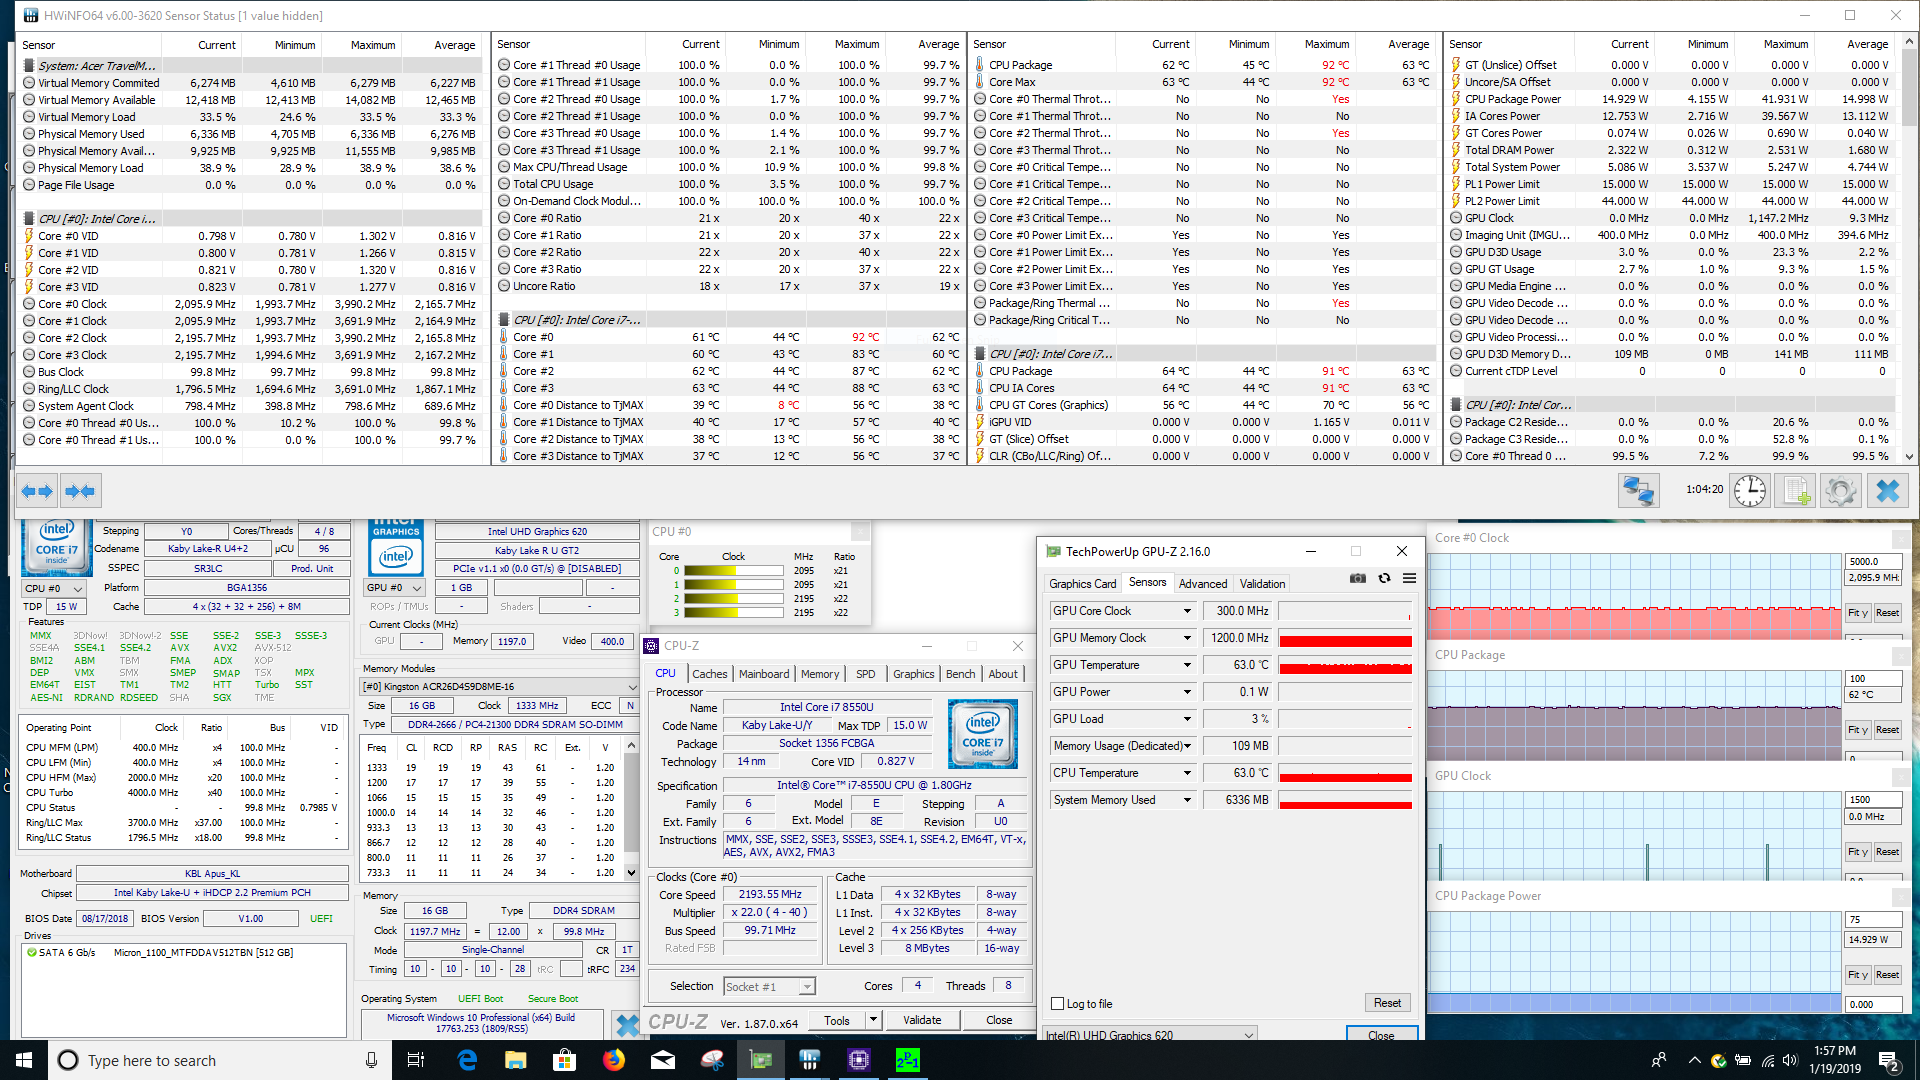
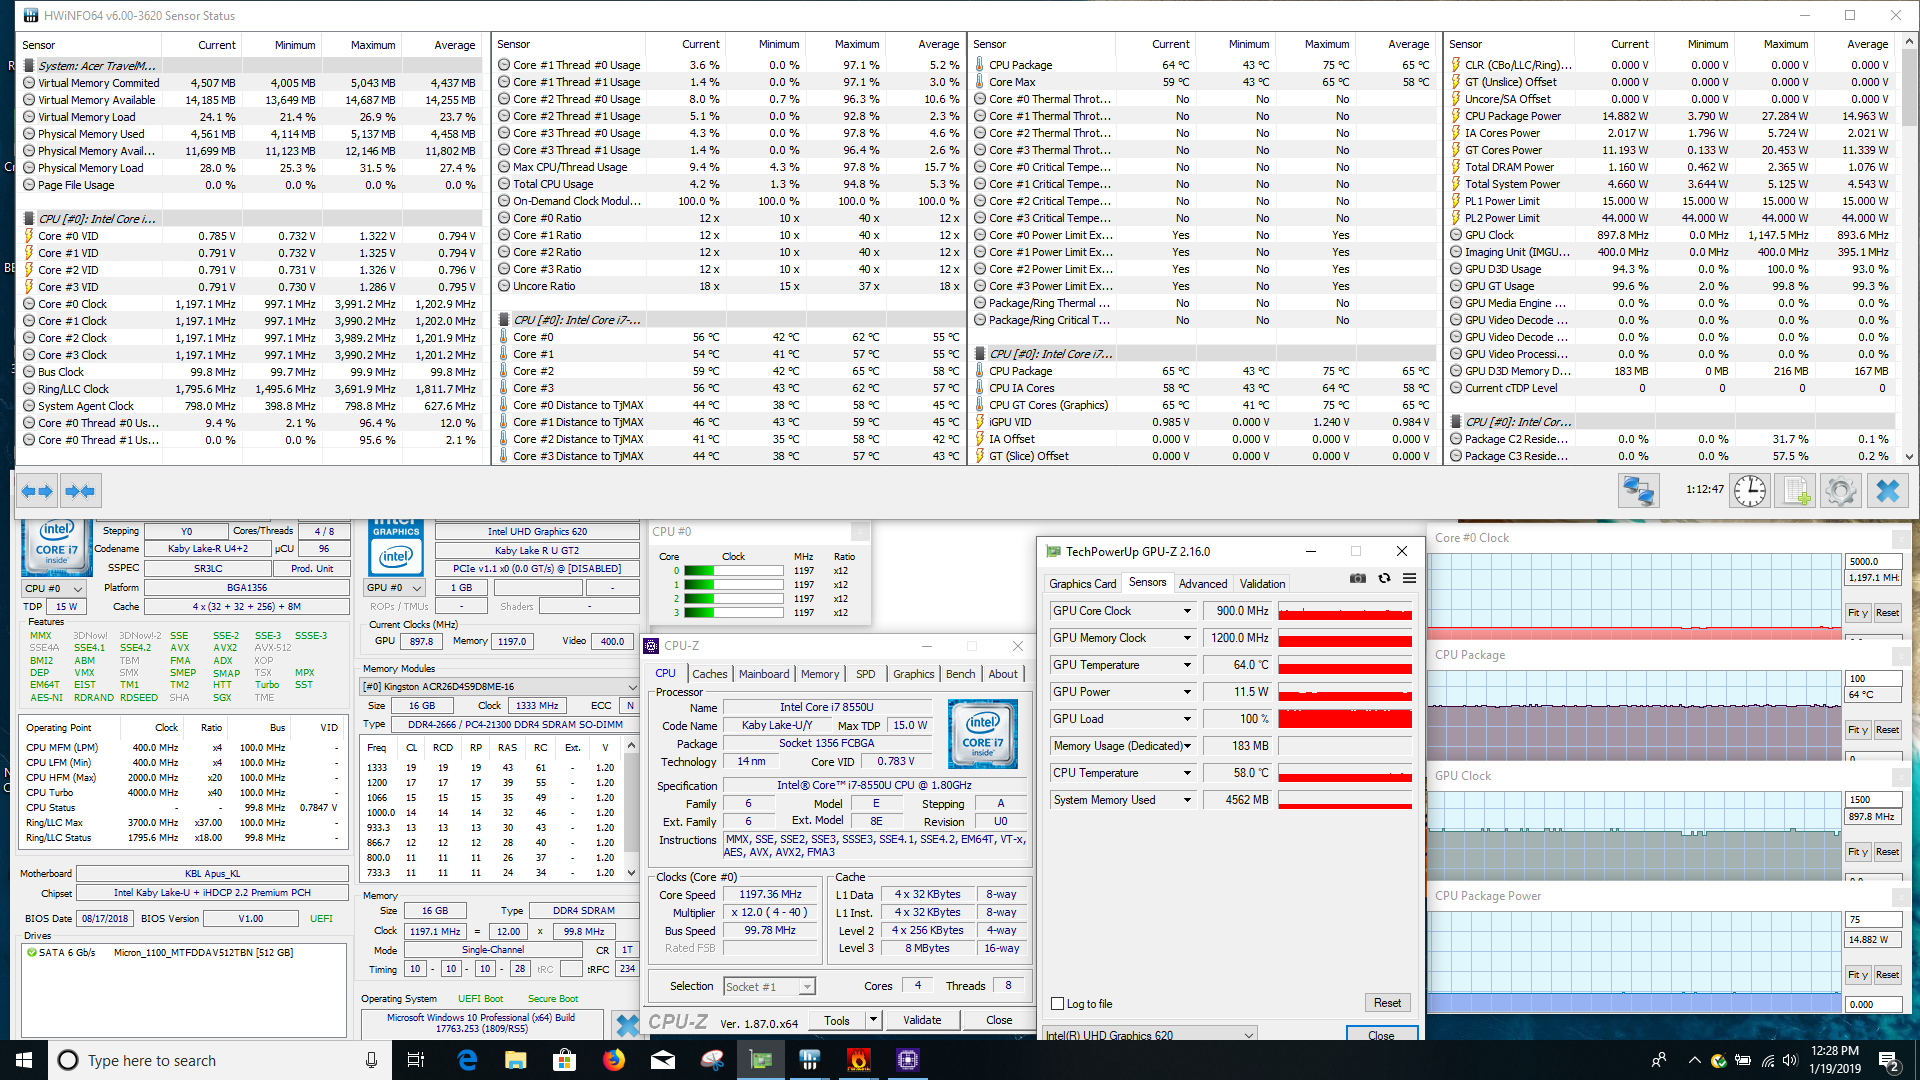
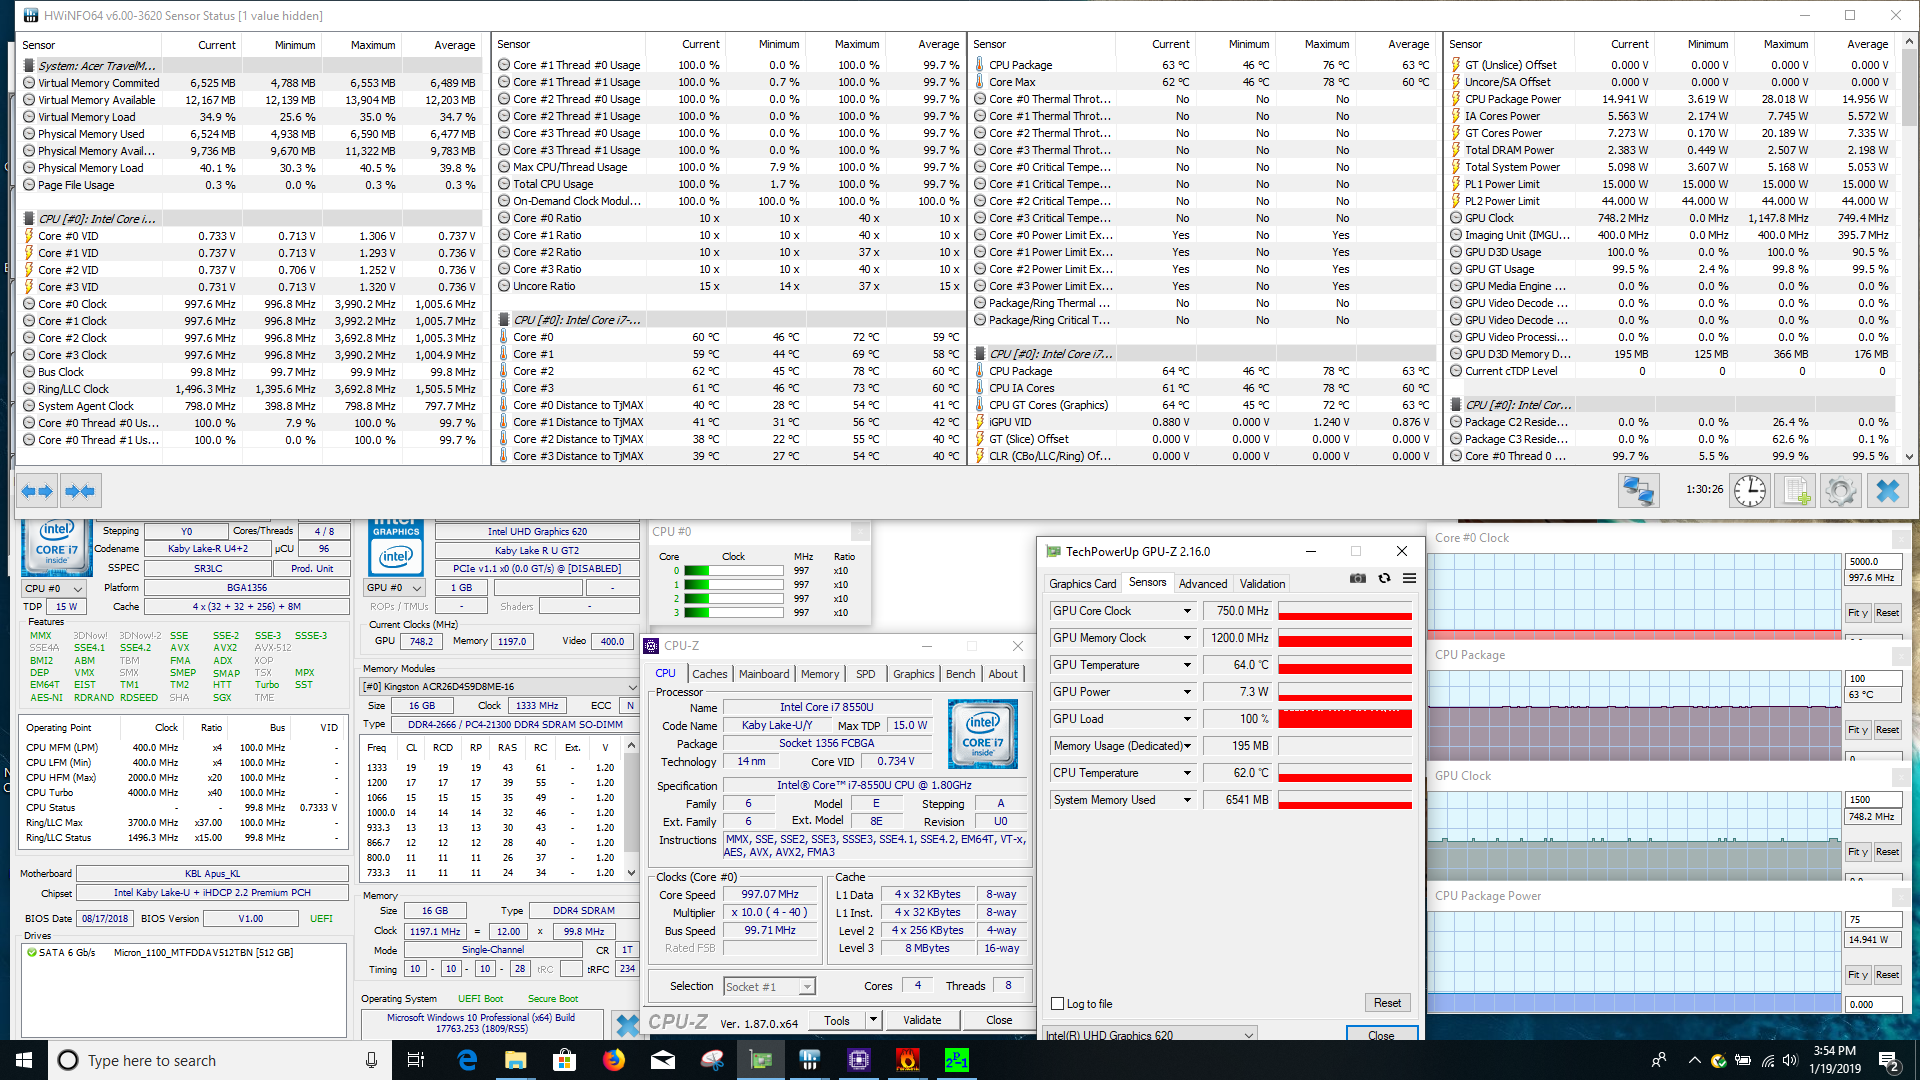
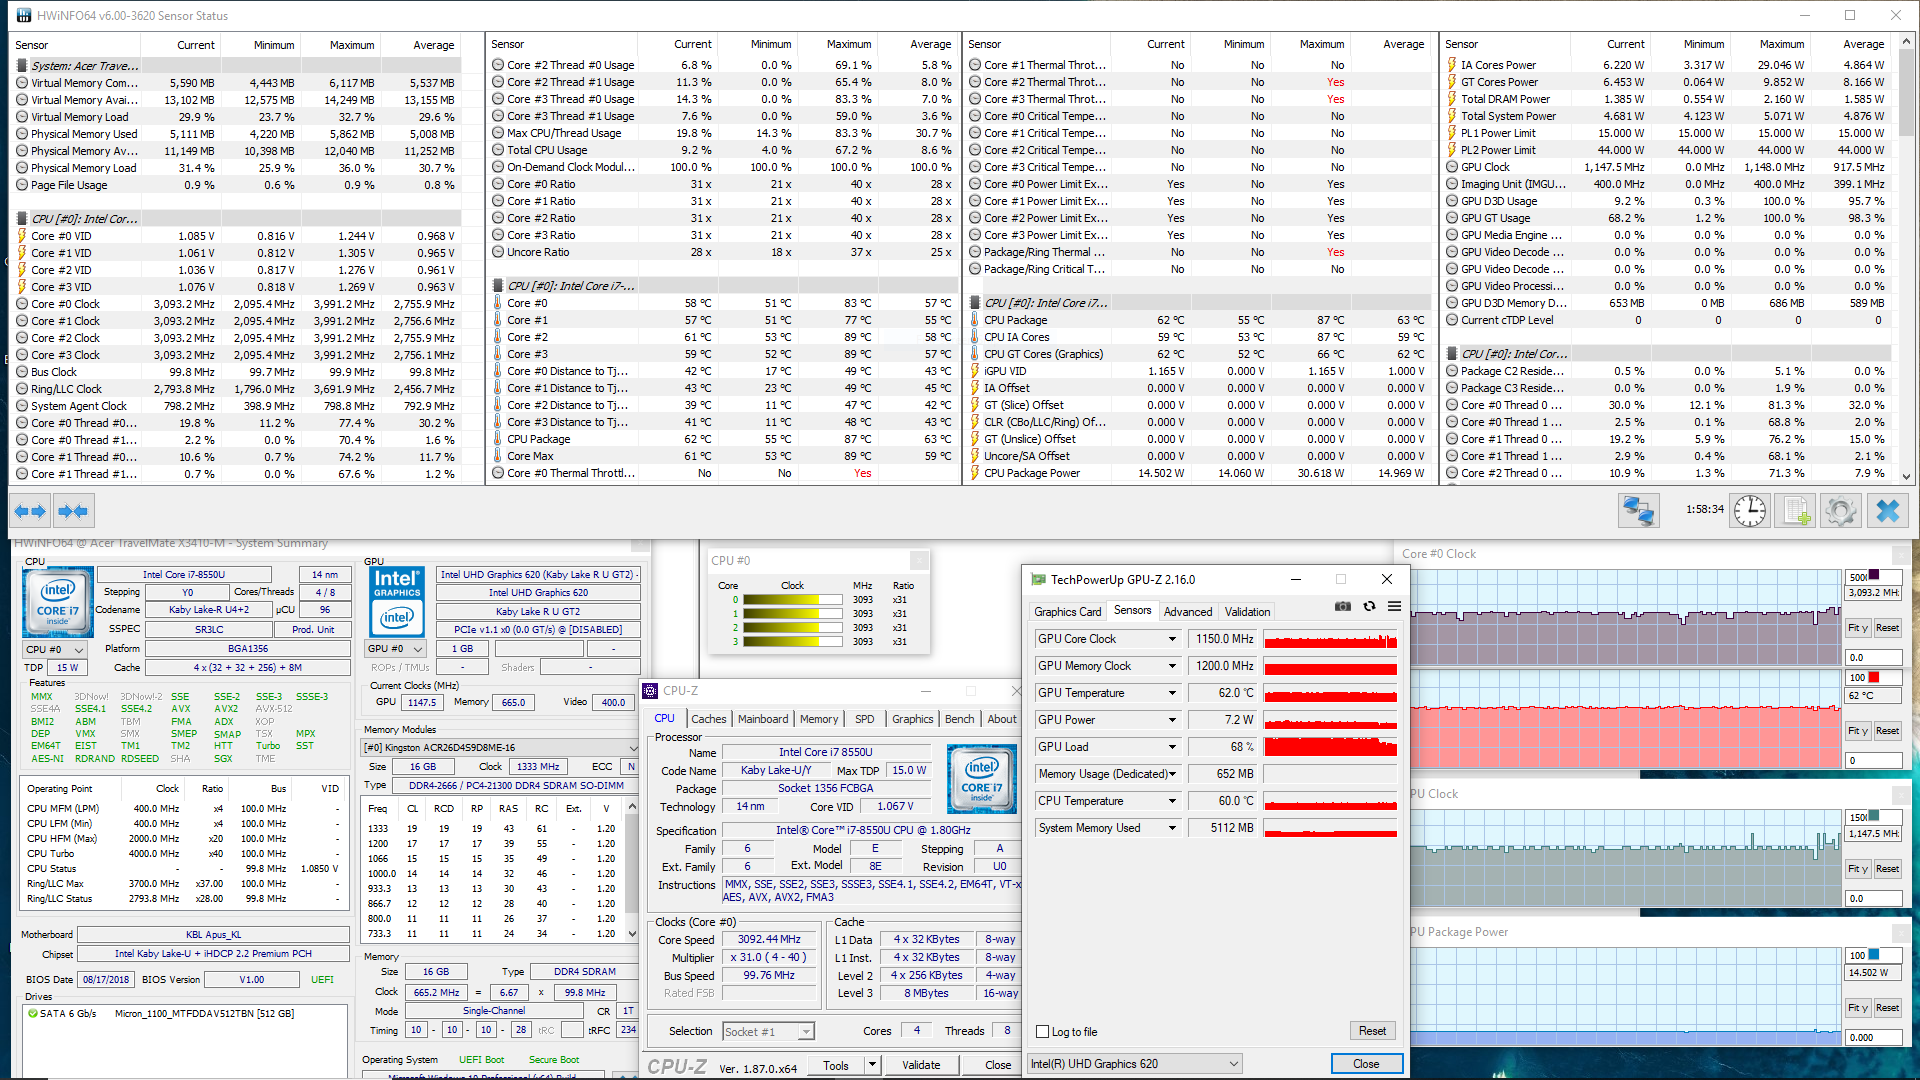
| CPU Clock (GHz) | GPU Clock (MHz) | Average CPU Temperature (°C) | Average GPU Temperature (°C) | |
| Prime95 Stress | 2.1 | - | 62 | 62 |
| FurMark Stress | 1.2 | 900 | 64 | 64 |
| Prime95 + FurMark Stress | 1.0 | 750 | 63 | 63 |
| Unigine Valley Stress | 2.8-3.1 | 1150 | 62 | 62 |
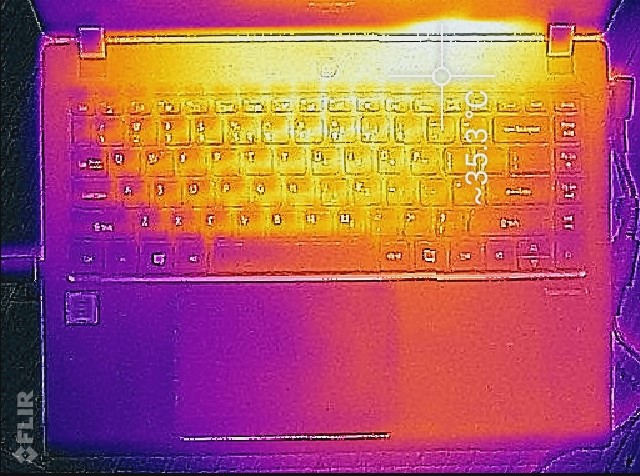
(+) The maximum temperature on the upper side is 35.2 °C / 95 F, compared to the average of 34.3 °C / 94 F, ranging from 21.2 to 62.5 °C for the class Office.
(+) The bottom heats up to a maximum of 39.4 °C / 103 F, compared to the average of 36.8 °C / 98 F
(+) In idle usage, the average temperature for the upper side is 25.7 °C / 78 F, compared to the device average of 29.5 °C / 85 F.
(+) The palmrests and touchpad are cooler than skin temperature with a maximum of 27.8 °C / 82 F and are therefore cool to the touch.
(±) The average temperature of the palmrest area of similar devices was 27.5 °C / 81.5 F (-0.3 °C / -0.5 F).
Speakers

The speakers are typical for a business-class notebook, but that's not a good thing. The down-firing speakers don't get very loud and are very tinny. Bass is almost non-existent up through the mid-range registers, making the overall sound feel thin and weak. The speakers also distort at higher volumes (~85% and higher), further impeding the overall sound profile.
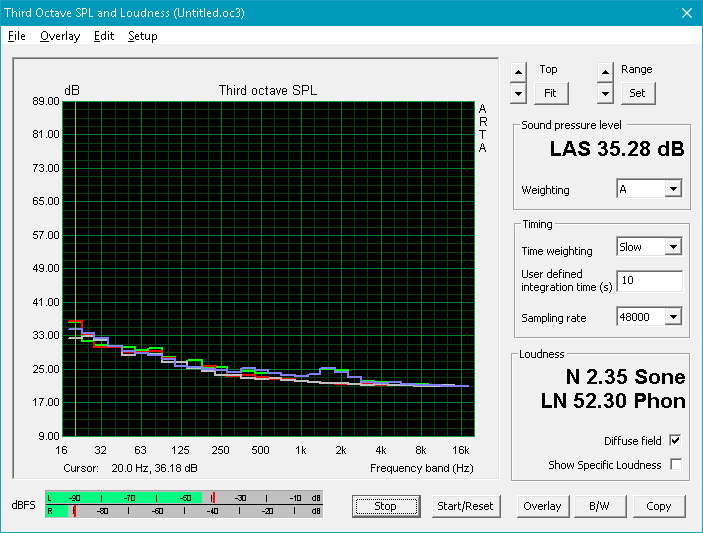
Acer TravelMate X3410-M-866T audio analysis
(-) | not very loud speakers (64.1 dB)
Bass 100 - 315 Hz
(-) | nearly no bass - on average 18.4% lower than median
(±) | linearity of bass is average (13% delta to prev. frequency)
Mids 400 - 2000 Hz
(+) | balanced mids - only 4% away from median
(±) | linearity of mids is average (8.7% delta to prev. frequency)
Highs 2 - 16 kHz
(+) | balanced highs - only 2.4% away from median
(±) | linearity of highs is average (8.5% delta to prev. frequency)
Overall 100 - 16.000 Hz
(±) | linearity of overall sound is average (25.8% difference to median)
Compared to same class
» 78% of all tested devices in this class were better, 7% similar, 15% worse
» The best had a delta of 7%, average was 21%, worst was 53%
Compared to all devices tested
» 79% of all tested devices were better, 4% similar, 17% worse
» The best had a delta of 4%, average was 24%, worst was 134%
Lenovo ThinkPad T480s-20L8S02E00 audio analysis
(±) | speaker loudness is average but good (78.9 dB)
Bass 100 - 315 Hz
(-) | nearly no bass - on average 19.4% lower than median
(±) | linearity of bass is average (12.1% delta to prev. frequency)
Mids 400 - 2000 Hz
(±) | higher mids - on average 6.5% higher than median
(±) | linearity of mids is average (9.6% delta to prev. frequency)
Highs 2 - 16 kHz
(+) | balanced highs - only 3.5% away from median
(±) | linearity of highs is average (7.6% delta to prev. frequency)
Overall 100 - 16.000 Hz
(±) | linearity of overall sound is average (22.1% difference to median)
Compared to same class
» 57% of all tested devices in this class were better, 8% similar, 34% worse
» The best had a delta of 7%, average was 21%, worst was 53%
Compared to all devices tested
» 64% of all tested devices were better, 6% similar, 30% worse
» The best had a delta of 4%, average was 24%, worst was 134%
Energy Management
Power Consumption
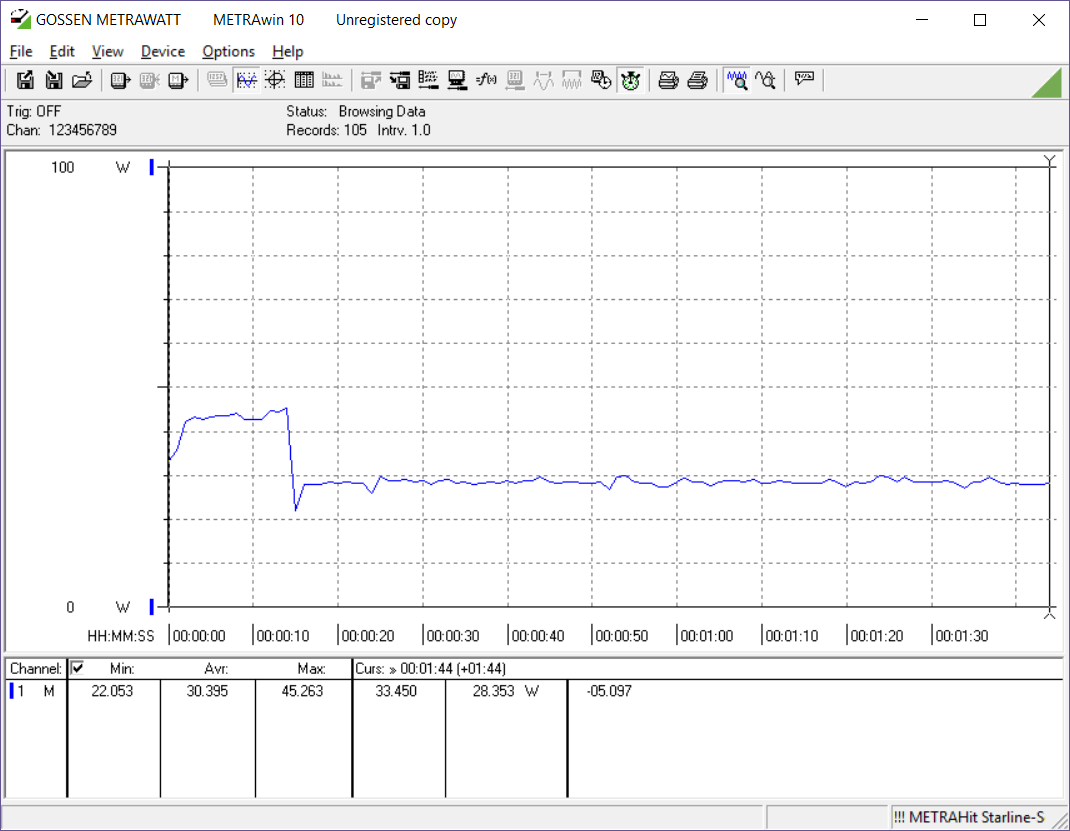
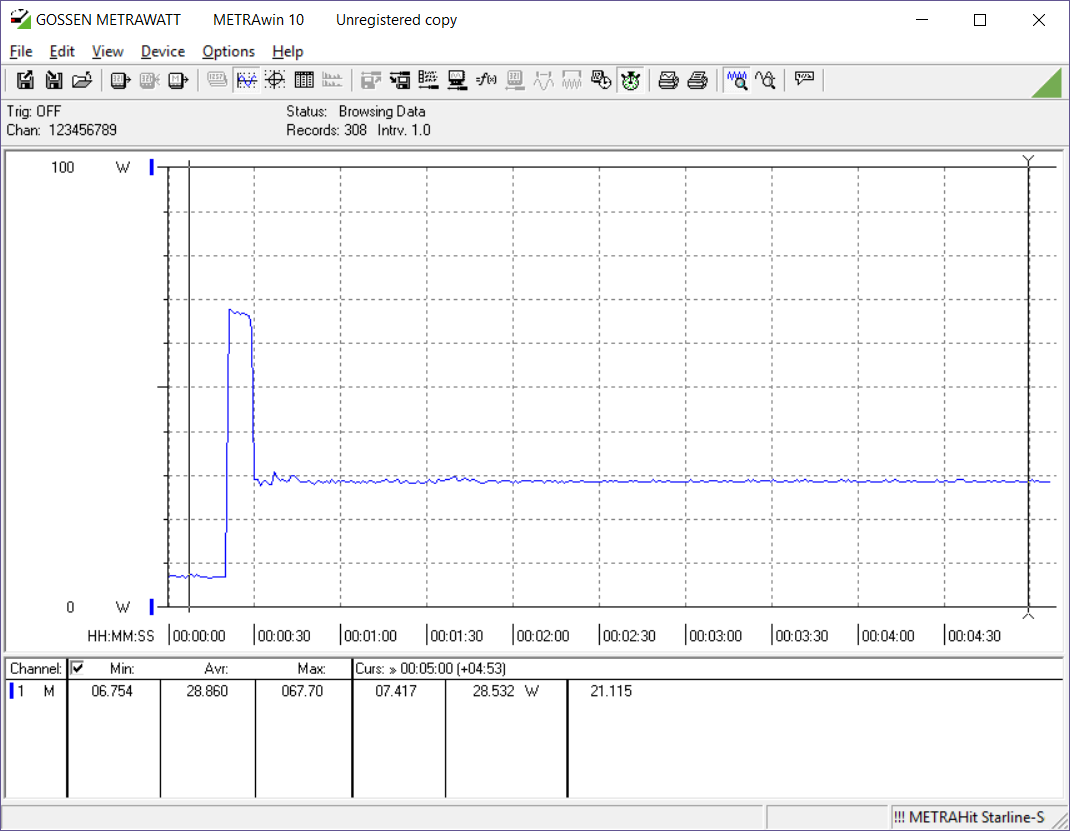
Analyzing power draw gives us a clearer picture of the throttling we've seen in benchmarks. The TravelMate pulls about 30 Watts on average when under load, which is a fair bit less than many other Ultrabooks with 8th gen ULV CPUs. Looking at power draw when running Prime95, there is an initial spike as the benchmark begins followed by an immediate drop, which indicates CPU throttling by reducing power draw. Running 3DMark 06 tells a similar story. Again, this throttling is curious as the TravelMate definitely has the thermal and electrical headroom for higher performance.
The included 65 Watt adapter should be adequate, though the TravelMate can hit or exceed this rating for brief moments under extreme stress. The machine does not stay at these levels for long and quickly drops back down to ~30-35 Watts.
| Off / Standby | |
| Idle | |
| Load |
|
Key:
min: | |
| Acer TravelMate X3410-M-866T i5-8550U, UHD Graphics 620, Micron SSD 1100 SED 512GB, M.2 (MTFDDAV512TBN), IPS, 1920x1080, 14" | Lenovo ThinkPad T480-20L50010US i7-8650U, UHD Graphics 620, Samsung SSD PM981 MZVLB512HAJQ, TFT-LCD, 1920x1080, 14" | Lenovo ThinkPad T480s-20L8S02E00 i5-8550U, GeForce MX150, Samsung SSD PM981 MZVLB512HAJQ, IPS LED, 2560x1440, 14" | Toshiba Portege X30T-E-109 i5-8550U, UHD Graphics 620, Samsung SSD PM981 MZVLB1T0HALR, IPS, 1920x1080, 13.3" | Toshiba Tecra X40-D i7-7600U, HD Graphics 620, Samsung PM961 MZVLW256HEHP, IPS, 1920x1080, 14" | Dell Latitude 7490 i5-8350U, UHD Graphics 620, Toshiba KSG60ZMV256G, IPS, 1920x1080, 14" | HP EliteBook 840 G5-3JX61EA i5-8550U, UHD Graphics 620, Toshiba KXG50ZNV1T02, IPS, 1920x1080, 14" | |
|---|---|---|---|---|---|---|---|
| Power Consumption | -13% | -29% | -25% | 9% | 22% | -10% | |
| Idle Minimum * (Watt) | 4.5 | 3.8 16% | 3.4 24% | 4.7 -4% | 5.2 -16% | 2 56% | 3.8 16% |
| Idle Average * (Watt) | 6.3 | 7.7 -22% | 7.5 -19% | 9.4 -49% | 6.9 -10% | 4.7 25% | 8.3 -32% |
| Idle Maximum * (Watt) | 7 | 9.3 -33% | 10.8 -54% | 16 -129% | 7 -0% | 5.7 19% | 10.7 -53% |
| Load Average * (Watt) | 28.7 | 45.7 -59% | 55.4 -93% | 26.4 8% | 24.6 14% | 38.4 -34% | 35.5 -24% |
| Load Maximum * (Watt) | 67.7 | 46.1 32% | 70.3 -4% | 34 50% | 30.1 56% | 38.9 43% | 37 45% |
| Witcher 3 ultra * (Watt) | 34 |
* ... smaller is better
Battery Life
One of the benefits of throttling the CPU's power is increased battery life, and this may be one of the primary motivators behind Acer's design. The TravelMate easily lasts 10 hours in our WiFi v1.3 battery test (screen at 150 nits, loading a new webpage every 30 seconds). These runtimes can be doubled if the screen is turned all the way down and workloads are light (e.g., reading documents). While it's now common for a business Ultrabook to just manage a full 8 hour work day, the TravelMate allows for work to be done on a train commute home as well.
It should be noted that other manufacturers typically sell models with larger batteries for longer runtimes. Lenovo's ThinkPads offer hot-swappable batteries in three different capacities.
| Acer TravelMate X3410-M-866T i5-8550U, UHD Graphics 620, 57 Wh | Lenovo ThinkPad T480-20L50010US i7-8650U, UHD Graphics 620, 24 Wh | Lenovo ThinkPad T480s-20L8S02E00 i5-8550U, GeForce MX150, 57 Wh | Lenovo ThinkPad X1 Carbon 2018-20KGS5DU00 i5-8550U, UHD Graphics 620, 57 Wh | Toshiba Portege X30T-E-109 i5-8550U, UHD Graphics 620, Wh | Toshiba Tecra X40-D i7-7600U, HD Graphics 620, 48 Wh | Dell Latitude 7490 i5-8350U, UHD Graphics 620, 60 Wh | HP EliteBook 840 G5-3JX61EA i5-8550U, UHD Graphics 620, 50 Wh | |
|---|---|---|---|---|---|---|---|---|
| Battery runtime | -29% | -15% | -13% | -11% | -26% | -12% | -28% | |
| Reader / Idle (h) | 20.8 | 22.8 10% | 14.6 -30% | |||||
| WiFi v1.3 (h) | 10.3 | 7.3 -29% | 8.8 -15% | 9 -13% | 9.2 -11% | 6 -42% | 9.1 -12% | 7.4 -28% |
| Load (h) | 2.2 | 1.3 -41% | 2.1 -5% |
Verdict
Pros
Cons
The Acer TravelMate X3410 is a good example of compromise. At US $1300, the TravelMate X3410 offers a portable and well-built chassis, a good amount of storage (512 GB), and adequate performance for office work. That said, the device falls short in almost every category when compared to its rivals, particularly Lenovo's ThinkPad T480s, Dell's Latitude 7490, and HP's EliteBook 840 G5.
The TravelMate's keyboard is responsive but feels cheap, the display is dim and grainy, and performance is heavily throttled with little reason. Battery life is excellent, but some rivals (like the ThinkPad T480) offer multiple battery configurations for longer runtimes.
All said, the TravelMate X3410 is a "good enough" business laptop. Those on a budget that want a thin and light office machine and don't mind compromising on a few key features may want to look at the Acer TravelMate X3410, but most users should pay a few hundred dollars more to get a better machine.
Acer TravelMate X3410-M-866T
- 01/28/2019 v6 (old)
Sam Medley
Price comparison
