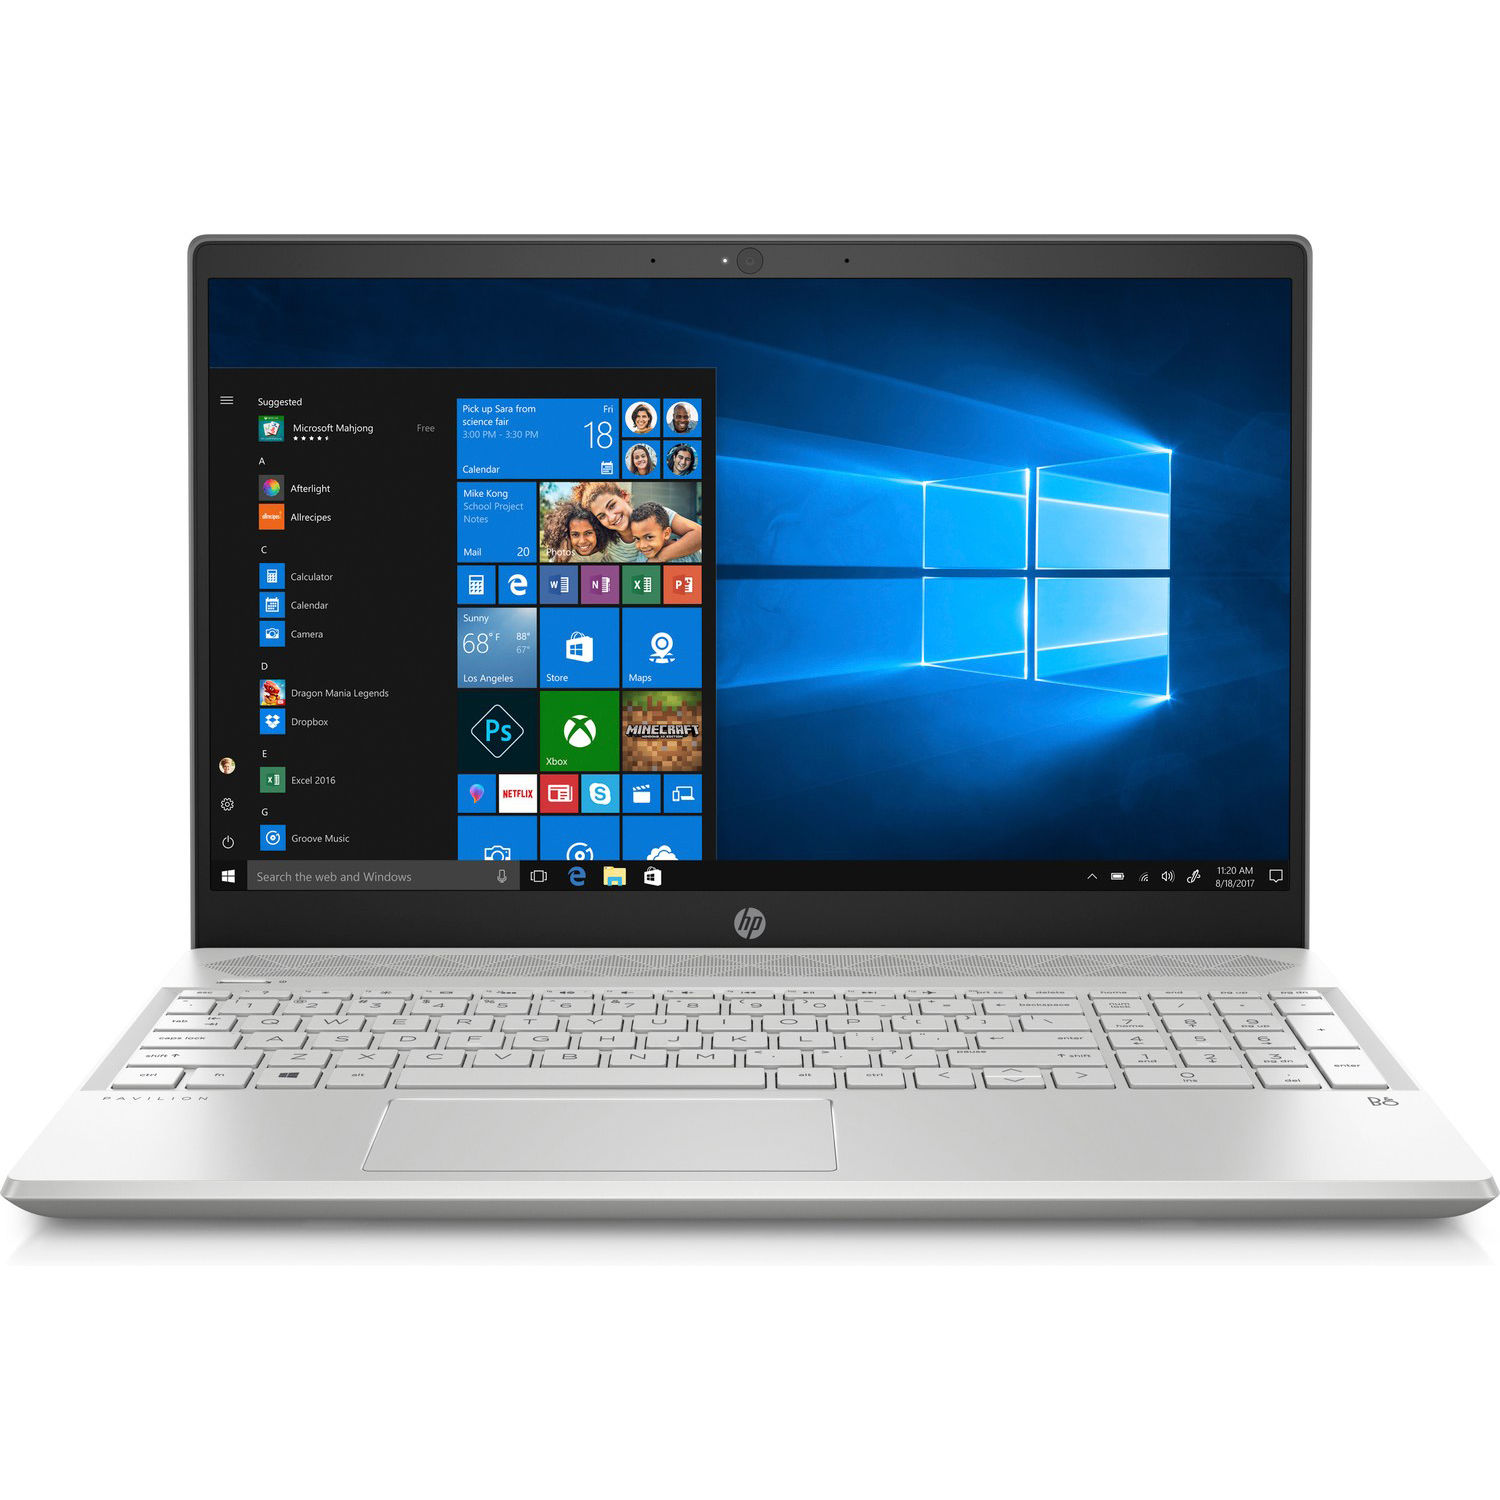
HP Pavilion 15 (Core i5-8250U, NVIDIA MX130) Laptop Review

The HP Pavilion is a familiar device in our offices. We first reviewed the Pavilion 15-cs0053cl, with its Intel Core i5-8250U processor and integrated graphics, which was followed up a few months later with the 15-cw0003ng and its AMD Ryzen 5 2500U APU.
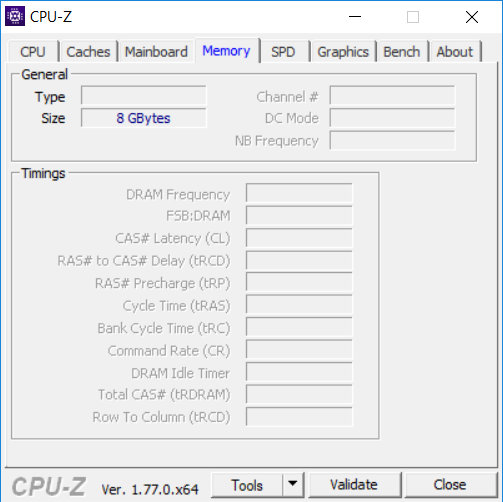
Now we have the 15-cs0003ng, which HP has equipped with a Core i5-8250U processor and an NVIDIA GeForce MX130 GPU. The device also has 8 GB of RAM, a 256 GB SSD and a 1 TB HDD.
We have chosen to compare our test device against not only its siblings but also other comparably equipped laptops. Our comparison devices will include the Acer TravelMate P2510-G2, the ASUS VivoBook 15 X542UF, the Lenovo IdeaPad 330S-15IKB and the Xiaomi Mi Notebook 15.6.
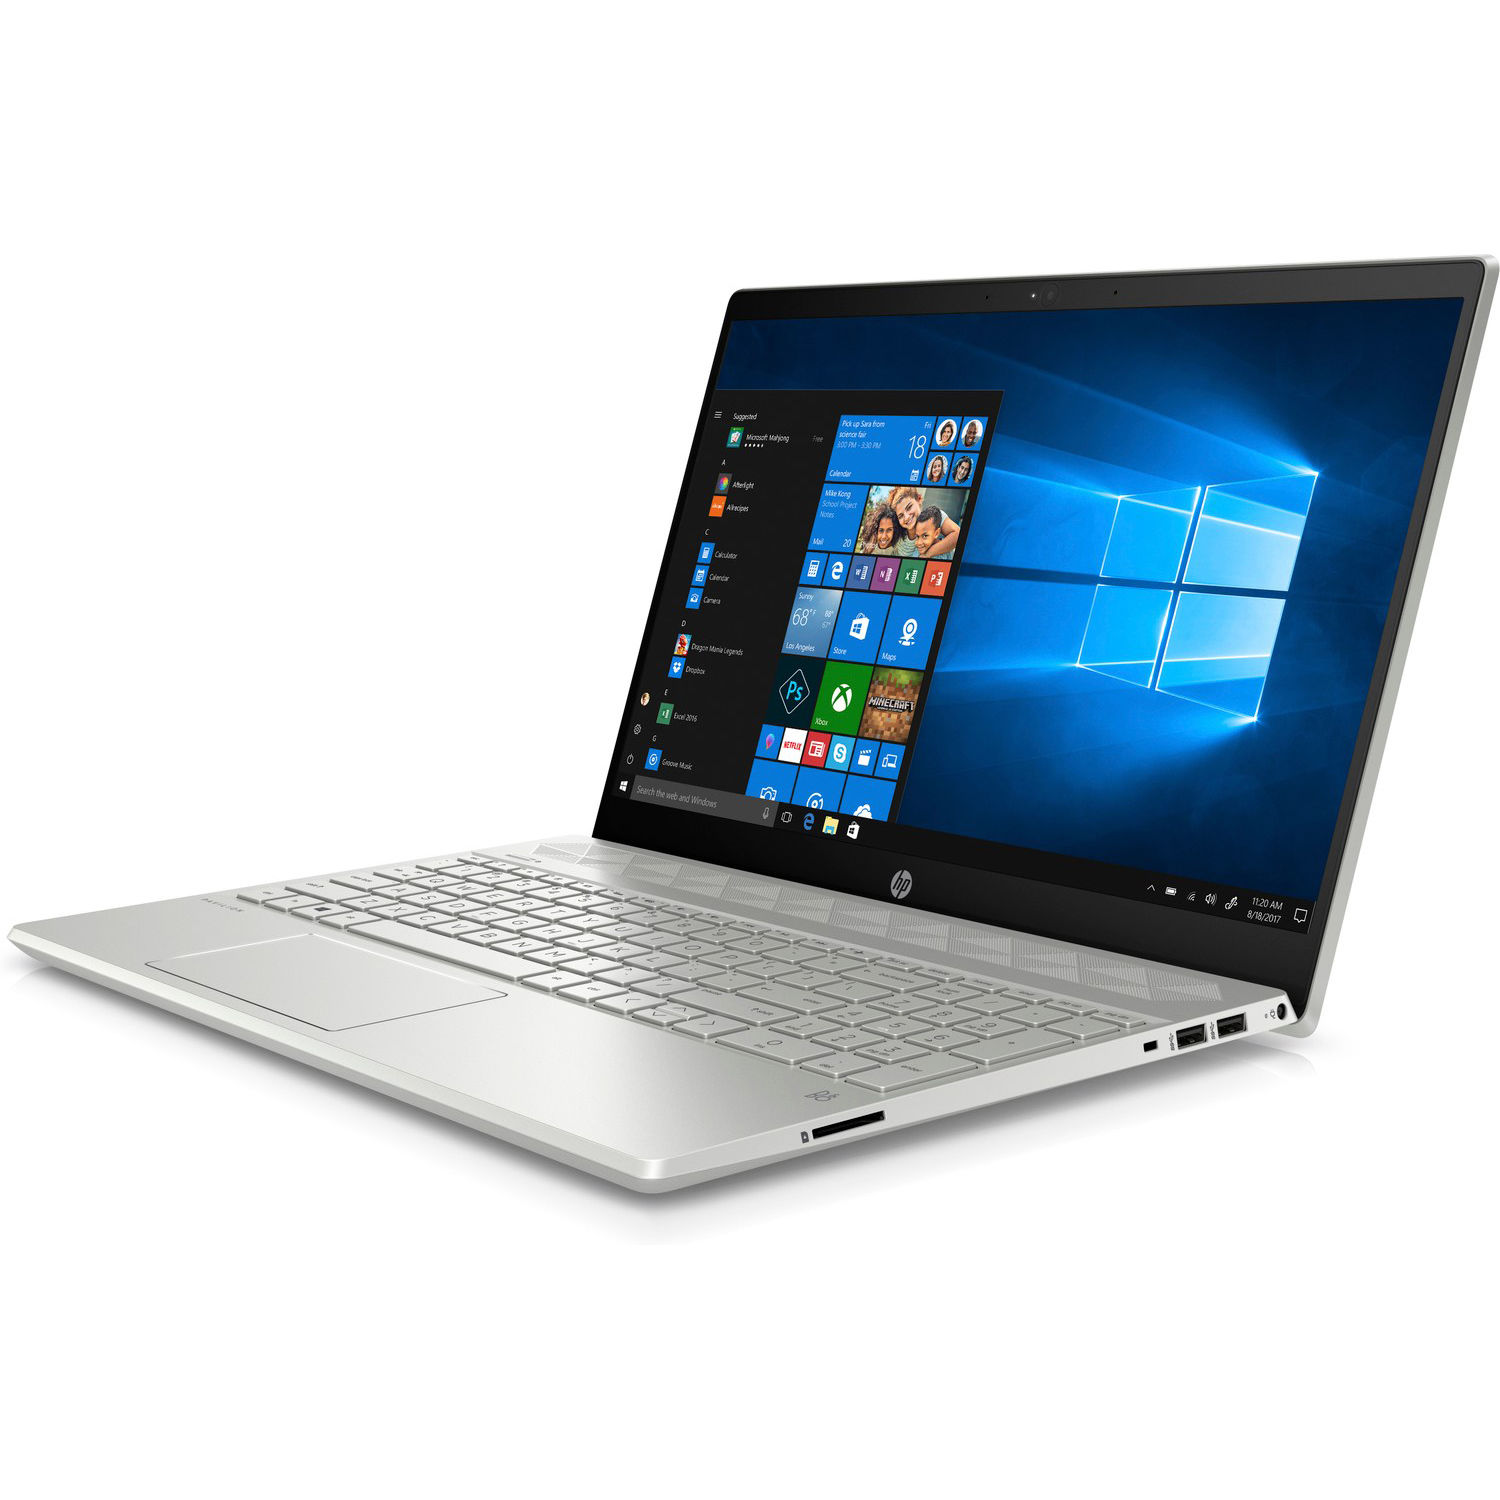
Case
HP has designed the 15-cs0003ng with the same case as it used on the 15-cw0003ng. Please see our review of the 15-cw0003ng here for our full thoughts on the Pavilion 15’s case.

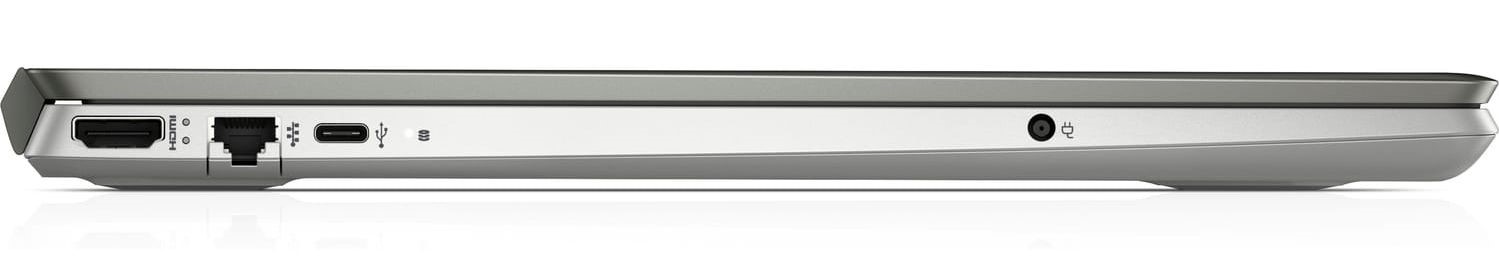
Connectivity
HP has equipped the Pavilion 15 with a basic selection of ports that should be enough for most users. The inclusion of a USB Type-C port somewhat future proofs the Pavilion though. The device lacks a fingerprint sensor, which HP has been reserving for its Envy and Spectre ranges.
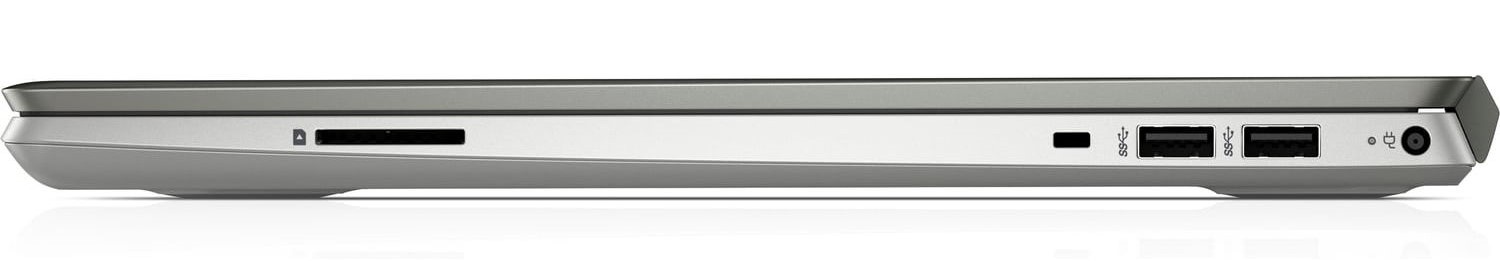
SD Card Reader
HP has equipped our test device with a below average SD card reader, but one which is on par with our comparison devices. The Pavilion 15 averaged around 35 MB/s with our Toshiba Exceria Pro SDXC reference card, which is well below its potential maximum speeds. SD cards do not protrude from the edge of the case though, which is a bonus.
| SD Card Reader | |
| average JPG Copy Test (av. of 3 runs) | |
| Average of class Multimedia (23 - 531, n=43, last 2 years) | |
| HP Pavilion 15-cw0003ng (Toshiba Exceria Pro SDXC 64 GB UHS-II) | |
| HP Pavilion 15-cs0053cl (Toshiba Exceria Pro SDXC 64 GB UHS-II) | |
| Asus VivoBook 15 X542UF-DM143T (Toshiba Exceria Pro SDXC 64 GB UHS-II) | |
| HP Pavilion 15-cs0003ng (Toshiba Exceria Pro SDXC 64 GB UHS-II) | |
| Acer TravelMate P2510-G2-MG-50WE (Toshiba Exceria Pro SDXC 64 GB UHS-II) | |
| Lenovo IdeaPad 330S-15IKB-81F500N5GE (Toshiba Exceria Pro SDXC 64 GB UHS-II) | |
| Xiaomi Mi Notebook 15.6 (E58514D1D) (Toshiba Exceria Pro SDXC 64 GB UHS-II) | |
| maximum AS SSD Seq Read Test (1GB) | |
| Average of class Multimedia (27.9 - 1455, n=42, last 2 years) | |
| HP Pavilion 15-cs0053cl (Toshiba Exceria Pro SDXC 64 GB UHS-II) | |
| HP Pavilion 15-cw0003ng (Toshiba Exceria Pro SDXC 64 GB UHS-II) | |
| HP Pavilion 15-cs0003ng (Toshiba Exceria Pro SDXC 64 GB UHS-II) | |
| Asus VivoBook 15 X542UF-DM143T (Toshiba Exceria Pro SDXC 64 GB UHS-II) | |
| Xiaomi Mi Notebook 15.6 (E58514D1D) (Toshiba Exceria Pro SDXC 64 GB UHS-II) | |
| Acer TravelMate P2510-G2-MG-50WE (Toshiba Exceria Pro SDXC 64 GB UHS-II) | |
Communication
The cs0003ng supports Bluetooth 4.2 and all Wi-Fi standards up to IEEE 802.11 ac, which means that it can connect to 2.4 or 5 GHz Wi-Fi networks. Our test device averaged 277 Mbps in both iperf3 Client tests, which only puts it above its siblings in our comparison tables. In short, the Pavilion 15 has considerably slower Wi-Fi performance than our comparison devices, especially the TravelMate P2510.
Accessories
HP includes only a 65-W charger in the box. The company does not sell any Pavilion 15 specific accessories either, but it does sell general laptop accessories such as keyboards, mice and speakers among others.
Maintenance
The Pavilion 15 does not have a maintenance cover, which would have made it easier to access the HDD, SSD and potentially the RAM. Accessing the internal components requires removing the bottom case, but we did not try doing so with our loaner for fear of damaging the case.
Warranty
The Pavilion 15 comes with 12 months manufacturer’s warranty. The device will also come with statutory warranties and those afforded by third-party sellers such as Amazon. Please see our Guarantees, Return policies and Warranties article for country-specific information.
Input Devices
Our test device has the same keyboard and trackpad as its siblings. Please see our cw0003ng review for our views on the Pavilion 15’s input devices.
Display
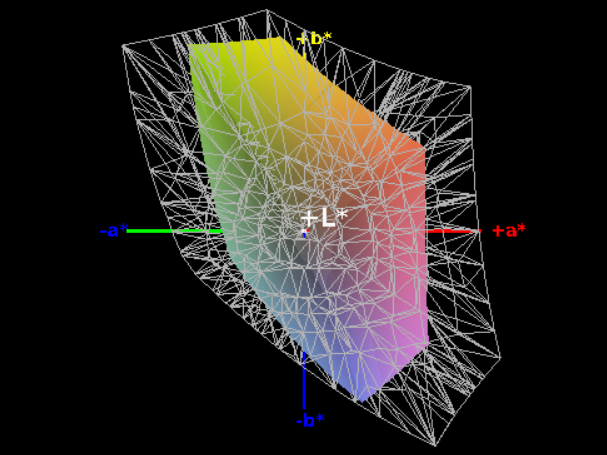
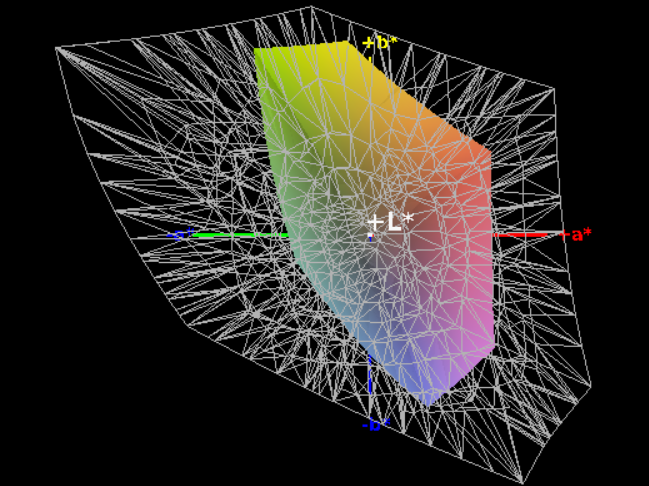
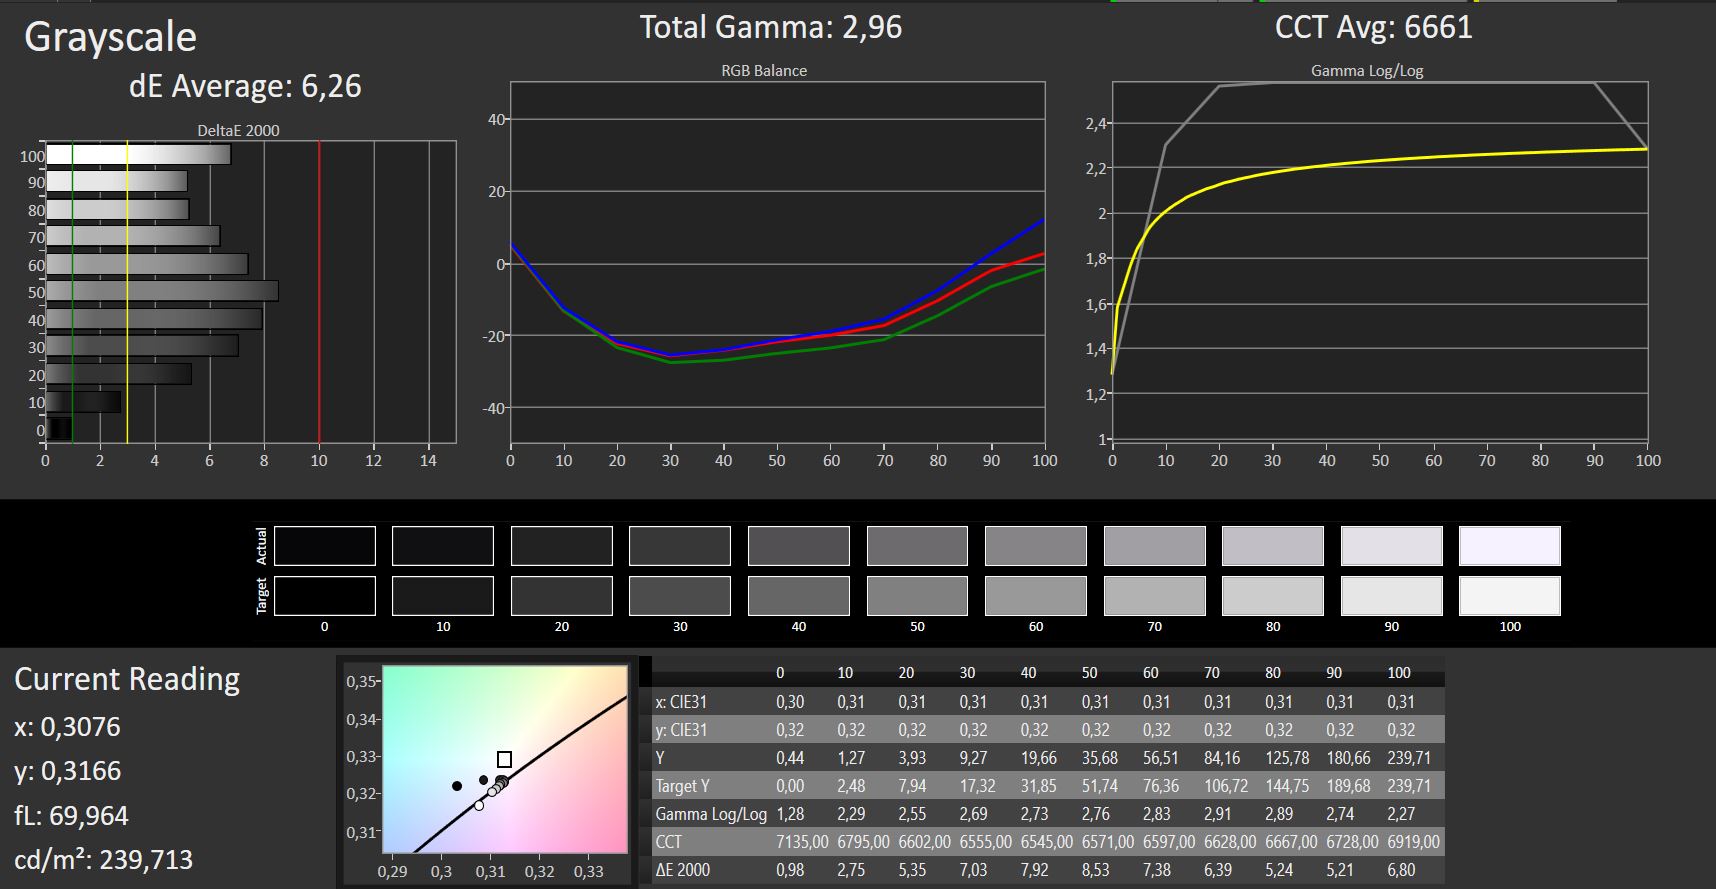
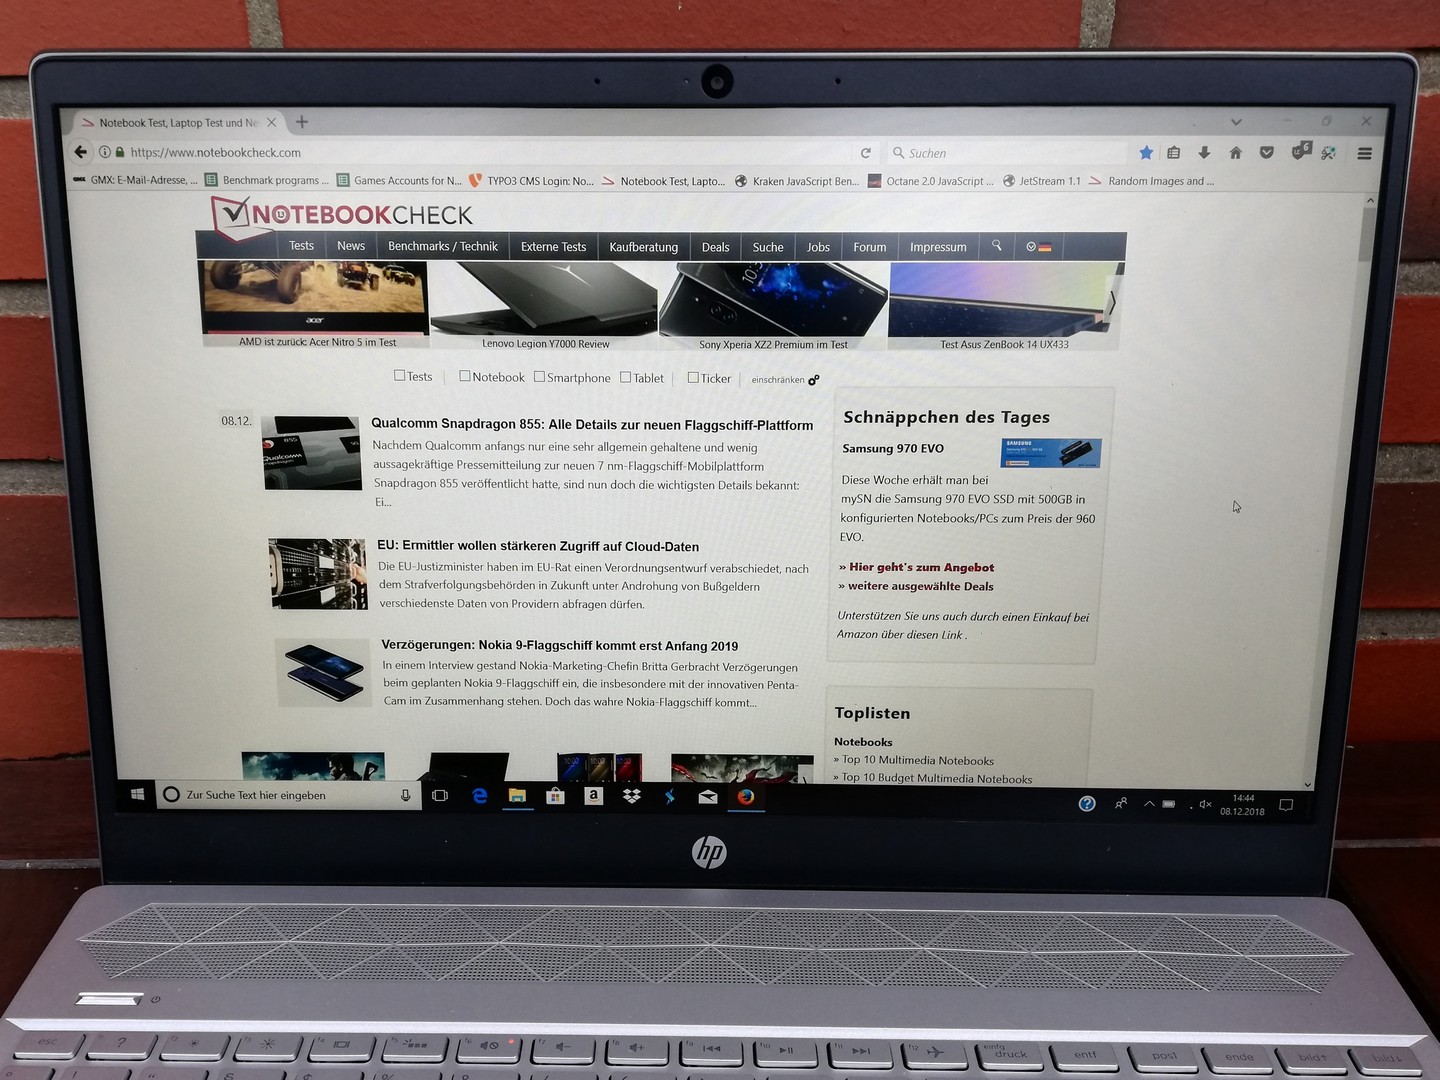
The Pavilion 15 device has a 15.6-inch IPS screen that runs natively at 1,920x1,080. Our test device achieved an average maximum brightness of 237 cd/m² according to X-Rite i1Pro 2, which puts it below the Xiaomi Mi Notebook 15.6 and the Lenovo IdeaPad 330S-15IKB in our comparison table. The display is 90% evenly lit though, which puts it on par with the best of our comparison devices.
HP also sells a variant of Pavilion 15 with a 1,366x768 display. Please see our Pavilion 15-cs0053cl review for our thoughts on the lower resolution display.
| |||||||||||||||||||||||||
Brightness Distribution: 90 %
Center on Battery: 209 cd/m²
Contrast: 571:1 (Black: 0.42 cd/m²)
ΔE ColorChecker Calman: 7.43 | ∀{0.5-29.43 Ø4.73}
ΔE Greyscale Calman: 6.26 | ∀{0.09-98 Ø4.97}
54% sRGB (Argyll 1.6.3 3D)
35% AdobeRGB 1998 (Argyll 1.6.3 3D)
37.47% AdobeRGB 1998 (Argyll 3D)
54.6% sRGB (Argyll 3D)
36.27% Display P3 (Argyll 3D)
Gamma: 2.96
CCT: 6661 K
| HP Pavilion 15-cs0003ng 1920x1080, 15.6" | Xiaomi Mi Notebook 15.6 (E58514D1D) BOE07C5 (NV156FHM-N42), , 1920x1080, 15.6" | Lenovo IdeaPad 330S-15IKB-81F500N5GE BOE0700, , 1920x1080, 15.6" | Acer TravelMate P2510-G2-MG-50WE Chi Mei CMN15D3, , 1920x1080, 15.6" | Asus VivoBook 15 X542UF-DM143T BOE CQ NT156FHM-N41, , 1920x1080, 15.6" | |
|---|---|---|---|---|---|
| Display | 10% | 9% | 17% | 3% | |
| Display P3 Coverage (%) | 36.27 | 40.21 11% | 39.85 10% | 42.27 17% | 37.47 3% |
| sRGB Coverage (%) | 54.6 | 59.6 9% | 58.8 8% | 63.5 16% | 56.4 3% |
| AdobeRGB 1998 Coverage (%) | 37.47 | 41.54 11% | 41.17 10% | 43.69 17% | 38.71 3% |
| Response Times | -12% | -5% | -2% | 21% | |
| Response Time Grey 50% / Grey 80% * (ms) | 45 ? | 46 ? -2% | 44 ? 2% | 40 ? 11% | 41 ? 9% |
| Response Time Black / White * (ms) | 28 ? | 34 ? -21% | 31 ? -11% | 32 ? -14% | 19 ? 32% |
| PWM Frequency (Hz) | 60 ? | 86000 ? | 25000 ? | 7000 ? | |
| Screen | 35% | 11% | 39% | 14% | |
| Brightness middle (cd/m²) | 240 | 280 17% | 283 18% | 259 8% | 230 -4% |
| Brightness (cd/m²) | 237 | 267 13% | 252 6% | 230 -3% | 221 -7% |
| Brightness Distribution (%) | 90 | 85 -6% | 75 -17% | 82 -9% | 91 1% |
| Black Level * (cd/m²) | 0.42 | 0.2 52% | 0.63 -50% | 0.19 55% | 0.45 -7% |
| Contrast (:1) | 571 | 1400 145% | 449 -21% | 1363 139% | 511 -11% |
| Colorchecker dE 2000 * | 7.43 | 5 33% | 4.02 46% | 3.13 58% | 3.6 52% |
| Colorchecker dE 2000 max. * | 12.42 | 7.9 36% | 8.77 29% | 7.81 37% | 5.59 55% |
| Greyscale dE 2000 * | 6.26 | 3.7 41% | 0.8 87% | 1.42 77% | 3.13 50% |
| Gamma | 2.96 74% | 2.08 106% | 2.35 94% | 2.36 93% | 2.45 90% |
| CCT | 6661 98% | 7309 89% | 6552 99% | 6391 102% | 7244 90% |
| Color Space (Percent of AdobeRGB 1998) (%) | 35 | 38.09 9% | 38 9% | 40 14% | 36 3% |
| Color Space (Percent of sRGB) (%) | 54 | 59.26 10% | 58 7% | 63 17% | 56 4% |
| Colorchecker dE 2000 calibrated * | 3.6 | 4.03 | 3.09 | ||
| Total Average (Program / Settings) | 11% /
24% | 5% /
9% | 18% /
29% | 13% /
12% |
* ... smaller is better
Our test device has a comparatively high 0.42 cd/m² black level, which yields a disappointing 571:1 contrast ratio. By comparison, the Mi Notebook 15.6 and the TravelMate P2510 have considerably higher contrast ratios than the Pavilion 15, so colours will look punchier and more vibrant on those two comparison devices than our test device.
Moreover, the 15-cs0003ng achieved lower colour space coverages than our comparison devices. No device is colour accurate enough for even semi-professional image or video editing though. Colours look balanced on our test device, but it has comparatively high DeltaE deviations too. We managed to improve our test device’s colour accuracy by calibrating the display, the ICC profile for which we have included in the box above our comparison table.

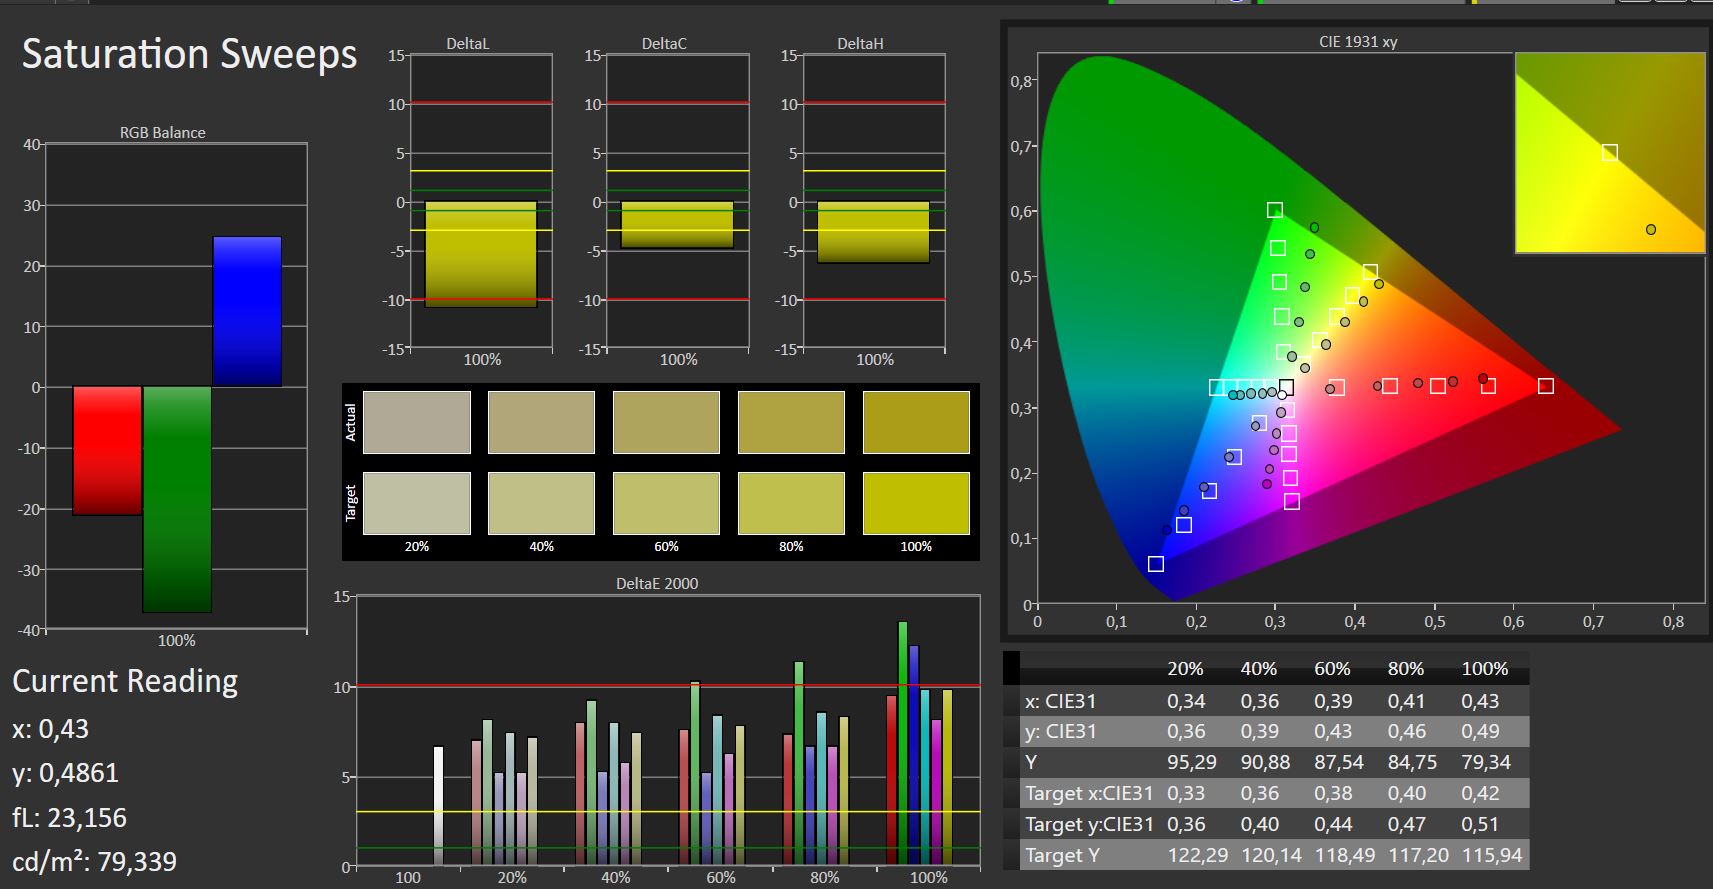
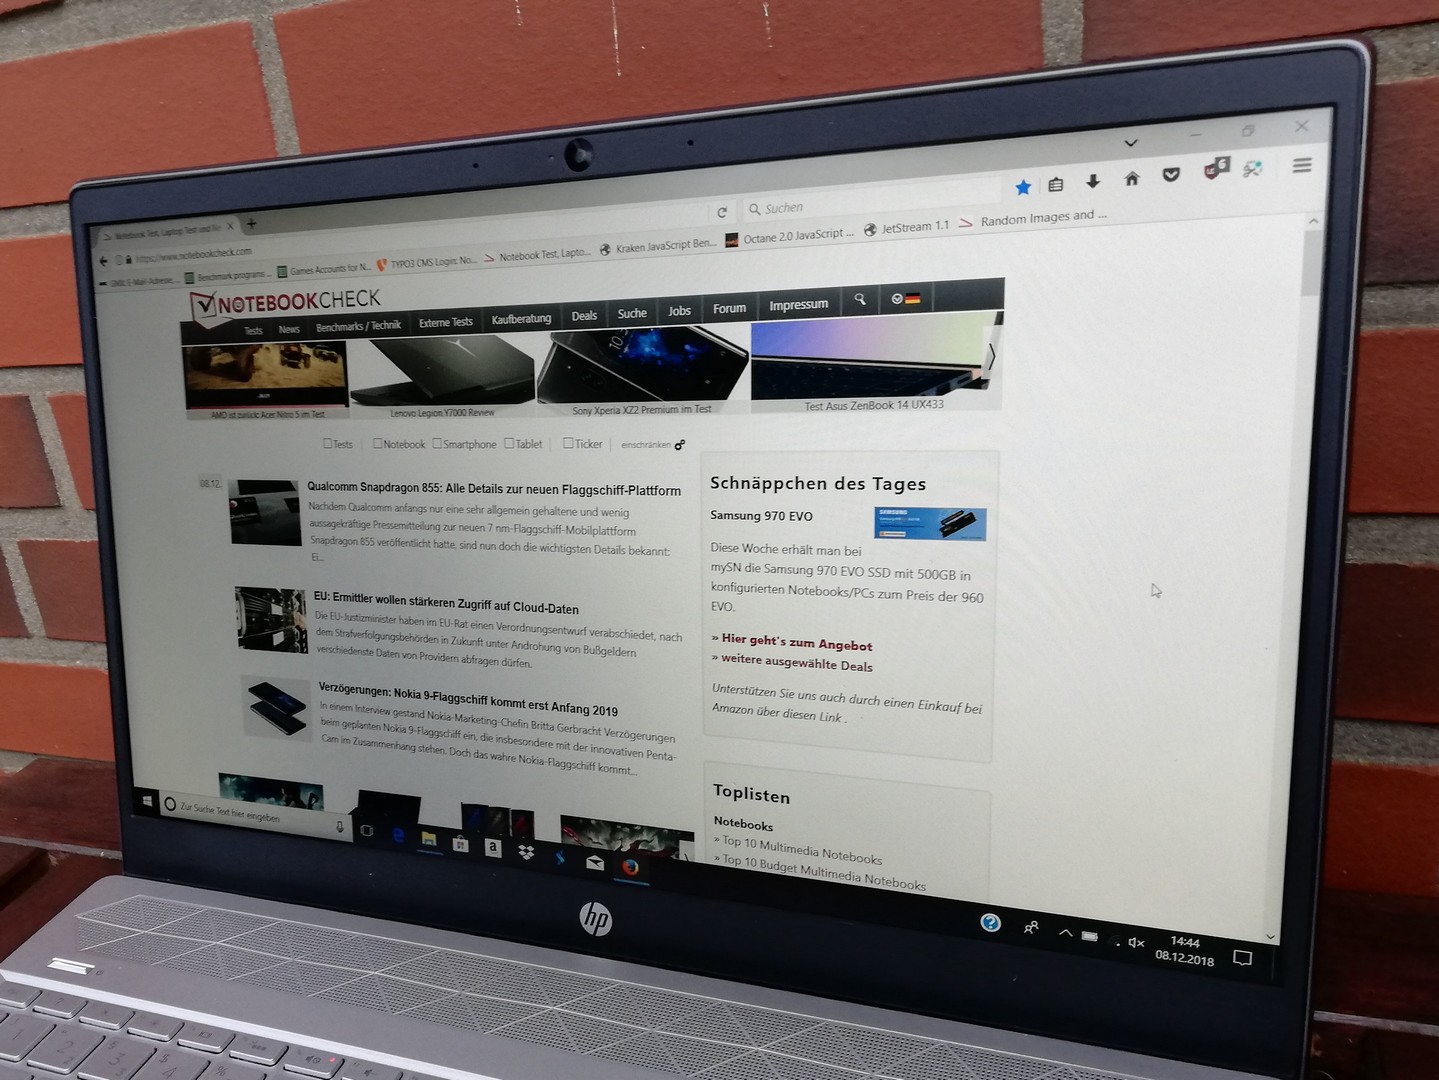
The 15-cs0003ng is tricky to use outdoors because of its dim display. We can read the display when using our test device outside on cloudy days, but the screen is quickly overwhelmed by reflections when there is any sunshine.
Display Response Times
| ↔ Response Time Black to White | ||
|---|---|---|
| 28 ms ... rise ↗ and fall ↘ combined | ↗ 16 ms rise | 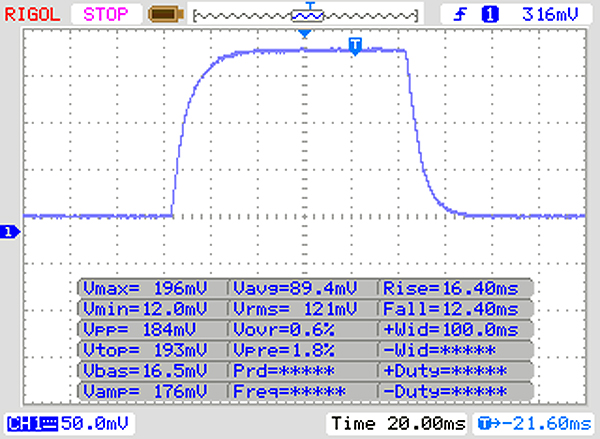 |
| ↘ 12 ms fall | ||
| The screen shows relatively slow response rates in our tests and may be too slow for gamers. In comparison, all tested devices range from 0.1 (minimum) to 240 (maximum) ms. » 71 % of all devices are better. This means that the measured response time is worse than the average of all tested devices (19.9 ms). | ||
| ↔ Response Time 50% Grey to 80% Grey | ||
| 45 ms ... rise ↗ and fall ↘ combined | ↗ 21 ms rise | 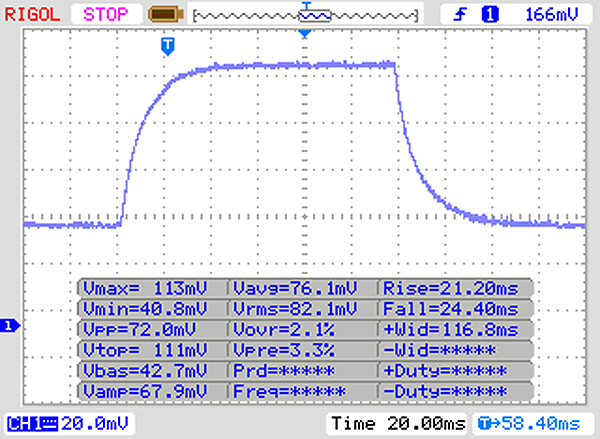 |
| ↘ 24 ms fall | ||
| The screen shows slow response rates in our tests and will be unsatisfactory for gamers. In comparison, all tested devices range from 0.165 (minimum) to 636 (maximum) ms. » 77 % of all devices are better. This means that the measured response time is worse than the average of all tested devices (31.1 ms). | ||
Screen Flickering / PWM (Pulse-Width Modulation)
| Screen flickering / PWM not detected | 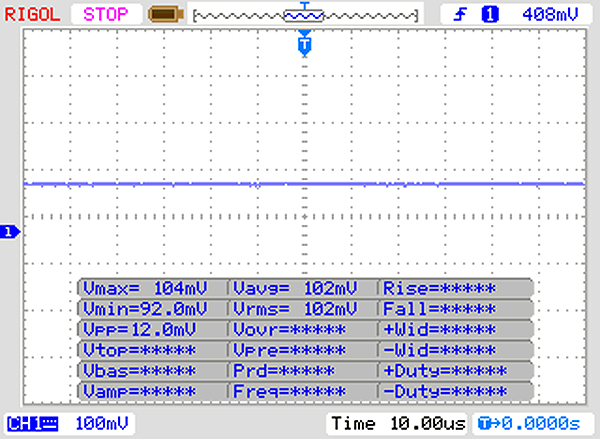 | ||
In comparison: 52 % of all tested devices do not use PWM to dim the display. If PWM was detected, an average of 7794 (minimum: 5 - maximum: 343500) Hz was measured. | |||
Our test device has stable viewing angles though thanks to its IPS display. We noticed no brightness, colour or image distortions even at acute viewing angles, so the 15-cs0003ng should be readable from almost any angle in daily use.

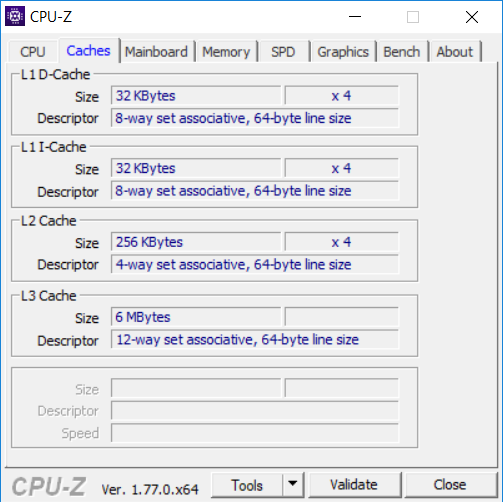
Performance
The 15-cs0003ng is equipped with an Intel Core i5-8250U processor, 8 GB of RAM, an NVIDIA GeForce MX130 GPU, a 256 GB SSD and a 1 TB HDD. The combination of hardware makes the device powerful enough for general office tasks and demanding 3D applications. The laptop can even play older games smoothly at medium graphics should you like to unwind with some light gaming.


Processor
The Core i5-8250U processor is one which we have covered in numerous laptop reviews. The quad-core processor is from Intel’s 8th generation Core series and has a 1.6 GHz base clock speed that can increase to 3.4 GHz when required by utilising Intel Turbo Boost technology. OEMs set the Turbo Boost time according to the effectiveness of a device’s cooling system. We subjected our test device to a looped Cinebench R15 multi-core benchmark to determine how well it manages its CPU performance under load. The 15-cs0003ng manages its performance well and maintains around 95% of its peak performance throughout the looped benchmark. The CB15 score drops by approximately 5% after the first benchmark pass through, but the scores remain consistent for the remaining 29 benchmark loops.
The Core i5-8250U is initially well beaten in the CB R15 multi-core benchmark by the AMD Ryzen 5 2500U powering the Pavilion 15-cw0003ng. However, the Ryzen 5 2500U thermal throttles so heavily that by the third benchmark loop the CB R15 scores have dropped around 10% behind our test device.
The 15-cs0003ng does not get the most from its processor though, as demonstrated by our CB R15 graph. The ASUS VivoBook 15 X542UF and the Mi Notebook 15.6 outscore the 15-cs0003ng by 10% and 20% respectively. Both devices thermal throttle harder than our test device does, but they still maintain significantly higher CB R15 scores in our looped benchmark, which underlines the effectiveness of their cooling systems.
System Performance
The 15-cs0003ng scores well in system performance benchmarks such as PCMark 8 and 10 too. Our test device generally keeps pace with our Core i5-8250U powered comparison devices and performed well in both versions of PCMark thanks to its NVIDIA GeForce MX130 GPU. The 15-cs0003ng outscores its Ryzen 5 2500U powered sibling too, although the difference is not as clear cut as it is in Cinebench.
Please see our CPU benchmark page for more information about the Core i5-8250U and how it performs in other laptops.
| PCMark 8 Home Score Accelerated v2 | 3647 points | |
| PCMark 8 Work Score Accelerated v2 | 4762 points | |
| PCMark 10 Score | 3402 points | |
Help | ||
Storage Devices
The 15-cs0003ng achieves only average transfer speeds in CrystalDiskMark and AS SSD benchmarks. The SK Hynix SSD is noticeably slower than the drive in the Lenovo IdeaPad 330s-15IKB, but it is on par with those in our other comparison devices. Our test device feels snappy in daily use though. We did not encounter any prolonged loading times or stuttering during our tests.
Please see our HDD/SSD benchmark page for more information on other drives.
| HP Pavilion 15-cs0003ng SK Hynix SC313 HFS256G39TNF | Xiaomi Mi Notebook 15.6 (E58514D1D) Samsung PM871b MZNLN128HAHQ | Lenovo IdeaPad 330S-15IKB-81F500N5GE | Acer TravelMate P2510-G2-MG-50WE SK Hynix HFS256G39TND-N210A | Asus VivoBook 15 X542UF-DM143T Micron 1100 MTFDDAV256TBN | Average SK Hynix SC313 HFS256G39TNF | |
|---|---|---|---|---|---|---|
| CrystalDiskMark 5.2 / 6 | -2% | 3% | -13% | 3% | -0% | |
| Write 4K (MB/s) | 66.9 | 77.3 16% | 71.8 7% | 94.9 42% | 71.3 ? 7% | |
| Read 4K (MB/s) | 30.33 | 29.77 -2% | 21.23 -30% | 27.3 -10% | 25.3 ? -17% | |
| Write Seq (MB/s) | 447.6 | 442.5 -1% | 158.1 -65% | 257.1 -43% | 410.4 -8% | 473 ? 6% |
| Read Seq (MB/s) | 534 | 442.7 -17% | 892 67% | 476.3 -11% | 464 -13% | 517 ? -3% |
| Write 4K Q32T1 (MB/s) | 197.5 | 173.8 -12% | 162.2 -18% | 202.6 3% | 246.5 25% | 209 ? 6% |
| Read 4K Q32T1 (MB/s) | 234.5 | 233.6 0% | 320.4 37% | 282 20% | 246.4 5% | 234 ? 0% |
| Write Seq Q32T1 (MB/s) | 495.6 | 510 3% | 160.2 -68% | 265.6 -46% | 451.4 -9% | 494 ? 0% |
| Read Seq Q32T1 (MB/s) | 559 | 530 -5% | 933 67% | 559 0% | 532 -5% | 552 ? -1% |
| AS SSD | -2% | -193% | -30% | -2% | -3% | |
| Seq Read (MB/s) | 522 | 489 -6% | 95.9 -82% | 487.3 -7% | 493.7 -5% | 499 ? -4% |
| Seq Write (MB/s) | 476.1 | 458 -4% | 78.9 -83% | 250.6 -47% | 420.1 -12% | 474 ? 0% |
| 4K Read (MB/s) | 30.14 | 30.24 0% | 2.25 -93% | 27.61 -8% | 25.01 -17% | 28.6 ? -5% |
| 4K Write (MB/s) | 64.3 | 81.6 27% | 54.9 -15% | 72.1 12% | 78.2 22% | 60.7 ? -6% |
| 4K-64 Read (MB/s) | 319.2 | 271.8 -15% | 43.28 -86% | 375.9 18% | 236.4 -26% | 298 ? -7% |
| 4K-64 Write (MB/s) | 239.8 | 163 -32% | 116.6 -51% | 202.1 -16% | 277.8 16% | 233 ? -3% |
| Access Time Read * (ms) | 0.131 | 0.092 30% | 2.127 -1524% | 0.08 39% | 0.104 21% | 0.1193 ? 9% |
| Access Time Write * (ms) | 0.056 | 0.044 21% | 0.045 20% | 0.233 -316% | 0.058 -4% | 0.06033 ? -8% |
| Score Read (Points) | 402 | 351 -13% | 55 -86% | 452 12% | 311 -23% | 376 ? -6% |
| Score Write (Points) | 352 | 290 -18% | 179 -49% | 299 -15% | 398 13% | 341 ? -3% |
| Score Total (Points) | 967 | 830 -14% | 262 -73% | 980 1% | 873 -10% | 918 ? -5% |
| Copy ISO MB/s (MB/s) | 253 | 287.4 | 514 ? | |||
| Copy Program MB/s (MB/s) | 108.8 | 155.4 | 259 ? | |||
| Copy Game MB/s (MB/s) | 154.4 | 245.8 | 521 ? | |||
| Total Average (Program / Settings) | -2% /
-2% | -95% /
-124% | -22% /
-22% | 1% /
0% | -2% /
-2% |
* ... smaller is better

Graphics Card
Intel UHD Graphics 620 and NVIDIA GeForce MX130 handle graphics on the 15-cs0003ng. While the former is integrated in the Core i5-8250U and is only suitable for graphically undemanding programs, the latter has 2 GB of dedicated VRAM, which allows it to handle more GPU heavy programs. This allows even more demanding 3D applications run as well as older games on medium levels of graphics smoothly.
It is worth keeping in mind that NVIDIA sells two versions of the GeForce MX130. The more powerful model is the one with 4 GB of GDDR5 VRAM, which is comparable to the GeForce 940MX. HP has equipped the 15-cs0003ng with the 2 GB version though, but many OEMs have done the same. Our test device achieves comparable 3DMark results to those of other GeForce MX130 equipped laptops that we have already tested.
Please see our GPU benchmarks page for more information on the GeForce MX130 and other GPUs.
| 3DMark 11 Performance | 3194 points | |
| 3DMark Cloud Gate Standard Score | 11187 points | |
| 3DMark Fire Strike Score | 2212 points | |
Help | ||
Gaming Performance
The GeForce MX130 is powerful enough for some light gaming. The 15-cs003ng comfortably handles games such as "BioShock Infinite", "F1 2018" and "Thief "at 1,366x768 on low graphics, but framerates will drop severely if you increase the resolution to 1080p. Older games such as "BioShock Infinite" will remain playable at up to high graphics at 1,366x768 though.
Please see our GPU games benchmark page for more information about the GeForce MX130 and other GPUs.
| Thief | |
| 1366x768 High Preset AA:FXAA & Low SS AF:4x | |
| HP Pavilion 15-cs0003ng | |
| Average NVIDIA GeForce MX130 (n=1) | |
| Lenovo IdeaPad 330S-15IKB-81F500N5GE | |
| 1366x768 Normal Preset AA:FX | |
| HP Pavilion 15-cs0003ng | |
| Average NVIDIA GeForce MX130 (n=1) | |
| Lenovo IdeaPad 330S-15IKB-81F500N5GE | |
| F1 2018 | |
| 1920x1080 High Preset AA:T AF:8x | |
| HP Pavilion 15-cs0003ng | |
| Average NVIDIA GeForce MX130 (n=1) | |
| HP Pavilion 15-cw0003ng | |
| 1920x1080 Medium Preset AF:4x | |
| HP Pavilion 15-cs0003ng | |
| Average NVIDIA GeForce MX130 (n=1) | |
| HP Pavilion 15-cw0003ng | |
| low | med. | high | ultra | |
|---|---|---|---|---|
| BioShock Infinite (2013) | 135 | 75.3 | 64.8 | 23.7 |
| Thief (2014) | 58.1 | 37.1 | 32.2 | 15.5 |
| F1 2018 (2018) | 48 | 26 | 20 |
Emissions
Fan Noise
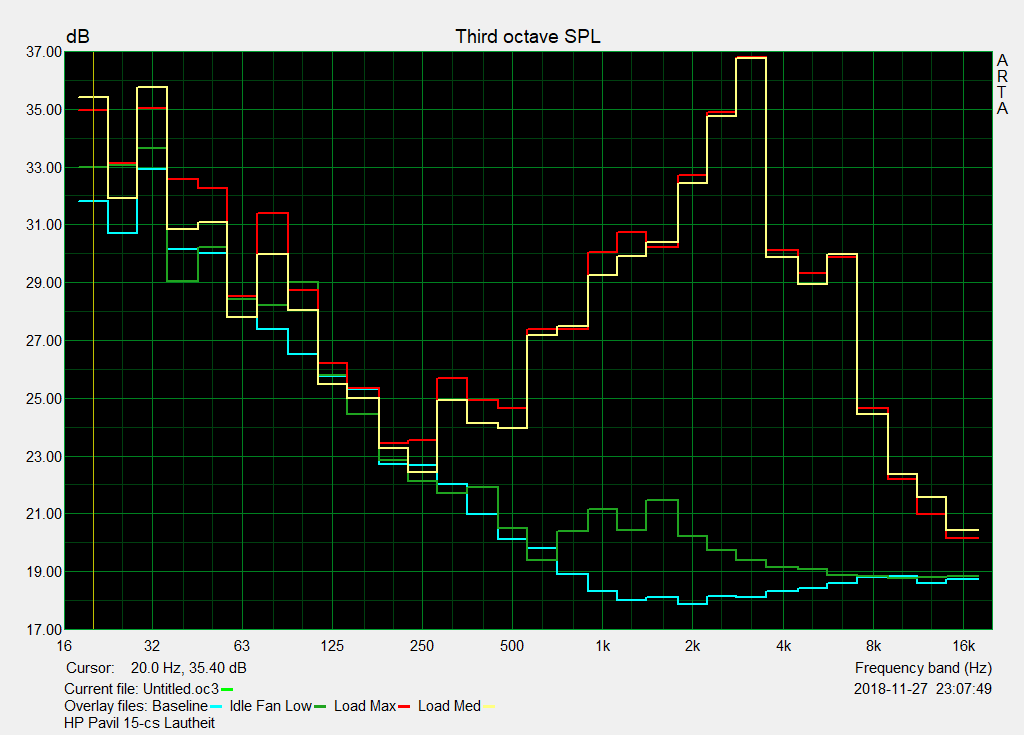
The 15-cs0003ng operates quietly at idle. Our test device is never silent though because its HDD spins at around 32 dB(A). Removing the drive would make the device run even quieter. Predictably, the fan gets louder under sustained load, but it starts emitting an uncomfortable whirring sound when the device is pushed hard. The fan noise is particularly intrusive in quiet rooms, so we would advise operating with caution if you to perform computationally intensive tasks in noise-sensitive environments.
Noise level
| Idle |
| 30.6 / 30.6 / 32.1 dB(A) |
| HDD |
| 32 dB(A) |
| Load |
| 43.2 / 43.4 dB(A) |
 | ||
30 dB silent 40 dB(A) audible 50 dB(A) loud |
||
min: | ||
Temperature
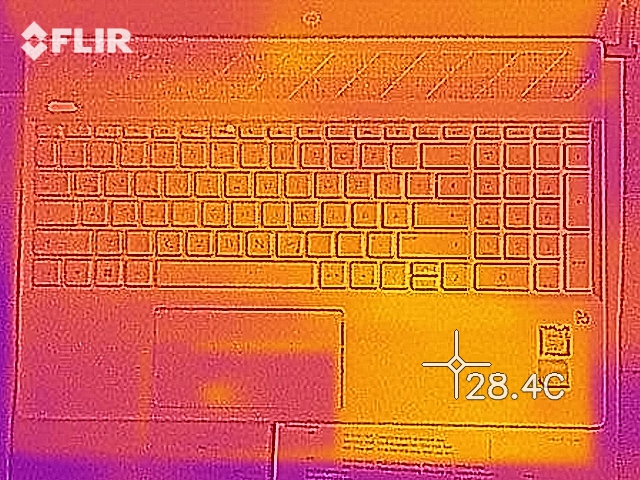
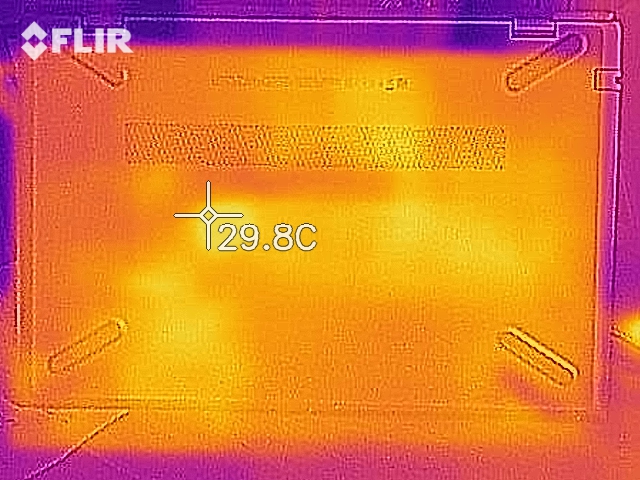
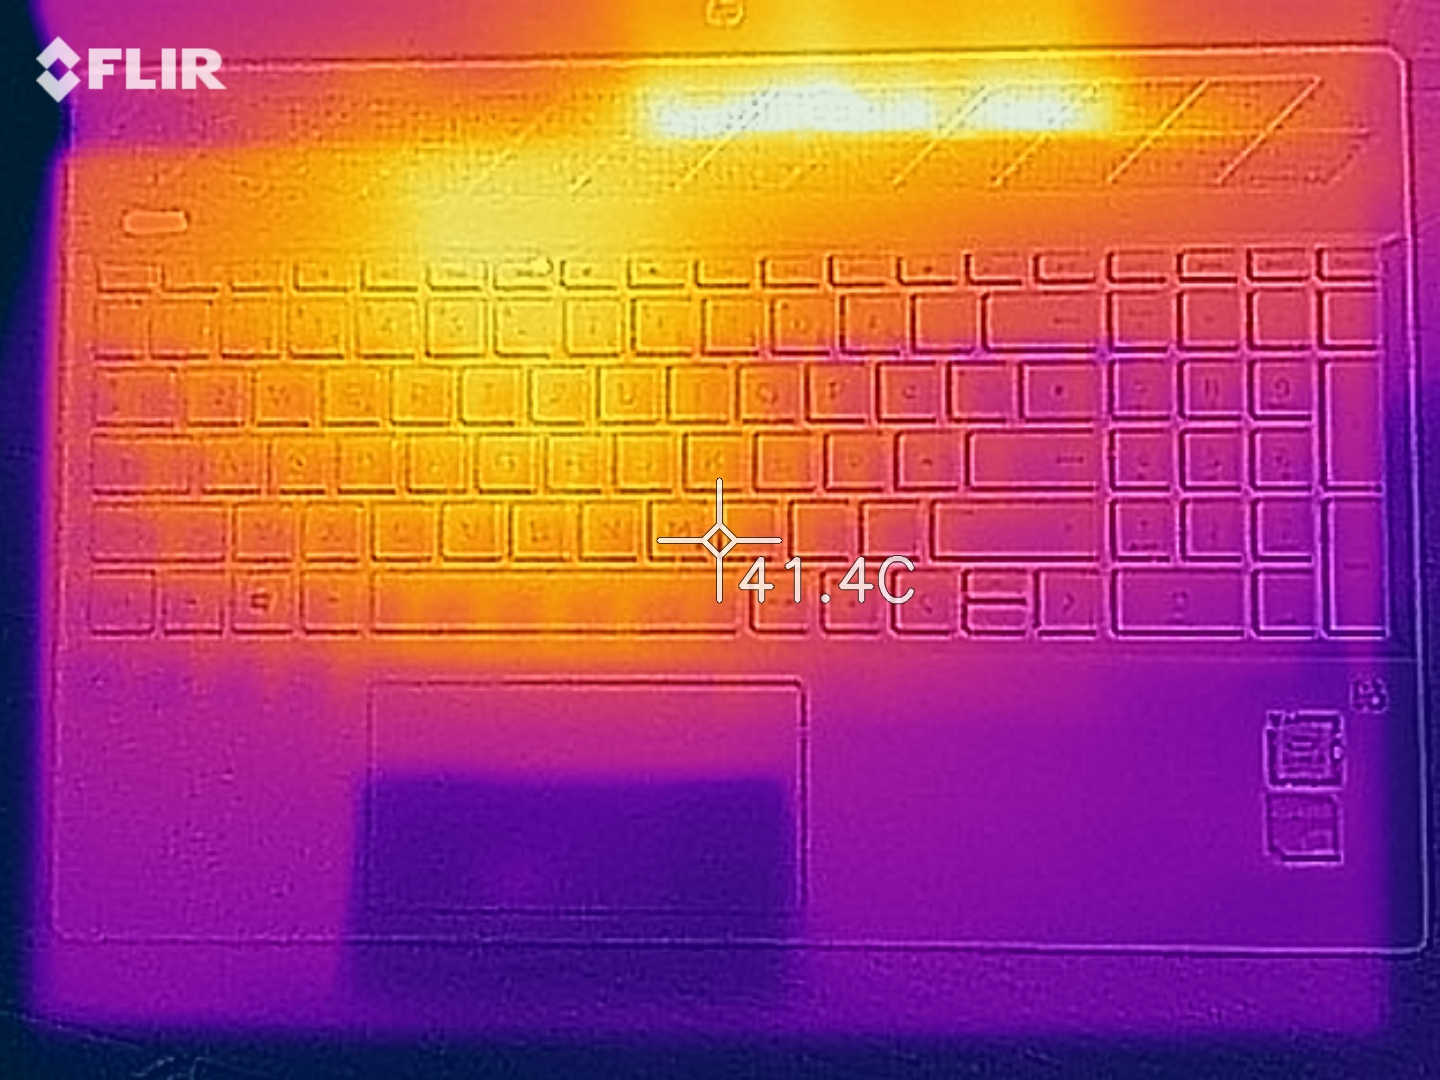
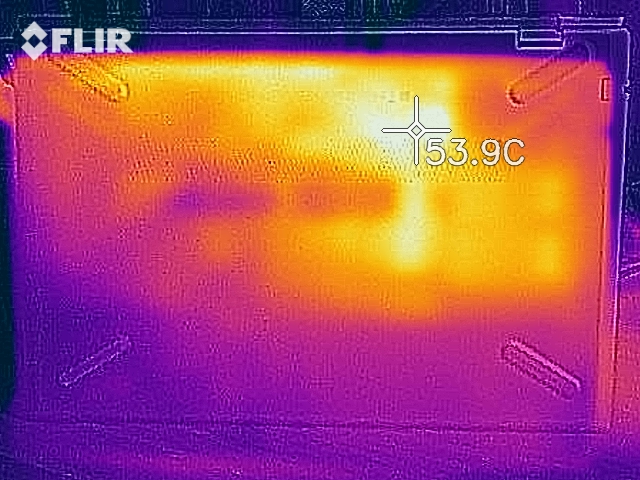
The 15-cs0003ng operates coolly at idle, with surface temperatures only reaching a maximum of 24.6 °C (~76 °F). The palm rest stays below 30 °C (~86 °F) under sustained load too, which ensures comfortable use even when the device is being pushed hard. However, surface temperatures reach 49 °C (~120 °F) on the underside of the device, which will feel hot if you are using it on your lap while gaming, for example. Hence, we would recommend placing the device on a table if you are stressing the system.
We also subjected the 15-cs0003ng to a stress test to determine whether the system thermal throttles. CPU core temperatures briefly exceed 60 °C (~140 °F) during a combined FurMark and Prime95 stress test, but the CPU then downclocks to 1.9-2.0 GHz to cool itself. The core clock throttling helps cores temperatures drop to around 55 °C (~131 °F). Hence, the CPU only operates at its maximum potential for the first 15-30 seconds of our hour-long stress test. This behaviour is less dramatic than it seems at first glance though since it only occurs when the CPU and GPU are both stressed simultaneously. By contrast, our test device maintained almost peak performance during our Cinebench R15 multi-core looped benchmark.
We have included screenshots below of our FurMark and Prime95 stress tests to give you a greater overview of clock speeds and core temperatures. Please keep in mind that up until 8 minutes in only Prime95 is stressing the CPU. The CPU briefly operates at 3.4 GHz, before quickly dropping to 1.95 GHz. After 8 minutes we started running FurMark, which caused the GPU core temperatures to reach 82 °C (~180 °F). The dGPU consistently maintained a 1,050 MHz clock speed throughout our stress tests.

(-) The maximum temperature on the upper side is 48 °C / 118 F, compared to the average of 36.8 °C / 98 F, ranging from 21 to 71 °C for the class Multimedia.
(-) The bottom heats up to a maximum of 49 °C / 120 F, compared to the average of 39.1 °C / 102 F
(+) In idle usage, the average temperature for the upper side is 23.7 °C / 75 F, compared to the device average of 31.3 °C / 88 F.
(+) The palmrests and touchpad are cooler than skin temperature with a maximum of 28.2 °C / 82.8 F and are therefore cool to the touch.
(±) The average temperature of the palmrest area of similar devices was 28.7 °C / 83.7 F (+0.5 °C / 0.9 F).
Speakers
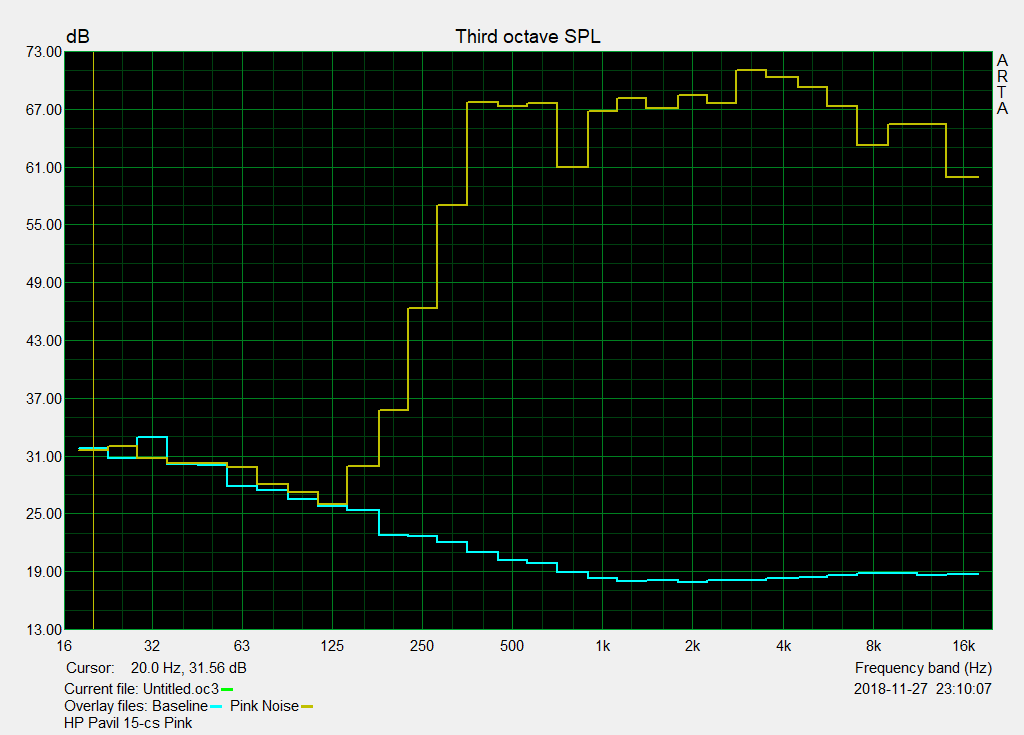
The Pavilion 15 has surprisingly decent speakers. The sound produced is balanced and can get comparatively loud. The sound spectrum is relatively even too, which make the speakers good enough for listening to music or watching videos for prolonged periods. You could connect external speakers or headphones via Bluetooth or the headphone jack if you prefer.
HP Pavilion 15-cs0003ng audio analysis
(-) | not very loud speakers (71 dB)
Bass 100 - 315 Hz
(-) | nearly no bass - on average 29.8% lower than median
(±) | linearity of bass is average (11.5% delta to prev. frequency)
Mids 400 - 2000 Hz
(+) | balanced mids - only 1.4% away from median
(±) | linearity of mids is average (7.1% delta to prev. frequency)
Highs 2 - 16 kHz
(+) | balanced highs - only 2.3% away from median
(+) | highs are linear (4.2% delta to prev. frequency)
Overall 100 - 16.000 Hz
(±) | linearity of overall sound is average (20.8% difference to median)
Compared to same class
» 71% of all tested devices in this class were better, 7% similar, 21% worse
» The best had a delta of 5%, average was 17%, worst was 45%
Compared to all devices tested
» 56% of all tested devices were better, 8% similar, 36% worse
» The best had a delta of 4%, average was 24%, worst was 134%
Apple MacBook 12 (Early 2016) 1.1 GHz audio analysis
(+) | speakers can play relatively loud (83.6 dB)
Bass 100 - 315 Hz
(±) | reduced bass - on average 11.3% lower than median
(±) | linearity of bass is average (14.2% delta to prev. frequency)
Mids 400 - 2000 Hz
(+) | balanced mids - only 2.4% away from median
(+) | mids are linear (5.5% delta to prev. frequency)
Highs 2 - 16 kHz
(+) | balanced highs - only 2% away from median
(+) | highs are linear (4.5% delta to prev. frequency)
Overall 100 - 16.000 Hz
(+) | overall sound is linear (10.2% difference to median)
Compared to same class
» 7% of all tested devices in this class were better, 2% similar, 91% worse
» The best had a delta of 5%, average was 18%, worst was 53%
Compared to all devices tested
» 5% of all tested devices were better, 1% similar, 94% worse
» The best had a delta of 4%, average was 24%, worst was 134%
Power Management
Power Consumption
The 15-cs0003ng is a comparatively energy efficient laptop. Our test device consumes a minimum of 3.3 W at idle, which is on par with the best of our comparison devices, and a maximum of 67 W under load. The device averages 56 W under load too, which may initially look alarming. However, the 15-cs0003ng has a more powerful GPU than most of our comparison devices and is on par with the VivoBook 15 X542UF, which also has a GeForce MX130 GPU.
HP includes a 65-W charger, which will be overwhelmed by the 15-cs0003ng when the system is pushed hard. This should not be a problem in daily use, but it is something worth keeping in mind if you are looking for a device on which you can also do some light gaming.
| Off / Standby | |
| Idle | |
| Load |
|
Key:
min: | |
| HP Pavilion 15-cs0003ng i5-8250U, GeForce MX130, SK Hynix SC313 HFS256G39TNF, IPS, 1920x1080, 15.6" | HP Pavilion 15-cw0003ng R5 2500U, Vega 8, Intel SSD 600p SSDPEKKW512G7, IPS, 1920x1080, 15.6" | Xiaomi Mi Notebook 15.6 (E58514D1D) i5-8250U, GeForce MX110, Samsung PM871b MZNLN128HAHQ, LED, 1920x1080, 15.6" | Lenovo IdeaPad 330S-15IKB-81F500N5GE i5-8250U, UHD Graphics 620, , IPS, 1920x1080, 15.6" | Acer TravelMate P2510-G2-MG-50WE i5-8250U, GeForce MX130, SK Hynix HFS256G39TND-N210A, IPS, 1920x1080, 15.6" | Asus VivoBook 15 X542UF-DM143T i5-8250U, GeForce MX130, Micron 1100 MTFDDAV256TBN, TN LED, 1920x1080, 15.6" | HP Pavilion 15-cs0053cl i5-8250U, UHD Graphics 620, Toshiba MQ04ABF100, TN LED, 1366x768, 15.6" | Average NVIDIA GeForce MX130 | Average of class Multimedia | |
|---|---|---|---|---|---|---|---|---|---|
| Power Consumption | 1% | -15% | 4% | 5% | -7% | 3% | -11% | -54% | |
| Idle Minimum * (Watt) | 3.3 | 4.5 -36% | 5.6 -70% | 5 -52% | 3.3 -0% | 4.75 -44% | 5.6 -70% | 4.54 ? -38% | 5.71 ? -73% |
| Idle Average * (Watt) | 6.1 | 7.3 -20% | 8.6 -41% | 7.6 -25% | 5.6 8% | 6.9 -13% | 7.1 -16% | 6.98 ? -14% | 10.1 ? -66% |
| Idle Maximum * (Watt) | 8.3 | 9.4 -13% | 8.7 -5% | 8.6 -4% | 7.8 6% | 7 16% | 7.9 5% | 9.08 ? -9% | 12.4 ? -49% |
| Load Average * (Watt) | 56 | 34 39% | 39.9 29% | 25.6 54% | 54 4% | 53 5% | 32.8 41% | 54.1 ? 3% | 65 ? -16% |
| Load Maximum * (Watt) | 67 | 41.9 37% | 59.9 11% | 34 49% | 63 6% | 65.3 3% | 30.5 54% | 66.4 ? 1% | 112.2 ? -67% |
| Witcher 3 ultra * (Watt) | 33.2 |
* ... smaller is better
Battery Life
The 15-cs0003ng has a 41 Wh battery, which has poor runtimes. Our test device lasted just 4:44 hours in our practical Wi-Fi test, during which we set the screen to approximately 150 cd/m² and run a script that simulates the load required to render websites. This runtime puts the 15-cs0003ng bottom of our comparison table and 11 minutes behind the Ryzen 5 2500U equipped Pavilion 15. In short, our test device has worse battery life than all our comparison devices and has around 4% shorter runtimes than the 15-cw0003ng. Likewise, the 15-cs0003ng also has 35% worse battery life than the 15-cs0053cl.
| HP Pavilion 15-cs0003ng i5-8250U, GeForce MX130, 41 Wh | HP Pavilion 15-cw0003ng R5 2500U, Vega 8, 41 Wh | Xiaomi Mi Notebook 15.6 (E58514D1D) i5-8250U, GeForce MX110, 40 Wh | Lenovo IdeaPad 330S-15IKB-81F500N5GE i5-8250U, UHD Graphics 620, 52 Wh | Acer TravelMate P2510-G2-MG-50WE i5-8250U, GeForce MX130, 48 Wh | Asus VivoBook 15 X542UF-DM143T i5-8250U, GeForce MX130, 38 Wh | HP Pavilion 15-cs0053cl i5-8250U, UHD Graphics 620, 41 Wh | Average of class Multimedia | |
|---|---|---|---|---|---|---|---|---|
| Battery runtime | 4% | 23% | 24% | 40% | 45% | 35% | 115% | |
| Reader / Idle (h) | 8.2 | 8.4 2% | 10.2 24% | 12.6 54% | 12 46% | 25.2 ? 207% | ||
| WiFi v1.3 (h) | 4.7 | 5 6% | 5.7 21% | 5.8 23% | 8.4 79% | 6.8 45% | 7 49% | 12 ? 155% |
| Load (h) | 2 | 2.1 5% | 1.9 -5% | 2 0% | 2.2 10% | 1.675 ? -16% |
Verdict
Pros
Cons
The HP Pavilion 15-cs0003ng has a modern design and an almost bezel-less display. Moreover, the Intel Core i5-8250U processor and NVIDIA GeForce MX130 GPU is a powerful combination that will breeze through general office tasks and even some games at the right graphics settings.
The HP Pavilion 15-cs0003ng is a well-rounded 15.6-inch laptop that has a great design and enough power for most tasks. However, it has comparatively short battery life and a noisy fan under load, which may put off some potential buyers.
Unfortunately, the NVIDIA GPU has a significant impact on battery life, with the practically identically equipped Pavilion 15-cs0053cl achieving twice as long runtimes in our tests as the 15-cs0003ng. Disabling the NVIDIA GPU in Device Manager would help improve battery life though. Overall, the Pavilion 15-cs0003ng is a great 15.6-inch laptop that falls short of the competition in a few areas.
HP Pavilion 15-cs0003ng
- 01/10/2019 v6 (old)
Mike Wobker
Price comparison

