HP Pavilion 15 (AMD Ryzen 5 2500U, Vega 8) Laptop Review

The 15-inch HP Pavilion has a matte FHD IPS display and is powered by an AMD Ryzen 5 2500U and the onboard graphics chip Vega 8. It comes with 8 GB of RAM and a 512 GB SSD. In this review, we compare the Ryzen 5 CPU directly to its rivals equipped with an Intel i5-8250U. We are interested primarily in the pure benchmark values and the cooling performance as well as the throttling behavior. The case has also been changed slightly in comparison to the predecessor model, appearing more modern and stylish now.
Case - The Pavilion Benefits from the Update
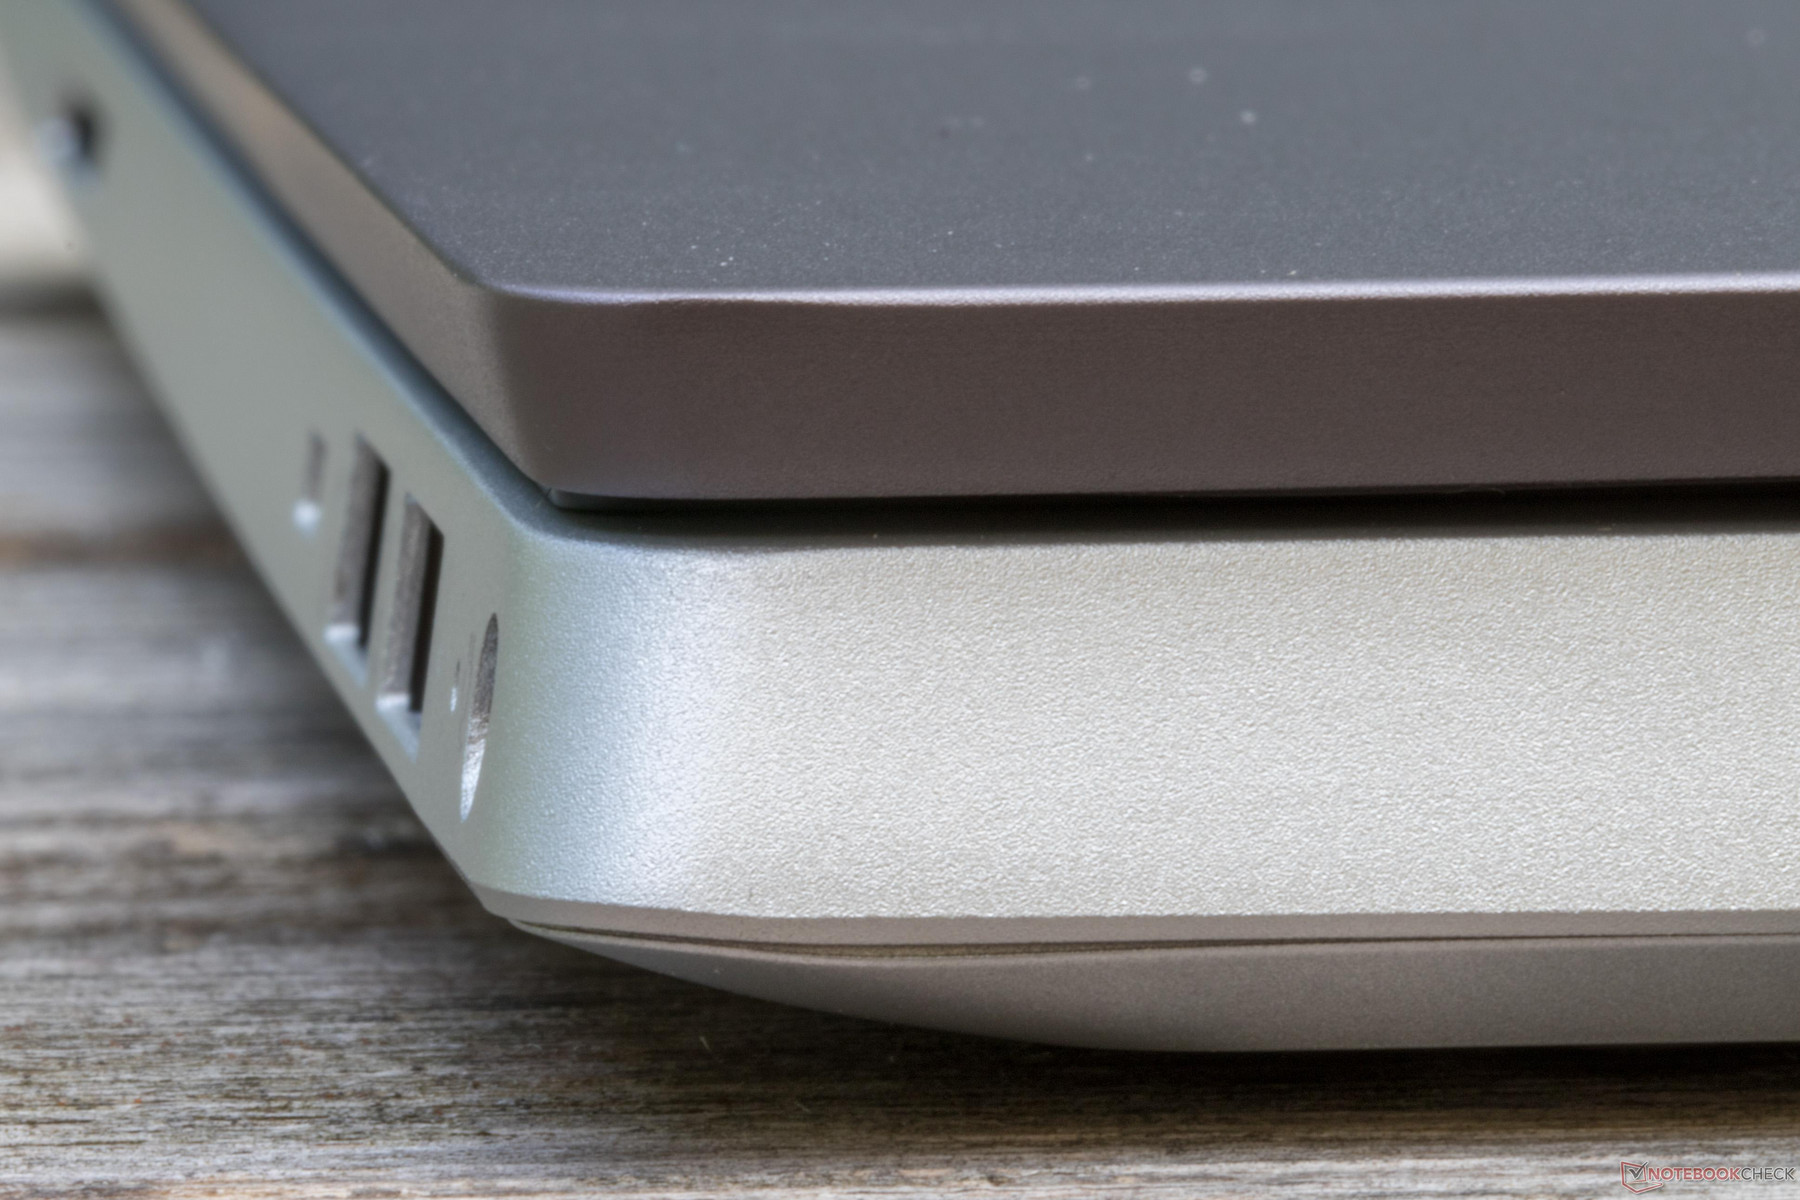
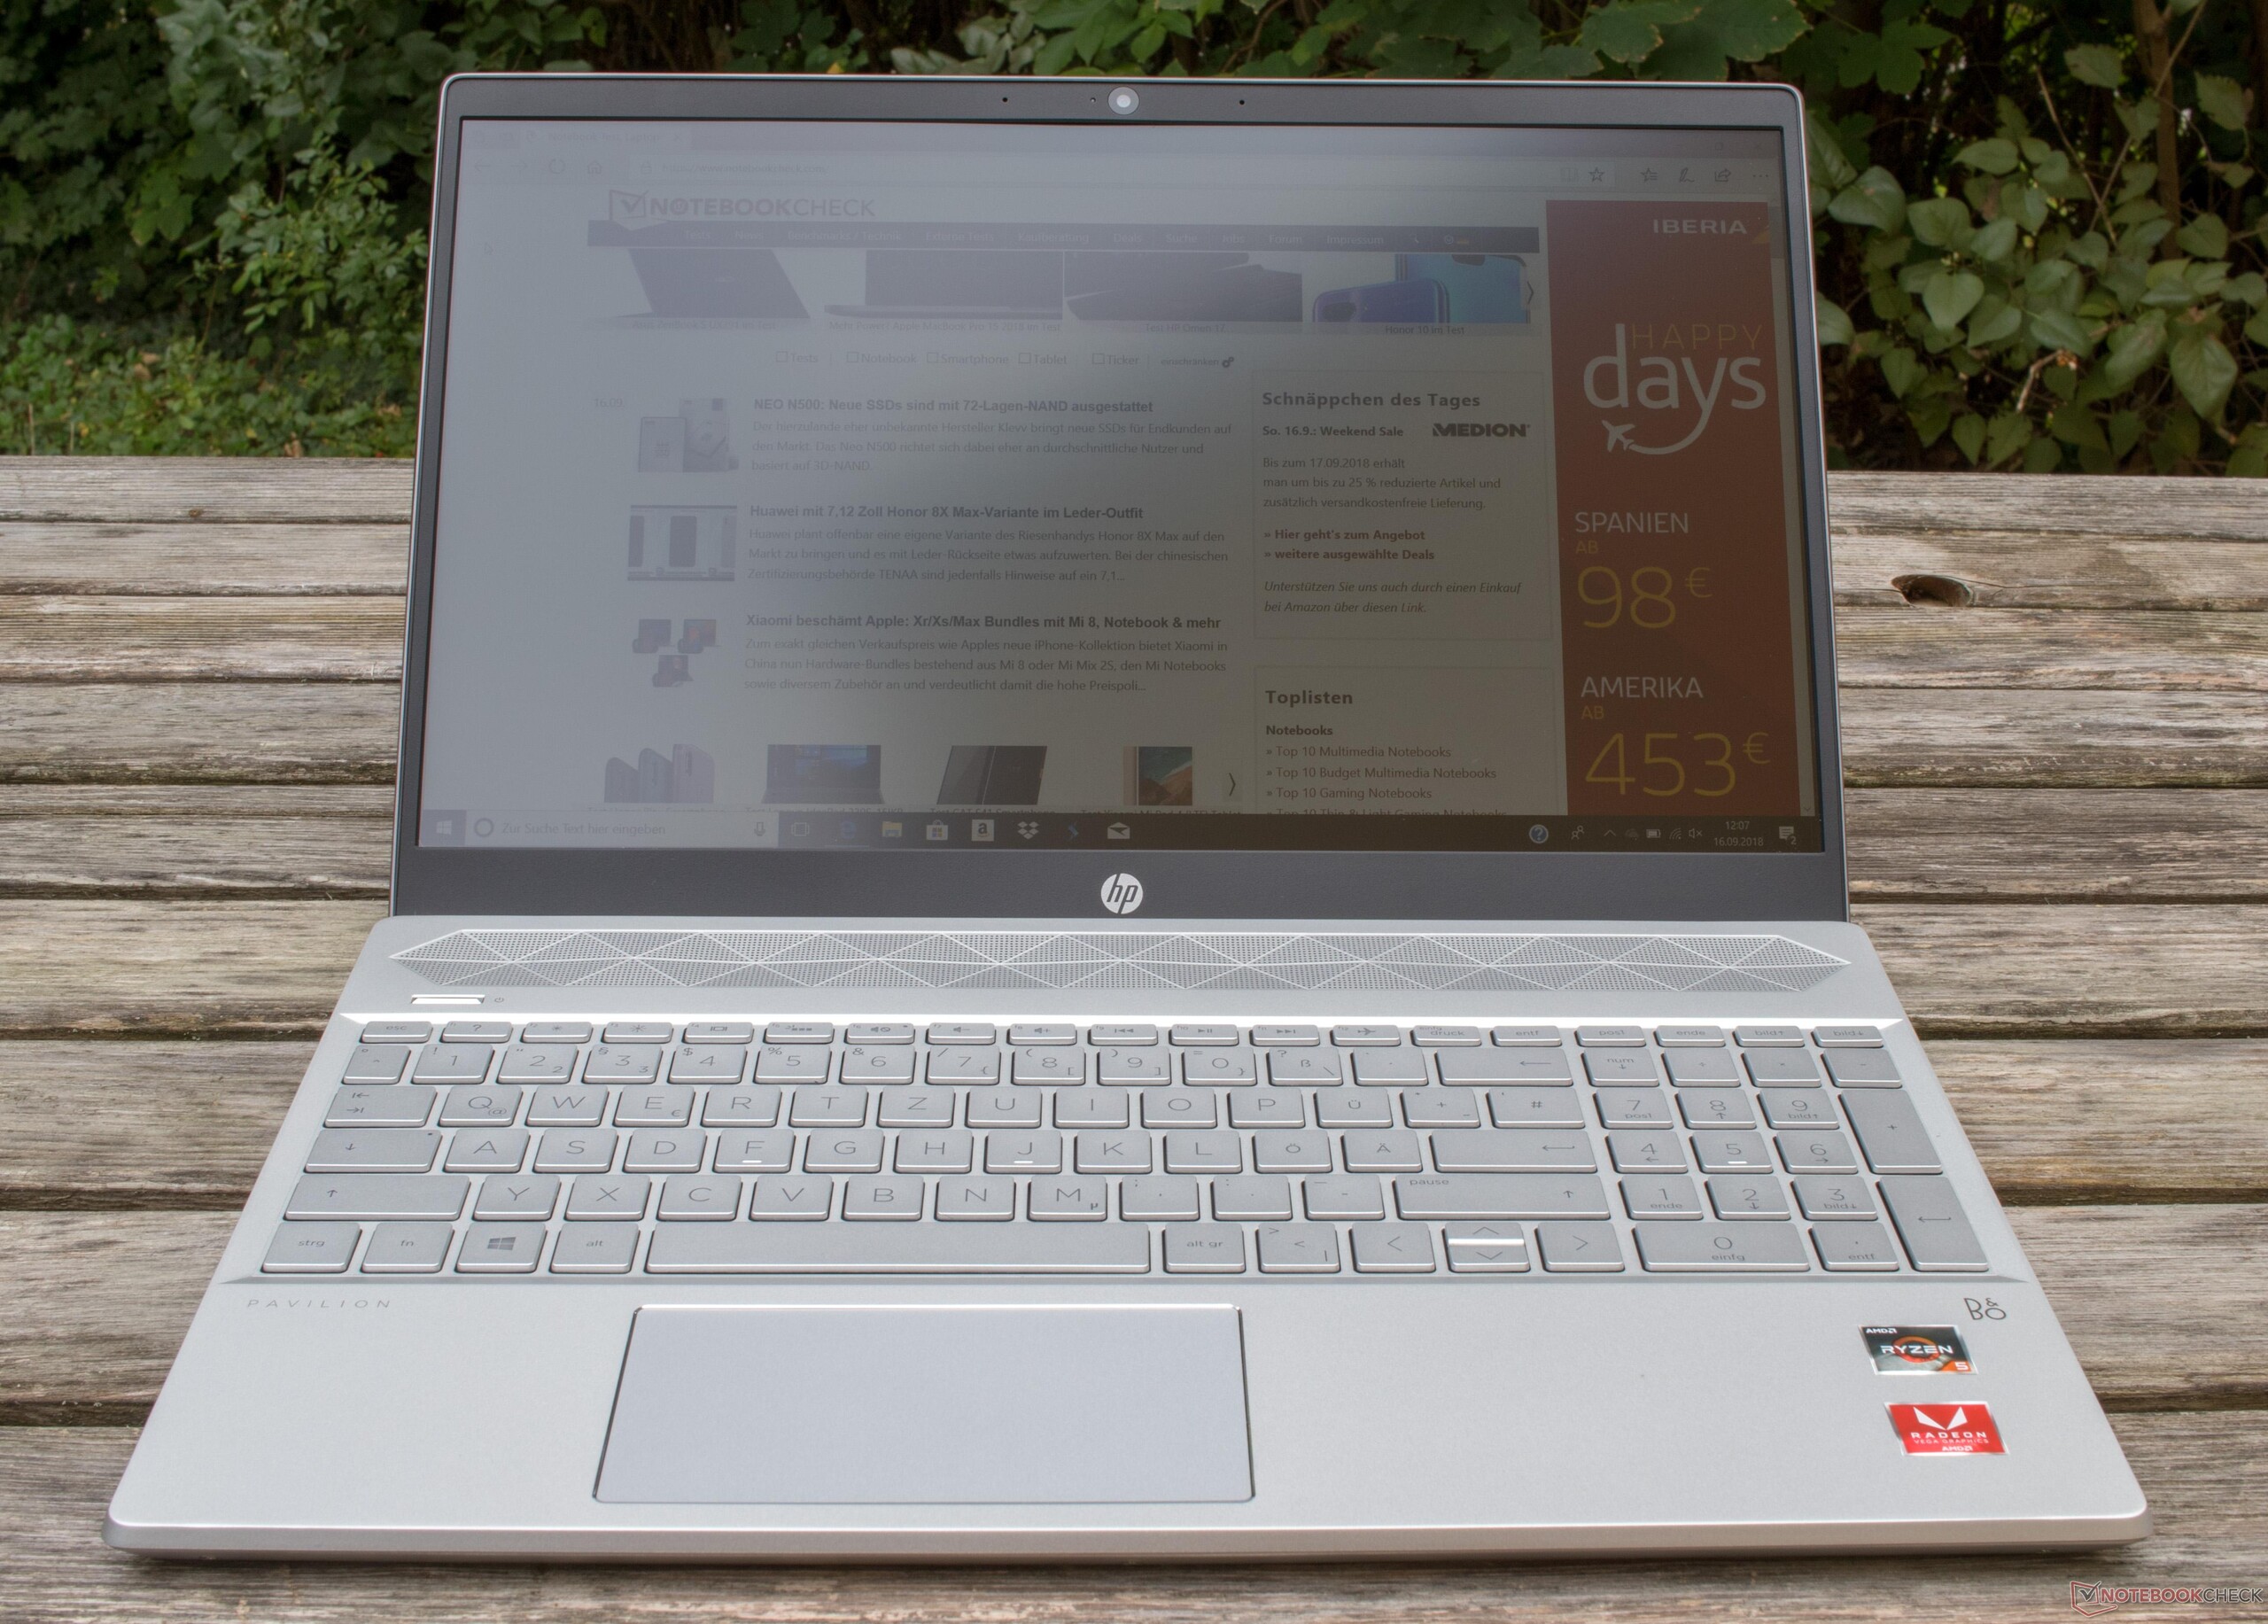
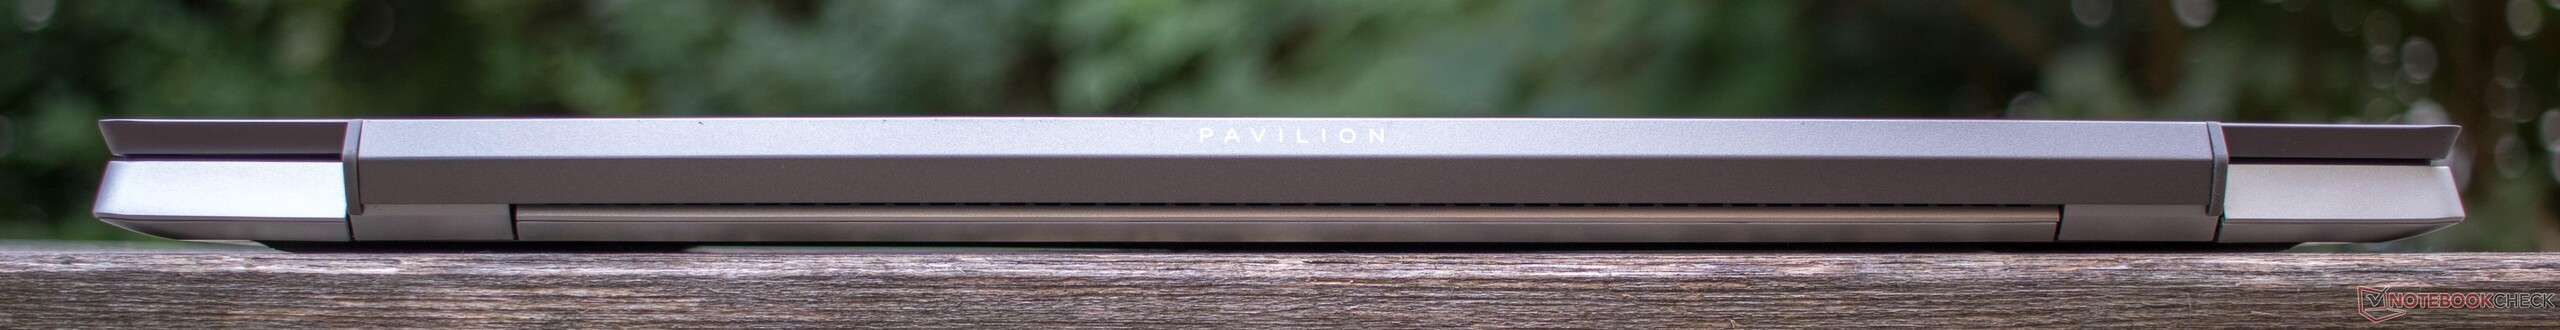
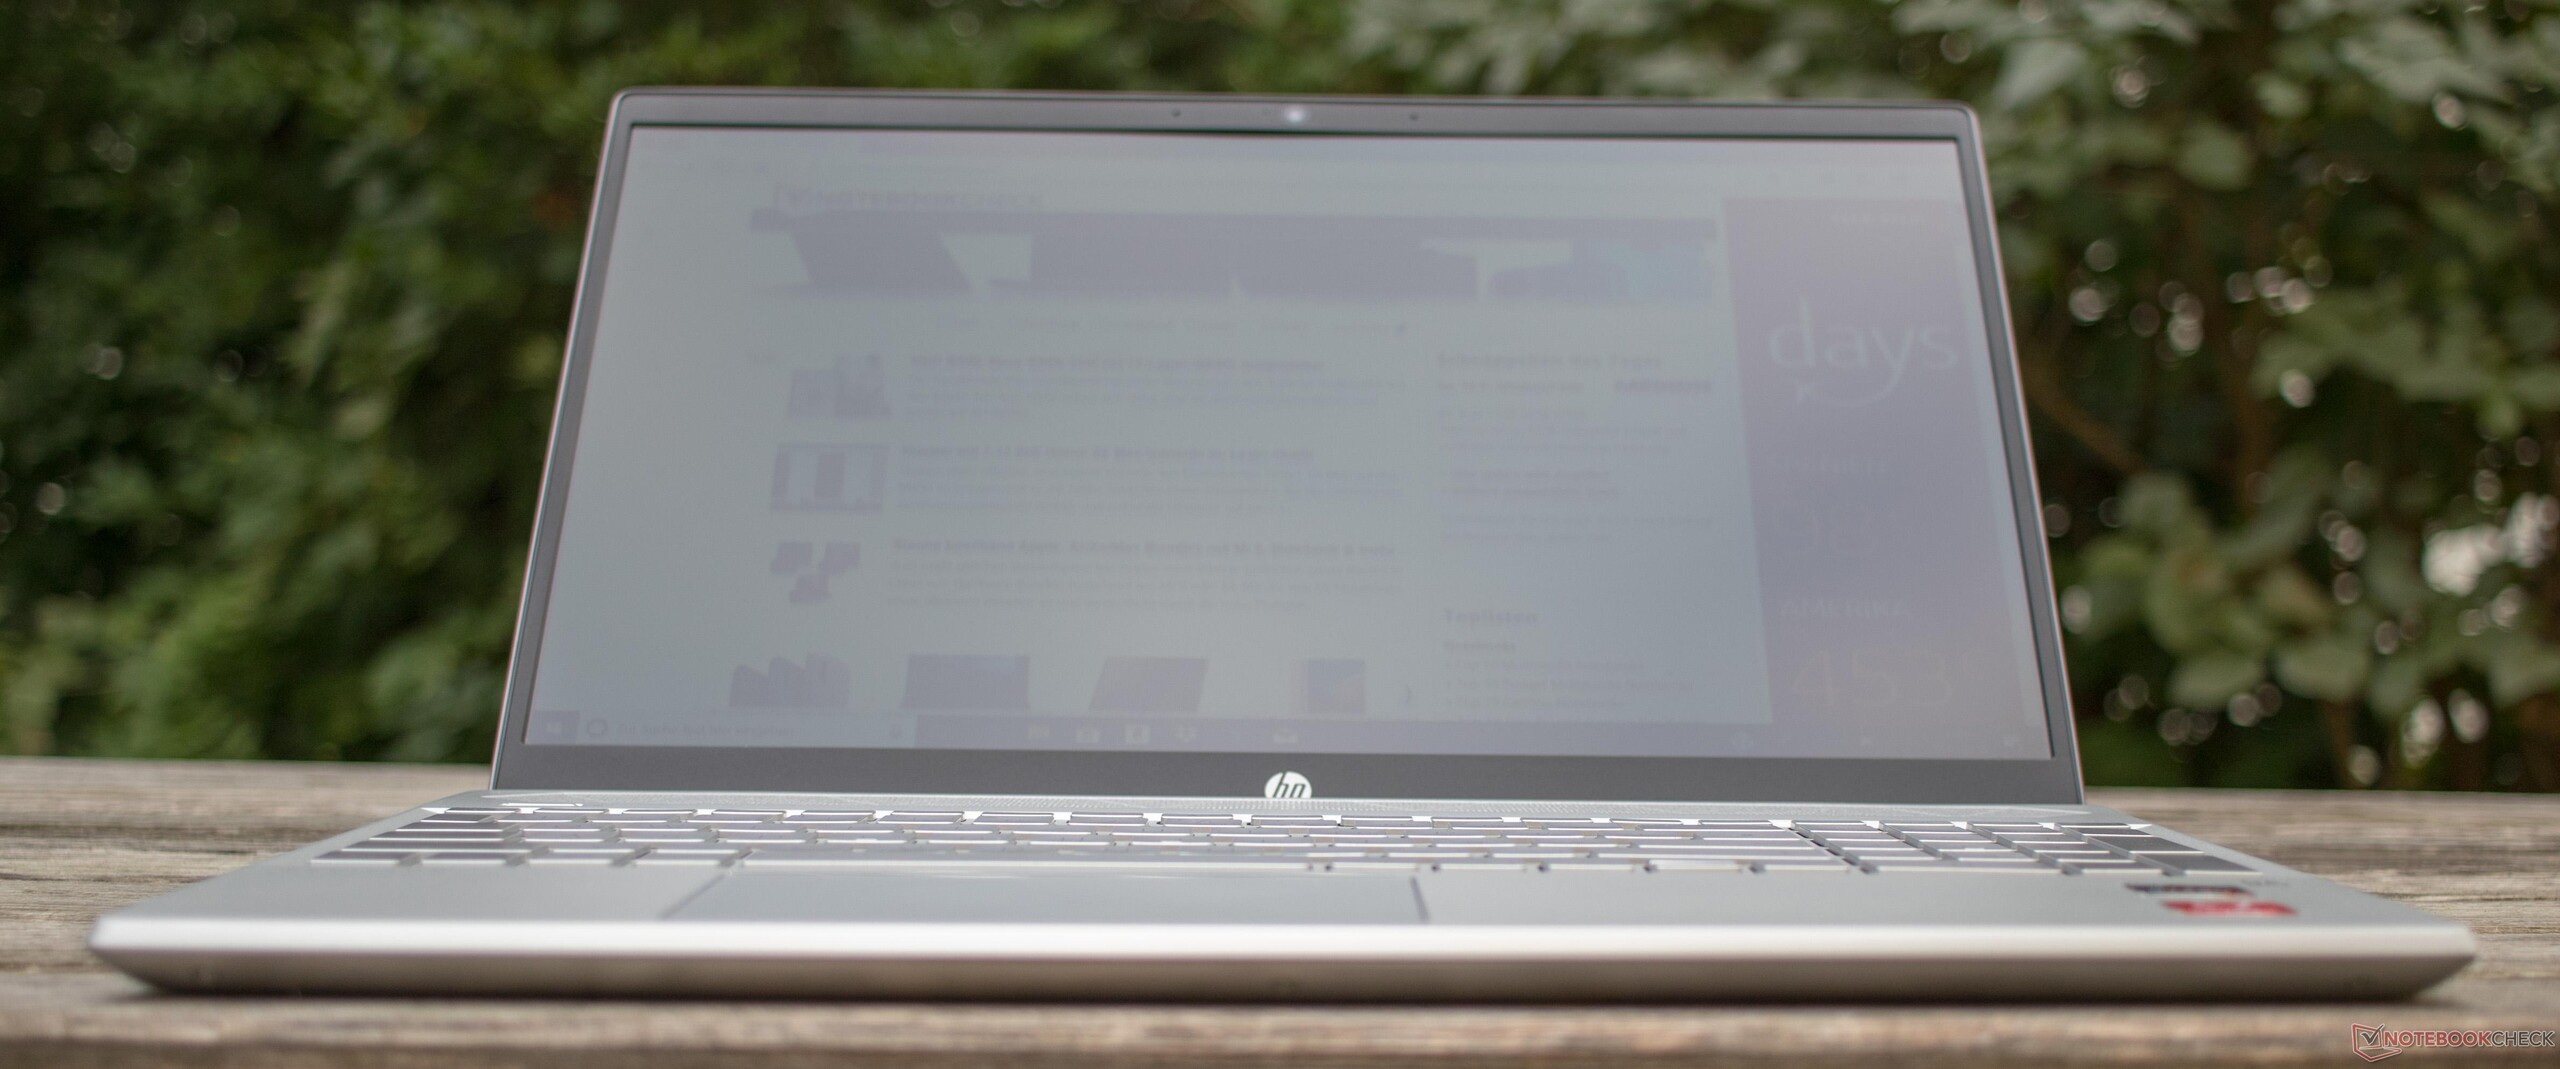
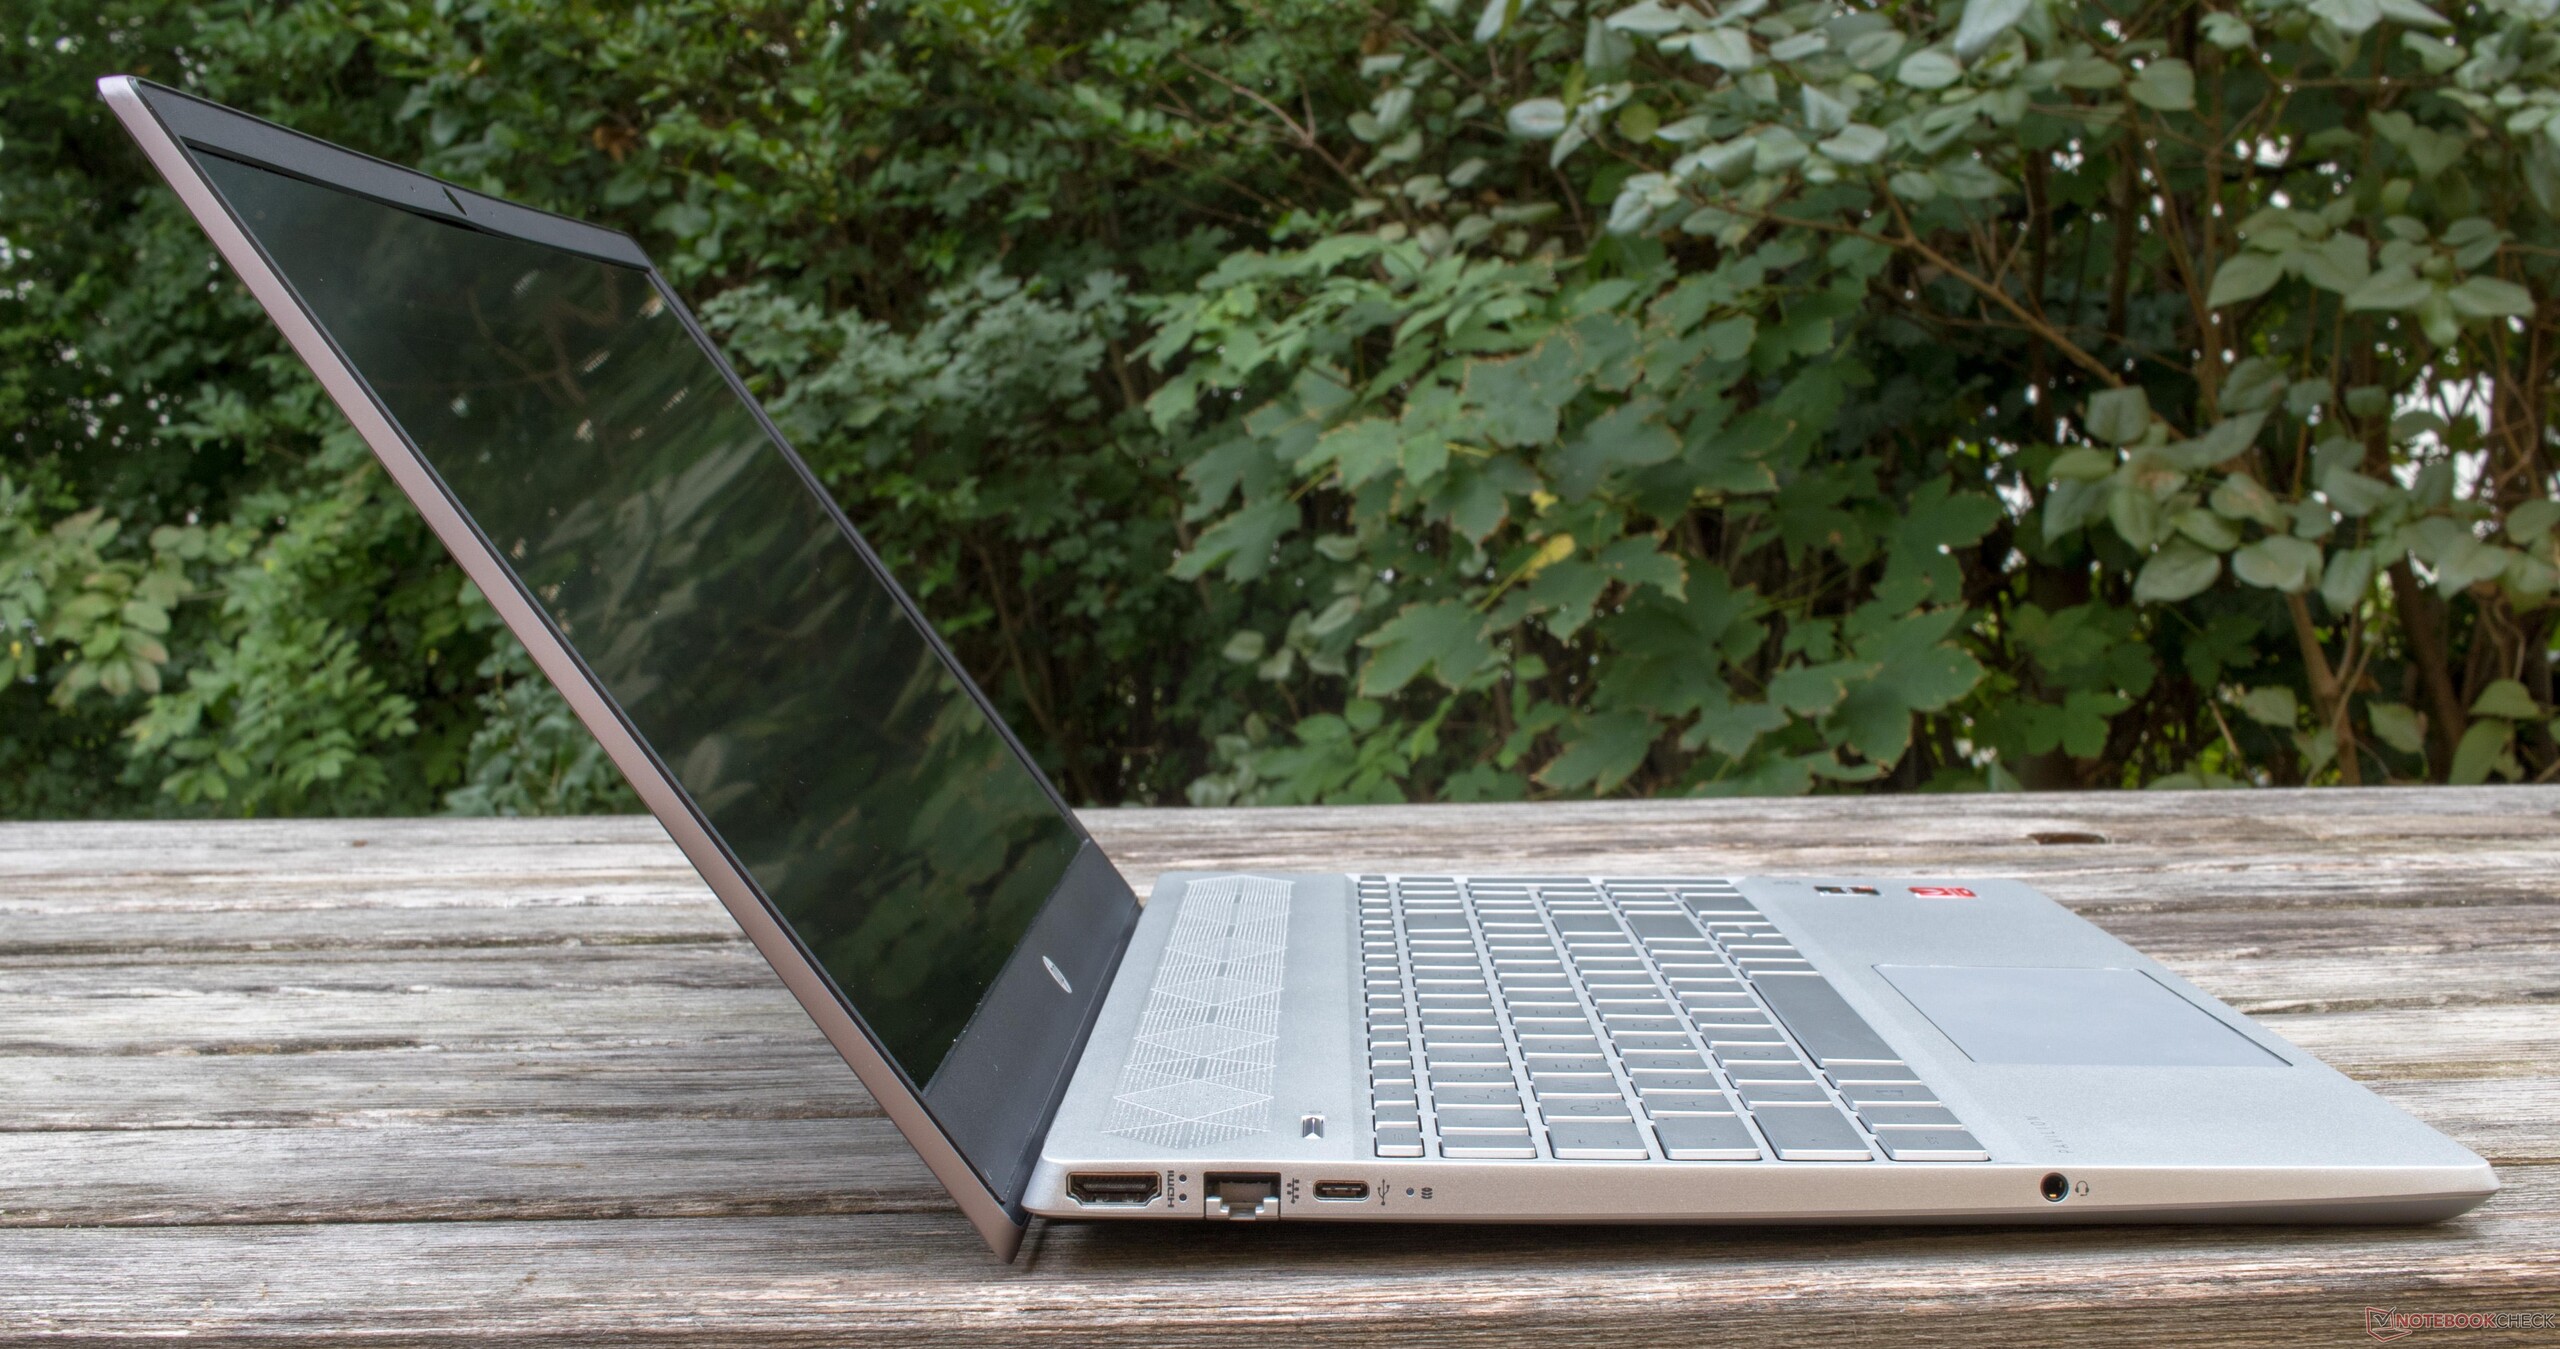
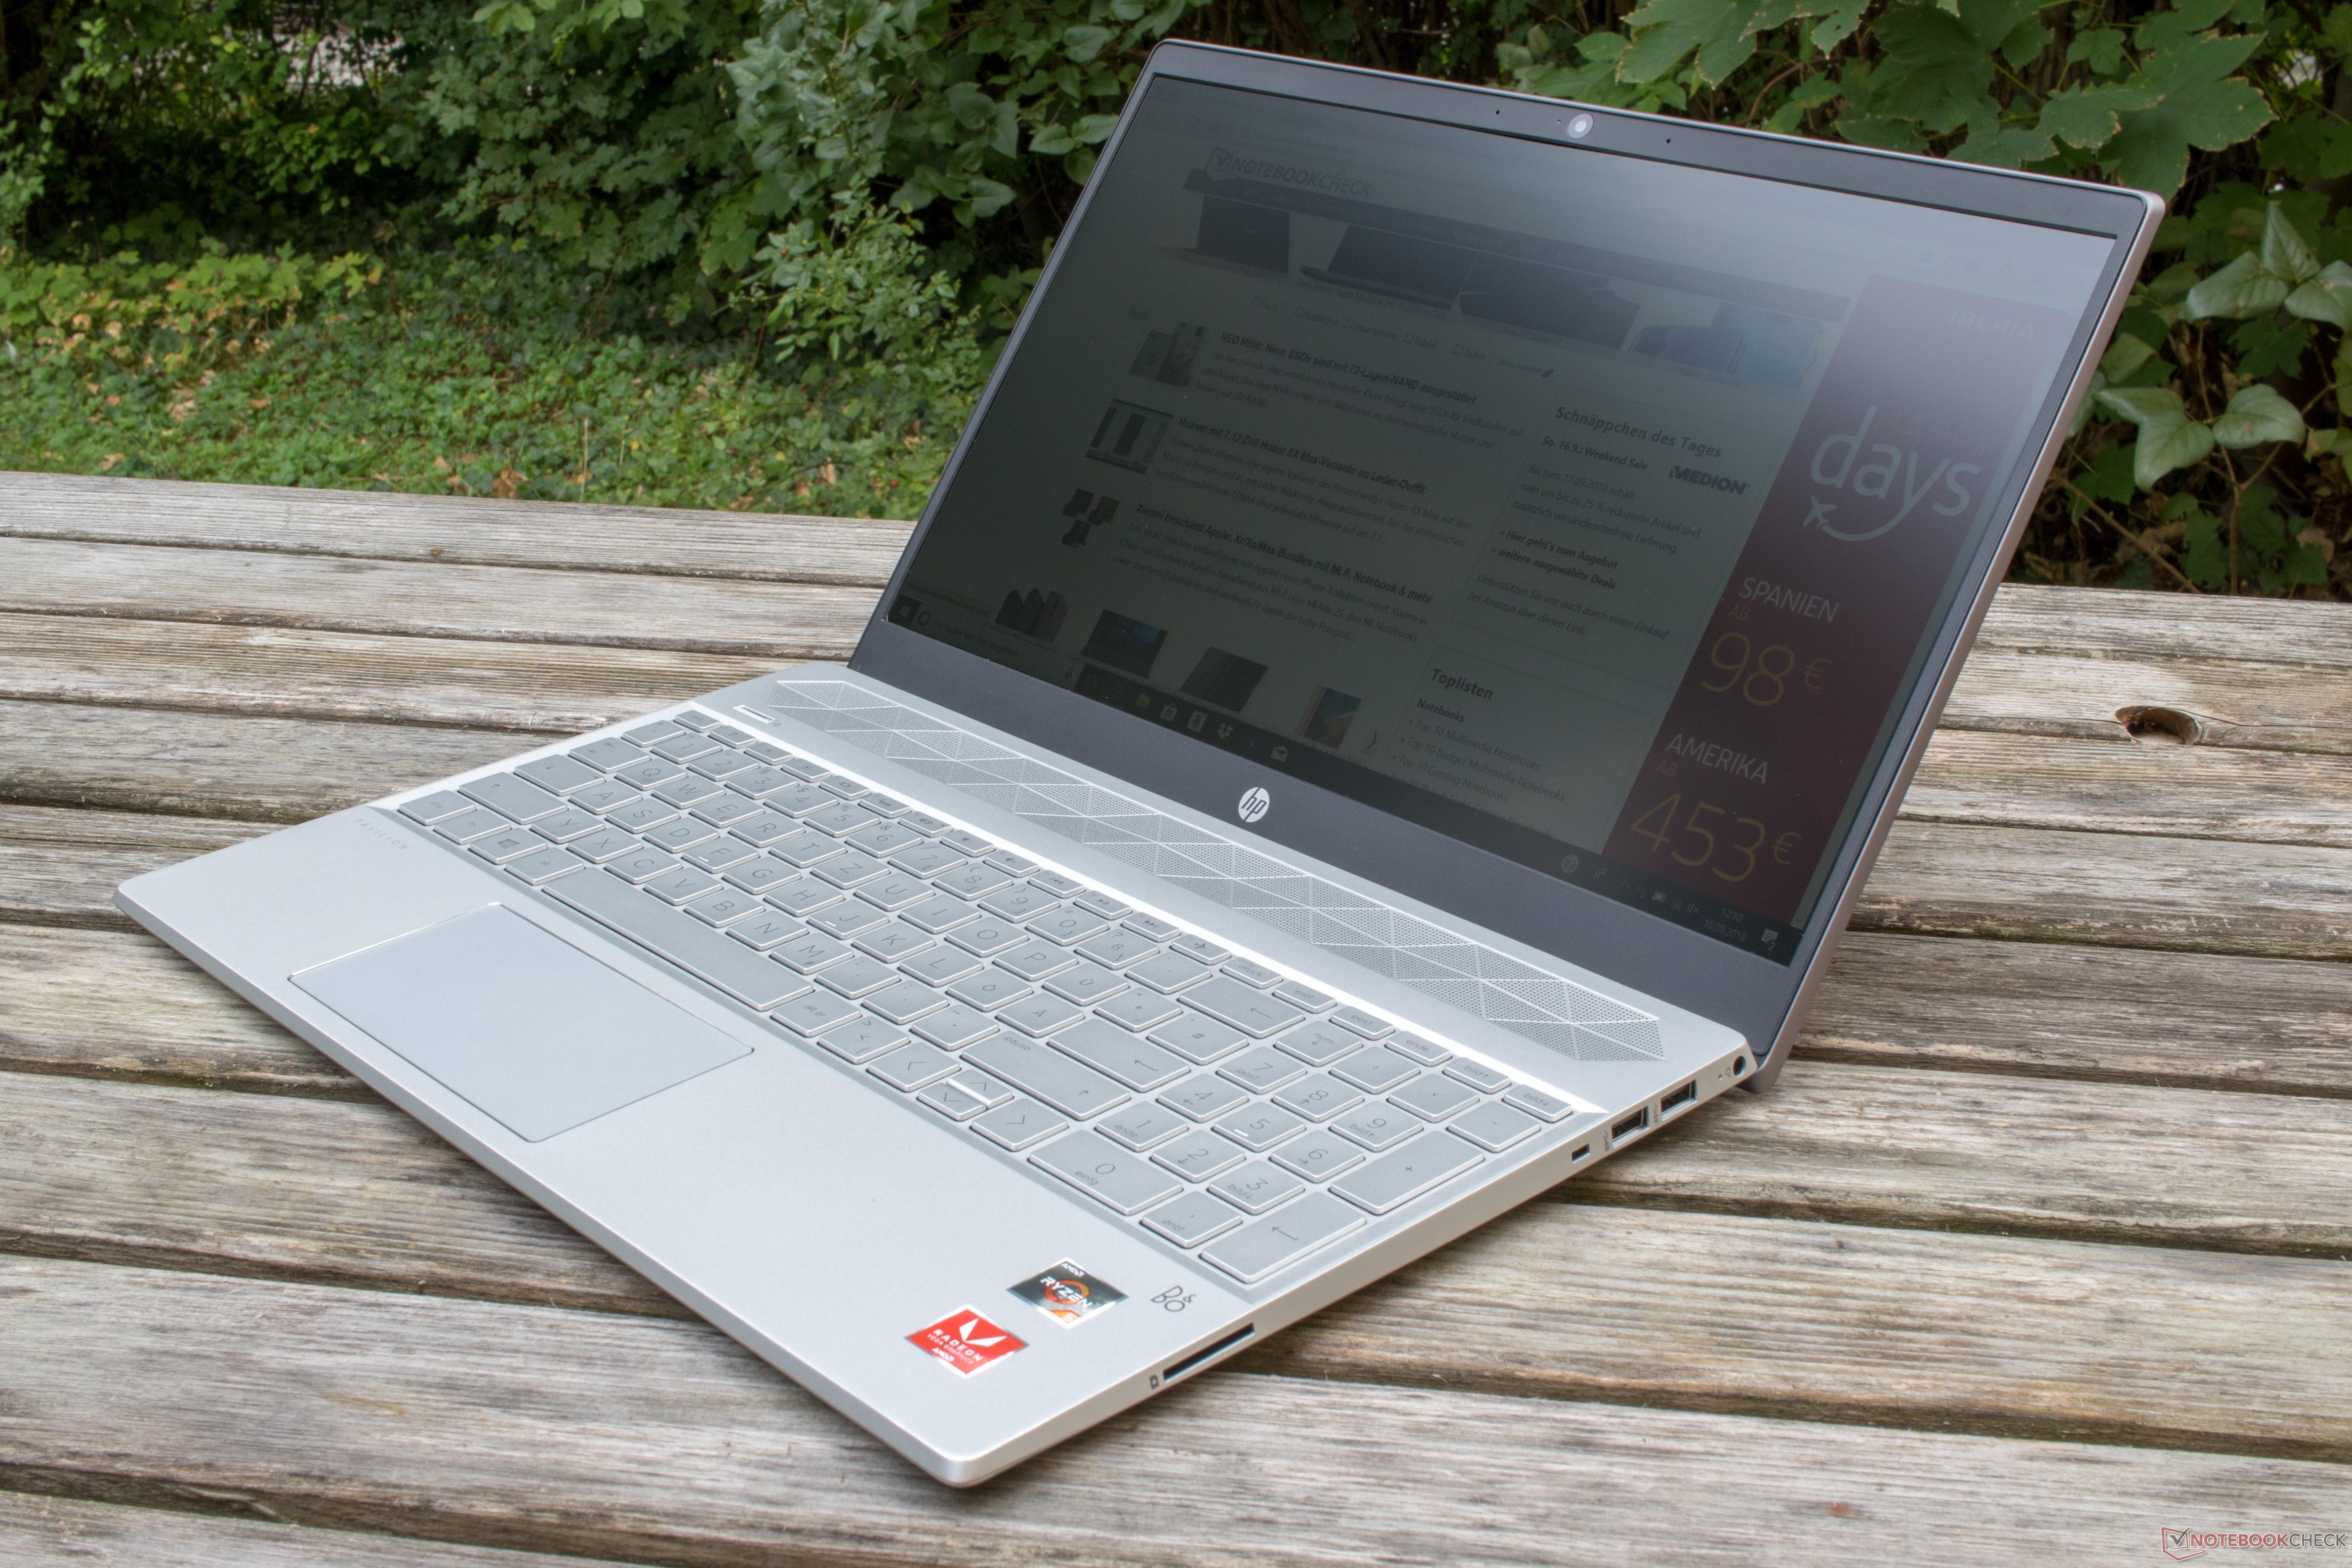
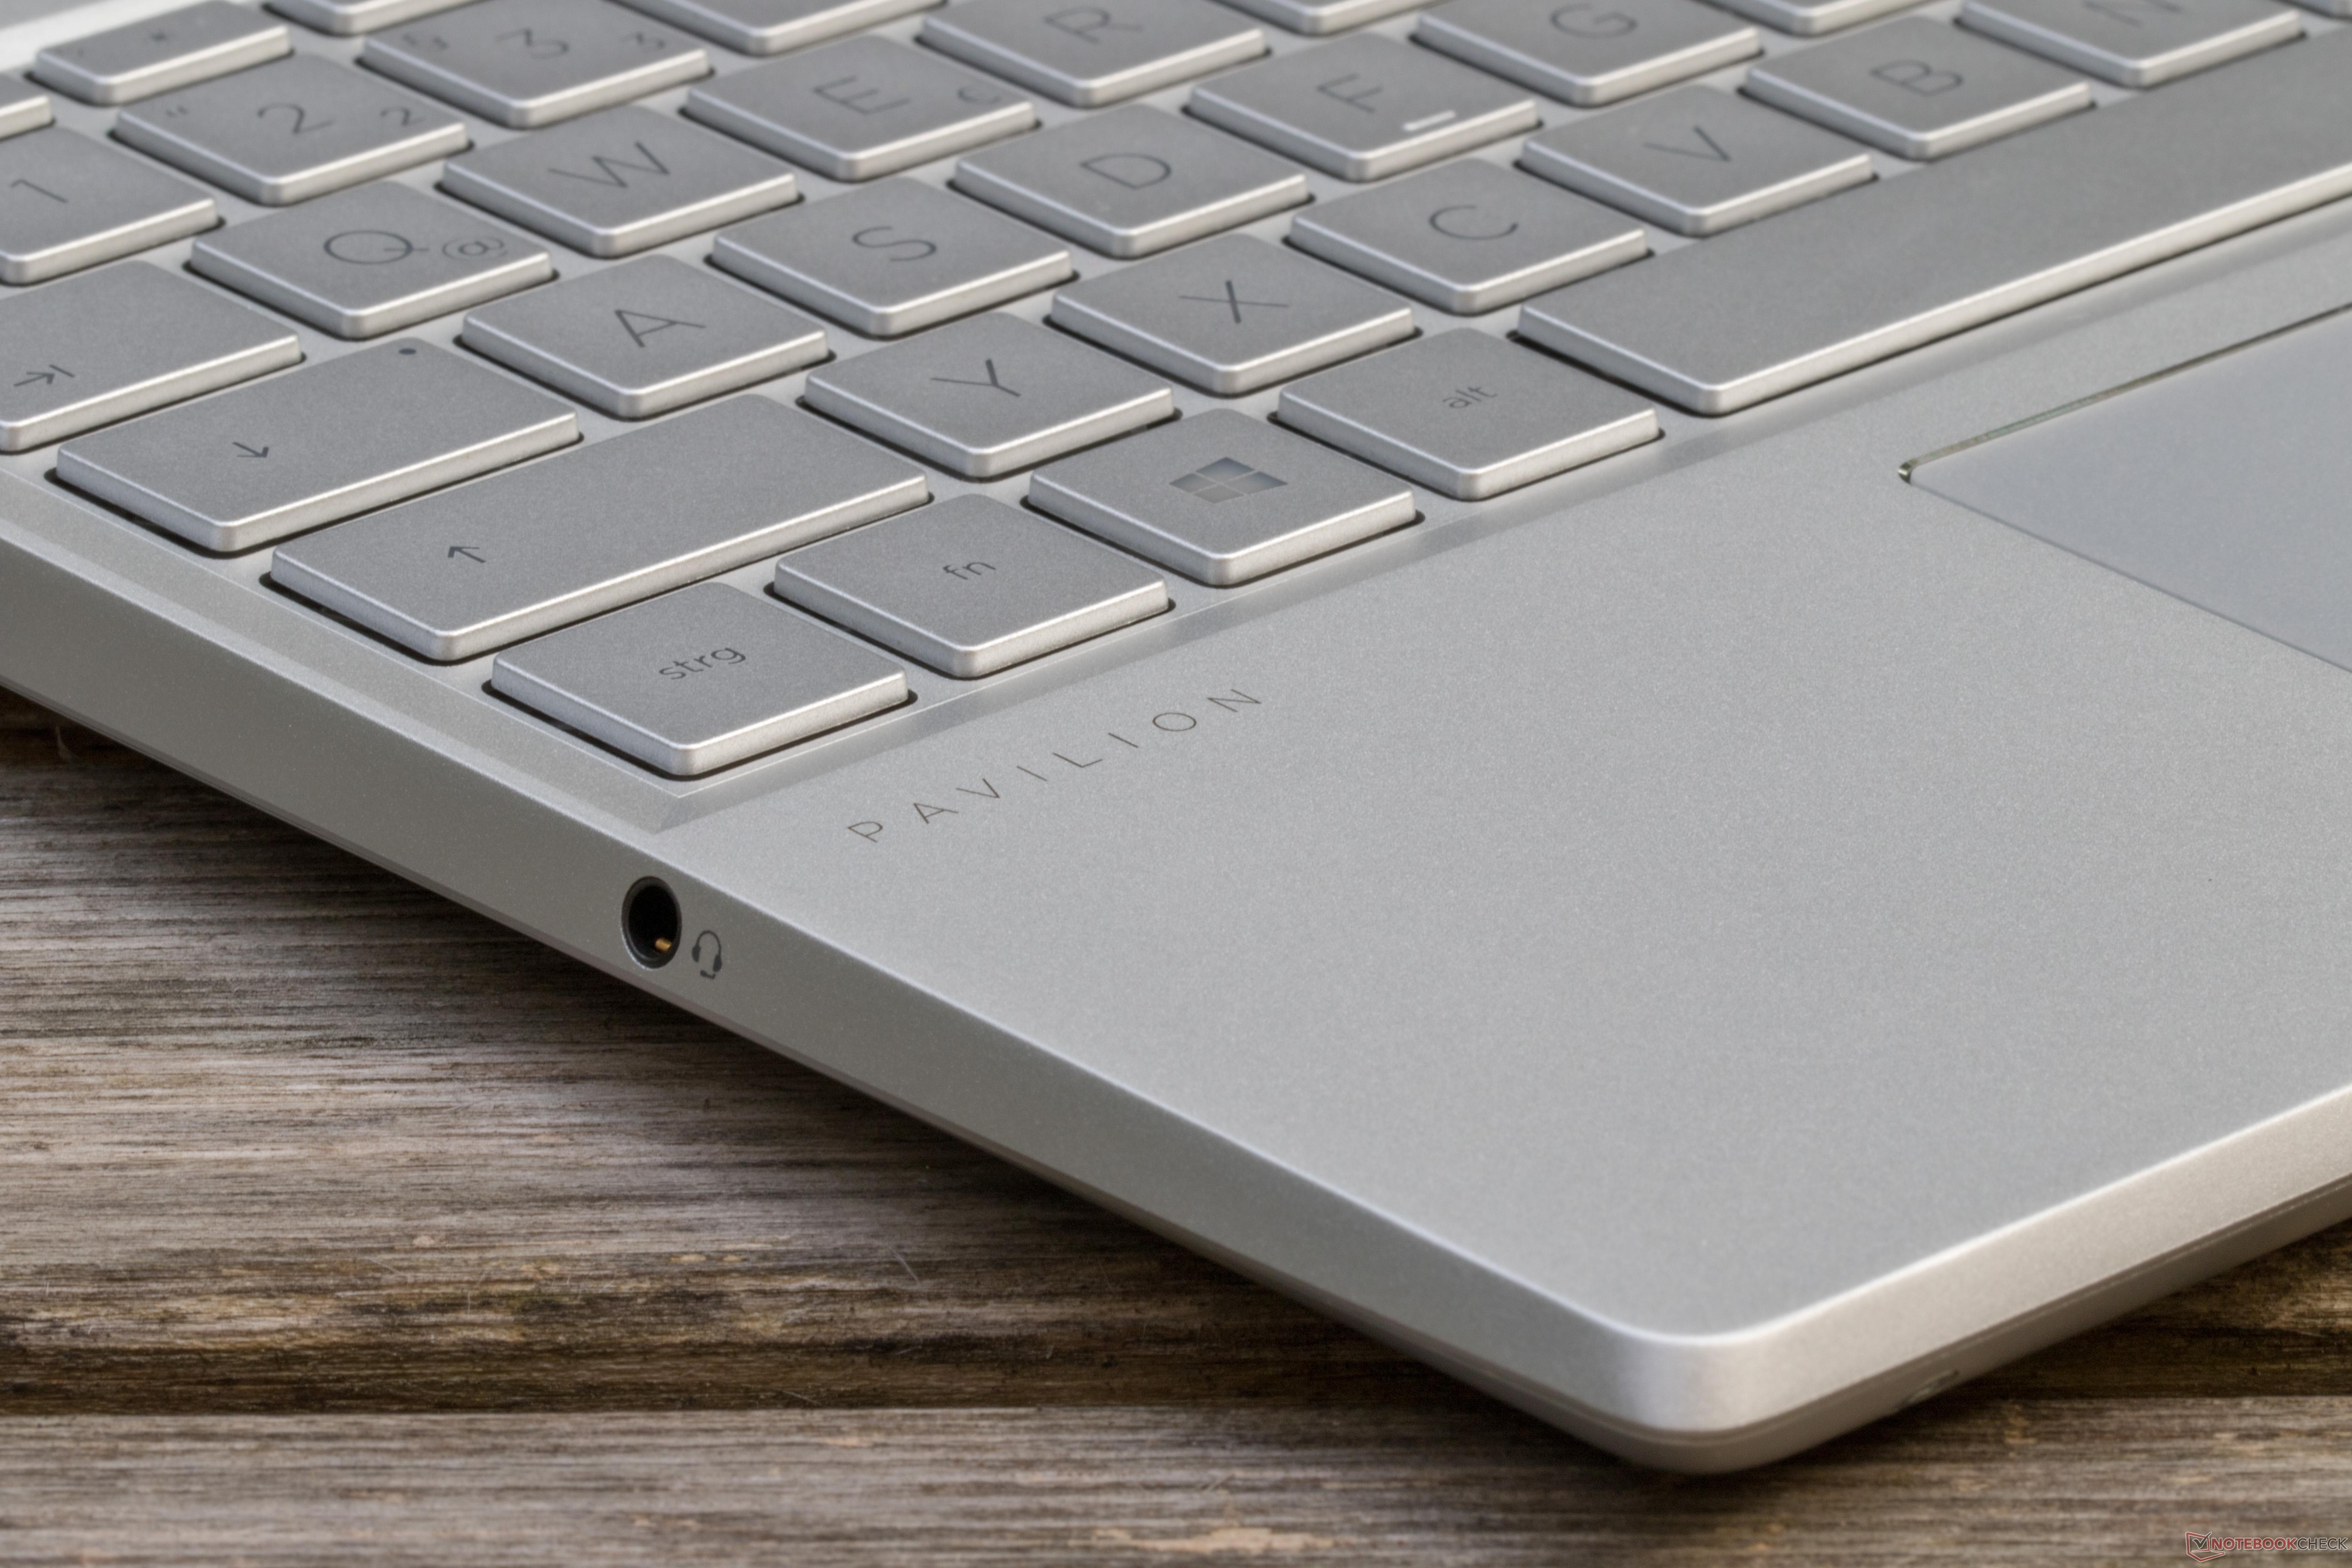
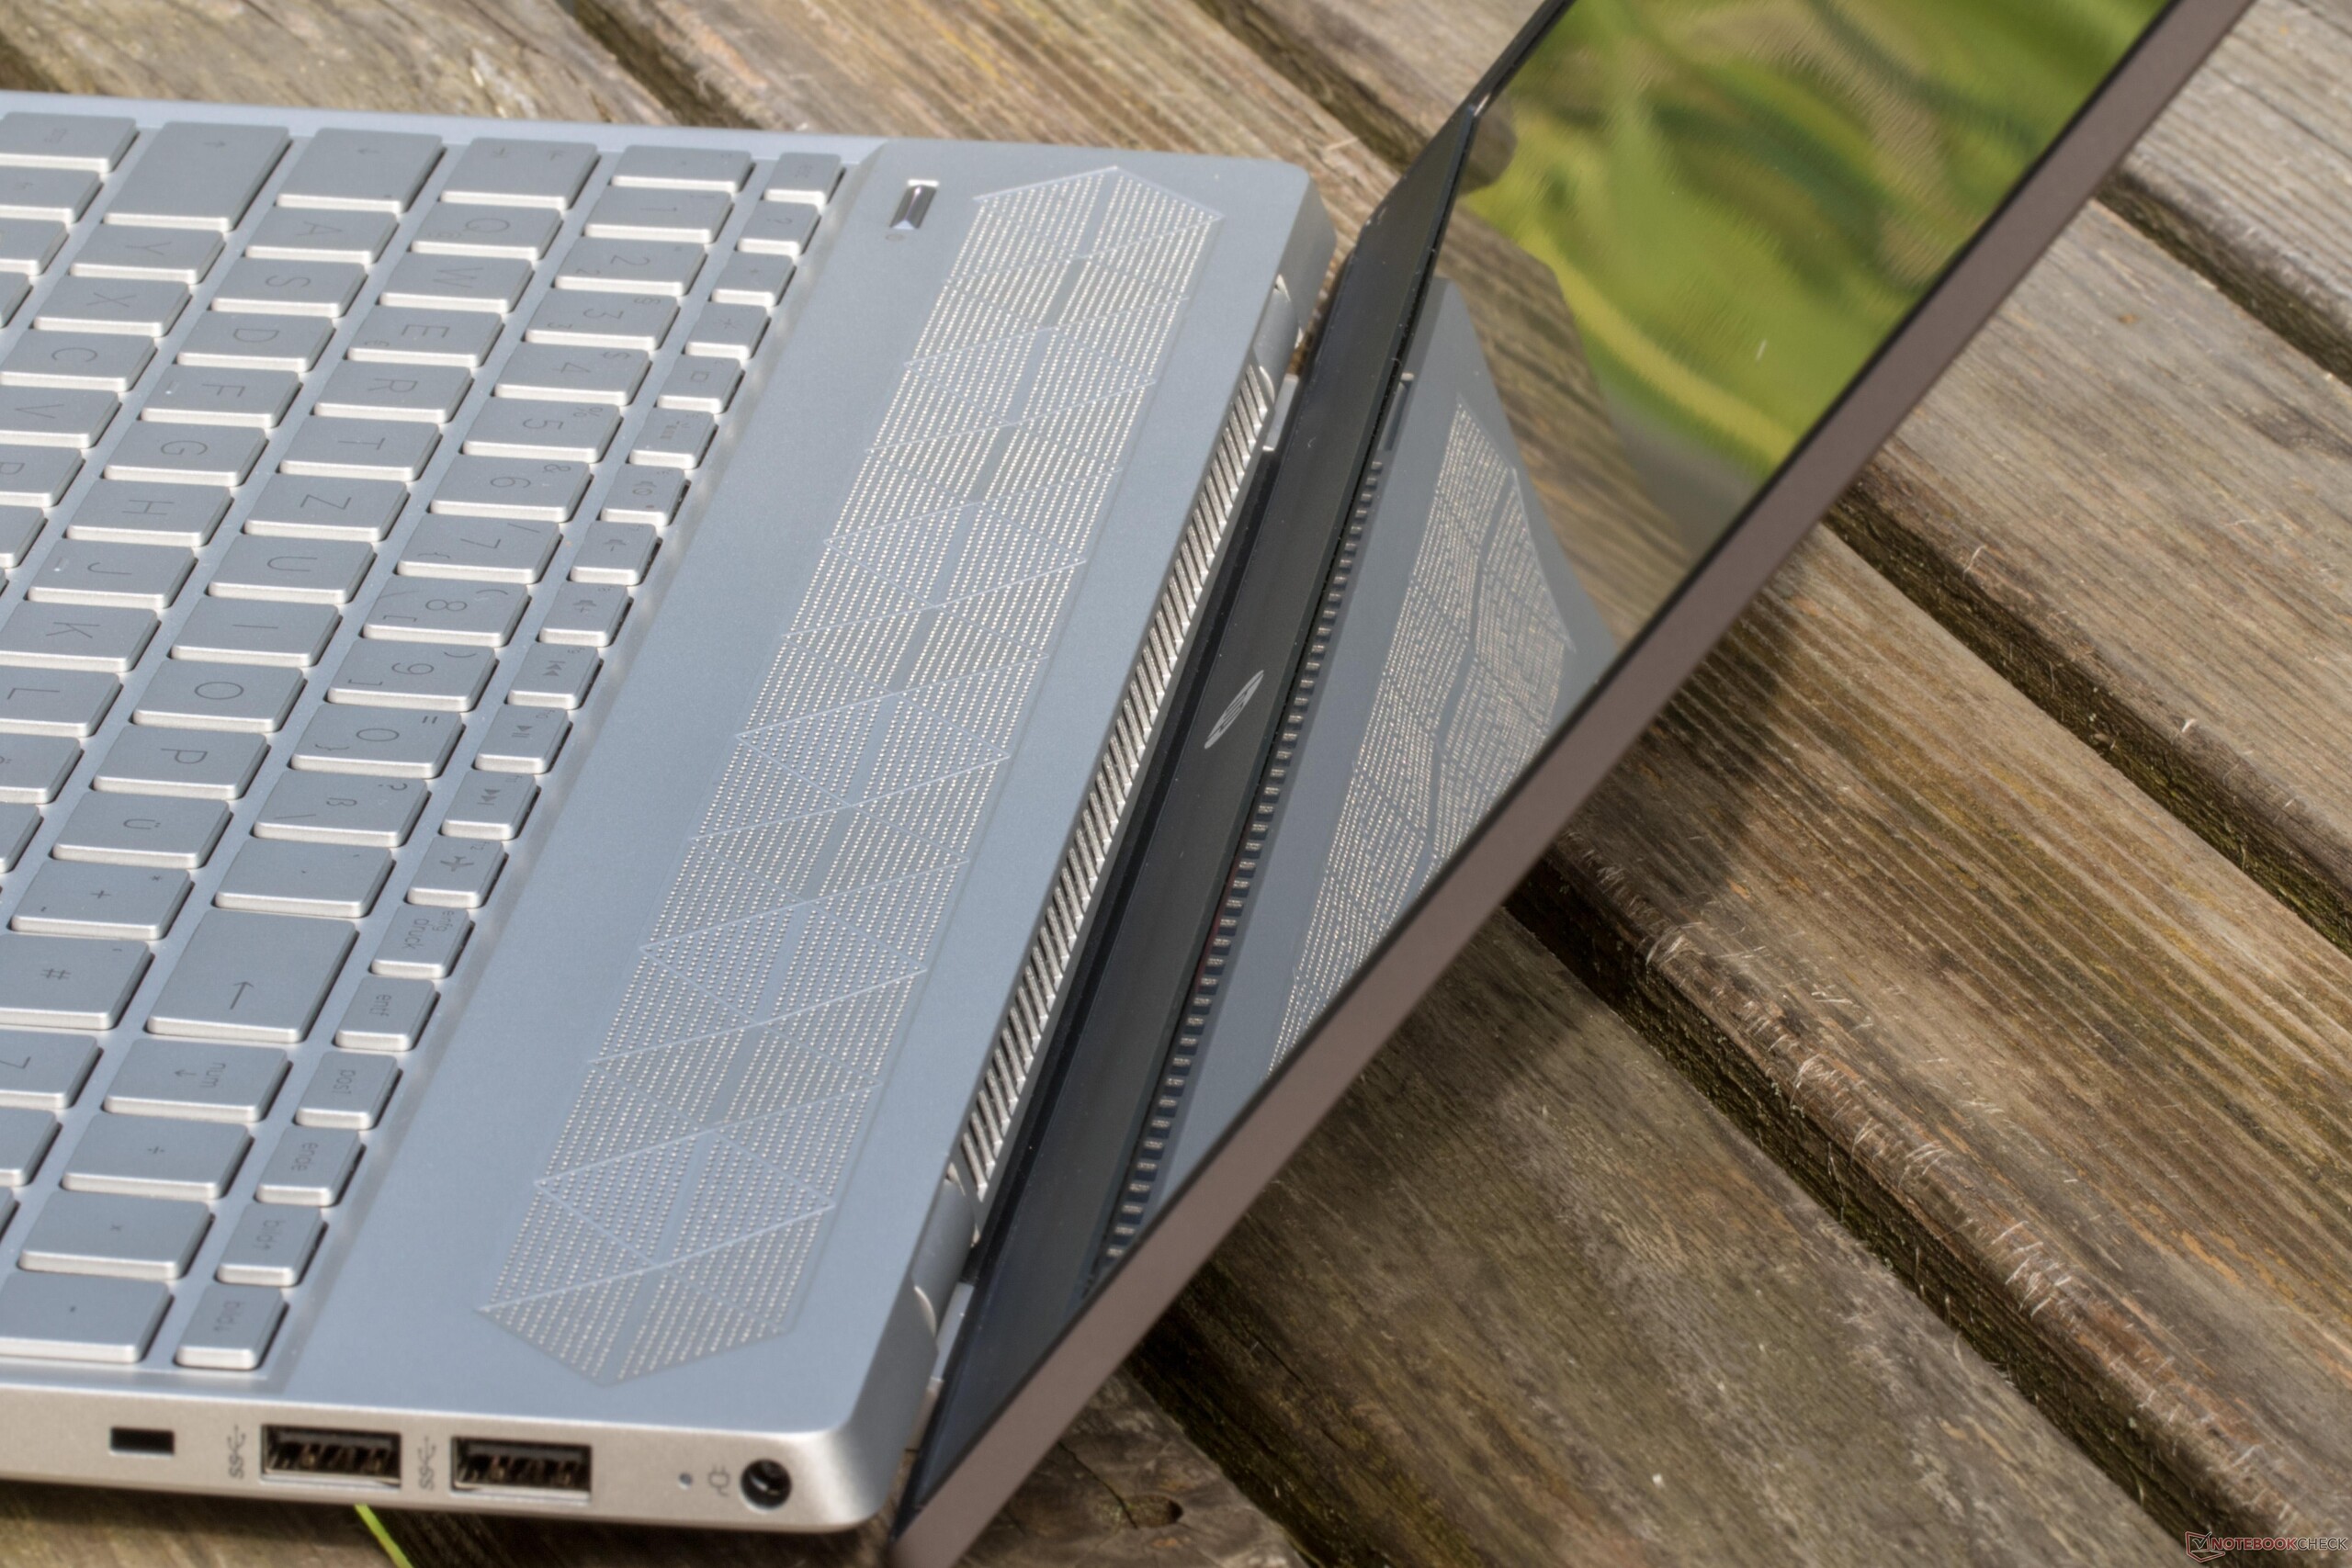
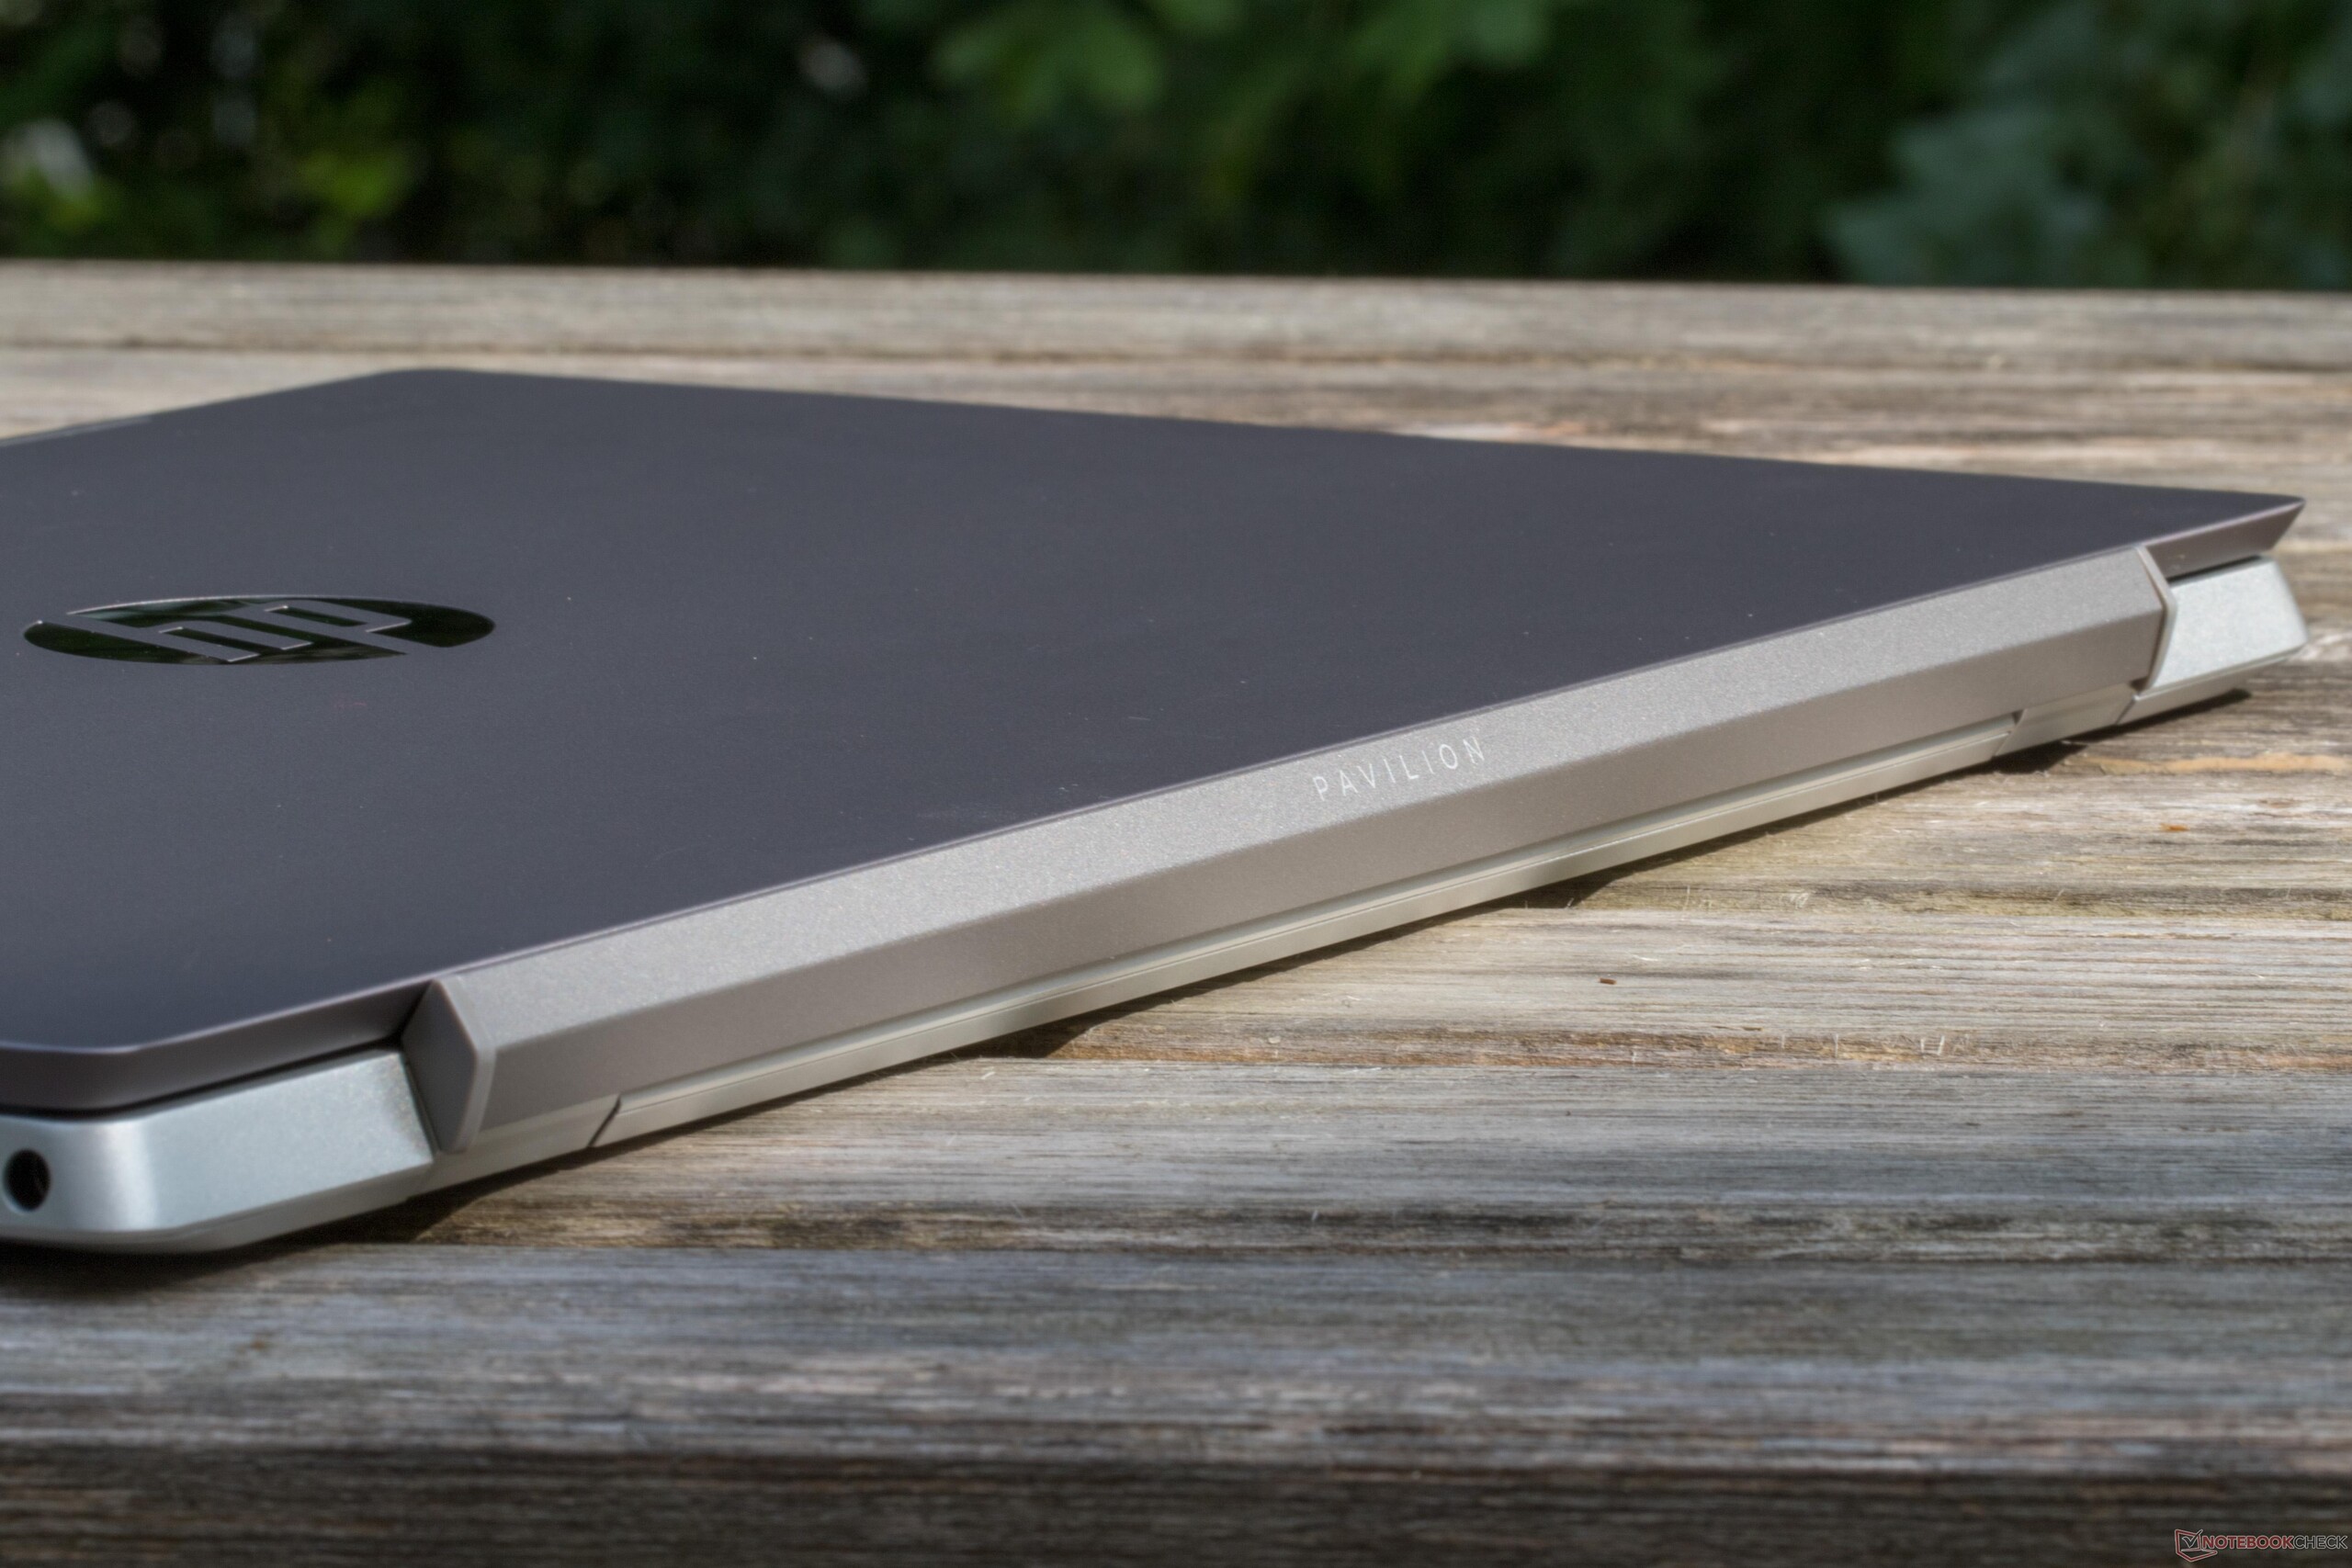
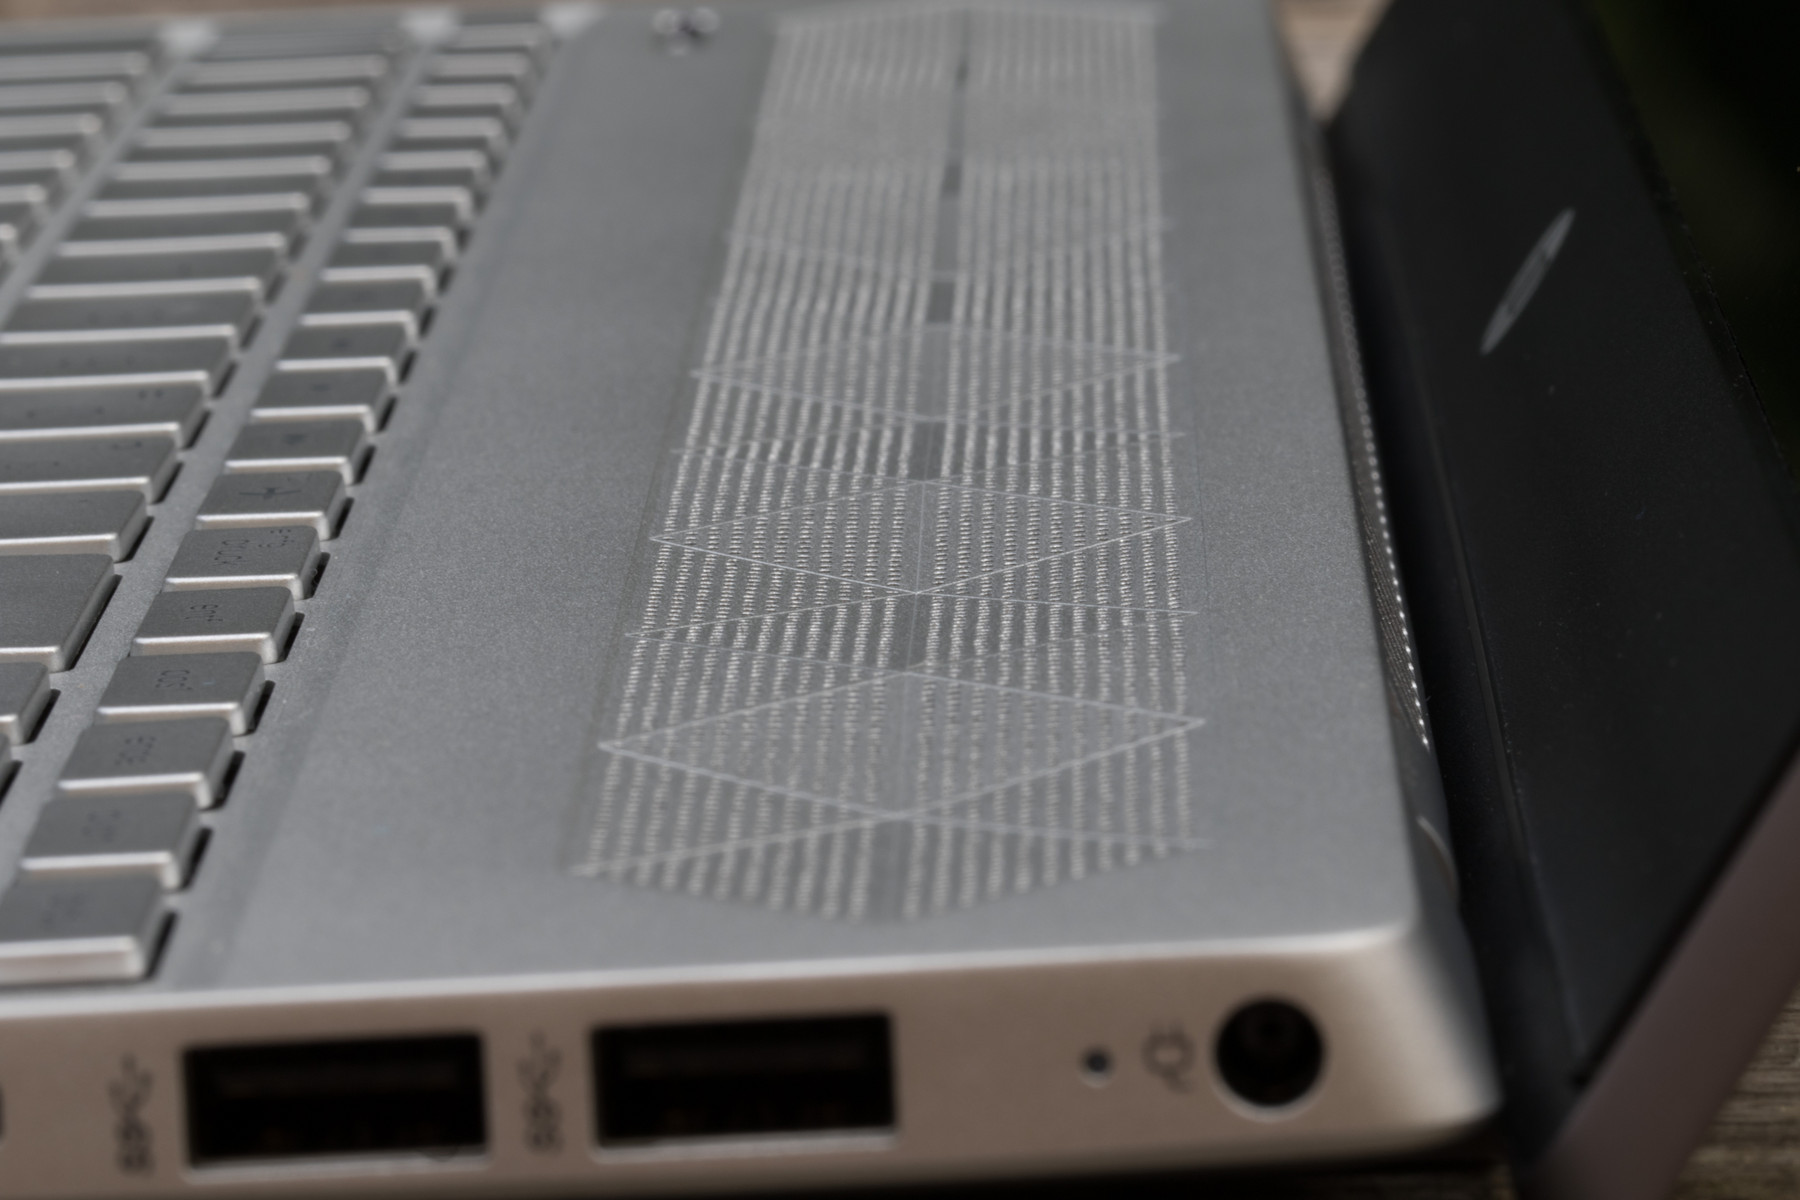
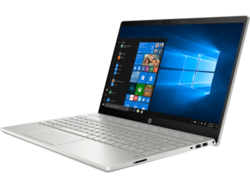
The 15-inch device has a new and modern design without the outdated edges, resulting in a fresh and trendy overall look. The micro-edge display design gives the lateral display frames a narrower appearance. The keyboard as a whole is placed inside a recess in the base with a depth of about two millimeters, and the speaker grill is embossed with a checkered design. The sides of the case are chamfered inwards, giving the Pavilion a modern feel.
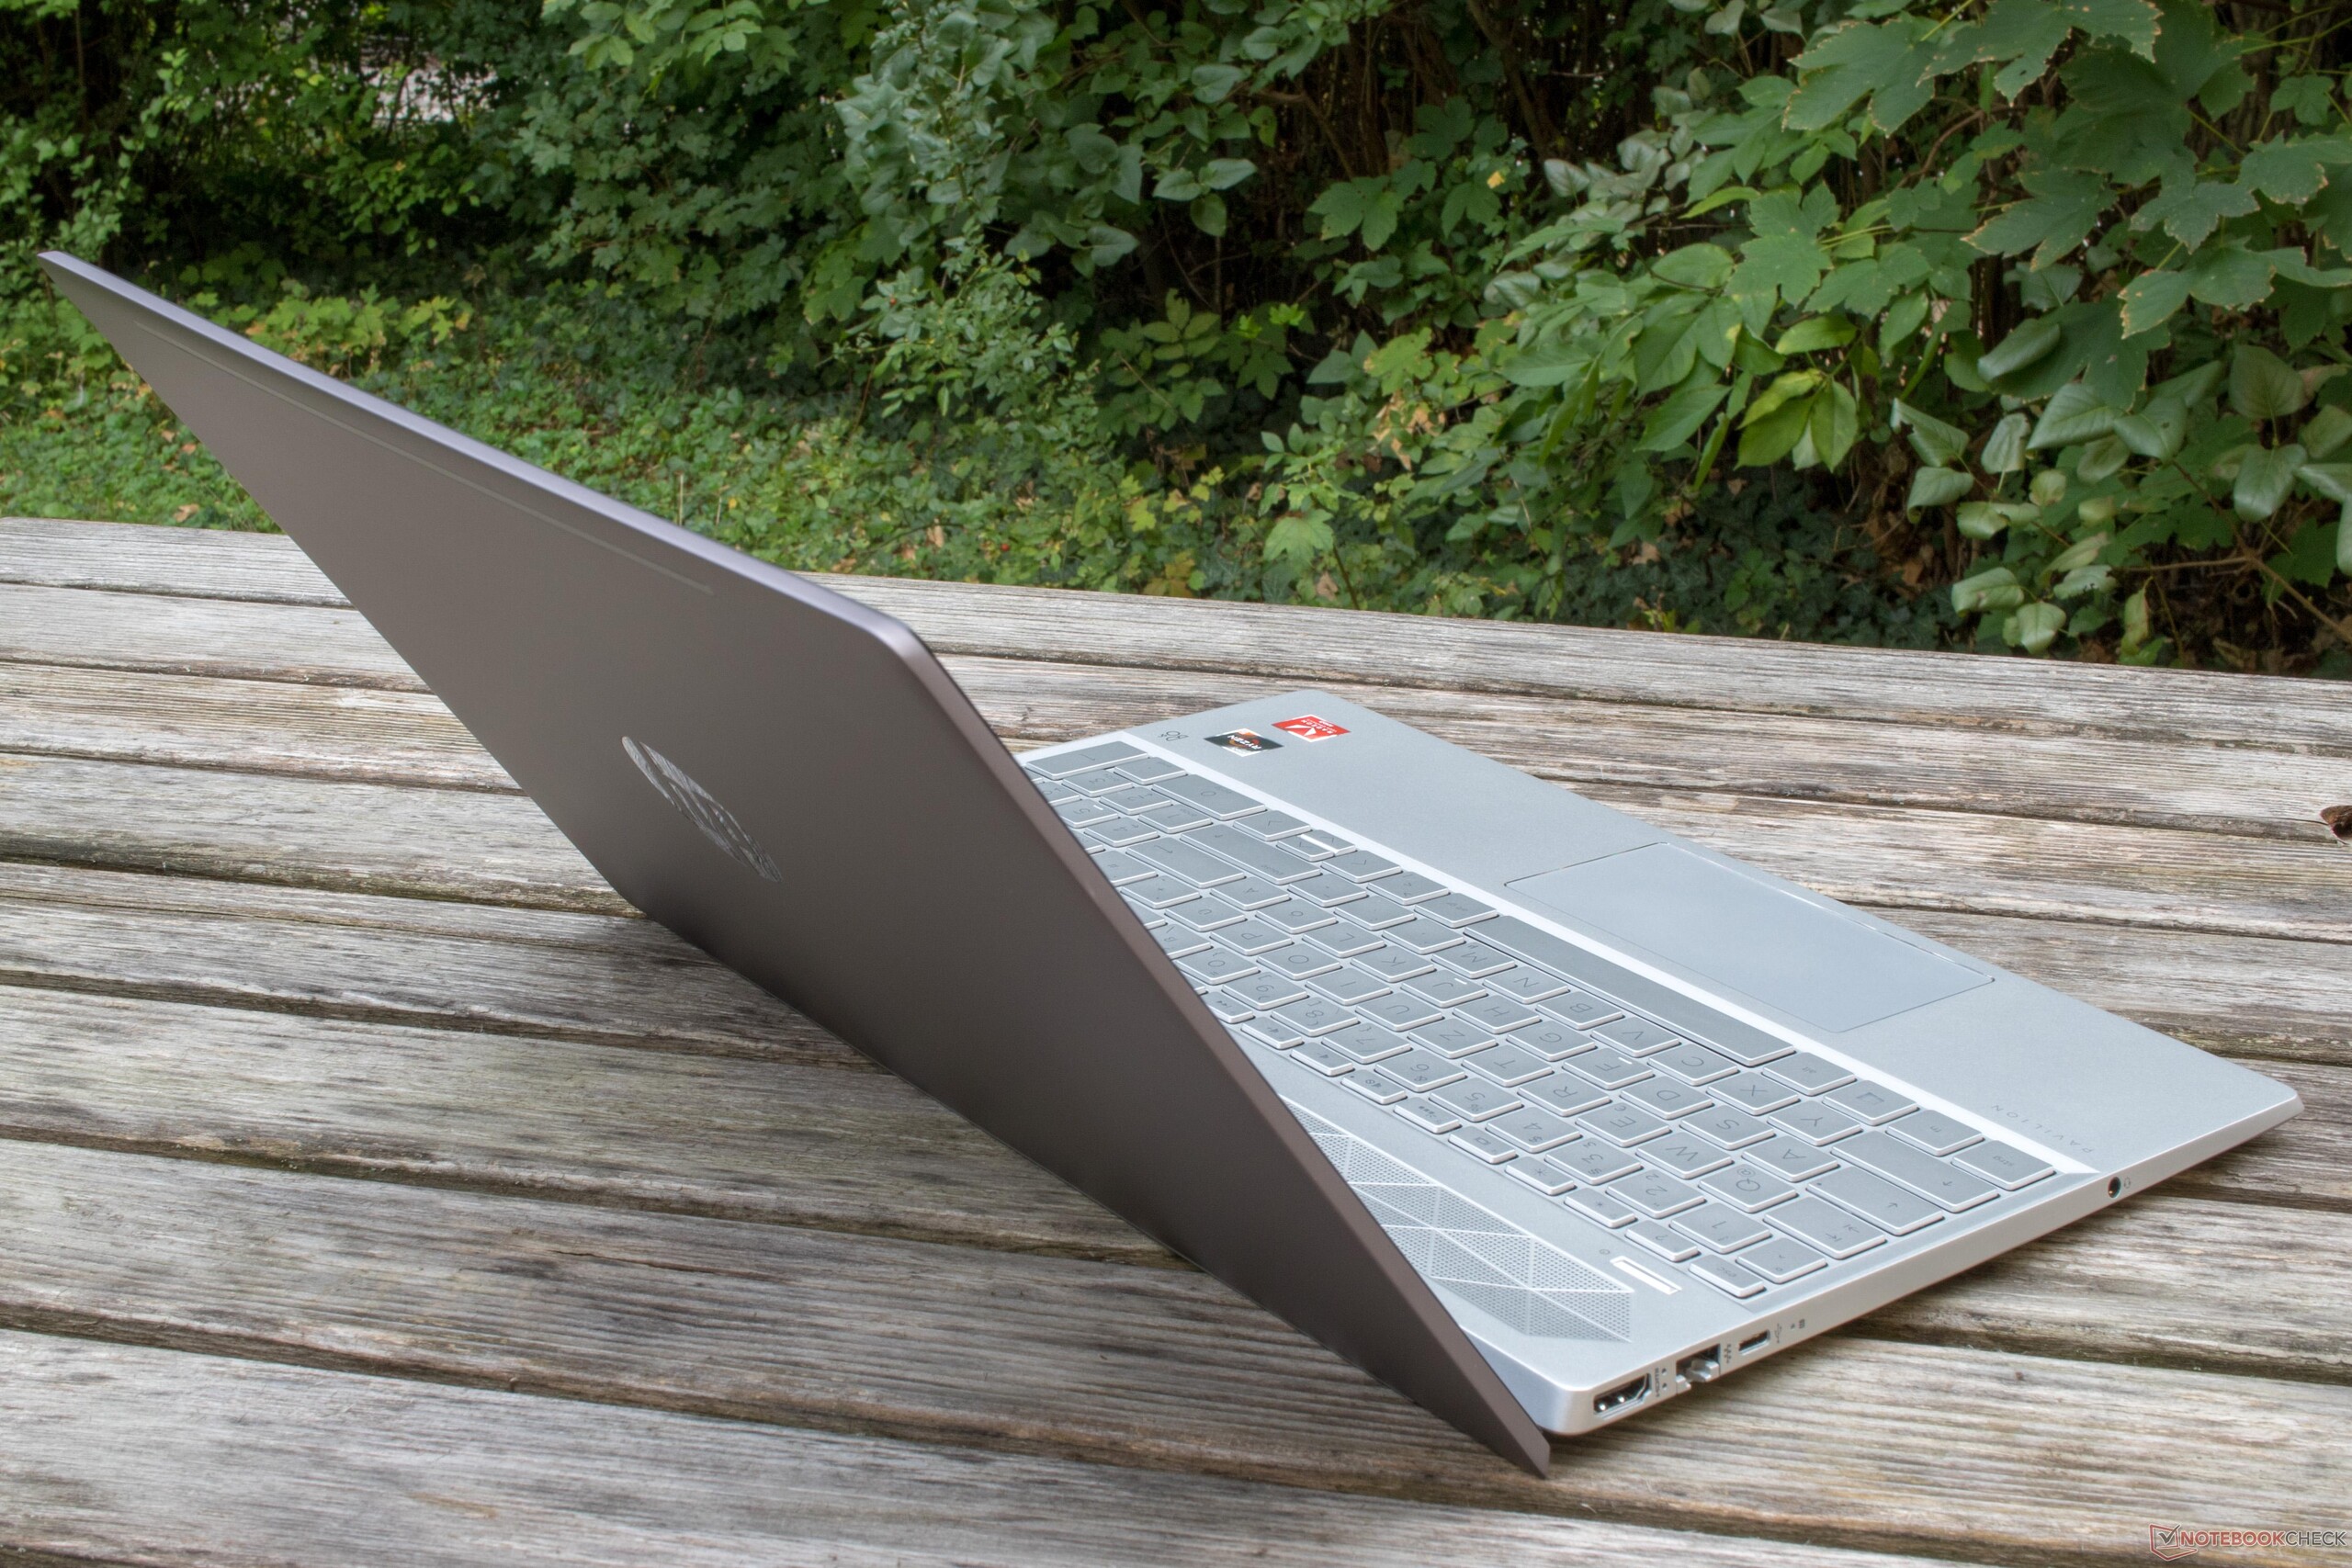
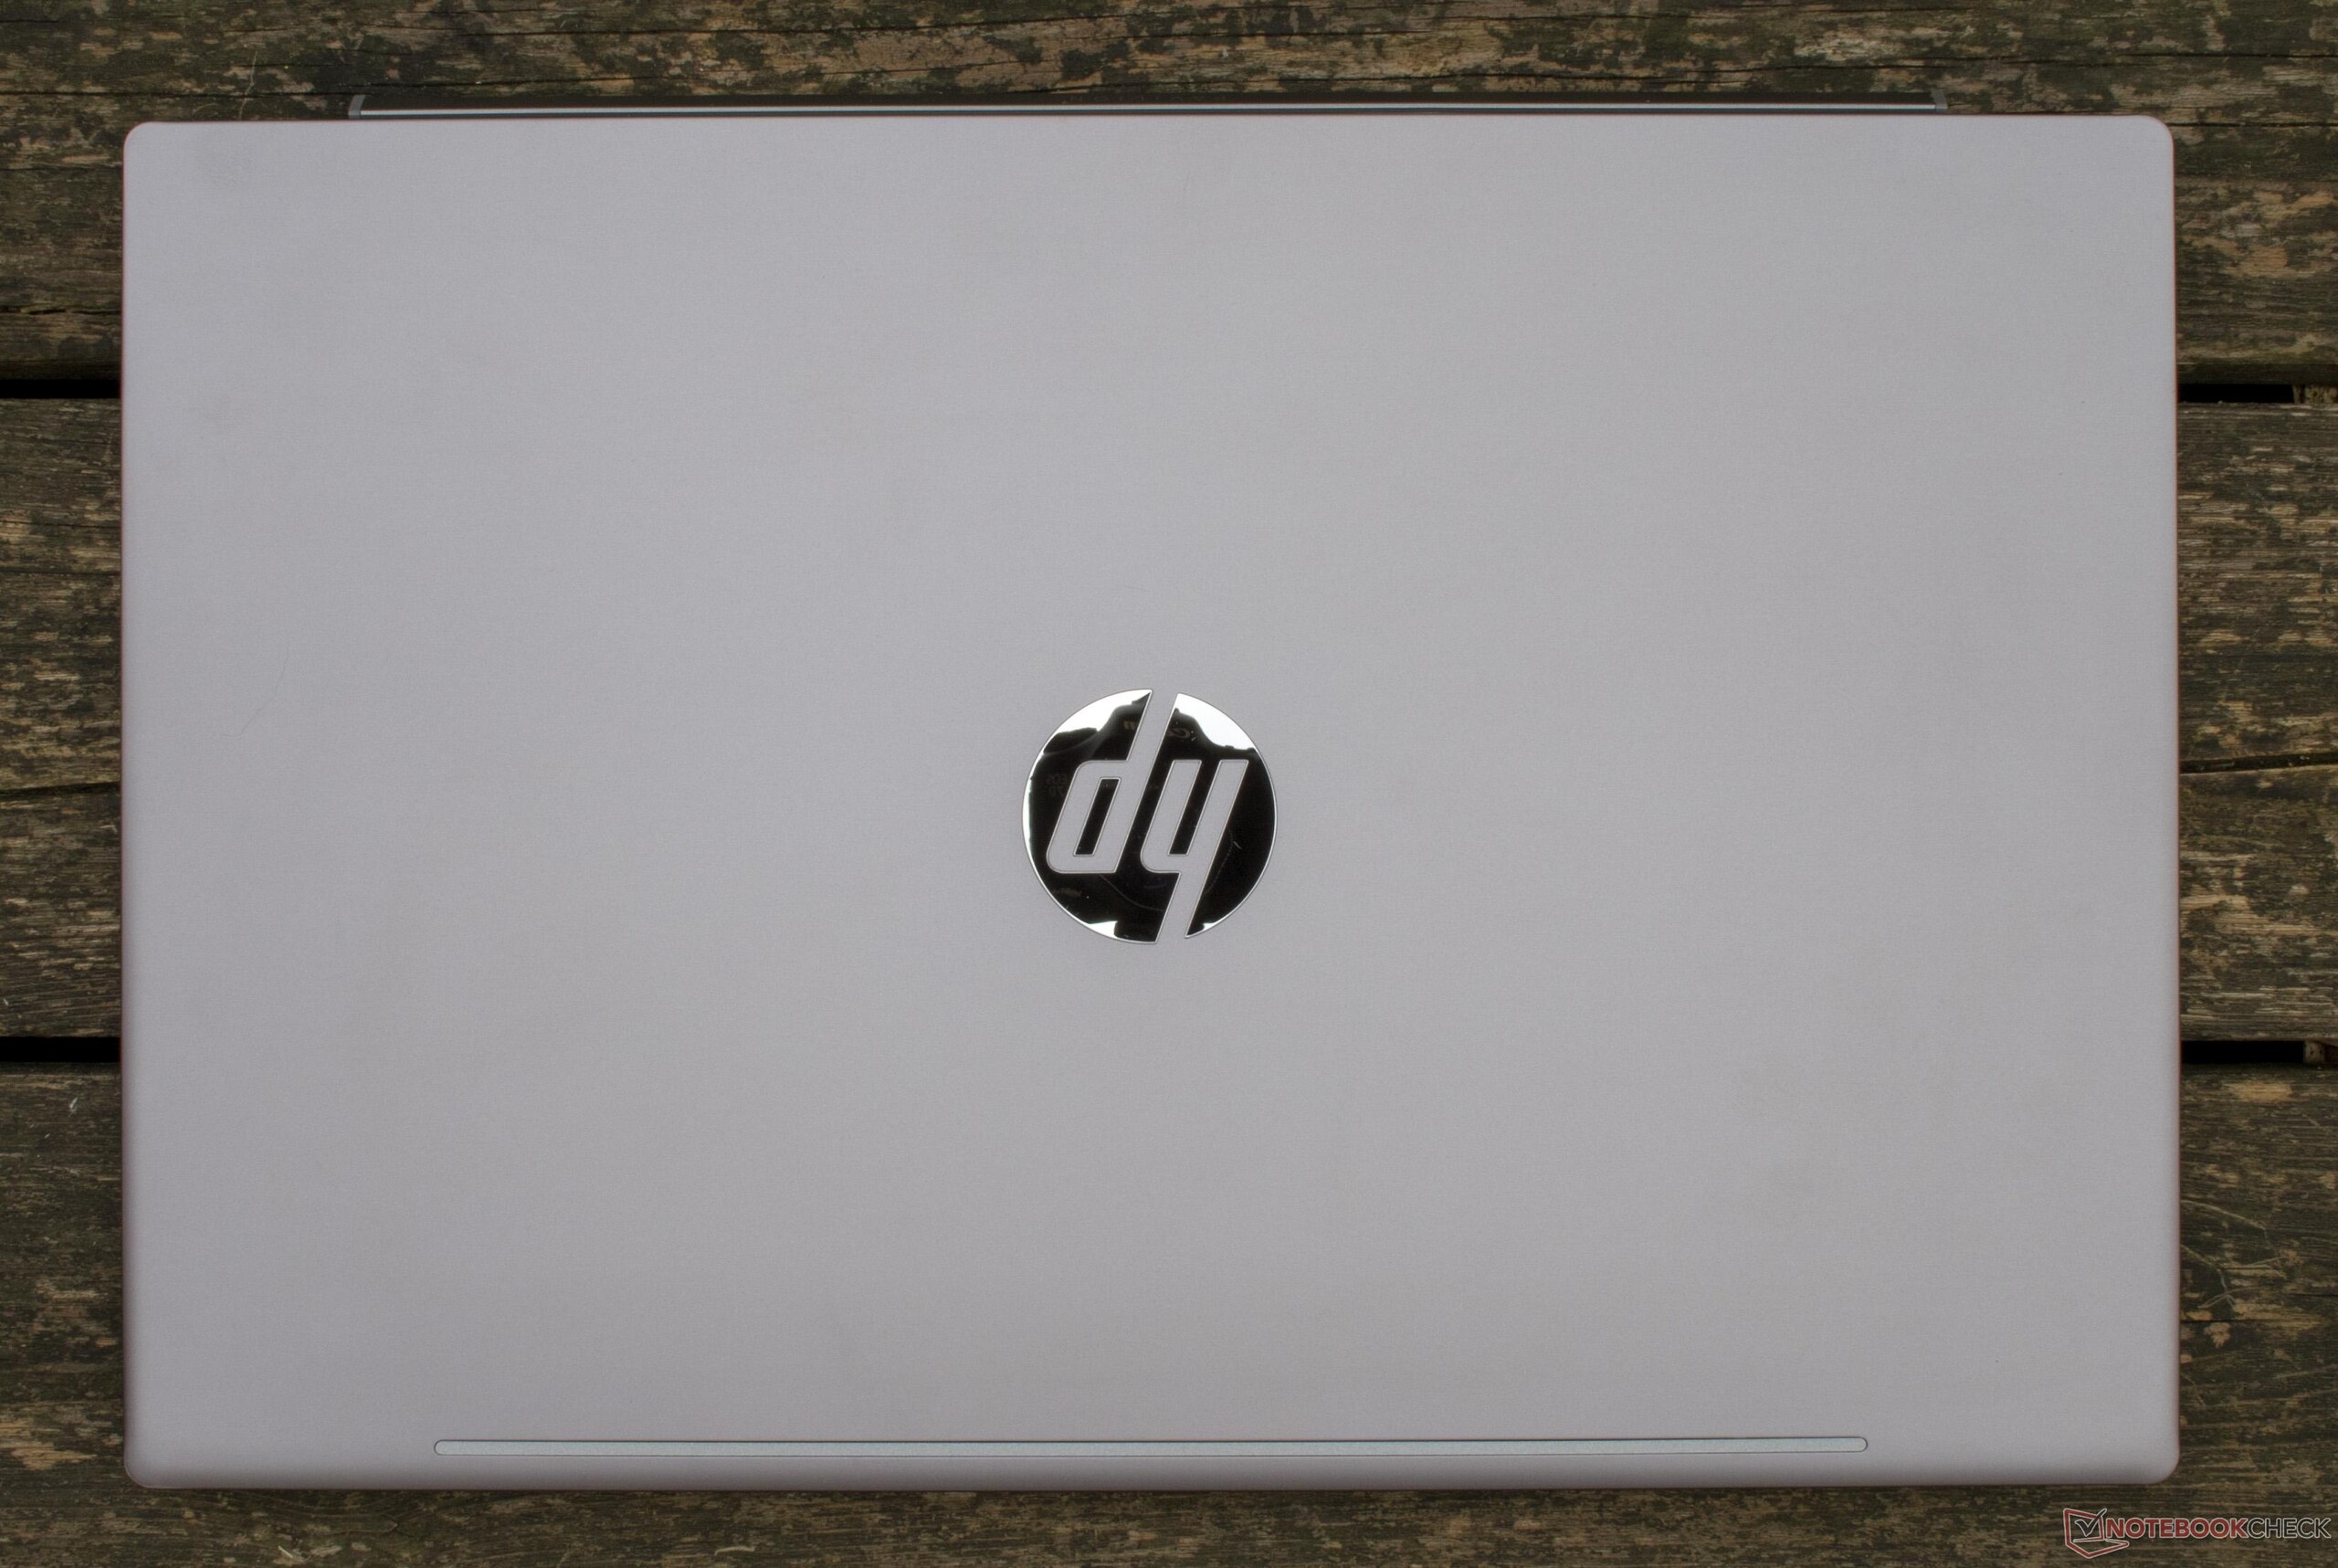
The materials used, such as sandblasted, eloxed metal on the back and the base, strengthen the Pavilion's form stability, but not quite as much as they do for the 14-inch Pavilion. Our 15-inch device's base can be pushed inwards and is not as torsion-resistant as the smaller model's base. Creaking noises can only be heard on the bottom part of the case because it is made of plastic. Fingerprints barely stand a chance.
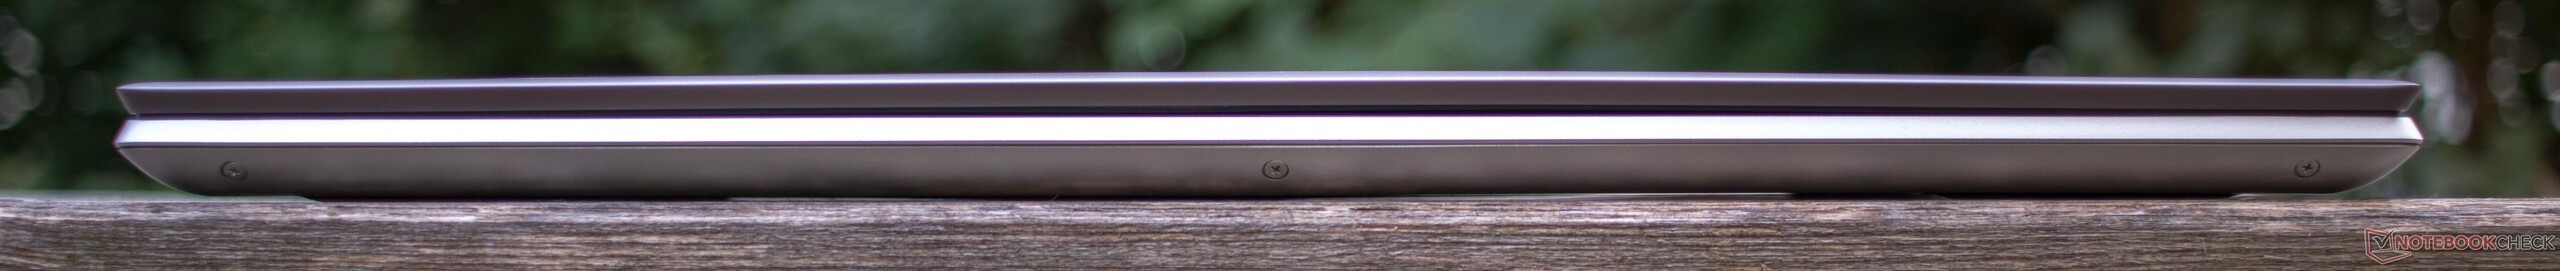
Peculiarly, the display hinge is designed to raise the whole base unit when opened, while the base shifts back slightly. This might seem like a constructional flaw at first glance, but it actually has an ergonomical reason because the keyboard is placed at an angle then. However, the opening angle of about 130 ° is a side effect of this constructional design that may not have been thought through entirely.
The maintenance options could have been more user-friendly as well. To be able to reach the inner components, the entire back has to be removed. Separate maintenance hatches would have been a more elegant solution.
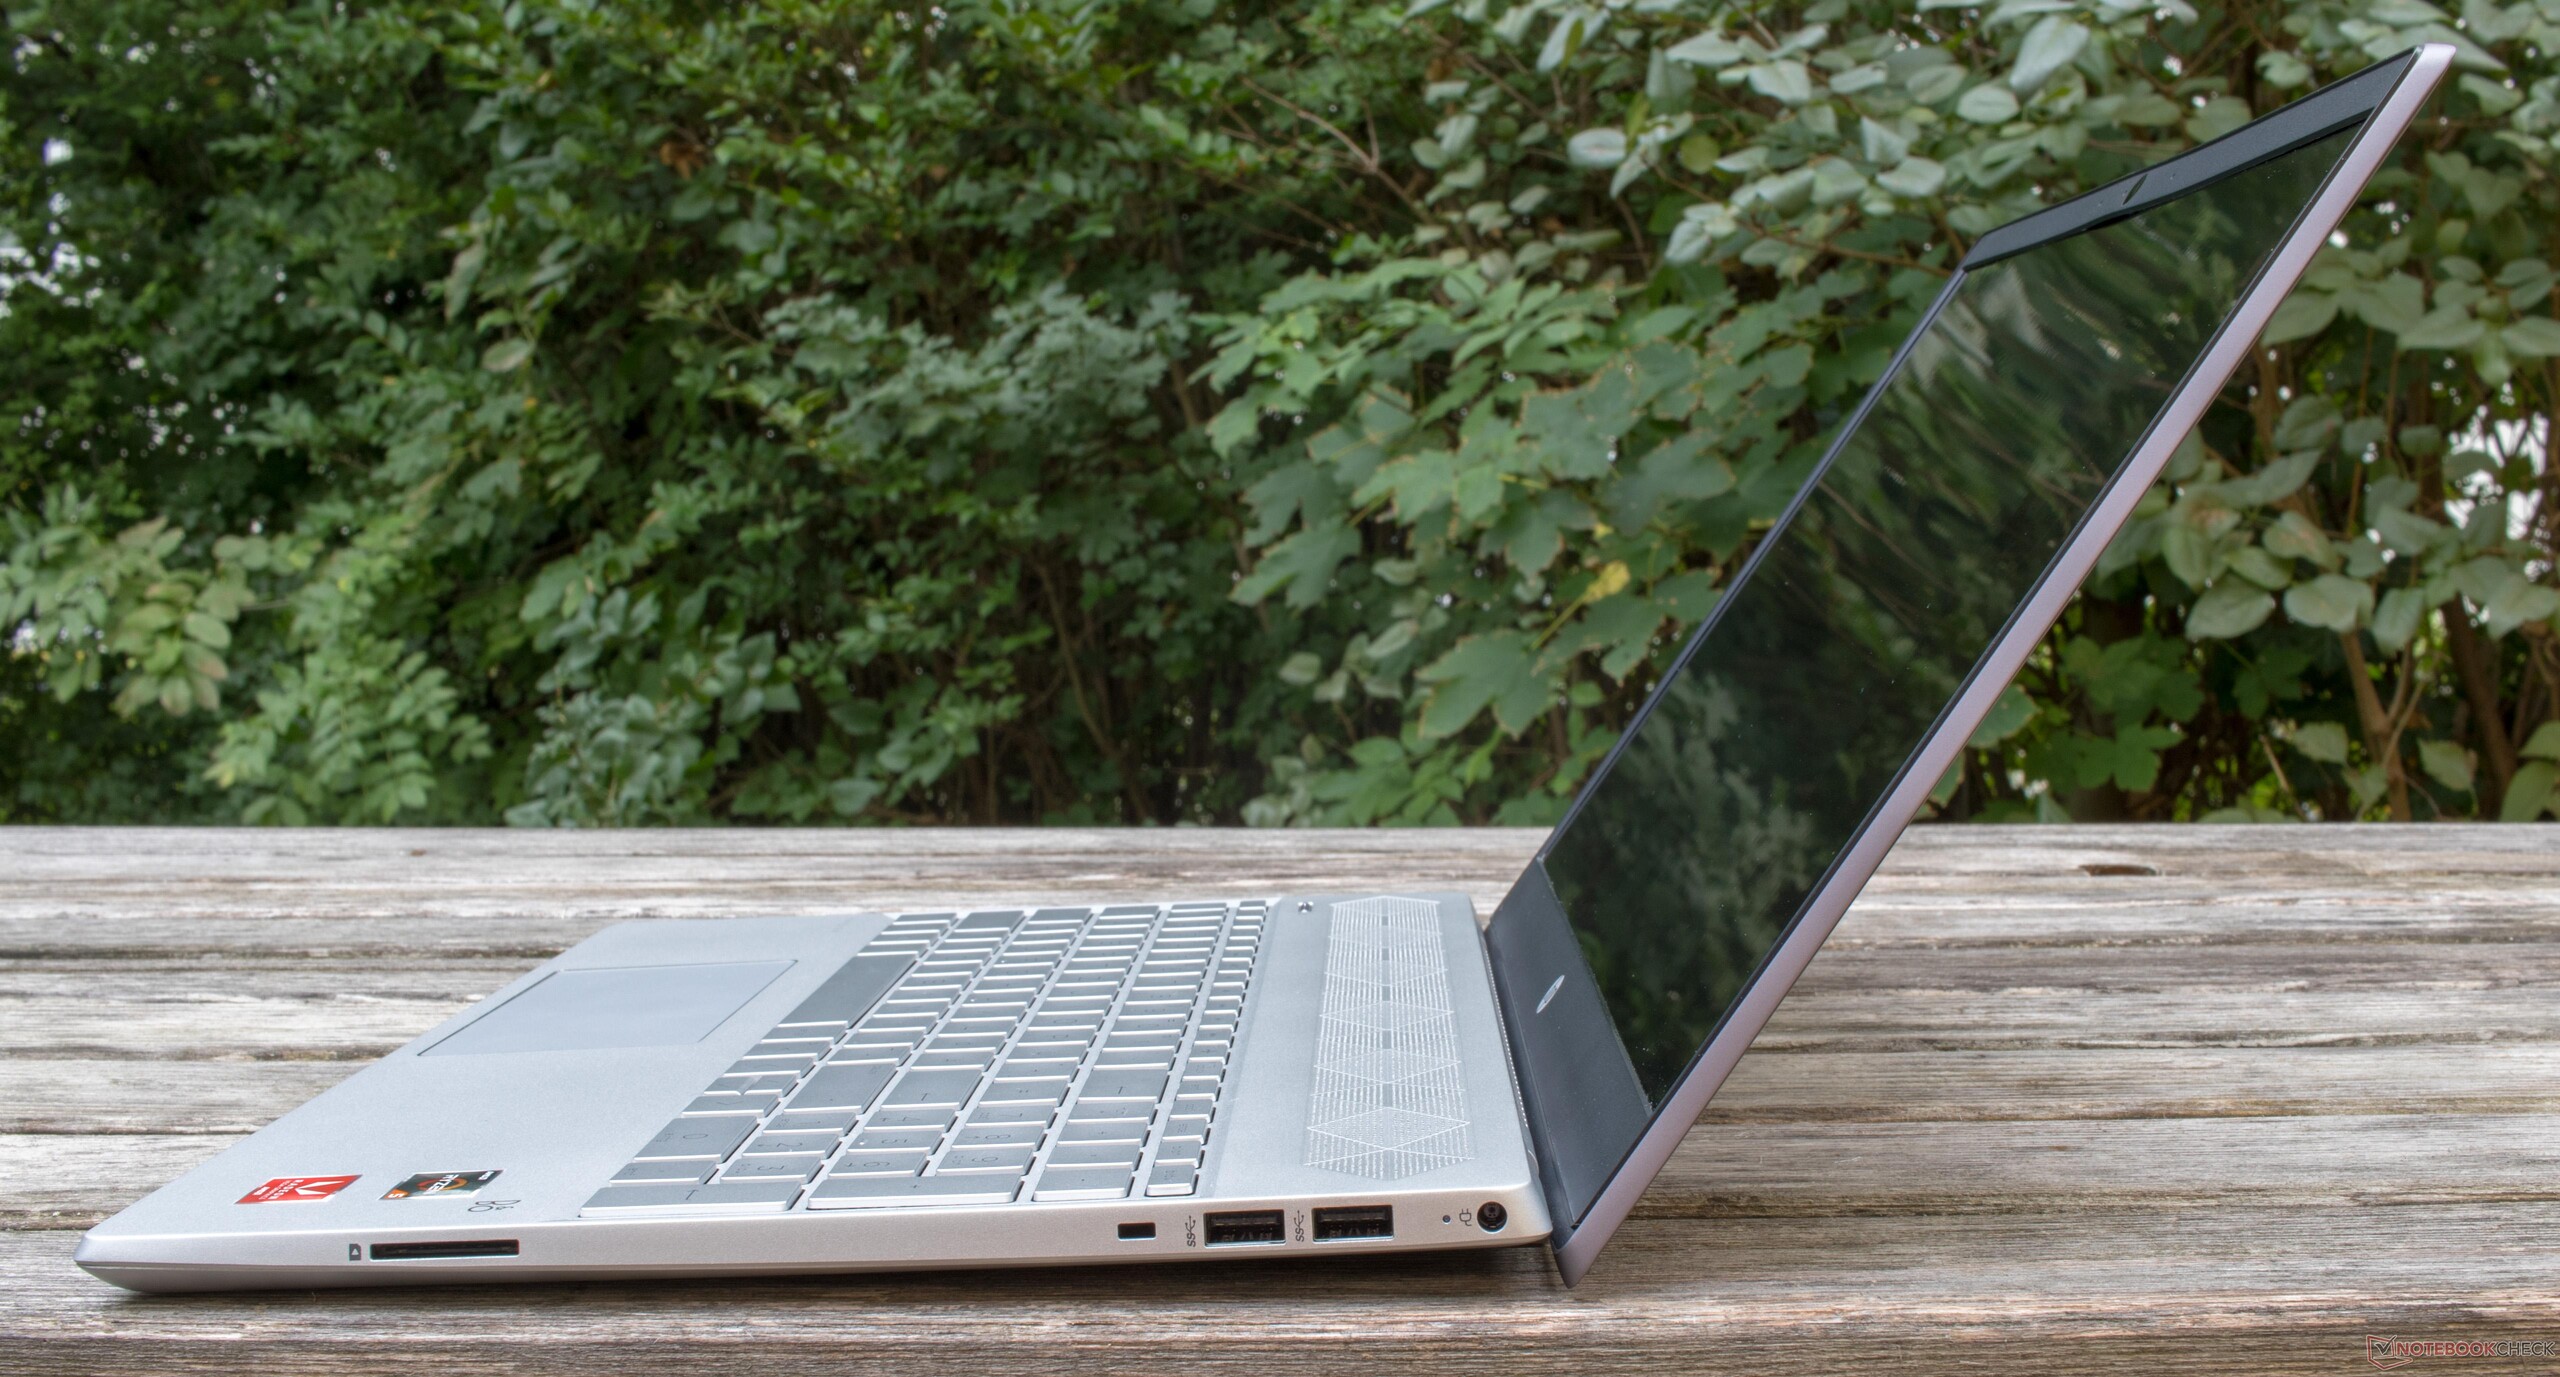
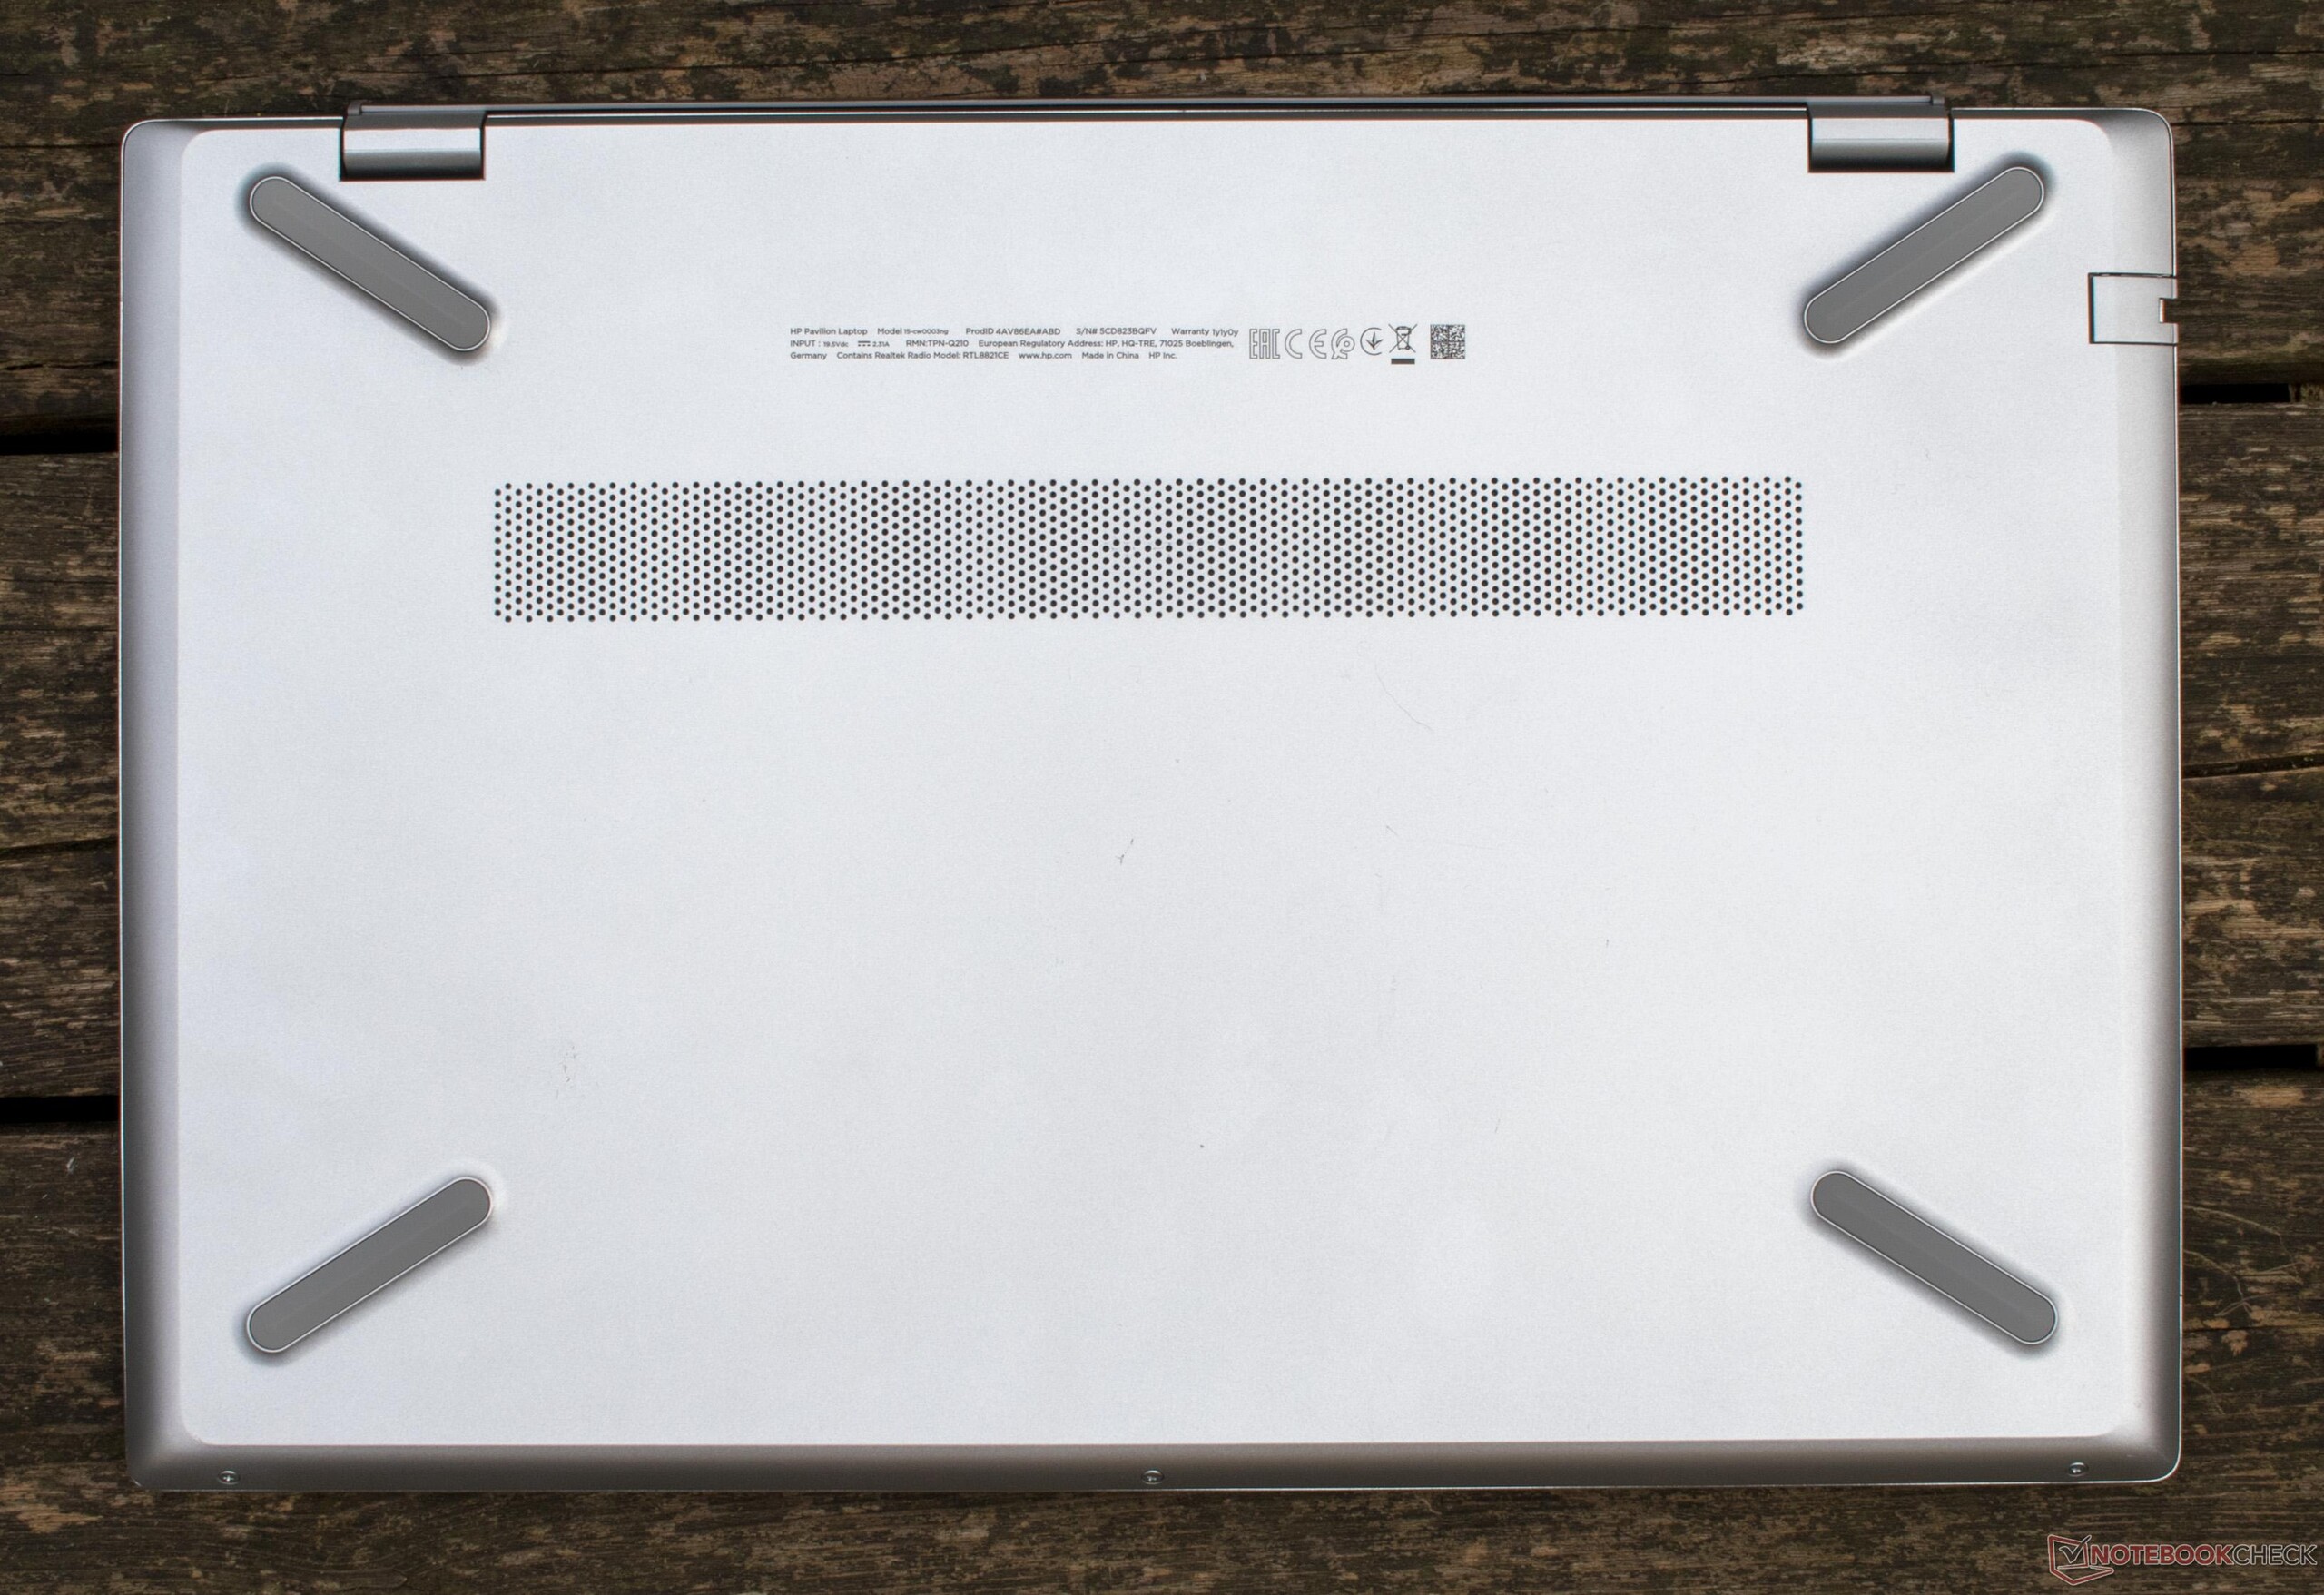
At 15 inches and with a footprint of 36.16 x 24.56 x 1.79 centimeters, the Pavilion does quite well in comparison to its direct rivals. HP also manages to cut the weight by 200 to 300 grams, making the Pavilion the lightest of the 15-inch devices in the comparison field. HP's included 45-watt power supply is pleasantly small and light.
Connectivity - The HP Pavilion Has the Basics
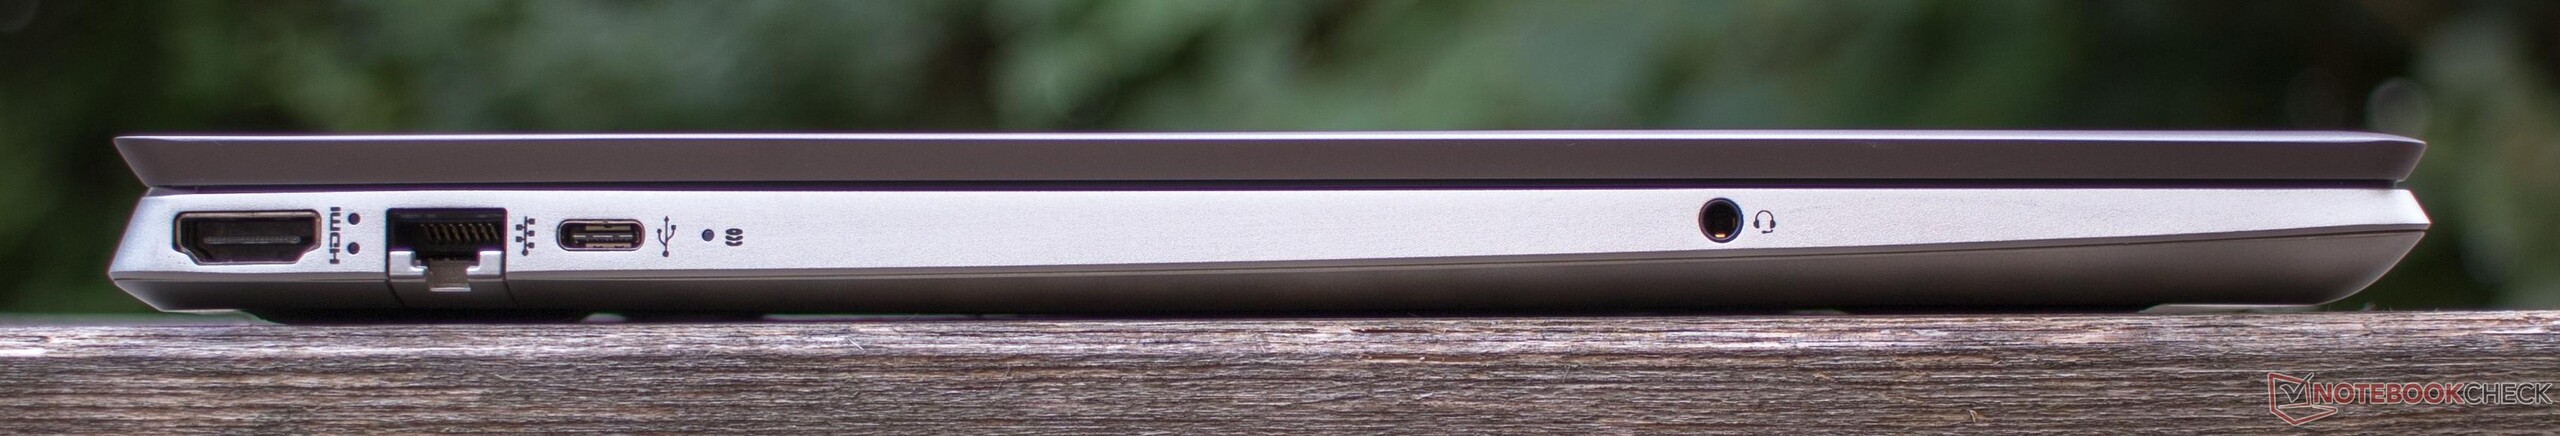
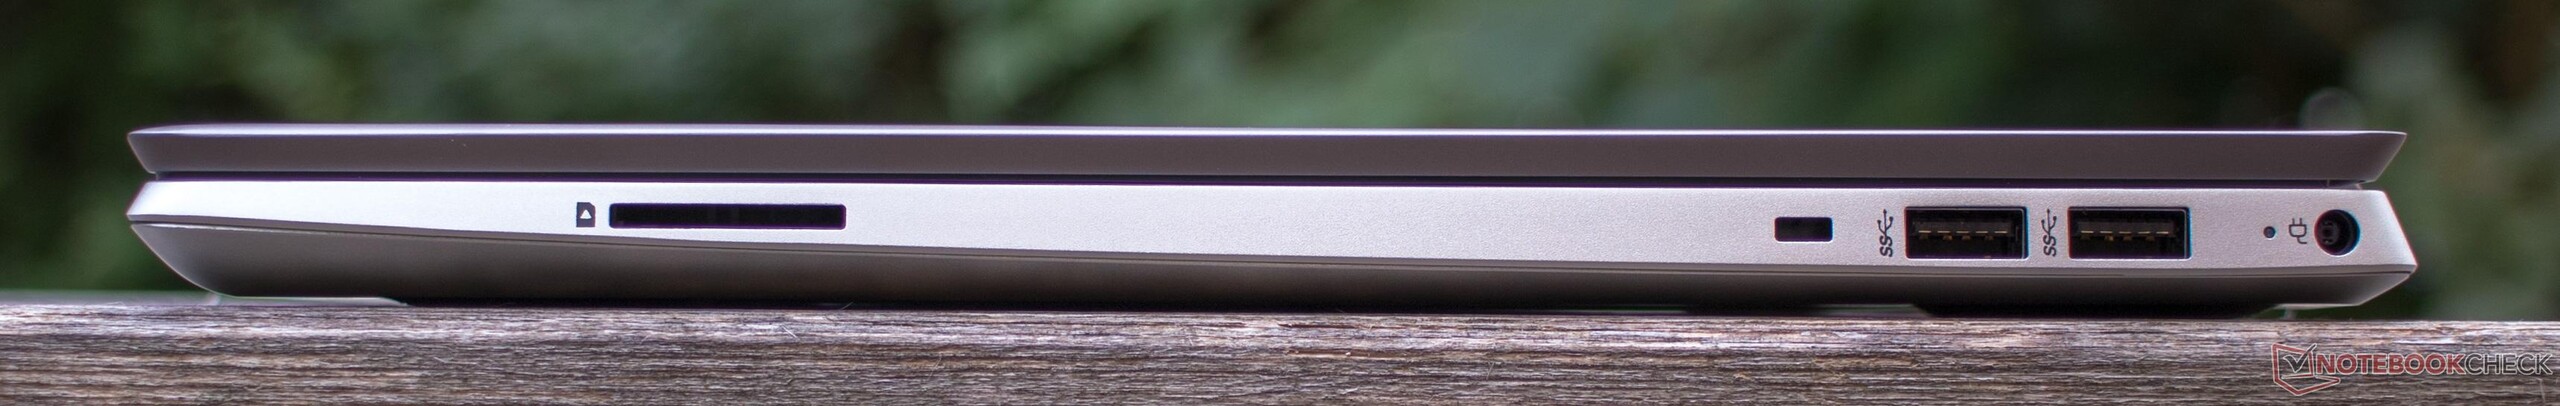
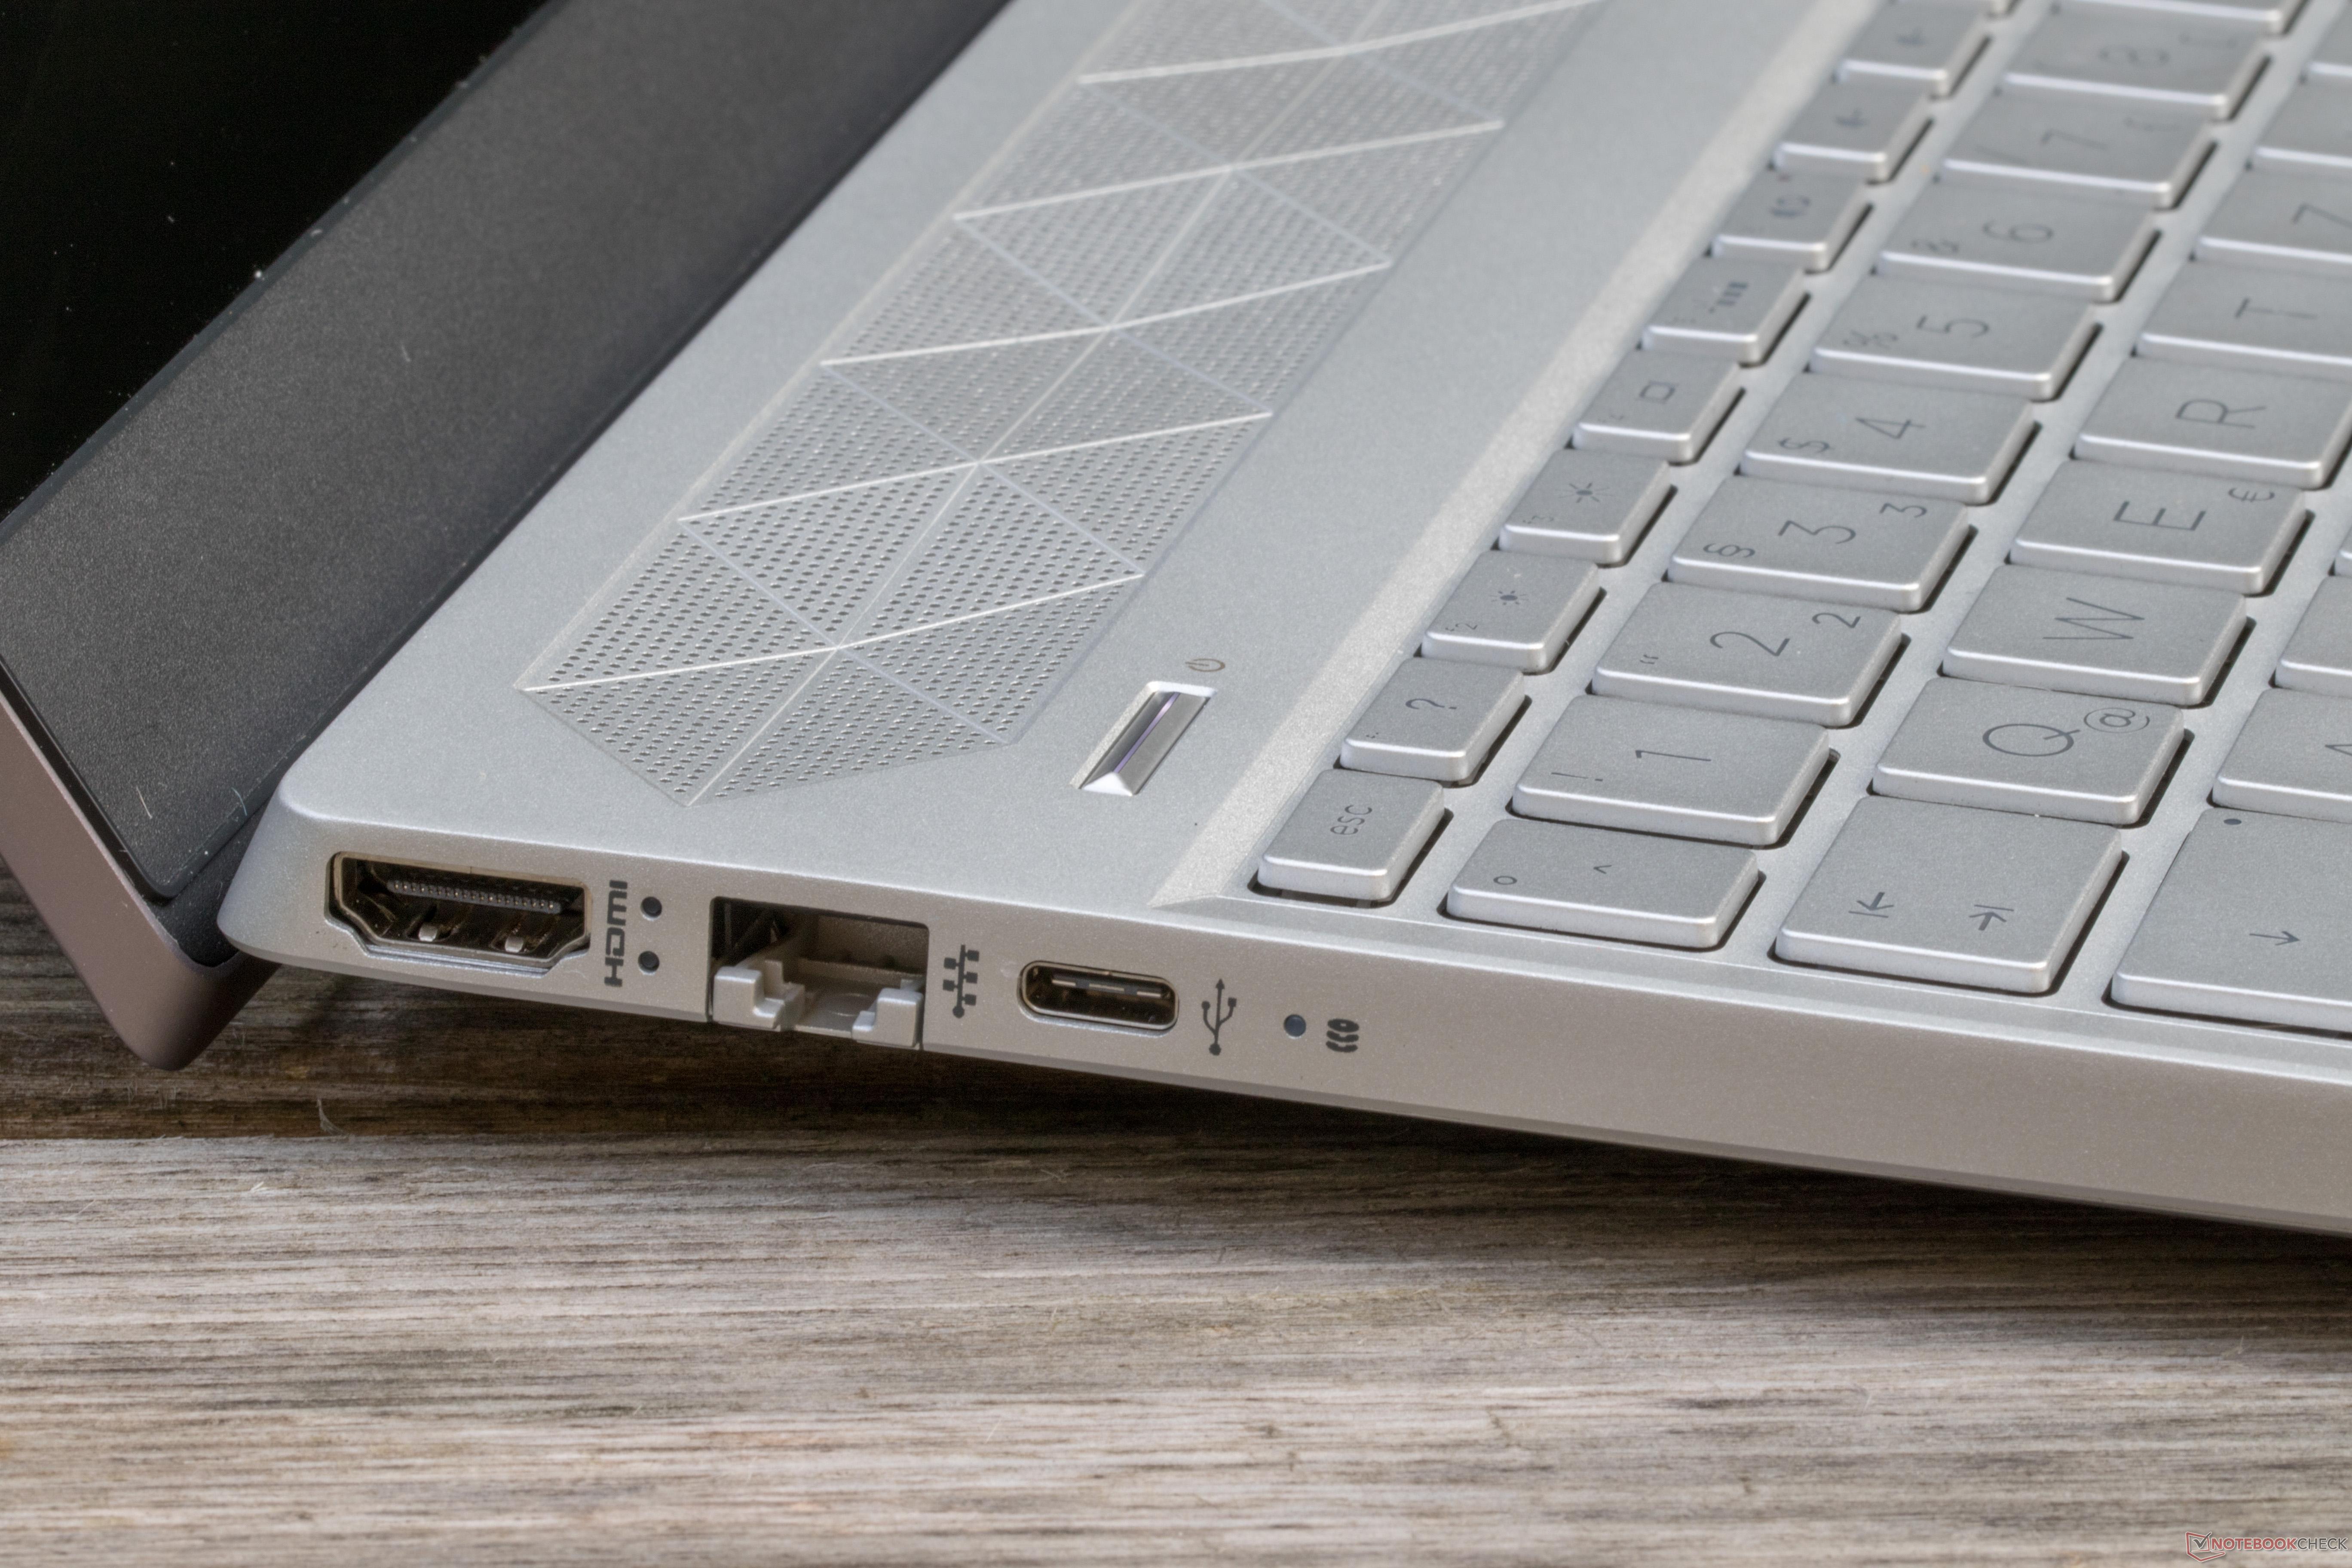
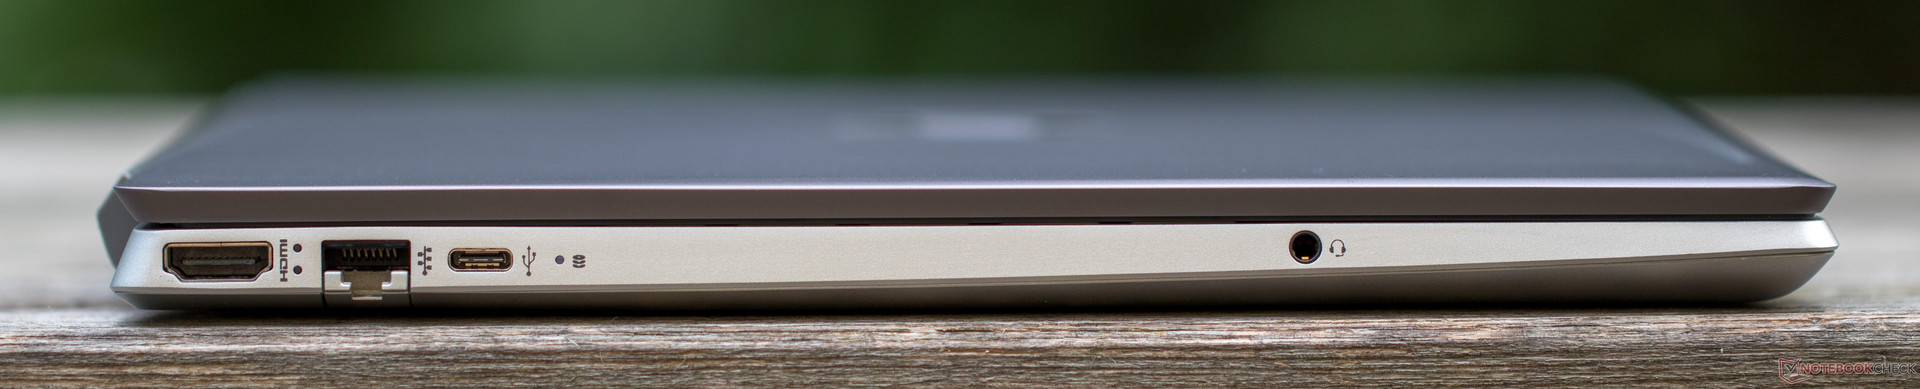
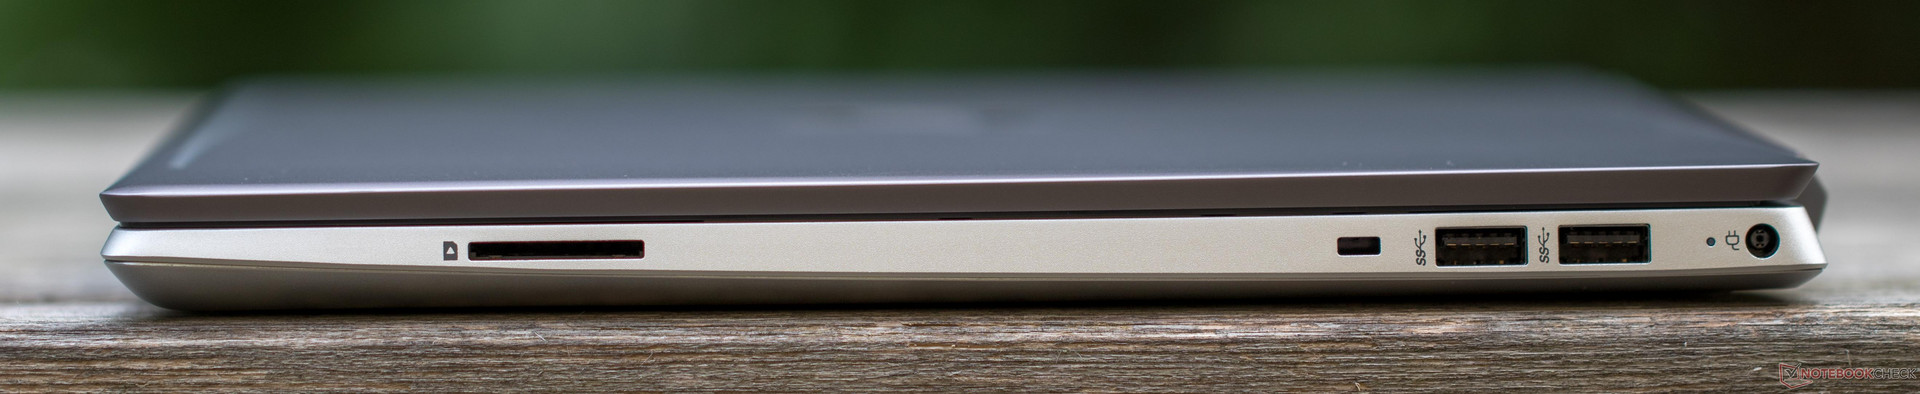
The HP Pavilion's port placement is well thought-out, so there should be no space issues even during full occupancy. The HDMI 1.4 port can be found at the left rear, followed by the RJ 45 network socket, the sole USB type-C port (3.1 Gen. 1), and the 3.5 mm audio jack (headphone and microphone combo). The right side harbors the power supply connector, two USB type-A ports (3.1 Gen. 1), a Kensington lock, and an SD card reader. In contrast to the 14-inch Pavilion, this device does not have a fingerprint sensor.
SD Card Reader
The SD card barely protrudes from the HP Pavilion 15's card reader, as it is spring-loaded. However, this is the only good news because at values below 40 MB/s, the speeds with our reference card Toshiba Exceria Pro SDXC 64 GB UHS-II in our JPG copy test and in the sequential reading test are far below the multimedia laptop average saved in our database.
| SD Card Reader | |
| average JPG Copy Test (av. of 3 runs) | |
| Average of class Multimedia (23 - 531, n=43, last 2 years) | |
| HP Envy x360 15-bq102ng (Toshiba Exceria Pro SDXC 64 GB UHS-II) | |
| HP Pavilion 14-ce0002ng (Toshiba Exceria Pro SDXC 64 GB UHS-II) | |
| HP Pavilion 15-cw0003ng (Toshiba Exceria Pro SDXC 64 GB UHS-II) | |
| HP Pavilion 15-cs0053cl (Toshiba Exceria Pro SDXC 64 GB UHS-II) | |
| Lenovo IdeaPad 330-15ARR 81D2005CUS (Toshiba Exceria Pro SDXC 64 GB UHS-II) | |
| Acer Swift 3 SF315-41G-R6BR (Toshiba Exceria Pro SDXC 64 GB UHS-II) | |
| Acer TravelMate P2510-G2-MG-50WE (Toshiba Exceria Pro SDXC 64 GB UHS-II) | |
| maximum AS SSD Seq Read Test (1GB) | |
| Average of class Multimedia (27.9 - 1455, n=42, last 2 years) | |
| HP Envy x360 15-bq102ng (Toshiba Exceria Pro SDXC 64 GB UHS-II) | |
| HP Pavilion 15-cs0053cl (Toshiba Exceria Pro SDXC 64 GB UHS-II) | |
| Lenovo IdeaPad 330-15ARR 81D2005CUS (Toshiba Exceria Pro SDXC 64 GB UHS-II) | |
| Acer Swift 3 SF315-41G-R6BR (Toshiba Exceria Pro SDXC 64 GB UHS-II) | |
| HP Pavilion 14-ce0002ng (Toshiba Exceria Pro SDXC 64 GB UHS-II) | |
| HP Pavilion 15-cw0003ng (Toshiba Exceria Pro SDXC 64 GB UHS-II) | |
| Acer TravelMate P2510-G2-MG-50WE (Toshiba Exceria Pro SDXC 64 GB UHS-II) | |
Communication
The values of the 1x1 Wi-Fi module by RealTek (RTL8821) in our test with the reference router Linksys EA8500 are far below the average of all multimedia laptops tested by us. We received data at a speed of 280 Mb/s and sent it at 269 Mb/s, which is in line with other Pavilions. At least we also have the option to connect to the network directly via Ethernet port and network cable.
Input Devices - Pavilion with Stylish Chiclet Keyboard
Keyboard
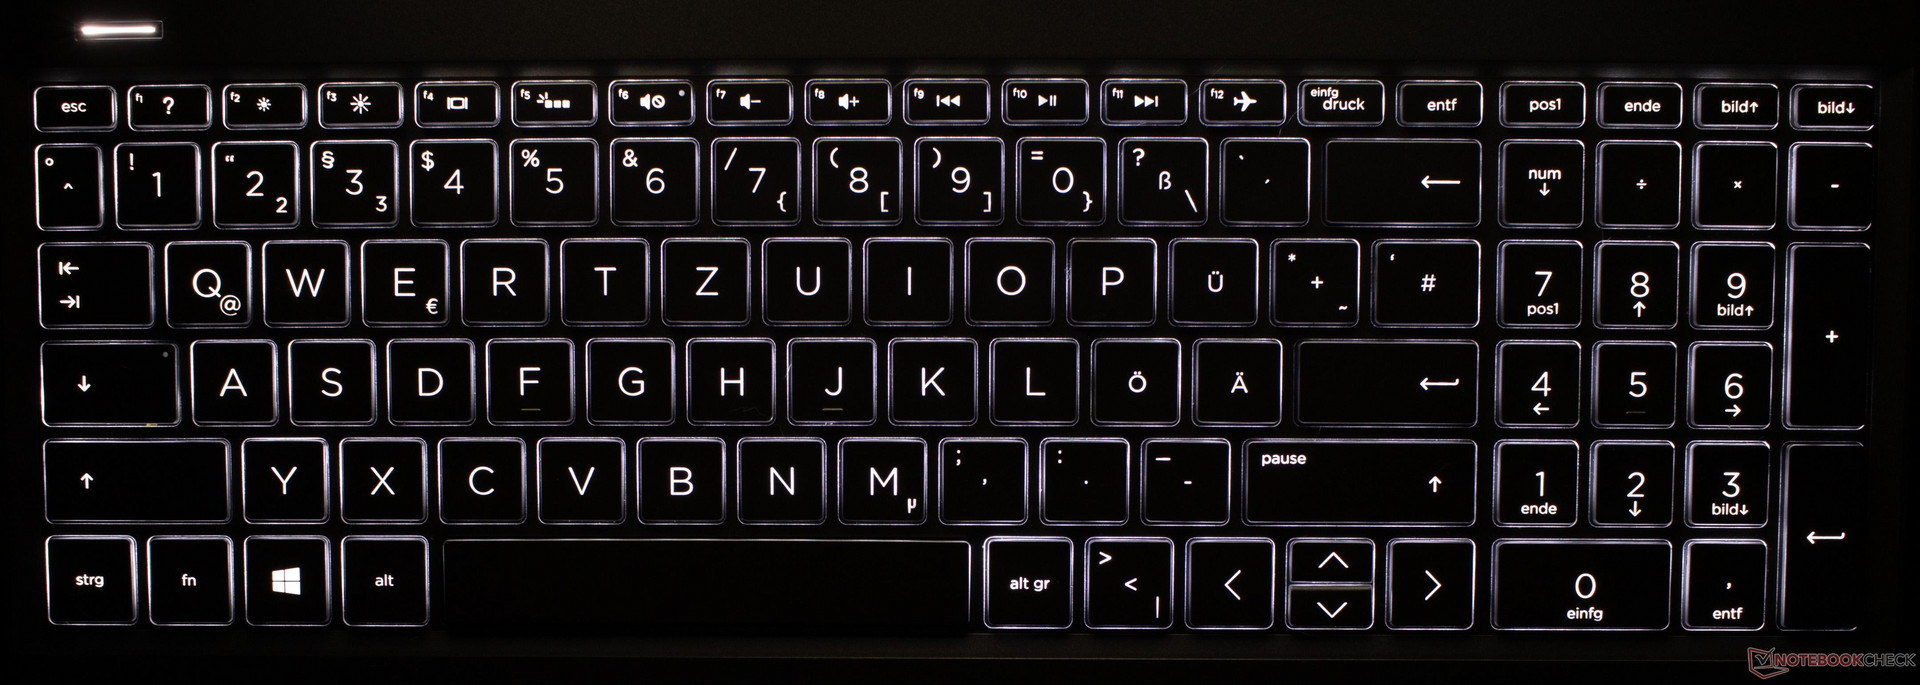
The keys of the chiclet keyboard have a crisp feedback and the surface feel while typing is rather smooth and flat. Fast and frequent writers will not have any problems with this keyboard, as the square keys have a short travel and a sufficient size with an edge length of 15 millimeters. The Pavilion's white backlight can be turned on and off via the F5 key, but no in-between levels are available. The silvery keys with letters backlit in white have a suboptimal readability under certain lighting conditions, but HP gave the design a higher priority in this case.
Touchpad
At 11.5 x 6 centimeters, the touchpad is wider than usual. It reacts well to inputs and movements, even in the corners and at the edges. The touchpad does not have any buttons on its own, instead functioning as a ClickPad in the lower area. The clicks performed this way are clean, but slightly less crisp than with the smaller 14-inch Pavilion.
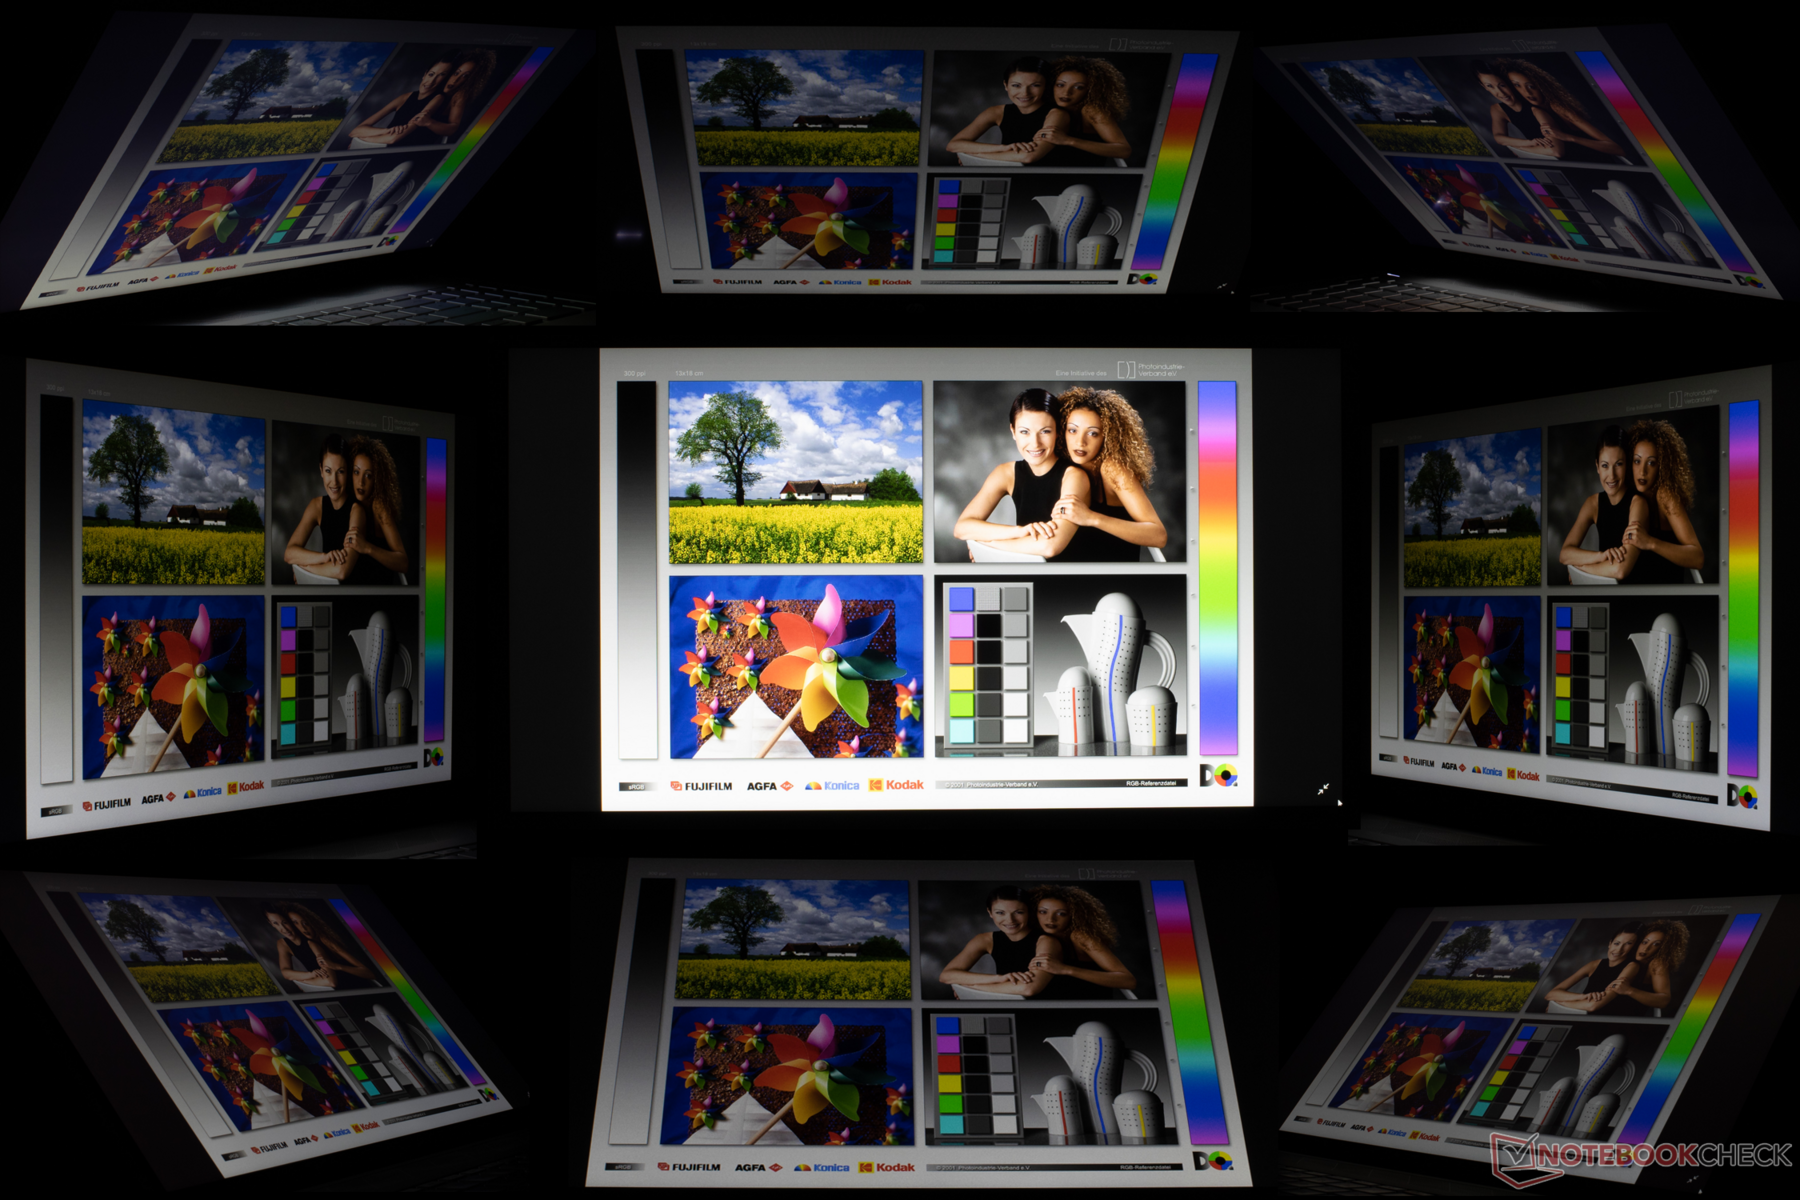
Display - Not the Brightest Pavilion

The HP Pavilion features an IPS panel by the manufacturer AU Optronics (AUO23ED). This 15.6-inch Full HD panel with a resolution of 1920x1080 pixels has a weakness, namely its extremely low brightness. Using our testing station, we measured a maximum brightness of 186 cd/m² in the center of the screen and an average brightness of 180 cd/m², with a brightness distribution of 88%. A direct comparison to the HP Pavilion 14 shows that the smaller model has a significantly higher brightness while achieving at least equal scores in almost all other areas.
| |||||||||||||||||||||||||
Brightness Distribution: 88 %
Center on Battery: 217 cd/m²
Contrast: 1240:1 (Black: 0.15 cd/m²)
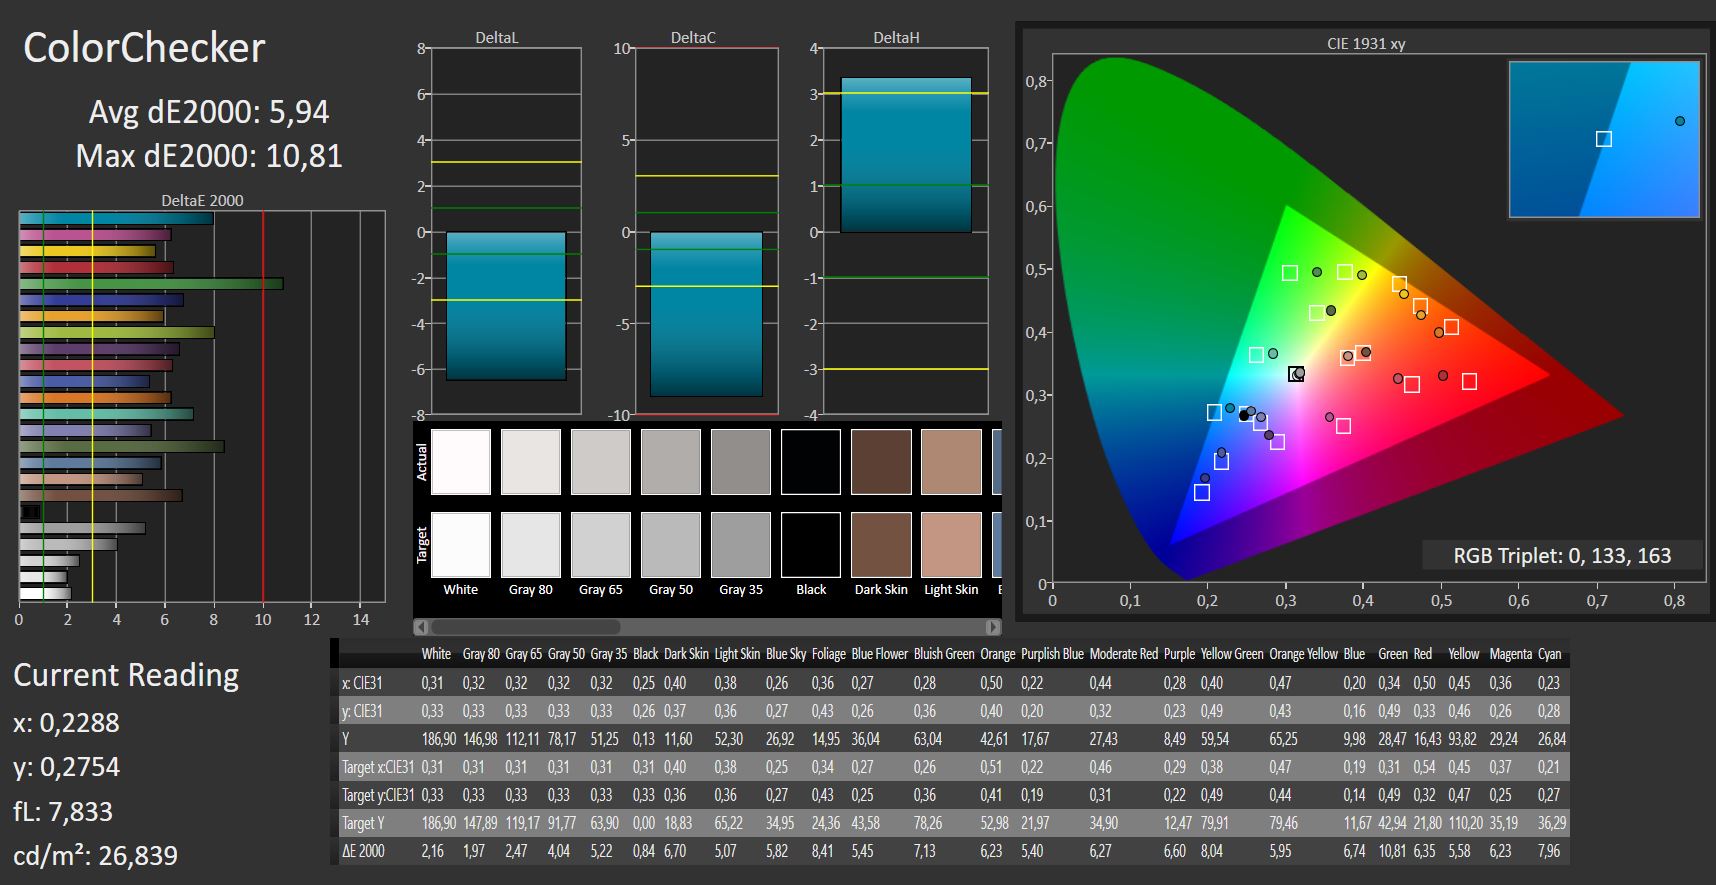
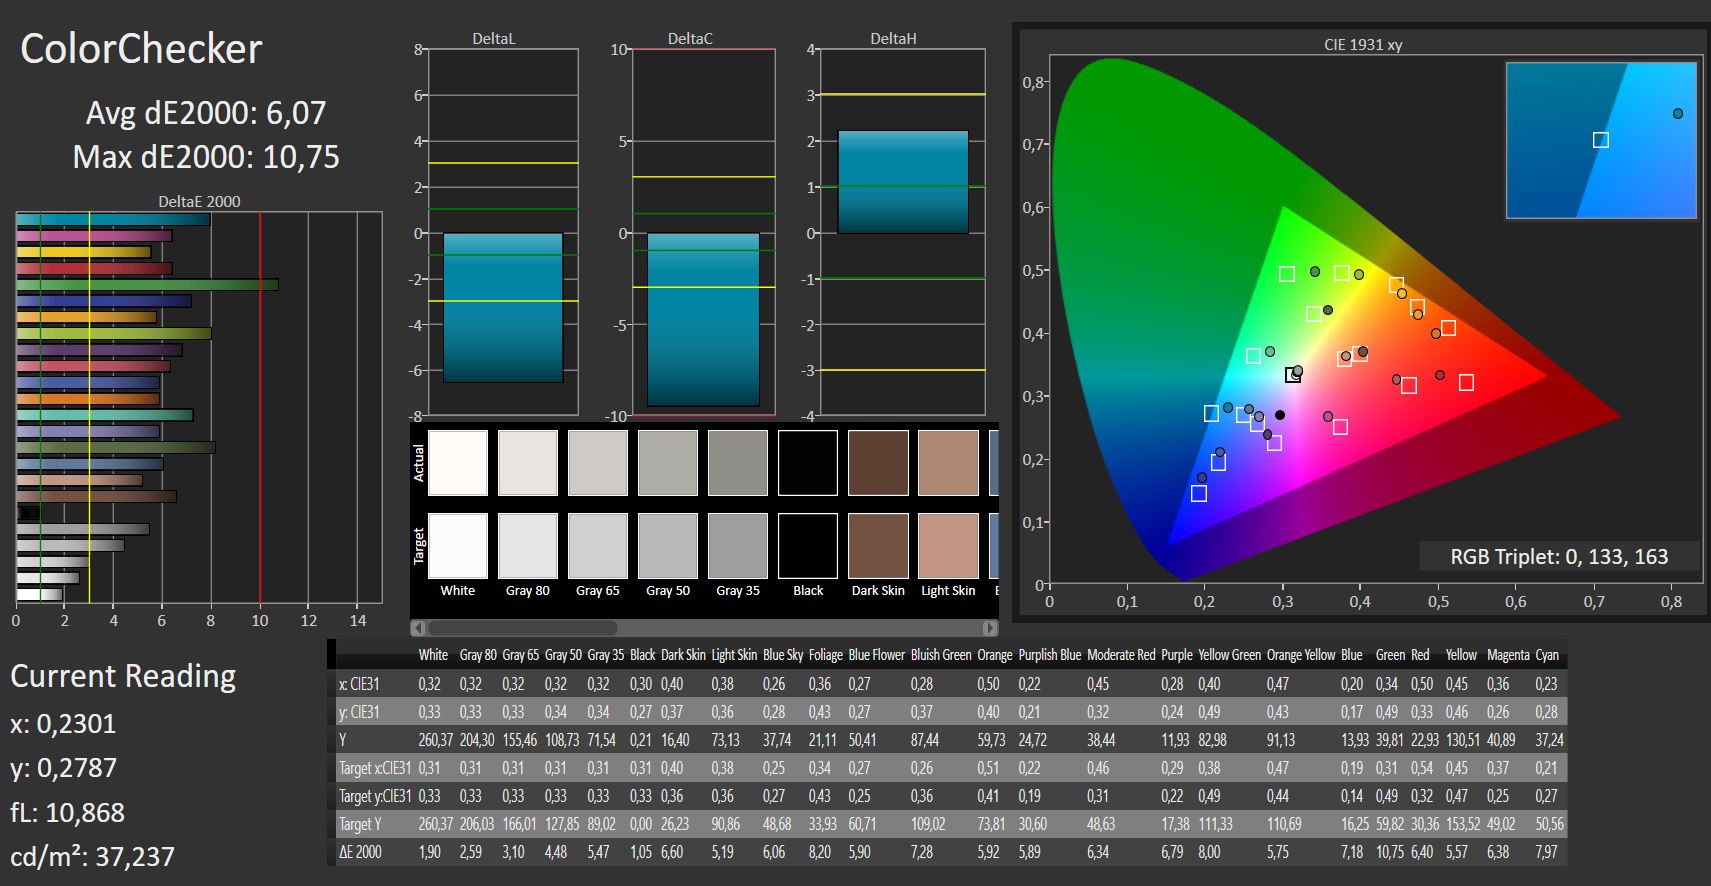
ΔE ColorChecker Calman: 5.94 | ∀{0.5-29.43 Ø4.73}
calibrated: 6.07
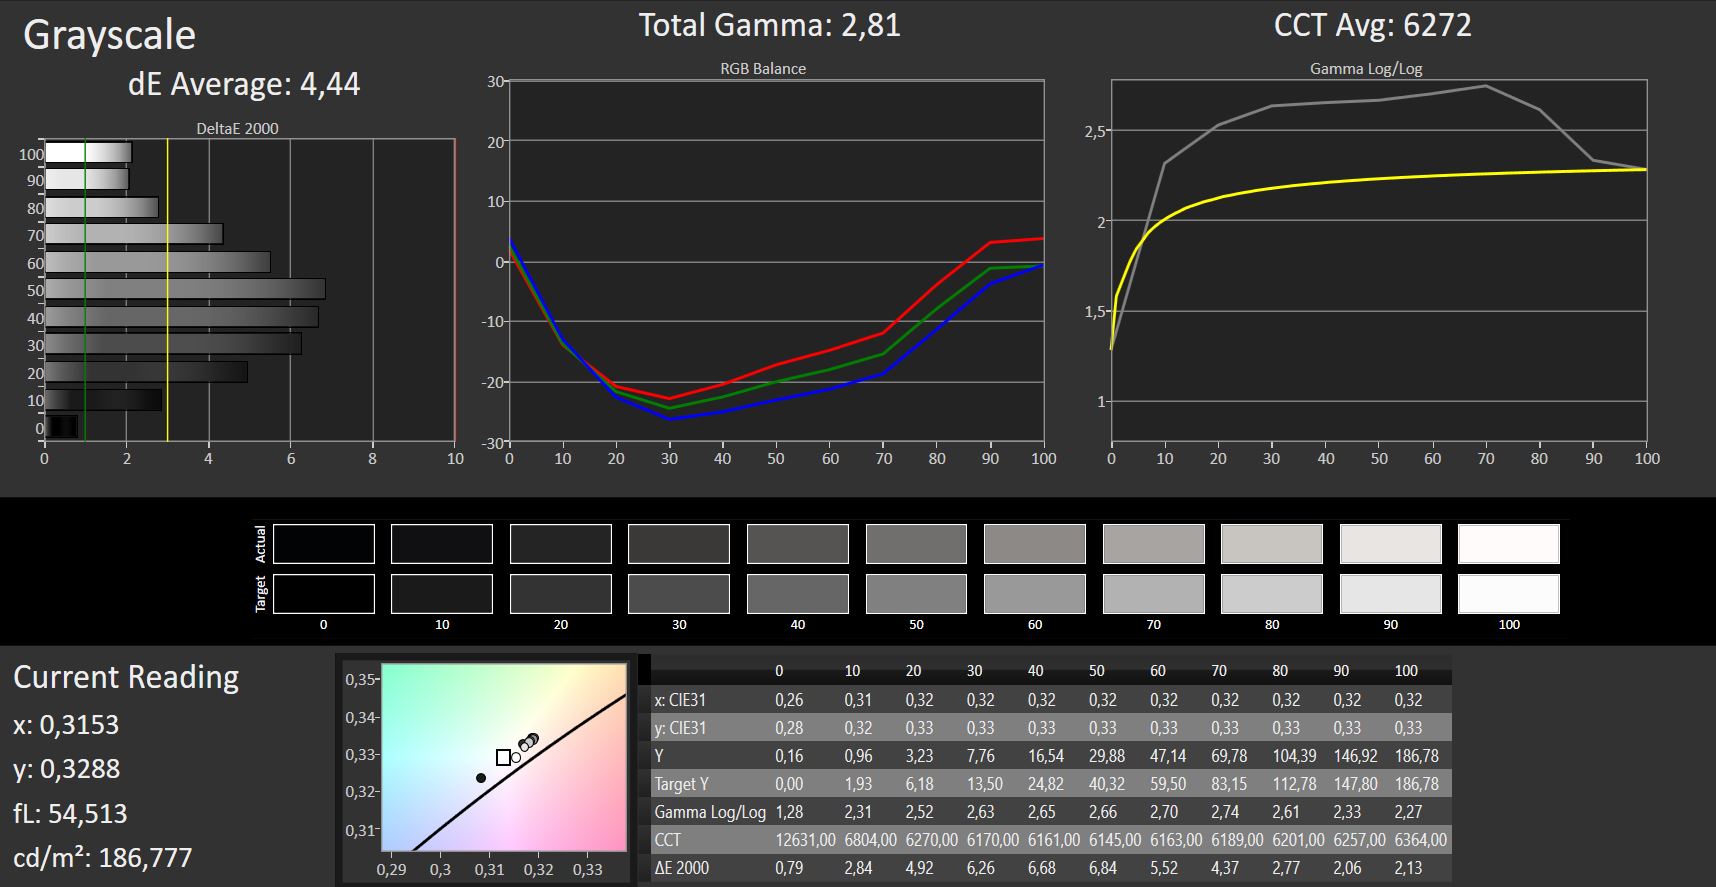
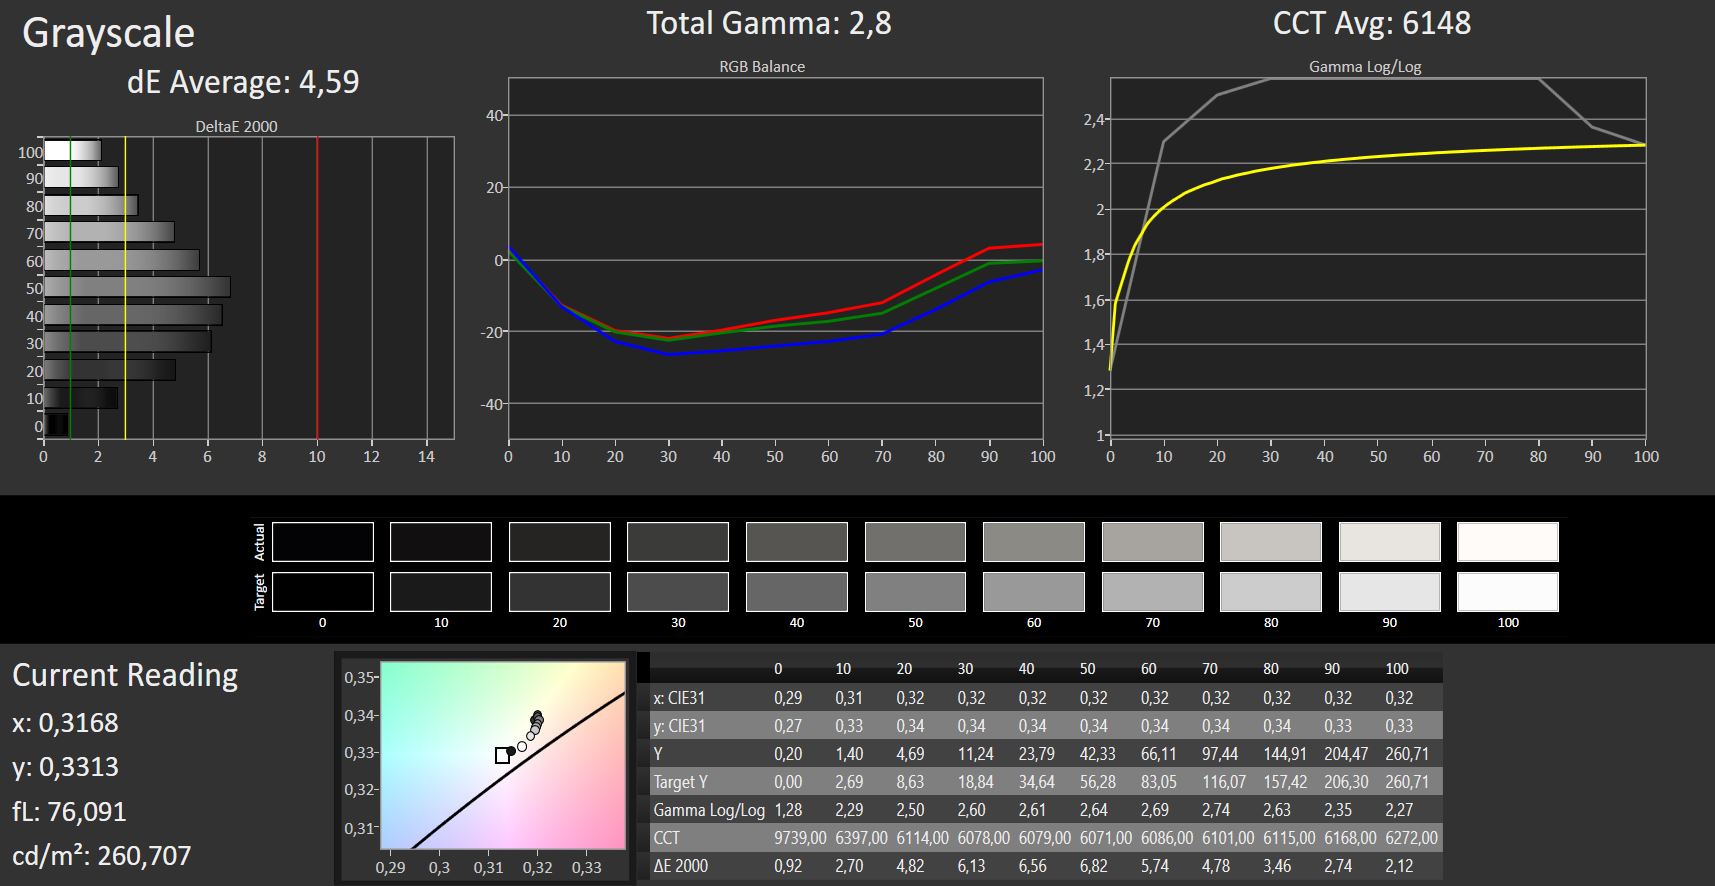
ΔE Greyscale Calman: 4.44 | ∀{0.09-98 Ø4.97}
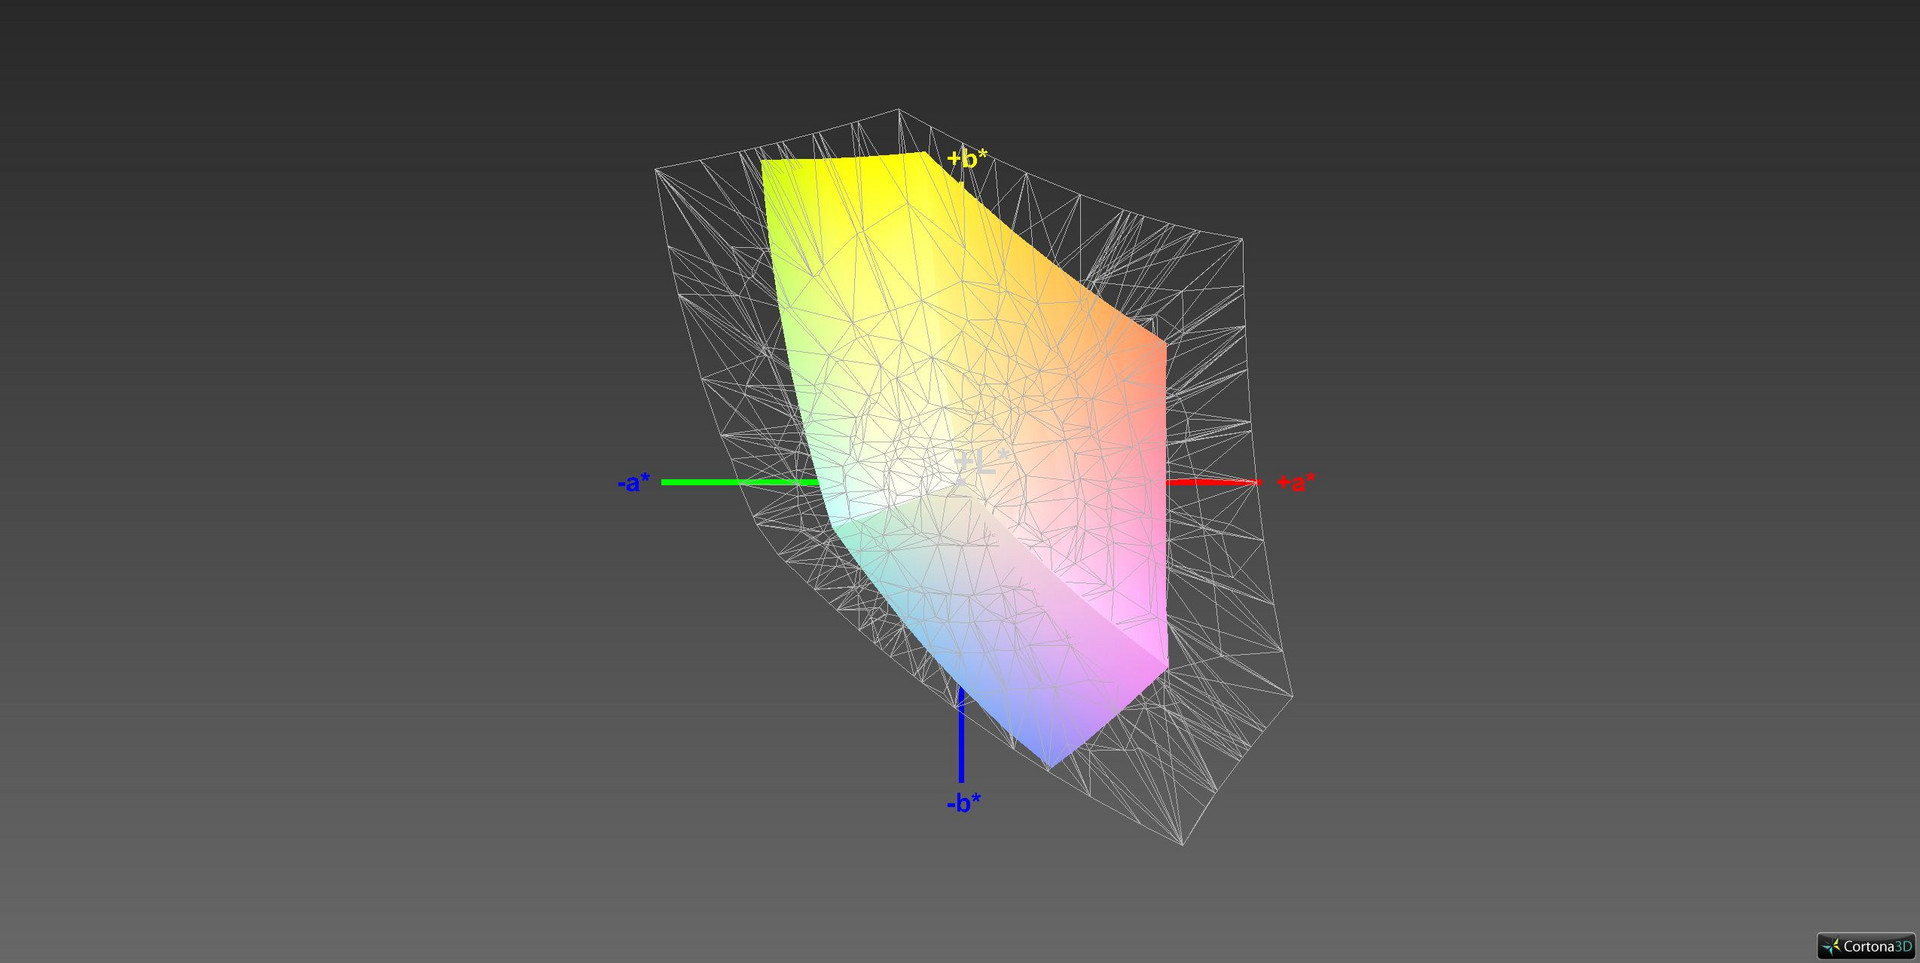
55% sRGB (Argyll 1.6.3 3D)
35% AdobeRGB 1998 (Argyll 1.6.3 3D)
37.91% AdobeRGB 1998 (Argyll 3D)
55% sRGB (Argyll 3D)
36.7% Display P3 (Argyll 3D)
Gamma: 2.81
CCT: 6272 K
| HP Pavilion 15-cw0003ng AU Optronics AUO23ED, , 1920x1080, 15.6" | HP Pavilion 14-ce0002ng BOE072C, , 1920x1080, 14" | Lenovo IdeaPad 330-15ARR 81D2005CUS AUO B156HTN03.8, , 1920x1080, 15.6" | Acer Swift 3 SF315-41G-R6BR BOE CQ NV156FHM-N48, , 1920x1080, 15.6" | HP Envy x360 15-bq102ng Chi Mei CM15E9, , 1920x1080, 15.6" | HP Pavilion 15-cs0053cl AU Optronics B156XW02 V0, , 1366x768, 15.6" | Acer TravelMate P2510-G2-MG-50WE Chi Mei CMN15D3, , 1920x1080, 15.6" | |
|---|---|---|---|---|---|---|---|
| Display | 8% | -1% | 8% | 13% | 5% | 15% | |
| Display P3 Coverage (%) | 36.7 | 39.64 8% | 36.36 -1% | 40.1 9% | 41.36 13% | 38.37 5% | 42.27 15% |
| sRGB Coverage (%) | 55 | 59.3 8% | 54.7 -1% | 59 7% | 62.2 13% | 57.7 5% | 63.5 15% |
| AdobeRGB 1998 Coverage (%) | 37.91 | 40.96 8% | 37.57 -1% | 41.43 9% | 42.74 13% | 39.65 5% | 43.69 15% |
| Response Times | -10% | 14% | -12% | 0% | 17% | -12% | |
| Response Time Grey 50% / Grey 80% * (ms) | 40 ? | 40 ? -0% | 38.8 ? 3% | 43 ? -8% | 40 ? -0% | 43.6 ? -9% | 40 ? -0% |
| Response Time Black / White * (ms) | 26 ? | 31 ? -19% | 19.6 ? 25% | 30 ? -15% | 26 ? -0% | 15.2 ? 42% | 32 ? -23% |
| PWM Frequency (Hz) | 200 ? | 1471 ? | 25000 ? | 25000 ? | |||
| Screen | -1% | -58% | 10% | 24% | -41% | 24% | |
| Brightness middle (cd/m²) | 186 | 239 28% | 252.2 36% | 284 53% | 221 19% | 220.1 18% | 259 39% |
| Brightness (cd/m²) | 180 | 223 24% | 251 39% | 254 41% | 207 15% | 210 17% | 230 28% |
| Brightness Distribution (%) | 88 | 88 0% | 84 -5% | 80 -9% | 87 -1% | 93 6% | 82 -7% |
| Black Level * (cd/m²) | 0.15 | 0.27 -80% | 0.54 -260% | 0.29 -93% | 0.15 -0% | 0.29 -93% | 0.19 -27% |
| Contrast (:1) | 1240 | 885 -29% | 467 -62% | 979 -21% | 1473 19% | 759 -39% | 1363 10% |
| Colorchecker dE 2000 * | 5.94 | 5.3 11% | 12.36 -108% | 4.22 29% | 4.35 27% | 11.4 -92% | 3.13 47% |
| Colorchecker dE 2000 max. * | 10.81 | 10.03 7% | 24.75 -129% | 9.29 14% | 8.98 17% | 25.96 -140% | 7.81 28% |
| Colorchecker dE 2000 calibrated * | 6.07 | 3.64 40% | 4.43 27% | 4.09 33% | 3.09 49% | ||
| Greyscale dE 2000 * | 4.44 | 5.85 -32% | 12.2 -175% | 1.17 74% | 3.09 30% | 12 -170% | 1.42 68% |
| Gamma | 2.81 78% | 2.45 90% | 1.83 120% | 2.39 92% | 2.23 99% | 2.09 105% | 2.36 93% |
| CCT | 6272 104% | 7169 91% | 13028 50% | 6360 102% | 6068 107% | 12625 51% | 6391 102% |
| Color Space (Percent of AdobeRGB 1998) (%) | 35 | 38 9% | 34.6 -1% | 38 9% | 56 60% | 36.5 4% | 40 14% |
| Color Space (Percent of sRGB) (%) | 55 | 59 7% | 54.5 -1% | 59 7% | 86 56% | 57.5 5% | 63 15% |
| Total Average (Program / Settings) | -1% /
-1% | -15% /
-38% | 2% /
7% | 12% /
19% | -6% /
-25% | 9% /
18% |
* ... smaller is better
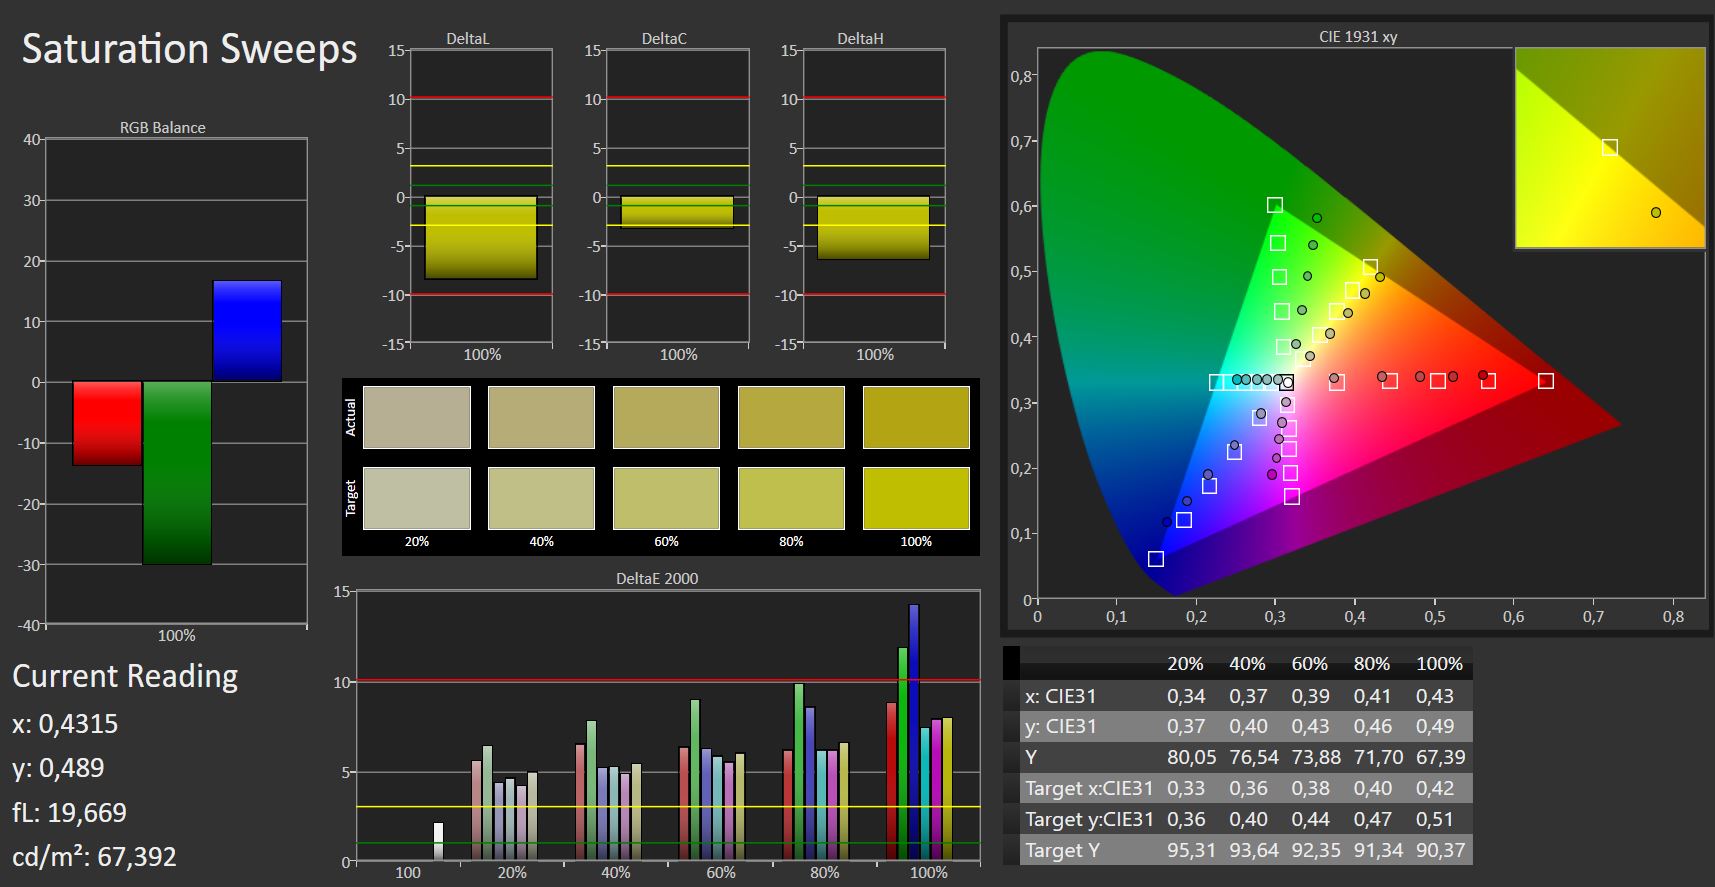
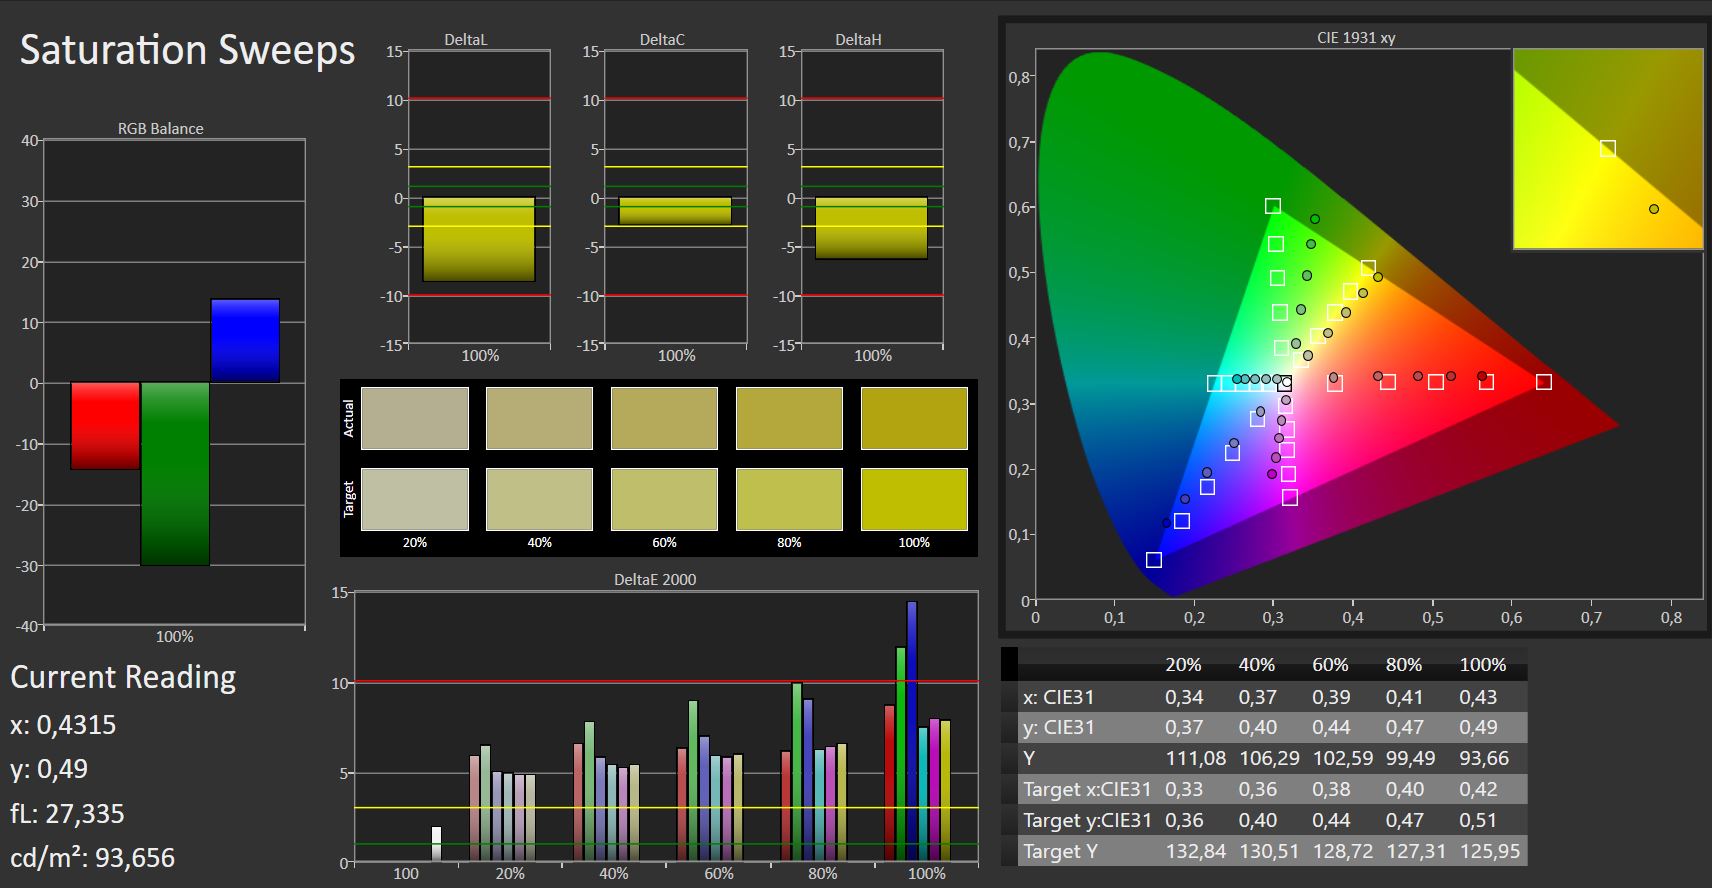
The only commendable feature of this display is its really good black level of 0.15 and the contrast of 1240:1. The Delta-E deviation (ColorChecker) is rather high at 5.94 and 4.44 for grayscales. Not even calibration was able to improve these values. Color-space coverage of only 35% for AdobeRGB and 55% for sRGB places the Pavilion at the rear end of our comparison field.

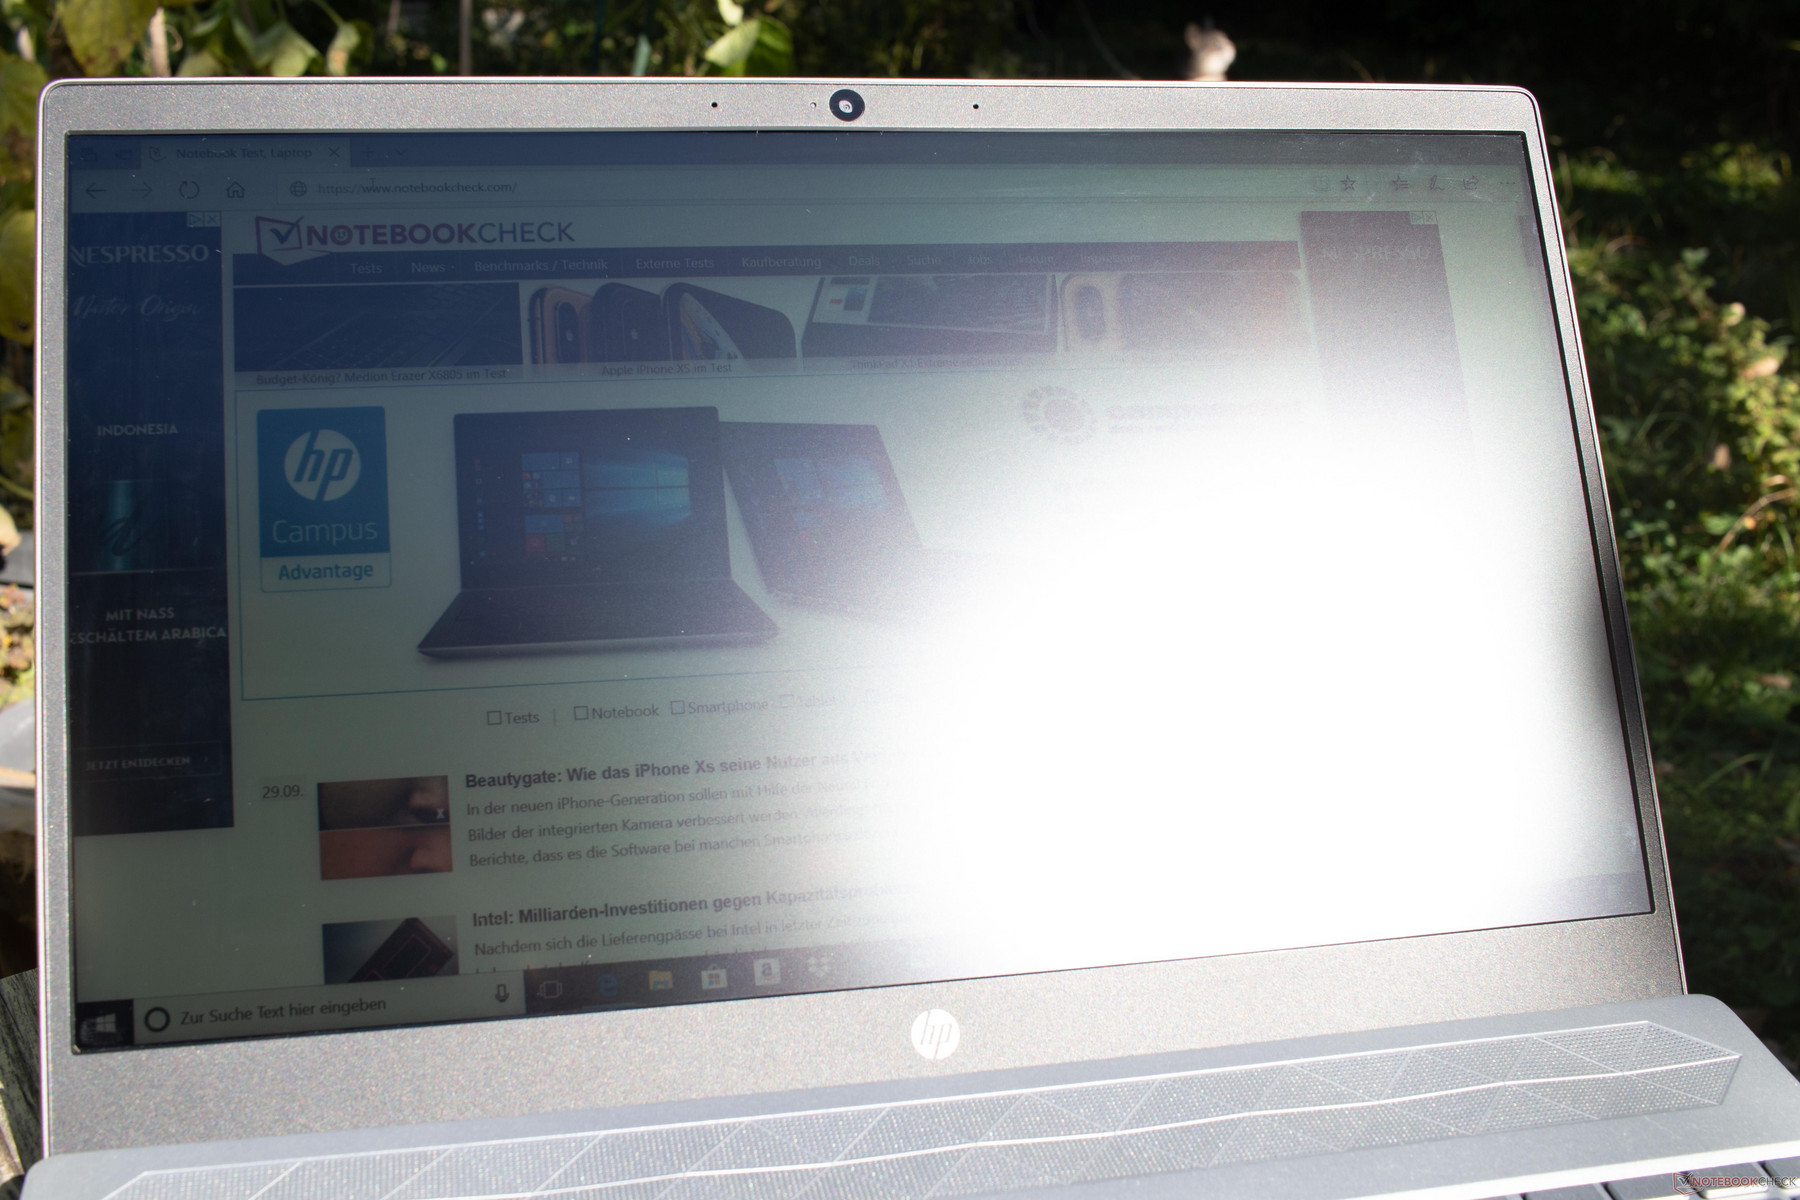
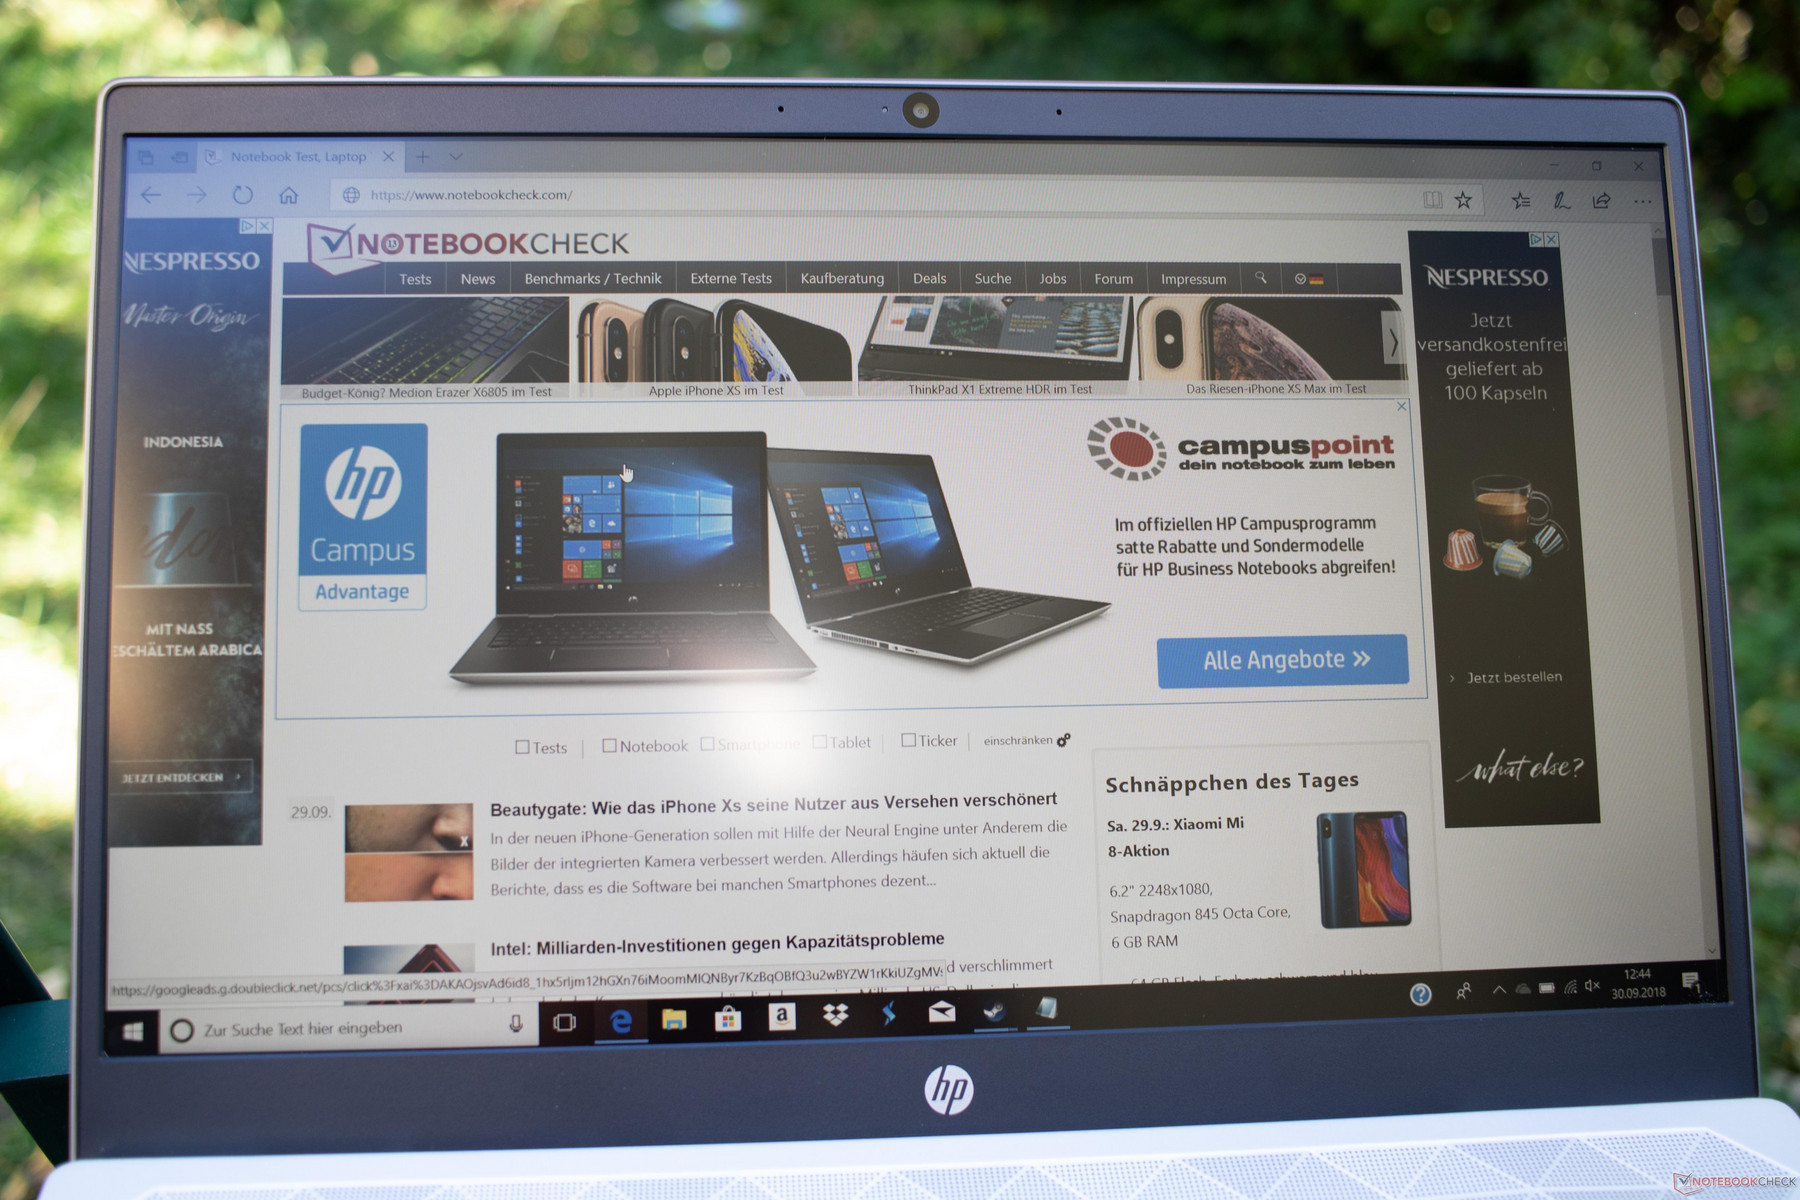
The readability in direct sunlight is better than we assumed, despite the low maximum brightness of 186 cd/m². This AU Optronics display is far better suited to outdoors usage than the BOE panel installed in the HP Pavilion 14, which has a case that is identical in construction to the Pavilion 15.
Display Response Times
| ↔ Response Time Black to White | ||
|---|---|---|
| 26 ms ... rise ↗ and fall ↘ combined | ↗ 16 ms rise | 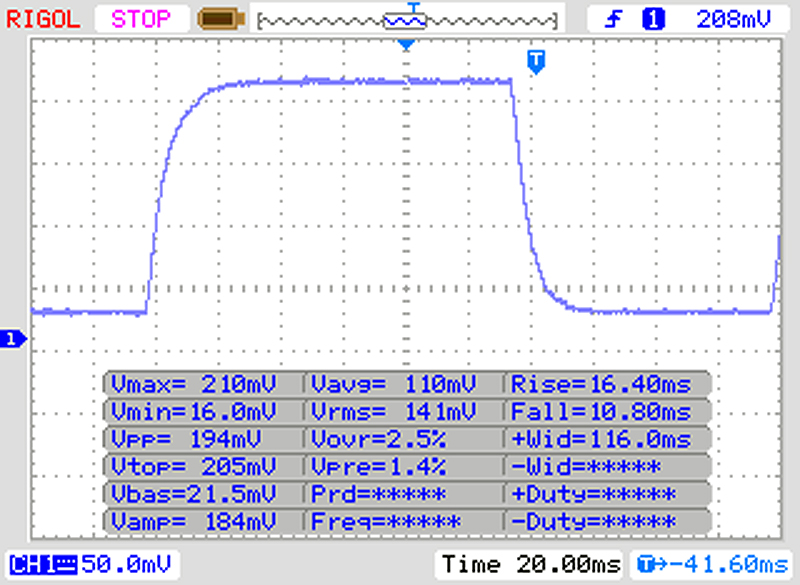 |
| ↘ 10 ms fall | ||
| The screen shows relatively slow response rates in our tests and may be too slow for gamers. In comparison, all tested devices range from 0.1 (minimum) to 240 (maximum) ms. » 62 % of all devices are better. This means that the measured response time is worse than the average of all tested devices (19.9 ms). | ||
| ↔ Response Time 50% Grey to 80% Grey | ||
| 40 ms ... rise ↗ and fall ↘ combined | ↗ 18 ms rise | 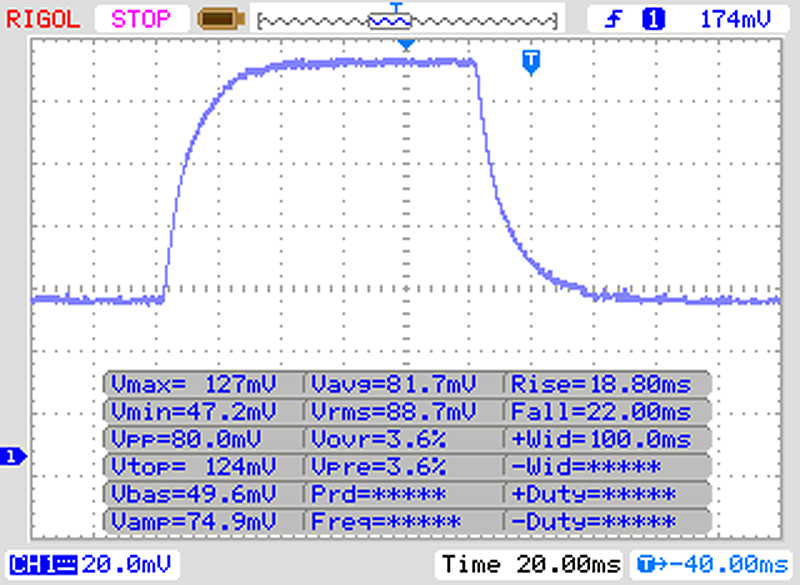 |
| ↘ 22 ms fall | ||
| The screen shows slow response rates in our tests and will be unsatisfactory for gamers. In comparison, all tested devices range from 0.165 (minimum) to 636 (maximum) ms. » 61 % of all devices are better. This means that the measured response time is worse than the average of all tested devices (31.1 ms). | ||
Screen Flickering / PWM (Pulse-Width Modulation)
| Screen flickering / PWM not detected | 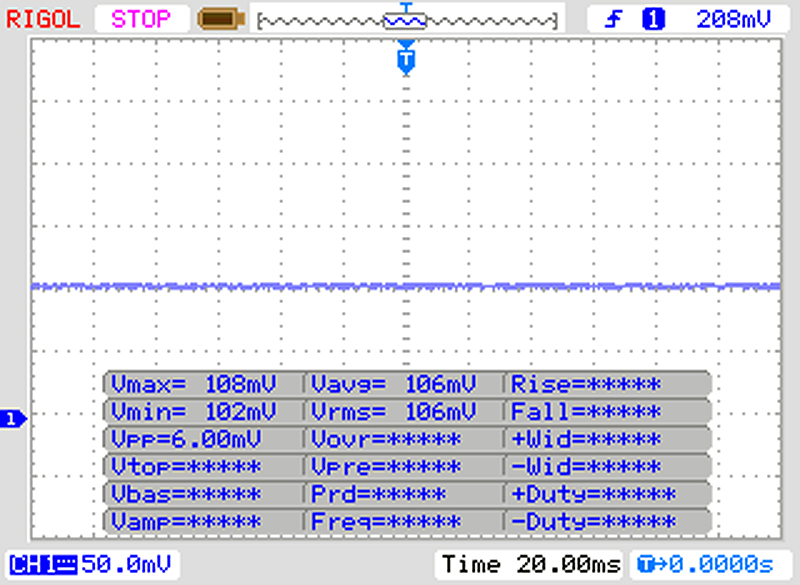 | ||
In comparison: 52 % of all tested devices do not use PWM to dim the display. If PWM was detected, an average of 7798 (minimum: 5 - maximum: 343500) Hz was measured. | |||
Performance - Thorough Examination of the Ryzen in the Pavilion
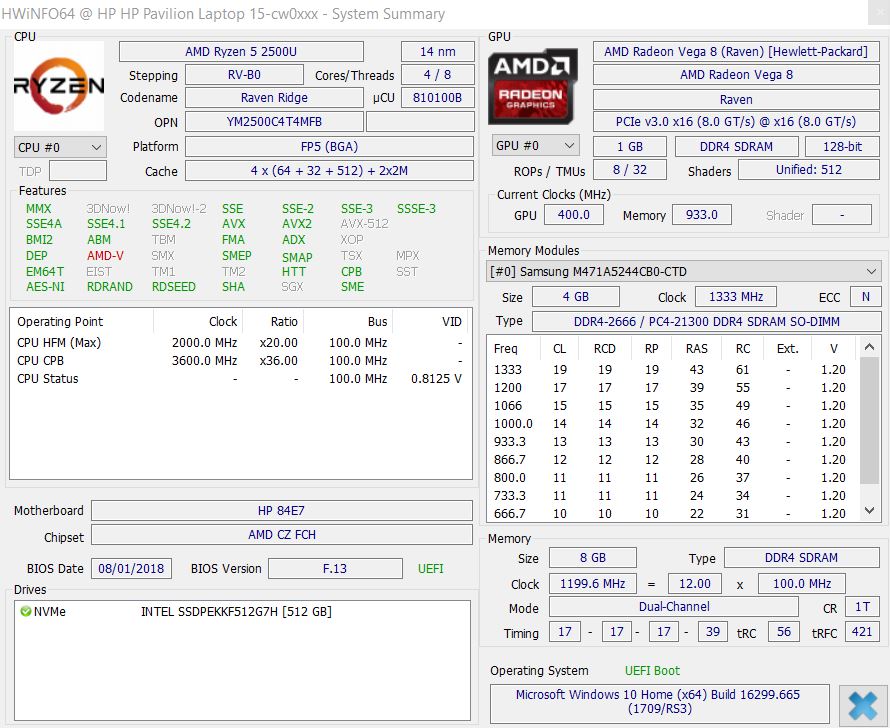
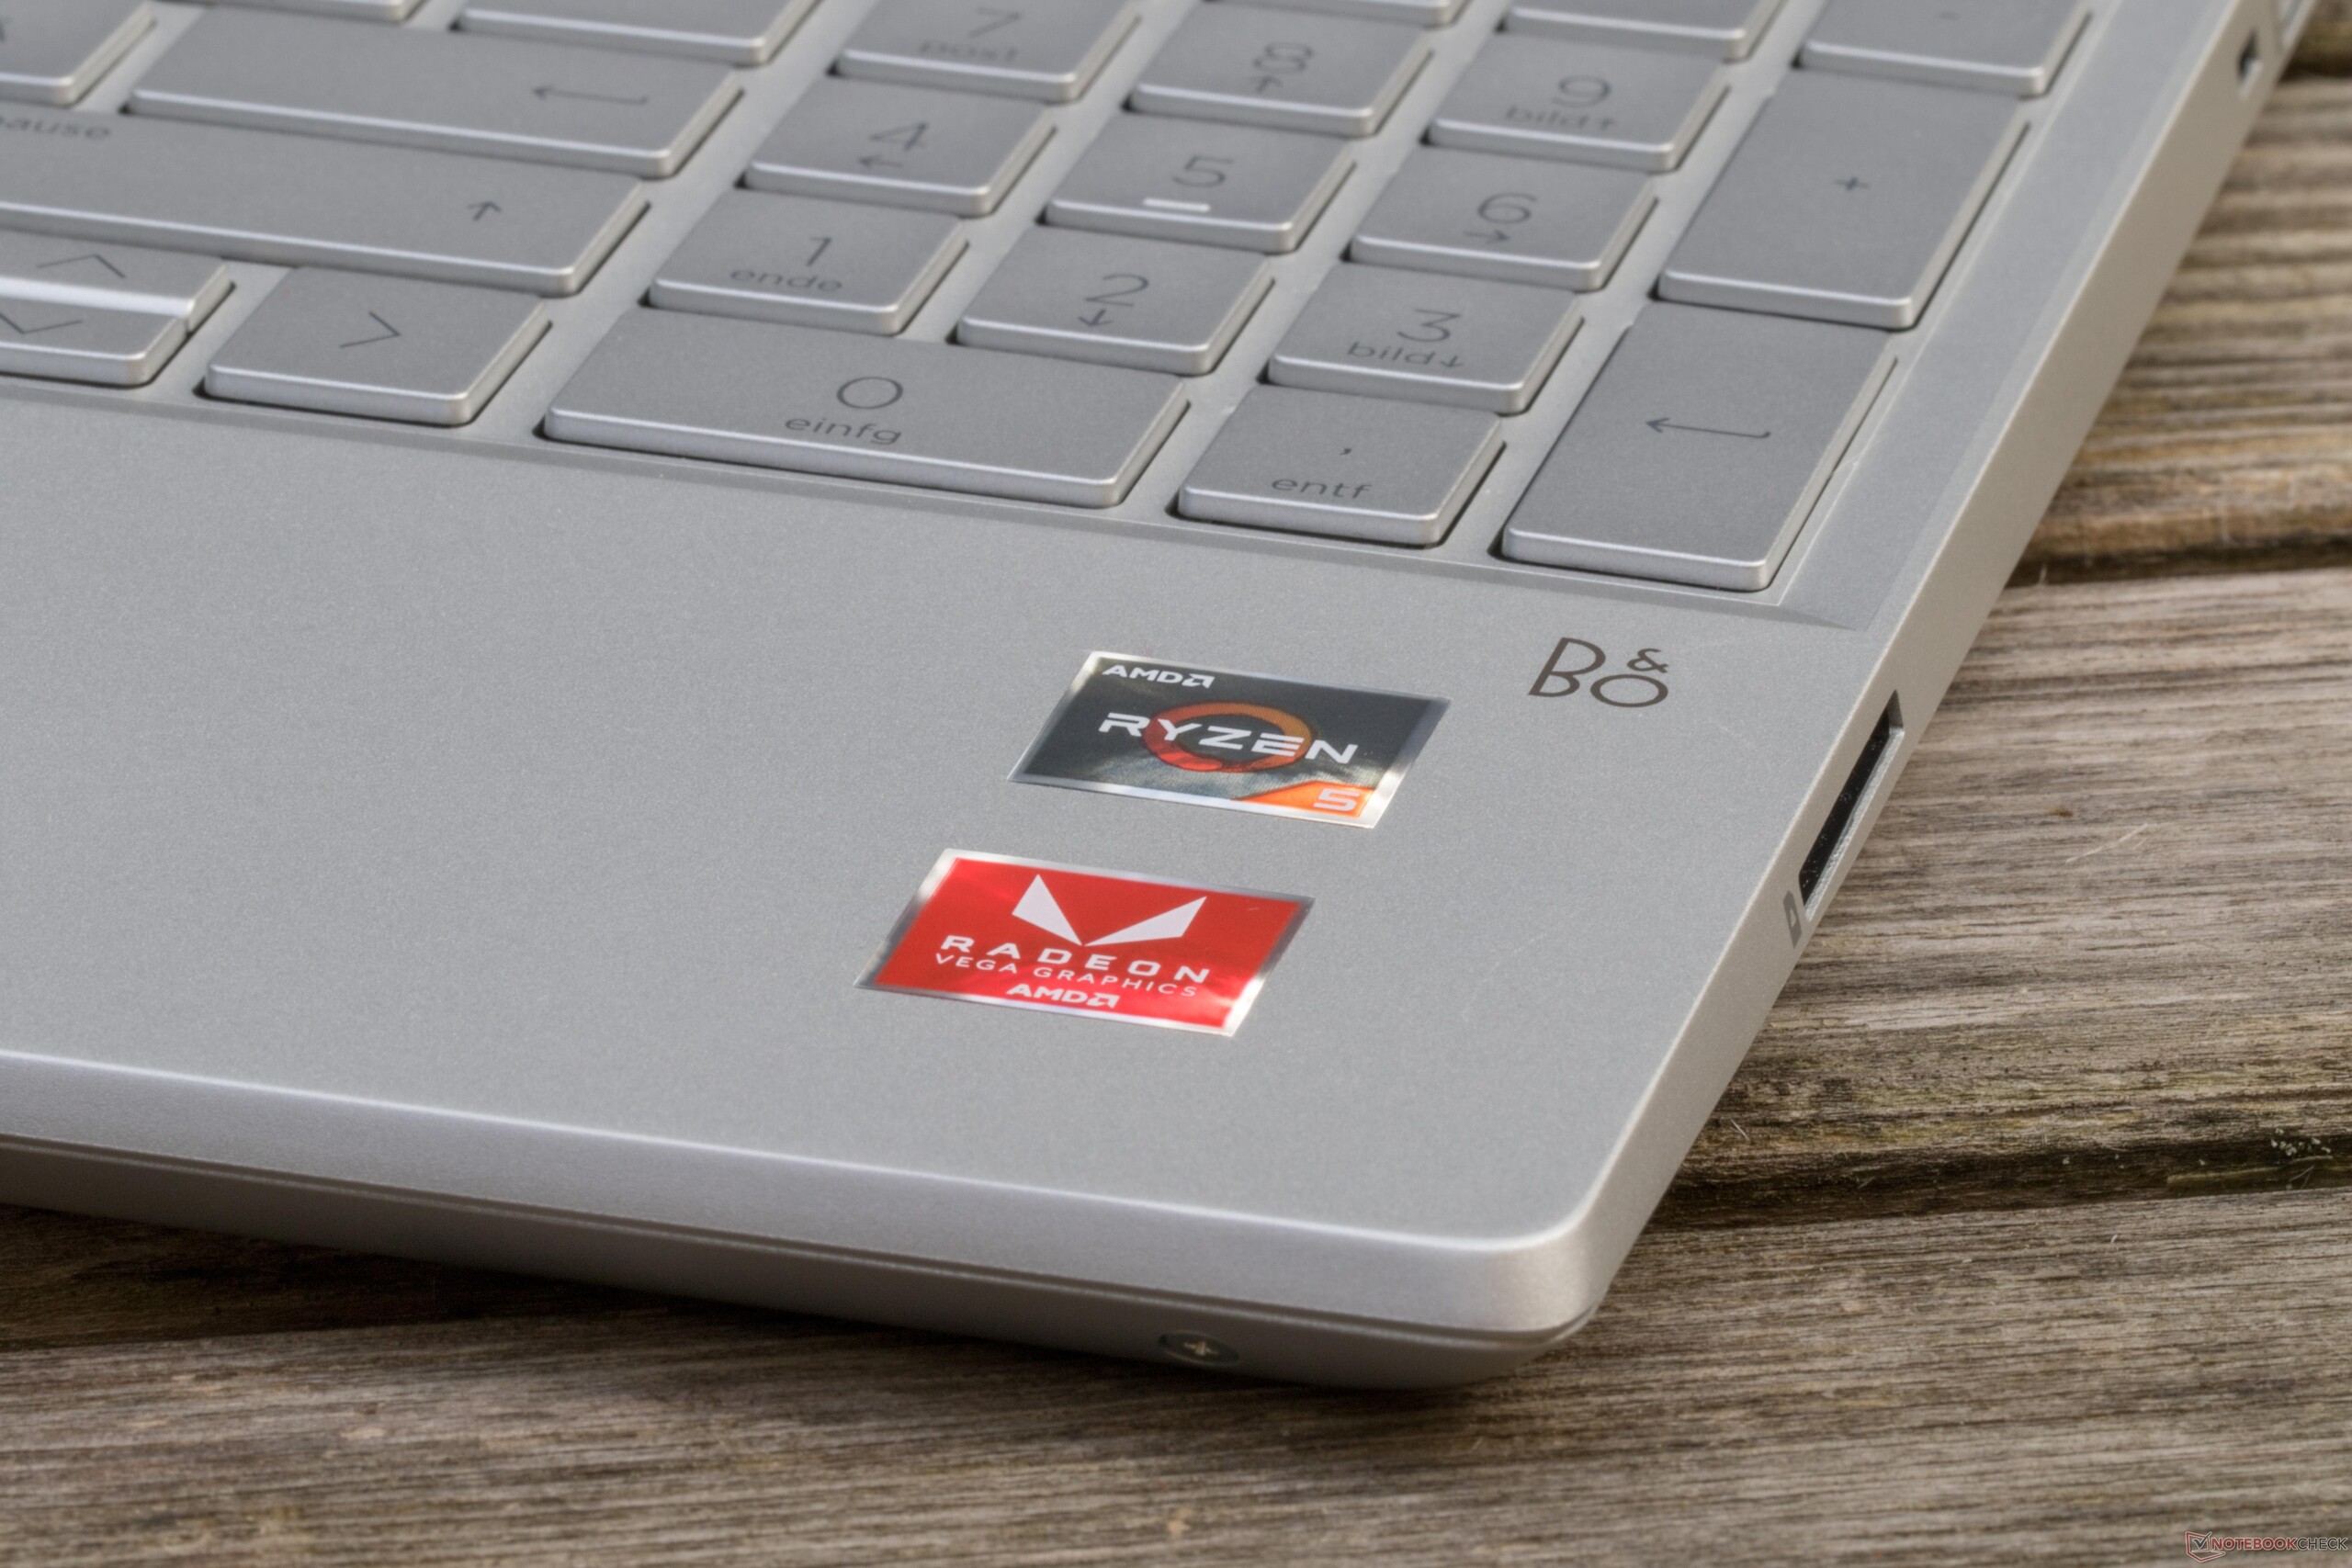
Our test device, the HP Pavilion 15-cw0003ng, is powered by an AMD quad-core Ryzen 5 2500U CPU. The graphics are processed by the integrated onboard graphics unit Radeon Vega 8. This HP laptop does not have a dedicated graphics card. Two 4 GB DDR4-2400 RAM modules by Samsung are installed in the laptop, which can be upgraded to 32 GB in theory. The installed storage solution is a 512 GB SSD by Intel. In our benchmarks, we are looking to compare the AMD Ryzen 5 processor directly to the Intel i5-8250U, which should be the matching counterpart for this AMD CPU.
Processor
The number of laptops with AMD processors on the market is incredibly low. The announcement of the mobile AMD processors Ryzen 5 and Ryzen 7 about a year ago raised two big questions: How do the AMD CPU and the onboard graphics unit fare in comparison to Intel, and how high is the power consumption, which is linked to the temperature emissions under load? These are the same questions that we are going to investigate in the following tests.
The performance data puts the AMD Ryzen 5 2500U on a level with the Intel Core i5-8250U. It also has four cores and a clock rate between 2 and 3.6 GHz. The laptop manufacturer can configure the TDP in a range from 12 to 25 watts, which makes it suitable for Ultrabooks as well. Just like Intel, the Ryzen 5 is equipped with an integrated graphics unit, the AMD Radeon RX Vega 8. Since our HP Pavilion 15 does not have a dedicated graphics card, we will test the Vega 8's performance directly in the games section.
The HP Pavilion was not particularly convincing in the CPU Single 64Bit test by Cinebench, still bringing up the rear of this group. The HP Envy x360 and the Acer Swift 3, both also powered by an AMD Ryzen 5 2500U, show the possibilities. The Pavilion is able to improve slightly in the Multi 64Bit test, leaving behind several Intel Core i5-8250s.
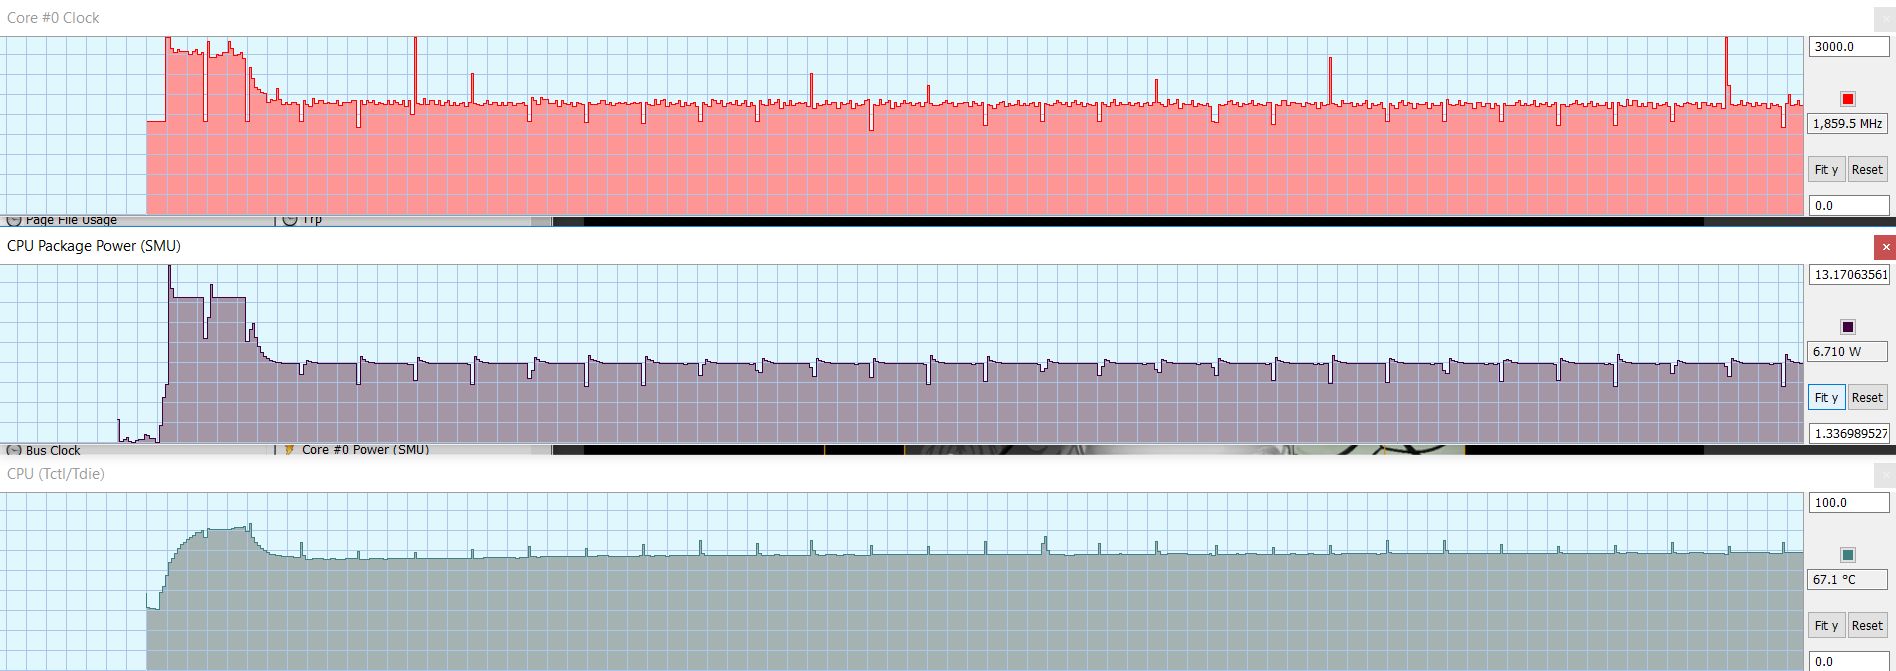
We ran the Cinebench Multi test 40 times in a loop to determine how strongly the HP throttles. The Ryzen 5 CPUs from our comparison model list had a rather strong throttling behavior in the first two loops, which the HP Pavilion 15 exhibits as well. It scored 606 points in the first iteration, 577 in the second, and then it dropped quite a bit to 437 points afterwards. This equates to a throttling of 39%!
The HWInfo graph shows clearly that we got about 12 watts TDP performance in the first two iterations. Afterwards, the TDP dropped to about 7 watts and the clock rate fell to 1.86 GHz. Meanwhile, the temperature remained relatively constant at 67 °C.
System Performance
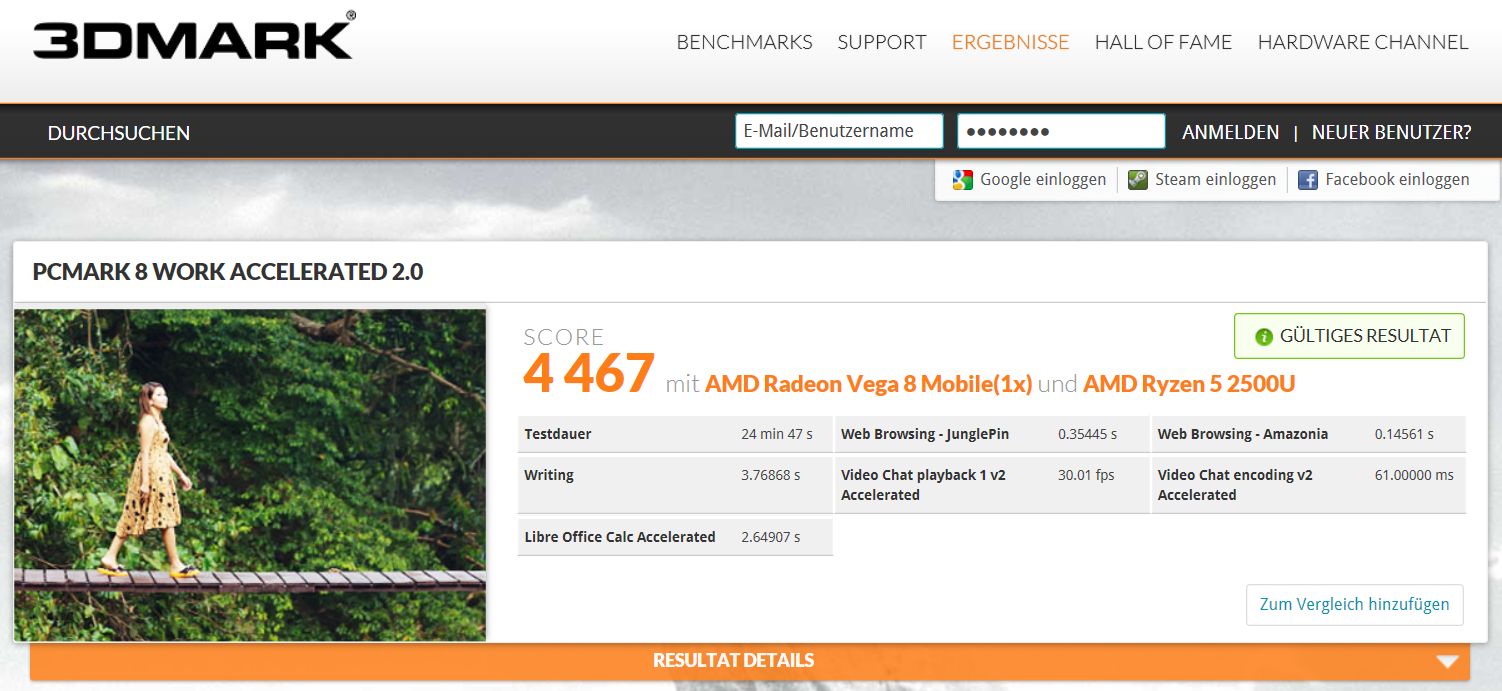
The AMD Ryzen 5 2500U installed in the HP Pavilion, in combination with 8 GB of DDR4 RAM and the Intel SSD, works really fast according to the synthetic benchmark tests, reaching above average performance values for both Work Score and Home Score in PCMark 8. We had a result of 4467 points for the Work Score, which is 15% above the average of all five comparison models documented in our database at the time of testing, which are also powered by a Ryzen 5 2500U processor and a Vega 8.
The performance difference is not quite as remarkable in the Home Score, equating to 3% above average. By the way, the Acer Swift 3 (Ryzen 5 2500U) had really good results here, with a 6 to 10% higher performance than our Pavilion, but it also has the advantage of a dedicated Radeon RX540 and costs around 100 Euros (~$115) more.
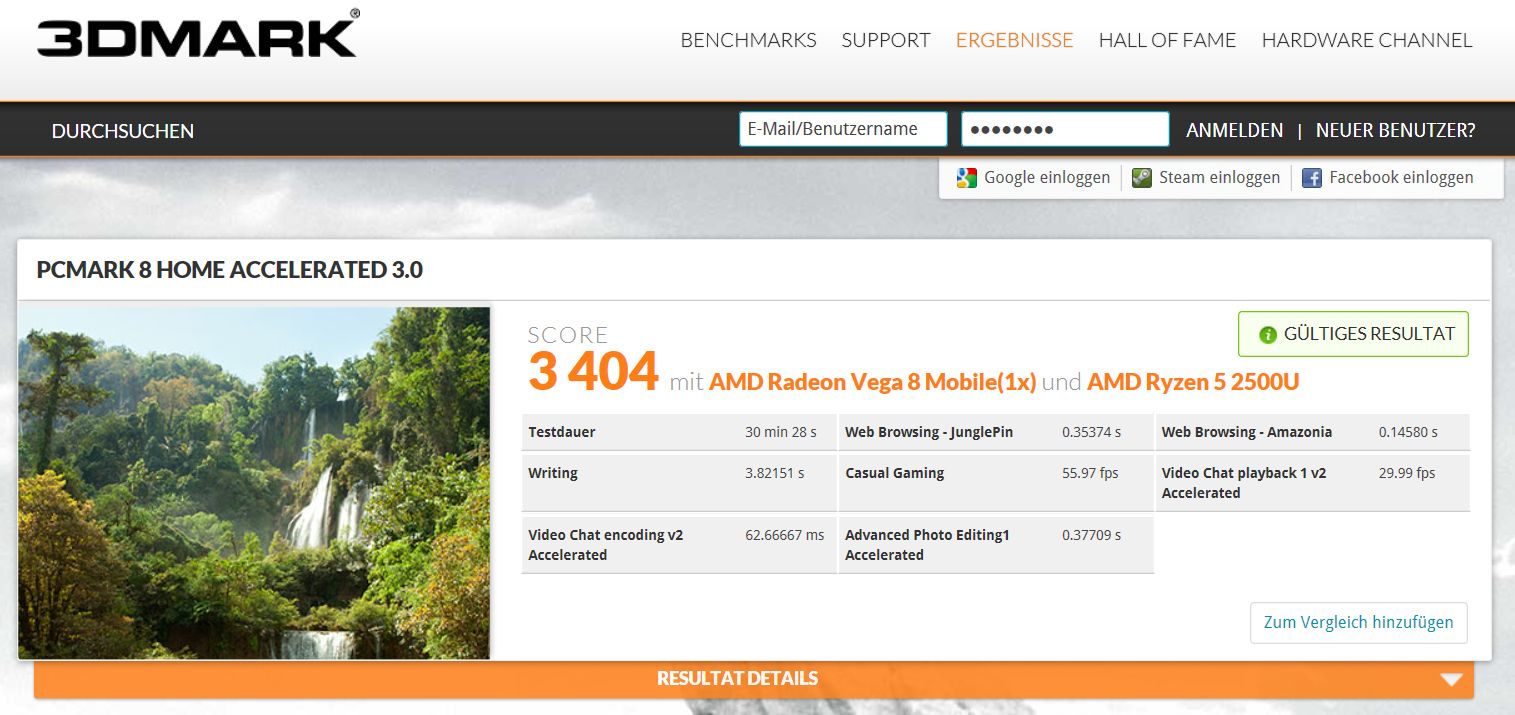
| PCMark 8 Home Score Accelerated v2 | 3404 points | |
| PCMark 8 Work Score Accelerated v2 | 4467 points | |
Help | ||
Storage Devices
Our test laptop's main storage device is an Intel SSD 600p (SSDPEKKW512G7) with a capacity of 512 GB. It is not the fastest in our comparison list, but at least it is still clearly ahead of the SanDisk SSD in the smaller Pavilion 14. The Pavilion 15's values for the 4K areas, which are important for everyday use, are only slightly behind the Acer Swift 3 and the HP Envy x360. Still, they are significantly below the possible average for the Intel SSD 600p from our database.
| HP Pavilion 15-cw0003ng Intel SSD 600p SSDPEKKW512G7 | HP Pavilion 14-ce0002ng SanDisk X600 SD9SN8W-128G | Acer Swift 3 SF315-41G-R6BR Intel SSD 600p SSDPEKKW256G7 | HP Envy x360 15-bq102ng Samsung PM961 MZVLW256HEHP | Acer TravelMate P2510-G2-MG-50WE SK Hynix HFS256G39TND-N210A | Average Intel SSD 600p SSDPEKKW512G7 | |
|---|---|---|---|---|---|---|
| CrystalDiskMark 3.0 | -15% | 51% | 130% | 6% | 102% | |
| Read Seq (MB/s) | 1040 | 508 -51% | 1123 8% | 1487 43% | 477.3 -54% | 1228 ? 18% |
| Write Seq (MB/s) | 179.9 | 202.4 13% | 601 234% | 1241 590% | 267.8 49% | 628 ? 249% |
| Read 512 (MB/s) | 641 | 309.6 -52% | 822 28% | 923 44% | 331.4 -48% | 856 ? 34% |
| Write 512 (MB/s) | 300.3 | 158.2 -47% | 534 78% | 797 165% | 268.4 -11% | 587 ? 95% |
| Read 4k (MB/s) | 19.99 | 33.15 66% | 25.03 25% | 49.38 147% | 25.41 27% | 61.5 ? 208% |
| Write 4k (MB/s) | 72 | 68.7 -5% | 94.7 32% | 97.3 35% | 78.2 9% | 151.4 ? 110% |
| Read 4k QD32 (MB/s) | 264.5 | 262.1 -1% | 262.2 -1% | 295 12% | 394.5 49% | 353 ? 33% |
| Write 4k QD32 (MB/s) | 206.1 | 116.4 -44% | 208.9 1% | 212.5 3% | 264.8 28% | 341 ? 65% |

Graphics
The AMD Radeon RX Vega 8, which processes the graphics in our HP Pavilion, is an onboard graphics chip integrated into the Ryzen 5. It does not have its own graphics memory, which makes it not ideal for gaming. In theory, the performance can be best compared to a GeForce 940MX. More information about the Vega 8 can be found in our graphics comparison.
Our benchmark test results do not make the Vega 8 in the HP Pavilion look particularly good. The average of all laptops in our database equipped with a Vega 8 reached a reference score of 3126 in 3DMark11. Our Pavilion falls behind by 24%, and it falls by 12% in the 3DMark benchmark tests. So we do not have much hope that the Vega 8 is suitable for gaming at all, not even on lowest details.
| 3DMark 11 Performance | 2549 points | |
| 3DMark Cloud Gate Standard Score | 6493 points | |
| 3DMark Fire Strike Score | 1617 points | |
Help | ||
Gaming Performance
As expected, gamers will not be happy with the Vega 8. Even on lowest details at a resolution of 1280x720 pixels, the frame rate was abysmal. Only F1 2018 on lowest settings was at least mostly playable at 29 fps. Users looking to play anything more demanding than a browser game would do better to avoid the Vega 8.
| F1 2018 | |
| 1280x720 Ultra Low Preset | |
| Average AMD Radeon RX Vega 8 (Ryzen 2000/3000) (29 - 64, n=3) | |
| HP Pavilion 15-cw0003ng | |
| 1920x1080 Medium Preset AF:4x | |
| Average AMD Radeon RX Vega 8 (Ryzen 2000/3000) (16 - 33, n=3) | |
| HP Pavilion 15-cw0003ng | |
| 1920x1080 High Preset AA:T AF:8x | |
| Average AMD Radeon RX Vega 8 (Ryzen 2000/3000) (12 - 25, n=3) | |
| HP Pavilion 15-cw0003ng | |
| low | med. | high | ultra | |
|---|---|---|---|---|
| Final Fantasy XV Benchmark (2018) | 13.5 | 6.6 | 3.7 | |
| Far Cry 5 (2018) | 15 | 7 | 7 | 6 |
| F1 2018 (2018) | 29 | 16 | 12 | 8 |
| Shadow of the Tomb Raider (2018) | 17 | 6 | 6 |
Emissions - HP Does a Good Job
Noise Emissions
The fan runs permanently, so the Pavilion has a constant noise level of 31.4 dB(A) even in idle mode. Subjectively, this fan noise is even more unpleasant than usual, because not only the outrushing air is audible but also the fan itself spins at a slightly higher frequency. It is only a minimal noise, but it is still clearly audible.
When the HP works under load, the fan volume rises only slightly by 2 dB(A). This makes the HP Pavilion one of the quieter laptops under load in our tests. Our HP Pavilion also did not exhibit any coil whine.
Noise level
| Idle |
| 31.4 / 31.4 / 31.6 dB(A) |
| Load |
| 33.5 / 35.9 dB(A) |
 | ||
30 dB silent 40 dB(A) audible 50 dB(A) loud |
||
min: | ||
Temperature
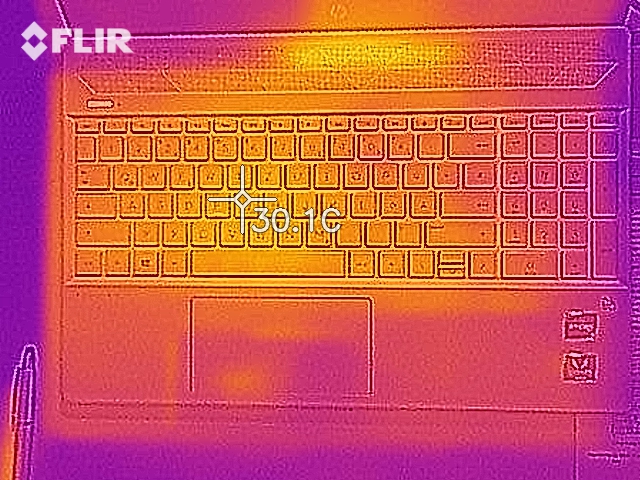
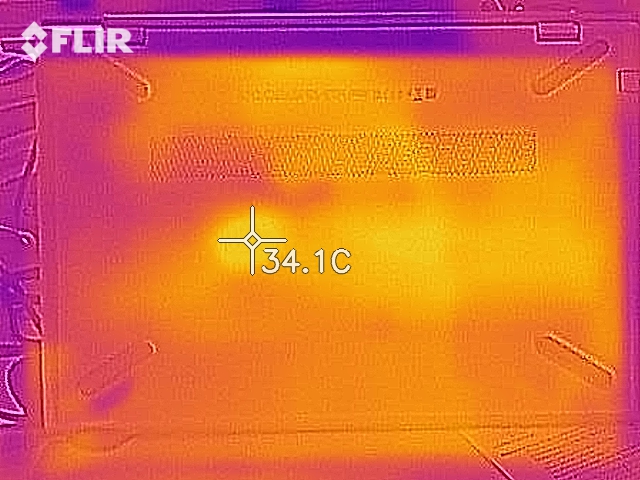
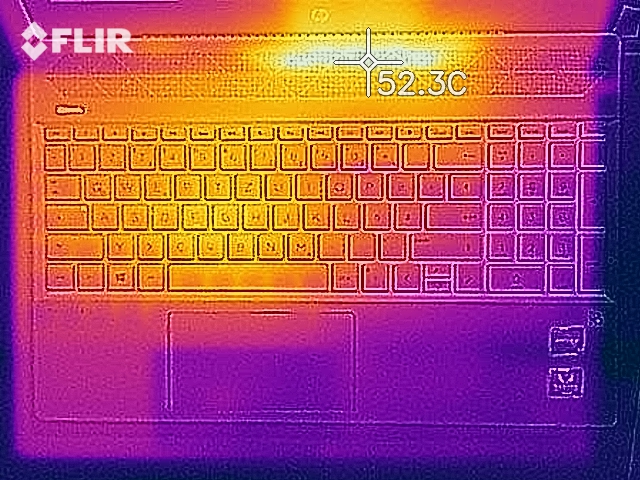
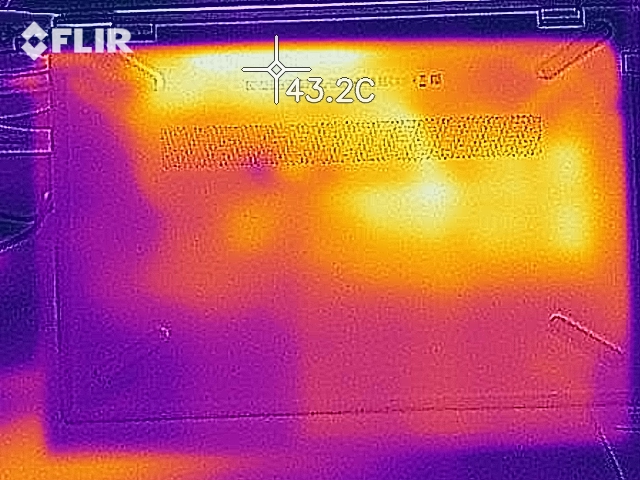
The 15-inch case does a far better job with the cooling than the smaller 14-inch model of identical construction. At a room temperature of 21 °C, we first measured the temperature in idle mode, which amounted to values between 22 and 24 °C. No matter how much load we put on the Pavilion in our stress test, the temperature never exceeded 37.3 °C. These results are outstanding, especially considering that the fan noise under full load never exceeds 36 dB(A) either.
(+) The maximum temperature on the upper side is 37.3 °C / 99 F, compared to the average of 36.8 °C / 98 F, ranging from 21 to 71 °C for the class Multimedia.
(+) The bottom heats up to a maximum of 37.3 °C / 99 F, compared to the average of 39.1 °C / 102 F
(+) In idle usage, the average temperature for the upper side is 22.6 °C / 73 F, compared to the device average of 31.3 °C / 88 F.
(+) The palmrests and touchpad are cooler than skin temperature with a maximum of 28.5 °C / 83.3 F and are therefore cool to the touch.
(±) The average temperature of the palmrest area of similar devices was 28.7 °C / 83.7 F (+0.2 °C / 0.4 F).
Speakers
The grill with B&O speakers above the keyboard delivers a medium sound quality. The speakers reach a maximum volume of 68 dB, which is not particularly loud. This can be imagined as watching a music video at full volume while sitting right in front of the laptop without feeling the urge to turn down the volume a bit. At this volume, the highs seem rather shrill and too dominant, while the bass is barely noticeable.
In addition to the speakers, the Pavilion has a 3.5 mm combo audio jack for headphones and a microphone.
HP Pavilion 15-cw0003ng audio analysis
(-) | not very loud speakers (68.3 dB)
Bass 100 - 315 Hz
(-) | nearly no bass - on average 28.1% lower than median
(±) | linearity of bass is average (12.8% delta to prev. frequency)
Mids 400 - 2000 Hz
(+) | balanced mids - only 2.2% away from median
(+) | mids are linear (6.4% delta to prev. frequency)
Highs 2 - 16 kHz
(+) | balanced highs - only 1% away from median
(+) | highs are linear (1.6% delta to prev. frequency)
Overall 100 - 16.000 Hz
(±) | linearity of overall sound is average (20.5% difference to median)
Compared to same class
» 70% of all tested devices in this class were better, 7% similar, 23% worse
» The best had a delta of 5%, average was 17%, worst was 45%
Compared to all devices tested
» 54% of all tested devices were better, 8% similar, 38% worse
» The best had a delta of 4%, average was 24%, worst was 134%
HP Pavilion 14-ce0002ng audio analysis
(-) | not very loud speakers (69.9 dB)
Bass 100 - 315 Hz
(-) | nearly no bass - on average 26.7% lower than median
(±) | linearity of bass is average (12.8% delta to prev. frequency)
Mids 400 - 2000 Hz
(+) | balanced mids - only 2.3% away from median
(+) | mids are linear (6.2% delta to prev. frequency)
Highs 2 - 16 kHz
(+) | balanced highs - only 1.5% away from median
(+) | highs are linear (2.8% delta to prev. frequency)
Overall 100 - 16.000 Hz
(±) | linearity of overall sound is average (20.6% difference to median)
Compared to same class
» 70% of all tested devices in this class were better, 8% similar, 22% worse
» The best had a delta of 5%, average was 17%, worst was 45%
Compared to all devices tested
» 55% of all tested devices were better, 8% similar, 37% worse
» The best had a delta of 4%, average was 24%, worst was 134%
Lenovo IdeaPad 330-15ARR 81D2005CUS audio analysis
(-) | not very loud speakers (70.3 dB)
Bass 100 - 315 Hz
(-) | nearly no bass - on average 22% lower than median
(±) | linearity of bass is average (11.9% delta to prev. frequency)
Mids 400 - 2000 Hz
(+) | balanced mids - only 3.6% away from median
(±) | linearity of mids is average (10.2% delta to prev. frequency)
Highs 2 - 16 kHz
(+) | balanced highs - only 3.8% away from median
(±) | linearity of highs is average (10.7% delta to prev. frequency)
Overall 100 - 16.000 Hz
(±) | linearity of overall sound is average (25.4% difference to median)
Compared to same class
» 77% of all tested devices in this class were better, 6% similar, 17% worse
» The best had a delta of 7%, average was 21%, worst was 53%
Compared to all devices tested
» 78% of all tested devices were better, 5% similar, 17% worse
» The best had a delta of 4%, average was 24%, worst was 134%
Acer Swift 3 SF315-41G-R6BR audio analysis
(±) | speaker loudness is average but good (74.2 dB)
Bass 100 - 315 Hz
(-) | nearly no bass - on average 15.1% lower than median
(+) | bass is linear (5% delta to prev. frequency)
Mids 400 - 2000 Hz
(+) | balanced mids - only 3.8% away from median
(+) | mids are linear (5.7% delta to prev. frequency)
Highs 2 - 16 kHz
(±) | higher highs - on average 6.6% higher than median
(+) | highs are linear (5.7% delta to prev. frequency)
Overall 100 - 16.000 Hz
(±) | linearity of overall sound is average (18.2% difference to median)
Compared to same class
» 54% of all tested devices in this class were better, 7% similar, 38% worse
» The best had a delta of 5%, average was 17%, worst was 45%
Compared to all devices tested
» 39% of all tested devices were better, 8% similar, 53% worse
» The best had a delta of 4%, average was 24%, worst was 134%
Energy Management - Energy-Efficient HP, but Low Battery Runtime
Power Consumption
The Pavilion is a very efficient device in terms of power consumption. No matter if in idle mode or under load, its power consumption is always lower than the average of other laptops belonging to the same class. The minimum consumption in idle mode is 4.5 watts, while the absolute maximum power consumption we measured was 41.9 watts. HP includes a 45-watt power supply, which should be sufficient.
| Off / Standby | |
| Idle | |
| Load |
|
Key:
min: | |
| HP Pavilion 15-cw0003ng R5 2500U, Vega 8, Intel SSD 600p SSDPEKKW512G7, IPS, 1920x1080, 15.6" | HP Pavilion 14-ce0002ng i5-8550U, GeForce MX150, SanDisk X600 SD9SN8W-128G, IPS, 1920x1080, 14" | Lenovo IdeaPad 330-15ARR 81D2005CUS R5 2500U, Vega 8, SK Hynix Canvas SC311 256GB HFS256G32TNF, TN LED, 1920x1080, 15.6" | Acer Swift 3 SF315-41G-R6BR R5 2500U, Radeon RX 540, Intel SSD 600p SSDPEKKW256G7, IPS, 1920x1080, 15.6" | HP Envy x360 15-bq102ng R5 2500U, Vega 8, Samsung PM961 MZVLW256HEHP, IPS, 1920x1080, 15.6" | HP Pavilion 15-cs0053cl i5-8250U, UHD Graphics 620, Toshiba MQ04ABF100, TN LED, 1366x768, 15.6" | Acer TravelMate P2510-G2-MG-50WE i5-8250U, GeForce MX130, SK Hynix HFS256G39TND-N210A, IPS, 1920x1080, 15.6" | Average AMD Radeon RX Vega 8 (Ryzen 2000/3000) | Average of class Multimedia | |
|---|---|---|---|---|---|---|---|---|---|
| Power Consumption | -39% | -21% | -40% | -6% | 5% | -8% | -15% | -71% | |
| Idle Minimum * (Watt) | 4.5 | 6.3 -40% | 7.6 -69% | 6.9 -53% | 4.8 -7% | 5.6 -24% | 3.3 27% | 5.68 ? -26% | 5.71 ? -27% |
| Idle Average * (Watt) | 7.3 | 8.4 -15% | 10.6 -45% | 9.6 -32% | 7 4% | 7.1 3% | 5.6 23% | 8.75 ? -20% | 10.1 ? -38% |
| Idle Maximum * (Watt) | 9.4 | 10.2 -9% | 11.8 -26% | 11.8 -26% | 9.5 -1% | 7.9 16% | 7.8 17% | 10.1 ? -7% | 12.4 ? -32% |
| Load Average * (Watt) | 34 | 59 -74% | 24.1 29% | 50 -47% | 40.8 -20% | 32.8 4% | 54 -59% | 37.8 ? -11% | 65 ? -91% |
| Load Maximum * (Watt) | 41.9 | 66.3 -58% | 39.4 6% | 60 -43% | 44.3 -6% | 30.5 27% | 63 -50% | 46.2 ? -10% | 112.2 ? -168% |
| Witcher 3 ultra * (Watt) | 30.3 |
* ... smaller is better
Battery Runtime
We would call the battery runtime adequate. With its 41 Wh battery, the HP Pavilion lasts just about two hours under load. During everyday web-browsing behavior, the 3-cell lithium-ion battery lasts about five hours. A short glance at the list shows that the slightly smaller 14-inch HP Pavilion with a battery of the same capacity lasts significantly longer in all scenarios. One reason for this is certainly the smaller display and possibly also the Intel CPU.
| HP Pavilion 15-cw0003ng R5 2500U, Vega 8, 41 Wh | HP Pavilion 14-ce0002ng i5-8550U, GeForce MX150, 41 Wh | Lenovo IdeaPad 330-15ARR 81D2005CUS R5 2500U, Vega 8, 35 Wh | Acer Swift 3 SF315-41G-R6BR R5 2500U, Radeon RX 540, 48 Wh | HP Envy x360 15-bq102ng R5 2500U, Vega 8, 55.8 Wh | HP Pavilion 15-cs0053cl i5-8250U, UHD Graphics 620, 41 Wh | Acer TravelMate P2510-G2-MG-50WE i5-8250U, GeForce MX130, 48 Wh | Average of class Multimedia | |
|---|---|---|---|---|---|---|---|---|
| Battery runtime | 41% | -20% | 31% | 42% | 29% | 63% | 163% | |
| Reader / Idle (h) | 8.4 | 13.3 58% | 12.1 44% | 12 43% | 25.2 ? 200% | |||
| H.264 (h) | 3.8 | 5.8 53% | 6.1 61% | 8.6 126% | 16.4 ? 332% | |||
| WiFi v1.3 (h) | 5 | 6.9 38% | 4 -20% | 6.7 34% | 7.1 42% | 7 40% | 8.4 68% | 12 ? 140% |
| Load (h) | 2.1 | 2.4 14% | 1.8 -14% | 2.2 5% | 2 -5% | 1.675 ? -20% |
Verdict
Pros
Cons
Honestly, our expectations before the test were a bit higher. The HP Pavilion 15 is a low-priced device with a stylish design and a good build quality. However, the system not only feels slower, it really is slower. We had the pleasure of testing this Pavilion 15 (AMD Ryzen 5 2500U) at the same time as the Pavilion 14 (Intel i7-8550U). Sometimes we started the benchmarks simultaneously and while the Pavilion with the Intel CPU was long done with the benchmark, the AMD Pavilion was still in the middle of it. Of course the Ryzen 5 2500U CPU is not on the same level as an i7-8550U and is closer to an i5-8250U, but the difference was considerable. This is why we cannot agree with the PCMark 8 results that depict the Pavilion 15 as faster than the 14-inch HP Pavilion.
However, the cooling performance and the quiet fans are definite pros. Even under full load, there is no overheating and the temperatures remain pleasant.
HP could have pushed the Pavilion a bit more, factory-configuring it for a higher TDP or a longer turbo duration.
On the other hand, this would have been detrimental to the battery runtime, which is already one of the 15-inch device's weak points. The benchmarks showed very clearly that this laptop is absolutely not suitable for gaming. The onboard graphics solution is far too weak to display games free of stutters even on lowest details. Overall, the HP Pavilion 15 is an average working device in a stylish design that does its job, but it does not stand out from the crowd while doing so.
HP Pavilion 15-cw0003ng
- 09/30/2018 v6 (old)
Daniel Puschina
Price comparison
