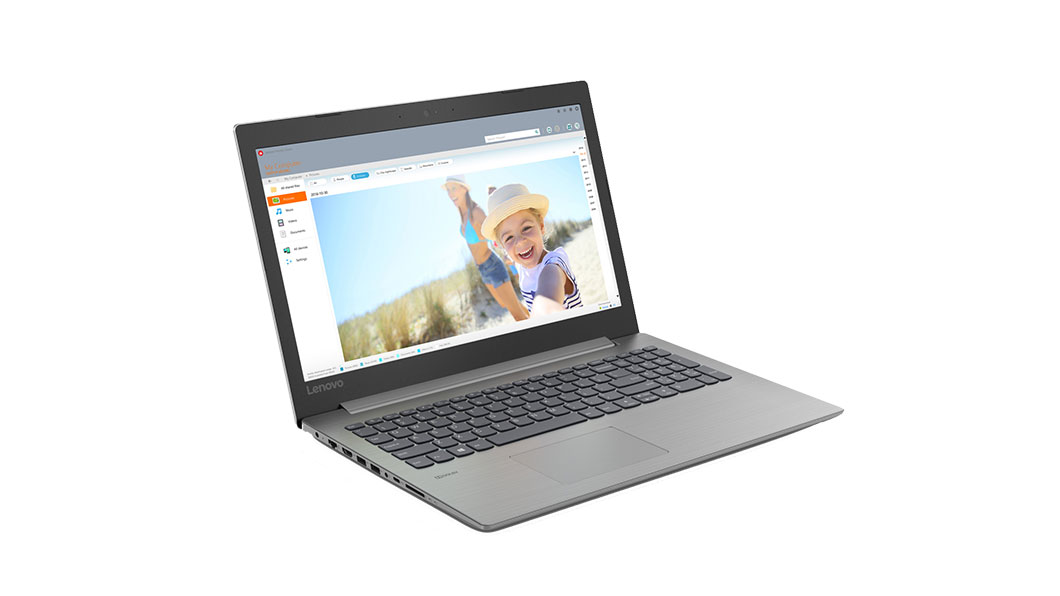
Lenovo IdeaPad 330 15 (Ryzen 5 2500U) Laptop Review
The Ideapad 330 15 is one of the least expensive 15-inch multimedia machines from Lenovo. The base configuration starts at just $330 USD for the AMD E2-9000 SoC with a 768p display while the most expensive option includes a Ryzen 7 2700U SoC with a 1080p display for $750. Our unit today is the middle option with a Ryzen 5 2500U SoC, 1080p display, and 256 GB SSD for roughly $550 USD.
This review page highlights the core performance features of the system. For more details and comments on the chassis, please stay tuned for our upcoming review on the Ryzen 3 2200U configuration of the same Ideapad 330 model.
Competitors in this entry-level price range include the HP Pavilion 15, Asus Vivobook 15, Dell Inspiron 15 5000 or 7000 series, Huawei Matebook D, and the Acer Aspire 3 series.
| SD Card Reader | |
| average JPG Copy Test (av. of 3 runs) | |
| Lenovo IdeaPad 330-15ARR 81D2005CUS (Toshiba Exceria Pro SDXC 64 GB UHS-II) | |
| Acer TravelMate P2510-G2-MG-50WE (Toshiba Exceria Pro SDXC 64 GB UHS-II) | |
| Lenovo Ideapad 530S-15IKB (Toshiba Exceria Pro SDXC 64 GB UHS-II) | |
| maximum AS SSD Seq Read Test (1GB) | |
| Lenovo IdeaPad 330-15ARR 81D2005CUS (Toshiba Exceria Pro SDXC 64 GB UHS-II) | |
| Lenovo Ideapad 530S-15IKB (Toshiba Exceria Pro SDXC 64 GB UHS-II) | |
| Acer TravelMate P2510-G2-MG-50WE (Toshiba Exceria Pro SDXC 64 GB UHS-II) | |
| Networking | |
| iperf3 transmit AX12 | |
| Lenovo Ideapad 530S-15IKB | |
| Huawei MateBook D 15-53010BAJ | |
| Lenovo IdeaPad 330-15ARR 81D2005CUS | |
| iperf3 receive AX12 | |
| Lenovo Ideapad 530S-15IKB | |
| Huawei MateBook D 15-53010BAJ | |
| Lenovo IdeaPad 330-15ARR 81D2005CUS | |
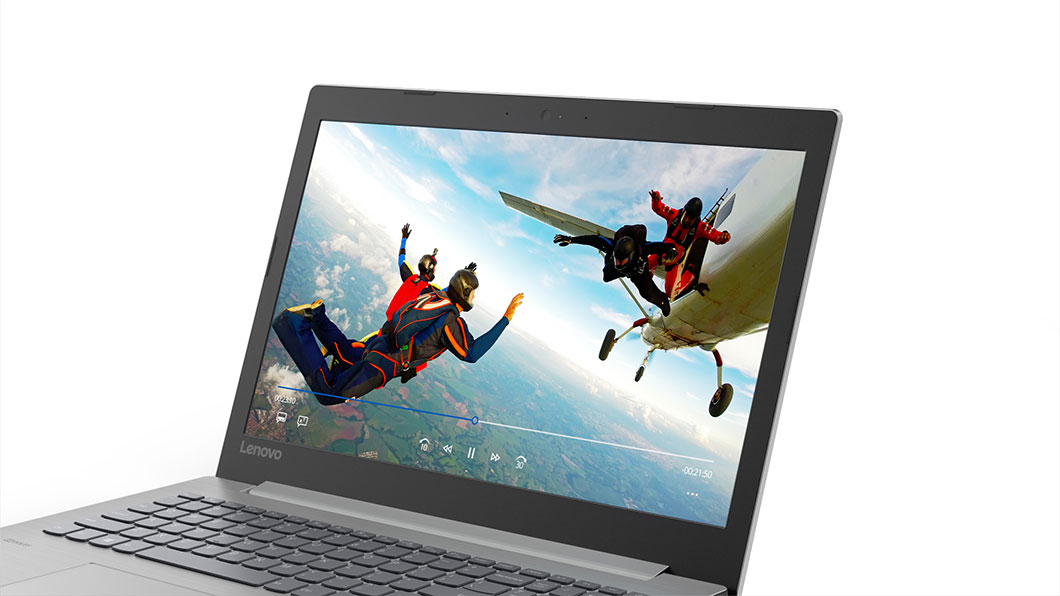
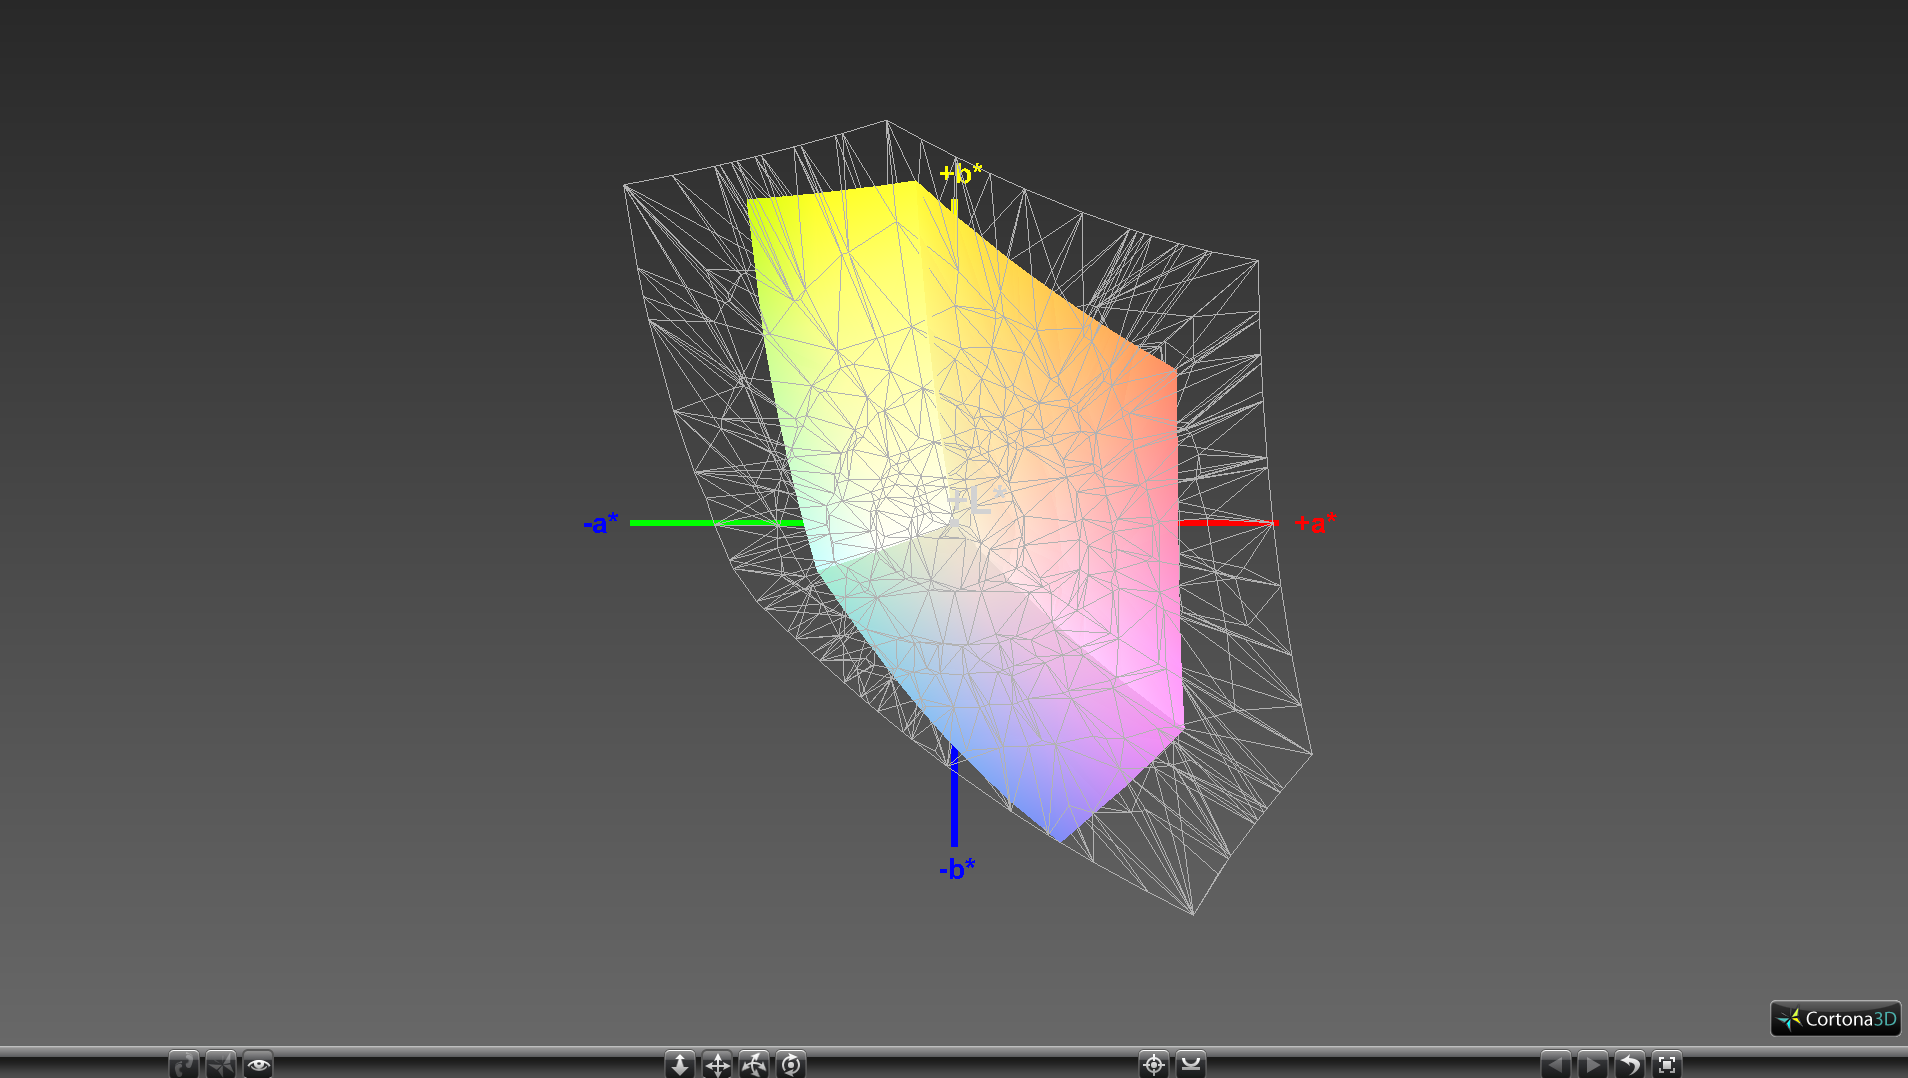
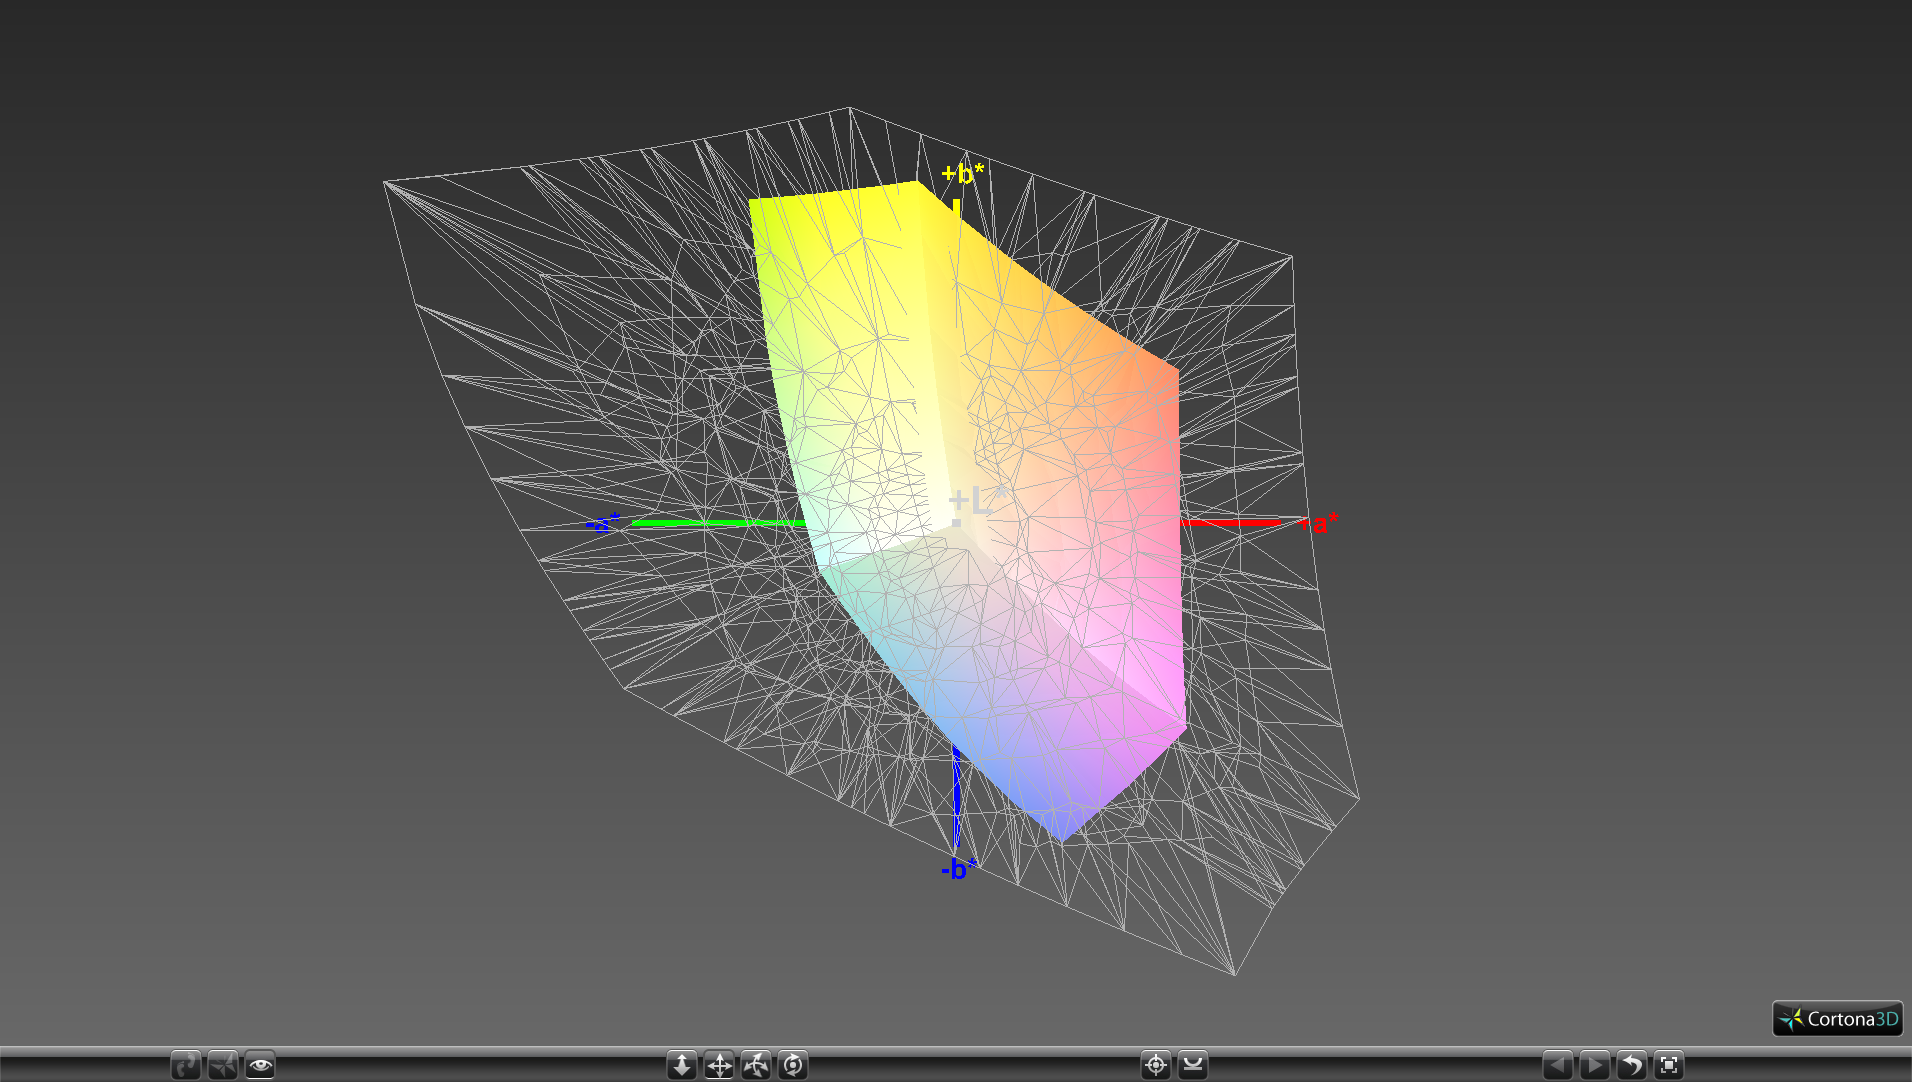
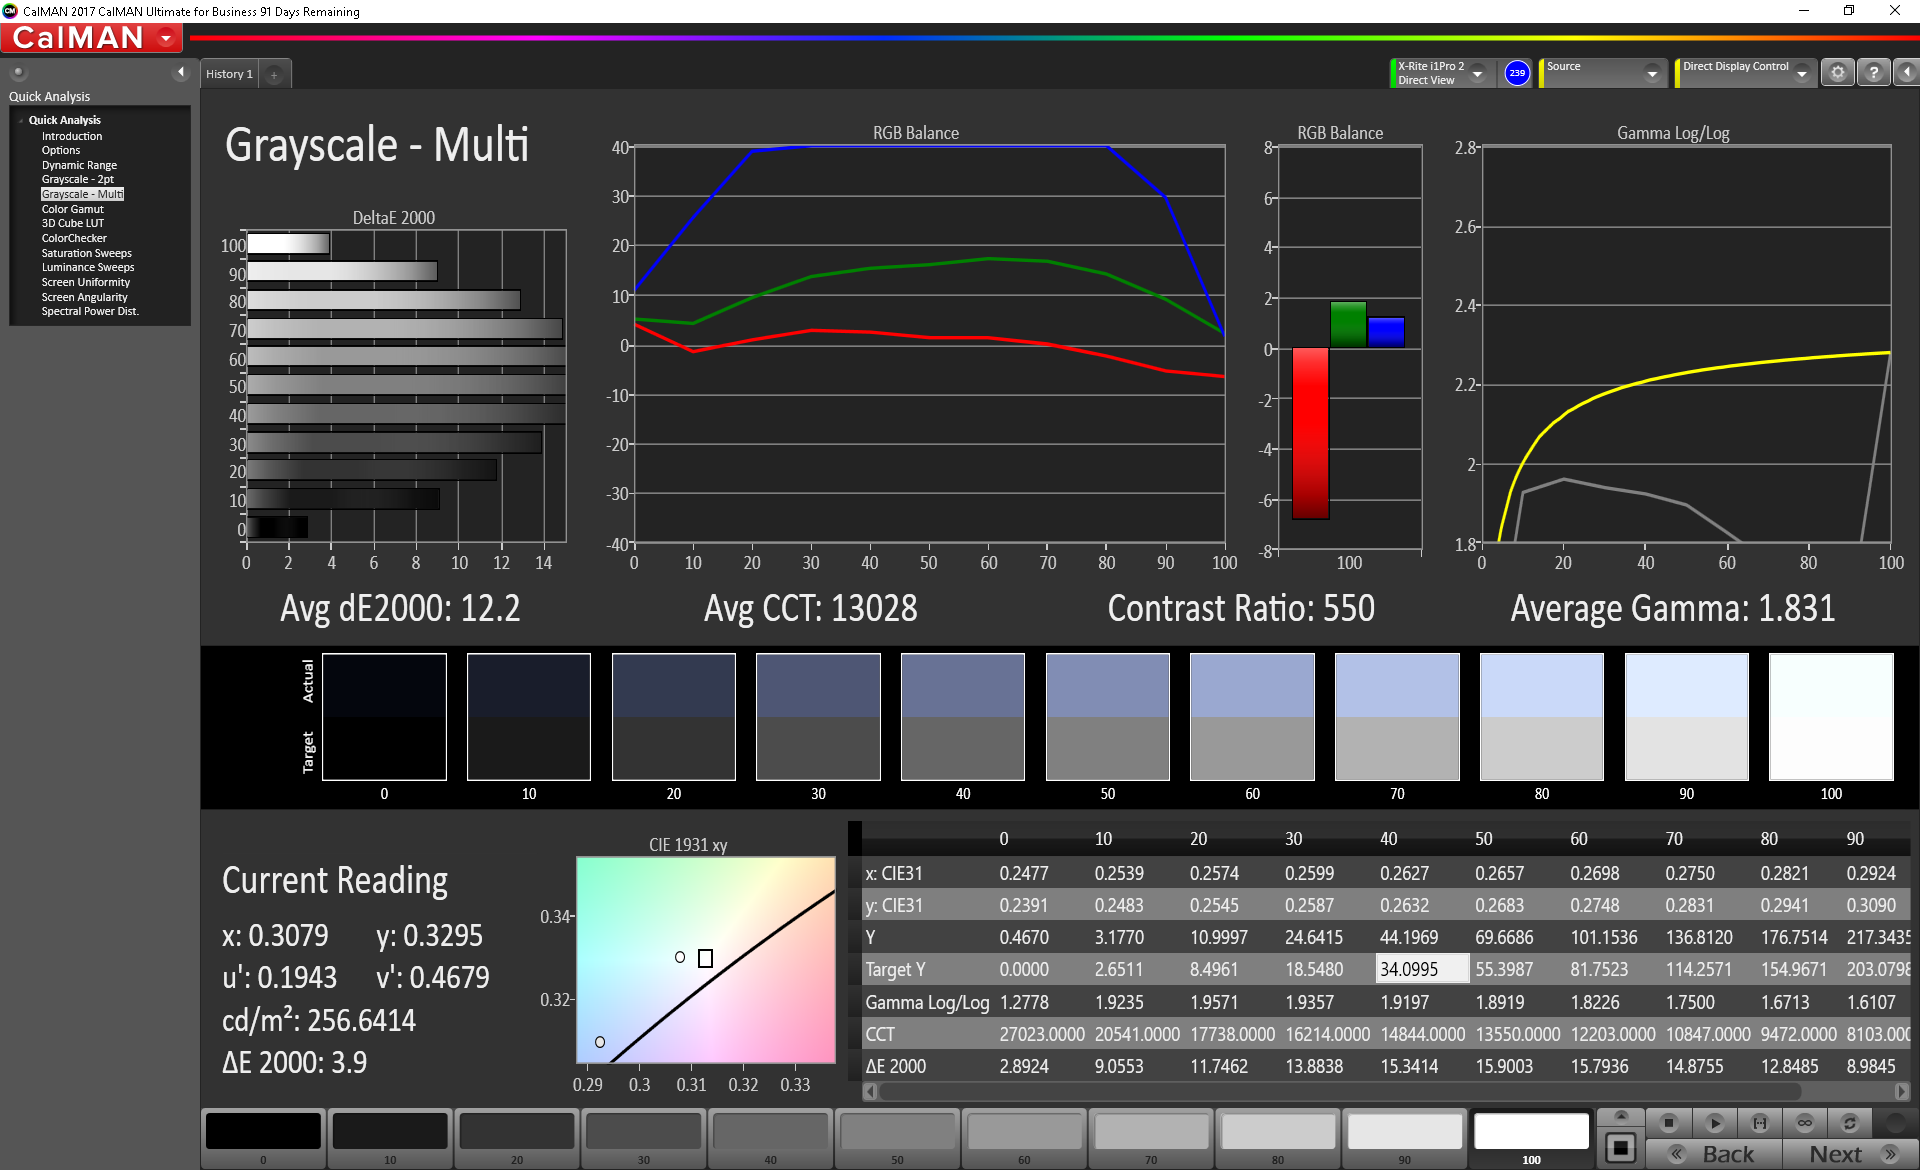
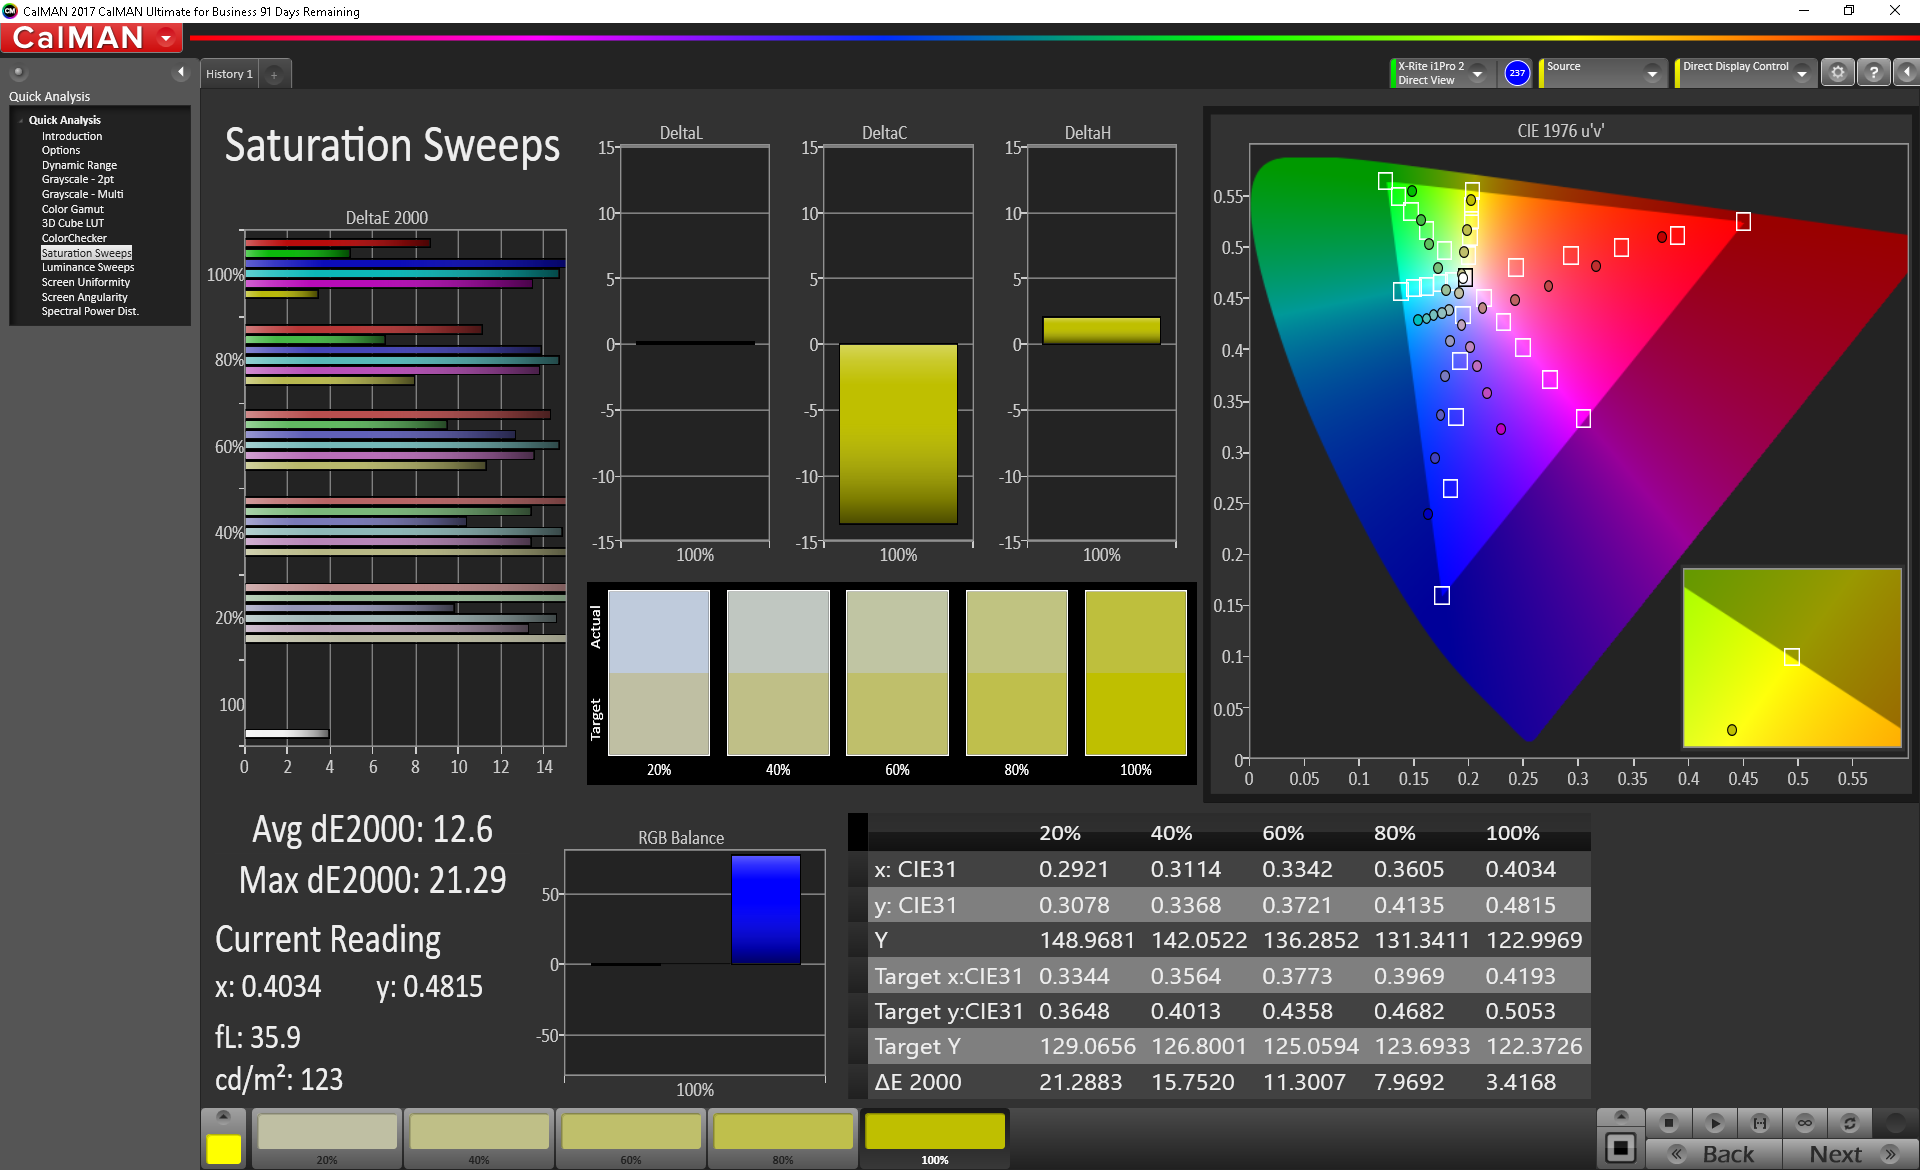
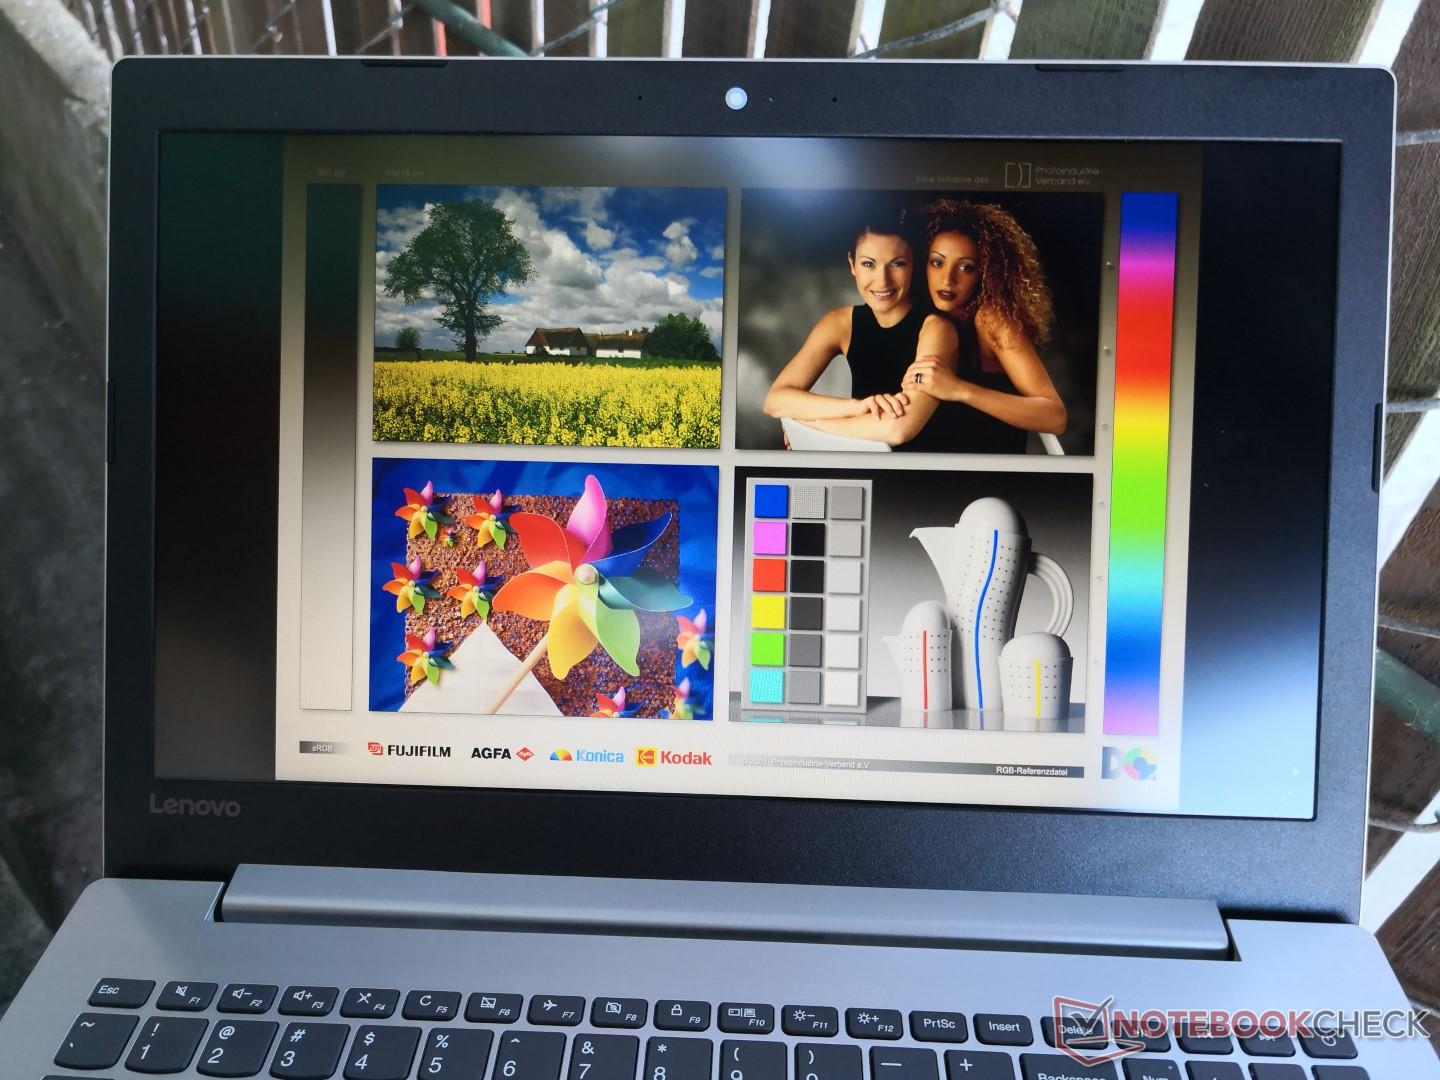
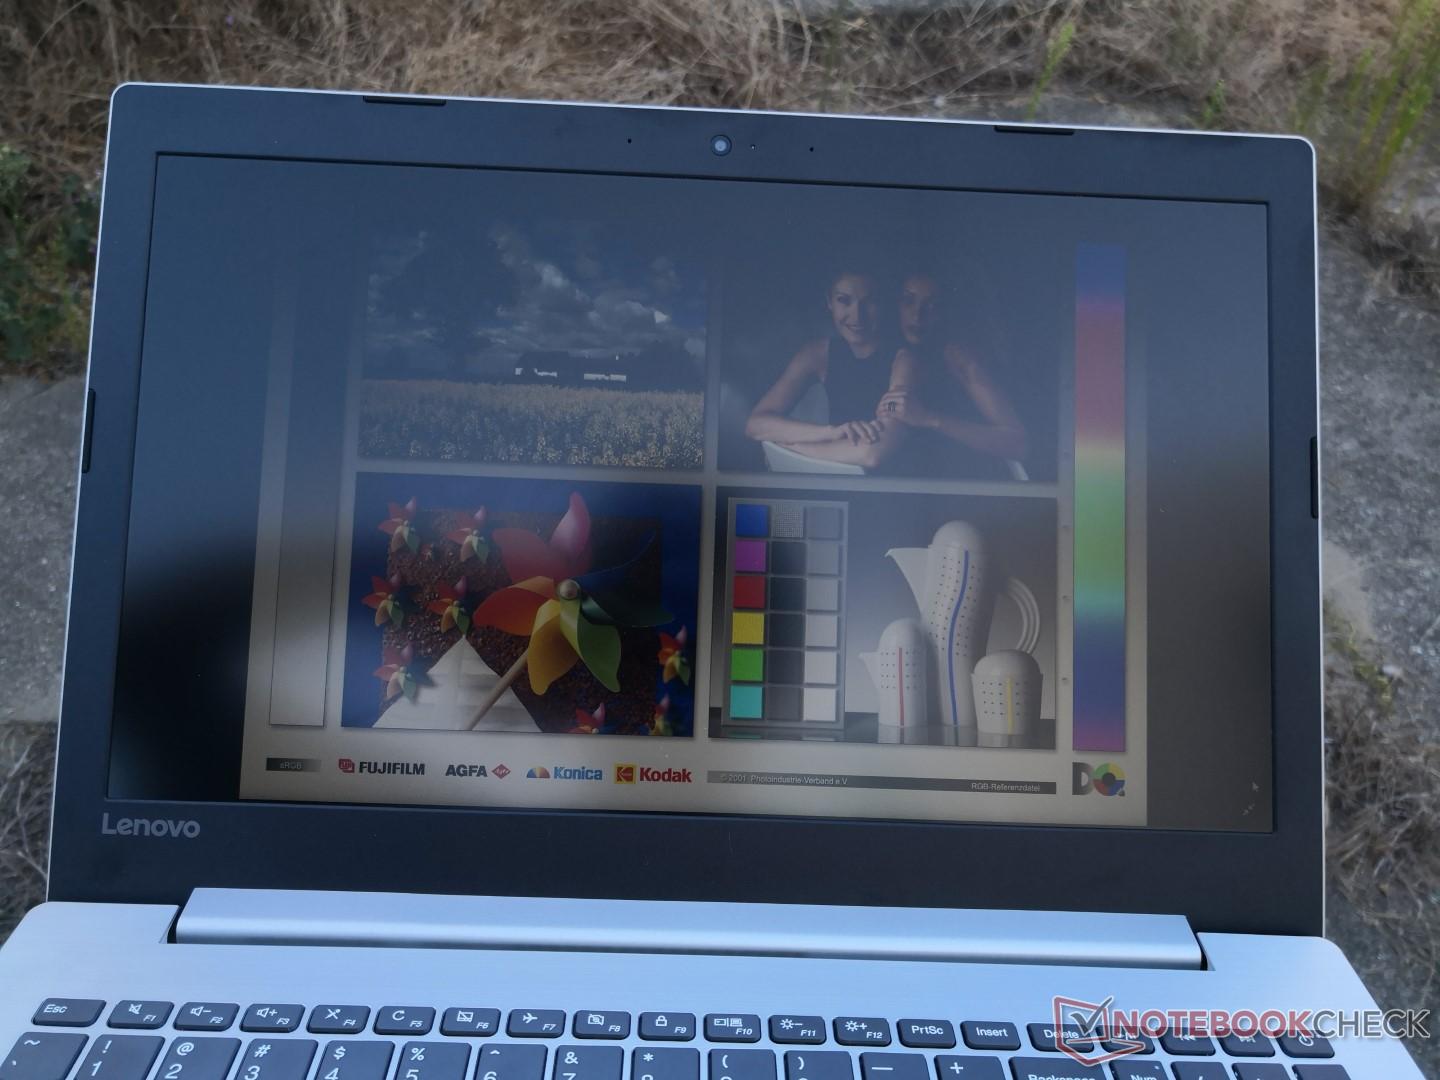
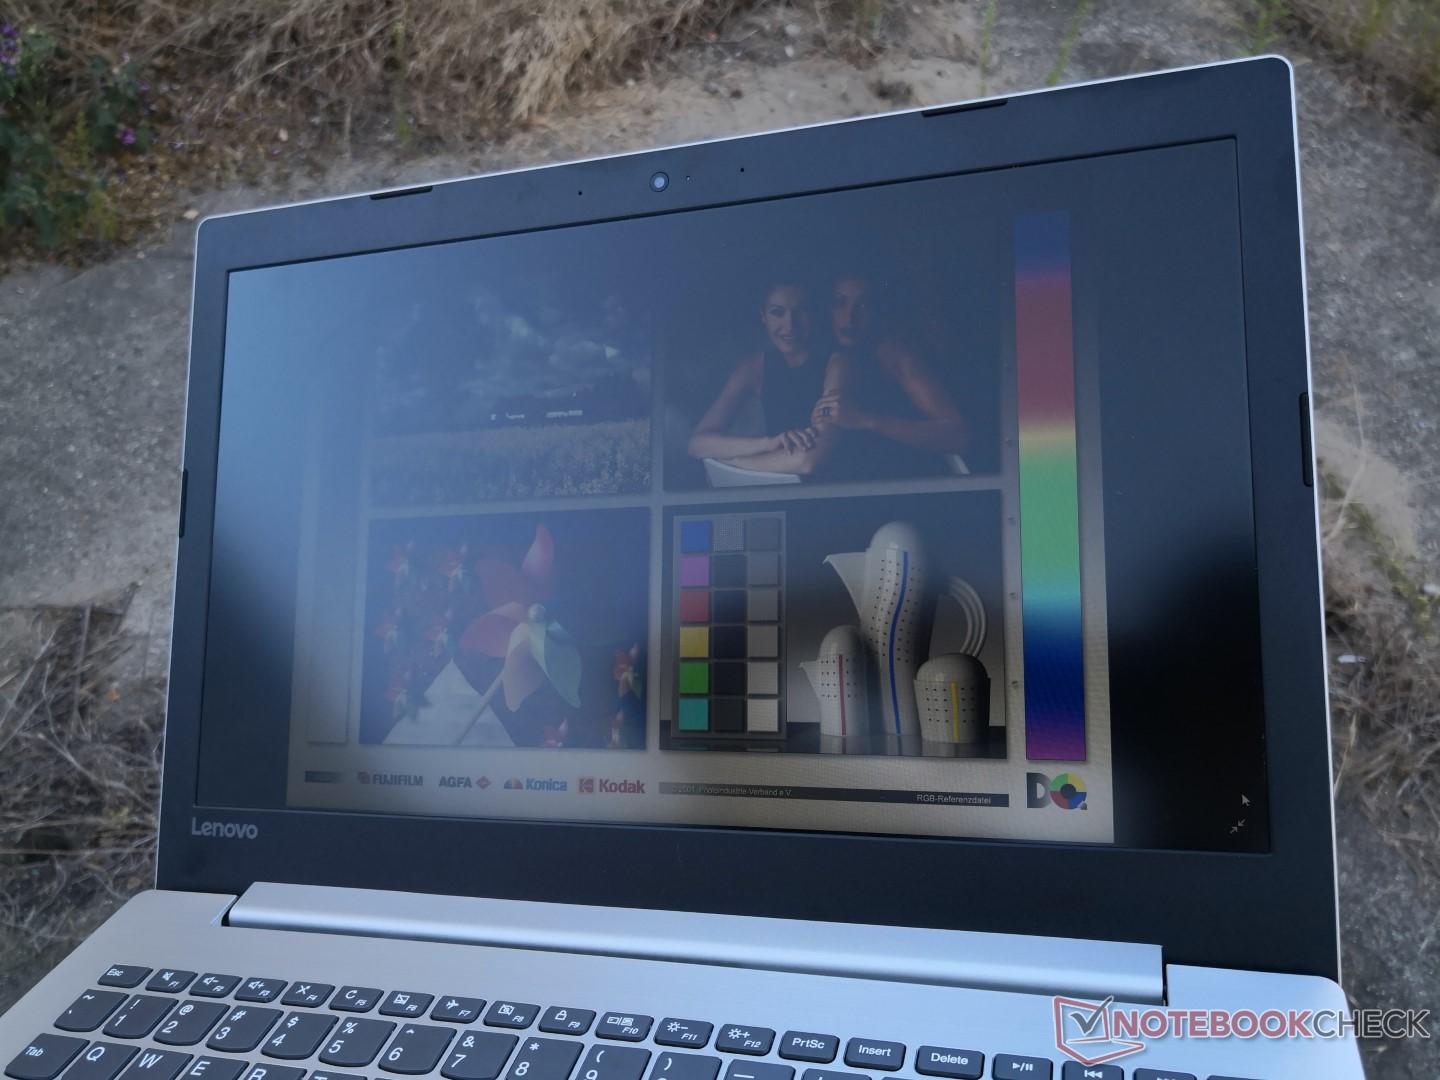
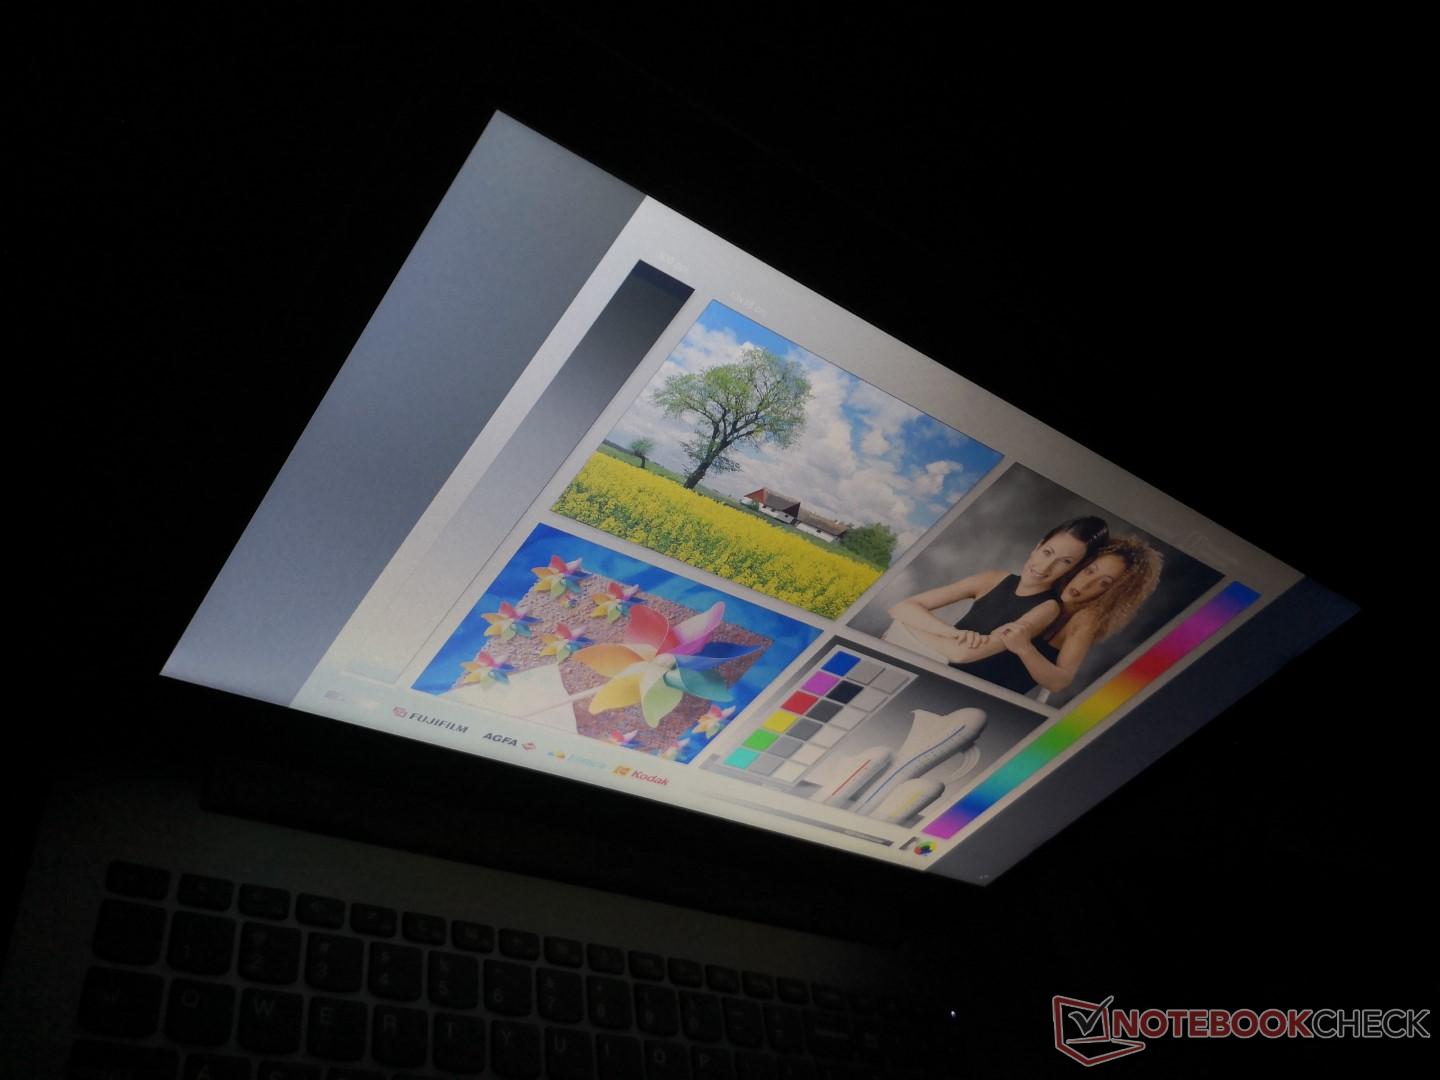
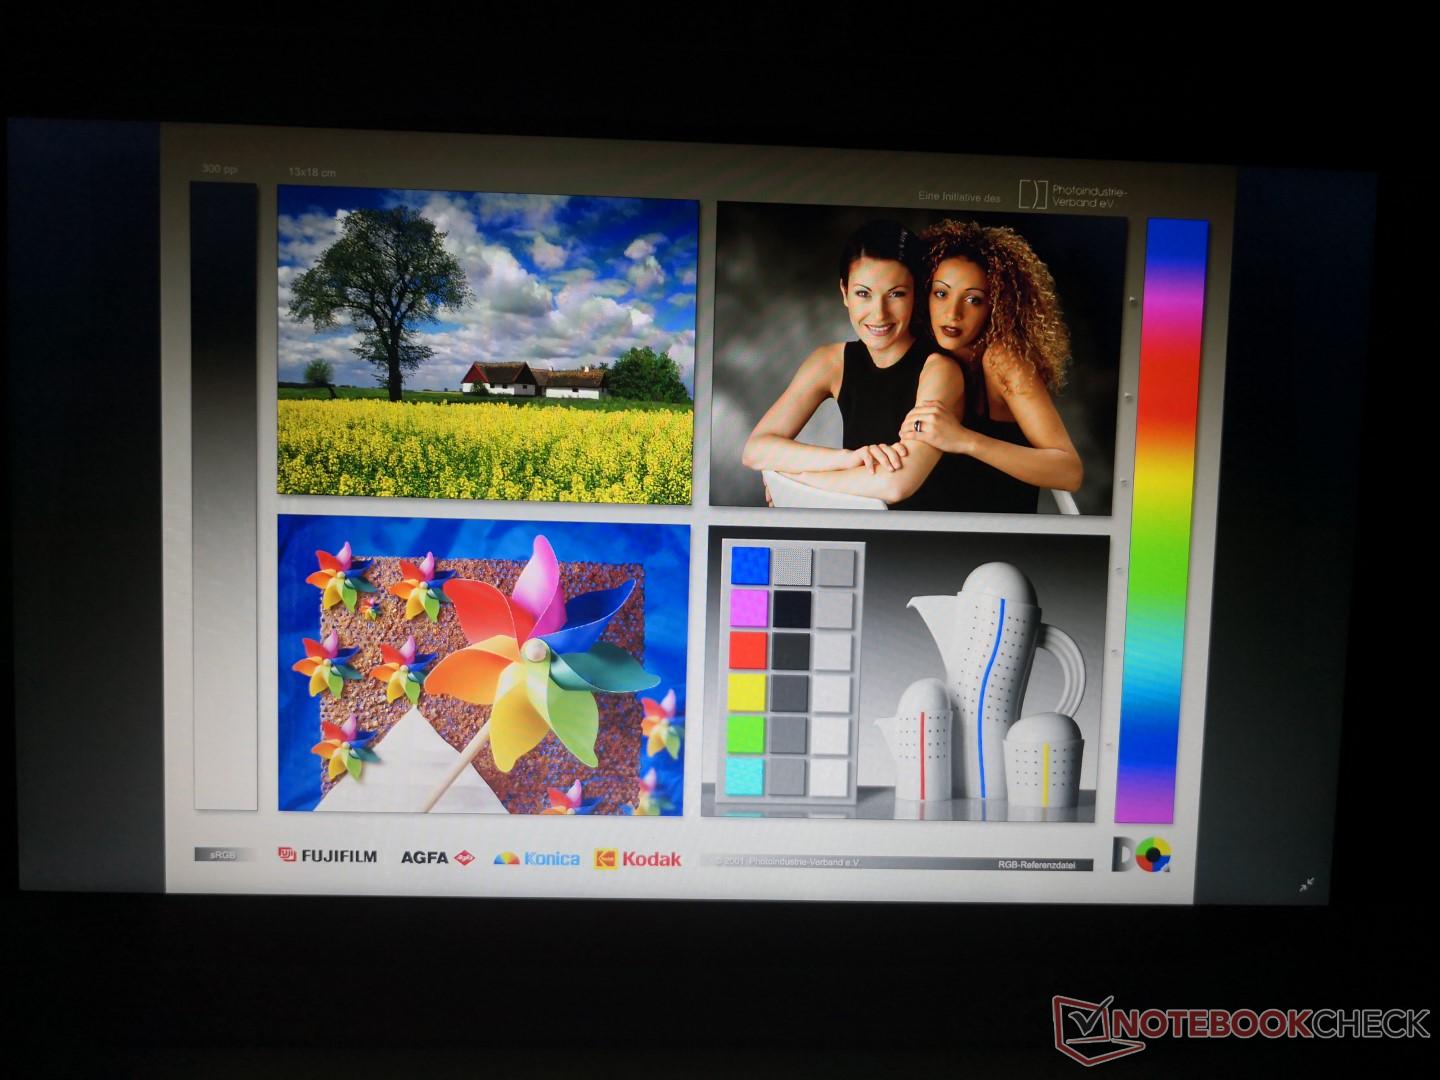
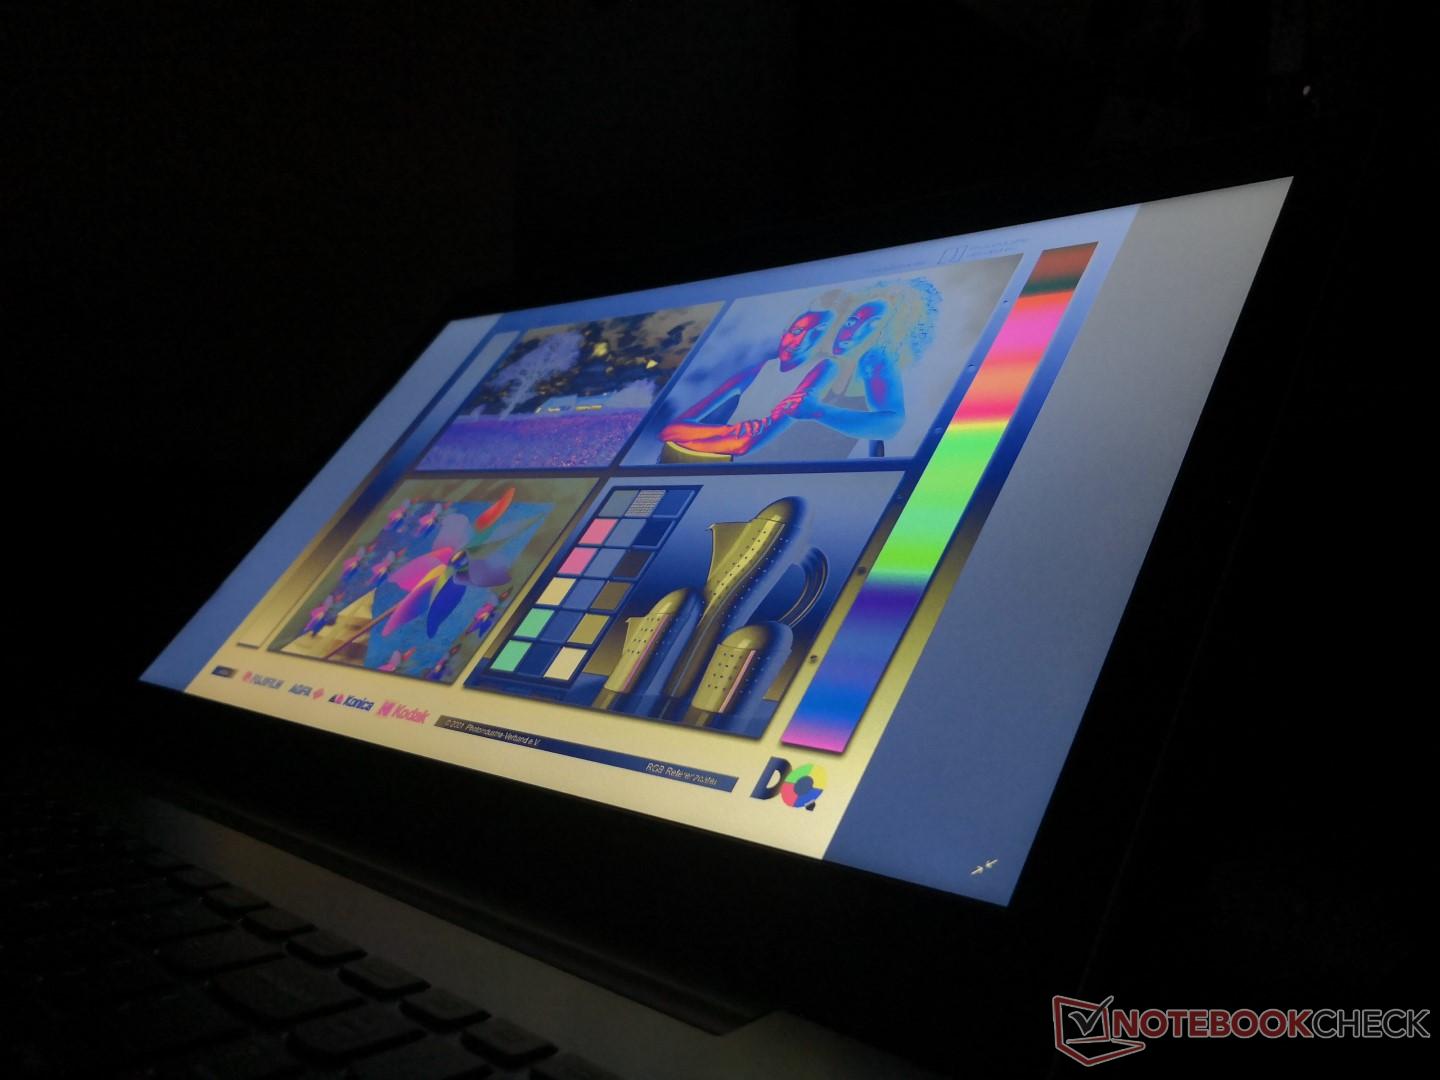
Display
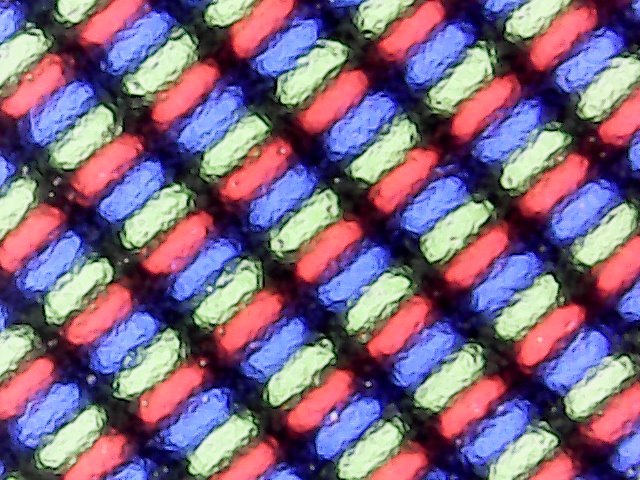
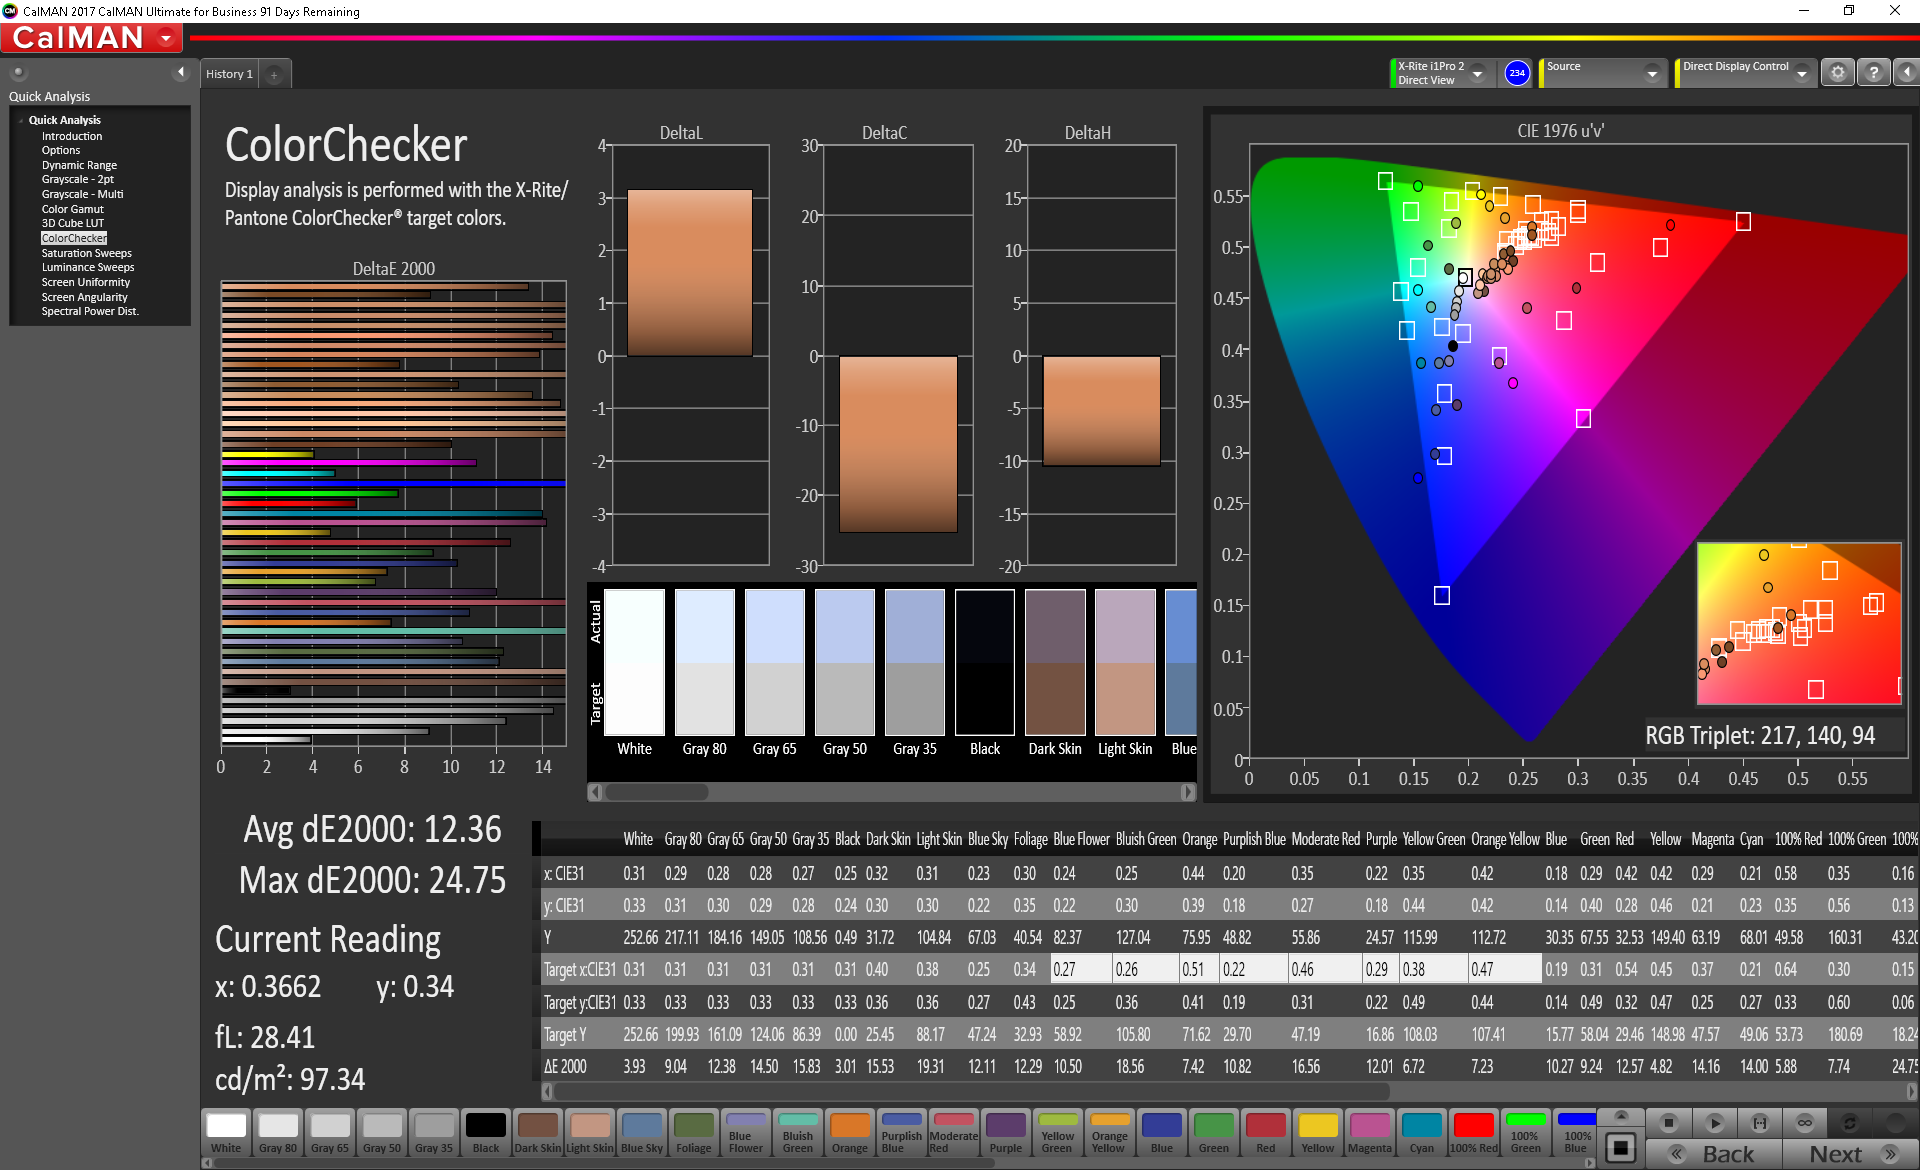
The TN panel exhibits all the features of a budget display. Color temperature is far too cool, contrast is low, color coverage is narrow, and the matte overlay has a grainy texture to it. Content appears washed out with very inaccurate colors. We highly recommend applying our ICC profile below to get the most out of the display.
| |||||||||||||||||||||||||
Brightness Distribution: 84 %
Center on Battery: 252.2 cd/m²
Contrast: 467:1 (Black: 0.54 cd/m²)
ΔE ColorChecker Calman: 12.36 | ∀{0.5-29.43 Ø4.73}
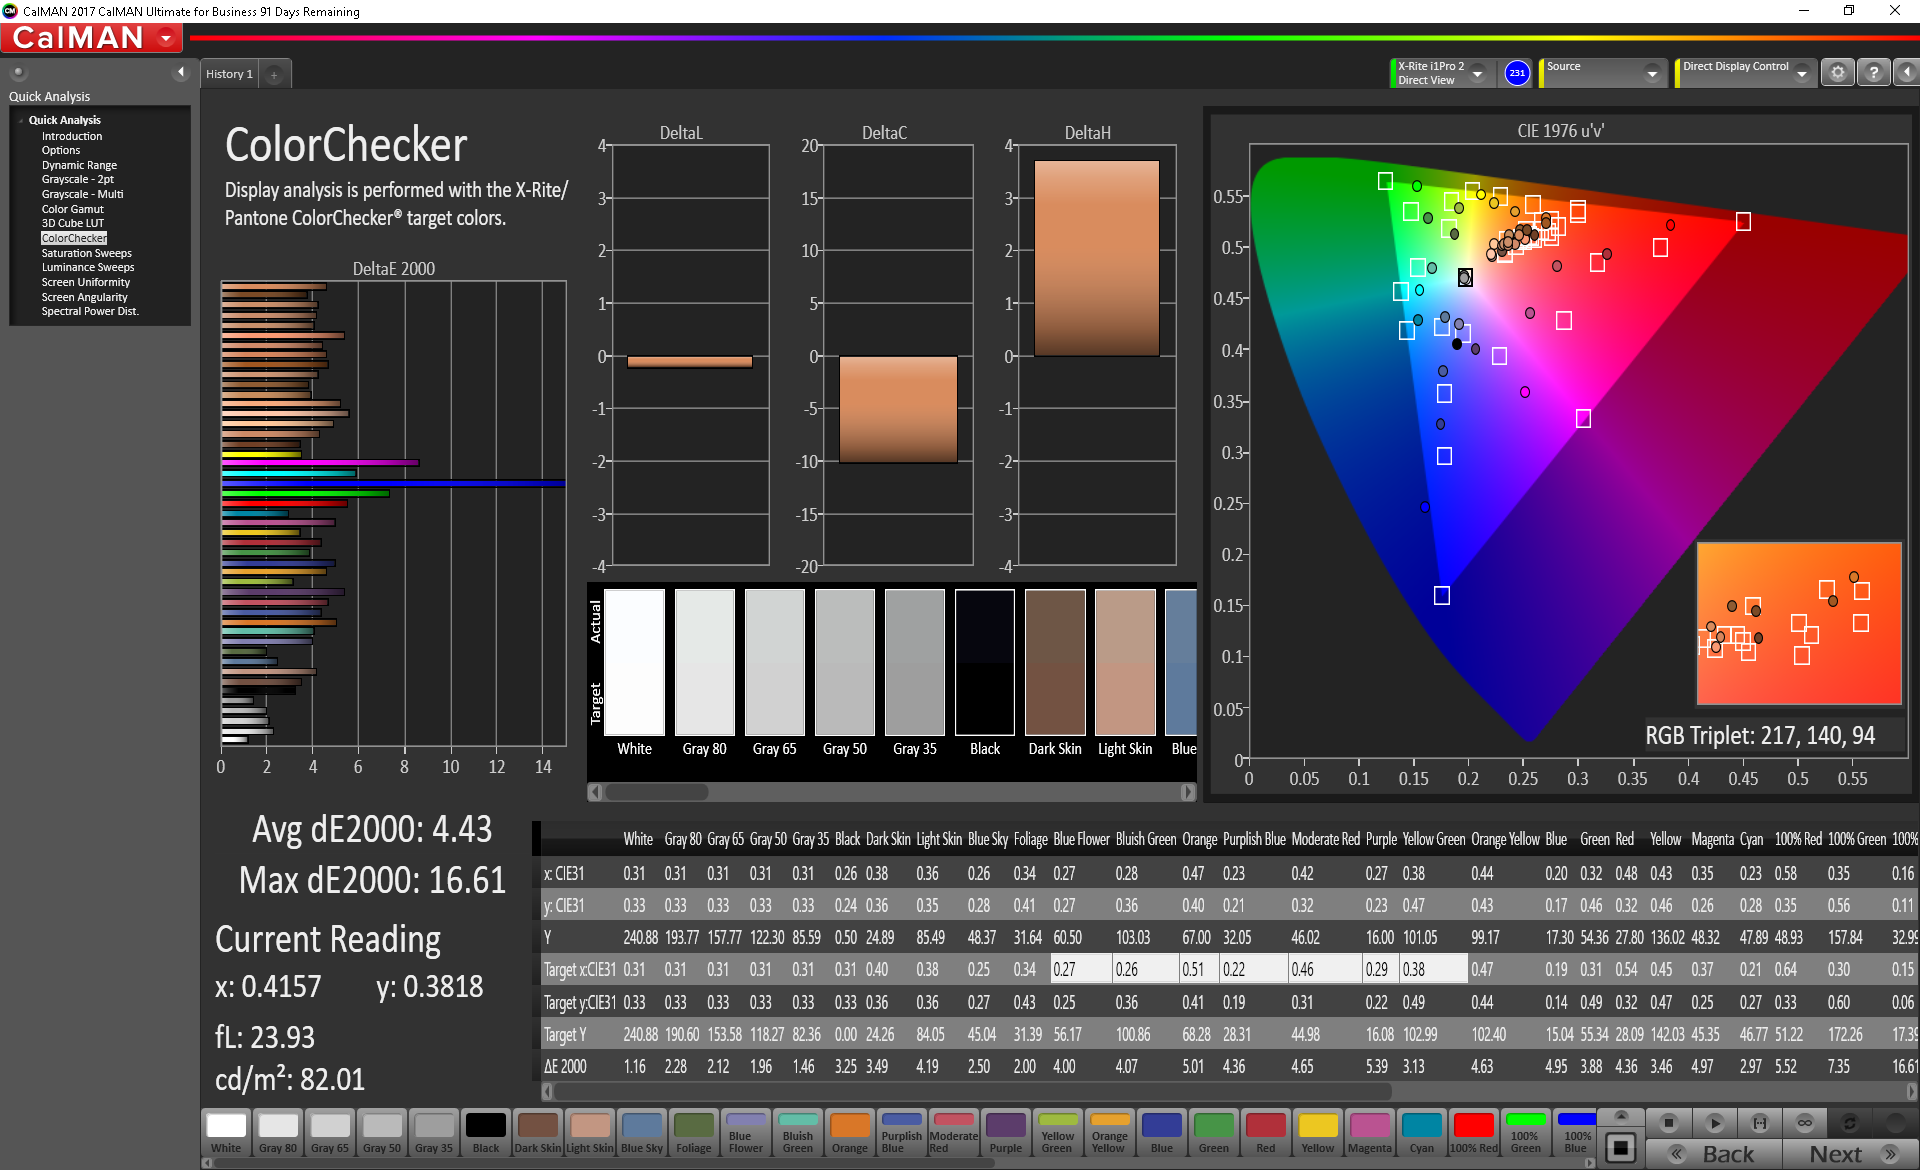
calibrated: 4.43
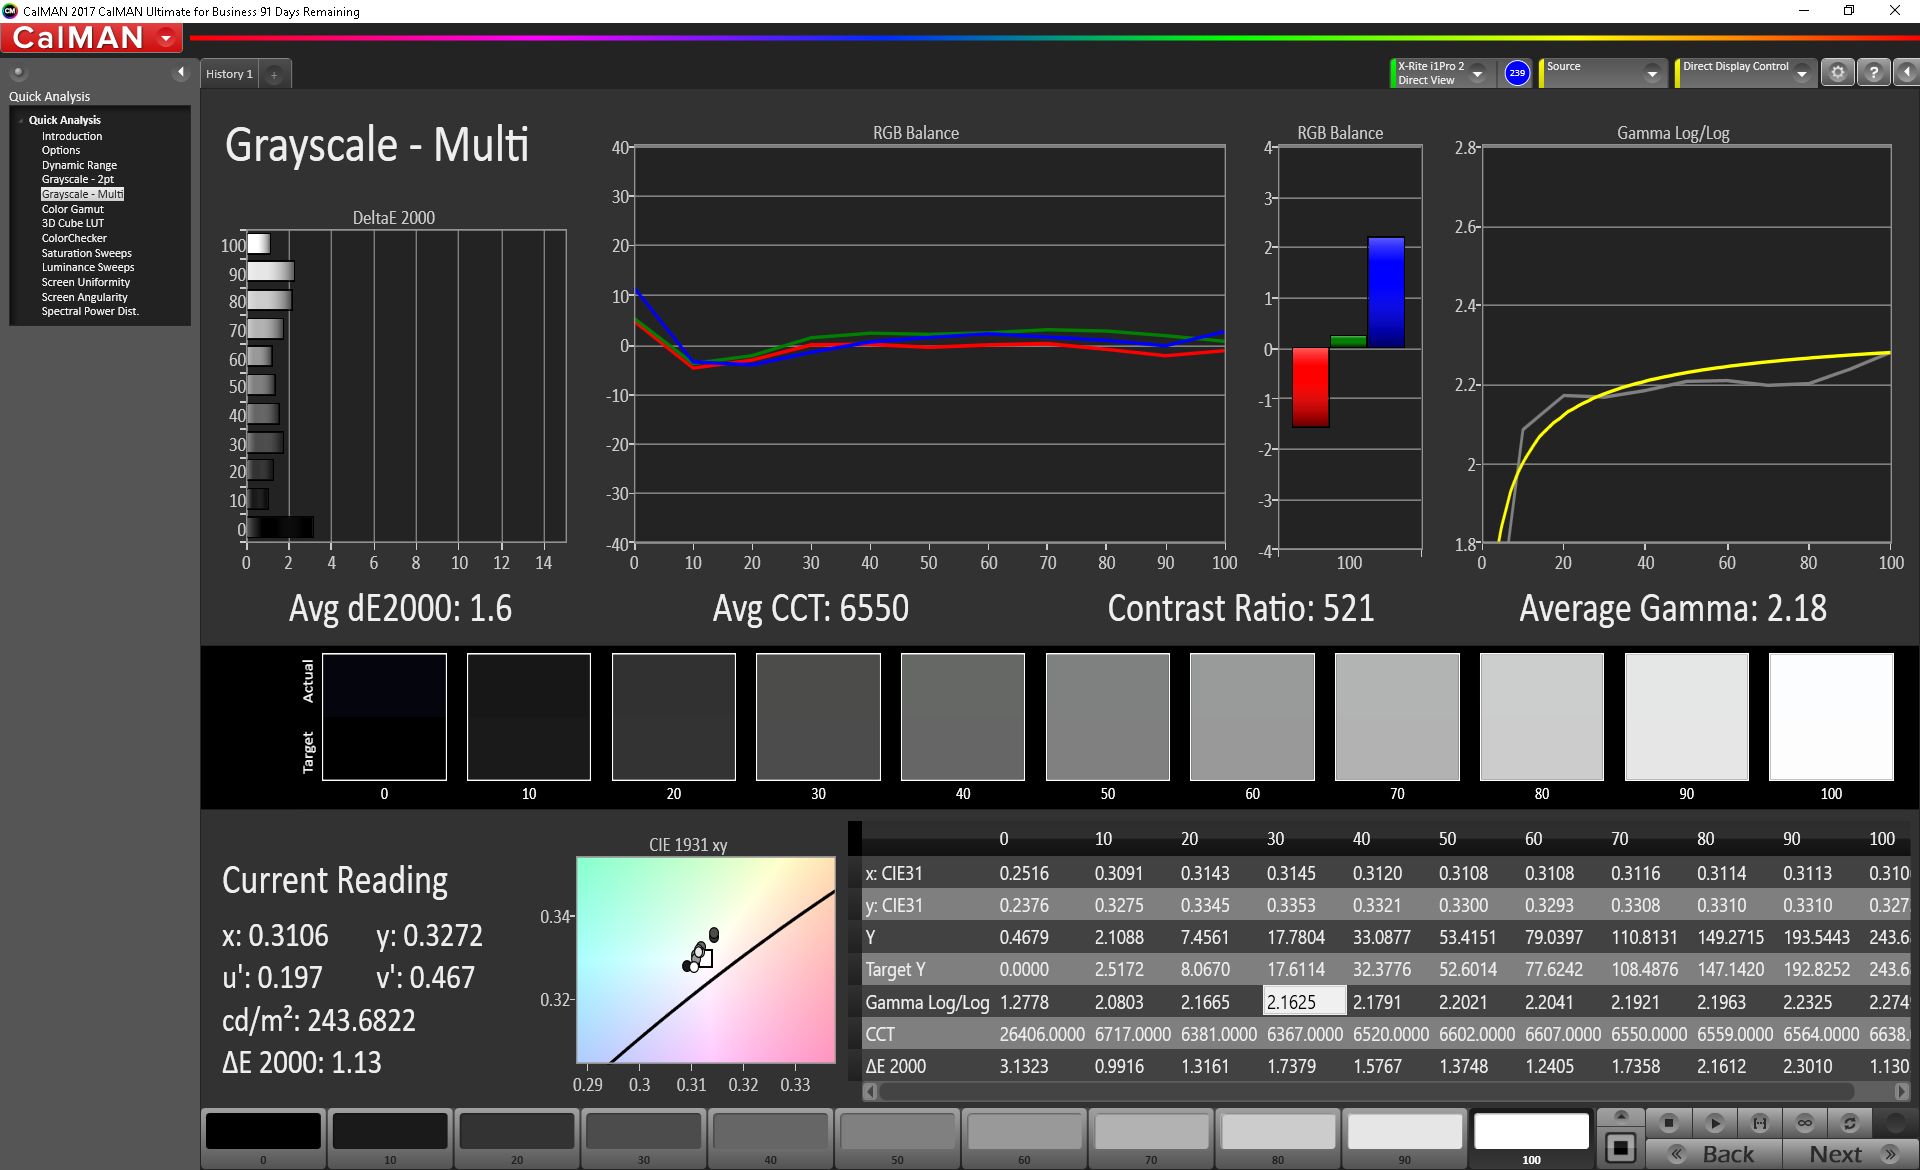
ΔE Greyscale Calman: 12.2 | ∀{0.09-98 Ø4.97}
54.5% sRGB (Argyll 1.6.3 3D)
34.6% AdobeRGB 1998 (Argyll 1.6.3 3D)
37.57% AdobeRGB 1998 (Argyll 3D)
54.7% sRGB (Argyll 3D)
36.36% Display P3 (Argyll 3D)
Gamma: 1.83
CCT: 13028 K
| Lenovo IdeaPad 330-15ARR 81D2005CUS AUO B156HTN03.8, TN LED, 15.6", 1920x1080 | Huawei MateBook D 15-53010BAJ AU Optronics B156HW02, IPS, 15.6", 1920x1080 | HP Pavilion 15-cs0053cl AU Optronics B156XW02 V0, TN LED, 15.6", 1366x768 | Asus VivoBook 15 F510UF-ES71 LG Philips LP156WF9-SPK2, IPS, 15.6", 1920x1080 | Lenovo Ideapad 530S-15IKB N156HCA-EAB, IPS, 15.6", 1920x1080 | |
|---|---|---|---|---|---|
| Display | 12% | 6% | 8% | 15% | |
| Display P3 Coverage (%) | 36.36 | 40.96 13% | 38.37 6% | 39.35 8% | 41.84 15% |
| sRGB Coverage (%) | 54.7 | 60.9 11% | 57.7 5% | 59.2 8% | 62.4 14% |
| AdobeRGB 1998 Coverage (%) | 37.57 | 42.24 12% | 39.65 6% | 40.65 8% | 43.32 15% |
| Response Times | -17% | 5% | 2% | -31% | |
| Response Time Grey 50% / Grey 80% * (ms) | 38.8 ? | 36.4 ? 6% | 43.6 ? -12% | 27.2 ? 30% | 37.2 ? 4% |
| Response Time Black / White * (ms) | 19.6 ? | 27.2 ? -39% | 15.2 ? 22% | 24.8 ? -27% | 32.4 ? -65% |
| PWM Frequency (Hz) | 25770 ? | ||||
| Screen | 29% | 10% | 27% | 34% | |
| Brightness middle (cd/m²) | 252.2 | 265.7 5% | 220.1 -13% | 257 2% | 285.1 13% |
| Brightness (cd/m²) | 251 | 258 3% | 210 -16% | 246 -2% | 271 8% |
| Brightness Distribution (%) | 84 | 91 8% | 93 11% | 89 6% | 88 5% |
| Black Level * (cd/m²) | 0.54 | 0.31 43% | 0.29 46% | 0.34 37% | 0.28 48% |
| Contrast (:1) | 467 | 857 84% | 759 63% | 756 62% | 1018 118% |
| Colorchecker dE 2000 * | 12.36 | 6.01 51% | 11.4 8% | 4.54 63% | 4.38 65% |
| Colorchecker dE 2000 max. * | 24.75 | 18.87 24% | 25.96 -5% | 16 35% | 24.07 3% |
| Colorchecker dE 2000 calibrated * | 4.43 | 3.94 11% | 4.09 8% | 3.61 19% | 3.95 11% |
| Greyscale dE 2000 * | 12.2 | 5 59% | 12 2% | 4.6 62% | 3.1 75% |
| Gamma | 1.83 120% | 2.7 81% | 2.09 105% | 2.44 90% | 2.24 98% |
| CCT | 13028 50% | 6569 99% | 12625 51% | 7096 92% | 6705 97% |
| Color Space (Percent of AdobeRGB 1998) (%) | 34.6 | 42.24 22% | 36.5 5% | 37.5 8% | 40 16% |
| Color Space (Percent of sRGB) (%) | 54.5 | 60.92 12% | 57.5 6% | 59.2 9% | 62 14% |
| Total Average (Program / Settings) | 8% /
20% | 7% /
9% | 12% /
21% | 6% /
22% |
* ... smaller is better
Display Response Times
| ↔ Response Time Black to White | ||
|---|---|---|
| 19.6 ms ... rise ↗ and fall ↘ combined | ↗ 15.6 ms rise | 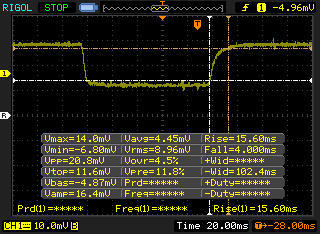 |
| ↘ 4 ms fall | ||
| The screen shows good response rates in our tests, but may be too slow for competitive gamers. In comparison, all tested devices range from 0.1 (minimum) to 240 (maximum) ms. » 43 % of all devices are better. This means that the measured response time is similar to the average of all tested devices (19.9 ms). | ||
| ↔ Response Time 50% Grey to 80% Grey | ||
| 38.8 ms ... rise ↗ and fall ↘ combined | ↗ 20 ms rise | 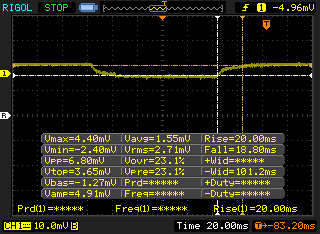 |
| ↘ 18.8 ms fall | ||
| The screen shows slow response rates in our tests and will be unsatisfactory for gamers. In comparison, all tested devices range from 0.165 (minimum) to 636 (maximum) ms. » 58 % of all devices are better. This means that the measured response time is worse than the average of all tested devices (31.1 ms). | ||
Screen Flickering / PWM (Pulse-Width Modulation)
| Screen flickering / PWM not detected | 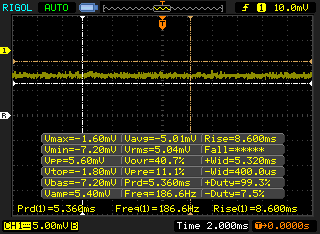 | ||
In comparison: 52 % of all tested devices do not use PWM to dim the display. If PWM was detected, an average of 7784 (minimum: 5 - maximum: 343500) Hz was measured. | |||
Performance
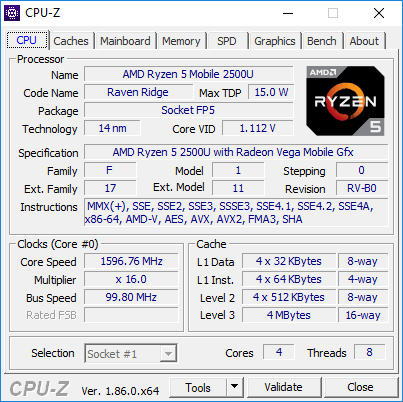
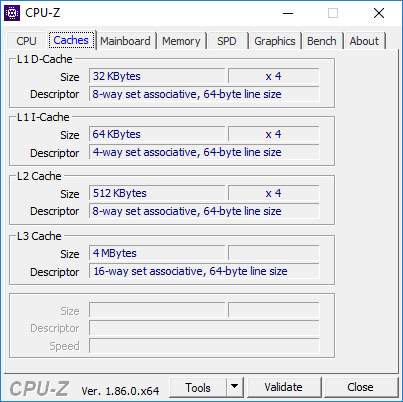
Processor
| wPrime 2.10 - 1024m | |
| Acer TravelMate P449-M-7407 | |
| Lenovo ThinkPad 25 | |
| Average AMD Ryzen 5 2500U (251 - 376, n=2) | |
| Lenovo ThinkPad X380 Yoga-20LH000LUS | |
| Acer Swift 3 SF315-41-R6J9 | |
* ... smaller is better
System Performance

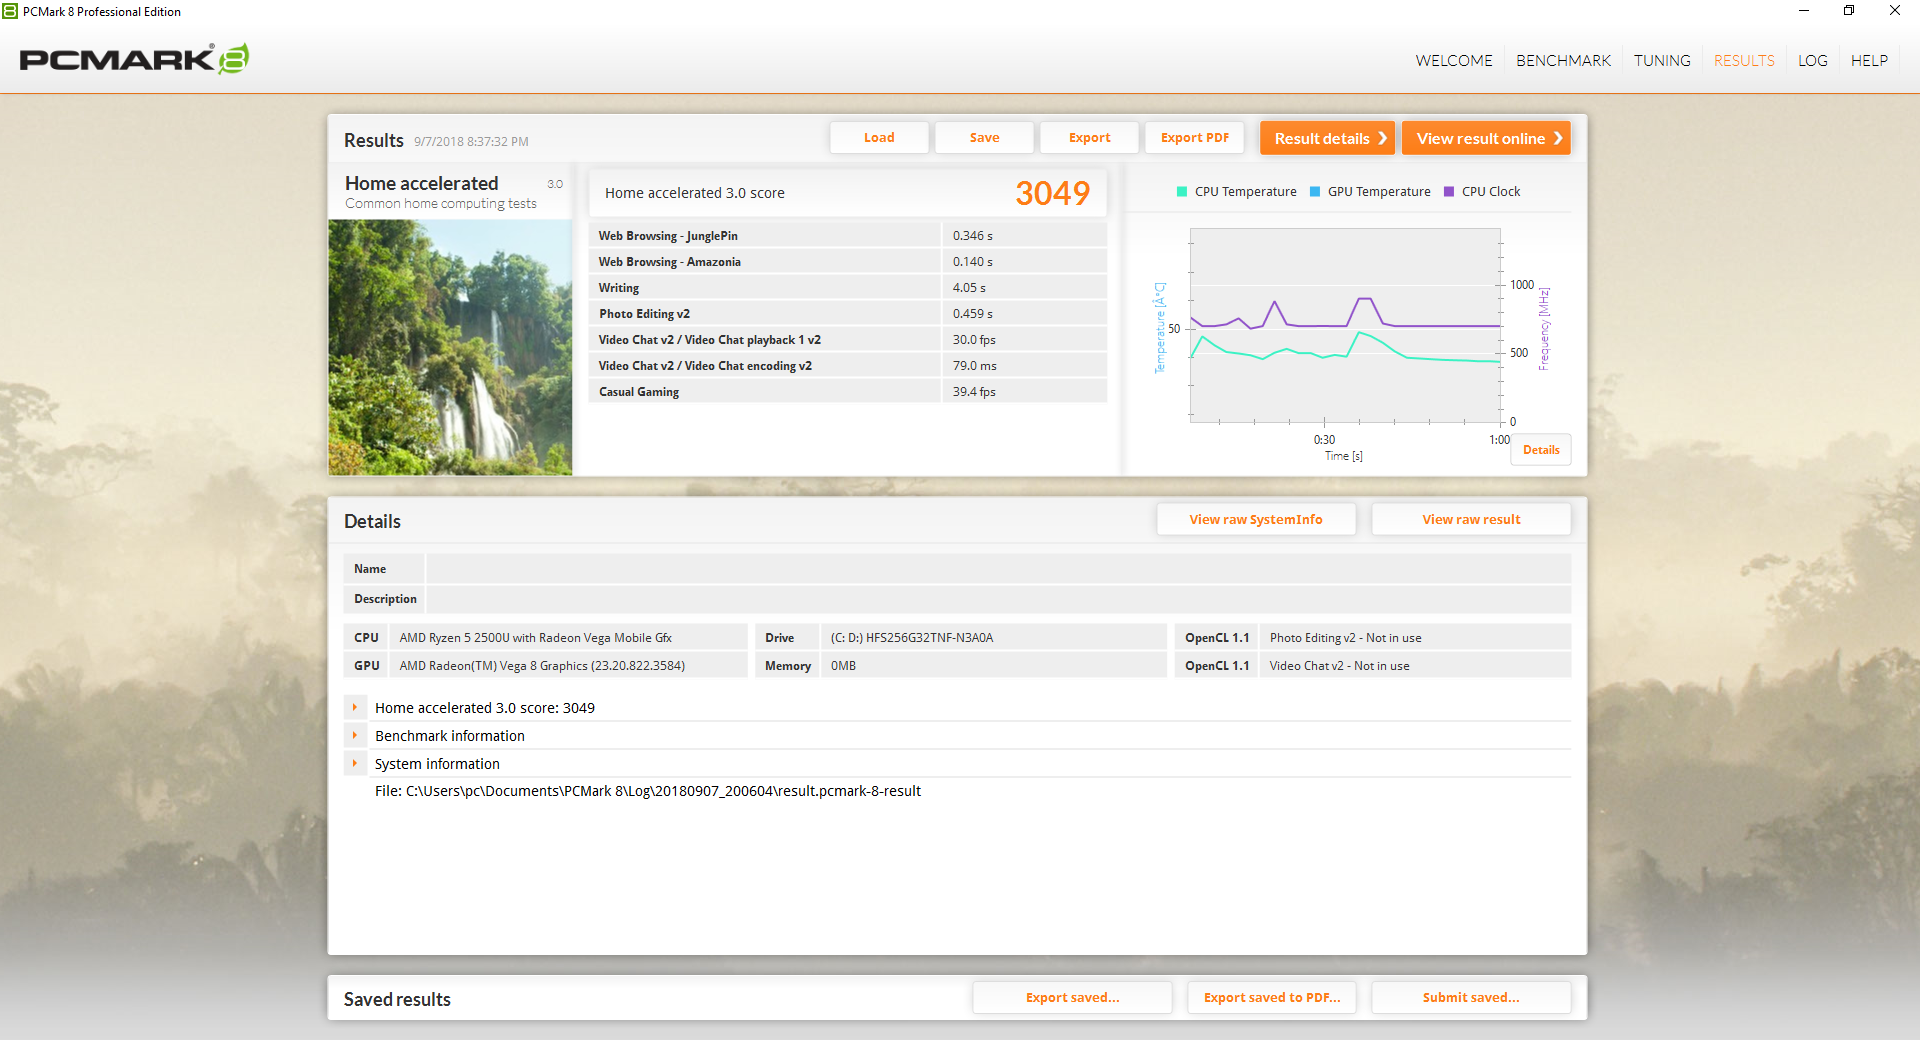
| PCMark 8 Home Score Accelerated v2 | 3049 points | |
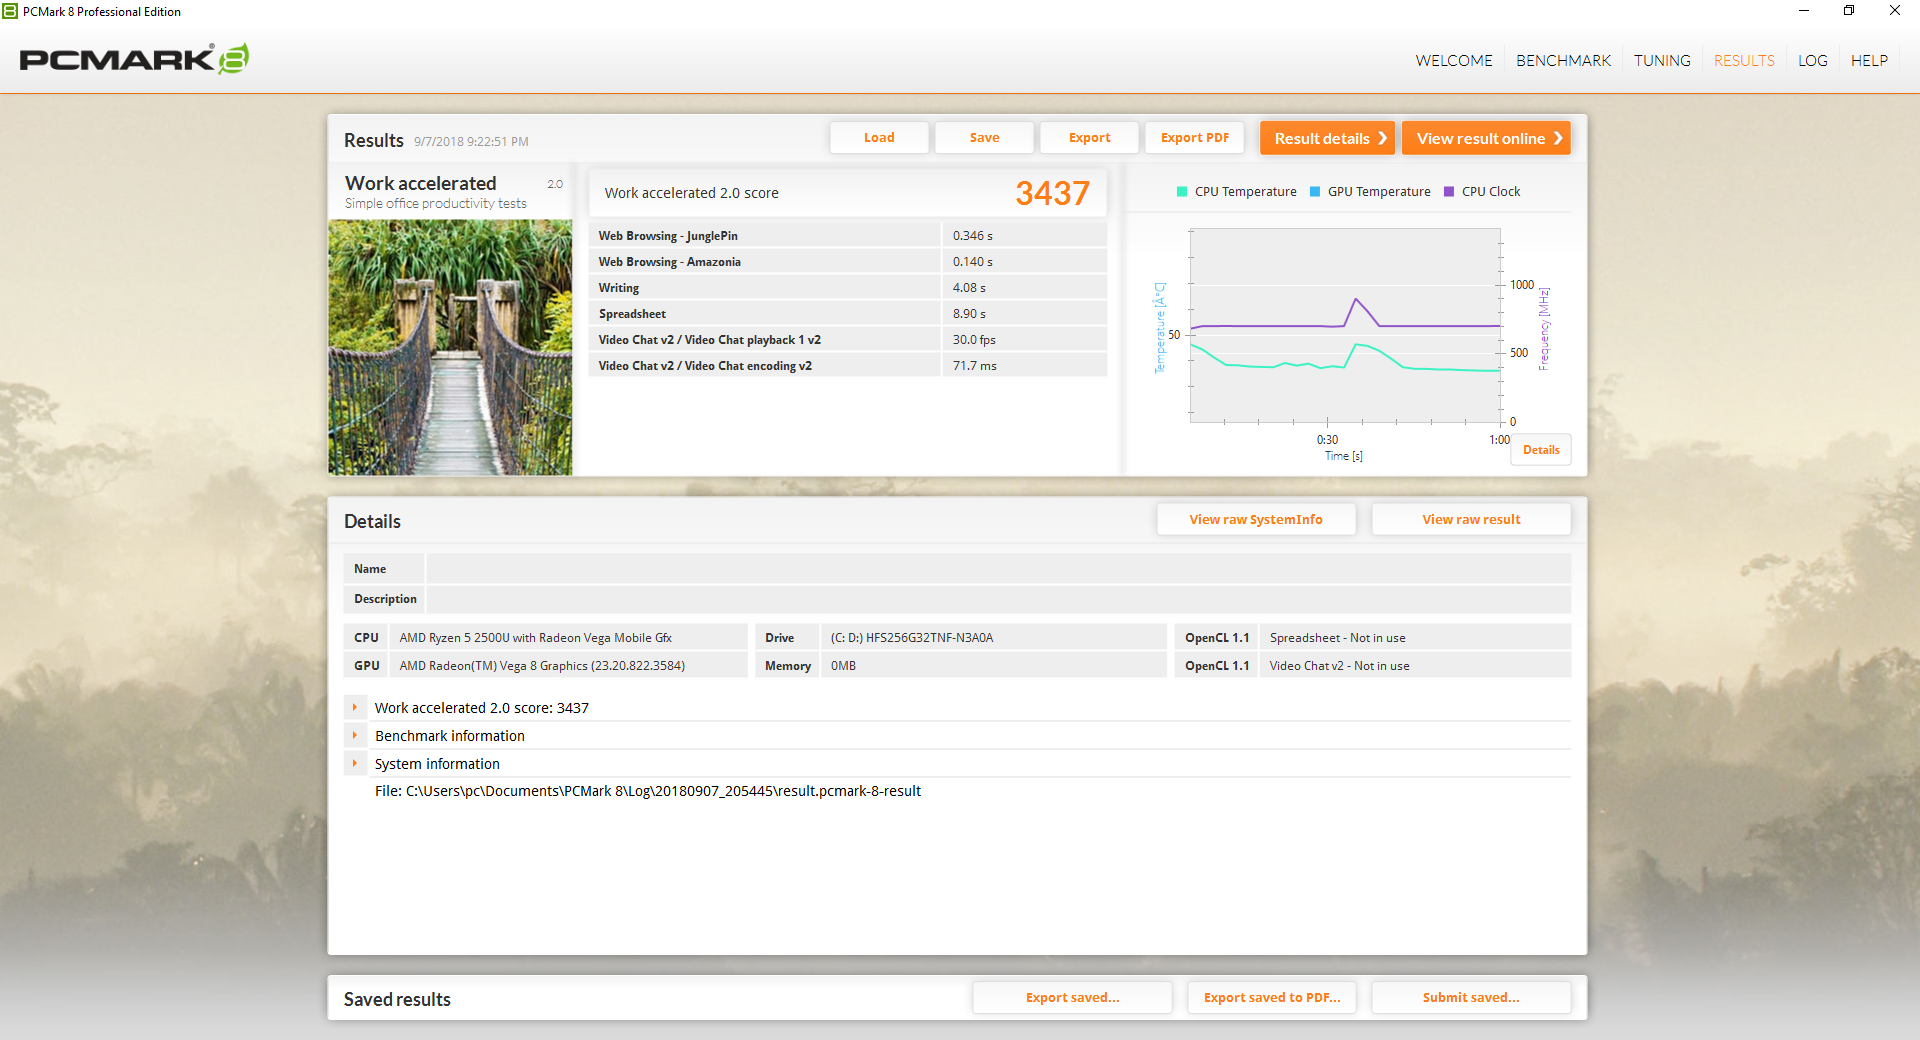
| PCMark 8 Work Score Accelerated v2 | 3437 points | |
| PCMark 10 Score | 2881 points | |
Help | ||
Storage Devices
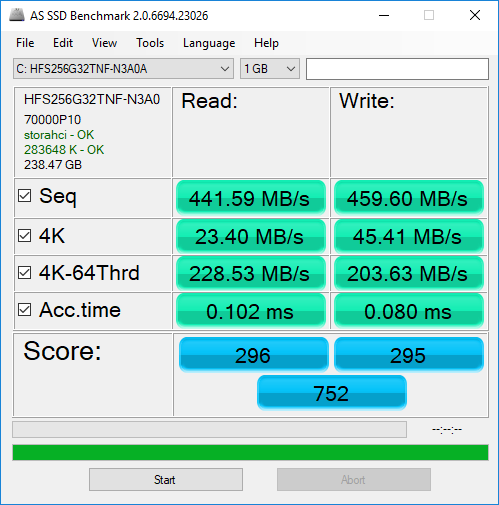
| Lenovo IdeaPad 330-15ARR 81D2005CUS SK Hynix Canvas SC311 256GB HFS256G32TNF | Lenovo Ideapad 530S-15IKB SK hynix PC401 HFS256GD9TNG | Acer Swift 3 SF315-41-R6J9 Micron SSD 1100 SED 512GB, M.2 (MTFDDAV512TBN) | Asus VivoBook E200HA-FD0041TS Hynix HBG4a2 32 GB eMMC | Lenovo IdeaPad Flex-1570 81CA000RUS SK Hynix PC401 512GB M.2 (HFS512GD9TNG) | |
|---|---|---|---|---|---|
| AS SSD | 80% | -8% | -120% | 143% | |
| Copy Game MB/s (MB/s) | 262.4 | 301.1 15% | 221.7 -16% | 56.8 -78% | 684 161% |
| Copy Program MB/s (MB/s) | 334 | 233.5 -30% | 174.4 -48% | 38.74 -88% | 495.6 48% |
| Copy ISO MB/s (MB/s) | 434.5 | 868 100% | 262.5 -40% | 60.7 -86% | 1013 133% |
| Score Total (Points) | 752 | 1387 84% | 727 -3% | 135 -82% | 2123 182% |
| Score Write (Points) | 295 | 415 41% | 275 -7% | 48 -84% | 832 182% |
| Score Read (Points) | 296 | 690 133% | 297 0% | 54 -82% | 860 191% |
| Access Time Write * (ms) | 0.08 | 0.051 36% | 0.072 10% | 0.575 -619% | 0.051 36% |
| Access Time Read * (ms) | 0.102 | 0.06 41% | 0.078 24% | 0.228 -124% | 0.045 56% |
| 4K-64 Write (MB/s) | 203.6 | 271.6 33% | 187 -8% | 25.33 -88% | 612 201% |
| 4K-64 Read (MB/s) | 228.5 | 431.3 89% | 231.8 1% | 23.97 -90% | 660 189% |
| 4K Write (MB/s) | 45.41 | 88.4 95% | 49.43 9% | 10.55 -77% | 99.5 119% |
| 4K Read (MB/s) | 23.4 | 38.69 65% | 20.27 -13% | 14.01 -40% | 40.59 73% |
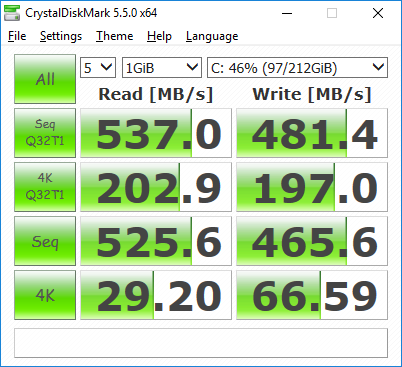
| Seq Write (MB/s) | 459.6 | 550 20% | 384.7 -16% | 124.7 -73% | 1209 163% |
| Seq Read (MB/s) | 441.6 | 2205 399% | 448.1 1% | 160.8 -64% | 1596 261% |
* ... smaller is better

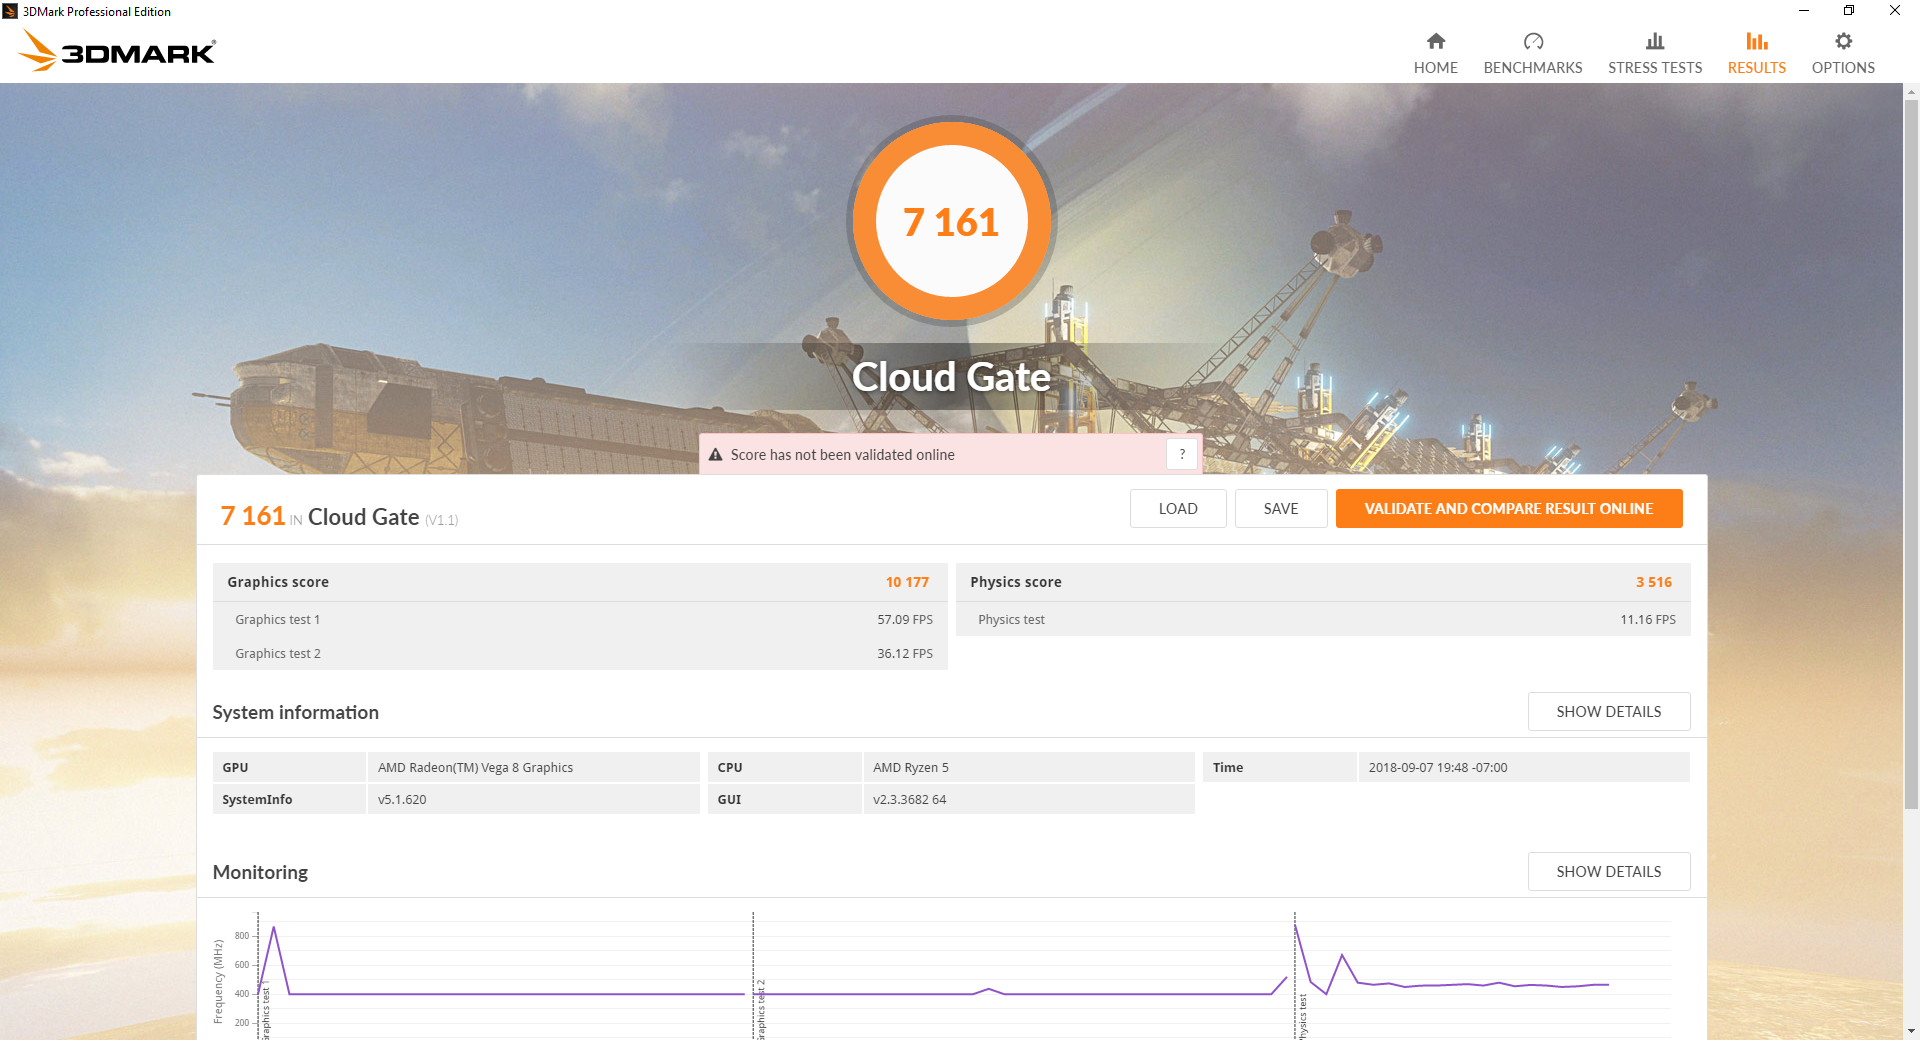
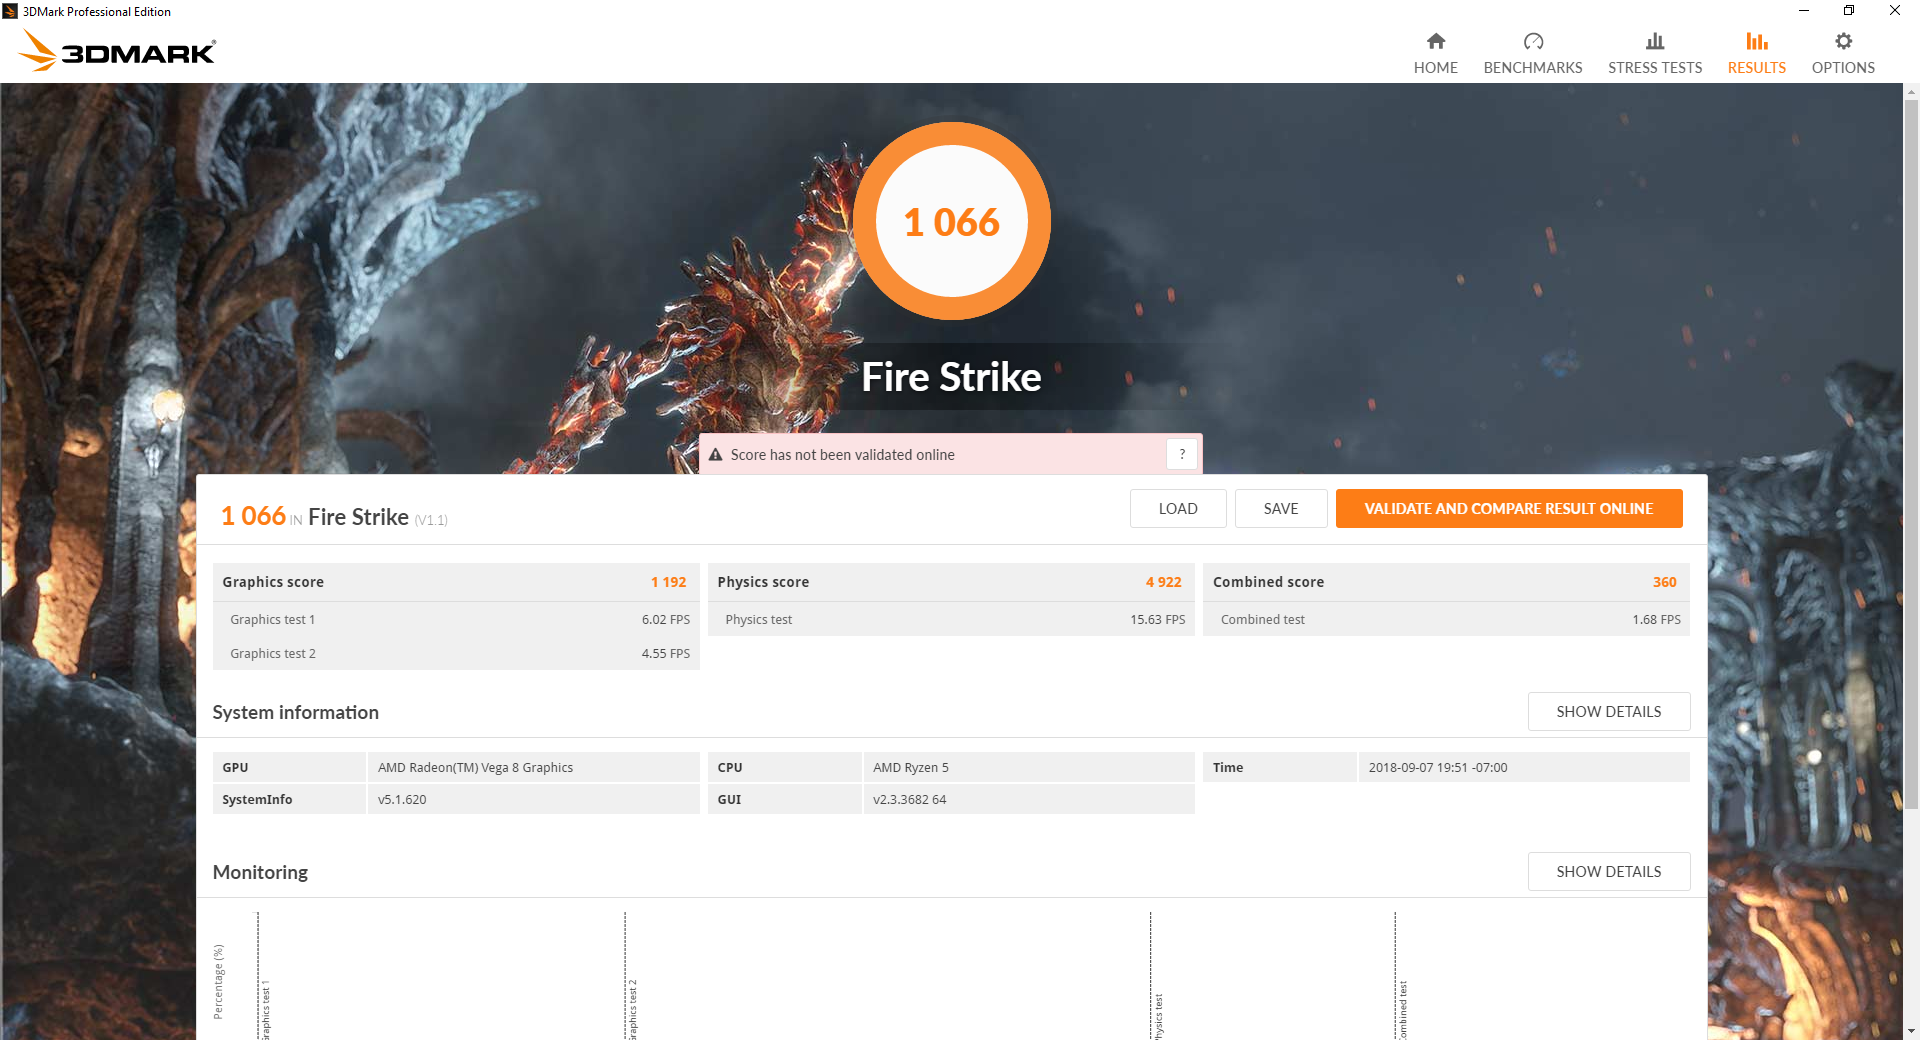
GPU Performance
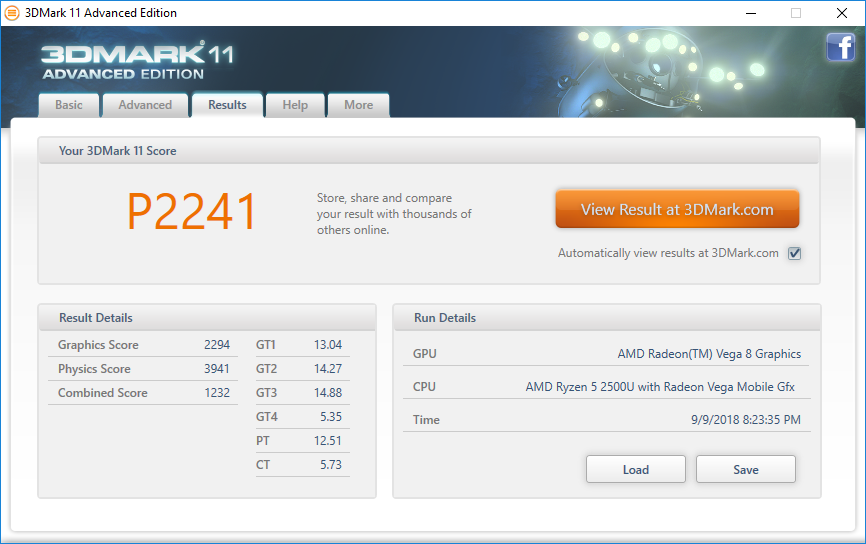
| 3DMark 11 Performance | 2241 points | |
| 3DMark Cloud Gate Standard Score | 7161 points | |
| 3DMark Fire Strike Score | 1066 points | |
Help | ||
| low | med. | high | ultra | |
|---|---|---|---|---|
| BioShock Infinite (2013) | 68.9 | 7.6 | ||
| The Witcher 3 (2015) | 22 |
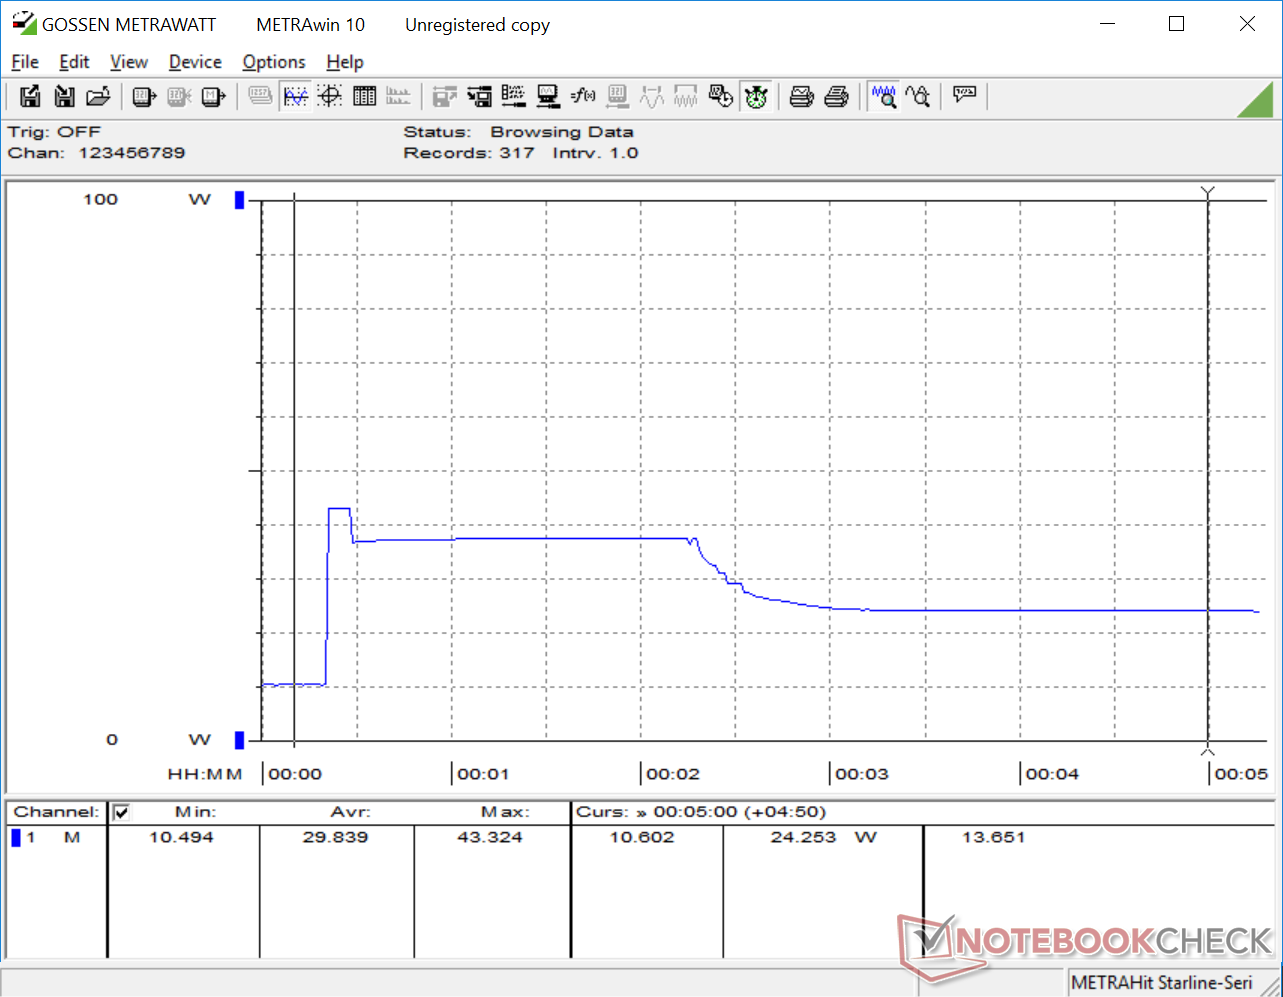
Stress Test
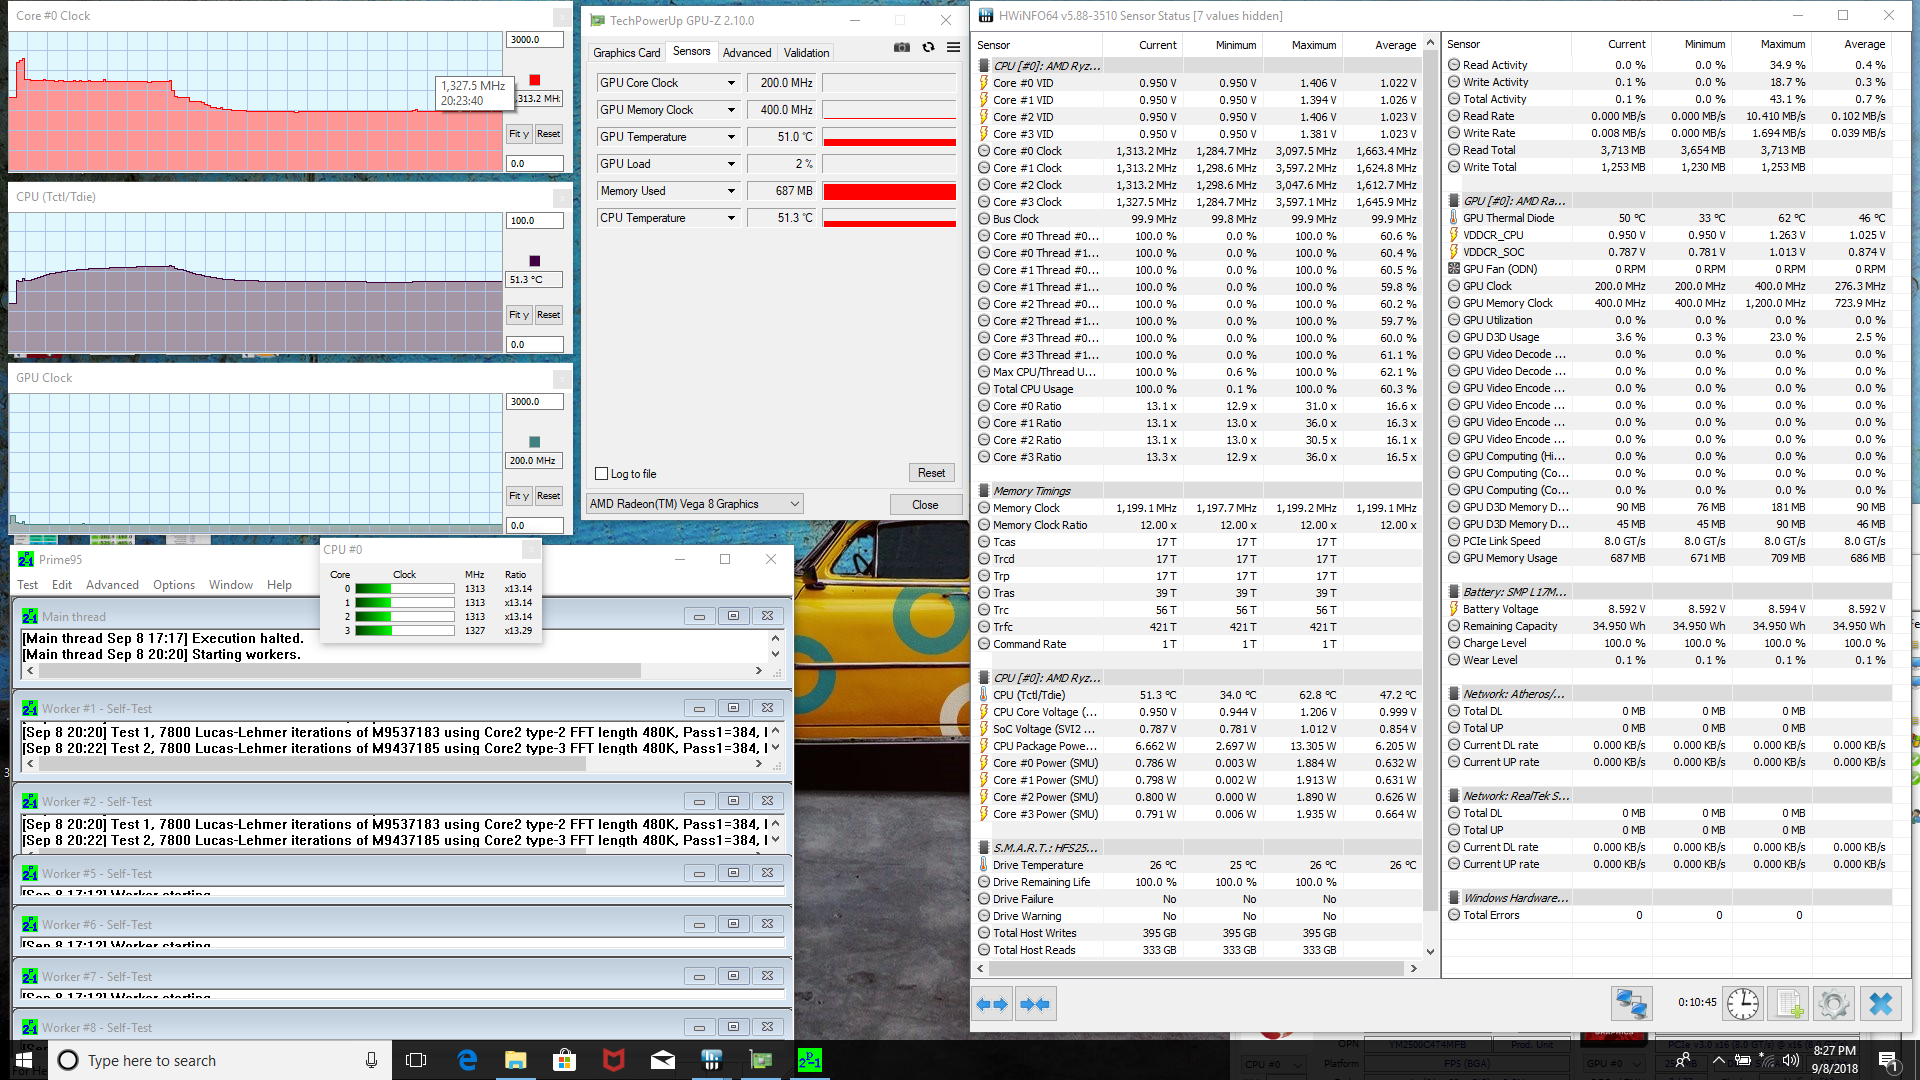
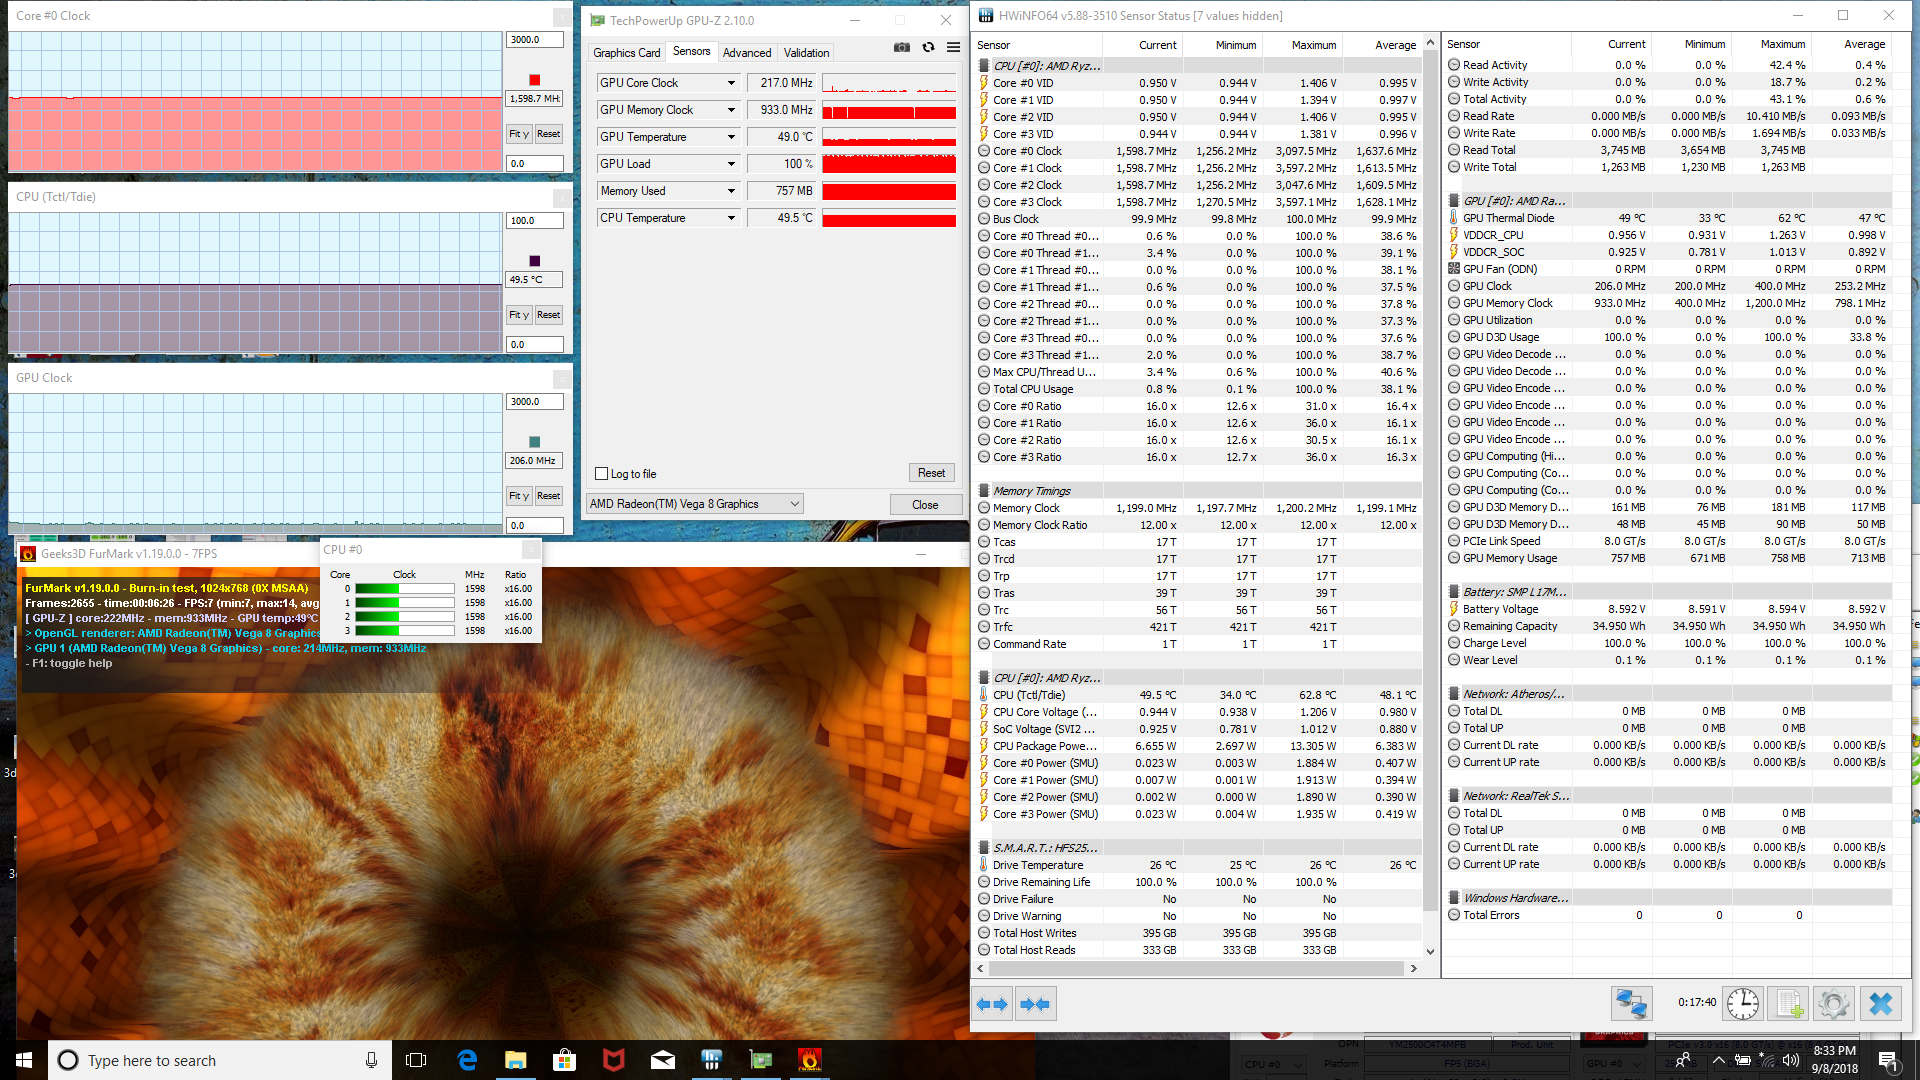
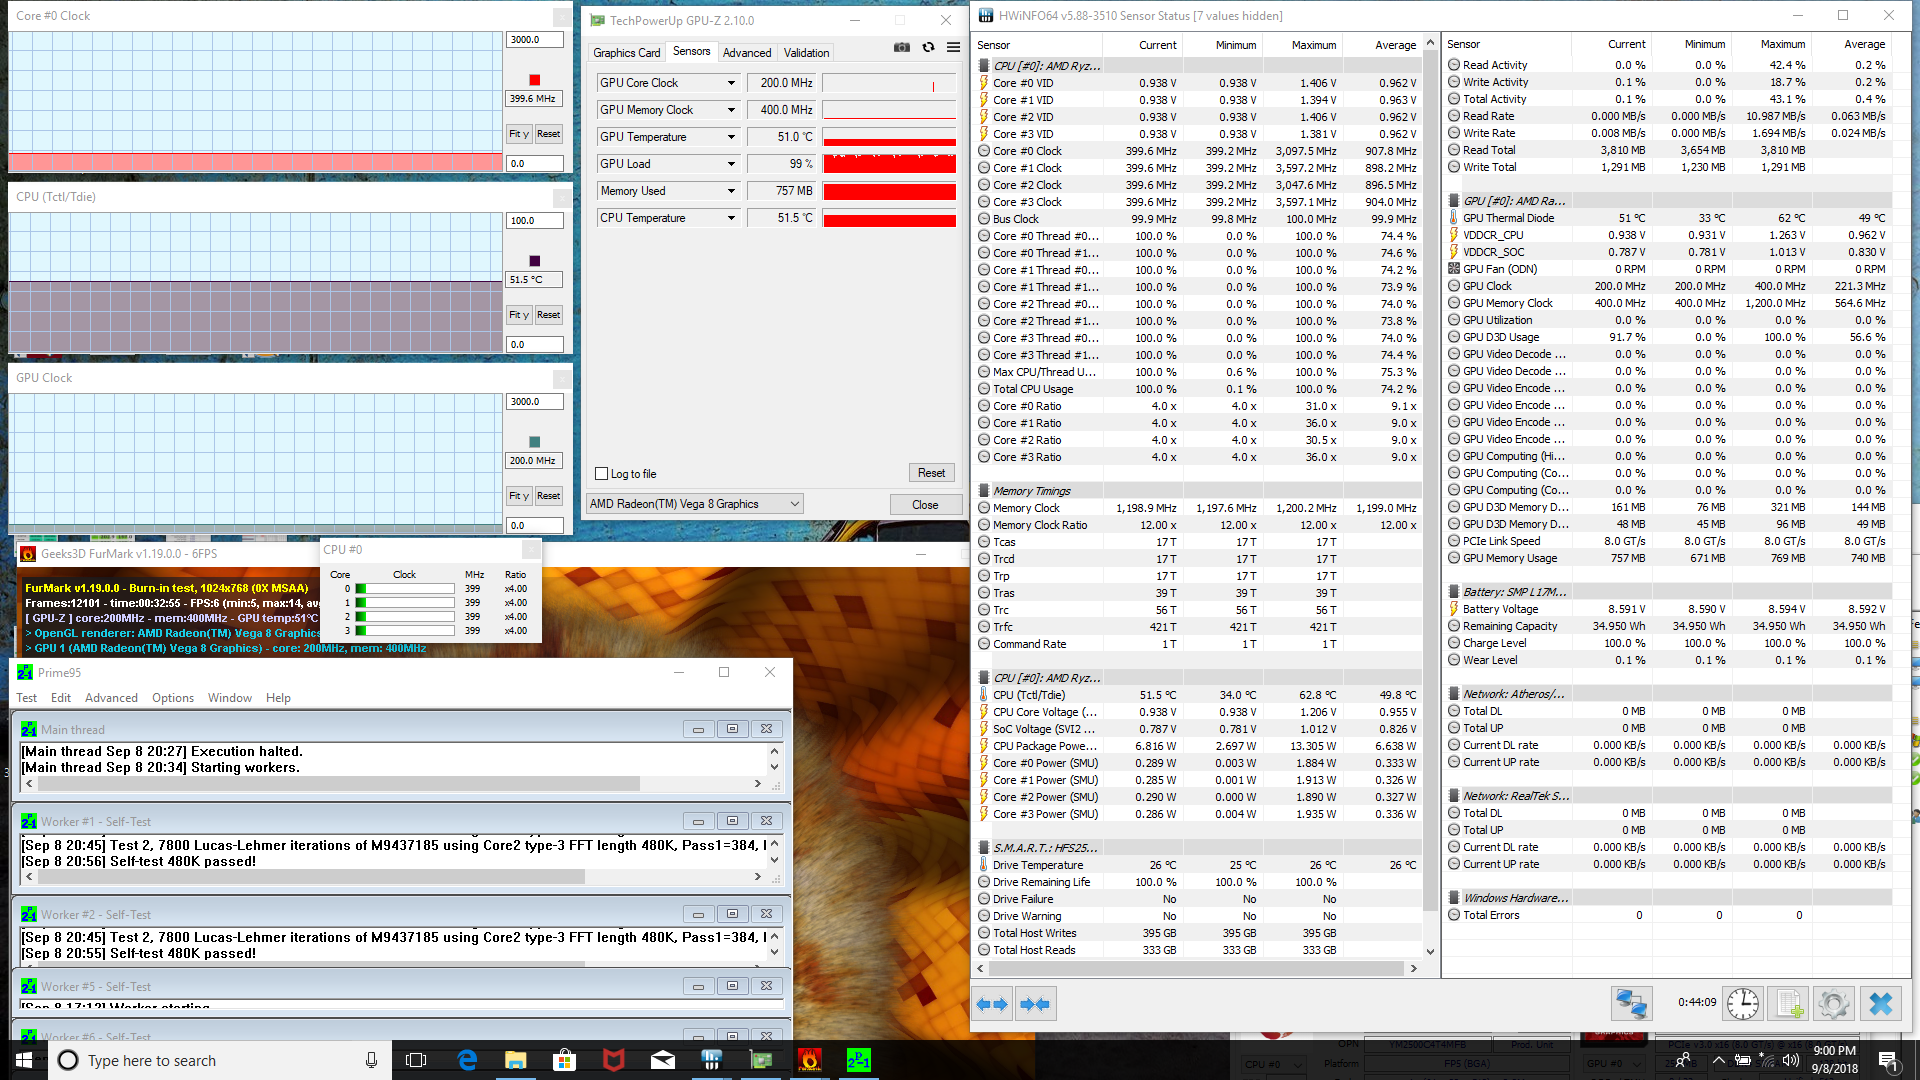
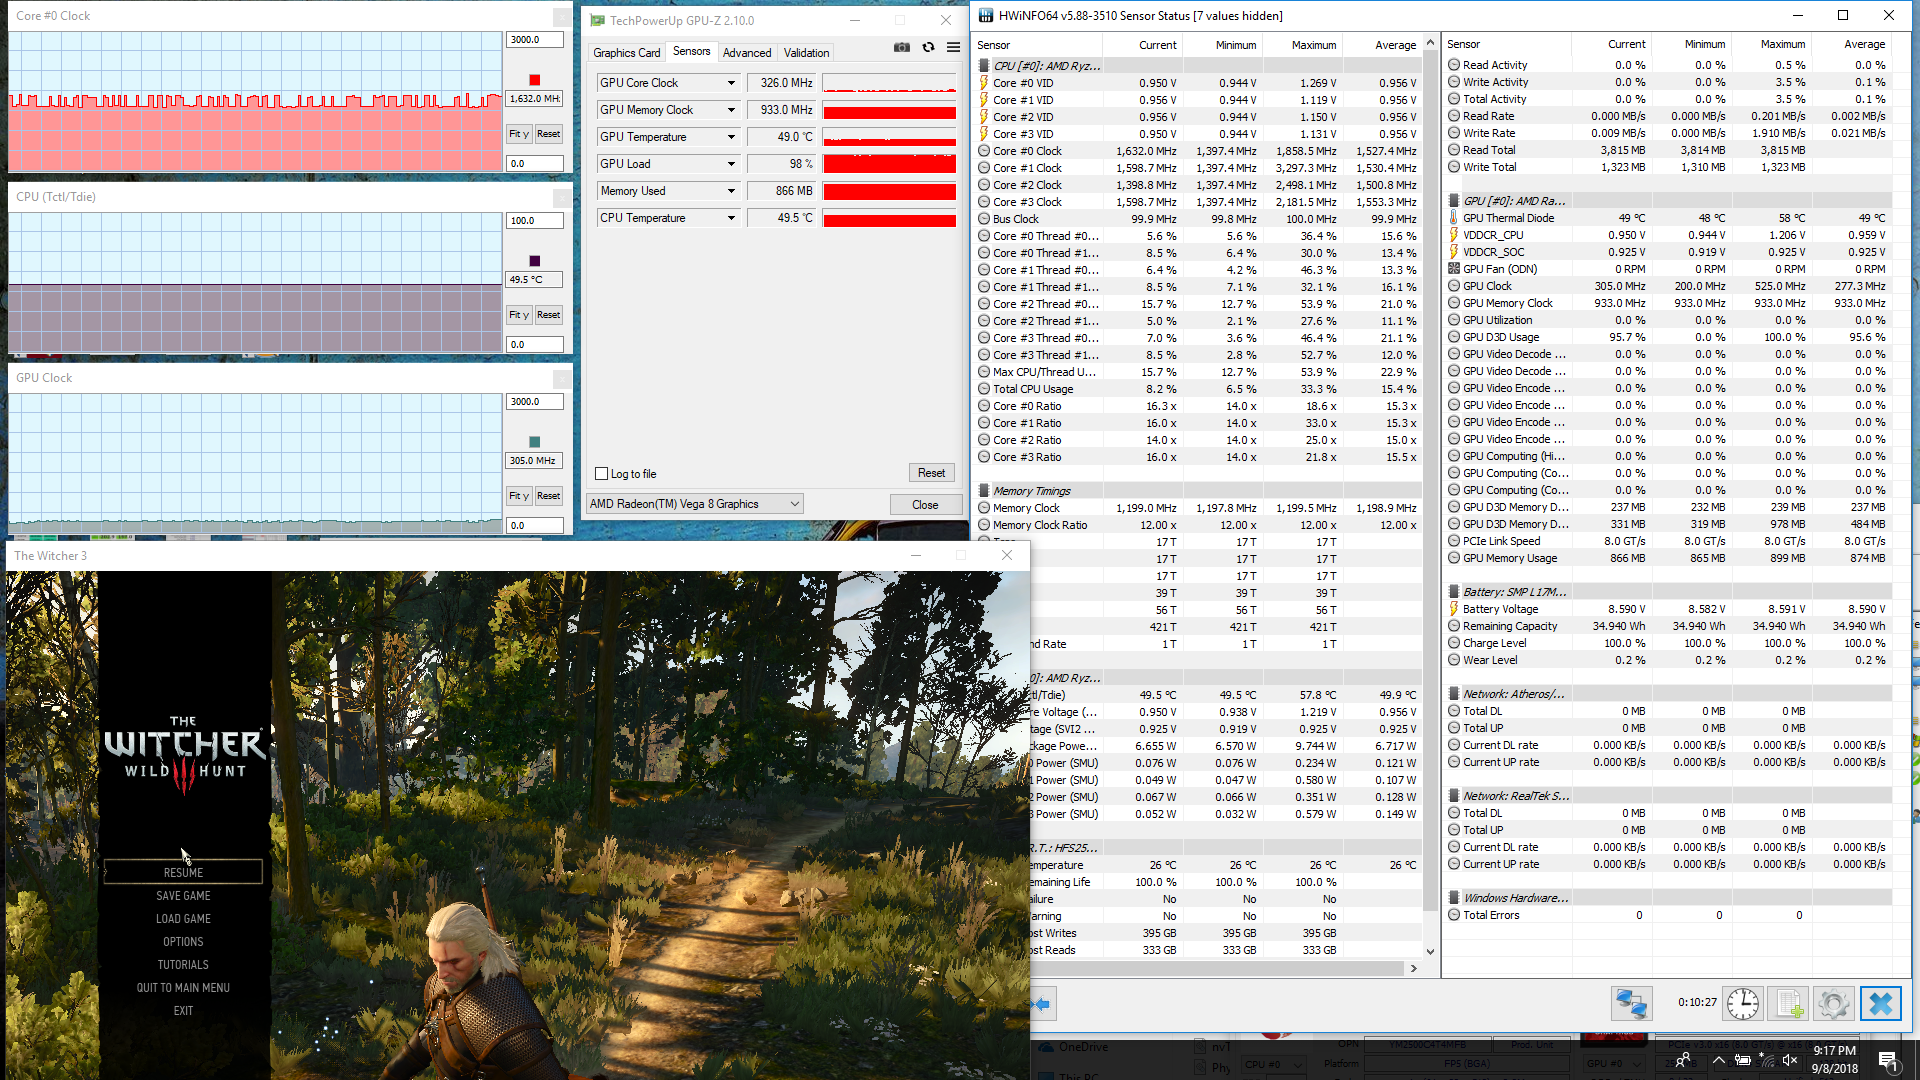
| CPU Clock (GHz) | GPU Clock (MHz) | Average CPU Temperature Tctl/Tidle (°C) | |
| Prime95 Stress | 1.3 | -- | 51 |
| FurMark Stress | -- | 206 | 50 |
| Prime95 + FurMark Stress | 0.4 | 200 | 52 |
| Witcher 3 Stress | ~1.6 | 305 | 50 |
Emissions
System Noise
Noise level
| Idle |
| 28.1 / 31.6 / 32.8 dB(A) |
| Load |
| 36.5 / 32.8 dB(A) |
 | ||
30 dB silent 40 dB(A) audible 50 dB(A) loud |
||
min: | ||
| Lenovo IdeaPad 330-15ARR 81D2005CUS Vega 8, R5 2500U, SK Hynix Canvas SC311 256GB HFS256G32TNF | Lenovo Ideapad 530S-15IKB UHD Graphics 620, i5-8250U, SK hynix PC401 HFS256GD9TNG | Huawei MateBook D 15-53010BAJ GeForce MX150, i5-8250U, Samsung SSD PM981 MZVLB512HAJQ | HP Pavilion 15-cs0053cl UHD Graphics 620, i5-8250U, Toshiba MQ04ABF100 | Asus VivoBook 15 F510UF-ES71 GeForce MX130, i5-8550U, Seagate Mobile HDD 1TB ST1000LM035 | |
|---|---|---|---|---|---|
| Noise | 6% | -11% | -1% | -16% | |
| off / environment * (dB) | 28.1 | 28 -0% | 27.8 1% | 28.2 -0% | 28.5 -1% |
| Idle Minimum * (dB) | 28.1 | 28 -0% | 29.4 -5% | 31.7 -13% | 30.8 -10% |
| Idle Average * (dB) | 31.6 | 28 11% | 29.6 6% | 31.7 -0% | 30.8 3% |
| Idle Maximum * (dB) | 32.8 | 30.1 8% | 29.6 10% | 32 2% | 31 5% |
| Load Average * (dB) | 36.5 | 30.2 17% | 43.5 -19% | 32.8 10% | 45.6 -25% |
| Witcher 3 ultra * (dB) | 32.8 | 43.5 -33% | 45.6 -39% | ||
| Load Maximum * (dB) | 32.8 | 33.2 -1% | 45.8 -40% | 35 -7% | 46.7 -42% |
* ... smaller is better
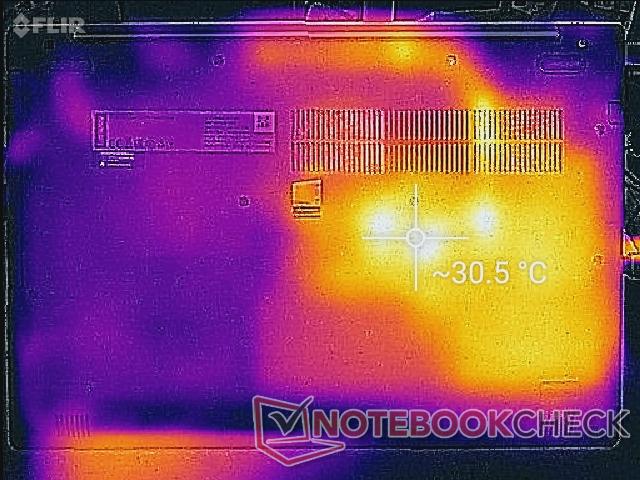
Temperature
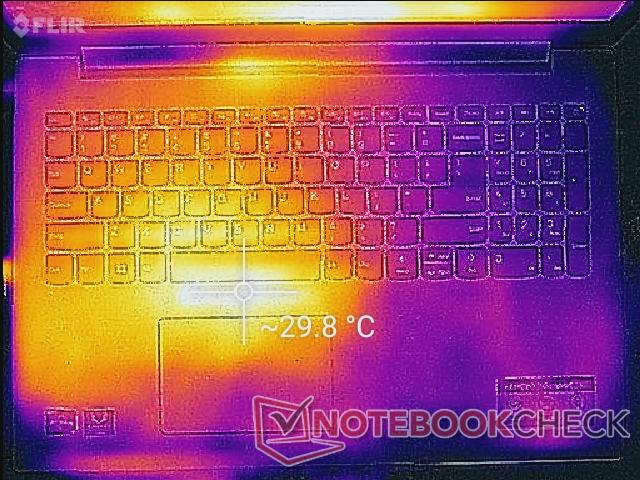
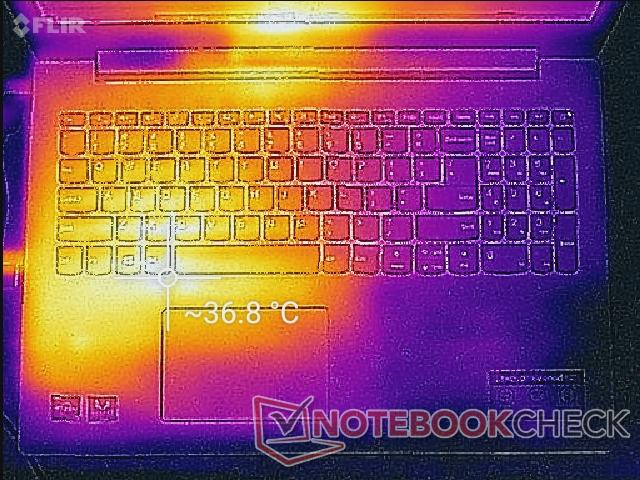

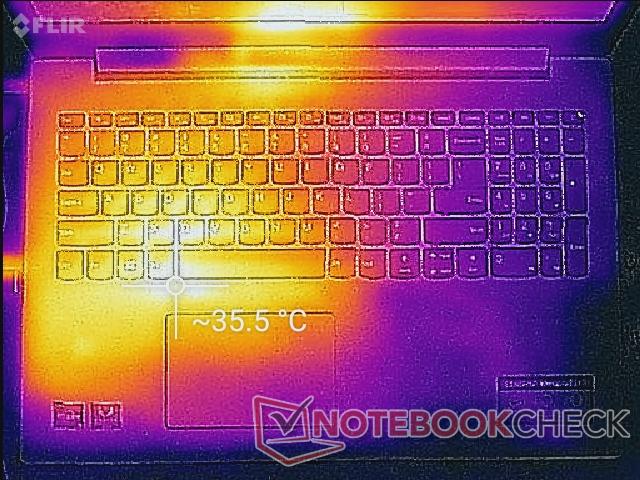

(+) The maximum temperature on the upper side is 36.8 °C / 98 F, compared to the average of 34.3 °C / 94 F, ranging from 21.2 to 62.5 °C for the class Office.
(±) The bottom heats up to a maximum of 42 °C / 108 F, compared to the average of 36.8 °C / 98 F
(+) In idle usage, the average temperature for the upper side is 26.4 °C / 80 F, compared to the device average of 29.5 °C / 85 F.
(+) Playing The Witcher 3, the average temperature for the upper side is 30.7 °C / 87 F, compared to the device average of 29.5 °C / 85 F.
(+) The palmrests and touchpad are reaching skin temperature as a maximum (34 °C / 93.2 F) and are therefore not hot.
(-) The average temperature of the palmrest area of similar devices was 27.5 °C / 81.5 F (-6.5 °C / -11.7 F).
Speakers
Lenovo IdeaPad 330-15ARR 81D2005CUS audio analysis
(-) | not very loud speakers (70.3 dB)
Bass 100 - 315 Hz
(-) | nearly no bass - on average 22% lower than median
(±) | linearity of bass is average (11.9% delta to prev. frequency)
Mids 400 - 2000 Hz
(+) | balanced mids - only 3.6% away from median
(±) | linearity of mids is average (10.2% delta to prev. frequency)
Highs 2 - 16 kHz
(+) | balanced highs - only 3.8% away from median
(±) | linearity of highs is average (10.7% delta to prev. frequency)
Overall 100 - 16.000 Hz
(±) | linearity of overall sound is average (25.4% difference to median)
Compared to same class
» 77% of all tested devices in this class were better, 6% similar, 17% worse
» The best had a delta of 7%, average was 21%, worst was 53%
Compared to all devices tested
» 78% of all tested devices were better, 5% similar, 17% worse
» The best had a delta of 4%, average was 24%, worst was 134%
Apple MacBook 12 (Early 2016) 1.1 GHz audio analysis
(+) | speakers can play relatively loud (83.6 dB)
Bass 100 - 315 Hz
(±) | reduced bass - on average 11.3% lower than median
(±) | linearity of bass is average (14.2% delta to prev. frequency)
Mids 400 - 2000 Hz
(+) | balanced mids - only 2.4% away from median
(+) | mids are linear (5.5% delta to prev. frequency)
Highs 2 - 16 kHz
(+) | balanced highs - only 2% away from median
(+) | highs are linear (4.5% delta to prev. frequency)
Overall 100 - 16.000 Hz
(+) | overall sound is linear (10.2% difference to median)
Compared to same class
» 7% of all tested devices in this class were better, 2% similar, 91% worse
» The best had a delta of 5%, average was 18%, worst was 53%
Compared to all devices tested
» 5% of all tested devices were better, 1% similar, 94% worse
» The best had a delta of 4%, average was 24%, worst was 134%
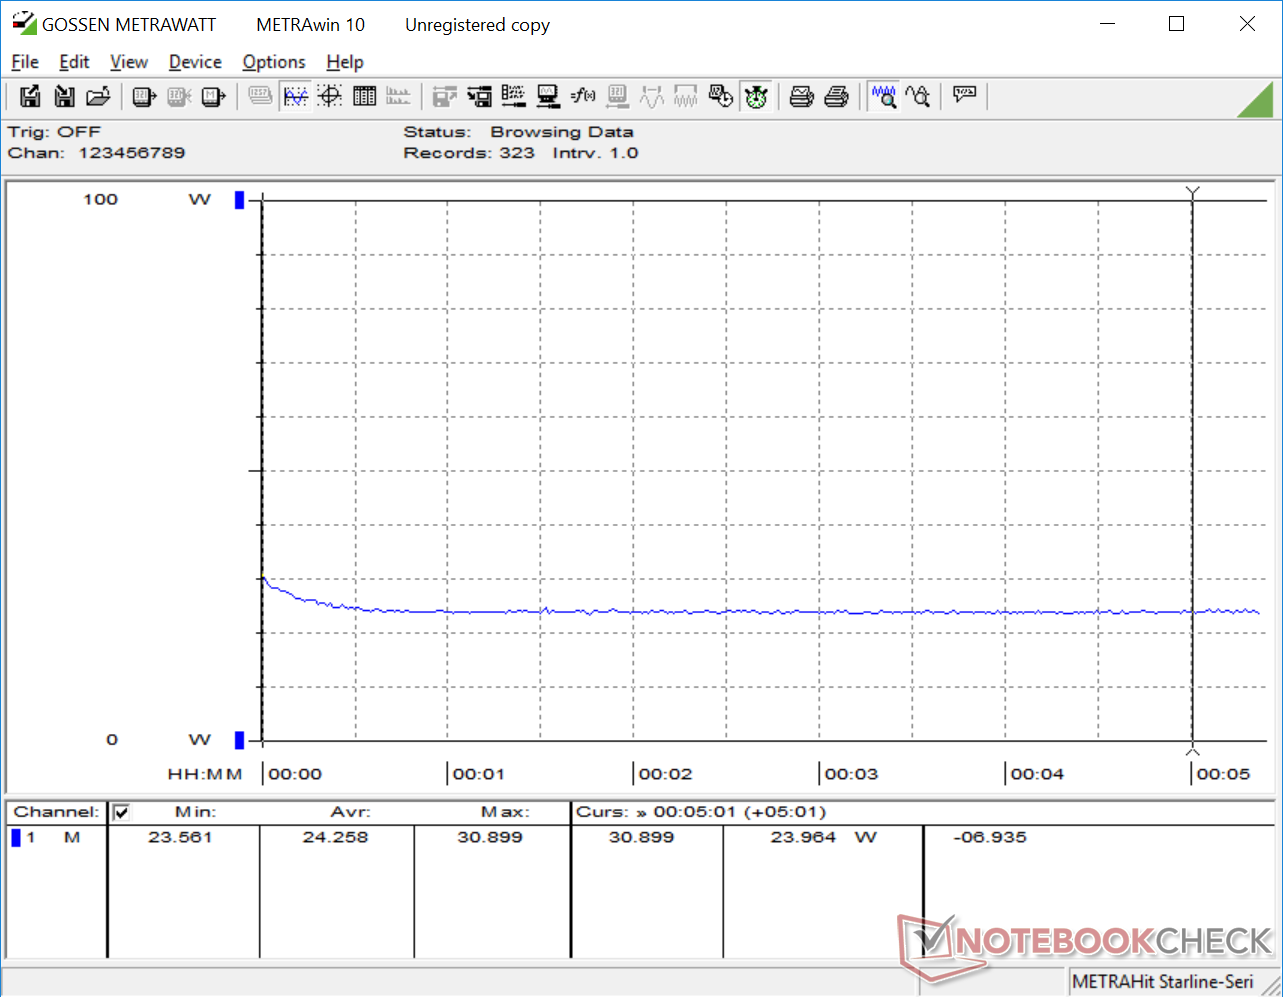
Energy Management
Power Consumption
| Off / Standby | |
| Idle | |
| Load |
|
Key:
min: | |
| Lenovo IdeaPad 330-15ARR 81D2005CUS R5 2500U, Vega 8, SK Hynix Canvas SC311 256GB HFS256G32TNF, TN LED, 1920x1080, 15.6" | Lenovo Ideapad 530S-15IKB i5-8250U, UHD Graphics 620, SK hynix PC401 HFS256GD9TNG, IPS, 1920x1080, 15.6" | Huawei MateBook D 15-53010BAJ i5-8250U, GeForce MX150, Samsung SSD PM981 MZVLB512HAJQ, IPS, 1920x1080, 15.6" | HP Pavilion 15-cs0053cl i5-8250U, UHD Graphics 620, Toshiba MQ04ABF100, TN LED, 1366x768, 15.6" | Asus VivoBook 15 F510UF-ES71 i5-8550U, GeForce MX130, Seagate Mobile HDD 1TB ST1000LM035, IPS, 1920x1080, 15.6" | |
|---|---|---|---|---|---|
| Power Consumption | 20% | -27% | 16% | -25% | |
| Idle Minimum * (Watt) | 7.6 | 3.5 54% | 4.2 45% | 5.6 26% | 5.9 22% |
| Idle Average * (Watt) | 10.6 | 5.6 47% | 7.2 32% | 7.1 33% | 7 34% |
| Idle Maximum * (Watt) | 11.8 | 10.3 13% | 12.1 -3% | 7.9 33% | 8.5 28% |
| Load Average * (Watt) | 24.1 | 30.5 -27% | 51.1 -112% | 32.8 -36% | 54.5 -126% |
| Witcher 3 ultra * (Watt) | 30.3 | 52.7 -74% | 50.6 -67% | ||
| Load Maximum * (Watt) | 39.4 | 33.8 14% | 59.9 -52% | 30.5 23% | 55.7 -41% |
* ... smaller is better
Battery Life
| Lenovo IdeaPad 330-15ARR 81D2005CUS R5 2500U, Vega 8, 35 Wh | Lenovo Ideapad 530S-15IKB i5-8250U, UHD Graphics 620, 45 Wh | Huawei MateBook D 15-53010BAJ i5-8250U, GeForce MX150, 43.3 Wh | HP Pavilion 15-cs0053cl i5-8250U, UHD Graphics 620, 41 Wh | Asus VivoBook 15 F510UF-ES71 i5-8550U, GeForce MX130, 42 Wh | |
|---|---|---|---|---|---|
| Battery runtime | 63% | 93% | 75% | -2% | |
| WiFi v1.3 (h) | 4 | 6.5 63% | 7.7 93% | 7 75% | 3.9 -2% |
| Reader / Idle (h) | 15.2 | 12 | |||
| Load (h) | 1.2 | 2.2 |
Pros
Cons
Verdict
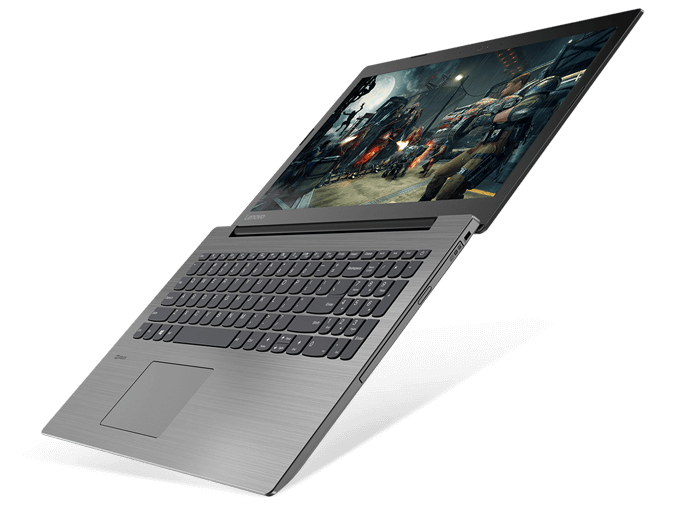
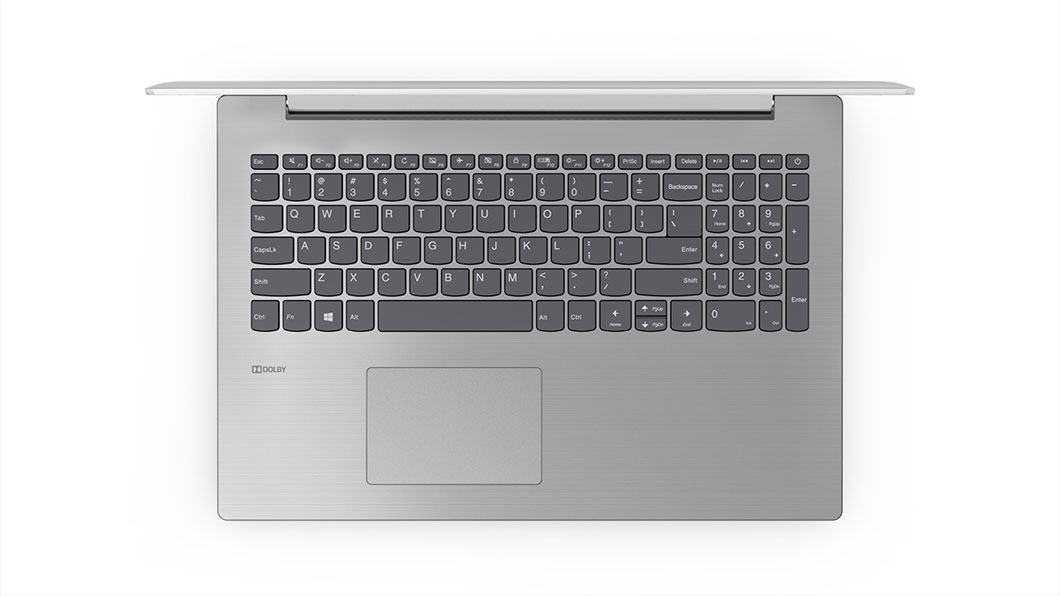
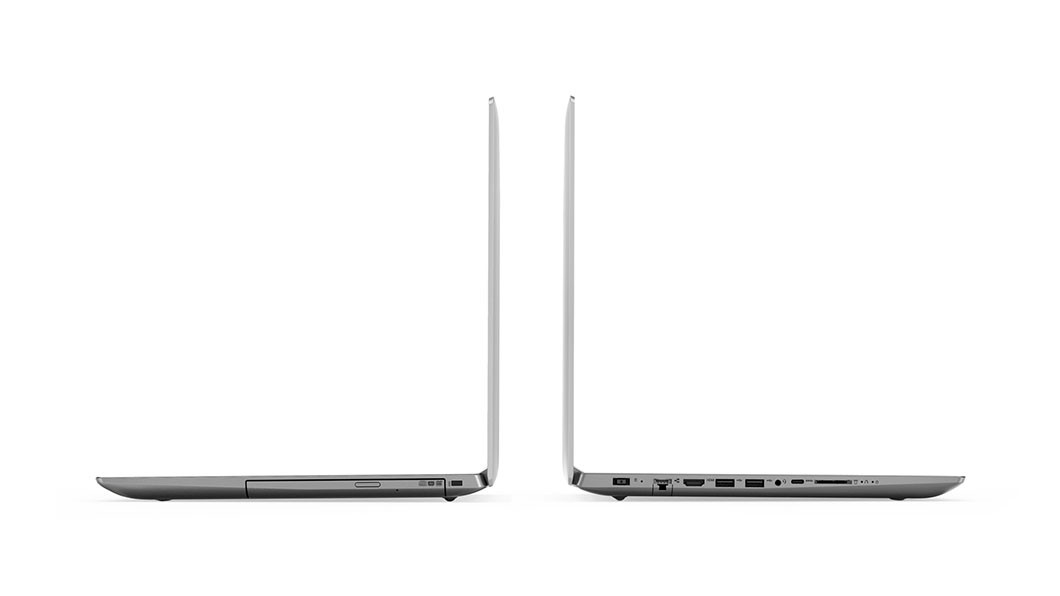
The 15-inch Ideapad 330 is a cheap multimedia solution and so we don't expect very much out of the system. Its chassis is smooth if not bland and its matte panel is great at reducing glare. It's also one of the few laptops shipping with both USB Type-C and an optical drive for users who may want them on one machine.
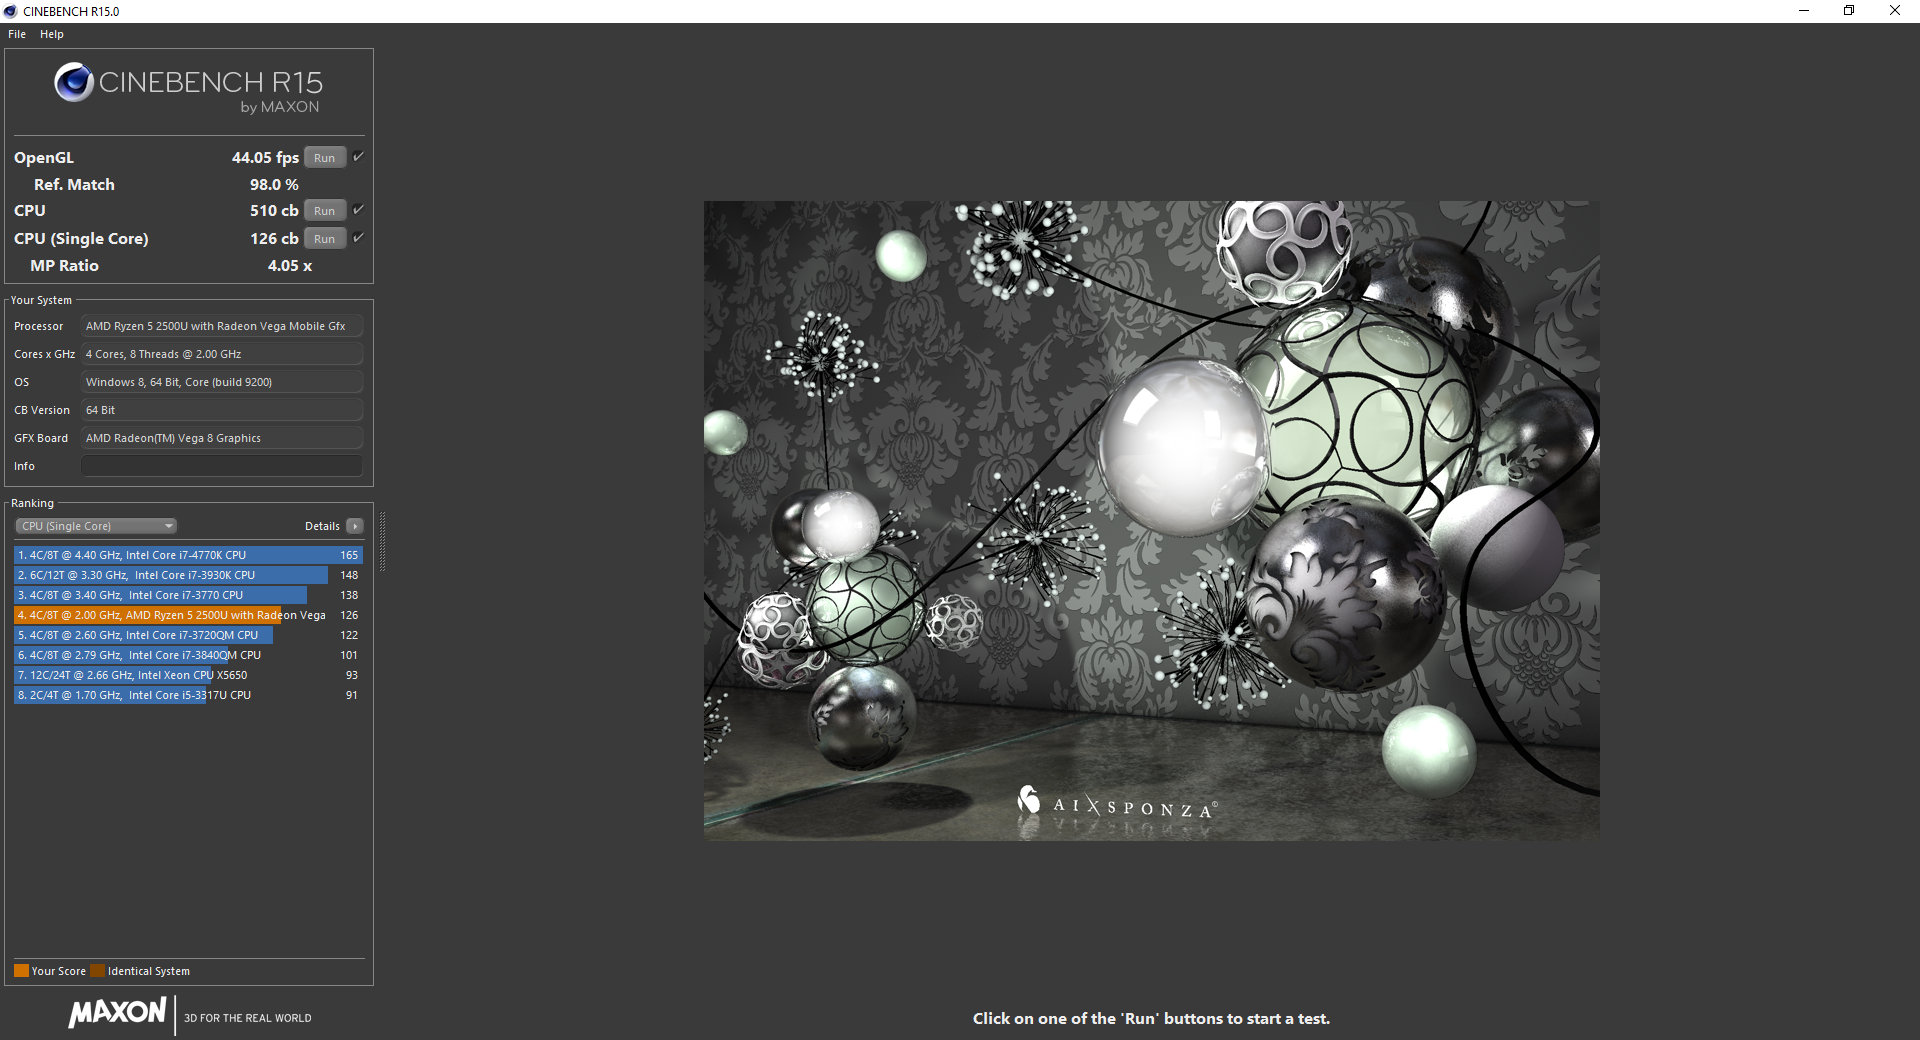
There is still a long list of disappointing qualities despite the low asking price. Colors and RGB balance are terrible out of the box and so an end-user calibration is recommend for an overall better experience especially when playing videos. Throttling is severe at almost 41 percent according to our CineBench R15 loop test. Thus, while the Ryzen 5 2500U is a powerful Intel alternative on paper, owners of the Lenovo won't benefit fully from the AMD processor when gaming or under high loads. The costlier SKU with the more powerful Ryzen 7 2700U could potentially be a poor buy since our less demanding Ryzen 5 2500U configuration already throttles so heavily. Battery life is short as well which makes the Ideapad 330 a poor travel companion.
For future revisions, we are hoping to see USB Type-C charging in lieu of the proprietary AC adapter and perhaps another USB Type-A port along the right edge. A brighter display, longer battery runtime, and reduced performance throttling would also go a long way to making this a better machine. The recent HP Pavilion 15 refresh is the stronger option overall for the same price range.
There are some core basics that the Ideapad 330 could have done better without bumping up the affordable price. A better calibrated display, manual fan controls for silent streaming, reduced performance throttling, and a USB Type-A port along the right edge could have made the Ideapad 330 an easier buy for the price. As it stands, the system is merely average.
Lenovo IdeaPad 330-15ARR 81D2005CUS
- 09/20/2018 v6 (old)
Allen Ngo
Price comparison
