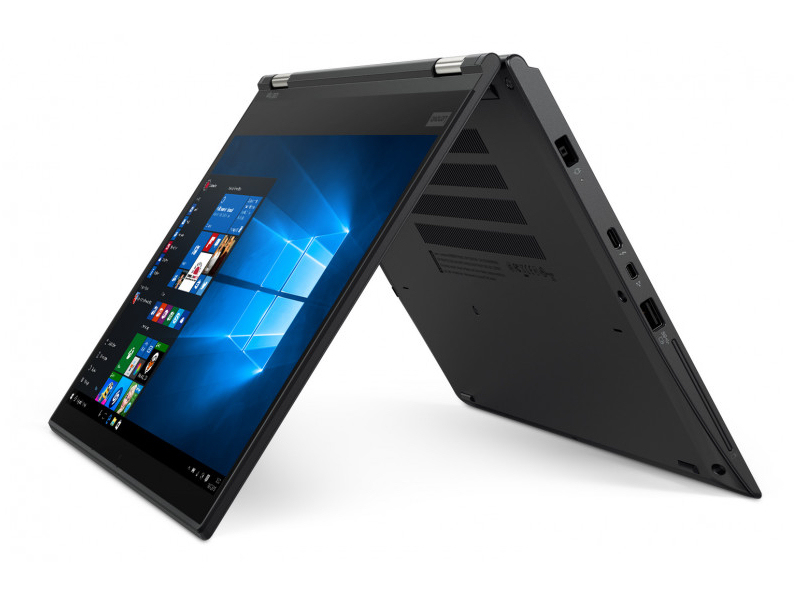
Lenovo ThinkPad X380 Yoga (i5-8250U, FHD) Convertible Review
Another year, another Yoga. We recently reviewed the highest-end ThinkPad X380 Yoga from Lenovo, a 2-in-1 equipped with Intel's new Kaby Lake R ULV Core i7-8550U. While we lauded the overall package, there were a few problems. Most notable were the poor CPU stability and thermal throttling issues over lengthy workloads. For a notebook bearing the ThinkPad moniker and priced at north of USD $1800, these omissions poisoned the well. Is the Core i5-8250U variant the remedy to these headaches?
As a premium convertible, the ThinkPad X380 Yoga competes against devices like HP's Spectre x360 13, Dell's Latitude 7390, and Lenovo's own ThinkPad X1 Yoga 2018. We will also compare the Microsoft Surface Book 2. Since this review is merely a differently specced variant of the ThinkPad X380 Yoga, we will not focus on the exterior factors of the notebook (case, maintenance, etc.), instead focusing on the performances differences between models. Let's dive in.
| SD Card Reader | |
| average JPG Copy Test (av. of 3 runs) | |
| Lenovo ThinkPad X1 Yoga 2018-20LD0015US | |
| Dell Latitude 7390 2-in-1 (Toshiba Exceria Pro M501 UHS-II) | |
| Microsoft Surface Book 2 (Toshiba Exceria Pro SDXC 64 GB UHS-II) | |
| HP Spectre x360 13-ae048ng (Toshiba Exceria Pro M501 microSDXC 64GB) | |
| Lenovo ThinkPad X380 Yoga-20LH000LUS (Toshiba Exceria Pro M501 UHS-II) | |
| Average of class Convertible (28.1 - 197, n=23, last 2 years) | |
| Lenovo ThinkPad X380 Yoga 20LJS02W00 (Toshiba Exceria Pro SDXC 64 GB UHS-II) | |
| maximum AS SSD Seq Read Test (1GB) | |
| Microsoft Surface Book 2 (Toshiba Exceria Pro SDXC 64 GB UHS-II) | |
| Dell Latitude 7390 2-in-1 (Toshiba Exceria Pro M501 UHS-II) | |
| Lenovo ThinkPad X1 Yoga 2018-20LD0015US | |
| HP Spectre x360 13-ae048ng (Toshiba Exceria Pro M501 microSDXC 64GB) | |
| Average of class Convertible (28.9 - 254, n=22, last 2 years) | |
| Lenovo ThinkPad X380 Yoga 20LJS02W00 (Toshiba Exceria Pro SDXC 64 GB UHS-II) | |
| Lenovo ThinkPad X380 Yoga-20LH000LUS (Toshiba Exceria Pro M501 UHS-II) | |
Display
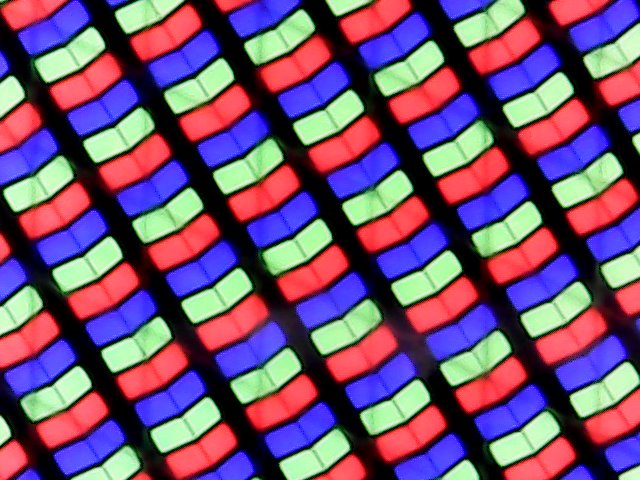
The Full HD touchscreen is very similar to the previous X380 Yoga's; response times are very similar, as is the presence of PWM. While it should not bother most users, other convertibles like the X1 Yoga and Latitude 7390 have no PWM at all. Aside from PWM, the panel is fairly good. The screen gets reasonably bright, averaging about 322 nits. The backlight is also fairly even (91% brightness distribution). Contrast is decent at 989:1, but there are better options with deeper black levels (including the previously reviewed X380 Yoga). That said, the screen is excellent overall and leaves little room for complaint.
| |||||||||||||||||||||||||
Brightness Distribution: 91 %
Center on Battery: 336.3 cd/m²
Contrast: 989:1 (Black: 0.34 cd/m²)
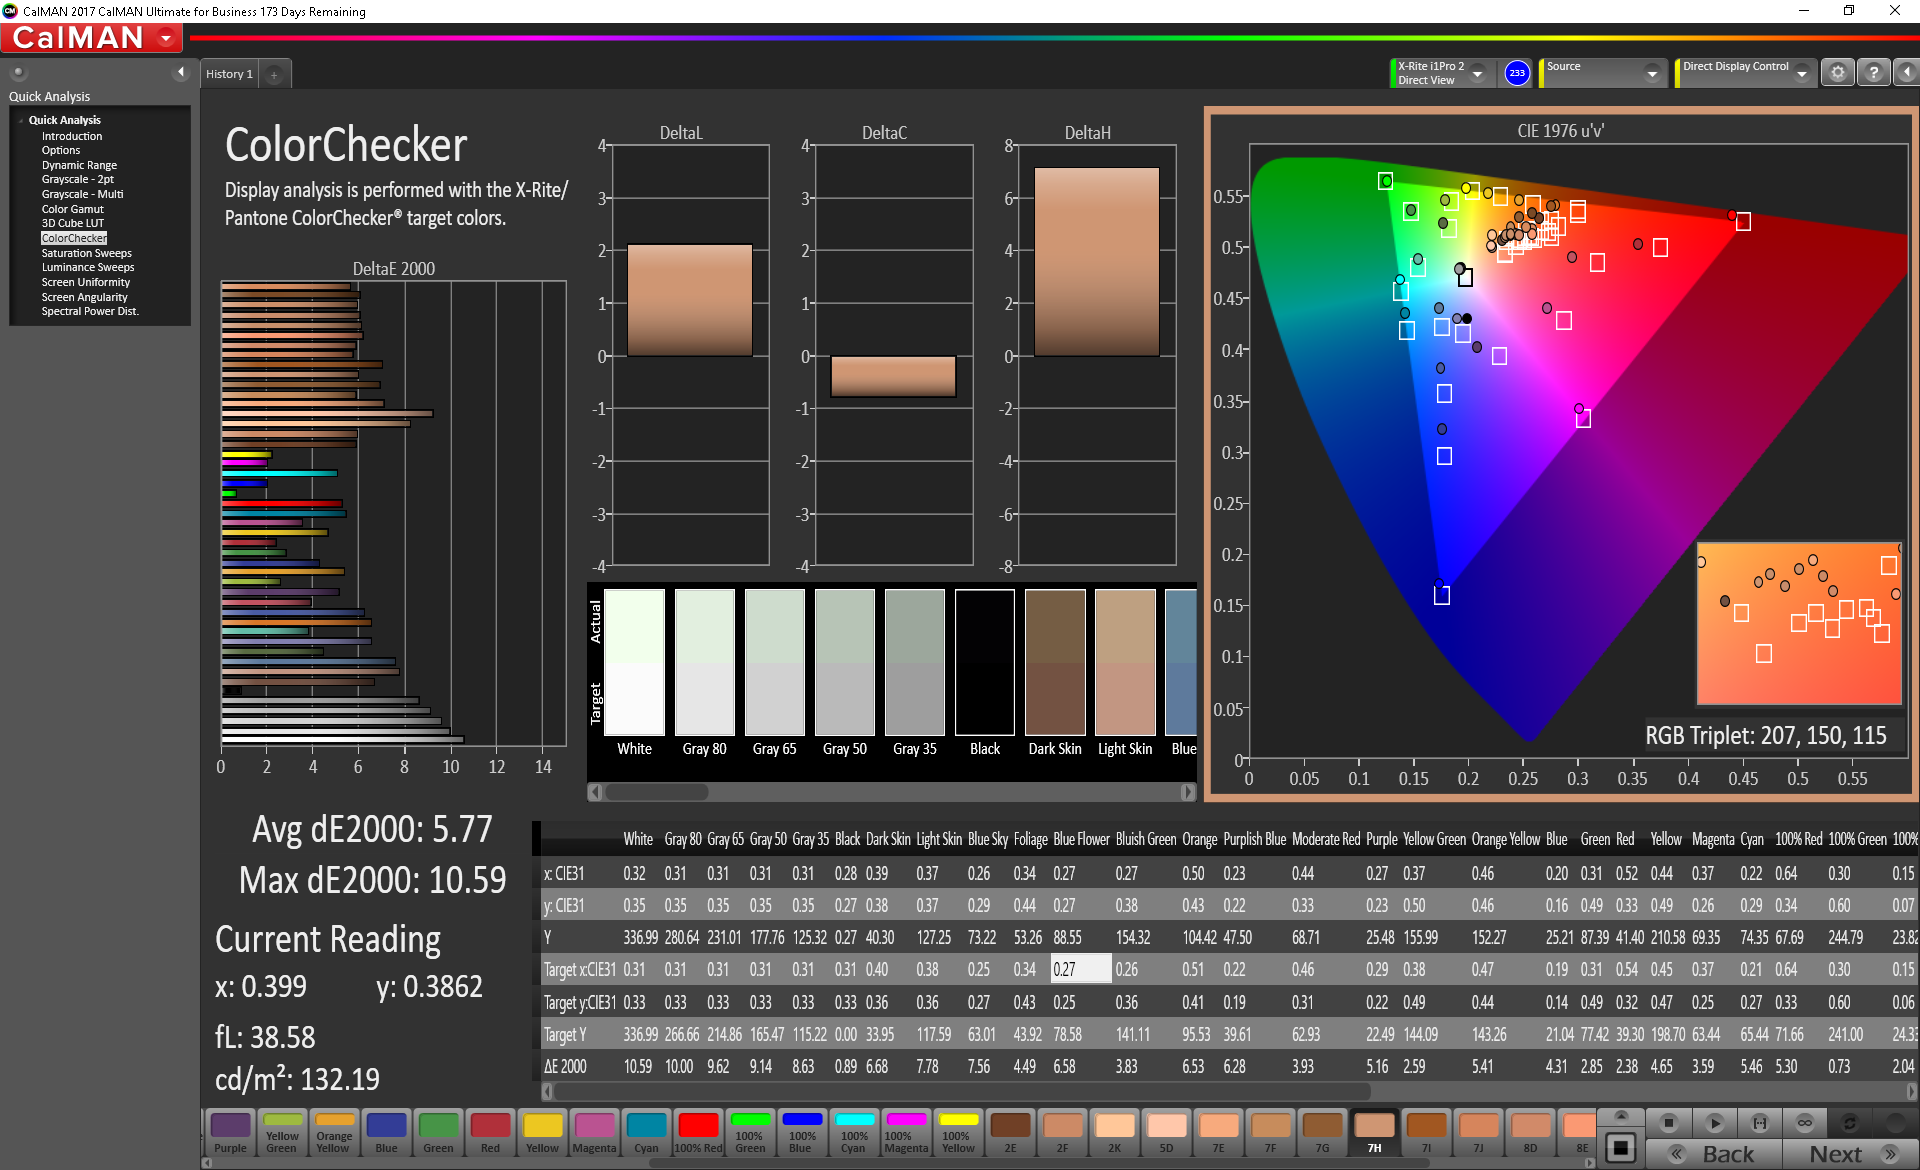
ΔE ColorChecker Calman: 5.77 | ∀{0.5-29.43 Ø4.73}
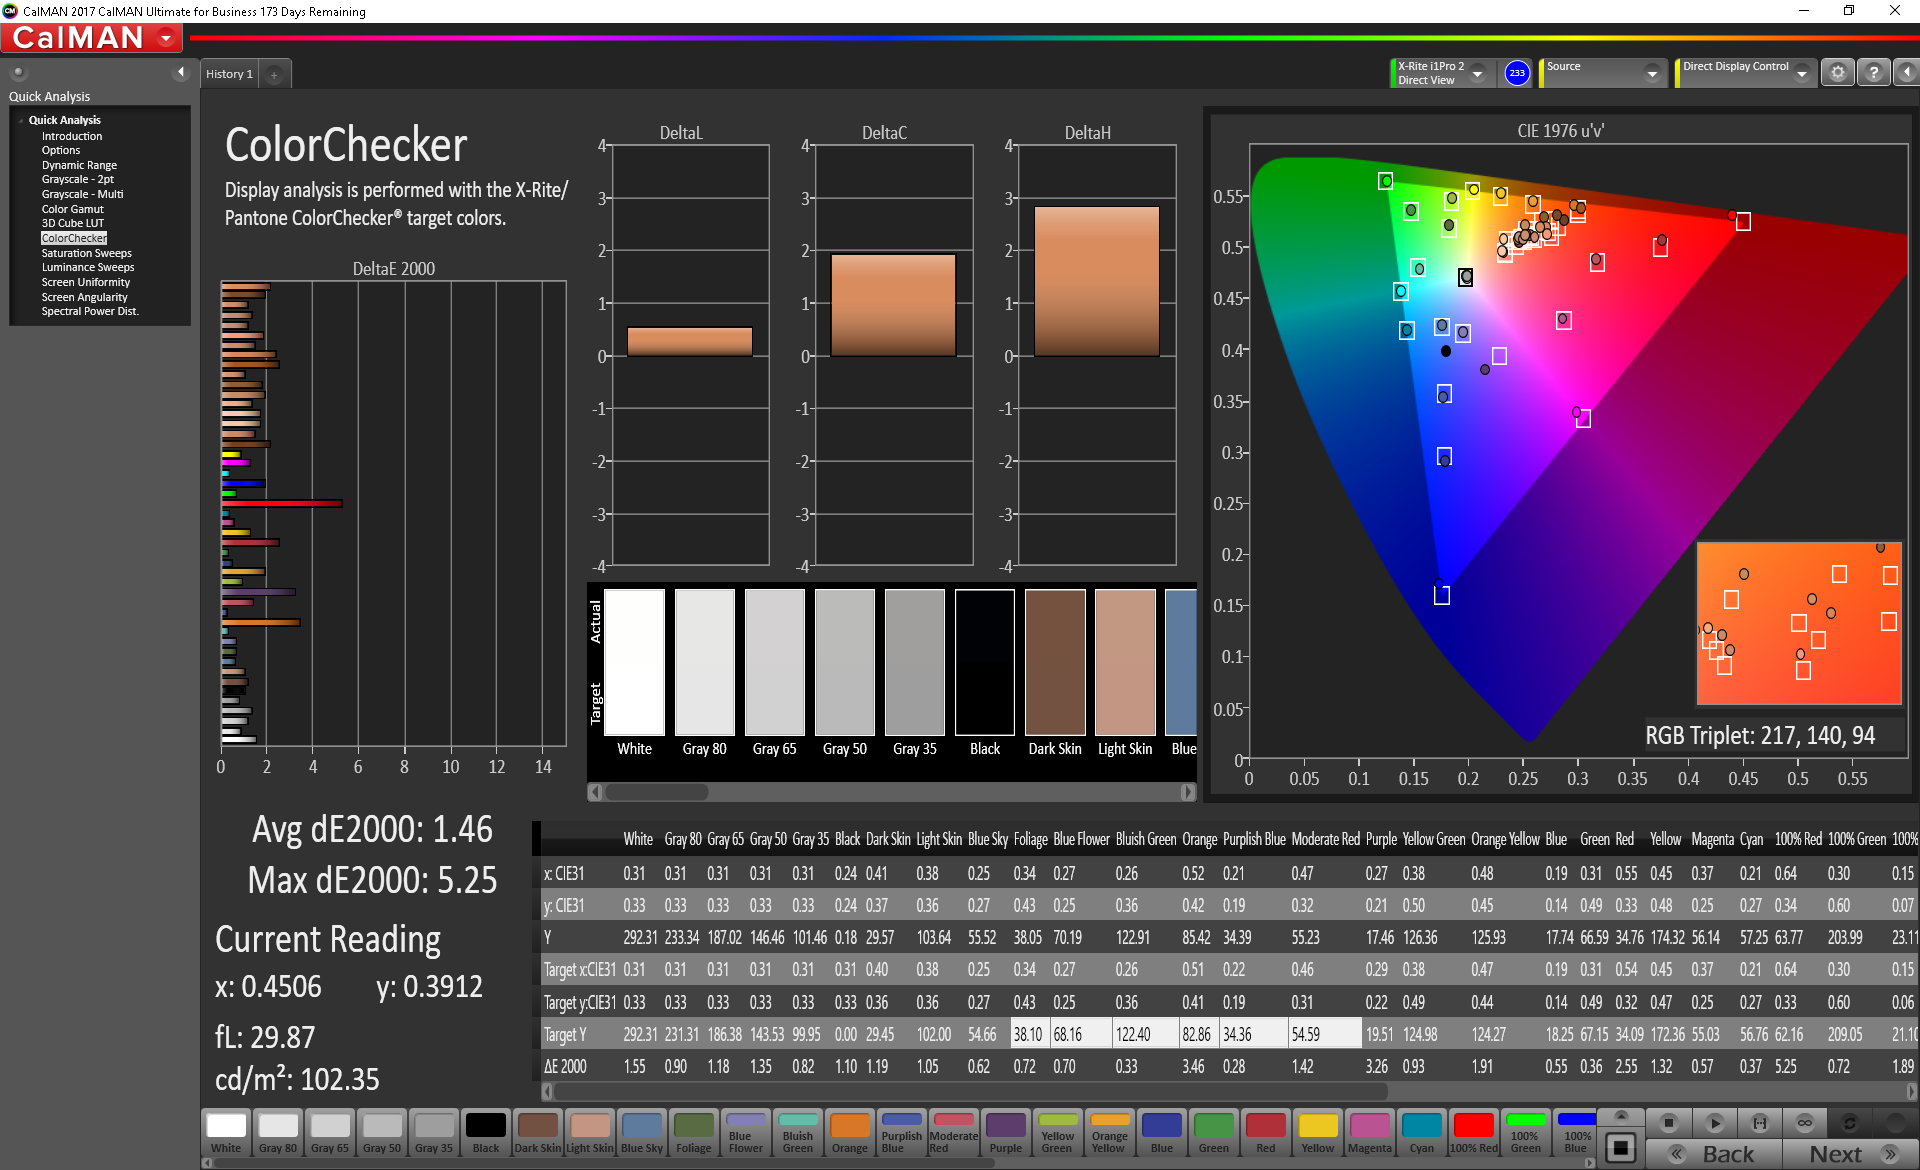
calibrated: 1.46
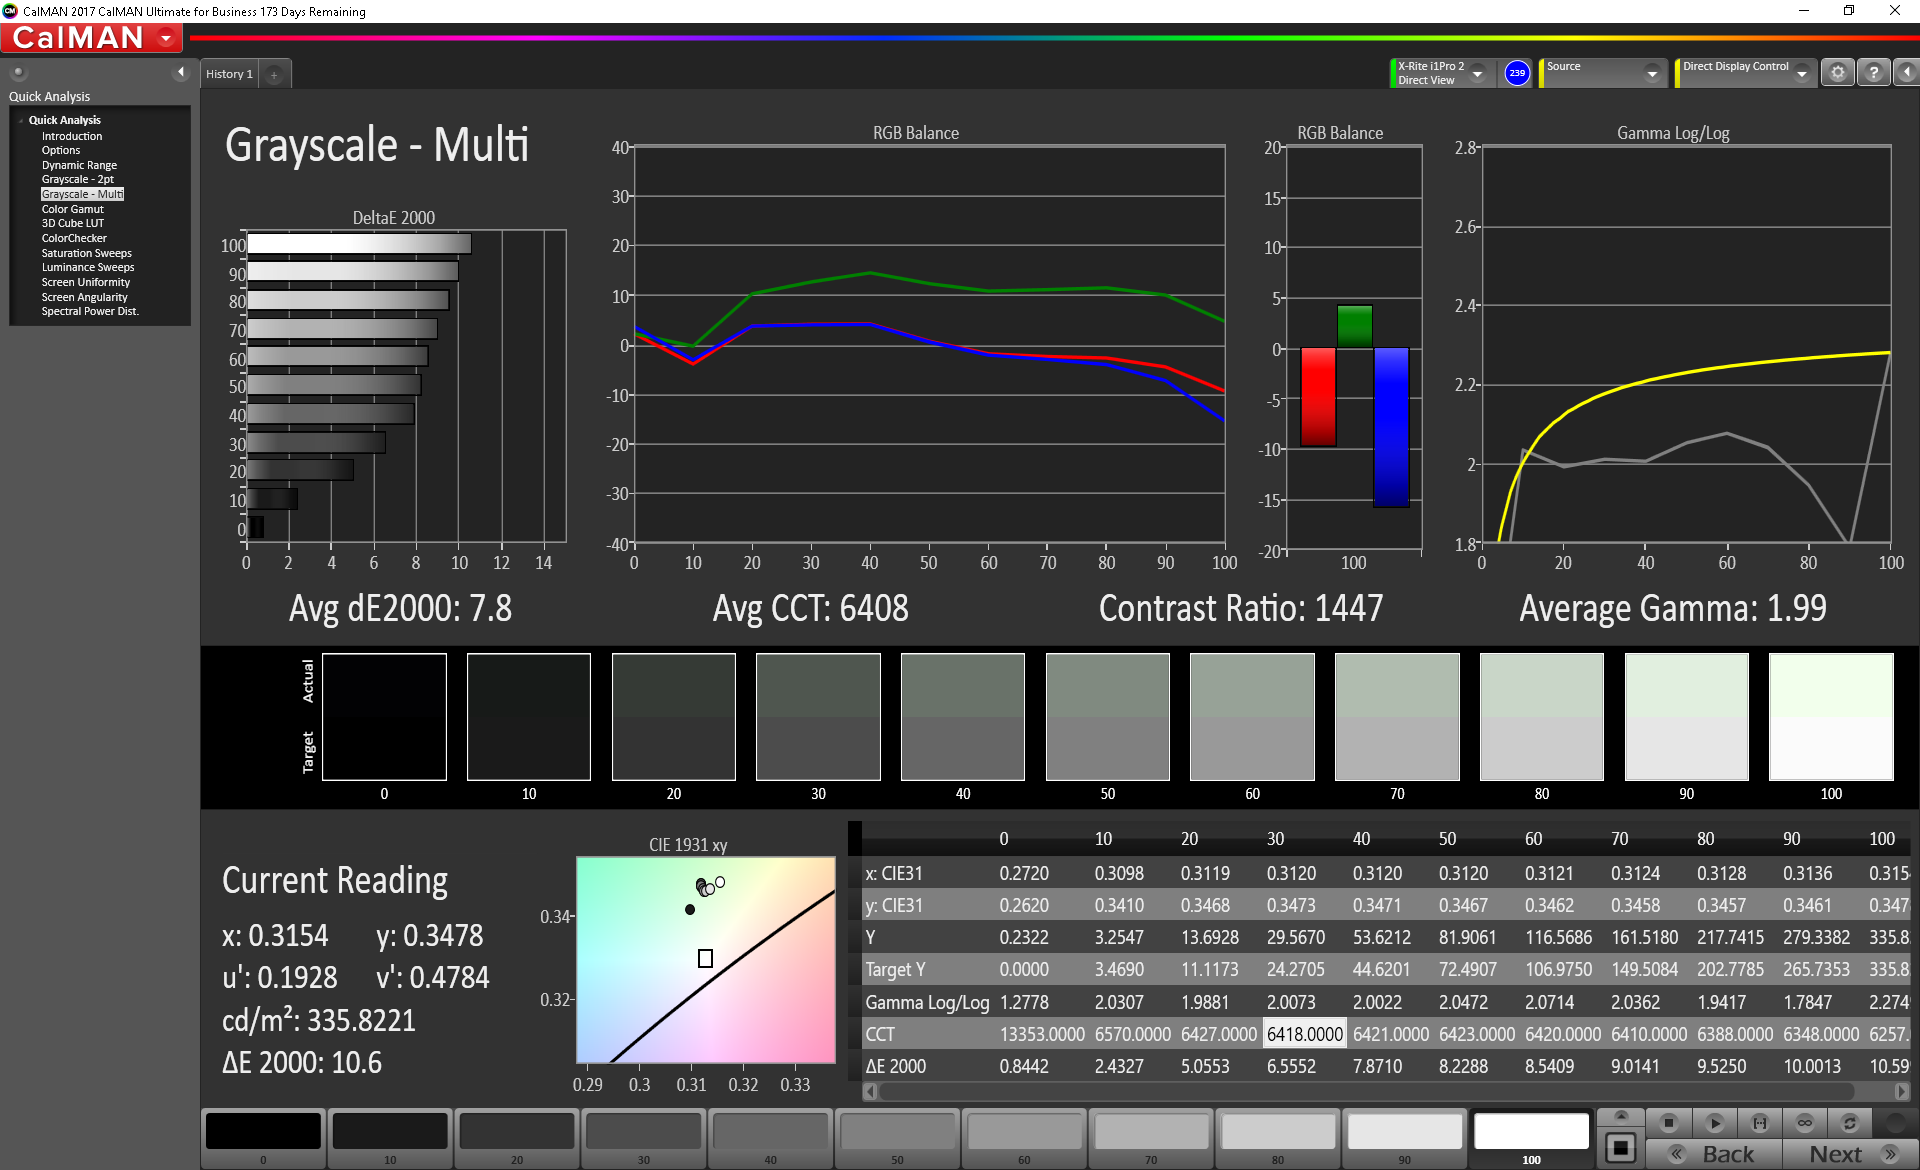
ΔE Greyscale Calman: 7.8 | ∀{0.09-98 Ø4.97}
96% sRGB (Argyll 1.6.3 3D)
61% AdobeRGB 1998 (Argyll 1.6.3 3D)
67.2% AdobeRGB 1998 (Argyll 3D)
95.8% sRGB (Argyll 3D)
65.4% Display P3 (Argyll 3D)
Gamma: 1.99
CCT: 6408 K
| Lenovo ThinkPad X380 Yoga-20LH000LUS Lenovo LEN4094, IPS, 13.3", 1920x1080 | Lenovo ThinkPad X380 Yoga 20LJS02W00 Lenovo M133NWF4 R3, IPS, 13.3", 1920x1080 | Lenovo ThinkPad X1 Yoga 2018-20LD0015US Lenovo LEN40A9, IPS, 14", 1920x1080 | HP Spectre x360 13-ae048ng Chi Mei (CMN1376), IPS, 13.3", 1920x1080 | Dell Latitude 7390 2-in-1 AUO462D, IPS, 13.3", 1920x1080 | Microsoft Surface Book 2 Panasonic MEI96A2 , IPS, 13.5", 3000x2000 | |
|---|---|---|---|---|---|---|
| Display | 1% | -8% | 4% | -7% | 2% | |
| Display P3 Coverage (%) | 65.4 | 65.9 1% | 60.9 -7% | 68.1 4% | 62.5 -4% | 67.9 4% |
| sRGB Coverage (%) | 95.8 | 95.8 0% | 86.4 -10% | 99.5 4% | 86.1 -10% | 95.7 0% |
| AdobeRGB 1998 Coverage (%) | 67.2 | 67.8 1% | 61.9 -8% | 70.2 4% | 62.9 -6% | 69.4 3% |
| Response Times | -6% | 6% | 14% | -7% | -11% | |
| Response Time Grey 50% / Grey 80% * (ms) | 44 ? | 50 ? -14% | 40.4 ? 8% | 36 ? 18% | 48.8 ? -11% | 52.8 ? -20% |
| Response Time Black / White * (ms) | 29.6 ? | 29 ? 2% | 28.8 ? 3% | 27 ? 9% | 30.4 ? -3% | 30 ? -1% |
| PWM Frequency (Hz) | 962 ? | 1000 ? | 25000 ? | |||
| Screen | 14% | -6% | 15% | -10% | 37% | |
| Brightness middle (cd/m²) | 336.3 | 314 -7% | 267.2 -21% | 311 -8% | 318.2 -5% | 385 14% |
| Brightness (cd/m²) | 322 | 302 -6% | 239 -26% | 278 -14% | 312 -3% | 372 16% |
| Brightness Distribution (%) | 91 | 84 -8% | 75 -18% | 82 -10% | 83 -9% | 89 -2% |
| Black Level * (cd/m²) | 0.34 | 0.16 53% | 0.27 21% | 0.2 41% | 0.3 12% | 0.21 38% |
| Contrast (:1) | 989 | 1963 98% | 990 0% | 1555 57% | 1061 7% | 1833 85% |
| Colorchecker dE 2000 * | 5.77 | 5.73 1% | 3.5 39% | 3.98 31% | 4.25 26% | 1.6 72% |
| Colorchecker dE 2000 max. * | 10.59 | 10.43 2% | 6.4 40% | 8.48 20% | 9.49 10% | 4.5 58% |
| Colorchecker dE 2000 calibrated * | 1.46 | 3.81 -161% | 4.38 -200% | |||
| Greyscale dE 2000 * | 7.8 | 7.39 5% | 1.3 83% | 5.57 29% | 2.1 73% | 1.5 81% |
| Gamma | 1.99 111% | 2.14 103% | 2.146 103% | 2.51 88% | 2.311 95% | 2.22 99% |
| CCT | 6408 101% | 6351 102% | 6523 100% | 7810 83% | 6588 99% | 6502 100% |
| Color Space (Percent of AdobeRGB 1998) (%) | 61 | 61 0% | 56 -8% | 64 5% | 56 -8% | 64 5% |
| Color Space (Percent of sRGB) (%) | 96 | 96 0% | 86 -10% | 99 3% | 85 -11% | 95.9 0% |
| Total Average (Program / Settings) | 3% /
9% | -3% /
-5% | 11% /
13% | -8% /
-9% | 9% /
24% |
* ... smaller is better
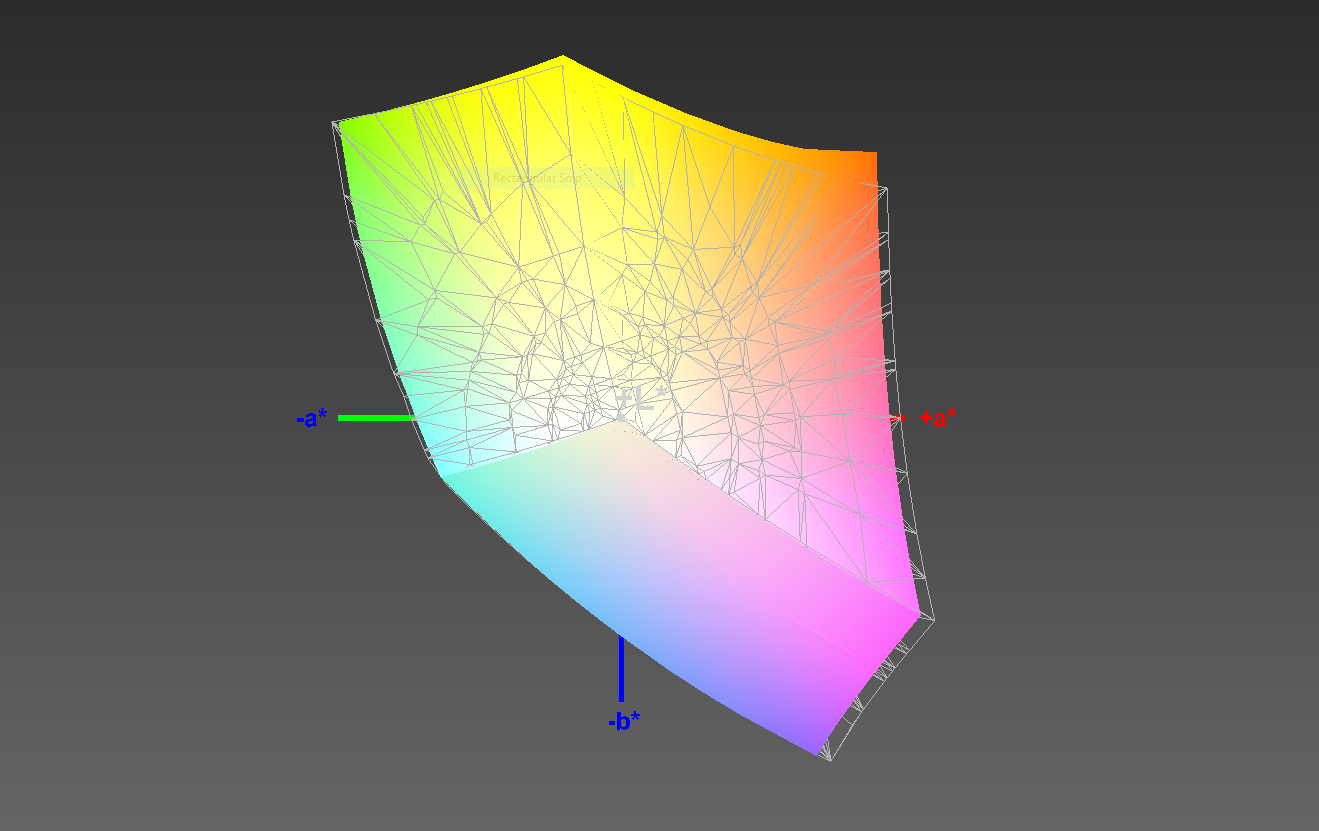
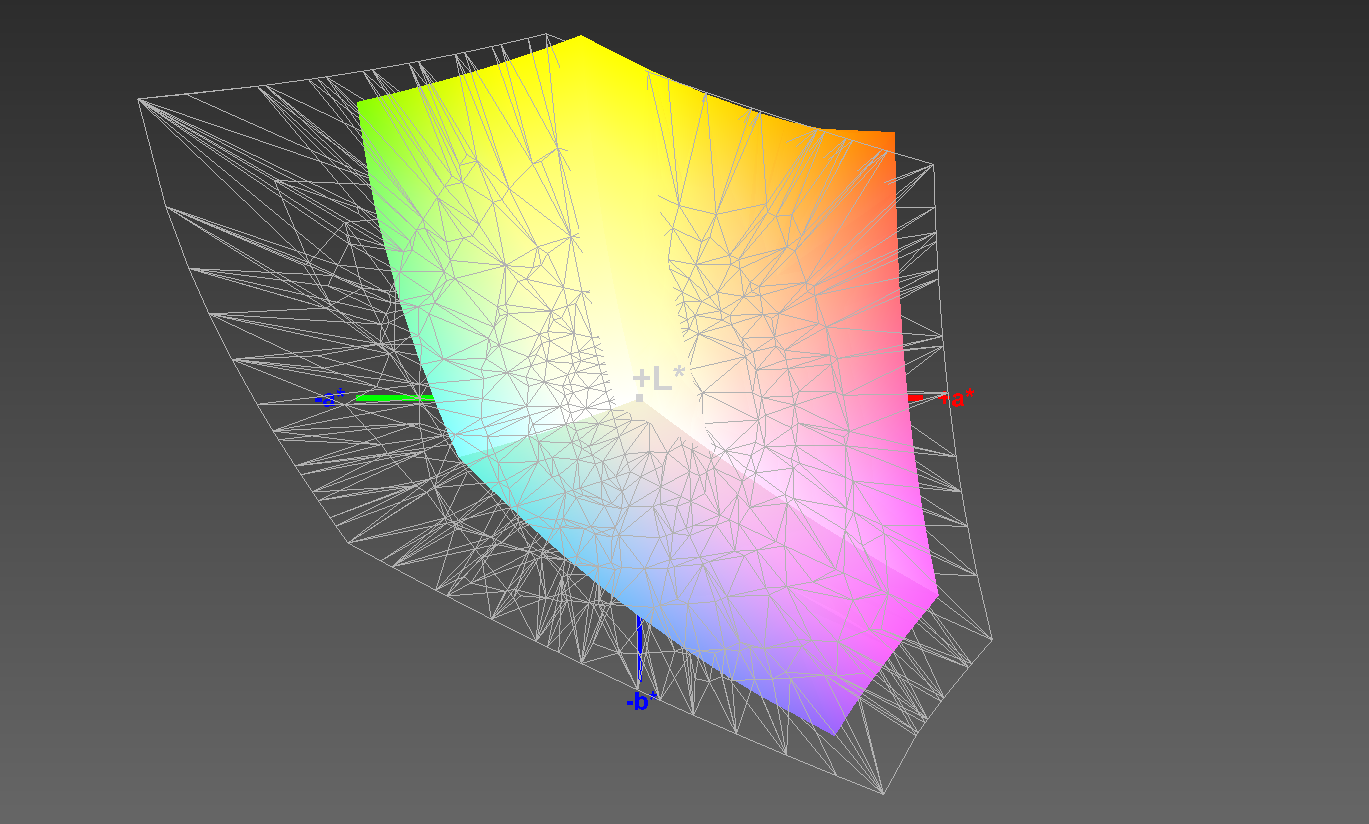
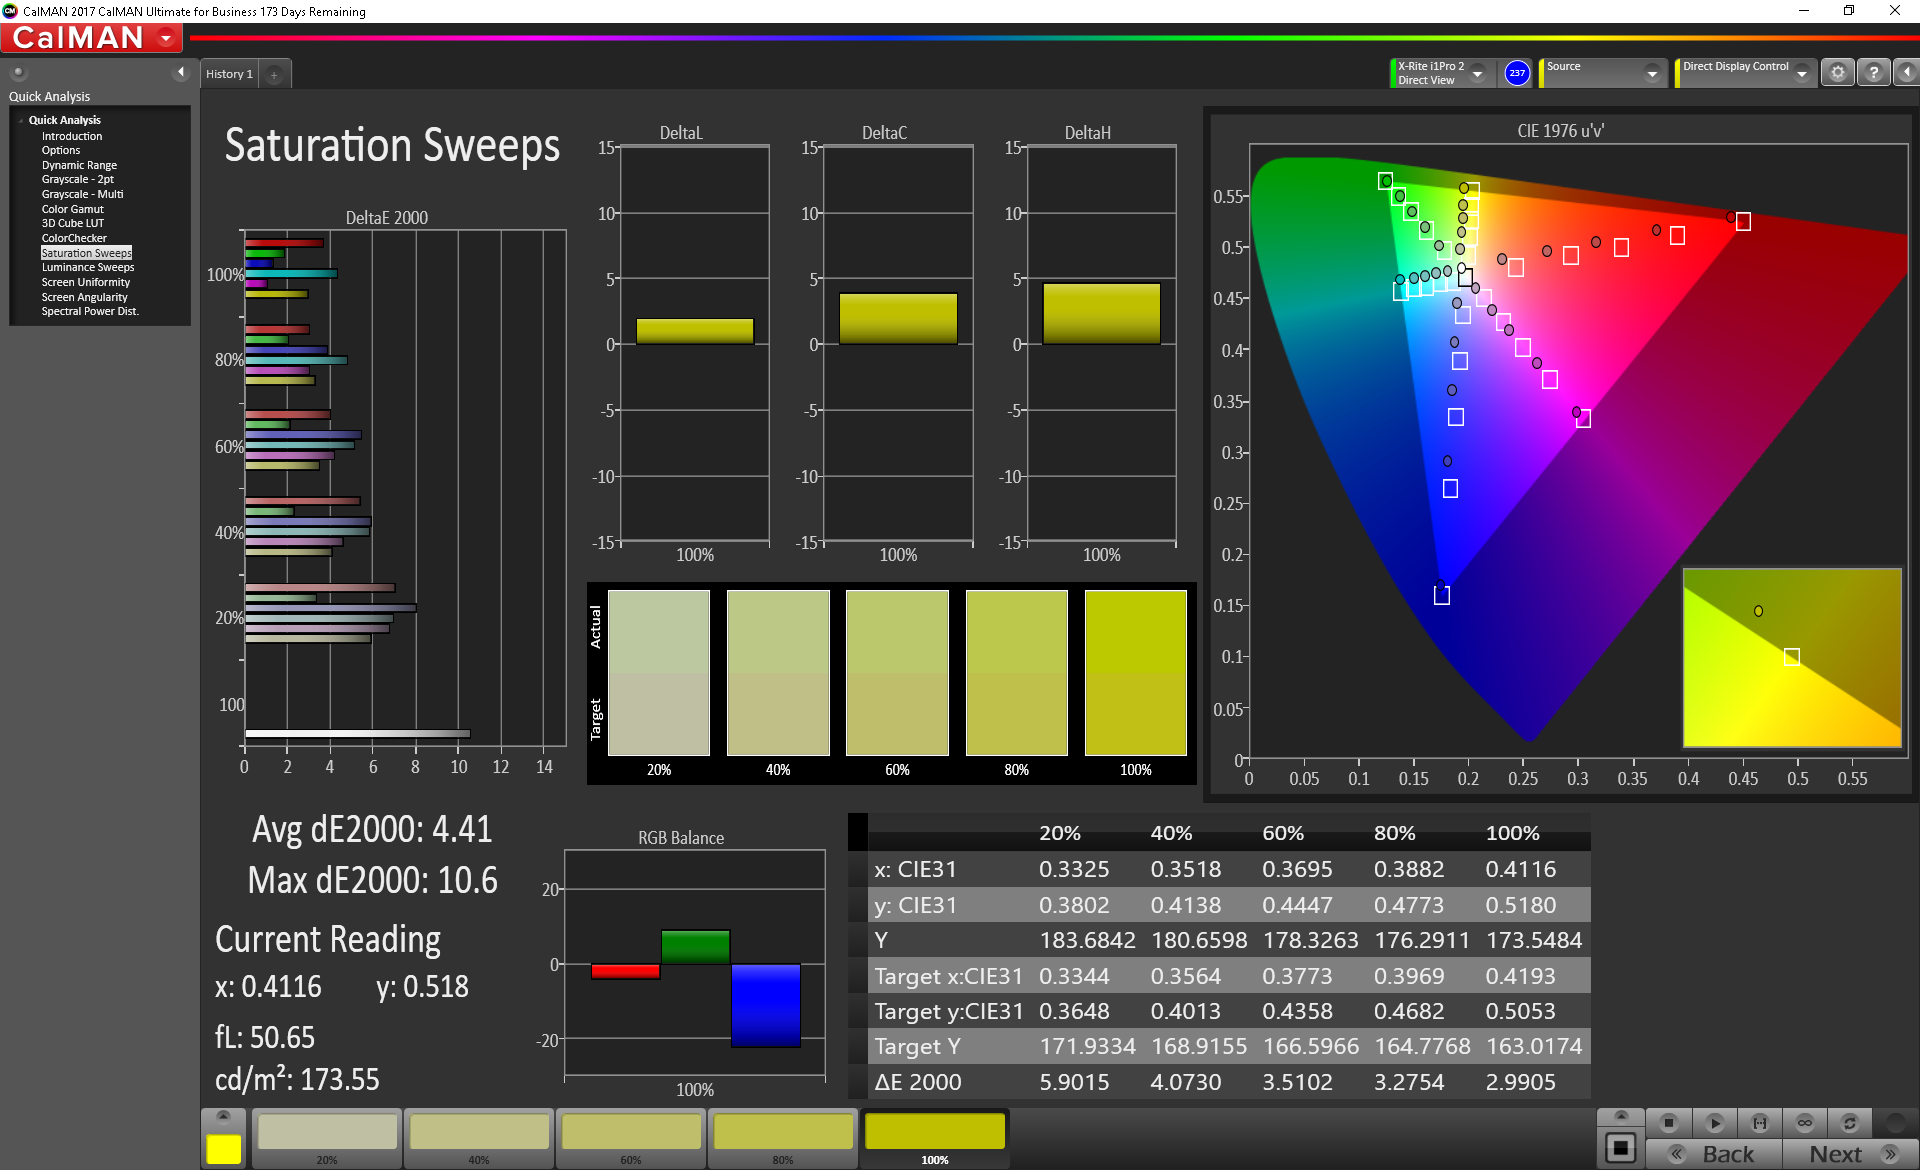
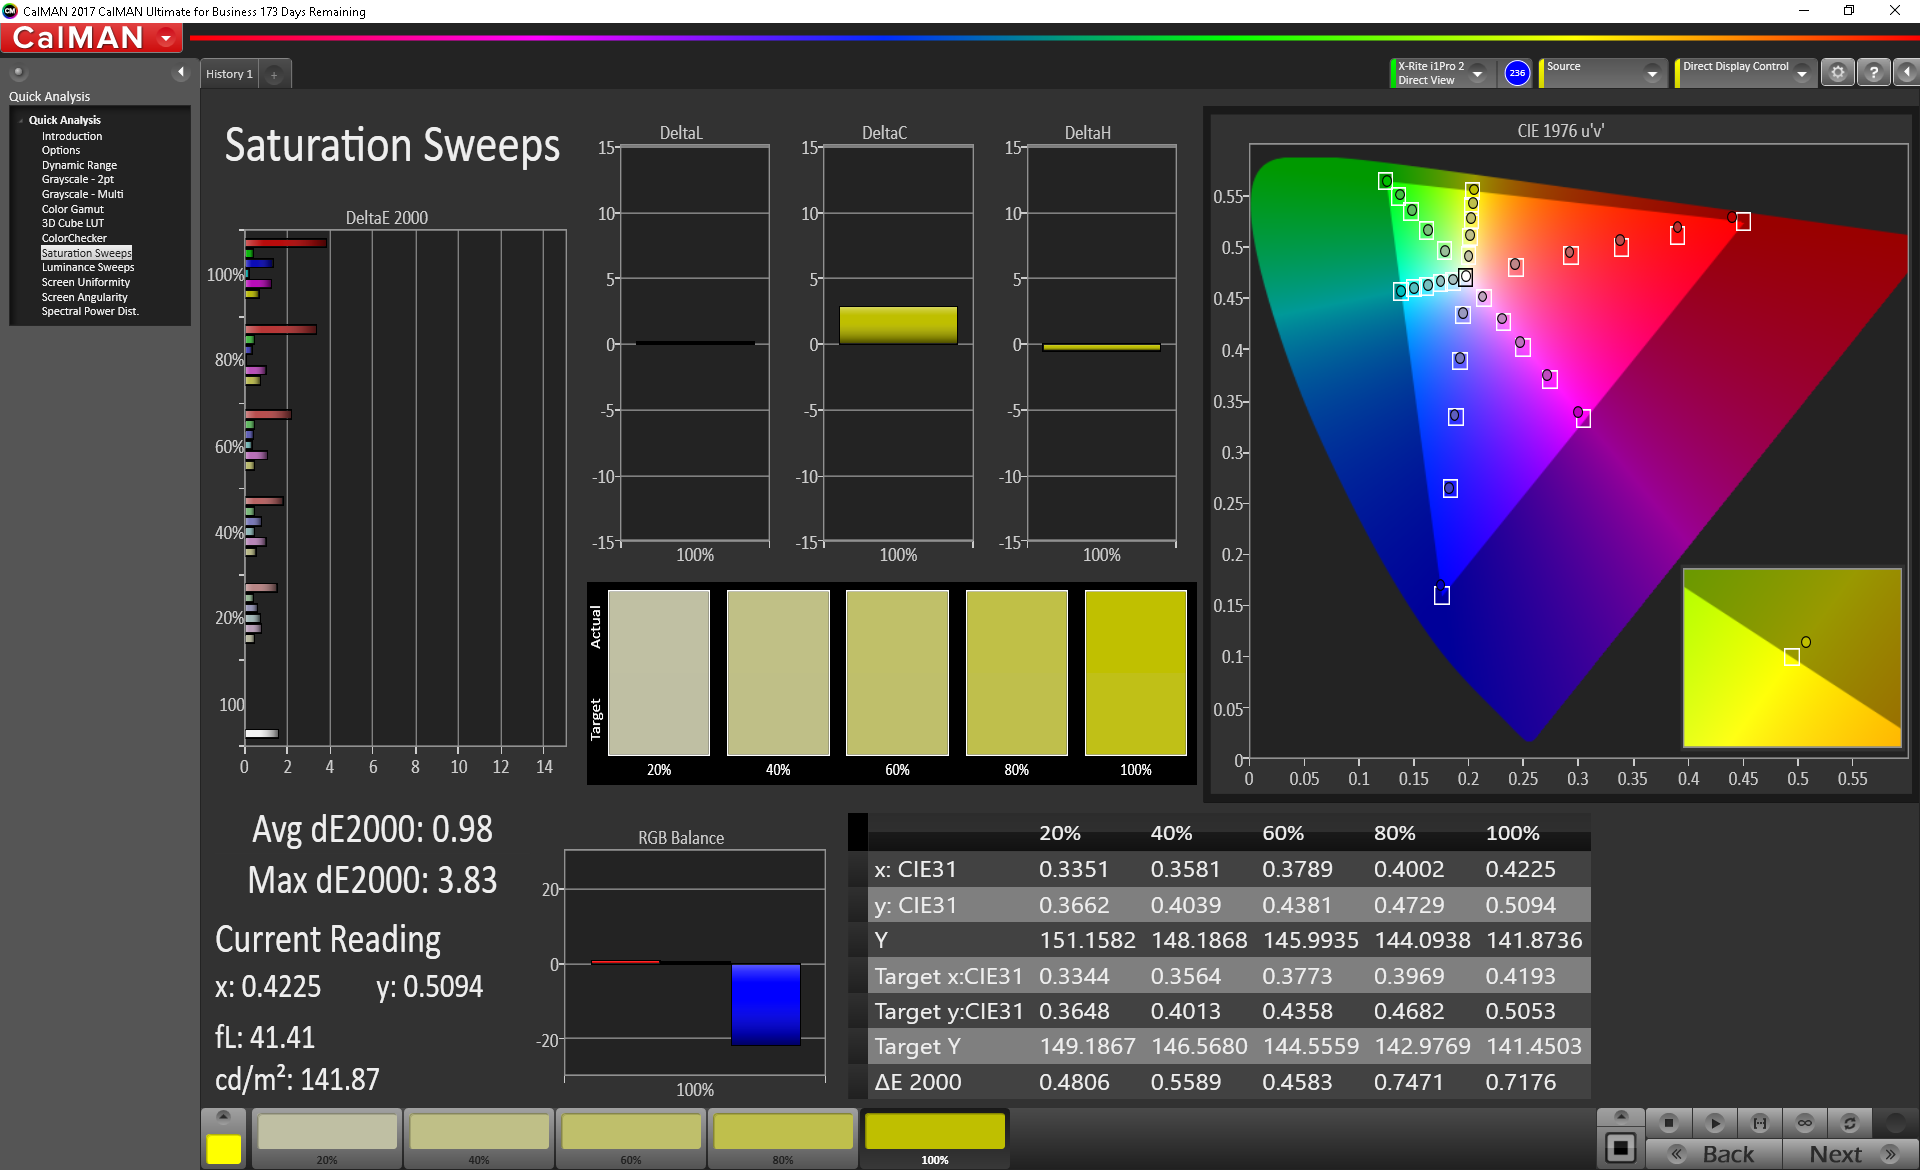
Color gamut coverage matches that of the i7 X380 Yoga exactly. Covering 96% of the sRGB gamut and 61% of the AdobeRGB color space, the X380 Yoga stands among the best convertibles. Combined with its excellent color accuracy (see below), the X380 Yoga is a serious contender for professionals (at least those that work in the sRGB color space).
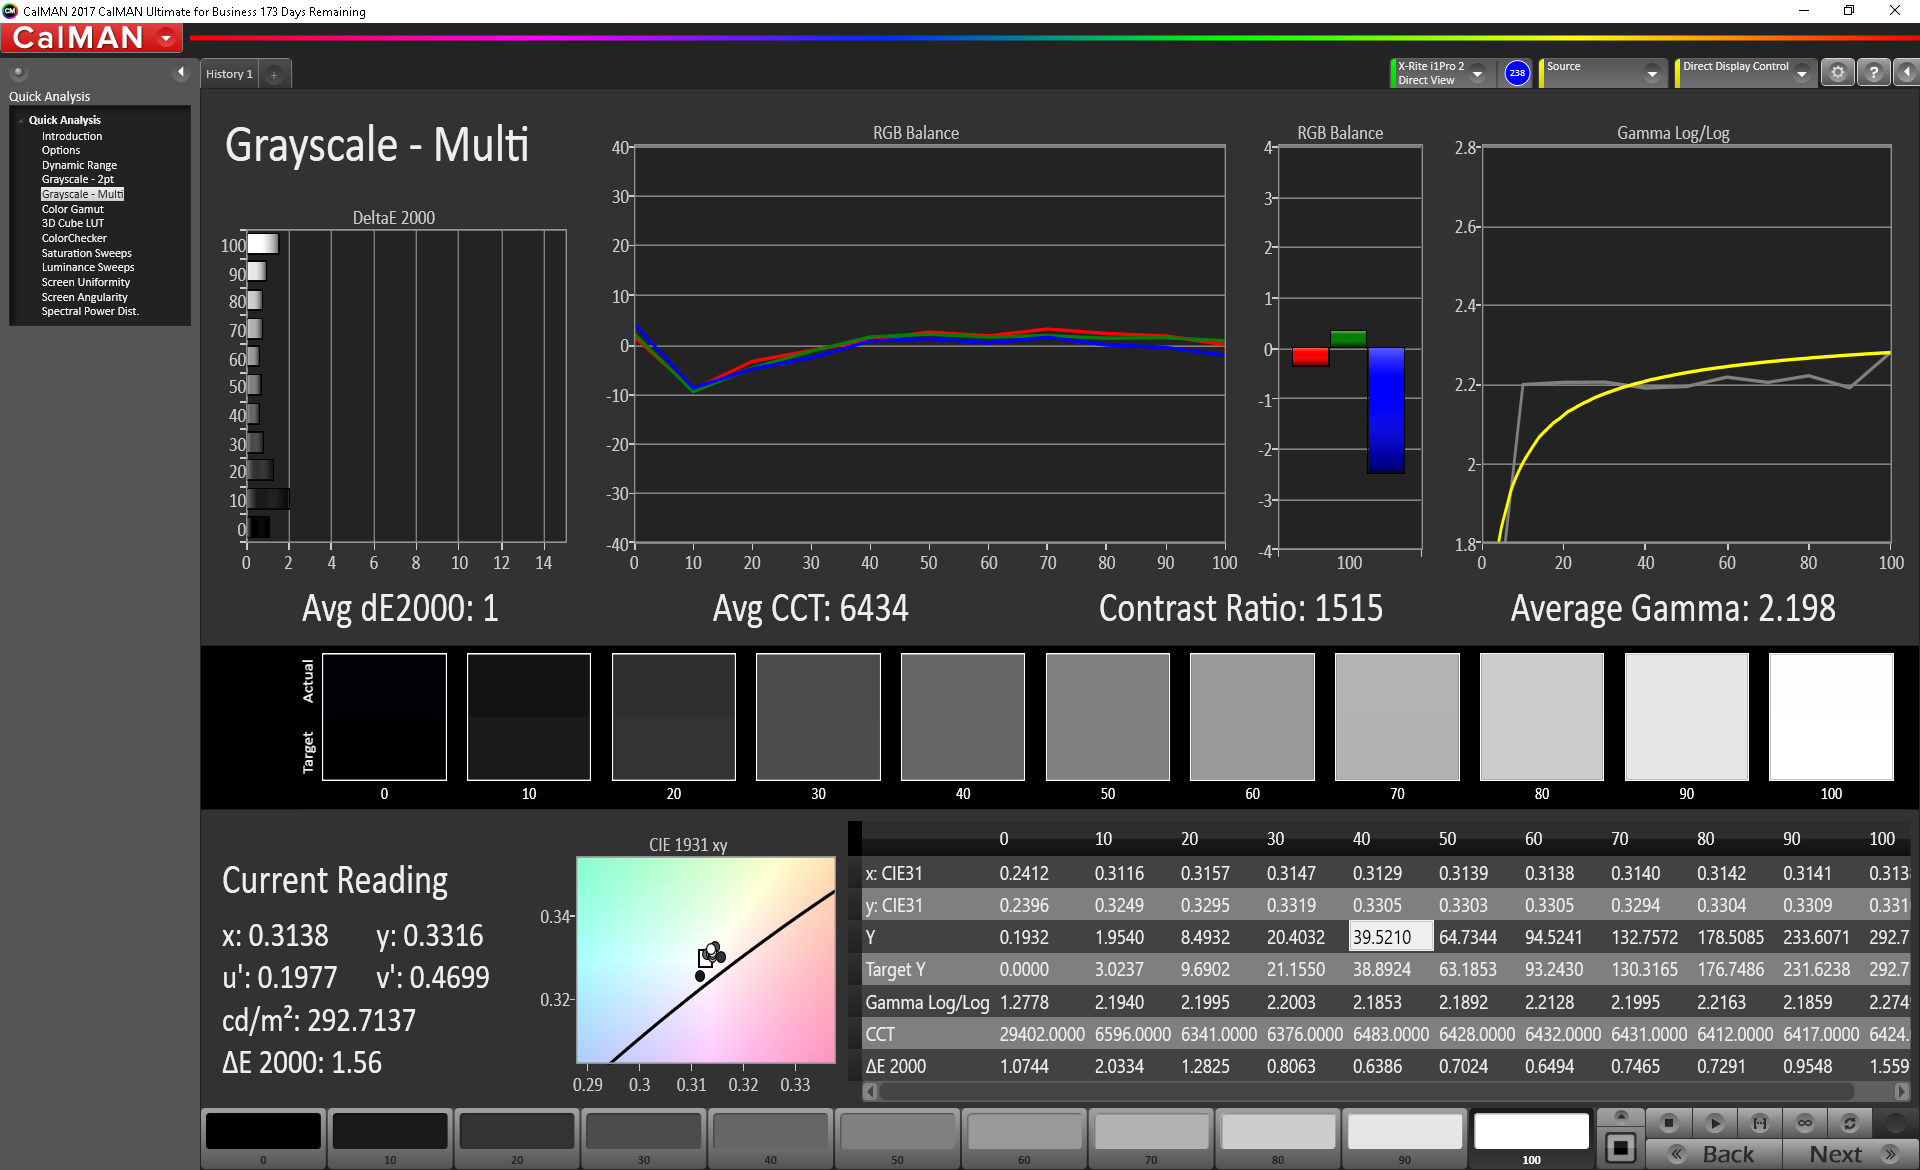
Color accuracy is, again, almost a carbon copy of its bigger brother's. Out of the box, the X380 Yoga is somewhat accurate with a DeltaE 2000 score of 5.77 for colors and 7.8 for blacks. Other convertibles have the X380 Yoga beat, but calibration tips the scales in the Yoga's favor. After a bit of work, the X380 Yoga sees excellent color reproduction; DeltaE 2000 scores drop to 1.46 and 1 for colors and blacks, respectively. Generally, a DeltaE 2000 score of 3 is considered acceptable for professional color work.
Display Response Times
| ↔ Response Time Black to White | ||
|---|---|---|
| 29.6 ms ... rise ↗ and fall ↘ combined | ↗ 15.6 ms rise | 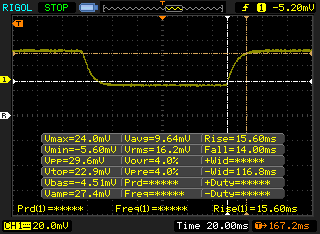 |
| ↘ 14 ms fall | ||
| The screen shows relatively slow response rates in our tests and may be too slow for gamers. In comparison, all tested devices range from 0.1 (minimum) to 240 (maximum) ms. » 79 % of all devices are better. This means that the measured response time is worse than the average of all tested devices (19.9 ms). | ||
| ↔ Response Time 50% Grey to 80% Grey | ||
| 44 ms ... rise ↗ and fall ↘ combined | ↗ 21.2 ms rise | 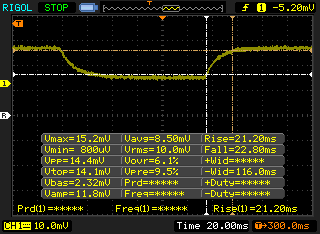 |
| ↘ 22.8 ms fall | ||
| The screen shows slow response rates in our tests and will be unsatisfactory for gamers. In comparison, all tested devices range from 0.165 (minimum) to 636 (maximum) ms. » 73 % of all devices are better. This means that the measured response time is worse than the average of all tested devices (31.1 ms). | ||
Screen Flickering / PWM (Pulse-Width Modulation)
| Screen flickering / PWM detected | 962 Hz | ≤ 99 % brightness setting | 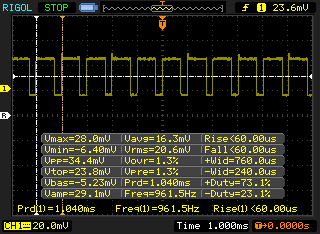 |
The display backlight flickers at 962 Hz (worst case, e.g., utilizing PWM) Flickering detected at a brightness setting of 99 % and below. There should be no flickering or PWM above this brightness setting. The frequency of 962 Hz is quite high, so most users sensitive to PWM should not notice any flickering. In comparison: 52 % of all tested devices do not use PWM to dim the display. If PWM was detected, an average of 7784 (minimum: 5 - maximum: 343500) Hz was measured. | |||
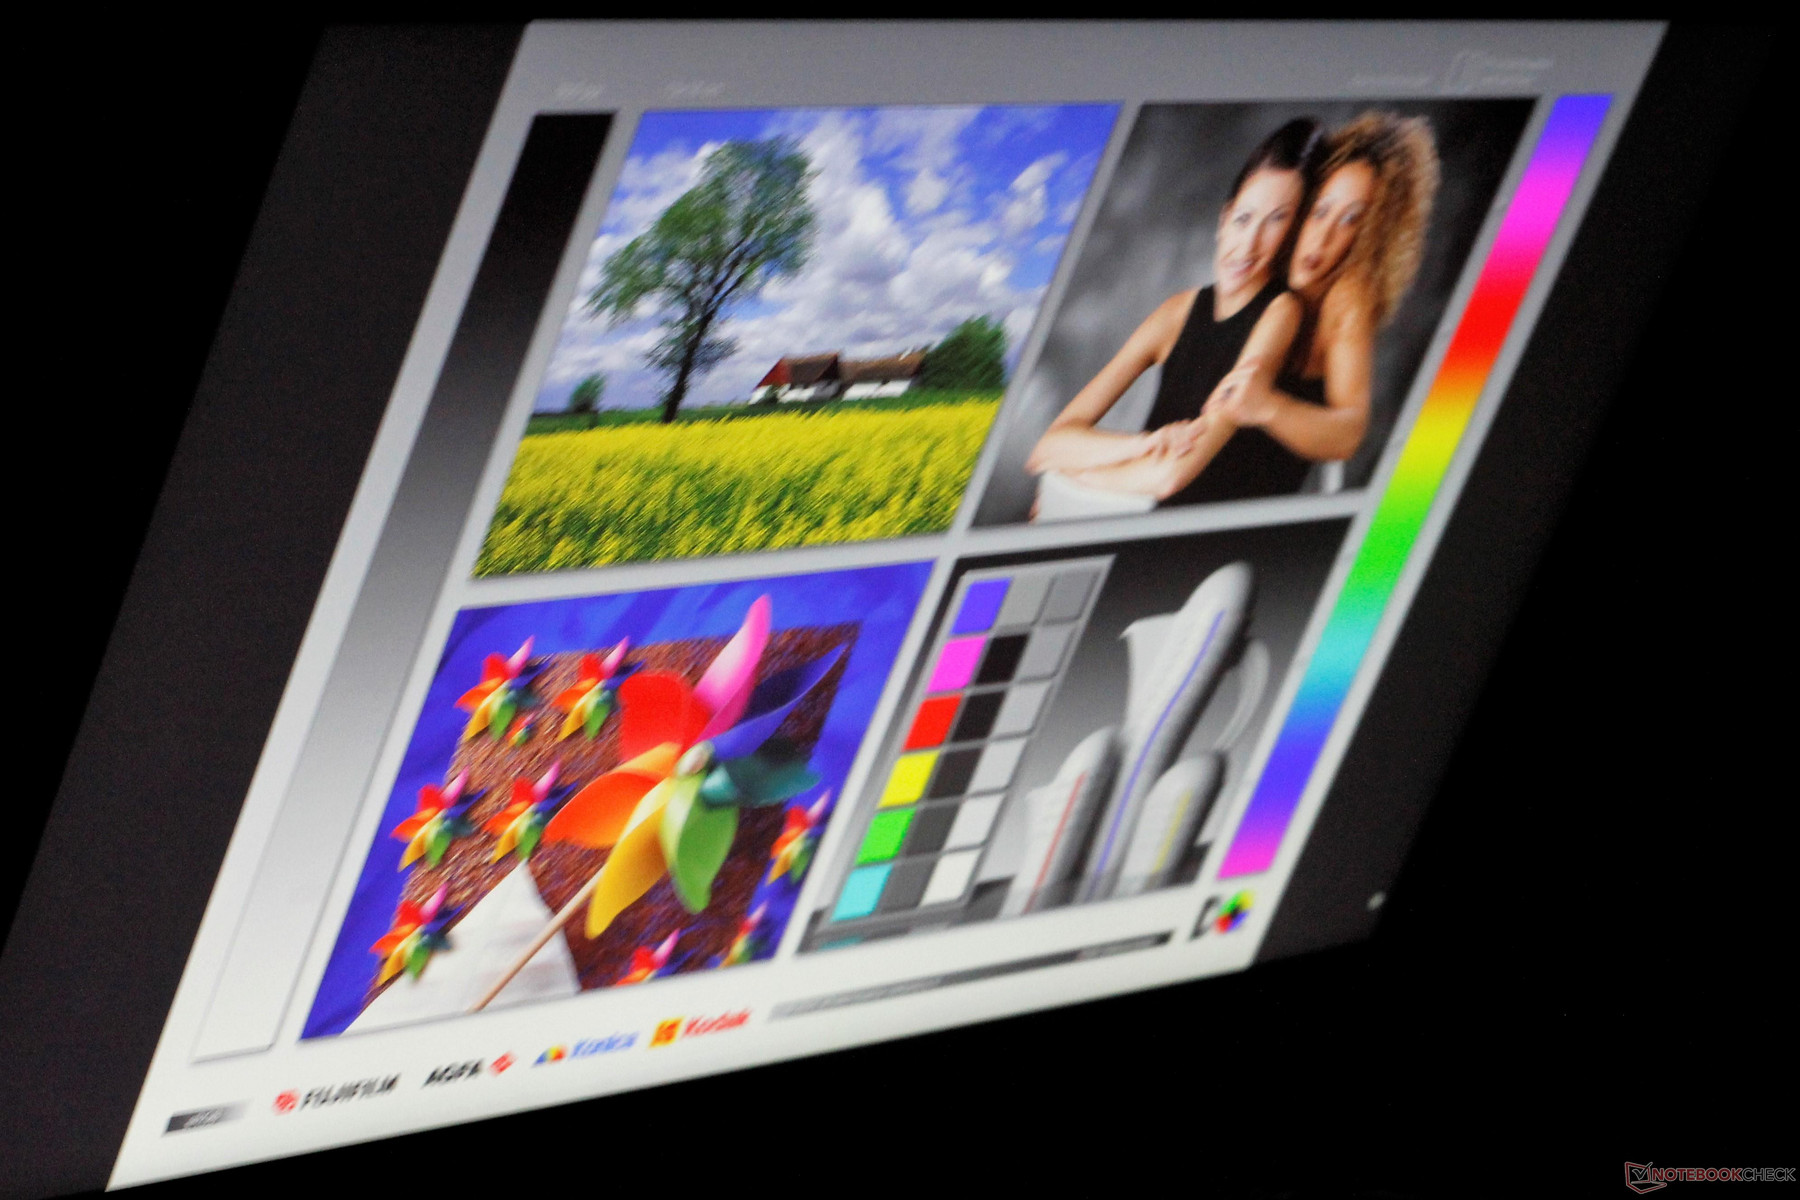
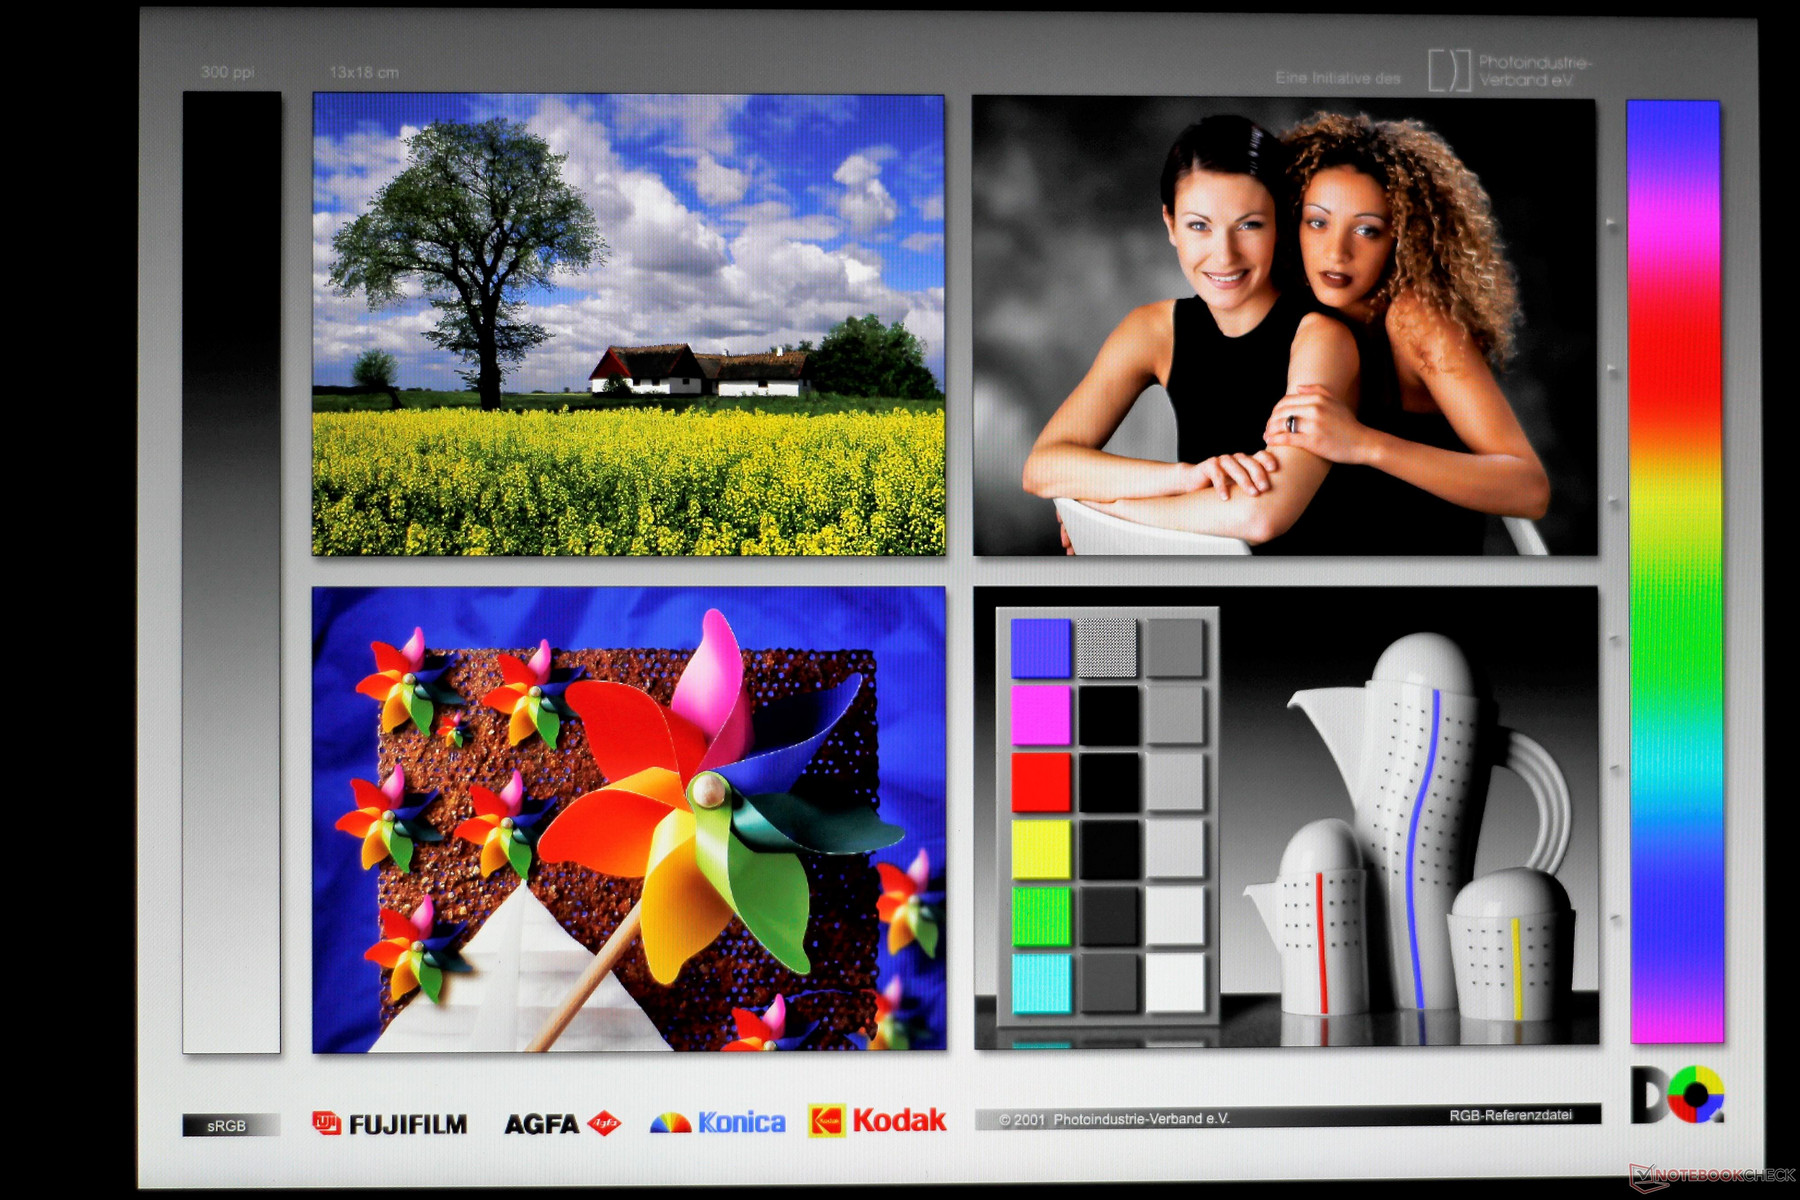
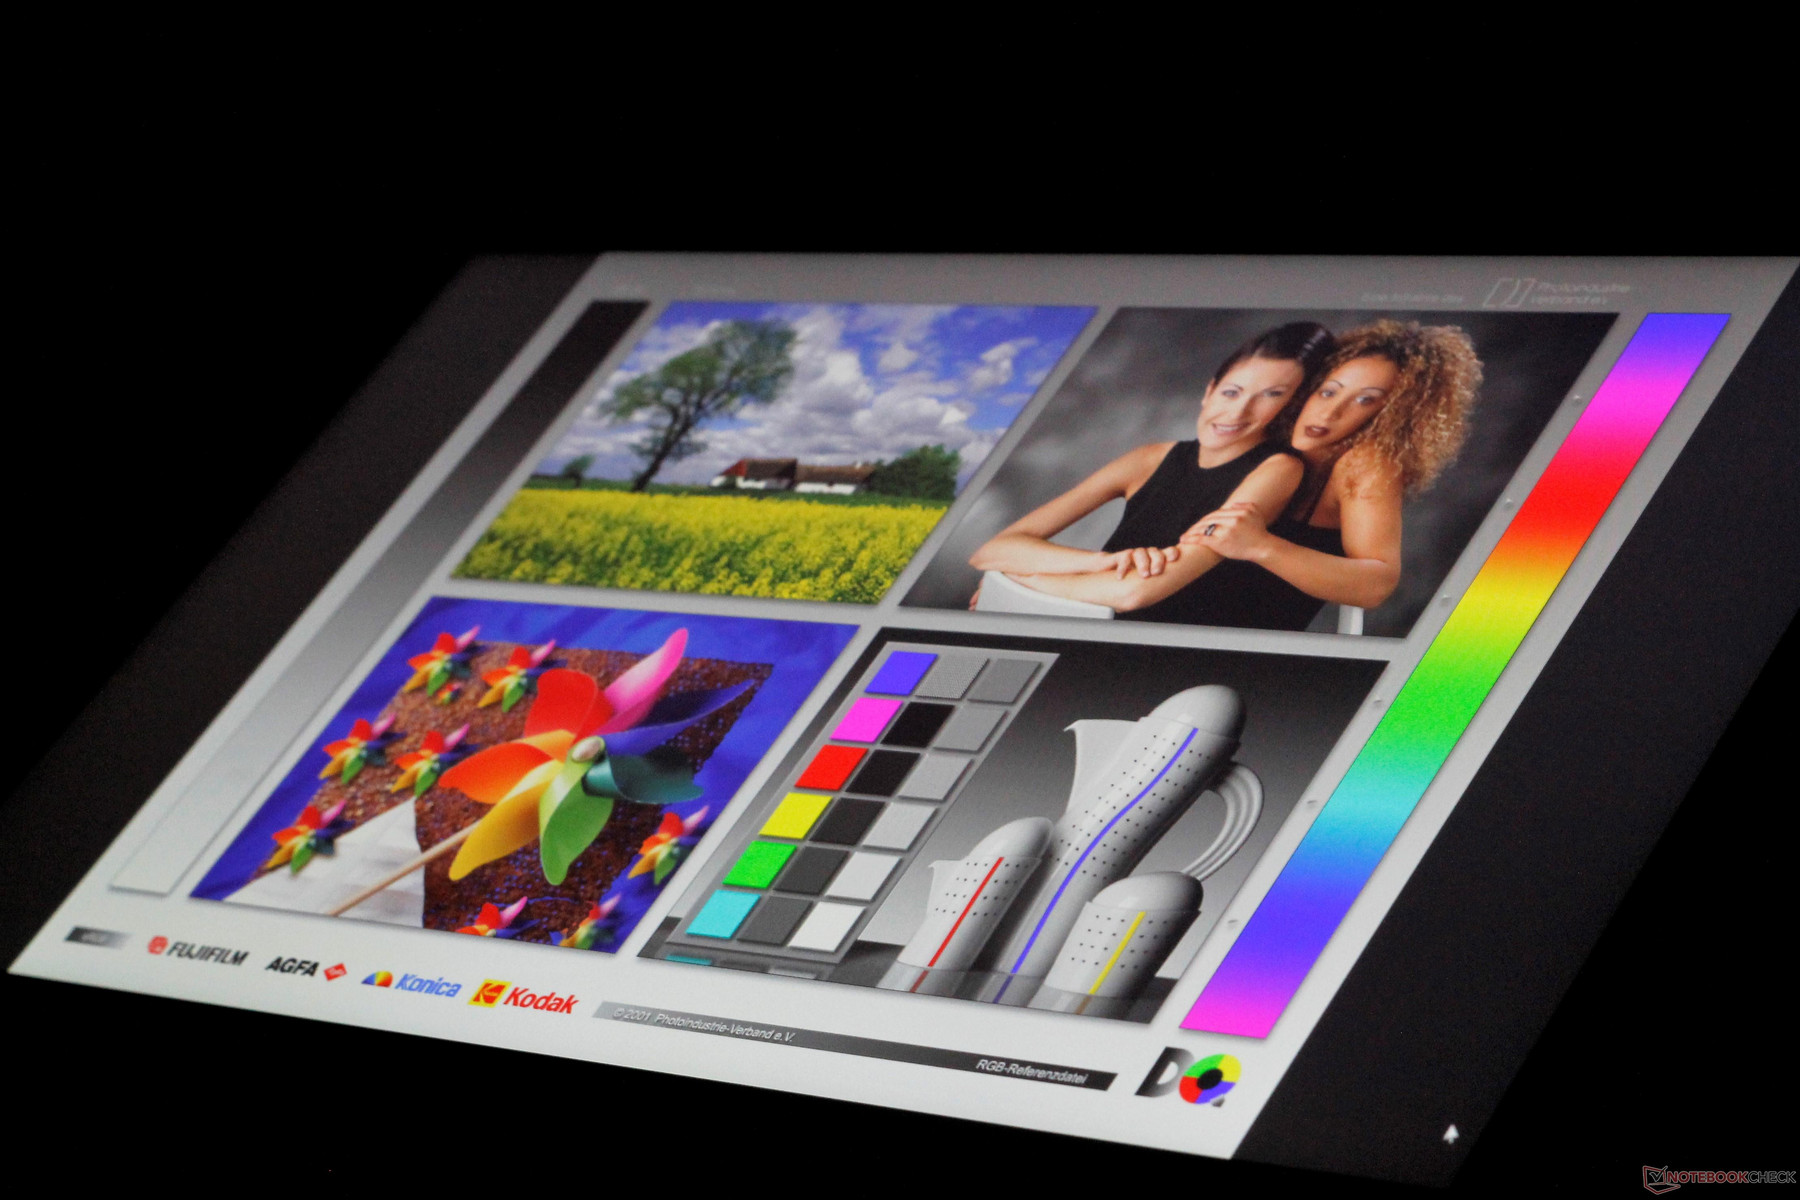
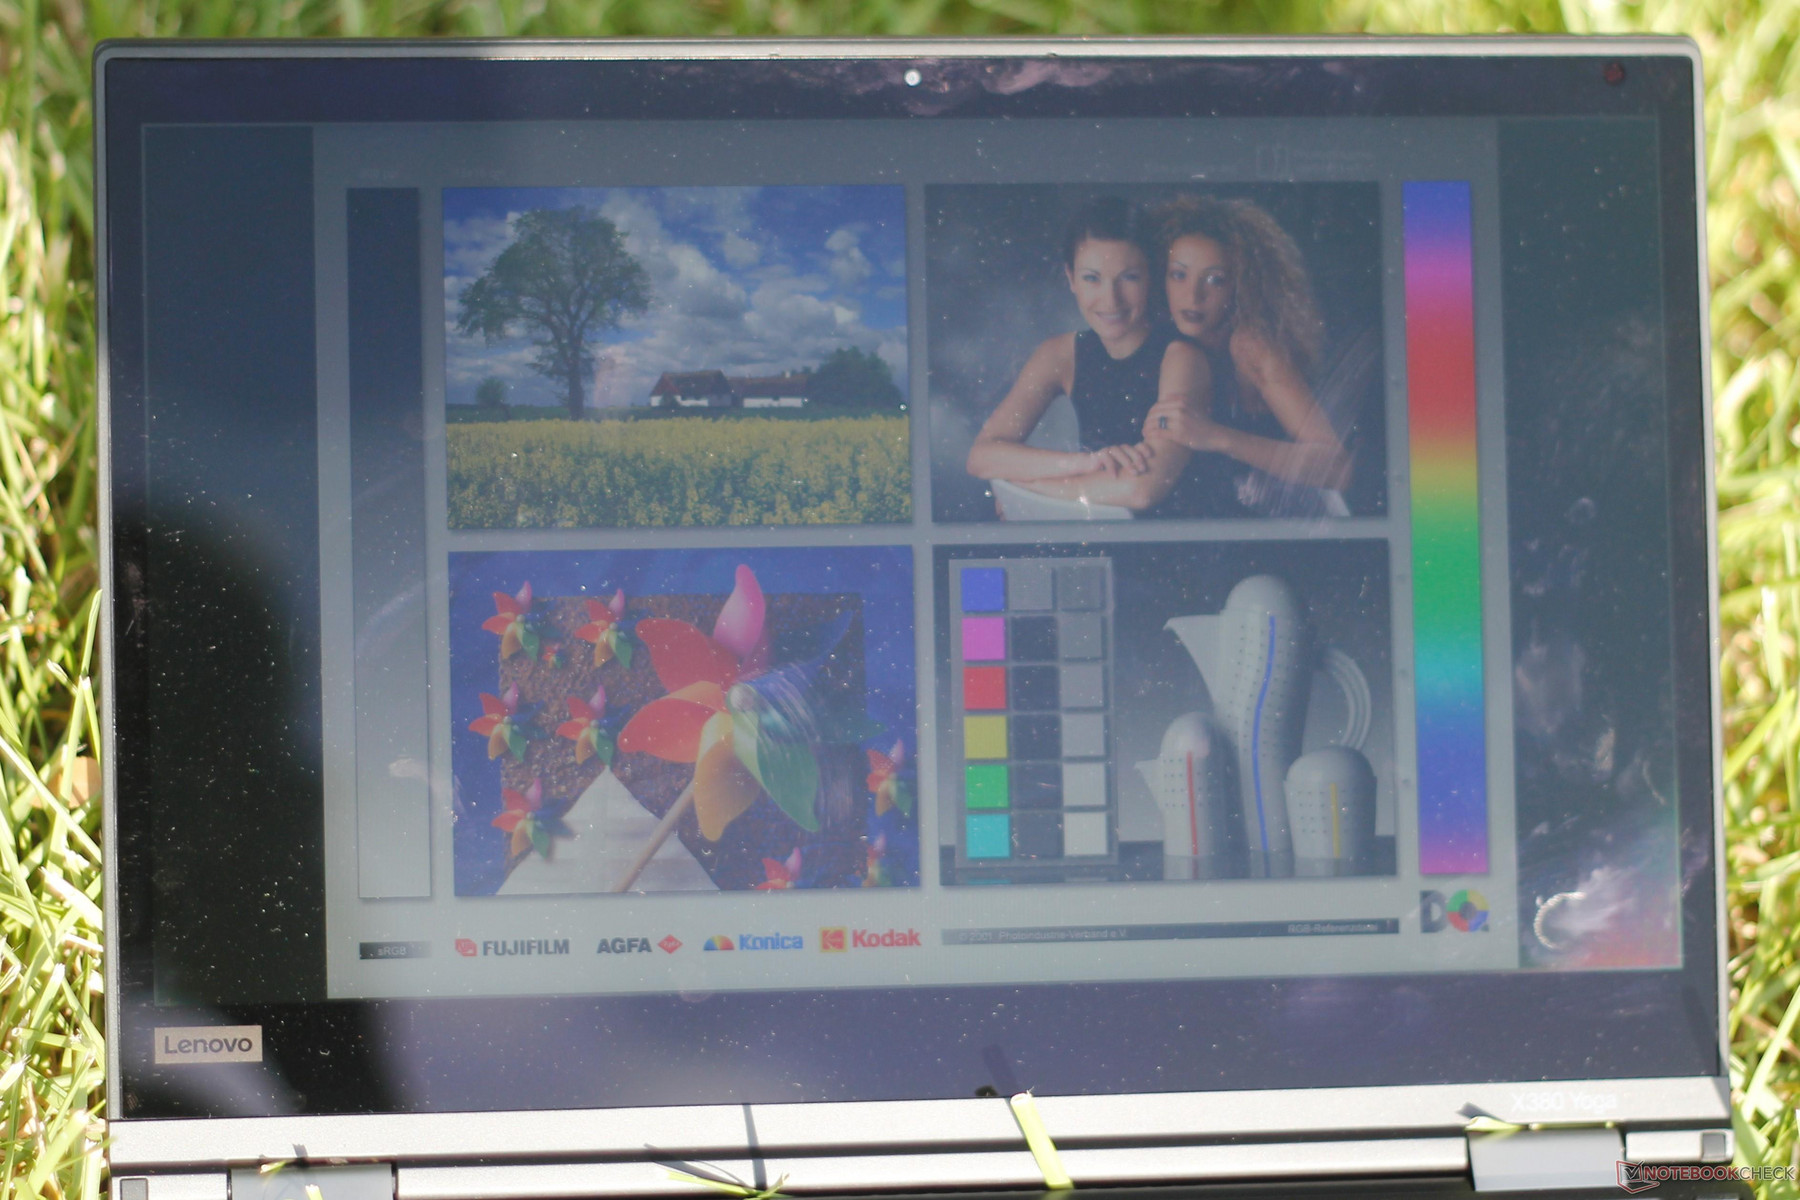
Viewing angles are good, as should be expected of an IPS panel. No matter how the X380 is held, images and text should remain clear and accurate. The screen gets dimmer when viewed from angles greater than about 60°, but this does not detract much from the overall viewing experience. Backlight bleed is almost non-existent; only the top corners show any signs of bleed, and even then, it is minimal. The X380 Yoga has an anti-reflective coating across the display glass. This coating greatly cuts reflections and allows for outdoor use. There is an iridescent band that appears when bright light hits the screen from an angle.


Performance
The disappointing performance we saw in the i7-equipped X380 Yoga begs the question: how much performance will actually be lost by downgrading to a Core i5? In short: not much.

Processor
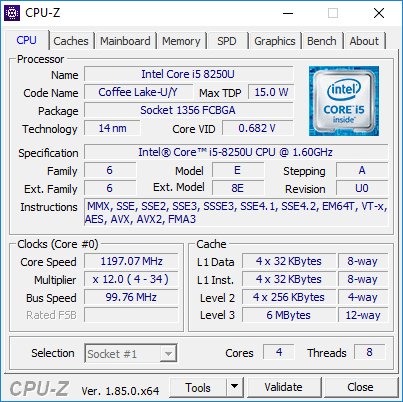
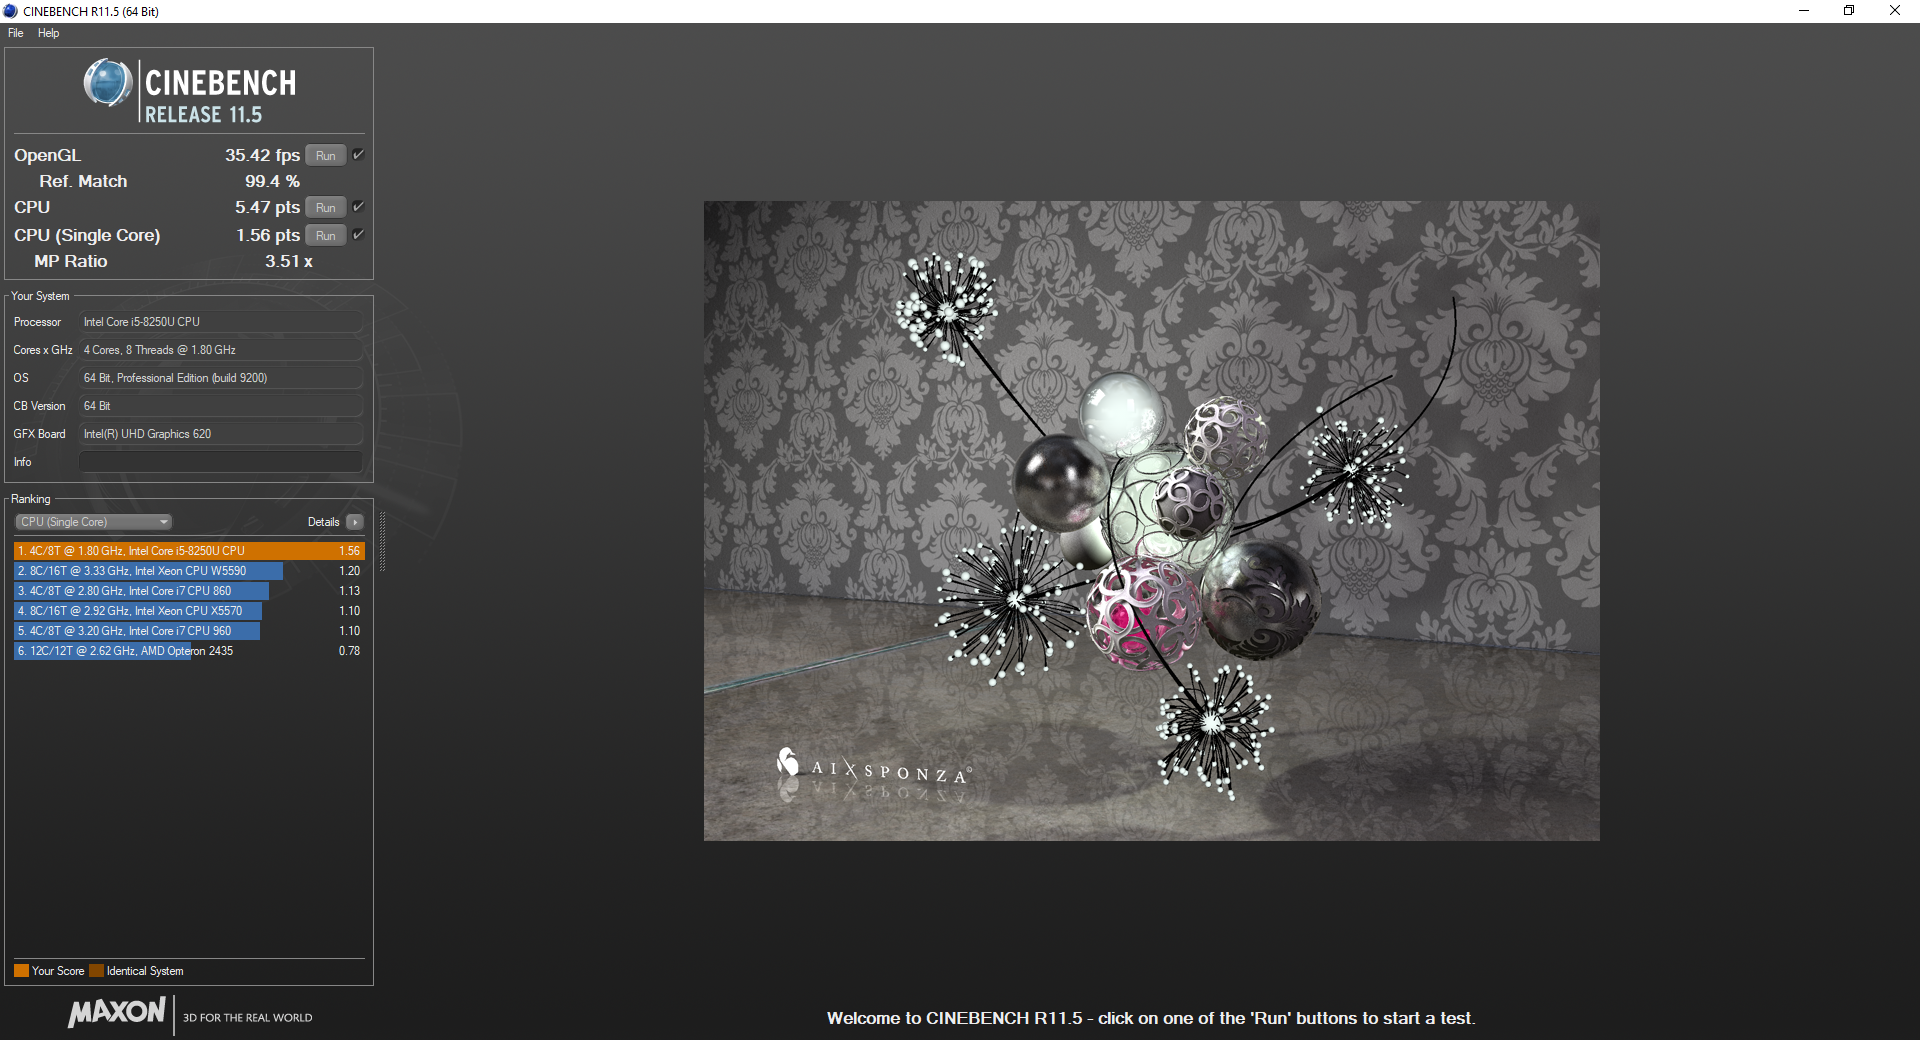
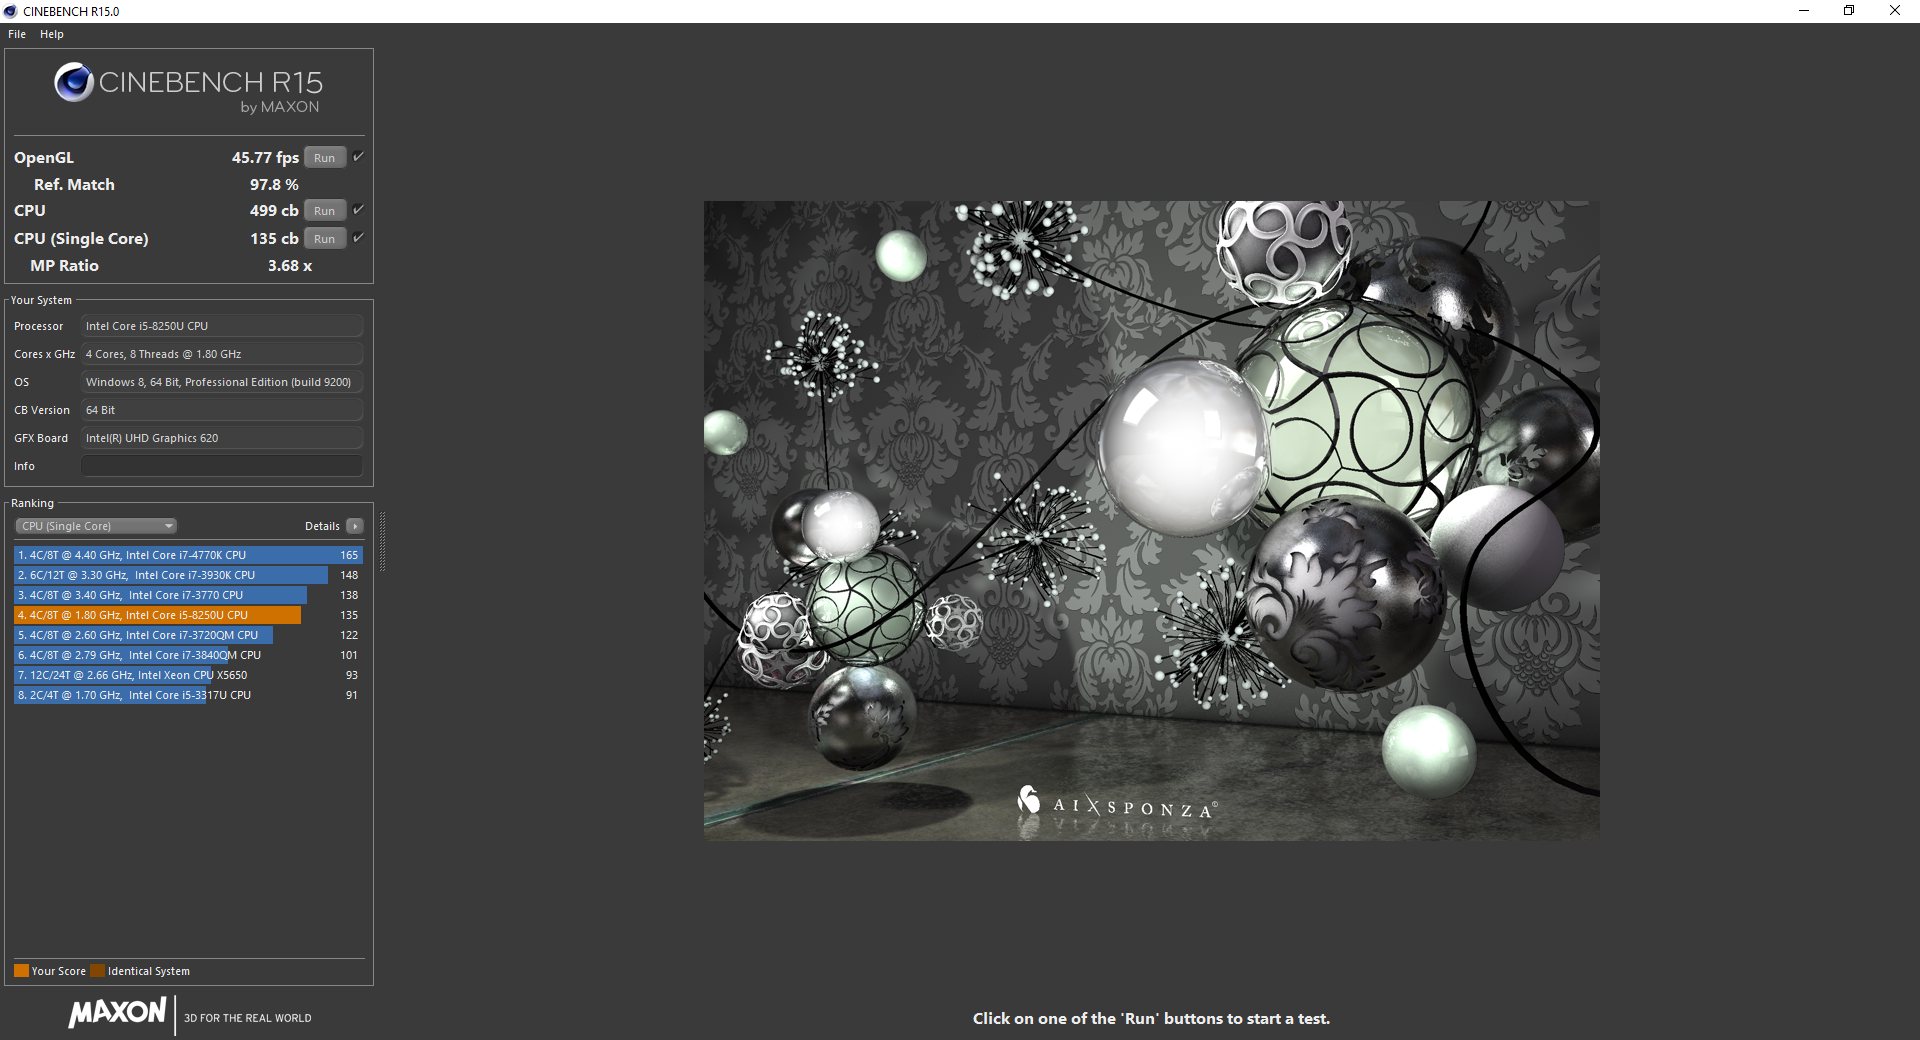
Intel's Kaby Lake R CPUs have brought huge gains to Ultrabooks without much sacrifice in power consumption. The 15 W Core i5-8250U is a prime example of the improvements to be had over the previous generation. In Cinebench R15's multicore test, the X380 shows almost a 50% increase in performance over the older Core i5-7300U. The X380 also beats out the higher-end Core i7 ULV CPUs (namely the i7-7500U and i7-7600U) by a similar margin. The doubled core count should make some users seriously consider an upgrade over devices sporting Intel's 7th gen CPUs.
The one stumbling block for the X380 Yoga is long-term stress testing. In our Cinebench R15 loop test, CPU performance steadily declines. Over the first half of the test, scores drop by about 46%. The latter half sees a rise and fall pattern. Lengthy CPU-intensive projects may experience similar instability. We will revisit this topic in the stress test section below.
For more information on the Intel Core i5-8250U, please see our dedicated CPU page here.
* ... smaller is better
System Performance
Processor-reliant tasks aside, total system performance is excellent. Office tasks, web browsing, and media streaming are all handled with aplomb. The combination of Intel's quad-core Kaby Lake R CPUs and Samsung's insanely fast PM981 NVMe drive create a snappy system that won't leave users waiting. Apps open almost instantly, and there are no hiccups or stutters during normal system use.
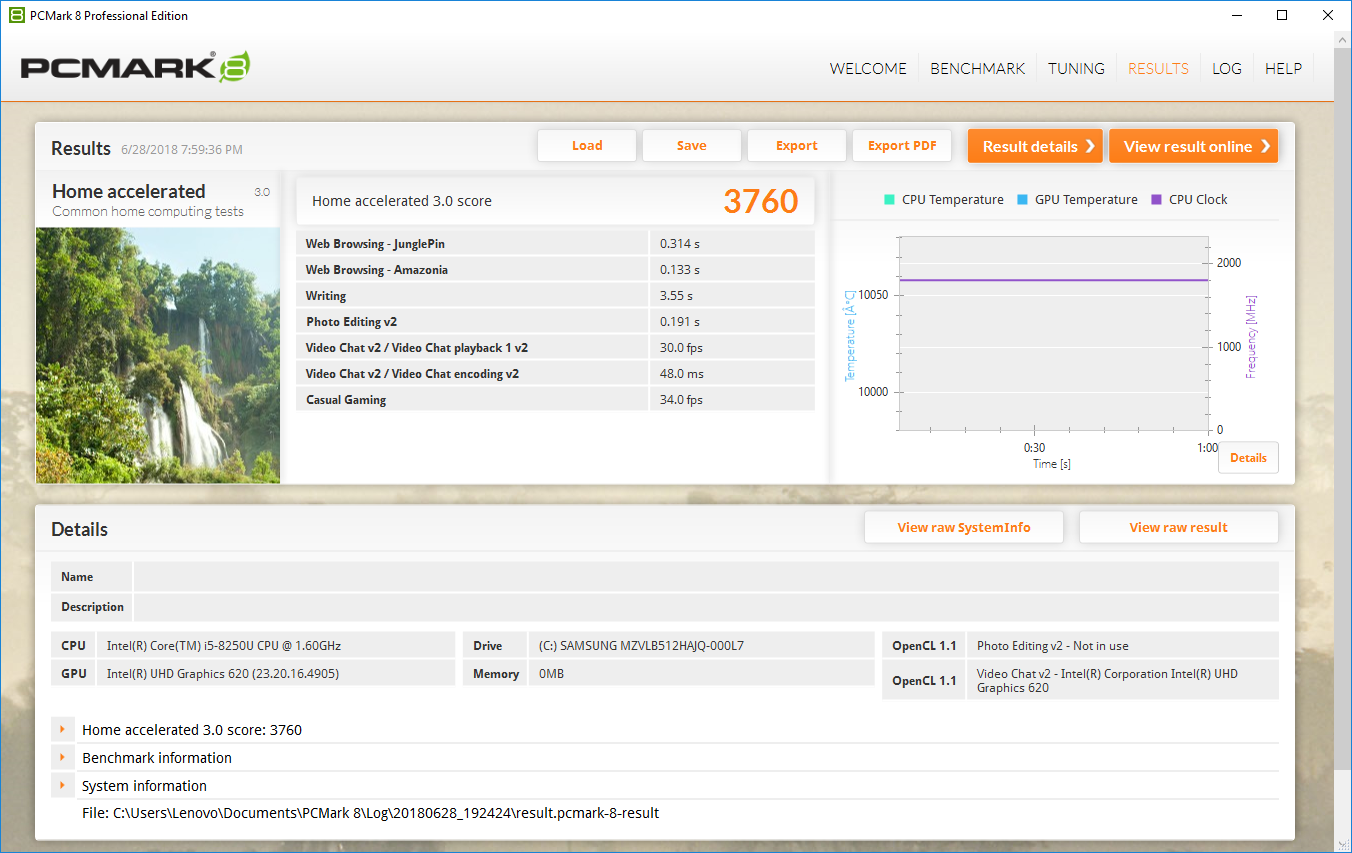

| PCMark 8 Home Score Accelerated v2 | 3760 points | |
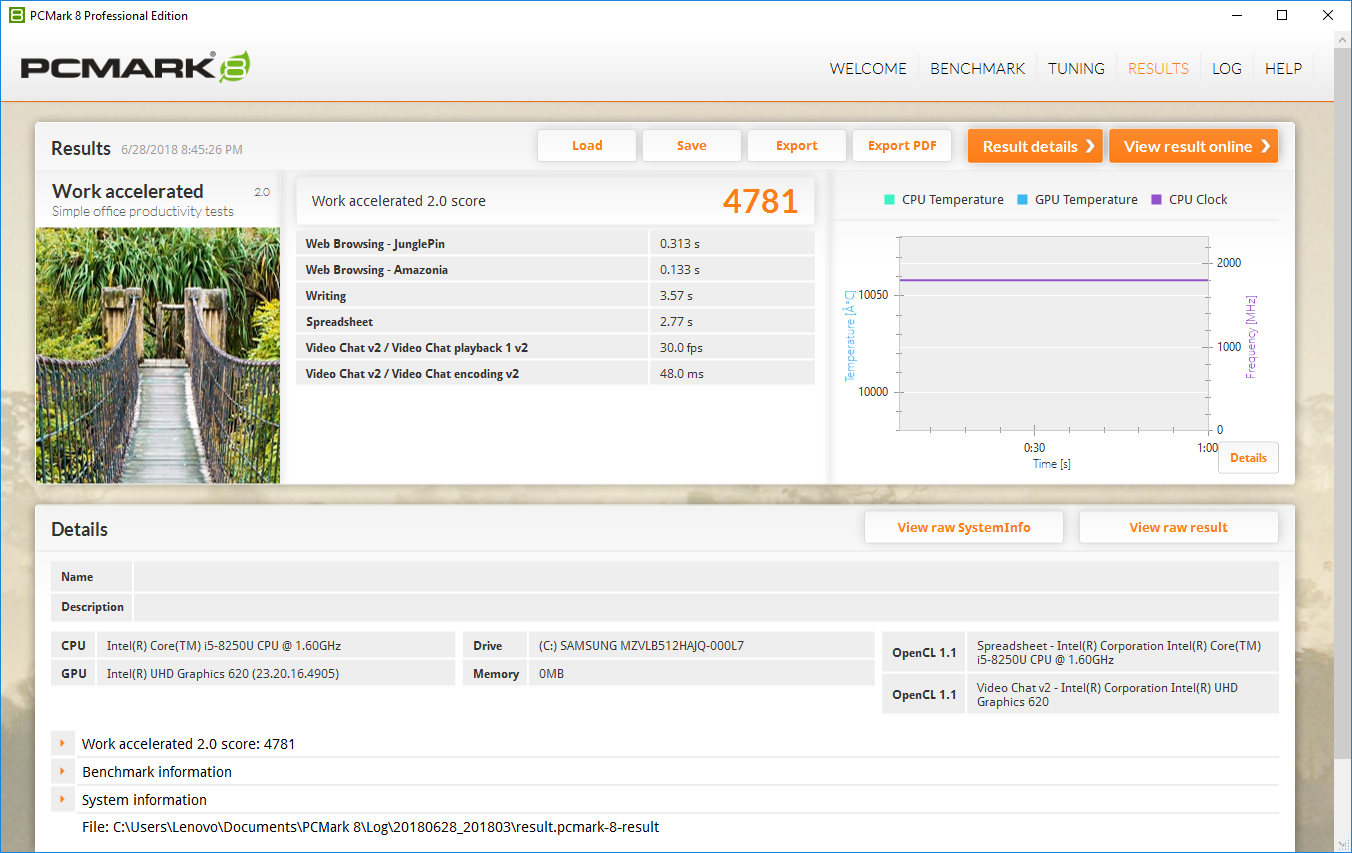
| PCMark 8 Work Score Accelerated v2 | 4781 points | |
| PCMark 10 Score | 3538 points | |
Help | ||
Storage Devices
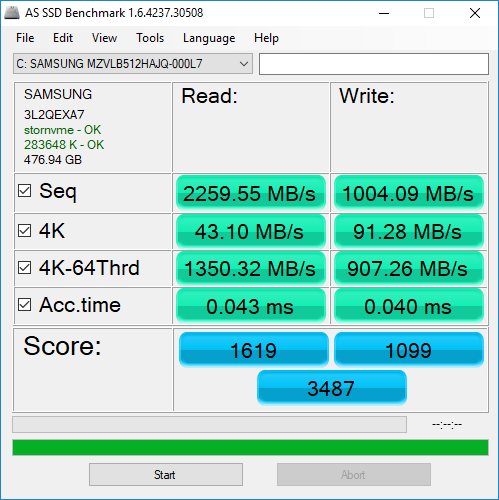
As mentioned above, the Samsung PM981 NVMe drive is fast and responsive. CrystalDiskMark 5 pegs read and write speeds at about 3.3 and 2.0 GB/s. The 512 GB of storage should be adequate for most, but the NVMe drive is accessible and can be swapped out with relative ease. Lenovo also sells a 1 TB NVMe drive, albeit at about USD $320 more.

| Lenovo ThinkPad X380 Yoga-20LH000LUS Samsung SSD PM981 MZVLB512HAJQ | Lenovo ThinkPad X380 Yoga 20LJS02W00 Samsung SSD PM981 MZVLB512HAJQ | Lenovo ThinkPad X1 Yoga 2018-20LD0015US Samsung SSD PM981 MZVLB512HAJQ | HP Spectre x360 13-ae048ng Toshiba NVMe THNSN51T02DUK | Dell Latitude 7390 2-in-1 SK hynix PC401 NVMe 500 GB | Average Samsung SSD PM981 MZVLB512HAJQ | |
|---|---|---|---|---|---|---|
| AS SSD | -7% | 11% | -596% | -25% | 6% | |
| Copy Game MB/s (MB/s) | 962 | 607 | 856 | 473.6 | 1057 ? | |
| Copy Program MB/s (MB/s) | 343 | 233.5 | 281.8 | 223.5 | 454 ? | |
| Copy ISO MB/s (MB/s) | 1770 | 917 | 1205 | 1377 | 1755 ? | |
| Score Total (Points) | 3487 | 2543 -27% | 3594 3% | 455 -87% | 2057 -41% | 3966 ? 14% |
| Score Write (Points) | 1099 | 1165 6% | 1359 24% | 42 -96% | 781 -29% | 1780 ? 62% |
| Score Read (Points) | 1619 | 896 -45% | 1487 -8% | 305 -81% | 877 -46% | 1451 ? -10% |
| Access Time Write * (ms) | 0.04 | 0.032 20% | 0.037 7% | 2.391 -5878% | 0.052 -30% | 0.08337 ? -108% |
| Access Time Read * (ms) | 0.04 | 0.039 2% | 0.043 -8% | 0.044 -10% | 0.045 -13% | 0.05092 ? -27% |
| 4K-64 Write (MB/s) | 907 | 926 2% | 1072 18% | 2.09 -100% | 606 -33% | 1504 ? 66% |
| 4K-64 Read (MB/s) | 1350 | 735 -46% | 1216 -10% | 115.6 -91% | 643 -52% | 1203 ? -11% |
| 4K Write (MB/s) | 91.3 | 111.6 22% | 102.3 12% | 1.73 -98% | 103.4 13% | 112 ? 23% |
| 4K Read (MB/s) | 43.1 | 51.5 19% | 49.11 14% | 31.73 -26% | 42.12 -2% | 50.5 ? 17% |
| Seq Write (MB/s) | 1044 | 1272 22% | 1840 76% | 377.1 -64% | 711 -32% | 1637 ? 57% |
| Seq Read (MB/s) | 2260 | 1099 -51% | 2218 -2% | 1574 -30% | 1911 -15% | 1976 ? -13% |
* ... smaller is better

GPU Performance
Intel's UHD Graphics 620 integrated GPU is adequate for office work, media streaming, and some light graphical loads, but not much more. The updated iGPU now supports the H.265/HEVC Main10 video codec, allowing it to playback 4K video with ease. Online streaming of UHD content (via sites like Netflix) is also possible; there are no stutters present in our testing.
Outside of video streaming, the iGPU is mostly useless. Very light rendering work (e.g., light Photoshop work) is possible, but the system will quickly reach its limits with heavier workloads. Users in need of more graphical horsepower should look to the HP Spectre x360 (or similarly-specced convertibles); the Nvidia GeForce MX150 offers a significant bump in graphical power.
For more information about the Intel UHD Graphics 620 iGPU, please see our dedicated page here.

| 3DMark 06 Standard Score | 10245 points | |
| 3DMark 11 Performance | 1790 points | |
| 3DMark Cloud Gate Standard Score | 7672 points | |
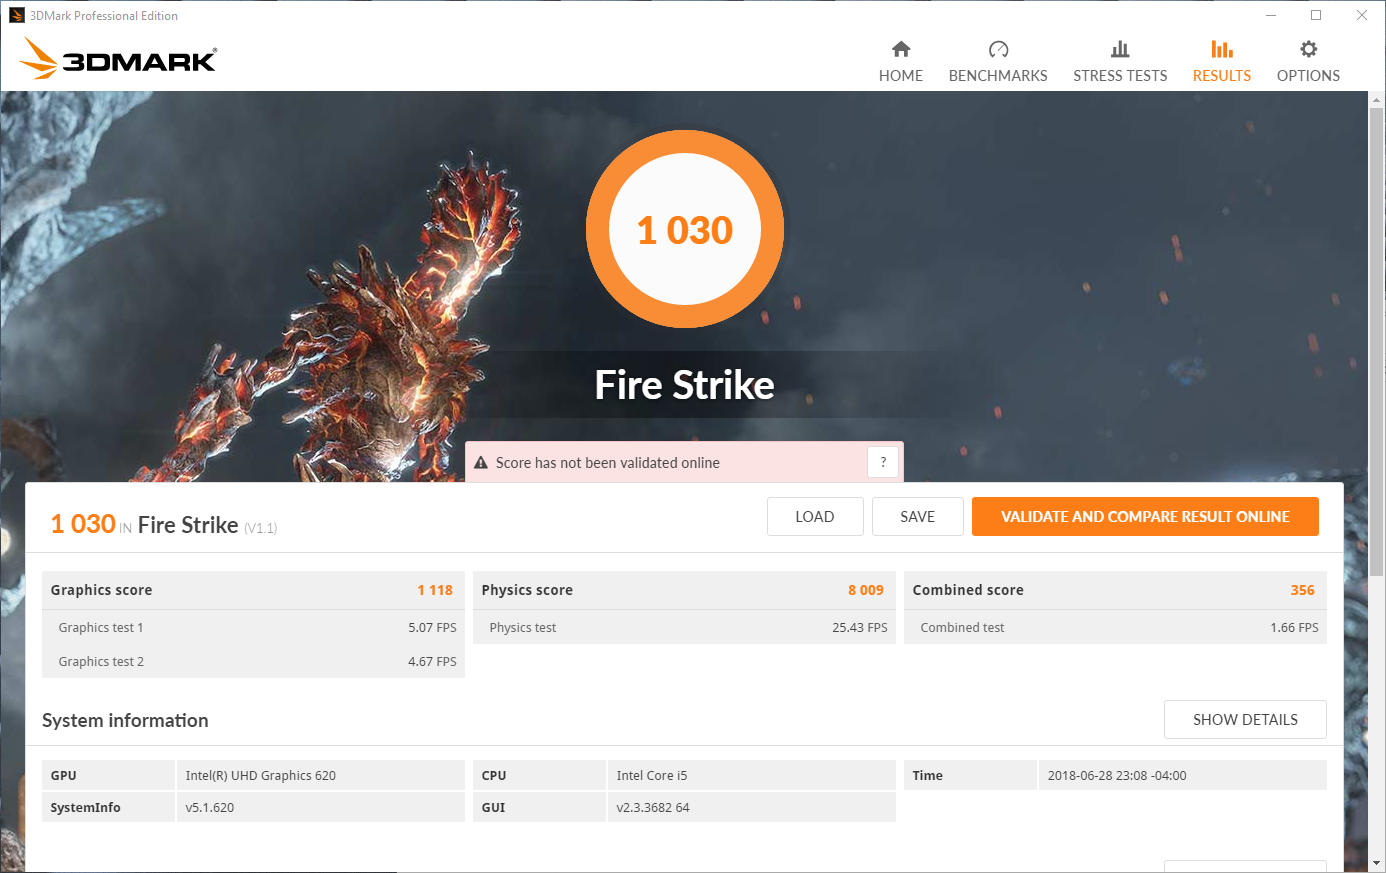
| 3DMark Fire Strike Score | 1030 points | |
Help | ||
Gaming Performance
In the same vein as the previous section, the X380 Yoga is not a suitable gaming machine. Older titles, such as Bioshock Infinite, are playable only at the lowest settings and resolutions; anything higher is a frustrating experience. Lighter titles such as Stardew Valley and other Indie games are certainly playable, but the latest AAA games are far out of reach.
Stress Test
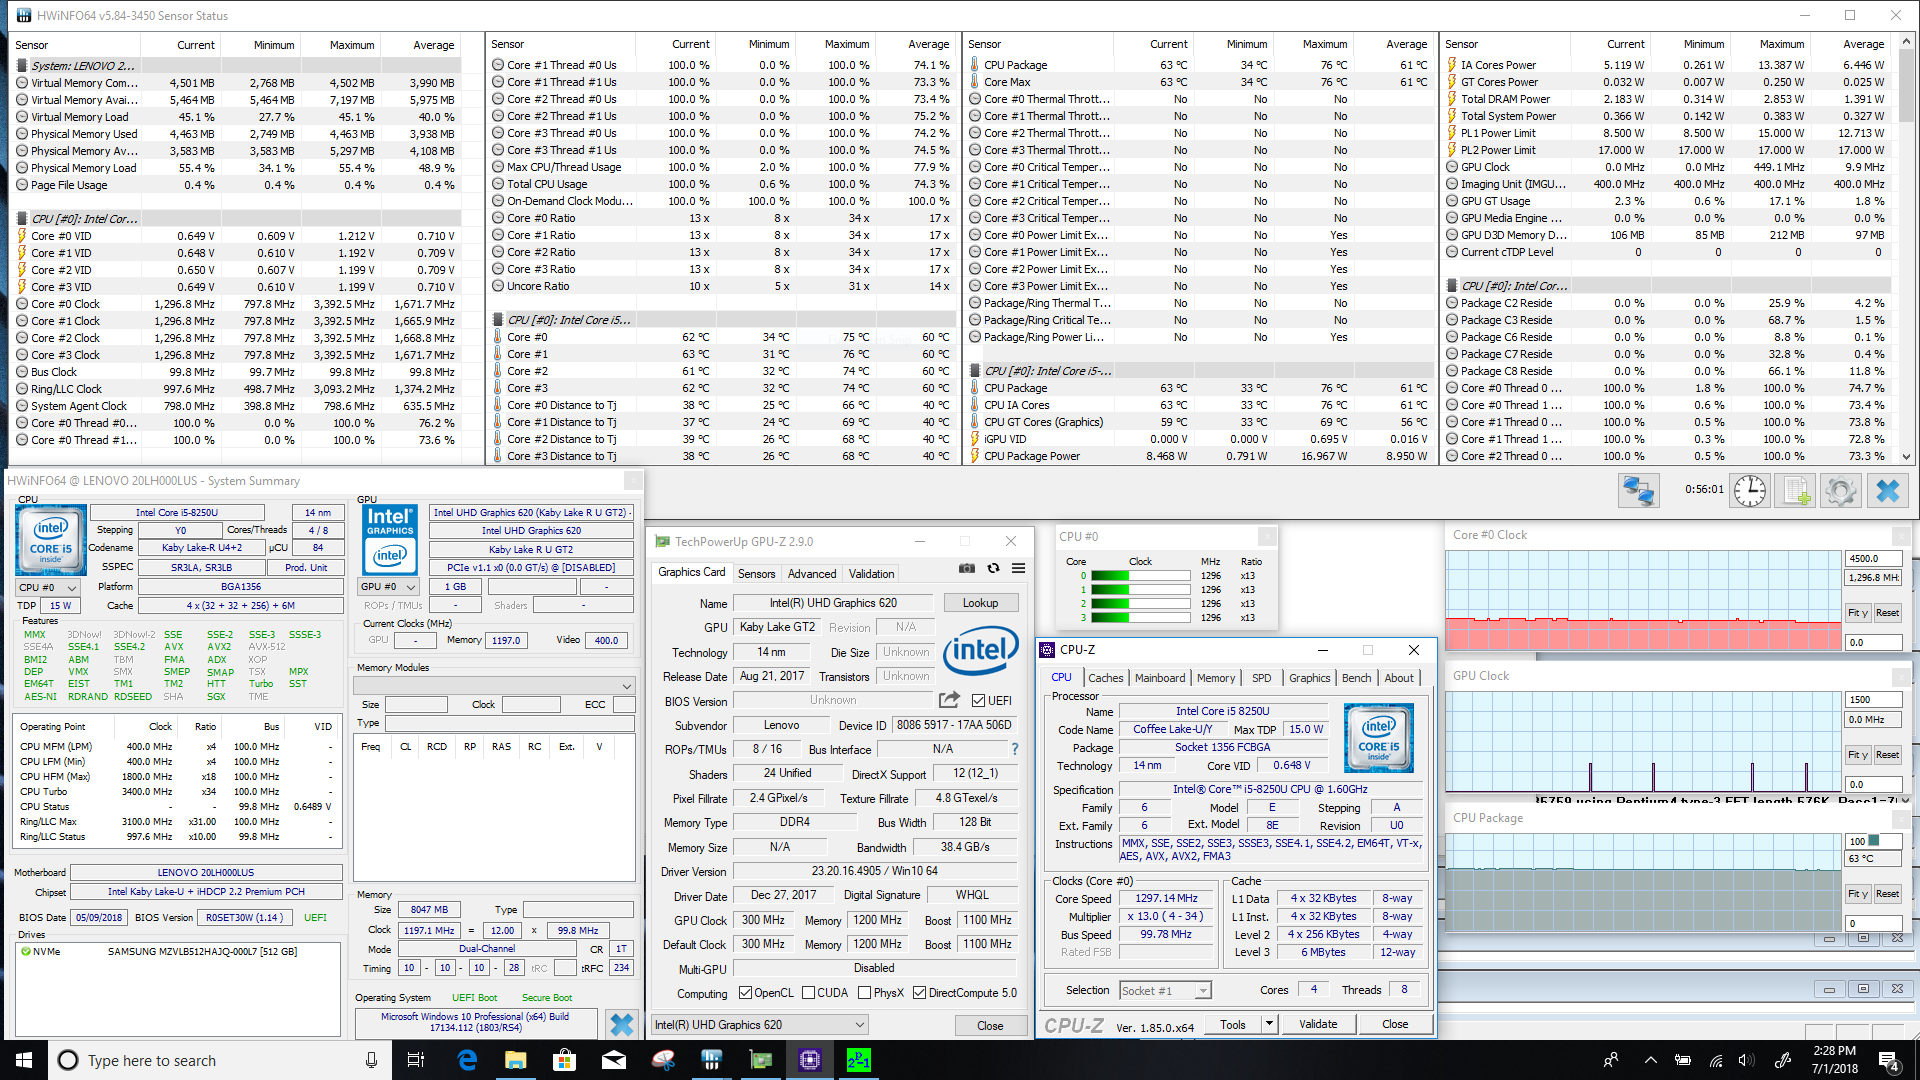
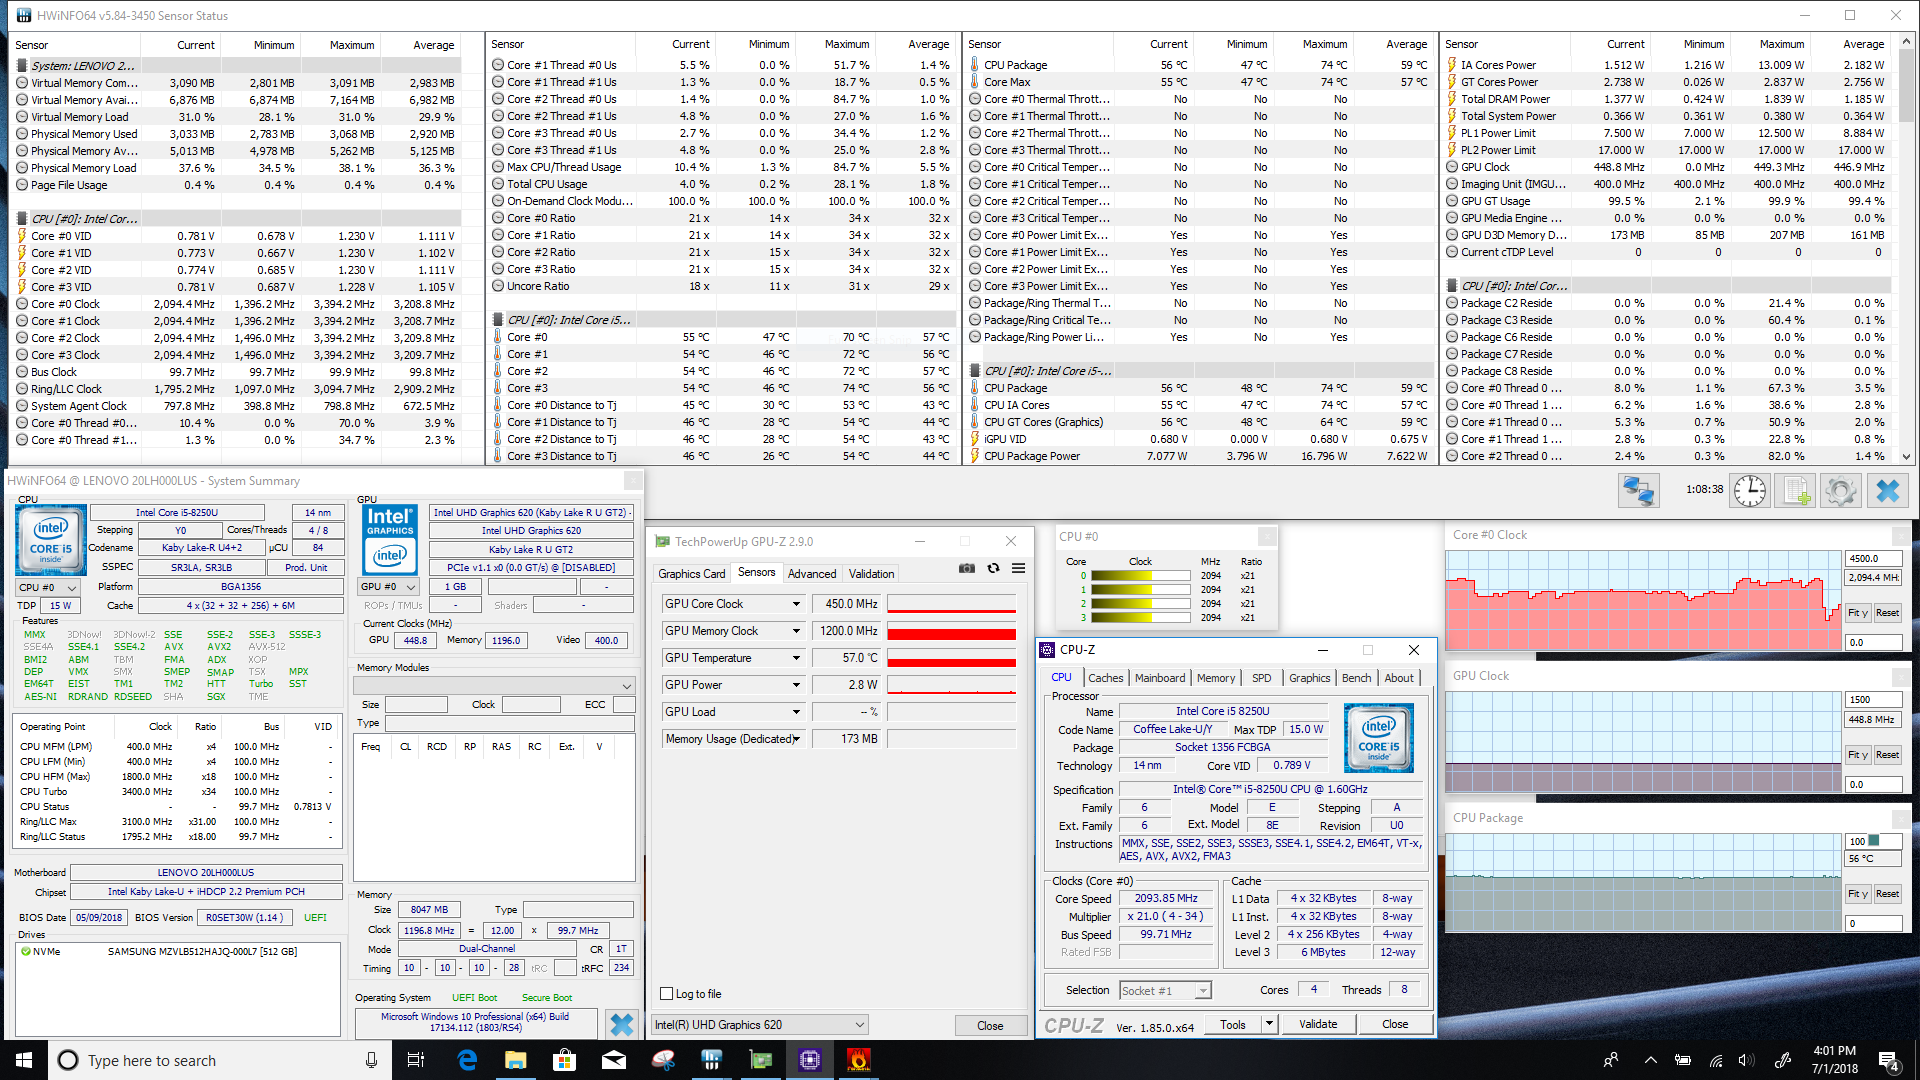
As seen when testing CPU performance, the X380 Yoga is inconsistent in long or stressful workloads. Under synthetic CPU load via Prime95, the CPU throttles back to 1.3-1.6 GHz for the majority of the test, intermittently boosting to its rated maximum of 3.4 GHz. This is curious, as temperatures never exceed 76° C. There is plenty of thermal headroom to push the CPU harder and for longer periods, but the X380 Yoga doesn't seem tuned to take advantage of this. FurMark is a similar story; while the UHD 620 Graphics iGPU is by no means a graphical workhorse, we should still see higher numbers than those recorded. However, the GPU remains flat at its base clock of 450 MHz. Again, temperatures are low and stay under 60° C.
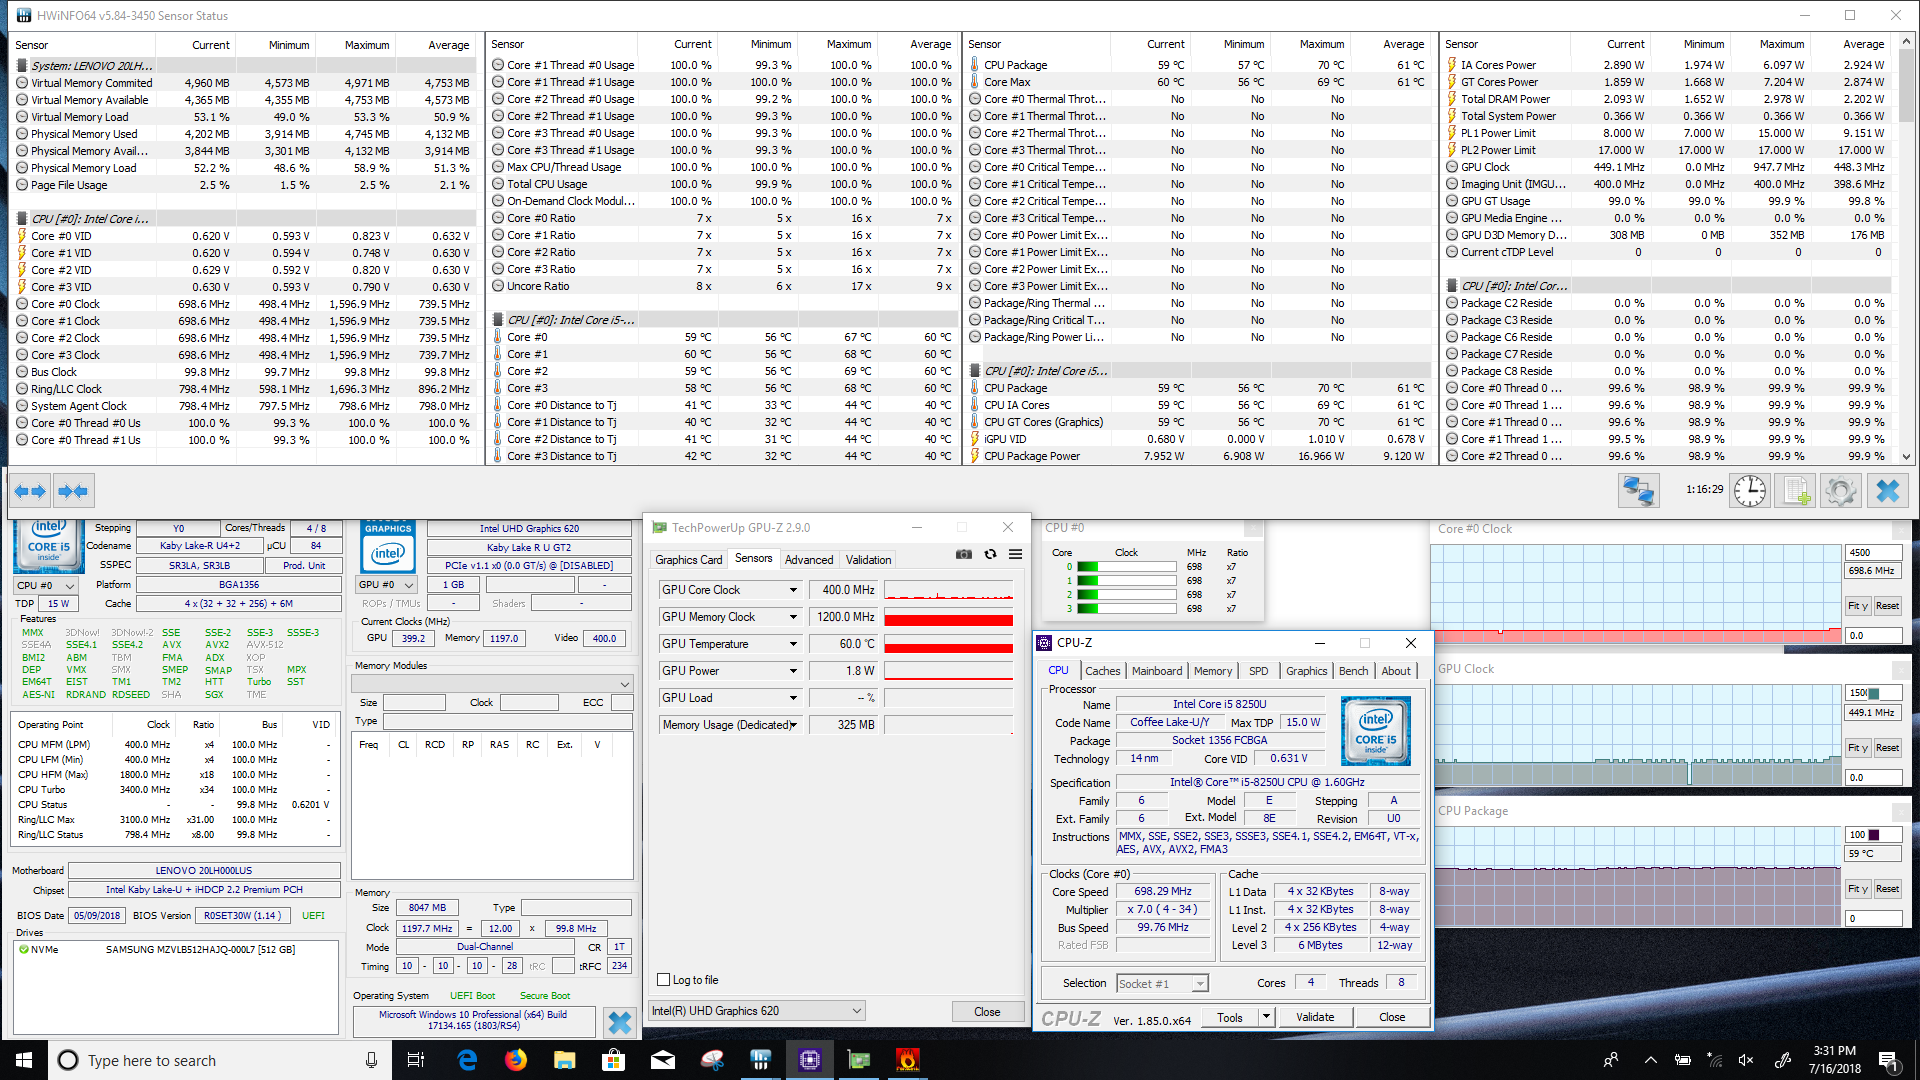
Running Prime95 and FurMark concurrently sees an even worse result. The CPU hovers at a mere 700 MHz for most of the test, refusing to boost. The GPU remains flat at its base clock as well. Temperatures never push past 70° C. All said, performance under stress is odd; while some systems buckle and throttle their CPU and/or GPU, this usually occurs as the result of high internal temperatures. It could be that Lenovo has very conservatively tuned the X380 Yoga so as to mitigate any problems with heat management. Either way, the end result is disappointing.
| CPU Clock (GHz) | GPU Clock (MHz) | Average CPU Temperature (°C) | Average GPU Temperature (°C) | |
| Prime95 Stress | 1.6 | - | 63 | - |
| FurMark Stress | 3.2 | 448 | 59 | 59 |
| Prime95 + FurMark Stress | 0.7 | 450 | 60 | 60 |
Emissions
System Noise
There is a silver lining to the aggressive throttling witnessed while stress testing the machine. Fan noise is quiet, even under load. The system stays under 38 dB(A) no matter the workload. Light tasks (word processing, web browsing, etc.) do not engage the fan at all, making for a near-silent experience. When the fan does ramp up, it has an even pitch that quickly blends in with ambient noises. There is no noticeable coil whine.
Noise level
| Idle |
| 28 / 28 / 29.1 dB(A) |
| Load |
| 34.5 / 36.4 dB(A) |
 | ||
30 dB silent 40 dB(A) audible 50 dB(A) loud |
||
min: | ||
| Lenovo ThinkPad X380 Yoga-20LH000LUS UHD Graphics 620, i5-8250U, Samsung SSD PM981 MZVLB512HAJQ | Lenovo ThinkPad X380 Yoga 20LJS02W00 UHD Graphics 620, i5-8550U, Samsung SSD PM981 MZVLB512HAJQ | Lenovo ThinkPad X1 Yoga 2018-20LD0015US UHD Graphics 620, i5-8250U, Samsung SSD PM981 MZVLB512HAJQ | HP Spectre x360 13-ae048ng UHD Graphics 620, i5-8550U, Toshiba NVMe THNSN51T02DUK | Dell Latitude 7390 2-in-1 UHD Graphics 620, i7-8650U, SK hynix PC401 NVMe 500 GB | Microsoft Surface Book 2 GeForce GTX 1050 Mobile, i7-8650U, Samsung PM961 MZVLW256HEHP | |
|---|---|---|---|---|---|---|
| Noise | -5% | -0% | -3% | -1% | -7% | |
| off / environment * (dB) | 28 | 30.4 -9% | 27.8 1% | 30.13 -8% | 28.2 -1% | 29.4 -5% |
| Idle Minimum * (dB) | 28 | 30.4 -9% | 27.8 1% | 30.13 -8% | 28.2 -1% | 29.4 -5% |
| Idle Average * (dB) | 28 | 30.4 -9% | 27.8 1% | 30 -7% | 28.2 -1% | 29.4 -5% |
| Idle Maximum * (dB) | 29.1 | 30.4 -4% | 27.8 4% | 30.13 -4% | 28.2 3% | 29.4 -1% |
| Load Average * (dB) | 34.5 | 34.2 1% | 33.9 2% | 33.4 3% | 32 7% | 31.4 9% |
| Load Maximum * (dB) | 36.4 | 35.2 3% | 39.9 -10% | 33 9% | 41.6 -14% | 49 -35% |
| Witcher 3 ultra * (dB) | 49 |
* ... smaller is better
Temperature
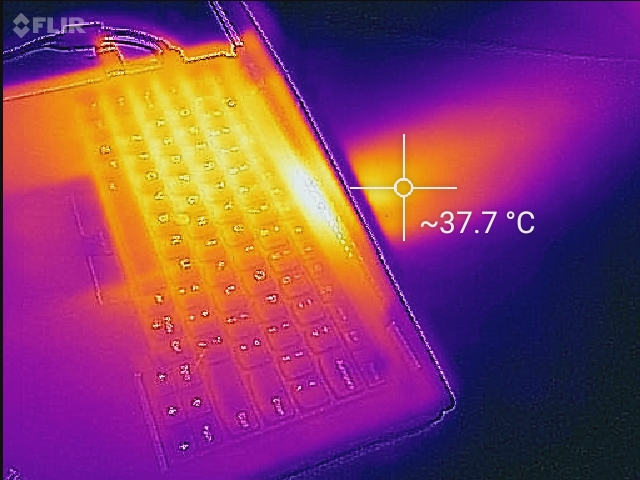
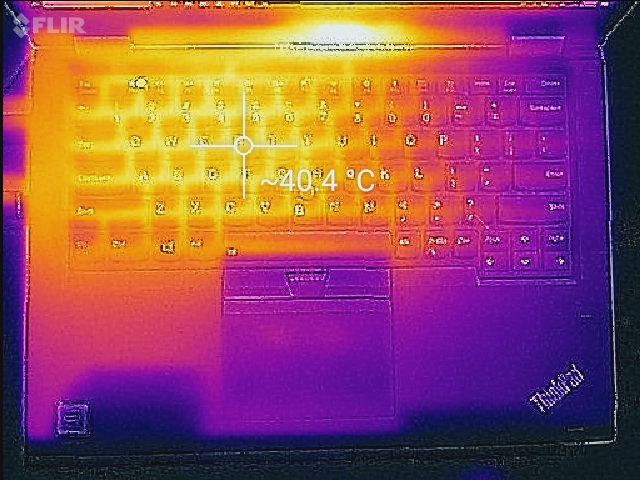
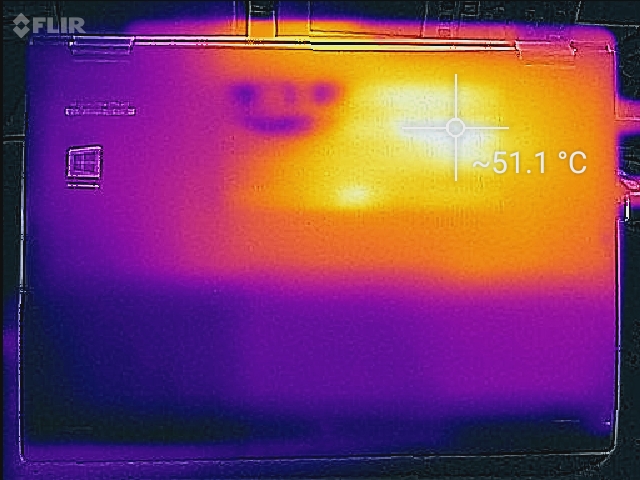
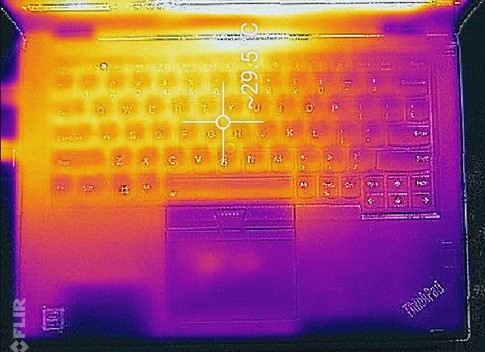
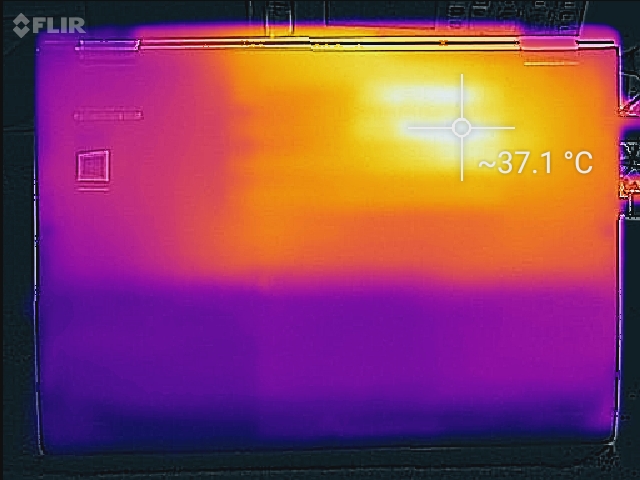
Exterior temperatures are well-managed, for the most part. When idle, the system remains relatively cool and comfortable. Under load, the keyboard warms up a bit but does not become uncomfortable. However, there is a hot spot directly over the CPU (upper-right corner of the bottom panel). This point can get uncomfortable when the machine is taxed, making lap use undesirable during heavier tasks.
In tablet mode, users should be careful not to place their hands in the middle of the hinge. The sole exhaust vent dumps heat here. Gripping the convertible here not only blocks this vent but grows uncomfortable rather quickly.
(±) The maximum temperature on the upper side is 40.4 °C / 105 F, compared to the average of 35.4 °C / 96 F, ranging from 19.6 to 60 °C for the class Convertible.
(-) The bottom heats up to a maximum of 51 °C / 124 F, compared to the average of 36.9 °C / 98 F
(+) In idle usage, the average temperature for the upper side is 27.2 °C / 81 F, compared to the device average of 30.3 °C / 87 F.
(+) The palmrests and touchpad are cooler than skin temperature with a maximum of 31.4 °C / 88.5 F and are therefore cool to the touch.
(-) The average temperature of the palmrest area of similar devices was 28 °C / 82.4 F (-3.4 °C / -6.1 F).
Speakers

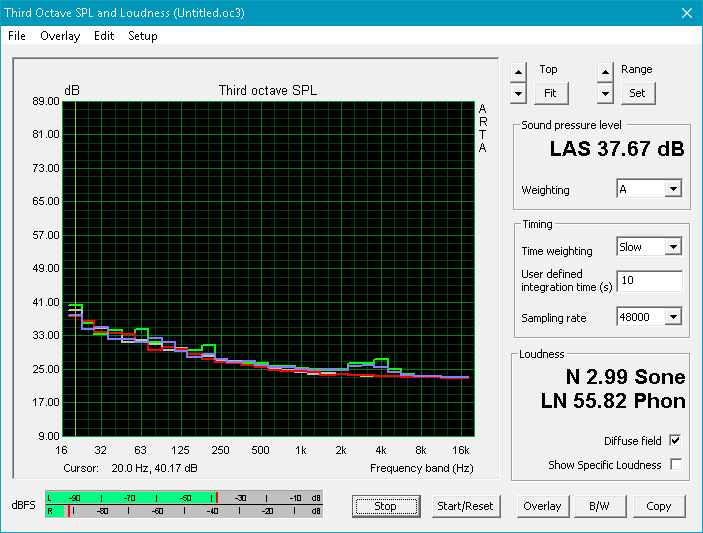
The speakers are typical for a small ultrabook. Sound is thin and tinny, and bass is almost non-existent. While not suitable for enjoying music, the speakers are fine for voice and video chats. The primary problem is overall loudness; at 68 dB, users may have a hard time clearly hearing audio in a coffee shop, airport, or noisy office. Further hindering the speakers is a nasty rattling that occurs at volume levels over 90%. The speakers crackle and the distorted sound will grate on the ears. Headphones are highly encouraged.
Lenovo ThinkPad X380 Yoga-20LH000LUS audio analysis
(-) | not very loud speakers (68.1 dB)
Bass 100 - 315 Hz
(-) | nearly no bass - on average 19.2% lower than median
(±) | linearity of bass is average (12.2% delta to prev. frequency)
Mids 400 - 2000 Hz
(±) | higher mids - on average 6.7% higher than median
(±) | linearity of mids is average (11.5% delta to prev. frequency)
Highs 2 - 16 kHz
(±) | higher highs - on average 5.4% higher than median
(±) | linearity of highs is average (9.8% delta to prev. frequency)
Overall 100 - 16.000 Hz
(-) | overall sound is not linear (35.9% difference to median)
Compared to same class
» 95% of all tested devices in this class were better, 1% similar, 4% worse
» The best had a delta of 6%, average was 20%, worst was 57%
Compared to all devices tested
» 94% of all tested devices were better, 1% similar, 5% worse
» The best had a delta of 4%, average was 24%, worst was 134%
Apple MacBook 12 (Early 2016) 1.1 GHz audio analysis
(+) | speakers can play relatively loud (83.6 dB)
Bass 100 - 315 Hz
(±) | reduced bass - on average 11.3% lower than median
(±) | linearity of bass is average (14.2% delta to prev. frequency)
Mids 400 - 2000 Hz
(+) | balanced mids - only 2.4% away from median
(+) | mids are linear (5.5% delta to prev. frequency)
Highs 2 - 16 kHz
(+) | balanced highs - only 2% away from median
(+) | highs are linear (4.5% delta to prev. frequency)
Overall 100 - 16.000 Hz
(+) | overall sound is linear (10.2% difference to median)
Compared to same class
» 7% of all tested devices in this class were better, 2% similar, 91% worse
» The best had a delta of 5%, average was 18%, worst was 53%
Compared to all devices tested
» 5% of all tested devices were better, 1% similar, 94% worse
» The best had a delta of 4%, average was 24%, worst was 134%
Energy Management
Power Consumption
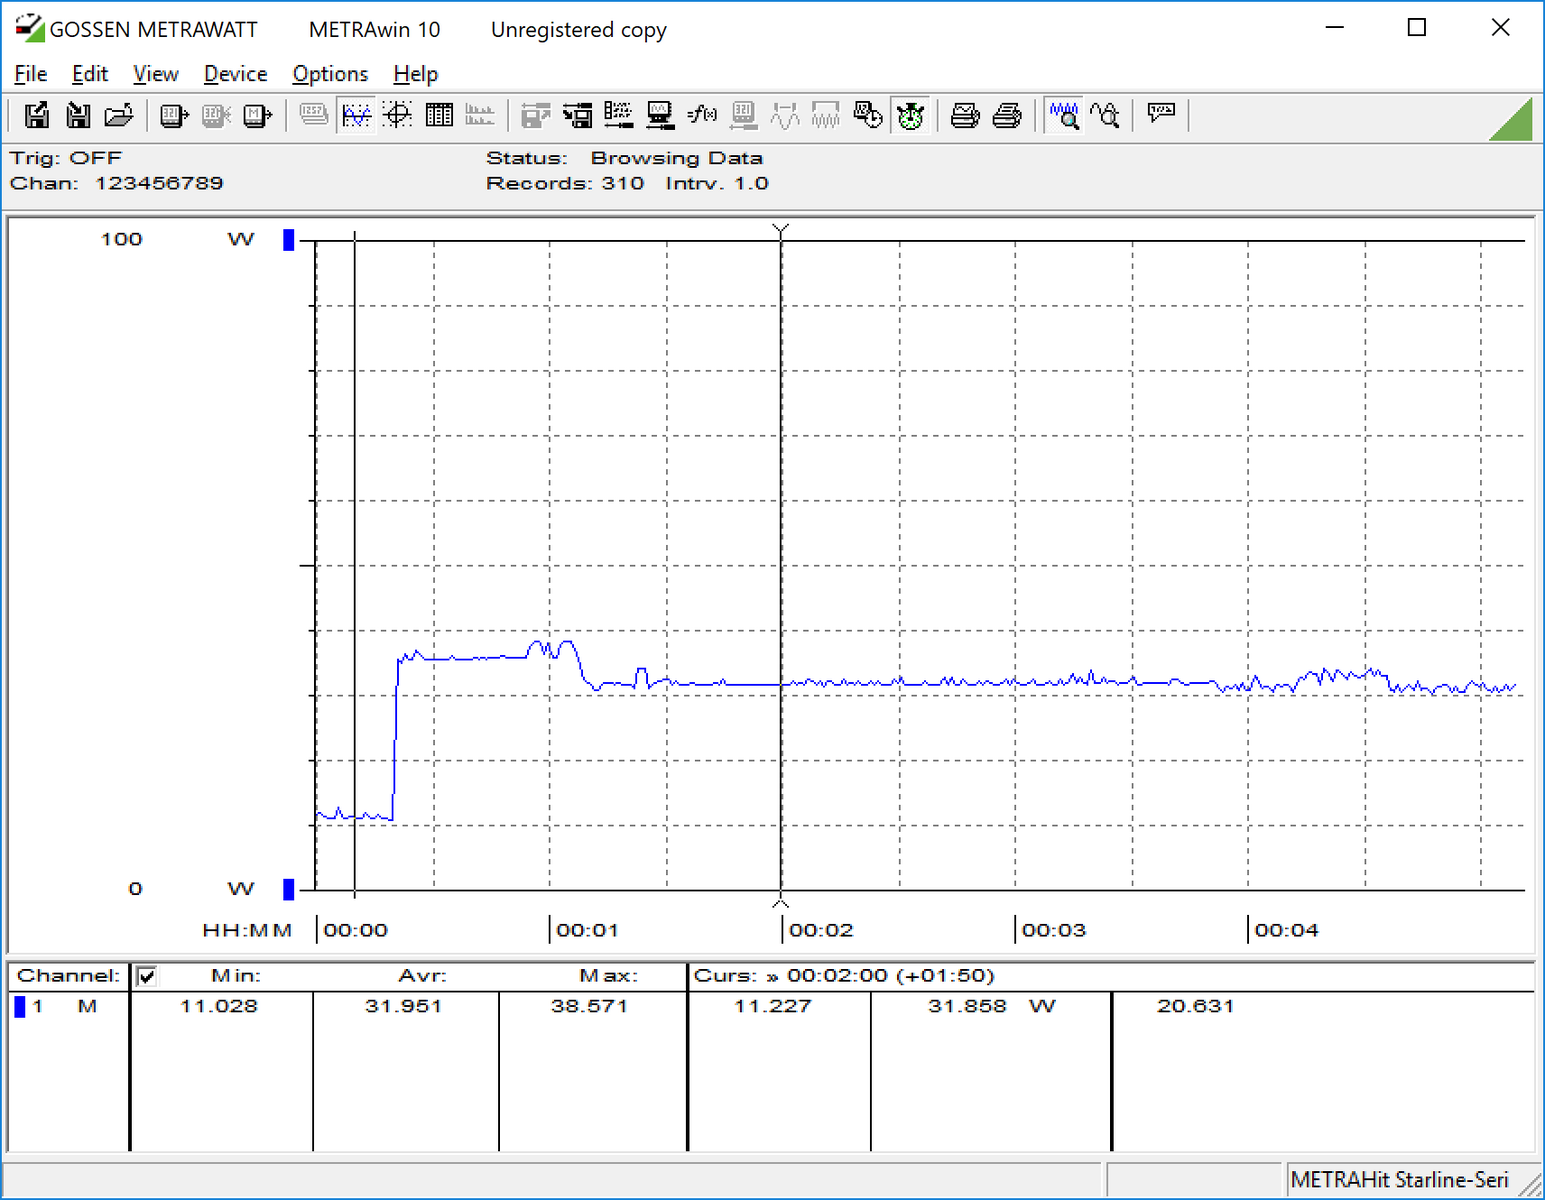
Power draw is in line with other 2-in-1 notebooks powered by an Intel ULV CPU. Under load, the machine pulls about 35 Watts, which is comparable to similarly-specced machines. Measuring power draw during our hour-long Prime95 stress test, we observe that the machine throttles about 1 minute 15 seconds in, which could explain the poor performance during that benchmark. The included 65 Watt adapter supplies more than enough power.
| Off / Standby | |
| Idle | |
| Load |
|
Key:
min: | |
| Lenovo ThinkPad X380 Yoga-20LH000LUS i5-8250U, UHD Graphics 620, Samsung SSD PM981 MZVLB512HAJQ, IPS, 1920x1080, 13.3" | Lenovo ThinkPad X1 Yoga 2018-20LD0015US i5-8250U, UHD Graphics 620, Samsung SSD PM981 MZVLB512HAJQ, IPS, 1920x1080, 14" | HP Spectre x360 13-ae048ng i5-8550U, UHD Graphics 620, Toshiba NVMe THNSN51T02DUK, IPS, 1920x1080, 13.3" | Dell Latitude 7390 2-in-1 i7-8650U, UHD Graphics 620, SK hynix PC401 NVMe 500 GB, IPS, 1920x1080, 13.3" | Microsoft Surface Book 2 i7-8650U, GeForce GTX 1050 Mobile, Samsung PM961 MZVLW256HEHP, IPS, 3000x2000, 13.5" | Lenovo ThinkPad X380 Yoga 20LJS02W00 i5-8550U, UHD Graphics 620, Samsung SSD PM981 MZVLB512HAJQ, IPS, 1920x1080, 13.3" | |
|---|---|---|---|---|---|---|
| Power Consumption | -0% | 12% | 20% | -82% | 12% | |
| Idle Minimum * (Watt) | 3.7 | 3 19% | 3.2 14% | 2.6 30% | 4.7 -27% | 4 -8% |
| Idle Average * (Watt) | 6.9 | 5.4 22% | 6 13% | 5.7 17% | 10.6 -54% | 4.9 29% |
| Idle Maximum * (Watt) | 11.3 | 7.5 34% | 9.2 19% | 6 47% | 12.3 -9% | 6.9 39% |
| Load Average * (Watt) | 34.2 | 40.1 -17% | 29.5 14% | 29.2 15% | 81 -137% | 36 -5% |
| Load Maximum * (Watt) | 35.6 | 57.1 -60% | 35.6 -0% | 38.8 -9% | 100.3 -182% | 34.4 3% |
| Witcher 3 ultra * (Watt) | 97 |
* ... smaller is better
Battery Life
Battery life is excellent and shouldn't be a concern for most users; the X380 Yoga lasted more than 9 hours in our WiFi v1.3 battery test, which simulates constant web browsing under Windows' Balanced power profile. The lower-clocked Core i5-8250U grants this variant of the X380 Yoga an extra hour in this benchmark, so road warriors may see the reduced performance a worthy sacrifice for improved run times. The X380 Yoga is an efficient machine and keeps up with most other Ultrabook convertibles.
| Lenovo ThinkPad X380 Yoga-20LH000LUS i5-8250U, UHD Graphics 620, 51 Wh | Lenovo ThinkPad X380 Yoga 20LJS02W00 i5-8550U, UHD Graphics 620, 51 Wh | Lenovo ThinkPad X1 Yoga 2018-20LD0015US i5-8250U, UHD Graphics 620, 54 Wh | HP Spectre x360 13-ae048ng i5-8550U, UHD Graphics 620, 60 Wh | Dell Latitude 7390 2-in-1 i7-8650U, UHD Graphics 620, 60 Wh | Microsoft Surface Book 2 i7-8650U, GeForce GTX 1050 Mobile, 75 Wh | |
|---|---|---|---|---|---|---|
| Battery runtime | -7% | 1% | 6% | -3% | 20% | |
| Reader / Idle (h) | 22.2 | 20.8 -6% | 20.3 -9% | 24.5 10% | ||
| WiFi v1.3 (h) | 9.4 | 8.5 -10% | 10.9 16% | 8.8 -6% | 9.2 -2% | 11.1 18% |
| Load (h) | 2.4 | 2.3 -4% | 2.3 -4% | 2.8 17% | 2.3 -4% | 3.2 33% |
| Witcher 3 ultra (h) | 3.8 |
Pros
Cons
Verdict
Lenovo's X380 Yoga scored well in our initial review but had some shortcomings. While the Core i7-8550U has an 18% faster clock speed on paper than the Core i5-8250U, it proved to be a bit too much for the X380 Yoga. The 8250U appears to be a better companion for the flexible device in most workloads. The device is excellent in almost every area, save for long-term CPU performance. The case is sturdy, port selection is excellent, and the durable hinges and retracting keyboard make tablet use comfortable and easy.
As an office machine, the X380 is excellent. Lenovo's ThinkPad Yoga line has long been at the top of the heap for business professionals in search of a well-built convertible. However, competitors have caught up and even surpassed Lenovo in some ways. HP's Spectre x360 13 is a beautifully crafted machine that doesn't suffer from the heavy throttling the X380 Yoga does. Dell's Latitude 7390 has enough room for two storage drives and a compact footprint. Microsoft's Surface Book 2 packs a ton of power in a convertible and smokes competitors in graphically-intensive tasks.
That said, each of these has its own shortcomings. The Spectre x360 has a limited selection of ports, the Latitude 7390 has a poor screen with a highly reflective finish, and the Surface Book 2 is prohibitively expensive. The X380 Yoga is a well-rounded machine with a reasonable price tag and is overall a joy to use.
The X380 Yoga, particularly the Core i5-8250U variant, is perhaps the best overall compact convertible for business users. While there are some flaws, the total package marries a well-built case with an excellent array of ports and throws in great battery life and a beautiful and color-accurate screen. Other office convertibles may cover one area of the notebook experience with excellence, but the X380 Yoga does them all well without leaving much behind.
Lenovo ThinkPad X380 Yoga-20LH000LUS
- 07/18/2018 v6 (old)
Sam Medley
Price comparison
