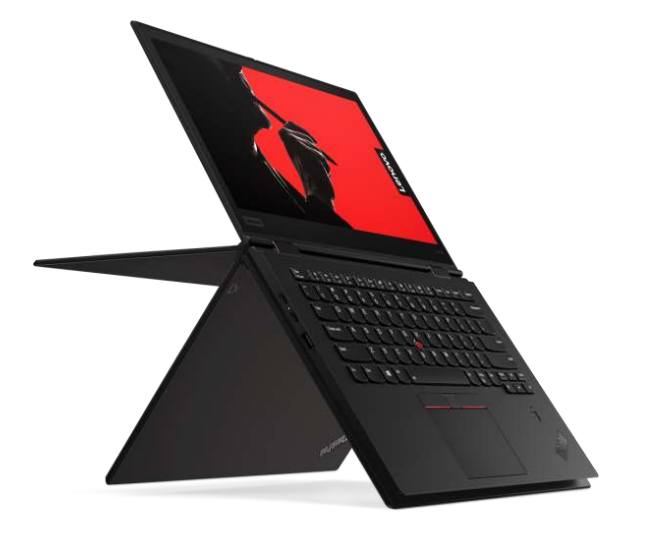
Lenovo ThinkPad X1 Yoga 2018 (Core i5-8250U, FHD) Convertible Review
We recently looked at the 2018 Lenovo ThinkPad X1 Yoga by reviewing the top-of-the-line model. While we deemed it an excellent notebook, we judged the price to be a bit too high. However, more budget-constricted users hoping to get their hands on Lenovo's sleek new hybrid may be in luck: today's review covers the mid-tier option of the ThinkPad X1 Yoga line. While users will have to sacrifice a bit on power and panache by settling for a Core i5-8250U and Full HD display, our review will show what (if anything) is really given up by downgrading the processor and screen resolution. Take heed: even this model is still a bit pricey at just under USD $1900 (MSRP).
Since the only changes lie in the choice of CPU and the display panel, we will forgo sections covering the exterior chassis of the device. For more information about the case, input devices, and other aspects not enumerated in this review, please read our write-up on the Core i7-8550U model of the X1 Yoga.
Display

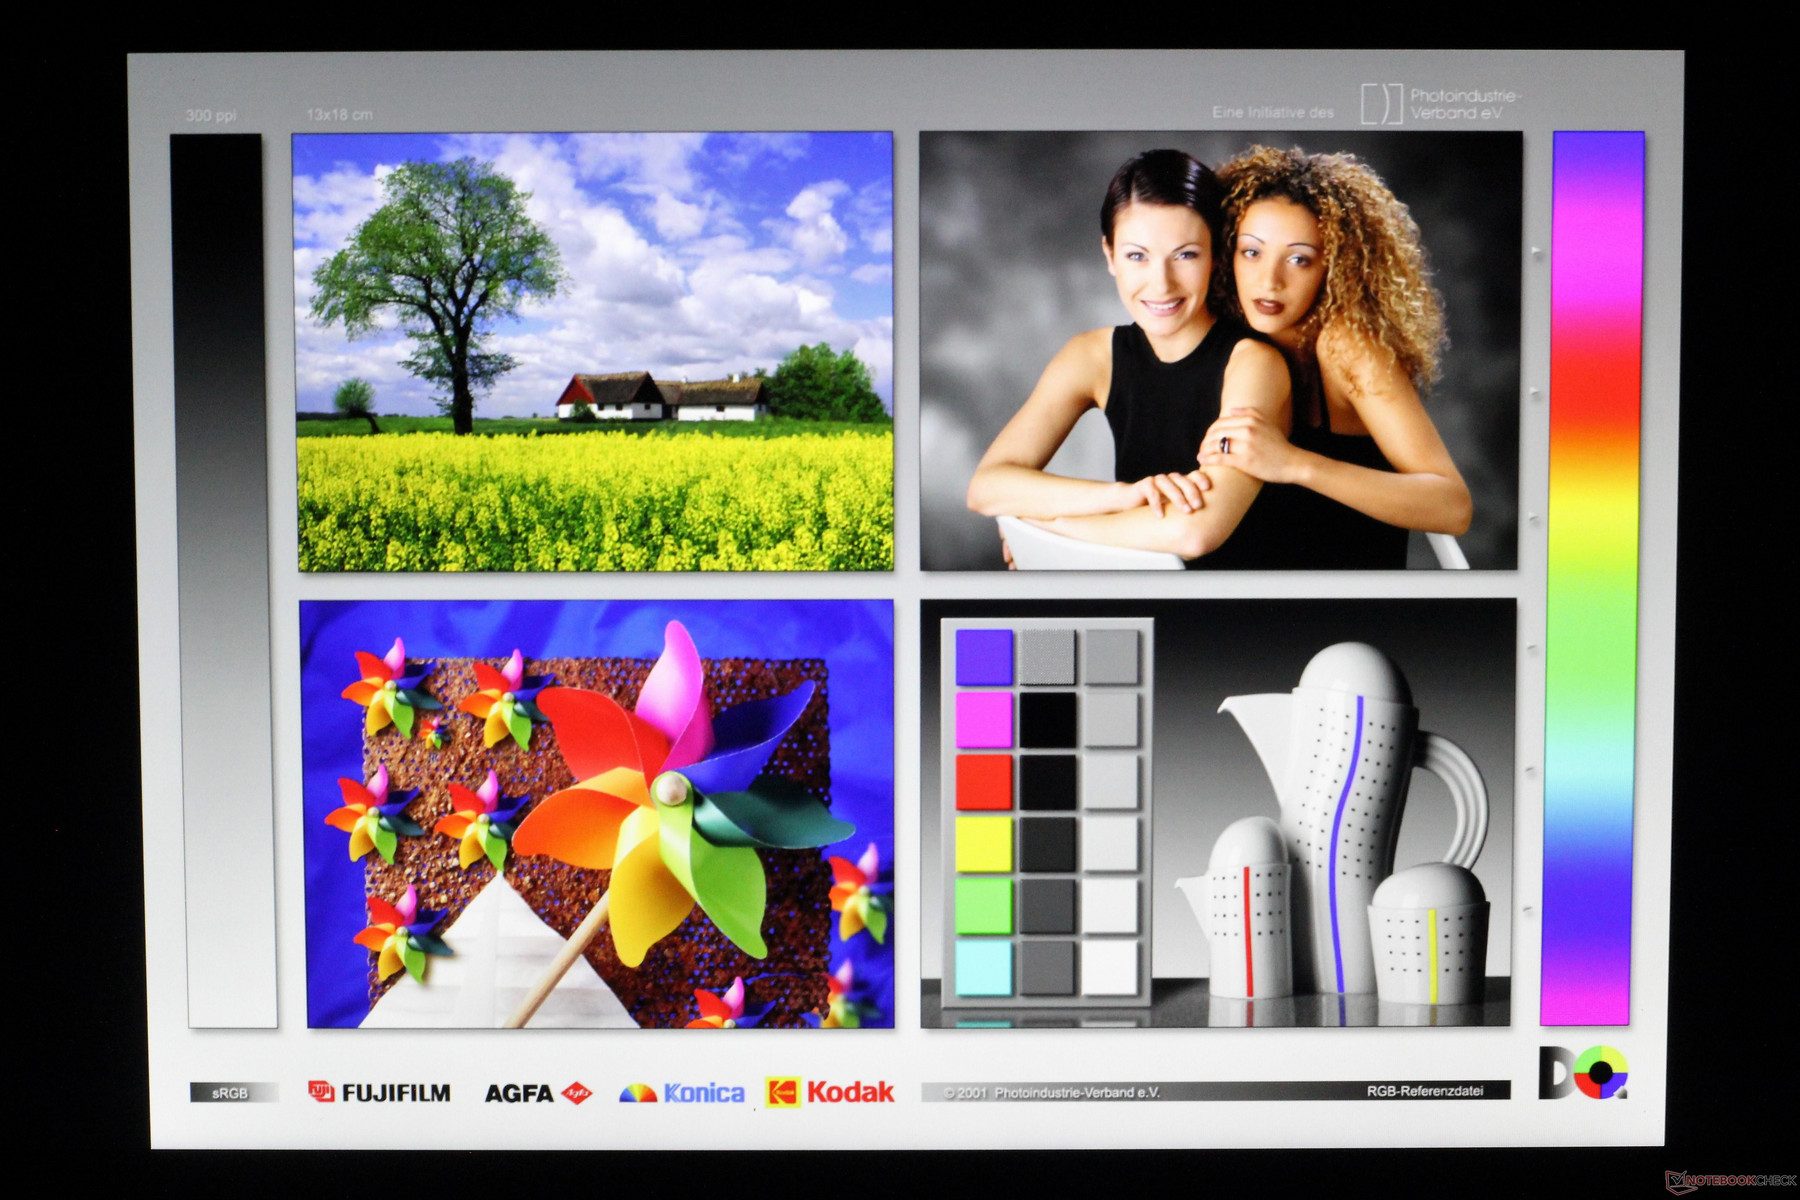
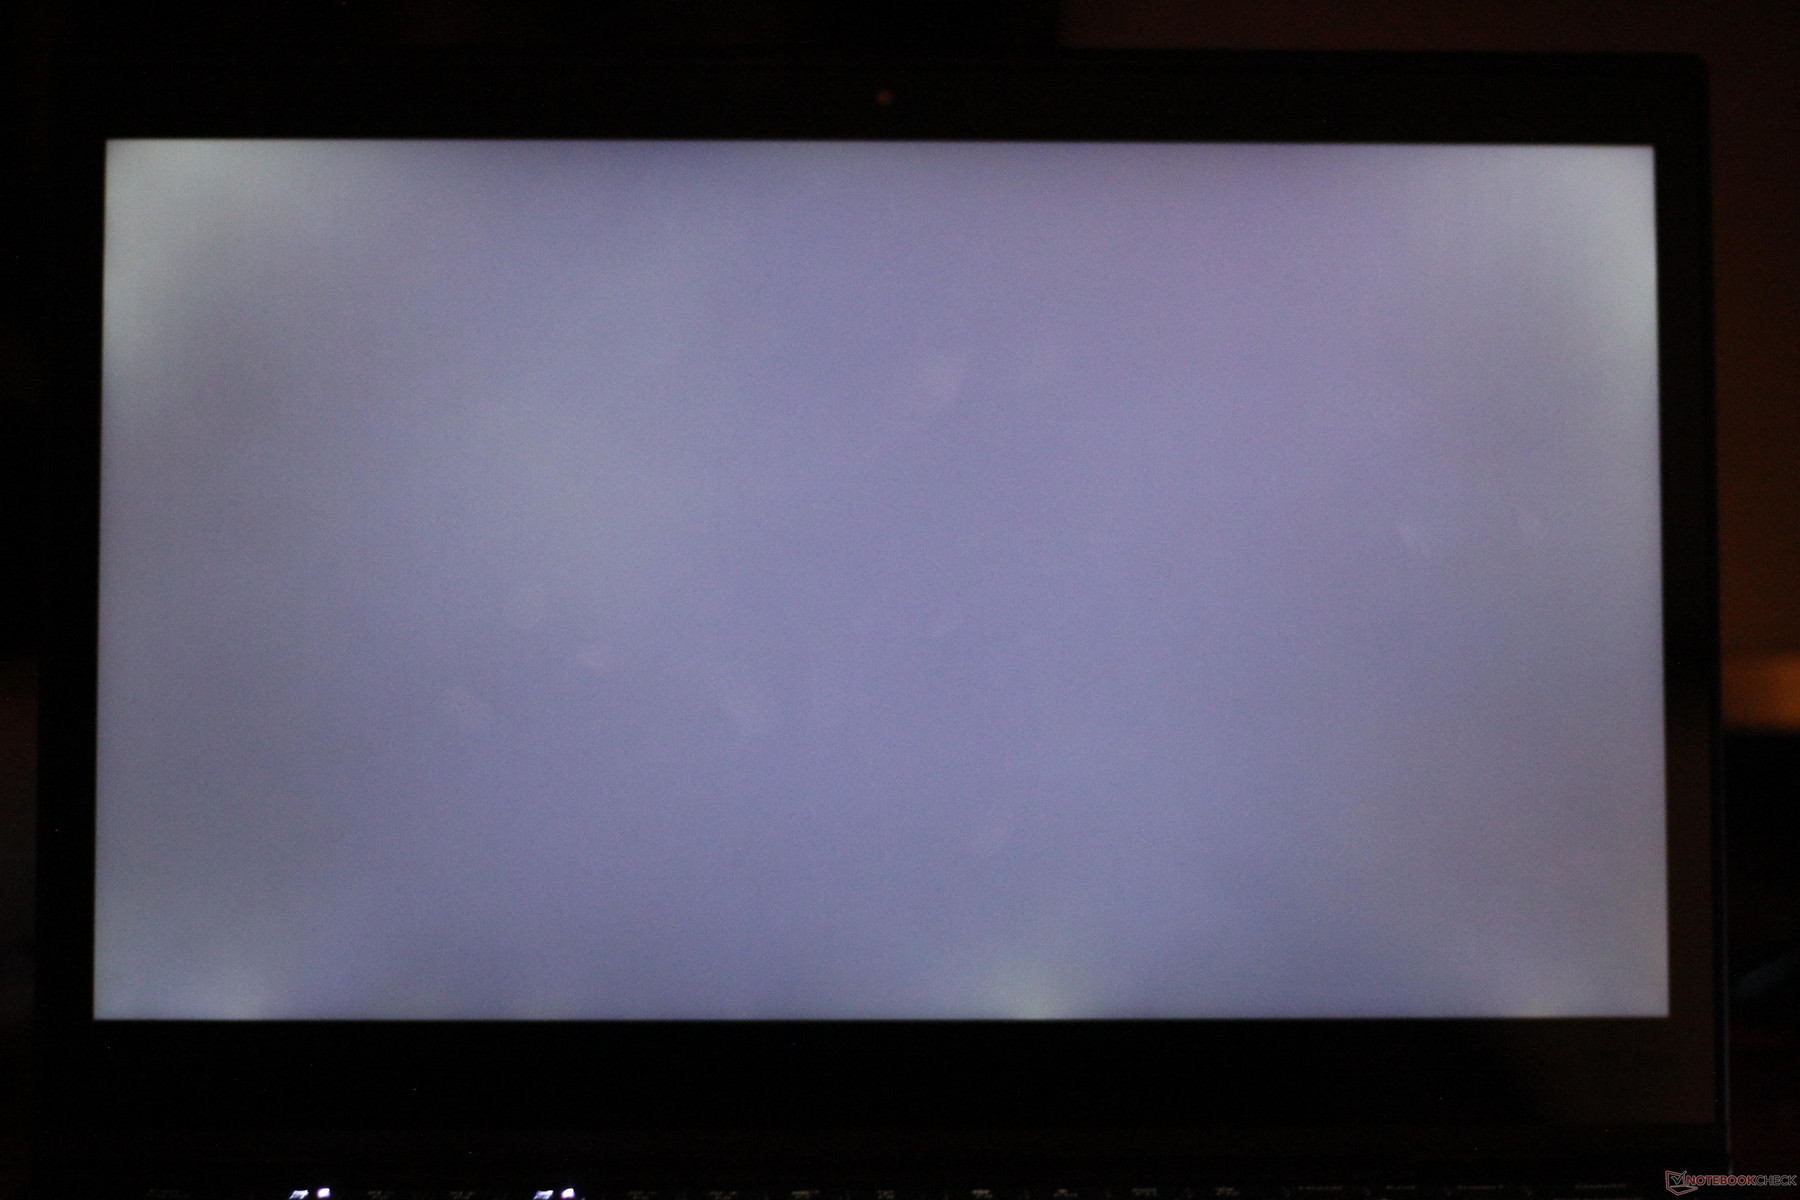
The glossy Full HD touchscreen is a considerable step down from the HDR WQHD display of the higher-end X1 Yoga. Response times of the FHD model are on the slower side of average but are within reason for an IPS display. The biggest weakness of the Full HD panel is its relatively dim backlight. Brightness averages only about 240 nits, which is comparatively low to many other business notebooks. The HDR X1 Yoga is in another league, more than doubling the luminosity of the FHD display. Brightness distribution across the 1080p panel is also low at about 75%, but as the screen is already dim, this isn't noticeable in day to day use and won't be distracting. Contrast is about average.
| |||||||||||||||||||||||||
Brightness Distribution: 75 %
Center on Battery: 267.2 cd/m²
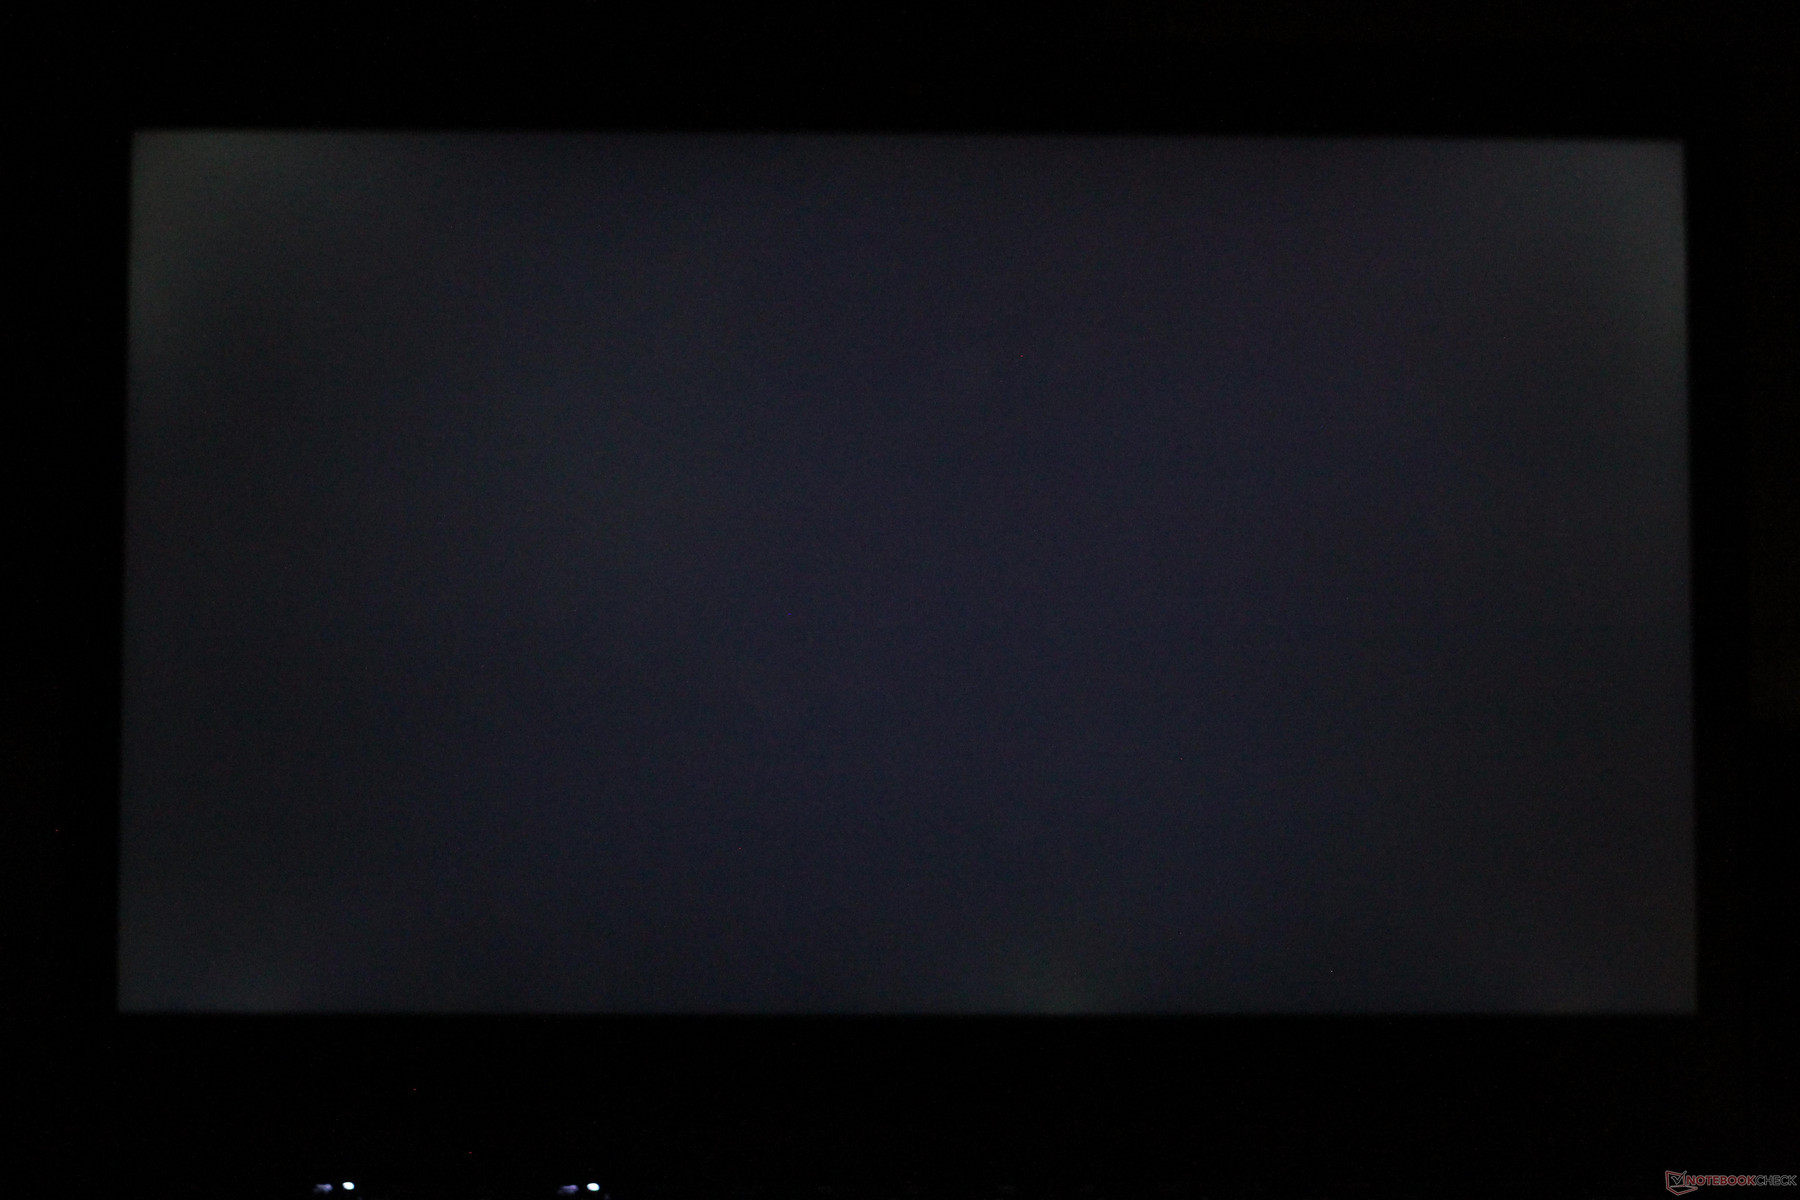
Contrast: 990:1 (Black: 0.27 cd/m²)
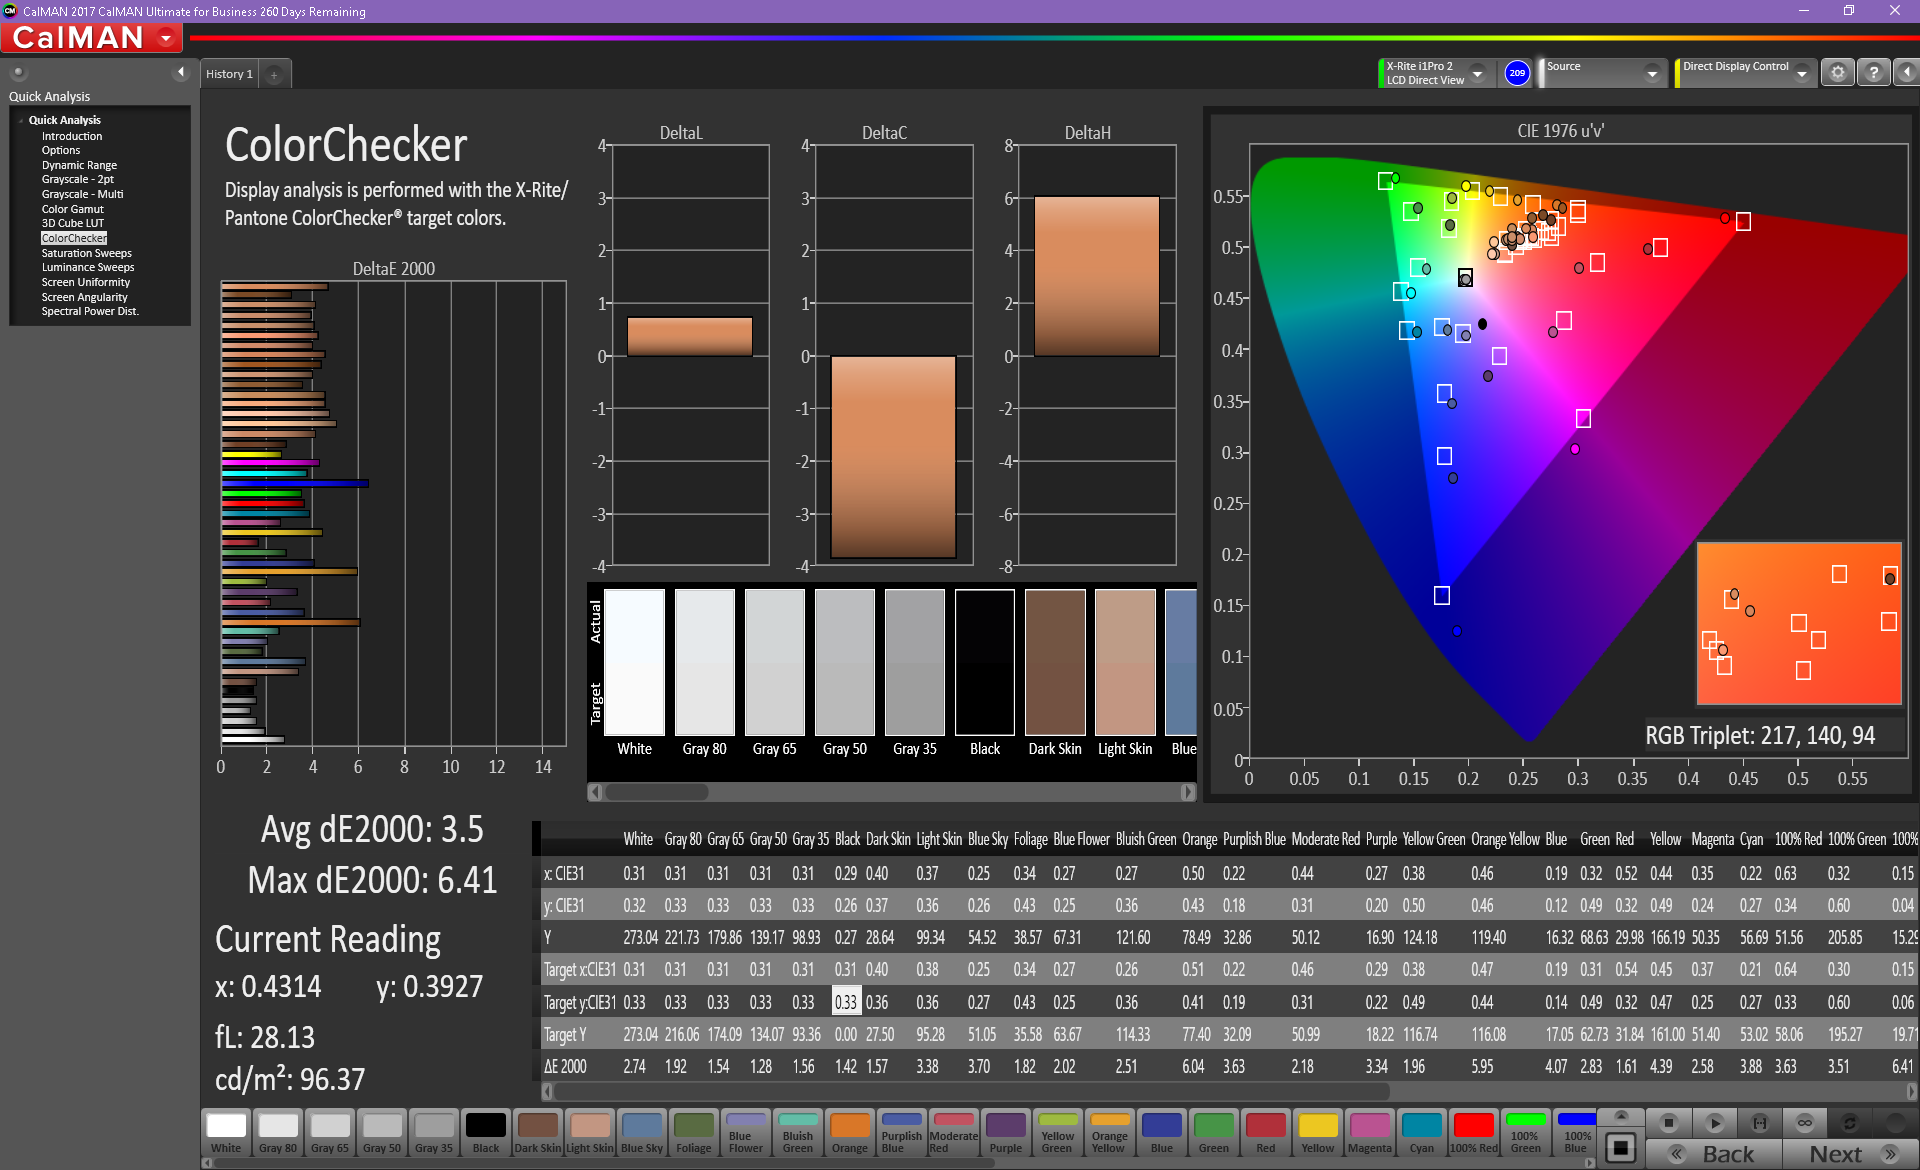
ΔE ColorChecker Calman: 3.5 | ∀{0.5-29.43 Ø4.71}
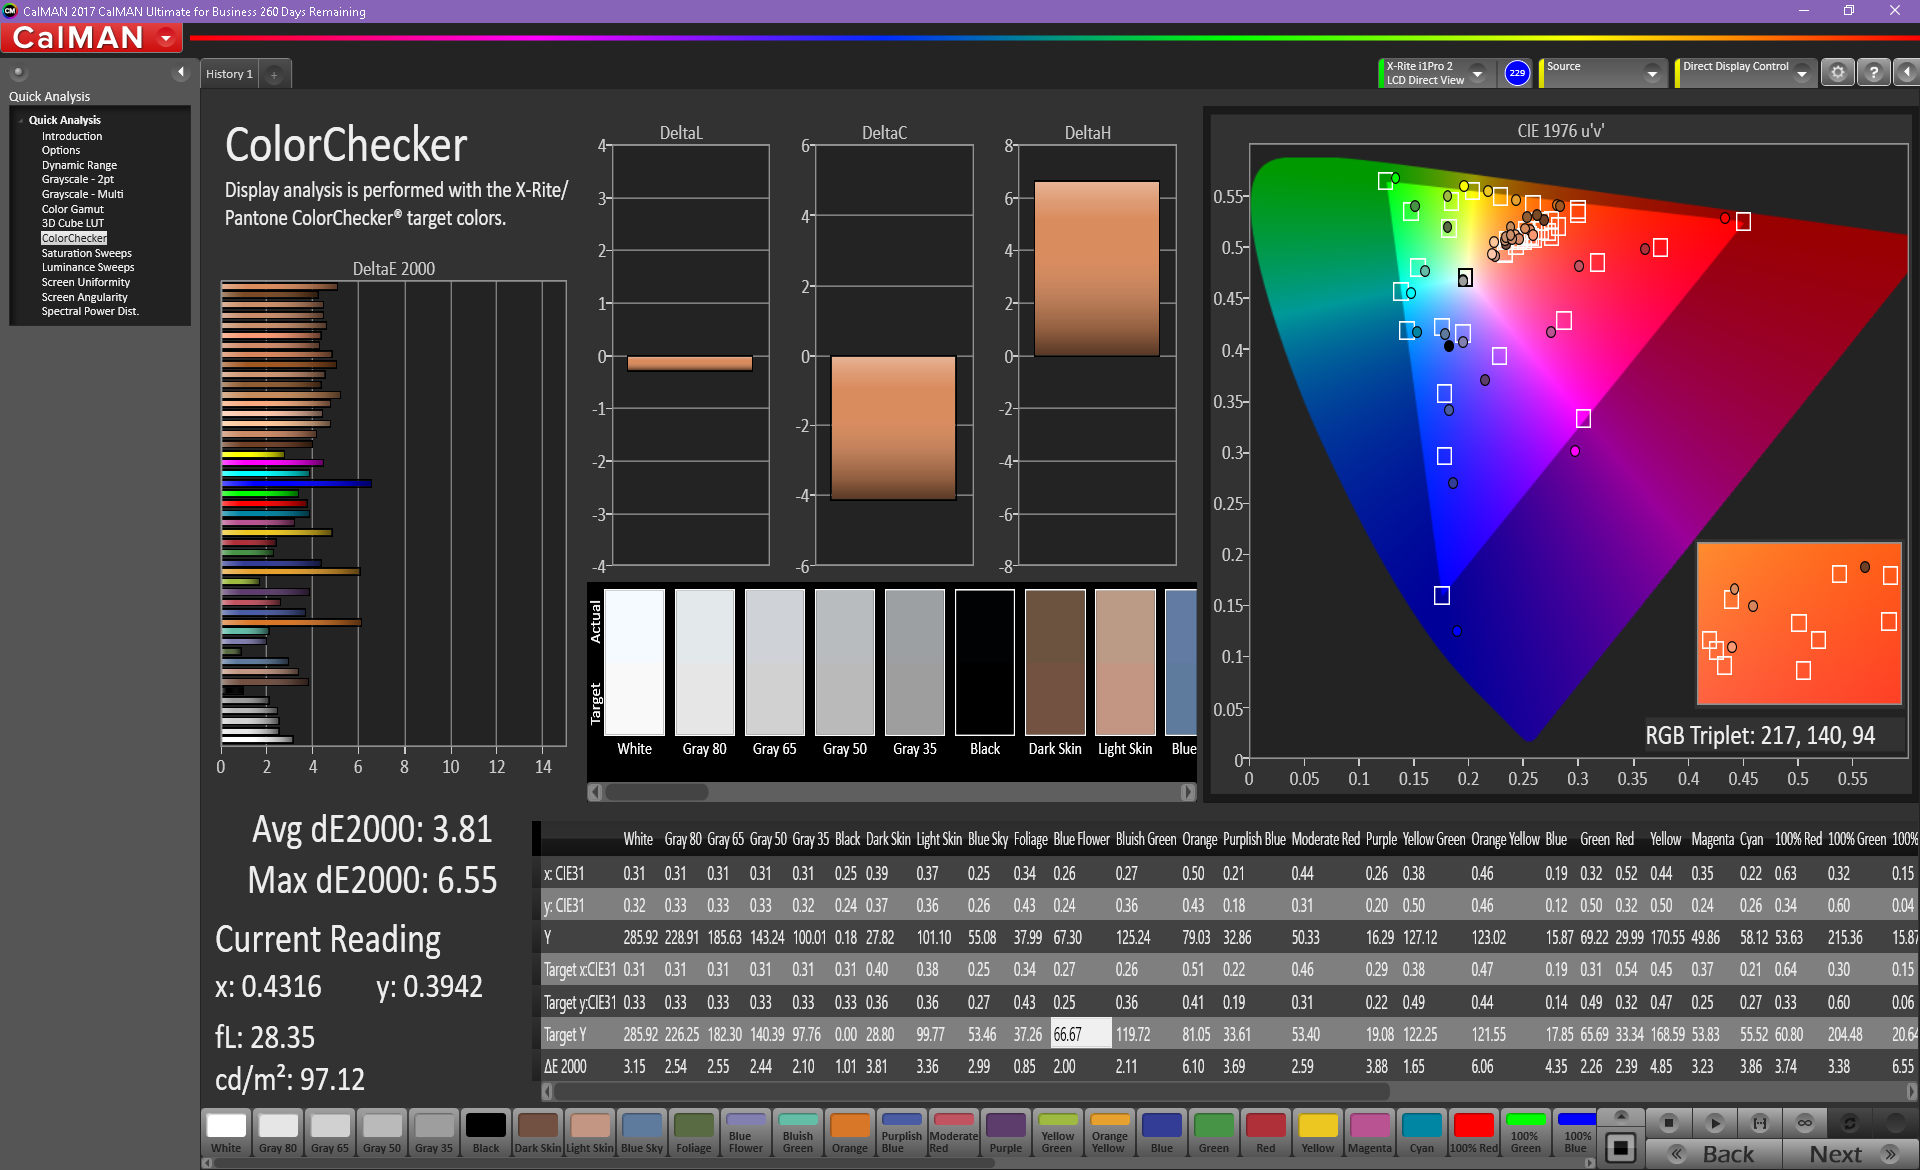
calibrated: 3.81
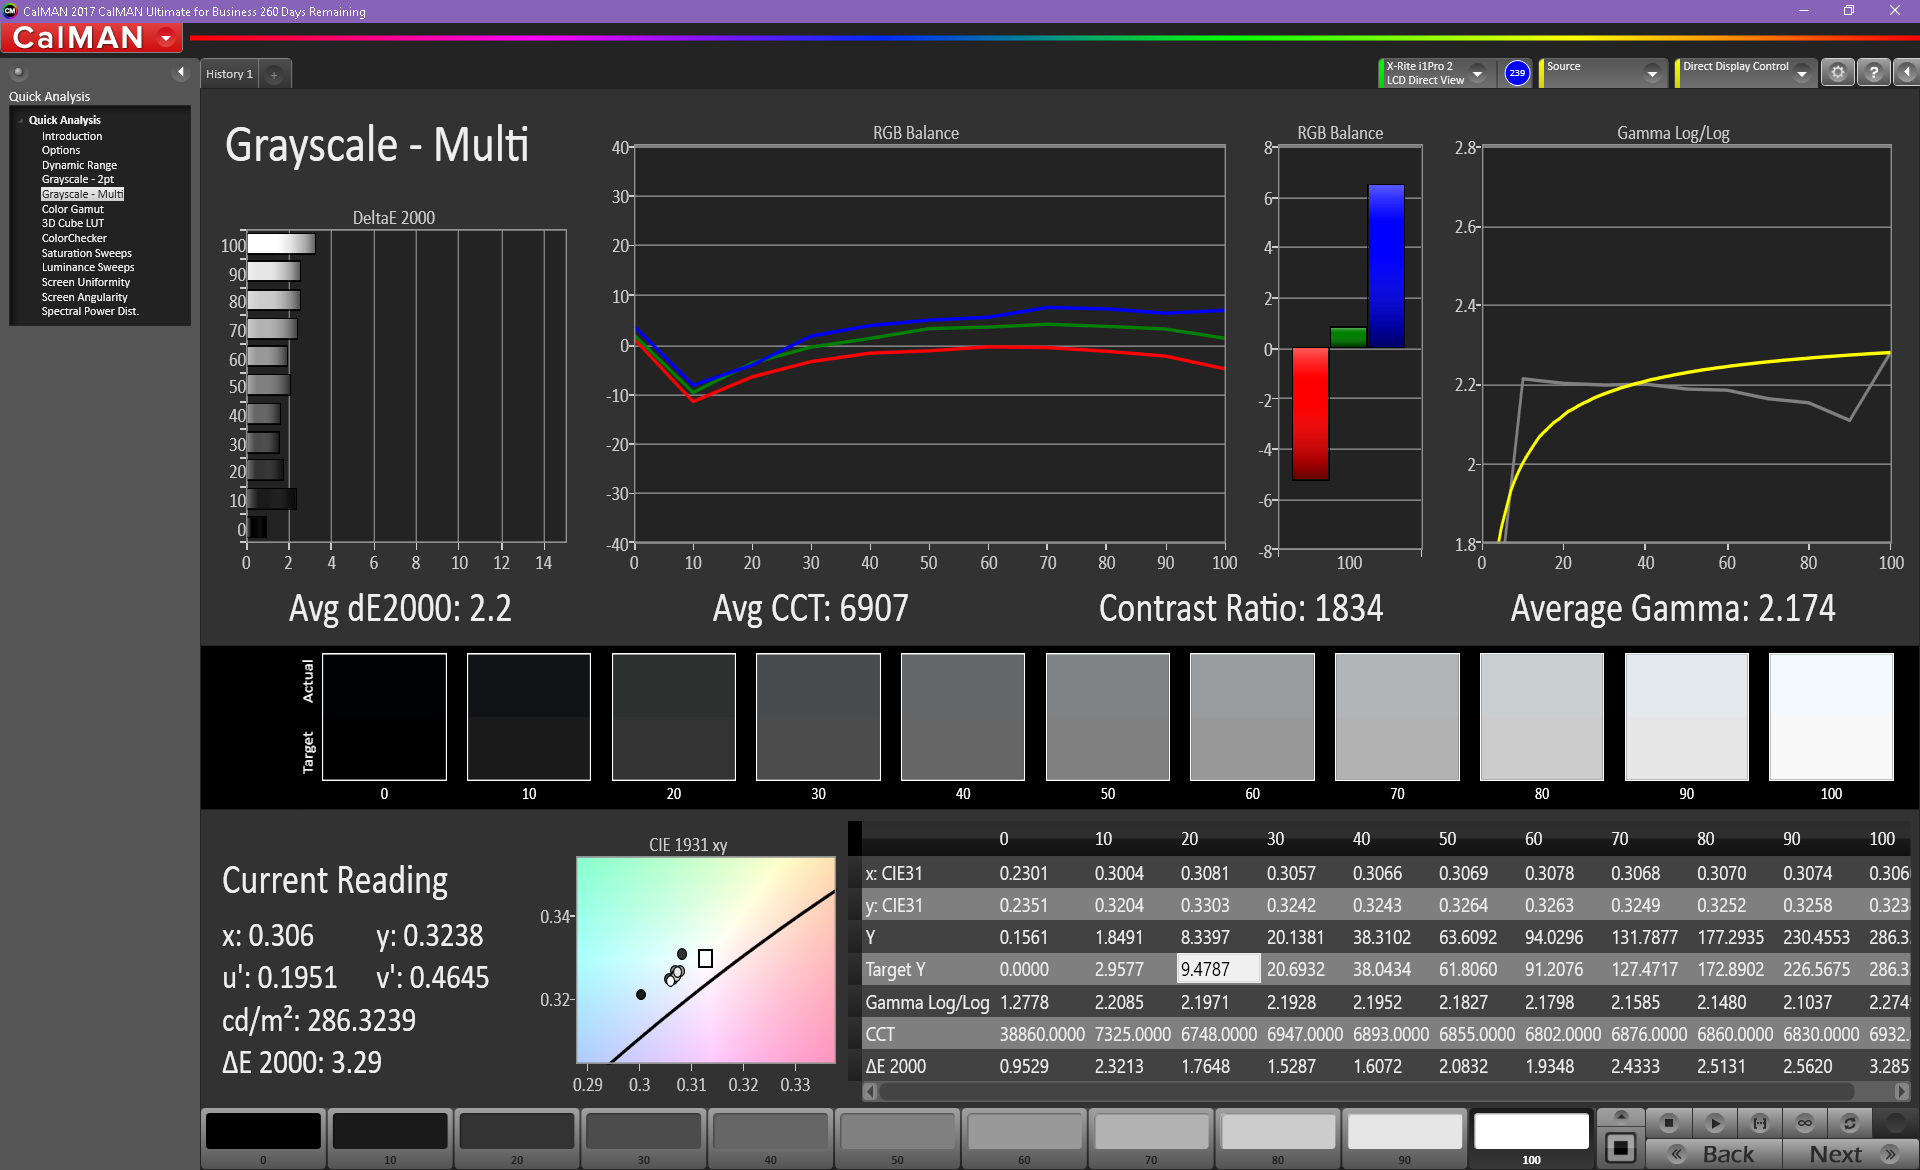
ΔE Greyscale Calman: 1.3 | ∀{0.09-98 Ø4.96}
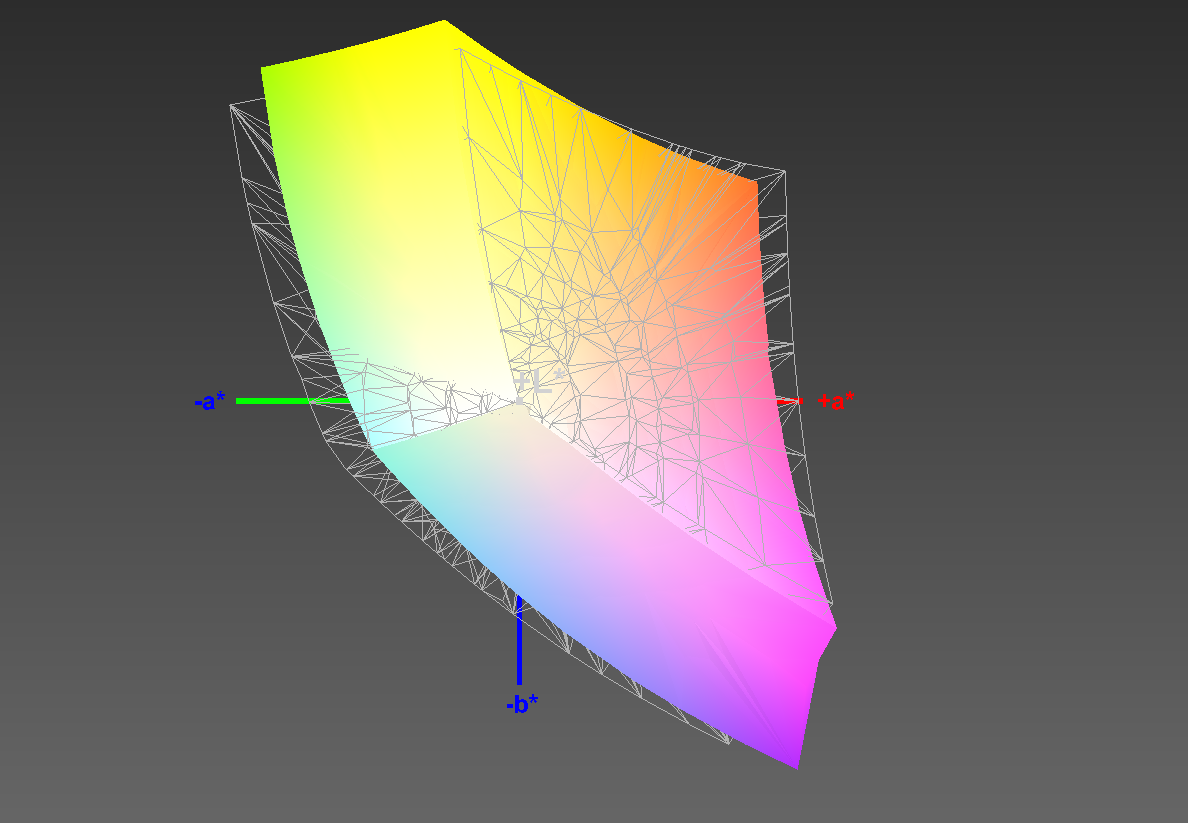
86% sRGB (Argyll 1.6.3 3D)
56% AdobeRGB 1998 (Argyll 1.6.3 3D)
61.9% AdobeRGB 1998 (Argyll 3D)
86.4% sRGB (Argyll 3D)
60.9% Display P3 (Argyll 3D)
Gamma: 2.146
CCT: 6523 K
| Lenovo ThinkPad X1 Yoga 2018-20LD0015US Lenovo LEN40A9, IPS, 14", 1920x1080 | Lenovo ThinkPad X1 Yoga 2018-20LES01W00 Lenovo 40AE / B140QAN02.0, IPS Dolby Vision HDR, 14", 2560x1440 | Lenovo Yoga 920-13IKB-80Y7 AU Optronics B139HAN03.0, IPS, 13.9", 1920x1080 | Dell XPS 13-9365 2-in-1 IPS, 13.3", 1920x1080 | HP EliteBook x360 1030 G2 CMN1374, IPS, 13.3", 1920x1080 | Microsoft Surface Pro (2017) i5 LG Display LP123WQ112604, IPS, 12.3", 2736x1824 | Asus ZenBook Flip 14 UX461UA BOE NV140FHM-N62, IPS, 14", 1920x1080 | |
|---|---|---|---|---|---|---|---|
| Display | 40% | 4% | -20% | 5% | 13% | 1% | |
| Display P3 Coverage (%) | 60.9 | 86.5 42% | 62.5 3% | 47.32 -22% | 65.5 8% | 67.6 11% | 64.4 6% |
| sRGB Coverage (%) | 86.4 | 100 16% | 91.7 6% | 71.1 -18% | 88.8 3% | 99 15% | 84.6 -2% |
| AdobeRGB 1998 Coverage (%) | 61.9 | 99.4 61% | 64.1 4% | 48.83 -21% | 64.9 5% | 69.1 12% | 61.8 0% |
| Response Times | -12% | -12% | -17% | -16% | -3% | -12% | |
| Response Time Grey 50% / Grey 80% * (ms) | 40.4 ? | 56.8 ? -41% | 46 ? -14% | 48 ? -19% | 55.2 ? -37% | 42 ? -4% | 44 ? -9% |
| Response Time Black / White * (ms) | 28.8 ? | 24 ? 17% | 31.6 ? -10% | 32.8 ? -14% | 27.2 ? 6% | 29 ? -1% | 33 ? -15% |
| PWM Frequency (Hz) | 1042 ? | 21000 | 200 ? | ||||
| Screen | 18% | -57% | -57% | -44% | 13% | -33% | |
| Brightness middle (cd/m²) | 267.2 | 562 110% | 297.9 11% | 322.6 21% | 262 -2% | 417 56% | 302 13% |
| Brightness (cd/m²) | 239 | 522 118% | 278 16% | 306 28% | 256 7% | 401 68% | 288 21% |
| Brightness Distribution (%) | 75 | 86 15% | 81 8% | 91 21% | 83 11% | 88 17% | 90 20% |
| Black Level * (cd/m²) | 0.27 | 0.3 -11% | 0.44 -63% | 0.19 30% | 0.25 7% | 0.29 -7% | 0.57 -111% |
| Contrast (:1) | 990 | 1873 89% | 677 -32% | 1698 72% | 1048 6% | 1438 45% | 530 -46% |
| Colorchecker dE 2000 * | 3.5 | 2.8 20% | 5.1 -46% | 7.7 -120% | 5.13 -47% | 3.63 -4% | 5.17 -48% |
| Colorchecker dE 2000 max. * | 6.4 | 5.8 9% | 11 -72% | 11.1 -73% | 9.46 -48% | 6.74 -5% | 7.68 -20% |
| Colorchecker dE 2000 calibrated * | 3.81 | ||||||
| Greyscale dE 2000 * | 1.3 | 4.5 -246% | 6.7 -415% | 7.9 -508% | 6.23 -379% | 2.18 -68% | 3.26 -151% |
| Gamma | 2.146 103% | 2.16 102% | 2.9 76% | 2.88 76% | 2.45 90% | 3.09 71% | 2.45 90% |
| CCT | 6523 100% | 7205 90% | 6839 95% | 7044 92% | 6413 101% | 6767 96% | 7142 91% |
| Color Space (Percent of AdobeRGB 1998) (%) | 56 | 88.9 59% | 64.1 14% | 44.1 -21% | 57.84 3% | 63 13% | 55 -2% |
| Color Space (Percent of sRGB) (%) | 86 | 100 16% | 91.7 7% | 69.9 -19% | 88.57 3% | 99 15% | 85 -1% |
| Total Average (Program / Settings) | 15% /
18% | -22% /
-39% | -31% /
-44% | -18% /
-30% | 8% /
11% | -15% /
-23% |
* ... smaller is better
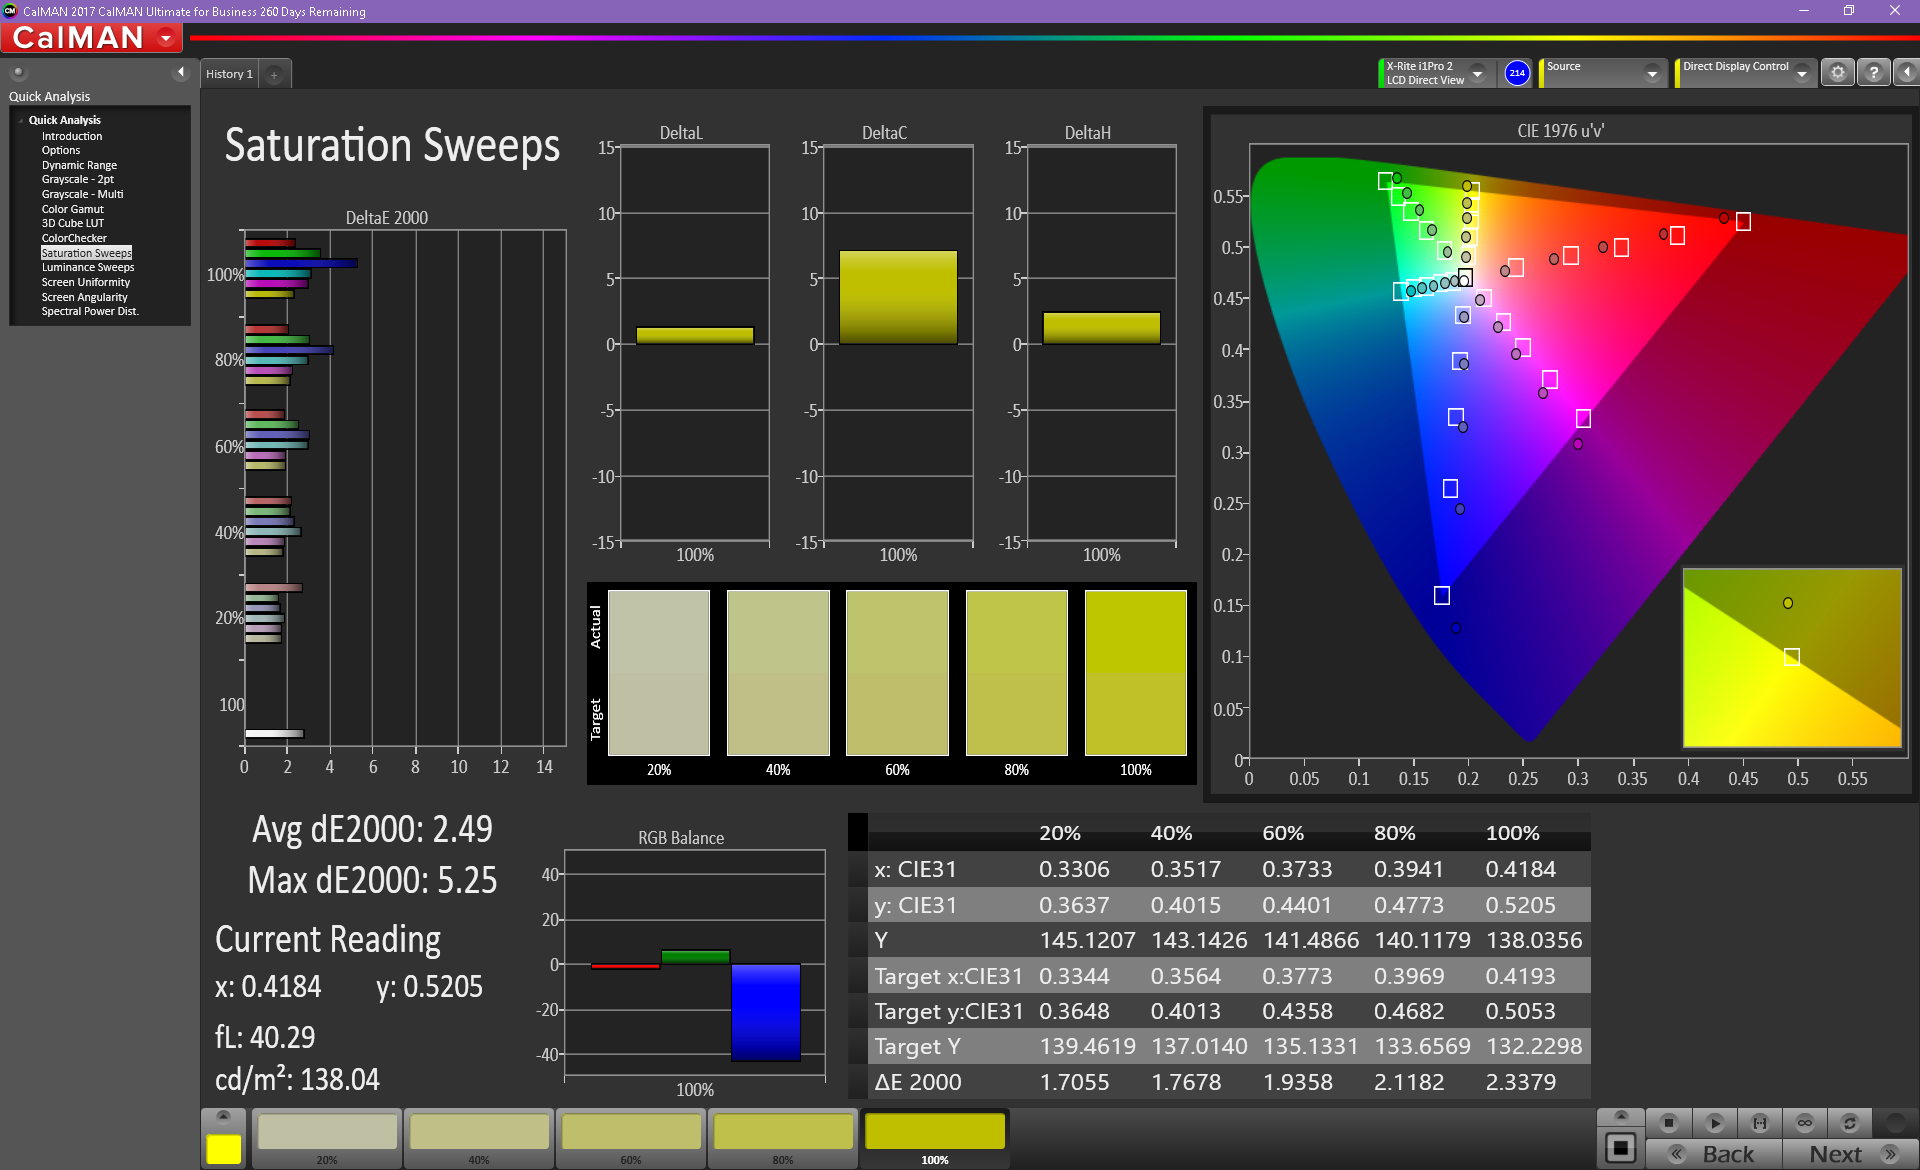
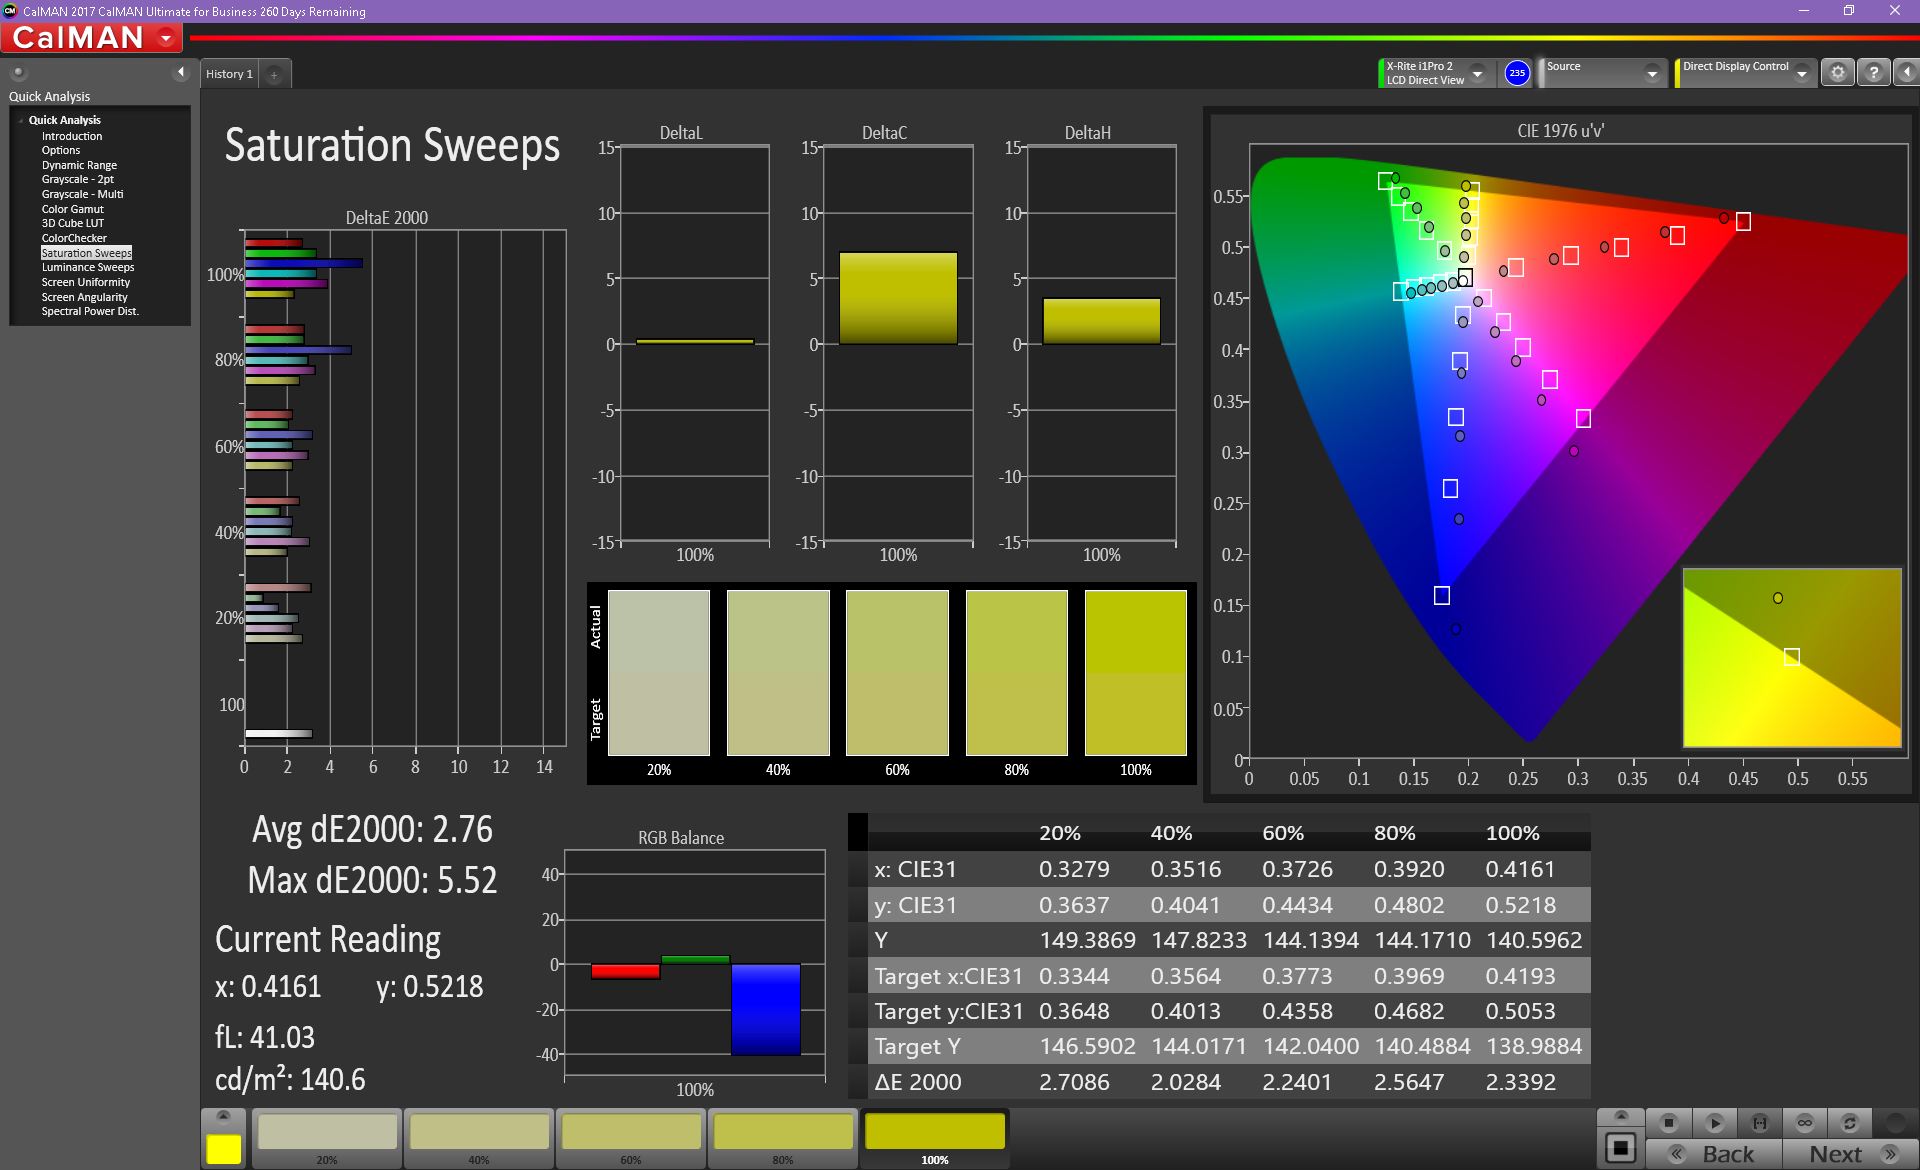
In spite of the FHD X1 Yoga falling flat compared to its HDR-enabled big brother, the screen is passable for office use. While it is fairly dim, color temperature is almost spot on at 6523 K. (6500 K is generally considered perfect.) Whites look balanced on this screen, as opposed to the blue shift we noticed with the WQHD model. Color accuracy is also respectable; the FHD X1 Yoga manages to hit DeltaE 2000 values of 3.5 and 1.3 for colors and grays, respectively. Ideally, these numbers should be at or below 3. Colors look vibrant and true-to-life. Most other business notebooks need some calibration to approach the level of this panel.
Color space coverage is adequate at about 56% of the AdobeRGB and 86% of the sRGB gamuts. This isn't best-in-class but should be more than good enough for productivity tasks and is about average for a business laptop. The HDR-capable X1 Yoga is a much better choice for those that need a wide berth of colors as it covers almost 90% of the AdobeRGB space and all of the sRGB gamut.


Display Response Times
| ↔ Response Time Black to White | ||
|---|---|---|
| 28.8 ms ... rise ↗ and fall ↘ combined | ↗ 17.2 ms rise | 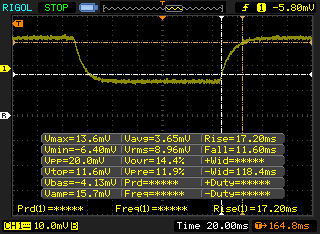 |
| ↘ 11.6 ms fall | ||
| The screen shows relatively slow response rates in our tests and may be too slow for gamers. In comparison, all tested devices range from 0.1 (minimum) to 240 (maximum) ms. » 76 % of all devices are better. This means that the measured response time is worse than the average of all tested devices (19.8 ms). | ||
| ↔ Response Time 50% Grey to 80% Grey | ||
| 40.4 ms ... rise ↗ and fall ↘ combined | ↗ 22.4 ms rise | 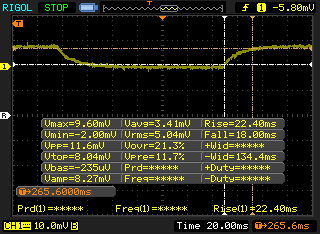 |
| ↘ 18 ms fall | ||
| The screen shows slow response rates in our tests and will be unsatisfactory for gamers. In comparison, all tested devices range from 0.165 (minimum) to 636 (maximum) ms. » 64 % of all devices are better. This means that the measured response time is worse than the average of all tested devices (31 ms). | ||
Screen Flickering / PWM (Pulse-Width Modulation)
| Screen flickering / PWM not detected | 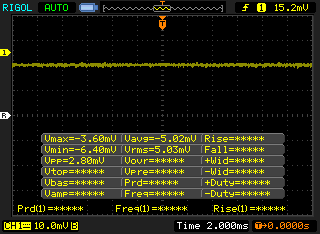 | ||
In comparison: 52 % of all tested devices do not use PWM to dim the display. If PWM was detected, an average of 7754 (minimum: 5 - maximum: 343500) Hz was measured. | |||
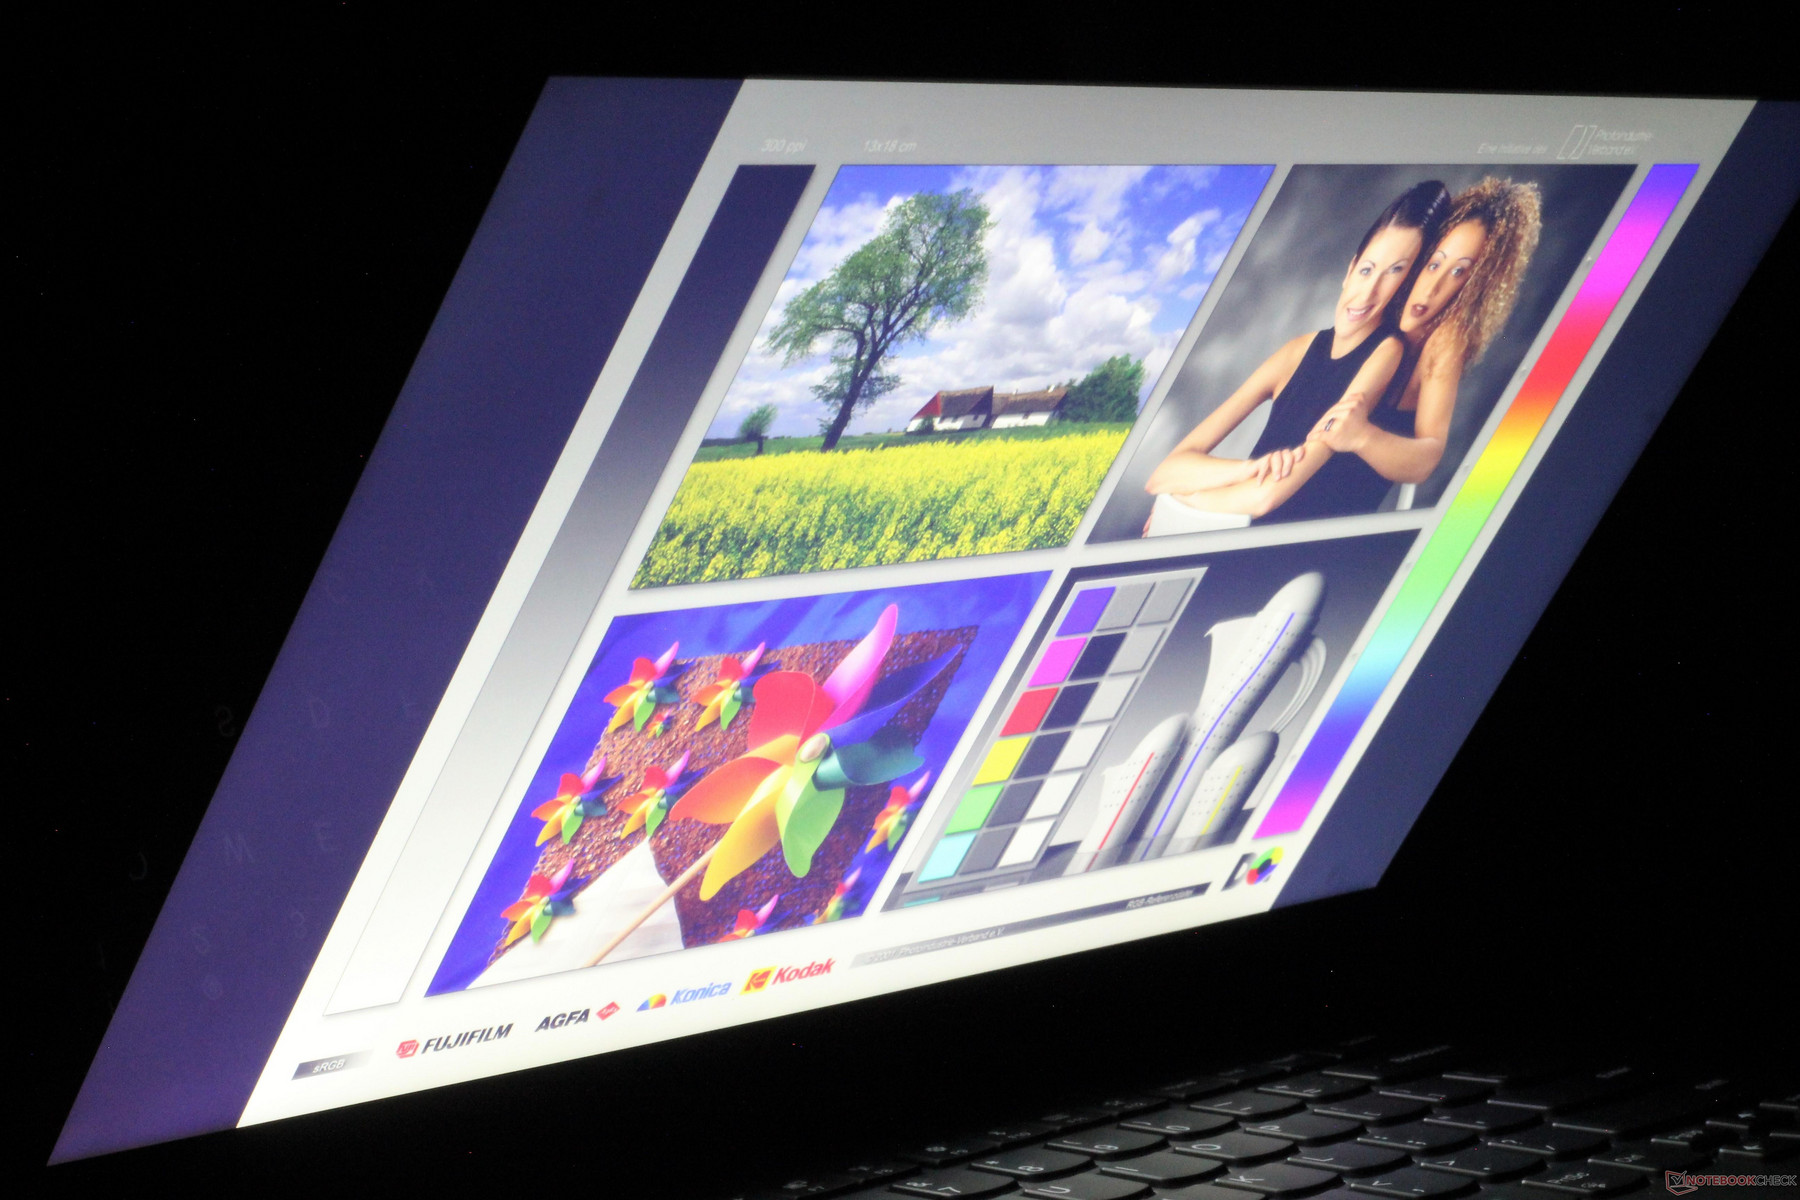
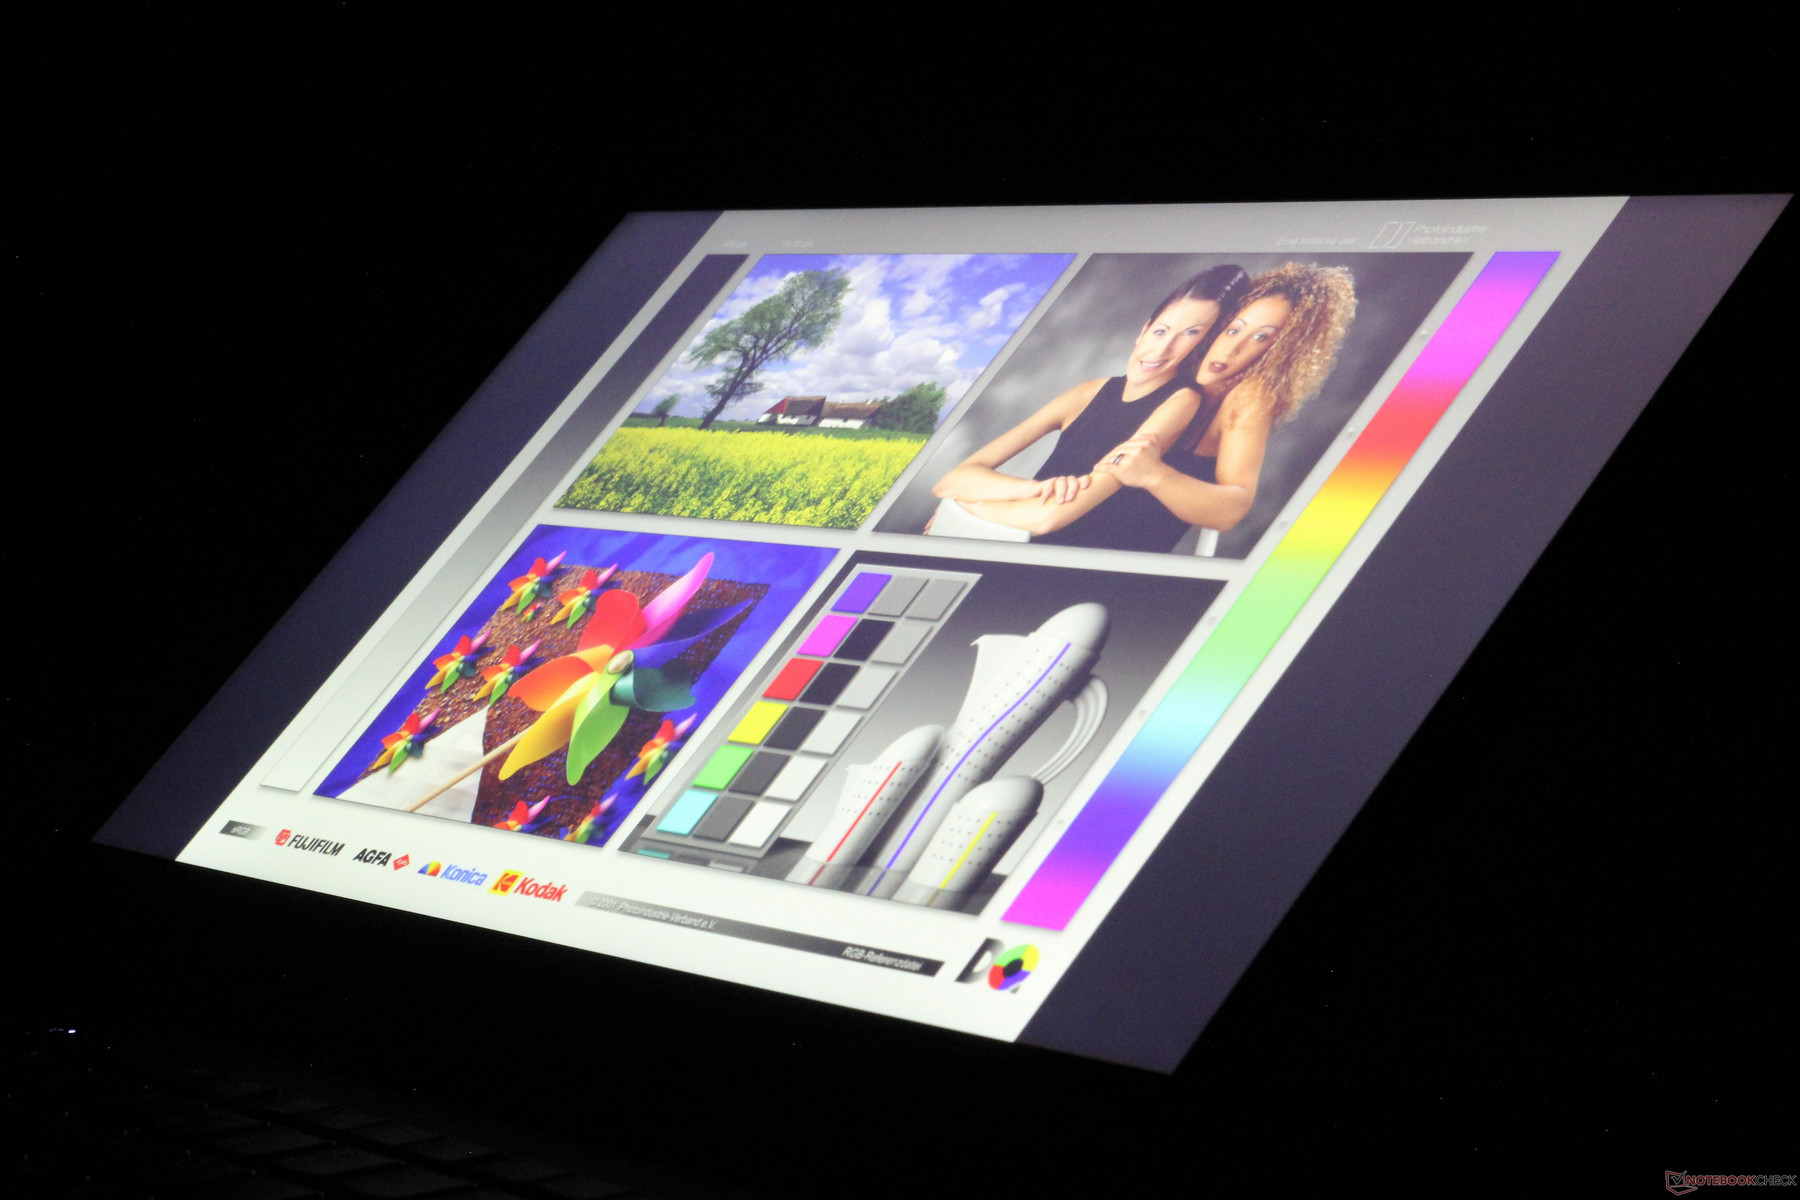
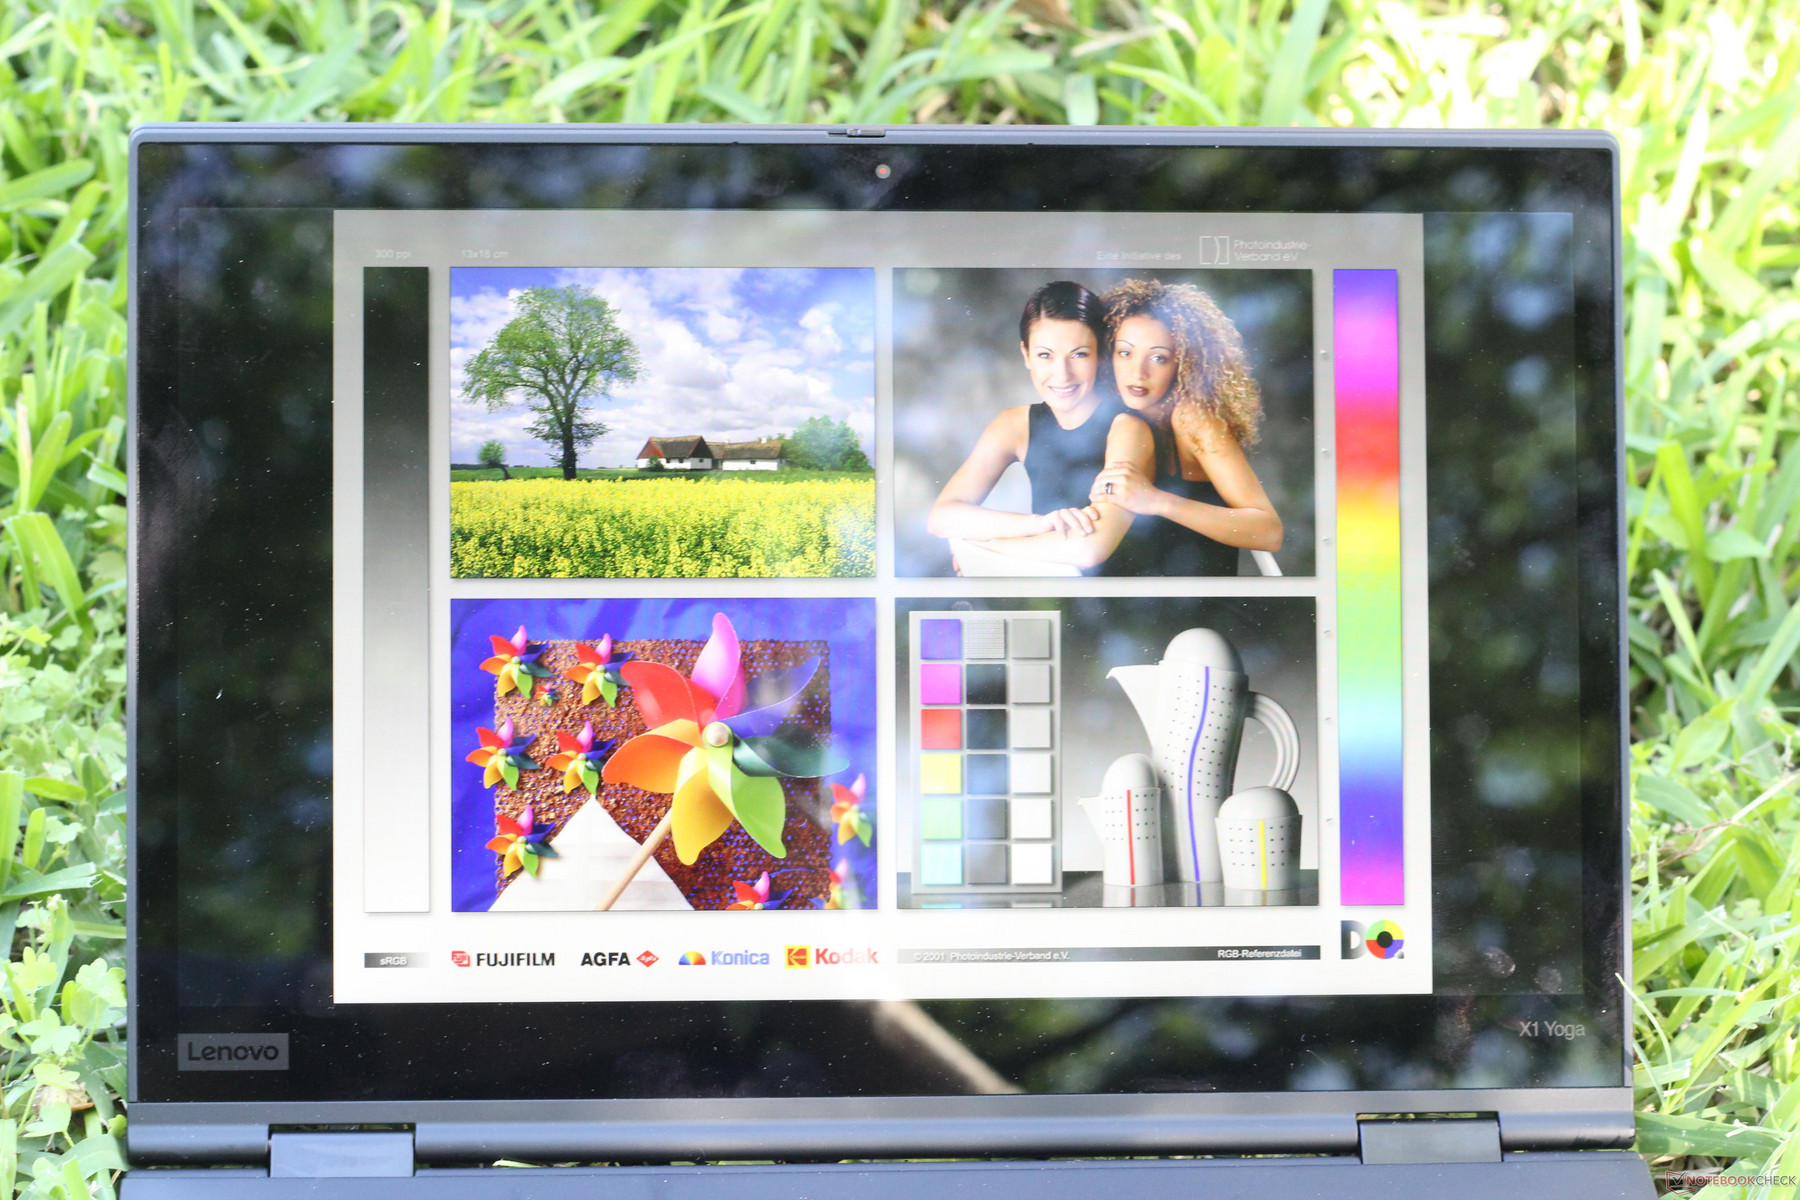
The lackluster brightness of the panel will cause some visibility issues outdoors. While Lenovo uses an anti-glare coating across the touchscreen, glare is still problematic, and the backlight cannot get bright enough to cut through direct sunlight. The screen is fine in shade or indoors, so long as light is not shining directly on it. Viewing angles are excellent; our test image remains vibrant and crisp at almost any angle.


Performance
We have so far been impressed with the 8th generation of Intel's ULV processors; the new four-core design has shown massive gains in performance, particularly in multi-threaded workloads. We have already looks at the Core i7-8550U in our previous X1 Yoga review. How does the lower-clocked Core i5-8250U compare? Let's find out.

Processor
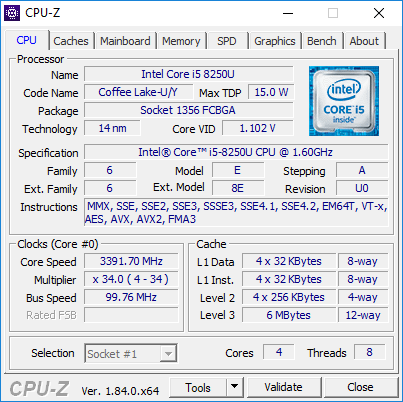
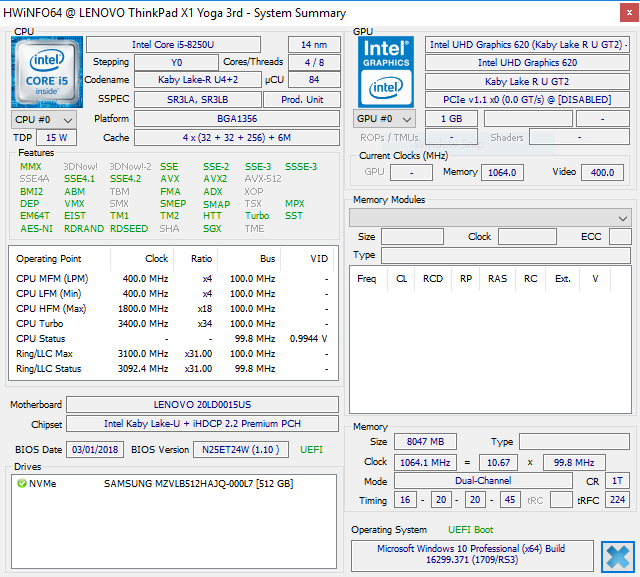
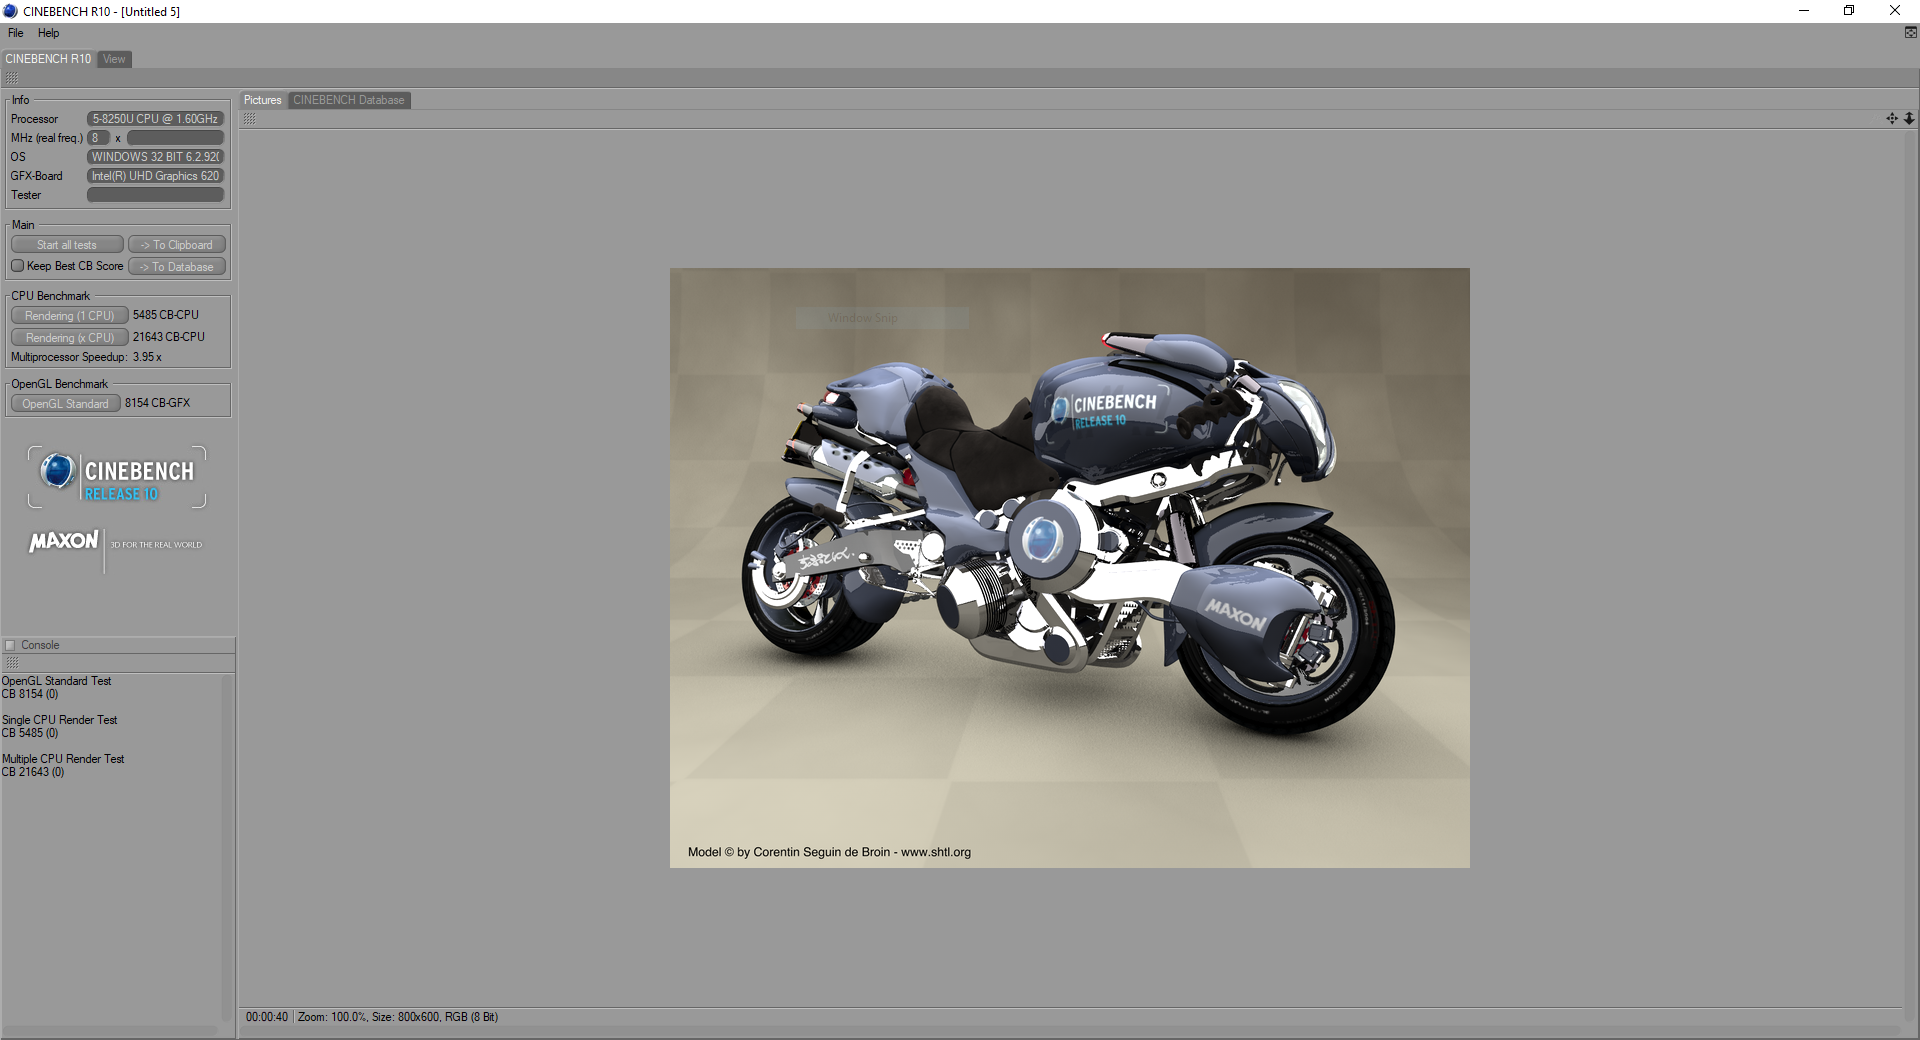
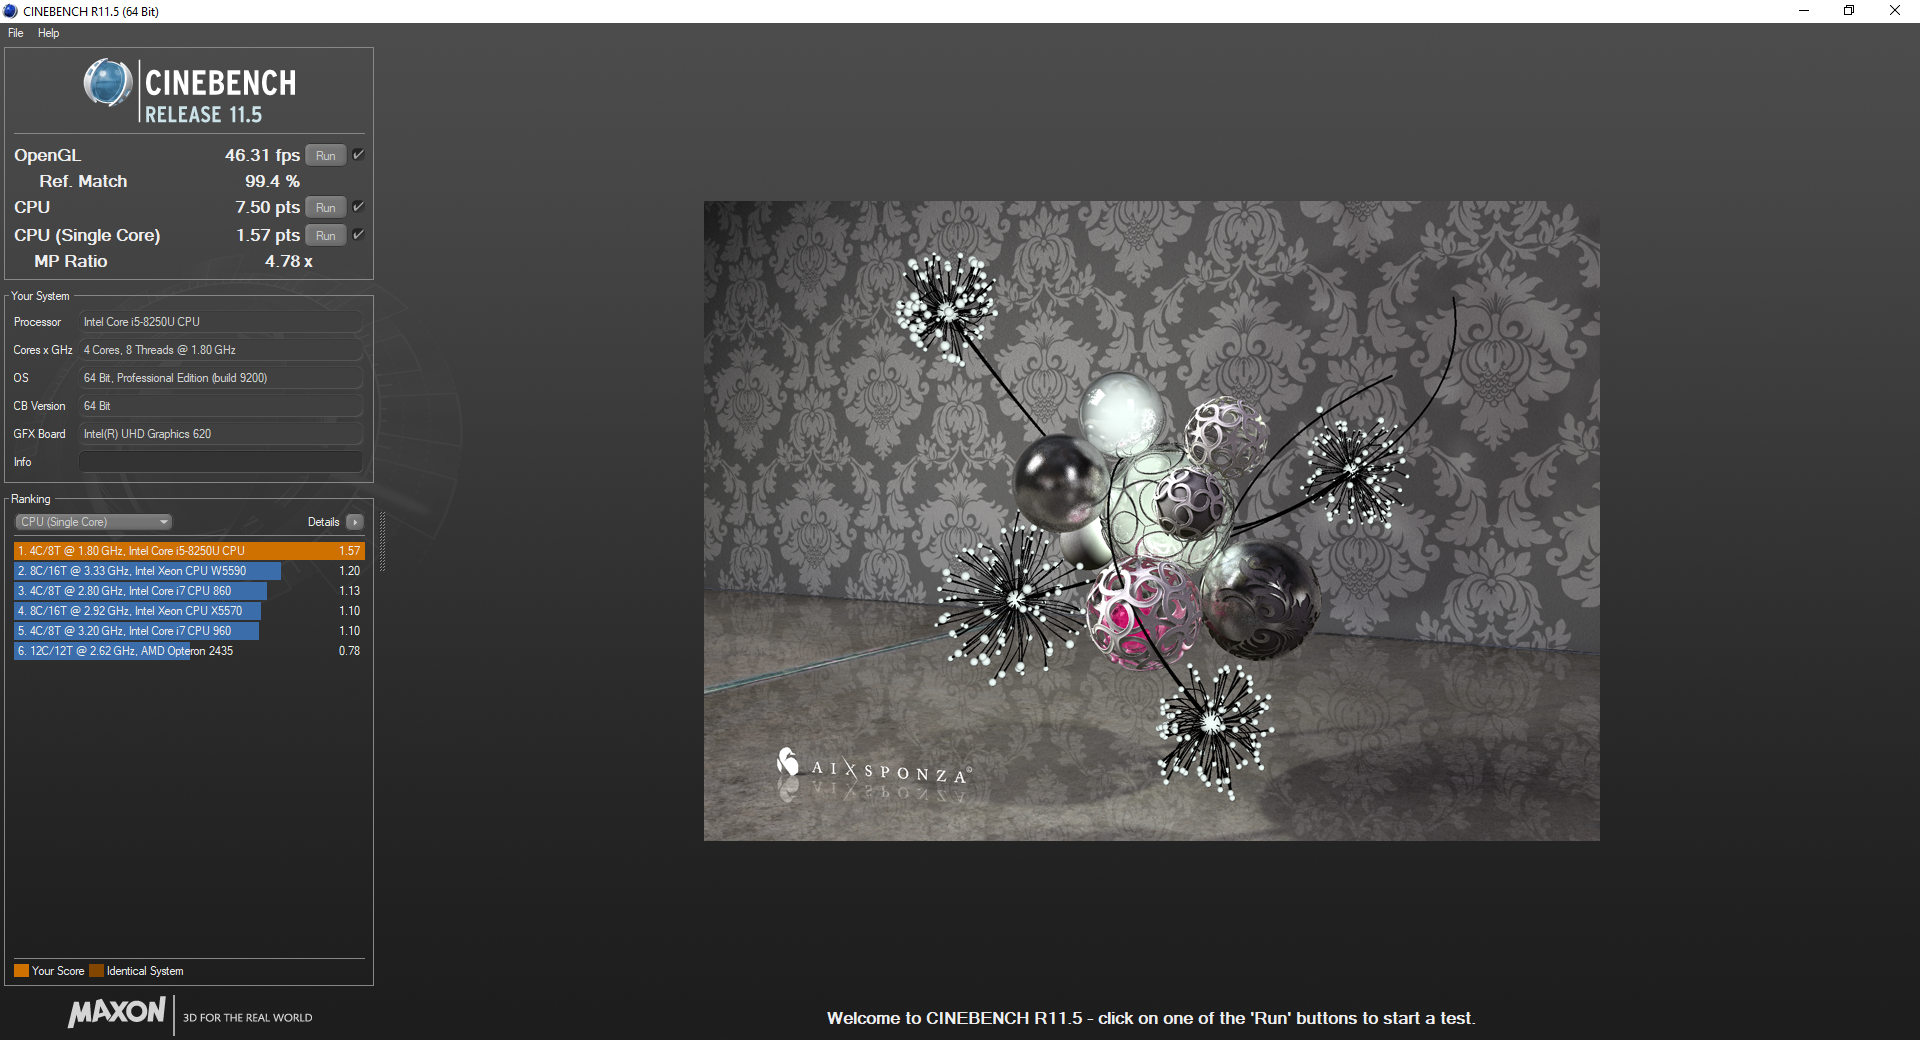
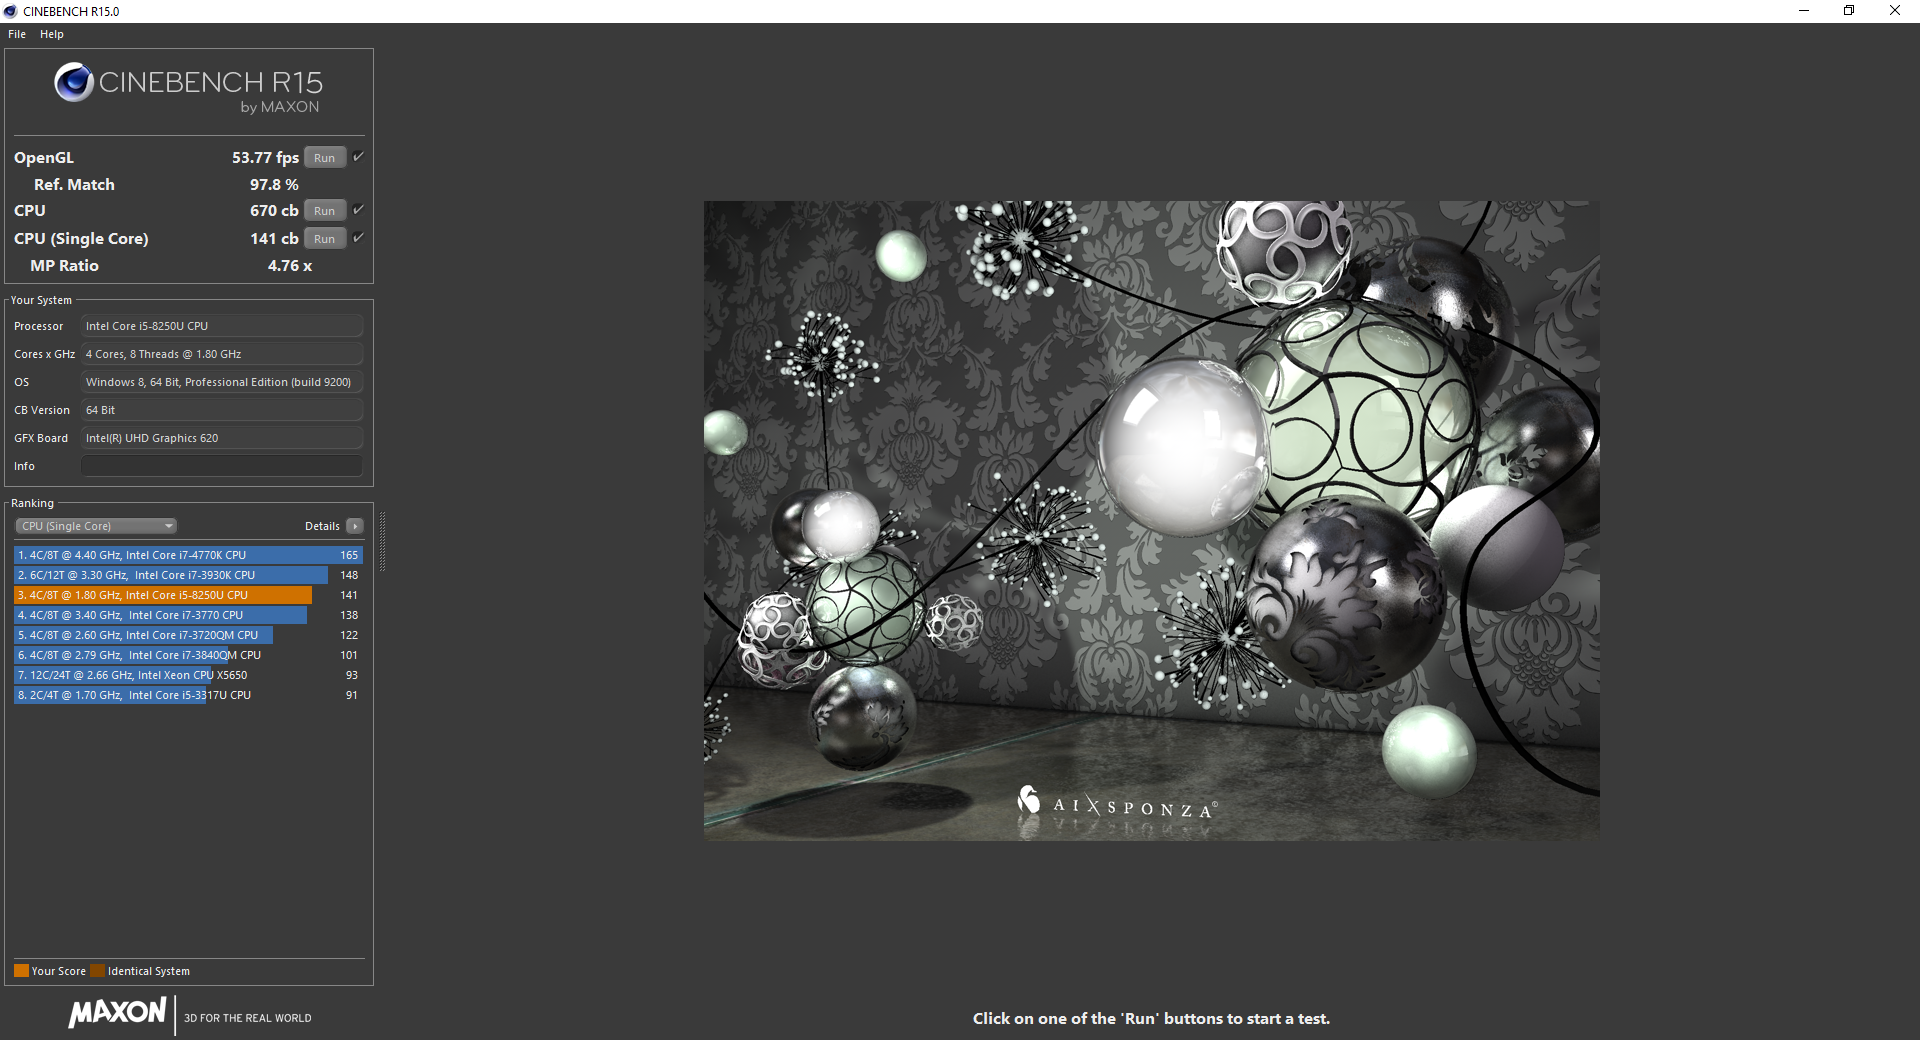
Intel's Core i5-8250U (1.6 GHz base, 3.4 GHz boost) is a boon for mid-tier ultrabooks and business laptops. As with the other 8th generation Core i5 and i7 processors, the 8250U doubles the core count of Intel's previous Ultrabook-class processors; the additional two cores should (in theory) result in near-doubled multi-threaded performance. This is indeed what we see in benchmarks. In Cinebench R15's multi-core test, the Core i5-8250U scores 94% higher than the Core i5-7300U in HP's EliteBook x360 1030 G2. Interestingly, the 8250U also bests the Core i7-7600U by 90%. It should be noted that our mid-tier X1 Yoga is able to keep pace with the higher-end model equipped with a Core i7-8550U in multi-threaded workloads.
Despite scoring well in single runs, long-term performance is disappointing. After a strong initial pass through Cinebench R15's mutli-core test, performance takes a measureable dip in performance. The X1 Yoga posts inconsistent results over the next several runs, which may mean it will deliver decreased performance during longer workloads for end users. On battery power, performance is about 90-95% of that when plugged in.
For more information about the Intel Core i5-8250U, please see our dedicated CPU page here.
* ... smaller is better
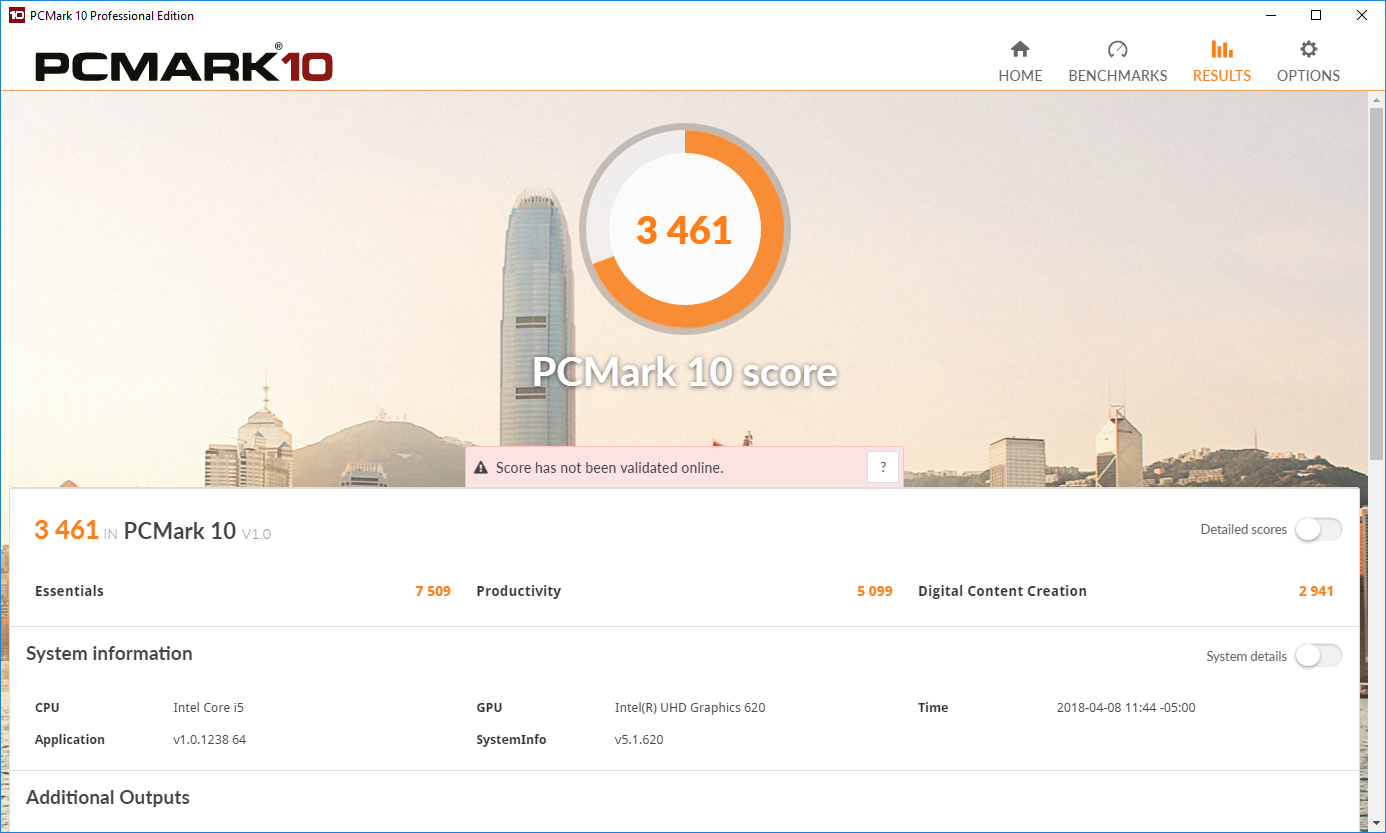
System Performance
Overall system performance is excellent and above average for most other mid-range business notebooks. The combination of a quad-core CPU with Samsung's blazing fast PM981 NVMe drive makes for incredibly quick system response times. The device will not leave users waiting; apps open almost instantly, and workloads finish quickly. The biggest bottleneck is the internal GPU (discussed below), which may be a point of contention for creative professionals.
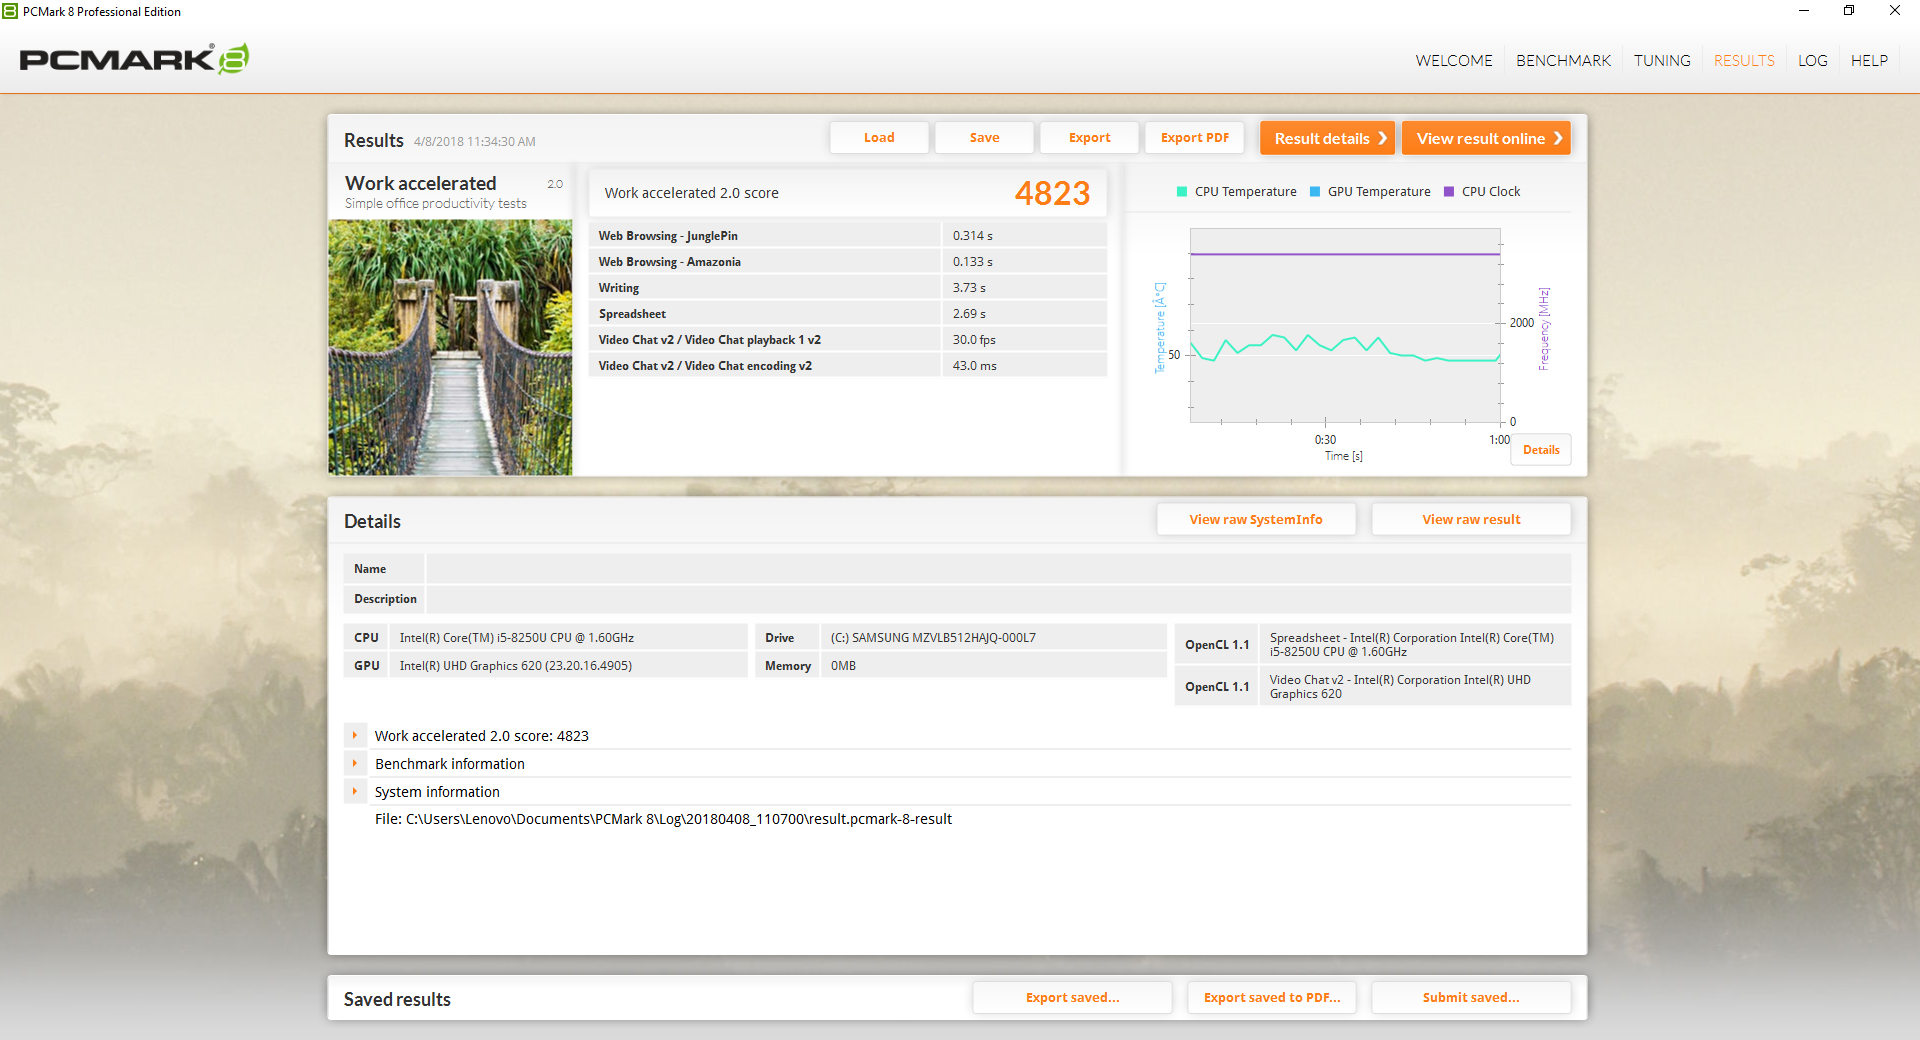


| PCMark 8 Home Score Accelerated v2 | 3946 points | |
| PCMark 8 Creative Score Accelerated v2 | 4879 points | |
| PCMark 8 Work Score Accelerated v2 | 4823 points | |
| PCMark 10 Score | 3461 points | |
Help | ||
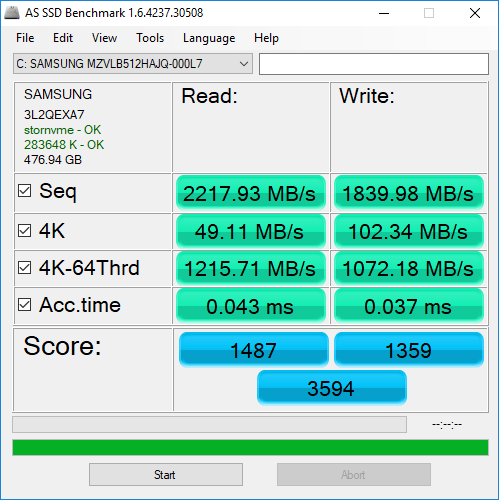
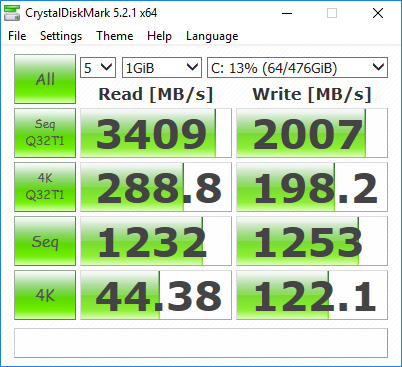
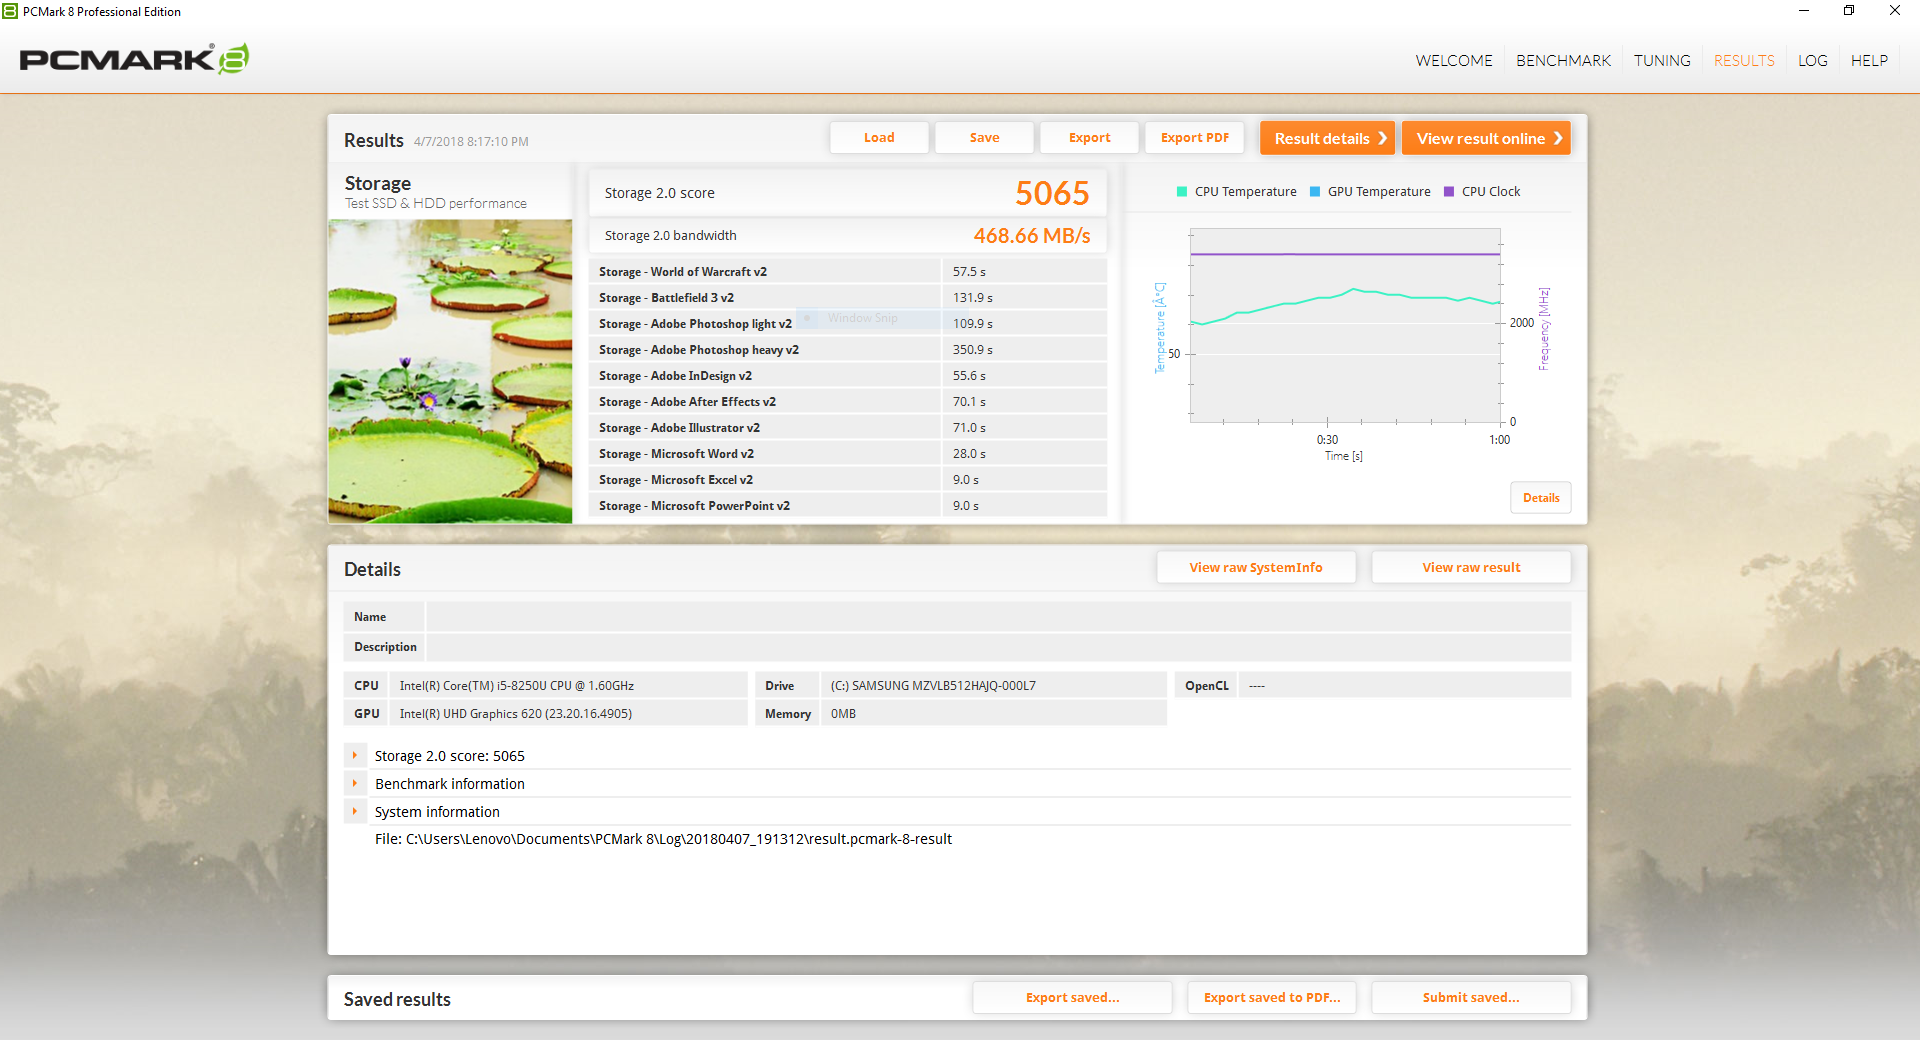
Storage Devices
Samsung's new PM981 PCIe NVMe solid-state drive is one of the fastest currently available on the market. Read and write speeds are insanely fast, hitting 3.4 GB/s and 2.01 GB/s, respectively. The biggest improvement is in write speeds; compared to the PM961, the PM981 in our X1 Yoga manages about 50% faster write speeds in AS SSD. 4K-64 write speeds (which measures how quickly the drive handles chunks of smaller piece of data) are also greatly improved. It should be noted that the larger drive size in our unit (512 GB) contributes to this performance; larger SSDs tend to be noticeably faster than smaller ones.
| Lenovo ThinkPad X1 Yoga 2018-20LD0015US Samsung SSD PM981 MZVLB512HAJQ | Lenovo Yoga 920-13IKB-80Y7 Samsung PM961 MZVLW256HEHP | Dell XPS 13-9365 2-in-1 Toshiba NVMe THNSN5256GPUK | HP EliteBook x360 1030 G2 Sandisk SD8TN8U-256G-1006 | Microsoft Surface Pro (2017) i5 Samsung PM971 KUS030202M | Asus ZenBook Flip 14 UX461UA SanDisk SD8SN8U256G1002 | Average Samsung SSD PM981 MZVLB512HAJQ | |
|---|---|---|---|---|---|---|---|
| AS SSD | -6% | -29% | -86% | -6942% | -81% | 13% | |
| Copy Game MB/s (MB/s) | 607 | 319.2 -47% | 726 20% | 178.5 -71% | 389 -36% | 186.1 -69% | 1057 ? 74% |
| Copy Program MB/s (MB/s) | 233.5 | 463.3 98% | 263.8 13% | 110.6 -53% | 141 -40% | 118.6 -49% | 454 ? 94% |
| Copy ISO MB/s (MB/s) | 917 | 1341 46% | 950 4% | 255.9 -72% | 572 -38% | 324.1 -65% | 1755 ? 91% |
| Score Total (Points) | 3594 | 2536 -29% | 1495 -58% | 736 -80% | 908 -75% | 3966 ? 10% | |
| Score Write (Points) | 1359 | 608 -55% | 375 -72% | 194 -86% | 236 -83% | 1780 ? 31% | |
| Score Read (Points) | 1487 | 1316 -11% | 752 -49% | 362 -76% | 441 -70% | 1451 ? -2% | |
| Access Time Write * (ms) | 0.037 | 0.028 24% | 0.037 -0% | 0.075 -103% | 23 -62062% | 0.086 -132% | 0.08337 ? -125% |
| Access Time Read * (ms) | 0.043 | 0.044 -2% | 0.045 -5% | 0.143 -233% | 0.071 -65% | 0.123 -186% | 0.05092 ? -18% |
| 4K-64 Write (MB/s) | 1072 | 391.3 -63% | 204.7 -81% | 120.9 -89% | 75 -93% | 146.4 -86% | 1504 ? 40% |
| 4K-64 Read (MB/s) | 1216 | 1039 -15% | 586 -52% | 286.2 -76% | 1222 0% | 368.3 -70% | 1203 ? -1% |
| 4K Write (MB/s) | 102.3 | 128.1 25% | 96.9 -5% | 52.6 -49% | 50.7 -50% | 112 ? 9% | |
| 4K Read (MB/s) | 49.11 | 48.46 -1% | 37.69 -23% | 27.37 -44% | 26.93 -45% | 50.5 ? 3% | |
| Seq Write (MB/s) | 1840 | 885 -52% | 735 -60% | 201.9 -89% | 156.7 -91% | 388.2 -79% | 1637 ? -11% |
| Seq Read (MB/s) | 2218 | 2282 3% | 1283 -42% | 486.9 -78% | 1037 -53% | 459.9 -79% | 1976 ? -11% |
* ... smaller is better

GPU Performance
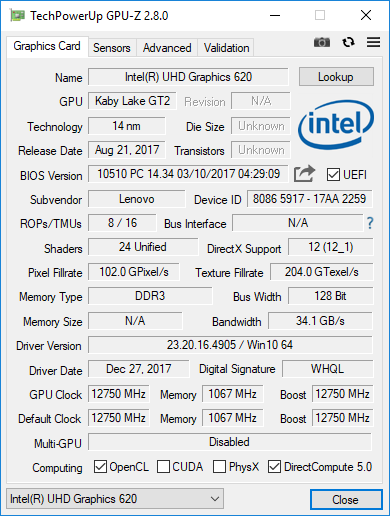
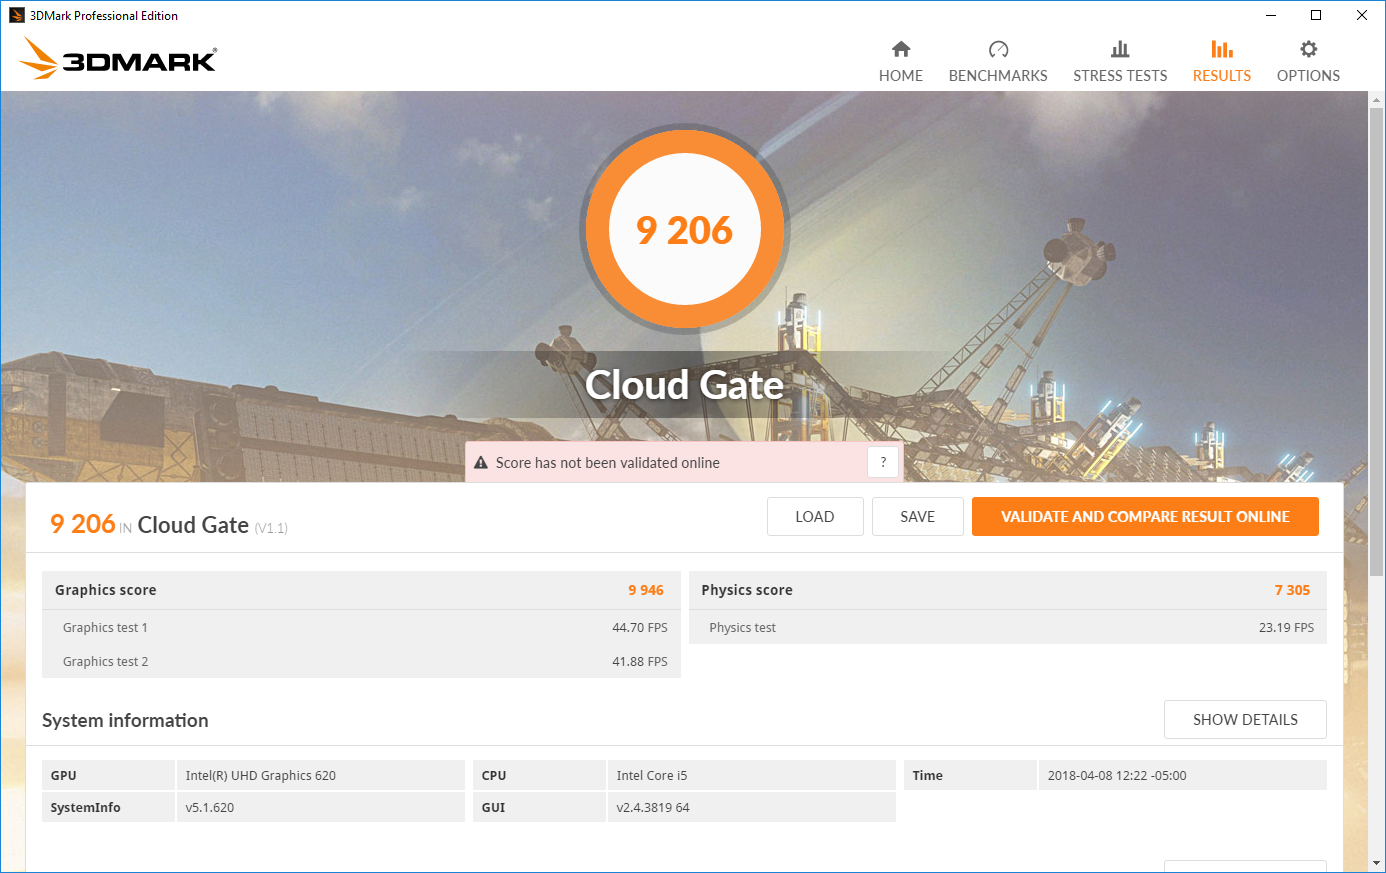
The Intel UHD Graphics 620 integrated GPU is adequate for office tasks and basic media consumption but not much else. The iGPU supports the H.265/HEVC codec and HDCP 2.2, meaning that 4K video streaming is possible. The graphics chip can also support a 4K monitor or up to three separate displays (two via the Thunderbolt ports plus the internal display), albeit not at 4K/60p. Complex 3D modelling is not viable with this chipset; users in need of a more powerful GPU should look to devices like the ThinkPad T480s, which sports an Nvidia GeForce MX150 graphics card; this device scored about 130% higher in 3DMark's Fire Strike benchmark. There are also other options with even more powerful graphics solutions, like the Dell XPS 15 (Nvidia GeForce GTX 1050) and Asus Zenbook Pro (Nvidia GeForce GTX 1050 Ti).
For more information on the Intel UHD Graphics 620 iGPU, please see our dedicate GPU page hereIntel UHD Graphics 620 GPU Review - Benchmarks and Specs.


| 3DMark 06 Standard Score | 12344 points | |
| 3DMark 11 Performance | 2040 points | |
| 3DMark Cloud Gate Standard Score | 9206 points | |
| 3DMark Fire Strike Score | 1119 points | |
Help | ||
Gaming Performance
The Intel iGPU is not suitable for most games, but some lighter or older titles are playable. The GPU can handle games like Rocket League, Civilization VI, and Bioshock Infinite, but settings and the resolution will need to be turned down. Most indie titles (Stardew Valley, Papers Please, etc.) are well within reason.
| low | med. | high | ultra | |
|---|---|---|---|---|
| BioShock Infinite (2013) | 56 | 35 | 30 | 10 |
| Civilization 6 (2016) | 37 | 16 | 7 | 6 |
| Farming Simulator 17 (2016) | 65 | 44 | 25 | 10 |
Stress Test
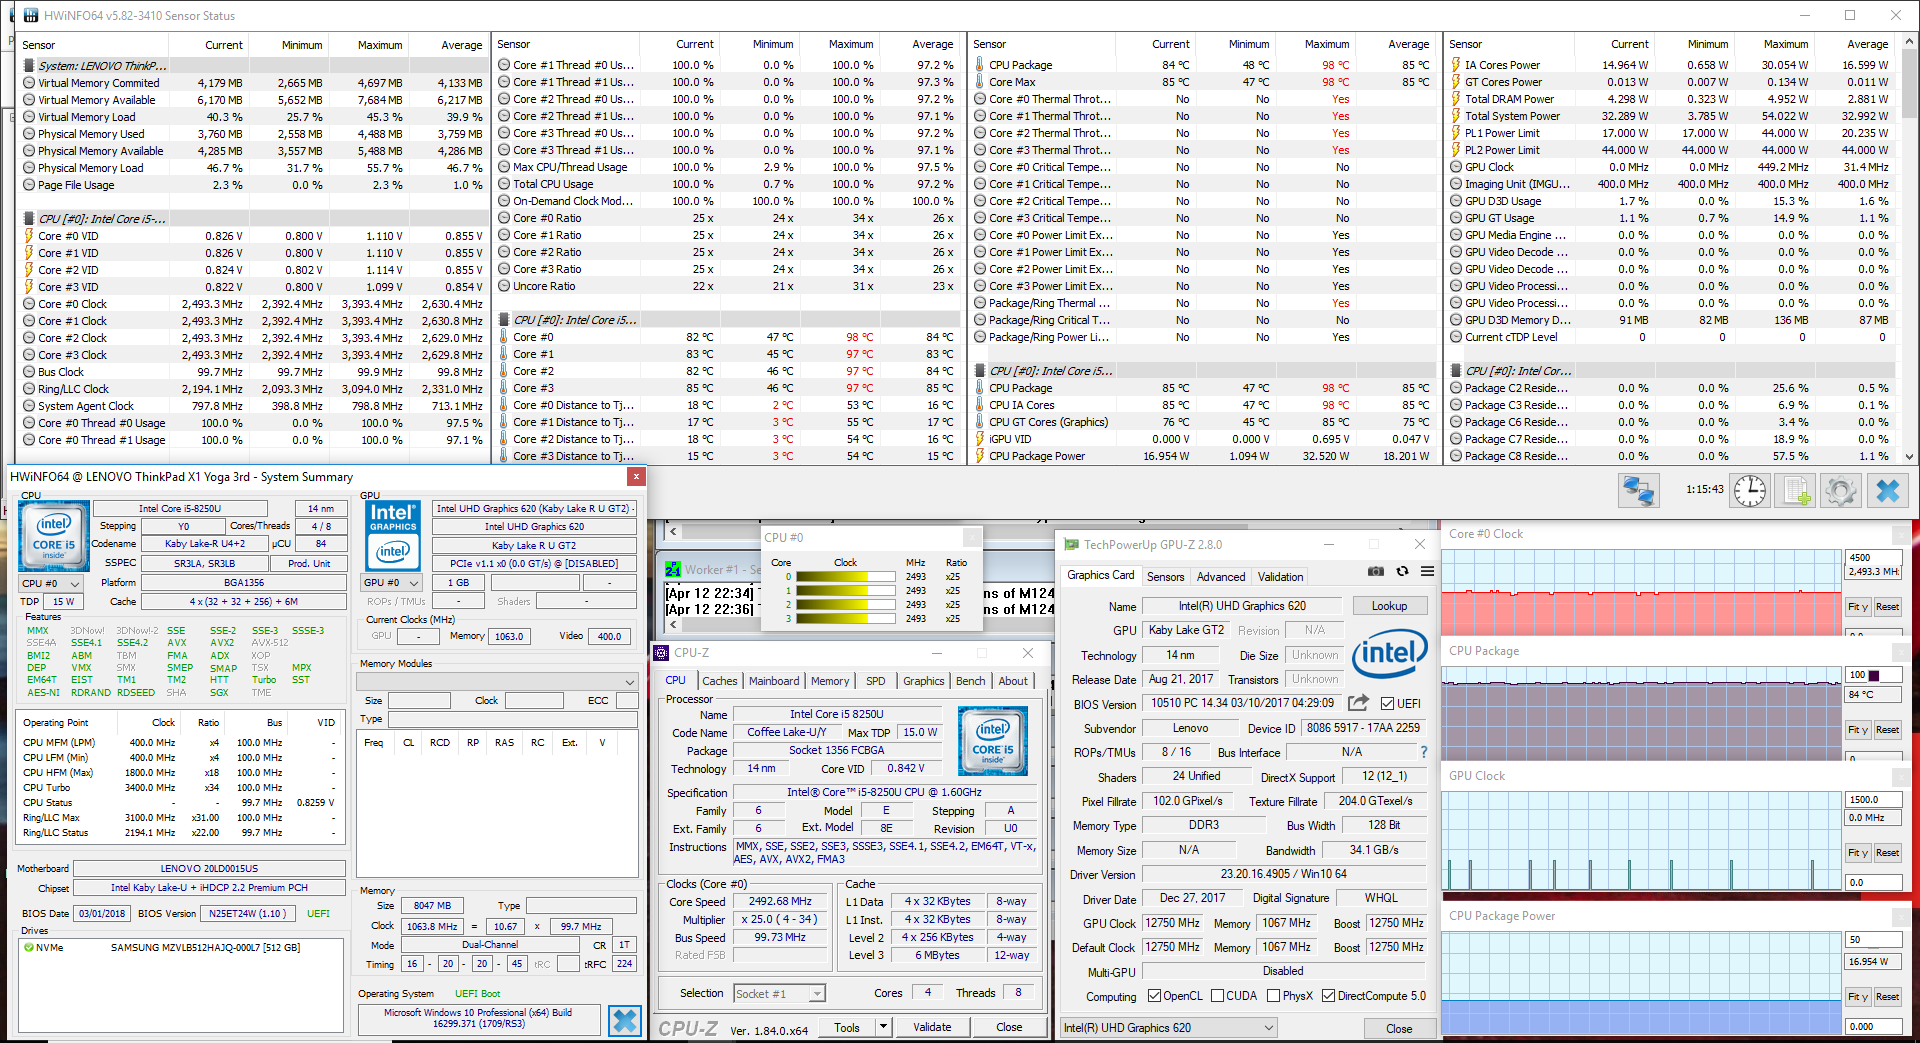
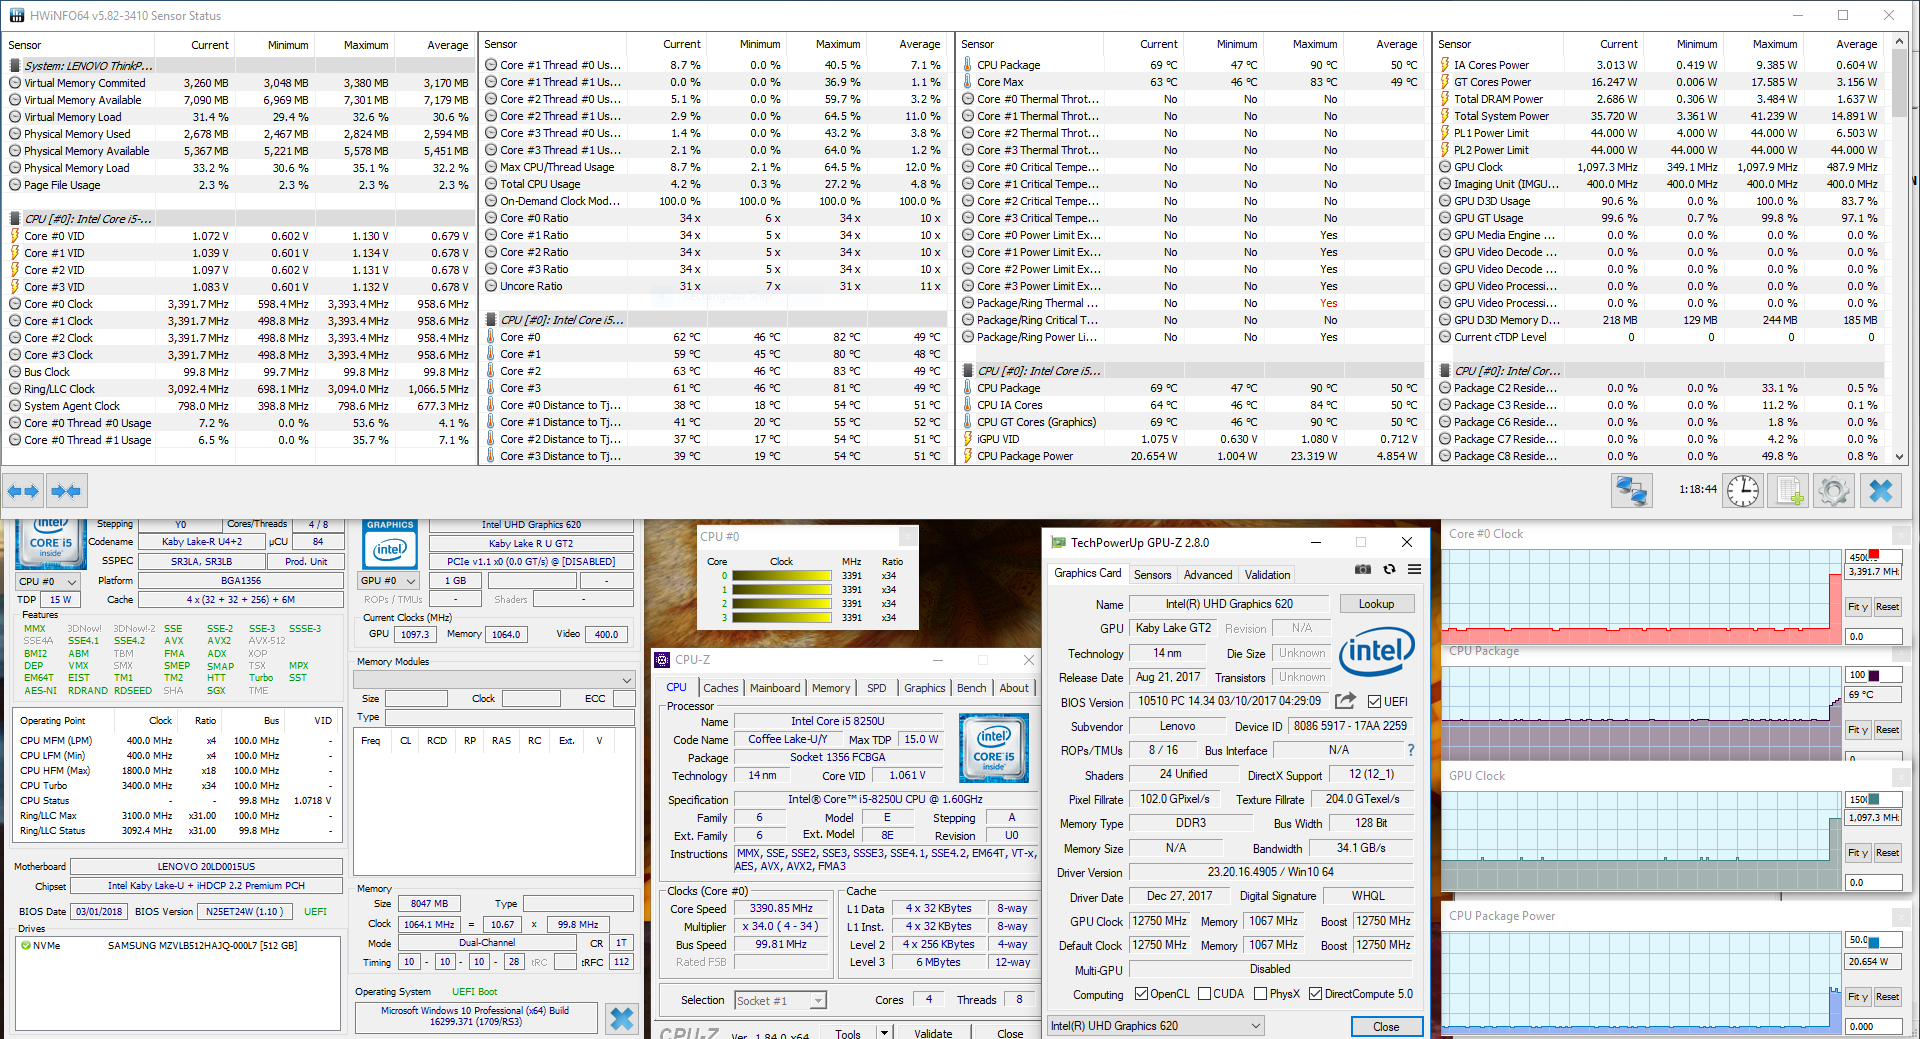
The X1 Yoga performs well under stress but experiences small spikes of high temperature. Running Prime95 to fully load all cores, the Core i5-8250U is able to boost to its rated maximum of 3.4 GHz, but temperatures rise to 97-98° C shortly after hitting this peak. This chokes the CPU to about 2.4 GHz in order to bring temperatures down (about 85° C). Running Prime95 and FurMark concurrently forces the CPU to pull back even further to 1.4 GHz, 200 MHz below its base clock. Again, there are intermittent boosts to 3.4 GHz, but these are short lived. The system doesn't seem to manage synthetic graphical stress well; FurMark (by itself) is able to run for about 20-30 minutes before crashing. CPU temperatures peak around 98-99° C prior to a crash, suggesting that heat limits are responsible for the failure.
Unigine Valley gives us a better idea of a more realistic load. Under this test, the CPU typically hangs near its base clock of 1.6 GHz, boosting as needed. The GPU performs well, clocking in at about 1100 MHz. Temperatures across the CPU package stay well within check, average about 79° C. Temperatures of 90° C can be recorded, but only after a single core hits its maximum rated boost. Overall, temperatures and performance are well-balanced under real-world stress.
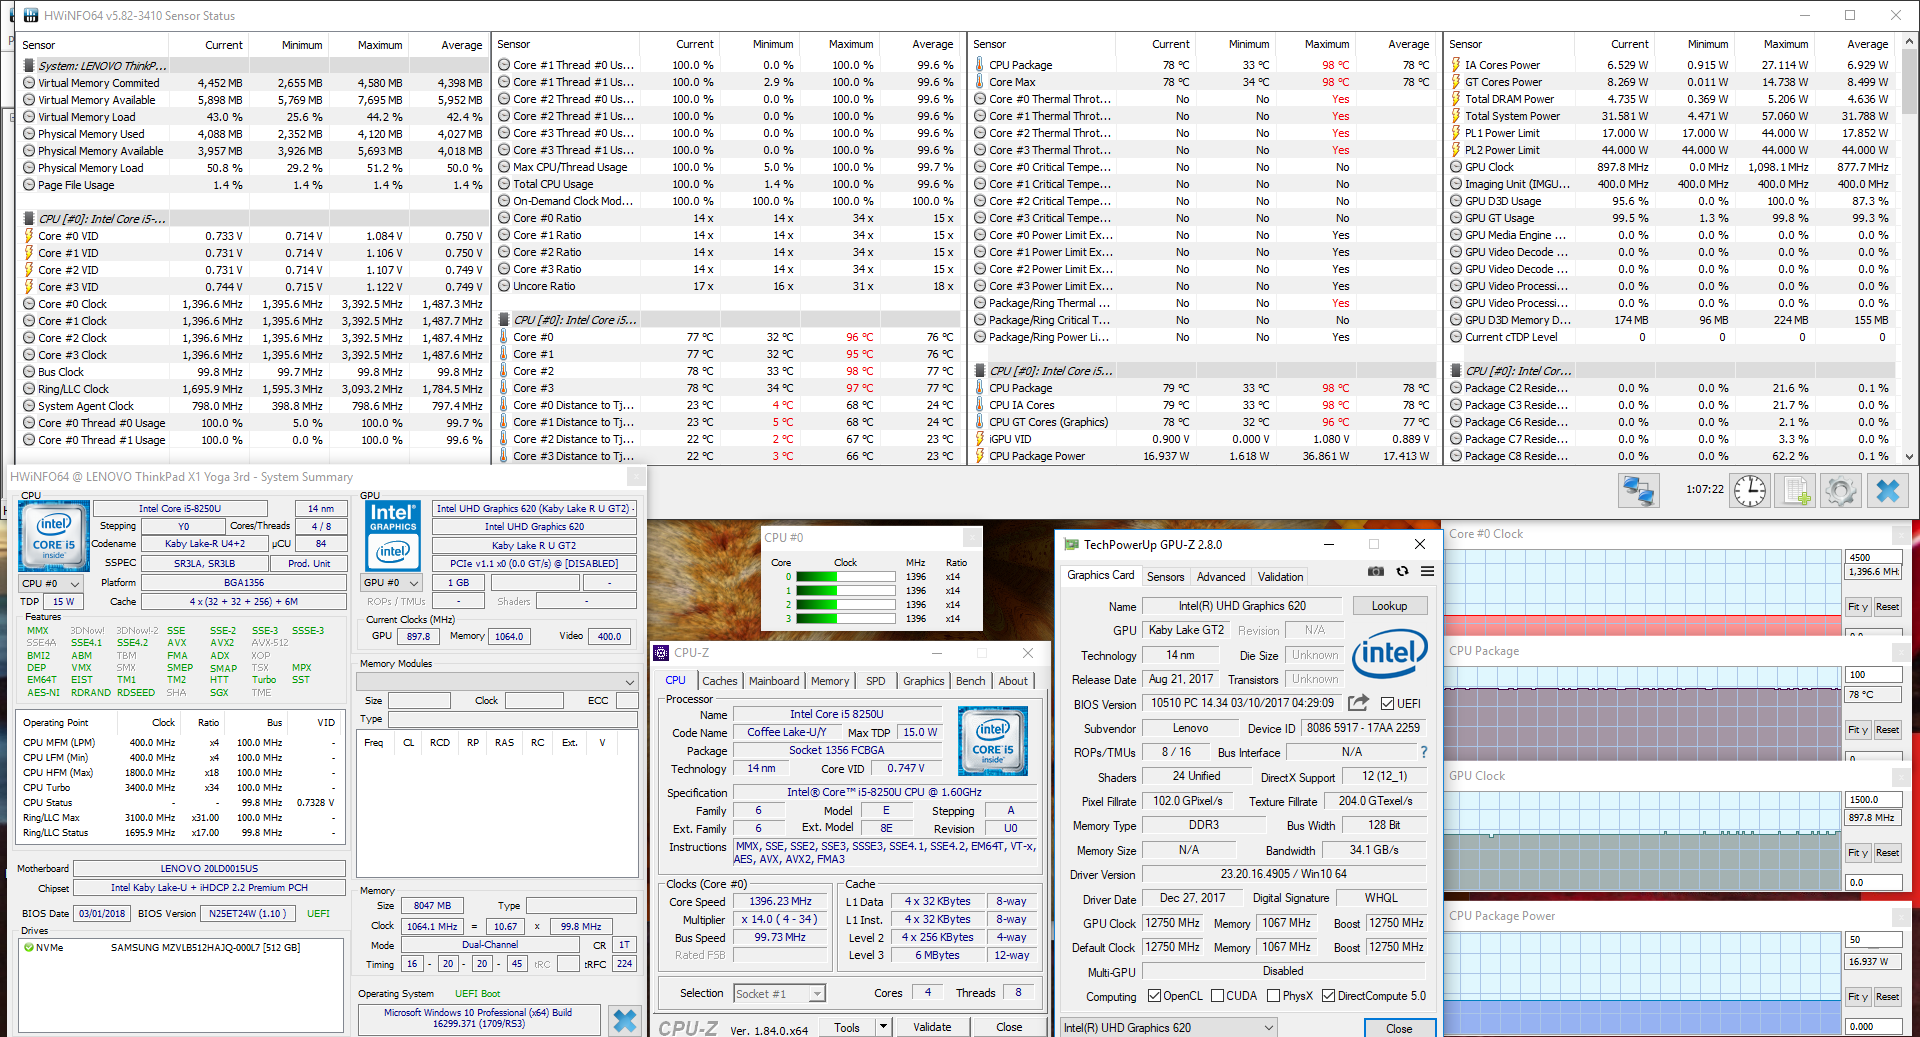
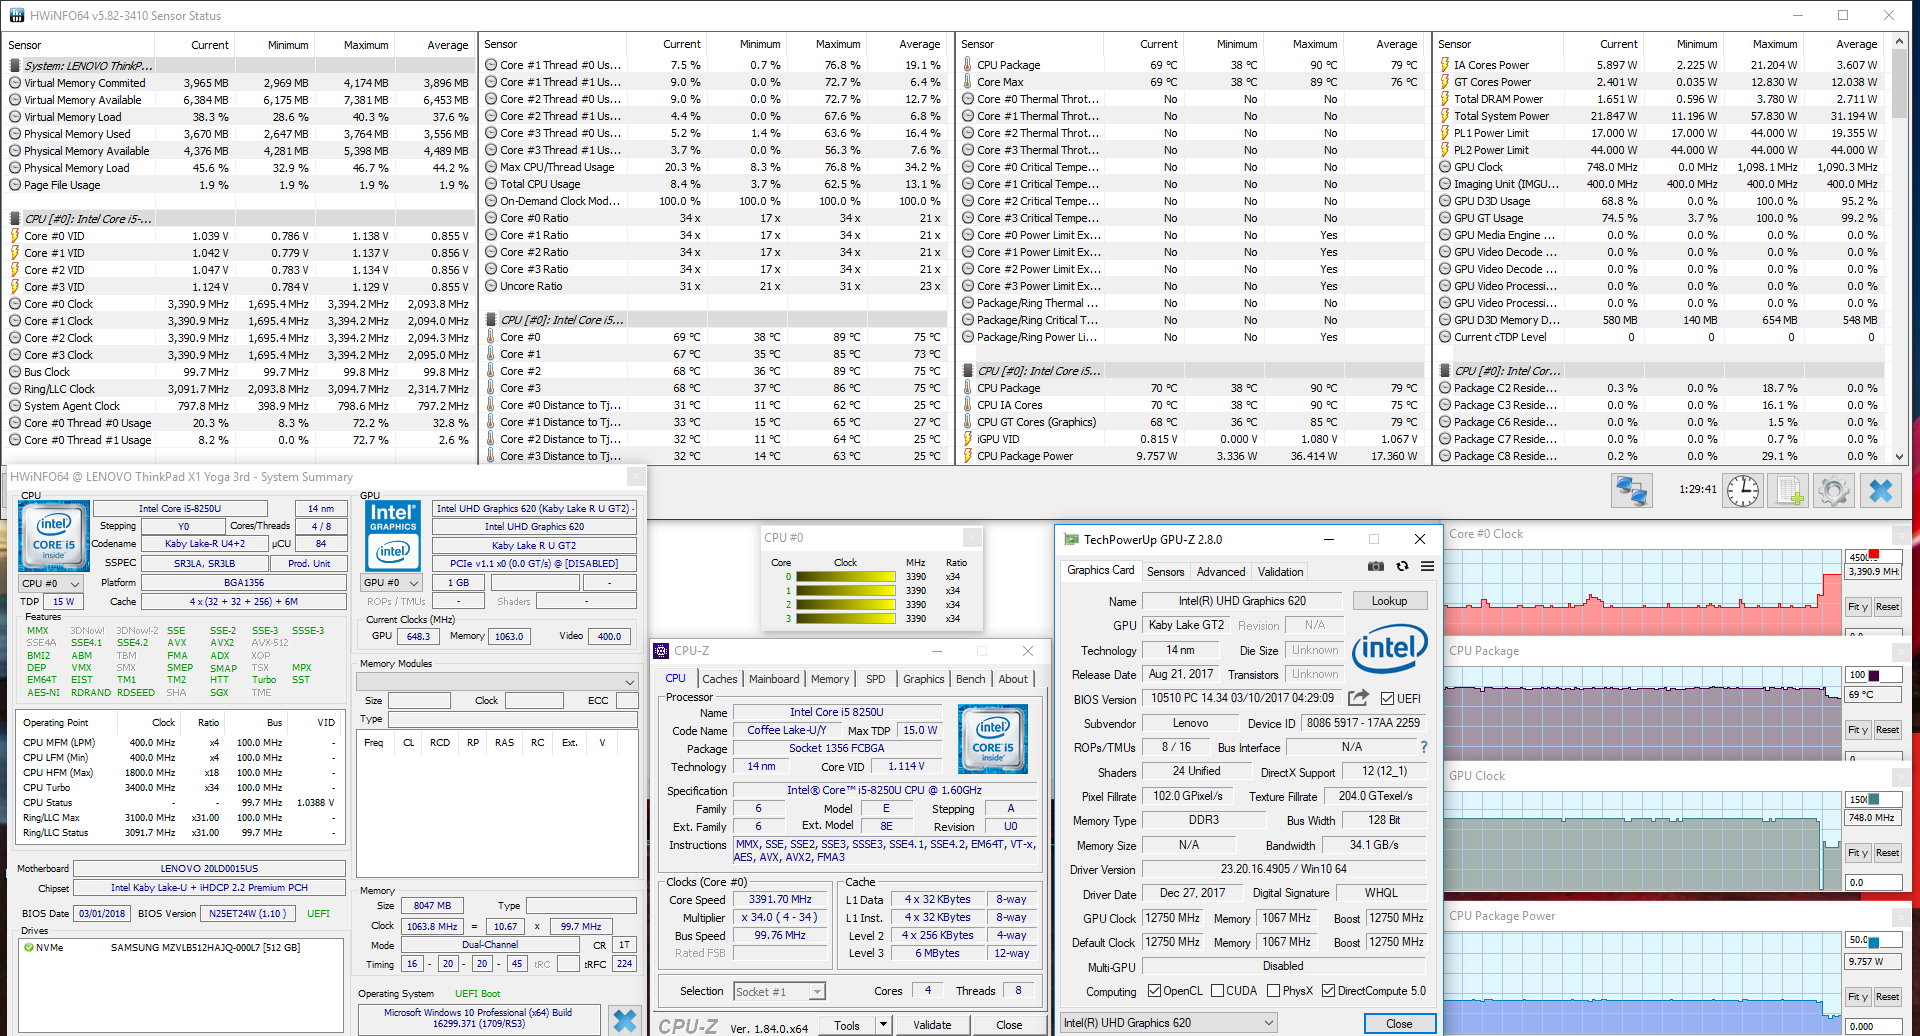
| CPU Clock (GHz) | GPU Clock (MHz) | Average CPU Temperature (°C) | Average GPU Temperature (°C) | |
| Prime95 Stress | 2.4 | - | 85 | - |
| Prime95 + FurMark Stress | 1.4 | 900 | 78 | 78 |
| Unigine Valley | 1.7 | 1090 | 79 | 79 |
Emissions
System Noise
The fan is quiet and generally inaudible except under strenuous load. When doing light tasks (word processing, checking email, etc.), the fan stays inert. Under medium load (browsing the web), the fan will begin to spin after about 10-15 seconds but remains fairly unobtrusive, quickly fading underneath normal ambient volume. The fan will sometimes ramp up for 10-20 seconds under these kinds of workloads but will fall back under room noise. Under full load, the fan hits about 40 dB(A), but its lower pitch means that even at this level, it will not sound harsh or shrill. There is no discernible coil whine or any other unwarranted system noise.
Noise level
| Idle |
| 27.8 / 27.8 / 27.8 dB(A) |
| Load |
| 33.9 / 39.9 dB(A) |
 | ||
30 dB silent 40 dB(A) audible 50 dB(A) loud |
||
min: | ||
| Lenovo ThinkPad X1 Yoga 2018-20LD0015US UHD Graphics 620, i5-8250U, Samsung SSD PM981 MZVLB512HAJQ | Lenovo ThinkPad X1 Yoga 2018-20LES01W00 UHD Graphics 620, i5-8550U, Samsung SSD PM981 MZVLB512HAJQ | Lenovo Yoga 920-13IKB-80Y7 UHD Graphics 620, i5-8550U, Samsung PM961 MZVLW256HEHP | HP EliteBook x360 1030 G2 HD Graphics 620, i5-7300U, Sandisk SD8TN8U-256G-1006 | Asus ZenBook Flip 14 UX461UA UHD Graphics 620, i5-8250U, SanDisk SD8SN8U256G1002 | |
|---|---|---|---|---|---|
| Noise | -6% | -1% | -1% | -4% | |
| off / environment * (dB) | 27.8 | 29.1 -5% | 28 -1% | 29 -4% | 30.4 -9% |
| Idle Minimum * (dB) | 27.8 | 29.1 -5% | 28 -1% | 29 -4% | 30.4 -9% |
| Idle Average * (dB) | 27.8 | 29.1 -5% | 28.8 -4% | 29 -4% | 30.4 -9% |
| Idle Maximum * (dB) | 27.8 | 31.3 -13% | 30.3 -9% | 29 -4% | 32 -15% |
| Load Average * (dB) | 33.9 | 37.6 -11% | 34.5 -2% | 33.6 1% | 31.7 6% |
| Load Maximum * (dB) | 39.9 | 37.6 6% | 34.3 14% | 35.8 10% | 35.9 10% |
* ... smaller is better
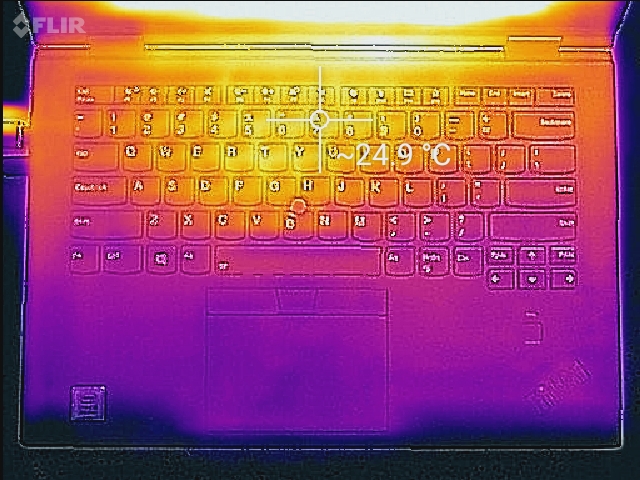
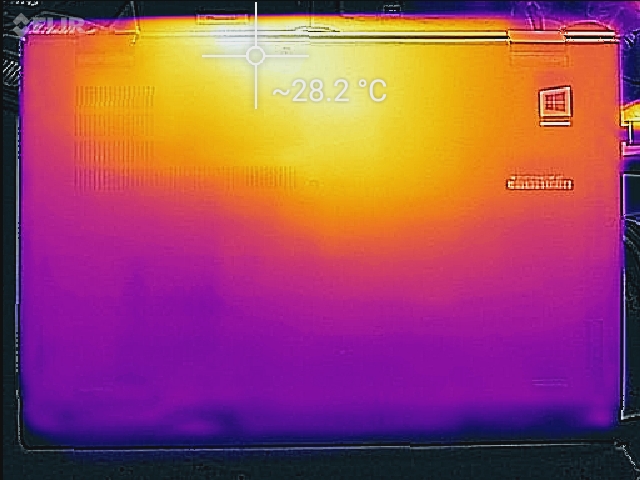
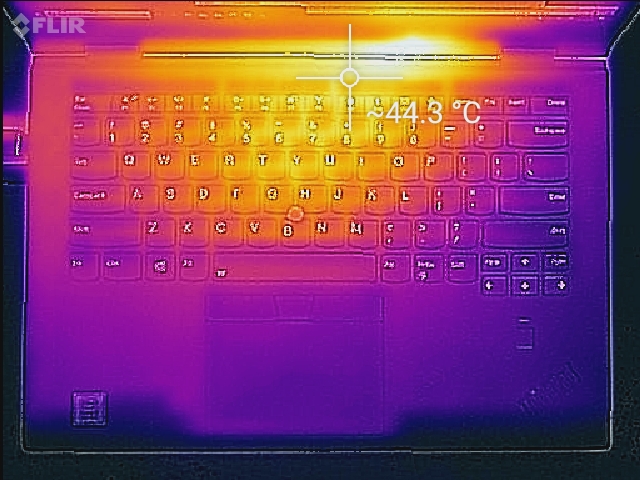
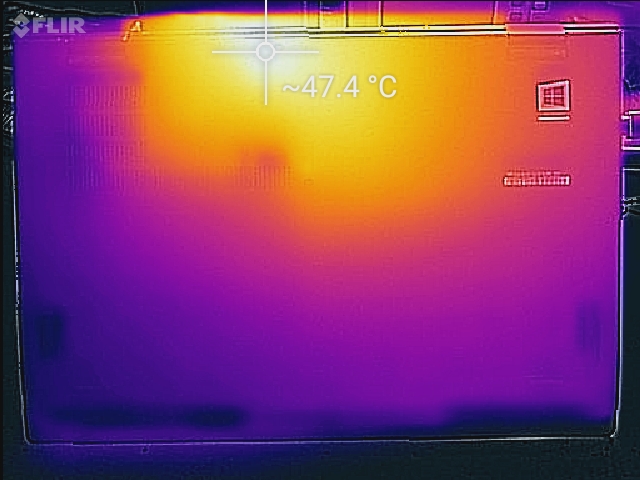
Temperature
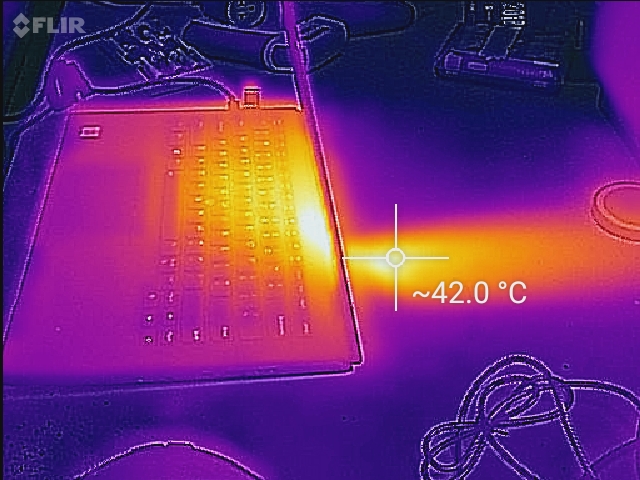
External temperatures are very well managed. Even under full load, the keyboard and most of the bottom panel remain cool to the touch. There is a hotspot directly over the center of the keyboard; while this spot gets warm, it never gets uncomfortable. The corresponding area on the bottom panel will feel uncomfortable after a short time. When the device is in tablet mode, these areas rarely (if ever) come into contact with the user's hand.
(±) The maximum temperature on the upper side is 43 °C / 109 F, compared to the average of 35.4 °C / 96 F, ranging from 19.6 to 60 °C for the class Convertible.
(-) The bottom heats up to a maximum of 47.4 °C / 117 F, compared to the average of 36.9 °C / 98 F
(+) In idle usage, the average temperature for the upper side is 22.8 °C / 73 F, compared to the device average of 30.3 °C / 87 F.
(+) The palmrests and touchpad are cooler than skin temperature with a maximum of 26 °C / 78.8 F and are therefore cool to the touch.
(±) The average temperature of the palmrest area of similar devices was 28 °C / 82.4 F (+2 °C / 3.6 F).
Speakers

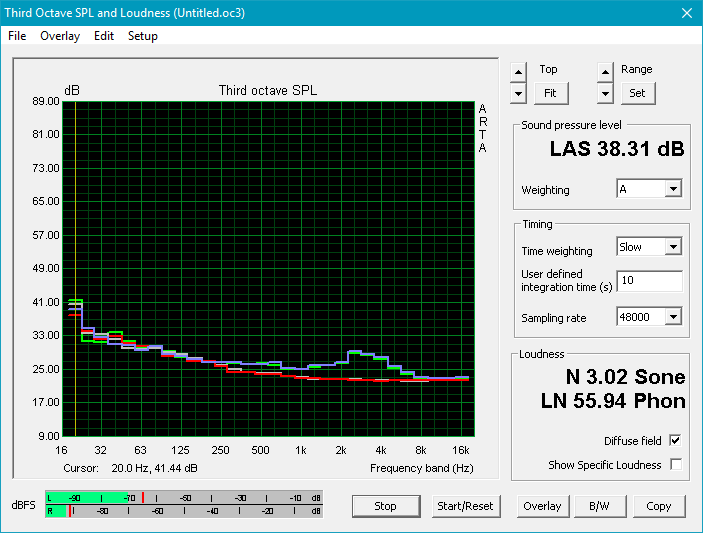
As is the norm for business notebooks, the speakers are fairly weak. Bass is absent, but mids and highs are reasonably level. The biggest problem with the speakers is their small size (1 Watt); the resultant sound is thin and tinny. Music will not be done justice, but web calls and vocals are adequately clear.
Lenovo ThinkPad X1 Yoga 2018-20LD0015US audio analysis
(±) | speaker loudness is average but good (72.9 dB)
Bass 100 - 315 Hz
(-) | nearly no bass - on average 15.2% lower than median
(±) | linearity of bass is average (14.1% delta to prev. frequency)
Mids 400 - 2000 Hz
(+) | balanced mids - only 3.9% away from median
(±) | linearity of mids is average (9.4% delta to prev. frequency)
Highs 2 - 16 kHz
(+) | balanced highs - only 2.3% away from median
(±) | linearity of highs is average (9.9% delta to prev. frequency)
Overall 100 - 16.000 Hz
(±) | linearity of overall sound is average (19% difference to median)
Compared to same class
» 45% of all tested devices in this class were better, 7% similar, 48% worse
» The best had a delta of 6%, average was 20%, worst was 57%
Compared to all devices tested
» 45% of all tested devices were better, 7% similar, 47% worse
» The best had a delta of 4%, average was 23%, worst was 134%
HP EliteBook x360 1030 G2 audio analysis
(+) | speakers can play relatively loud (86.3 dB)
Analysis not possible as minimum curve is missing or too high
Energy Management
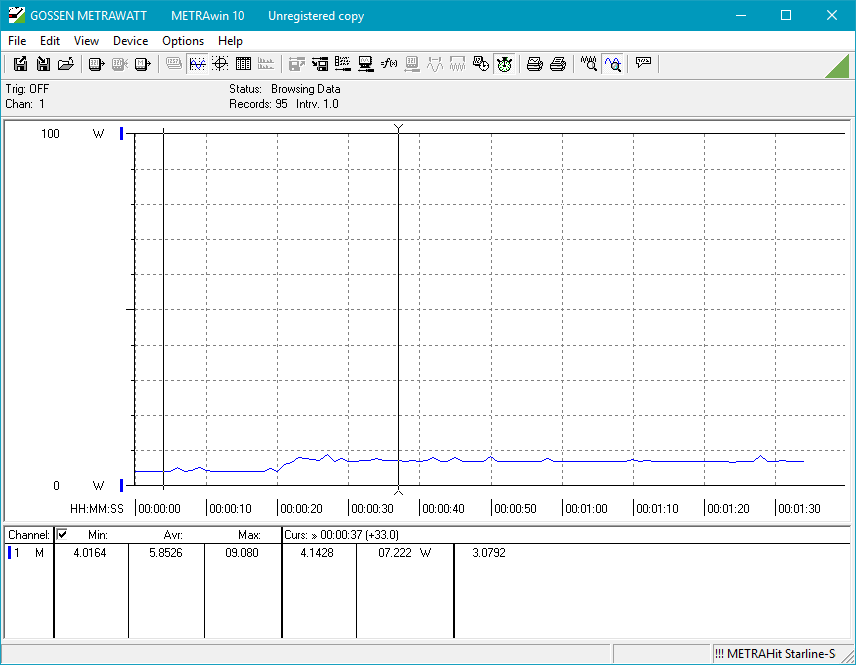
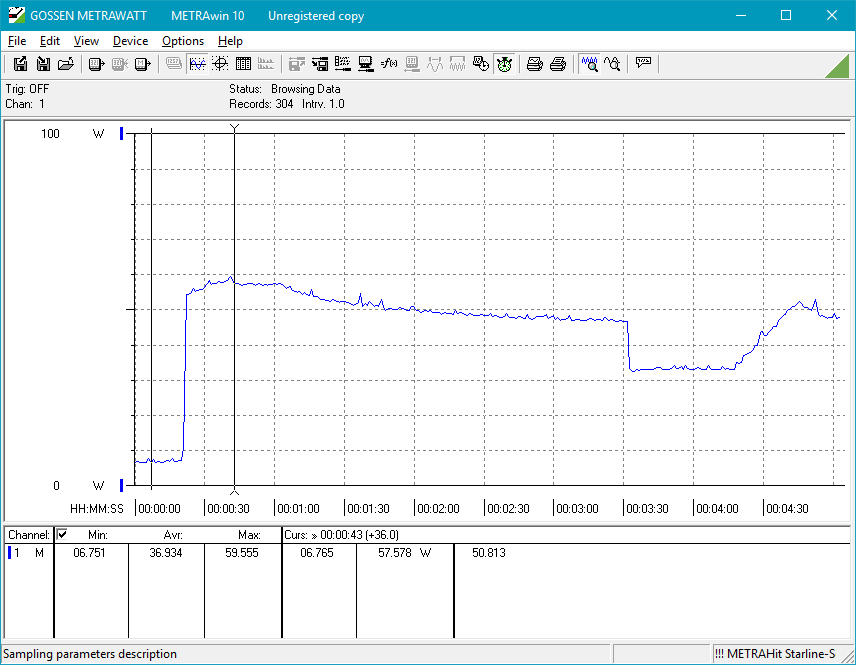
Power Consumption
Power draw is a bit higher than average for a mid-range business laptop. Power usage when idle is within the expected range. Under maximum load, our device pulls 57 Watts from the wall. The i7 model, in contrast, draws 71 Watts, or 25% more. However, other mid-tier business 2-in-1s, like the EliteBook x360 1030, pull almost 30% less under load.
| Off / Standby | |
| Idle | |
| Load |
|
Key:
min: | |
| Lenovo ThinkPad X1 Yoga 2018-20LD0015US i5-8250U, UHD Graphics 620, Samsung SSD PM981 MZVLB512HAJQ, IPS, 1920x1080, 14" | Lenovo ThinkPad X1 Yoga 2018-20LES01W00 i5-8550U, UHD Graphics 620, Samsung SSD PM981 MZVLB512HAJQ, IPS Dolby Vision HDR, 2560x1440, 14" | Lenovo Yoga 920-13IKB-80Y7 i5-8550U, UHD Graphics 620, Samsung PM961 MZVLW256HEHP, IPS, 1920x1080, 13.9" | Dell XPS 13-9365 2-in-1 i7-7Y75, HD Graphics 615, Toshiba NVMe THNSN5256GPUK, IPS, 1920x1080, 13.3" | HP EliteBook x360 1030 G2 i5-7300U, HD Graphics 620, Sandisk SD8TN8U-256G-1006, IPS, 1920x1080, 13.3" | Microsoft Surface Pro (2017) i5 i5-7300U, HD Graphics 620, Samsung PM971 KUS030202M, IPS, 2736x1824, 12.3" | Asus ZenBook Flip 14 UX461UA i5-8250U, UHD Graphics 620, SanDisk SD8SN8U256G1002, IPS, 1920x1080, 14" | |
|---|---|---|---|---|---|---|---|
| Power Consumption | -37% | 7% | 30% | 12% | 2% | -2% | |
| Idle Minimum * (Watt) | 3 | 3.4 -13% | 3.1 -3% | 3.1 -3% | 3.2 -7% | 3.6 -20% | 3.3 -10% |
| Idle Average * (Watt) | 5.4 | 8.8 -63% | 6.6 -22% | 4.3 20% | 5.5 -2% | 8.1 -50% | 6.3 -17% |
| Idle Maximum * (Watt) | 7.5 | 11.9 -59% | 7 7% | 4.9 35% | 6.5 13% | 8.7 -16% | 11 -47% |
| Load Average * (Watt) | 40.1 | 50.4 -26% | 35.2 12% | 24.3 39% | 29.7 26% | 25.5 36% | 30 25% |
| Load Maximum * (Watt) | 57.1 | 71.2 -25% | 34.6 39% | 22.8 60% | 41.3 28% | 23.5 59% | 35.4 38% |
* ... smaller is better
Battery Life
Battery life is excellent for a 2-in-1 device, especially considering the size of the battery. The X1 Yoga chugs through our WiFi test for almost 11 hours before calling it quits, which is rather impressive. Despite its larger 70 Wh battery, the Yoga 920 only manages about a half hour more during this test. The X1 Yoga should get most users through an entire business day, but for those that run the battery dry, the included 65 Watt charger is relatively small and can charge the device in about 1.5 hours. The X1 Yoga can be charged through either USB Type-C port.
| Lenovo ThinkPad X1 Yoga 2018-20LD0015US i5-8250U, UHD Graphics 620, 54 Wh | Lenovo ThinkPad X1 Yoga 2018-20LES01W00 i5-8550U, UHD Graphics 620, 54 Wh | Lenovo Yoga 920-13IKB-80Y7 i5-8550U, UHD Graphics 620, 70 Wh | Dell XPS 13-9365 2-in-1 i7-7Y75, HD Graphics 615, 46 Wh | HP EliteBook x360 1030 G2 i5-7300U, HD Graphics 620, 57 Wh | Microsoft Surface Pro (2017) i5 i5-7300U, HD Graphics 620, 45 Wh | Asus ZenBook Flip 14 UX461UA i5-8250U, UHD Graphics 620, 57 Wh | |
|---|---|---|---|---|---|---|---|
| Battery runtime | -19% | 14% | 4% | 29% | 8% | -10% | |
| Reader / Idle (h) | 20.3 | 20.1 -1% | 27.6 36% | 16.2 -20% | 23.1 14% | 17.6 -13% | 18.9 -7% |
| WiFi v1.3 (h) | 10.9 | 8.6 -21% | 11.4 5% | 11.4 5% | 10.5 -4% | 12.4 14% | 9.4 -14% |
| Load (h) | 2.3 | 1.5 -35% | 2.3 0% | 2.9 26% | 4.1 78% | 2.8 22% | 2.1 -9% |
Pros
Cons
Verdict
We held the Core i7 HDR variant of the 2018 X1 Yoga in a positive light. We lauded its well-built chassis, good performance, and quiet operation but took some issue with its high price tag. At USD $2400, that model of the X1 Yoga may be out of the price range of most users. At $600 less, the Core i5 FHD model is better for the budget while maintaining most of the niceties of the more expensive model.
The performance difference between the Core i5-8250U and Core i7-8550U is negligible at best. As such, most users won't see any noticeable change by dropping the CPU down. Rather than investing in a slightly faster processor, potential buyers should put that money toward the HDR WQHD display, which is about $170 more. The more expensive panel doubles the brightness and has nearly unparalleled contrast and color reproduction. The best configuration available would be a pairing of the Core i5-8250U and WQHD HDR display.
The Core i5 variant of the X1 Yoga retains the best pieces from its more expensive brother while cutting costs. for $600 less, the Core i5 FHD X1 Yoga offers similar performance wrapped in the same excellent chassis. If you are hunting for a business-class convertible and can forego a 5% bump in processing power for the HDR screen, this is the machine to get.
Lenovo ThinkPad X1 Yoga 2018-20LD0015US
- 04/15/2018 v6 (old)
Sam Medley
Price comparison
