Asus VivoBook S14 S410UQ (i7-8550U, 940MX, Full HD) Laptop Review

At the end of January, our German colleagues put the 14-inch Asus VivoBook S14 S406UA with Intel Core i5-8250U and a - some might say rather outdated - TN display with HD resolution display through its paces. This time around, we'll take a closer look at the S14 S410UQ with i7-8550U, entry-level GeForce 940MX graphics card, and IPS Full HD display. It might seem surprising to some that Asus chose to incorporate the older Maxwell-based GeForce 940MX instead of the newer MX150 into a notebook with 8th-generation processor, but on their US website, Asus also lists the VivoBook S14 S410UN - equipped with the Pascal version of Nvidia's entry-level graphics card - as an option. Speaking of models: while our version (at least on paper) is also offered with the TN HD display, the other two available models ship with the IPS Full HD display only. The third model of the bunch - the S410UA - is also different in that it forgoes a dedicated GPU and makes use of the integrated Intel Graphics 620 only.
At the time of writing, our particular review notebook is available from Computer Upgrade King (CUKUSA) for $775 or $800 elsewhere. We couldn't locate any of the other listed models, however. Competitors in this realm are a-plenty and include other 14-inch notebooks like the Acer Swift 3 SF314 or the Lenovo IdeaPad 320s, but also the more expensive stalwarts in the 13.3-inch category like the HP Spectre 13 or the newest iteration of the venerable Dell XPS 13. Asus of course also offers their more upscale, metal-clad Zenbooks like the 14-inch ZenBook UX3410UA and the 13.3-inch ZenBook 13 UX331UN.
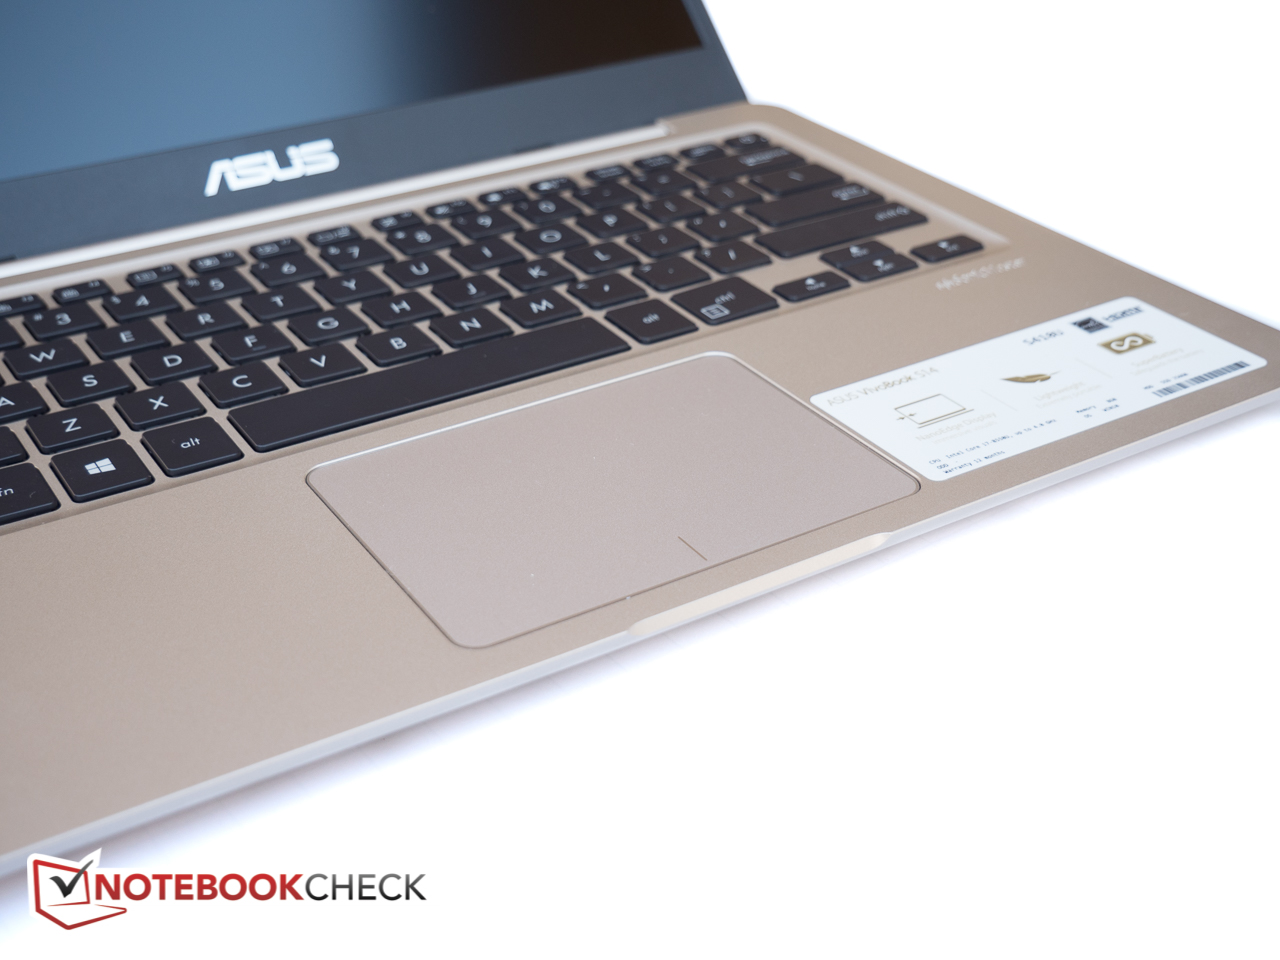
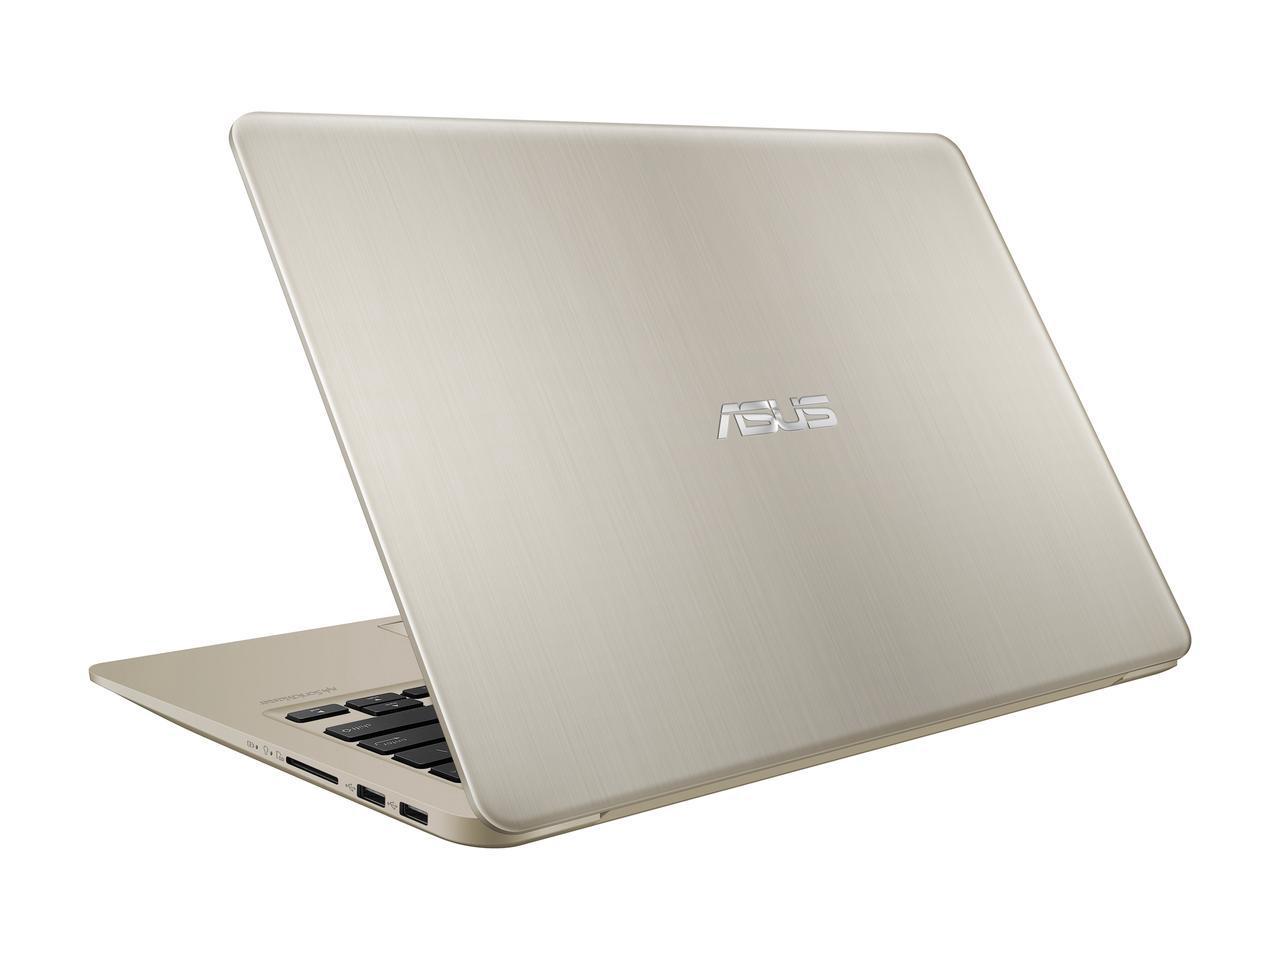
Case - a mix of metal and plastic
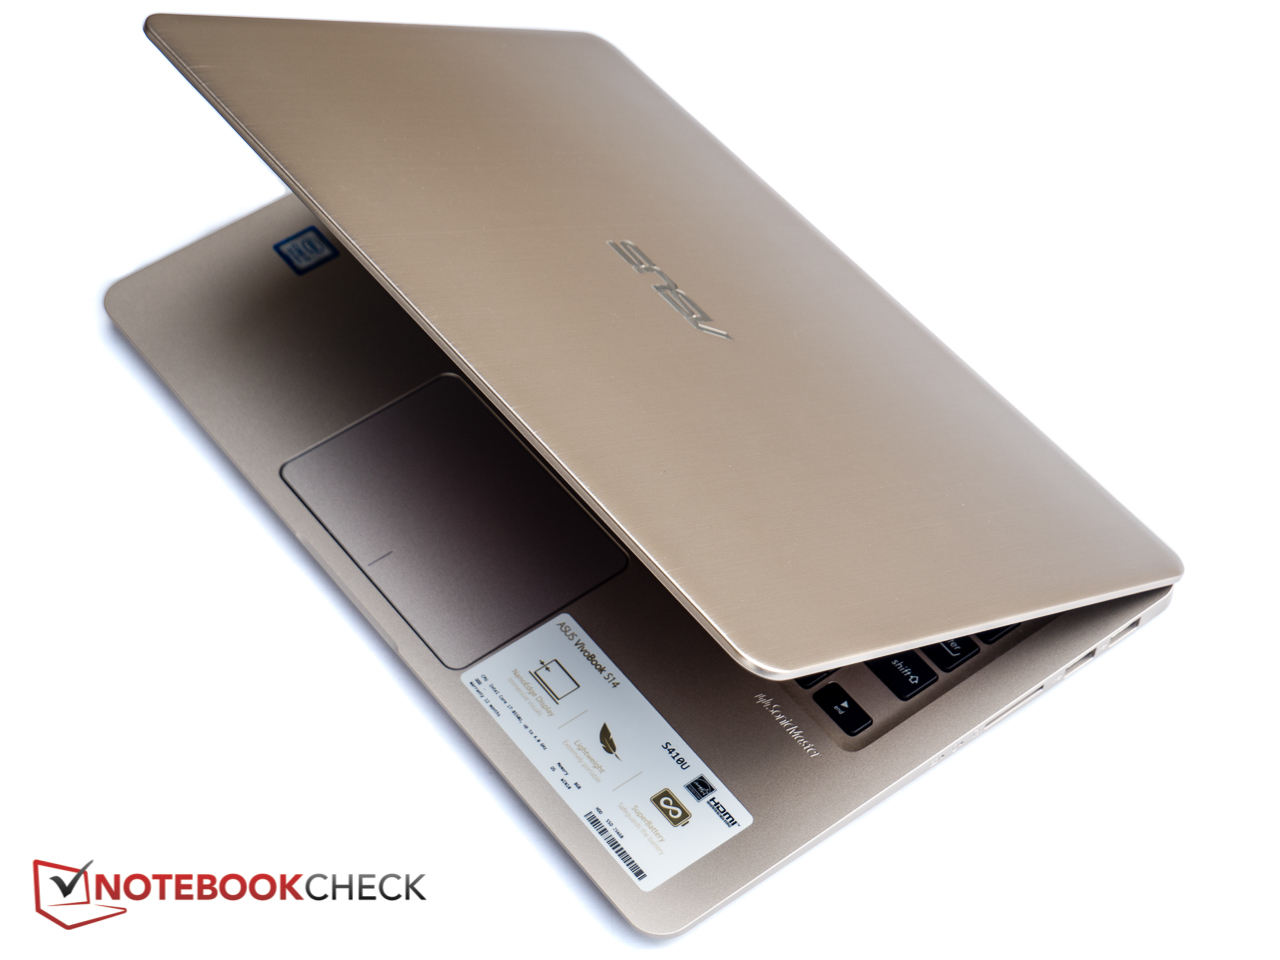
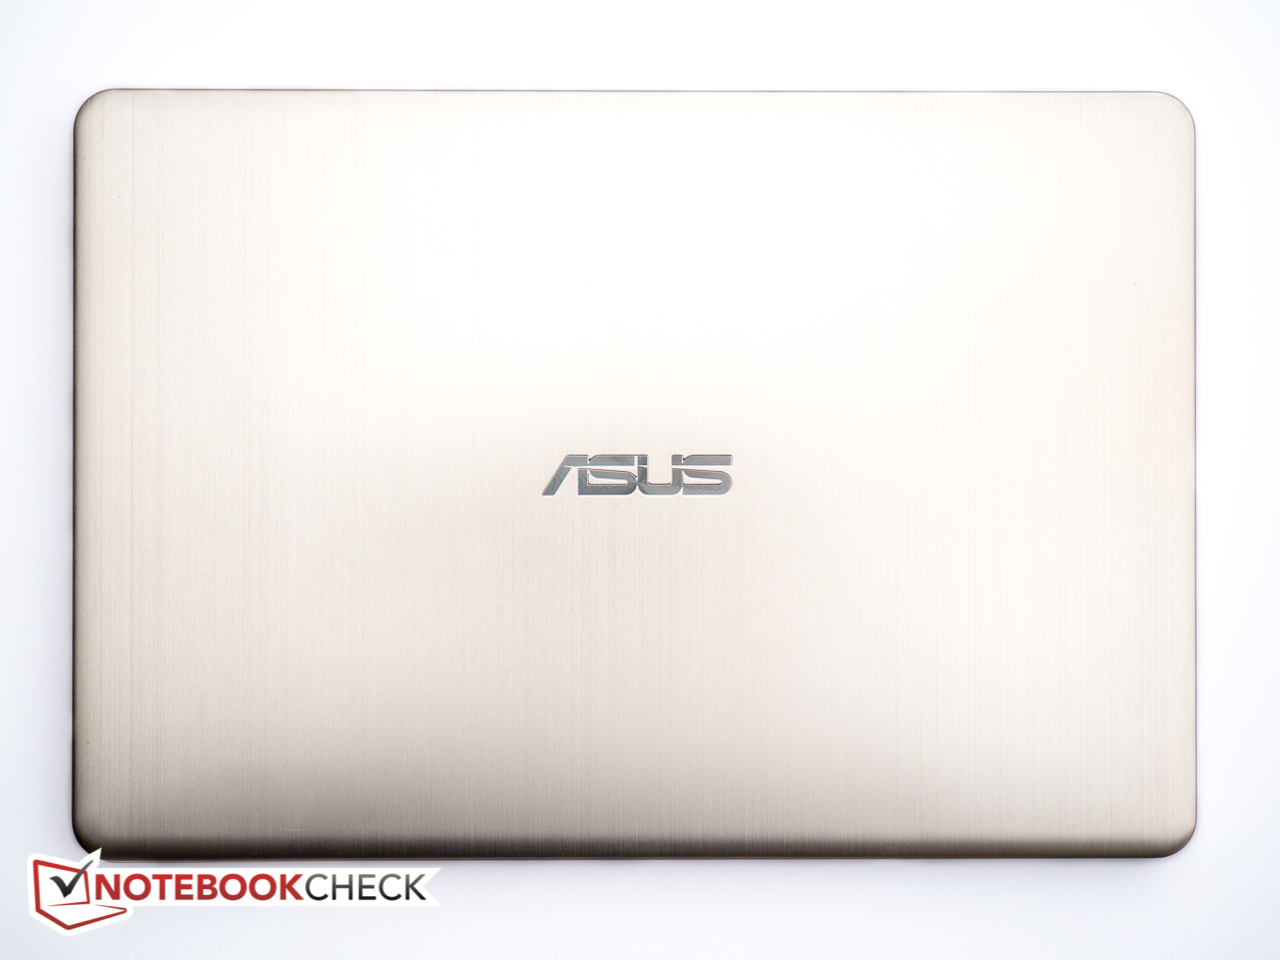
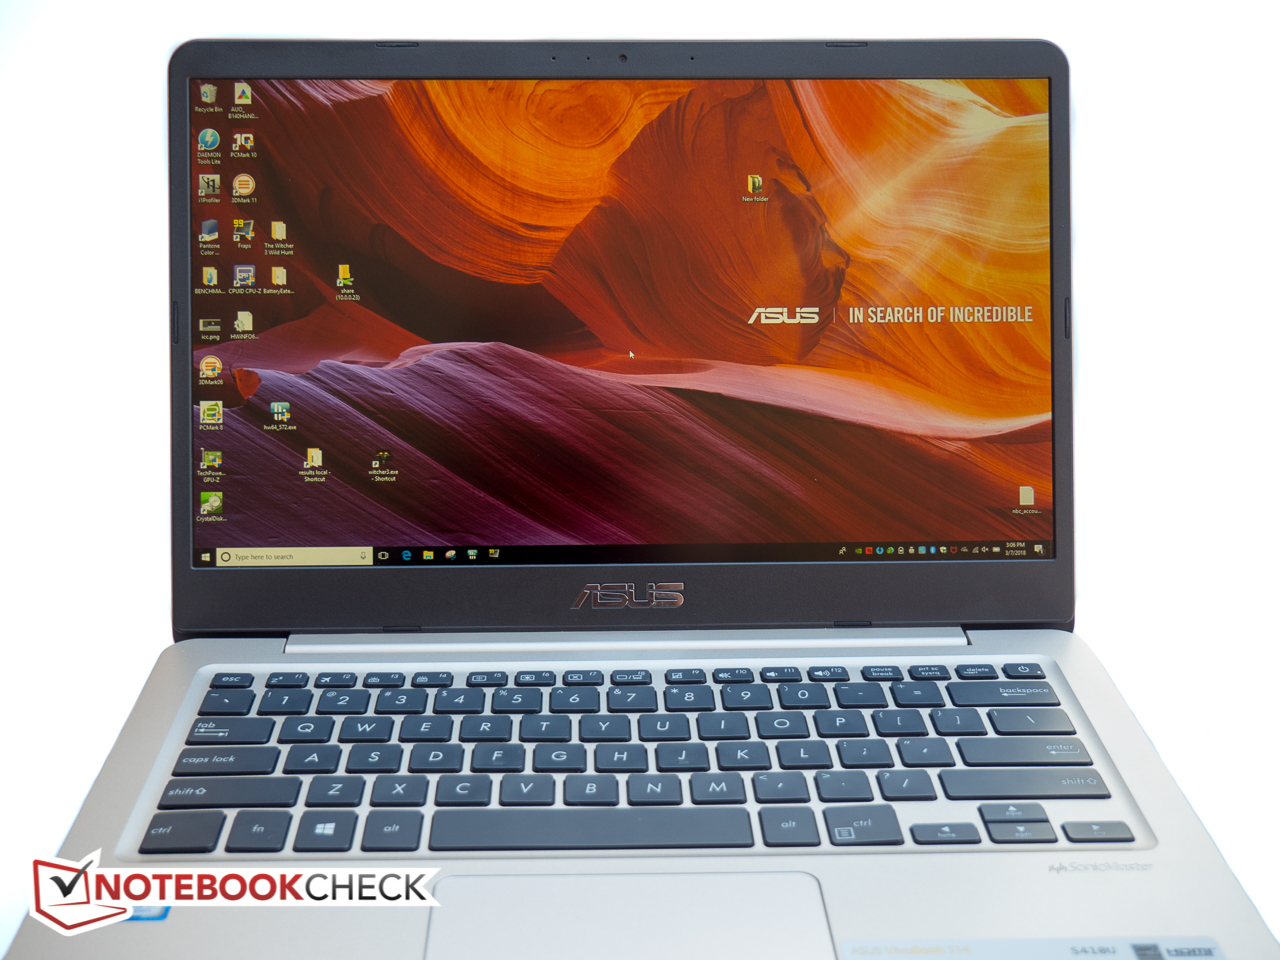
Like other competitors in this price range, Asus' notebook - which from a design perspective closely resembles its higher-end Zenbook sibling UX3410UQ from 2017 - features a mix of materials: while the lid is made from textured (brushed) metal, the semi-unibody chassis consists of plastic. Asus calls our color "Icicle Gold"; "Star Grey" appears to be the other option. Stability unfortunately leaves to be desired, as the entire keyboard deck flexes noticeably even with just moderate pressure applied. Torsional stability is surprisingly good, however, as the bottom unit isn't all that easy to twist and produces no creaking sounds in the process. Despite the use of metal, the display lid flexes slightly more than we would like, although it requires a fair amount of pressure on the back to induce any waves or ripples on the front. The hinges are stiff enough to require two hands when opening the lid, but despite the inherent stiffness, we noticed significant display teetering up to the maximum opening angle of 135 degrees. The build quality on the other hand is just fine with narrow and even gaps and no sharp or protruding edges.
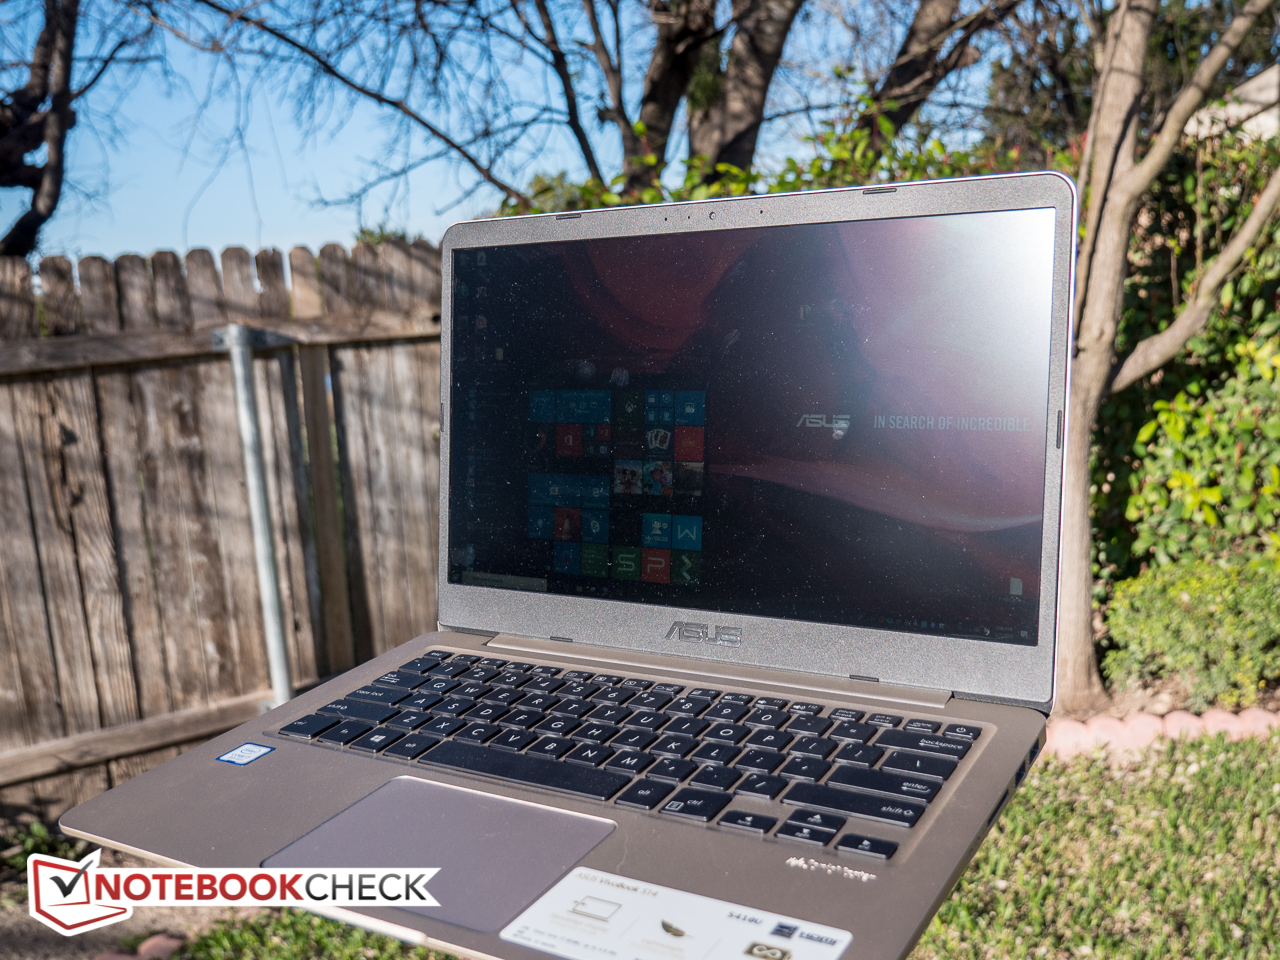
Asus claims a 77% screen-to-body ratio thanks to their NanoEdge display technology, which allows the company to incorporate a 14-inch display into a 13-inch chassis. While the left and right bezels are indeed narrower at 8 mm than those of most regular notebooks, the top and especially the bottom bezels aren't particularly slim at 14 and 22 mm, respectively. In other words: in a world of ever-shrinking display bezels, the S410UQ doesn't stand out as a particular svelte design even when compared to a 14-inch business notebooks like the Dell Latitude 7480, although the chassis of the consumer-oriented Acer Swift 3 SF314 is about 10 mm wider and 8 mm deeper. Both the 13.3-inch Dell XPS 13 as well as the HP Spectre 13 are in a league of their own here, as they pack 13.3-inch displays into 12.5-inch chassis designs.
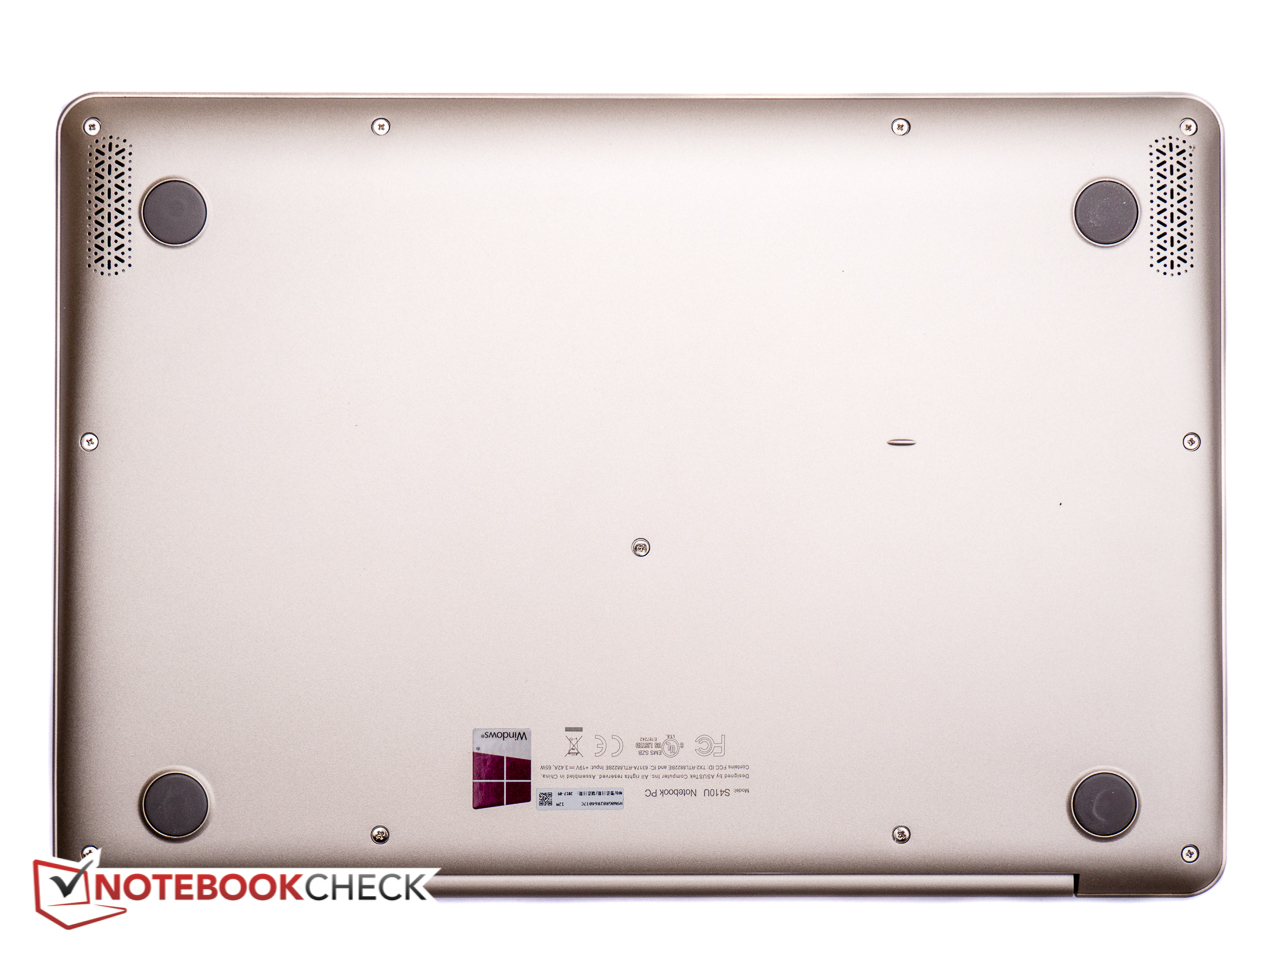
With a thickness of about 18 mm, the Asus S14 S410UQ compares well to the other 14-inch notebooks, although the 13.3-inch competition is much thinner still, in particular the Spectre 13, which measures just over 10 mm thick. The S14 tipped our scales at just over 1.3 kg / 3 lbs, so it's one of the lightest 14-inch notebooks. The Acer Swift 3 for example weighs a more substantial 1.6 kg / 3.5 lbs.
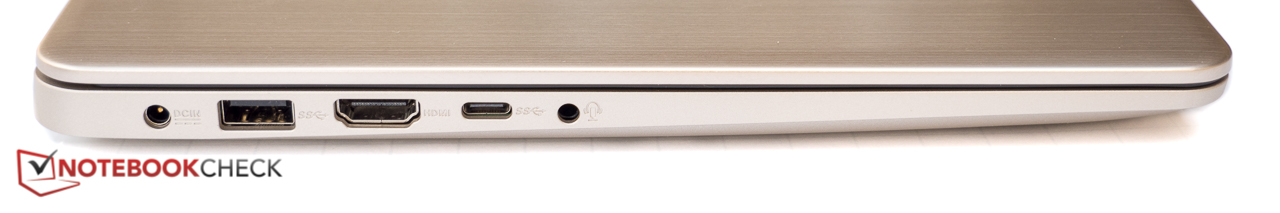
Connectivity - no Thunderbolt?
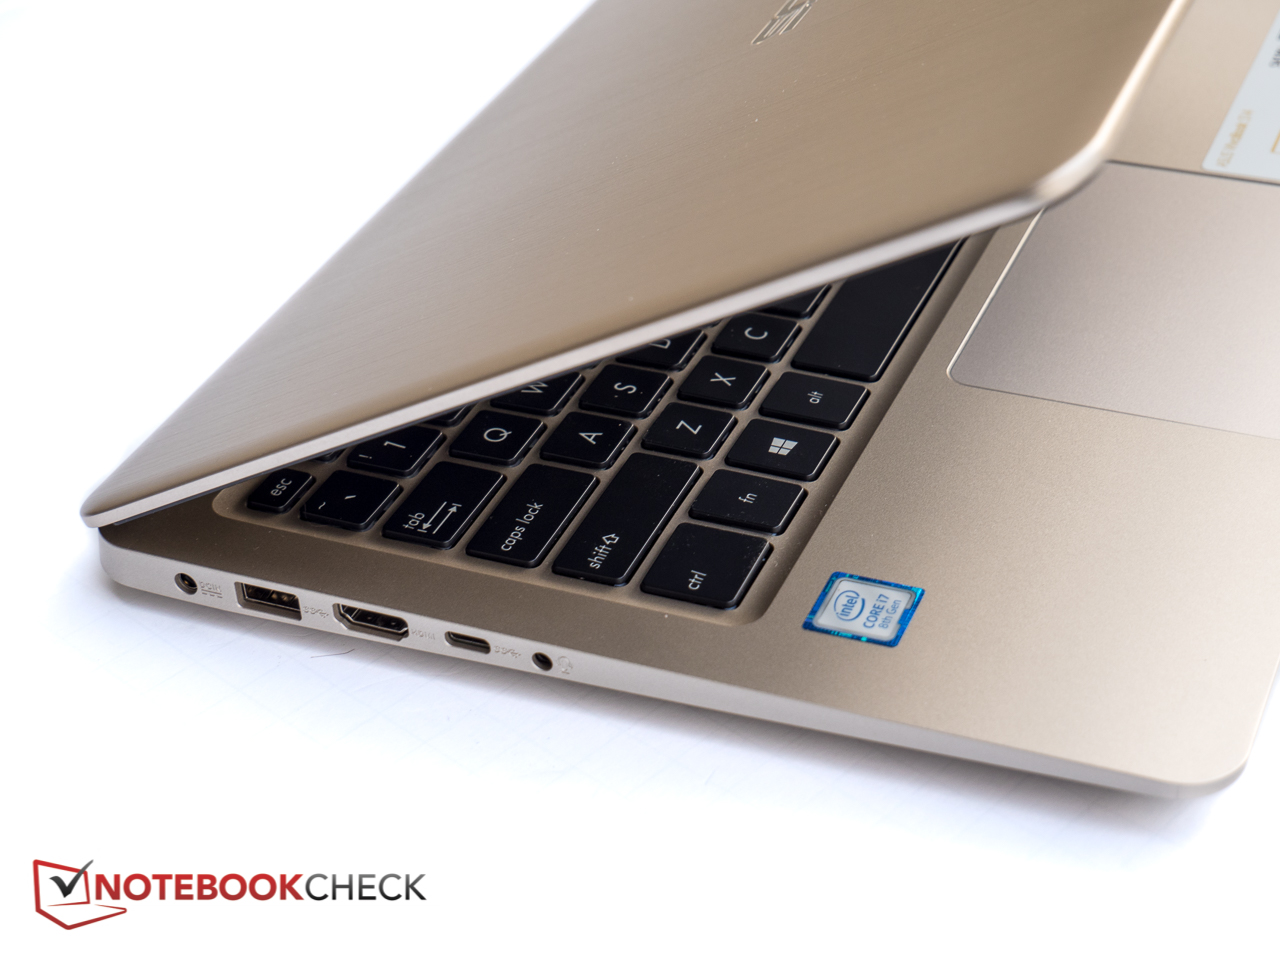
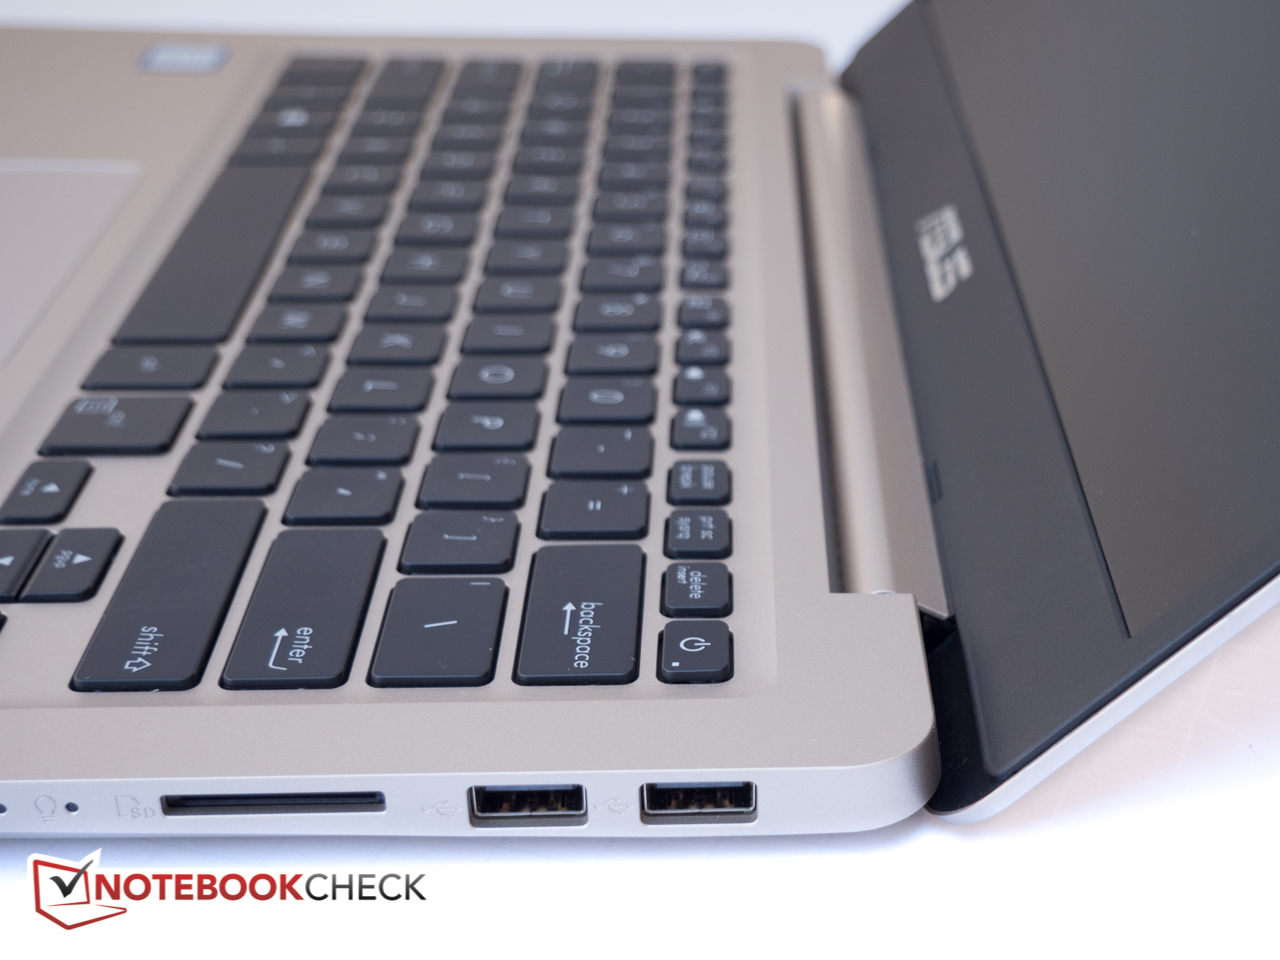
Port selection on the S410UQ has changed slightly and for the better compared to the previously-reviewed VivoBook S14 S406UA. Our review notebook is equipped with a full-sized HDMI port and SD card slot, while the S406UA was equipped with a less convenient MicroHDMI-out and a MicroSD card reader. As before, the right side is home to 2x USB 2.0 - we would've preferred one additional USB 3.0 port instead. All physical ports are located behind the mid-line, so plugged-in cables or device are - at least for right-handers - unlikely to interfere with the operation of an external mouse. Thunderbolt 3 is unfortunately not available.
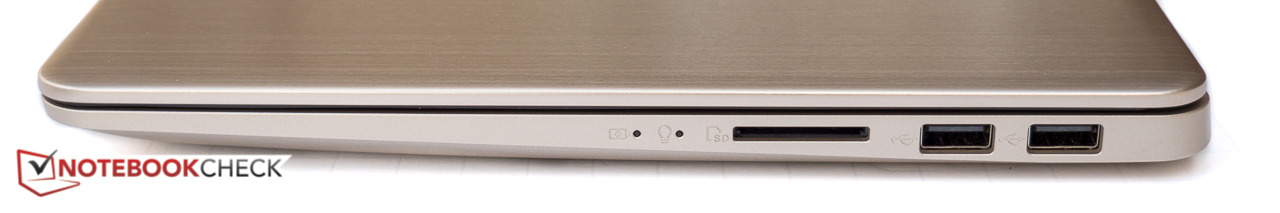
SD Card Reader
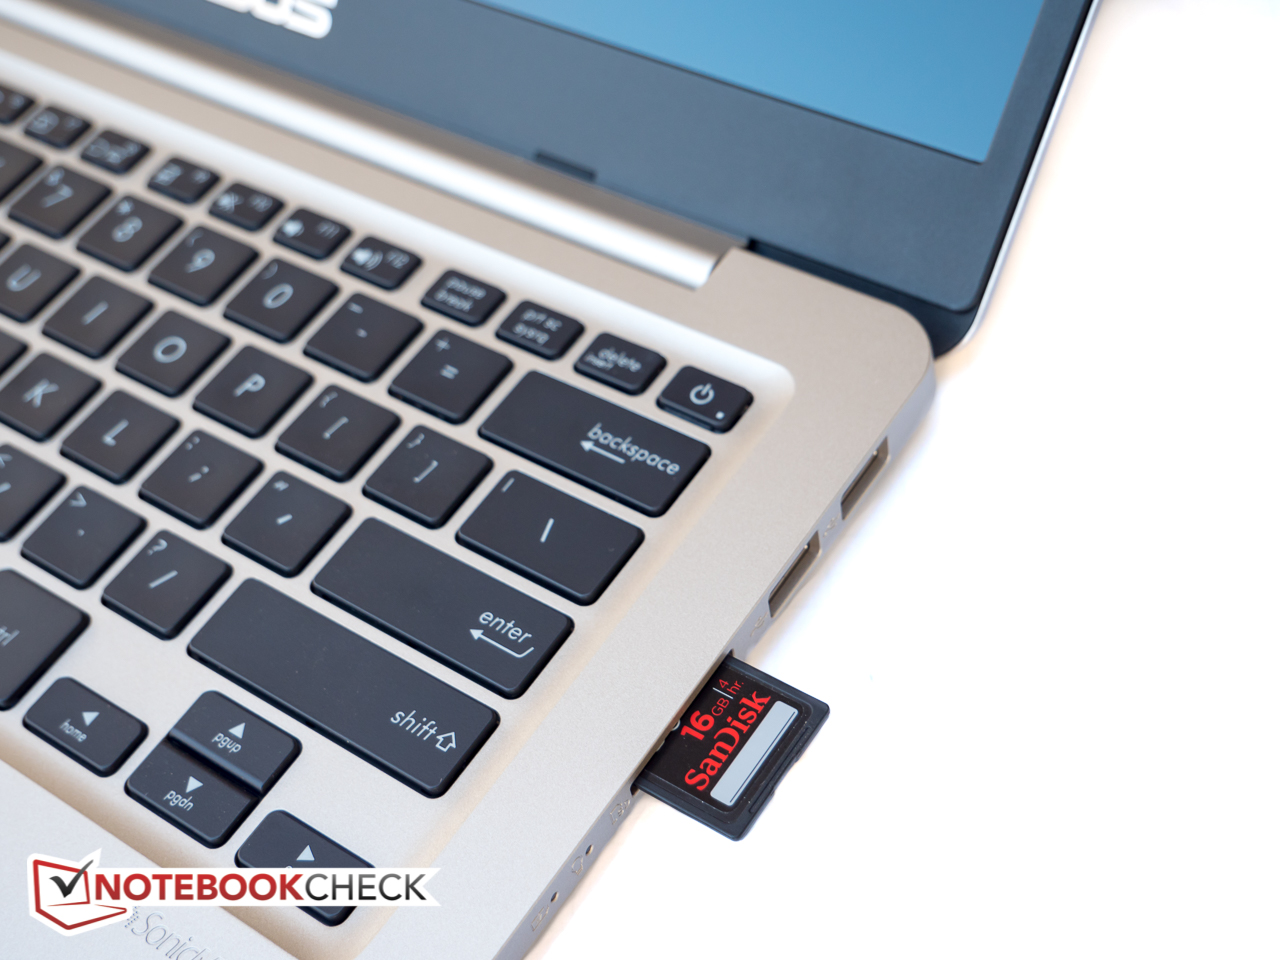
The transfer rates of the card reader on the right edge are dreadfully slow and limited to USB 2.0 speeds. AS SSD attests sustained sequential transfer rates of just about 35 MB/s, while copying 1 GB of JPG files to the desktop takes about 33 seconds. The Acer Swift 3 operates at even more middling speeds, however. As always, we use a Toshiba Exceria Pro SDXC 64 GB UHS-II reference card for our speed tests. Note that the card reader is not spring loaded and more than half of the card sticks out, which could potentially lead to breakage when bumping the notebook inadvertently or carrying it with the card inserted.
| SD Card Reader | |
| average JPG Copy Test (av. of 3 runs) | |
| Dell XPS 13 9370 i5 UHD (Toshiba Exceria Pro M501 64 GB UHS-II) | |
| Average of class Multimedia (23 - 531, n=43, last 2 years) | |
| Dell Latitude 7480 (Toshiba (Exceria Pro SDXC UHS-II 64 GB) | |
| Asus ZenBook 13 UX331UN (Toshiba Exceria Pro M501) | |
| Lenovo IdeaPad 320s-14IKB (Toshiba Exceria Pro SDXC 64 GB UHS-II) | |
| Asus VivoBook S410UQ-NH74 (Toshiba Exceria Pro SDXC 64 GB UHS-II) | |
| Acer Swift 3 SF314-52G-89SL (Toshiba Exceria Pro SDXC 64 GB UHS-II) | |
| maximum AS SSD Seq Read Test (1GB) | |
| Dell XPS 13 9370 i5 UHD (Toshiba Exceria Pro M501 64 GB UHS-II) | |
| Average of class Multimedia (27.9 - 1455, n=42, last 2 years) | |
| Dell Latitude 7480 (Toshiba (Exceria Pro SDXC UHS-II 64 GB) | |
| Lenovo IdeaPad 320s-14IKB (Toshiba Exceria Pro SDXC 64 GB UHS-II) | |
| Asus ZenBook 13 UX331UN (Toshiba Exceria Pro M501) | |
| Asus VivoBook S410UQ-NH74 (Toshiba Exceria Pro SDXC 64 GB UHS-II) | |
| Acer Swift 3 SF314-52G-89SL (Toshiba Exceria Pro SDXC 64 GB UHS-II) | |
Communication
Our VivoBook is equipped withe an 802.11ac module from Realtek (RTL8822BE) with Bluetooth 4.2 support. Transfer speeds during our standardized real-world WLAN test one meter from the Linksys EA8500 test router show good transmit and receive rates of about 602 Mbps and 607 Mbps, respectively, so the higher-end competitors aren't significantly faster here. The previously-reviewed Asus VivoBook S14 S406UA with Qualcomm Atheros module (QCA9377) is about 50 % slower. We didn't experience any dropouts or other connectivity issues during the review period.
Accessories
Asus only supplies the notebook, the power supply, and a couple of pamphlets. On their website, the manufacturer also lists generic accessories like the USB 3.0 HZ-2 Docking Station as well as keyboards and mice.
Maintenance
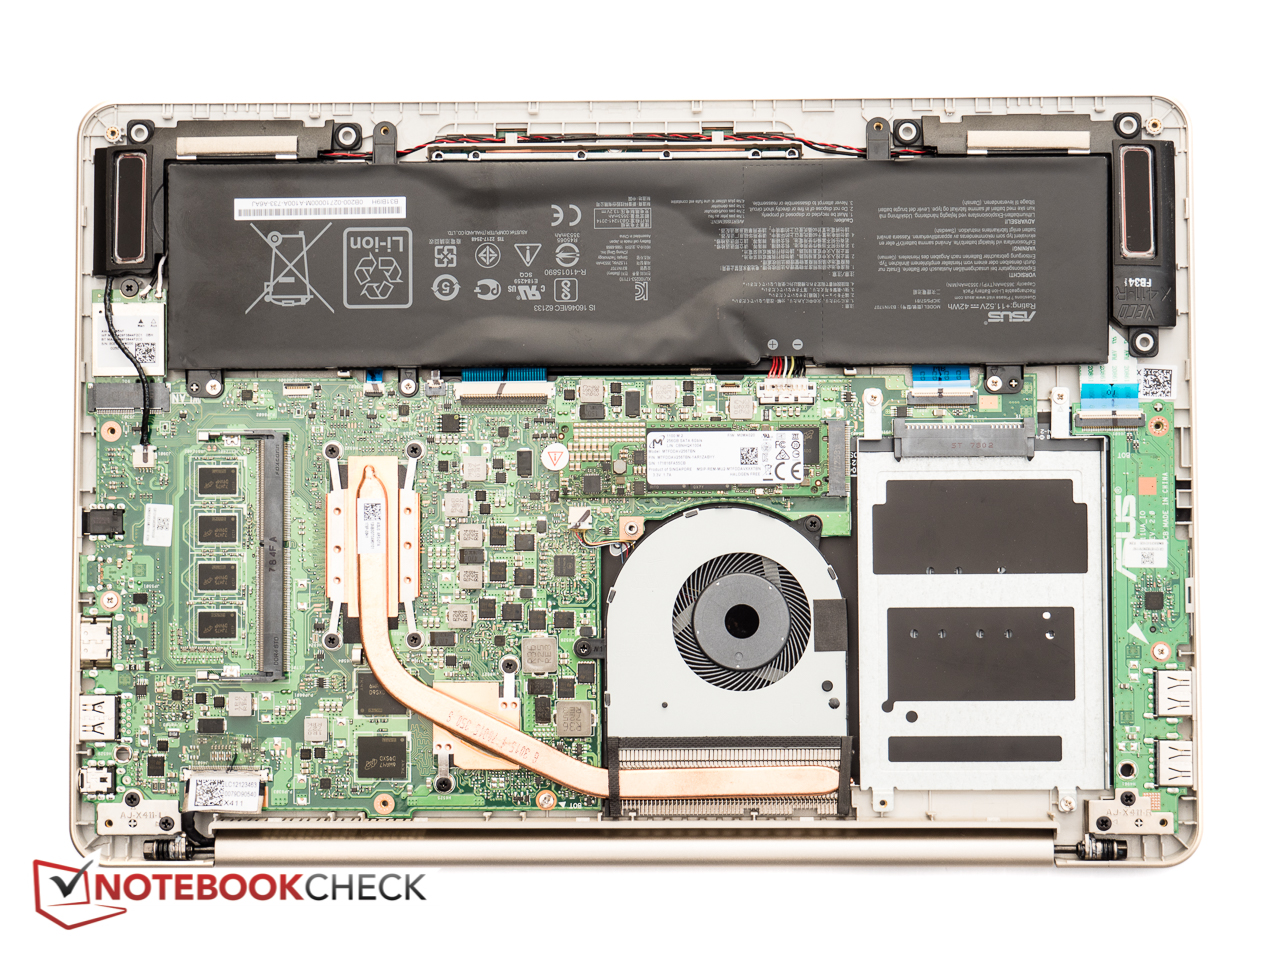
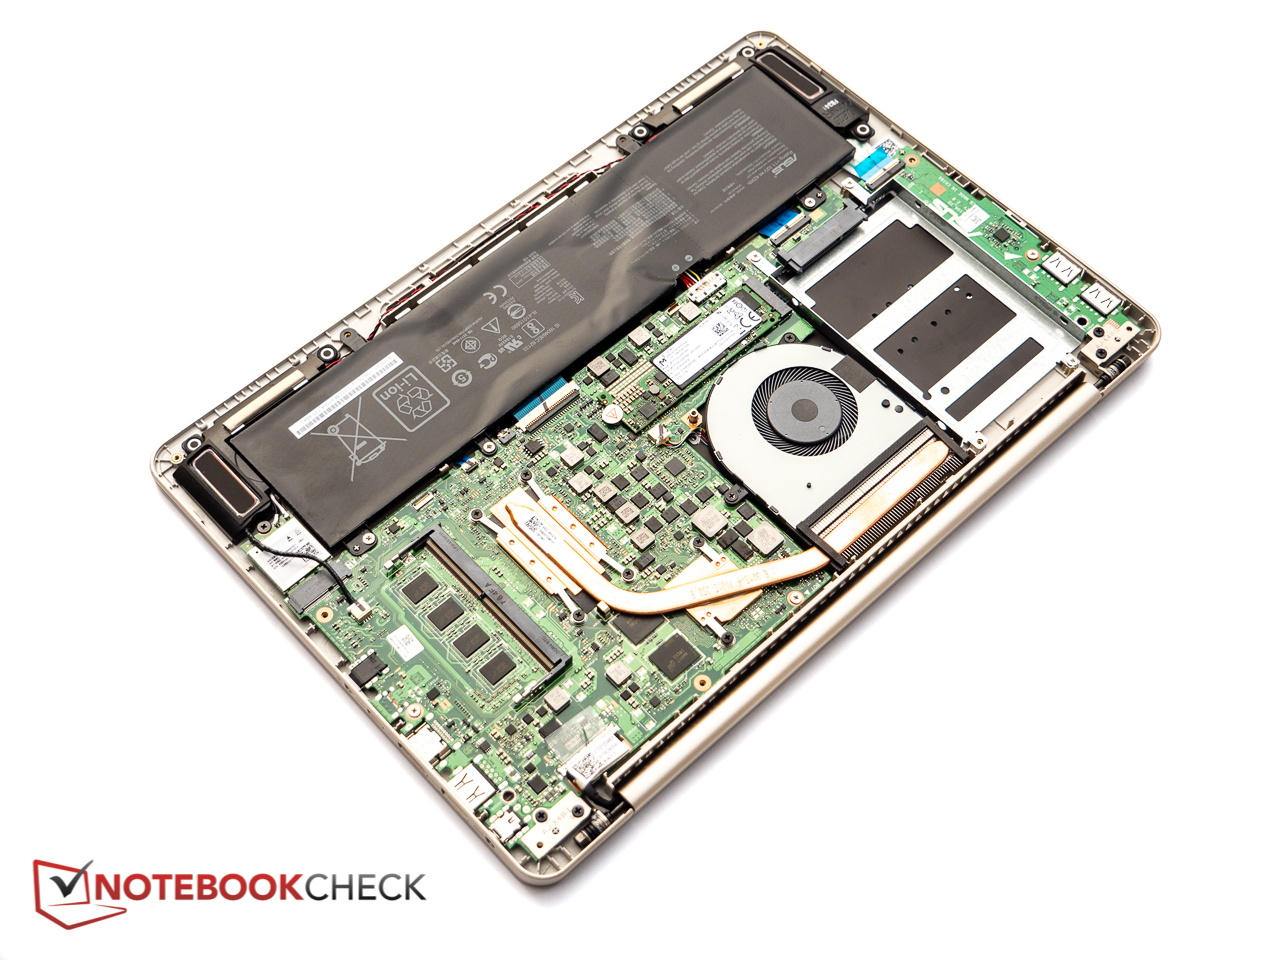
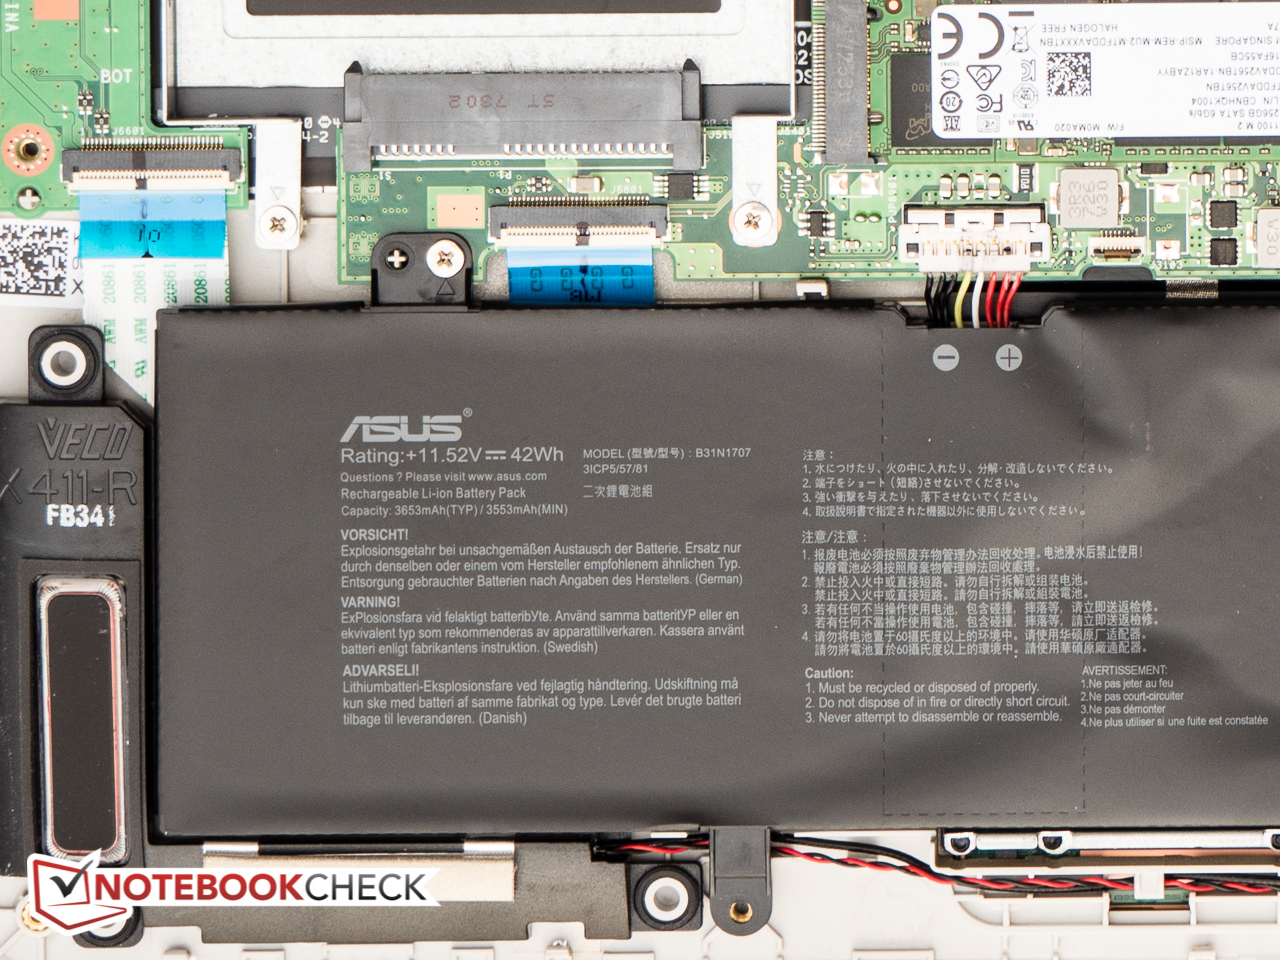
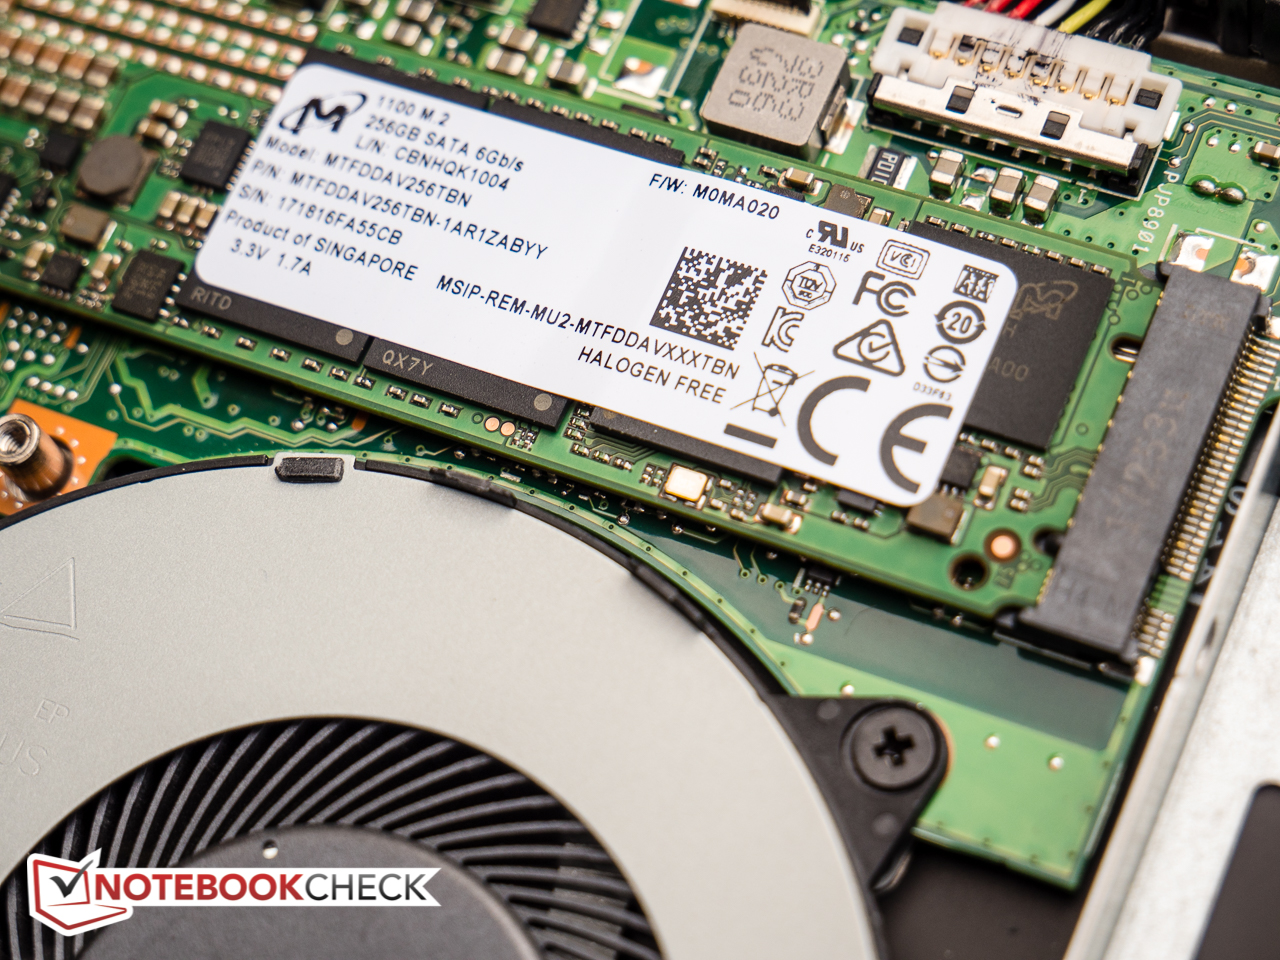
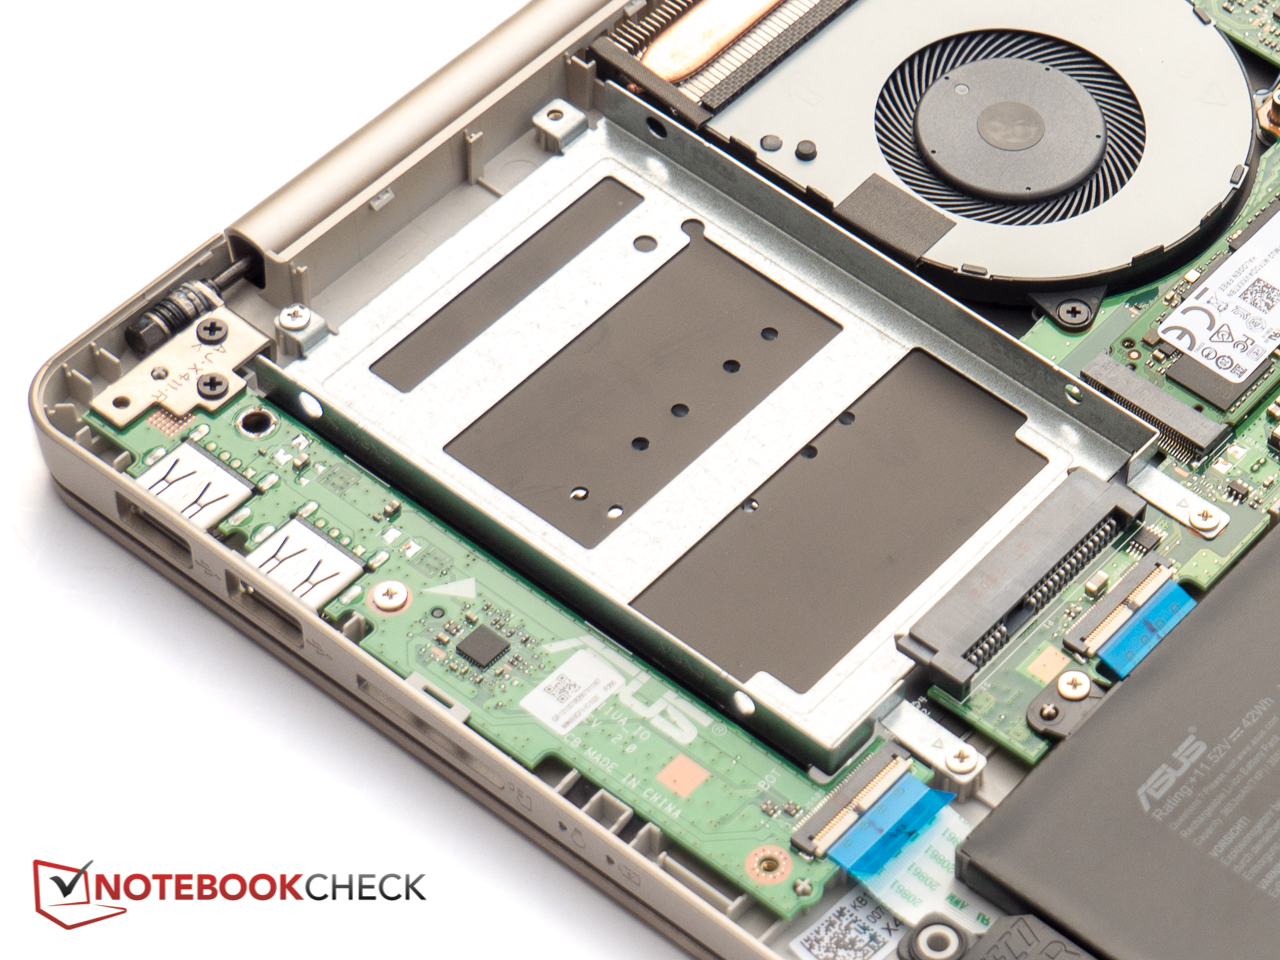
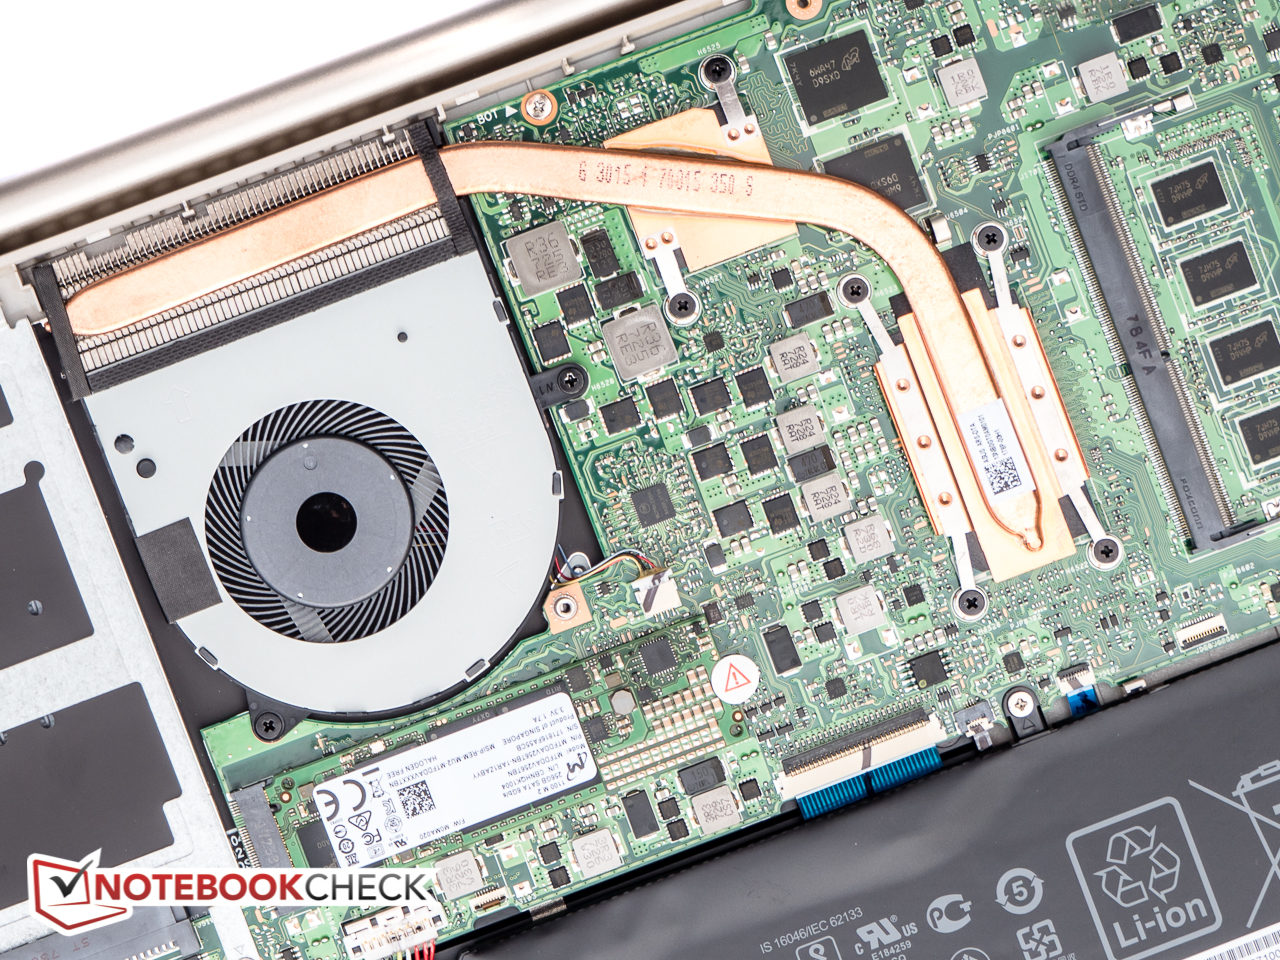
Despite the lack of a dedicated maintenance hatch, the serviceability is actually decent for a slim-and-light system. After the removal of 11 Phillips screws, the bottom panel can be pried off with relative ease with the aid of an old credit card or similar tool. Since 8 GB of RAM are soldered onto the motherboard, the user has access to the secondary RAM slot, the M.2 SSD, the WLAN module, as well as the system fan should a cleaning become necessary. According to Asus' spec sheet, some versions of the VivoBook S14 S410UQ could also feature conventional hard drives - and indeed, our review notebook has an open 2.5-inch bay with the appropriate SATA connector on the motherboard.
Warranty
The VivoBook S14 is covered against manufacturers defects for a period of 12 months, which also includes a one-year international warranty service within Europe, North America, Asia, and Australia, among others.
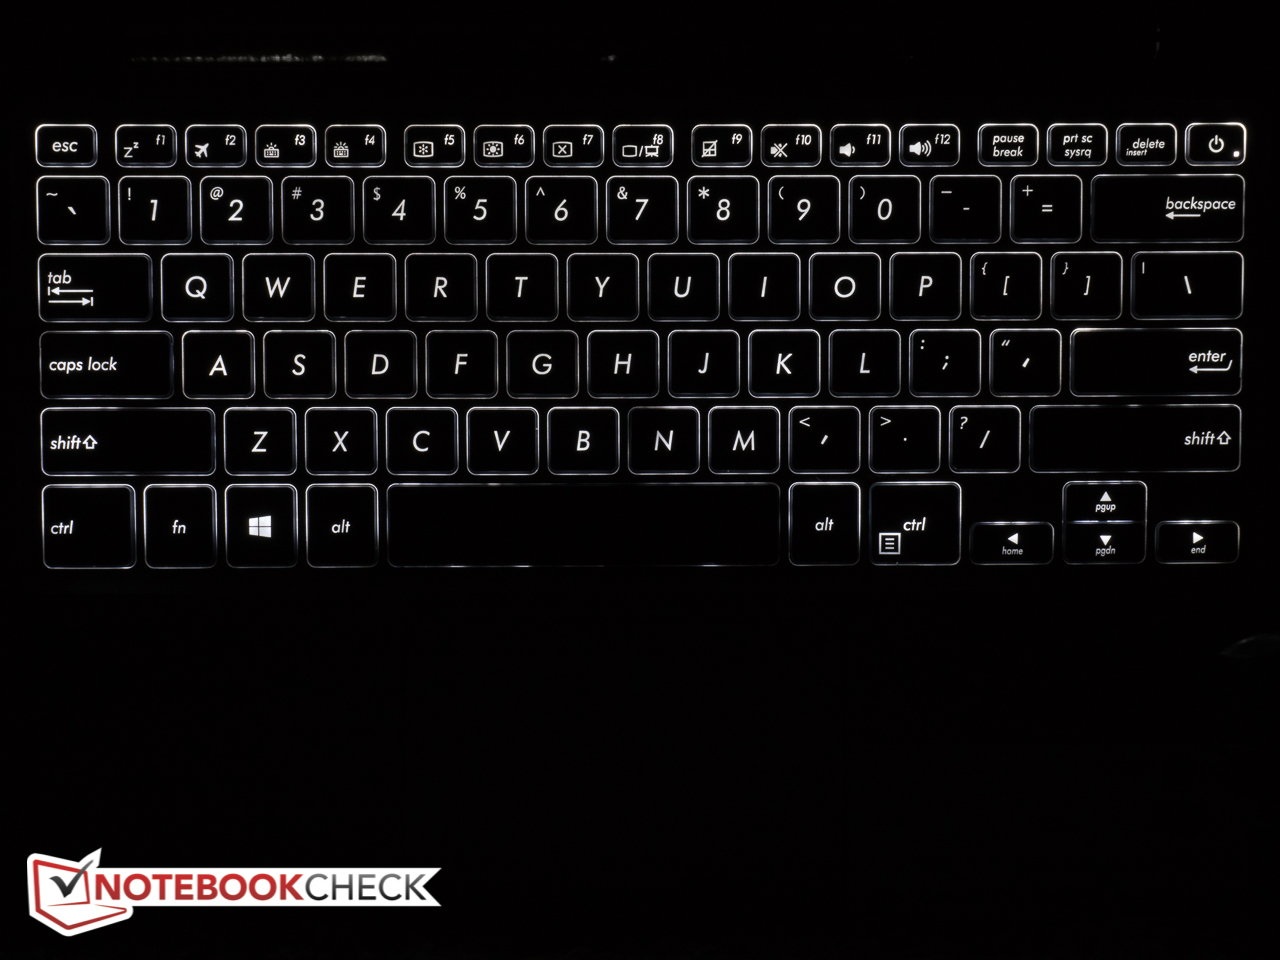
Input Devices - too much keyboard flex
Keyboard
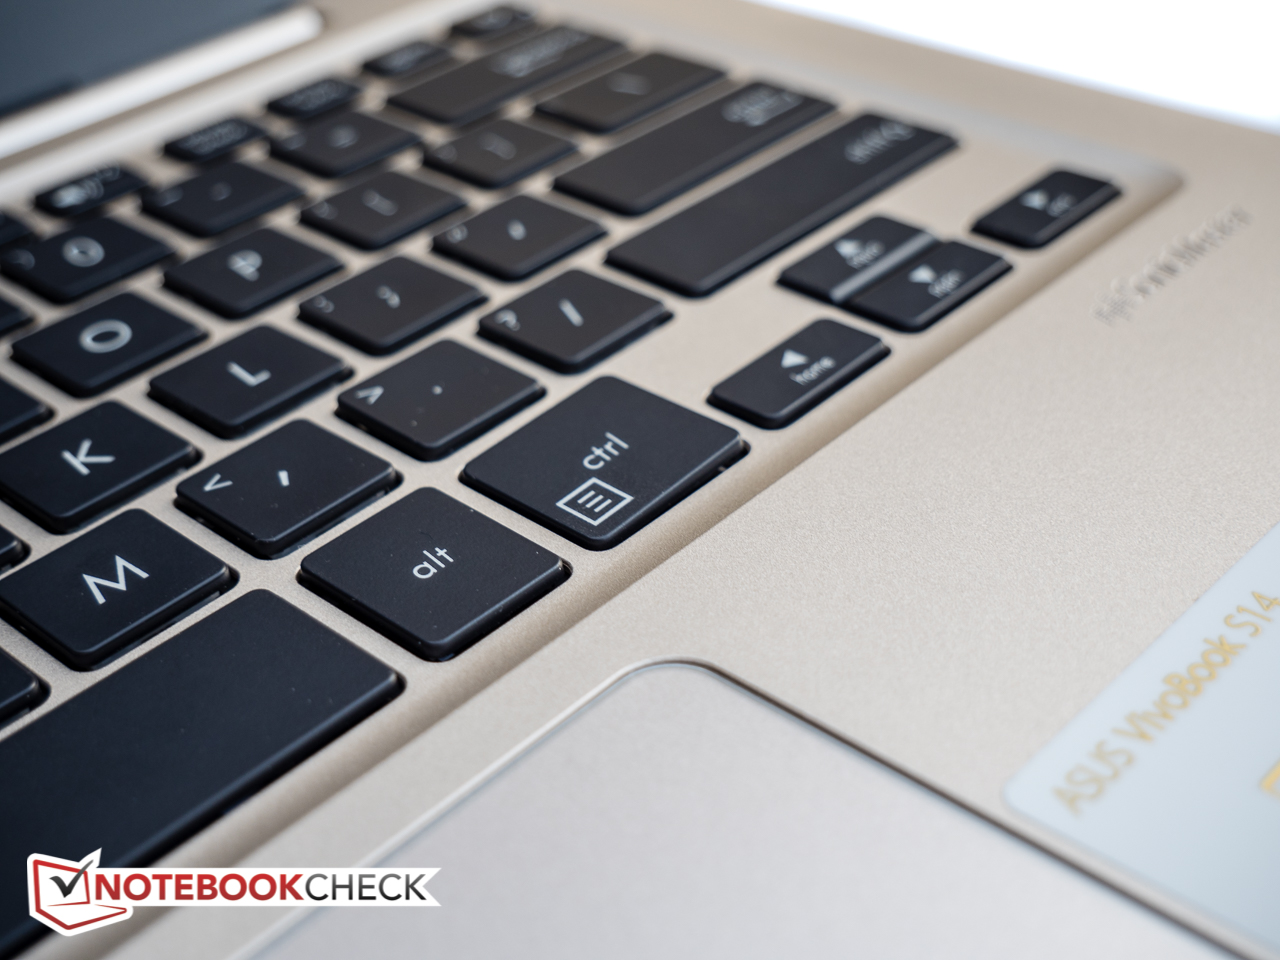
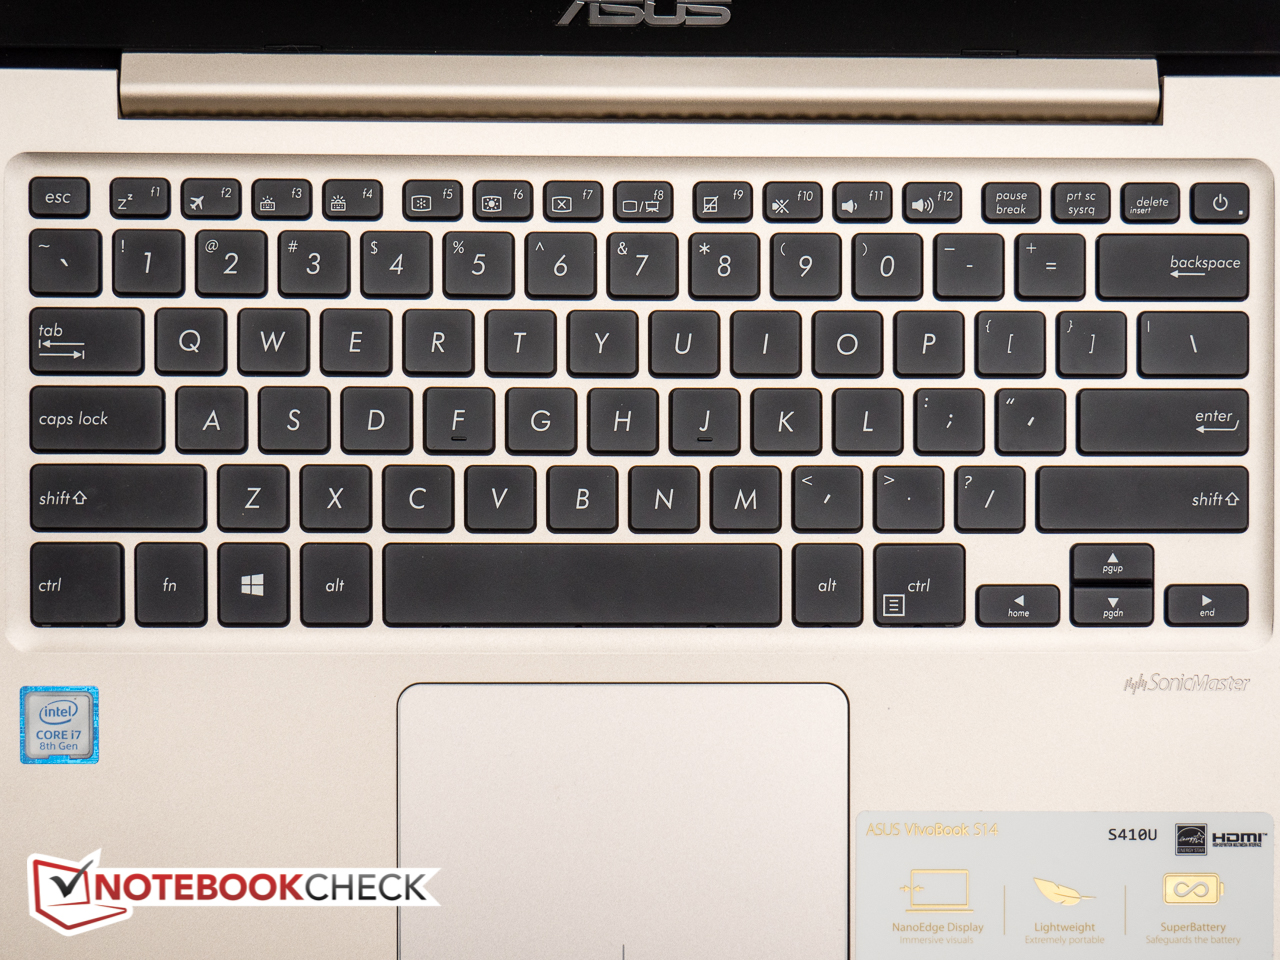
The Asus VivoBook S14 S410UQ is equipped with a backlit (3 brightness levels + off) chiclet-style keyboard. The regular keys measure 15 mm, are completely flat and lightly textured. Travel seems adequate for a subnotebook and the pressure point is well defined, but because of the aforementioned flex, heavy-handed touch typists in particular are going to be treated to a very bouncy typing experience. The function row keys are less than half-sized with the power on/off button integrated on the far right side right next to the delete key - not an ideal move on Asus' part in our opinion, as it is certainly possible to inadvertently put the notebook into standby mode while attempting to hit delete. The keyboard on our review notebook also has an additional issue with uneven keys: the right CTRL key in particular clearly slopes downwards towards the left front corner. We can't say for sure if this build quality problem only affects the review unit or not. The keys remain unobtrusive unless hit very hard and the notebook is suited quite well for quiet environments.
Touchpad
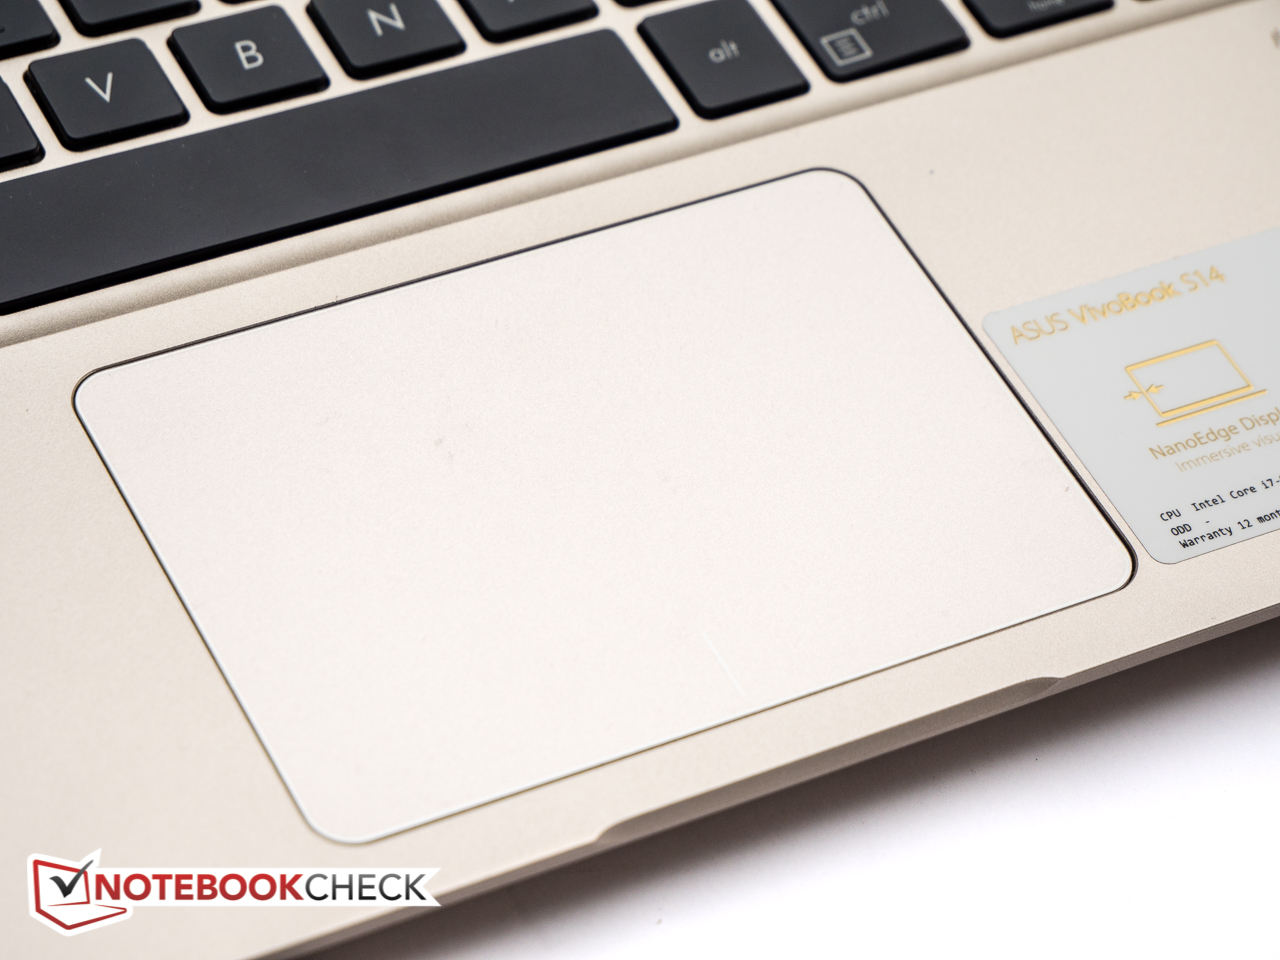
The ClickPad measures 10.5 x 7.3 cm (4.1 x 2.9 in) and supports Windows Precision Touchpad standards and thus multitouch. Fingers glide easily on the lightly textured surface and gestures up to four fingers work very well. Left clicks can be executed across the entire surface area, while right-clicks are only recognized in the bottom right corner. Travel is short with distinct haptic and slightly noisy audible feedback. Unlike the Asus VivoBook S14 S406UA, the S410UQ does not feature the ClickPad-integrated fingerprint reader.
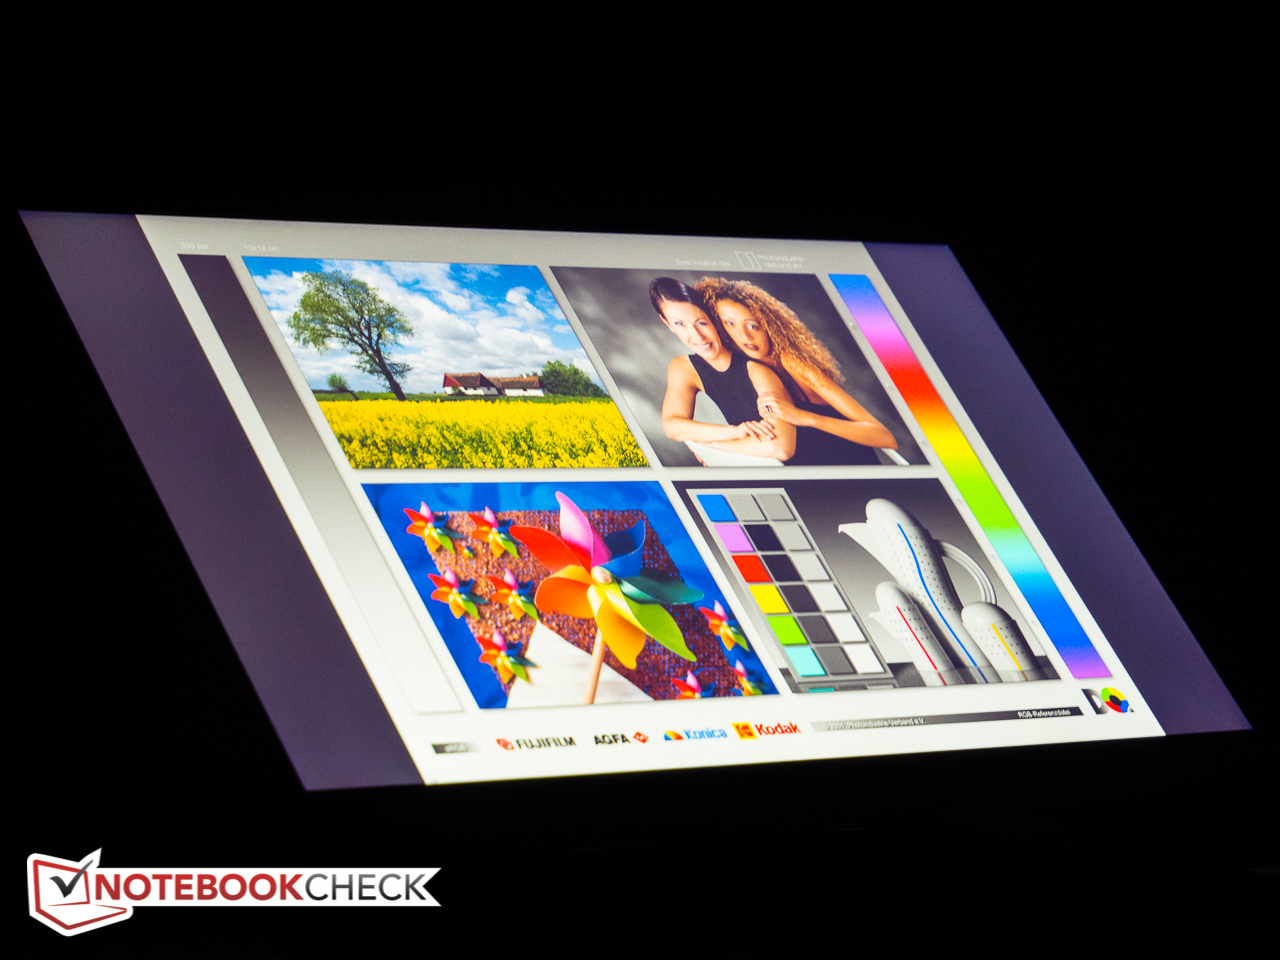
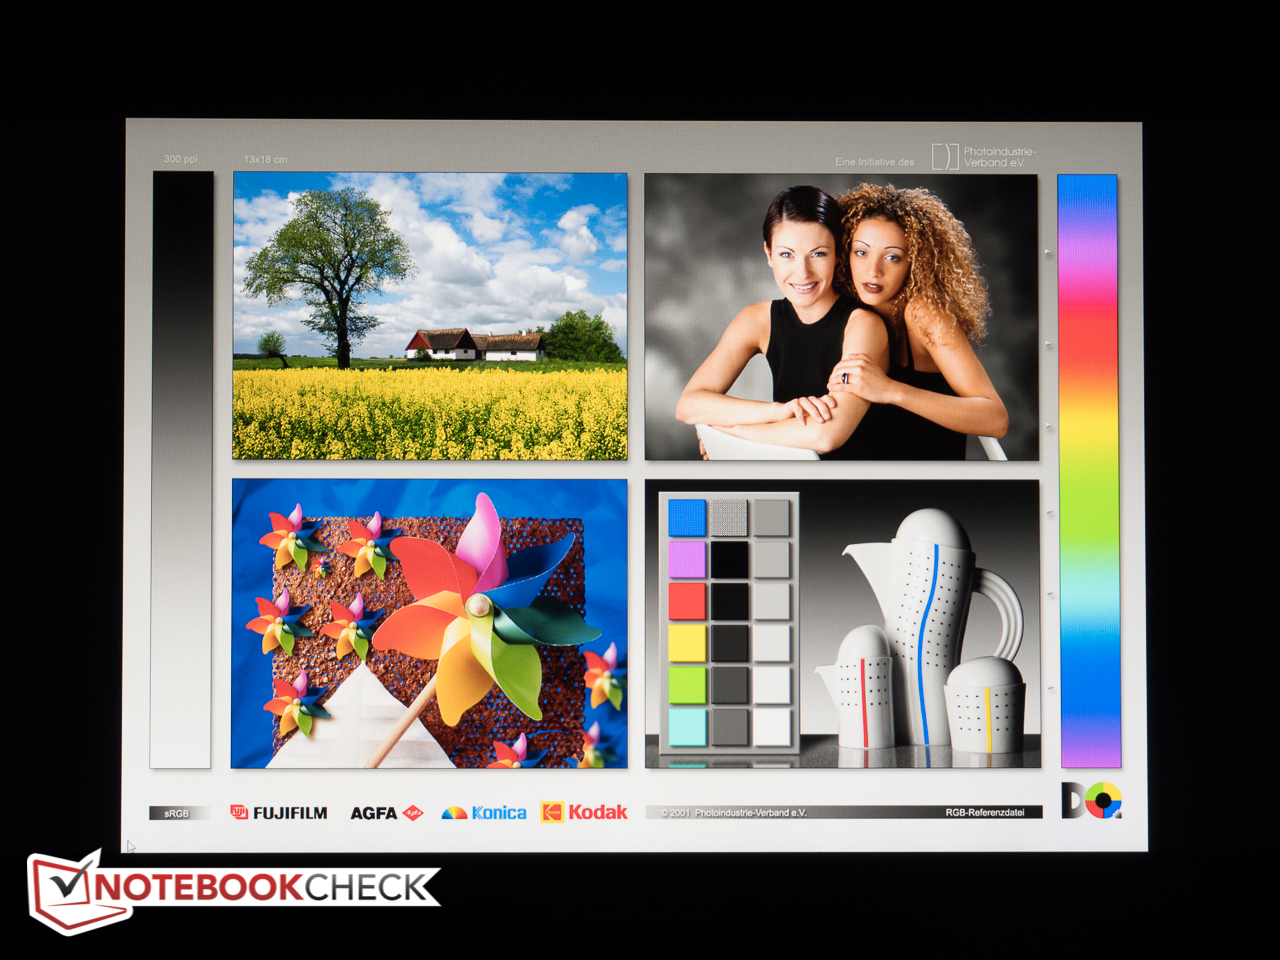
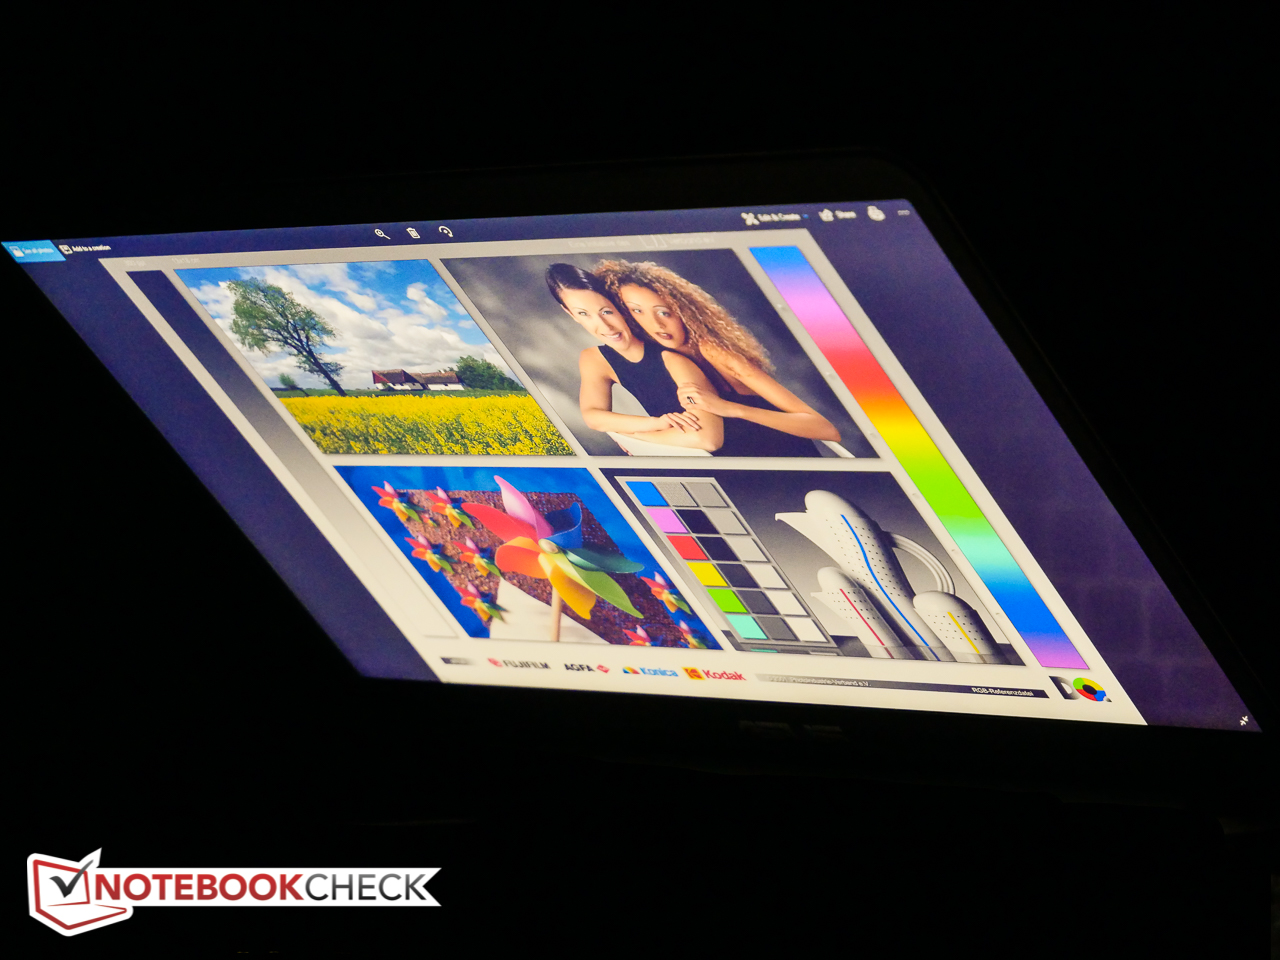
Display - IPS, but not very bright
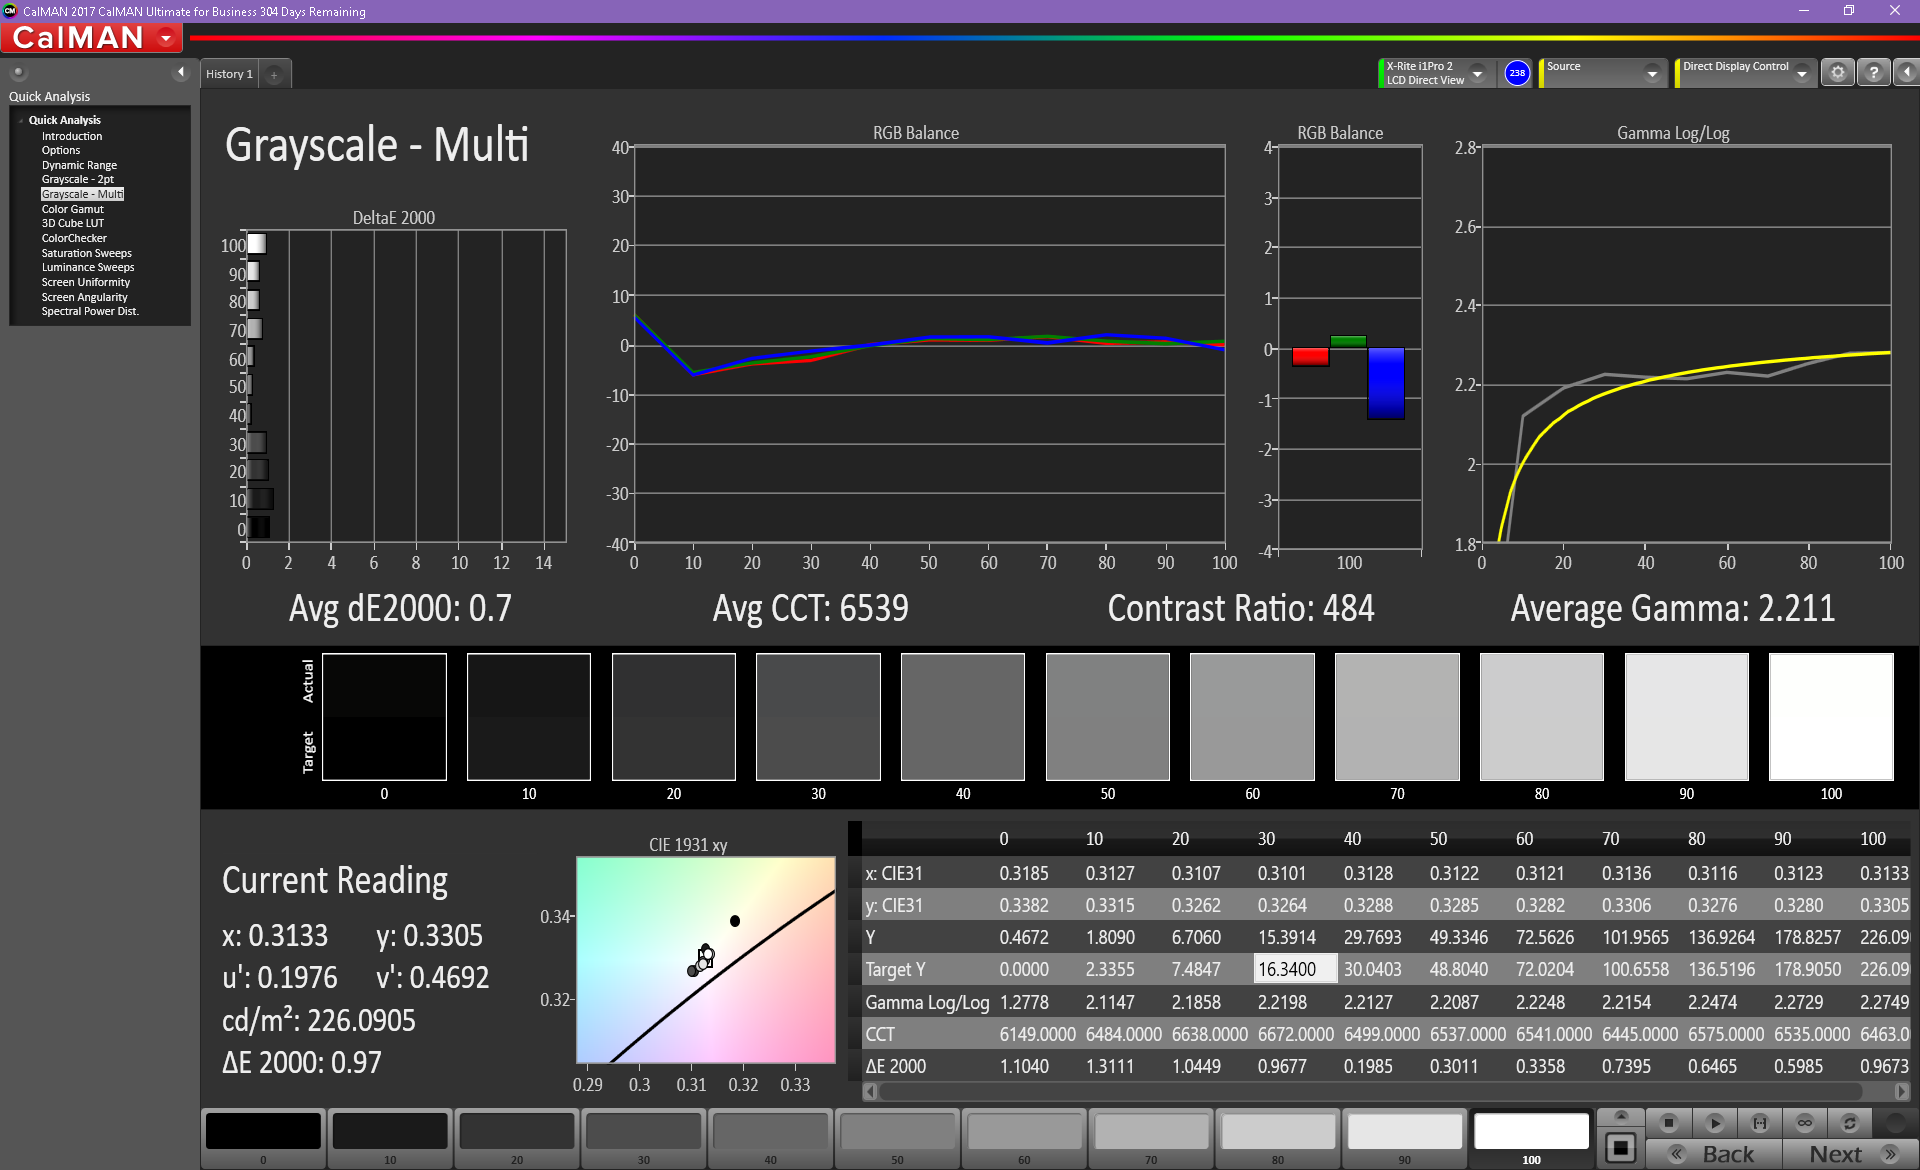
Unlike the VivoBook S14 S406UA with HD TN panel, our review notebook is equipped with a matte 14-inch 1080p IPS display from AU Optronics (B140HAN04.2). With a brightness of about 240 cd/m² and a contrast ratio of 820:1, the panel is decidedly average, although many lower-end notebooks in our comparison don't fare any better. The Acer Swift 3, for example, features a similar panel type from AUO and tops out at only 220 cd/m². The higher-end ZenBook sibling UX3410UQ with Chi Mei panel is over 50 % brighter.
Fortunately, Asus does not employ PWM to regulate the brightness, so the notebook should work well for users with sensitive eyes.
Backlight bleeding is also fairly minimal and not a problem during normal use, although the brighter spot on the bottom left can be visible when watching movies.
| |||||||||||||||||||||||||
Brightness Distribution: 84 %
Center on Battery: 253.9 cd/m²
Contrast: 819:1 (Black: 0.31 cd/m²)
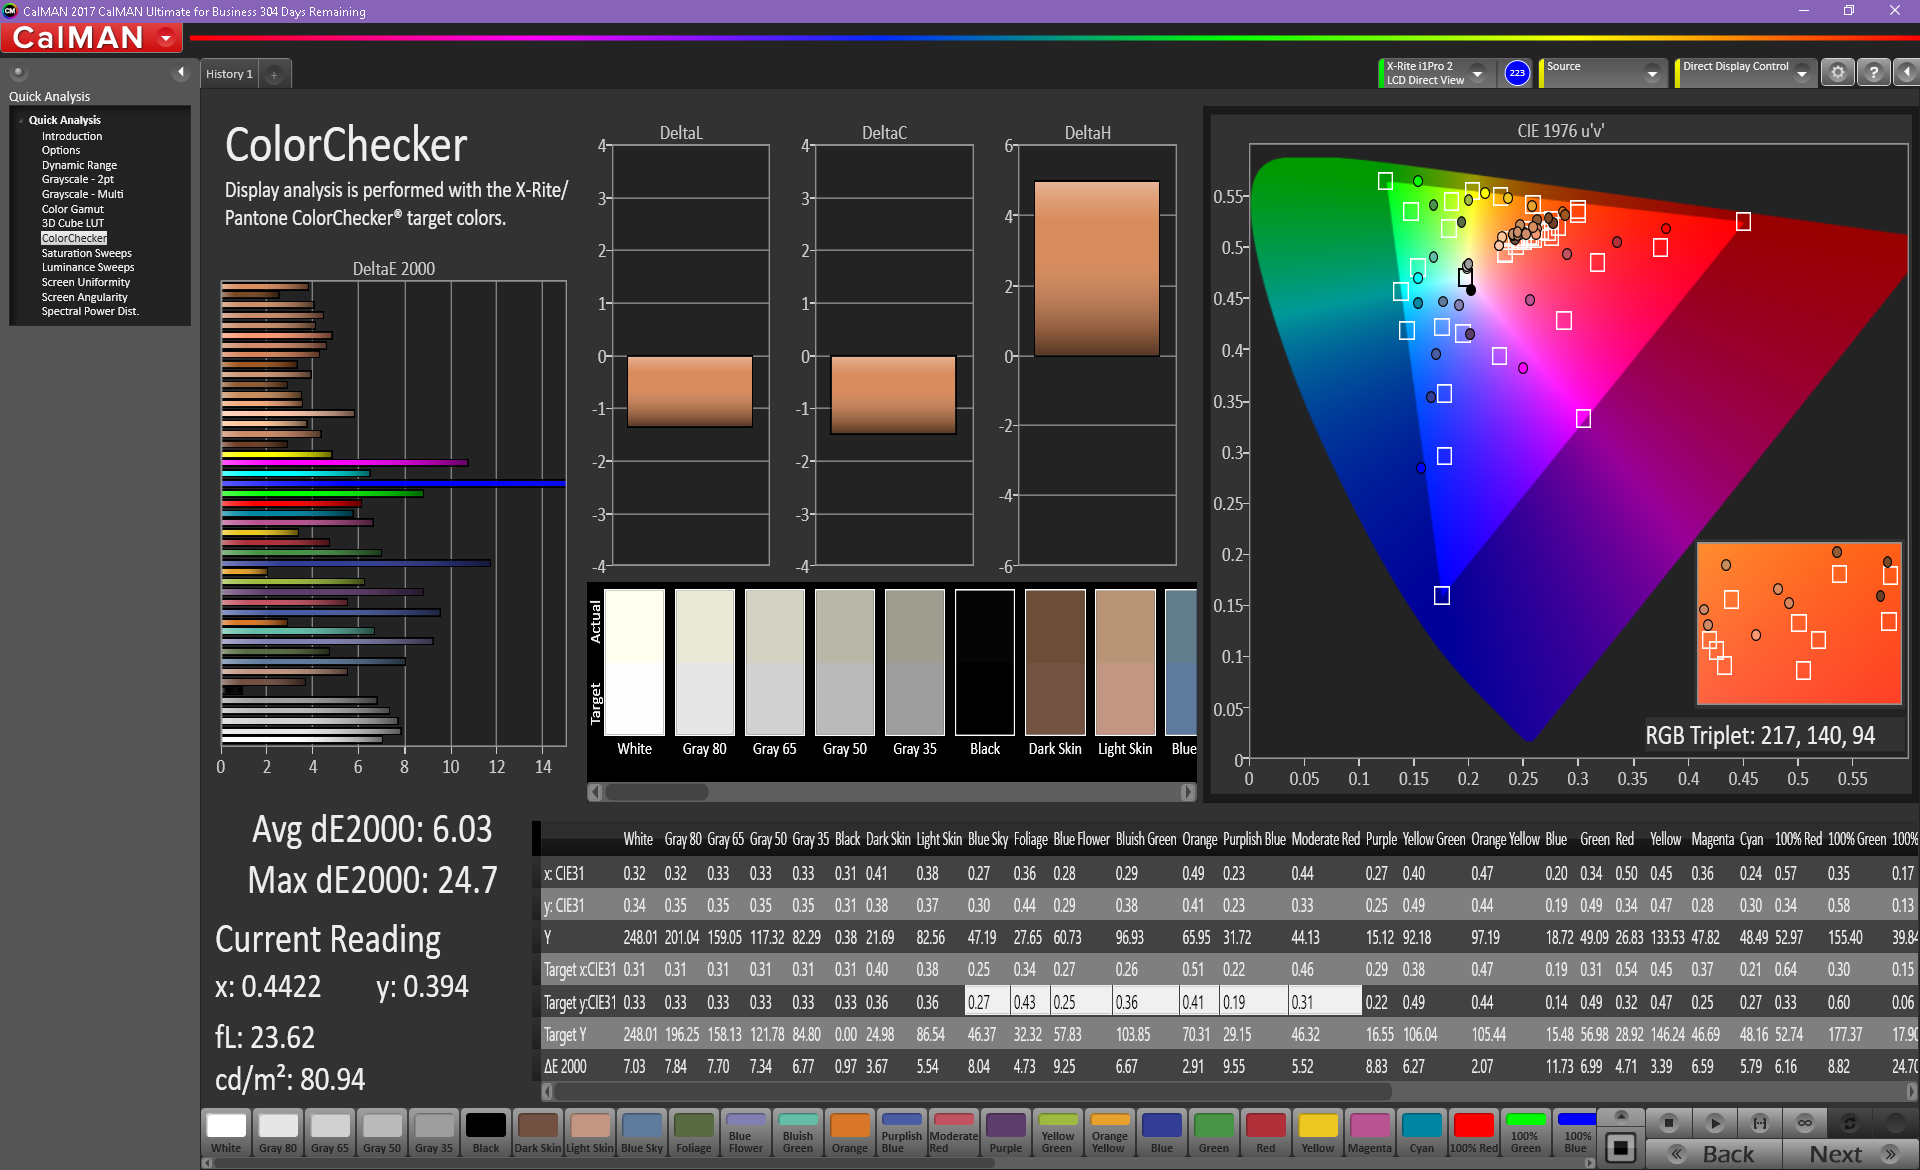
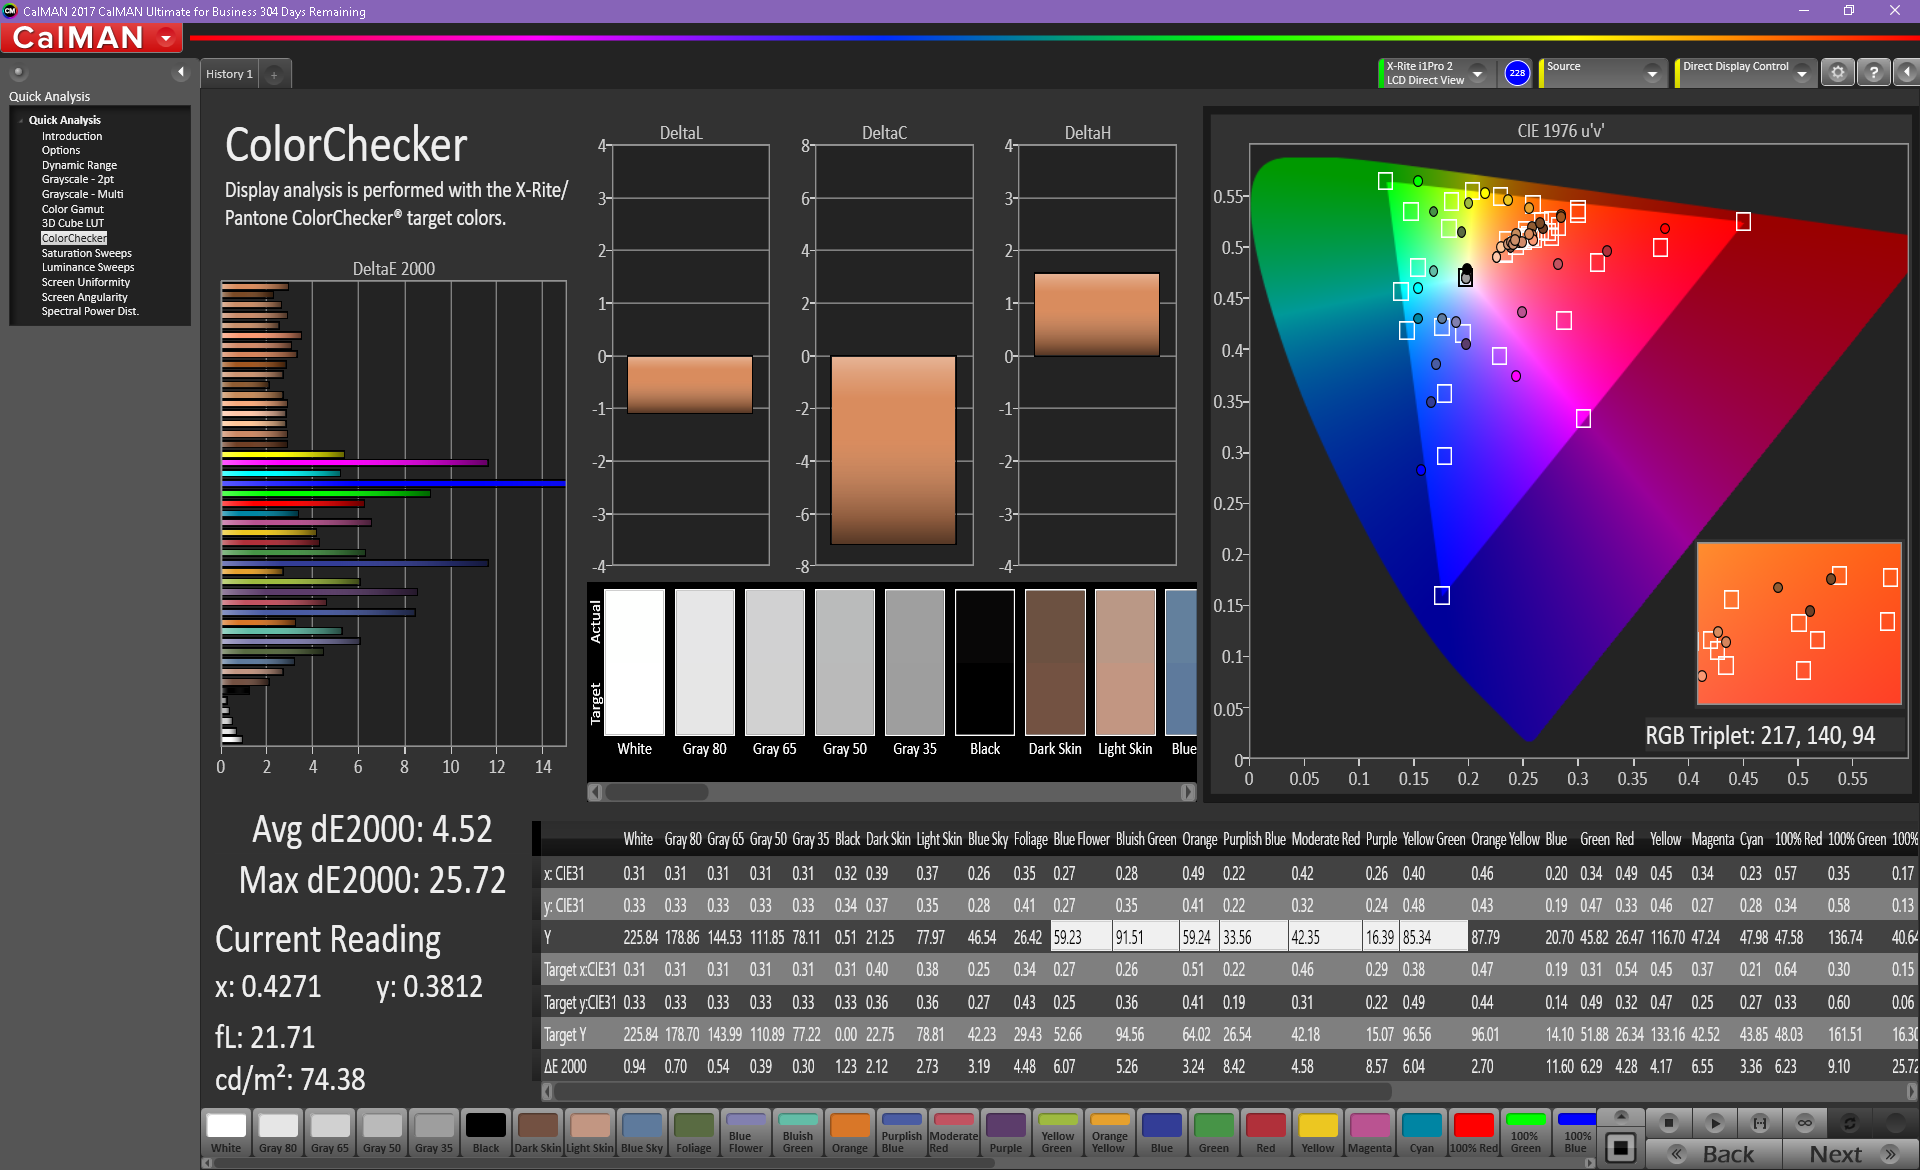
ΔE ColorChecker Calman: 6.03 | ∀{0.5-29.43 Ø4.73}
calibrated: 4.52
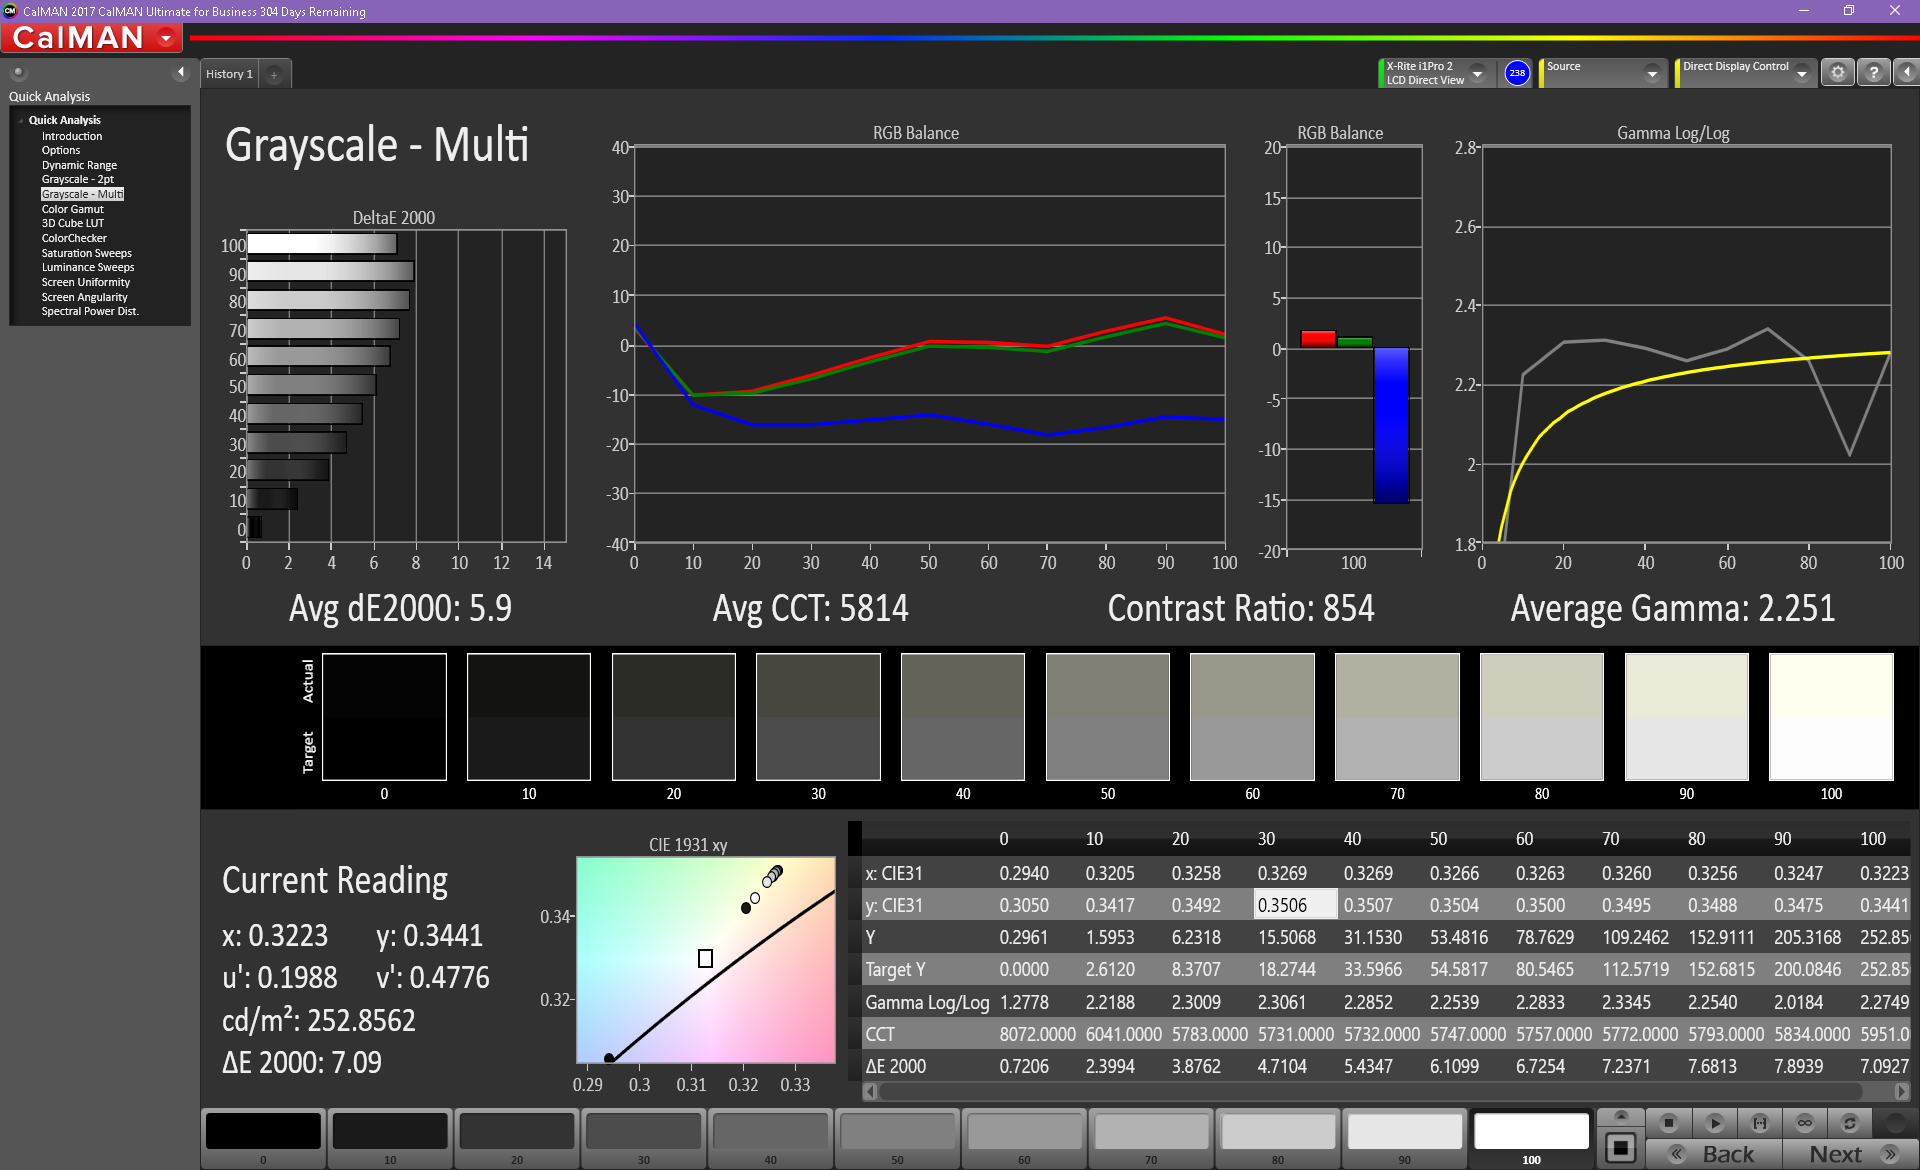
ΔE Greyscale Calman: 5.9 | ∀{0.09-98 Ø4.97}
56.59% sRGB (Calman 2D)
56.59% sRGB (Argyll 1.6.3 3D)
39.3% AdobeRGB 1998 (Argyll 1.6.3 3D)
39.3% AdobeRGB 1998 (Argyll 3D)
56.6% sRGB (Argyll 3D)
38.04% Display P3 (Argyll 3D)
Gamma: 2.25
CCT: 5814 K
| Asus VivoBook S410UQ-NH74 AUO B140HAN04.2, IPS, 14", 1920x1080 | Asus Zenbook UX3410UQ-GV077T Chi Mei N140HCE-EN1, IPS, 14", 1920x1080 | Acer Swift 3 SF314-52G-89SL AU Optronics B140HAN02.1, IPS, 14", 1920x1080 | Lenovo IdeaPad 320s-14IKB BOE CQ NV140FHM-N49, IPS, 14", 1920x1080 | Dell XPS 13 9370 i5 UHD ID: Sharp SHP148B, Name: LQ133D1, Dell P/N: 8XDHY, IPS, 13.3", 3840x2160 | Asus VivoBook S14 S406UA-BV023T BOE CQ NT140WHM-N44, TN LED, 14", 1366x768 | |
|---|---|---|---|---|---|---|
| Display | 76% | -5% | 3% | 77% | 2% | |
| Display P3 Coverage (%) | 38.04 | 67.2 77% | 36.09 -5% | 39.26 3% | 68.9 81% | 38.82 2% |
| sRGB Coverage (%) | 56.6 | 99.2 75% | 54.2 -4% | 57.6 2% | 98.4 74% | 58.2 3% |
| AdobeRGB 1998 Coverage (%) | 39.3 | 69.3 76% | 37.28 -5% | 40.56 3% | 69.5 77% | 40.11 2% |
| Response Times | -10% | 1% | -12% | -63% | 22% | |
| Response Time Grey 50% / Grey 80% * (ms) | 38.8 ? | 44 ? -13% | 41 ? -6% | 44 ? -13% | 67.2 ? -73% | 42 ? -8% |
| Response Time Black / White * (ms) | 27.2 ? | 29 ? -7% | 25 ? 8% | 30 ? -10% | 41.6 ? -53% | 13 ? 52% |
| PWM Frequency (Hz) | 60 ? | 357 ? | 2500 ? | 200 ? | ||
| Screen | 42% | 6% | 19% | 45% | -20% | |
| Brightness middle (cd/m²) | 253.9 | 381 50% | 233 -8% | 245 -4% | 496.4 96% | 215 -15% |
| Brightness (cd/m²) | 239 | 368 54% | 217 -9% | 235 -2% | 469 96% | 208 -13% |
| Brightness Distribution (%) | 84 | 84 0% | 88 5% | 71 -15% | 84 0% | 81 -4% |
| Black Level * (cd/m²) | 0.31 | 0.3 3% | 0.27 13% | 0.21 32% | 0.5 -61% | 0.4 -29% |
| Contrast (:1) | 819 | 1270 55% | 863 5% | 1167 42% | 993 21% | 538 -34% |
| Colorchecker dE 2000 * | 6.03 | 2.84 53% | 5.85 3% | 4.85 20% | 2.9 52% | 9.37 -55% |
| Colorchecker dE 2000 max. * | 24.7 | 6.5 74% | 11.51 53% | 8.99 64% | 5.26 79% | 15.84 36% |
| Colorchecker dE 2000 calibrated * | 4.52 | |||||
| Greyscale dE 2000 * | 5.9 | 4.02 32% | 4.87 17% | 2.64 55% | 3.9 34% | 10.52 -78% |
| Gamma | 2.25 98% | 2.42 91% | 2.47 89% | 2.18 101% | 2.066 106% | 2.45 90% |
| CCT | 5814 112% | 7430 87% | 6908 94% | 6161 106% | 7169 91% | 11214 58% |
| Color Space (Percent of AdobeRGB 1998) (%) | 39.3 | 56 42% | 34 -13% | 37 -6% | 63.9 63% | 37 -6% |
| Color Space (Percent of sRGB) (%) | 56.59 | 86 52% | 54 -5% | 57 1% | 98.2 74% | 58 2% |
| Total Average (Program / Settings) | 36% /
42% | 1% /
3% | 3% /
11% | 20% /
37% | 1% /
-10% |
* ... smaller is better
At 39 percent and 57 percent of the sRGB and AdobeRGB standards the coverage of the professional color spaces is also not overly impressive, but once again within the expected range for a lower-priced thin-and-light system. Competitors like the Lenovo IdeaPad 320s-14IKB or the Acer Swift 3 SF314-52G-89SL offer comparable performance here, while the significantly more expensive Dell XPS 13 9370 with UHD display offers almost full sRGB coverage.
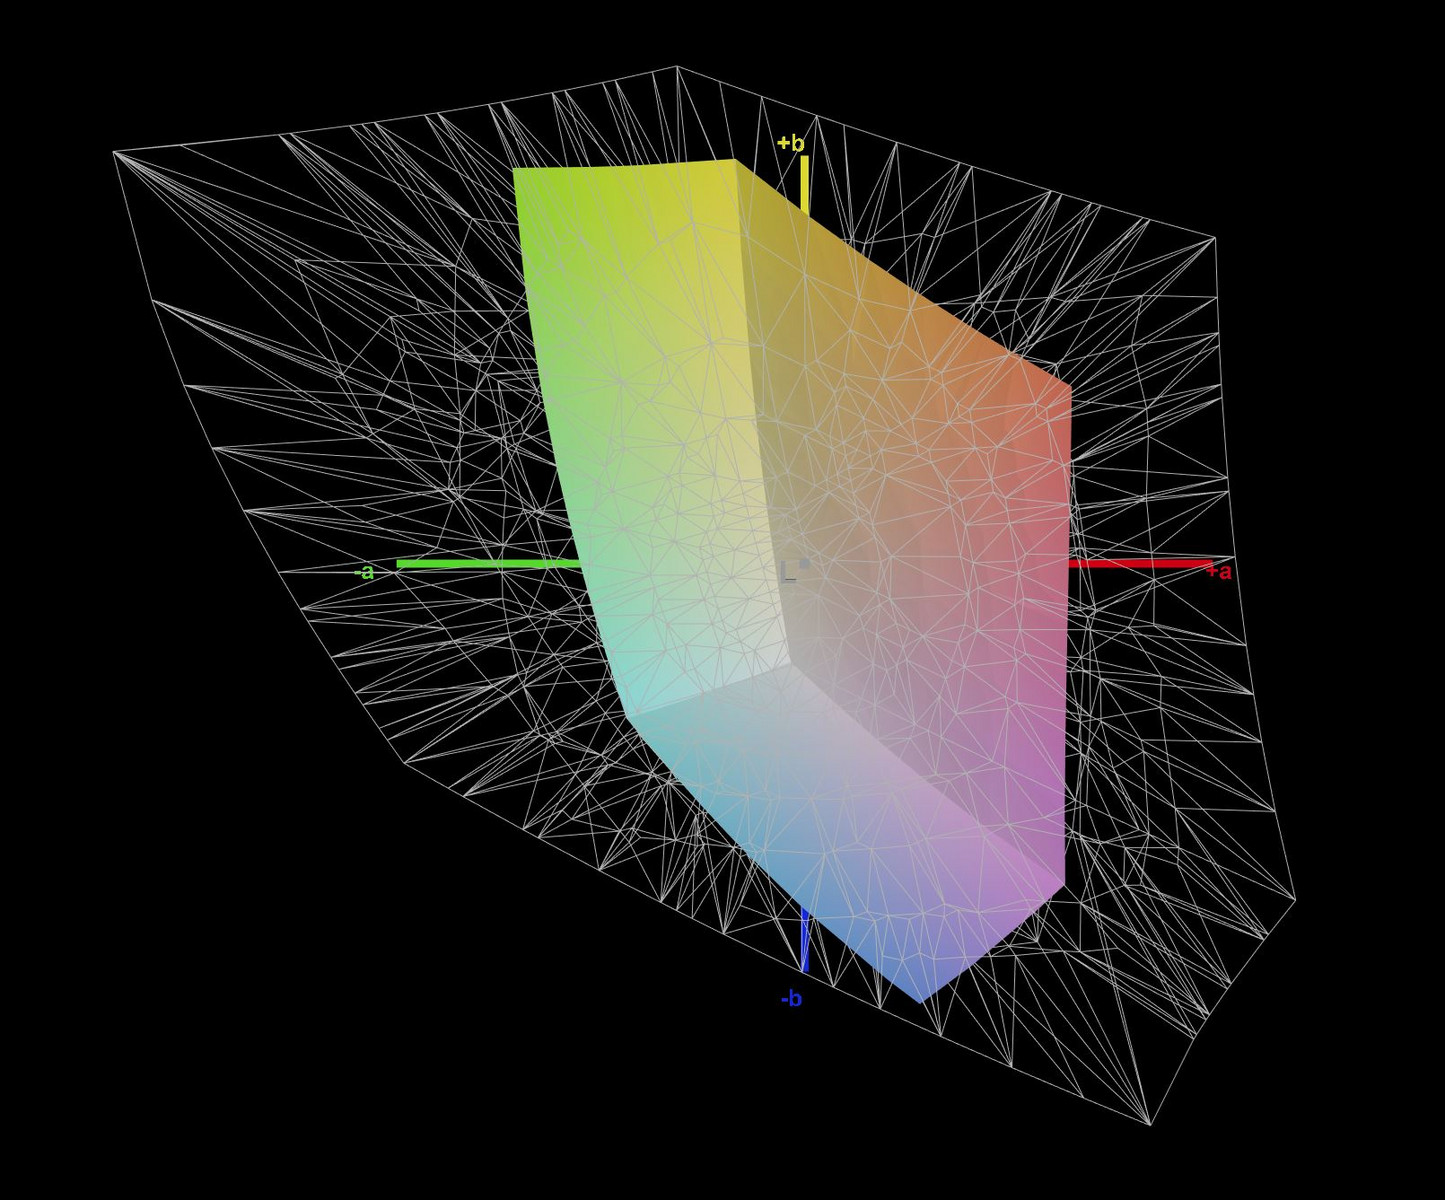
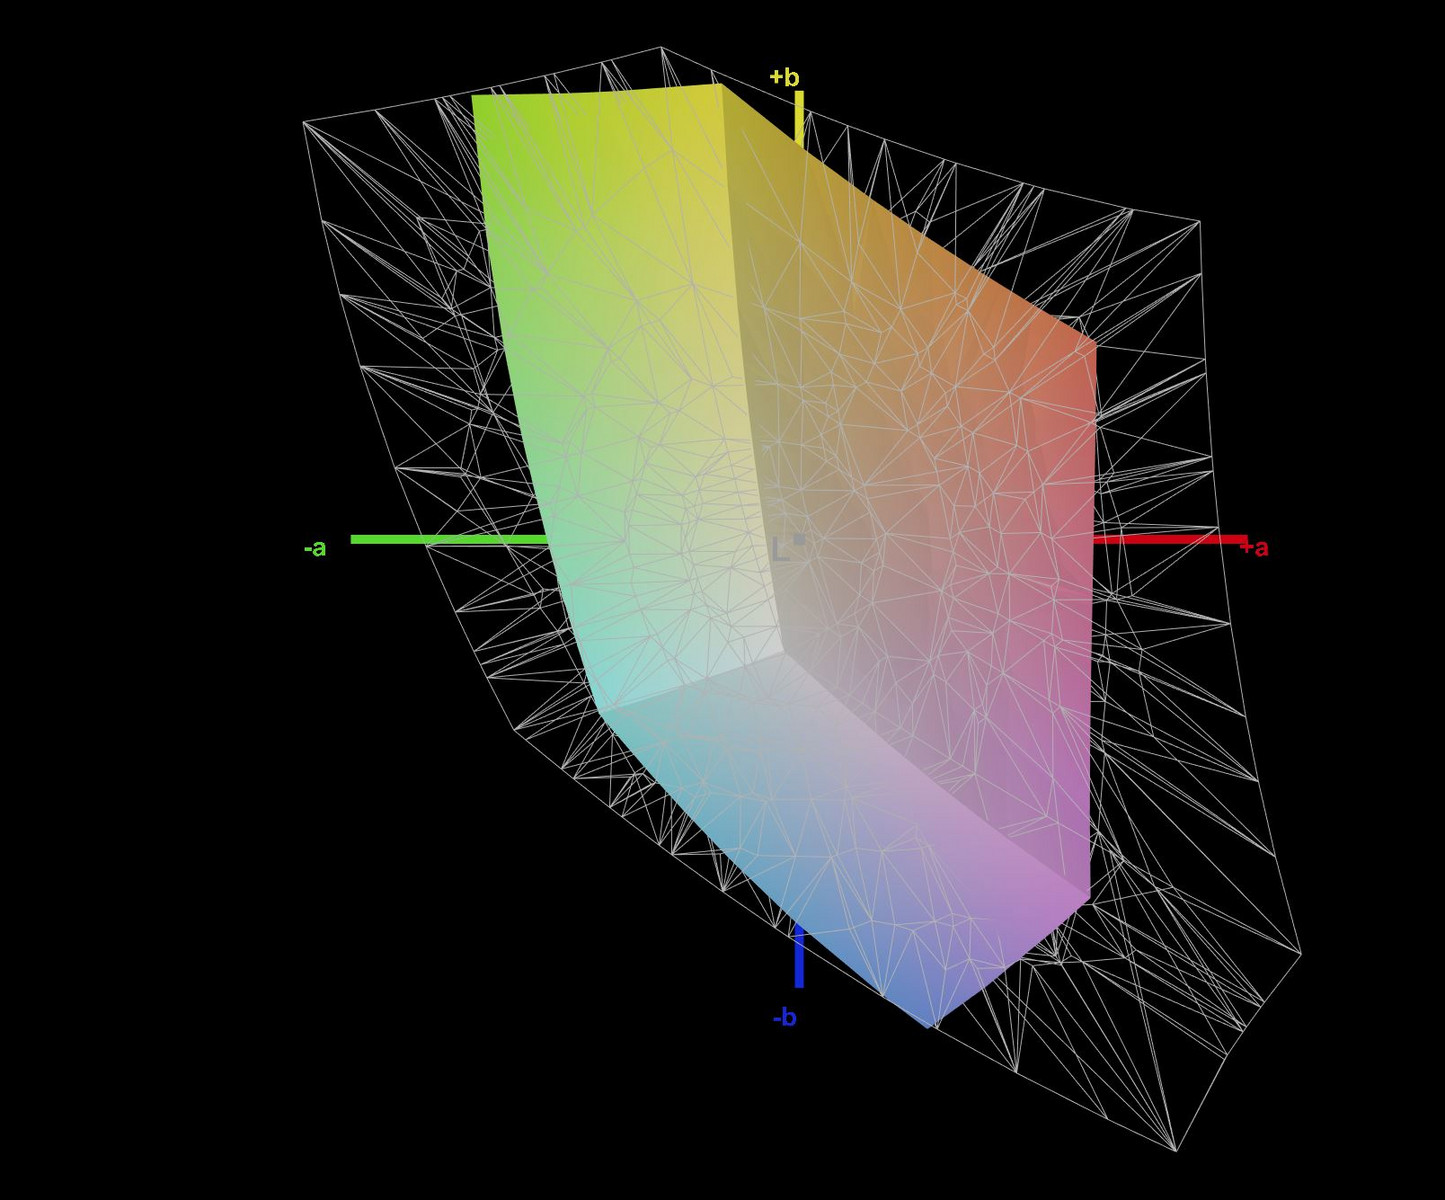
Our measurements with the X-Rite spectrophotometer show below average grayscale and color as shipped with DeltaE values around 6. The color blue is particularly troublesome with a DeltaE of almost 25. A calibration does wonders for grayscale with the DetlaE dropping below 1, but has next to no effect on the blue/magenta color tones. Blue is also very inaccurate even at moderate saturation levels. Suffice to say that we can't really recommend the S14 even for semi-professional photo or video editing because of the poor color space coverage and inaccurate colors.

Display Response Times
| ↔ Response Time Black to White | ||
|---|---|---|
| 27.2 ms ... rise ↗ and fall ↘ combined | ↗ 14 ms rise | 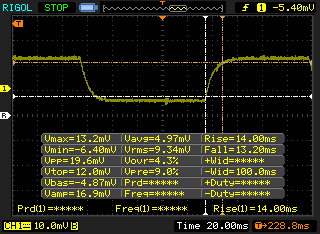 |
| ↘ 13.2 ms fall | ||
| The screen shows relatively slow response rates in our tests and may be too slow for gamers. In comparison, all tested devices range from 0.1 (minimum) to 240 (maximum) ms. » 69 % of all devices are better. This means that the measured response time is worse than the average of all tested devices (19.9 ms). | ||
| ↔ Response Time 50% Grey to 80% Grey | ||
| 38.8 ms ... rise ↗ and fall ↘ combined | ↗ 20 ms rise | 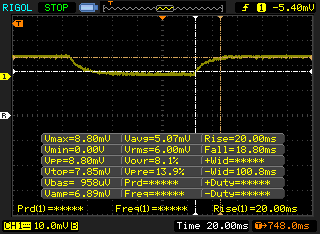 |
| ↘ 18.8 ms fall | ||
| The screen shows slow response rates in our tests and will be unsatisfactory for gamers. In comparison, all tested devices range from 0.165 (minimum) to 636 (maximum) ms. » 58 % of all devices are better. This means that the measured response time is worse than the average of all tested devices (31.1 ms). | ||
Screen Flickering / PWM (Pulse-Width Modulation)
| Screen flickering / PWM not detected | 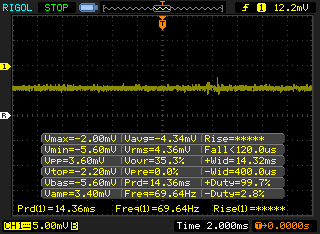 | ||
In comparison: 52 % of all tested devices do not use PWM to dim the display. If PWM was detected, an average of 7798 (minimum: 5 - maximum: 343500) Hz was measured. | |||
With an average brightness of only 240 nits, the VivoBook S14 S410UQ isn't particularly well-suited for outdoor use. Thanks to the anti-glare coating, reflections are not too much of an issue in the shade or under overcast conditions, but the LED backlight doesn't get nearly bright enough to overcome direct sunlight. Stil, in a shady spot it's certainly possible to work for longer periods without too much eye strain. Since the panel is based on IPS technology, the viewing angle stability is also decent with no substantial color changes or darkening at more shallow angles. The VivoBook S14 S406UA with HD TN panel has a much harder time with similar conditions.
Performance - new CPU and old graphics
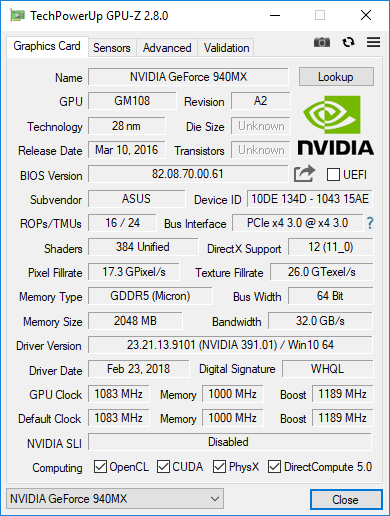
According to the tech specs, the VivoBook S14 S410UQ is available with either a Core i3-7100U, Core i5-8250U, or Core i7 8550U processor and either 8 or 16 GB of RAM. Hard drives range from a 500 GB 5400 RPM platter-based drive to a 512 GB Sata M.2 SSD. Our review version, the S410UQ-NH74, is equipped with the i7 CPU, a 256 GB SSD, 8 GB of RAM and a Nvidia GeForce 940MX. The S14 S410UN features a GeForce MX150, while the S14 S410UA comes with the integrated Intel UHD Graphics 620 only. The first two models make use of Nvidia's Optimus technology and can switch between dedicated and integrated graphics depending on the graphics load. Since Asus doesn't allow for customization, it remains to be seen which models are actually going to be offered in the US either from Asus or various resellers.
Users purchasing their notebook from CUKUSA have a bit more flexibility and can for example upgrade to 16 GB of RAM ($80) or add an internal 2 TB HDD ($70) at the time of purchase.

Processor
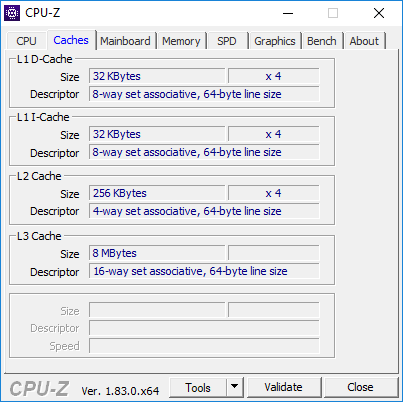
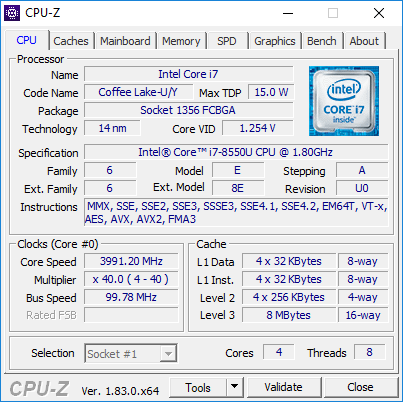
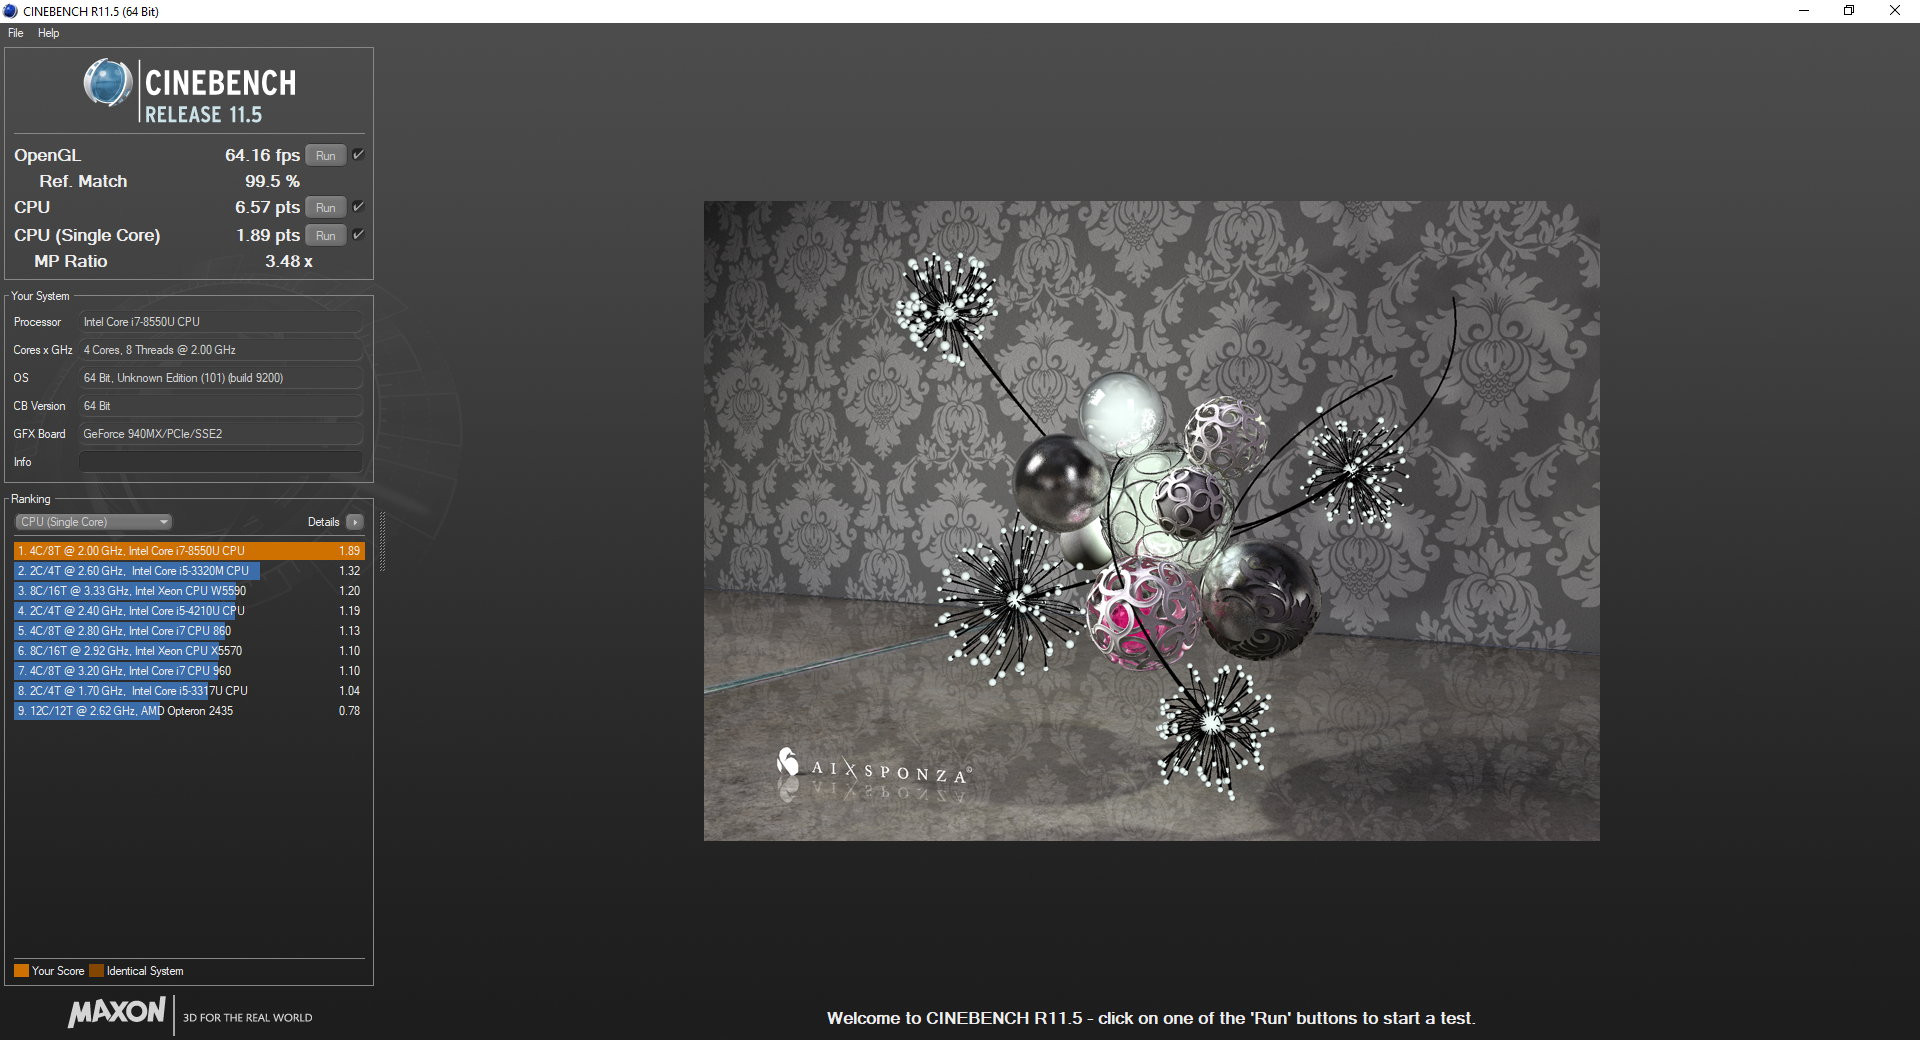
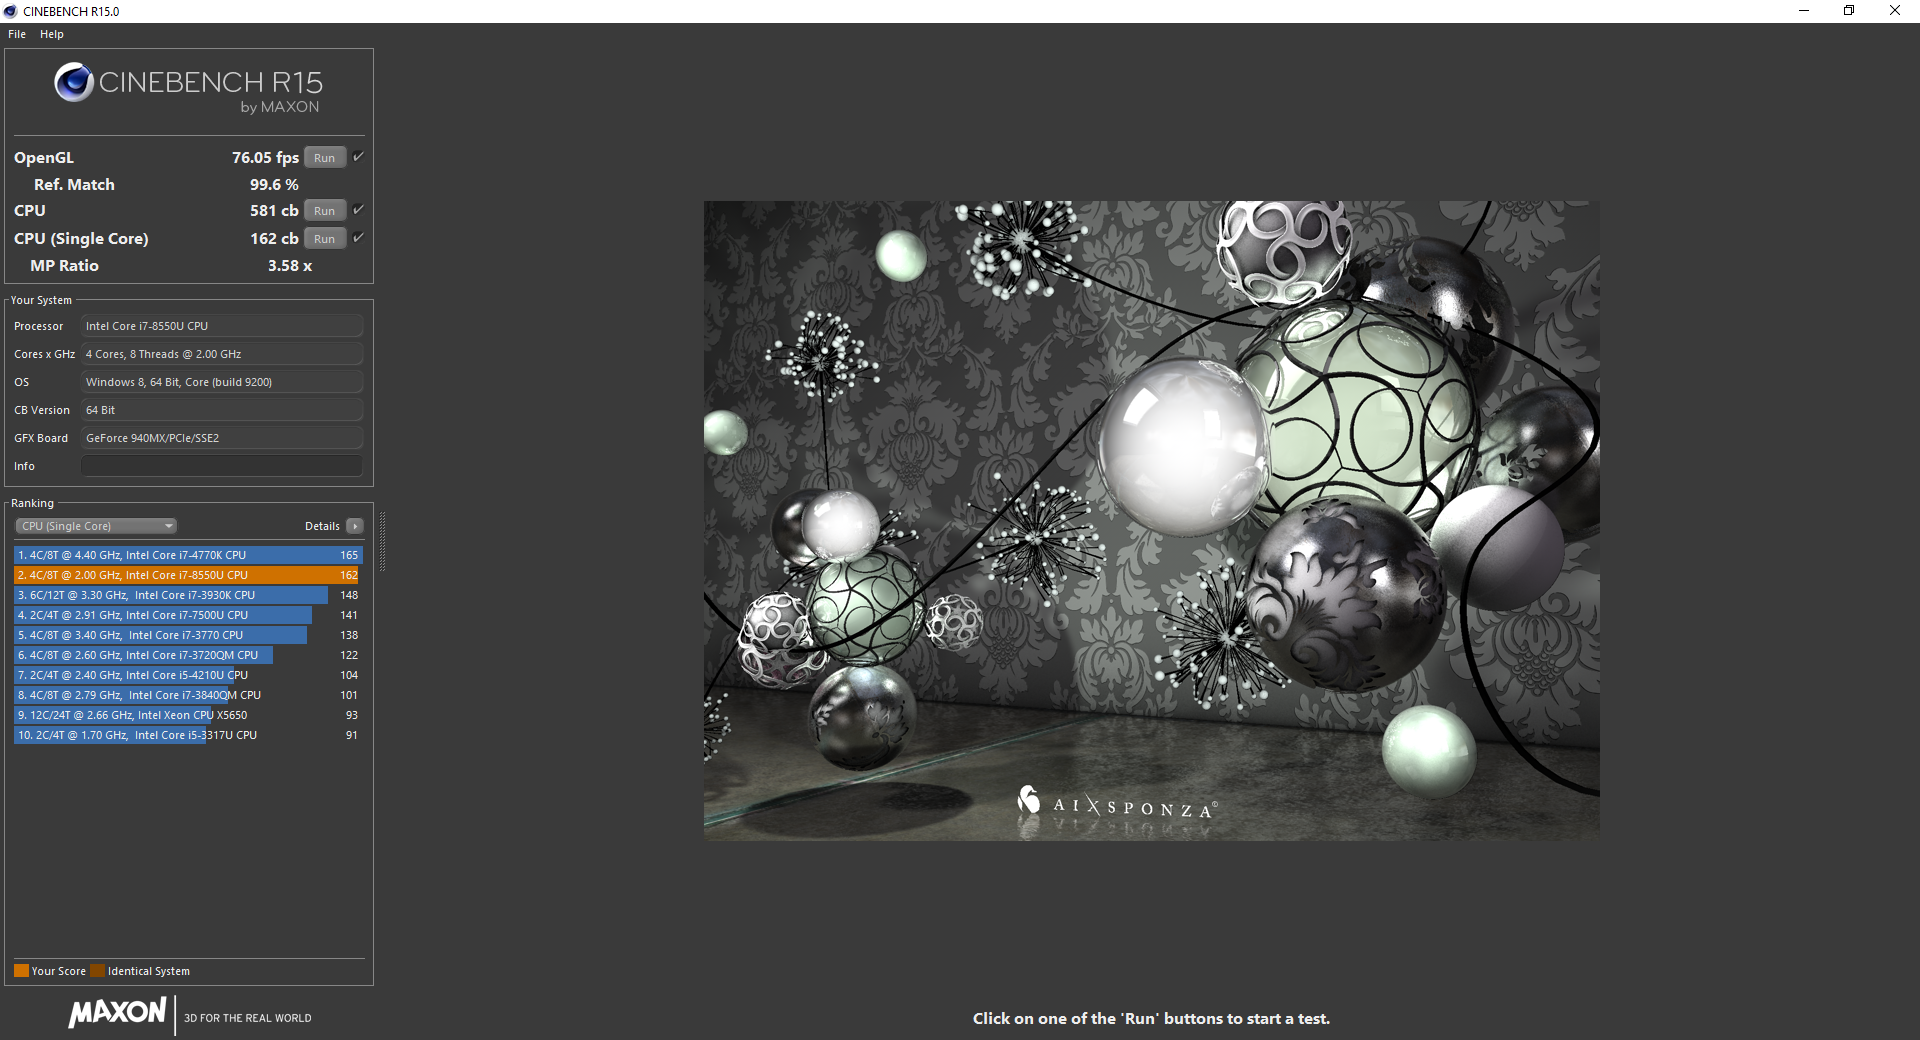
Performance of the 8th-generation quad-core Intel Core i7-8550U is generally much higher than that of the dual-core predecessors i7-7500U and i7-7600U with performance boosts of up to 70 % when all cores are utilized. Single-core performance of the CPU in our review unit is right where we expected it to be; the multi-core performance on the other hand lags slightly behind other systems equipped with the same CPU. A check with the tool HWinfo during a Cinebench R15 Multi test run shows a clock speed drop from 3.7 GHz (the maximum for all 4 cores) down to 2.2 - 2.3 GHz within seconds after the start - likely in response to the temperature, which can climb as high as 96 C. It seems that the single fan simply can't keep up with generated heat under heavy load. Interesting as well is the fact that the Asus VivoBook S14 S406UA-BV023T with Intel Core i5-8250U actually manages a slightly higher initial multi-core score, likely because the heat buildup occurs somewhat slower. Speaking of sustained performance: as shown in the graph below, the score drops nearly 10 % after the first couple runs of our Cinebench R15 loop test (50 iterations in this case), but there is no further degradation even towards the very end of the test.
For more information about the Intel Core i7-8550 and additional benchmarks, please visit our dedicated processor page for the Intel Core i7-8550U.
| wPrime 2.10 - 1024m | |
| Dell Latitude 7480 | |
| Asus VivoBook S410UQ-NH74 | |
| Average Intel Core i7-8550U (258 - 435, n=11) | |
| Average of class Multimedia (227 - 340, n=6, last 2 years) | |
| Dell XPS 13 9370 i5 UHD | |
* ... smaller is better
System Performance
The system performance according to the PCMark benchmarks is very good, but the review notebook curiously once again trails the VivoBook S14 S406UA with i5 CPU and integrated graphics. A check of the Nvidia Control Panel reveals the reason: PCMark 8 is forced to run on the integrated GPU with no way for the user to change this setting. The PCMark 10 performance also remains below expectations, even though the dedicated GPU is actually used in this case. Booting the system to the Windows desktop takes about 15 seconds. Applications launch reasonably quick, although we noticed some minor lag at times compared to other notebooks. We are being nitpicky here though, since the system offers very good performance overall with no major bottlenecks during normal operation.
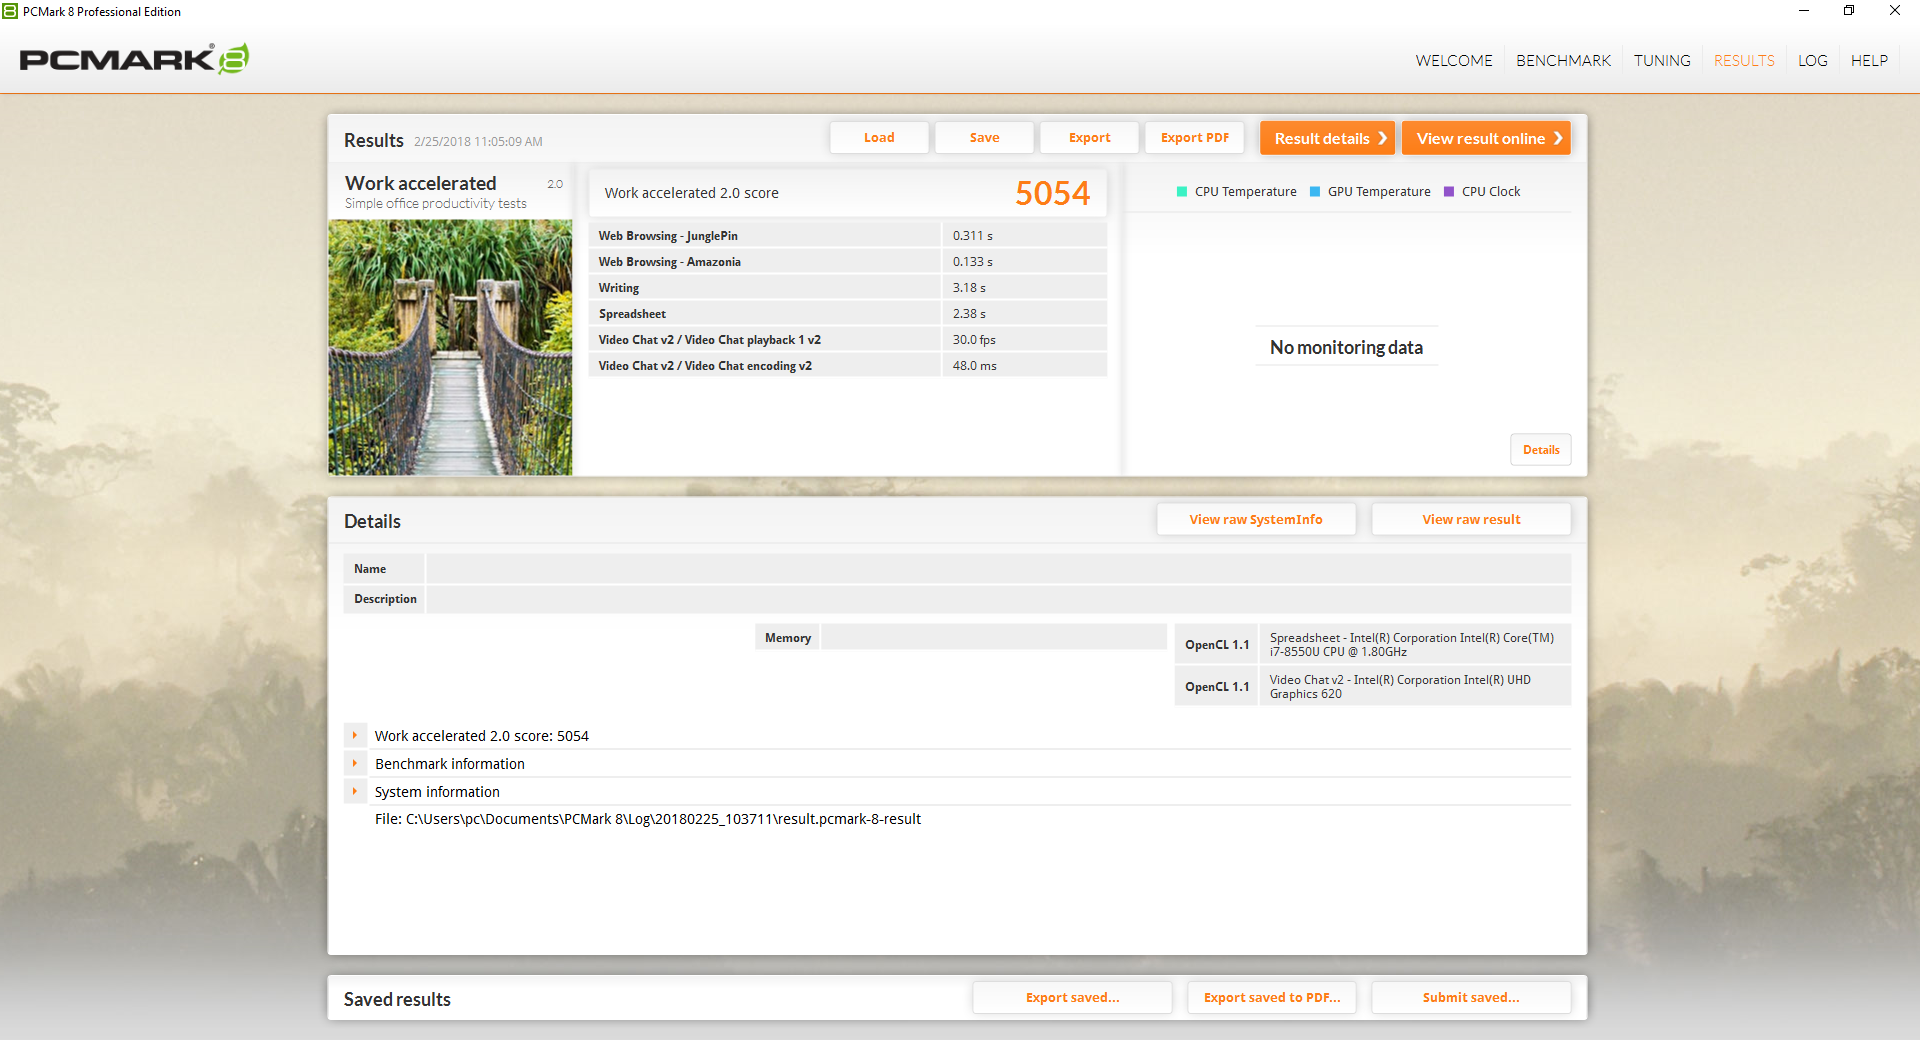


| PCMark 8 Home Score Accelerated v2 | 3792 points | |
| PCMark 8 Creative Score Accelerated v2 | 4871 points | |
| PCMark 8 Work Score Accelerated v2 | 5054 points | |
| PCMark 10 Score | 3433 points | |
Help | ||
Storage Devices
The SSD from Micron (model MTFDDAV256TBN) has a capacity of 256 GB and operates at SATA III speeds, so the maximum throughput limit is 6Gb/s. With sustained read and write rates of 490 MB/s and 390 MB/s according to CrystalDiskMark 3, the drive performs quite well, although competing notebooks with PCIe NVMe drives are significantly faster. As we mentioned earlier, the secondary storage bay can accept 2.5-inch hard drives up to 7 mm thickness should the user require additional storage for files or music. An installed hard drive was recognized instantly upon bootup.
See our list of HDDs and SSDs for additional benchmark comparisons.
| Asus VivoBook S410UQ-NH74 Micron 1100 MTFDDAV256TBN | Acer Swift 3 SF314-52G-89SL Intel SSD 600p SSDPEKKW512G7 | Lenovo IdeaPad 320s-14IKB Liteonit CV3-DE256 | HP Spectre 13-af033ng Samsung PM961 NVMe MZVLW512HMJP | Asus Zenbook UX3410UQ-GV077T SanDisk SD8SNAT256G1002 | Dell Latitude 7480 Intel SSDSCKKF256H6 | Average Micron 1100 MTFDDAV256TBN | |
|---|---|---|---|---|---|---|---|
| CrystalDiskMark 3.0 | 56% | -5% | 88% | -15% | 3% | -8% | |
| Write 4k QD32 (MB/s) | 295.6 | 496.2 68% | 238.7 -19% | 476 61% | 257.2 -13% | 252.8 -14% | 233 ? -21% |
| Read 4k QD32 (MB/s) | 248 | 462.6 87% | 334.8 35% | 543 119% | 147 -41% | 280.2 13% | 227 ? -8% |
| Write 4k (MB/s) | 101.9 | 133.6 31% | 61.6 -40% | 144 41% | 79.5 -22% | 90.5 -11% | 80.8 ? -21% |
| Read 4k (MB/s) | 28.01 | 13.98 -50% | 25.9 -8% | 60 114% | 22.78 -19% | 29.25 4% | 24.6 ? -12% |
| Write 512 (MB/s) | 352.3 | 483.3 37% | 258 -27% | 546 55% | 288 -18% | 306.8 -13% | 315 ? -11% |
| Read 512 (MB/s) | 259.4 | 616 137% | 272.8 5% | 515 99% | 289 11% | 354.3 37% | 315 ? 21% |
| Write Seq (MB/s) | 389.2 | 552 42% | 417.8 7% | 878 126% | 323.7 -17% | 418.6 8% | 379 ? -3% |
| Read Seq (MB/s) | 490.2 | 944 93% | 511 4% | 907 85% | 497 1% | 486.5 -1% | 465 ? -5% |

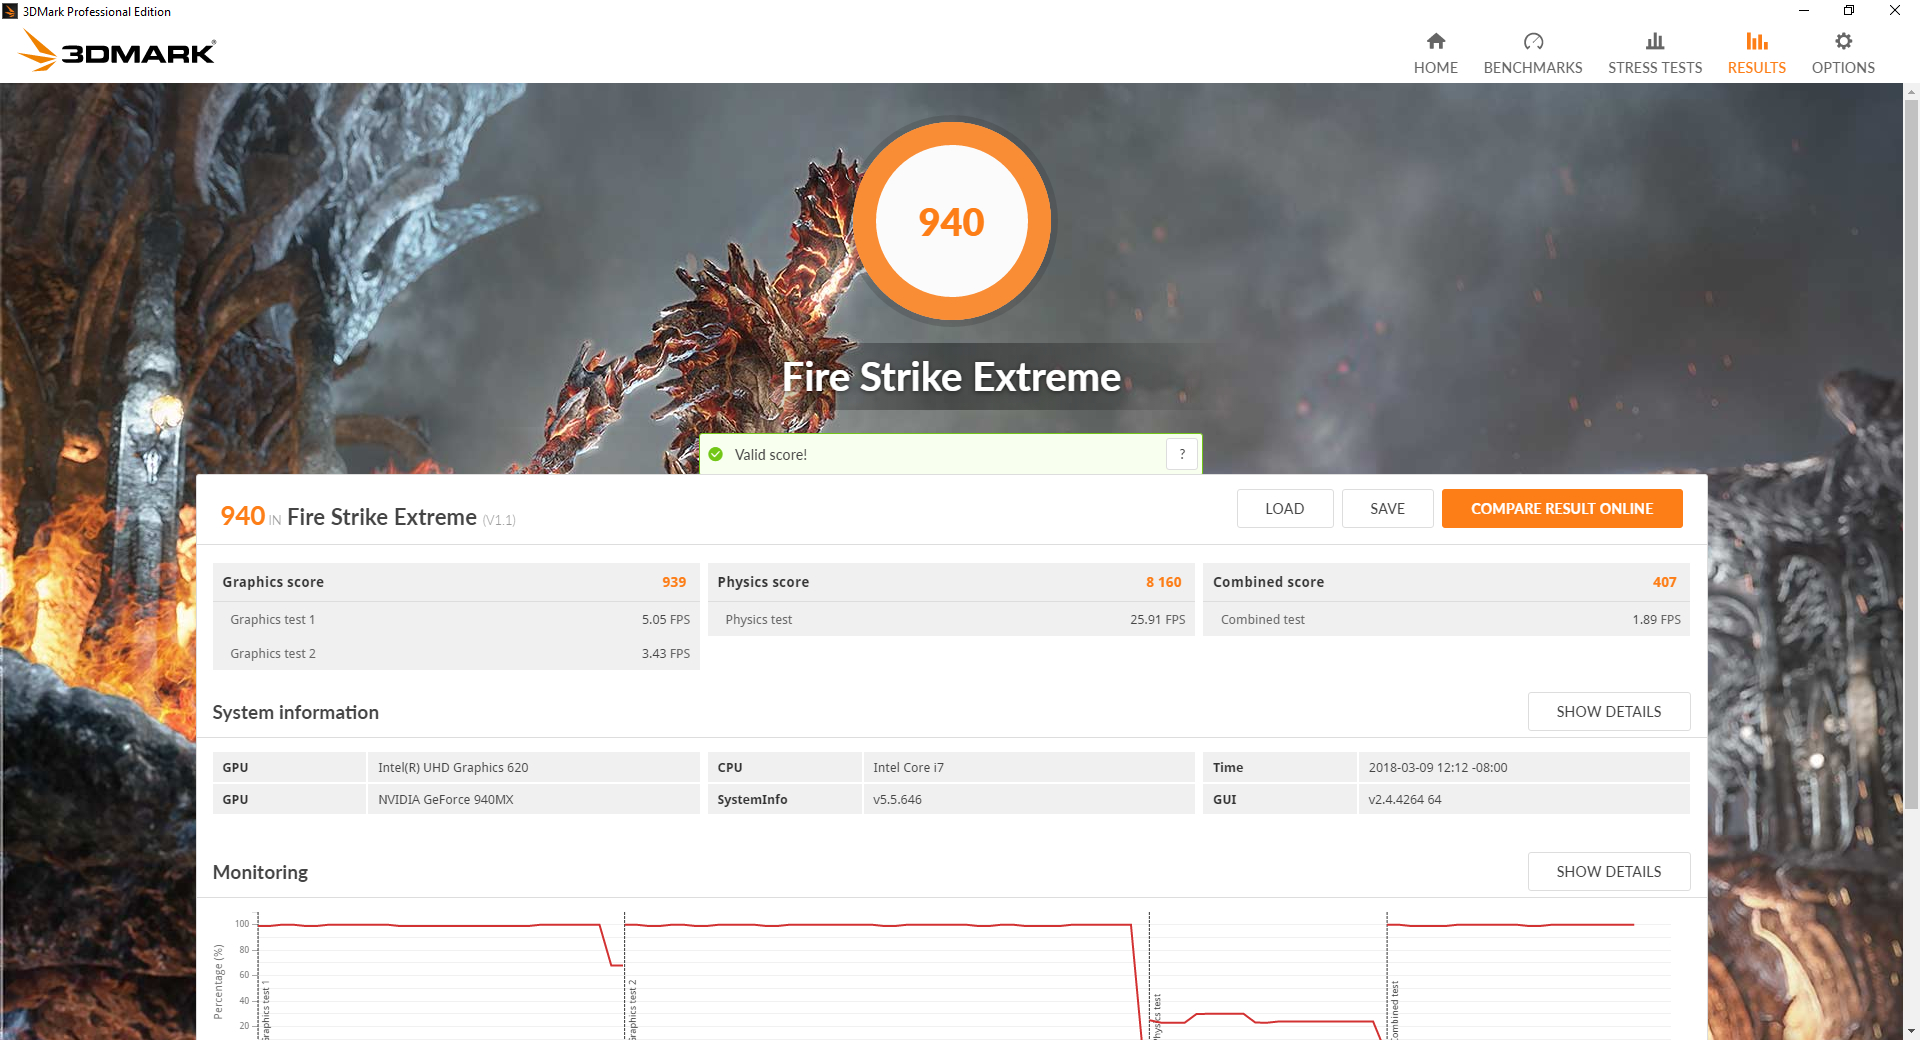
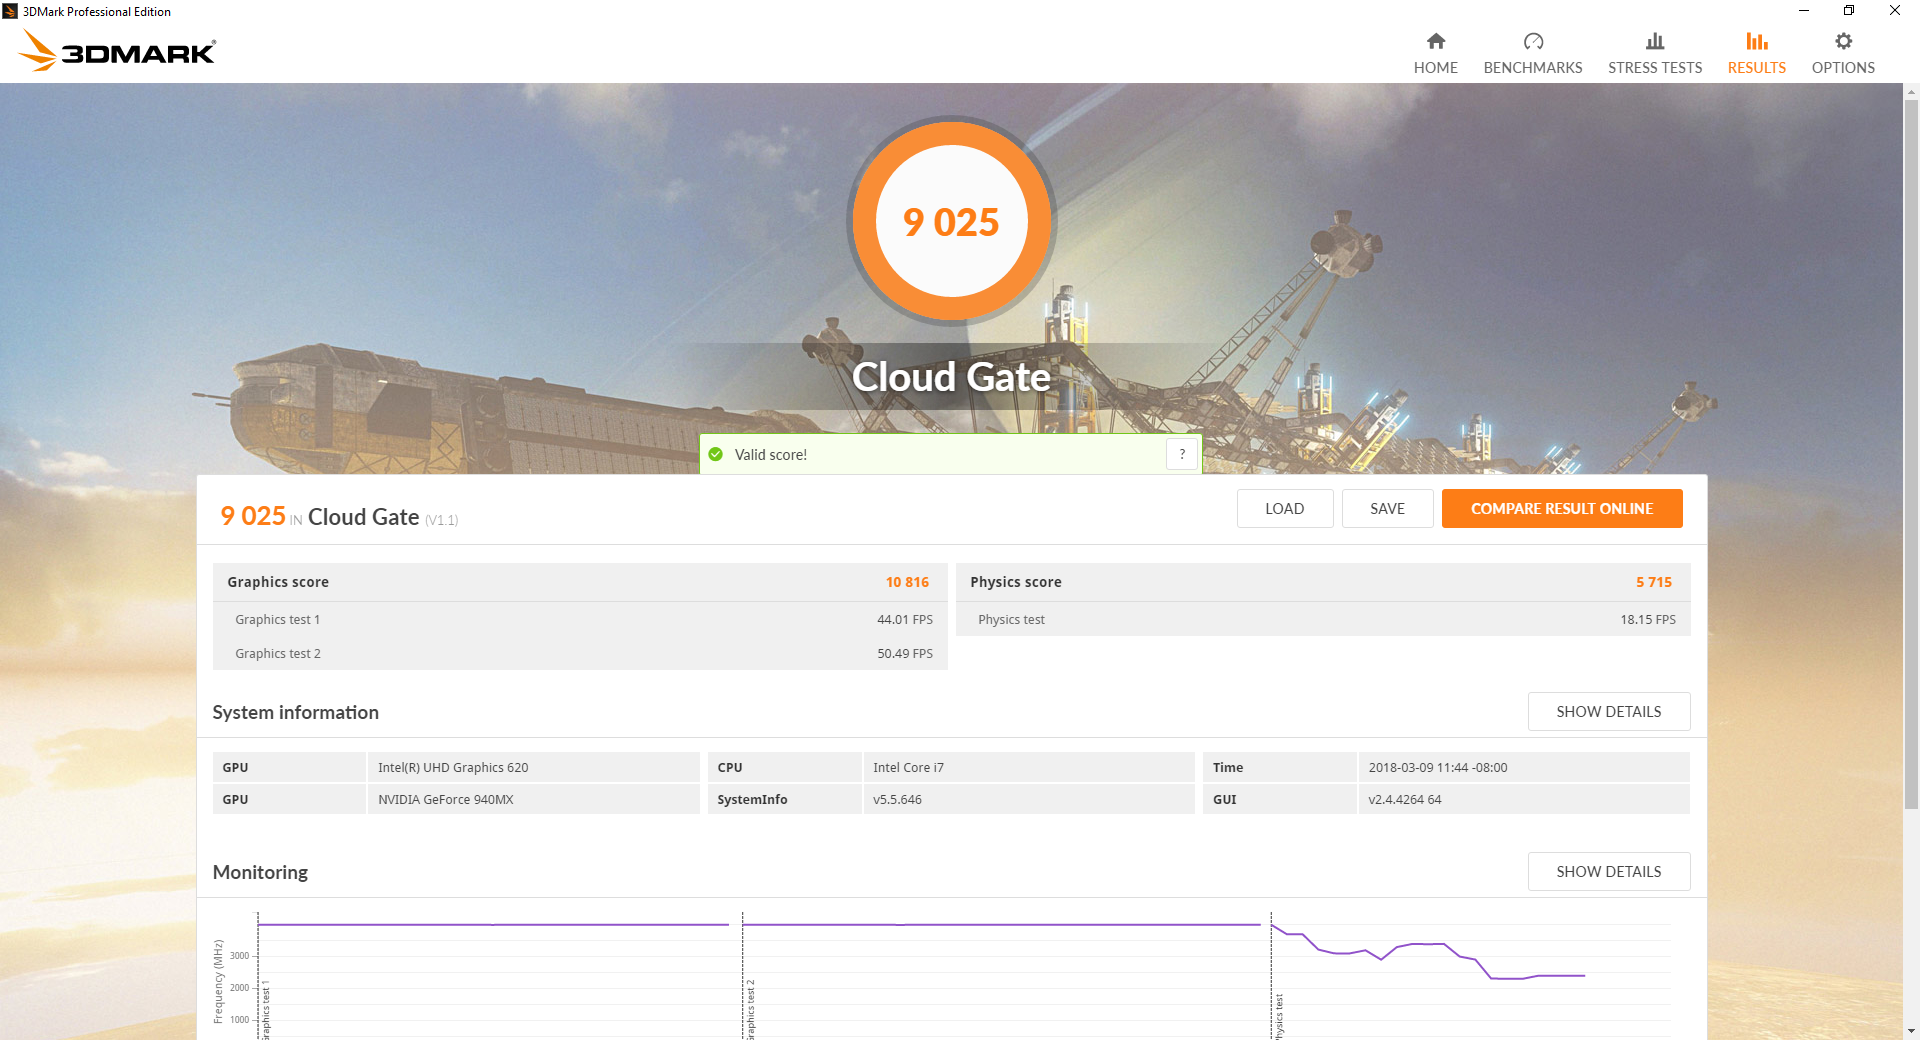
GPU Performance
When it comes to the synthetic benchmark performance, the Maxwell-based Nvidia GeForce 940MX trails its newer Pascal sibling GeForce MX150 by a substantial margin: depending on the test, the latter GPU can have a performance advantage of up to 80 %. The Acer Swift 3 SF315-41-R4W1 with AMD Radeon RX Vega 8 graphics card offers about the same speed in some tests and pulls ahead by up to 30 % in others. The difference between the GeForce 940MX and the processor-integrated Intel UHD Graphics 620 ranges from 15 - 30 % and is certainly not as high as one might hope when switching to a dedicated GPU.
See our dedicated review page on the 940MX for more technical information.

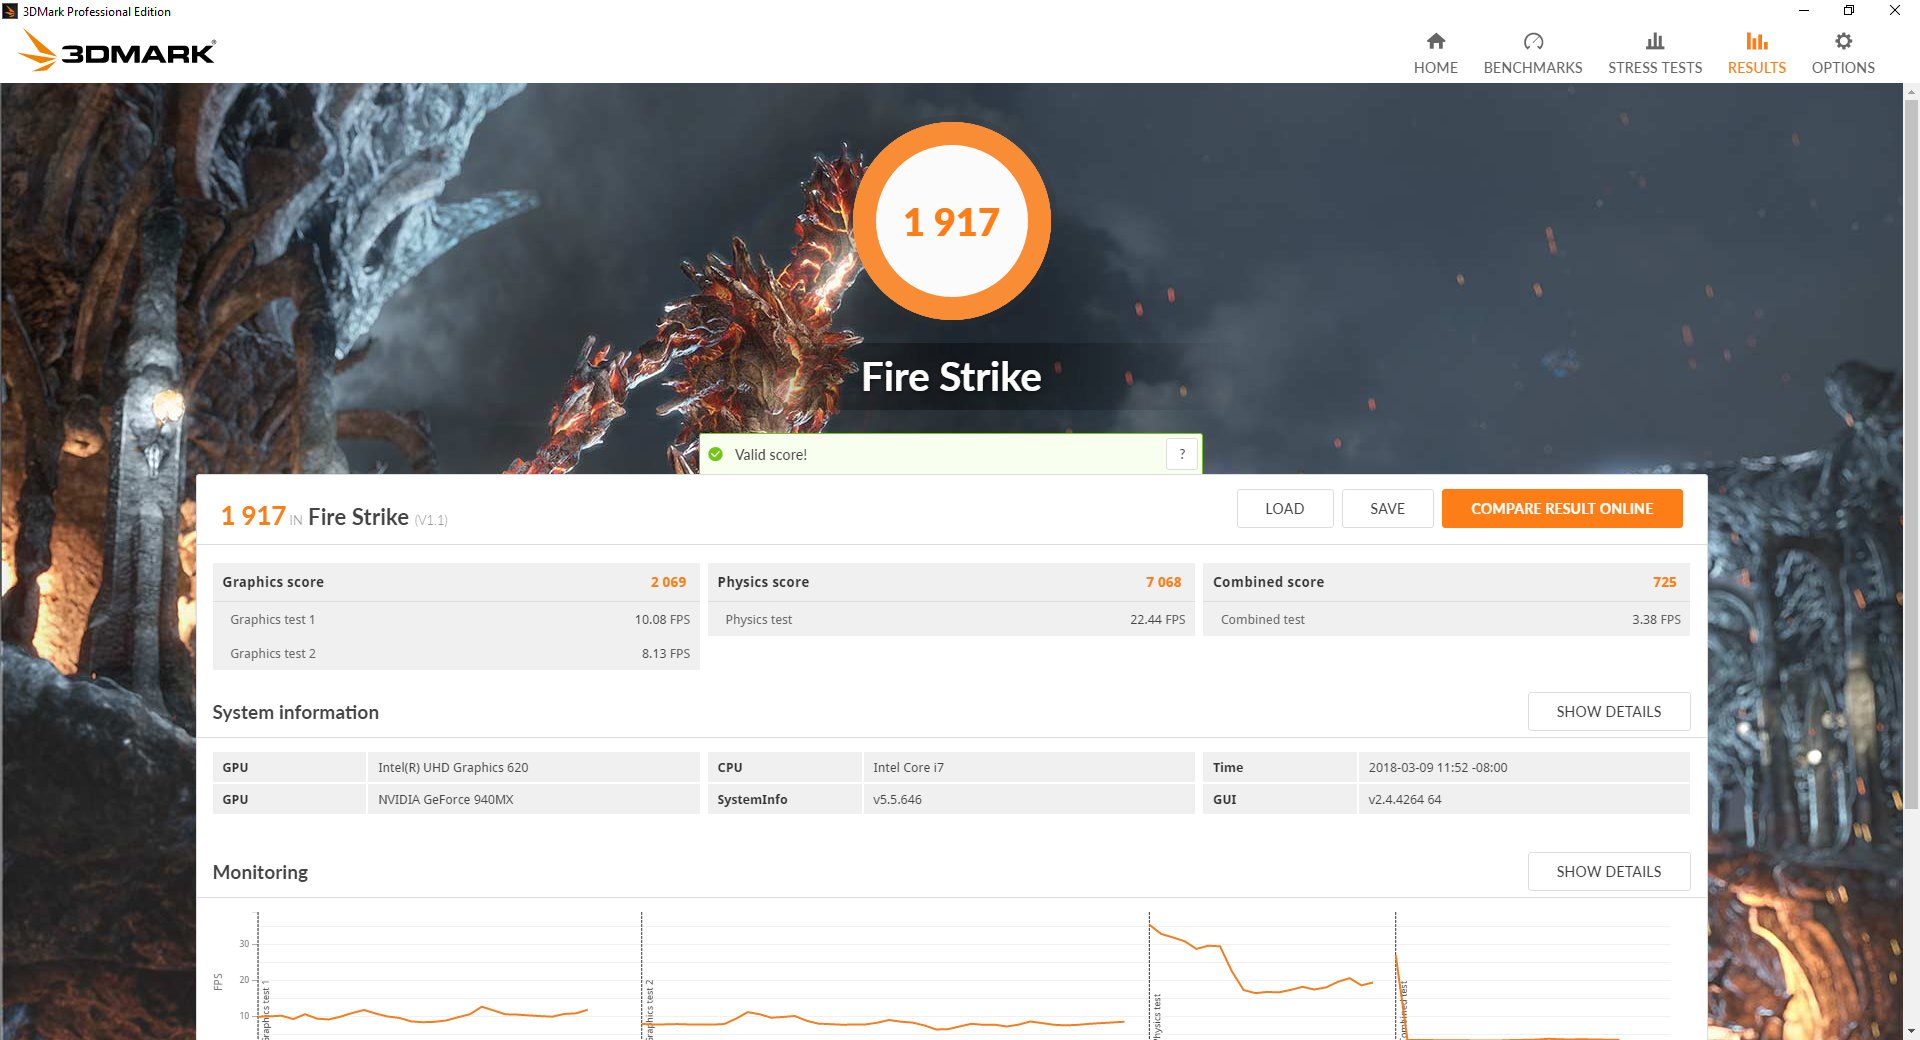
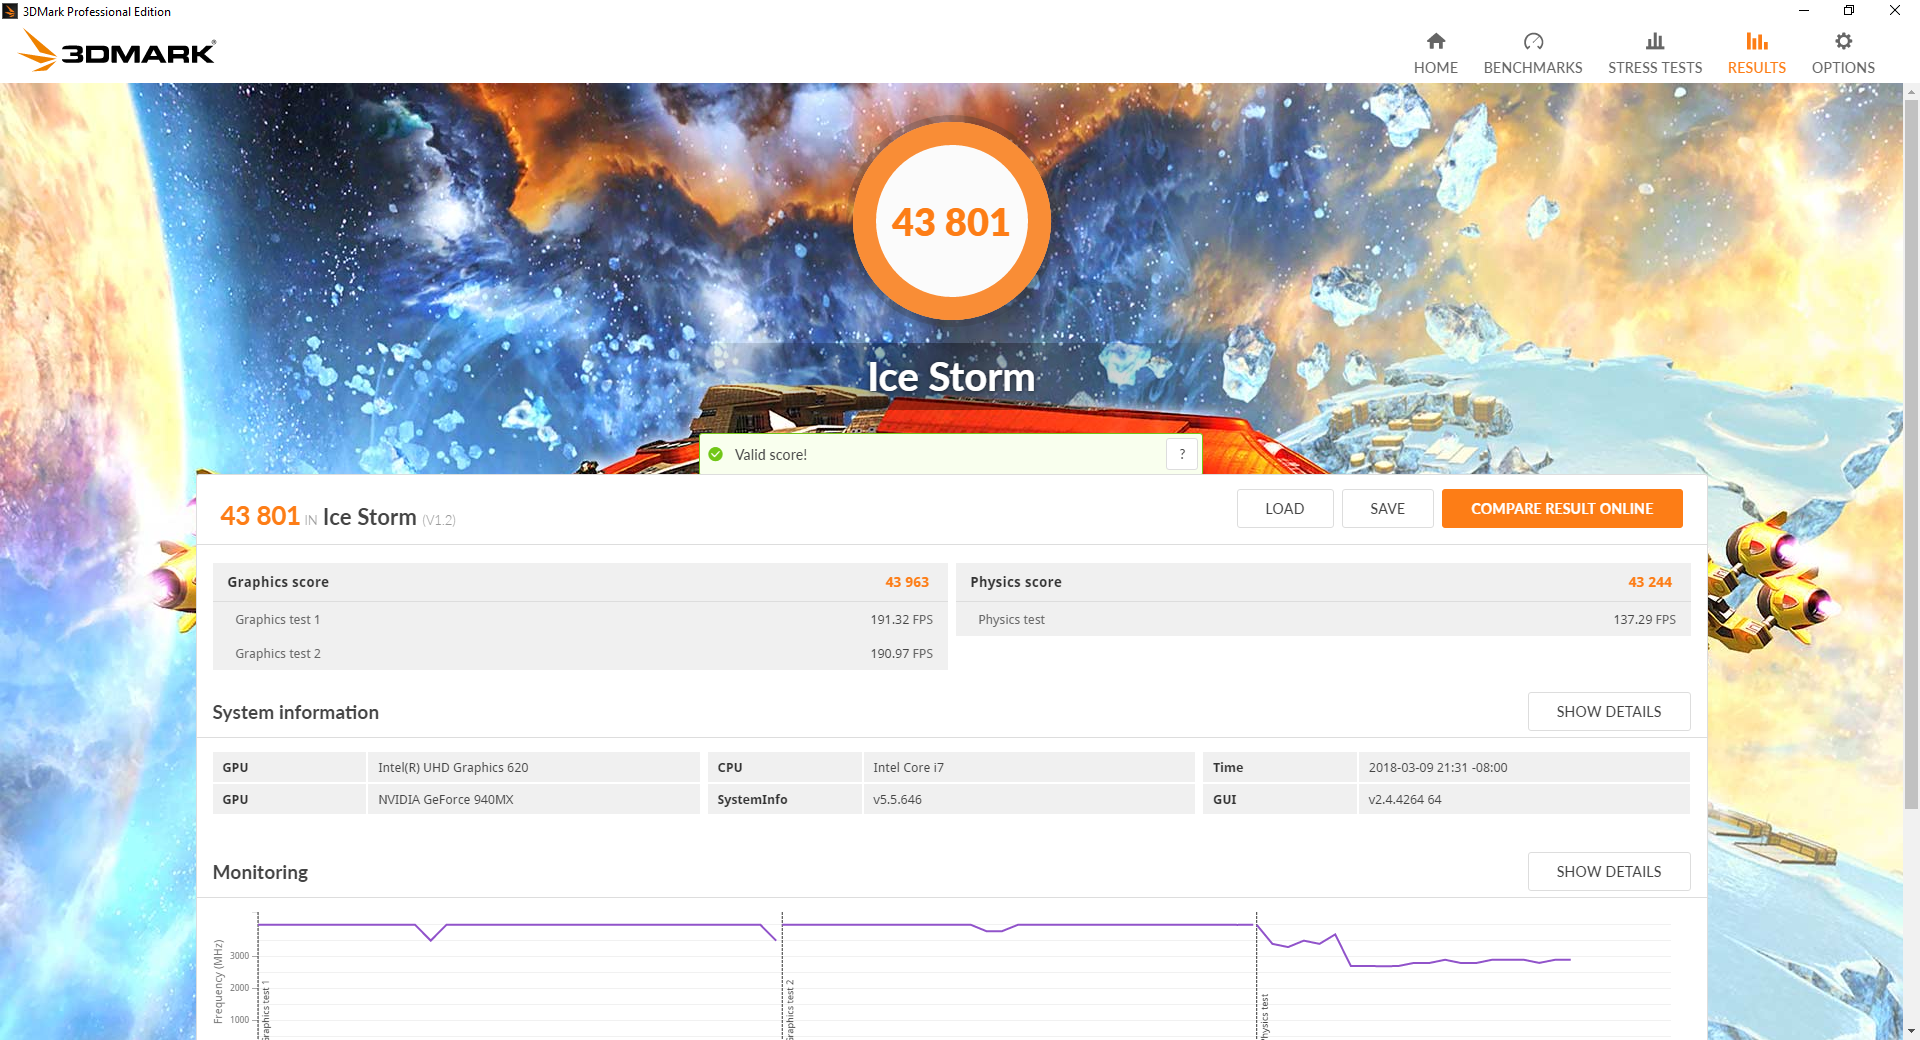
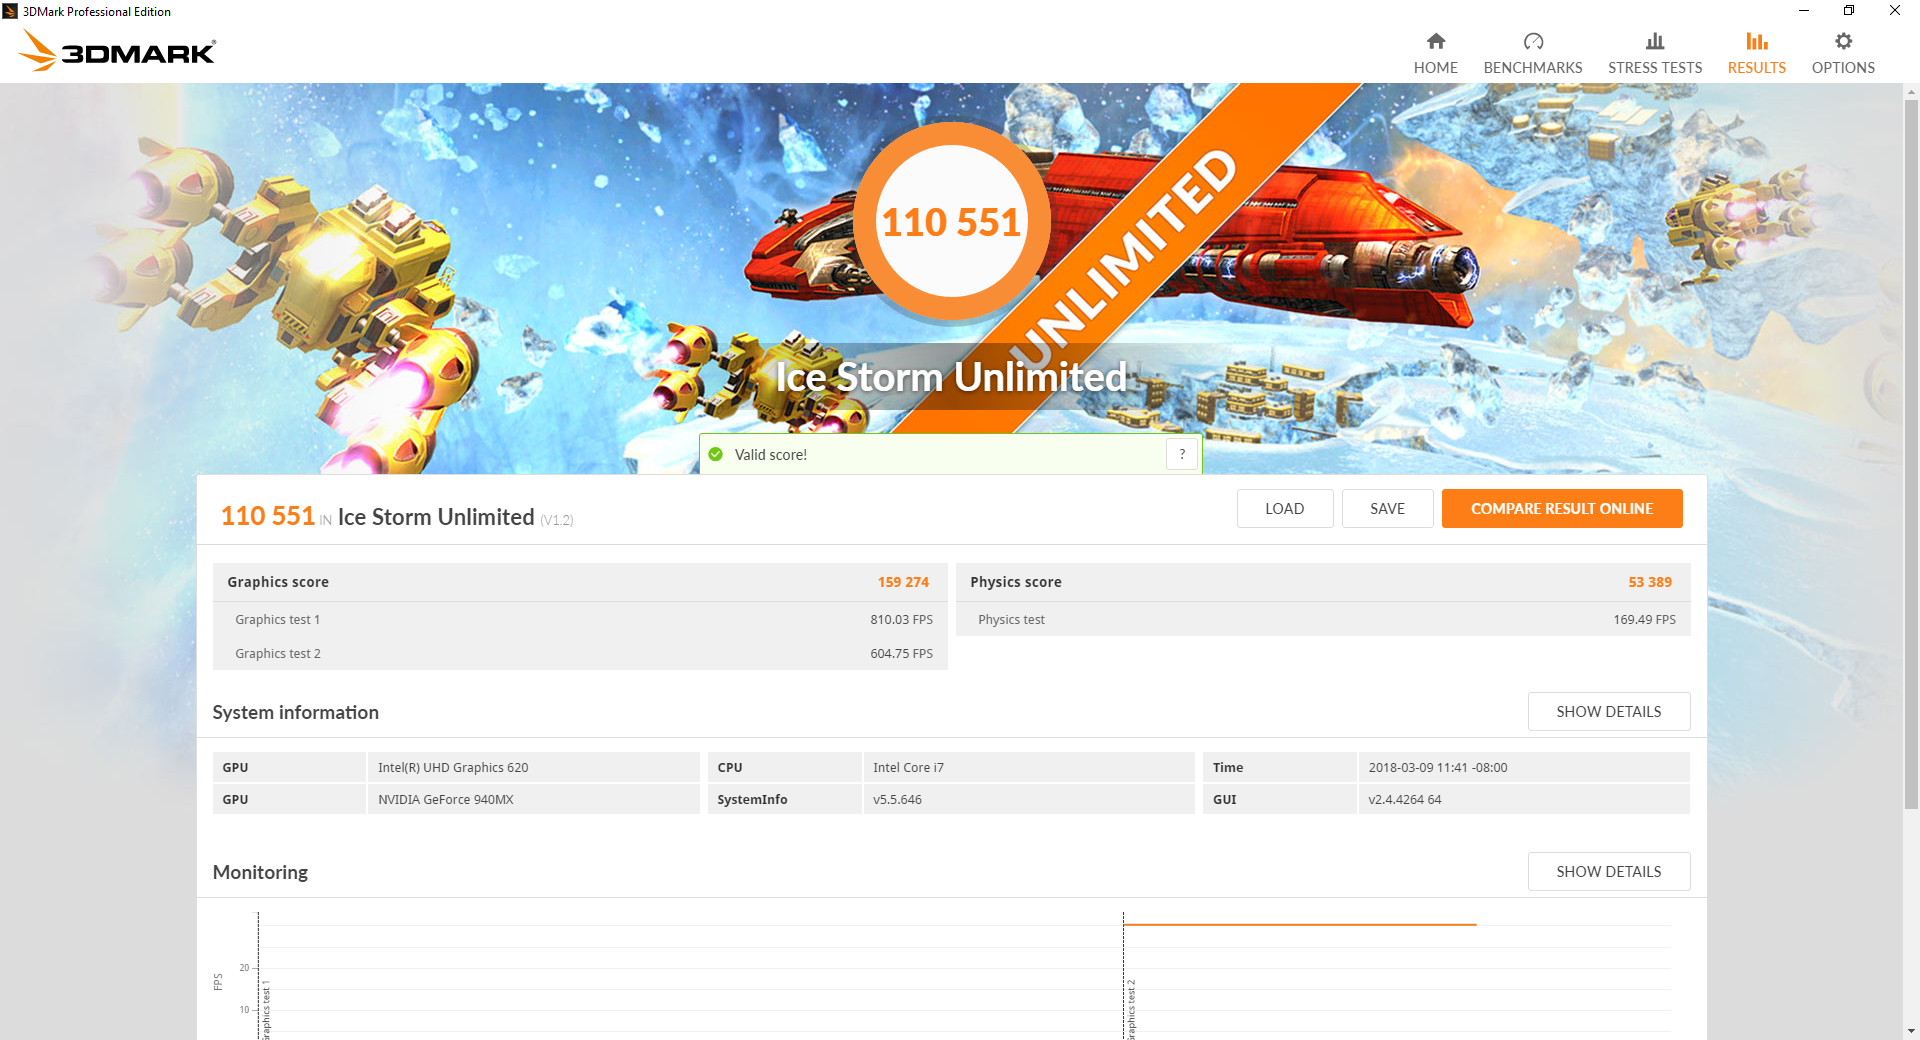
| 3DMark 11 Performance | 2844 points | |
| 3DMark Ice Storm Standard Score | 43801 points | |
| 3DMark Cloud Gate Standard Score | 9025 points | |
| 3DMark Fire Strike Score | 1917 points | |
| 3DMark Fire Strike Extreme Score | 940 points | |
Help | ||
Gaming Performance
As expected, the gaming performance is fairly limited and just good enough for either older games or possibly newer ones at lower resolution and reduced quality settings. Many games should be playable at a resolution of 1366 x 668 pixels and medium details. The GeForce MX150 is a better choice than the outdated 940MX and allows for higher frame rates - anywhere from 30 - 70 % depending on the game.
| Tomb Raider | |
| 1920x1080 Ultra Preset AA:FX AF:16x (sort by value) | |
| Asus VivoBook S410UQ-NH74 | |
| Dell Latitude 7480 | |
| Acer Swift 3 SF315-41-R4W1 | |
| Average NVIDIA GeForce 940MX (18.3 - 29.4, n=7) | |
| 1366x768 High Preset AA:FX AF:8x (sort by value) | |
| Asus VivoBook S410UQ-NH74 | |
| Dell Latitude 7480 | |
| Acer Swift 3 SF315-41-R4W1 | |
| Average NVIDIA GeForce 940MX (34.5 - 62.6, n=8) | |
| 1366x768 Normal Preset AA:FX AF:4x (sort by value) | |
| Asus VivoBook S410UQ-NH74 | |
| Dell Latitude 7480 | |
| Acer Swift 3 SF315-41-R4W1 | |
| Average NVIDIA GeForce 940MX (58.6 - 96.4, n=7) | |
| 1024x768 Low Preset (sort by value) | |
| Asus VivoBook S410UQ-NH74 | |
| Dell Latitude 7480 | |
| Acer Swift 3 SF315-41-R4W1 | |
| Average NVIDIA GeForce 940MX (132.9 - 184.4, n=7) | |
| Rise of the Tomb Raider | |
| 1920x1080 Very High Preset AA:FX AF:16x (sort by value) | |
| Asus VivoBook S410UQ-NH74 | |
| Average NVIDIA GeForce 940MX (8.2 - 13.8, n=10) | |
| 1920x1080 High Preset AA:FX AF:4x (sort by value) | |
| Asus VivoBook S410UQ-NH74 | |
| HP Spectre 13-af033ng | |
| Acer Swift 3 SF315-41-R4W1 | |
| Average NVIDIA GeForce 940MX (10.4 - 17, n=17) | |
| 1366x768 Medium Preset AF:2x (sort by value) | |
| Asus VivoBook S410UQ-NH74 | |
| HP Spectre 13-af033ng | |
| Average NVIDIA GeForce 940MX (13.4 - 30.6, n=20) | |
| 1024x768 Lowest Preset (sort by value) | |
| Asus VivoBook S410UQ-NH74 | |
| HP Spectre 13-af033ng | |
| Acer Swift 3 SF315-41-R4W1 | |
| Average NVIDIA GeForce 940MX (26.9 - 52.8, n=20) | |
| low | med. | high | ultra | |
|---|---|---|---|---|
| Tomb Raider (2013) | 157.9 | 77 | 48.1 | 23.7 |
| BioShock Infinite (2013) | 108.4 | 63.1 | 53.2 | 19.8 |
| The Witcher 3 (2015) | 23 | |||
| Rise of the Tomb Raider (2016) | 44.8 | 26.5 | 14.5 | 11.3 |
Stress Test
We subject each and every review notebook to unrealistically high loads to identify throttling and potential stability issues. When running Prime95, the CPU cores immediately drop from their initial 3.4 GHz down to 2.2 - 2.3 GHz, since the temperature increases to above 90 C within seconds. The temperature subsequently decreases to about 76 C and remains at this level. Under Furmark load, the 940MX starts out at 1150 MHz at 60 C, but the frequency drops to 1032 MHz at about 80 C and eventually declines to 888 MHz at 78 C. Note that it is actually the CPU that is the limiting factor: during the test, the processor reaches 96 C, which in turn leads to throttling of the GPU. The single fan / single heat pipe design is definitely pushed to its limits during prolonged periods of high load.
Running both Prime95 and FurMark in parallel results in a CPU clock rate of 2.0 GHz at a temperature of 80 C; the GPU runs at 992 MHz at 78 C. Roughly 10 minutes into the test, the CPU has dropped down to 1.3 GHz at 78 C, while the GPU maintains at a stable 888 MHz at 80 C. On systems with dedicated GPUs we also run Witcher 3, as it better represents real-world gaming stress. The GPU now runs at between 823 - 1150 MHz at 78 - 80 C depending on the load; the CPU cores generally remain around 4 GHz with the temperature ranging from 75 - 86 C.
With the notebook on battery power, the system performance takes a slight hit according to 3DMark Fire Strike. Our results show a graphics score reduction of about 6 % and an overall performance reduction of a little over 9 %.
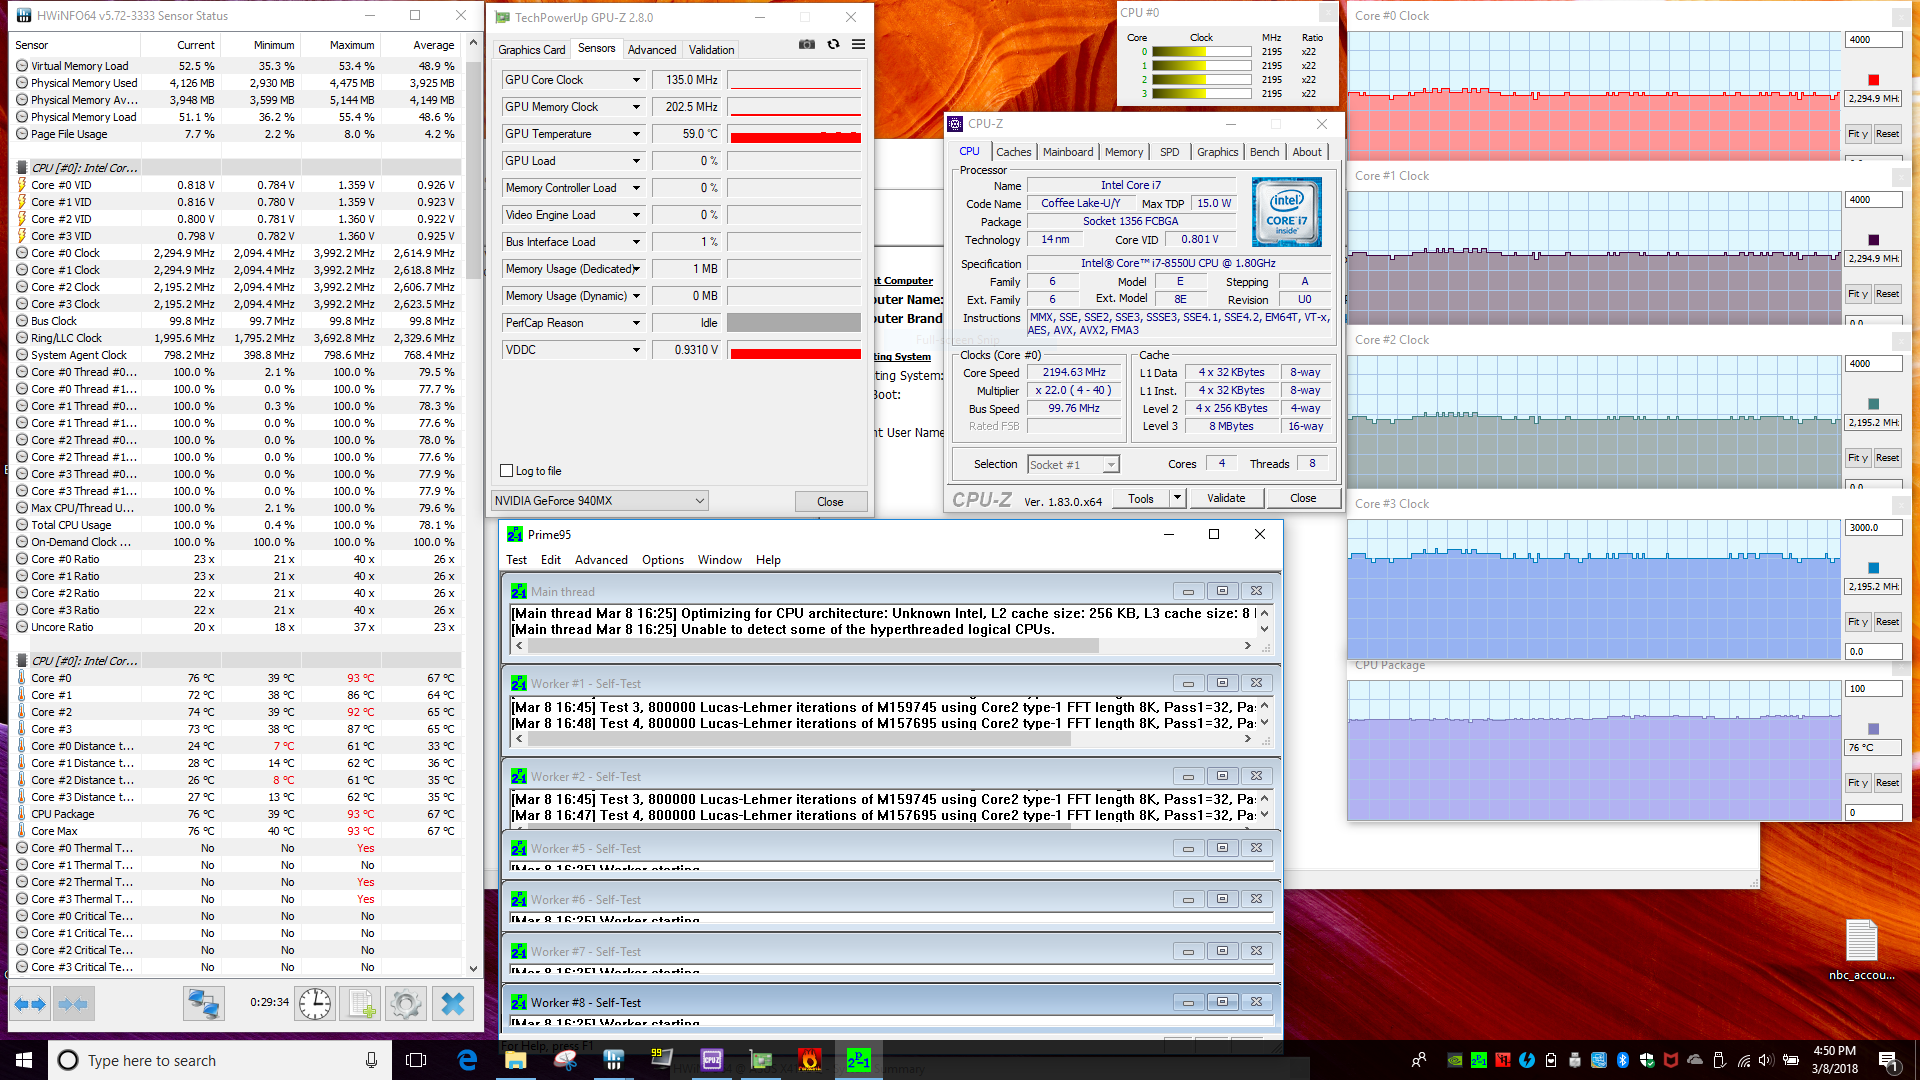
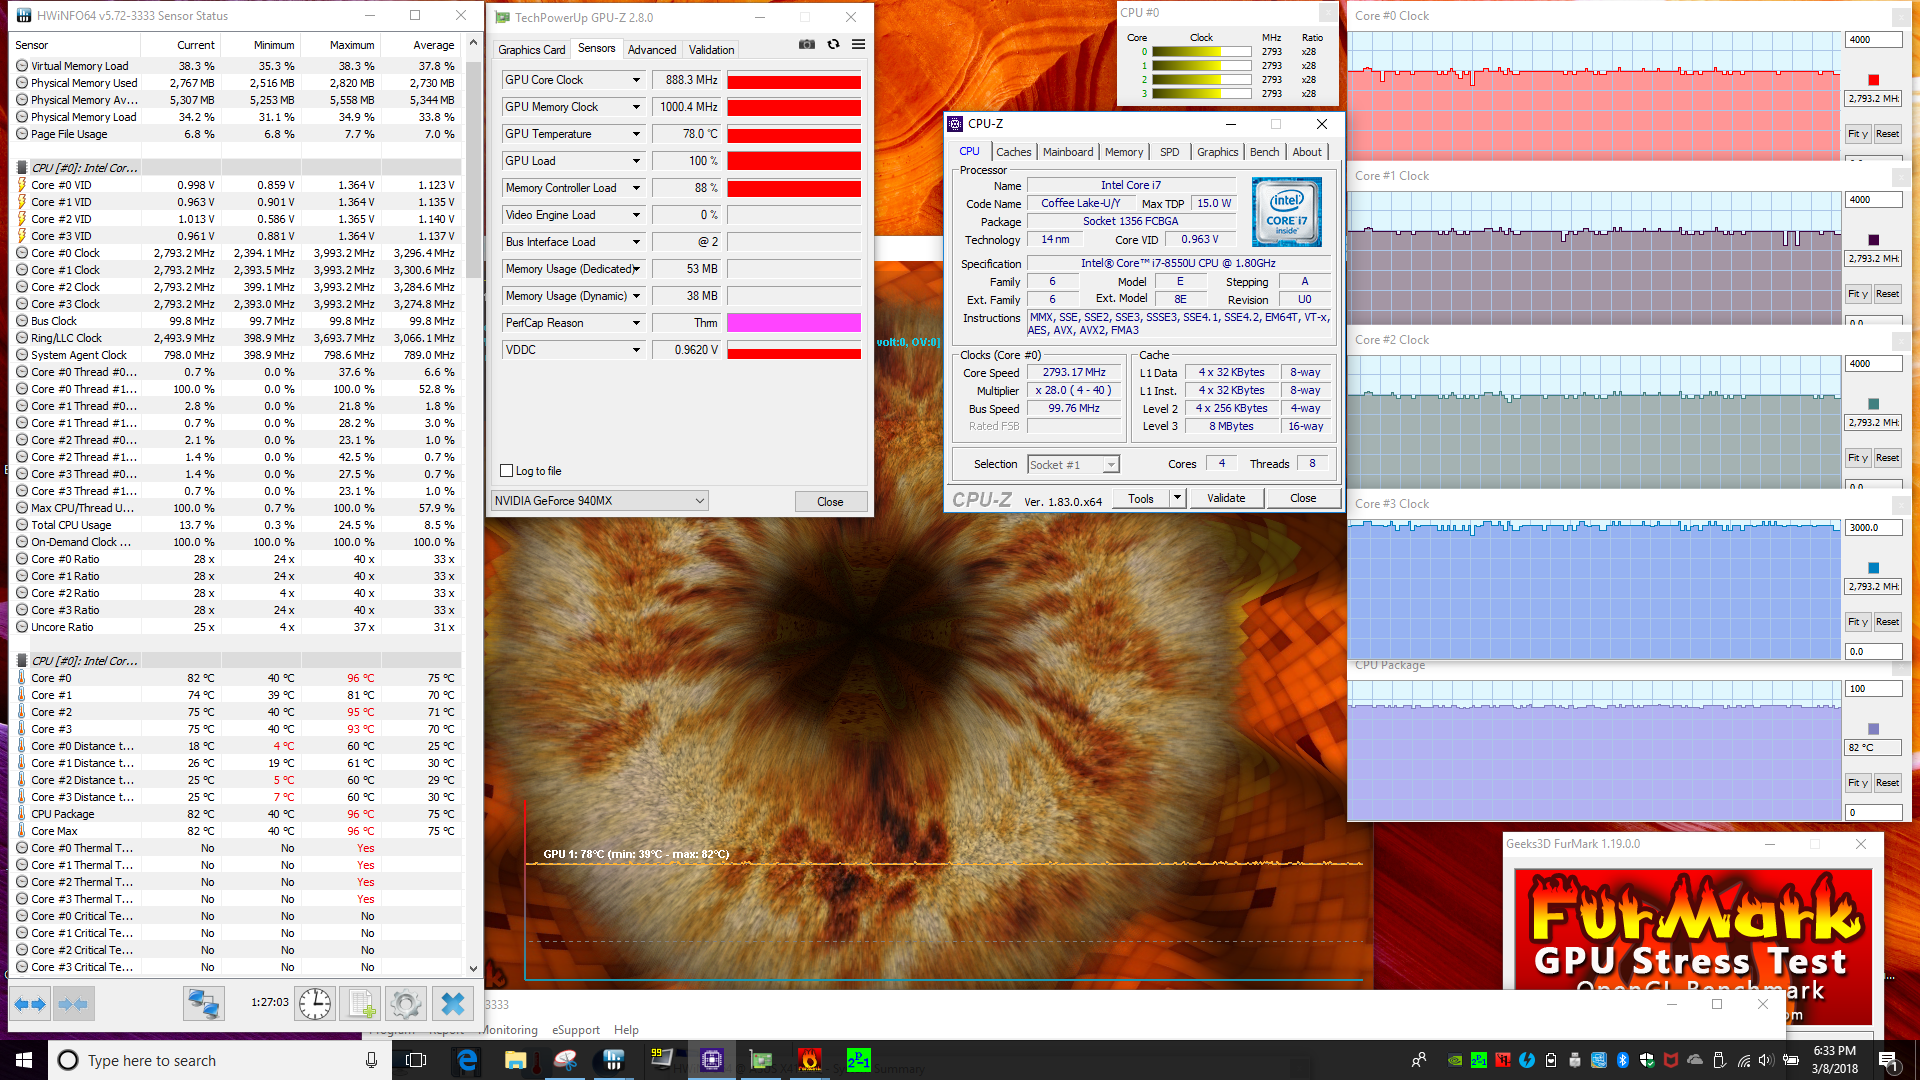
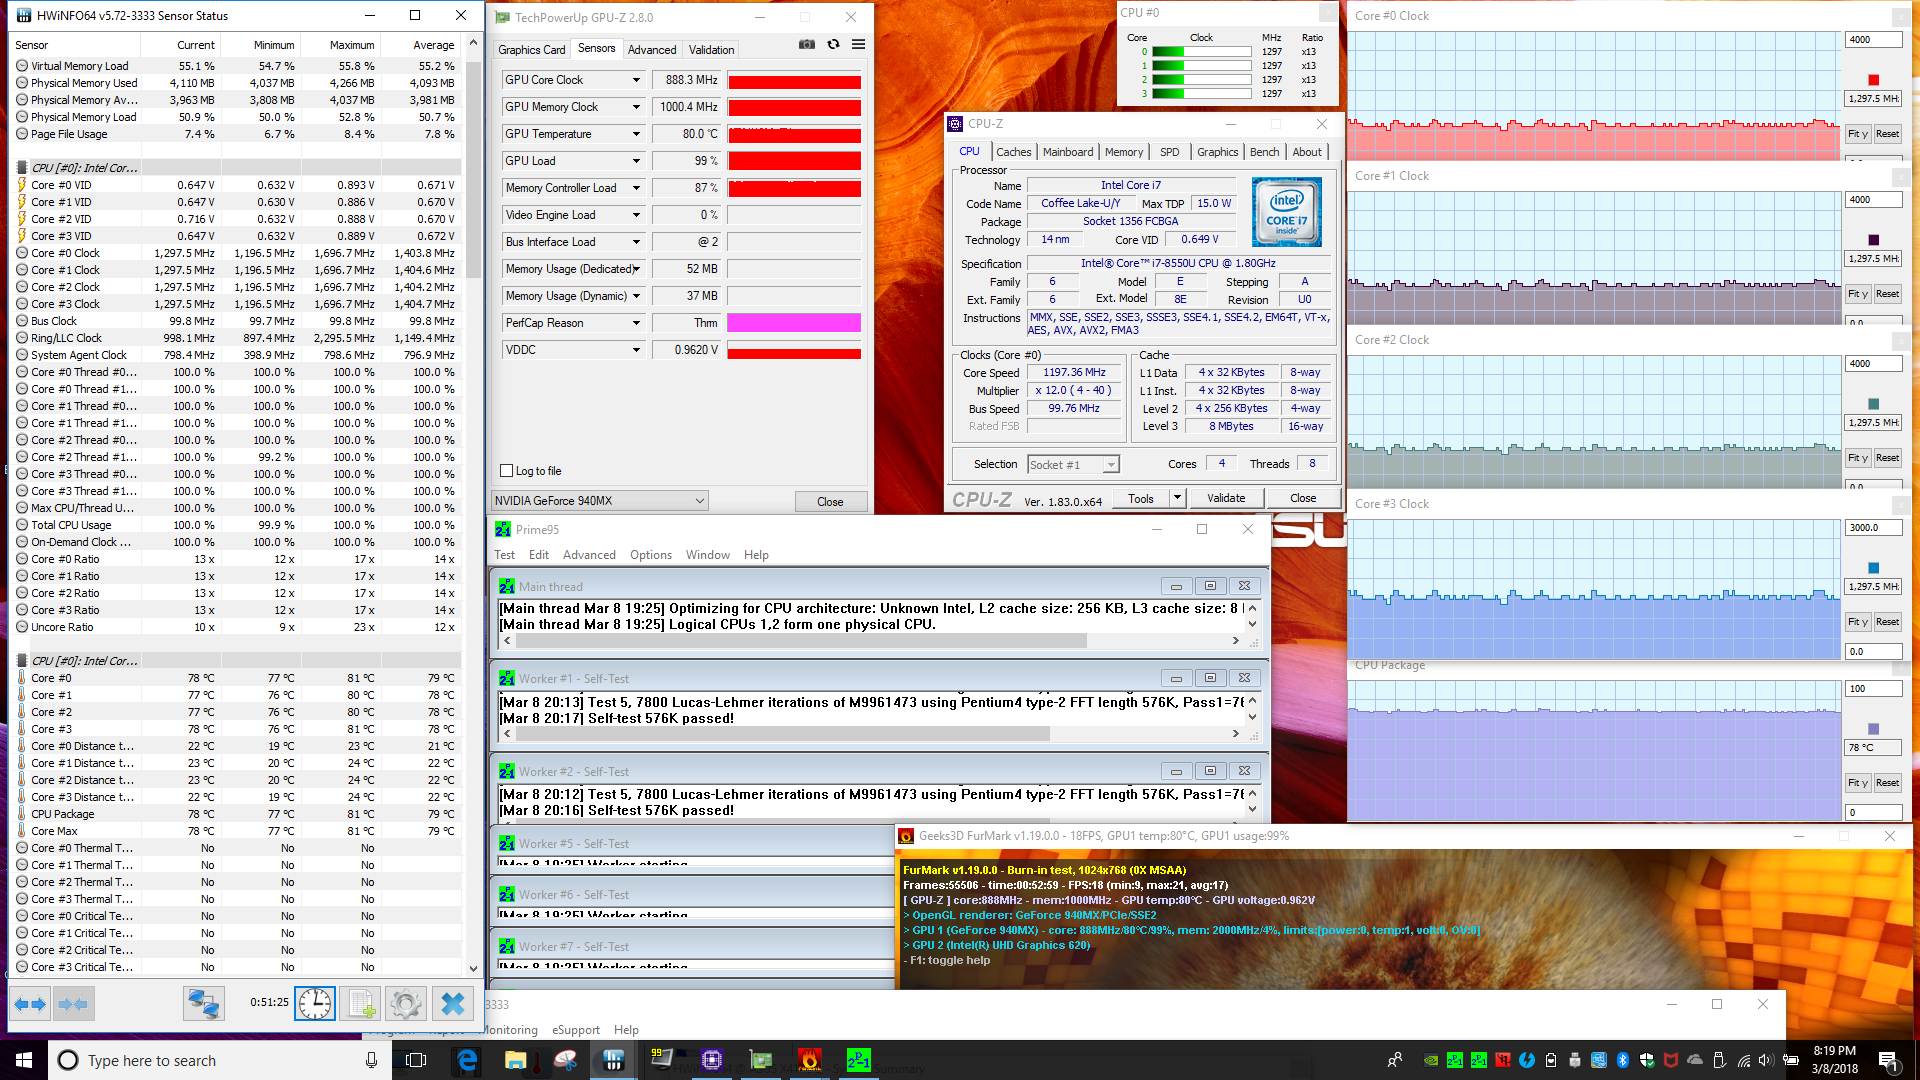
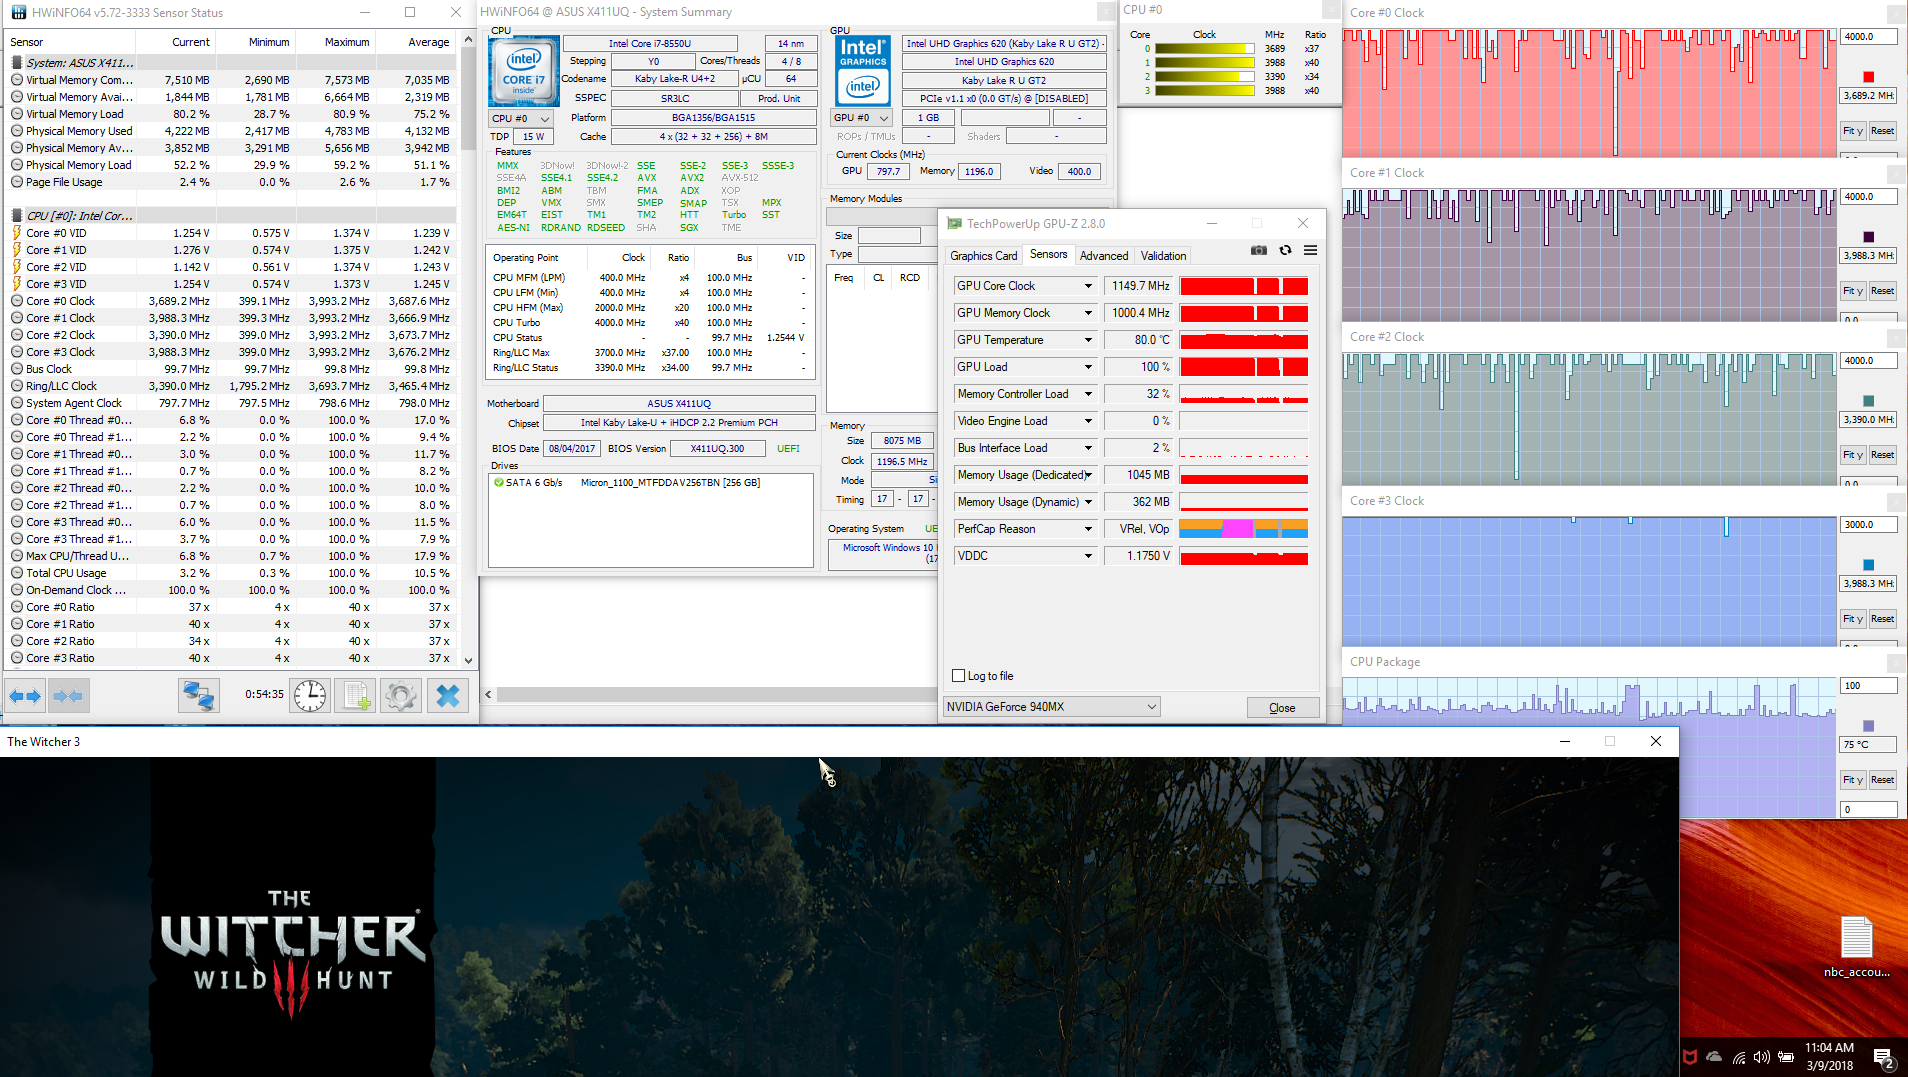
| CPU Clock (GHz) | GPU Clock (MHz) | Average CPU Temperature (°C) | Average GPU Temperature (°C) | |
| Prime95 Stress | 2.2-2.3 | - | 76 | - |
| FurMark Stress | - | 888 | - | 78 |
| Prime95 + FurMark Stress | 1.3 | 888 | 78 | |
| Witcher 3 Stress | 3.7-4.0 | 823-1150 | 75-86 | 78-80 |
Emissions - noisy and warm
System Noise
The VivoBook S14 S410UQ-NH74 is basically inaudible at idle, since the cooling system is largely inactive. The fan spools up when browsing the web or watching videos, but the noise floor is nonetheless acceptable. The picture changes at higher load settings: at medium load with 3DMark06 and maximum load with Prime95 and Furmark, the S410UQ is noisier than most competing notebooks - except for Asus' own VivoBook and Zenbook models. At maximum load, the S14 reaches almost 43 dB, which easily surpasses the output of much thinner notebooks like the XPS 13 or Spectre 13. The Acer Swift 3 SF314 with Intel Core i7-8550U and GeForce MX150 tops out at only 35 dB and still offers much better overall performance thanks to the more powerful graphics.
We noticed some coil whine in close proximity to the notebook and while running hard drive benchmarks. During normal use, this noise is more ore less undetectable.
Noise level
| Idle |
| 28.3 / 28.3 / 29.8 dB(A) |
| Load |
| 39 / 42.6 dB(A) |
 | ||
30 dB silent 40 dB(A) audible 50 dB(A) loud |
||
min: | ||
| Asus VivoBook S410UQ-NH74 GeForce 940MX, i5-8550U, Micron 1100 MTFDDAV256TBN | Acer Swift 3 SF314-52G-89SL GeForce MX150, i5-8550U, Intel SSD 600p SSDPEKKW512G7 | Asus ZenBook 13 UX331UN GeForce MX150, i5-8550U, SanDisk SD8SN8U512G1002 | Lenovo IdeaPad 320s-14IKB GeForce 920MX, i5-7200U, Liteonit CV3-DE256 | Dell Latitude 7480 HD Graphics 620, i7-7600U, Intel SSDSCKKF256H6 | HP Spectre 13-af033ng UHD Graphics 620, i5-8550U, Samsung PM961 NVMe MZVLW512HMJP | Dell XPS 13 9370 i5 UHD UHD Graphics 620, i5-8250U, Toshiba XG5 KXG50ZNV256G | Asus VivoBook S14 S406UA-BV023T UHD Graphics 620, i5-8250U, SanDisk SD8SN8U256G1002 | Acer Swift 3 SF315-41-R4W1 Vega 8, R5 2500U, Intel SSD 600p SSDPEKKW256G7 | |
|---|---|---|---|---|---|---|---|---|---|
| Noise | 2% | -4% | -1% | 10% | 4% | 4% | -4% | -2% | |
| off / environment * (dB) | 28.3 | 30.5 -8% | 29.6 -5% | 30.13 -6% | 30.13 -6% | 29 -2% | 30.2 -7% | 31.8 -12% | |
| Idle Minimum * (dB) | 28.3 | 30.5 -8% | 29.6 -5% | 30.8 -9% | 28.6 -1% | 30.13 -6% | 29 -2% | 30.2 -7% | 31.8 -12% |
| Idle Average * (dB) | 28.3 | 30.5 -8% | 29.6 -5% | 30.8 -9% | 28.6 -1% | 30.13 -6% | 29 -2% | 30.2 -7% | 32.1 -13% |
| Idle Maximum * (dB) | 29.8 | 30.9 -4% | 29.6 1% | 30.8 -3% | 28.6 4% | 30.13 -1% | 29 3% | 31.3 -5% | 32.1 -8% |
| Load Average * (dB) | 39 | 35.6 9% | 41.7 -7% | 35.5 9% | 30.2 23% | 31.5 19% | 32 18% | 40.1 -3% | 33 15% |
| Witcher 3 ultra * (dB) | 40.6 | 35.1 14% | 43.5 -7% | ||||||
| Load Maximum * (dB) | 42.6 | 35.6 16% | 43.5 -2% | 36.2 15% | 31.2 27% | 33.5 21% | 40.1 6% | 40.4 5% | 34.8 18% |
* ... smaller is better
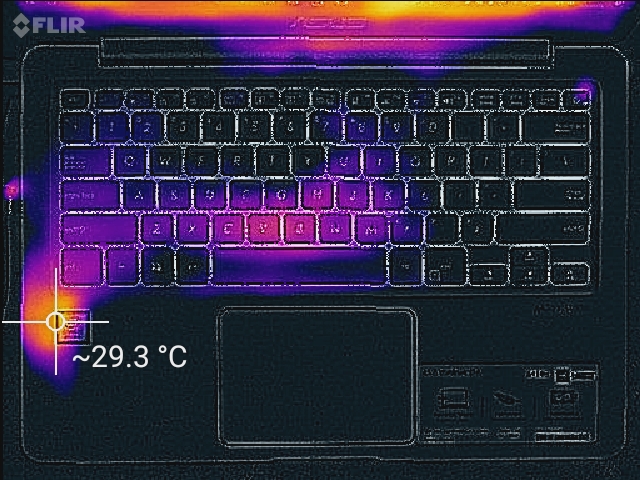
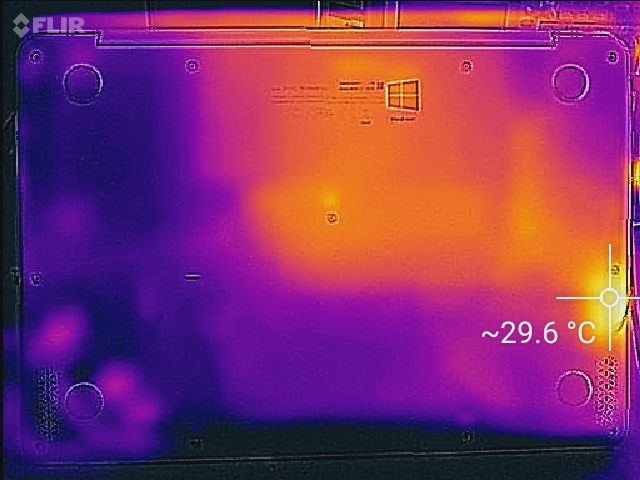
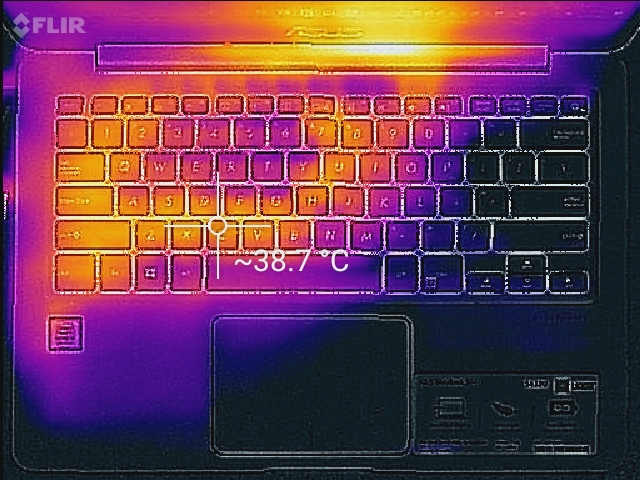
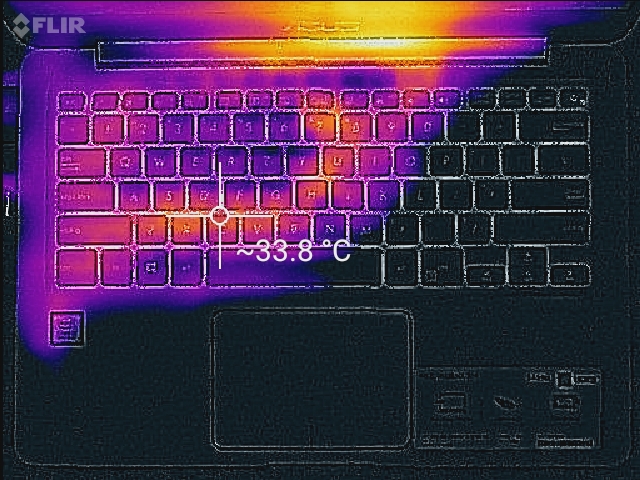
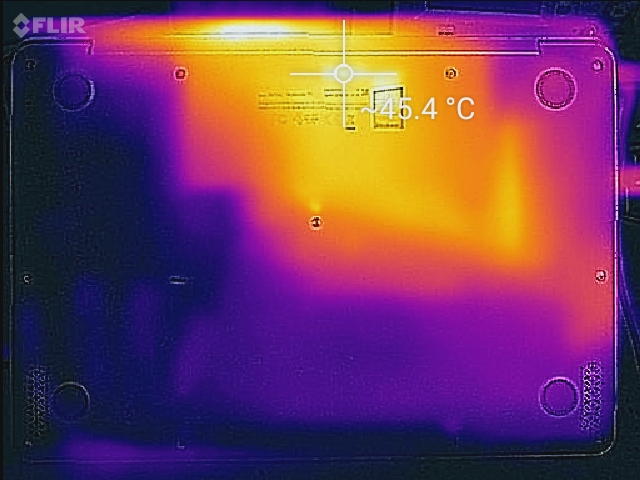
Temperature
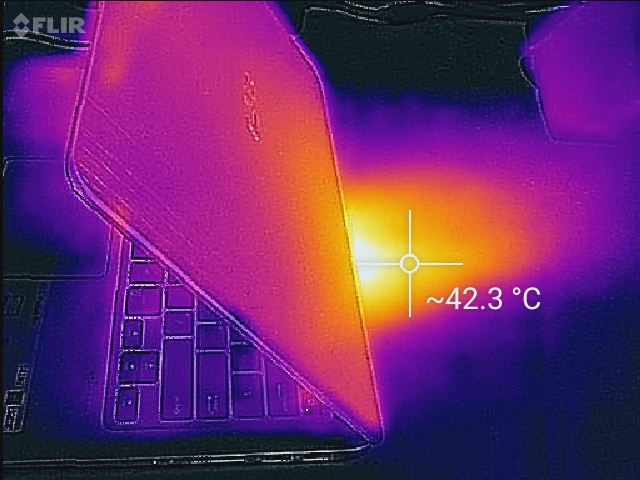
Because of its dedicated GPU, the review notebook runs noticeably warmer than the S14 S406UA with Core i5-8250U and Intel UHD Graphics 620. Idle temperatures are fairly flat with a 5 degree C temperature differential between the top right and bottom left corners. At maximum load during the stress test, the notebook reaches a toasty 47 C on the bottom - thankfully in the middle towards the back, so operation on the lap is still possible without major discomfort. While the palm rests and the touchpad remain cool at a maximum fof 28 C, the middle and left sides of the keyboard get comparatively warm as well. When running Witcher 3, the maximum recorded temperature barely drops at all, while the remainder of the notebook doesn't get nearly as warm.
The Acer Swift 3 with AMD Ryzen 5 2500U (Raven Ridge) reaches a maximum of 41 C during the stress test; the Lenovo IdeaPad 320s-14IKB with older i5-7200U CPU and GeForce 920MX graphics card reaches 45 C.
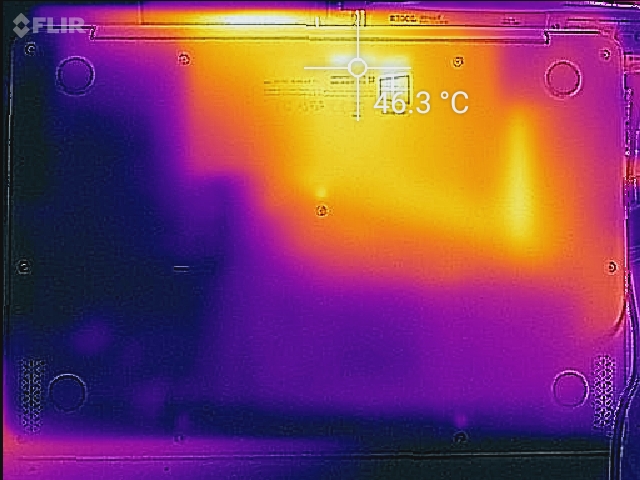
(+) The maximum temperature on the upper side is 39 °C / 102 F, compared to the average of 36.8 °C / 98 F, ranging from 21 to 71 °C for the class Multimedia.
(-) The bottom heats up to a maximum of 47 °C / 117 F, compared to the average of 39.1 °C / 102 F
(+) In idle usage, the average temperature for the upper side is 25.8 °C / 78 F, compared to the device average of 31.3 °C / 88 F.
(+) Playing The Witcher 3, the average temperature for the upper side is 27.9 °C / 82 F, compared to the device average of 31.3 °C / 88 F.
(+) The palmrests and touchpad are cooler than skin temperature with a maximum of 29.6 °C / 85.3 F and are therefore cool to the touch.
(±) The average temperature of the palmrest area of similar devices was 28.7 °C / 83.7 F (-0.9 °C / -1.6 F).
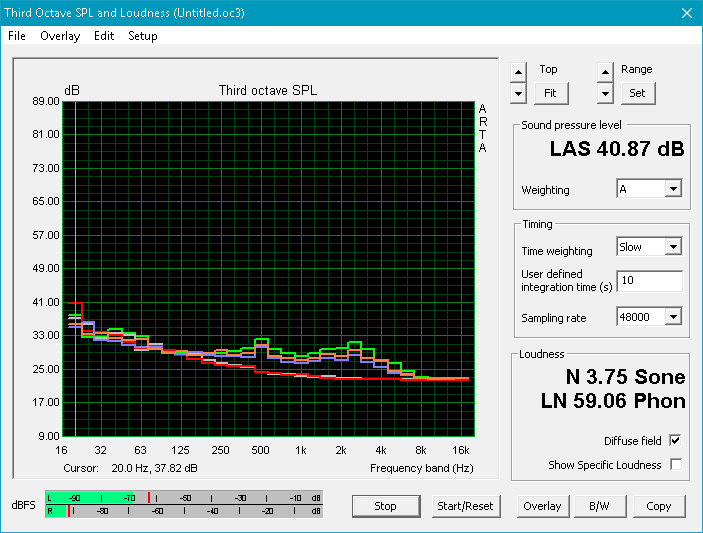
Speakers
The two stereo speakers are located at the front left and right edges and are angled, so they fire both downward and outward. The sound quality unfortunately disappoints: the speakers don't get very loud and the overall sound is quite tinny. The S14 comes with Asus' AudioWizard software preinstalled, so the user can tweak the settings and improve them - particularly when switching to the manual equalizer. Because of the location of the speakers, even moderate volume leads to noticeable vibrations in the palm rests. We can only encourage the use of headphones, particularly when listening to music.

")


Asus VivoBook S410UQ-NH74 audio analysis
(-) | not very loud speakers (59.9 dB)
Bass 100 - 315 Hz
(-) | nearly no bass - on average 15.6% lower than median
(±) | linearity of bass is average (13.5% delta to prev. frequency)
Mids 400 - 2000 Hz
(±) | reduced mids - on average 5.2% lower than median
(±) | linearity of mids is average (8.3% delta to prev. frequency)
Highs 2 - 16 kHz
(+) | balanced highs - only 2.9% away from median
(±) | linearity of highs is average (9.9% delta to prev. frequency)
Overall 100 - 16.000 Hz
(±) | linearity of overall sound is average (26.3% difference to median)
Compared to same class
» 92% of all tested devices in this class were better, 1% similar, 6% worse
» The best had a delta of 5%, average was 17%, worst was 45%
Compared to all devices tested
» 81% of all tested devices were better, 4% similar, 15% worse
» The best had a delta of 4%, average was 24%, worst was 134%
Apple MacBook 12 (Early 2016) 1.1 GHz audio analysis
(+) | speakers can play relatively loud (83.6 dB)
Bass 100 - 315 Hz
(±) | reduced bass - on average 11.3% lower than median
(±) | linearity of bass is average (14.2% delta to prev. frequency)
Mids 400 - 2000 Hz
(+) | balanced mids - only 2.4% away from median
(+) | mids are linear (5.5% delta to prev. frequency)
Highs 2 - 16 kHz
(+) | balanced highs - only 2% away from median
(+) | highs are linear (4.5% delta to prev. frequency)
Overall 100 - 16.000 Hz
(+) | overall sound is linear (10.2% difference to median)
Compared to same class
» 7% of all tested devices in this class were better, 2% similar, 91% worse
» The best had a delta of 5%, average was 18%, worst was 53%
Compared to all devices tested
» 5% of all tested devices were better, 1% similar, 94% worse
» The best had a delta of 4%, average was 24%, worst was 134%
Frequency Comparison (Checkbox selectable!)
Graph 1: Pink Noise 100% Vol.; Graph 2: Audio off
Energy Management - higher draw under load
Power Consumption
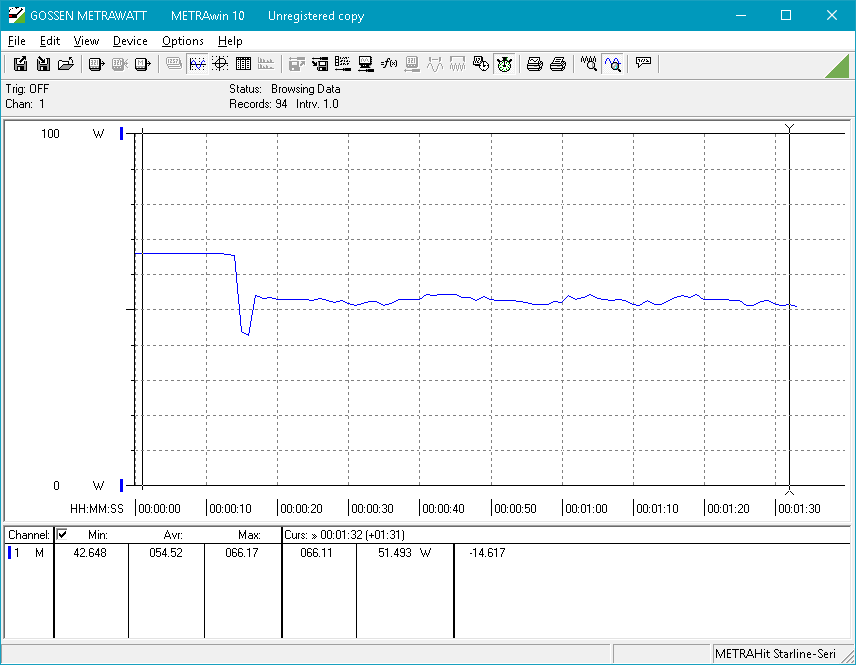
Power consumption when idling is right where expected with the average of 5.6 W, which matches the draw of the S406UA almost exactly. This changes at medium load levels (3DMark06) where the review notebooks consumes roughly 30 % more power (52 vs. 37 W) than the sibling with integrated graphics. During the stress test with Prime95 and FurMark we recorded a maximum power consumption of about 55 W, which is higher than the other notebooks in our review, including the Acer Swift 3 SF314 with the same processor and GeForce MX150 (~50 W)).
The small AC adapter (~6.2 x 6.2 x 2.8 cm) is rated for 65 W and is able to handle the maximum draw without getting too hot.
| Off / Standby | |
| Idle | |
| Load |
|
Key:
min: | |
| Asus VivoBook S410UQ-NH74 i5-8550U, GeForce 940MX, Micron 1100 MTFDDAV256TBN, IPS, 1920x1080, 14" | Acer Swift 3 SF314-52G-89SL i5-8550U, GeForce MX150, Intel SSD 600p SSDPEKKW512G7, IPS, 1920x1080, 14" | Lenovo IdeaPad 320s-14IKB i5-7200U, GeForce 920MX, Liteonit CV3-DE256, IPS, 1920x1080, 14" | HP Spectre 13-af033ng i5-8550U, UHD Graphics 620, Samsung PM961 NVMe MZVLW512HMJP, IPS, 1920x1080, 13.3" | Dell XPS 13 9370 i5 UHD i5-8250U, UHD Graphics 620, Toshiba XG5 KXG50ZNV256G, IPS, 3840x2160, 13.3" | Asus VivoBook S14 S406UA-BV023T i5-8250U, UHD Graphics 620, SanDisk SD8SN8U256G1002, TN LED, 1366x768, 14" | Acer Swift 3 SF315-41-R4W1 R5 2500U, Vega 8, Intel SSD 600p SSDPEKKW256G7, IPS, 1920x1080, 15.6" | |
|---|---|---|---|---|---|---|---|
| Power Consumption | -14% | 12% | 7% | -14% | 9% | -47% | |
| Idle Minimum * (Watt) | 3.5 | 4.4 -26% | 3.2 9% | 2.8 20% | 4.3 -23% | 3.7 -6% | 7.3 -109% |
| Idle Average * (Watt) | 5.65 | 6.6 -17% | 5.9 -4% | 6.2 -10% | 8 -42% | 5.6 1% | 9.7 -72% |
| Idle Maximum * (Watt) | 6.5 | 9.2 -42% | 6.7 -3% | 9.4 -45% | 8.1 -25% | 7.6 -17% | 13 -100% |
| Load Average * (Watt) | 52.3 | 61 -17% | 36.7 30% | 32.2 38% | 46.6 11% | 37.4 28% | 40.4 23% |
| Witcher 3 ultra * (Watt) | 46.2 | 40 13% | |||||
| Load Maximum * (Watt) | 54.5 | 50 8% | 39 28% | 36.6 33% | 49.8 9% | 33 39% | 42.2 23% |
* ... smaller is better
Battery Life
The VivoBook S14 comes equipped with a 3-cell, 42 Wh Lithium-Ion battery. Run times are surprisingly good, especially when considering that the notebook has one of the smaller batteries compared to the rest of the field. During our WLAN test with the screen set to 150 nits and the balanced profile enabled, we recorded a run time of over 8 hours. The Acer Swift 13 with Intel CPU and GeForce MX150 trails the review notebook by 5 %; the Acer Swift 3 with AMD Ryzen 5 2500U CPU doesn't have the same stamina and only lasts about 6 hours.
| Asus VivoBook S410UQ-NH74 i5-8550U, GeForce 940MX, 42 Wh | Acer Swift 3 SF314-52G-89SL i5-8550U, GeForce MX150, 48 Wh | Asus ZenBook 13 UX331UN i5-8550U, GeForce MX150, 50 Wh | Lenovo IdeaPad 320s-14IKB i5-7200U, GeForce 920MX, 52.5 Wh | Dell Latitude 7480 i7-7600U, HD Graphics 620, 60 Wh | HP Spectre 13-af033ng i5-8550U, UHD Graphics 620, 43 Wh | Dell XPS 13 9370 i5 UHD i5-8250U, UHD Graphics 620, 52 Wh | Asus VivoBook S14 S406UA-BV023T i5-8250U, UHD Graphics 620, 39 Wh | Acer Swift 3 SF315-41-R4W1 R5 2500U, Vega 8, 48 Wh | |
|---|---|---|---|---|---|---|---|---|---|
| Battery runtime | -4% | 35% | 9% | 84% | -11% | 4% | -2% | -17% | |
| Reader / Idle (h) | 12.5 | 22 76% | 27.7 122% | 14.5 16% | 12.2 -2% | ||||
| WiFi v1.3 (h) | 8.1 | 7.8 -4% | 8.4 4% | 8.8 9% | 12 48% | 5.9 -27% | 6.8 -16% | 7.9 -2% | 5.2 -36% |
| Load (h) | 1.6 | 2 25% | 2.9 81% | 1.7 6% | 1.8 13% | 1.4 -13% |
Pros
Cons
Verdict

The VivoBook S14 S410UQ-NH74 features a Full HD 14-inch display in a 13.3-inch chassis. Unfortunately, the display is not particular bright and suffers from poor color accuracy as well as just average coverage of the professional color spaces. Nonetheless: the IPS display is without a doubt a worthy upgrade over the HD TN display the VivoBook S14 S406UA is equipped with. While the notebook certainly looks the part with its sleek metal and plastic design, the keyboard deck flexes too much for comfort when applying just moderate amounts of pressure. As a result, the typing experience is not nearly as pleasant as it could be. The system performance is decent, but we encountered heavy throttling under maximum load, as the single heat pipe / single fan design can't keep up with the generated heat. We also question Asus' decision to pair up an 8th-generation i7 CPU with an outdated entry-level graphics card. Many competing designs already incorporate the much more powerful GeForce MX150 instead.
Still, the notebook remains unobtrusive with lighter workloads and the battery can last all day with careful battery management. We also appreciate the thin-and-light and appealing design and the fact that the S14 comes with an empty 2.5-inch hard drive bay and corresponding SATA 3 connector. Users requiring more space can thus easily and cheaply expand the storage without having to resort to external drives.
Because of the substantial amount of keyboard flex, the VivoBook S14 might not be one of the strongest contenders in the multimedia segment, but it is still a decent choice for users who can accept the aforementioned shortcomings.
Asus VivoBook S410UQ-NH74
- 03/10/2018 v6 (old)
Bernie Pechlaner
Price comparison