Asus ZenBook UX3410UQ (7500U, 940MX, Full HD) Laptop Review
For the original German review, see here.
With the ZenBook-UX3410 models, Asus extends the ZenBook series with 14-inch sub-notebooks which however, use the usual 13.3-inch cases. The notebook is not unknown to us. With the UX3410UQ, we have the sibling model of identical build as the ZenBook UX3410UA which we have already tested. Unlike the UX3410UA, the UX3410UQ uses a dedicated GeForce graphics core. The competitors are 13.3 as well as 14-inch notebooks. Here we mention the Acer Swift 5 SF514, the Acer TravelMate X349-G2, the HP Spectre 13, the Lenovo ThinkPad X1, and the Apple MacBook Pro 13.
Since both the ZenBook models have the same build, we will not discuss the case, features, input devices, and speakers here. The relevant information can be found in the ZenBook UX3410UA review. Note that the UX3410 ZenBook series is currently not available in the US, but the 14-inch ZenBooks are in the similar UX400s series (UX410, UX430) instead. For a comparison of the model specifications, see here.
| SD Card Reader | |
| average JPG Copy Test (av. of 3 runs) | |
| Acer Swift 5 SF514-51-59AV | |
| Lenovo ThinkPad X1 Carbon 2017-20HQS03P00 | |
| Asus Zenbook UX3410UQ-GV077T | |
| Asus UX310UQ-FC396T | |
| Asus Zenbook UX3410UA | |
| Acer TravelMate X349-G2 | |
| maximum AS SSD Seq Read Test (1GB) | |
| Acer Swift 5 SF514-51-59AV | |
| Lenovo ThinkPad X1 Carbon 2017-20HQS03P00 | |
| Asus Zenbook UX3410UQ-GV077T | |
| Asus Zenbook UX3410UA | |
| Asus UX310UQ-FC396T | |
| Acer TravelMate X349-G2 | |
| Networking | |
| iperf3 transmit AX12 | |
| Acer TravelMate X349-G2 | |
| HP Spectre 13-v131ng | |
| Asus UX310UQ-FC396T (jseb) | |
| Apple MacBook Pro 13 2016 (Klaus I211) | |
| Lenovo ThinkPad X1 Carbon 2017-20HQS03P00 | |
| Asus Zenbook UX3410UQ-GV077T | |
| Asus Zenbook UX3410UA | |
| iperf3 receive AX12 | |
| Apple MacBook Pro 13 2016 (Klaus I211) | |
| Asus Zenbook UX3410UQ-GV077T | |
| Lenovo ThinkPad X1 Carbon 2017-20HQS03P00 | |
| Acer TravelMate X349-G2 | |
| Asus UX310UQ-FC396T (jseb) | |
| HP Spectre 13-v131ng | |
| Asus Zenbook UX3410UA | |
Display
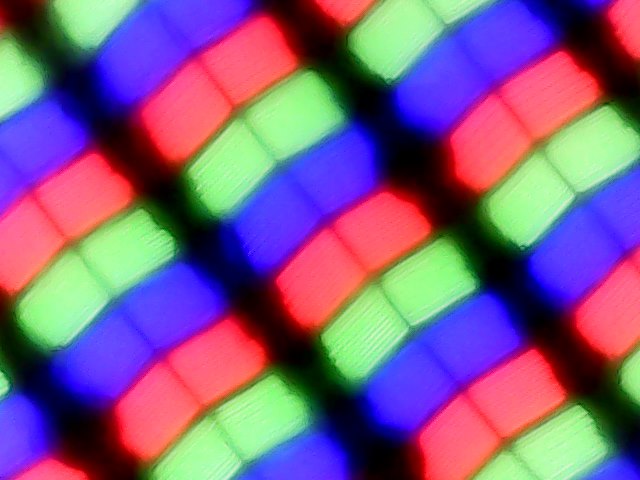
The matte 14-inch display of the ZenBook works with a native resolution of 1920x1080 pixels. The brightness (367.8 cd/m2) and contrast (1270:1) know how to please. Unfortunately, with brightness levels of 30% and lower, the screen shows some PWM flickering with a frequency of 60 Hz. Even for people who are not sensitive, this can lead to headaches or eye problems.
| |||||||||||||||||||||||||
Brightness Distribution: 84 %
Center on Battery: 381 cd/m²
Contrast: 1270:1 (Black: 0.3 cd/m²)
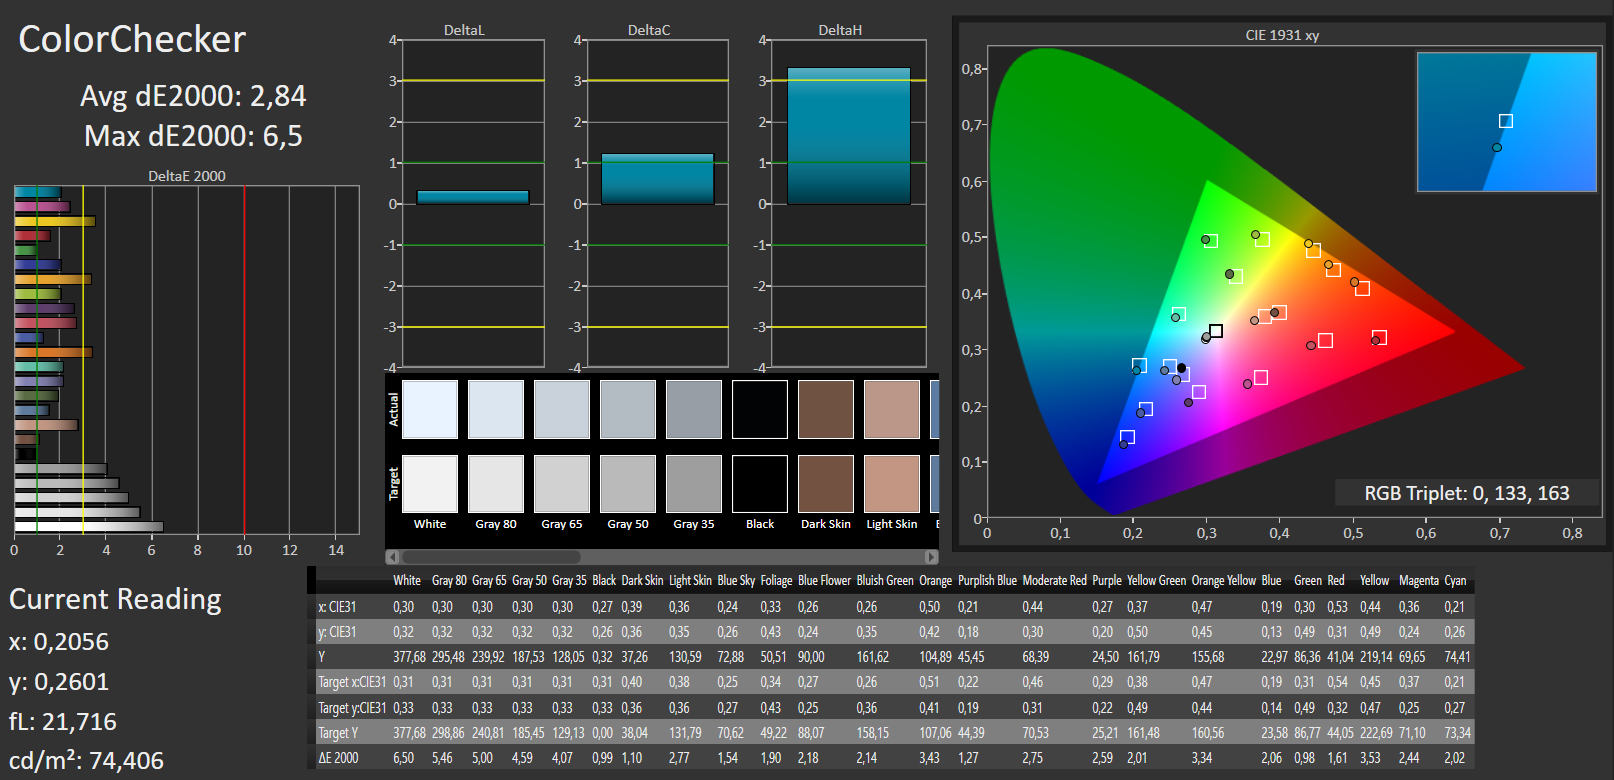
ΔE ColorChecker Calman: 2.84 | ∀{0.5-29.43 Ø4.77}
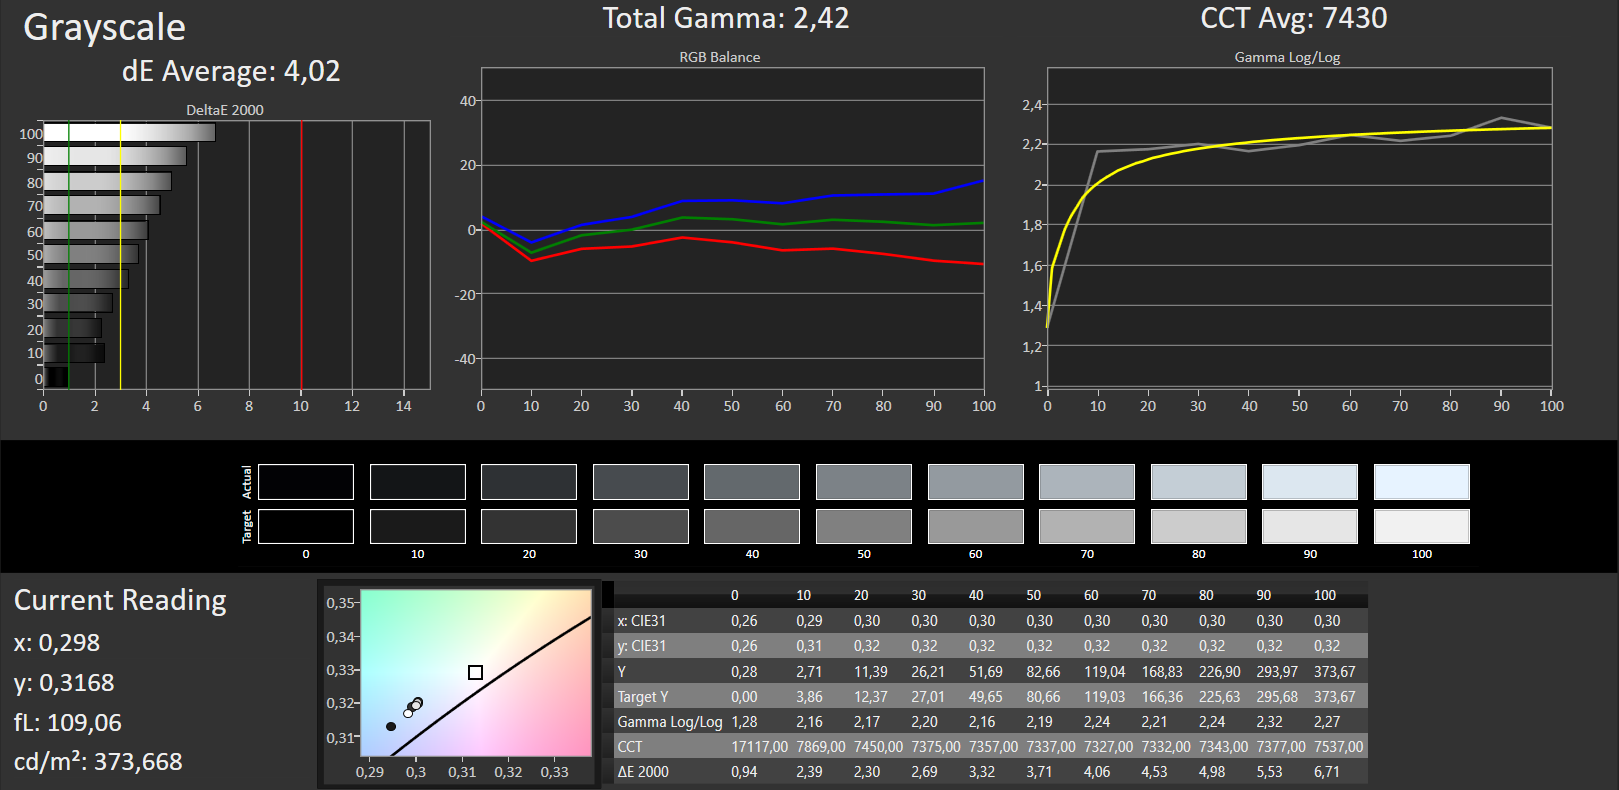
ΔE Greyscale Calman: 4.02 | ∀{0.09-98 Ø5}
86% sRGB (Argyll 1.6.3 3D)
56% AdobeRGB 1998 (Argyll 1.6.3 3D)
69.3% AdobeRGB 1998 (Argyll 3D)
99.2% sRGB (Argyll 3D)
67.2% Display P3 (Argyll 3D)
Gamma: 2.42
CCT: 7430 K
| Asus Zenbook UX3410UQ-GV077T IPS, 1920x1080, 14" | Asus Zenbook UX3410UA IPS, 1920x1080, 14" | Acer TravelMate X349-G2 IPS, 1920x1080, 14" | Acer Swift 5 SF514-51-59AV IPS, 1920x1080, 14" | Lenovo ThinkPad X1 Carbon 2017-20HQS03P00 IPS, 1920x1080, 14" | Apple MacBook Pro 13 2016 2560x1600, 13.3" | HP Spectre 13-v131ng IPS UWVA, 1920x1080, 13.3" | |
|---|---|---|---|---|---|---|---|
| Display | 0% | -38% | -7% | -11% | 23% | -7% | |
| Display P3 Coverage (%) | 67.2 | 67.7 1% | 41.81 -38% | 62.8 -7% | 61.4 -9% | 97.1 44% | 64.6 -4% |
| sRGB Coverage (%) | 99.2 | 99.1 0% | 62.3 -37% | 91.3 -8% | 85.9 -13% | 99.8 1% | 88.8 -10% |
| AdobeRGB 1998 Coverage (%) | 69.3 | 69.4 0% | 43.26 -38% | 64.3 -7% | 62.4 -10% | 86.7 25% | 64.8 -6% |
| Response Times | 4% | -4% | -7% | -2% | -43% | -10% | |
| Response Time Grey 50% / Grey 80% * (ms) | 44 ? | 33 ? 25% | 43 ? 2% | 51 ? -16% | 41.6 ? 5% | 47.2 ? -7% | 46 ? -5% |
| Response Time Black / White * (ms) | 29 ? | 34 ? -17% | 32 ? -10% | 28 ? 3% | 31.6 ? -9% | 51.6 ? -78% | 33 ? -14% |
| PWM Frequency (Hz) | 60 ? | 25000 ? | |||||
| Screen | -2% | -36% | -26% | -20% | 21% | -20% | |
| Brightness middle (cd/m²) | 381 | 376 -1% | 271 -29% | 393 3% | 311 -18% | 600 57% | 404 6% |
| Brightness (cd/m²) | 368 | 355 -4% | 253 -31% | 338 -8% | 288 -22% | 564 53% | 382 4% |
| Brightness Distribution (%) | 84 | 87 4% | 83 -1% | 79 -6% | 85 1% | 89 6% | 91 8% |
| Black Level * (cd/m²) | 0.3 | 0.32 -7% | 0.35 -17% | 0.29 3% | 0.24 20% | 0.57 -90% | 0.35 -17% |
| Contrast (:1) | 1270 | 1175 -7% | 774 -39% | 1355 7% | 1296 2% | 1053 -17% | 1154 -9% |
| Colorchecker dE 2000 * | 2.84 | 3.2 -13% | 5.05 -78% | 6.17 -117% | 5.5 -94% | 1.5 47% | 5.37 -89% |
| Colorchecker dE 2000 max. * | 6.5 | 7.1 -9% | 11.74 -81% | 11.21 -72% | 9 -38% | 2.9 55% | 9.46 -46% |
| Greyscale dE 2000 * | 4.02 | 4.4 -9% | 4.3 -7% | 6.8 -69% | 6.2 -54% | 2 50% | 6.44 -60% |
| Gamma | 2.42 91% | 2.12 104% | 2.44 90% | 2.27 97% | 2.02 109% | 2.27 97% | 2.52 87% |
| CCT | 7430 87% | 7440 87% | 6726 97% | 6873 95% | 5950 109% | 6855 95% | 6738 96% |
| Color Space (Percent of AdobeRGB 1998) (%) | 56 | 63.78 14% | 42 -25% | 51 -9% | 55.96 0% | 77 38% | 58 4% |
| Color Space (Percent of sRGB) (%) | 86 | 98.98 15% | 39 -55% | 91 6% | 85.77 0% | 92 7% | 89 3% |
| Total Average (Program / Settings) | 1% /
-1% | -26% /
-32% | -13% /
-20% | -11% /
-16% | 0% /
13% | -12% /
-16% |
* ... smaller is better
Screen Flickering / PWM (Pulse-Width Modulation)
| Screen flickering / PWM detected | 60 Hz | ≤ 30 % brightness setting | 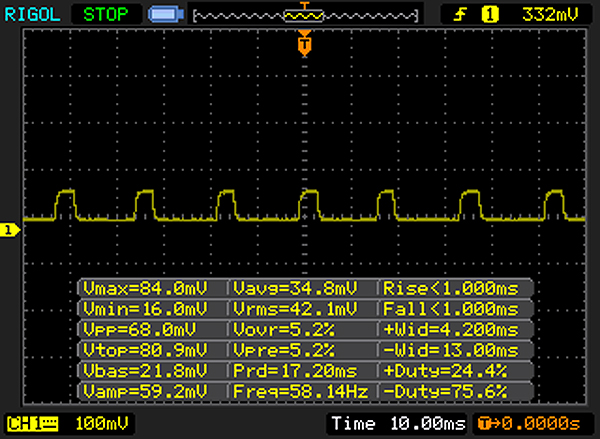 |
The display backlight flickers at 60 Hz (worst case, e.g., utilizing PWM) Flickering detected at a brightness setting of 30 % and below. There should be no flickering or PWM above this brightness setting. The frequency of 60 Hz is very low, so the flickering may cause eyestrain and headaches after extended use. In comparison: 53 % of all tested devices do not use PWM to dim the display. If PWM was detected, an average of 8073 (minimum: 5 - maximum: 343500) Hz was measured. | |||
Asus delivers the ZenBook with a preinstalled color profile. Thus the display shows a good color reproduction already as it comes from the factory. At 2.84, the DeltaE-2000 color discrepancy is fully within limits and the display does not suffer from a blue tint.
Display Response Times
| ↔ Response Time Black to White | ||
|---|---|---|
| 29 ms ... rise ↗ and fall ↘ combined | ↗ 17 ms rise | 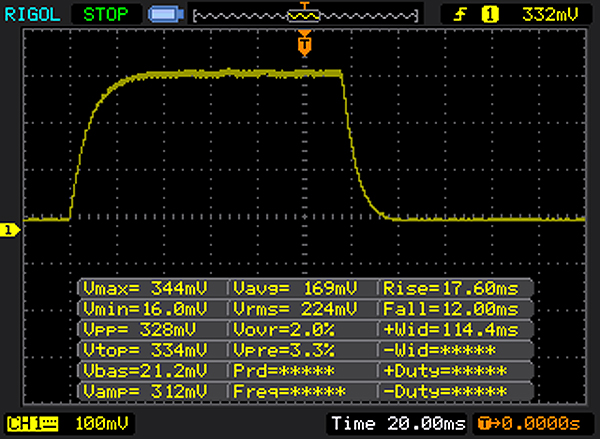 |
| ↘ 12 ms fall | ||
| The screen shows relatively slow response rates in our tests and may be too slow for gamers. In comparison, all tested devices range from 0.1 (minimum) to 240 (maximum) ms. » 76 % of all devices are better. This means that the measured response time is worse than the average of all tested devices (20.2 ms). | ||
| ↔ Response Time 50% Grey to 80% Grey | ||
| 44 ms ... rise ↗ and fall ↘ combined | ↗ 24 ms rise | 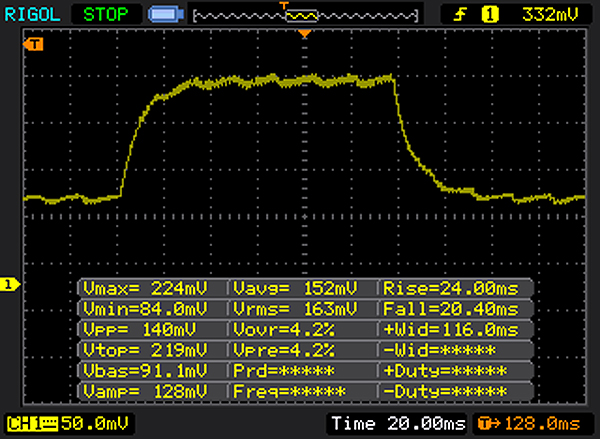 |
| ↘ 20 ms fall | ||
| The screen shows slow response rates in our tests and will be unsatisfactory for gamers. In comparison, all tested devices range from 0.165 (minimum) to 636 (maximum) ms. » 73 % of all devices are better. This means that the measured response time is worse than the average of all tested devices (31.5 ms). | ||
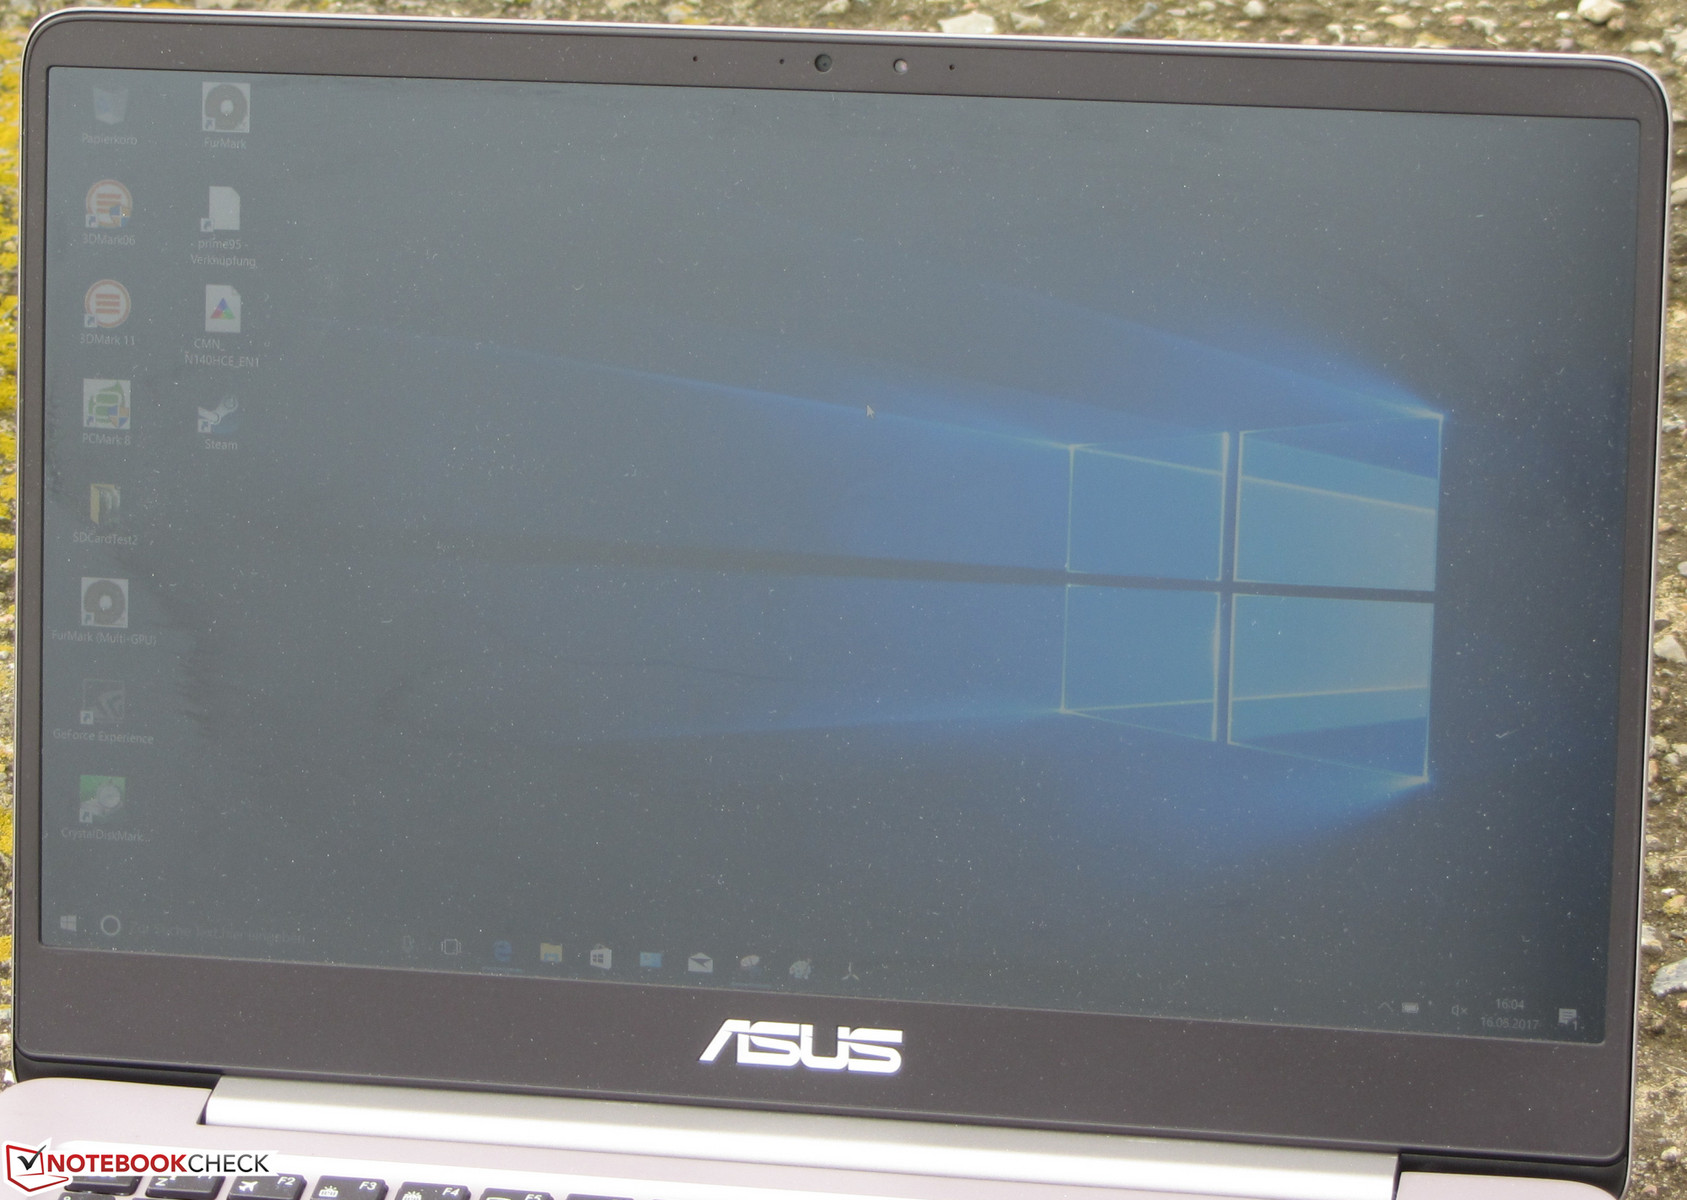
Asus has equipped the ZenBook with an IPS panel whose viewing angles are stable: the screen can be read from any viewing angle. The notebook can easily be used outside, but direct sun should be avoided.
Performance
With the ZenBook, Asus has a slim notebook that brings a 14-inch display to its offerings. The hardware used offers sufficient computing power for all the usual application scenarios. Our test unit can be purchased for about 1300 Euros (~$1443). Variants with other features are available with prices starting at about 900 Euros (~$1000).
Processor
The ZenBook is driven by an Intel Core i7-7500U (Kaby Lake) dual-core processor. This is an energy-efficient ULV all-round processor, which does well in all the usual application areas. Those who want to save some money can grab a ZenBook model that is equipped with a Core i5-7200U processor. A slightly lower maximum performance is countered by a considerably lower price. The CPU operates with a basic speed of 2.7 GHz. Via Turbo, this can be increased up to 3.5 GHz (both cores).
The Turbo can be used in mains as well as battery operation. However, in the Multithread tests, the Turbo can only run at full speed for a few seconds. After that, the speed is decreased to 2.9 to 3 GHz. A further lowering of the speed does not occur. We ran the Cinebench R15 Multithread test in a continuous loop for about 30 minutes. From the second run on, the results remain on the same level.
| Cinebench R10 | |
| Rendering Multiple CPUs 32Bit | |
| Asus UX310UQ-FC396T | |
| Asus Zenbook UX3410UQ-GV077T | |
| HP Spectre 13-v131ng | |
| Apple MacBook Pro 13 2016 | |
| Rendering Single 32Bit | |
| Asus Zenbook UX3410UQ-GV077T | |
| HP Spectre 13-v131ng | |
| Asus UX310UQ-FC396T | |
| Apple MacBook Pro 13 2016 | |
| Geekbench 3 | |
| 32 Bit Multi-Core Score | |
| Asus Zenbook UX3410UQ-GV077T | |
| 32 Bit Single-Core Score | |
| Asus Zenbook UX3410UQ-GV077T | |
| Geekbench 4.0 | |
| 64 Bit Multi-Core Score | |
| Asus Zenbook UX3410UQ-GV077T | |
| Apple MacBook Pro 13 2016 | |
| Apple MacBook Pro 13 2016 | |
| 64 Bit Single-Core Score | |
| Asus Zenbook UX3410UQ-GV077T | |
| Apple MacBook Pro 13 2016 | |
| Apple MacBook Pro 13 2016 | |
| Geekbench 4.4 | |
| 64 Bit Multi-Core Score | |
| Asus Zenbook UX3410UQ-GV077T | |
| 64 Bit Single-Core Score | |
| Asus Zenbook UX3410UQ-GV077T | |
System Performance
The hardware used ensures a fast and smooth running system. We did not encounter any problems. The PC Mark benchmark result confirms that the ZenBook has more than enough computing power for applications in the office and Internet areas. The performance cannot be increased, since Asus has already used up all the options.
| PCMark 8 Home Score Accelerated v2 | 3923 points | |
Help | ||
Storage Solution
In the ZenBook, Asus bets on a solid-state drive by SanDisk. It is a M.2 model (2280), which offers a total capacity of 256 GB, of which around 200 GB is usable. The remaining storage space is taken by the Windows installation and the recovery partition. The transfer rates of the SSD turn out well. In addition, the ZenBook brings a conventional 2.5-inch hard drive with a capacity of 1 TB.

| Asus Zenbook UX3410UQ-GV077T SanDisk SD8SNAT256G1002 | Asus Zenbook UX3410UA SanDisk SD8SN8U512G1002 | Acer TravelMate X349-G2 Intel SSD 600p SSDPEKKW512G7 | Acer Swift 5 SF514-51-59AV SK Hynix HFS256G39TND-N210A | Lenovo ThinkPad X1 Carbon 2017-20HQS03P00 Samsung PM961 NVMe MZVLW512HMJP | Apple MacBook Pro 13 2016 Apple SSD AP0256 | HP Spectre 13-v131ng Samsung PM961 NVMe MZVLW512HMJP | |
|---|---|---|---|---|---|---|---|
| CrystalDiskMark 3.0 | 29% | 125% | 13% | 218% | 168% | 158% | |
| Read Seq (MB/s) | 497 | 494.5 -1% | 1818 266% | 517 4% | 1827 268% | 1345 171% | 1090 119% |
| Write Seq (MB/s) | 323.7 | 461.7 43% | 582 80% | 258.1 -20% | 1383 327% | 1320 308% | 1088 236% |
| Read 512 (MB/s) | 289 | 328 13% | 1134 292% | 355 23% | 814 182% | 831 188% | 753 161% |
| Write 512 (MB/s) | 288 | 419.7 46% | 586 103% | 258.5 -10% | 1098 281% | 1486 416% | 911 216% |
| Read 4k (MB/s) | 22.78 | 27.53 21% | 34.93 53% | 29.65 30% | 61 168% | 31.68 39% | 57.5 152% |
| Write 4k (MB/s) | 79.5 | 56.5 -29% | 133.4 68% | 77.3 -3% | 172.2 117% | 11.02 -86% | 140.2 76% |
| Read 4k QD32 (MB/s) | 147 | 351 139% | 373.7 154% | 277.1 89% | 601 309% | 533 263% | 497.1 238% |
| Write 4k QD32 (MB/s) | 257.2 | 249.3 -3% | 210.8 -18% | 242.5 -6% | 495.6 93% | 362 41% | 416 62% |
Graphics Card
With the GeForce 940MX graphics core, a dedicated Nvidia mid-range GPU is built into the ZenBook. It supports DirectX 12 and reaches speeds of up to 1176 MHz. The graphics core is supported by 2048 MB DDR3 graphics memory. The results in the 3D Mark benchmarks remain at normal levels for the graphics core. In addition to the 940MX GPU, the notebook also has Intel's integrated HD Graphics 620 GPU. The two GPUs form a switchable graphics solution (Optimus). The Intel graphics core is responsible for the everyday and battery operation and the GeForce GPU is used during tasks that are graphics intensive.
The ZenBook UX3410UA sibling model which we have already tested has no dedicated GPU on board and can only offer the integrated HD Graphics 620 graphics core. The GeForce 940X GPU offers about 30% to 40% higher performance than the Intel iGPU. A look at our comparison chart shows the performance difference.
| 3DMark 11 Performance | 2205 points | |
Help | ||
Gaming Performance
The CPU-GPU combination built into the ZenBook fluidly displays quite a lot of games on the screen. Most games reach sufficiently high frame rates in HD resolution (1366x768 pixels) and low to medium quality settings. Games that do not have high demands on the hardware offer more. For a game such as "Mafia 3" however, the computing performance of the built-in hardware is not sufficient.
| low | med. | high | ultra | |
|---|---|---|---|---|
| BioShock Infinite (2013) | 83.8 | 45.4 | 37.4 | 13.2 |
Emissions
Noise Emissions
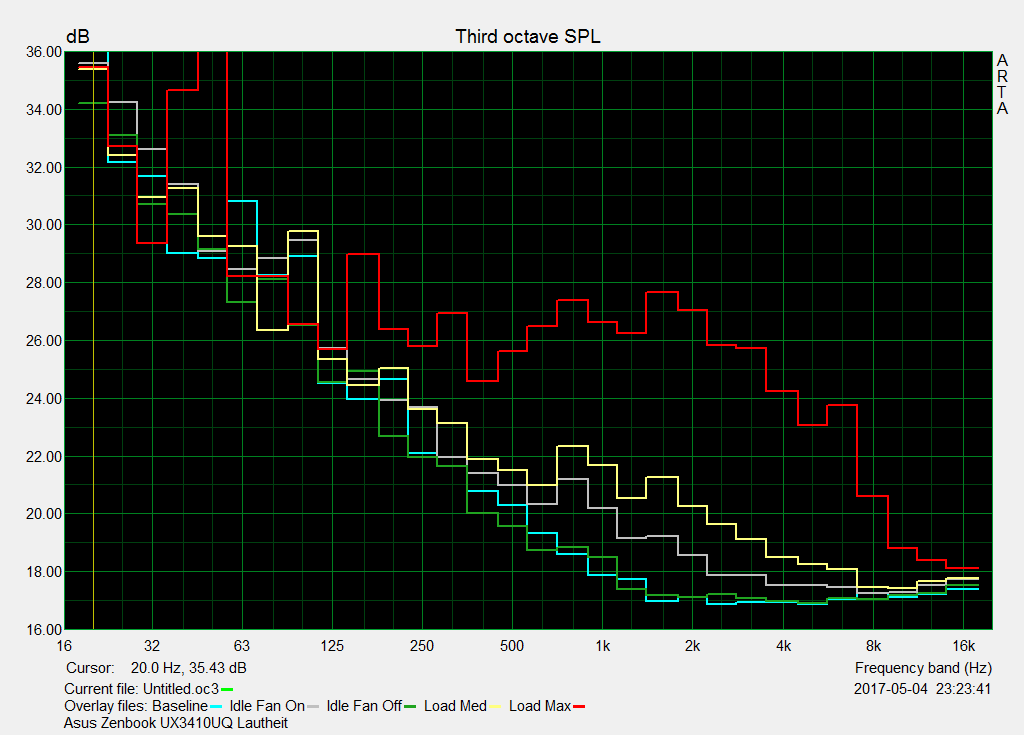
The ZenBook does not produce much noise during any kind of load scenario. During load, the fan does not rev up very much and during the stress test we measured a sound pressure level of 37.6 dB(A) - a good value. During idle, the fan is often stopped and it is completely silent. However, a small load (such as opening web sites) is sufficient to start up the fan. It then runs with a constant low speed which cannot be heard in normal environment noise levels. In quiet surroundings, the whirring of the fan can be annoying, though. Users of the ZenBook UX3410UA sibling model also talk about this in our forum.
Using the Notebook FanControl tool, the fan can be silenced in idle most of the time. Some users of our forum report that the profile for the Asus ZenBook UX360UAK can be used. We can confirm that. After we left the automatic control of the fan to Notebook FanControl, we did not hear anything anymore. Note that the use of Notebook FanControl is at your own risk and possible damage to the notebook is the responsibility of the user.
Noise level
| Idle |
| 30 / 30 / 31.1 dB(A) |
| HDD |
| 31 dB(A) |
| Load |
| 32.2 / 37.6 dB(A) |
 | ||
30 dB silent 40 dB(A) audible 50 dB(A) loud |
||
min: | ||
Temperature
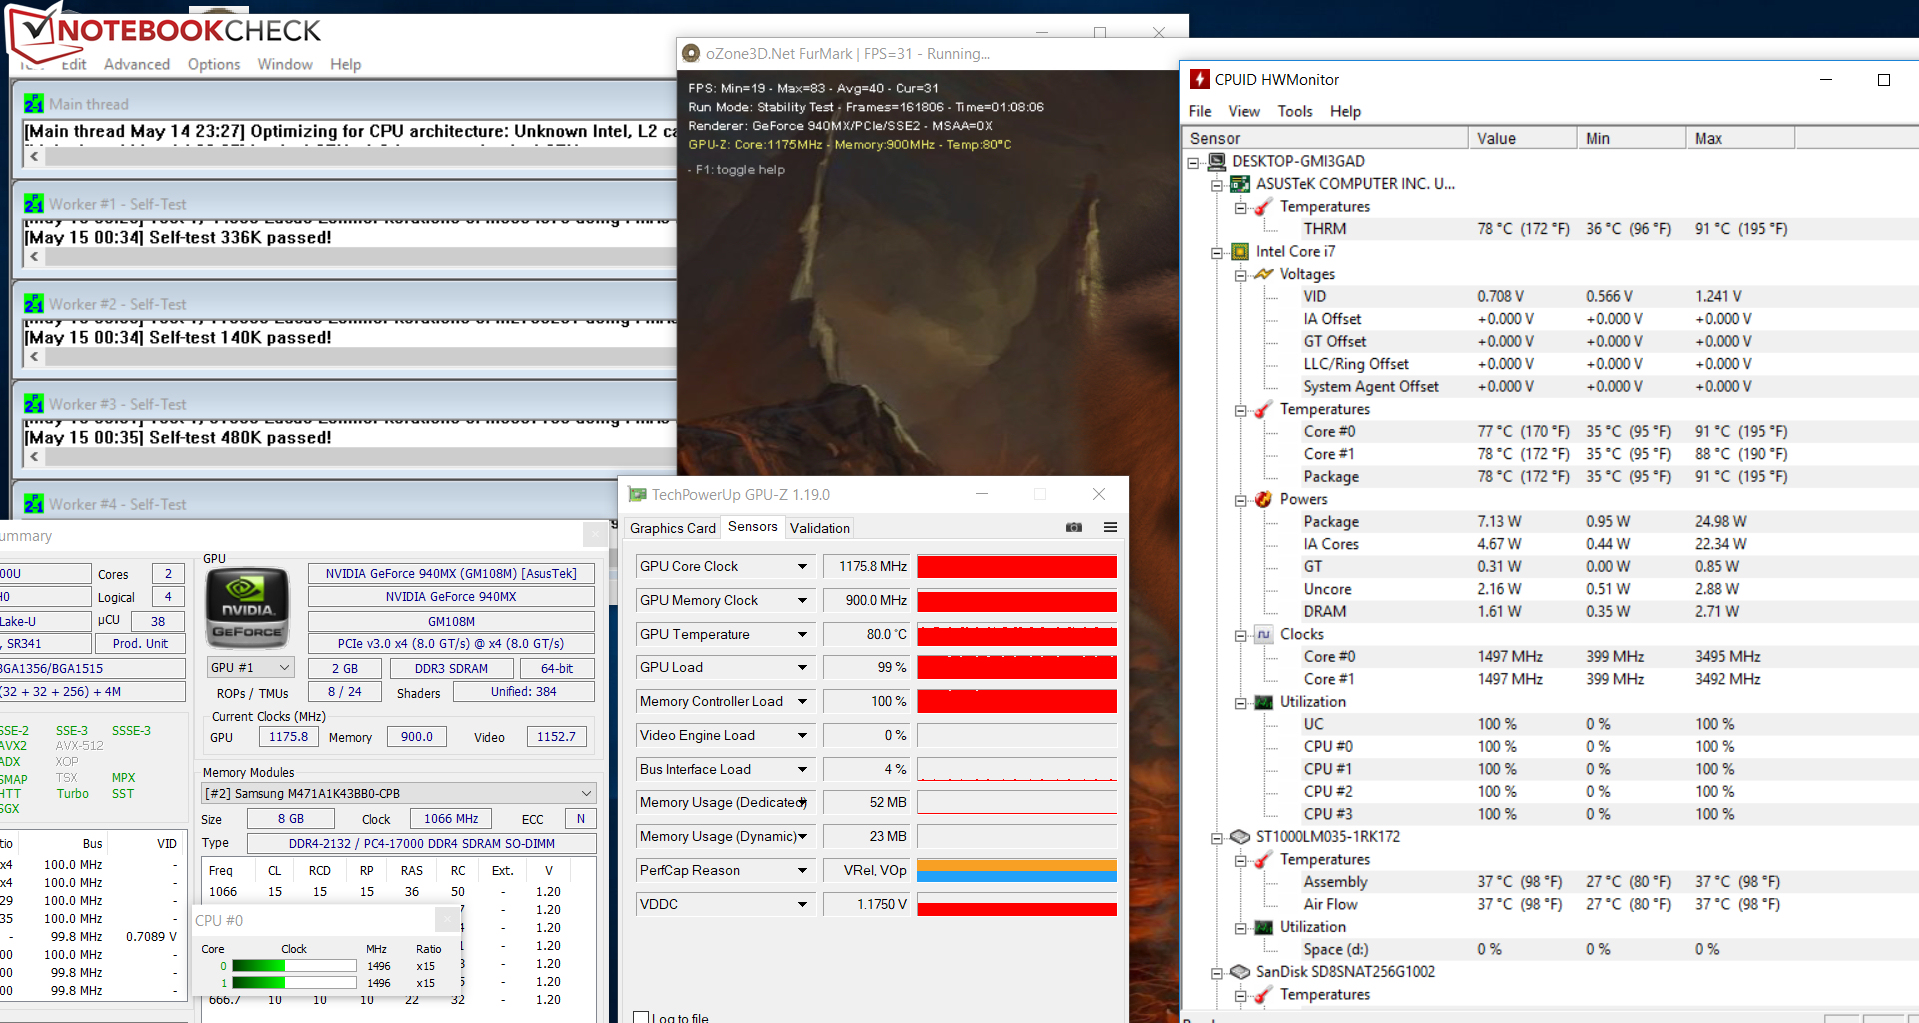
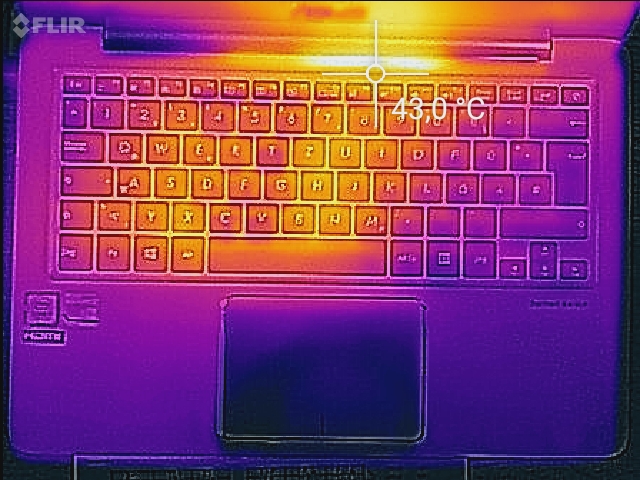
The ZenBook runs through our stress test (Prime95 and FurMark run for at least one hour) in slightly different ways in mains and battery operation. The graphics core always runs at full speed (1176 MHz). In mains operation, the processor begins the stress test at 2.5 GHz. The speed then is lowered rather quickly in steps down to 1.5 - 1.6 GHz and remains at that level. In battery operation, the CPU runs through the stress test mostly at 400 MHz. At times, some individual cores are accelerated up to 3.5 GHz. During the stress test (mains operation), the notebook hardly warms, and at all measured points the temperatures remain below 40 °C (104 °F).
(+) The maximum temperature on the upper side is 34.1 °C / 93 F, compared to the average of 35.9 °C / 97 F, ranging from 21.4 to 59 °C for the class Subnotebook.
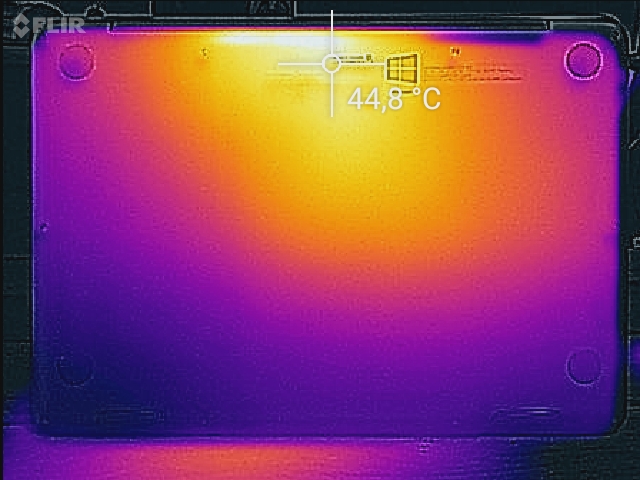
(+) The bottom heats up to a maximum of 38.3 °C / 101 F, compared to the average of 39.3 °C / 103 F
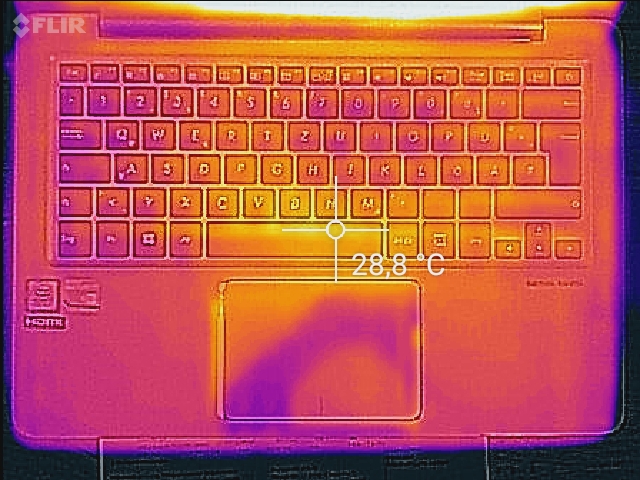
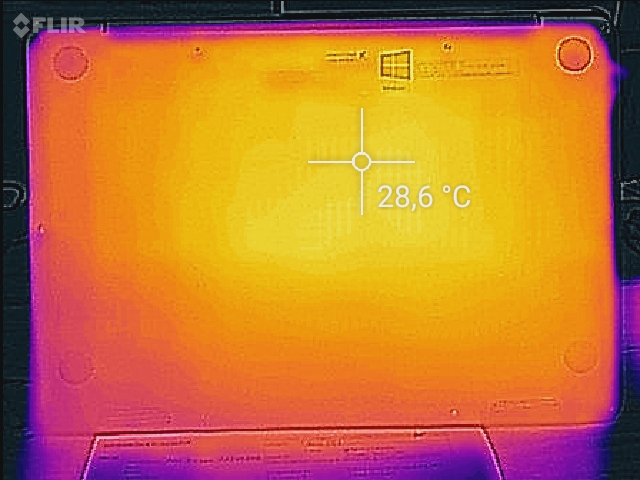
(+) In idle usage, the average temperature for the upper side is 21.4 °C / 71 F, compared to the device average of 30.8 °C / 87 F.
(+) The palmrests and touchpad are cooler than skin temperature with a maximum of 28.2 °C / 82.8 F and are therefore cool to the touch.
(±) The average temperature of the palmrest area of similar devices was 28.2 °C / 82.8 F (0 °C / 0 F).
Speakers
Asus Zenbook UX3410UQ-GV077T audio analysis
(±) | speaker loudness is average but good (73 dB)
Bass 100 - 315 Hz
(±) | reduced bass - on average 12% lower than median
(+) | bass is linear (4.5% delta to prev. frequency)
Mids 400 - 2000 Hz
(±) | higher mids - on average 6.5% higher than median
(+) | mids are linear (6.7% delta to prev. frequency)
Highs 2 - 16 kHz
(+) | balanced highs - only 3.9% away from median
(+) | highs are linear (4.8% delta to prev. frequency)
Overall 100 - 16.000 Hz
(±) | linearity of overall sound is average (17% difference to median)
Compared to same class
» 43% of all tested devices in this class were better, 8% similar, 50% worse
» The best had a delta of 5%, average was 18%, worst was 53%
Compared to all devices tested
» 30% of all tested devices were better, 8% similar, 62% worse
» The best had a delta of 4%, average was 24%, worst was 134%
Apple MacBook 12 (Early 2016) 1.1 GHz audio analysis
(+) | speakers can play relatively loud (83.6 dB)
Bass 100 - 315 Hz
(±) | reduced bass - on average 11.3% lower than median
(±) | linearity of bass is average (14.2% delta to prev. frequency)
Mids 400 - 2000 Hz
(+) | balanced mids - only 2.4% away from median
(+) | mids are linear (5.5% delta to prev. frequency)
Highs 2 - 16 kHz
(+) | balanced highs - only 2% away from median
(+) | highs are linear (4.5% delta to prev. frequency)
Overall 100 - 16.000 Hz
(+) | overall sound is linear (10.2% difference to median)
Compared to same class
» 7% of all tested devices in this class were better, 2% similar, 91% worse
» The best had a delta of 5%, average was 18%, worst was 53%
Compared to all devices tested
» 4% of all tested devices were better, 1% similar, 94% worse
» The best had a delta of 4%, average was 24%, worst was 134%
Frequency diagram in comparison (checkboxes above can be checked/un-checked!)
Power Management
Power Consumption
While idling, we measured a maximum power consumption of 7.1 Watts - a good value. During the stress test, the power consumption rises to 65 watts. Since the operating speed of the CPU decreases quickly, the power consumption decreases as well. The power supply is rated at 65 watts.
| Off / Standby | |
| Idle | |
| Load |
|
Key:
min: | |
Battery Life
Our practically relevant WLAN test simulates the load when opening web pages. The "balanced" profile is active, the power saving functions are deactivated, and the display brightness is adjusted to about 150 cd/m². The ZenBook achieves a runtime of 8:31 h. This is on the same level as its 13.3-inch sibling model. However, it lasts for about 90 minutes longer than the 14-inch ZenBook UX3410UA sibling, which does not have dedicated graphics.
Verdict
Pros
Cons
Asus has equipped the ZenBook with a Core-i7 processor of the Kaby-Lake generation. In combination with the GeForce 940MX graphics core, the computer offers sufficient power even for applications beyond the office and Internet. The built-in GeForce graphics core is the main difference compared to the ZenBook UX3410UA that we have already tested, which does not have a dedicated GPU.
You might be concerned that the additional graphics core would lead to an increased noise development and decreased battery life. We cannot confirm this.
Overall, the UX3410UQ operates more quietly than the UX3410UA and achieves a better runtime in our practically relevant WLAN test.
A solid-state drive assures a fast running system. In addition, there is a conventional 2.5-inch hard-drive (1 TB) serving as data storage. Both of the storage media can be switched. However, to do that, you will have to open the case. The matte IPS display pleases with high brightness and contrast and stable viewing angles.
Asus Zenbook UX3410UQ-GV077T
- 05/17/2017 v6 (old)
Sascha Mölck
Price comparison
