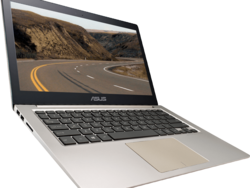
Asus Zenbook UX303UB-DH74T Notebook Review
Asus was one of the first manufacturers in line to launch the Ultrabook platform back in 2011 with the Zenbook UX31E. Now, over four years later, the Zenbook series continues to live strong with some of the more popular Ultrabooks under its belt.
We've tested our fair share of the ever-expanding Zenbook UX303 series with a handful of those pages listed below. Today's model is the QHD SKU of the last UX303 we published earlier last month. Does the new resolution bring any changes to the table?
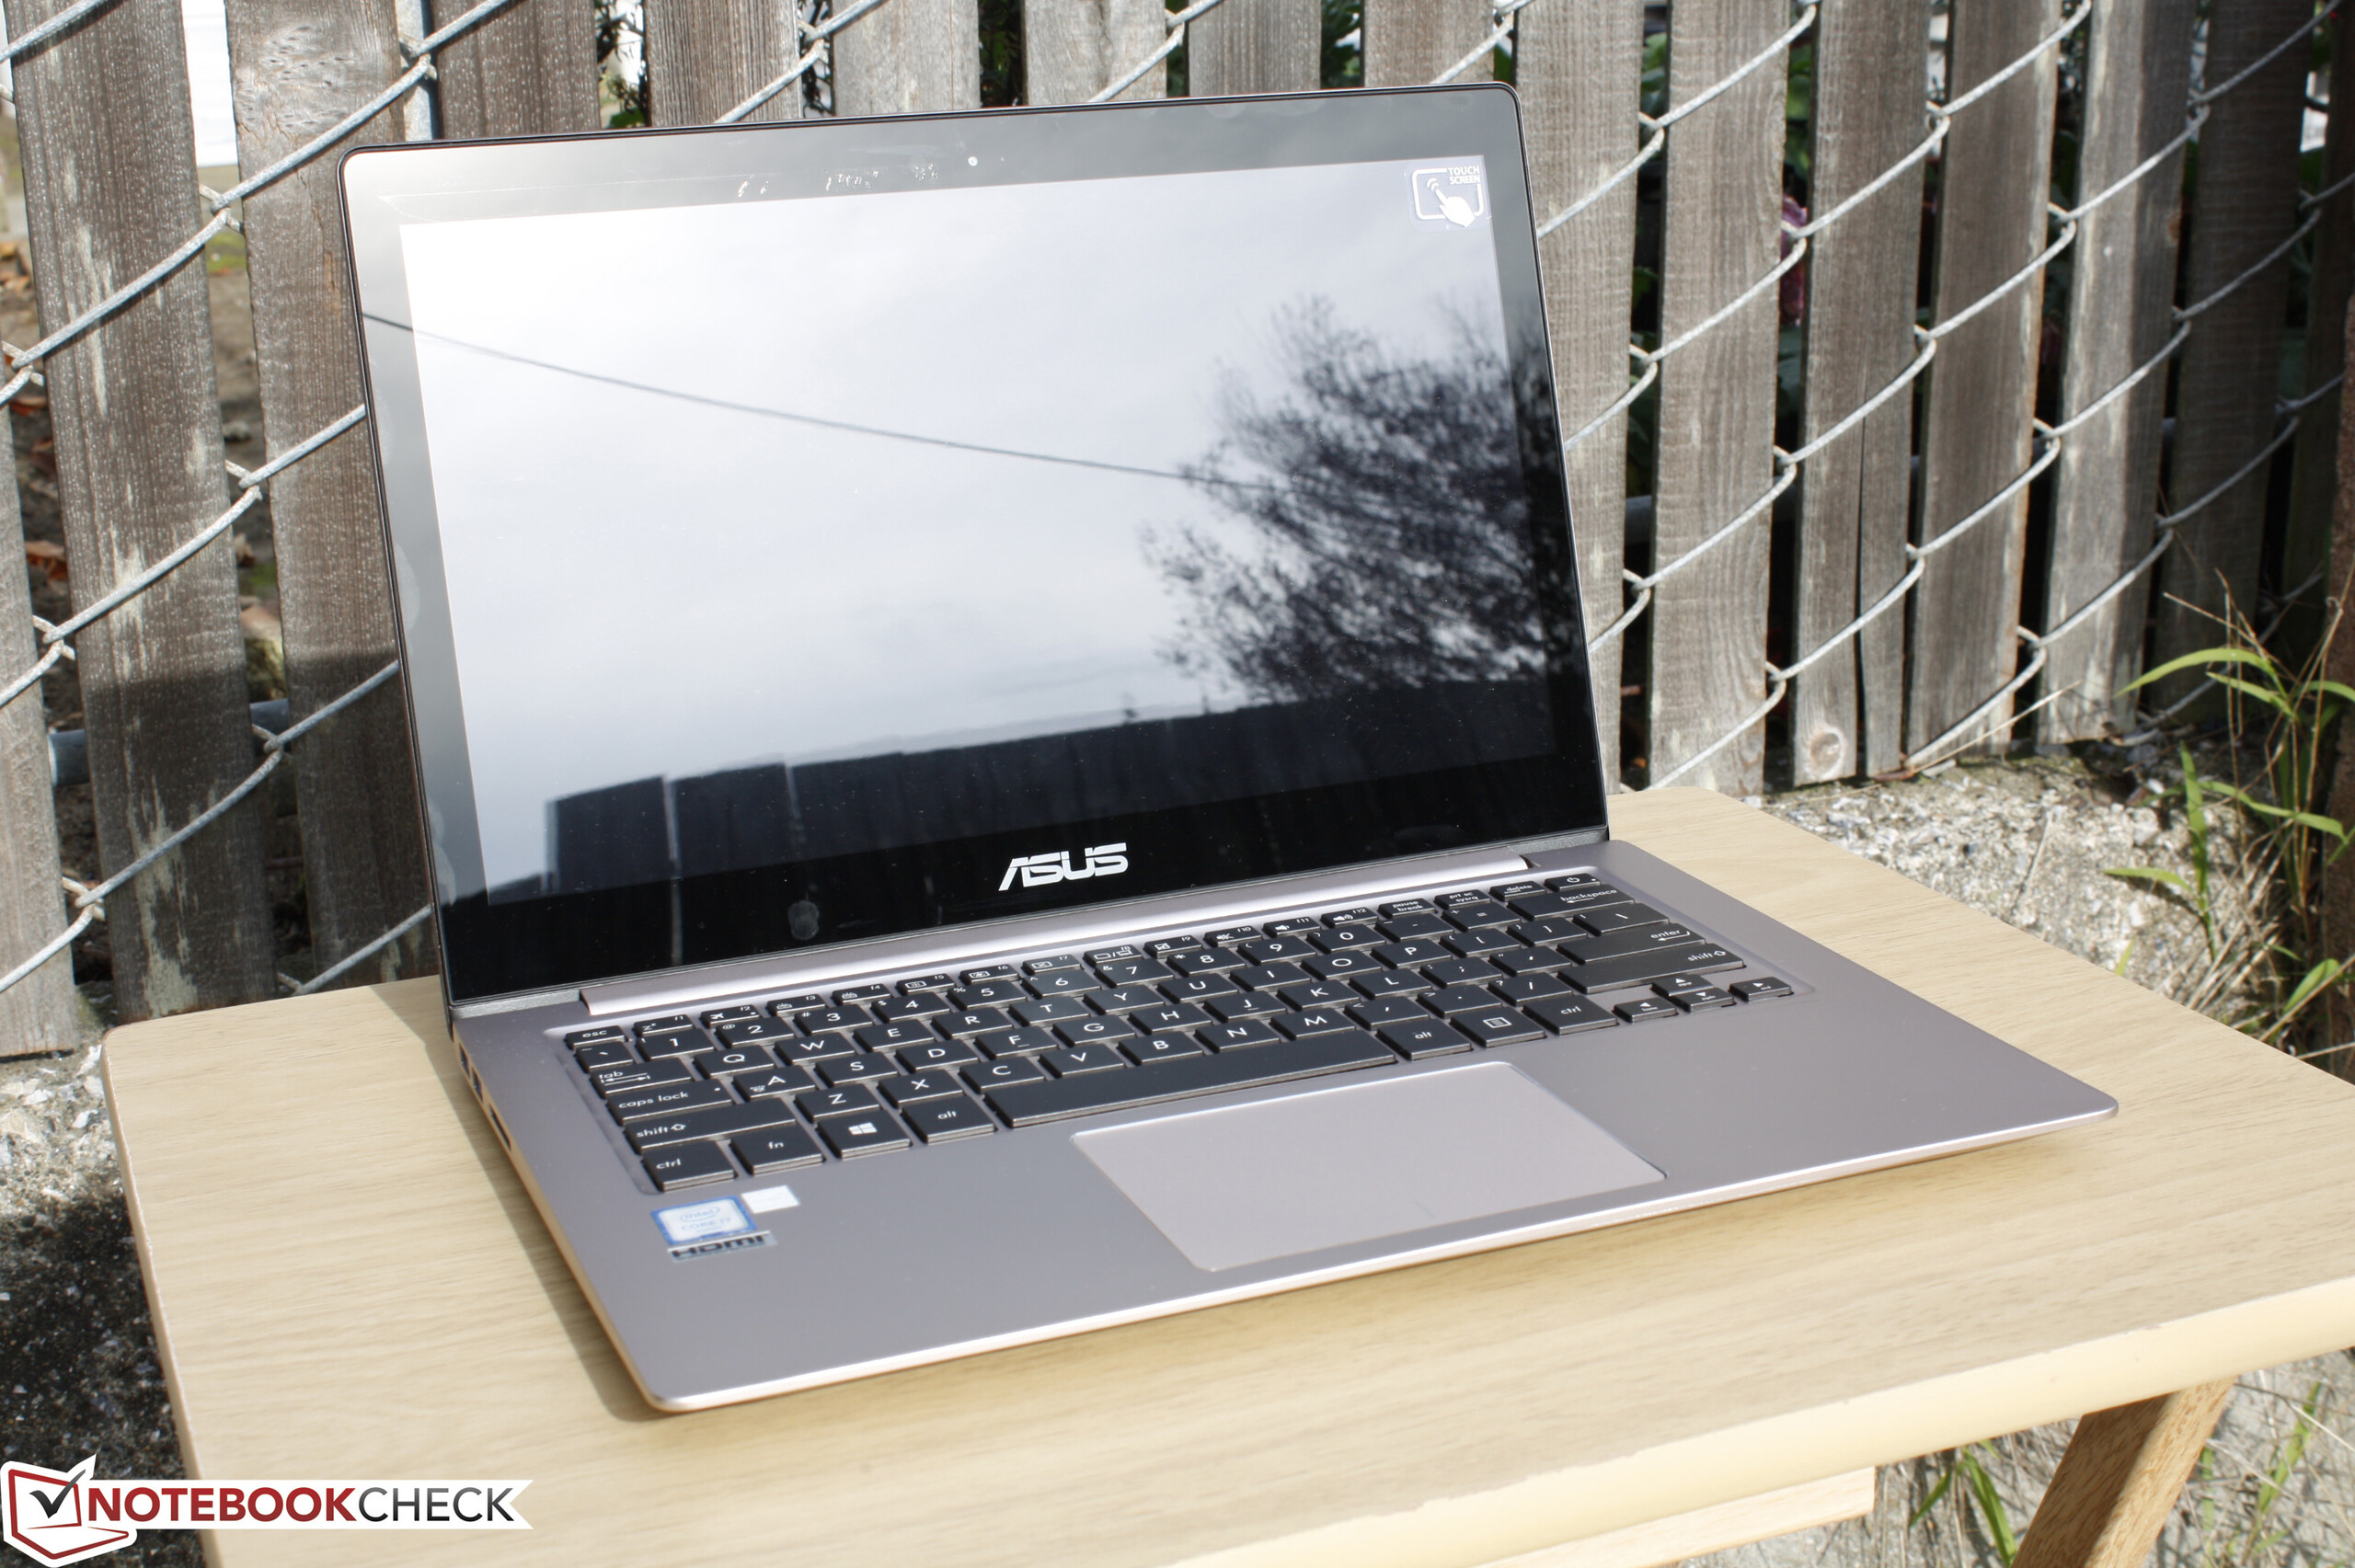
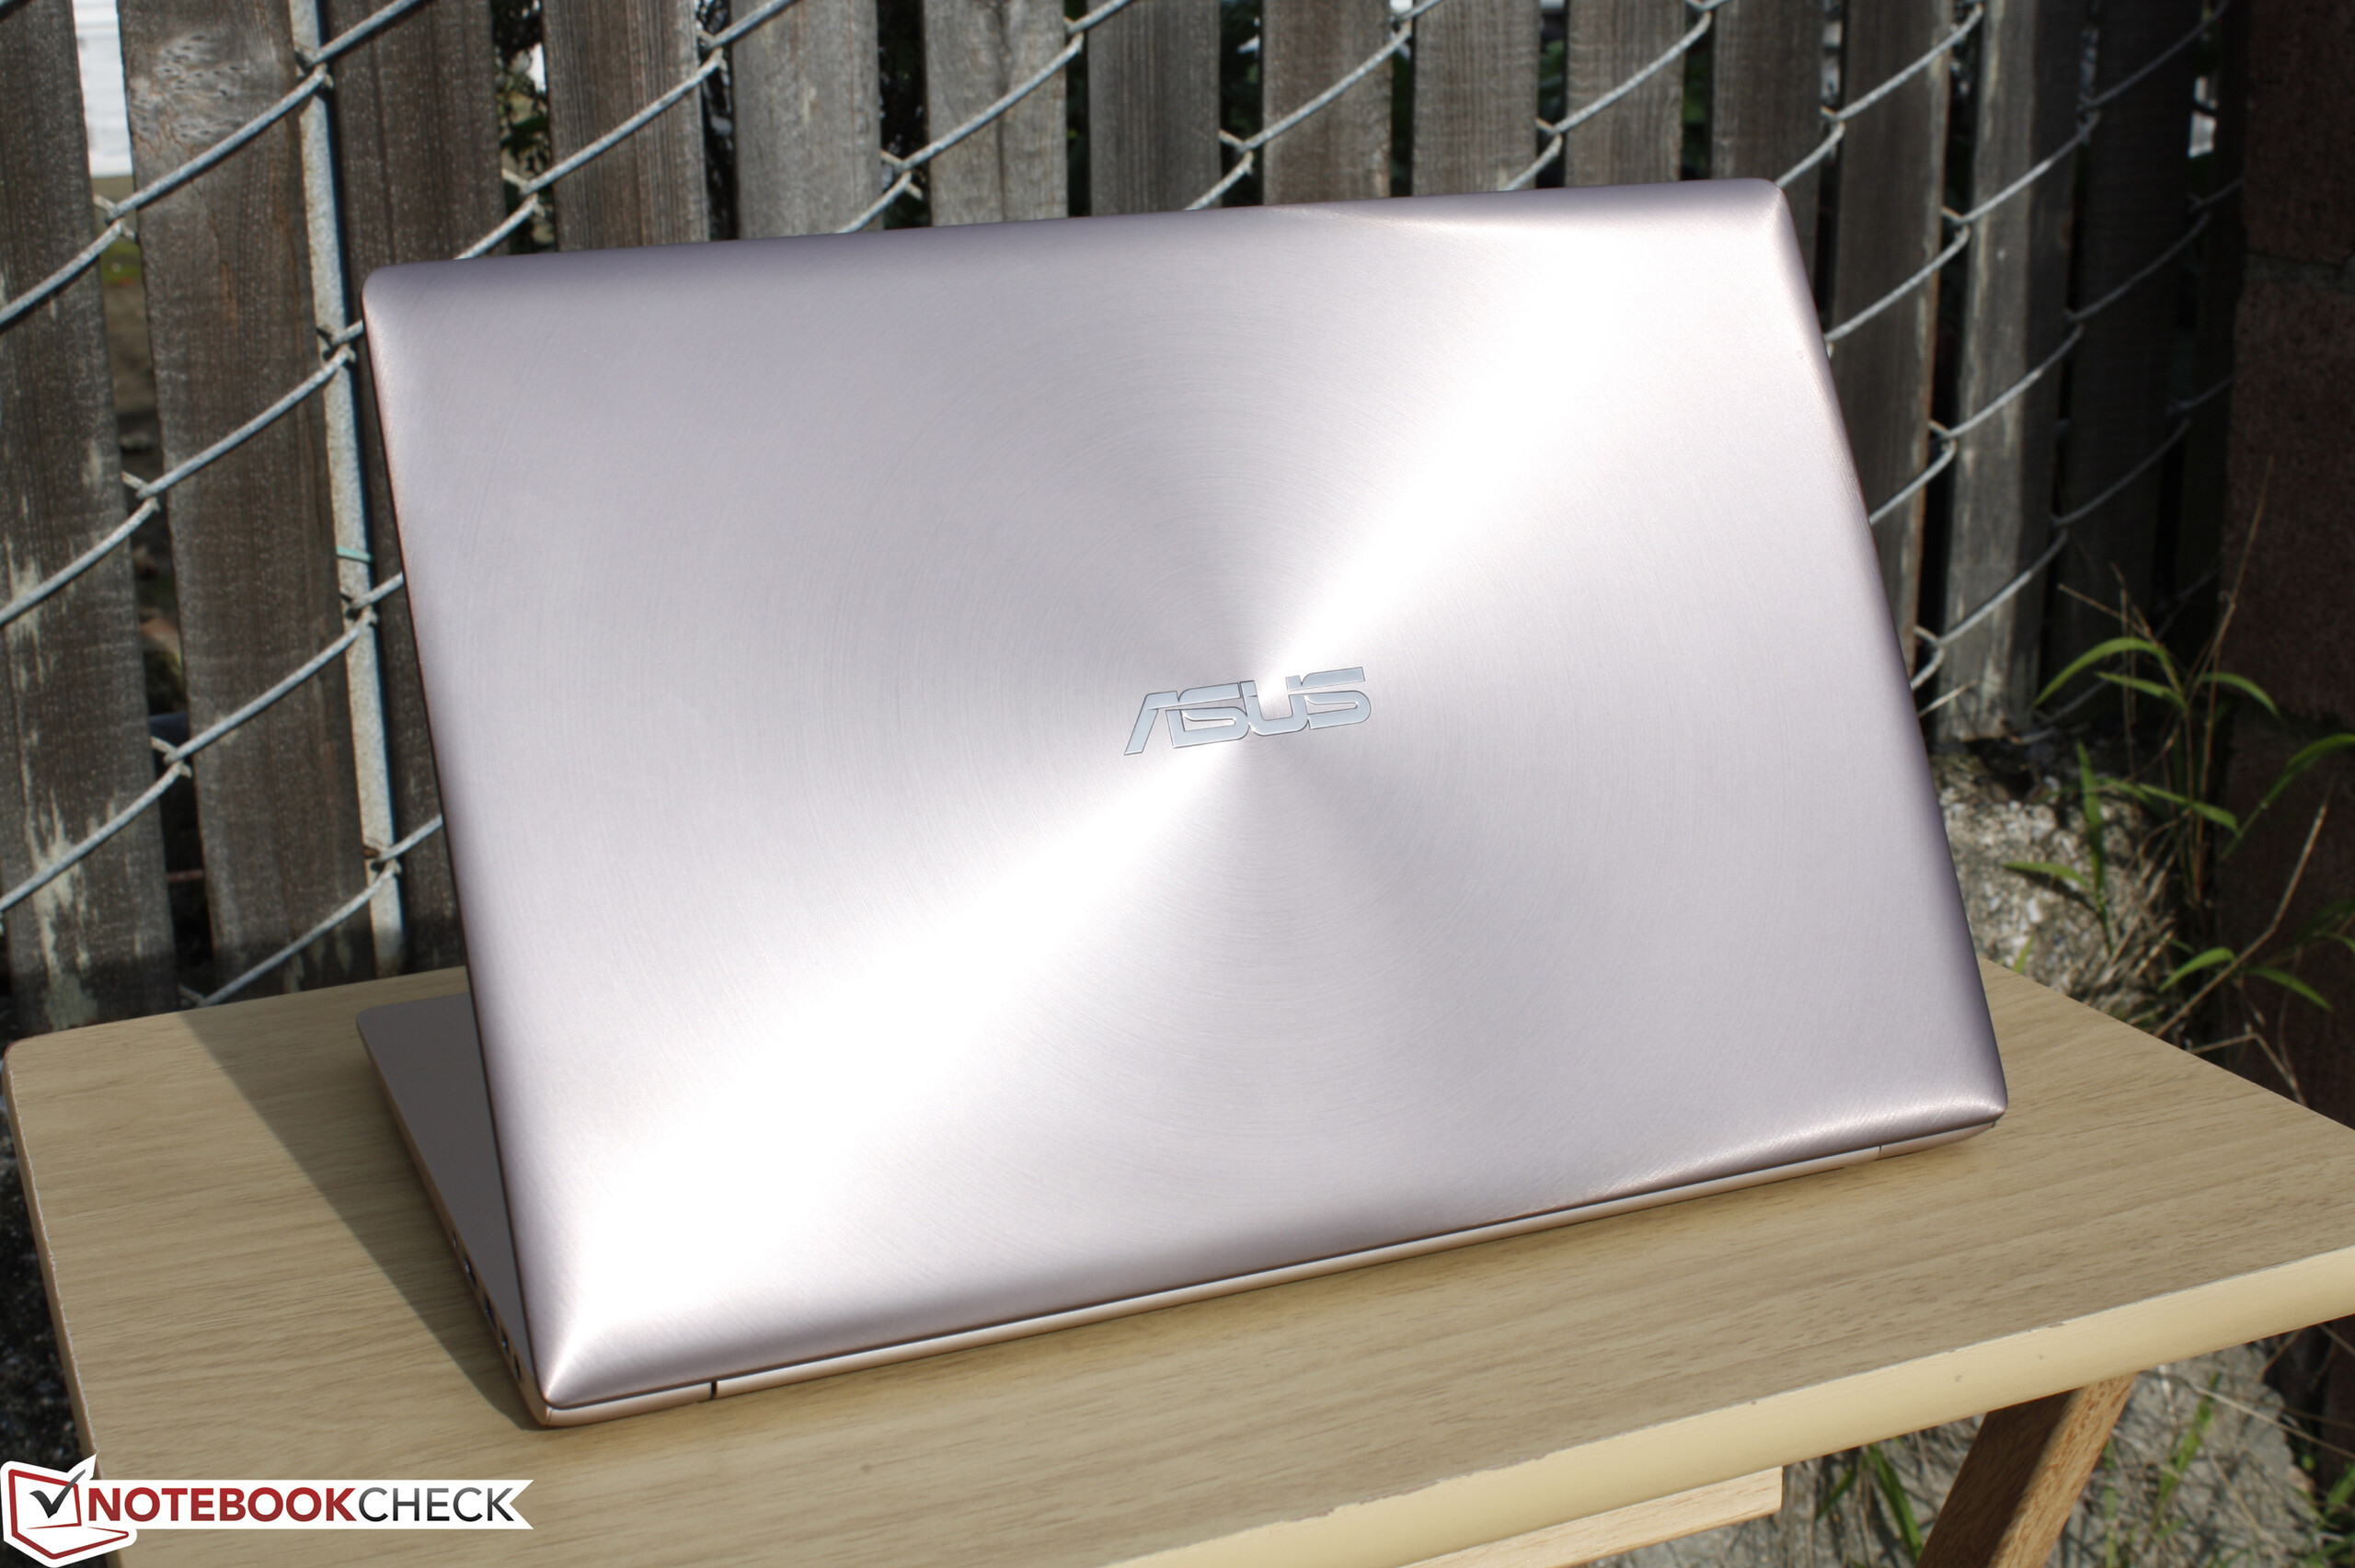
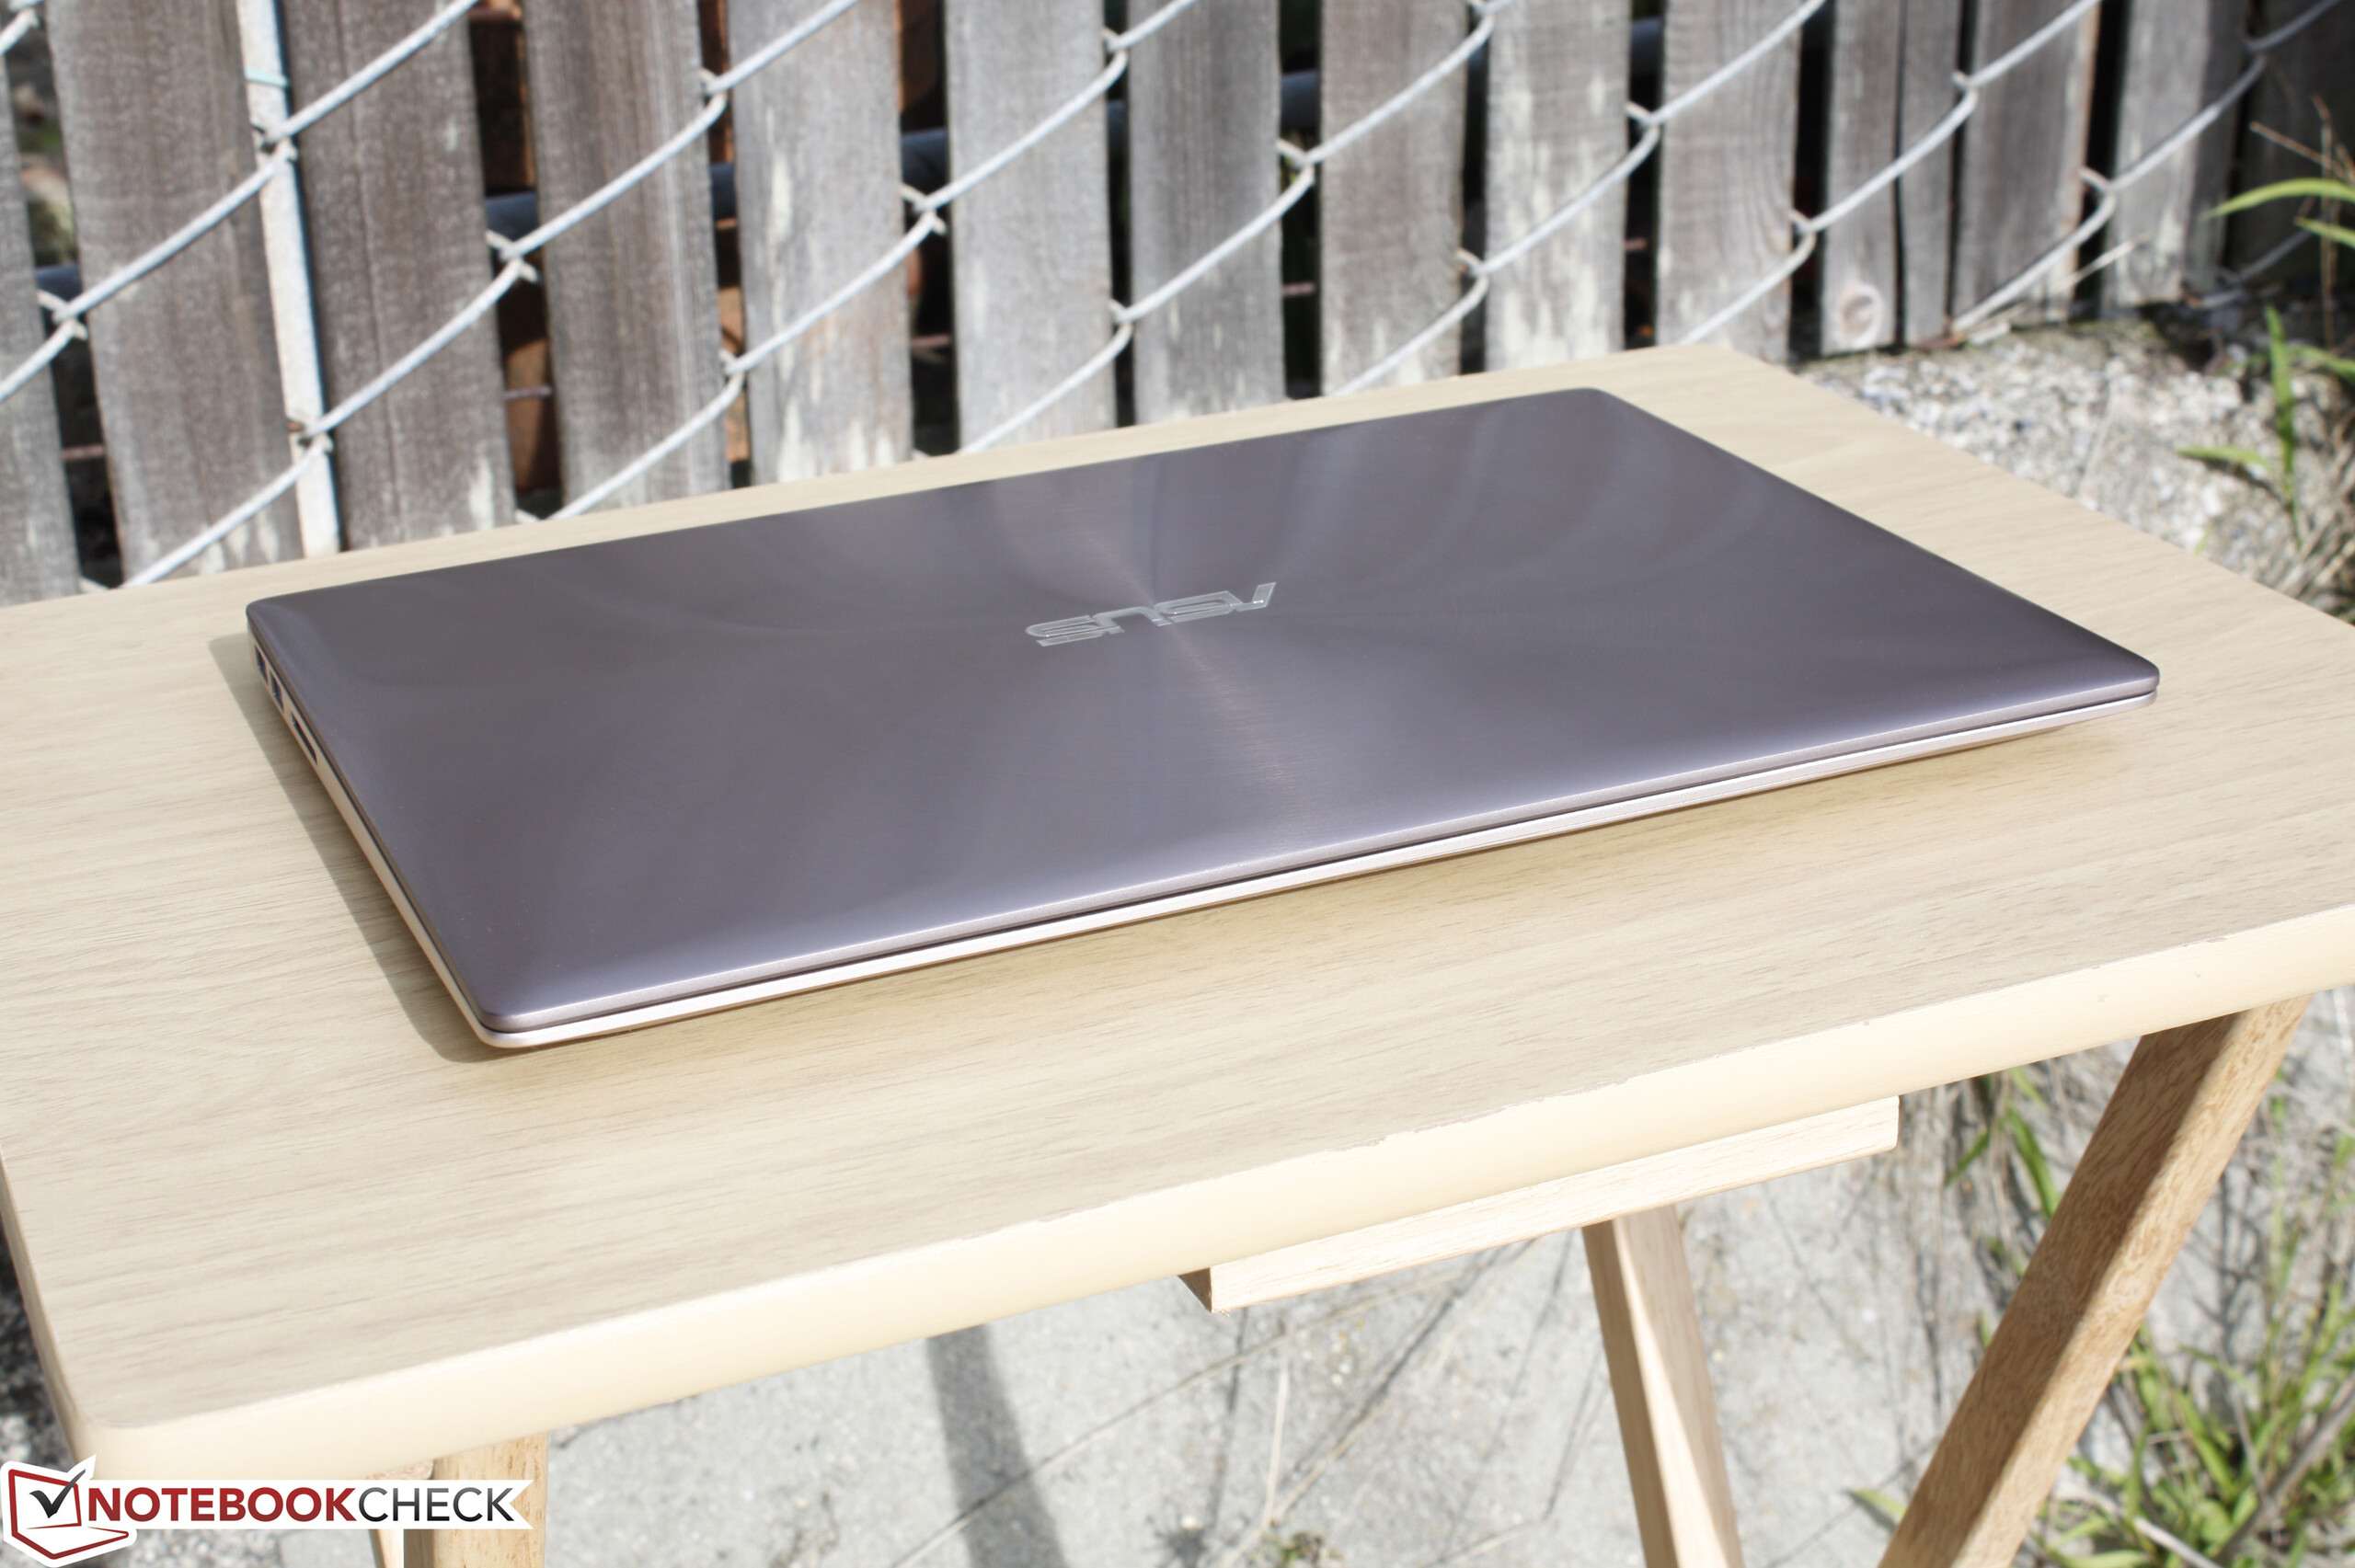
Case
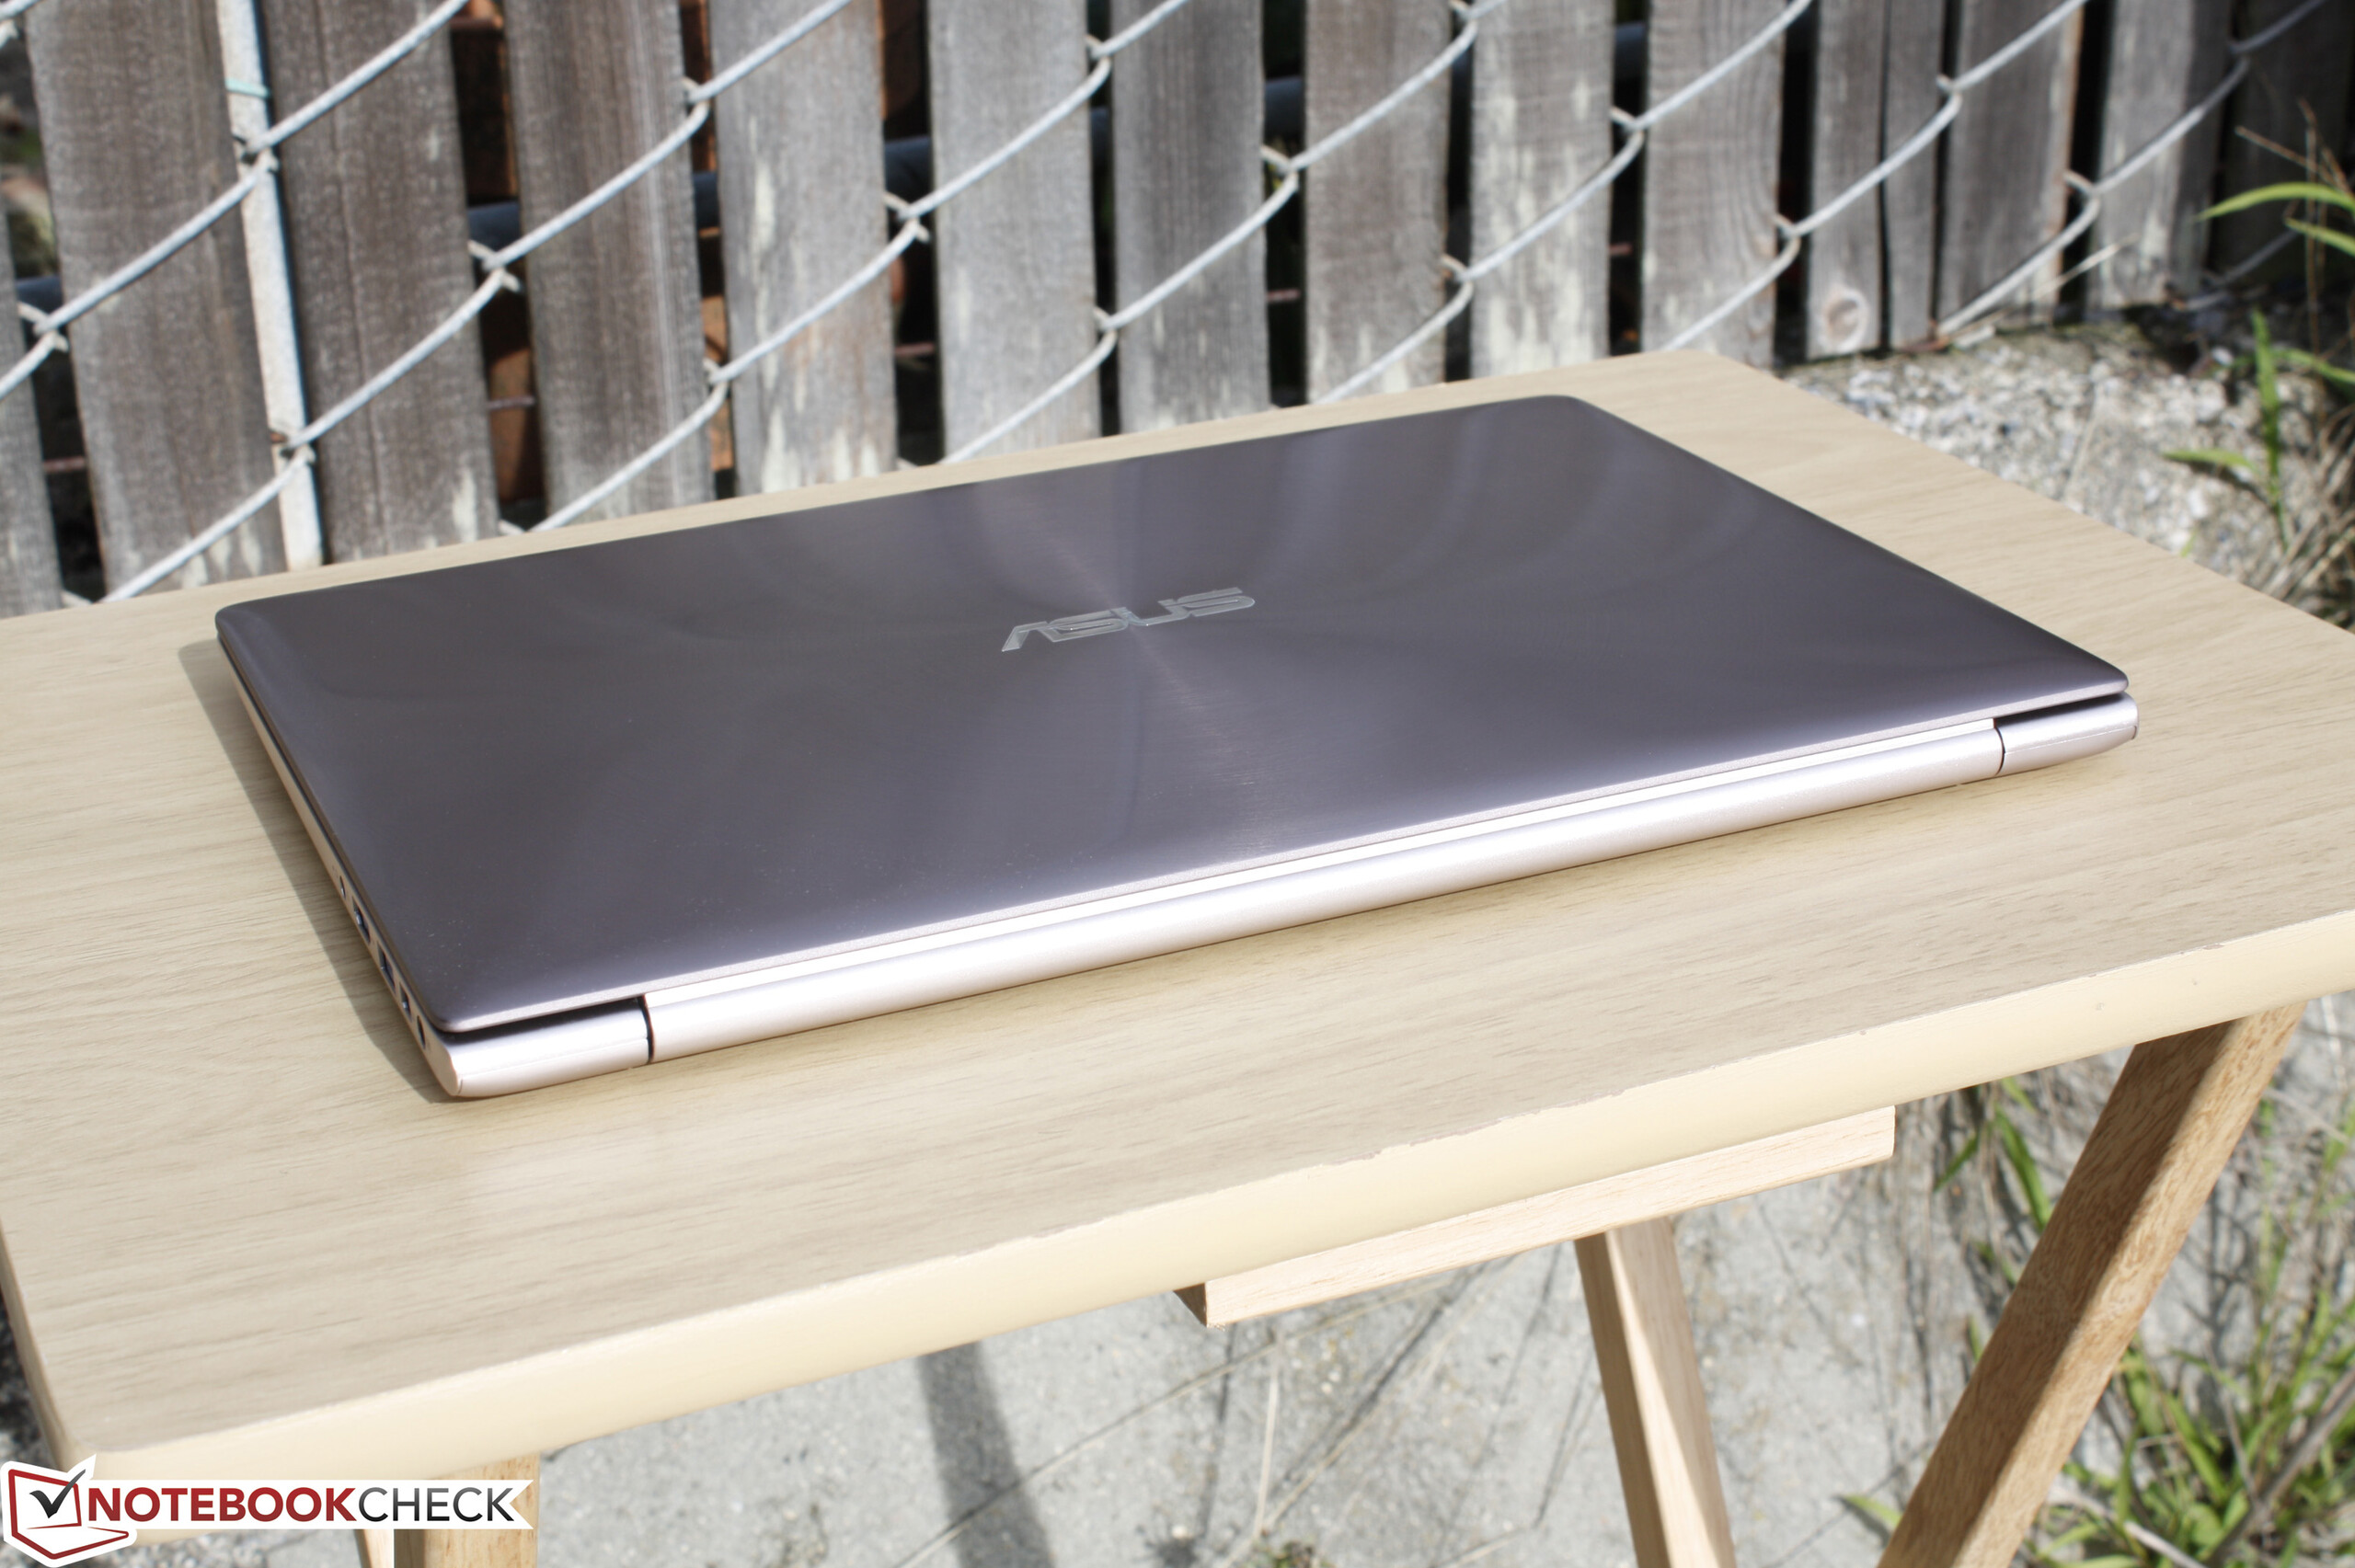
We refer to our previous reviews for our comments on case quality and construction on the UX303. Instead, we'll mention here that this particular Zenbook is thicker than most other recent 13-inch offerings including the Dell XPS 13, HP Spectre x360, and the recent Lenovo Yoga 900. The Asus is also heavier by over 200 grams compared to the Dell and Lenovo and 50 grams compared to the HP. In turn, the UX303 includes dedicated Nvidia graphics for superior graphics performance than most other Ultrabooks.
Connectivity
Connectivity features remain identical to the UX303LN. It's still worth noting that the system includes dual video-out options, which is not common for its size class. Asus will likely include USB Type-C should the manufacturer unveil a complete redesign of the series in the future.


Communication
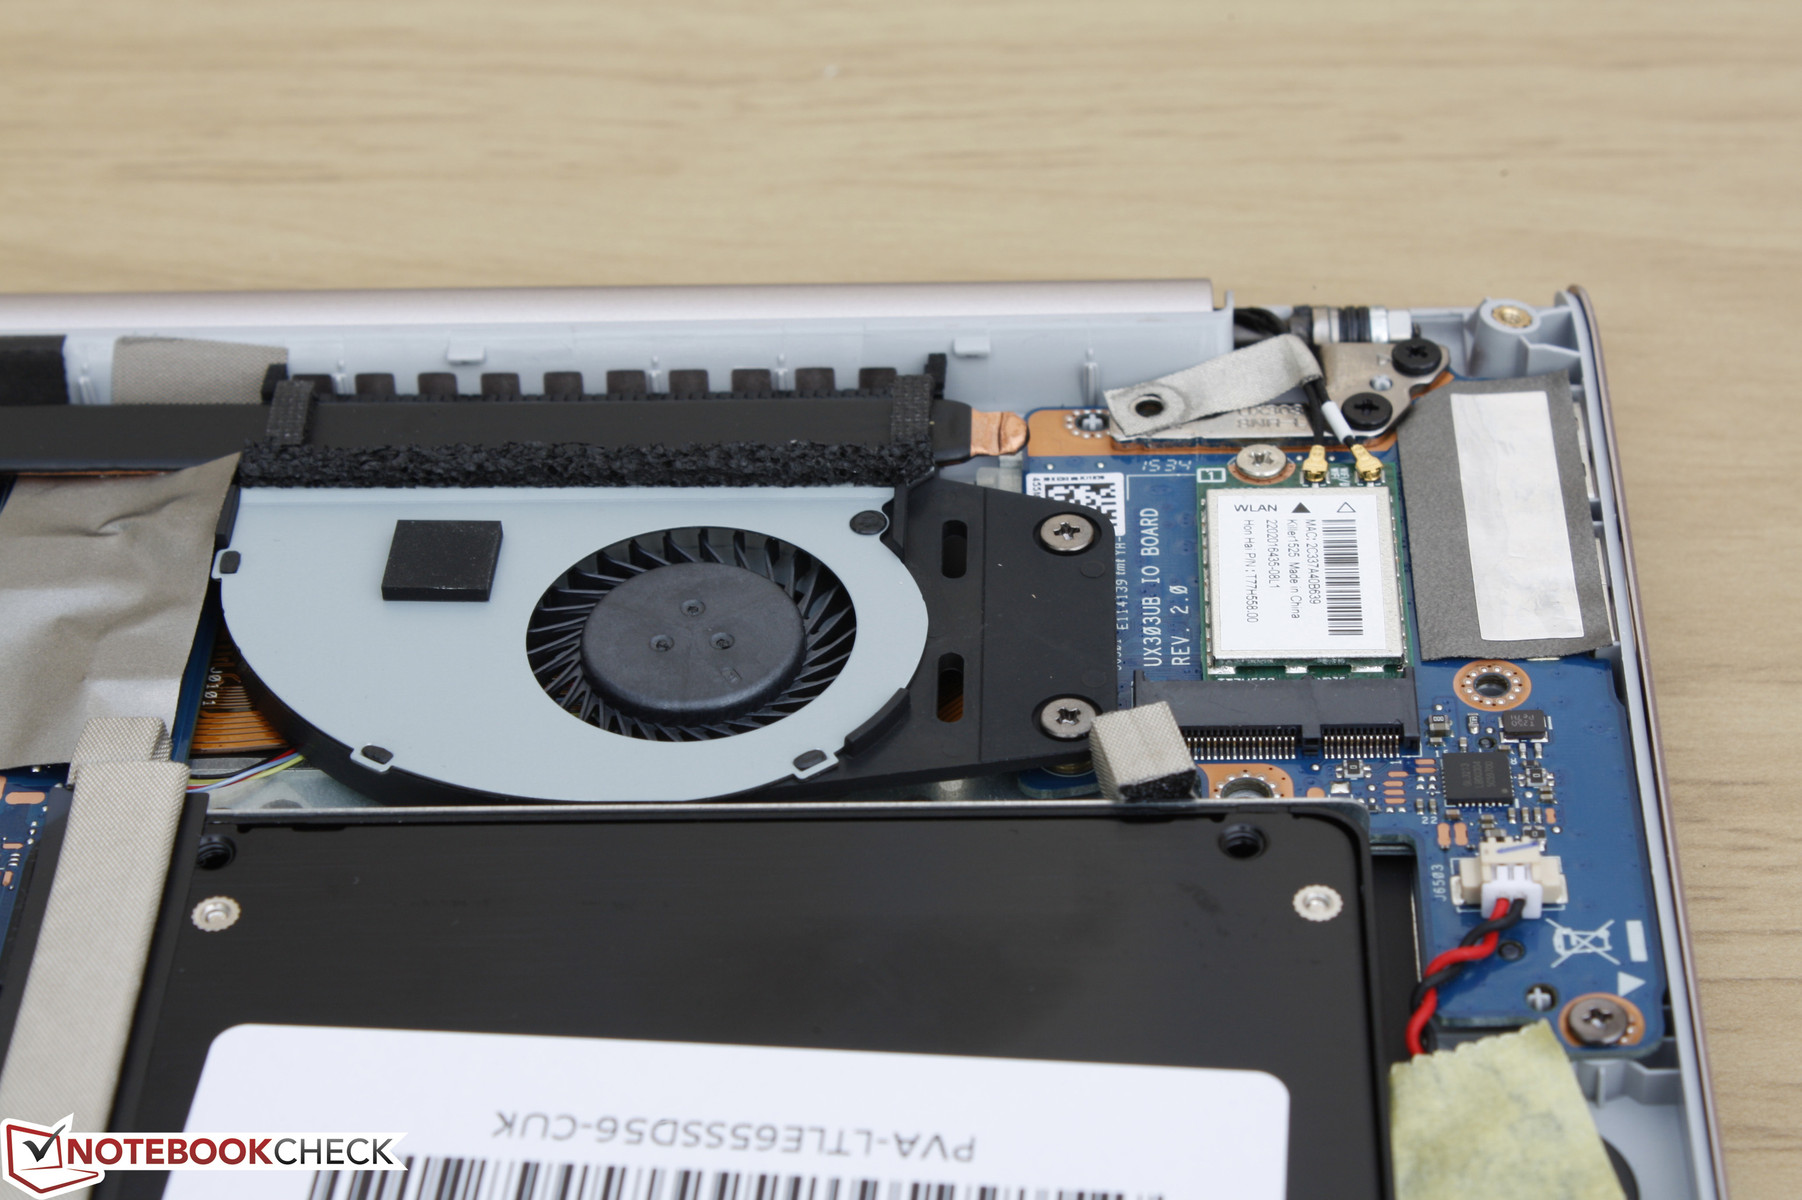
Wireless is outfitted with a dual-band Qualcomm Killer 1525 M.2 NGFF adapter and promises theoretical transfer rates of up to 867 Mbps. Less costly UX303 SKUs may sport an Intel adapter instead, though all configurations should be 802.11ac compatible. We experienced no latency or dropout issues during our time with the test model.
Accessories
Included extras are a protective case, cable tie, screen wipe, mDP-VGA adapter, and USB-Ethernet adapter. There are more extras here than what most other manufacturers offer as standard with their Ultrabooks. Note that the USB-Ethernet adapter is fast Ethernet only and does not provide Gigabit speeds.
Maintenance
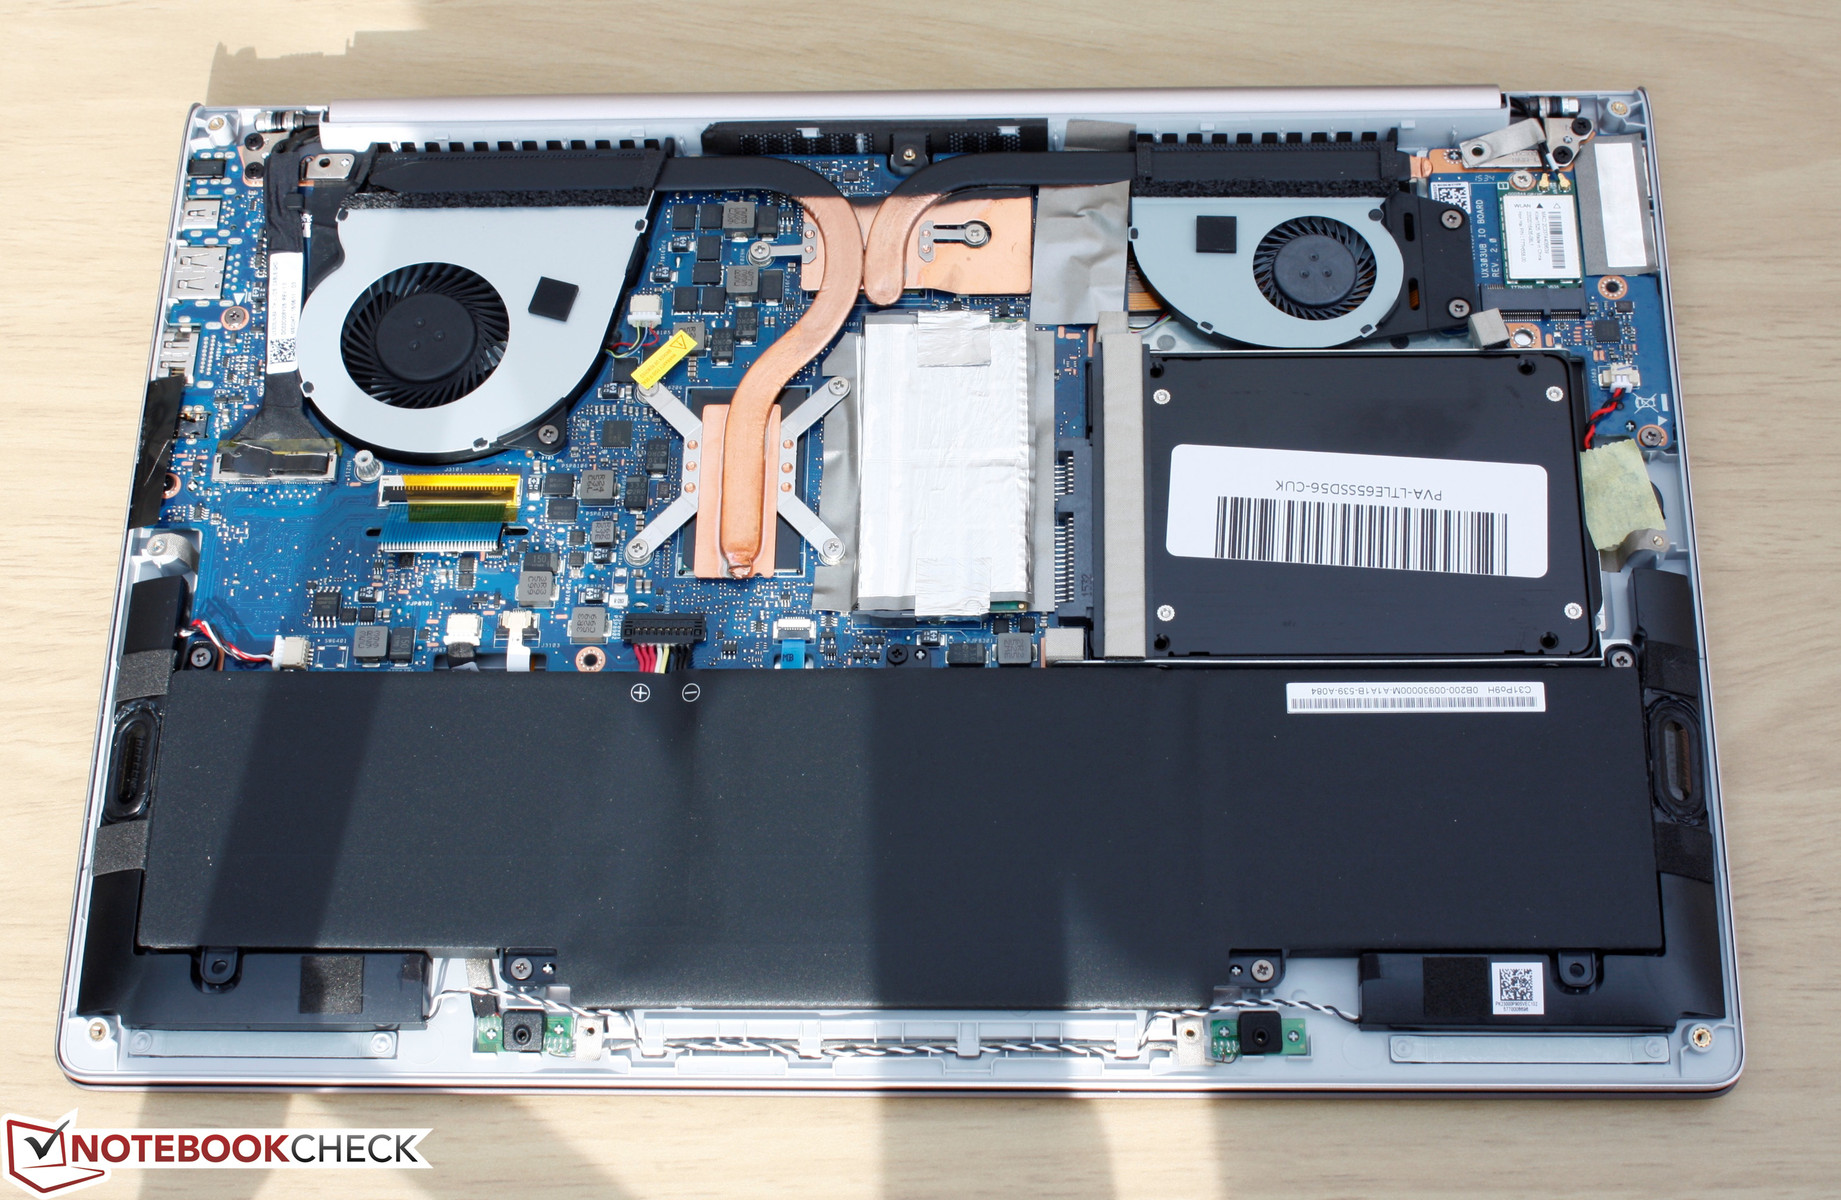
The bottom panel is easy to remove provided that you have both Torx and Philips screwdrivers. There are two additional screws hidden underneath the rear rubber footing, which can be difficult to remove. Users are otherwise granted full access to the dual system fans, M.2 slot, single SODIMM slot, 2.5-inch bay, battery, and cooling system.
CUKUSA provides a detailed disassembly manual with step-by-step instructions and images for the UX303UB.
Warranty
Aside from the standard 12-month manufacturer warranty, additional warranty options are available from reseller CUKUSA for up to three years with diagnostic support via phone or email.
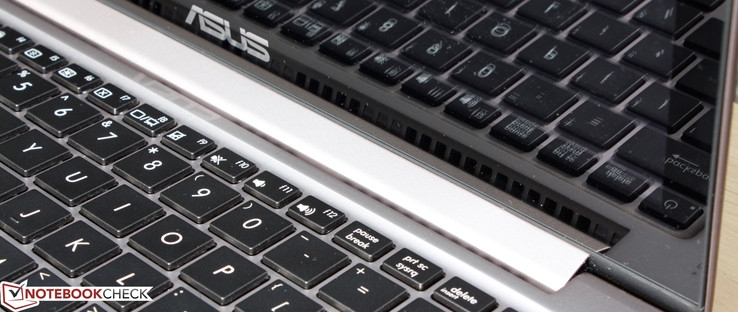
Input Devices
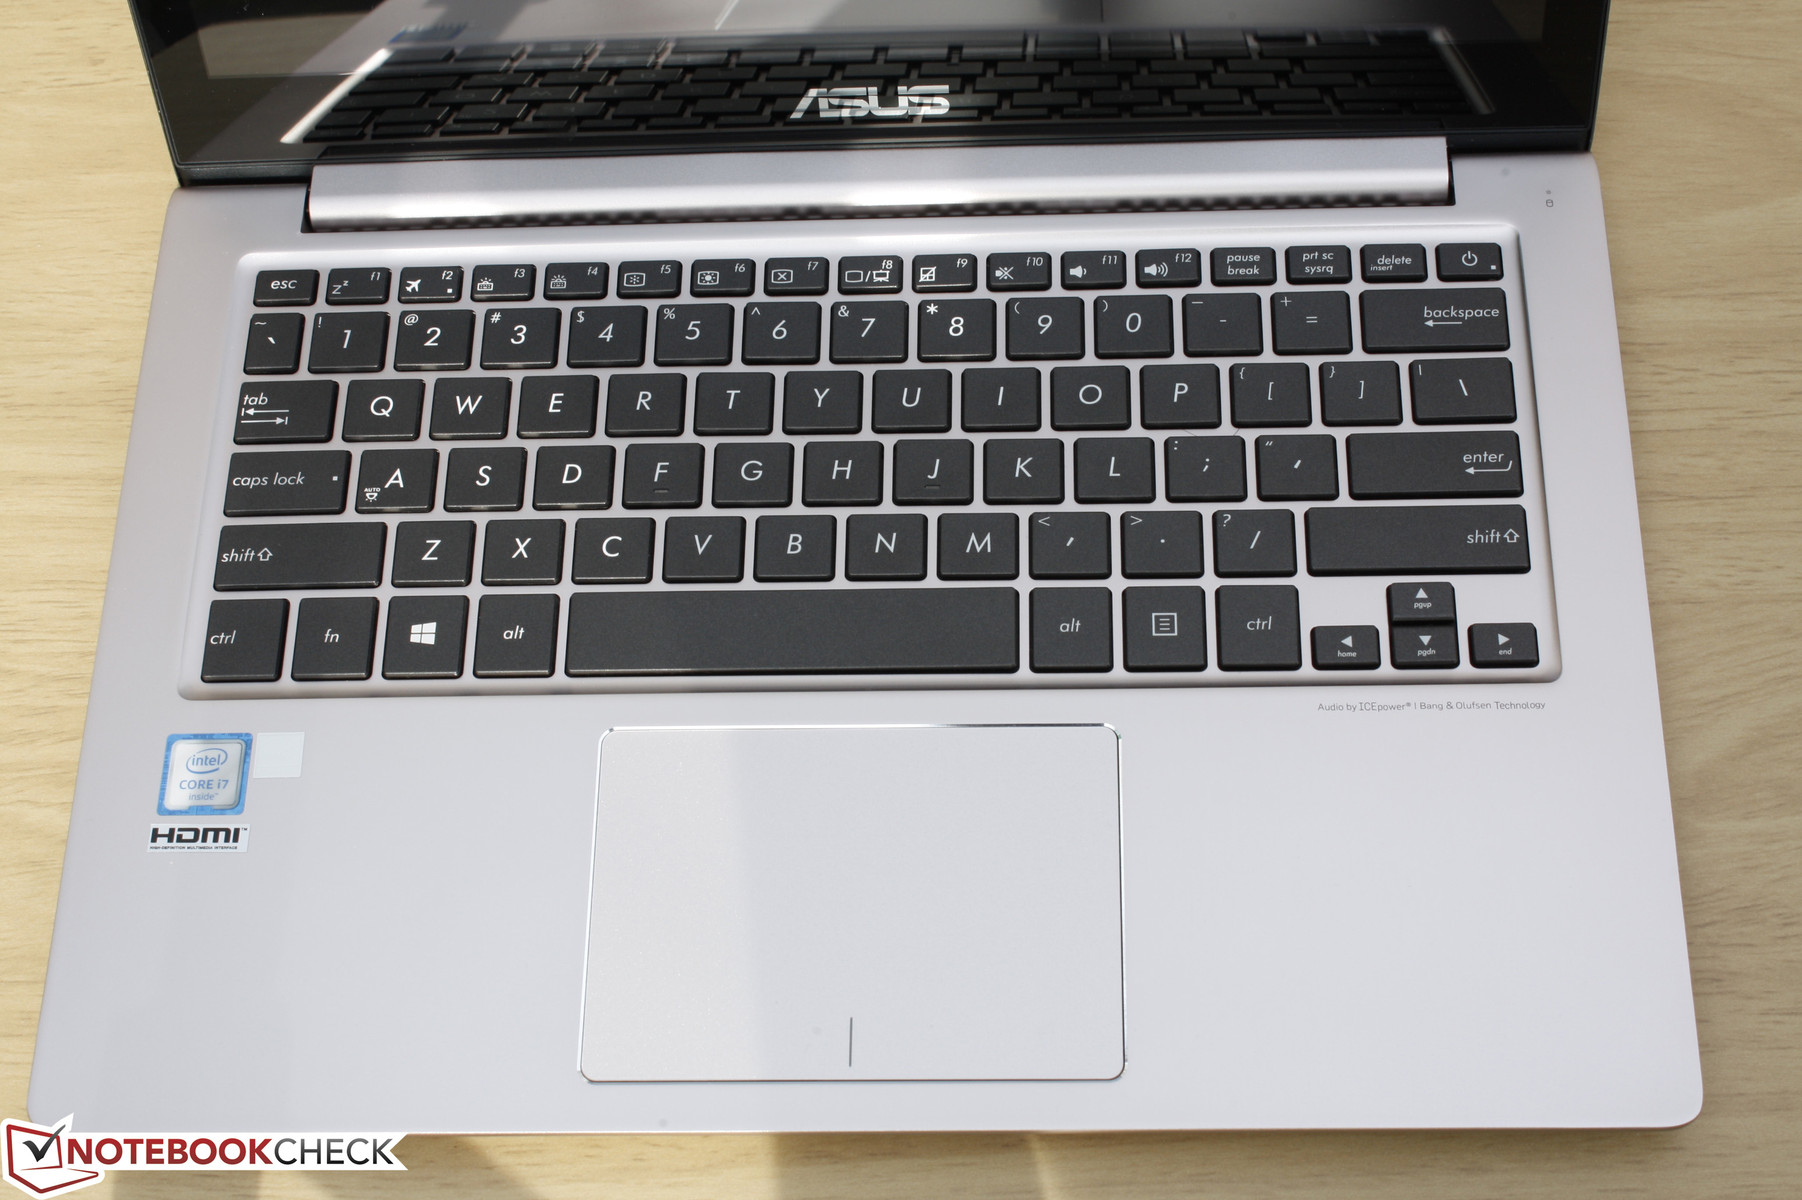
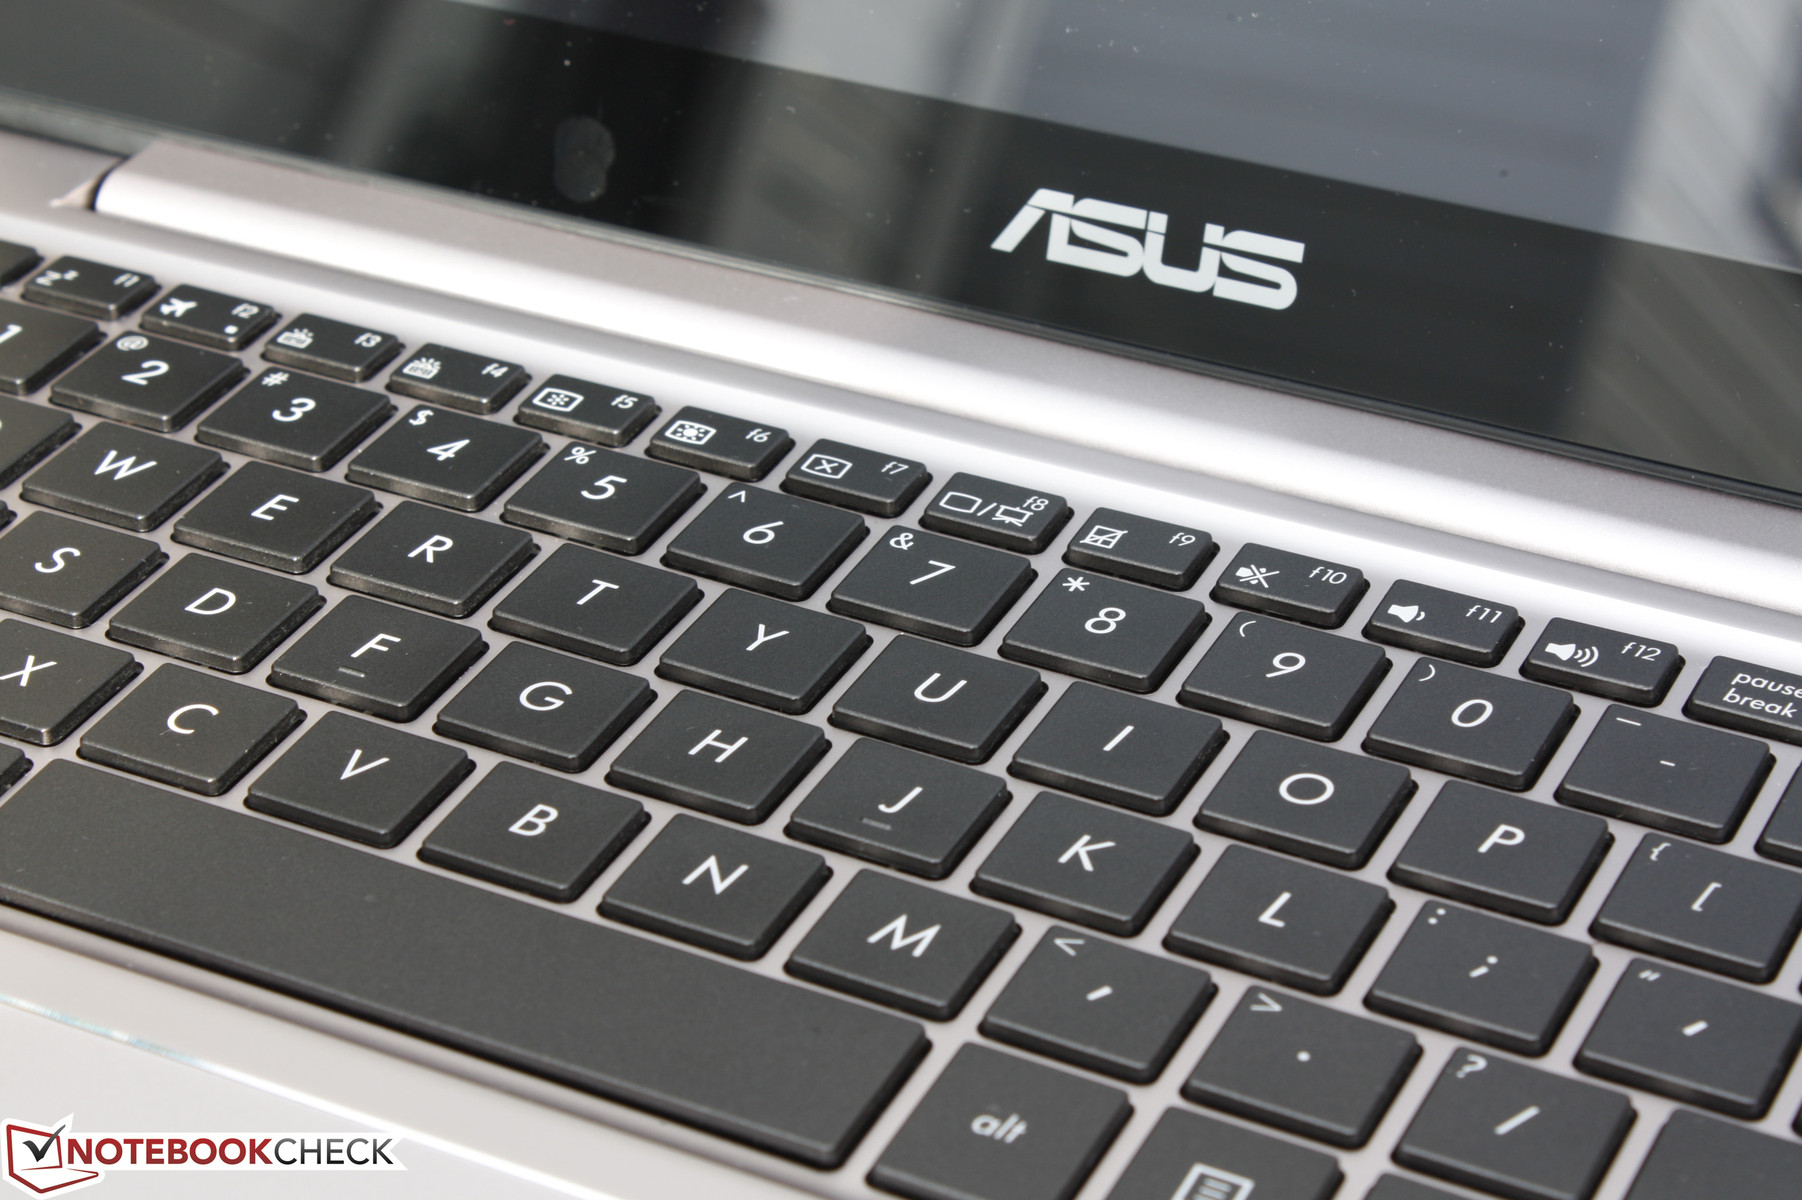
The backlit keyboard and touchpad have been largely untouched since the old UX32 days. The touchpad is now slightly larger (10.5 x 7.5 cm), but still feels nearly identical with very firm feedback from the integrated mouse keys. Travel and feedback from the keyboard keys are good for an Ultrabook especially when compared to the Samsung Series 9 notebooks. Still, the right half of the keyboard surface warps slightly more easily to pressure than the left.
Display
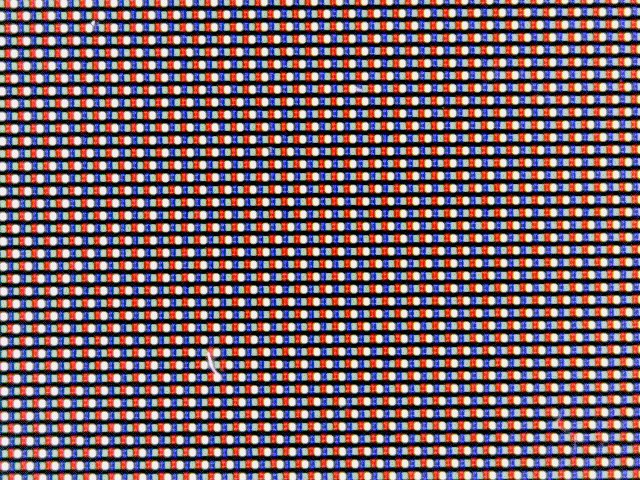
With a PPI of 276, there's no arguing that the QHD panel on the Asus is gorgeous. Texts and images are extraordinarily crisp and the touchscreen only adds to the fun factor. Its Samsung 133YL03-P01 panel is not found on any other notebook currently in our database.
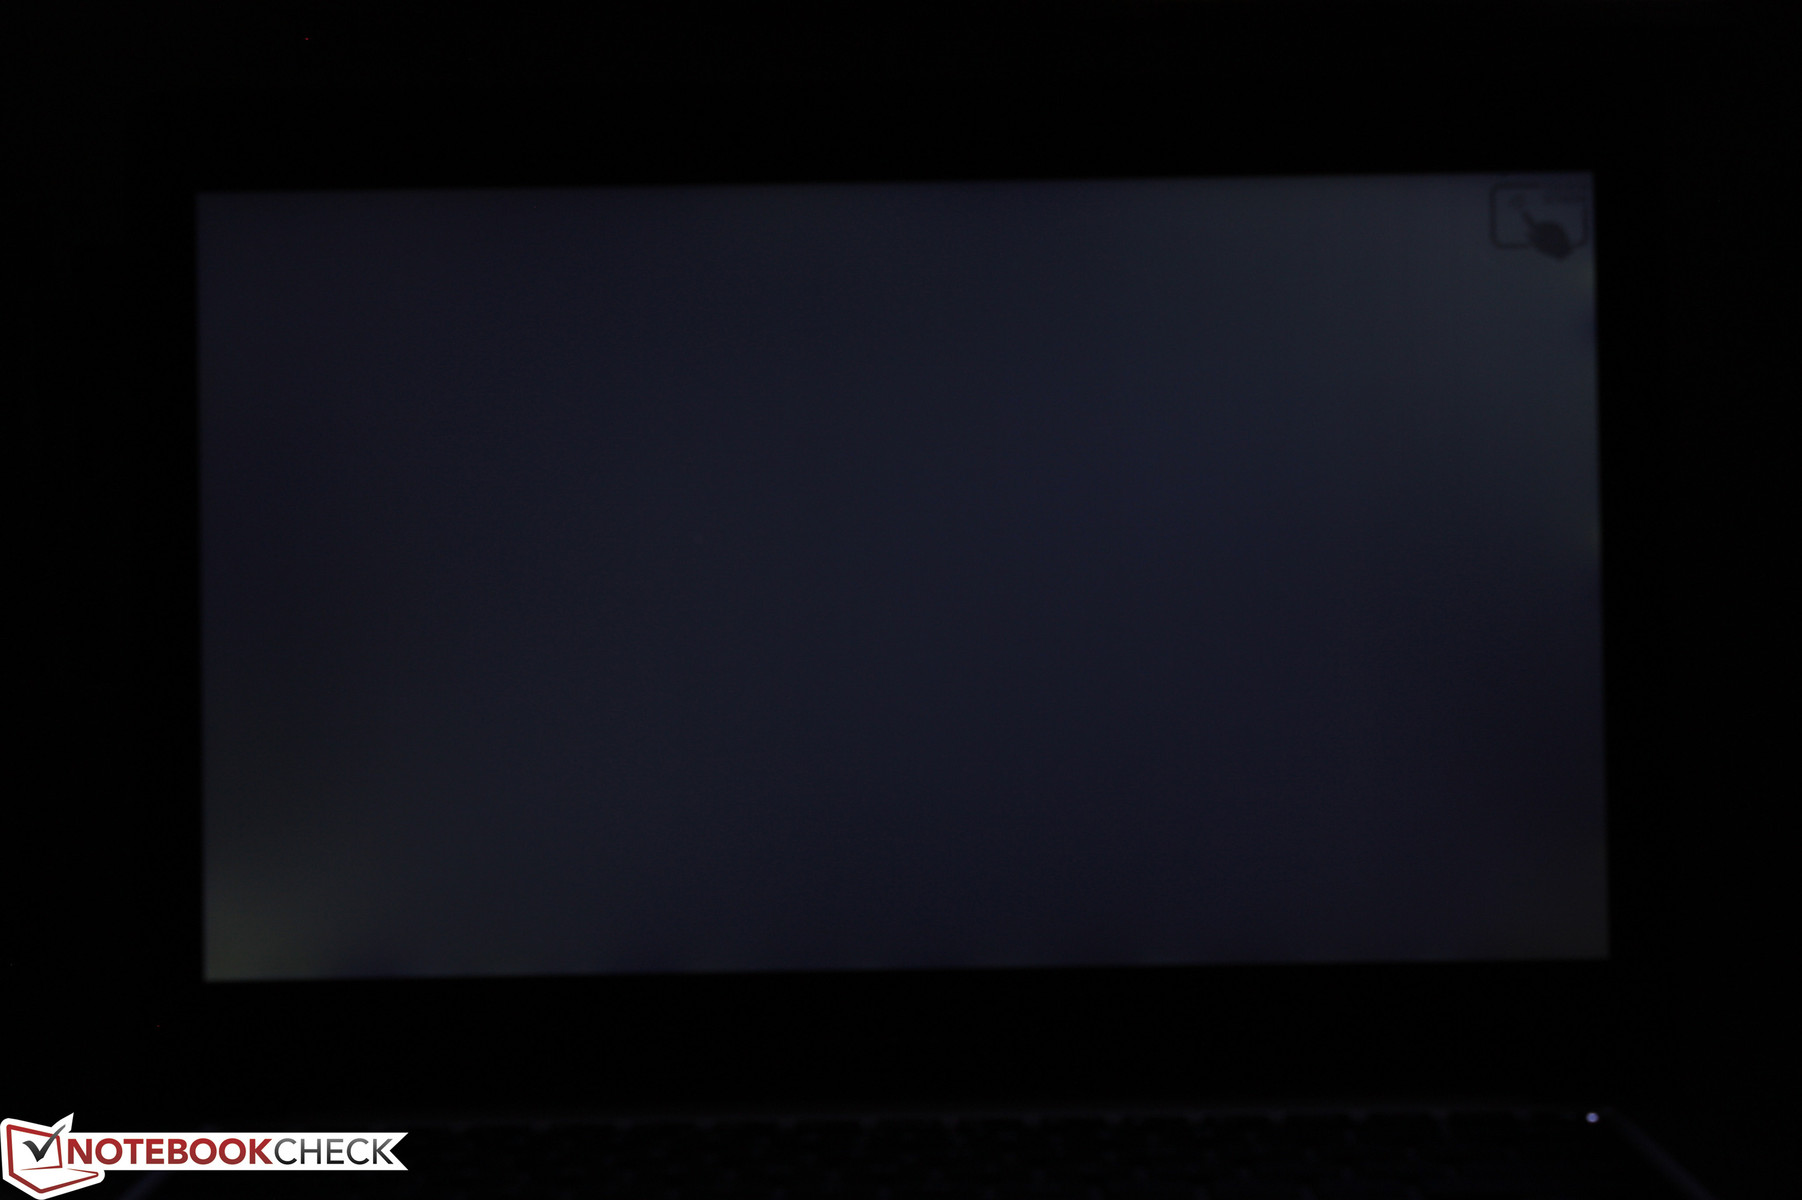
With that said, the QHD panel is a downgrade in more ways than one compared to our UX303UB FHD SKU. Maximum brightness has dropped and black levels are much higher for an average contrast of around 300:1. The display uses a RGBW matrix similar to the Yoga 900, which also suffers from lower-than-expected contrast. There is also some minor backlight bleeding on our test unit that only becomes noticeable when under darkened environments and content.
| |||||||||||||||||||||||||
Brightness Distribution: 84 %
Center on Battery: 291.4 cd/m²
Contrast: 305:1 (Black: 0.954 cd/m²)
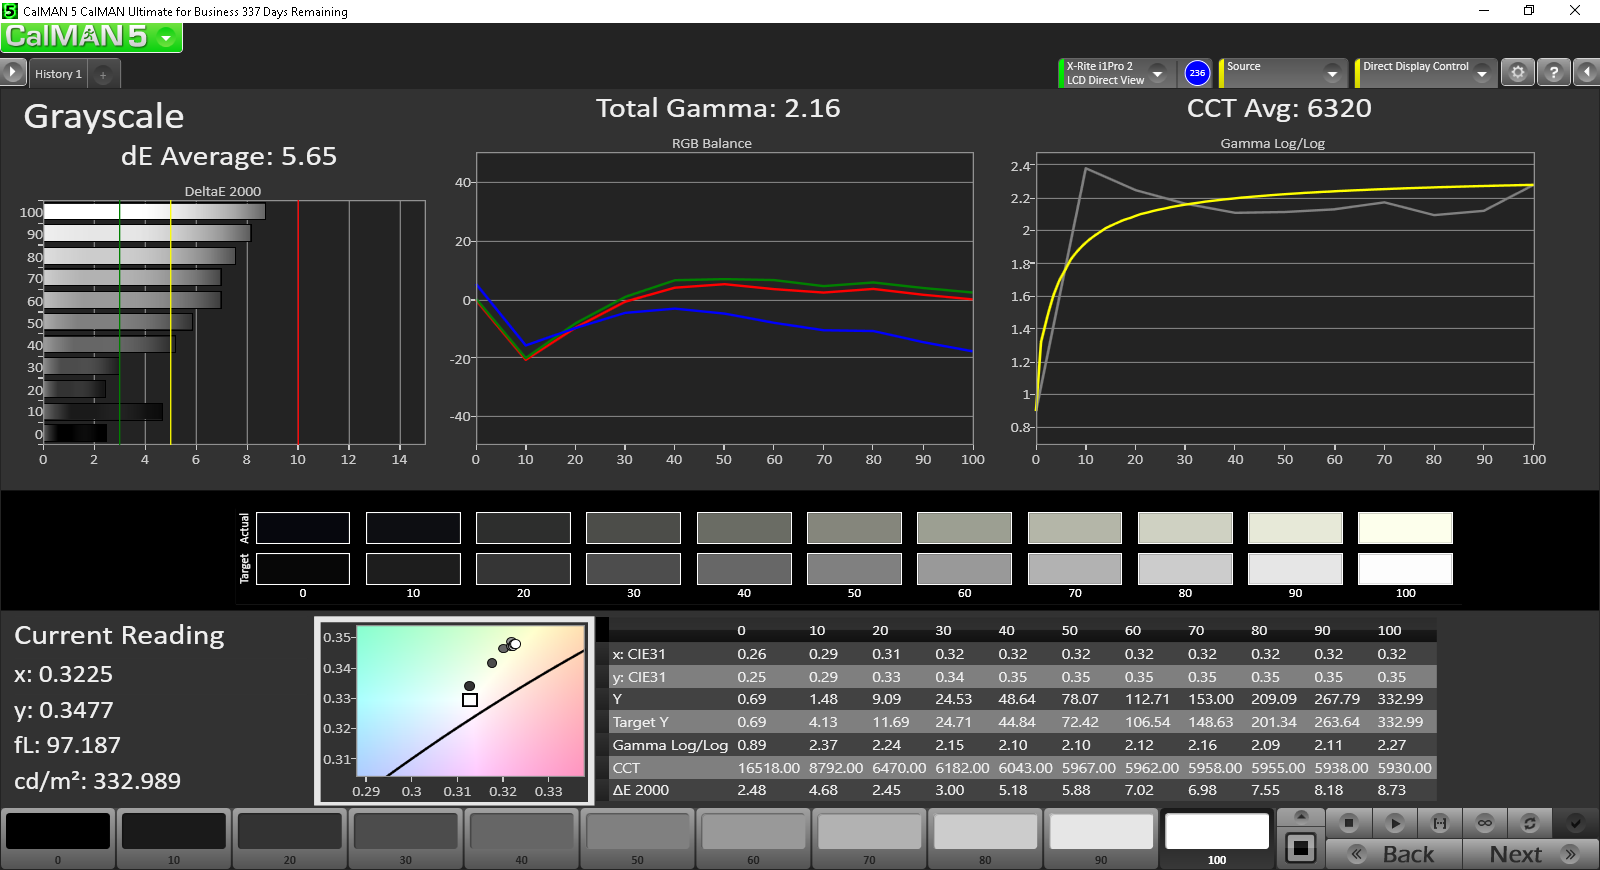
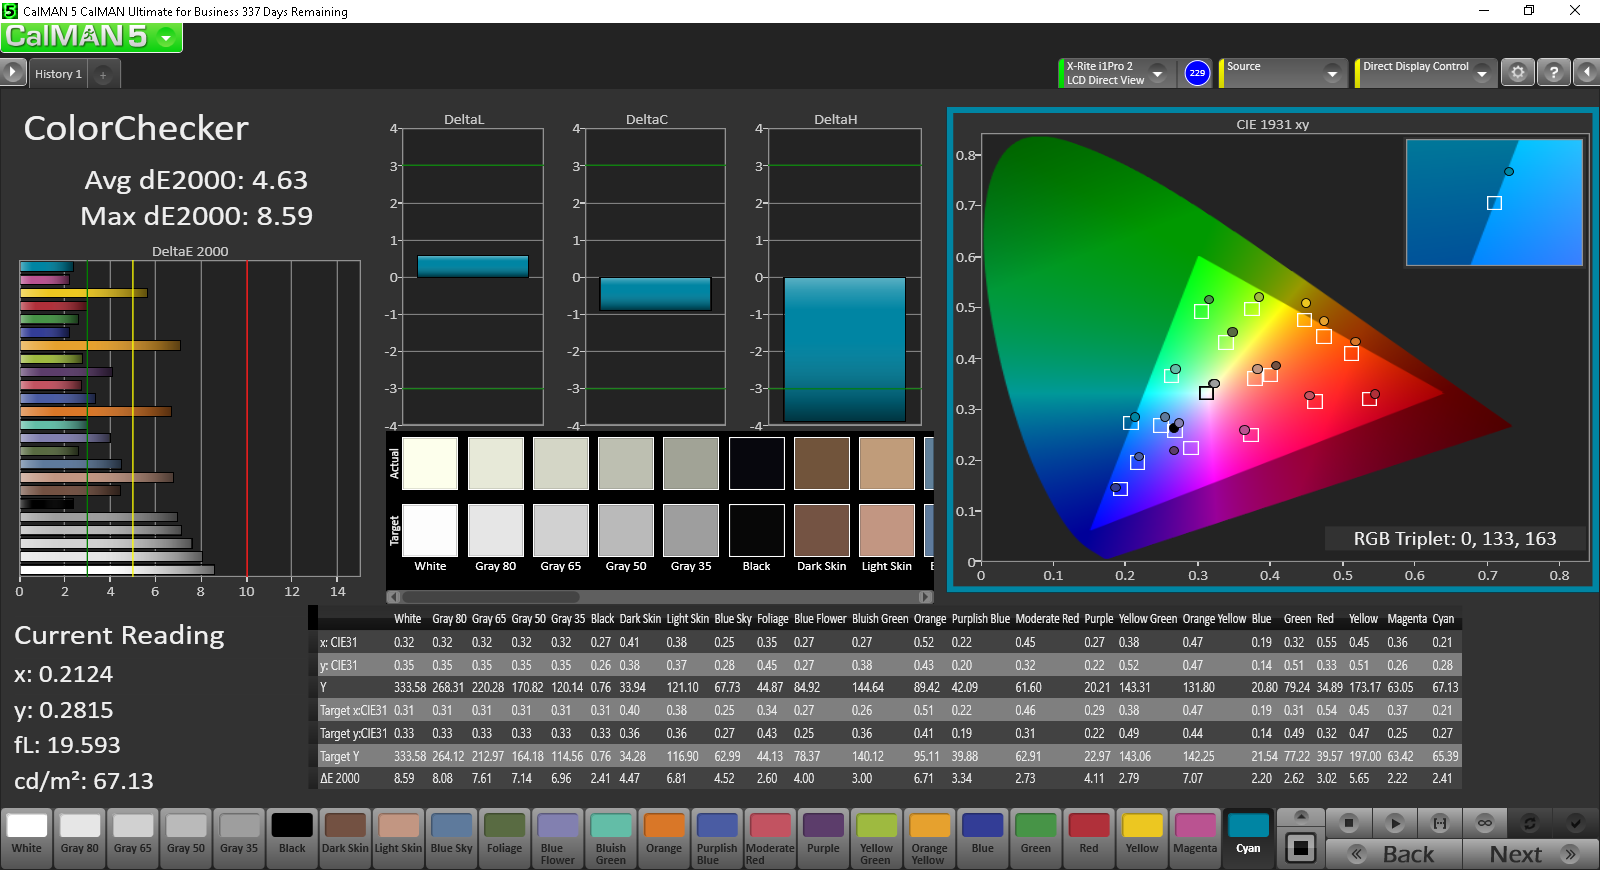
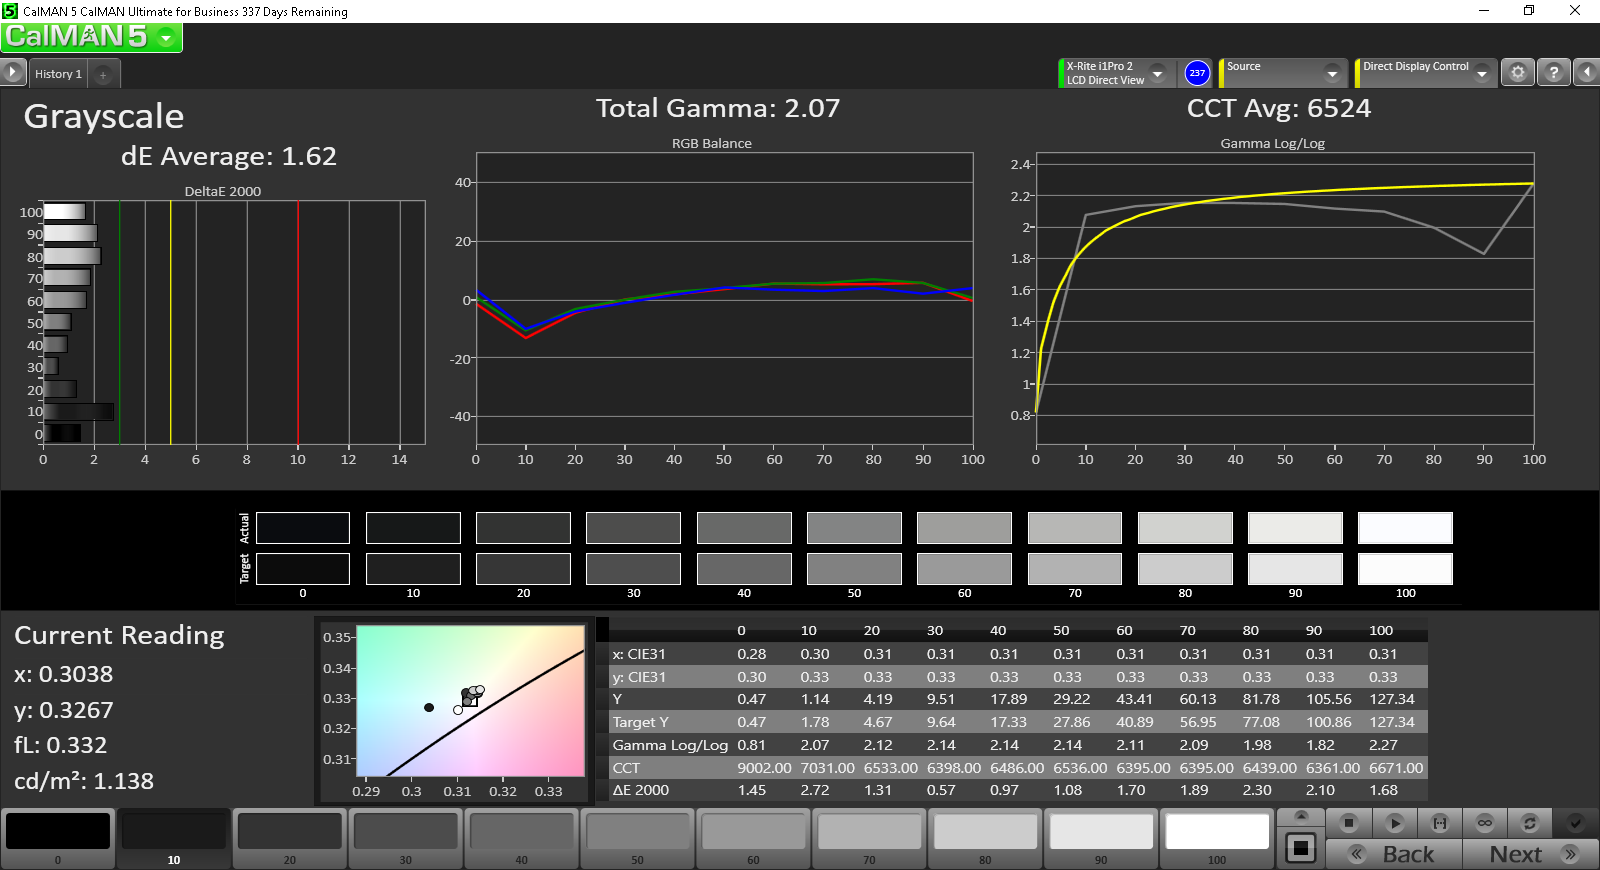
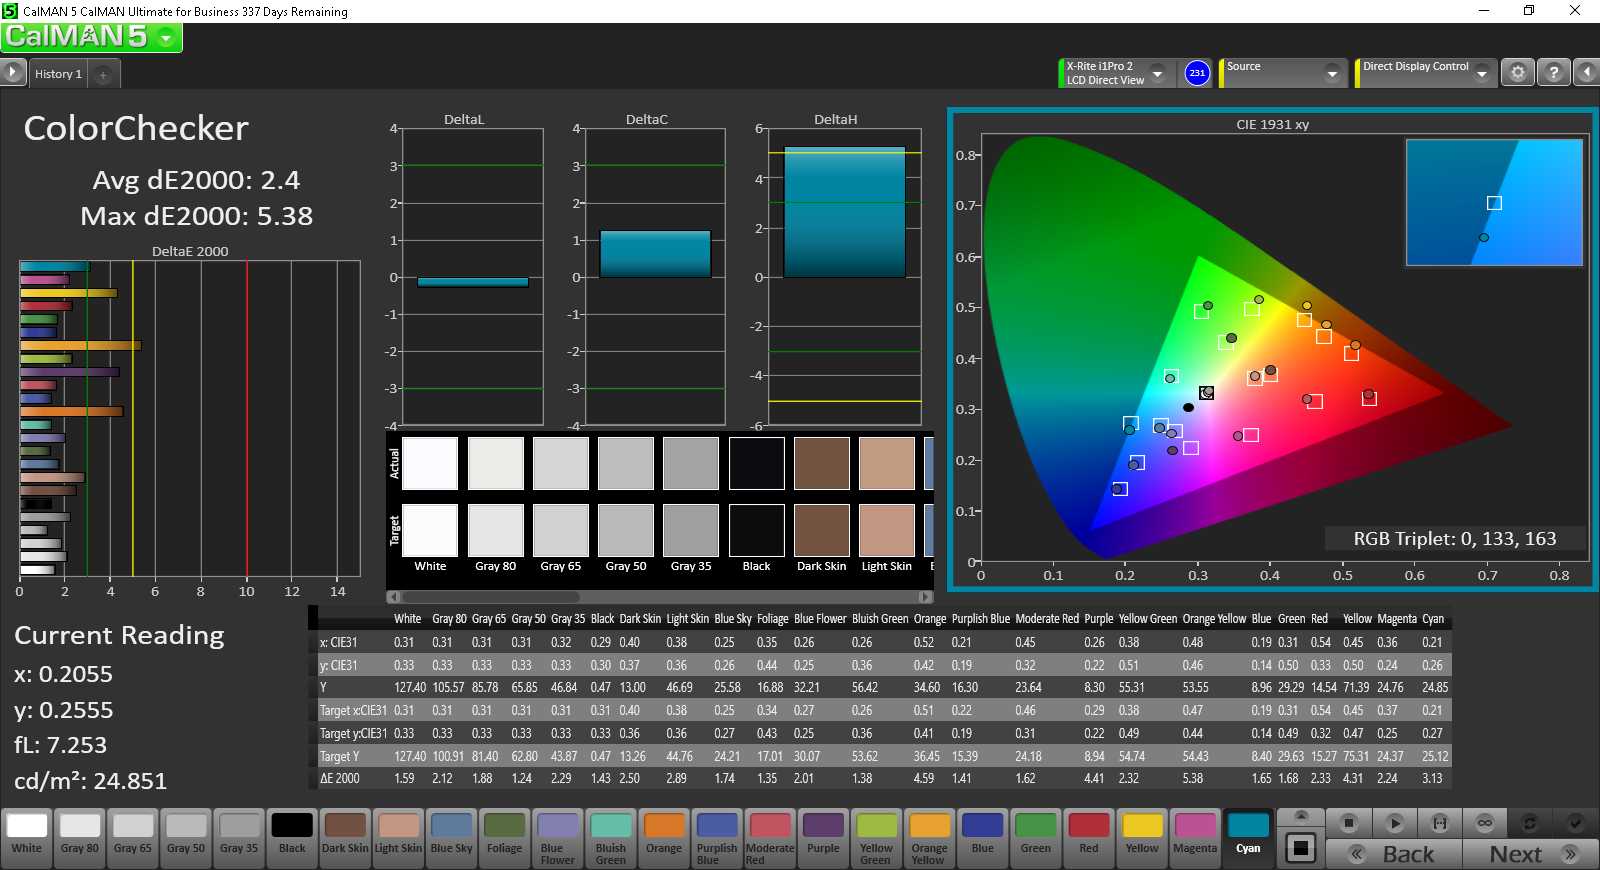
ΔE ColorChecker Calman: 4.63 | ∀{0.5-29.43 Ø4.76}
ΔE Greyscale Calman: 5.65 | ∀{0.09-98 Ø5}
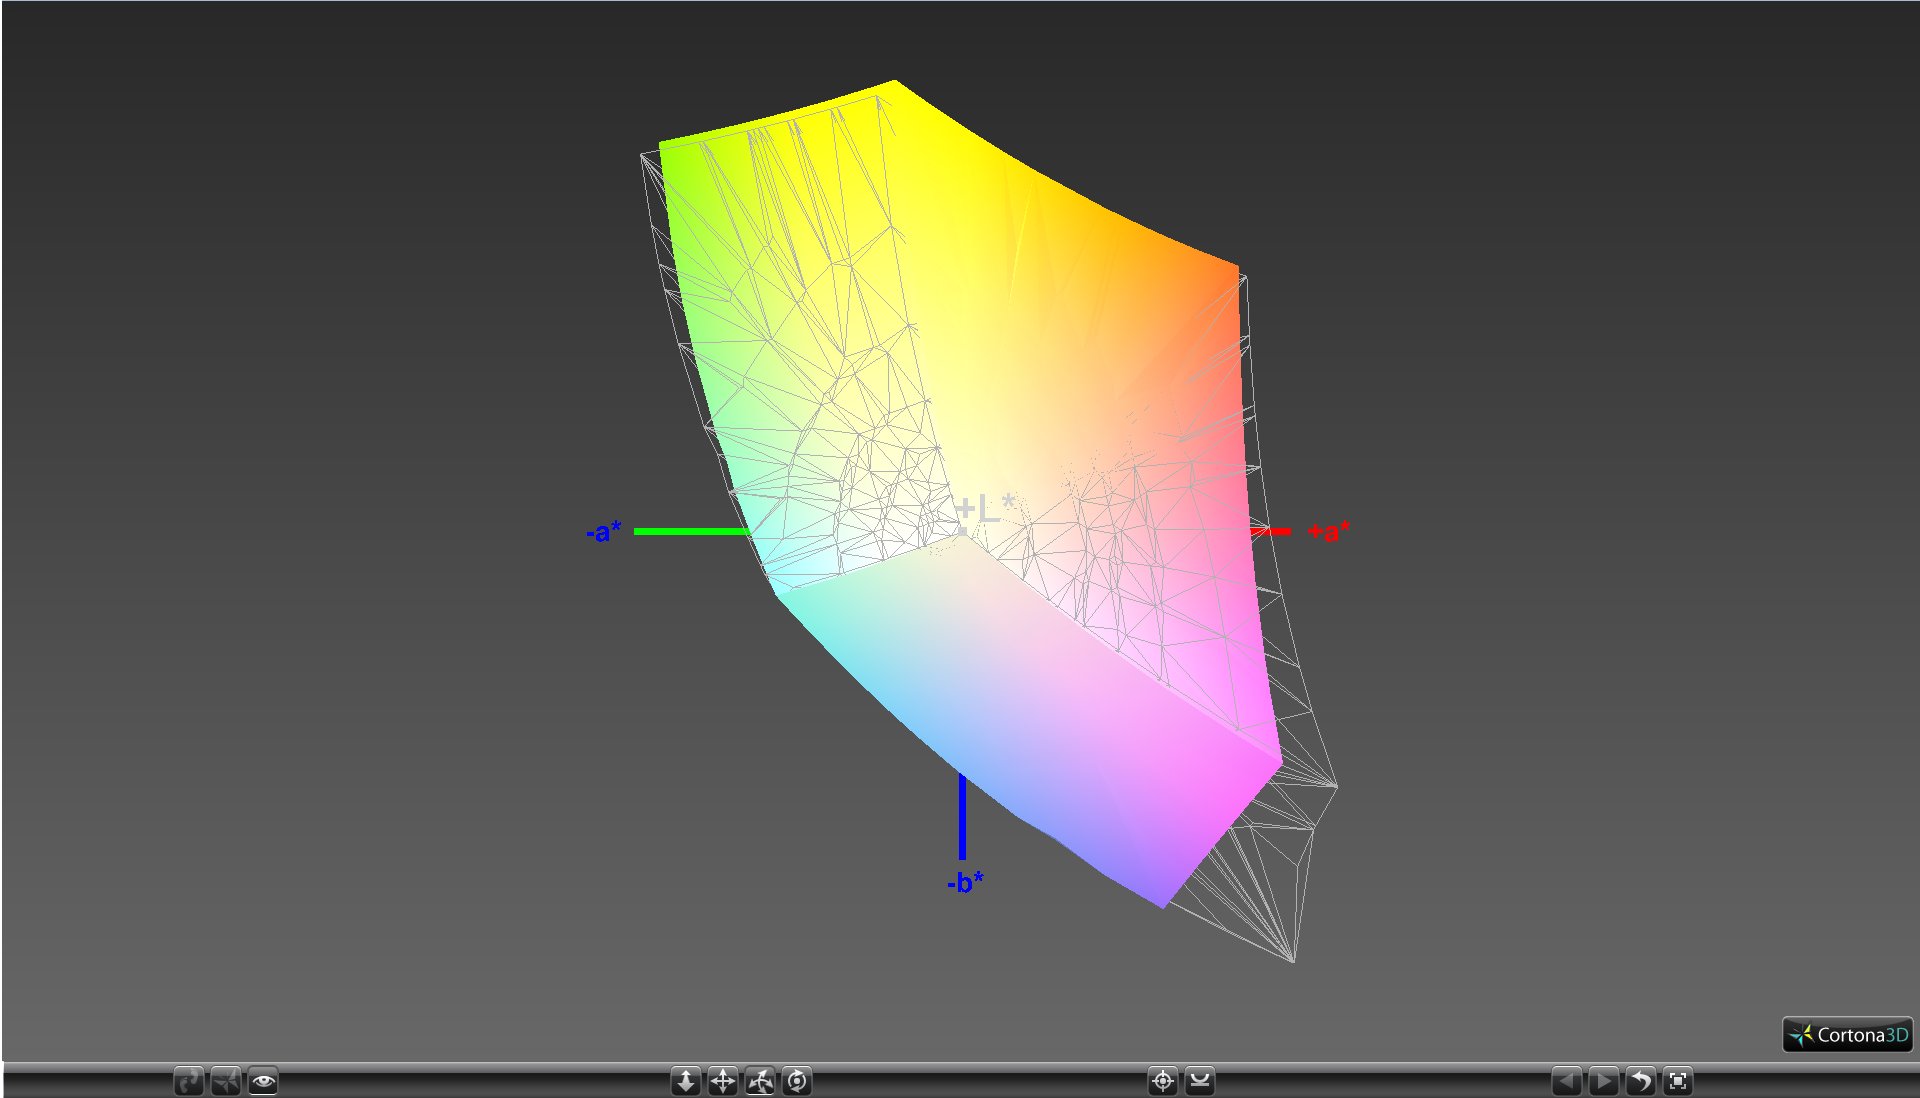
85.2% sRGB (Argyll 1.6.3 3D)
55.2% AdobeRGB 1998 (Argyll 1.6.3 3D)
62.5% AdobeRGB 1998 (Argyll 3D)
85.4% sRGB (Argyll 3D)
60.9% Display P3 (Argyll 3D)
Gamma: 2.16
CCT: 6320 K
| Asus Zenbook UX303UB-DH74T 13.3", 3200x1800 | Asus Zenbook UX303UB-R4100T 13.3", 1920x1080 | Asus Zenbook UX305LA-FC012H 13.3", 1920x1080 | HP Spectre x360 13-4104ng 13.3", 2560x1440 | HP Envy 13-d000ng 13.3", 3200x1800 | Dell XPS 13 2016 i7 256GB QHD 13.3", 3200x1800 | |
|---|---|---|---|---|---|---|
| Display | 9% | 5% | 9% | 4% | 6% | |
| Display P3 Coverage (%) | 60.9 | 66.9 10% | 63.9 5% | 66.8 10% | 64 5% | 63.6 4% |
| sRGB Coverage (%) | 85.4 | 92.3 8% | 91.6 7% | 92.8 9% | 88.8 4% | 93.6 10% |
| AdobeRGB 1998 Coverage (%) | 62.5 | 67.6 8% | 65 4% | 67.3 8% | 65 4% | 65.5 5% |
| Response Times | -25% | 47% | 22% | 14% | ||
| Response Time Grey 50% / Grey 80% * (ms) | 44.4 ? | 68 ? -53% | 24 ? 46% | 37.6 ? 15% | 40 ? 10% | |
| Response Time Black / White * (ms) | 36 ? | 35 ? 3% | 19 ? 47% | 26 ? 28% | 30 ? 17% | |
| PWM Frequency (Hz) | 1389 | 178 ? | 1316 ? | 4900 ? | ||
| Screen | 46% | 54% | 40% | 21% | 59% | |
| Brightness middle (cd/m²) | 291.4 | 385 32% | 349 20% | 324 11% | 291 0% | 285 -2% |
| Brightness (cd/m²) | 270 | 394 46% | 338 25% | 324 20% | 276 2% | 281 4% |
| Brightness Distribution (%) | 84 | 89 6% | 87 4% | 90 7% | 82 -2% | 90 7% |
| Black Level * (cd/m²) | 0.954 | 0.41 57% | 0.25 74% | 0.34 64% | 0.63 34% | 0.18 81% |
| Contrast (:1) | 305 | 939 208% | 1396 358% | 953 212% | 462 51% | 1583 419% |
| Colorchecker dE 2000 * | 4.63 | 3.84 17% | 5.49 -19% | 4.36 6% | 2.76 40% | 4.89 -6% |
| Greyscale dE 2000 * | 5.65 | 3.79 33% | 5.43 4% | 4.62 18% | 2.61 54% | 5.16 9% |
| Gamma | 2.16 102% | 2.23 99% | 2.17 101% | 2.18 101% | 2.31 95% | 2.15 102% |
| CCT | 6320 103% | 6499 100% | 7055 92% | 6857 95% | 6731 97% | 7106 91% |
| Color Space (Percent of AdobeRGB 1998) (%) | 55.2 | 60 9% | 60 9% | 60 9% | 57.5 4% | 59 7% |
| Color Space (Percent of sRGB) (%) | 85.2 | 92 8% | 92 8% | 93 9% | 88.7 4% | 93 9% |
| Total Average (Program / Settings) | 10% /
28% | 30% /
42% | 32% /
34% | 16% /
17% | 26% /
41% |
* ... smaller is better
Color coverage is 55.2 percent and 85.2 percent of the AdobeRGB and sRGB standards, respectively. This is representative of a high quality display as cheaper panels typically cover much less than half of AdobeRGB and around 60 percent of sRGB.
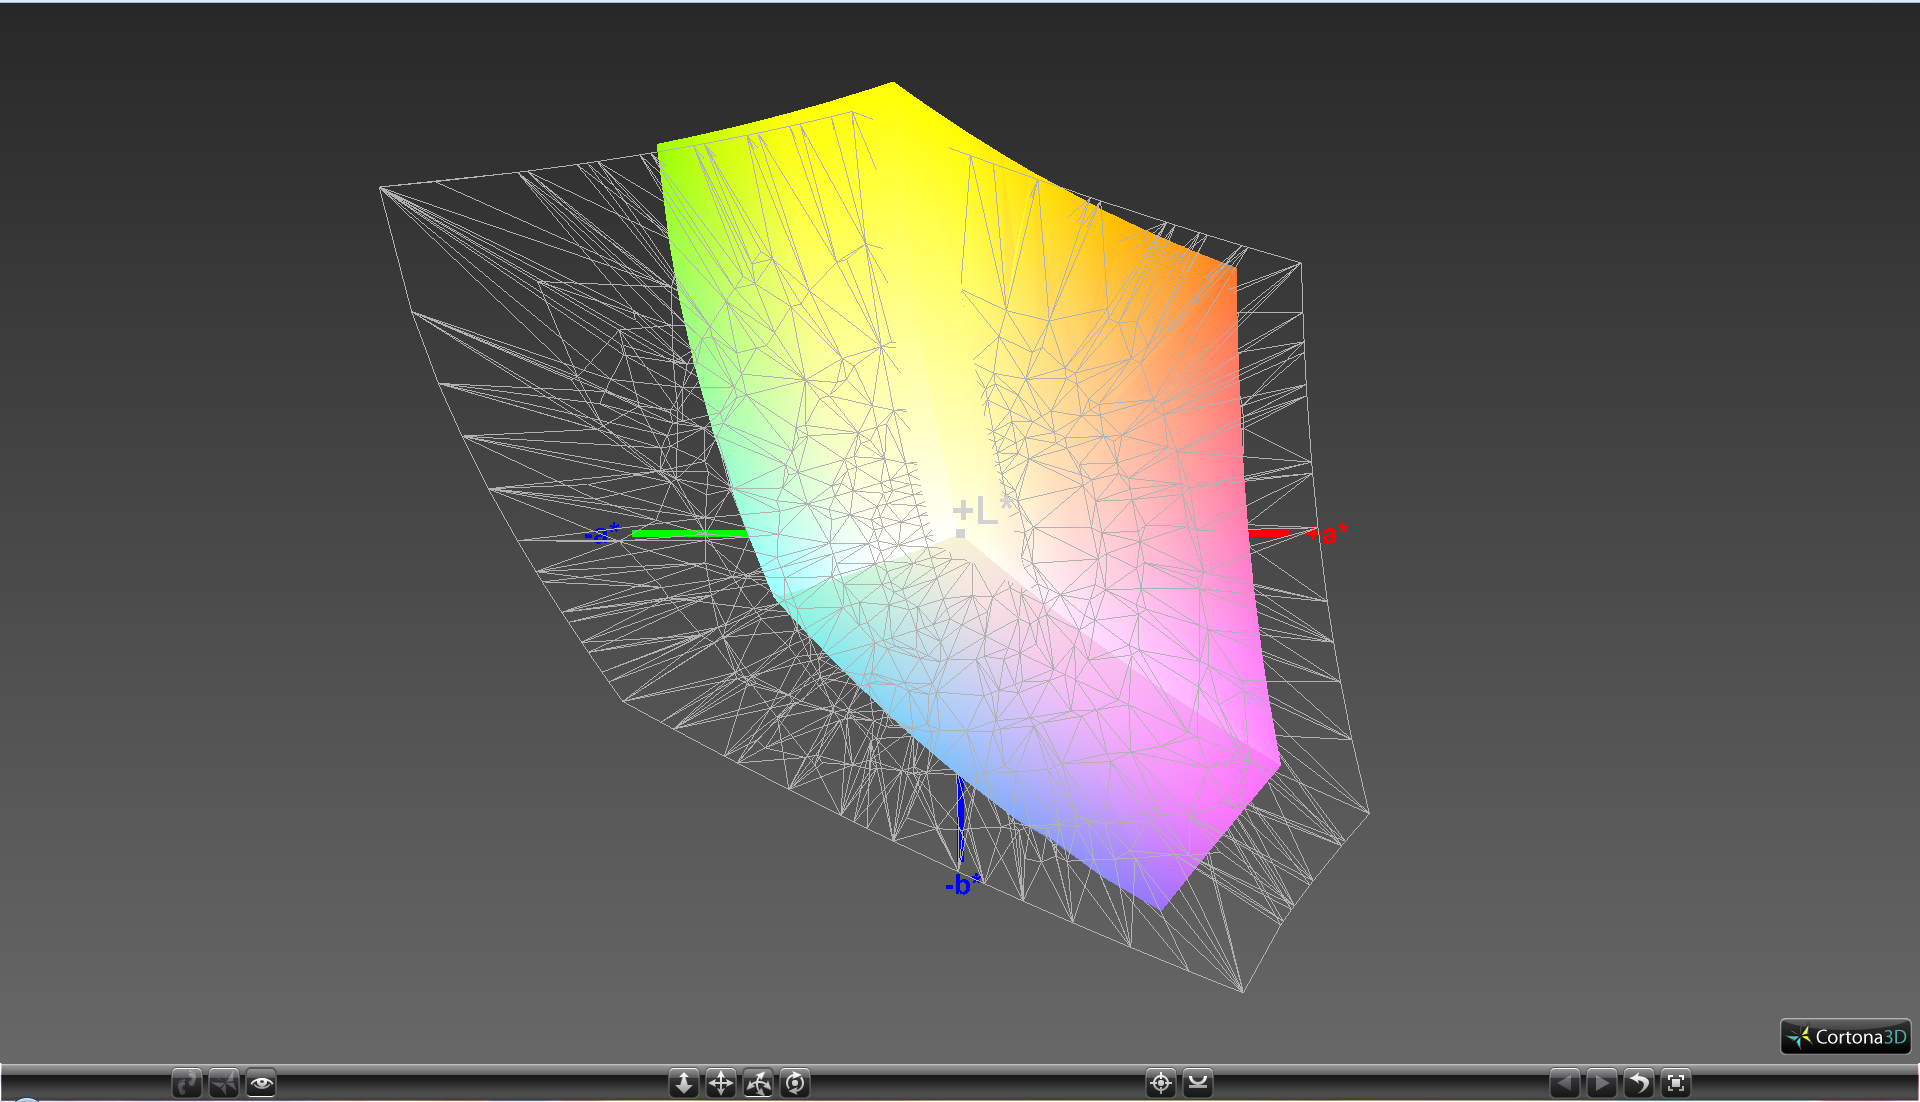
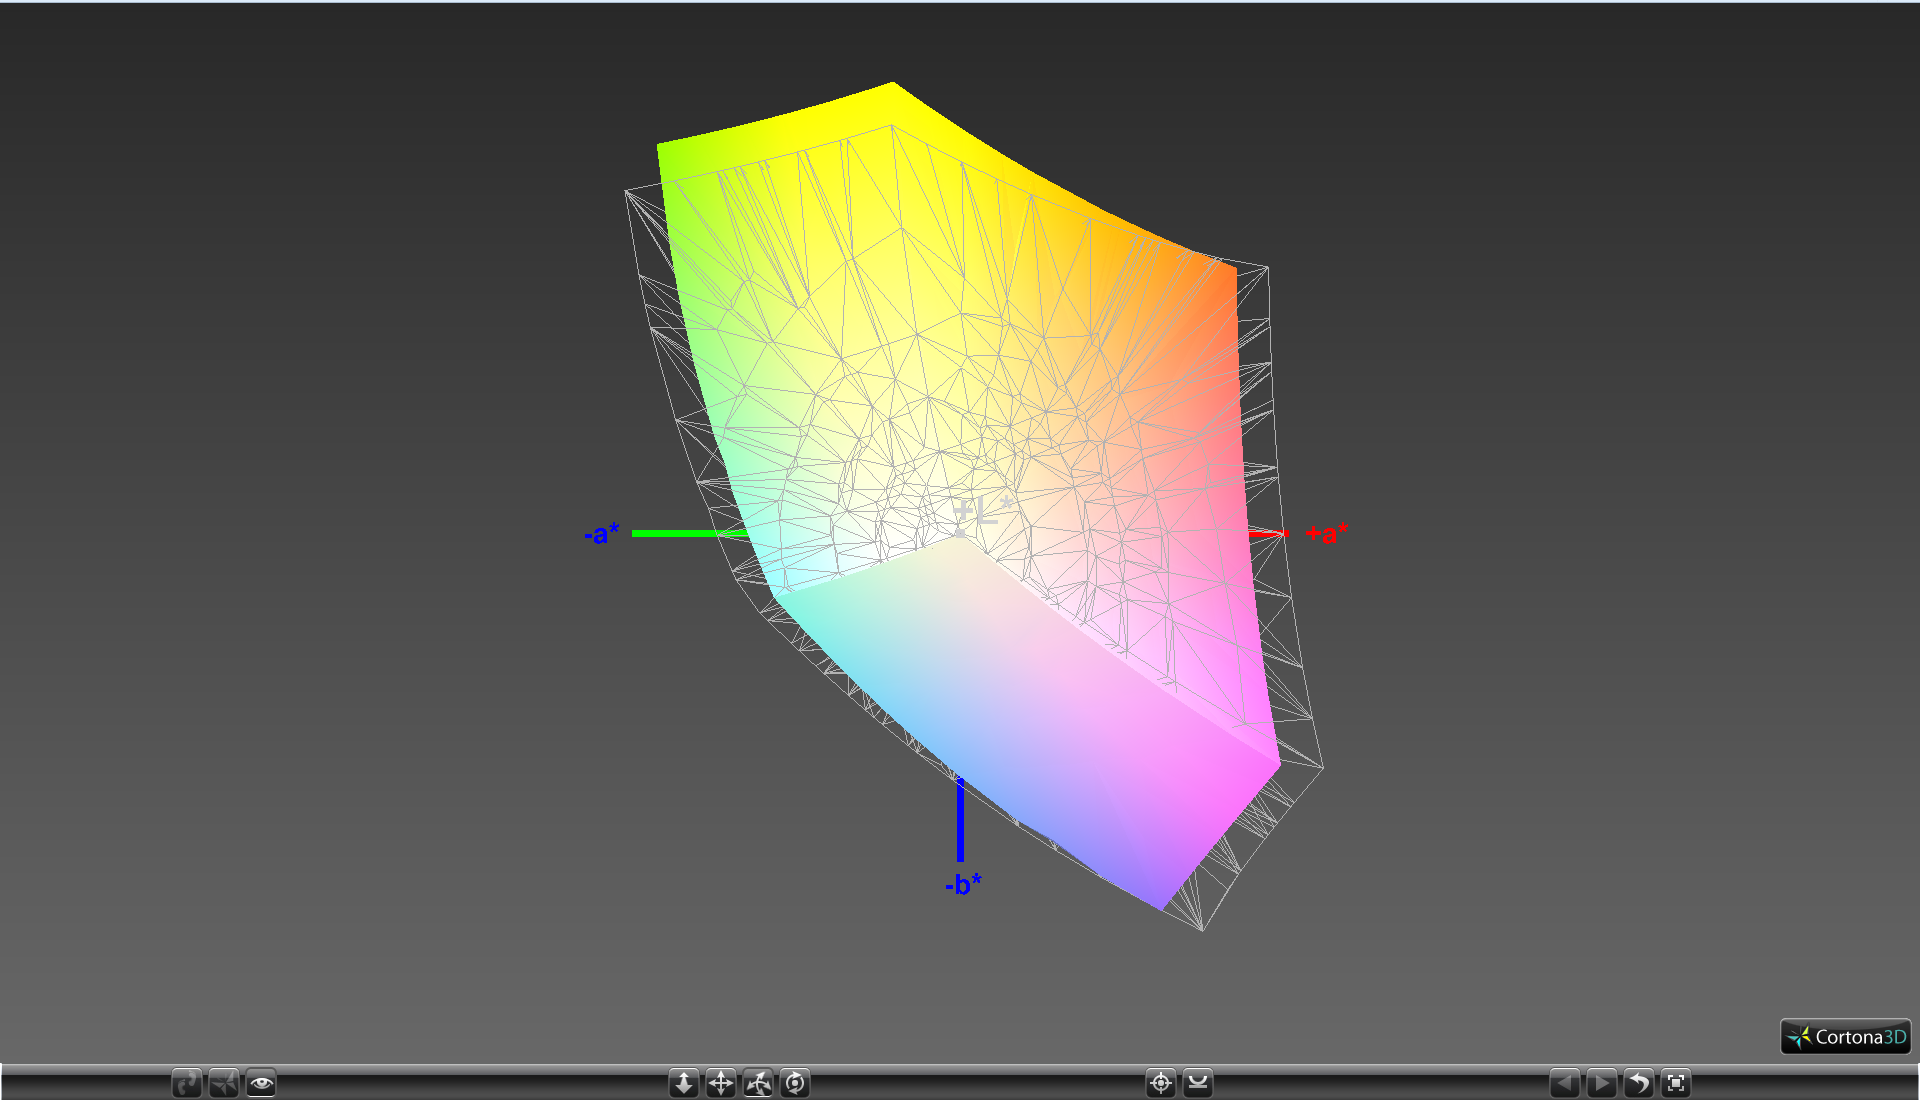

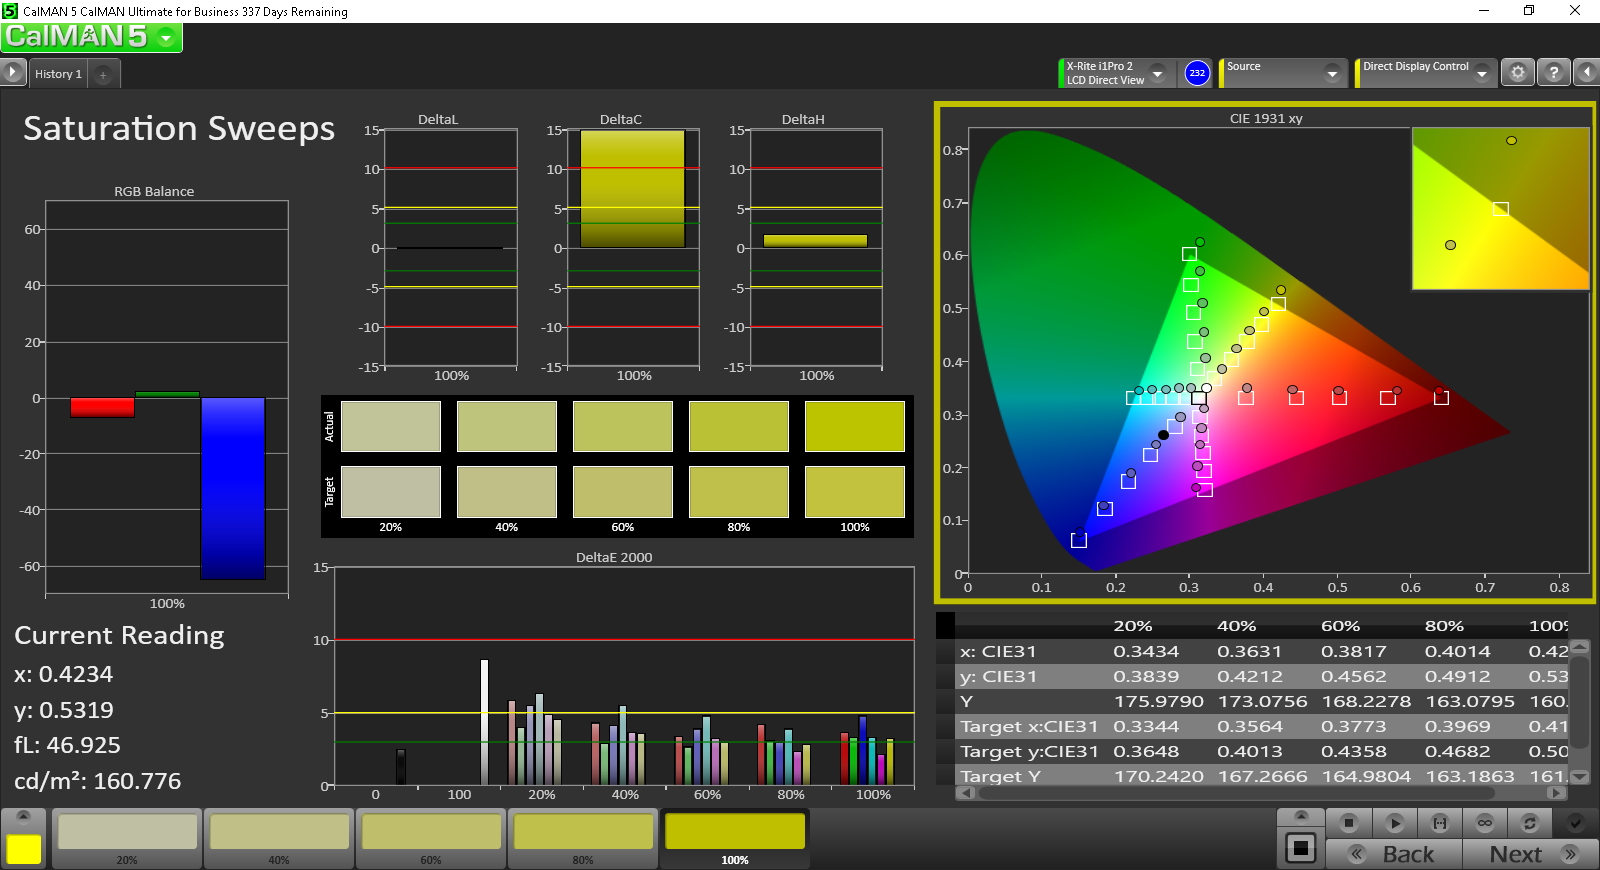
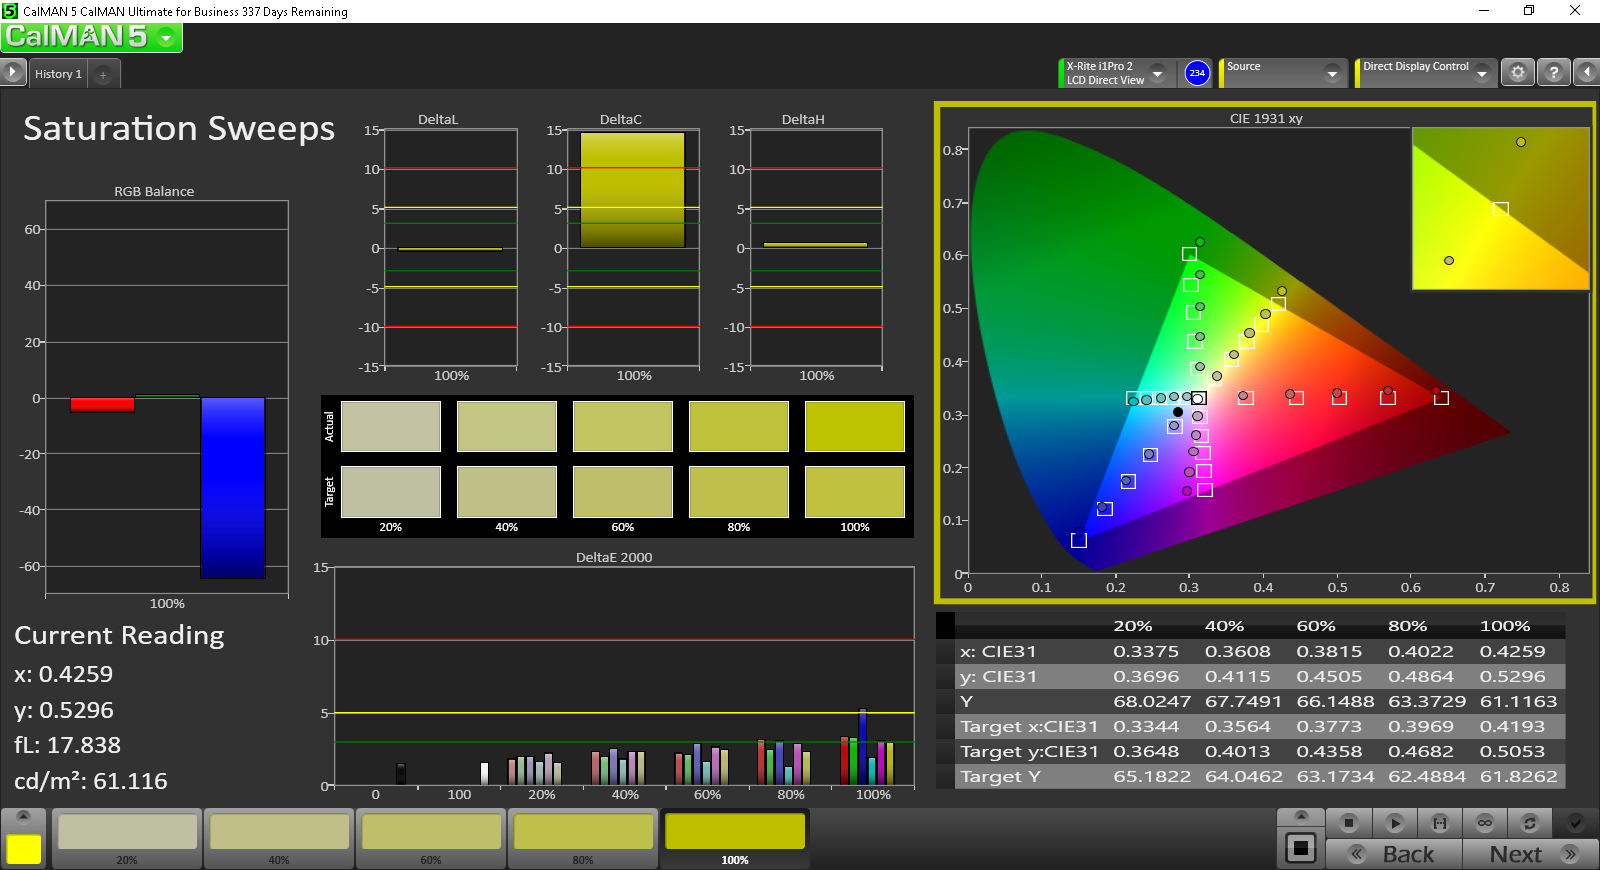
Colors and grayscale are only average out-of-the-box. Many other high-end 13.3-inch notebooks or even the FHD SKU of the UX303 exhibit more accurate colors without necessitating end-user calibration. We recommend a quick calibration as this will noticeably improve grayscale and colors across the board. Colors become slightly less accurate the higher the saturation level due to imperfect sRGB coverage.
Display Response Times
| ↔ Response Time Black to White | ||
|---|---|---|
| 36 ms ... rise ↗ and fall ↘ combined | ↗ 15.6 ms rise | 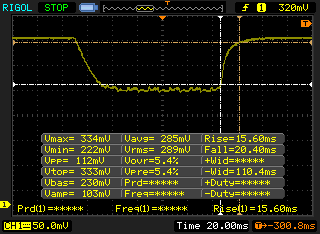 |
| ↘ 20.4 ms fall | ||
| The screen shows slow response rates in our tests and will be unsatisfactory for gamers. In comparison, all tested devices range from 0.1 (minimum) to 240 (maximum) ms. » 93 % of all devices are better. This means that the measured response time is worse than the average of all tested devices (20.1 ms). | ||
| ↔ Response Time 50% Grey to 80% Grey | ||
| 44.4 ms ... rise ↗ and fall ↘ combined | ↗ 19.6 ms rise | 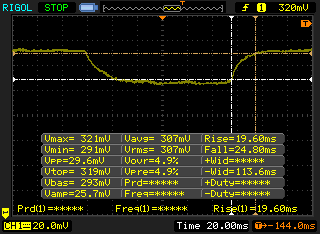 |
| ↘ 24.8 ms fall | ||
| The screen shows slow response rates in our tests and will be unsatisfactory for gamers. In comparison, all tested devices range from 0.165 (minimum) to 636 (maximum) ms. » 75 % of all devices are better. This means that the measured response time is worse than the average of all tested devices (31.4 ms). | ||
Screen Flickering / PWM (Pulse-Width Modulation)
| Screen flickering / PWM detected | 1389 Hz | 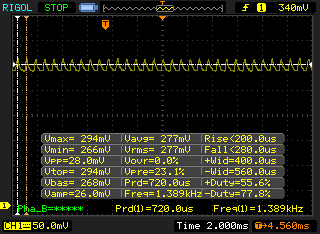 | |
The display backlight flickers at 1389 Hz (worst case, e.g., utilizing PWM) . The frequency of 1389 Hz is quite high, so most users sensitive to PWM should not notice any flickering. In comparison: 53 % of all tested devices do not use PWM to dim the display. If PWM was detected, an average of 8013 (minimum: 5 - maximum: 343500) Hz was measured. | |||
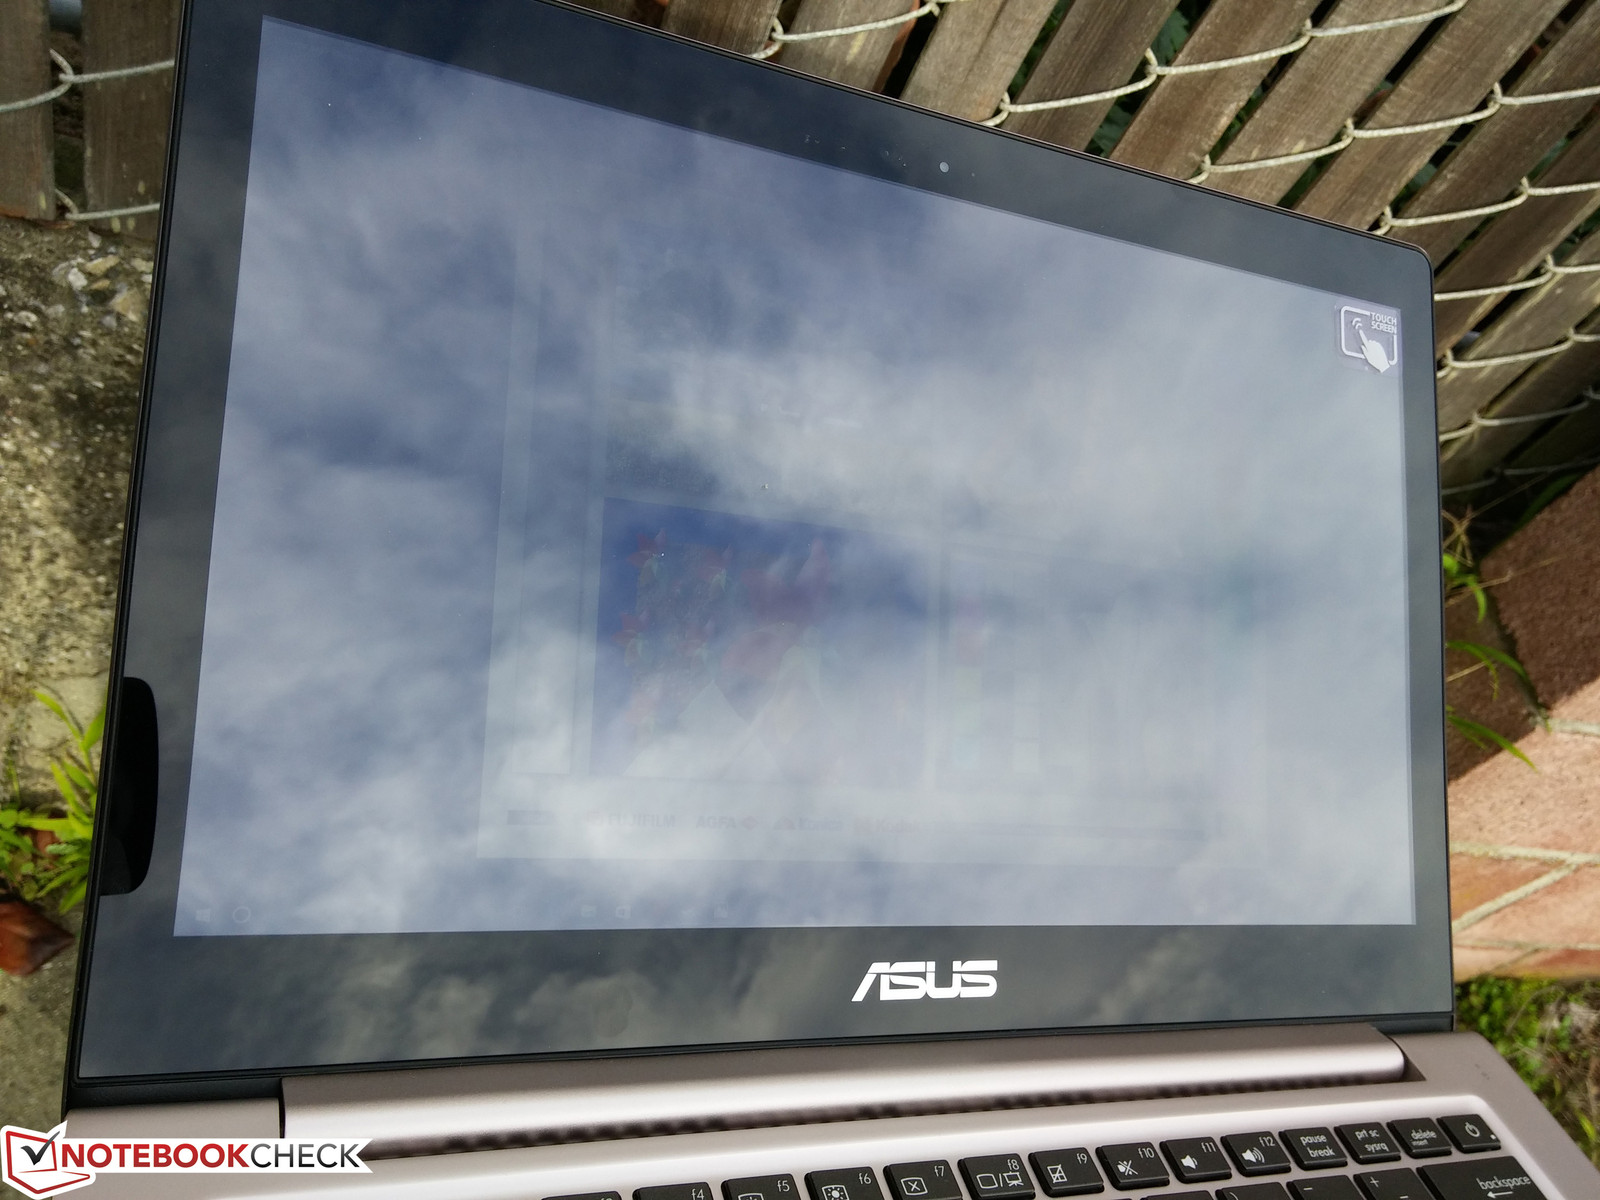
Outdoor usability is worse than existing UX303 models due to the lower maximum brightness of almost 100 nits on the QHD configuration. It's certainly still usable on overcast days, though glare will be more apparent.
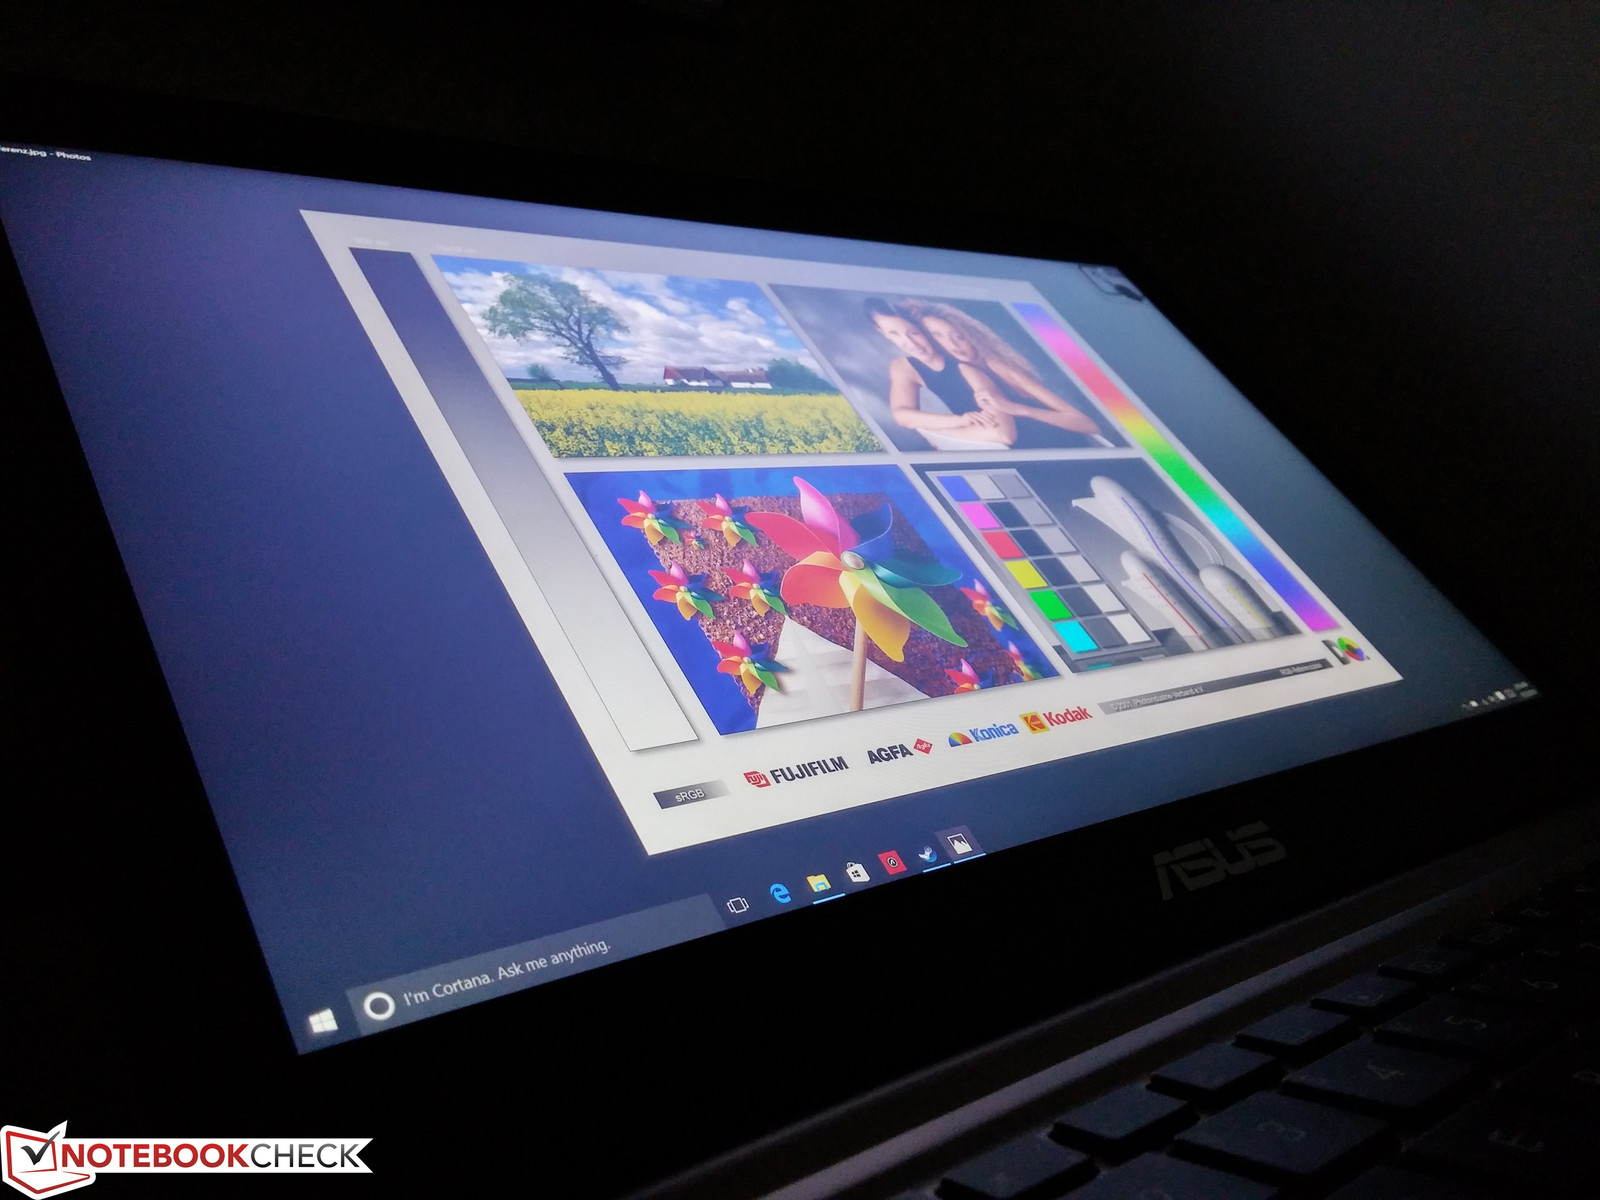
Viewing angles from the IPS panel is good with slight to moderate shifts in colors and contrast from extreme angles.
Performance
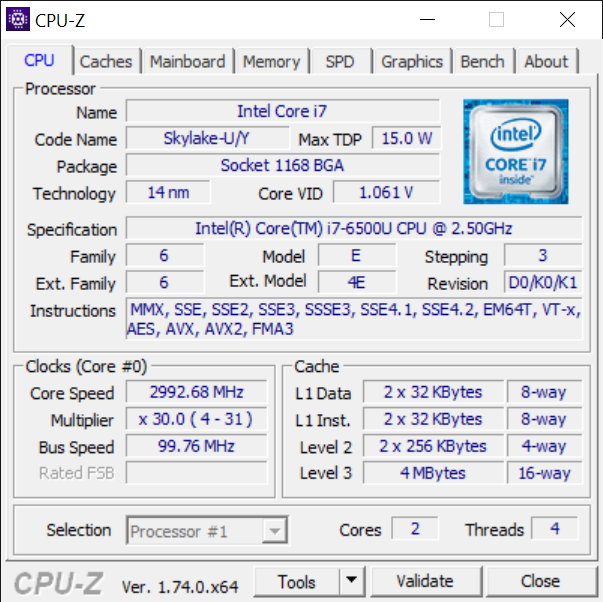
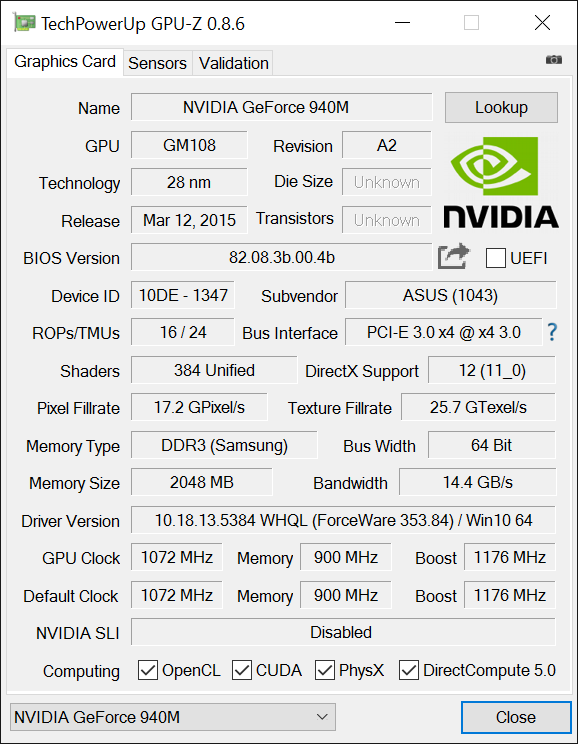
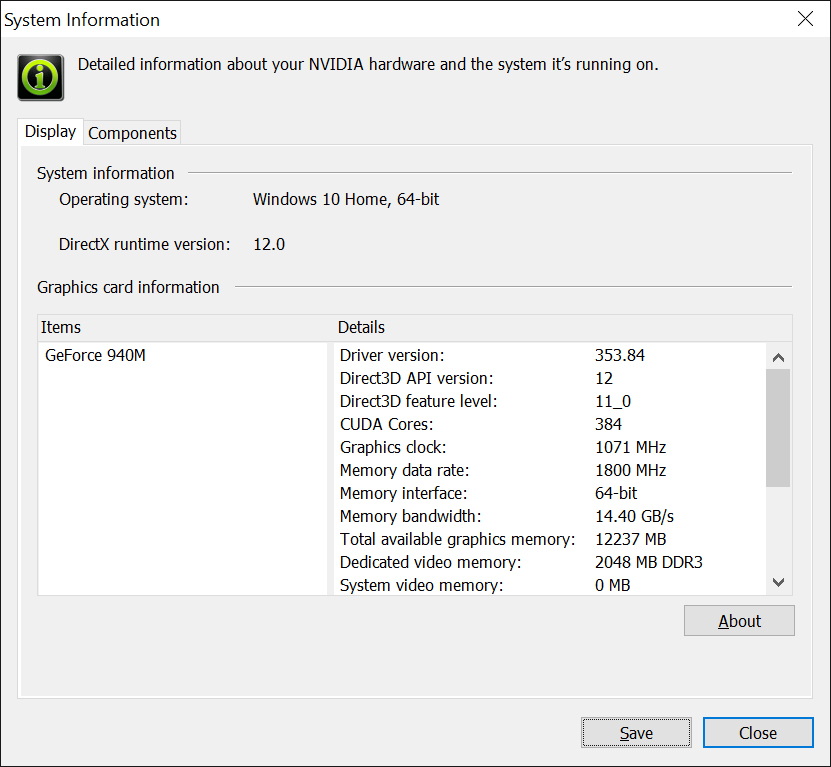
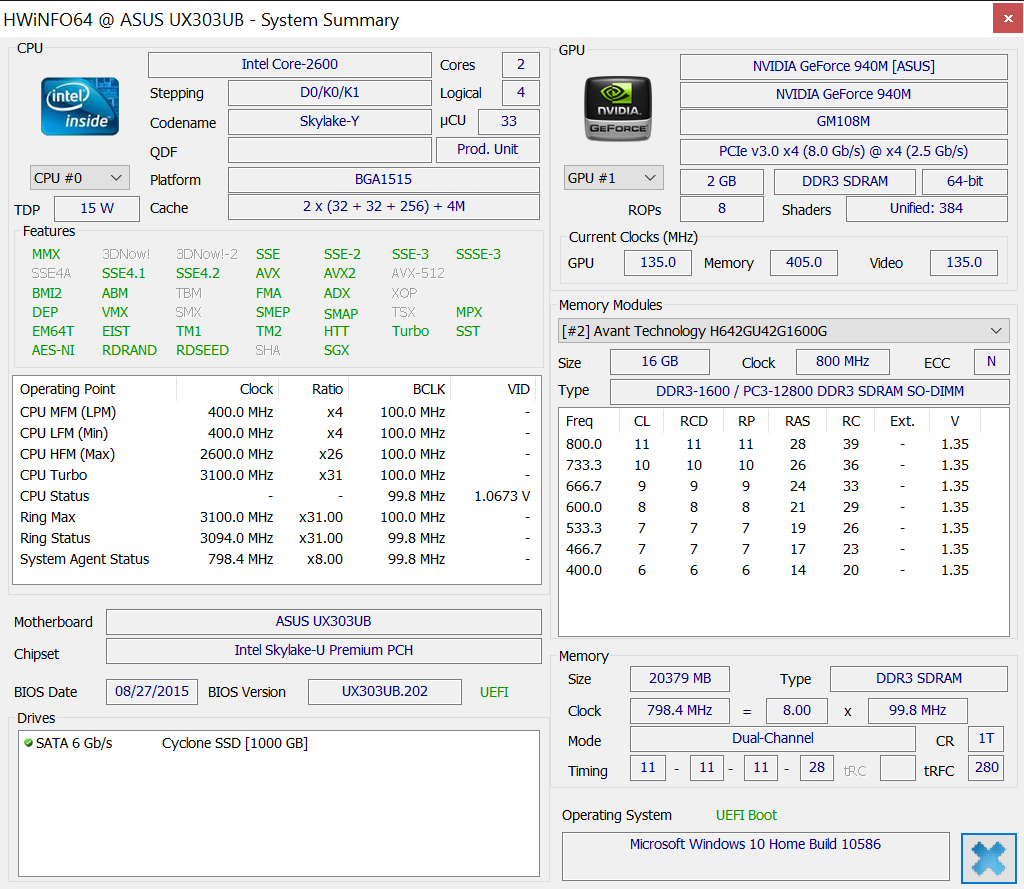
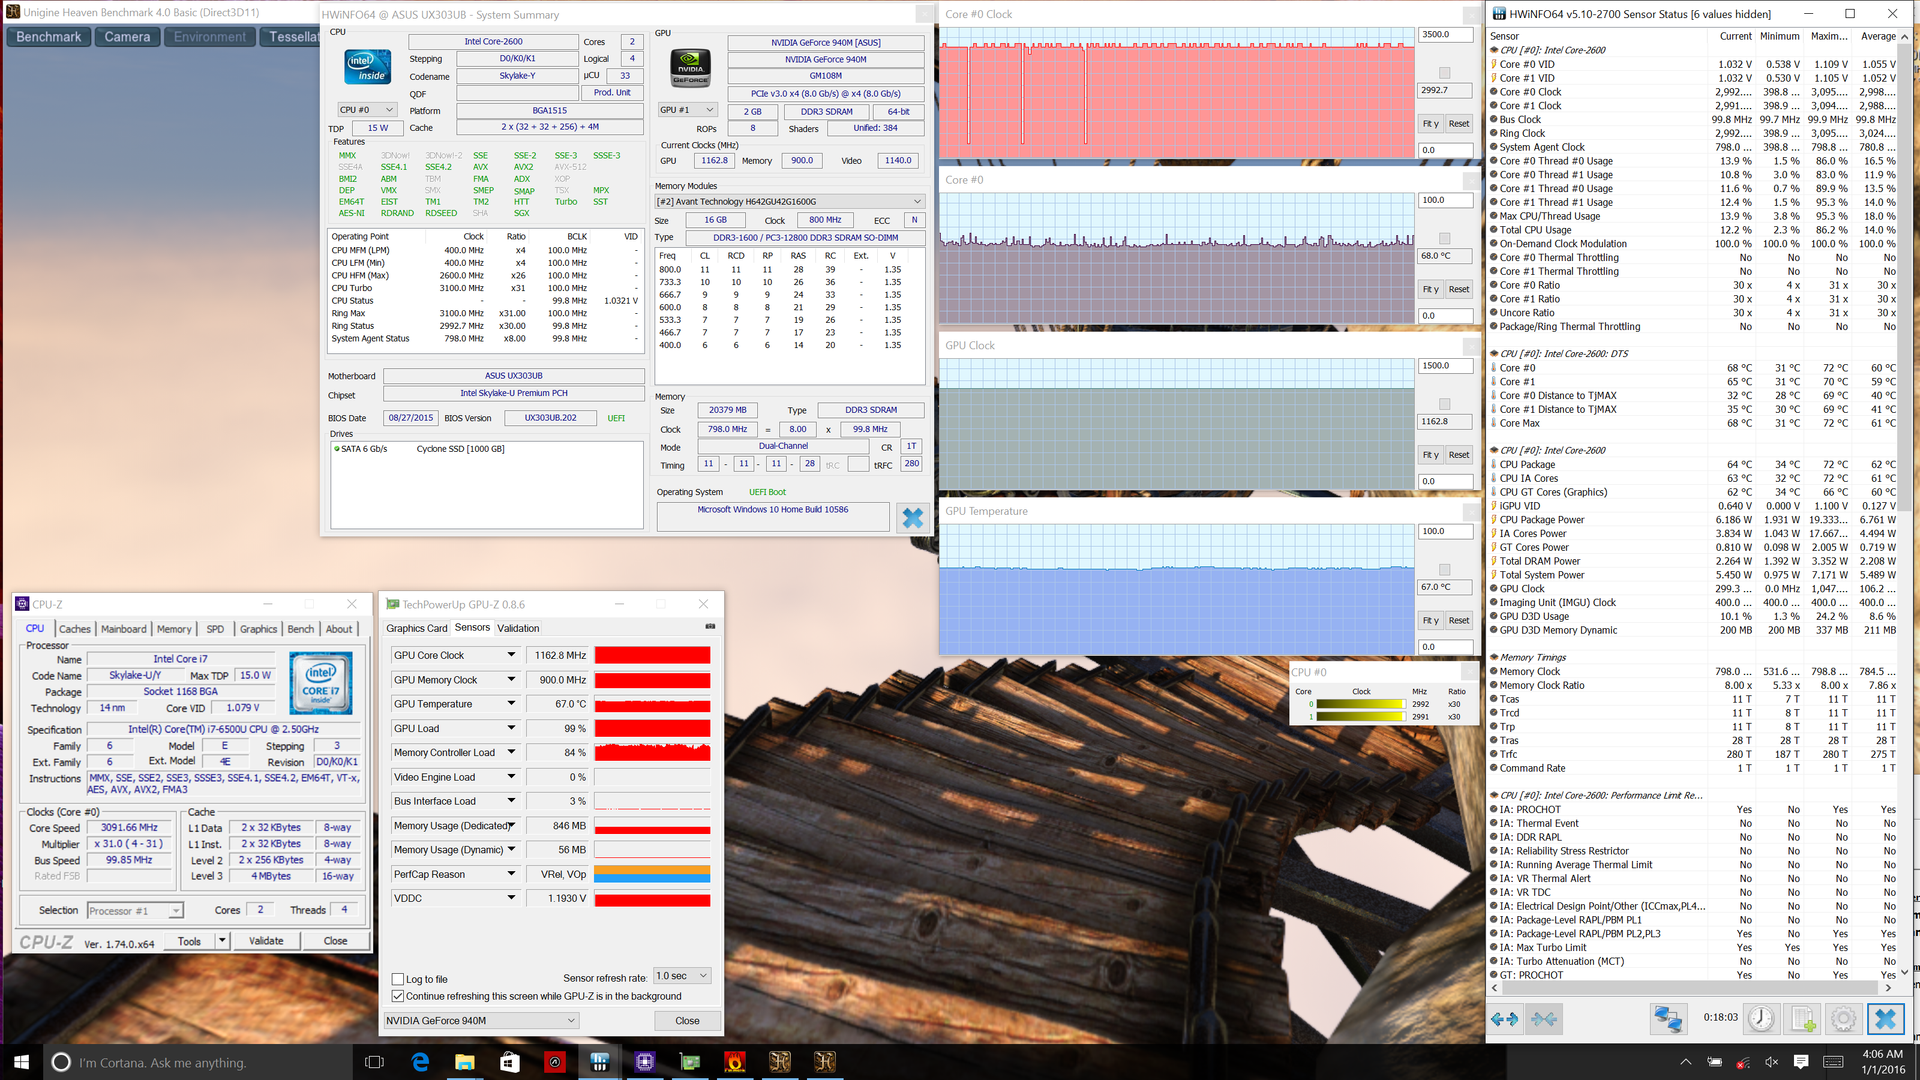
Unlike the thinner and fanless UX305 series, the UX303 can be equipped with ULV Core ix processors and dedicated GPUs. Our test model is the higher-end SKU with a Core i7-6500U and GT 940M able to operate up to 3.1 GHz and 1163 MHz, respectively, depending on the system load. The HD Graphics 520 is available via Optimus for additional power savings and the CPU itself can idle as low as 800 MHz.
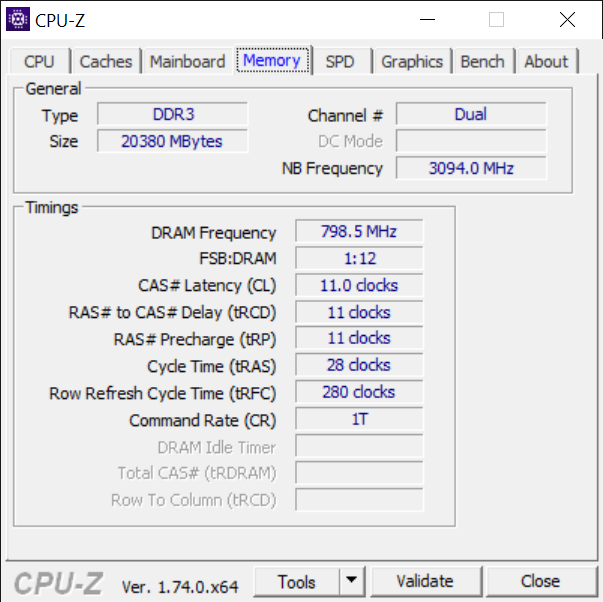
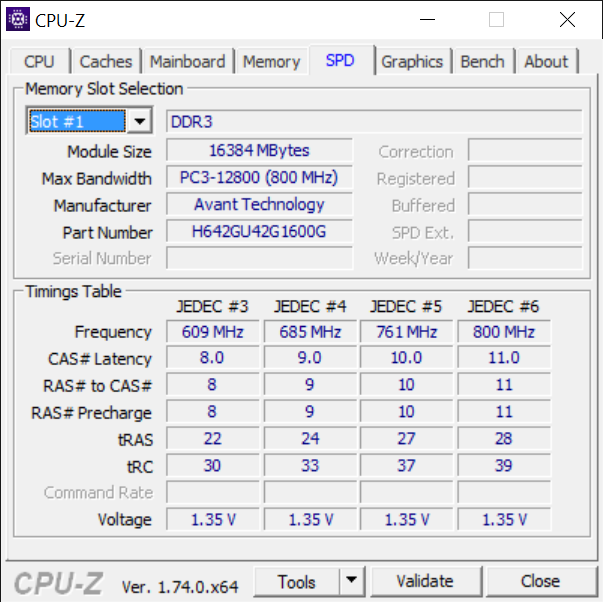
4 GB RAM is soldered directly onto the board with one free SODIMM slot for an additional 16 GB for up to 20 GB total like we have here. LatencyMon shows no recurring latency spikes even with the wireless radio active.
Processor
The Skylake i7-6500U is roughly 20 percent and 5 percent ahead of the Haswell i5-4200U and the Broadwell i7-5600U, respectively, in single-threaded operations according to CineBench. Perhaps more notably, performance is within just a few percentage points from the standard voltage i7-4720HQ that is popular on gaming notebooks. The performance delta between our ULV core and more standard mobile processors grows larger in multi-threaded operations due to the more limited Turbo Boost potential under these conditions.
See our dedicated CPU page on the Core i7-6500U for more technical information and comparisons.
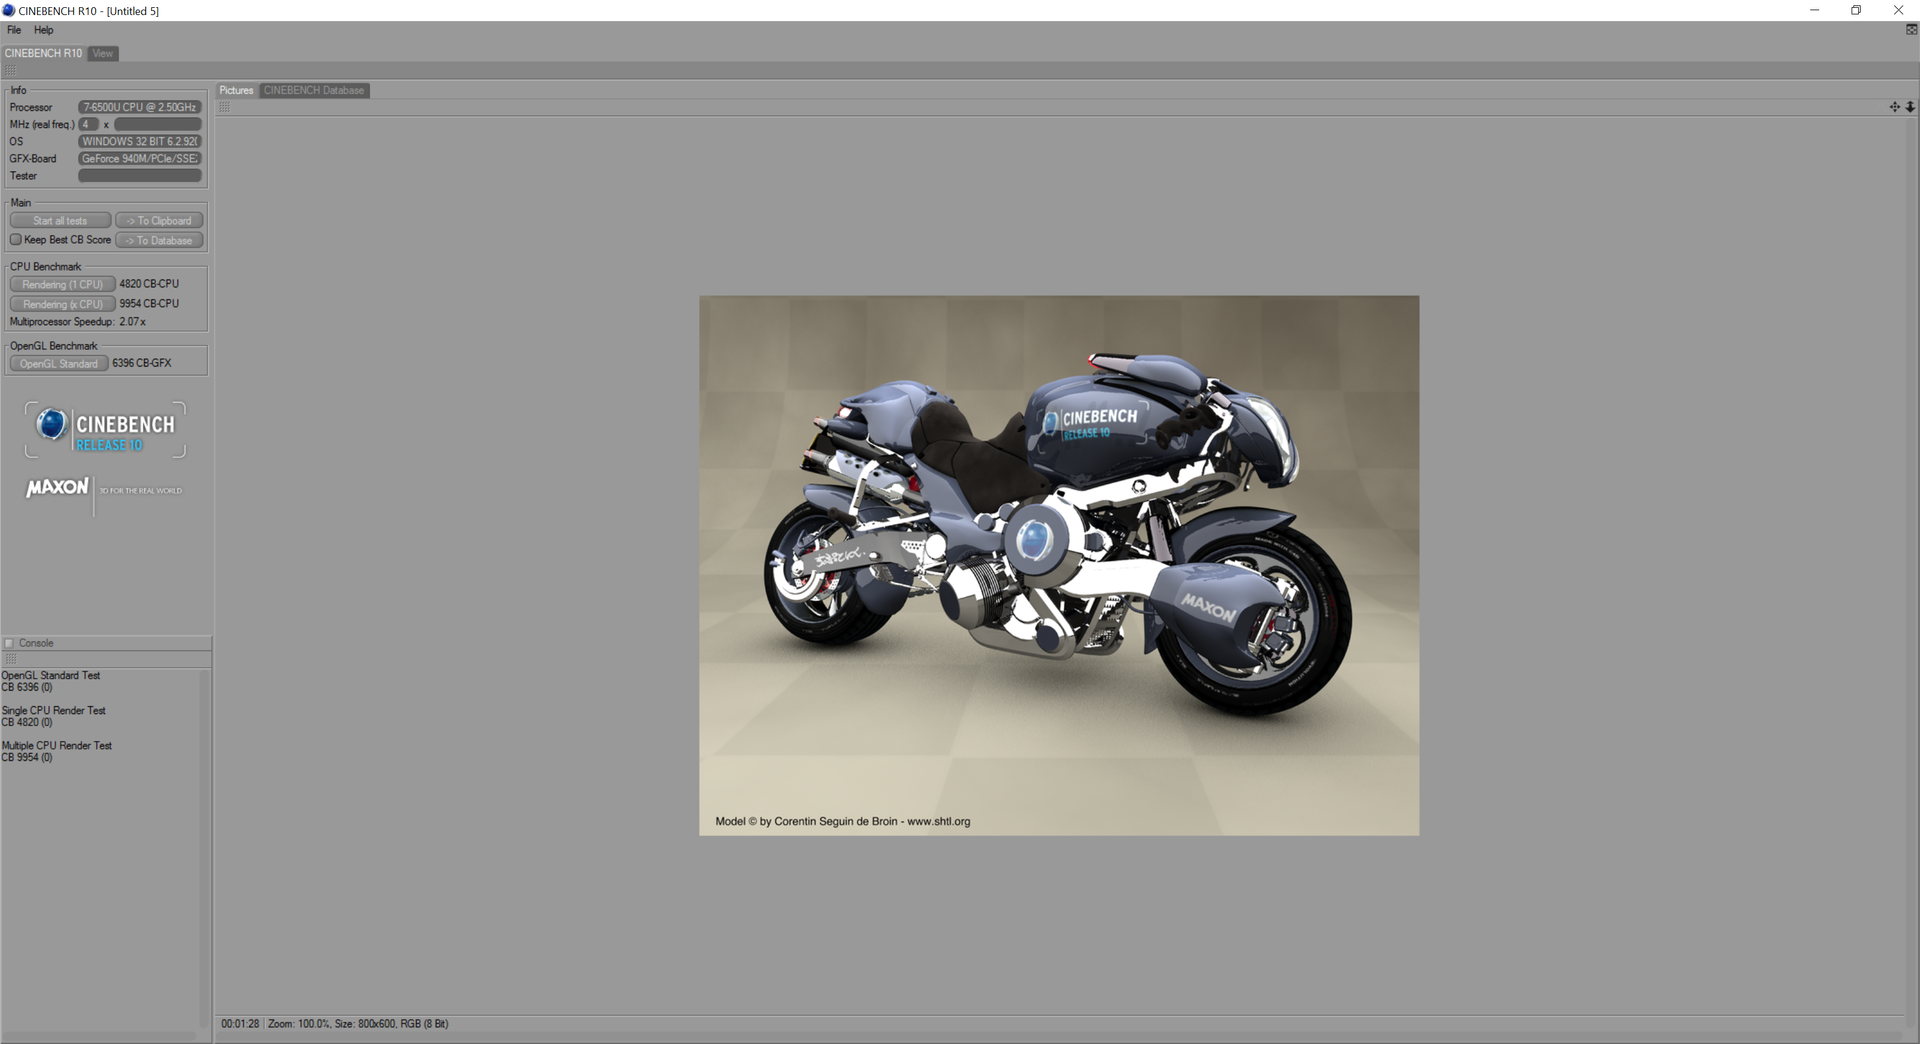
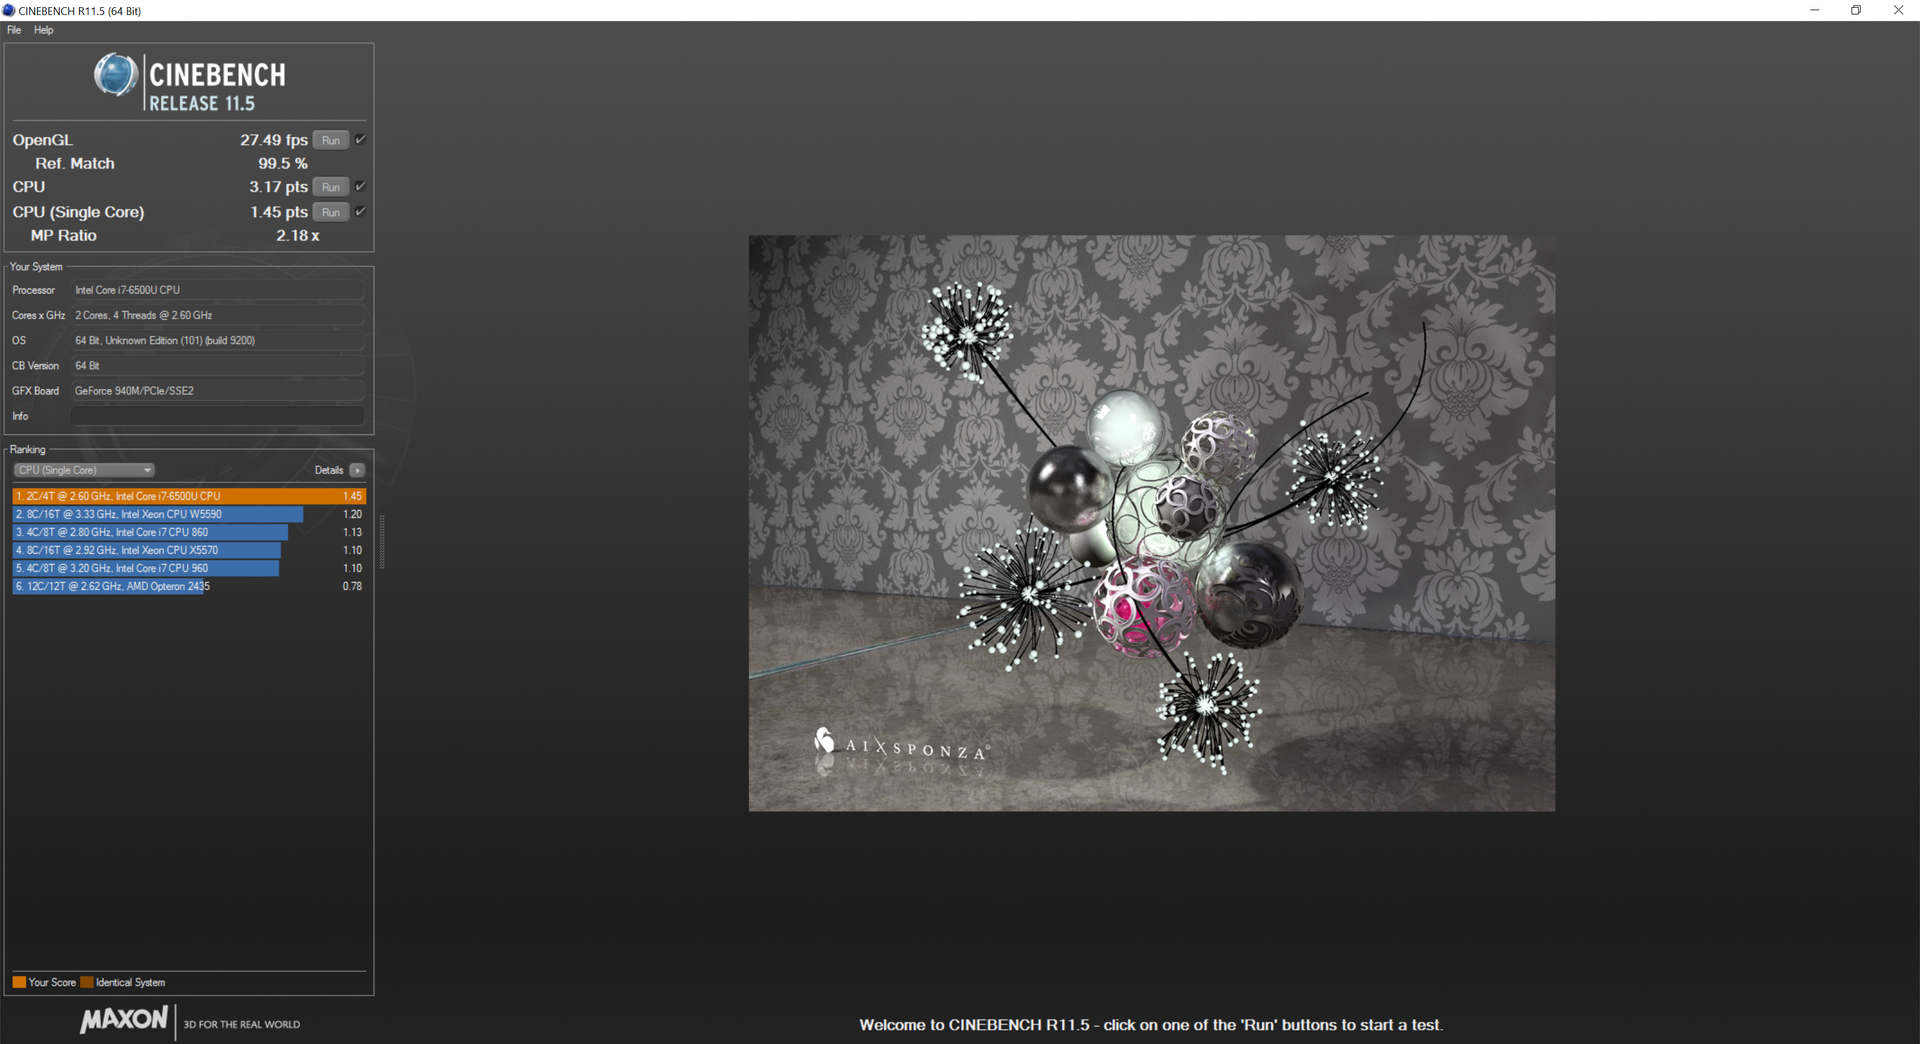
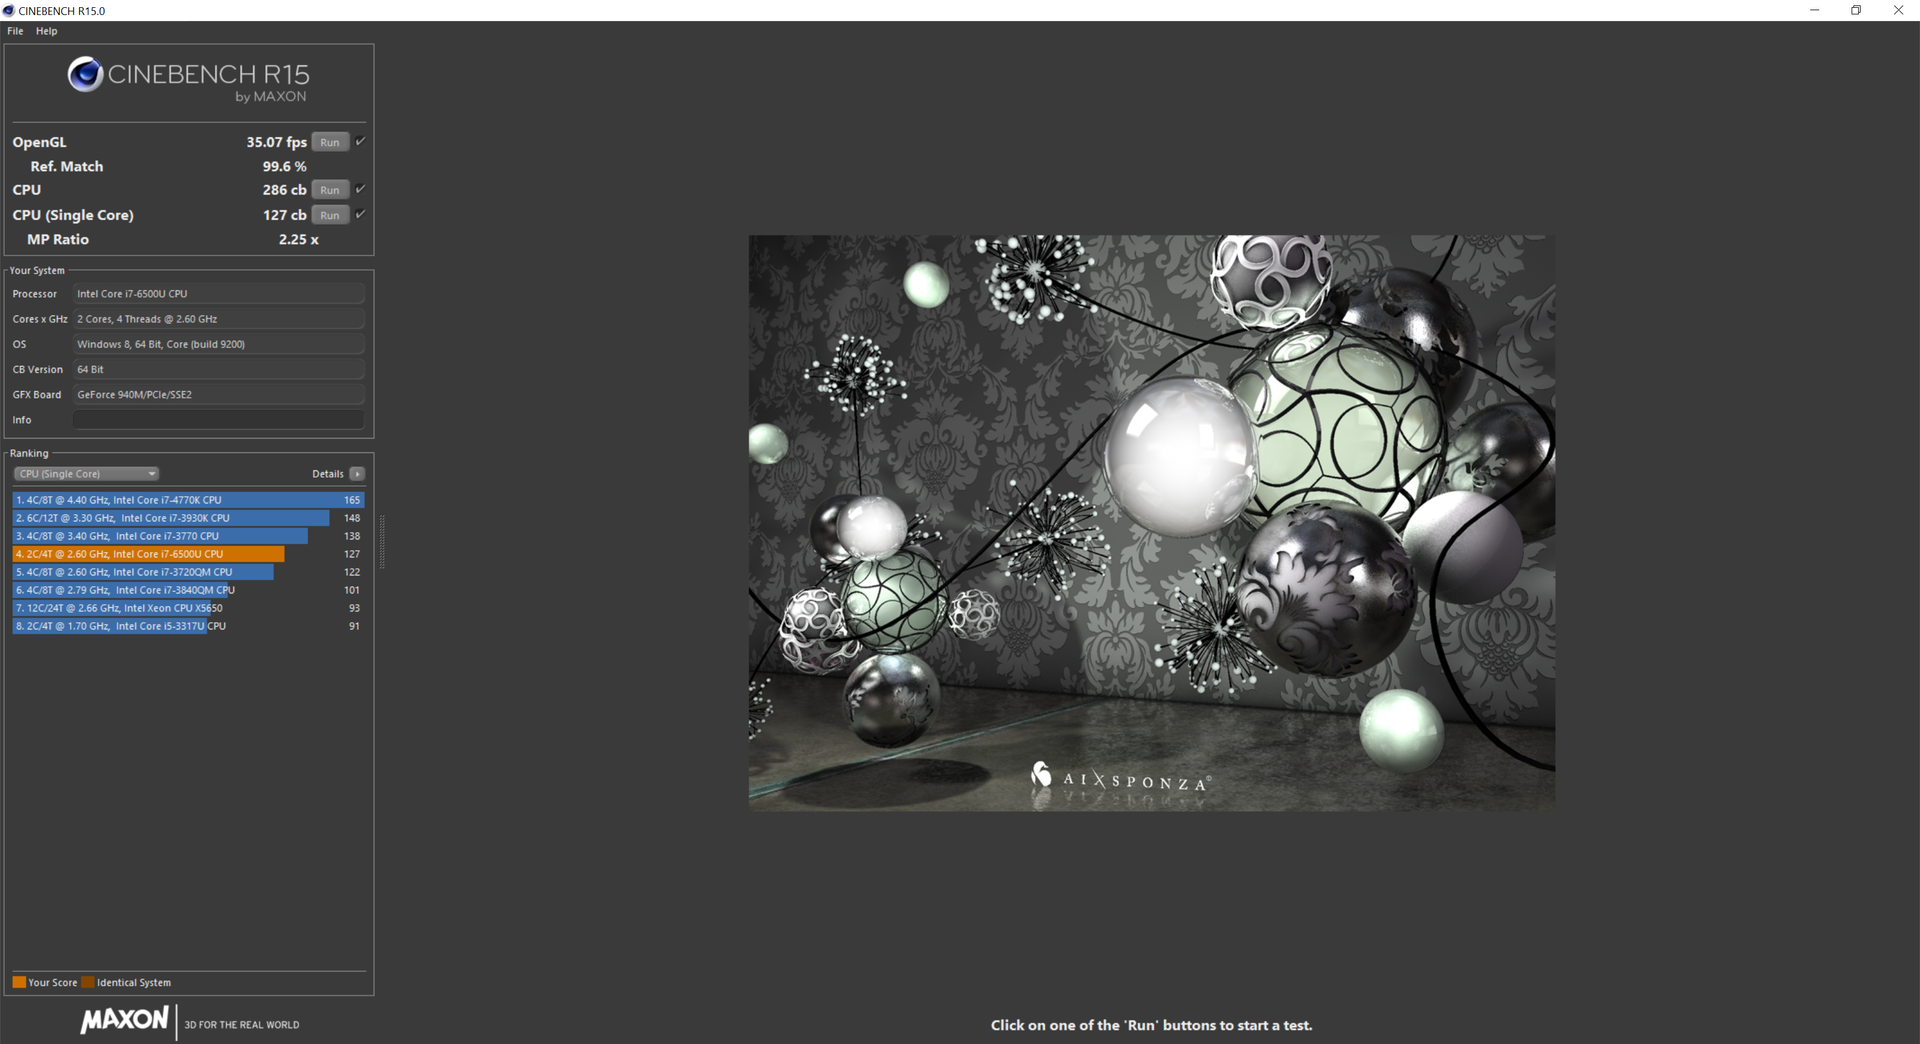
| Cinebench R10 | |
| Rendering Multiple CPUs 32Bit (sort by value) | |
| Asus Zenbook UX303UB-DH74T | |
| Eurocom Shark 4 | |
| HP EliteBook Folio 1040 G2 | |
| Dell Inspiron 17 5759-5118 | |
| Rendering Single 32Bit (sort by value) | |
| Asus Zenbook UX303UB-DH74T | |
| Eurocom Shark 4 | |
| HP EliteBook Folio 1040 G2 | |
| Dell Inspiron 17 5759-5118 | |
System Performance
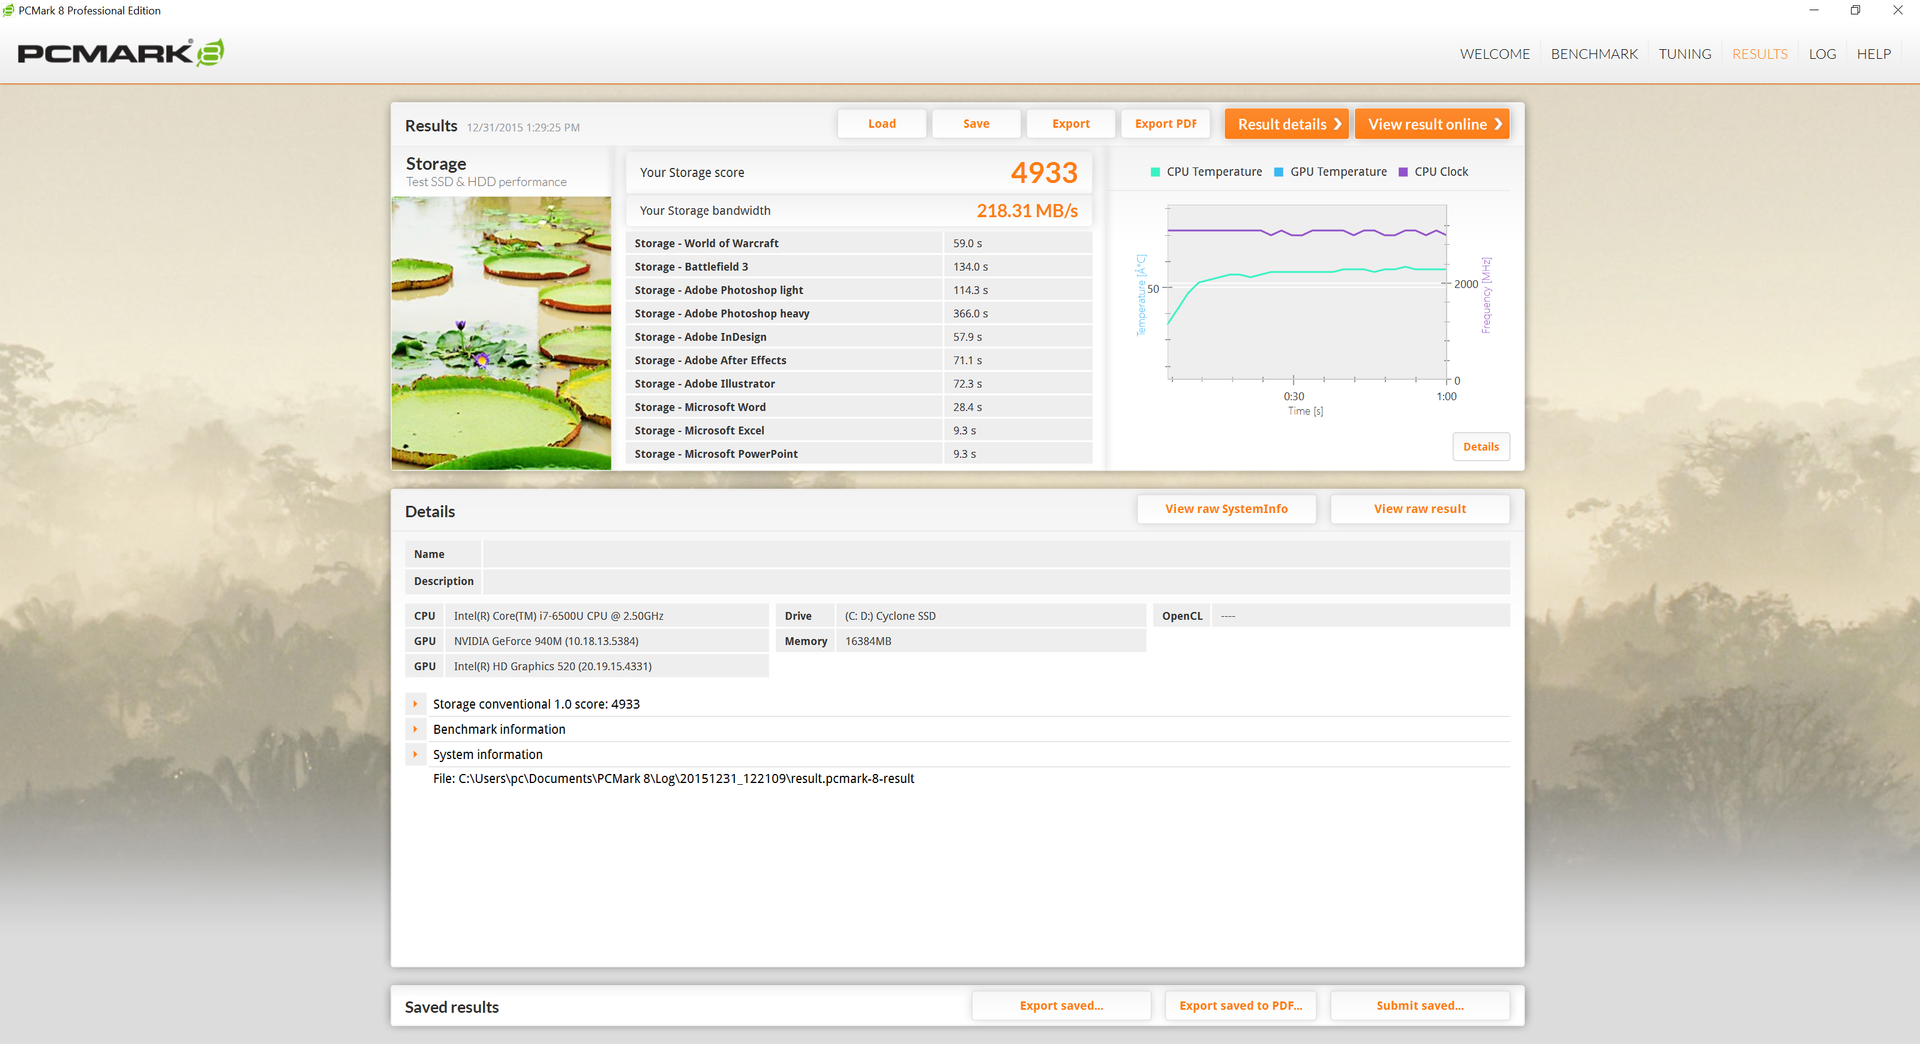
PCMark scores are consistently ahead of the fanless UX305 by as much as 11 to 18 percent depending on the benchmark and comparable to other Ultrabooks in its size class including the HP Spectre 13 and Dell XPS 13. The scores diverge a bit more under PCMark 8 where the MacBook Air 13 is shown to be ahead on all accounts.
Subjectively, we experienced no system crashes or unexpected hardware issues. The screen exhibited jitters and behaved oddly during a single 3DMark 11 run, but we were unable to reproduce the results.
| PCMark 7 - Score (sort by value) | |
| Asus Zenbook UX303UB-DH74T | |
| Apple MacBook Air 13 inch 2015-03 | |
| HP Spectre 13-4001ng x360 | |
| Dell XPS 13 2016 i7 256GB QHD | |
| Asus Zenbook UX305CA-EHM1 | |
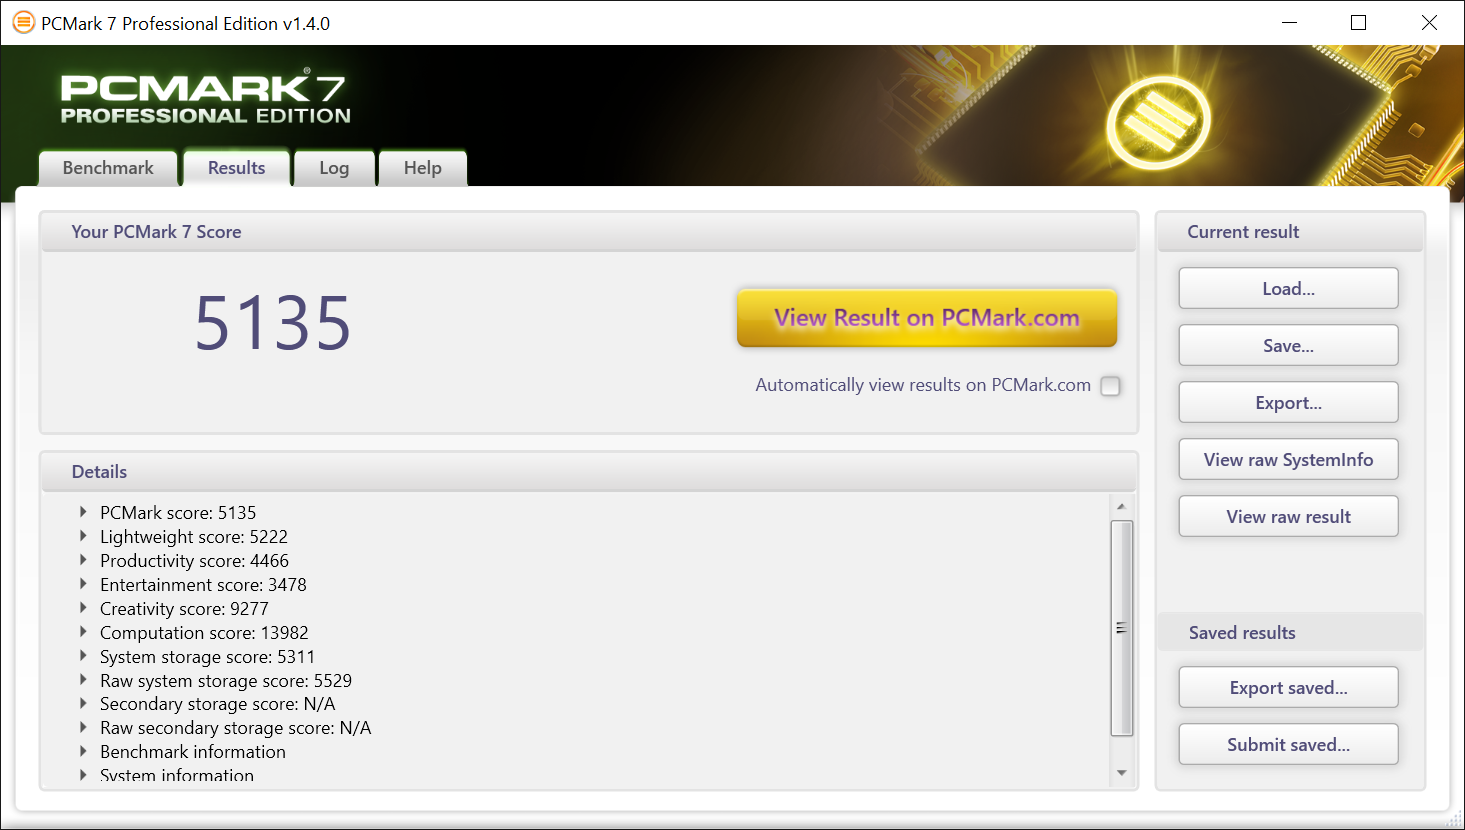
| PCMark 7 Score | 5135 points | |
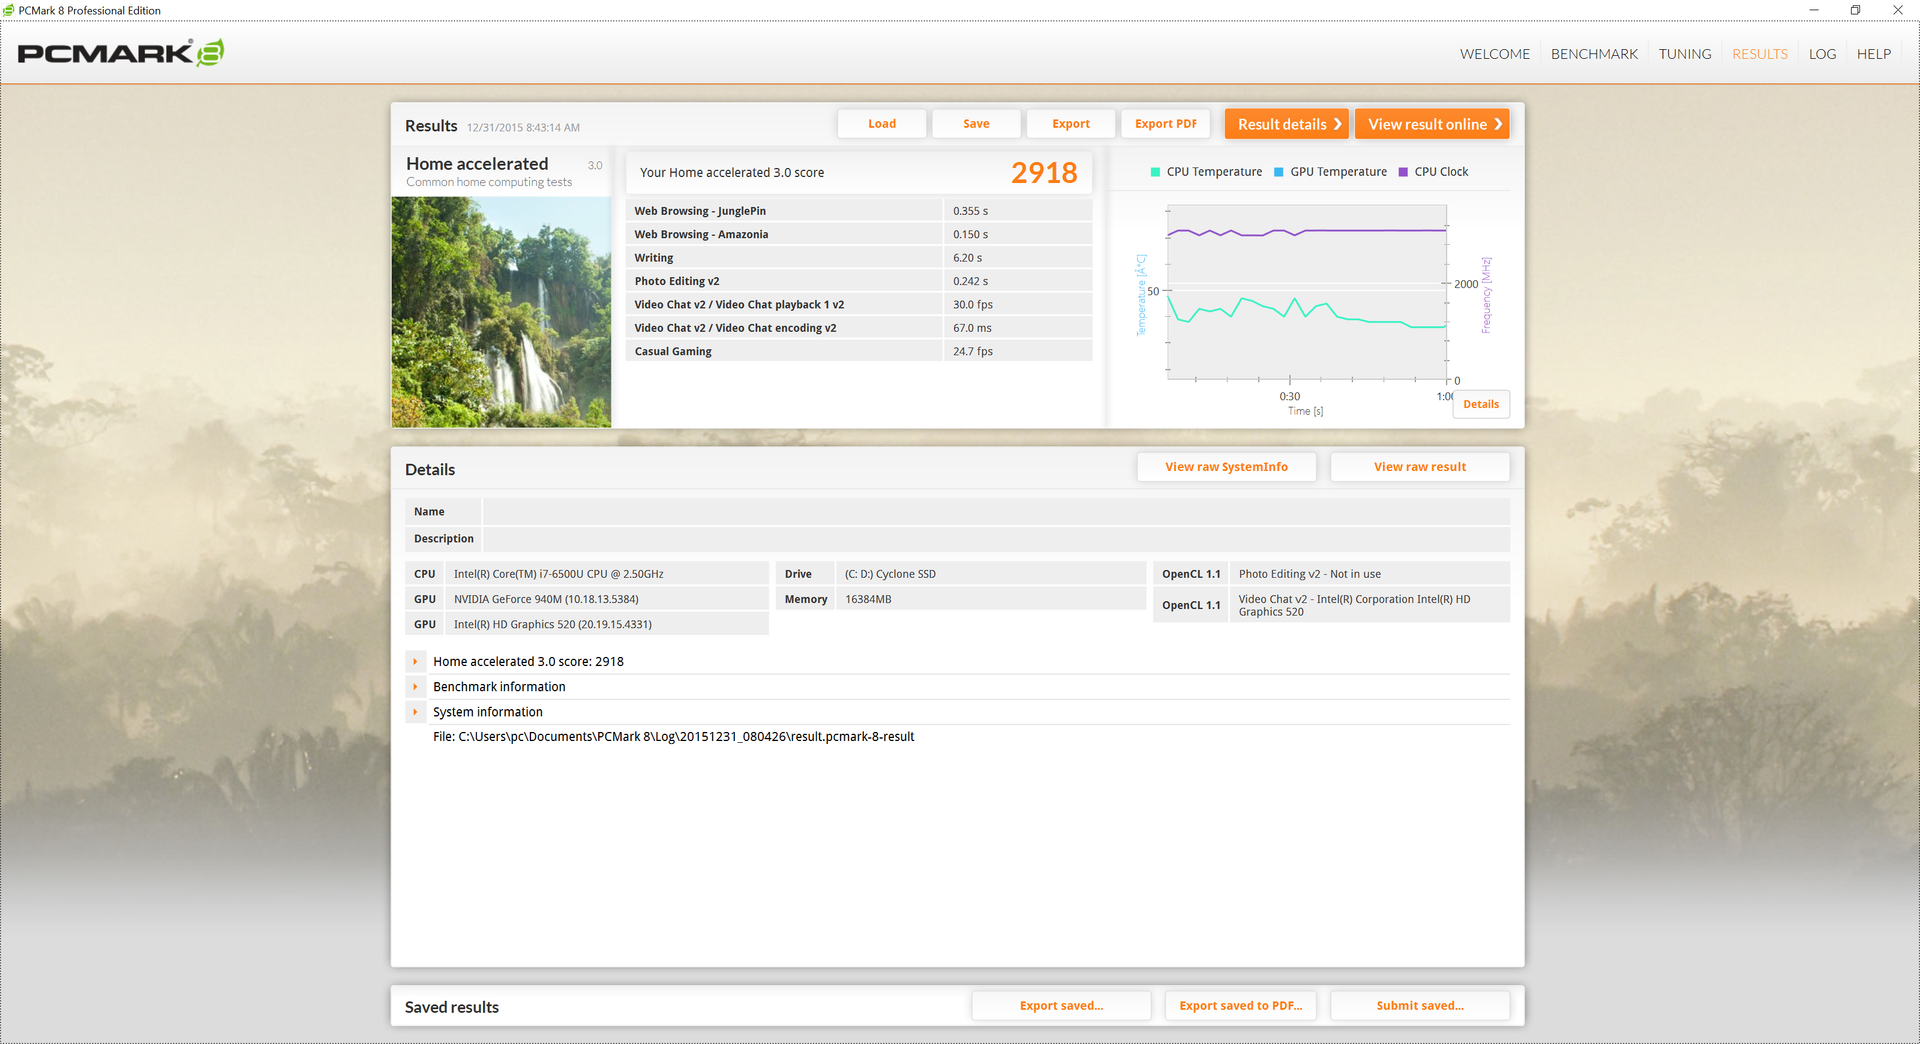
| PCMark 8 Home Score Accelerated v2 | 2918 points | |
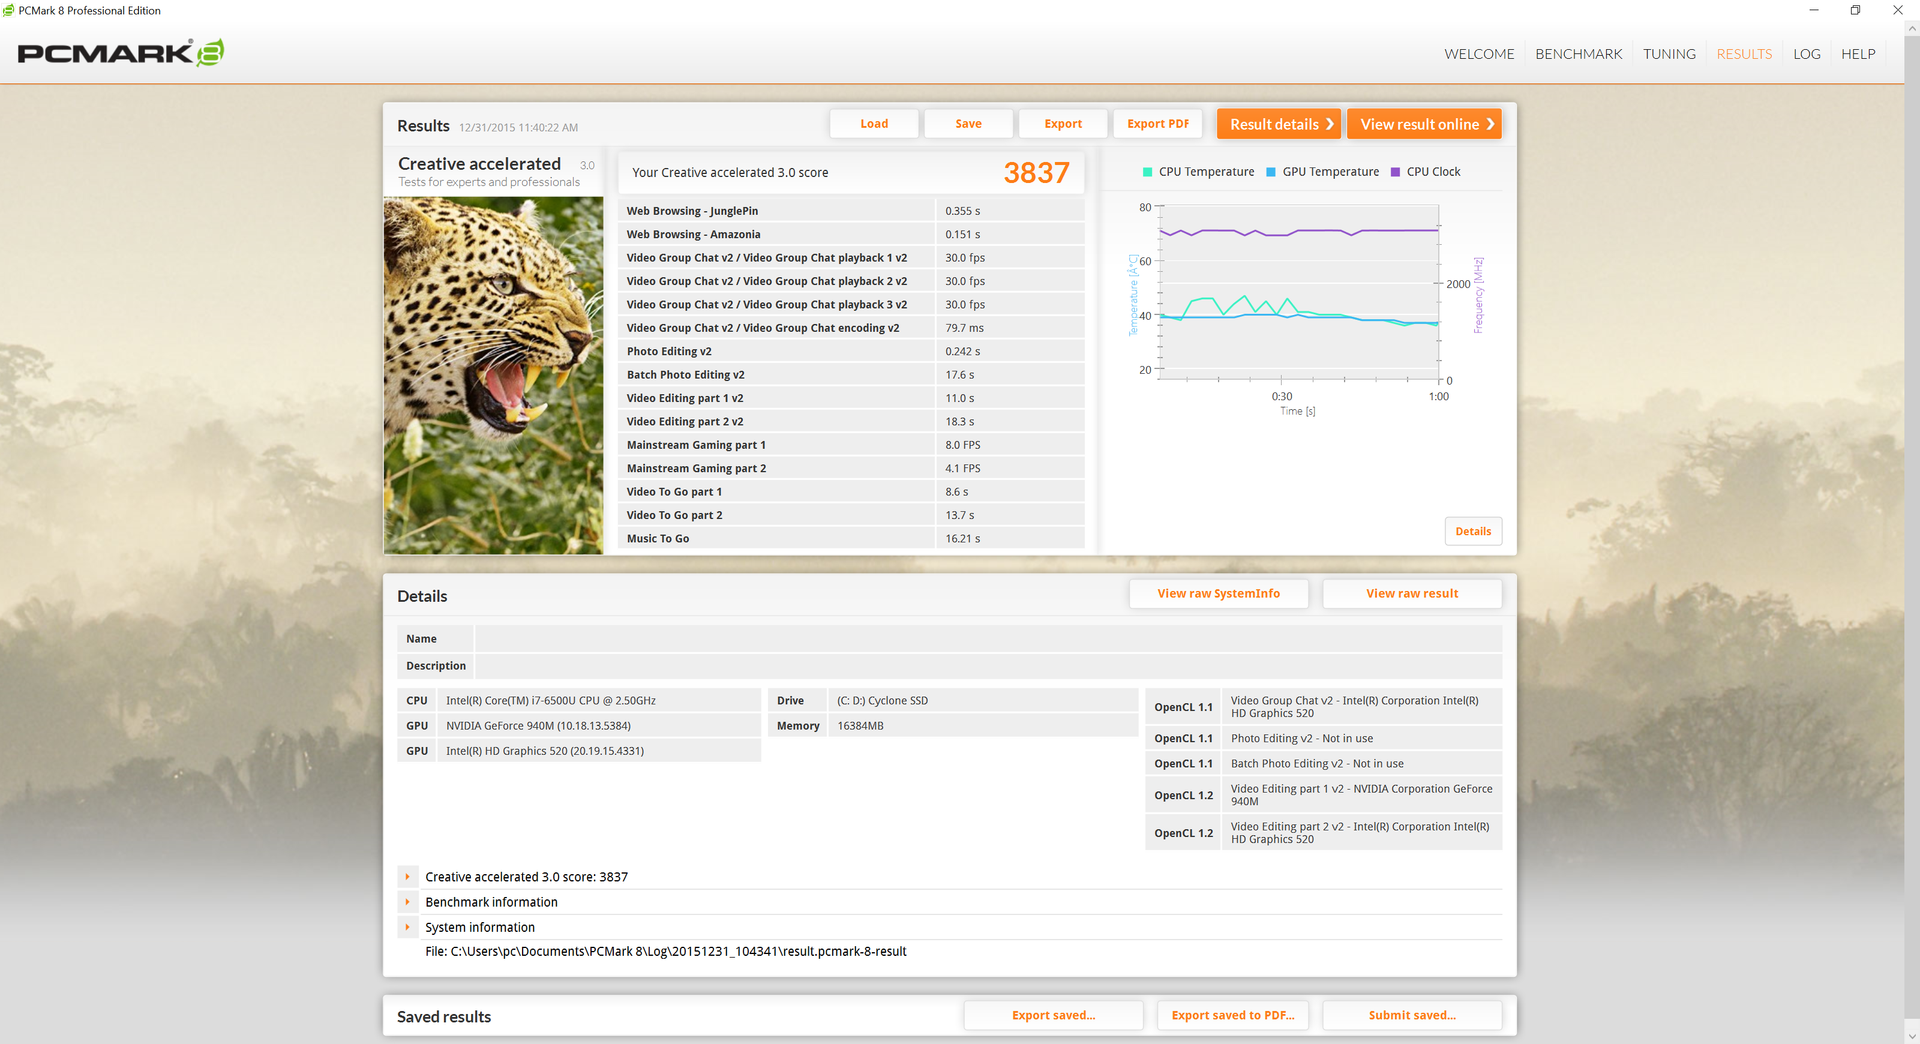
| PCMark 8 Creative Score Accelerated v2 | 3837 points | |
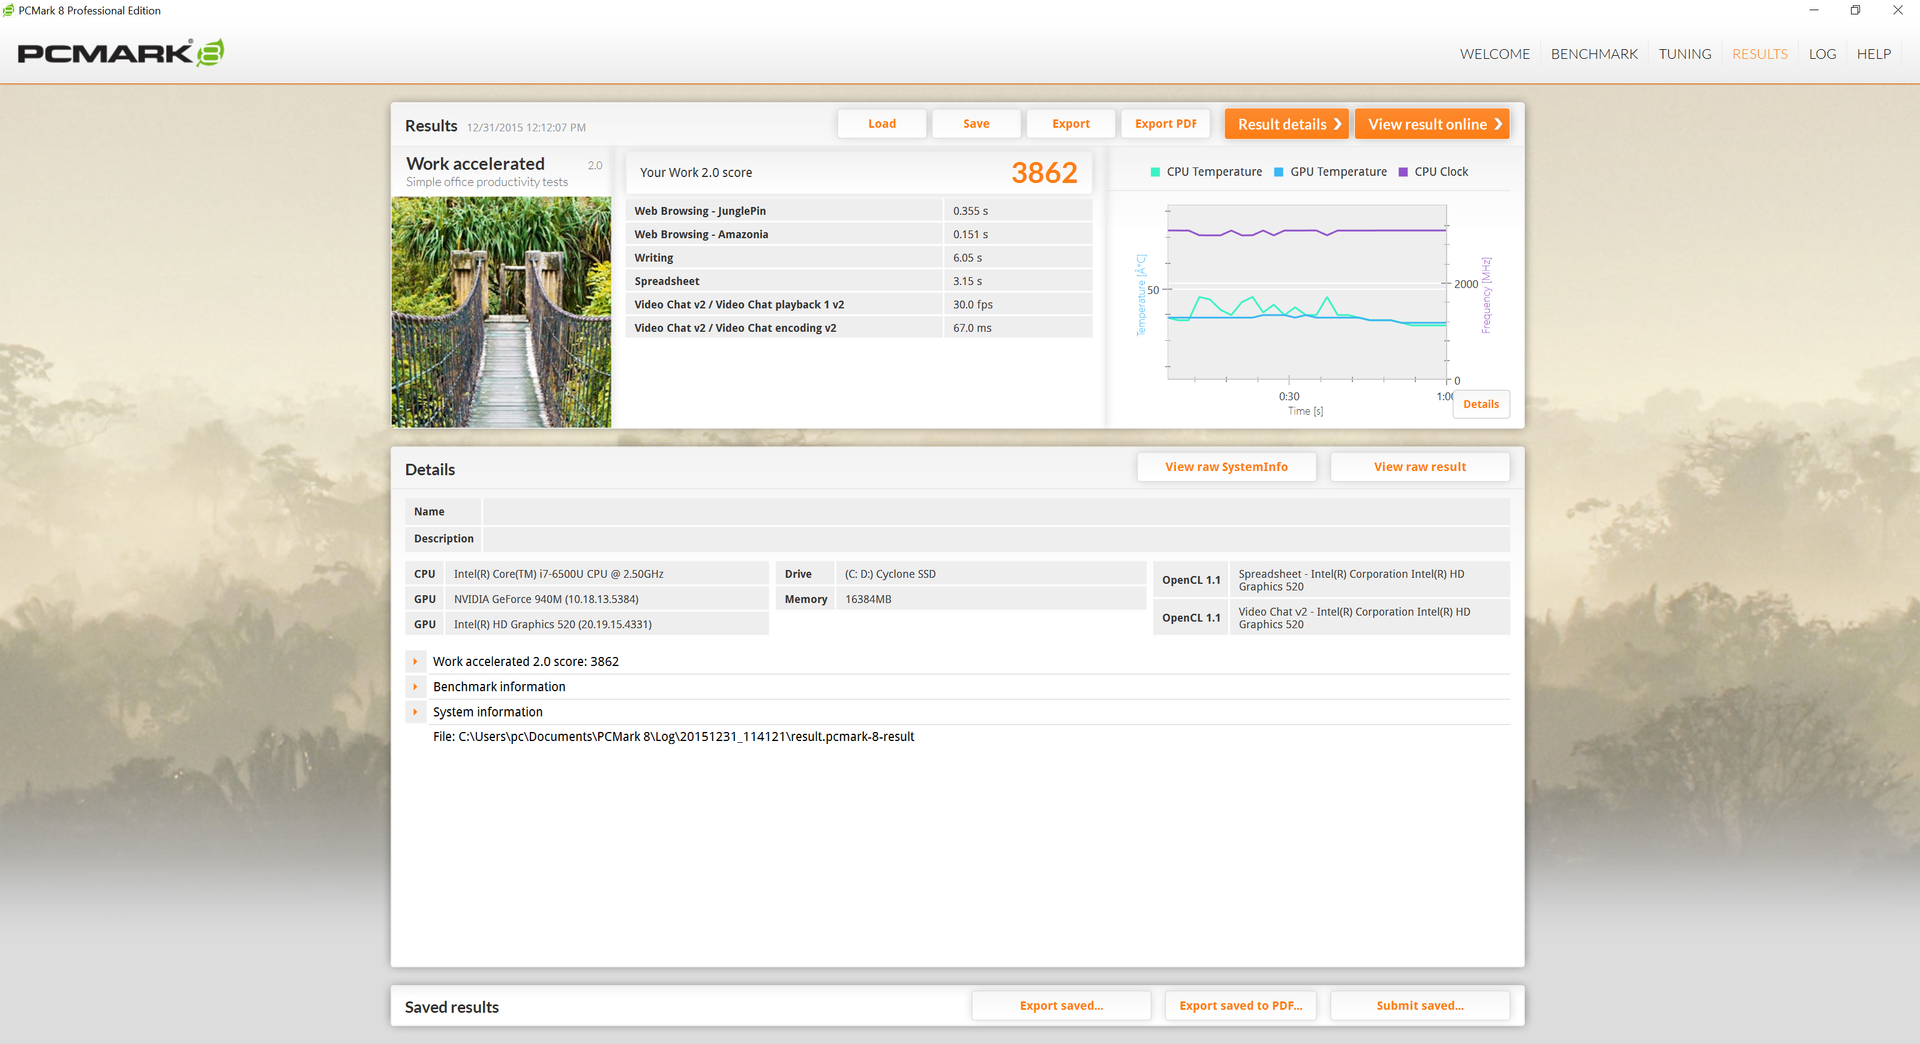
| PCMark 8 Work Score Accelerated v2 | 3862 points | |
Help | ||
Storage Devices
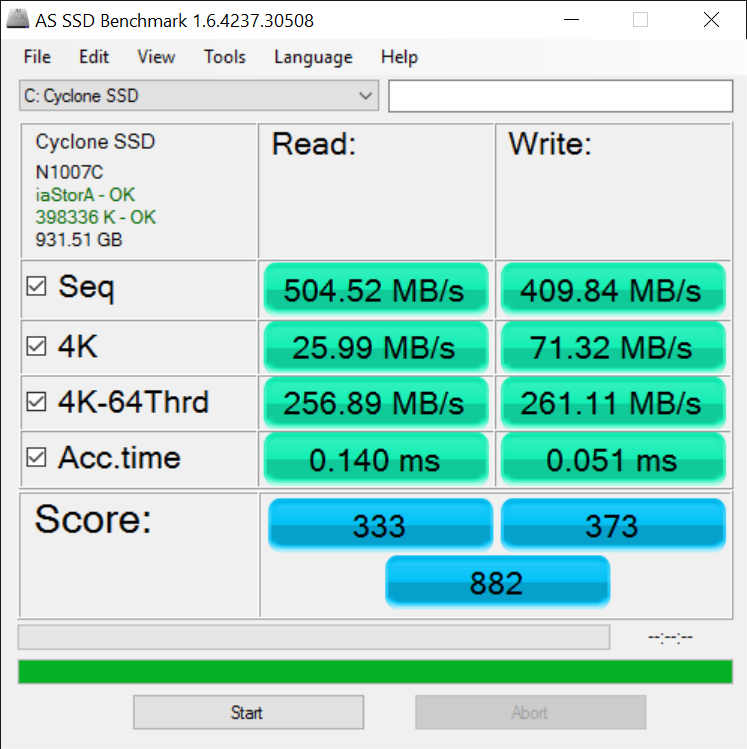
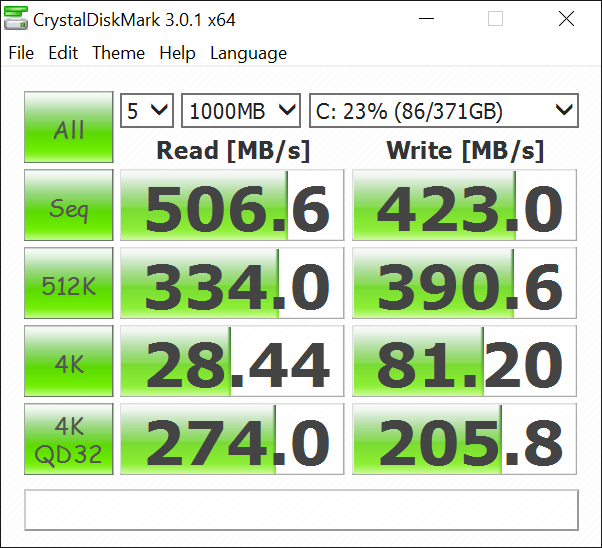
Only a single 2.5-inch SATA III bay is available for internal storage. CUKUSA has outfitted our system with its own 7 mm Cyclone SSD. Unlike many other OEM drives, the Cyclone runs on the MEX controller and provides AES 256-bit Encryption and Auto Garbage Collection.
According to AS SSD, the drive is comparable to high-end 2.5-inch SSDs like the Samsung 850 EVO in our Ideapad Y700. Newer NVMe solutions found on the latest Ultrabooks or Apple MacBooks will still handily outperform the SSD in our Zenbook.

| Asus Zenbook UX303UB-DH74T GeForce 940M, 6500U, CUK Cyclone SSD 1TB | Aorus X3 Plus v5 GeForce GTX 970M, 6700HQ, Samsung SM951 MZVPV512HDGL m.2 PCI-e | Dell XPS 13 2016 i7 256GB QHD HD Graphics 520, 6500U, Samsung PM951 NVMe MZ-VLV256D | Lenovo Yoga 900-13ISK 80MK HD Graphics 520, 6500U, Samsung SSD PM871 MZNLN512HCJH | Lenovo Ideapad Y700-17 80QK7709PB GeForce GTX 960M, 6700HQ, Samsung SSD 850 EVO 500GB | |
|---|---|---|---|---|---|
| AS SSD | 151% | 53% | 18% | 11% | |
| Copy Game MB/s (MB/s) | 392.8 | 927 136% | 298.7 -24% | ||
| Copy Program MB/s (MB/s) | 233.7 | 368.6 58% | 249.6 7% | ||
| Copy ISO MB/s (MB/s) | 382.5 | 1158 203% | 364.5 -5% | ||
| Score Total (Points) | 882 | 2652 201% | 1603 82% | 1129 28% | 853 -3% |
| Score Write (Points) | 373 | 630 69% | 391 5% | 429 15% | 279 -25% |
| Score Read (Points) | 333 | 1345 304% | 809 143% | 458 38% | 372 12% |
| Access Time Write * (ms) | 0.051 | 0.032 37% | 0.034 33% | 0.039 24% | 0.035 31% |
| Access Time Read * (ms) | 0.14 | 0.041 71% | 0.071 49% | 0.054 61% | 0.053 62% |
| 4K-64 Write (MB/s) | 261.1 | 368.3 41% | 263.7 1% | 303 16% | 138.6 -47% |
| 4K-64 Read (MB/s) | 256.9 | 1113 333% | 698 172% | 374.8 46% | 286 11% |
| 4K Write (MB/s) | 71.3 | 114 60% | 97.6 37% | 80.6 13% | 93.7 31% |
| 4K Read (MB/s) | 25.99 | 46.24 78% | 38.21 47% | 32.29 24% | 34.86 34% |
| Seq Write (MB/s) | 409.8 | 1474 260% | 301.2 -27% | 454.6 11% | 470.2 15% |
| Seq Read (MB/s) | 505 | 1859 268% | 735 46% | 505 0% | 514 2% |
* ... smaller is better
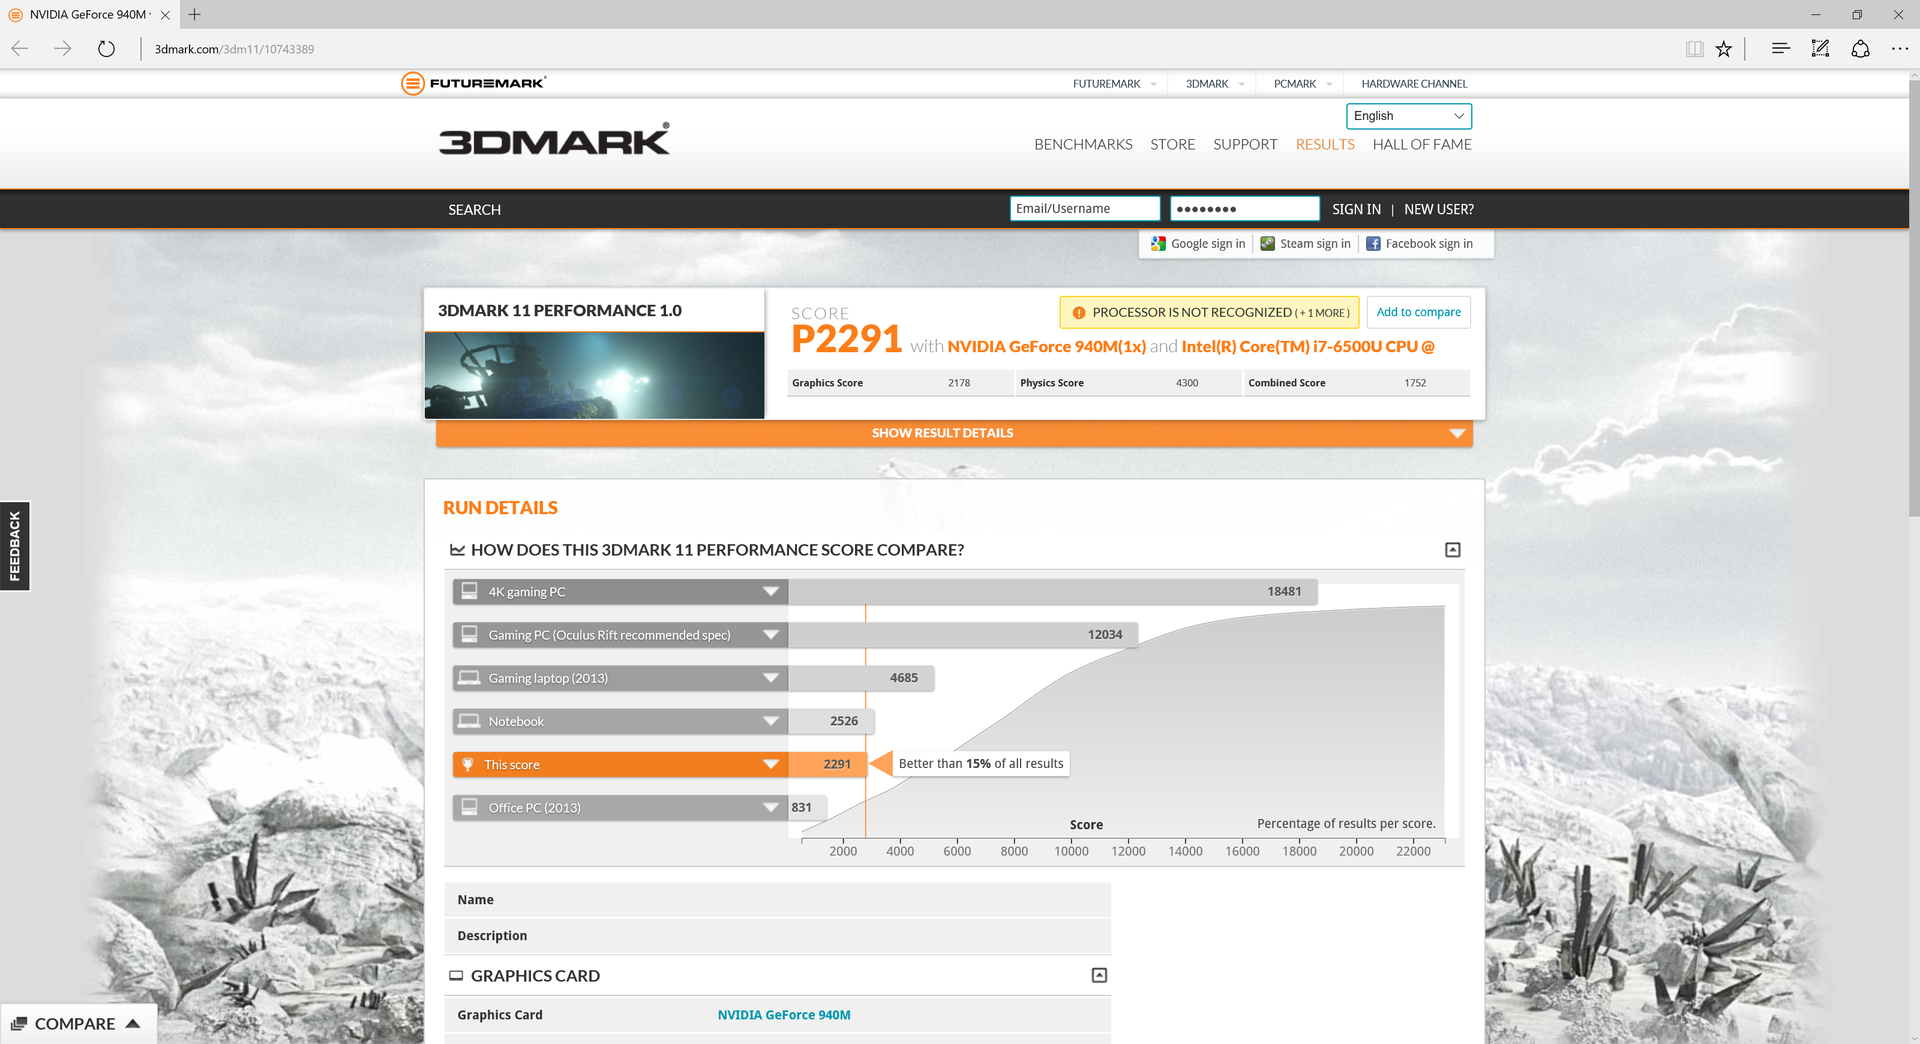
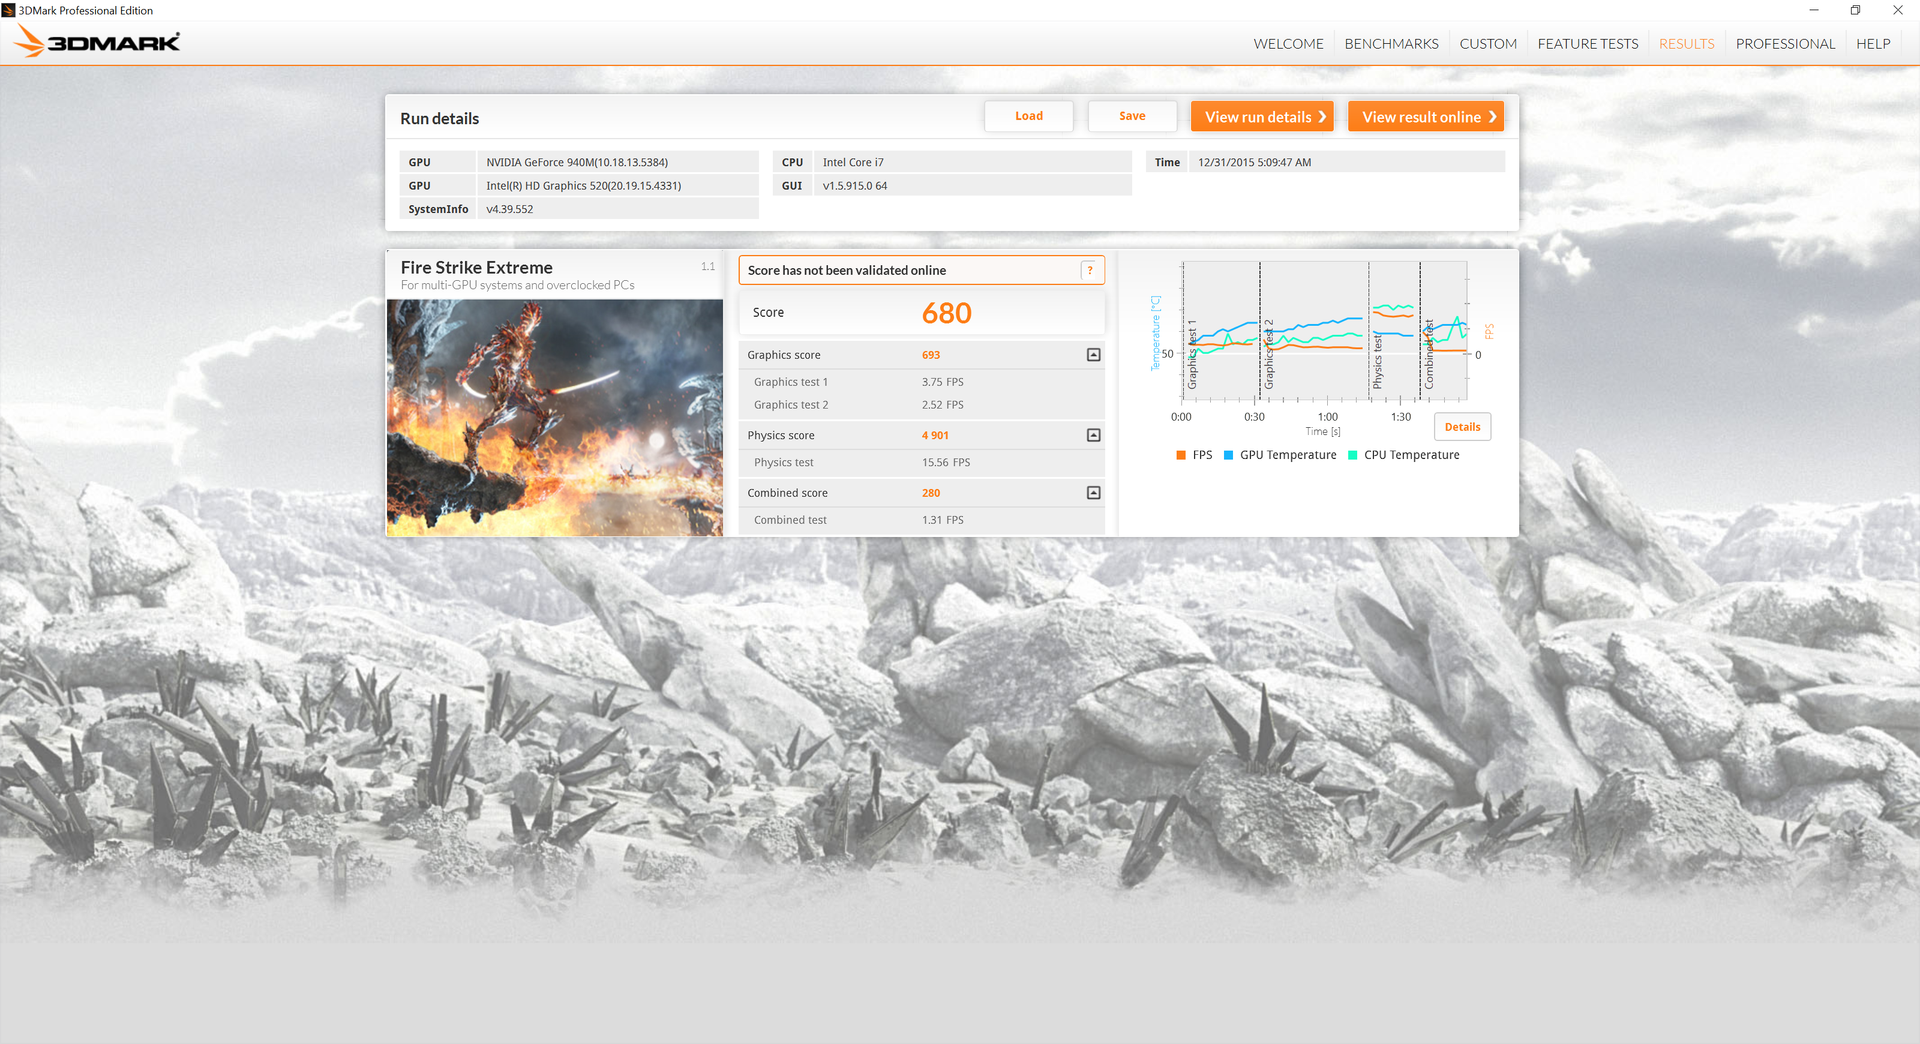
GPU Performance
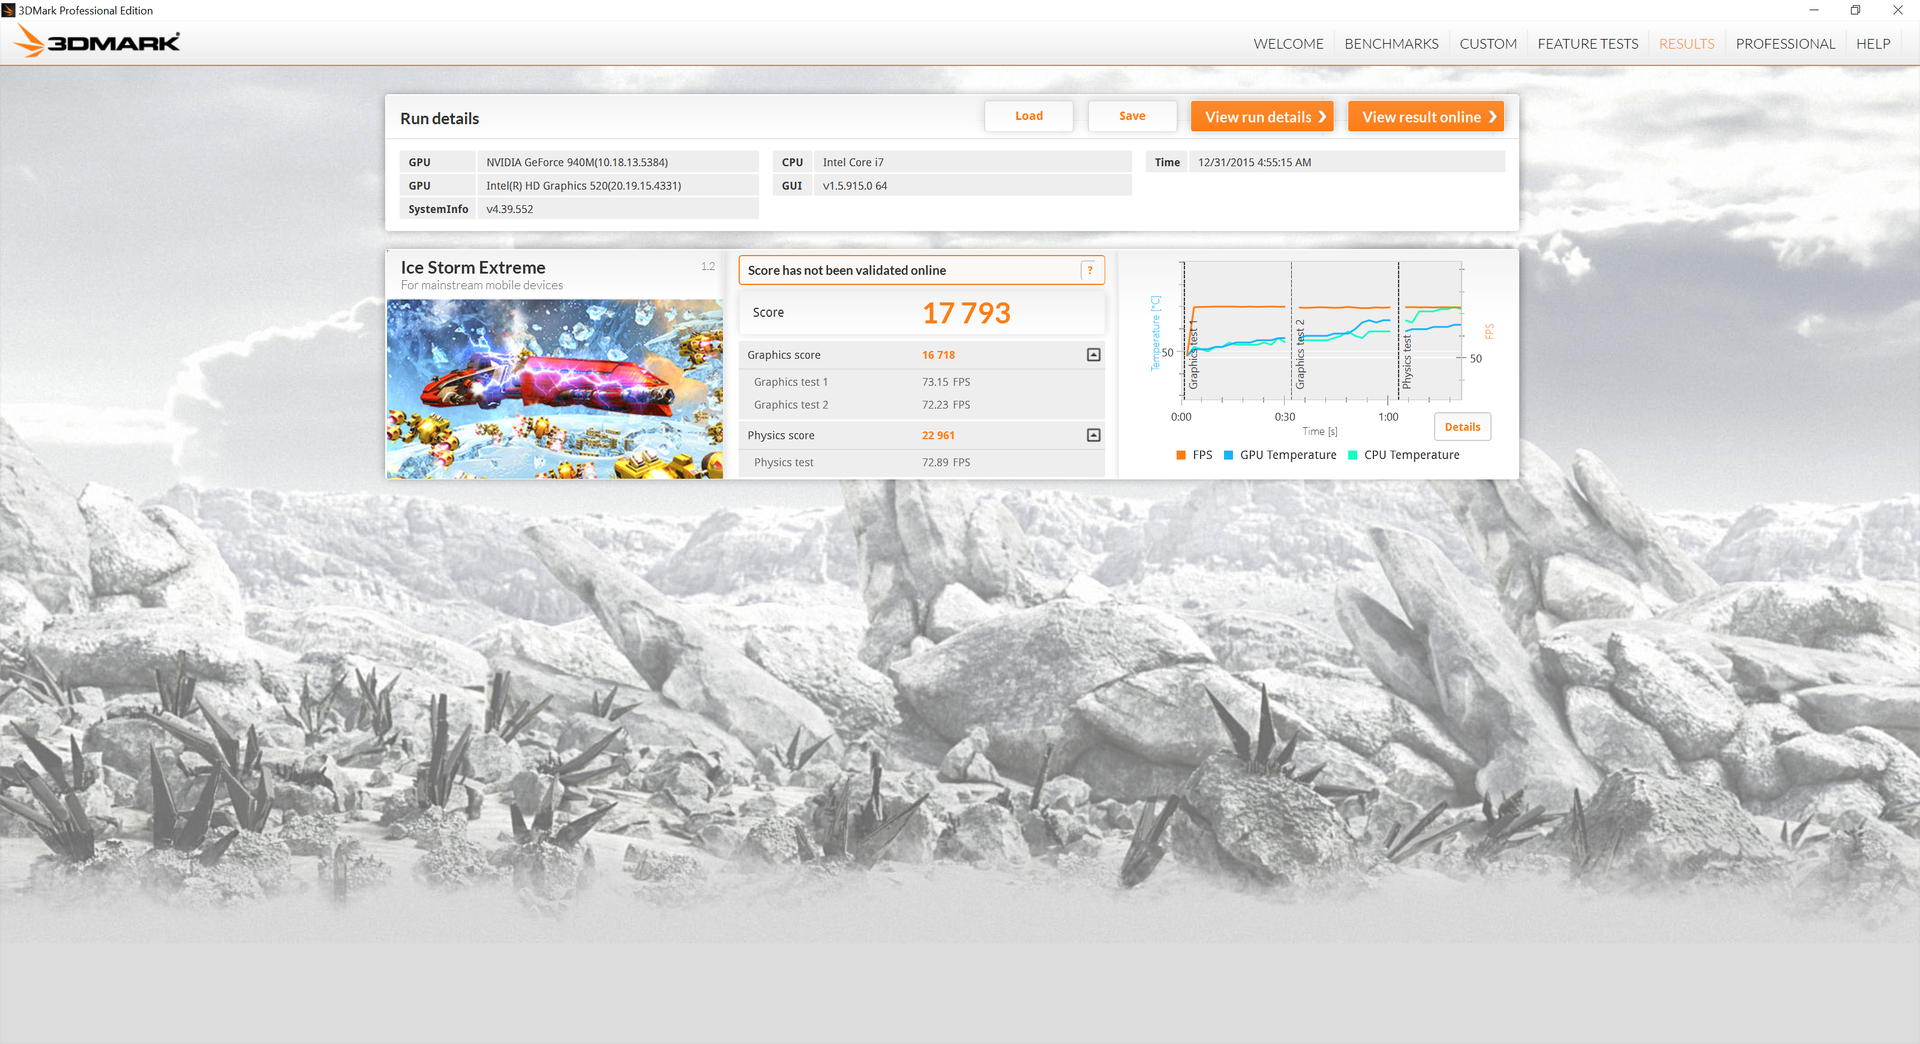
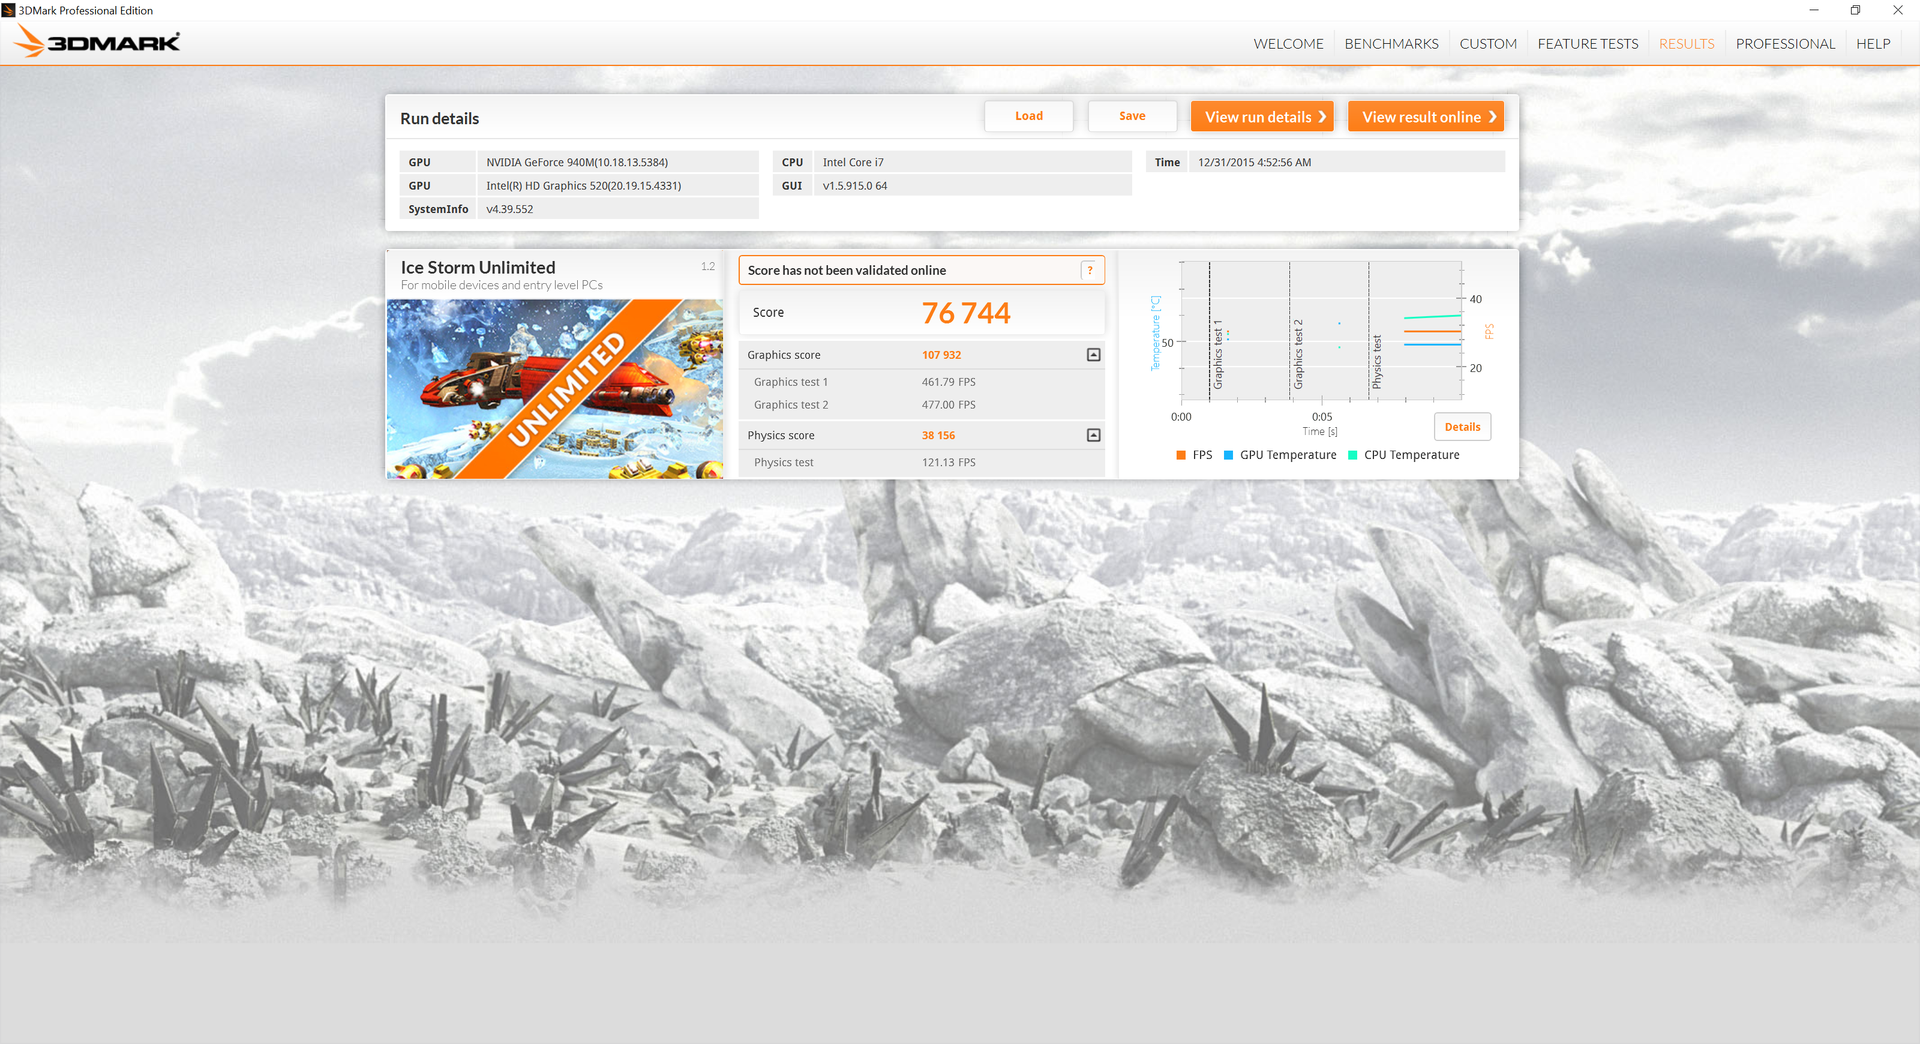
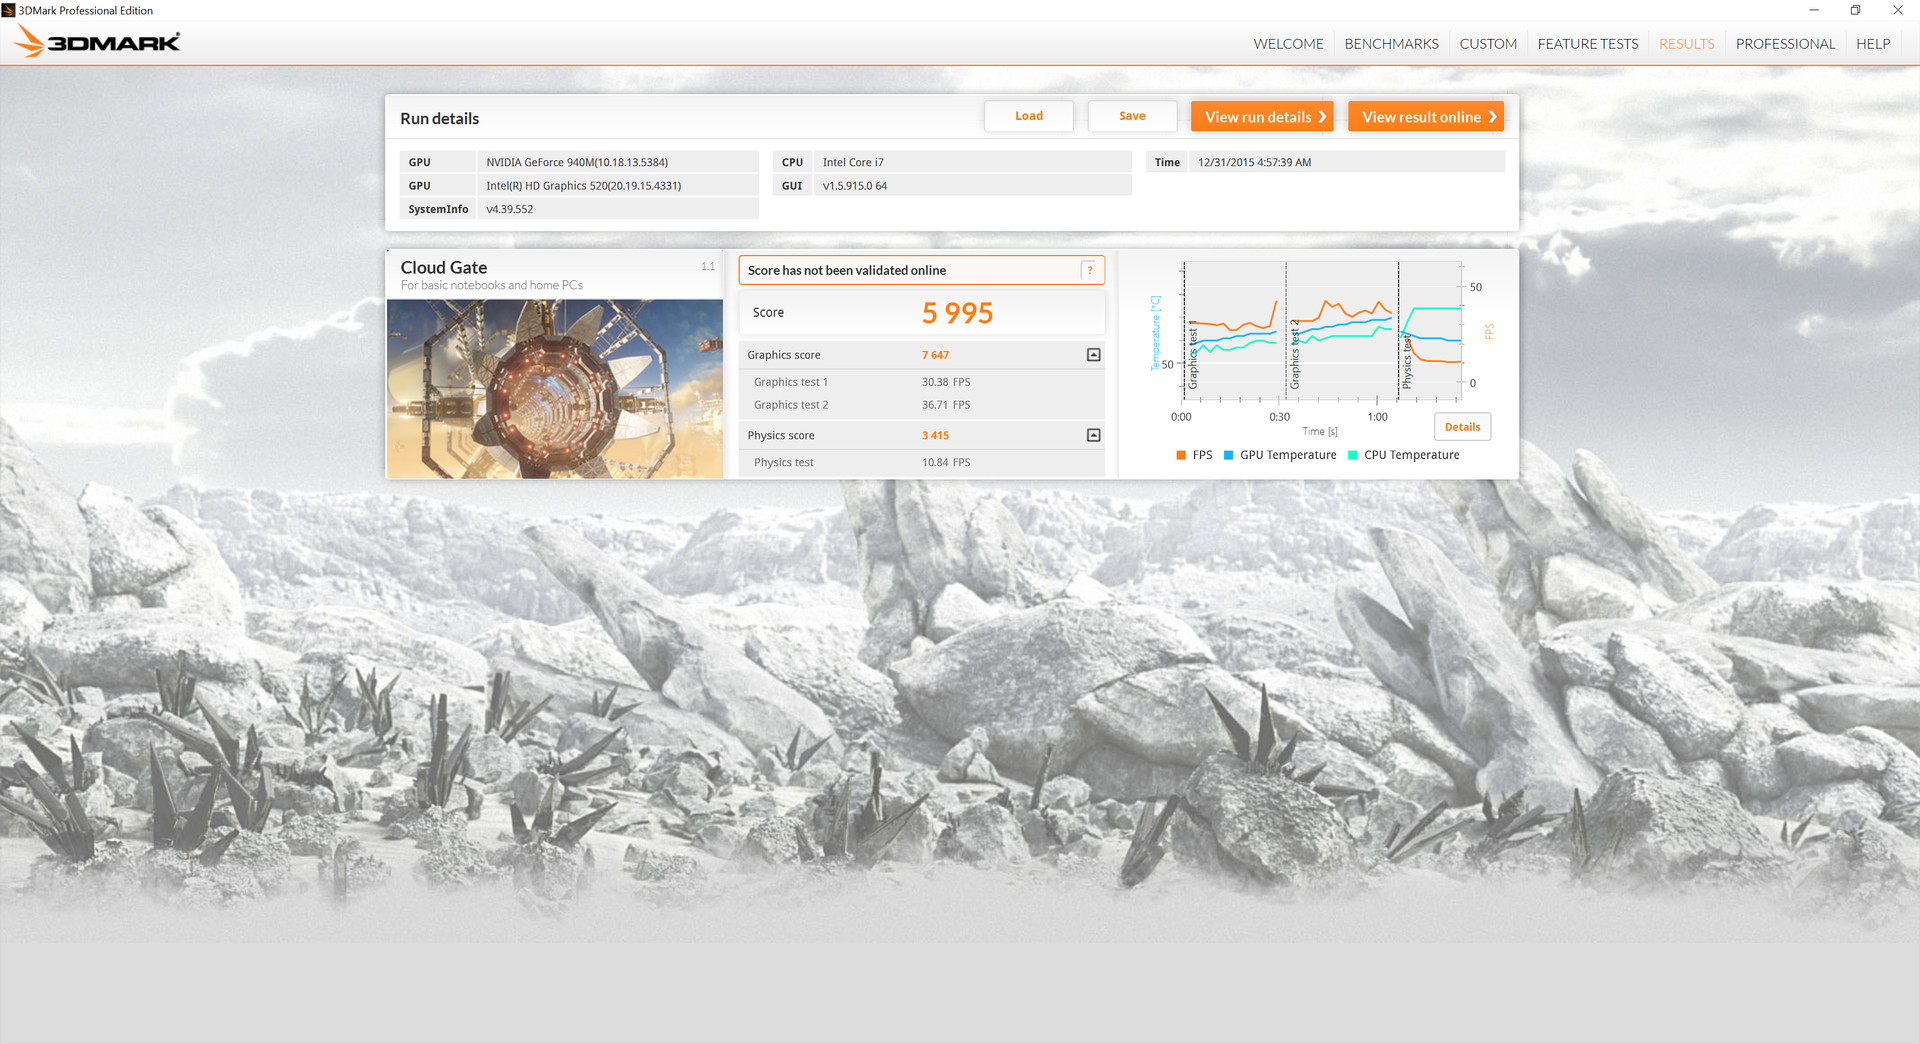
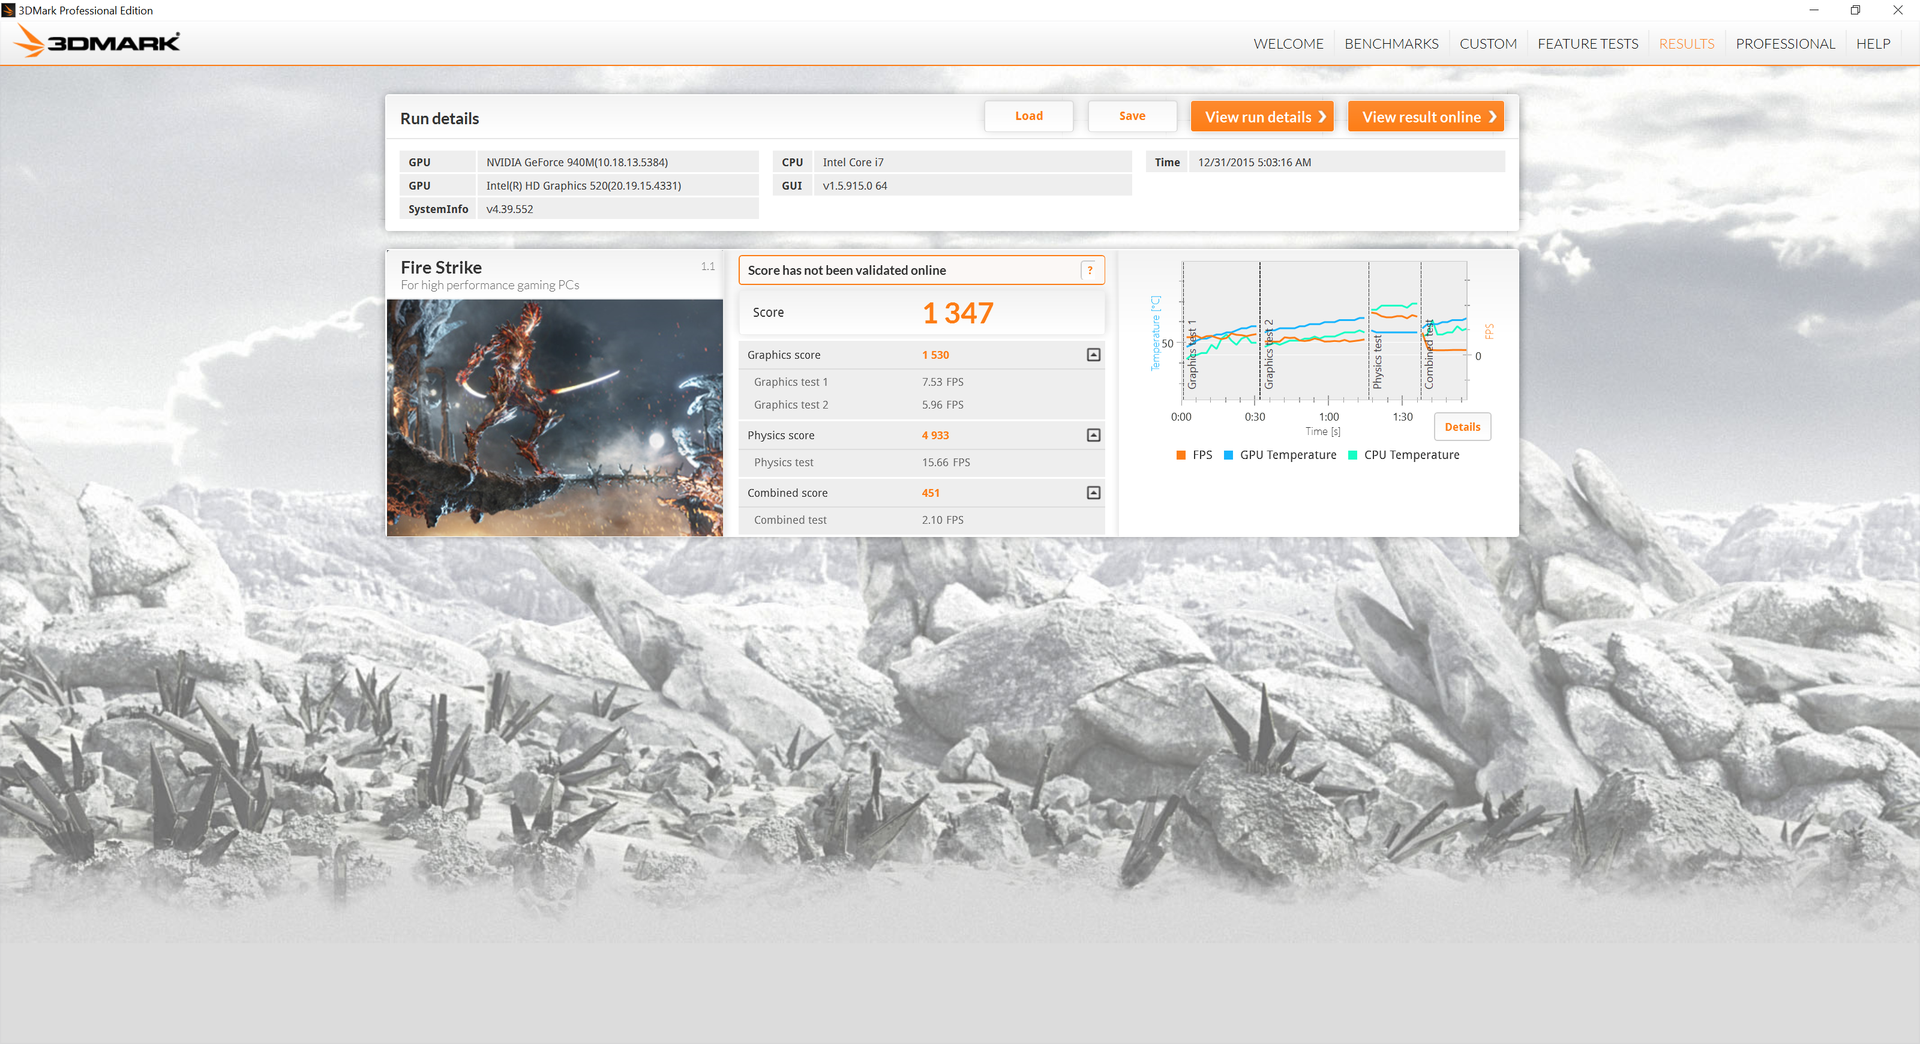
3DMark benchmarks rank our Asus system well ahead of the integrated HD Graphics 520 while being slightly behind the Iris Graphics 540 in the higher-end Microsoft Surface Pro 4. When compared to the previous generation GeForce 840M, the 940M shows an advantage of only a few percentage points.
| 3DMark | |
| 1920x1080 Fire Strike Score (sort by value) | |
| Asus Zenbook UX303UB-DH74T | |
| Nexoc M731III W670RBQ | |
| Microsoft Surface Pro 4 Core i7 | |
| Lenovo Flex 2 Pro-15 | |
| HP Envy 13-d000ng | |
| 1280x720 Cloud Gate Standard Score (sort by value) | |
| Asus Zenbook UX303UB-DH74T | |
| Nexoc M731III W670RBQ | |
| Microsoft Surface Pro 4 Core i7 | |
| Lenovo Flex 2 Pro-15 | |
| HP Envy 13-d000ng | |
| 1280x720 Ice Storm Standard Score (sort by value) | |
| Asus Zenbook UX303UB-DH74T | |
| Nexoc M731III W670RBQ | |
| Microsoft Surface Pro 4 Core i7 | |
| Lenovo Flex 2 Pro-15 | |
| HP Envy 13-d000ng | |
| 3DMark 11 Performance | 2291 points | |
| 3DMark Ice Storm Standard Score | 17839 points | |
| 3DMark Cloud Gate Standard Score | 5995 points | |
| 3DMark Fire Strike Score | 1347 points | |
| 3DMark Fire Strike Extreme Score | 680 points | |
Help | ||
Gaming Performance
The dedicated Nvidia GPU is not designed for enthusiast-level gaming. Even mainstream settings on more recent and demanding titles like Arkham Knight are off-limits for the GT 940M let alone for gaming on a native resolution of 3200 x 1800. Even the Razer Blade 14 and its GTX 970M has trouble playing titles at such high resolutions.
More technical details and comparisons on the Nvidia 940M can be found on our dedicated GPU page.
| low | med. | high | ultra | |
|---|---|---|---|---|
| Tomb Raider (2013) | 60.3 | 32.7 | 16.2 | |
| BioShock Infinite (2013) | 43.2 | 38.5 | 13.3 | |
| Metro: Last Light (2013) | 32.9 | 21.8 | 10.8 | |
| Thief (2014) | 23.9 | 19.3 | 8.9 | |
| Batman: Arkham Knight (2015) | 21 | |||
| Fallout 4 (2015) | 20 | 11 | 9 |
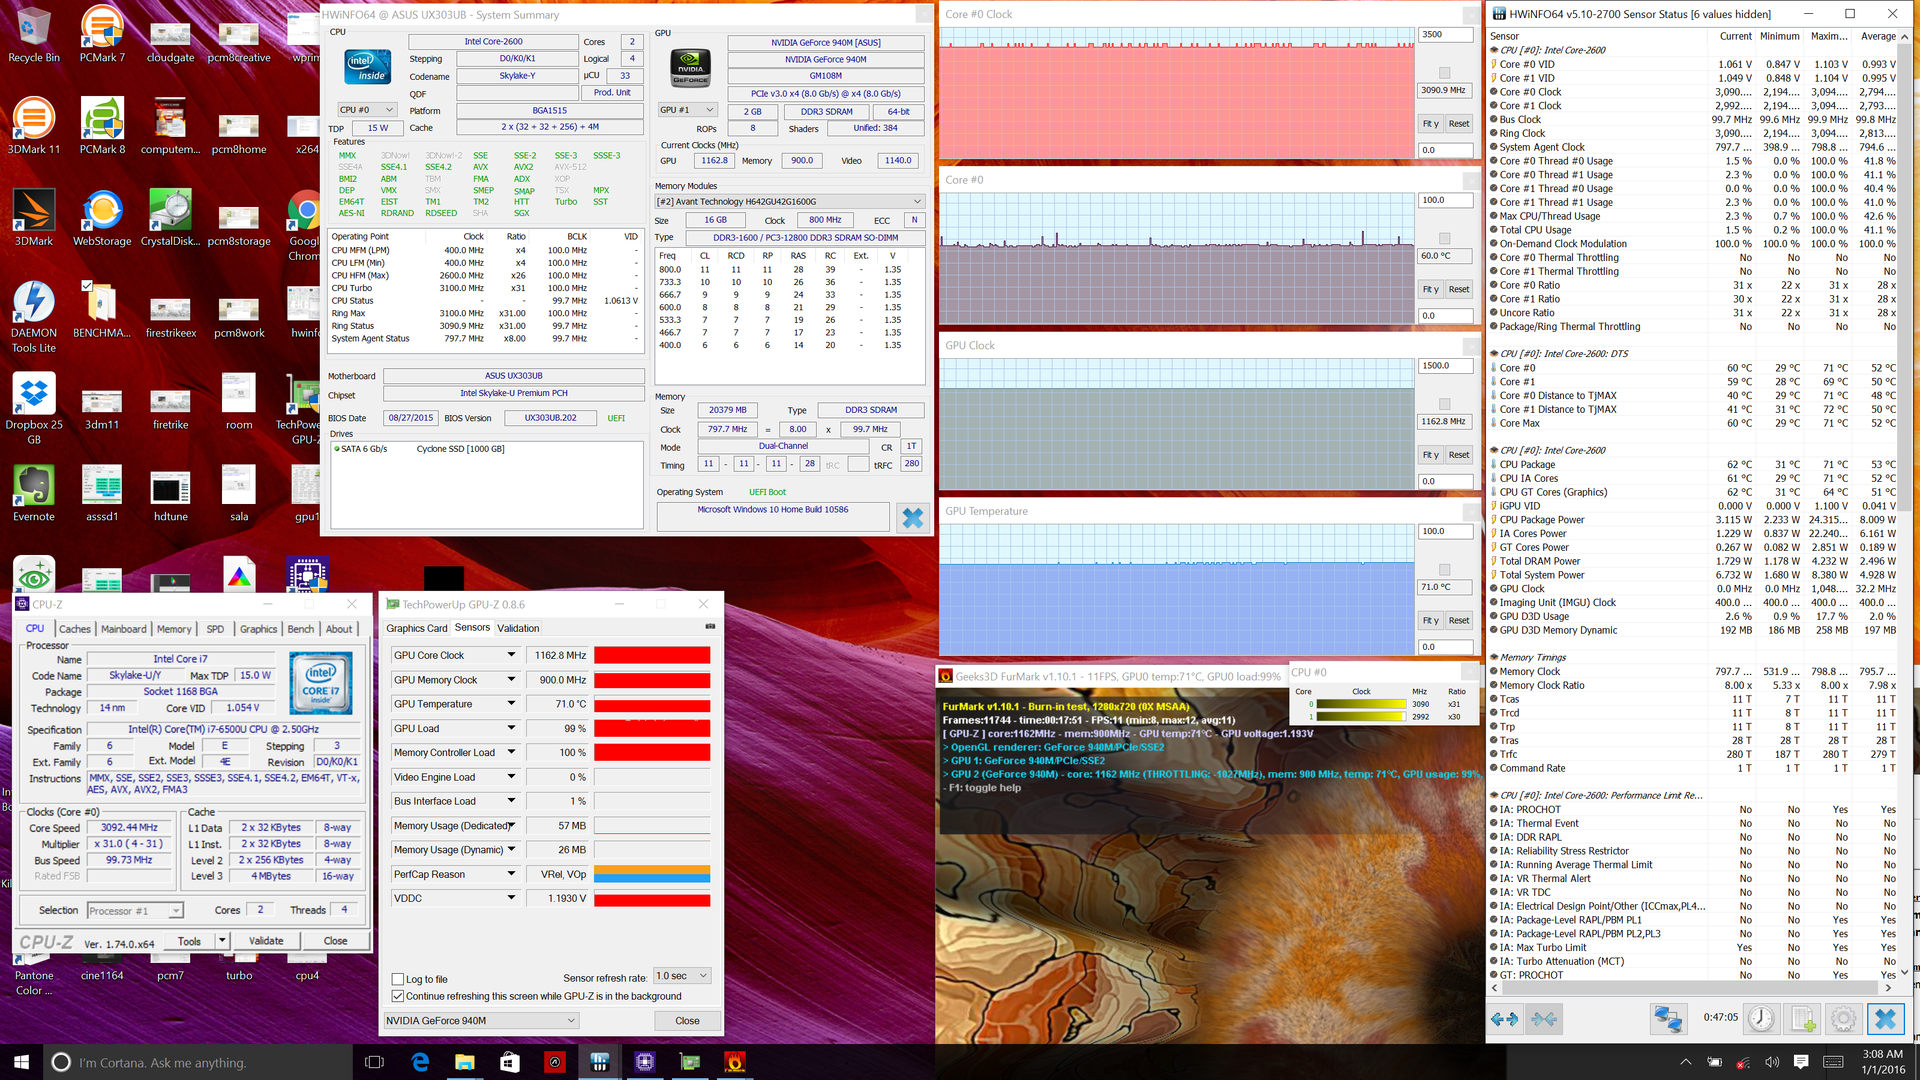
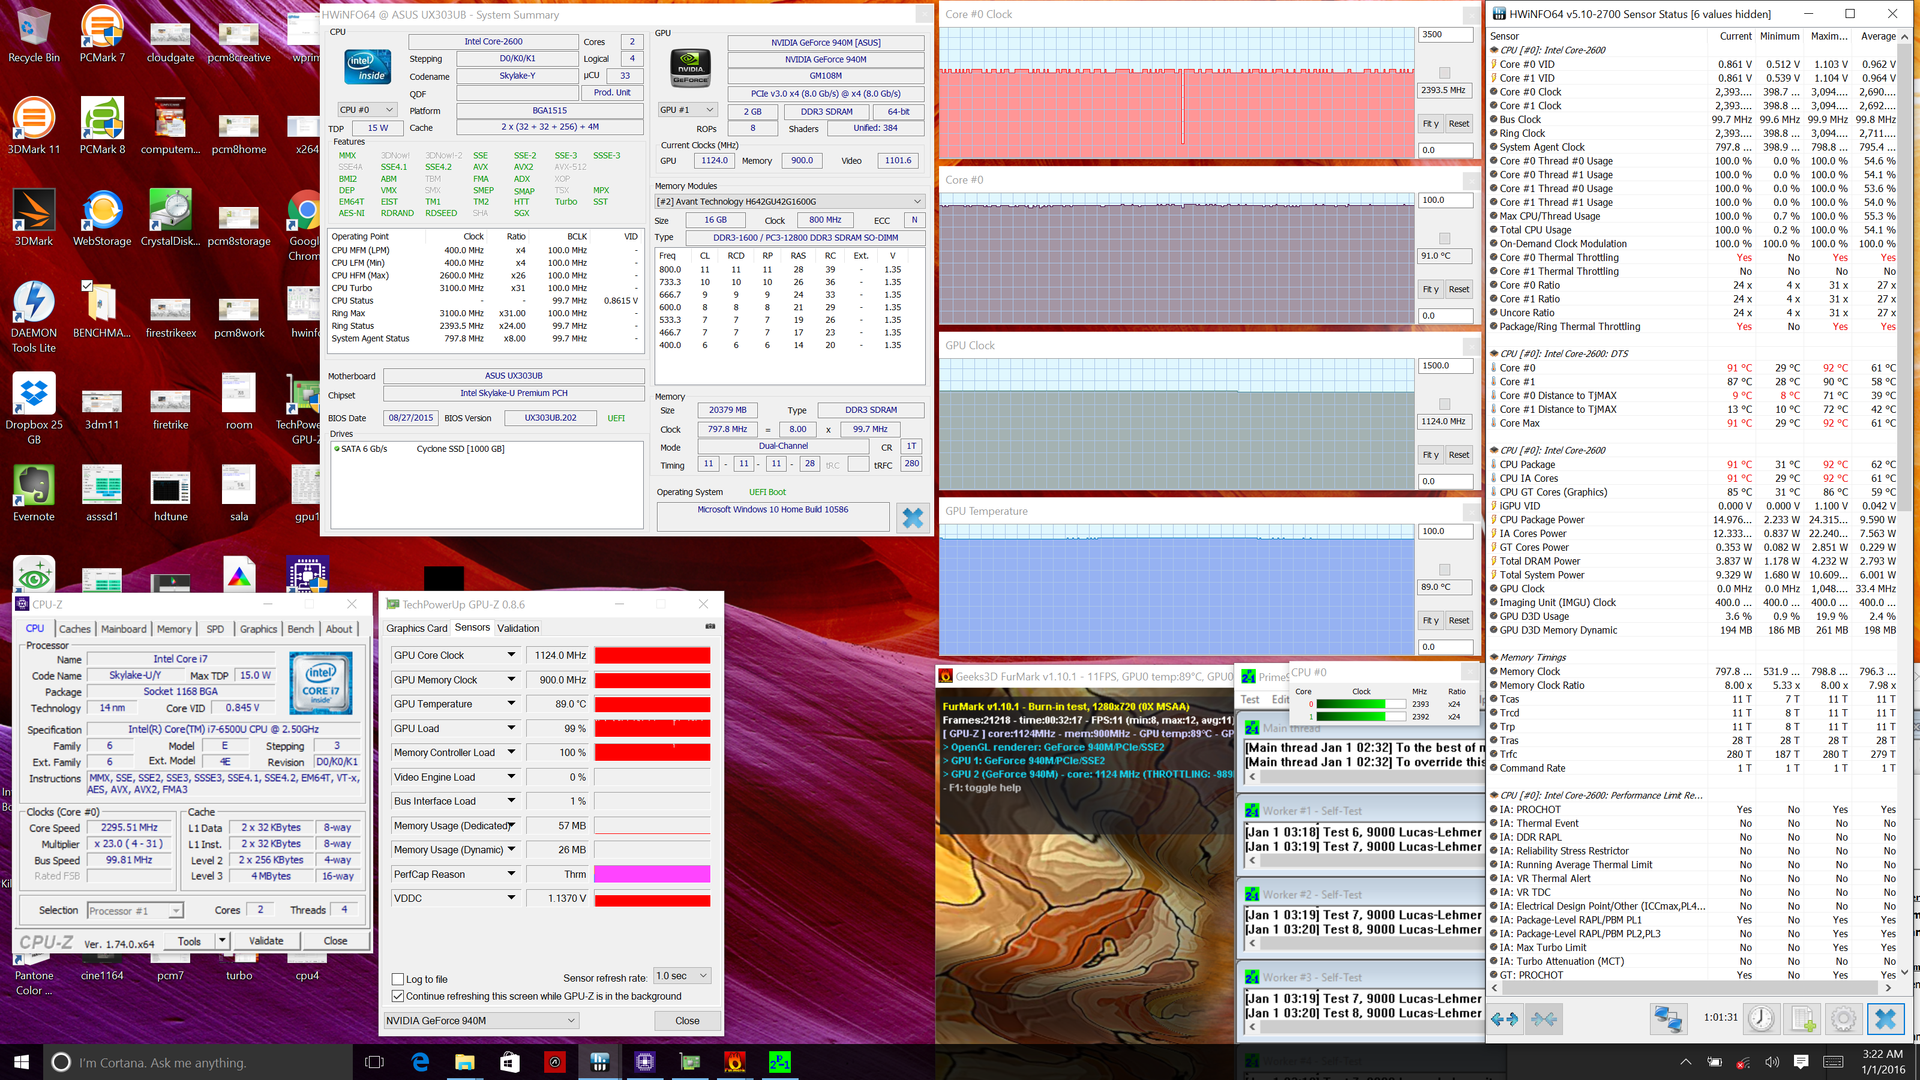
Stress Test
The system stabilizes at a relatively low 55 C when under Prime95 stress. When FurMark is introduced, however, core temperatures rise dramatically to the 90 C range for both the CPU and GPU. Unigine Heaven stress will cause temperatures to hover in the high 60 C range. Thus, much of the heat output from the system is from the Nvidia GPU itself. Otherwise, we're impressed to see consistent Turbo Boost and GPU Boost when gaming out of the thin system.
Running on battery power will not drop GPU performance, but CPU performance will suffer slightly with less frequent Turbo Boost. A 3DMark 11 run on battery power returns Physics and Graphics scores of 4062 and 2218 points, respectively, compared to 4300 and 2178 points when on mains.
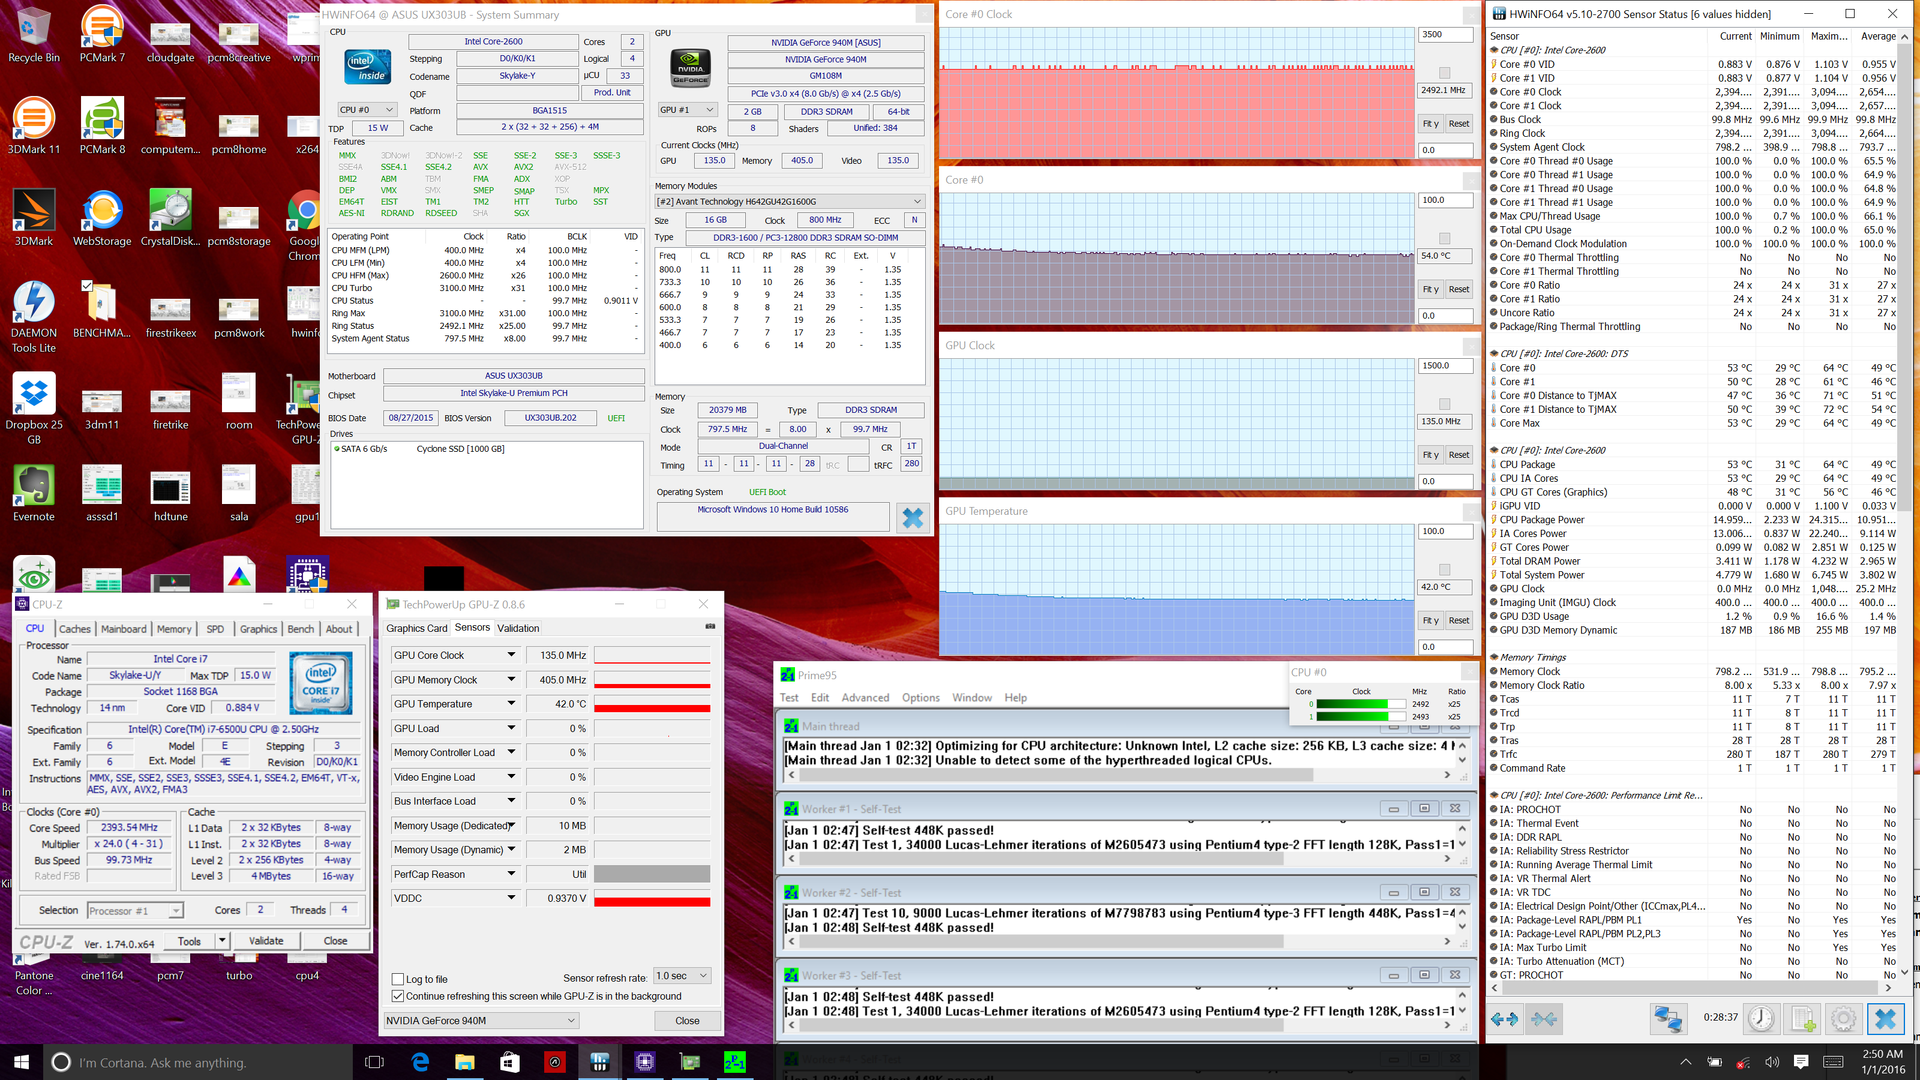
| CPU Clock (GHz) | GPU Clock (MHz) | Average CPU Temperature (C) | Average GPU Temperature (C) | |
| Prime95 Stress | 2.4 - 2.5 | -- | ~55 | -- |
| FurMark Stress | -- | 1163 | -- | ~71 |
| Prime95 + FurMark Stress | 2.4 | 1124 | ~91 | ~89 |
| Unigine Heaven Stress | 3.0 | 1163 | ~68 | ~67 |
Emissions
System Noise
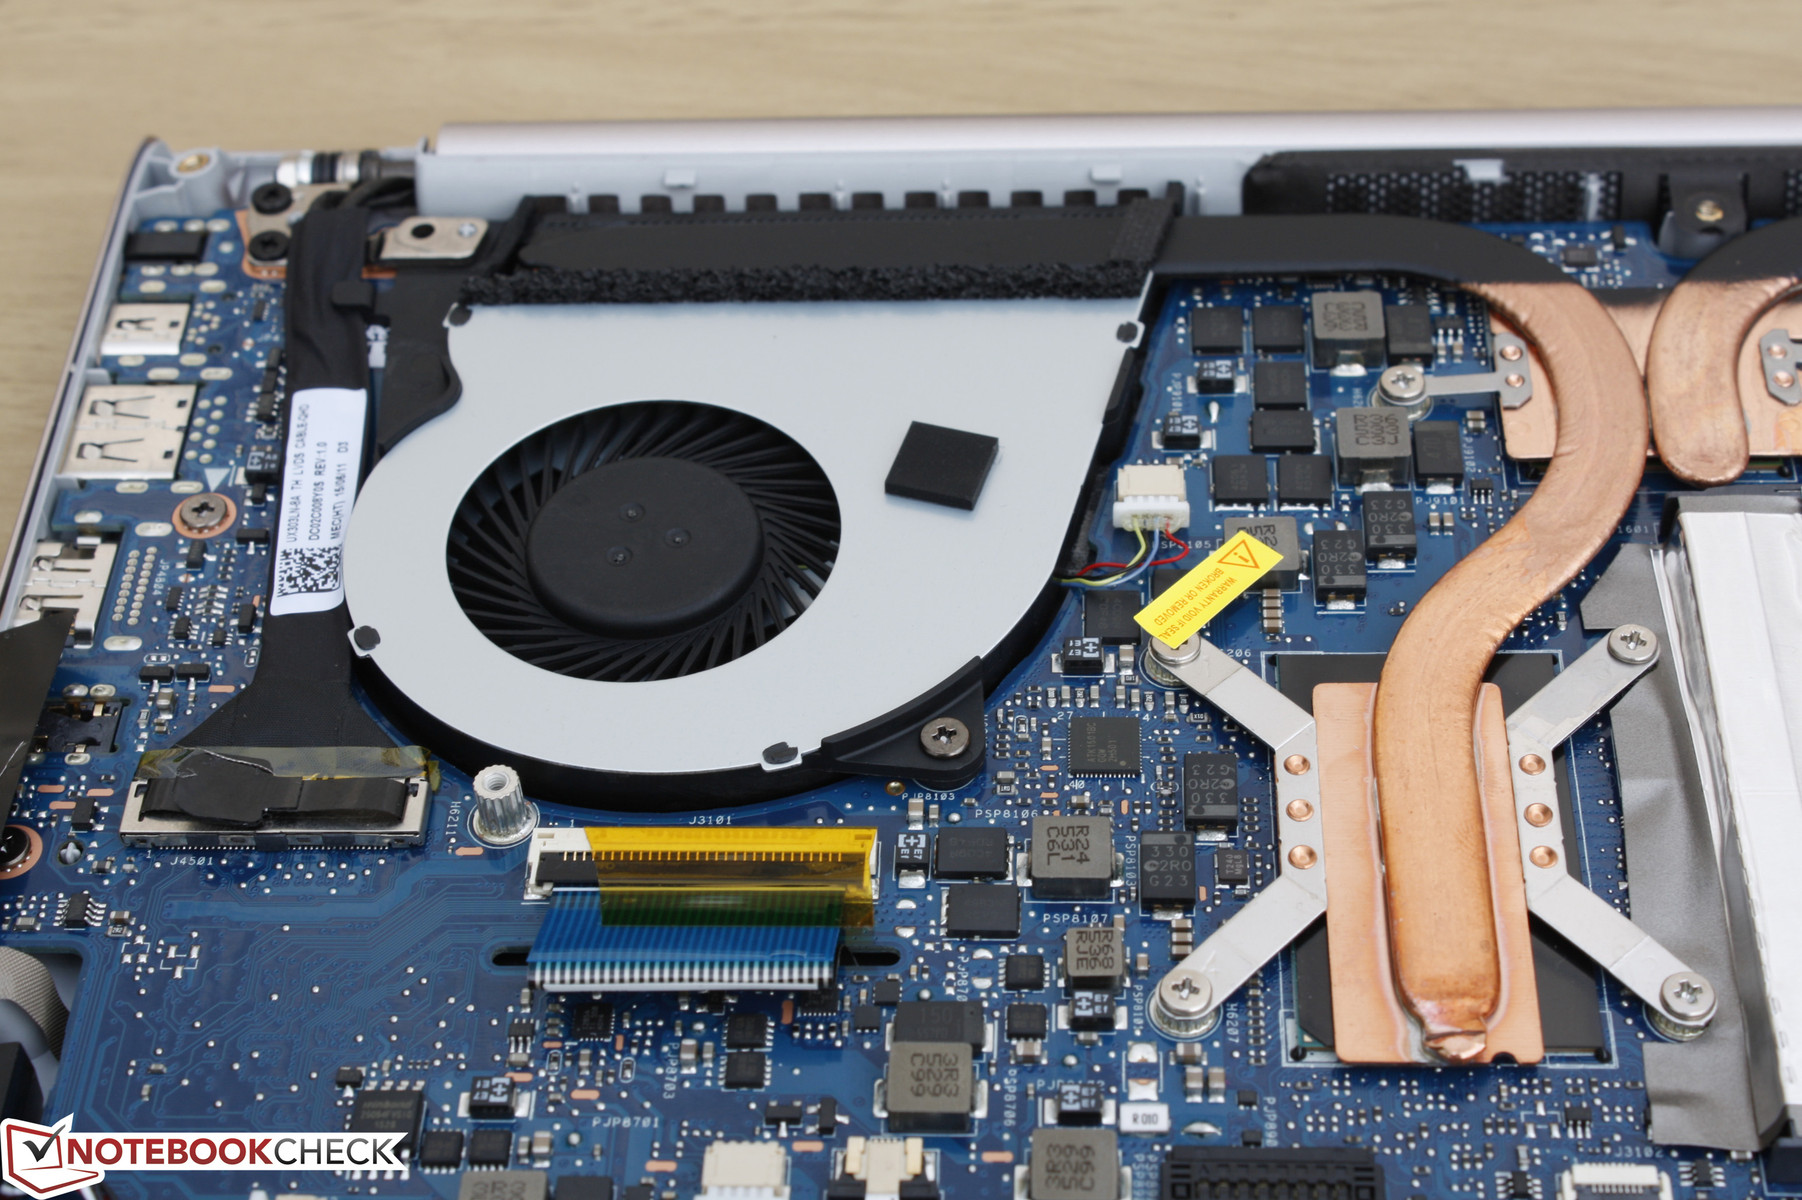
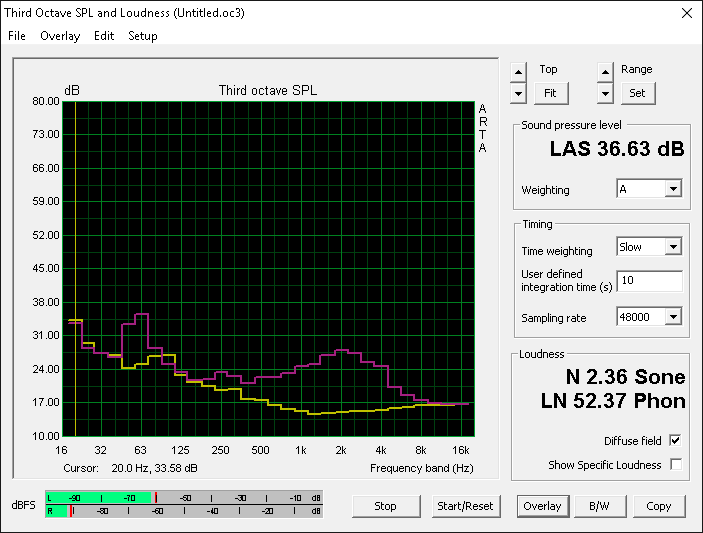
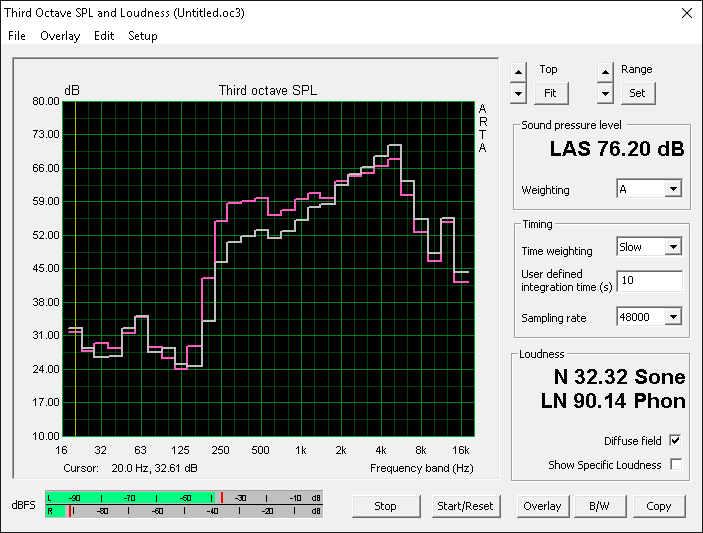
The cooling system consists of a pair of asymmetric heat pipes alongside a pair of asymmetric fans. The system stays quiet and almost noise free when under light to even moderate loads. Running Unigine Heaven will bump fan noise to the 37 dB(A) range or even higher over extended periods or higher loads (FurMark, Prime95, etc.).
Unfortunately, we noticed the same electronic noise on our QHD model as we did on our previous FHD model. It's quite faint, but detectable by ear nonetheless when up close to the notebook.
| Asus Zenbook UX303UB-DH74T GeForce 940M, 6500U, CUK Cyclone SSD 1TB | Lenovo Yoga 900-13ISK 80MK HD Graphics 520, 6500U, Samsung SSD PM871 MZNLN512HCJH | Dell XPS 13 2016 i7 256GB QHD HD Graphics 520, 6500U, Samsung PM951 NVMe MZ-VLV256D | HP Spectre 13-4001ng x360 HD Graphics 5500, 5500U, ADATA AXNS381E-256GM-B | Acer Aspire V3-372-50LK HD Graphics 520, 6200U, Toshiba HG6 THNSNJ256G8NU | |
|---|---|---|---|---|---|
| Noise | 3% | -2% | -0% | 3% | |
| Idle Minimum * (dB) | 29.8 | 29.7 -0% | 31.8 -7% | 29.6 1% | 31.5 -6% |
| Idle Average * (dB) | 29.8 | 29.8 -0% | 31.8 -7% | 29.6 1% | 31.5 -6% |
| Idle Maximum * (dB) | 29.8 | 30 -1% | 34.8 -17% | 29.6 1% | 31.5 -6% |
| Load Average * (dB) | 37.4 | 32 14% | 34.8 7% | 38.6 -3% | 32.4 13% |
| Load Maximum * (dB) | 40.3 | 38.5 4% | 34.8 14% | 41 -2% | 32.3 20% |
* ... smaller is better
Noise level
| Idle |
| 29.8 / 29.8 / 29.8 dB(A) |
| Load |
| 37.4 / 40.3 dB(A) |
 | ||
30 dB silent 40 dB(A) audible 50 dB(A) loud |
||
min: | ||
Temperature
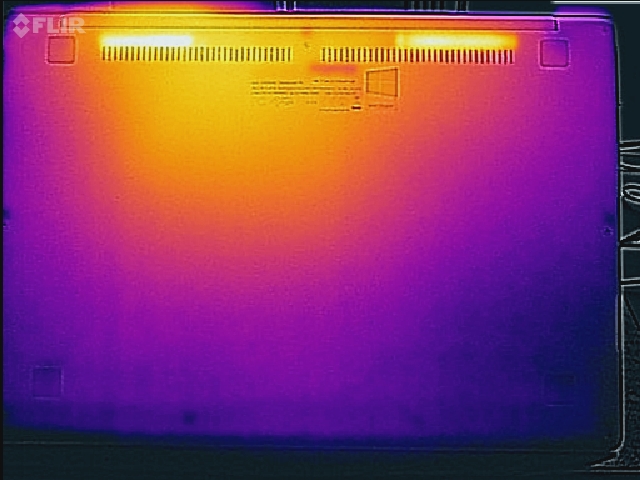
Surface temperature development is relatively flat when the system is idling with warm spots nearest the center of the keyboard. The hot spots only becomes more noticeable when under extreme loads whilst the palm rests and touchpad up front remain cool. The right side of the notebook is generally warmer than the left when under load due to the positioning of the heat pipes, CPU, and GPU.
We were able to measure a surface temperature of 45 C at the highest. This is compared to 47 C on the Yoga 900 and 57 C on the XPS 13, both of which sport the same i7-6500U CPU.
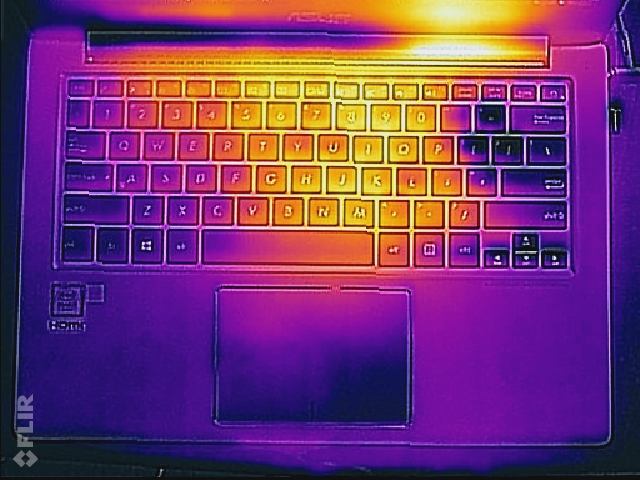
(±) The maximum temperature on the upper side is 45 °C / 113 F, compared to the average of 35.9 °C / 97 F, ranging from 21.4 to 59 °C for the class Subnotebook.
(±) The bottom heats up to a maximum of 42 °C / 108 F, compared to the average of 39.3 °C / 103 F
(+) In idle usage, the average temperature for the upper side is 24.1 °C / 75 F, compared to the device average of 30.8 °C / 87 F.
(+) The palmrests and touchpad are cooler than skin temperature with a maximum of 31.6 °C / 88.9 F and are therefore cool to the touch.
(-) The average temperature of the palmrest area of similar devices was 28.2 °C / 82.8 F (-3.4 °C / -6.1 F).
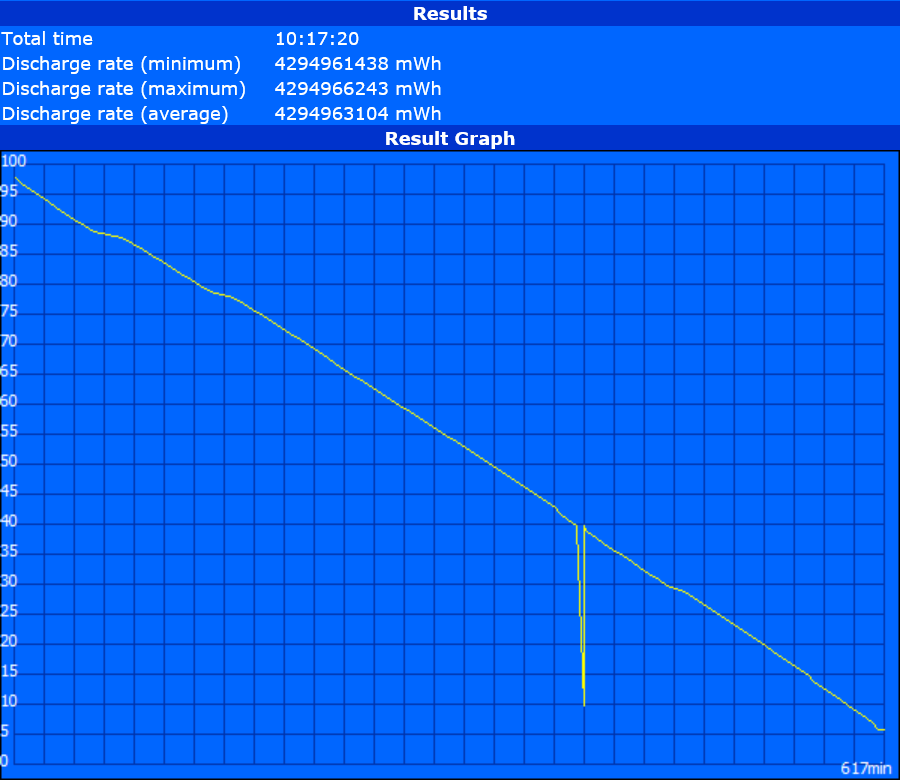
Battery Life
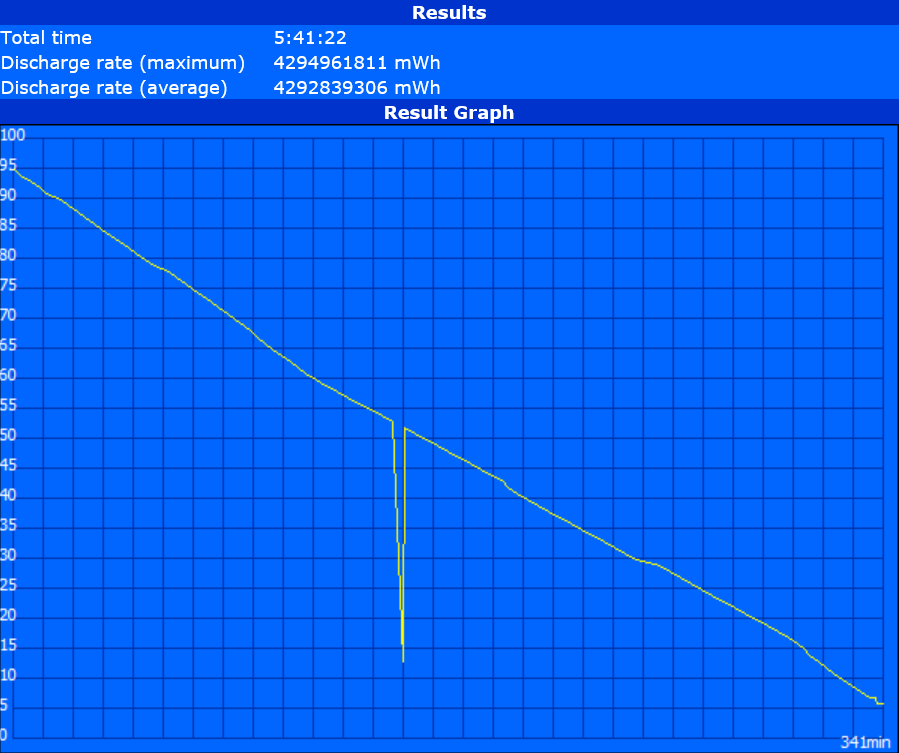
Runtimes are good at just over 5.5 hours under our WLAN testing conditions (150 nits brightness, looping browsing script, Balanced profile, iGPU active). The higher power demands of the QHD screen can be felt as runtimes are noticeably lower across the board compared to our UX303UB FHD configuration under the same conditions. Newer models with higher battery capacities like the Yoga 900 and XPS 13 can last for even longer than our Asus.
| Asus Zenbook UX303UB-DH74T 50 Wh | Asus Zenbook UX303UB-R4100T 50 Wh | Lenovo Yoga 900-13ISK 80MK 66 Wh | HP Spectre x360 13-4104ng 56 Wh | HP Envy 13-d000ng 45 Wh | Dell XPS 13 2016 i7 256GB QHD 56 Wh | |
|---|---|---|---|---|---|---|
| Battery runtime | 33% | 26% | 46% | -5% | 18% | |
| Reader / Idle (h) | 10.3 | 16.6 61% | 14.1 37% | 8.6 -17% | 13.1 27% | |
| WiFi v1.3 (h) | 5.7 | 6.8 19% | 6.7 18% | 8.3 46% | 5.4 -5% | 7.2 26% |
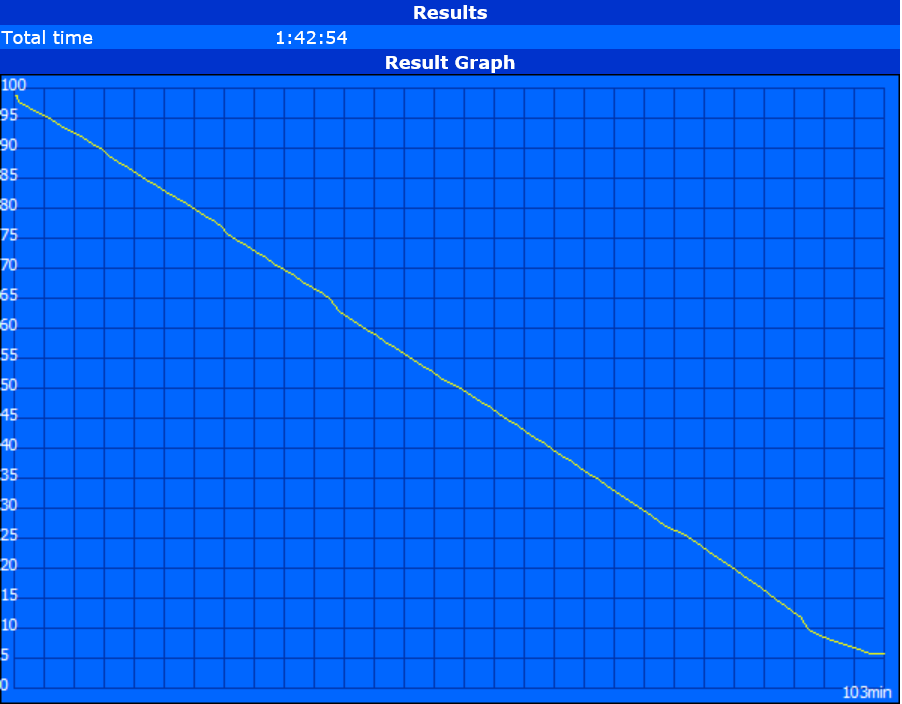
| Load (h) | 1.7 | 2 18% | 2.1 24% | 1.8 6% | 1.7 0% |
Pros
Cons
Verdict

The Zenbook series still holds some of the better Ultrabooks available assuming that novel features like 360-degree hinges or detachable keyboards are of no interest to the user. This QHD configuration, however, is both a step forward and a step backward. Yes, the resolution upgrade is fantastic and crisp, but there is more to a display than a simple resolution bullet point. Factors such as backlight brightness, contrast, and color accuracy are worse than its FHD SKU. Response times are also below average, though the display thankfully does not utilize pulse-width modulation for brightness control. Lastly, battery life has taken a hit as the internal module has not been upgraded in capacity to compensate for the more demanding screen.
We don't have any qualms about QHD or UHD displays. Nonetheless, such high resolutions should not come at the price of other important factors. Opting for a less expensive FHD Zenbook SKU may be the better choice for most users.
Asus Zenbook UX303UB-DH74T
- 01/12/2016 v4.1 (old)
Allen Ngo
Price comparison
