Reviews for the Intel Core i5-4200U processor
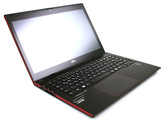
Fujitsu Lifebook U574 Ultrabook Review
Deceptive. Slim and good-looking business laptops are possible nowadays. The non-glare touchscreen of Fujitsu's Lifebook U574 is rare, though. Is it only smoke and mirrors or a solid business subnotebook that meets all fundamental criteria?
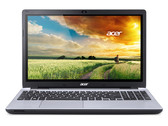
Intel Core i5-4200U, HD Graphics 4400, 13.3", 1.6 kgAcer Aspire V3-572PG-604M Notebook Review
Long-lasting allrounder. Lots of storage, suitable for gaming, long battery life, and a decent keyboard: the Aspire V3-572PG ticks all the check boxes for an allrounder notebook. How compelling is the overall package?
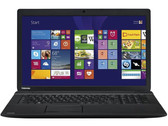
Intel Core i5-4200U, NVIDIA GeForce 840M, 15.6", 2.5 kgToshiba Satellite Pro C70-B-111 Notebook Review
Multimedia endurance machine. Technically Toshiba has done a great job with this laptop and its runtime endurance places it in the top rankings in the category comparison. Our in-depth report reveals whether the casing, input devices, screen, and general performance can match that.
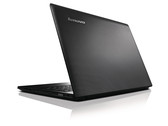
Intel Core i5-4200U, AMD Radeon R7 M260, 17.3", 2.7 kgLenovo IdeaPad G50-70 Notebook Review
A good idea? Lenovo want their IdeaPad G50-70 to be a tempting, low-cost notebook with at least basic gaming power. Equipped with a dedicated graphics card, our test device certainly could be just that. But is the Radeon R5 230M the right graphics card for the task? Read on to find out.
Intel Core i5-4200U, AMD Radeon R5 M230, 15.6", 2.3 kgLenovo Z40-59422614 Notebook Review
With great power… comes great compromise? The Z40 is most certainly among the most affordable machines to combine a Core i5 CPU, a discrete GPU, and good battery life into a single package. Surely you’re asking yourself: what’s the catch?
Intel Core i5-4200U, NVIDIA GeForce 820M, 14", 2.1 kgAsus Transformer Book T300LA-C4006H: Intel HD Graphics 4400, 13.30", 1.9 kg
Review » Asus Transformer Book T300LA-C4006H Convertible Review
Toshiba Tecra Z40 A-147: Intel HD Graphics 4400, 14.00", 1.5 kg
Review » Toshiba Tecra Z40 A-147 Notebook Review
Asus UX32LA-R3025H: Intel HD Graphics 4400, 13.30", 1.5 kg
Review » Asus Zenbook UX32LA-R3025H Ultrabook Review
Asus UX32LN: NVIDIA GeForce 840M, 13.30", 1.4 kg
Review » Asus Zenbook UX32LN-R4053H Ultrabook Review
Samsung ATIV Book 9 2014 (NP930X5J-K02DE): Intel HD Graphics 4400, 15.60", 1.8 kg
Review » Samsung ATIV Book 9 2014 (NP930X5J-K02DE) Ultrabook Review
Sony Vaio SVF14N13CXB: Intel HD Graphics 4400, 14.00", 2 kg
Review » Sony Vaio Flip 14A SVF14N13CXB Convertible Review
Asus VivoBook S451LB-CA072H: NVIDIA GeForce GT 740M, 14.00", 2.2 kg
Review » Review Asus VivoBook S451LB Notebook
Dell Latitude 13 3340 Education Series: Intel HD Graphics 4400, 13.30", 1.8 kg
Review » Review Dell Latitude 3340 Notebook
Asus X550LB-NH52: NVIDIA GeForce GT 740M, 15.60", 2.3 kg
Review » Review Asus X550LB-NH52 Notebook
Acer Aspire V5-561G: AMD Radeon R7 M265, 15.60", 2.4 kg
Review » Review Acer Aspire V5-561G Notebook
Samsung ATIV Book 9 900X3G-K01: Intel HD Graphics 4400, 13.30", 1.1 kg
Review » Review Samsung ATIV Book 9 900X3G-K01DE Notebook
Acer TravelMate P255-MG-54204G50Mnkk: AMD Radeon R7 M265, 15.60", 2.4 kg
Review » Review Acer TravelMate P255-MG-54204G50Mnkk Notebook
Acer Aspire E1-572G-54204G50Mnkk: AMD Radeon R7 M265, 15.60", 2.4 kg
Review » Review Acer Aspire E1-572G-54204G50Mnkk Notebook
Fujitsu LifeBook U904-0M75A1DE: Intel HD Graphics 4400, 14.00", 1.4 kg
Review » Review Update Fujitsu LifeBook U904-0M75A1DE Ultrabook
Schenker S403 FHD GT745M (W840SN): NVIDIA GeForce GT 745M, 14.00", 1.8 kg
Review » Review Clevo W840SN (Schenker S403 FHD/GT745M) Barebones Ultrabook
Asus VivoBook S301LA-C1073H: Intel HD Graphics 4400, 13.30", 1.8 kg
Review » Review Asus VivoBook S301LA-C1073H Ultrabook
HP EliteBook Folio 1040 G1 (H5F62ET): Intel HD Graphics 4400, 14.00", 1.5 kg
Review » Review HP EliteBook Folio 1040 G1 (H5F62ET) Ultrabook
Acer Aspire S3-392G: NVIDIA GeForce GT 735M, 13.30", 1.7 kg
Review » Review Acer Aspire S3-392G Ultrabook
Dell XPS 13-9333: Intel HD Graphics 4400, 13.30", 1.4 kg
Review » Review Update Dell XPS 13-9333 Touchscreen Ultrabook
HP Pavilion 15-n213eg: NVIDIA GeForce GT 740M, 15.60", 2.3 kg
Review » Review Update HP Pavilion 15-n213eg Notebook
HP EliteBook 850 G1-H5G34ET: Intel HD Graphics 4400, 15.60", 2 kg
Review » Review HP EliteBook 850 G1-H5G34ET Notebook
Acer TravelMate P255-M-54204G50Mnss: Intel HD Graphics 4400, 15.60", 2.4 kg
Review » Review Acer TravelMate P255-M-54204G50Mnss Notebook
Acer TravelMate P455-M-54204G50Makk: Intel HD Graphics 4400, 15.60", 2.4 kg
Review » Review Acer TravelMate P455-M-54204G50Makk Notebook
Lenovo ThinkPad S540 20B30059GE: AMD Radeon HD 8670M, 15.60", 2.1 kg
Review » Review Lenovo ThinkPad S540 20B30059GE Ultrabook
Asus Zenbook UX302LA-C4003H: Intel HD Graphics 4400, 13.30", 1.5 kg
Review » Review Asus Zenbook UX302LA-C4003H Ultrabook
Sony Vaio Fit multi-flip SV-F13N1L2E/S : Intel HD Graphics 4400, 13.30", 1.3 kg
Review » Review Sony Vaio Fit 13A SV-F13N1L2E/S Convertible
Lenovo ThinkPad Yoga: Intel HD Graphics 4400, 12.50", 1.6 kg
Review » Review Lenovo ThinkPad Yoga Convertible
Toshiba Satellite M50-A-11L: NVIDIA GeForce GT 740M, 15.60", 2.2 kg
Review » Review Toshiba Satellite M50-A-11L Notebook
Lenovo Yoga 2 Pro: Intel HD Graphics 4400, 13.30", 1.4 kg
Review » Review Lenovo Yoga 2 Pro Convertible
Dell Latitude 3440: NVIDIA GeForce GT 740M, 14.00", 2.1 kg
Review » Review Dell Latitude 3440 Notebook
Dell Latitude E7440: Intel HD Graphics 4400, 14.00", 1.6 kg
Review » Review Dell Latitude E7440 Notebook
Dell Latitude 13 3540: AMD Radeon HD 8850M, 15.60", 2.3 kg
Review » Review Dell Latitude 3540 Notebook
Microsoft Surface Pro 2: Intel HD Graphics 4400, 10.60", 0.9 kg
Review » Review Microsoft Surface Pro 2 Tablet
Fujitsu Lifebook U554: Intel HD Graphics 4400, 13.30", 1.5 kg
Review » Review Fujitsu Lifebook U554 Notebook
HP Pavilion 15-n005sg: Intel HD Graphics 4400, 15.60", 2.3 kg
Review » Review HP Pavilion 15-n005sg Notebook
Lenovo IdeaPad Flex 14-59395501: Intel HD Graphics 4400, 14.00", 1.9 kg
Review » Review Lenovo IdeaPad Flex 14 Notebook
HP ProBook 430-G1: Intel HD Graphics 4400, 13.30", 1.6 kg
Review » Review HP ProBook 430-G1 Notebook
Toshiba Satellite U50t-A-100: Intel HD Graphics 4400, 15.60", 2.4 kg
Review » Review Toshiba Satellite U50t-A-100 Notebook
Samsung ATIV Book 9 Plus: Intel HD Graphics 4400, 13.30", 1.4 kg
Review » Review Samsung ATIV Book 9 Plus 940X3G Ultrabook
Lenovo ThinkPad T440s 20AQ-S00500: Intel HD Graphics 4400, 14.00", 1.6 kg
Review » Review Lenovo ThinkPad T440s 20AQ-S00500 Notebook
Dell Latitude E7240: Intel HD Graphics 4400, 12.50", 1.3 kg
Review » Review Dell Latitude E7240 Notebook
Lenovo IdeaPad U430 Touch 59372369: NVIDIA GeForce GT 730M, 14.00", 1.9 kg
Review » Review Lenovo IdeaPad U430 Touch Ultrabook
Dell XPS 12-9Q33: Intel HD Graphics 4400, 12.50", 1.5 kg
Review » Review Update Dell XPS 12-9Q33 Convertible
Lenovo IdeaPad U330p: Intel HD Graphics 4400, 13.30", 1.5 kg
Review » Review Lenovo IdeaPad U330p Notebook
Acer Aspire E1-572G-54204G75Mnkk: AMD Radeon HD 8750M, 15.60", 2.4 kg
Review » Review Acer Aspire E1-572G-54204G75Mnkk Notebook
Acer Aspire V7-582P-6673: Intel HD Graphics 4400, 15.60", 2.2 kg
Review » Review Acer Aspire V7-582P-6673 Ultrabook
Acer Aspire V5-573G-54208G50aii : NVIDIA GeForce GT 750M, 15.60", 2 kg
Review » Review Acer Aspire V5-573G-54208G50aii Notebook
Sony Vaio Pro 11 SVP121M2EB.G4: Intel HD Graphics 4400, 11.60", 0.9 kg
Review » Review Sony Vaio Pro 11 SVP121M2EB.G4 Ultrabook
Sony Vaio Duo 13 SVD1321M2E: Intel HD Graphics 4400, 13.30", 1.3 kg
Review » Review Sony Vaio Duo 13 SVD1321M2E Convertible Ultrabook
Acer Aspire ES1-571-50VH: Intel HD Graphics 4400, 15.60", 2.4 kg
External Review » Acer Aspire ES1-571-50VH
Lenovo IdeaPad U330p: Intel HD Graphics 4400, 13.30", 1.5 kg
External Review » Lenovo IdeaPad U330p
Fujitsu Lifebook U554: Intel HD Graphics 4400, 13.30", 1.5 kg
External Review » Fujitsu Lifebook U554
Acer Travelmate P645-MG-54208G1.02ttkk: Intel HD Graphics 4400, 14.00", 1.5 kg
External Review » Acer Travelmate P645-MG-54208G1.02ttkk
Toshiba Satellite Z30T-A-111: Intel HD Graphics 4400, 13.30", 1.4 kg
External Review » Toshiba Satellite Z30T-A-111
Samsung 940X3G-K07DE: Intel HD Graphics 4400, 13.30", 1.4 kg
External Review » Samsung 940X3G-K07DE
Asus UX32LN: NVIDIA GeForce 840M, 13.30", 1.4 kg
External Review » Asus UX32LN
Lenovo IdeaPad U430-59399823: NVIDIA GeForce GT 730M, 14.00", 1.9 kg
External Review » Lenovo IdeaPad U430-59399823
Lenovo IdeaPad U330-59427487: Intel HD Graphics 4400, 13.30", 1.7 kg
External Review » Lenovo IdeaPad U330-59427487
Dell Inspiron 15 7537-7697: NVIDIA GeForce GT 750M, 15.60", 2.6 kg
External Review » Dell Inspiron 15 7537-7697
Asus VivoBook S451LN: NVIDIA GeForce 840M, 14.00", 2.2 kg
External Review » Asus VivoBook S451LN
Lenovo IdeaPad G50-70: AMD Radeon R5 M230, 15.60", 2.3 kg
External Review » Lenovo IdeaPad G50-70
Toshiba Satellite L70-B-11C: Intel HD Graphics 4400, 17.30", 2.7 kg
External Review » Toshiba Satellite L70-B-11C
Asus X550LN-XX031H: NVIDIA GeForce 840M, 15.60"
External Review » Asus X550LN-XX031H
Asus K551LN: NVIDIA GeForce 840M, 15.60", 2.2 kg
External Review » Asus K551LN
Asus ASUSPRO Advanced BU401LA-CZ040G: Intel HD Graphics 4400, 14.00", 1.7 kg
External Review » Asus ASUSPRO Advanced BU401LA-CZ040G
Acer Aspire V7-482P: Intel HD Graphics 4400, 14.00", 1.9 kg
External Review » Acer Aspire V7-482P
Lenovo IdeaPad Z40-59422614: NVIDIA GeForce 820M, 14.00", 2.1 kg
External Review » Lenovo IdeaPad Z40-59422614
Acer Aspire V5-561G: AMD Radeon R7 M265, 15.60", 2.4 kg
External Review » Acer Aspire V5-561G
Acer Aspire S3-392G-54206G50tws: Intel HD Graphics 4400, 13.30", 1.7 kg
External Review » Acer Aspire S3-392G-54206G50tws
Asus VivoBook S301LA-C1073H: Intel HD Graphics 4400, 13.30", 1.8 kg
External Review » Asus VivoBook S301LA-C1073H
Asus K550LB-XX182D: NVIDIA GeForce GT 740M, 15.60", 2.3 kg
External Review » Asus K550LB-XX182D
Toshiba Satellite Z30-A-12R: Intel HD Graphics 4400, 13.30", 1.2 kg
External Review » Toshiba Satellite Z30-A-12R
Asus Zenbook UX302LA-C4004H: Intel HD Graphics 4400, 13.30", 1.5 kg
External Review » Asus Zenbook UX302LA-C4004H
Toshiba Portege Z30T-A-11C: Intel HD Graphics 4400, 13.30", 1.4 kg
External Review » Toshiba Portege Z30T-A-11C
Acer Aspire M5-583P-6637: Intel HD Graphics 4400, 15.60", 2.4 kg
External Review » Acer Aspire M5-583P-6637
Asus VivoBook S451LA-CA045H: Intel HD Graphics 4400, 14.00", 2.2 kg
External Review » Asus VivoBook S451LA-CA045H
Acer Travelmate Pro TMP645-MG: AMD Radeon HD 8750M, 14.00", 1.5 kg
External Review » Acer Travelmate Pro TMP645-MG
Toshiba Tecra Z50-A-11H: Intel HD Graphics 4400, 15.60", 1.8 kg
External Review » Toshiba Tecra Z50-A-11H
HP Spectre 13-3010ea: Intel HD Graphics 4400, 13.30", 1.5 kg
External Review » HP Spectre 13-3010ea
Asus Transformer Book T300LA-C4001H: Intel HD Graphics 4400, 13.30", 1.9 kg
External Review » Asus Transformer Book T300LA-C4001H
Toshiba Satellite U50-A-L4M: NVIDIA GeForce GT 740M, 15.60", 2.1 kg
External Review » Toshiba Satellite U50-A-L4M
Fujitsu Lifebook U574: Intel HD Graphics 4400, 13.30", 1.6 kg
External Review » Fujitsu Lifebook U574
Samsung 940X5J-K01US: Intel HD Graphics 4600, 15.60", 1.8 kg
External Review » Samsung 940X5J-K01US
Toshiba Satellite L50-B-1DV: Intel HD Graphics 4400, 15.60", 2.2 kg
External Review » Toshiba Satellite L50-B-1DV
Asus Zenbook UX32L: NVIDIA GeForce 840M, 13.30", 1.5 kg
External Review » Asus Zenbook UX32L
Asus B551LA-CN018G: Intel HD Graphics 4400, 15.60", 2.5 kg
External Review » Asus B551LA-CN018G
Acer Aspire R7-572G-54208G1.02TASS: NVIDIA GeForce GT 750M, 15.60", 2.5 kg
External Review » Acer Aspire R7-572G-54208G1.02TASS
Lenovo ThinkPad Edge E540-20C6006JGE: NVIDIA GeForce GT 740M, 15.60", 2.5 kg
External Review » Lenovo ThinkPad Edge E540-20C6006JGE
Samsung ATIV Book 9 900X3G-K01: Intel HD Graphics 4400, 13.30", 1.1 kg
External Review » Samsung ATIV Book 9 900X3G-K01
Acer Aspire V5-561-6607: Intel HD Graphics 4400, 15.60", 2.5 kg
External Review » Acer Aspire V5-561-6607
Dell Latitude 13 3340 Education Series: Intel HD Graphics 4400, 13.30", 1.8 kg
External Review » Dell Latitude 3340 i5
HP Pavilion TouchSmart 15-n232sa: NVIDIA GeForce GT 740M, 15.60", 2.5 kg
External Review » HP Pavilion TouchSmart 15-n232sa
Fujitsu LifeBook U904-0M75A1DE: Intel HD Graphics 4400, 14.00", 1.4 kg
External Review » Fujitsu LifeBook U904-0M75A1DE
Acer TravelMate P645-M-5420G12Tkk: Intel HD Graphics 4400, 14.00", 1.5 kg
External Review » Acer TravelMate P645-M-5420G12Tkk
Toshiba Portege Z30-A-M5S: Intel HD Graphics 4400, 13.30", 1.2 kg
External Review » Toshiba Portege Z30-A-M5S
Acer Aspire V5-561PG-6686: AMD Radeon R7 M265, 15.60", 2.5 kg
External Review » Acer Aspire V5-561PG-6686
Acer Aspire E1-472G-6844: NVIDIA GeForce 820M, 14.00", 2.1 kg
External Review » Acer Aspire E1-472G-6844
Lenovo IdeaPad Yoga 2 13 inch-59402636: Intel HD Graphics 4400, 13.30", 1.6 kg
External Review » Lenovo IdeaPad Yoga 2 13 inch-59402636
Asus Transformer Book Trio TX201LA-CQ026H: Intel HD Graphics 4400, 11.60", 1.7 kg
External Review » Asus Transformer Book Trio TX201LA-CQ026H
HP Spectre 13 Pro: Intel HD Graphics 4400, 13.00", 1.5 kg
External Review » HP Spectre 13 Pro
Toshiba Satellite M50-A-11C: NVIDIA GeForce GT 740M, 15.60", 2.2 kg
External Review » Toshiba Satellite M50-A-11C
Acer Aspire S3-392G: NVIDIA GeForce GT 735M, 13.30", 1.7 kg
External Review » Acer Aspire S3-392G
Acer Aspire S7-392-6807: Intel HD Graphics 4400, 13.30", 1.3 kg
External Review » Acer Aspire S7-392-6807
Asus VivoBook V451LA-DS51T: Intel HD Graphics 4400, 14.00", 2.2 kg
External Review » Asus VivoBook V451LA-DS51T
Asus UX301LA-DH51T: Intel HD Graphics 4400, 13.30", 1.2 kg
External Review » Asus UX301LA-DH51T
Acer TravelMate P255-MG-54204G50Mnkk: AMD Radeon R7 M265, 15.60", 2.4 kg
External Review » Acer TravelMate P255-M-54204G50Mnkk
Asus UX32L : Intel HD Graphics 4400, 13.30", 1.5 kg
External Review » Asus UX32L
HP Spectre 13-3000eo: Intel HD Graphics 4400, 13.30", 1.5 kg
External Review » HP Spectre 13-3000eo
Dell Latitude 13 3540: AMD Radeon HD 8850M, 15.60", 2.3 kg
External Review » Dell Latitude 3540
HP Pavilion 15-n213eg: NVIDIA GeForce GT 740M, 15.60", 2.3 kg
External Review » HP Pavilion 15-n213eg
Sony Vaio Flip 15 SV-F15N1L2ES: Intel HD Graphics 4400, 15.60", 2.3 kg
External Review » Sony Vaio Flip 15 SV-F15N1L2ES
Acer Aspire S3-392G-54204G1.02Ttws: NVIDIA GeForce GT 735M, 13.30", 1.6 kg
External Review » Acer Aspire S3-392G-54204G1.02Ttws
Acer Aspire R7-572-6423: Intel HD Graphics 4400, 15.60", 2.4 kg
External Review » Acer Aspire R7-572-6423
Acer Aspire V5-561: AMD Radeon R7 M265, 15.60", 2.5 kg
External Review » Acer Aspire V5-561
Toshiba Satellite Z30-A-134: Intel HD Graphics 4400, 13.30", 1.2 kg
External Review » Toshiba Satellite Z30-A-134
Toshiba Satellite M50T-A-10G: NVIDIA GeForce GT 740M, 15.60", 2.3 kg
External Review » Toshiba Satellite M50T-A-10G
HP Spectre 13-3090EF: Intel HD Graphics 4400, 13.30", 1.5 kg
External Review » HP Spectre 13-3090EF
Sony VAIO 13 SV-F13N1A4E: Intel HD Graphics 4400, 13.30", 1.3 kg
External Review » Sony VAIO 13 SV-F13N1A4E
Toshiba Portege Z30-A-12N: Intel HD Graphics 4400, 13.00", 1.2 kg
External Review » Toshiba Portege Z30-A-12N
Toshiba Satellite M50-A-11L: NVIDIA GeForce GT 740M, 15.60", 2.2 kg
External Review » Toshiba Satellite M50-A-11L
Lenovo ThinkPad X1 Carbon 2014: Intel HD Graphics 4400, 14.00", 1.4 kg
External Review » Lenovo ThinkPad X1 Carbon 2014
Toshiba Portege Z30-A-12T: Intel HD Graphics 4400, 13.30", 1.2 kg
External Review » Toshiba Portege Z30-A-12T
Lenovo ThinkPad X240-20AL007YGE: Intel HD Graphics 4400, 12.50", 1.4 kg
External Review » Lenovo ThinkPad X240-20AL007YGE
Asus Transformer Book Trio TX201LA-CQ004: Intel HD Graphics 4400, 11.60", 1.7 kg
External Review » Asus Transformer Book Trio TX201LA-CQ004
Dell XPS 13-9333: Intel HD Graphics 4400, 13.30", 1.4 kg
External Review » Dell XPS 13-9333
Toshiba Satellite U50t-A-10F: Intel HD Graphics 4400, 15.60", 2.4 kg
External Review » Toshiba Satellite U50t-A-10F
HP Pavilion 15-n007sg: NVIDIA GeForce GT 740M, 15.60", 2.3 kg
External Review » HP Pavilion 15-n007sg
Toshiba Kirabook 2014: Intel HD Graphics 4400, 13.30", 1.4 kg
External Review » Toshiba Kirabook 2014
HP Pavilion Touchsmart 15-N062SF: AMD Radeon HD 8670M, 15.60", 3.8 kg
External Review » HP Pavilion Touchsmart 15-N062SF
Sony Vaio Pro SVP1321M2E: Intel HD Graphics 4400, 13.30", 1 kg
External Review » Sony Vaio Pro SVP1321M2E
Acer Aspire V7-582PG-54208G25TII: NVIDIA GeForce GT 750M, 15.60", 2.1 kg
External Review » Acer Aspire V7-582PG-54208G25TII
Acer Aspire S7-392-54208G12tws: Intel HD Graphics 4400, 13.30", 1.3 kg
External Review » Acer Aspire S7-392-54208G12tws
Toshiba Satellite U50t-A-10H: Intel HD Graphics 4400, 15.60", 2.2 kg
External Review » Toshiba Satellite U50t-A-10H
Acer Aspire E1-572G-54204G75Mnkk: AMD Radeon HD 8750M, 15.60", 2.4 kg
External Review » Acer Aspire E1-572G-54204G75Mnkk
Toshiba Satellite E45t-A4300: Intel HD Graphics 4400, 14.00", 2 kg
External Review » Toshiba Satellite E45t-A4300
Acer Aspire V7-582PG-54204G52T: NVIDIA GeForce GT 720M, 15.60", 2.2 kg
External Review » Acer Aspire V7-582PG-54204G52T
Lenovo ThinkPad Yoga: Intel HD Graphics 4400, 12.50", 1.6 kg
External Review » Lenovo ThinkPad Yoga
HP Spectre 13t-3000: Intel HD Graphics 4600, 13.30", 1.4 kg
External Review » HP Spectre 13t-3000
Lenovo IdeaPad Flex 15-59393845: Intel HD Graphics 4400, 15.60", 2.2 kg
External Review » Lenovo IdeaPad Flex 15-59393845
Sony Vaio Fit multi-flip SV-F13N1L2E/S : Intel HD Graphics 4400, 13.30", 1.3 kg
External Review » Sony Vaio Fit multi-flip SV-F13N1L2E/S
Samsung ATIV 940X3G-K01NL: Intel HD Graphics 4400, 13.30", 2.4 kg
External Review » Samsung ATIV 940X3G-K01NL
Samsung ATIV 940X3G-K01PL: Intel HD Graphics 4400, 13.30", 1.3 kg
External Review » Samsung ATIV 940X3G-K01PL
HP EliteBook 820 G1: Intel HD Graphics 4400, 12.50", 1.3 kg
External Review » HP EliteBook 820 G1
HP Split 13-m115sg x2: Intel HD Graphics 4600, 13.30", 2.3 kg
External Review » HP Split 13-m115sg x2
Toshiba Satellite M50-A-110: NVIDIA GeForce GT 740M, 15.60", 2.2 kg
External Review » Toshiba Satellite M50-A-110
Dell Latitude 3440: NVIDIA GeForce GT 740M, 14.00", 2.1 kg
External Review » Dell Latitude 3440
Acer TravelMate P255-MG-54204G50Mnkk: AMD Radeon HD 8750M, 15.60", 2.3 kg
External Review » Acer TravelMate P255-MG-54208G50Mnkk
Sony Vaio Flip 13 SV-F13N13CXB: Intel HD Graphics 4400, 13.30", 1.3 kg
External Review » Sony Vaio Flip 13 SV-F13N13CXB
Samsung ATIV 940X3G-K01HU: Intel HD Graphics 4400, 13.30", 1.3 kg
External Review » Samsung ATIV 940X3G-K01HU
Toshiba Satellite M50-A-108: NVIDIA GeForce GT 740M, 15.60", 2.1 kg
External Review » Toshiba Satellite M50-A-108
Sony Vaio Duo 13 SVD1321M2E: Intel HD Graphics 4400, 13.30", 1.3 kg
External Review » Sony Vaio Duo 13 SVD1321M2E
Samsung ATIV 940X3G-K01SE: Intel HD Graphics 4400, 13.30", 1.4 kg
External Review » Samsung ATIV 940X3G-K01SE
Acer Aspire V5-573G-54208G50aii : NVIDIA GeForce GT 750M, 15.60", 2 kg
External Review » Acer Aspire V5-573G-54208G50aii
Dell Inspiron 17-7737: NVIDIA GeForce GT 750M, 17.30", 3.2 kg
External Review » Dell Inspiron 17-7737
Dell Latitude E7240: Intel HD Graphics 4400, 12.50", 1.3 kg
External Review » Dell Latitude E7240
Asus UX301LA-C4019H: Intel HD Graphics 4400, 13.30", 1.2 kg
External Review » Asus UX301LA-C4019H
HP Pavilion 15-n020tx: NVIDIA GeForce GT 740M, 15.60", 2.4 kg
External Review » HP Pavilion 15-n020tx
Acer Aspire E1-472G: NVIDIA GeForce GT 720M, 14.00", 2.1 kg
External Review » Acer Aspire E1-472G
Lenovo IdeaPad U330-59372367: Intel HD Graphics 4400, 13.30", 1.7 kg
External Review » Lenovo IdeaPad U330-59372367
Acer Aspire V7-482PG-6629: NVIDIA GeForce GT 750M, 14.00", 2.1 kg
External Review » Acer Aspire V7-482PG-6629
Acer Aspire S7-392-6832: Intel HD Graphics 4400, 13.30", 1.3 kg
External Review » Acer Aspire S7-392-6832
Sony Vaio Flip 14 SV-F14N13CXB: Intel HD Graphics 4400, 14.10", 1.9 kg
External Review » Sony Vaio Flip 14 SV-F14N13CXB
Samsung 940X3G-K01DE: Intel HD Graphics 4400, 13.30", 1.3 kg
External Review » Samsung 940X3G-K01DE
Toshiba Satellite L50T-A-130: Intel HD Graphics 4400, 15.60", 2.6 kg
External Review » Toshiba Satellite L50T-A-130
Samsung ATIV Book 9 Plus: Intel HD Graphics 4400, 13.30", 1.4 kg
External Review » Samsung ATIV Book 9 Plus
Lenovo IdeaPad Flex 14-59395501: Intel HD Graphics 4400, 14.00", 1.9 kg
External Review » Lenovo IdeaPad Flex 14-59395501
Samsung ATIV 940X3G-K01FR: Intel HD Graphics 4400, 13.30", 1.4 kg
External Review » Samsung ATIV 940X3G-K01FR
Toshiba Satellite U50t-A-100: Intel HD Graphics 4400, 15.60", 2.4 kg
External Review » Toshiba Satellite U50t-A-100
Lenovo ThinkPad T440s 20AQ-S00500: Intel HD Graphics 4400, 14.00", 1.6 kg
External Review » Lenovo ThinkPad T440s 20AQ-S00500
Lenovo ThinkPad X240s: Intel HD Graphics 4400, 12.50", 1.3 kg
External Review » Lenovo ThinkPad X240s
HP ProBook 430-G1: Intel HD Graphics 4400, 13.30", 1.6 kg
External Review » HP ProBook 430-G1
HP Envy 14-k008tx Sleekbook: NVIDIA GeForce GT 740M, 14.00", 1.7 kg
External Review » HP Envy 14-k008tx Sleekbook
Acer Aspire V5-473G-54204G50aii: NVIDIA GeForce GT 750M, 14.00", 1.8 kg
External Review » Acer Aspire V5-473G-54204G50aii
Dell Inspiron 14R-5437: NVIDIA GeForce GT 740M, 14.00", 2.8 kg
External Review » Dell Inspiron 14R-5437
HP Envy TouchSmart 14-k031tx: NVIDIA GeForce GT 740M, 14.00", 2 kg
External Review » HP Envy TouchSmart 14-k031tx
Acer Aspire V7-582P-6673: Intel HD Graphics 4400, 15.60", 2.2 kg
External Review » Acer Aspire V7-582P-6673
Microsoft Surface Pro 2: Intel HD Graphics 4400, 10.60", 0.9 kg
External Review » Microsoft Surface Pro 2
Asus VivoBook S551LB-CJ025H: NVIDIA GeForce GT 740M, 15.60", 2.5 kg
External Review » Asus VivoBook S551LB-CJ025H
Sony Vaio SV-P1321WSNB: Intel HD Graphics 4400, 13.30", 1.1 kg
External Review » Sony Vaio SV-P1321WSNB
Toshiba Satellite E45t-A4200: Intel HD Graphics 4400, 14.00", 2 kg
External Review » Toshiba Satellite E45t-A4200
Sony Vaio Duo 13 SV-D1321L2EW: Intel HD Graphics 4400, 13.30", 1.3 kg
External Review » Sony Vaio Duo 13 SV-D1321L2EW
Lenovo IdeaPad U430 Touch 59372369: NVIDIA GeForce GT 730M, 14.00", 1.9 kg
External Review » Lenovo IdeaPad U430 Touch 59372369
Samsung ATIV 940X3G-K01US: Intel HD Graphics 4400, 13.30", 1.4 kg
External Review » Samsung ATIV 940X3G-K01US
HP Envy TouchSmart 14t-k000: Intel HD Graphics 4400, 14.00", 2 kg
External Review » HP Envy TouchSmart 14t-k000
Lenovo Yoga 2 Pro: Intel HD Graphics 4400, 13.30", 1.4 kg
External Review » Lenovo IdeaPad Yoga 2 Pro
Asus UX301: Intel Iris Graphics 5100, 13.30", 1.4 kg
External Review » Asus UX301
Asus Transformer Book T300: Intel HD Graphics 4000, 13.30", 1.2 kg
External Review » Asus Transformer Book T300
Sony Vaio Pro SVP1321M9RB: Intel HD Graphics 4400, 13.30", 1.1 kg
External Review » Sony Vaio Pro SVP1321M9RB
Acer Aspire V5-573PG-542012Taii: NVIDIA GeForce GT 750M, 15.60", 2.2 kg
External Review » Acer Aspire V5-573PG-542012Taii
Acer Aspire V5-573G-54208G50akk: NVIDIA GeForce GT 750M SLI, 15.60", 2 kg
External Review » Acer Aspire V5-573G-54208G50akk
Sony Vaio Duo 13 SV-D1321M2R: Intel HD Graphics 4400, 13.30", 1.4 kg
External Review » Sony Vaio Duo 13 SV-D1321M2R
Samsung ATIV 940X3G-K03DE: Intel HD Graphics 4400, 13.30", 1.3 kg
External Review » Samsung ATIV 940X3G-K03DE
Toshiba Satellite P55t-A5202: Intel HD Graphics 4000, 15.60", 2.4 kg
External Review » Toshiba Satellite P55t-A5202
Acer Aspire M5-583P-6428: Intel HD Graphics 4400, 15.60", 2.4 kg
External Review » Acer Aspire M5-583P-6428
Acer Aspire E1-572-6870: Intel HD Graphics 4400, 15.60", 2.3 kg
External Review » Acer Aspire E1-572-6870
Sony Vaio Pro SVP1321L1EBI.G4: Intel HD Graphics 4400, 13.30", 1 kg
External Review » Sony Vaio Pro SVP1321L1EBI.G4
Sony Vaio Pro 11 SVP121M2EB.G4: Intel HD Graphics 4400, 11.60", 0.9 kg
External Review » Sony Vaio Pro 11 SVP121M2EB.G4
Dell XPS 12-9Q33: Intel HD Graphics 4400, 12.50", 1.5 kg
External Review » Dell XPS 12-9Q33
Sony Vaio SV-P1121M2E: Intel HD Graphics 4400, 11.60", 0.9 kg
External Review » Sony Vaio SV-P1121M2E
Sony Vaio SV-P13213CGB: Intel HD Graphics 4400, 13.30", 1.1 kg
External Review » Sony Vaio SV-P13213CGB
Sony Vaio SV-P13213CXB: Intel HD Graphics 4400, 13.30", 1.1 kg
External Review » Sony Vaio SV-P13213CXB
Acer Aspire S7-392-6411: Intel HD Graphics 4400, 13.30", 1.3 kg
External Review » Acer Aspire S7-392-6411
Sony Vaio Duo 13 SV-D13213CXB: Intel HD Graphics 4400, 13.30", 1.4 kg
External Review » Sony Vaio Duo 13 SV-D13213CXB