Review Update Dell XPS 12-9Q33 Convertible

If it ain’t broke… well, you know how the idiom goes. Suffice it to say, Dell’s impressive XPS 12 was anything but broken when we first encountered it, with a sturdy and thoughtful construction, a stunningly beautiful display, and great performance. Apart from the effects of the sweeping model refreshes that have been prompted by the introduction of Intel’s Haswell CPUs (which provide significantly improved battery life paired with great performance), not much else has changed since last year’s XPS 12—but then again, we can’t say we would have expected it to. The only notable design-related differences are a slightly larger battery and a slightly lower weight. But don’t be fooled—the Haswell mobile CPUs can have an amazing effect on notebooks.
Our $1,200 (MSRP) review unit features an Intel Core i5-4200U 1.6 GHz Haswell CPU with Intel HD Graphics 4400, 4 GB DDR3 RAM, and a 128 GB solid-state drive. While we’ll briefly recap the basics of the XPS 12’s design, we’ll refer you to our review of last year’s model for more in-depth information on the construction quality, input devices, and connectivity features. We’ll instead be placing our focus on the performance and battery life improvements that the new chipset has brought to the table. Should the XPS 12-9Q33 be on your short list?
Case
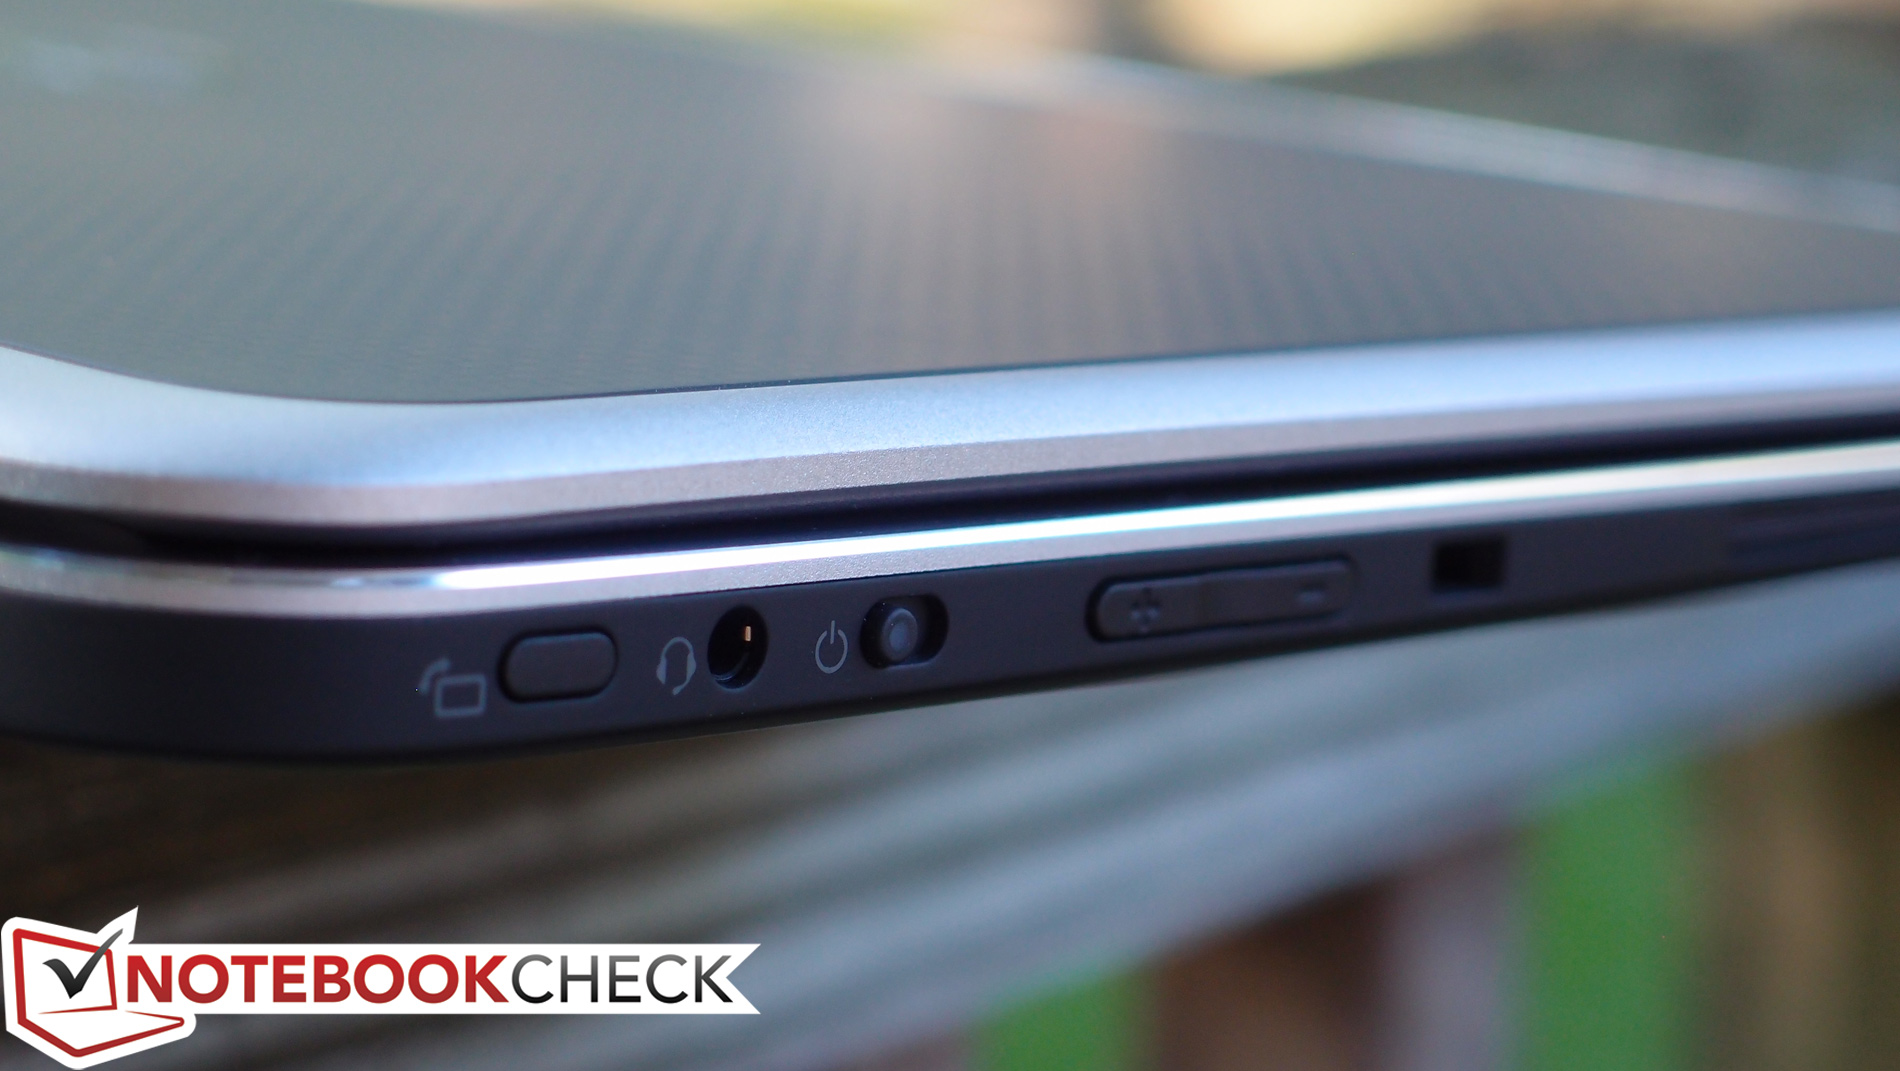
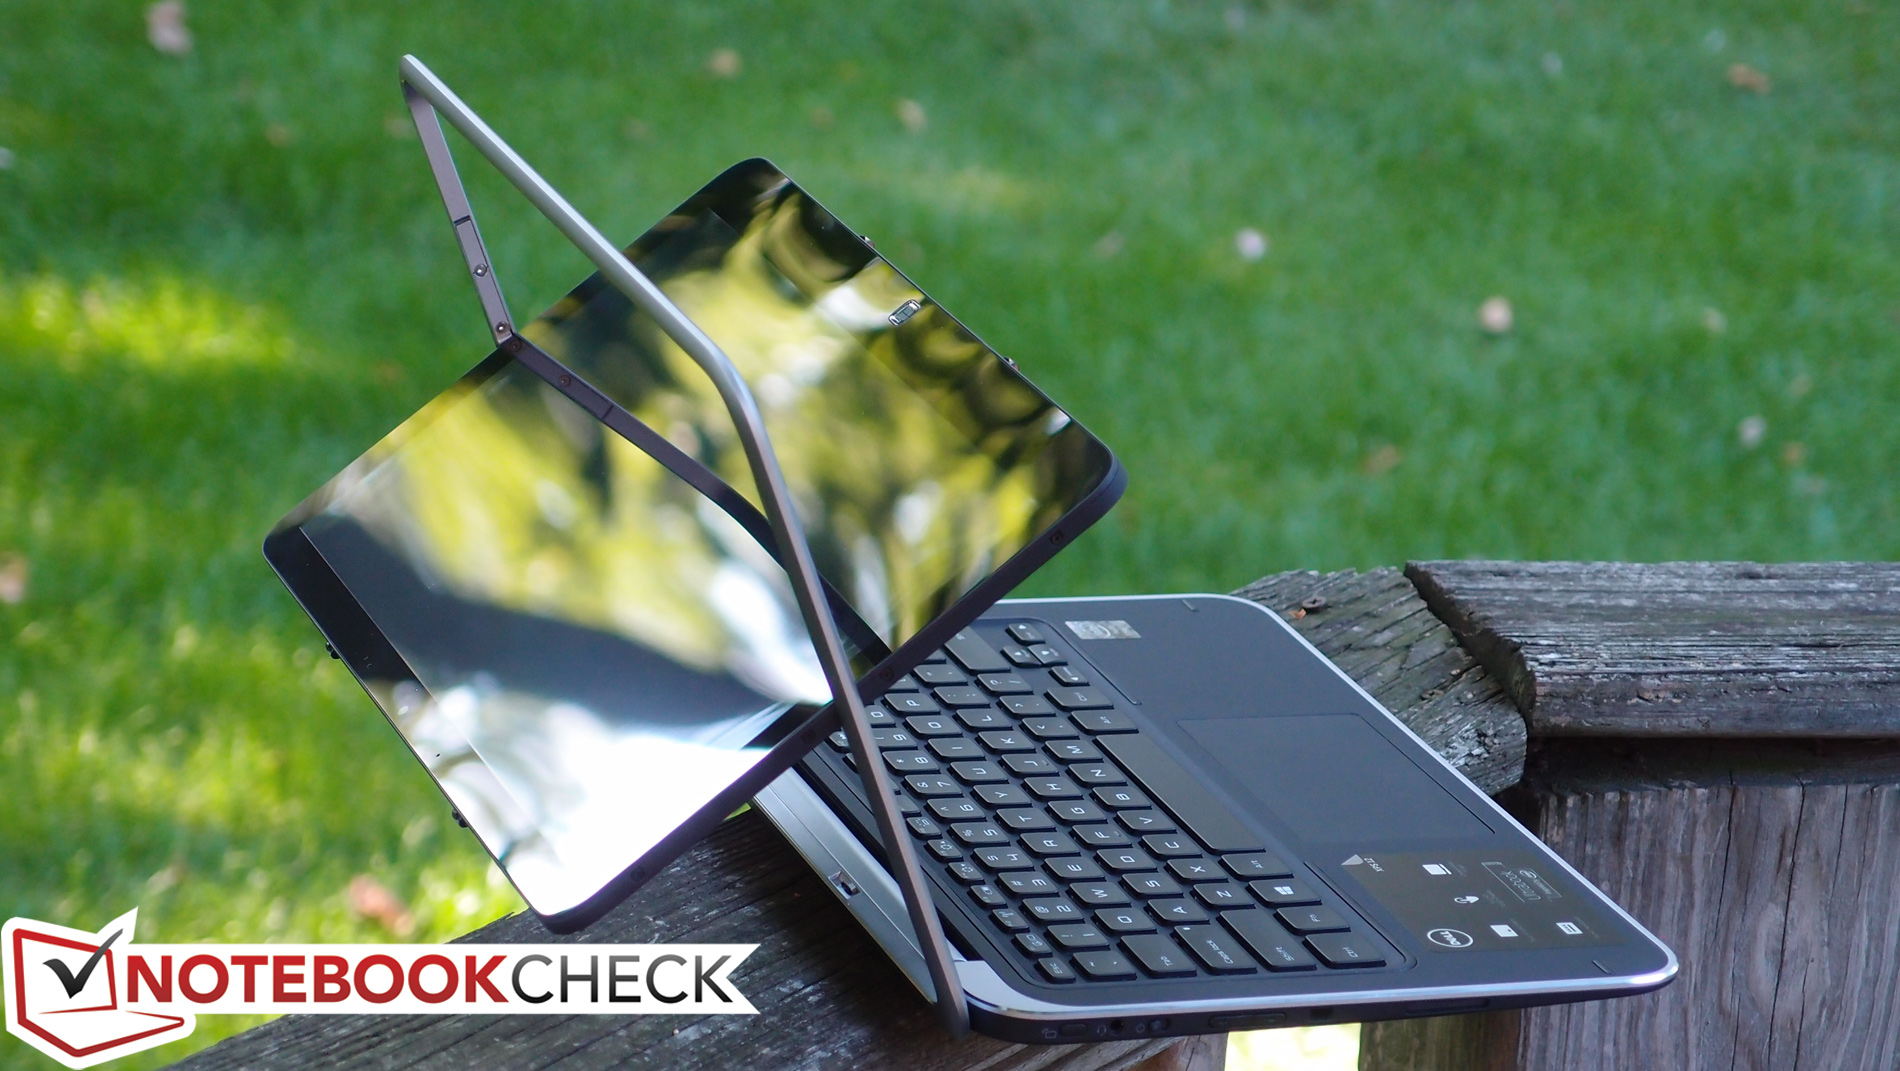
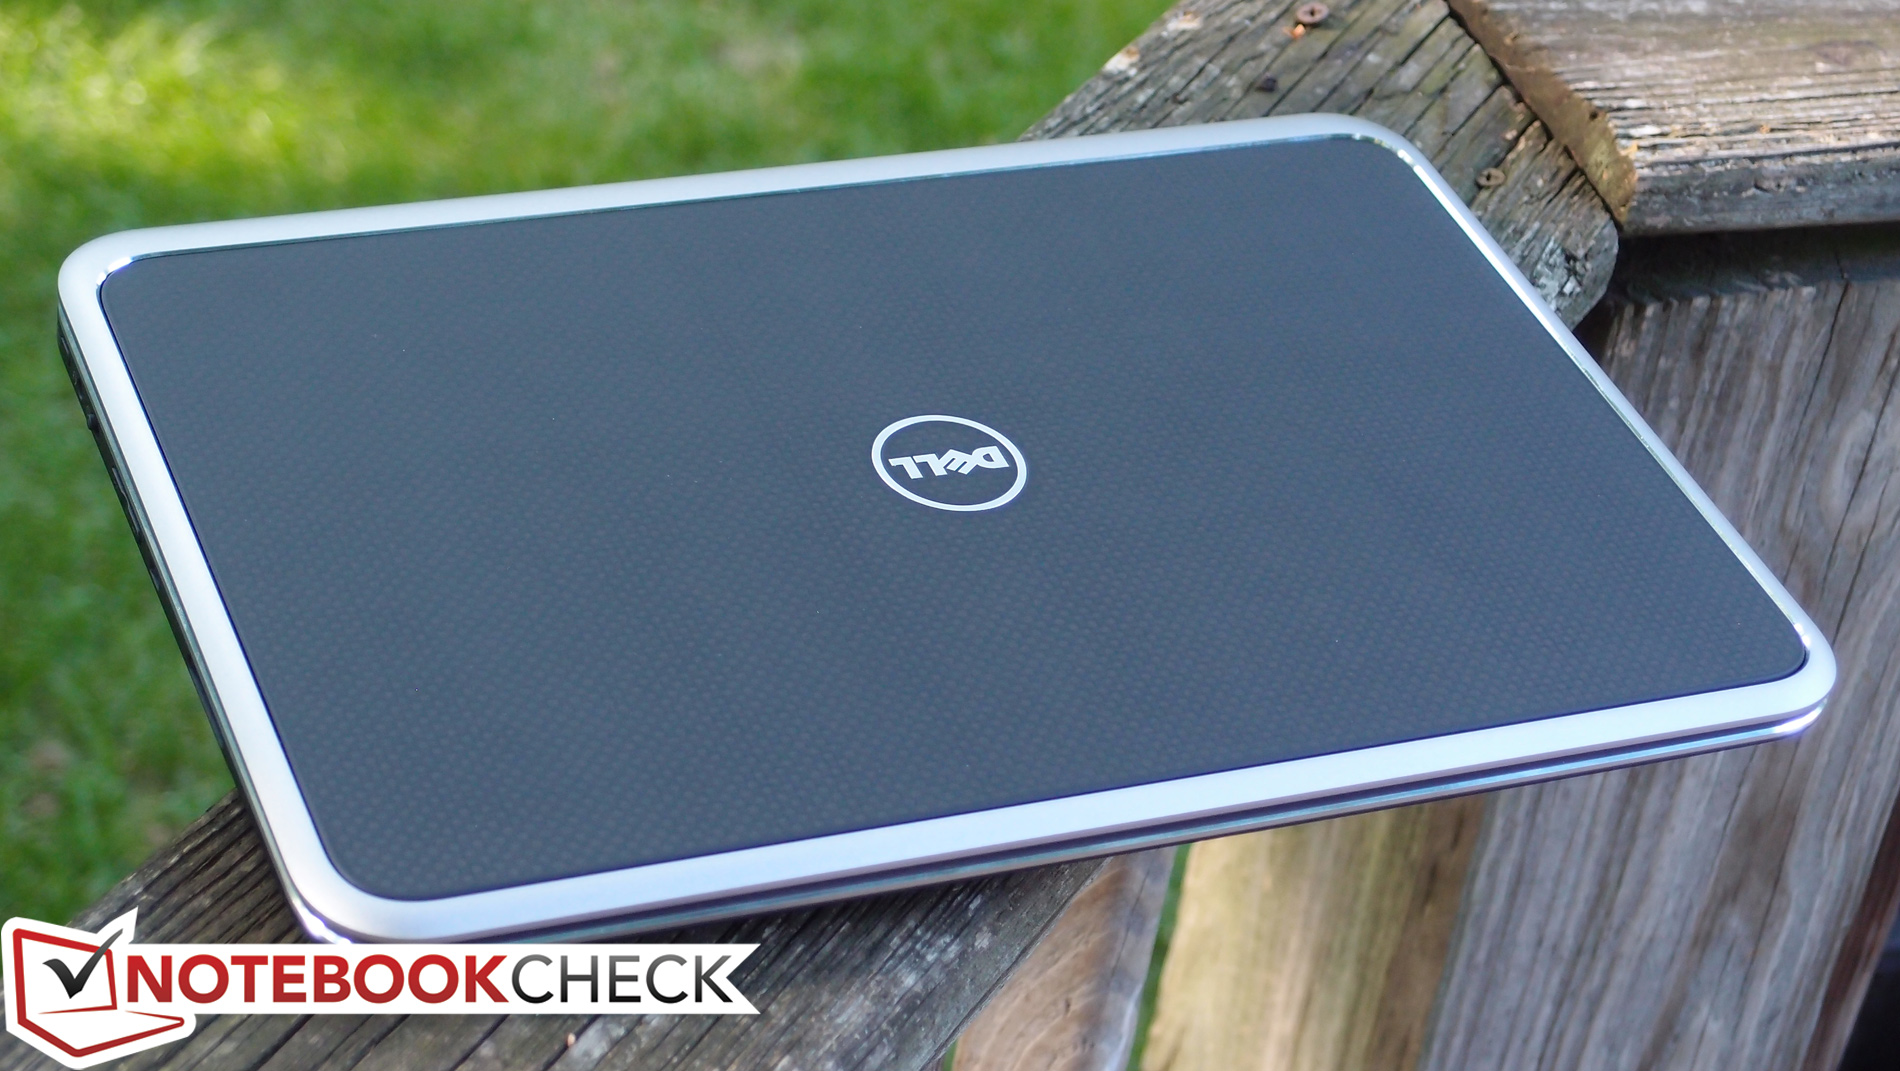
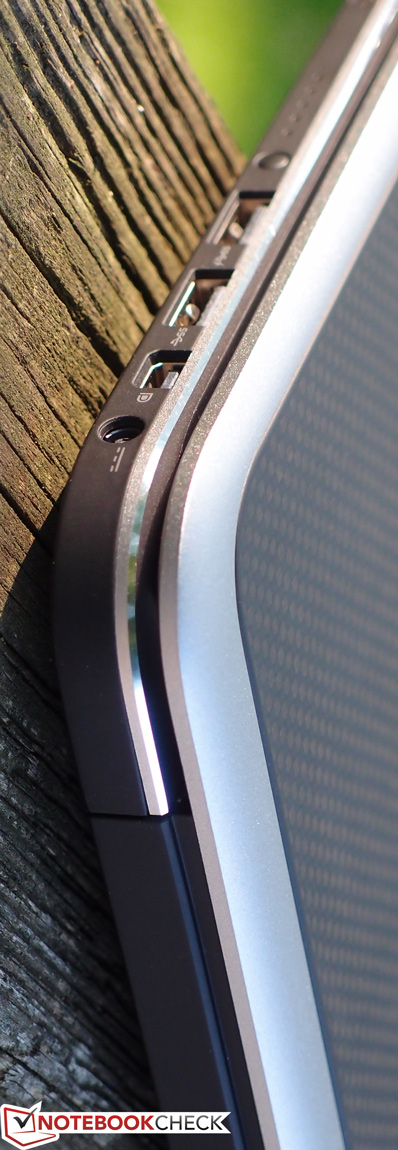
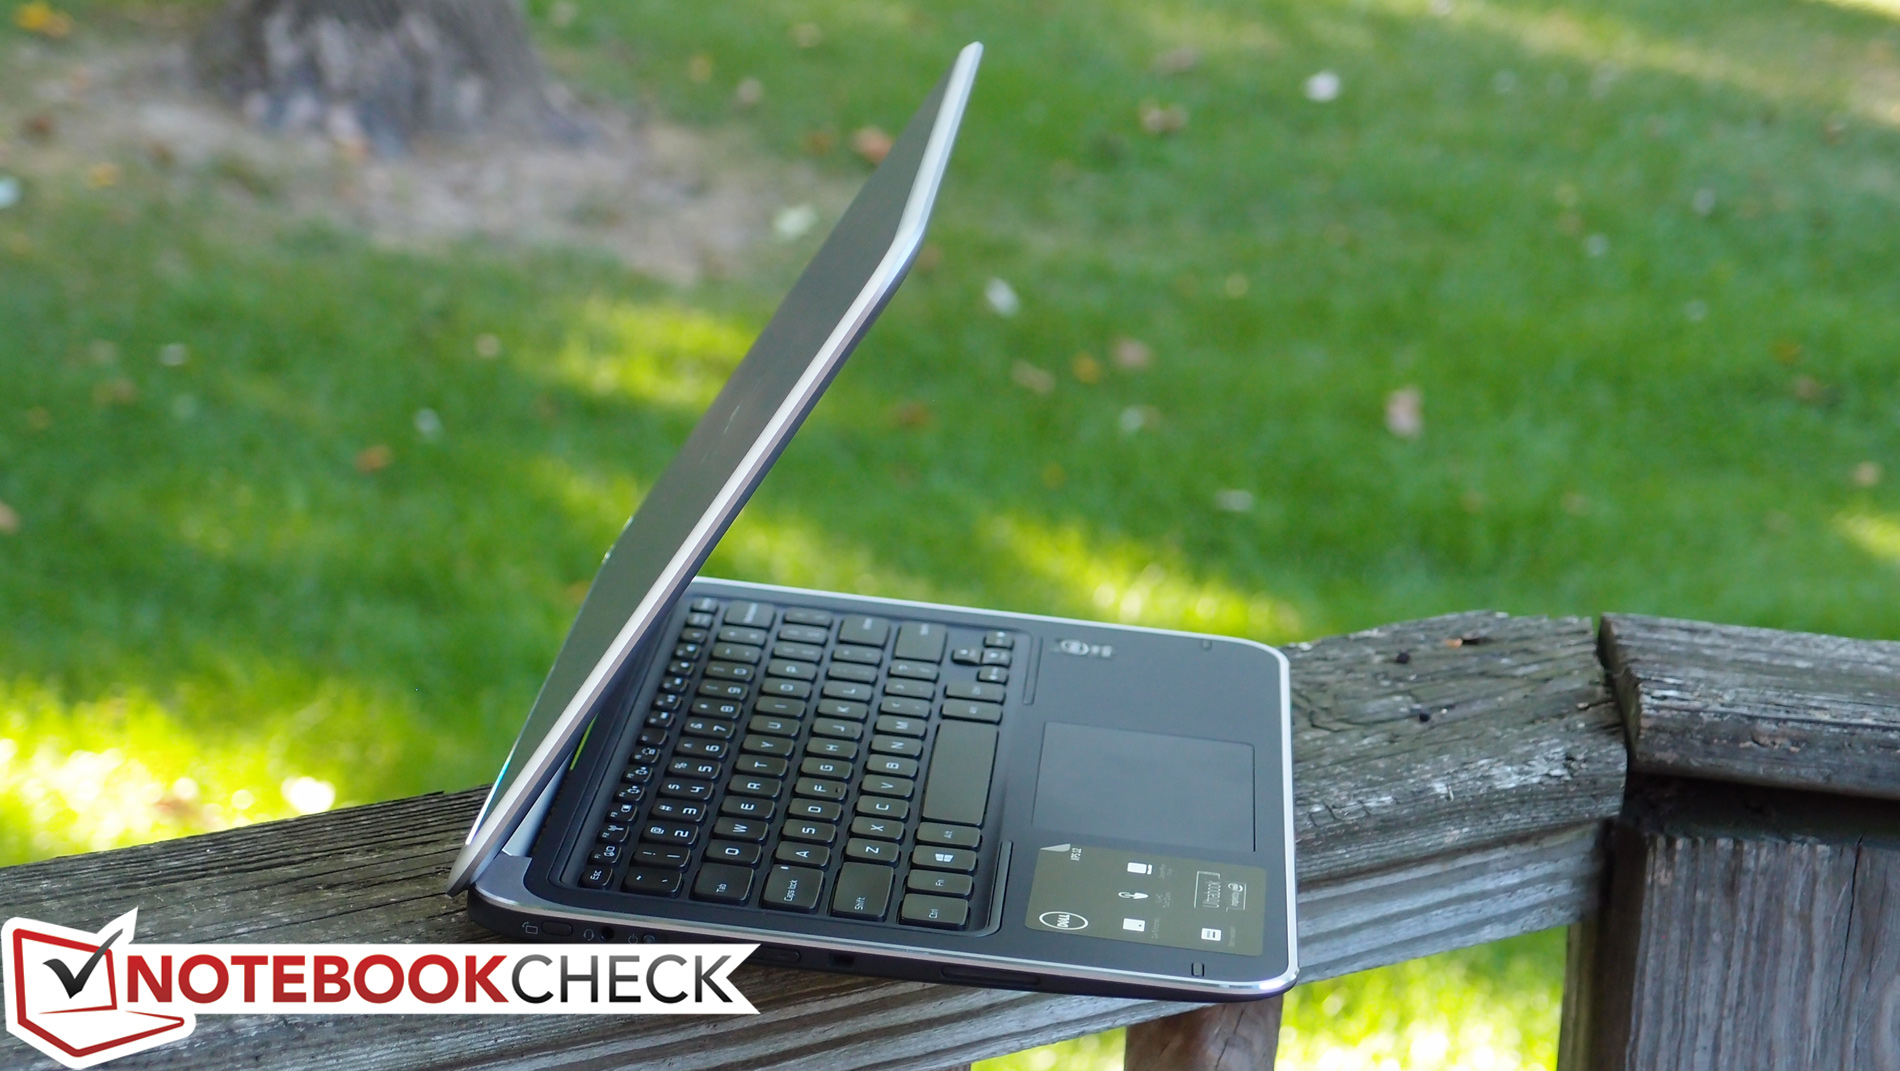
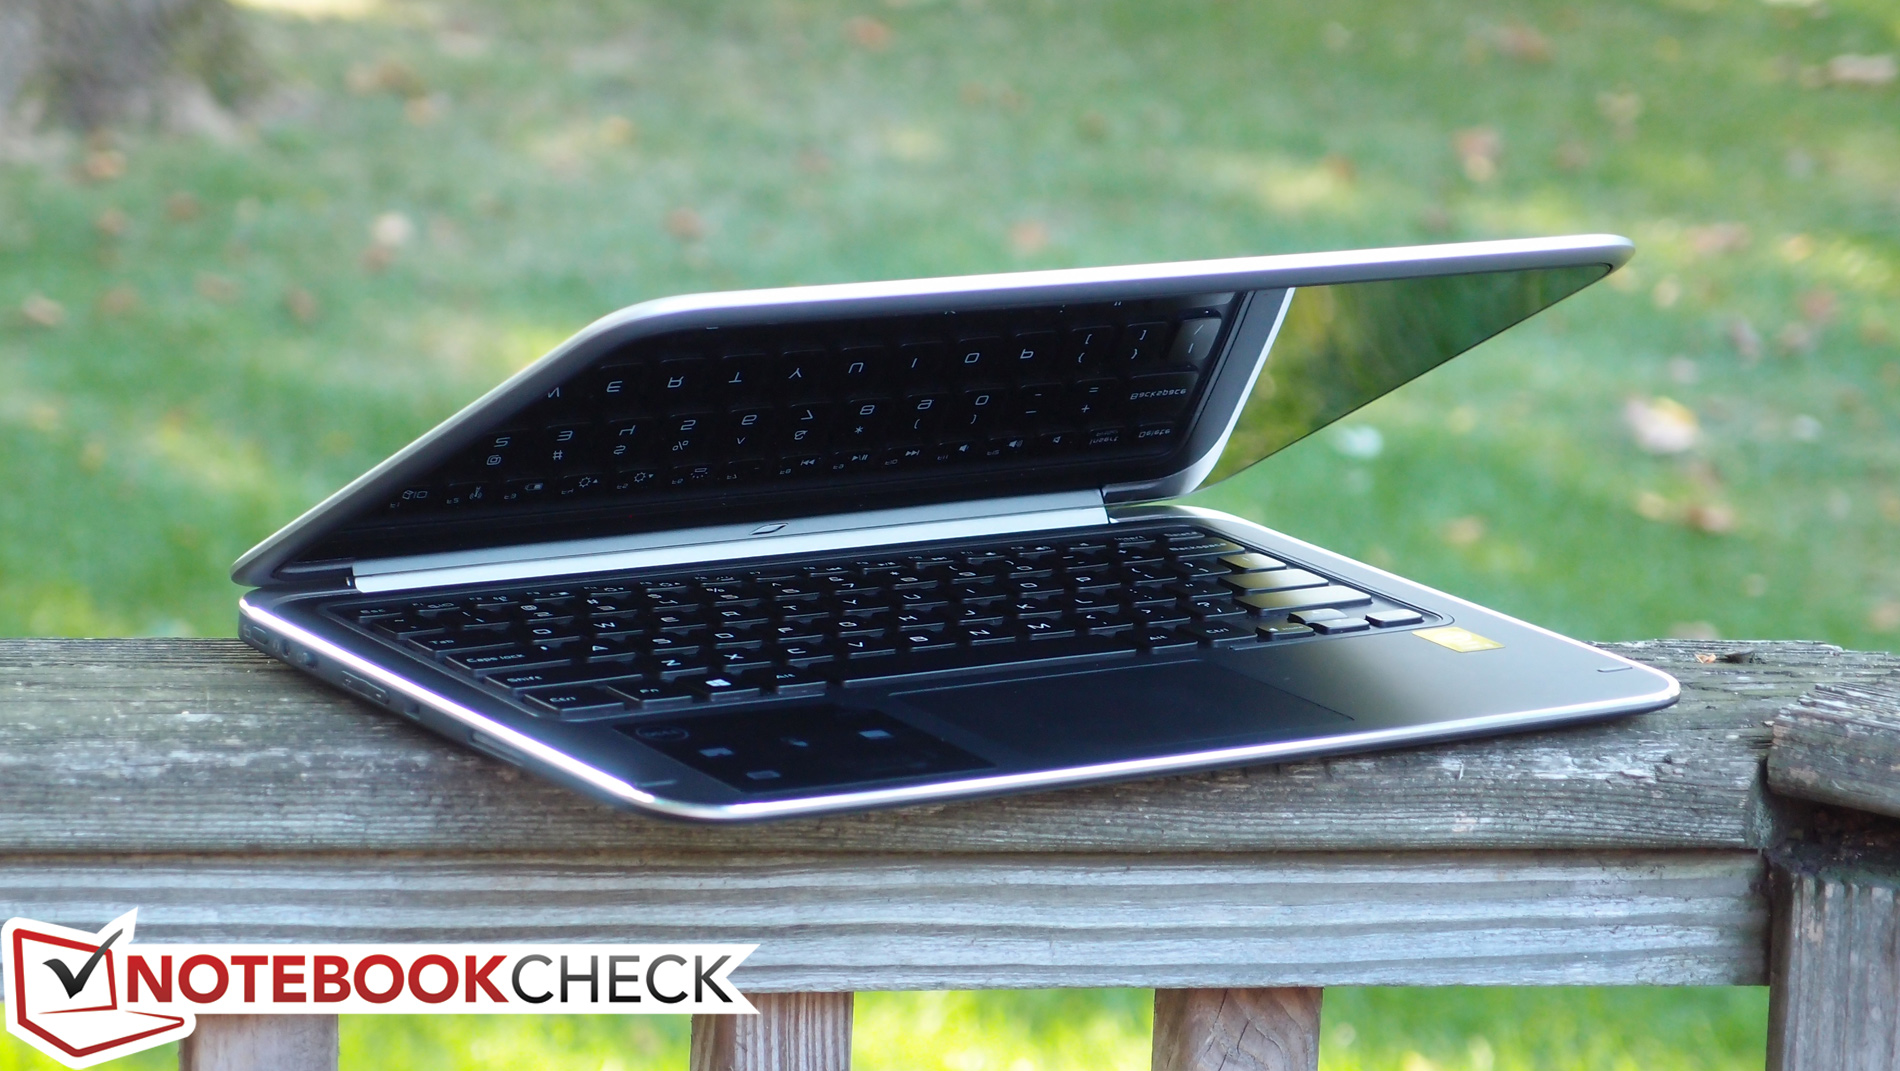
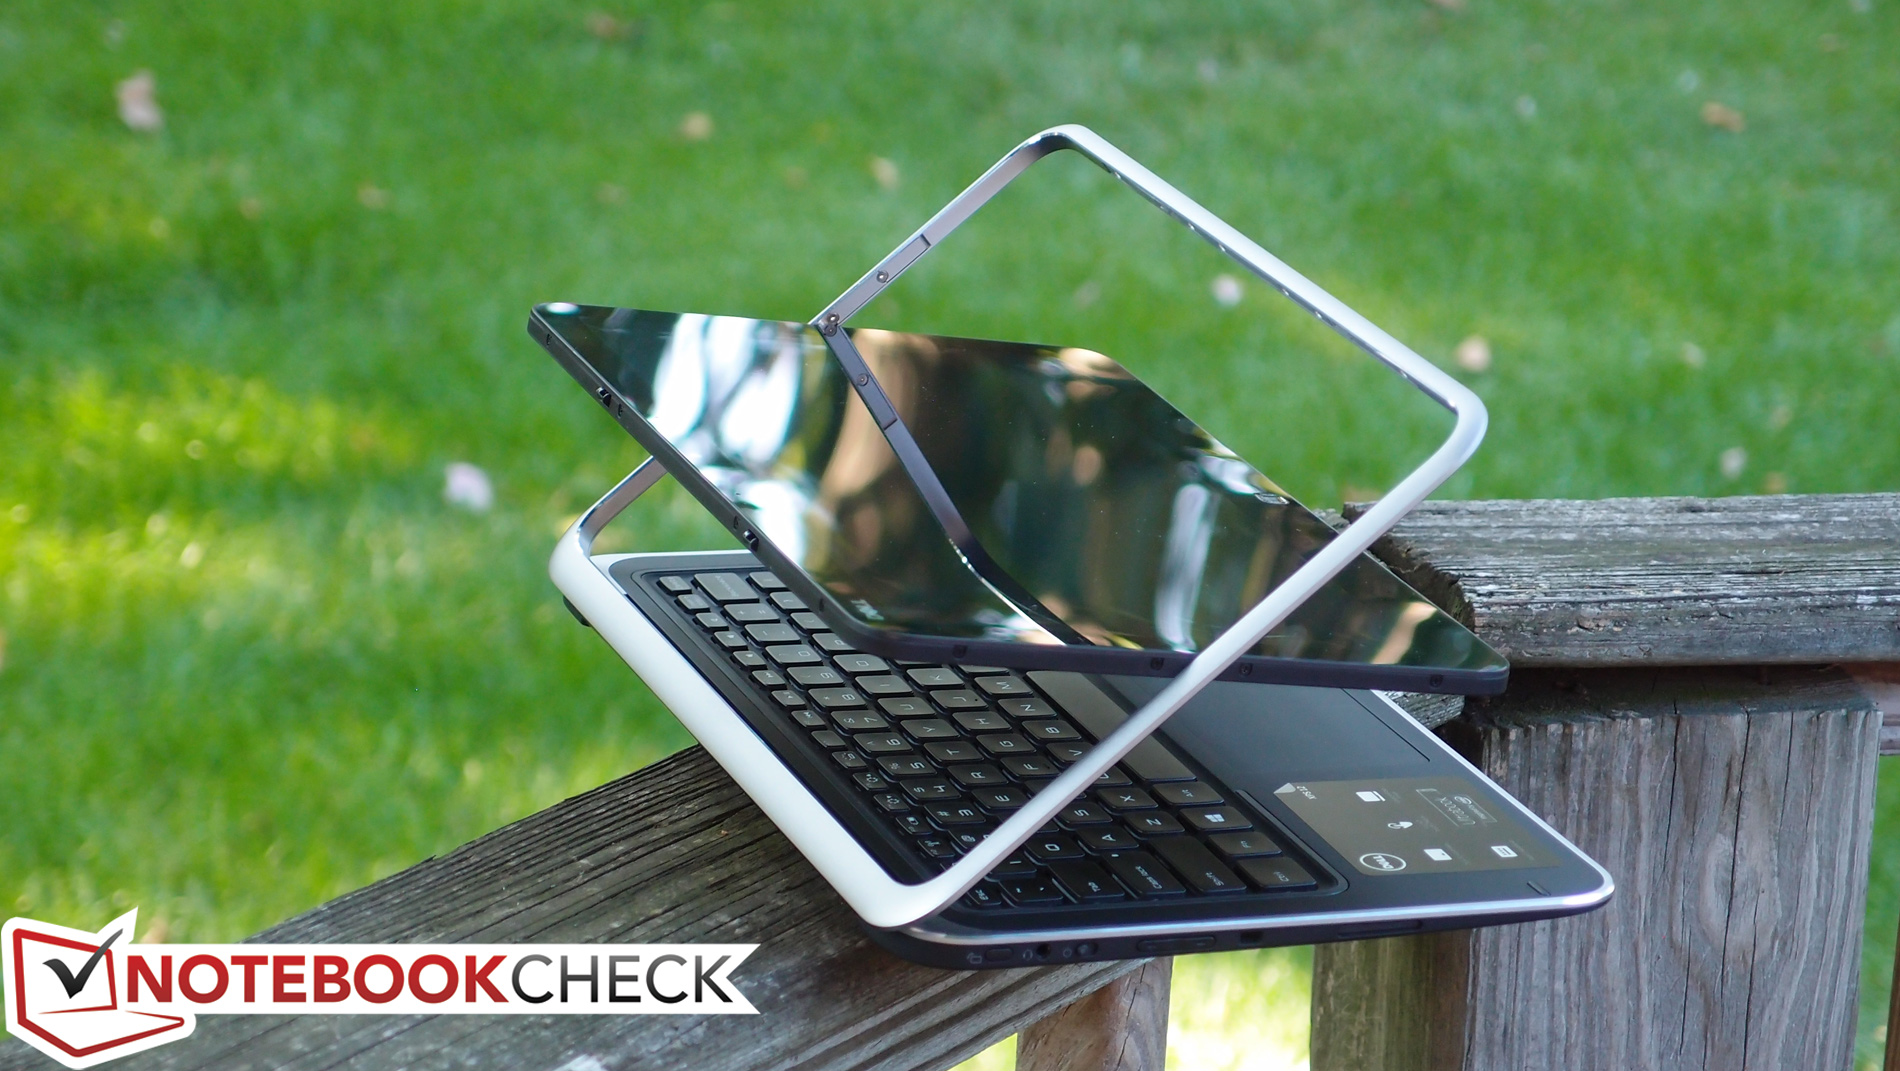
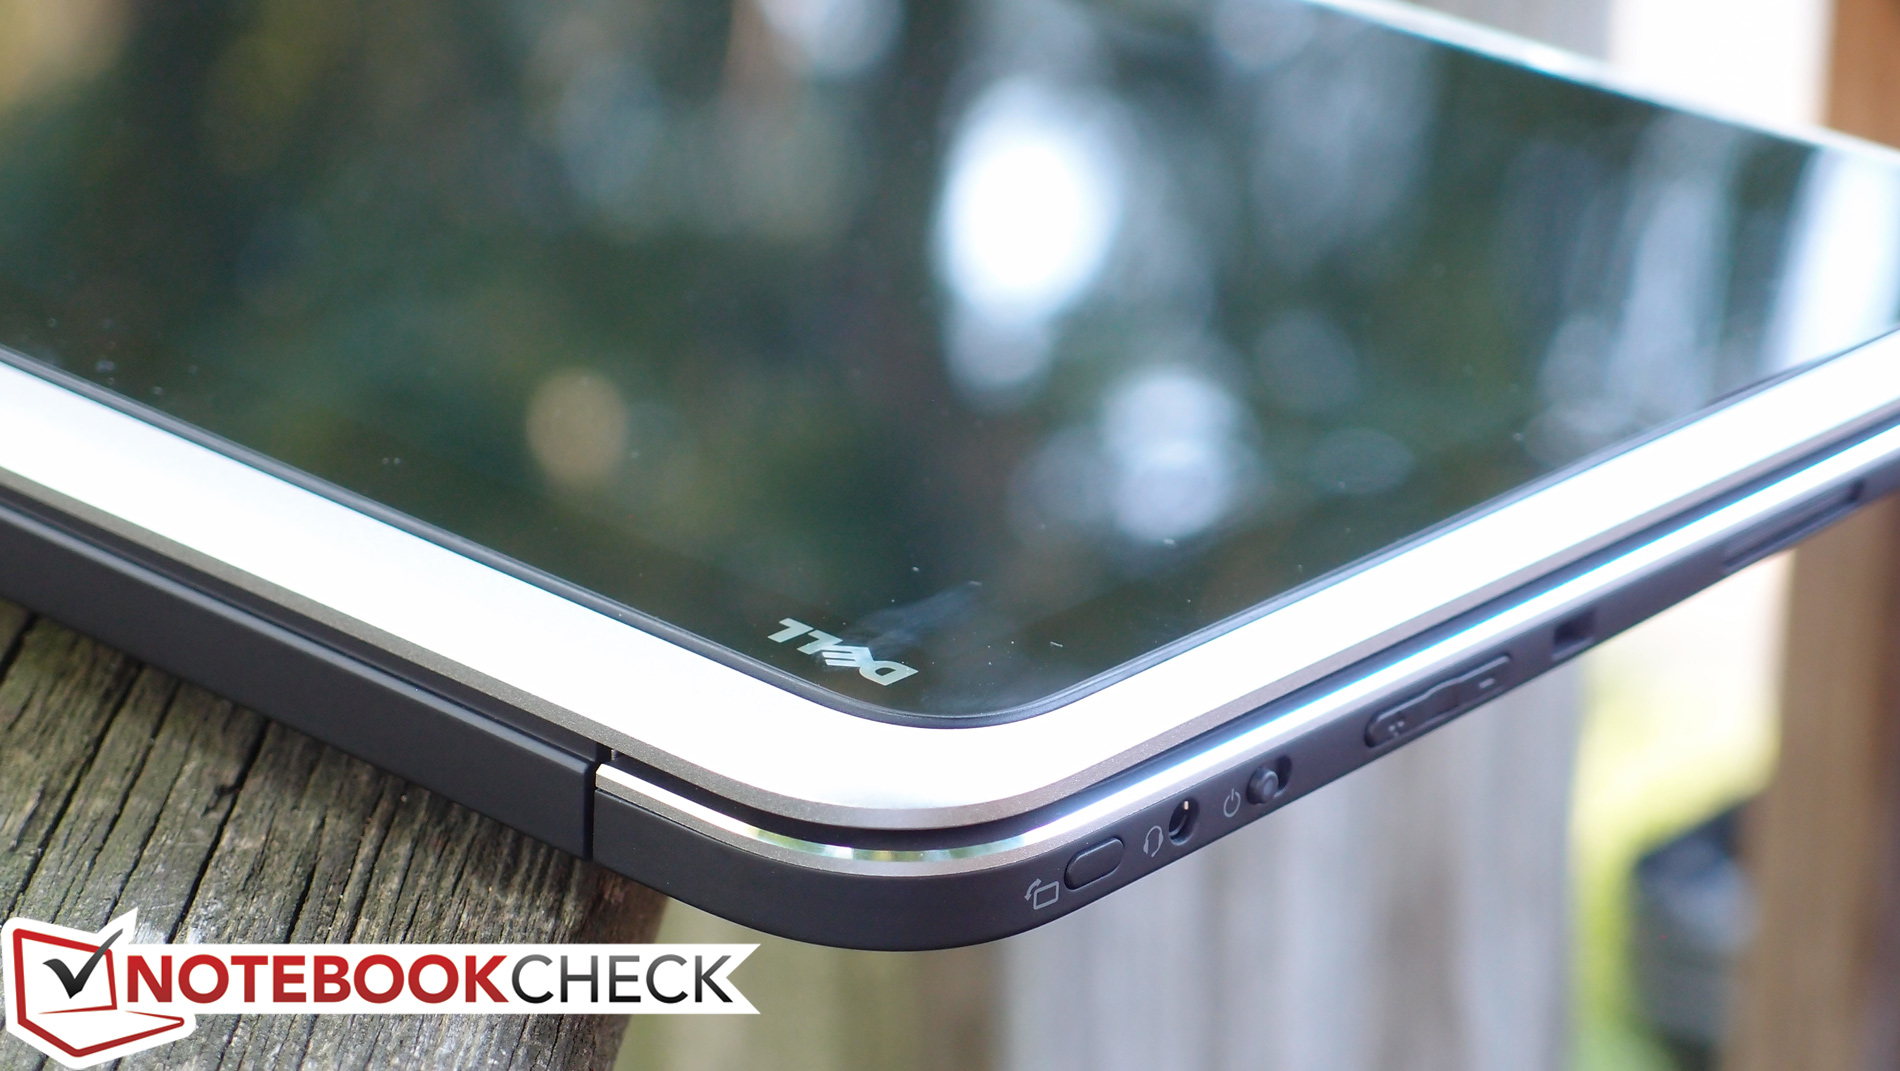
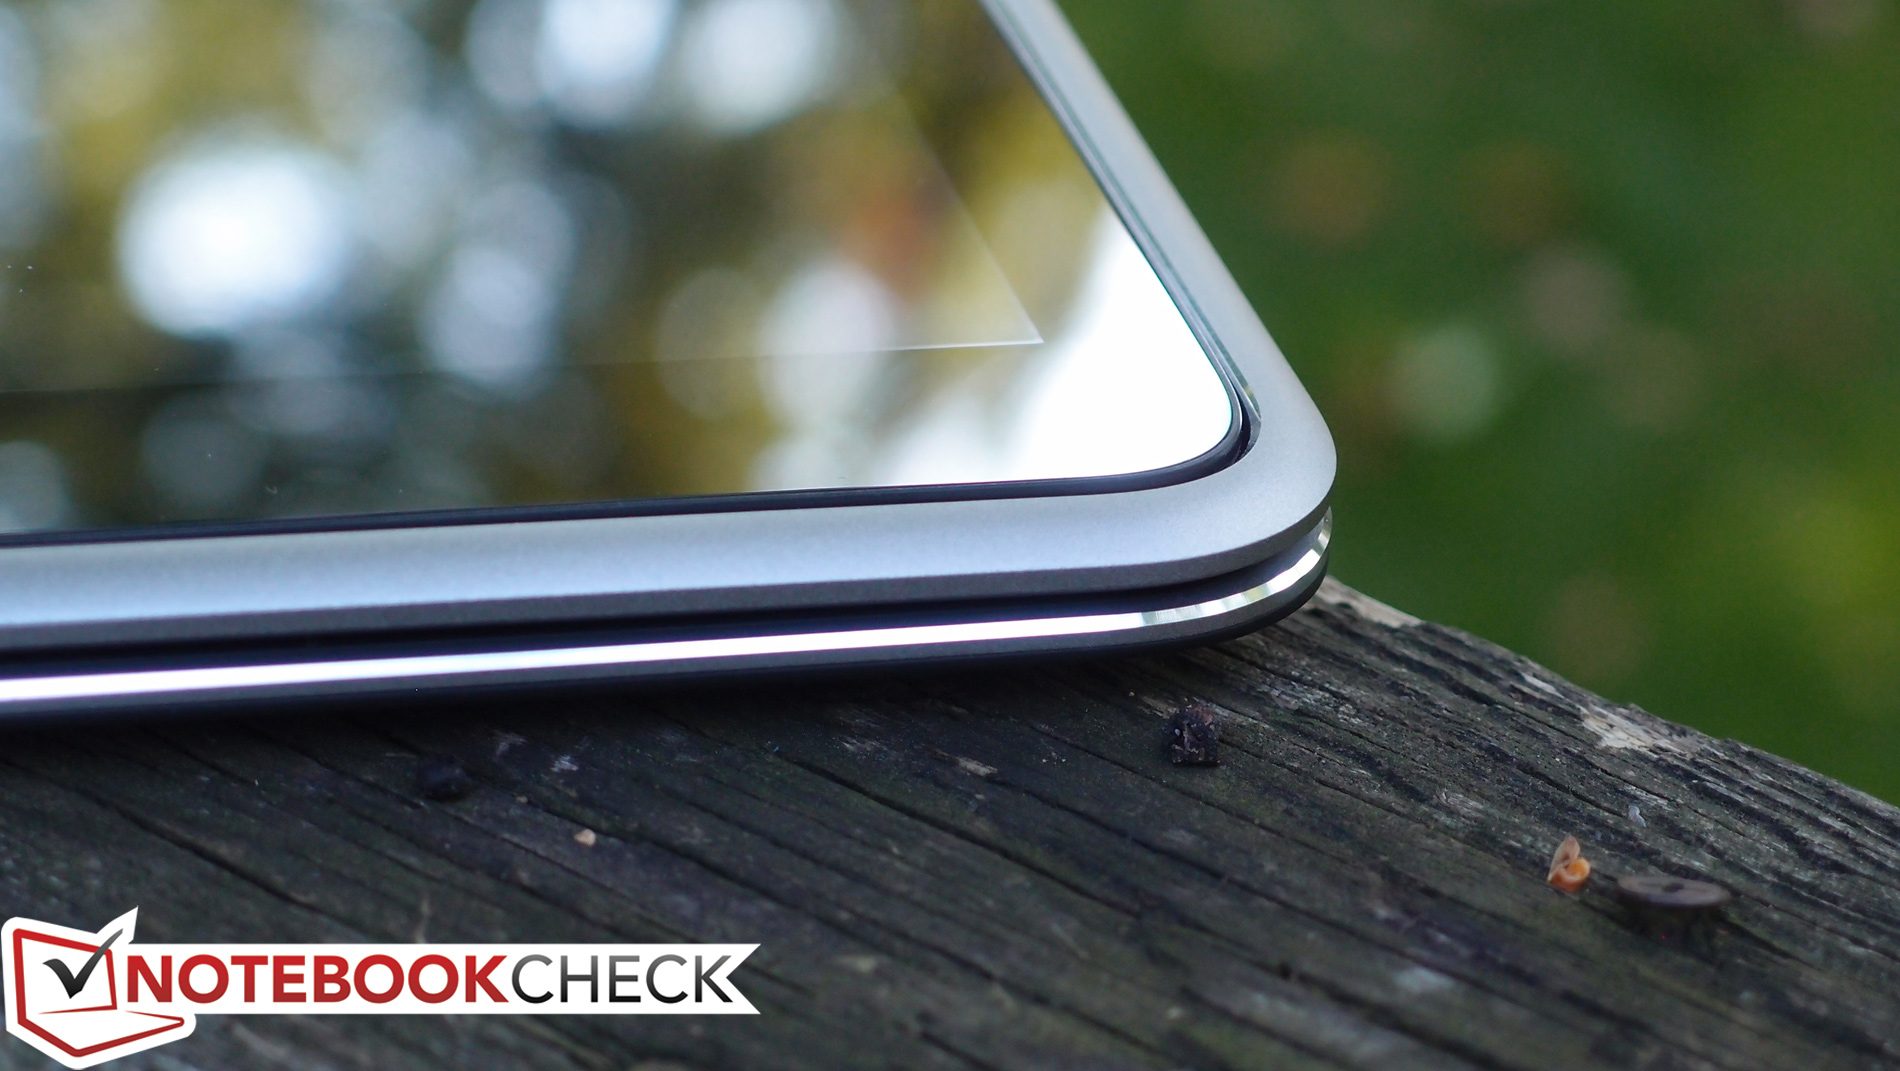
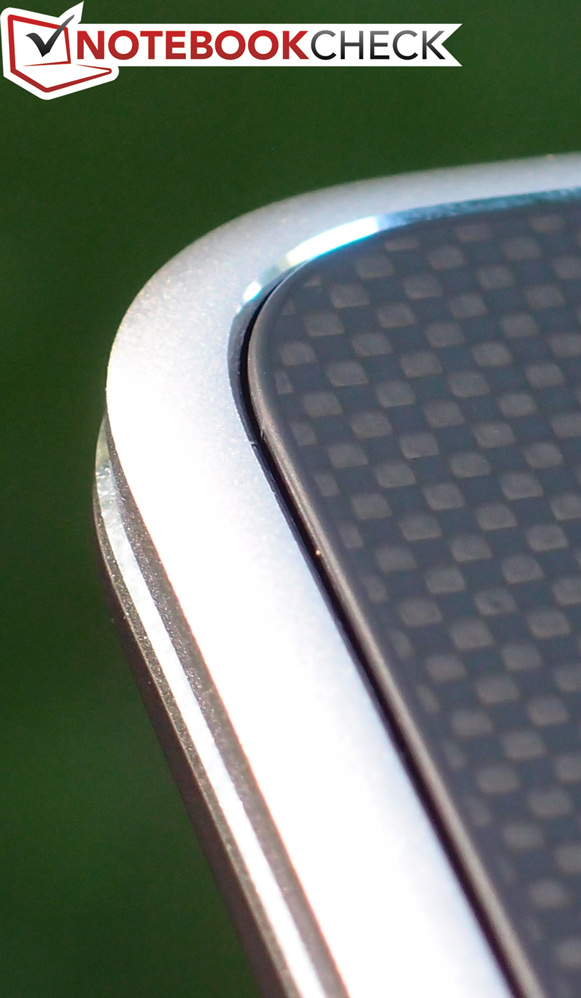
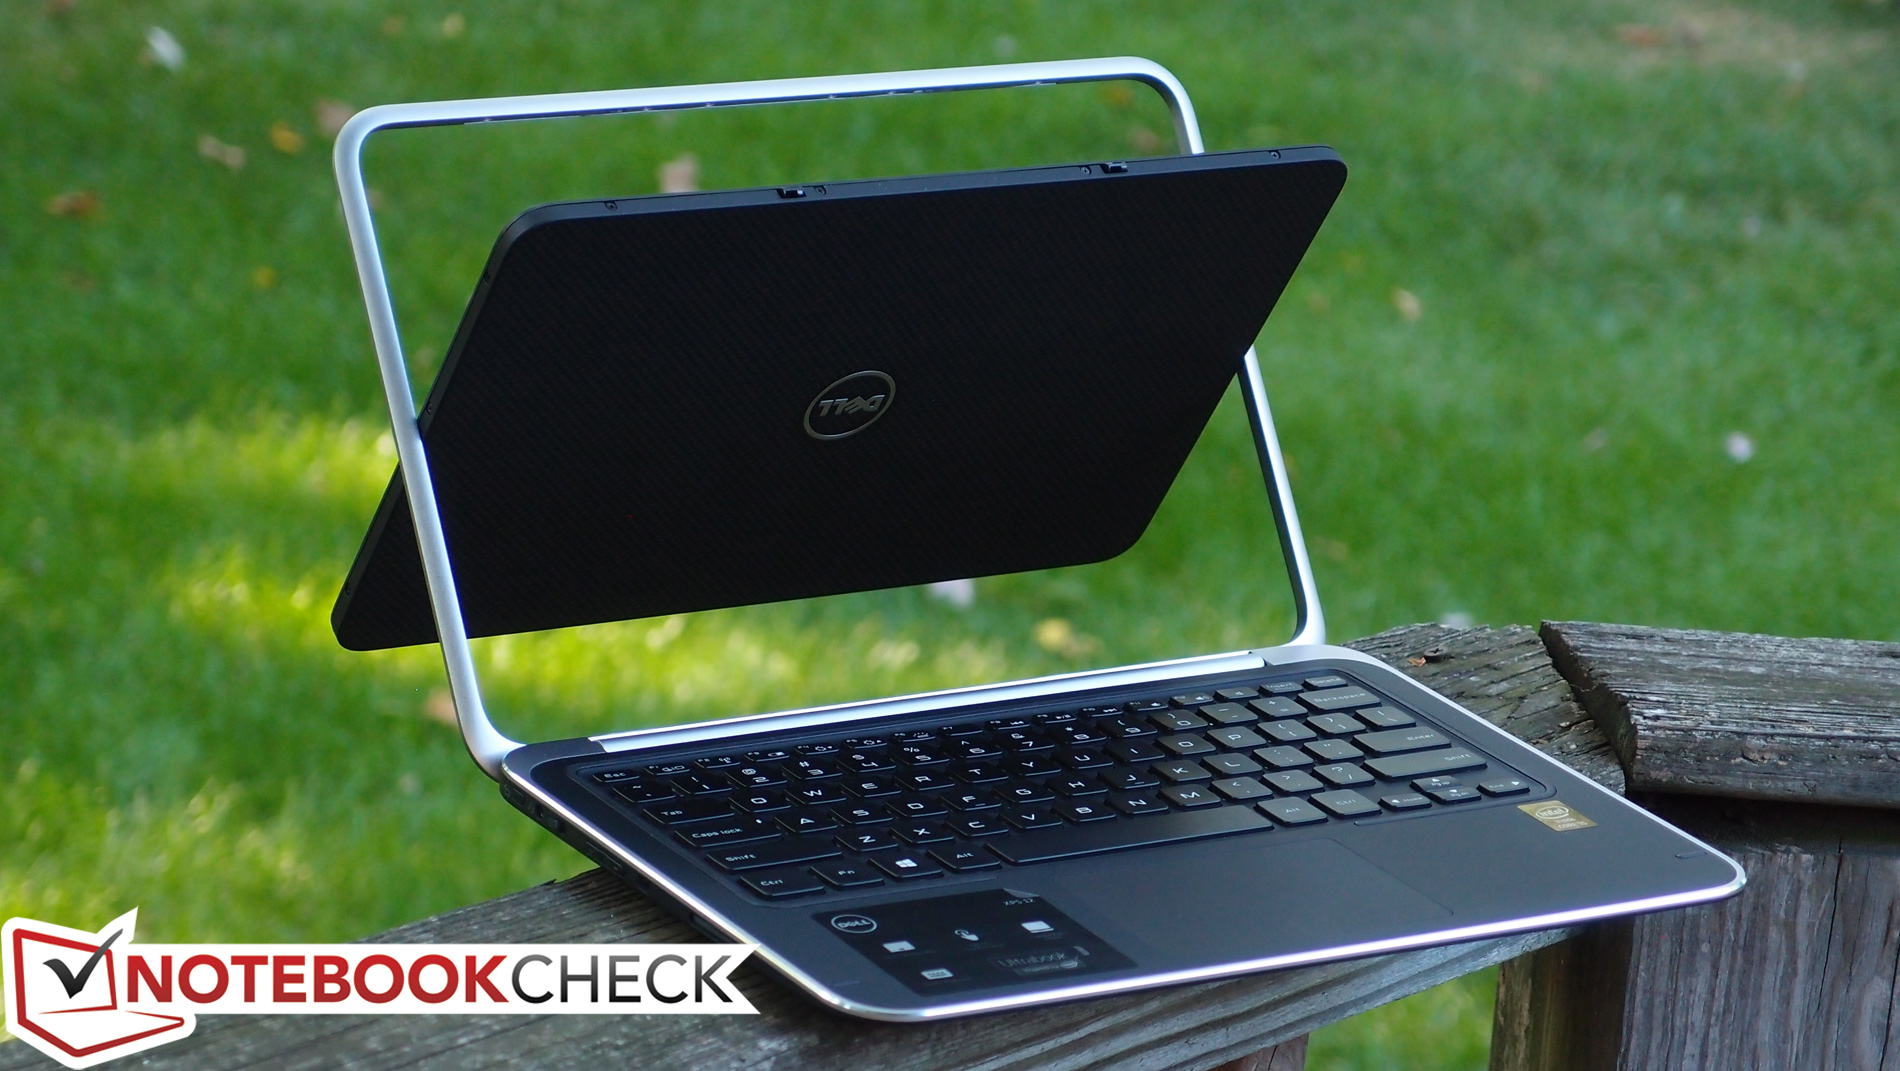
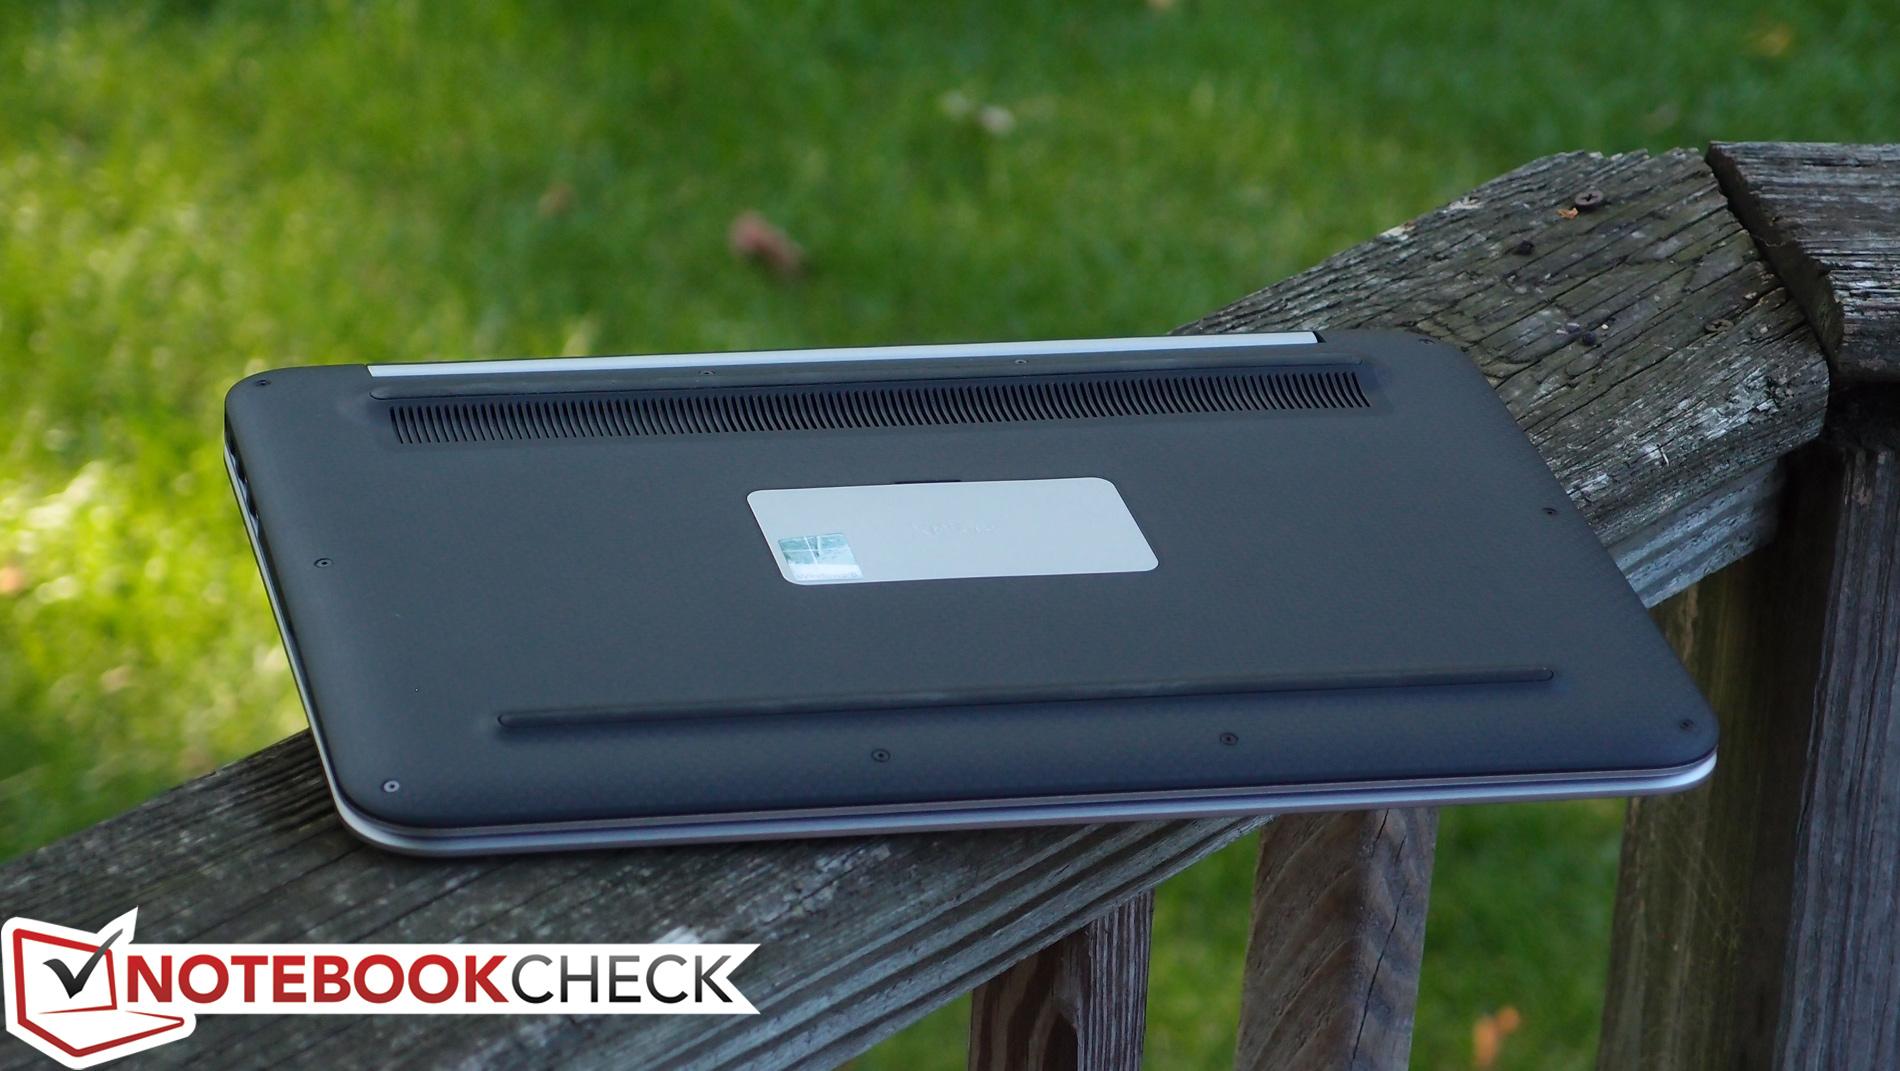
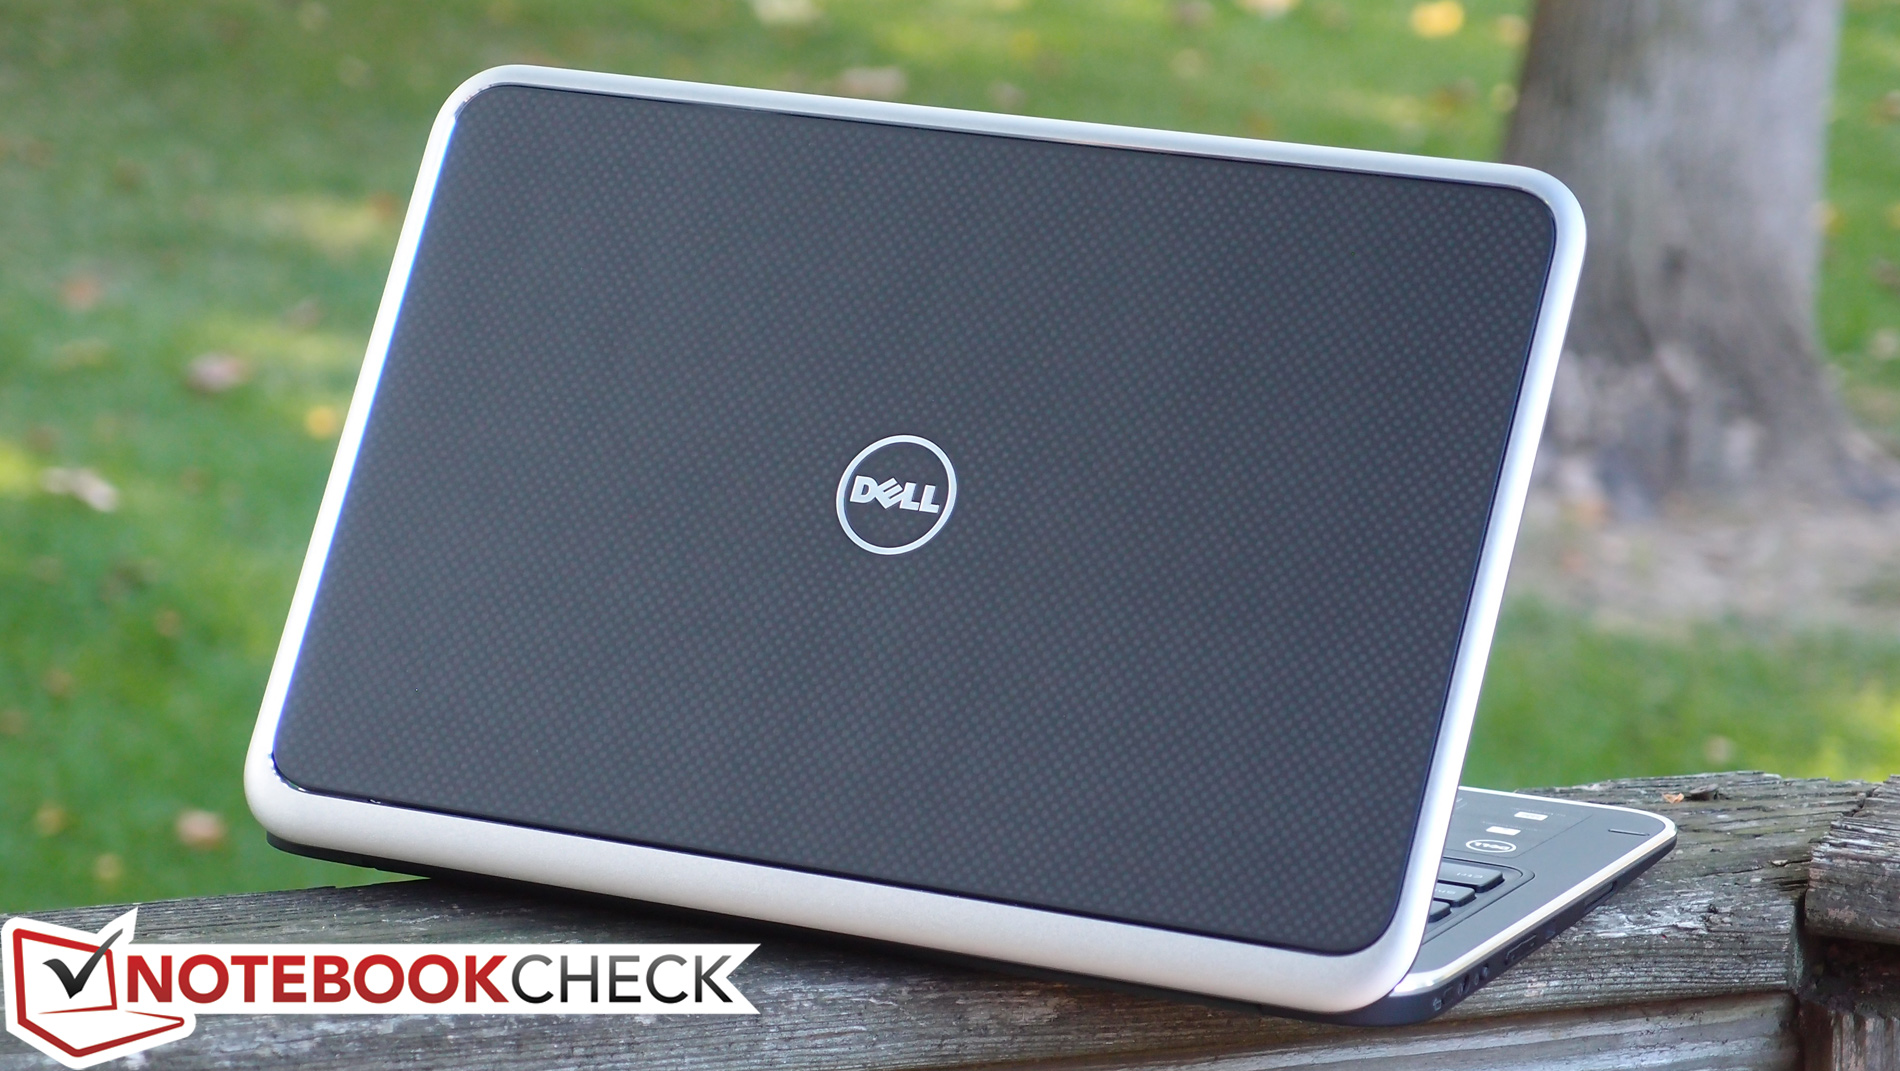
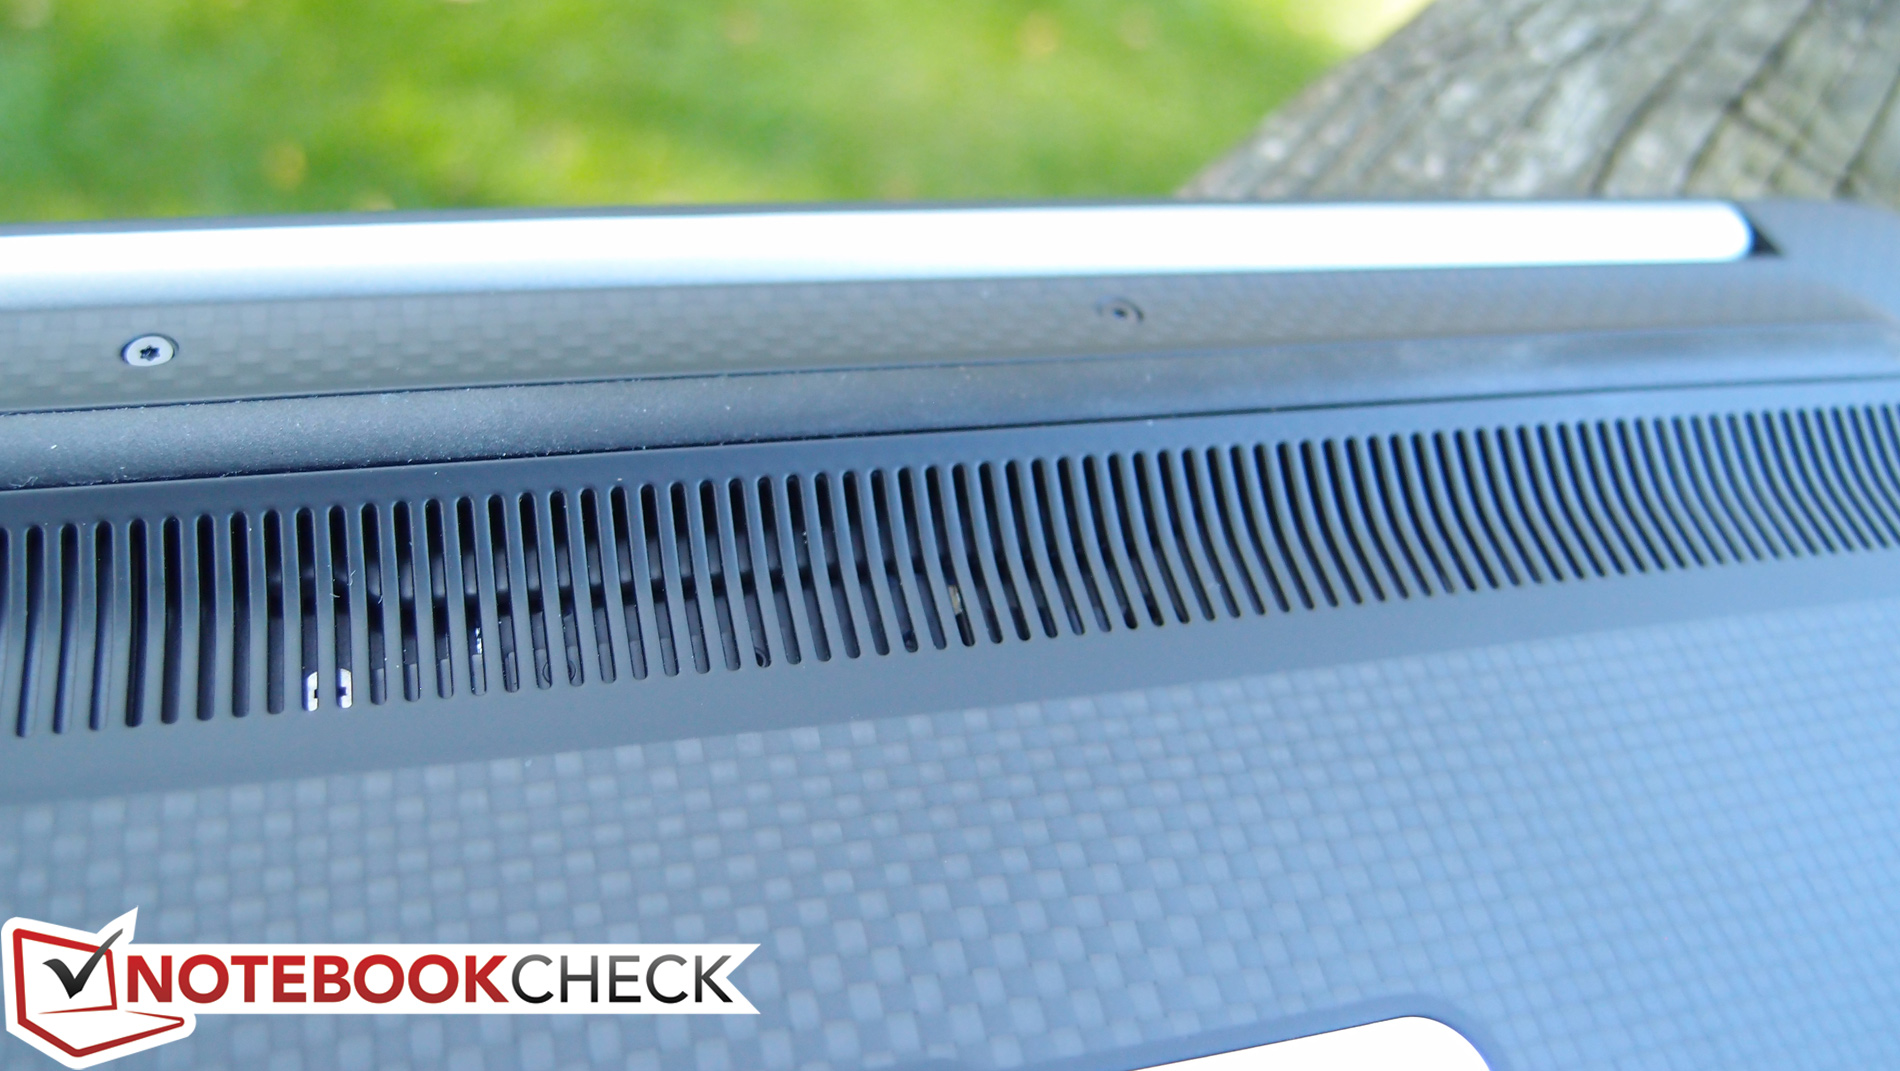
Chiseled out of machined aluminum (the edges of the base unit and lid), carbon fiber (the display back and base), and magnesium (palmrest and keyboard surround), the Dell XPS 12 remains a solidly-built piece of technology. Unlike many of its competitors, however, it features a soft-touch paint that lends even metal surfaces (such as the palmrest) a matte and subtle appearance. The sense of structural rigidity is reinforced by long rubber feet spanning most of the width of the bottom of the unit; this provides for very little flex across the breadth of the base. Meanwhile, the aluminum bracket that surrounds the rotating screen seems well-equipped to protect its cargo, and even the freely-rotating screen itself (with its magnesium back) seems unlikely to break, unless it were subjected to significant force while open. From materials to fit and finish, this is certainly a top-tier device.
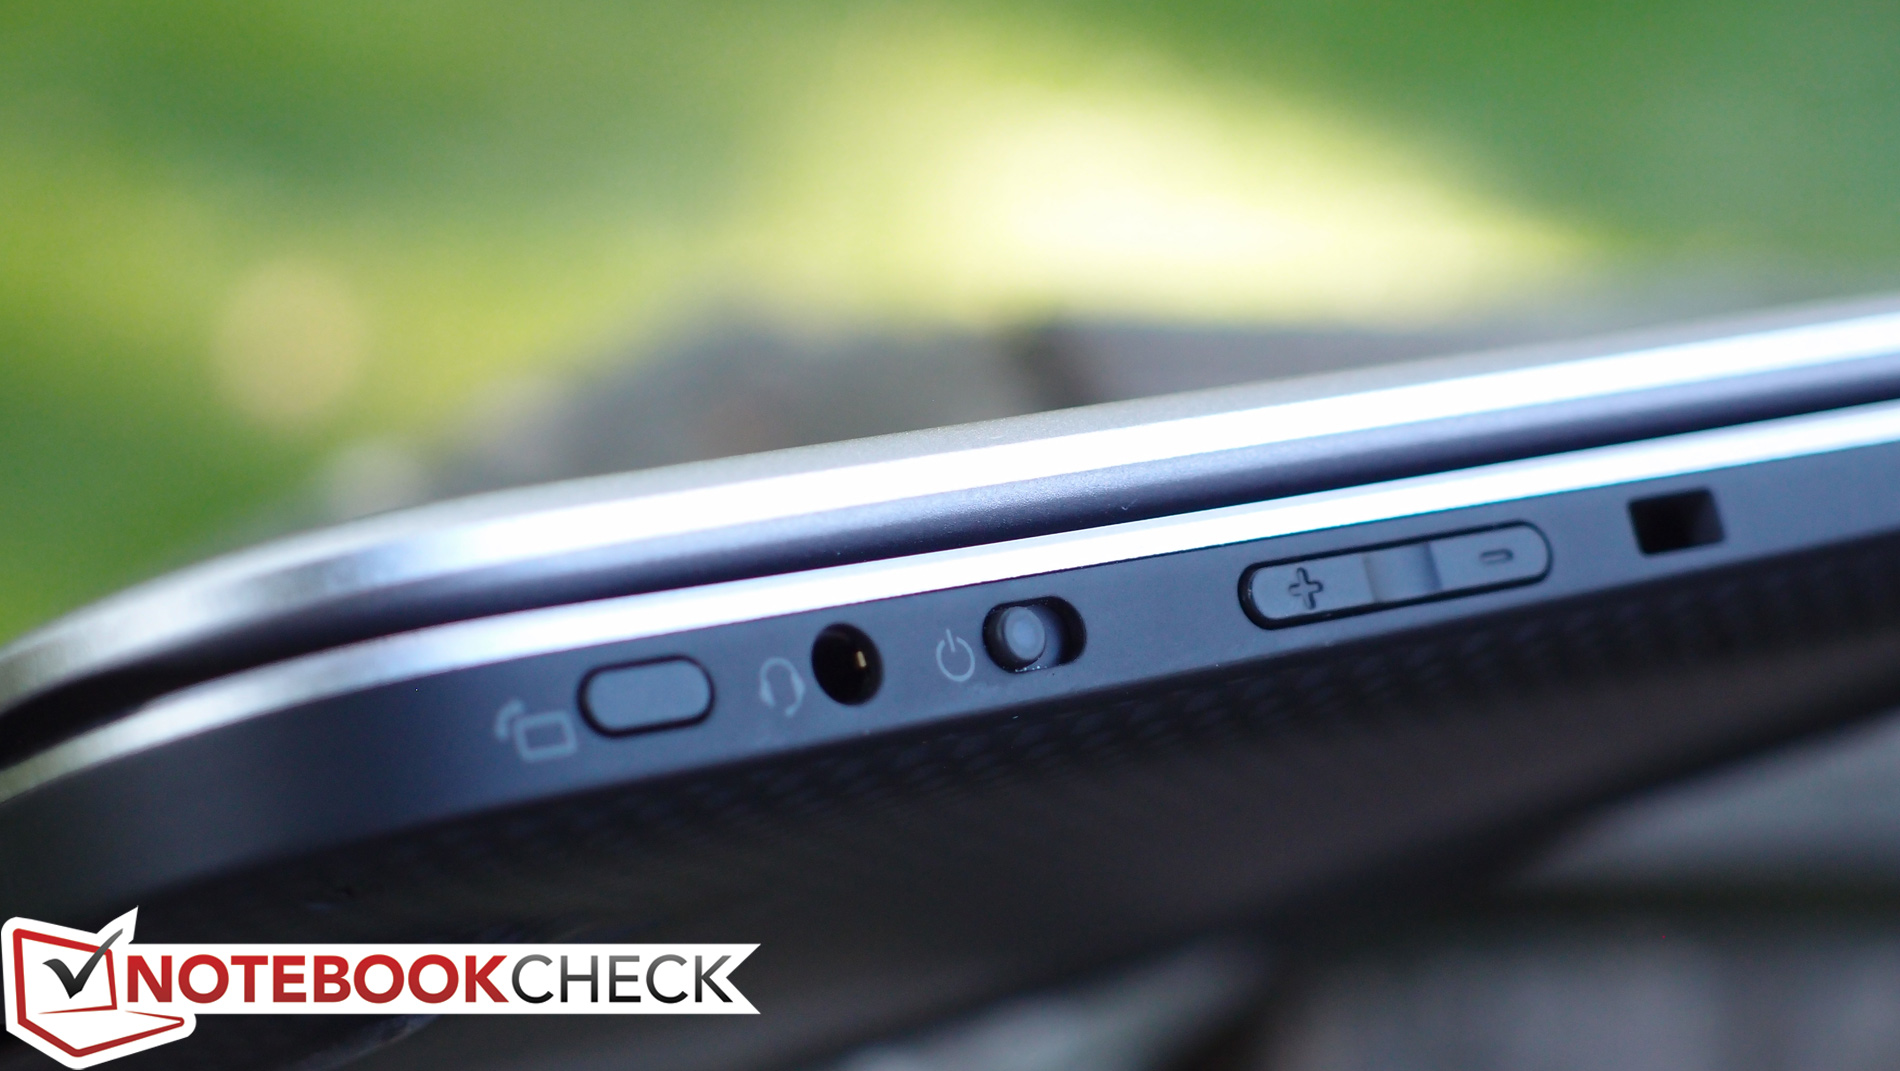
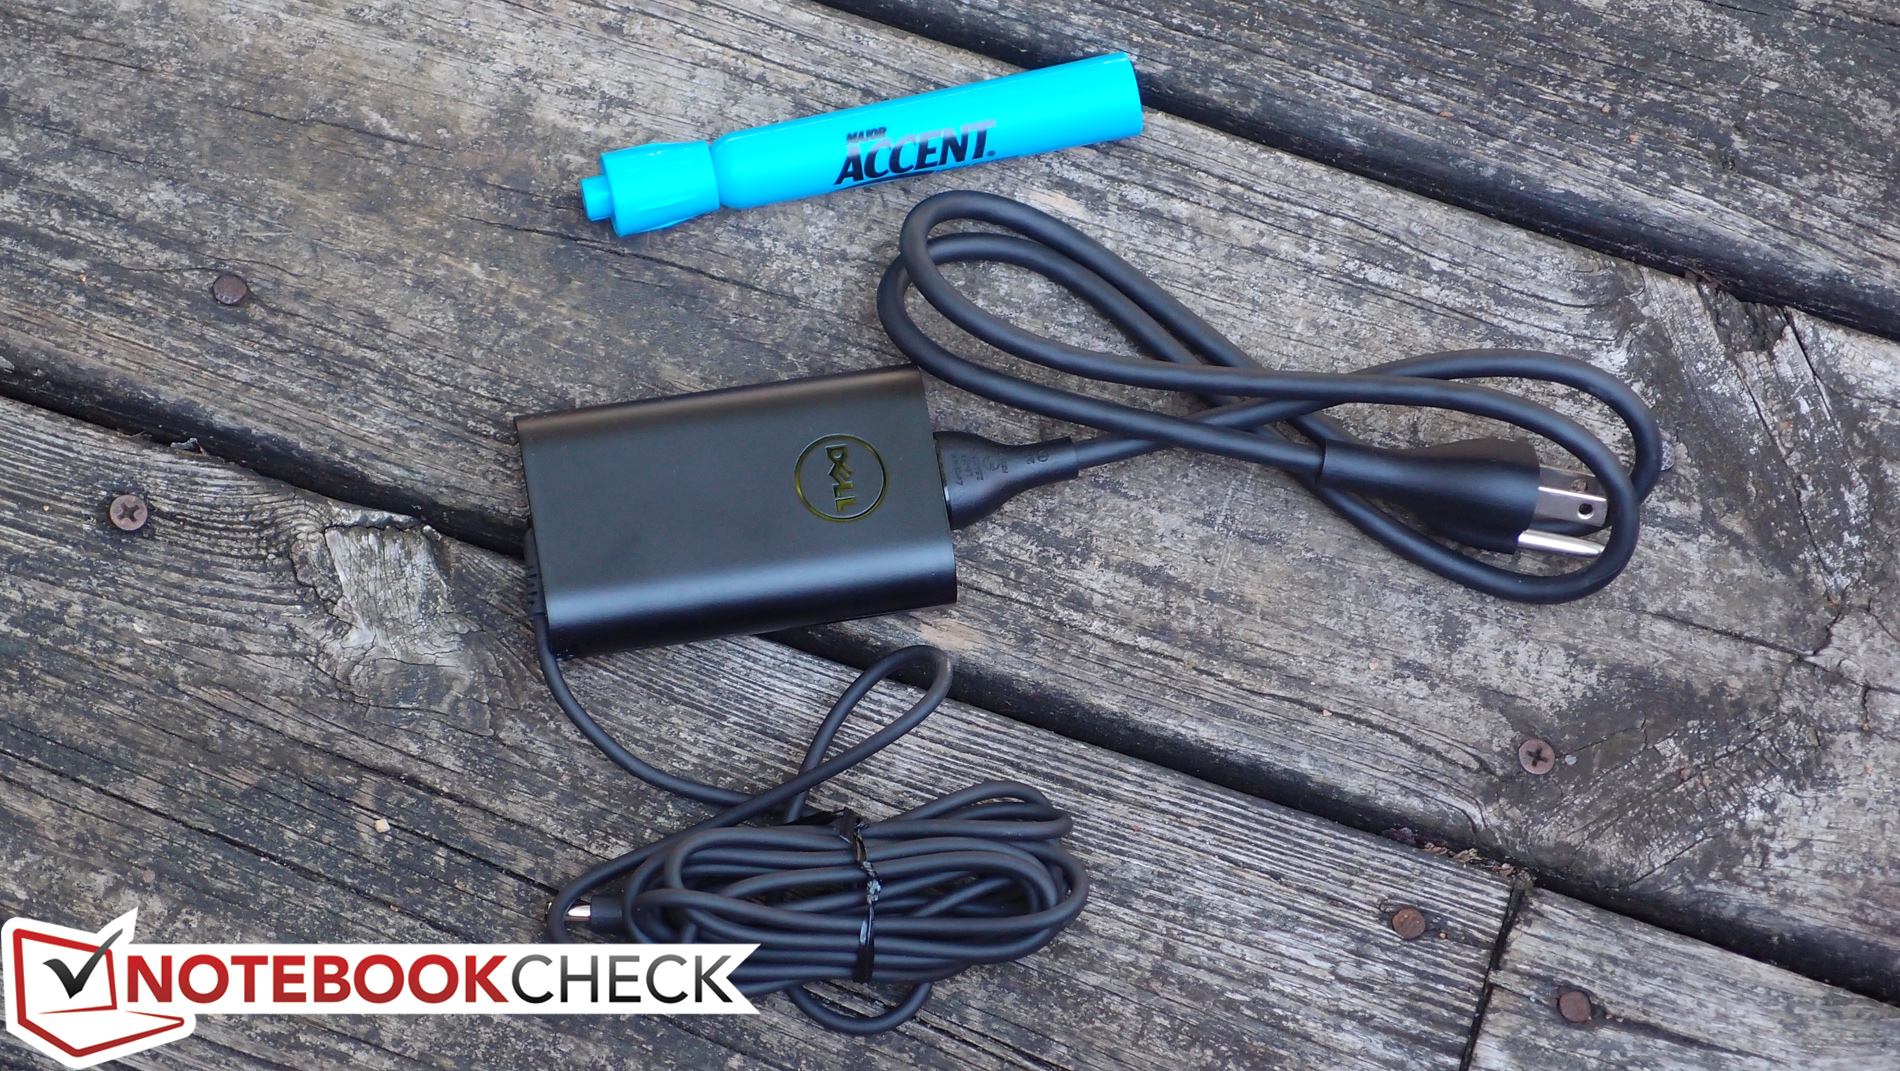
In short, our impressions have not budged from that of our initial encounter with the Dell XPS 12. Even the connectivity, communication options, accessories, and input devices remain identical by our judgment, except for the inclusion of NFC (near-field communication) functionality. The minor differences introduced by the introduction of a larger battery and slight adjustments to the internal design (which have led to a minor reduction in weight of .04 kg—to a new total of 1.5 kg) are not discernible in everyday use. In light of this, don’t miss our original review of the XPS 12 from last year, which covers these topics in much more detail than we will in today’s review update.
Warranty
Dell ships the XPS 12 with 1 year of Enhanced Warranty Support, which includes in-home service following remote diagnosis of a problem. Expanded warranty options are available, from up to 4-years of coverage ($269 extra) to Accidental Damage Protection.
Display
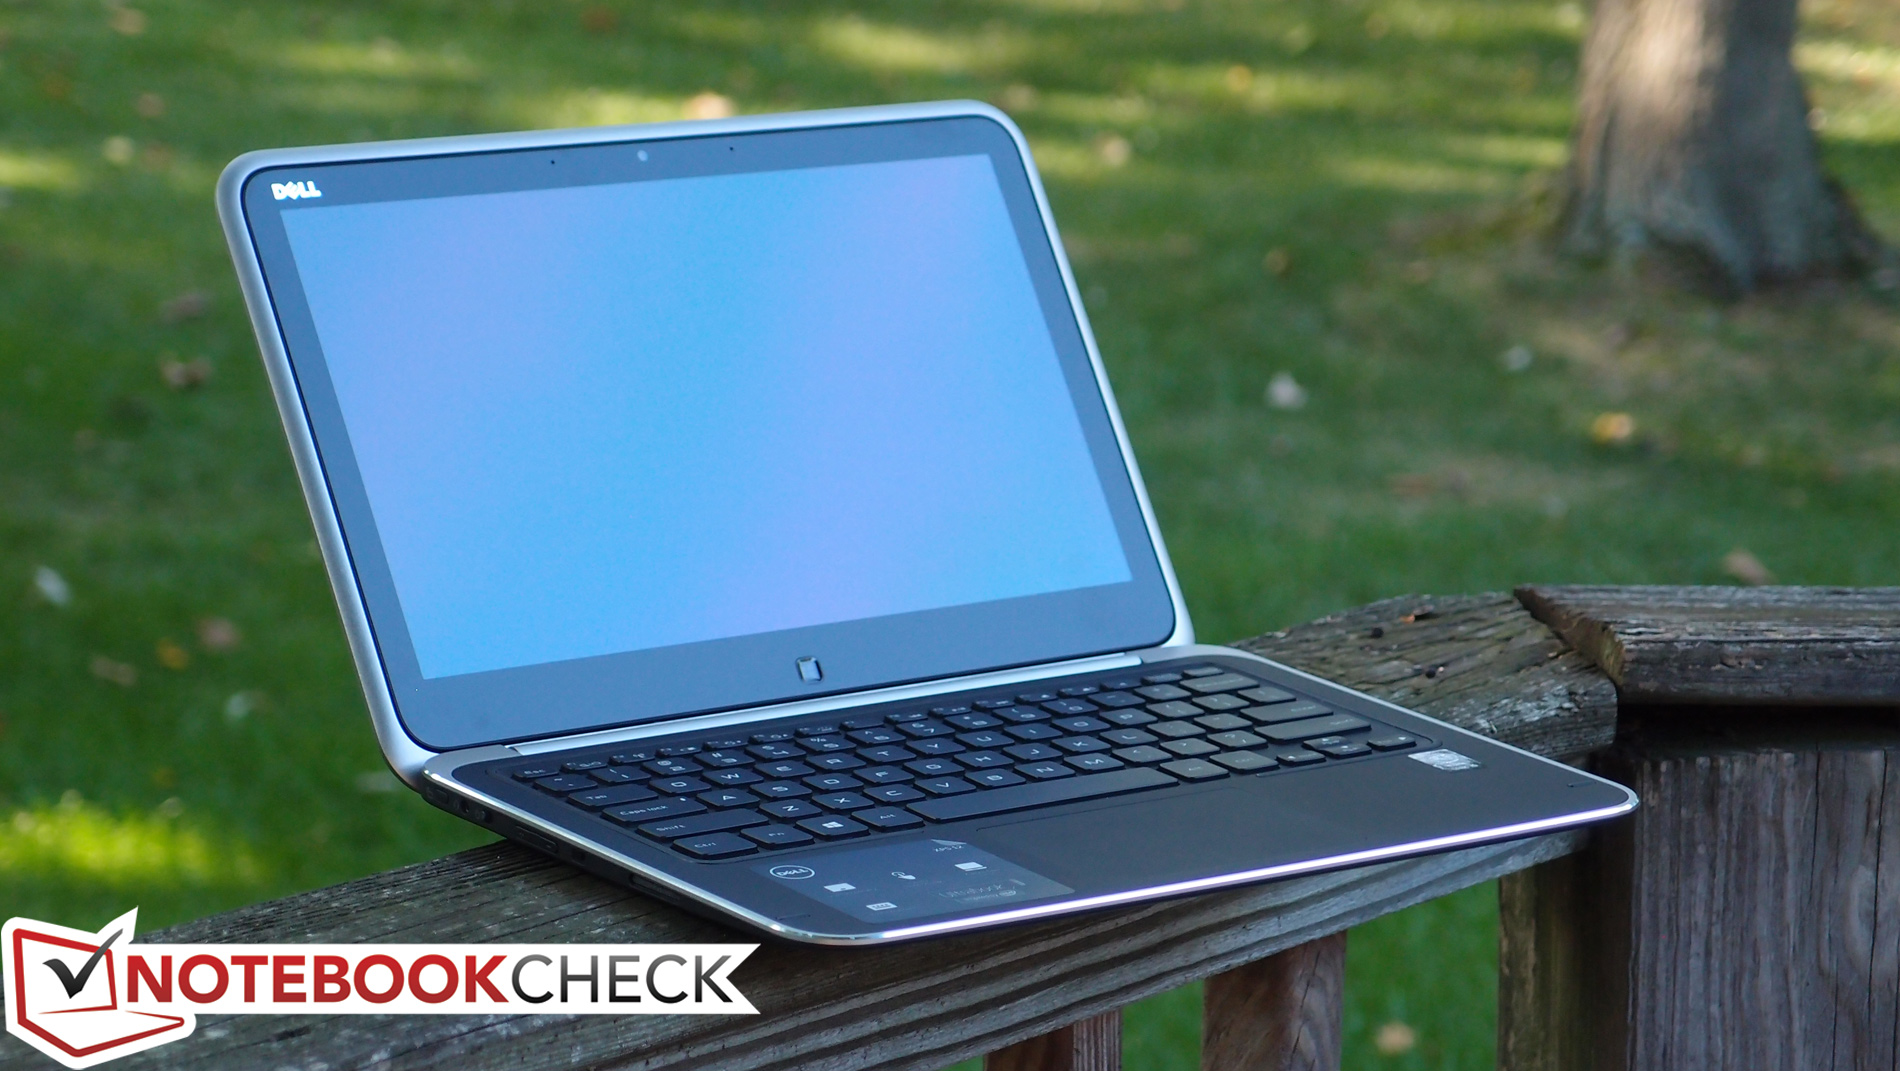
The Dell XPS 12’s 12.5-inch Full HD (1920x1080 pixels) display, tucked underneath a layer of Gorilla Glass, was the subject of much praise in our review of last year’s model. The 2013 Haswell refresh of the XPS 12 appears to maintain a similar level of excellence, though our measurements do suggest a slight retreat from the stellar contrast and brightness distribution values that applied to the original model. Subjectively, very little of this matters, however: colors still have some pop to them, and the contrast—especially when taken in context with the panel’s excellent brightness—is perfectly adequate.
| |||||||||||||||||||||||||
Brightness Distribution: 85 %
Center on Battery: 285.4 cd/m²
Contrast: 412:1 (Black: 0.83 cd/m²)
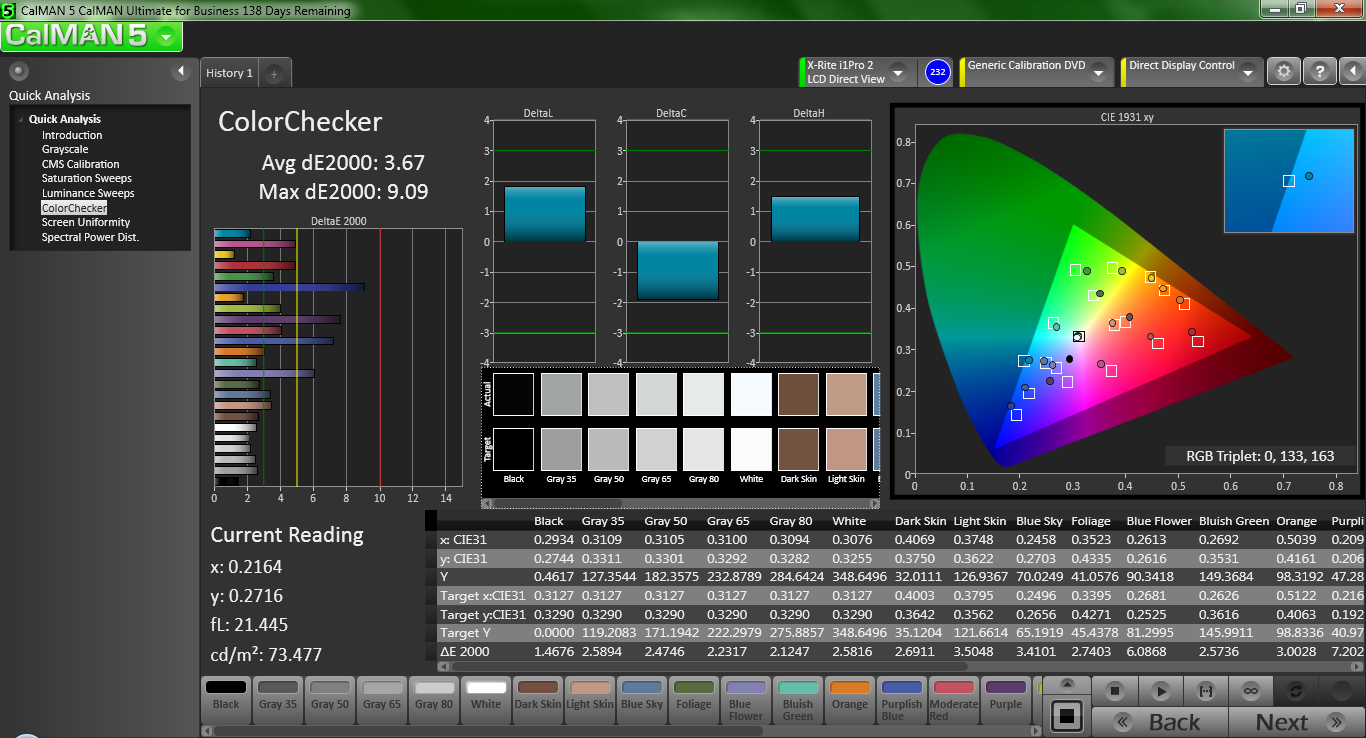
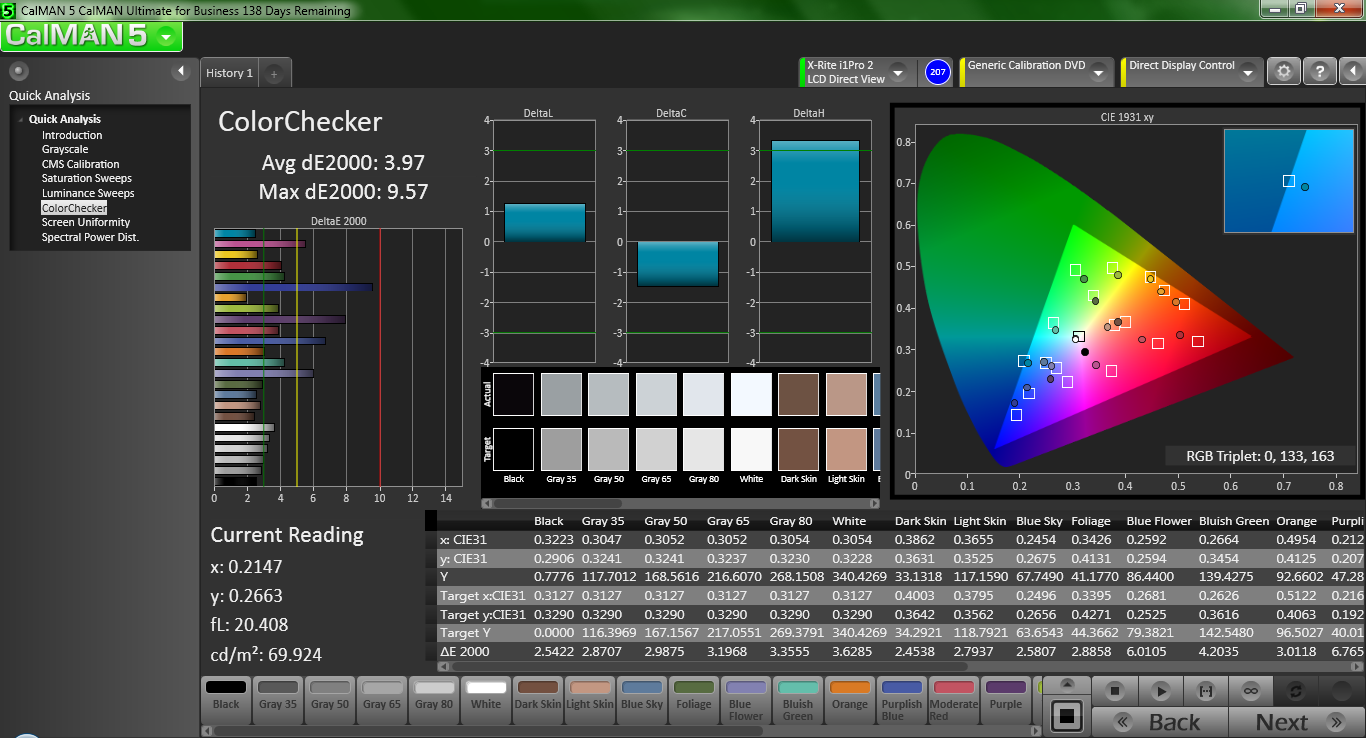
ΔE ColorChecker Calman: 3.67 | ∀{0.5-29.43 Ø4.77}
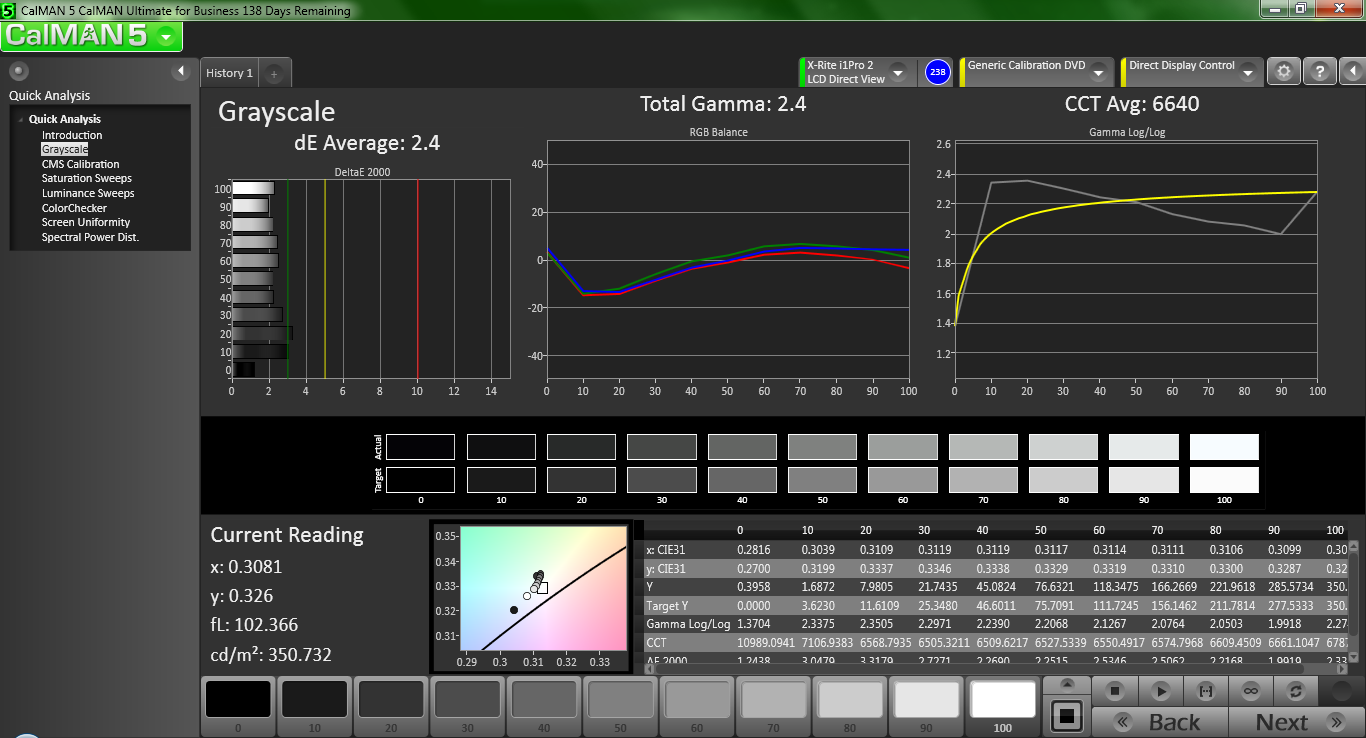
ΔE Greyscale Calman: 2.4 | ∀{0.09-98 Ø5}
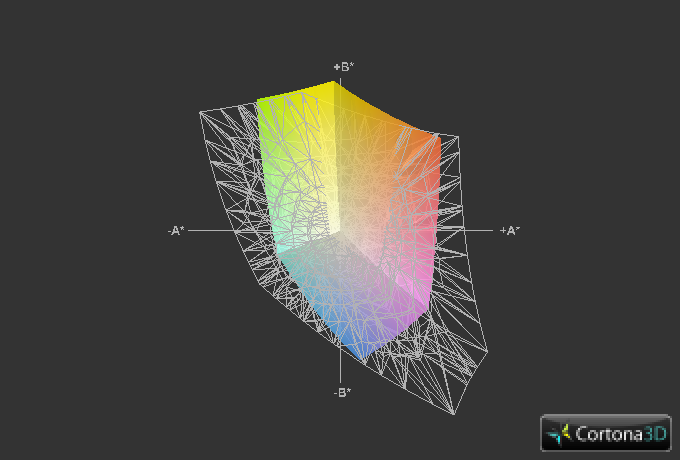
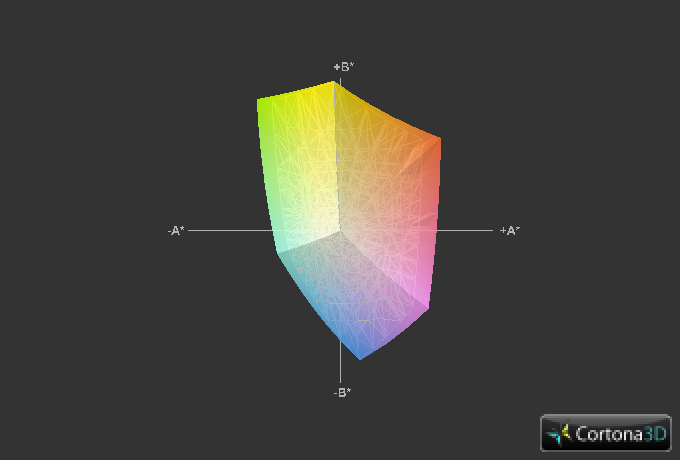
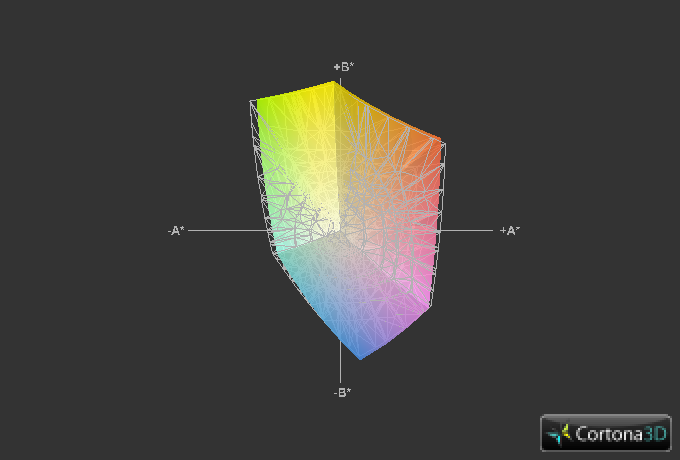
42.9% AdobeRGB 1998 (Argyll 1.6.3 3D)
45.9% AdobeRGB 1998 (Argyll 3D)
65.7% sRGB (Argyll 3D)
44.28% Display P3 (Argyll 3D)
Gamma: 2.4
CCT: 6640 K
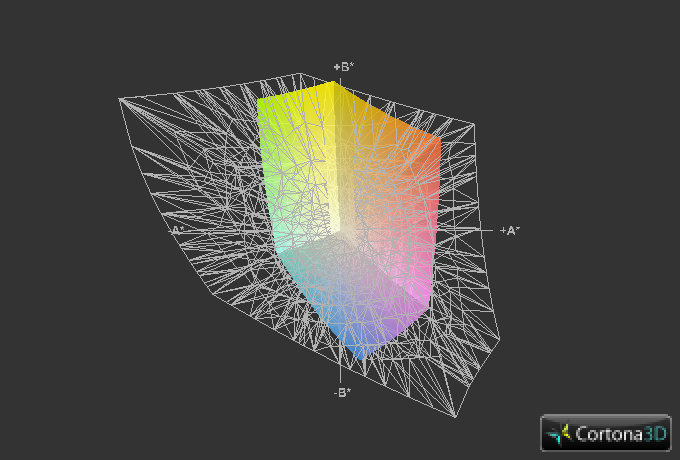
Our measurements help to explain this. Although the original XPS 12 unit we reviewed managed better contrast values (708:1 vs. 412:1) and brightness distribution (92% vs. 85%), the new XPS 12 unit offers roughly 20% better color reproduction (50.5% vs. 62.5% of sRGB). 62.5% still isn’t a great figure for sRGB color spectrum coverage, but it’s better than 50%, and it’s more than enough as long as you aren’t planning on doing any professional photo editing or other color-critical work.
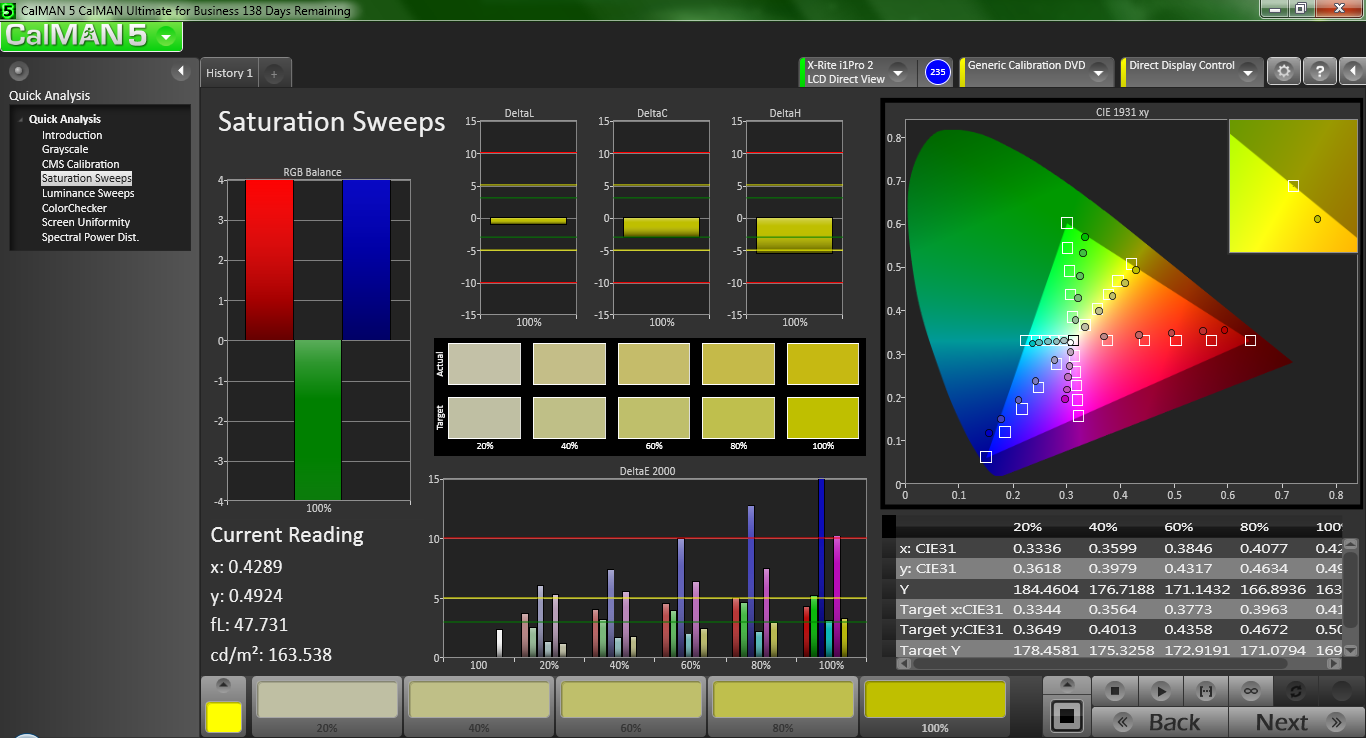
Continuing our analysis of the system’s color reproduction, we turn to CalMan 5 for more in-depth display quality assessment. Here, we find an average DeltaE of 3.67, which is good by any account. Specifically, blues and purples experience DeltaE values above 6, which translates to noticeable deviations in color accuracy on those particular channels. The 2.4 gamma value, meanwhile, is very close to the ideal value of 2.2 (when conforming to sRGB). The minor issues remain post-calibration, but it’s nothing worth worrying about unless—again—color accuracy is of supreme importance to you.
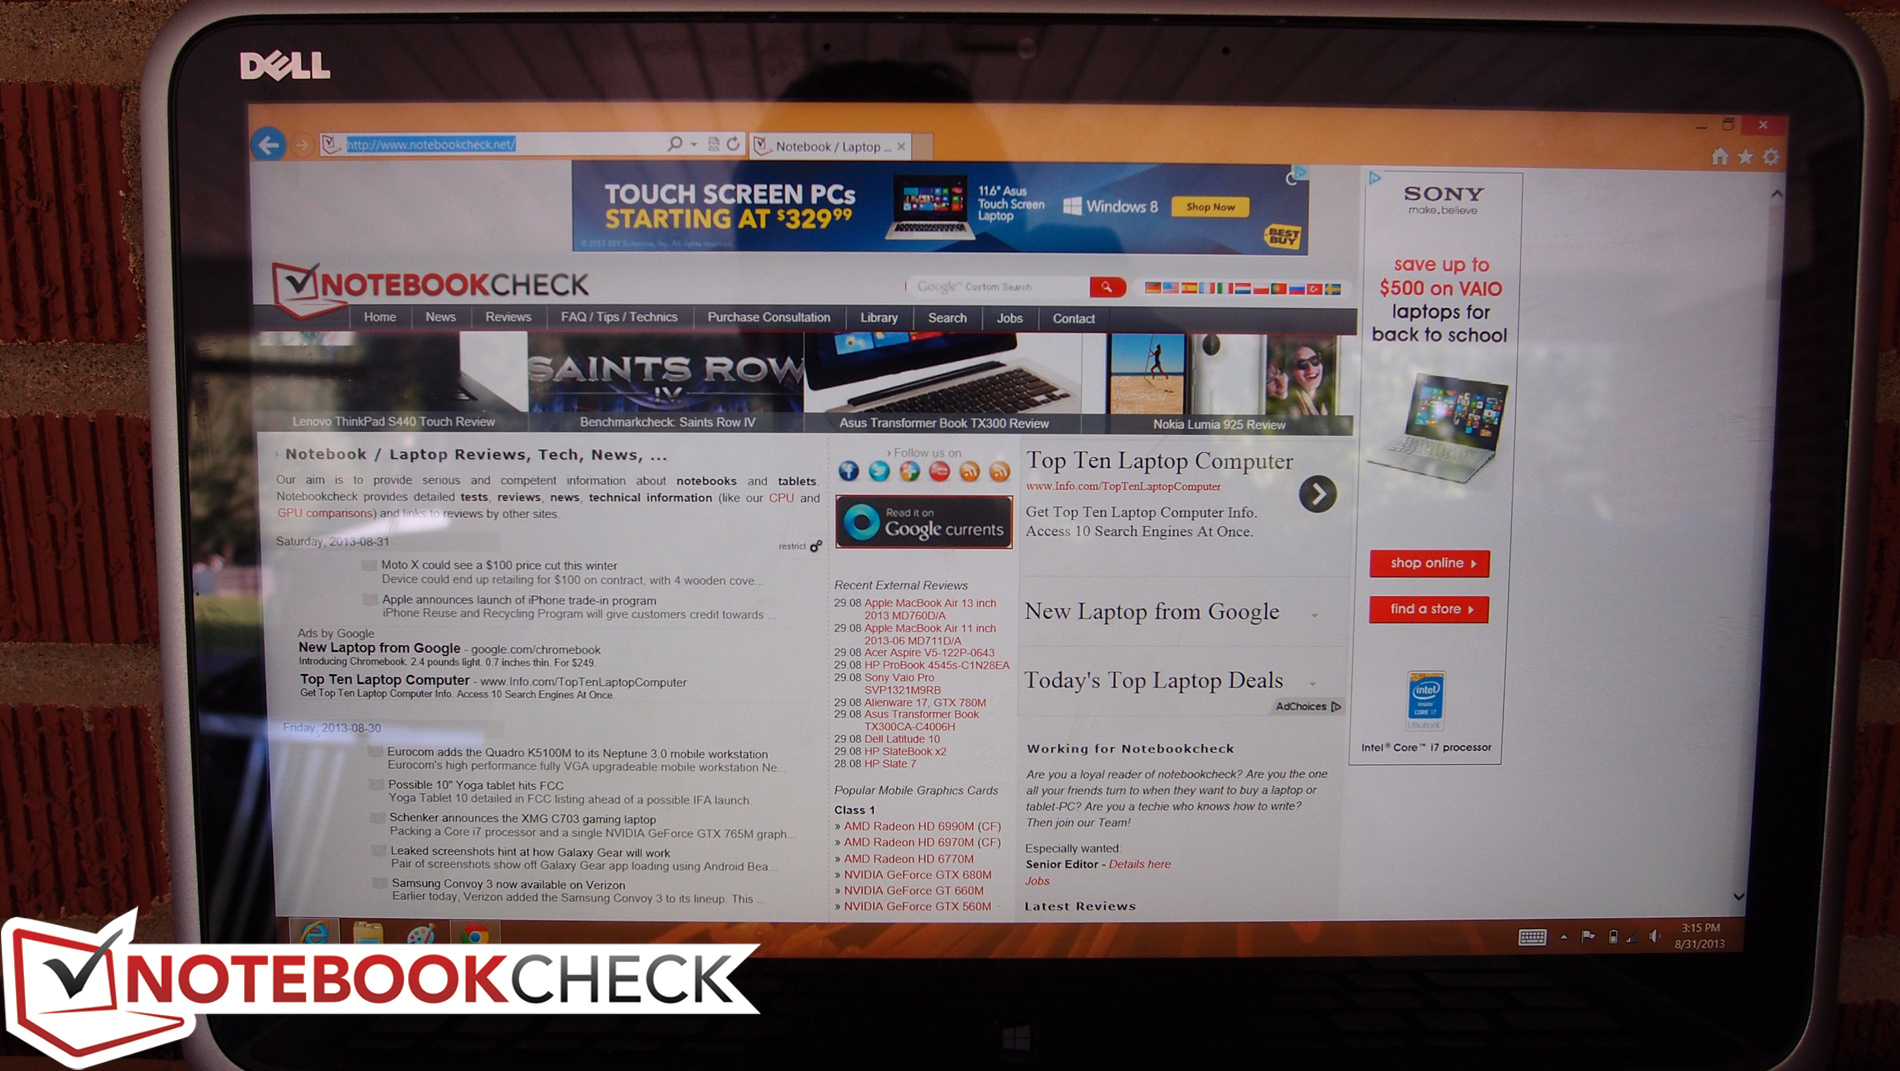
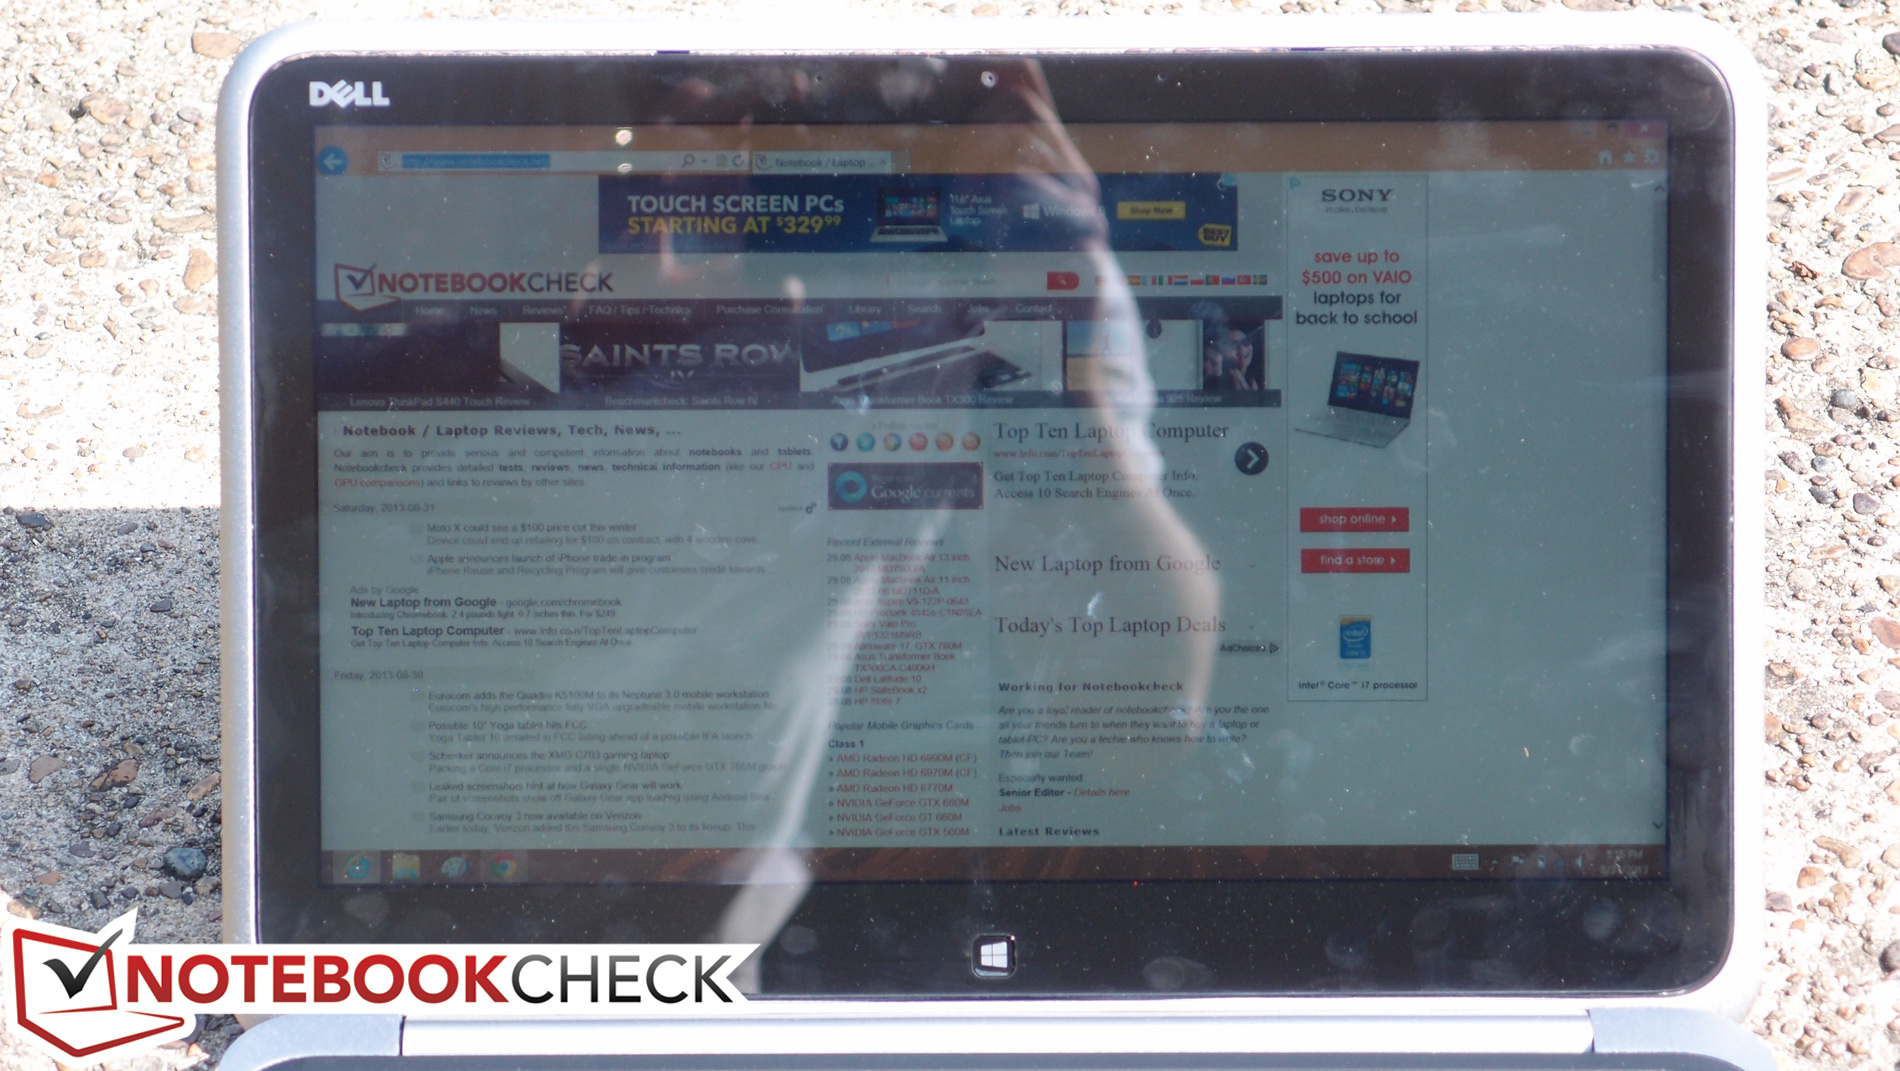
The panel’s average brightness of 340 cd/m² is nearly identical to that of the previous XPS 12, which means that the performance outdoors hasn’t changed much either. While reflective displays are always prohibitive in their outdoor utility, the XPS 12 manages to overcome more minor distractions with its strong brightness and sufficient contrast. Besides, this is nothing unique in the world of modern tablets, nearly all of which are saddled with highly reflective, edge-to-edge glass displays thanks to the requirements of capacitive touchscreen technology.
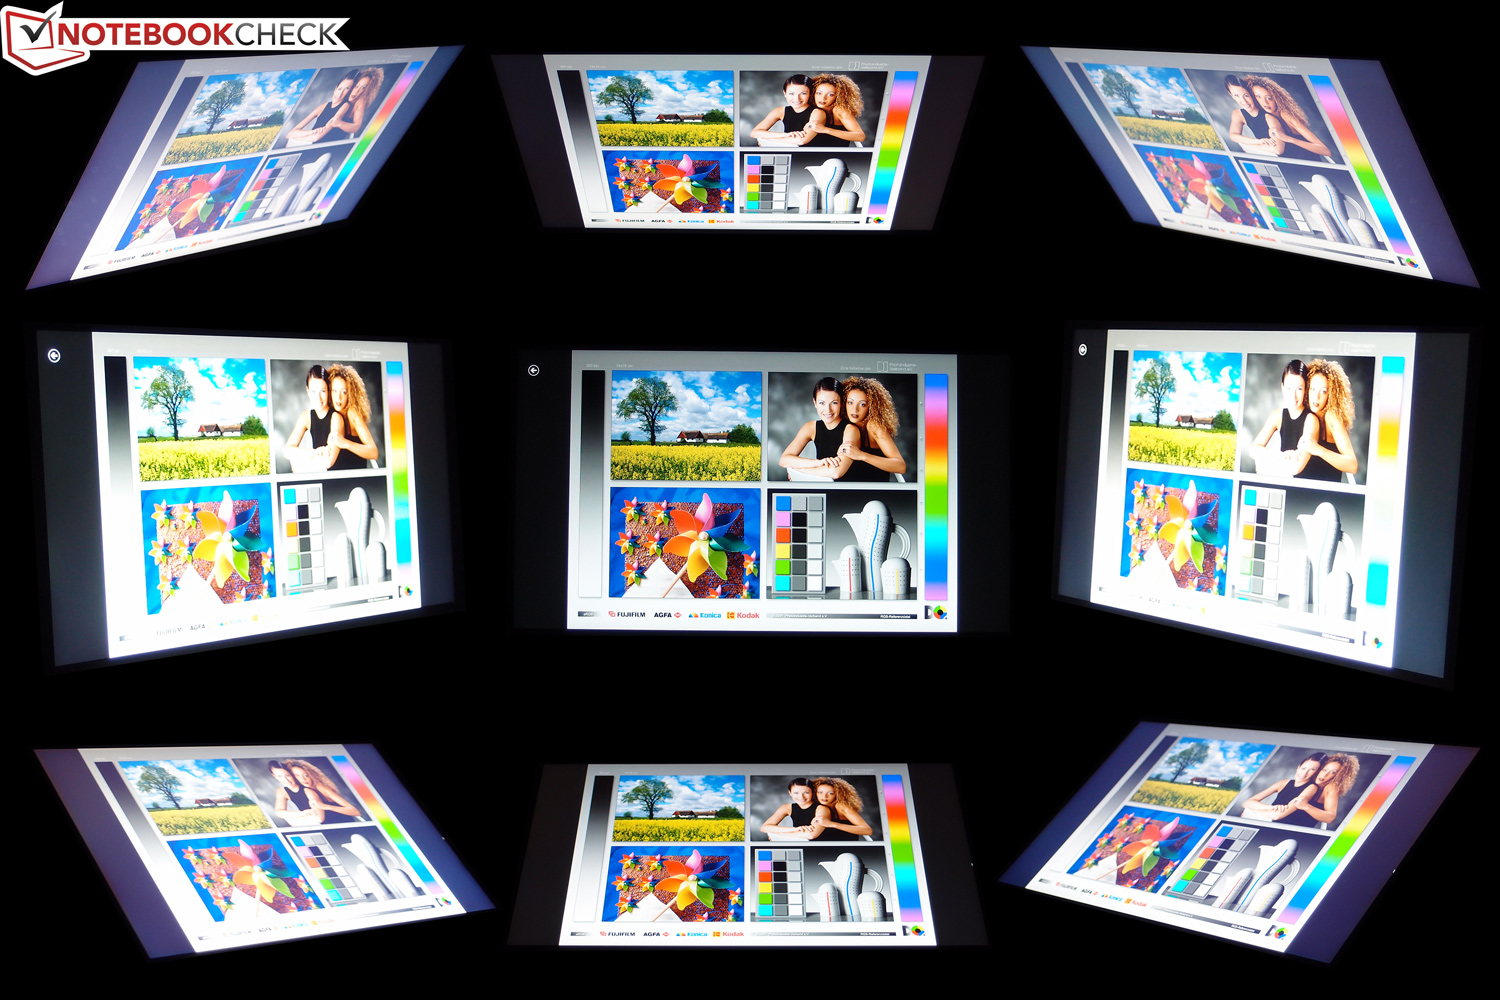
Finally, as is always the case with IPS displays, the XPS 12 looks good from any angle, with good contrast and no color inversion regardless of where you’re sitting. This is particular helpful given that it’s meant for use as a tablet as much as it is a notebook.
Performance
The new XPS 12 is currently configurable with three different CPU options: an Intel Core i5-4200U, a Core i7-4500U, or a top-end Core i7-4650U. All three CPUs are very capable performers, and all are based on the Intel Haswell microarchitecture—which promises great benefits in terms of power efficiency (more on this later). Our review unit came equipped with the former (i5-4200U), which is a dual-core 1.6 GHz model that can Turbo Boost up to 2.6 GHz where conditions warrant it (and provided thermal headroom exists). This particular CPU features a TDP of 15 W, which is 2 W below the TDP of comparable Ivy Bridge predecessors. Performance is expected to be similar regardless of the drop in TDP.
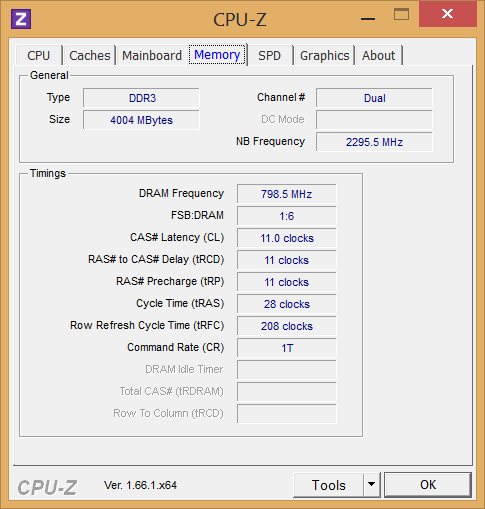
In terms of memory, the new XPS 12 is available with either 4 GB or 8 GB of dual-channel RAM, depending on the configuration you choose (currently, the i5 model is available only with 4 GB, whereas the i7 models all feature 8 GB). Our review unit included 4 GB of dual-channel DDR3L-RS 1600 MHz RAM, which is soldered to the motherboard (and thus not able to be upgraded). DDR3L-RS is a bit more expensive than traditional DDR3 RAM, but it also provides better power efficiency.
Turning to some hard figures, our synthetic benchmarks of our review unit suggest that the XPS 12’s CPU performance is right in line with equivalently-equipped rivals. For instance, the closest competitor to the new XPS 12 was the Aspire V7-582P-6673, which scored around 3% better than the new XPS 12 in wPrime 2.0 1024m (729.4 seconds versus the XPS 12’s 754.5 seconds), but 2% worse in Super Pi 32m (755 seconds versus 740 seconds). Probing deeper, 3DMark 06’s CPU test assigns the XPS 12 a score of 3104, whereas the Aspire V7-582P-6673 manages only 2999. Results are similarly wishy-washy when other Ultrabooks sharing the same CPU are compared, with the Vaio Duo 13 SVD1321M2E mostly matching it, but the Vaio Pro 11 SVP121M2EB.G4 frequently falling short.
How well does the new XPS 12’s CPU performance compare to that of the model we reviewed last year, you ask? Well, for starters, our previous XPS 12 review unit featured a high-end CPU that wasn’t even available for configuration when reviewed—the Core i7-3667U—so in some sense this is comparing apples and oranges. Considering the higher Turbo frequency of 3.2 GHz (versus the i5-4200U’s 2.6 GHz), it should come as no surprise that the i7-3667U easily outperforms the i5-4200U in single-core operations, notwithstanding any microarchitectural benefits that come along with the refresh. Our Haswell XPS 12 review unit is roughly 15% slower in single-core CPU operations (wPrime, Super Pi) than the i7-3667U, but only 3% below in Cinebench R11.5’s xCPU test and 9% below in 3DMark 06’s CPU test. That’s significant, but hardly a deal-breaker, especially when most consumers are so much more heavily interested in battery life as opposed to marginal performance gains in an Ultrabook.
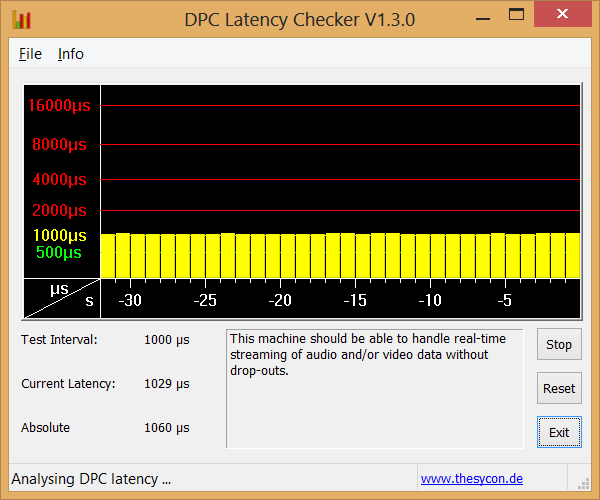
To check whether the XPS 12-9Q33’s performance was detrimentally affected when running only on battery power, we performed a subsequent run of 3DMark 06 under those conditions. The resulting score of 5632 confirms that this is not an issue. Finally, to assess the machine’s capability of streaming real-time audio and video without hiccups, we ran DPC Latency Checker on it and monitored for spikes in latency. We experienced no problems whatsoever here, as indicated by the graph.
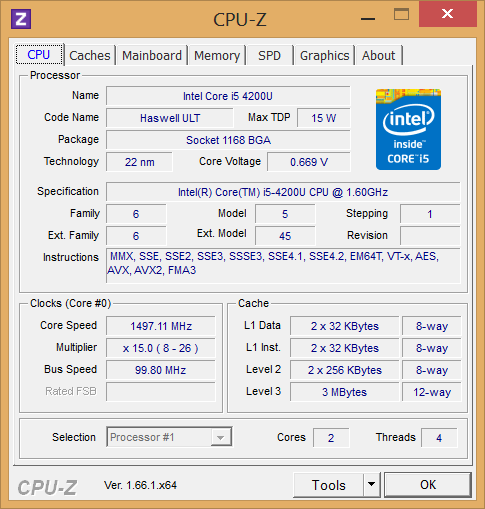
Processor
The Intel Core i5-4200U CPU’s performance is most similar to that of the Ivy Bridge Core i5-3317U (as suggested by our database of CPU benchmarks). Both of these processors perform nearly identically in all benchmarks, falling within a few percentage points of each other in most cases with a few exceptions (the i5-4200U always wins where discrepancies exist). The critical point, however, is that this occurs in spite of a lower TDP (15 W vs 17 W) for the i5-4200U, as well as a clock rate of 100 MHz less. Perhaps even more impressively, with regard to multi-core performance, it actually stands directly alongside the 35 W TDP Sandy Bridge Core i5-2410M from a couple of years ago (see the 64-bit xCPU Cinebench results for an example, where both CPUs are within 2% of each other). In other words, the i5-4200U provides more than adequate performance more efficiently than before.
System Performance
We assess overall system performance using PCMark 7. It’s reasonable to expect good results from the XPS 12 thanks to its very fast solid-state drive—an asset which is valued highly in PCMark’s formula, but for good reason: fast storage devices translate (perhaps more than any other element) to a sense of overall responsiveness and speed. Still, the incredibly high score of 4900 must indicate a very capable device. It trumps even that of the Ivy Bridge Dell XPS 12 (4751) and is significantly higher than that of the Vaio Duo 13 and Vaio Pro 11 that we mentioned earlier (4594 and 4182, respectively).
| PCMark Vantage Result | 10294 points | |
| PCMark 7 Score | 4900 points | |
Help | ||
Storage Devices
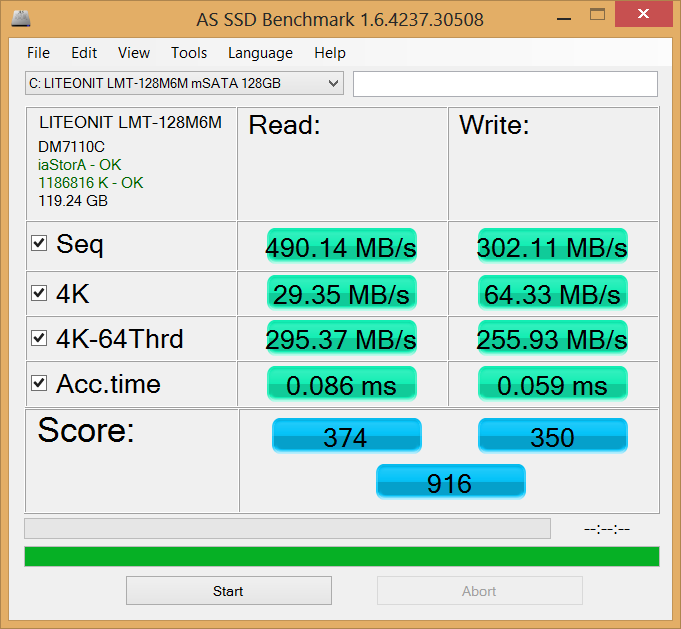
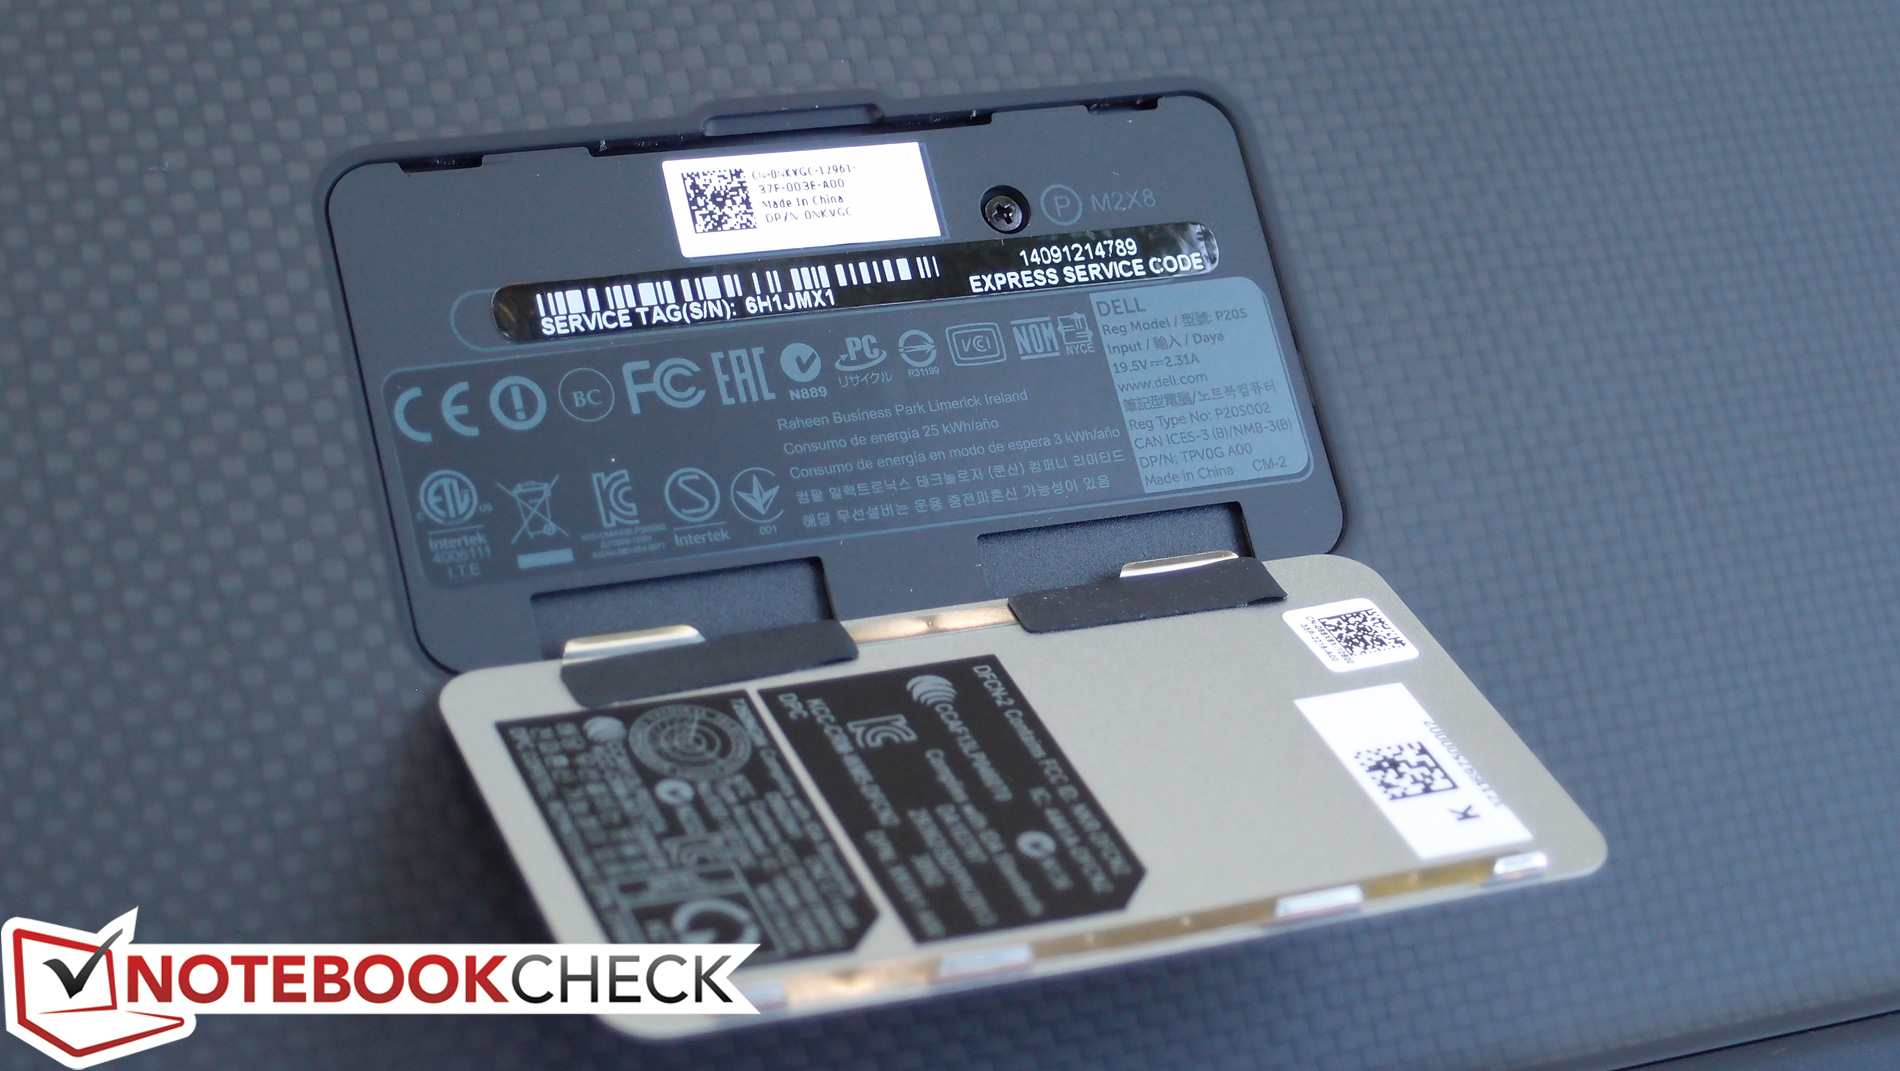
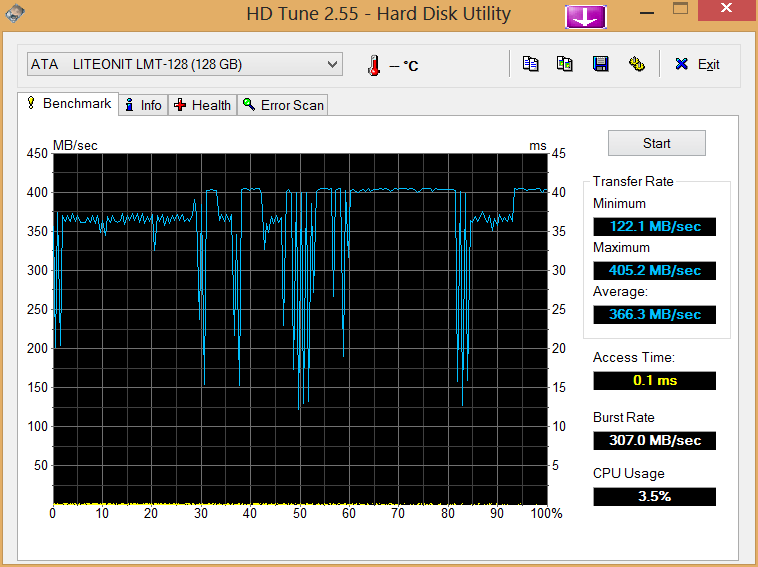
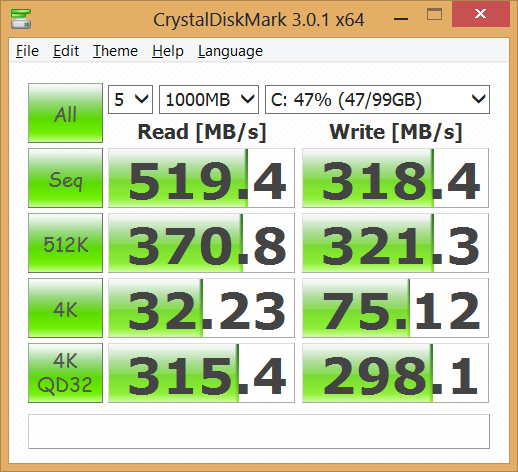
The Dell XPS 12-9Q33 features solid-state storage devices, with three capacity choices: 128 GB, 256 GB, and 512 GB. At the time of this writing, the price difference between each choice is roughly $300. Although maintenance is a bit prohibitive (not least of which thanks to the Torx screws lining the bottom of the unit), it is at least possible to swap this drive out later for a larger capacity if you choose to start small. Our review unit featured a LITEONIT LMT-128M6M 128 GB SSD, which is an mSATA model (as opposed to the more traditional 7 mm/9.5 mm standard form factor drives).
The Lite-On drive in our review unit performs admirably regardless of its capacity, however. AS SSD reports sequential read and write speeds of 490.14 MB/s and 302.11 MB/s, respectively, which are fantastic speeds no matter how you slice it. It continues to impress with a 4K read/write of 29.35 MB/s and 64.33 MB/s, and equally good 4K-64Thrd and Access Time values. These scores help to explain the stellar PCMark performance we witnessed earlier; make no mistake about it, this is one fast drive.

GPU Performance
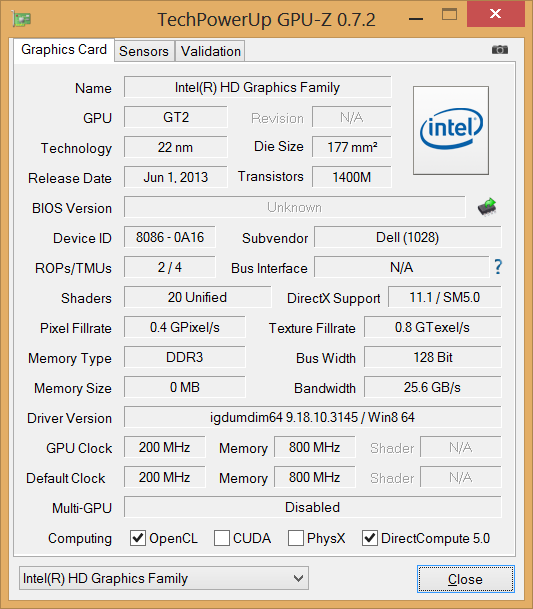
The Dell XPS 12-9Q33 is paired with the Intel HD Graphics 4400 integrated GPU, which performs better than any comparable Ivy Bridge integrated GPU, but is still well below the Intel HD Graphics 5000 that comes paired with full-voltage Haswell CPUs. It's actually possible to purchase the XPS 12 with HD Graphics 5000 included if you opt for the top-end i7-4650 CPU—but don't expect full-scale Turbo Boost, as the TDP is the primary limiting factor in these 15 W models (which it remains). Nevertheless, performance is impressive for integrated graphics of any type, such that it should be possible to enjoy most modern games on low settings. The closest competition to this adapter in terms of overall performance is probably either the AMD Radeon HD 7570M or the nVidia GeForce GT 540M—both of which are perfectly respectable discrete adapters. Let’s see how things stack up in our benchmarks for a closer look.
Overall, as compared to other notebooks we’ve reviewed with the same CPU and GPU, the XPS 12-9Q33 comes up short by around 7 to 10%. In 3DMark 06, for instance, our total score of 5601 is beaten by the Aspire C7-582P-6673’s score of 6204, and also by the Vaio Duo 13 (6095). 3DMark 11 reveals similar discrepancies, where the XPS 12 manages a performance score of 902 versus the Vaio Duo 13 (967) and Aspire V7 (964). It is worth mentioning that in both of these benchmarks (and all other GPU-related tests, as well), the XPS 12 is still far ahead of the IdeaPad U330p and Vaio Pro 11, both of which most likely were experiencing some form of throttling due to TDP constraints.
Looking back at our benchmarks with the Ivy Bridge XPS 12, our Haswell refresh unit absolutely trounces the performance, however. Consider: 3DMark 06 (5601 vs. 4087 – 37% better) and 3DMark 11 (596 vs. 902 – 51% better). Our gaming benchmarks reinforce these findings. Modern games should run fluidly on low or even medium settings in many instances. When compared to the previous-gen XPS 12, the performance premium is as much as 60% in-game; that’s a remarkable improvement.
| 3DMark 03 Standard | 13006 points | |
| 3DMark 05 Standard | 8802 points | |
| 3DMark 06 Standard Score | 5601 points | |
| 3DMark Vantage P Result | 3664 points | |
| 3DMark 11 Performance | 902 points | |
Help | ||
| low | med. | high | ultra | |
|---|---|---|---|---|
| StarCraft 2 (2010) | 122 | 35 | 20 | 11 |
| Diablo III (2012) | 52 | 36 | 31 | 20 |
| Fifa 13 (2012) | 127 | 87 | 65 | 38 |
Emissions
System Noise
Not much has changed since the Ivy Bridge XPS 12 in terms of system noise, but that isn’t necessarily a bad thing. While idle (and, in fact, most of the time), the notebook is nearly silent; we measured values even below that of before, at roughly 28.5 dB(A) average. Under load, things quickly become more noticeable, with noise levels closer to 37.2 dB(A)—but eventually reaching peaks of 44.9 dB(A). Still, the fan’s tone is fairly subdued, which helps. This is compared to the previous XPS 12’s vales of 38.3 dB(A) and 42.9 dB(A), respectively—in other words, not noticeably better or worse, and still tolerable.
Noise level
| Idle |
| 28.4 / 28.5 / 28.6 dB(A) |
| Load |
| 37.2 / 44.9 dB(A) |
 | ||
30 dB silent 40 dB(A) audible 50 dB(A) loud |
||
min: | ||
Temperature
It’s much the same story for average temperatures on the XPS 12, although load values have been more conveniently spread out across the breadth of the unit (which helps to eliminate hot spots—a welcomed change). For instance, where we previously saw a hot spot of 62 °C (in the rear center of the bottom of the unit), we now read just 52.2 °C, which isn’t comfortable on the lap, but is far improved as compared to the previous reading (nearly 10 °C lower). Idle temperatures are still mostly reasonable, with averages of around 33 °C recorded on the top and bottom of the unit. However, things do remain relatively warm near the back of the bottom of the unit, at nearly 39 °C in the back-left corner. That’s high for an idle value, but not unbearable—merely warm.
(-) The maximum temperature on the upper side is 47.8 °C / 118 F, compared to the average of 35.3 °C / 96 F, ranging from 19.6 to 60 °C for the class Convertible.
(-) The bottom heats up to a maximum of 52.2 °C / 126 F, compared to the average of 36.8 °C / 98 F
(±) In idle usage, the average temperature for the upper side is 32.8 °C / 91 F, compared to the device average of 30.3 °C / 87 F.
(+) The palmrests and touchpad are reaching skin temperature as a maximum (32.2 °C / 90 F) and are therefore not hot.
(-) The average temperature of the palmrest area of similar devices was 27.9 °C / 82.2 F (-4.3 °C / -7.8 F).
Stress Test
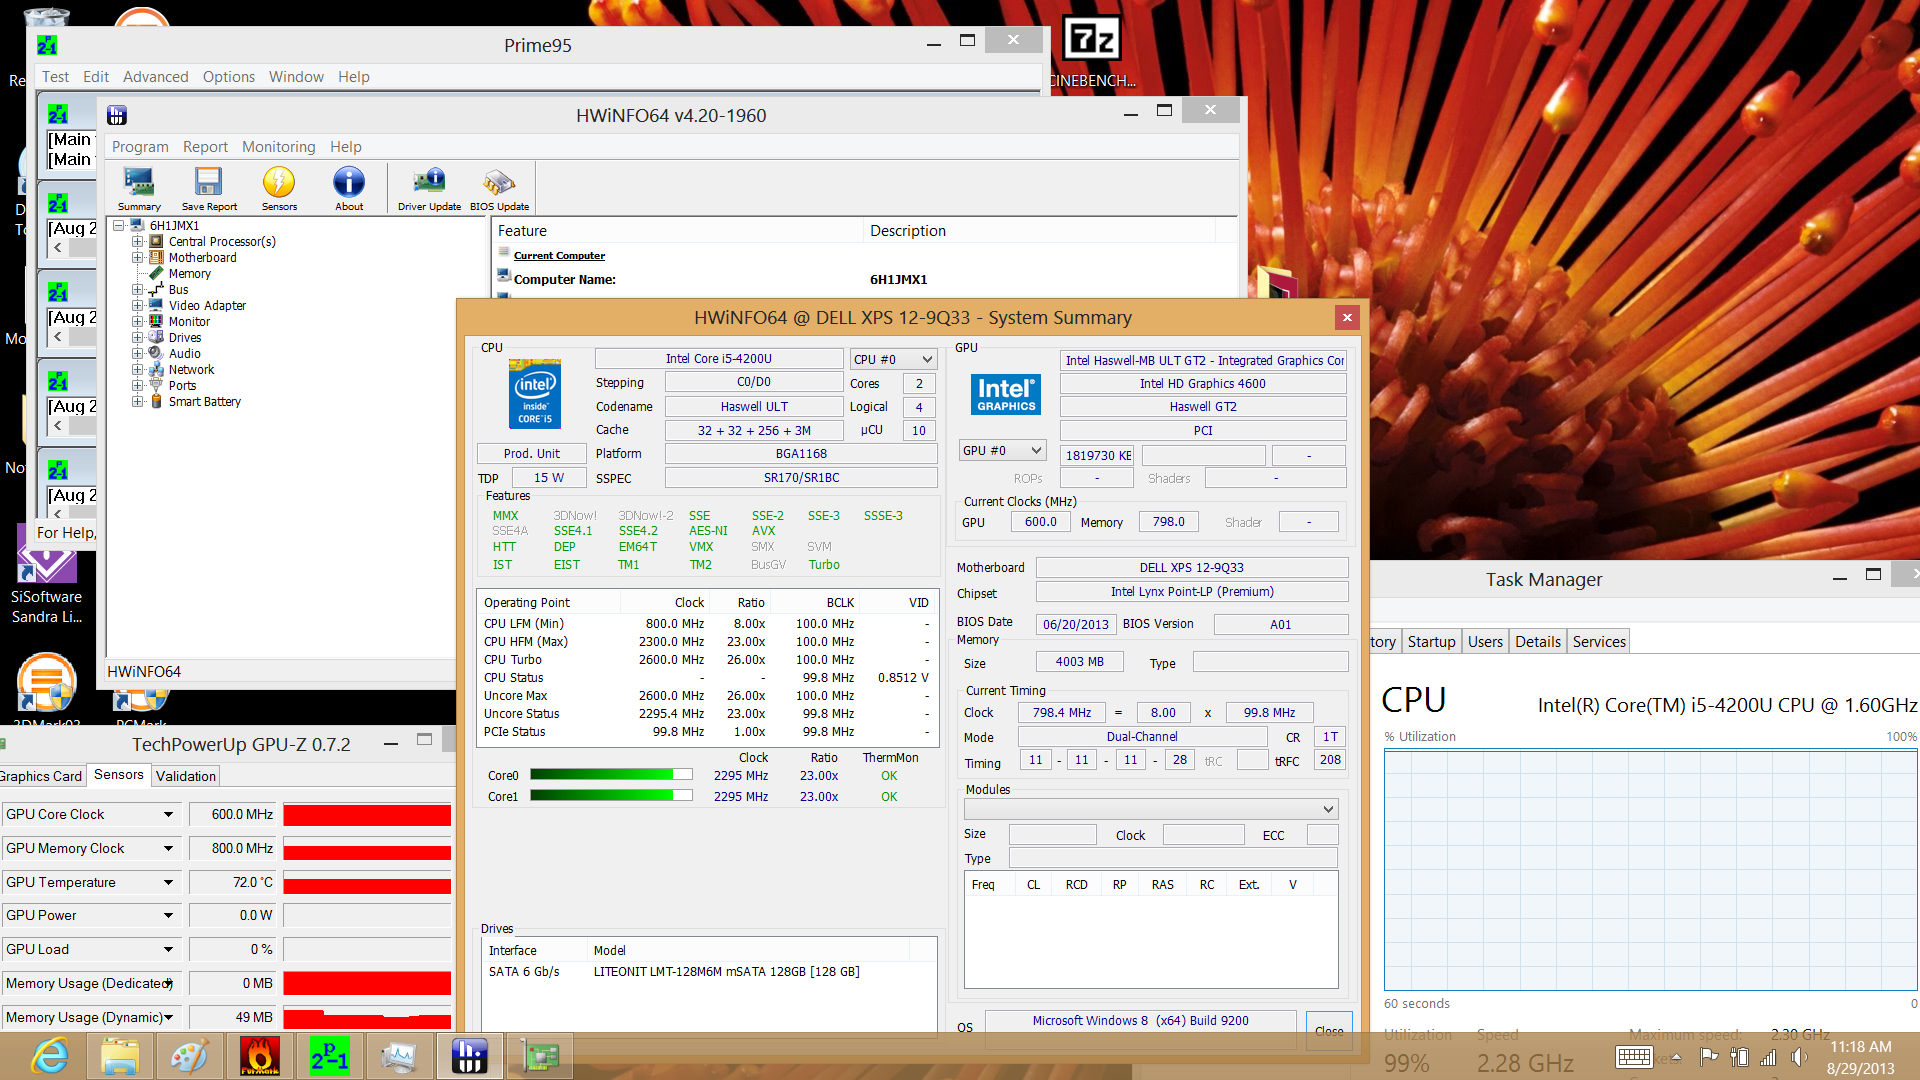
To assess the ability to handle heavy workloads, we subject each and every notebook we review to a stress test. This stress test includes full CPU stress followed by full GPU stress, and finally, both CPU and GPU load simultaneously. To simulate these heavy load conditions, we utilize Prime95 and FurMark.
Under full CPU stress (using Prime95 only), the notebook easily managed to sustain the full CPU Turbo Boost frequency of 2.6 GHz. Even after running the benchmark for over 30 minutes, the clock rates did not budge—a good sign.
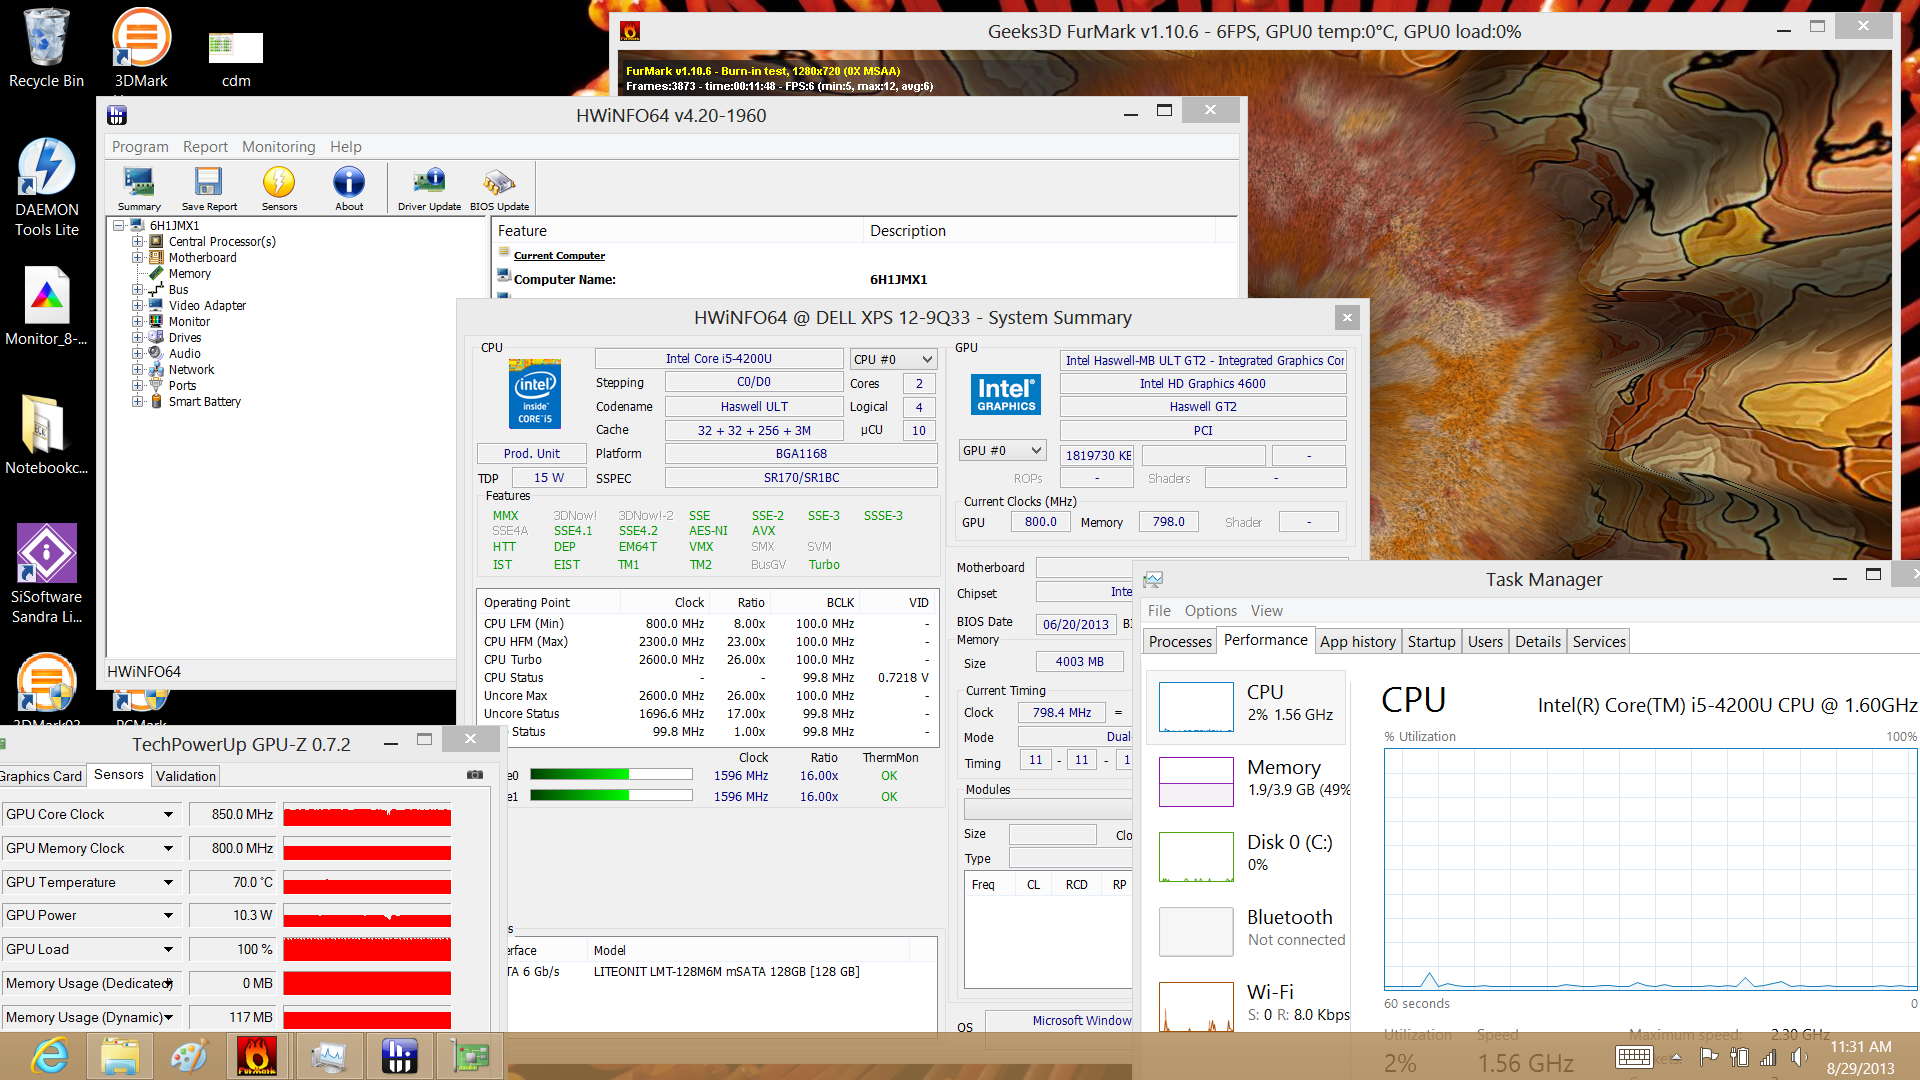
Next, under full GPU stress (using FurMark only), we witnessed fluctuating GPU clock rates between 800 MHz and 850 MHz. While these are below the highest possible Turbo Boost clock rate of 1 GHz, they’re still above the base frequency of 200 MHz, which means that no throttling is occurring.
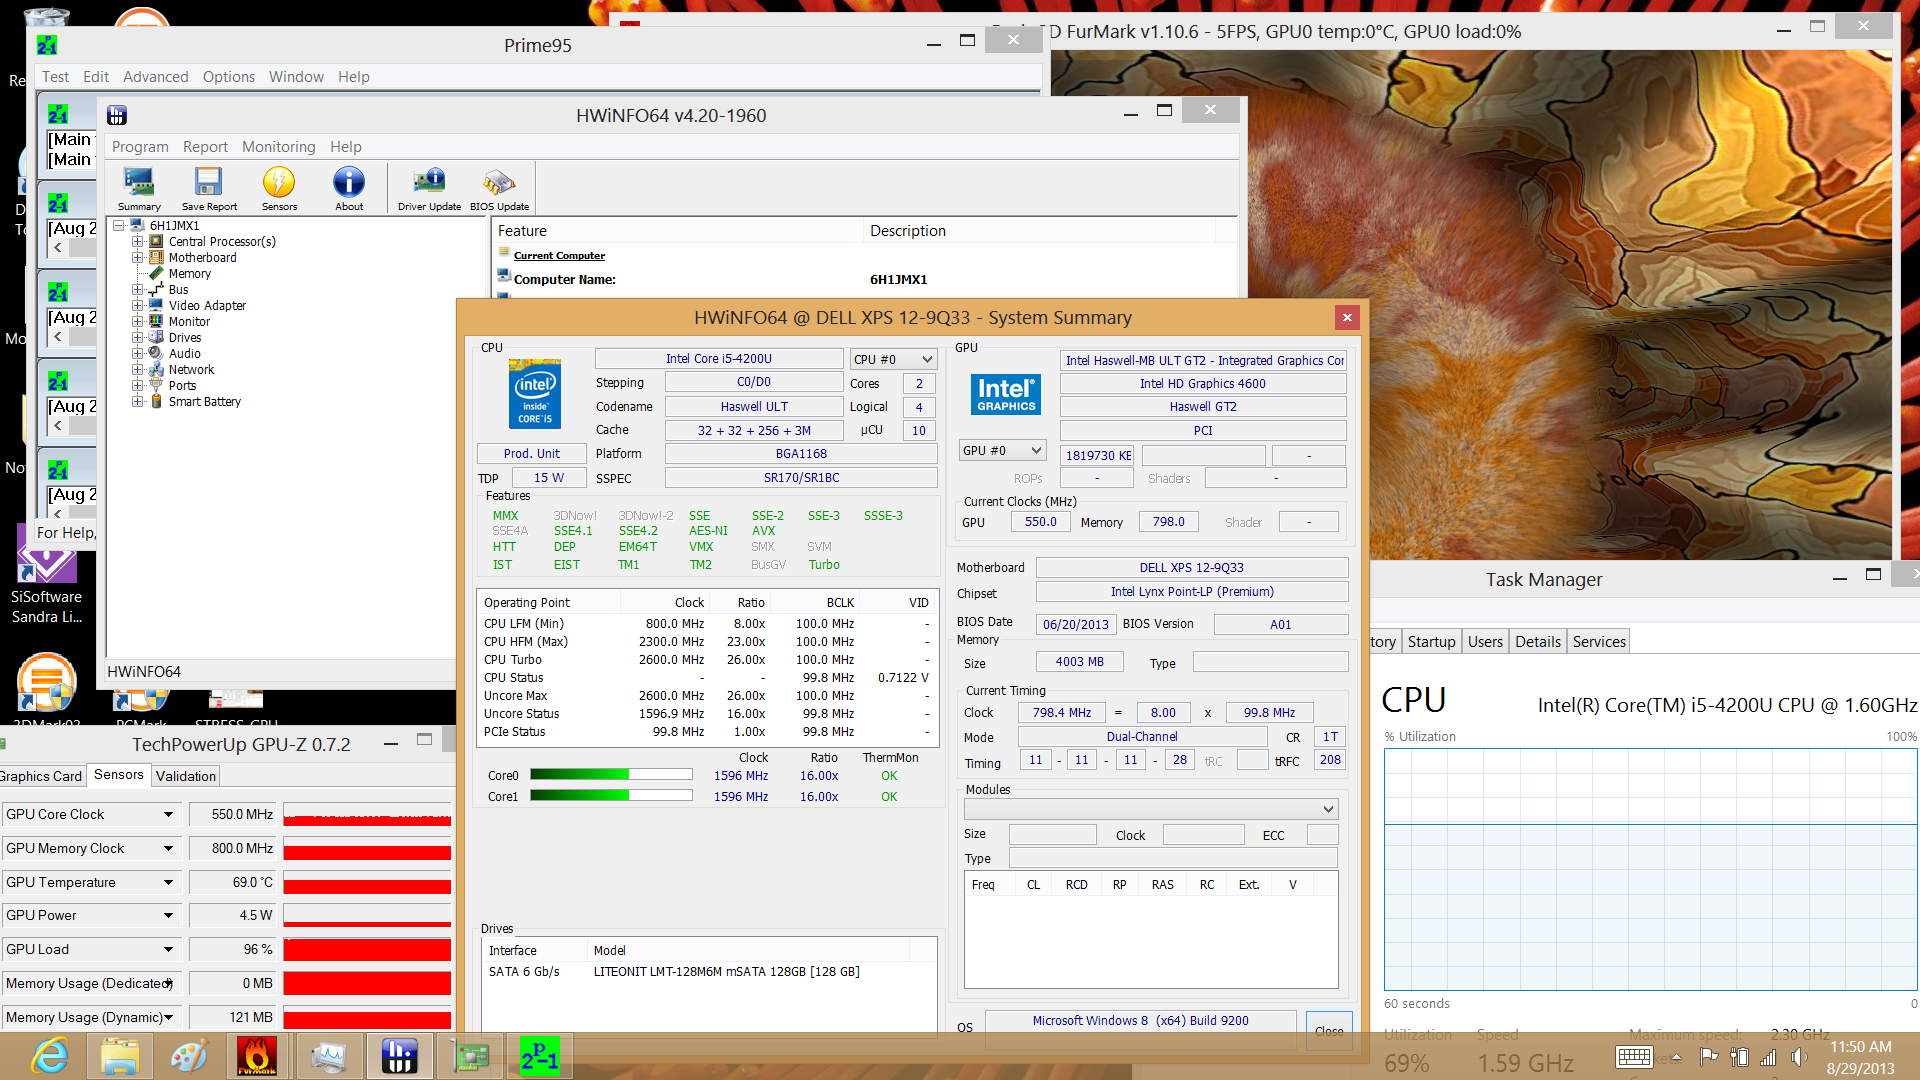
Finally, under full system stress—as is usually the case (especially with Ultrabooks)—things quickly collapse. The GPU’s frequency eventually settles in at a lower frequency between 500 and 550 MHz, while the CPU locks itself at 1.6 GHz. Again, this is technically not throttling, but rather simply a failure to sustain maximum Turbo Boost frequencies—and it’s almost expected amongst Ultrabooks, which rely on low-power chipsets with restrictive TDP (such as the XPS 12-9Q33’s 15 W).
Speakers
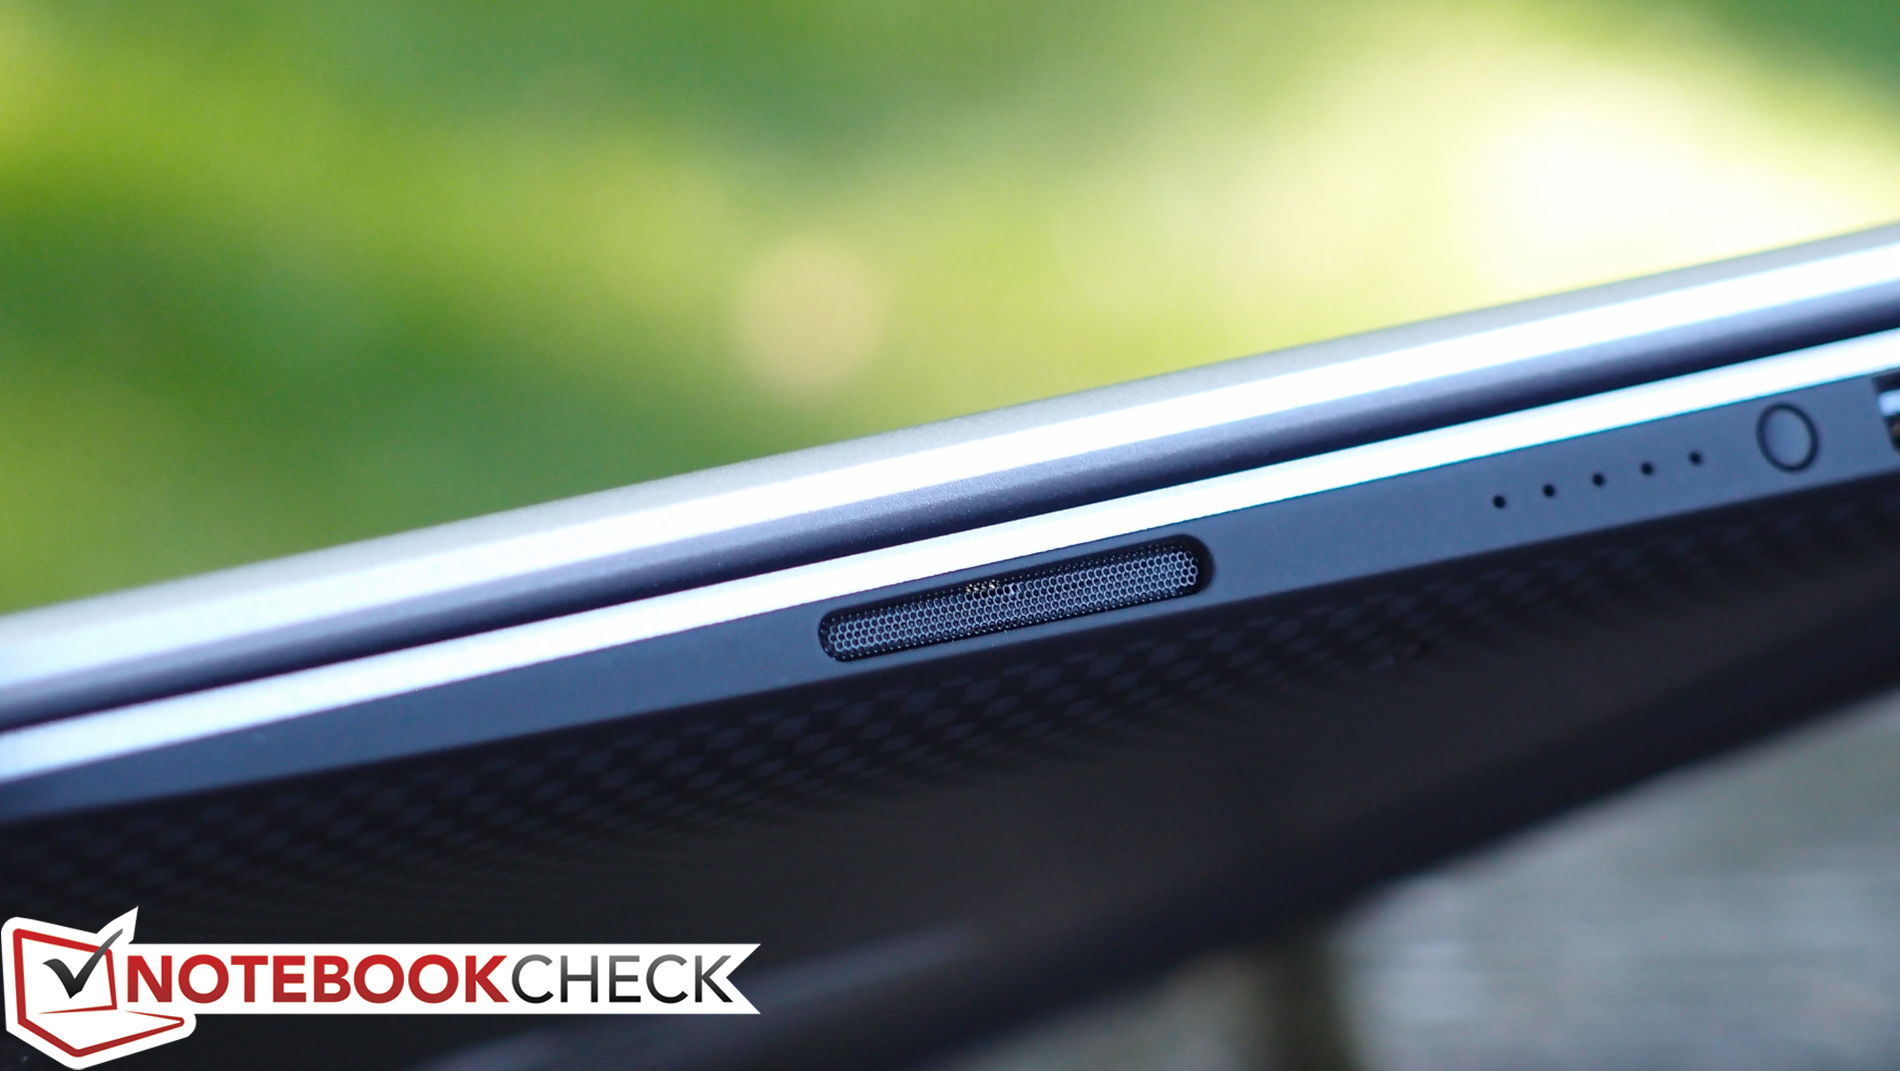
The XPS 12’s side-mounted speakers provide good stereo separation on account of their location. Volume is also sufficient—and quite good for its class—though it’s significantly louder when resting on a flat surface. Meanwhile, frequency response is less than perfect (again, not surprising in the realm of Ultrabooks with tiny speakers), with an overall rather hollow sound and the usual lack of bass. Low frequencies can be synthetically boosted using the included Dell Audio customization software, but nothing compensates for the constraints of the small drivers.
Battery Life
Apart from the aforementioned benefits in terms of GPU performance, the real story with Haswell has always been the power consumption. Such improvements are particularly relevant for Ultrabooks, where power efficiency is paramount and balancing battery life with performance is the name of the game. We measure battery life under a variety of scenarios using Battery Eater Pro coupled with preset power profiles and configuration templates. During all tests, all screen and device timeouts are disabled.
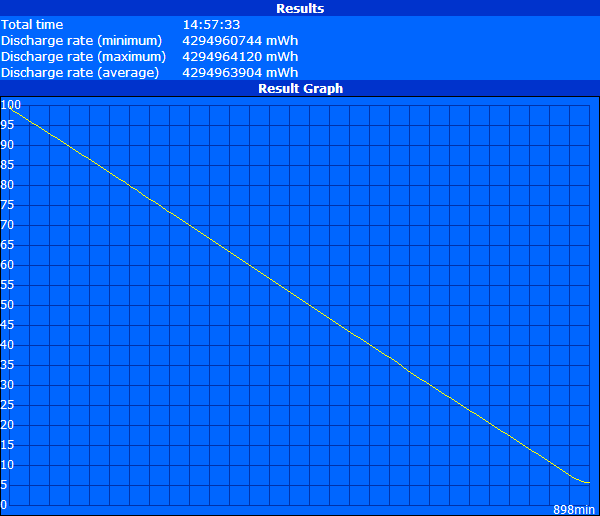
To assess maximum battery life, we first set the notebook’s power profile to Power Saver, lower brightness to the minimum, disable all wireless radios, and run the Reader’s Test. Here, the notebook managed 14 hours and 57 minutes, which is an excellent result.
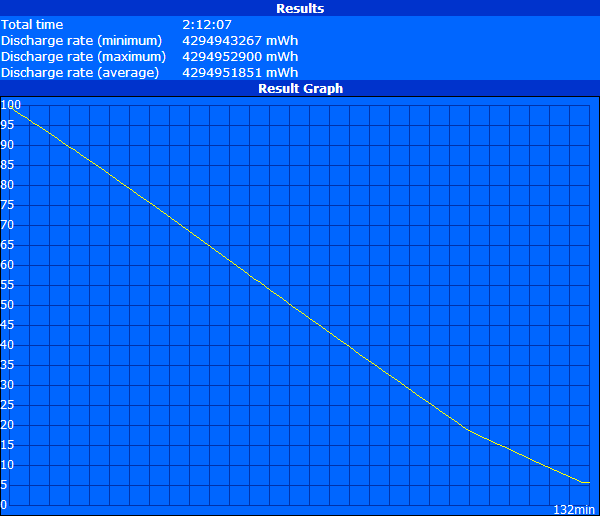
Next, to estimate minimum battery life, we switch to the High Performance power profile, max out brightness, enable all wireless radios, and run the Classic Test. Under these conditions, the notebook held out for 2 hours and 12 minutes before shutting down.
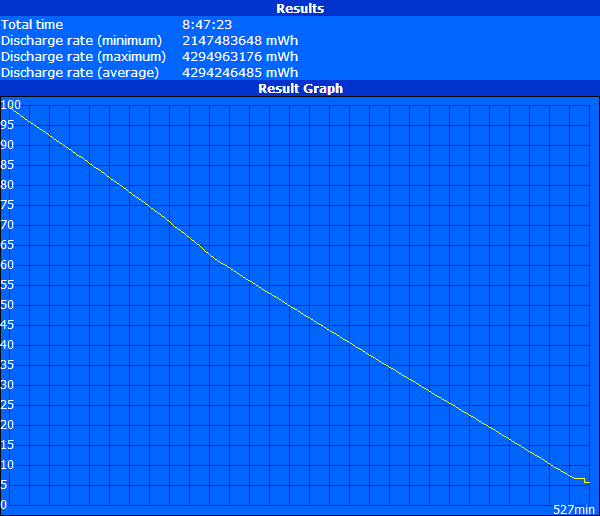
Finally, for a more realistic assessment of typical battery life, we perform our Surfing with Wi-Fi test. Here, we set the power profile to Balanced, set the brightness as close as possible to 150 cd/m², and run a script to simulate normal web surfing behavior. Under this setup, the notebook lasted for 8 hours and 47 minutes, which is once again a fantastic result.
These results are far ahead of last generation’s XPS 12, and even well beyond that of most other competing Ultrabooks, such as the Sony Vaio Pro 11. This is some of the best battery life we’ve seen yet from a high-end convertible.
Verdict

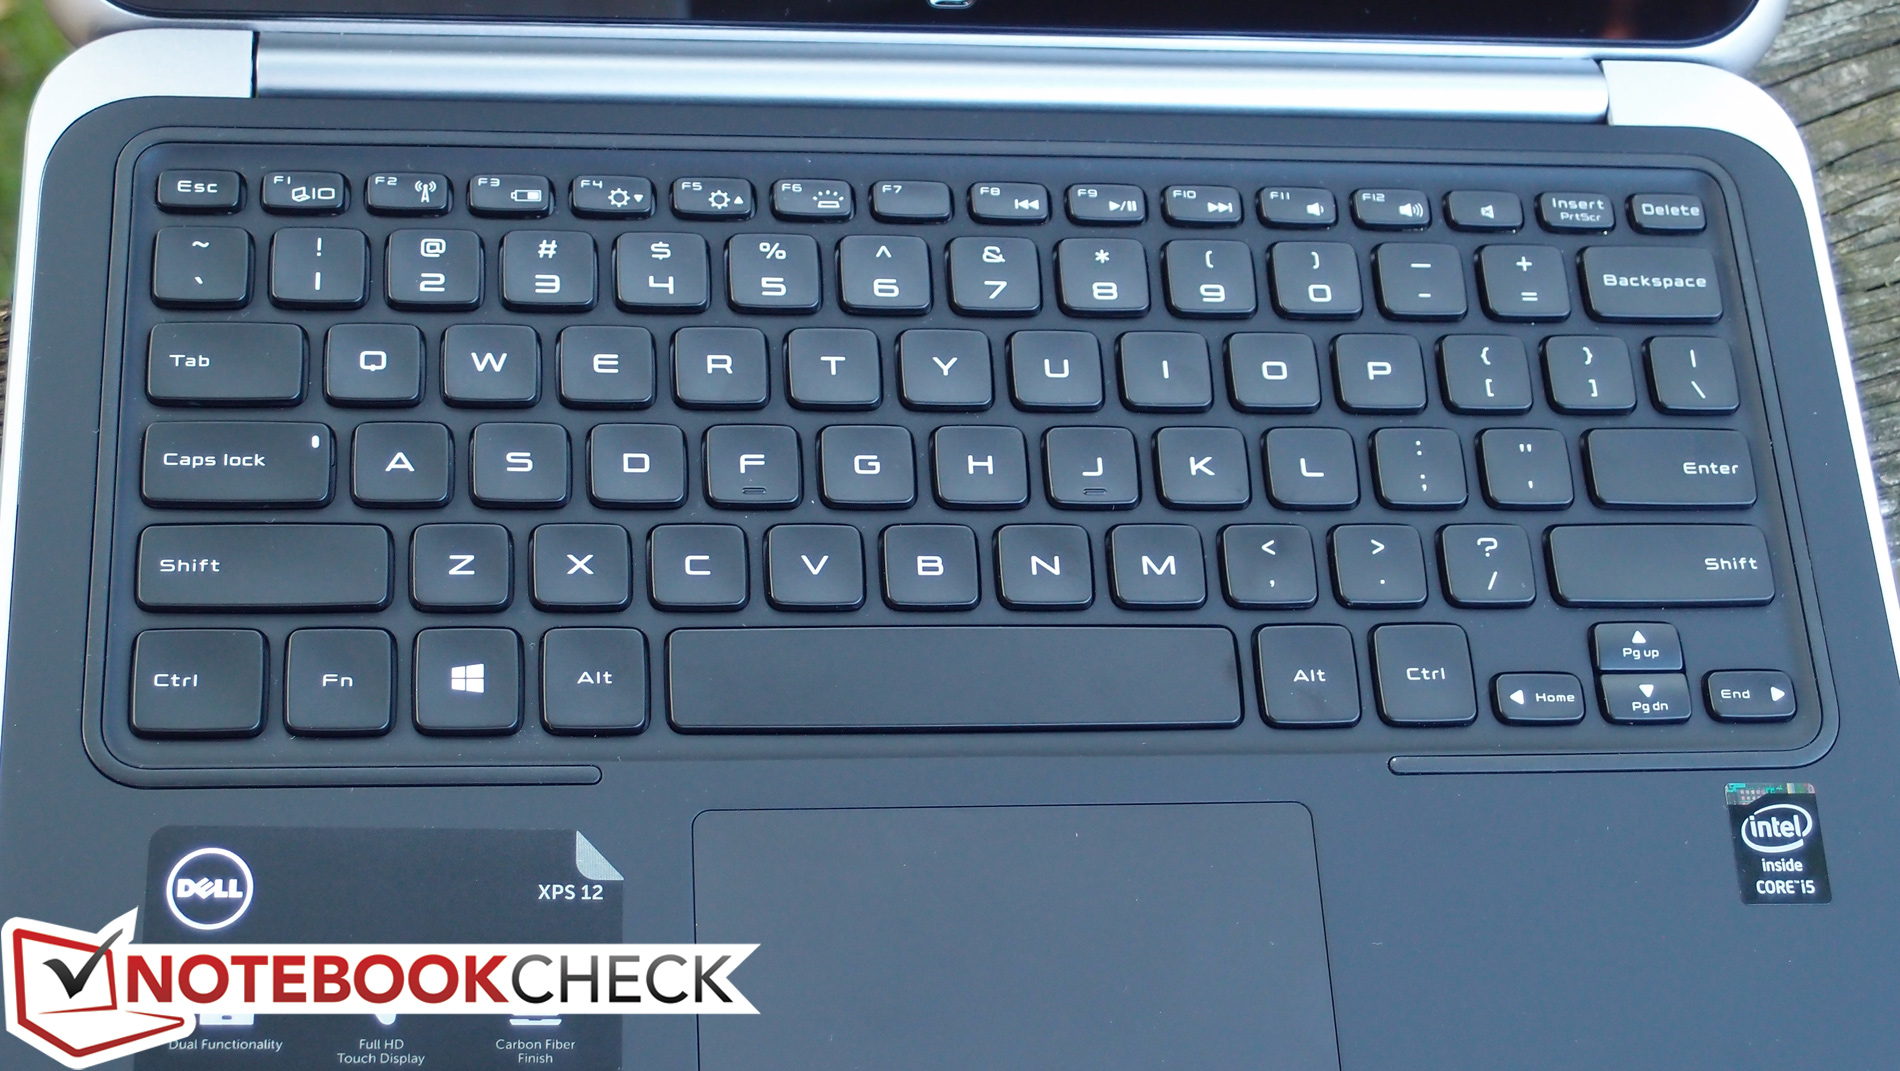
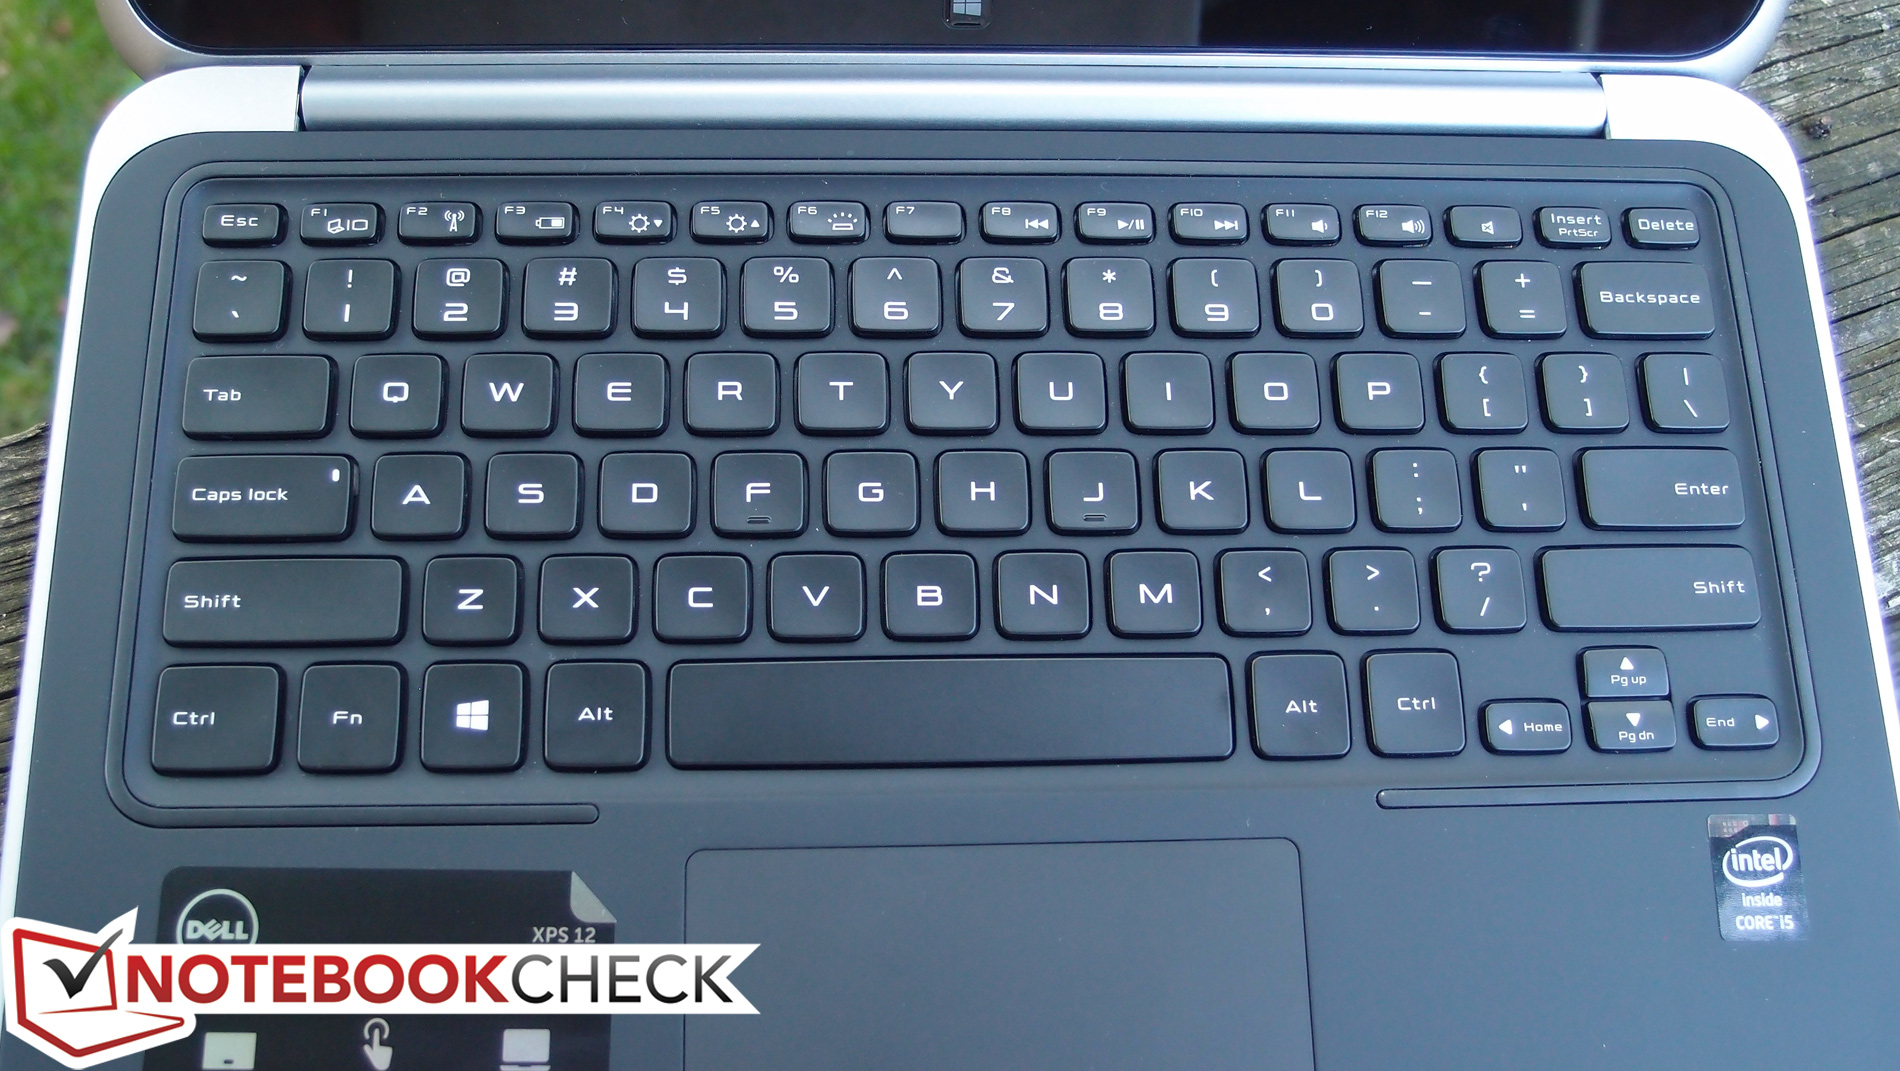
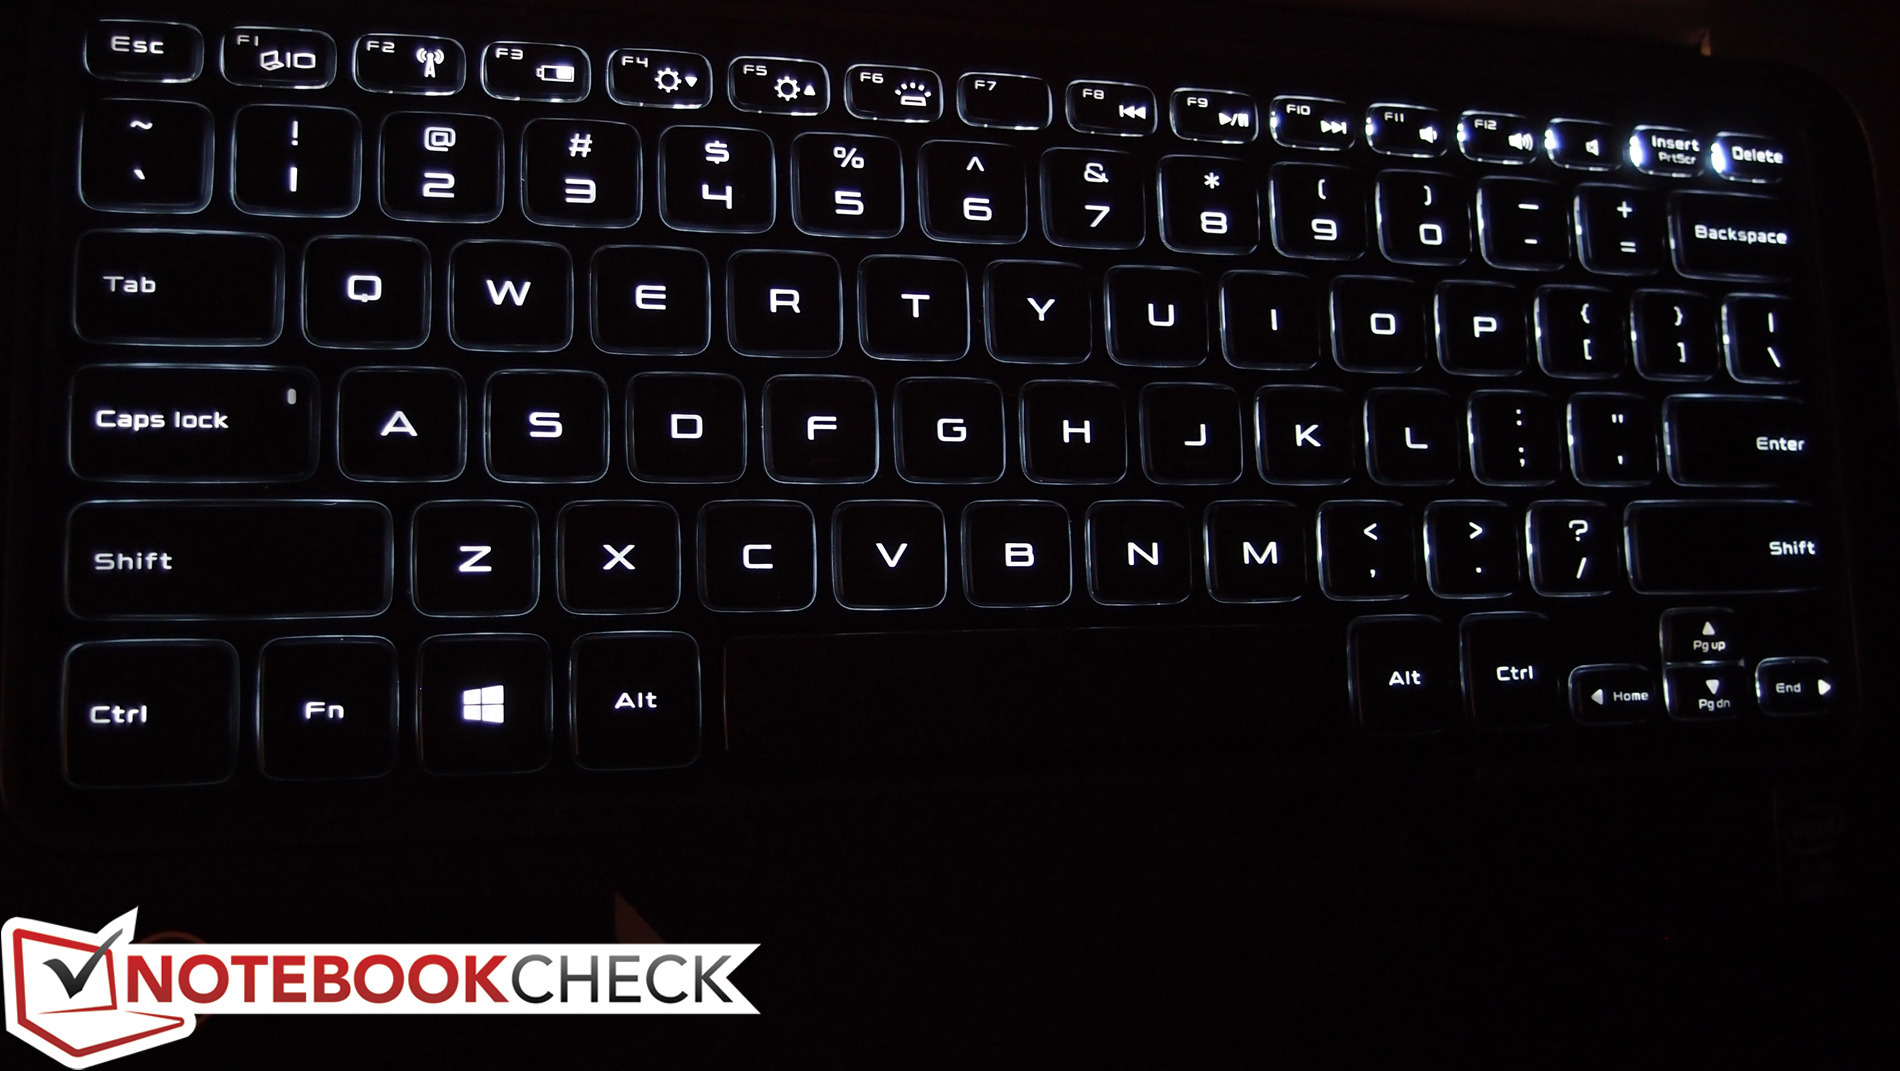
Truly, there is not much to criticize about Dell’s latest XPS 12. It is a top-tier piece of technology that excels in nearly every department, from its exquisite construction to its clever, versatile design. It maintains one of the best keyboards on any Ultrabook to date, coupled with a comfortable touchpad, accurate 10-point multi-touch screen, and a reasonable weight that—while still a bit heavy by tablet standards—communicates quality. And it’s incredibly stylish, to boot.
The Full HD IPS screen, with its high brightness, good contrast, and great viewing angles, exchanges some benefits of its predecessor for slightly better color spectrum coverage—overall, a reasonable trade. Audio quality is sufficient, though Ultrabooks always struggle in this department. In addition to that minor gripe, the only other complaint is that temperatures could be improved, and we’d love to see a third USB port.
Performance is excellent thanks to an exceptionally fast SSD and a powerful CPU. Gaming performance in particular is much improved over last generation, scoring anywhere from 35 to 60% better than the Ivy Bridge XPS 12. But the most impressive improvement of all is in the area of battery life, where the XPS 12 manages a premium of nearly 60%—translating to nearly 9 hours unplugged under typical usage.
All of this adds up to one of the very best convertible Ultrabooks to date, and there really isn’t much out there in the way of true competition. Only the Sony Vaio Duo 13 comes to mind, which features a better screen and a lighter weight, but still can’t match the battery life of the XPS 12. If you’re bothered by price, you might also consider something like the IdeaPad Yoga 11S—but if cost isn’t a concern, it’s hard to beat the XPS 12-9Q33.