Reviews for the AMD Ryzen 3 3200U processor
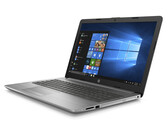
HP 255 G7 in review: Multiple weaknesses, no strengths
The HP 255 G7 offers a Ryzen 3 APU, 8 GB of RAM, a DVD drive, and a 512 GB NVMe SSD. Windows 10 Pro serves as the operating system. Moreover, the built-in display disappoints in every respect.
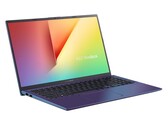
AMD Ryzen 3 3200U, Vega 3, 15.6", 1.8 kgAsus Vivobook 15 F512DA Laptop Review: AMD Ryzen 3 for $400
Can you get a good laptop for just a few hundred dollars? The entry-level Asus VivoBook 15 with the AMD Ryzen 3 3200U retails for about $100 less than the Intel Core i3 version without being all that much slower.
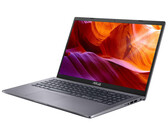
AMD Ryzen 3 3200U, Vega 3, 15.6", 1.8 kgAsus M509DA Review: Slow Speed WiFi in Ryzen 3 Notebook
Asus presents a 15.6-inch notebook with the M509DA, which can score with a large-capacity NVMe SSD, good performance development and low warming. The dark, low-contrast, viewing angle-unstable display doesn't arouse any enthusiasm.
AMD Ryzen 3 3200U, Vega 3, 15.6", 1.8 kgAsus Vivobook 15 F512DA-SH31: AMD Radeon RX Vega 3, 15.60", 1.8 kg
External Review » Asus Vivobook 15 F512DA-SH31
HP 15s-eq0803ng: AMD Radeon RX Vega 3, 15.60", 1.7 kg
External Review » HP 15s-eq0803ng
Asus M509DA-BR241: AMD Radeon RX Vega 3, 15.60", 1.9 kg
External Review » Asus M509DA-BR241
Lenovo Ideapad S340-14API-81NB00D4SP: AMD Radeon RX Vega 3, 14.00", 1.6 kg
External Review » Lenovo Ideapad S340-14API-81NB00D4SP
Asus VivoBook 15 S512DA-BR658T: AMD Radeon RX Vega 3, 15.60"
External Review » Asus VivoBook 15 S512DA-BR658T
Lenovo Ideapad C340-14API 81N600A8GE: AMD Radeon RX Vega 3, 14.00", 1.7 kg
External Review » Lenovo Ideapad C340-14API 81N600A8GE
Lenovo V155-15API-81V50004SP: AMD Radeon RX Vega 3, 15.60", 2.2 kg
External Review » Lenovo V155-15API-81V50004SP
Asus VivoBook D509DA-EJ102T: AMD Radeon RX Vega 3, 15.60", 1.8 kg
External Review » Asus VivoBook D509DA-EJ102T
Lenovo Ideapad S340-15API-81NC007QSP: AMD Radeon RX Vega 3, 15.60", 1.8 kg
External Review » Lenovo Ideapad S340-15API-81NC007QSP
Lenovo Ideapad S145-15API-81UT00DYMB: AMD Radeon RX Vega 3, 15.60", 1.9 kg
External Review » Lenovo Ideapad S145-15API-81UT00DYMB
HP 15-db1000ng: AMD Radeon RX Vega 3, 15.60", 1.9 kg
External Review » HP 15-db1000ng
Asus M509DA-BR151: AMD Radeon RX Vega 3, 15.60", 1.9 kg
External Review » Asus M509DA-BR151
Asus VivoBook 14 D409DA, Ryzen 3-3200U: AMD Radeon RX Vega 3, 14.00", 1.5 kg
External Review » Asus VivoBook 14 D409DA, Ryzen 3-3200U
Acer Aspire 3 A315-42-R1BU: AMD Radeon RX Vega 3, 15.60", 1.9 kg
External Review » Acer Aspire 3 A315-42-R1BU
Asus D509DA-BR128: AMD Radeon RX Vega 3, 15.60", 1.9 kg
External Review » Asus D509DA-BR128
HP 15-db1002ns: AMD Radeon RX Vega 3, 15.60", 1.8 kg
External Review » HP 15-db1002ns
Lenovo Ideapad S340-14API-81NB0045GE: AMD Radeon RX Vega 3, 14.00", 1.7 kg
External Review » Lenovo Ideapad S340-14API-81NB0045GE
HP 14-dk0014ns: AMD Radeon RX Vega 3, 14.00", 1.5 kg
External Review » HP 14-dk0014ns
Asus VivoBook S512DA-BR608: AMD Radeon RX Vega 3, 15.60", 1.6 kg
External Review » Asus VivoBook S512DA-BR608
Acer Swift 3 SF314-41-R4J1: AMD Radeon RX Vega 3, 14.00", 1.5 kg
External Review » Acer Swift 3 SF314-41-R4J1
Acer Aspire 5 A515-43-R19L: AMD Radeon RX Vega 3, 15.60", 1.8 kg
External Review » Acer Aspire 5 A515-43-R19L
HP 14s-dk0001ax: AMD Radeon RX Vega 3, 14.00", 1.5 kg
External Review » HP 14s-dk0001ax
HP 15-db1013ns: AMD Radeon RX Vega 3, 15.60", 1.8 kg
External Review » HP 15-db1013ns
HP 15-db1002ng: AMD Radeon RX Vega 3, 15.60", 1.8 kg
External Review » HP 15-db1002ng
HP 14-dk0001ns: AMD Radeon RX Vega 3, 14.00", 1.5 kg
External Review » HP 14-dk0001ns
HP 255 G7 159P1EA: AMD Radeon RX Vega 3, 15.60", 1.8 kg
» HP 255 G7: Office laptop with poor display quality
Asus Vivobook 15 F512DA-SH31: AMD Radeon RX Vega 3, 15.60", 1.8 kg
» The Ryzen 3 3200U performs so closely to the Core i3-8145U that any differences are essentially negligible to the target budget user