Reviews for the AMD Ryzen 7 3750H processor
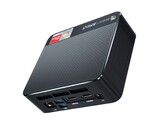
Beelink SER3 mini PC review: The older Ryzen 7 3750H has its uses
If Intel isn't your thing, then the AMD-powered SER3 can offer a similar level of performance as an older 8th gen Core-U series while costing a bit less. It also comes with dual storage and RAM options for easy upgrades down the road.
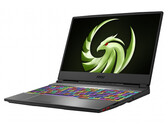
AMD Ryzen 7 3750H, Vega 10, 492 gMSI Alpha 15 A3DDK Laptop Review: A mid-range and power-hungry gaming laptop
The all-AMD team in the Alpha 15 runs all current games smoothly onto the device's matte, FHD, IPS, 144 Hz and FreeSync compatible 15.6-inch screen. However, its comparatively high power requirements take their toll.
AMD Ryzen 7 3750H, Radeon RX 5500M, 15.6", 2.3 kgMSI Alpha 15 Hands-On Gaming Laptop Review: Ryzen and Navi instead of Intel and NVIDIA
AMD made its comeback into the CPU business with its Ryzen series not only on desktops but also on laptops. The company made a similar foray into the GPU market with its Navi desktop cards earlier this year, a move that it is trying to replicate on laptops with its Navi 14 GPUs. NVIDIA has dominated the upper midrange of laptop GPUs for a while, but AMD is looking to change that, offering consumers more choice in the process. Read on to find out what we think of one the first upcoming all-AMD laptops.
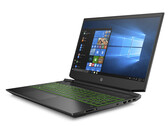
AMD Ryzen 7 3750H, Radeon RX 5500M, 15.6", 2.3 kgHP Pavilion Gaming 15 in Review: HP's 15.6-inch laptop combines gaming prowess and stamina
The HP Pavilion Gaming 15 runs all current games smoothly and displays them on its matte 15.6-inch screen (FHD, IPS). The laptop is well-equipped: 16 GB of RAM (dual-channel mode), NVMe SSD, HDD. Surprisingly, the battery life is excellent.
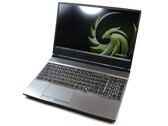
AMD Ryzen 7 3750H, NVIDIA GeForce GTX 1660 Ti Max-Q, 15.6", 2.3 kgNo Intel Required: Asus TUF FX505DT Laptop Review with Ryzen 7 and GeForce GTX 1650
As it turns out, mid-range Nvidia GPUs pair very well with AMD's latest Ryzen H-series of CPUs. Asus is doubling down on even more Intel-less gaming laptops that gamers on tight budgets ought to consider.
AMD Ryzen 7 3750H, NVIDIA GeForce GTX 1650 Mobile, 15.6", 2.2 kgAsus ROG Zephyrus G15 GA502DU: NVIDIA GeForce GTX 1660 Ti Max-Q, 15.60", 2.1 kg
Review » Asus ROG Zephyrus G GA502DU (Ryzen 7 3750H, GTX 1660 Ti Max-Q) Laptop Review
Asus TUF FX505DT-HN540: NVIDIA GeForce GTX 1650 Mobile, 15.60", 2.2 kg
External Review » Asus TUF FX505DT-HN540
Asus TUF FX505DT-BQ613T: NVIDIA GeForce GTX 1650 Mobile, 15.60", 2.2 kg
External Review » Asus TUF FX505DT-BQ613T
Asus TUF FX505DV-AL116: NVIDIA GeForce RTX 2060 Mobile, 15.60", 2.2 kg
External Review » Asus TUF FX505DV-AL116
Asus TUF FX505DT-BQ600: NVIDIA GeForce GTX 1650 Mobile, 15.60", 2.2 kg
External Review » Asus TUF FX505DT-BQ600
Asus TUF FX505DT-BQ208: NVIDIA GeForce GTX 1650 Mobile, 15.60", 2.2 kg
External Review » Asus TUF FX505DT-BQ208
Acer Aspire 7 A715-41G-R3J5: NVIDIA GeForce GTX 1650 Mobile, 15.60", 2.4 kg
External Review » Acer Aspire 7 A715-41G-R3J5
HP Pavilion Gaming 15-ec0012ng: NVIDIA GeForce GTX 1660 Ti Mobile, 15.60", 2.3 kg
External Review » HP Pavilion Gaming 15-ec0012ng
HP Pavilion Gaming 15-ec0014nl: NVIDIA GeForce GTX 1650 Mobile, 15.60", 2.3 kg
External Review » HP Pavilion Gaming 15-ec0014nl
HP Gaming Pavilion 15-ec0001ns: AMD Radeon RX Vega 10, 15.60", 2.3 kg
External Review » HP Gaming Pavilion 15-ec0001ns
Asus TUF FX505DT-BQ121: NVIDIA GeForce GTX 1650 Mobile, 15.60", 2.2 kg
External Review » Asus TUF FX505DT-BQ121
HP Pavilion Gaming 15-ec0003ns: NVIDIA GeForce GTX 1650 Mobile, 15.60", 2.3 kg
External Review » HP Pavilion Gaming 15-ec0003ns
Asus ROG Zephyrus G15 GA502DU-BQ015T: NVIDIA GeForce GTX 1660 Ti Max-Q, 15.60", 2.1 kg
External Review » Asus Zephyrus G15 GA502DU-BQ015T
MSI Alpha 15 A3DDK-007NL: AMD Radeon RX 5500M, 15.60", 2.3 kg
External Review » MSI Alpha 15 A3DDK-007NL
Asus TUF Gaming FX505DV-AL014: NVIDIA GeForce RTX 2060 Mobile, 15.60", 2.2 kg
External Review » Asus TUF Gaming FX505DV-AL014
HP Pavilion Gaming 15-ec0022ax: NVIDIA GeForce GTX 1660 Ti Mobile, 15.60", 2 kg
External Review » HP Pavilion Gaming 15-ec0022ax
MSI Alpha 15 A3DDK-001XES: AMD Radeon RX 5500M, 15.60", 2.3 kg
External Review » MSI Alpha 15 A3DDK-001XES
Asus TUF FX505DD: NVIDIA GeForce RTX 2060 Mobile, 15.60", 2.2 kg
External Review » Asus TUF FX505DD
Asus TUF FX505DD-BQ067: NVIDIA GeForce GTX 1050 Mobile, 15.60", 2.2 kg
External Review » Asus TUF FX505DD-BQ067
HP Pavilion Gaming 15-ec0017ng: NVIDIA GeForce GTX 1660 Ti Max-Q, 15.60", 2.3 kg
External Review » HP Pavilion Gaming 15-ec0017ng
Asus TUF FX505DV-BQ099T: NVIDIA GeForce RTX 2060 Mobile, 15.60", 2.2 kg
External Review » Asus TUF FX505DV-BQ099T
MSI Alpha 15 A3DDK: AMD Radeon RX 5500M, 15.60", 2.3 kg
External Review » MSI Alpha 15 A3DDK
Asus TUF FX505DV-AL019: NVIDIA GeForce RTX 2060 Mobile, 15.60", 2.3 kg
External Review » Asus TUF FX505DV-AL019
Asus ROG Zephyrus G15 GA502DU-BQ015: NVIDIA GeForce GTX 1660 Ti Mobile, 15.60", 2.1 kg
External Review » Asus ROG Zephyrus G GA502DU-BQ015
Asus TUF Gaming FX505DU-AL085T: NVIDIA GeForce GTX 1660 Ti Mobile, 15.60", 2.2 kg
External Review » Asus TUF Gaming FX505DU-AL085T
Asus TUF FX705DU-AU029T: NVIDIA GeForce GTX 1660 Ti Mobile, 17.30", 2.7 kg
External Review » Asus TUF FX705DU-AU029T
Asus ROG Zephyrus G15 GA502DU-AL025T: NVIDIA GeForce GTX 1660 Ti Mobile, 15.60", 2.1 kg
External Review » Asus Zephyrus G GA502DU-AL025T
Asus TUF FX705DT-AU028T: NVIDIA GeForce GTX 1650 Mobile, 17.30", 2.6 kg
External Review » Asus TUF FX705DT-AU028T
Asus TUF FX505DT-EB73: NVIDIA GeForce GTX 1650 Mobile, 15.60", 2.2 kg
External Review » Asus TUF FX505DT-EB73
Asus TUF FX505DU-BQ045: NVIDIA GeForce GTX 1660 Ti Mobile, 15.60", 2.2 kg
External Review » Asus TUF FX505DU-BQ045
Asus TUF FX705DU-AU053T: NVIDIA GeForce GTX 1660 Ti Mobile, 17.30", 2.6 kg
External Review » Asus TUF FX705DU-AU053T
Asus TUF FX705DU-AU019T: NVIDIA GeForce GTX 1660 Ti Mobile, 17.30", 2.6 kg
External Review » Asus TUF FX705DU-AU019T
Asus TUF FX505DU-MB74: NVIDIA GeForce GTX 1660 Ti Mobile, 15.60", 2.2 kg
External Review » Asus TUF FX505DU-MB74
MSI Alpha 15 A3DDK-034: AMD Radeon RX 5500M, 15.60", 2.3 kg
» MSI Alpha 15: High power consumption and short battery life plague MSI's latest mid-range gaming laptop