MSI Alpha 15 Hands-On Gaming Laptop Review: Ryzen and Navi instead of Intel and NVIDIA
Positioned at around US$1,000, the MSI Alpha 15 brings something genuinely new to the gaming laptop market. Value for money is the name of the game, the most important player of which here being AMD. Ryzen processors have already shown what the American company can do in the mobile CPU market, equalling Intel Core i5 chips in many respects. Until now, NVIDIA has only been the only choice for people looking for a laptop that can handle 1080p gaming. Variants of the GeForce GTX 1650 and GTX 1660 Ti can handle most modern triple-A titles at decent framerates at this resolution, but AMD has something up its sleeve, and the MSI Alpha 15 is one of the first examples of it.
Please note that we conducted our hands-on review with a pre-production model of the Alpha 15 with which MSI kindly provided us. Since the laptop does not necessarily represent how the retail unit will perform, we have avoided awarding a final rating or measurements for some areas. We shall submit a full review when we have a retail model, though.
Device Overview
Rating | Date | Model | Weight | Height | Size | Resolution | Price |
|---|---|---|---|---|---|---|---|
v (old) | 11 / 2019 | MSI Alpha 15 A3DDK R7 3750H, Radeon RX 5500M | 2.3 kg | 27.5 mm | 15.60" | 1920x1080 | |
| 80.4 % v6 (old) | 07 / 2019 | Asus TUF FX505DT-EB73 R7 3750H, GeForce GTX 1650 Mobile | 2.2 kg | 26.8 mm | 15.60" | 1920x1080 | |
| 79.3 % v7 (old) | 10 / 2019 | Dell G3 3590 i5-9300H, GeForce GTX 1650 Mobile | 2.5 kg | 21.6 mm | 15.60" | 1920x1080 | |
| 77 % v7 (old) | 09 / 2019 | Lenovo IdeaPad L340-15IRH 81LK00BMGE i5-9300H, GeForce GTX 1650 Mobile | 2.1 kg | 23.9 mm | 15.60" | 1920x1080 | |
| 81.5 % v7 (old) | 07 / 2019 | HP Omen 15-dc1020ng i5-9300H, GeForce GTX 1650 Mobile | 2.3 kg | 25 mm | 15.60" | 1920x1080 | |
| 82.5 % v6 (old) | 05 / 2019 | Acer Aspire Nitro 5 AN515-54-53Z2 i5-9300H, GeForce GTX 1650 Mobile | 2.2 kg | 27 mm | 15.60" | 1920x1080 | |
| 82.3 % v7 (old) | 08 / 2019 | Lenovo Legion Y540-15IRH-81SX00B2GE i7-9750H, GeForce GTX 1660 Ti Mobile | 2.2 kg | 26 mm | 15.60" | 1920x1080 | |
| 83.9 % v7 (old) | 08 / 2019 | HP Gaming Pavilion 15-dk0009ng i7-9750H, GeForce GTX 1660 Ti Max-Q | 2.4 kg | 23.4 mm | 15.60" | 1920x1080 | |
| 83.3 % v6 (old) | 05 / 2019 | Asus ROG Zephyrus G15 GA502DU R7 3750H, GeForce GTX 1660 Ti Max-Q | 2.1 kg | 20.4 mm | 15.60" | 1920x1080 |
Case
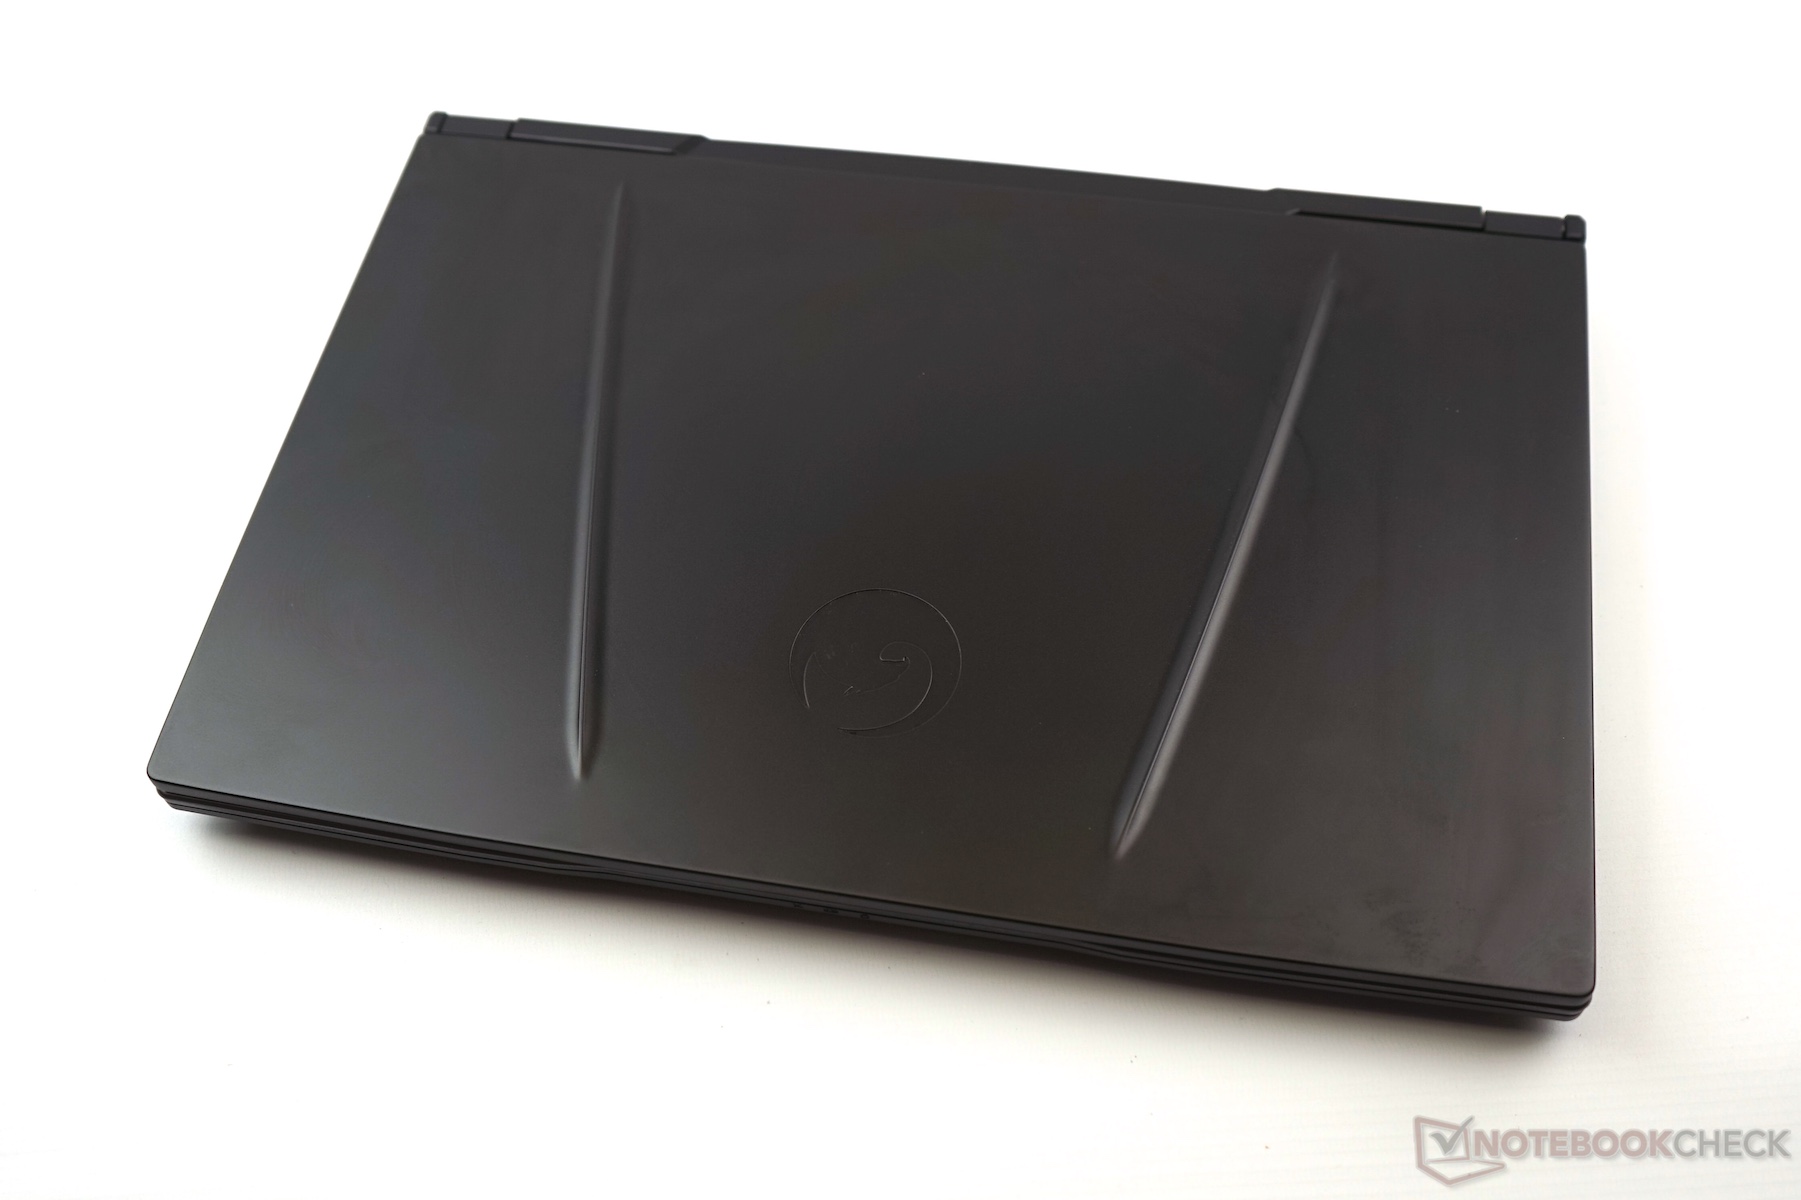
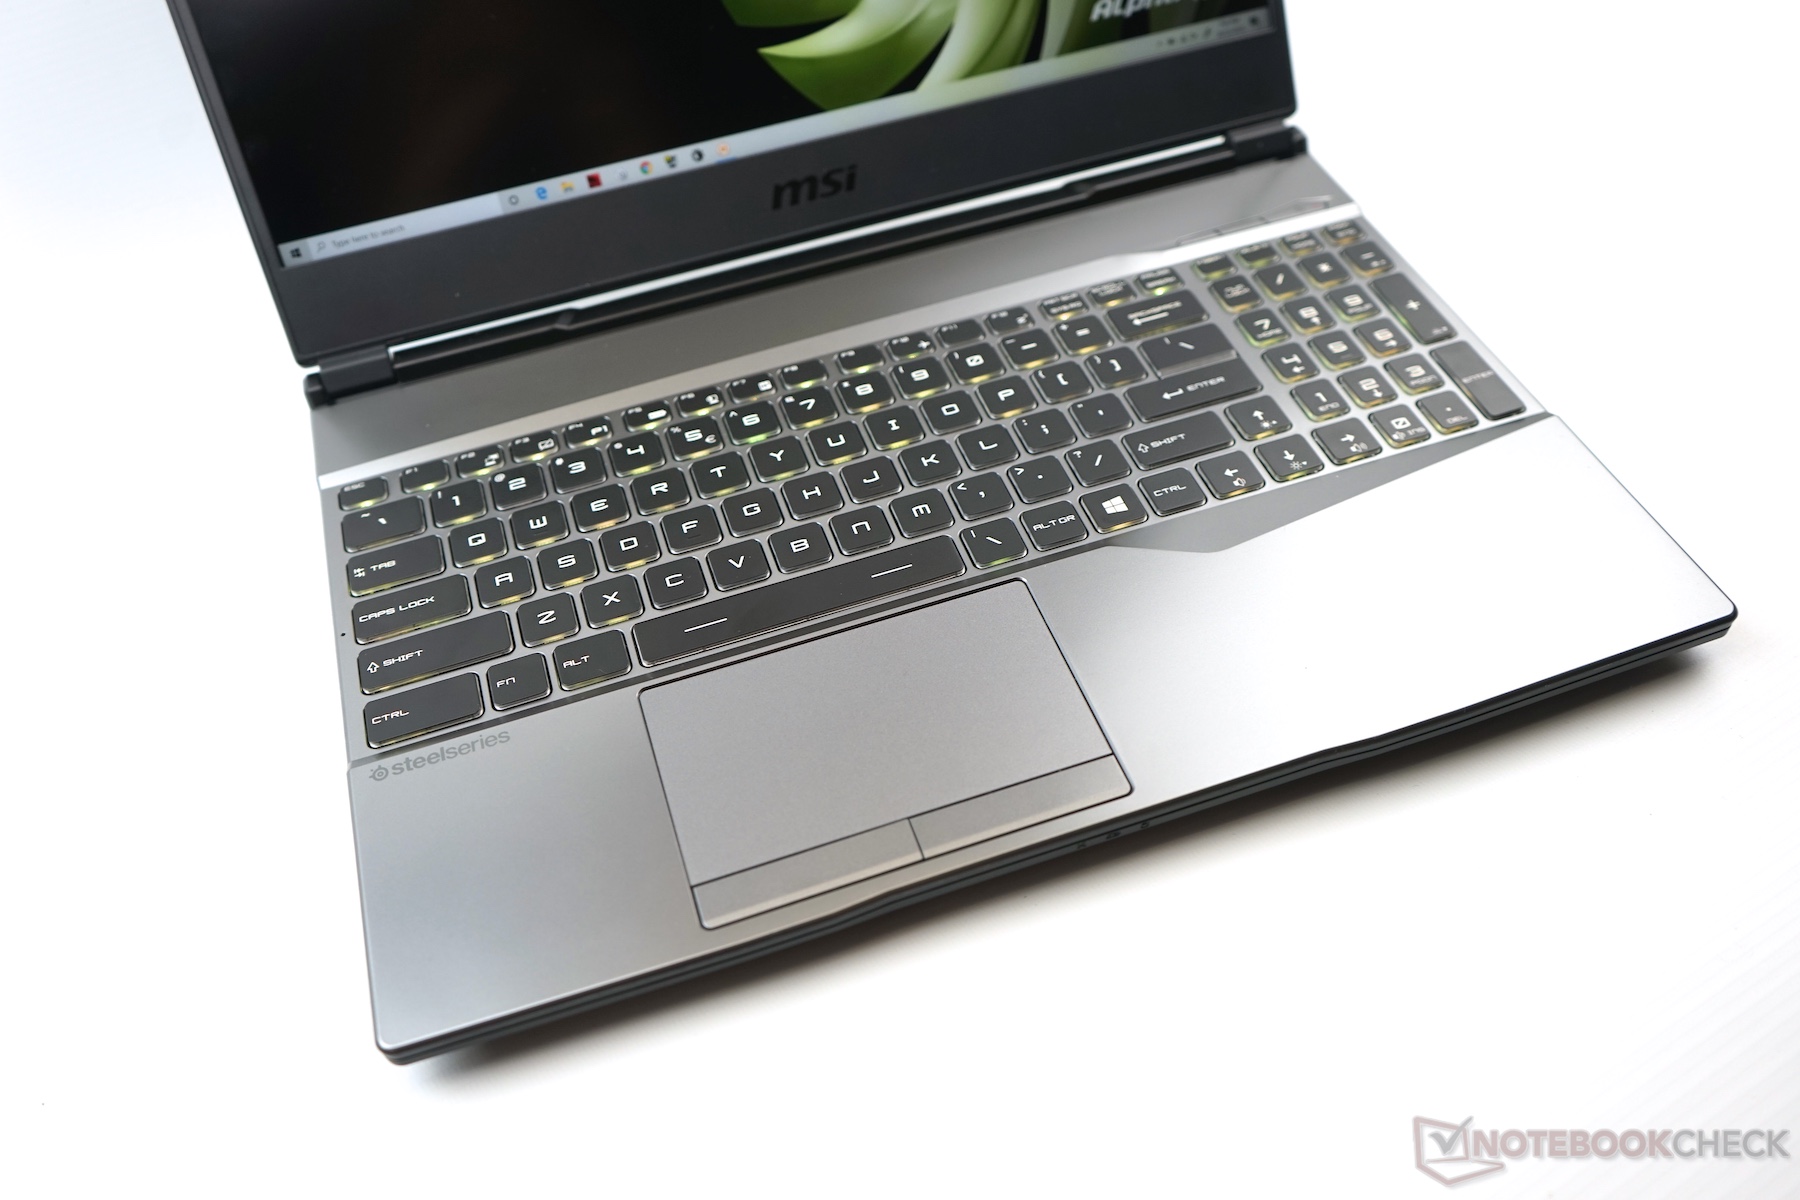
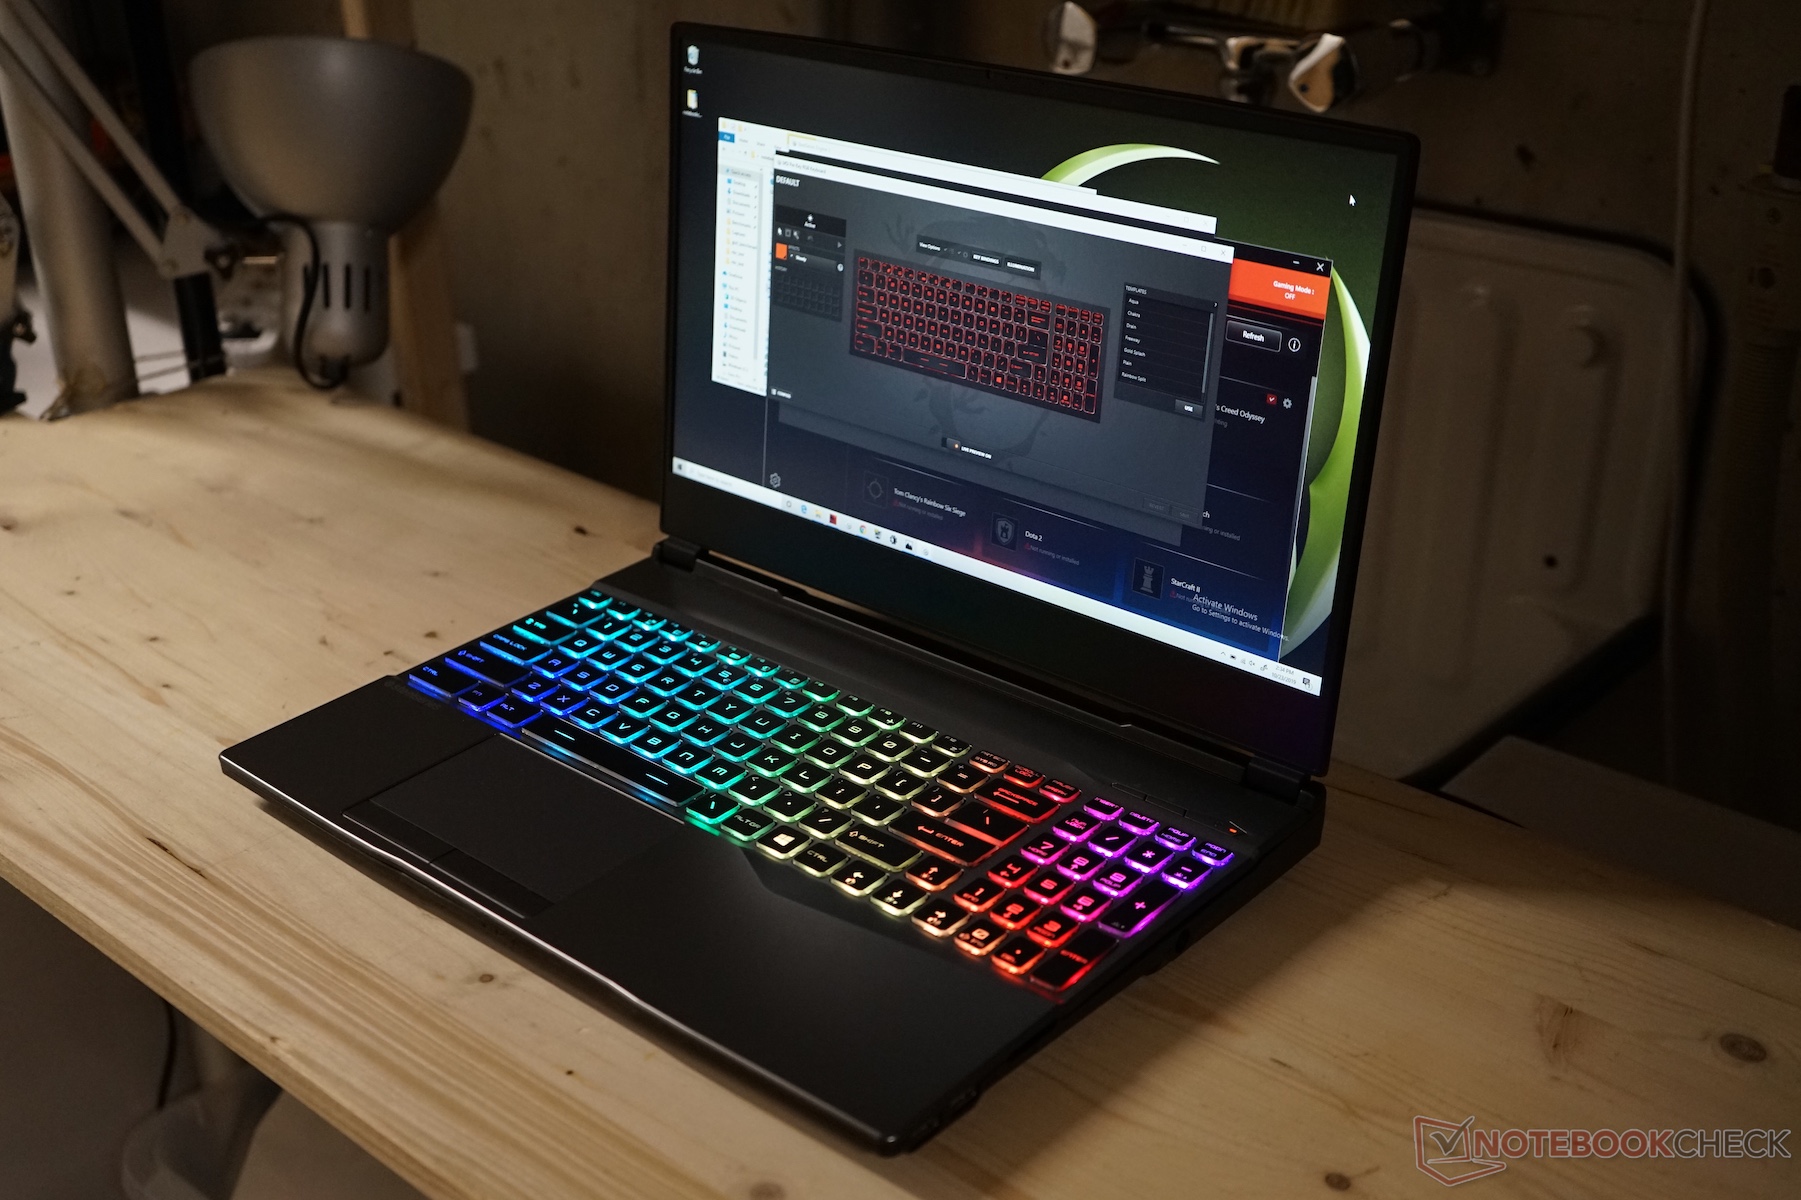
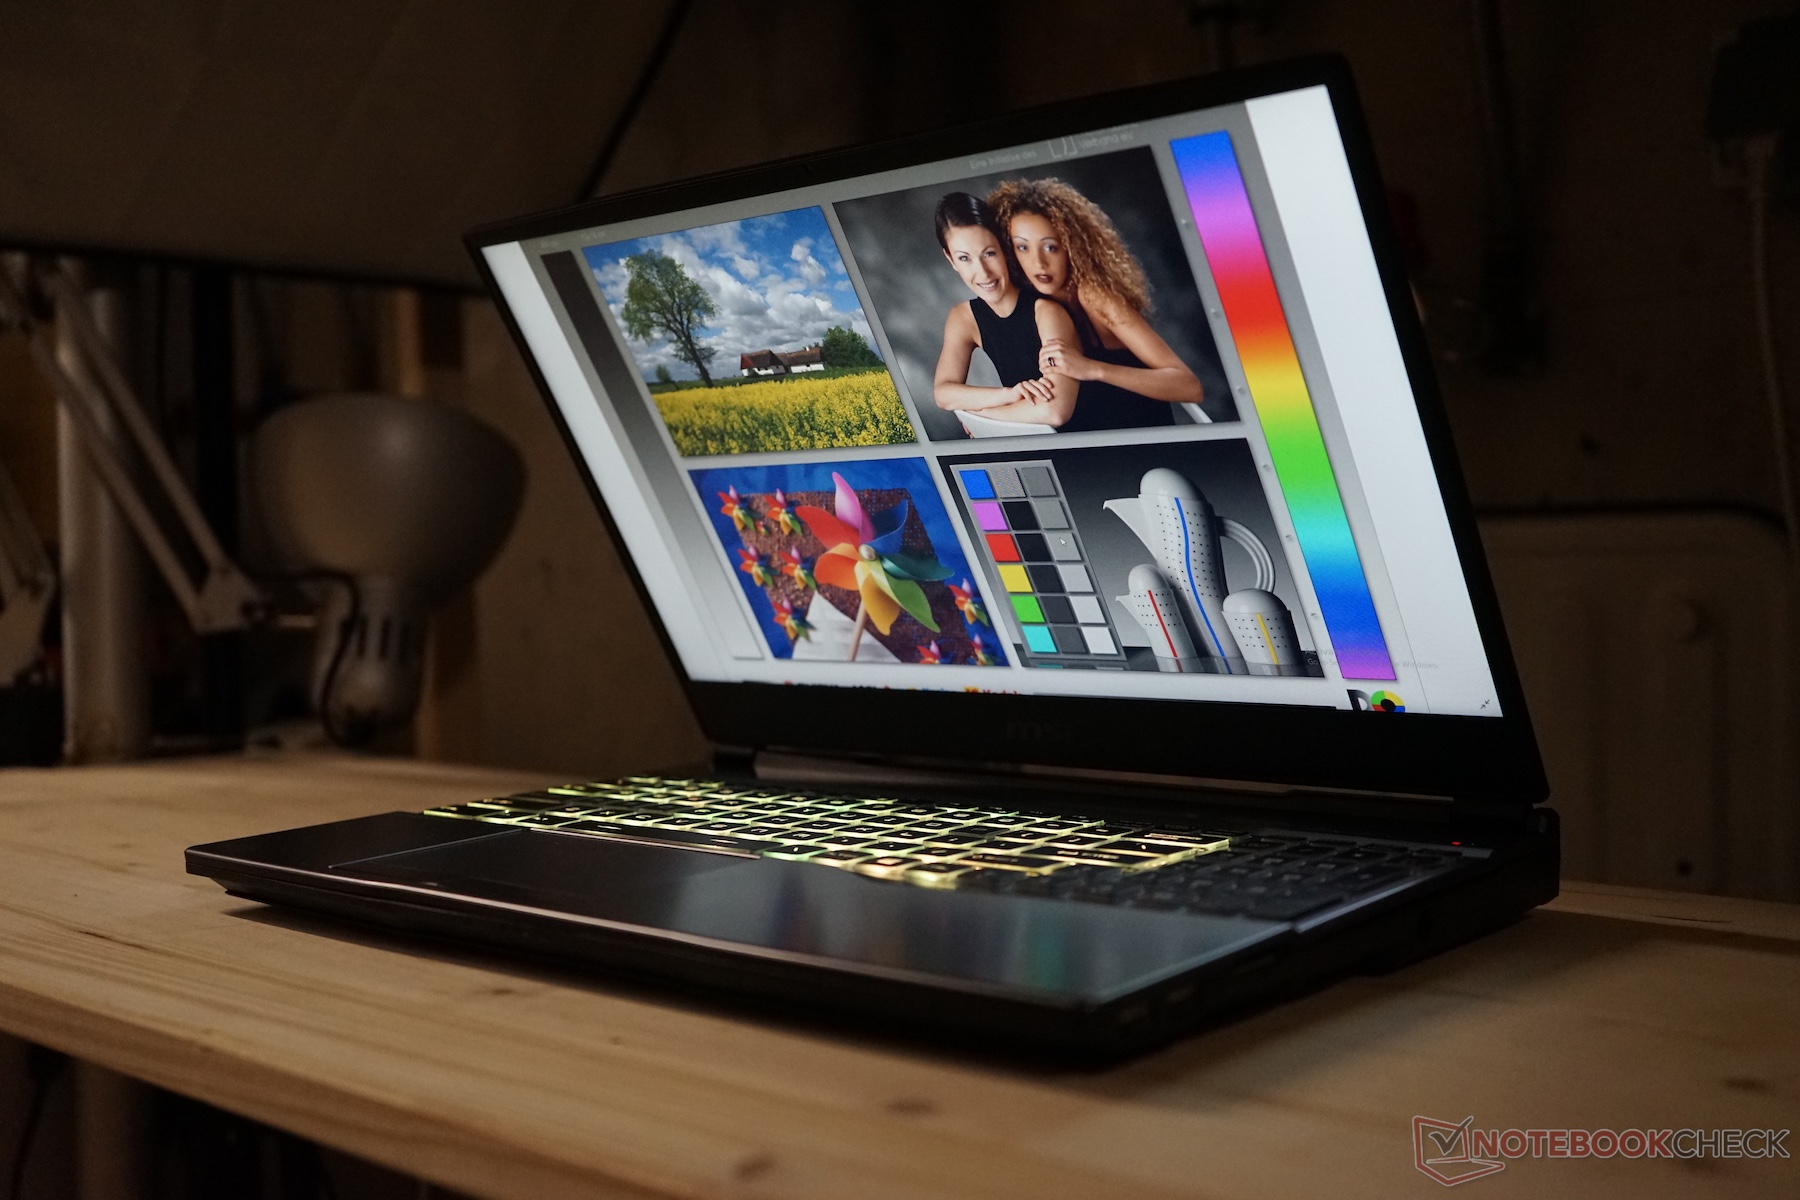
The Alpha 15 has a simple design, with the flourishes on the back and bottom of the device the only external indications that it is a gaming laptop. MSI has relied on cheap materials too, with the chassis mostly made of plastic. Undoubtedly, the aim of choosing plastic over metal is to keep the device on the more competitive side of US$1,000. The device is not all plastic though, with MSI opting for an aluminium display lid, which gives the display excellent stability. Incidentally, the Alpha 15 is probably based on the same design as MSI used with the GL65 9SEK, which we reviewed earlier this month.
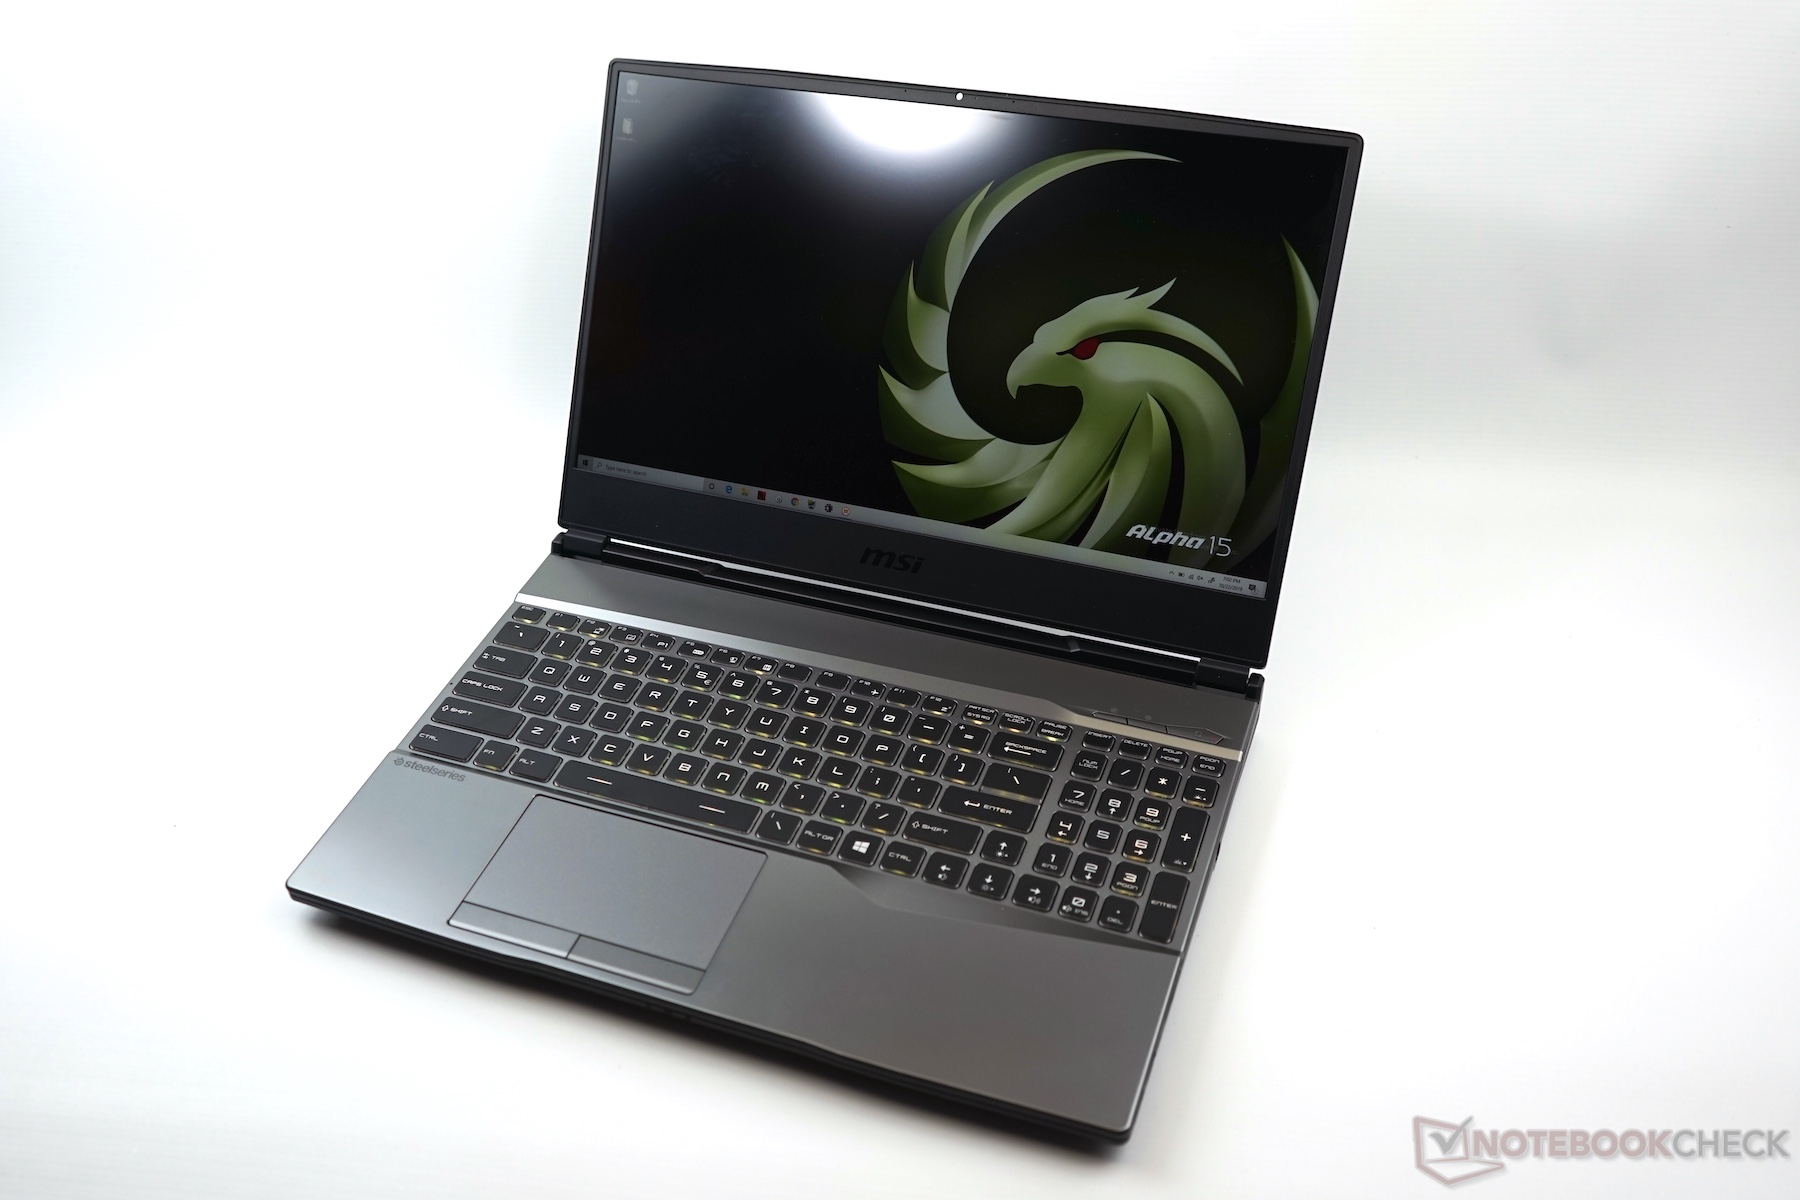
The Alpha 15 weighs and is about as thick as its competitors. Our pre-production weighs 2.3 kg (~5.1 lb) and is about 27 mm (~1.1 in) thick, both of which will probably remain the same on the final retail unit. Only the Dell G3 15 3590 is noticeably slimmer than the Alpha 15 of those in our comparison chart, but the Lenovo IdeaPad L340 is a few hundred grams lighter.
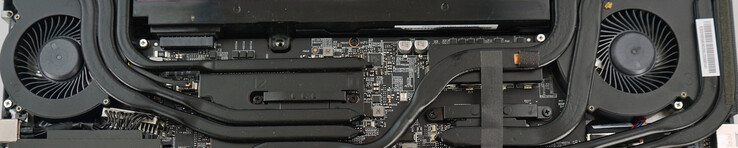
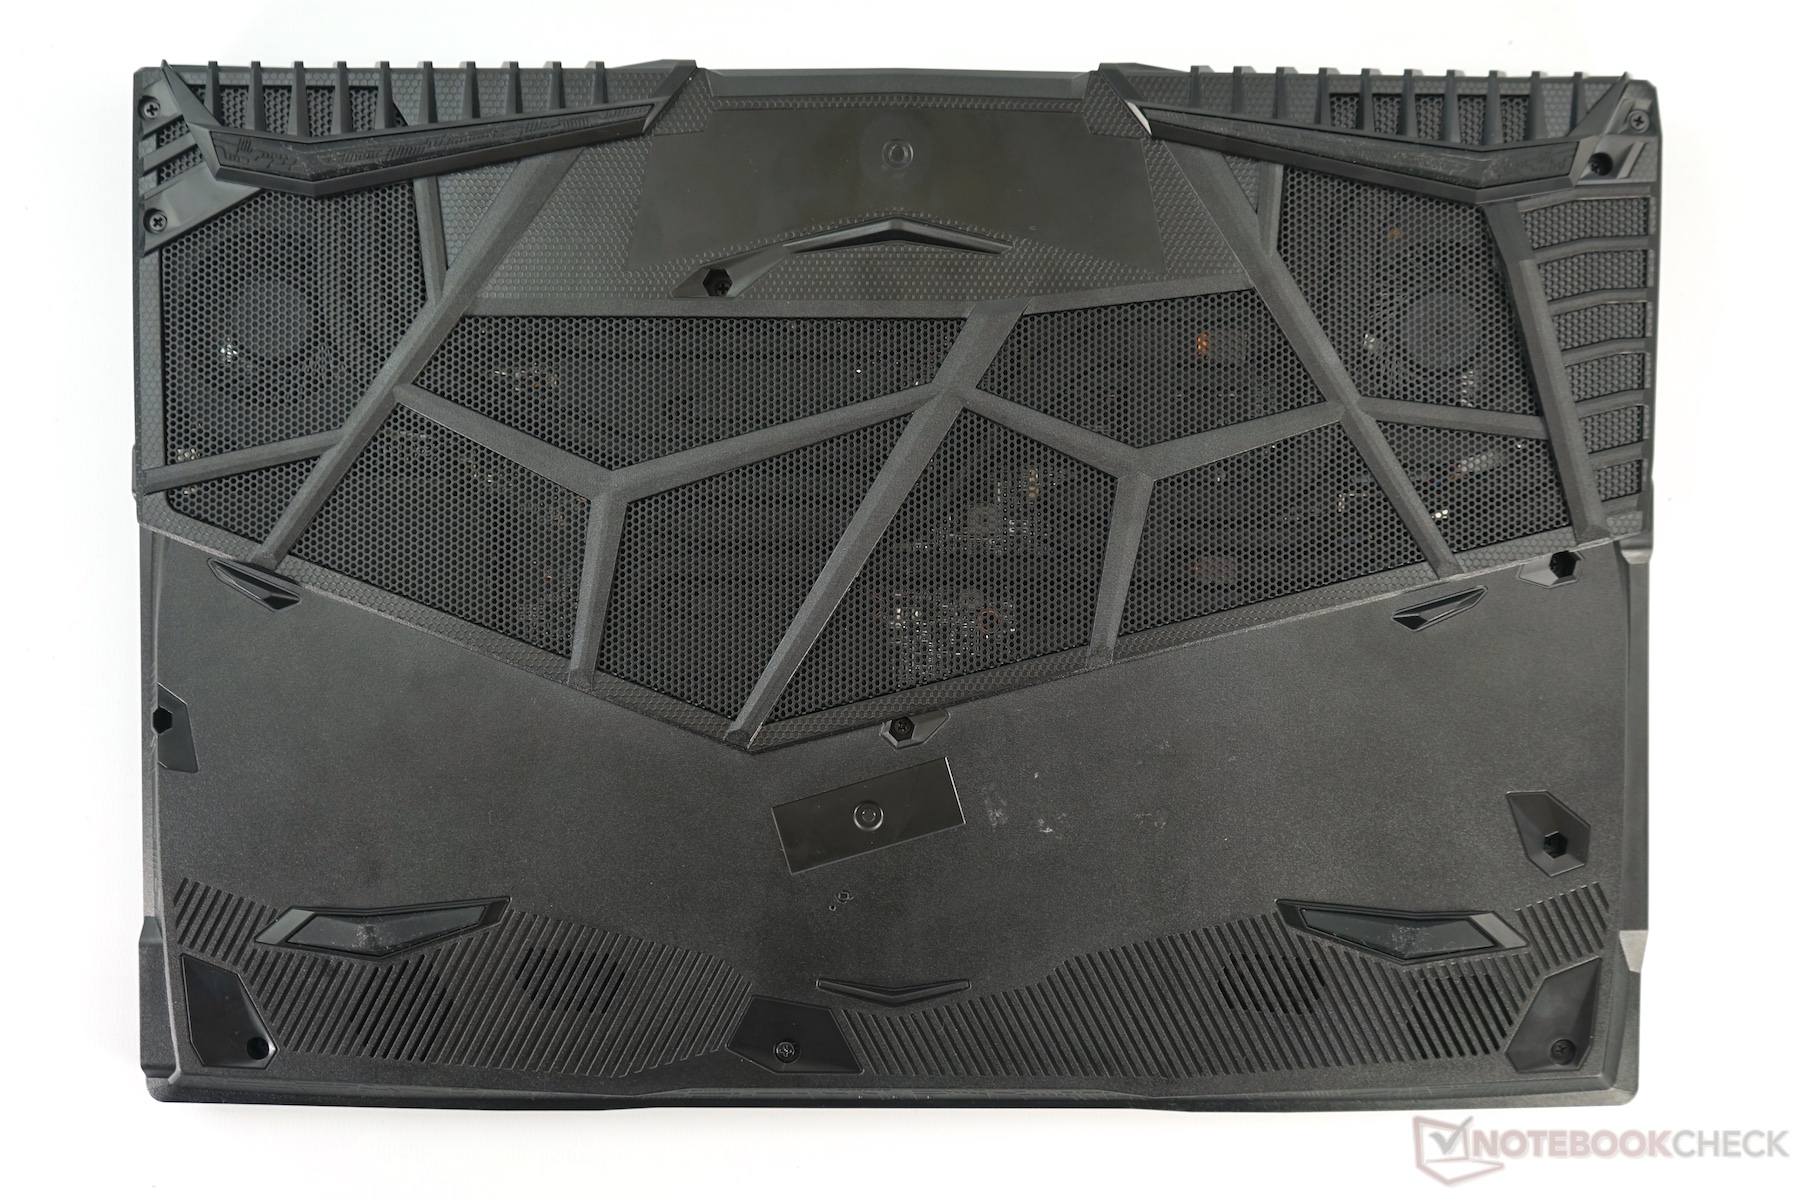
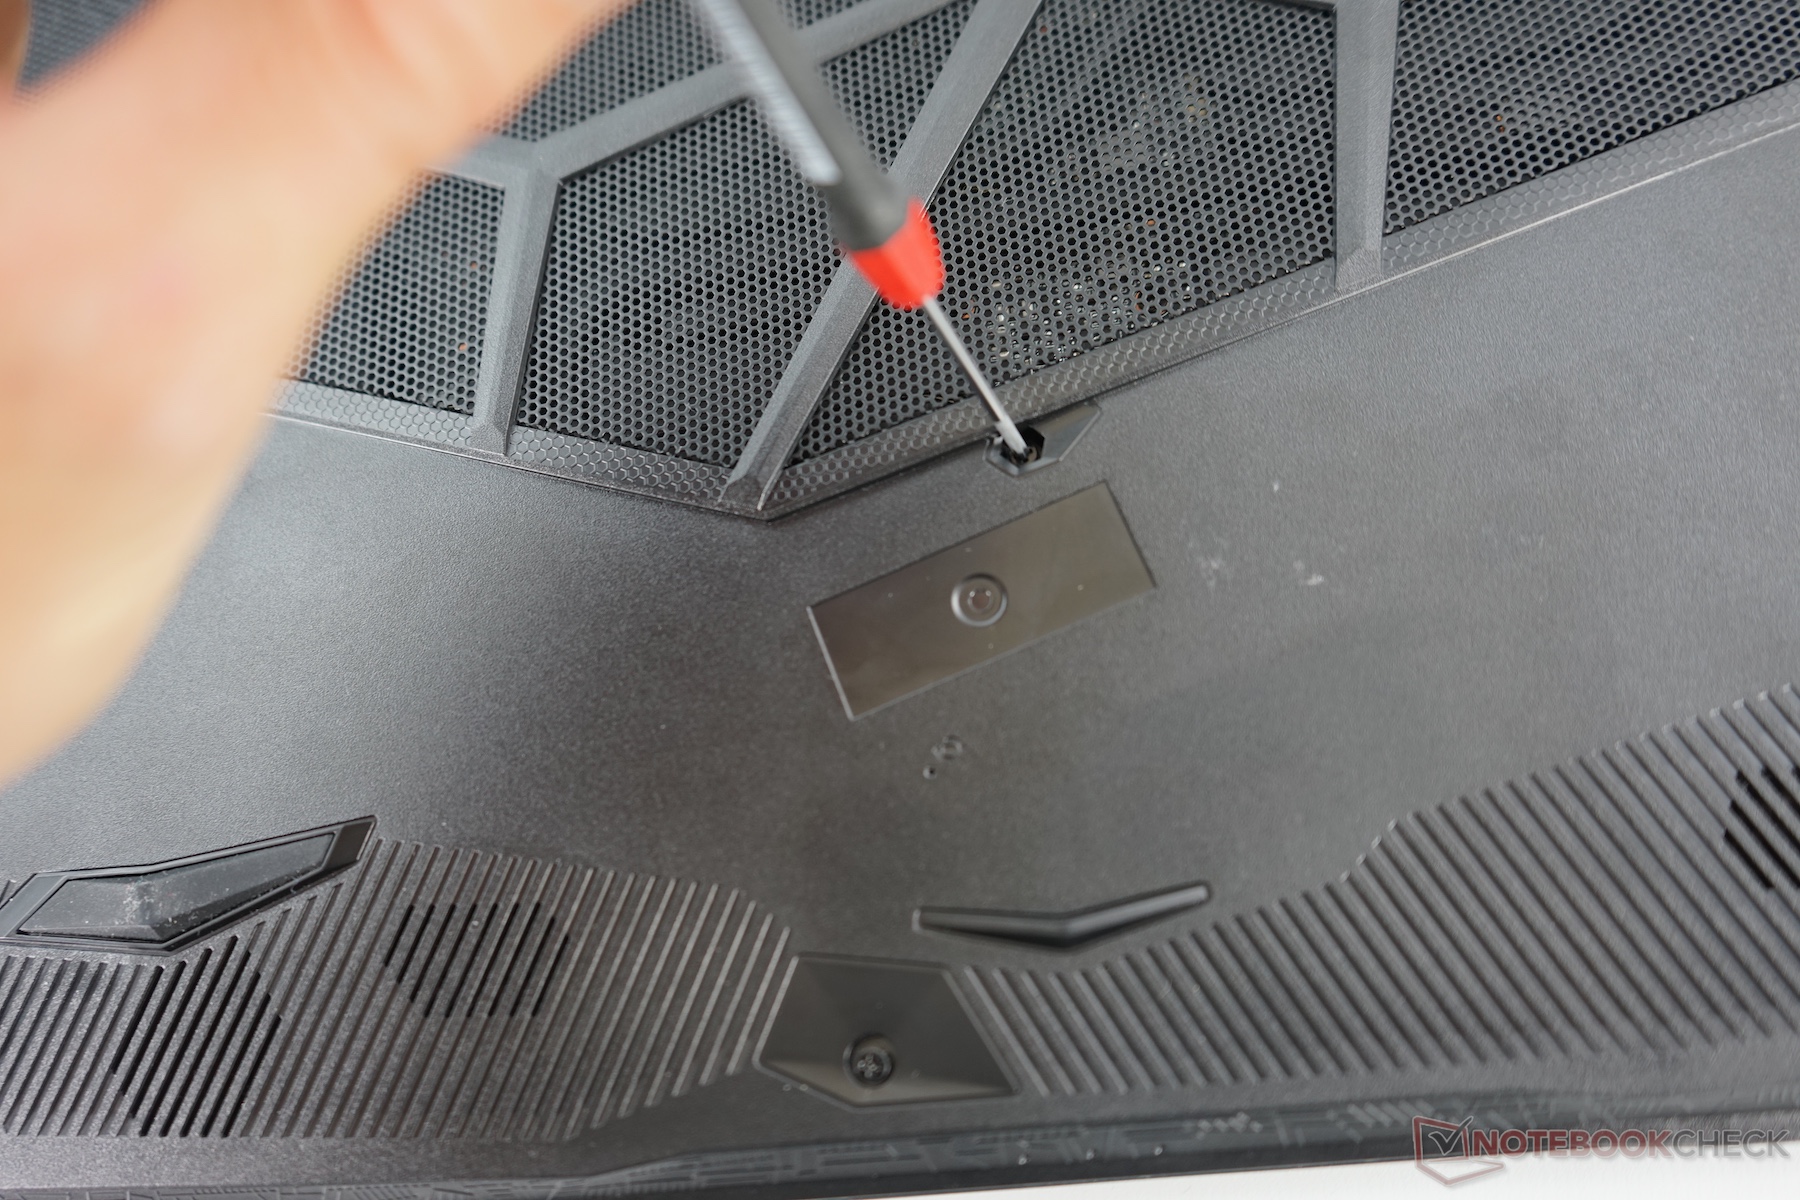
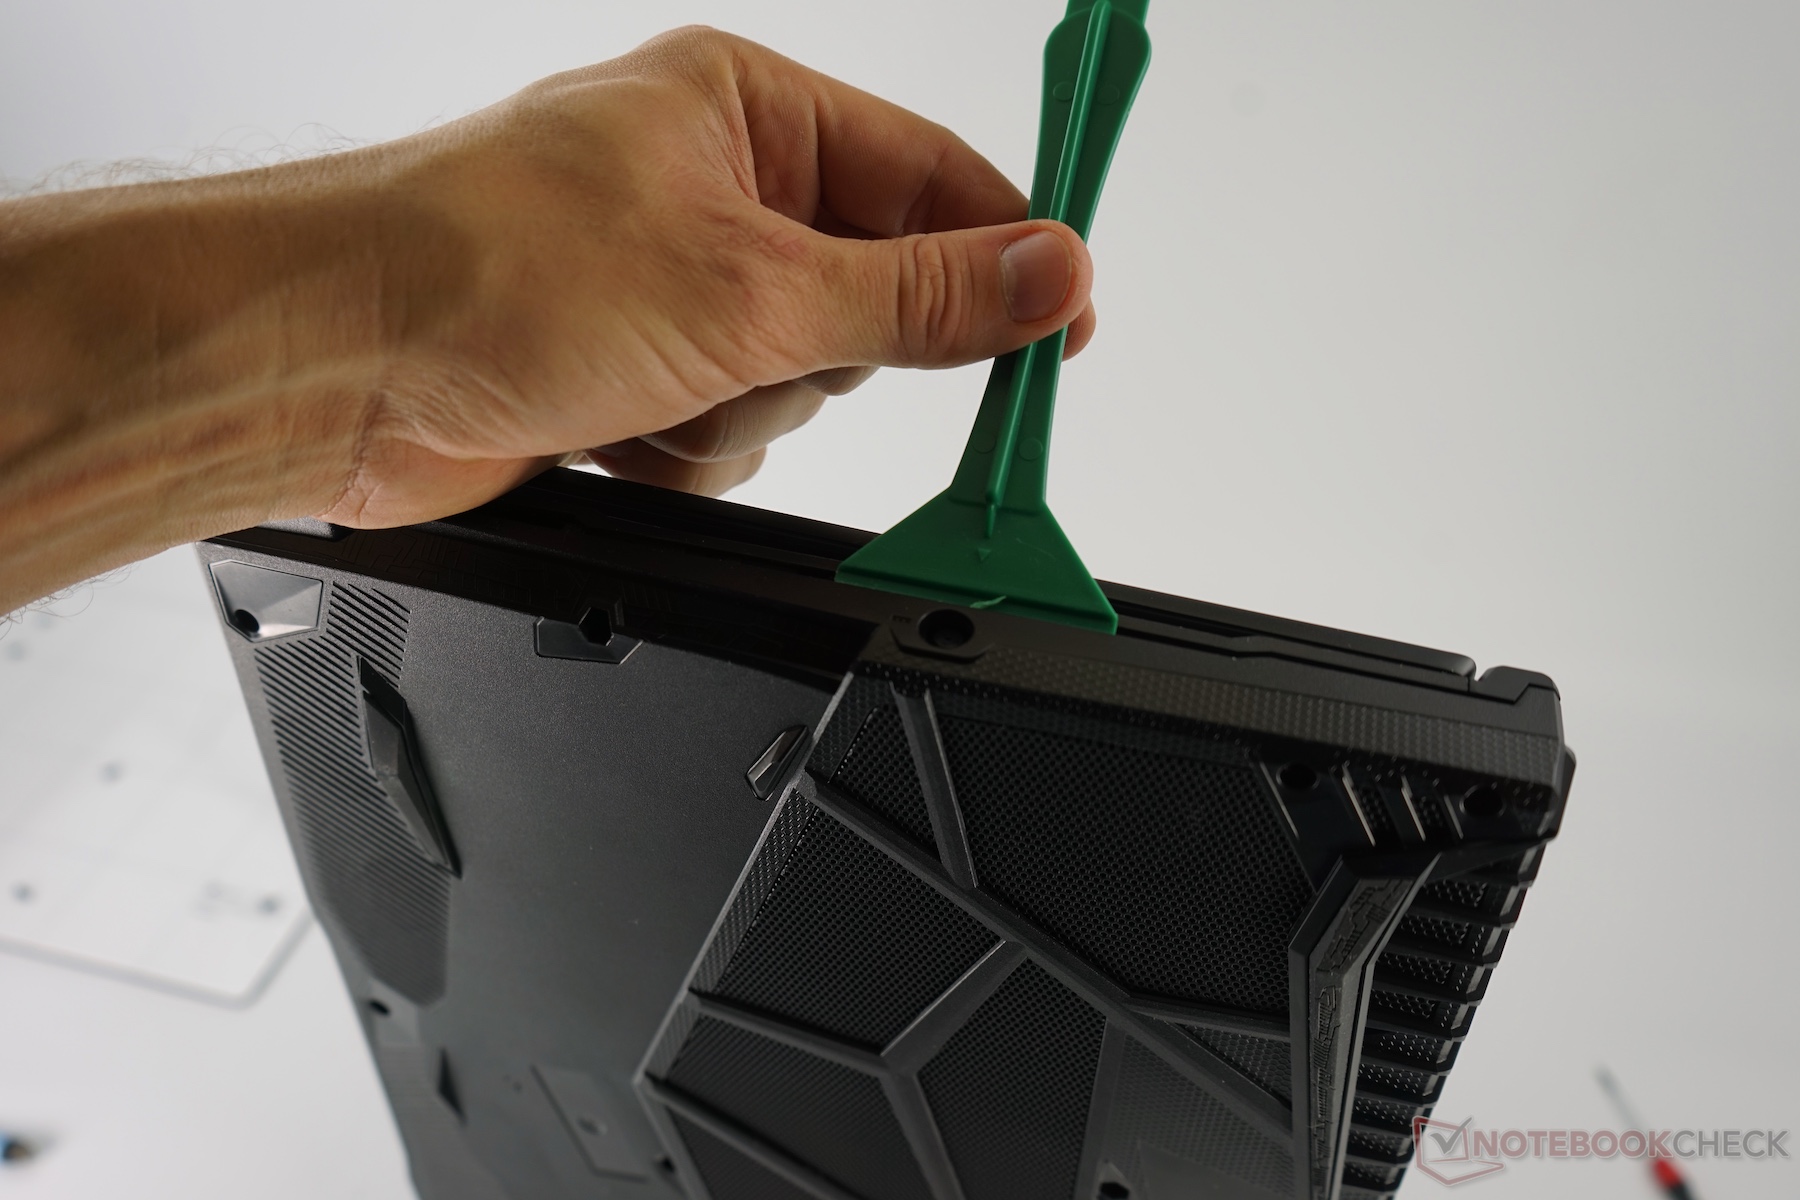
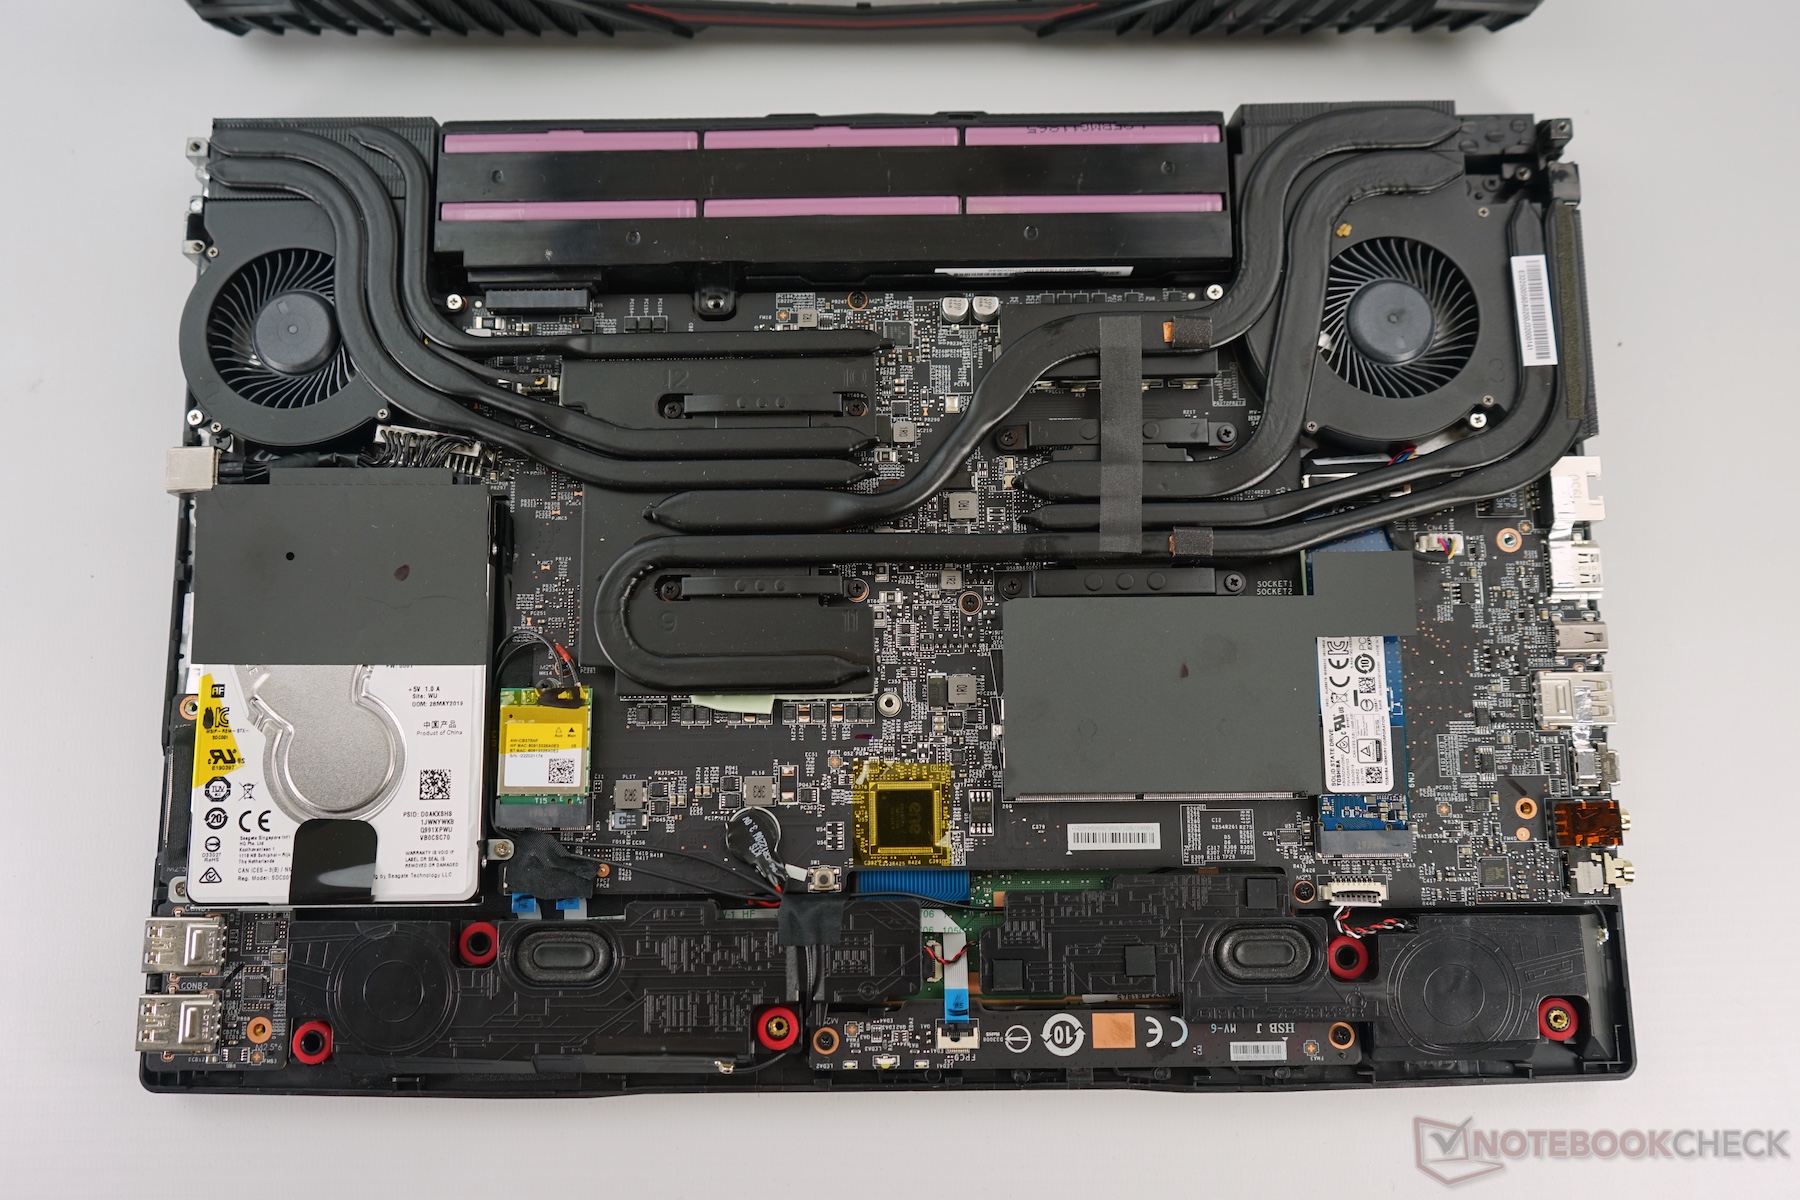
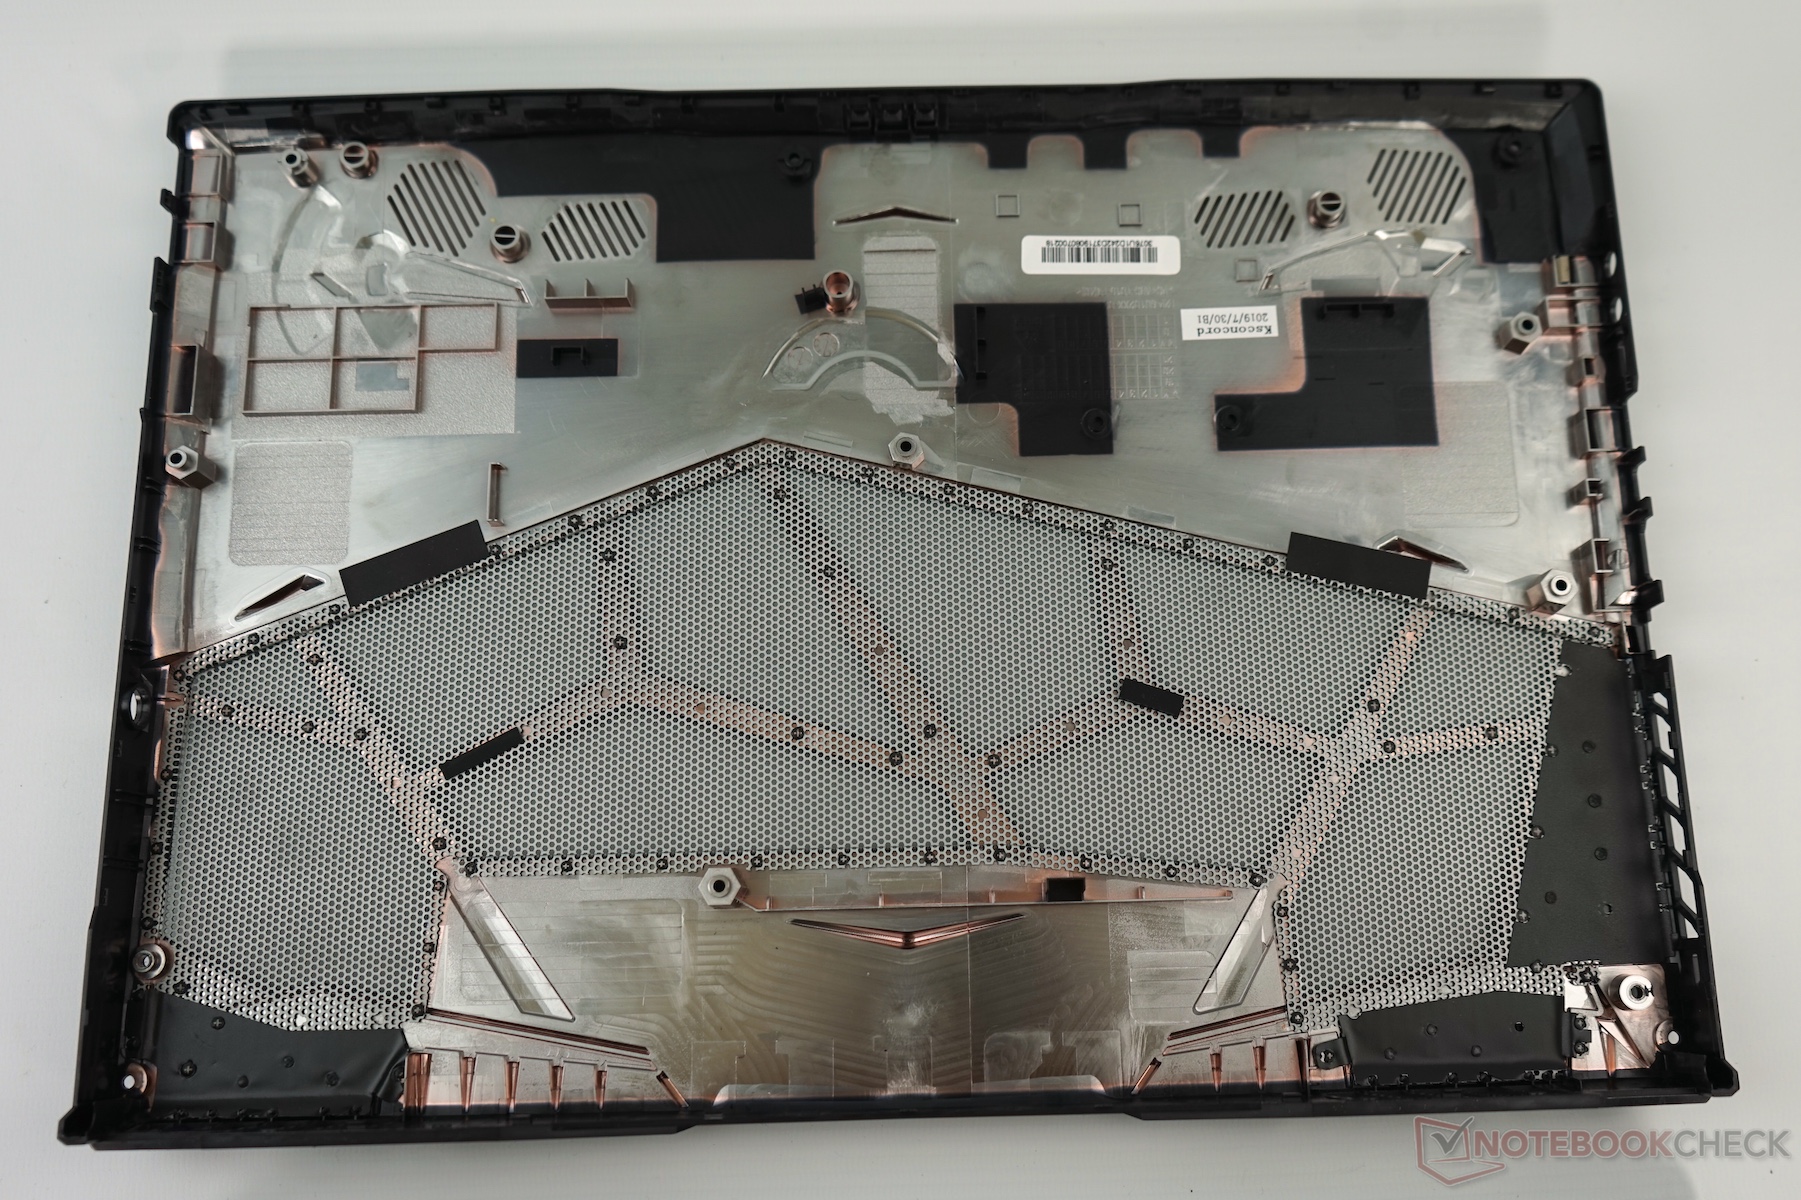
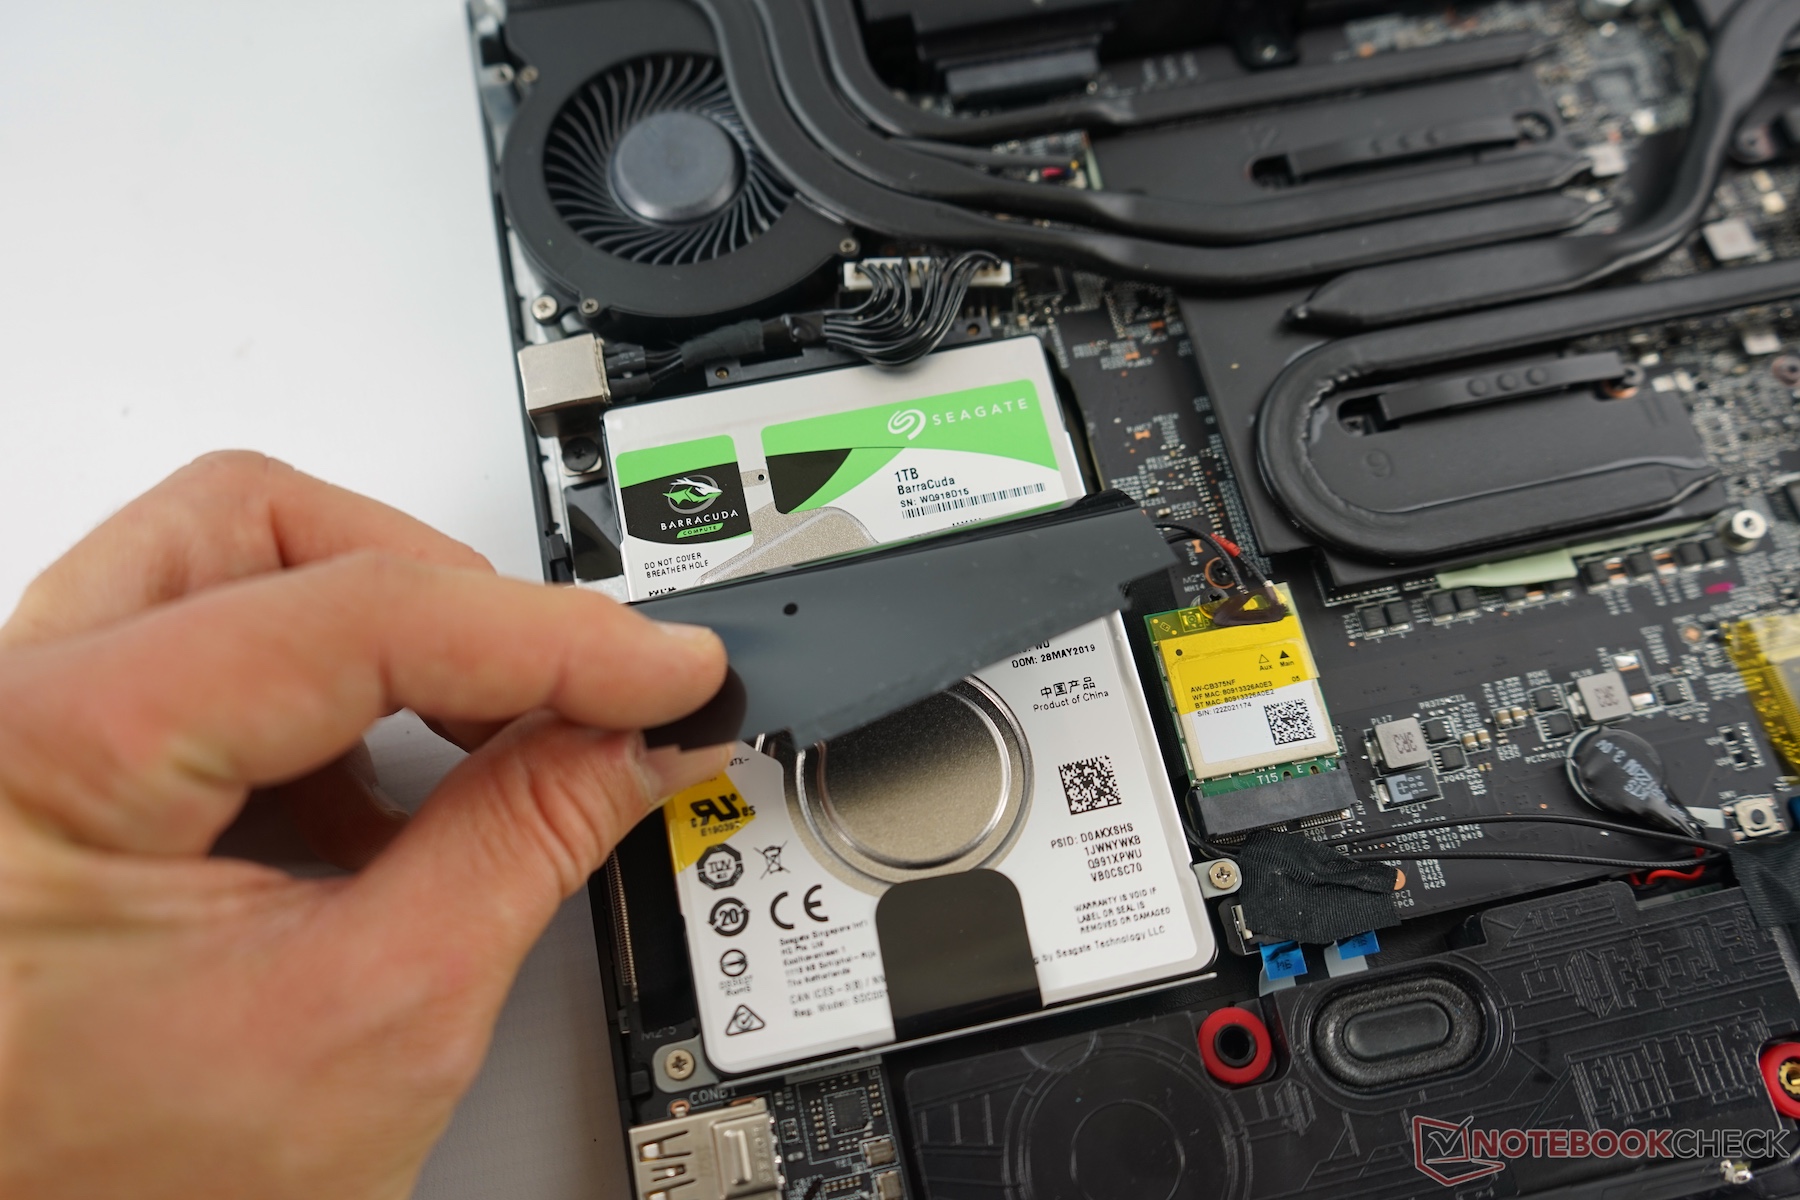
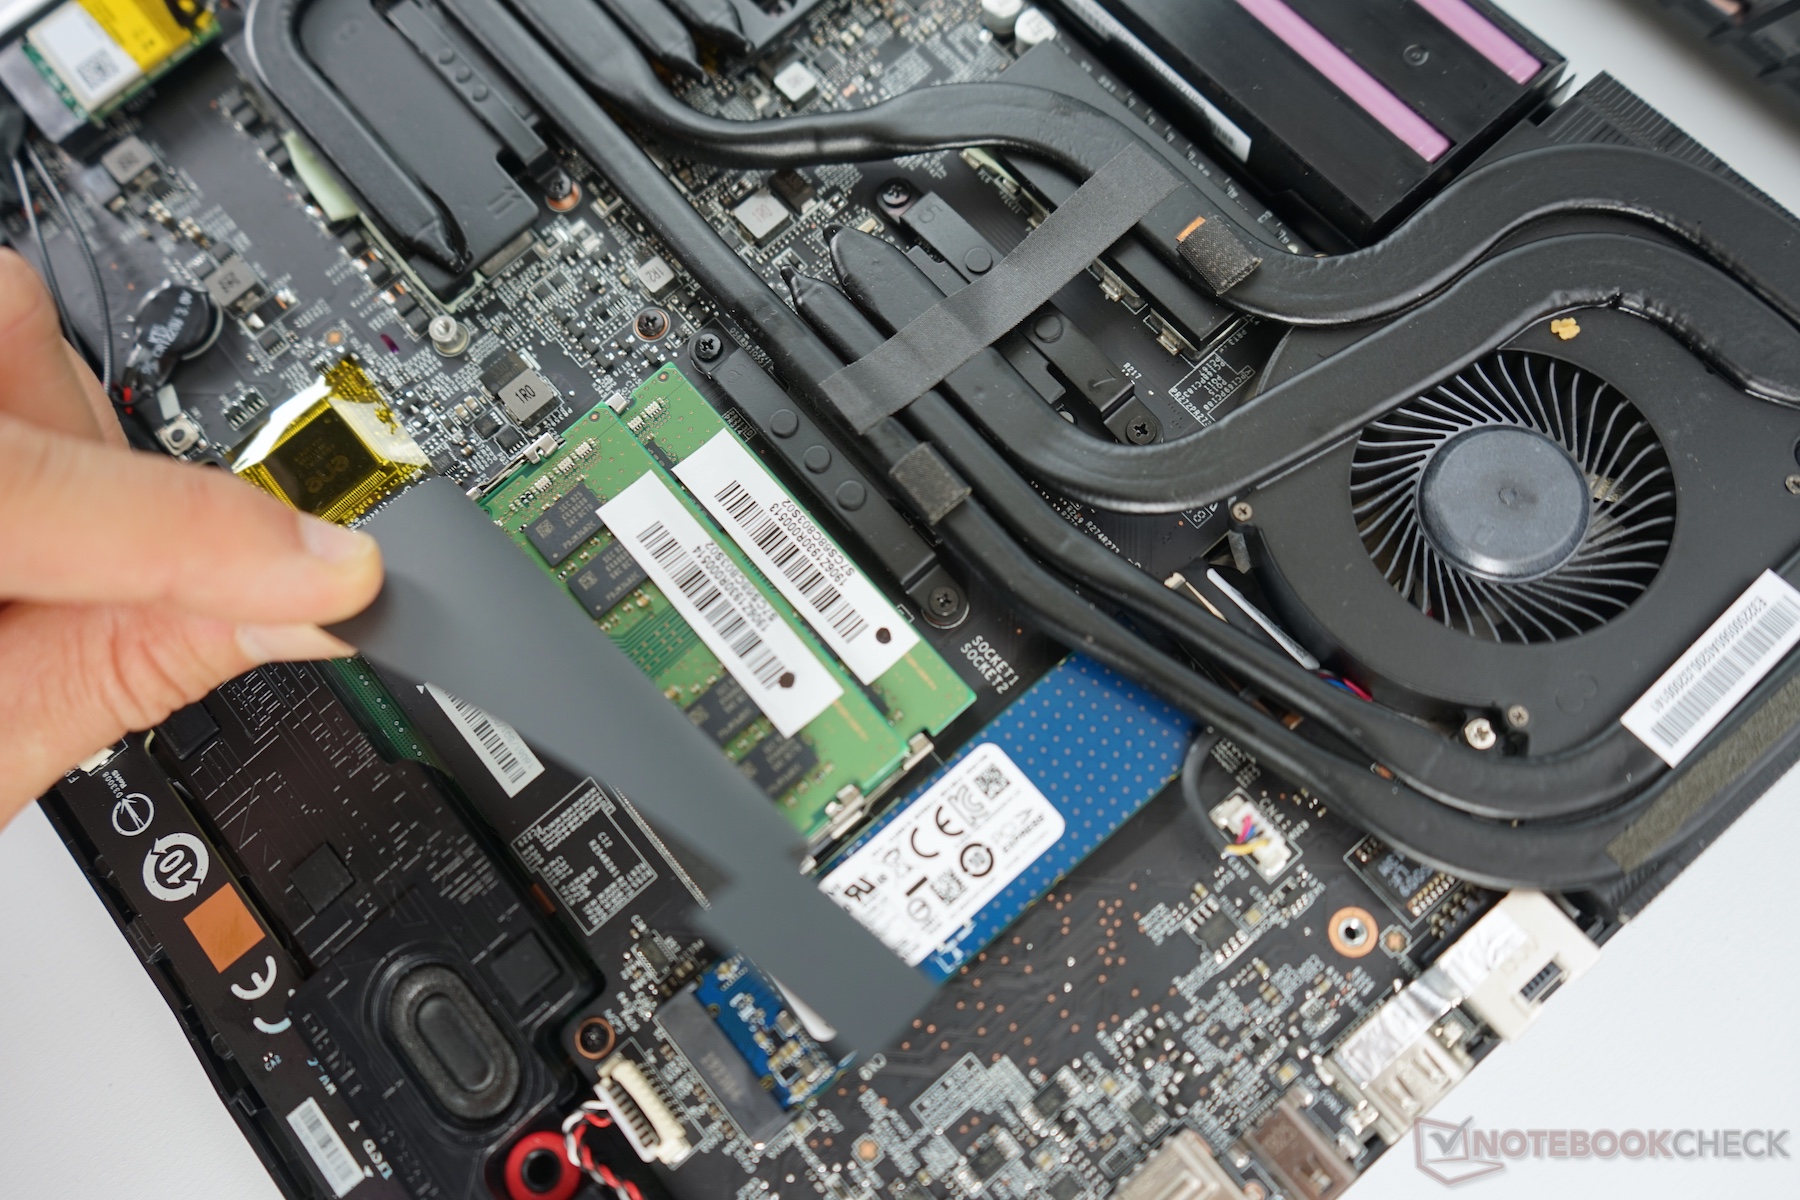
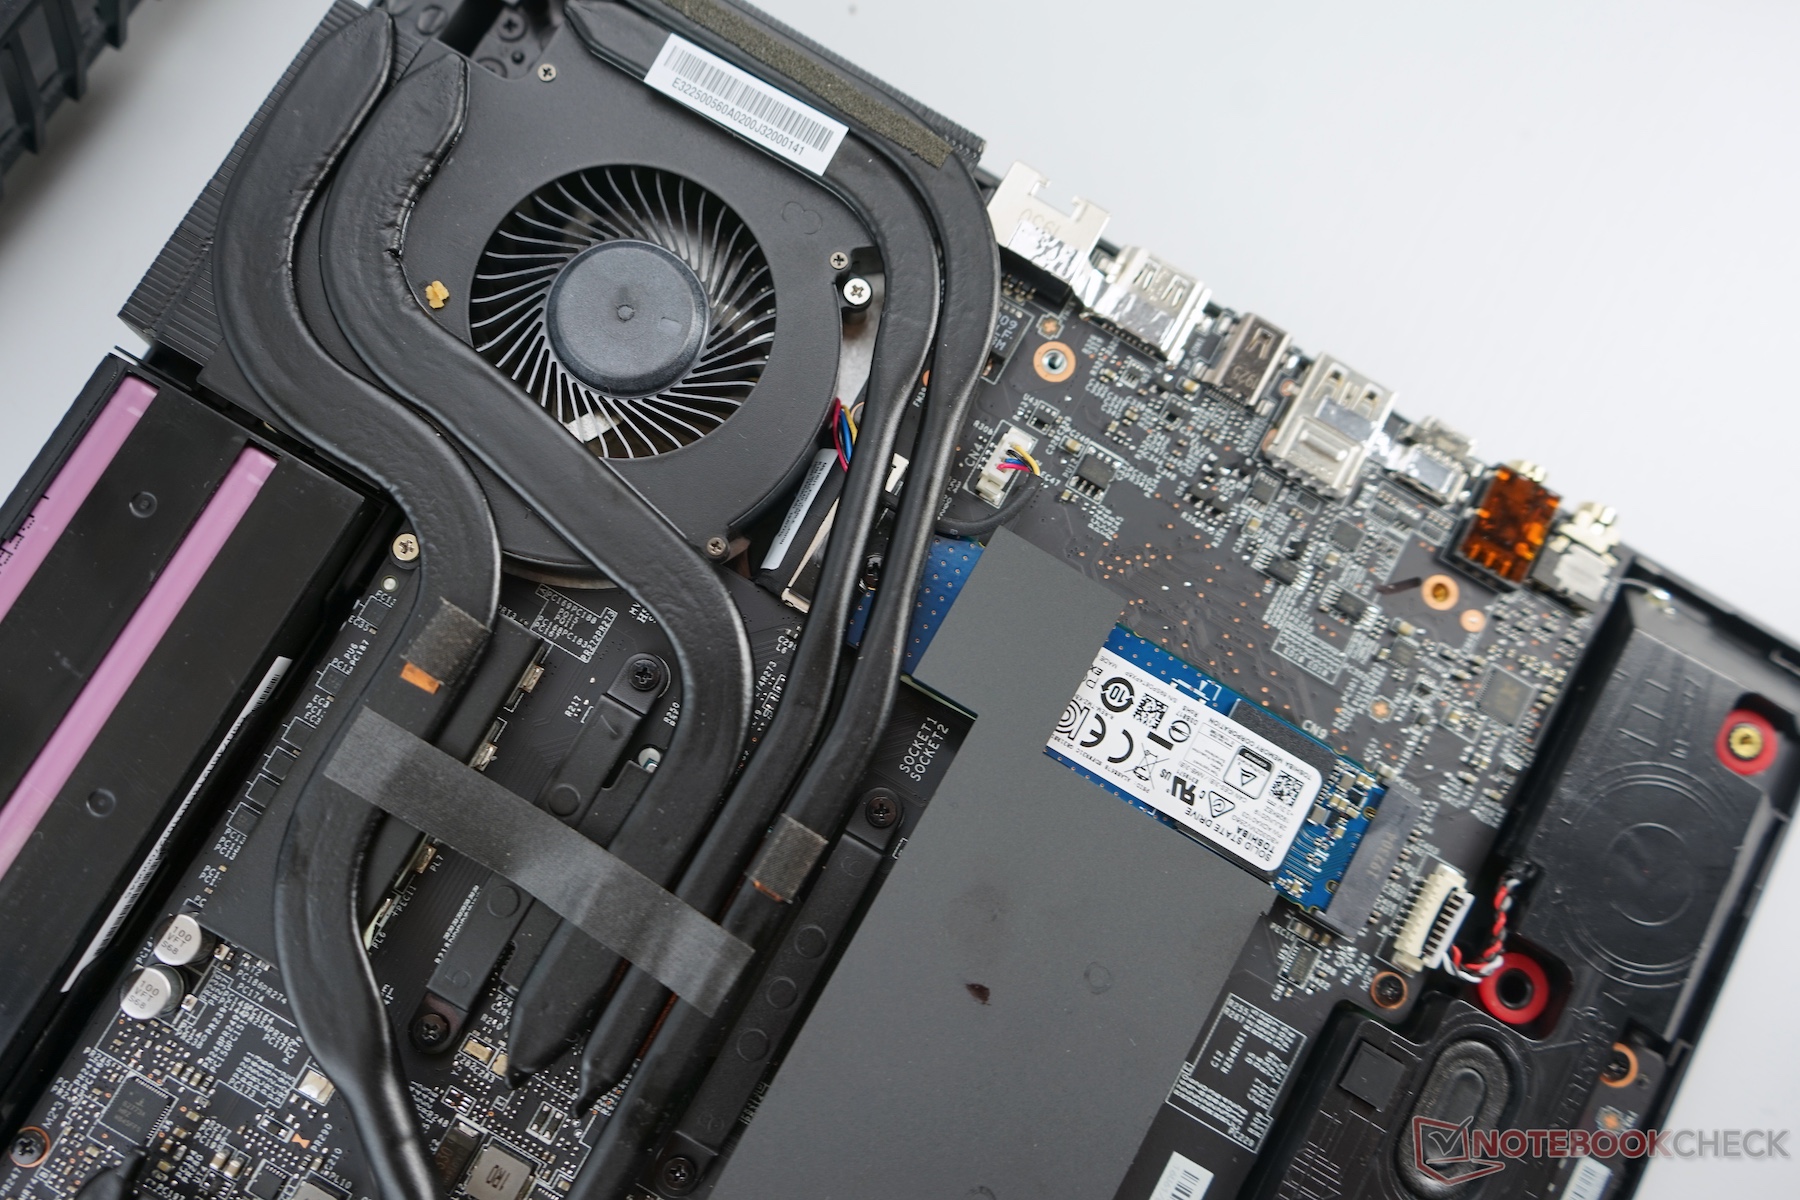
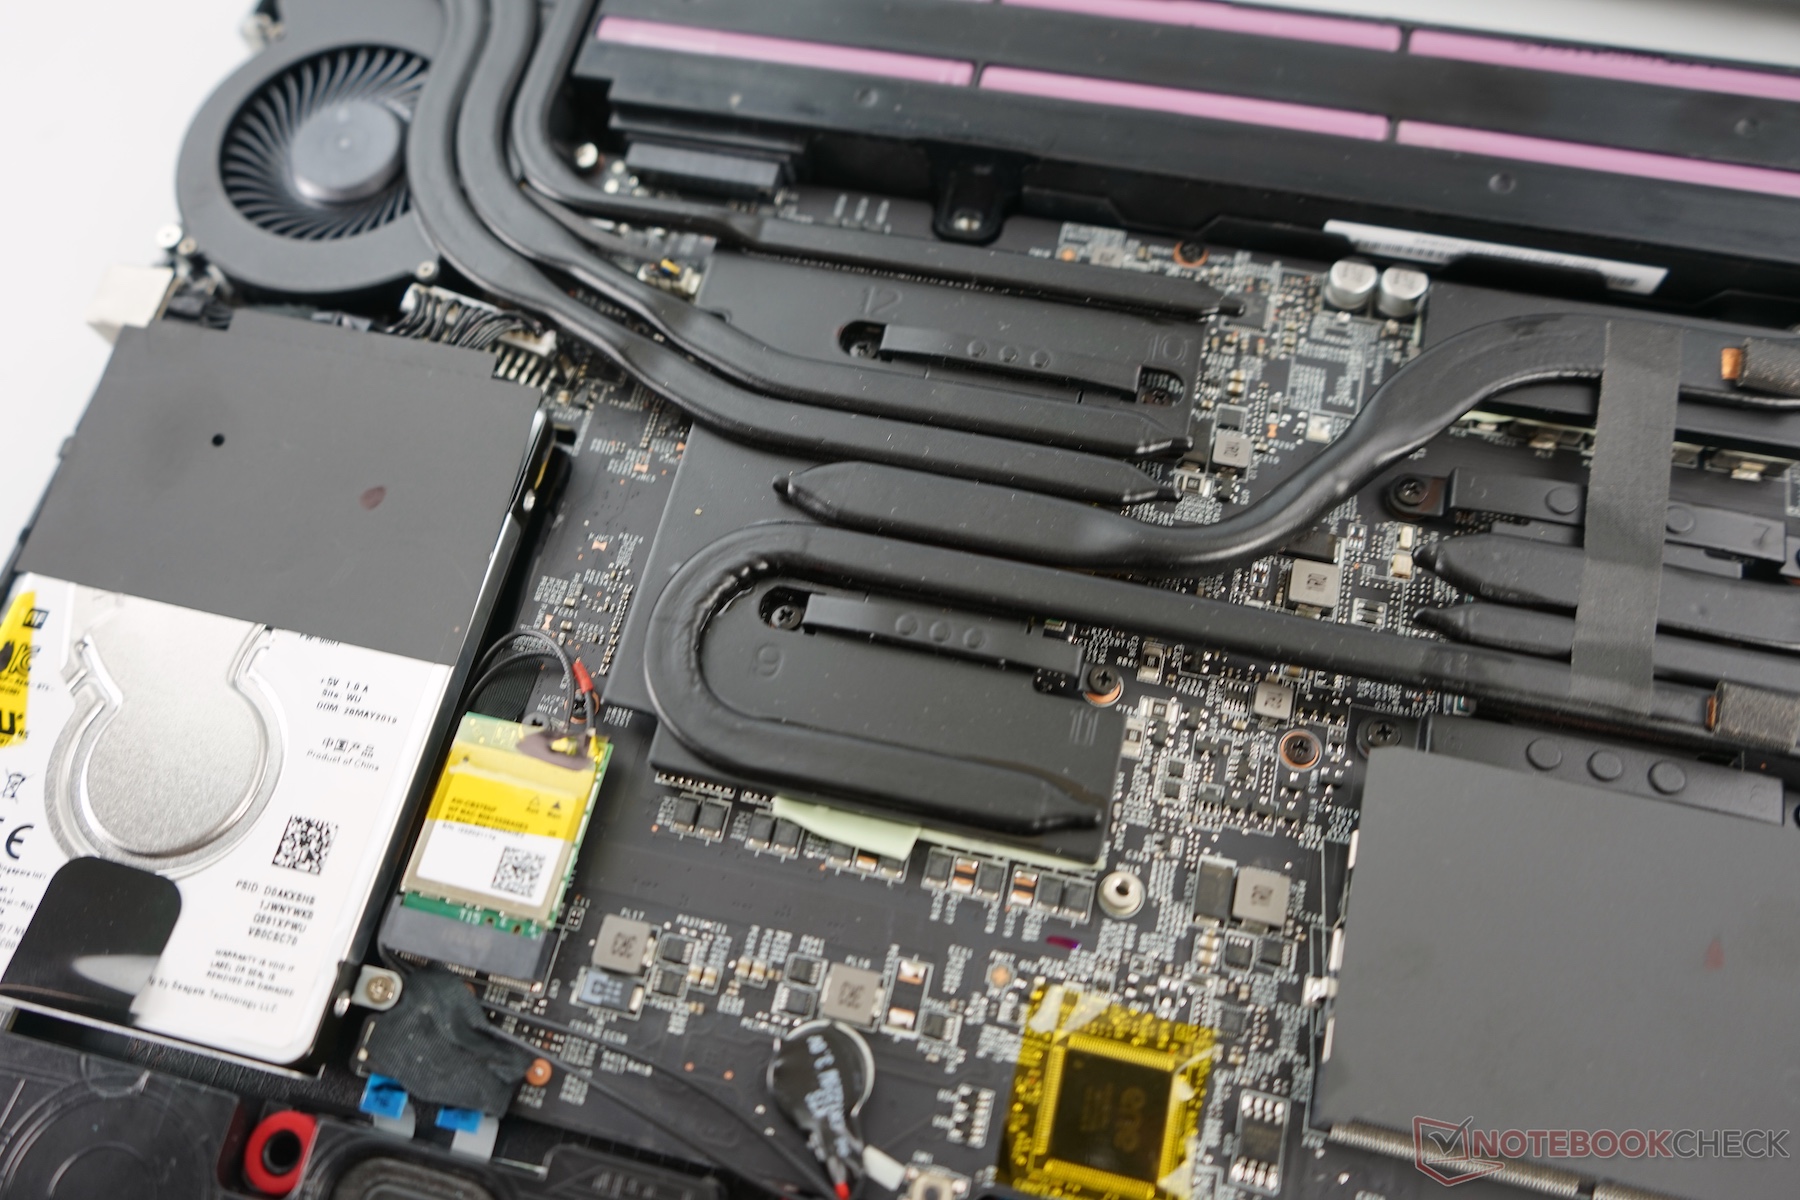
Maintenance
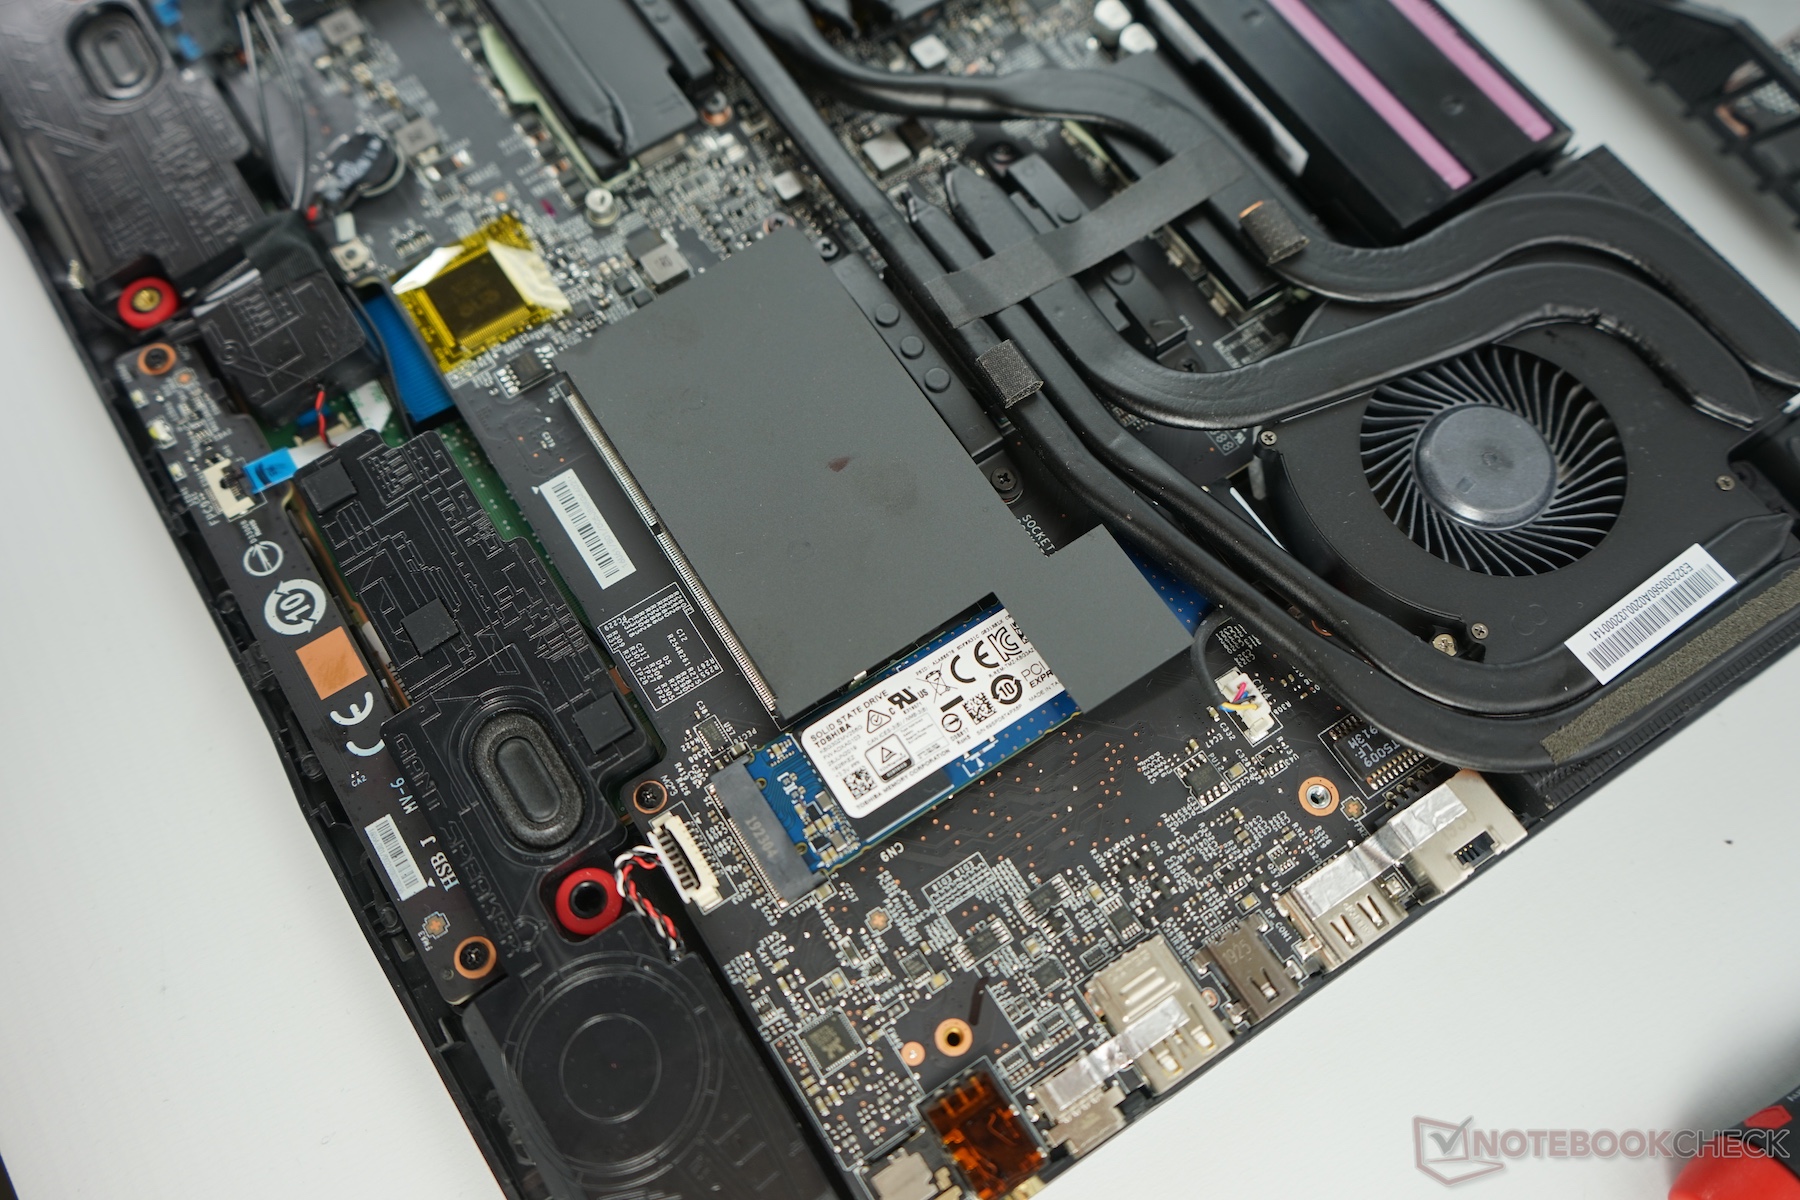
The Alpha 15 is relatively easy to open, and all relevant components are accessible. Unfavourably, MSI has placed the screw securing the M.2 2280 SSD beneath the heatsink, meaning that one must remove the latter to access the former. The fans, heatsink, 2.5-inch drive, RAM and other components are freely accessible though.
Input Devices
Keyboard & Trackpad
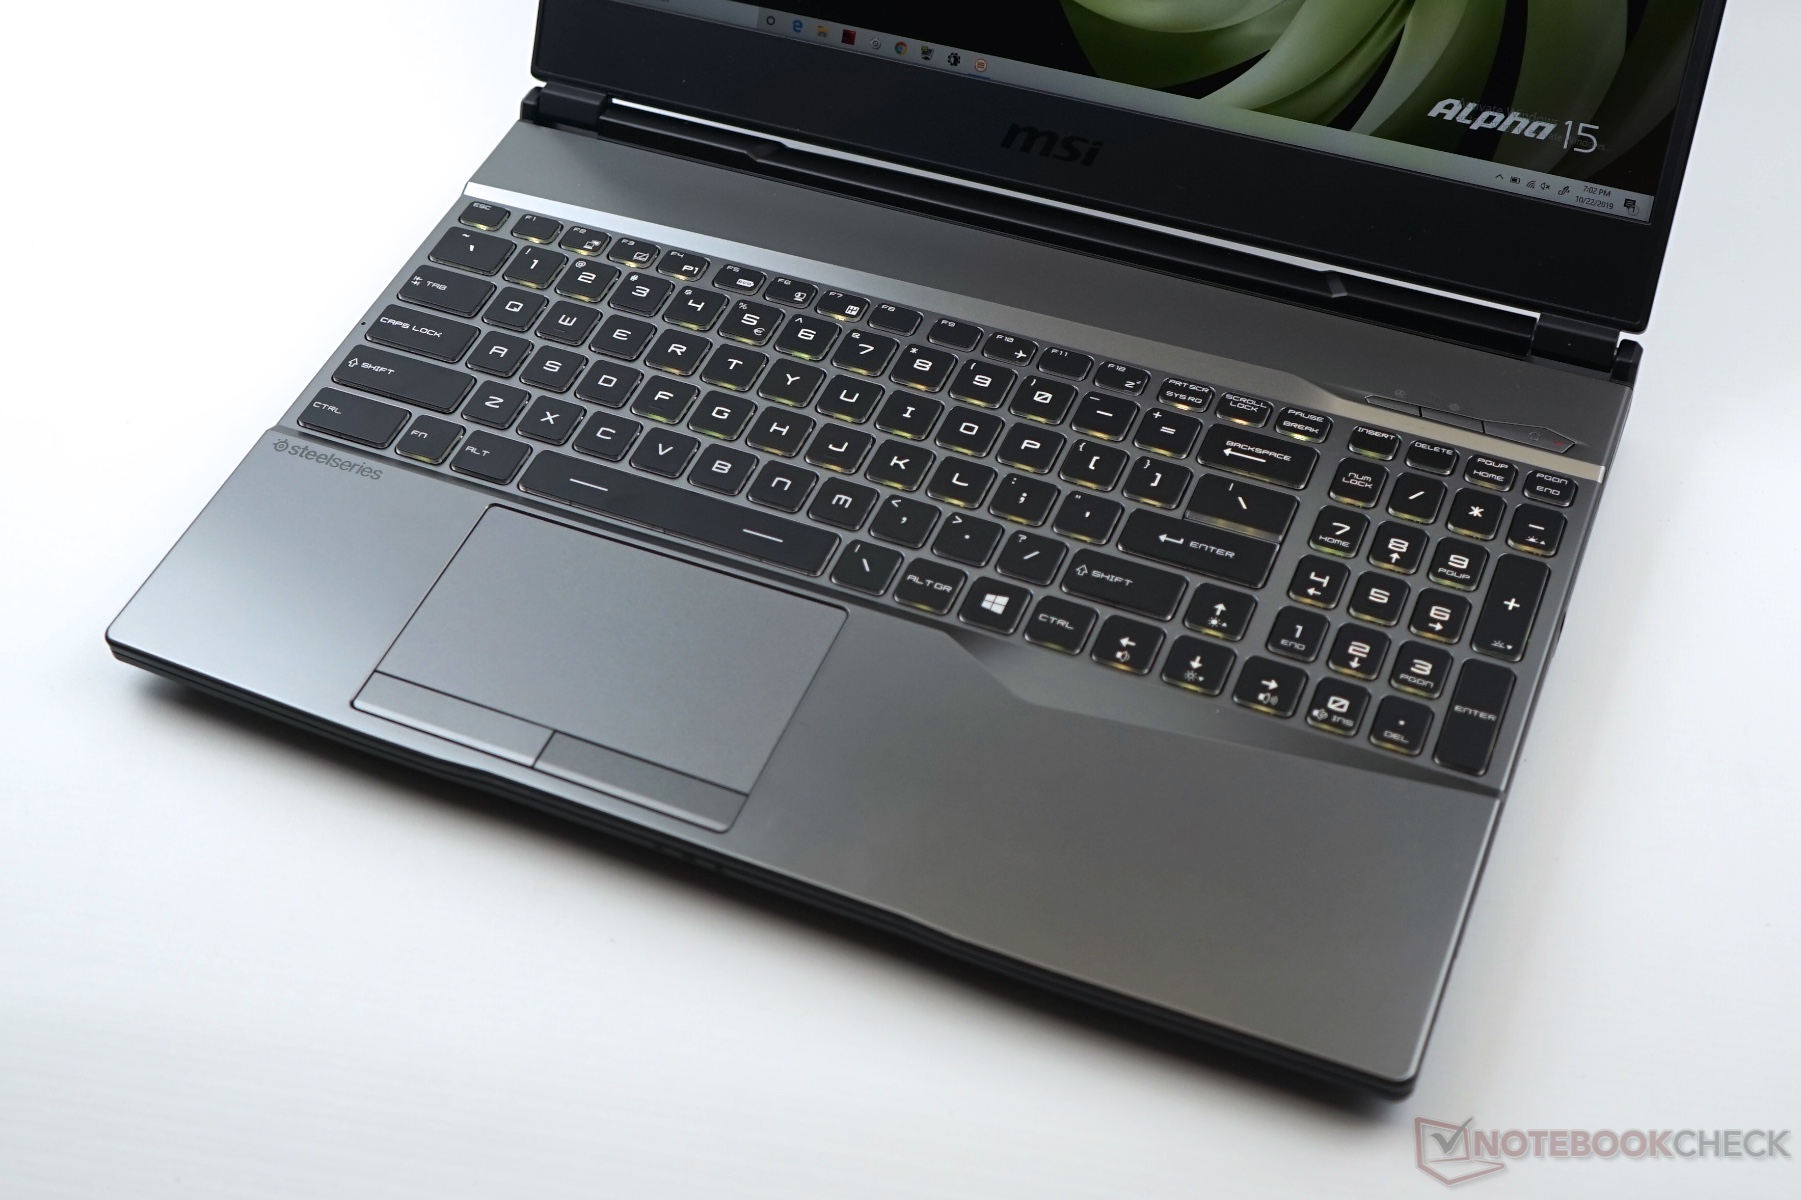
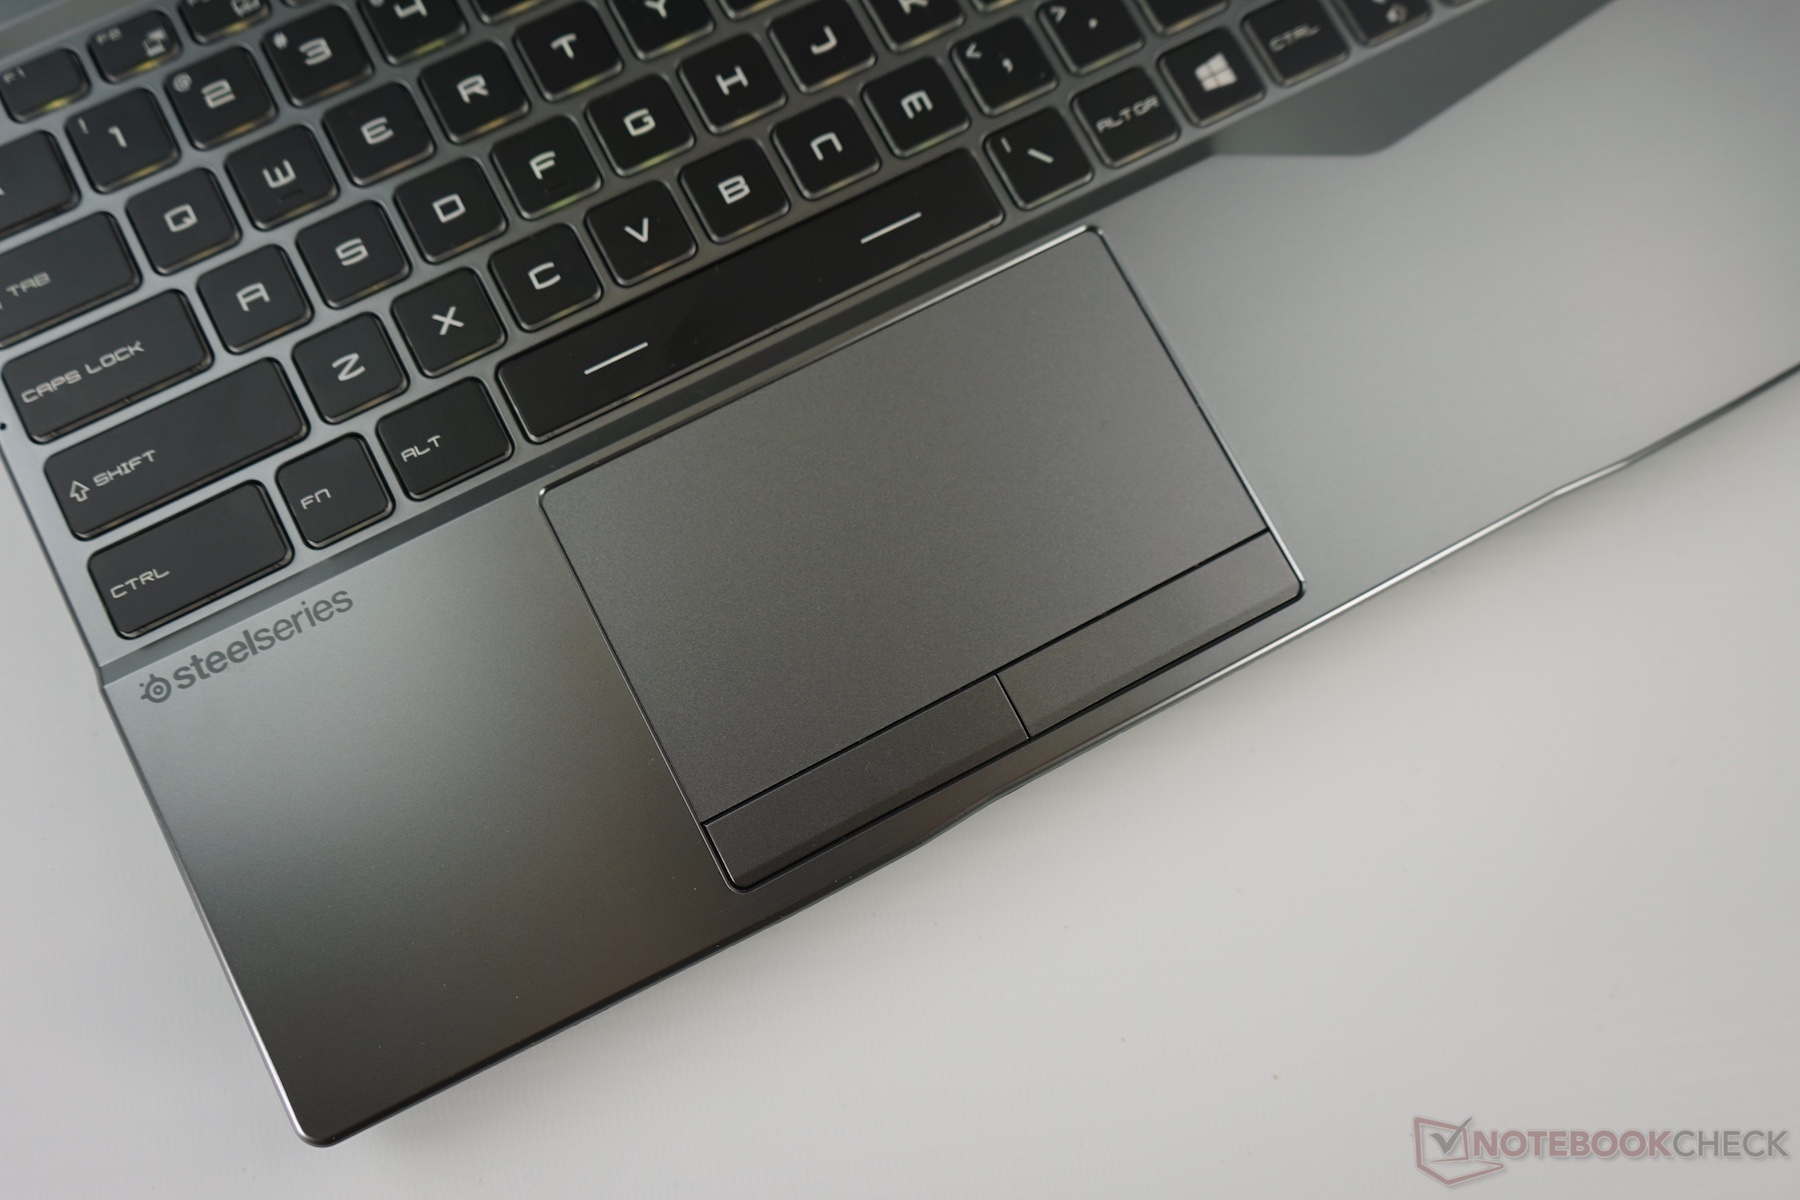
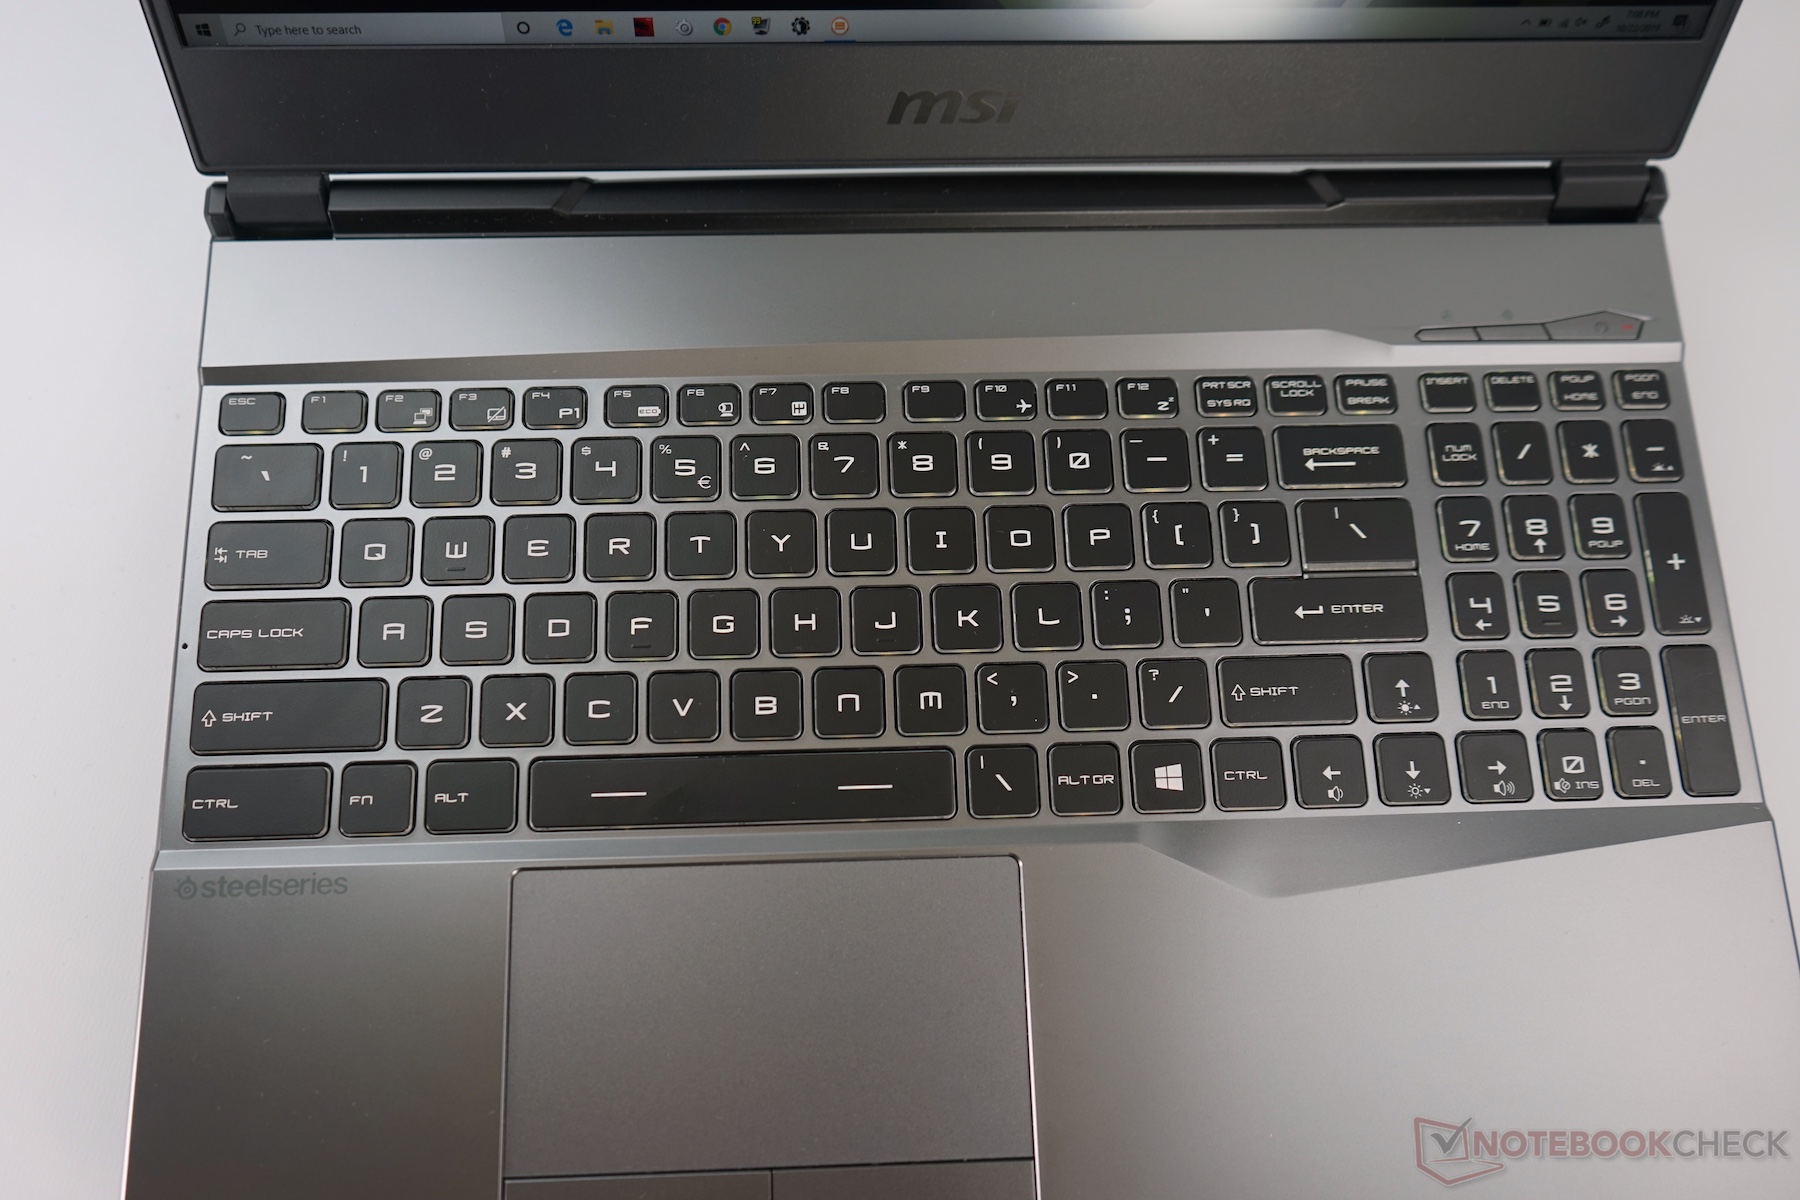
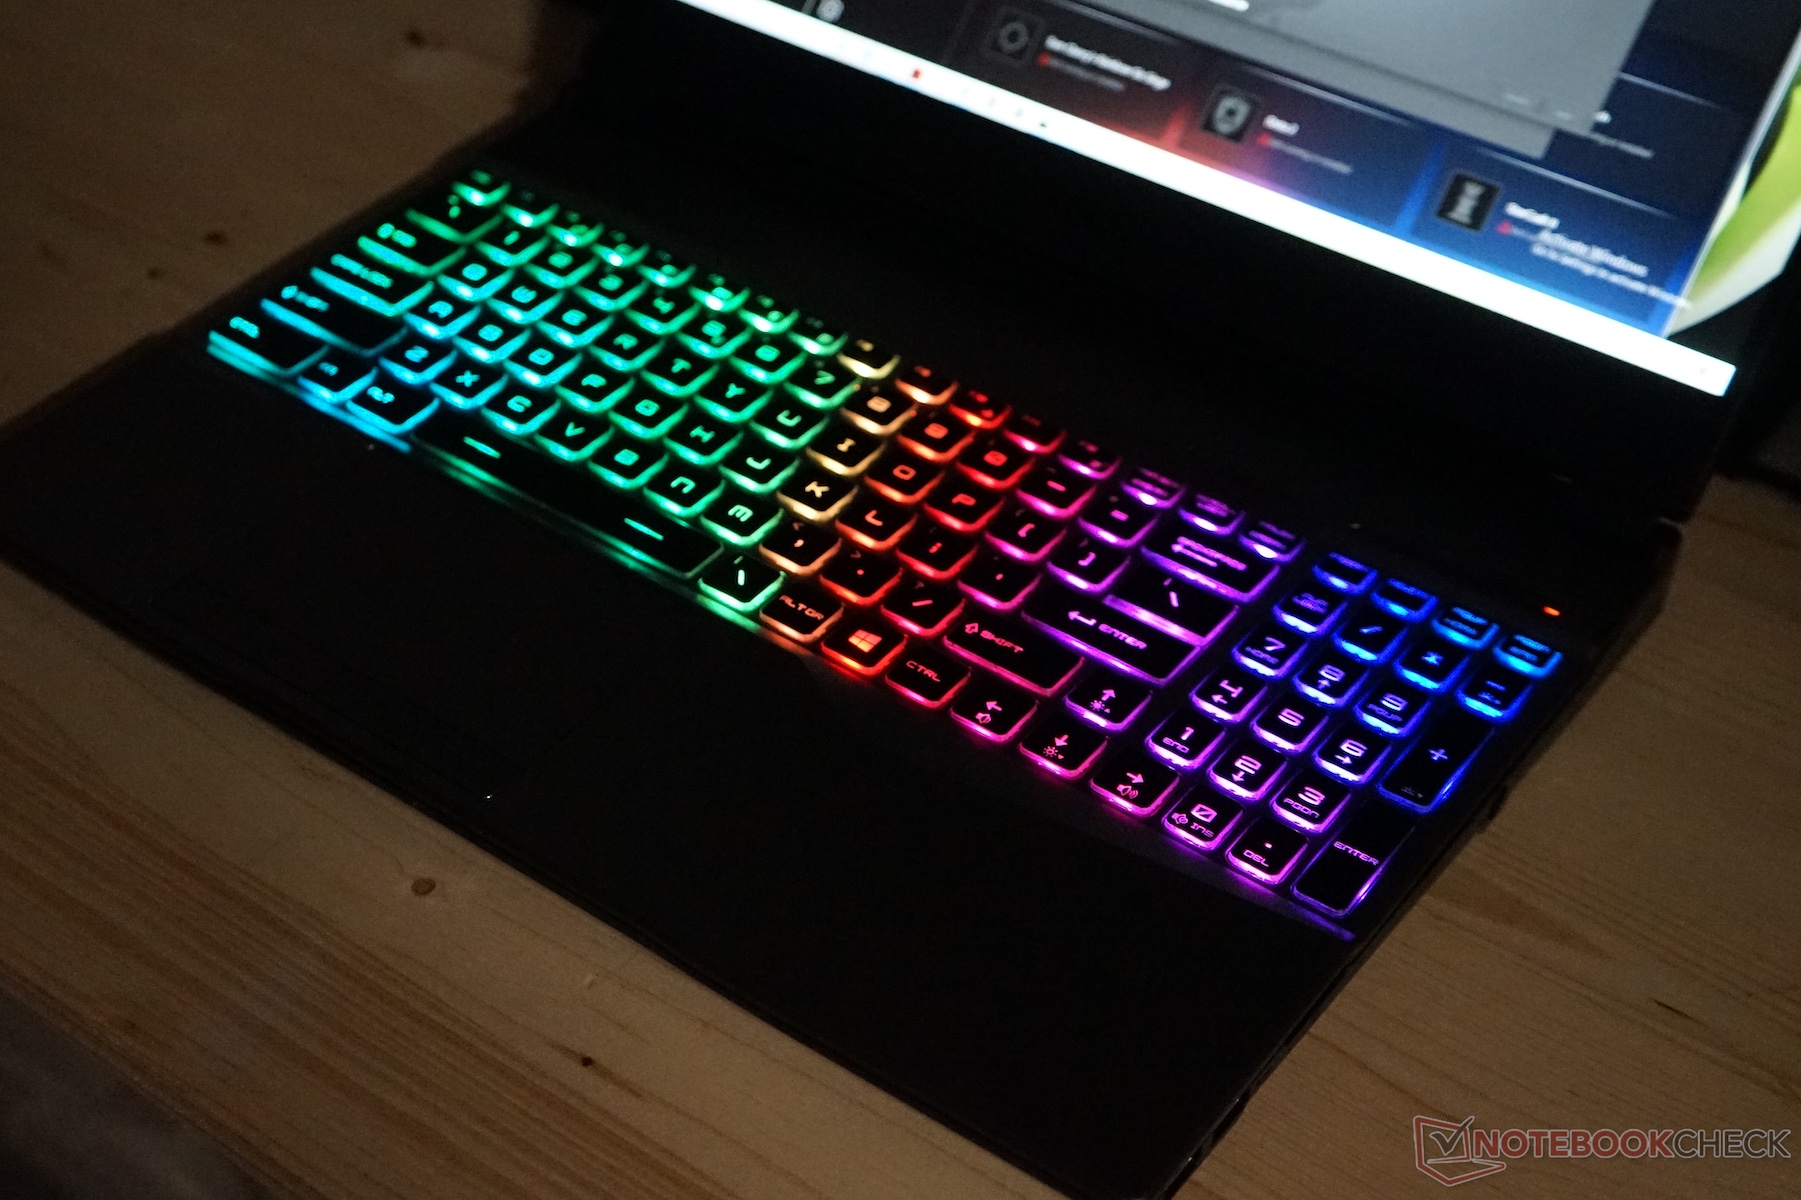
The Alpha 15 should come with a standard Steelseries keyboard, the likes of which MSI currently uses in the GL65 9SEK. The keyboard in our pre-production model has per-key RGB backlighting and delivers pleasant haptics. The trackpad is fine too.
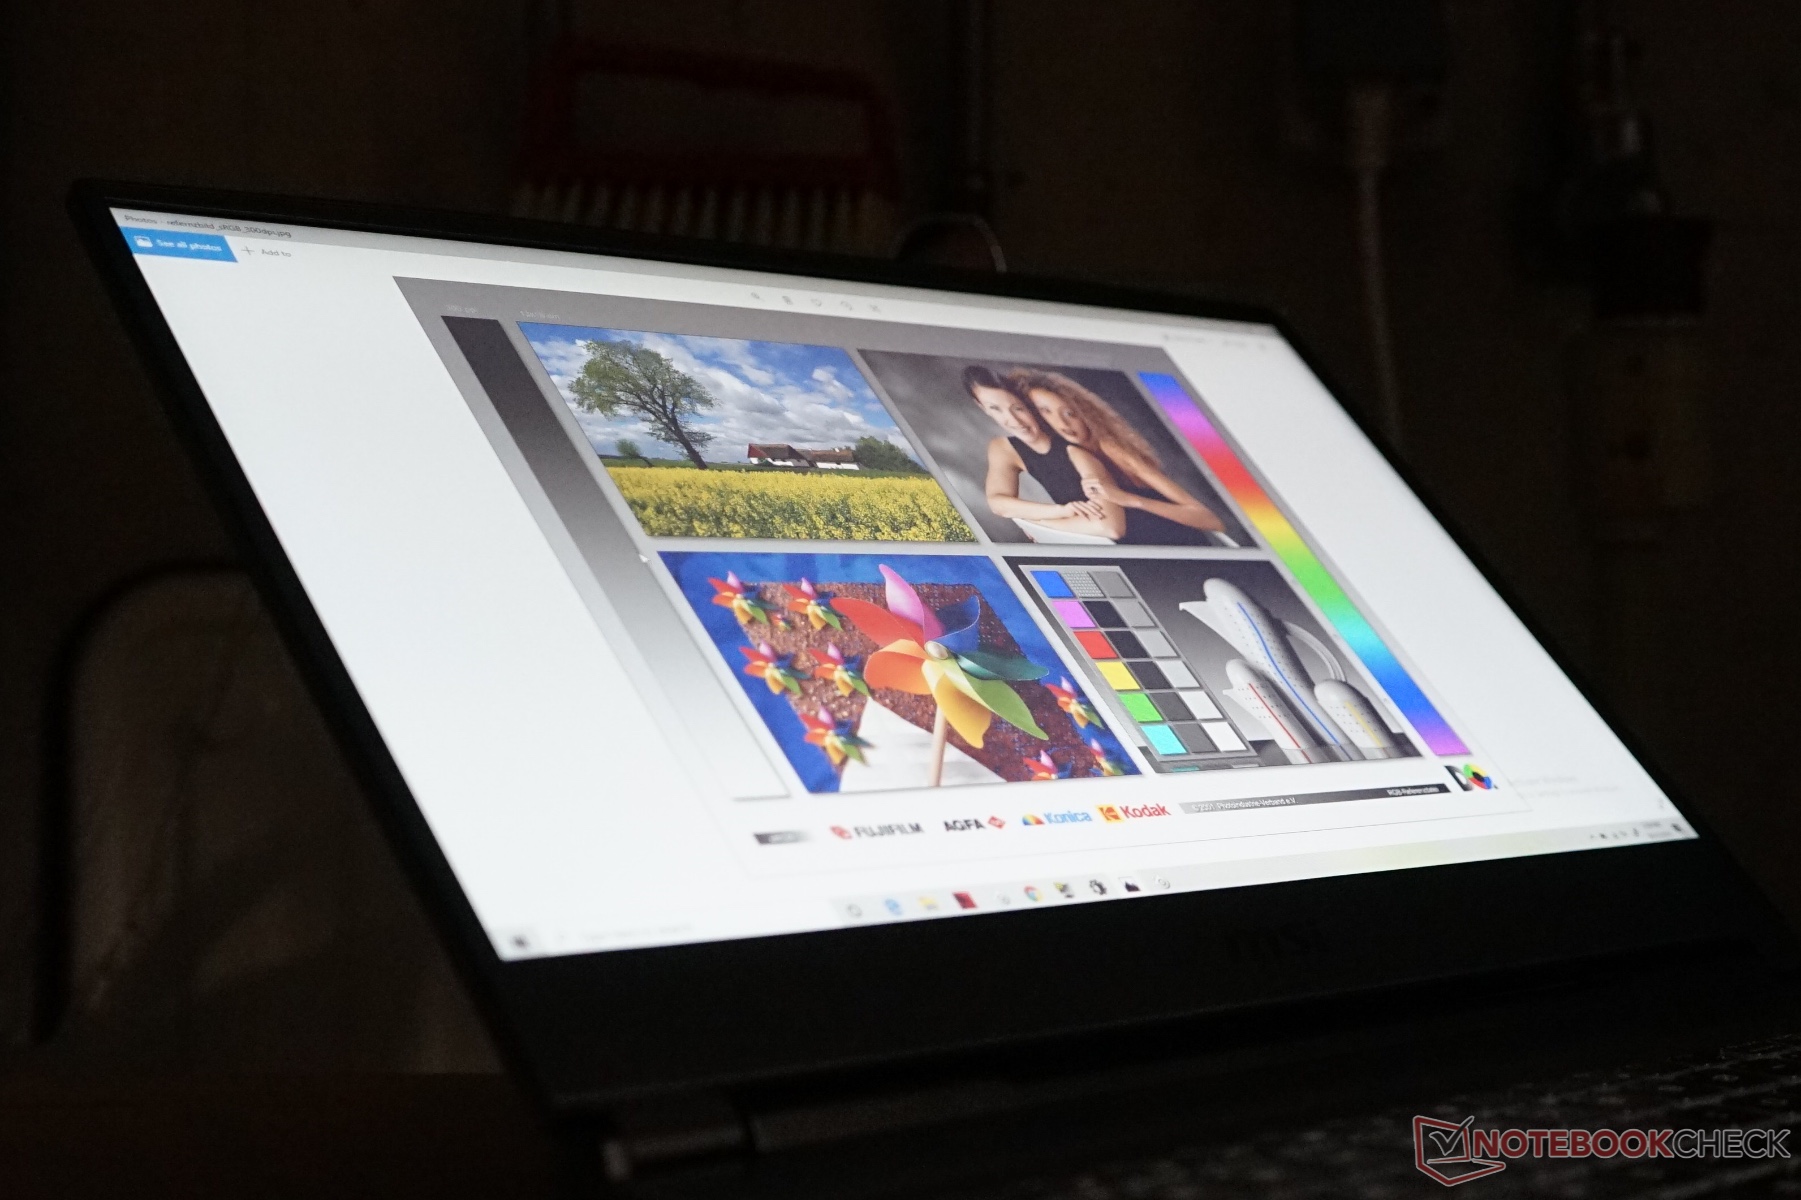
Display
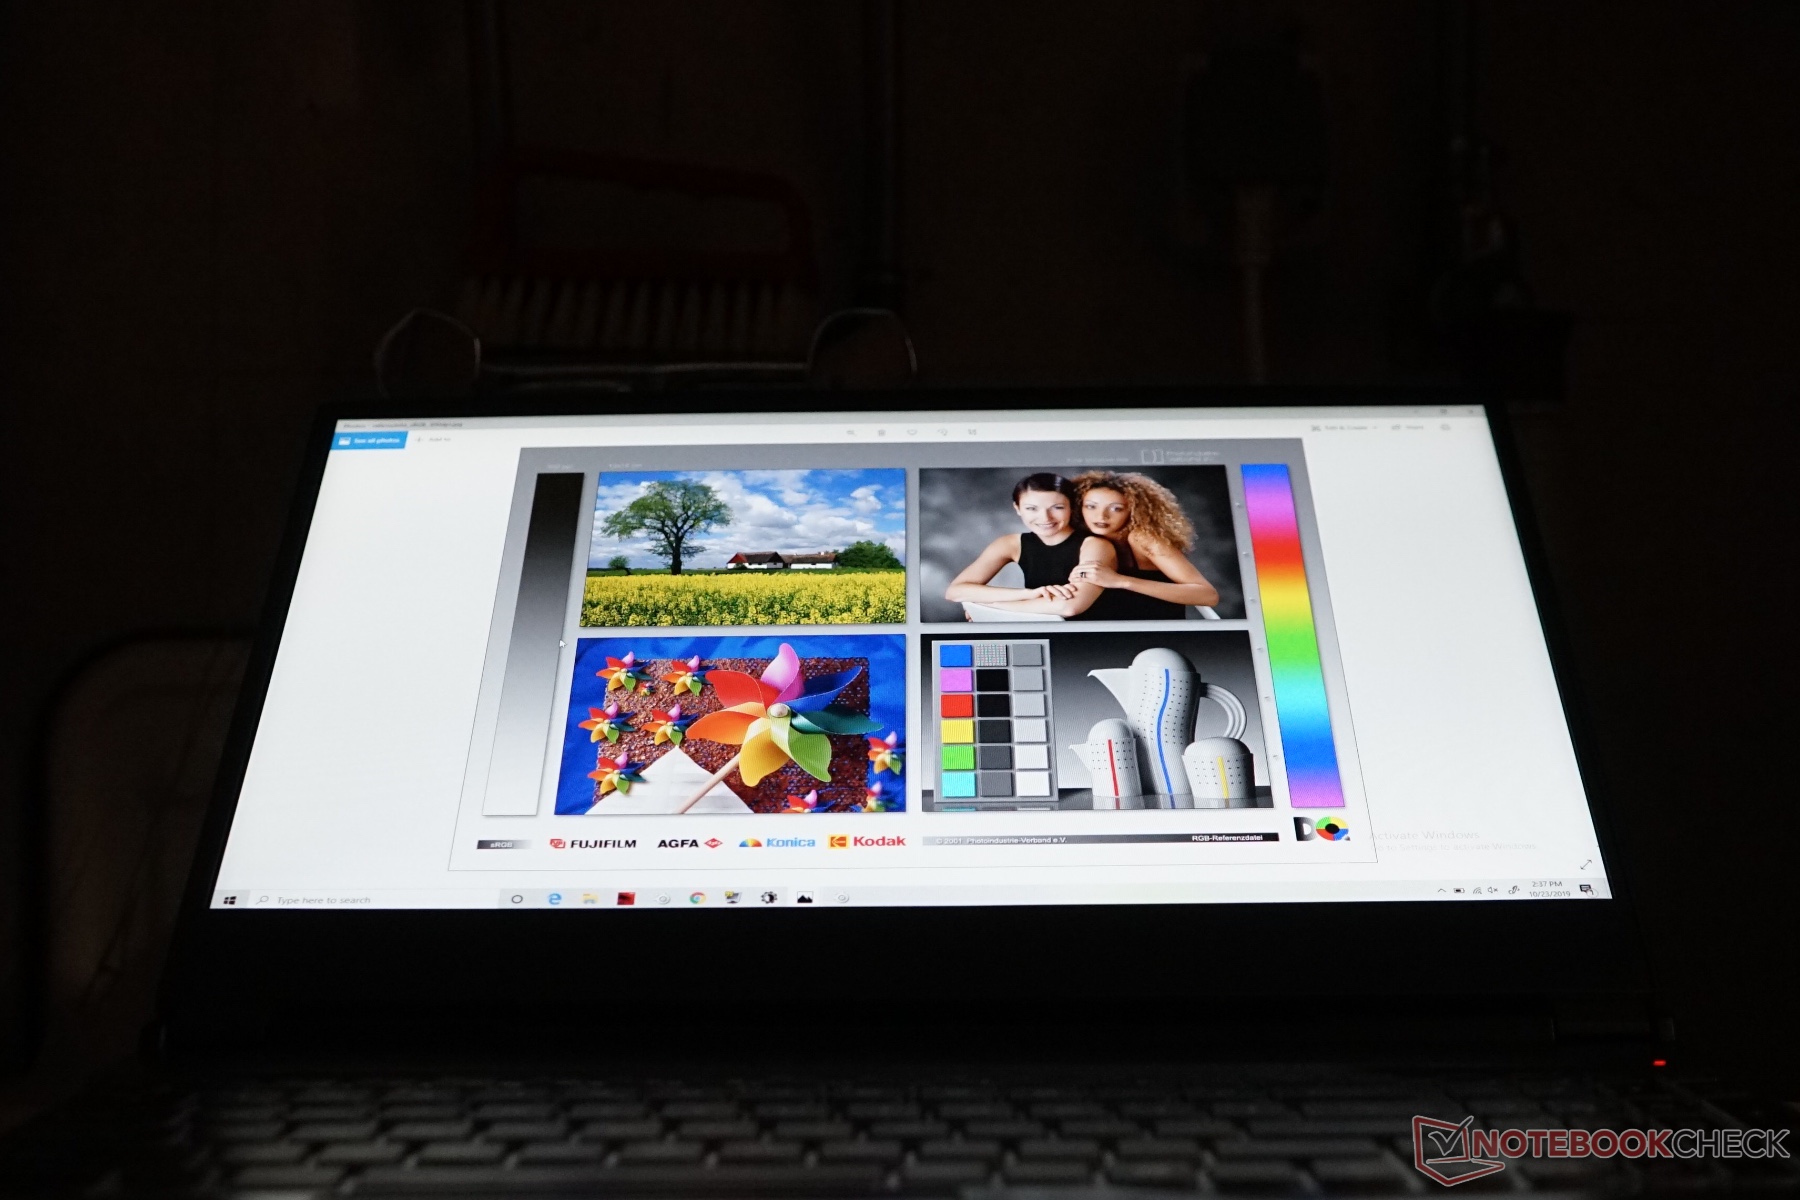
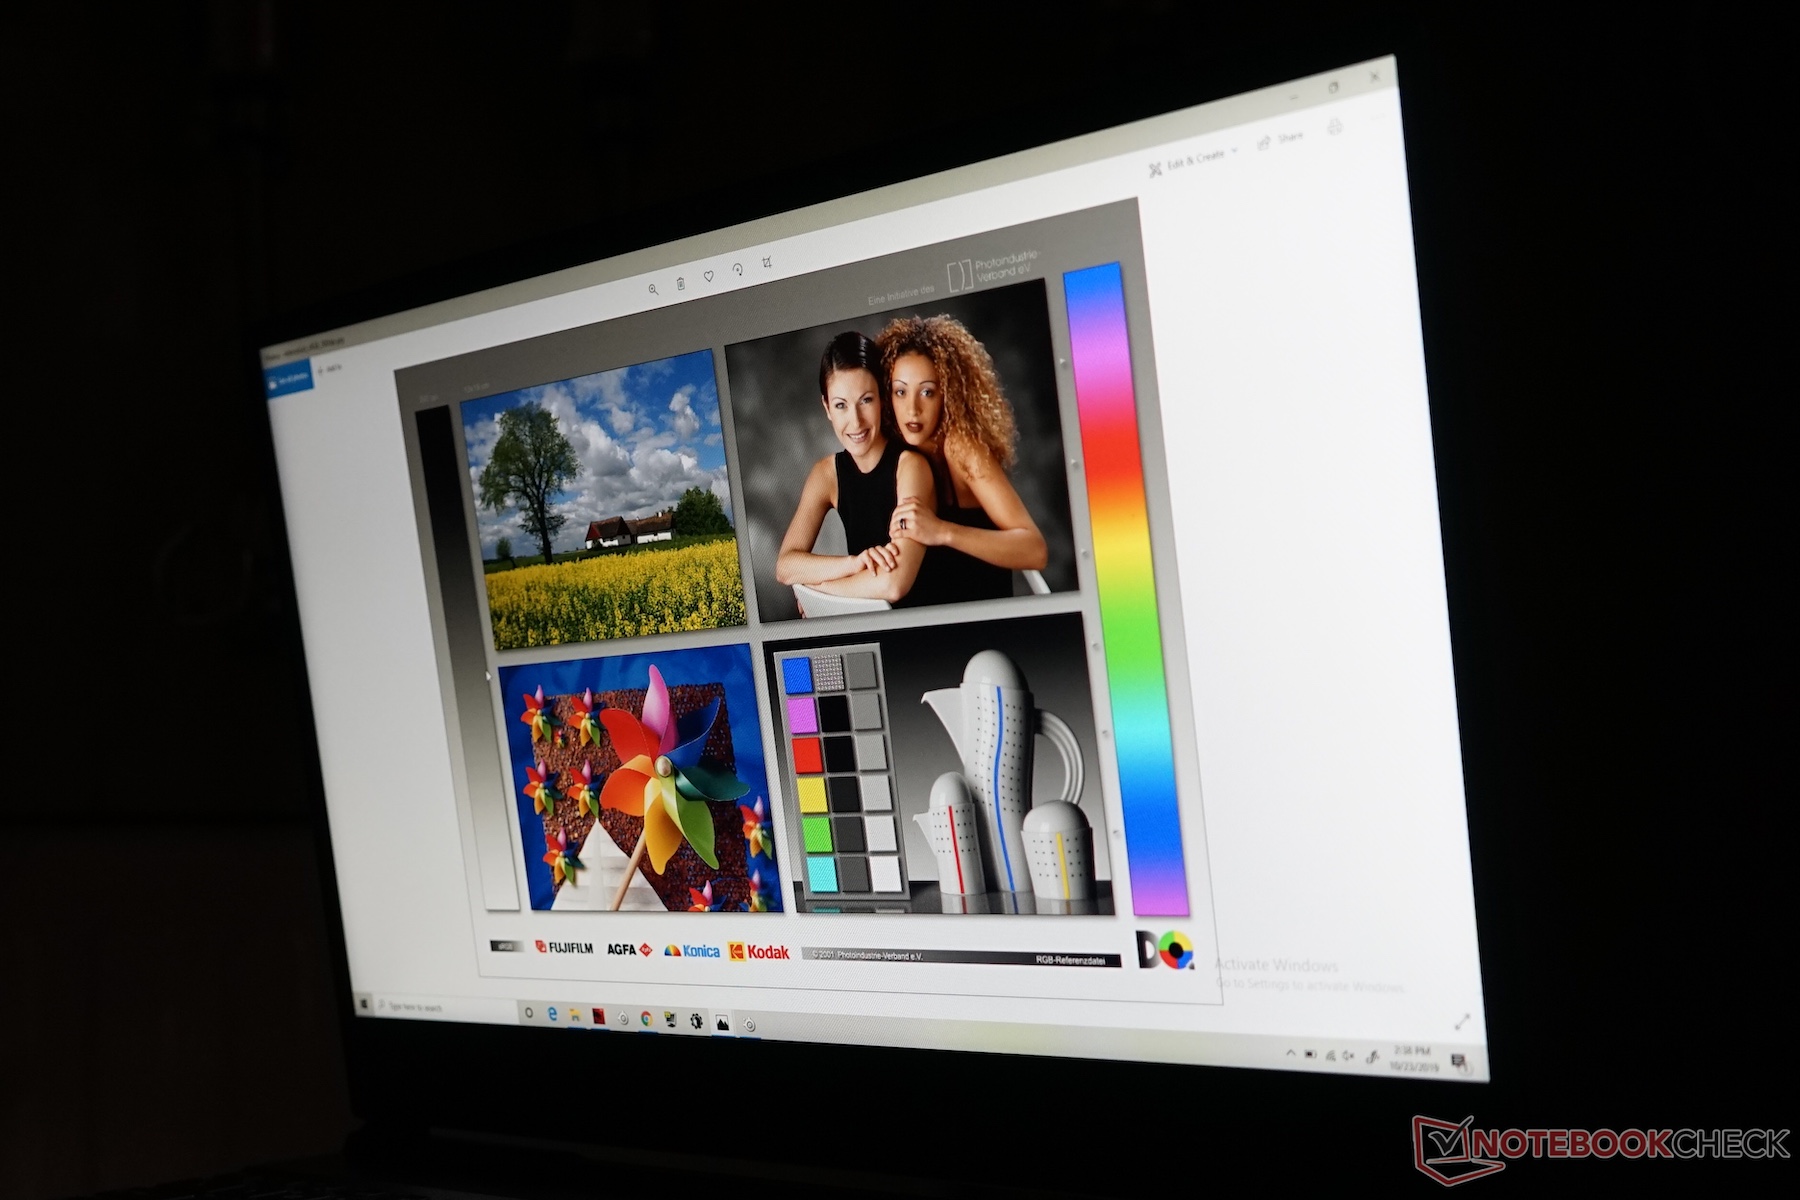
According to initial information, MSI will offer the Alpha 15 with either 120 or 144 Hz displays. The latter will cost around €100 (~US$111) more than the former. Our pre-production model has the entry-level 120 Hz display, a 1080p panel manufactured by AU Optronics. The display, which carries the model number AUOD0ED, fits well with the targeted performance of the Ryzen 7 3750H and Radeon RX 5500M.
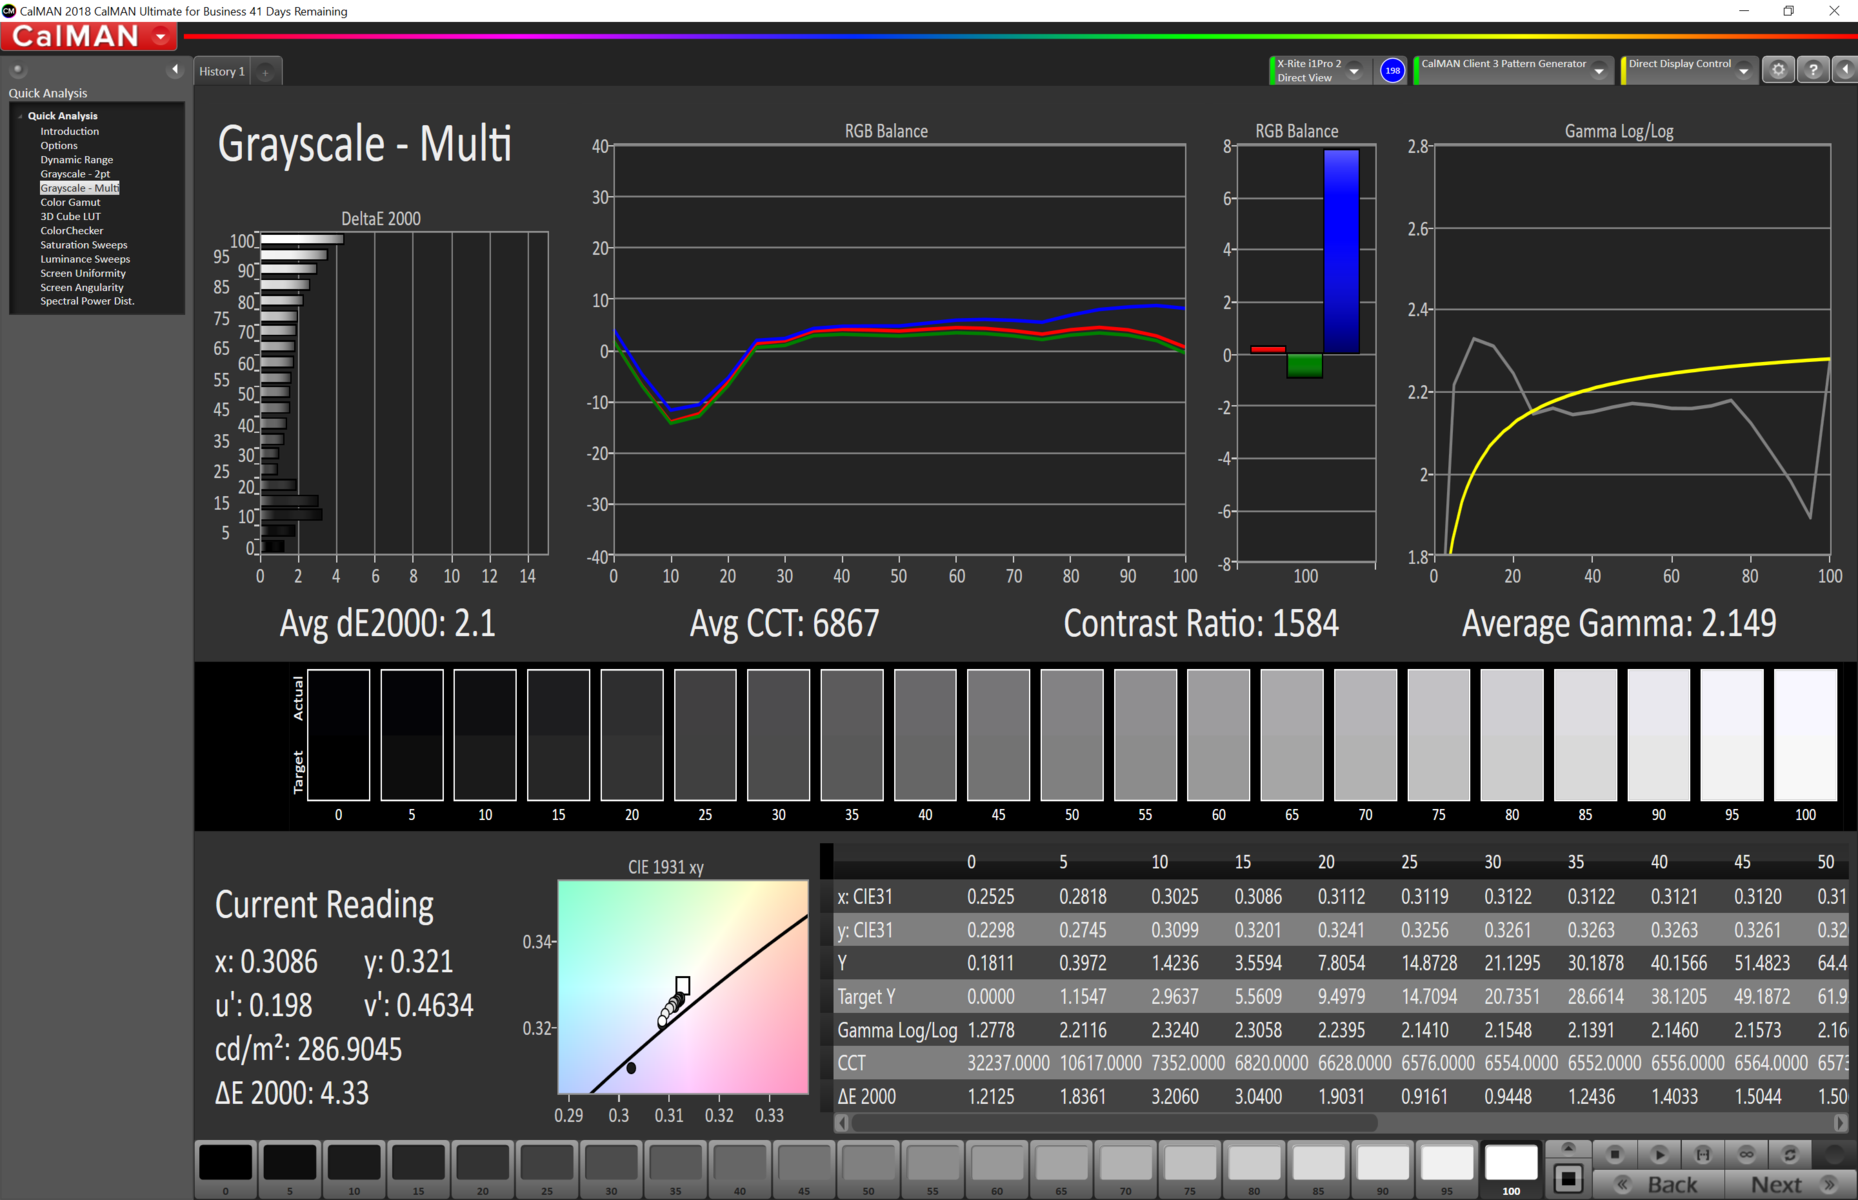
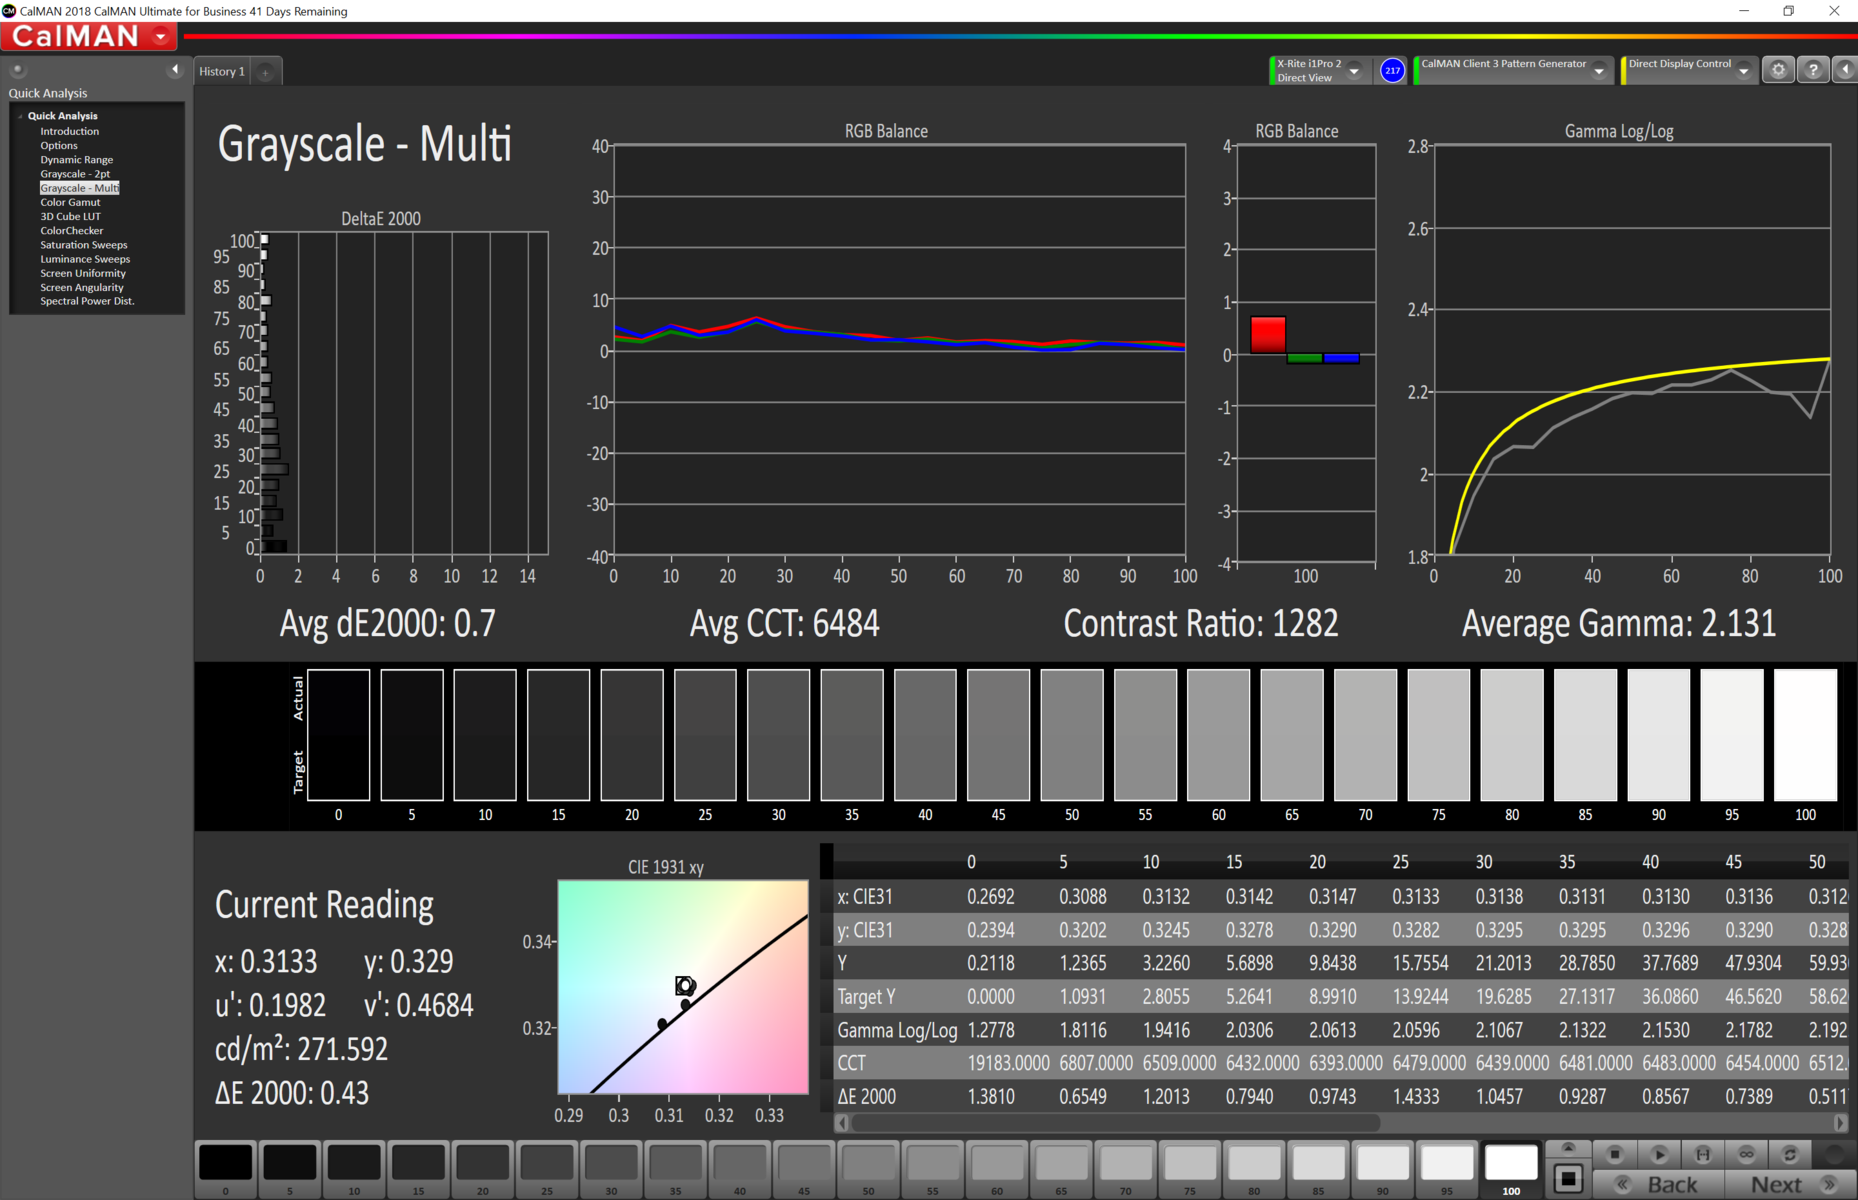
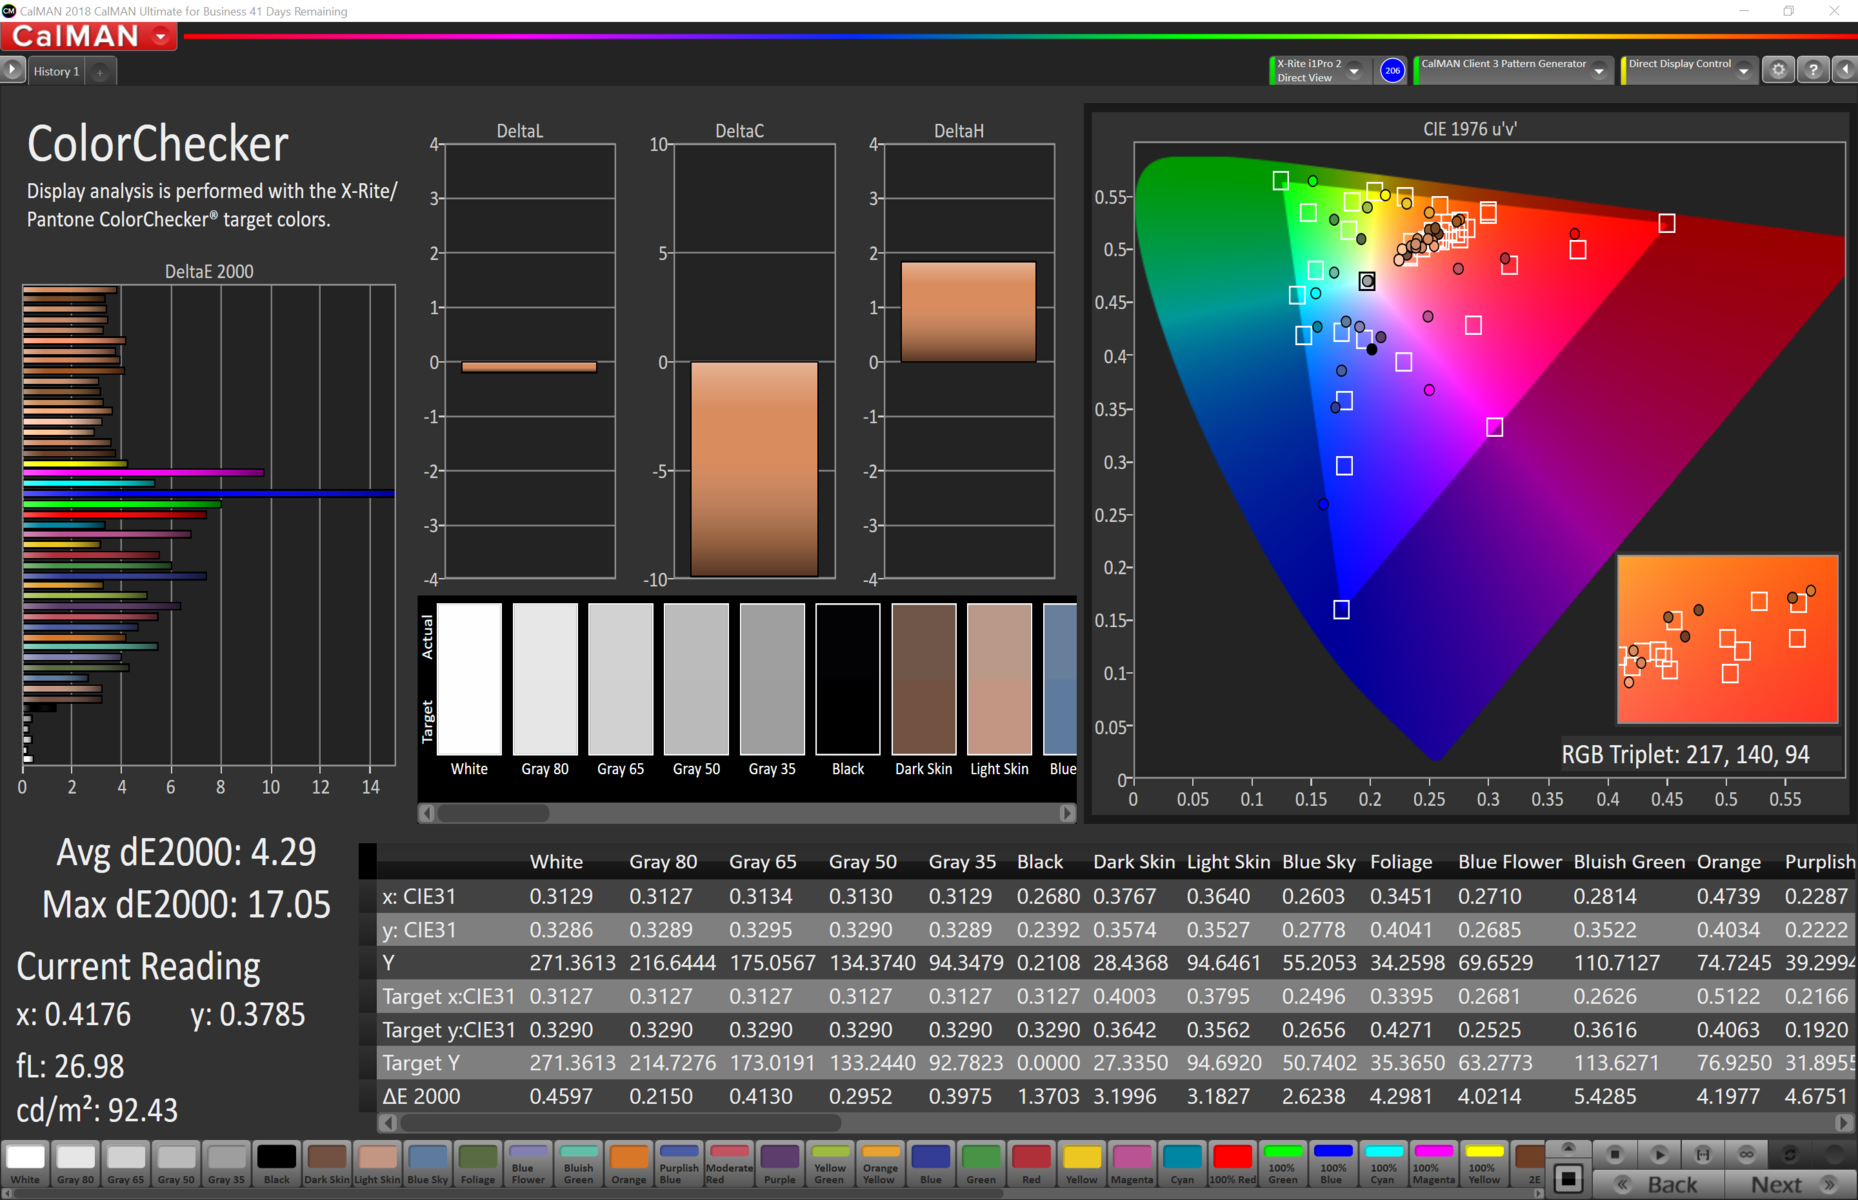
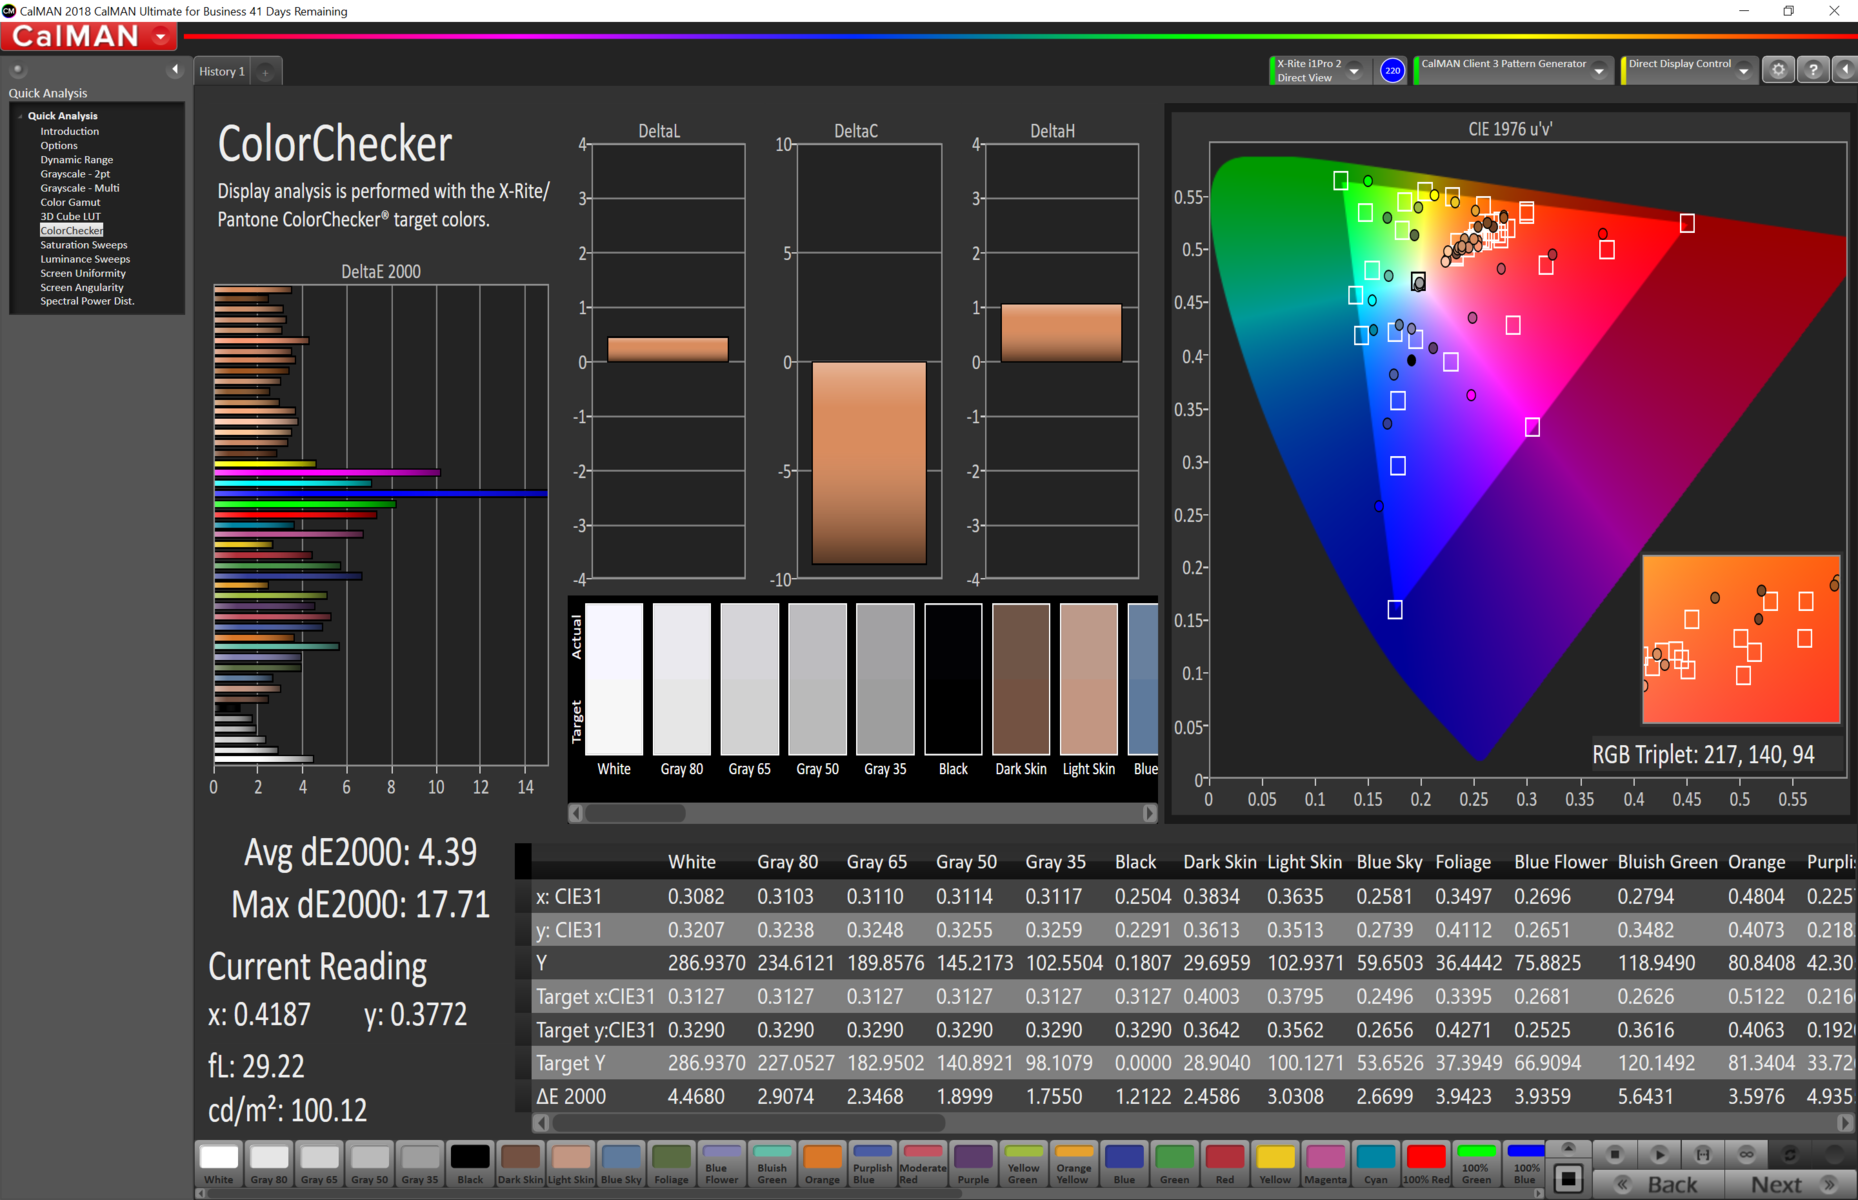
The Alpha 15 achieved a rather unspectacular peak average brightness of 266 cd/m² according to X-Rite i1Pro 2, but a decent black level of 0.18 cd/m² that yields a pleasingly high contrast ratio of 1,506:1. The panel has an acceptable colour reproduction, with ColorChecker and greyscale DeltaE deviations of 4.38 and 2.1 respectively. However, its limited colour space coverage results in significant variations with red and blue tones. Calibrating the display mainly improved the white point.
The display in our pre-production model also averaged 26.4 ms response times from black to white and 36.1 ms from 50% to 80% grey. These are noticeably longer than the Legion Y540 and HP Pavilion Gaming 15 achieved, both of which have 144 Hz panels. The 144 Hz version of the Alpha 15 may have better response times than its 120 Hz pre-production colleague too.
| |||||||||||||||||||||||||
Brightness Distribution: 91 %
Center on Battery: 266 cd/m²
Contrast: 1506:1 (Black: 0.18 cd/m²)
ΔE ColorChecker Calman: 4.38 | ∀{0.5-29.43 Ø4.71}
calibrated: 4.29
ΔE Greyscale Calman: 2.1 | ∀{0.09-98 Ø4.96}
36.74% AdobeRGB 1998 (Argyll 3D)
53.5% sRGB (Argyll 3D)
35.56% Display P3 (Argyll 3D)
Gamma: 2.15
CCT: 6867 K
| MSI Alpha 15 A3DDK AU Optronics B156HAN13.0 (AUOD0ED), IPS, 1920x1080, 15.6" | Asus TUF FX505DT-EB73 Panda LM156LF-GL, IPS, 1920x1080, 15.6" | Dell G3 3590 BOE NV15N3D, IPS, 1920x1080, 15.6" | Lenovo IdeaPad L340-15IRH 81LK00BMGE CMN 156HCA-EAB, IPS, 1920x1080, 15.6" | Lenovo Legion Y540-15IRH-81SX00B2GE BOE 084D, IPS, 1920x1080, 15.6" | HP Gaming Pavilion 15-dk0009ng LG Philips LGD05FE, IPS, 1920x1080, 15.6" | |
|---|---|---|---|---|---|---|
| Display | 11% | 13% | 20% | 76% | 79% | |
| Display P3 Coverage (%) | 35.56 | 39.56 11% | 40.13 13% | 42.81 20% | 63.6 79% | 64.2 81% |
| sRGB Coverage (%) | 53.5 | 59.5 11% | 59.8 12% | 63.8 19% | 91.7 71% | 95.1 78% |
| AdobeRGB 1998 Coverage (%) | 36.74 | 40.91 11% | 41.47 13% | 44.31 21% | 65.2 77% | 65.8 79% |
| Response Times | 6% | -25% | -22% | 66% | 58% | |
| Response Time Grey 50% / Grey 80% * (ms) | 36.1 | 30.4 ? 16% | 46 ? -27% | 45.6 ? -26% | 8.8 ? 76% | 16.4 ? 55% |
| Response Time Black / White * (ms) | 26.4 | 27.6 ? -5% | 32.4 ? -23% | 30.8 ? -17% | 12 ? 55% | 10.4 ? 61% |
| PWM Frequency (Hz) | 200 ? | 25910 ? | ||||
| Screen | -34% | -20% | -15% | -5% | 15% | |
| Brightness middle (cd/m²) | 271 | 286.2 6% | 276.2 2% | 275 1% | 299 10% | 345 27% |
| Brightness (cd/m²) | 266 | 267 0% | 261 -2% | 253 -5% | 290 9% | 324 22% |
| Brightness Distribution (%) | 91 | 84 -8% | 86 -5% | 83 -9% | 89 -2% | 86 -5% |
| Black Level * (cd/m²) | 0.18 | 0.33 -83% | 0.24 -33% | 0.18 -0% | 0.29 -61% | 0.42 -133% |
| Contrast (:1) | 1506 | 867 -42% | 1151 -24% | 1528 1% | 1031 -32% | 821 -45% |
| Colorchecker dE 2000 * | 4.38 | 5.45 -24% | 5.56 -27% | 5.4 -23% | 3.7 16% | 1.3 70% |
| Colorchecker dE 2000 max. * | 17.6 | 18.08 -3% | 23.45 -33% | 21.3 -21% | 7 60% | 2.8 84% |
| Colorchecker dE 2000 calibrated * | 4.29 | 4.47 -4% | 5.23 -22% | 4.4 -3% | 2 53% | 1.1 74% |
| Greyscale dE 2000 * | 2.1 | 5.3 -152% | 2.8 -33% | 3.7 -76% | 4.1 -95% | 1.2 43% |
| Gamma | 2.15 102% | 2.1 105% | 2.37 93% | 2.12 104% | 2.19 100% | 2.31 95% |
| CCT | 6867 95% | 7679 85% | 6710 97% | 6376 102% | 7166 91% | 6476 100% |
| Color Space (Percent of AdobeRGB 1998) (%) | 37.6 | 37.8 | 40.8 | 59.3 | 60.5 | |
| Color Space (Percent of sRGB) (%) | 59.1 | 59 | 63.6 | 91.5 | 94.9 | |
| Total Average (Program / Settings) | -6% /
-19% | -11% /
-14% | -6% /
-8% | 46% /
23% | 51% /
35% |
* ... smaller is better
Display Response Times
| ↔ Response Time Black to White | ||
|---|---|---|
| 26.4 ms ... rise ↗ and fall ↘ combined | ↗ ms rise | 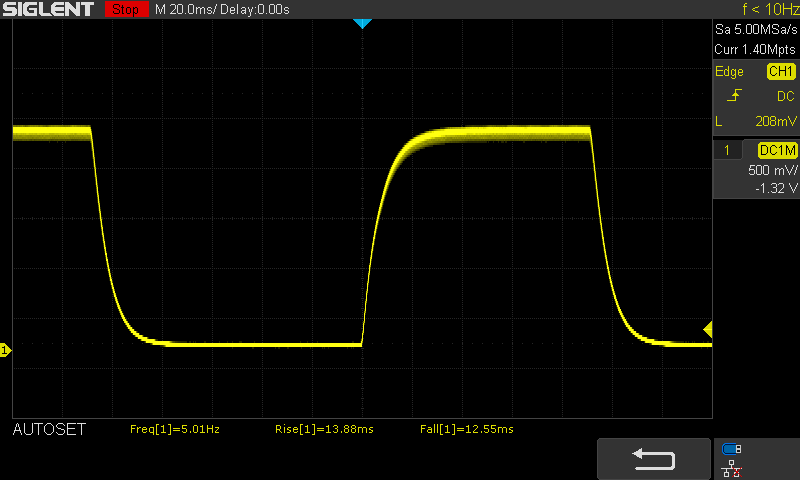 |
| ↘ ms fall | ||
| The screen shows relatively slow response rates in our tests and may be too slow for gamers. In comparison, all tested devices range from 0.1 (minimum) to 240 (maximum) ms. » 66 % of all devices are better. This means that the measured response time is worse than the average of all tested devices (19.8 ms). | ||
| ↔ Response Time 50% Grey to 80% Grey | ||
| 36.1 ms ... rise ↗ and fall ↘ combined | ↗ ms rise | 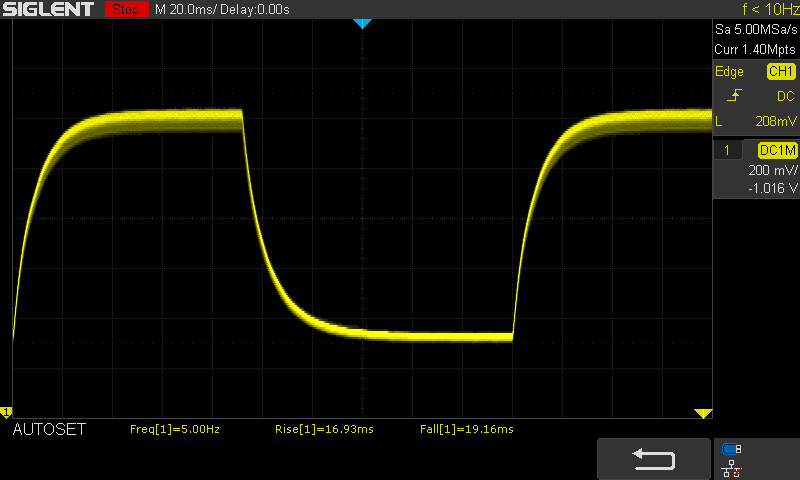 |
| ↘ ms fall | ||
| The screen shows slow response rates in our tests and will be unsatisfactory for gamers. In comparison, all tested devices range from 0.165 (minimum) to 636 (maximum) ms. » 52 % of all devices are better. This means that the measured response time is worse than the average of all tested devices (30.9 ms). | ||
Screen Flickering / PWM (Pulse-Width Modulation)
| Screen flickering / PWM not detected | 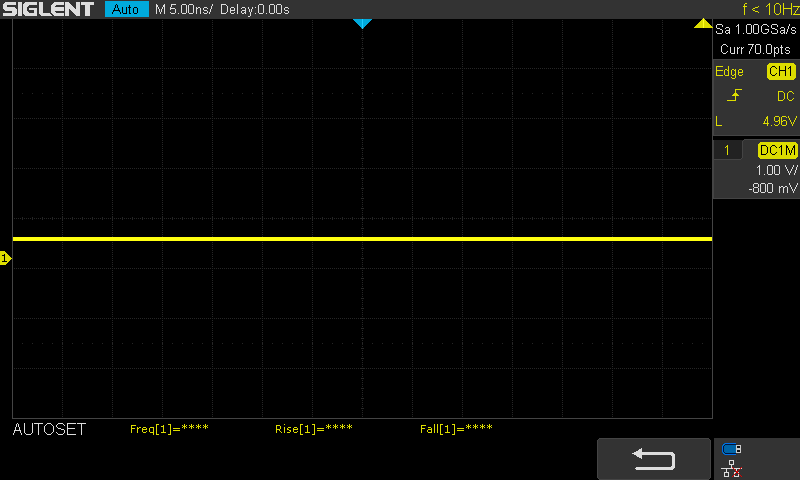 | ||
In comparison: 52 % of all tested devices do not use PWM to dim the display. If PWM was detected, an average of 7748 (minimum: 5 - maximum: 343500) Hz was measured. | |||

Performance
Gaming laptops equipped with an AMD CPU and GPU have been relatively rare, primarily because of the lack of available graphics cards in recent years. The introduction of Navi 14 GPUs changes that, with AMD laying the foundations for a comeback. AMD bases the 7 nm chips on its Radeon DNA (RDNA) architecture, and are expected to challenge the power and performance of current midrange NVIDIA laptop cards.
BIOS and driver revisions play a part in not only the performance but also emissions of components. In this respect, we would like to point out once again that the following benchmarks and measurements are based on a pre-production model. Hence, it does not necessarily represent how retail units will perform.
Processor
The Ryzen 7 3750H is well known around these parts, with AMD having introduced the quad-core chip in early 2019. Since then, the processor has appeared in several laptops that we have tested. The Ryzen 7 3750H roughly compares with the Core i5-9300H in synthetic benchmarks, putting the former in the entry-level segment of mobile gaming CPUs.
However, the Ryzen 7 3750H in our pre-production Alpha 15 unit does not quite live up to the billing. According to our tests, the Alpha 15 fell around 5% behind other Ryzen 7 3750H powered devices and even those equipped with the Core i5-9300H. The Alpha 15 did not fare well under sustained load either, with it losing out by between 5% and 10% in Cinebench R15 Multi 64Bit. The device also throttles by around 5% after a few benchmark pass-throughs.
Overall, the Ryzen 7 3750H has the potential to deliver much better multi-core performance than the Alpha 15 manages. The ROG Zephyrus G GA502DU scores around 15% more than the Alpha 15 does, for example.
System Performance
The Alpha 15 also underwhelms in system performance benchmarks. The combination of a Ryzen 7 3750H processor, Radeon RX 5500M GPU, and a Toshiba NVMe SSD put the device in the lower half of our PCMark 10 comparison table. In short, there is less than 10% difference between the Alpha 15 and the Acer Aspire Nitro 5 or the HP Omen 15, for example.
| PCMark 8 Home Score Accelerated v2 | 4800 points | |
| PCMark 8 Creative Score Accelerated v2 | 6613 points | |
| PCMark 8 Work Score Accelerated v2 | 5167 points | |
| PCMark 10 Score | 4733 points | |
Help | ||
Graphics Card
Undoubtedly, the most exciting part of the Alpha 15 is the brand new Radeon RX 5500M. Based on AMD's RDNA architecture, the Navi 14 chip is built on a 7 nm process. By contrast, NVIDIA is on 12 nm with its Turing architecture. The Radeon RX 5500M currently spearheads AMD's mobile GPU offering, outperforming the Radeon RX580 that the company built on its Polaris architecture. There are other cards on the horizon though, with the Radeon RX 5300M having leaked recently. While this is also based on Navi 14, the Radeon RX 5500M is the more powerful of the two GPUs. There should be more powerful Navi laptop GPUs in the works too.
Based on previously published information about the Radeon RX 5500M, its performance should sit between that of the GTX 1650 and GTX 1660 Ti Max-Q. Our initial benchmark tests verify this, with the Radeon RX 5500M only 10% shy of the GTX 1660 Ti in 3DMark and roughly on par with the GTX 1660 Ti Max-Q. The Radeon RX 5500M also scores approximately 30% more than the GTX 1650 in the same benchmark.
However, the Radeon RX 5500M falls back slightly in 3DMark Time Spy, where it scores 21% less than the average of GTX 1660 Ti Max-Q devices that we have tested and 29% behind the GTX 1660 Ti. The Radeon RX 5500M placed 12% above the average of GTX 1650 equipped devices that we have tested too. Meanwhile, it moves away from the latter in 3DMark Fire Strike and closer to the GTX 1660 Ti Max-Q, although there is still an 11% deficit between the Radeon RX 5500M and GTX 1660 Ti Max-Q. Similarly, the gap to the GTX 1660 Ti is 25%.
| 3DMark 06 Standard Score | 26559 points | |
| 3DMark 11 Performance | 13344 points | |
| 3DMark Cloud Gate Standard Score | 22627 points | |
| 3DMark Fire Strike Score | 10080 points | |
| 3DMark Time Spy Score | 4024 points | |
Help | ||
Gaming Performance
Ultimately, synthetic GPU benchmarks tell only half the story, as most people will probably use the Radeon RX 5500M for gaming. Our pre-production model averaged 43.6 FPS in "The Witcher 3" on Ultra Settings at 1080p, which puts it between the performance of the GTX 1650 and GTX 1660 Ti Max-Q, which it leads and trails by 24% and 15% respectively.
The Radeon RX 5500M performed even better in "Shadow of the Tomb Raider", with its lead over the GTX 1650 growing to 26%. Likewise, the Alpha 15 is only 2% behind the average of GTX 1660 Ti Max-Q devices that we have tested, while it is 8% ahead of the GTX 1660 Ti Max-Q equipped ROG Zephyrus G GA502DU and HP Pavilion Gaming 15. There are some anomalies like "Dota 2 Reborn", where the Radeon RX 5500M and even the GTX 1660 Ti Max-Q fall short of the GTX 1650, but generally the Radeon RX 5500M falls between the GTX 1650 and GTX 1660 Ti Max-Q. Our results in "Anno 1800", "F1 2019" and "Rage 2" reflect this, while the Radeon RX 5500M comes close to the GTX 1660 Ti in "BioShock Infinite".
In short, the picture is not always clear. On the whole, the Radeon RX 5500M offers between GTX 1650 and GTX 1660 Ti Max-Q performance. However, AMD's new GPU sometimes nearly matches the more powerful GTX 1660 Ti, while other times it only performs at GTX 1650 levels. We suspect that AMD will resolve these variations with subsequent driver updates.
We should also point out that processor performance does influence the framerates of some games. Hence, the Radeon RX 5500M would deliver better performance if it were paired with a recent Core i7 or i9 processor.
| F1 2019 - 1920x1080 Ultra High Preset AA:T AF:16x | |
| Average NVIDIA GeForce GTX 1660 Ti Mobile (91 - 99, n=4) | |
| HP Pavilion Gaming 15-ec0017ng | |
| Average NVIDIA GeForce GTX 1660 Ti Max-Q (71 - 77, n=2) | |
| HP Gaming Pavilion 15-dk0009ng | |
| MSI Alpha 15 A3DDK | |
| HP Omen 15-dc1020ng | |
| Average NVIDIA GeForce GTX 1650 Mobile (59 - 65, n=5) | |
| HP Omen 15-dc1020ng | |
| Dell G5 15 5590-PCNJJ | |
| Rage 2 - 1920x1080 Ultra Preset (Resolution Scale Off) | |
| Average NVIDIA GeForce GTX 1660 Ti Mobile (67.9 - 68.8, n=2) | |
| HP Pavilion Gaming 15-ec0017ng | |
| Average NVIDIA GeForce GTX 1660 Ti Max-Q (58.2 - 64.8, n=2) | |
| HP Omen 15-dc1020ng | |
| HP Gaming Pavilion 15-dk0009ng | |
| MSI Alpha 15 A3DDK | |
| Average NVIDIA GeForce GTX 1650 Mobile (45.1 - 60, n=3) | |
| HP Omen 15-dc1020ng | |
| Dell G5 15 5590-PCNJJ | |
| Ghost Recon Breakpoint - 1920x1080 Ultra Preset AA:T | |
| Average NVIDIA GeForce GTX 1660 Ti Mobile (51 - 55, n=2) | |
| Average NVIDIA GeForce GTX 1660 Ti Max-Q (48 - 51, n=2) | |
| HP Pavilion Gaming 15-ec0017ng | |
| Average NVIDIA GeForce GTX 1650 Mobile (30 - 37, n=2) | |
| Dell G5 15 5590-PCNJJ | |
| MSI Alpha 15 A3DDK | |
| Borderlands 3 - 1920x1080 Badass Overall Quality (DX11) | |
| Average NVIDIA GeForce GTX 1660 Ti Mobile (46.6 - 48.6, n=3) | |
| Average NVIDIA GeForce GTX 1660 Ti Max-Q (41.5 - 42.3, n=2) | |
| HP Pavilion Gaming 15-ec0017ng | |
| MSI Alpha 15 A3DDK | |
| Average NVIDIA GeForce GTX 1650 Mobile (29 - 34.6, n=5) | |
| Dell G5 15 5590-PCNJJ | |
| Total War: Three Kingdoms - 1920x1080 Ultra (incl textures) | |
| Average NVIDIA GeForce GTX 1660 Ti Mobile (n=1) | |
| HP Gaming Pavilion 15-dk0009ng | |
| Average NVIDIA GeForce GTX 1660 Ti Max-Q (41.1 - 41.6, n=2) | |
| HP Pavilion Gaming 15-ec0017ng | |
| MSI Alpha 15 A3DDK | |
| Average NVIDIA GeForce GTX 1650 Mobile (24.4 - 26.9, n=4) | |
| Dell G5 15 5590-PCNJJ | |
The Alpha 15 also performed well when we left "The Witcher 3" running for an hour one the Ultra preset at 1080p. Our pre-production unit averaged 40.9 FPS here, while only fluctuating between 39 and 44 FPS. The slight change in framerates occurred during the day and night cycle, so you should not expect any throttling even during prolonged gaming sessions.
| low | med. | high | ultra | QHD | 4K | |
|---|---|---|---|---|---|---|
| Counter-Strike: GO (2012) | 191 | 137 | 76.3 | |||
| BioShock Infinite (2013) | 201 | 169 | 123 | |||
| GTA V (2015) | 93 | 48.6 | 20.2 | |||
| The Witcher 3 (2015) | 165 | 72 | 43.6 | |||
| Dota 2 Reborn (2015) | 93 | 86 | 81 | 72 | 53 | |
| World of Warships (2015) | 93 | 54.9 | ||||
| Rainbow Six Siege (2015) | 151 | 143 | 59.6 | |||
| Overwatch (2016) | 124 | 109 | 74 | |||
| Rocket League (2017) | 175 | 175 | 72 | |||
| Playerunknown's Battlegrounds (PUBG) (2017) | 59.4 | |||||
| Middle-earth: Shadow of War (2017) | 70 | 24 | ||||
| Assassin´s Creed Origins (2017) | 41 | 35 | ||||
| Fortnite (2018) | 65 | |||||
| Far Cry 5 (2018) | 62 | 59 | 48 | |||
| Shadow of the Tomb Raider (2018) | 59 | 53 | 32 | 15 | ||
| Assassin´s Creed Odyssey (2018) | 48 | 43 | 40 | 31 | ||
| Call of Duty Black Ops 4 (2018) | 67.5 | 53.9 | 28.8 | |||
| Battlefield V (2018) | 61 | 43.7 | 16.2 | |||
| Farming Simulator 19 (2018) | 70 | 49.1 | 32.8 | |||
| Apex Legends (2019) | 72 | 51.7 | 28.4 | |||
| Far Cry New Dawn (2019) | 51 | 47 | 25 | |||
| Metro Exodus (2019) | 92.3 | 45.4 | 38.1 | 32.2 | 25 | |
| Anthem (2019) | 48 (stuttering) | 47 (stuttering) | 44 (stuttering) | 32 (stuttering) | ||
| Dirt Rally 2.0 (2019) | 58.4 | 38.1 | 22.8 | |||
| The Division 2 (2019) | 51 | 42 | ||||
| Anno 1800 (2019) | 60 | 46.3 | 23.9 | |||
| Rage 2 (2019) | 67 | 55.7 | 53.4 | 15.4 | ||
| Total War: Three Kingdoms (2019) | 134 | 69.1 | 48.7 | 35.8 | 19.4 | 6.9 |
| F1 2019 (2019) | 79 | 74 | 64 | 64 | 49.1 | 33.3 |
| Control (2019) | 119 | 47.5 | 34.2 | |||
| Borderlands 3 (2019) | 76 | 66 | 47.2 | 35.6 | 23.9 | 6.7 |
| FIFA 20 (2019) | 122 | 122 | 96 | |||
| Ghost Recon Breakpoint (2019) | 58 | 53 | 48 | 26 | ||
| GRID 2019 (2019) | 81 | 67 | 36.7 | 29.9 | 15.2 | |
| Call of Duty Modern Warfare 2019 (2019) | 112 | 94 | 81 | 64 | 35.4 | 20.1 |
| Need for Speed Heat (2019) | 63 | 57.7 | 52.3 | 45.8 | 41 | 14.1 |
| Star Wars Jedi Fallen Order (2019) | 58.6 | 40.1 | 19.8 | |||
| Red Dead Redemption 2 (2019) | 92 | 63 | 40.5 | 23.8 | ||
| God of War (2022) | 36.1 | 36 | 33 | 9.06 | ||
| Rainbow Six Extraction (2022) | 95 | 78 | 76 | 36 | ||
| GRID Legends (2022) | 81 | 71.8 | 71.1 | 59.2 | ||
| Elden Ring (2022) | 37 | 35.8 | 35.2 | 35.2 | ||
| Cyberpunk 2077 1.6 (2022) | 55.9 | 44.9 | 34.4 | 27.7 | ||
| Elex 2 (2022) | 20.1 | 19.3 | 19.4 | 18.8 | ||
| Ghostwire Tokyo (2022) | 56 | 56 | 55.7 | 54.9 | ||
| Tiny Tina's Wonderlands (2022) | 88.5 | 71.2 | 38.6 | 28.3 | ||
| Vampire Bloodhunt (2022) | 93.8 | 82.1 | 78.7 | 77.3 | ||
| F1 22 (2022) | 95 | 92 | 78 | 66 | ||
| The Quarry (2022) | 65.5 | 47 | 40.3 | 23.8 | ||
| FIFA 23 (2022) | 46.6 | 38.4 | 33.3 | 33.2 | ||
| A Plague Tale Requiem (2022) | 47.2 | 36.9 | 26.9 | 20.7 | ||
| Uncharted Legacy of Thieves Collection (2022) | 36.6 | 32.3 | 20.6 | 18.6 | ||
| Call of Duty Modern Warfare 2 2022 (2022) | 70 | 66 | 56 | 43 | ||
| Spider-Man Miles Morales (2022) | 48 | 43.3 | 30.6 | 26 | ||
| The Callisto Protocol (2022) | 57.7 | 47.4 | 29.8 | 28.6 | ||
| Need for Speed Unbound (2022) | 43.2 | 41 | 34.7 | 27.3 |
Emissions
Fan Noise
MSI includes several predefined fan profiles on the Alpha 15, which it calls Silence Mode, Balanced Mode and Extreme Performance respectively. Fan noise changes for each profile, especially when the machine is not under any significant load. We used Balanced Mode for our tests and adjusted the Windows Power Mode accordingly.
Our pre-production model runs quietly when idling, with its fans peaking at 35.5 dB(A). However, the two fans ramp up when gaming, while our stress test pushed them to 53.6 dB(A). MSI promises that it will continue to refine the fan control and pre-configured profiles, so expect Alpha 15 retail units to perform slightly differently than our pre-production model in this regard.
Noise level
| Idle |
| 31.1 / 34.8 / 35.5 dB(A) |
| Load |
| 43 / 53.6 dB(A) |
 | ||
30 dB silent 40 dB(A) audible 50 dB(A) loud |
||
min: | ||
Temperature
Surface temperatures are rather low, though. The warmest areas of our pre-production model reached 45 °C (~113 °F) during our stress tests and 44 °C (~111 °F) when playing "The Witcher 3", which is not overly hot. The rest of the chassis remains below 40 °C (~104 °F) too, with the palm rest not exceeding 30 °C (~86 °F).
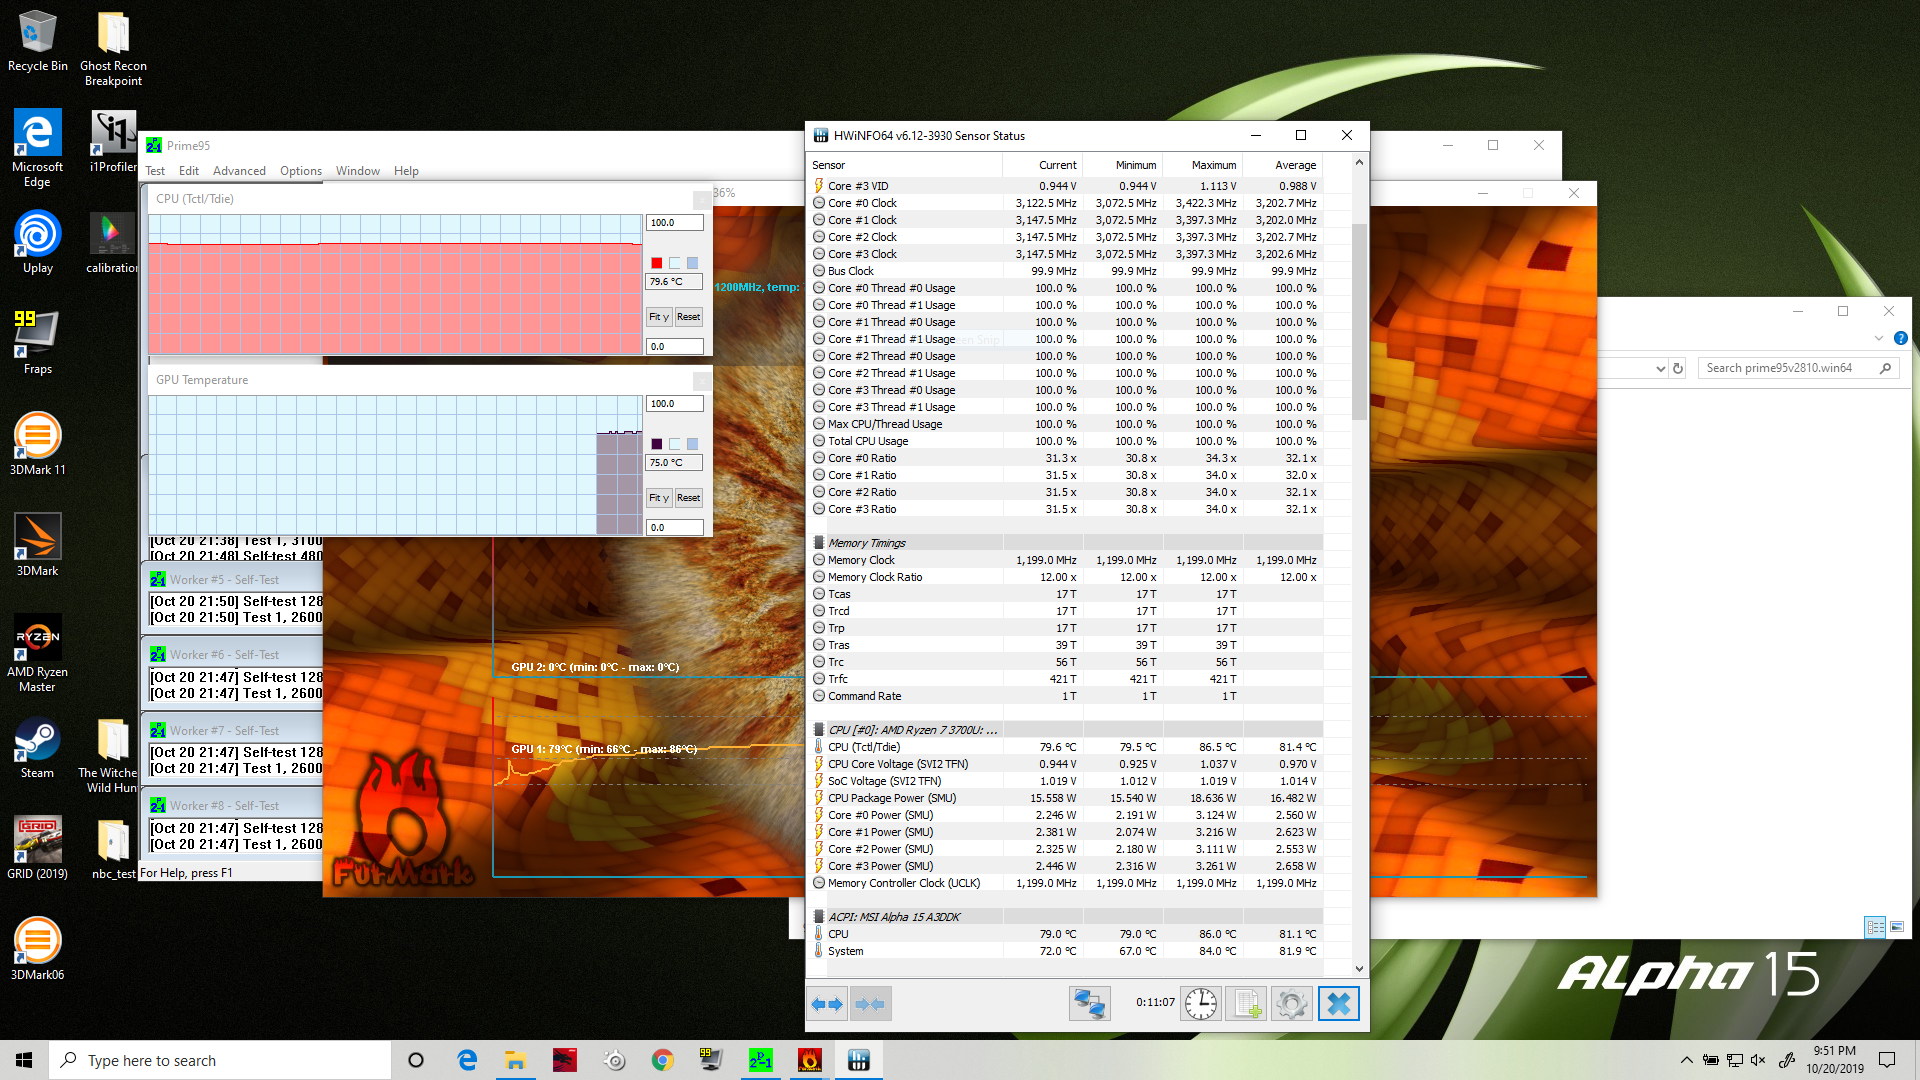
Our stress test also did not cause the Alpha 15 to thermal throttle. The device was happy to keep its CPU and GPU core temperatures at 86 °C (~187 °F) throughout, which is also over 10 °C (~18 °F) shy of their critical operating temperatures.
(±) The maximum temperature on the upper side is 42 °C / 108 F, compared to the average of 40.4 °C / 105 F, ranging from 21.2 to 68.8 °C for the class Gaming.
(±) The bottom heats up to a maximum of 45 °C / 113 F, compared to the average of 43.2 °C / 110 F
(+) In idle usage, the average temperature for the upper side is 29.1 °C / 84 F, compared to the device average of 33.9 °C / 93 F.
(+) Playing The Witcher 3, the average temperature for the upper side is 31.3 °C / 88 F, compared to the device average of 33.9 °C / 93 F.
(+) The palmrests and touchpad are reaching skin temperature as a maximum (32 °C / 89.6 F) and are therefore not hot.
(-) The average temperature of the palmrest area of similar devices was 28.8 °C / 83.8 F (-3.2 °C / -5.8 F).
Speakers
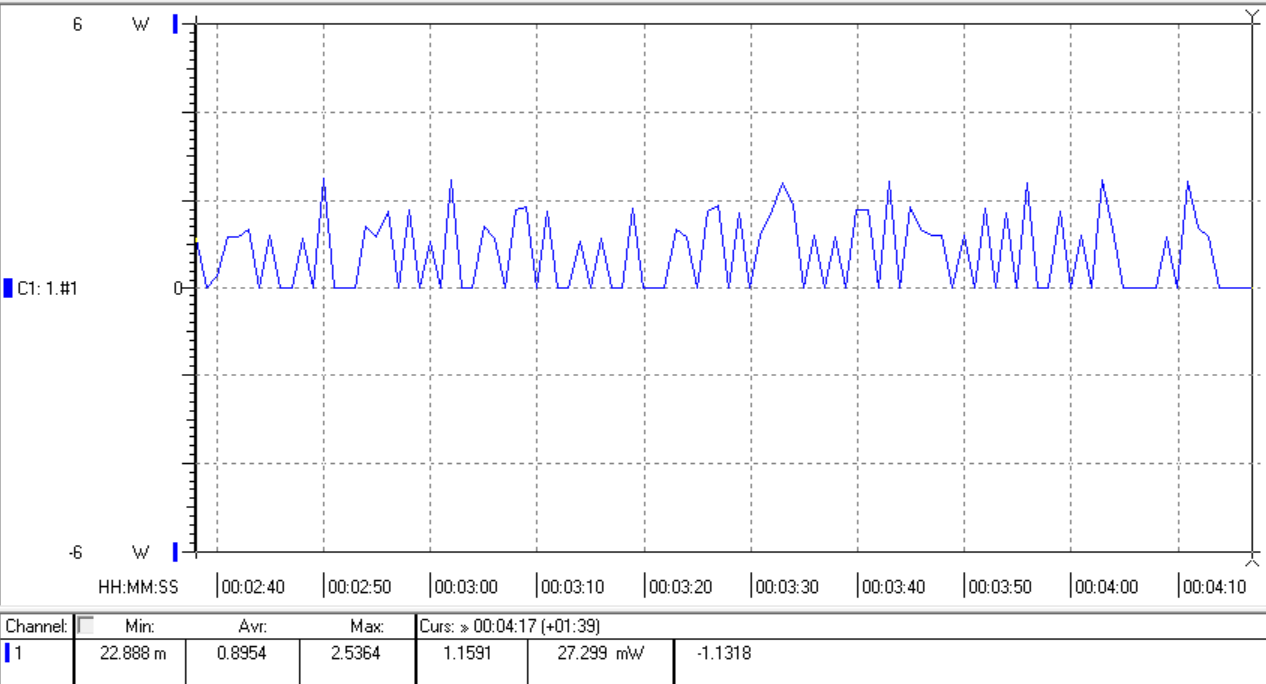
The stereo speakers in the Alpha 15 can get pleasantly loud while reproducing high-pitched frequencies linearly. The biggest downside here is the lack of bass, but that is an issue with almost all laptop speakers.
MSI Alpha 15 A3DDK audio analysis
(+) | speakers can play relatively loud (90.6 dB)
Bass 100 - 315 Hz
(-) | nearly no bass - on average 26.4% lower than median
(±) | linearity of bass is average (7.3% delta to prev. frequency)
Mids 400 - 2000 Hz
(±) | higher mids - on average 6.9% higher than median
(±) | linearity of mids is average (7.6% delta to prev. frequency)
Highs 2 - 16 kHz
(+) | balanced highs - only 2% away from median
(+) | highs are linear (6.2% delta to prev. frequency)
Overall 100 - 16.000 Hz
(±) | linearity of overall sound is average (17.7% difference to median)
Compared to same class
» 52% of all tested devices in this class were better, 10% similar, 38% worse
» The best had a delta of 6%, average was 18%, worst was 132%
Compared to all devices tested
» 35% of all tested devices were better, 8% similar, 57% worse
» The best had a delta of 4%, average was 23%, worst was 134%
Apple MacBook 12 (Early 2016) 1.1 GHz audio analysis
(+) | speakers can play relatively loud (83.6 dB)
Bass 100 - 315 Hz
(±) | reduced bass - on average 11.3% lower than median
(±) | linearity of bass is average (14.2% delta to prev. frequency)
Mids 400 - 2000 Hz
(+) | balanced mids - only 2.4% away from median
(+) | mids are linear (5.5% delta to prev. frequency)
Highs 2 - 16 kHz
(+) | balanced highs - only 2% away from median
(+) | highs are linear (4.5% delta to prev. frequency)
Overall 100 - 16.000 Hz
(+) | overall sound is linear (10.2% difference to median)
Compared to same class
» 7% of all tested devices in this class were better, 2% similar, 90% worse
» The best had a delta of 5%, average was 18%, worst was 53%
Compared to all devices tested
» 5% of all tested devices were better, 1% similar, 94% worse
» The best had a delta of 4%, average was 23%, worst was 134%
Power Management
Power Consumption
A first look at power consumption at different operating conditions shows the Alpha 15 to be particularly thirsty when idling. While MSI has significantly reduced this with a BIOS update, it remains much higher than the values achieved by our comparison devices.
Our pre-production averages anywhere between 10 to 20 W less than our Core i5-9300H and GTX 1650 powered comparison devices under load, though. We conducted this by running the first scene of 3DMark 2006, for reference. By contrast, our Ryzen 7 3750H powered comparison devices roughly consume the same as the Alpha 15 under these conditions. Hence, the Radeon RX 5500M does not seem to consume more power than its NVIDIA counterparts. However, the Alpha 15 did peak at 191 W, which is at least 50 W higher than all our comparison devices.
We should point out that the Alpha 15 also consumed 148 W during our "The Witcher 3" test, during which we had the device connected to an external monitor. This is also considerably more than our GTX 1650, and GTX 1660 Ti Max-Q equipped comparison devices. These high consumption values may be different on final retail units, though.


| Off / Standby | |
| Idle | |
| Load |
|
Key:
min: | |
| MSI Alpha 15 A3DDK R7 3750H, Radeon RX 5500M, Toshiba KBG30ZMV256G, IPS, 1920x1080, 15.6" | Asus TUF FX505DT-EB73 R7 3750H, GeForce GTX 1650 Mobile, Intel SSD 660p SSDPEKNW512G8, IPS, 1920x1080, 15.6" | Dell G3 3590 i5-9300H, GeForce GTX 1650 Mobile, Toshiba BG4 KBG40ZNS128G, IPS, 1920x1080, 15.6" | Acer Aspire Nitro 5 AN515-54-53Z2 i5-9300H, GeForce GTX 1650 Mobile, WDC PC SN520 SDAPNUW-512G, IPS, 1920x1080, 15.6" | Asus ROG Zephyrus G15 GA502DU R7 3750H, GeForce GTX 1660 Ti Max-Q, Intel SSD 660p SSDPEKNW512G8, IPS, 1920x1080, 15.6" | Lenovo IdeaPad L340-15IRH 81LK00BMGE i5-9300H, GeForce GTX 1650 Mobile, WDC PC SN520 SDAPMUW-512, IPS, 1920x1080, 15.6" | HP Omen 15-dc1020ng i5-9300H, GeForce GTX 1650 Mobile, WDC PC SN720 SDAQNTW-512G, IPS, 1920x1080, 15.6" | Dell G5 15 5590-PCNJJ i5-9300H, GeForce GTX 1650 Mobile, KBG30ZMS128G, IPS, 1920x1080, 15.6" | HP Pavilion Gaming 15-ec0017ng R7 3750H, GeForce GTX 1660 Ti Max-Q, WDC PC SN720 SDAPNTW-256G, IPS, 1920x1080, 15.6" | |
|---|---|---|---|---|---|---|---|---|---|
| Power Consumption | 32% | 18% | 35% | 11% | 43% | 36% | 34% | 38% | |
| Idle Minimum * (Watt) | 11.7 | 7 40% | 6.2 47% | 5 57% | 7.4 37% | 3.8 68% | 4.04 65% | 4 66% | 3.4 71% |
| Idle Average * (Watt) | 15.7 | 9.9 37% | 8.4 46% | 7 55% | 8.6 45% | 6.6 58% | 7.2 54% | 7 55% | 7.6 52% |
| Idle Maximum * (Watt) | 22.4 | 12 46% | 27.7 -24% | 11 51% | 39.1 -75% | 8.9 60% | 11.4 49% | 12 46% | 10.2 54% |
| Load Average * (Watt) | 70.7 | 68.4 3% | 91 -29% | 89 -26% | 65.9 7% | 78.4 -11% | 80.8 -14% | 95 -34% | 73 -3% |
| Witcher 3 ultra * (Watt) | 148 | 94.9 36% | 94.4 36% | 90 39% | 106.9 28% | 82 45% | 93.6 37% | 86 42% | 107 28% |
| Load Maximum * (Watt) | 191 | 130.9 31% | 131.5 31% | 132 31% | 141.3 26% | 124 35% | 144.5 24% | 135 29% | 140.5 26% |
* ... smaller is better
Battery Life
Since we have been testing a pre-production model, we shall forego offering any detailed battery life measurements at this time. Our unit lasted around 40 minutes before it switched off during our "The Witcher 3" test, which we ran at full brightness. However, BIOS, firmware and software updates will probably drastically improve battery life. We shall update this section accordingly when we receive a retail unit.
Initial Verdict
While MSI has not attempted to overthrow the best in class with the Alpha 15, it has developed a package that inconspicuously challenges the midrange market that Intel and NVIDIA have dominated until now. In short, the Alpha 15 represents an initial foray into a market in which AMD could gain a foothold.
The key feature with the Alpha 15 is its Radeon RX 5500M GPU, based on AMD's Navi architecture. The GPU, manufactured on a 7 nm processor, sits between the GeForce GTX 1650 and GTX 1660 Ti Max-Q on paper, something which our tests with our pre-production model confirmed. However, it must be noted that the range of possible results is high for the time being. For example, while the RX 5500M does not go beyond the level of a GTX 1650 in some games, it reaches GTX 1660 Ti Max-Q levels in others. Overall, it generally sits between the two, though.
The MSI Alpha 15 can compete against Core i5-9300H, and GeForce 1660 Ti Max-Q powered laptops in some games with its Ryzen 7 3750H processor and new Radeon RX 5500M GPU.
Whether one can speak of the device as a success for AMD or MSI depends on the price at which the Alpha 15 launches. Early information suggests that the device will ship for US$999 to US$1099 for 120 and 144 Hz options, pricing that puts the Alpha 15 beyond the reach of Core i5-9300H and GTX 1650 powered, which typically cost well under US$1,000. However, GTX 1660 Ti Max-Q laptops generally exceed US$1,000, which puts the RX 5500M in a better light. We imagine that deciding between the three GPUs will depend on what features the laptops in which they are paired offer too.
Overall, the Alpha 15 has offered a positive impression of the Radeon RX 5500M and the RDNA architecture on laptops. It seems that deciding between AMD and NVIDIA will once again be a real choice, although the extent to which AMD can penetrate the high-end gaming laptop market remains to be seen. What is certain is that more powerful laptop GPUs than the RX 5500M are likely on their way.
Price comparison

