MSI Alpha 15 Gaming Laptop Review: Ryzen 7 5800H and Radeon RX 6600M augur well for mainstream 1080p gaming
Back during Computex 2021, AMD introduced the Radeon RX 6000M series of mobile GPUs and also the AMD Advantage Design Framework. The AMD Advantage program includes laptops with Ryzen 5000 APUs, Radeon RX 6000M graphics, Smart Access Memory, SmartShift, and FreeSync Premium displays. The program promises several minimum standards in these laptops such as 1080p 100 fps gaming, 144 Hz low latency 300-nit displays, NVMe storage, and 10 hours of video playback time on battery.
Despite having good potential, we've only seen a handful of RX 6000M/AMD Advantage-powered laptops on the market so far. These include the Asus ROG Strix G15 and ROG Strix G17, HP Omen 16, MSI Delta 15, and the MSI Alpha 15 and Alpha 17 series. We now have with us the MSI Alpha 15 for review.
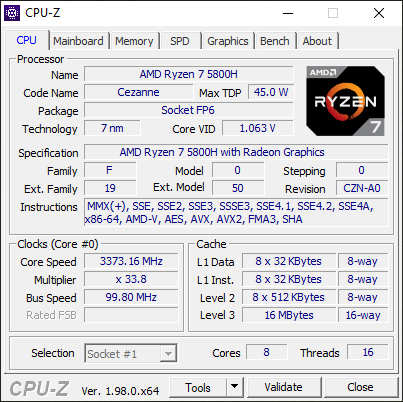
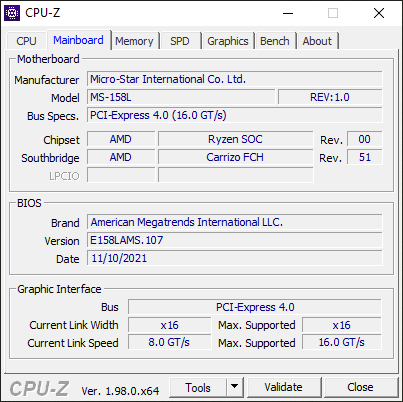
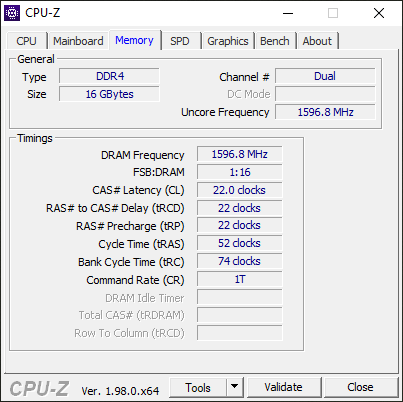
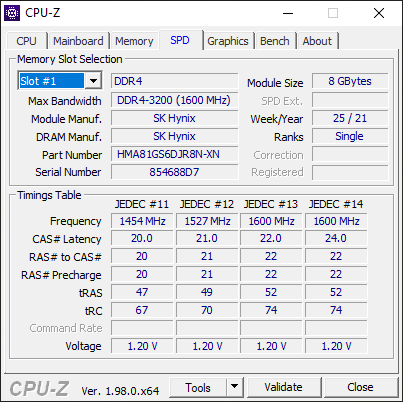
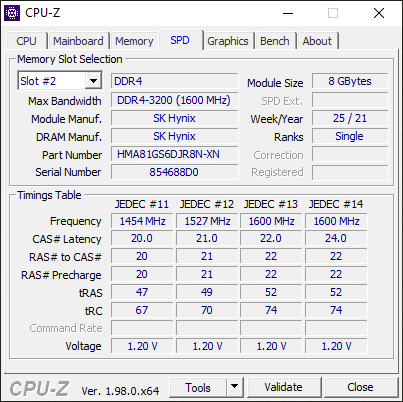
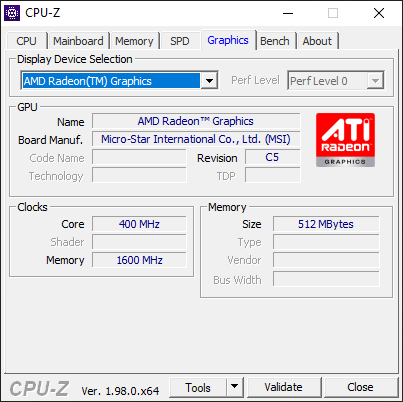
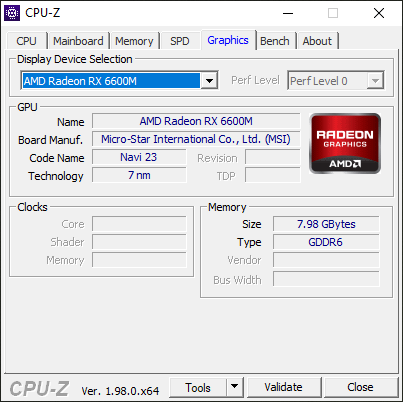
Our MSI Alpha 15 review sample is powered by the AMD Ryzen 7 5800H APU with Radeon RX Vega 8 graphics and a discrete Radeon RX 6600M GPU. Also onboard are 16 GB DDR4-3200 memory, a 1 TB PCIe NVMe SSD, and a 90 Whr battery. This configuration will set you back by ₹1,45,990 MRP (US$1,959) but can be currently availed for about ₹1,06,990 (US$1,436) via online retailers.
The MSI Alpha 15 is primarily targeted at 1080p 100 fps gamers. In this review, we put the MSI Alpha 15 through its paces, compare its performance with the competition featuring Intel/Nvidia offerings, and see whether going full Team Red actually offers any purported benefits.
Potential Competitors in Comparison
Rating | Date | Model | Weight | Height | Size | Resolution | Price |
|---|---|---|---|---|---|---|---|
| 82.6 % v7 (old) | 01 / 2022 | MSI Alpha 15 B5EEK-008 R7 5800H, Radeon RX 6600M | 2.4 kg | 23.95 mm | 15.60" | 1920x1080 | |
| 79.2 % v7 (old) | 09 / 2021 | MSI Katana GF66 11UG-220 i7-11800H, GeForce RTX 3070 Laptop GPU | 2.3 kg | 25 mm | 15.60" | 1920x1080 | |
| 82.9 % v7 (old) | 10 / 2021 | MSI Delta 15 A5EFK R9 5900HX, Radeon RX 6700M | 2 kg | 19 mm | 15.60" | 1920x1080 | |
| 84.4 % v7 (old) | 11 / 2021 | Schenker XMG Apex 15 NH57E PS R7 5800H, GeForce RTX 3060 Laptop GPU | 2.1 kg | 29 mm | 15.60" | 1920x1080 | |
| 84.7 % v7 (old) | 07 / 2021 | Asus ROG Strix G15 G513QY R9 5900HX, Radeon RX 6800M | 2.4 kg | 27.9 mm | 15.60" | 1920x1080 | |
| 87.9 % v7 (old) | 11 / 2021 | Lenovo Legion S7 15ACH6 82K80030GE R9 5900HX, GeForce RTX 3060 Laptop GPU | 2 kg | 18.9 mm | 15.60" | 3840x2160 | |
| 85.4 % v7 (old) | 12 / 2021 | MSI GP66 Leopard 11UH-028 i7-11800H, GeForce RTX 3080 Laptop GPU | 2.3 kg | 23.4 mm | 15.60" | 1920x1080 | |
| 85.9 % v7 (old) | 06 / 2021 | Asus TUF Gaming F15 FX506HM i7-11800H, GeForce RTX 3060 Laptop GPU | 2.3 kg | 24.9 mm | 15.60" | 1920x1080 | |
| 82.8 % v7 (old) | 06 / 2021 | Asus TUF Gaming F17 FX706HM i9-11900H, GeForce RTX 3060 Laptop GPU | 2.7 kg | 26 mm | 17.30" | 1920x1080 | |
| 85.6 % v7 (old) | 08 / 2021 | Gigabyte Aero 15 OLED XD i7-11800H, GeForce RTX 3070 Laptop GPU | 2.2 kg | 20 mm | 15.60" | 3840x2160 |
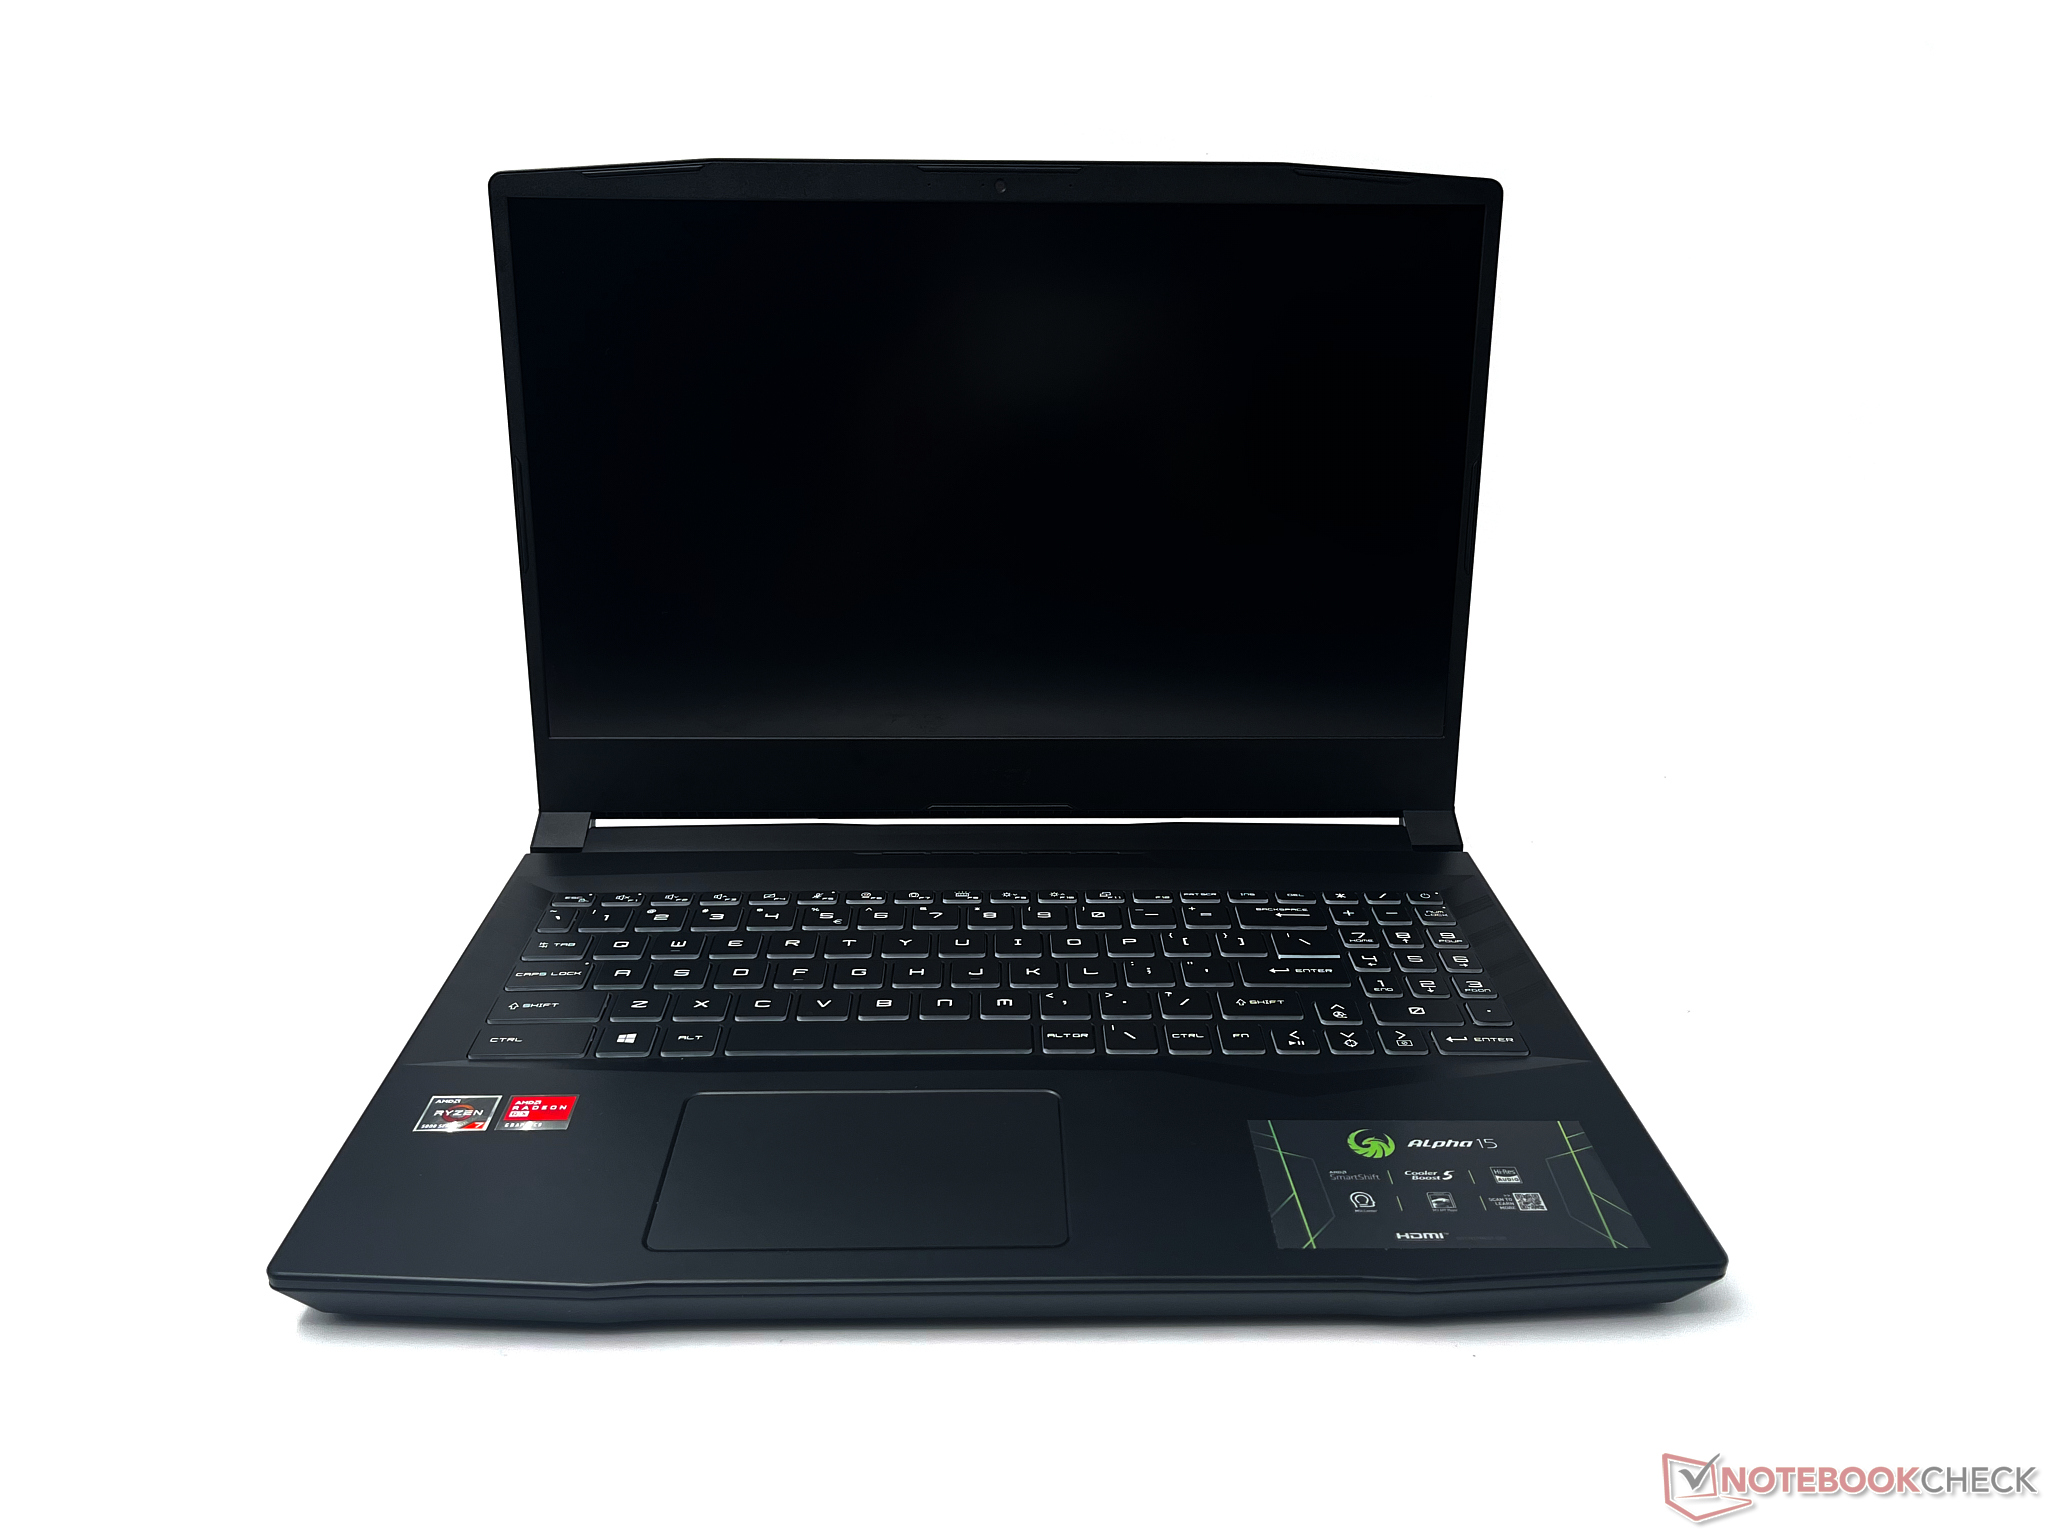
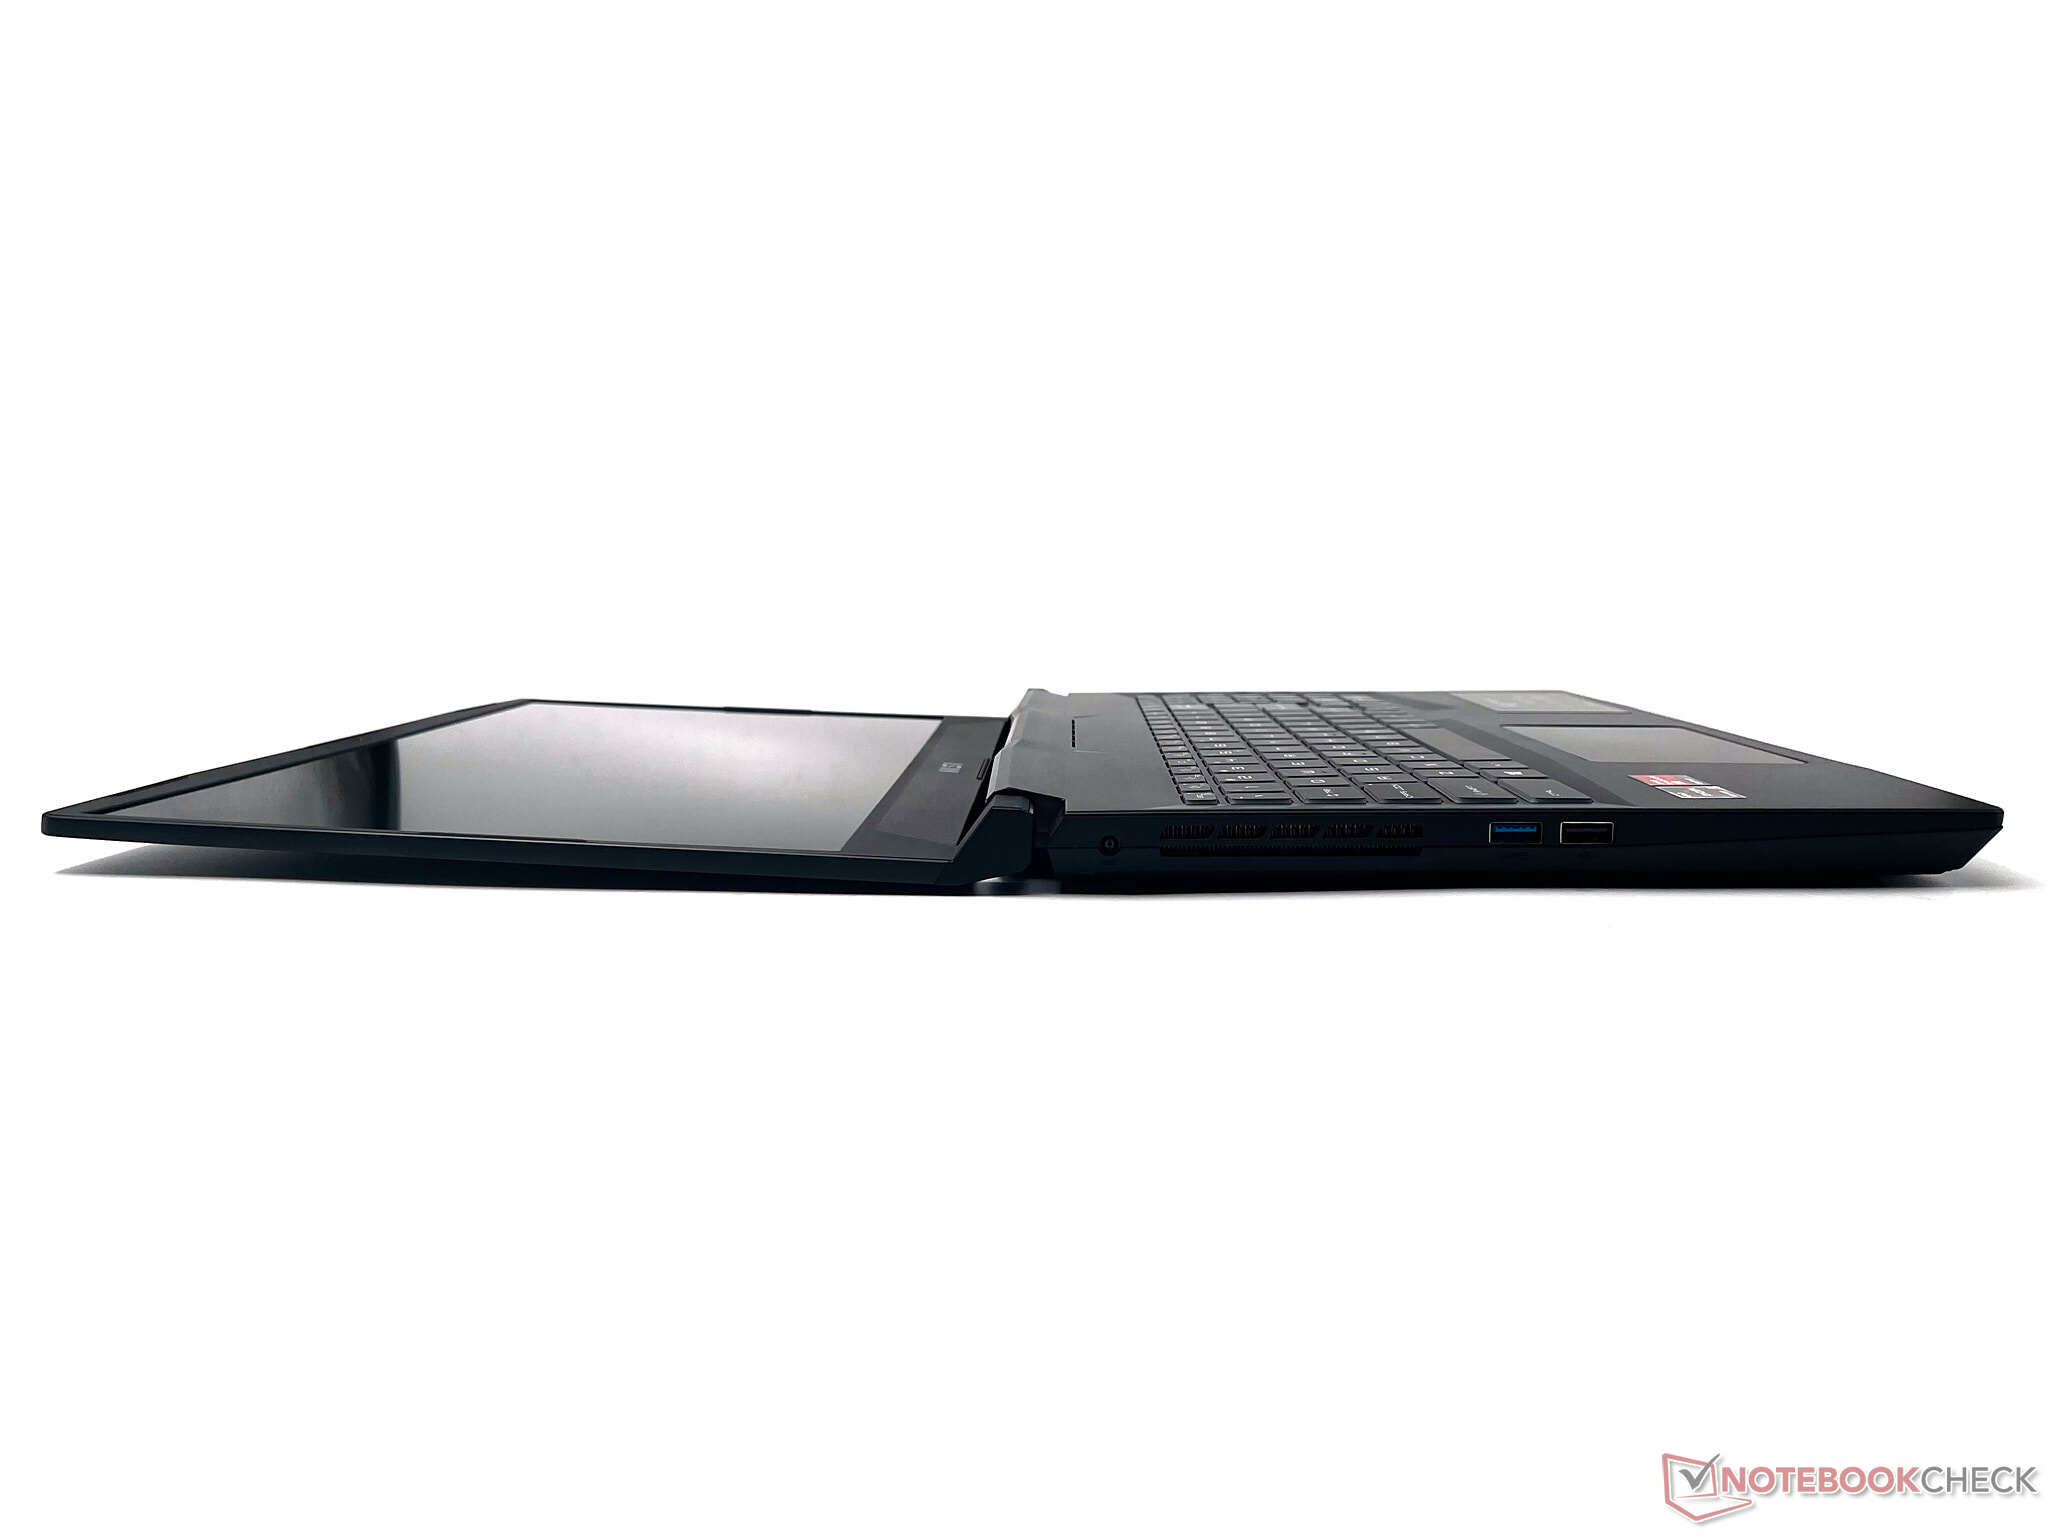
Case: In plastic but not quite fantastic
The Alpha 15's case is reminiscent of that of the Katana GF66 11UG and is not the most premium one you will come across. The entire chassis is made of plastic save for back of the lid, which is made of aluminum. The design is pretty much similar to its predecessor, the MSI Alpha 15 A3DDK. The idea clearly is to keep the costs low as much as possible with respect to build quality while focusing more on the internal prowess.
Thanks to the aluminum construction, the lid does not flex unless deliberately twisted. The lid can be opened with one finger, but the base does slide a bit while doing so. The hinges feel strong, and the lid can be rotated flat to a full 180°. There is some wobble in the display when disturbed. We also felt some flex in the keyboard deck when pressure is applied.
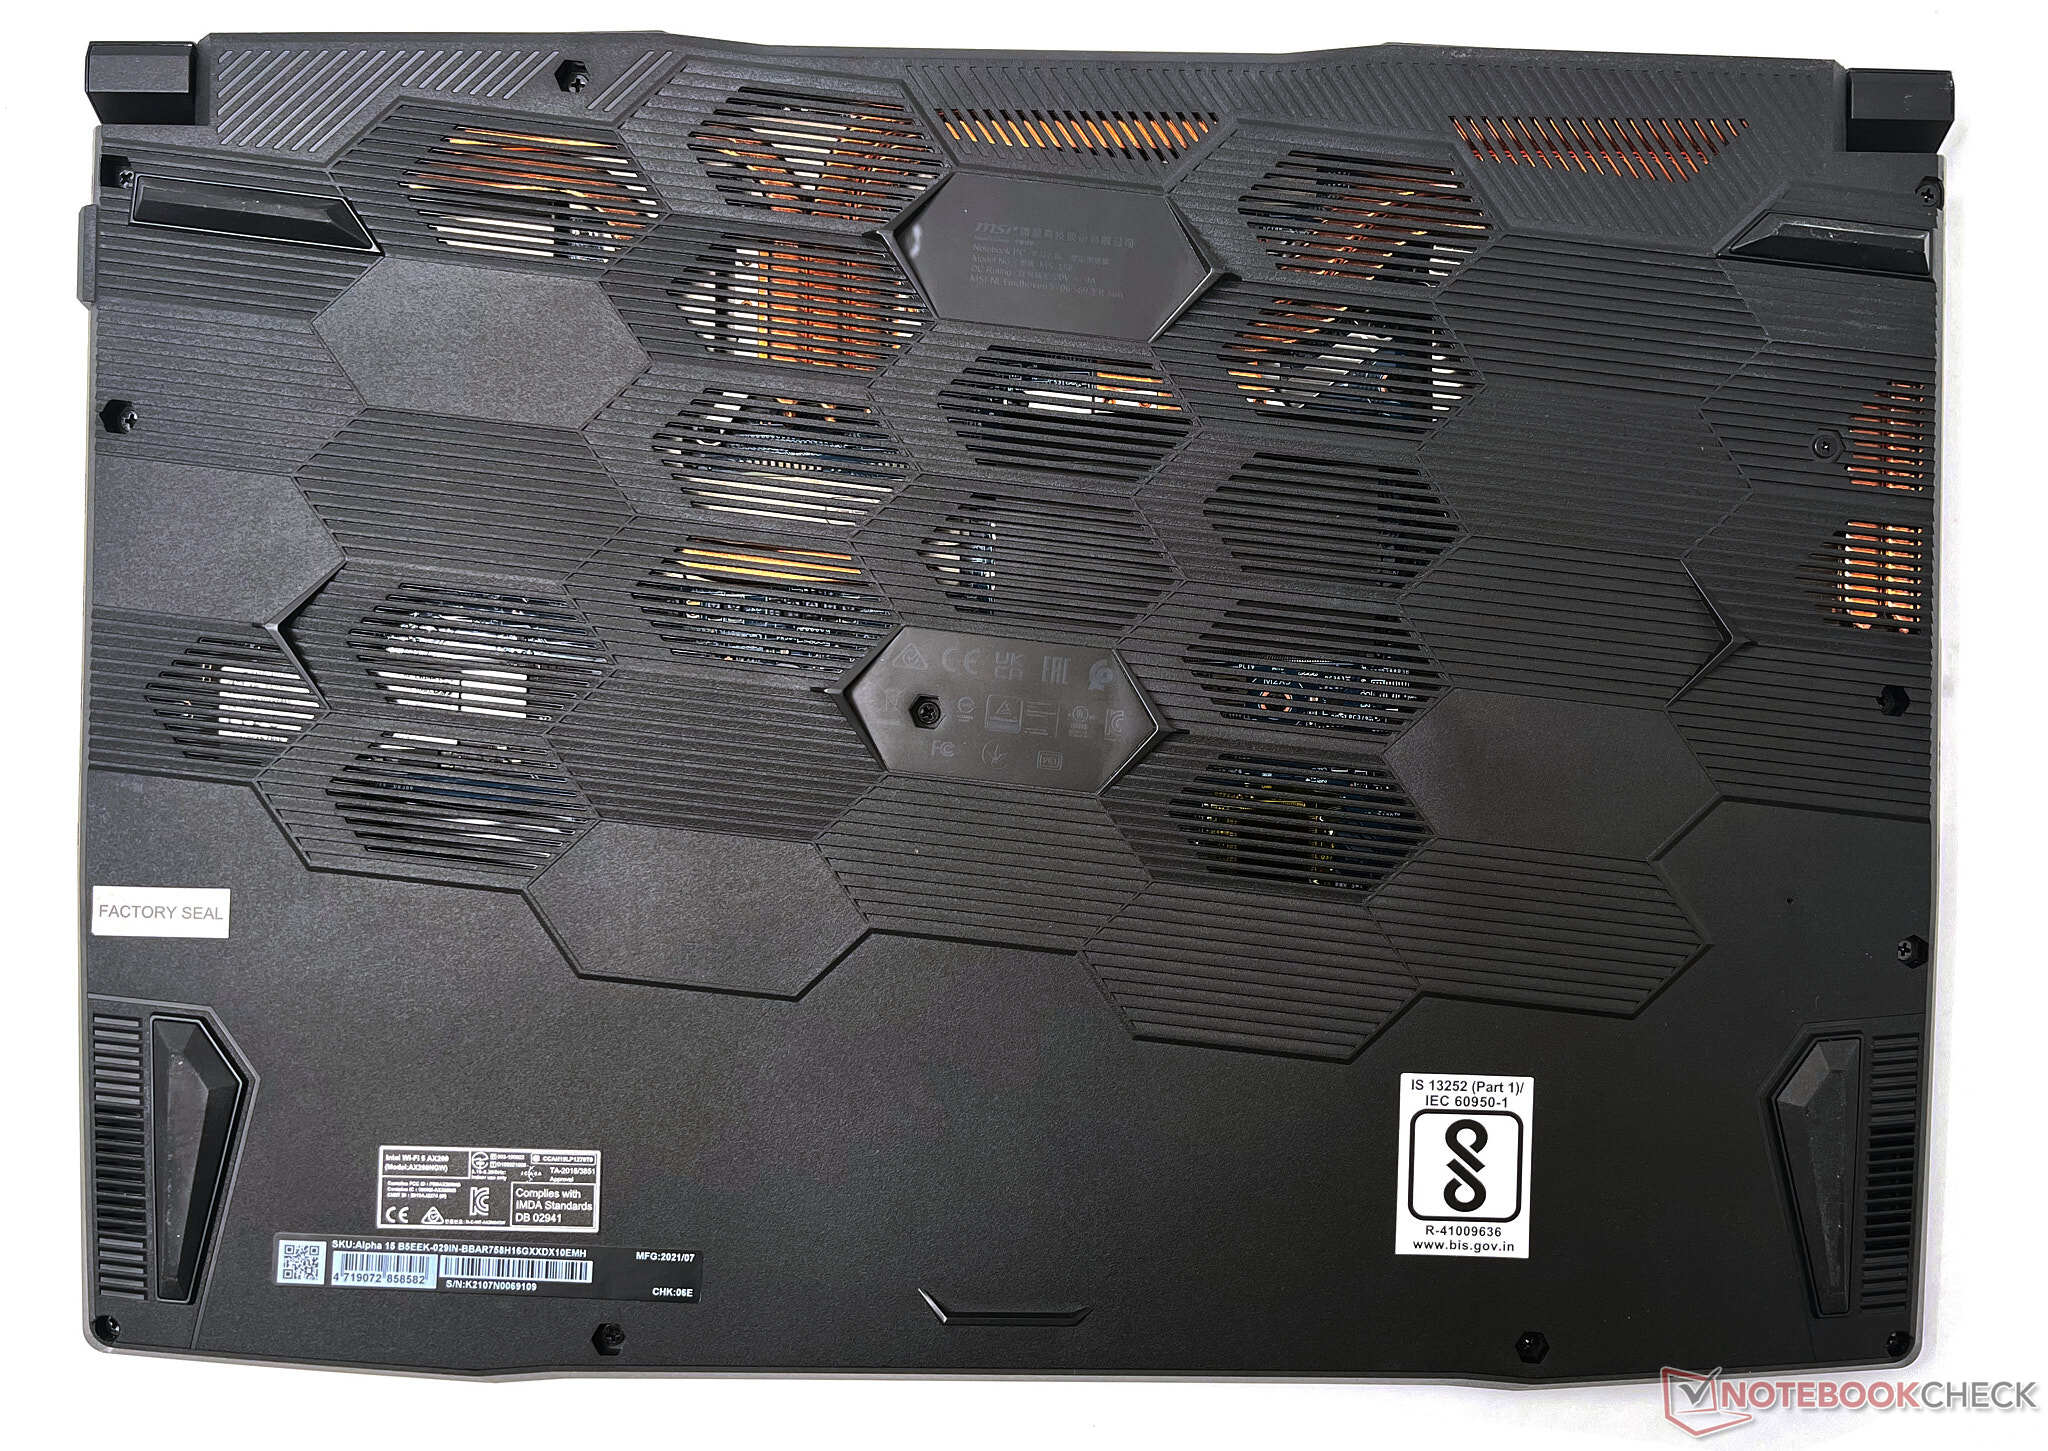
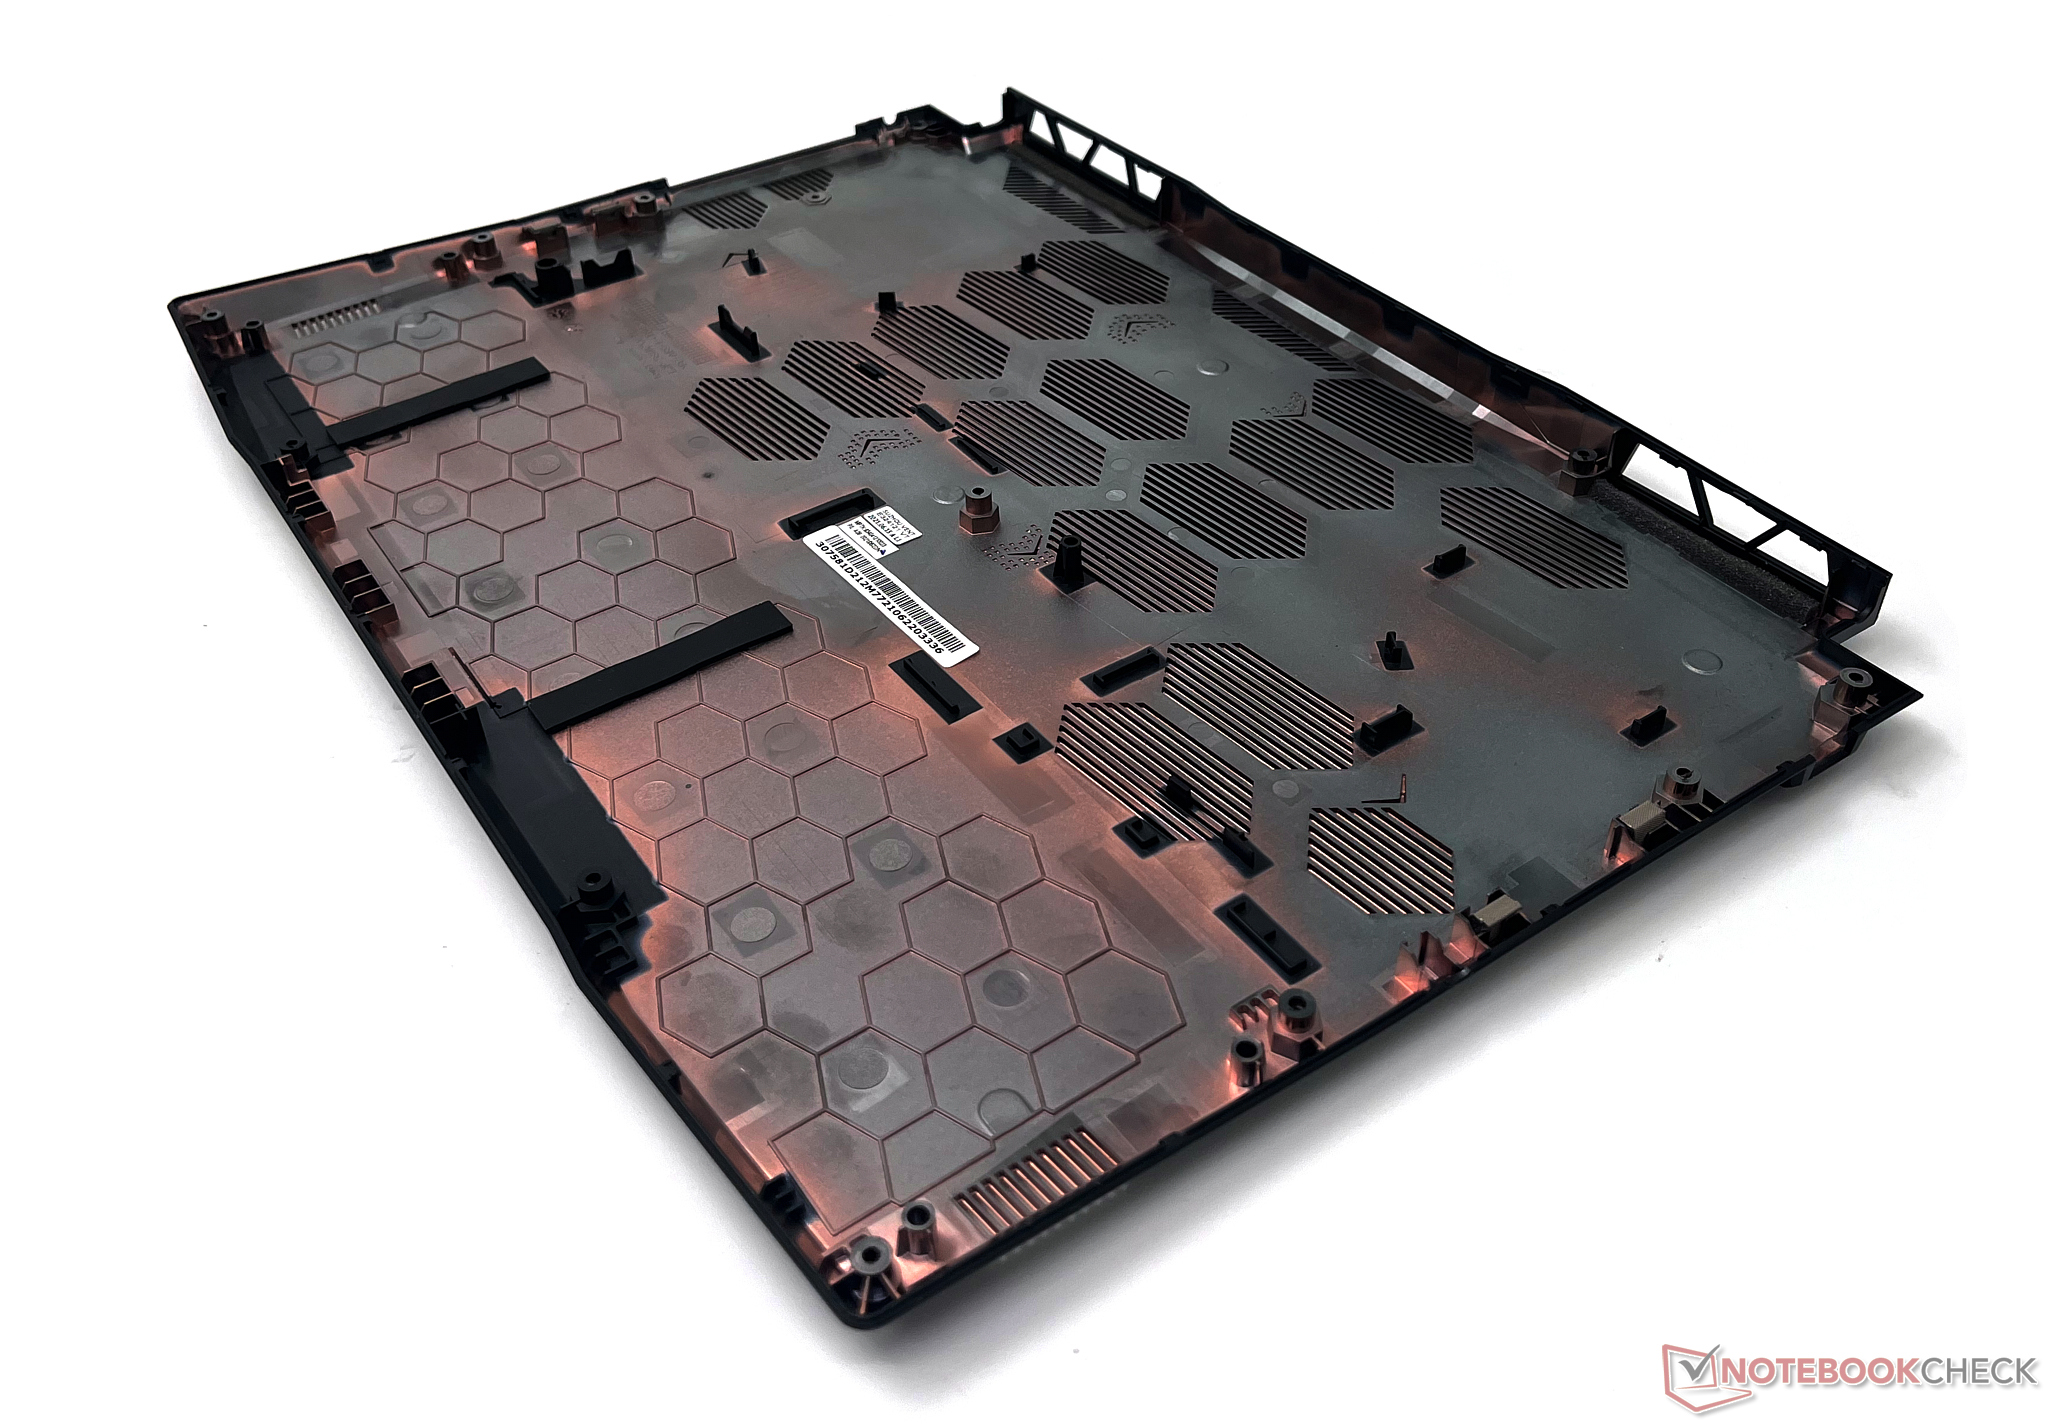
The base cover of the laptop is once again plastic but feels somewhat fragile compared to the rest of the chassis. It offers sufficient clearance from the main components and features enough ventilation grills for air intake. The 2.35 kg weight is also on the higher side given that its cousin, the Delta 15, weighs just about 1.96 kg.
Overall, despite a plastic construction, the MSI Alpha 15 B5EEK feels sturdy for the most part. Just don't expect it to give off any premium vibes.
Connectivity: Enough to get the job done
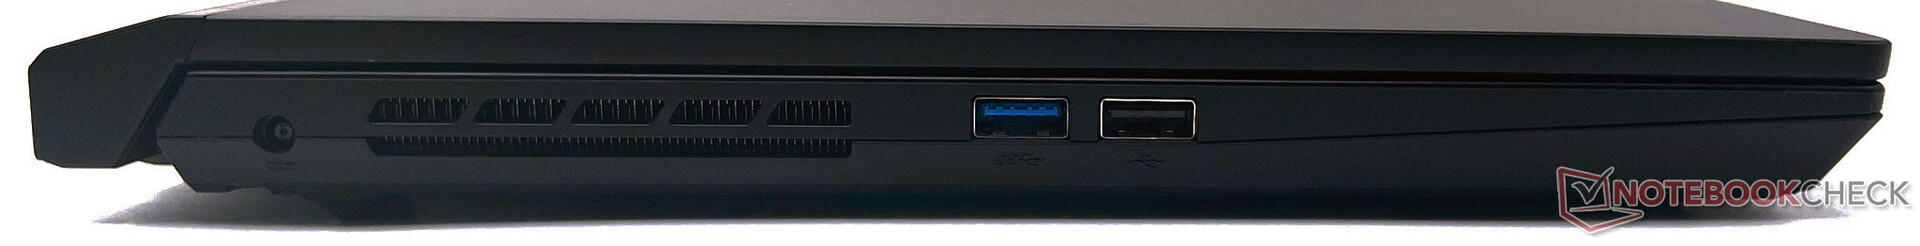
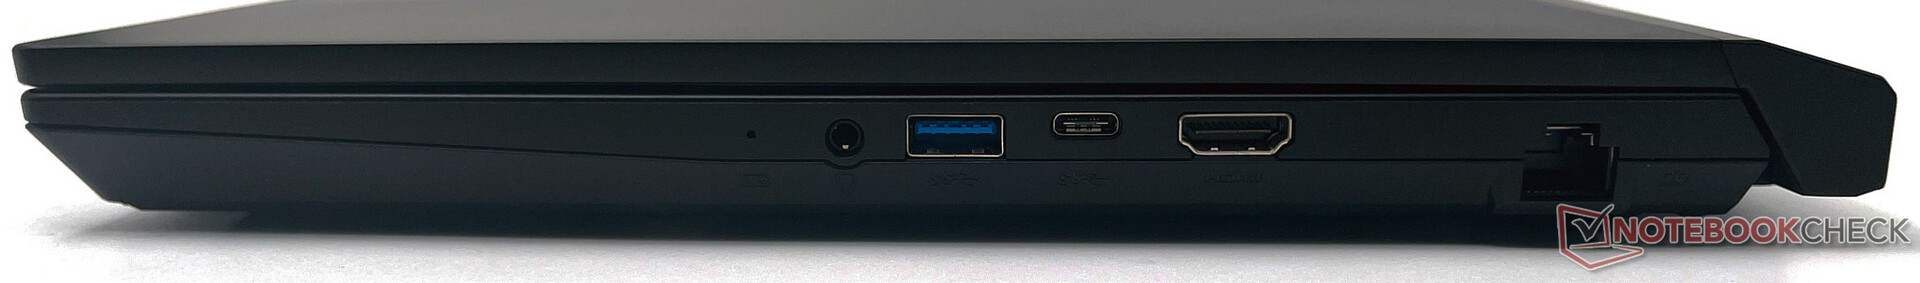
The MSI Alpha 15 does not offer a chock full of ports but covers most essentials. On the left, we have one USB 3.2 Gen1 Type-A and a USB 2.0 Type-A. Towards the right, we get a USB 3.2 Gen1 Type-C port with DisplayPort-out, another USB 3.2 Gen1 Type-A, a HDMI 2.0b port that supports 4K60 output, and a 3.5 mm combo audio jack. An RJ-45 Gigabit port is available as well.
While we did not face any issues in connecting multiple USB devices adjacent to each other, the central placement of ports on the sides may not be very optimal for unhindered movements with a wired mouse. Since this is an AMD-based platform, there is no Thunderbolt 4 port available. Unfortunately, a Kensington lock slot and a card reader are missing as well.
Communication
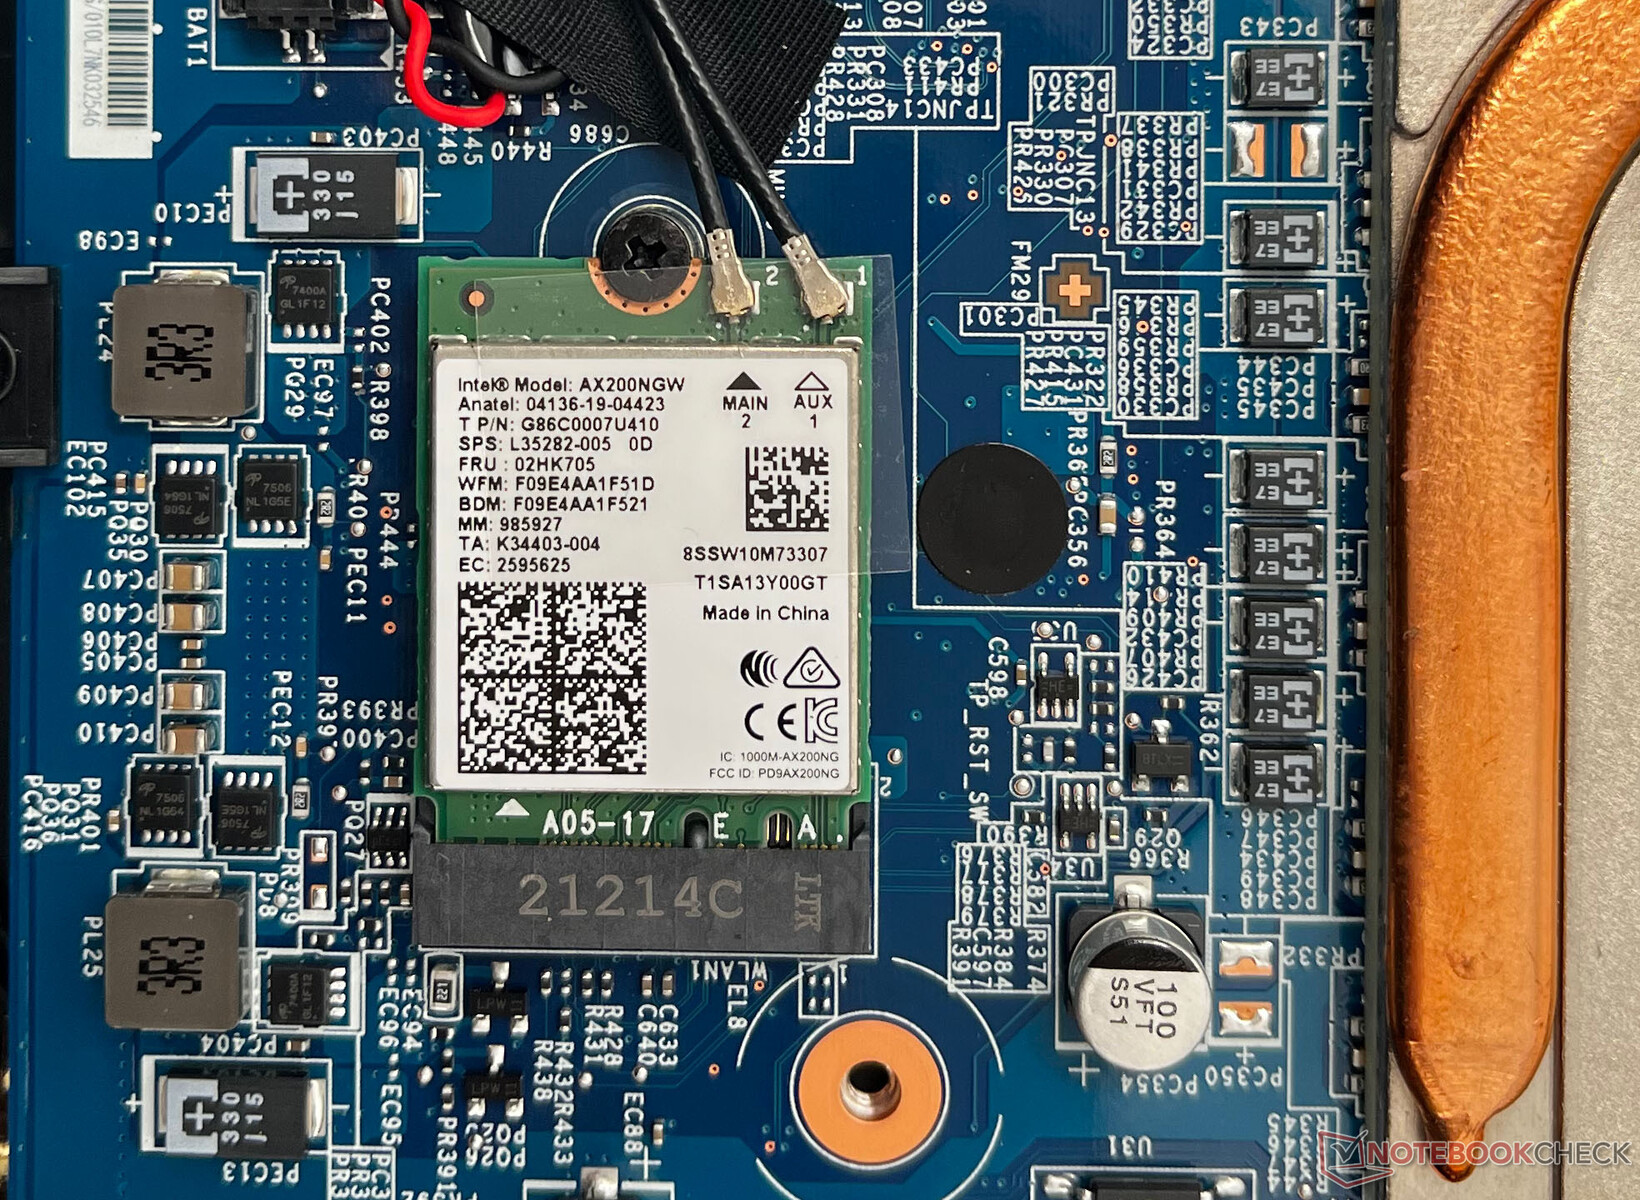
The Alpha 15 features an Intel Wi-Fi 6 AX200 WLAN card with Bluetooth 5.1. We observed good transmit and receive speeds reaching near to 1.5 Gbps in our standardized Wi-Fi test routine at a distance of 1 m from our reference Netgear Nighthawk AX12 RAX120 router.
The Alpha 15's Wi-Fi throughput and stability seem to be better than that of the Delta 15 with the only major instance of throttling seen at the 14th round of the transmit test. Users, therefore, should not be having much trouble with heavy data transfers or online gaming over Wi-Fi.
Webcam
The webcam is the standard 720p fare with high color deviations and lack of adequate sharpness even under good ambient light. Images turn out to be extremely grainy in low light.
There is no IR camera for Windows Hello or a physical privacy shutter, but pressing the shortcut on the F6 key toggles the camera on and off.


Security
There are no special security features built into the device. The Alpha 15 lacks any form of biometric authentication. However, a discrete TPM 2.0 module is present that should enable an easy Windows 11 upgrade down the line.
Accessories
There are no special accessories in the box apart from the usual paperwork and a 180 W power adapter.
Maintenance
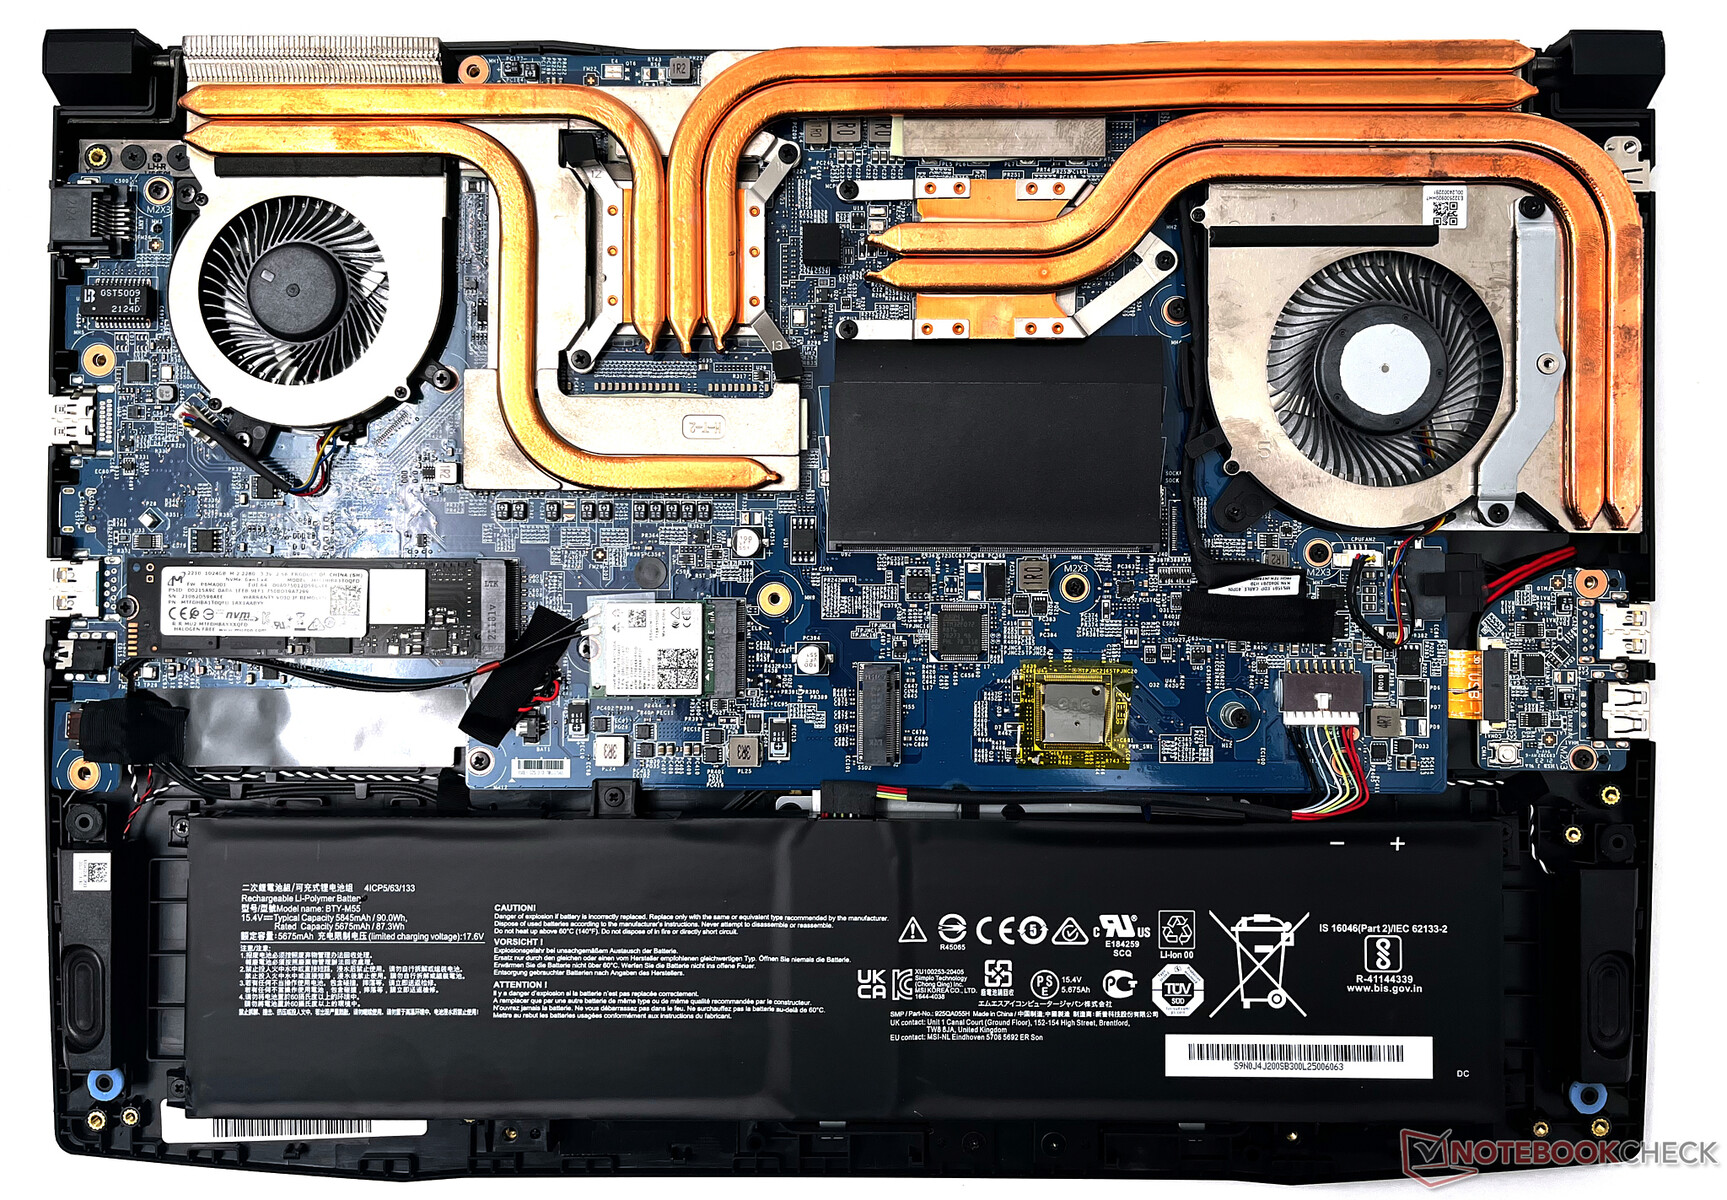
Removing the 13 PH0 screws in the bottom enables prying open the base cover of the laptop giving access to various internals. Note that one of the screws is hidden under a factory seal sticker.
The WLAN card, M.2 SSD, and the RAM are all user-swappable. An additional M.2 SSD slot is also available for storage expansion. The battery can be replaced if needed as well.
Warranty
MSI offers a standard one-year carry-in warranty for the Alpha 15, but it may be possible to get up to two years of coverage at some retailers. According to MSI's official documentation, warranty is generally limited to the country of purchase unless a global travel insurance is specifically applied for.
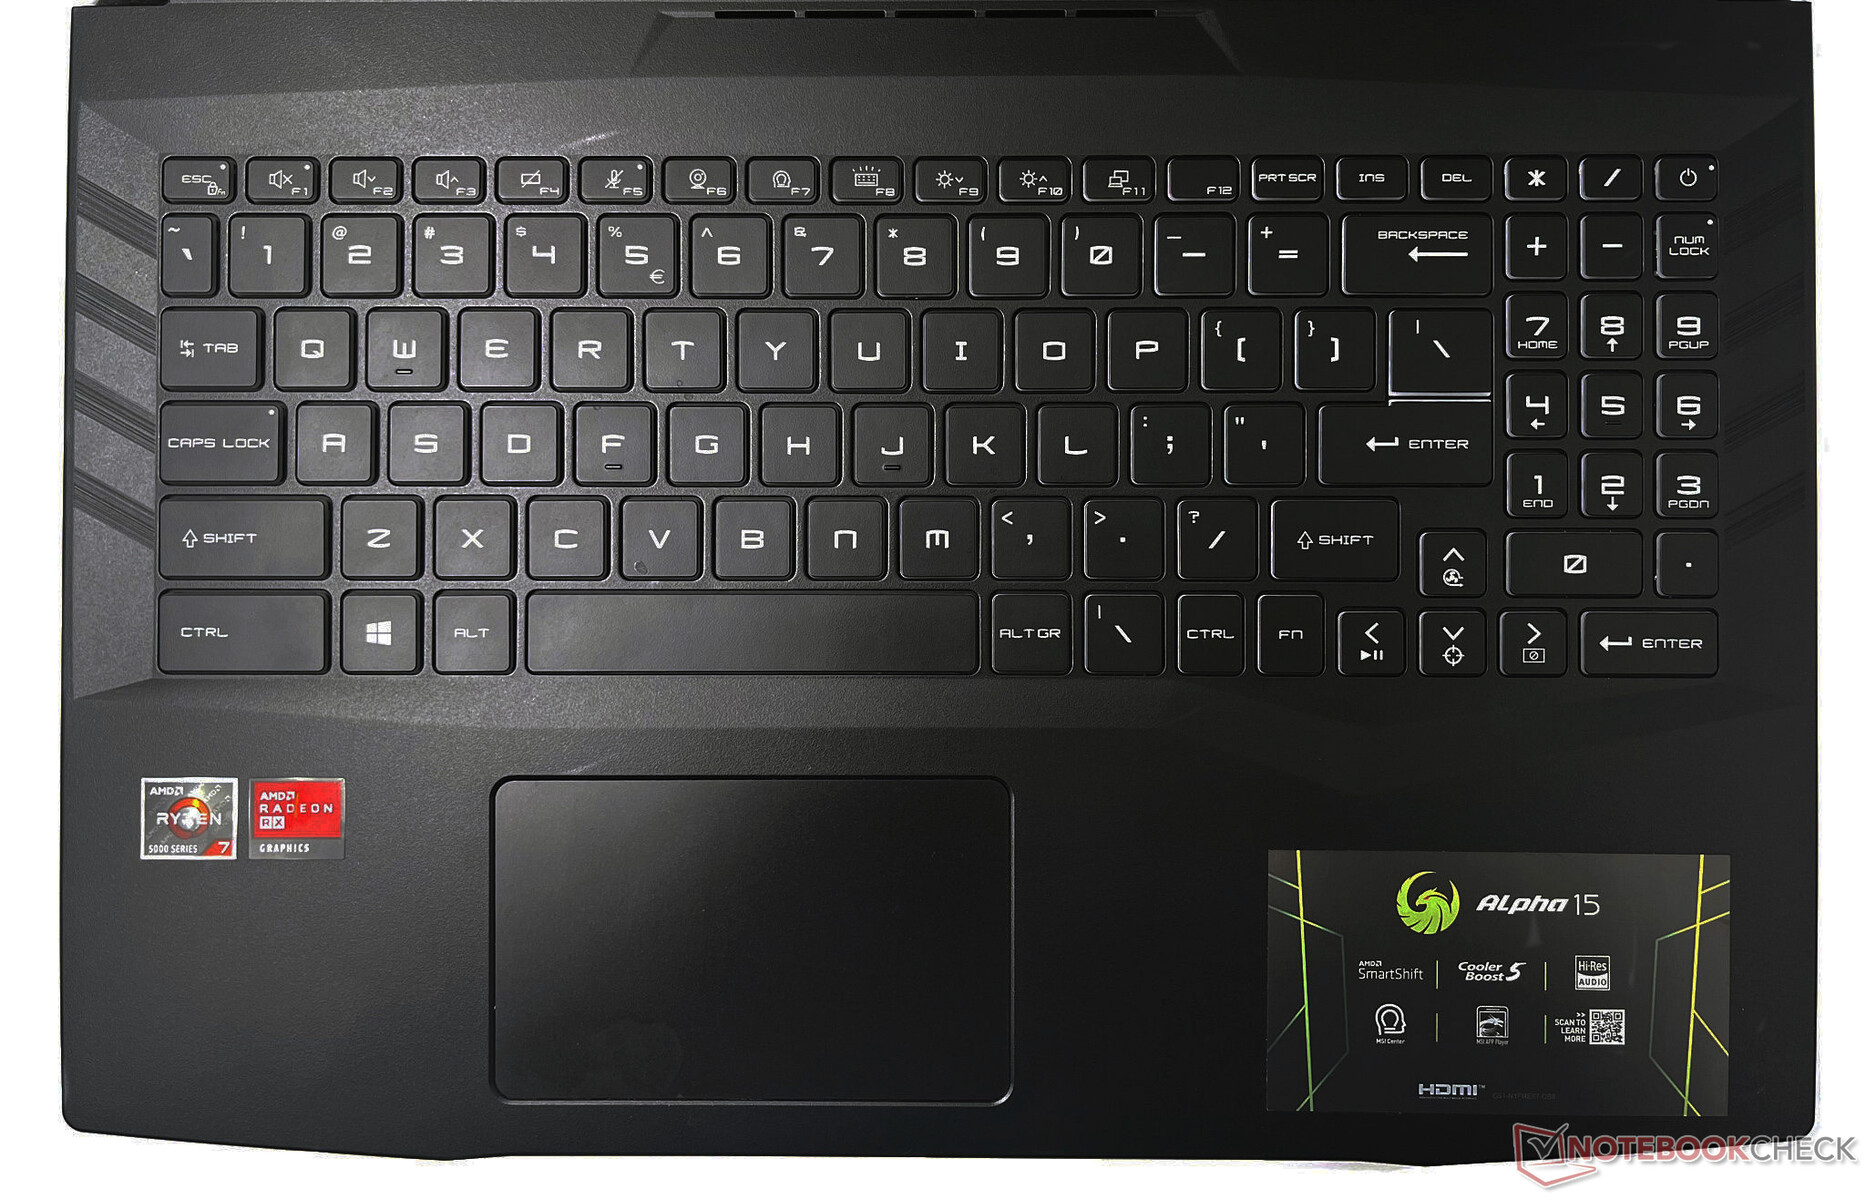
Input Devices: Good keyboard but cramped touchpad
Keyboard
The Alpha 15's keyboard has both pros and cons to it. The keyboard offers a good typing experience with adequately-sized keys that offer decent tactile feedback. While the presence of full-size arrow keys will be appreciated by many, it comes at the cost of a truncated right Shift key.
The top row function keys are narrower than the rest. The numpad is more compact than we'd like, but this shouldn't pose any particular issues though the odd placement of the Fn key will take some time to get used to.
MSI enables RGB functionality for the keyboard, which can be cycled by pressing the shortcut on the F8 key or customized via the MSI Center app. However, there is no per-key or zonal RGB lighting option. The RGB lighting works well, and the keys offer enough transparency for the lighting effects to shine through.
Overall, the Alpha 15's keyboard offers enough to cater to most typing and gaming needs. That being said, a SteelSeries keyboard like the one found in the previous generation Alpha 15 A3DDK would have been a welcome feature.
Touchpad
At about 10.5 cm x 6.5 cm, the touchpad area feels quite cramped and is placed off-center. However, gamers are most likely to use an external mouse so this is a moot point.
The touchpad surface glides with relative ease and Windows Precision gestures are fully supported. The whole surface acts as a left mouse button and the click noise, though somewhat high, is tolerable.
Display: FreeSync Premium with good response times and no PWM
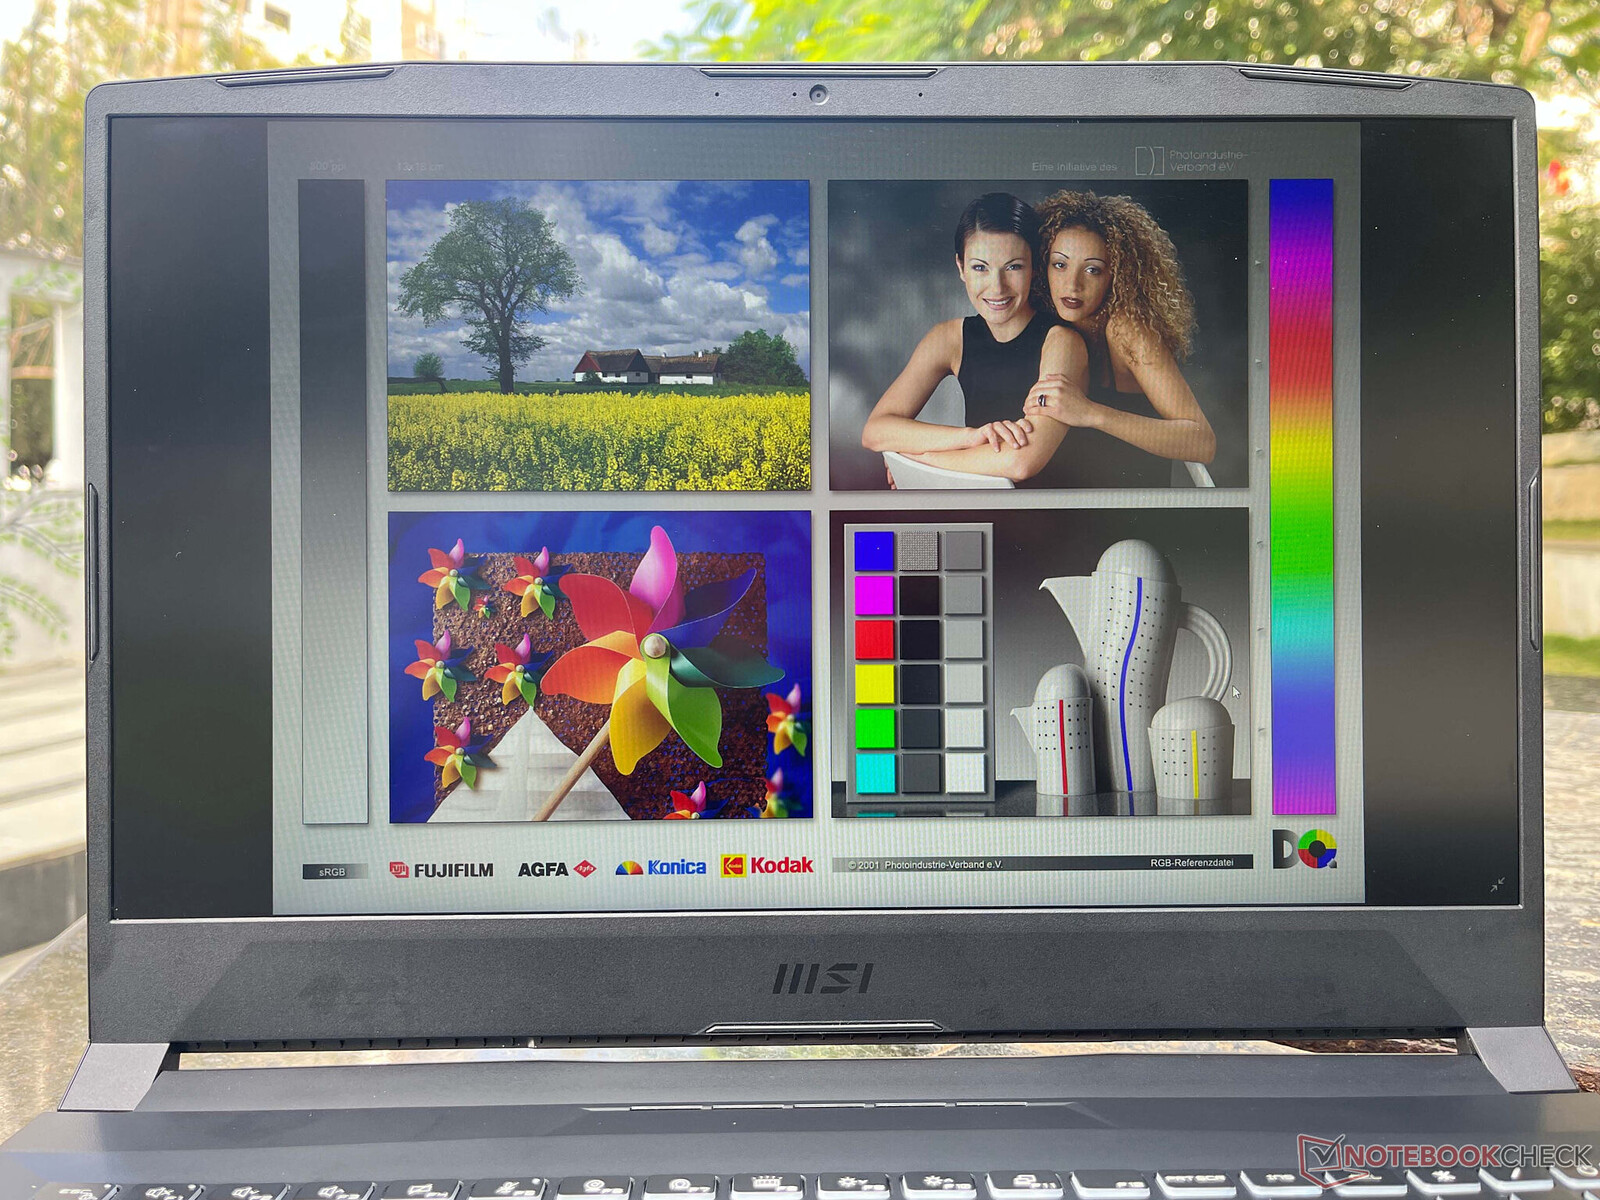
Our MSI Alpha 15 unit came equipped with a 15.6-inch AU Optronics B156HAN08.0 1080p panel with good response times and a high 144 Hz refresh rate. The panel supports AMD FreeSync Premium for tear-free visuals.
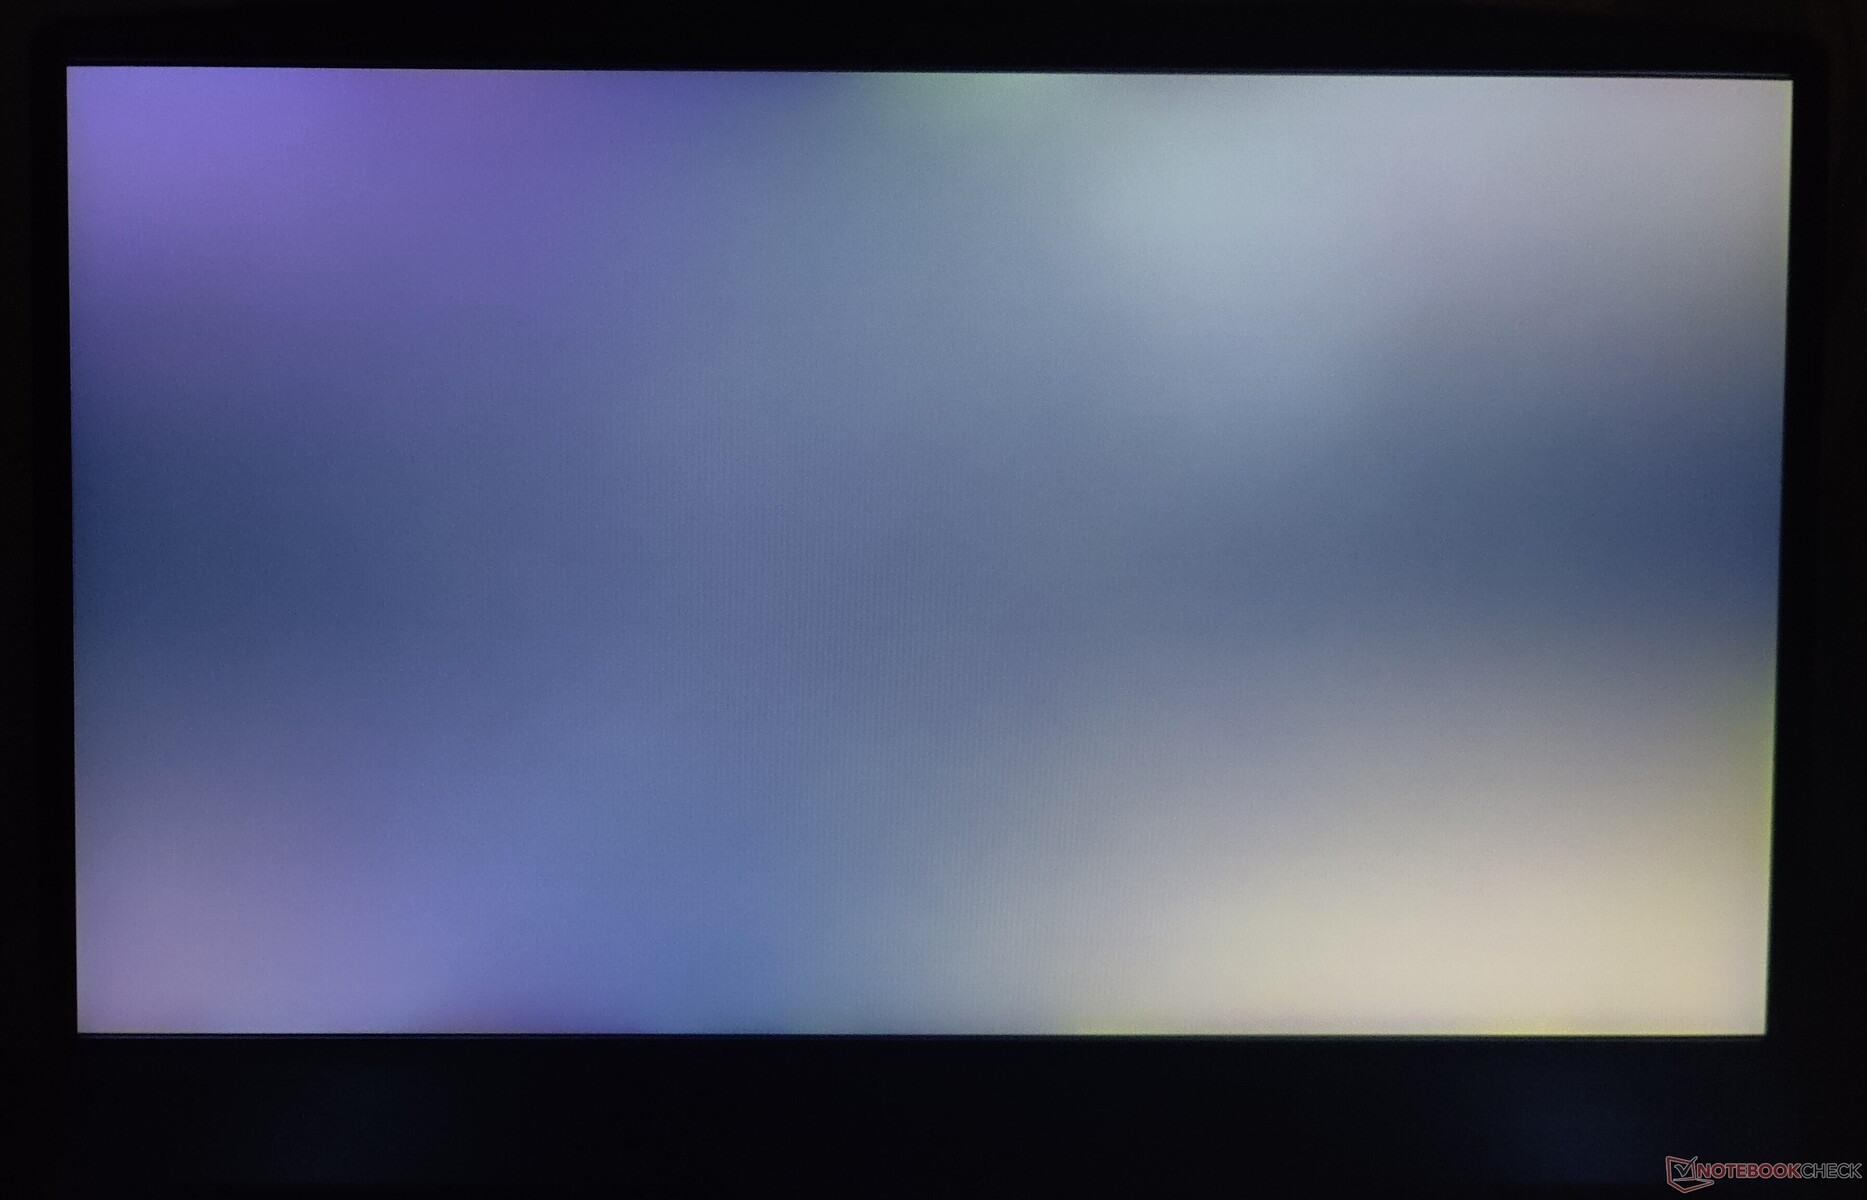
The sub-pixel arrangement appears fuzzy due to the matte coating. Long exposures reveal significant backlight bleeding at the corners of the display. The brightness distribution is decent at 84%, though the center of the panel isn't as bright as the other zones.
| |||||||||||||||||||||||||
Brightness Distribution: 84 %
Center on Battery: 306 cd/m²
Contrast: 1414:1 (Black: 0.22 cd/m²)
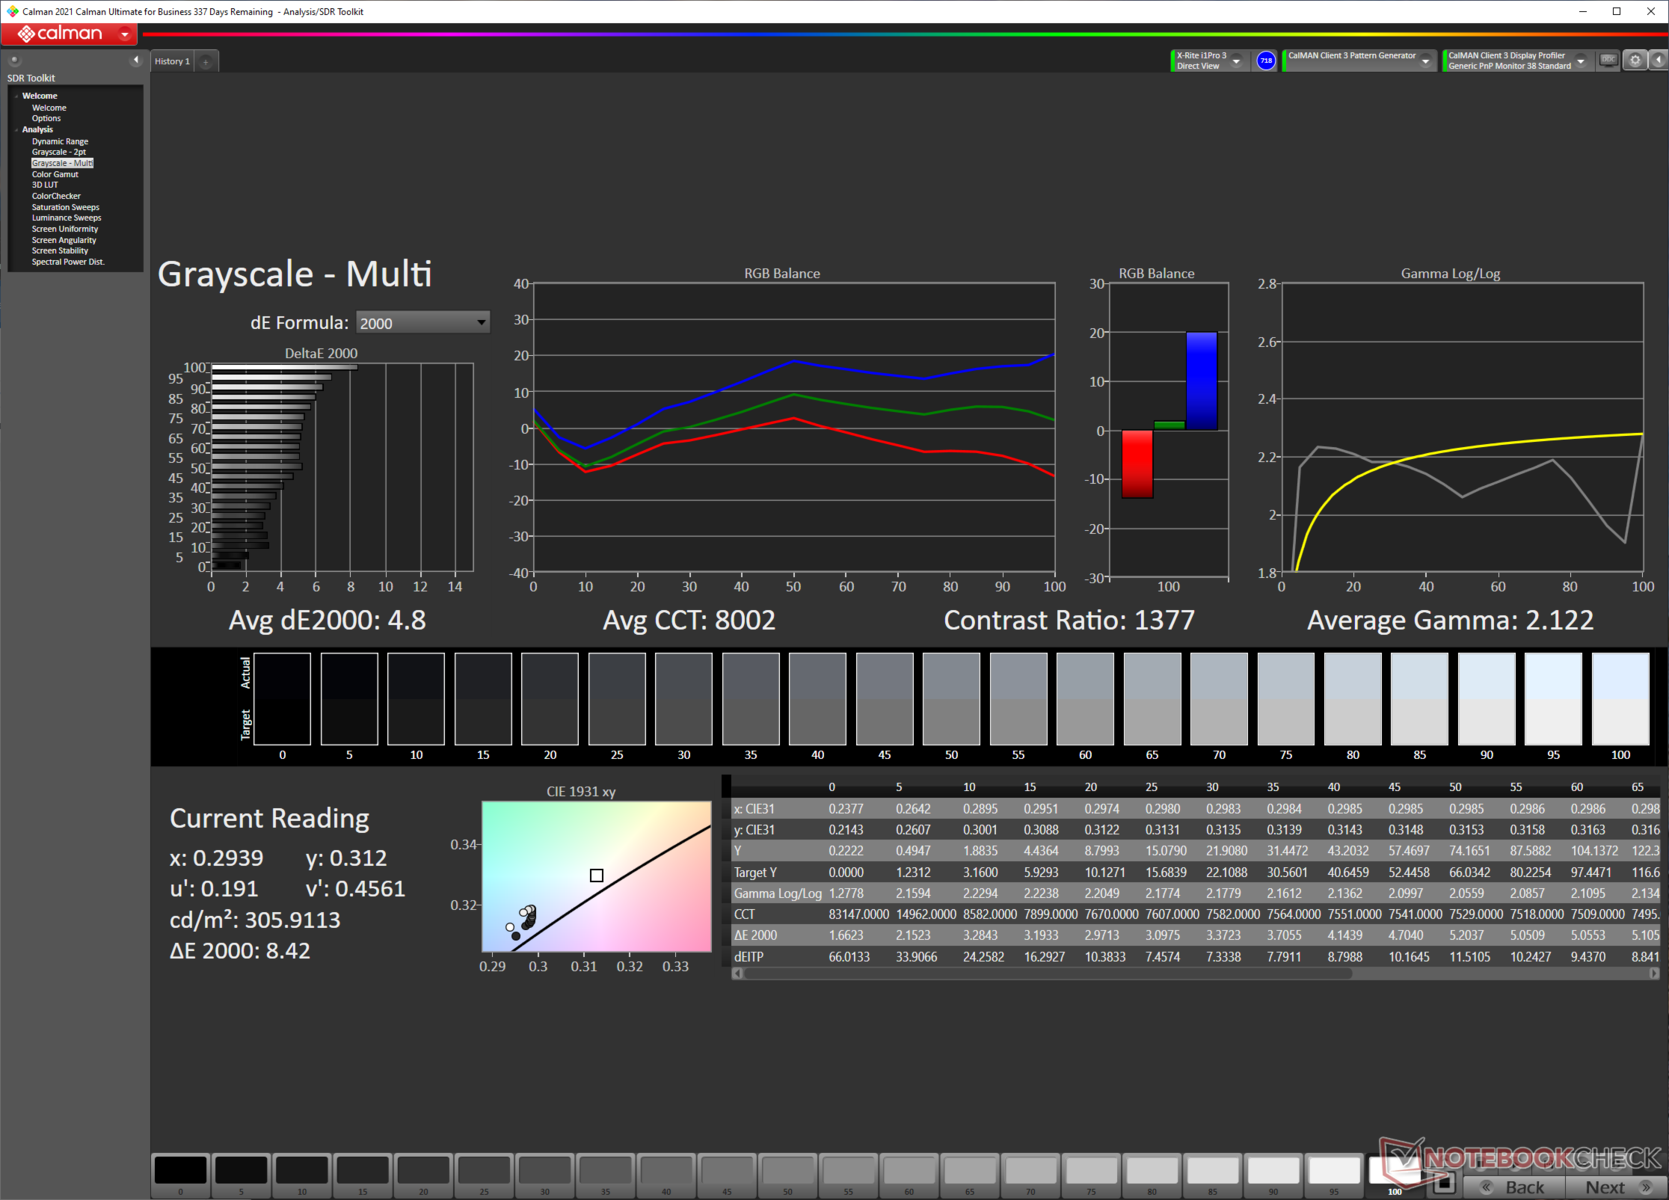
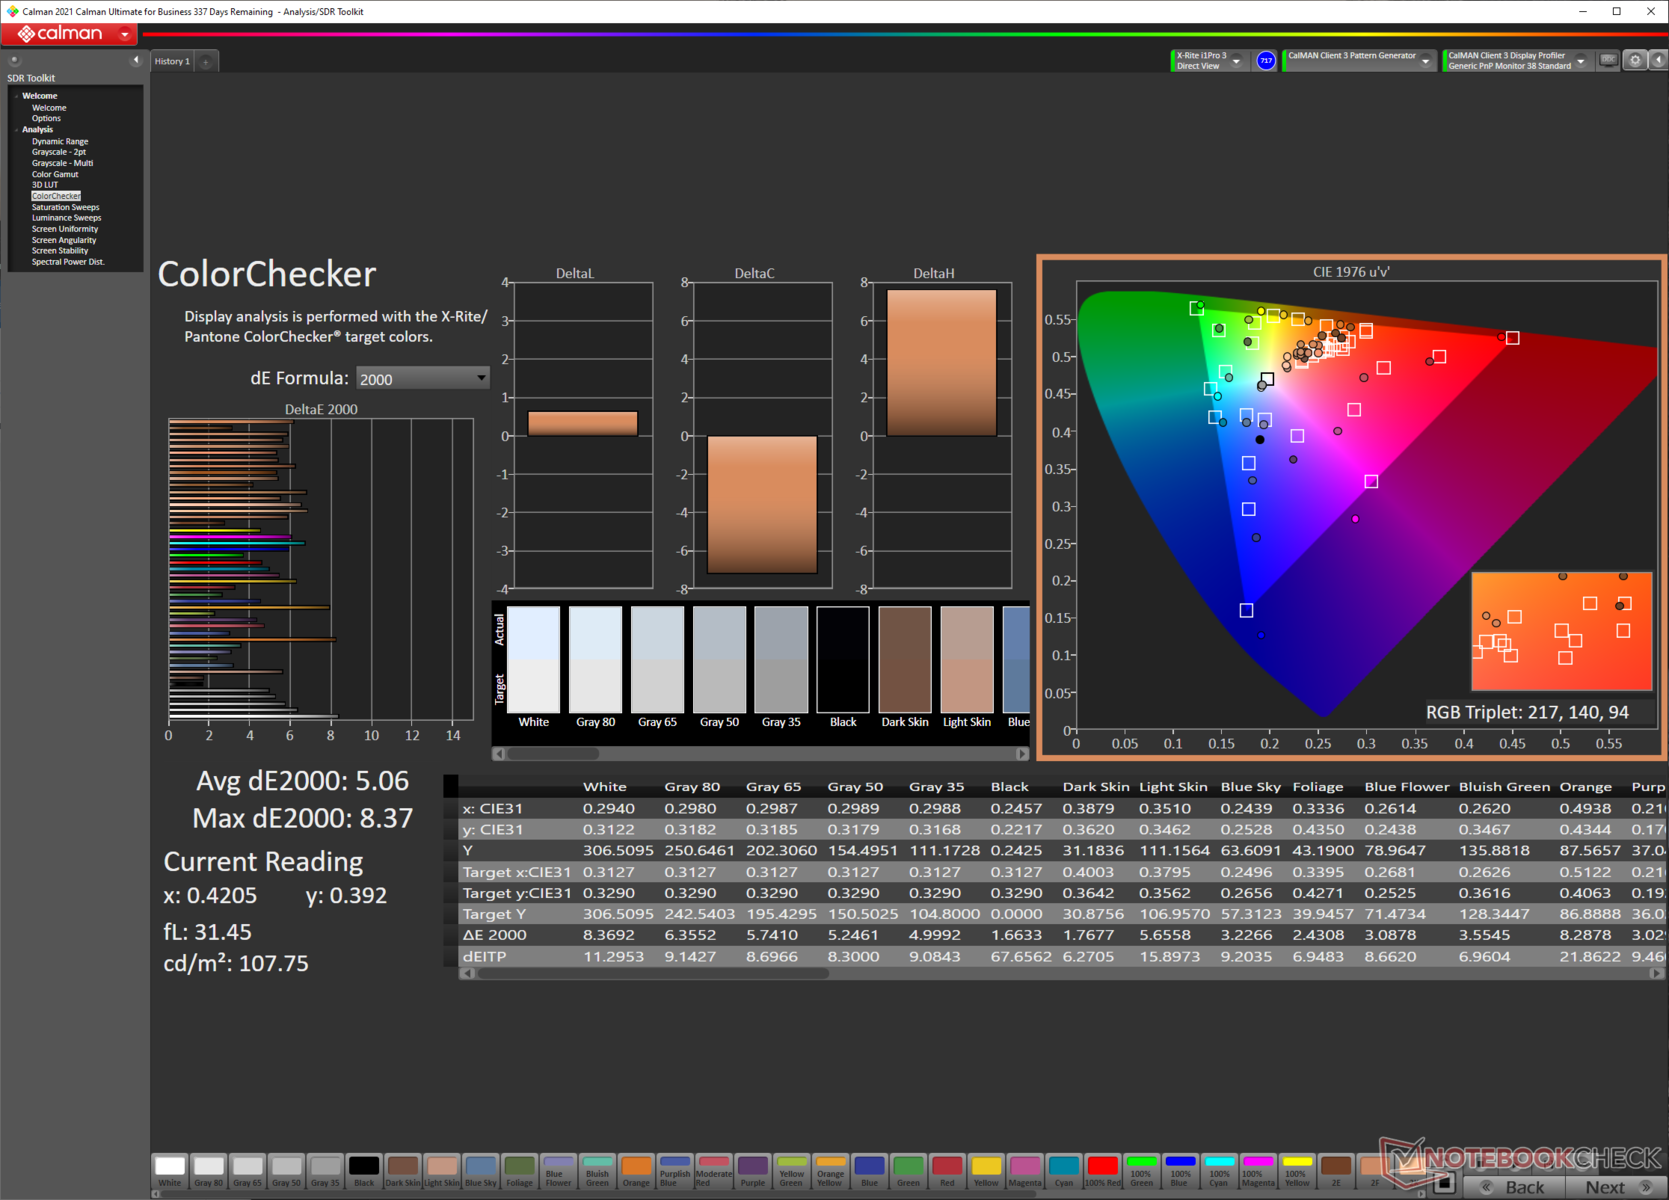
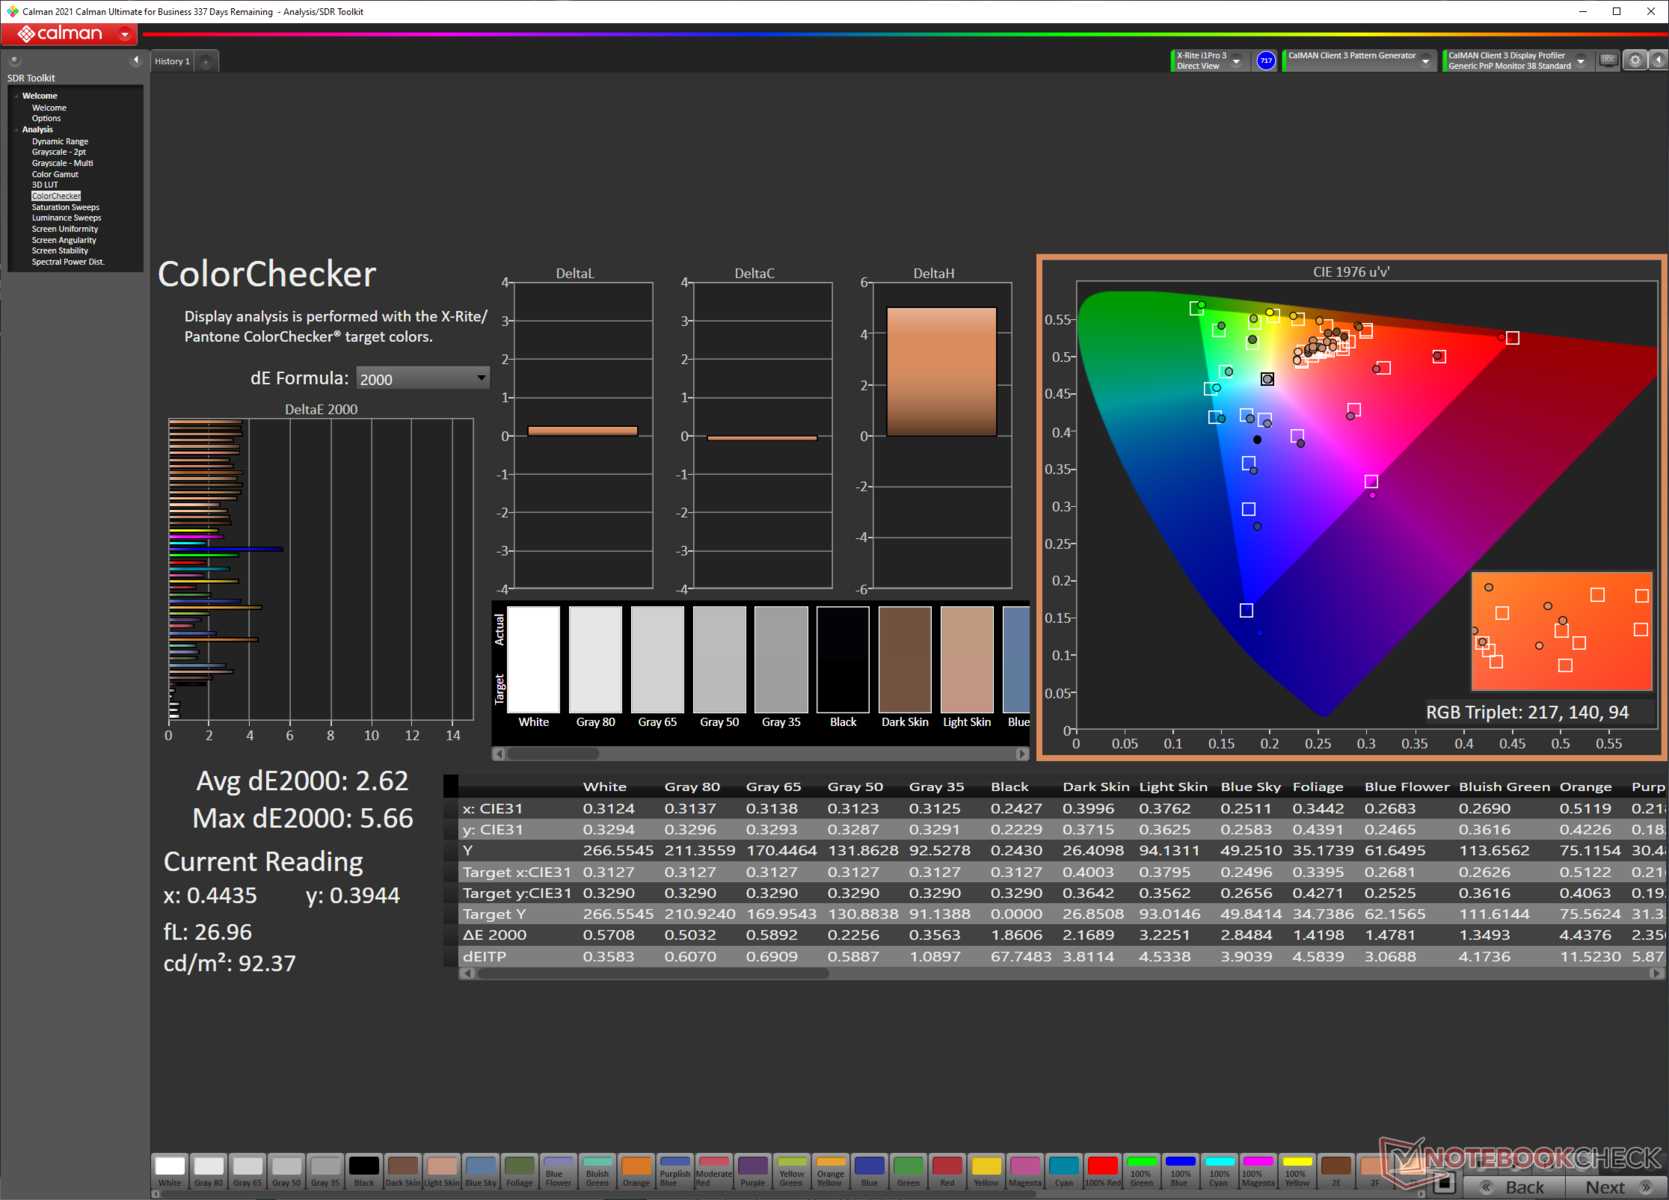
ΔE ColorChecker Calman: 5.06 | ∀{0.5-29.43 Ø4.73}
calibrated: 2.62
ΔE Greyscale Calman: 4.8 | ∀{0.09-98 Ø4.97}
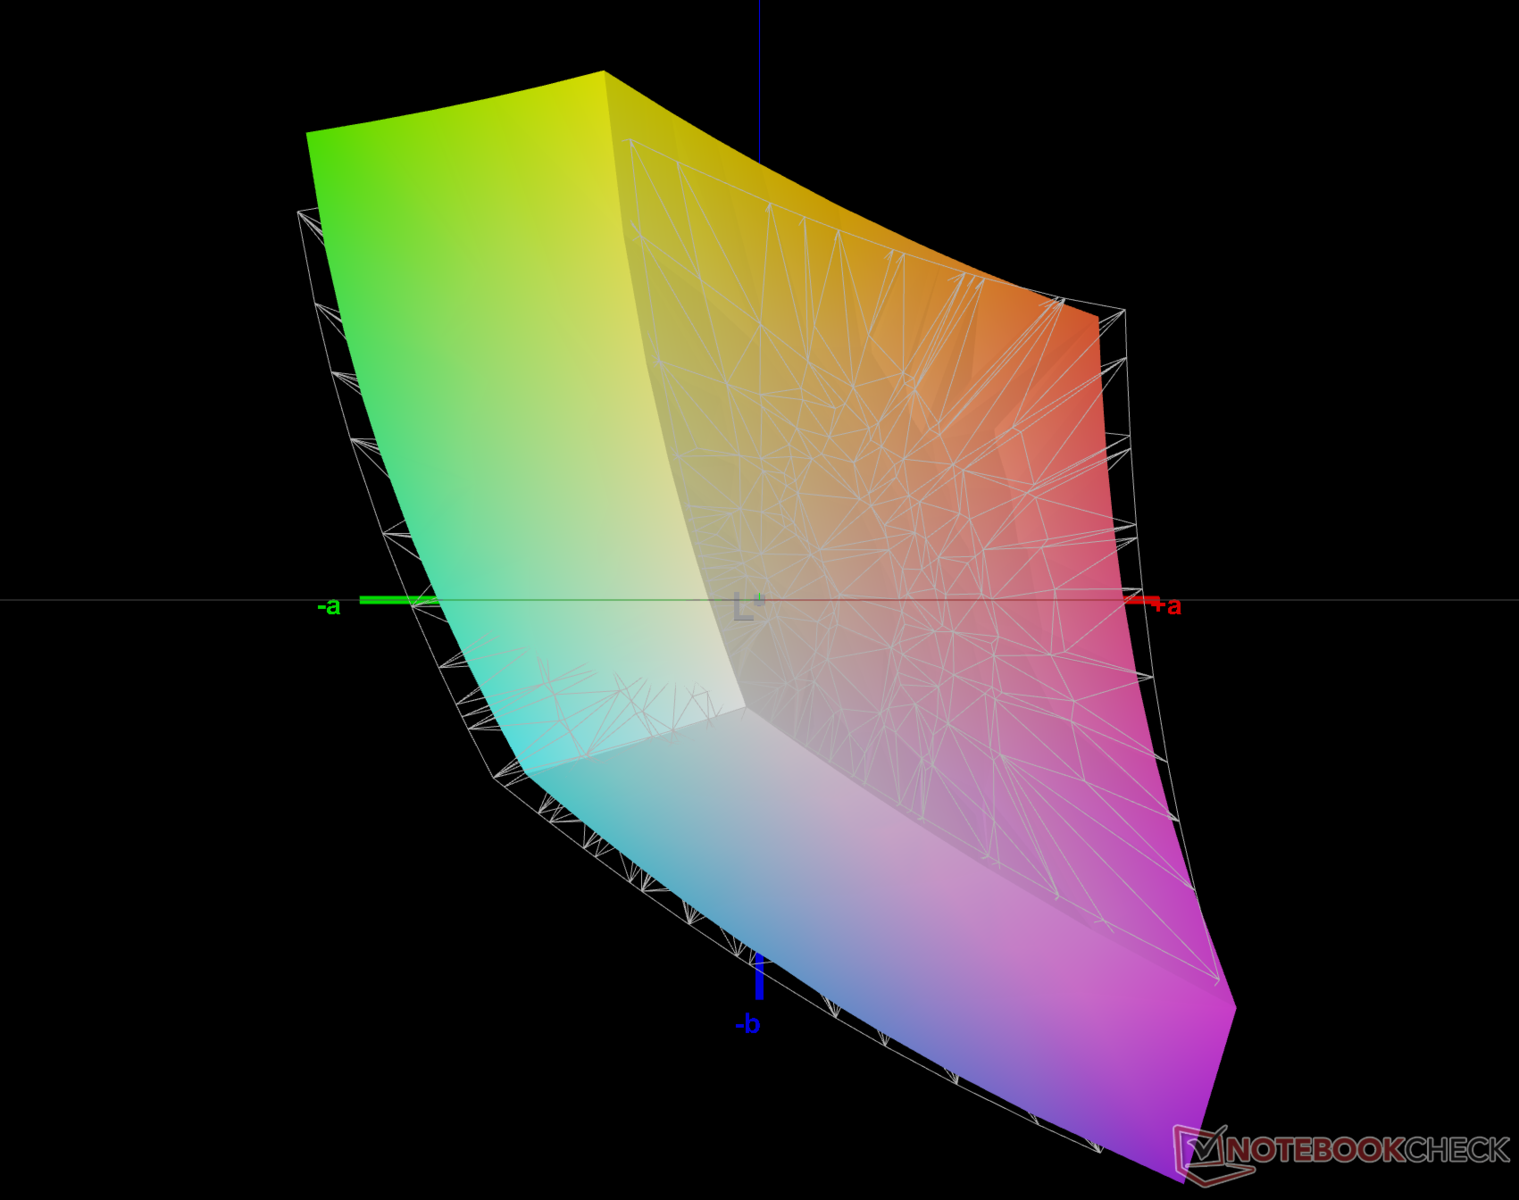
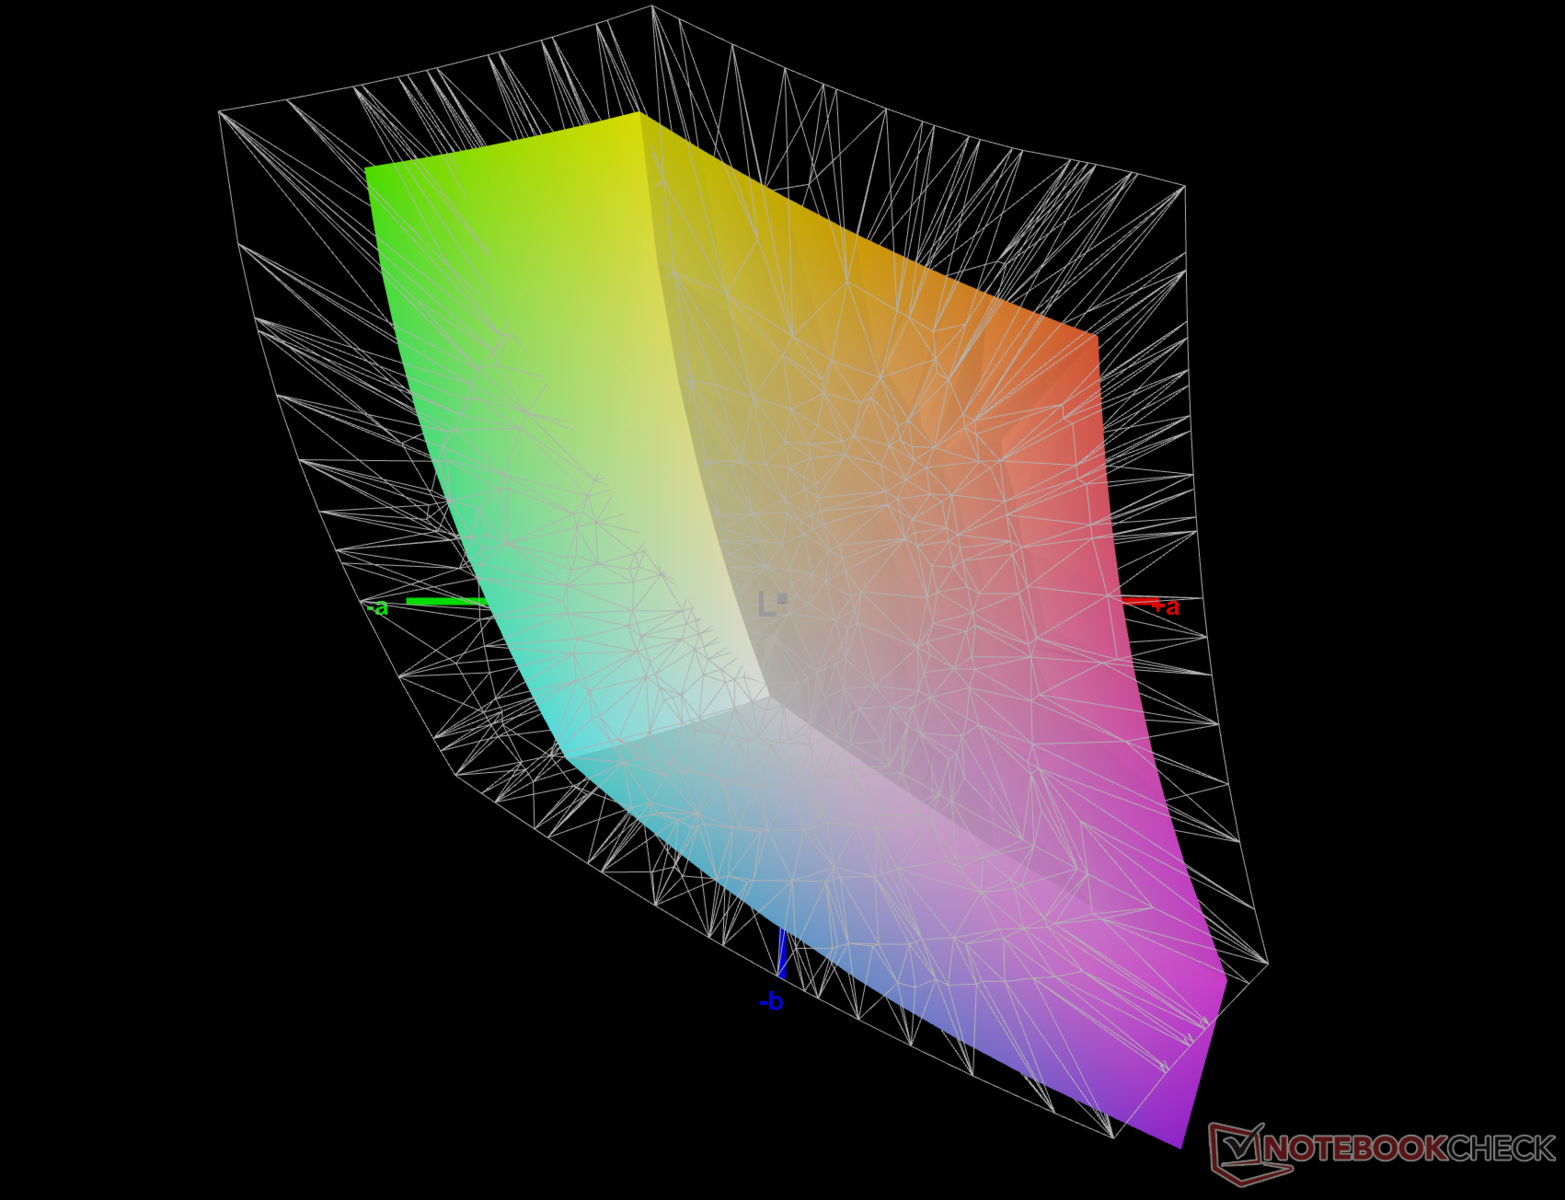
67% AdobeRGB 1998 (Argyll 3D)
91.6% sRGB (Argyll 3D)
65.9% Display P3 (Argyll 3D)
Gamma: 2.12
CCT: 8002 K
| MSI Alpha 15 B5EEK-008 AU Optronics B156HAN08.0, IPS, 1920x1080, 15.6" | MSI Katana GF66 11UG-220 AU Optronics B156HAN08.0, IPS, 1920x1080, 15.6" | MSI Delta 15 A5EFK LQ156M1JW03 (SHP155D), IPS-Level, 1920x1080, 15.6" | Schenker XMG Apex 15 NH57E PS LG Philips LGD0625 (LP156WFG-SPB3), IPS, 1920x1080, 15.6" | Asus ROG Strix G15 G513QY Sharp SHP152C, IPS, 1920x1080, 15.6" | Lenovo Legion S7 15ACH6 82K80030GE CSOT T3 MNF601EA1-6, IPS, 3840x2160, 15.6" | MSI GP66 Leopard 11UH-028 LGD0625 (LP156WFG-SPB3), IPS, 1920x1080, 15.6" | Asus TUF Gaming F15 FX506HM Chi Mei N156HRA-EA1, IPS, 1920x1080, 15.6" | Asus TUF Gaming F17 FX706HM AU Optronics AUI8294 (B173HAN04.9), IPS, 1920x1080, 17.3" | Gigabyte Aero 15 OLED XD Samsung SDC4143, OLED, 3840x2160, 15.6" | |
|---|---|---|---|---|---|---|---|---|---|---|
| Display | -0% | 3% | 0% | 3% | 28% | 1% | -34% | -37% | 37% | |
| Display P3 Coverage (%) | 65.9 | 65.4 -1% | 66.5 1% | 64.5 -2% | 66.5 1% | 85.2 29% | 65.2 -1% | 41.9 -36% | 40.1 -39% | 99.9 52% |
| sRGB Coverage (%) | 91.6 | 91.3 0% | 97.8 7% | 95.9 5% | 97.7 7% | 98.8 8% | 95.8 5% | 62.9 -31% | 60 -34% | 100 9% |
| AdobeRGB 1998 Coverage (%) | 67 | 66.7 0% | 67.6 1% | 65.8 -2% | 67.6 1% | 98.2 47% | 66 -1% | 43.3 -35% | 41.4 -38% | 99.5 49% |
| Response Times | -49% | -97% | -126% | -46% | -320% | -111% | -326% | -371% | 59% | |
| Response Time Grey 50% / Grey 80% * (ms) | 5.06 ? | 7.4 ? -46% | 12.8 ? -153% | 15 -196% | 8 ? -58% | 31.6 ? -525% | 14 ? -177% | 28.4 ? -461% | 32.4 -540% | 2.8 ? 45% |
| Response Time Black / White * (ms) | 7.44 ? | 11.2 ? -51% | 10.4 ? -40% | 11.6 -56% | 10 ? -34% | 16 ? -115% | 10.8 ? -45% | 21.6 ? -190% | 22.4 -201% | 2 ? 73% |
| PWM Frequency (Hz) | 23580 ? | 240 ? | ||||||||
| Screen | -2% | 0% | 4% | -4% | 45% | 1% | -28% | -9% | 109% | |
| Brightness middle (cd/m²) | 311 | 307 -1% | 291 -6% | 393 26% | 306 -2% | 607 95% | 390 25% | 268.3 -14% | 266 -14% | 440 41% |
| Brightness (cd/m²) | 325 | 321 -1% | 266 -18% | 353 9% | 283 -13% | 605 86% | 362 11% | 257 -21% | 264 -19% | 446 37% |
| Brightness Distribution (%) | 84 | 83 -1% | 88 5% | 83 -1% | 86 2% | 93 11% | 87 4% | 84 0% | 79 -6% | 92 10% |
| Black Level * (cd/m²) | 0.22 | 0.27 -23% | 0.36 -64% | 0.47 -114% | 0.25 -14% | 0.41 -86% | 0.41 -86% | 0.34 -55% | 0.32 -45% | 0.04 82% |
| Contrast (:1) | 1414 | 1137 -20% | 808 -43% | 836 -41% | 1224 -13% | 1480 5% | 951 -33% | 789 -44% | 831 -41% | 11000 678% |
| Colorchecker dE 2000 * | 5.06 | 4.67 8% | 2.98 41% | 2.84 44% | 4.97 2% | 0.84 83% | 2.66 47% | 5.05 -0% | 3.97 22% | 2.53 50% |
| Colorchecker dE 2000 max. * | 8.37 | 7.53 10% | 7.59 9% | 7.15 15% | 10.12 -21% | 3.02 64% | 7.14 15% | 15.43 -84% | 8.93 -7% | 7.82 7% |
| Colorchecker dE 2000 calibrated * | 2.62 | 2.41 8% | 0.91 65% | 0.67 74% | 0.7 73% | 0.69 74% | 2.56 2% | 3.21 -23% | 3.5 -34% | 2.57 2% |
| Greyscale dE 2000 * | 4.8 | 4.5 6% | 4.2 12% | 3.73 22% | 7.2 -50% | 1.1 77% | 3.63 24% | 5.5 -15% | 1.8 62% | 1.2 75% |
| Gamma | 2.12 104% | 2.276 97% | 2.293 96% | 2.53 87% | 2.23 99% | 2.131 103% | 2.57 86% | 2.35 94% | 2.31 95% | 2.206 100% |
| CCT | 8002 81% | 6824 95% | 7624 85% | 7312 89% | 7784 84% | 6648 98% | 6894 94% | 7392 88% | 6754 96% | 6371 102% |
| Color Space (Percent of AdobeRGB 1998) (%) | 67.6 | 41.4 | ||||||||
| Color Space (Percent of sRGB) (%) | 97.7 | 60 | ||||||||
| Total Average (Program / Settings) | -17% /
-8% | -31% /
-13% | -41% /
-16% | -16% /
-9% | -82% /
-11% | -36% /
-15% | -129% /
-72% | -139% /
-67% | 68% /
86% |
* ... smaller is better
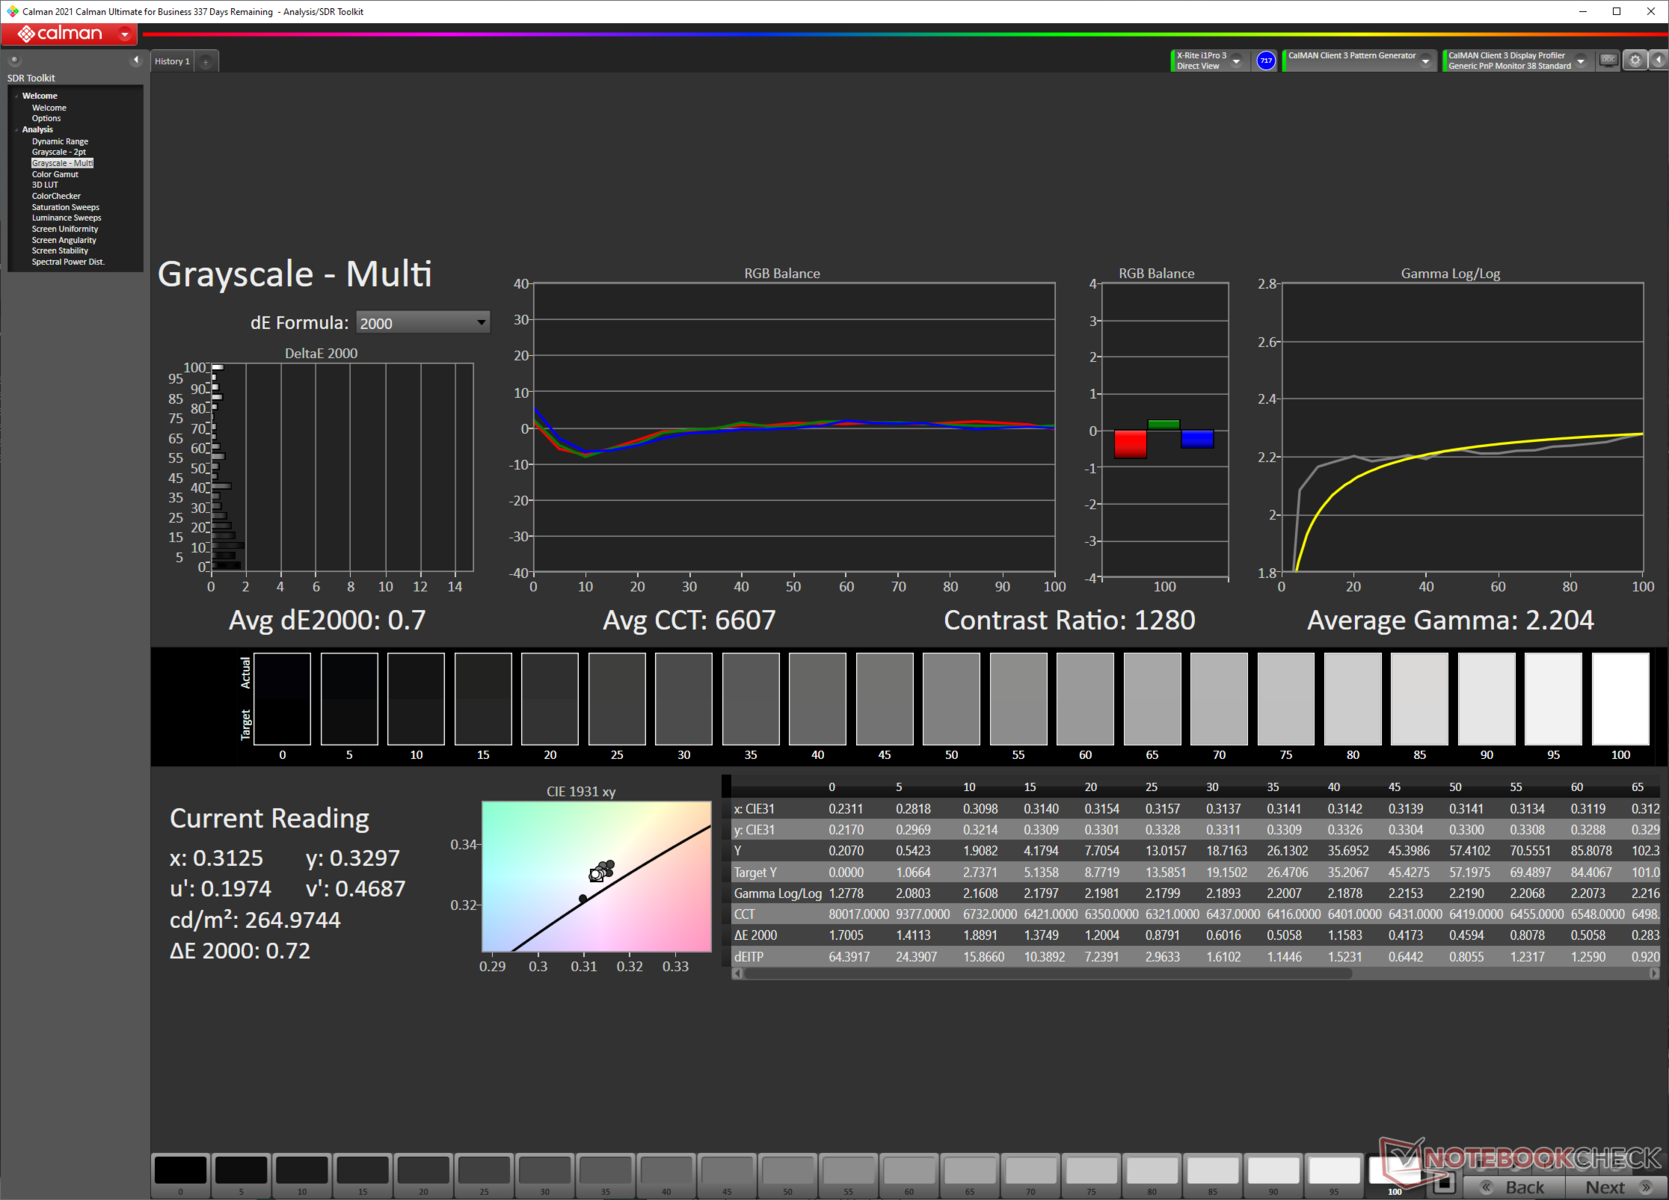
The AU Optronics B156HAN08.0 panel is beginning to show its age, and MSI could have very well incorporated a newer panel with better overall color characteristics. The Alpha 15 covers close to 92% of the sRGB color space. Adobe RGB and DCI-P3 coverages are on expected lines for this category.
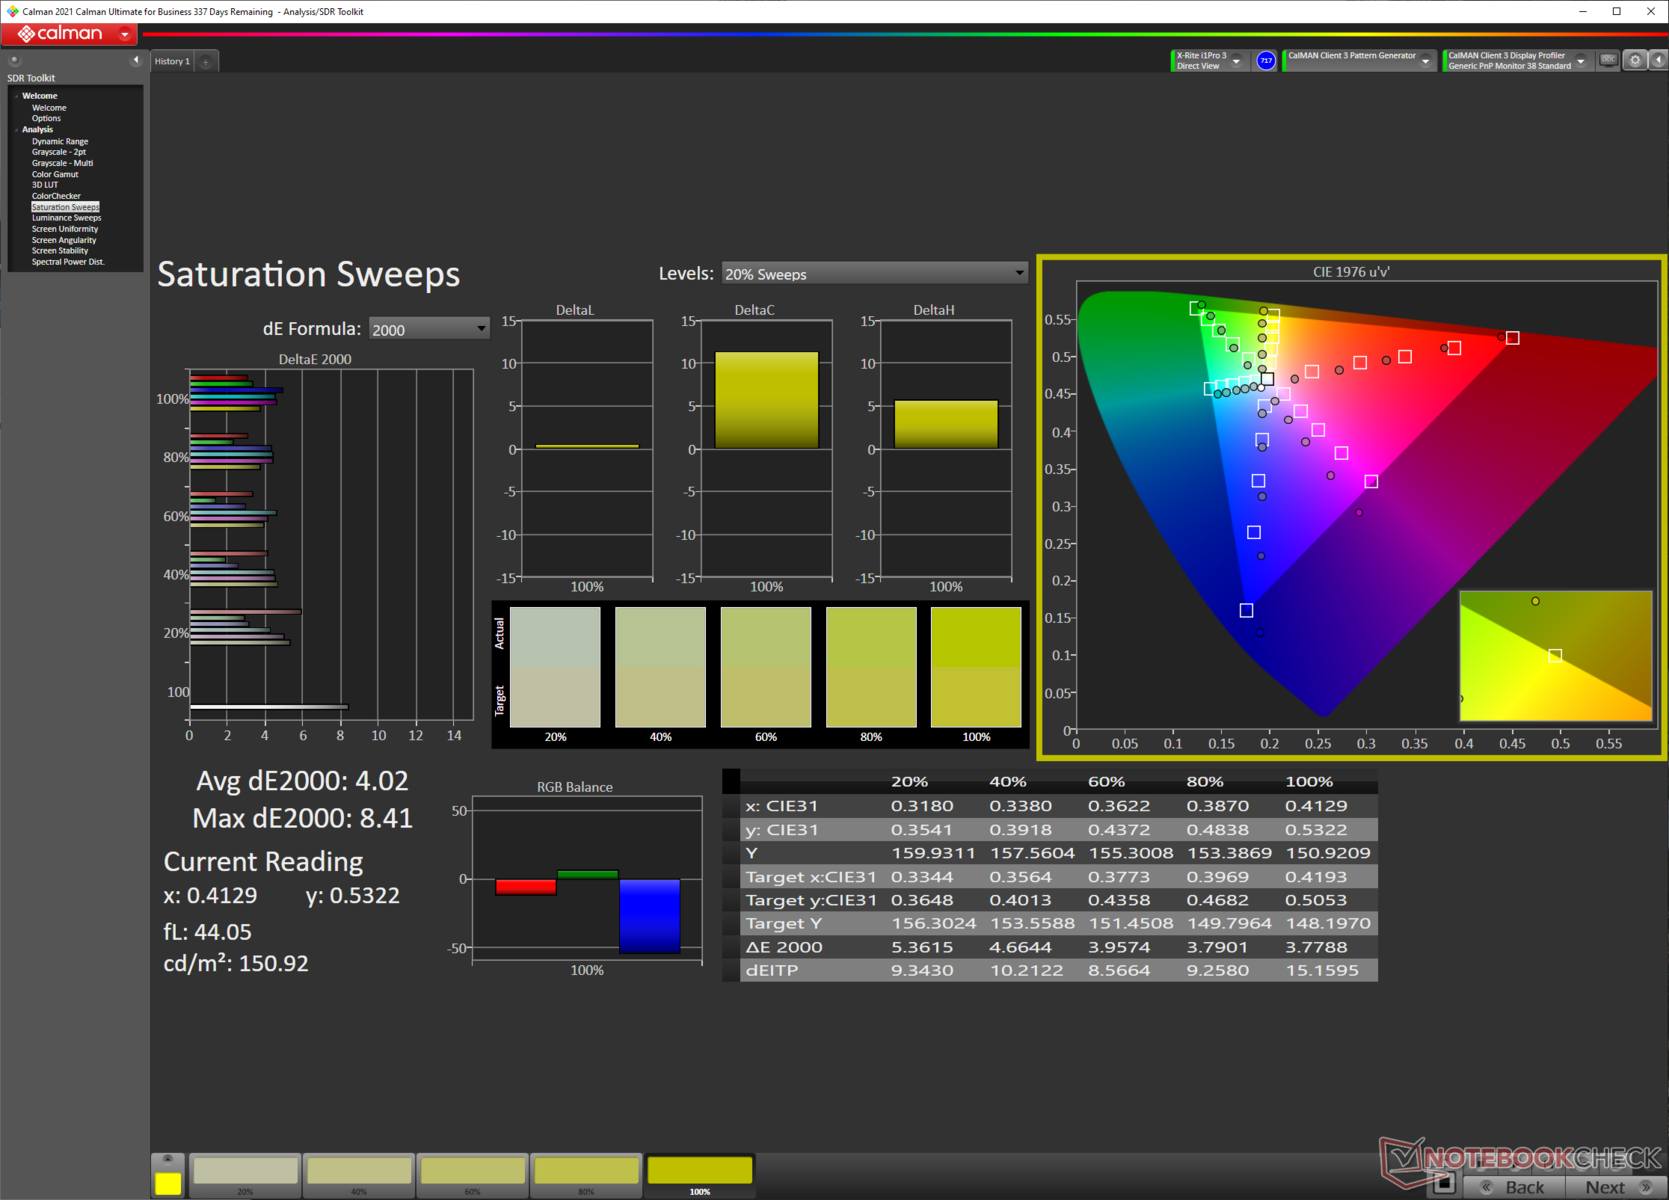
Color accuracy out-of-the-box is not very good with an average Grayscale Delta E of 4.8, average ColorChecker Delta E of 5.06, and a cool white balance. However, our calibration routine improves color accuracy significantly and helps bring down the average Grayscale and ColorChecker Delta E values to 0.7 and 2.62, respectively. We find that the panel shows the highest deviation while reproducing the 100% Blue part of the spectrum.
Readers can download the calibrated ICC file from the above link.
While the overall display quality gets you by just fine for gaming, the competition has moved on to better displays with wider gamut coverages and improved out-of-the-box color accuracies.
The panel offers fast response times, which should please competitive gamers. We measured combined black to white and 50% grey to 80% grey response times of 7.44 ms and 5.06 ms, respectively.
The Alpha 15's panel could be using overdrive to achieve such low 50% grey to 80% grey response times as evidenced by the signal overshoot "horn" we see in the oscilloscope data.
We did not observe any PWM flickering across all brightness levels, so this panel should be relatively less-strenuous on the eyes.
For more information, check out our article "Why Pulse Width Modulation (PWM) is such a headache" and also our PWM ranking table for PWM frequency comparison across all reviewed devices.
Display Response Times
| ↔ Response Time Black to White | ||
|---|---|---|
| 7.44 ms ... rise ↗ and fall ↘ combined | ↗ 3.76 ms rise | 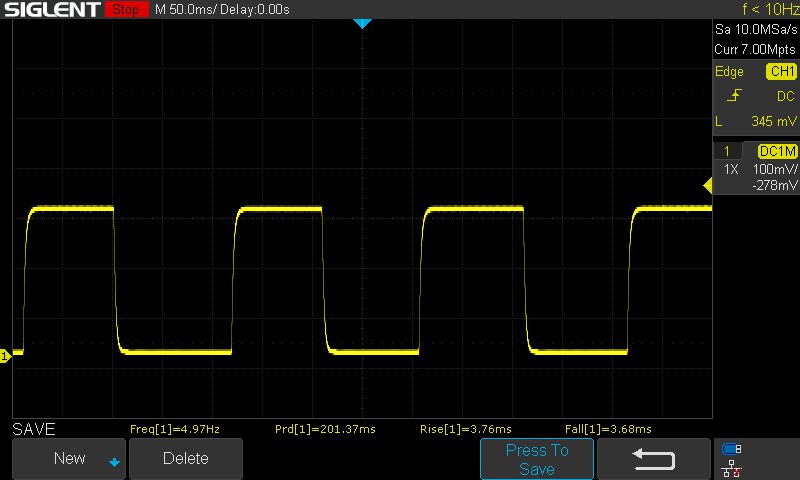 |
| ↘ 3.68 ms fall | ||
| The screen shows very fast response rates in our tests and should be very well suited for fast-paced gaming. In comparison, all tested devices range from 0.1 (minimum) to 240 (maximum) ms. » 22 % of all devices are better. This means that the measured response time is better than the average of all tested devices (19.9 ms). | ||
| ↔ Response Time 50% Grey to 80% Grey | ||
| 5.06 ms ... rise ↗ and fall ↘ combined | ↗ 2.5 ms rise | 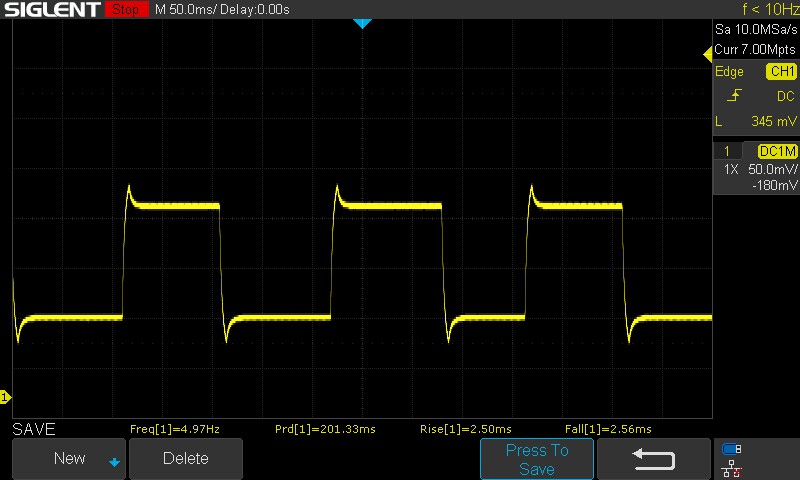 |
| ↘ 2.56 ms fall | ||
| The screen shows very fast response rates in our tests and should be very well suited for fast-paced gaming. In comparison, all tested devices range from 0.165 (minimum) to 636 (maximum) ms. » 17 % of all devices are better. This means that the measured response time is better than the average of all tested devices (31.1 ms). | ||
Screen Flickering / PWM (Pulse-Width Modulation)
| Screen flickering / PWM not detected | ≤ 100 % brightness setting | 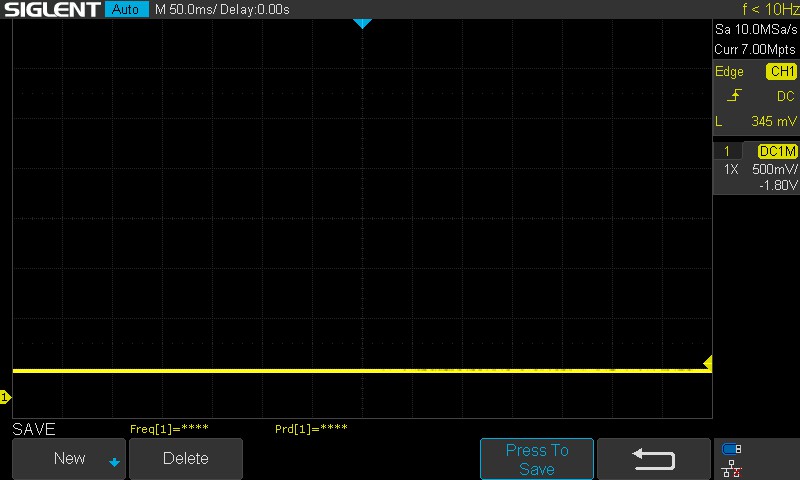 | |
In comparison: 52 % of all tested devices do not use PWM to dim the display. If PWM was detected, an average of 7798 (minimum: 5 - maximum: 343500) Hz was measured. | |||
Due to the low panel brightness, outdoor viewing can be impacted in direct sunlight. The viewing angles seem relatively stable but some loss of brightness and color information can be observed at extreme angles.


Performance: Unhindered Ryzen 7 5800H takes on the Core i7-11800H
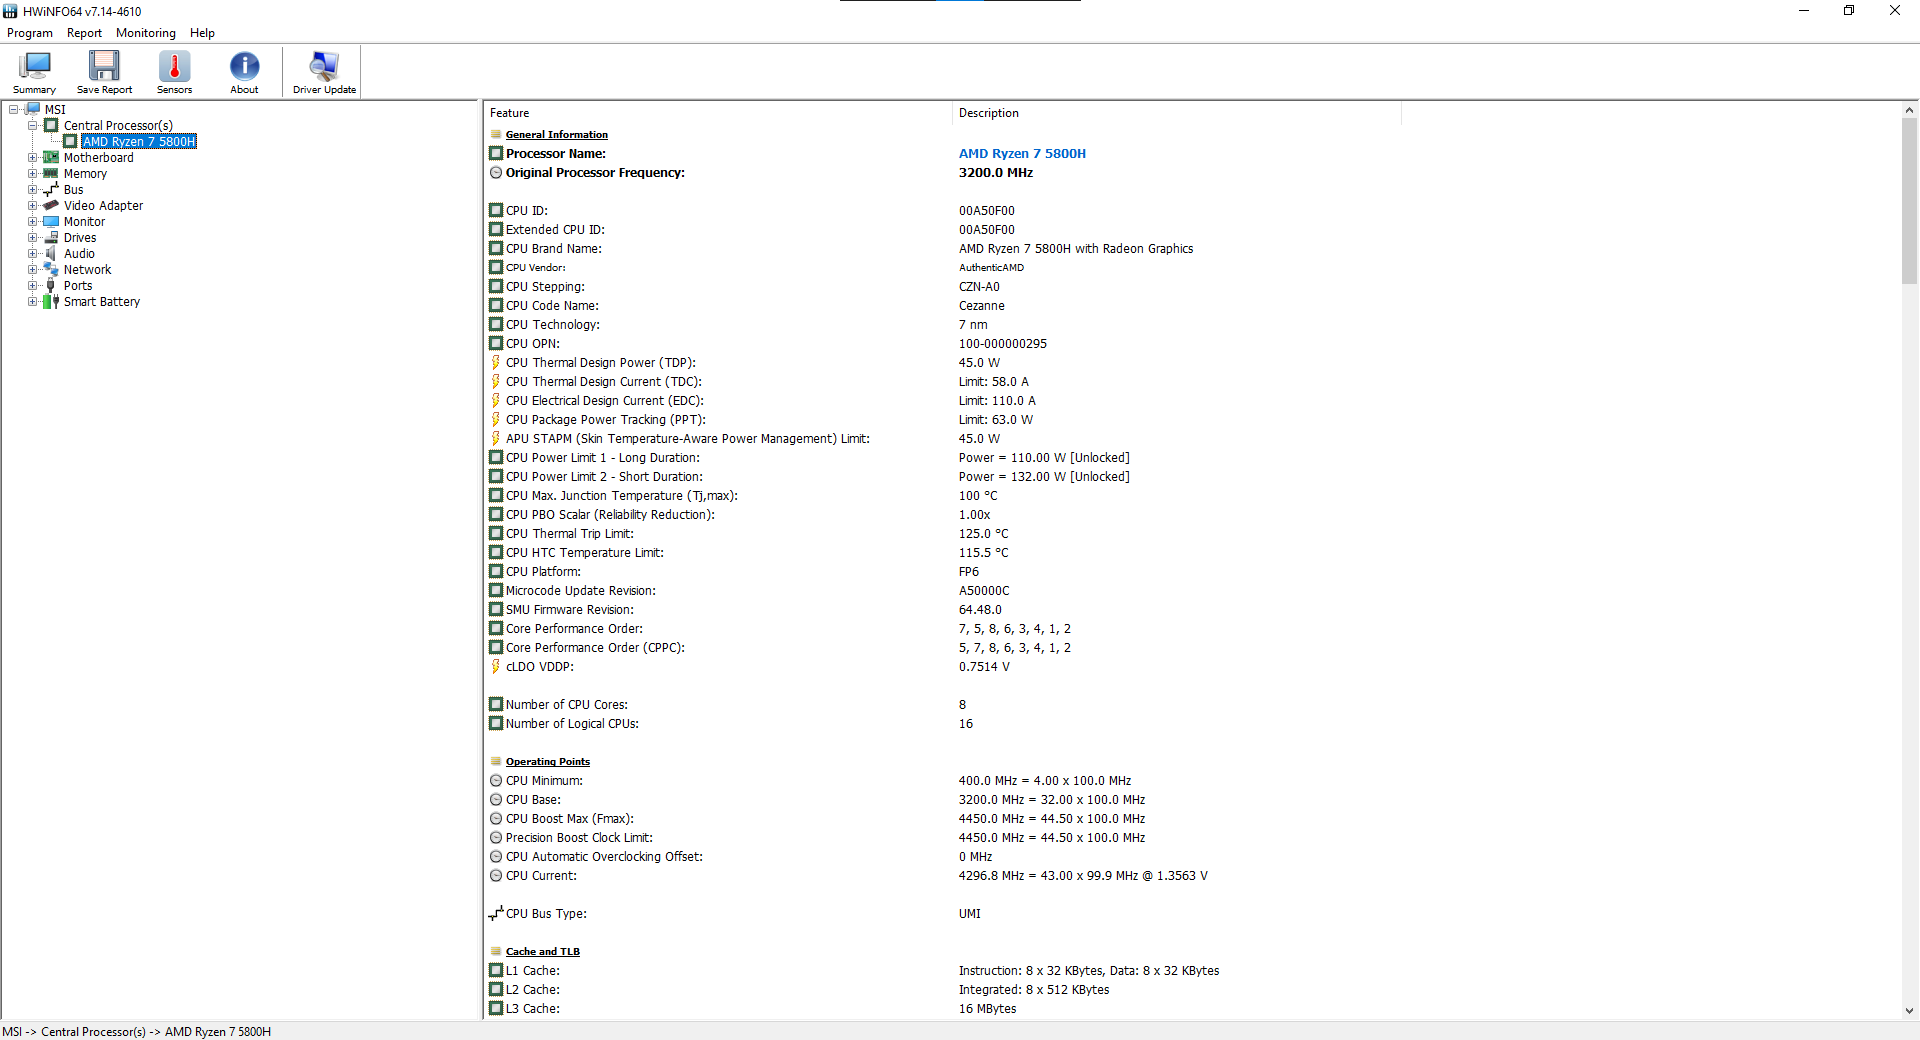
Our MSI Alpha 15 B5EEK sample is powered by the AMD Ryzen 7 5800H APU and a Radeon RX 6600M dGPU. Buyers also have the option of an Alpha 15 B5EE with similar specifications but with only a single red color backlight for the keyboard.
Testing Conditions
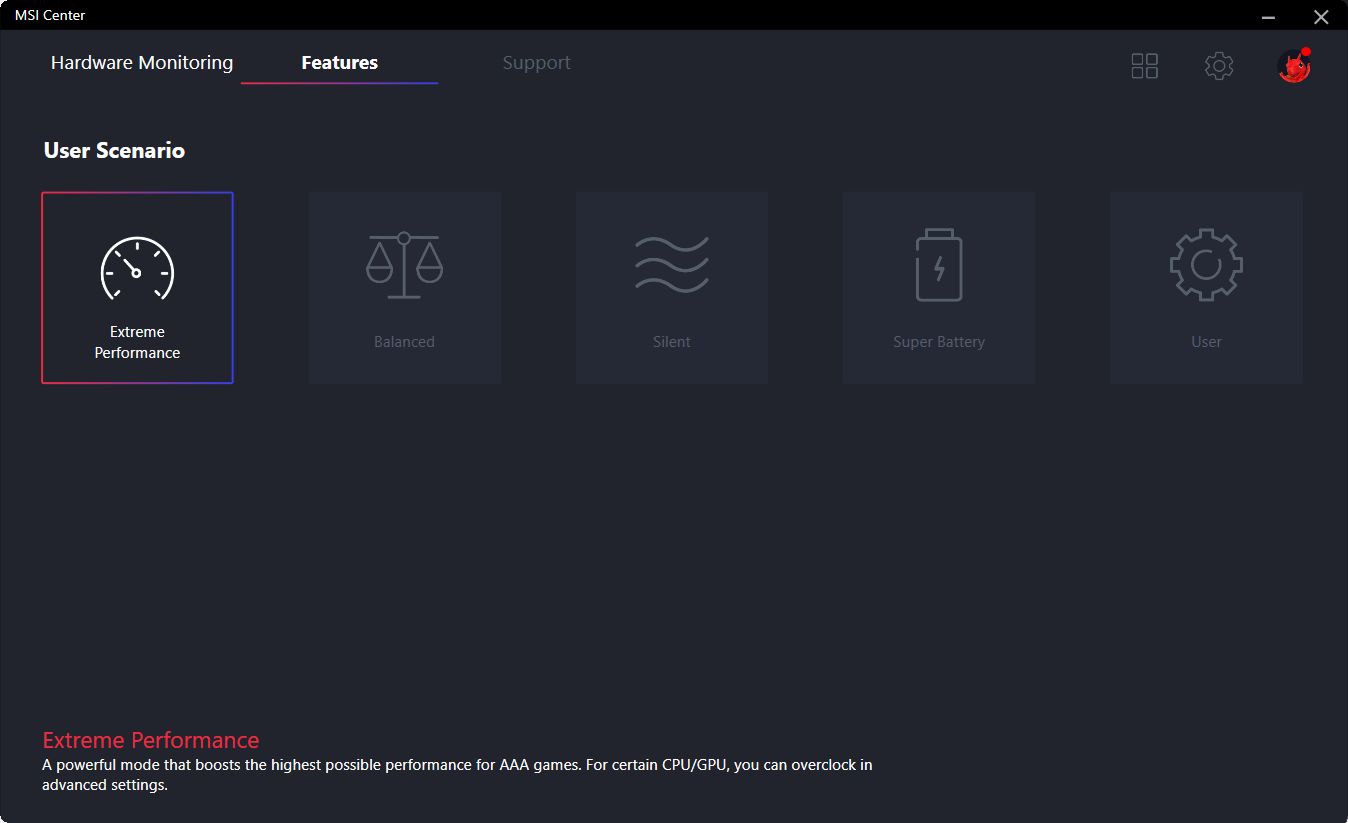
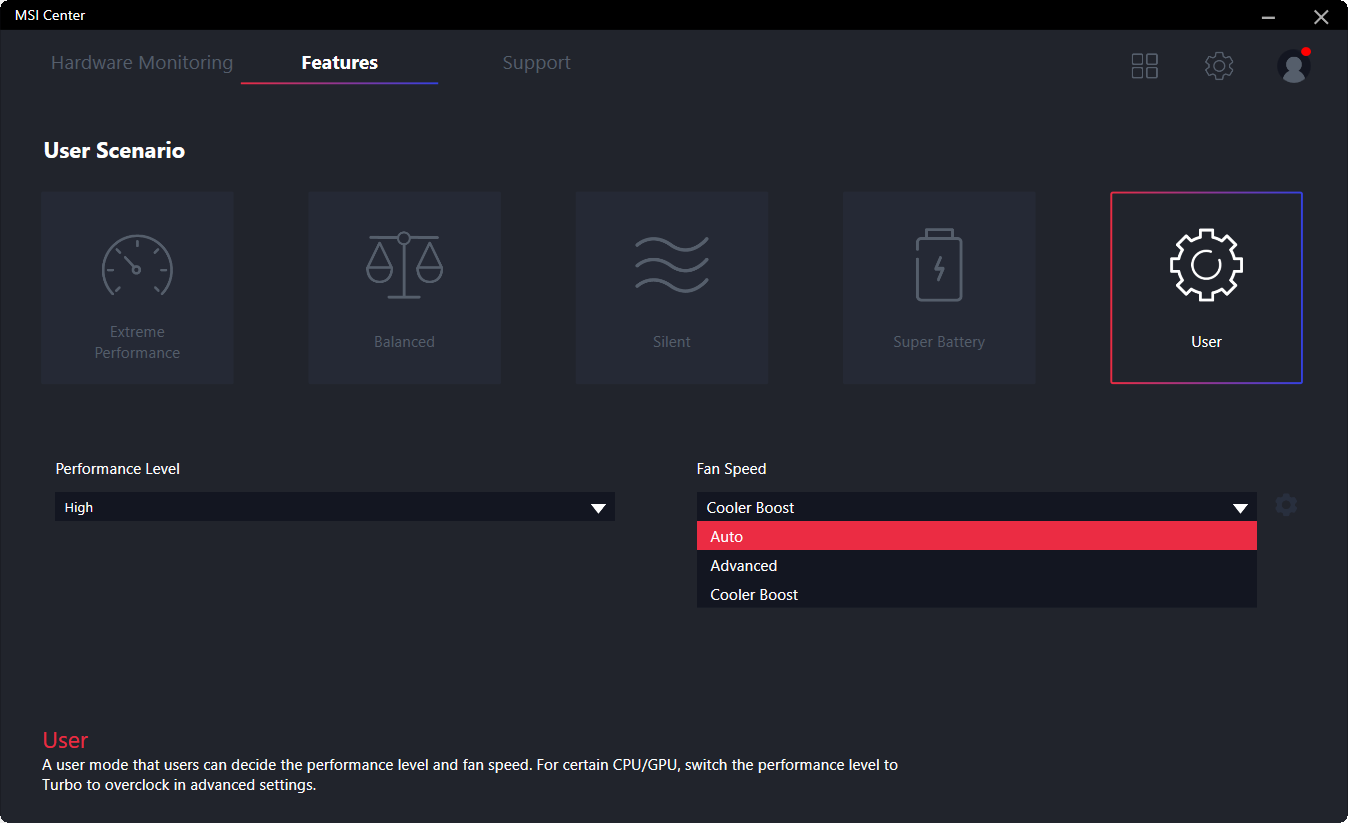
The MSI Center app allows choosing between four performance modes — Extreme Performance, Balanced, Silent, and Super Battery. We used the Extreme Performance mode as default for all benchmarks and measurements except for the Battery Life test for which we went with Balanced.
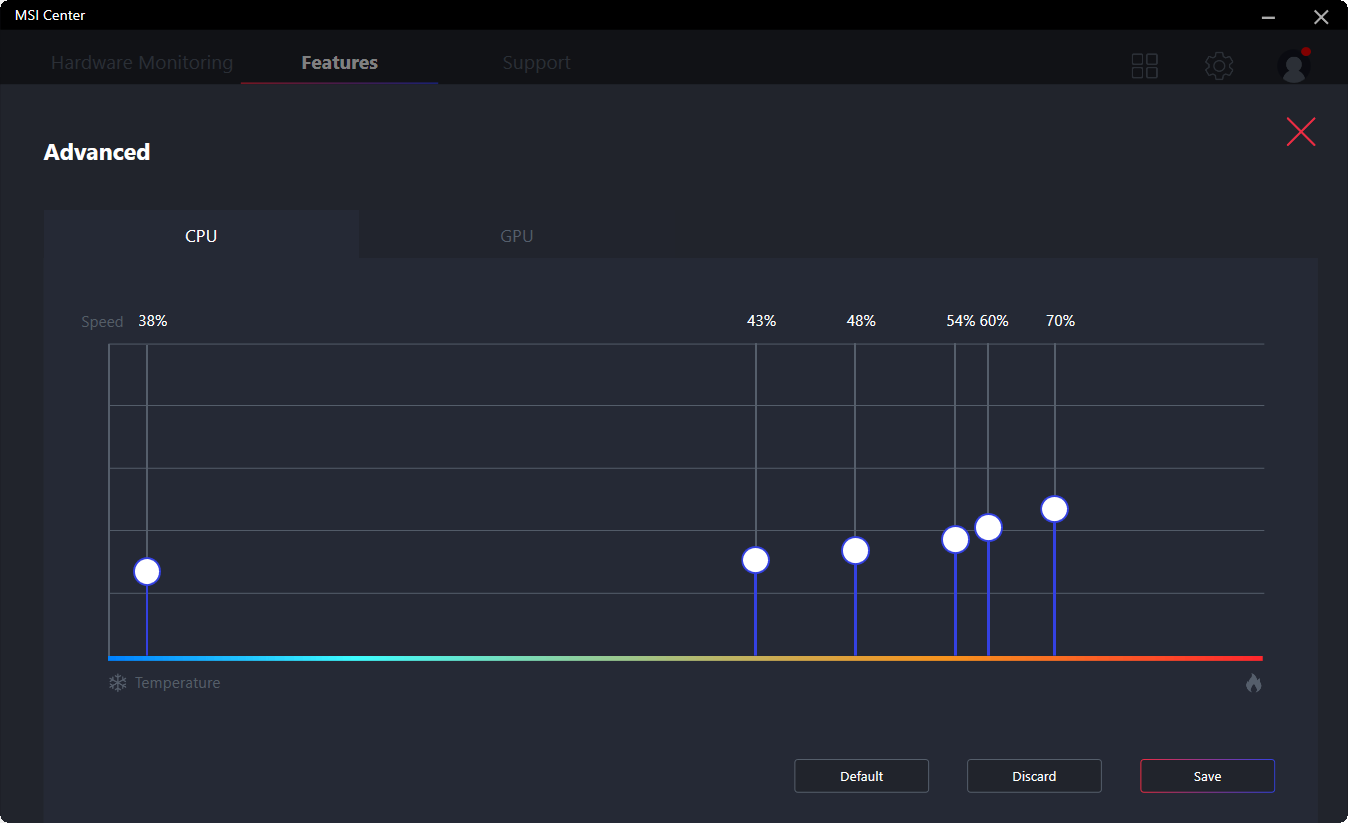
These performance modes can significantly impact the scores and noise profiles, so we have shown a comparison between Extreme Performance, Balanced, and Silent modes wherever applicable. The MSI Center app also allows users to customize the fan curves individually for both the CPU and the GPU. A Cooler Boost mode is also available that continuously spins the fans in full speed irrespective of load.
The following table shows how various performance modes affect the power limits. We recommend using Extreme Performance for heavy workloads and gaming unless fan noise is an issue.
| Performance Mode | PL0 / AMD STAPM Limit (W) | PL1 Limit (W) | PL2 Limit (W) |
|---|---|---|---|
| Extreme Performance | 132 | 110 | 132 |
| Balanced | 78 | 90 | 108 |
| Silent | 55 | 60 | 72 |
| Super Battery | 50 | 45 | 54 |
Processor
The AMD Ryzen 7 5800H in the MSI Alpha 15 is not power-limited. Therefore, we see the PL1 and PL2 limits indicated as 110 W and 132 W, respectively. This gives the Alpha 15 a lot of headroom to make good use of AMD SmartShift.
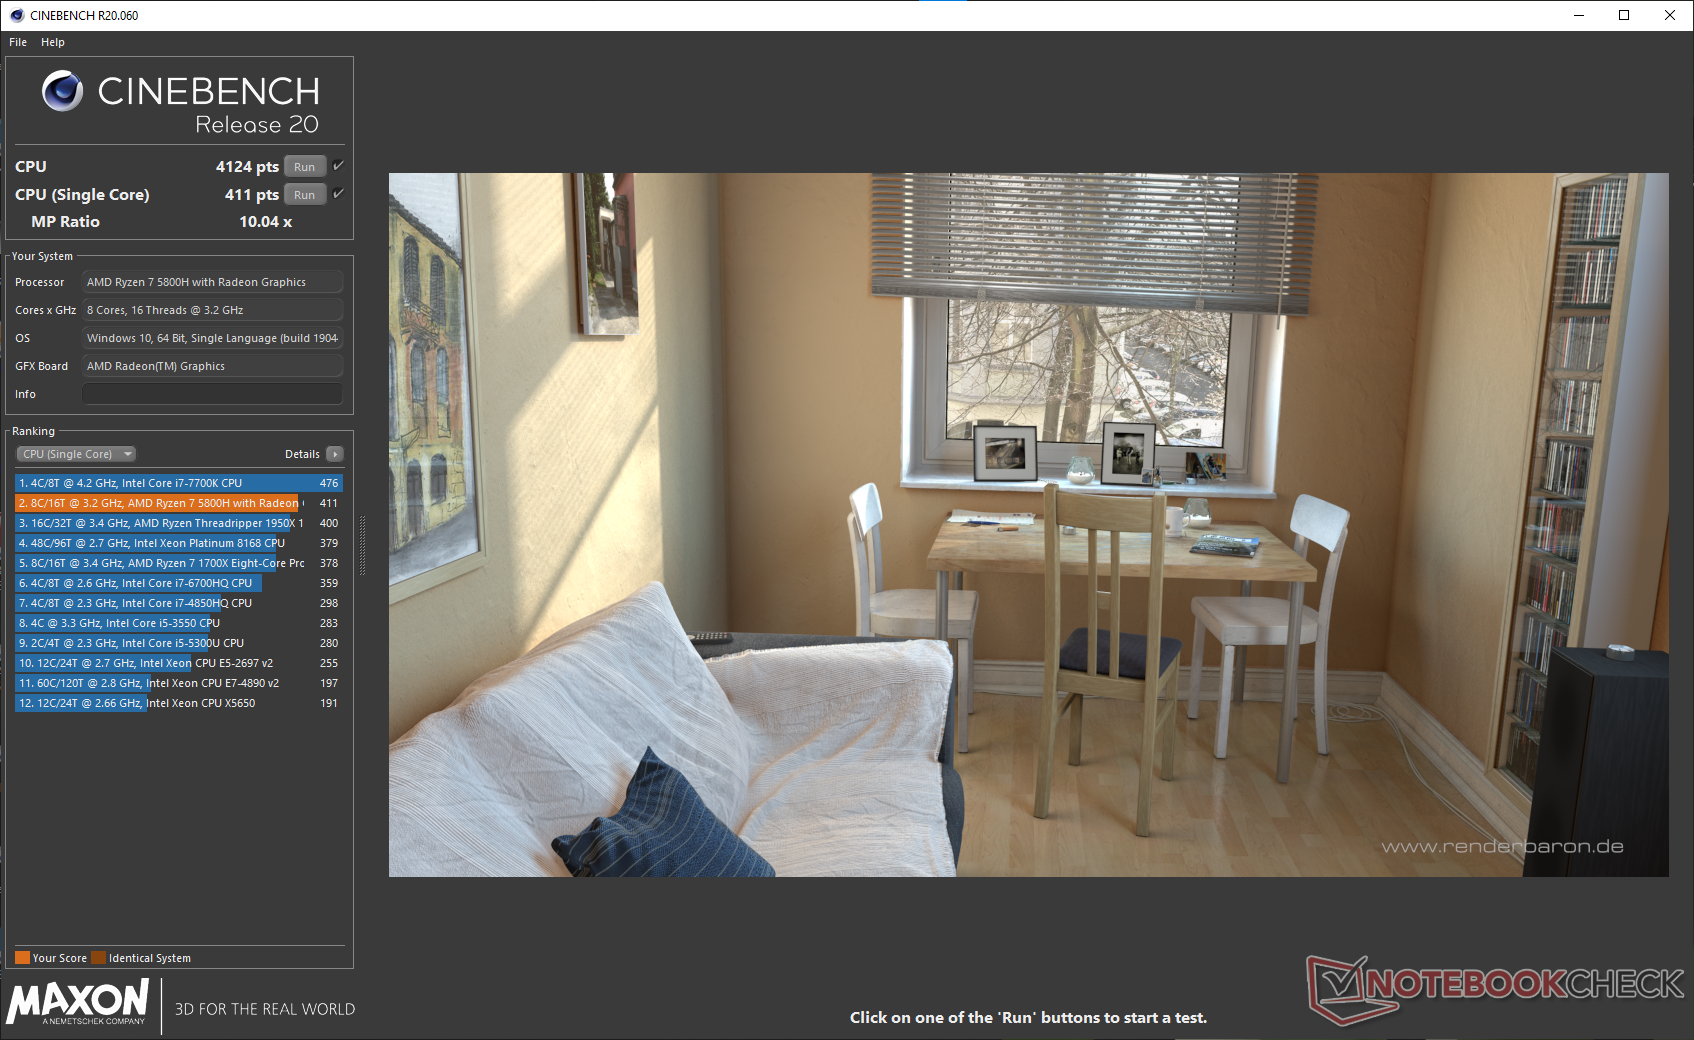
Thanks to the capable cooling system, our Cinebench R15 loop test shows no throttling issues with the processor. The Ryzen 7 5800H's multi-core scores are bested only by the Ryzen 9 5900HX in the MSI Delta 15 and the Asus ROG Strix G15, both of which are AMD Advantage laptops as well.
Though the Intel Tiger Lake-H chips such as the Core i7-11800H and the Core i9-11900H do have an upper hand in single-core benchmarks, the Ryzen 7 5800H is able to come within striking distance of both. Therefore, workloads requiring single and multi-core prowess stand to benefit from this APU.
Changing between Extreme Performance, Balanced, and Silent does not seem to impact single-core scores much. However, multi-core performance shows large differences between these three modes.
On battery, the PL1 and PL2 drop to 54 W and 68 W, respectively and the laptop switches to the Balanced mode. As a consequence, the Cinebench R20 scores drop by 26% and 11.5% in single-core and multi-core runs, respectively.
Cinebench R15 Multi Loop
Cinebench R23: Multi Core | Single Core
Cinebench R20: CPU (Multi Core) | CPU (Single Core)
Cinebench R15: CPU Multi 64Bit | CPU Single 64Bit
Blender: v2.79 BMW27 CPU
7-Zip 18.03: 7z b 4 | 7z b 4 -mmt1
Geekbench 5.5: Multi-Core | Single-Core
HWBOT x265 Benchmark v2.2: 4k Preset
LibreOffice : 20 Documents To PDF
R Benchmark 2.5: Overall mean
| CPU Performance rating | |
| Average of class Gaming | |
| Asus ROG Strix G15 G513QY | |
| MSI Delta 15 A5EFK | |
| MSI GP66 Leopard 11UH-028 | |
| Asus TUF Gaming F17 FX706HM | |
| Schenker XMG Apex 15 NH57E PS | |
| Asus TUF Gaming F15 FX506HM -2! | |
| Lenovo Legion S7 15ACH6 82K80030GE | |
| MSI Alpha 15 B5EEK-008 | |
| MSI Alpha 15 B5EEK-008 | |
| Average AMD Ryzen 7 5800H | |
| Gigabyte Aero 15 OLED XD | |
| MSI Katana GF66 11UG-220 | |
| MSI Alpha 15 B5EEK-008 | |
| Cinebench R23 / Multi Core | |
| Average of class Gaming (10488 - 40970, n=112, last 2 years) | |
| Lenovo Legion S7 15ACH6 82K80030GE | |
| Asus TUF Gaming F15 FX506HM | |
| Asus ROG Strix G15 G513QY | |
| Schenker XMG Apex 15 NH57E PS | |
| MSI GP66 Leopard 11UH-028 | |
| MSI Alpha 15 B5EEK-008 | |
| Average AMD Ryzen 7 5800H (8812 - 13214, n=29) | |
| MSI Delta 15 A5EFK | |
| Asus TUF Gaming F17 FX706HM | |
| MSI Alpha 15 B5EEK-008 | |
| Gigabyte Aero 15 OLED XD | |
| MSI Alpha 15 B5EEK-008 | |
| MSI Katana GF66 11UG-220 | |
| Cinebench R23 / Single Core | |
| Average of class Gaming (1166 - 2356, n=112, last 2 years) | |
| Asus TUF Gaming F17 FX706HM | |
| MSI GP66 Leopard 11UH-028 | |
| MSI Katana GF66 11UG-220 | |
| Asus TUF Gaming F15 FX506HM | |
| Lenovo Legion S7 15ACH6 82K80030GE | |
| Asus ROG Strix G15 G513QY | |
| MSI Delta 15 A5EFK | |
| Schenker XMG Apex 15 NH57E PS | |
| MSI Alpha 15 B5EEK-008 | |
| MSI Alpha 15 B5EEK-008 | |
| MSI Alpha 15 B5EEK-008 | |
| Average AMD Ryzen 7 5800H (1294 - 1441, n=29) | |
| Gigabyte Aero 15 OLED XD | |
| Cinebench R20 / CPU (Multi Core) | |
| Average of class Gaming (4029 - 16108, n=111, last 2 years) | |
| Lenovo Legion S7 15ACH6 82K80030GE | |
| Asus TUF Gaming F15 FX506HM | |
| Asus ROG Strix G15 G513QY | |
| Schenker XMG Apex 15 NH57E PS | |
| MSI GP66 Leopard 11UH-028 | |
| MSI Alpha 15 B5EEK-008 | |
| Average AMD Ryzen 7 5800H (3430 - 5020, n=31) | |
| MSI Delta 15 A5EFK | |
| Asus TUF Gaming F17 FX706HM | |
| MSI Alpha 15 B5EEK-008 | |
| Gigabyte Aero 15 OLED XD | |
| MSI Alpha 15 B5EEK-008 | |
| MSI Katana GF66 11UG-220 | |
| Cinebench R20 / CPU (Single Core) | |
| Average of class Gaming (442 - 895, n=111, last 2 years) | |
| Asus TUF Gaming F17 FX706HM | |
| Asus ROG Strix G15 G513QY | |
| MSI Katana GF66 11UG-220 | |
| Asus TUF Gaming F15 FX506HM | |
| MSI GP66 Leopard 11UH-028 | |
| Lenovo Legion S7 15ACH6 82K80030GE | |
| MSI Delta 15 A5EFK | |
| Schenker XMG Apex 15 NH57E PS | |
| MSI Alpha 15 B5EEK-008 | |
| MSI Alpha 15 B5EEK-008 | |
| MSI Alpha 15 B5EEK-008 | |
| Average AMD Ryzen 7 5800H (502 - 560, n=30) | |
| Gigabyte Aero 15 OLED XD | |
| Cinebench R15 / CPU Multi 64Bit | |
| Average of class Gaming (1578 - 6271, n=111, last 2 years) | |
| Lenovo Legion S7 15ACH6 82K80030GE | |
| Asus ROG Strix G15 G513QY | |
| MSI Katana GF66 11UG-220 | |
| MSI Katana GF66 11UG-220 | |
| Asus TUF Gaming F15 FX506HM | |
| MSI Delta 15 A5EFK | |
| Schenker XMG Apex 15 NH57E PS | |
| Asus TUF Gaming F17 FX706HM | |
| MSI GP66 Leopard 11UH-028 | |
| MSI Alpha 15 B5EEK-008 | |
| Average AMD Ryzen 7 5800H (1487 - 2119, n=28) | |
| MSI Alpha 15 B5EEK-008 | |
| Gigabyte Aero 15 OLED XD | |
| MSI Alpha 15 B5EEK-008 | |
| Cinebench R15 / CPU Single 64Bit | |
| Average of class Gaming (188.8 - 343, n=111, last 2 years) | |
| Asus TUF Gaming F17 FX706HM | |
| Asus ROG Strix G15 G513QY | |
| MSI Delta 15 A5EFK | |
| Lenovo Legion S7 15ACH6 82K80030GE | |
| Schenker XMG Apex 15 NH57E PS | |
| Asus TUF Gaming F15 FX506HM | |
| MSI Katana GF66 11UG-220 | |
| MSI Katana GF66 11UG-220 | |
| MSI Alpha 15 B5EEK-008 | |
| MSI GP66 Leopard 11UH-028 | |
| MSI Alpha 15 B5EEK-008 | |
| Average AMD Ryzen 7 5800H (209 - 234, n=29) | |
| MSI Alpha 15 B5EEK-008 | |
| Gigabyte Aero 15 OLED XD | |
| Blender / v2.79 BMW27 CPU | |
| MSI Katana GF66 11UG-220 | |
| MSI Alpha 15 B5EEK-008 | |
| Gigabyte Aero 15 OLED XD | |
| MSI Alpha 15 B5EEK-008 | |
| Average AMD Ryzen 7 5800H (237 - 340, n=29) | |
| MSI Alpha 15 B5EEK-008 | |
| Schenker XMG Apex 15 NH57E PS | |
| MSI GP66 Leopard 11UH-028 | |
| Asus TUF Gaming F17 FX706HM | |
| MSI Delta 15 A5EFK | |
| Asus TUF Gaming F15 FX506HM | |
| Asus ROG Strix G15 G513QY | |
| Lenovo Legion S7 15ACH6 82K80030GE | |
| Average of class Gaming (80 - 330, n=109, last 2 years) | |
| 7-Zip 18.03 / 7z b 4 | |
| Average of class Gaming (33491 - 148086, n=110, last 2 years) | |
| Lenovo Legion S7 15ACH6 82K80030GE | |
| MSI Delta 15 A5EFK | |
| Schenker XMG Apex 15 NH57E PS | |
| MSI Alpha 15 B5EEK-008 | |
| Asus ROG Strix G15 G513QY | |
| MSI Alpha 15 B5EEK-008 | |
| Average AMD Ryzen 7 5800H (45773 - 59986, n=28) | |
| MSI GP66 Leopard 11UH-028 | |
| Asus TUF Gaming F15 FX506HM | |
| Asus TUF Gaming F17 FX706HM | |
| MSI Alpha 15 B5EEK-008 | |
| Gigabyte Aero 15 OLED XD | |
| MSI Katana GF66 11UG-220 | |
| 7-Zip 18.03 / 7z b 4 -mmt1 | |
| Average of class Gaming (4199 - 7436, n=110, last 2 years) | |
| Asus TUF Gaming F17 FX706HM | |
| Lenovo Legion S7 15ACH6 82K80030GE | |
| MSI Delta 15 A5EFK | |
| Asus ROG Strix G15 G513QY | |
| Asus TUF Gaming F15 FX506HM | |
| Schenker XMG Apex 15 NH57E PS | |
| MSI GP66 Leopard 11UH-028 | |
| MSI Katana GF66 11UG-220 | |
| MSI Alpha 15 B5EEK-008 | |
| MSI Alpha 15 B5EEK-008 | |
| MSI Alpha 15 B5EEK-008 | |
| Average AMD Ryzen 7 5800H (5038 - 5632, n=29) | |
| Gigabyte Aero 15 OLED XD | |
| Geekbench 5.5 / Multi-Core | |
| Average of class Gaming (6460 - 27010, n=110, last 2 years) | |
| MSI GP66 Leopard 11UH-028 | |
| Gigabyte Aero 15 OLED XD | |
| MSI Delta 15 A5EFK | |
| Lenovo Legion S7 15ACH6 82K80030GE | |
| MSI Alpha 15 B5EEK-008 | |
| Schenker XMG Apex 15 NH57E PS | |
| MSI Alpha 15 B5EEK-008 | |
| Average AMD Ryzen 7 5800H (6551 - 9062, n=28) | |
| MSI Alpha 15 B5EEK-008 | |
| Asus TUF Gaming F17 FX706HM | |
| Asus ROG Strix G15 G513QY | |
| MSI Katana GF66 11UG-220 | |
| Geekbench 5.5 / Single-Core | |
| Average of class Gaming (986 - 2474, n=110, last 2 years) | |
| MSI Katana GF66 11UG-220 | |
| MSI GP66 Leopard 11UH-028 | |
| Asus TUF Gaming F17 FX706HM | |
| MSI Delta 15 A5EFK | |
| Lenovo Legion S7 15ACH6 82K80030GE | |
| Gigabyte Aero 15 OLED XD | |
| Schenker XMG Apex 15 NH57E PS | |
| Asus ROG Strix G15 G513QY | |
| MSI Alpha 15 B5EEK-008 | |
| MSI Alpha 15 B5EEK-008 | |
| MSI Alpha 15 B5EEK-008 | |
| Average AMD Ryzen 7 5800H (1336 - 1505, n=28) | |
| HWBOT x265 Benchmark v2.2 / 4k Preset | |
| Average of class Gaming (11.5 - 44.3, n=110, last 2 years) | |
| Lenovo Legion S7 15ACH6 82K80030GE | |
| Asus TUF Gaming F15 FX506HM | |
| MSI Delta 15 A5EFK | |
| Schenker XMG Apex 15 NH57E PS | |
| MSI GP66 Leopard 11UH-028 | |
| Asus ROG Strix G15 G513QY | |
| MSI Alpha 15 B5EEK-008 | |
| Asus TUF Gaming F17 FX706HM | |
| Average AMD Ryzen 7 5800H (11.6 - 16.1, n=29) | |
| MSI Alpha 15 B5EEK-008 | |
| Gigabyte Aero 15 OLED XD | |
| MSI Alpha 15 B5EEK-008 | |
| MSI Katana GF66 11UG-220 | |
| LibreOffice / 20 Documents To PDF | |
| Lenovo Legion S7 15ACH6 82K80030GE | |
| Average AMD Ryzen 7 5800H (47.4 - 113, n=29) | |
| MSI Alpha 15 B5EEK-008 | |
| Schenker XMG Apex 15 NH57E PS | |
| MSI Delta 15 A5EFK | |
| Asus ROG Strix G15 G513QY | |
| MSI Alpha 15 B5EEK-008 | |
| MSI Alpha 15 B5EEK-008 | |
| MSI Katana GF66 11UG-220 | |
| Average of class Gaming (19 - 88.8, n=110, last 2 years) | |
| MSI GP66 Leopard 11UH-028 | |
| Gigabyte Aero 15 OLED XD | |
| Asus TUF Gaming F17 FX706HM | |
| Asus TUF Gaming F15 FX506HM | |
| R Benchmark 2.5 / Overall mean | |
| Gigabyte Aero 15 OLED XD | |
| MSI GP66 Leopard 11UH-028 | |
| Asus TUF Gaming F15 FX506HM | |
| MSI Katana GF66 11UG-220 | |
| Asus TUF Gaming F17 FX706HM | |
| Average AMD Ryzen 7 5800H (0.511 - 0.559, n=28) | |
| MSI Alpha 15 B5EEK-008 | |
| MSI Alpha 15 B5EEK-008 | |
| MSI Alpha 15 B5EEK-008 | |
| Asus ROG Strix G15 G513QY | |
| Schenker XMG Apex 15 NH57E PS | |
| MSI Delta 15 A5EFK | |
| Lenovo Legion S7 15ACH6 82K80030GE | |
| Average of class Gaming (0.3439 - 0.759, n=111, last 2 years) | |
Cinebench R23: Multi Core | Single Core
Cinebench R20: CPU (Multi Core) | CPU (Single Core)
Cinebench R15: CPU Multi 64Bit | CPU Single 64Bit
Blender: v2.79 BMW27 CPU
7-Zip 18.03: 7z b 4 | 7z b 4 -mmt1
Geekbench 5.5: Multi-Core | Single-Core
HWBOT x265 Benchmark v2.2: 4k Preset
LibreOffice : 20 Documents To PDF
R Benchmark 2.5: Overall mean
* ... smaller is better
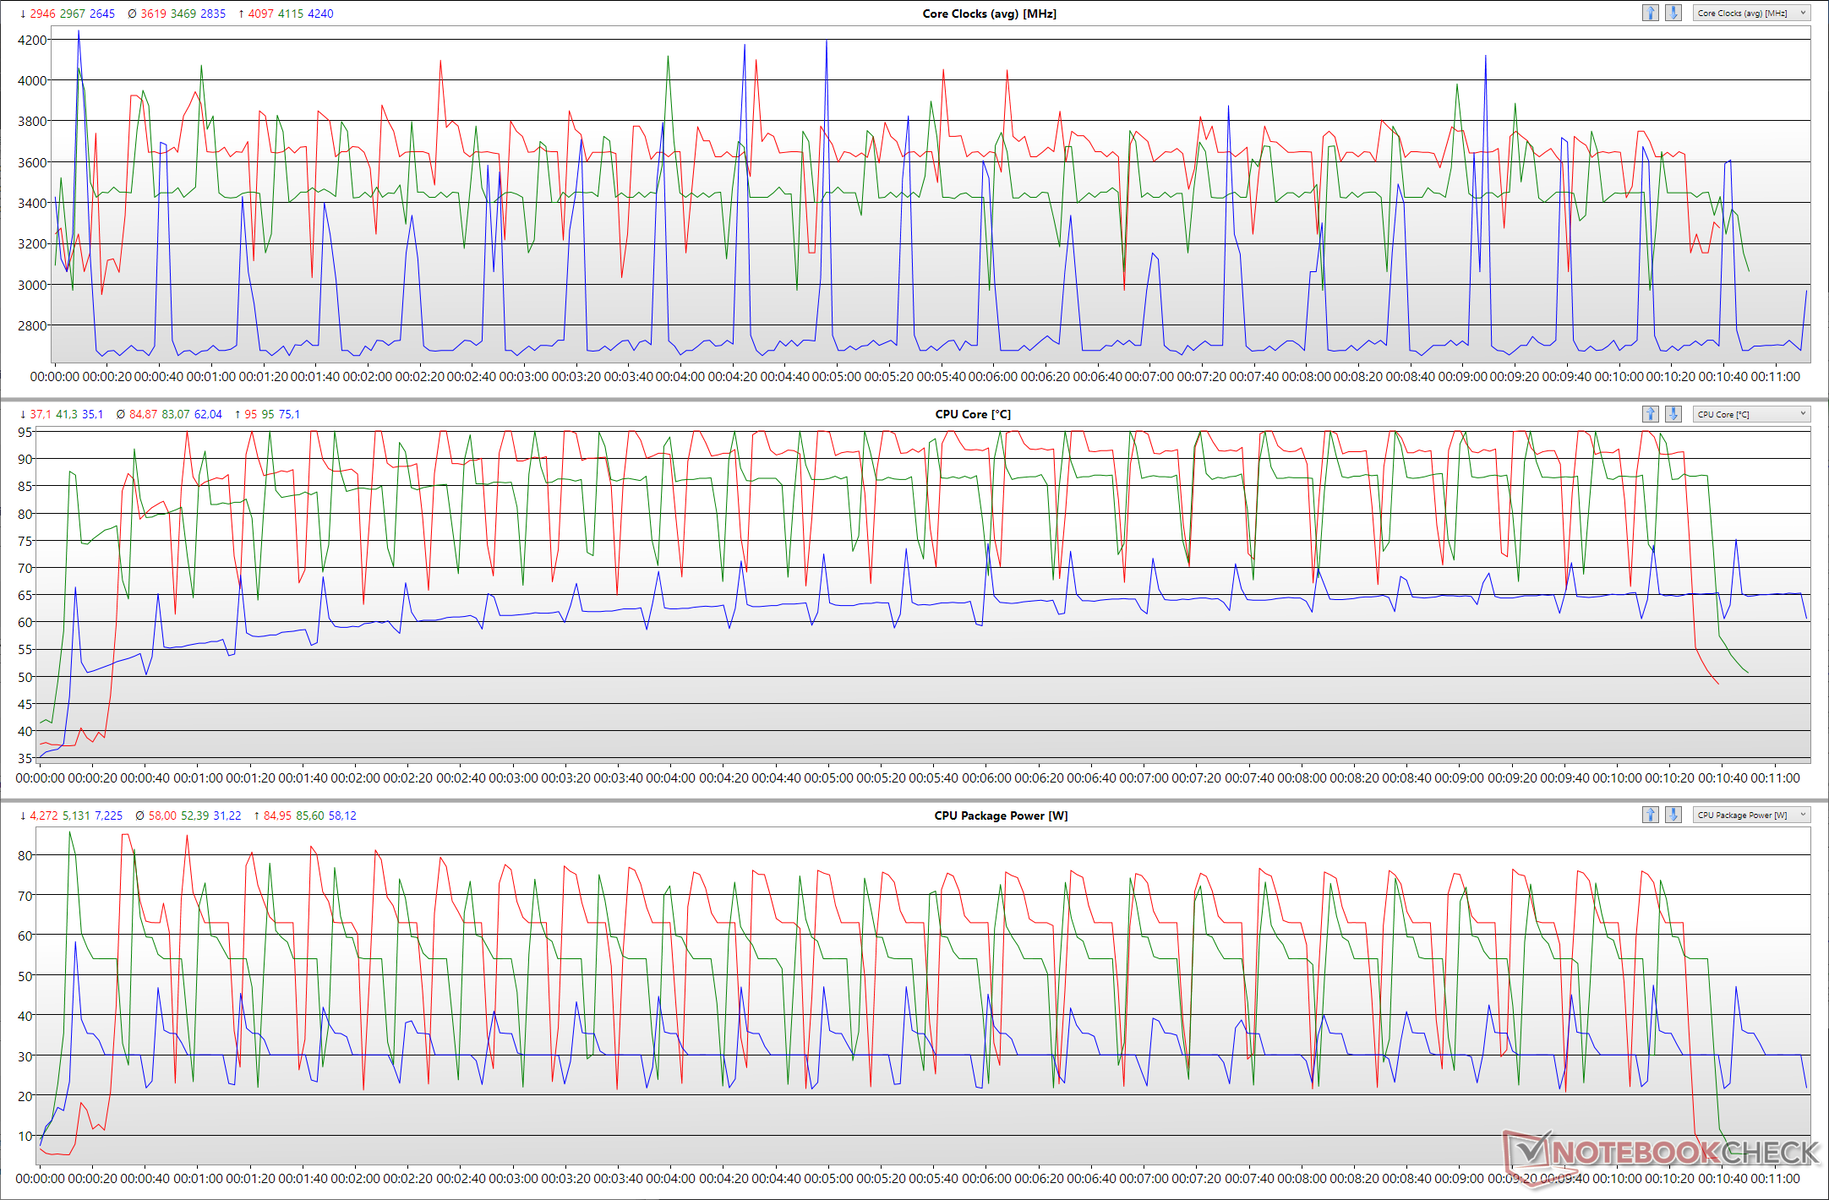
The following graphs illustrate how CPU clocks, core temperatures, and CPU package powers change in each performance mode during a Cinebench R15 loop test. Though the Balanced mode starts at lower clocks and temperatures, it is eventually able to match up to Extreme Performance due to increase in power allotment.
In Silent mode, the package power hovers just around the 40 W mark. While this helps keep the temperatures low between 60 °C and 70 °C, the processor is only able to hit 3.8 GHz for the most part with occasional spikes to 4.2 GHz.
Users will, therefore, have to select the appropriate performance mode based on their workflow. Refer to the Emissions section for a comparison of fan noise characteristics in each of these performance modes.
AIDA64: FP32 Ray-Trace | FPU Julia | CPU SHA3 | CPU Queen | FPU SinJulia | FPU Mandel | CPU AES | CPU ZLib | FP64 Ray-Trace | CPU PhotoWorxx
| Performance rating | |
| Average of class Gaming | |
| Lenovo Legion S7 15ACH6 82K80030GE | |
| MSI Delta 15 A5EFK | |
| Asus ROG Strix G15 G513QY | |
| Schenker XMG Apex 15 NH57E PS | |
| MSI Alpha 15 B5EEK-008 | |
| MSI GP66 Leopard 11UH-028 | |
| MSI Alpha 15 B5EEK-008 | |
| Average AMD Ryzen 7 5800H | |
| MSI Alpha 15 B5EEK-008 | |
| AIDA64 / FP32 Ray-Trace | |
| Average of class Gaming (10227 - 85542, n=109, last 2 years) | |
| Lenovo Legion S7 15ACH6 82K80030GE | |
| Asus ROG Strix G15 G513QY | |
| MSI Delta 15 A5EFK | |
| Schenker XMG Apex 15 NH57E PS | |
| MSI GP66 Leopard 11UH-028 | |
| MSI Alpha 15 B5EEK-008 | |
| Average AMD Ryzen 7 5800H (10349 - 15169, n=29) | |
| MSI Alpha 15 B5EEK-008 | |
| MSI Alpha 15 B5EEK-008 | |
| AIDA64 / FPU Julia | |
| Average of class Gaming (51376 - 238426, n=109, last 2 years) | |
| Lenovo Legion S7 15ACH6 82K80030GE | |
| Asus ROG Strix G15 G513QY | |
| MSI Delta 15 A5EFK | |
| Schenker XMG Apex 15 NH57E PS | |
| MSI Alpha 15 B5EEK-008 | |
| Average AMD Ryzen 7 5800H (63663 - 95954, n=29) | |
| MSI Alpha 15 B5EEK-008 | |
| MSI Alpha 15 B5EEK-008 | |
| MSI GP66 Leopard 11UH-028 | |
| AIDA64 / CPU SHA3 | |
| Average of class Gaming (2180 - 9817, n=109, last 2 years) | |
| MSI GP66 Leopard 11UH-028 | |
| Lenovo Legion S7 15ACH6 82K80030GE | |
| Asus ROG Strix G15 G513QY | |
| MSI Delta 15 A5EFK | |
| Schenker XMG Apex 15 NH57E PS | |
| MSI Alpha 15 B5EEK-008 | |
| Average AMD Ryzen 7 5800H (2096 - 3287, n=29) | |
| MSI Alpha 15 B5EEK-008 | |
| MSI Alpha 15 B5EEK-008 | |
| AIDA64 / CPU Queen | |
| Average of class Gaming (49785 - 173351, n=100, last 2 years) | |
| MSI Delta 15 A5EFK | |
| Asus ROG Strix G15 G513QY | |
| Lenovo Legion S7 15ACH6 82K80030GE | |
| Schenker XMG Apex 15 NH57E PS | |
| MSI Alpha 15 B5EEK-008 | |
| MSI Alpha 15 B5EEK-008 | |
| MSI Alpha 15 B5EEK-008 | |
| Average AMD Ryzen 7 5800H (91846 - 99215, n=29) | |
| MSI GP66 Leopard 11UH-028 | |
| AIDA64 / FPU SinJulia | |
| Average of class Gaming (4424 - 33636, n=109, last 2 years) | |
| MSI Delta 15 A5EFK | |
| Asus ROG Strix G15 G513QY | |
| Lenovo Legion S7 15ACH6 82K80030GE | |
| Schenker XMG Apex 15 NH57E PS | |
| MSI Alpha 15 B5EEK-008 | |
| MSI Alpha 15 B5EEK-008 | |
| Average AMD Ryzen 7 5800H (9962 - 11871, n=29) | |
| MSI Alpha 15 B5EEK-008 | |
| MSI GP66 Leopard 11UH-028 | |
| AIDA64 / FPU Mandel | |
| Average of class Gaming (25115 - 128721, n=109, last 2 years) | |
| Lenovo Legion S7 15ACH6 82K80030GE | |
| Asus ROG Strix G15 G513QY | |
| MSI Delta 15 A5EFK | |
| Schenker XMG Apex 15 NH57E PS | |
| MSI Alpha 15 B5EEK-008 | |
| Average AMD Ryzen 7 5800H (36083 - 52732, n=29) | |
| MSI Alpha 15 B5EEK-008 | |
| MSI GP66 Leopard 11UH-028 | |
| MSI Alpha 15 B5EEK-008 | |
| AIDA64 / CPU AES | |
| MSI GP66 Leopard 11UH-028 | |
| Lenovo Legion S7 15ACH6 82K80030GE | |
| Asus ROG Strix G15 G513QY | |
| MSI Delta 15 A5EFK | |
| Schenker XMG Apex 15 NH57E PS | |
| MSI Alpha 15 B5EEK-008 | |
| MSI Alpha 15 B5EEK-008 | |
| Average AMD Ryzen 7 5800H (50226 - 127832, n=29) | |
| Average of class Gaming (39258 - 247074, n=109, last 2 years) | |
| MSI Alpha 15 B5EEK-008 | |
| AIDA64 / CPU ZLib | |
| Average of class Gaming (574 - 2531, n=109, last 2 years) | |
| Lenovo Legion S7 15ACH6 82K80030GE | |
| Asus ROG Strix G15 G513QY | |
| MSI Delta 15 A5EFK | |
| Schenker XMG Apex 15 NH57E PS | |
| MSI Alpha 15 B5EEK-008 | |
| MSI GP66 Leopard 11UH-028 | |
| Average AMD Ryzen 7 5800H (591 - 828, n=29) | |
| MSI Alpha 15 B5EEK-008 | |
| MSI Alpha 15 B5EEK-008 | |
| AIDA64 / FP64 Ray-Trace | |
| Average of class Gaming (5509 - 45446, n=109, last 2 years) | |
| Lenovo Legion S7 15ACH6 82K80030GE | |
| Asus ROG Strix G15 G513QY | |
| MSI GP66 Leopard 11UH-028 | |
| MSI Delta 15 A5EFK | |
| Schenker XMG Apex 15 NH57E PS | |
| MSI Alpha 15 B5EEK-008 | |
| Average AMD Ryzen 7 5800H (5457 - 7884, n=29) | |
| MSI Alpha 15 B5EEK-008 | |
| MSI Alpha 15 B5EEK-008 | |
| AIDA64 / CPU PhotoWorxx | |
| Average of class Gaming (12271 - 89891, n=109, last 2 years) | |
| MSI GP66 Leopard 11UH-028 | |
| MSI Alpha 15 B5EEK-008 | |
| MSI Alpha 15 B5EEK-008 | |
| MSI Delta 15 A5EFK | |
| MSI Alpha 15 B5EEK-008 | |
| Schenker XMG Apex 15 NH57E PS | |
| Lenovo Legion S7 15ACH6 82K80030GE | |
| Average AMD Ryzen 7 5800H (14445 - 25421, n=29) | |
| Asus ROG Strix G15 G513QY | |
Check out our dedicated AMD Ryzen 7 5800H page for more information and performance benchmarks.
System Performance
Overall system performance of the MSI Alpha 15 is excellent. Most productivity apps are highly responsive and start quickly. Boot up times and resume from standby are impressively fast as well.
PCMark 10 scores show the Alpha 15 right on the heels of Tiger Lake-H-powered gaming laptops such as the Gigabyte Aero 15 OLED, Asus TUF Gaming F17, and MSI's own GP66 Leopard 11UH.
AIDA64 memory benchmarks show no perceivable differences in the three tested performance modes.
| PCMark 10 / Score | |
| Average of class Gaming (5828 - 11574, n=95, last 2 years) | |
| MSI Delta 15 A5EFK | |
| Asus ROG Strix G15 G513QY | |
| MSI GP66 Leopard 11UH-028 | |
| Gigabyte Aero 15 OLED XD | |
| Average AMD Ryzen 7 5800H, AMD Radeon RX 6600M (6875 - 7150, n=2) | |
| Asus TUF Gaming F17 FX706HM | |
| MSI Alpha 15 B5EEK-008 | |
| Asus TUF Gaming F15 FX506HM | |
| Schenker XMG Apex 15 NH57E PS | |
| MSI Katana GF66 11UG-220 | |
| Lenovo Legion S7 15ACH6 82K80030GE | |
| PCMark 10 / Essentials | |
| Average of class Gaming (8810 - 12600, n=99, last 2 years) | |
| Asus TUF Gaming F17 FX706HM | |
| Asus TUF Gaming F15 FX506HM | |
| MSI Delta 15 A5EFK | |
| MSI GP66 Leopard 11UH-028 | |
| Asus ROG Strix G15 G513QY | |
| Average AMD Ryzen 7 5800H, AMD Radeon RX 6600M (9907 - 10479, n=2) | |
| Gigabyte Aero 15 OLED XD | |
| MSI Alpha 15 B5EEK-008 | |
| Schenker XMG Apex 15 NH57E PS | |
| Lenovo Legion S7 15ACH6 82K80030GE | |
| MSI Katana GF66 11UG-220 | |
| PCMark 10 / Productivity | |
| Average of class Gaming (6845 - 18766, n=97, last 2 years) | |
| Gigabyte Aero 15 OLED XD | |
| MSI Delta 15 A5EFK | |
| MSI Katana GF66 11UG-220 | |
| Average AMD Ryzen 7 5800H, AMD Radeon RX 6600M (8922 - 9231, n=2) | |
| Asus TUF Gaming F17 FX706HM | |
| Asus ROG Strix G15 G513QY | |
| MSI Alpha 15 B5EEK-008 | |
| Asus TUF Gaming F15 FX506HM | |
| Lenovo Legion S7 15ACH6 82K80030GE | |
| Schenker XMG Apex 15 NH57E PS | |
| MSI GP66 Leopard 11UH-028 | |
| PCMark 10 / Digital Content Creation | |
| Average of class Gaming (7602 - 19657, n=97, last 2 years) | |
| Asus ROG Strix G15 G513QY | |
| MSI Delta 15 A5EFK | |
| MSI GP66 Leopard 11UH-028 | |
| Average AMD Ryzen 7 5800H, AMD Radeon RX 6600M (9977 - 10257, n=2) | |
| MSI Alpha 15 B5EEK-008 | |
| Gigabyte Aero 15 OLED XD | |
| MSI Katana GF66 11UG-220 | |
| Asus TUF Gaming F15 FX506HM | |
| Schenker XMG Apex 15 NH57E PS | |
| Asus TUF Gaming F17 FX706HM | |
| Lenovo Legion S7 15ACH6 82K80030GE | |
| PCMark 8 Home Score Accelerated v2 | 5722 points | |
| PCMark 8 Work Score Accelerated v2 | 5804 points | |
| PCMark 10 Score | 6875 points | |
Help | ||
| AIDA64 / Memory Copy | |
| Average of class Gaming (21750 - 129946, n=109, last 2 years) | |
| MSI GP66 Leopard 11UH-028 | |
| MSI Alpha 15 B5EEK-008 | |
| Schenker XMG Apex 15 NH57E PS | |
| MSI Alpha 15 B5EEK-008 | |
| MSI Alpha 15 B5EEK-008 | |
| MSI Delta 15 A5EFK | |
| Lenovo Legion S7 15ACH6 82K80030GE | |
| Average AMD Ryzen 7 5800H (34964 - 44180, n=29) | |
| Asus ROG Strix G15 G513QY | |
| AIDA64 / Memory Read | |
| Average of class Gaming (22956 - 118858, n=109, last 2 years) | |
| MSI GP66 Leopard 11UH-028 | |
| Schenker XMG Apex 15 NH57E PS | |
| MSI Alpha 15 B5EEK-008 | |
| MSI Alpha 15 B5EEK-008 | |
| MSI Alpha 15 B5EEK-008 | |
| MSI Delta 15 A5EFK | |
| Lenovo Legion S7 15ACH6 82K80030GE | |
| Average AMD Ryzen 7 5800H (39548 - 47260, n=29) | |
| Asus ROG Strix G15 G513QY | |
| AIDA64 / Memory Write | |
| Average of class Gaming (22297 - 135096, n=109, last 2 years) | |
| MSI GP66 Leopard 11UH-028 | |
| MSI Alpha 15 B5EEK-008 | |
| MSI Alpha 15 B5EEK-008 | |
| Schenker XMG Apex 15 NH57E PS | |
| MSI Alpha 15 B5EEK-008 | |
| MSI Delta 15 A5EFK | |
| Lenovo Legion S7 15ACH6 82K80030GE | |
| Average AMD Ryzen 7 5800H (28456 - 47022, n=29) | |
| Asus ROG Strix G15 G513QY | |
| AIDA64 / Memory Latency | |
| Average of class Gaming (75.3 - 259, n=109, last 2 years) | |
| MSI GP66 Leopard 11UH-028 | |
| Average AMD Ryzen 7 5800H (76.3 - 105.1, n=29) | |
| Asus ROG Strix G15 G513QY | |
| MSI Alpha 15 B5EEK-008 | |
| MSI Alpha 15 B5EEK-008 | |
| MSI Alpha 15 B5EEK-008 | |
| Lenovo Legion S7 15ACH6 82K80030GE | |
| Schenker XMG Apex 15 NH57E PS | |
| MSI Delta 15 A5EFK | |
* ... smaller is better
DPC Latency
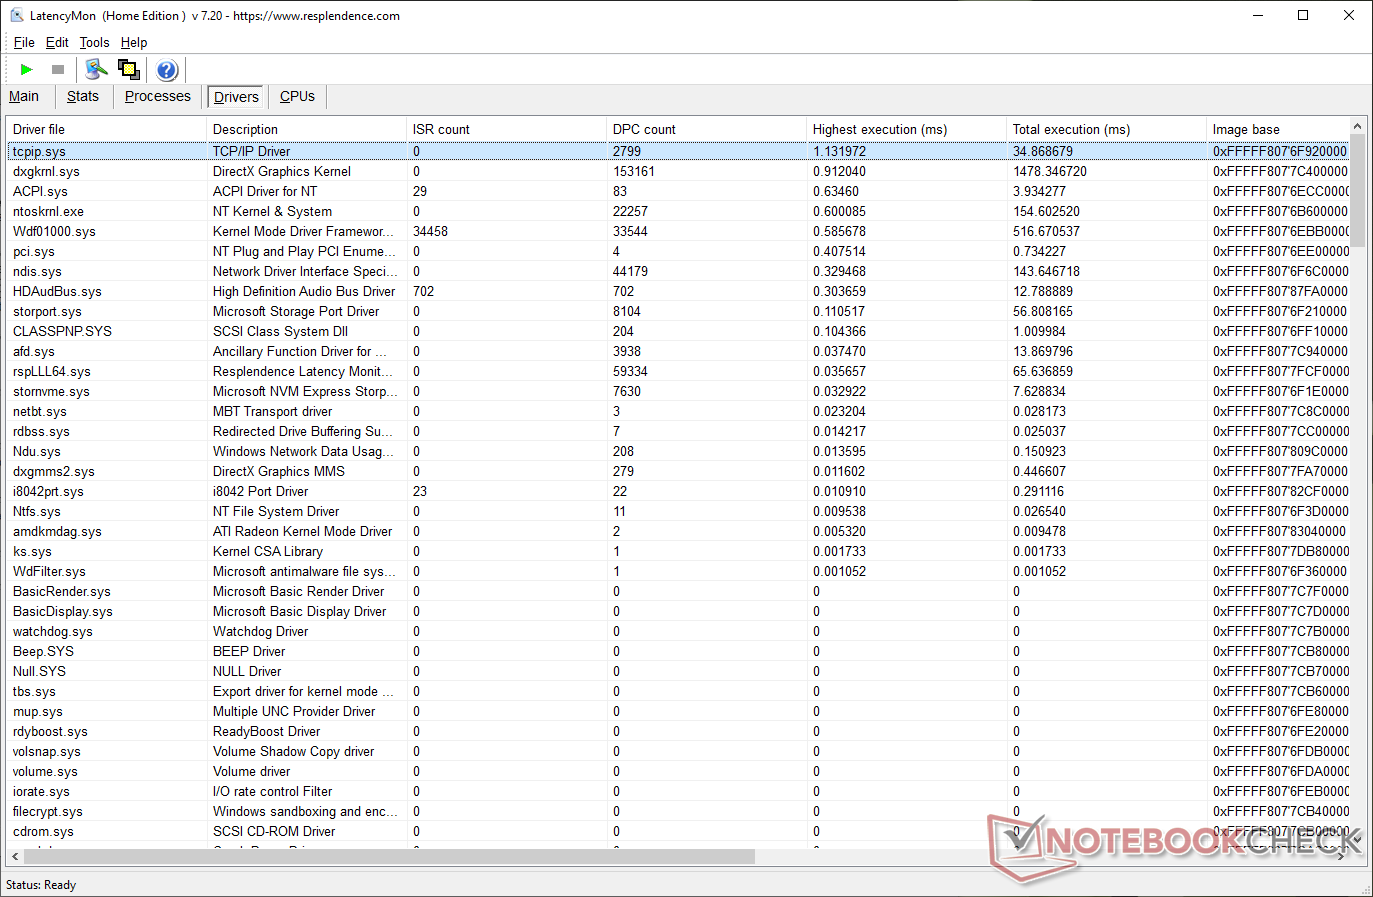
We observed a maximum interrupt to process latency of about 1010.4 µs in our standardized DPC latency measurement routine, which includes opening of several browser tabs, playback of our demo 4K60 video on YouTube, and running an instance of Prime95 in-place large FFTs torture test for 10 seconds.
This latency is lower than some of the Alpha 15's competition, but those into real-time audio and video workflows can still run into potential hiccups. The TCP/IP driver was found to have the highest execution time among all other drivers in the system.
Check out our dedicated DPC Latency Ranking page for more latency comparisons across tested devices.

| DPC Latencies / LatencyMon - interrupt to process latency (max), Web, Youtube, Prime95 | |
| Asus ROG Strix G15 G513QY | |
| MSI Delta 15 A5EFK | |
| Asus TUF Gaming F15 FX506HM | |
| Asus TUF Gaming F17 FX706HM | |
| Schenker XMG Apex 15 NH57E PS | |
| MSI Alpha 15 B5EEK-008 | |
| MSI Katana GF66 11UG-220 | |
| MSI GP66 Leopard 11UH-028 | |
| Gigabyte Aero 15 OLED XD | |
| Lenovo Legion S7 15ACH6 82K80030GE | |
* ... smaller is better
Storage Devices
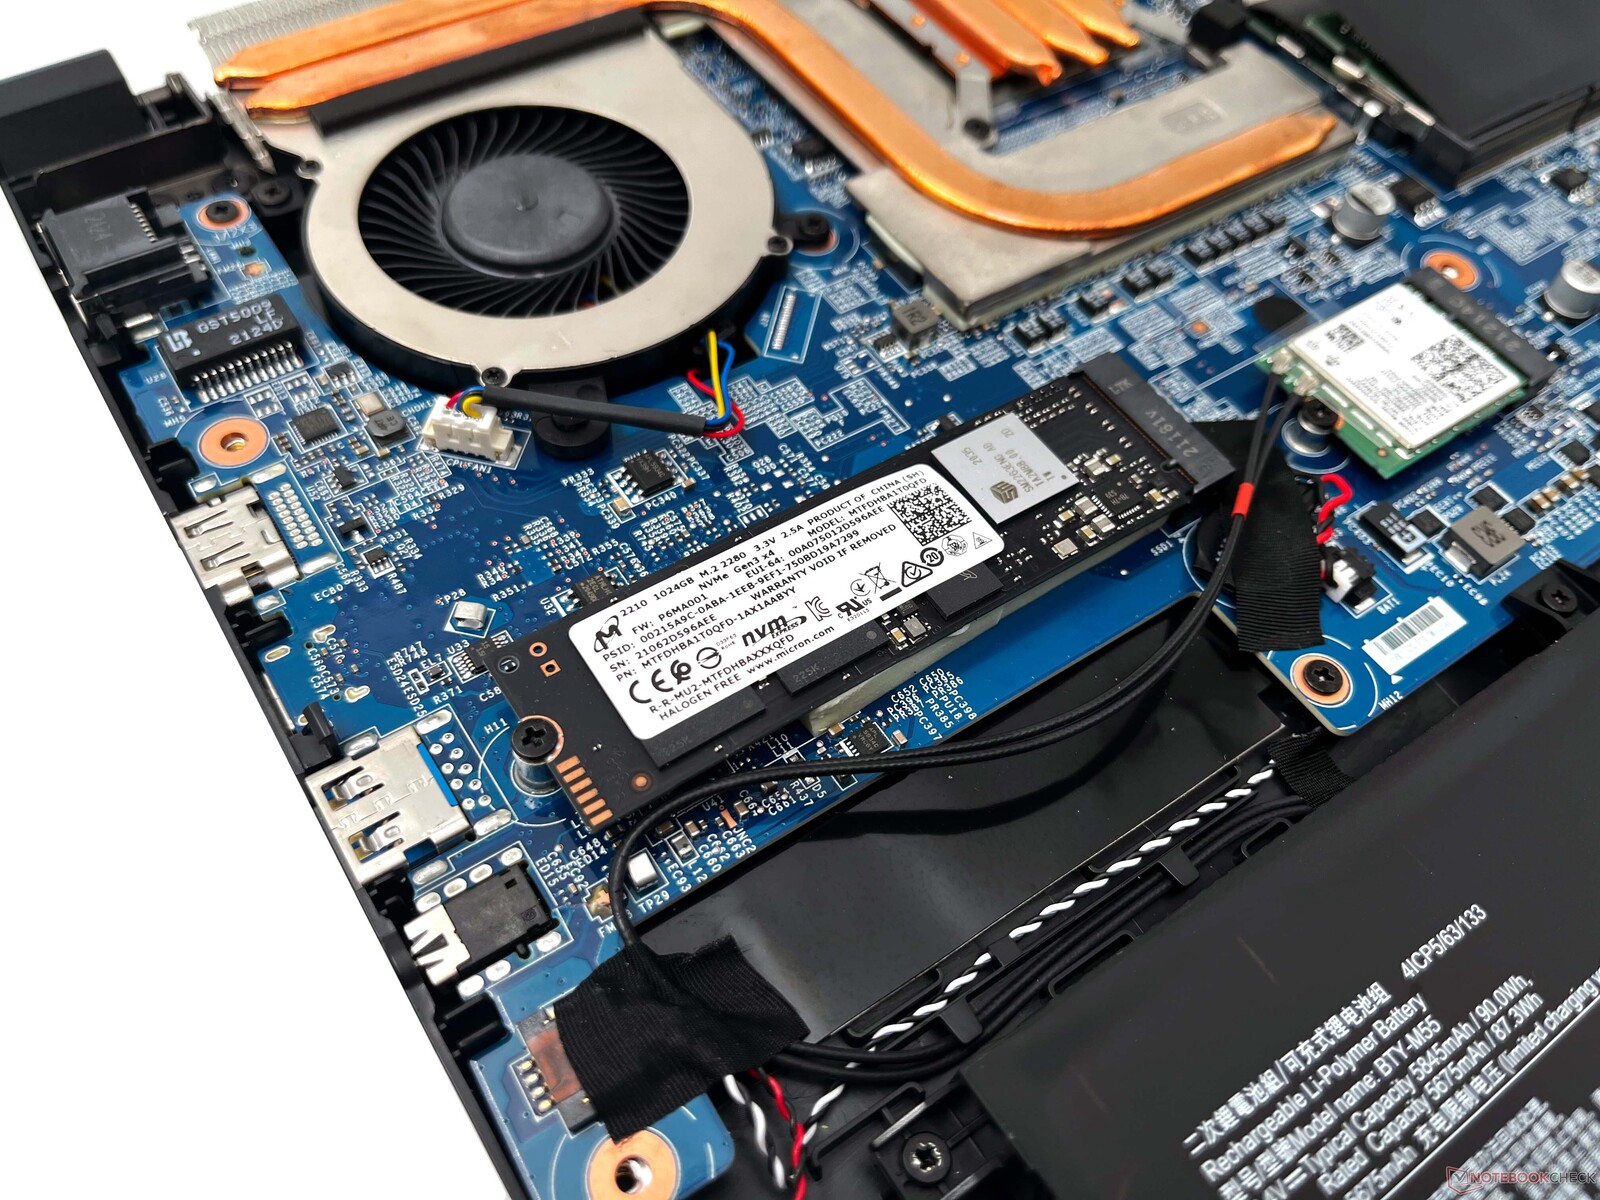
The performance of the Micron NVMe SSD is fine for most use cases. However, it does trail significantly behind the competition featuring Samsung PM991, PM981a, and PM9A1 offerings in raw benchmarks.
The Alpha 15's SSD offers well-sustained performance for the most part, but we did observe significant throttling twice during the DiskSpd read loop test at a queue depth of 8. There is no thermal solution provided for the SSD either in the main chassis or in the back cover.
There is no scope for installing a 2.5-inch SATA SSD or HDD. However, MSI offers a vacant M.2 2280 slot for NVMe storage expansion.
More storage performance comparisons can be found in our dedicated SSD and HDD Benchmarks page.

| MSI Alpha 15 B5EEK-008 Micron 2210 MTFDHBA1T0QFD | MSI Katana GF66 11UG-220 Kingston OM8PDP3512B-AI1 | MSI Delta 15 A5EFK Micron 2210 MTFDHBA1T0QFD | Asus ROG Strix G15 G513QY Samsung PM991 MZVLQ512HALU | Lenovo Legion S7 15ACH6 82K80030GE Samsung PM981a MZVLB1T0HBLR | MSI GP66 Leopard 11UH-028 Samsung PM9A1 MZVL21T0HCLR | Average Micron 2210 MTFDHBA1T0QFD | Average of class Gaming | |
|---|---|---|---|---|---|---|---|---|
| Drive Performance rating | ||||||||
| Percent (pt) | 44 | 21.1 -52% | 44.8 2% | 45.8 4% | 59.6 35% | 96.8 120% | 44.4 1% | 81.7 86% |
| DiskSpd | -18% | 12% | 18% | 60% | 193% | 1% | 140% | |
| seq read (MB/s) | 1049 | 1389 32% 1389 32% | 1725 64% | 2025 93% | 2466 135% | 4608 339% | 1377 ? 31% | 3481 ? 232% |
| seq write (MB/s) | 1891 | 1157 -39% | 1923 2% | 1588 -16% | 2788 47% | 4304 128% | 1693 ? -10% | 3924 ? 108% |
| seq q8 t1 read (MB/s) | 1665 | 2008 21% 2008 21% | 2138 28% | 2876 73% | 3529 112% | 6670 301% | 1767 ? 6% | 7291 ? 338% |
| seq q8 t1 write (MB/s) | 1960 | 1194 -39% 1194 -39% | 1995 2% | 1607 -18% | 2801 43% | 4933 152% | 1763 ? -10% | 5766 ? 194% |
| 4k q1 t1 read (MB/s) | 60.7 | 29.9 -51% 29.9 -51% | 61.6 1% | 48 -21% | 49.8 -18% | 93 53% | 64.4 ? 6% | 69.7 ? 15% |
| 4k q1 t1 write (MB/s) | 145 | 114 -21% | 146 1% | 143 -1% | 144 -1% | 237 63% | 168.5 ? 16% | 201 ? 39% |
| 4k q32 t16 read (MB/s) | 961 | 493 -49% | 968 1% | 1443 50% | 1851 93% | 4183 335% | 848 ? -12% | 2326 ? 142% |
| 4k q32 t16 write (MB/s) | 1289 | 891 -31% | 1253 -3% | 1125 -13% | 2131 65% | 3549 175% | 1084 ? -16% | 1930 ? 50% |
| AS SSD | -144% | -1% | 8% | 41% | 122% | -1% | 84% | |
| Score Total (Points) | 3300 | 1033 -69% | 3233 -2% | 3818 16% | 5318 61% | 8764 166% | 3136 ? -5% | 6815 ? 107% |
| Score Read (Points) | 1157 | 478 -59% | 1158 0% | 1658 43% | 1959 69% | 3353 190% | 1164 ? 1% | 2252 ? 95% |
| Score Write (Points) | 1546 | 387 -75% | 1478 -4% | 1360 -12% | 2355 52% | 3755 143% | 1368 ? -12% | 3481 ? 125% |
| Seq Read (MB/s) | 2016 | 1978 -2% | 2023 0% | 2706 34% | 2790 38% | 5189 157% | 2012 ? 0% | 5490 ? 172% |
| Seq Write (MB/s) | 1830 | 308.3 -83% | 1836 0% | 1652 -10% | 2768 51% | 3941 115% | 1826 ? 0% | 3914 ? 114% |
| 4K Read (MB/s) | 55.2 | 24.04 -56% | 56.4 2% | 45.46 -18% | 50.4 -9% | 84.8 54% | 62.5 ? 13% | 70 ? 27% |
| 4K Write (MB/s) | 127.7 | 113.7 -11% | 130.2 2% | 128.5 1% | 134.5 5% | 208.8 64% | 146.4 ? 15% | 215 ? 68% |
| 4K-64 Read (MB/s) | 901 | 256.5 -72% | 899 0% | 1342 49% | 1630 81% | 2749 205% | 900 ? 0% | 1633 ? 81% |
| 4K-64 Write (MB/s) | 1235 | 242.8 -80% | 1164 -6% | 1066 -14% | 1944 57% | 3152 155% | 1039 ? -16% | 2875 ? 133% |
| Access Time Read * (ms) | 0.087 | 0.15 -72% | 0.096 -10% | 0.095 -9% | 0.059 32% | 0.035 60% | 0.09075 ? -4% | 0.06415 ? 26% |
| Access Time Write * (ms) | 0.032 | 0.353 -1003% | 0.031 3% | 0.03 6% | 0.028 12% | 0.02 37% | 0.0312 ? 2% | 0.03953 ? -24% |
| Total Average (Program / Settings) | -71% /
-77% | 4% /
4% | 10% /
12% | 45% /
48% | 145% /
151% | 0% /
0% | 103% /
106% |
* ... smaller is better
Disk Throttling: DiskSpd Read Loop, Queue Depth 8
GPU Performance


The MSI Alpha 15 is the only laptop other than the Lenovo Legion 5 and the HP Omen 16 to employ the RDNA 2-based AMD Radeon RX 6600M discrete mobile GPU. This 100 W discrete GPU is leveraged for heavy-duty workloads while the integrated Radeon RX Vega 8 handles all basic tasks including desktop composition. As we shall see in the stress tests below, the RX 6600M in the Alpha 15 actually seems to work at 80 W.
The RX 6600M is about 5% slower than the RX 6700M in overall 3DMark performance, though larger differences become apparent when looked into individual tests. For instance, in 3DMark Fire Strike Graphics, the Alpha 15 with the RX 6600M trails by 23% compared to the RX 6700M-powered MSI Delta 15 and by 37% compared to the ROG Strix G15 that uses the RX 6800M. The Alpha 15 is on par with the Gigabyte Aero 15 featuring the GeForce RTX 3070 Laptop GPU in this test.
In 3DMark Time Spy Graphics, the Alpha 15 ends up at the bottom of the chart. The performance in comparison with the RTX 3060 Laptop GPU can vary anywhere between 5% and 19% depending on the TGP of the RTX 3060 considered.
We observe drastically reduced 3DMark Time Spy scores on battery power with a 66% reduction in the total score and a 69% reduction in the graphics component of the test.


| 3DMark 11 Performance | 22934 points | |
| 3DMark Ice Storm Standard Score | 147334 points | |
| 3DMark Cloud Gate Standard Score | 54719 points | |
| 3DMark Fire Strike Score | 19451 points | |
| 3DMark Fire Strike Extreme Score | 9466 points | |
| 3DMark Time Spy Score | 7476 points | |
Help | ||
Taking the scores achieved in the Balanced profile as reference, the following table shows how various performance modes affect key 3DMark scores.
| 3DMark Test | Extreme Performance | Balanced | Silent |
|---|---|---|---|
| Time Spy Score | 7476 (+9.04%) | 6856 | 5759 (-16%) |
| Time Spy Graphics | 7200 (+8.9%) | 6611 | 5515 (-16.57%) |
| Time Spy CPU | 9558 (+10%) | 8685 | 7693 (-16%) |
| Fire Strike Score | 19451 (+26.37%) | 15391 | 14683 (-4.6%) |
| Fire Strike Graphics | 21876 (+18.11%) | 18521 | 17172 (-7.28%) |
| Fire Strike Physics | 24357 (+4.41%) | 23327 | 19552 (-16.18%) |
| Fire Strike Extreme Score | 9466 (+14%) | 8299 | 7659 (-7.71%) |
| Fire Strike Extreme Graphics | 10016 (+12%) | 8934 | 8149 (-8.78%) |
| Fire Strike Extreme Physics | 24245 (+2.94%) | 23552 | 19465 (-17.35%) |
Gaming Performance
MSI claims the Alpha 15 is capable of 1080p 100 fps gaming in modern titles, and we find this to be mostly true if played at High settings. Performance in 1080p Ultra is good as well with most titles easily crossing the 60 fps mark.
We find that the Radeon RX 6600M is on par with an RTX 3060 Laptop GPU rated at 95 W and up to 25% slower than a 130 W RTX 3060 depending on the title. While the RX 6700M in the Delta 15 enjoys a comfortable lead, the RX 6600M matches or even slightly exceeds the former in titles such as Far Cry 6 and F1 2021.
Overall, we find that the Ryzen 7 5800H and RX 6600M combination can match up to Core i7-11800H and 95 W RTX 3060 configurations in most games.
| Cyberpunk 2077 1.0 | |
| 1920x1080 Medium Preset | |
| MSI Delta 15 A5EFK | |
| Gigabyte Aero 15 OLED XD | |
| MSI Katana GF66 11UG-220 | |
| MSI Alpha 15 B5EEK-008 | |
| Average AMD Radeon RX 6600M (n=1) | |
| 1920x1080 High Preset | |
| MSI Delta 15 A5EFK | |
| Gigabyte Aero 15 OLED XD | |
| MSI Katana GF66 11UG-220 | |
| MSI Alpha 15 B5EEK-008 | |
| Average AMD Radeon RX 6600M (n=1) | |
| 1920x1080 Ultra Preset | |
| Gigabyte Aero 15 OLED XD | |
| MSI Delta 15 A5EFK | |
| MSI Katana GF66 11UG-220 | |
| MSI Alpha 15 B5EEK-008 | |
| Average AMD Radeon RX 6600M (n=1) | |
| 1920x1080 Ray Tracing Ultra Preset (DLSS off) | |
| MSI Katana GF66 11UG-220 | |
| Gigabyte Aero 15 OLED XD | |
| MSI Delta 15 A5EFK | |
| MSI Alpha 15 B5EEK-008 | |
| Average AMD Radeon RX 6600M (n=1) | |
| Far Cry 6 | |
| 1920x1080 Medium Graphics Quality AA:SM | |
| Average of class Gaming (132.1 - 150.2, n=2, last 2 years) | |
| Lenovo Legion S7 15ACH6 82K80030GE | |
| MSI Alpha 15 B5EEK-008 | |
| MSI Delta 15 A5EFK | |
| Average AMD Radeon RX 6600M (86.6 - 117, n=6) | |
| Asus ROG Strix G15 G513QY | |
| 1920x1080 High Graphics Quality AA:T | |
| Average of class Gaming (120.8 - 136, n=2, last 2 years) | |
| Lenovo Legion S7 15ACH6 82K80030GE | |
| Asus ROG Strix G15 G513QY | |
| Average AMD Radeon RX 6600M (78.2 - 108.9, n=6) | |
| MSI Alpha 15 B5EEK-008 | |
| MSI Delta 15 A5EFK | |
| 1920x1080 Ultra Graphics Quality + HD Textures AA:T | |
| Average of class Gaming (96.3 - 135.7, n=3, last 2 years) | |
| Lenovo Legion S7 15ACH6 82K80030GE | |
| Asus ROG Strix G15 G513QY | |
| Average AMD Radeon RX 6600M (51.6 - 91.7, n=6) | |
| MSI Alpha 15 B5EEK-008 | |
| MSI Delta 15 A5EFK | |
| 1920x1080 Ultra Graphics Quality + HD Textures + DXR AA:T | |
| Average of class Gaming (n=1last 2 years) | |
| Lenovo Legion S7 15ACH6 82K80030GE | |
| MSI Delta 15 A5EFK | |
| Average AMD Radeon RX 6600M (45.6 - 66.8, n=4) | |
| MSI Alpha 15 B5EEK-008 | |
| Assassin´s Creed Valhalla | |
| 1920x1080 Medium Preset | |
| MSI Delta 15 A5EFK | |
| Average AMD Radeon RX 6600M (82 - 108, n=2) | |
| MSI Alpha 15 B5EEK-008 | |
| 1920x1080 High Preset | |
| MSI Delta 15 A5EFK | |
| Average AMD Radeon RX 6600M (69 - 88, n=2) | |
| MSI Alpha 15 B5EEK-008 | |
| 1920x1080 Ultra High Preset | |
| MSI Delta 15 A5EFK | |
| Average AMD Radeon RX 6600M (61 - 76, n=2) | |
| MSI Alpha 15 B5EEK-008 | |
| Forza Horizon 5 | |
| 1920x1080 Medium Preset | |
| Average AMD Radeon RX 6600M (107 - 159, n=5) | |
| MSI Alpha 15 B5EEK-008 | |
| Asus ROG Strix G15 G513QY | |
| 1920x1080 High Preset | |
| Average AMD Radeon RX 6600M (96 - 149, n=5) | |
| MSI Alpha 15 B5EEK-008 | |
| Asus ROG Strix G15 G513QY | |
| 1920x1080 Extreme Preset | |
| Average AMD Radeon RX 6600M (56 - 89, n=5) | |
| Asus ROG Strix G15 G513QY | |
| MSI Alpha 15 B5EEK-008 | |
| F1 2021 | |
| 1920x1080 Medium Preset AA:T AF:16x | |
| Average AMD Radeon RX 6600M (194.2 - 283, n=5) | |
| Asus ROG Strix G15 G513QY | |
| MSI Delta 15 A5EFK | |
| MSI Alpha 15 B5EEK-008 | |
| Lenovo Legion S7 15ACH6 82K80030GE | |
| MSI Katana GF66 11UG-220 | |
| 1920x1080 High Preset AA:T AF:16x | |
| Average AMD Radeon RX 6600M (174.4 - 217, n=5) | |
| Asus ROG Strix G15 G513QY | |
| MSI Delta 15 A5EFK | |
| MSI Alpha 15 B5EEK-008 | |
| MSI Katana GF66 11UG-220 | |
| Lenovo Legion S7 15ACH6 82K80030GE | |
| 1920x1080 Ultra High Preset + Raytracing AA:T AF:16x | |
| Asus ROG Strix G15 G513QY | |
| MSI Delta 15 A5EFK | |
| Lenovo Legion S7 15ACH6 82K80030GE | |
| Average AMD Radeon RX 6600M (80.9 - 95.9, n=5) | |
| MSI Katana GF66 11UG-220 | |
| MSI Alpha 15 B5EEK-008 | |
The Witcher 3 FPS Chart
We see largely stable performance hovering around the 77 fps mark during The Witcher 3 stress at 1080p Ultra. There is a momentary drop to 40 fps towards the end of the test, but the laptop is able to recover quickly and stabilize at about 72 fps.
| low | med. | high | ultra | |
|---|---|---|---|---|
| BioShock Infinite (2013) | 379.8 | 316.8 | 291 | 162.9 |
| GTA V (2015) | 154 | 130 | 111 | 65.9 |
| The Witcher 3 (2015) | 292 | 217 | 133 | 75.4 |
| Dota 2 Reborn (2015) | 147.5 | 132.4 | 126.9 | 110.1 |
| Final Fantasy XV Benchmark (2018) | 157 | 95.8 | 72.1 | |
| X-Plane 11.11 (2018) | 67.8 | 51.3 | 45.6 | |
| Far Cry 5 (2018) | 125 | 106 | 102 | 95 |
| Strange Brigade (2018) | 290 | 185 | 157 | 138 |
| Borderlands 3 (2019) | 110 | 95.3 | 76.3 | 59.9 |
| Doom Eternal (2020) | 309 | 160 | 148 | 144 |
| Assassin´s Creed Valhalla (2020) | 131 | 82 | 69 | 61 |
| Cyberpunk 2077 1.0 (2020) | 125 | 68.6 | 56.1 | 46.4 |
| F1 2021 (2021) | 297 | 207 | 175 | 80.9 |
| Far Cry 6 (2021) | 113 | 98.5 | 86.6 | 75.2 |
| Forza Horizon 5 (2021) | 176 | 107 | 96 | 56 |
Emissions: A mini jet engine under load
System Noise
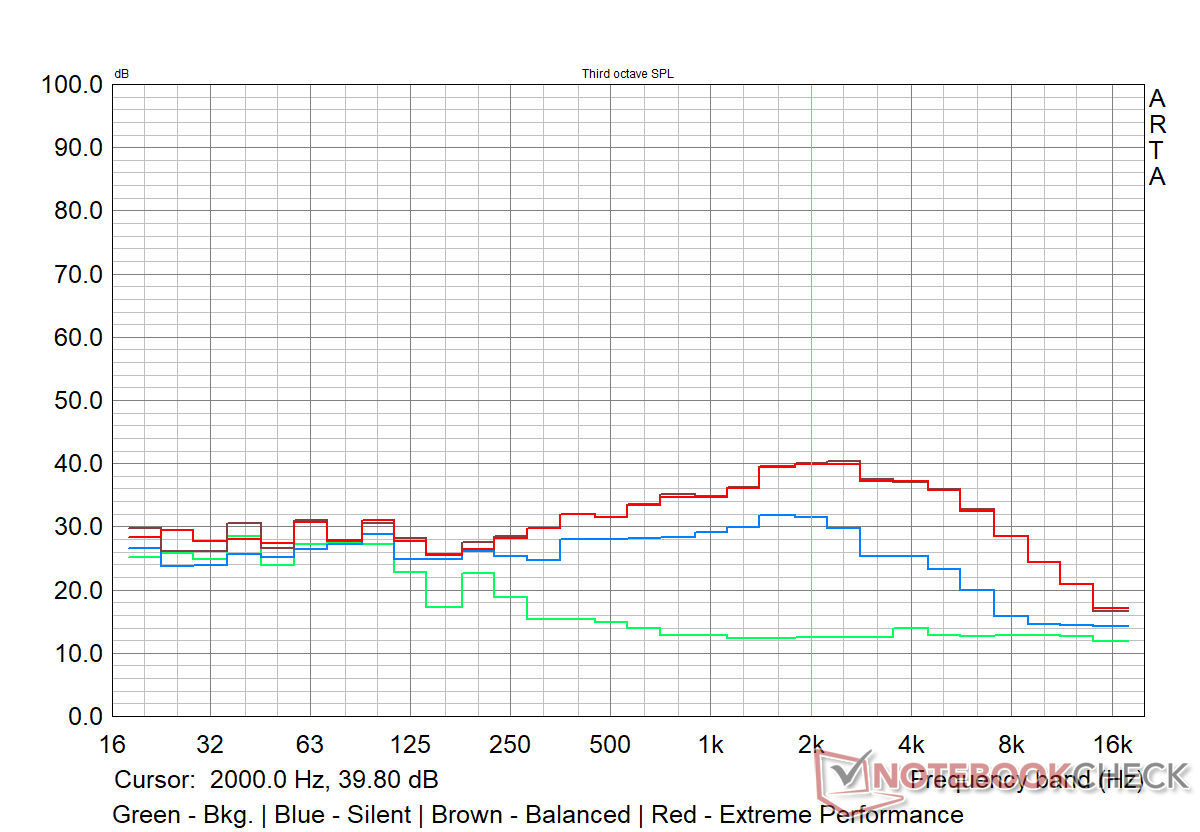
The MSI Alpha 15 offers a dual-fan system, which does lead to higher noise emissions. That being said, such emissions aren't surprising when it comes to gaming laptops. We recorded fan noise levels in three performance modes — Silent, Balanced, and Extreme Performance.
MSI seems to have capped the noise emissions in the Silent profile to 40 dB(A) no matter the load. The Balanced and Extreme Performance modes are almost similar when it comes fan noise.
In the Balanced profile, we notice that the fan noise under maximum load (Prime95+FurMark) was lower than that of the average load (3DMark 06 - Return to Proxycon). This was observed with repeat measurements as well.
It could be that AMD SmartShift is coming into play here to ensure an equitable energy distribution between the CPU and GPU resulting in a lower noise profile given the lower PL2 limits in Balanced compared to the Extreme Performance profile.
We did not notice any random clicks or stray noises during the test.

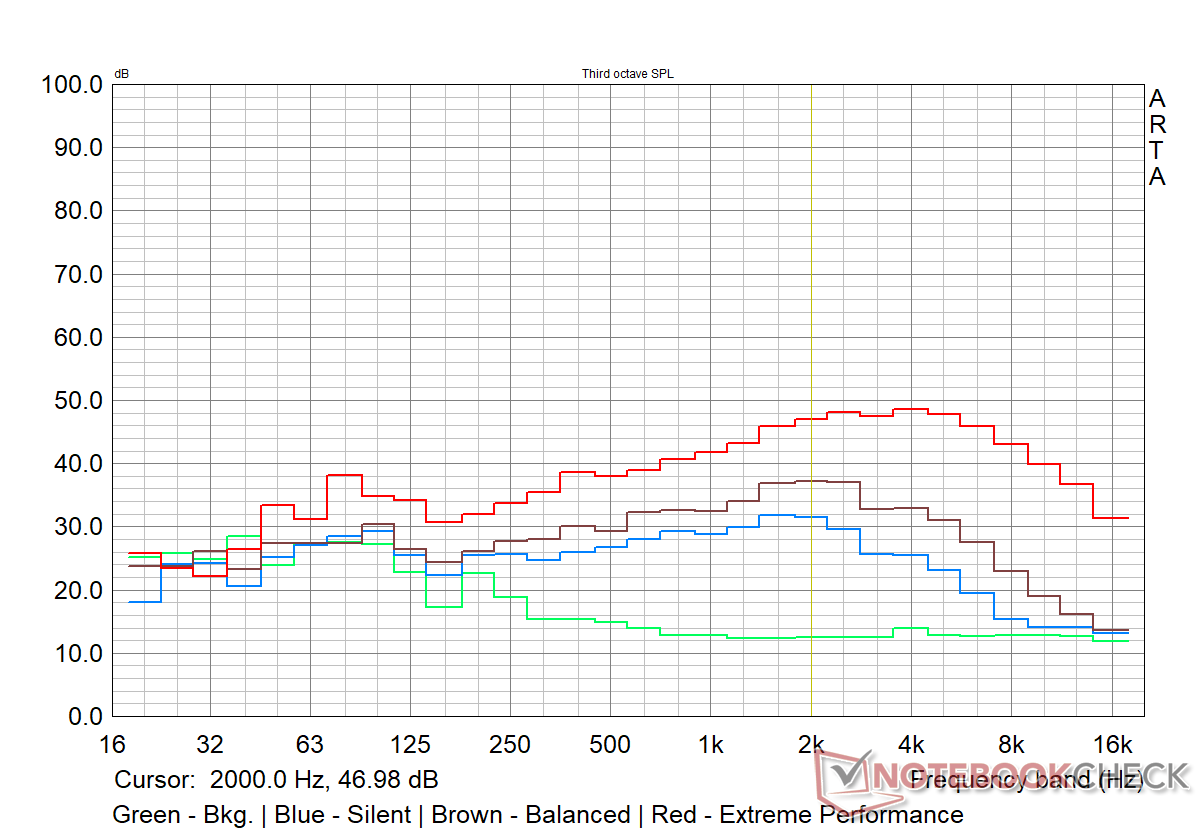
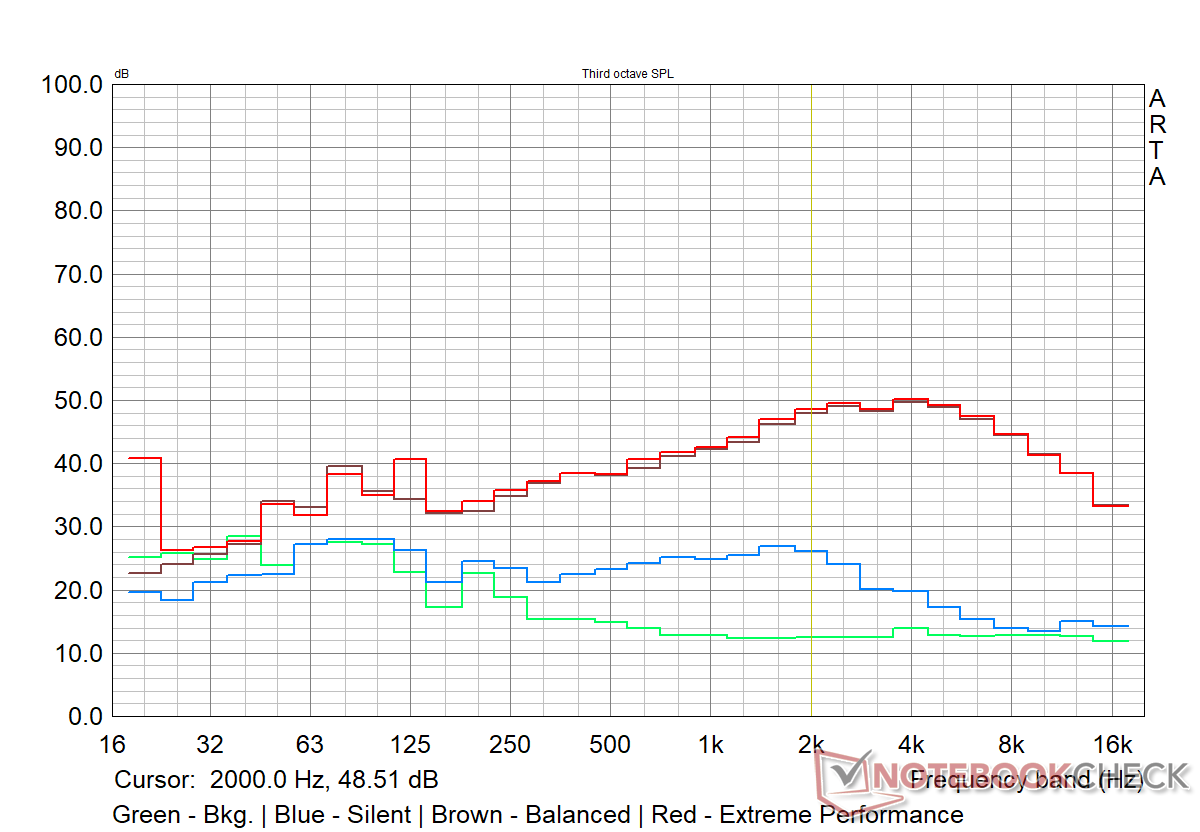
Noise level
| Idle |
| 29.57 / 29.57 / 29.57 dB(A) |
| Load |
| 48.61 / 57.66 dB(A) |
 | ||
30 dB silent 40 dB(A) audible 50 dB(A) loud |
||
min: | ||
| MSI Alpha 15 B5EEK-008 AMD Radeon RX 6600M, AMD Ryzen 7 5800H, Alpha 15 B5EEK | MSI Alpha 15 B5EEK-008 AMD Radeon RX 6600M, AMD Ryzen 7 5800H, Alpha 15 B5EEK (Balanced) | MSI Alpha 15 B5EEK-008 AMD Radeon RX 6600M, AMD Ryzen 7 5800H, Alpha 15 B5EEK (Silent) | MSI Katana GF66 11UG-220 NVIDIA GeForce RTX 3070 Laptop GPU, Intel Core i7-11800H, | MSI Delta 15 A5EFK AMD Radeon RX 6700M, AMD Ryzen 9 5900HX, | Asus ROG Strix G15 G513QY AMD Radeon RX 6800M, AMD Ryzen 9 5900HX, | Lenovo Legion S7 15ACH6 82K80030GE NVIDIA GeForce RTX 3060 Laptop GPU, AMD Ryzen 9 5900HX, | |
|---|---|---|---|---|---|---|---|
| Noise | 3% | 13% | -2% | 2% | 5% | 3% | |
| off / environment * (dB) | 25.49 | 25.49 -0% | 25.49 -0% | 25 2% | 25 2% | 26 -2% | 25 2% |
| Idle Minimum * (dB) | 29.57 | 29.72 -1% | 29.44 -0% | 34 -15% | 25 15% | 26 12% | 25 15% |
| Idle Average * (dB) | 29.57 | 29.72 -1% | 29.44 -0% | 35 -18% | 30 -1% | 31 -5% | 30 -1% |
| Idle Maximum * (dB) | 29.57 | 29.72 -1% | 29.44 -0% | 36 -22% | 40 -35% | 34 -15% | 36 -22% |
| Load Average * (dB) | 48.61 | 48.78 -0% | 40.04 18% | 48 1% | 47 3% | 44 9% | 42 14% |
| Witcher 3 ultra * (dB) | 59 | 58.6 1% | 35.26 40% | 46 22% | 48 19% | 48.5 18% | 53 10% |
| Load Maximum * (dB) | 57.66 | 45.57 21% | 40 31% | 49 15% | 51 12% | 49 15% | 54 6% |
* ... smaller is better
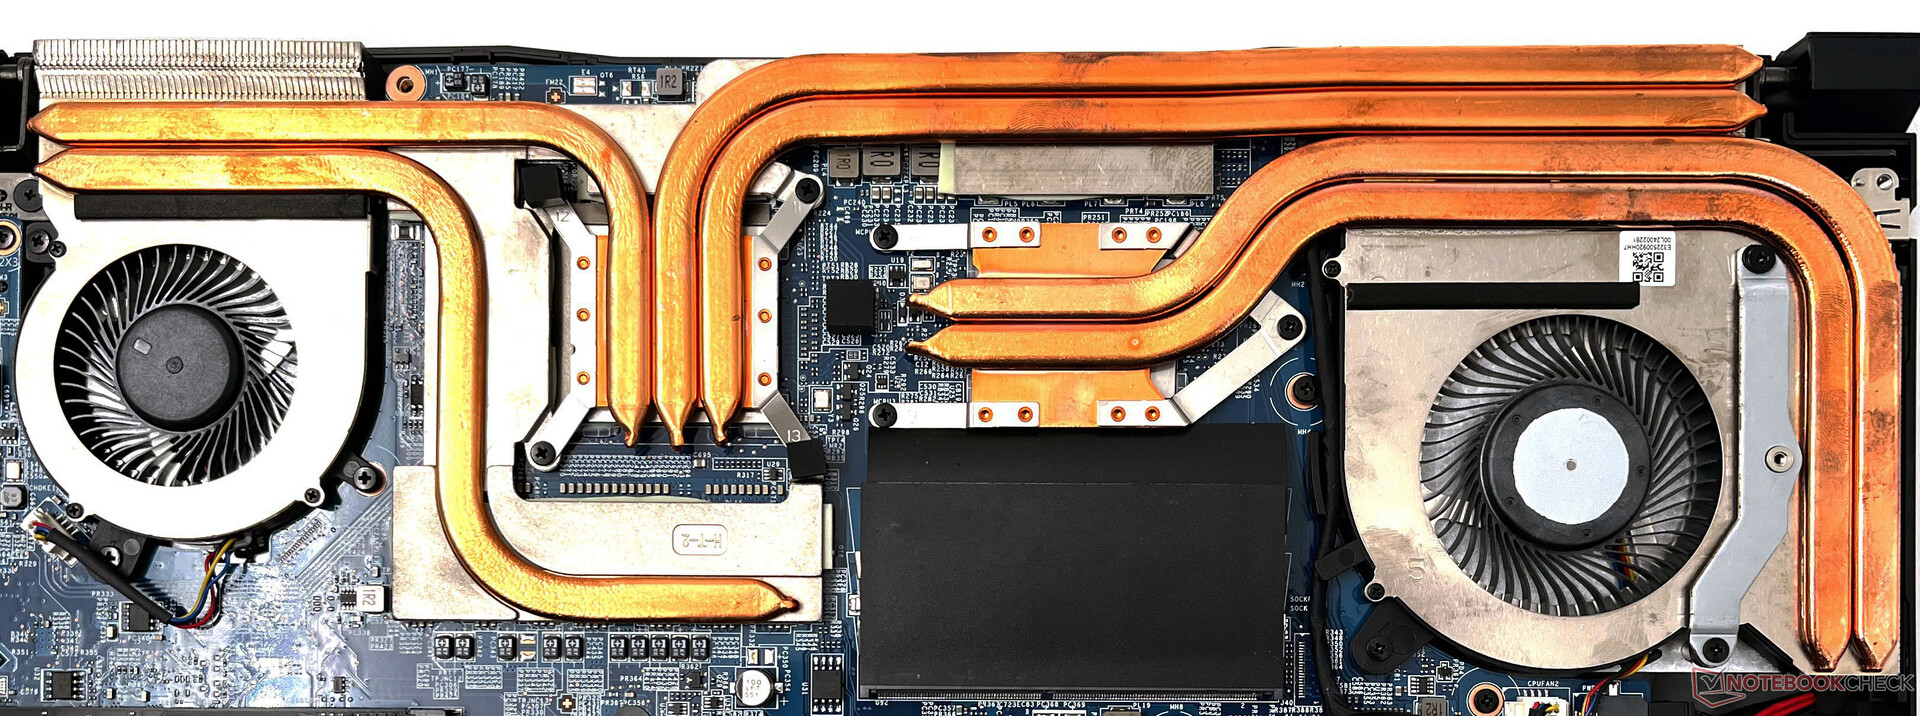
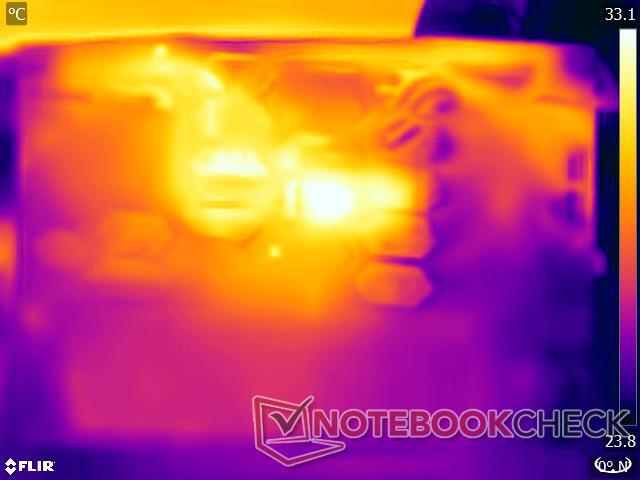
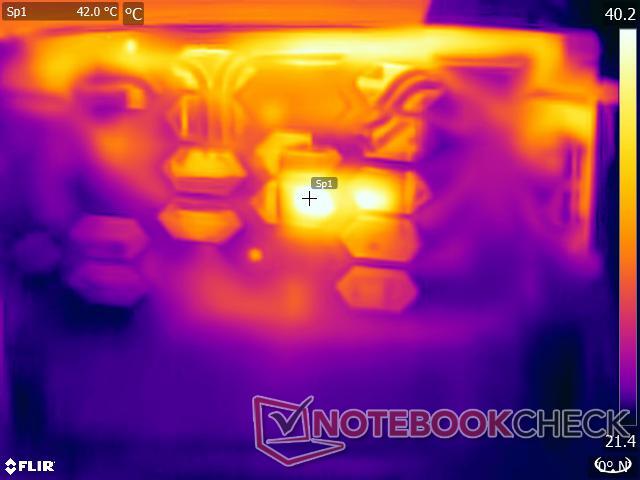
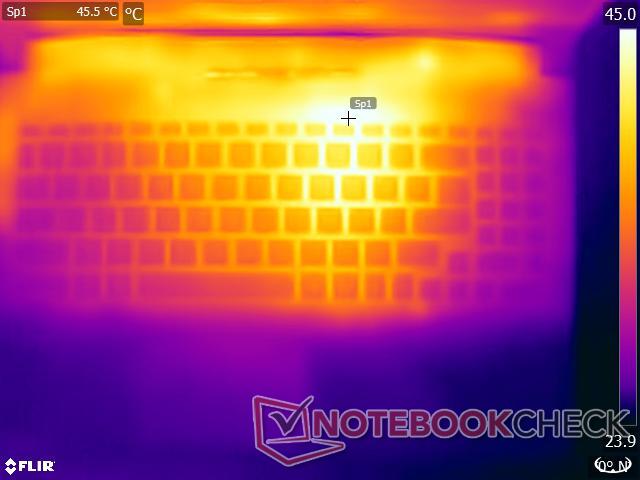
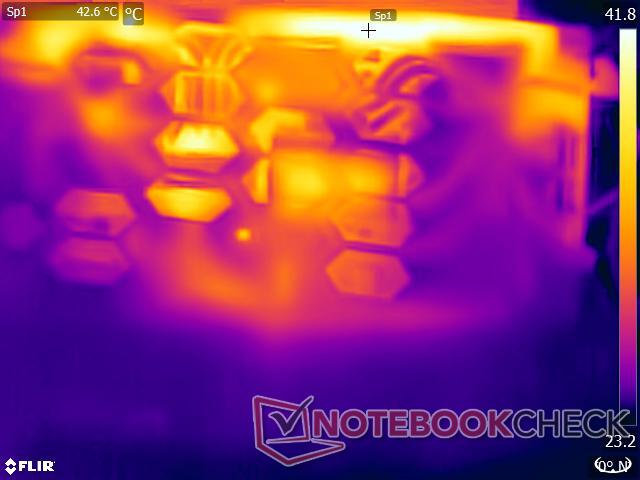
Temperature
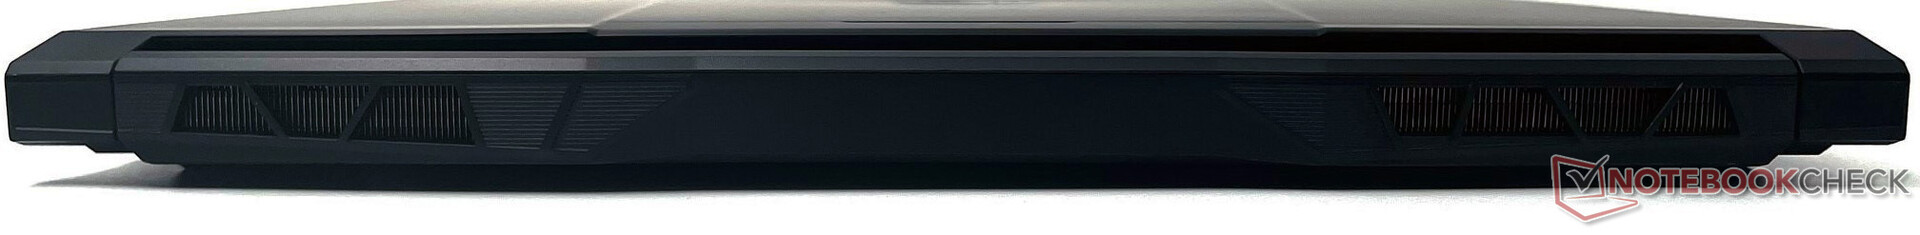
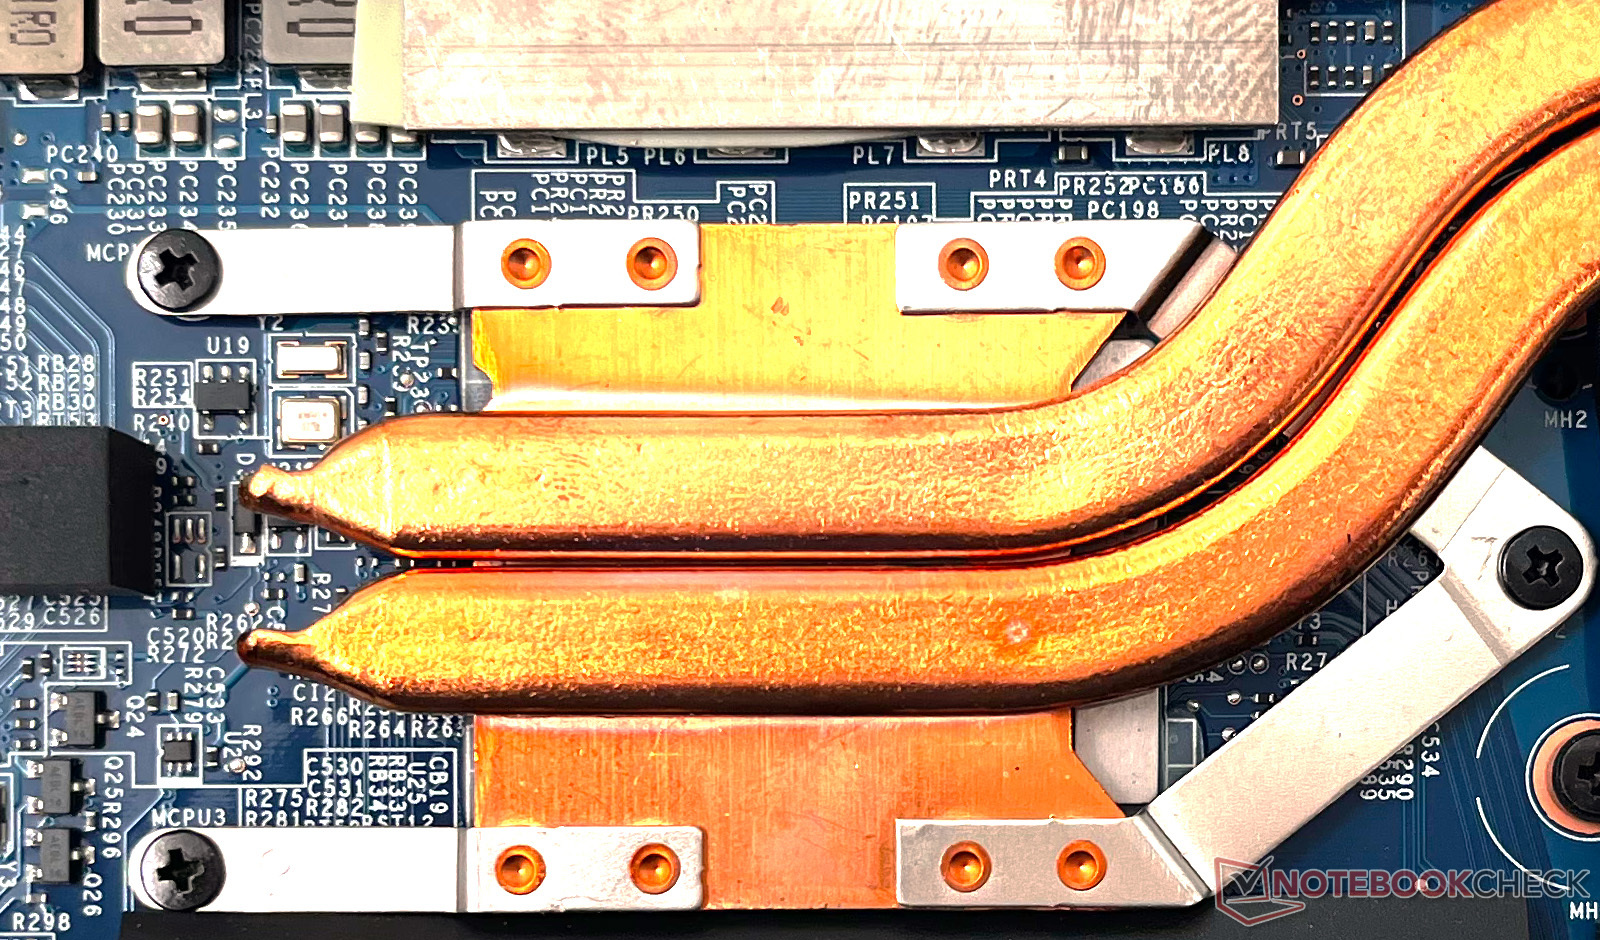
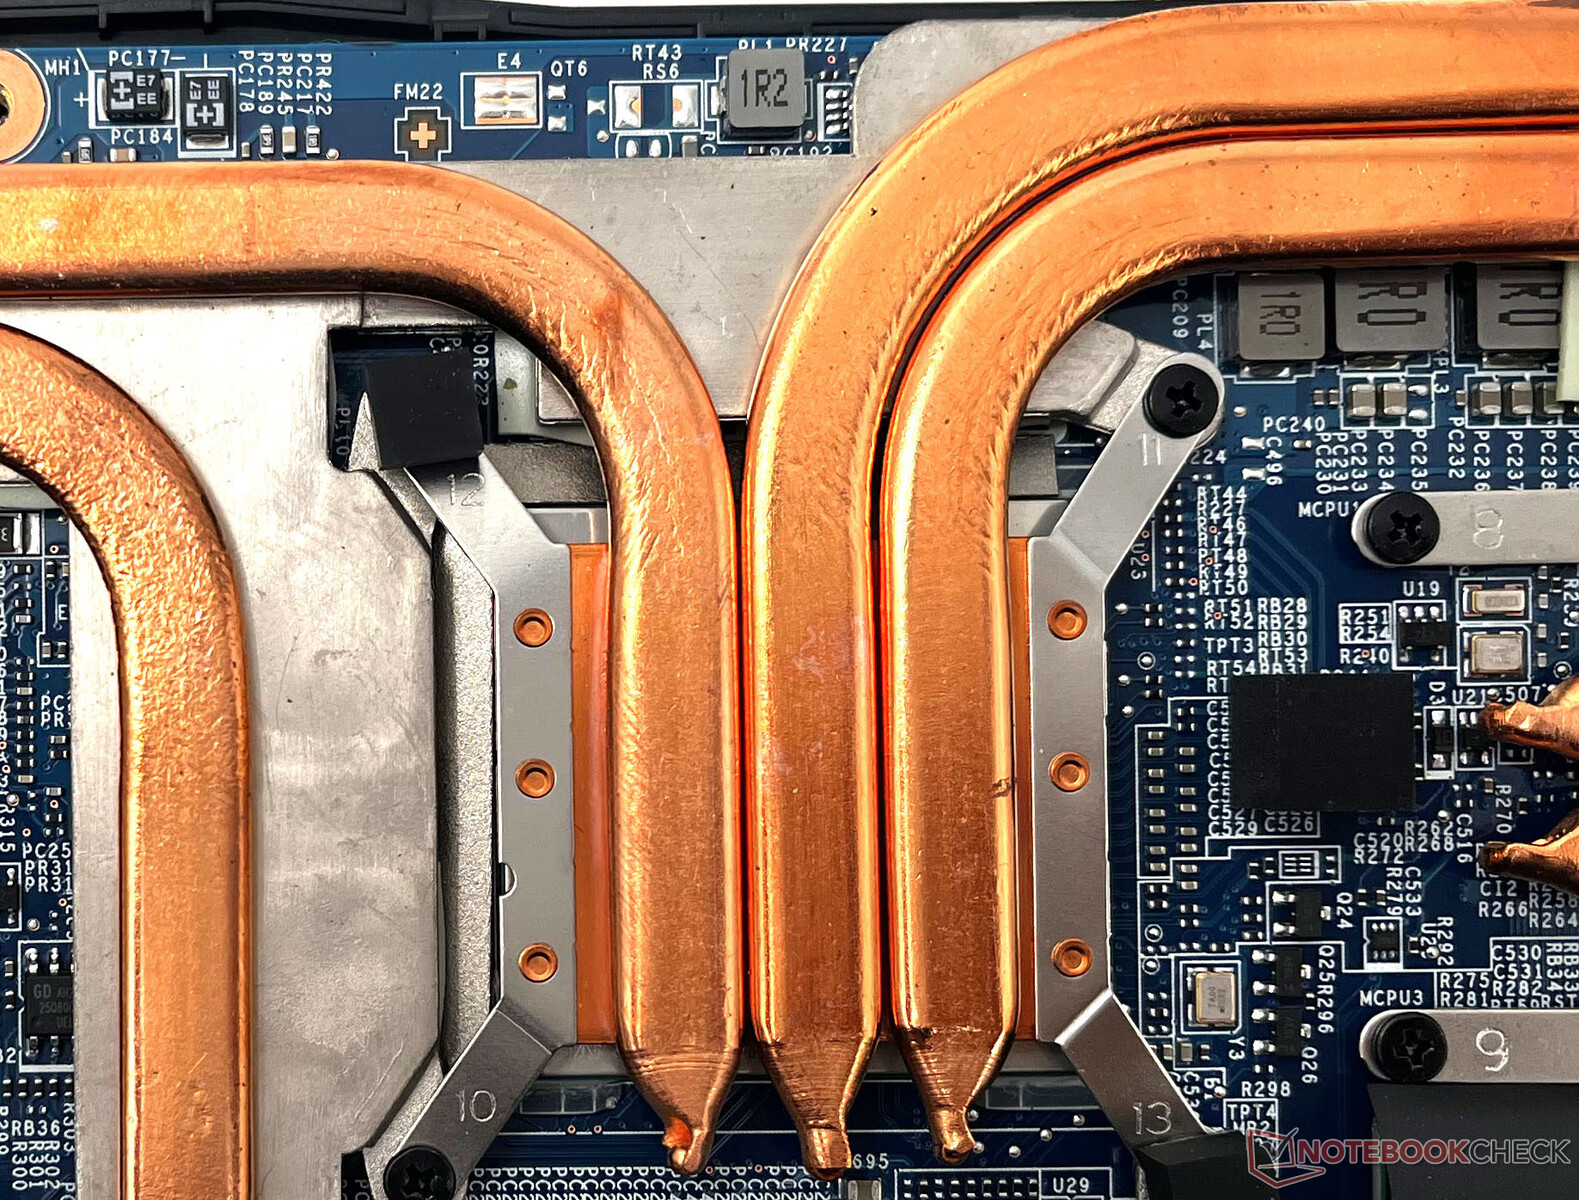
MSI's Cooler Boost 5 with two fans and six heatpipes ensures stable operating temperatures under different stress conditions. Surface temperatures under various loads are on expected lines for a gaming laptop. There is no blockage of fan exhausts due to the hinge, thus avoiding any heat accumulation.
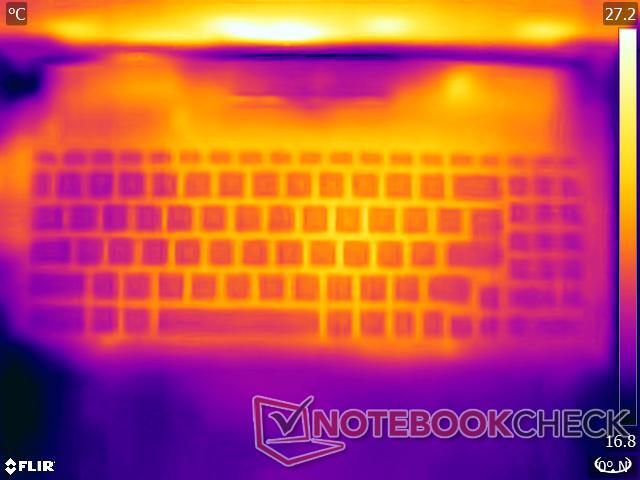
We find that the top of the device can get quite warm while the bottom palmrest and touchpad areas remain relatively cool under various stress conditions. Though the device does get quite warm under load, the considerable gap between the bottom panel and the internals ensures that temperatures for the most part are relatively tolerable. Nevertheless, we do not advise using the device on the lap when running heavy programs.
(±) The maximum temperature on the upper side is 44.4 °C / 112 F, compared to the average of 40.4 °C / 105 F, ranging from 21.2 to 68.8 °C for the class Gaming.
(-) The bottom heats up to a maximum of 48.6 °C / 119 F, compared to the average of 43.2 °C / 110 F
(+) In idle usage, the average temperature for the upper side is 29.2 °C / 85 F, compared to the device average of 33.9 °C / 93 F.
(±) Playing The Witcher 3, the average temperature for the upper side is 36.7 °C / 98 F, compared to the device average of 33.9 °C / 93 F.
(+) The palmrests and touchpad are cooler than skin temperature with a maximum of 27 °C / 80.6 F and are therefore cool to the touch.
(±) The average temperature of the palmrest area of similar devices was 28.8 °C / 83.8 F (+1.8 °C / 3.2 F).

| MSI Alpha 15 B5EEK-008 AMD Ryzen 7 5800H, AMD Radeon RX 6600M | MSI Katana GF66 11UG-220 Intel Core i7-11800H, NVIDIA GeForce RTX 3070 Laptop GPU | MSI Delta 15 A5EFK AMD Ryzen 9 5900HX, AMD Radeon RX 6700M | Asus ROG Strix G15 G513QY AMD Ryzen 9 5900HX, AMD Radeon RX 6800M | Lenovo Legion S7 15ACH6 82K80030GE AMD Ryzen 9 5900HX, NVIDIA GeForce RTX 3060 Laptop GPU | MSI GP66 Leopard 11UH-028 Intel Core i7-11800H, NVIDIA GeForce RTX 3080 Laptop GPU | Gigabyte Aero 15 OLED XD Intel Core i7-11800H, NVIDIA GeForce RTX 3070 Laptop GPU | |
|---|---|---|---|---|---|---|---|
| Heat | -7% | -5% | 6% | 0% | -2% | -8% | |
| Maximum Upper Side * (°C) | 44.4 | 56 -26% | 50 -13% | 38.9 12% | 49 -10% | 49 -10% | 45 -1% |
| Maximum Bottom * (°C) | 48.6 | 49 -1% | 55 -13% | 34.6 29% | 50 -3% | 47 3% | 54 -11% |
| Idle Upper Side * (°C) | 31.2 | 36 -15% | 31 1% | 34.4 -10% | 29 7% | 31 1% | 34 -9% |
| Idle Bottom * (°C) | 32.2 | 28 13% | 30 7% | 34.4 -7% | 30 7% | 33 -2% | 36 -12% |
* ... smaller is better
Stress Test
Stressing the Alpha 15 reveals several insights into the performance of the CPU and the GPU and the overall effectiveness of the cooling system as well.
In idle, the discrete RX 6600M does not register any clock, though the average GPU temperature is still quite warm at 41.3 °C. Since we are testing in the Extreme Performance profile, the clocks in idle are around the 3.2 GHz mark while the average CPU core temperatures are at 35.8 °C.
Prime95 Stress

When stressed with Prime95 alone, we find the average core clocks largely lying between the 3.5 GHz and 4 GHz mark. We do see that increase in CPU core temperatures has an inversely proportional effect on the CPU clocks as well.
The CPU attains a package power close to 70 W during this run leading to temperatures that touch 90 °C. The total graphics power (TGP) of the RX 6600M remains below 10 W resulting in temperatures around the 55 °C mark.
Prime95+FurMark Stress
In a combined stress with both Prime95 and FurMark, we see that the RX 6600M is, interestingly, not stressed enough. While CPU clocks stabilize just above 3.5 GHz, the GPU is only able to attain about 1,000 MHz while operating at just 30 W TGP.
As a result, the Ryzen 7 5800H's temperatures hover between the 85 °C and 90 °C mark while the RX6600M remains relatively stable at 70 °C. It could be that the Radeon Adrenalin driver is limiting GPU power and clocks upon detecting FurMark. This has been the norm since many years now even with Catalyst drivers from over a decade ago.
The Witcher 3 Stress

The Witcher 3 at 1080p Ultra, therefore, is a more real-world representation of how GPU metrics can change under stress. Here, we see that the RX 6600M more or less maxes out the clocks at 2,057 MHz while operating close to 80 W TGP.
The RX 6600M is actually a 100 W TGP card, but we find the hotspot temperature already reaching the 90 °C at 80 W. Given the fact that the RX 6600M is already able to attain close to its maximum boost by now, it is likely that MSI could have chosen to limit the RX 6600M's TGP at 80 W to keep temperatures in check.


| Stress Test | CPU Clock (GHz) | GPU Clock (MHz) | Average CPU Temperature (°C) | Average GPU Temperature (°C) |
| System Idle | 3.2 | 400 (RX Vega 8) 0 (RX 6600M) |
37.2 | 37.5 (RX Vega 8) 41.3 (RX 6600M) |
| Prime95 | 3.07 | 200 (RX Vega 8) 20 (RX 6600M) |
62 | 59.2 (RX Vega 8) 48.3 (RX 6600M) |
| Prime95 + FurMark | 3.62 | 200 (RX Vega 8) 868 (RX 6600M) |
77.6 | 72.9 (RX Vega 8) 66 (RX 6600M) |
| The Witcher 3 | 3.17 | 400 (RX Vega 8) 2,059 (RX 6600M) |
68.3 | 64.5 (RX Vega 8) 69.7 (RX 6600M) |
Speakers

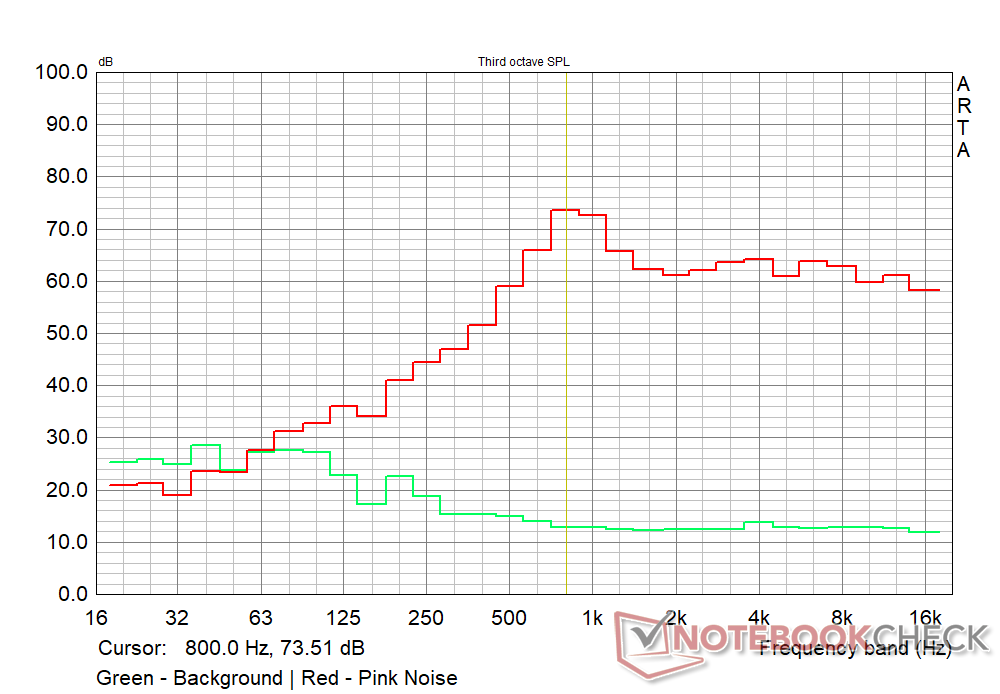
The MSI Alpha 15 is equipped with a pair of bottom-firing stereo speakers. The speakers seem quite small for a chassis this big, and their loudness is just about serviceable at 78 db(A).
The small size means there is not enough room for the passive radiators to properly reproduce low frequencies. As a result, the bass is virtually non-existent. However, the mids and highs are quite good. There was no perceivable distortion at high volumes.
As is standard for MSI laptops, the Alpha 15 too offers the Nahimic app for additional audio customization. We recommend using a proper gaming headset for a better aural experience.
MSI Alpha 15 B5EEK-008 audio analysis
(±) | speaker loudness is average but good (78 dB)
Bass 100 - 315 Hz
(-) | nearly no bass - on average 21.8% lower than median
(+) | bass is linear (6.8% delta to prev. frequency)
Mids 400 - 2000 Hz
(±) | higher mids - on average 5.8% higher than median
(±) | linearity of mids is average (10.1% delta to prev. frequency)
Highs 2 - 16 kHz
(+) | balanced highs - only 1.8% away from median
(+) | highs are linear (3.9% delta to prev. frequency)
Overall 100 - 16.000 Hz
(±) | linearity of overall sound is average (19.2% difference to median)
Compared to same class
» 65% of all tested devices in this class were better, 7% similar, 28% worse
» The best had a delta of 6%, average was 18%, worst was 132%
Compared to all devices tested
» 46% of all tested devices were better, 7% similar, 47% worse
» The best had a delta of 4%, average was 24%, worst was 134%
Apple MacBook 12 (Early 2016) 1.1 GHz audio analysis
(+) | speakers can play relatively loud (83.6 dB)
Bass 100 - 315 Hz
(±) | reduced bass - on average 11.3% lower than median
(±) | linearity of bass is average (14.2% delta to prev. frequency)
Mids 400 - 2000 Hz
(+) | balanced mids - only 2.4% away from median
(+) | mids are linear (5.5% delta to prev. frequency)
Highs 2 - 16 kHz
(+) | balanced highs - only 2% away from median
(+) | highs are linear (4.5% delta to prev. frequency)
Overall 100 - 16.000 Hz
(+) | overall sound is linear (10.2% difference to median)
Compared to same class
» 7% of all tested devices in this class were better, 2% similar, 91% worse
» The best had a delta of 5%, average was 18%, worst was 53%
Compared to all devices tested
» 5% of all tested devices were better, 1% similar, 94% worse
» The best had a delta of 4%, average was 24%, worst was 134%
Energy Management: Ryzen 7 5800H and RX 6600M don't guzzle much power
Power Consumption
The Alpha 15's overall power consumption seems to be quite economical for a device of its class. We find the Schenker XMG Apex 15 with a Ryzen 7 5800H and a 130 W RTX 3060 to be about 29% less economical while the Asus TUF Gaming F15 with a Core i7-11800H and 95 W RTX 3060 trails by 23%. The Alpha 15's closest cousin, the Delta 15, is significantly more power hungry — its power consumption is even higher than that of the Asus ROG Strix G15, which is powered by a Ryzen 9 5900HX and a Radeon RX 6800M.
| Off / Standby | |
| Idle | |
| Load |
|
Key:
min: | |
| MSI Alpha 15 B5EEK-008 R7 5800H, Radeon RX 6600M, IPS, 1920x1080, 15.6" | MSI Katana GF66 11UG-220 i7-11800H, GeForce RTX 3070 Laptop GPU, IPS, 1920x1080, 15.6" | MSI Delta 15 A5EFK R9 5900HX, Radeon RX 6700M, IPS-Level, 1920x1080, 15.6" | Schenker XMG Apex 15 NH57E PS R7 5800H, GeForce RTX 3060 Laptop GPU, IPS, 1920x1080, 15.6" | Asus ROG Strix G15 G513QY R9 5900HX, Radeon RX 6800M, IPS, 1920x1080, 15.6" | MSI GP66 Leopard 11UH-028 i7-11800H, GeForce RTX 3080 Laptop GPU, IPS, 1920x1080, 15.6" | Asus TUF Gaming F15 FX506HM i7-11800H, GeForce RTX 3060 Laptop GPU, IPS, 1920x1080, 15.6" | Average AMD Radeon RX 6600M | Average of class Gaming | |
|---|---|---|---|---|---|---|---|---|---|
| Power Consumption | -17% | -44% | -29% | -37% | -43% | -23% | -42% | -59% | |
| Idle Minimum * (Watt) | 9.1 | 8 12% | 10 -10% | 10.5 -15% | 12.1 -33% | 13 -43% | 9.5 -4% | 13.7 ? -51% | 13.2 ? -45% |
| Idle Average * (Watt) | 14.61 | 12 18% | 18 -23% | 15 -3% | 13 11% | 17 -16% | 12.1 17% | 16.6 ? -14% | 18.9 ? -29% |
| Idle Maximum * (Watt) | 15.05 | 22 -46% | 25 -66% | 17 -13% | 14.7 2% | 18 -20% | 22.5 -50% | 19.1 ? -27% | 24.3 ? -61% |
| Load Average * (Watt) | 77.8 | 98 -26% | 101 -30% | 109 -40% | 90.3 -16% | 96 -23% | 99.5 -28% | 114.4 ? -47% | 108 ? -39% |
| Witcher 3 ultra * (Watt) | 131 | 152 -16% | 187 -43% | 186 -42% | 200 -53% | 207 -58% | 157 -20% | ||
| Load Maximum * (Watt) | 114.42 | 162 -42% | 217 -90% | 186 -63% | 263.4 -130% | 223 -95% | 173.5 -52% | 197.8 ? -73% | 254 ? -122% |
* ... smaller is better
Interestingly, we found that Prime95 stress results in a gradual decrease of power consumption. If stressed with Prime95 alone, it takes about 2.5 minutes before we see the decline. Adding FurMark reduces this window to about 1.5 minutes before we observe reduction in power consumption.
We can only speculate as to what the reason could be, but we suspect this has to do something with AMD SmartShift having a higher GPU bias as was observed in our stress test above.
Power Consumption - The Witcher 3 / Stress test
Power Consumption - External Monitor
Battery Life
Battery life is not generally the forte of most gaming laptops, and the MSI Alpha 15 is no different. We used the Balanced profile while evaluating battery run times. In our standardized Wi-Fi browsing test at a brightness of 150 cd/m2, the Alpha 15's 90 Whr battery manages a run time close to 8 hours and 45 minutes, which may not seem like much but is definitely better than most of its competition.
Gaming on battery does not seem to be a good idea on the Alpha 15 as the backup was just short of two hours with The Witcher 3 at 1080p Ultra at 150 cd/m2. Video playback run times come close to the 10 hours promise of the AMD Advantage program but short of the 13-hour claim by MSI.
We recommend using the Silent or Super Battery profiles when disconnected from AC power to get the maximum possible battery life.
| MSI Alpha 15 B5EEK-008 R7 5800H, Radeon RX 6600M, 90 Wh | MSI Katana GF66 11UG-220 i7-11800H, GeForce RTX 3070 Laptop GPU, 90 Wh | MSI Delta 15 A5EFK R9 5900HX, Radeon RX 6700M, 82 Wh | Schenker XMG Apex 15 NH57E PS R7 5800H, GeForce RTX 3060 Laptop GPU, 49 Wh | Asus ROG Strix G15 G513QY R9 5900HX, Radeon RX 6800M, 90 Wh | MSI GP66 Leopard 11UH-028 i7-11800H, GeForce RTX 3080 Laptop GPU, 65 Wh | Asus TUF Gaming F15 FX506HM i7-11800H, GeForce RTX 3060 Laptop GPU, 90 Wh | Average of class Gaming | |
|---|---|---|---|---|---|---|---|---|
| Battery runtime | -28% | -4% | -28% | 30% | -50% | 4% | -17% | |
| Reader / Idle (h) | 12.3 | 9.1 -26% | 11.1 -10% | 16.1 31% | 11 -11% | 8.71 ? -29% | ||
| H.264 (h) | 9.8 | 4.6 -53% | 3.5 -64% | 8.26 ? -16% | ||||
| WiFi v1.3 (h) | 8.7 | 5.3 -39% | 7.9 -9% | 6.5 -25% | 9.2 6% | 3.6 -59% | 7.9 -9% | 7.02 ? -19% |
| Witcher 3 ultra (h) | 1.9 | 0.8 -58% | ||||||
| Load (h) | 1.5 | 1.2 -20% | 1.6 7% | 1.4 -7% | 2.3 53% | 1.2 -20% | 2 33% | 1.47 ? -2% |
Pros
Cons
Verdict: Advantage for both AMD and the user
The MSI Alpha 15 aims to offer quite the holistic package for mainstream 1080p gamers, and it largely succeeds in this endeavor. While the case isn't a premium offering, it is sturdy-enough for daily use given that this laptop is more of a desk machine than a thin and light gaming notebook. MSI has ensured that all necessary ports are available including an Ethernet port. The laptop is easy to maintain and upgrade.
While the plastic construction can be overlooked, we found that MSI also had to compromise on the display front. Sure, the panel offers excellent response times and does not show any PWM. However, it is quite dated and the brightness levels and color characteristics aren't that enticing. Competing laptops, such as the MSI Delta 15, Schenker XMG Apex 15, and the Asus ROG Strix G15, offer better panels if higher color gamut coverage is a concern. The Lenovo Legion S7 even offers a 4K panel albeit at a significantly higher markup.
The MSI Alpha 15 is a great showcase for the AMD Advantage program and for the Radeon RX 6600M with few inevitable compromises. The Alpha 15 definitely merits a high consideration if you are on the lookout for a capable Intel/Nvidia alternative for competitive 1080p gaming."
MSI does not hinder the Ryzen 7 5800H's performance in any way. You can choose between several performance modes depending on the workload and your tolerance of fan noise levels. We did not face any issues with our gamut of games tested, but we did observe that the RX 6600M may not fully attain the 100 W TGP limit. Nevertheless, this does not hamper clocks or performance much.
While the RX 6600M is a good RTX 3060 competitor, higher wattages of the latter will have a performance edge. Besides, Nvidia currently has the upper hand with DLSS and ray tracing while game developers have only begun warming up to AMD FSR. Power consumption and battery life seem much better than the competition, though gaming on battery isn't quite as rewarding as we'd like.
Overall, the Alpha 15 seems to be doing a lot of justice to the ₹1,06,990 (US$1,436) price tag. With AMD announcing further expansion of the AMD Advantage program at CES 2022 with new features and more partner devices, we hope to see even more such devices that guarantee a certain performance metric for the given configuration.
Price and Availability
MSI does not specifically list any Indian retailers on its website. The Alpha 15 B5EEK configuration we have reviewed is available across several retailers and e-tailers in India including Amazon India and Flipkart. Buyers in the US can find the laptop on Newegg presently retailing at US$1,599.99.
MSI Alpha 15 B5EEK-008
- 01/08/2022 v7 (old)
Vaidyanathan Subramaniam
Price comparison
