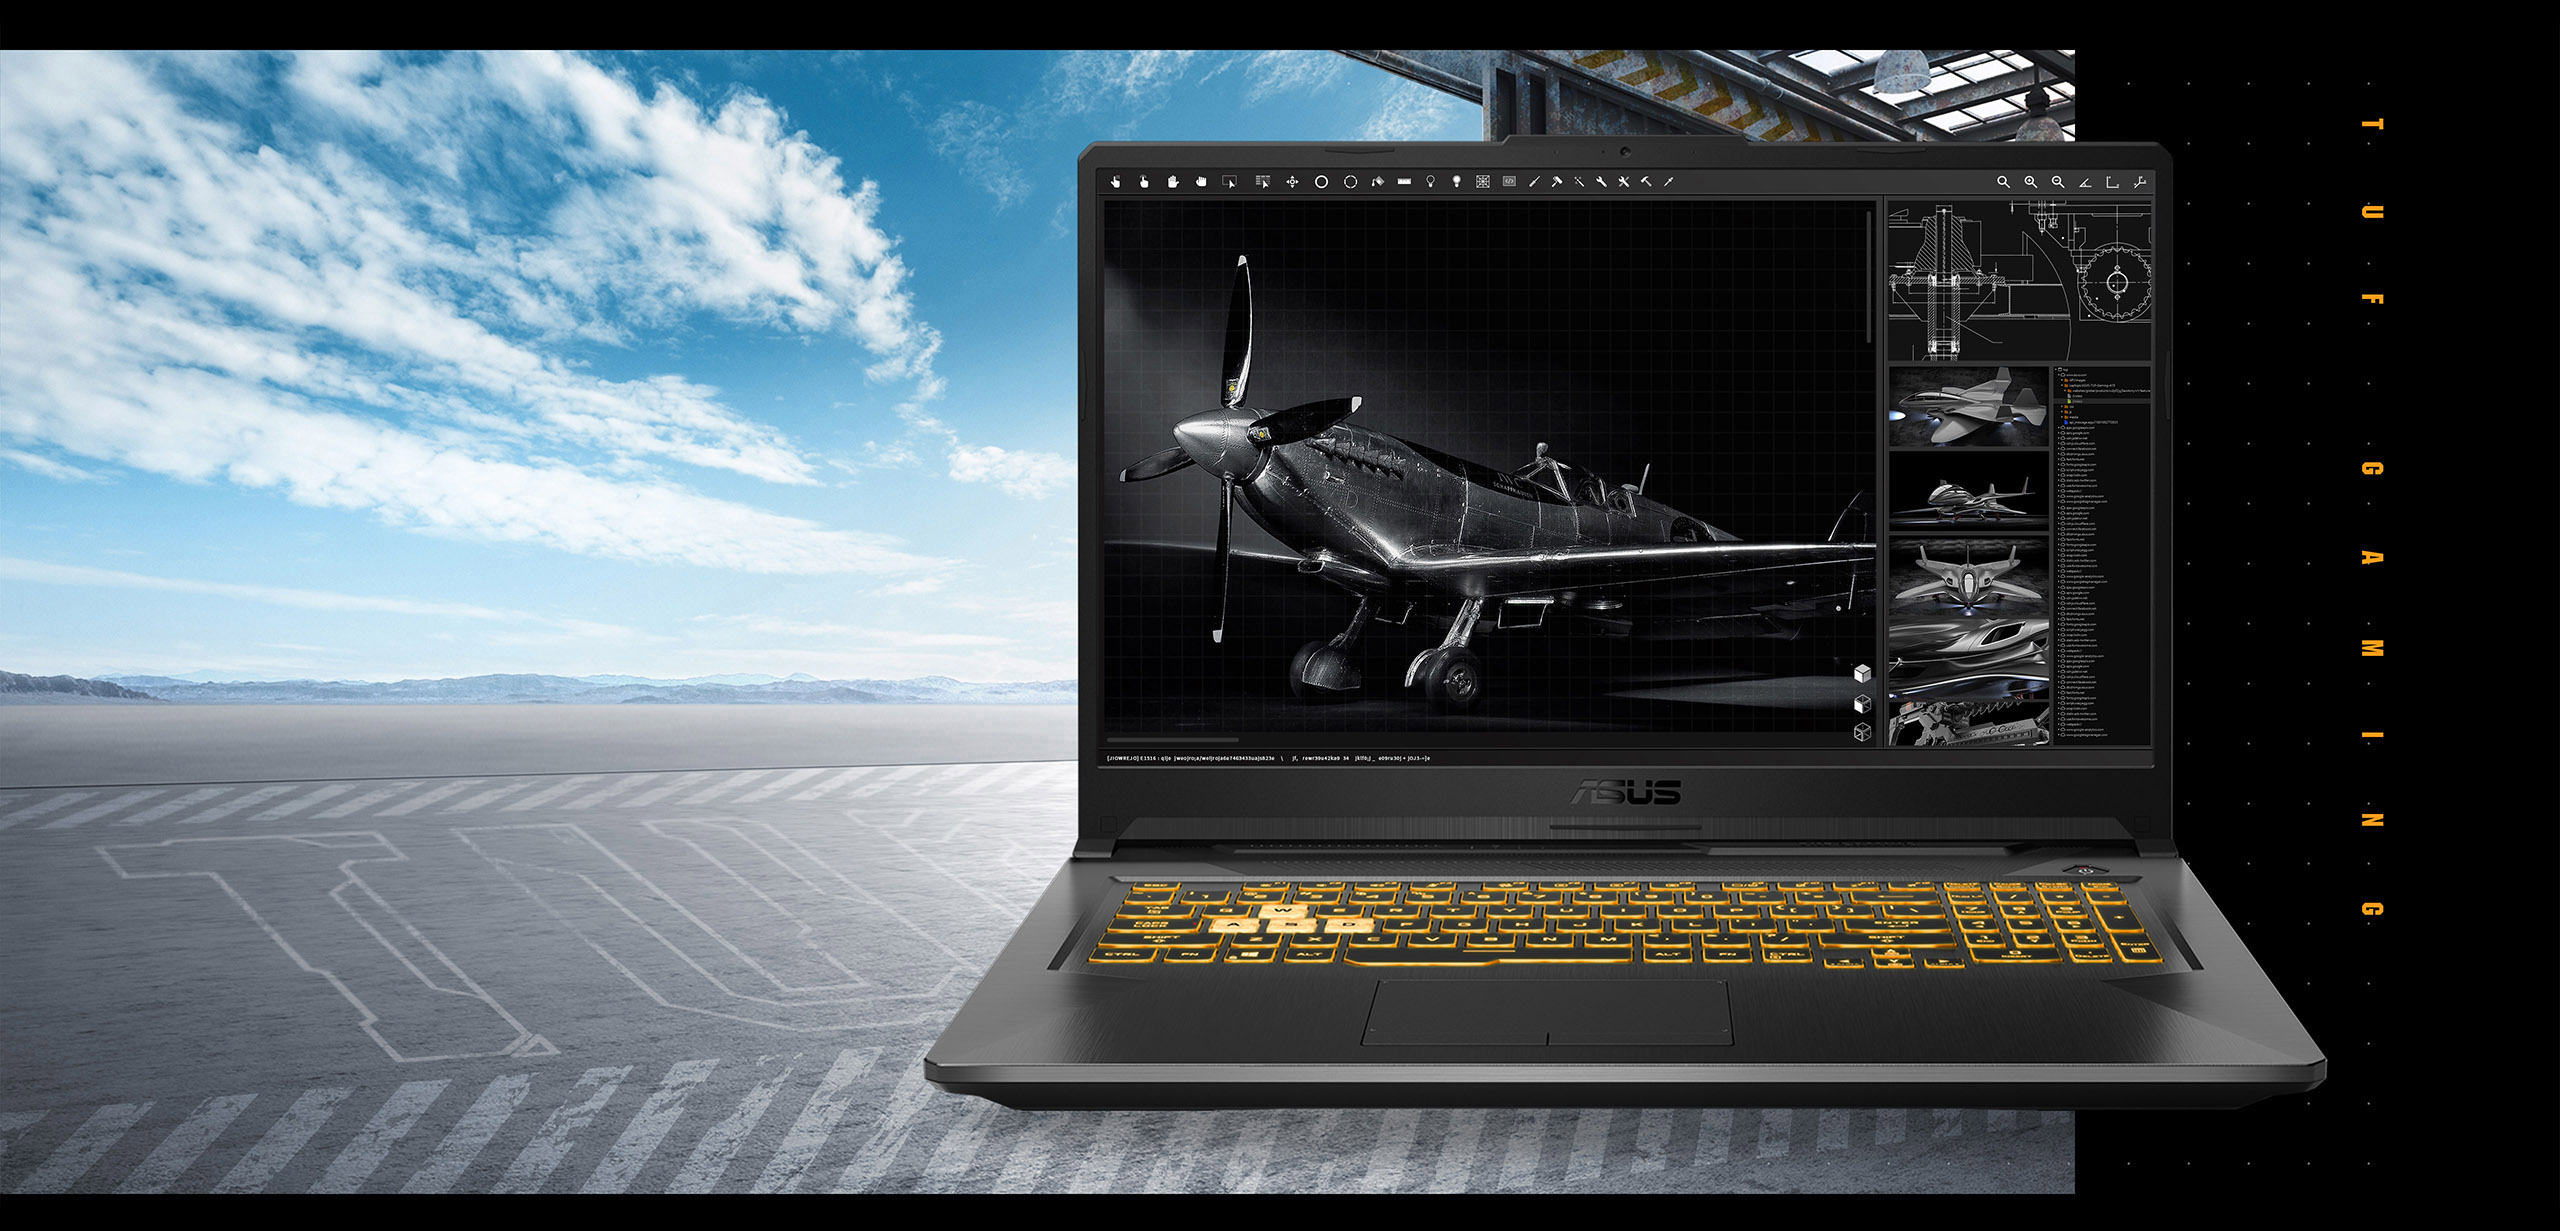
Asus TUF Gaming F17 laptop review: Good gaming device with RTX 3060 but average display despite 144 Hz
Asus has sent us its new, affordable TUF gaming laptop with a Tiger Lake processor and an RTX 3060. Last year, we reviewed the the TUF A17, a model from the previous series equipped with a Ryzen 7 and a GTX 1660 Ti. The new model should be much faster, at least in graphics applications and games, although the total TGP of 95 watts is rather in the middle to lower performance range of an RTX 3060. The display now supports 144 Hz instead of the former 120 Hz.
Besides the virtual predecessor, we naturally also want to compare it with the competition found in the same price segment. This primarily includes the Schenker XMG Core 17, but also the MSI Alpha 17 and, for lack of further 17-inch competition, the MSI GF65 Thin and the Acer Nitro 5 AN515-55 15-inch rivals.
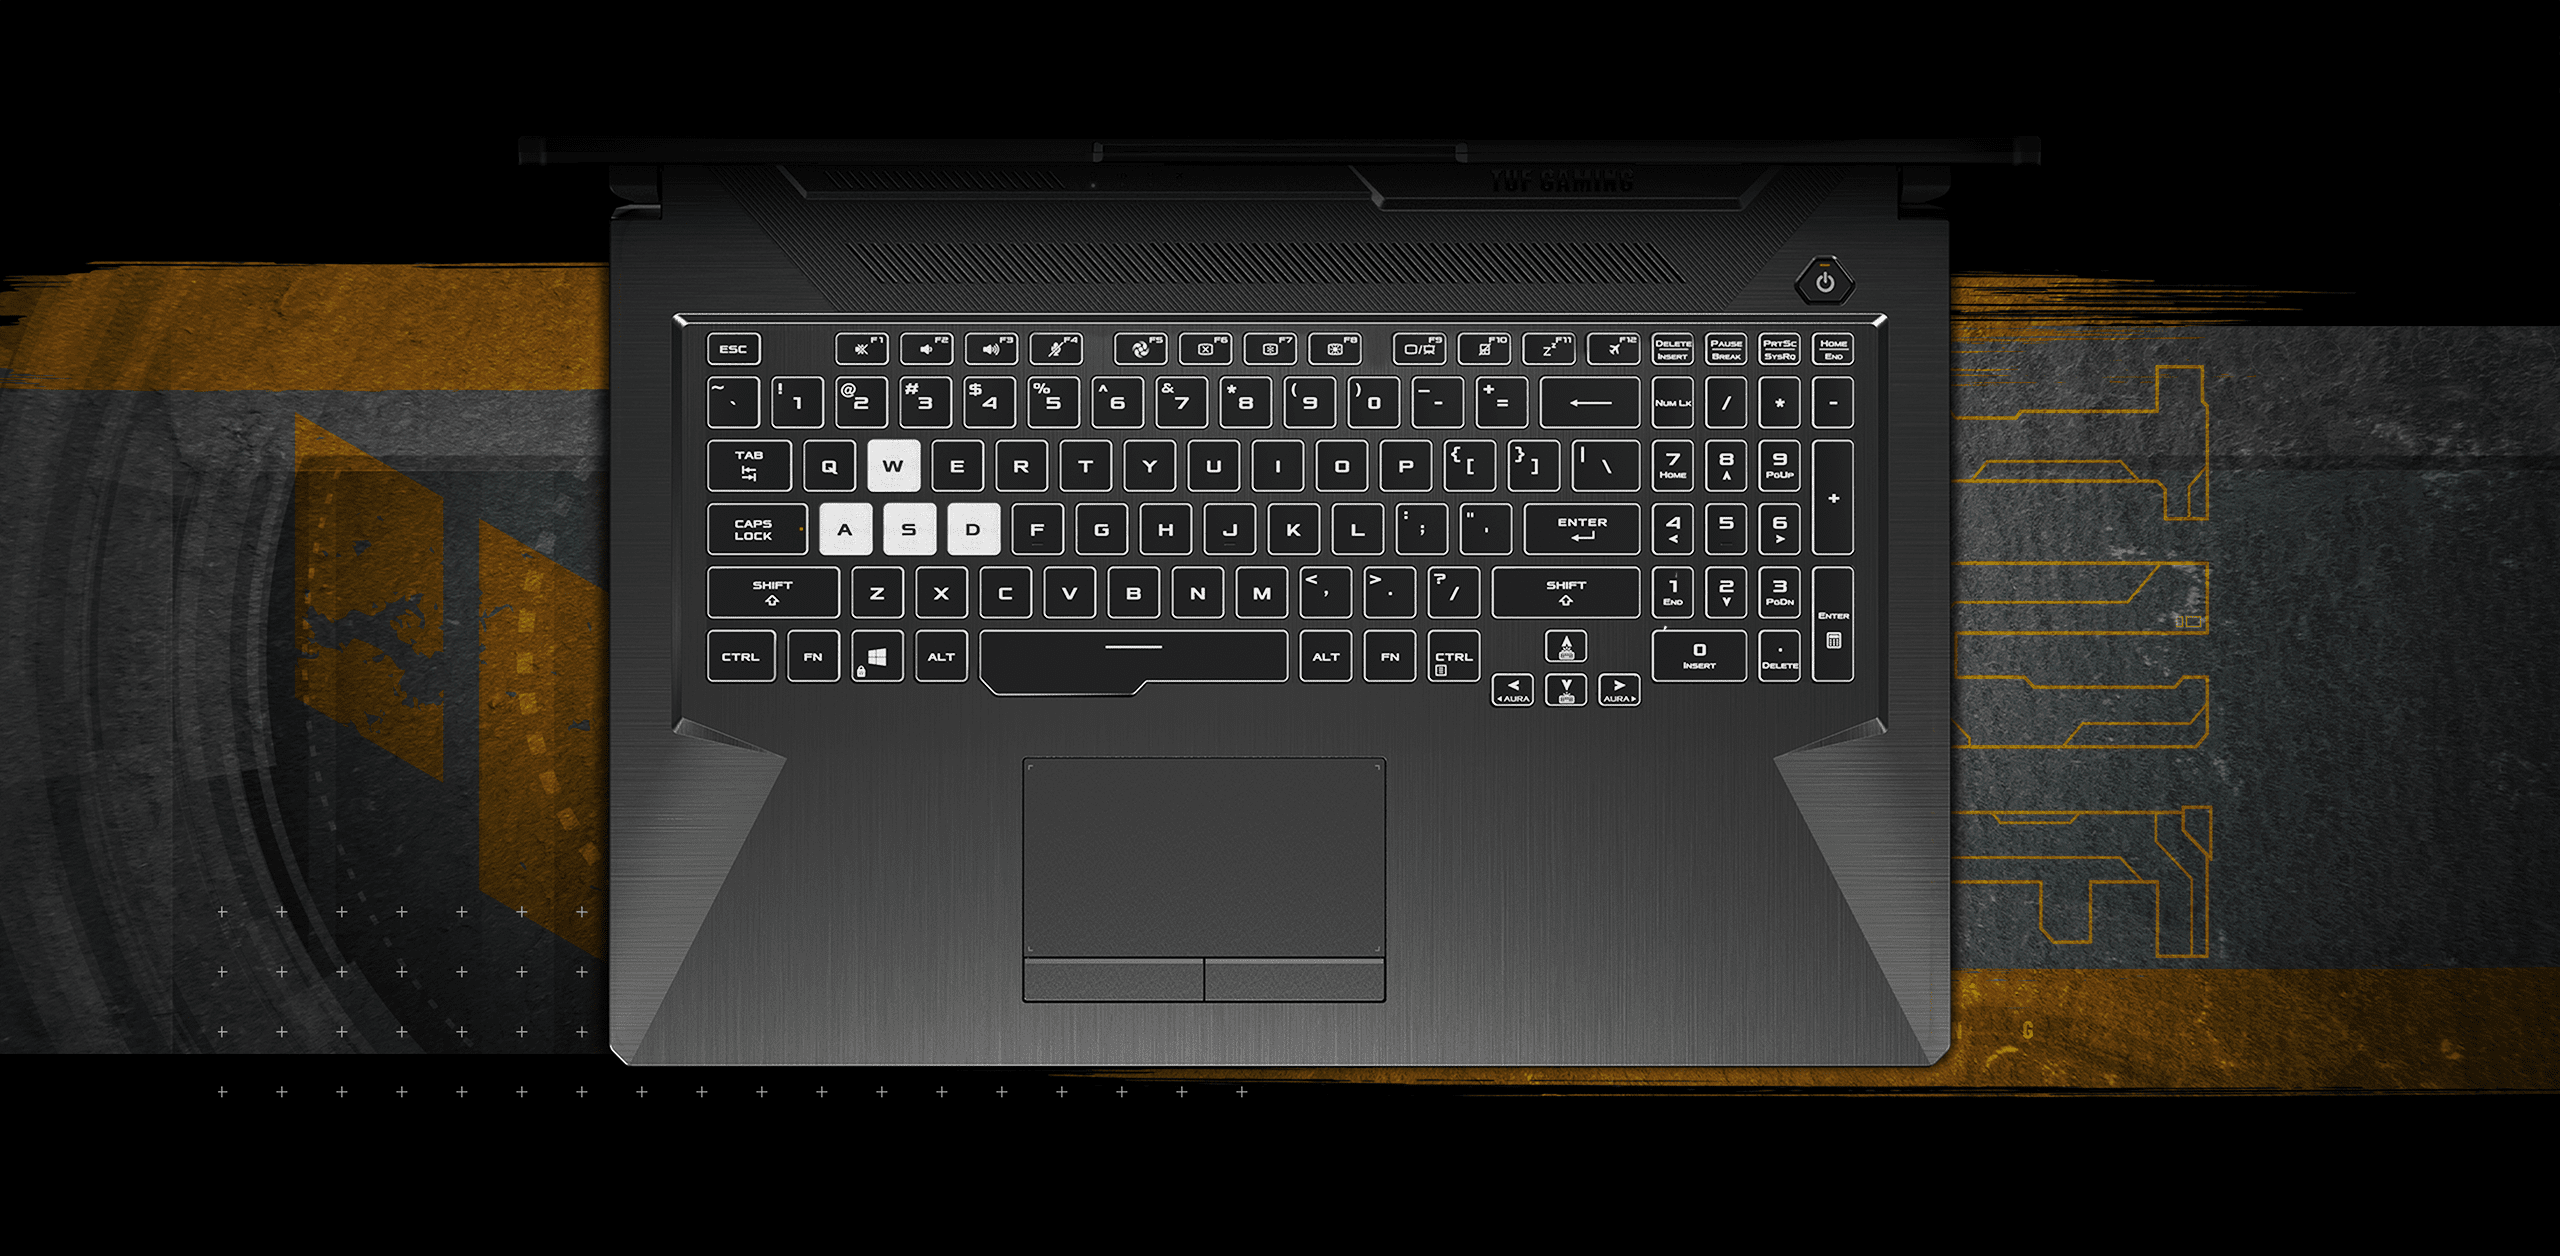
Since the exterior remains the same, we won't go into details regarding the case, maintenance, input devices, etc., as long as there are no changes. This information can be found in the review of the review of the Asus TUF A17.
Possible contenders in comparison
Rating | Date | Model | Weight | Height | Size | Resolution | Price |
|---|---|---|---|---|---|---|---|
| 82.8 % v7 (old) | 06 / 2021 | Asus TUF Gaming F17 FX706HM i9-11900H, GeForce RTX 3060 Laptop GPU | 2.7 kg | 26 mm | 17.30" | 1920x1080 | |
| 82.9 % v7 (old) | 05 / 2020 | Asus TUF A17 FA706IU-AS76 R7 4800H, GeForce GTX 1660 Ti Mobile | 2.6 kg | 26 mm | 17.30" | 1920x1080 | |
| 83.9 % v7 (old) | 06 / 2021 | Schenker XMG Core 17 (Early 2021) i7-10870H, GeForce RTX 3060 Laptop GPU | 2.5 kg | 30.05 mm | 17.30" | 2560x1440 | |
| 83.3 % v7 (old) | 02 / 2021 | MSI Alpha 17 A4DEK R7 4800H, Radeon RX 5600M | 2.6 kg | 28 mm | 17.30" | 1920x1080 | |
| 80.4 % v7 (old) | 03 / 2021 | MSI GF65 Thin 10UE i7-10750H, GeForce RTX 3060 Laptop GPU | 1.9 kg | 21.7 mm | 15.60" | 1920x1080 | |
| 80.5 % v7 (old) | 05 / 2021 | Acer Aspire Nitro 5 AN515-55-57GF i5-10300H, GeForce RTX 3060 Laptop GPU | 2.3 kg | 23.9 mm | 15.60" | 1920x1080 |
Case - Smaller and with more metal
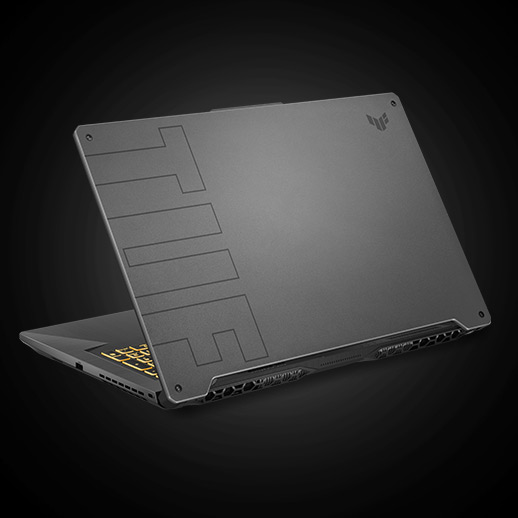


The MSI Alpha is slightly deeper and thicker, while the Schenker XMG is thicker but smaller overall. Our F17 is just about the heaviest device in comparison.
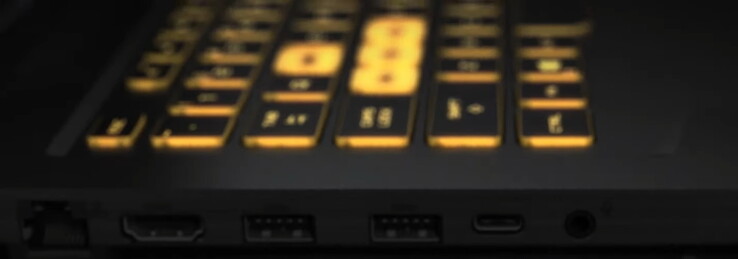
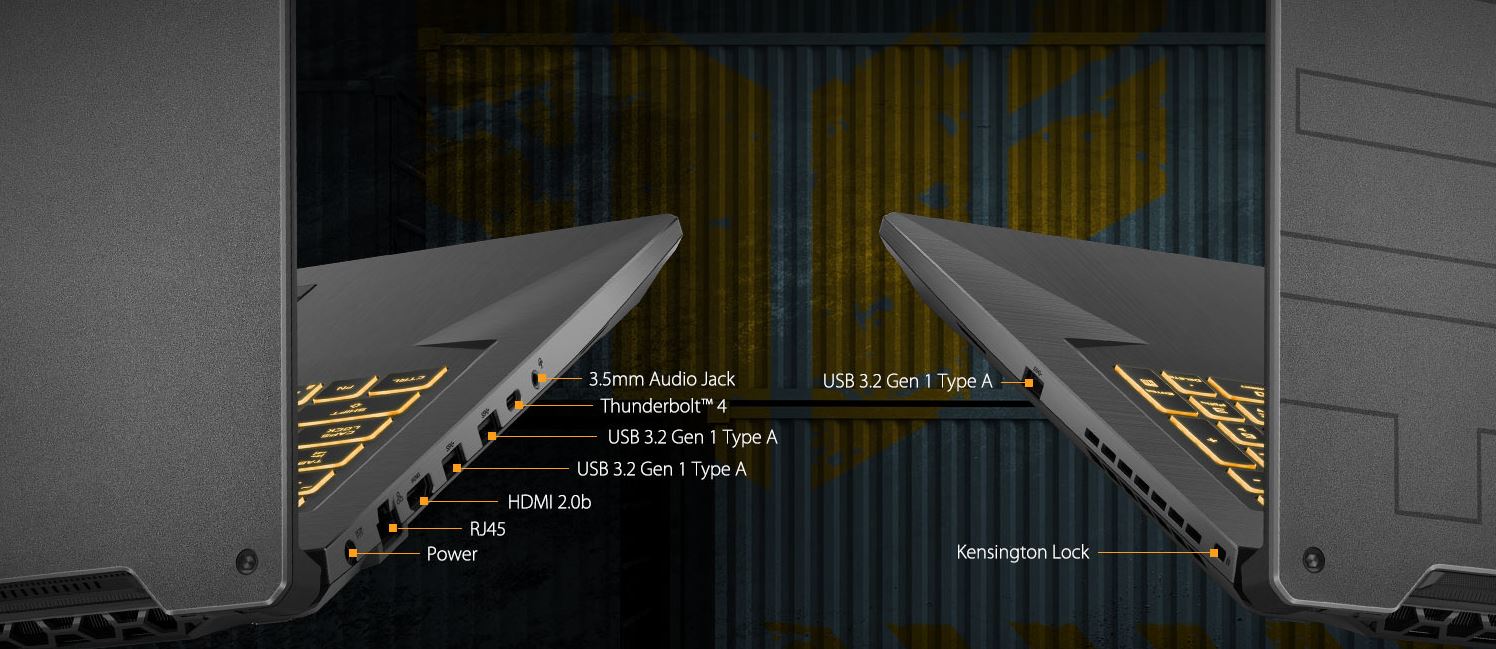
Connectivity - Thunderbolt 4
It's great that the F17 has now integrated Thunderbolt 4. The remaining ports are the standard ones, and their distribution is heavily concentrated on the left side, which is very convenient for right-handed users. There are no ports at the front or back. A missing feature is the SD card reader.
Communication
In terms of Bluetooth, the F17 offers the latest Bluetooth 5.2, but the Asus device lags behind in terms of Wi-Fi transfer speeds. The speed for receiving data in particular is below average; the A17 didn't score particularly well in this regard either, and the competition is faster.
Webcam


Security
A slot for a Kensington lock is available, and TPM 2.0 is supported as well.
Accessories
Except for the usual leaflets, the only extra is an A5-sized sheet of paper with TUF gaming stickers on it.
Warranty
The manufacturer provides a standard one-year warranty.
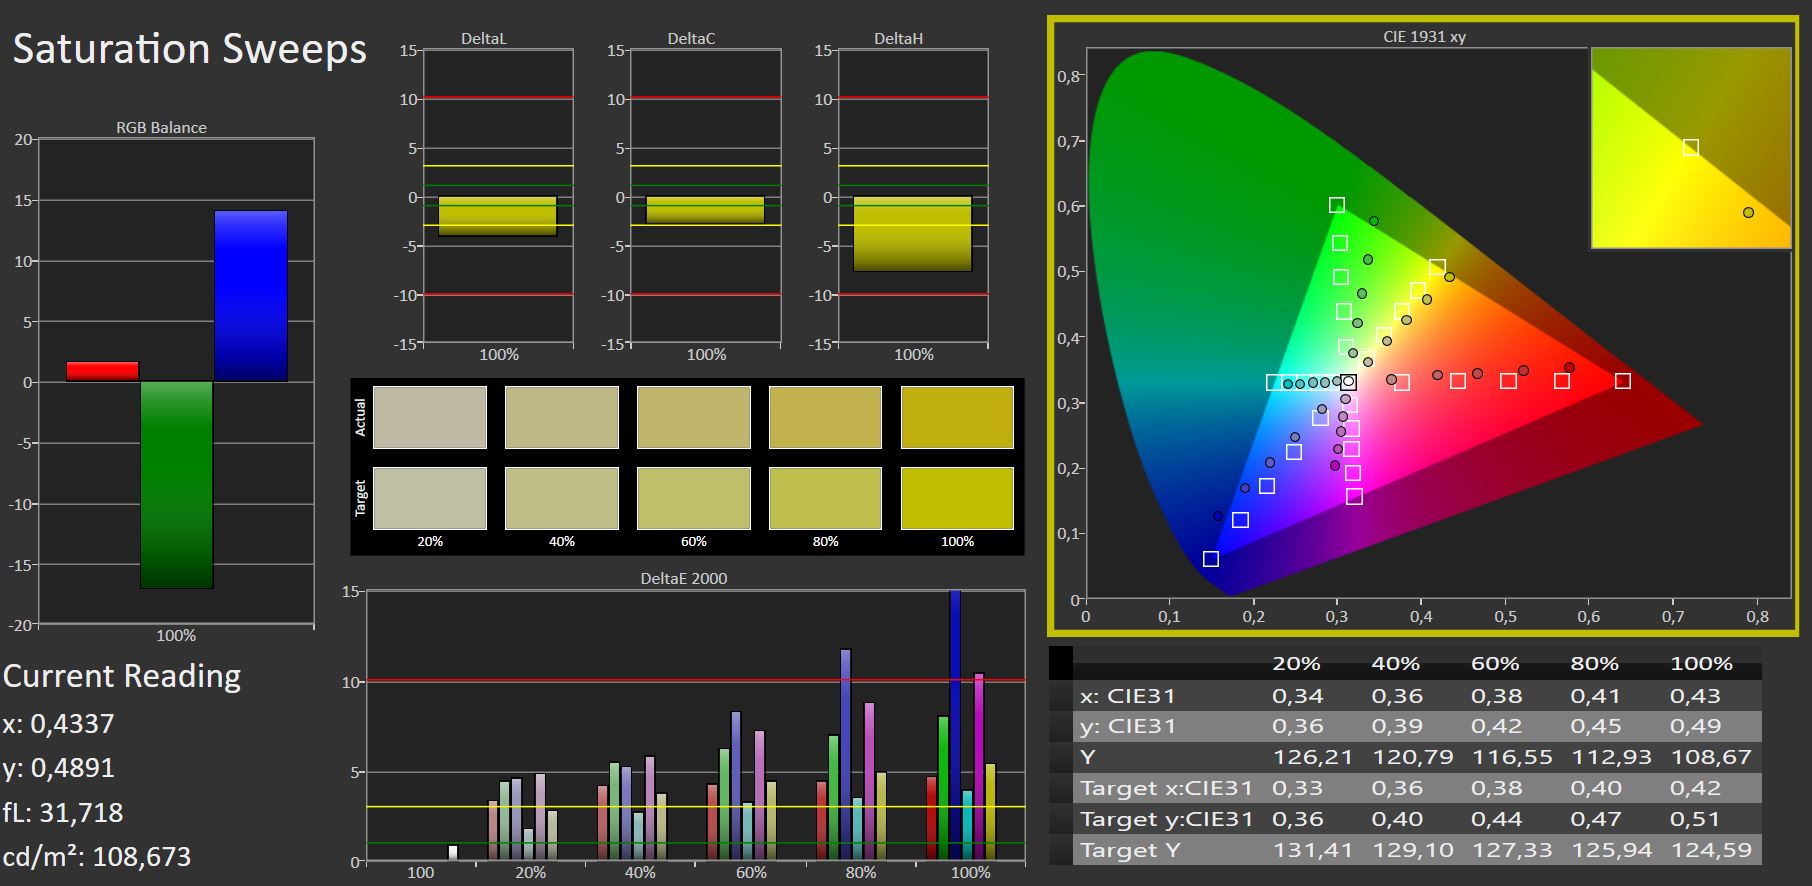
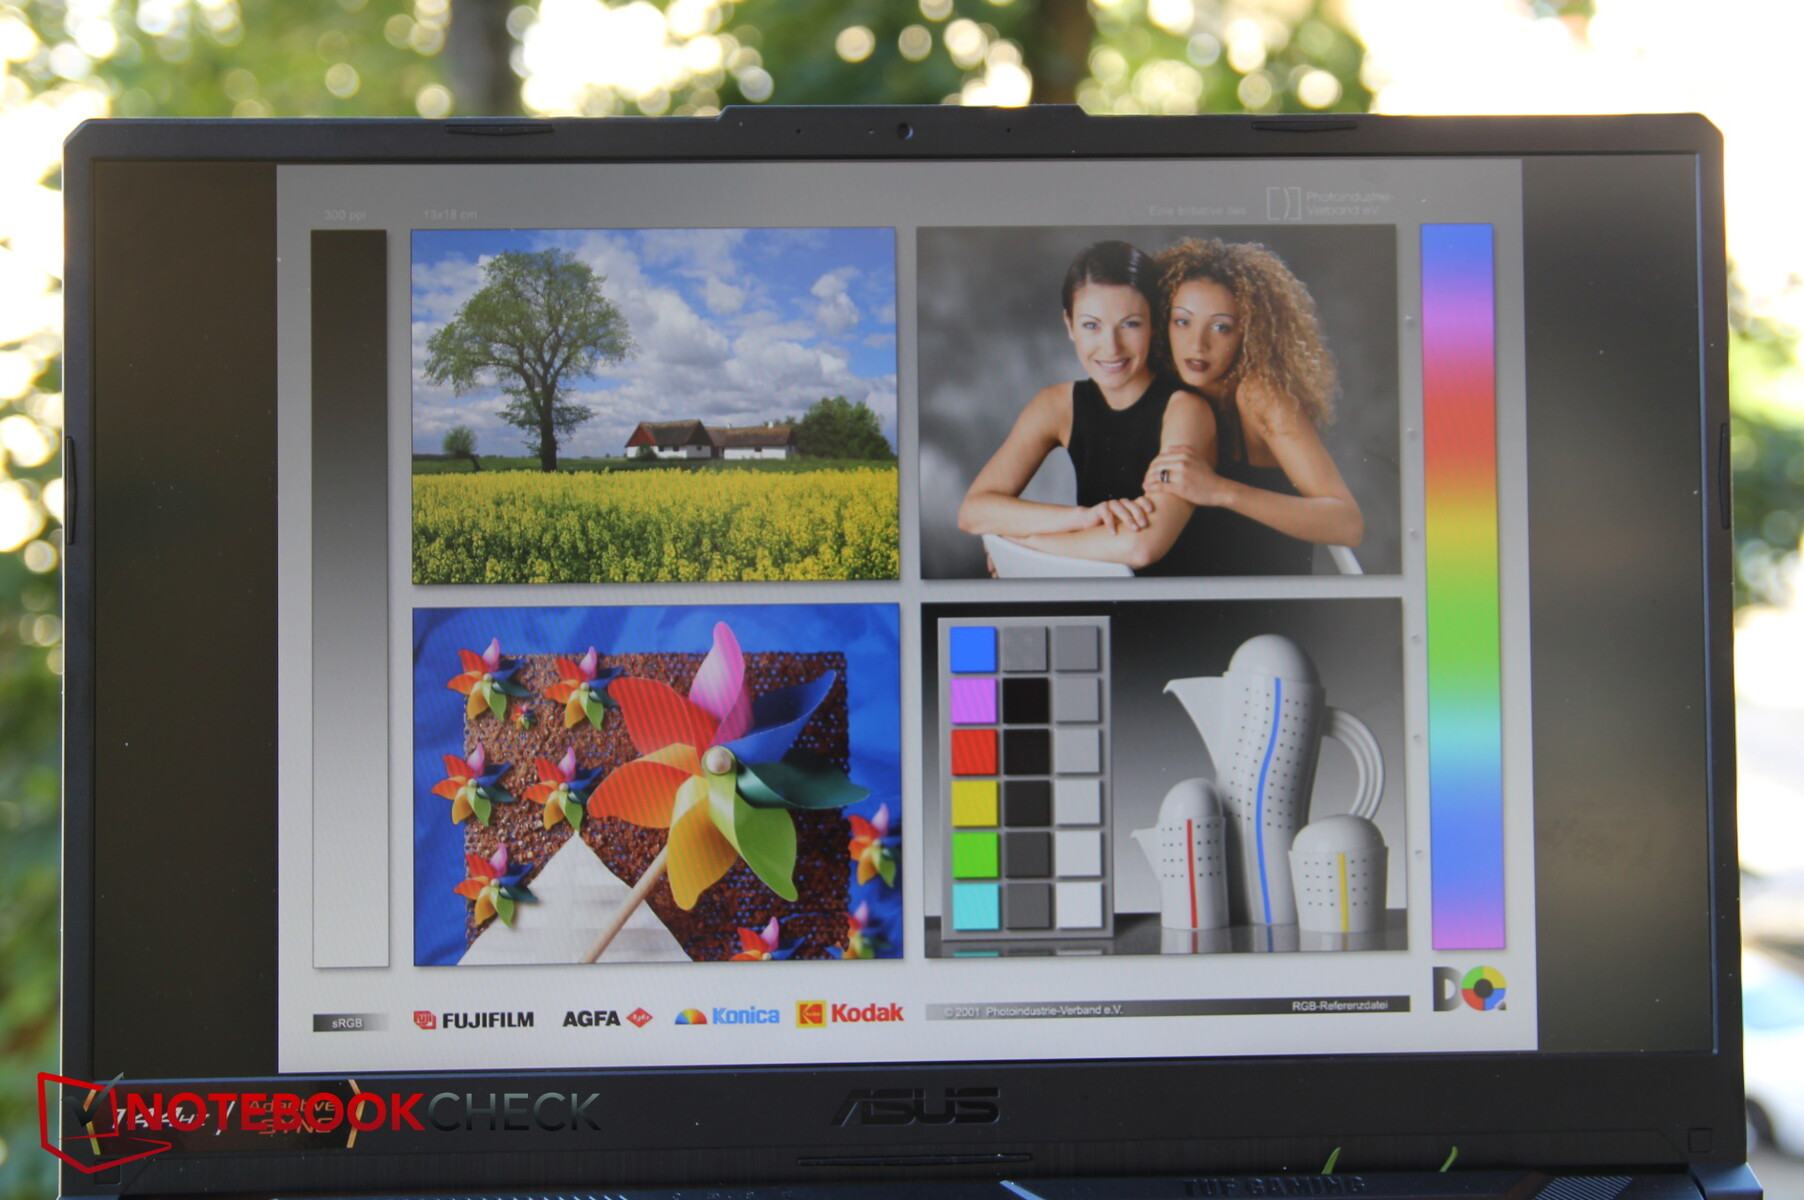
Display - There are better options
We don't have the top configuration when it comes to the display, since there's still a variant with an sRGB coverage of 100% and a refresh rate of 300 Hz.
The present model is a 17.3-inch matte Full HD IPS display with a refresh rate of 144 Hz and Adaptive Sync. The panel from AU Optronics delivers anything but top rates, which isn't unusual in this price range. The competition even performs worse here in some cases, and only the Schenker's display is better.
The average brightness of 264 nits is only just okay, but the brightness distribution of only 79% is extremely uneven. The maximum brightness is strongly reduced on battery power, and we only register 144 nits, but this can be deactivated in the driver.
Unfortunately, response times aren't great for a gaming device either, which can have a negative impact in very fast shooters.
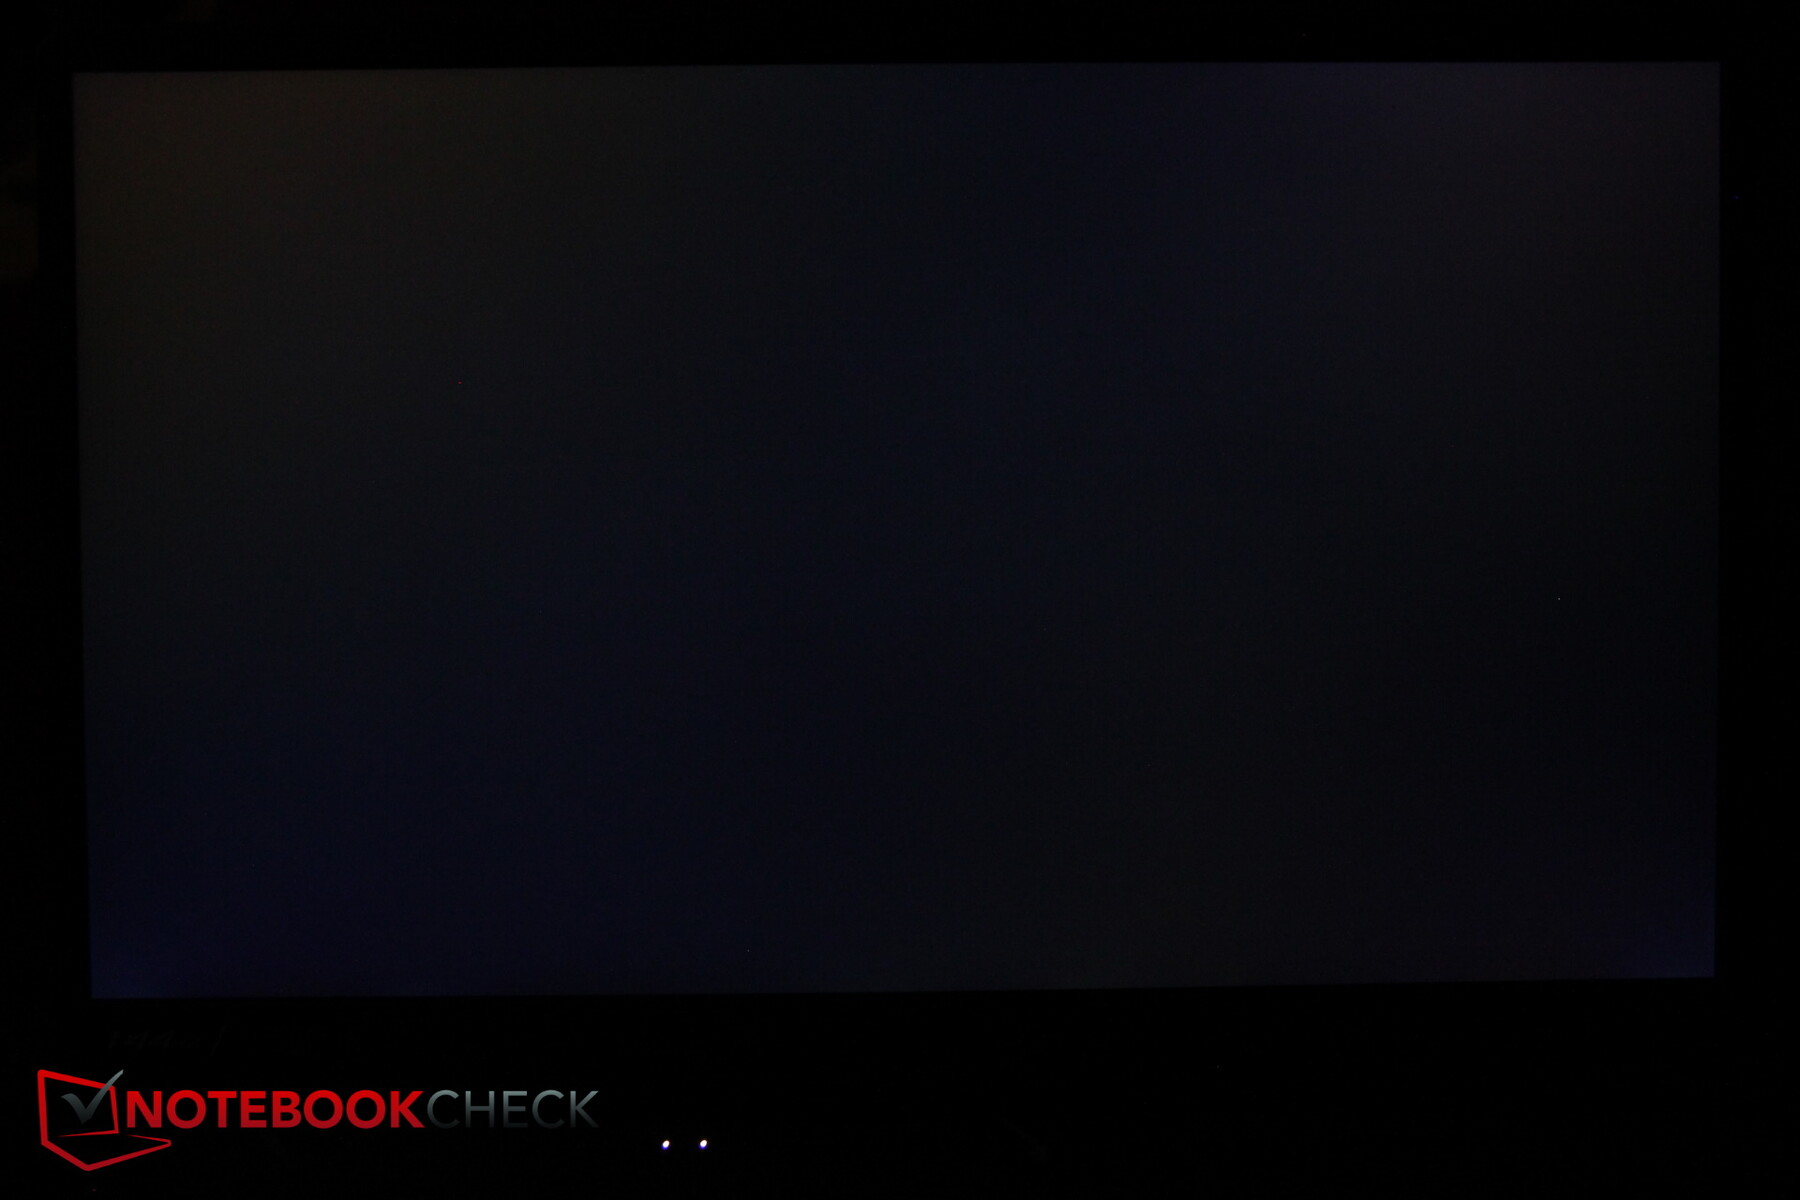
Screen bleeding is minimally present along the corners and edges, but it's hardly noticeable even in dark scenes and, therefore, not bothersome.
| |||||||||||||||||||||||||
Brightness Distribution: 79 %
Center on Battery: 144 cd/m²
Contrast: 831:1 (Black: 0.32 cd/m²)
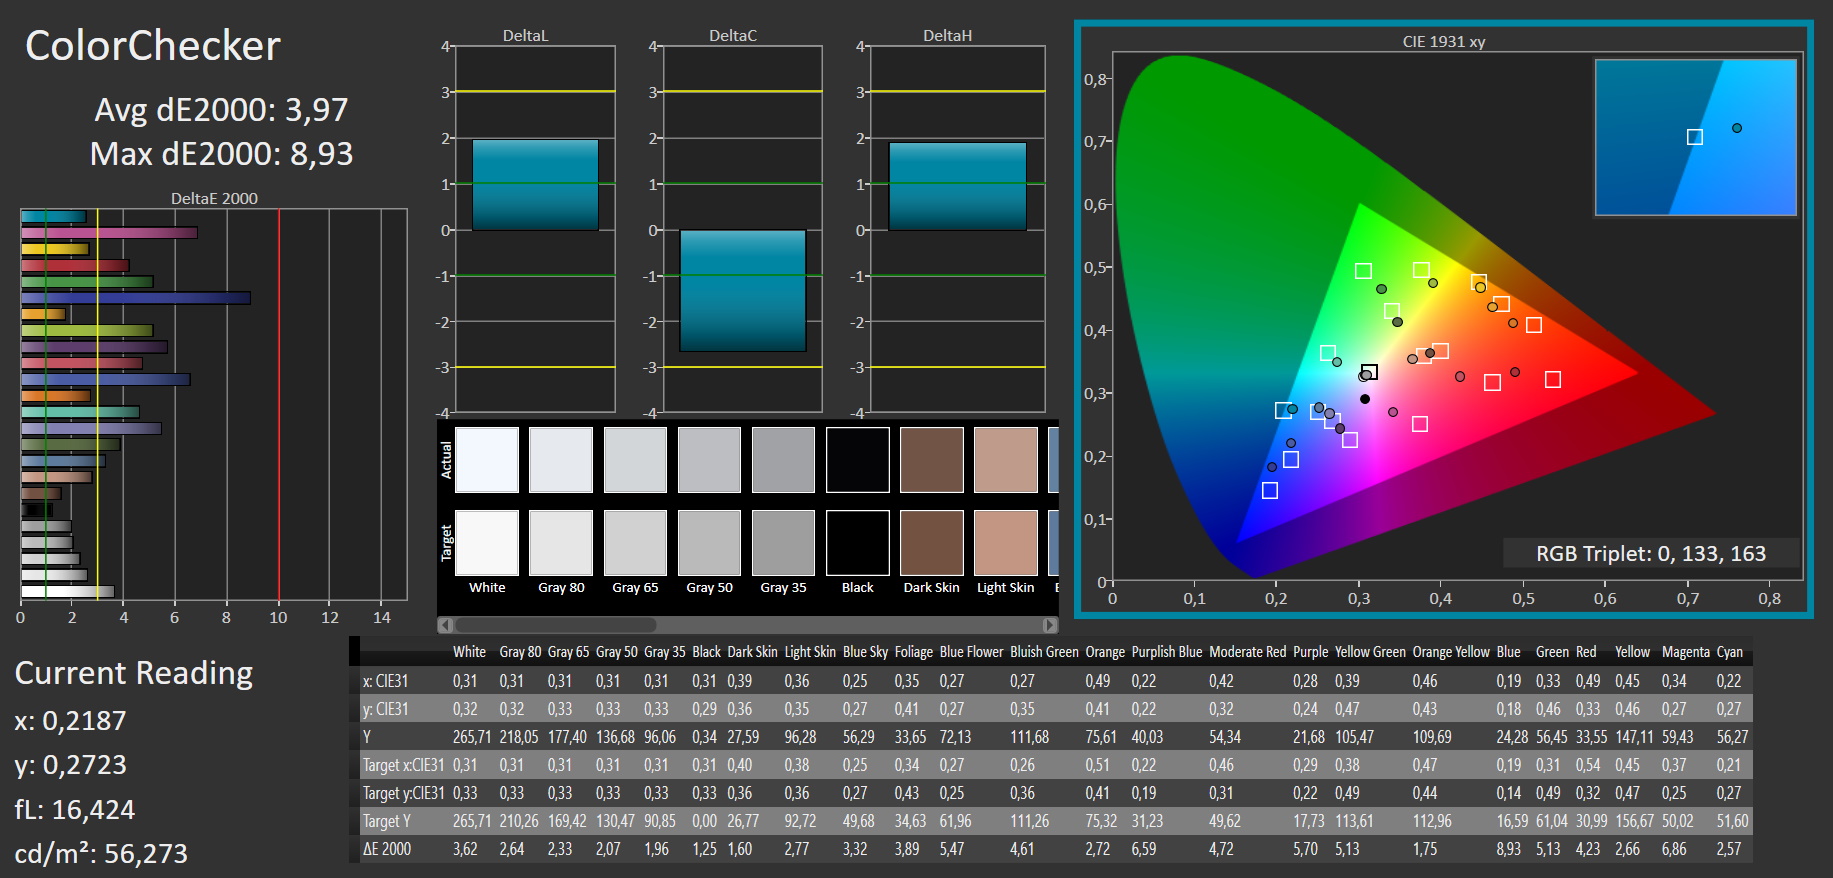
ΔE ColorChecker Calman: 3.97 | ∀{0.5-29.43 Ø4.73}
calibrated: 3.5
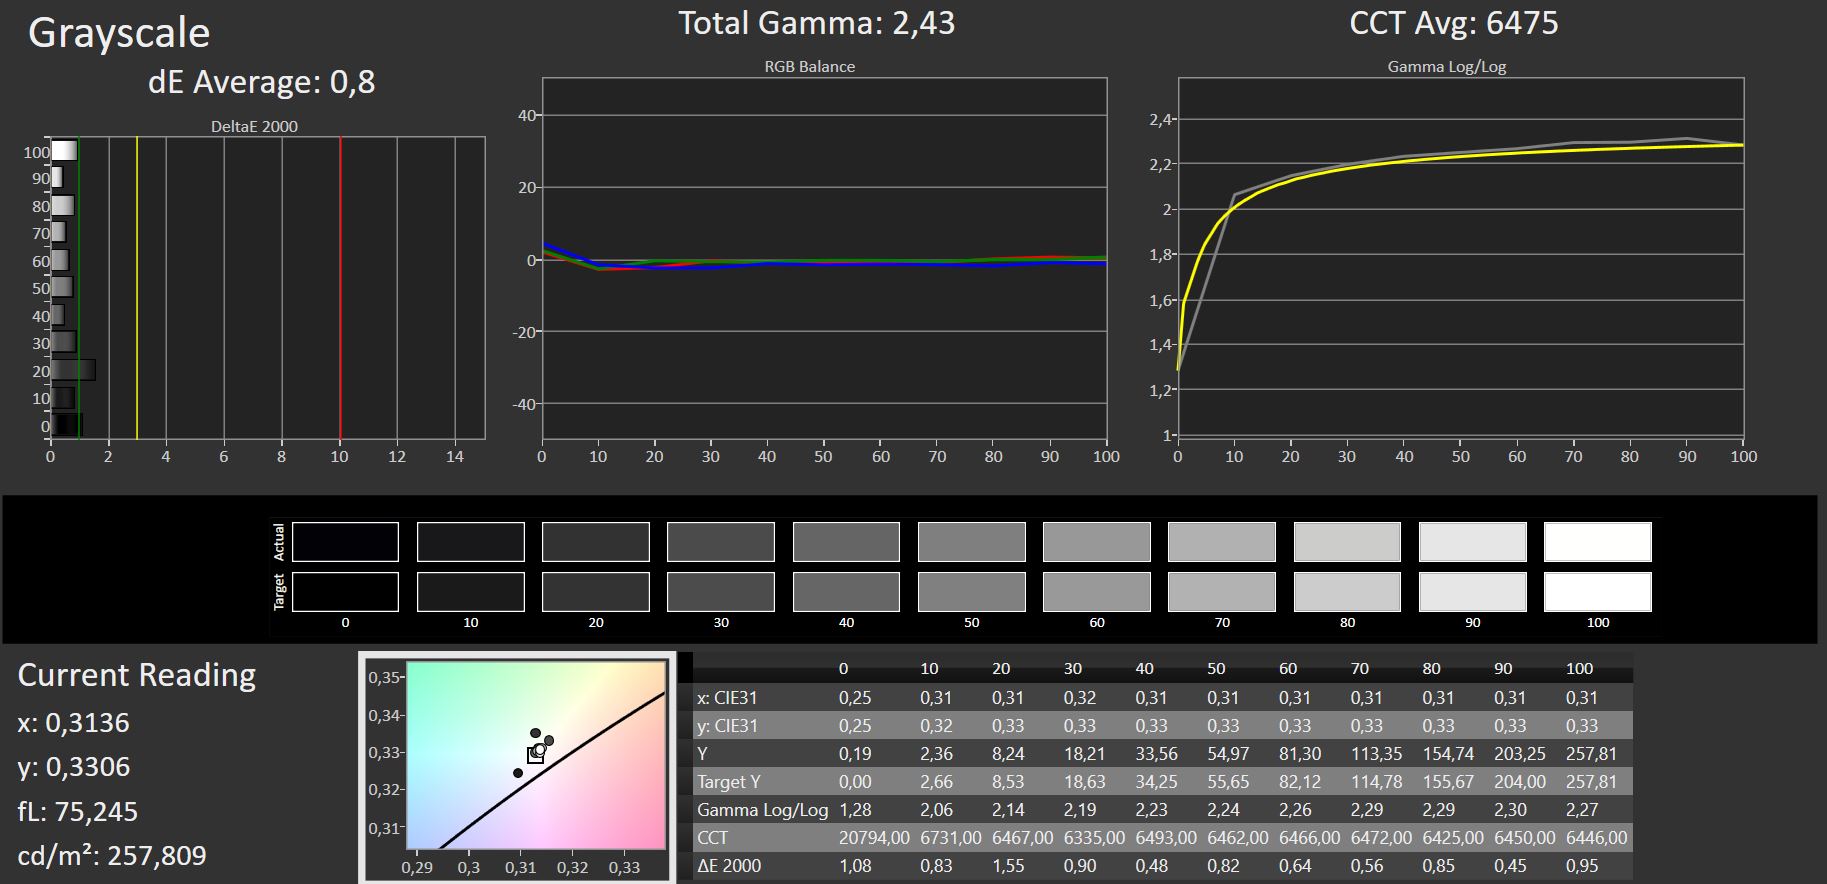
ΔE Greyscale Calman: 1.8 | ∀{0.09-98 Ø4.97}
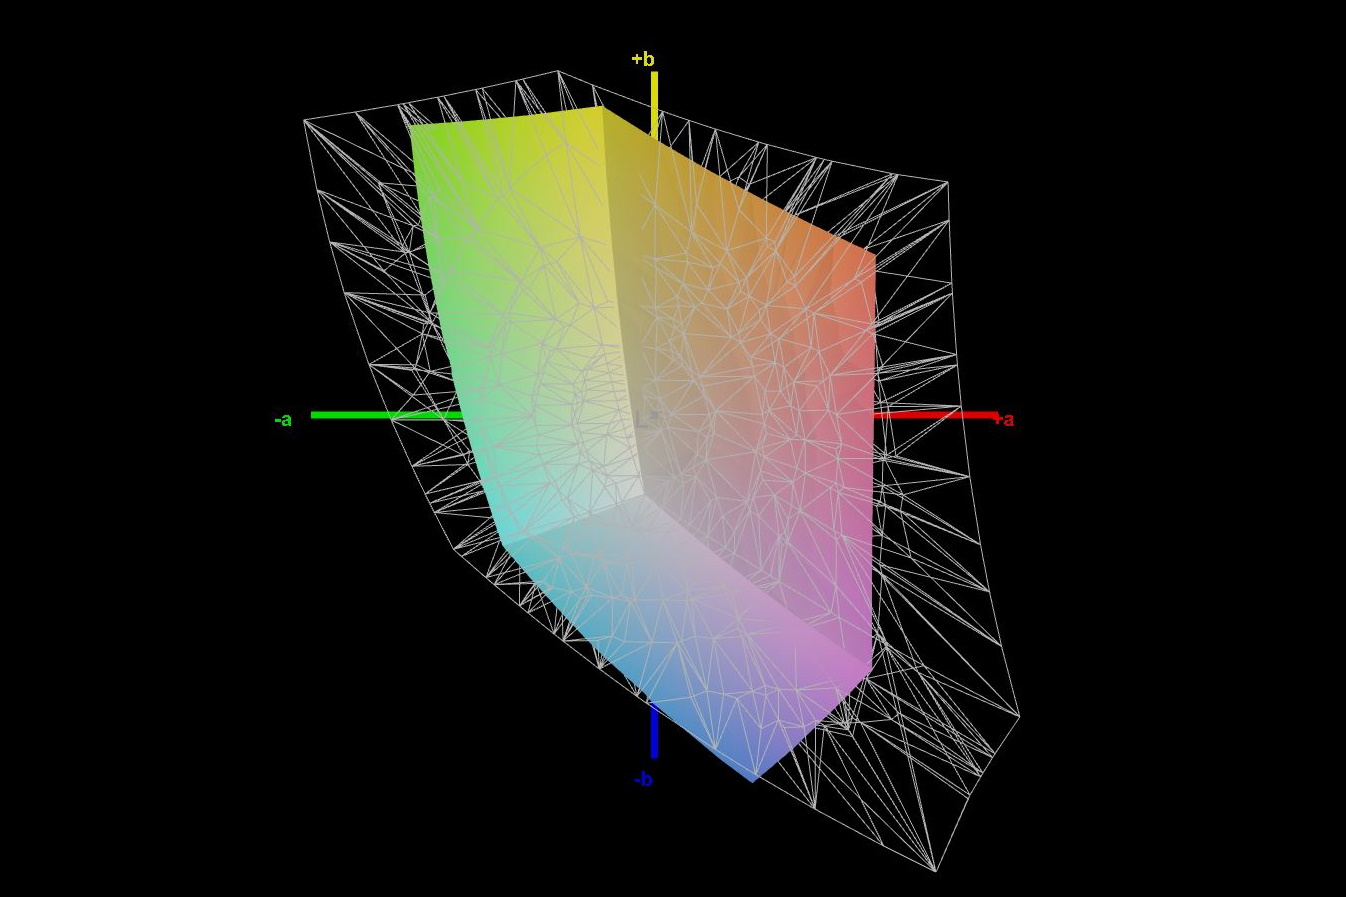
60% sRGB (Argyll 1.6.3 3D)
41.4% AdobeRGB 1998 (Argyll 1.6.3 3D)
41.4% AdobeRGB 1998 (Argyll 3D)
60% sRGB (Argyll 3D)
40.1% Display P3 (Argyll 3D)
Gamma: 2.31
CCT: 6754 K
| Asus TUF Gaming F17 FX706HM AU Optronics AUI8294 (B173HAN04.9), IPS, 1920x1080, 17.3" | Asus TUF A17 FA706IU-AS76 BOE NV173FHM-NX1, IPS, 1920x1080, 17.3" | Schenker XMG Core 17 (Early 2021) BOE CQ NE173QHM-NY2, IPS, 2560x1440, 17.3" | MSI Alpha 17 A4DEK AU Optronics AUO978F, IPS, 1920x1080, 17.3" | MSI GF65 Thin 10UE AU Optronics B156HAN08.4, IPS, 1920x1080, 15.6" | |
|---|---|---|---|---|---|
| Display | 1% | 67% | -1% | -6% | |
| Display P3 Coverage (%) | 40.1 | 40.55 1% | 68.1 70% | 39.55 -1% | 37.65 -6% |
| sRGB Coverage (%) | 60 | 59.7 0% | 98.5 64% | 59.2 -1% | 56.3 -6% |
| AdobeRGB 1998 Coverage (%) | 41.4 | 41.89 1% | 69.3 67% | 40.86 -1% | 38.9 -6% |
| Response Times | 23% | 52% | -27% | -28% | |
| Response Time Grey 50% / Grey 80% * (ms) | 32.4 | 22.4 ? 31% | 16.8 ? 48% | 40 ? -23% | 36.8 ? -14% |
| Response Time Black / White * (ms) | 22.4 | 19.2 ? 14% | 10 ? 55% | 29.2 ? -30% | 31.6 ? -41% |
| PWM Frequency (Hz) | |||||
| Screen | -12% | 18% | -13% | -18% | |
| Brightness middle (cd/m²) | 266 | 264.8 0% | 370 39% | 254 -5% | 266.5 0% |
| Brightness (cd/m²) | 264 | 253 -4% | 333 26% | 254 -4% | 262 -1% |
| Brightness Distribution (%) | 79 | 90 14% | 84 6% | 93 18% | 91 15% |
| Black Level * (cd/m²) | 0.32 | 0.31 3% | 0.38 -19% | 0.23 28% | 0.18 44% |
| Contrast (:1) | 831 | 854 3% | 974 17% | 1104 33% | 1481 78% |
| Colorchecker dE 2000 * | 3.97 | 4.73 -19% | 2.41 39% | 4.12 -4% | 5.33 -34% |
| Colorchecker dE 2000 max. * | 8.93 | 18.89 -112% | 7.32 18% | 19.66 -120% | 18.28 -105% |
| Colorchecker dE 2000 calibrated * | 3.5 | 4.64 -33% | 1.19 66% | 3.78 -8% | 4.36 -25% |
| Greyscale dE 2000 * | 1.8 | 1.4 22% | 3.9 -117% | 3.2 -78% | 4.5 -150% |
| Gamma | 2.31 95% | 2.16 102% | 2.287 96% | 2.179 101% | 2.35 94% |
| CCT | 6754 96% | 6641 98% | 7302 89% | 6754 96% | 6289 103% |
| Color Space (Percent of AdobeRGB 1998) (%) | 41.4 | 38.4 -7% | 69 67% | 41 -1% | 35.6 -14% |
| Color Space (Percent of sRGB) (%) | 60 | 59.3 -1% | 93 55% | 59 -2% | 55.8 -7% |
| Total Average (Program / Settings) | 4% /
-5% | 46% /
31% | -14% /
-12% | -17% /
-17% |
* ... smaller is better
The black level is acceptable, but contrast is clearly below 1,000:1 and could be improved as a result.
The display is calibrated fairly well at least, and color deviations are rather low. Manual calibration only allows these to be minimally reduced.

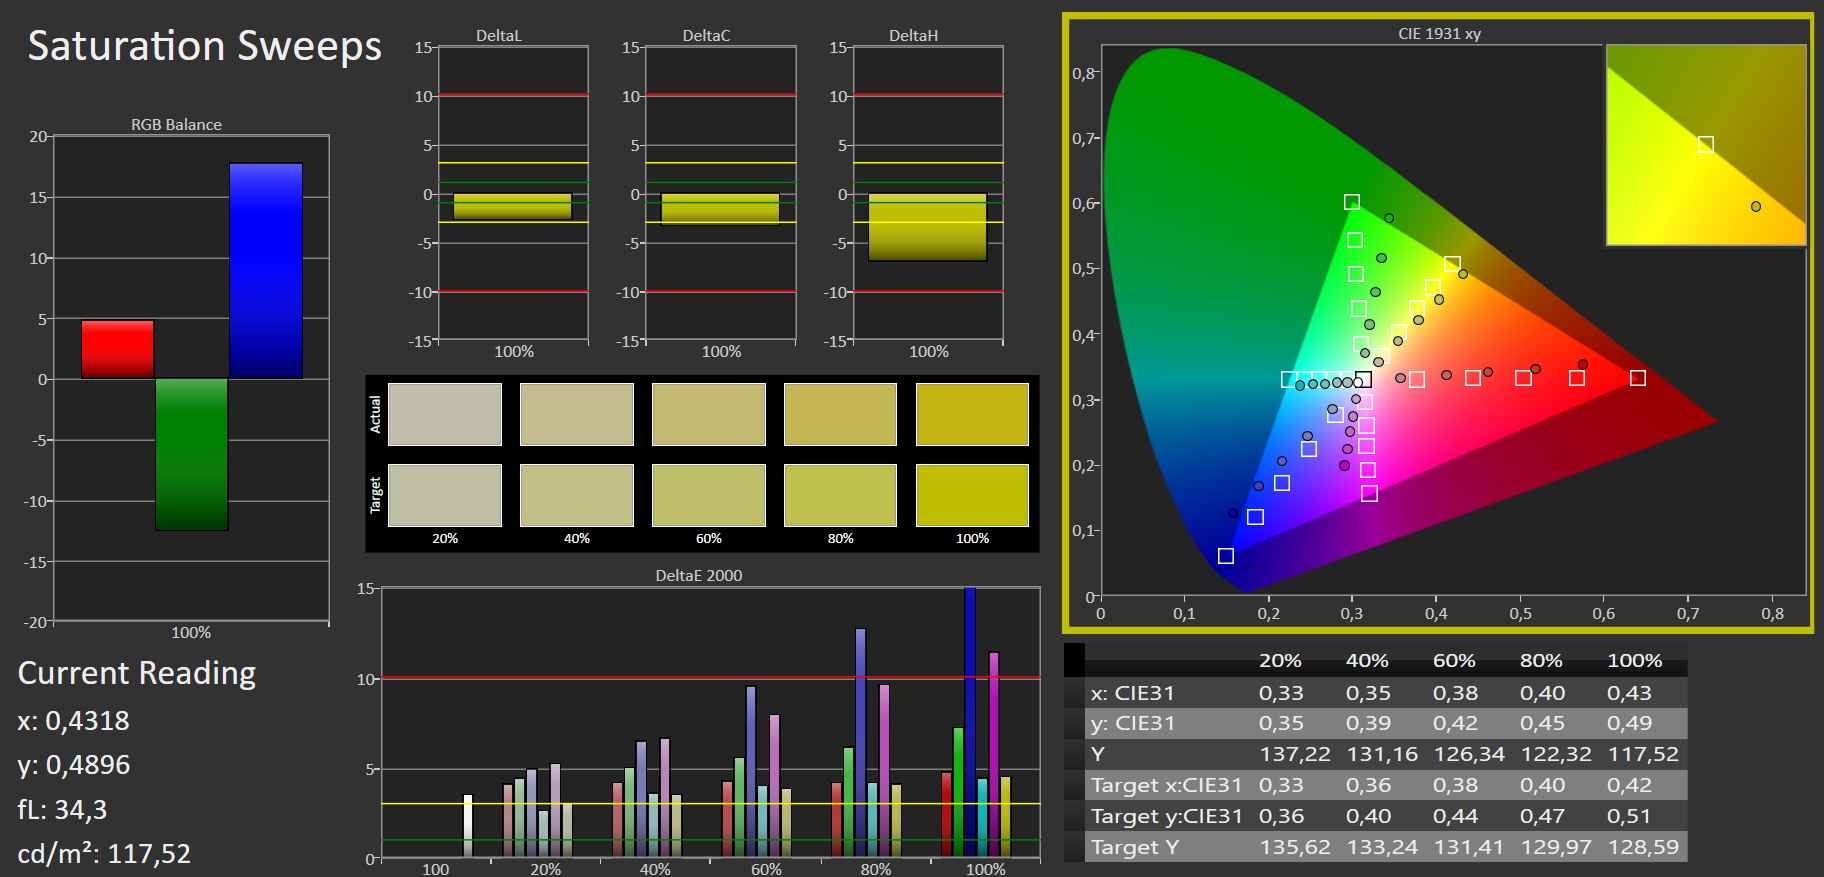
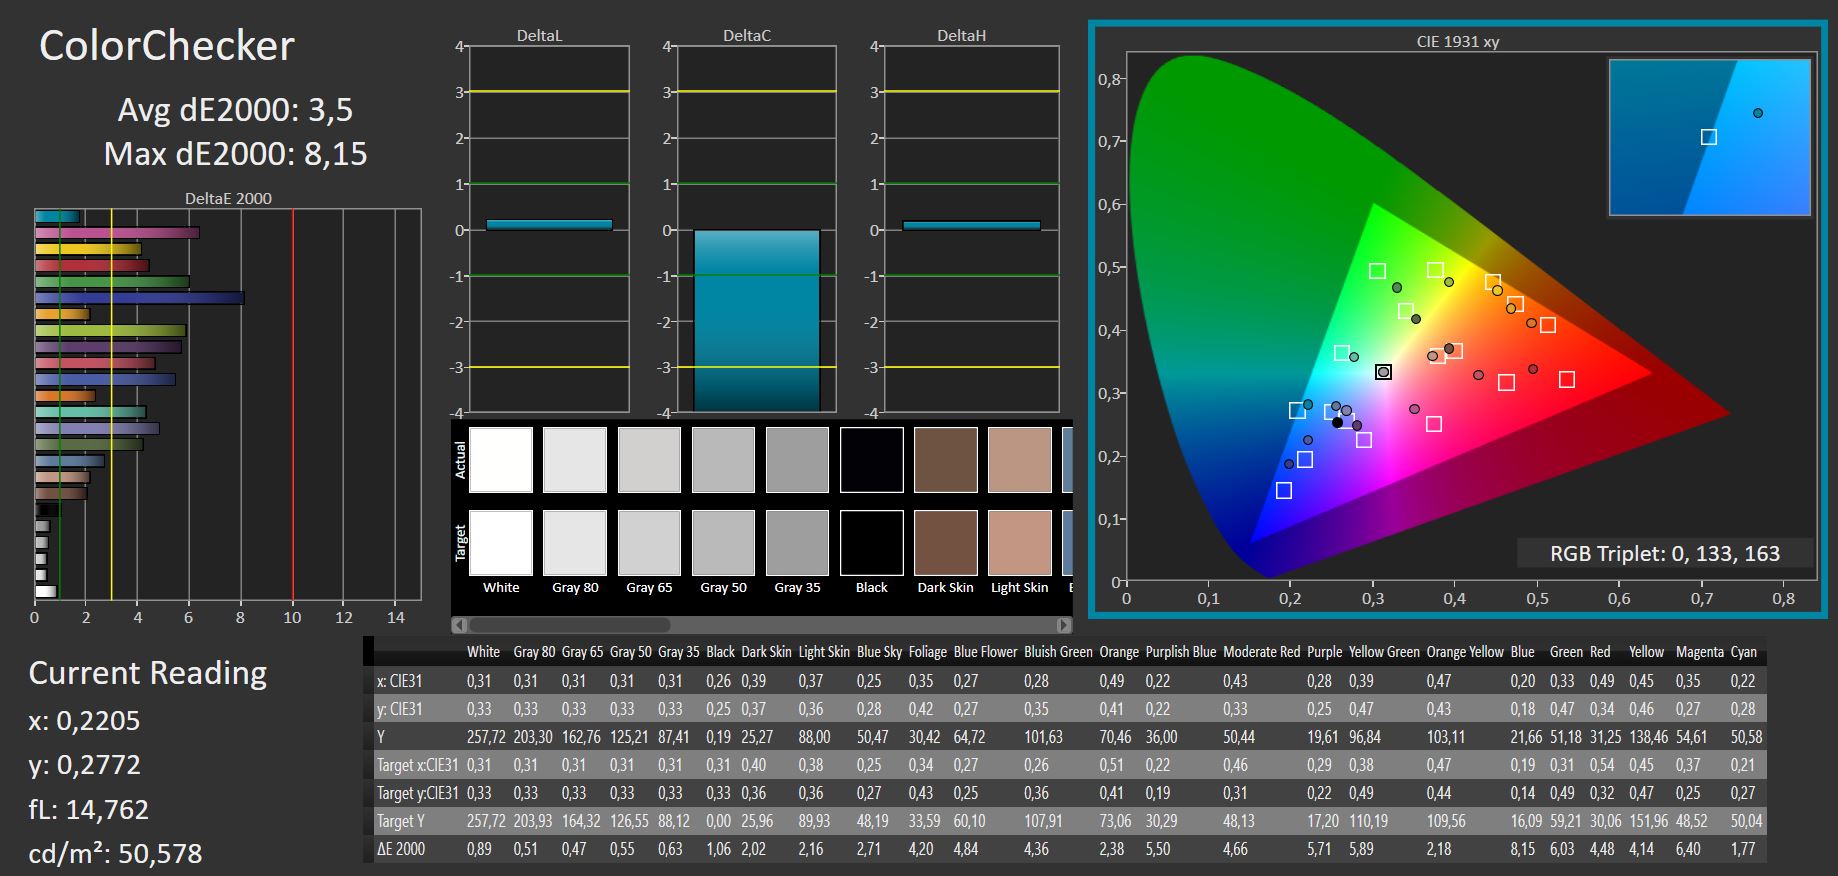
The available color space is quite narrow; only 60% of sRGB and 41% of AdobeRGB aren't particularly good rates. However, the competition scores similarly poorly here, and only the slightly more expensive Schenker laptop can do a better job.
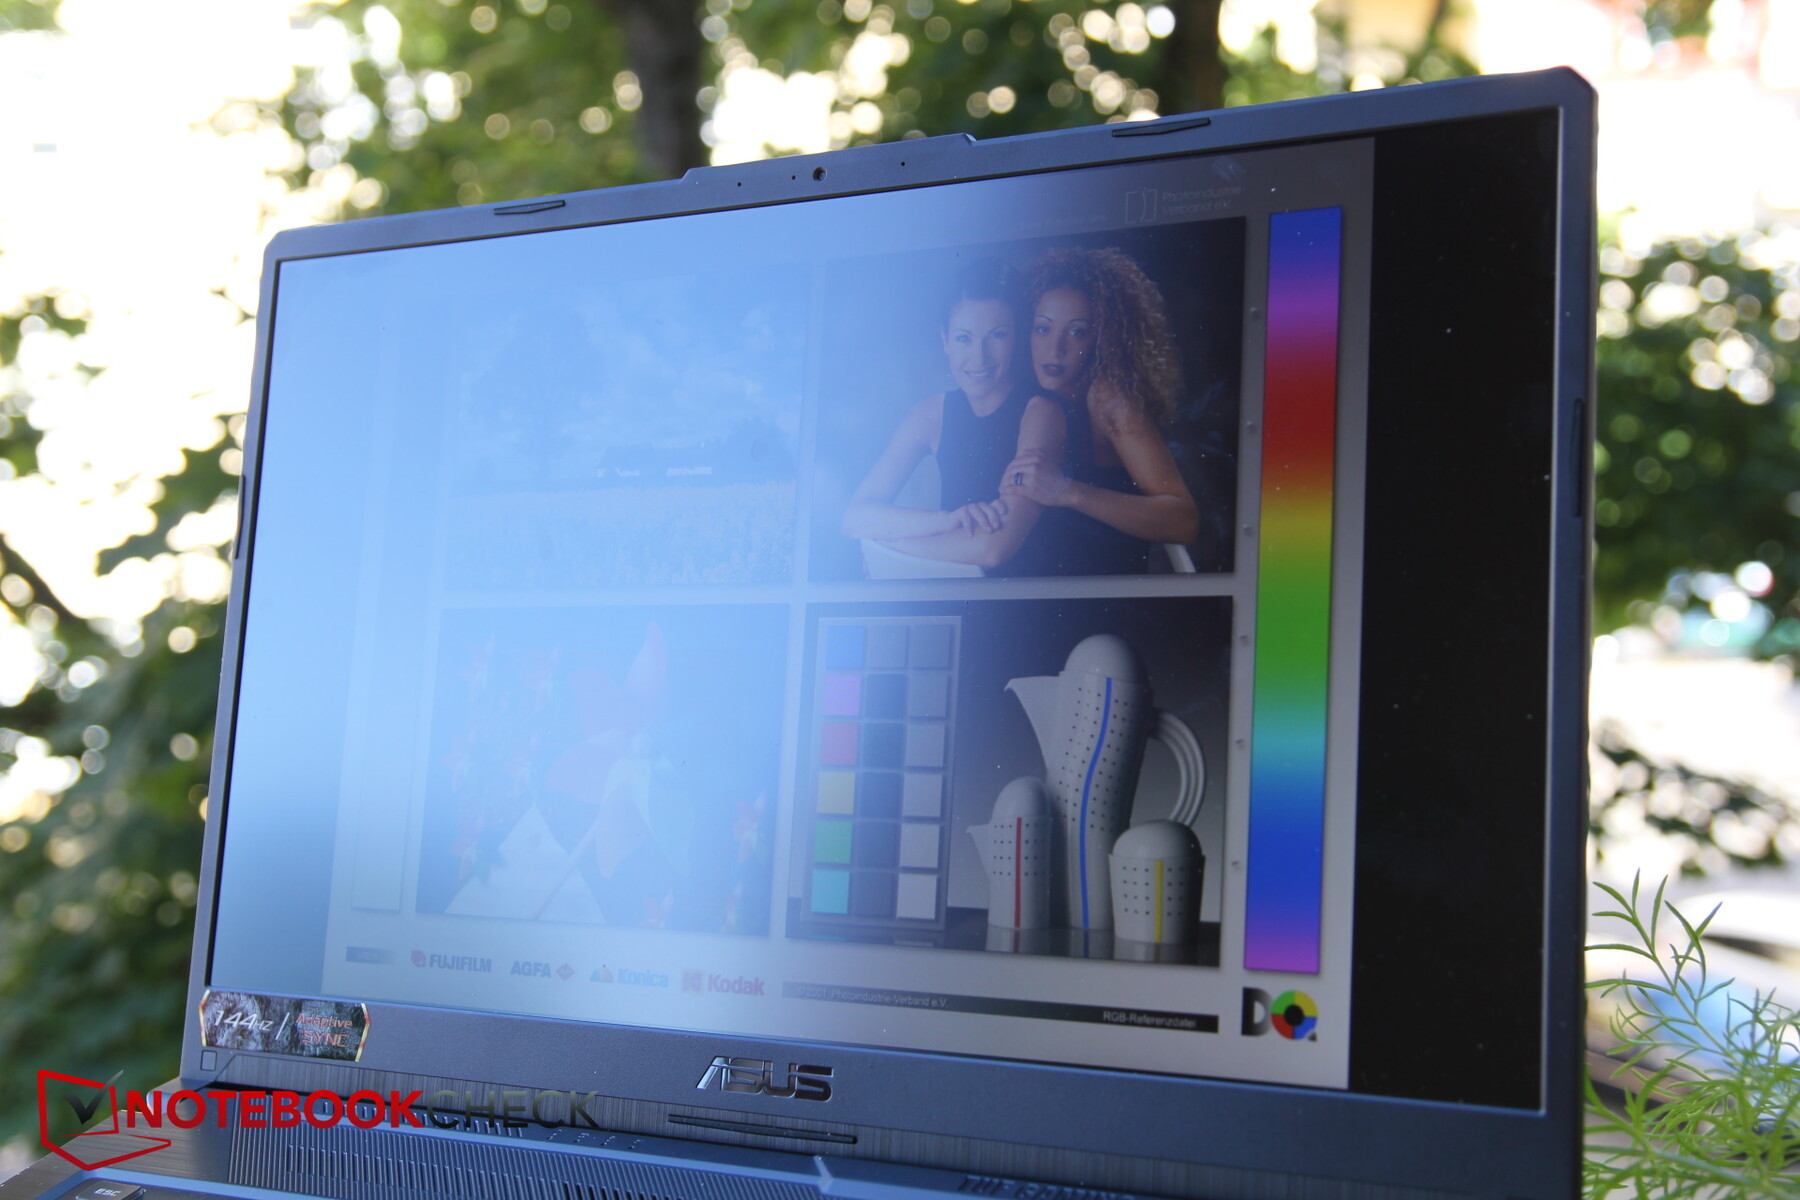
Although the matte surface eliminates most reflections, since the already moderate brightness is additionally reduced in a considerable way on battery power, outdoor visibility isn't optimal. We recommend looking for a place with plenty of shade and viewing the display from a direct angle.
Display Response Times
| ↔ Response Time Black to White | ||
|---|---|---|
| 22.4 ms ... rise ↗ and fall ↘ combined | ↗ ms rise |  |
| ↘ ms fall | ||
| The screen shows good response rates in our tests, but may be too slow for competitive gamers. In comparison, all tested devices range from 0.1 (minimum) to 240 (maximum) ms. » 50 % of all devices are better. This means that the measured response time is worse than the average of all tested devices (19.9 ms). | ||
| ↔ Response Time 50% Grey to 80% Grey | ||
| 32.4 ms ... rise ↗ and fall ↘ combined | ↗ ms rise |  |
| ↘ ms fall | ||
| The screen shows slow response rates in our tests and will be unsatisfactory for gamers. In comparison, all tested devices range from 0.165 (minimum) to 636 (maximum) ms. » 44 % of all devices are better. This means that the measured response time is similar to the average of all tested devices (31.1 ms). | ||
Screen Flickering / PWM (Pulse-Width Modulation)
| Screen flickering / PWM not detected |  | ||
In comparison: 52 % of all tested devices do not use PWM to dim the display. If PWM was detected, an average of 7798 (minimum: 5 - maximum: 343500) Hz was measured. | |||
Considering that this is an IPS panel, viewing-angle stability could be better. When looking at the display from oblique angles, brightness losses can definitely be noticed quite quickly.

Performance - Meets expectations well
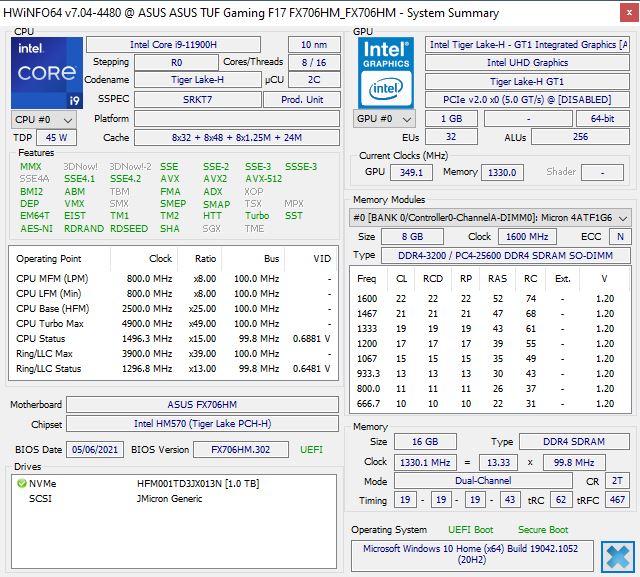
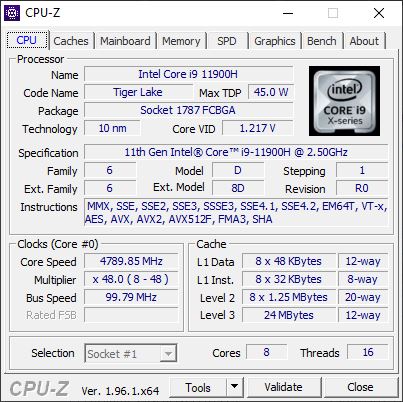
Since gaming is already included in the F17's name, the laptop has to prove itself precisely in this field. An Intel Core i9-11900H together with an Nvidia GeForce RTX 3060 Laptop GPU, and 16 GB of RAM illustrate these ambitions, even though 17-inch laptops often feature even higher-performance hardware. But the F17 is also a gaming device for price-conscious customers, which is why the TUF Gaming will also be available with an RTX 3050 or 3050 Ti in the near future. Likewise, this CPU represents the top configuration, with Core i7 and Core i5 models also available as alternatives.
The MyAsus software theoretically handles all relevant performance and fan profiles. Theoretically, because Asus seems to be using a new software at the moment, and we're pointed to the Asus Armoury Crate program within MyAsus. All relevant settings can actually be found here, but the software is quite cluttered. We set the fan profile to "Windows" for the benchmarks, which hopefully means that Windows gets to decide, resulting in its performance profiles having priority. We set the Windows slider to "Best Performance".
Processor
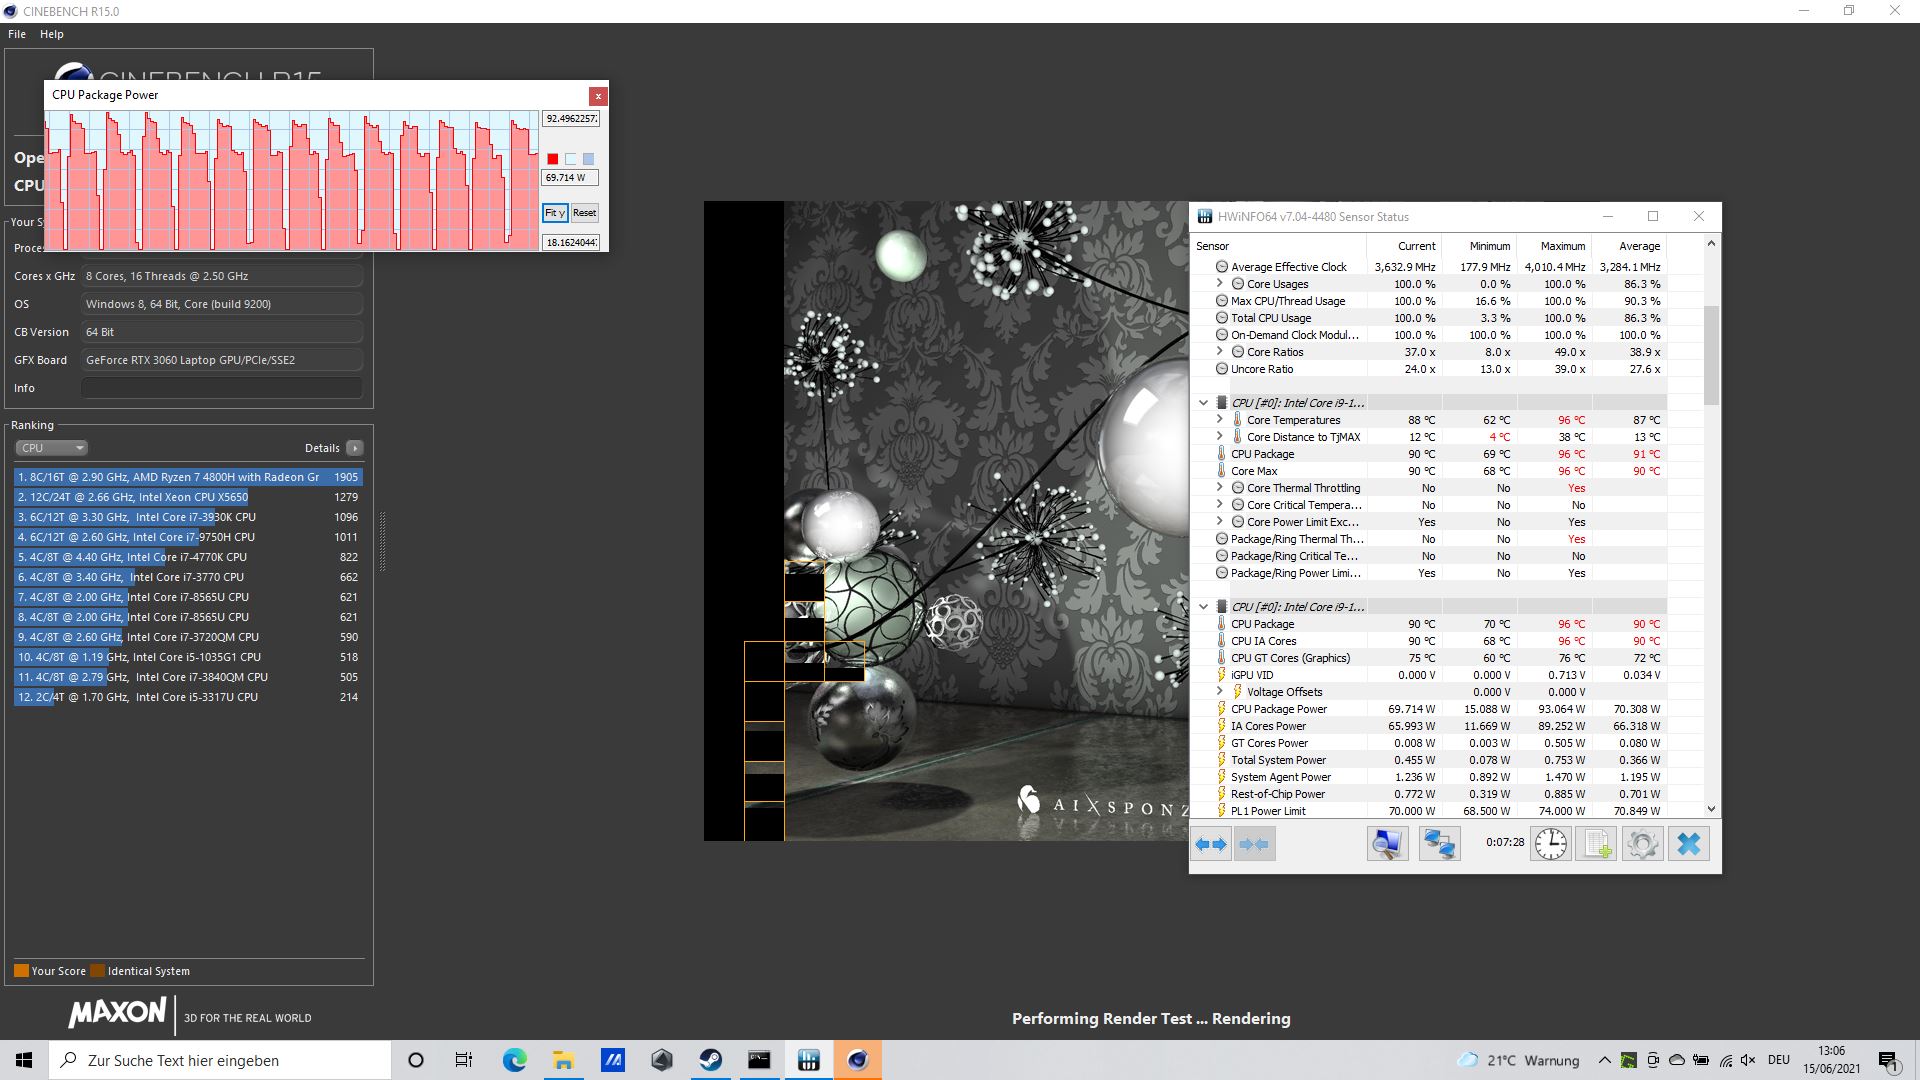
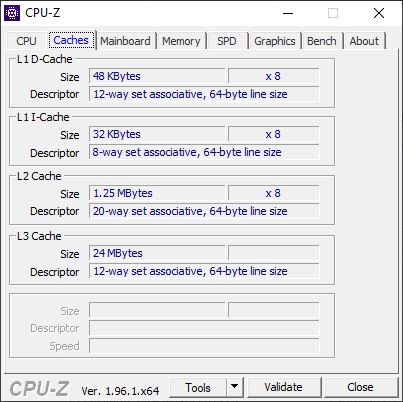
The Intel Core i9-11900H is an octa-core CPU with cores that run at a base clock speed of 2.5 GHz. All cores can simultaneously run at 4.4 GHz in Turbo mode, and one core alone can reach up to 4.9 GHz. The TDP is theoretically 45 watts, but it can be configured.
Performance is relatively constant in the Cinebench multithread loop. At the beginning of a run, the TDP briefly soars to 92 watts (later only 85 watts), and it drops to about 68 watts after half of a run. The CPU sometimes only manages 80 to 85 watts at the beginning of subsequent runs due to a high core temperature, and the 92 watts only applies to the first couple of runs.
Overall, the i9-11900H is on par with last year's Ryzen 7 4800H found in the Schenker XMG or the TUF A17 when it comes to the Cinebench multithread test. However, performance seems to drop a bit more over time; it's also slightly more erratic and marginally less constant.
On battery power, the F17 only scores 1,358 points instead of the previous 1,700 to 2,000 points, meaning that its CPU performance gets throttled pretty heavily.
Cinebench R20: CPU (Single Core) | CPU (Multi Core)
Cinebench R15: CPU Single 64Bit | CPU Multi 64Bit
Blender: v2.79 BMW27 CPU
7-Zip 18.03: 7z b 4 -mmt1 | 7z b 4
Geekbench 5.5: Single-Core | Multi-Core
HWBOT x265 Benchmark v2.2: 4k Preset
LibreOffice : 20 Documents To PDF
R Benchmark 2.5: Overall mean
| Cinebench R23 / Single Core | |
| Average of class Gaming (1166 - 2356, n=112, last 2 years) | |
| Average Intel Core i9-11900H (1574 - 1605, n=4) | |
| Asus TUF Gaming F17 FX706HM | |
| MSI GF65 Thin 10UE | |
| Schenker XMG Core 17 (Early 2021) | |
| Acer Aspire Nitro 5 AN515-55-57GF | |
| Cinebench R23 / Multi Core | |
| Average of class Gaming (10488 - 40970, n=112, last 2 years) | |
| Average Intel Core i9-11900H (11135 - 13012, n=4) | |
| Asus TUF Gaming F17 FX706HM | |
| Schenker XMG Core 17 (Early 2021) | |
| MSI GF65 Thin 10UE | |
| Acer Aspire Nitro 5 AN515-55-57GF | |
| Cinebench R20 / CPU (Single Core) | |
| Average of class Gaming (442 - 895, n=111, last 2 years) | |
| Average Intel Core i9-11900H (600 - 615, n=5) | |
| Asus TUF Gaming F17 FX706HM | |
| MSI Alpha 17 A4DEK | |
| MSI GF65 Thin 10UE | |
| Asus TUF A17 FA706IU-AS76 | |
| Schenker XMG Core 17 (Early 2021) | |
| Acer Aspire Nitro 5 AN515-55-57GF | |
| Cinebench R20 / CPU (Multi Core) | |
| Average of class Gaming (4029 - 16108, n=111, last 2 years) | |
| Average Intel Core i9-11900H (4324 - 5160, n=5) | |
| MSI Alpha 17 A4DEK | |
| Asus TUF Gaming F17 FX706HM | |
| Asus TUF A17 FA706IU-AS76 | |
| Schenker XMG Core 17 (Early 2021) | |
| MSI GF65 Thin 10UE | |
| Acer Aspire Nitro 5 AN515-55-57GF | |
| Cinebench R15 / CPU Single 64Bit | |
| Average of class Gaming (188.8 - 343, n=111, last 2 years) | |
| Asus TUF Gaming F17 FX706HM | |
| Average Intel Core i9-11900H (236 - 243, n=5) | |
| MSI GF65 Thin 10UE | |
| Schenker XMG Core 17 (Early 2021) | |
| MSI Alpha 17 A4DEK | |
| Asus TUF A17 FA706IU-AS76 | |
| Acer Aspire Nitro 5 AN515-55-57GF | |
| Cinebench R15 / CPU Multi 64Bit | |
| Average of class Gaming (1578 - 6271, n=111, last 2 years) | |
| Average Intel Core i9-11900H (1770 - 2211, n=5) | |
| Asus TUF Gaming F17 FX706HM | |
| MSI Alpha 17 A4DEK | |
| Asus TUF A17 FA706IU-AS76 | |
| Schenker XMG Core 17 (Early 2021) | |
| MSI GF65 Thin 10UE | |
| Acer Aspire Nitro 5 AN515-55-57GF | |
| Blender / v2.79 BMW27 CPU | |
| Acer Aspire Nitro 5 AN515-55-57GF | |
| MSI GF65 Thin 10UE | |
| Schenker XMG Core 17 (Early 2021) | |
| Asus TUF A17 FA706IU-AS76 | |
| MSI Alpha 17 A4DEK | |
| Average Intel Core i9-11900H (231 - 270, n=5) | |
| Asus TUF Gaming F17 FX706HM | |
| Average of class Gaming (80 - 330, n=109, last 2 years) | |
| 7-Zip 18.03 / 7z b 4 -mmt1 | |
| Average of class Gaming (4199 - 7436, n=110, last 2 years) | |
| Asus TUF Gaming F17 FX706HM | |
| Average Intel Core i9-11900H (5582 - 6018, n=5) | |
| Schenker XMG Core 17 (Early 2021) | |
| MSI GF65 Thin 10UE | |
| Acer Aspire Nitro 5 AN515-55-57GF | |
| Asus TUF A17 FA706IU-AS76 | |
| MSI Alpha 17 A4DEK | |
| 7-Zip 18.03 / 7z b 4 | |
| Average of class Gaming (33491 - 148086, n=110, last 2 years) | |
| Average Intel Core i9-11900H (49486 - 57263, n=5) | |
| MSI Alpha 17 A4DEK | |
| Asus TUF Gaming F17 FX706HM | |
| Asus TUF A17 FA706IU-AS76 | |
| Schenker XMG Core 17 (Early 2021) | |
| MSI GF65 Thin 10UE | |
| Acer Aspire Nitro 5 AN515-55-57GF | |
| Geekbench 5.5 / Single-Core | |
| Average of class Gaming (986 - 2474, n=110, last 2 years) | |
| Average Intel Core i9-11900H (1576 - 1692, n=5) | |
| Asus TUF Gaming F17 FX706HM | |
| MSI GF65 Thin 10UE | |
| Schenker XMG Core 17 (Early 2021) | |
| MSI Alpha 17 A4DEK | |
| Acer Aspire Nitro 5 AN515-55-57GF | |
| Asus TUF A17 FA706IU-AS76 | |
| Geekbench 5.5 / Multi-Core | |
| Average of class Gaming (6460 - 27010, n=110, last 2 years) | |
| Average Intel Core i9-11900H (7725 - 9856, n=5) | |
| MSI Alpha 17 A4DEK | |
| Asus TUF A17 FA706IU-AS76 | |
| Asus TUF Gaming F17 FX706HM | |
| Schenker XMG Core 17 (Early 2021) | |
| MSI GF65 Thin 10UE | |
| Acer Aspire Nitro 5 AN515-55-57GF | |
| HWBOT x265 Benchmark v2.2 / 4k Preset | |
| Average of class Gaming (11.5 - 44.3, n=110, last 2 years) | |
| Average Intel Core i9-11900H (13.6 - 16.7, n=5) | |
| Asus TUF Gaming F17 FX706HM | |
| MSI Alpha 17 A4DEK | |
| Asus TUF A17 FA706IU-AS76 | |
| Schenker XMG Core 17 (Early 2021) | |
| MSI GF65 Thin 10UE | |
| Acer Aspire Nitro 5 AN515-55-57GF | |
| LibreOffice / 20 Documents To PDF | |
| Asus TUF A17 FA706IU-AS76 | |
| Acer Aspire Nitro 5 AN515-55-57GF | |
| MSI Alpha 17 A4DEK | |
| Schenker XMG Core 17 (Early 2021) | |
| Average of class Gaming (19 - 88.8, n=110, last 2 years) | |
| Asus TUF Gaming F17 FX706HM | |
| MSI GF65 Thin 10UE | |
| Average Intel Core i9-11900H (40.5 - 49.3, n=5) | |
| R Benchmark 2.5 / Overall mean | |
| Acer Aspire Nitro 5 AN515-55-57GF | |
| Asus TUF A17 FA706IU-AS76 | |
| MSI GF65 Thin 10UE | |
| Schenker XMG Core 17 (Early 2021) | |
| MSI Alpha 17 A4DEK | |
| Average Intel Core i9-11900H (0.52 - 0.544, n=5) | |
| Asus TUF Gaming F17 FX706HM | |
| Average of class Gaming (0.3439 - 0.759, n=111, last 2 years) | |
* ... smaller is better
System performance
Our F17 easily takes the top spot in PCMark 10, while the A17 and the XMG lag behind by 7% to 20% depending on the test.
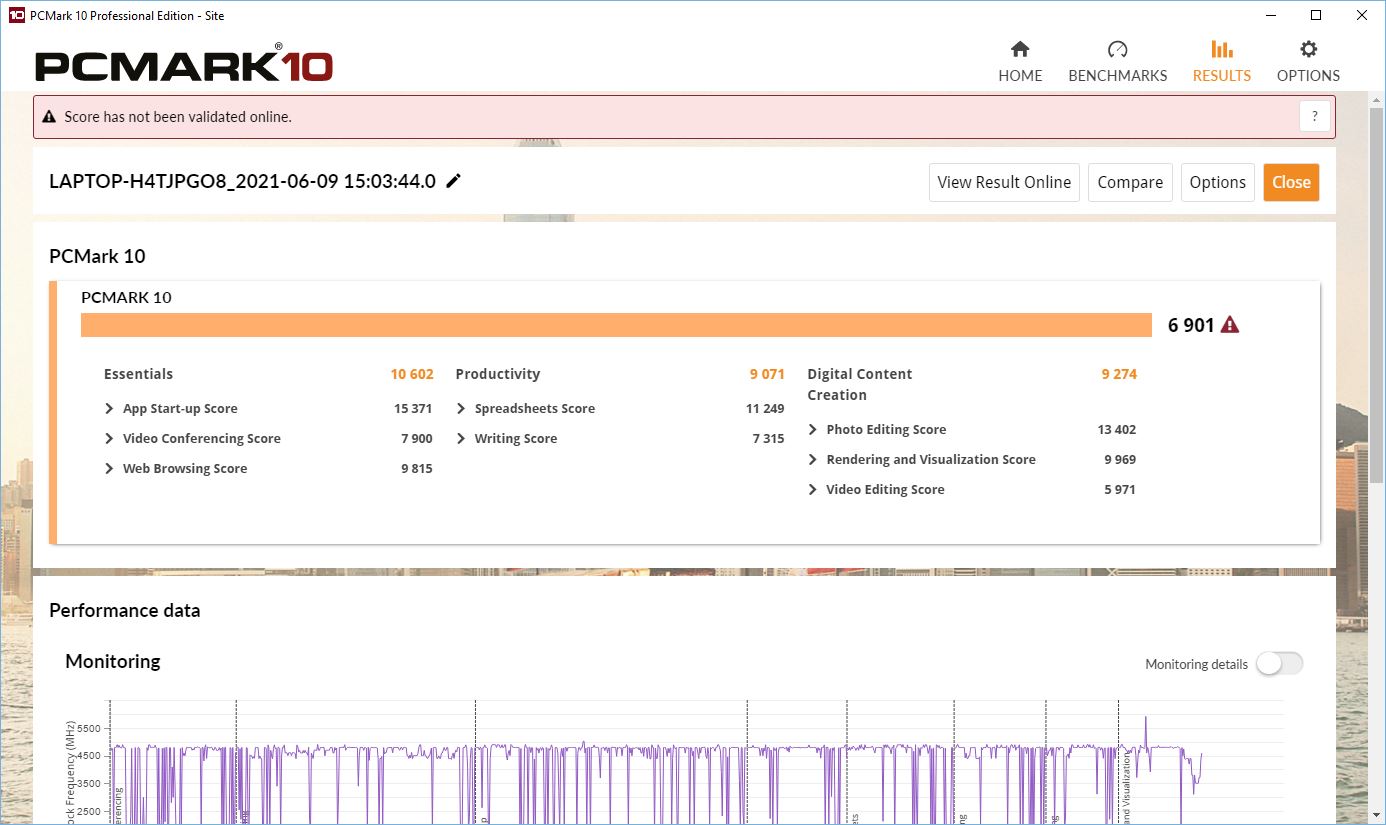
| PCMark 10 Score | 6901 points | |
Help | ||
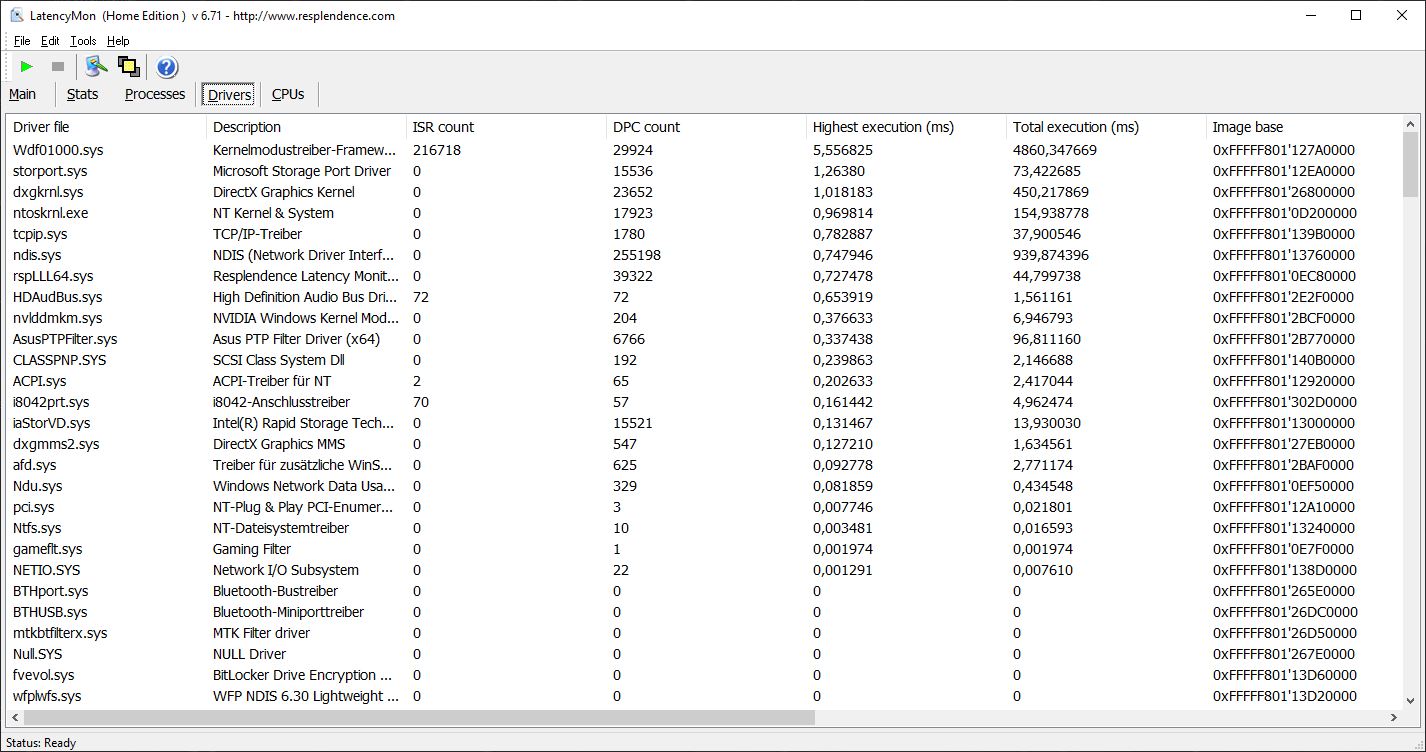
DPC latencies
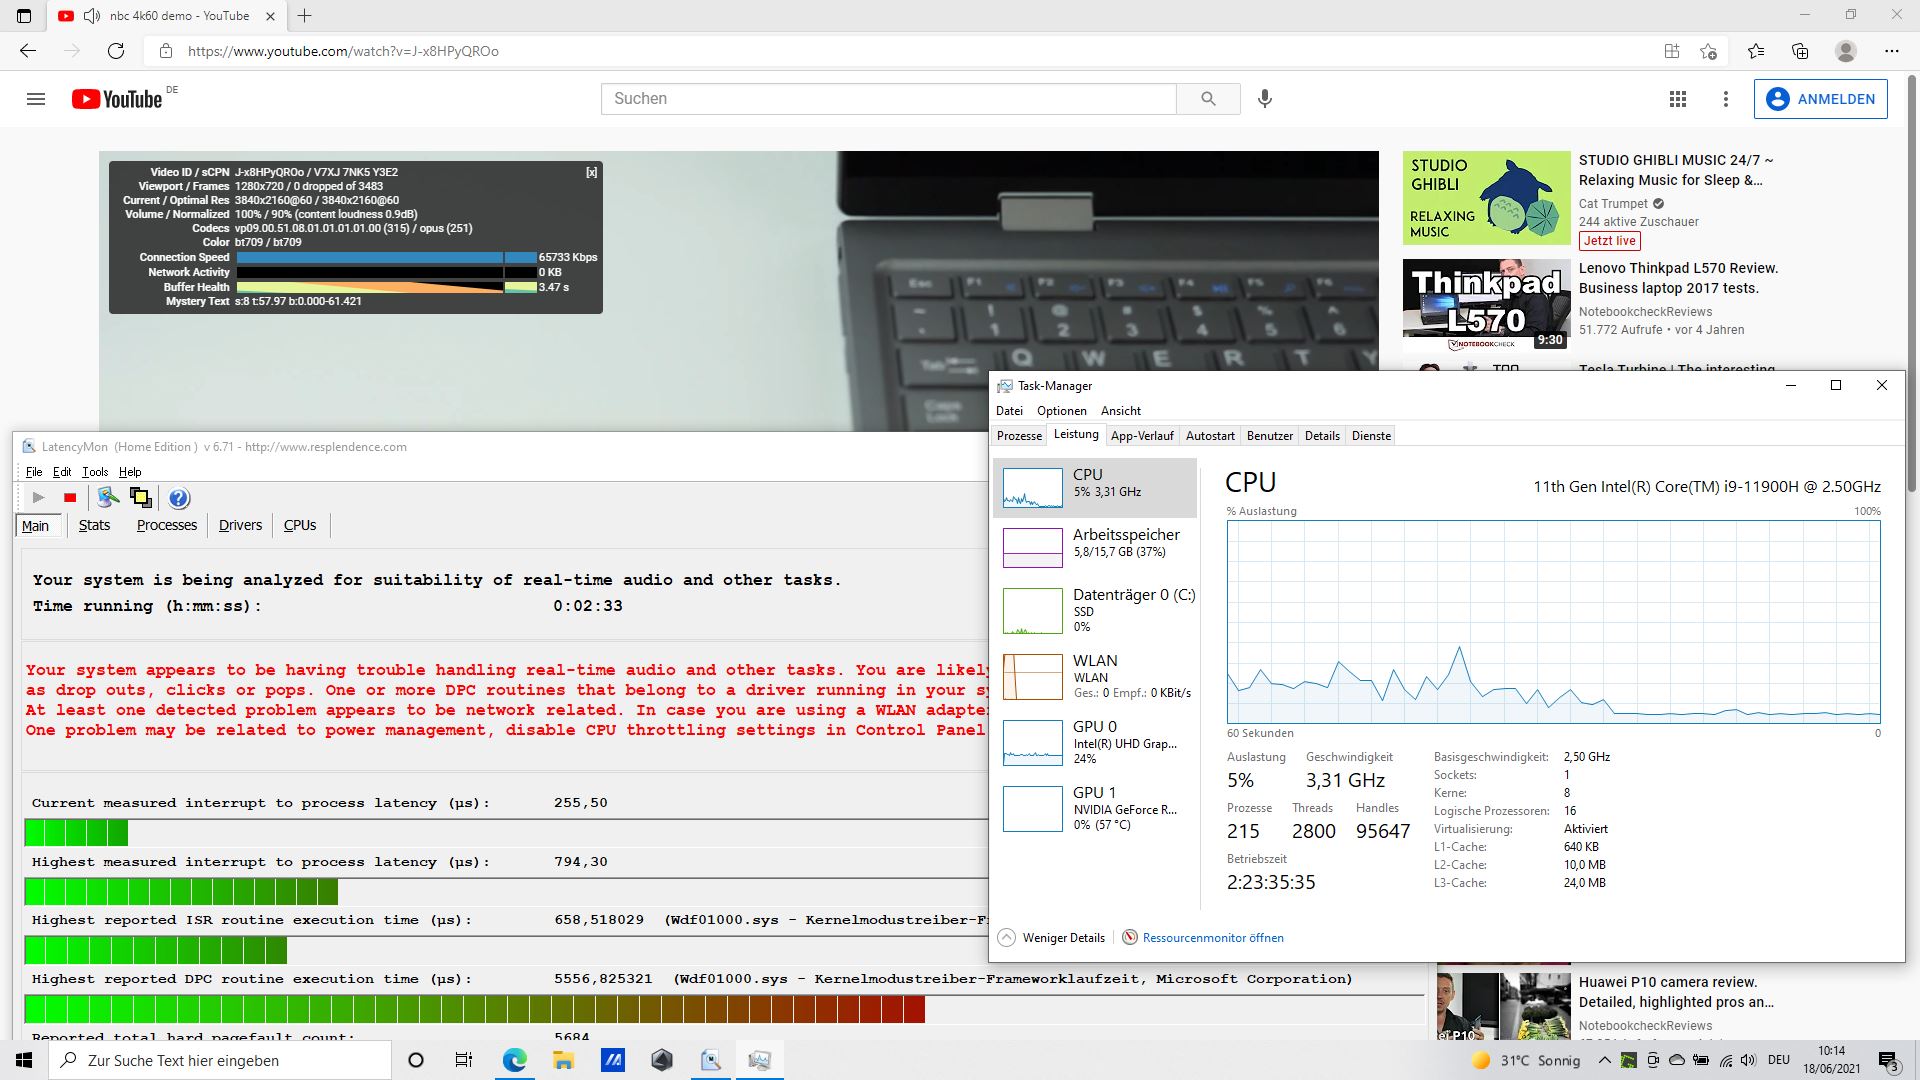
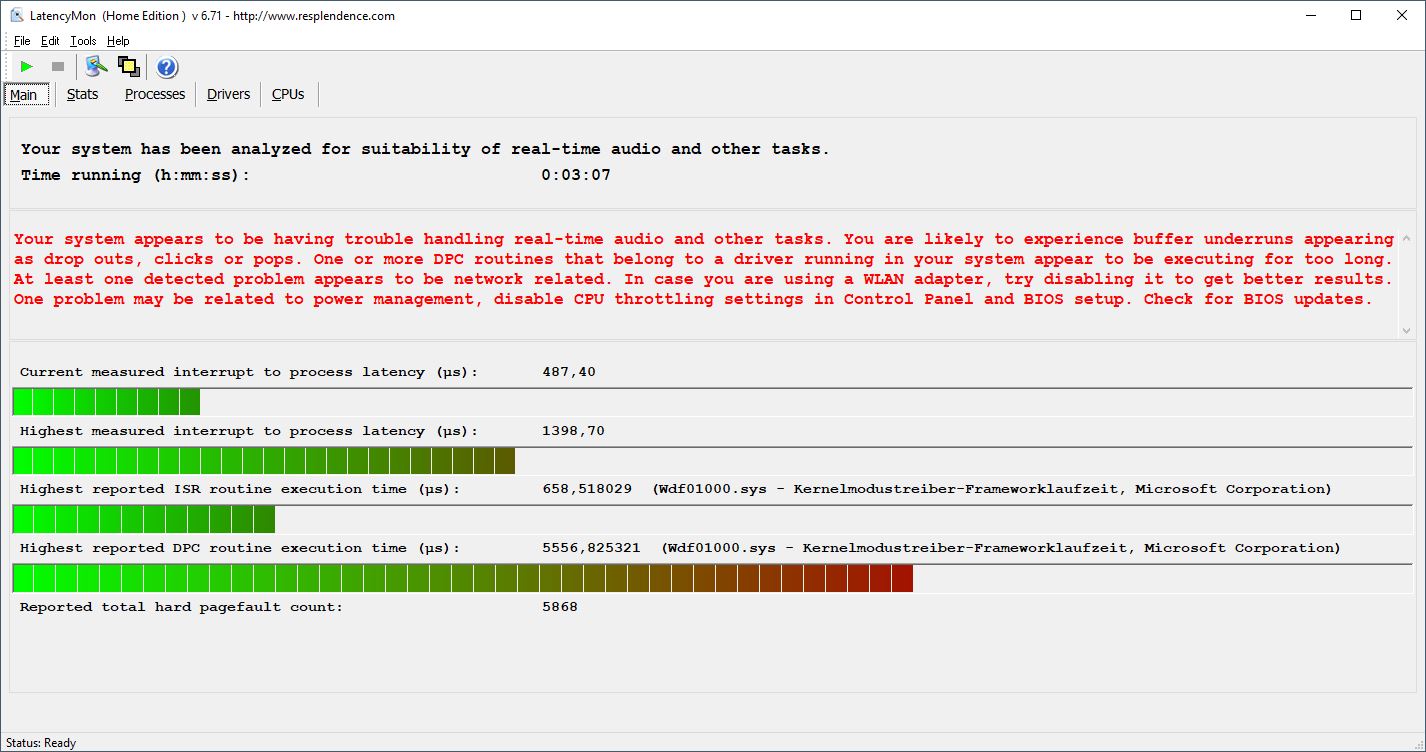
The F17 doesn't get bogged down when opening several browser tabs, but it does when playing our 4K/60 fps YouTube video. There were no dropped frames to complain about at least, but LatencyMon still detected latencies, which means that there might be problems when reproducing real-time audio. The Kernel Mode Driver Framework Runtime is particularly problematic.
| DPC Latencies / LatencyMon - interrupt to process latency (max), Web, Youtube, Prime95 | |
| Asus TUF A17 FA706IU-AS76 | |
| MSI Alpha 17 A4DEK | |
| Asus TUF Gaming F17 FX706HM | |
| Schenker XMG Core 17 (Early 2021) | |
* ... smaller is better
Storage
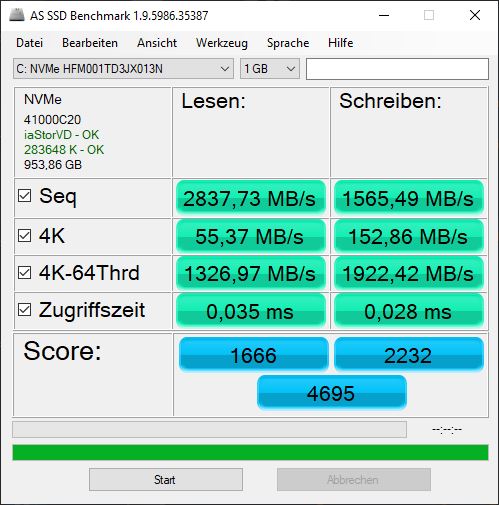
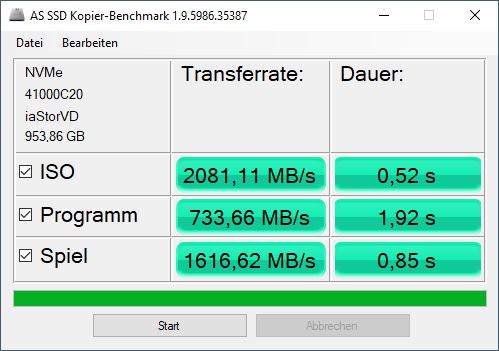
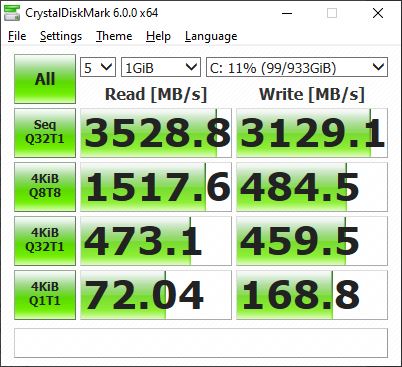
Mass storage consists of a 1 TB NVMe SSD, but the F17 is also available with a smaller 512 GB SSD. This storage drive is ranked 28th in our HDD/SSD Benchmarks article. It achieves good rates in comparison and manages to leave the assembled (budget) competition behind, which is surely a reason for the comparatively good system performance.
| Asus TUF Gaming F17 FX706HM SK Hynix HFM001TD3JX013N | Asus TUF A17 FA706IU-AS76 Intel SSD 660p 1TB SSDPEKNW010T8 | Schenker XMG Core 17 (Early 2021) Samsung SSD 970 EVO Plus 1TB | MSI Alpha 17 A4DEK Kingston OM8PCP3512F-AB | MSI GF65 Thin 10UE Samsung SSD PM981 MZVLB1T0HALR | Acer Aspire Nitro 5 AN515-55-57GF WDC PC SN530 SDBPNPZ-512G | Apple MacBook 12 (Early 2016) 1.1 GHz Apple SSD AP0256 | Acer Predator Helios 300 PH315-53-77N5 WDC PC SN730 SDBQNTY-512GB | Average SK Hynix HFM001TD3JX013N | |
|---|---|---|---|---|---|---|---|---|---|
| CrystalDiskMark 5.2 / 6 | -12% | -1% | -24% | -12% | -26% | -12% | 3% | ||
| Write 4K (MB/s) | 168.8 | 189.7 12% | 145.7 -14% | 204.7 21% | 157.3 -7% | 118 -30% | 137.5 -19% | 155.8 ? -8% | |
| Read 4K (MB/s) | 72 | 62.3 -13% | 51.3 -29% | 50.4 -30% | 46.69 -35% | 48.5 -33% | 48.24 -33% | 57 ? -21% | |
| Write Seq (MB/s) | 1681 | 3036 | 985 | 2389 | 1828 | 2644 | 3943 ? | ||
| Read Seq (MB/s) | 1608 | 2837 | 1193 | 2196 | 1530 | 1718 | 2180 ? | ||
| Write 4K Q32T1 (MB/s) | 459.5 | 468.6 2% | 511 11% | 537 17% | 407.6 -11% | 400 -13% | 416.6 -9% | 452 ? -2% | |
| Read 4K Q32T1 (MB/s) | 473.1 | 541 14% | 582 23% | 300 -37% | 519 10% | 493 4% | 525 11% | 447 ? -6% | |
| Write Seq Q32T1 (MB/s) | 3129 | 1770 -43% | 3294 5% | 982 -69% | 2401 -23% | 1828 -42% | 2705 -14% | 2859 ? -9% | |
| Read Seq Q32T1 (MB/s) | 3529 | 1898 -46% | 3522 0% | 1985 -44% | 3344 -5% | 2128 -40% | 3213 -9% | 3515 ? 0% | |
| Write 4K Q8T8 (MB/s) | 484.5 | 791 ? 63% | |||||||
| Read 4K Q8T8 (MB/s) | 1518 | 1649 ? 9% | |||||||
| AS SSD | -50% | -0% | -54% | -12% | -49% | -116% | -19% | -11% | |
| Seq Read (MB/s) | 2837 | 1320 -53% | 2876 1% | 251.9 -91% | 3002 6% | 1479 -48% | 1056 -63% | 2753 -3% | 2839 ? 0% |
| Seq Write (MB/s) | 1565 | 1539 -2% | 2803 79% | 925 -41% | 2420 55% | 1715 10% | 651 -58% | 2495 59% | 1917 ? 22% |
| 4K Read (MB/s) | 55.4 | 56.3 2% | 55.3 0% | 58.2 5% | 48.46 -13% | 27.8 -50% | 16.4 -70% | 38.64 -30% | 53 ? -4% |
| 4K Write (MB/s) | 152.9 | 158.5 4% | 106.9 -30% | 98 -36% | 114.3 -25% | 106 -31% | 22.1 -86% | 88.8 -42% | 127.3 ? -17% |
| 4K-64 Read (MB/s) | 1327 | 586 -56% | 1662 25% | 461.4 -65% | 1873 41% | 406 -69% | 509 -62% | 952 -28% | 1369 ? 3% |
| 4K-64 Write (MB/s) | 1922 | 820 -57% | 2101 9% | 924 -52% | 1882 -2% | 1119 -42% | 283 -85% | 1568 -18% | 1939 ? 1% |
| Access Time Read * (ms) | 0.035 | 0.043 -23% | 0.067 -91% | 0.09 -157% | 0.045 -29% | 0.128 -266% | 0.186 -431% | 0.0468 ? -34% | |
| Access Time Write * (ms) | 0.028 | 0.113 -304% | 0.037 -32% | 0.022 21% | 0.101 -261% | 0.04 -43% | 0.044 -57% | 0.0532 ? -90% | |
| Score Read (Points) | 1666 | 775 -53% | 2005 20% | 545 -67% | 2221 33% | 581 -65% | 1266 -24% | 1706 ? 2% | |
| Score Write (Points) | 2232 | 1132 -49% | 2488 11% | 1114 -50% | 2238 0% | 1396 -37% | 1906 -15% | 2258 ? 1% | |
| Score Total (Points) | 4695 | 2333 -50% | 5520 18% | 1994 -58% | 5565 19% | 2294 -51% | 3811 -19% | 4797 ? 2% | |
| Copy ISO MB/s (MB/s) | 2081 | 1736 -17% | 2029 -2% | 2421 16% | 1747 -16% | 545 -74% | 2037 -2% | 1908 ? -8% | |
| Copy Program MB/s (MB/s) | 734 | 553 -25% | 691 -6% | 705 -4% | 975 33% | 475.6 -35% | 665 ? -9% | ||
| Copy Game MB/s (MB/s) | 1617 | 1264 -22% | 1513 -6% | 1490 -8% | 1453 -10% | 1018 -37% | 1349 ? -17% | ||
| Total Average (Program / Settings) | -31% /
-39% | -1% /
-0% | -39% /
-43% | -12% /
-12% | -38% /
-42% | -116% /
-116% | -16% /
-17% | -4% /
-6% |
* ... smaller is better

Continuous load read: DiskSpd Read Loop, Queue Depth 8
Graphics card
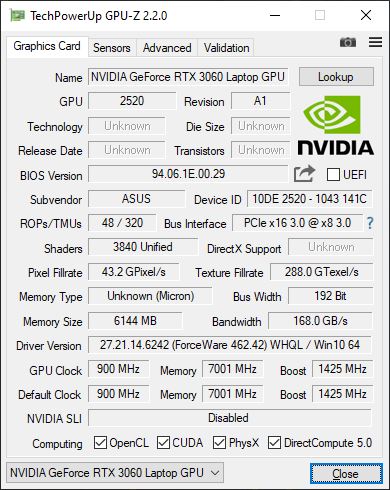
Asus has used an Nvidia GeForce RTX 3060, but the F17 will soon be available with an RTX 3050 and its Ti variant as well. The TGP of an RTX 3060 ranges from about 60 to 130 watts, which means that its performance is very variable depending on the model. In the TUF Gaming F17, the TGP including Dynamic Boost is 95 watts; therefore, it's placed roughly in the middle of the performance range.
Consequently, the card performs around the expected average level. In most cases, the XMG Pro is an insignificant 3% ahead of our F17, despite its higher TGP of 130 watts. The A17 with its 1660 Ti is beaten by about 25% to 80%.
Running 3DMark 11 again on battery power power only yields 19,609 graphics points instead of the previous 25,793 points when plugged in. In other words, graphics performance is reduced by about 24% when the laptop is on the go.
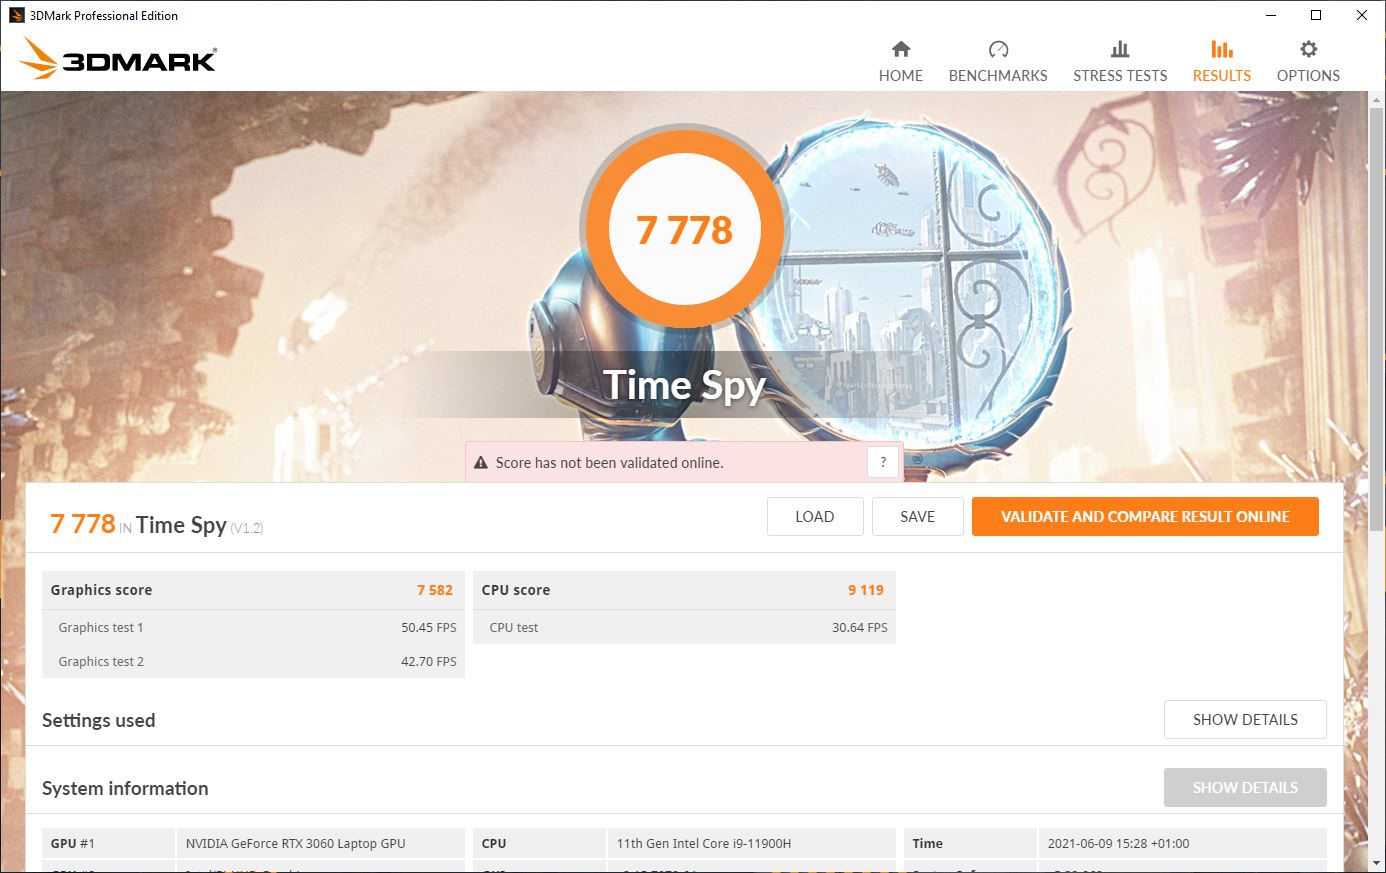
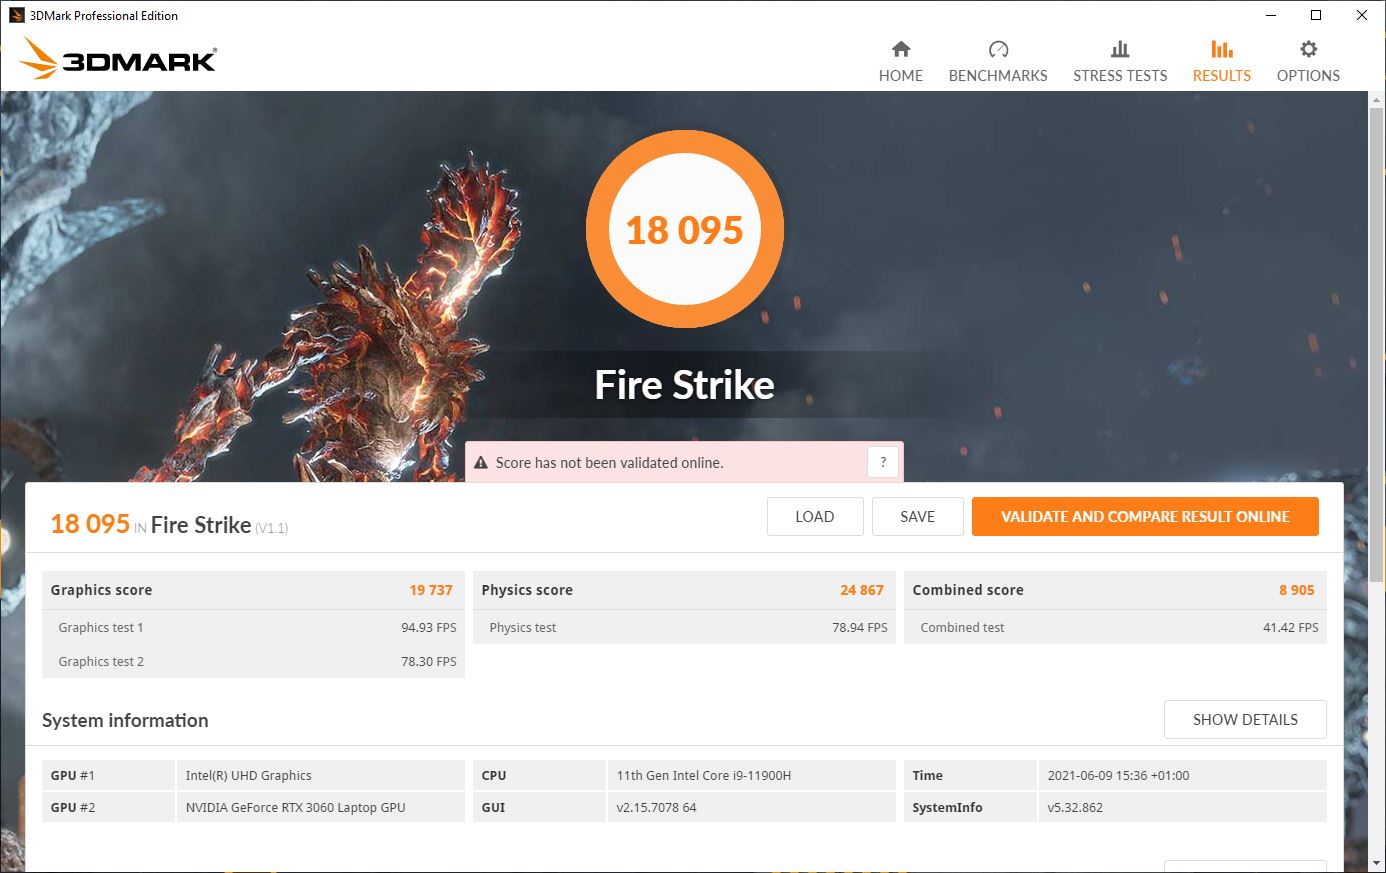
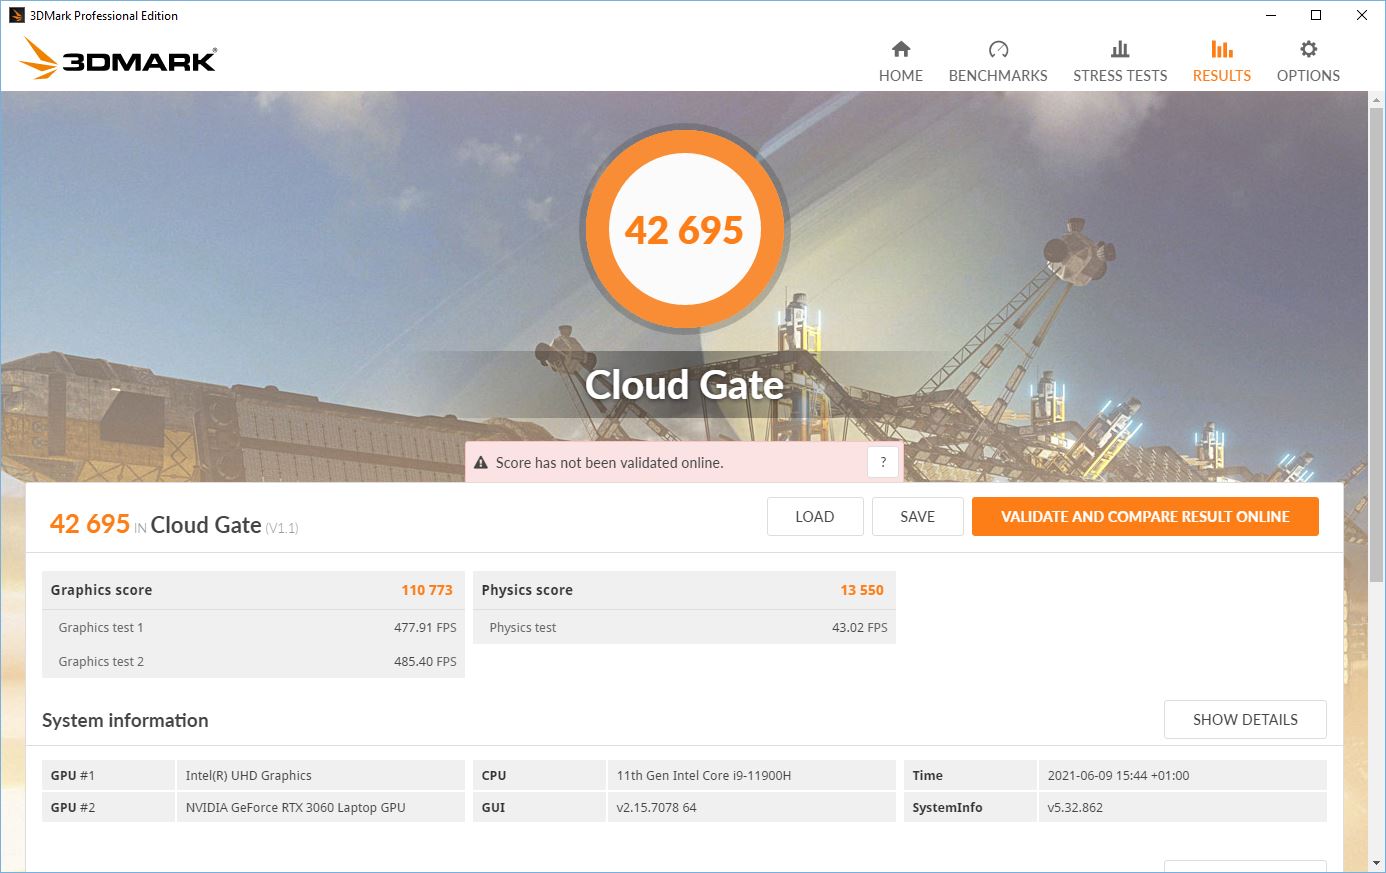
| 3DMark 11 Performance | 22367 points | |
| 3DMark Cloud Gate Standard Score | 42695 points | |
| 3DMark Fire Strike Score | 18095 points | |
| 3DMark Time Spy Score | 7778 points | |
Help | ||
Gaming performance
The graphics card should be able to run all the latest games smoothly at Full HD resolution and maximum details. In The Witcher 3, the Schenker device only has a lead of about 5% with its higher TGP. The game also runs smoothly in Ultra settings at Full HD resolution and 74 fps. Across all the games that we tested, the RTX 3060 in the F17 performs about 3% to 5% below an average RTX 3060. While the Schenker is about 7% faster, it also has a much higher TGP.
The Witcher 3 frame rates remain quite constant over time; they only seem to suddenly fluctuate more strongly towards the end of the one-hour test period.
| low | med. | high | ultra | |
|---|---|---|---|---|
| GTA V (2015) | 181 | 173 | 141 | 80.4 |
| The Witcher 3 (2015) | 328.6 | 218.6 | 140.7 | 74 |
| Dota 2 Reborn (2015) | 165 | 147 | 135 | 121 |
| Final Fantasy XV Benchmark (2018) | 140 | 95.1 | 72.3 | |
| X-Plane 11.11 (2018) | 118 | 97.1 | 80.1 | |
| Far Cry 5 (2018) | 146 | 107 | 100 | 93 |
| Strange Brigade (2018) | 367 | 187 | 149 | 130 |
Emissions - Relatively quiet and balanced
Noise emissions
Using the "Windows" fan profile at least (and the "Best Performance" setting in Windows), the F17 operates fairly quietly, adapting itself dynamically to its cooling needs without ever becoming irritatingly loud. However, a "Turbo" performance mode can also be selected in the Armoury Crate software; it enables the eGPU regardless of the load level, making the fans a bit louder in the process. Nevertheless, they don't run at full speed without regard for load at least, but instead, they adapt dynamically to it in this mode as well.
Noise level
| Idle |
| 26 / 31 / 33 dB(A) |
| Load |
| 48 / 49 dB(A) |
 | ||
30 dB silent 40 dB(A) audible 50 dB(A) loud |
||
min: | ||
| Asus TUF Gaming F17 FX706HM GeForce RTX 3060 Laptop GPU, i9-11900H, SK Hynix HFM001TD3JX013N | Asus TUF A17 FA706IU-AS76 GeForce GTX 1660 Ti Mobile, R7 4800H, Intel SSD 660p 1TB SSDPEKNW010T8 | Schenker XMG Core 17 (Early 2021) GeForce RTX 3060 Laptop GPU, i7-10870H, Samsung SSD 970 EVO Plus 1TB | MSI Alpha 17 A4DEK Radeon RX 5600M, R7 4800H, Kingston OM8PCP3512F-AB | MSI GF65 Thin 10UE GeForce RTX 3060 Laptop GPU, i7-10750H, Samsung SSD PM981 MZVLB1T0HALR | Acer Aspire Nitro 5 AN515-55-57GF GeForce RTX 3060 Laptop GPU, i5-10300H, WDC PC SN530 SDBPNPZ-512G | |
|---|---|---|---|---|---|---|
| Noise | -4% | -8% | -1% | -4% | 1% | |
| off / environment * (dB) | 25 | 28.7 -15% | 25 -0% | 25 -0% | 24.7 1% | 25 -0% |
| Idle Minimum * (dB) | 26 | 28.7 -10% | 30 -15% | 31 -19% | 33.1 -27% | 25 4% |
| Idle Average * (dB) | 31 | 30.5 2% | 32 -3% | 32 -3% | 33.1 -7% | 30 3% |
| Idle Maximum * (dB) | 33 | 32.5 2% | 36 -9% | 33 -0% | 33.1 -0% | 33 -0% |
| Load Average * (dB) | 48 | 42.5 11% | 53 -10% | 38 21% | 42.7 11% | 46 4% |
| Witcher 3 ultra * (dB) | 47 | 50.1 -7% | 51 -9% | 46 2% | 40.6 14% | 47 -0% |
| Load Maximum * (dB) | 49 | 53.4 -9% | 54 -10% | 54 -10% | 59.4 -21% | 50 -2% |
* ... smaller is better
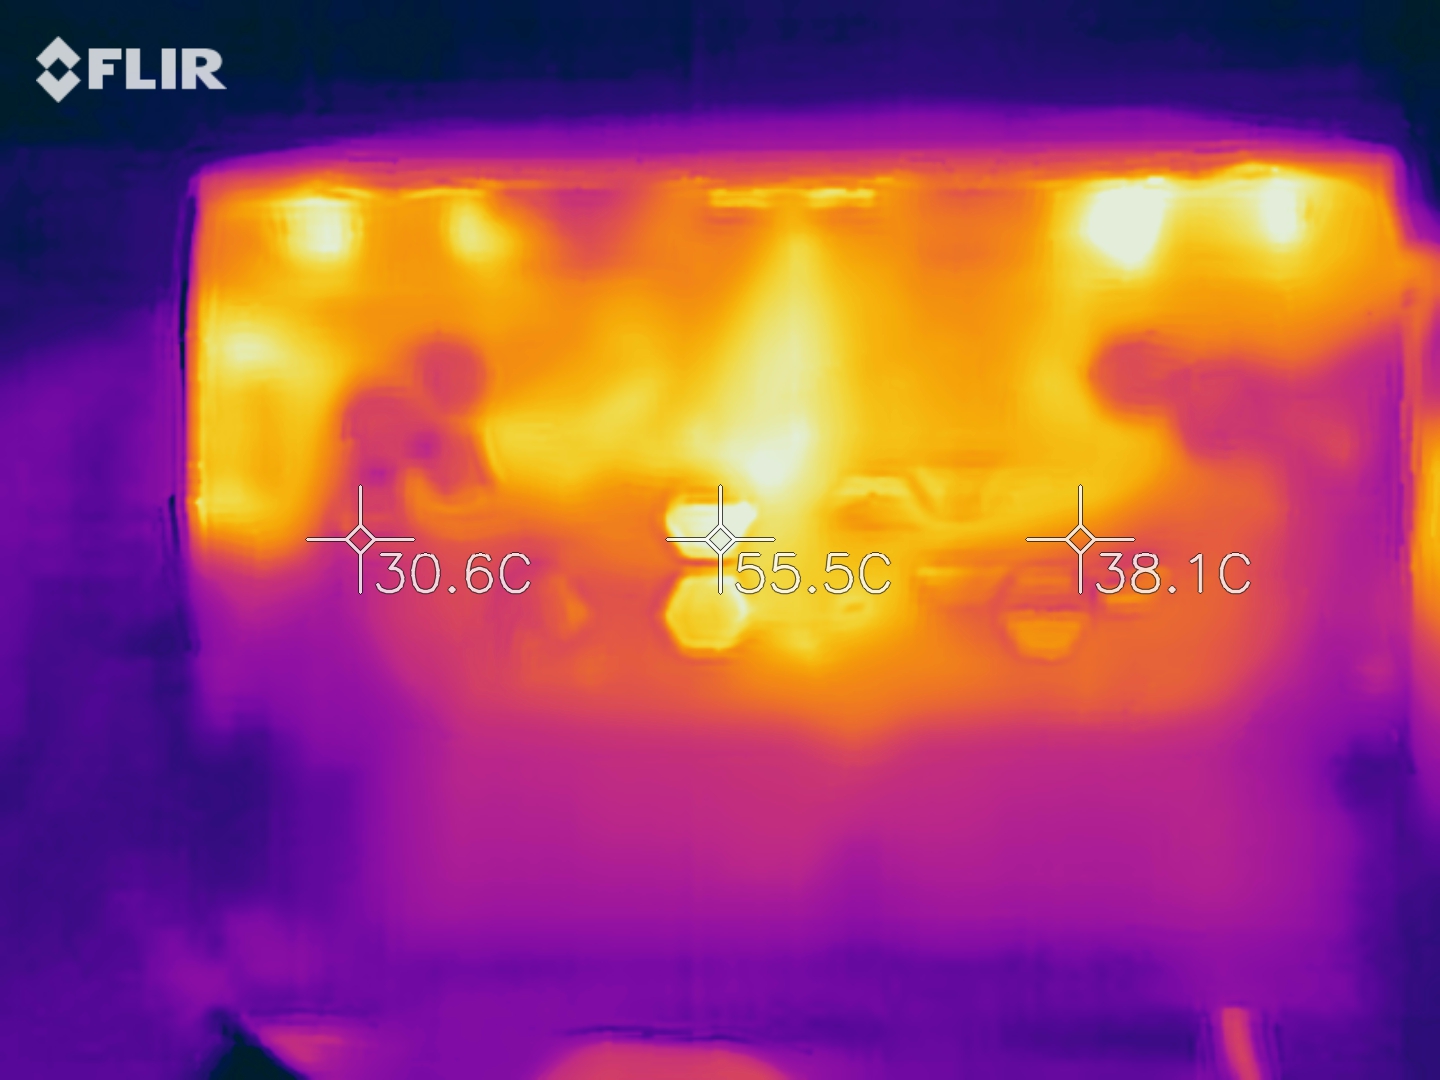
Temperature
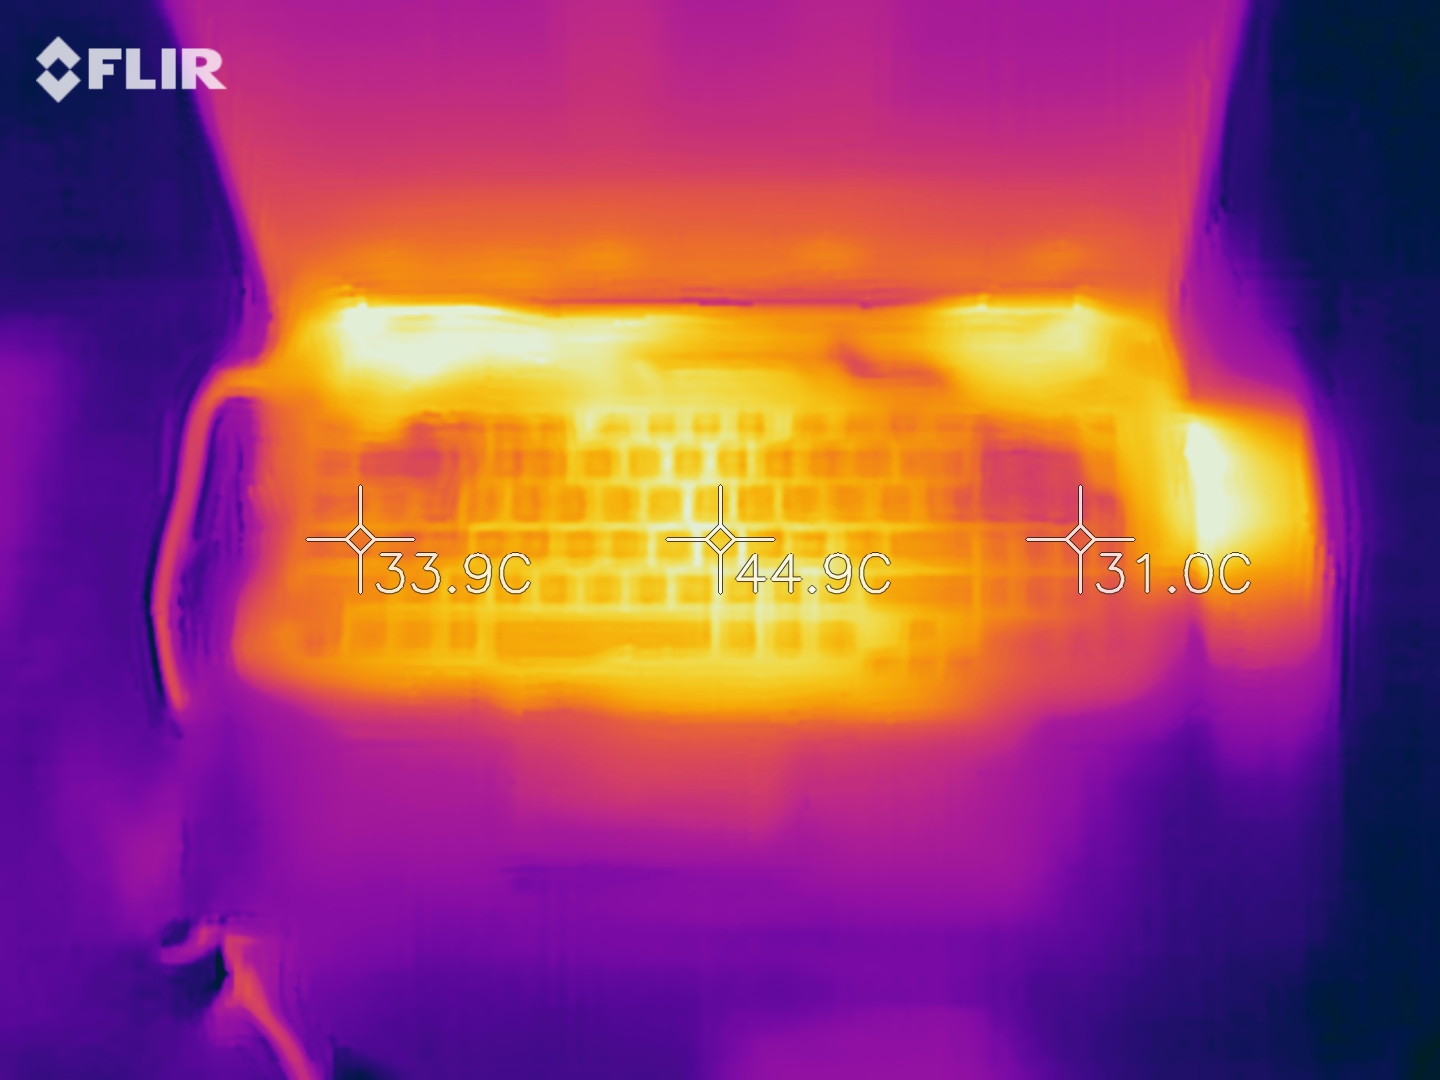
Under maximum load, the F17 heats up to just under 60 °C (~140 °F). The hotspots are on the left and right towards the display; the palm rests always stay at the coolest temperature, and even the WASD keys don't get excessively warm.
(-) The maximum temperature on the upper side is 58.5 °C / 137 F, compared to the average of 40.4 °C / 105 F, ranging from 21.2 to 68.8 °C for the class Gaming.
(-) The bottom heats up to a maximum of 58.5 °C / 137 F, compared to the average of 43.2 °C / 110 F
(±) In idle usage, the average temperature for the upper side is 34 °C / 93 F, compared to the device average of 33.9 °C / 93 F.
(-) Playing The Witcher 3, the average temperature for the upper side is 39.8 °C / 104 F, compared to the device average of 33.9 °C / 93 F.
(+) The palmrests and touchpad are cooler than skin temperature with a maximum of 31 °C / 87.8 F and are therefore cool to the touch.
(-) The average temperature of the palmrest area of similar devices was 28.8 °C / 83.8 F (-2.2 °C / -4 F).
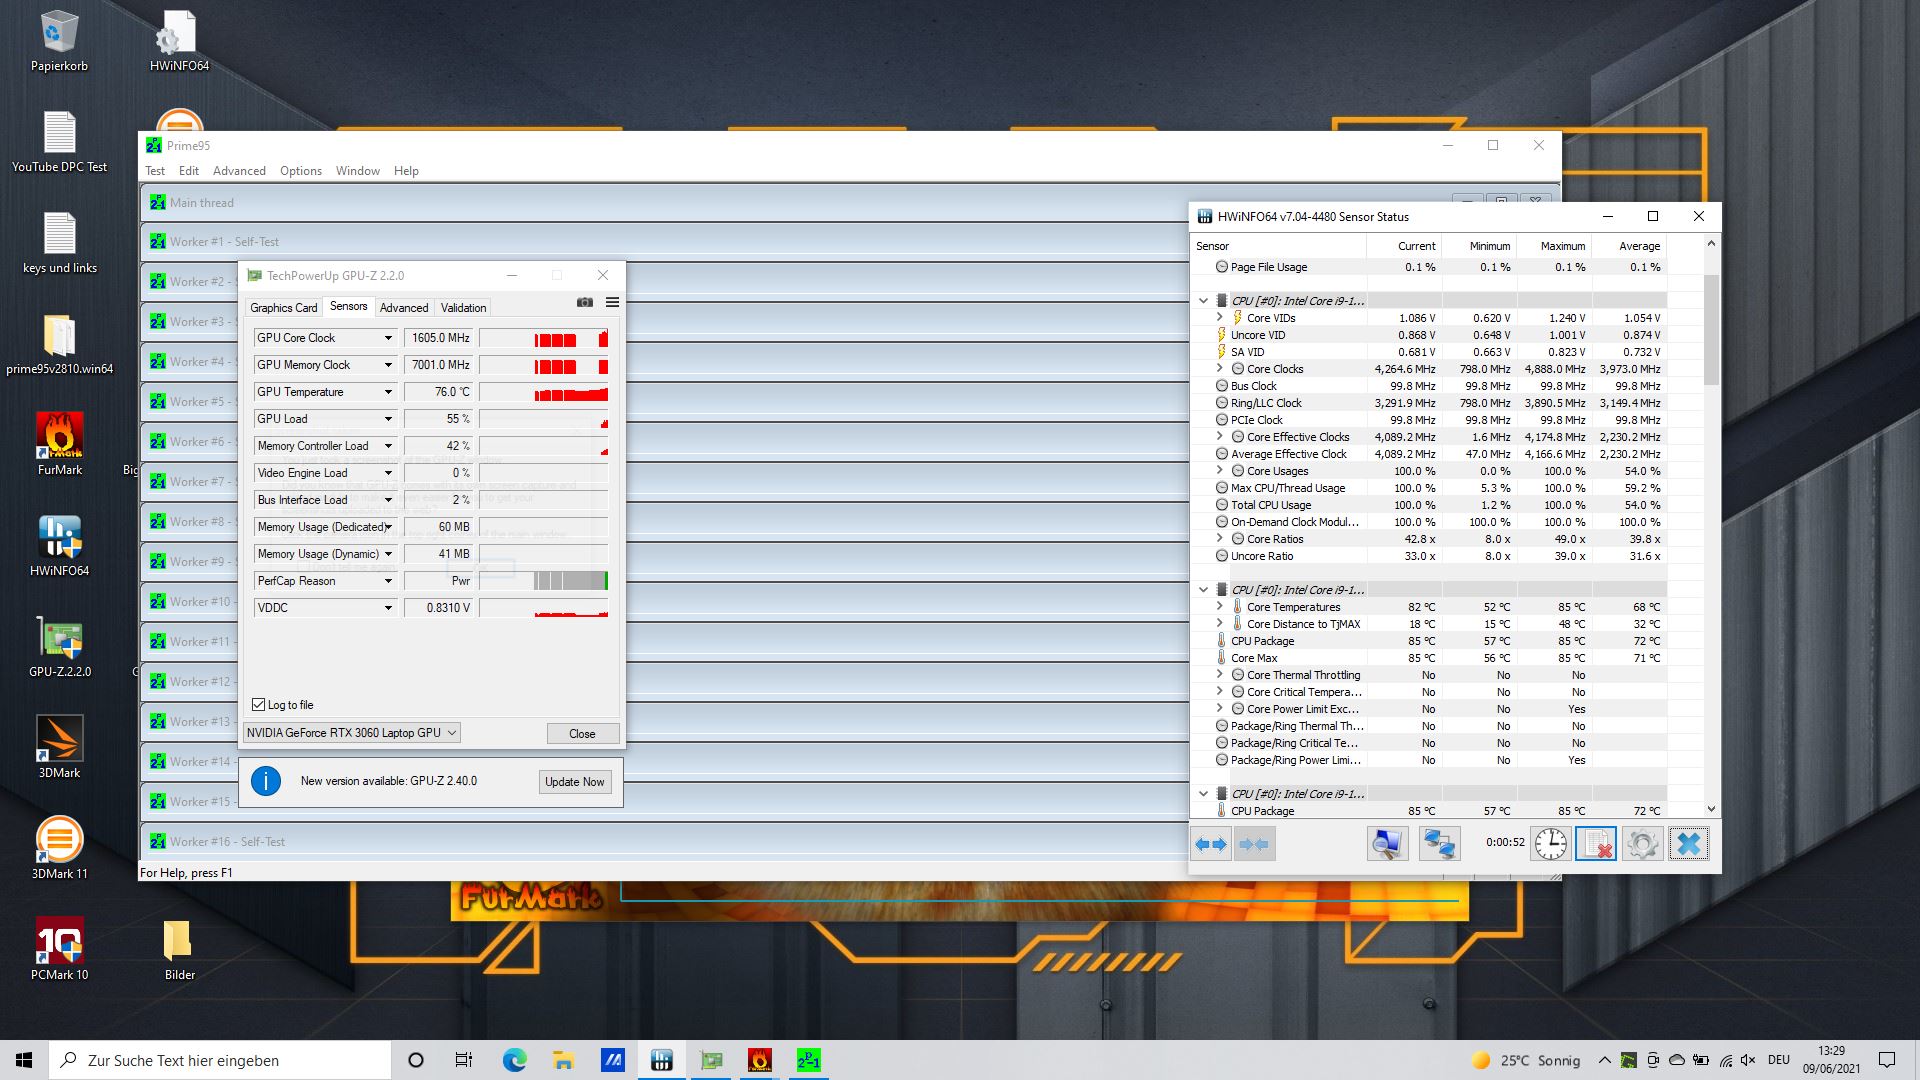
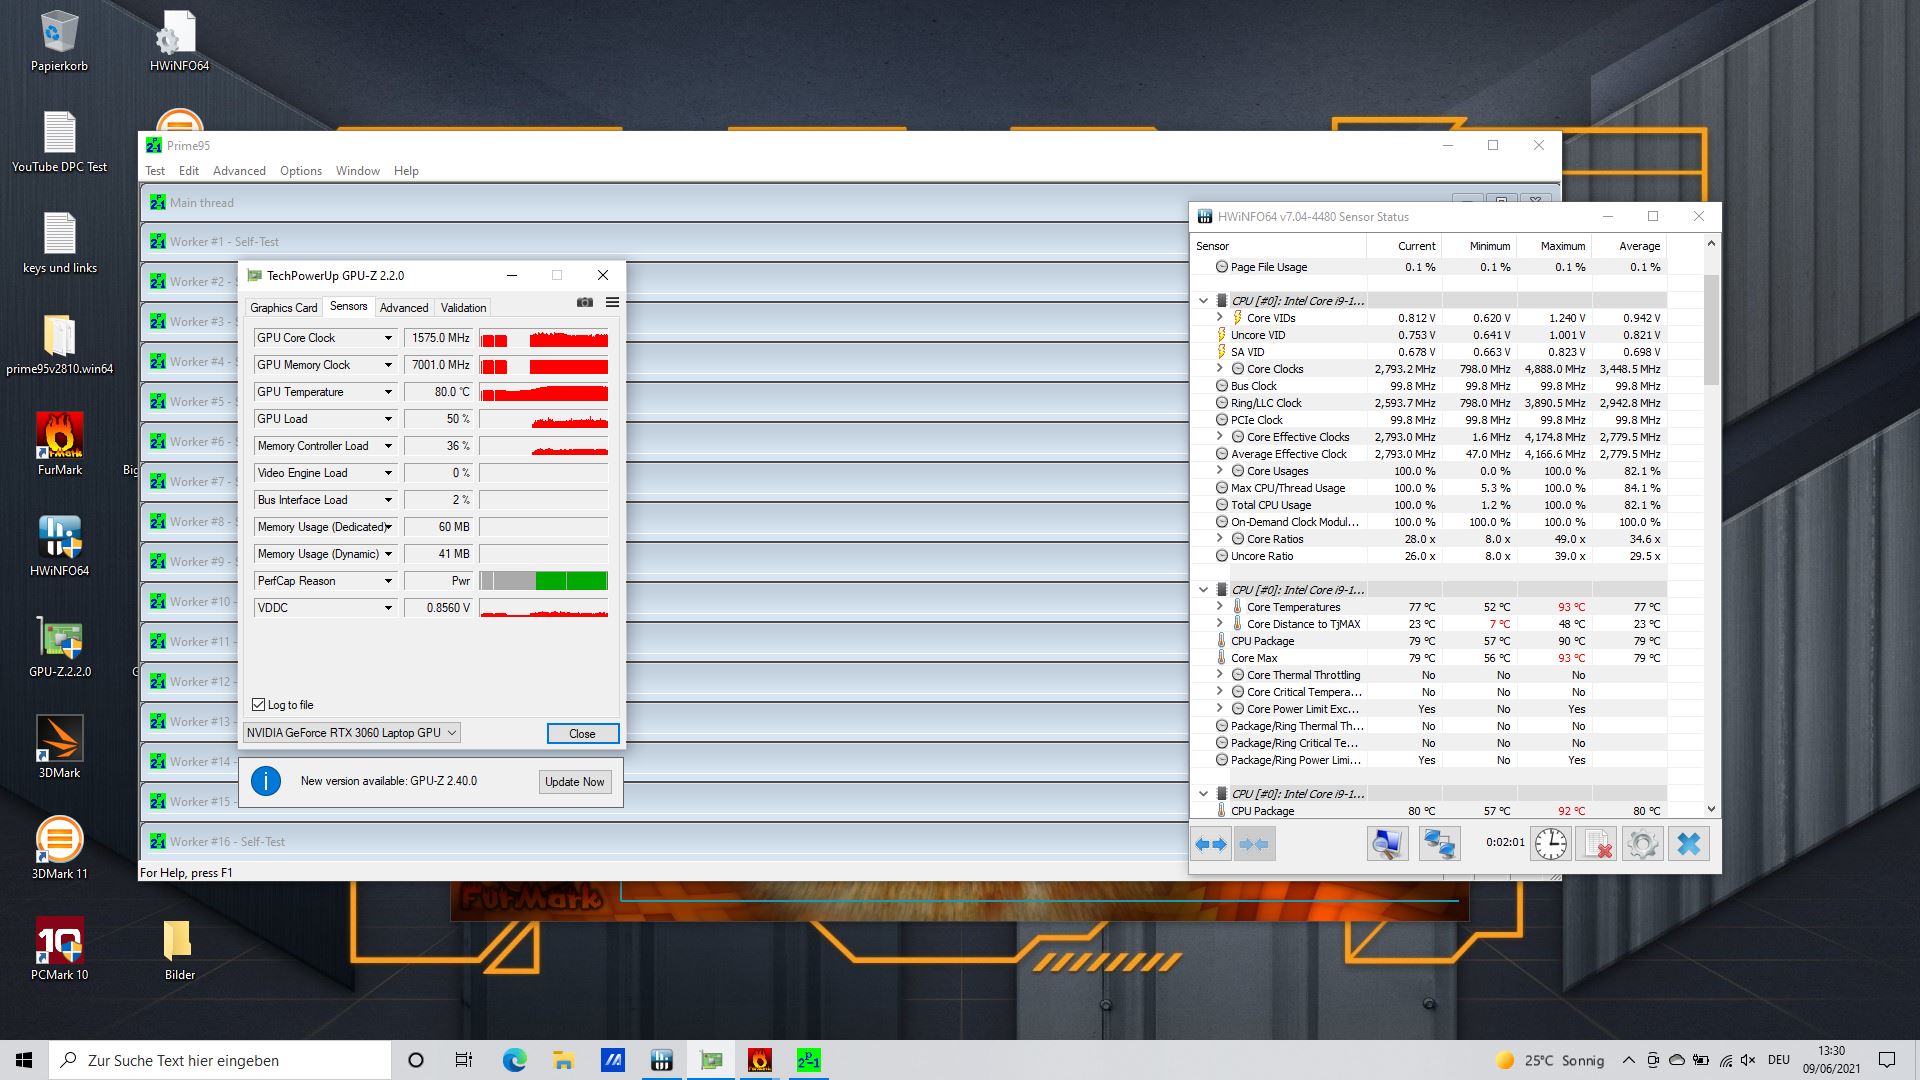
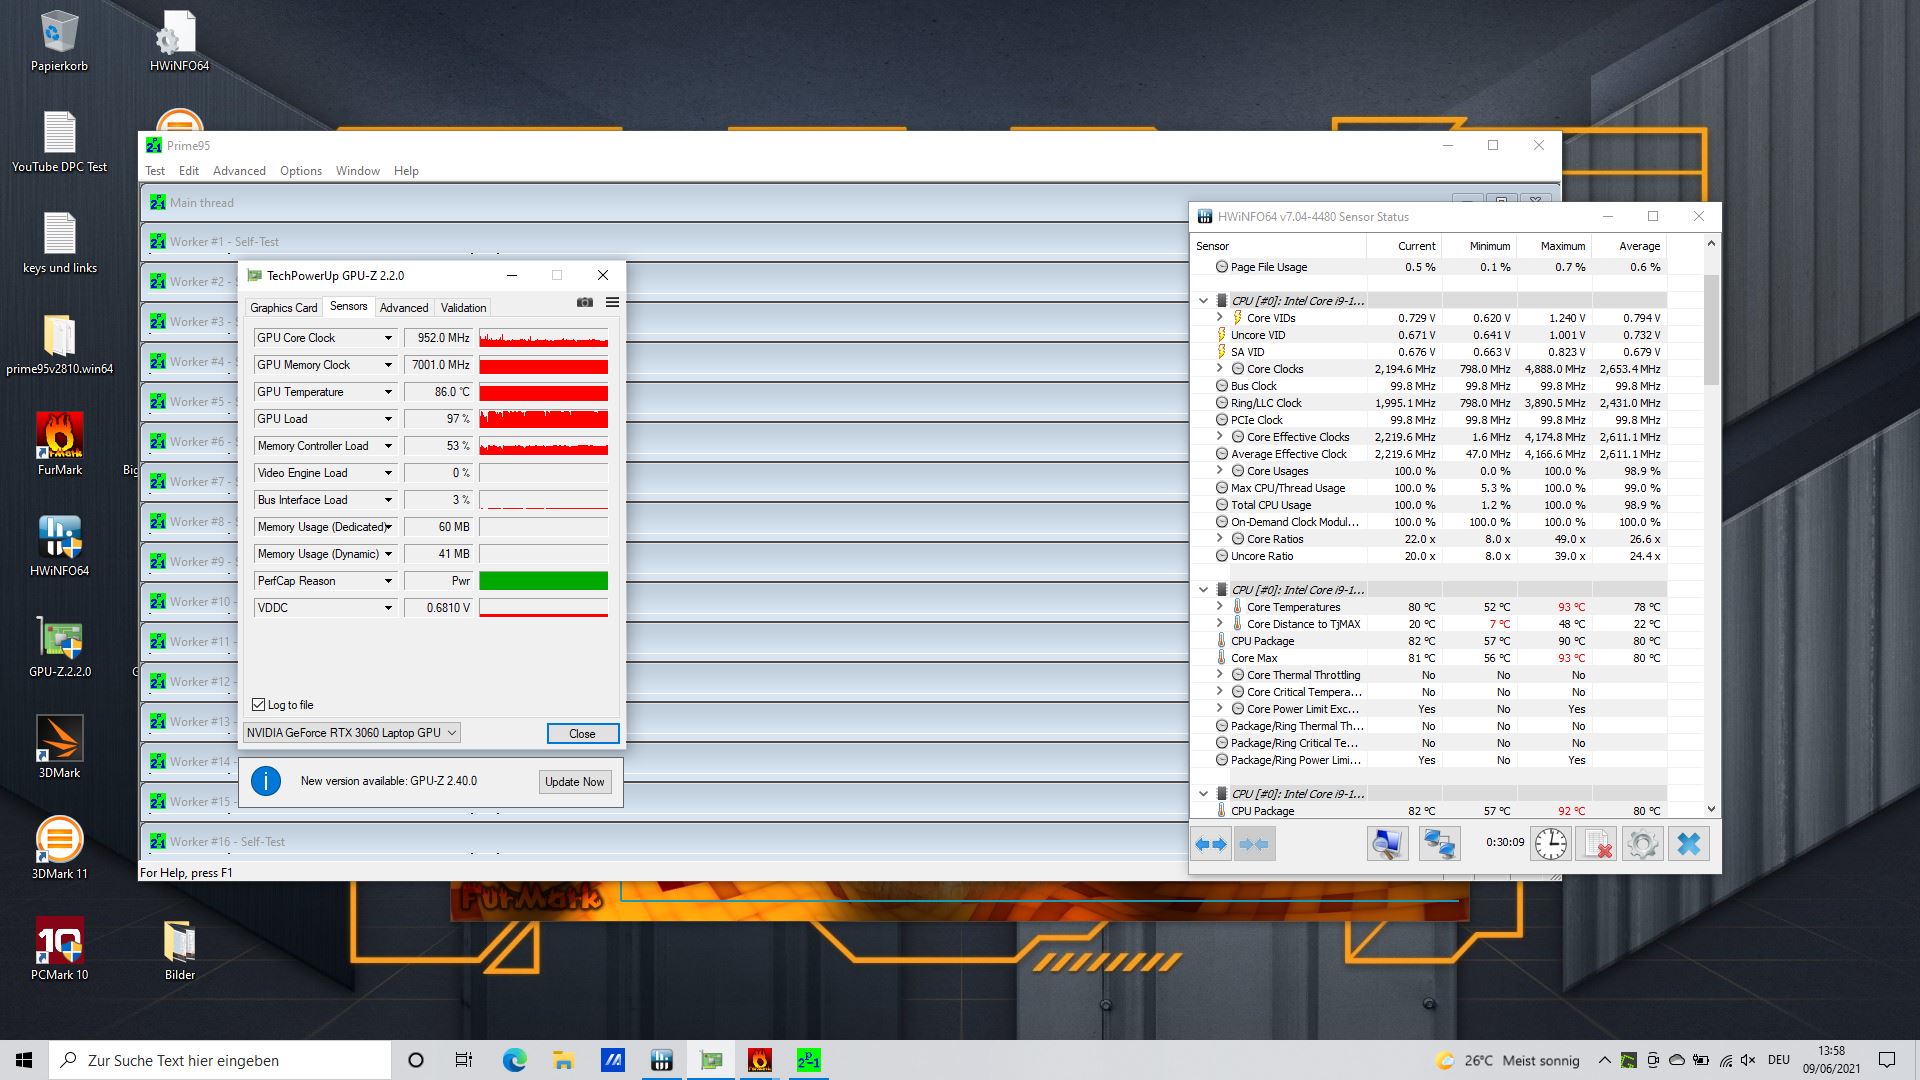
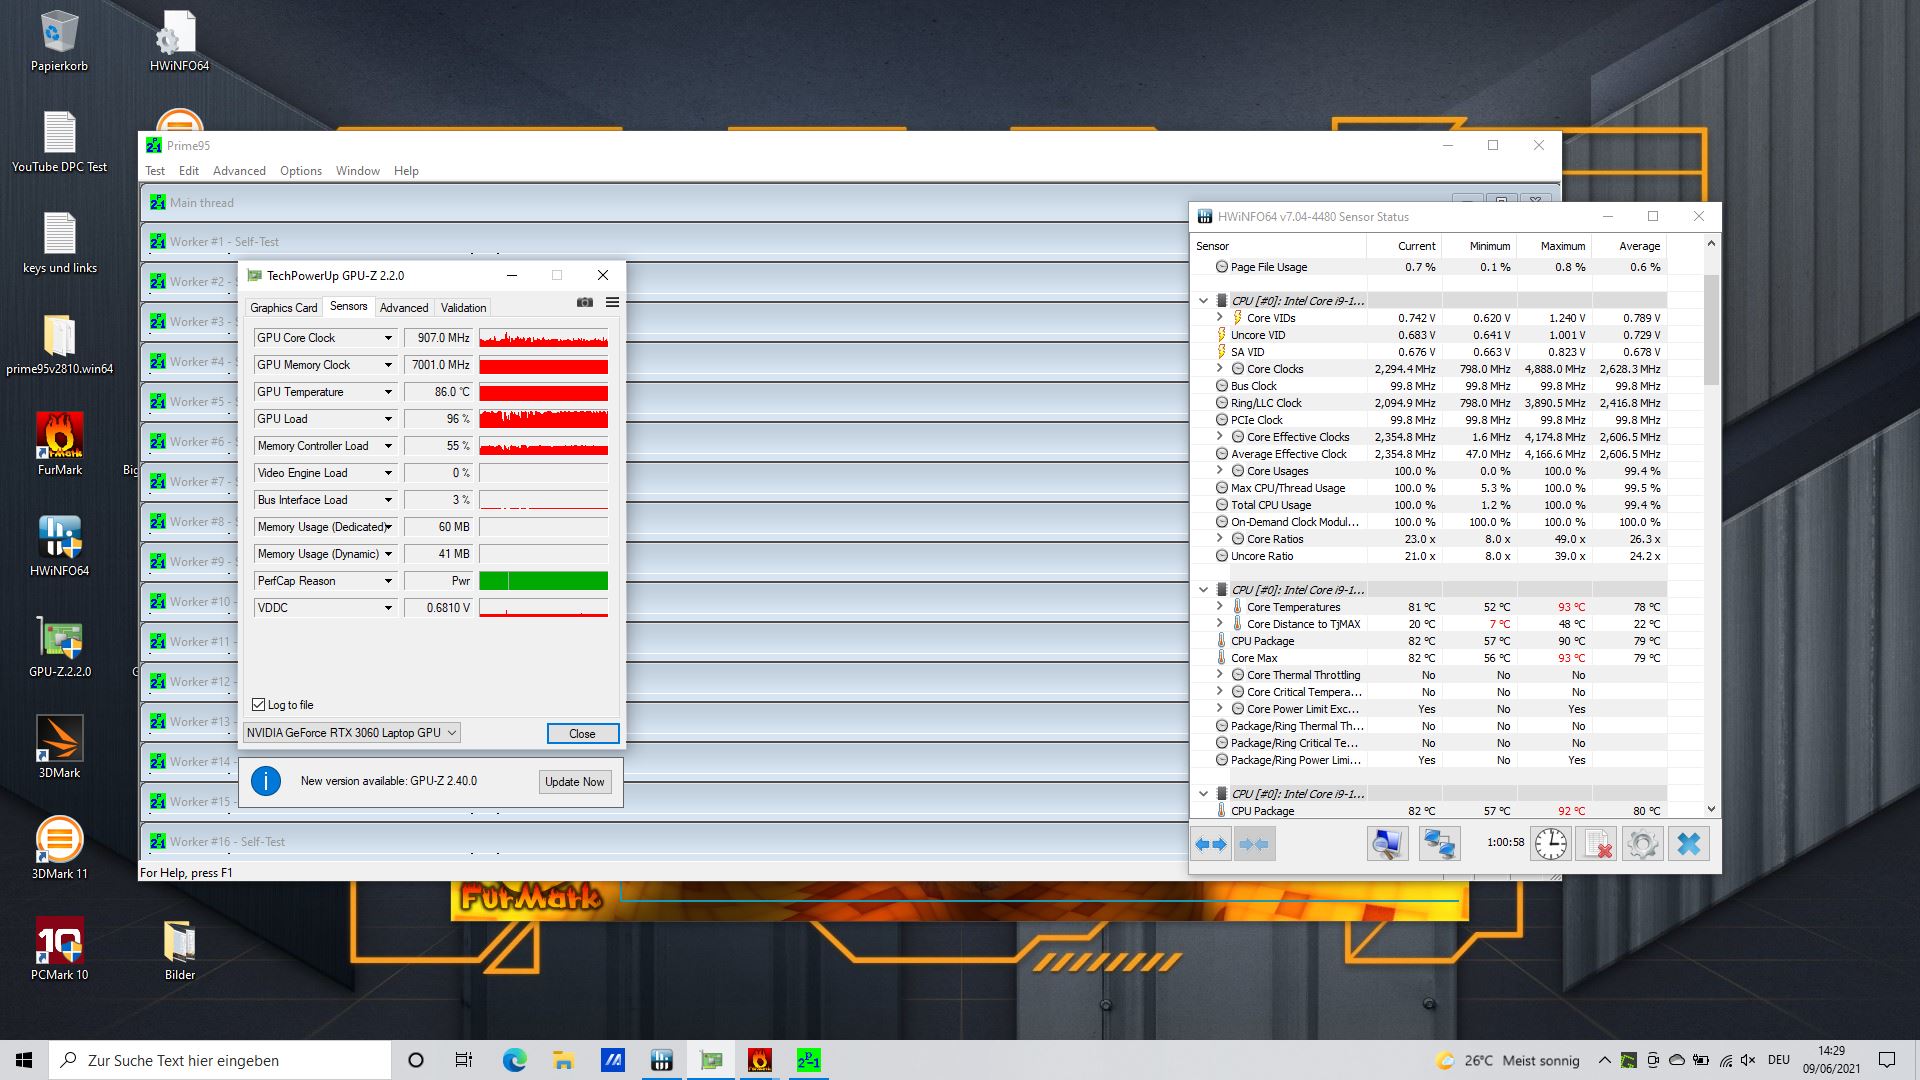
The Asus begins our stress test at around 4.3 GHz. Thermal throttling kicks in after only a short time, since the core temperatures reach over 90 °C (~194 °F). The CPU clock speed eventually settles at around 2.3 GHz and consequently slightly below the base clock rate of 2.5 GHz.
The graphics card's clock rate is about 1.6 GHz at the beginning. It drops pretty continuously over the test duration to finally reach 900 MHz.
A new 3DMark 11 run directly after the stress test results in a score of 22,300 instead of the original 25,793 points. This means that the laptop needs some time to recover, but the performance loss isn't very high.
Speakers
The speakers are average at best compared to the already underwhelming performance of current laptop speakers. They're a bit too quiet, there's virtually no bass at all, and even mids and highs could be more balanced.
Therefore, external audio devices like headphones, which can be connected using the combined headset jack, are recommended.
Asus TUF Gaming F17 FX706HM audio analysis
(±) | speaker loudness is average but good (79 dB)
Bass 100 - 315 Hz
(-) | nearly no bass - on average 15.8% lower than median
(±) | linearity of bass is average (8.7% delta to prev. frequency)
Mids 400 - 2000 Hz
(±) | higher mids - on average 5.5% higher than median
(+) | mids are linear (6.8% delta to prev. frequency)
Highs 2 - 16 kHz
(+) | balanced highs - only 3.2% away from median
(±) | linearity of highs is average (9.3% delta to prev. frequency)
Overall 100 - 16.000 Hz
(±) | linearity of overall sound is average (17.8% difference to median)
Compared to same class
» 53% of all tested devices in this class were better, 10% similar, 37% worse
» The best had a delta of 6%, average was 18%, worst was 132%
Compared to all devices tested
» 36% of all tested devices were better, 8% similar, 56% worse
» The best had a delta of 4%, average was 24%, worst was 134%
Schenker XMG Core 17 (Early 2021) audio analysis
(+) | speakers can play relatively loud (82 dB)
Bass 100 - 315 Hz
(-) | nearly no bass - on average 27.5% lower than median
(±) | linearity of bass is average (12.8% delta to prev. frequency)
Mids 400 - 2000 Hz
(+) | balanced mids - only 2.3% away from median
(+) | mids are linear (5.4% delta to prev. frequency)
Highs 2 - 16 kHz
(+) | balanced highs - only 3.5% away from median
(±) | linearity of highs is average (9.9% delta to prev. frequency)
Overall 100 - 16.000 Hz
(±) | linearity of overall sound is average (17.5% difference to median)
Compared to same class
» 49% of all tested devices in this class were better, 12% similar, 40% worse
» The best had a delta of 6%, average was 18%, worst was 132%
Compared to all devices tested
» 34% of all tested devices were better, 8% similar, 58% worse
» The best had a delta of 4%, average was 24%, worst was 134%
Energy management - Large battery and low energy consumption
Energy consumption
The F17 consumes only a few percentage points more than the A17 with does with its GTX 1660 Ti, while the XMG Pro, which is about 7% faster in graphics applications, consumes 30% more. Overall, the TUF Gaming has a relatively low power consumption. We measured a maximum consumption of 190 watts, which should be easily covered by the 200-watt power adapter.
| Off / Standby | |
| Idle | |
| Load |
|
Key:
min: | |
| Asus TUF Gaming F17 FX706HM i9-11900H, GeForce RTX 3060 Laptop GPU, SK Hynix HFM001TD3JX013N, IPS, 1920x1080, 17.3" | Asus TUF A17 FA706IU-AS76 R7 4800H, GeForce GTX 1660 Ti Mobile, Intel SSD 660p 1TB SSDPEKNW010T8, IPS, 1920x1080, 17.3" | Schenker XMG Core 17 (Early 2021) i7-10870H, GeForce RTX 3060 Laptop GPU, Samsung SSD 970 EVO Plus 1TB, IPS, 2560x1440, 17.3" | MSI Alpha 17 A4DEK R7 4800H, Radeon RX 5600M, Kingston OM8PCP3512F-AB, IPS, 1920x1080, 17.3" | MSI GF65 Thin 10UE i7-10750H, GeForce RTX 3060 Laptop GPU, Samsung SSD PM981 MZVLB1T0HALR, IPS, 1920x1080, 15.6" | Acer Aspire Nitro 5 AN515-55-57GF i5-10300H, GeForce RTX 3060 Laptop GPU, WDC PC SN530 SDBPNPZ-512G, IPS, 1920x1080, 15.6" | Average NVIDIA GeForce RTX 3060 Laptop GPU | Average of class Gaming | |
|---|---|---|---|---|---|---|---|---|
| Power Consumption | 7% | -30% | 1% | 10% | 21% | -14% | -35% | |
| Idle Minimum * (Watt) | 10.3 | 7.4 28% | 13 -26% | 9 13% | 5.4 48% | 5 51% | 10.4 ? -1% | 13.2 ? -28% |
| Idle Average * (Watt) | 13.1 | 10.5 20% | 16 -22% | 12 8% | 12.8 2% | 9 31% | 14.5 ? -11% | 18.9 ? -44% |
| Idle Maximum * (Watt) | 14.1 | 17 -21% | 29 -106% | 18 -28% | 19.5 -38% | 13 8% | 21.4 ? -52% | 24.3 ? -72% |
| Load Average * (Watt) | 110 | 103.7 6% | 100 9% | 76 31% | 86.6 21% | 84 24% | 109.3 ? 1% | 108 ? 2% |
| Witcher 3 ultra * (Watt) | 138 | 128.1 7% | 173 -25% | 136 1% | 115.7 16% | 125 9% | ||
| Load Maximum * (Watt) | 190 | 183.2 4% | 213 -12% | 222 -17% | 175.2 8% | 190 -0% | 206 ? -8% | 254 ? -34% |
* ... smaller is better
Battery life
At 90 Wh, the battery is quite large; this has a very positive effect on runtimes, which are surprisingly long for a gaming laptop. The Schenker XMG Pro and MSI Alpha competitors are only equipped with 62 Wh and 65 Wh batteries, respectively.
In the WLAN test, the F17 lasted a whole 7.5 hours and therefore about 2.5 hours longer than the XMG Pro.
| Asus TUF Gaming F17 FX706HM i9-11900H, GeForce RTX 3060 Laptop GPU, 90 Wh | Asus TUF A17 FA706IU-AS76 R7 4800H, GeForce GTX 1660 Ti Mobile, 90 Wh | Schenker XMG Core 17 (Early 2021) i7-10870H, GeForce RTX 3060 Laptop GPU, 62 Wh | MSI Alpha 17 A4DEK R7 4800H, Radeon RX 5600M, 65 Wh | MSI GF65 Thin 10UE i7-10750H, GeForce RTX 3060 Laptop GPU, 51 Wh | Acer Aspire Nitro 5 AN515-55-57GF i5-10300H, GeForce RTX 3060 Laptop GPU, 57.5 Wh | Average of class Gaming | |
|---|---|---|---|---|---|---|---|
| Battery runtime | 22% | -43% | -22% | -48% | -31% | -17% | |
| H.264 (h) | 8.5 | 4.7 -45% | 6.2 -27% | 8.26 ? -3% | |||
| WiFi v1.3 (h) | 7.6 | 8.5 12% | 4.9 -36% | 7.3 -4% | 4.6 -39% | 5.7 -25% | 7.02 ? -8% |
| Load (h) | 2.5 | 3.3 32% | 1.3 -48% | 1.5 -40% | 1.1 -56% | 1.5 -40% | 1.47 ? -41% |
| Reader / Idle (h) | 9.1 | 7.7 | 10.5 | 11.1 | 8.71 ? |
Pros
Cons
Verdict - Good budget gaming laptop
The RTX 3060 in the F17 only has a maximum TGP of 95 watts, but it performs only marginally slower in games than the XMG Pro with its TGP of 130 watts. As a result, you definitely won't go wrong with the budget gaming laptop in terms of performance. Thunderbolt 4 is certainly not a given for a budget gaming device, and customers will also be pleased with the SSD, which is good for this price range, and above all with the strong battery life. In addition, the display supports Adaptive Sync and 144 Hz.
However, the monitor's remaining rates are less impressive, and the weak Wi-Fi connection is also worthy of criticism. But the positive aspects prevail by far, so that users will get a good gaming laptop with the F17. The only question now is at what price the laptop will be sold, which will determine whether purchasing it is recommendable or whether there are better alternatives in this price range.
The TUF Gaming F17 offers good gaming performance, Thunderbolt 4, and 144 Hz with Adaptive Sync. However, the display could be better as could Wi-Fi performance.
Price and availability
Asus TUF Gaming F17 FX706HM
- 06/24/2021 v7 (old)
Christian Hintze
Price comparison

