Notebook reviews with NVIDIA GeForce RTX 3050 Ti Laptop GPU graphics card
Asus VivoBook Pro 16 review: A multimedia laptop with a Core i7, RTX 3050 Ti and DCI-P3
The VivoBook doesn't exactly come with the newest hardware (Alder Lake, Ampere), but it does score points for other reasons: The Asus laptop has a bright 16-inch screen (2,560 x 1,600 pixels) in 16:10 format which has a high refresh rate (120 Hz) and great color space coverage (DCI-P3).
Intel Core i7-12700H, NVIDIA GeForce RTX 3050 Ti Laptop GPU, 16", 1.9 kgHP Victus 15 laptop review: Expensive for a budget gamer
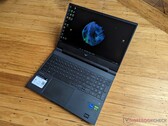
The Victus 15 is supposed to be a wallet-friendly alternative to the Omen series, but it walks a fine line with its hefty retail price of US$1200 for an entry-level GPU that performs almost identically to the two-year old GTX 1660 Ti.
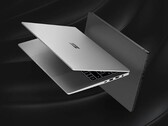
Intel Core i7-12700H, NVIDIA GeForce RTX 3050 Ti Laptop GPU, 15.6", 2.3 kgMSI Prestige 15 laptop review: Dazzling 4K image quality, solid performance
MSI's Creator notebook combines outstanding image values with an efficient and powerful processor as well as a separate graphics chip with implemented ray tracing. The combination seems particularly suitable for image editing/processing at a higher level.
Intel Core i7-1280P, NVIDIA GeForce RTX 3050 Ti Laptop GPU, 15.6", 1.8 kgSchenker Vision 14 Laptop in review - Massive Core i7-12700H performance upgrade
Considering the low weight, even the Tiger Lake Schenker Vision 14 with the GeForce RTX 3050 Ti GPU was a very powerful 14-inch laptop that gets a massive boost with this generation's Alder Lake Core i7-12700H upgrade. Additionally, the battery size has been increased for significantly improved runtimes.
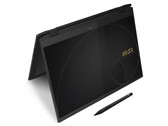
Intel Core i7-12700H, NVIDIA GeForce RTX 3050 Ti Laptop GPU, 14", 1.3 kgMSI Summit E16 Flip review: 2-in-1 laptop with pen, 16:10 display, and RTX 3050 Ti
The Summit E16 Flip offers a 16-inch touchscreen display in the more office-friendly 16:10 format, Thunderbolt 4, and a dedicated GeForce RTX 3050 Ti Laptop GPU. The touchscreen can be operated with fingers or the included MSI input pen.
Intel Core i7-1280P, NVIDIA GeForce RTX 3050 Ti Laptop GPU, 16", 1.9 kgLenovo IdeaPad Gaming 3 15IAH7: Intel Core i5-12500H, 15.60", 2.4 kg
Review » Lenovo IdeaPad Gaming 3 15IAH7 review: One of the most powerful RTX 3050 Ti laptops
HP Pavilion Gaming 17-cd2146ng: Intel Core i5-11300H, 17.30", 2.8 kg
Review » HP Pavilion Gaming 17 laptop review: A good display at a budget price
Dell Inspiron 16 Plus 7620: Intel Core i7-12700H, 16.00", 2.1 kg
Review » Dell Inspiron 16 Plus 7620 review: The do-it-all multimedia laptop
Dell XPS 15 9520 RTX 3050 Ti: Intel Core i7-12700H, 15.60", 1.9 kg
Review » 2022 Dell XPS 15 9520 3.5K OLED laptop review: Skip or buy?
HP Victus 16-e0145ng: AMD Ryzen 5 5600H, 16.10", 2.4 kg
Review » HP Victus 16 review: Affordable gaming laptop with AMD CPU and Nvidia GPU
Asus Zenbook Pro 15 OLED UM535Q: AMD Ryzen 9 5900HX, 15.60", 1.9 kg
Review » Asus Zenbook Pro 15 OLED UM535Q laptop review: Like an AMD-powered XPS 15
Dell G15 5510-43NHT: Intel Core i5-10200H, 15.60", 2.5 kg
Review » Dell G15 5510 laptop review: Budget 120 Hz gaming laptop faces its AMD counterpart
Lenovo ThinkBook 15p G2 ITH 21B1000YGE: Intel Core i7-11800H, 15.60", 1.9 kg
Review » Lenovo ThinkBook 15p G2: Testing the creator laptop with RTX and 4K
Lenovo Ideapad Gaming 3 15IHU-82K1002RGE: Intel Core i5-11300H, 15.60", 2 kg
Review » Lenovo IdeaPad Gaming 3i 15 G6 Laptop Review: Budget Gaming Laptop with Poor Display
Microsoft Surface Laptop Studio i7 RTX 3050 Ti: Intel Core i7-11370H, 14.40", 1.8 kg
Review » Microsoft Surface Laptop Studio Review: Interesting concept with slow Intel CPU
Asus ROG Flow Z13 GZ301ZE: Intel Core i9-12900H, 13.40", 1.2 kg
Review » Asus ROG Flow Z13 in review: Gaming tablet with powerful Alder Lake i9 CPU
Schenker Vision 14: Intel Core i7-11370H, 14.00", 1.1 kg
Review » Schenker Vision 14 laptop in review: Now also available with the GeForce RTX 3050 Ti
Asus Vivobook Pro 16X-M7600QE: AMD Ryzen 9 5900HX, 16.10", 1.9 kg
Review » Asus Vivobook Pro 16X pre-production unit review: Performance, endurance and mighty OLED display
Lenovo ThinkPad X1 Extreme G4-20Y5CTO1WW (3050 Ti): Intel Core i7-11800H, 16.00", 2 kg
Review » Lenovo ThinkPad X1 Extreme Gen 4 laptop review: Performance flagship with 16:10 touchscreen
Dell G15 5515: AMD Ryzen 7 5800H, 15.60", 2.4 kg
Review » Dell G15 5515 Ryzen Edition review: An affordable FHD gaming laptop
Asus Zephyrus G14 GA401QEC: AMD Ryzen 9 5900HS, 14.00", 1.7 kg
Review » Asus Zephyrus G14 GA401Q review: Alan Walker Special Edition 14-inch gaming laptop
Schenker XMG Focus 17: Intel Core i7-11800H, 17.30", 2.5 kg
Review » XMG Focus 17 (Clevo NP70HK) laptop review: Mid-range gaming laptop equipped with the RTX 3050 Ti
Schenker XMG Focus 15: Intel Core i7-11800H, 15.60", 1.9 kg
Review » XMG Focus 15 (Clevo NP50HK) gaming laptop review: RTX 3050 Ti at its limits
Asus ROG Strix G17 G713QE-RB74: AMD Ryzen 7 5800H, 17.30", 2.5 kg
Review » Asus ROG Strix G17 G713QE laptop review: GeForce RTX 3050 Ti drags down a great system
Dell XPS 15 9510 11800H RTX 3050 Ti OLED: Intel Core i7-11800H, 15.60", 1.9 kg
Review » Dell XPS 15 9510 Review: Multimedia Laptop convinces with new OLED Panel
Dell G15 5515: AMD Ryzen 7 5800H, 15.60", 2.4 kg
External Review » Dell G15 5515
HP Victus 16-e1000ax: AMD Ryzen 5 6600H, 16.10", 2.4 kg
External Review » HP Victus 16-e1000ax
HP Victus 16-e0145ng: AMD Ryzen 5 5600H, 16.10", 2.4 kg
External Review » HP Victus 16-e0145ng
HP Victus 16-d1008ns: Intel Core i5-12500H, 16.10", 2.5 kg
External Review » HP Victus 16-d1008ns
HP Victus 16-d1018ns: Intel Core i5-12500H, 16.10", 2.5 kg
External Review » HP Victus 16-d1018ns
Acer Aspire 7 A715-51G-51BY: Intel Core i5-1240P, 15.60", 2.1 kg
External Review » Acer Aspire 7 A715-51G-51BY
HP Victus 16-d1023ns: Intel Core i7-12700H, 16.10", 2.5 kg
External Review » HP Victus 16-d1023ns
HP Omen 16-c0025ns: AMD Ryzen 7 5800H, 16.10", 2.3 kg
External Review » HP Omen 16-c0025ns
Acer Nitro 5 AN515-58-7365: Intel Core i7-12700H, 15.60", 2.5 kg
External Review » Acer Nitro 5 AN515-58-7365
Asus VivoBook Pro 16: Intel Core i7-12700H, 16.00", 1.9 kg
External Review » Asus VivoBook Pro 16 K6602ZE-KV040W
MSI Katana GF66 12UD-436: Intel Core i7-12650H, 15.60", 2.3 kg
External Review » MSI Katana GF66 12UD-436
Acer Aspire 7 A715-43G-R83Y: AMD Ryzen 7 5825U, 15.60", 2.2 kg
External Review » Acer Aspire 7 A715-43G-R83Y
MSI Sword 17 A12UD: Intel Core i7-12700H, 17.30", 2.6 kg
External Review » MSI Sword 17 A12UD
LG UltraPC 17, i7-1260P RTX 3050 Ti: Intel Core i7-1260P, 17.00", 2 kg
External Review » LG UltraPC 17, i7-1260P RTX 3050 Ti
Asus ZenBook Pro 15 UM535QE, R7 5800H: AMD Ryzen 7 5800H, 15.60", 2 kg
External Review » Asus ZenBook Pro 15 UM535QE, R7 5800H
Dell G15 5520, i5-12500H RTX 3050 Ti: Intel Core i5-12500H, 15.60", 2.7 kg
External Review » Dell G15 5520, i5-12500H RTX 3050 Ti
Asus TUF Gaming A17 FA707RE-HX030W: AMD Ryzen 7 6800H, 17.30", 2.6 kg
External Review » Asus TUF Gaming A17 FA707RE-HX030W
Acer Swift X SFX14-42G-R607: AMD Ryzen 7 5825U, 14.00", 1.4 kg
External Review » Acer Swift X SFX14-42G-R607
MSI Katana GF66 12UD-064FR: Intel Core i7-12700H, 15.60", 2.3 kg
External Review » MSI Katana GF66 12UD-064FR
Asus Vivobook Pro 14X N7401ZE: Intel Core i7-12700H, 14.50", 1.7 kg
External Review » Asus Vivobook Pro 14X N7401ZE
Asus VivoBook Pro 16X M7600RE: AMD Ryzen 9 6900HX, 16.00", 2 kg
External Review » Asus VivoBook Pro 16X M7600RE
HP Victus 16-d1027ns: Intel Core i7-12700H, 16.10", 2.5 kg
External Review » HP Victus 16-d1027ns
HP Omen 16-n0000ns: AMD Ryzen 7 6800H, 16.10", 2.3 kg
External Review » HP Omen 16-n0000ns
Dell G15 5520, i7-12700H RTX 3050 Ti: Intel Core i7-12700H, 15.60", 2.7 kg
External Review » Dell G15 5520, i7-12700H RTX 3050 Ti
Lenovo Legion 5 15IAH7-82RC004JGE: Intel Core i5-12500H, 15.60", 2.4 kg
External Review » Lenovo Legion 5 15IAH7-82RC004JGE
Lenovo Ideapad Gaming 3 15ARH7-82SB0073GE: AMD Ryzen 7 6800H, 15.60", 2.3 kg
External Review » Lenovo Ideapad Gaming 3 15ARH7-82SB0073GE
HP Victus 16-e0091ns: AMD Ryzen 5 5600H, 16.10", 2.5 kg
External Review » HP Victus 16-e0091ns
Lenovo IdeaPad Gaming 3 15IAH7-82S90075SP: Intel Core i5-12500H, 15.60", 2.3 kg
External Review » Lenovo IdeaPad Gaming 3 15IAH7-82S90075SP
Lenovo IdeaPad Gaming 3 15IAH7, i7-12700H RTX 3050 Ti: Intel Core i7-12700H, 15.60", 2.3 kg
External Review » Lenovo IdeaPad Gaming 3 15IAH7, i7-12700H RTX 3050 Ti
Alienware x14, i7-12700H 3050 Ti: Intel Core i7-12700H, 14.00", 1.8 kg
External Review » Alienware x14, i7-12700H 3050 Ti
Dell Inspiron 16 Plus 7620: Intel Core i7-12700H, 16.00", 2.1 kg
External Review » Dell Inspiron 16 Plus 7620
HP Omen 16-c0027ns: AMD Ryzen 7 5800H, 16.10", 2.3 kg
External Review » HP Omen 16-c0027ns
HP Victus 16-e0093ns: AMD Ryzen 7 5800H, 16.10", 2.5 kg
External Review » HP Victus 16-e0093ns
HP Victus 15-fb0012AX: AMD Ryzen 7 5800H, 15.60", 2.3 kg
External Review » HP Victus 15-fb0012AX
HP Victus 16-e1085cl: AMD Ryzen 7 6800H, 16.10", 2.5 kg
External Review » HP Victus 16-e1085cl
MSI Thin GF63 11UD: Intel Core i7-11800H, 15.60", 1.9 kg
External Review » MSI Thin GF63 11UD
Acer Predator Triton 300 PT315-53-54XN: Intel Core i5-11400H, 15.60", 2.1 kg
External Review » Acer Predator Triton 300 PT315-53-54XN
HP Victus 15-fb0028n: AMD Ryzen 7 5800H, 15.60", 2.3 kg
External Review » HP Victus 15-fb0028n
MSI Summit E16 Flip A12UDT-031: Intel Core i7-1280P, 16.00", 1.9 kg
External Review » MSI Summit E16 Flip A12UDT-031
MSI Prestige 15 A12UD-049ES: Intel Core i7-1280P, 15.60", 1.7 kg
External Review » MSI Prestige 15 A12UD-049ES
Dell XPS 15 9520, i9-12900H 3050 Ti: Intel Core i9-12900H, 15.60", 1.9 kg
External Review » Dell XPS 15 9520, i9-12900H 3050 Ti
Dell Vostro 16 7620, i7-12700H RTX 3050 Ti: Intel Core i7-12700H, 16.00", 2 kg
External Review » Dell Vostro 16 7620, i7-12700H RTX 3050 Ti
Lenovo IdeaPad Gaming 3 15IAH7, i7-12650H RTX 3050 Ti: Intel Core i7-12650H, 15.60", 2.3 kg
External Review » Lenovo IdeaPad Gaming 3 15IAH7, i7-12650H RTX 3050 Ti
Asus ROG Strix G17 G713IC-HX011: AMD Ryzen 7 4800H, 17.30", 2.4 kg
External Review » Asus ROG Strix G17 G713IC-HX011
HP Omen 16-c0615nd: AMD Ryzen 7 5800H, 16.10", 2.3 kg
External Review » HP Omen 16-c0615nd
Acer Nitro 5 AN515-57-505V: Intel Core i5-11400H, 15.60", 2.2 kg
External Review » Acer Nitro 5 AN515-57-505V
Alienware m15 R7, i7-12700H RTX 3050 Ti: Intel Core i7-12700H, 15.60", 2.4 kg
External Review » Alienware m15 R7, i7-12700H RTX 3050 Ti
Asus TUF Dash F15 FX517ZE-HN044W: Intel Core i5-12450H, 15.60", 2 kg
External Review » Asus TUF Dash F15 FX517ZE-HN044W
Acer Nitro 5 AN515-58-NH.QFKEK.001: Intel Core i5-12500H, 15.60", 2.5 kg
External Review » Acer Nitro 5 AN515-58-NH.QFKEK.001
Acer Predator Helios 300 PH315-54 NH.QC5EP.00A: Intel Core i5-11400H, 15.60", 2.2 kg
External Review » Acer Predator Helios 300 PH315-54 NH.QC5EP.00A
Asus ROG Zephyrus G15 GA503QE: AMD Ryzen 9 5900HS, 15.60", 1.9 kg
External Review » Asus ROG Zephyrus G15 GA503QE
Acer Predator Helios 300 PH315-54-582Q: Intel Core i5-11400H, 15.60", 2.9 kg
External Review » Acer Predator Helios 300 PH315-54-582Q
Asus TUF Gaming F15 FX506HE-HN012: Intel Core i5-11400H, 15.60", 2.3 kg
External Review » Asus TUF Gaming F15 FX506HE-HN012
Asus ZenBook Pro 14 Duo UX8402ZE-M3075W: Intel Core i7-12700H, 14.00", 1.8 kg
External Review » Asus ZenBook Pro 14 Duo UX8402ZE-M3075W
MSI Summit E16 Flip A12UDT-006: Intel Core i7-1260P, 16.00", 1.9 kg
External Review » MSI Summit E14 Flip Evo A12MT-016
HP Victus 16-e0090ns: AMD Ryzen 7 5800H, 16.10", 2.5 kg
External Review » HP Victus 16-e0090ns
Asus TUF Dash F15 FX517ZE: Intel Core i7-12650H, 15.60", 2 kg
External Review » Asus TUF Dash F15 FX517ZE
Asus Zenbook Pro 14 Duo UX8402ZE-M3030W: Intel Core i9-12900H, 14.50", 1.8 kg
External Review » Asus Zenbook Pro Duo 14 UX8402ZE-M3030W
MSI Prestige 15 A12UD-093: Intel Core i7-1280P, 15.60", 1.8 kg
External Review » MSI Prestige 15 A12UD-093
Dell XPS 15 9520 RTX 3050 Ti: Intel Core i7-12700H, 15.60", 1.9 kg
External Review » Dell XPS 15 9520 RTX 3050 Ti
MSI Katana GF66 12UD-251: Intel Core i7-12700H, 15.60", 2.3 kg
External Review » MSI Katana GF66 12UD-251
Lenovo Legion S7 15ACH6-82K8002YGE: AMD Ryzen 7 5800H, 15.60", 1.9 kg
External Review » Lenovo Legion S7 15ACH6-82K8002YGE
MSI Creator M16 A12UD-283: Intel Core i7-12700H, 16.00", 2.3 kg
External Review » MSI Creator M16 A12UD-283
MSI Katana GF76 12UD-041: Intel Core i7-12700H, 17.30", 2.6 kg
External Review » MSI Katana GF76 12UD-041
Asus ROG Flow X13 GV301RE-LJ096W: AMD Ryzen 9 6900HS, 13.40", 1.3 kg
External Review » Asus ROG Flow X13 GV301RE-LJ096W
Acer Nitro 5 AN515-58-77YB: Intel Core i7-12700H, 15.60", 2.5 kg
External Review » Acer Nitro 5 AN515-58-77YB
Asus ROG Flow X13 GV301RE-LI134W: AMD Ryzen 7 6800HS, 13.40", 1.3 kg
External Review » Asus ROG Flow X13 GV301RE-LI134W
MSI Katana GF66 11UD-1222PL: Intel Core i5-11400H, 15.60", 2.1 kg
External Review » MSI Katana GF66 11UD-1222PL
MSI Katana GF66 11UD-480XUA: Intel Core i5-11400H, 15.60", 2.1 kg
External Review » MSI Katana GF66 11UD-480XUA
Acer Swift X SFX14-51G-79RJ: Intel Core i7-1260P, 14.00", 1.4 kg
External Review » Acer Swift X SFX14-51G-79RJ
HP Omen 16-c0010ca: AMD Ryzen 7 5800H, 16.10", 2.3 kg
External Review » HP Omen 16-c0010ca
HP Omen 16-b0352TX: Intel Core i7-11800H, 16.00", 2.3 kg
External Review » HP Omen 16-b0352TX
Lenovo ThinkPad X1 Extreme G4-20Y5001NGE: Intel Core i7-11800H, 16.00", 1.9 kg
External Review » Lenovo ThinkPad X1 Extreme G4-20Y5001NGE
HP Envy 15-ep1074ng: Intel Core i7-11800H, 15.60", 2.2 kg
External Review » HP Envy 15-ep1074ng
Lenovo ThinkBook 15p G2 ITH 21B1000YGE: Intel Core i7-11800H, 15.60", 1.9 kg
External Review » Lenovo ThinkBook 15p G2 ITH 21B1000YGE
Asus Zenbook Pro 15 OLED UM535Q: AMD Ryzen 9 5900HX, 15.60", 1.9 kg
External Review » Asus Zenbook Pro 15 OLED UM535Q
Acer Swift X SFX14-41G-R1GH: AMD Ryzen 7 5800U, 14.00", 1.5 kg
External Review » Acer Swift X SFX14-41G-R1GH
Microsoft Surface Laptop Studio i7 RTX 3050 Ti: Intel Core i7-11370H, 14.40", 1.8 kg
External Review » Microsoft Surface Laptop Studio i7 RTX 3050 Ti
HP Pavilion Gaming 15-dk2070ng: Intel Core i7-11370H, 15.60", 2.3 kg
External Review » HP Pavilion Gaming 15-dk2070ng
Asus ROG Zephyrus G14 GA401QE-HZ047: AMD Ryzen 9 5900HS, 14.00", 1.6 kg
External Review » Asus ROG Zephyrus G14 GA401QE-HZ047
Asus ROG Strix G17 G713IE-HX011: AMD Ryzen 7 4800H, 17.30", 2.7 kg
External Review » Asus ROG Strix G17 G713IE-HX011
Samsung Galaxy Book Odyssey 15 NP762XDA-XA1US: Intel Core i7-11600H, 15.60", 1.9 kg
External Review » Samsung Galaxy Book Odyssey 15 NP762XDA-XA1US
Asus ROG Flow Z13 GZ301ZE: Intel Core i9-12900H, 13.40", 1.2 kg
External Review » Asus ROG Flow Z13 GZ301ZE
Lenovo Legion 5 15ITH6, i7-11600H RTX 3050 Ti: Intel Core i7-11600H, 15.60", 2.4 kg
External Review » Lenovo Legion 5 15ITH6, i7-11600H RTX 3050 Ti
HP Victus 16-d0065ng: Intel Core i7-11800H, 16.10", 2.5 kg
External Review » HP Victus 16-d0065ng
Asus ROG Strix G15 G513IE-HN004W: AMD Ryzen 7 4800H, 15.60", 2.3 kg
External Review » Asus ROG Strix G15 G513IE-HN004W
MSI Sword 15 A11UD: Intel Core i7-11800H, 15.60", 2.3 kg
External Review » MSI Sword 15 A11UD
Acer Nitro 5 AN517-54-79L1: Intel Core i7-11800H, 17.30", 2.7 kg
External Review » Acer Nitro 5 AN517-54-79L1
Asus VivoBook Pro 15 M3500-L1179T: AMD Ryzen 9 5900HX, 15.60", 1.7 kg
External Review » Asus VivoBook Pro 15 M3500-L1179T
Asus TUF Gaming F15 FX506HCB-HN243T: Intel Core i5-11400H, 15.60", 2.3 kg
External Review » Asus TUF Gaming F15 FX506HCB-HN243T
Dell G15 5511-RNGVW: Intel Core i7-11800H, 15.60", 2.8 kg
External Review » Dell G15 5511-RNGVW
Dell G15 5515-2CMCX: AMD Ryzen 7 5800H, 15.60", 2.8 kg
External Review » Dell G15 5515-2CMCX
Tuxedo InfinityBook Pro 14 Gen6, 11370H 3K: Intel Core i7-11370H, 14.00", 1 kg
External Review » Tuxedo InfinityBook Pro 14 Gen6, 11370H 2K
Asus Vivobook Pro 16X-M7600QE: AMD Ryzen 9 5900HX, 16.10", 1.9 kg
External Review » Asus Vivobook Pro 16X-M7600QE
HP Victus 16-d0367ng: Intel Core i5-11400H, 16.10", 2.5 kg
External Review » HP Victus 16-d0367ng
Dell G15 5515, 5600H RTX 3050 Ti: AMD Ryzen 5 5600H, 15.60", 2.6 kg
External Review » Dell G15 5515, 5600H RTX 3050 Ti
Lenovo Legion S7 15ACH6-82K8CTO1WW: AMD Ryzen 5 5600H, 15.60", 1.9 kg
External Review » Lenovo Legion S7 15ACH6-82K8CTO1WW
Acer Swift X SFX16-51G-76HE: Intel Core i7-11390H, 16.00", 1.8 kg
External Review » Acer Swift X SFX16-51G-76HE
Acer ConceptD 3 Ezel CC315-73G-74TT: Intel Core i7-11800H, 15.60", 2.2 kg
External Review » Acer ConceptD 3 Ezel CC315-73G-74TT
Asus Vivobook Pro 14X M7400, 5800H 3050 Ti: AMD Ryzen 7 5800H, 14.00", 1.5 kg
External Review » Asus Vivobook Pro 14X M7400, 5800H 3050 Ti
Lenovo Legion 5 15ITH6, i7-11800H 3050 Ti: Intel Core i7-11800H, 15.60", 2.4 kg
External Review » Lenovo Legion 5 15ITH6, i7-11800H 3050 Ti
Dell XPS 15 9510, 11900H RTX 3050 Ti OLED: Intel Core i9-11900H, 15.60", 2 kg
External Review » Dell XPS 15 9510, 11900H RTX 3050 Ti OLED
Acer Nitro 5 AN517-54-77KG: Intel Core i7-11800H, 17.30", 2.7 kg
External Review » Acer Nitro 5 AN517-54-77KG
HP Victus 16-e0076ng: AMD Ryzen 7 5800H, 16.10", 2.5 kg
External Review » HP Victus 16-e0076ng
Asus ROG Zephyrus G14 GA401QE-HZ055T: AMD Ryzen 7 5800HS, 14.00", 1.7 kg
External Review » Asus ROG Zephyrus G14 GA401QE-HZ055T
Microsoft Surface Laptop Studio, i7-11370H RTX 3050 Ti: Intel Core i7-11370H, 14.40", 1.8 kg
External Review » Microsoft Surface Laptop Studio, i7-11370H RTX 3050 Ti
Gigabyte G5 MD-51US123SH: Intel Core i5-11400H, 15.60", 2.2 kg
External Review » Gigabyte G5 MD-51US123SH
MSI GF75 Thin 10UD: Intel Core i7-10750H, 17.30", 2.2 kg
External Review » MSI GF75 Thin 10UD
MSI Katana GF66 11UD-836XFR: Intel Core i5-11400H, 15.60", 2.1 kg
External Review » MSI Katana GF66 11UD-836XFR
Asus Vivobook Pro 14X M7400, 5900HX 3050 Ti: AMD Ryzen 9 5900HX, 14.00", 1.5 kg
External Review » Asus Vivobook Pro 14X M7400, 5900HX 3050 Ti
Acer Nitro 5 AN515-57-796N: Intel Core i7-11800H, 15.60", 2.3 kg
External Review » Acer Nitro 5 AN515-57-796N
Asus Vivobook Pro 16X M7600, 5900HX 3050 Ti: AMD Ryzen 9 5900HX, 16.00", 2 kg
External Review » Asus Vivobook Pro 16X M7600, 5900HX 3050 Ti
Acer Swift X SFX14-41G-R1S6: AMD Ryzen 7 5800U, 14.00", 1.5 kg
External Review » Acer Swift X SFX14-41G-R1S6
MSI Katana GF66 11UD-092: Intel Core i7-11800H, 15.60", 2.1 kg
External Review » MSI Katana GF66 11UD-092
MSI Pulse GL66 11UDK: Intel Core i7-11800H, 15.60", 2.3 kg
External Review » MSI Pulse GL66 11UDK
MSI Pulse GL76 11UDK: Intel Core i7-11800H, 17.30", 2.3 kg
External Review » MSI Pulse GL76 11UDK
Dell XPS 15 9510, 11800H RTX 3050 Ti FHD: Intel Core i7-11800H, 15.60", 2 kg
External Review » Dell XPS 15 9510, 11800H RTX 3050 Ti FHD
Dell XPS 15 9510 11800H RTX 3050 Ti OLED: Intel Core i7-11800H, 15.60", 1.9 kg
External Review » Dell XPS 15 9510 11800H RTX 3050 Ti OLED
Asus Zephyrus G14 GA401QEC: AMD Ryzen 9 5900HS, 14.00", 1.7 kg
External Review » Asus Zephyrus G14 GA401Q - Alan Walker Special Edition
Lenovo Legion 5 15ACH6H-82JW0012US: AMD Ryzen 7 5800H, 15.60", 2.4 kg
External Review » Lenovo Legion 5 15ACH6H-82JW0012US
Asus TUF Dash F15 TUF516PE-AB73: Intel Core i7-11370H, 15.60", 2 kg
External Review » Asus TUF Dash F15 TUF516PE-AB73
Asus ROG Flow X13 GV301QE-K6149T: AMD Ryzen 9 5900HS, 13.40", 1.3 kg
External Review » Asus ROG Flow X13 GV301QE-K6149T
Asus ROG Strix G17 G713QE-RB74: AMD Ryzen 7 5800H, 17.30", 2.5 kg
External Review » Asus ROG Strix G17 G713QE-RB74
MSI Katana GF76 11UD-050: Intel Core i7-11800H, 17.30", 2.3 kg
External Review » MSI Katana GF76 11UD-050
Asus TUF Gaming F15 TUF506HE-DS74: Intel Core i7-11800H, 15.60", 2.3 kg
External Review » Asus TUF Gaming F15 TUF506HE-DS74
Asus TUF Dash F15 FX516PE-HN006T: Intel Core i7-11370H, 15.60", 2 kg
External Review » Asus TUF Dash F15 FX516P-EHN006T
Dell G15 5510, i5-10200H RTX 3050 Ti: Intel Core i5-10200H, 15.60", 2.7 kg
External Review » Dell G15 5510, i5-10200H RTX 3050 Ti
Acer Swift X SFX14-41G-R4VH: AMD Ryzen 7 5800U, 14.00", 1.4 kg
External Review » Acer Swift X SFX14-41G-R4VH
Microsoft Surface Laptop Studio i7 RTX 3050 Ti: Intel Core i7-11370H, 14.40", 1.8 kg
» Microsoft Surface Laptop Studio notebooks on clearance up to $594 off MSRP at BestBuy this Christmas season
HP Victus 16-e0145ng: AMD Ryzen 5 5600H, 16.10", 2.4 kg
» Affordable HP Victus 15 gaming laptop records massive 33% discount at Best Buy
Dell XPS 15 9520 RTX 3050 Ti: Intel Core i7-12700H, 15.60", 1.9 kg
» Dell XPS 15 laptop with 3.5K OLED display receives 41% discount
Microsoft Surface Laptop Studio i7 RTX 3050 Ti: Intel Core i7-11370H, 14.40", 1.8 kg
» Unique Microsoft Surface Laptop Studio gets largest discount ever on Amazon
HP Victus 15 fa0020nr: Intel Core i7-12700H, 15.60", 2.3 kg
» HP Victus 15 has a short two-hour battery life even when on the lowest power settings
MSI Prestige 15 A12UD-093: Intel Core i7-1280P, 15.60", 1.8 kg
» MSI Prestige 15: Perfectly tuned for creative work
Schenker Vision 14 2022 RTX 3050 Ti: Intel Core i7-12700H, 14.00", 1.3 kg
» Maximum performance in a 2.4-lb chassis - Schenker Vision 14 shines with Core i7-12700H and GeForce RTX 3050 Ti
MSI Summit E16 Flip A12UDT-031: Intel Core i7-1280P, 16.00", 1.9 kg
» MSI Summit E16 Flip A12UDT: 2-in-1 laptop with gaming qualities
Dell XPS 15 9520 RTX 3050 Ti: Intel Core i7-12700H, 15.60", 1.9 kg
» Dell XPS 15 9520 is 15 to 35 percent faster than XPS 15 9510, lacks Wi-Fi 6E support despite coming with an Intel AX211
Dell G15 5510-43NHT: Intel Core i5-10200H, 15.60", 2.5 kg
» The Intel version of the Dell G15 5510 gaming laptop doesn't stand a chance against the Ryzen Edition in our review
Lenovo ThinkBook 15p G2 ITH 21B1000YGE: Intel Core i7-11800H, 15.60", 1.9 kg
» Mixed feelings with the Lenovo ThinkBook 15p G2: Not right for everyone
Microsoft Surface Laptop Studio i7 RTX 3050 Ti: Intel Core i7-11370H, 14.40", 1.8 kg
» Microsoft's new Surface Laptop Studio is very expensive for old tech
Schenker Vision 14: Intel Core i7-11370H, 14.00", 1.1 kg
» The Schenker Vision 14 with the GeForce RTX 3050 Ti does not really have any competitors
Dell G15 5515: AMD Ryzen 7 5800H, 15.60", 2.4 kg
» Dell G15 5515: A gaming laptop with a long battery life
Schenker XMG Focus 17: Intel Core i7-11800H, 17.30", 2.5 kg
» XMG Focus 17: Putting the RTX 3050 Ti through its paces
Schenker XMG Focus 15: Intel Core i7-11800H, 15.60", 1.9 kg
» XMG Focus 15: The difficult position of the RTX 3050 Ti
Asus ROG Strix G17 G713QE-RB74: AMD Ryzen 7 5800H, 17.30", 2.5 kg
» The 2021 Asus Strix G17 G713 comes in different thicknesses and weights. Don't buy the wrong one
Dell XPS 15 9510 11800H RTX 3050 Ti OLED: Intel Core i7-11800H, 15.60", 1.9 kg
» When do we finally get the Dell XPS 15 with AMD Ryzen CPUs?
» The new Dell XPS 15 9510 OLED has problems with the GPU Performance