Lenovo ThinkBook 15p G2: Testing the creator laptop with RTX and 4K
Lenovo's current ThinkBook 15p G2, whose predecessor we already reviewed, is able to remedy a few problems of the predecessor. For example, we finally also see Thunderbolt 4 among the connections, and the quality of video calling isn't at such a low level anymore. There is no model anymore that doesn't offer an additional graphics card, with the entry card being the slightly older Nvidia GeForce GTX 1650 Max-Q. In addition, you can still save significantly on the RAM, the SSD, and particularly on the display compared to the top model that we tested. However, even the smallest model still offers sufficient graphics performance for creative tasks.
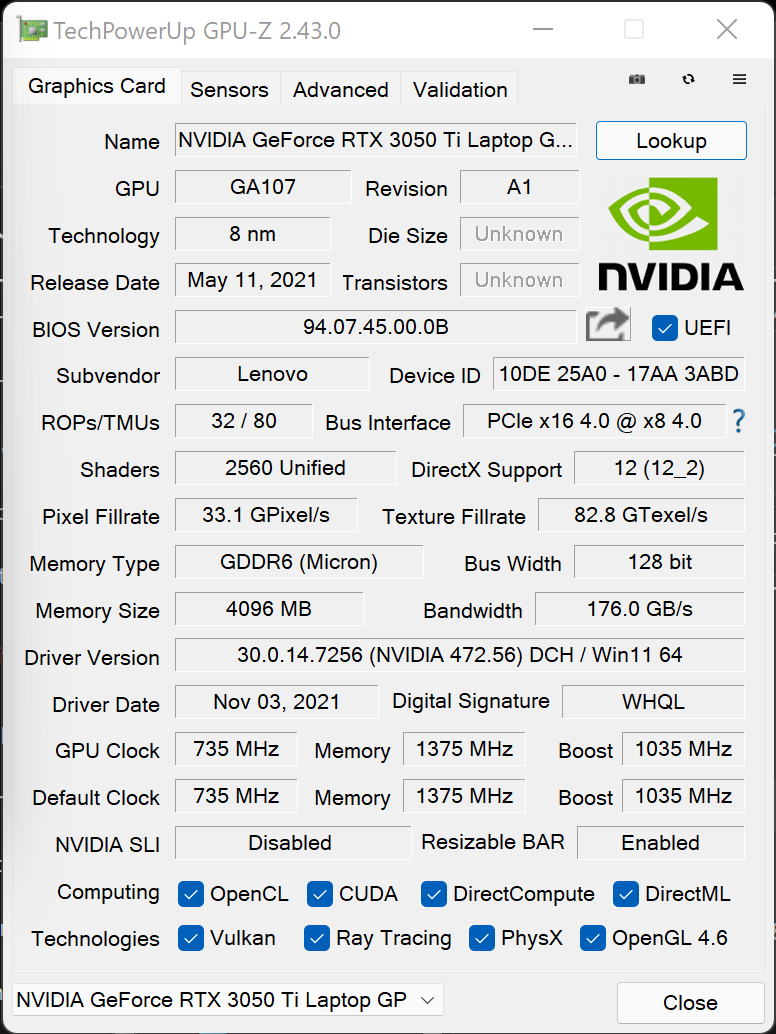
With our tested Nvidia RTX 3050 Ti and Intel's i7-11800H Tiger Lake processor, the similarities to the Lenovo ThinkPad X1 Extreme are obvious. The Dell XPS 15 9510 basically offers a very similar configuration. We will see why the asking price of almost 1800 Euros (~$1984) is still set considerably lower.
We already described the case, input devices, connection equipment, and speakers in our review of the Lenovo ThinkBook 15p predecessor. The following only addresses the new changes, since the basic frame remained the same.
Possible Competitors in Comparison
Rating | Date | Model | Weight | Height | Size | Resolution | Price |
|---|---|---|---|---|---|---|---|
| 85.6 % v7 (old) | 03 / 2022 | Lenovo ThinkBook 15p G2 ITH 21B1000YGE i7-11800H, GeForce RTX 3050 Ti Laptop GPU | 1.9 kg | 20 mm | 15.60" | 3840x2160 | |
| 86.4 % v7 (old) | 03 / 2021 | Lenovo ThinkBook 15p Gen1 4K i7-10750H, GeForce GTX 1650 Ti Max-Q | 2 kg | 19.9 mm | 15.60" | 3840x2160 | |
| 82.6 % v7 (old) | 11 / 2021 | Dell Inspiron 16 Plus 7610-MHJ8F i7-11800H, UHD Graphics Xe 32EUs (Tiger Lake-H) | 2 kg | 19 mm | 16.00" | 3072x1920 | |
| 86.7 % v7 (old) | 11 / 2021 | MSI Creator Z16 A11UET-209 i7-11800H, GeForce RTX 3060 Laptop GPU | 2.2 kg | 15.9 mm | 16.00" | 2560x1600 | |
| 85.9 % v7 (old) | 11 / 2021 | Asus VivoBook 15 Pro M3500QC-L1062 R5 5600H, GeForce RTX 3050 4GB Laptop GPU | 1.7 kg | 19.9 mm | 15.60" | 1920x1080 | |
| 81.7 % v7 (old) | 11 / 2021 | Gigabyte G5 GD i5-11400H, GeForce RTX 3050 4GB Laptop GPU | 2.1 kg | 31.6 mm | 15.60" | 1920x1080 | |
| 88.4 % v7 (old) | 08 / 2021 | Dell XPS 15 9510 11800H RTX 3050 Ti OLED i7-11800H, GeForce RTX 3050 Ti Laptop GPU | 1.9 kg | 18 mm | 15.60" | 3456x2160 | |
| 87 % v7 (old) | 09 / 2021 | Lenovo ThinkBook 16p G2 ACH R9 5900HX, GeForce RTX 3060 Laptop GPU | 2 kg | 19.5 mm | 16.00" | 2560x1600 |
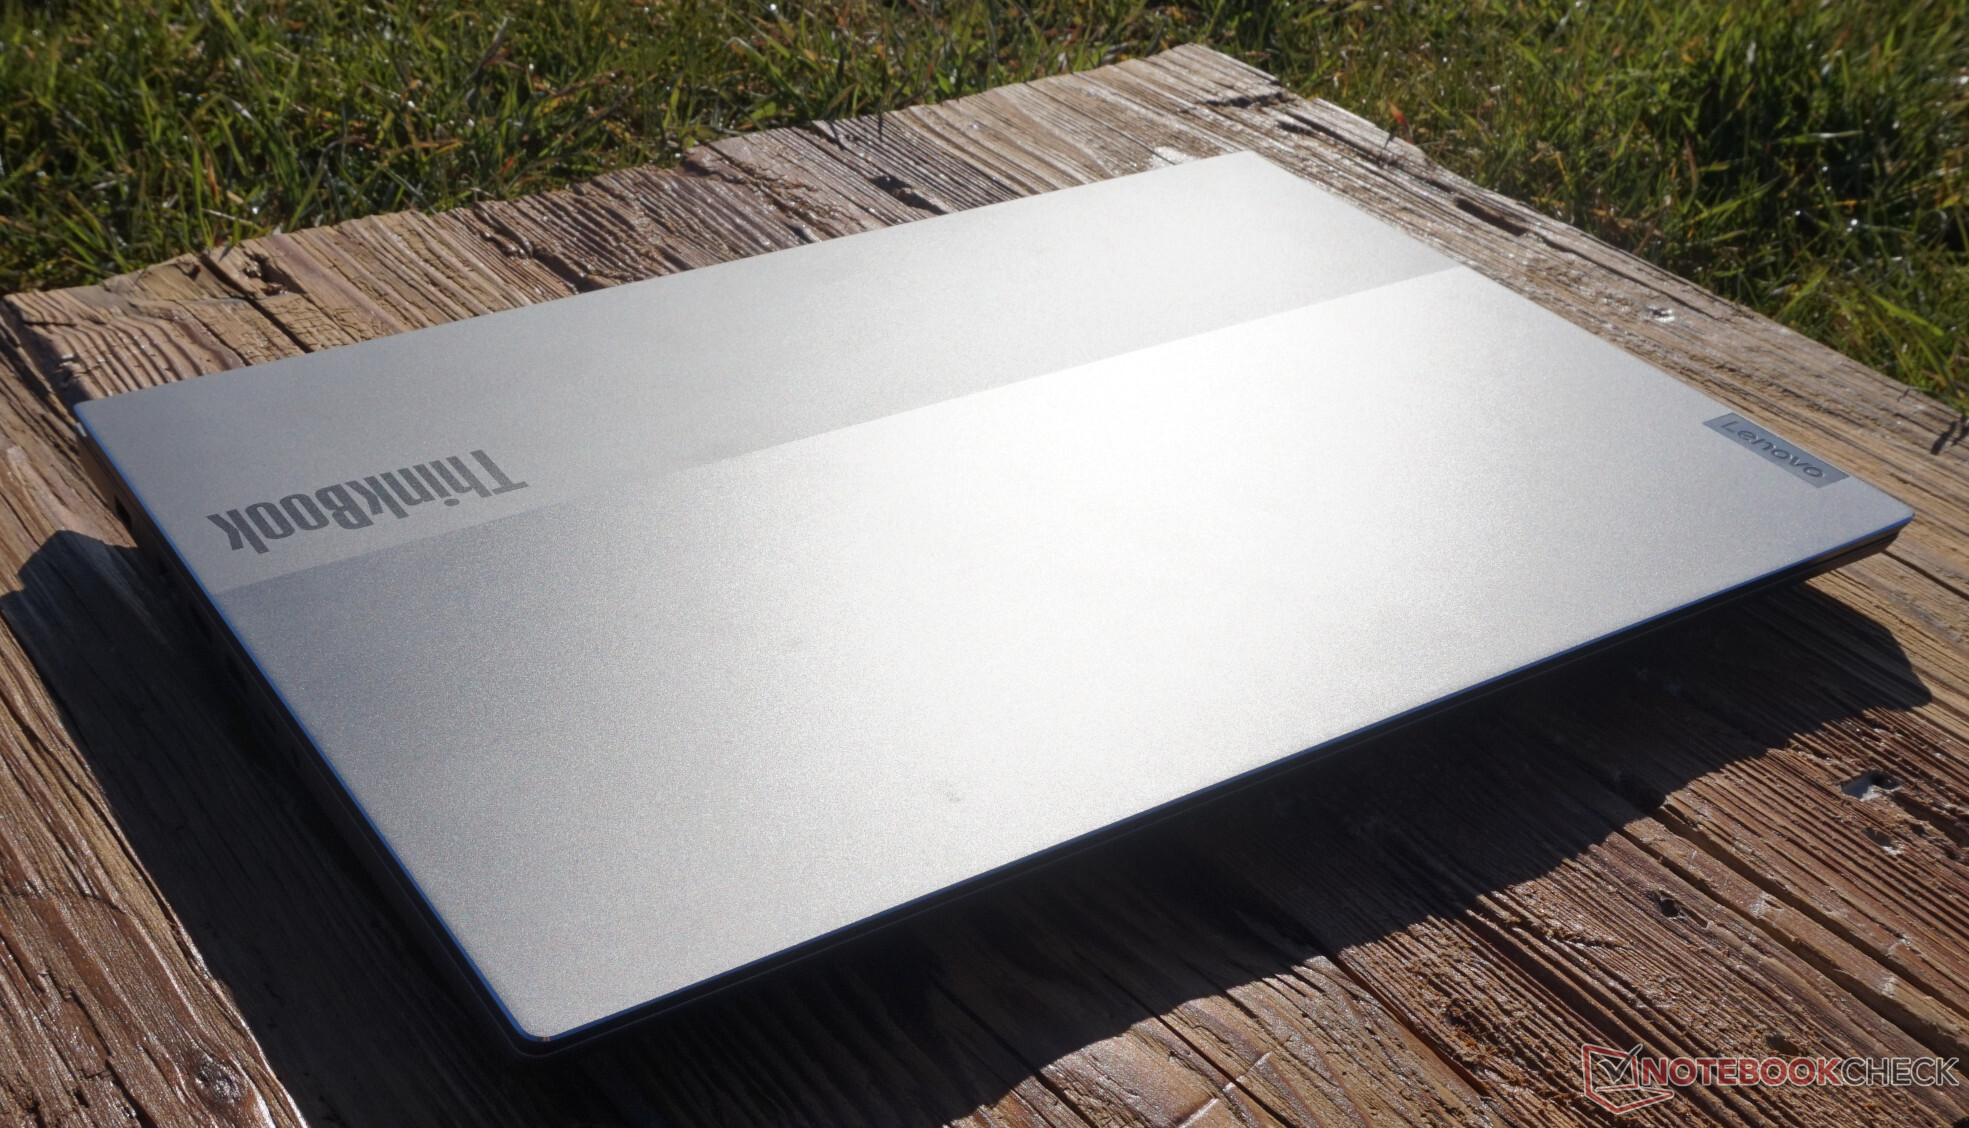
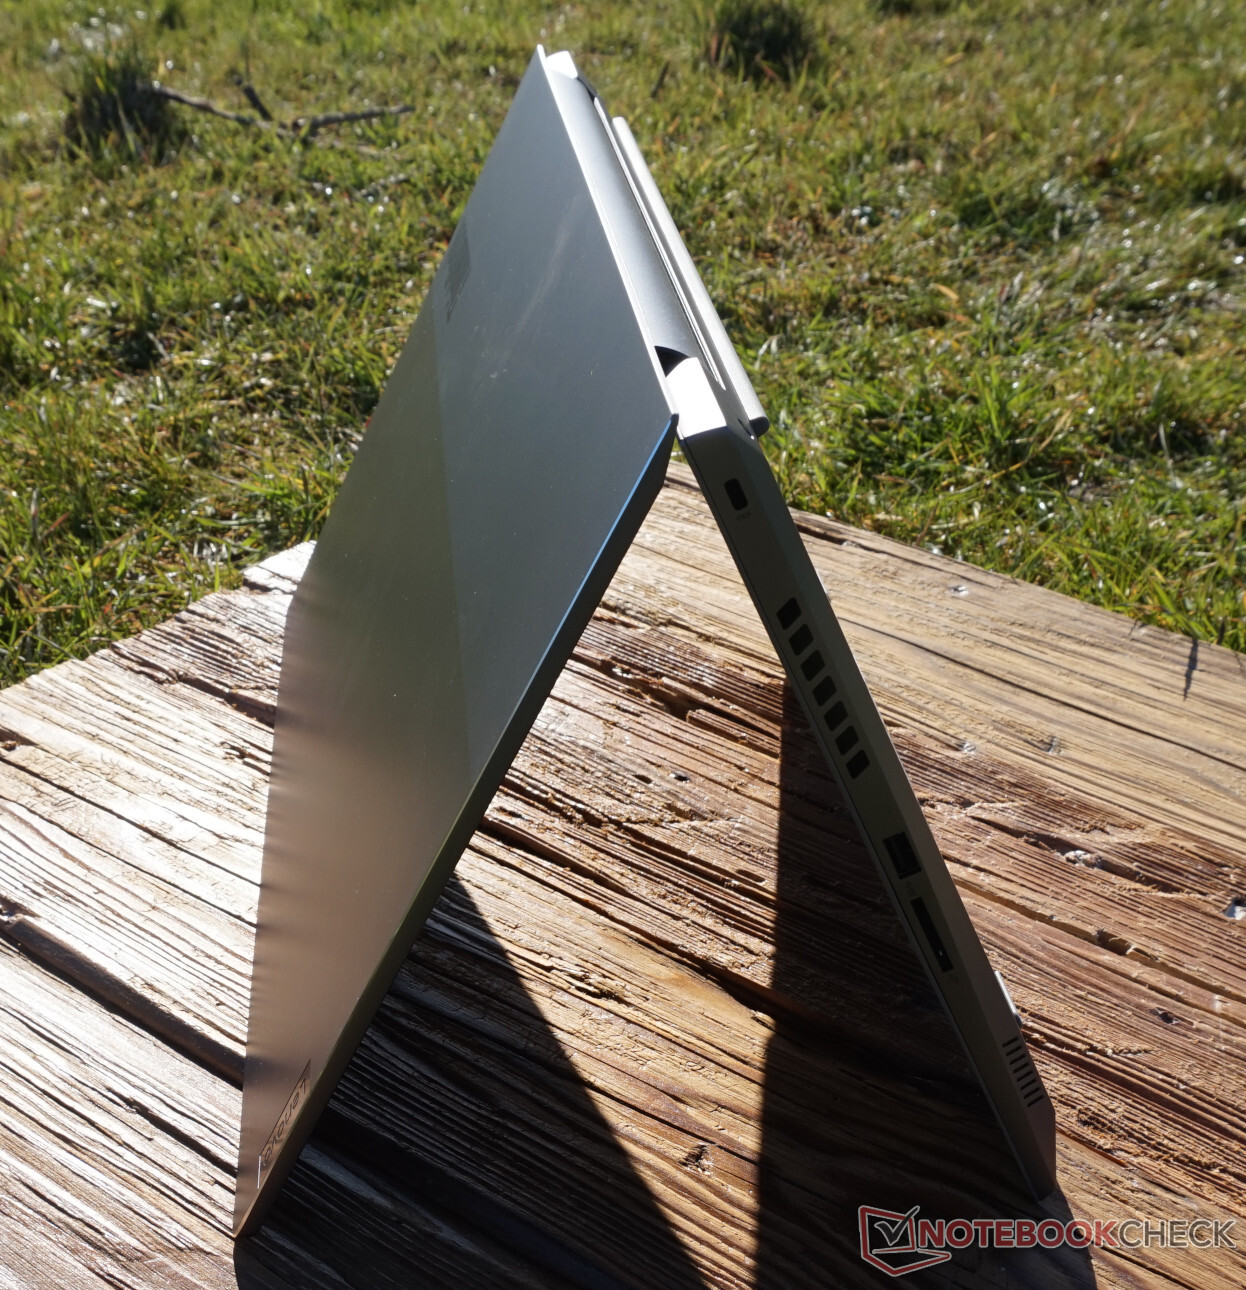
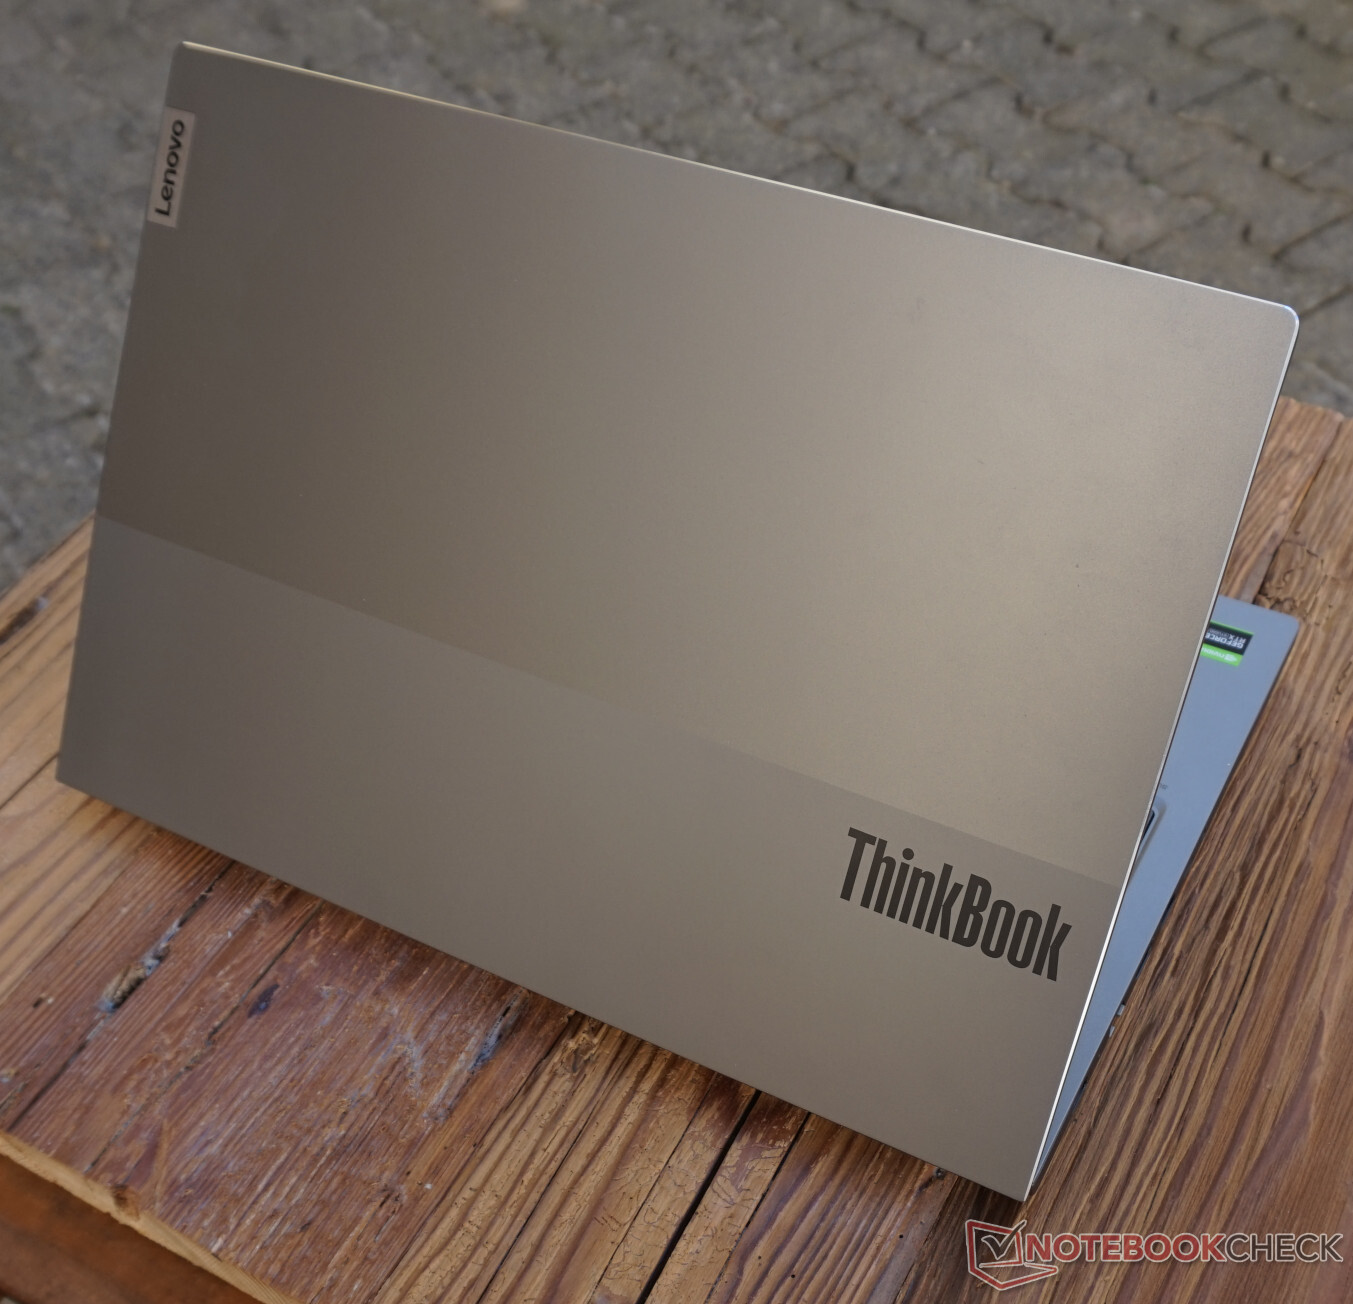
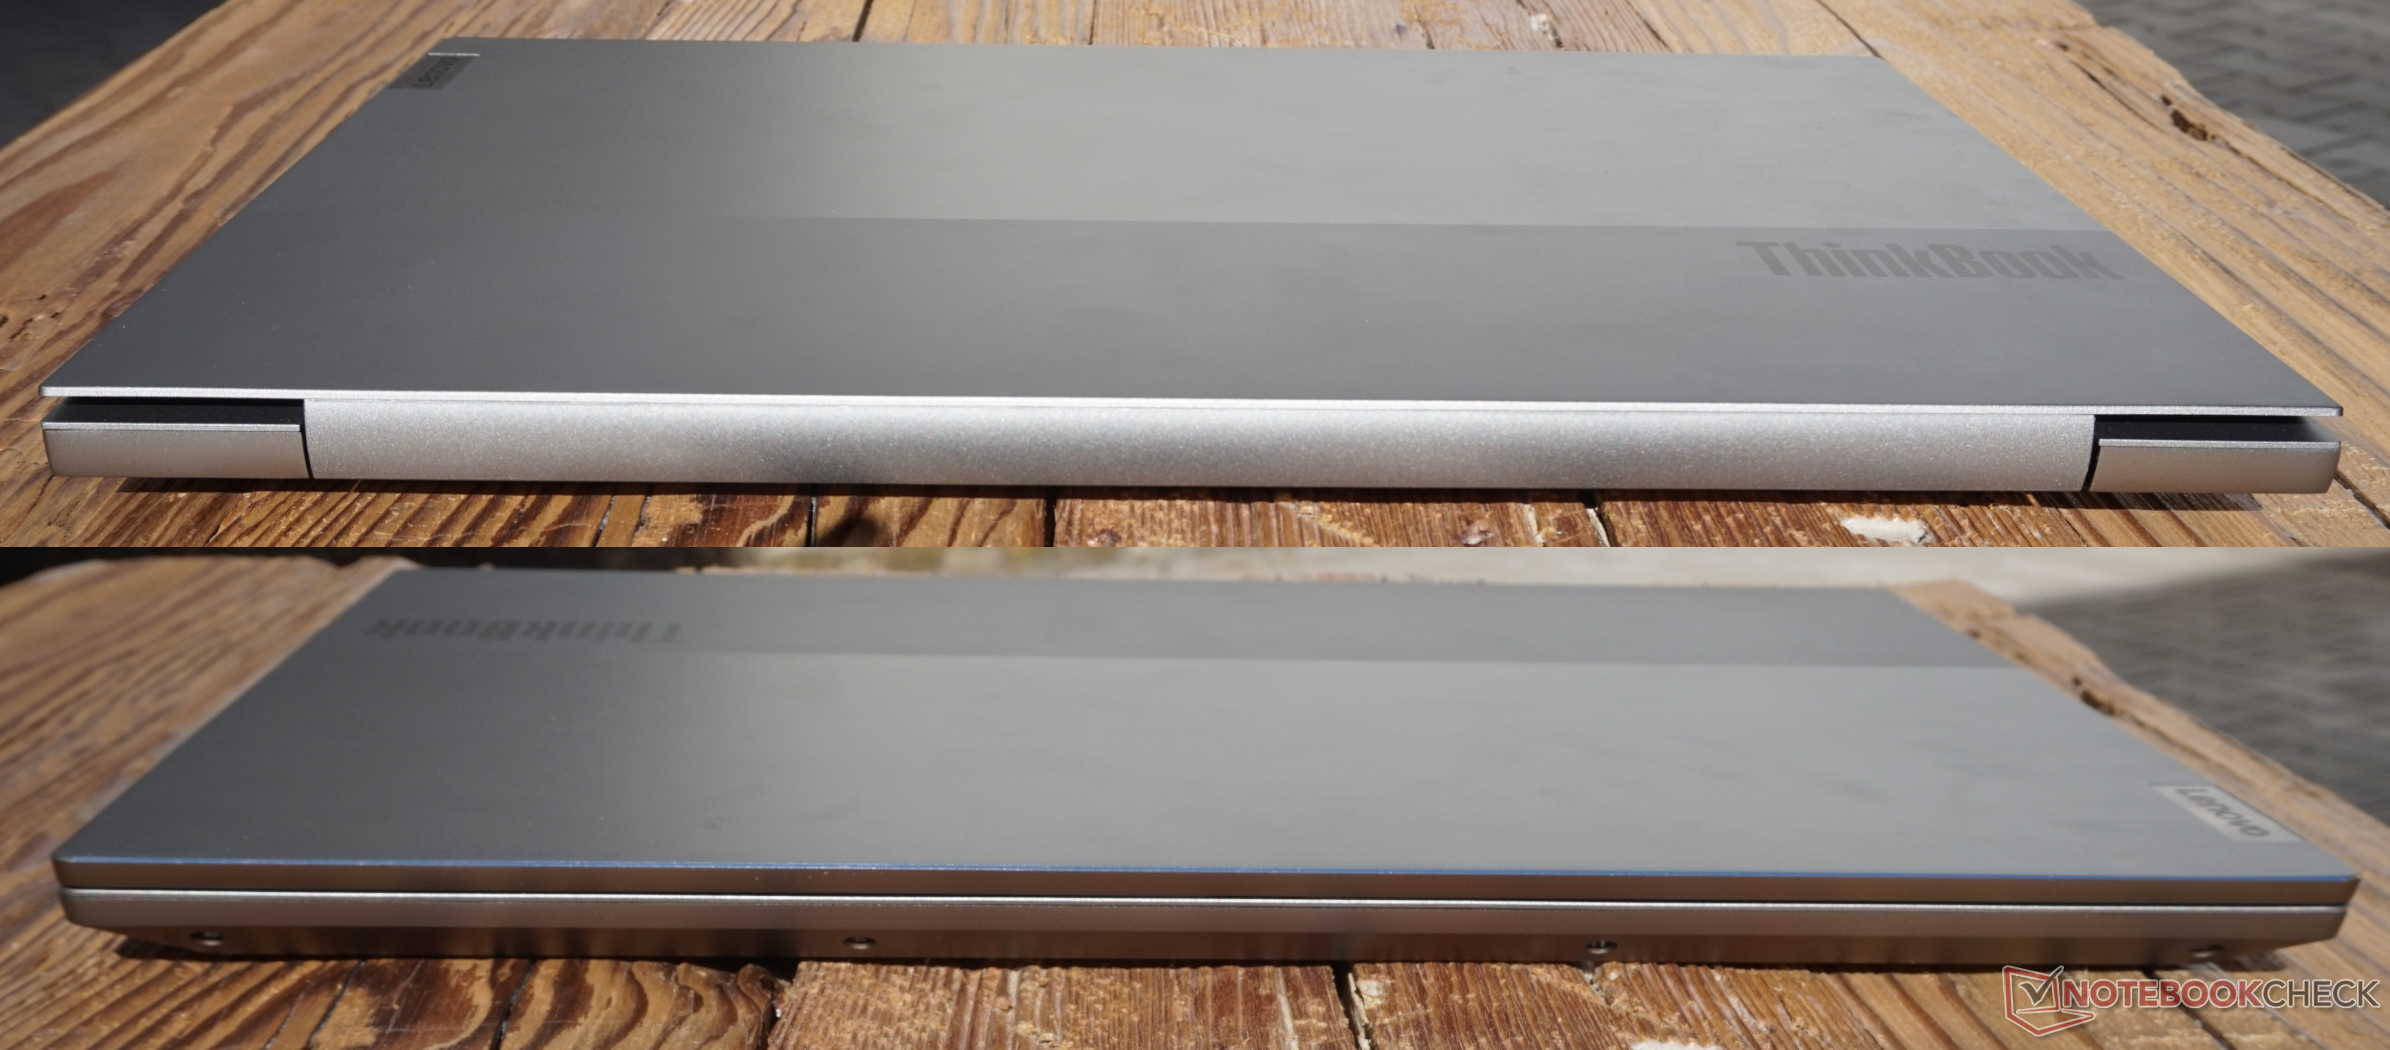
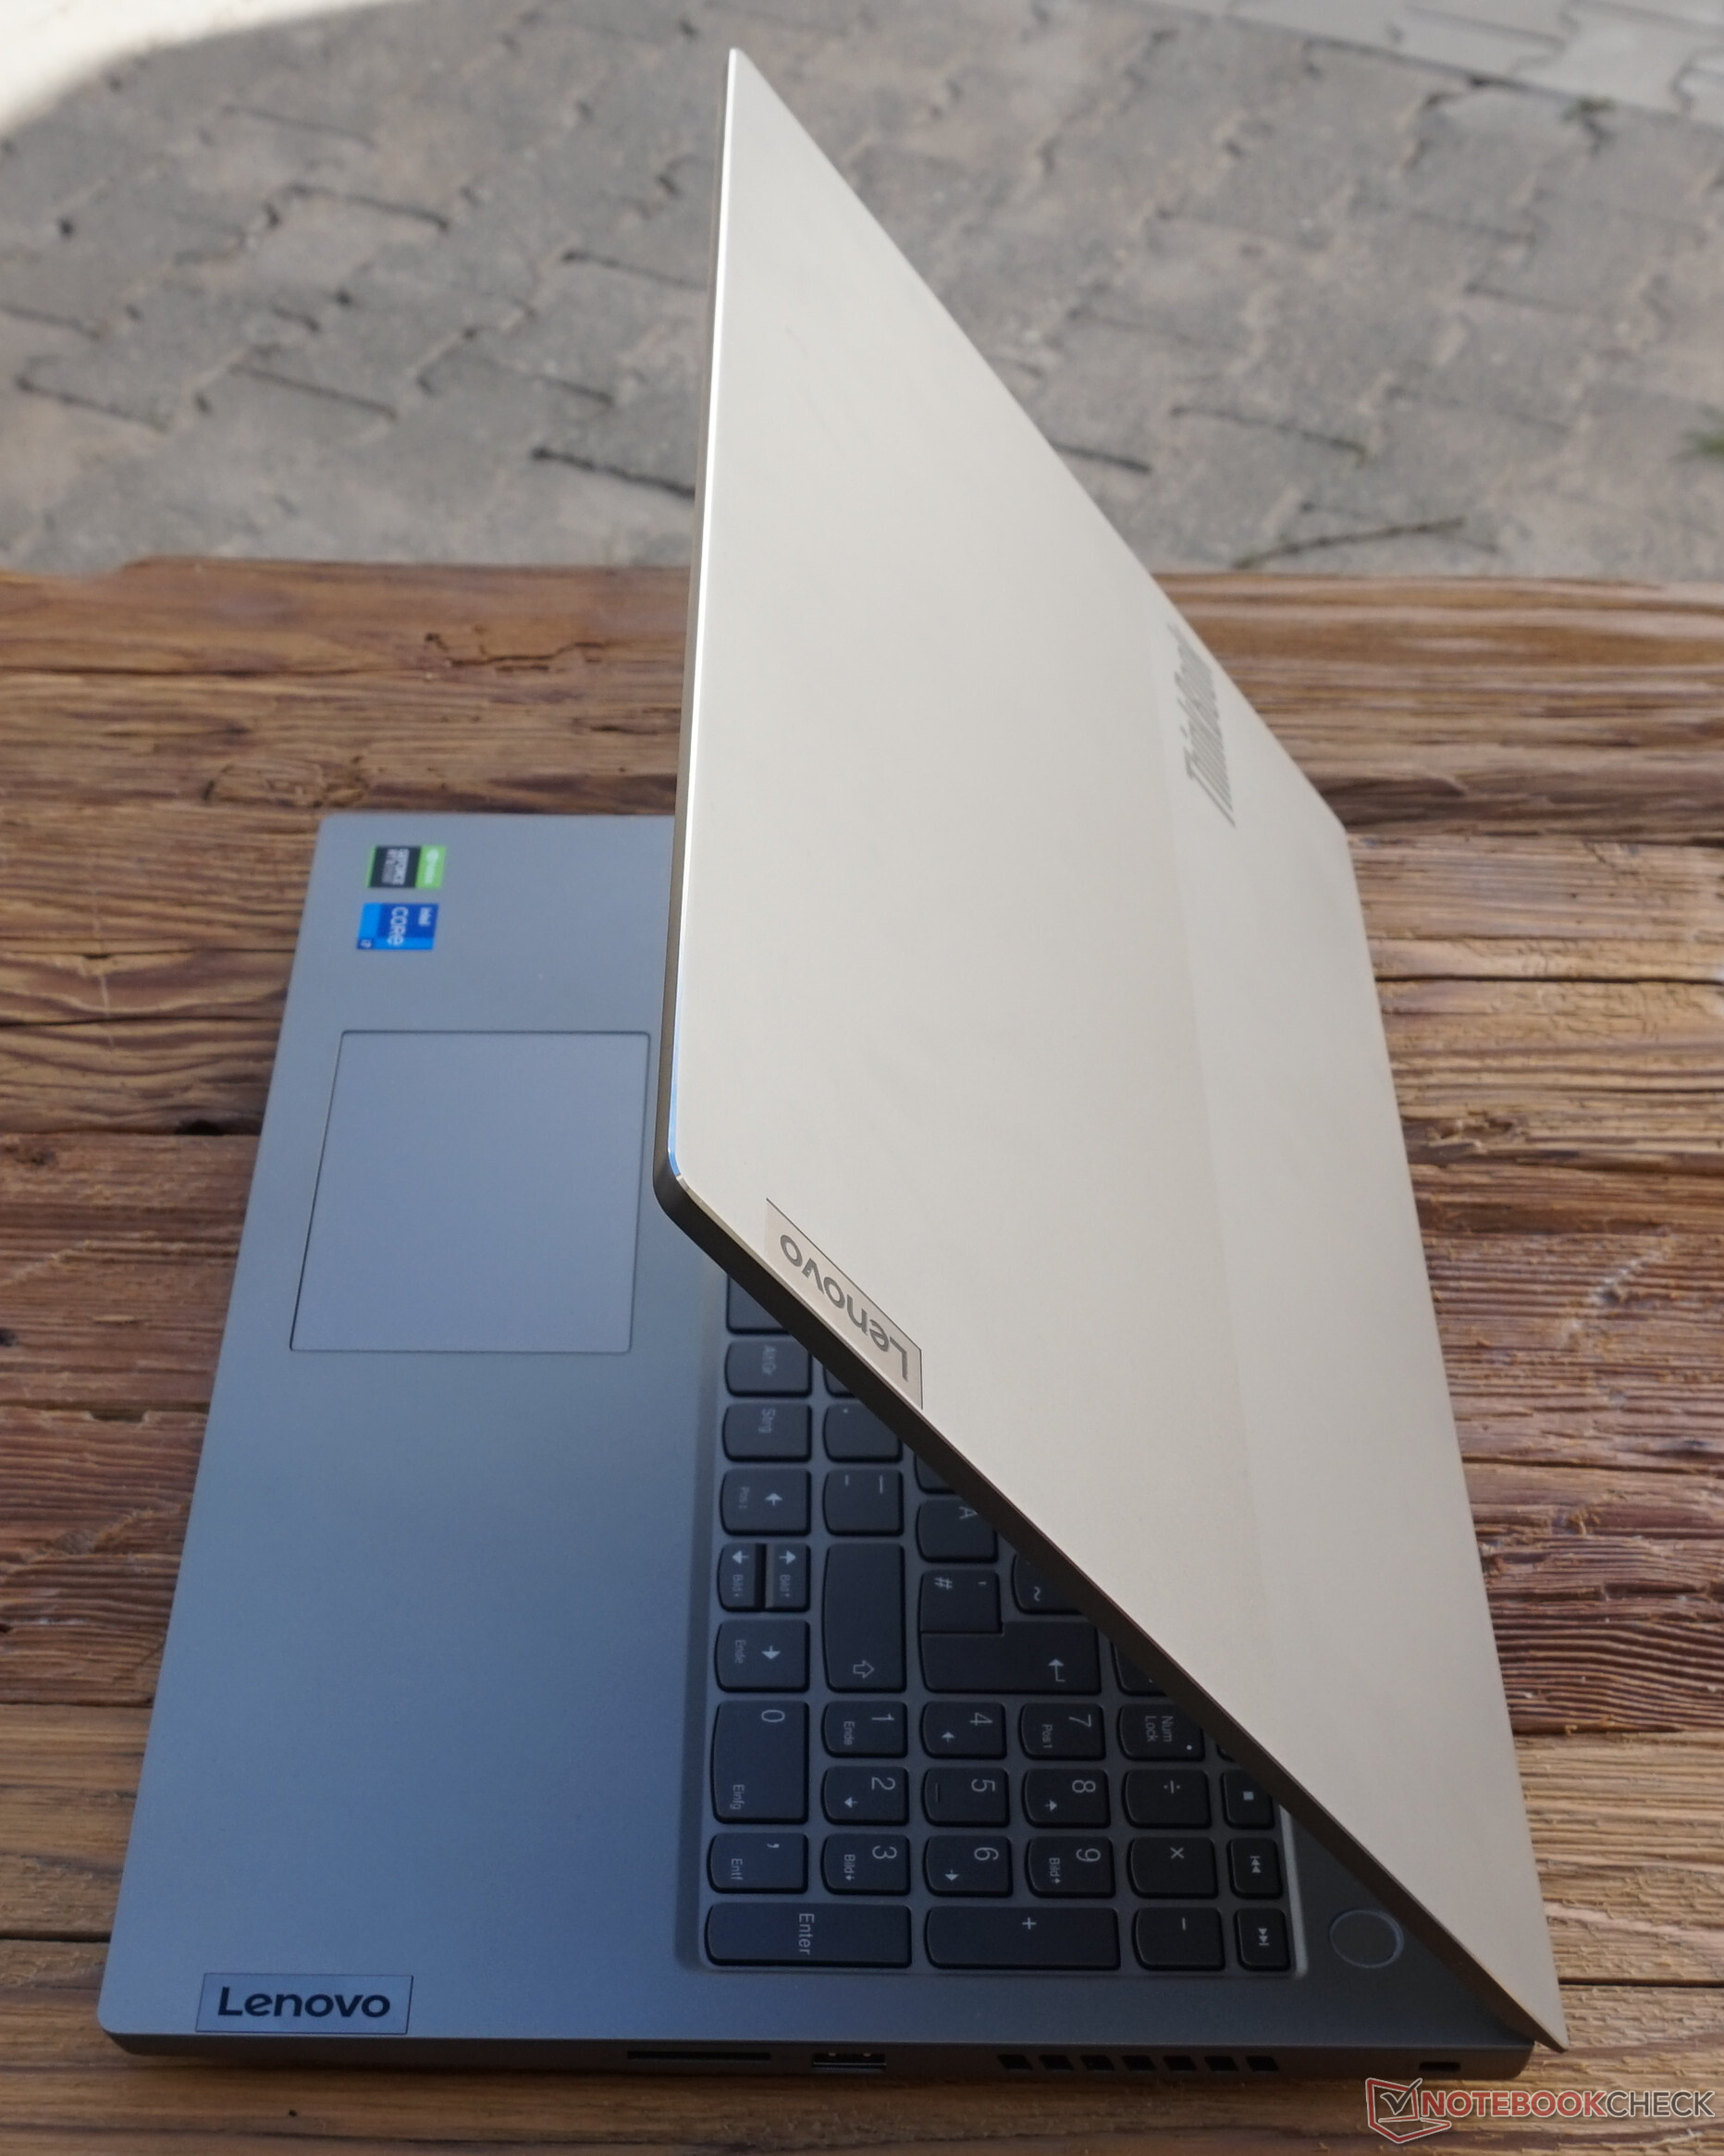
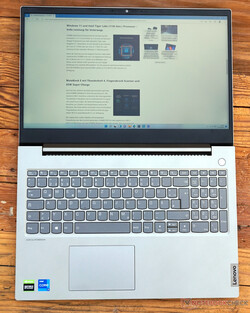
Case - A creator laptop with a beautiful lid
When Lenovo speaks about an aluminum case, they mean the display lid. The bottom of the case and the keyboard frame, although showing a high-quality workmanship, are made of plastic. This combination of materials might explain the very noticeable creaking noise that can be heard when lifting or opening the laptop. Fortunately, the case surface doesn't get pushed down noticeably while typing.
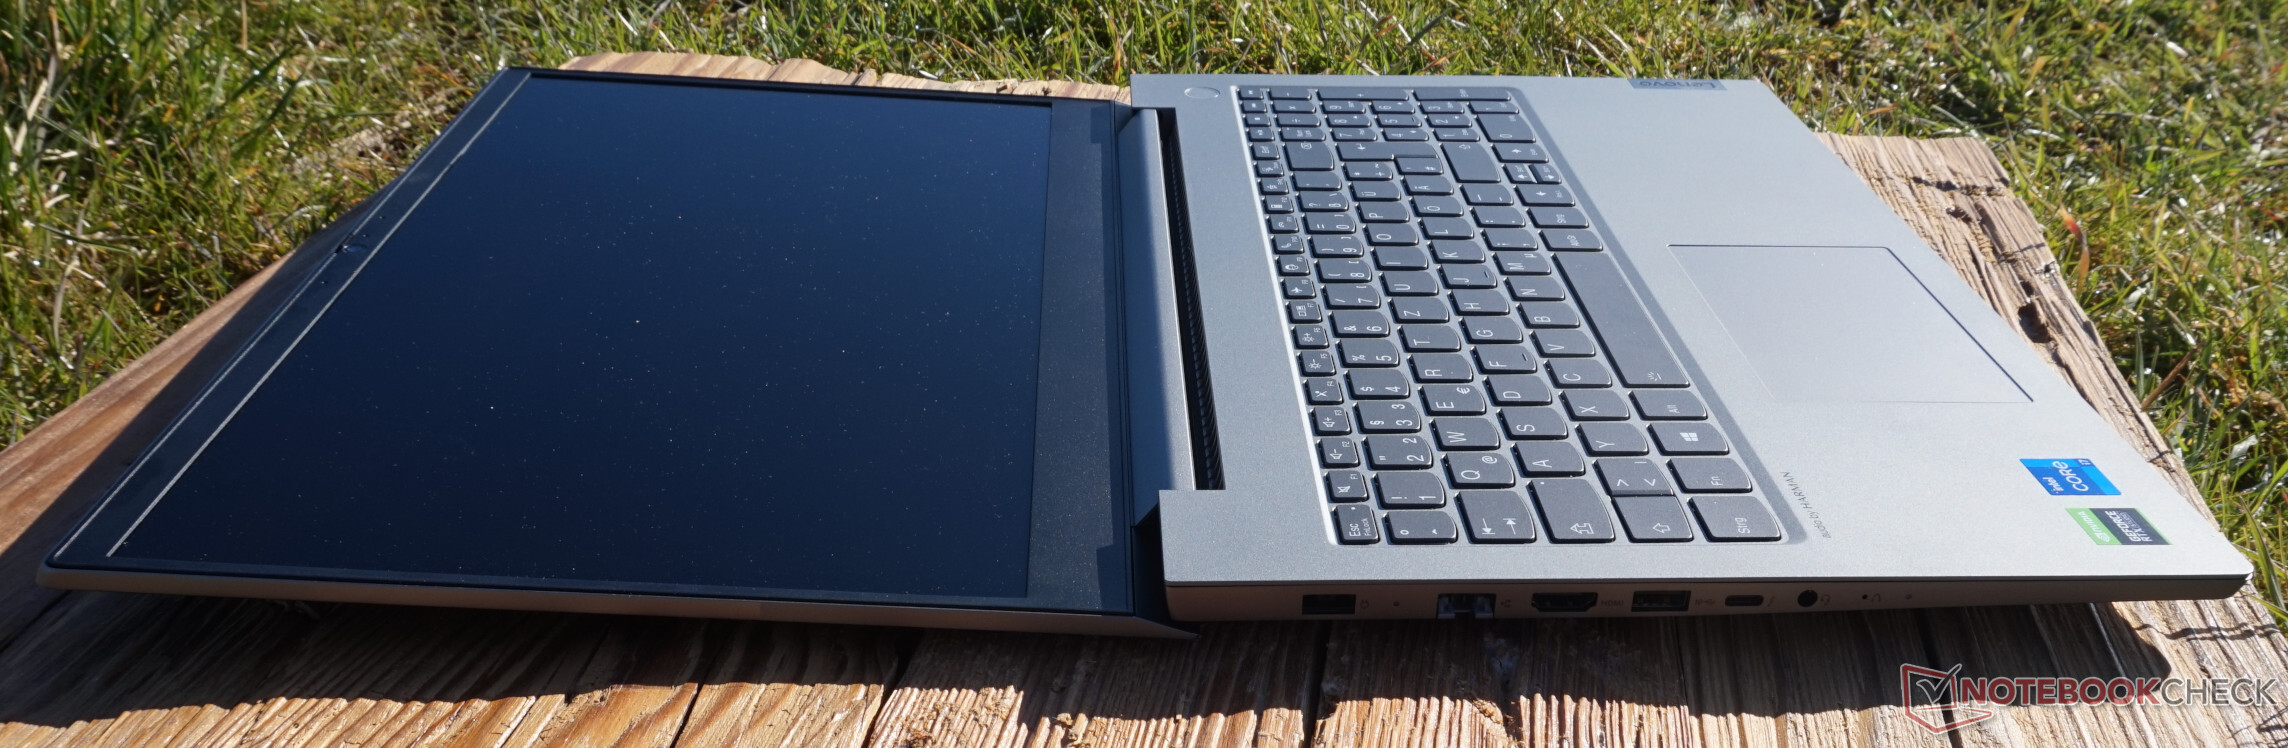


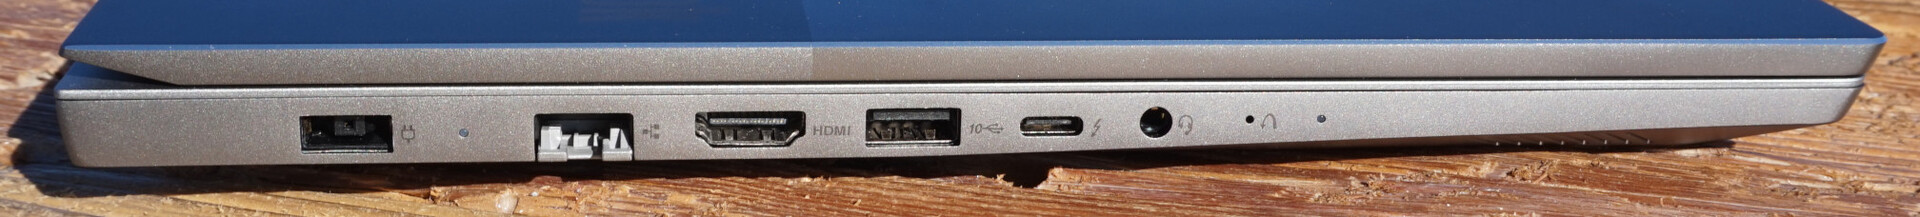
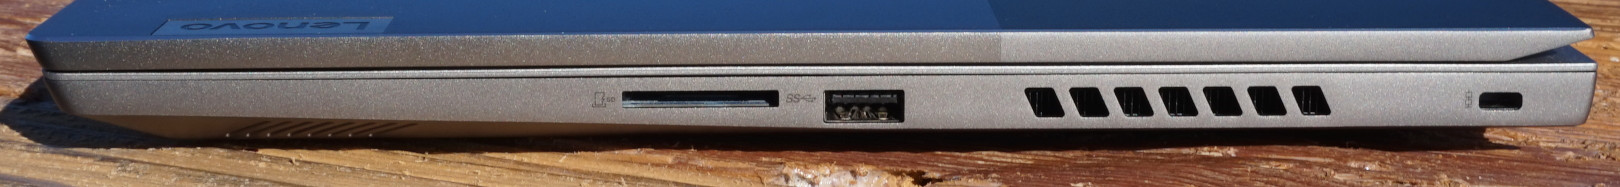
Equipment - TB4 finally in the Lenovo ThinkBook
While the selection of connections could be more numerous, it is still versatile. The LAN port and finally also Thunderbolt 4 stand out as positive examples. The latter also supports two external 4K monitors, for example, and you could connect a third monitor via HDMI. However, the entry-level model among the multimedia laptops lacks a docking port.
SD Card Reader
| SD Card Reader | |
| average JPG Copy Test (av. of 3 runs) | |
| MSI Creator Z16 A11UET-209 (AV Pro SD microSD 128 GB V60) | |
| Dell XPS 15 9510 11800H RTX 3050 Ti OLED (AV Pro V60) | |
| Average of class Multimedia (23 - 531, n=41, last 2 years) | |
| Gigabyte G5 GD (AV PRO microSD 128 GB V60) | |
| Asus VivoBook 15 Pro M3500QC-L1062 (AV Pro V60) | |
| Lenovo ThinkBook 15p Gen1 4K (AV Pro V60) | |
| Lenovo ThinkBook 15p G2 ITH 21B1000YGE (AV Pro V60) | |
| Dell Inspiron 16 Plus 7610-MHJ8F (AV Pro SD microSD 128 GB V60) | |
| maximum AS SSD Seq Read Test (1GB) | |
| Dell XPS 15 9510 11800H RTX 3050 Ti OLED (AV Pro V60) | |
| Average of class Multimedia (37.3 - 1455, n=40, last 2 years) | |
| MSI Creator Z16 A11UET-209 (AV Pro SD microSD 128 GB V60) | |
| Gigabyte G5 GD (AV PRO microSD 128 GB V60) | |
| Asus VivoBook 15 Pro M3500QC-L1062 (AV Pro V60) | |
| Lenovo ThinkBook 15p Gen1 4K (AV Pro V60) | |
| Dell Inspiron 16 Plus 7610-MHJ8F (AV Pro SD microSD 128 GB V60) | |
| Lenovo ThinkBook 15p G2 ITH 21B1000YGE (AV Pro V60) | |
Communication
Like its predecessor, the WLAN module places very high on top, and the ThinkBook 15p G2 is able surpass particularly the average of the multimedia class by almost 50%. Assuming you have the corresponding router placed not too far away, you can also wirelessly transfer huge amounts of data quickly.
Webcam
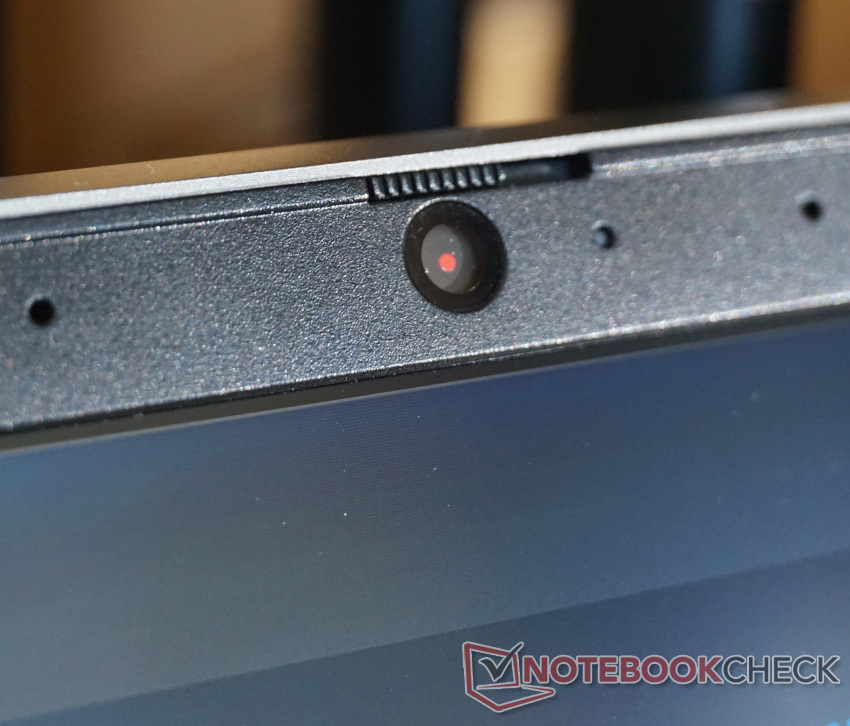
The resolution of the webcam was increased. Now at 2 MP, which is the Full HD resolution, this results in an image quality particularly for video calls that can be compared at least to simple tablets. For many laptops, even those of a high quality, this is often not the case.
The clarity in weak light conditions continues to be convincing. On the other hand, the color accuracy turns out very bad and the color distortions are clearly visible.


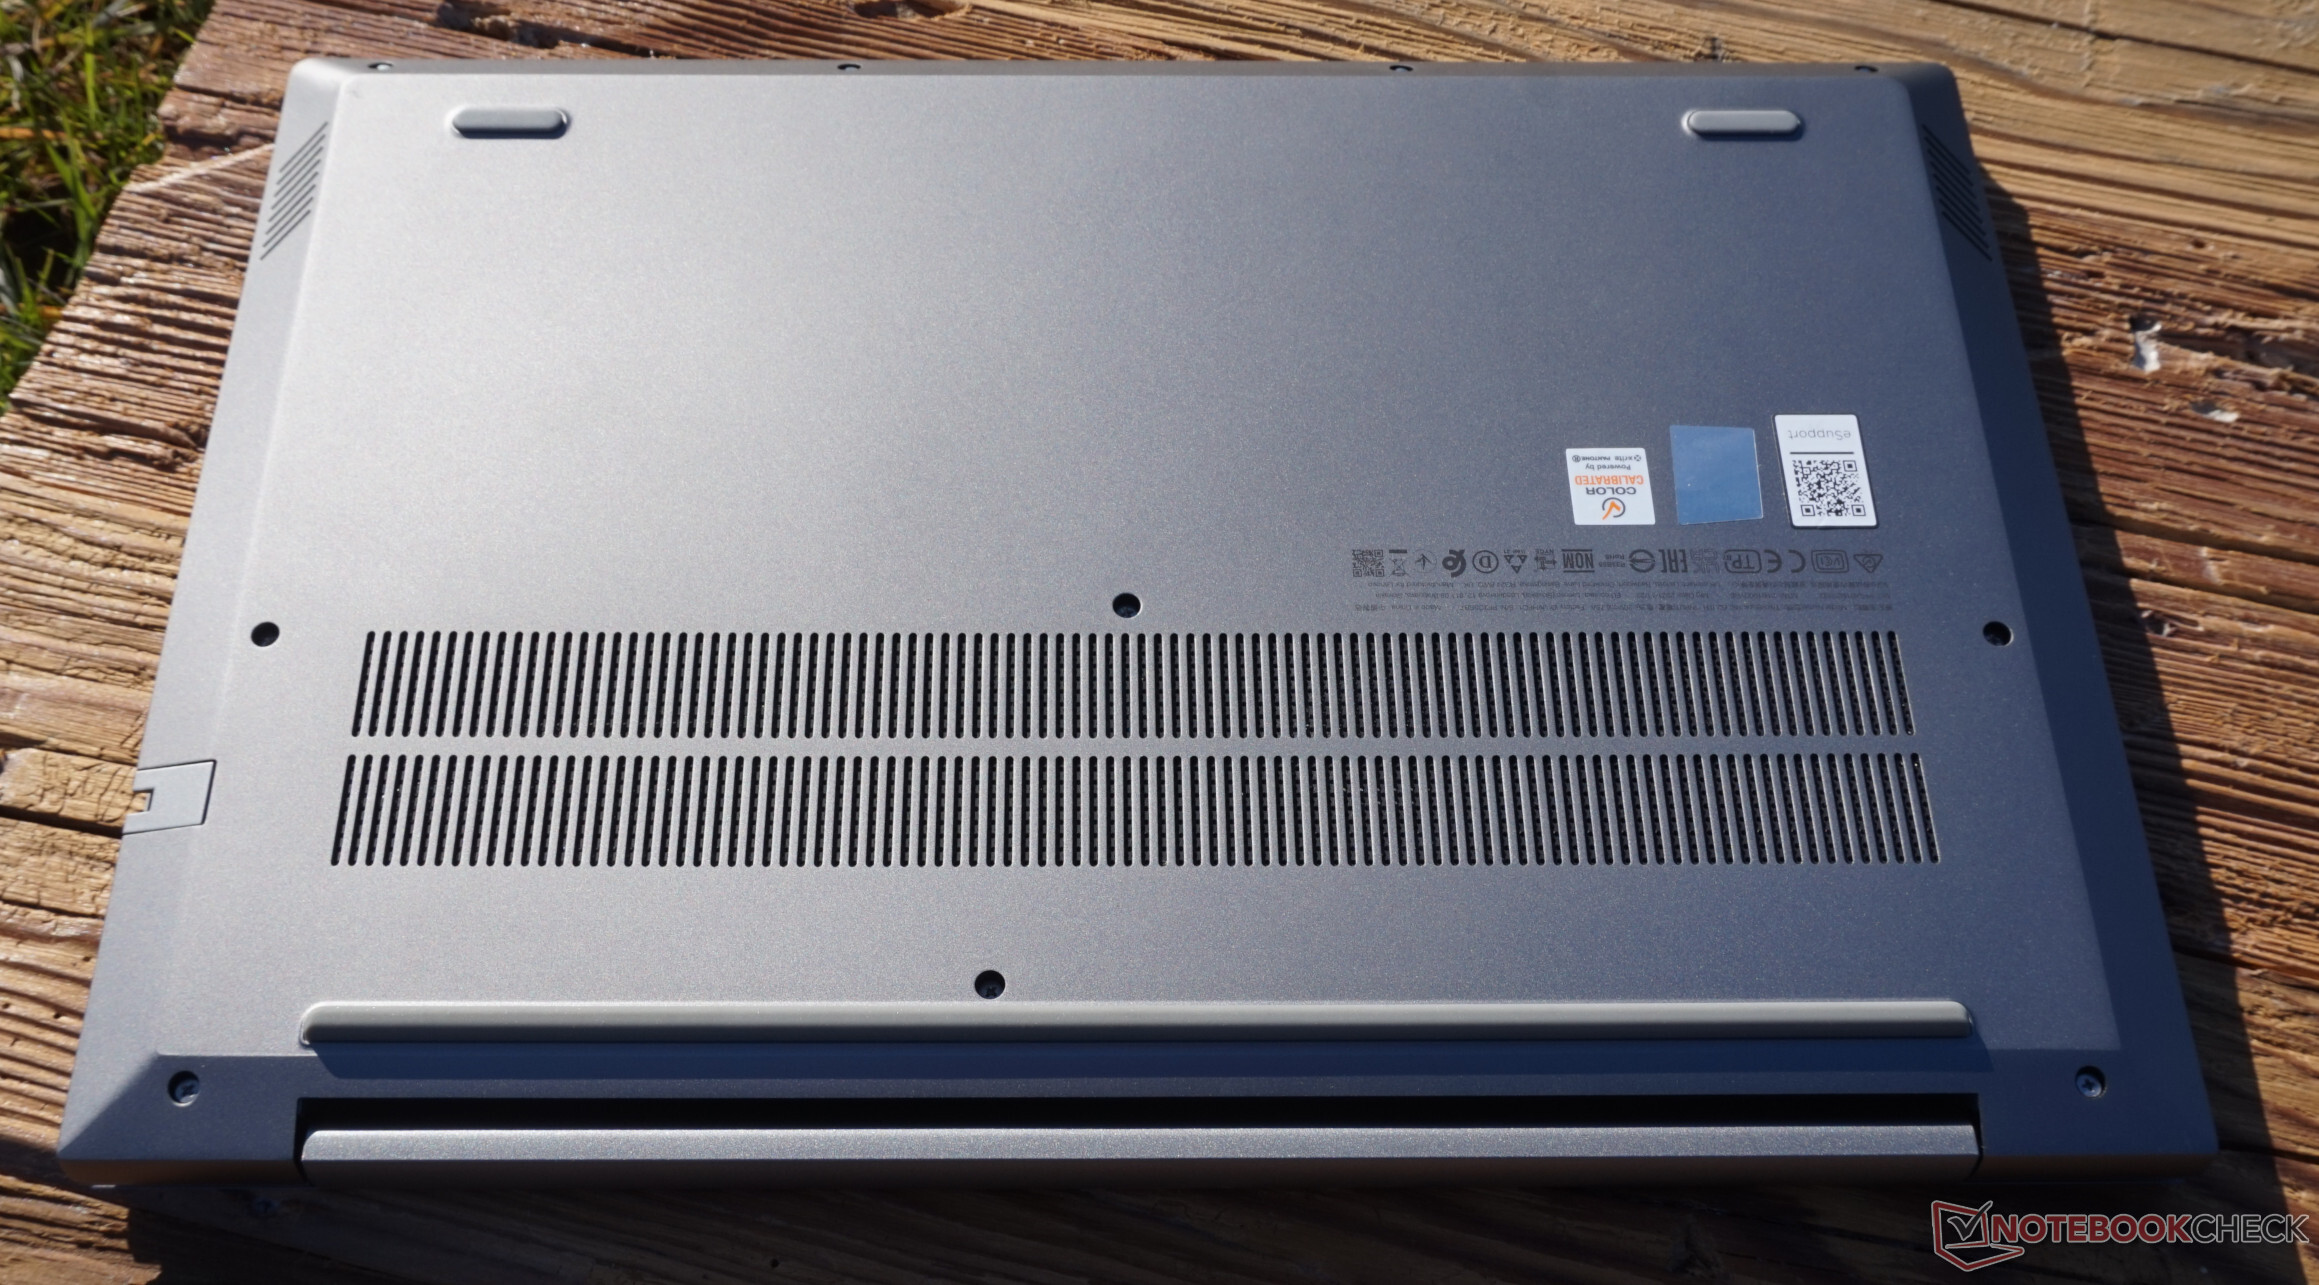
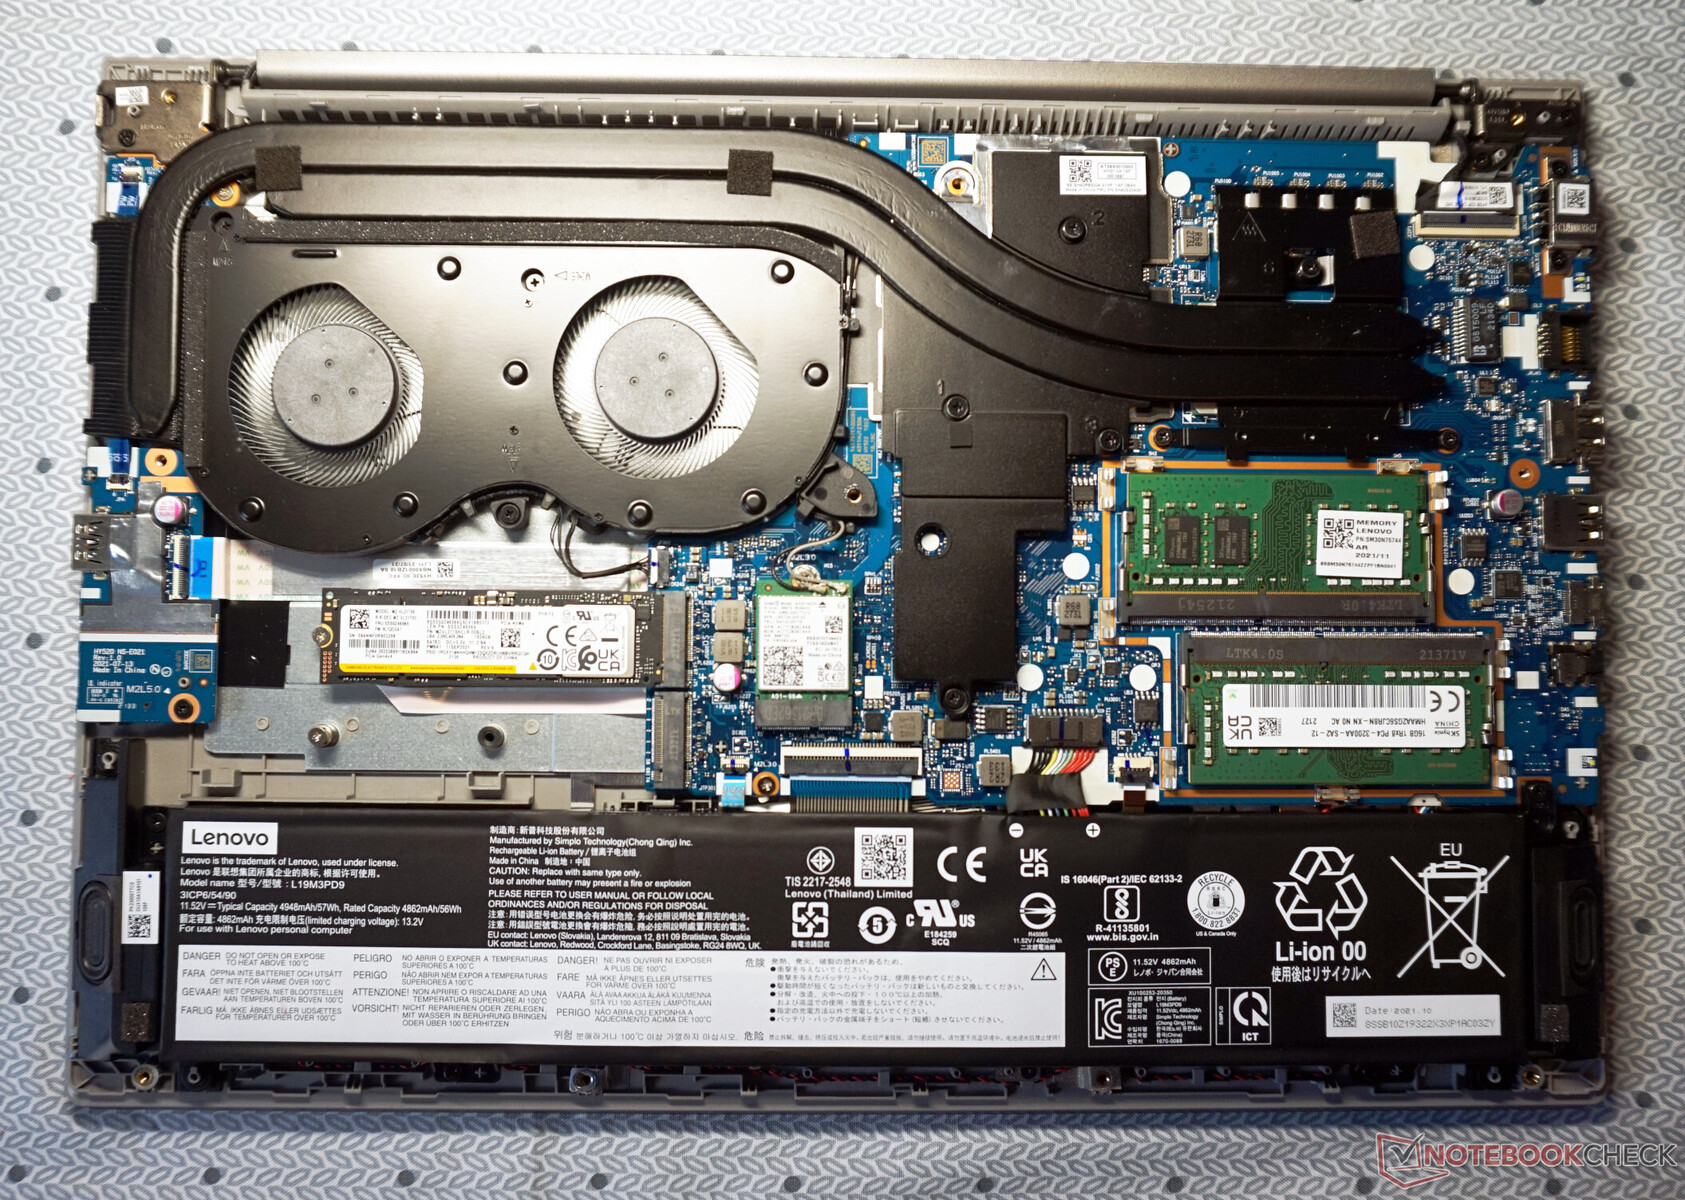
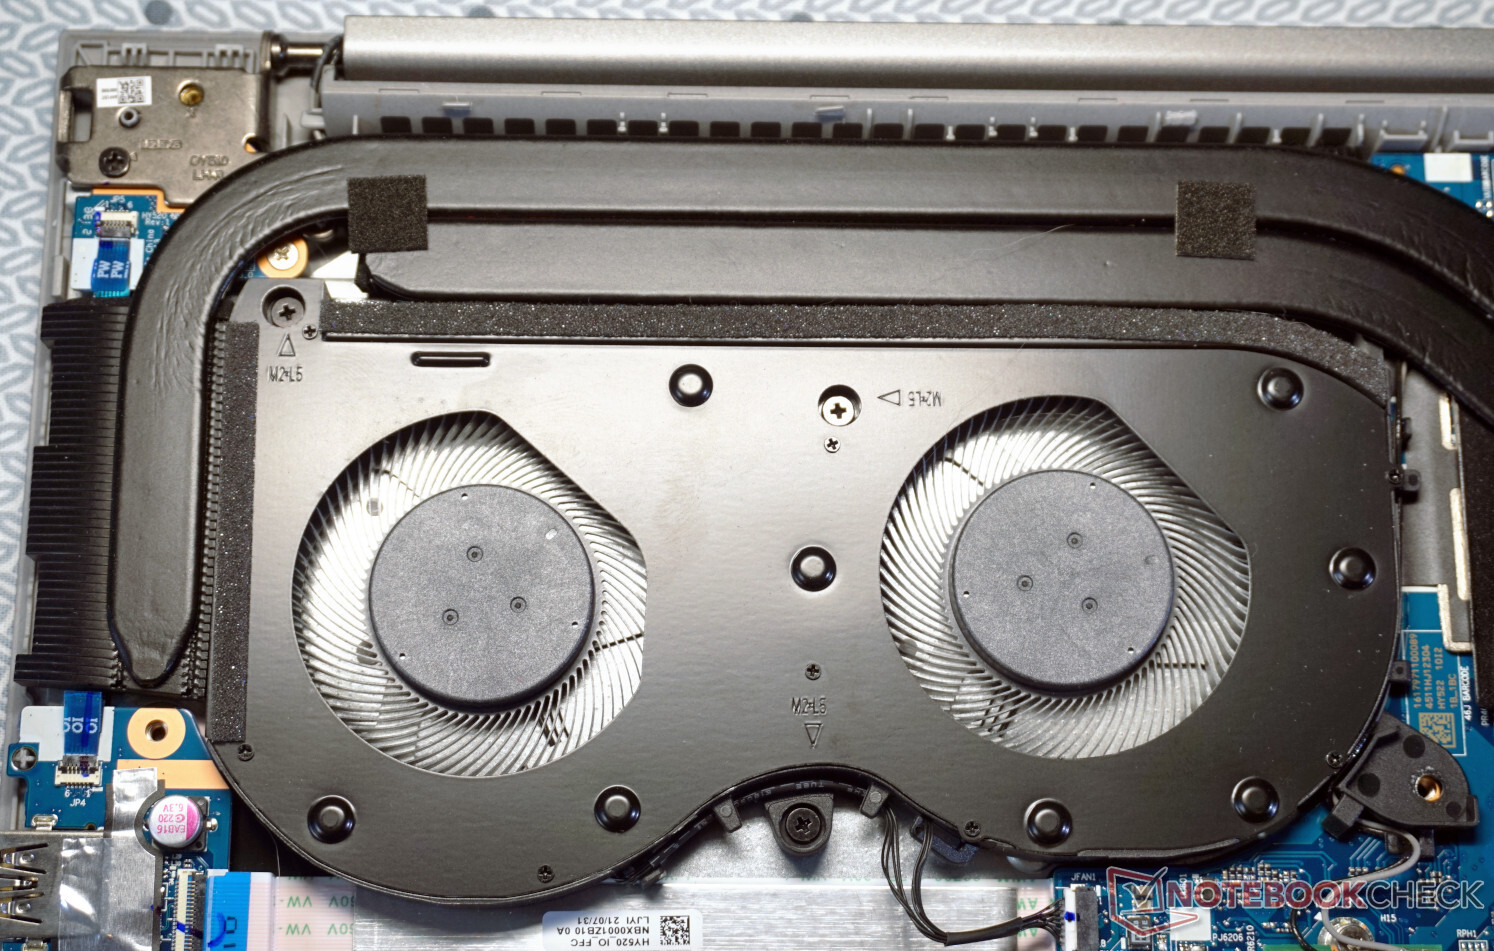
Maintenance
Lenovo doesn't really make it easy to remove the bottom cover. Even though all ten screws are freely accessible, the cover is tightly attached to the case by a multitude of plastic clamps. It is very likely that a few of them break if you try to pry them open. While you should basically be able to open the case and close it back up without causing any visible damage, you might need some suitable prying tools, like you can find in some tool sets for precision mechanics, for example.
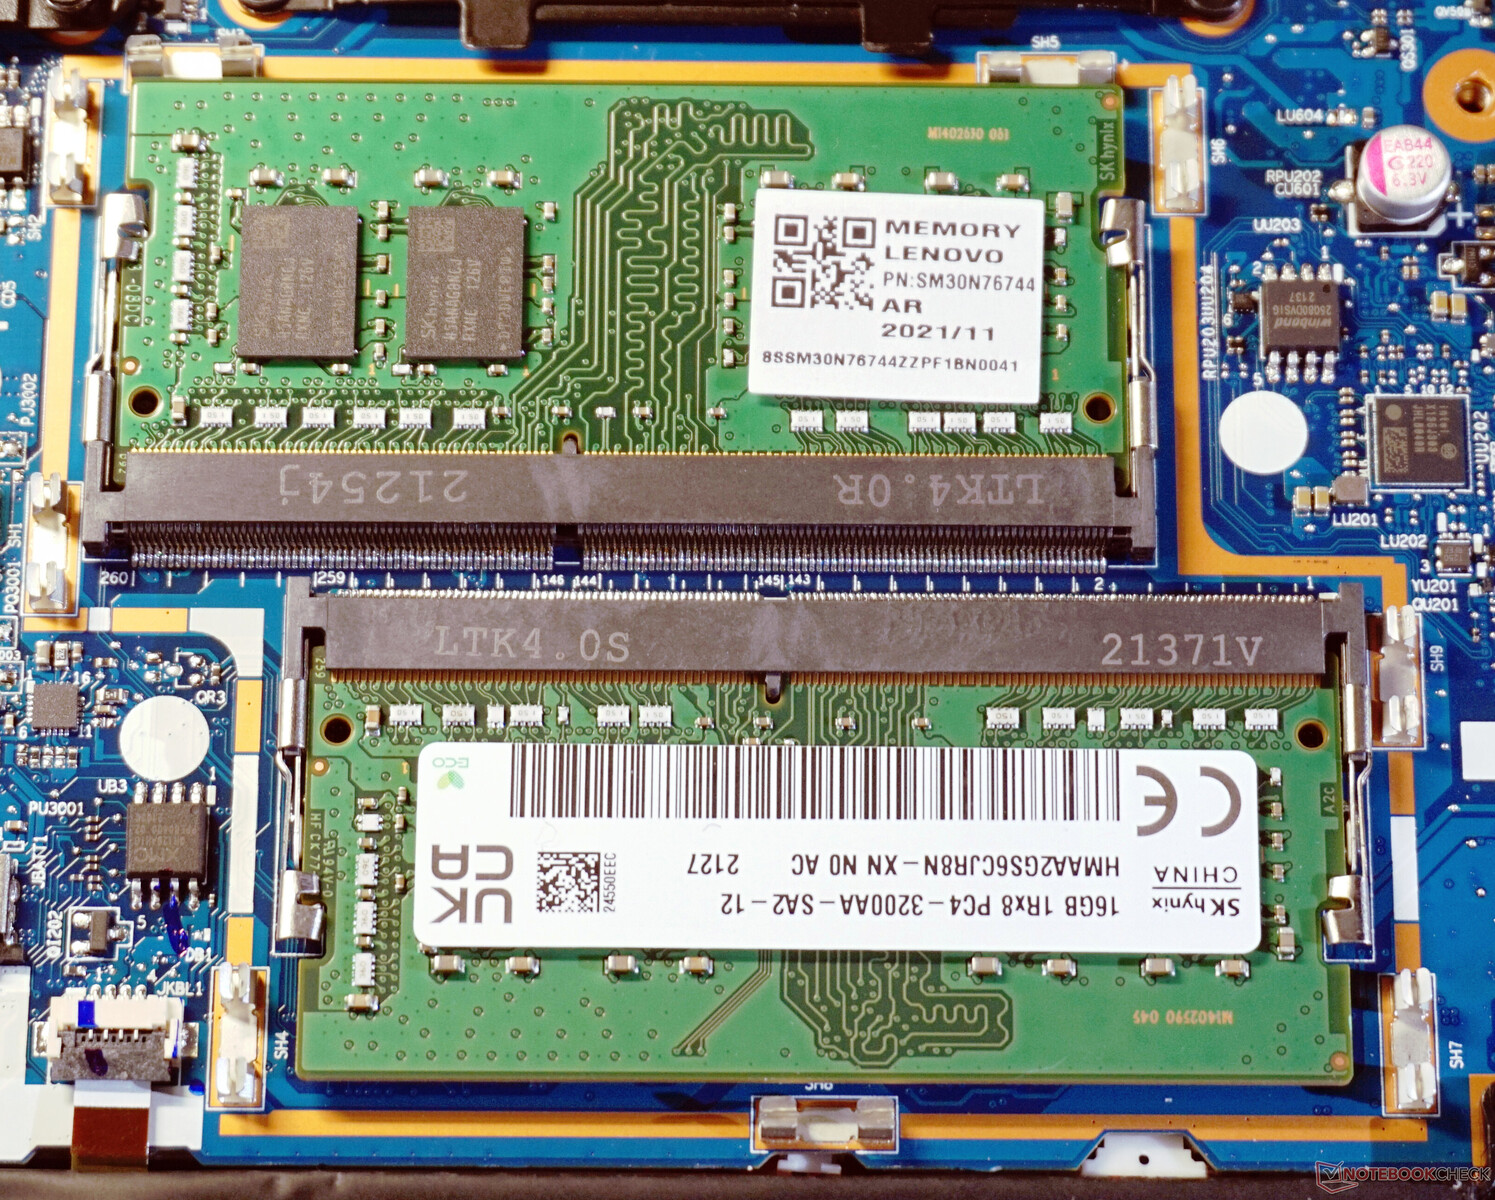
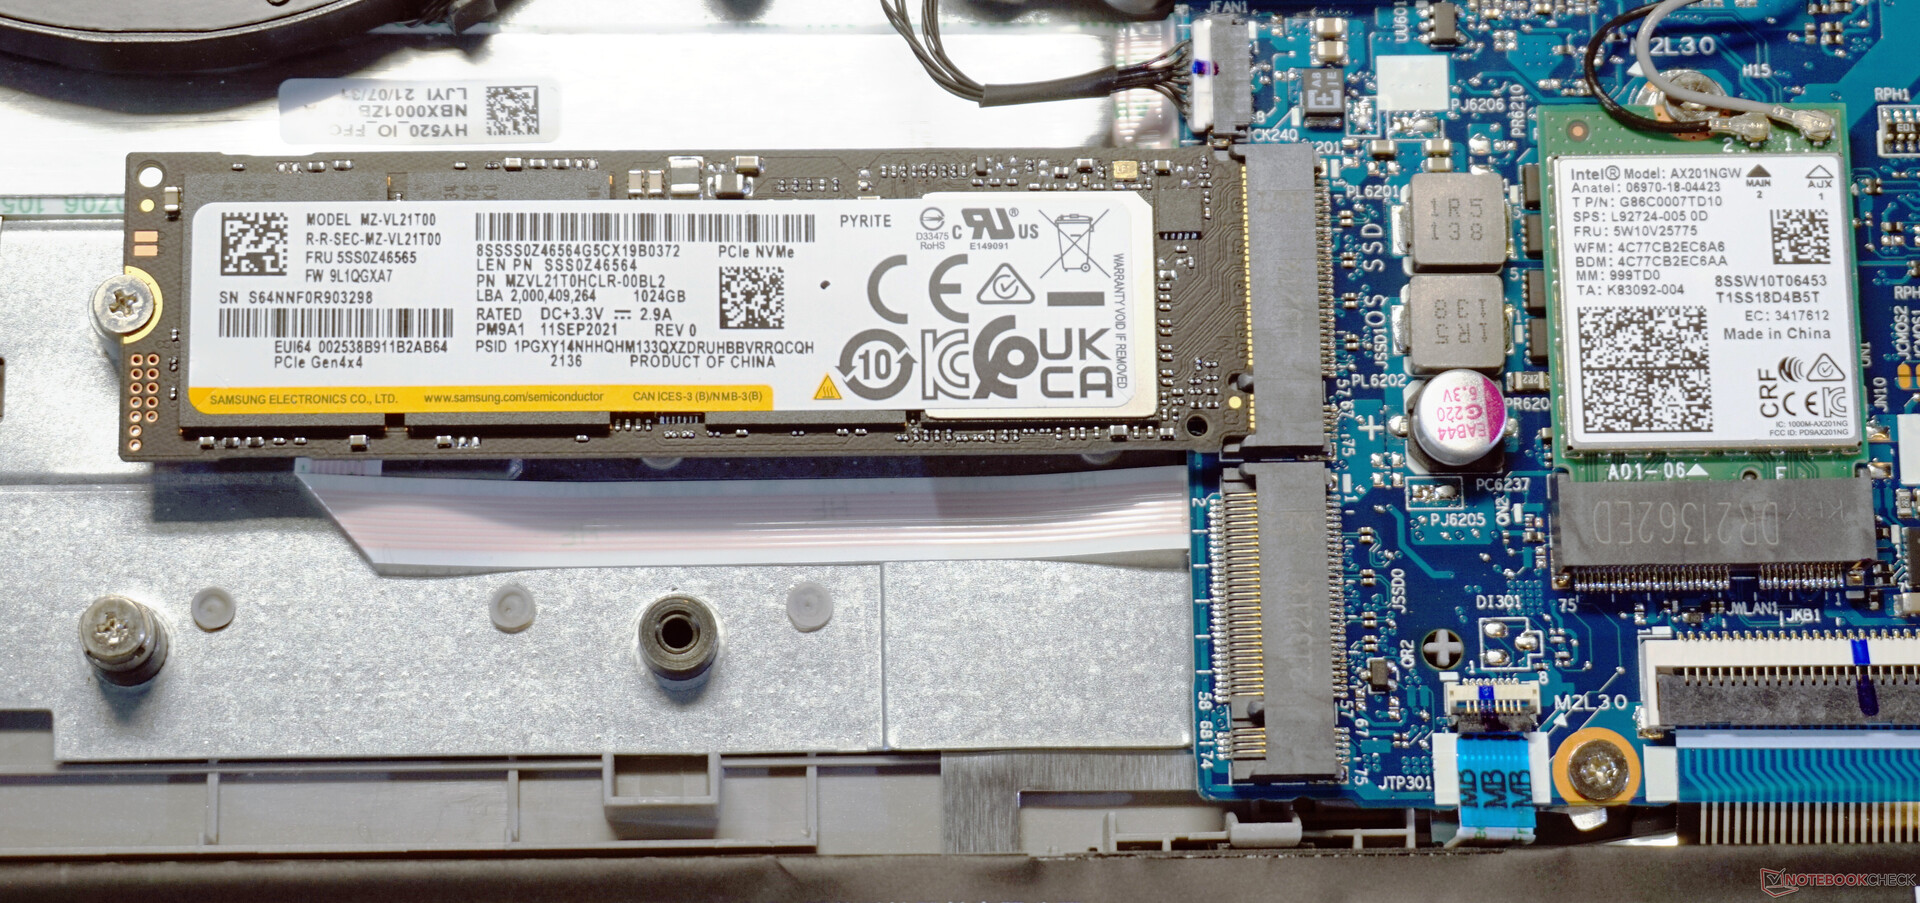
Looking inside, you can see an easily accessible and therefore easily cleanable double fan for CPU and GPU. The working memory modules can be replaced. A completely free slot for an additional NVMe SSD is also noticeable, allowing you to quickly equip the ThinkBook 15p G2 with more storage. In addition, you can also replace the WLAN model, and the battery is only held in place by two screws.
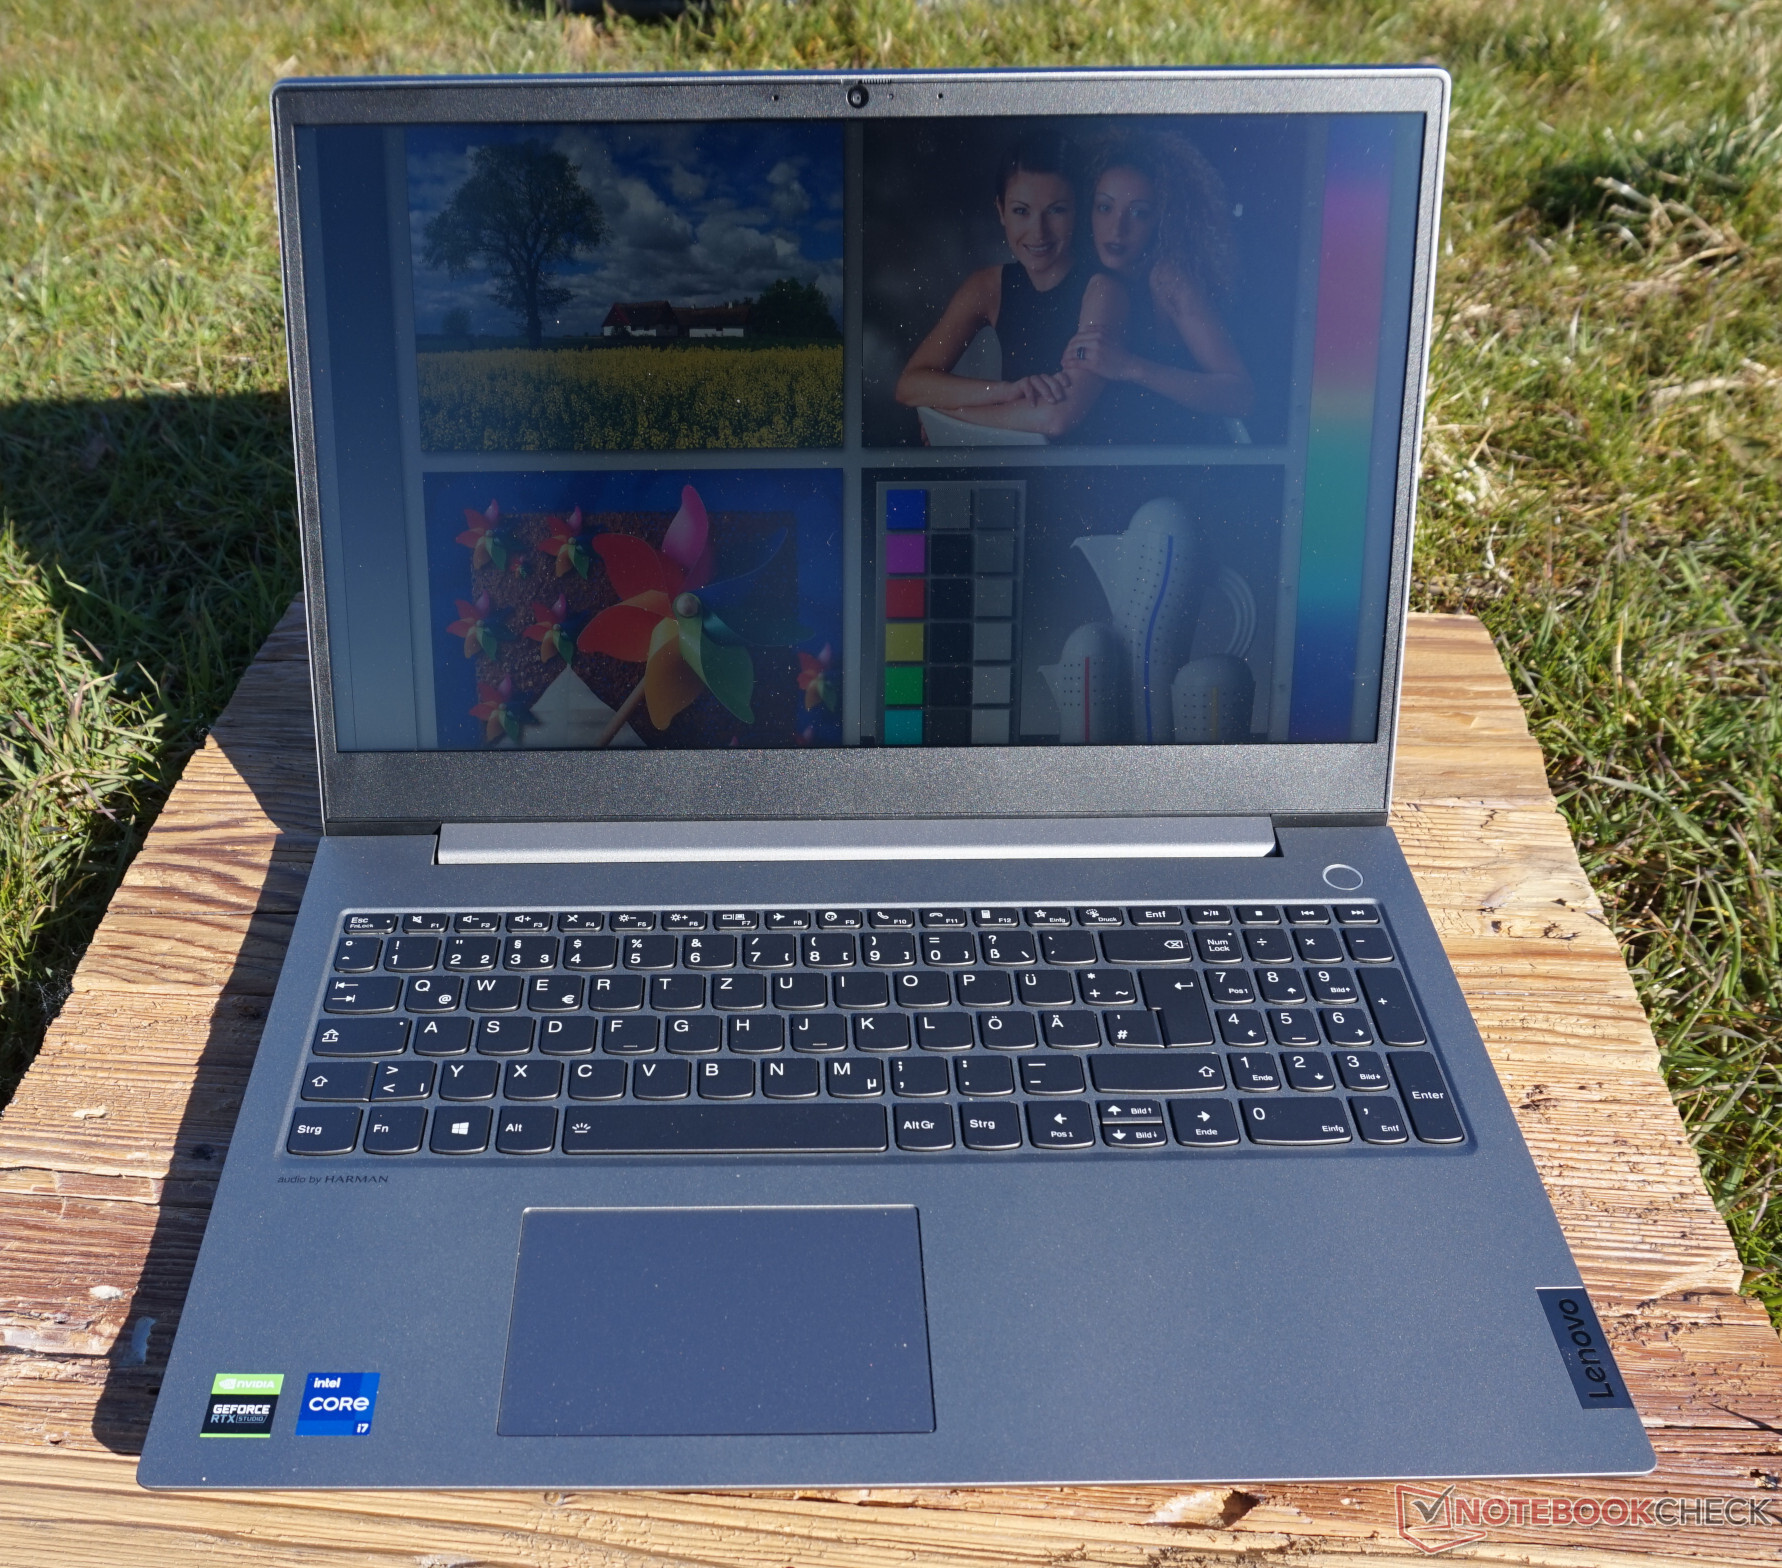
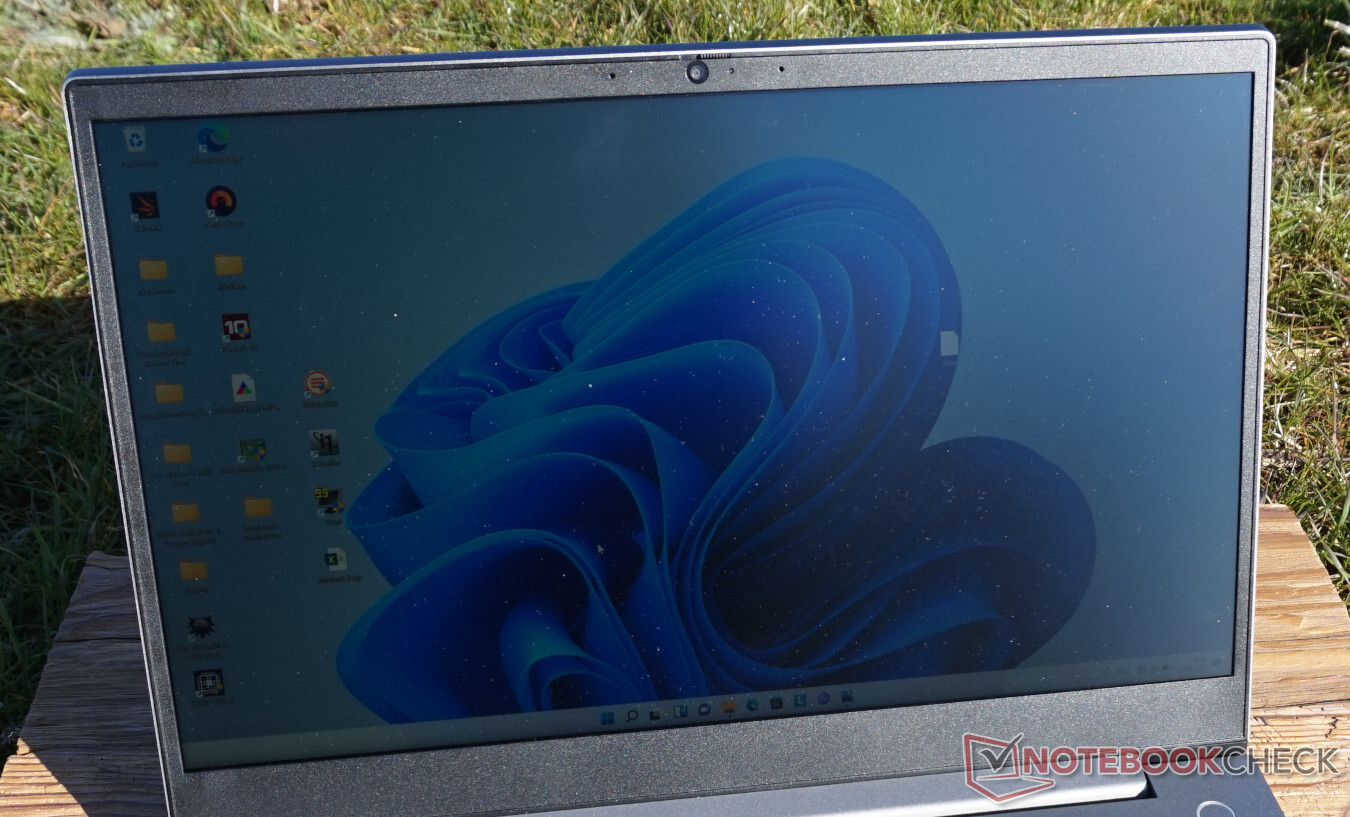
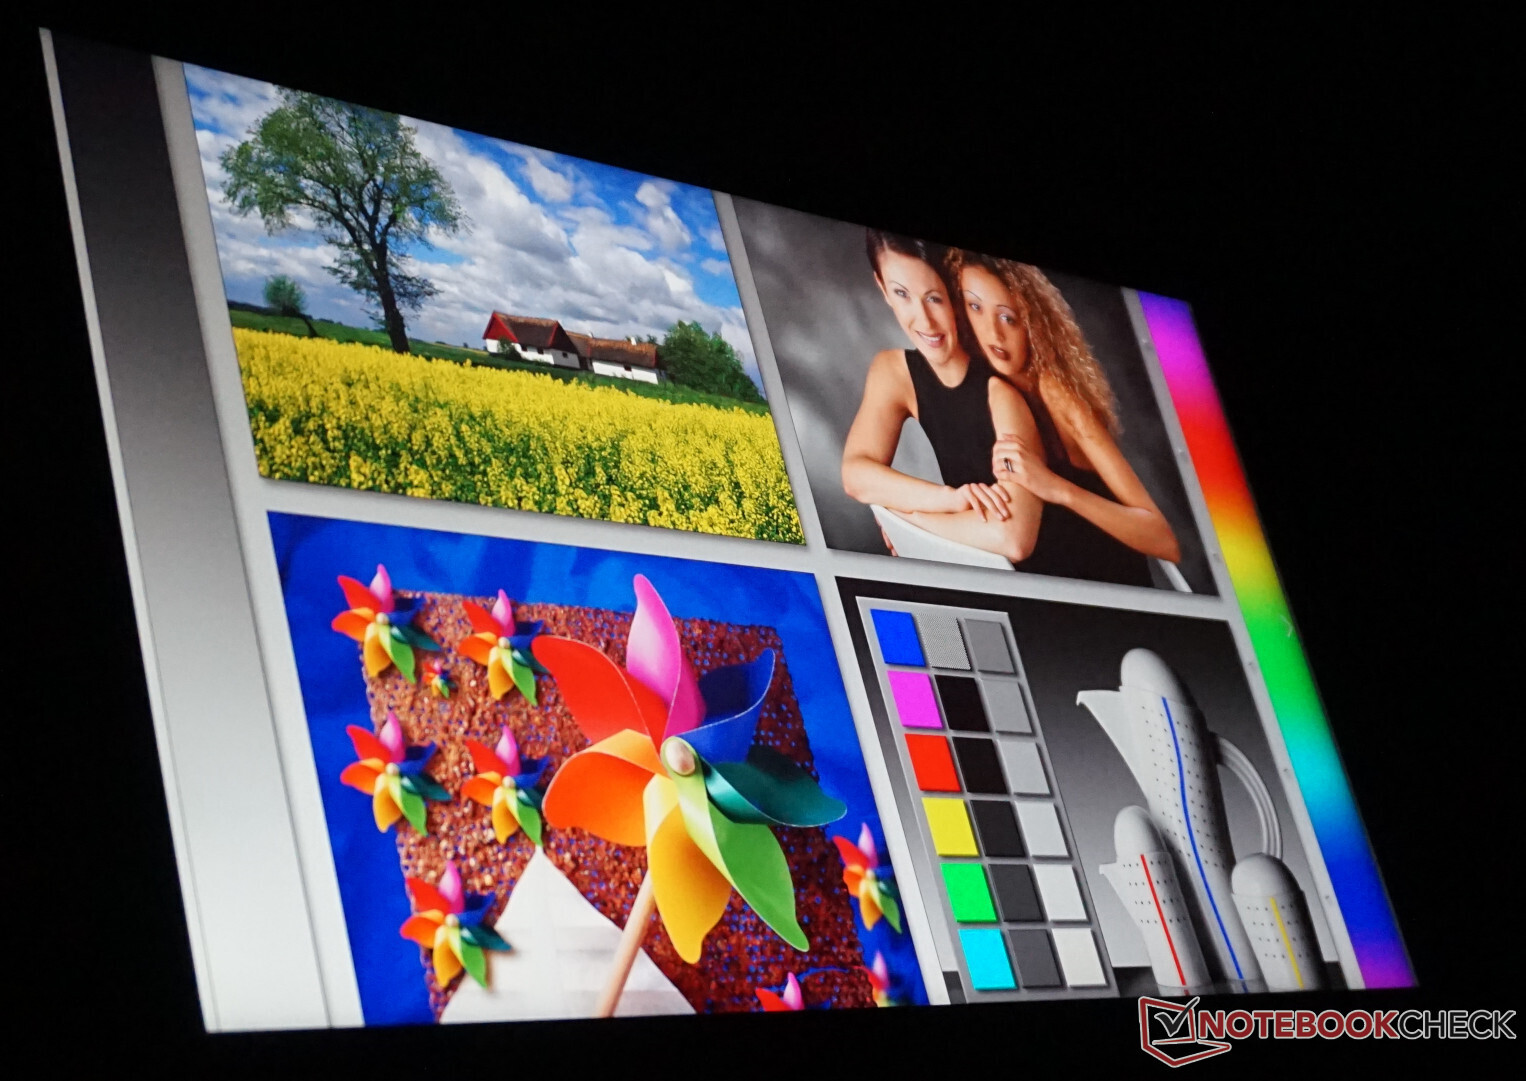
Display - Center piece of the multimedia laptop


In the ThinkBook 15p G2, a different panel is used than in the first generation. In our measurements, this achieves on average 100 cd/m² less brightness than the older model, and this is also 100 cd/m² less than specified (with Lenovo specifying a maximum value). At 73%, the brightness distribution is also missing the value of the predecessor or other comparable laptops by far. Unfortunately, the display still keeps the 16:9 format. While this might be optimal for video streaming and more, if you want to do some serious work with the ThinkBook, 16:10 or even 3:2 would be a better format. We could mention the example of the Lenovo ThinkBook 16p, which offers this additional screen real estate.
Nonetheless, an average brightness of 500 cd/m² and a 4K resolution in barely 15.6 inches are hard to beat. At the same time, it is almost impossible to work with Windows without increasing the text and symbol size to at least 175% or even better, to 200%. It is also basically impossible to distinguish a recording in Full HD from one in 4K from a viewing distance of 30 cm (~1 ft).
So those who don't want to use it for at least semi-professional image processing will probably be better served with the Full HD display with 300 cd/m² that is also available.
| |||||||||||||||||||||||||
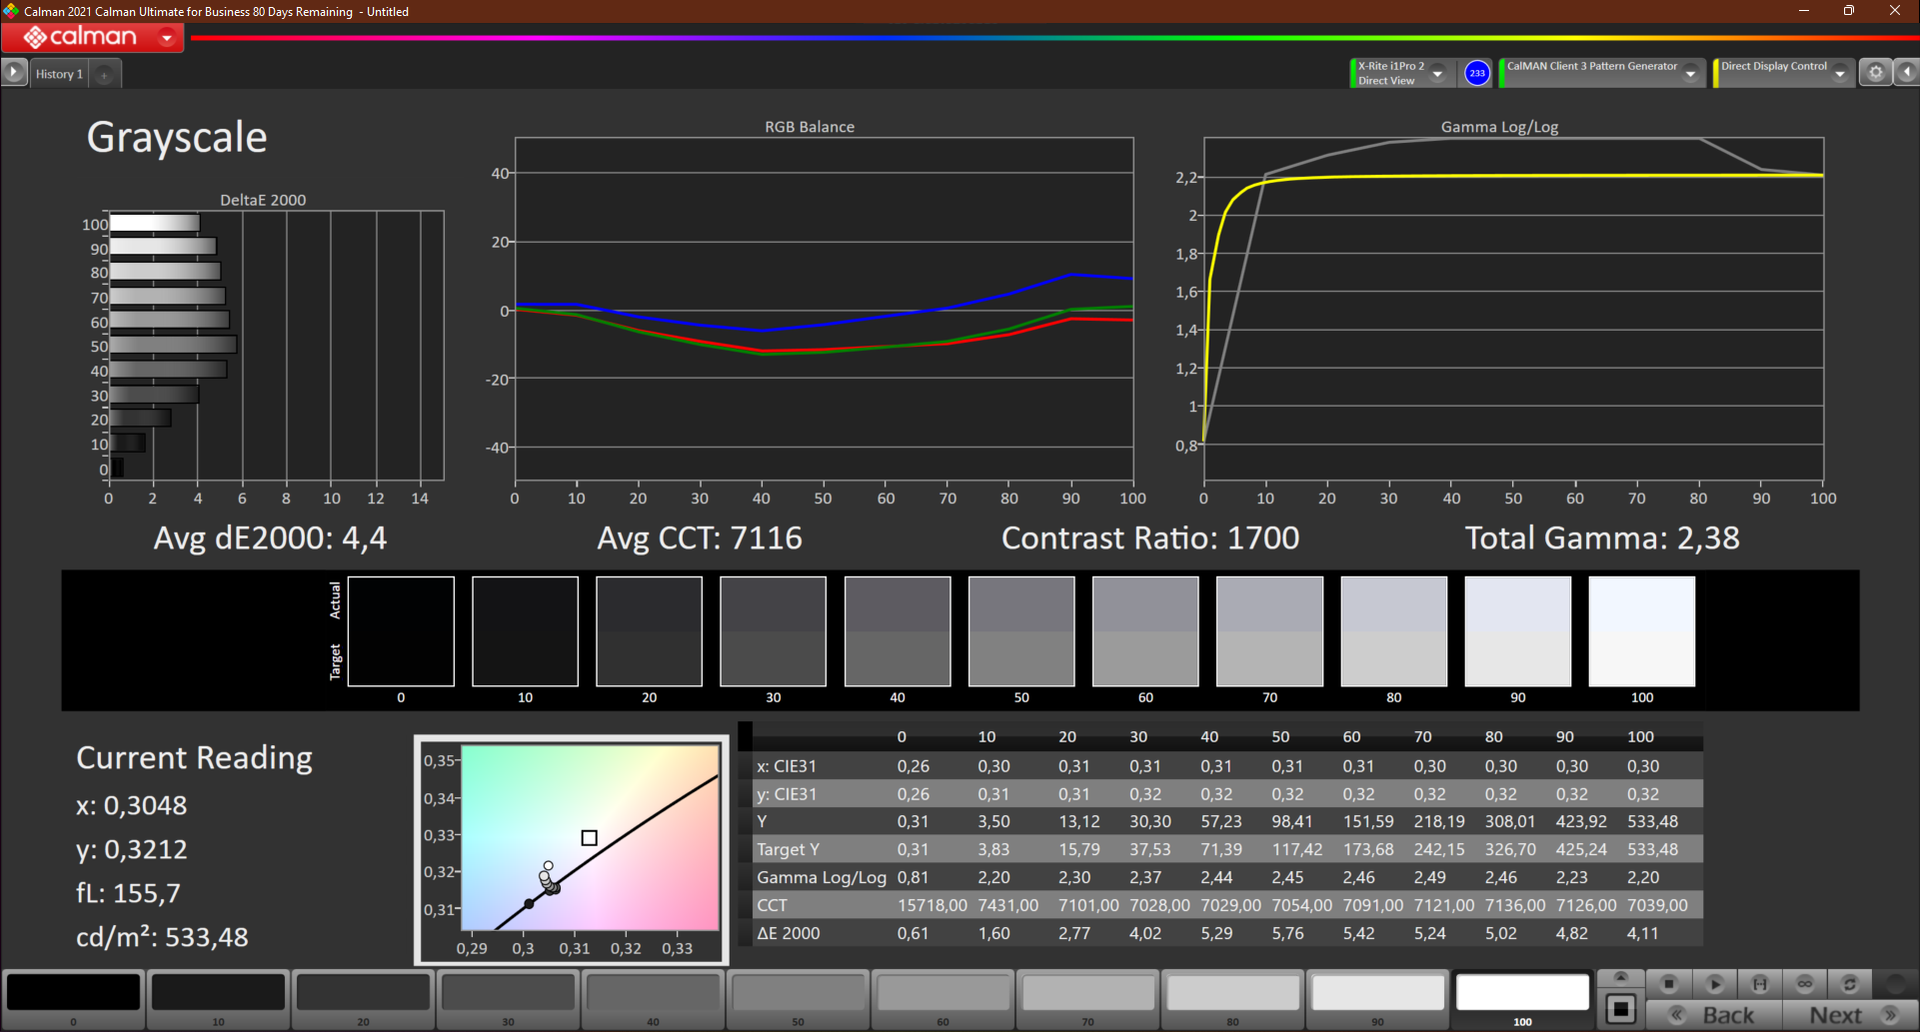
Brightness Distribution: 73 %
Center on Battery: 542 cd/m²
Contrast: 1748:1 (Black: 0.31 cd/m²)
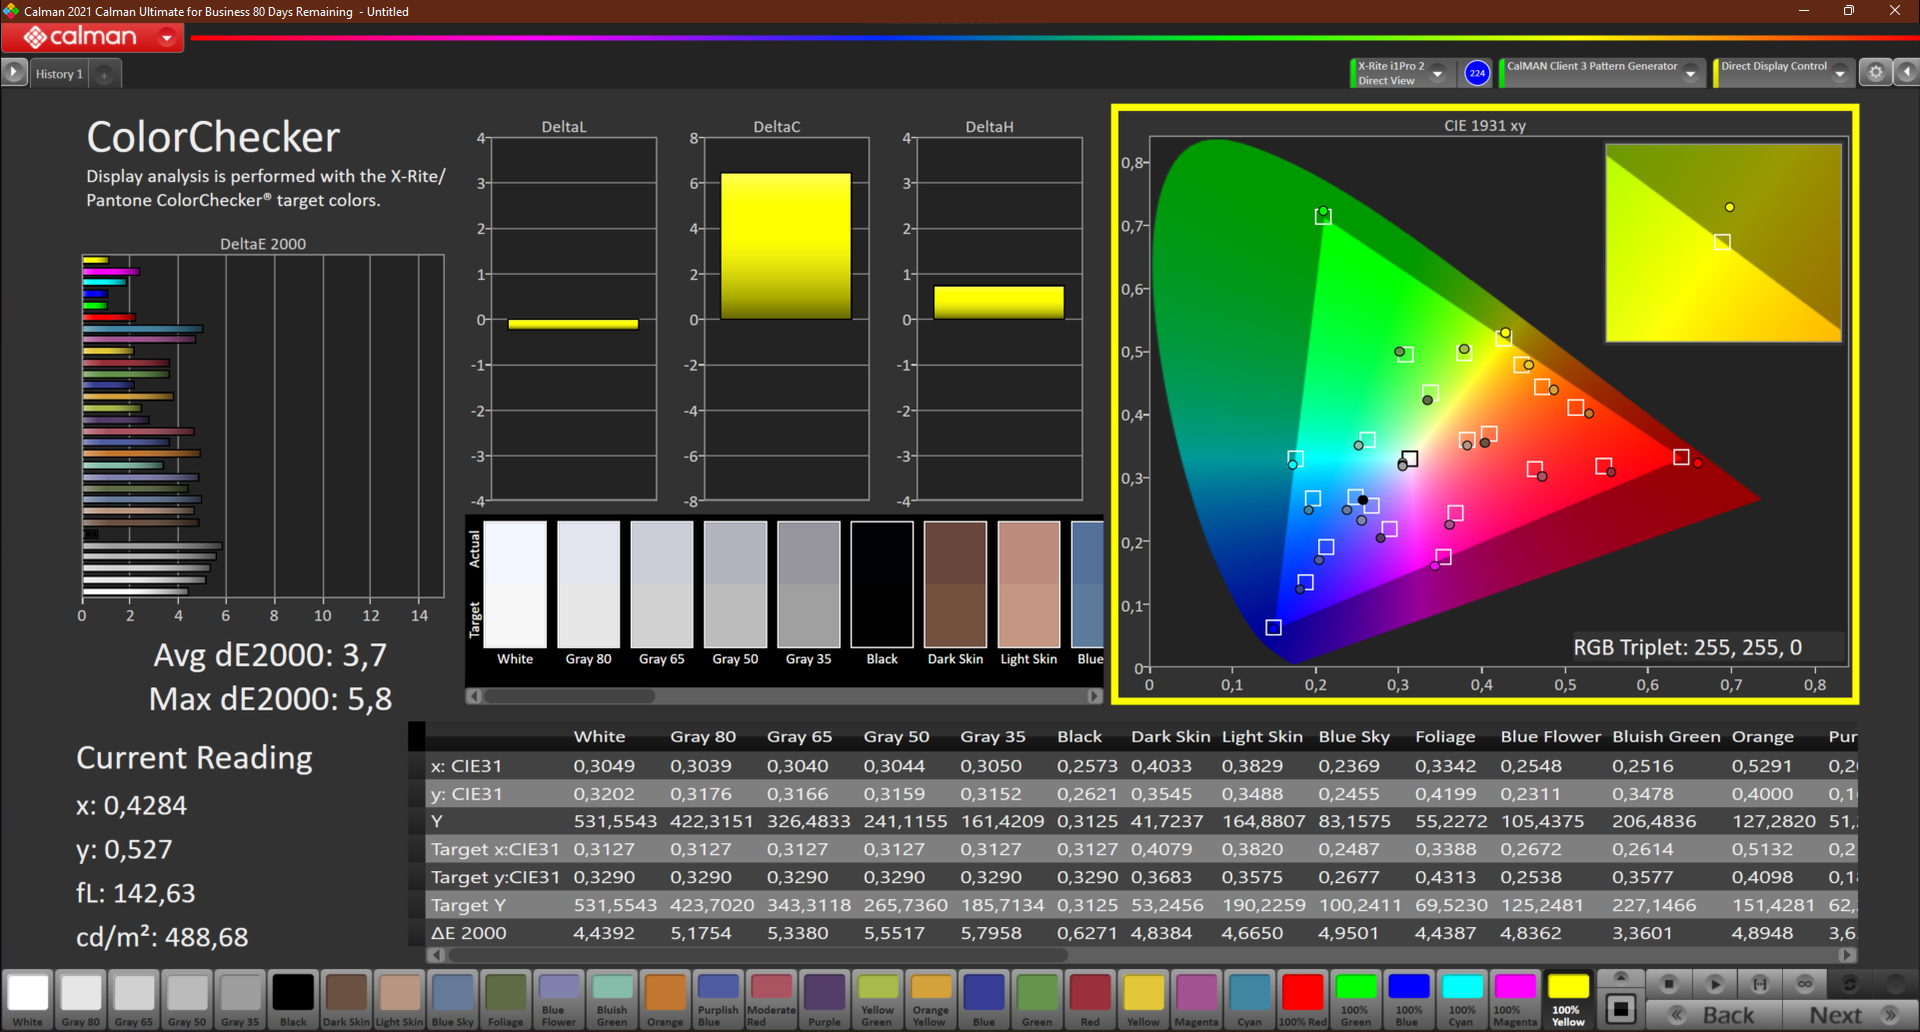
ΔE ColorChecker Calman: 3.7 | ∀{0.5-29.43 Ø4.72}
calibrated: 1.1
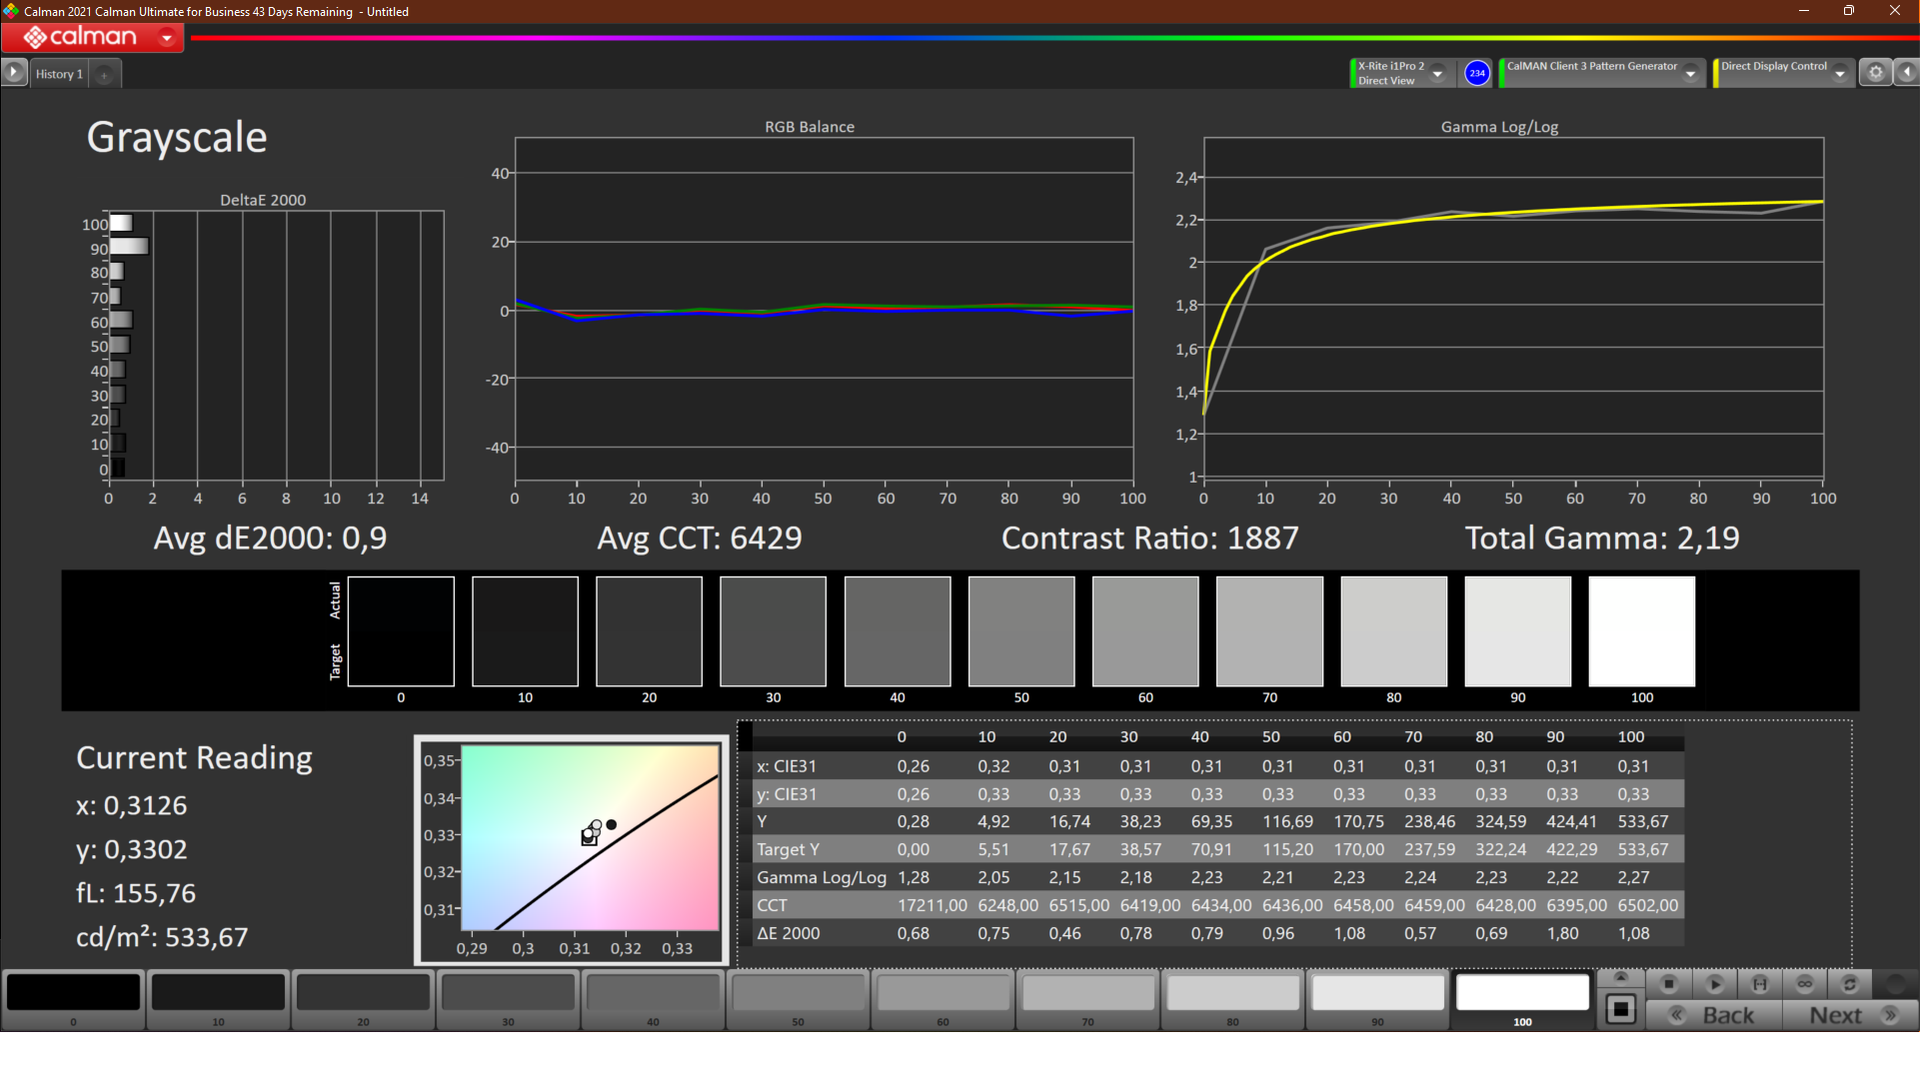
ΔE Greyscale Calman: 4.4 | ∀{0.09-98 Ø4.97}
100% AdobeRGB 1998 (Argyll 3D)
100% sRGB (Argyll 3D)
90.2% Display P3 (Argyll 3D)
Gamma: 2.38
CCT: 7116 K
| Lenovo ThinkBook 15p G2 ITH 21B1000YGE LEN156UHD, IPS, 3840x2160, 15.6" | Lenovo ThinkBook 15p Gen1 4K CSOT T3 MNF601EA-1, IPS, 3840x2160, 15.6" | MSI Creator Z16 A11UET-209 AUO B160QAN02.P, IPS True Pixel, 2560x1600, 16" | Asus VivoBook 15 Pro M3500QC-L1062 ATNA56YX03-0, AMOLED, 1920x1080, 15.6" | Dell XPS 15 9510 11800H RTX 3050 Ti OLED SDC414D, OLED, 3456x2160, 15.6" | Lenovo ThinkBook 16p G2 ACH Lenovo LEN8A95 (AUO B160QAN02.M), IPS, 2560x1600, 16" | |
|---|---|---|---|---|---|---|
| Display | -2% | 2% | 2% | 3% | -13% | |
| Display P3 Coverage (%) | 90.2 | 87.4 -3% | 100 11% | 99.9 11% | 99.9 11% | 76.4 -15% |
| sRGB Coverage (%) | 100 | 99.6 0% | 100 0% | 99.9 0% | 100 0% | 100 0% |
| AdobeRGB 1998 Coverage (%) | 100 | 96.9 -3% | 96 -4% | 95.8 -4% | 98.1 -2% | 77.4 -23% |
| Response Times | 24% | 79% | 93% | 93% | 47% | |
| Response Time Grey 50% / Grey 80% * (ms) | 66 ? | 44.8 ? 32% | 14 ? 79% | 3.2 ? 95% | 3.6 ? 95% | 36 45% |
| Response Time Black / White * (ms) | 32 ? | 26.8 ? 16% | 7 ? 78% | 3.2 ? 90% | 2.8 ? 91% | 16.4 49% |
| PWM Frequency (Hz) | 60.2 ? | 59.5 ? | ||||
| Screen | 24% | -17% | 9% | 35% | 3% | |
| Brightness middle (cd/m²) | 542 | 599 11% | 375 -31% | 396 -27% | 362 -33% | 439 -19% |
| Brightness (cd/m²) | 496 | 599 21% | 348 -30% | 397 -20% | 367 -26% | 397 -20% |
| Brightness Distribution (%) | 73 | 91 25% | 89 22% | 99 36% | 97 33% | 83 14% |
| Black Level * (cd/m²) | 0.31 | 0.37 -19% | 0.41 -32% | 0.06 81% | 0.44 -42% | |
| Contrast (:1) | 1748 | 1619 -7% | 915 -48% | 6033 245% | 998 -43% | |
| Colorchecker dE 2000 * | 3.7 | 1.4 62% | 2.59 30% | 2 46% | 2.1 43% | 1.68 55% |
| Colorchecker dE 2000 max. * | 5.8 | 2.9 50% | 7.08 -22% | 4.8 17% | 4.1 29% | 2.36 59% |
| Colorchecker dE 2000 calibrated * | 1.1 | 2.18 -98% | 1.8 -64% | 2.5 -127% | 1.57 -43% | |
| Greyscale dE 2000 * | 4.4 | 2.2 50% | 1.88 57% | 1 77% | 1.4 68% | 1.64 63% |
| Gamma | 2.38 92% | 2.14 103% | 2.37 93% | 2.17 101% | 2.18 101% | 2.39 92% |
| CCT | 7116 91% | 6842 95% | 6470 100% | 6608 98% | 6608 98% | 6616 98% |
| Color Space (Percent of AdobeRGB 1998) (%) | 83.6 | |||||
| Color Space (Percent of sRGB) (%) | 99.5 | |||||
| Total Average (Program / Settings) | 15% /
18% | 21% /
1% | 35% /
21% | 44% /
36% | 12% /
6% |
* ... smaller is better
Despite the calibration in the state of delivery, our measured color deviation is slightly too high and could be noticeable by a trained eye. This is even more the case since the ThinkBook with the bright 4K display is also targeted toward professional users.
However, after our evaluation with the CalMAN software and measurements via X-Rite i1 Pro 2 spectral photometer, we were able to remedy the color deviation almost completely via calibration. The display is now able to reproduce colors very accurately. You can download the corresponding ICC profile from the link in the field with the display values above.
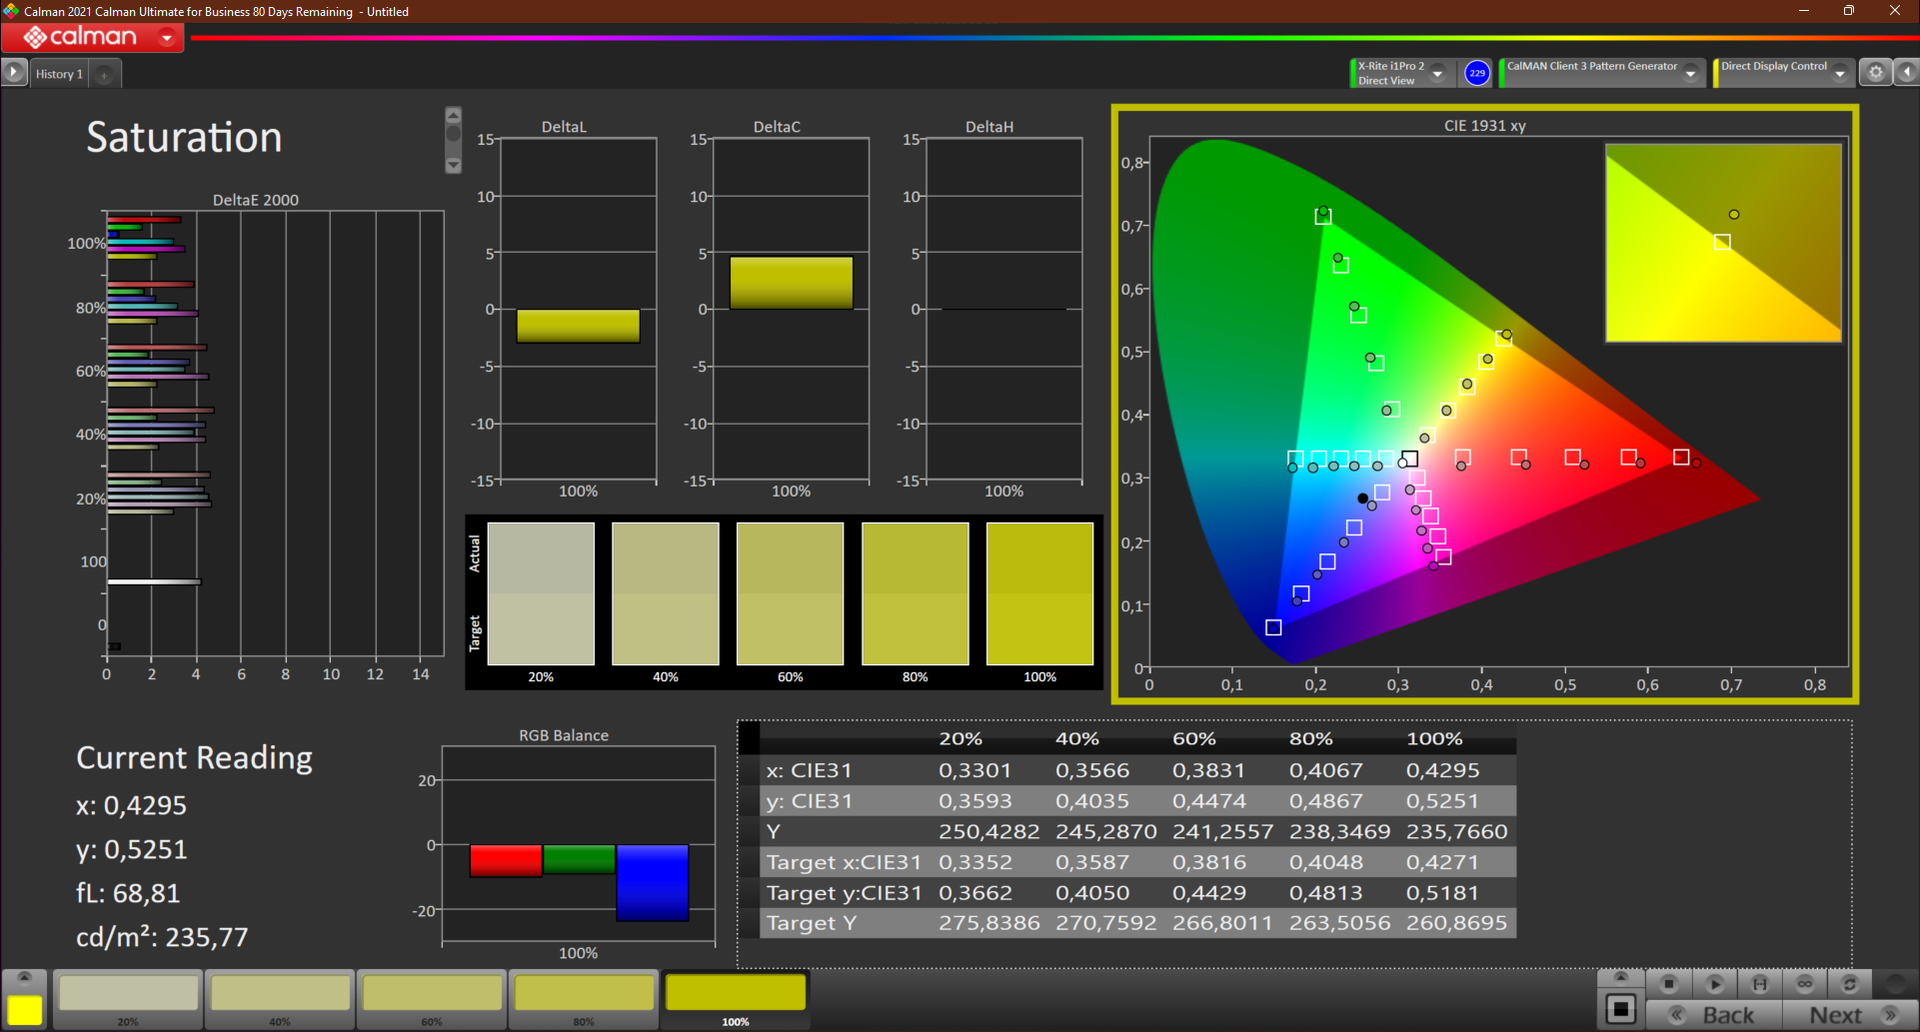
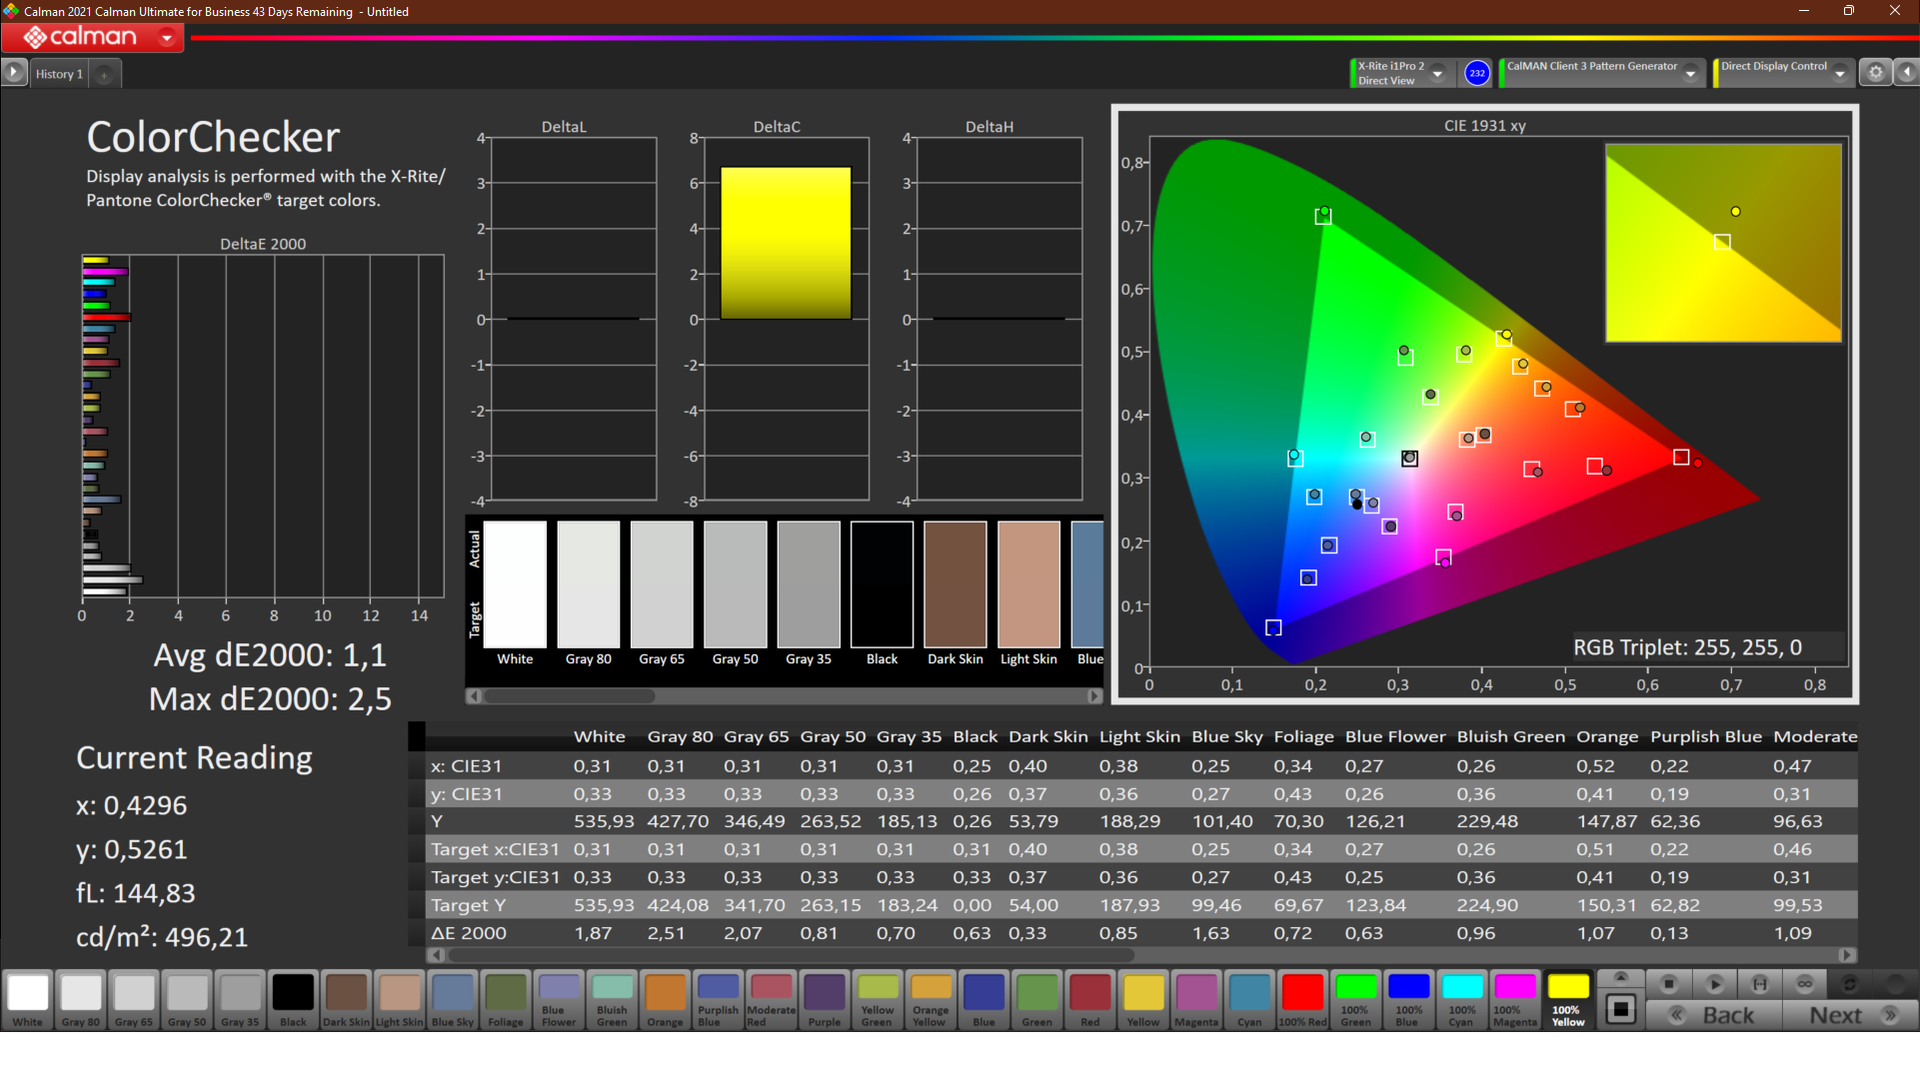
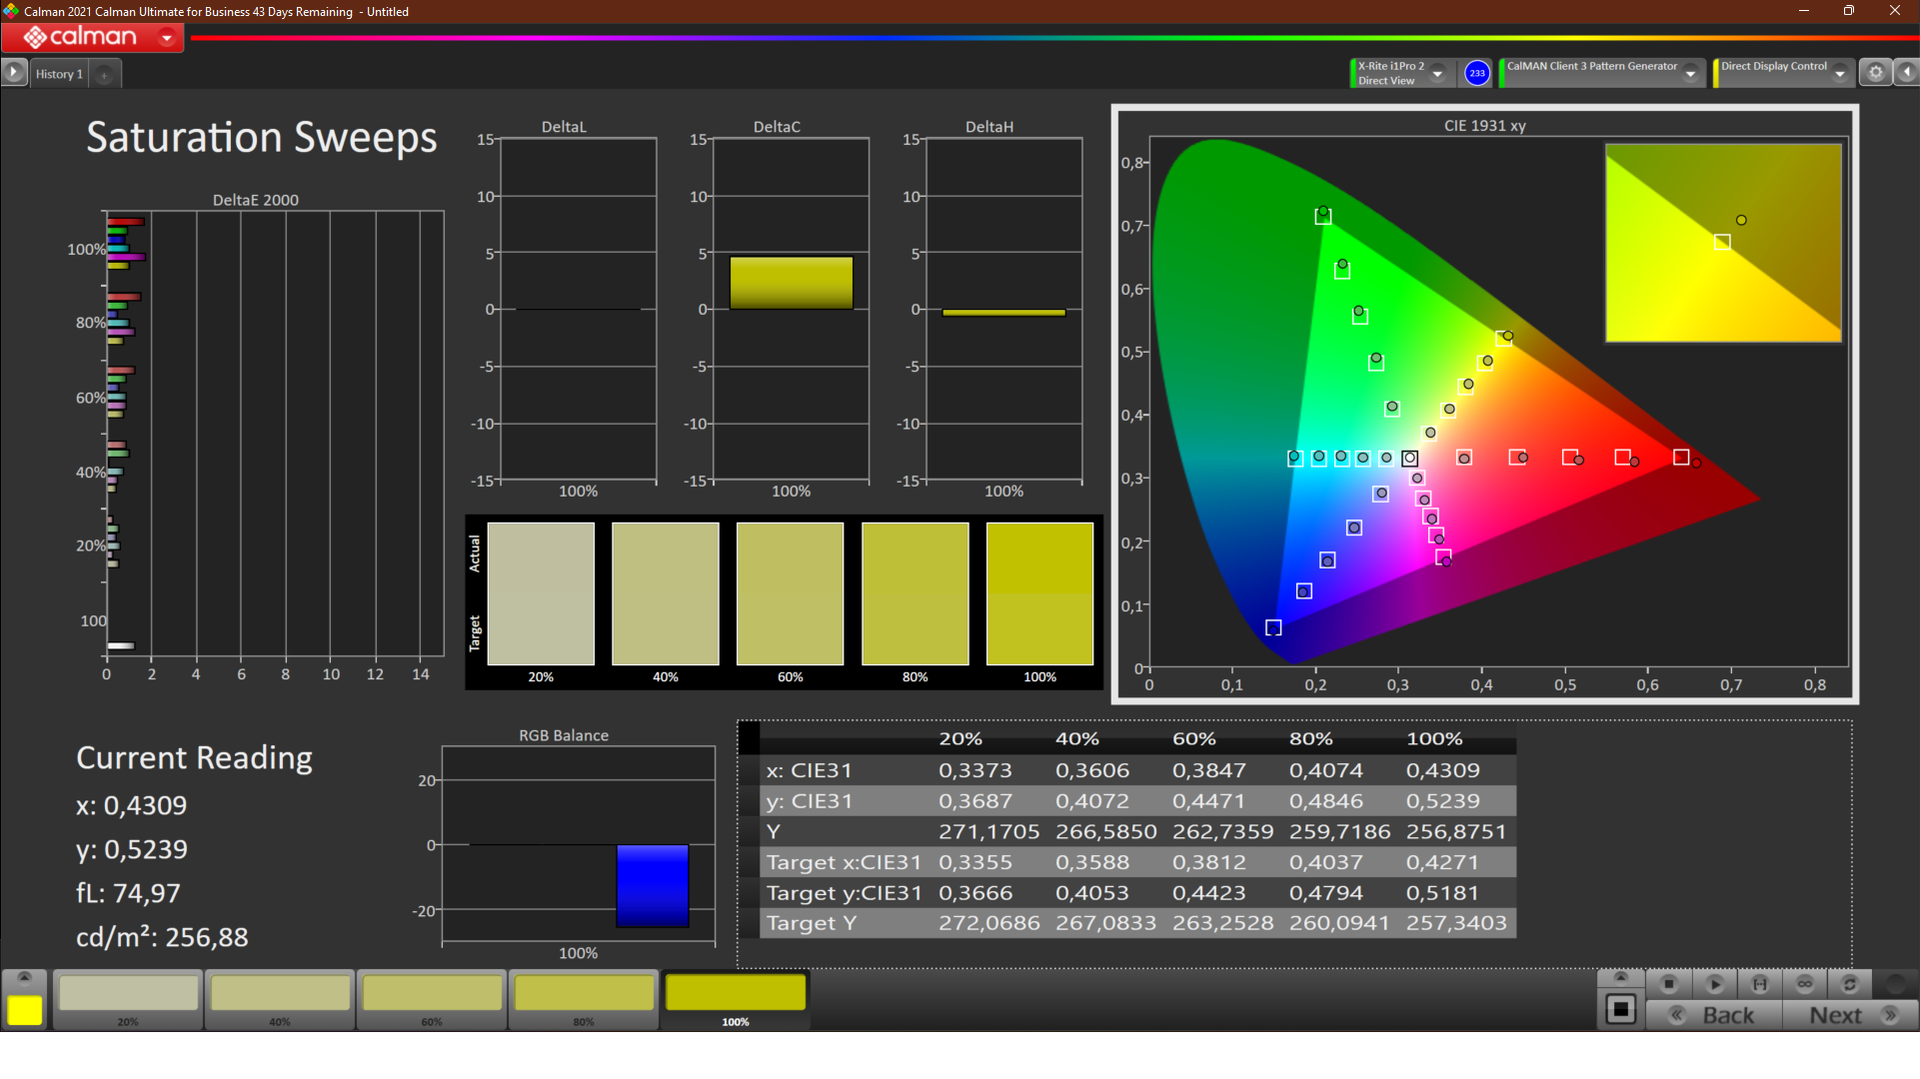
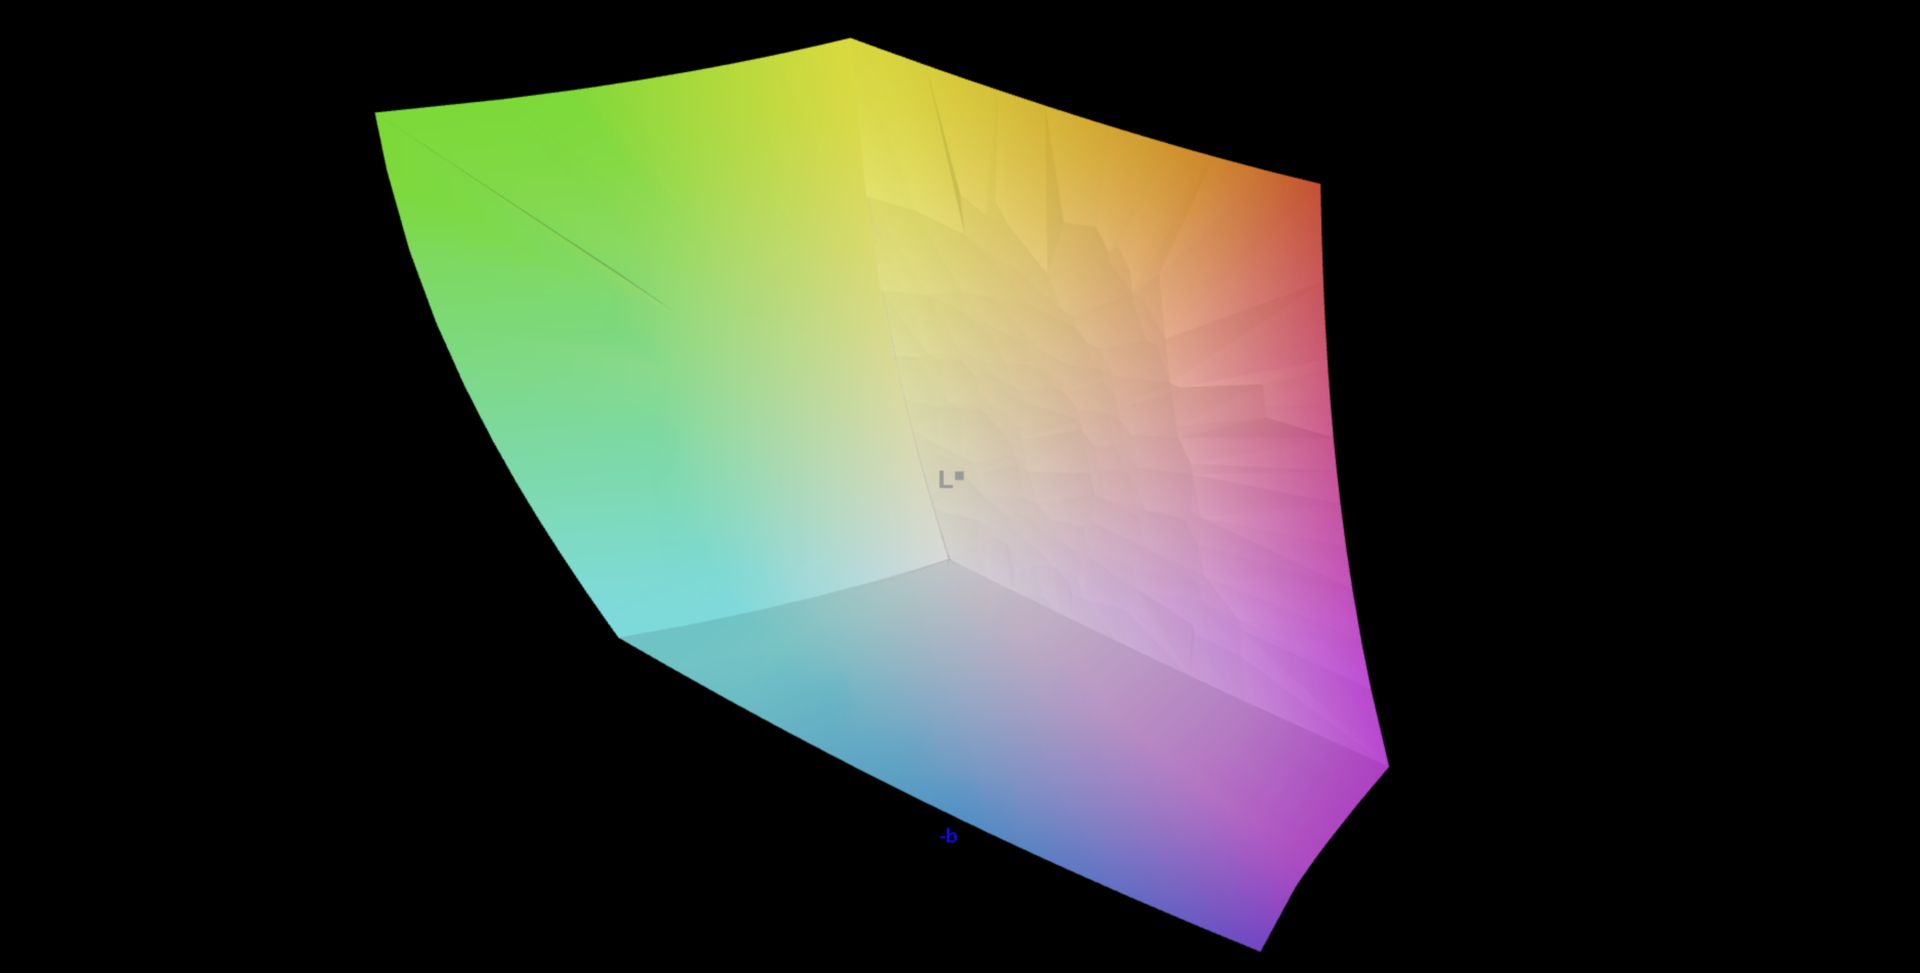
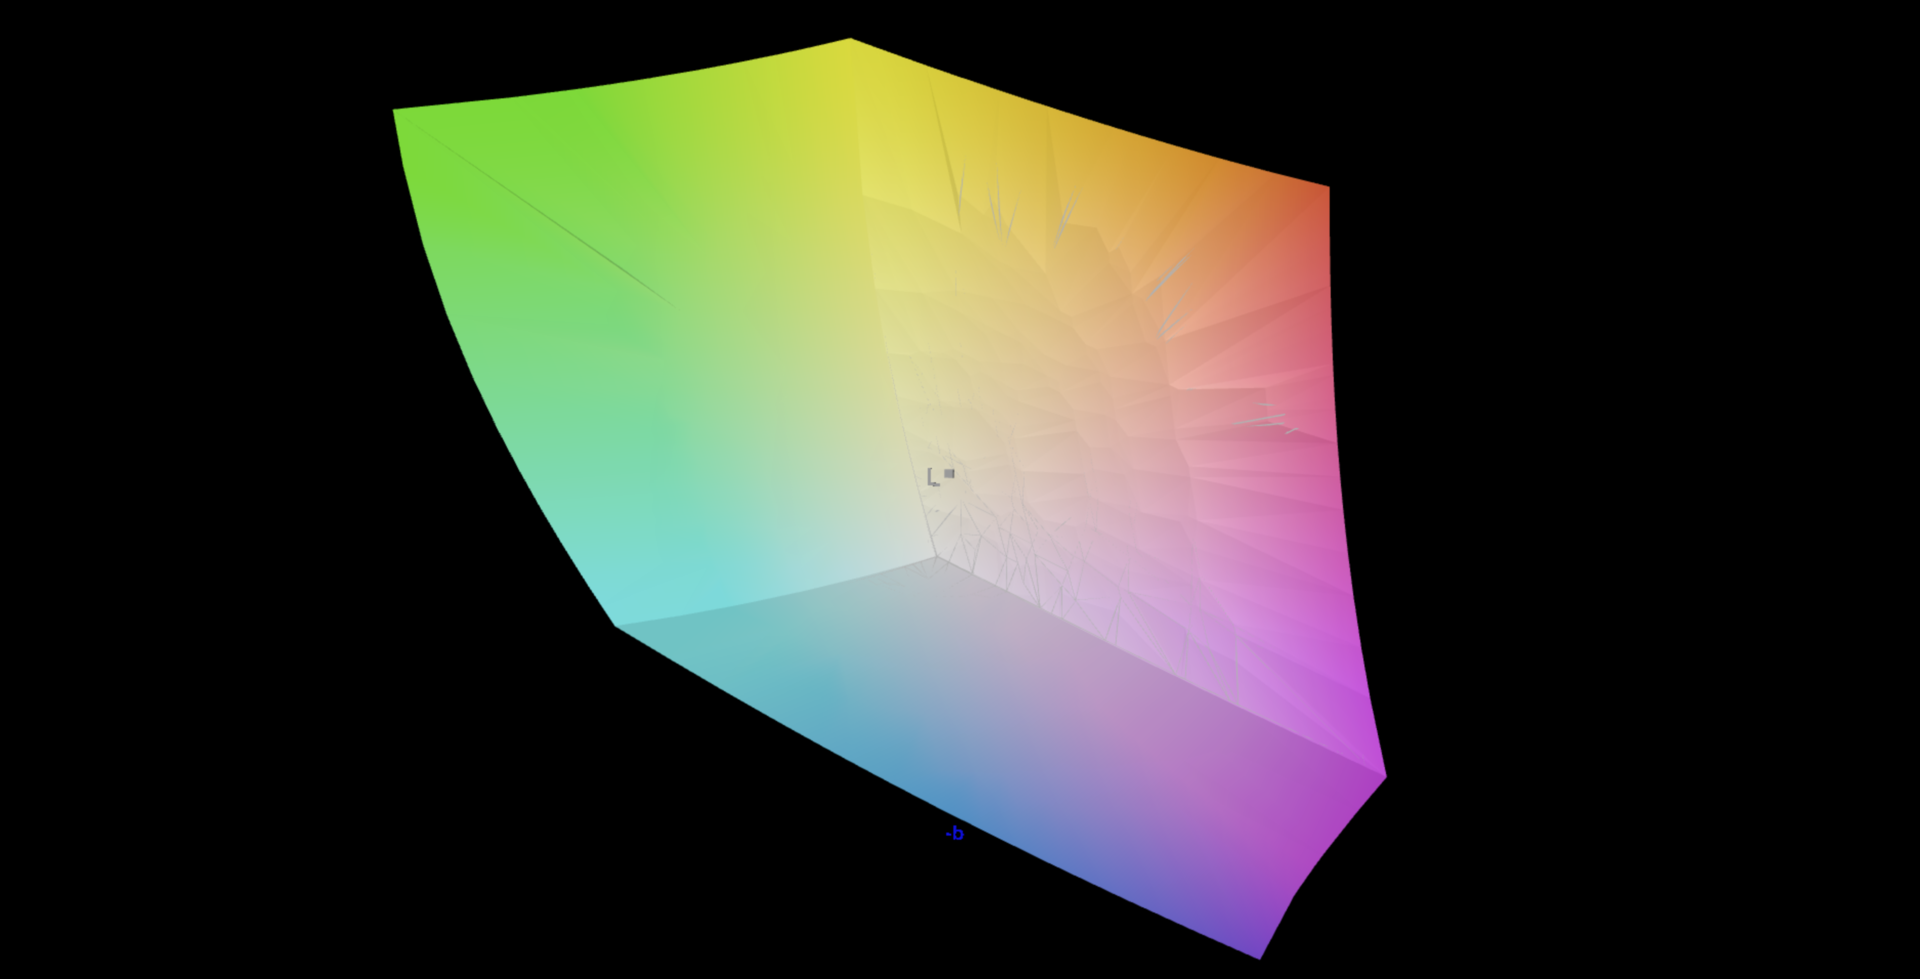
In terms of the color space, Lenovo doesn't promise too much by any means. The advertised 100% coverage of the AdobeRGB color space corresponds to the truth, allowing you to optimally perform processing and corrections of image material. Thanks to these values and the fact that there are no measurable deviations in the calibrated state, the display is also suited for professional users.
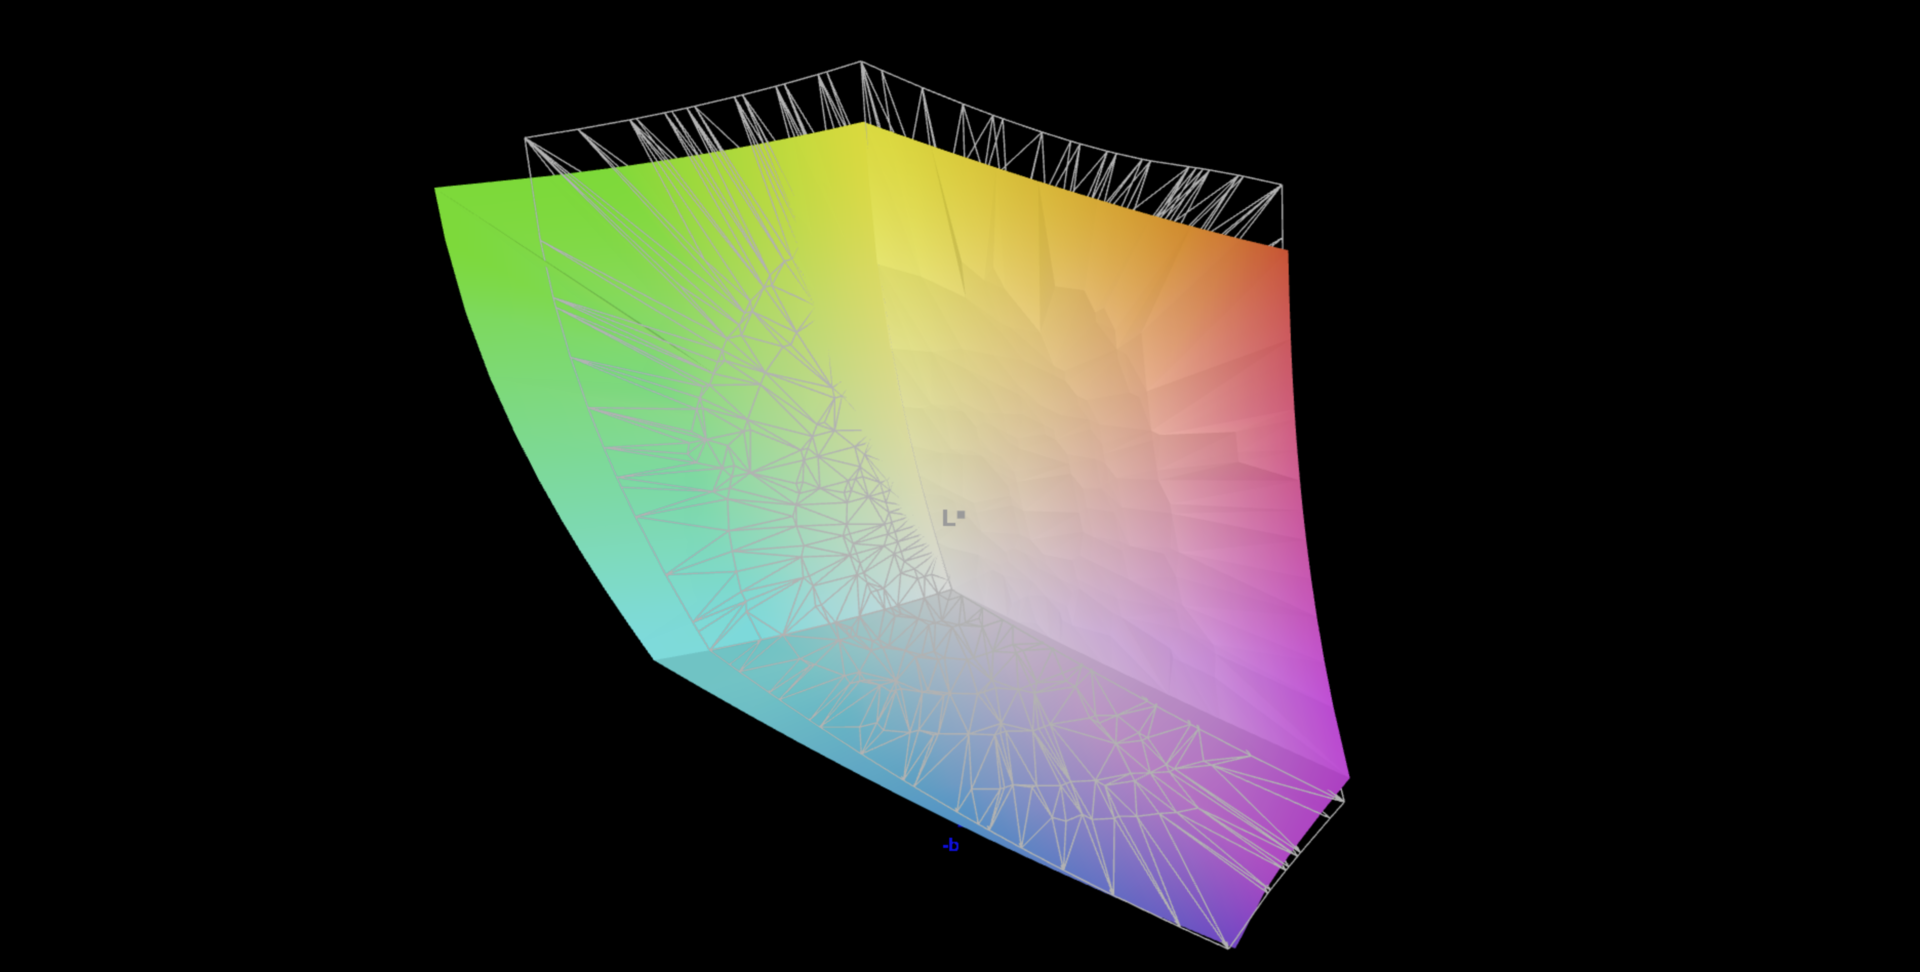
The panel is able to reproduce the minimally larger DCI-P3 color space with the larger red portion to almost 90%. While this small difference wouldn't really be visible, a better value would be more advantageous for processing of HDR content.
Display Response Times
| ↔ Response Time Black to White | ||
|---|---|---|
| 32 ms ... rise ↗ and fall ↘ combined | ↗ 15 ms rise | 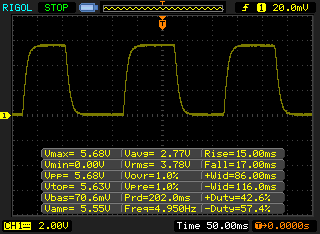 |
| ↘ 17 ms fall | ||
| The screen shows slow response rates in our tests and will be unsatisfactory for gamers. In comparison, all tested devices range from 0.1 (minimum) to 240 (maximum) ms. » 86 % of all devices are better. This means that the measured response time is worse than the average of all tested devices (19.8 ms). | ||
| ↔ Response Time 50% Grey to 80% Grey | ||
| 66 ms ... rise ↗ and fall ↘ combined | ↗ 35 ms rise | 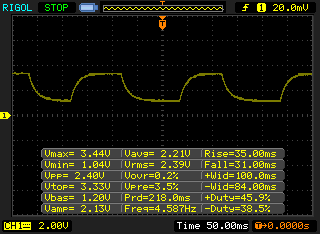 |
| ↘ 31 ms fall | ||
| The screen shows slow response rates in our tests and will be unsatisfactory for gamers. In comparison, all tested devices range from 0.165 (minimum) to 636 (maximum) ms. » 98 % of all devices are better. This means that the measured response time is worse than the average of all tested devices (31 ms). | ||
Screen Flickering / PWM (Pulse-Width Modulation)
| Screen flickering / PWM not detected | 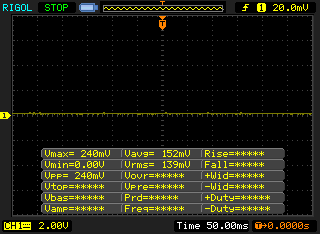 | ||
In comparison: 52 % of all tested devices do not use PWM to dim the display. If PWM was detected, an average of 7750 (minimum: 5 - maximum: 343500) Hz was measured. | |||
Thanks to the high maximum brightness, all the contents also remain recognizable in particularly bright surroundings, and this is also the case in shady places outdoors anyways.
While a brightness sensor would have been nice, this is probably wishful thinking in this price class. We noticed particularly toward the evening, that the brightness, which is usually just right, would be reduced too late manually, since it often remains adjusted too high at the desk.

As usual for an IPS panel, the colors and brightness are not affected by a steep viewing angle.
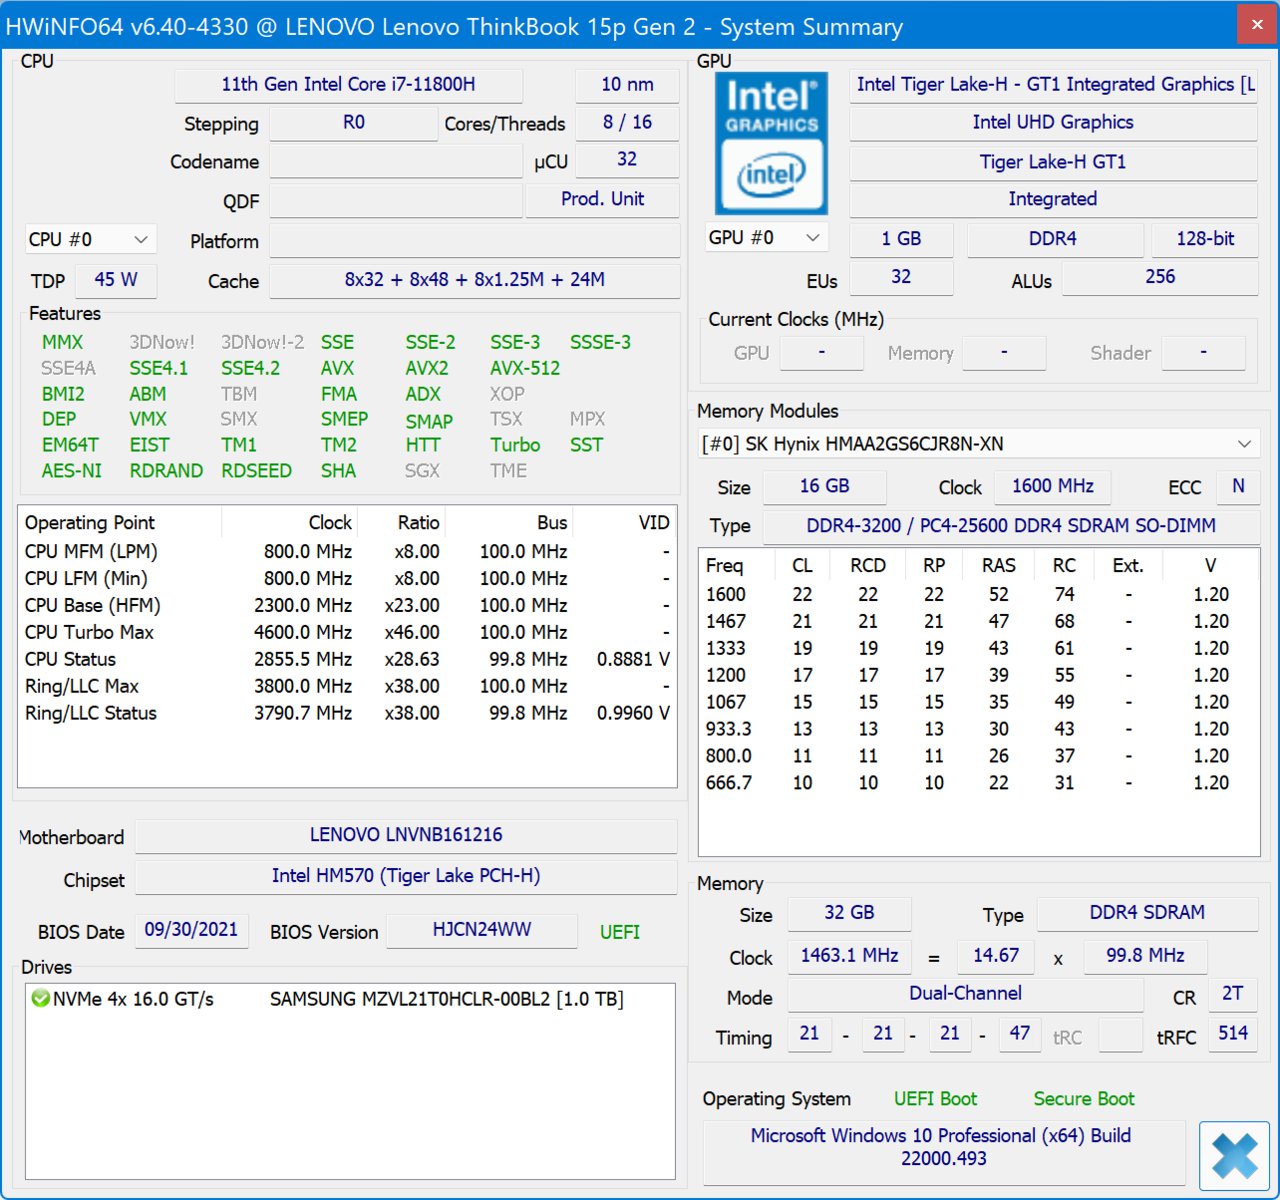
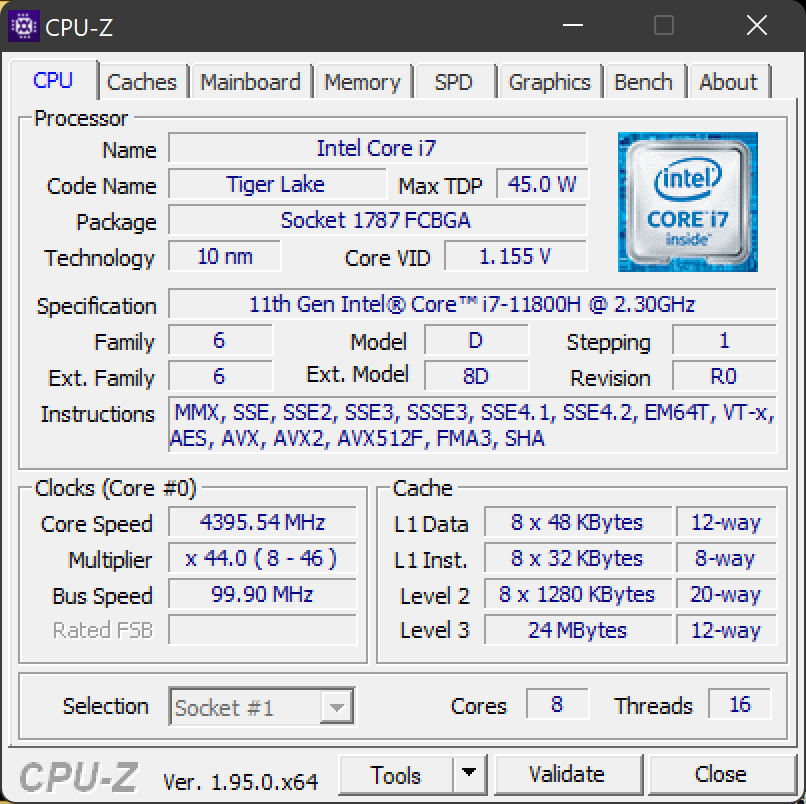
Performance - Full speed ahead for the i7 in the ThinkBook
With the i7-11800H, a processor is used that you can otherwise find mostly in gaming laptops. In addition, with 32 GB of RAM (of course in dual-channel mode) and the Nvidia GeForce RTX 3050 Ti, there are powerful components that create high expectations. The graphics card is designed more for media content creation and processing than playing current games. This is even more the case for the two other optional graphics cards that have even slightly lower performance values. However, it is still possible to use them for gaming, even if the display isn't really suitable for this.
The "Fn + Q" shortcut gives access to three performance presets that allow you to adjust the processor directly to various situations, particularly in terms of the noise and heat development:
| Maximum | Cooler working | Saving mode | Battery operation | |
| PL2 (2.4 ms) | 90 W | 85 W | 60 W | 20 W |
| PL1 (56 s) | 55 W | 50 W | 35 W | 20 W |
Processor
The Intel i7-11800H Tiger Lake processor in the ThinkBook 15p G2 is distinguished particularly by its high power consumption. A maximum of 90 watts is a lot for a multimedia laptop comparatively, resulting in the Lenovo laptop placing 10% above the average in the performance rating, for example. Only in thicker gaming laptops with powerful cooling, the same i7 is provided with even more power.
Under constant load, the power consumption first drops to 50 watts and then finally to 35 watts. If the CPU temperature allows for it, it can also be increased again. We can easily see the drop of the power consumption in the constant load test from Cinebench. After the first runs, the result drops significantly. At a later point, there is an additional drop, but only by a few percentage points.
Overall, the CPU should be able to handle most tasks up to complex computations, video rendering, and demanding multitasking. Its performance profile is well adjusted to the relatively slim case and even ventilation.
Cinebench R15 Multi Constant Load Test
Cinebench R23: Multi Core | Single Core
Cinebench R20: CPU (Multi Core) | CPU (Single Core)
Cinebench R15: CPU Multi 64Bit | CPU Single 64Bit
Blender: v2.79 BMW27 CPU
7-Zip 18.03: 7z b 4 | 7z b 4 -mmt1
Geekbench 5.5: Multi-Core | Single-Core
HWBOT x265 Benchmark v2.2: 4k Preset
LibreOffice : 20 Documents To PDF
R Benchmark 2.5: Overall mean
| CPU Performance rating | |
| Average of class Multimedia | |
| MSI Creator Z16 A11UET-209 -3! | |
| Average Intel Core i7-11800H | |
| Lenovo ThinkBook 15p G2 ITH 21B1000YGE | |
| Dell XPS 15 9510 11800H RTX 3050 Ti OLED | |
| Dell Inspiron 16 Plus 7610-MHJ8F | |
| Gigabyte G5 GD | |
| Asus VivoBook 15 Pro M3500QC-L1062 | |
| Lenovo ThinkBook 15p Gen1 4K | |
| Cinebench R23 / Multi Core | |
| Average of class Multimedia (4861 - 33362, n=78, last 2 years) | |
| MSI Creator Z16 A11UET-209 | |
| Average Intel Core i7-11800H (6508 - 14088, n=48) | |
| Lenovo ThinkBook 15p G2 ITH 21B1000YGE | |
| Dell Inspiron 16 Plus 7610-MHJ8F | |
| Dell XPS 15 9510 11800H RTX 3050 Ti OLED | |
| Asus VivoBook 15 Pro M3500QC-L1062 | |
| Gigabyte G5 GD | |
| Lenovo ThinkBook 15p Gen1 4K | |
| Cinebench R23 / Single Core | |
| Average of class Multimedia (1128 - 2459, n=70, last 2 years) | |
| MSI Creator Z16 A11UET-209 | |
| Dell XPS 15 9510 11800H RTX 3050 Ti OLED | |
| Dell Inspiron 16 Plus 7610-MHJ8F | |
| Average Intel Core i7-11800H (1386 - 1522, n=45) | |
| Lenovo ThinkBook 15p G2 ITH 21B1000YGE | |
| Gigabyte G5 GD | |
| Asus VivoBook 15 Pro M3500QC-L1062 | |
| Lenovo ThinkBook 15p Gen1 4K | |
| Cinebench R20 / CPU (Multi Core) | |
| Average of class Multimedia (1887 - 12912, n=61, last 2 years) | |
| MSI Creator Z16 A11UET-209 | |
| Average Intel Core i7-11800H (2498 - 5408, n=50) | |
| Lenovo ThinkBook 15p G2 ITH 21B1000YGE | |
| Dell Inspiron 16 Plus 7610-MHJ8F | |
| Dell XPS 15 9510 11800H RTX 3050 Ti OLED | |
| Asus VivoBook 15 Pro M3500QC-L1062 | |
| Gigabyte G5 GD | |
| Lenovo ThinkBook 15p Gen1 4K | |
| Cinebench R20 / CPU (Single Core) | |
| Average of class Multimedia (425 - 853, n=61, last 2 years) | |
| Dell XPS 15 9510 11800H RTX 3050 Ti OLED | |
| MSI Creator Z16 A11UET-209 | |
| Dell Inspiron 16 Plus 7610-MHJ8F | |
| Lenovo ThinkBook 15p G2 ITH 21B1000YGE | |
| Average Intel Core i7-11800H (520 - 586, n=47) | |
| Gigabyte G5 GD | |
| Asus VivoBook 15 Pro M3500QC-L1062 | |
| Lenovo ThinkBook 15p Gen1 4K | |
| Cinebench R15 / CPU Multi 64Bit | |
| Average of class Multimedia (856 - 5224, n=65, last 2 years) | |
| Dell XPS 15 9510 11800H RTX 3050 Ti OLED | |
| Dell XPS 15 9510 11800H RTX 3050 Ti OLED | |
| MSI Creator Z16 A11UET-209 | |
| Lenovo ThinkBook 15p G2 ITH 21B1000YGE | |
| Average Intel Core i7-11800H (1342 - 2173, n=50) | |
| Dell Inspiron 16 Plus 7610-MHJ8F | |
| Asus VivoBook 15 Pro M3500QC-L1062 | |
| Asus VivoBook 15 Pro M3500QC-L1062 | |
| Asus VivoBook 15 Pro M3500QC-L1062 | |
| Gigabyte G5 GD | |
| Lenovo ThinkBook 15p Gen1 4K | |
| Cinebench R15 / CPU Single 64Bit | |
| Average of class Multimedia (184.8 - 326, n=63, last 2 years) | |
| Dell XPS 15 9510 11800H RTX 3050 Ti OLED | |
| Lenovo ThinkBook 15p G2 ITH 21B1000YGE | |
| Dell Inspiron 16 Plus 7610-MHJ8F | |
| Average Intel Core i7-11800H (201 - 231, n=46) | |
| Asus VivoBook 15 Pro M3500QC-L1062 | |
| Gigabyte G5 GD | |
| MSI Creator Z16 A11UET-209 | |
| Lenovo ThinkBook 15p Gen1 4K | |
| Blender / v2.79 BMW27 CPU | |
| Lenovo ThinkBook 15p Gen1 4K | |
| Gigabyte G5 GD | |
| Asus VivoBook 15 Pro M3500QC-L1062 | |
| Dell Inspiron 16 Plus 7610-MHJ8F | |
| Dell XPS 15 9510 11800H RTX 3050 Ti OLED | |
| Lenovo ThinkBook 15p G2 ITH 21B1000YGE | |
| Average Intel Core i7-11800H (217 - 454, n=46) | |
| MSI Creator Z16 A11UET-209 | |
| Average of class Multimedia (100 - 557, n=62, last 2 years) | |
| 7-Zip 18.03 / 7z b 4 | |
| Average of class Multimedia (26062 - 130368, n=59, last 2 years) | |
| Average Intel Core i7-11800H (33718 - 56758, n=46) | |
| Lenovo ThinkBook 15p G2 ITH 21B1000YGE | |
| Lenovo ThinkBook 15p G2 ITH 21B1000YGE | |
| Dell Inspiron 16 Plus 7610-MHJ8F | |
| Asus VivoBook 15 Pro M3500QC-L1062 | |
| Dell XPS 15 9510 11800H RTX 3050 Ti OLED | |
| Gigabyte G5 GD | |
| Lenovo ThinkBook 15p Gen1 4K | |
| 7-Zip 18.03 / 7z b 4 -mmt1 | |
| Average of class Multimedia (3666 - 7545, n=60, last 2 years) | |
| Lenovo ThinkBook 15p G2 ITH 21B1000YGE | |
| Lenovo ThinkBook 15p G2 ITH 21B1000YGE | |
| Average Intel Core i7-11800H (5138 - 5732, n=46) | |
| Asus VivoBook 15 Pro M3500QC-L1062 | |
| Dell XPS 15 9510 11800H RTX 3050 Ti OLED | |
| Dell Inspiron 16 Plus 7610-MHJ8F | |
| Gigabyte G5 GD | |
| Lenovo ThinkBook 15p Gen1 4K | |
| Geekbench 5.5 / Multi-Core | |
| Average of class Multimedia (4652 - 20422, n=60, last 2 years) | |
| MSI Creator Z16 A11UET-209 | |
| MSI Creator Z16 A11UET-209 | |
| Lenovo ThinkBook 15p G2 ITH 21B1000YGE | |
| Average Intel Core i7-11800H (4655 - 9851, n=40) | |
| Dell XPS 15 9510 11800H RTX 3050 Ti OLED | |
| Dell Inspiron 16 Plus 7610-MHJ8F | |
| Dell Inspiron 16 Plus 7610-MHJ8F | |
| Dell Inspiron 16 Plus 7610-MHJ8F | |
| Gigabyte G5 GD | |
| Asus VivoBook 15 Pro M3500QC-L1062 | |
| Lenovo ThinkBook 15p Gen1 4K | |
| Geekbench 5.5 / Single-Core | |
| Average of class Multimedia (805 - 2974, n=60, last 2 years) | |
| Lenovo ThinkBook 15p G2 ITH 21B1000YGE | |
| MSI Creator Z16 A11UET-209 | |
| MSI Creator Z16 A11UET-209 | |
| Dell Inspiron 16 Plus 7610-MHJ8F | |
| Dell Inspiron 16 Plus 7610-MHJ8F | |
| Dell Inspiron 16 Plus 7610-MHJ8F | |
| Average Intel Core i7-11800H (1429 - 1625, n=40) | |
| Dell XPS 15 9510 11800H RTX 3050 Ti OLED | |
| Gigabyte G5 GD | |
| Asus VivoBook 15 Pro M3500QC-L1062 | |
| Lenovo ThinkBook 15p Gen1 4K | |
| HWBOT x265 Benchmark v2.2 / 4k Preset | |
| Average of class Multimedia (5.26 - 36.1, n=60, last 2 years) | |
| MSI Creator Z16 A11UET-209 | |
| Average Intel Core i7-11800H (7.38 - 17.4, n=46) | |
| Lenovo ThinkBook 15p G2 ITH 21B1000YGE | |
| Dell XPS 15 9510 11800H RTX 3050 Ti OLED | |
| Dell Inspiron 16 Plus 7610-MHJ8F | |
| Asus VivoBook 15 Pro M3500QC-L1062 | |
| Gigabyte G5 GD | |
| Lenovo ThinkBook 15p Gen1 4K | |
| LibreOffice / 20 Documents To PDF | |
| Lenovo ThinkBook 15p Gen1 4K | |
| Asus VivoBook 15 Pro M3500QC-L1062 | |
| Average of class Multimedia (23.9 - 146.7, n=61, last 2 years) | |
| Dell XPS 15 9510 11800H RTX 3050 Ti OLED | |
| Average Intel Core i7-11800H (38.6 - 59.9, n=45) | |
| Dell Inspiron 16 Plus 7610-MHJ8F | |
| Lenovo ThinkBook 15p G2 ITH 21B1000YGE | |
| Gigabyte G5 GD | |
| R Benchmark 2.5 / Overall mean | |
| Lenovo ThinkBook 15p Gen1 4K | |
| Gigabyte G5 GD | |
| Dell Inspiron 16 Plus 7610-MHJ8F | |
| Dell XPS 15 9510 11800H RTX 3050 Ti OLED | |
| Average Intel Core i7-11800H (0.548 - 0.615, n=46) | |
| MSI Creator Z16 A11UET-209 | |
| Lenovo ThinkBook 15p G2 ITH 21B1000YGE | |
| Asus VivoBook 15 Pro M3500QC-L1062 | |
| Average of class Multimedia (0.3604 - 0.947, n=60, last 2 years) | |
* ... smaller is better
AIDA64: FP32 Ray-Trace | FPU Julia | CPU SHA3 | CPU Queen | FPU SinJulia | FPU Mandel | CPU AES | CPU ZLib | FP64 Ray-Trace | CPU PhotoWorxx
| Performance rating | |
| Average of class Multimedia | |
| Lenovo ThinkBook 15p G2 ITH 21B1000YGE | |
| Average Intel Core i7-11800H | |
| Dell Inspiron 16 Plus 7610-MHJ8F | |
| MSI Creator Z16 A11UET-209 -7! | |
| Asus VivoBook 15 Pro M3500QC-L1062 | |
| Gigabyte G5 GD | |
| Lenovo ThinkBook 15p Gen1 4K | |
| Dell XPS 15 9510 11800H RTX 3050 Ti OLED -9! | |
| AIDA64 / FP32 Ray-Trace | |
| Average of class Multimedia (2214 - 50388, n=57, last 2 years) | |
| Lenovo ThinkBook 15p G2 ITH 21B1000YGE | |
| Average Intel Core i7-11800H (8772 - 15961, n=20) | |
| Asus VivoBook 15 Pro M3500QC-L1062 | |
| Gigabyte G5 GD | |
| Dell Inspiron 16 Plus 7610-MHJ8F | |
| Lenovo ThinkBook 15p Gen1 4K | |
| AIDA64 / FPU Julia | |
| Average of class Multimedia (12867 - 201874, n=58, last 2 years) | |
| Asus VivoBook 15 Pro M3500QC-L1062 | |
| Lenovo ThinkBook 15p G2 ITH 21B1000YGE | |
| Average Intel Core i7-11800H (39404 - 65636, n=20) | |
| Dell Inspiron 16 Plus 7610-MHJ8F | |
| Gigabyte G5 GD | |
| Lenovo ThinkBook 15p Gen1 4K | |
| AIDA64 / CPU SHA3 | |
| Lenovo ThinkBook 15p G2 ITH 21B1000YGE | |
| Average of class Multimedia (626 - 8623, n=58, last 2 years) | |
| Average Intel Core i7-11800H (2599 - 4439, n=20) | |
| Dell Inspiron 16 Plus 7610-MHJ8F | |
| Gigabyte G5 GD | |
| Asus VivoBook 15 Pro M3500QC-L1062 | |
| Lenovo ThinkBook 15p Gen1 4K | |
| AIDA64 / CPU Queen | |
| Dell Inspiron 16 Plus 7610-MHJ8F | |
| Lenovo ThinkBook 15p G2 ITH 21B1000YGE | |
| Average Intel Core i7-11800H (85233 - 91941, n=20) | |
| Average of class Multimedia (13483 - 181505, n=45, last 2 years) | |
| Asus VivoBook 15 Pro M3500QC-L1062 | |
| Lenovo ThinkBook 15p Gen1 4K | |
| Gigabyte G5 GD | |
| AIDA64 / FPU SinJulia | |
| Lenovo ThinkBook 15p G2 ITH 21B1000YGE | |
| Average Intel Core i7-11800H (6420 - 9792, n=20) | |
| Average of class Multimedia (886 - 28794, n=58, last 2 years) | |
| Dell Inspiron 16 Plus 7610-MHJ8F | |
| Asus VivoBook 15 Pro M3500QC-L1062 | |
| Gigabyte G5 GD | |
| Lenovo ThinkBook 15p Gen1 4K | |
| AIDA64 / FPU Mandel | |
| Average of class Multimedia (6395 - 105740, n=57, last 2 years) | |
| Lenovo ThinkBook 15p G2 ITH 21B1000YGE | |
| Asus VivoBook 15 Pro M3500QC-L1062 | |
| Average Intel Core i7-11800H (23365 - 39464, n=20) | |
| Dell Inspiron 16 Plus 7610-MHJ8F | |
| Gigabyte G5 GD | |
| Lenovo ThinkBook 15p Gen1 4K | |
| AIDA64 / CPU AES | |
| Lenovo ThinkBook 15p G2 ITH 21B1000YGE | |
| Average Intel Core i7-11800H (74617 - 149388, n=20) | |
| Dell Inspiron 16 Plus 7610-MHJ8F | |
| Gigabyte G5 GD | |
| Asus VivoBook 15 Pro M3500QC-L1062 | |
| Average of class Multimedia (8171 - 126790, n=58, last 2 years) | |
| Lenovo ThinkBook 15p Gen1 4K | |
| AIDA64 / CPU ZLib | |
| Average of class Multimedia (143.8 - 2022, n=58, last 2 years) | |
| Lenovo ThinkBook 15p G2 ITH 21B1000YGE | |
| MSI Creator Z16 A11UET-209 | |
| Dell Inspiron 16 Plus 7610-MHJ8F | |
| Asus VivoBook 15 Pro M3500QC-L1062 | |
| Gigabyte G5 GD | |
| Lenovo ThinkBook 15p Gen1 4K | |
| Average Intel Core i7-11800H (461 - 830, n=43) | |
| Dell XPS 15 9510 11800H RTX 3050 Ti OLED | |
| AIDA64 / FP64 Ray-Trace | |
| Average of class Multimedia (1014 - 26875, n=58, last 2 years) | |
| MSI Creator Z16 A11UET-209 | |
| Lenovo ThinkBook 15p G2 ITH 21B1000YGE | |
| Average Intel Core i7-11800H (4545 - 8717, n=21) | |
| Dell Inspiron 16 Plus 7610-MHJ8F | |
| Asus VivoBook 15 Pro M3500QC-L1062 | |
| Gigabyte G5 GD | |
| Lenovo ThinkBook 15p Gen1 4K | |
| AIDA64 / CPU PhotoWorxx | |
| Average of class Multimedia (8187 - 88154, n=58, last 2 years) | |
| Gigabyte G5 GD | |
| MSI Creator Z16 A11UET-209 | |
| Average Intel Core i7-11800H (11898 - 26757, n=21) | |
| Lenovo ThinkBook 15p G2 ITH 21B1000YGE | |
| Lenovo ThinkBook 15p Gen1 4K | |
| Dell Inspiron 16 Plus 7610-MHJ8F | |
| Asus VivoBook 15 Pro M3500QC-L1062 | |
System Performance
There are no noticeable differences in the comparison to the direct competitors. We can only see that the ThinkBook is able to clearly surpass the average of multimedia laptops, which can be quickly explained by the good processor. The differences to the MSI Creator Z16 or the Dell XPS 15 9510 lie within a range of a few percentage points, so they are basically even.
We are not very surprised about its good results in the digital content creation area, since the ThinkBook is designed exactly for that. However, the difference to the ThinkBook 15p Gen1, which of course also uses older hardware, turns out very large at a 60% advantage.
| PCMark 10 / Score | |
| Average of class Multimedia (4325 - 10386, n=56, last 2 years) | |
| Average Intel Core i7-11800H, NVIDIA GeForce RTX 3050 Ti Laptop GPU (6019 - 6556, n=5) | |
| Lenovo ThinkBook 15p G2 ITH 21B1000YGE | |
| MSI Creator Z16 A11UET-209 | |
| Dell XPS 15 9510 11800H RTX 3050 Ti OLED | |
| Asus VivoBook 15 Pro M3500QC-L1062 | |
| Gigabyte G5 GD | |
| Dell Inspiron 16 Plus 7610-MHJ8F | |
| Lenovo ThinkBook 15p Gen1 4K | |
| PCMark 10 / Essentials | |
| Average of class Multimedia (8025 - 11664, n=55, last 2 years) | |
| Average Intel Core i7-11800H, NVIDIA GeForce RTX 3050 Ti Laptop GPU (9490 - 10846, n=5) | |
| Asus VivoBook 15 Pro M3500QC-L1062 | |
| Dell Inspiron 16 Plus 7610-MHJ8F | |
| Lenovo ThinkBook 15p G2 ITH 21B1000YGE | |
| Dell XPS 15 9510 11800H RTX 3050 Ti OLED | |
| Gigabyte G5 GD | |
| MSI Creator Z16 A11UET-209 | |
| Lenovo ThinkBook 15p Gen1 4K | |
| PCMark 10 / Productivity | |
| Average of class Multimedia (7323 - 18233, n=55, last 2 years) | |
| Asus VivoBook 15 Pro M3500QC-L1062 | |
| Gigabyte G5 GD | |
| Average Intel Core i7-11800H, NVIDIA GeForce RTX 3050 Ti Laptop GPU (8176 - 8723, n=5) | |
| Dell XPS 15 9510 11800H RTX 3050 Ti OLED | |
| MSI Creator Z16 A11UET-209 | |
| Lenovo ThinkBook 15p G2 ITH 21B1000YGE | |
| Lenovo ThinkBook 15p Gen1 4K | |
| Dell Inspiron 16 Plus 7610-MHJ8F | |
| PCMark 10 / Digital Content Creation | |
| Average of class Multimedia (3651 - 16240, n=55, last 2 years) | |
| MSI Creator Z16 A11UET-209 | |
| Lenovo ThinkBook 15p G2 ITH 21B1000YGE | |
| Average Intel Core i7-11800H, NVIDIA GeForce RTX 3050 Ti Laptop GPU (7475 - 8577, n=5) | |
| Dell XPS 15 9510 11800H RTX 3050 Ti OLED | |
| Gigabyte G5 GD | |
| Asus VivoBook 15 Pro M3500QC-L1062 | |
| Dell Inspiron 16 Plus 7610-MHJ8F | |
| Lenovo ThinkBook 15p Gen1 4K | |
| PCMark 10 Score | 6196 points | |
Help | ||
| AIDA64 / Memory Copy | |
| Average of class Multimedia (11299 - 132135, n=58, last 2 years) | |
| MSI Creator Z16 A11UET-209 | |
| Lenovo ThinkBook 15p G2 ITH 21B1000YGE | |
| Average Intel Core i7-11800H (24508 - 48144, n=21) | |
| Gigabyte G5 GD | |
| Dell Inspiron 16 Plus 7610-MHJ8F | |
| Asus VivoBook 15 Pro M3500QC-L1062 | |
| Lenovo ThinkBook 15p Gen1 4K | |
| AIDA64 / Memory Read | |
| Average of class Multimedia (11624 - 174586, n=58, last 2 years) | |
| Lenovo ThinkBook 15p G2 ITH 21B1000YGE | |
| Gigabyte G5 GD | |
| Dell Inspiron 16 Plus 7610-MHJ8F | |
| Average Intel Core i7-11800H (25882 - 50365, n=20) | |
| Asus VivoBook 15 Pro M3500QC-L1062 | |
| Lenovo ThinkBook 15p Gen1 4K | |
| AIDA64 / Memory Write | |
| Average of class Multimedia (11755 - 134998, n=58, last 2 years) | |
| Gigabyte G5 GD | |
| Lenovo ThinkBook 15p G2 ITH 21B1000YGE | |
| Dell Inspiron 16 Plus 7610-MHJ8F | |
| Average Intel Core i7-11800H (22240 - 46214, n=20) | |
| Lenovo ThinkBook 15p Gen1 4K | |
| Asus VivoBook 15 Pro M3500QC-L1062 | |
| AIDA64 / Memory Latency | |
| Average of class Multimedia (7 - 535, n=57, last 2 years) | |
| Dell Inspiron 16 Plus 7610-MHJ8F | |
| MSI Creator Z16 A11UET-209 | |
| Gigabyte G5 GD | |
| Lenovo ThinkBook 15p G2 ITH 21B1000YGE | |
| Asus VivoBook 15 Pro M3500QC-L1062 | |
| Lenovo ThinkBook 15p Gen1 4K | |
| Average Intel Core i7-11800H (71.9 - 104.1, n=44) | |
| Dell XPS 15 9510 11800H RTX 3050 Ti OLED | |
* ... smaller is better
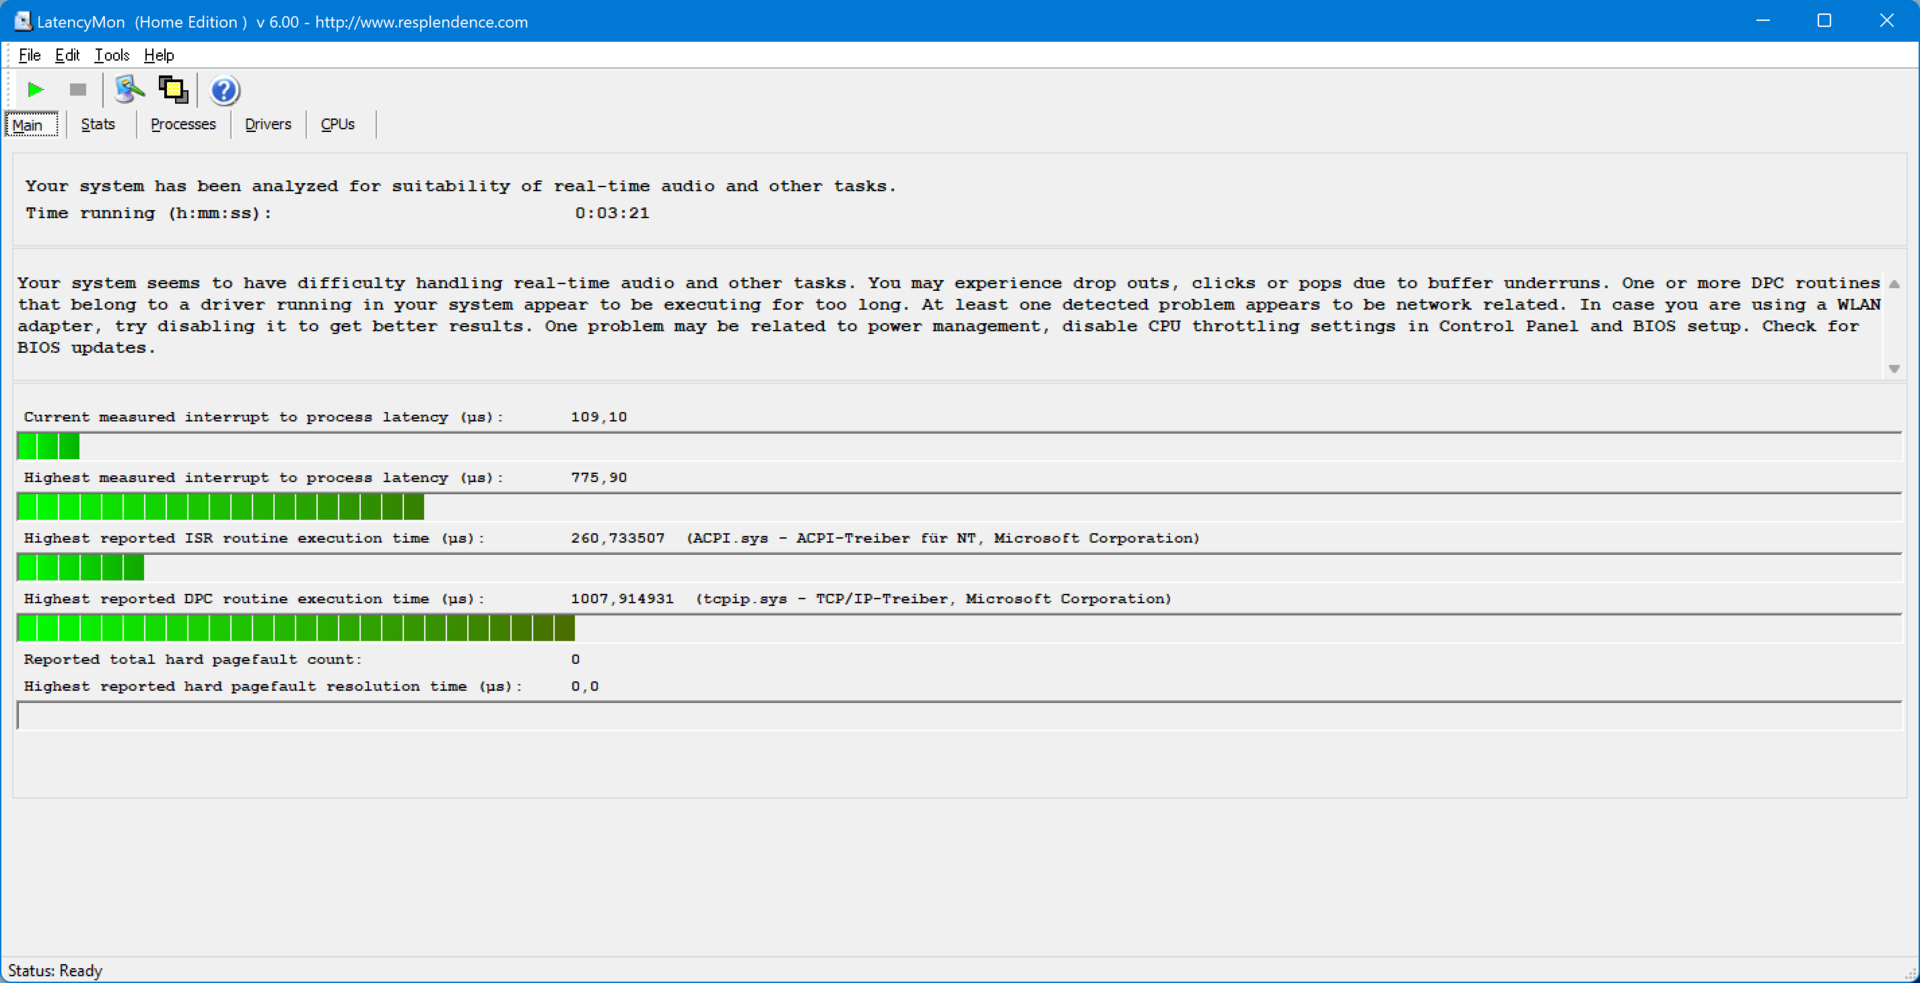
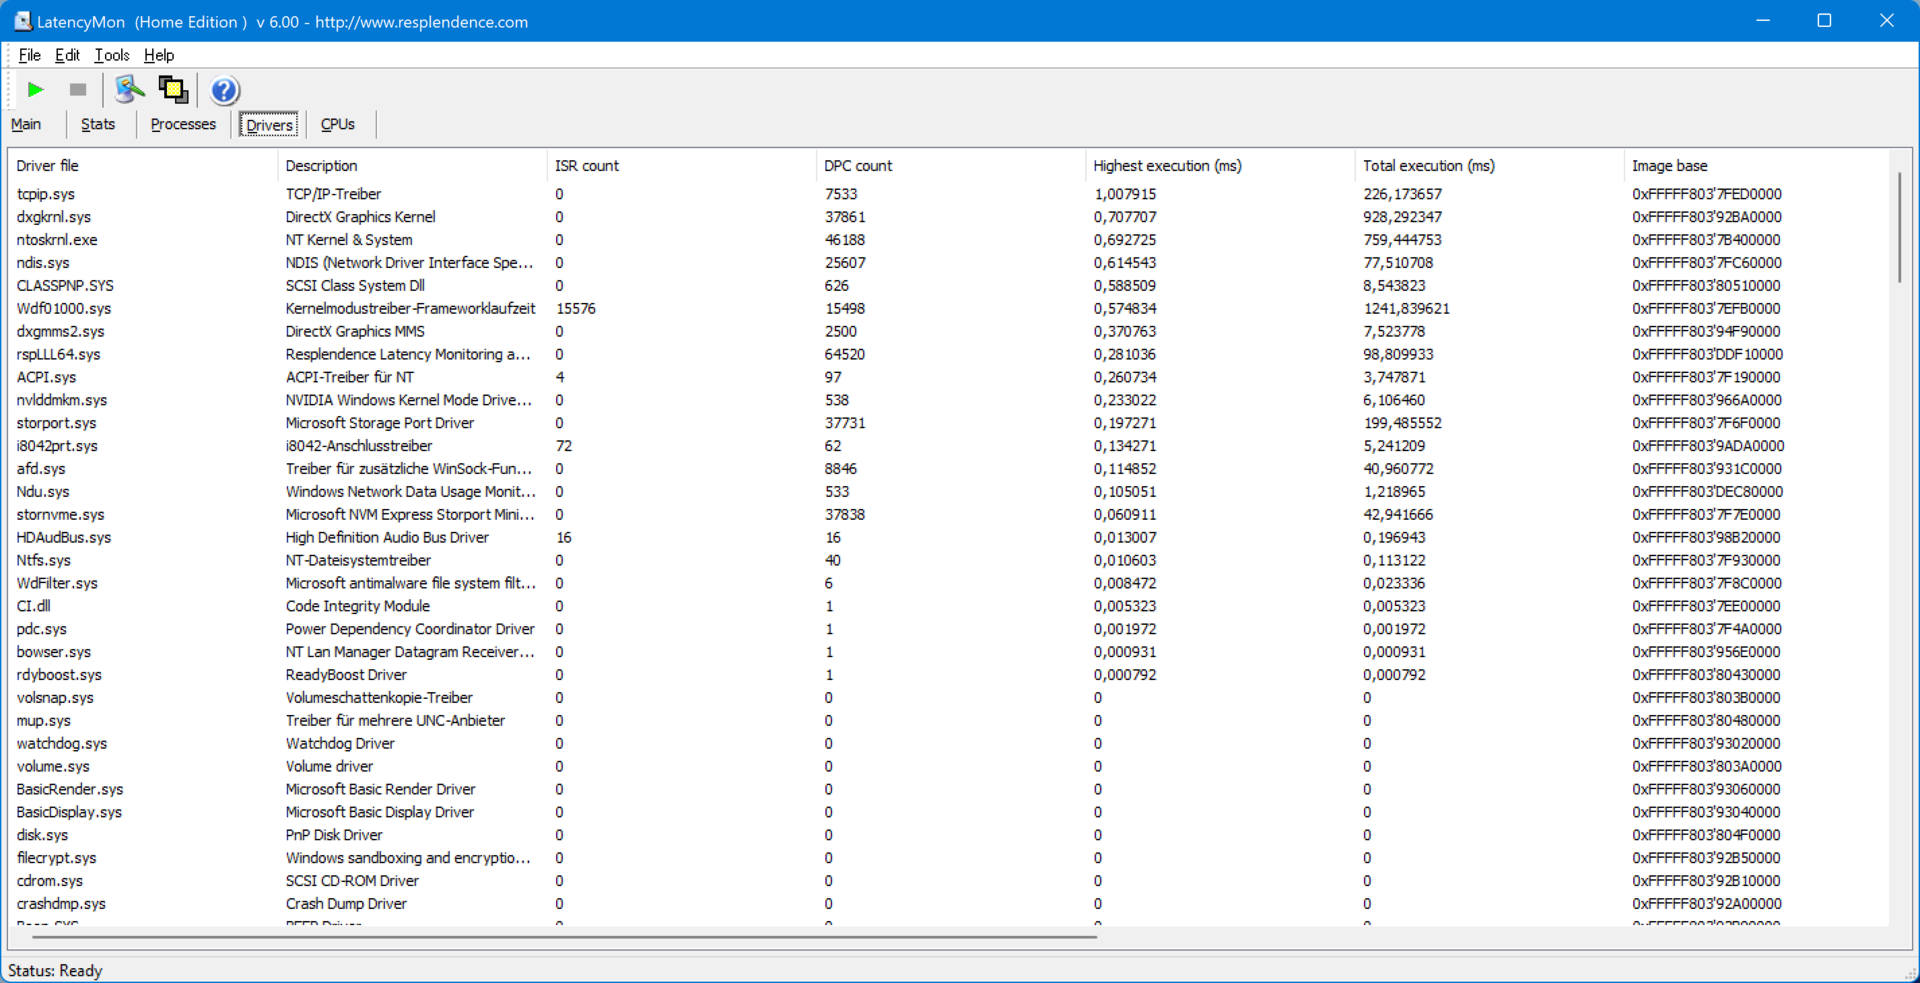
DPC Latencies
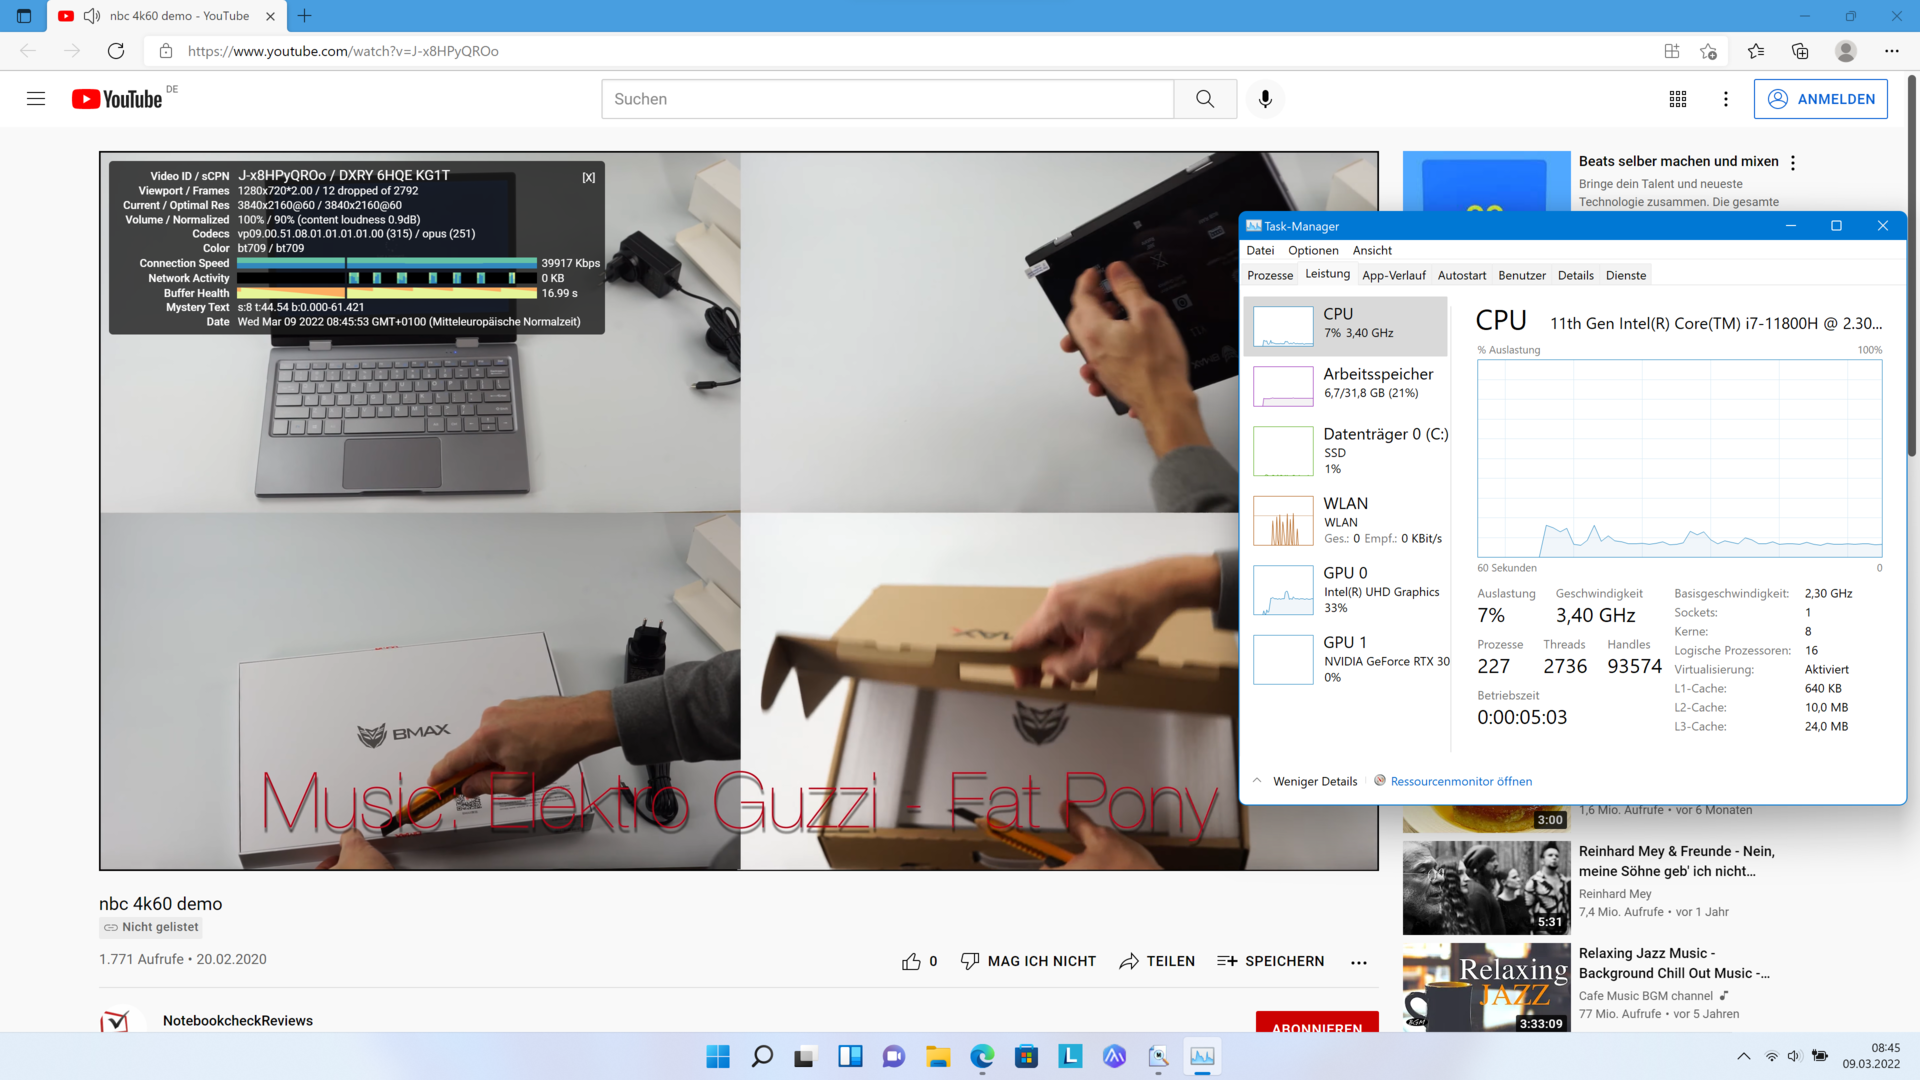
The measured latencies are within the range of comparable laptops. While less than 0.8 ms are very little, it could already present some difficulties for real-time audio applications. A look at the 4K YouTube video reproduction shows a similar result, and 11 dropped frames aren't bad. However, you should also be able to expect no frame drops at all from a multimedia laptop with current hardware.
| DPC Latencies / LatencyMon - interrupt to process latency (max), Web, Youtube, Prime95 | |
| MSI Creator Z16 A11UET-209 | |
| Dell XPS 15 9510 11800H RTX 3050 Ti OLED | |
| Lenovo ThinkBook 15p Gen1 4K | |
| Lenovo ThinkBook 15p G2 ITH 21B1000YGE | |
| Gigabyte G5 GD | |
| Asus VivoBook 15 Pro M3500QC-L1062 | |
* ... smaller is better
Storage Solution
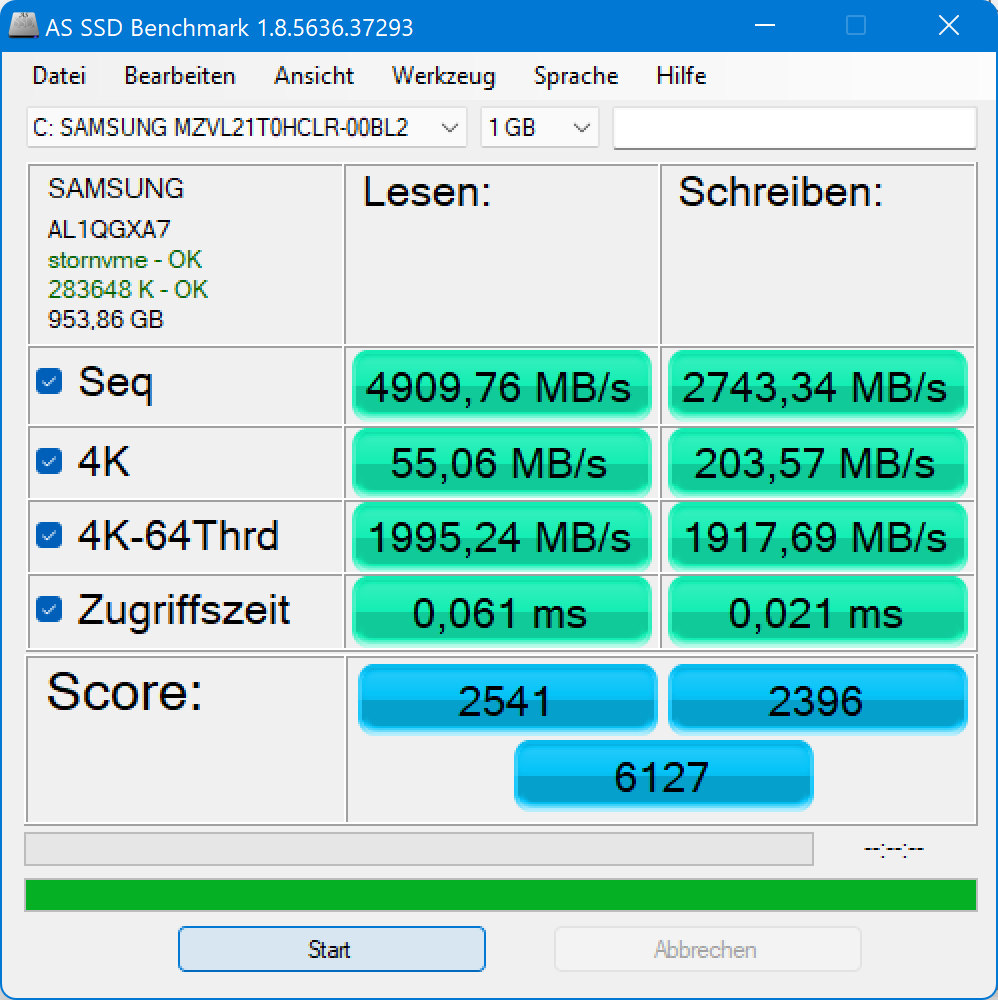
Not only does Lenovo change from Western Digital to Samsung but also from PCIe 3.0 to PCIe 4.0. The measured performance values also correspond approximately to the average values of the Samsung PM9A1 MZVL21T0HCLR, which can be found right on top of our list of best SSDs.
This means that the installed SSD shouldn't become a bottleneck at any time. Particularly to the first generation of the ThinkBook 15p, the difference is very significant. In addition, a storage space of 1 TB is sufficiently large, and you could also install a second SSD. With this, there should be sufficient space particularly for video processing even without using a NAS or external hard drive.

| Lenovo ThinkBook 15p G2 ITH 21B1000YGE Samsung PM9A1 MZVL21T0HCLR | Lenovo ThinkBook 15p Gen1 4K WDC PC SN730 SDBPNTY-1T00 | Dell Inspiron 16 Plus 7610-MHJ8F OM3PDP3-AD NVMe KDI 512GB | MSI Creator Z16 A11UET-209 Phison 1TB SM2801T24GKBB4S-E162 | Asus VivoBook 15 Pro M3500QC-L1062 SK Hynix HFM512GD3JX013N | Gigabyte G5 GD ESR512GTLG-E6GBTNB4 | Dell XPS 15 9510 11800H RTX 3050 Ti OLED Micron 2300 512GB MTFDHBA512TDV | Average Samsung PM9A1 MZVL21T0HCLR | Average of class Multimedia | |
|---|---|---|---|---|---|---|---|---|---|
| Drive Performance rating | |||||||||
| Percent (pt) | 88.7 | 59.5 -33% | 39.8 -55% | 70.8 -20% | 68 -23% | 64.5 -27% | 35.7 -60% | 85.6 -3% | 67.6 -24% |
| DiskSpd | -46% | -64% | -38% | -43% | -32% | -62% | -20% | -36% | |
| seq read (MB/s) | 4480 | 2107 -53% | 1717 -62% | 2561 -43% 2503 -44% | 2052 -54% | 2913 -35% | 1877 -58% | 3766 ? -16% | 2944 ? -34% |
| seq write (MB/s) | 4304 | 2478 -42% | 1159 -73% | 2432 -43% 2421 -44% | 2885 -33% | 2534 -41% | 2094 -51% | 3581 ? -17% | 3129 ? -27% |
| seq q8 t1 read (MB/s) | 6624 | 3412 -48% | 4999 -25% 4977 -25% | 3601 -46% | 5005 -24% | 3224 -51% | 6483 ? -2% | 5727 ? -14% | |
| seq q8 t1 write (MB/s) | 4965 | 3106 -37% | 1201 -76% | 2425 -51% 2422 -51% | 2980 -40% | 2543 -49% | 2869 -42% | 4810 ? -3% | 4644 ? -6% |
| 4k q1 t1 read (MB/s) | 93.8 | 41.2 -56% | 52.2 -44% | 59.5 -37% 59 -37% | 58.1 -38% | 62 -34% | 29 -69% | 76.5 ? -18% | 62.7 ? -33% |
| 4k q1 t1 write (MB/s) | 251 | 120 -52% | 190 -24% | 226 -10% 226 -10% | 123 -51% | 274 9% | 112 -55% | 188.5 ? -25% | 157.9 ? -37% |
| 4k q32 t16 read (MB/s) | 4178 | 2250 -46% | 710 -83% | 1649 -61% 1648 -61% | 2227 -47% | 1727 -59% | 720 -83% | 2586 ? -38% | 1420 ? -66% |
| 4k q32 t16 write (MB/s) | 3402 | 2259 -34% | 466 -86% | 2426 -29% 2426 -29% | 2331 -31% | 2539 -25% | 422 -88% | 1959 ? -42% | 990 ? -71% |
| AS SSD | -23% | -48% | -3% | -7% | -21% | -92% | 9% | -29% | |
| Score Total (Points) | 6127 | 5095 -17% | 2510 -59% | 6101 0% | 5913 -3% | 3660 -40% | 2160 -65% | 6892 ? 12% | 5069 ? -17% |
| Score Read (Points) | 2541 | 1822 -28% | 1074 -58% | 2347 -8% | 2252 -11% | 1675 -34% | 545 -79% | 2433 ? -4% | 1591 ? -37% |
| Score Write (Points) | 2396 | 2369 -1% | 939 -61% | 2650 11% | 2524 5% | 1195 -50% | 1319 -45% | 3284 ? 37% | 2724 ? 14% |
| Seq Read (MB/s) | 4910 | 2852 -42% | 2143 -56% | 3641 -26% | 3142 -36% | 4145 -16% | 1362 -72% | 4901 ? 0% | 4496 ? -8% |
| Seq Write (MB/s) | 2743 | 2344 -15% | 840 -69% | 1557 -43% | 2806 2% | 2397 -13% | 1440 -48% | 3334 ? 22% | 3066 ? 12% |
| 4K Read (MB/s) | 55.1 | 37.3 -32% | 50.2 -9% | 69.3 26% | 54.4 -1% | 80.8 47% | 38.43 -30% | 72.4 ? 31% | 61.6 ? 12% |
| 4K Write (MB/s) | 203.6 | 79.6 -61% | 220.9 8% | 226 11% | 125 -39% | 255.9 26% | 121.4 -40% | 186 ? -9% | 185.7 ? -9% |
| 4K-64 Read (MB/s) | 1995 | 1500 -25% | 810 -59% | 1913 -4% | 1884 -6% | 1179 -41% | 370.5 -81% | 1871 ? -6% | 1080 ? -46% |
| 4K-64 Write (MB/s) | 1918 | 2055 7% | 634 -67% | 2268 18% | 2118 10% | 700 -64% | 1054 -45% | 2764 ? 44% | 2231 ? 16% |
| Access Time Read * (ms) | 0.061 | 0.053 13% | 0.118 -93% | 0.082 -34% | 0.032 48% | 0.109 -79% | 0.042 31% | 0.0377 ? 38% | 0.06007 ? 2% |
| Access Time Write * (ms) | 0.021 | 0.033 -57% | 0.022 -5% | 0.017 19% | 0.031 -48% | 0.015 29% | 0.135 -543% | 0.03431 ? -63% | 0.07561 ? -260% |
| Total Average (Program / Settings) | -34% /
-33% | -56% /
-54% | -20% /
-23% | -24% /
-22% | -27% /
-26% | -71% /
-79% | -5% /
-3% | -30% /
-32% |
* ... smaller is better
Constant Performance Reading: DiskSpd Read Loop, Queue Depth 8
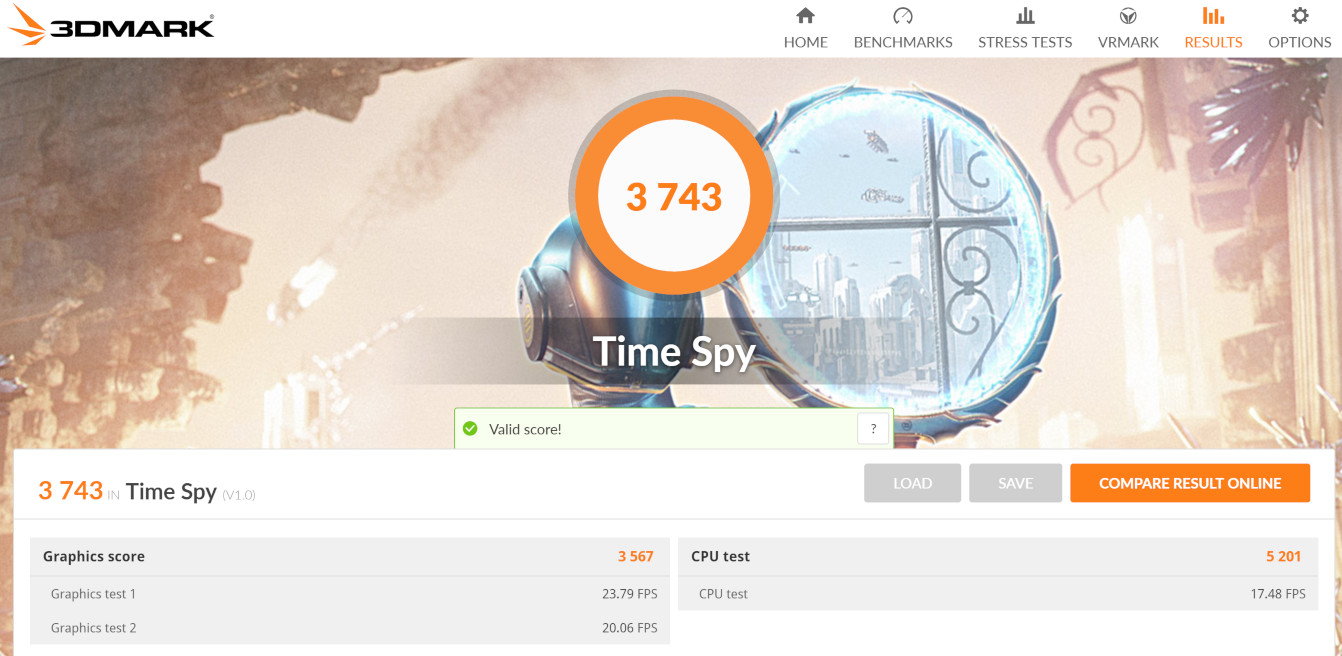
Graphics Card
The Nvidia GeForce RTX 3050 Ti with 4 GB of video storage is designed especially for multimedia laptops such as the ThinkBook. While it doesn't reach the highest performance in 3D applications, it is clearly superior to integrated graphics units in most aspects. It uses these capabilities in video rendering or image processing, for example.
When the demands on the graphics remain minimal, the 3050 Ti won't be used, and the necessary computing operations are then handled by the integrated Intel UHD Graphics Xe 32EUs.

| 3DMark 11 Performance | 16312 points | |
| 3DMark Cloud Gate Standard Score | 30279 points | |
| 3DMark Fire Strike Score | 11506 points | |
| 3DMark Time Spy Score | 5344 points | |
Help | ||
Gaming Performance
With a maximum power consumption of 50 watts, the graphics card remains slightly below the average values we measured for this model. This limitation serves mainly to avoid overtaxing the cooling and to limit the emissions.
However, the values achieved in older games are respectable. Even at high detail level, 60 frames per second remain realistic. With newer games, you have to accept some compromises in terms of the quality. However, this is only the case for the Full HD resolution, and the graphics performance is definitely too low for 4K.
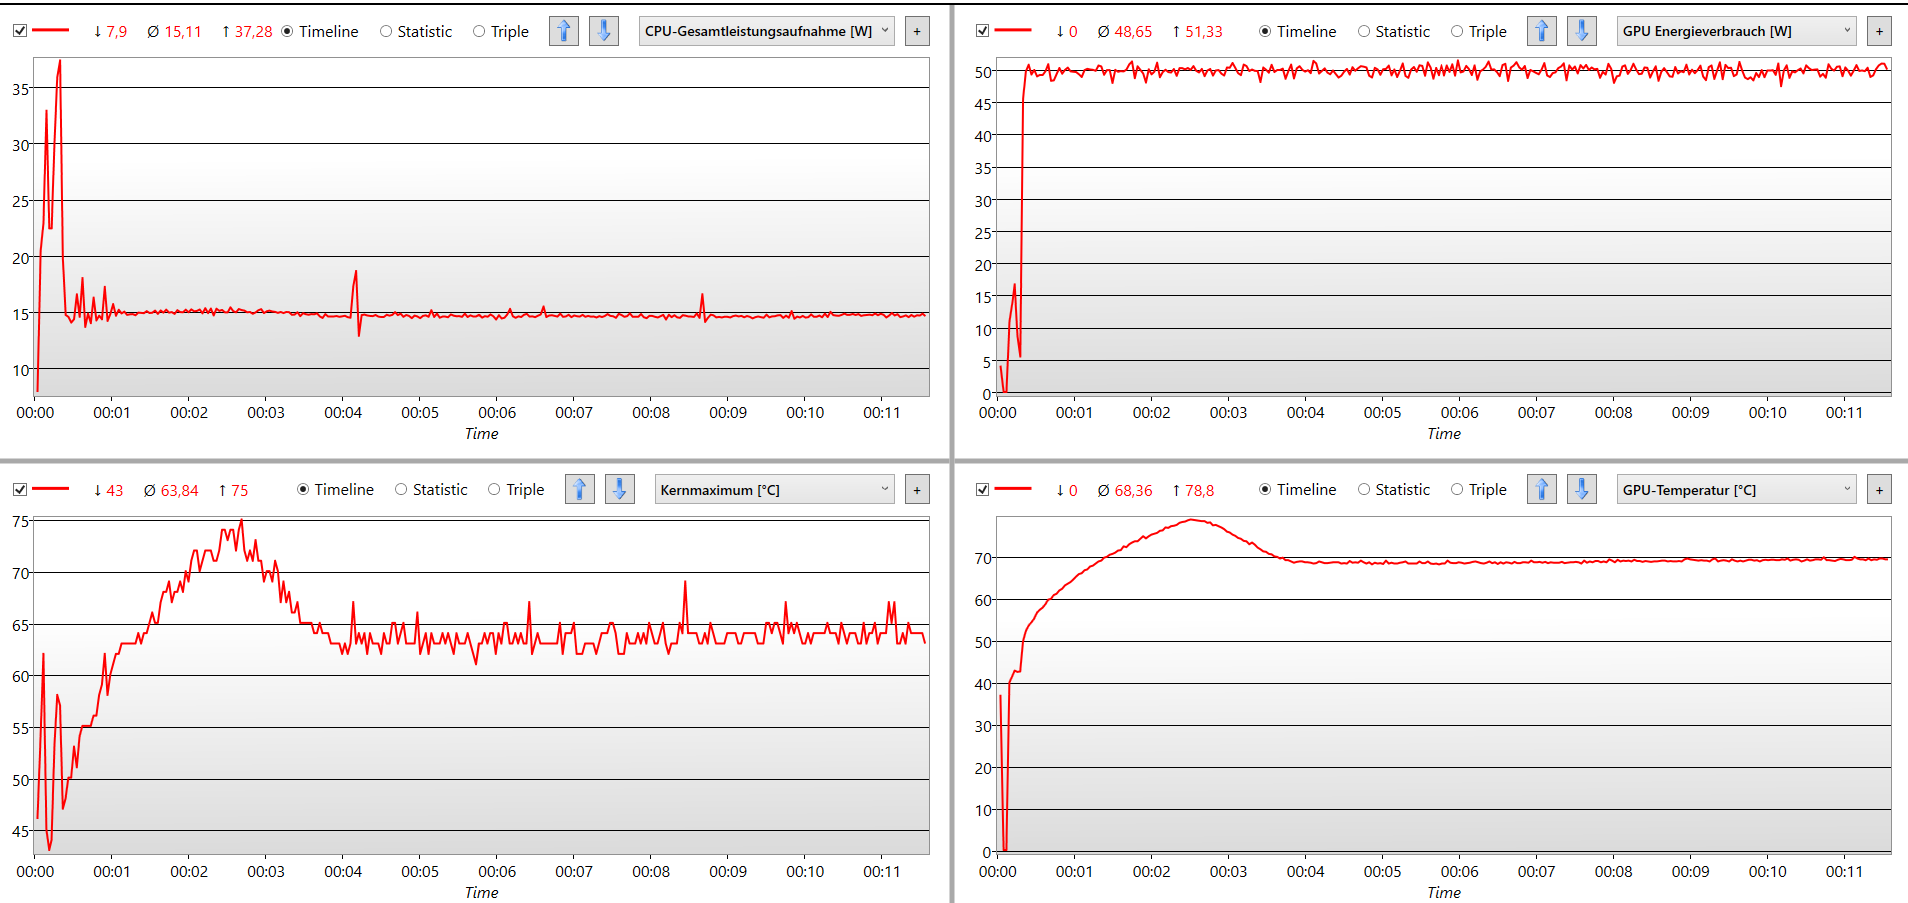
The example of our The Witcher 3 fps chart shows that you don't have to expect a performance drop in more complex programs even over longer periods of time. Despite a higher load, this is hardly surprising, since you can see in the chart on top that while the graphics card operates with the maximum power of 50 watts, the CPU only receives a total of 15 watts. With this, the temperature of the components remains within a healthy range, and the cooling doesn't have to kick in too much.
The Witcher 3 FPS Chart
| low | med. | high | ultra | QHD | 4K | |
|---|---|---|---|---|---|---|
| GTA V (2015) | 175 | 169 | 131 | 65.6 | ||
| The Witcher 3 (2015) | 228 | 165 | 92 | 52 | 26 | |
| Dota 2 Reborn (2015) | 154 | 136 | 128 | 115 | 76.6 | |
| Final Fantasy XV Benchmark (2018) | 131 | 73.8 | 53.3 | 38.9 | 21.4 | |
| X-Plane 11.11 (2018) | 110 | 94.6 | 77.6 | 58.9 | ||
| Far Cry 5 (2018) | 139 | 90 | 85 | 79 | 55 | 26 |
| Strange Brigade (2018) | 289 | 128 | 103 | 89.7 | ||
| Elex 2 (2022) | 66 | 55 | 53 | 48 | 31 | 16 |
Emissions - ThinkBook 15p G2 behavior is tolerable
Noise Emissions
There is no noticeable fan noise while surfing or with simple office or other comparable tasks. With increasing load, the fan noise becomes increasingly noticeable, but this occurs evenly and gradually, without any sudden revving noises or decreases.
With a demand for maximum performance, whether during gaming or while rendering, the discreet background noise turns into a powerful air stream. While this is definitely noticeable, it isn't very annoying, since it always remains at the same level. When the components slowly start to cool after a program is finished, for example, the fan speed also drops gradually rather than abruptly in some fixed steps.
Noise level
| Idle |
| 26.15 / 26.15 / 26.15 dB(A) |
| Load |
| 33.34 / 45.79 dB(A) |
 | ||
30 dB silent 40 dB(A) audible 50 dB(A) loud |
||
min: | ||
| Lenovo ThinkBook 15p G2 ITH 21B1000YGE GeForce RTX 3050 Ti Laptop GPU, i7-11800H, Samsung PM9A1 MZVL21T0HCLR | Lenovo ThinkBook 15p Gen1 4K GeForce GTX 1650 Ti Max-Q, i7-10750H, WDC PC SN730 SDBPNTY-1T00 | Dell Inspiron 16 Plus 7610-MHJ8F UHD Graphics Xe 32EUs (Tiger Lake-H), i7-11800H, OM3PDP3-AD NVMe KDI 512GB | MSI Creator Z16 A11UET-209 GeForce RTX 3060 Laptop GPU, i7-11800H, Phison 1TB SM2801T24GKBB4S-E162 | Asus VivoBook 15 Pro M3500QC-L1062 GeForce RTX 3050 4GB Laptop GPU, R5 5600H, SK Hynix HFM512GD3JX013N | Gigabyte G5 GD GeForce RTX 3050 4GB Laptop GPU, i5-11400H, ESR512GTLG-E6GBTNB4 | Dell XPS 15 9510 11800H RTX 3050 Ti OLED GeForce RTX 3050 Ti Laptop GPU, i7-11800H, Micron 2300 512GB MTFDHBA512TDV | |
|---|---|---|---|---|---|---|---|
| Noise | -6% | -1% | -15% | -0% | -19% | 9% | |
| off / environment * (dB) | 26.15 | 28.7 -10% | 26.3 -1% | 26.3 -1% | 24.8 5% | 24 8% | 23.8 9% |
| Idle Minimum * (dB) | 26.15 | 28.7 -10% | 26.3 -1% | 26.3 -1% | 24.8 5% | 29 -11% | 23.8 9% |
| Idle Average * (dB) | 26.15 | 28.7 -10% | 26.3 -1% | 26.3 -1% | 24.8 5% | 30 -15% | 23.8 9% |
| Idle Maximum * (dB) | 26.15 | 28.7 -10% | 26.3 -1% | 26.4 -1% | 32 -22% | 23.8 9% | |
| Load Average * (dB) | 33.34 | 34.8 -4% | 33 1% | 53.9 -62% | 42.8 -28% | 53 -59% | 36 -8% |
| Witcher 3 ultra * (dB) | 44.64 | 43.6 2% | 44 1% | 53.9 -21% | 42.8 4% | 52 -16% | 36 19% |
| Load Maximum * (dB) | 45.79 | 45.6 -0% | 49.2 -7% | 54.8 -20% | 42.8 7% | 54 -18% | 38.2 17% |
* ... smaller is better
Temperatures
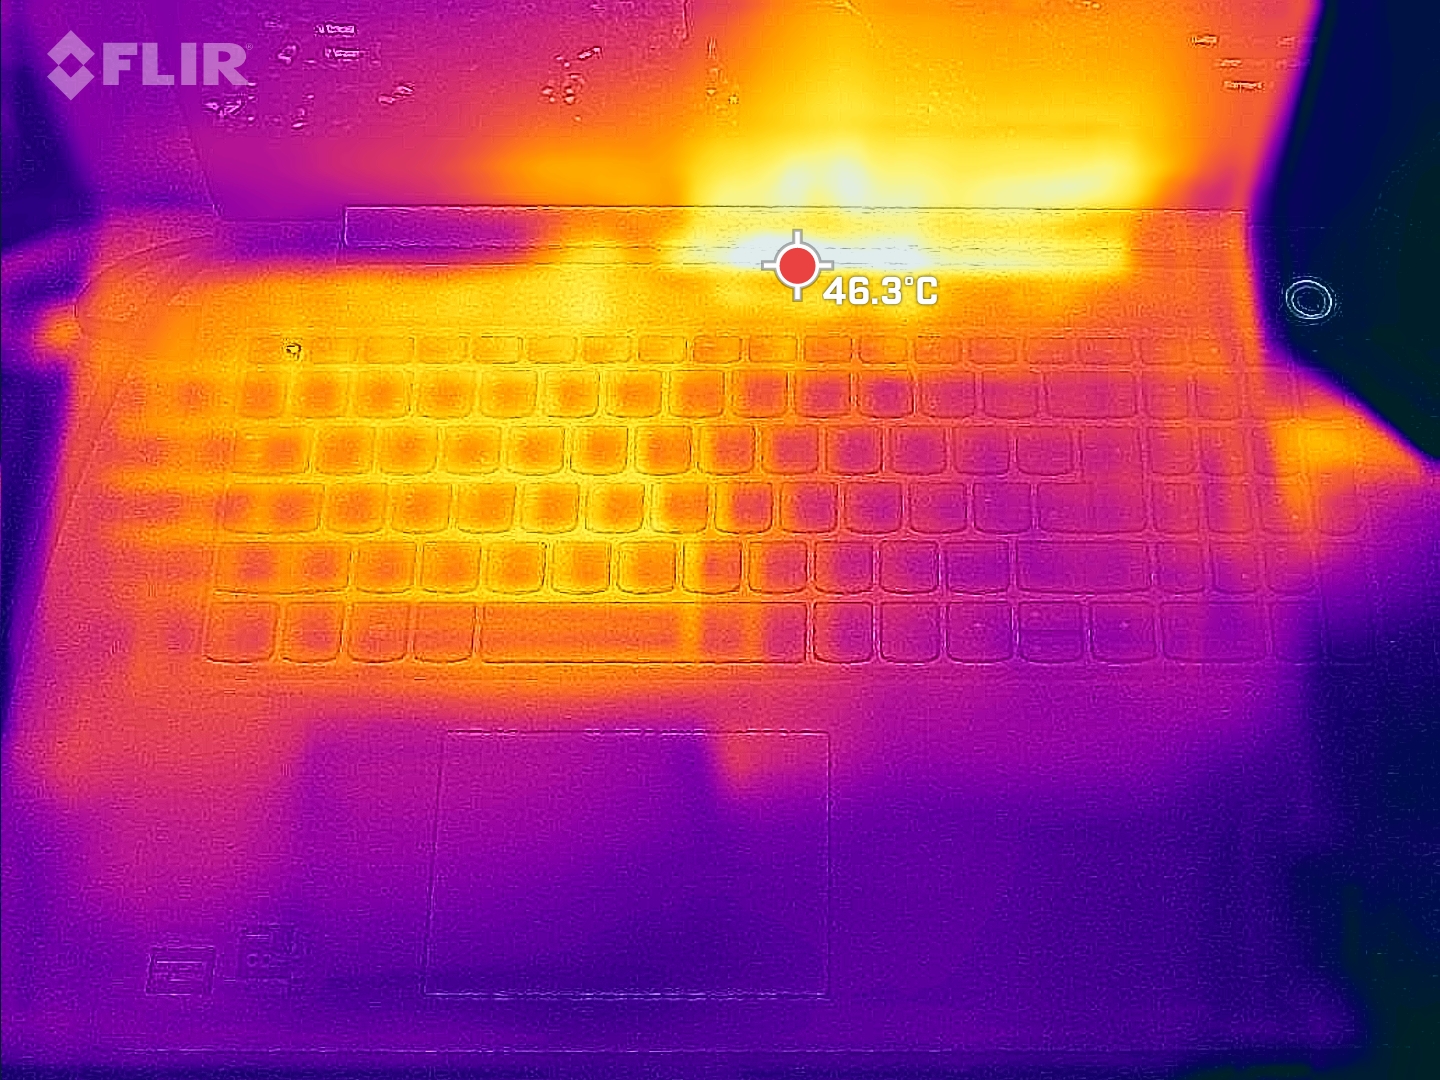
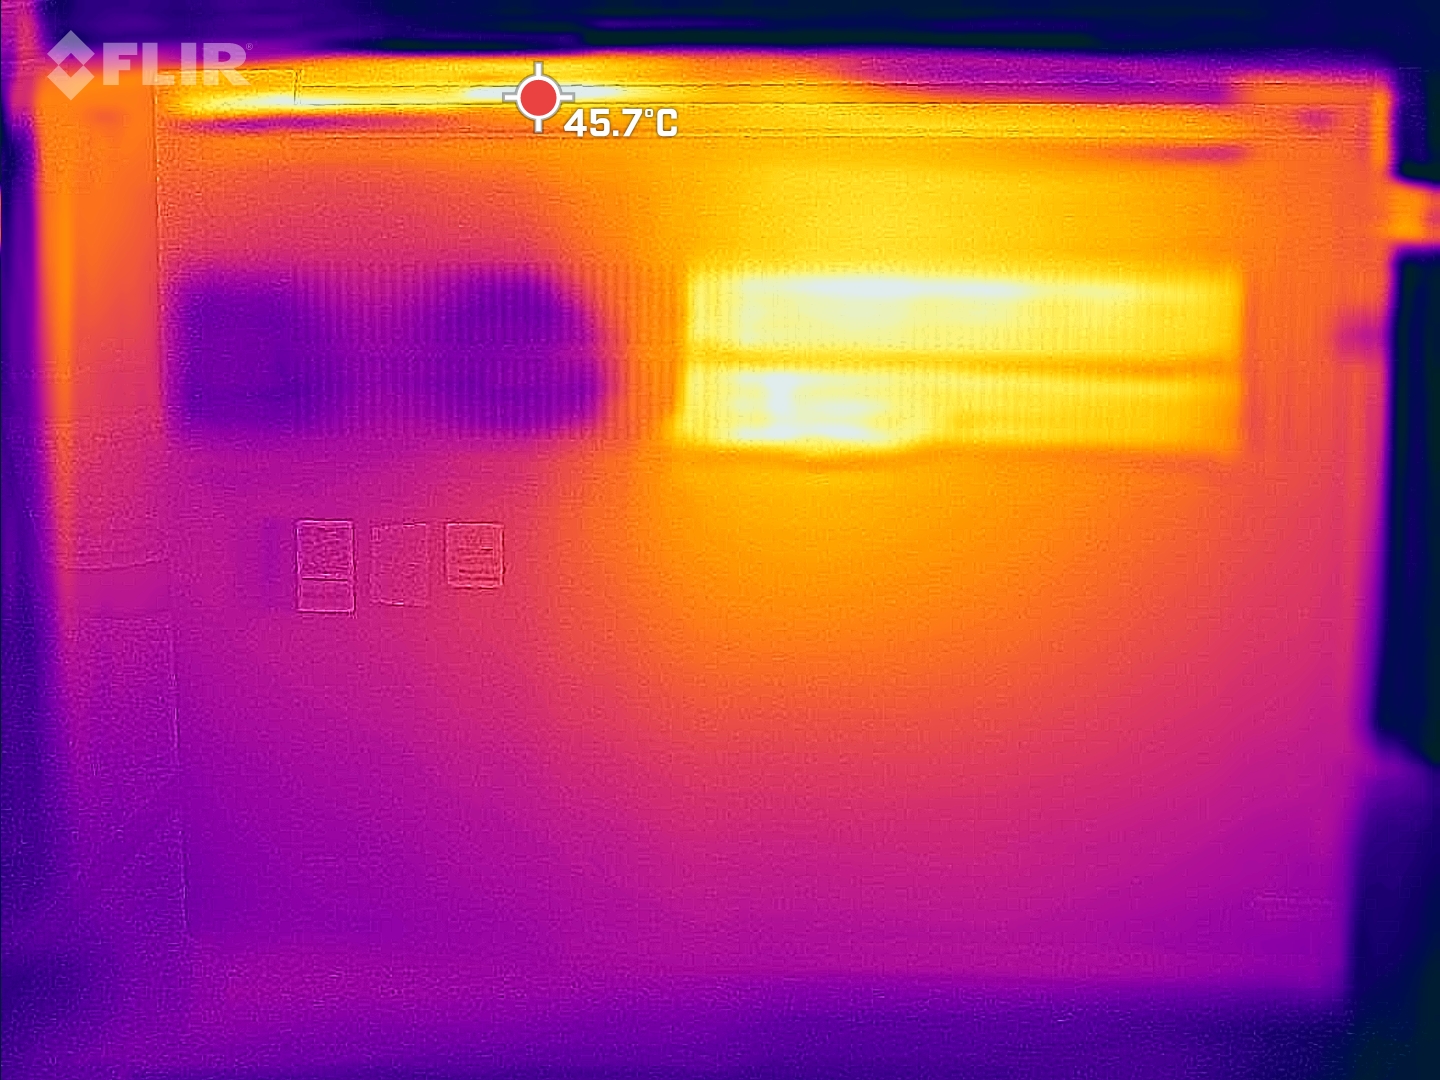
In battery operation and during less demanding tasks in general, the temperature development of the ThinkBook case remains moderate. Particularly in the keyboard and touchpad area, we do not register any uncomfortable temperature increases. An average of 29 °C (84 °F) that is fairly evenly distributed won't become uncomfortable at any time.
When you connect the charger, first the performance values, followed by the temperatures, and finally the fan speed will jump higher. Under load, the left area of the keyboard, which houses the CPU and GPU directly underneath, will then warm up strongly. The bottom will even get much hotter. The heat map during constant load from The Witcher 3 shows a maximum of 46 °C (115 °F). However, since most 3D rendering tasks will probably be run with the laptop on the desk, this should hardly become noticeable.
(±) The maximum temperature on the upper side is 42.8 °C / 109 F, compared to the average of 36.8 °C / 98 F, ranging from 21 to 71 °C for the class Multimedia.
(-) The bottom heats up to a maximum of 48.6 °C / 119 F, compared to the average of 39.1 °C / 102 F
(+) In idle usage, the average temperature for the upper side is 29.5 °C / 85 F, compared to the device average of 31.3 °C / 88 F.
(±) Playing The Witcher 3, the average temperature for the upper side is 33.3 °C / 92 F, compared to the device average of 31.3 °C / 88 F.
(+) The palmrests and touchpad are cooler than skin temperature with a maximum of 28.5 °C / 83.3 F and are therefore cool to the touch.
(±) The average temperature of the palmrest area of similar devices was 28.7 °C / 83.7 F (+0.2 °C / 0.4 F).
| Lenovo ThinkBook 15p G2 ITH 21B1000YGE Intel Core i7-11800H, NVIDIA GeForce RTX 3050 Ti Laptop GPU | Lenovo ThinkBook 15p Gen1 4K Intel Core i7-10750H, NVIDIA GeForce GTX 1650 Ti Max-Q | Dell Inspiron 16 Plus 7610-MHJ8F Intel Core i7-11800H, Intel UHD Graphics Xe 32EUs (Tiger Lake-H) | MSI Creator Z16 A11UET-209 Intel Core i7-11800H, NVIDIA GeForce RTX 3060 Laptop GPU | Asus VivoBook 15 Pro M3500QC-L1062 AMD Ryzen 5 5600H, NVIDIA GeForce RTX 3050 4GB Laptop GPU | Gigabyte G5 GD Intel Core i5-11400H, NVIDIA GeForce RTX 3050 4GB Laptop GPU | Dell XPS 15 9510 11800H RTX 3050 Ti OLED Intel Core i7-11800H, NVIDIA GeForce RTX 3050 Ti Laptop GPU | |
|---|---|---|---|---|---|---|---|
| Heat | 16% | 4% | -12% | 15% | 2% | 9% | |
| Maximum Upper Side * (°C) | 42.8 | 41.2 4% | 43.4 -1% | 52.5 -23% | 37.8 12% | 45 -5% | 45.5 -6% |
| Maximum Bottom * (°C) | 48.6 | 47 3% | 45.1 7% | 56.7 -17% | 48.4 -0% | 50 -3% | 44.2 9% |
| Idle Upper Side * (°C) | 36 | 22.6 37% | 30.6 15% | 33.9 6% | 24 33% | 28 22% | 27 25% |
| Idle Bottom * (°C) | 29.2 | 23.1 21% | 31.1 -7% | 32.7 -12% | 25.1 14% | 31 -6% | 26.7 9% |
* ... smaller is better
Stress Test
A look at the measurement sensors shows that the temperature of the CPU briefly comes close to 90 °C (194 °F), but is then kept below 80 °C (176 °F) in the long run. For as long as there are no graphically demanding tasks, the graphics card remains unused, but the iGPU instead contributes additionally to the temperature increase of the SoC.
When the Nvidia RTX 3050 Ti is activated, the GPU and CPU temperatures both level out at about 75 °C (167 °F). With the cooling fans, the full performance of both components is only available for a few moments, before the CPU is throttled.
| CPU Clock (GHz) | GPU Clock (MHz) | Average CPU Temperature (°C) | Average GPU Temperature (°C) | |
| System Idle | 1,4 | 0 | 44 | <40 |
| Prime95 Stress | 3,1 | 0 | 76 | <40 |
| Prime95 + FurMark Stress | 1,9 | 1.190 | 71 | 74 |
Speakers
Other than the audio system being labeled with the name "harman," we unfortunately don't notice anything that is remarkable. The bass is weak, as can be expected from a laptop. But we also hear some limitations in the high frequencies. The sound isn't very balanced and lacks details. The overall volume is also surprisingly limited. There is no noticeable increase in the volume between 70 and 100% but only an annoying increase in distortions.
This makes the speakers not very suitable for a multimedia laptop. A look inside also shows that they turned out relatively small, which explains a large part of the deficits. For the consumption of media content, the quality is usually sufficient, but you should use external devices for more demanding tasks.
Lenovo ThinkBook 15p G2 ITH 21B1000YGE audio analysis
(-) | not very loud speakers (68.4 dB)
Bass 100 - 315 Hz
(-) | nearly no bass - on average 15.3% lower than median
(-) | bass is not linear (16.1% delta to prev. frequency)
Mids 400 - 2000 Hz
(+) | balanced mids - only 1.9% away from median
(+) | mids are linear (6.2% delta to prev. frequency)
Highs 2 - 16 kHz
(+) | balanced highs - only 2.5% away from median
(±) | linearity of highs is average (7.4% delta to prev. frequency)
Overall 100 - 16.000 Hz
(±) | linearity of overall sound is average (17% difference to median)
Compared to same class
» 46% of all tested devices in this class were better, 7% similar, 46% worse
» The best had a delta of 5%, average was 17%, worst was 45%
Compared to all devices tested
» 30% of all tested devices were better, 8% similar, 62% worse
» The best had a delta of 4%, average was 23%, worst was 134%
Apple MacBook Pro 16 2021 M1 Pro audio analysis
(+) | speakers can play relatively loud (84.7 dB)
Bass 100 - 315 Hz
(+) | good bass - only 3.8% away from median
(+) | bass is linear (5.2% delta to prev. frequency)
Mids 400 - 2000 Hz
(+) | balanced mids - only 1.3% away from median
(+) | mids are linear (2.1% delta to prev. frequency)
Highs 2 - 16 kHz
(+) | balanced highs - only 1.9% away from median
(+) | highs are linear (2.7% delta to prev. frequency)
Overall 100 - 16.000 Hz
(+) | overall sound is linear (4.6% difference to median)
Compared to same class
» 0% of all tested devices in this class were better, 0% similar, 100% worse
» The best had a delta of 5%, average was 17%, worst was 45%
Compared to all devices tested
» 0% of all tested devices were better, 0% similar, 100% worse
» The best had a delta of 4%, average was 23%, worst was 134%
Power Management
Power Consumption
The power consumption is surprisingly high already in idle operation. Even with only minimal demands, the system already consumes almost 11 watts. A Dell XPS 15 9510 with comparable hardware consumes 30% less. Under full load, all the power of the 135-Watt power supply is used, but only for a short time. The CPU and GPU together will then consume 105 watts.
| Off / Standby | |
| Idle | |
| Load |
|
Key:
min: | |
| Lenovo ThinkBook 15p G2 ITH 21B1000YGE i7-11800H, GeForce RTX 3050 Ti Laptop GPU, Samsung PM9A1 MZVL21T0HCLR, IPS, 3840x2160, 15.6" | Lenovo ThinkBook 15p Gen1 4K i7-10750H, GeForce GTX 1650 Ti Max-Q, WDC PC SN730 SDBPNTY-1T00, IPS, 3840x2160, 15.6" | Dell Inspiron 16 Plus 7610-MHJ8F i7-11800H, UHD Graphics Xe 32EUs (Tiger Lake-H), OM3PDP3-AD NVMe KDI 512GB, IPS, 3072x1920, 16" | MSI Creator Z16 A11UET-209 i7-11800H, GeForce RTX 3060 Laptop GPU, Phison 1TB SM2801T24GKBB4S-E162, IPS True Pixel, 2560x1600, 16" | Gigabyte G5 GD i5-11400H, GeForce RTX 3050 4GB Laptop GPU, ESR512GTLG-E6GBTNB4, IPS, 1920x1080, 15.6" | Dell XPS 15 9510 11800H RTX 3050 Ti OLED i7-11800H, GeForce RTX 3050 Ti Laptop GPU, Micron 2300 512GB MTFDHBA512TDV, OLED, 3456x2160, 15.6" | Average NVIDIA GeForce RTX 3050 Ti Laptop GPU | Average of class Multimedia | |
|---|---|---|---|---|---|---|---|---|
| Power Consumption | 21% | 46% | -12% | -8% | 27% | 13% | 35% | |
| Idle Minimum * (Watt) | 10.69 | 4.3 60% | 5.4 49% | 9 16% | 13 -22% | 7.6 29% | 8.2 ? 23% | 5.67 ? 47% |
| Idle Average * (Watt) | 17.85 | 10.8 39% | 9.8 45% | 14 22% | 15 16% | 9.9 45% | 12.6 ? 29% | 10.1 ? 43% |
| Idle Maximum * (Watt) | 18.67 | 13.2 29% | 14 25% | 26.7 -43% | 20 -7% | 10.8 42% | 17.2 ? 8% | 12.3 ? 34% |
| Load Average * (Watt) | 98.17 | 103.2 -5% | 44 55% | 119 -21% | 102 -4% | 81 17% | 92 ? 6% | 65.6 ? 33% |
| Witcher 3 ultra * (Watt) | 100 | 94 6% | 44 56% | 125 -25% | 124 -24% | 76.2 24% | ||
| Load Maximum * (Watt) | 135.55 | 140.2 -3% | 76.8 43% | 160 -18% | 148 -9% | 131 3% | 139.1 ? -3% | 113.2 ? 16% |
* ... smaller is better
Power Consumption The Witcher 3 / Stress Test
Power Consumption With External Monitor
Battery Life
The battery life turns out correspondingly low. Considering that it only has a 57-Wh battery, less than 4 hours in the web surfing test are not surprising. At full brightness, the battery life will drop by another hour. The fact that it lasts 20% longer playing videos in Full HD might be due to the graphics card then being completely turned off. The iGPU can handle this task without any help, which lowers the power consumption.
This means that using it for longer periods away from the outlet is hardly possible. The ThinkPad X1 Extreme G4 or the Dell XPS 15 9510, which have significantly larger batteries at 90 and 86 Wh respectively, will deliver runtimes that are much more practical.
| Lenovo ThinkBook 15p G2 ITH 21B1000YGE i7-11800H, GeForce RTX 3050 Ti Laptop GPU, 57 Wh | Lenovo ThinkBook 15p Gen1 4K i7-10750H, GeForce GTX 1650 Ti Max-Q, 57 Wh | Dell Inspiron 16 Plus 7610-MHJ8F i7-11800H, UHD Graphics Xe 32EUs (Tiger Lake-H), 86 Wh | MSI Creator Z16 A11UET-209 i7-11800H, GeForce RTX 3060 Laptop GPU, 90 Wh | Gigabyte G5 GD i5-11400H, GeForce RTX 3050 4GB Laptop GPU, 41 Wh | Dell XPS 15 9510 11800H RTX 3050 Ti OLED i7-11800H, GeForce RTX 3050 Ti Laptop GPU, 86 Wh | Average of class Multimedia | |
|---|---|---|---|---|---|---|---|
| Battery runtime | 87% | 196% | 88% | -15% | 88% | 173% | |
| H.264 (h) | 4.5 | 7.3 62% | 3.6 -20% | 10.4 131% | 16.3 ? 262% | ||
| WiFi v1.3 (h) | 3.8 | 9.8 158% | 9.5 150% | 9.5 150% | 3.1 -18% | 7 84% | 12.1 ? 218% |
| Witcher 3 ultra (h) | 2 | ||||||
| Load (h) | 1.2 | 1.7 42% | 4.1 242% | 1.5 25% | 1.1 -8% | 1.8 50% | 1.654 ? 38% |
| Reader / Idle (h) | 22.5 | 13 | 5.7 | 25.2 ? | |||
| WiFi (h) | 9.5 |
Pros
Cons
Verdict - The Lenovo ThinkBook is weak at the right places
The entry into the multimedia class definitely succeeds with the ThinkBook 15p G2. The configuration that we tested even allows pursuing more ambitioned goals, since the performance values approach those of a Lenovo ThinkPad X1 Extreme G4. Overall, the offered amount of performance is suitable for creative work. The selection of connections is also convincing, particularly with Thunderbolt 4. The improvements compared to the predecessor also go significantly beyond TB4. With the next generation of CPU and GPU, we were able to see some clear jumps in performance.
In addition, there is also the very good display, even if that was slightly better in the predecessor. Unfortunately, the measured brightness remains slightly behind the values specified by the manufacturer, but it is still above average at 500 cd/m². The 16:9 format is also not optimal for working on content that has that format, since the space above and below for icons and navigation is lacking.
However, in most cases it might not be that important if the case doesn't fulfill the highest demands on quality or if the battery life leaves something to be desired. But the slow card slot might become a problem when you need to transfer photos and videos from the SD card. The competitors usually manage this in a quarter of the time.
The Lenovo ThinkBook 15p G2 provides the desired performance for creative tasks and displays all that on a worthy display. However, this goes at the expense of the battery life and increases the heat development, resulting in the ThinkBook staying on the desk most of the time.
All the versions of the ThinkBook are distinguished by their good price-performance ratio. This is also because Lenovo choses their weaknesses well. If you need a larger battery and more efficient cooling, the Dell XPS 15 9510, which is much more expensive at 2400 Euros (~$2645), would represent an alternative with a similar performance. The significantly more affordable Gigabyte G5 GD would also deliver a similar graphics performance, but for barely 800 Euros (~$882), it turns out worse in all the other areas.
Price and Availability
With an i7-11800H, Nvidia GeForce GTX 1650, UHD resolution, 16 GB of RAM, and 512 GB SSD, the Lenovo ThinkBook 15p G2 is available from Amazon for $1460. The Lenovo store also offers many configurations starting from $1246.
Lenovo ThinkBook 15p G2 ITH 21B1000YGE
- 03/11/2022 v7 (old)
Mario Petzold
Price comparison

