Dell XPS 15 9510 Review: Multimedia Laptop convinces with new OLED Panel

Dell updates its premium multimedia laptop XPS 15 9510 this year with new processors from Intel (Tiger Lake-H) and new graphics cards from Nvidia (RTX 3050 & RTX 3050 Ti). You can also get a new 3.5K OLED touchscreen, which complements the two familiar display options (FHD & 4K IPS). The new model starts at 1599 Euros with a Core i5 processor and without a dedicated graphics card.
Our test unit is equipped with the new Core i7-11800H with eight cores, the Nvidia GeForce RTX 3050 Ti GPU as well as the new OLED screen. This configuration with 16 GB RAM and 512 GB SSD storage is available for around 2450 Euros.
Possible competitors
Rating | Date | Model | Weight | Height | Size | Resolution | Price |
|---|---|---|---|---|---|---|---|
| 88.4 % v7 (old) | 08 / 2021 | Dell XPS 15 9510 11800H RTX 3050 Ti OLED i7-11800H, GeForce RTX 3050 Ti Laptop GPU | 1.9 kg | 18 mm | 15.60" | 3456x2160 | |
| 89.7 % v7 (old) | 12 / 2019 | Apple MacBook Pro 16 2019 i9 5500M i9-9880H, Radeon Pro 5500M | 2 kg | 16.2 mm | 16.00" | 3072x1920 | |
| 90.1 % v7 (old) | 01 / 2021 | Lenovo ThinkPad X1 Extreme Gen3-20TLS0UV00 i7-10750H, GeForce GTX 1650 Ti Max-Q | 1.7 kg | 18.7 mm | 15.60" | 1920x1080 | |
| 85.6 % v7 (old) | 08 / 2021 | Gigabyte Aero 15 OLED XD i7-11800H, GeForce RTX 3070 Laptop GPU | 2.2 kg | 20 mm | 15.60" | 3840x2160 | |
| 90.1 % v7 (old) | 06 / 2020 | Dell XPS 15 9500 Core i7 4K UHD i7-10875H, GeForce GTX 1650 Ti Mobile | 2 kg | 18 mm | 15.60" | 3840x2400 |
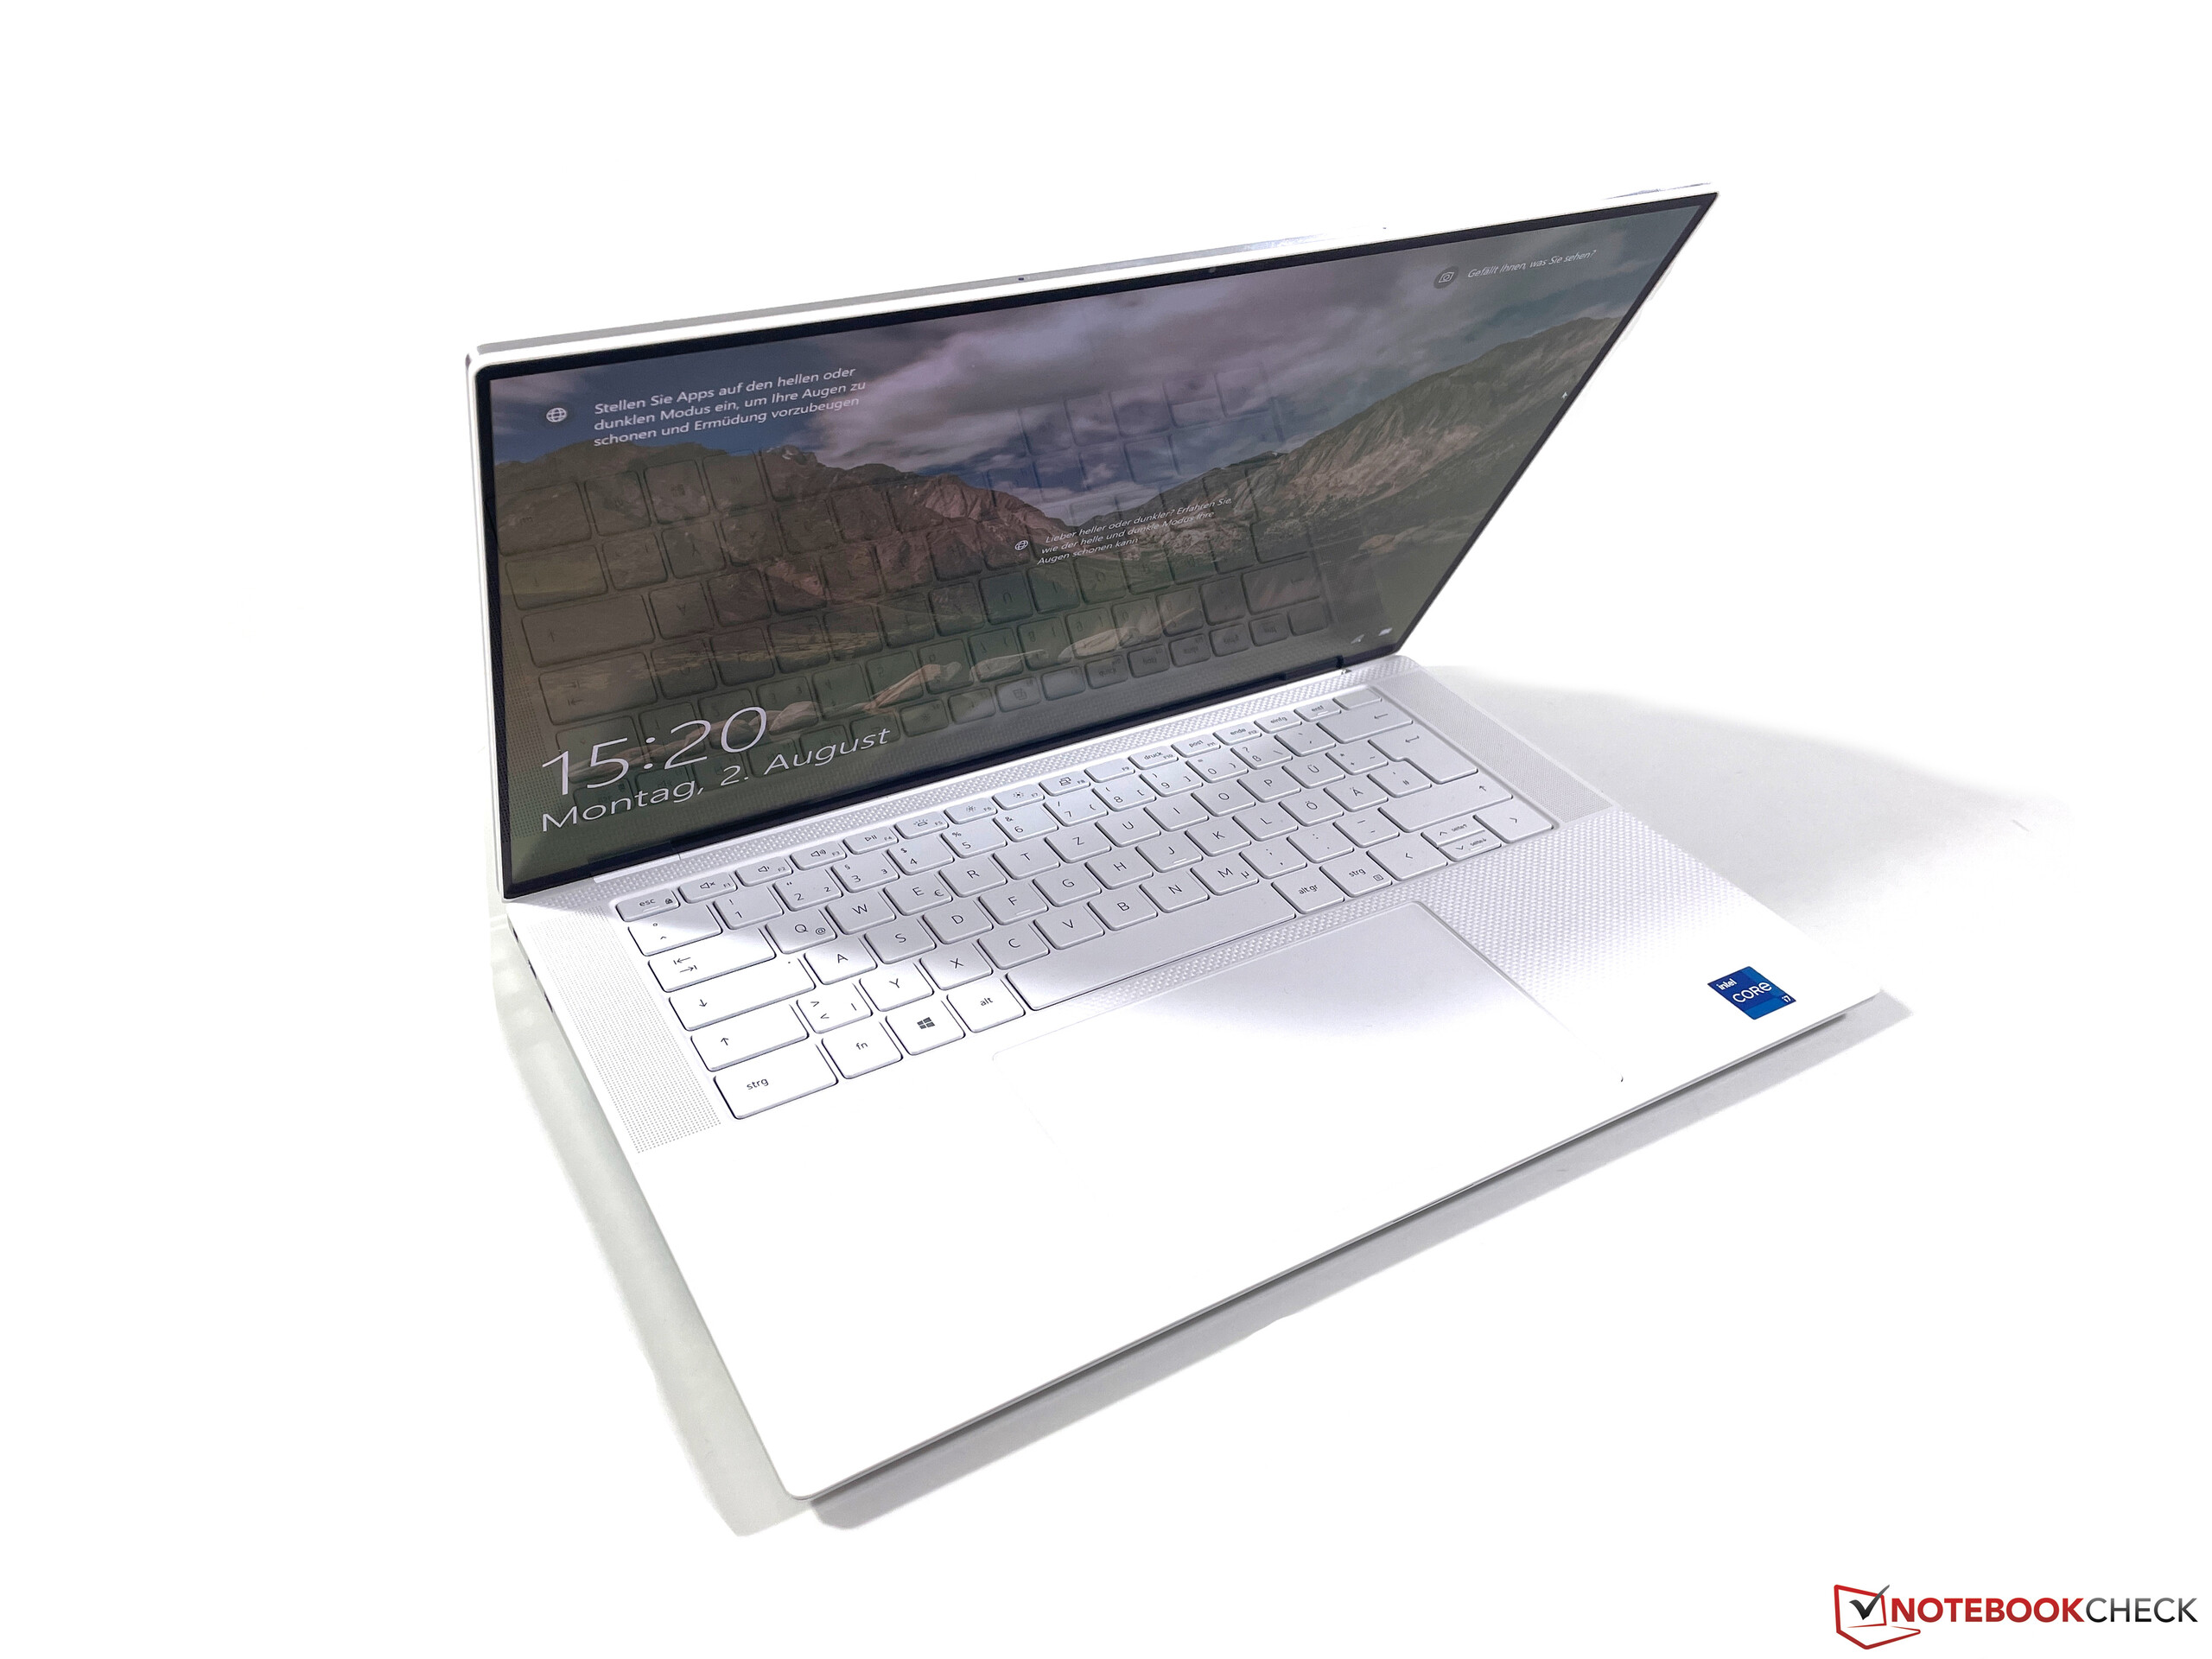
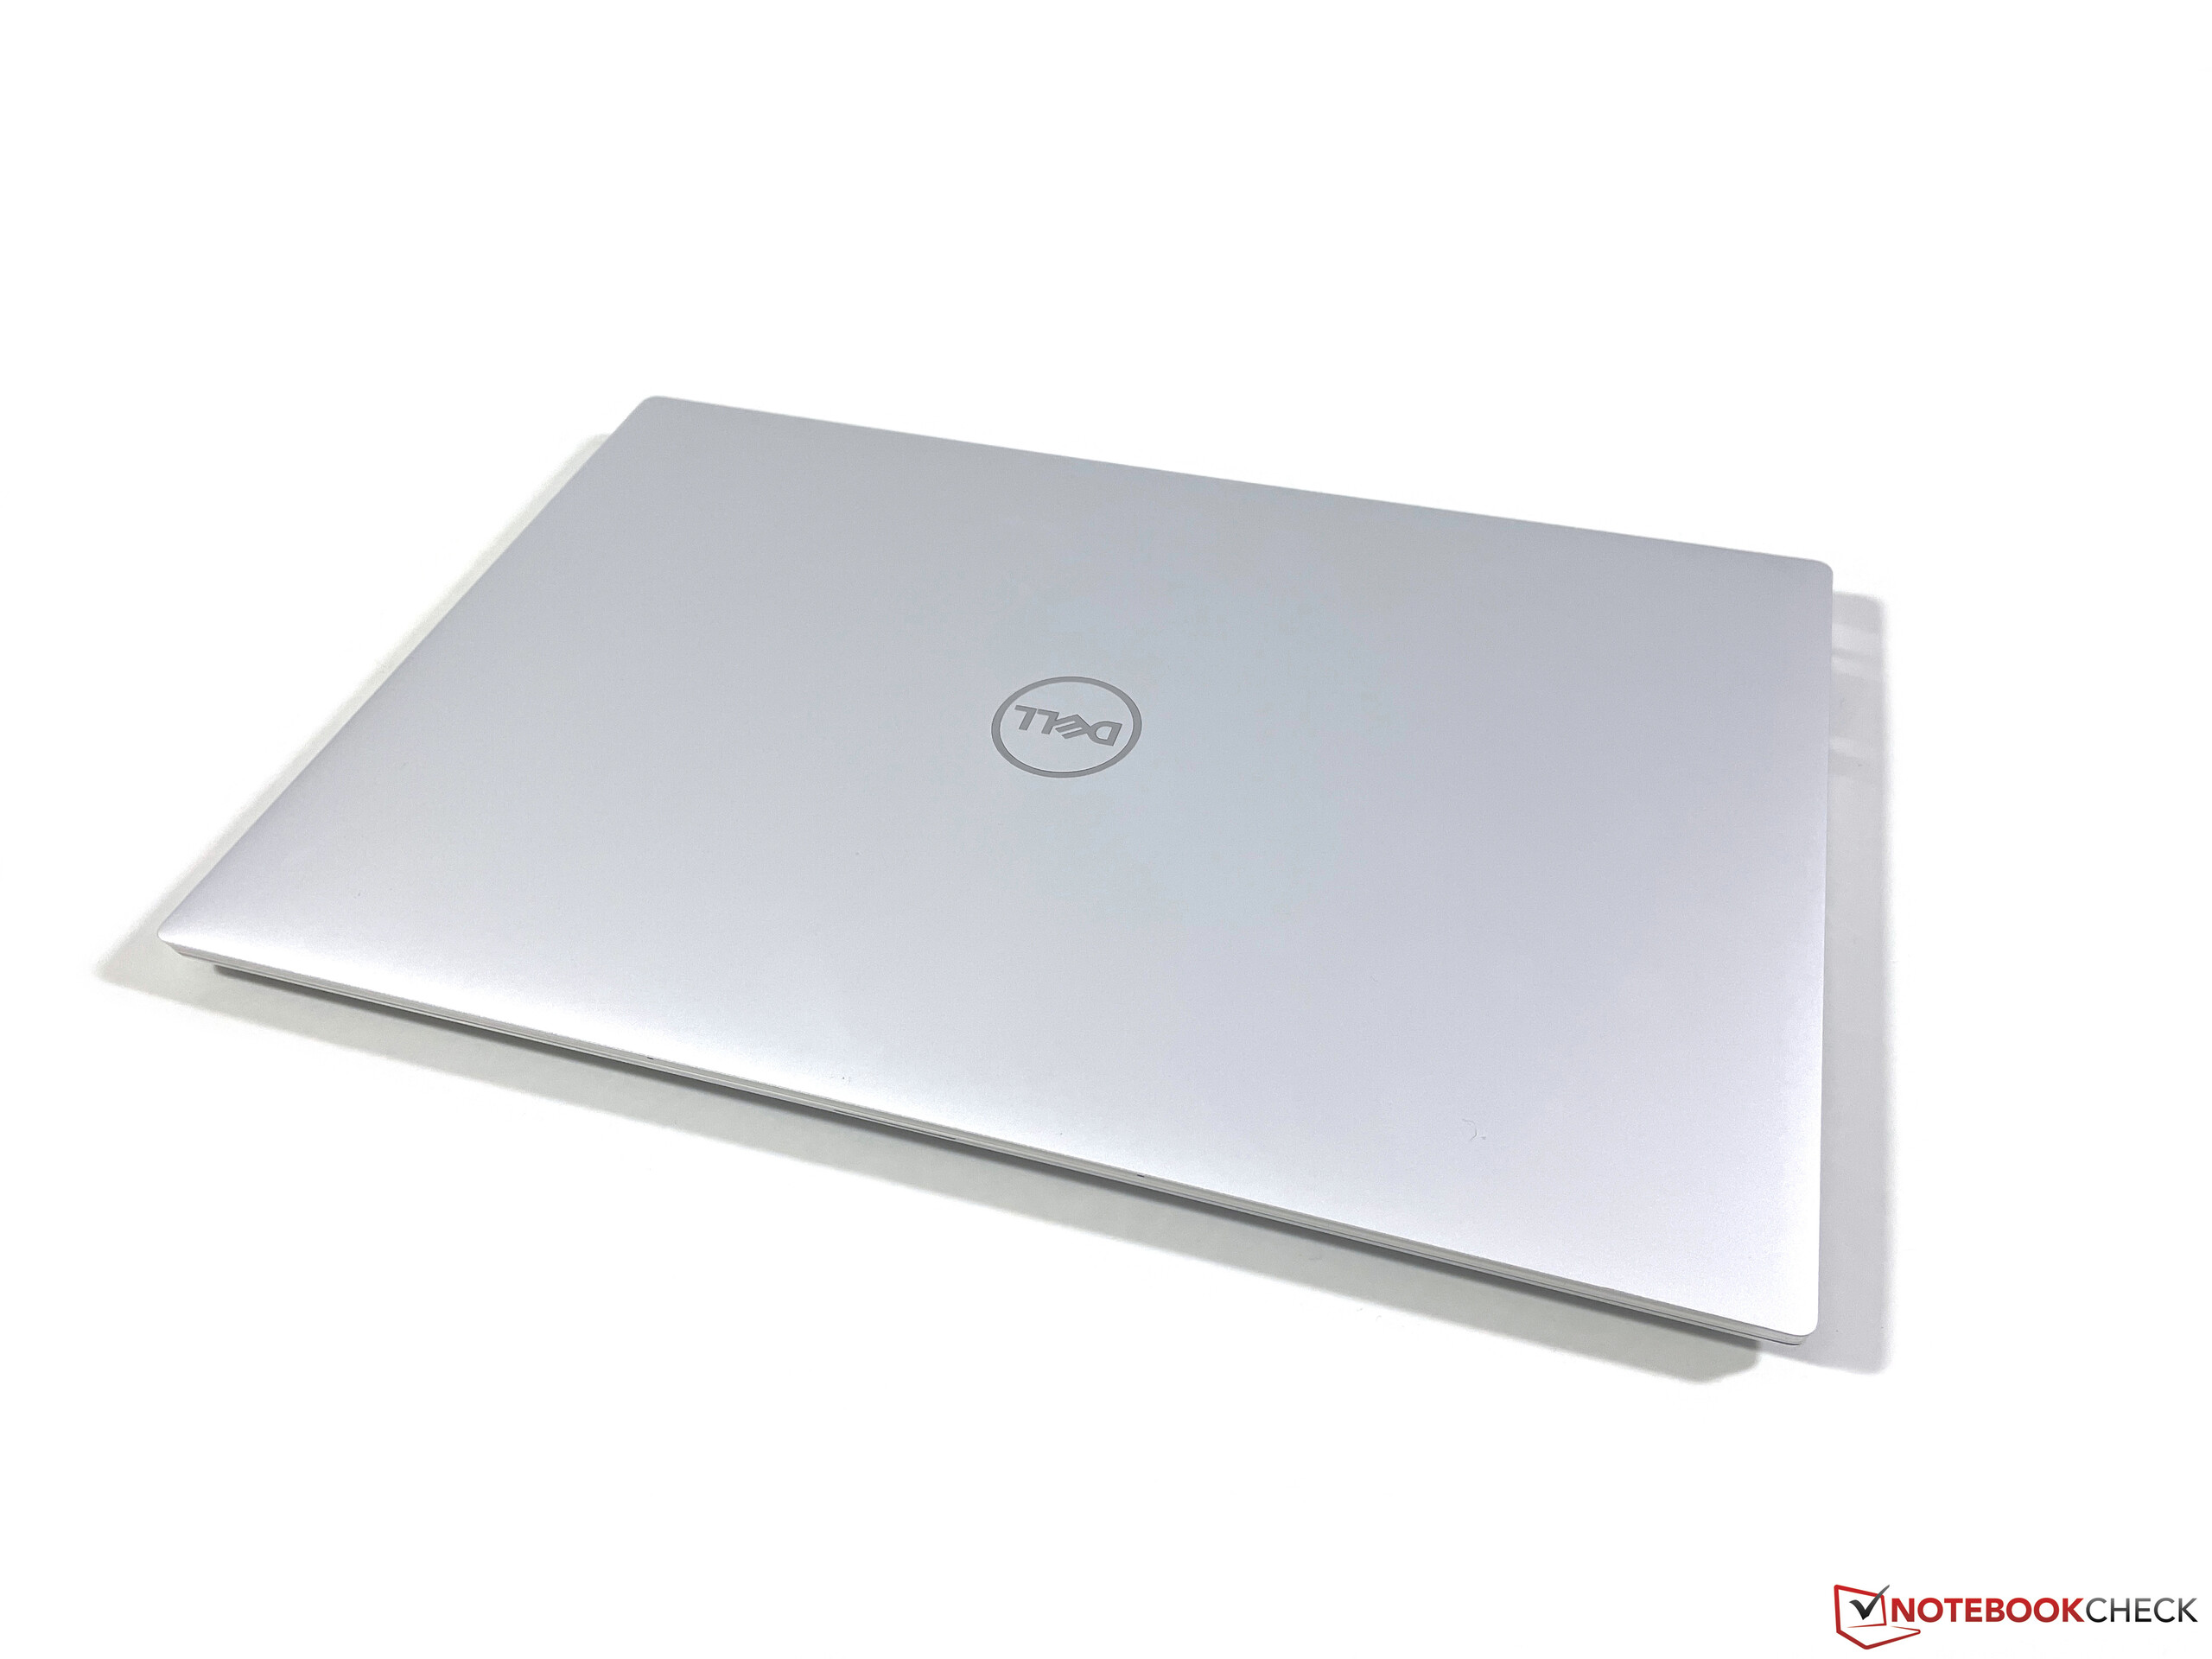
Case - Dell uses familiar design
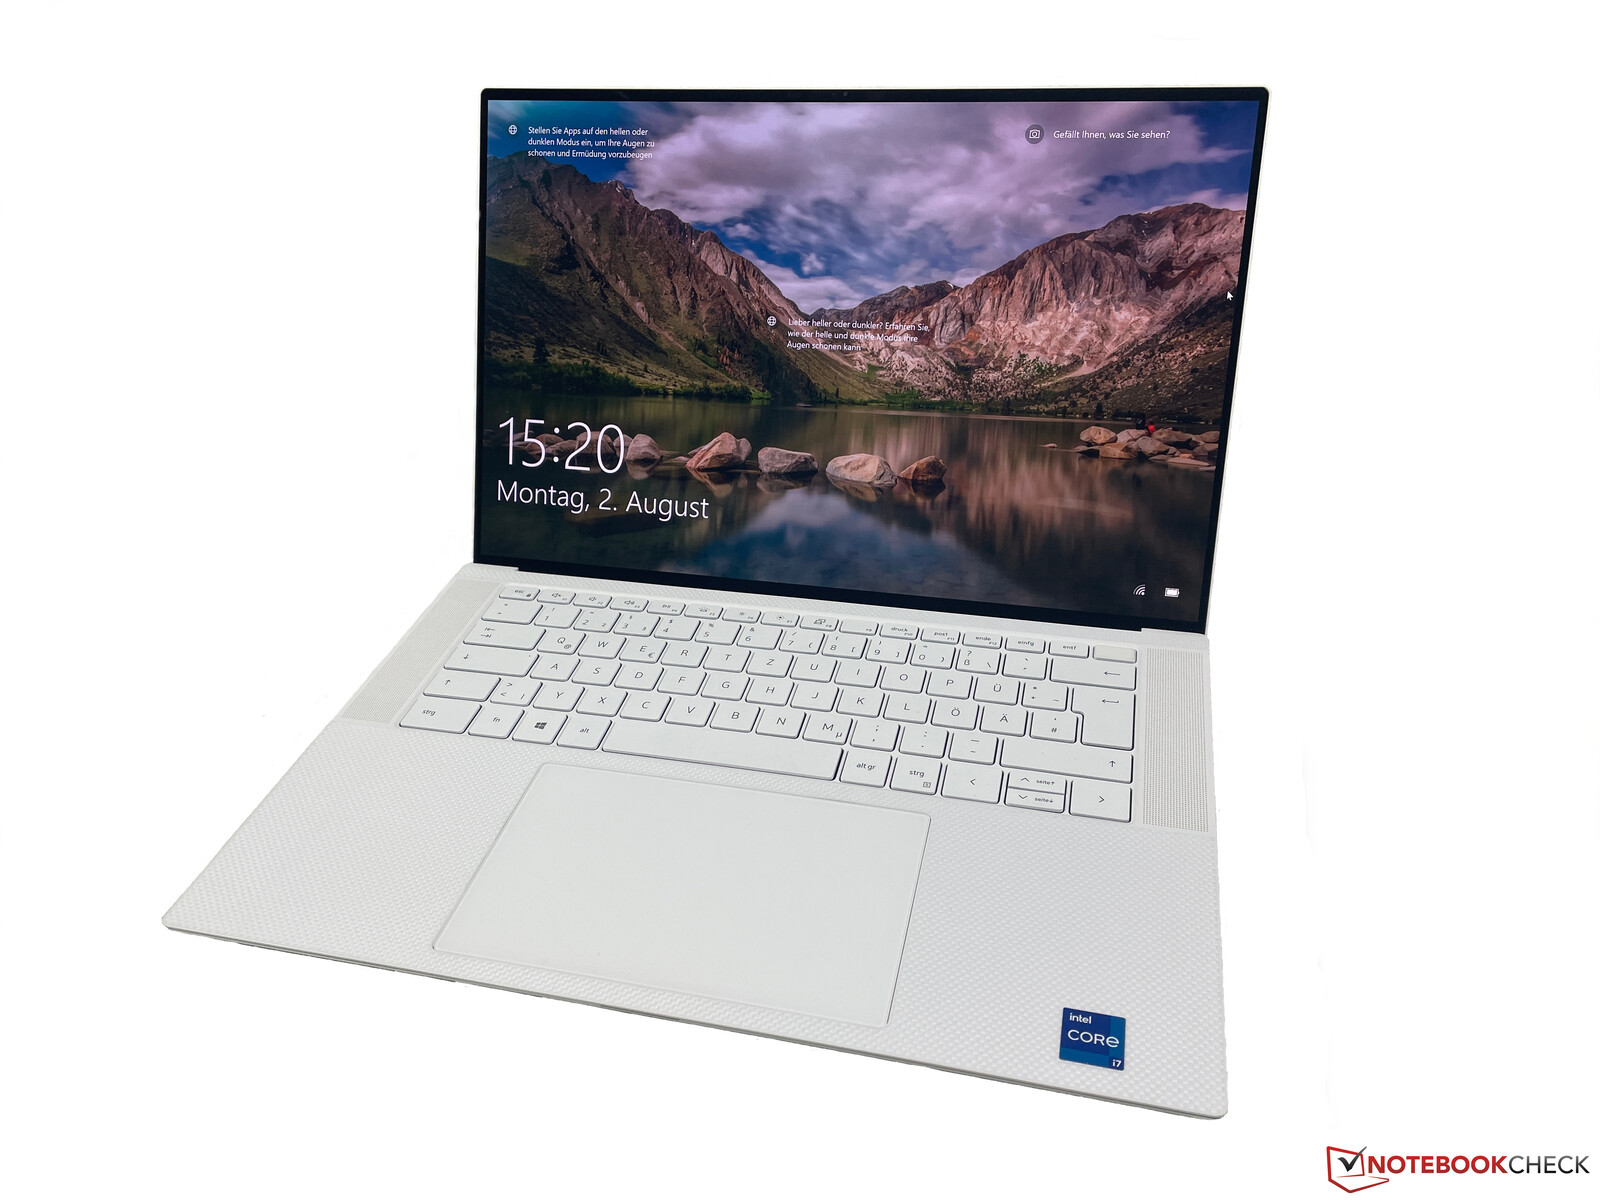
The case did not change compared to the previous XPS 15 9500. Dell still offers a dark and a white version, which is also the color of the review unit. The silver of the lid as well as the bottom panel is a bit brighter and the top of the base unit is white with the familiar pattern. Compared to the darker model, you will not notice fingerprints, but we cannot say how the white surfaces will hold up over time. This is obviously the case for the white keyboard as well.
Both the build quality as well as the stability are very good; especially the sturdy screen is a positive surprise. You cannot twist it and even concentrated pressure from behind is no problem at all.
The bezels are once again very slim on all four sides, which looks very modern and it also results in a screen-to-body ratio of almost 90%.

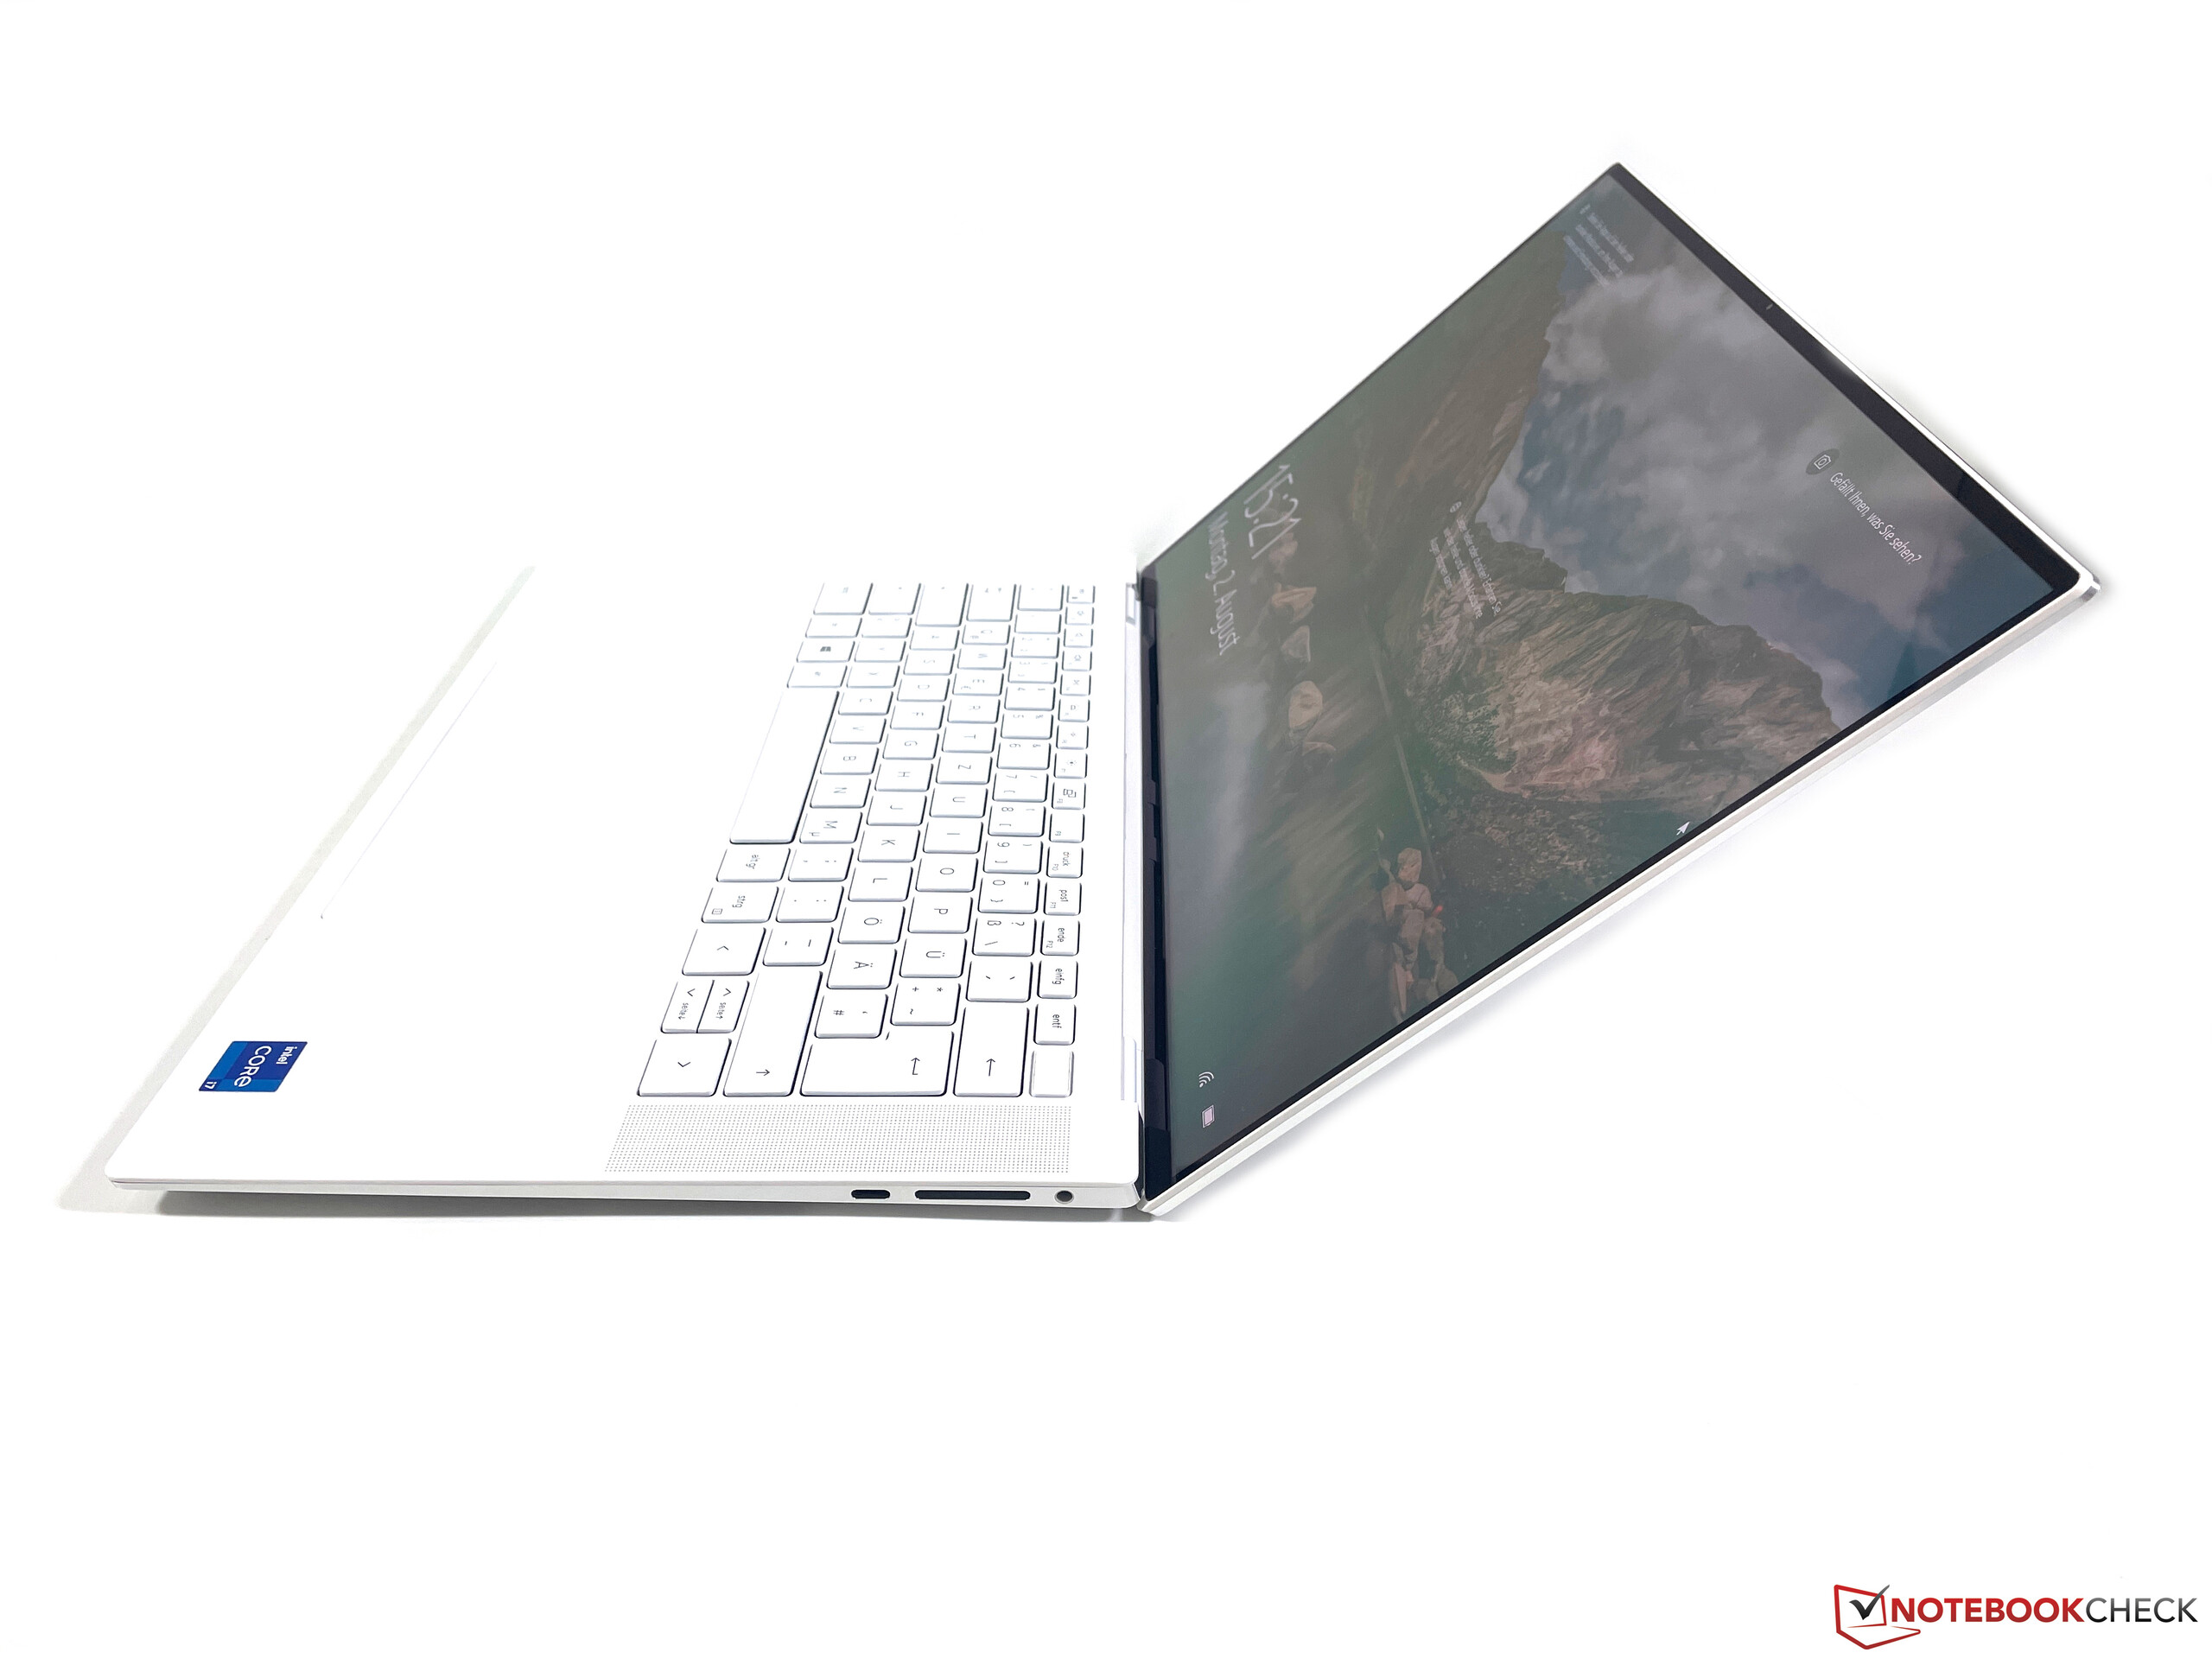
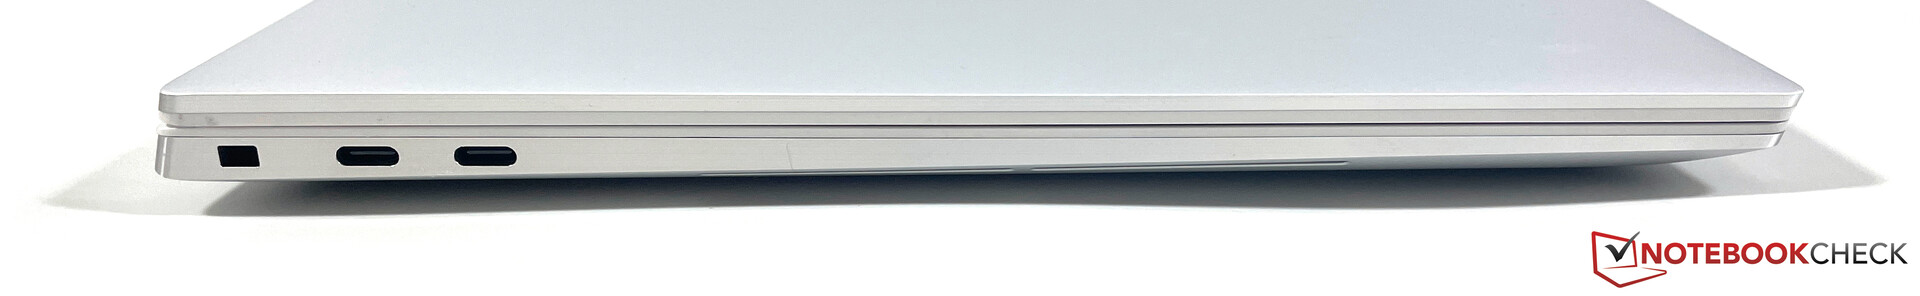
Connectivity - Thunderbolt 4 and USB-C Adapter
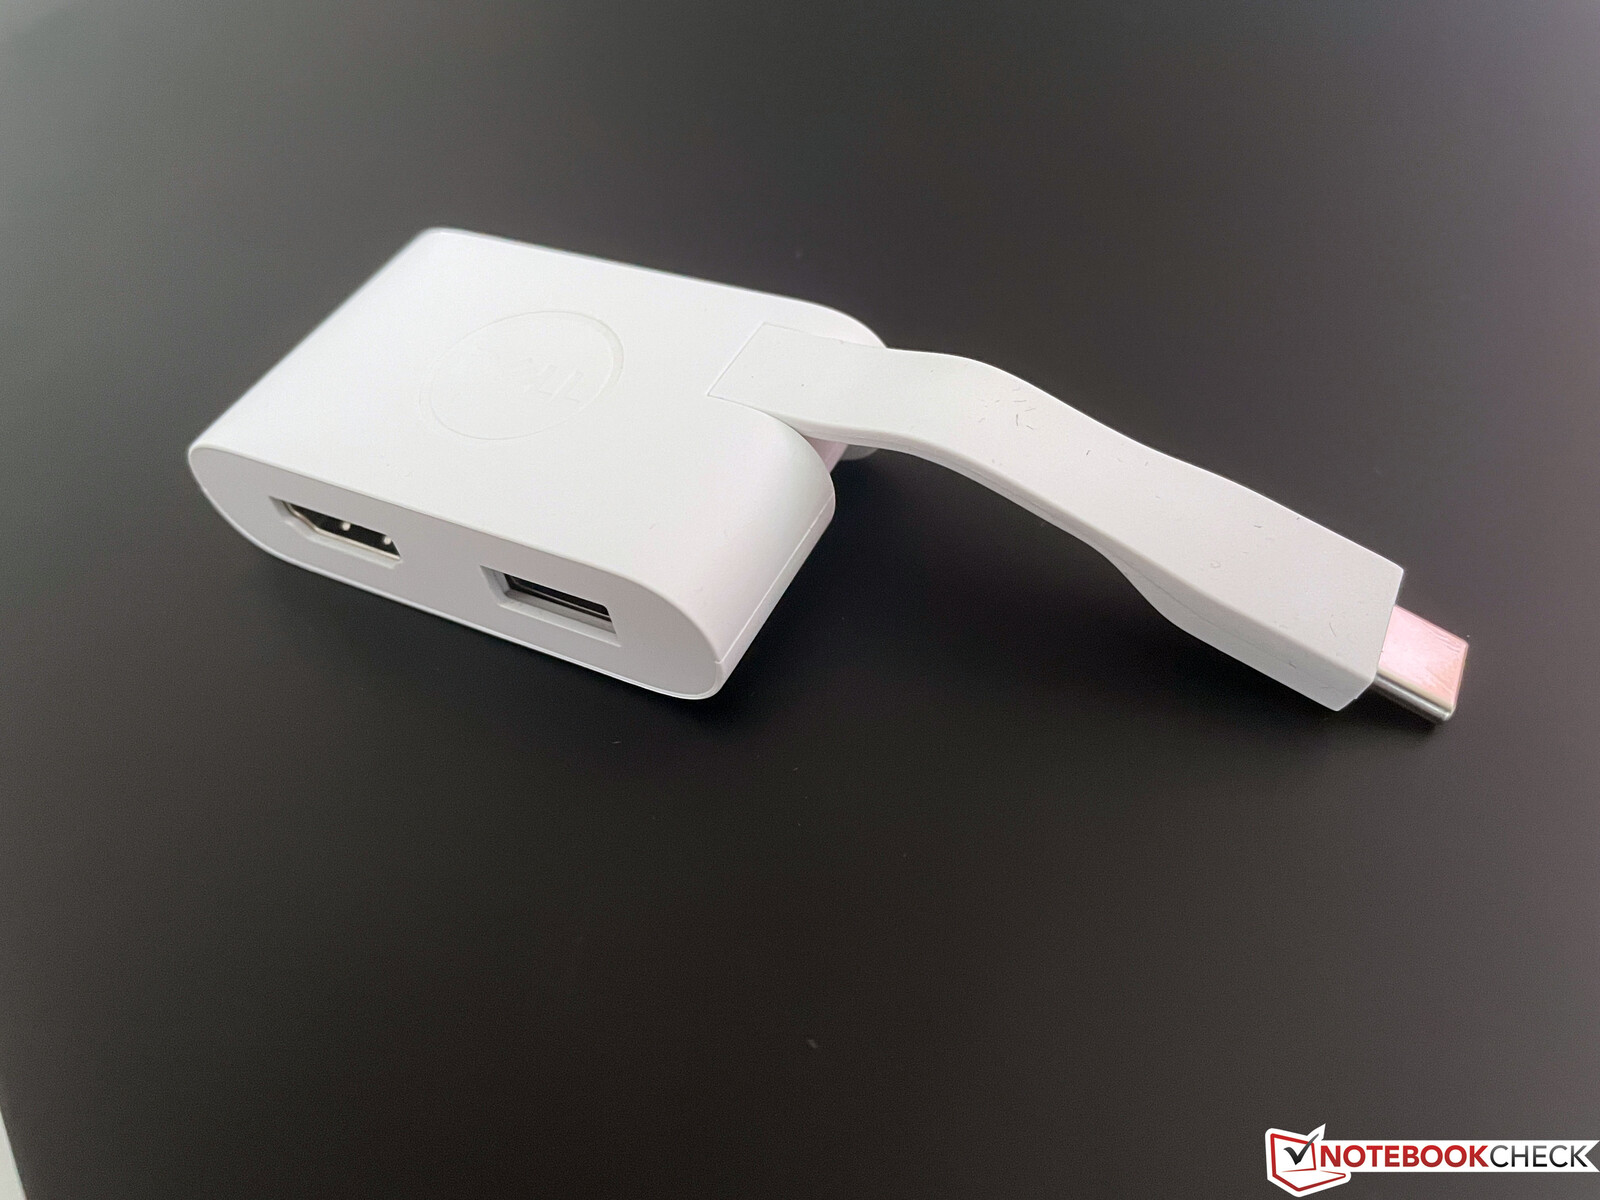
The port selection is limited to modern USB-C ports, and the ports on the left side also support the new Thunderbolt 4 standard. Dell also ships the XPS 15 with a compact adapter from USB-C to USB-A and HDMI.
Otherwise, you also get a standard 3.5 mm stereo jack and even a slot for a security lock.
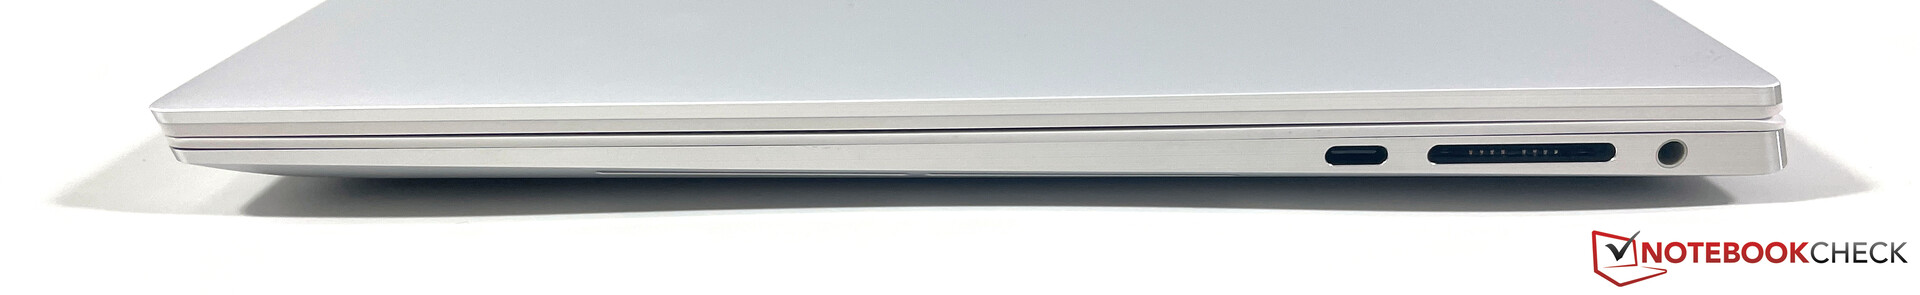
SDCardreader
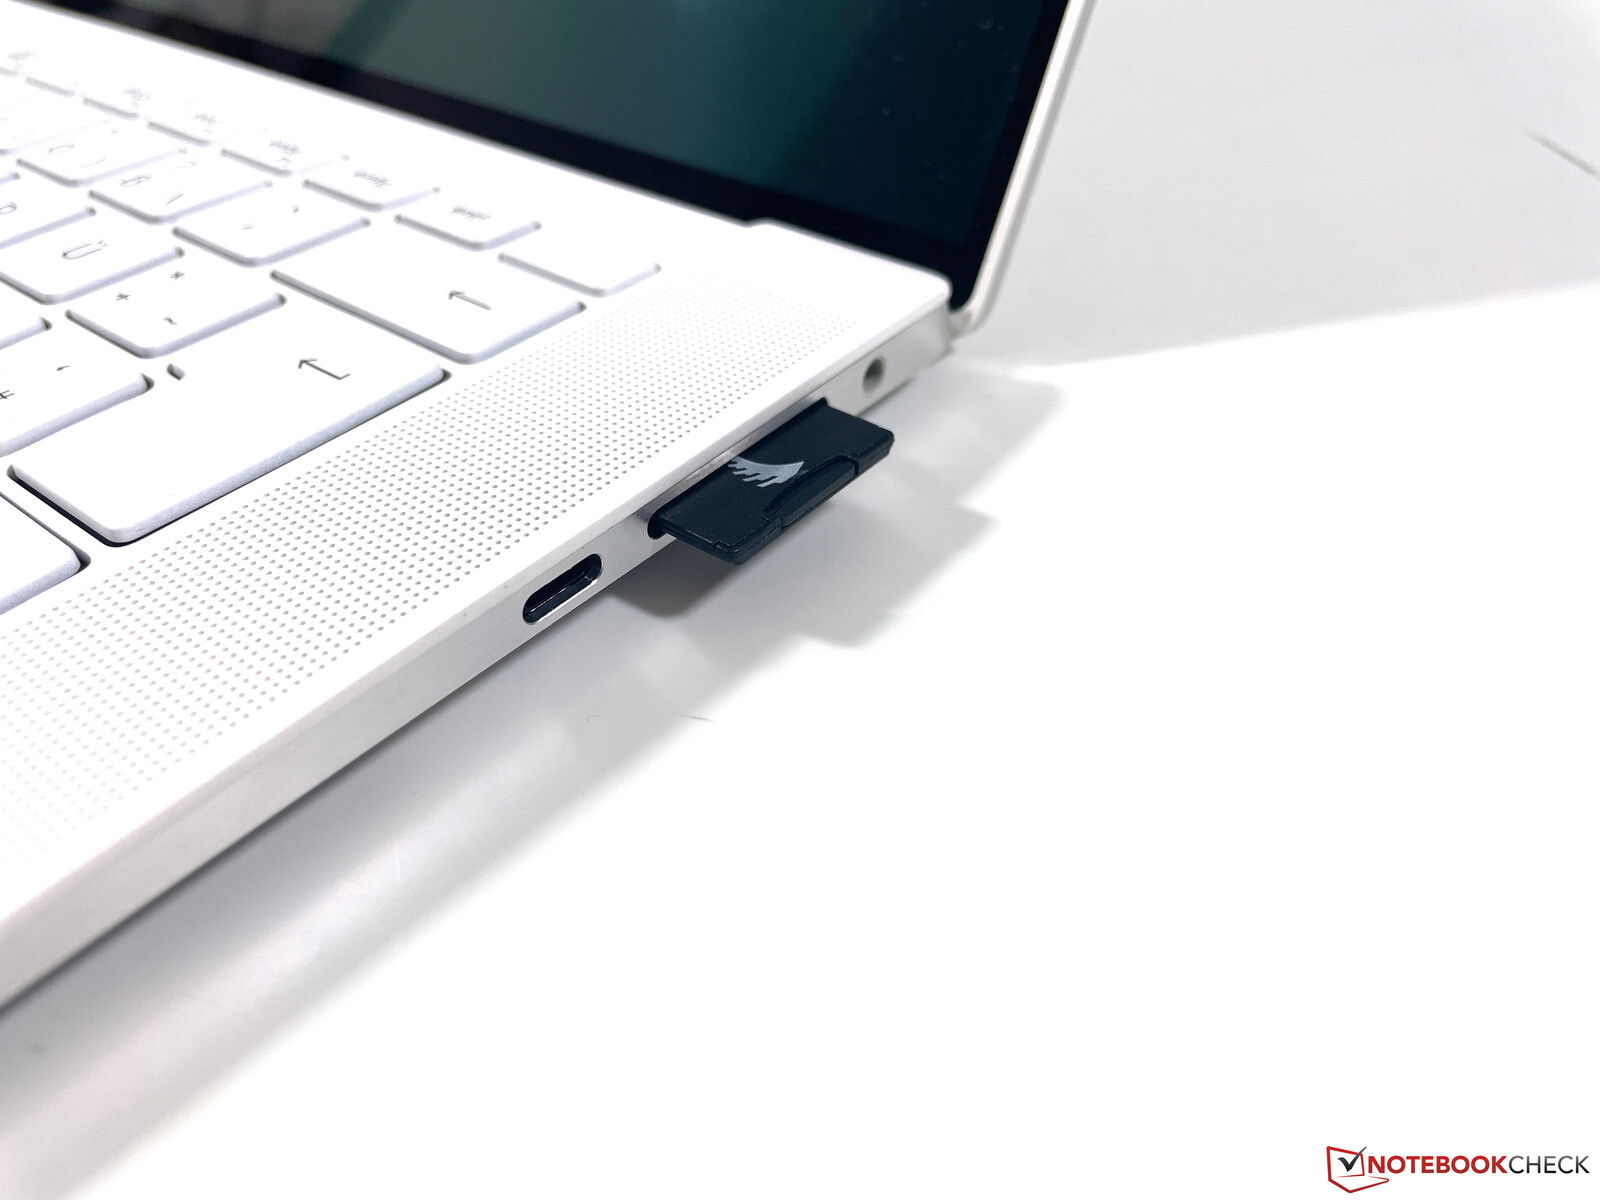
The XPS 15 is one of the few notebooks that still offers a full-size SD-card reader, so there is no need for an external solution. It is also a very fast module and we can see transfer rates of more than 220 MB/s with our reference card AV Pro V60 (UHS-II). However, the card reader is not really suited for permanent storage expansion, because the SD-card will protrude by about half a centimeter.
| SD Card Reader | |
| average JPG Copy Test (av. of 3 runs) | |
| Dell XPS 15 9510 11800H RTX 3050 Ti OLED (AV Pro V60) | |
| Dell XPS 15 9500 Core i7 4K UHD (Toshiba Exceria Pro SDXC 64 GB UHS-II) | |
| Gigabyte Aero 15 OLED XD (AV PRO microSD 128 GB V60) | |
| Average of class Multimedia (22.2 - 531, n=45, last 2 years) | |
| Lenovo ThinkPad X1 Extreme Gen3-20TLS0UV00 (Toshiba Exceria Pro SDXC 64 GB UHS-II) | |
| maximum AS SSD Seq Read Test (1GB) | |
| Lenovo ThinkPad X1 Extreme Gen3-20TLS0UV00 (Toshiba Exceria Pro SDXC 64 GB UHS-II) | |
| Dell XPS 15 9510 11800H RTX 3050 Ti OLED (AV Pro V60) | |
| Dell XPS 15 9500 Core i7 4K UHD (Toshiba Exceria Pro SDXC 64 GB UHS-II) | |
| Gigabyte Aero 15 OLED XD (AV PRO microSD 128 GB V60) | |
| Average of class Multimedia (27.9 - 1455, n=44, last 2 years) | |
Communication
Dell equips the XPS 15 with the Wi-Fi 6 module Killer AX1650s (160 MHz), which supports all the common standards. Our standardized test with the router Netgear Nighthawk RAX120 determines very good transfer rates and the results are also slightly better compared to last year’s model. We have also tested the laptop with a Fritz!Box 7590 (Wi-Fi 5, 80211ac) and there were issues with the speed or the signal strength.
You can realize wired networks via Thunderbolt adapters, but the XPS 15 has no dedicated networks card. Contrary to some business devices, there are no options for LTE or even 5G modules.
Webcam
The webcam is still the familiar 720p model, which does not take good pictures even under good lighting conditions. There is no mechanical shutter.


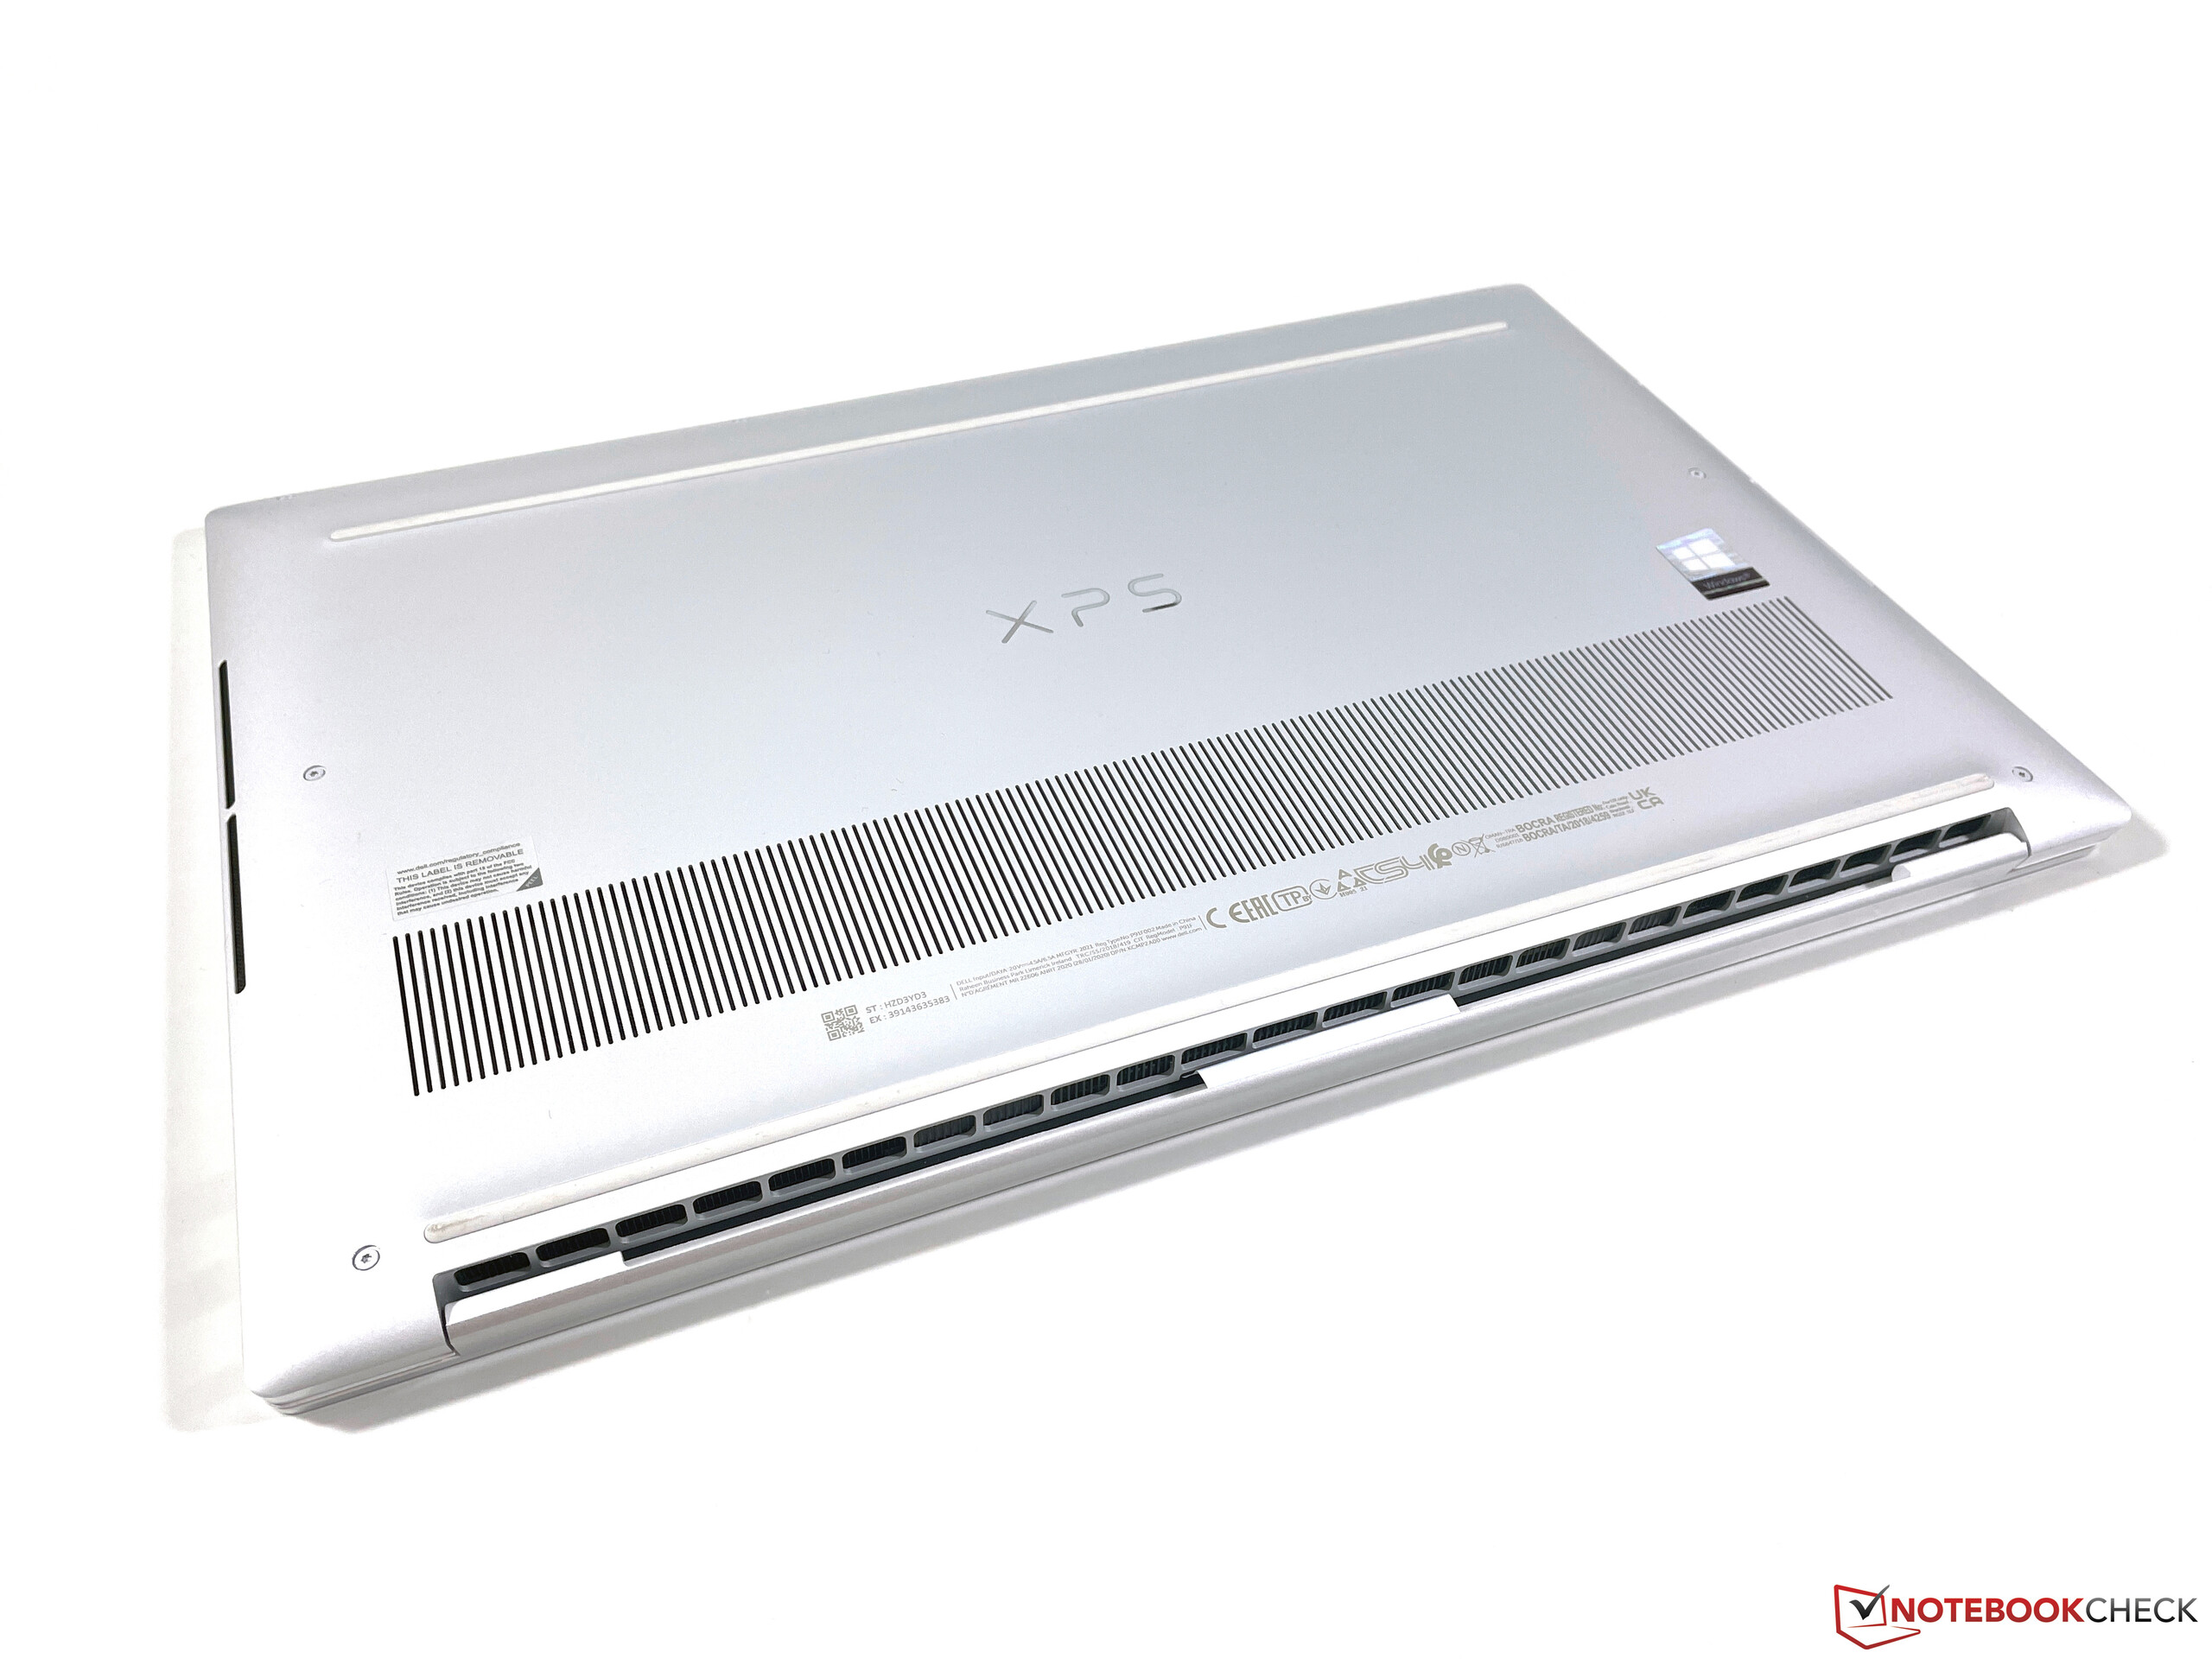
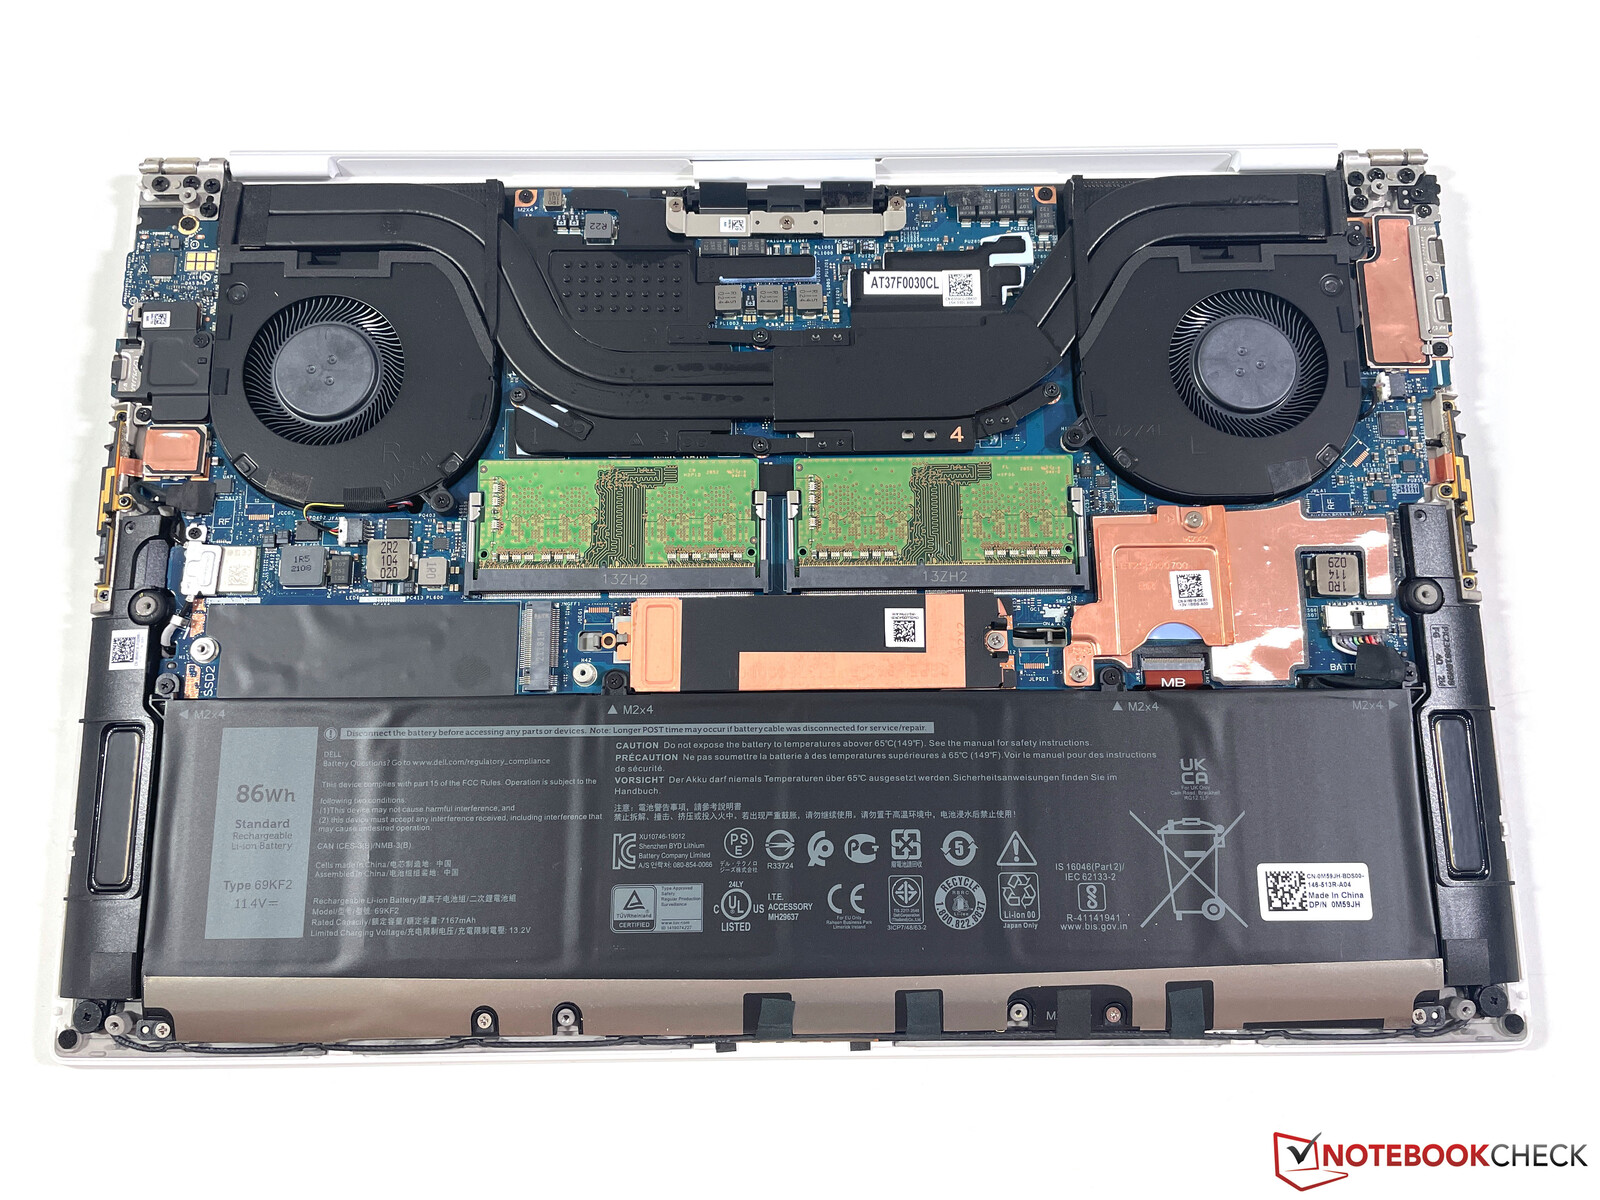
Maintenance
You can remove the bottom panel with a corresponding screwdriver (Torx T5) pretty easily. Some components like the Wi-Fi module are soldered onto the mainboard, but both the SODIMM slots as well as the two M.2-2280 slots are accessible and make upgrades pretty easy. You can also clean the fans.
Waranty
Dell ships the XPS 15 with a one-year warranty (premium support with on-site service) by default, but you can extend the warranty period and the service during the configuration process. An upgrade to a 3-year on-site service, for example, is offered for around 120 Euros.
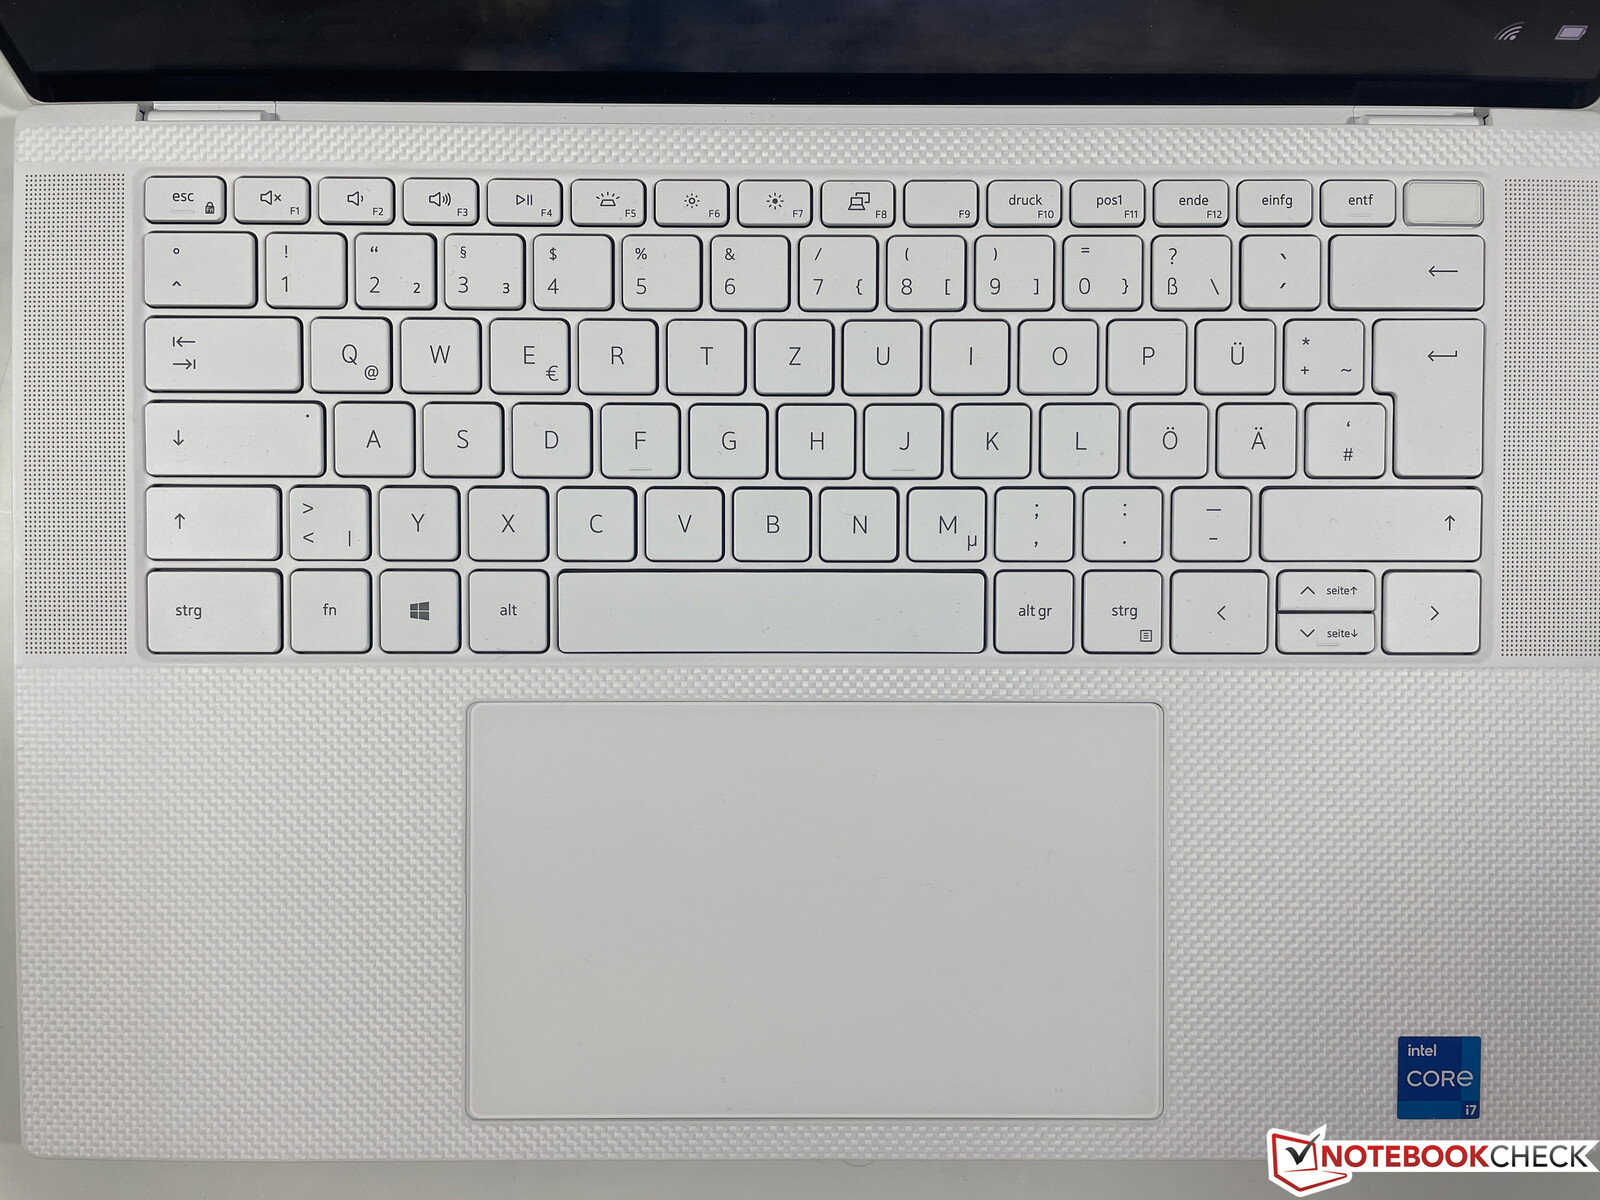
Input Devices - Huge touchpad in the multimedia laptop
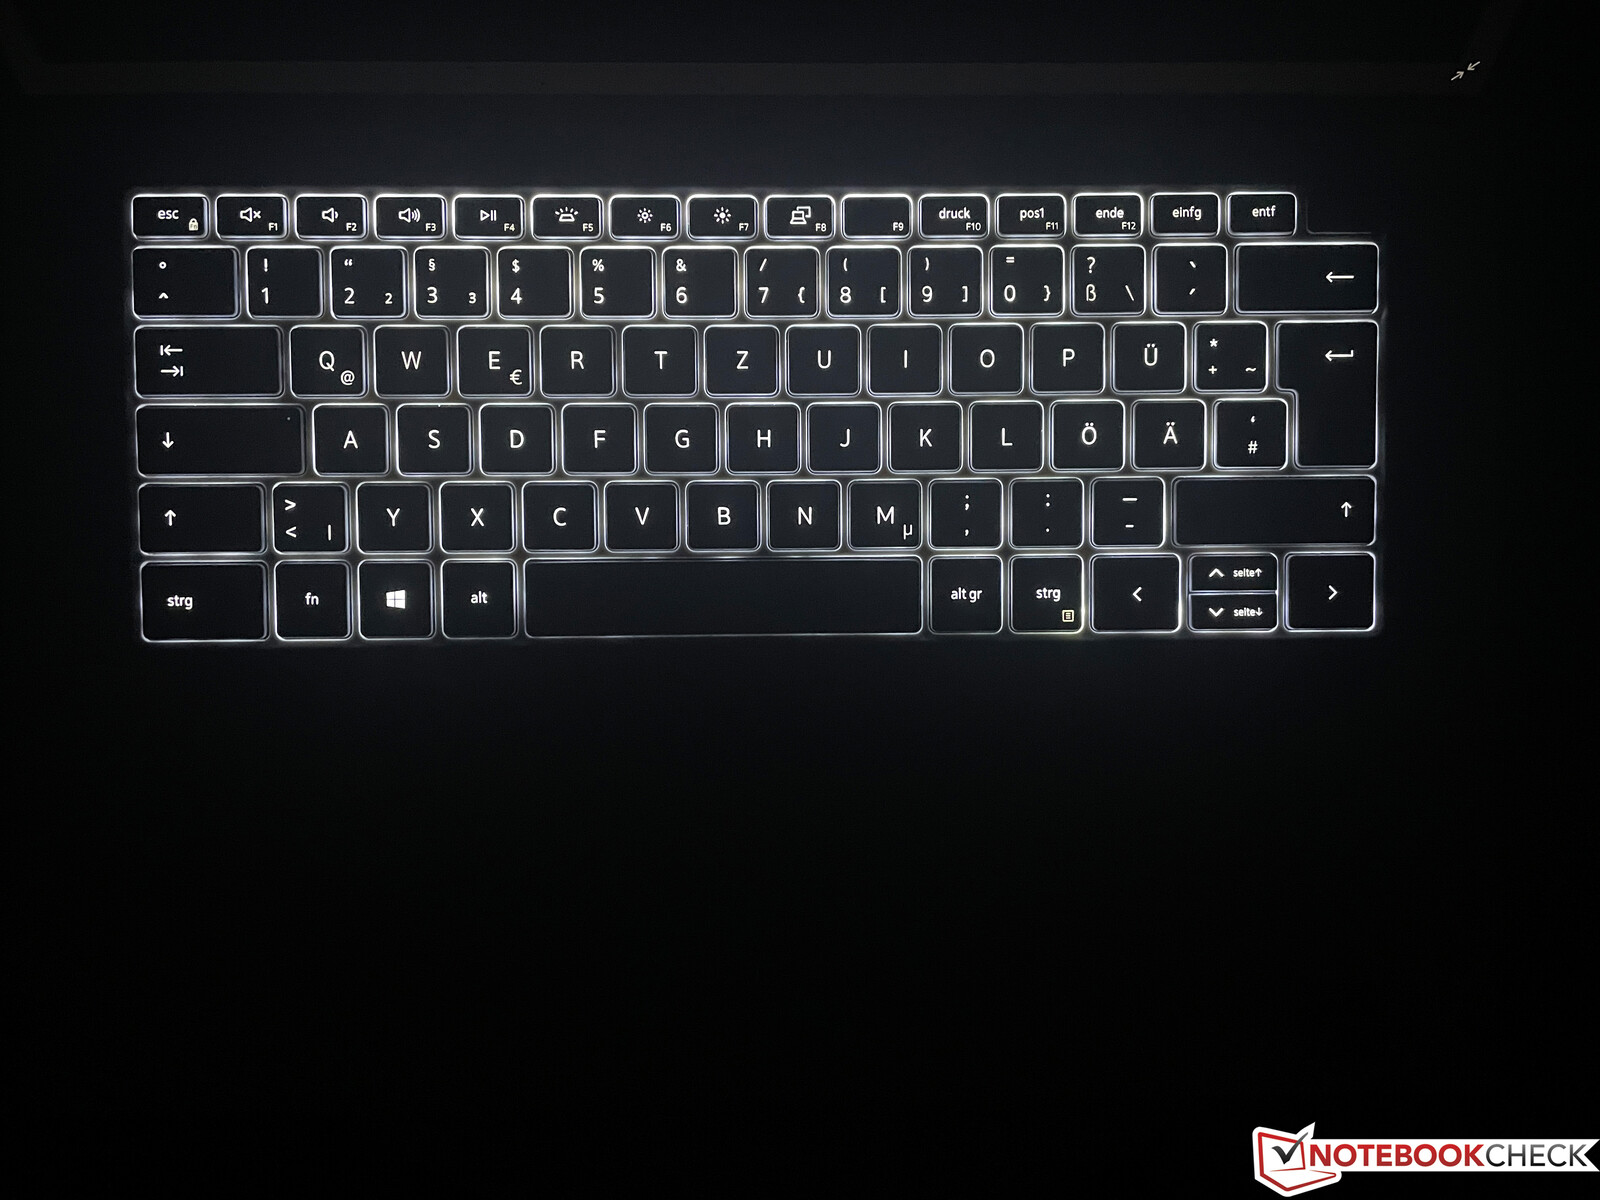
Both the keyboard as well as the huge touchpad are also familiar form the previous model and there is not much else to tell. The typing experience benefits from the precise feedback and even longer tests are not problem, but it could still be better. Some business models (including laptops from Dell) have even better keyboards. The white keyboard illumination can be a bit of an issue in combination, because there is hardly any contrast depending on the ambient lighting. This is obviously no problem in dark environments.
The touchpad (15.1 x 9.1 cm) offers plenty of room and the handling is excellent. Inputs are well executed and even gestures are no problem. The lower part of the pad can be clicked, but this results in a pretty loud clicking noise. We recommend you just use tap-to-click.
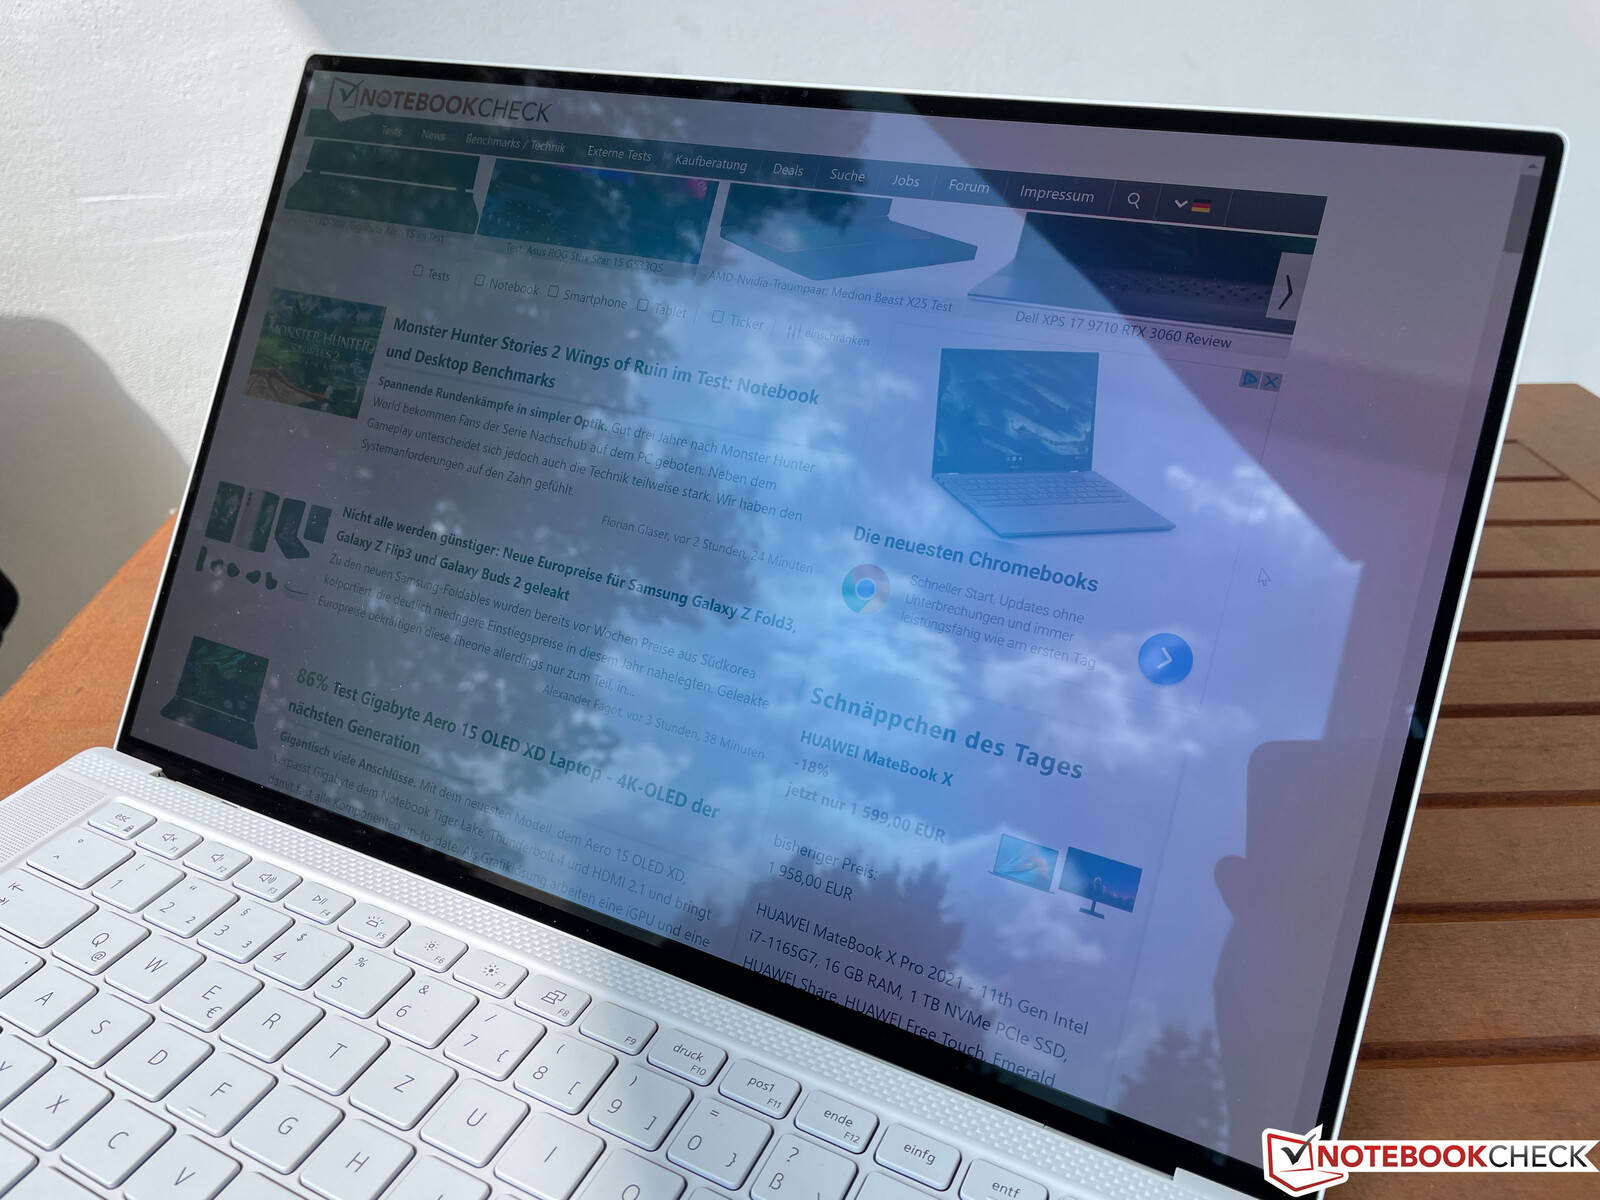
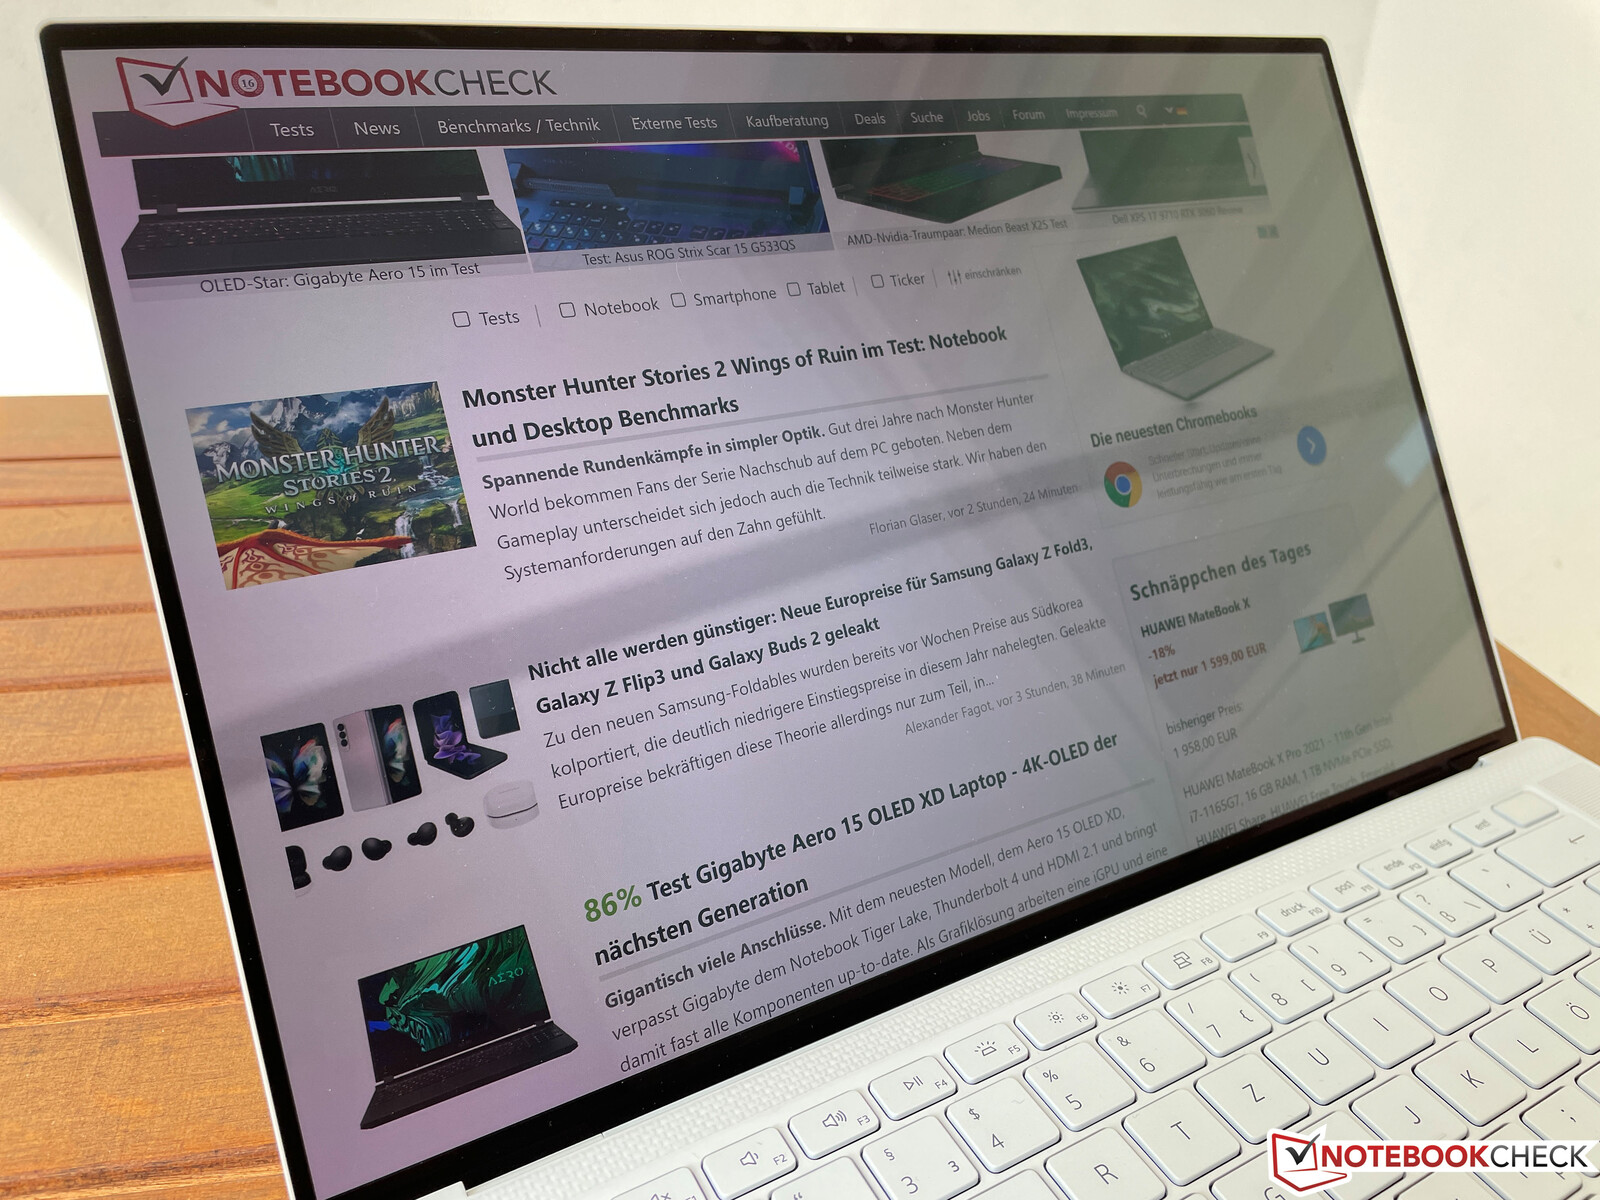
Display - 15-inch XPS now with optional OLED touchscreen
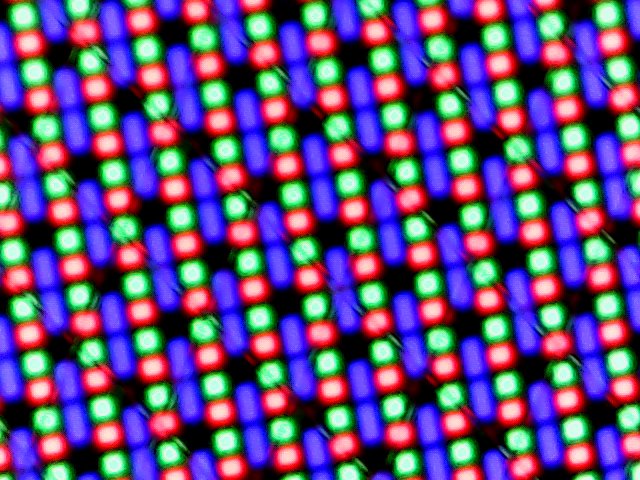
In addition to the two familiar 16:10 screens (Full-HD or 4K), which we reviewed with in the previous model, Dell now also offers an OLED touchscreen, which is 50 Euros less compared to the 4K screen. Dell calls it 3.5K, which corresponds with a resolution of 3456 x 2160 pixels. The panel is provided by Samsung (SDC414D) and the subjective picture quality is excellent: Crisp images, vivid colors, perfect blacks and extremely fast response times.
Our measurements show that the test unit does not meet the advertised brightness of 400 cd/m² with about 370 cd/m² on average, so it is the darkest panel within our comparison group. However, this is not a huge problem thanks to the very high contrast ratio and you can still use it comfortable in bright environments. The PWM flickering at 60 Hz for brightness levels of 99% or lower is a bigger issue. If you already have problems with OLED smartphones, you should avoid the new display option when you configure the XPS 15. Backlight bleeding is no problem thanks to the display technology.
| |||||||||||||||||||||||||
Brightness Distribution: 97 %
Center on Battery: 363 cd/m²
Contrast: 6033:1 (Black: 0.06 cd/m²)
ΔE ColorChecker Calman: 2.1 | ∀{0.5-29.43 Ø4.73}
calibrated: 2.5
ΔE Greyscale Calman: 1.4 | ∀{0.09-98 Ø4.97}
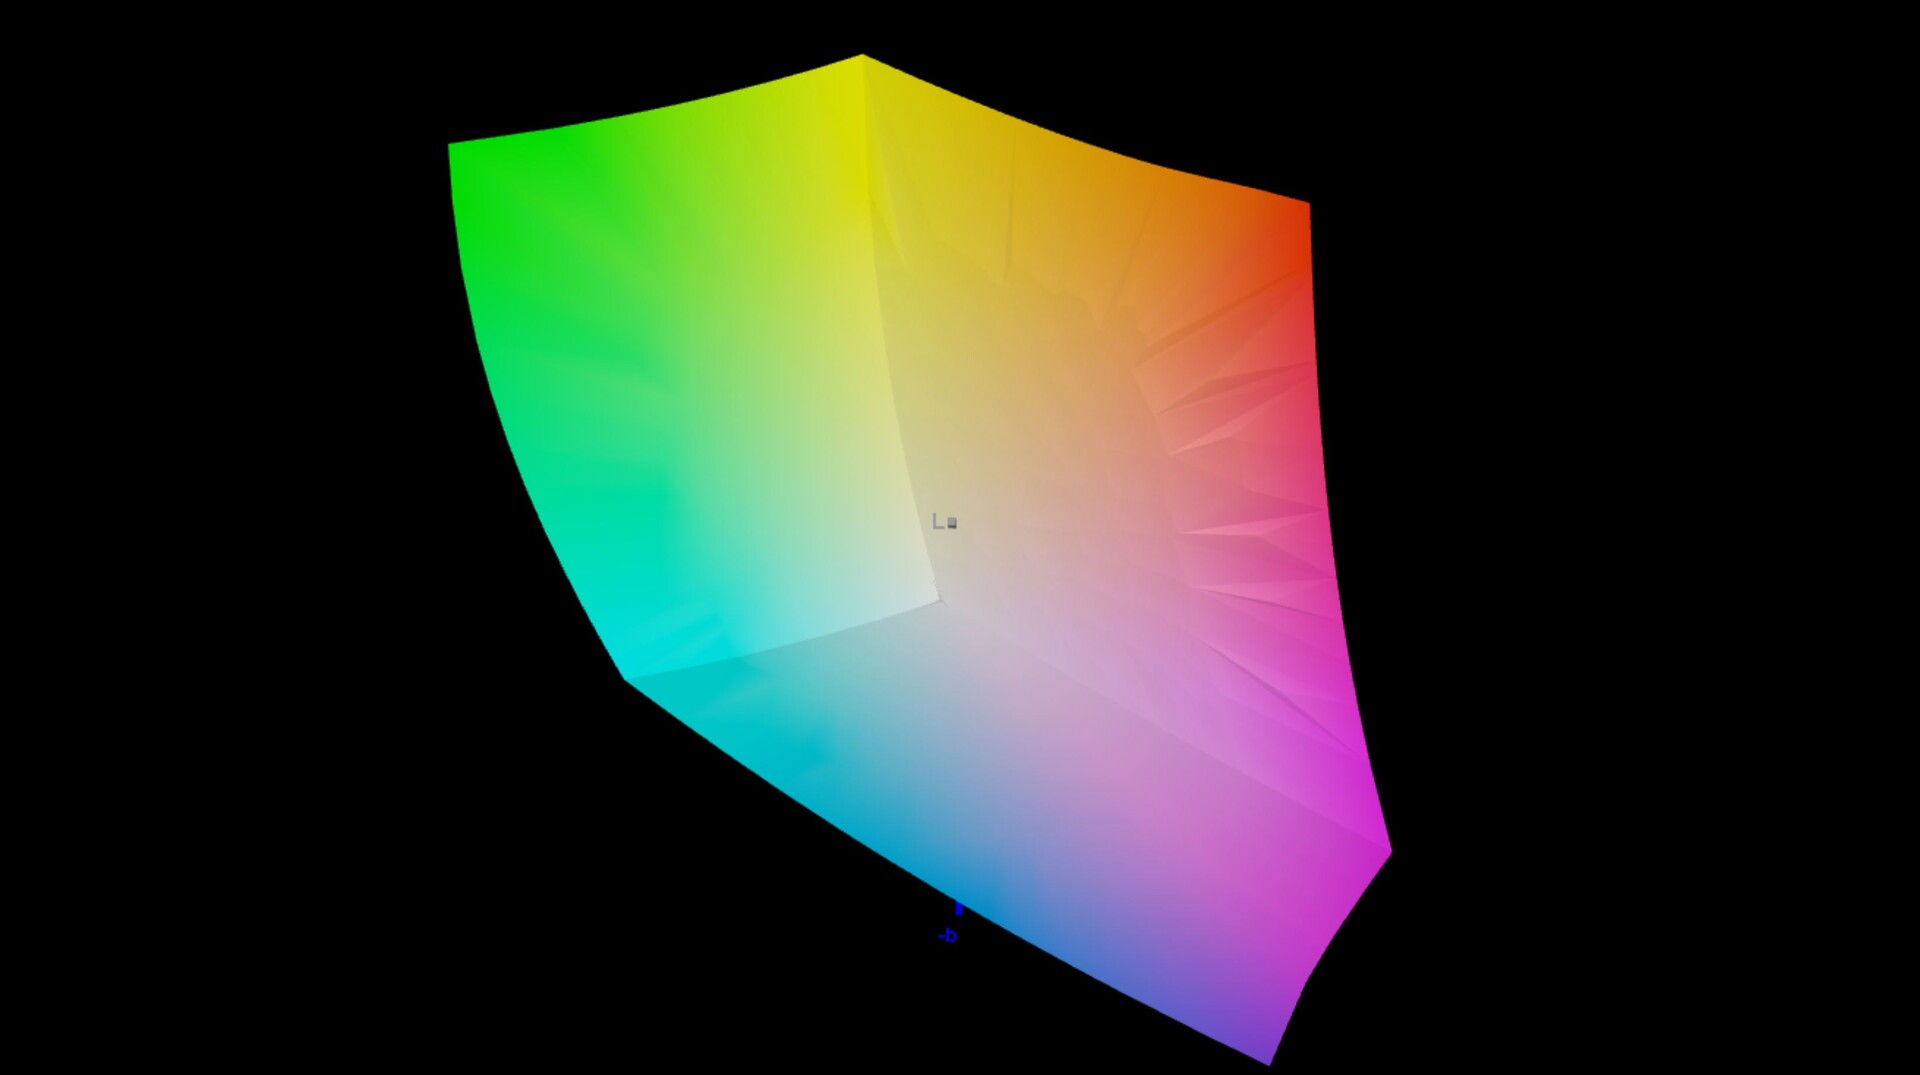
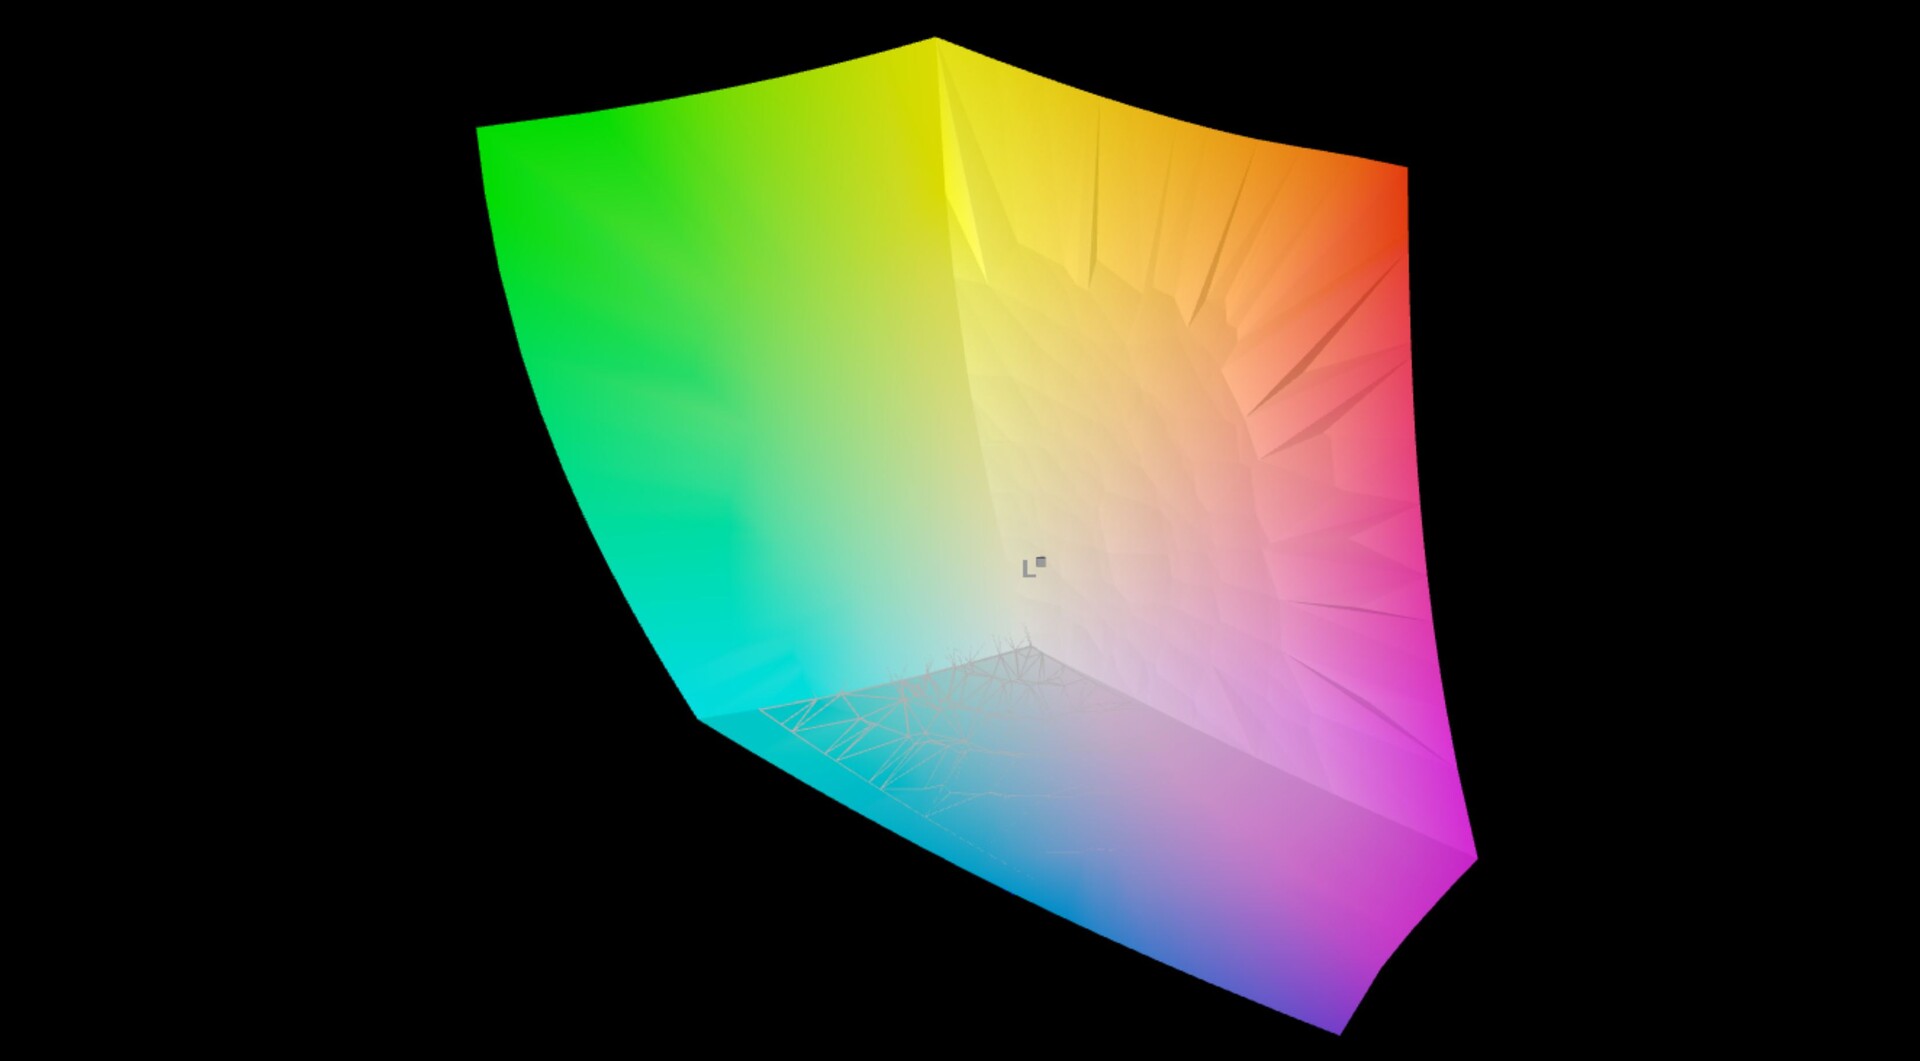
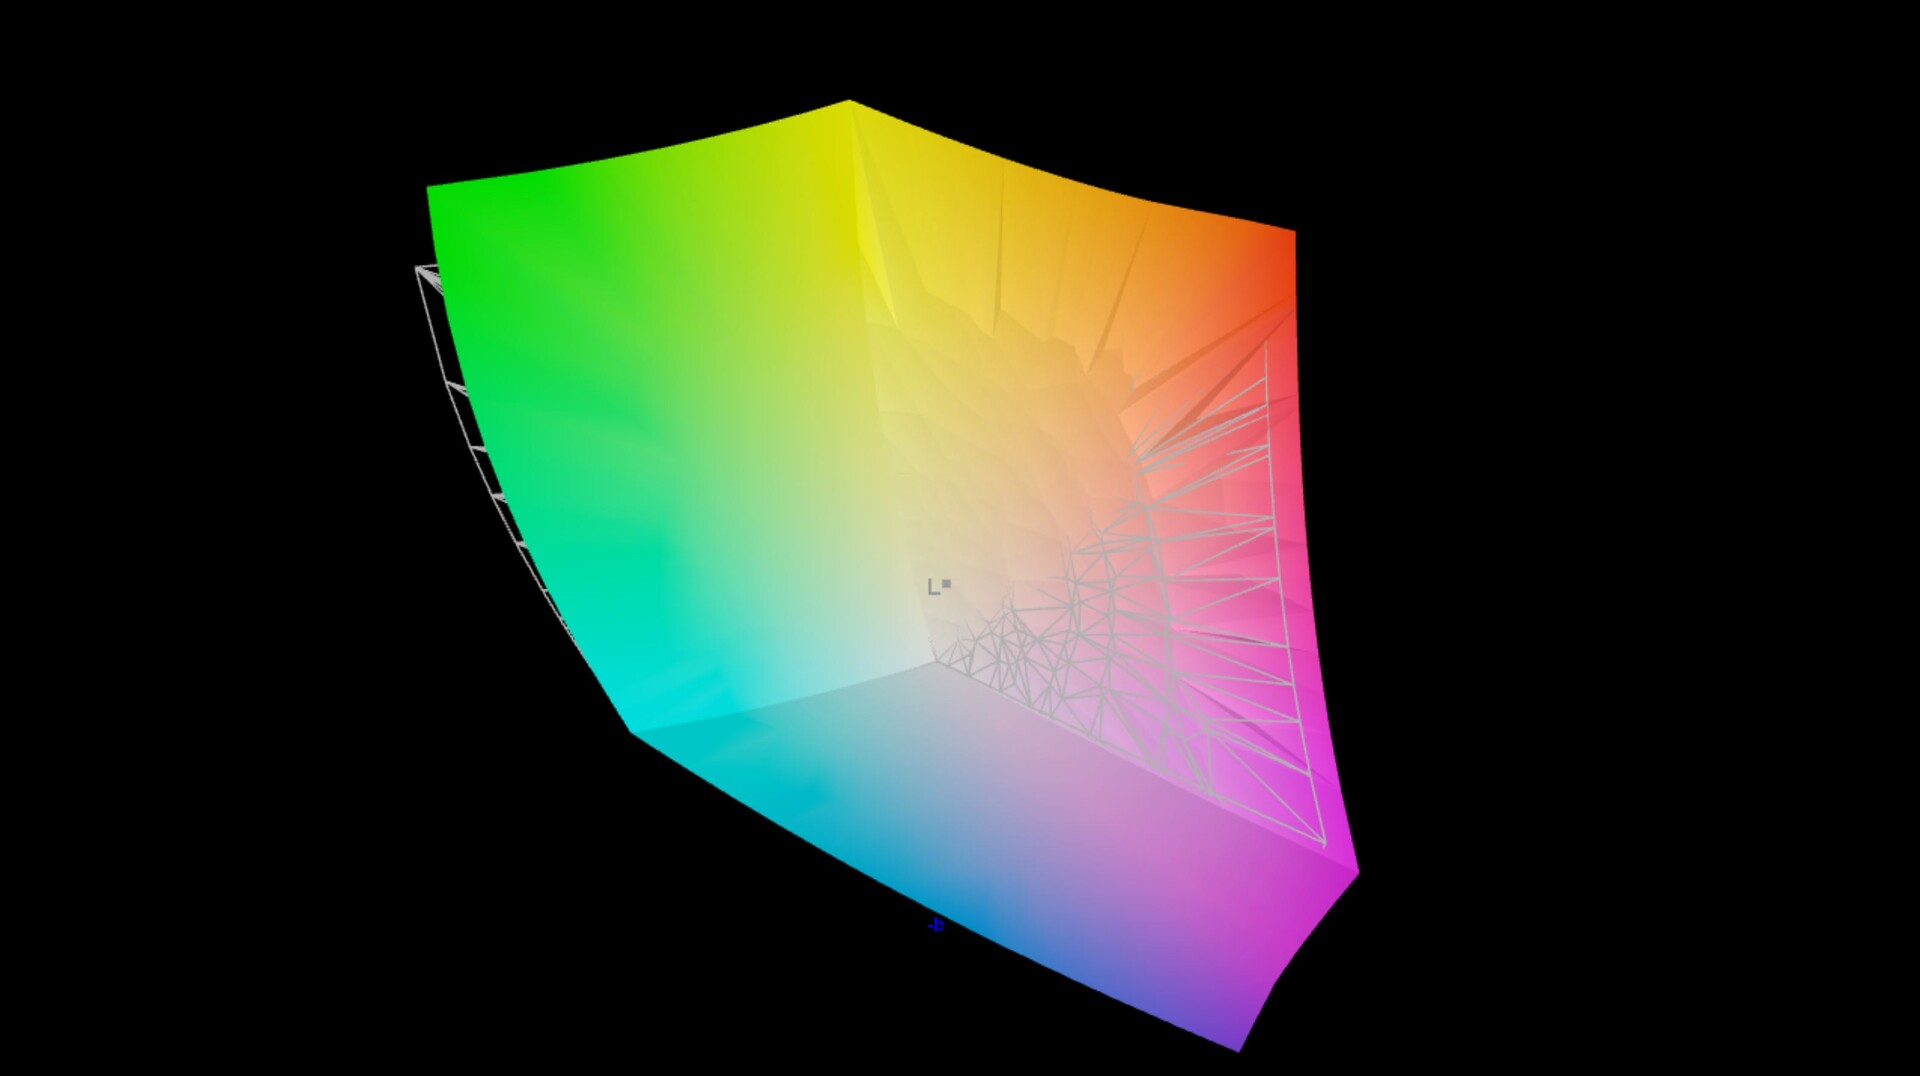
98.1% AdobeRGB 1998 (Argyll 3D)
100% sRGB (Argyll 3D)
99.9% Display P3 (Argyll 3D)
Gamma: 2.18
CCT: 6608 K
| Dell XPS 15 9510 11800H RTX 3050 Ti OLED SDC414D, OLED, 3456x2160, 15.6" | Apple MacBook Pro 16 2019 i9 5500M APPA044, IPS, 3072x1920, 16" | Lenovo ThinkPad X1 Extreme Gen3-20TLS0UV00 N156HCE-GN1, IPS, 1920x1080, 15.6" | Gigabyte Aero 15 OLED XD Samsung SDC4143, OLED, 3840x2160, 15.6" | Dell XPS 15 9500 Core i7 4K UHD Sharp LQ156R1, IPS, 3840x2400, 15.6" | |
|---|---|---|---|---|---|
| Display | -29% | 0% | -3% | ||
| Display P3 Coverage (%) | 99.9 | 61 -39% | 99.9 0% | 89.7 -10% | |
| sRGB Coverage (%) | 100 | 89.9 -10% | 100 0% | 100 0% | |
| AdobeRGB 1998 Coverage (%) | 98.1 | 62.2 -37% | 99.5 1% | 99.8 2% | |
| Response Times | -1251% | -767% | 26% | -1243% | |
| Response Time Grey 50% / Grey 80% * (ms) | 3.6 ? | 52.4 ? -1356% | 33.6 ? -833% | 2.8 ? 22% | 54 ? -1400% |
| Response Time Black / White * (ms) | 2.8 ? | 34.9 ? -1146% | 22.4 ? -700% | 2 ? 29% | 33.2 ? -1086% |
| PWM Frequency (Hz) | 59.5 ? | 131700 | 26040 ? | 240 ? | |
| Screen | -59% | -66% | 6% | -102% | |
| Brightness middle (cd/m²) | 362 | 519 43% | 518 43% | 440 22% | 557.9 54% |
| Brightness (cd/m²) | 367 | 477 30% | 513 40% | 446 22% | 541 47% |
| Brightness Distribution (%) | 97 | 86 -11% | 88 -9% | 92 -5% | 91 -6% |
| Black Level * (cd/m²) | 0.06 | 0.39 -550% | 0.38 -533% | 0.04 33% | 0.39 -550% |
| Contrast (:1) | 6033 | 1331 -78% | 1363 -77% | 11000 82% | 1431 -76% |
| Colorchecker dE 2000 * | 2.1 | 2.28 -9% | 2.1 -0% | 2.53 -20% | 4.54 -116% |
| Colorchecker dE 2000 max. * | 4.1 | 6.54 -60% | 4.5 -10% | 7.82 -91% | 7.92 -93% |
| Colorchecker dE 2000 calibrated * | 2.5 | 0.86 66% | 1.3 48% | 2.57 -3% | 3.82 -53% |
| Greyscale dE 2000 * | 1.4 | 0.9 36% | 2.7 -93% | 1.2 14% | 3.2 -129% |
| Gamma | 2.18 101% | 2145 0% | 2.35 94% | 2.206 100% | 1.99 111% |
| CCT | 6608 98% | 6572 99% | 7042 92% | 6371 102% | 6451 101% |
| Color Space (Percent of AdobeRGB 1998) (%) | 78 | 57.7 | 89.5 | ||
| Color Space (Percent of sRGB) (%) | 90.4 | 100 | |||
| Total Average (Program / Settings) | -655% /
-276% | -287% /
-158% | 11% /
8% | -449% /
-244% |
* ... smaller is better
We use the professional CalMAN software in combination with the X-Rite i1 Pro 2 to analyze/calibrate the panel. Dell preloaded its PremierColor software, which can be used to calibrate the panel and it also offers multiple profiles for different color spaces (P3, AdobeRGB etc.). We tested multiple profiles and got the best results with the preset Brilliant (Full).
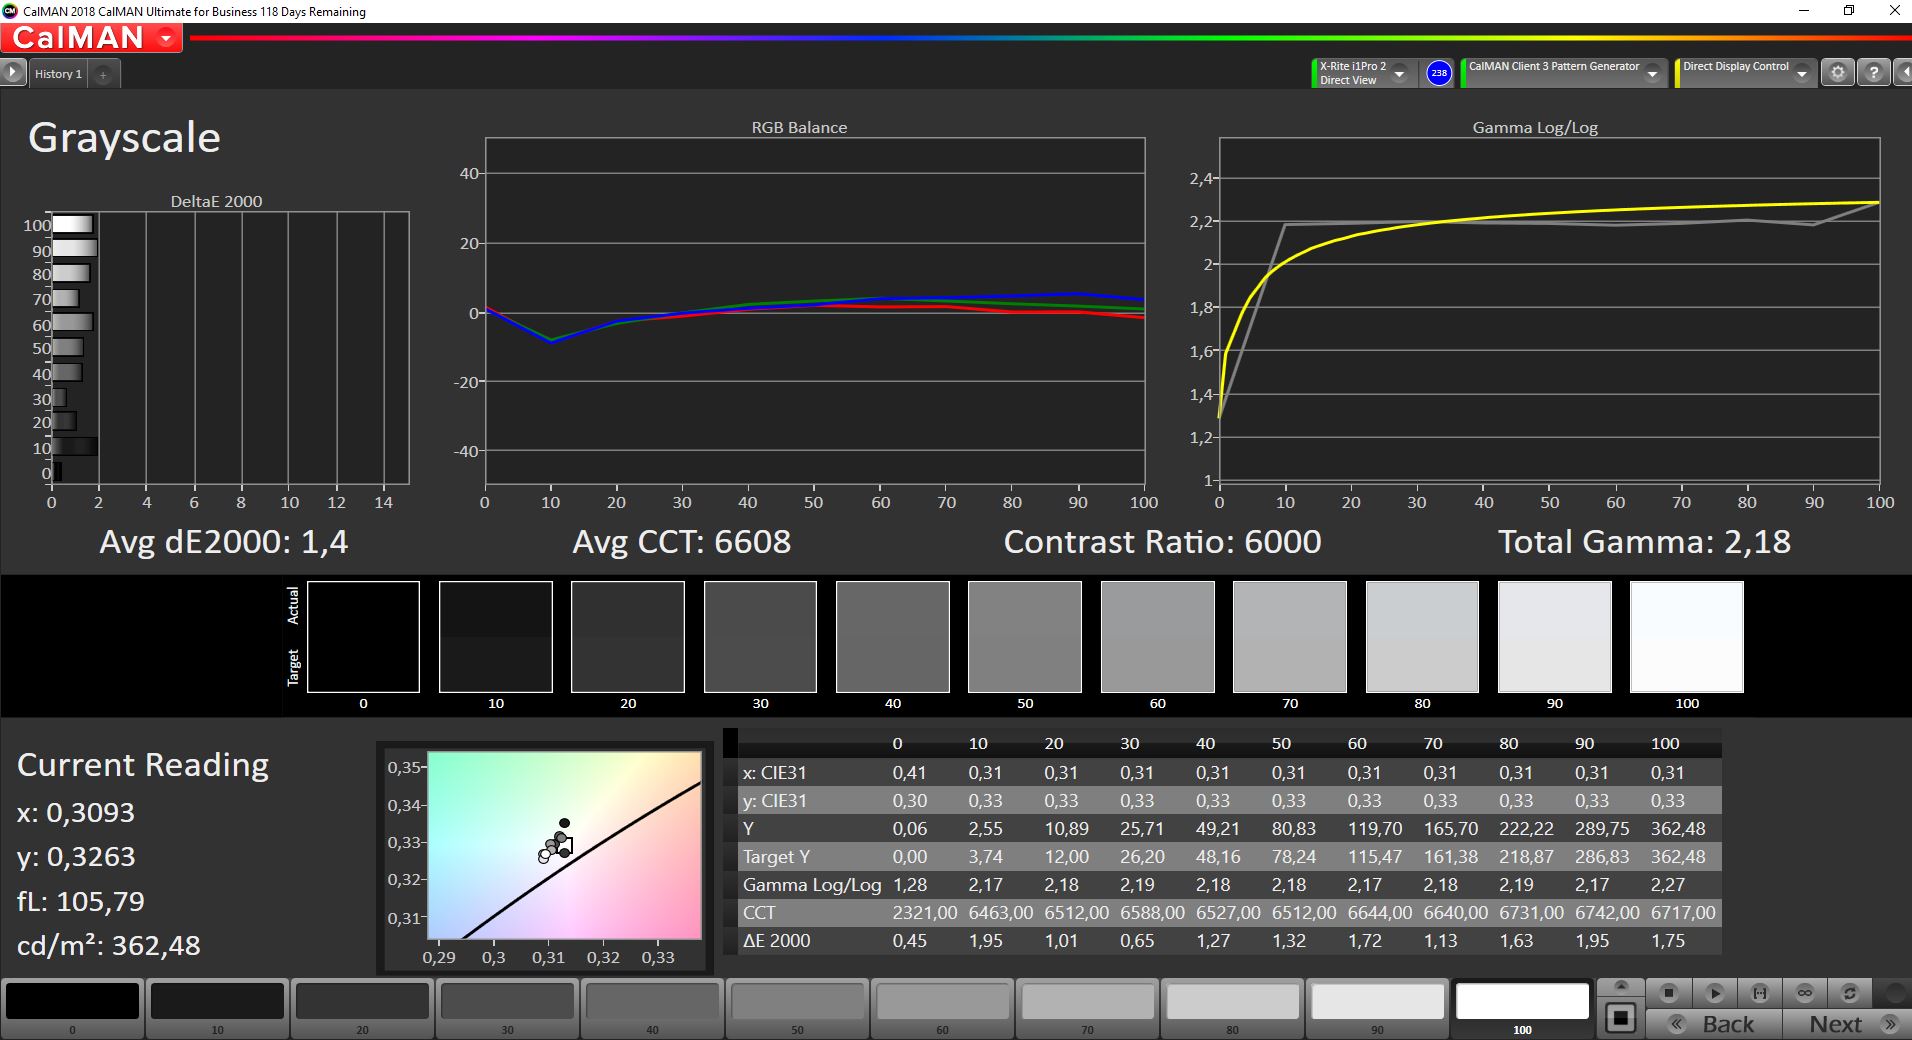
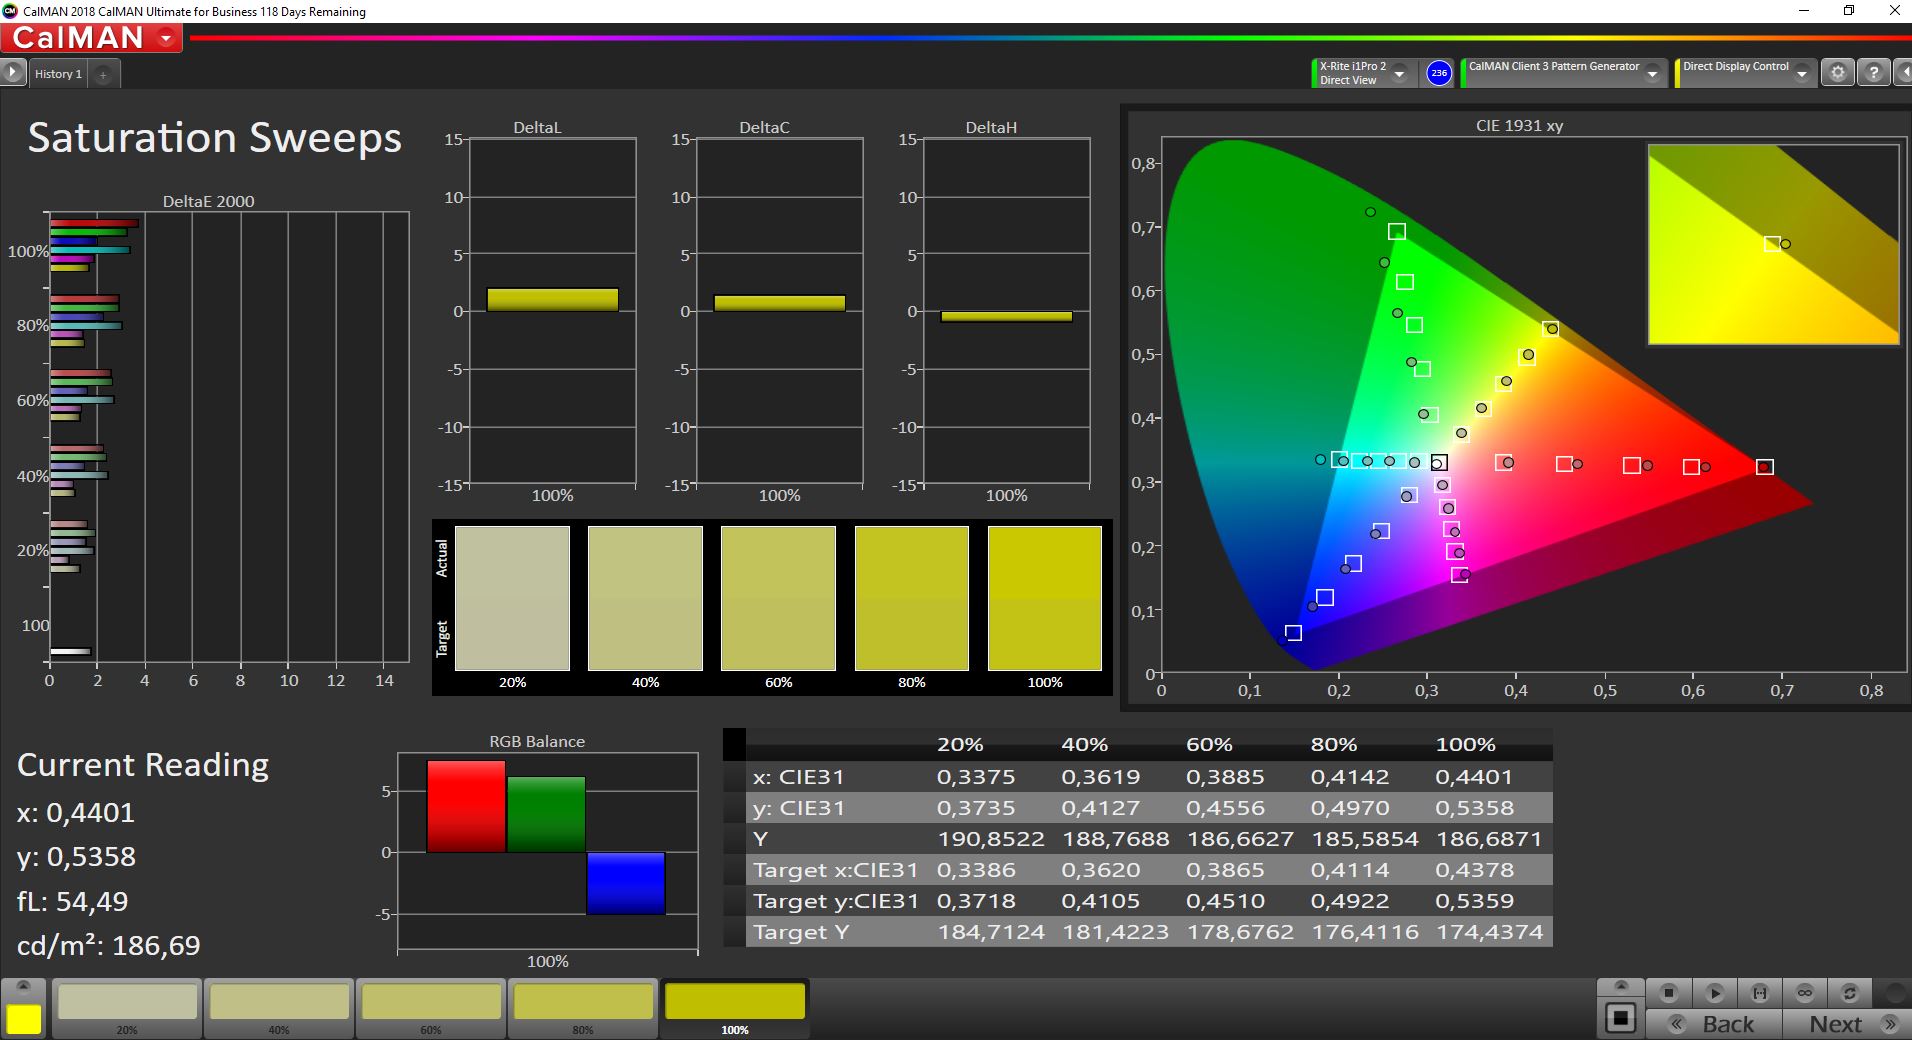
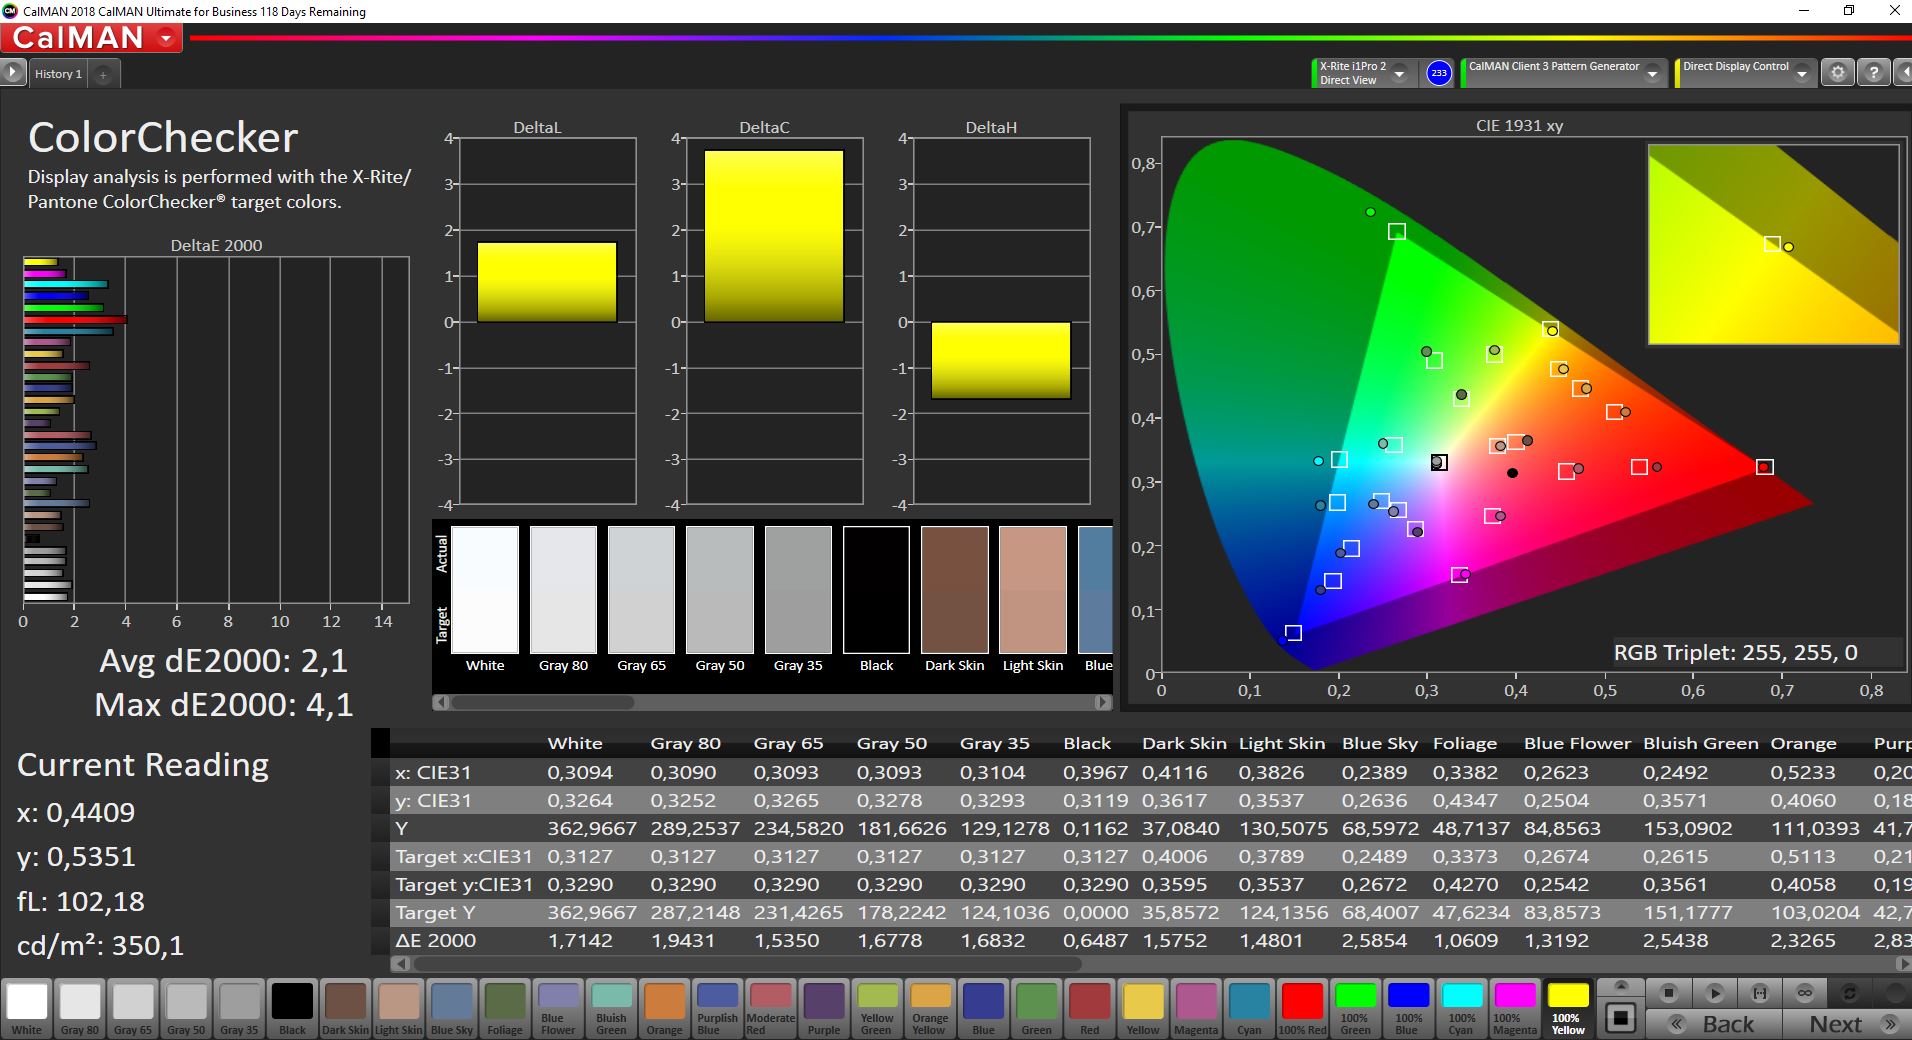
The average DeltaE2000 deviations of the grayscale and the colors compared to the reference color space P3 are already very low out of the box and only a couple of colors slightly surpass the important mark of 3. There is no color cast and the color temperature is also decent. We tried to calibrate the panel multiple times, but the result was always a bit worse, so we do not offer our calibrated profile at this point.
We can confirm the full coverage of the P3 reference color space, so the OLED panel is suited for picture/video editing.
Display Response Times
| ↔ Response Time Black to White | ||
|---|---|---|
| 2.8 ms ... rise ↗ and fall ↘ combined | ↗ 1.2 ms rise | 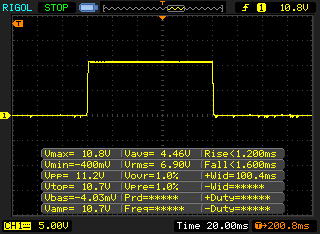 |
| ↘ 1.6 ms fall | ||
| The screen shows very fast response rates in our tests and should be very well suited for fast-paced gaming. In comparison, all tested devices range from 0.1 (minimum) to 240 (maximum) ms. » 14 % of all devices are better. This means that the measured response time is better than the average of all tested devices (19.9 ms). | ||
| ↔ Response Time 50% Grey to 80% Grey | ||
| 3.6 ms ... rise ↗ and fall ↘ combined | ↗ 2 ms rise | 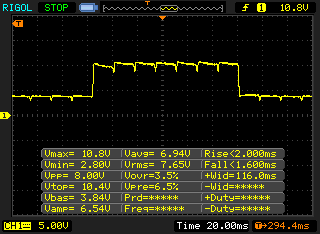 |
| ↘ 1.6 ms fall | ||
| The screen shows very fast response rates in our tests and should be very well suited for fast-paced gaming. In comparison, all tested devices range from 0.165 (minimum) to 636 (maximum) ms. » 14 % of all devices are better. This means that the measured response time is better than the average of all tested devices (31.1 ms). | ||
Screen Flickering / PWM (Pulse-Width Modulation)
| Screen flickering / PWM detected | 59.5 Hz | ≤ 99 % brightness setting | 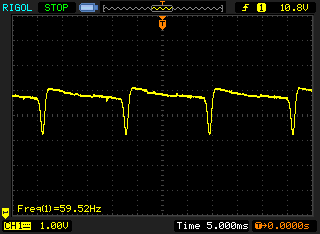 |
The display backlight flickers at 59.5 Hz (worst case, e.g., utilizing PWM) Flickering detected at a brightness setting of 99 % and below. There should be no flickering or PWM above this brightness setting. The frequency of 59.5 Hz is very low, so the flickering may cause eyestrain and headaches after extended use. In comparison: 52 % of all tested devices do not use PWM to dim the display. If PWM was detected, an average of 7810 (minimum: 5 - maximum: 343500) Hz was measured. | |||
The high contrast ratio is a big advantage outdoors, and you can still work quite comfortable with the glossy panel at the maximum brightness as long as you avoid reflections from direct light sources. The viewing angle stability is excellent, but there are some color deviations from extreme angles, which are typical for OLED panels. However, this should not be an issue in everyday situations.

Performance - XPS 15 with Tiger Lake-H
The XPS 15 9510 is a multimedia laptop, so it does not use the most powerful graphics cards you get in gaming laptops. If you just want a premium notebook without a dedicated GPU, you can once again get the XPS 15 without the GeForce GPU, so the integrated GPU from the processor takes care of all the graphics calculations. However, the iGPU of the Tiger Lake-H CPUs is much slower than the iGPU from the Tiger Lake-U chips you currently find in many laptops, so we would always recommend to get at least the smaller GeForce RTX 3050.
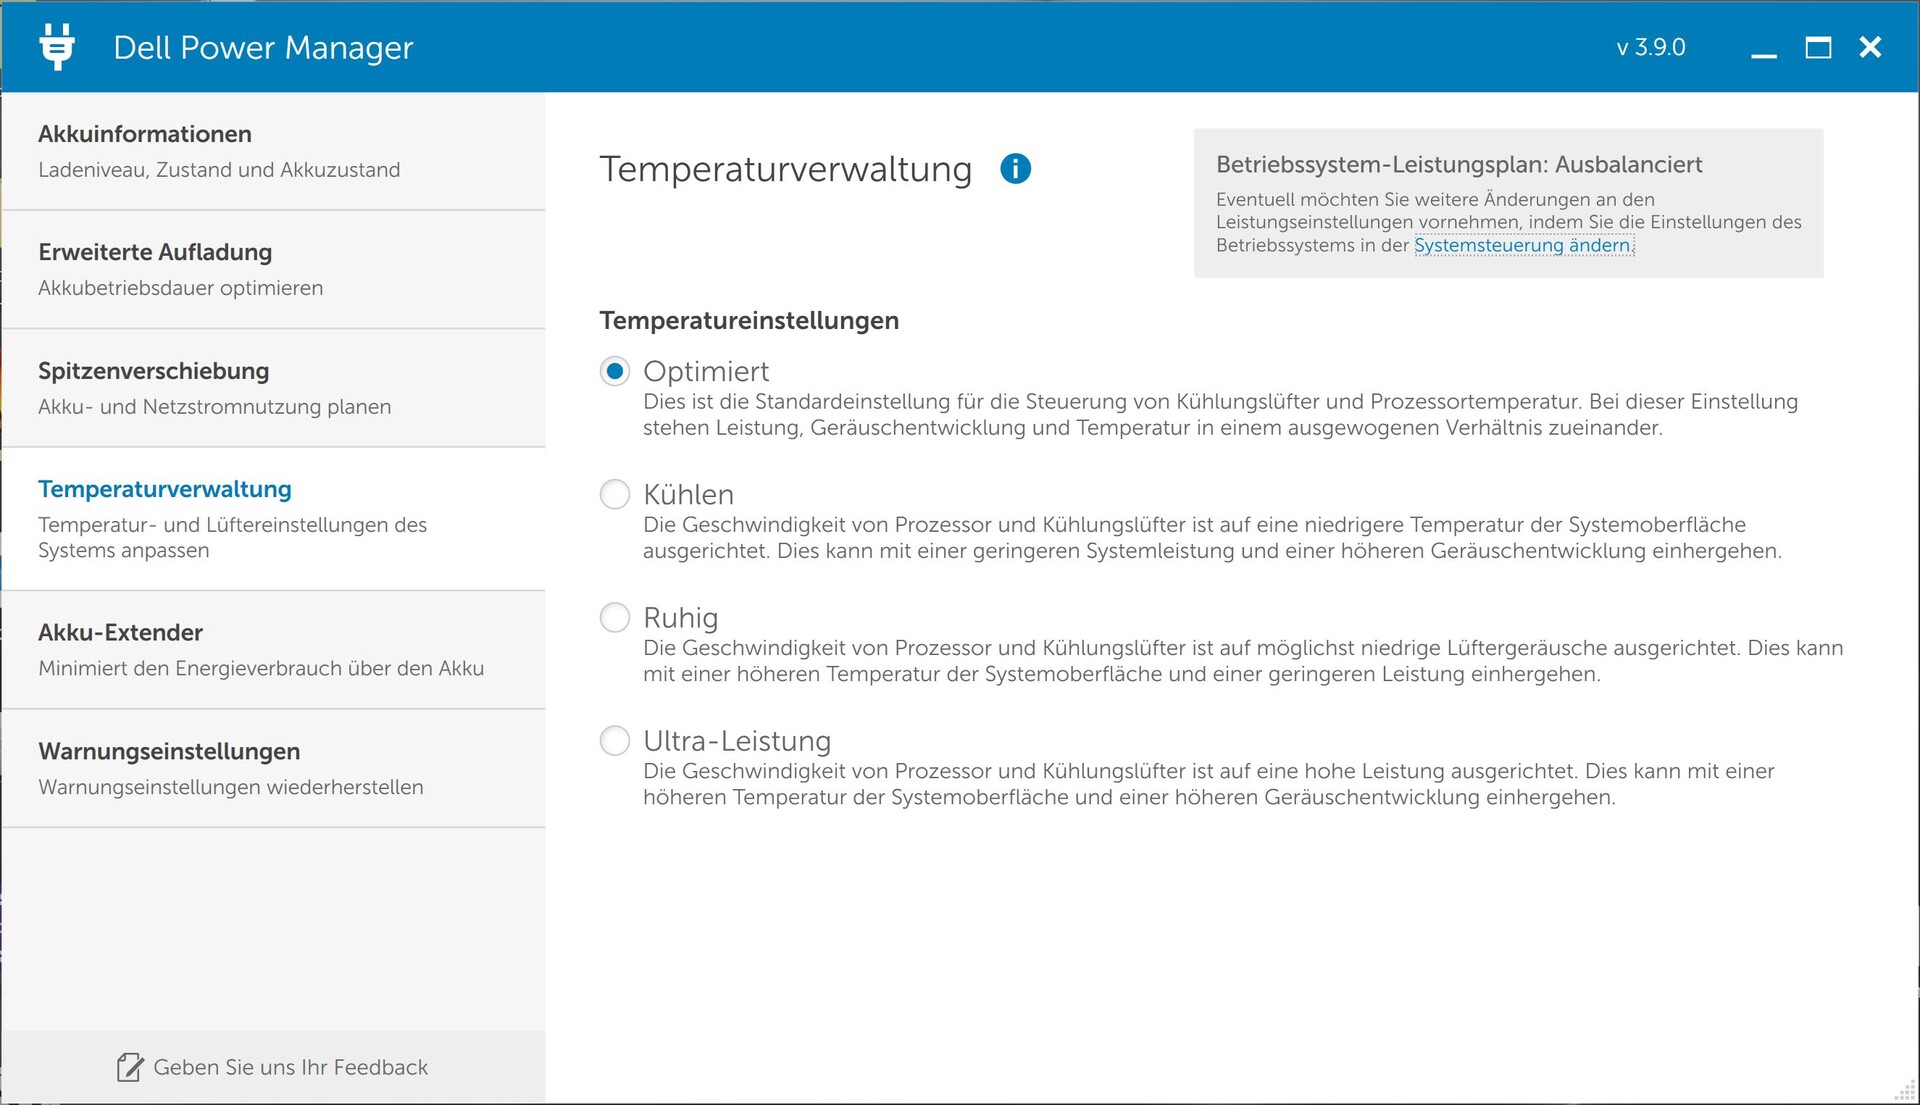
The Windows power settings only offer the Balanced profile, but Dell offers additional options in the preloaded Power Manager. The default profile is Optimized, which we used for all our benchmarks and measurements. We also had a look at the Ultra-Performance profile in some sections.
Dell launched BIOS version 1.4 during the review period, so we repeated all the tests with the new version. The processor performance did not change, but the GPU performance is better in synthetic benchmarks. There are still some limitations during gaming and when you stress the CPU and GPU at the same time.
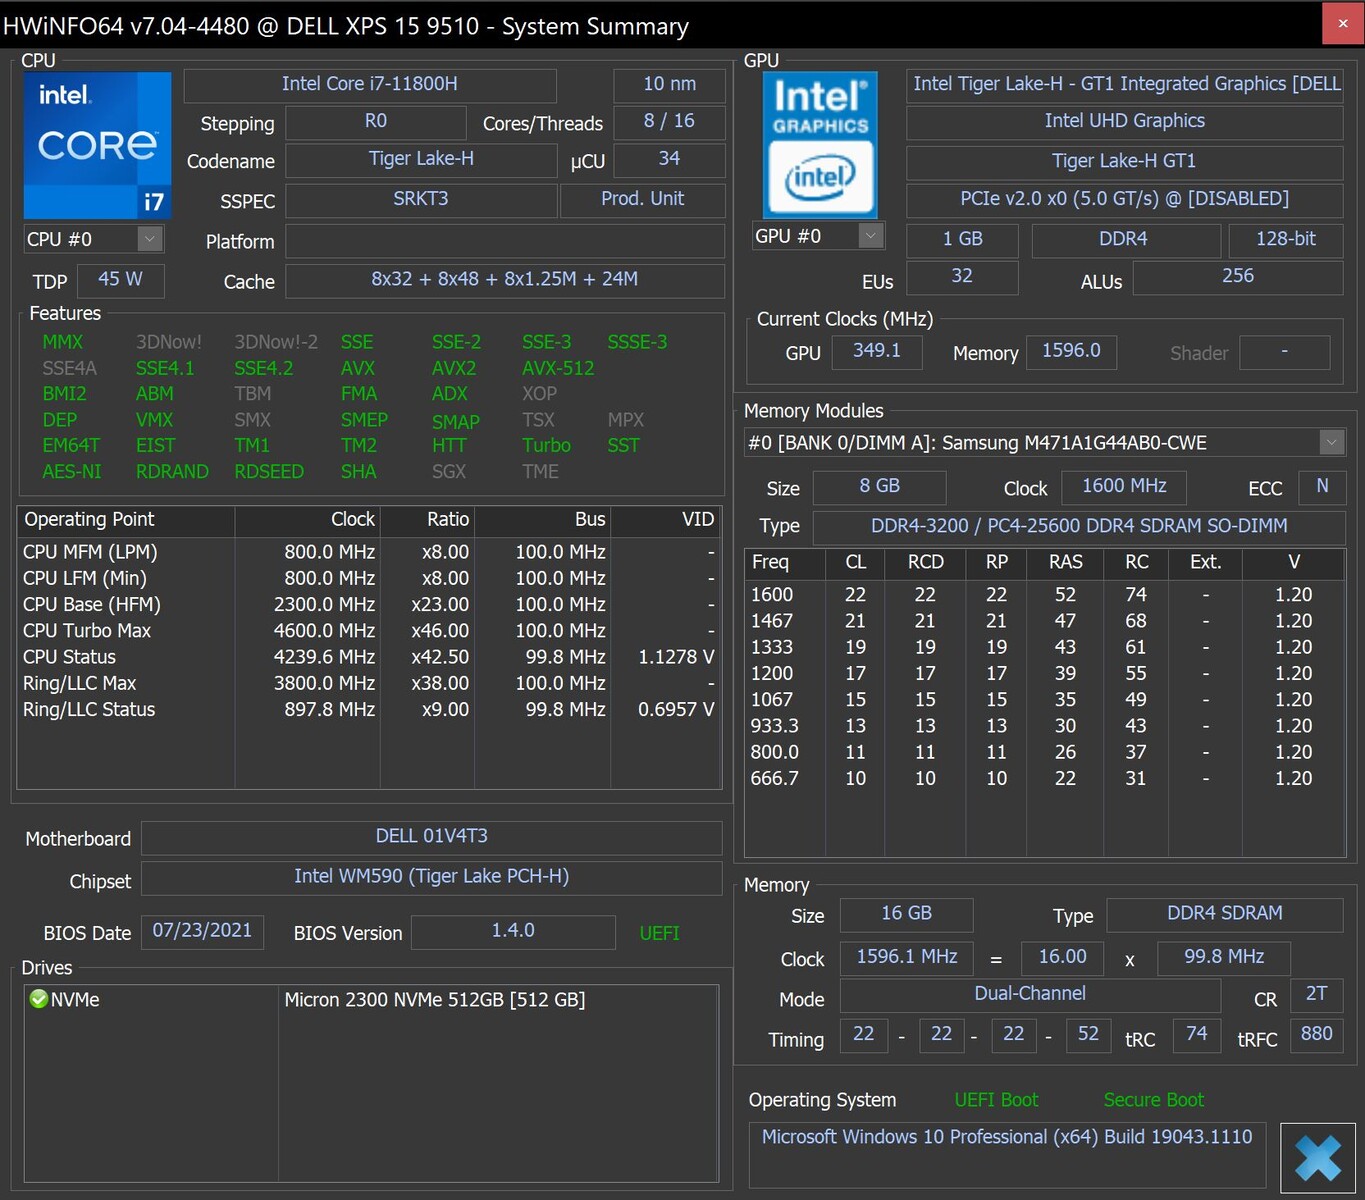
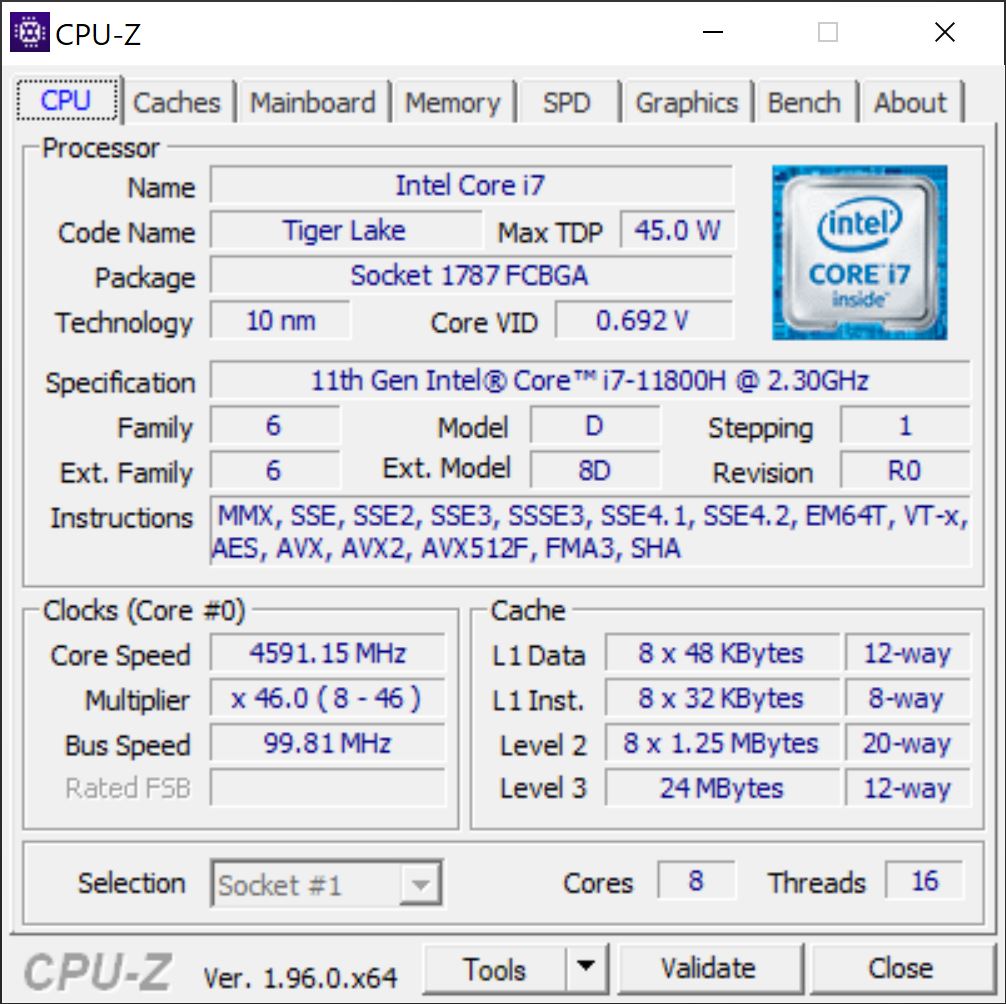
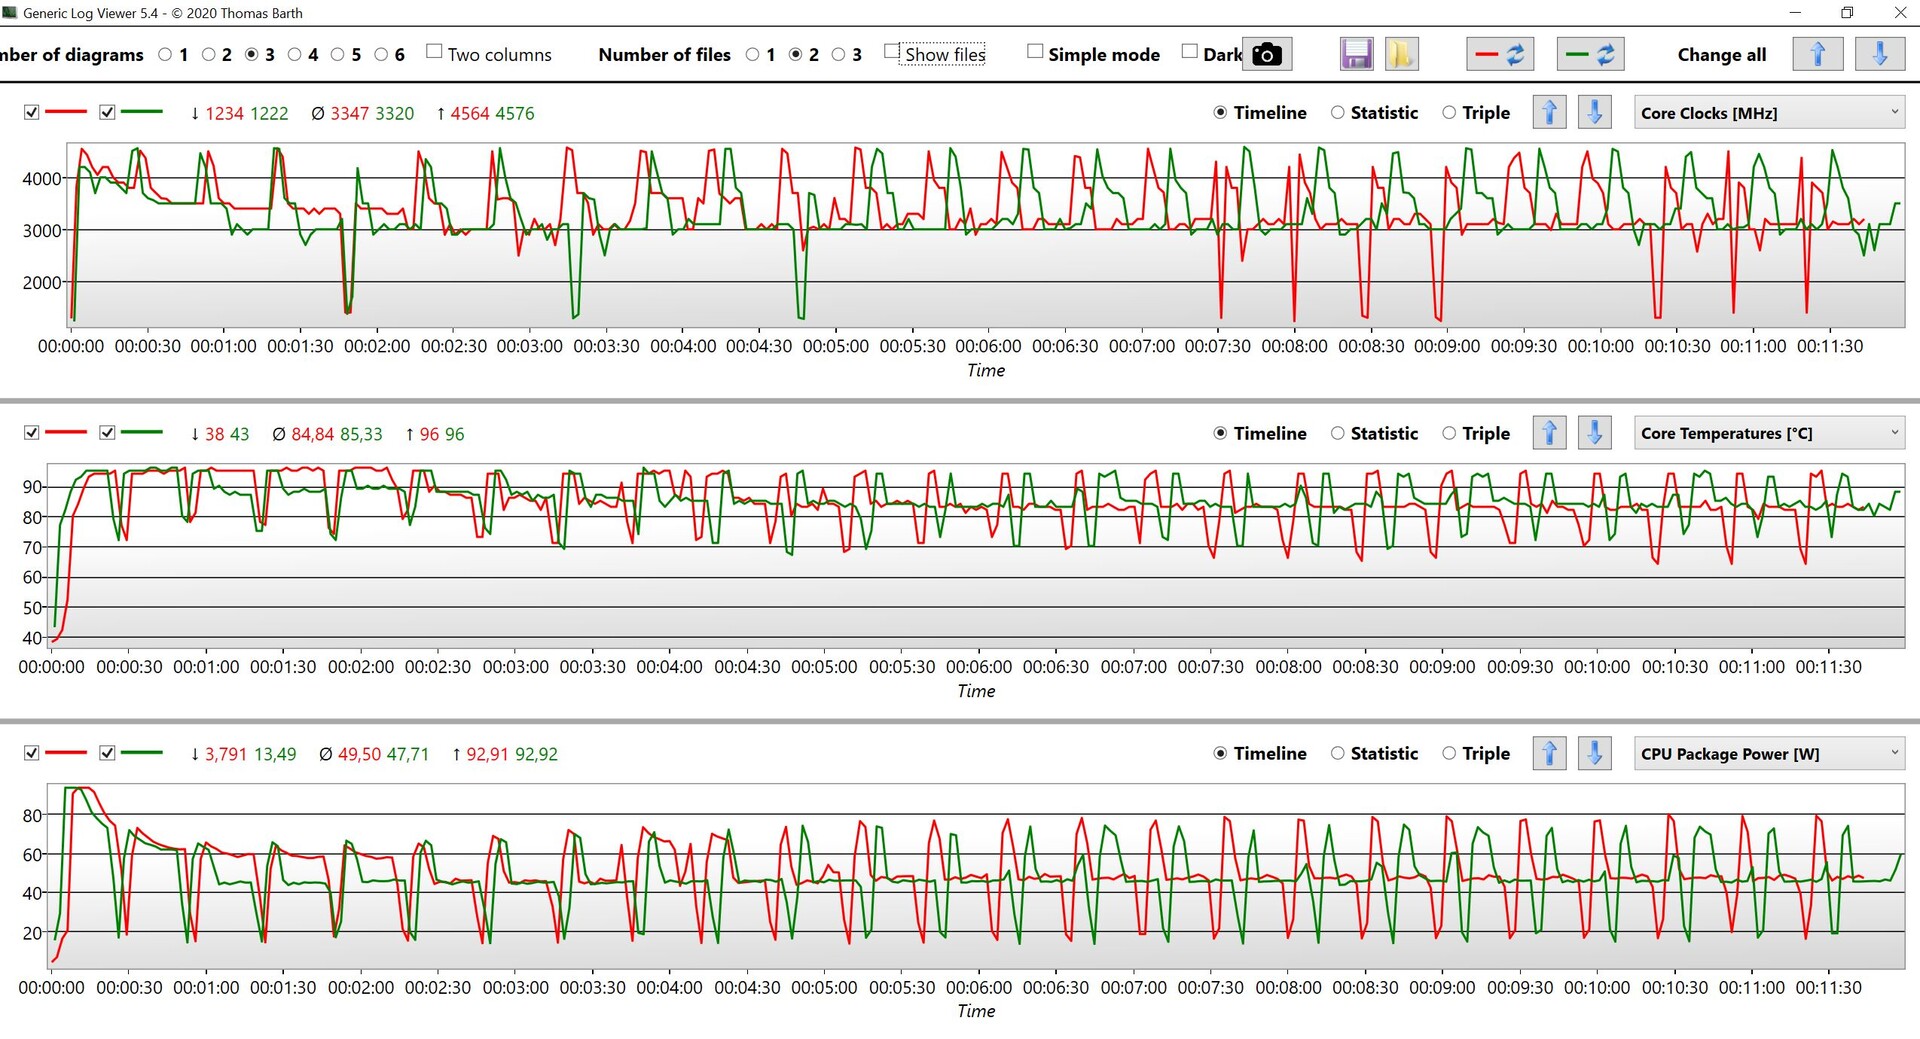
Processor - 45W Core i7-11800H
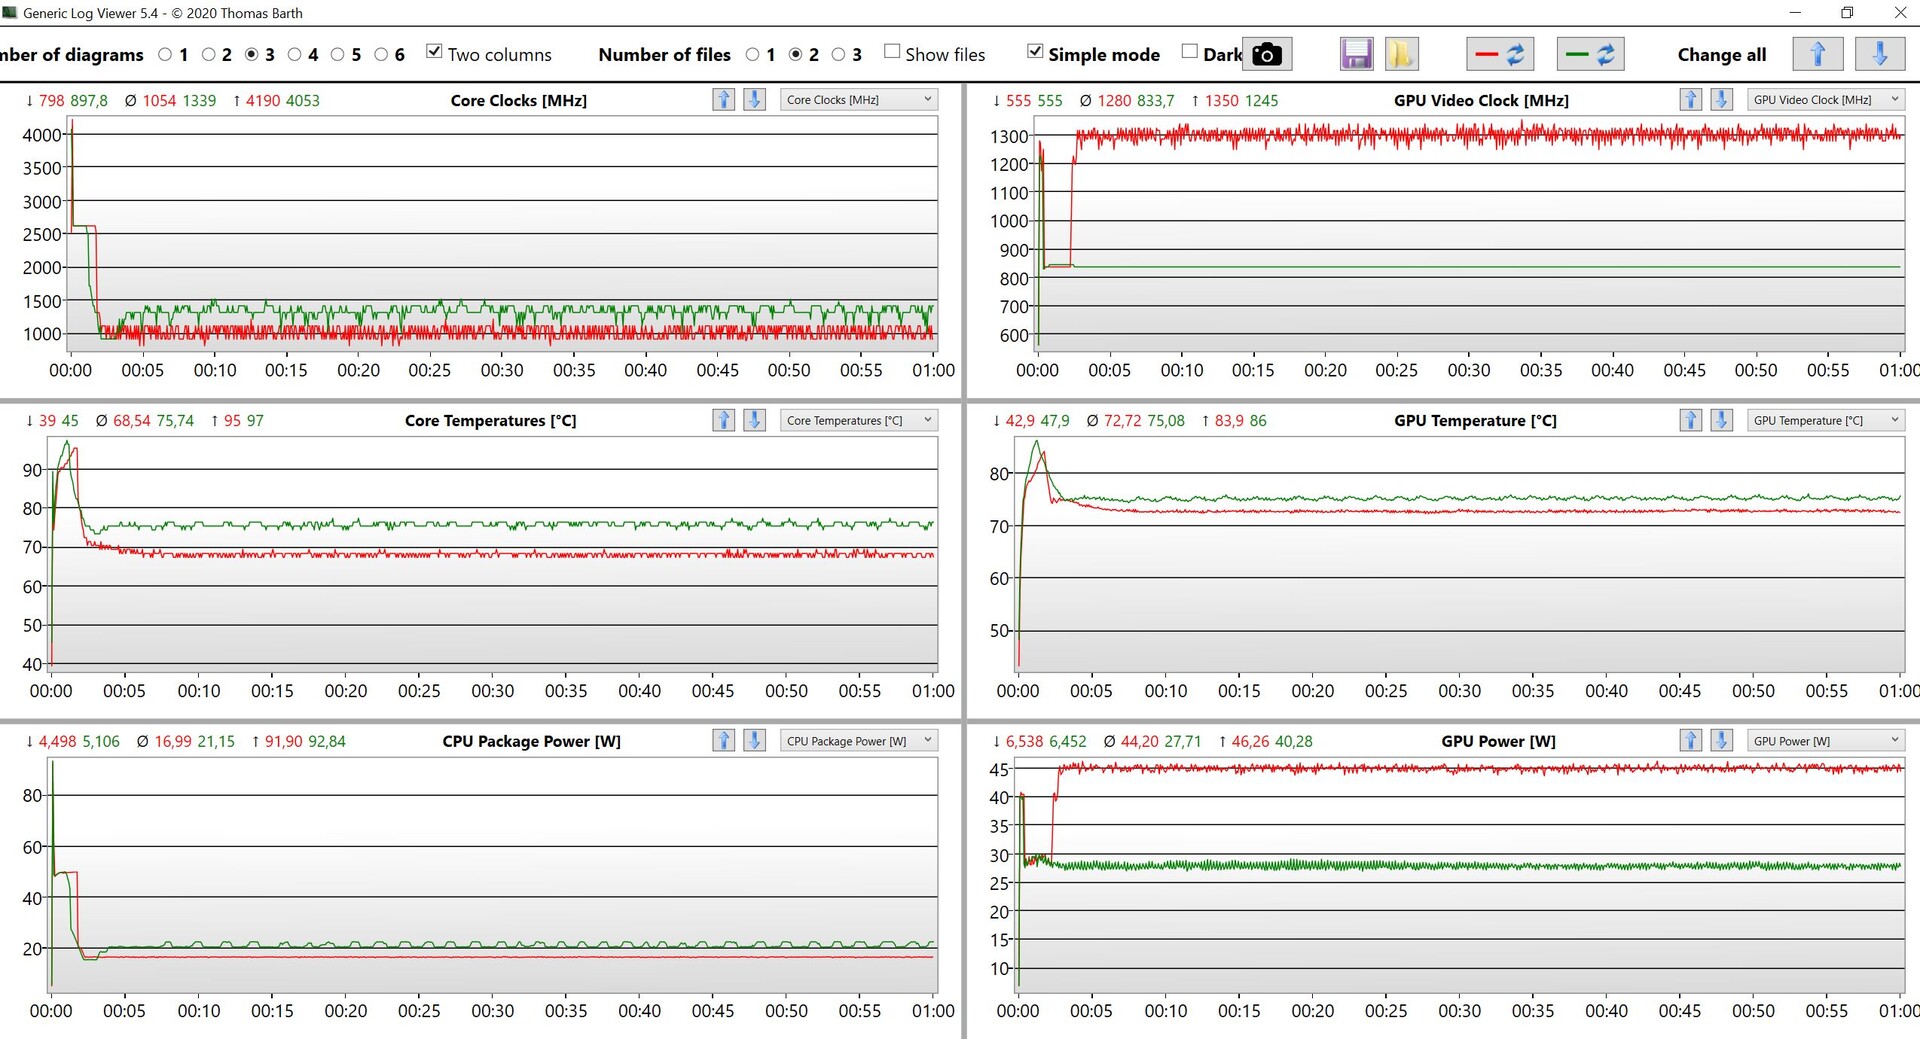
Our test unit is equipped with the Core i7-11800H with 8 cores (16 threads) and a nominal TDP of 45W. Dell allows the processor to consume up to 93W, which is also necessary for the maximum clock of 4.2 GHz on all 8 cores. However, this value can only be maintained for a few seconds and the power consumption will quickly drop to the sustained value of 45W. The behavior is similar in the Ultra-Performance mode, only the sustained value is increased to 48W. The Ultra-Performance mode is therefore only interesting for the first few minutes of CPU load, after that both profiles will offer roughly the same performance.
Cinebench R15 Multi Loop
The new Tiger Lake-H processor is around 25% than its direct predecessor in the old XPS 15 9500 under sustained workloads, but the advantage can be even bigger in shorter benchmarks where the i7-11800H benefits from the high power limit. The Intel CPU also performs well in single-core benchmarks, but you also have to compare the results with the latest AMD chips. We also added the results of the Ryzen 7 5800H in the Asus TUF Gaming F15, where the CPU is configured with lower power limits (64/35W). The AMD chip is almost on the same level in the single-core tests and the multi-core scores are comparable at first, but the Ryzen 7 is about 15% faster under sustained workloads despite the much lower power limits.
All in all, the new i7 in the XPS 15 performs well and the performance is completely sufficient for a multimedia laptop, but it could be even better with an AMD CPU.
The power limits are basically identical on battery power, but there are massive differences depending on the application. Cinebench R15, for example, results in a massive drop (60-70% slower), while the performance is absolutely fine in Cinebench R23. We suspect an issue with the energy settings and Dell should have another look at it. More CPU benchmarks are available in our tech section.
Cinebench R20: CPU (Single Core) | CPU (Multi Core)
Cinebench R15: CPU Single 64Bit | CPU Multi 64Bit
Blender: v2.79 BMW27 CPU
7-Zip 18.03: 7z b 4 -mmt1 | 7z b 4
Geekbench 5.5: Single-Core | Multi-Core
HWBOT x265 Benchmark v2.2: 4k Preset
LibreOffice : 20 Documents To PDF
R Benchmark 2.5: Overall mean
| Cinebench R23 / Single Core | |
| Average of class Multimedia (1128 - 2459, n=75, last 2 years) | |
| Dell XPS 15 9510 11800H RTX 3050 Ti OLED | |
| Average Intel Core i7-11800H (1386 - 1522, n=45) | |
| Gigabyte Aero 15 OLED XD | |
| Lenovo ThinkPad X1 Extreme Gen3-20TLS0UV00 | |
| Apple MacBook Pro 16 2019 i9 5500M | |
| Cinebench R23 / Multi Core | |
| Average of class Multimedia (4861 - 33362, n=83, last 2 years) | |
| Average Intel Core i7-11800H (6508 - 14088, n=48) | |
| Gigabyte Aero 15 OLED XD | |
| Dell XPS 15 9510 11800H RTX 3050 Ti OLED | |
| Apple MacBook Pro 16 2019 i9 5500M | |
| Apple MacBook Pro 16 2019 i9 5500M | |
| Lenovo ThinkPad X1 Extreme Gen3-20TLS0UV00 | |
| Cinebench R20 / CPU (Single Core) | |
| Average of class Multimedia (420 - 853, n=66, last 2 years) | |
| Dell XPS 15 9510 11800H RTX 3050 Ti OLED | |
| Average Intel Core i7-11800H (520 - 586, n=47) | |
| Asus TUF Gaming A15 FA506QR-AZ061T | |
| Gigabyte Aero 15 OLED XD | |
| Dell XPS 15 9500 Core i7 4K UHD | |
| Lenovo ThinkPad X1 Extreme Gen3-20TLS0UV00 | |
| Apple MacBook Pro 16 2019 i9 5500M | |
| Apple MacBook Pro 16 2019 i9 5500M | |
| Cinebench R20 / CPU (Multi Core) | |
| Average of class Multimedia (1887 - 12912, n=66, last 2 years) | |
| Asus TUF Gaming A15 FA506QR-AZ061T | |
| Average Intel Core i7-11800H (2498 - 5408, n=50) | |
| Gigabyte Aero 15 OLED XD | |
| Dell XPS 15 9510 11800H RTX 3050 Ti OLED | |
| Apple MacBook Pro 16 2019 i9 5500M | |
| Apple MacBook Pro 16 2019 i9 5500M | |
| Dell XPS 15 9500 Core i7 4K UHD | |
| Lenovo ThinkPad X1 Extreme Gen3-20TLS0UV00 | |
| Cinebench R15 / CPU Single 64Bit | |
| Average of class Multimedia (184.8 - 326, n=68, last 2 years) | |
| Asus TUF Gaming A15 FA506QR-AZ061T | |
| Dell XPS 15 9510 11800H RTX 3050 Ti OLED | |
| Average Intel Core i7-11800H (201 - 231, n=46) | |
| Lenovo ThinkPad X1 Extreme Gen3-20TLS0UV00 | |
| Dell XPS 15 9500 Core i7 4K UHD | |
| Gigabyte Aero 15 OLED XD | |
| Apple MacBook Pro 16 2019 i9 5500M | |
| Apple MacBook Pro 16 2019 i9 5500M | |
| Cinebench R15 / CPU Multi 64Bit | |
| Average of class Multimedia (856 - 5224, n=70, last 2 years) | |
| Dell XPS 15 9510 11800H RTX 3050 Ti OLED | |
| Dell XPS 15 9510 11800H RTX 3050 Ti OLED | |
| Asus TUF Gaming A15 FA506QR-AZ061T | |
| Average Intel Core i7-11800H (1342 - 2173, n=50) | |
| Gigabyte Aero 15 OLED XD | |
| Apple MacBook Pro 16 2019 i9 5500M | |
| Apple MacBook Pro 16 2019 i9 5500M | |
| Dell XPS 15 9500 Core i7 4K UHD | |
| Lenovo ThinkPad X1 Extreme Gen3-20TLS0UV00 | |
| Blender / v2.79 BMW27 CPU | |
| Lenovo ThinkPad X1 Extreme Gen3-20TLS0UV00 | |
| Dell XPS 15 9500 Core i7 4K UHD | |
| Apple MacBook Pro 16 2019 i9 5500M | |
| Gigabyte Aero 15 OLED XD | |
| Dell XPS 15 9510 11800H RTX 3050 Ti OLED | |
| Average Intel Core i7-11800H (217 - 454, n=46) | |
| Asus TUF Gaming A15 FA506QR-AZ061T | |
| Average of class Multimedia (100 - 557, n=67, last 2 years) | |
| 7-Zip 18.03 / 7z b 4 -mmt1 | |
| Average of class Multimedia (3666 - 7545, n=65, last 2 years) | |
| Asus TUF Gaming A15 FA506QR-AZ061T | |
| Average Intel Core i7-11800H (5138 - 5732, n=46) | |
| Dell XPS 15 9510 11800H RTX 3050 Ti OLED | |
| Gigabyte Aero 15 OLED XD | |
| Lenovo ThinkPad X1 Extreme Gen3-20TLS0UV00 | |
| Dell XPS 15 9500 Core i7 4K UHD | |
| Apple MacBook Pro 16 2019 i9 5500M | |
| 7-Zip 18.03 / 7z b 4 | |
| Average of class Multimedia (29095 - 130368, n=64, last 2 years) | |
| Asus TUF Gaming A15 FA506QR-AZ061T | |
| Average Intel Core i7-11800H (33718 - 56758, n=46) | |
| Gigabyte Aero 15 OLED XD | |
| Dell XPS 15 9510 11800H RTX 3050 Ti OLED | |
| Apple MacBook Pro 16 2019 i9 5500M | |
| Dell XPS 15 9500 Core i7 4K UHD | |
| Lenovo ThinkPad X1 Extreme Gen3-20TLS0UV00 | |
| Geekbench 5.5 / Single-Core | |
| Average of class Multimedia (805 - 2974, n=64, last 2 years) | |
| Average Intel Core i7-11800H (1429 - 1625, n=40) | |
| Dell XPS 15 9510 11800H RTX 3050 Ti OLED | |
| Gigabyte Aero 15 OLED XD | |
| Asus TUF Gaming A15 FA506QR-AZ061T | |
| Dell XPS 15 9500 Core i7 4K UHD | |
| Lenovo ThinkPad X1 Extreme Gen3-20TLS0UV00 | |
| Apple MacBook Pro 16 2019 i9 5500M | |
| Geekbench 5.5 / Multi-Core | |
| Average of class Multimedia (4652 - 20422, n=64, last 2 years) | |
| Gigabyte Aero 15 OLED XD | |
| Average Intel Core i7-11800H (4655 - 9851, n=40) | |
| Dell XPS 15 9510 11800H RTX 3050 Ti OLED | |
| Dell XPS 15 9500 Core i7 4K UHD | |
| Asus TUF Gaming A15 FA506QR-AZ061T | |
| Apple MacBook Pro 16 2019 i9 5500M | |
| Lenovo ThinkPad X1 Extreme Gen3-20TLS0UV00 | |
| HWBOT x265 Benchmark v2.2 / 4k Preset | |
| Average of class Multimedia (5.26 - 36.1, n=65, last 2 years) | |
| Average Intel Core i7-11800H (7.38 - 17.4, n=46) | |
| Asus TUF Gaming A15 FA506QR-AZ061T | |
| Dell XPS 15 9510 11800H RTX 3050 Ti OLED | |
| Gigabyte Aero 15 OLED XD | |
| Apple MacBook Pro 16 2019 i9 5500M | |
| Dell XPS 15 9500 Core i7 4K UHD | |
| Lenovo ThinkPad X1 Extreme Gen3-20TLS0UV00 | |
| LibreOffice / 20 Documents To PDF | |
| Apple MacBook Pro 16 2019 i9 5500M | |
| Apple MacBook Pro 16 2019 i9 5500M | |
| Dell XPS 15 9500 Core i7 4K UHD | |
| Average of class Multimedia (23.9 - 146.7, n=66, last 2 years) | |
| Asus TUF Gaming A15 FA506QR-AZ061T | |
| Lenovo ThinkPad X1 Extreme Gen3-20TLS0UV00 | |
| Gigabyte Aero 15 OLED XD | |
| Dell XPS 15 9510 11800H RTX 3050 Ti OLED | |
| Average Intel Core i7-11800H (38.6 - 59.9, n=45) | |
| R Benchmark 2.5 / Overall mean | |
| Apple MacBook Pro 16 2019 i9 5500M | |
| Apple MacBook Pro 16 2019 i9 5500M | |
| Lenovo ThinkPad X1 Extreme Gen3-20TLS0UV00 | |
| Gigabyte Aero 15 OLED XD | |
| Dell XPS 15 9500 Core i7 4K UHD | |
| Dell XPS 15 9510 11800H RTX 3050 Ti OLED | |
| Average Intel Core i7-11800H (0.548 - 0.615, n=46) | |
| Asus TUF Gaming A15 FA506QR-AZ061T | |
| Average of class Multimedia (0.3604 - 0.947, n=65, last 2 years) | |
* ... smaller is better
System Performance
The subjective performance impression is very good and the components are well balanced. There is no bottleneck and there won’t be one in the next couple of years. All inputs are executed quickly and without noticeable delays. We did not experience any issues with the laptop during our review period. The XPS 15 also performs very well in the synthetic benchmarks and is only beaten by devices with more powerful GPUs.
| PCMark 10 / Score | |
| Average of class Multimedia (4325 - 10386, n=59, last 2 years) | |
| Gigabyte Aero 15 OLED XD | |
| Average Intel Core i7-11800H, NVIDIA GeForce RTX 3050 Ti Laptop GPU (6019 - 6556, n=5) | |
| Dell XPS 15 9510 11800H RTX 3050 Ti OLED | |
| Apple MacBook Pro 16 2019 i9 5500M | |
| Lenovo ThinkPad X1 Extreme Gen3-20TLS0UV00 | |
| Dell XPS 15 9500 Core i7 4K UHD | |
| PCMark 10 / Essentials | |
| Average of class Multimedia (8025 - 11664, n=58, last 2 years) | |
| Average Intel Core i7-11800H, NVIDIA GeForce RTX 3050 Ti Laptop GPU (9490 - 10846, n=5) | |
| Gigabyte Aero 15 OLED XD | |
| Dell XPS 15 9500 Core i7 4K UHD | |
| Dell XPS 15 9510 11800H RTX 3050 Ti OLED | |
| Lenovo ThinkPad X1 Extreme Gen3-20TLS0UV00 | |
| PCMark 10 / Productivity | |
| Average of class Multimedia (7323 - 18233, n=58, last 2 years) | |
| Gigabyte Aero 15 OLED XD | |
| Average Intel Core i7-11800H, NVIDIA GeForce RTX 3050 Ti Laptop GPU (8176 - 8723, n=5) | |
| Dell XPS 15 9510 11800H RTX 3050 Ti OLED | |
| Dell XPS 15 9500 Core i7 4K UHD | |
| Lenovo ThinkPad X1 Extreme Gen3-20TLS0UV00 | |
| PCMark 10 / Digital Content Creation | |
| Average of class Multimedia (3651 - 16240, n=58, last 2 years) | |
| Gigabyte Aero 15 OLED XD | |
| Average Intel Core i7-11800H, NVIDIA GeForce RTX 3050 Ti Laptop GPU (7475 - 8577, n=5) | |
| Dell XPS 15 9510 11800H RTX 3050 Ti OLED | |
| Lenovo ThinkPad X1 Extreme Gen3-20TLS0UV00 | |
| Dell XPS 15 9500 Core i7 4K UHD | |
| PCMark 10 Score | 6019 points | |
Help | ||
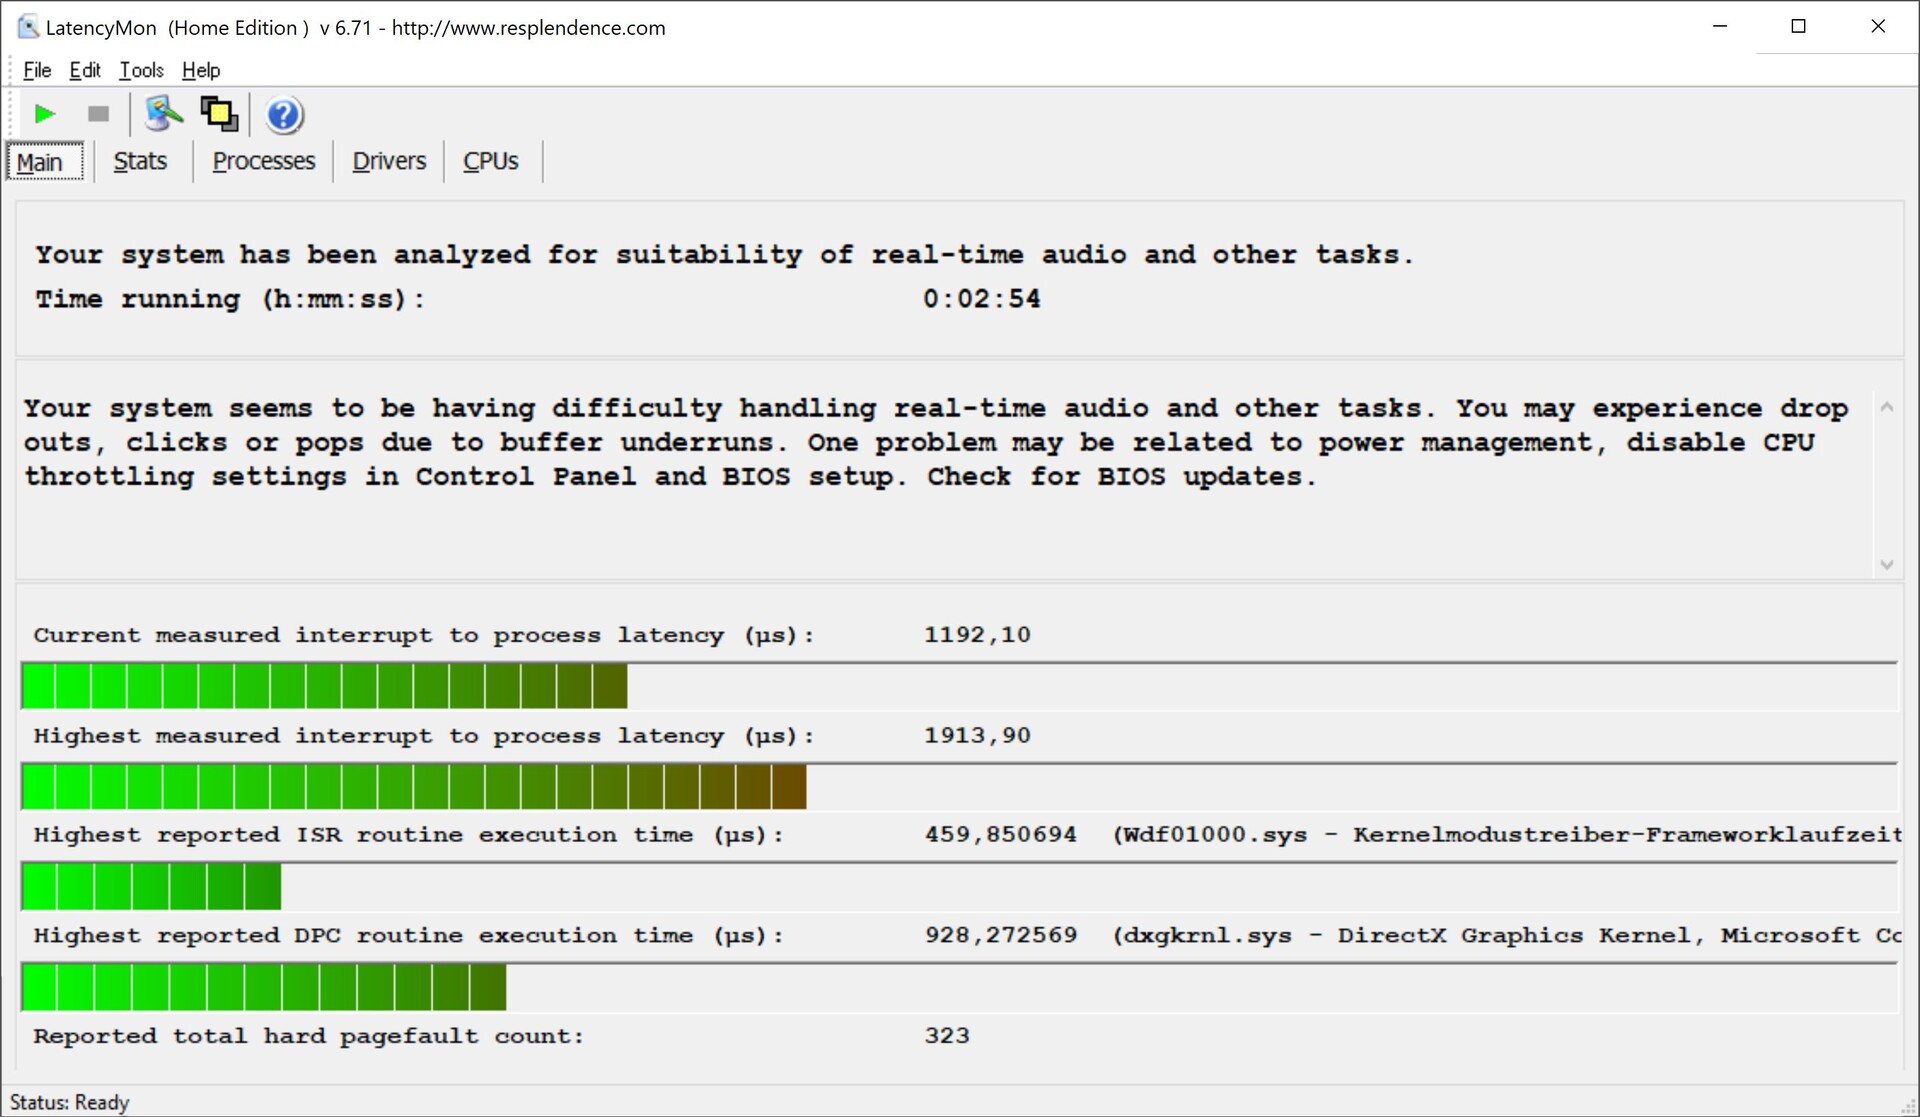
DPC Latency
Our DPC latency test shows that the XPS 15 9510 has some problems with the current BIOS version and it is therefore not ideal for real-time audio applications. There are, however, big improvements compared to the previous model, which had even more problems.
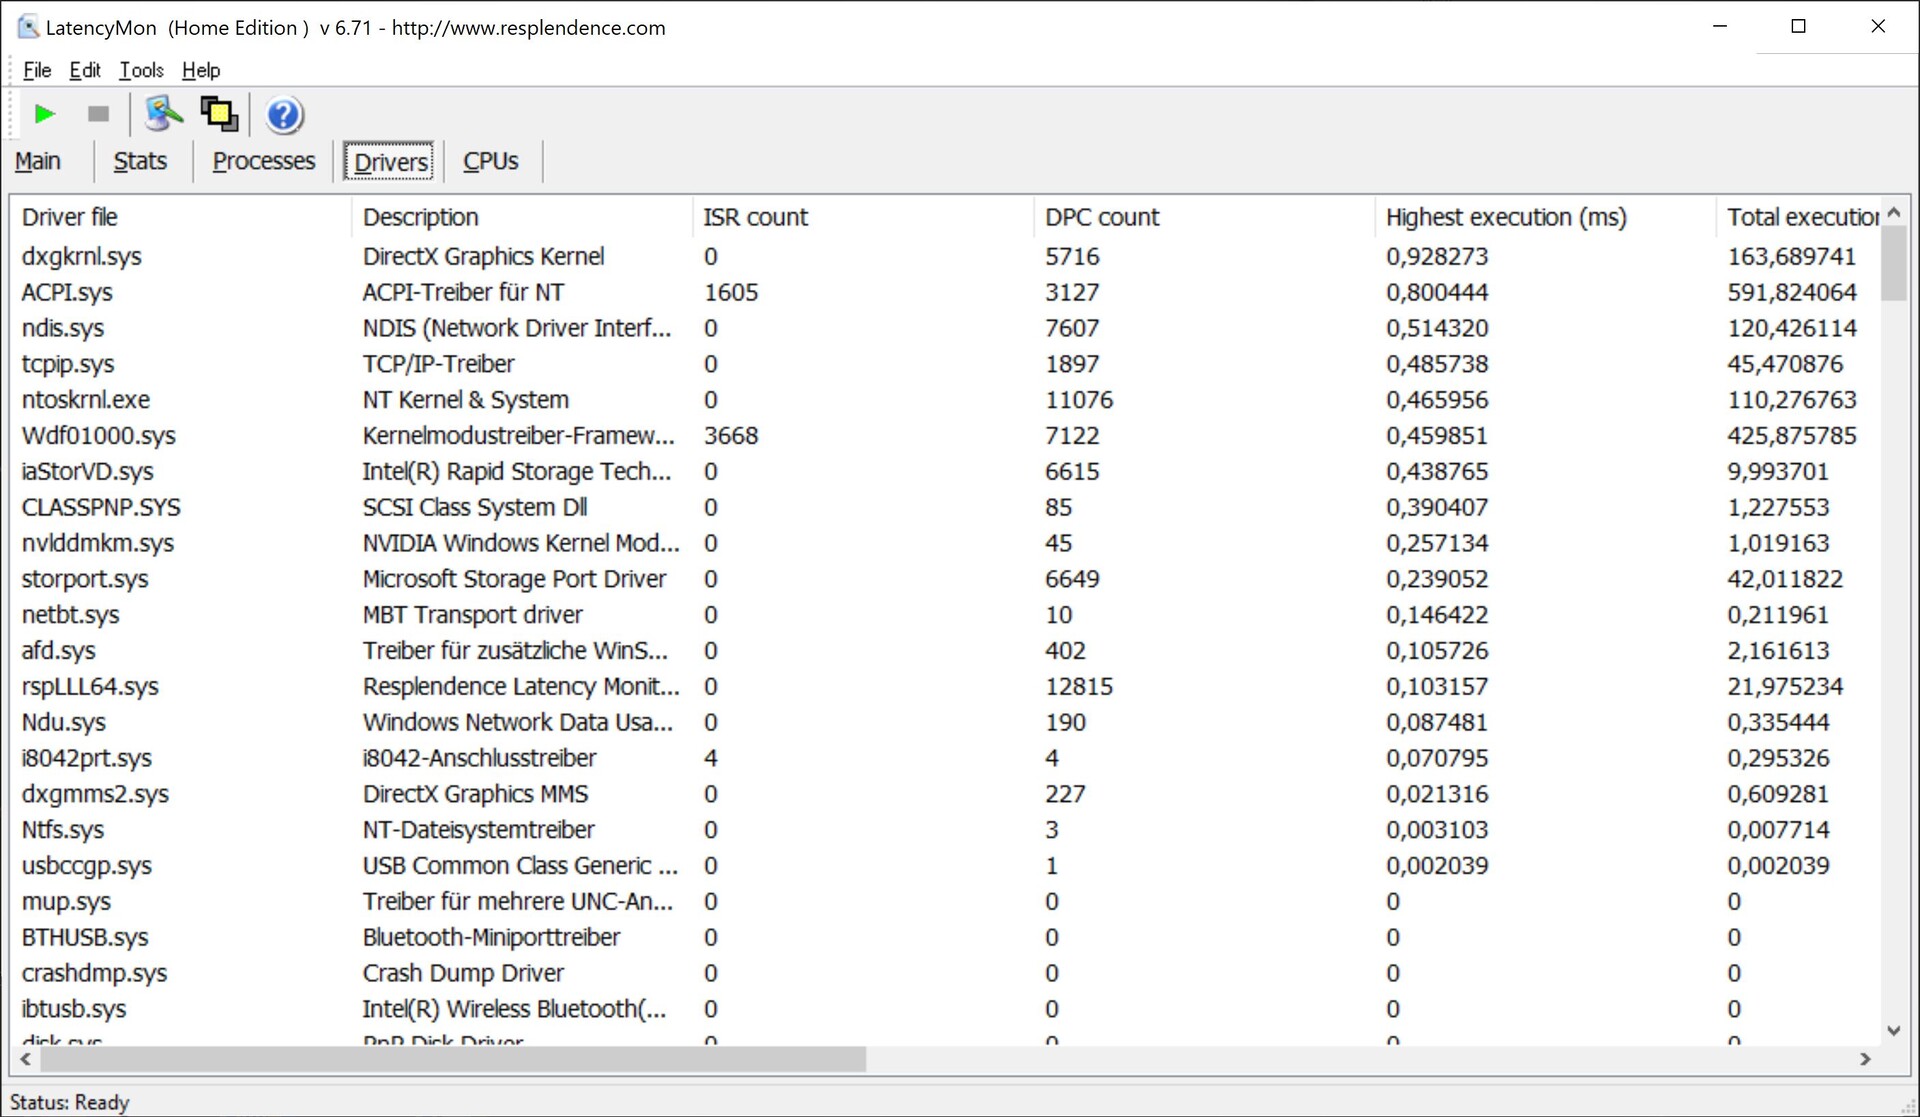
| DPC Latencies / LatencyMon - interrupt to process latency (max), Web, Youtube, Prime95 | |
| Dell XPS 15 9500 Core i7 4K UHD | |
| Dell XPS 15 9510 11800H RTX 3050 Ti OLED | |
| Gigabyte Aero 15 OLED XD | |
| Lenovo ThinkPad X1 Extreme Gen3-20TLS0UV00 | |
* ... smaller is better
Storage Devices
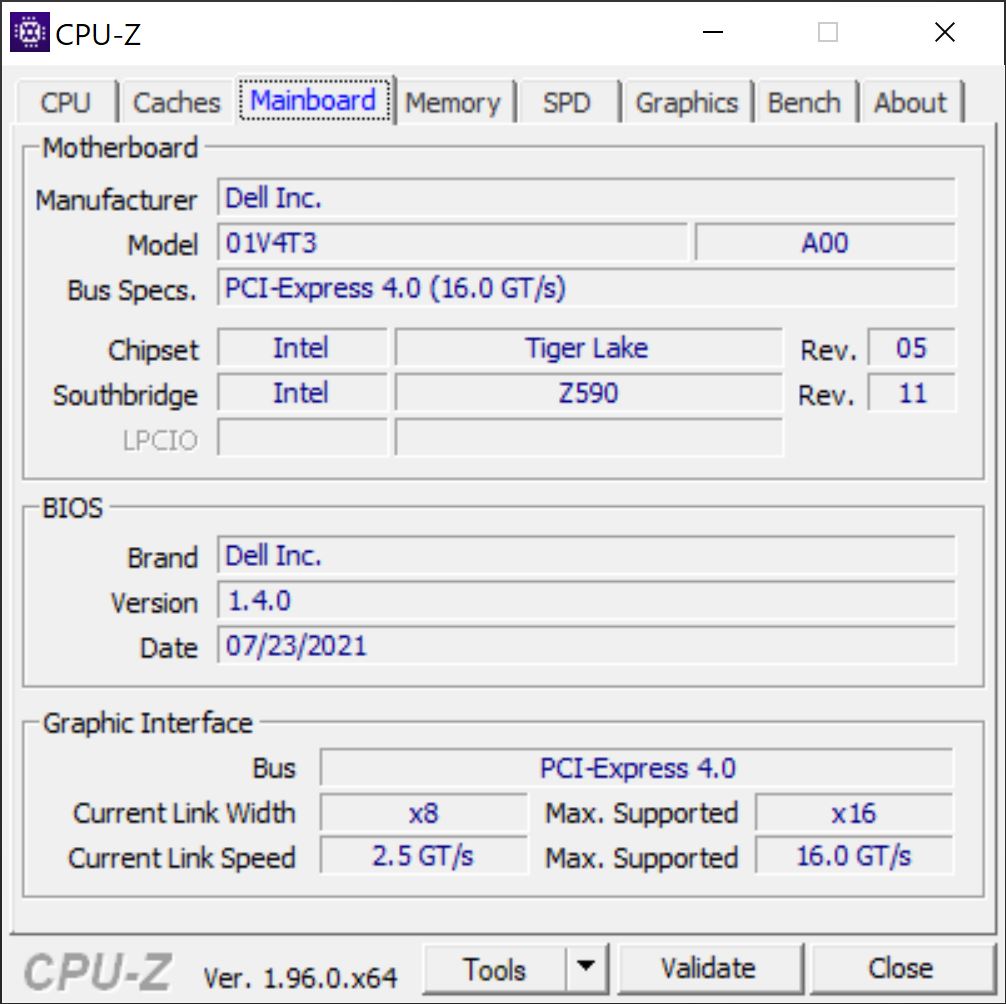
Our test unit is equipped with a 512 GB PCIe-SSD (NVMe 1.3) from Micron (2300). You can use 393 GB after the initial set-up. The XPS 15 supports the new PCIe 4.0 standard, but Dell still uses a PCIe 3.0 x4 drive. This is not a big deal in everyday scenarios and the transfer rates are good, but the XPS is a premium device and the drive could be faster. More SSD benchmarks are available here.
| Dell XPS 15 9510 11800H RTX 3050 Ti OLED Micron 2300 512GB MTFDHBA512TDV | Apple MacBook Pro 16 2019 i9 5500M Apple SSD AP1024 7171 | Lenovo ThinkPad X1 Extreme Gen3-20TLS0UV00 Toshiba XG6 KXG6AZNV1T02 | Gigabyte Aero 15 OLED XD Samsung PM9A1 MZVL21T0HCLR | Dell XPS 15 9500 Core i7 4K UHD SK Hynix PC611 512GB | Average Micron 2300 512GB MTFDHBA512TDV | |
|---|---|---|---|---|---|---|
| CrystalDiskMark 5.2 / 6 | -12% | 10% | 91% | -6% | 0% | |
| Write 4K (MB/s) | 109.3 | 55.5 -49% | 159.5 46% | 231.4 112% | 123.3 13% | 105.5 ? -3% |
| Read 4K (MB/s) | 53.9 | 16.21 -70% | 53.1 -1% | 89.5 66% | 41.85 -22% | 51.2 ? -5% |
| Write Seq (MB/s) | 1991 | 1959 -2% | 1723 -13% | 4208 111% | 2054 3% | 2041 ? 3% |
| Read Seq (MB/s) | 1759 | 1763 0% | 2164 23% | 4512 157% | 1617 -8% | 1845 ? 5% |
| Write 4K Q32T1 (MB/s) | 499.8 | 398.5 -20% | 469.2 -6% | 648 30% | 413 -17% | 494 ? -1% |
| Read 4K Q32T1 (MB/s) | 438.8 | 648 48% | 543 24% | 691 57% | 377.5 -14% | 445 ? 1% |
| Write Seq Q32T1 (MB/s) | 2835 | 2727 -4% | 3055 8% | 5111 80% | 2705 -5% | 2867 ? 1% |
| Read Seq Q32T1 (MB/s) | 3235 | 3242 0% | 3296 2% | 7002 116% | 3442 6% | 3272 ? 1% |
| AS SSD | 36% | 61% | 205% | 23% | 24% | |
| Seq Read (MB/s) | 1362 | 2531 86% | 2553 87% | 5357 293% | 2072 52% | 2300 ? 69% |
| Seq Write (MB/s) | 1440 | 2289 59% | 974 -32% | 3978 176% | 1486 3% | 1550 ? 8% |
| 4K Read (MB/s) | 38.43 | 15.85 -59% | 49.69 29% | 50.6 32% | 47.41 23% | 45 ? 17% |
| 4K Write (MB/s) | 121.4 | 39.88 -67% | 139.5 15% | 156.2 29% | 117.6 -3% | 106.6 ? -12% |
| 4K-64 Read (MB/s) | 370.5 | 1267 242% | 1462 295% | 2465 565% | 967 161% | 676 ? 82% |
| 4K-64 Write (MB/s) | 1054 | 1749 66% | 1474 40% | 3360 219% | 715 -32% | 1616 ? 53% |
| Access Time Read * (ms) | 0.042 | 0.122 -190% | 0.063 -50% | 0.08 -90% | 0.057 -36% | 0.059 ? -40% |
| Access Time Write * (ms) | 0.135 | 0.095 30% | 0.031 77% | 0.027 80% | 0.096 29% | 0.1807 ? -34% |
| Score Read (Points) | 545 | 1536 182% | 1767 224% | 3052 460% | 1222 124% | 952 ? 75% |
| Score Write (Points) | 1319 | 2018 53% | 1711 30% | 3914 197% | 981 -26% | 1877 ? 42% |
| Score Total (Points) | 2160 | 4317 100% | 4308 99% | 8449 291% | 2809 30% | 3290 ? 52% |
| Copy ISO MB/s (MB/s) | 1406 | 1995 42% | 2094 49% | 1999 42% | 1603 ? 14% | |
| Copy Program MB/s (MB/s) | 844 | 584 -31% | 657 -22% | 627 -26% | 843 ? 0% | |
| Copy Game MB/s (MB/s) | 1353 | 1135 -16% | 1447 7% | 1001 -26% | 1570 ? 16% | |
| Total Average (Program / Settings) | 12% /
18% | 36% /
42% | 148% /
157% | 9% /
12% | 12% /
16% |
* ... smaller is better

Disk Throttling: DiskSpd Read Loop, Queue Depth 8
GPU Performance - GeForce RTX 3050 Ti with 45 Watts
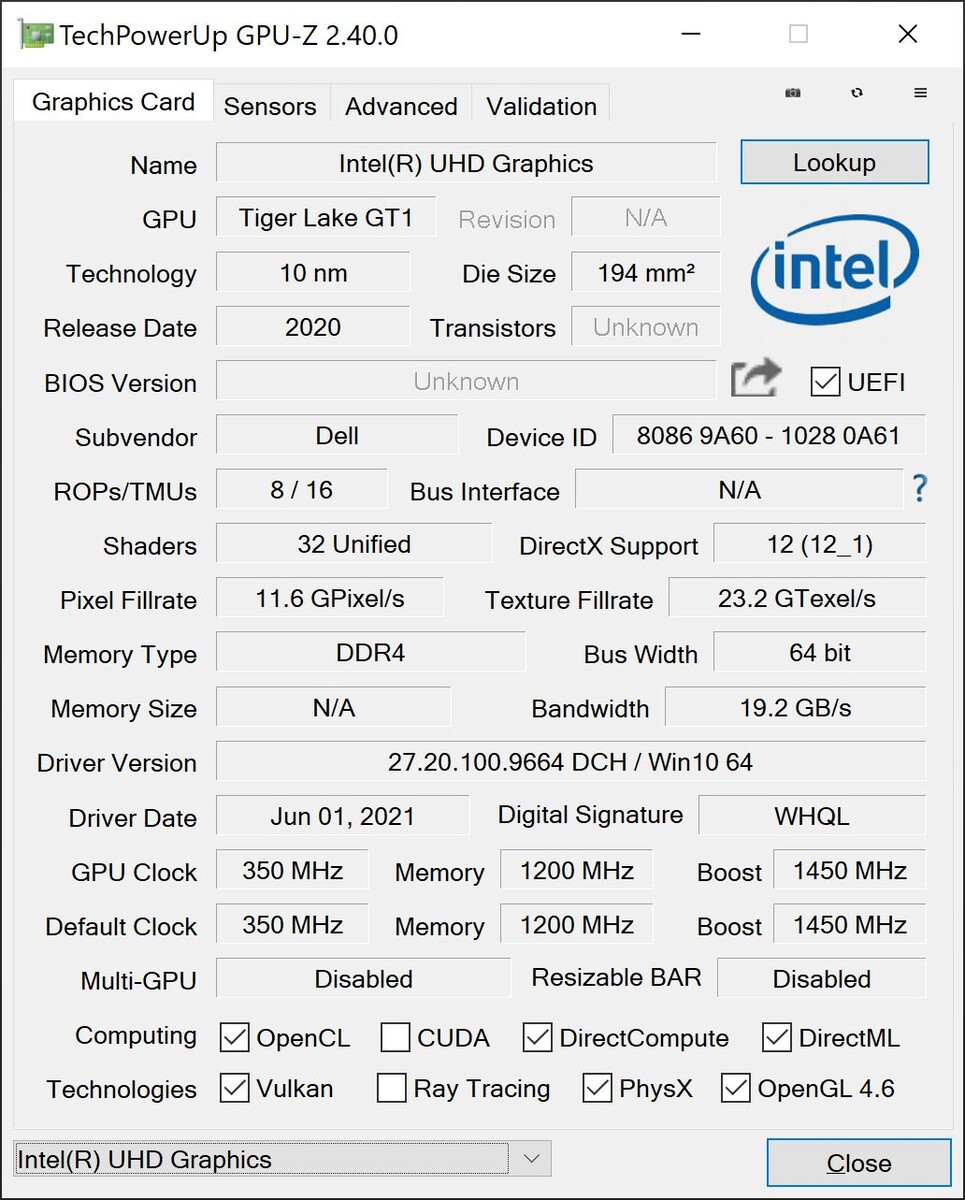
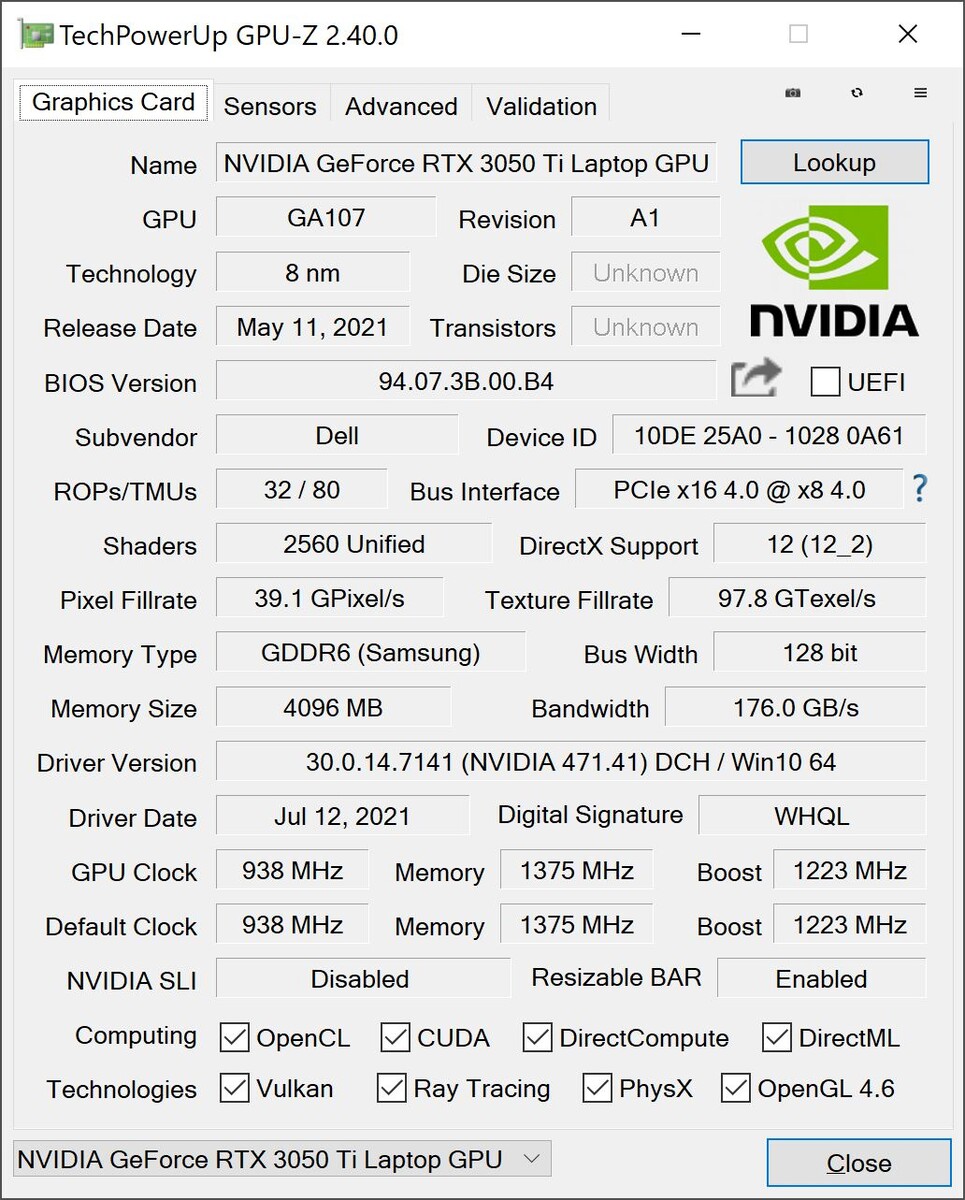
The integrated UHD Graphics Xe 750 of the processor usually handles all the graphics calculations in undemanding scenarios and the dedicated GeForce RTX 3050 Ti automatically takes over when you need more performance. This GPU can be configured with 35-80W and Dell decided to use the version with a TGP of 45W. More technical information about the GPU is available here.
The graphics performance is more stable after the BIOS update to version 1.4 and the 3DMArk Time Spy stress test is now also passed with the standard performance profile (Optimized). However, there is still a drop to ~30W when you stress the CPU simultaneously, so you should use the profile Ultra-Performance in these situations instead, where the GPU is running with the specified 45W.
Synthetic benchmarks show that the new RTX 3050 Ti is faster than the old XPS 15 9500 with the GeForce GTX 1650 Ti (~20% faster on average), but it is “only” the 45W model (vs. 50W GTX 1650 Ti in the old XPS 15), so the average results for the RTX 3050 Ti in our database are better (between 11-25%). We do not know the TGP for the regular RTX 3050 in the new XPS 15, so we cannot make any statements about the performance difference.
Similar to the processor, we can see big differences on battery power. Some applications like 3DMark will be affected massively (almost 85% slower; Time Spy Graphics 4591 vs. 622 points), while games (Witcher 3, AC: Valhalla) are not affected at all. More benchmarks with the RTX 3050 Ti are available here.
| 3DMark 11 Performance | 14027 points | |
| 3DMark Cloud Gate Standard Score | 26532 points | |
| 3DMark Fire Strike Score | 10777 points | |
| 3DMark Time Spy Score | 4729 points | |
Help | ||
Gaming Performance
If you want to play games on the XPS 15 9510, you should definitely use the Ultra-Performance profile, otherwise there can be (depending on the ratio between CPU and GPU load) performance drops of around 20% after a little while, even after the BIOS update to version 1.4. You can see the exact behavior in the chart of our Witcher 3 test below. This title, however, is not very demanding for the CPU, so there can be differences when you play titles with more CPU load.
Witcher 3 FPS Chart
We tested multiple titles and the overall performance is comparable to the old XPS 15 9500. Depending on the title there can be advantages/disadvantages for the new model, but you should not expect a big improvement. Other laptops with the RTX 3050 Ti also offer more gaming performance. The XPS 15 is obviously no gaming laptop and the performance is still adequate for many multimedia users (many popular titles run smoothly at high or maximum settings), but if you want to play a lot, you should get a laptop with a more powerful GPU. More gaming benchmarks are available here.
| F1 2021 | |
| 2560x1440 Ultra High Preset + Raytracing AA:T AF:16x | |
| Average NVIDIA GeForce RTX 3050 Ti Laptop GPU (30.9 - 43.1, n=5) | |
| Dell XPS 15 9510 11800H RTX 3050 Ti OLED | |
| 1920x1080 Ultra High Preset + Raytracing AA:T AF:16x | |
| Average NVIDIA GeForce RTX 3050 Ti Laptop GPU (44.4 - 69, n=11) | |
| Dell XPS 15 9510 11800H RTX 3050 Ti OLED | |
| 1920x1080 High Preset AA:T AF:16x | |
| Dell XPS 15 9510 11800H RTX 3050 Ti OLED | |
| Average NVIDIA GeForce RTX 3050 Ti Laptop GPU (68 - 131, n=11) | |
| 1920x1080 Medium Preset AA:T AF:16x | |
| Average NVIDIA GeForce RTX 3050 Ti Laptop GPU (72 - 150, n=11) | |
| Dell XPS 15 9510 11800H RTX 3050 Ti OLED | |
| 1280x720 Ultra Low Preset | |
| Average NVIDIA GeForce RTX 3050 Ti Laptop GPU (105 - 230, n=11) | |
| Dell XPS 15 9510 11800H RTX 3050 Ti OLED | |
| Watch Dogs Legion | |
| 2560x1440 Ultra Preset (DX12) | |
| Average NVIDIA GeForce RTX 3050 Ti Laptop GPU (19 - 21, n=2) | |
| Dell XPS 15 9510 11800H RTX 3050 Ti OLED | |
| Lenovo ThinkPad X1 Extreme Gen3-20TLS0UV00 | |
| 1920x1080 Ultra Preset (DX12) | |
| Average NVIDIA GeForce RTX 3050 Ti Laptop GPU (28 - 29, n=3) | |
| Dell XPS 15 9510 11800H RTX 3050 Ti OLED | |
| Lenovo ThinkPad X1 Extreme Gen3-20TLS0UV00 | |
| 1920x1080 High Preset (DX12) | |
| Average NVIDIA GeForce RTX 3050 Ti Laptop GPU (42 - 70, n=3) | |
| Dell XPS 15 9510 11800H RTX 3050 Ti OLED | |
| Lenovo ThinkPad X1 Extreme Gen3-20TLS0UV00 | |
| 1920x1080 Medium Preset (DX12) | |
| Average NVIDIA GeForce RTX 3050 Ti Laptop GPU (46 - 79, n=3) | |
| Dell XPS 15 9510 11800H RTX 3050 Ti OLED | |
| Lenovo ThinkPad X1 Extreme Gen3-20TLS0UV00 | |
| 1280x720 Low Preset (DX12) | |
| Lenovo ThinkPad X1 Extreme Gen3-20TLS0UV00 | |
| Dell XPS 15 9510 11800H RTX 3050 Ti OLED | |
| Average NVIDIA GeForce RTX 3050 Ti Laptop GPU (44 - 77, n=2) | |
| low | med. | high | ultra | QHD | |
|---|---|---|---|---|---|
| GTA V (2015) | 175 | 166 | 110 | 57.2 | 43.8 |
| The Witcher 3 (2015) | 213 | 154 | 91 | 43.7 | |
| Dota 2 Reborn (2015) | 159 | 139 | 121 | 109 | |
| Final Fantasy XV Benchmark (2018) | 92.2 | 51.6 | 37.4 | 26.8 | |
| X-Plane 11.11 (2018) | 106 | 88.8 | 74.2 | ||
| Far Cry 5 (2018) | 125 | 76 | 73 | 65 | 50 |
| Strange Brigade (2018) | 245 | 117 | 94 | 84 | 61 |
| F1 2020 (2020) | 186 | 119 | 104 | 78.4 | 56.4 |
| Watch Dogs Legion (2020) | 77 | 59 | 55 | 28 | 19 |
| Assassin´s Creed Valhalla (2020) | 79 | 60 | 35 | 28 | 26 |
| Cyberpunk 2077 1.0 (2020) | 59 | 40.3 | 34.8 | 30.8 | 18.6 |
| F1 2021 (2021) | 176 | 123 | 105 | 52.8 | 37.4 |
Emissions - Dell prefers a quieter system
System Noise
The new XPS 15 9510 is a very quiet device overall and the fans are often deactivated in everyday scenarios. The fan behavior under load is pretty interesting, because it takes about 2 minutes before they reach their maximum speed even under maximum load. It seems the fans start spinning as soon as the core temperature reaches 100 °C. In combined workloads (compare our gaming tests) this can result in a short period (~2 minutes) where you do not get the full performance. This behavior is beneficial for many users because you will rarely notice the fans, but we would have preferred a more aggressive fan curve for the Ultra-Performance mode, so you get the maximum performance right away.
The fans will be a bit louder when you use the Ultra-Performance mode (~38 vs. 40 dB(A)), but the new model is still noticeably quieter than the predecessor and it is one of the quietest multimedia devices in this performance segment. The fan noise is not annoying and headphones are not a must. Our test system did not have problems with other electronic sounds like coil whine.
Noise level
| Idle |
| 23.8 / 23.8 / 23.8 dB(A) |
| Load |
| 36 / 38.2 dB(A) |
 | ||
30 dB silent 40 dB(A) audible 50 dB(A) loud |
||
min: | ||
| Dell XPS 15 9510 11800H RTX 3050 Ti OLED GeForce RTX 3050 Ti Laptop GPU, i7-11800H, Micron 2300 512GB MTFDHBA512TDV | Apple MacBook Pro 16 2019 i9 5500M Radeon Pro 5500M, i9-9880H, Apple SSD AP1024 7171 | Lenovo ThinkPad X1 Extreme Gen3-20TLS0UV00 GeForce GTX 1650 Ti Max-Q, i7-10750H, Toshiba XG6 KXG6AZNV1T02 | Gigabyte Aero 15 OLED XD GeForce RTX 3070 Laptop GPU, i7-11800H, Samsung PM9A1 MZVL21T0HCLR | Dell XPS 15 9500 Core i7 4K UHD GeForce GTX 1650 Ti Mobile, i7-10875H, SK Hynix PC611 512GB | |
|---|---|---|---|---|---|
| Noise | -24% | -20% | -33% | -21% | |
| off / environment * (dB) | 23.8 | 29.8 -25% | 29.5 -24% | 25 -5% | 28.4 -19% |
| Idle Minimum * (dB) | 23.8 | 29.9 -26% | 29.5 -24% | 30 -26% | 28.4 -19% |
| Idle Average * (dB) | 23.8 | 29.9 -26% | 29.5 -24% | 32 -34% | 28.4 -19% |
| Idle Maximum * (dB) | 23.8 | 29.9 -26% | 29.9 -26% | 35 -47% | 28.4 -19% |
| Load Average * (dB) | 36 | 43 -19% | 44.2 -23% | 44 -22% | 46 -28% |
| Witcher 3 ultra * (dB) | 36 | 45.4 -26% | 36.1 -0% | 51 -42% | 42 -17% |
| Load Maximum * (dB) | 38.2 | 46.1 -21% | 44.2 -16% | 60 -57% | 47.1 -23% |
* ... smaller is better
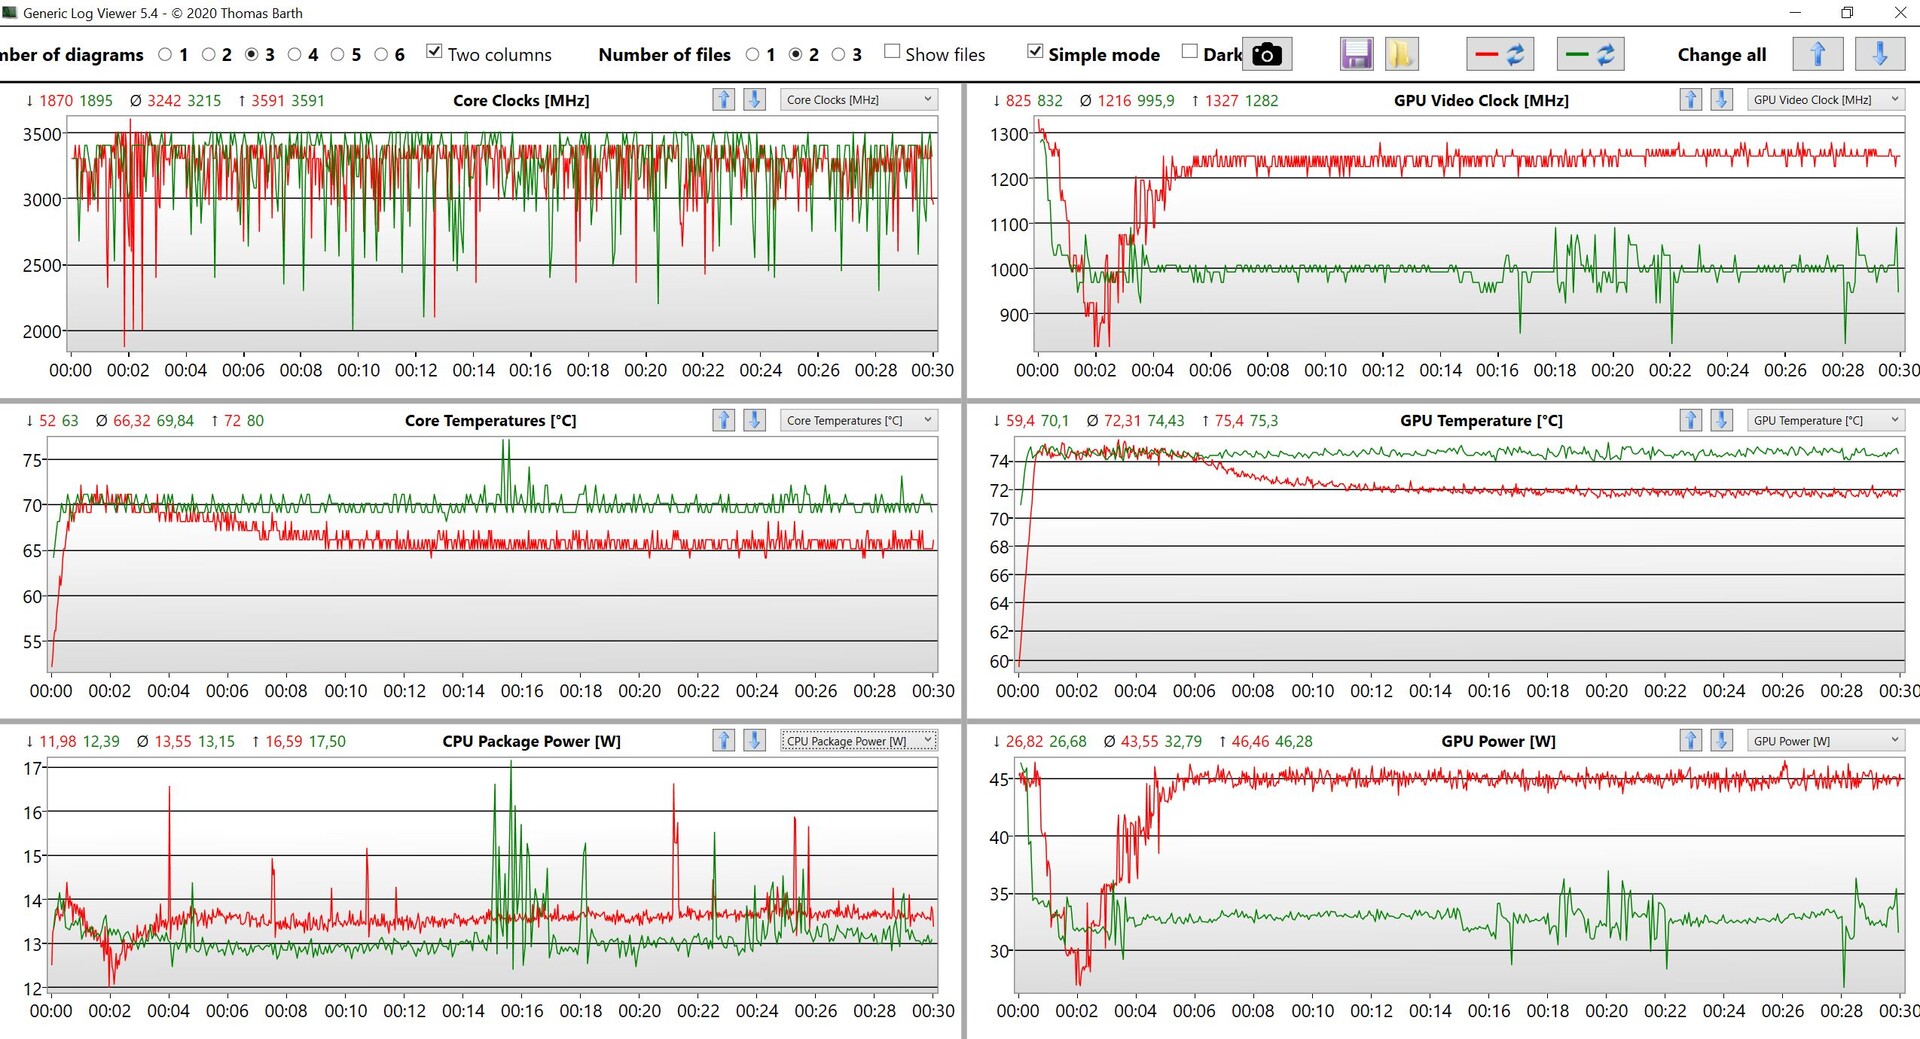
Temperature
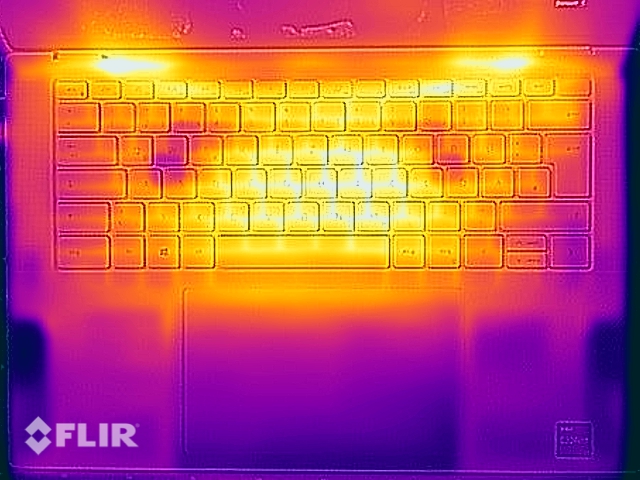
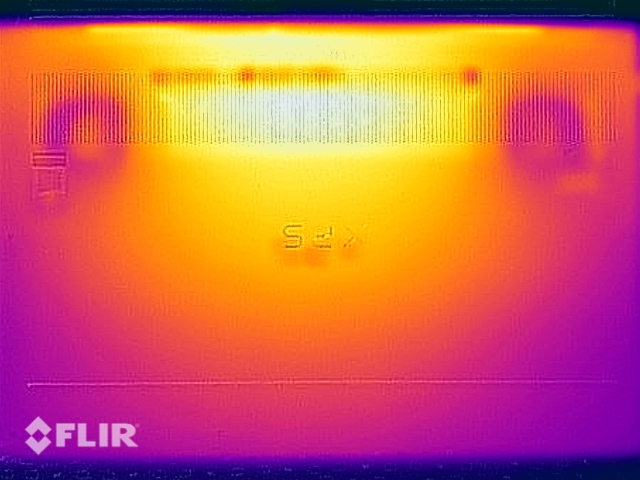
The surface temperatures of the XPS 15 are completely okay even under load, because the hot spots on the top and the bottom of the base unit only reach around 45 °C, which means you can still use it on your lap. You will notice the warm keyboard during typing, but there are no limitations and the palm rests are always comfortably cool. The surface temperatures do not change when you use the Ultra-Performance profile, because the additional heat is compensated by the higher fan speeds.
The behavior under combined workloads changed a bit after the BIOS update to version 1.4. We can see around 22W for the CPU and 28W for the GPU with the profile Optimized, but the GPU now gets more headroom when you use Ultra-Performance with 45W and 17W for the processor. It looks like the overall cooling performance of the system is around 50-60W with this fan configuration.
(-) The maximum temperature on the upper side is 45.5 °C / 114 F, compared to the average of 36.8 °C / 98 F, ranging from 21 to 71 °C for the class Multimedia.
(±) The bottom heats up to a maximum of 44.2 °C / 112 F, compared to the average of 39.1 °C / 102 F
(+) In idle usage, the average temperature for the upper side is 26.2 °C / 79 F, compared to the device average of 31.3 °C / 88 F.
(-) Playing The Witcher 3, the average temperature for the upper side is 38.8 °C / 102 F, compared to the device average of 31.3 °C / 88 F.
(+) The palmrests and touchpad are reaching skin temperature as a maximum (32 °C / 89.6 F) and are therefore not hot.
(-) The average temperature of the palmrest area of similar devices was 28.7 °C / 83.7 F (-3.3 °C / -5.9 F).
Speakers
The sound system (2 stereo tweeters with 1.5W + 2 stereo woofers with 2.5W) with a total power of 8W is one of the best in the mobile segment. It can be really loud and produces a rich and powerful sound. Our measurement also shows that the sound is very balanced, while many laptops have a focus on high tones.
However, there is a problem with very tones (like Windows notification sounds or classic music) because the modules will quickly start to clink even at comparatively low volumes. After the tip of a reader, we deleted the preloaded audio drivers from RealTek and just used the regular Windows drivers. This will solve the problem, but the sound is noticeably thinner and quieter, so this cannot be a permanent solution. Dell should definitely fix the drivers.
Dell XPS 15 9510 11800H RTX 3050 Ti OLED audio analysis
(+) | speakers can play relatively loud (88.8 dB)
Bass 100 - 315 Hz
(±) | reduced bass - on average 5.6% lower than median
(+) | bass is linear (4.3% delta to prev. frequency)
Mids 400 - 2000 Hz
(+) | balanced mids - only 3.9% away from median
(+) | mids are linear (4.1% delta to prev. frequency)
Highs 2 - 16 kHz
(+) | balanced highs - only 2.4% away from median
(+) | highs are linear (4.9% delta to prev. frequency)
Overall 100 - 16.000 Hz
(+) | overall sound is linear (8.4% difference to median)
Compared to same class
» 9% of all tested devices in this class were better, 2% similar, 89% worse
» The best had a delta of 5%, average was 17%, worst was 45%
Compared to all devices tested
» 2% of all tested devices were better, 1% similar, 97% worse
» The best had a delta of 4%, average was 24%, worst was 134%
Apple MacBook Pro 16 2019 i9 5500M audio analysis
(+) | speakers can play relatively loud (82.3 dB)
Bass 100 - 315 Hz
(+) | good bass - only 2.3% away from median
(+) | bass is linear (5% delta to prev. frequency)
Mids 400 - 2000 Hz
(+) | balanced mids - only 2.7% away from median
(+) | mids are linear (3.4% delta to prev. frequency)
Highs 2 - 16 kHz
(+) | balanced highs - only 2.1% away from median
(+) | highs are linear (2.6% delta to prev. frequency)
Overall 100 - 16.000 Hz
(+) | overall sound is linear (6.9% difference to median)
Compared to same class
» 5% of all tested devices in this class were better, 1% similar, 94% worse
» The best had a delta of 5%, average was 17%, worst was 45%
Compared to all devices tested
» 1% of all tested devices were better, 0% similar, 99% worse
» The best had a delta of 4%, average was 24%, worst was 134%
Lenovo ThinkPad X1 Extreme Gen3-20TLS0UV00 audio analysis
(±) | speaker loudness is average but good (77.2 dB)
Bass 100 - 315 Hz
(±) | reduced bass - on average 9.1% lower than median
(±) | linearity of bass is average (11.6% delta to prev. frequency)
Mids 400 - 2000 Hz
(±) | higher mids - on average 7.2% higher than median
(+) | mids are linear (5.4% delta to prev. frequency)
Highs 2 - 16 kHz
(+) | balanced highs - only 3.9% away from median
(+) | highs are linear (5.7% delta to prev. frequency)
Overall 100 - 16.000 Hz
(±) | linearity of overall sound is average (19.7% difference to median)
Compared to same class
» 65% of all tested devices in this class were better, 6% similar, 29% worse
» The best had a delta of 5%, average was 17%, worst was 45%
Compared to all devices tested
» 50% of all tested devices were better, 7% similar, 43% worse
» The best had a delta of 4%, average was 24%, worst was 134%
Energy Management - OLED costs battery runtime
Power Consumption
The power consumption of models with OLED panels is always hard to measure since there can be big differences depending on whether you have dark or bright pictures. Dell also uses the dark theme of Windows and the background image is also pretty dark. If you primarily browse the web, however, where there are often bright websites, the consumption will be higher.
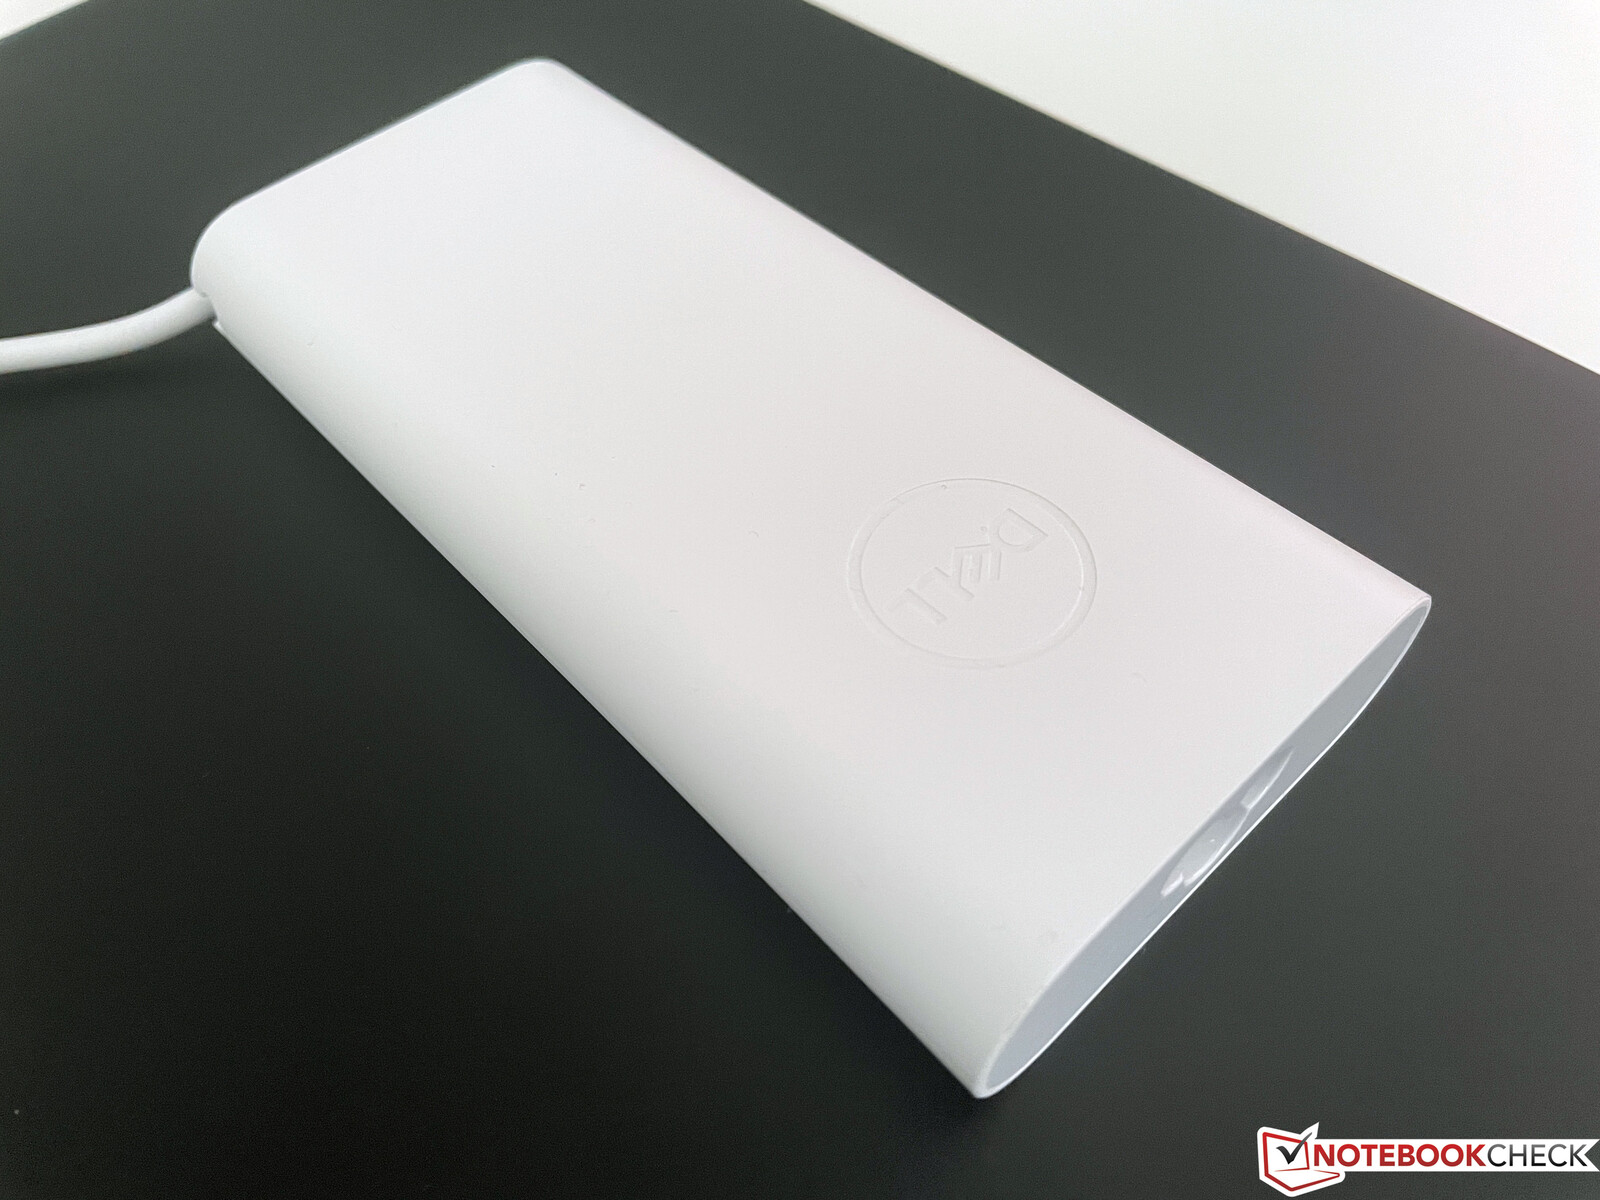
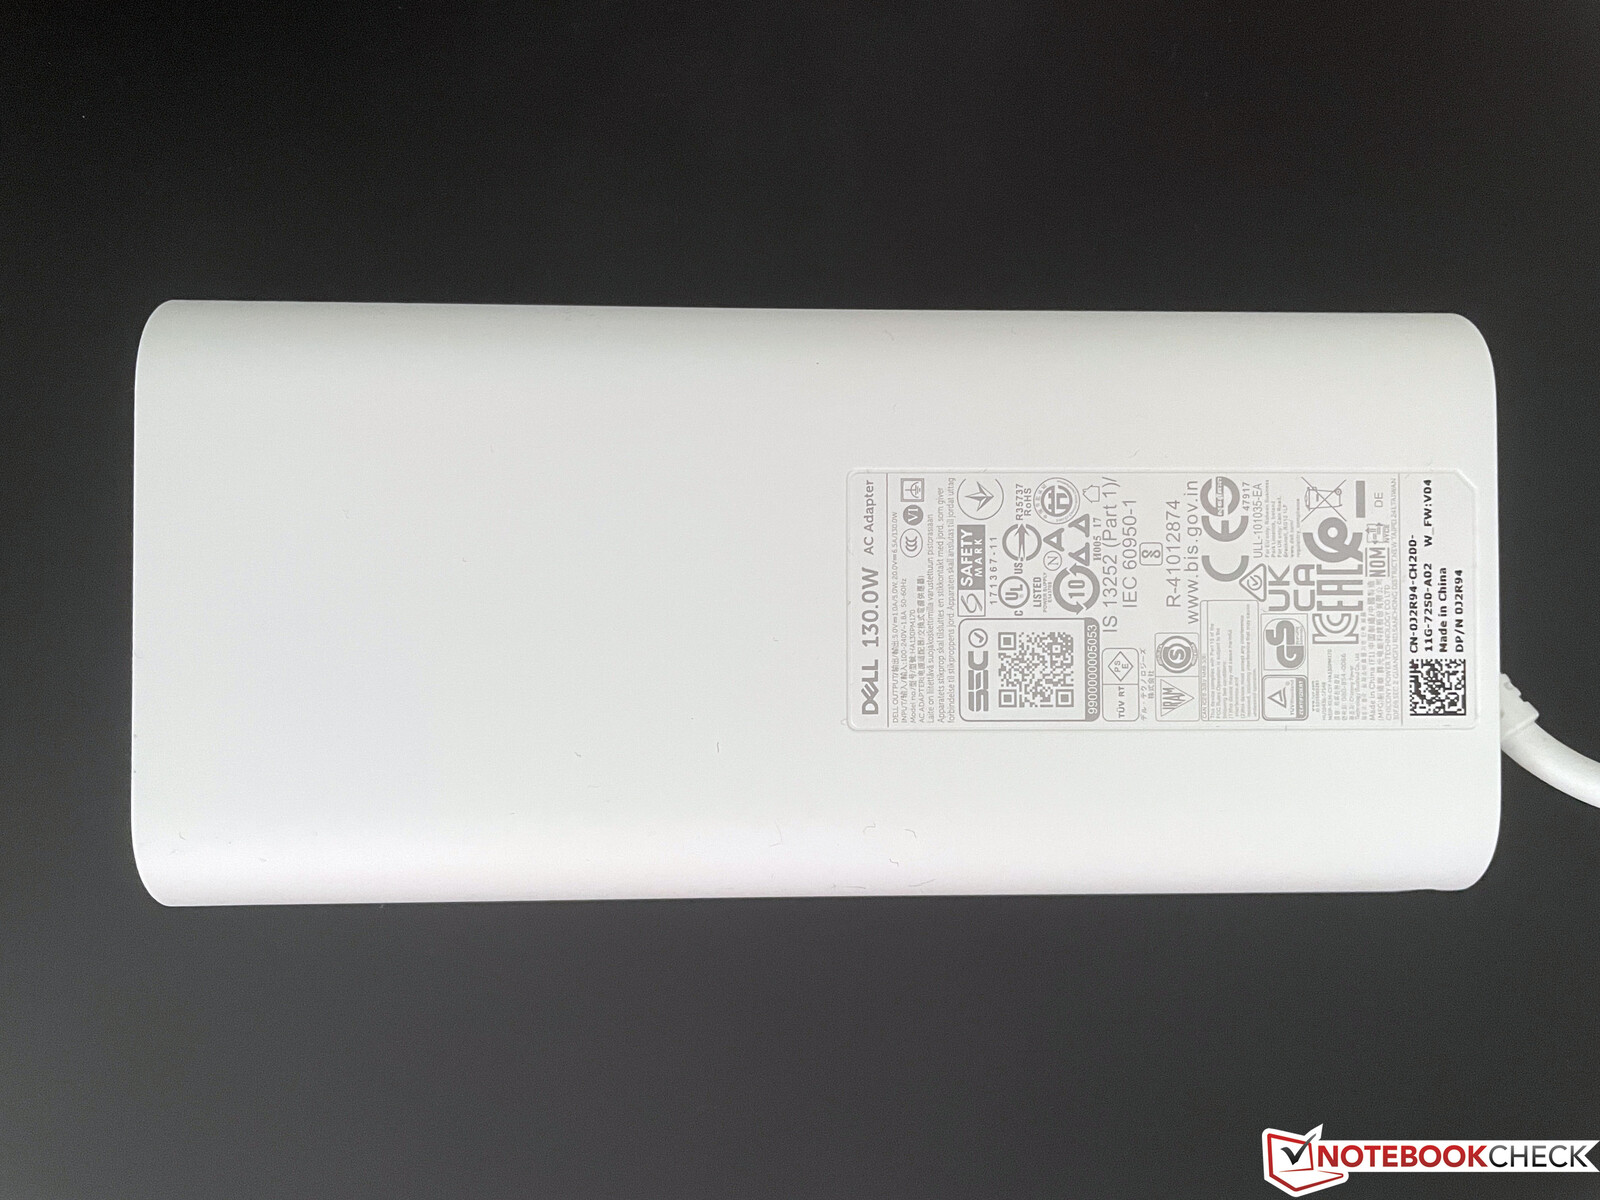
There are no surprises under load. The maximum value of 130W under load is limited to a few seconds and quickly drops to around 105W during the stress test before it levels off at about 80W. The provided 130W PSU (USB-C) is therefore completely sufficient.
| Off / Standby | |
| Idle | |
| Load |
|
Key:
min: | |
| Dell XPS 15 9510 11800H RTX 3050 Ti OLED i7-11800H, GeForce RTX 3050 Ti Laptop GPU, Micron 2300 512GB MTFDHBA512TDV, OLED, 3456x2160, 15.6" | Apple MacBook Pro 16 2019 i9 5500M i9-9880H, Radeon Pro 5500M, Apple SSD AP1024 7171, IPS, 3072x1920, 16" | Lenovo ThinkPad X1 Extreme Gen3-20TLS0UV00 i7-10750H, GeForce GTX 1650 Ti Max-Q, Toshiba XG6 KXG6AZNV1T02, IPS, 1920x1080, 15.6" | Gigabyte Aero 15 OLED XD i7-11800H, GeForce RTX 3070 Laptop GPU, Samsung PM9A1 MZVL21T0HCLR, OLED, 3840x2160, 15.6" | Dell XPS 15 9500 Core i7 4K UHD i7-10875H, GeForce GTX 1650 Ti Mobile, SK Hynix PC611 512GB, IPS, 3840x2400, 15.6" | Average NVIDIA GeForce RTX 3050 Ti Laptop GPU | Average of class Multimedia | |
|---|---|---|---|---|---|---|---|
| Power Consumption | -9% | -1% | -127% | -26% | -23% | 9% | |
| Idle Minimum * (Watt) | 7.6 | 3.7 51% | 5 34% | 23 -203% | 5.7 25% | 8.2 ? -8% | 5.67 ? 25% |
| Idle Average * (Watt) | 9.9 | 12.1 -22% | 9 9% | 26 -163% | 13.5 -36% | 12.6 ? -27% | 9.99 ? -1% |
| Idle Maximum * (Watt) | 10.8 | 17 -57% | 12.2 -13% | 34 -215% | 19.6 -81% | 17.2 ? -59% | 12.4 ? -15% |
| Load Average * (Watt) | 81 | 91.5 -13% | 94.4 -17% | 99 -22% | 114.1 -41% | 92 ? -14% | 64.7 ? 20% |
| Witcher 3 ultra * (Watt) | 76.2 | 103 -35% | 89 -17% | 163 -114% | 93 -22% | ||
| Load Maximum * (Watt) | 131 | 102.3 22% | 133.9 -2% | 190 -45% | 135.2 -3% | 139.1 ? -6% | 112 ? 15% |
* ... smaller is better
Power Consumption Witcher 3 / Stress test
Battery Runtime
The practical battery runtime also depends a lot on the display contents. Our Wi-Fi test, for example, uses a lot of bright websites, which is definitely noticeable. The test unit only manages 7 hours at 150 cd/m², which is much shorter compared to the predecessor with the 4K IPS screen. If you use the maximum brightness, the runtime even drops to just about 6 hours with the large 86 Wh battery. The video test with more dark scenes improves the runtime to more than 10 hours. All in all, you have to expect shorter battery runtimes compared to the optional 4K panel.
| Dell XPS 15 9510 11800H RTX 3050 Ti OLED i7-11800H, GeForce RTX 3050 Ti Laptop GPU, 86 Wh | Apple MacBook Pro 16 2019 i9 5500M i9-9880H, Radeon Pro 5500M, 99.8 Wh | Lenovo ThinkPad X1 Extreme Gen3-20TLS0UV00 i7-10750H, GeForce GTX 1650 Ti Max-Q, 80 Wh | Gigabyte Aero 15 OLED XD i7-11800H, GeForce RTX 3070 Laptop GPU, 99 Wh | Dell XPS 15 9500 Core i7 4K UHD i7-10875H, GeForce GTX 1650 Ti Mobile, 86 Wh | Dell XPS 15 9500 Core i5 i5-10300H, UHD Graphics 630, 56 Wh | Average of class Multimedia | |
|---|---|---|---|---|---|---|---|
| Battery runtime | 7% | 20% | 21% | 21% | 11% | 40% | |
| H.264 (h) | 10.4 | 9.7 -7% | 12.2 17% | 16.3 ? 57% | |||
| WiFi v1.3 (h) | 7 | 12 71% | 11.6 66% | 8.5 21% | 9.1 30% | 9.3 33% | 12 ? 71% |
| Load (h) | 1.8 | 1 -44% | 1.4 -22% | 2 11% | 1.6 -11% | 1.672 ? -7% | |
| Witcher 3 ultra (h) | 0.9 | 2.2 | |||||
| Reader / Idle (h) | 23 | 26.4 | 25.2 ? |
Pros
Cons
Verdict - XPS 15 still has some software bugs
Dell uses new processor, new graphics cards and a new optional display for the XPS 15 9510. After our review, not all aspects are very convincing. It seems there are still a couple of software issues, which were improved with the latest BIOS updates, but not all of them have been fixed.
The new Intel processor offers good performance, but also requires a lot of power. You can only use the full performance in multi-core scenarios for a couple of seconds. A comparison with modern AMD CPUs also shows that Intel CPUs are falling behind in terms of efficiency.
The graphics card is another problem. The switch from the GTX 1650 Ti to the new RTX 3050 Ti is an improvement in general, but the GPU performance is not stable with the default settings in Dell’s energy software and you have to use the Ultra-Performance mode. However, you should not expect major improvements, because the predecessor was still equipped with a 50W model of the GTX 1650 Ti, but now it is “only” the 45W version.
The performance might not fully meet our expectations, but it is still decent for a multimedia laptop and you can enjoy much quieter fans in most situations. The fan curve is also very defensive and peak load is often compensated without the activation of the fans.
The new XPS 15 9510 with the OLED screen is once again a very good multimedia laptop, but some software/drivers issues prevent a better score and should be fixed soon. You should not expect big performance improvements from the graphics card, because Dell uses one of the slowest version of the GeForce RTX 3050 Ti.
The new OLED screen offers great image quality and convinces with good color accuracy and extremely fast response times. However, we detected PWM flickering and the battery runtime is shorter compared to the 4K IPS screen.
The sound system is also very good, but the modules clink noticeably when you play very high tones (like Windows notification sounds or classic music). The problem is solved after the removal of the RealTek drivers, but the sound will be much thinner and quieter, so it is not a real solution.
The software issues concerning the performance utilization or the drivers issue with the speakers should be fixed as soon as possible. The new XPS 15 9510 is still a very good multimedia laptop, but there are some things you should know before you buy it. Right now, we cannot yet recommend it for all users.
The competition is very strong in the price range of 2500 Euros and there are much more powerful gaming laptops like the Gigabyte Aero 15, which is also equipped with an OLED screen. If you prefer a better keyboard and want more ports, you should have a look at the Lenovo ThinkPad X1 Extreme, which will also get an update very soon. Apple’s MacBook Pro 16 is also a strong rival, but we expect a major refresh soon, so we would not recommend the current model with old processors for the full price anymore.
Price and Availability
The new XPS 15 9510 can be configured on Dell's website starting from $1299 with the Core i5 processor. Our review configuration is sold for $2500.
Dell XPS 15 9510 11800H RTX 3050 Ti OLED
- 08/08/2021 v7 (old)
Andreas Osthoff
Price comparison
