Lenovo ThinkPad X1 Extreme 2019 Laptop Review: The second generation of Lenovo's premier multimedia laptop has gotten worse
It has only been a year since Lenovo entered the premium multimedia laptop market, with the ThinkPad X1 Extreme competing against the Dell XPS 15, the HP Spectre x360 15 and the Apple MacBook Pro 15. The company's first attempt convinced us with the usual qualities of ThinkPads, while its numerous security features made the device interesting for consumers and professionals alike.
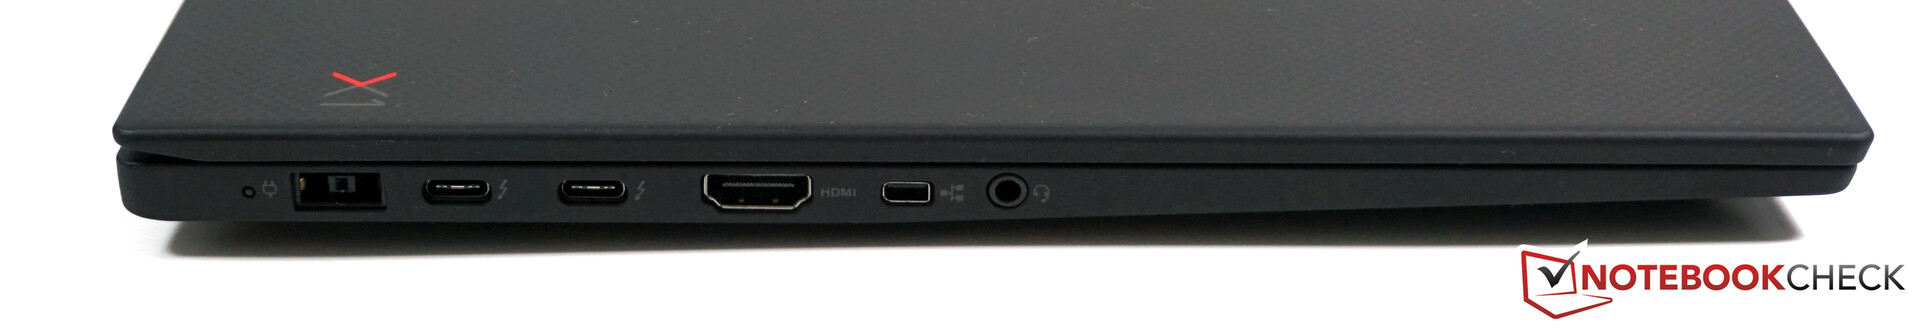
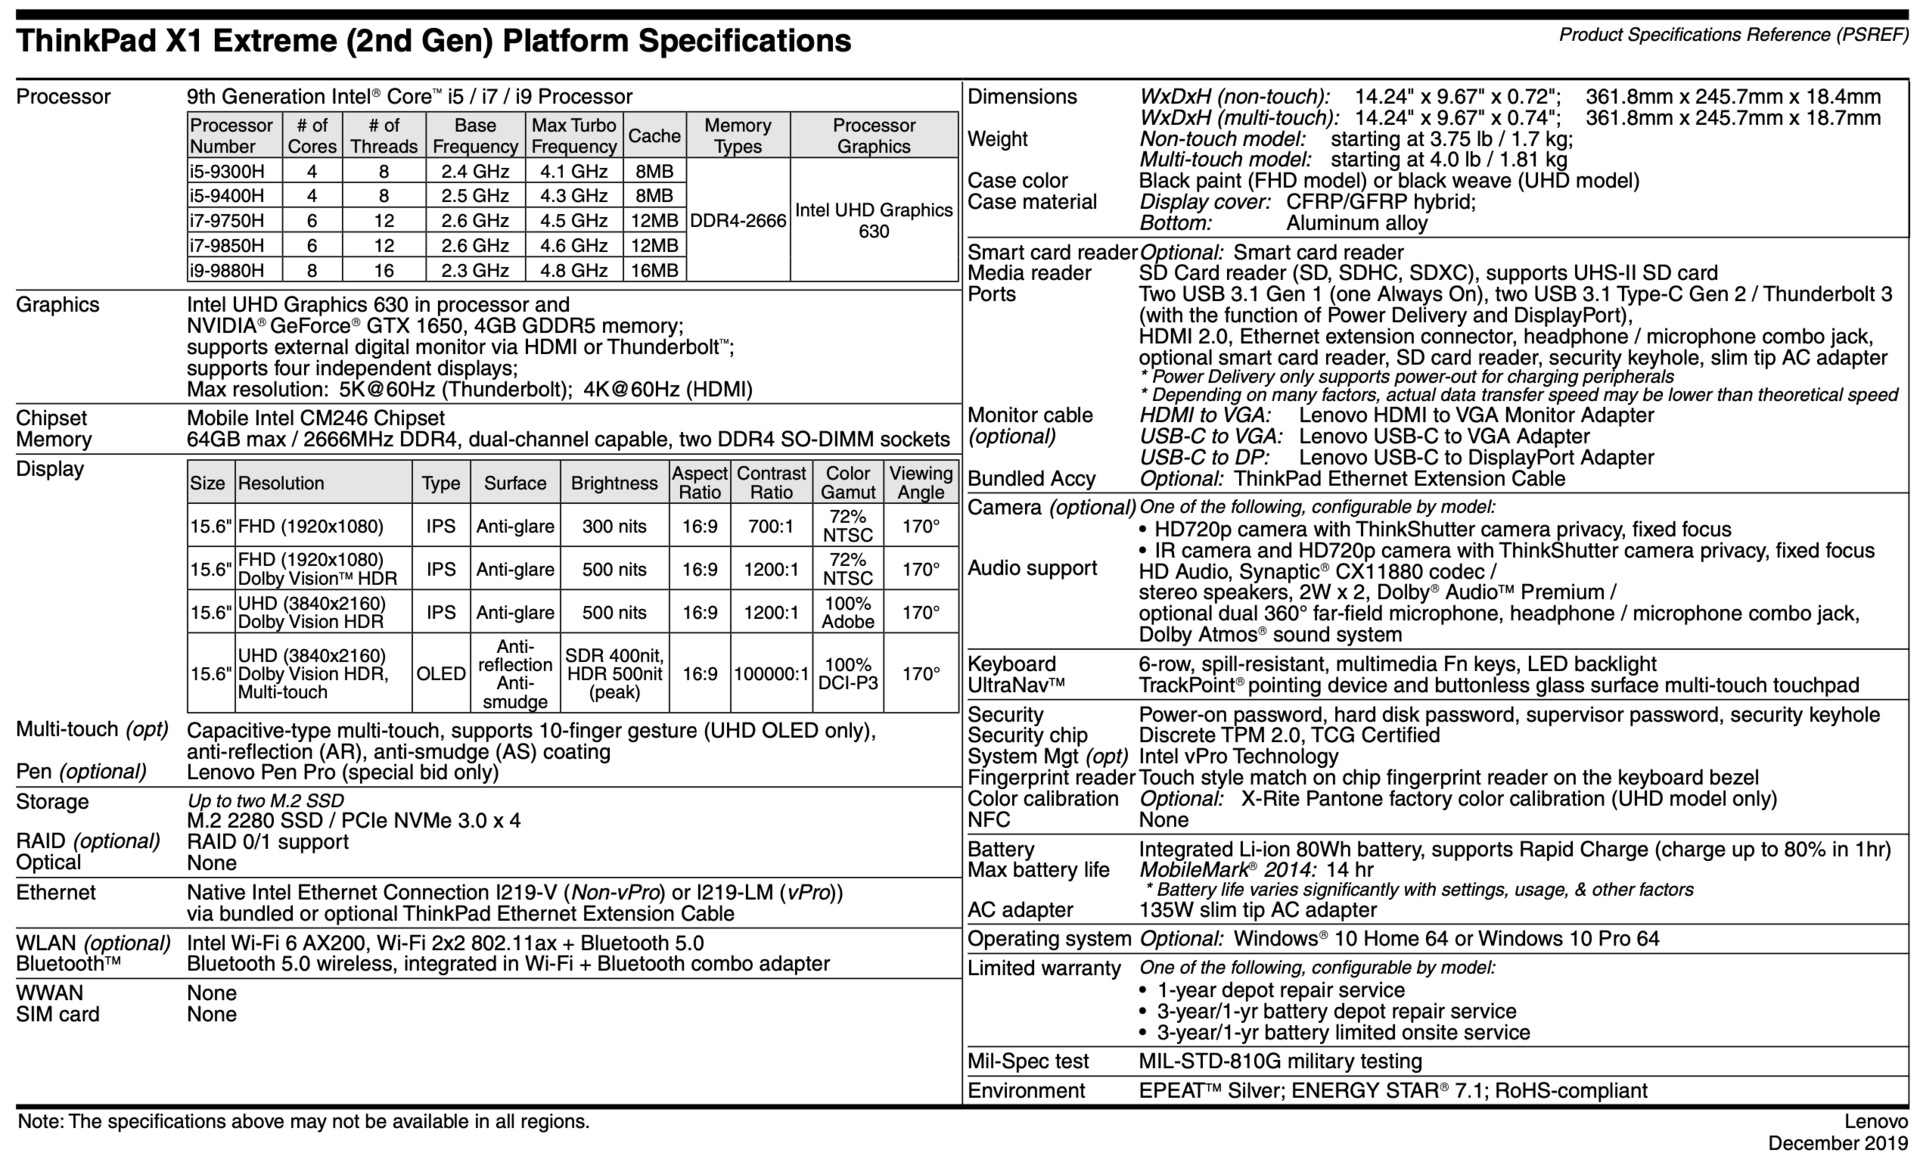
Since then, Lenovo has released a second generation, with which it equipped updated components and new displays options. Since almost nothing has changed visually this year, we shall refer you to our review of last year's model for our thoughts here. The same applies to the ports and input devices that the X1 Extreme Gen 2 offers. Alternatively, we have also reviewed the ThinkPad P1 2019, the workstation offshoot of the X1 Extreme. The ThinkPad P1 2019 and X1 Extreme Gen 2 share the same chassis, ports and connectivity, for reference.
Update 03/06/2020: Nvidia now confirmed that the second generation of the ThinkPad X1 Extreme is equipped with the Max-Q version of the GeForce GTX 1650. The designation is supposed to be corrected with the next driver version. However, we still have no official answer from Lenovo. The fact that official spec sheets list different versions is highly irritating for potential customers and should be fixed.
Rating | Date | Model | Weight | Height | Size | Resolution | Price |
|---|---|---|---|---|---|---|---|
| 87.1 % v7 (old) | 02 / 2020 | Lenovo ThinkPad X1 Extreme 2019 20QV000WGE i7-9750H, GeForce GTX 1650 Mobile | 1.7 kg | 18.7 mm | 15.60" | 3840x2160 | |
| 87.8 % v7 (old) | 08 / 2019 | Dell XPS 15 7590 9980HK GTX 1650 i9-9980HK, GeForce GTX 1650 Mobile | 2 kg | 17 mm | 15.60" | 3840x2160 | |
| 89.7 % v7 (old) | 12 / 2019 | Apple MacBook Pro 16 2019 i9 5500M i9-9880H, Radeon Pro 5500M | 2 kg | 16.2 mm | 16.00" | 3072x1920 | |
| 87.3 % v7 (old) | 11 / 2019 | Acer ConceptD 7 CN715-71-743N i7-9750H, GeForce RTX 2060 Mobile | 2.2 kg | 17.9 mm | 15.60" | 3840x2160 | |
| 86 % v7 (old) | 12 / 2019 | Lenovo Yoga C940-15IRH i7-9750H, GeForce GTX 1650 Max-Q | 2 kg | 19.7 mm | 15.60" | 1920x1080 | |
| 85.2 % v7 (old) | 11 / 2019 | MSI Prestige 15 A10SC i7-10710U, GeForce GTX 1650 Max-Q | 1.7 kg | 16 mm | 15.60" | 3840x2160 |
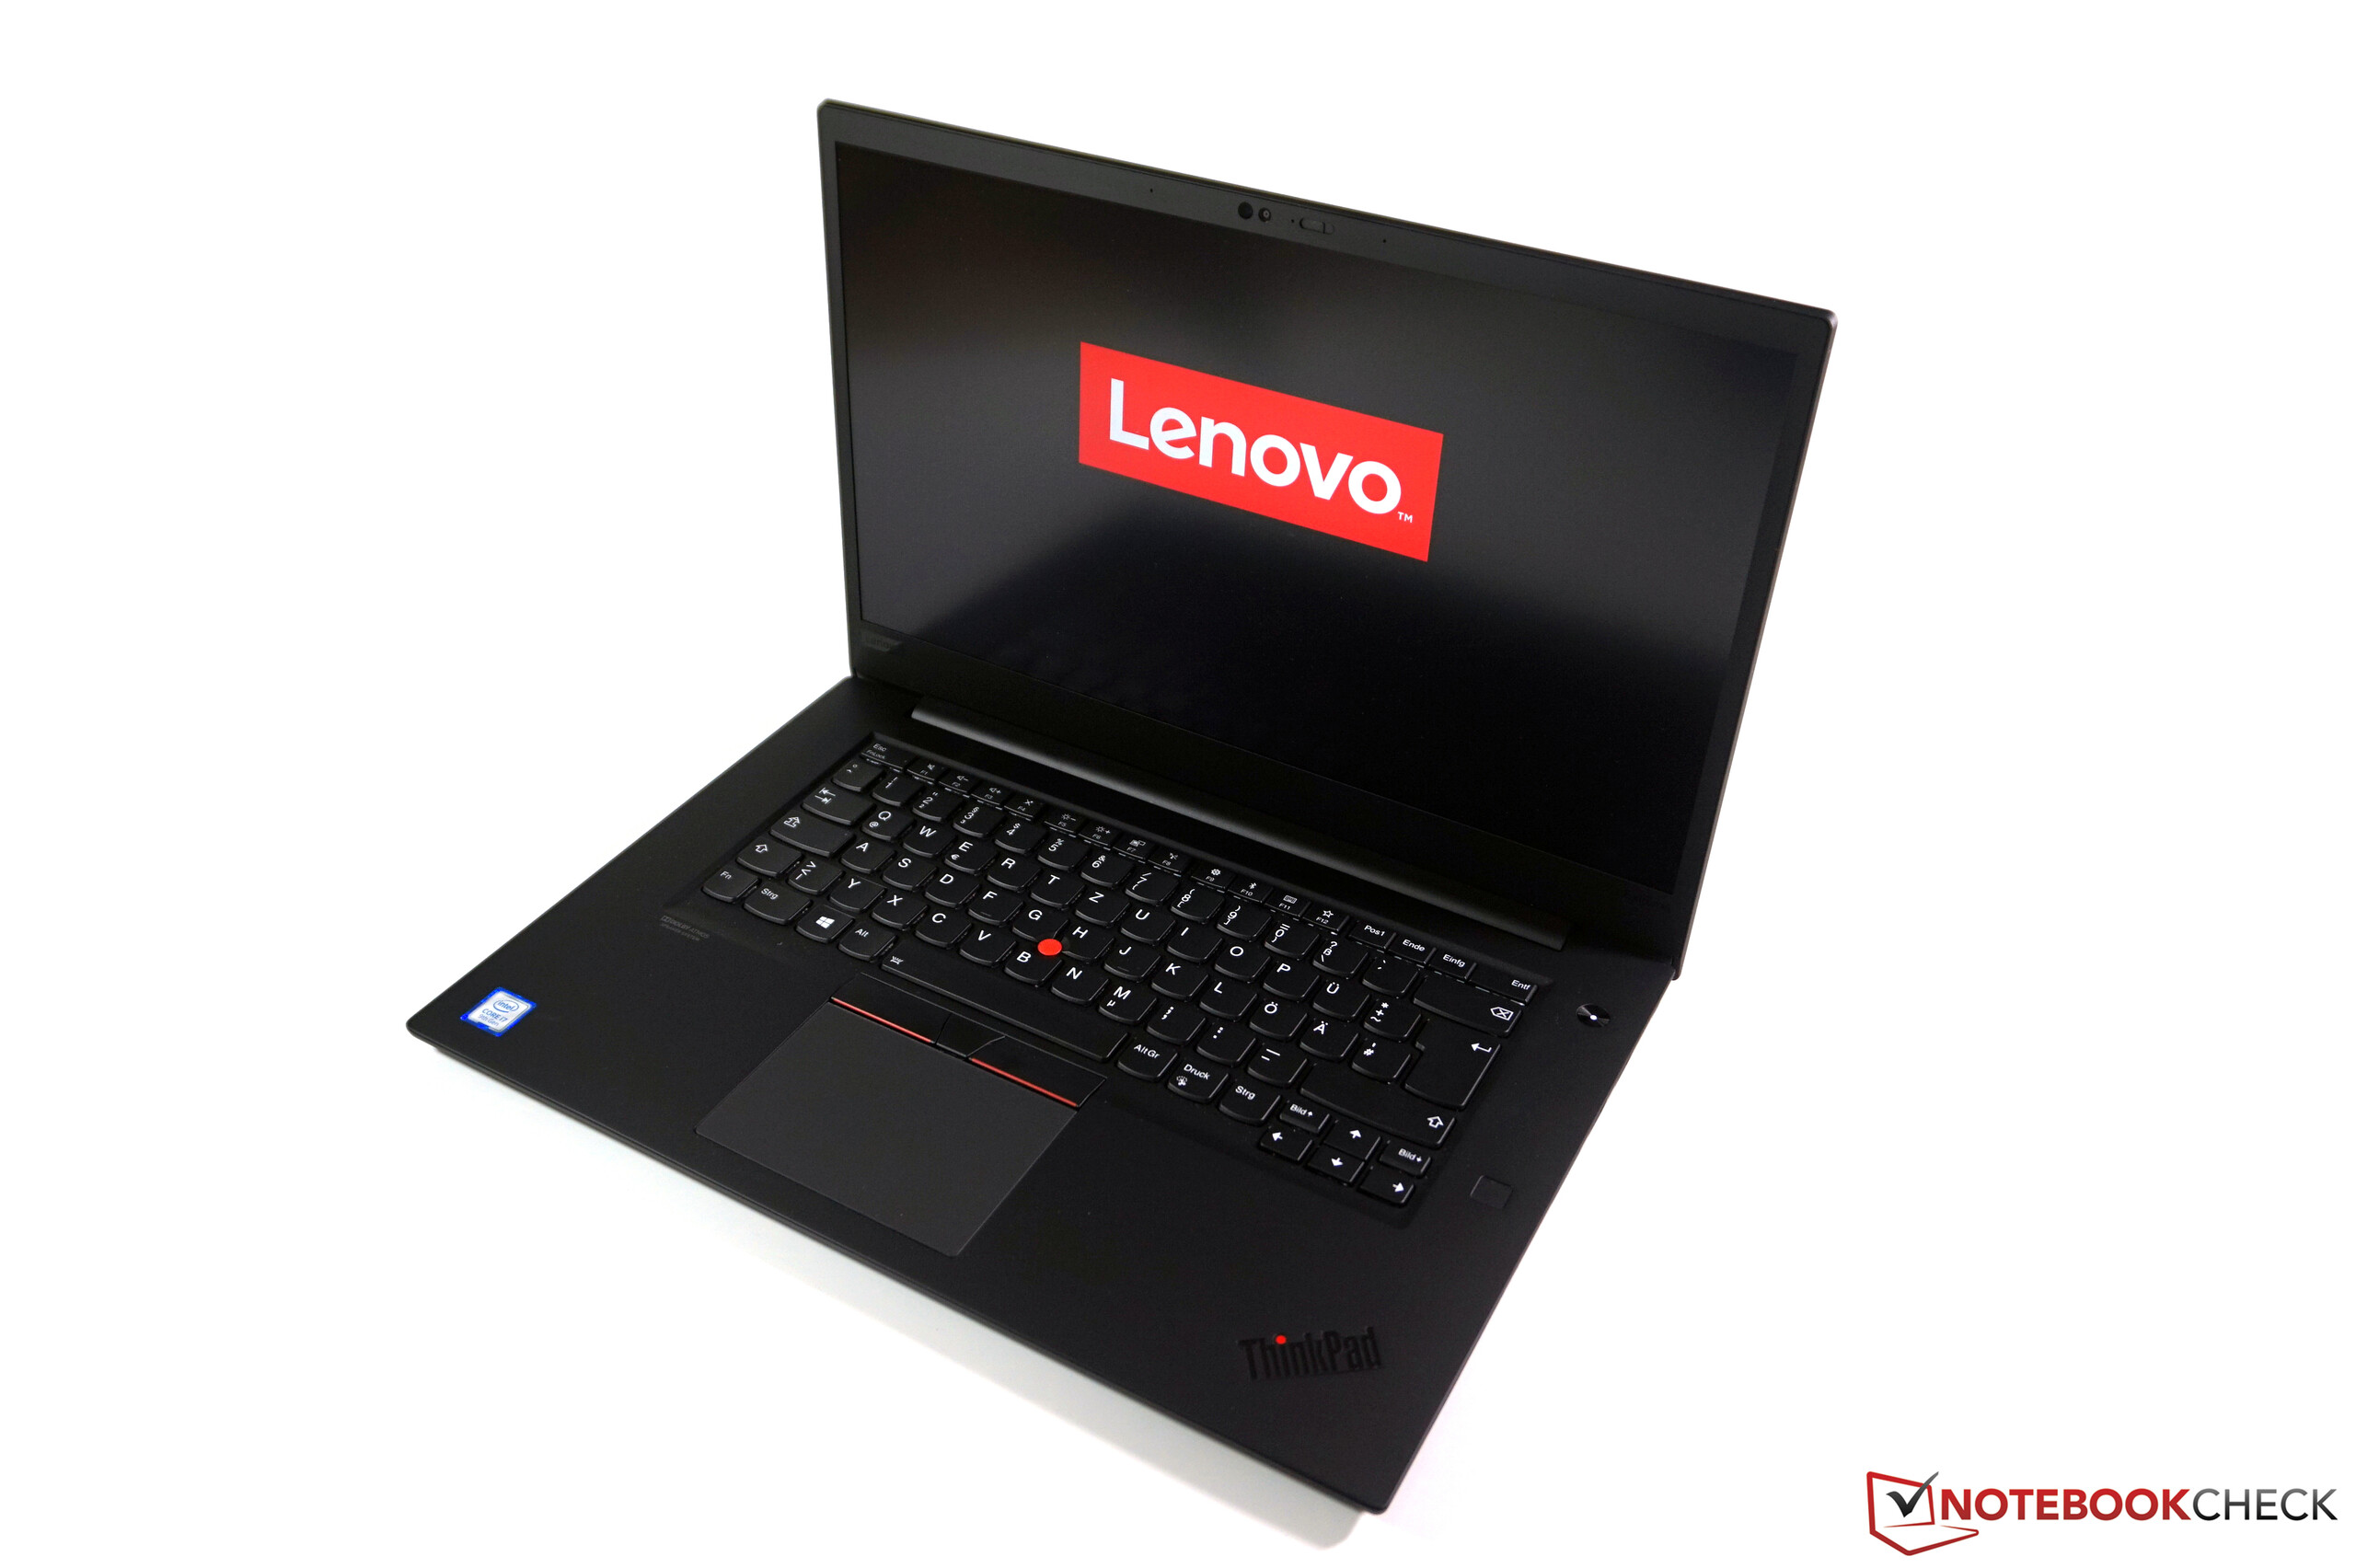
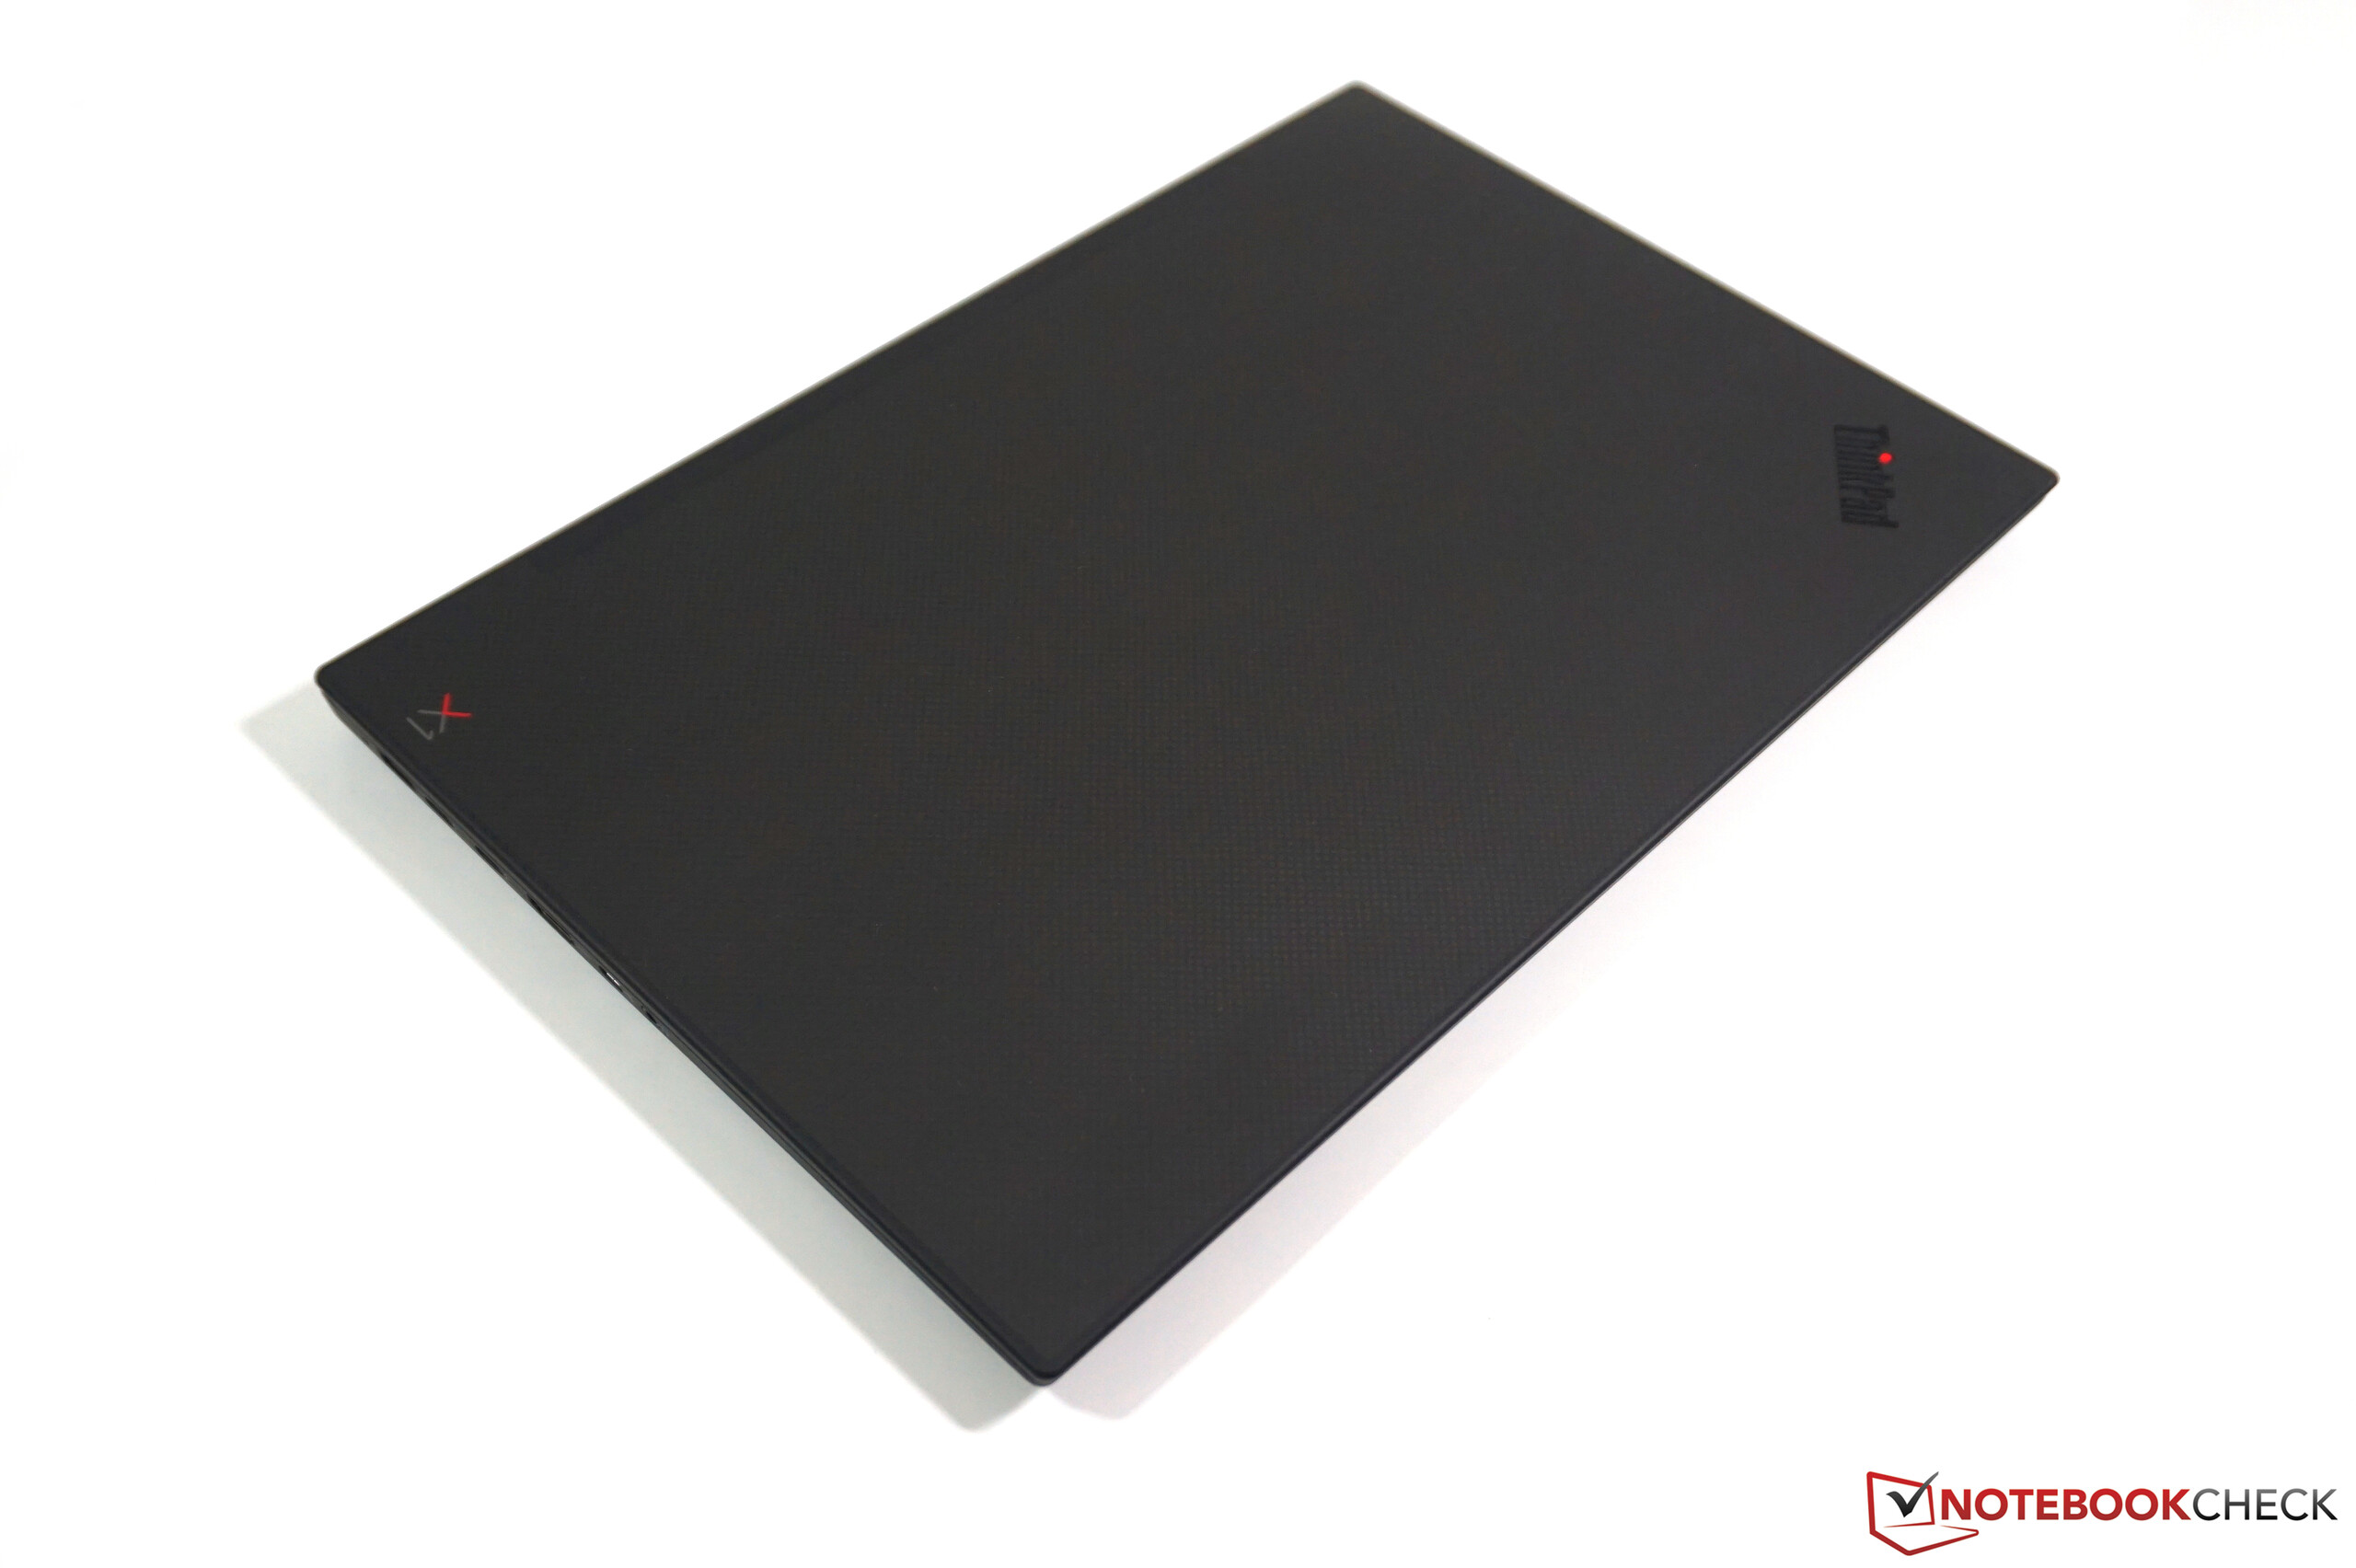
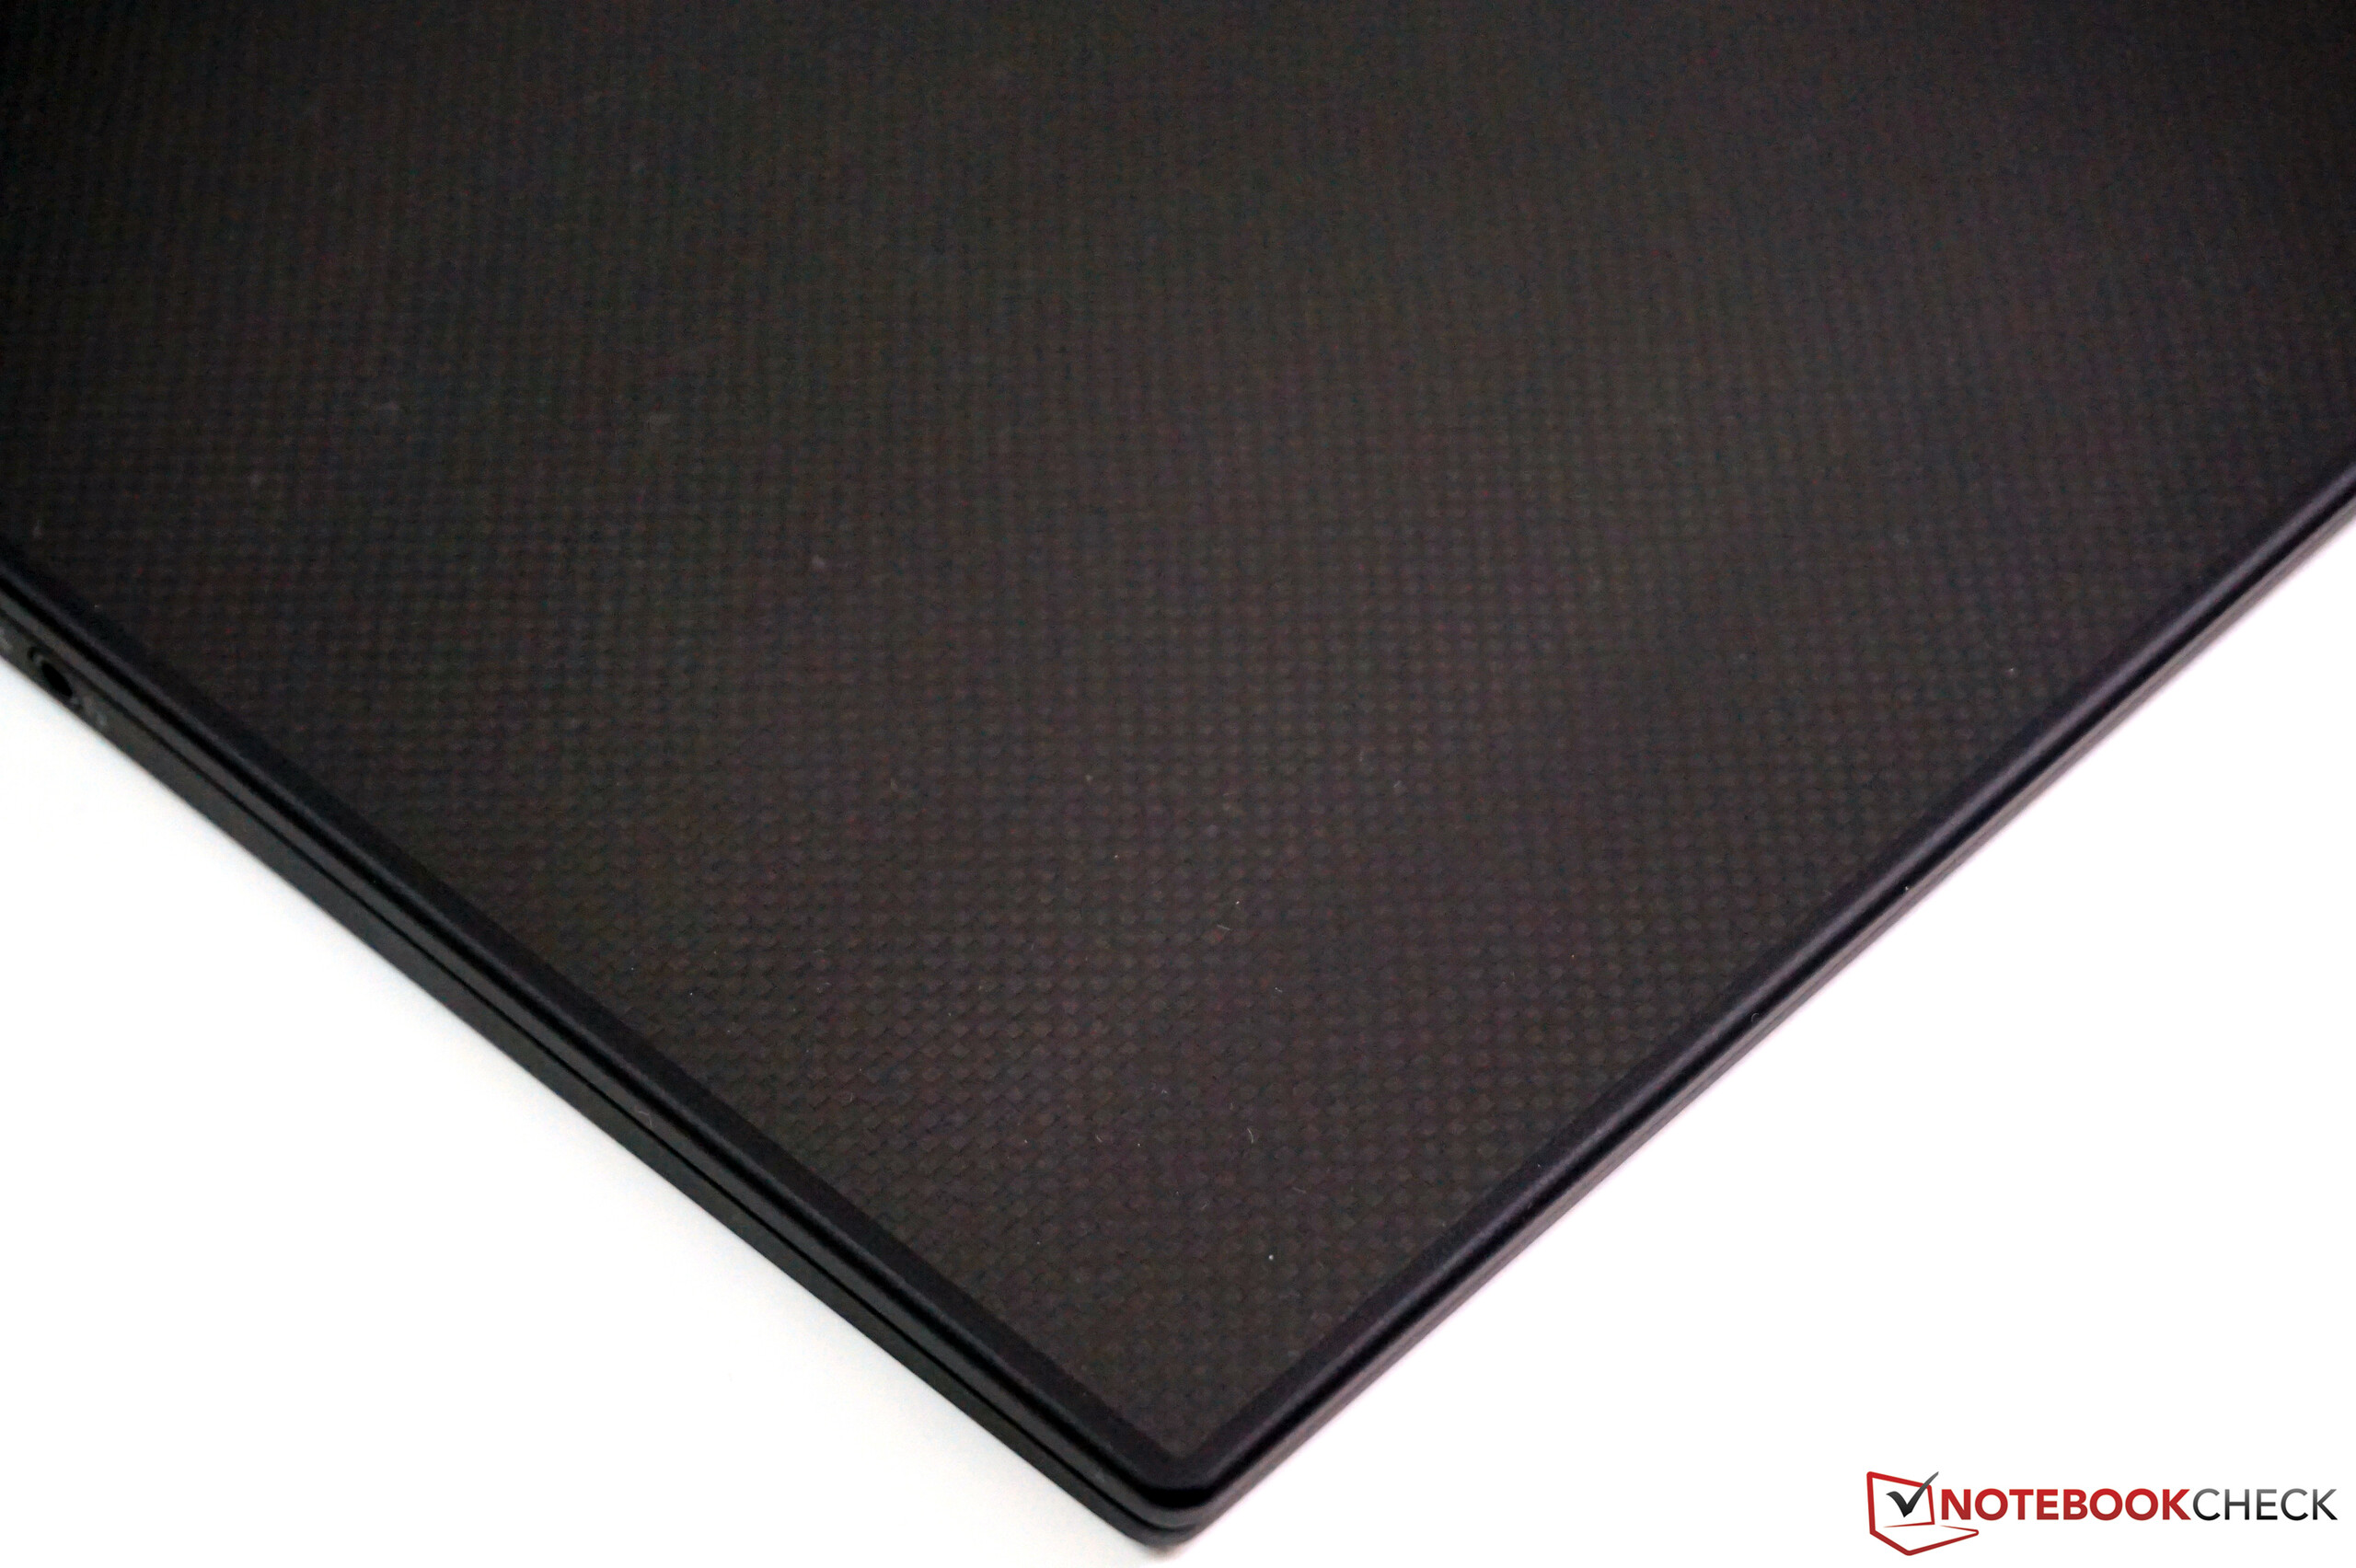
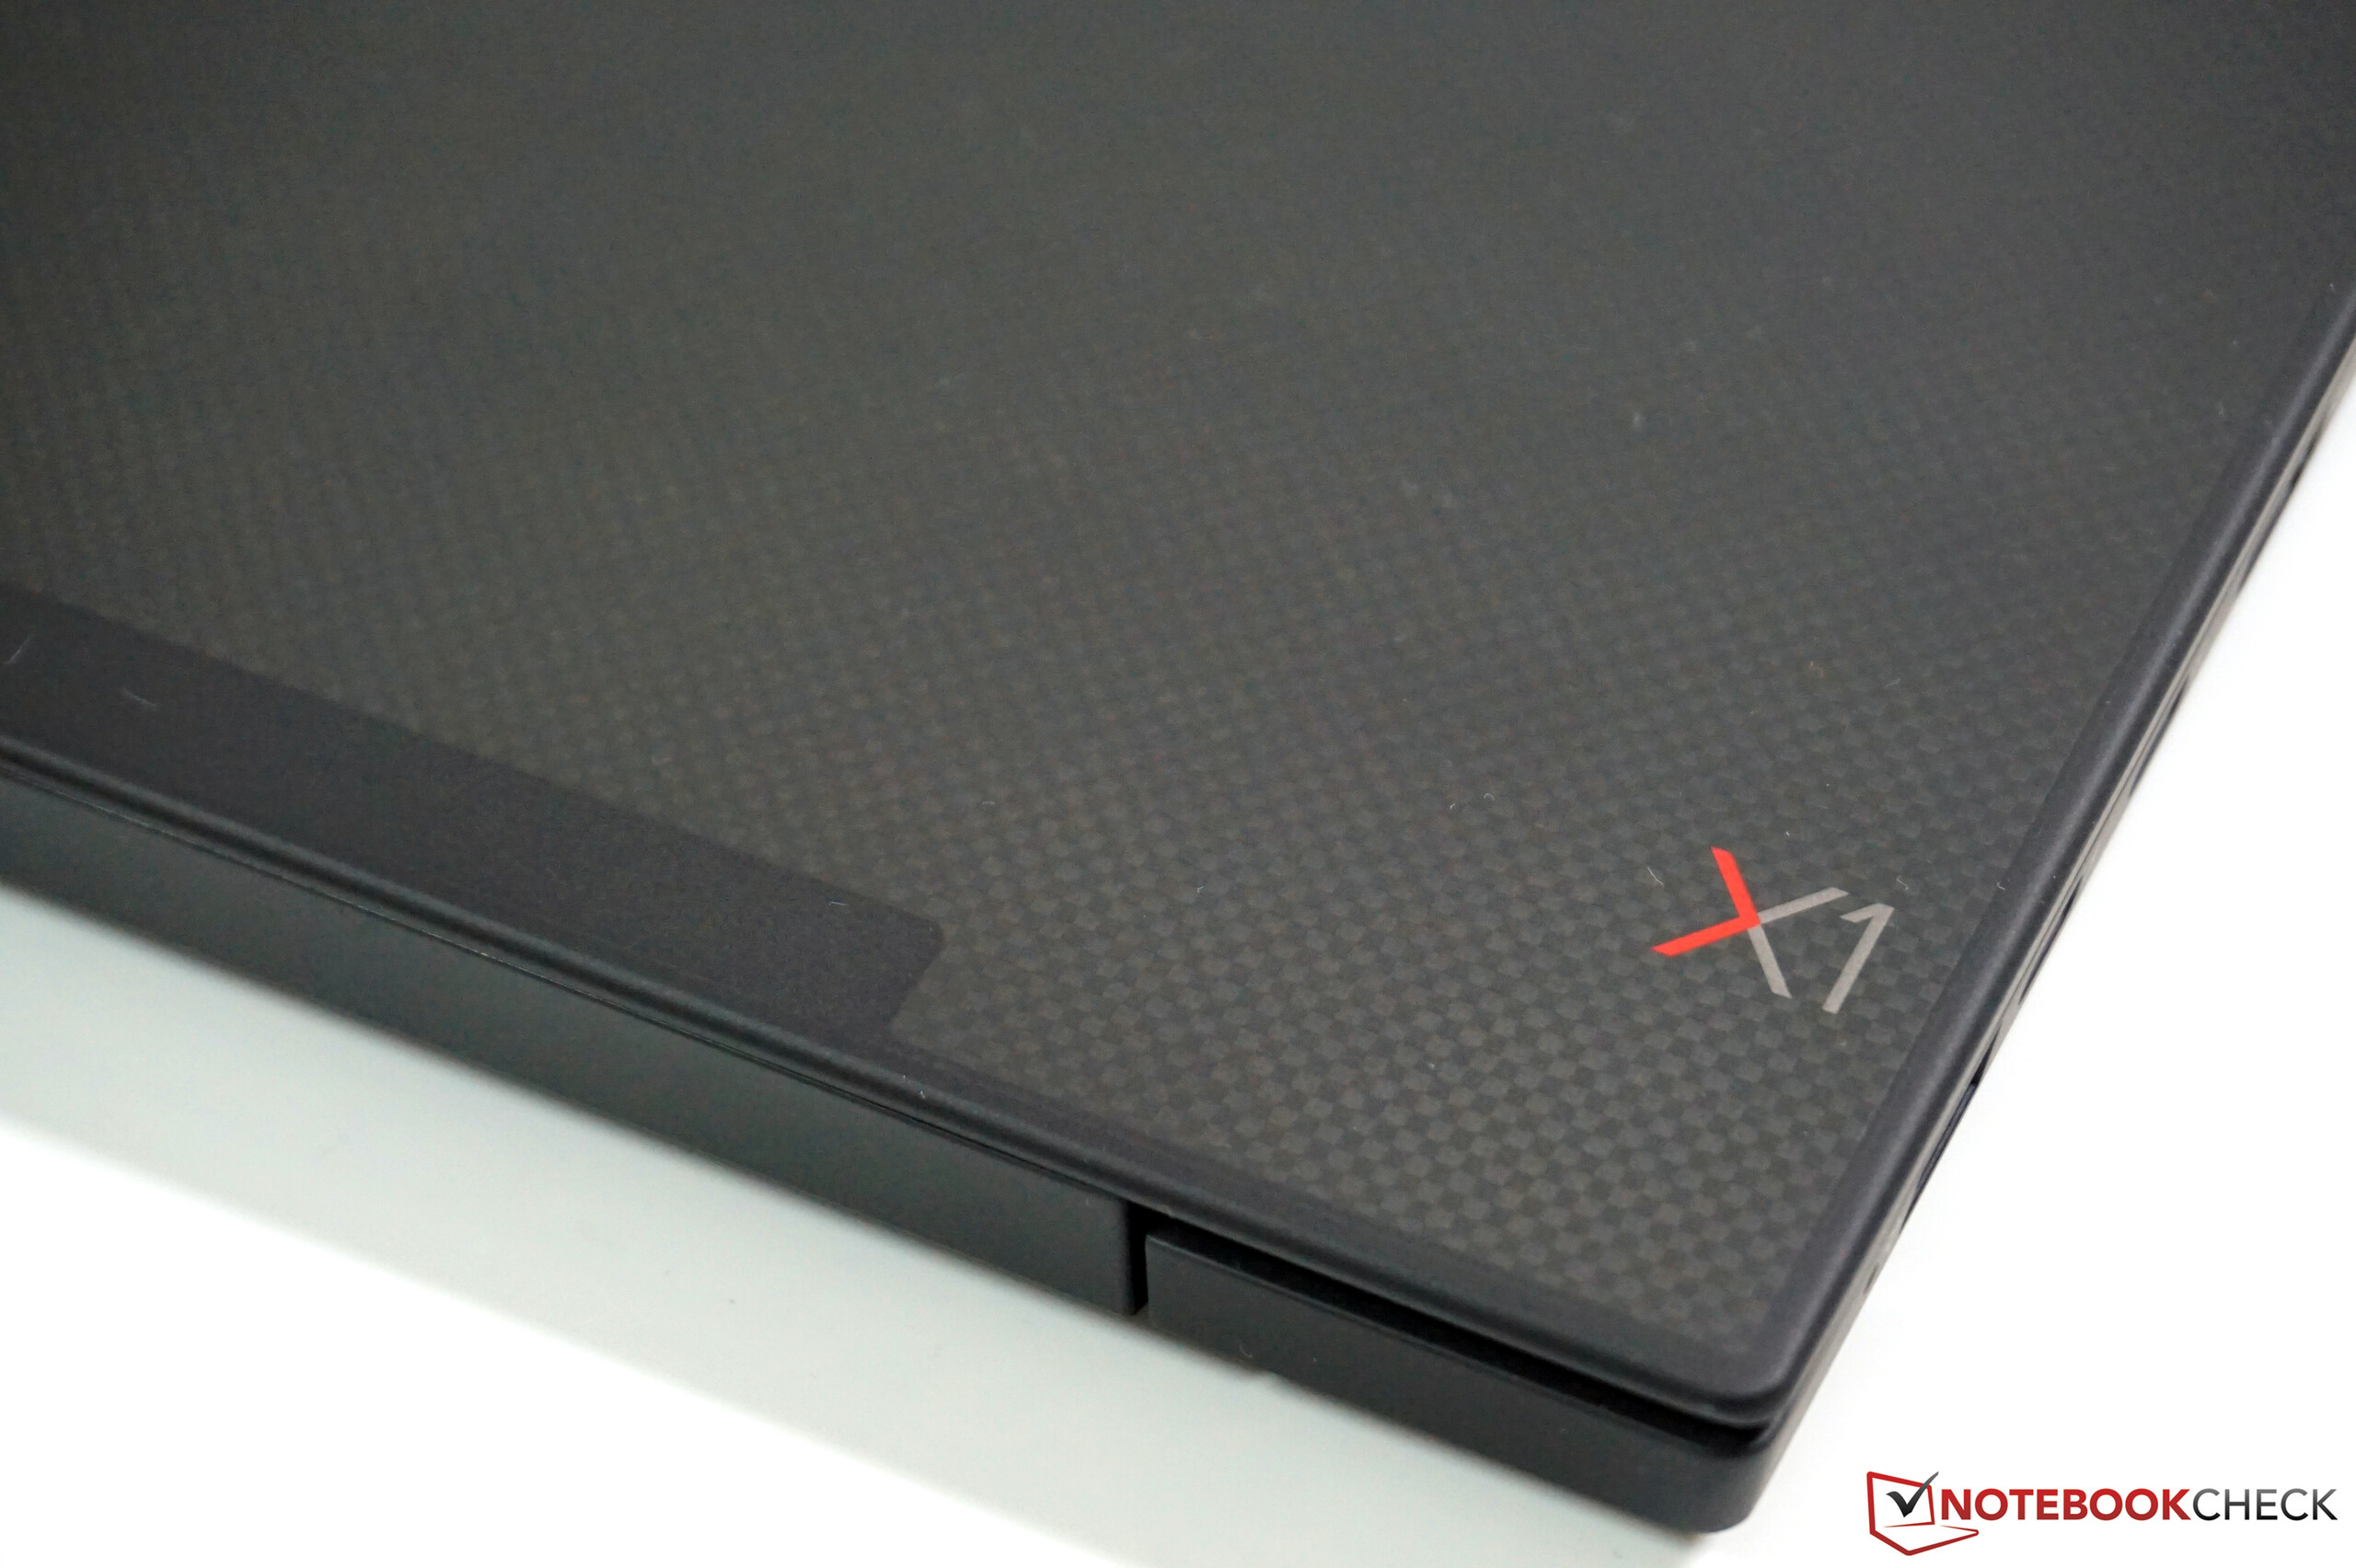
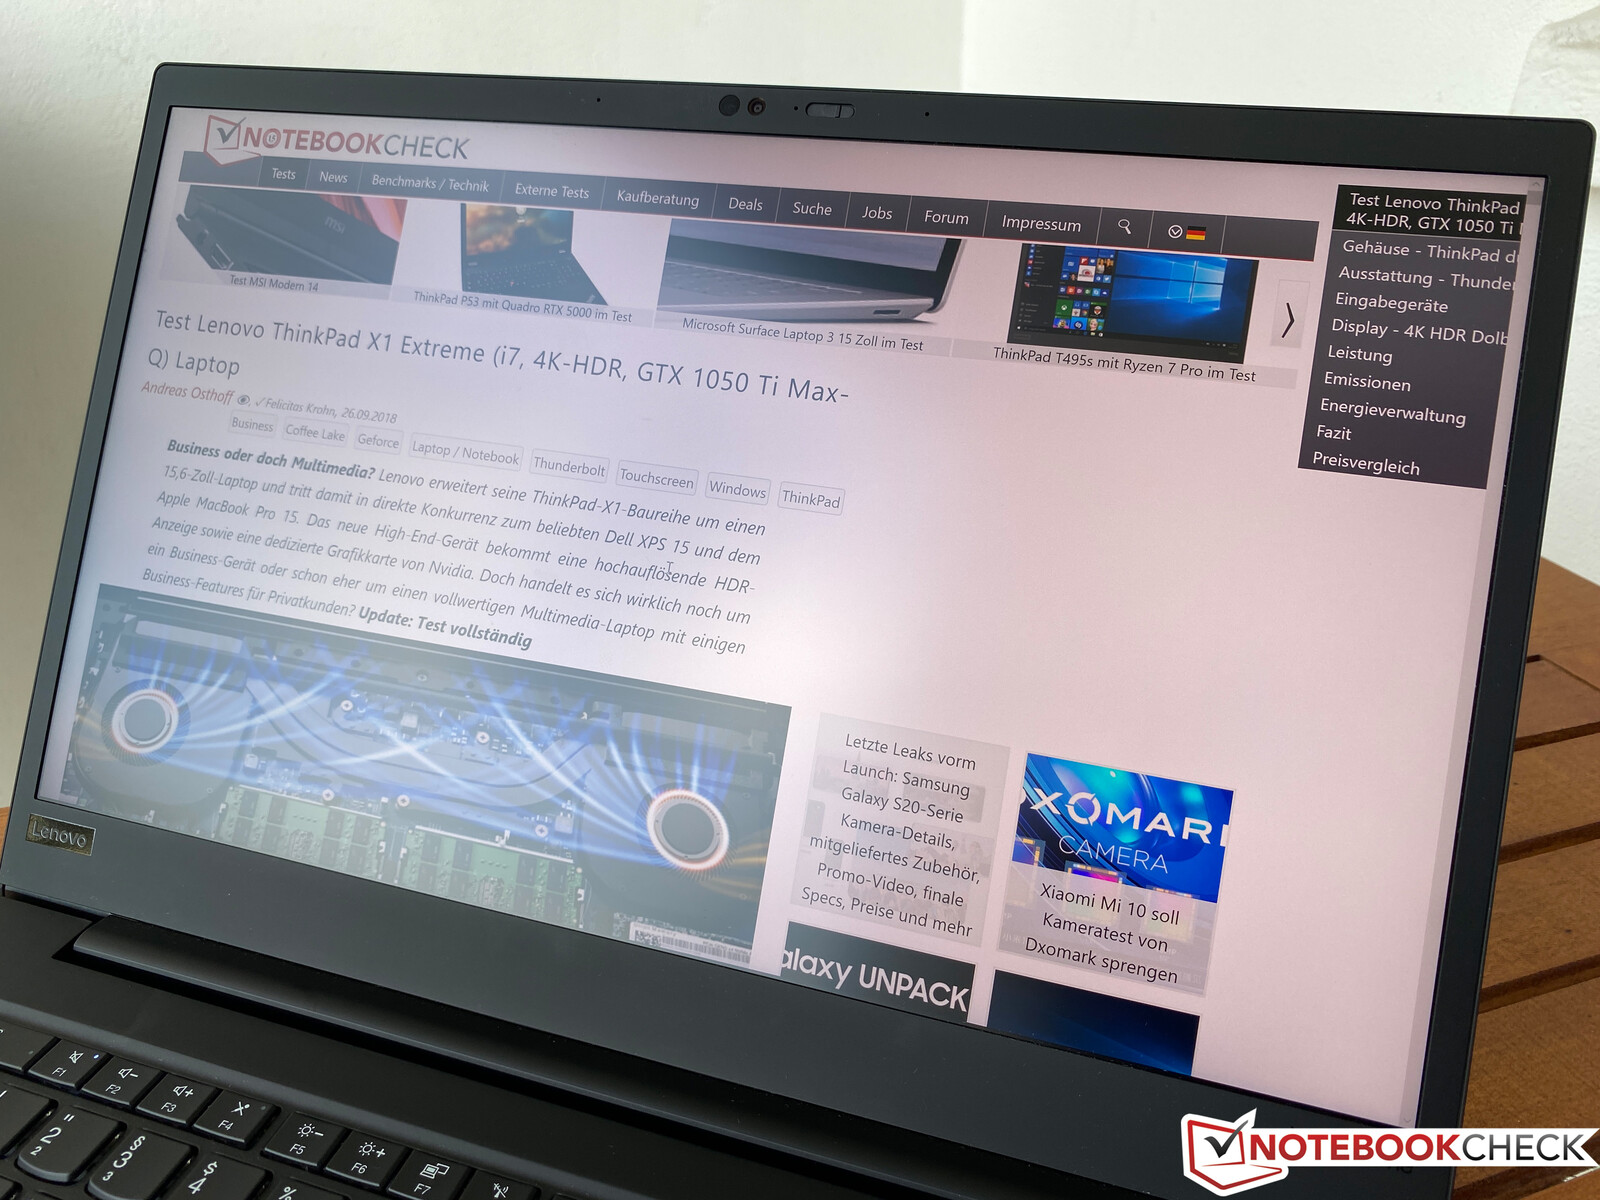
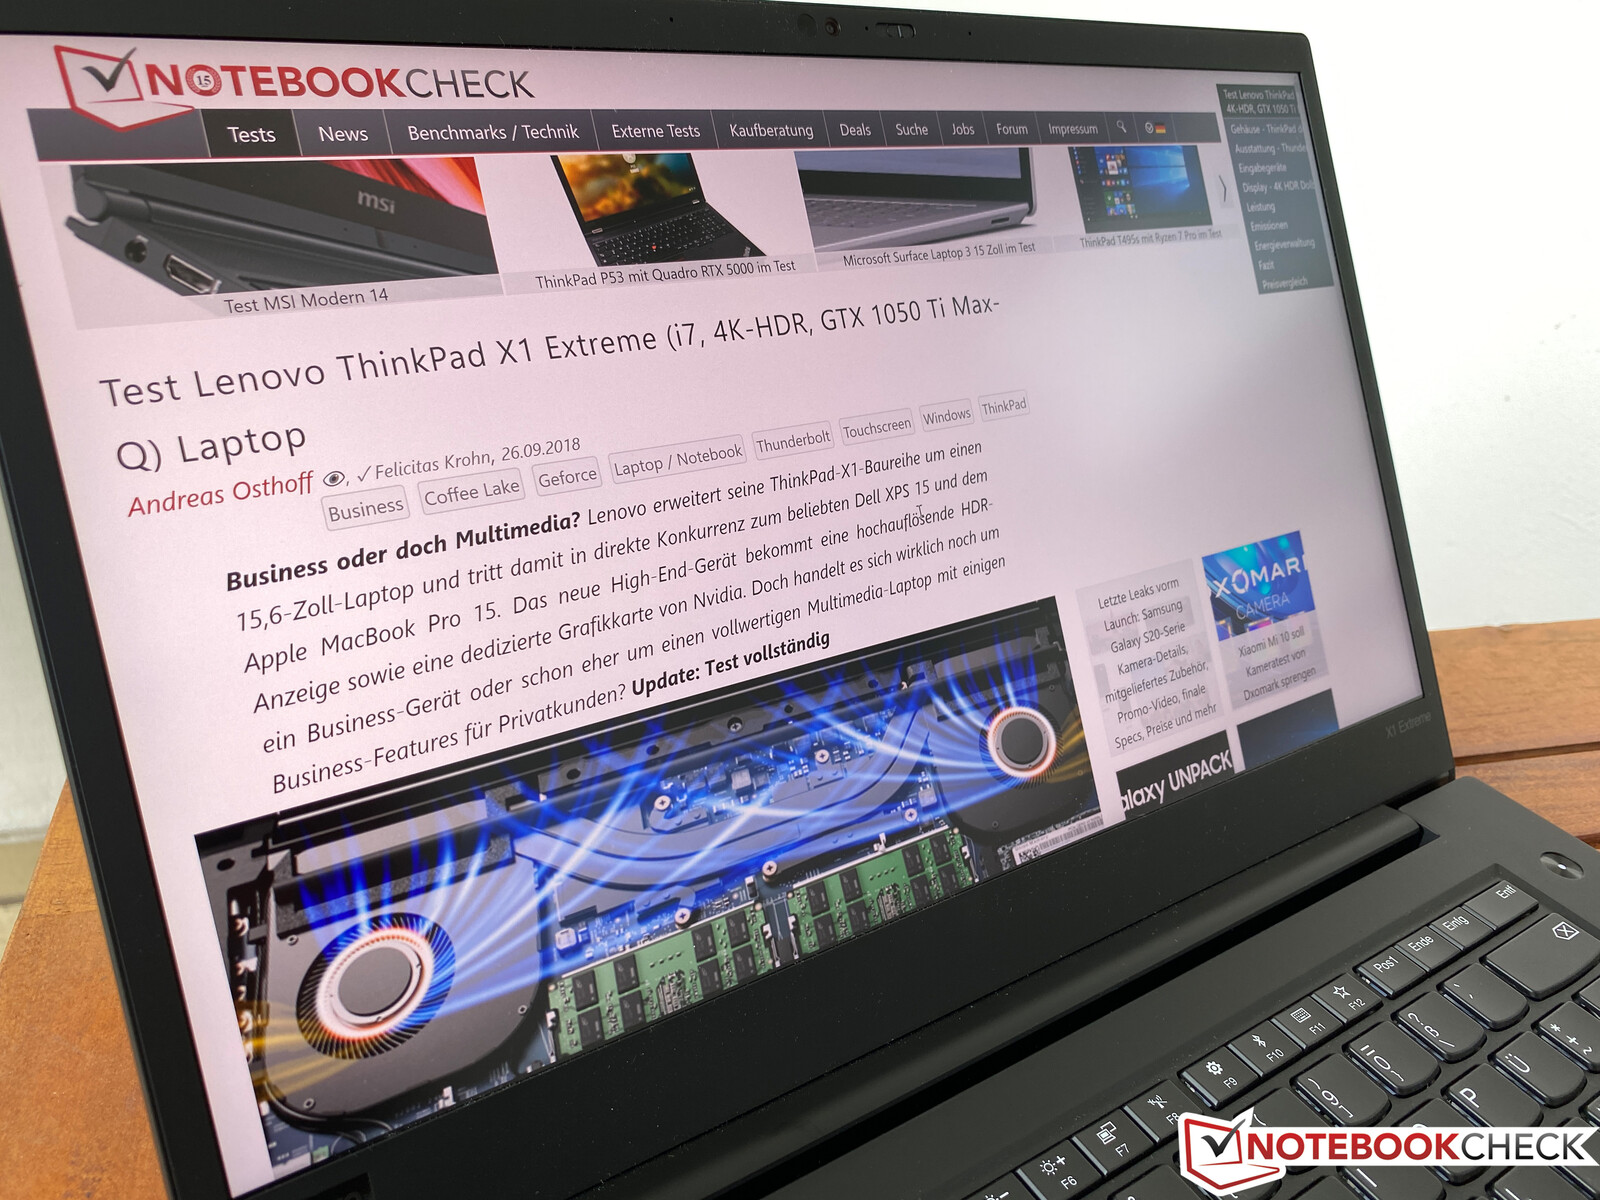
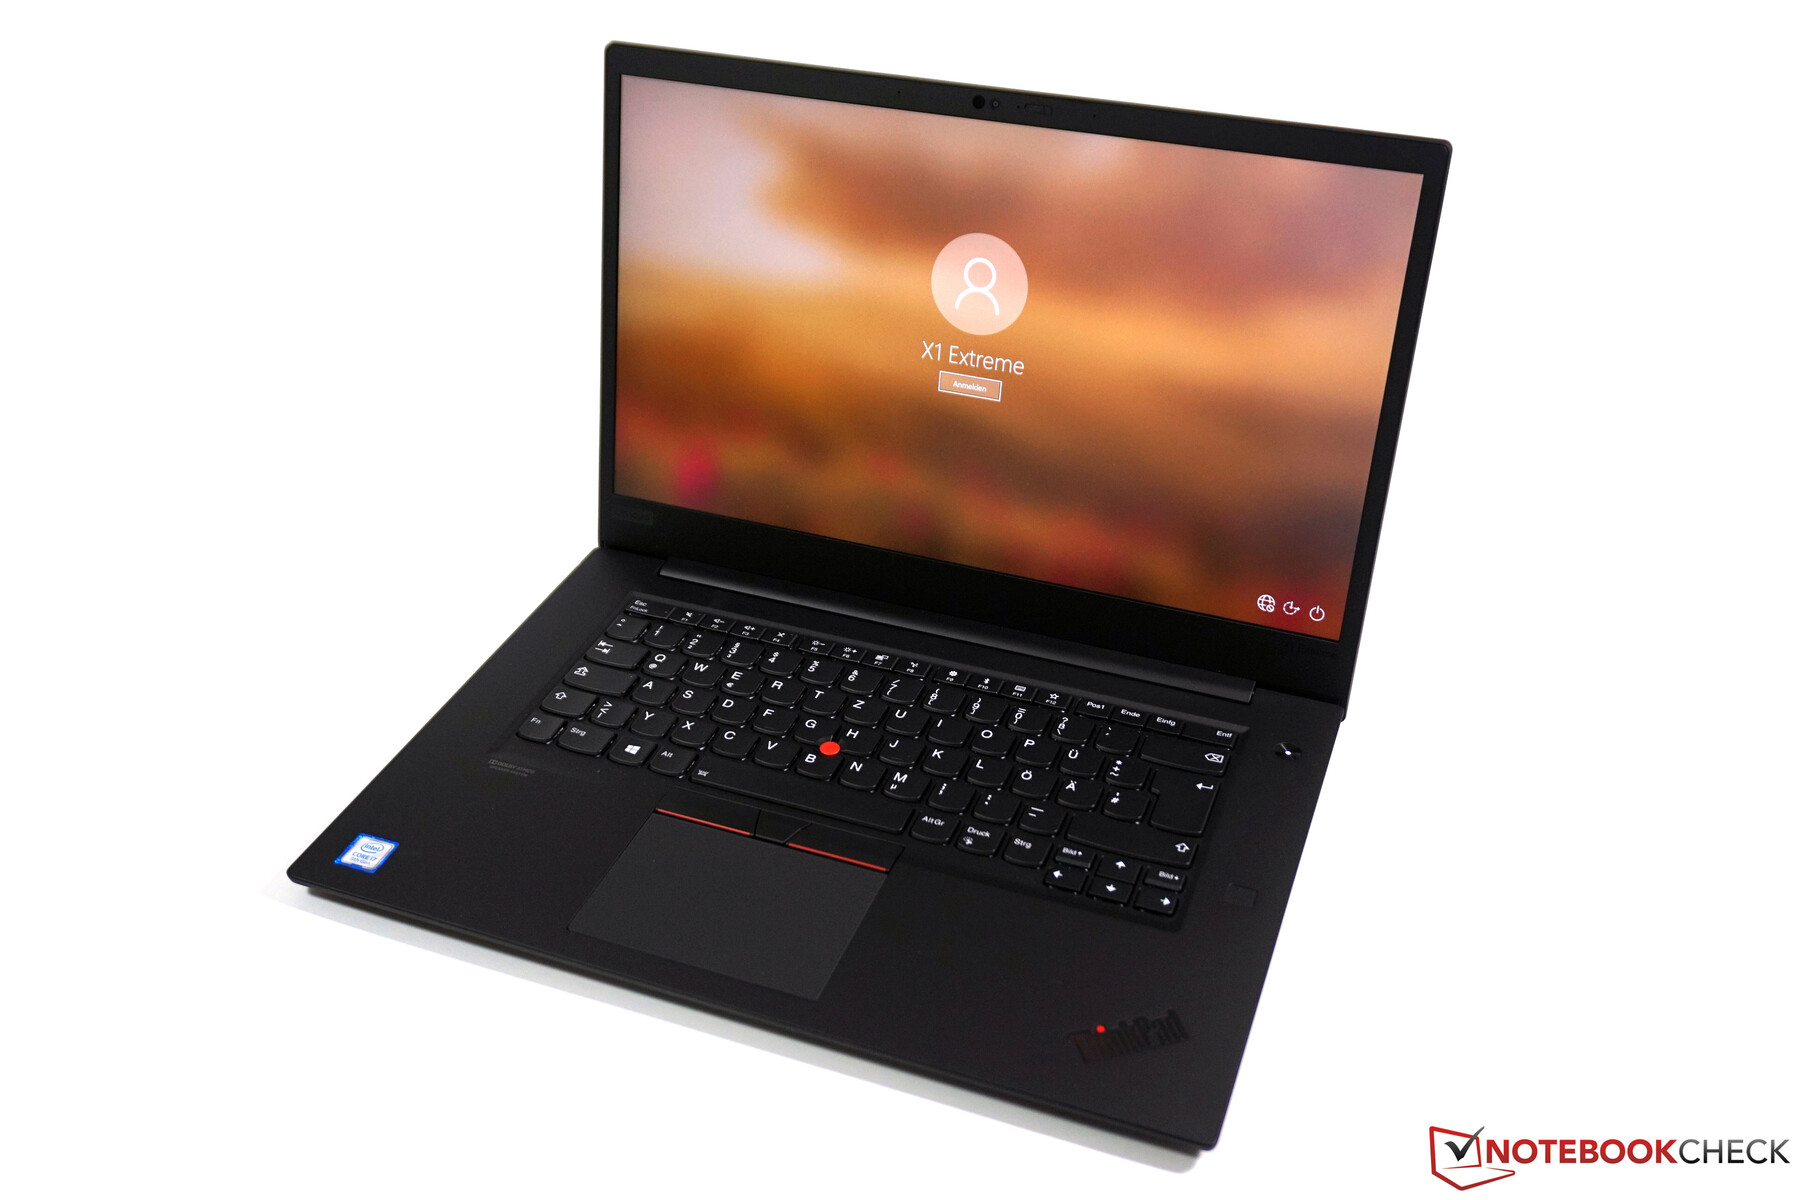
Case - The 4K X1 Extreme comes with a carbon-fibre finish
As mentioned in the preceding section, nothing has changed with the case from last year's model. There is one minor change, though. Lenovo now distinguishes machines that have 4K displays by giving their display lids a different finish. As with the smaller ThinkPad X1 Carbon, the display lid has a carbon-fibre finish. While this looks like the keyboard deck found on the Dell XPS 15, for example, the corners of the lid reveal that this finish is only a sticker or a print of some kind. The design is certainly a matter of taste, but it is less susceptible to picking up fingerprints, at least.

| SD Card Reader | |
| average JPG Copy Test (av. of 3 runs) | |
| Dell XPS 15 7590 9980HK GTX 1650 (Toshiba Exceria Pro SDXC 64 GB UHS-II) | |
| Lenovo ThinkPad X1 Extreme 2019 20QV000WGE (Toshiba Exceria Pro SDXC 64 GB UHS-II) | |
| MSI Prestige 15 A10SC (Toshiba Exceria Pro M501 UHS-II) | |
| Average of class Multimedia (21.1 - 531, n=47, last 2 years) | |
| maximum AS SSD Seq Read Test (1GB) | |
| Lenovo ThinkPad X1 Extreme 2019 20QV000WGE (Toshiba Exceria Pro SDXC 64 GB UHS-II) | |
| MSI Prestige 15 A10SC (Toshiba Exceria Pro M501 UHS-II) | |
| Dell XPS 15 7590 9980HK GTX 1650 (Toshiba Exceria Pro SDXC 64 GB UHS-II) | |
| Average of class Multimedia (27.4 - 1455, n=47, last 2 years) | |
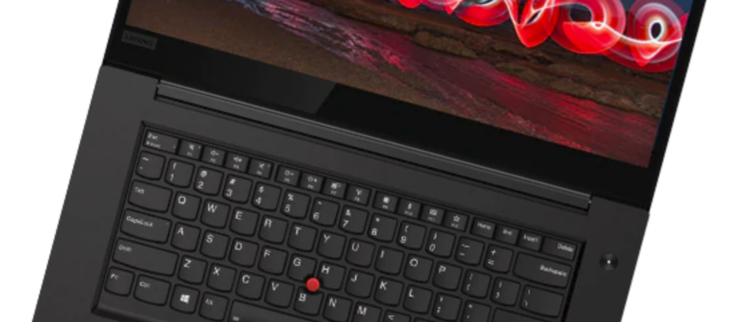
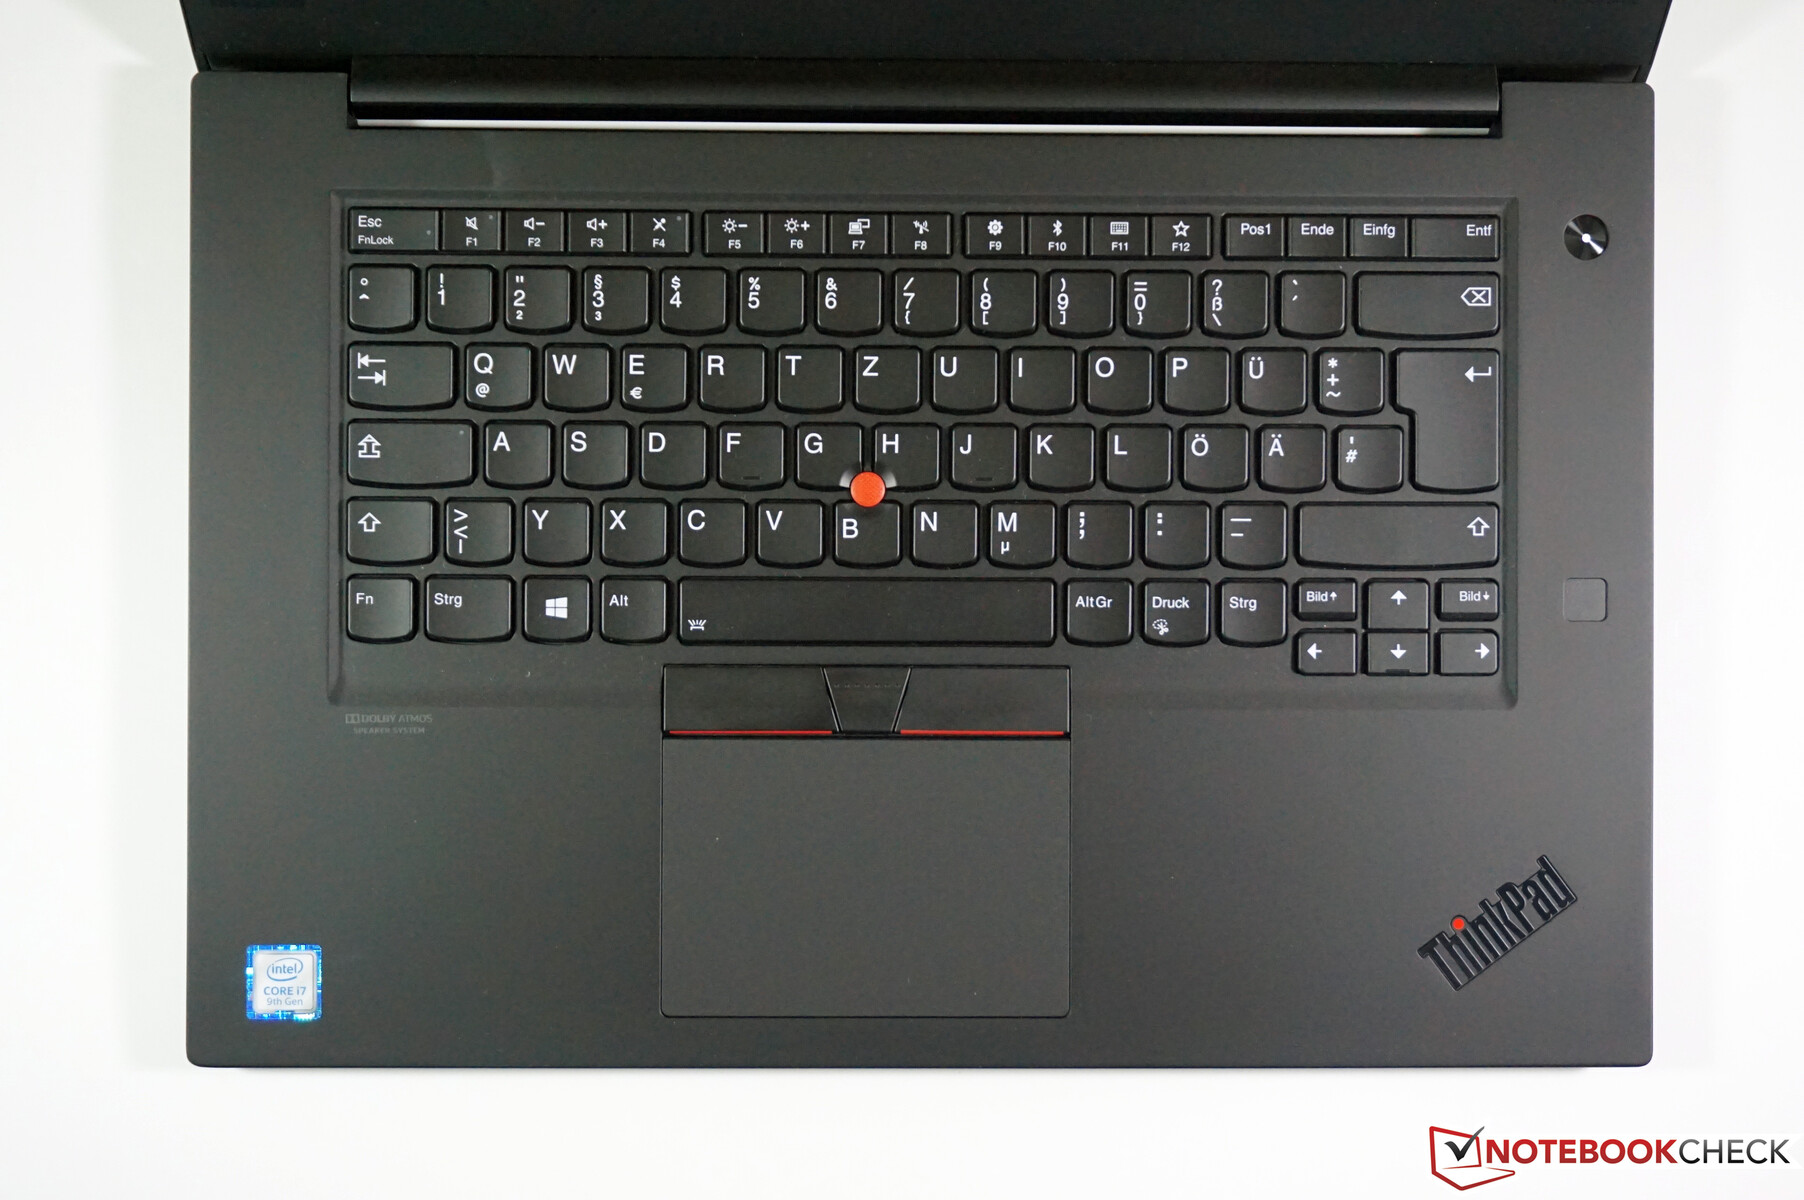
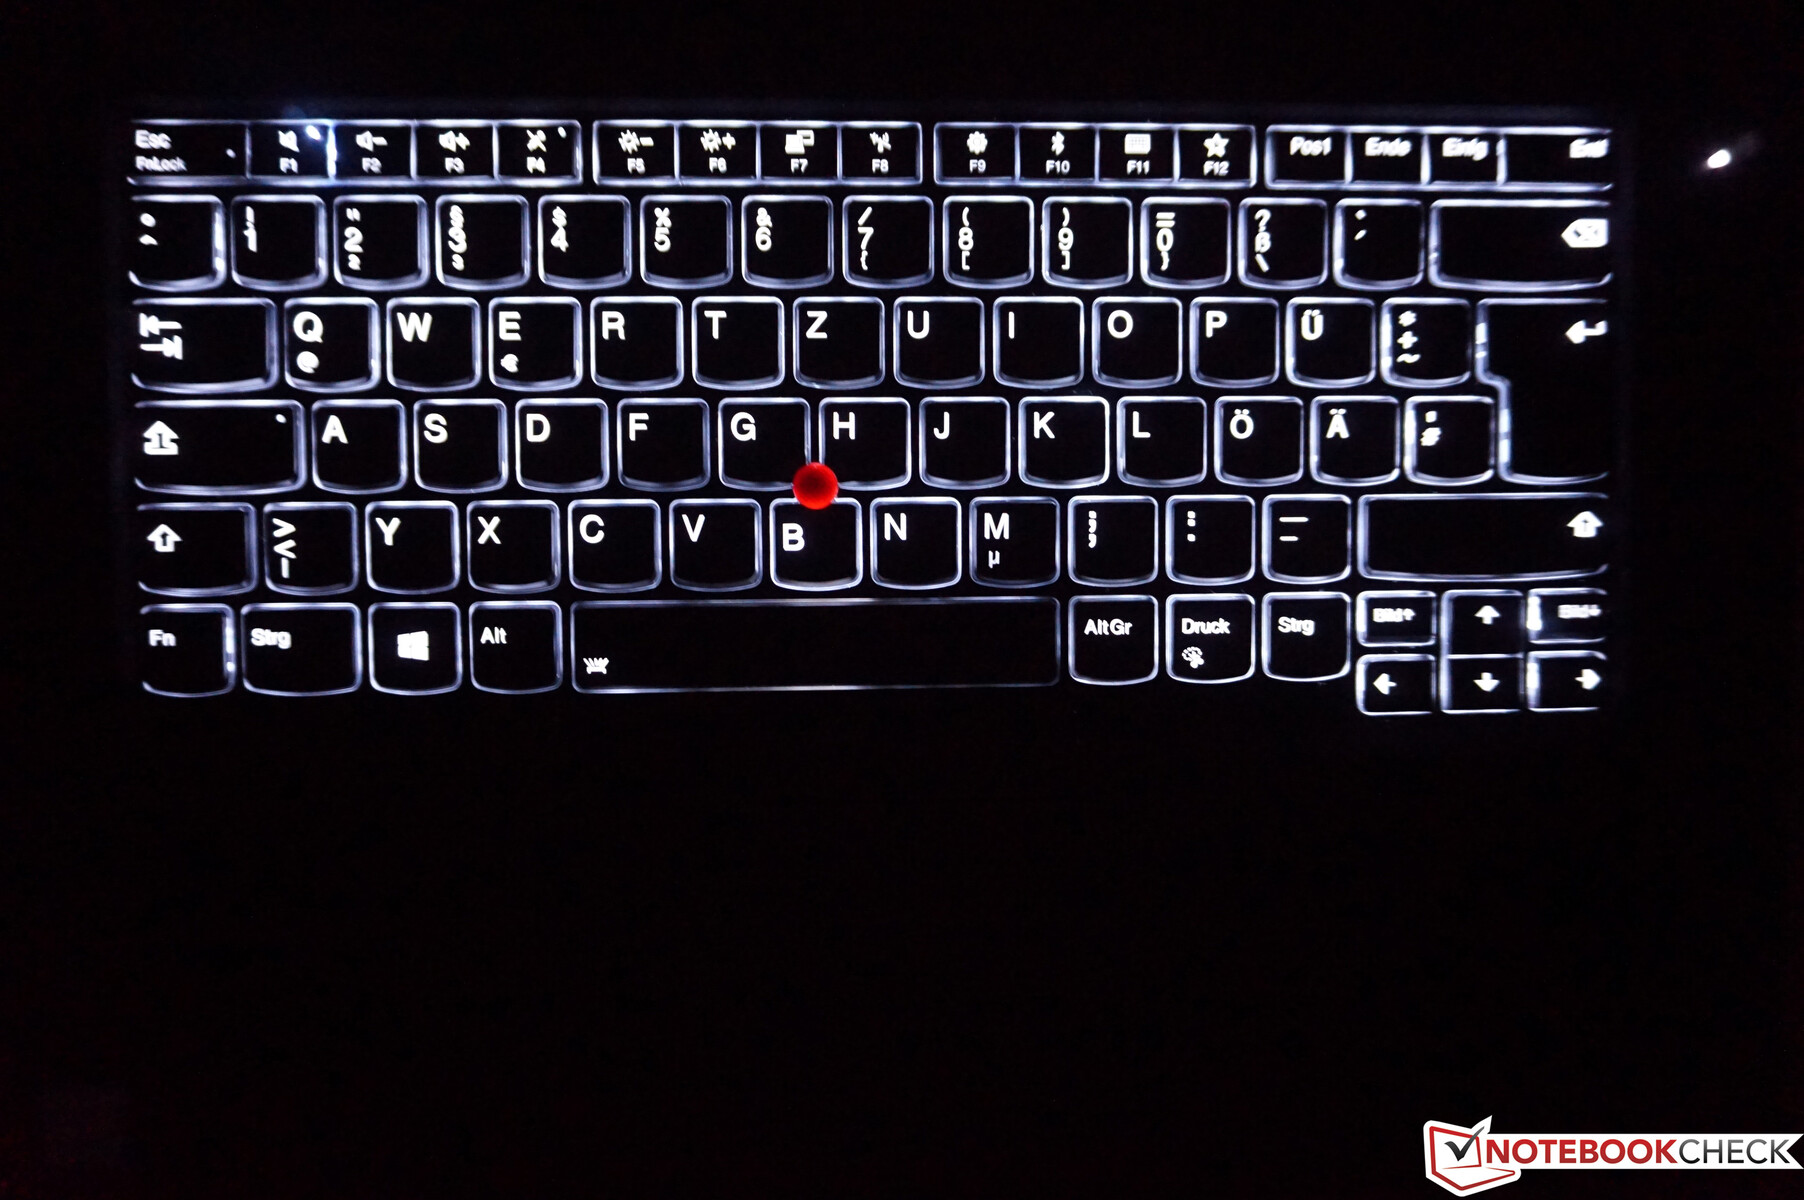
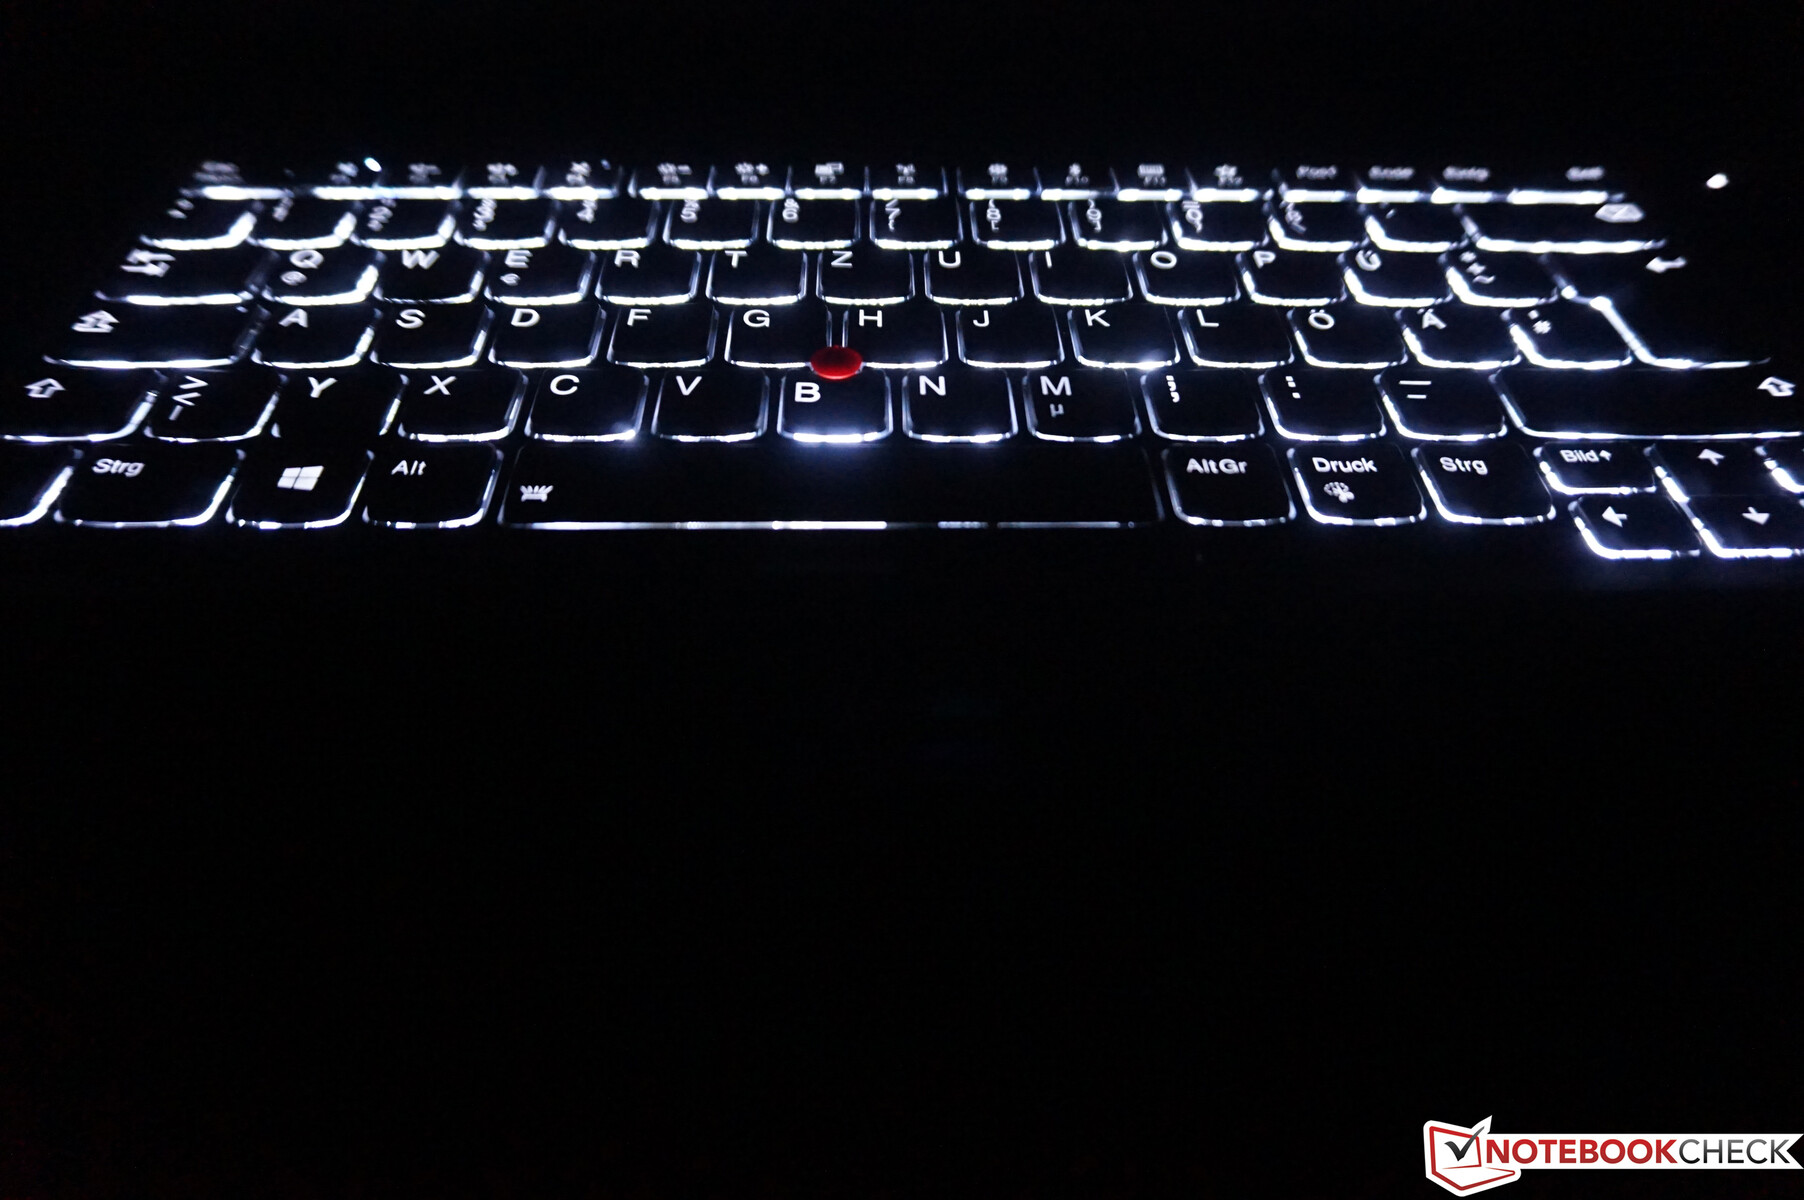
Input Devices - Good, but there are dropouts
In principle, nothing has changed with the keyboard on the ThinkPad X1 Extreme Gen 2 either, but reports of occasional dropouts when typing have been piling up online. We can confirm that the problem affects our X1 Extreme Gen 2, too. These dropouts are rare, though. We cannot say exactly what the problem is, but for some people having the keyboard replaced has helped. If you experience similar problems with your device, then we would recommend contacting Lenovo Service. However, if the keyboard works properly, then the X1 Extreme Gen 2 offers one of the best typing experiences on a laptop.
Display - ThinkPad with a matte 4K panel

Lenovo offers significantly more display options with the X1 Extreme Gen 2 than it did with its predecessor. In addition to two matte FHD panels, the company now sells two 4K panels. One is a matte IPS panel, while the other is an OLED panel that has a glossy finish. Our test device has the former, which should be very bright and is also advertised with 100% AdobeRGB coverage.
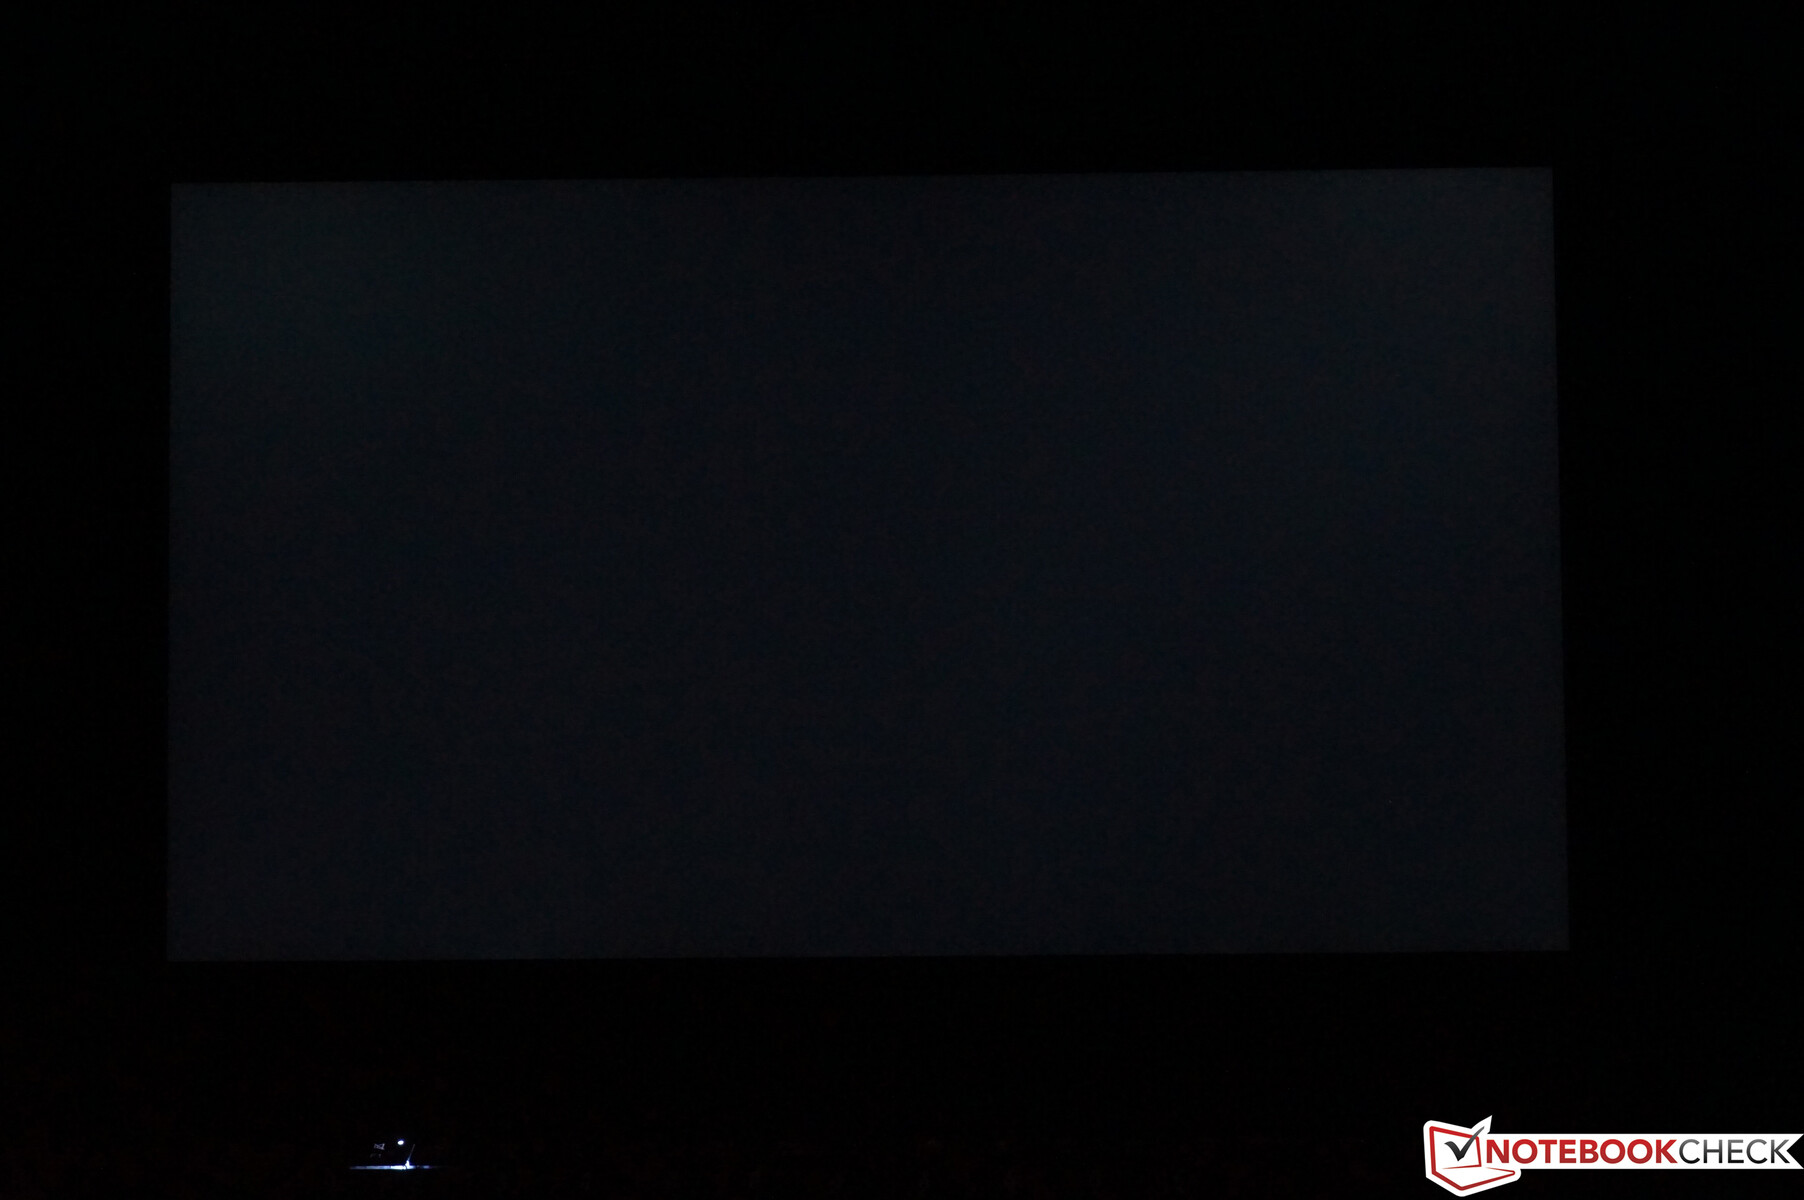
Subjectively, the X1 Extreme Gen 2 offers decent image quality, but there is a slight red tint that makes content look quite warm. Additionally, we cannot confirm the advertised brightness of 500 nits. Our review unit peaks at 470 cd/m² but only in one area of the display, with its average falling to just under 450 cd/m². This is still an improvement over the old X1 Extreme, though. However, our review unit has a higher black level than the one we measured in its predecessor, which yields a lower contrast ratio. Furthermore, the panel's matte finish makes content look less sharp than it does on some competitors. We also found that images look a little grainy on light surfaces. The absence of PWM is a positive though, as is the lack of backlight bleeding.
| |||||||||||||||||||||||||
Brightness Distribution: 90 %
Center on Battery: 465 cd/m²
Contrast: 1289:1 (Black: 0.36 cd/m²)
ΔE ColorChecker Calman: 4.2 | ∀{0.5-29.43 Ø4.75}
calibrated: 0.8
ΔE Greyscale Calman: 7.2 | ∀{0.09-98 Ø5}
99% sRGB (Argyll 1.6.3 3D)
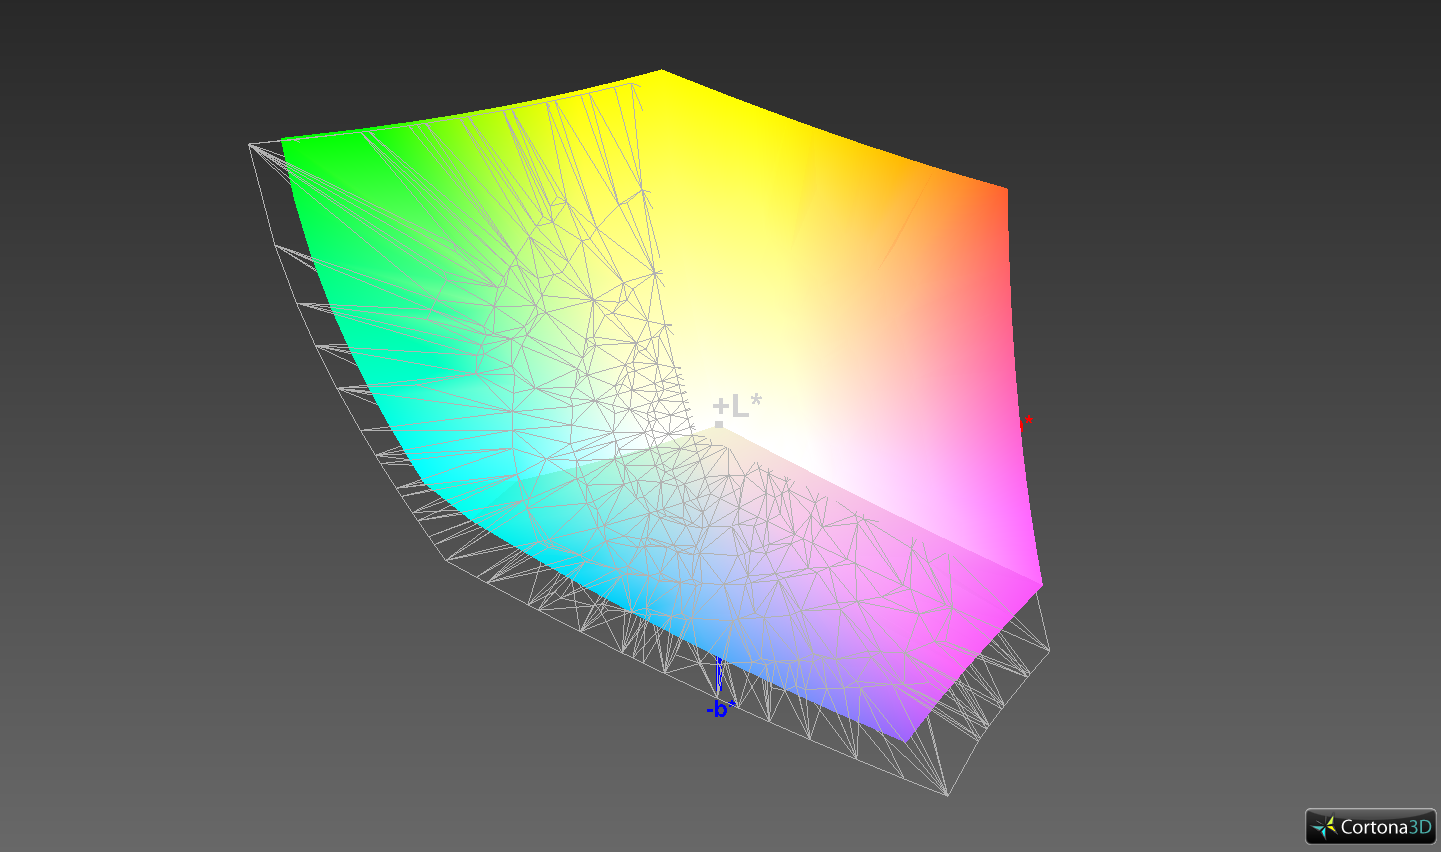
85.2% AdobeRGB 1998 (Argyll 1.6.3 3D)
96.9% AdobeRGB 1998 (Argyll 3D)
99.1% sRGB (Argyll 3D)
82% Display P3 (Argyll 3D)
Gamma: 2.17
CCT: 6345 K
| Lenovo ThinkPad X1 Extreme 2019 20QV000WGE NE156QUM-N66, IPS, 3840x2160, 15.6" | Dell XPS 15 7590 9980HK GTX 1650 Samsung 156WR04, SDCA029, OLED, 3840x2160, 15.6" | Apple MacBook Pro 16 2019 i9 5500M APPA044, IPS, 3072x1920, 16" | Acer ConceptD 7 CN715-71-743N AU Optronics AUO31EB, IPS, 3840x2160, 15.6" | Lenovo Yoga C940-15IRH LG Philips LP156WFC-SPU1, IPS, 1920x1080, 15.6" | MSI Prestige 15 A10SC Sharp LQ156D1JW42, IPS, 3840x2160, 15.6" | Lenovo ThinkPad X1 Extreme-20MF000XGE B156ZAN03.2, IPS, 3840x2160, 15.6" | |
|---|---|---|---|---|---|---|---|
| Display | 1% | 3% | -22% | -1% | 3% | ||
| Display P3 Coverage (%) | 82 | 88.1 7% | 85.7 5% | 61.5 -25% | 82 0% | 86.3 5% | |
| sRGB Coverage (%) | 99.1 | 99.6 1% | 100 1% | 92.7 -6% | 98.3 -1% | 100 1% | |
| AdobeRGB 1998 Coverage (%) | 96.9 | 91.8 -5% | 99 2% | 63.6 -34% | 96.2 -1% | 99.4 3% | |
| Response Times | 94% | -14% | -3% | -12% | -33% | -19% | |
| Response Time Grey 50% / Grey 80% * (ms) | 46.4 ? | 2.3 ? 95% | 52.4 ? -13% | 49 ? -6% | 48.4 ? -4% | 60 ? -29% | 61.6 ? -33% |
| Response Time Black / White * (ms) | 30.4 ? | 2.4 ? 92% | 34.9 ? -15% | 30 ? 1% | 36.4 ? -20% | 41.2 ? -36% | 32 ? -5% |
| PWM Frequency (Hz) | 59.5 ? | 131700 | 26040 ? | ||||
| Screen | -0% | 17% | 18% | 3% | -23% | 4% | |
| Brightness middle (cd/m²) | 464 | 421.2 -9% | 519 12% | 365 -21% | 484.8 4% | 464.5 0% | 396 -15% |
| Brightness (cd/m²) | 448 | 417 -7% | 477 6% | 357 -20% | 463 3% | 451 1% | 380 -15% |
| Brightness Distribution (%) | 90 | 94 4% | 86 -4% | 84 -7% | 82 -9% | 92 2% | 90 0% |
| Black Level * (cd/m²) | 0.36 | 0.39 -8% | 0.275 24% | 0.26 28% | 0.5 -39% | 0.28 22% | |
| Contrast (:1) | 1289 | 1331 3% | 1327 3% | 1865 45% | 929 -28% | 1414 10% | |
| Colorchecker dE 2000 * | 4.2 | 6.06 -44% | 2.28 46% | 0.99 76% | 4.5 -7% | 3.36 20% | 4 5% |
| Colorchecker dE 2000 max. * | 11.4 | 11.89 -4% | 6.54 43% | 1.89 83% | 7.55 34% | 7.06 38% | 7.6 33% |
| Colorchecker dE 2000 calibrated * | 0.8 | 0.86 -8% | 1.01 -26% | 1.19 -49% | 3.42 -327% | 0.9 -13% | |
| Greyscale dE 2000 * | 7.2 | 2.8 61% | 0.9 87% | 1.29 82% | 5.7 21% | 1.3 82% | 6.1 15% |
| Gamma | 2.17 101% | 2.15 102% | 2145 0% | 2.2 100% | 2.45 90% | 2.14 103% | 2.25 98% |
| CCT | 6345 102% | 6235 104% | 6572 99% | 6548 99% | 6101 107% | 6596 99% | 7786 83% |
| Color Space (Percent of AdobeRGB 1998) (%) | 85.2 | 81 -5% | 78 -8% | 88 3% | 58.7 -31% | 84.8 0% | 88.5 4% |
| Color Space (Percent of sRGB) (%) | 99 | 99.6 1% | 100 1% | 92.8 -6% | 98.3 -1% | 100 1% | |
| Total Average (Program / Settings) | 32% /
14% | 2% /
12% | 6% /
13% | -10% /
-4% | -19% /
-20% | -4% /
1% |
* ... smaller is better
We used the professional CalMAN software for our display measurements in connection with an X-Rite i1 Pro 2 spectrophotometer. The slight red tint that we had already noticed appeared again in these tests, with CalMAN and the spectrophotometer confirming that it affects greyscale too. We were surprised overall though as the factory calibration is anything but good. There are clear deviations from the target values for both greyscale and colours, for example, with additional calibration the only way of being able to exploit the full potential of the display. The results were impressive, too. In short, the NE156QUM-N66 matte 4K panel here needs additional calibration. You can download our calibrated ICC profile from the box above our comparison table.
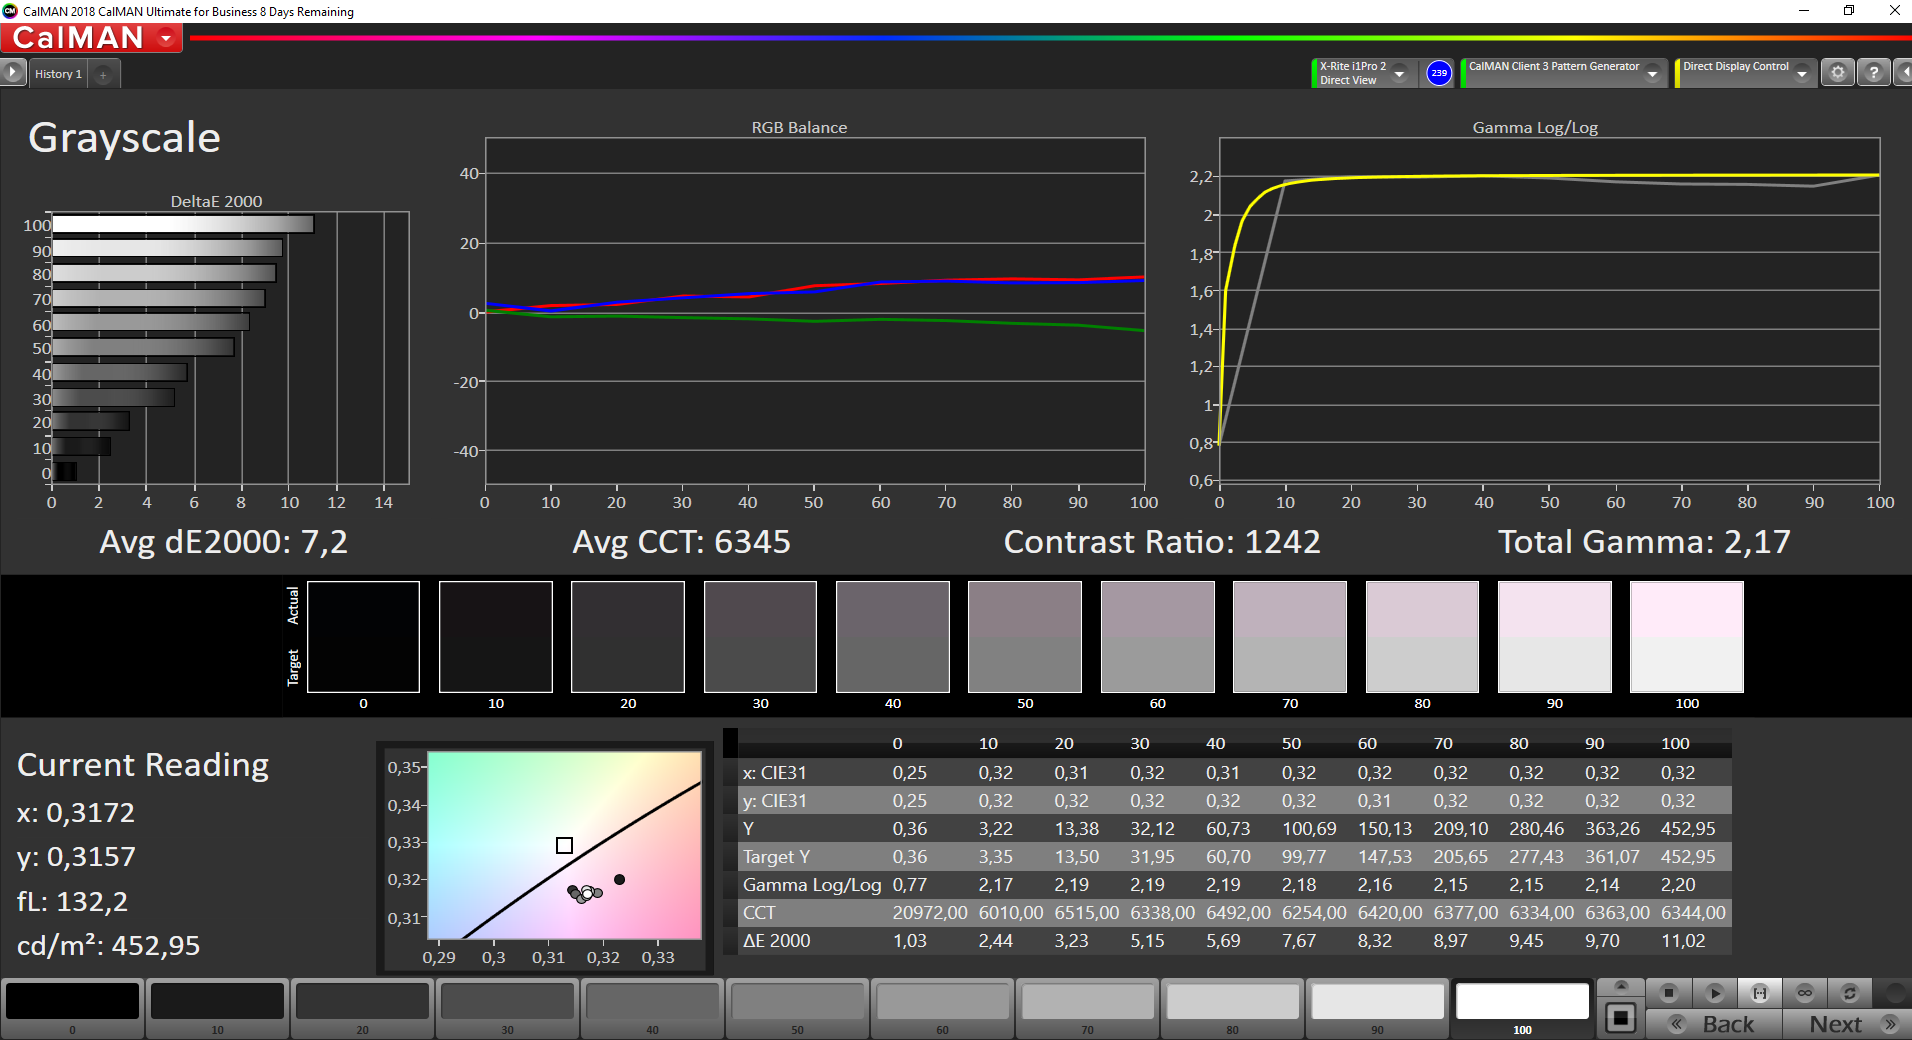
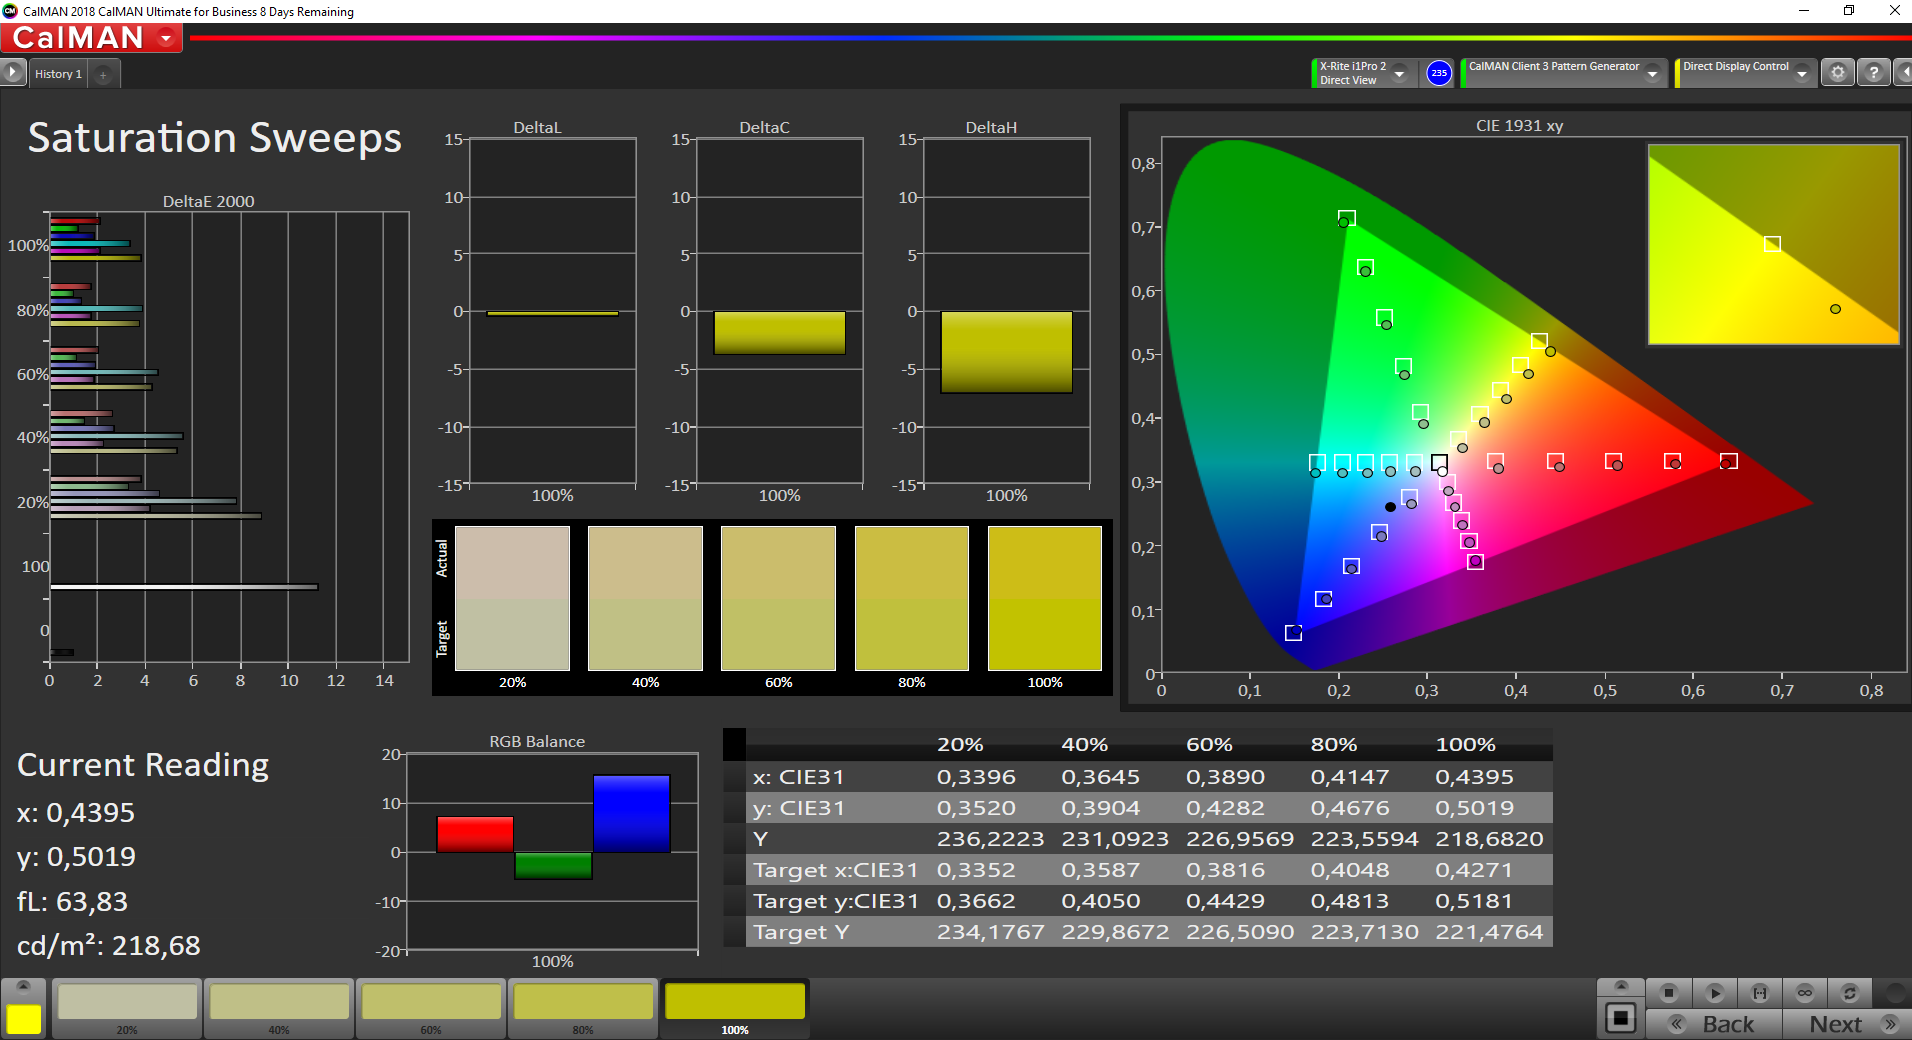
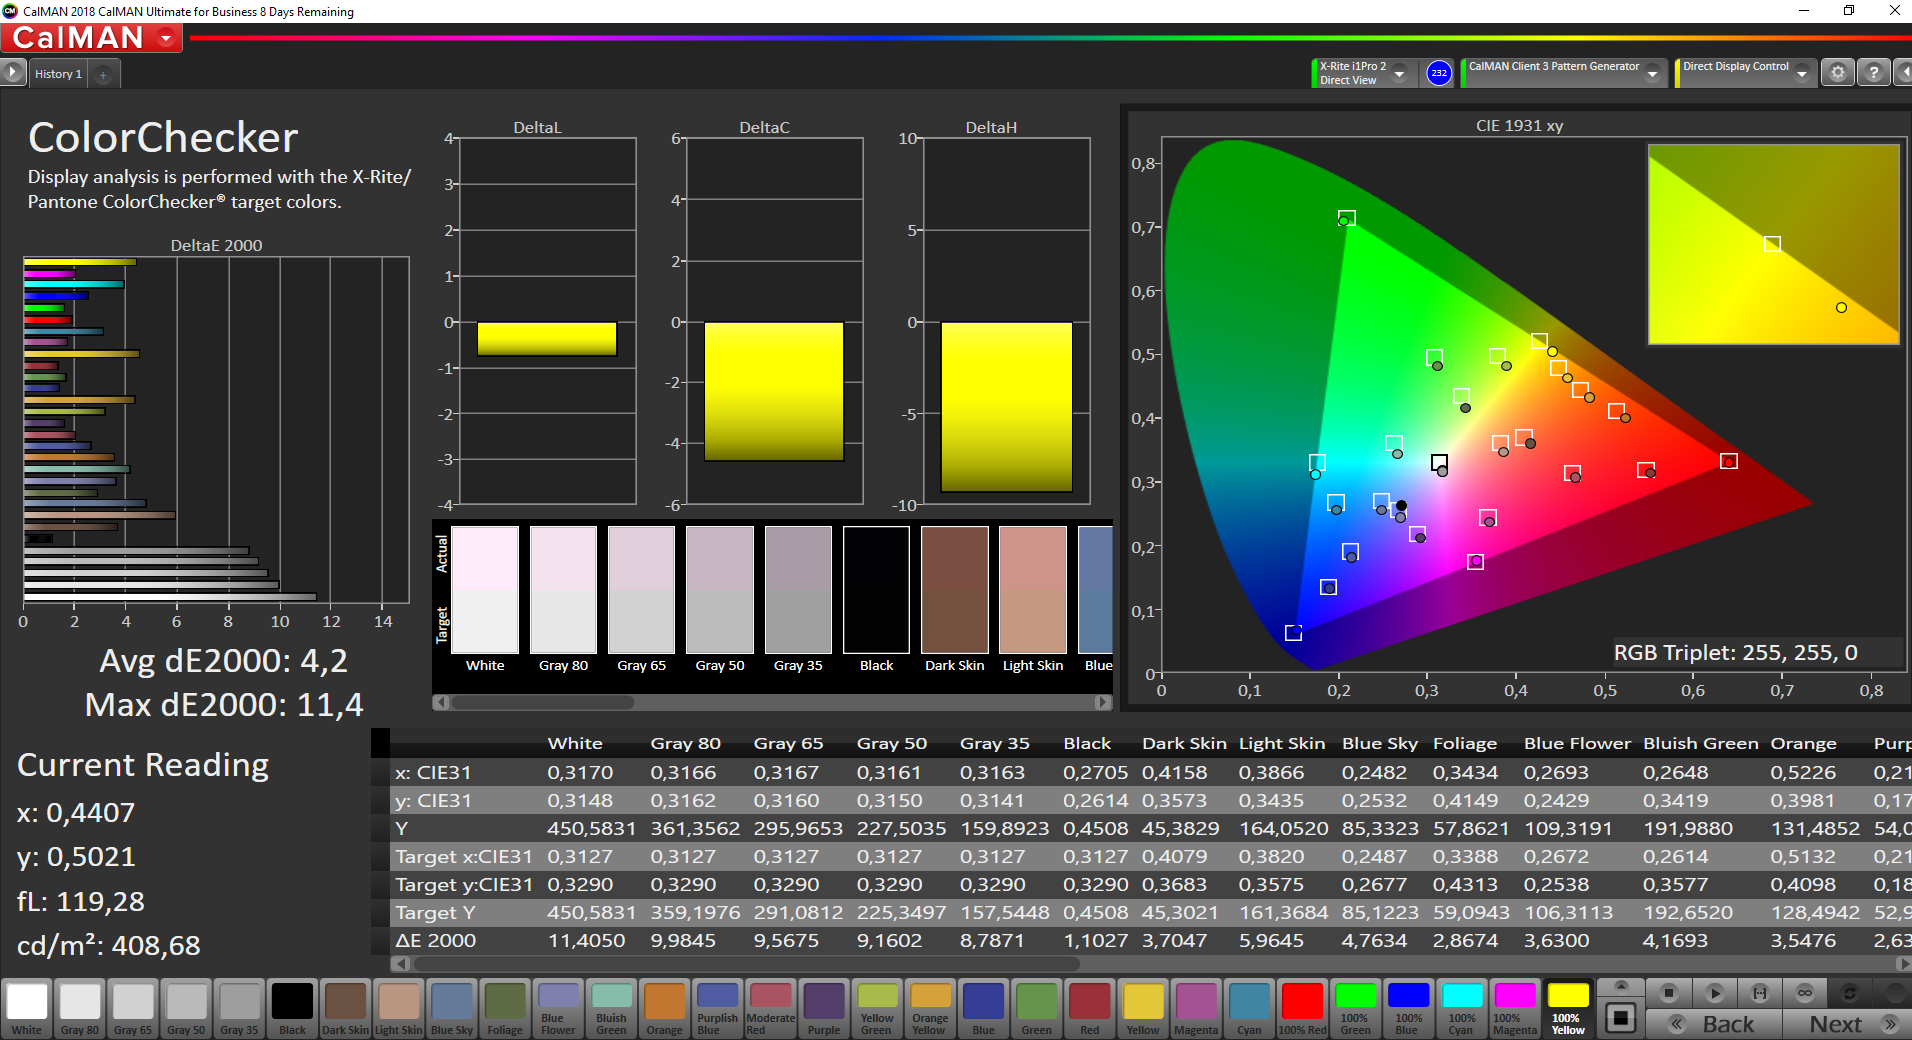
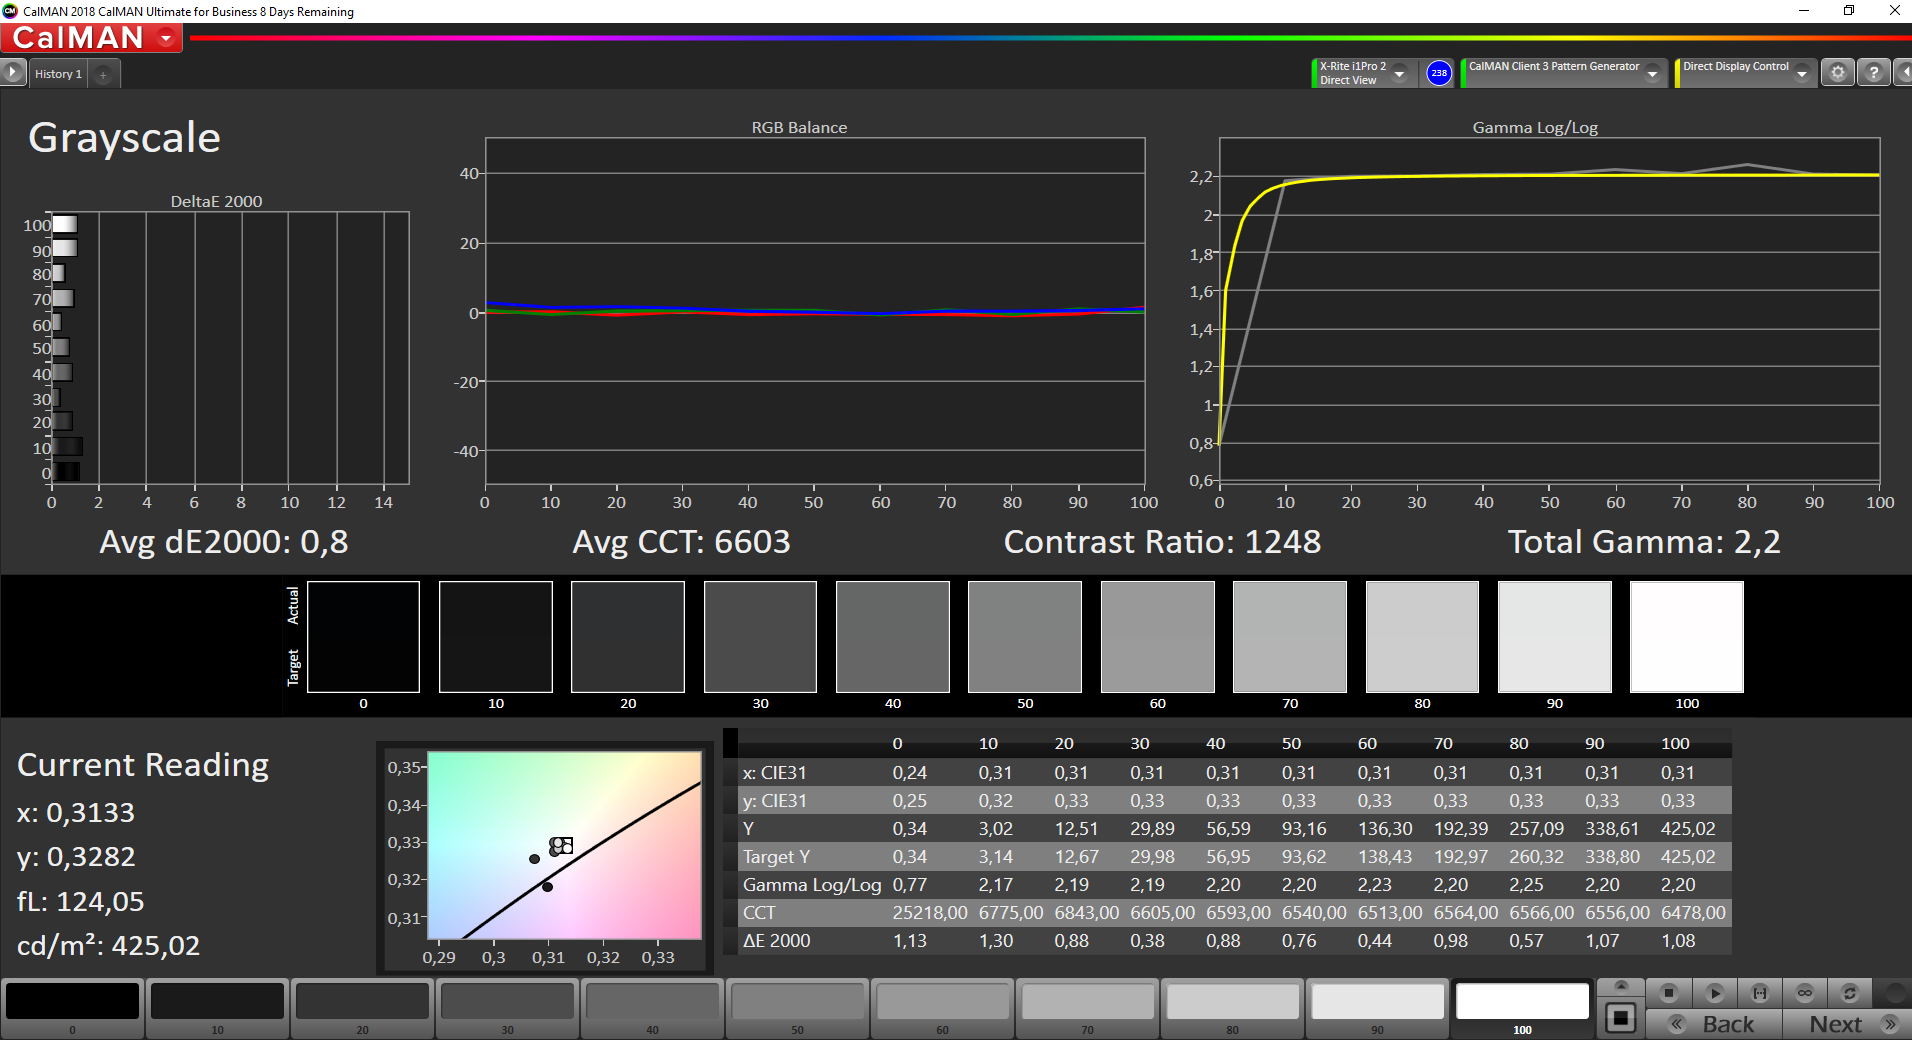
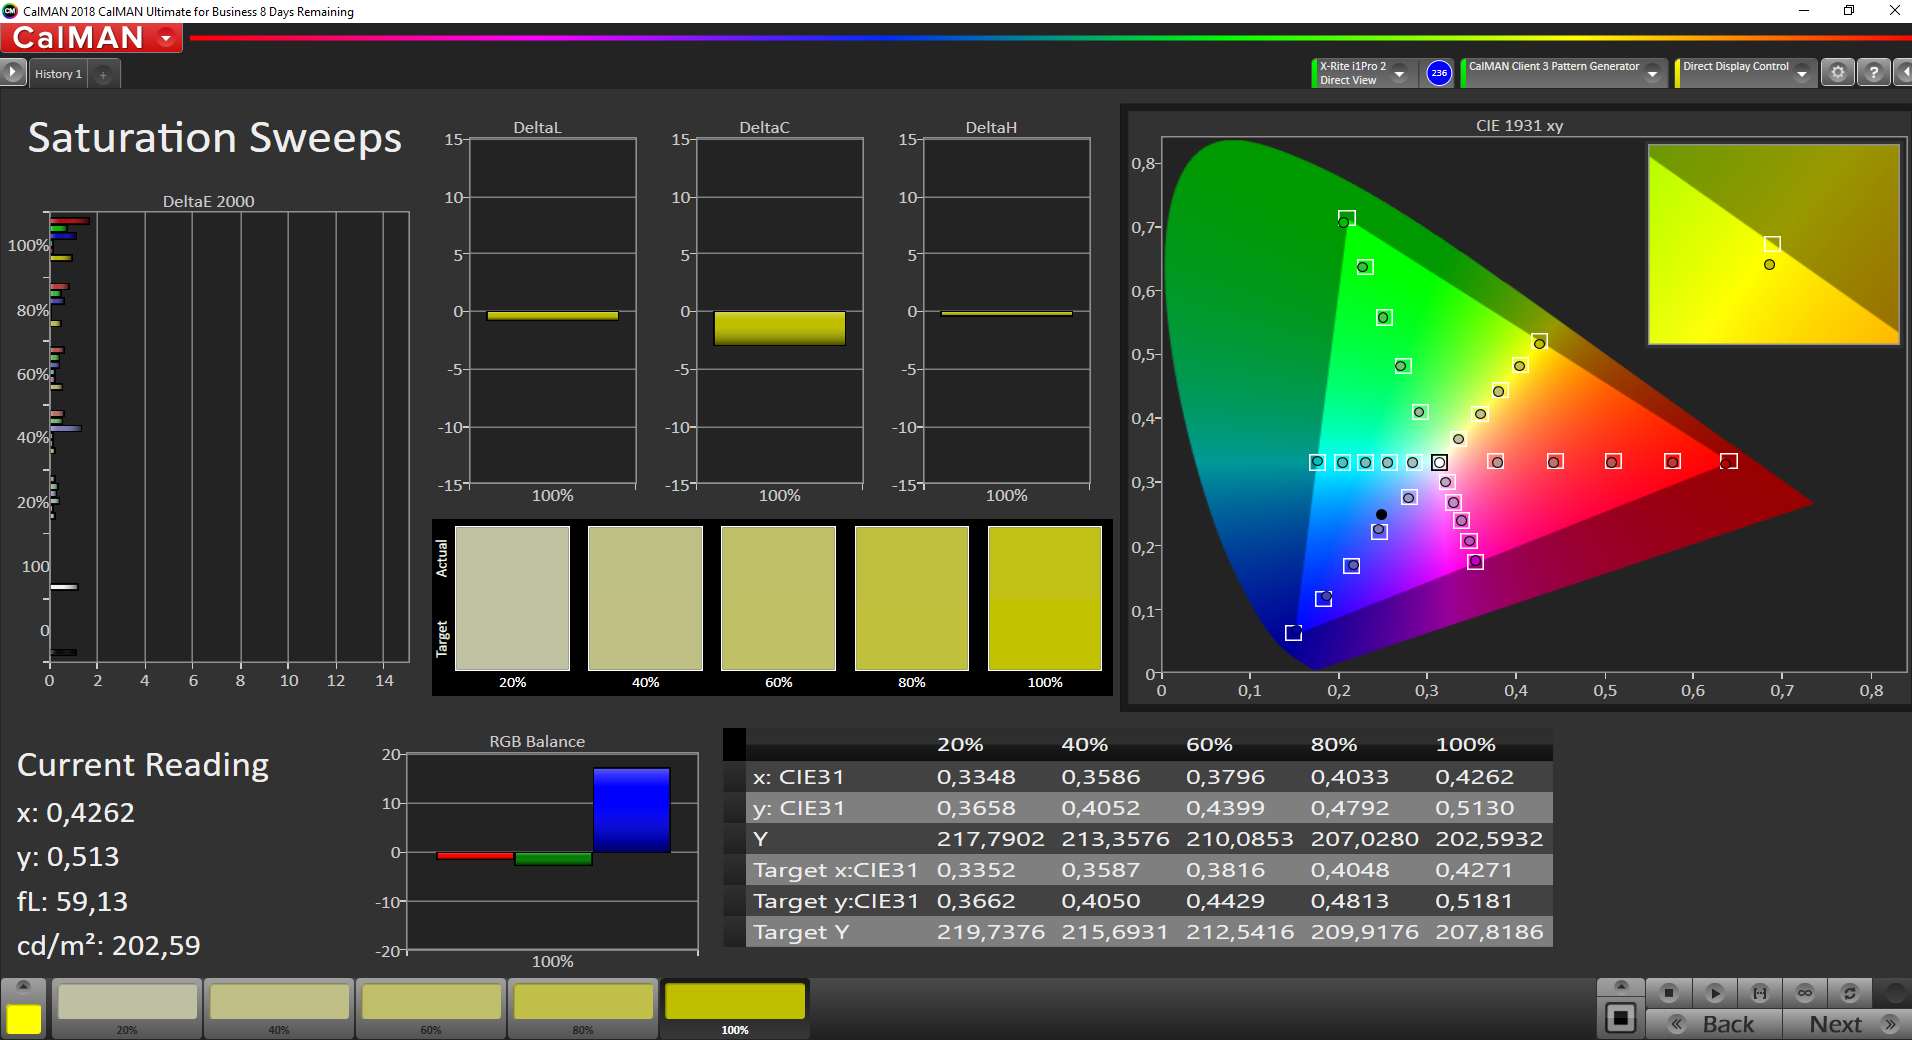
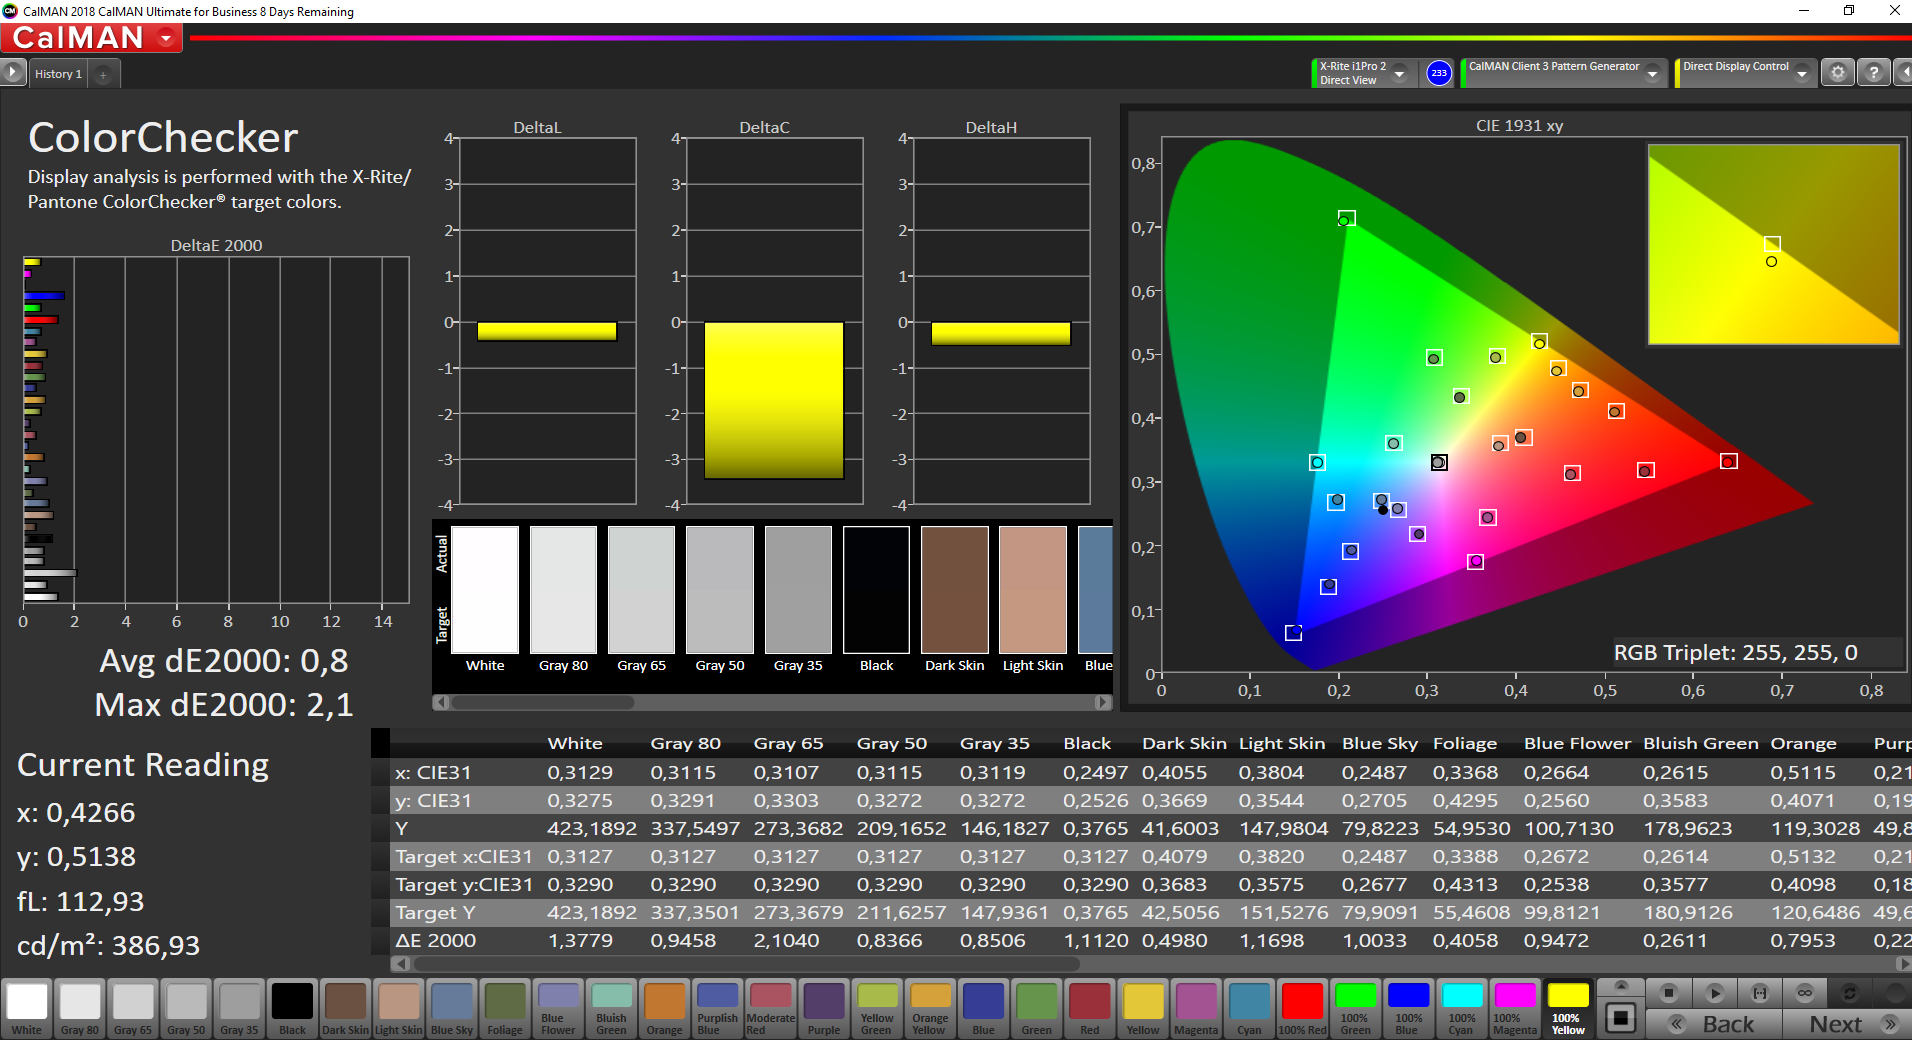
Photo-editing is not a problem after calibrating the display, albeit so long as you are using the AdobeRGB colour space. As usual, Lenovo does not offer any profiles for additional colour spaces like sRGB. While the company advertises 100% AdobeRGB coverage, neither CalMAN nor Argyll could confirm this. Last year's 4K panel performed somewhat better in this regard.


Display Response Times
| ↔ Response Time Black to White | ||
|---|---|---|
| 30.4 ms ... rise ↗ and fall ↘ combined | ↗ 17.2 ms rise | 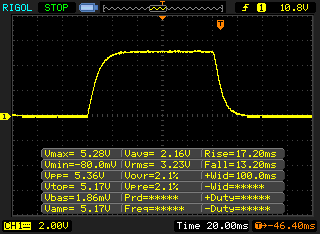 |
| ↘ 13.2 ms fall | ||
| The screen shows slow response rates in our tests and will be unsatisfactory for gamers. In comparison, all tested devices range from 0.1 (minimum) to 240 (maximum) ms. » 82 % of all devices are better. This means that the measured response time is worse than the average of all tested devices (20.1 ms). | ||
| ↔ Response Time 50% Grey to 80% Grey | ||
| 46.4 ms ... rise ↗ and fall ↘ combined | ↗ 22 ms rise | 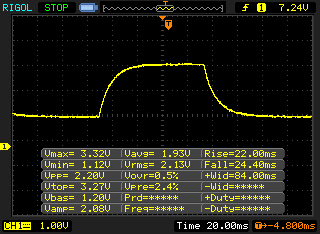 |
| ↘ 24.4 ms fall | ||
| The screen shows slow response rates in our tests and will be unsatisfactory for gamers. In comparison, all tested devices range from 0.165 (minimum) to 636 (maximum) ms. » 80 % of all devices are better. This means that the measured response time is worse than the average of all tested devices (31.4 ms). | ||
Screen Flickering / PWM (Pulse-Width Modulation)
| Screen flickering / PWM not detected | 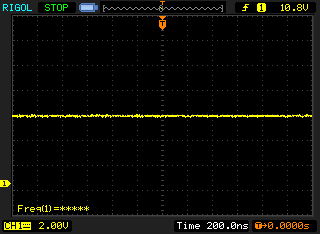 | ||
In comparison: 53 % of all tested devices do not use PWM to dim the display. If PWM was detected, an average of 7986 (minimum: 5 - maximum: 343500) Hz was measured. | |||
We encountered no problems with using the X1 Extreme Gen 2 outdoors, though. The IPS panel has stable viewing angles, too.

Performance - The X1 Extreme Gen 2 falls short of its potential
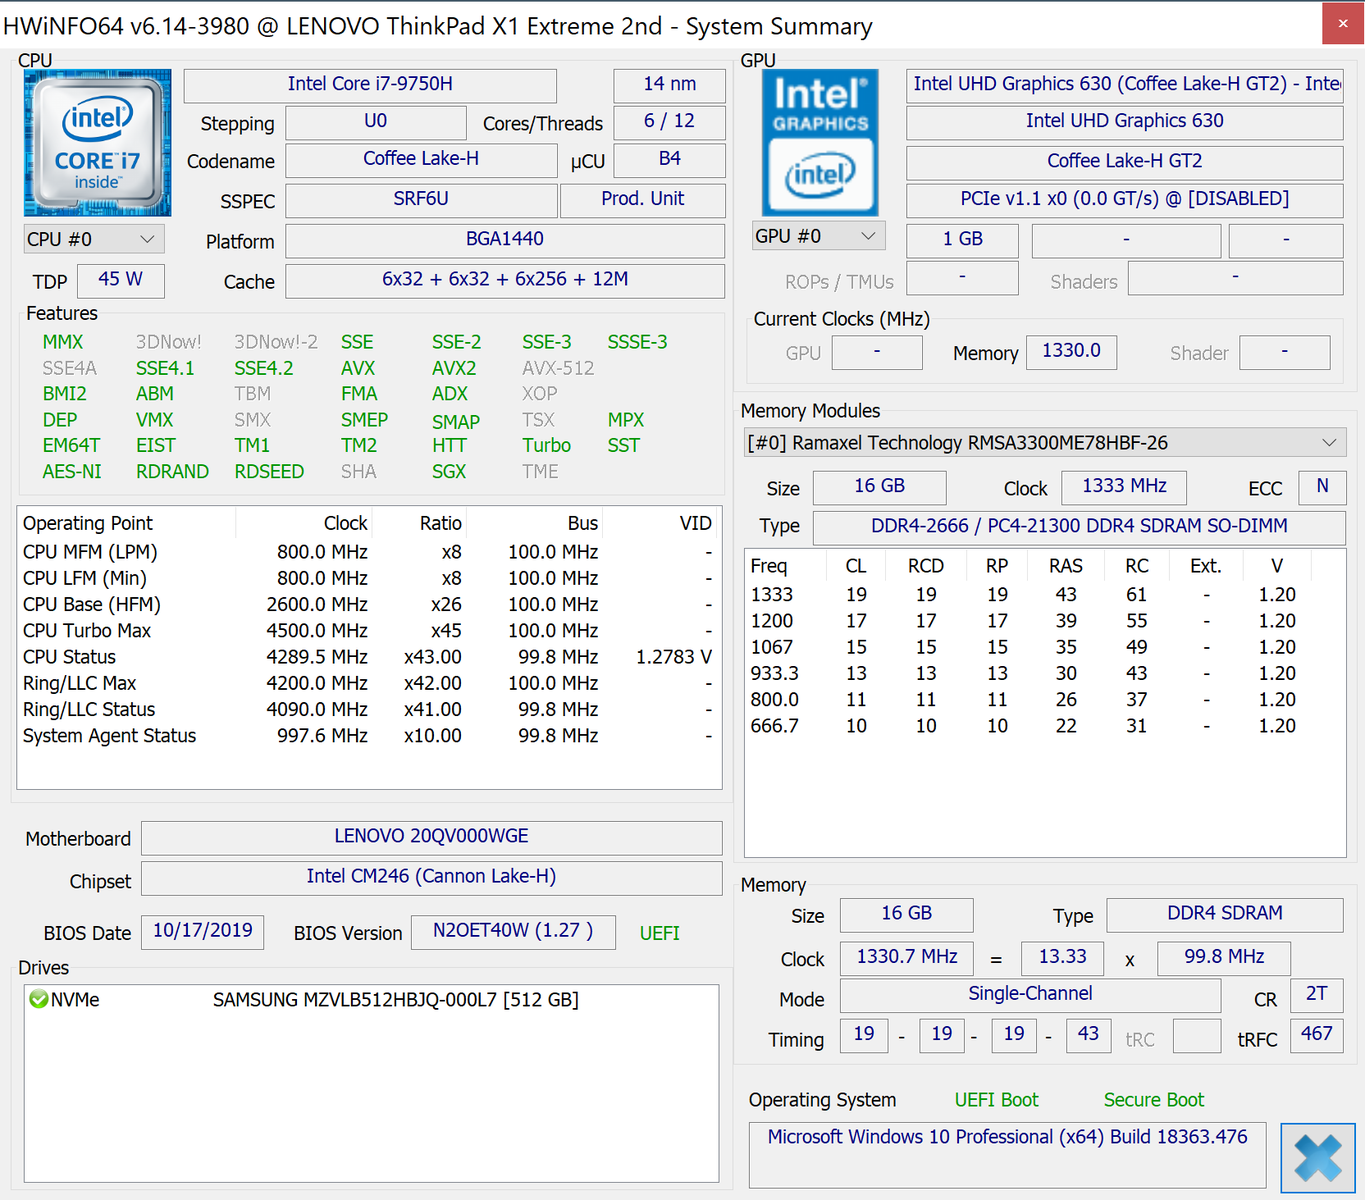

Processor - The Core i7-9750H performs worse than its predecessor
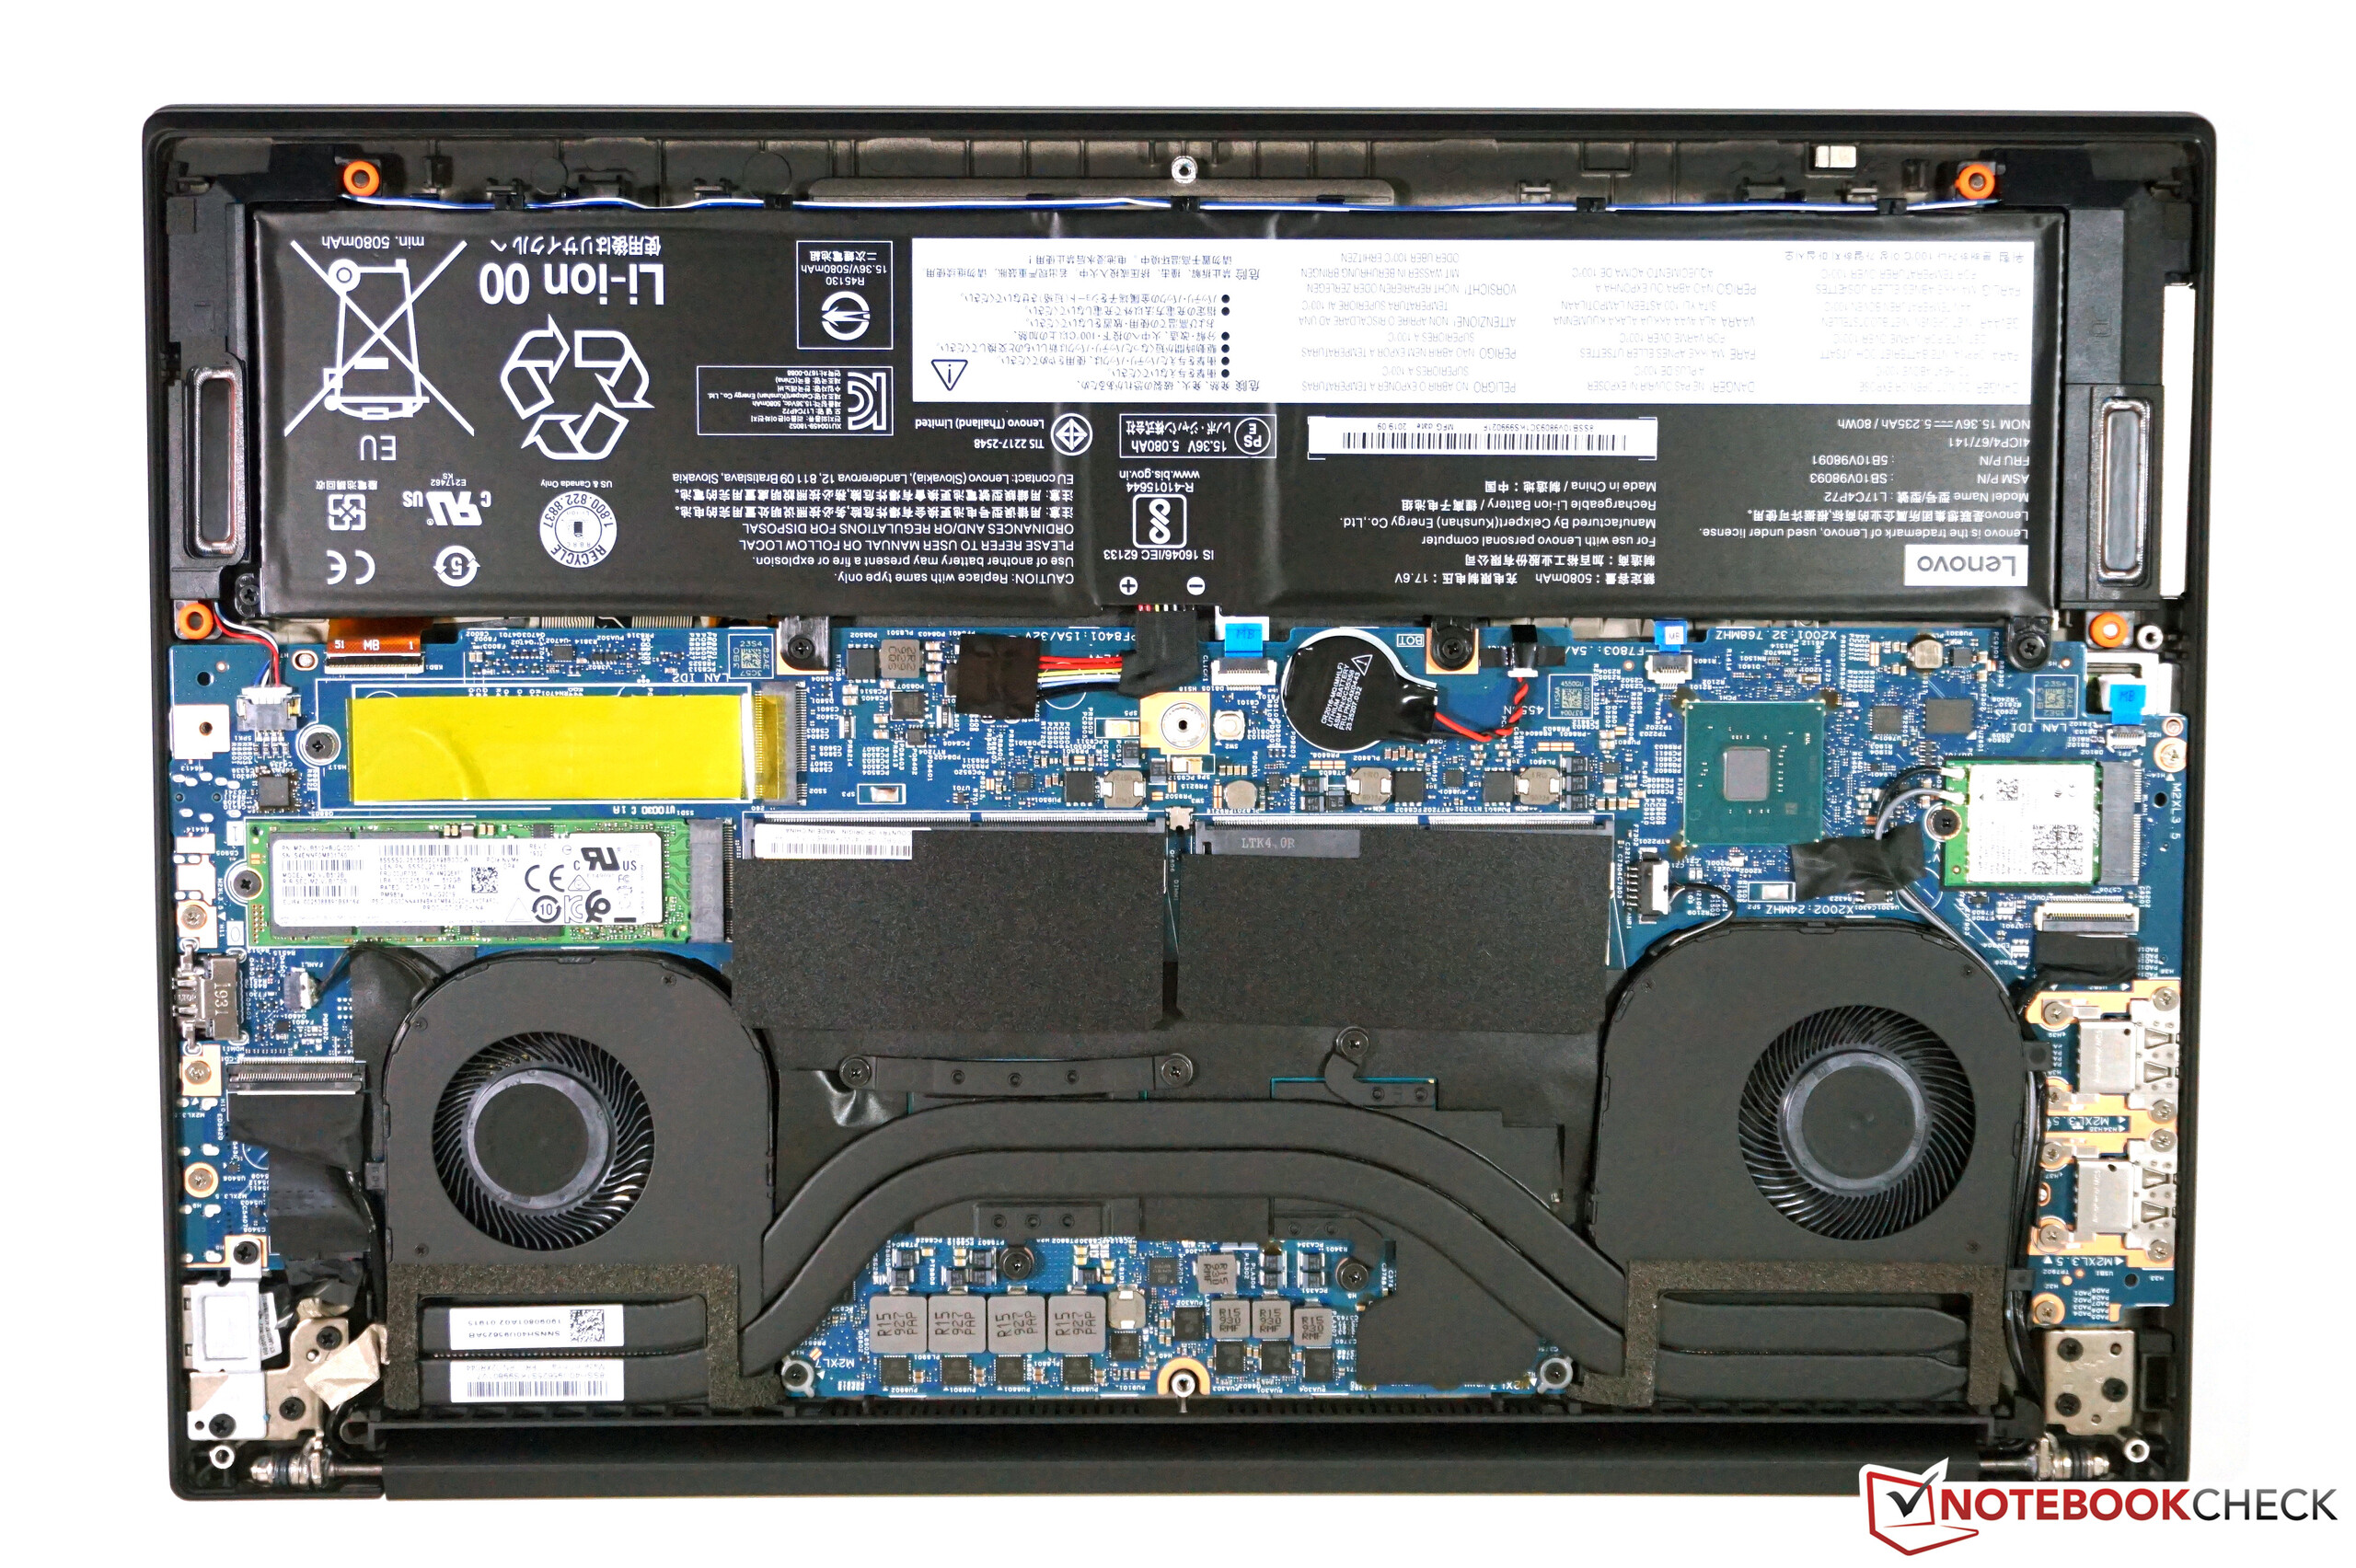
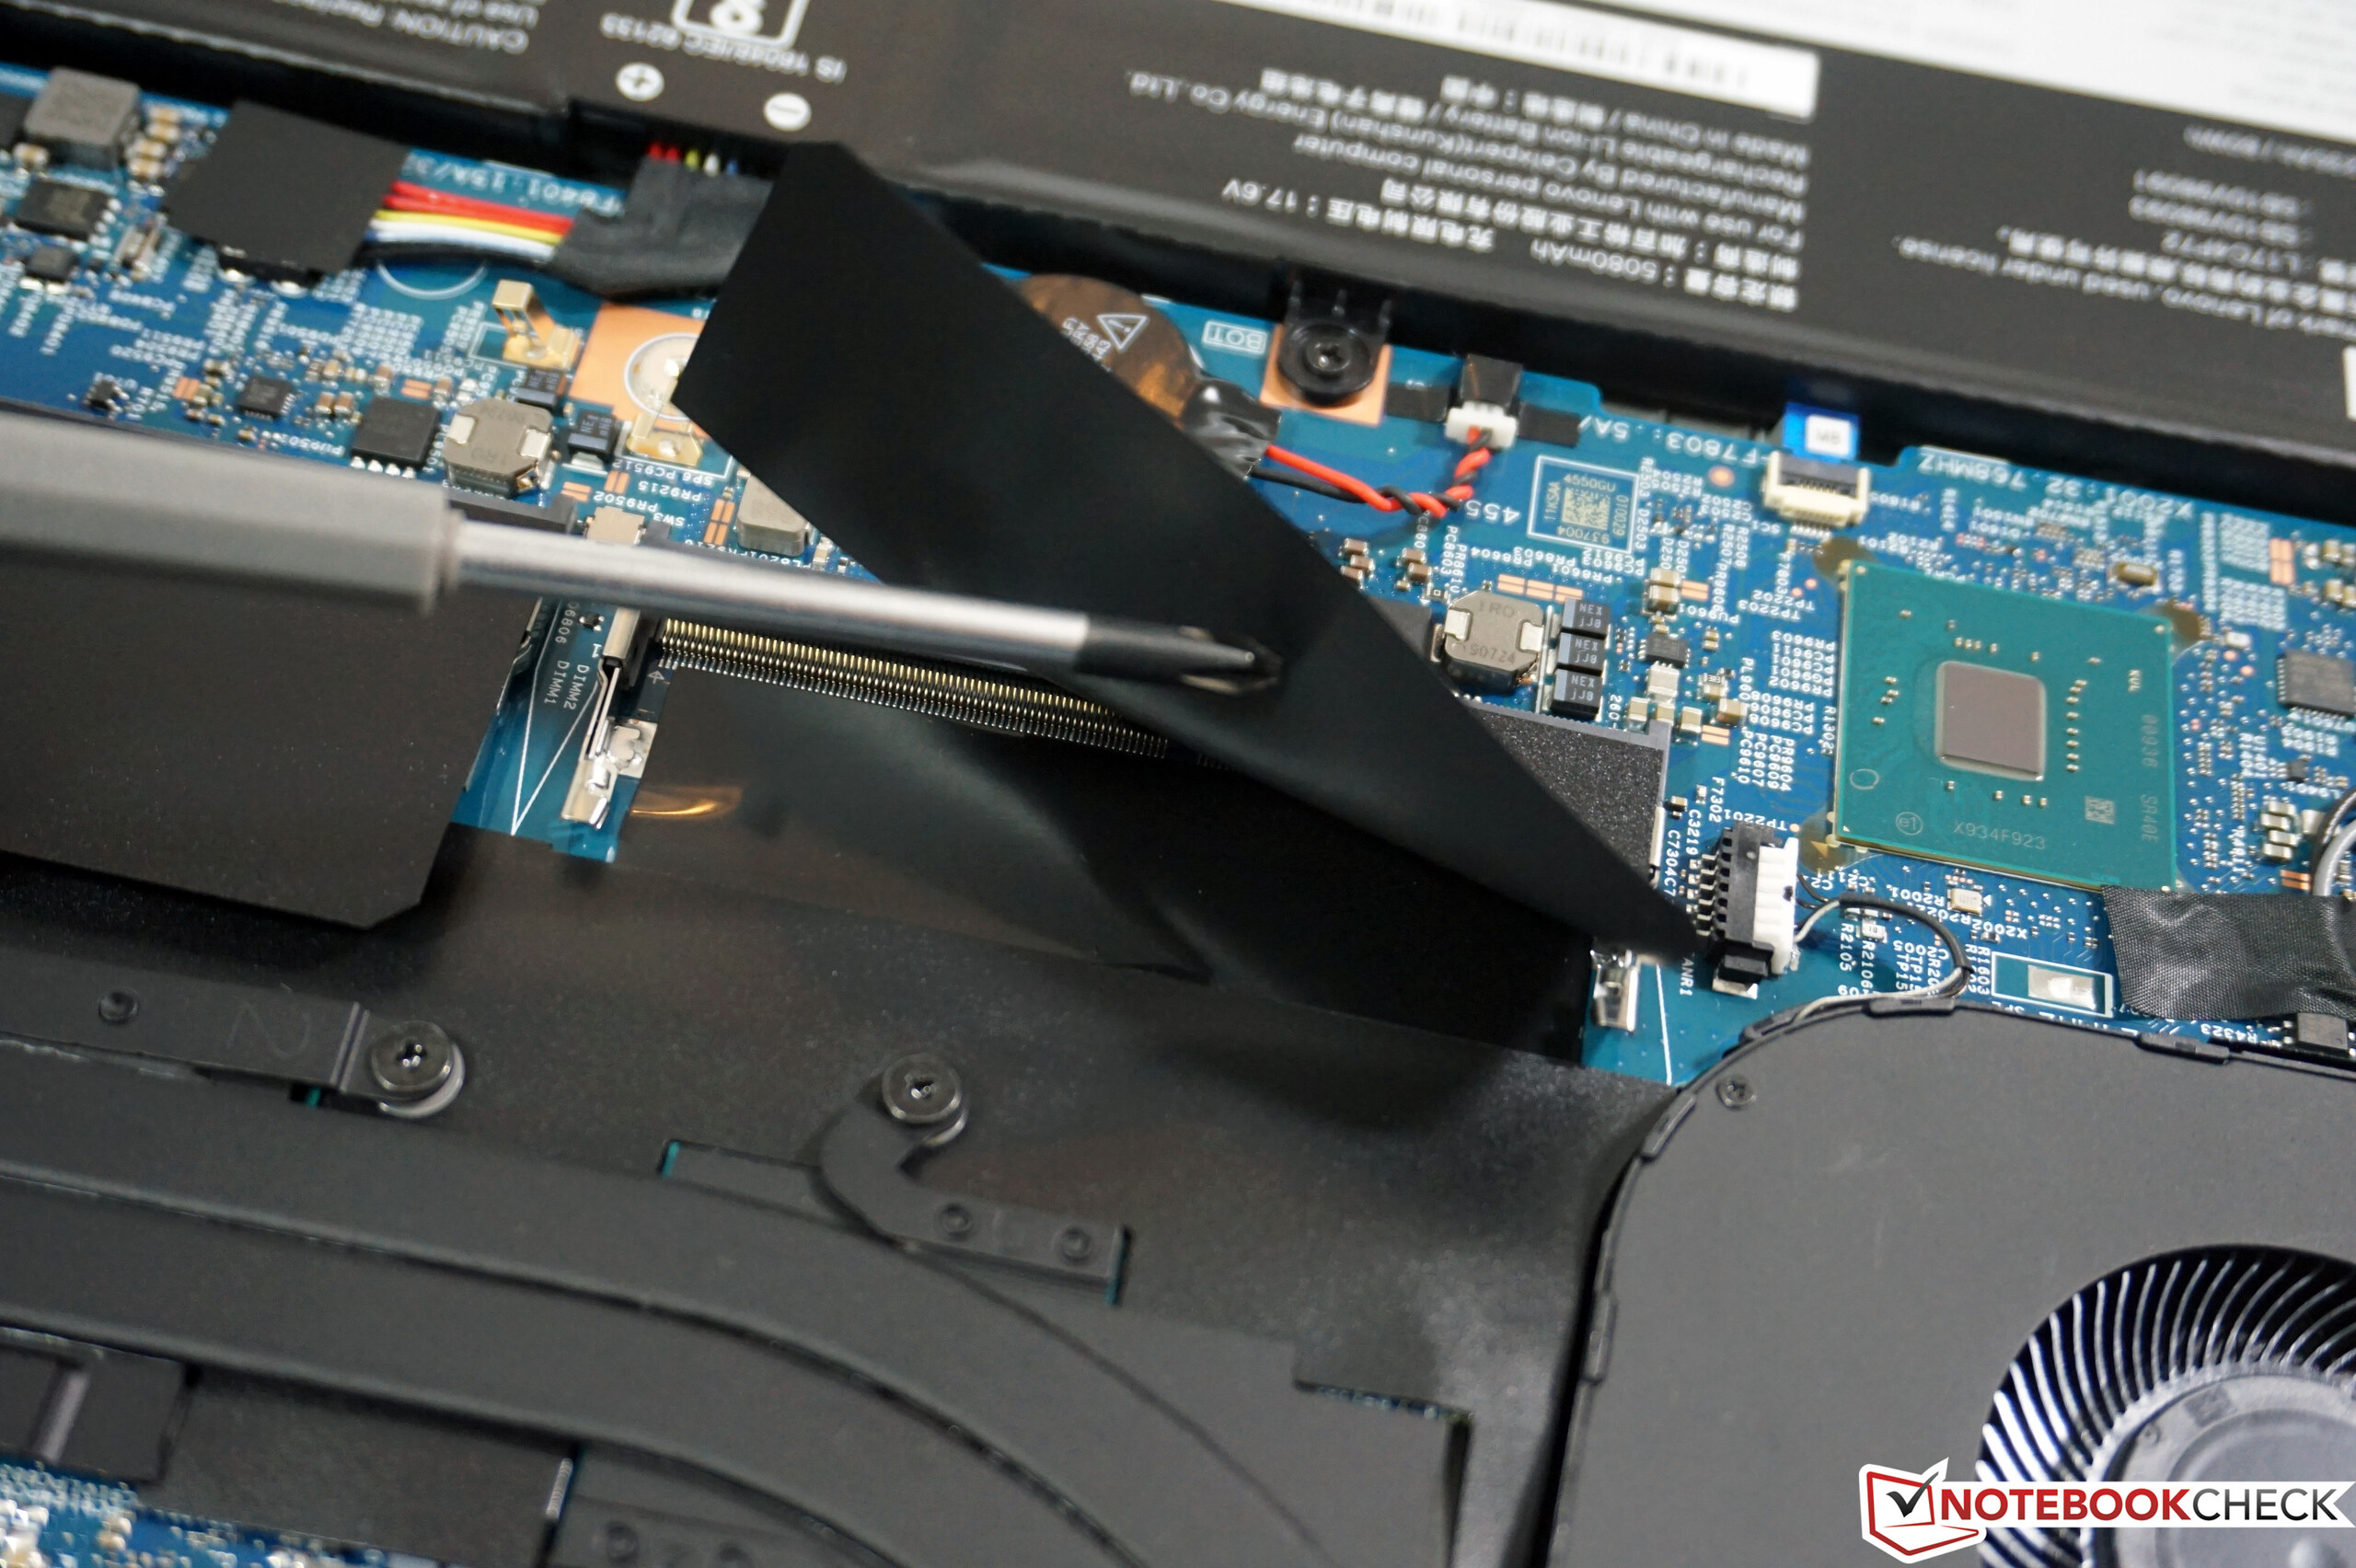
Lenovo offers various Intel processors that have 4, 6 or 8 native cores. In our test device we find the Core i7-9750H, a Coffee Lake Refresh processor that has 6 cores. As with the visually identical ThinkPad P1 2019, the X1 Extreme Gen 2 artificially throttles CPU performance. After a short time, the processor can only consume around 30 W even under pure CPU load. In practice, this means that the processor can only operate at 2.1-2.2 GHz on all cores in benchmarks like Cinebench R15 Multi 64Bit. This is unfortunate and means that the X1 Extreme Gen 2 ranks below its predecessor. Within our comparison group, for example, the X1 Extreme Gen 2 can only muster last place. The device further reduces its performance on battery power, too. Please see our dedicated Core i7-9750H page for more benchmarks and information about the CPU.
System Performance - X1 Extreme Gen 2 performs well in everyday life
The same applies even in synthetic benchmarks like PCMark, where our review unit often finished near the bottom of our comparison tables. However, its results are by no means bad. These performance issues do not show any noticeable restrictions in everyday life either, because its fast PCIe SSD helps the system react and implement inputs quickly.
| PCMark 8 Home Score Accelerated v2 | 3417 points | |
| PCMark 8 Creative Score Accelerated v2 | 4836 points | |
| PCMark 8 Work Score Accelerated v2 | 4241 points | |
| PCMark 10 Score | 4535 points | |
Help | ||

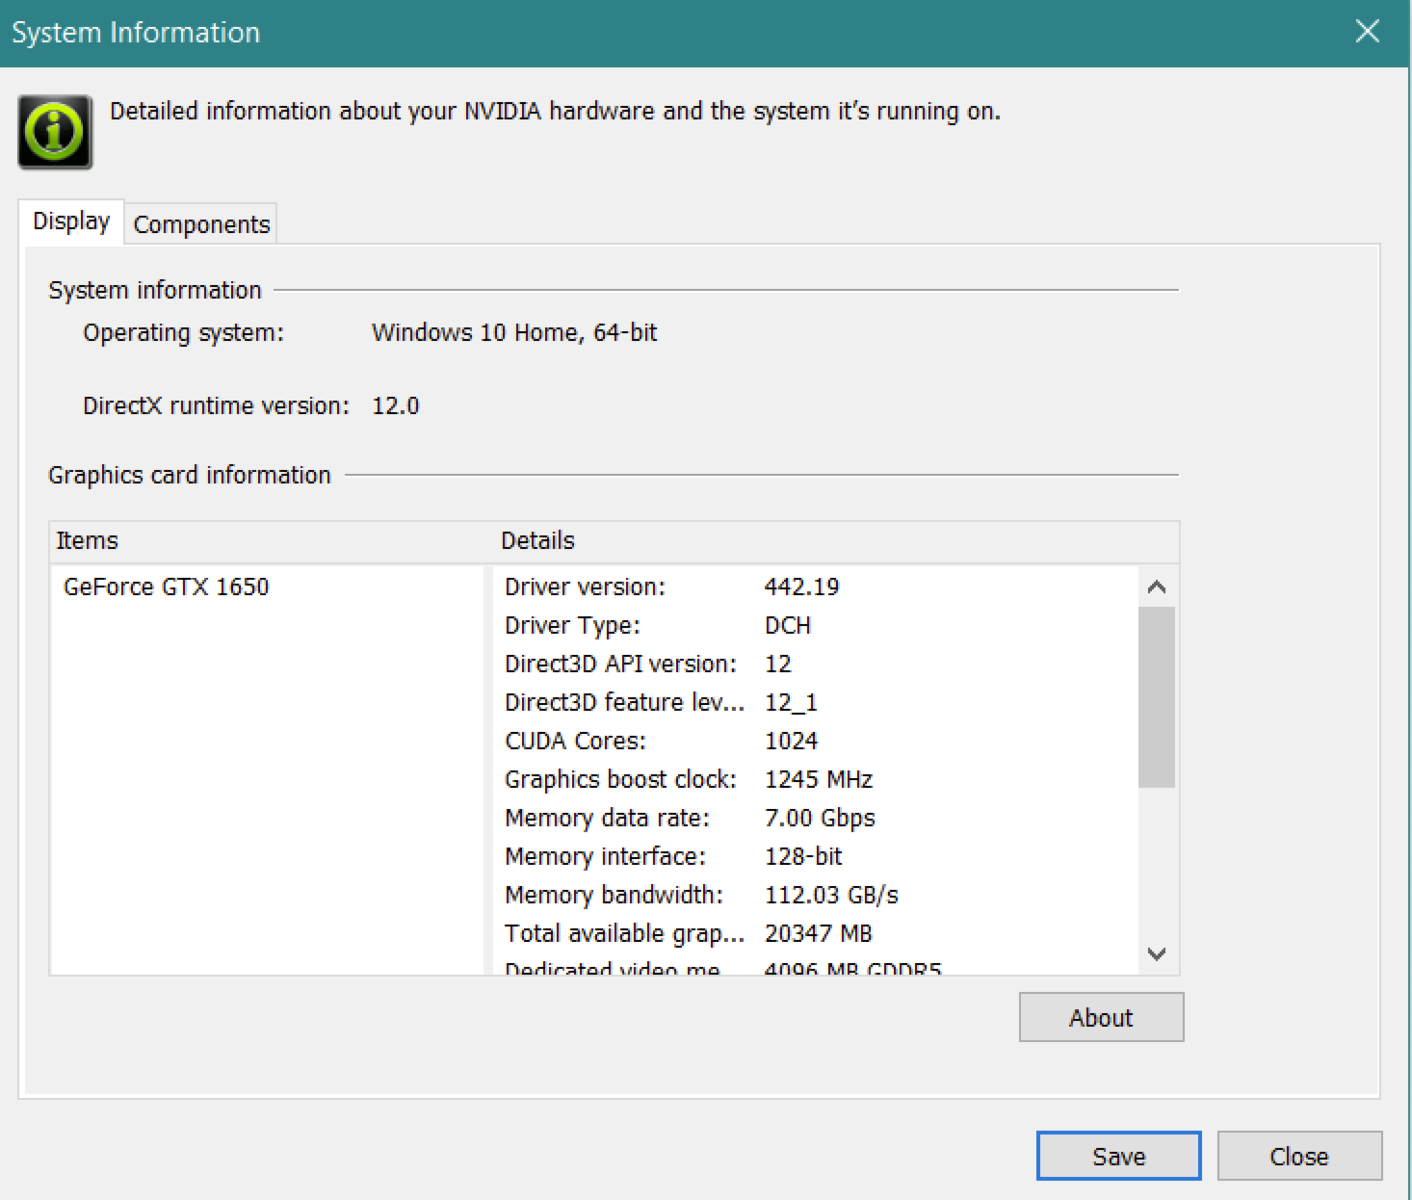
Graphics Card - A GeForce GTX 1650 or a GTX 1650 Max-Q?
Since OEMs do not always divulge that they have equipped laptops with NVIDIA GeForce Max-Q GPUs, we were not sure at first whether Lenovo had opted for the GeForce GTX 1650 or the slower GeForce GTX 1650 Max-Q in the X1 Extreme Gen 2. According to our contacts at NVIDIA, the driver information should reveal which model a laptop has. In this case, the driver reports the GeForce GTX 1650. This is also an upgrade compared to the GeForce GTX 1050 Ti found in its predecessor, but our review unit does not get the most from its GPU, either.
If we compare the results with other GeForce GTX 1650-powered devices in our database, then the GPU in the X1 Extreme is about 15% slower, putting it at the level of the GeForce GTX 1650 Max-Q, instead. The advantage over the older GeForce GTX 1050 Ti in its predecessor is, therefore, rather small. The GPU performs stably even under prolonged load though, as attested by the 3DMark Time Spy stress test, which our review unit passed without any problems at 99.2%. However, the device throttles GPU performance when running on battery power, too. The device scored 7,045 points in Fire Strike Graphics on battery power, for example, compared to the 7,741 points it scored when connected to the mains. All in all, the results are practically identical to the Quadro T1000-powered ThinkPad P1 2019.
| 3DMark 11 Performance | 10546 points | |
| 3DMark Fire Strike Score | 6909 points | |
| 3DMark Fire Strike Extreme Score | 3425 points | |
| 3DMark Time Spy Score | 3080 points | |
Help | ||
Gaming Performance
Our observations on graphics performance also apply to gaming performance. In terms of performance, the X1 Extreme Gen 2 is more at the level of the GeForce GTX 1650 Max-Q than the regular GeForce GTX 1650. Nevertheless, the 15.6-inch laptop is suitable for playing most current games, even if you usually must contend without running them at the highest graphics settings. GPU performance remains stable when gaming too.
| low | med. | high | ultra | 4K | |
|---|---|---|---|---|---|
| The Witcher 3 (2015) | 160.2 | 102.6 | 55.4 | 29.9 | 19.6 |
| Dota 2 Reborn (2015) | 121 | 109 | 94 | 89 | 43.6 |
| Rise of the Tomb Raider (2016) | 154.9 | 102.8 | 57.8 | 47.3 | 20.2 |
| X-Plane 11.11 (2018) | 90 | 68 | 59.2 | ||
| GRID 2019 (2019) | 98.2 | 67.3 | 51.7 | 34.3 | 13.5 |
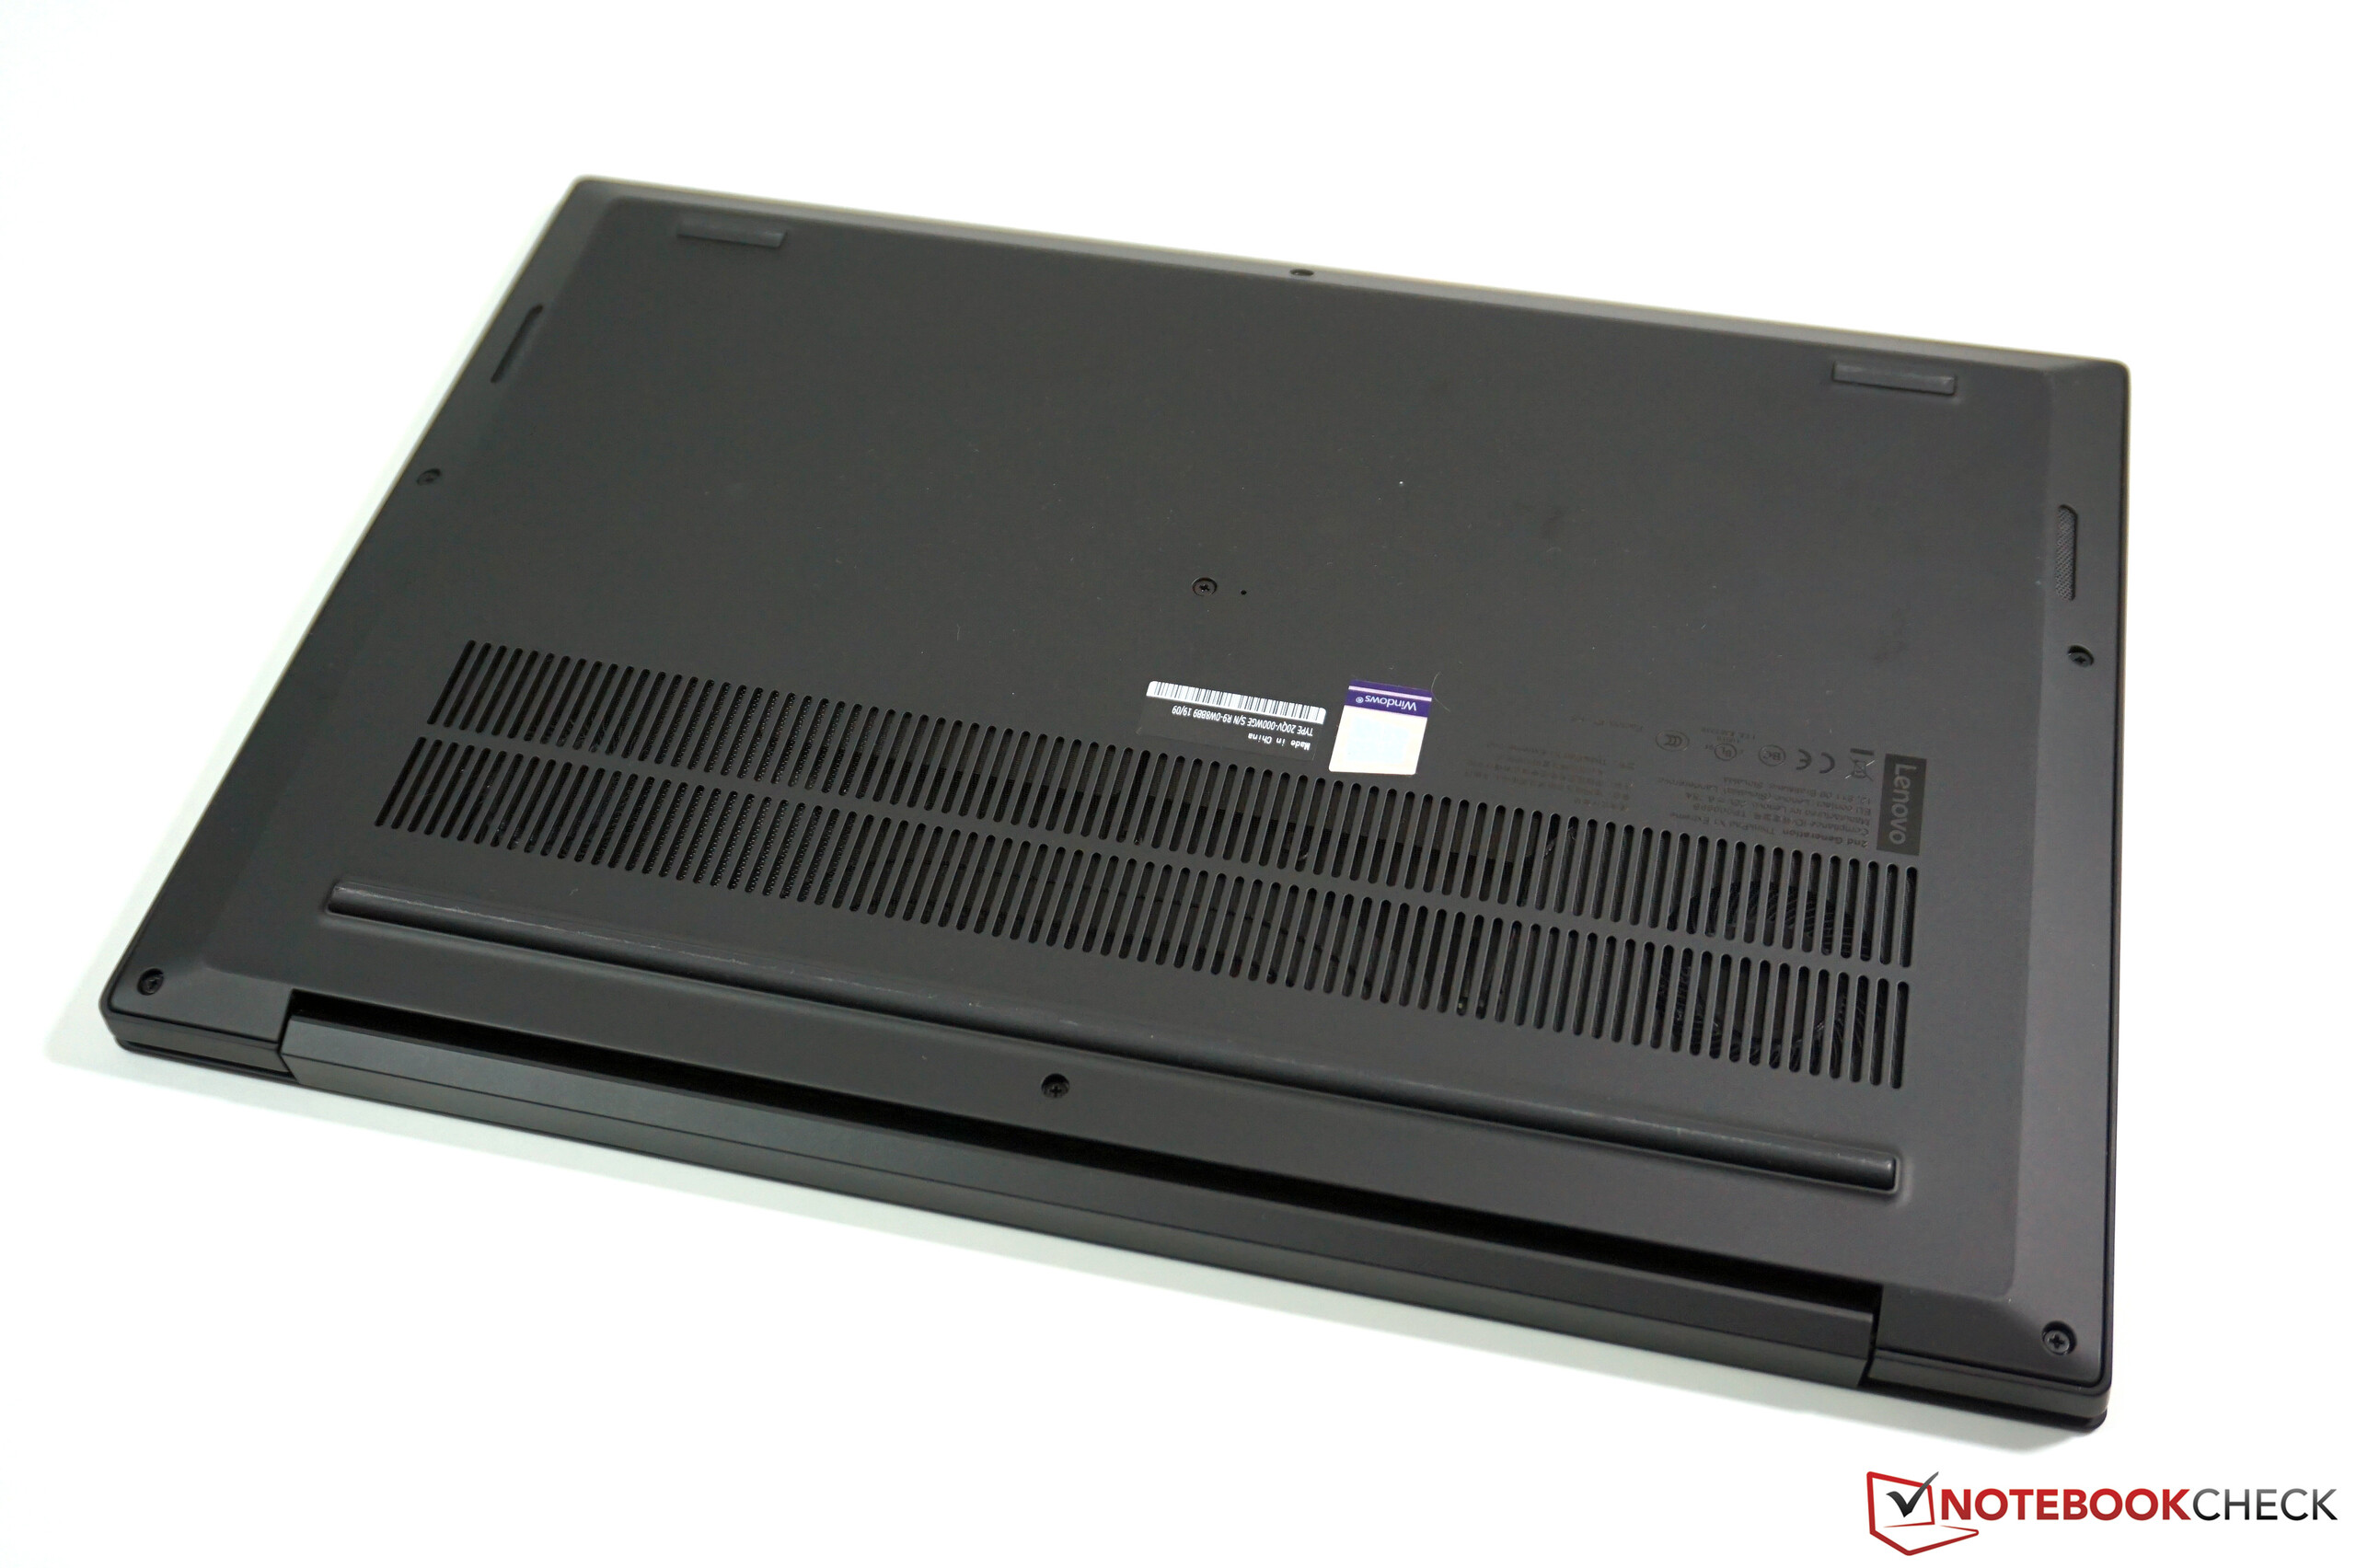
Emissions - The X1 Extreme now has quieter fans
Fan Noise
Like the ThinkPad P1 2019, the fans in the X1 Extreme Gen 2 sound quieter under load than those in its predecessor. Overall, the X1 Extreme Gen 2 is a relatively quiet laptop, with its fans usually remaining off even during short load peaks. The X1 Extreme Gen 2 generally runs silently in everyday life too, and we cannot hear any coil whine being emitted from our test device. In short, the X1 Extreme Gen 2 is one of the quietest devices in our comparison field.
Noise level
| Idle |
| 28.5 / 28.5 / 28.5 dB(A) |
| Load |
| 36.3 / 36.3 dB(A) |
 | ||
30 dB silent 40 dB(A) audible 50 dB(A) loud |
||
min: | ||
| Lenovo ThinkPad X1 Extreme 2019 20QV000WGE GeForce GTX 1650 Mobile, i7-9750H, Samsung SSD PM981 MZVLB512HAJQ | Dell XPS 15 7590 9980HK GTX 1650 GeForce GTX 1650 Mobile, i9-9980HK, Toshiba XG6 KXG60ZNV1T02 | Apple MacBook Pro 16 2019 i9 5500M Radeon Pro 5500M, i9-9880H, Apple SSD AP1024 7171 | Acer ConceptD 7 CN715-71-743N GeForce RTX 2060 Mobile, i7-9750H, WDC PC SN720 SDAPNTW-512G | Lenovo Yoga C940-15IRH GeForce GTX 1650 Max-Q, i7-9750H, Intel Optane Memory H10 with Solid State Storage 32GB + 512GB HBRPEKNX0202A(L/H) | MSI Prestige 15 A10SC GeForce GTX 1650 Max-Q, i7-10710U, Samsung SSD PM981 MZVLB1T0HALR | Lenovo ThinkPad X1 Extreme-20MF000XGE GeForce GTX 1050 Ti Max-Q, i7-8750H, Samsung SSD PM981 MZVLB1T0HALR | |
|---|---|---|---|---|---|---|---|
| Noise | -12% | -13% | -13% | -11% | -6% | -3% | |
| off / environment * (dB) | 28.5 | 28.2 1% | 29.8 -5% | 30.4 -7% | 28.7 -1% | 29.3 -3% | 28.8 -1% |
| Idle Minimum * (dB) | 28.5 | 28.2 1% | 29.9 -5% | 30.6 -7% | 28.7 -1% | 30.1 -6% | 28.8 -1% |
| Idle Average * (dB) | 28.5 | 28.2 1% | 29.9 -5% | 30.6 -7% | 28.8 -1% | 30.2 -6% | 28.8 -1% |
| Idle Maximum * (dB) | 28.5 | 30.4 -7% | 29.9 -5% | 30.6 -7% | 28.8 -1% | 30.2 -6% | 31.3 -10% |
| Load Average * (dB) | 36.3 | 43.8 -21% | 43 -18% | 44 -21% | 45 -24% | 31.5 13% | 36.4 -0% |
| Witcher 3 ultra * (dB) | 36.3 | 47.2 -30% | 45.4 -25% | 43.9 -21% | 44.7 -23% | 37 -2% | 36.4 -0% |
| Load Maximum * (dB) | 36.3 | 47.2 -30% | 46.1 -27% | 44.2 -22% | 44.7 -23% | 47 -29% | 39.2 -8% |
* ... smaller is better
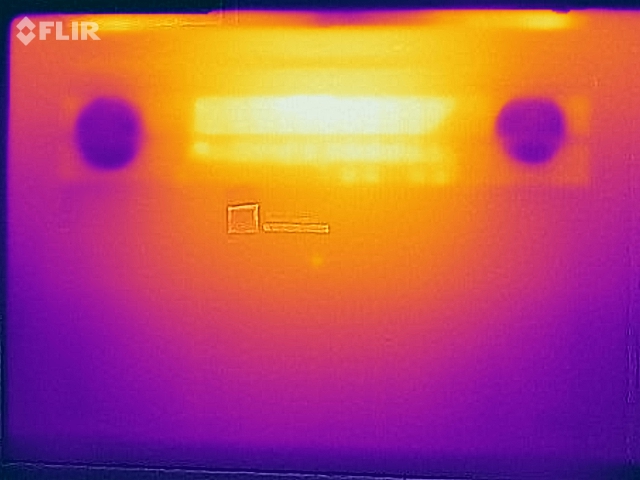
Temperature
Temperatures also remain, in comparison to its predecessor, relatively stable. There are no problems with less demanding tasks, for instance. The chassis only becomes noticeably warm under load, during which you should not rest the device on your thighs. We found our fingers also getting warm when typing, but there are no restrictions here.
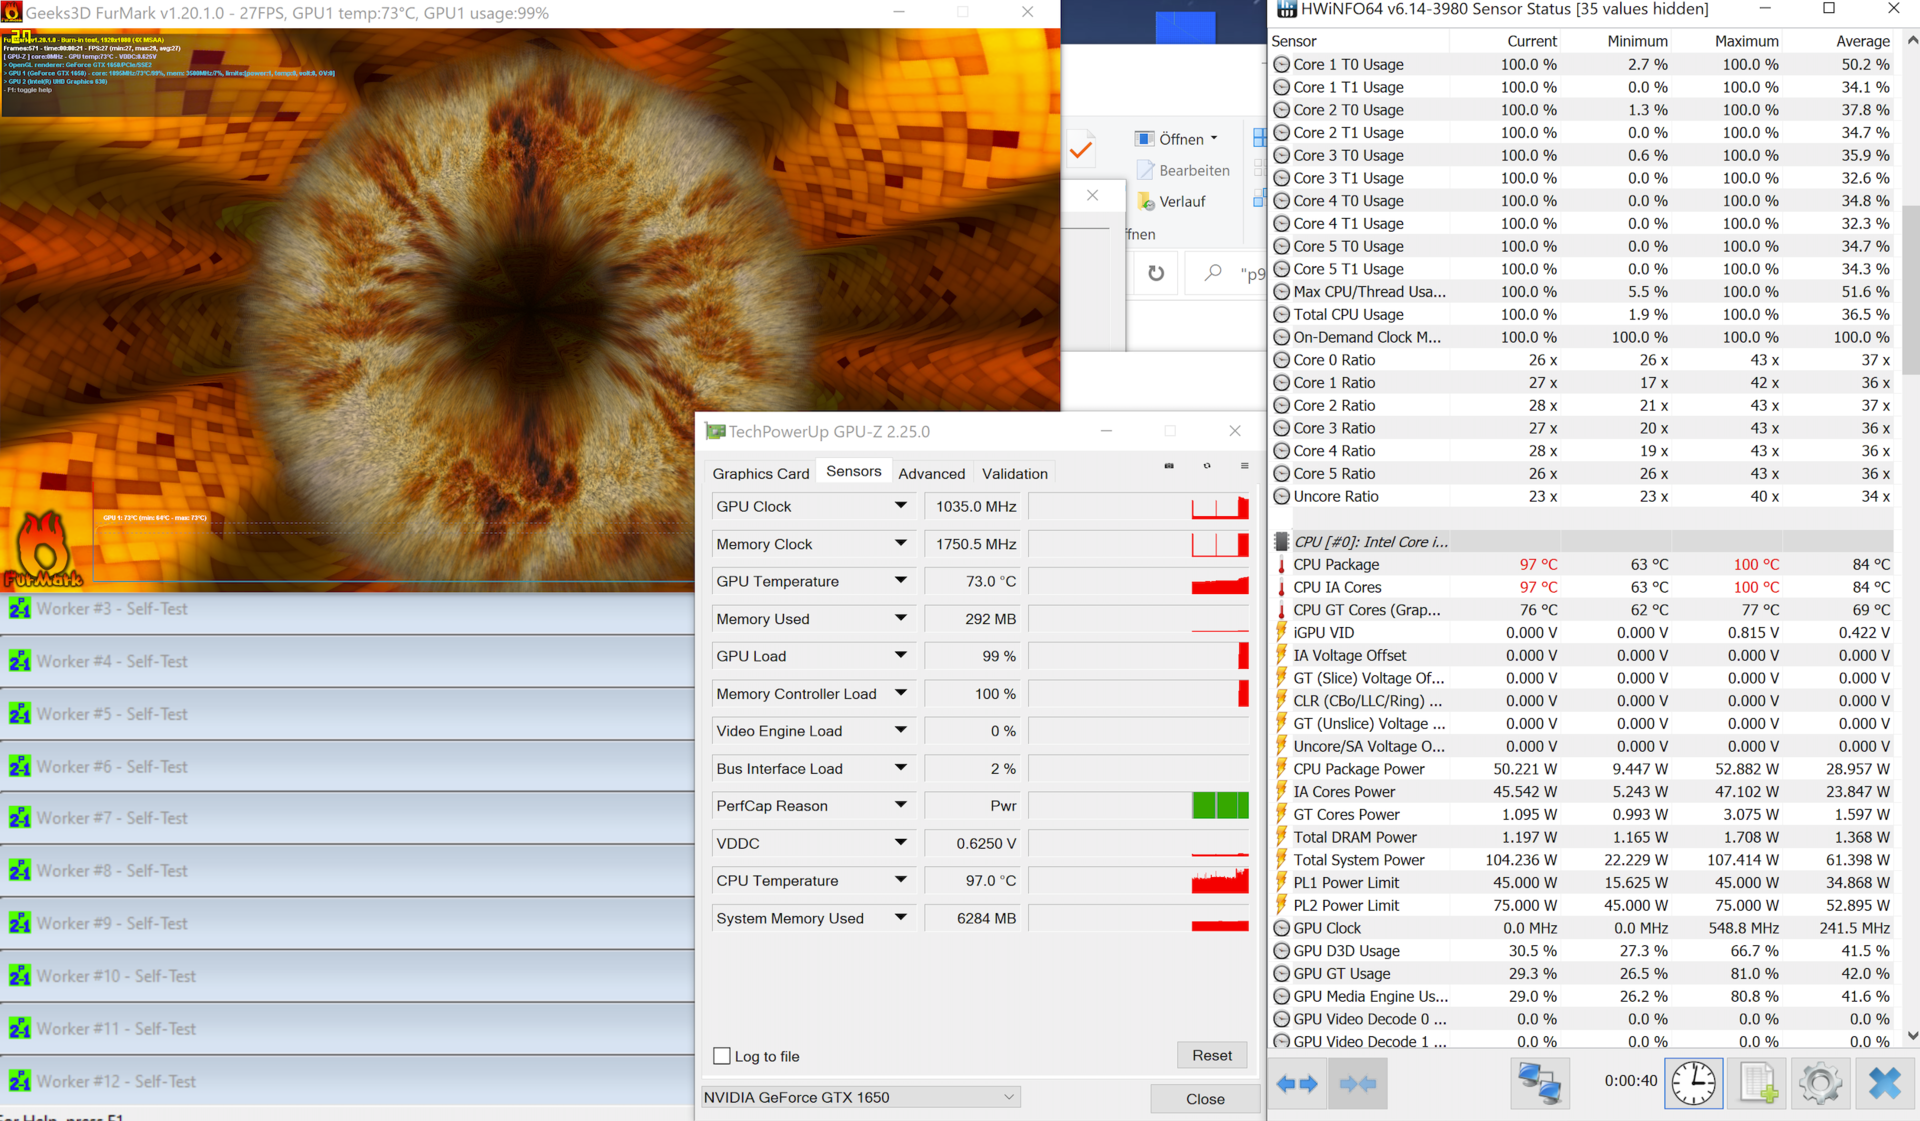
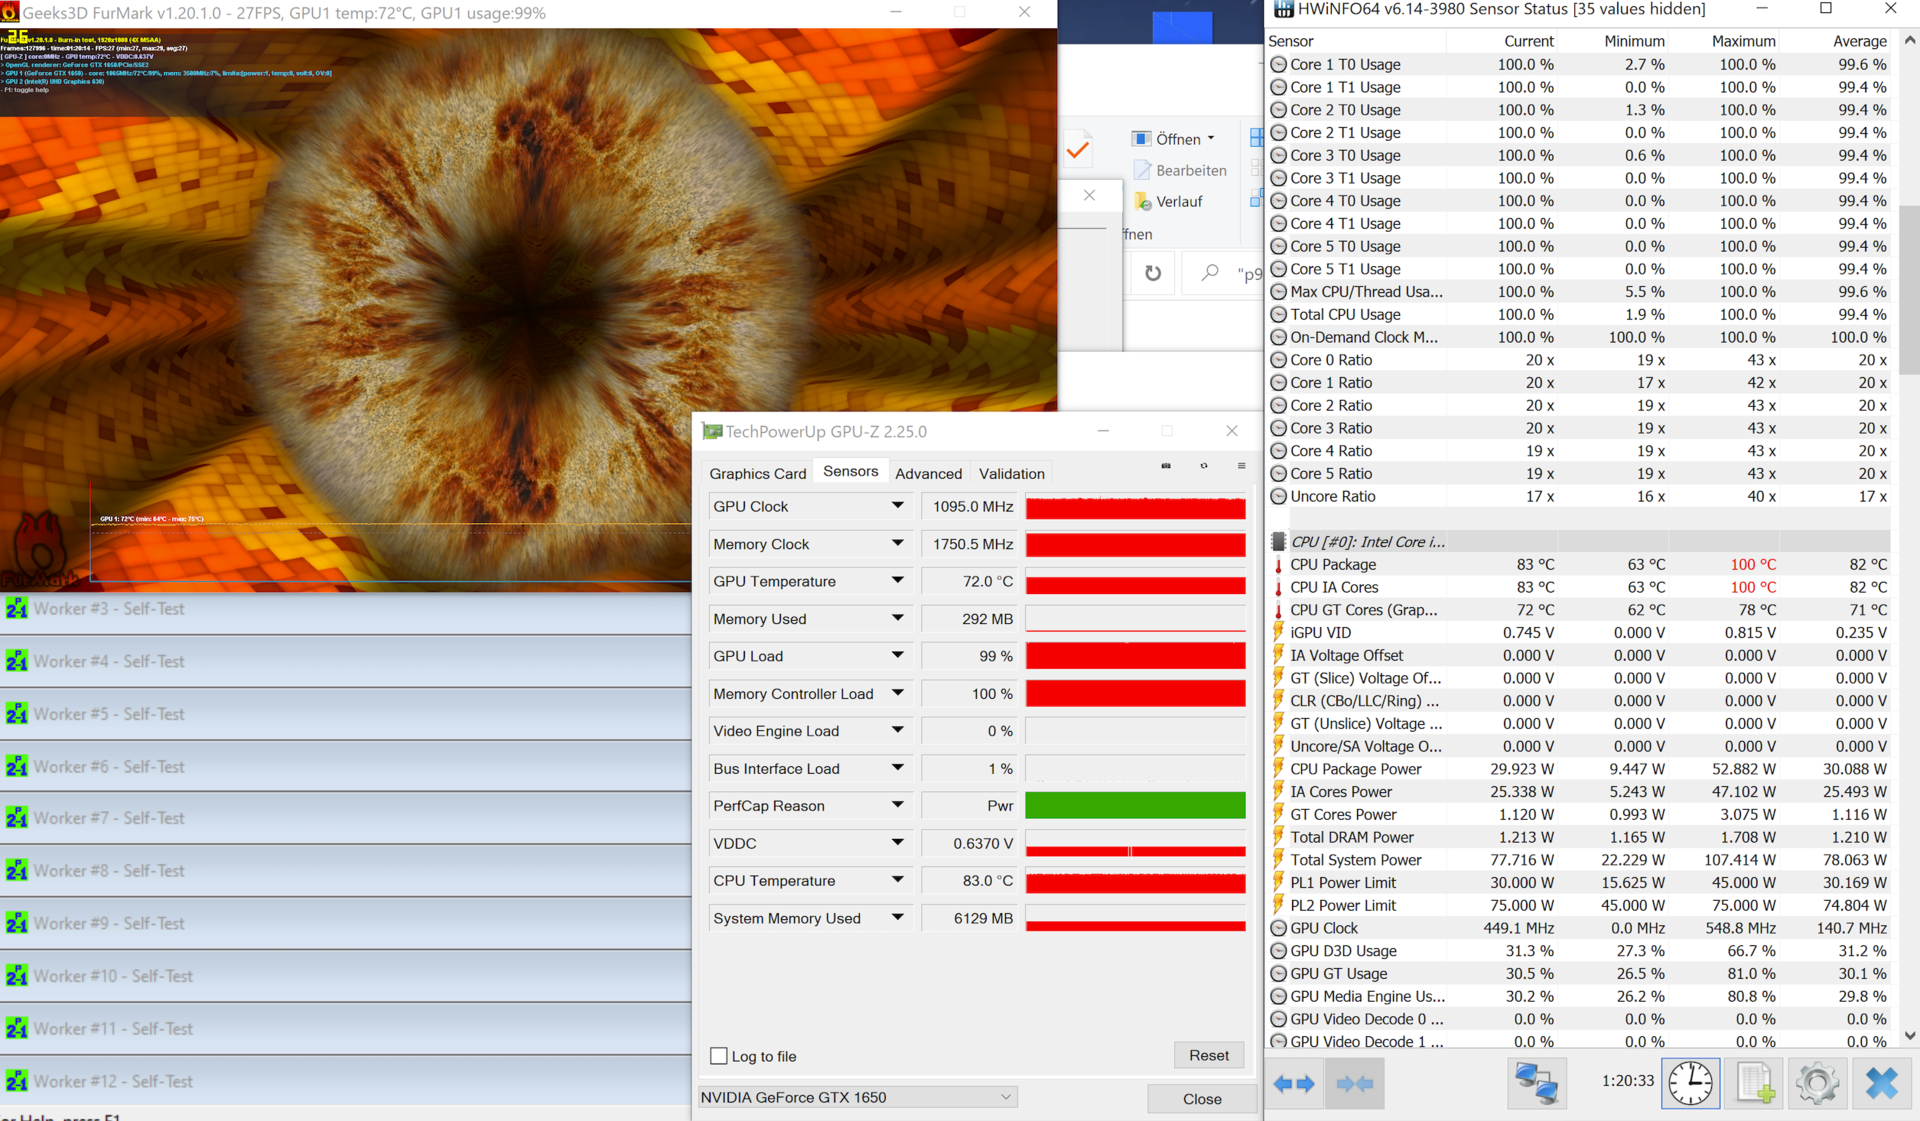
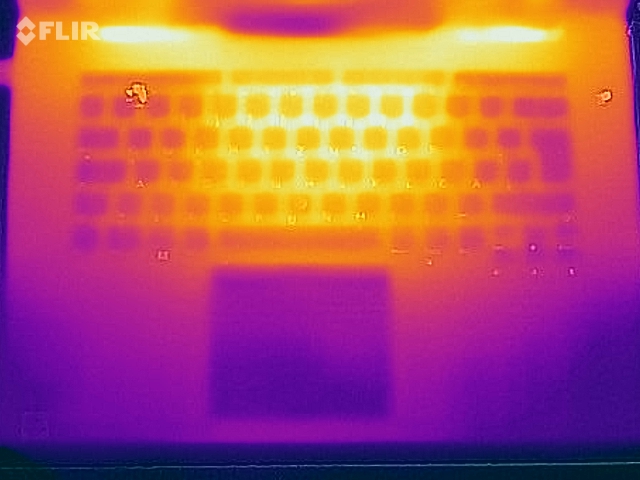
Our review unit did not perform well in our stress test, though. Again, the CPU drops to 30 W after a short time, with it only able to maintain an all-core clock speed of between 1.9 and 2.0 GHz. The GPU, on the other hand, constantly sat at around 1,090 MHz. We encountered no restrictions after the stress test, either.
(-) The maximum temperature on the upper side is 46.8 °C / 116 F, compared to the average of 36.9 °C / 98 F, ranging from 21 to 71 °C for the class Multimedia.
(-) The bottom heats up to a maximum of 52.4 °C / 126 F, compared to the average of 39.1 °C / 102 F
(+) In idle usage, the average temperature for the upper side is 24 °C / 75 F, compared to the device average of 31.3 °C / 88 F.
(±) Playing The Witcher 3, the average temperature for the upper side is 37.3 °C / 99 F, compared to the device average of 31.3 °C / 88 F.
(+) The palmrests and touchpad are cooler than skin temperature with a maximum of 31.9 °C / 89.4 F and are therefore cool to the touch.
(-) The average temperature of the palmrest area of similar devices was 28.7 °C / 83.7 F (-3.2 °C / -5.7 F).
Speakers
Lenovo ThinkPad X1 Extreme 2019 20QV000WGE audio analysis
(±) | speaker loudness is average but good (73.1 dB)
Bass 100 - 315 Hz
(±) | reduced bass - on average 8.6% lower than median
(±) | linearity of bass is average (11.9% delta to prev. frequency)
Mids 400 - 2000 Hz
(±) | higher mids - on average 7.7% higher than median
(±) | linearity of mids is average (7.5% delta to prev. frequency)
Highs 2 - 16 kHz
(±) | reduced highs - on average 6.1% lower than median
(±) | linearity of highs is average (7.5% delta to prev. frequency)
Overall 100 - 16.000 Hz
(±) | linearity of overall sound is average (24.2% difference to median)
Compared to same class
» 85% of all tested devices in this class were better, 5% similar, 10% worse
» The best had a delta of 5%, average was 17%, worst was 45%
Compared to all devices tested
» 73% of all tested devices were better, 6% similar, 21% worse
» The best had a delta of 4%, average was 24%, worst was 134%
Dell XPS 15 7590 9980HK GTX 1650 audio analysis
(+) | speakers can play relatively loud (88.4 dB)
Bass 100 - 315 Hz
(-) | nearly no bass - on average 24.9% lower than median
(±) | linearity of bass is average (14.4% delta to prev. frequency)
Mids 400 - 2000 Hz
(+) | balanced mids - only 2.8% away from median
(±) | linearity of mids is average (7.8% delta to prev. frequency)
Highs 2 - 16 kHz
(+) | balanced highs - only 1.9% away from median
(+) | highs are linear (5.3% delta to prev. frequency)
Overall 100 - 16.000 Hz
(±) | linearity of overall sound is average (17.8% difference to median)
Compared to same class
» 51% of all tested devices in this class were better, 8% similar, 42% worse
» The best had a delta of 5%, average was 17%, worst was 45%
Compared to all devices tested
» 35% of all tested devices were better, 8% similar, 56% worse
» The best had a delta of 4%, average was 24%, worst was 134%
Apple MacBook Pro 16 2019 i9 5500M audio analysis
(+) | speakers can play relatively loud (82.3 dB)
Bass 100 - 315 Hz
(+) | good bass - only 2.3% away from median
(+) | bass is linear (5% delta to prev. frequency)
Mids 400 - 2000 Hz
(+) | balanced mids - only 2.7% away from median
(+) | mids are linear (3.4% delta to prev. frequency)
Highs 2 - 16 kHz
(+) | balanced highs - only 2.1% away from median
(+) | highs are linear (2.6% delta to prev. frequency)
Overall 100 - 16.000 Hz
(+) | overall sound is linear (6.9% difference to median)
Compared to same class
» 5% of all tested devices in this class were better, 0% similar, 95% worse
» The best had a delta of 5%, average was 17%, worst was 45%
Compared to all devices tested
» 1% of all tested devices were better, 0% similar, 99% worse
» The best had a delta of 4%, average was 24%, worst was 134%
Power Management - The 4K panel affects battery life
Power Consumption
| Off / Standby | |
| Idle | |
| Load |
|
Key:
min: | |
| Lenovo ThinkPad X1 Extreme 2019 20QV000WGE i7-9750H, GeForce GTX 1650 Mobile, Samsung SSD PM981 MZVLB512HAJQ, IPS, 3840x2160, 15.6" | Lenovo ThinkPad P1 2019-20QT000RGE i7-9850H, Quadro T1000 (Laptop), WDC PC SN720 SDAQNTW-512G, IPS LED, 1920x1080, 15.6" | Dell XPS 15 7590 9980HK GTX 1650 i9-9980HK, GeForce GTX 1650 Mobile, Toshiba XG6 KXG60ZNV1T02, OLED, 3840x2160, 15.6" | Apple MacBook Pro 16 2019 i9 5500M i9-9880H, Radeon Pro 5500M, Apple SSD AP1024 7171, IPS, 3072x1920, 16" | Acer ConceptD 7 CN715-71-743N i7-9750H, GeForce RTX 2060 Mobile, WDC PC SN720 SDAPNTW-512G, IPS, 3840x2160, 15.6" | Lenovo Yoga C940-15IRH i7-9750H, GeForce GTX 1650 Max-Q, Intel Optane Memory H10 with Solid State Storage 32GB + 512GB HBRPEKNX0202A(L/H), IPS, 1920x1080, 15.6" | MSI Prestige 15 A10SC i7-10710U, GeForce GTX 1650 Max-Q, Samsung SSD PM981 MZVLB1T0HALR, IPS, 3840x2160, 15.6" | Lenovo ThinkPad X1 Extreme-20MF000XGE i7-8750H, GeForce GTX 1050 Ti Max-Q, Samsung SSD PM981 MZVLB1T0HALR, IPS, 3840x2160, 15.6" | Average NVIDIA GeForce GTX 1650 Mobile | Average of class Multimedia | |
|---|---|---|---|---|---|---|---|---|---|---|
| Power Consumption | -14% | 6% | 16% | -14% | 8% | 18% | 7% | 23% | 27% | |
| Idle Minimum * (Watt) | 8.5 | 13.7 -61% | 6.2 27% | 3.7 56% | 7.6 11% | 5.2 39% | 6.1 28% | 7.6 11% | 4.96 ? 42% | 5.83 ? 31% |
| Idle Average * (Watt) | 14.7 | 17.5 -19% | 9.6 35% | 12.1 18% | 13.6 7% | 10.7 27% | 13.2 10% | 14.8 -1% | 8.61 ? 41% | 10.3 ? 30% |
| Idle Maximum * (Watt) | 19.4 | 20.9 -8% | 21.2 -9% | 17 12% | 18.2 6% | 24.3 -25% | 19.2 1% | 17.6 9% | 14.8 ? 24% | 12.2 ? 37% |
| Load Average * (Watt) | 89.6 | 77.2 14% | 104.3 -16% | 91.5 -2% | 102 -14% | 84.4 6% | 75 16% | 86 4% | 81.7 ? 9% | 66.9 ? 25% |
| Witcher 3 ultra * (Watt) | 96.1 | 91.7 5% | 103 -7% | 144 -50% | 83.9 13% | 74 23% | 85 12% | |||
| Load Maximum * (Watt) | 129.8 | 123.7 5% | 135.3 -4% | 102.3 21% | 183 -41% | 142.8 -10% | 89.7 31% | 118.9 8% | 131.9 ? -2% | 113 ? 13% |
* ... smaller is better
Battery Life
Battery life is the Achilles' heel of the X1 Extreme Gen 2, at least if you opt for the matte 4K panel. It is worth noting that the optional OLED panel will use even more power than the 4K IPS one does. As you could already guess from our review unit's high power consumption, its battery life is much worse than those of its competitors. This even includes its 4K-equipped predecessor.
In our normal Wi-Fi test, which we conduct by setting the display to 150 cd/m², our review unit cannot even manage 5 hours before it needs recharging. Worse still, this value dropped to just over 4 hours when we re-ran it at maximum brightness. If battery life is important to you, then you should opt for a 1080p display. We tested the ThinkPad P1 2019 with a 1080p panel, for example, and this achieved almost twice as long runtimes as our X1 Extreme Gen 2 review unit does.
| Lenovo ThinkPad X1 Extreme 2019 20QV000WGE i7-9750H, GeForce GTX 1650 Mobile, 80 Wh | Dell XPS 15 7590 9980HK GTX 1650 i9-9980HK, GeForce GTX 1650 Mobile, 97 Wh | Apple MacBook Pro 16 2019 i9 5500M i9-9880H, Radeon Pro 5500M, 99.8 Wh | Acer ConceptD 7 CN715-71-743N i7-9750H, GeForce RTX 2060 Mobile, 84 Wh | Lenovo Yoga C940-15IRH i7-9750H, GeForce GTX 1650 Max-Q, 69 Wh | MSI Prestige 15 A10SC i7-10710U, GeForce GTX 1650 Max-Q, 82 Wh | Lenovo ThinkPad X1 Extreme-20MF000XGE i7-8750H, GeForce GTX 1050 Ti Max-Q, 80 Wh | Lenovo ThinkPad P1 2019-20QT000RGE i7-9850H, Quadro T1000 (Laptop), 80 Wh | Average of class Multimedia | |
|---|---|---|---|---|---|---|---|---|---|
| Battery runtime | 119% | 80% | 50% | 43% | 67% | 44% | 64% | 142% | |
| H.264 (h) | 4.7 | 9.7 106% | 6.5 38% | 6.2 32% | 9.3 98% | 16.2 ? 245% | |||
| WiFi v1.3 (h) | 4.8 | 7.8 63% | 12 150% | 8.6 79% | 9.7 102% | 7.6 58% | 6.4 33% | 8.9 85% | 11.7 ? 144% |
| Load (h) | 1.2 | 3.3 175% | 1 -17% | 1.6 33% | 1 -17% | 2.1 75% | 2 67% | 1.3 8% | 1.656 ? 38% |
| Reader / Idle (h) | 15.2 | 13.7 | 18.2 | 19.1 | 11.5 | 25.2 ? | |||
| Witcher 3 ultra (h) | 0.9 | 1.1 |
Pros
Cons
Verdict - Lenovo has made the X1 Extreme worse
Firstly, the ThinkPad X1 Extreme Gen 2 sounds like it should be an excellent multimedia laptop. Combining the chassis of its predecessor with more display options and faster components should be a recipe for success. However, in practice the changes have not always proved to be positive ones.
Starting with the good things, the matte 4K panel offers decent image quality, albeit post additional calibration. The X1 Extreme Gen 2 has some of the best input devices on the market too, although there are some reliability problems from which our review unit also suffers. The X1 Extreme Gen 2 also runs more quietly under load.
From now on, however, we only have bad news. We have the feeling that Lenovo has simply installed new components while maintaining the same cooling solution. The newer processor suffers here because of the faster graphics card, although the latter also falls short of expectations. The result is that the X1 Extreme Gen 2 has a slower CPU than its predecessor and only a minimally faster GPU. Another problem is the device's massive power consumption, owing to its matte 4K panel, which yields sub-5-hour runtimes.
The second generation of the ThinkPad X1 Extreme has gotten worse in some places. CPU performance is below its predecessor, for example, and its GPU cannot reach its potential. While the matte 4K panel is a good option when it comes to image quality, it needs additional calibration and has a significant impact on battery life.
The performance of our review unit is certainly not bad in itself. You should have no problems in everyday usage, for instance. The competition simply offers more, though. We would also recommend considering the optional 500-nit 1080p display over the 4K IPS one here, which offers very good image quality while consuming significantly less power.
Lenovo ThinkPad X1 Extreme 2019 20QV000WGE
- 02/13/2020 v7 (old)
Andreas Osthoff
Price comparison

