HP Spectre X360 15 Late 2019 Convertible Review: Comet Lake Core i7 with GeForce MX Graphics
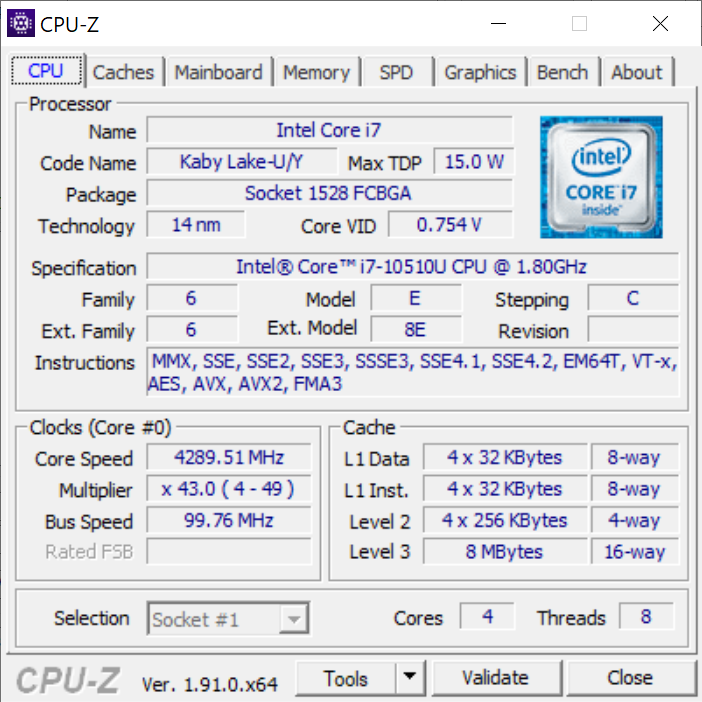
At CES 2020, HP unveiled a refreshed Spectre x360 15 with narrower bezels, new CPU options, and an unspecified GeForce GPU that will more than likely be a yet-to-be-announced next generation GeForce offering. The 2019 model we are reviewing today directly precedes the 2020 Spectre x360 15 with a Comet Lake-U quad-core Core i7-10510U CPU, GeForce MX250 GPU, and 4K UHD IPS display for about $1300 USD on CUKUSA.com.
When compared to the 2018 Spectre x360 15, the 2019 model includes plenty of changes both internal and external. Nonetheless, we recommend checking out our existing review on the 2018 model since they still share several characteristics. The HP Spectre x360 15 competes directly with other ~$1000 15.6-inch laptops including the Dell XPS 15 and XPS 15 2-in-1, Lenovo IdeaPad S740, Lenovo Yoga C940 15, and the Asus ZenBook 15.
More HP reviews:
Rating | Date | Model | Weight | Height | Size | Resolution | Price |
|---|---|---|---|---|---|---|---|
| 85 % v7 (old) | 01 / 2020 | HP Spectre X360 15-5ZV31AV i7-10510U, GeForce MX250 | 2.1 kg | 19.3 mm | 15.60" | 3840x2160 | |
| 86 % v7 (old) | 12 / 2019 | Lenovo Yoga C940-15IRH i7-9750H, GeForce GTX 1650 Max-Q | 2 kg | 19.7 mm | 15.60" | 1920x1080 | |
| 83.1 % v7 (old) | 09 / 2019 | Asus ZenBook 15 UX534FT-DB77 i7-8565U, GeForce GTX 1650 Max-Q | 1.7 kg | 18.9 mm | 15.60" | 1920x1080 | |
| 86.5 % v6 (old) | 07 / 2018 | HP Spectre x360 15-ch011nr i5-8550U, GeForce MX150 | 2.1 kg | 19.3 mm | 15.60" | 3840x2160 | |
| 85.2 % v7 (old) | 11 / 2019 | MSI Prestige 15 A10SC i7-10710U, GeForce GTX 1650 Max-Q | 1.7 kg | 16 mm | 15.60" | 3840x2160 |
Case
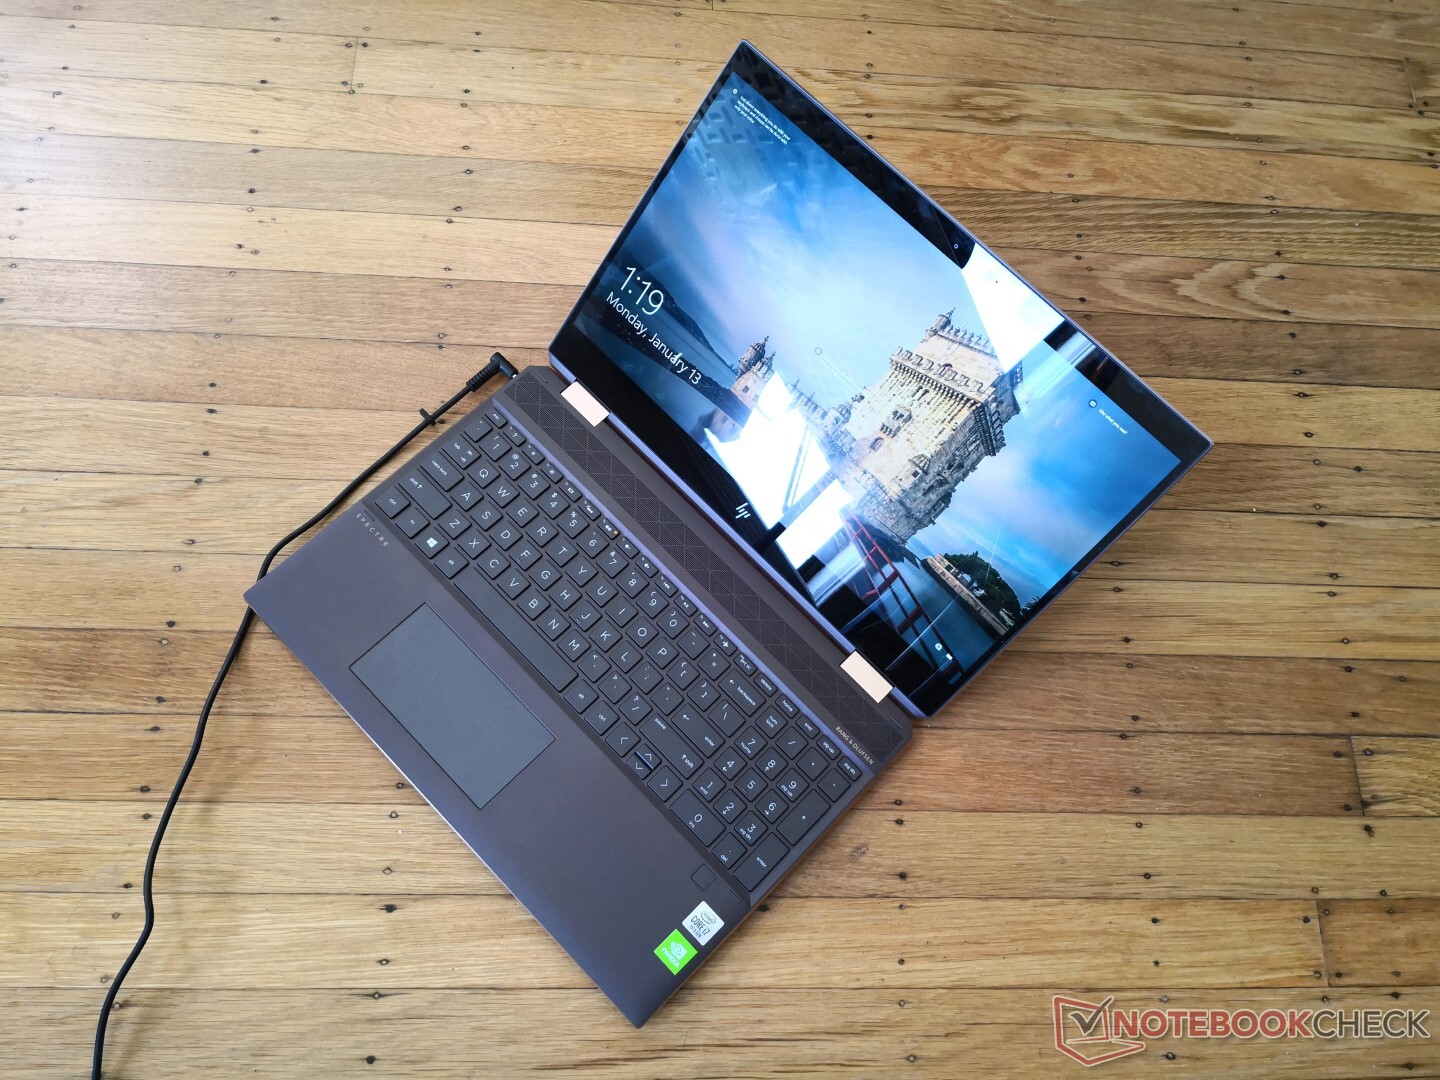
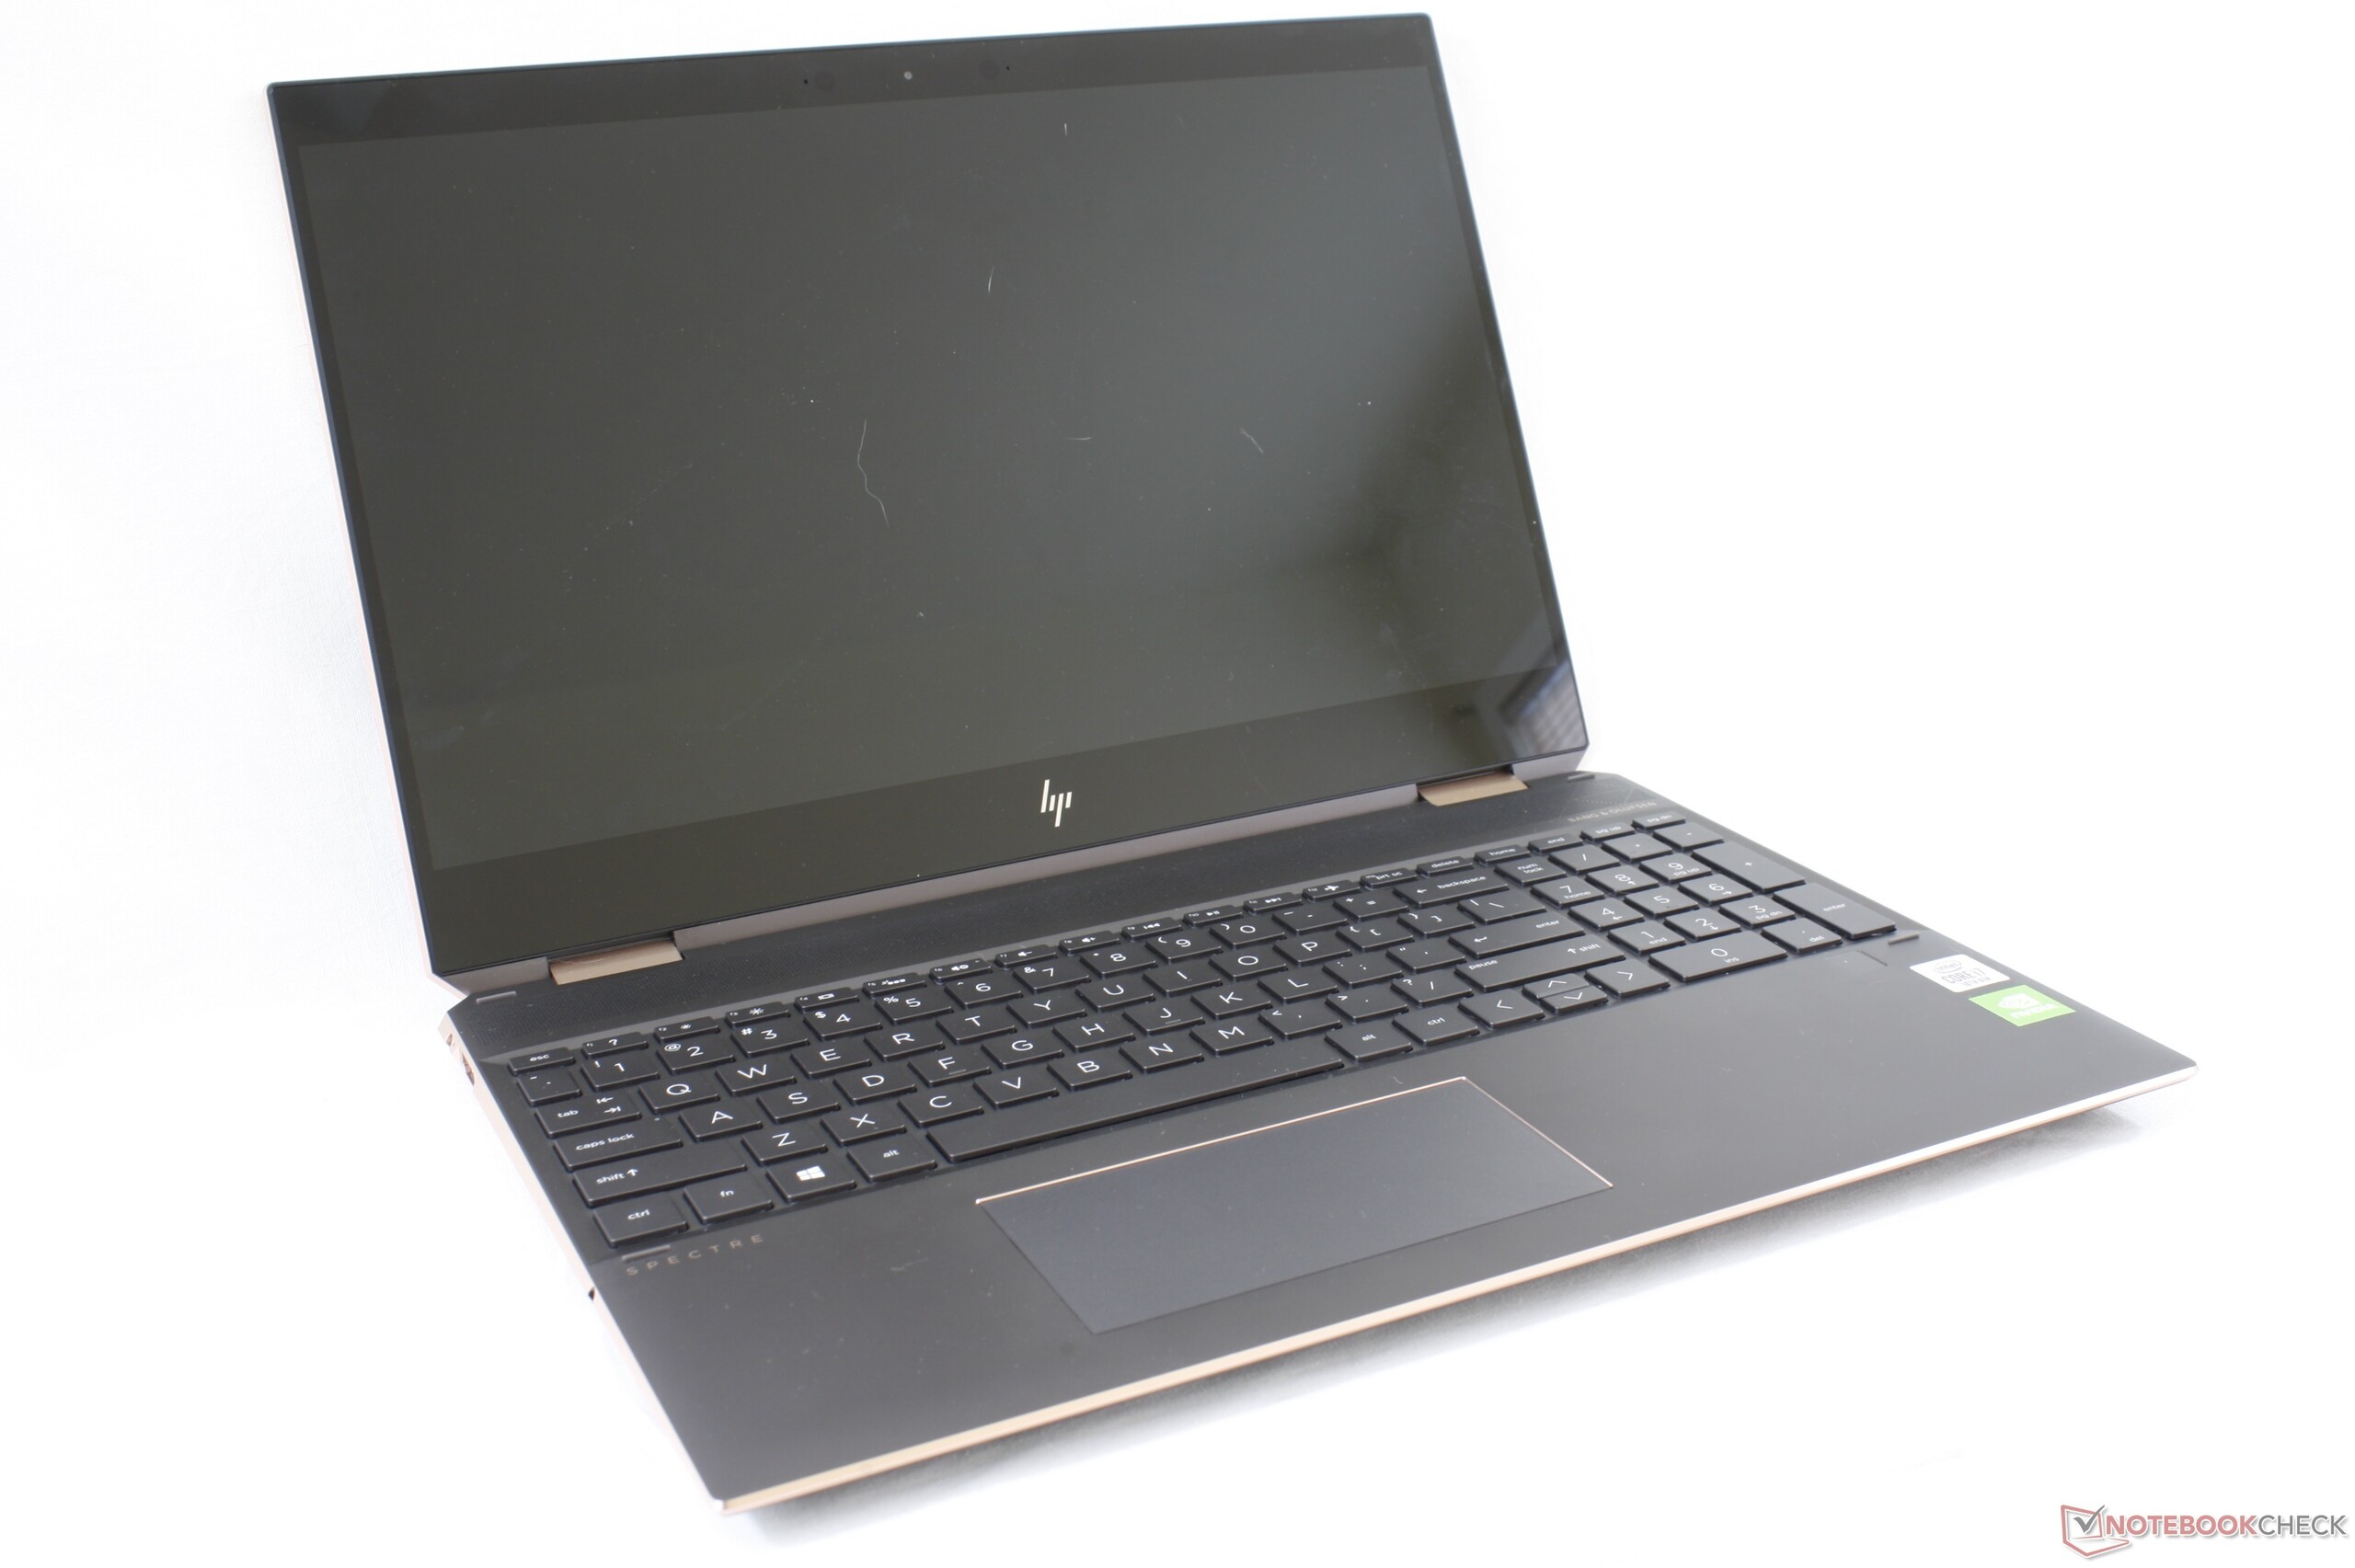
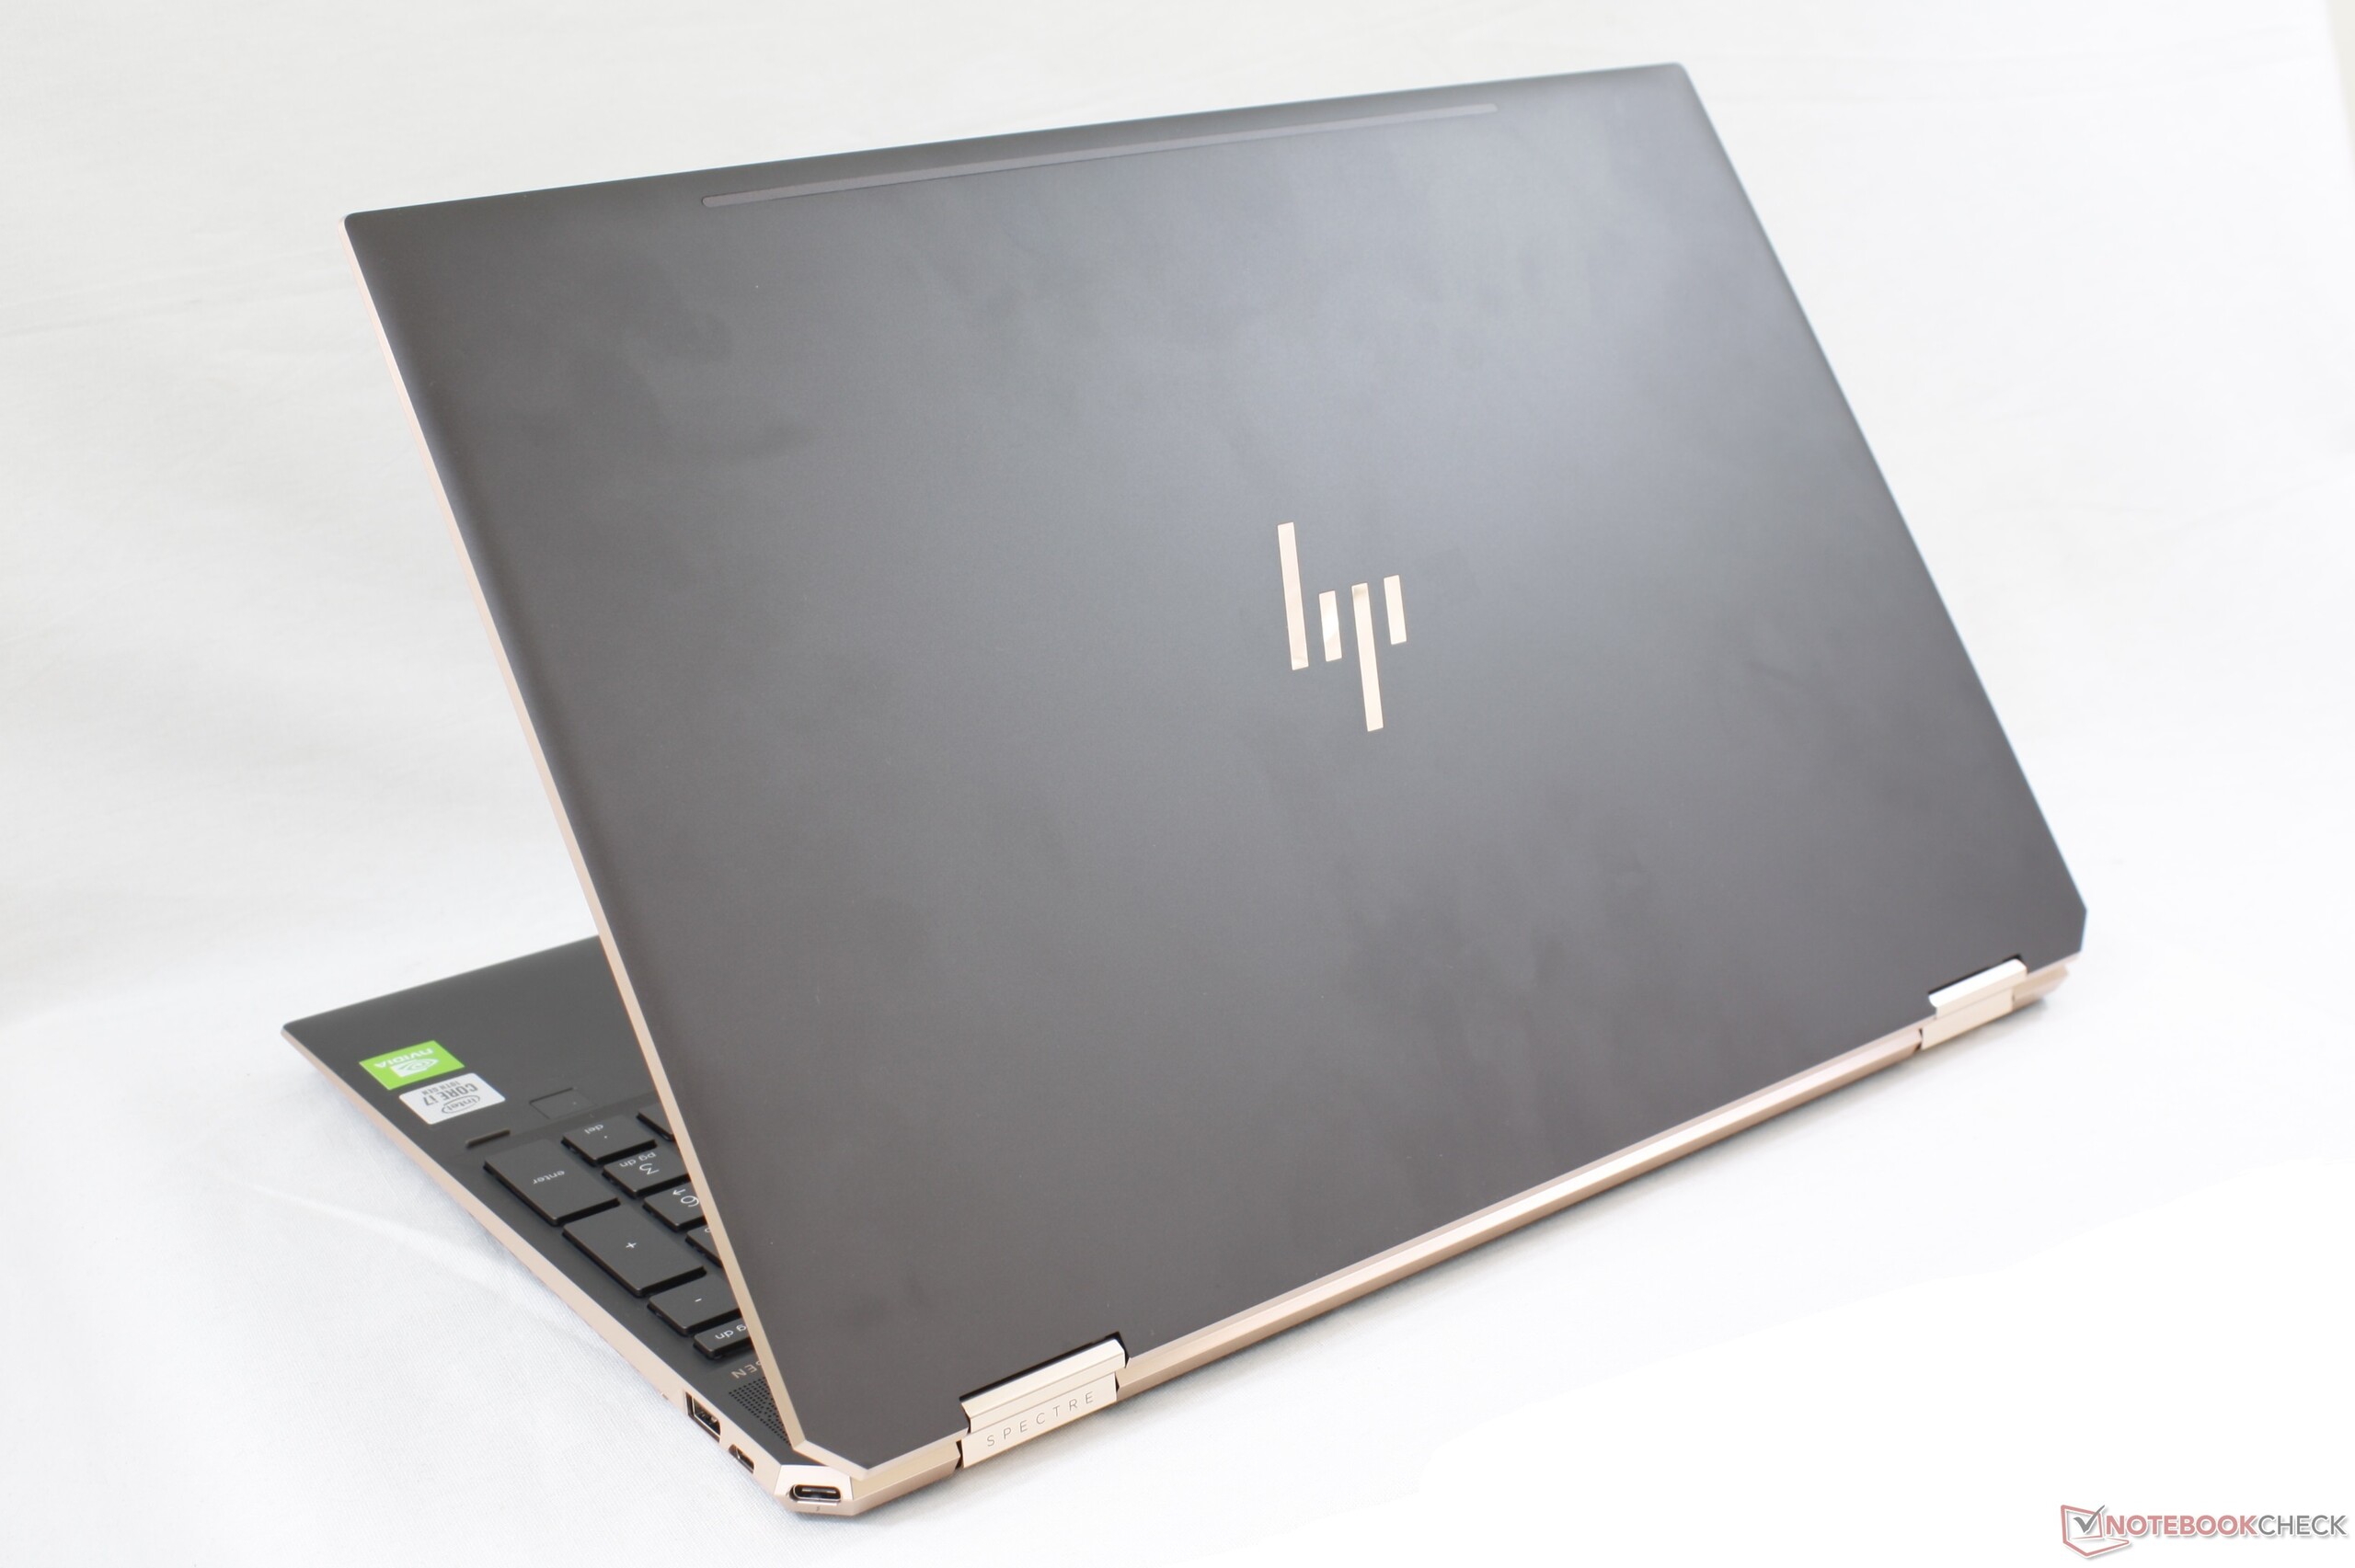
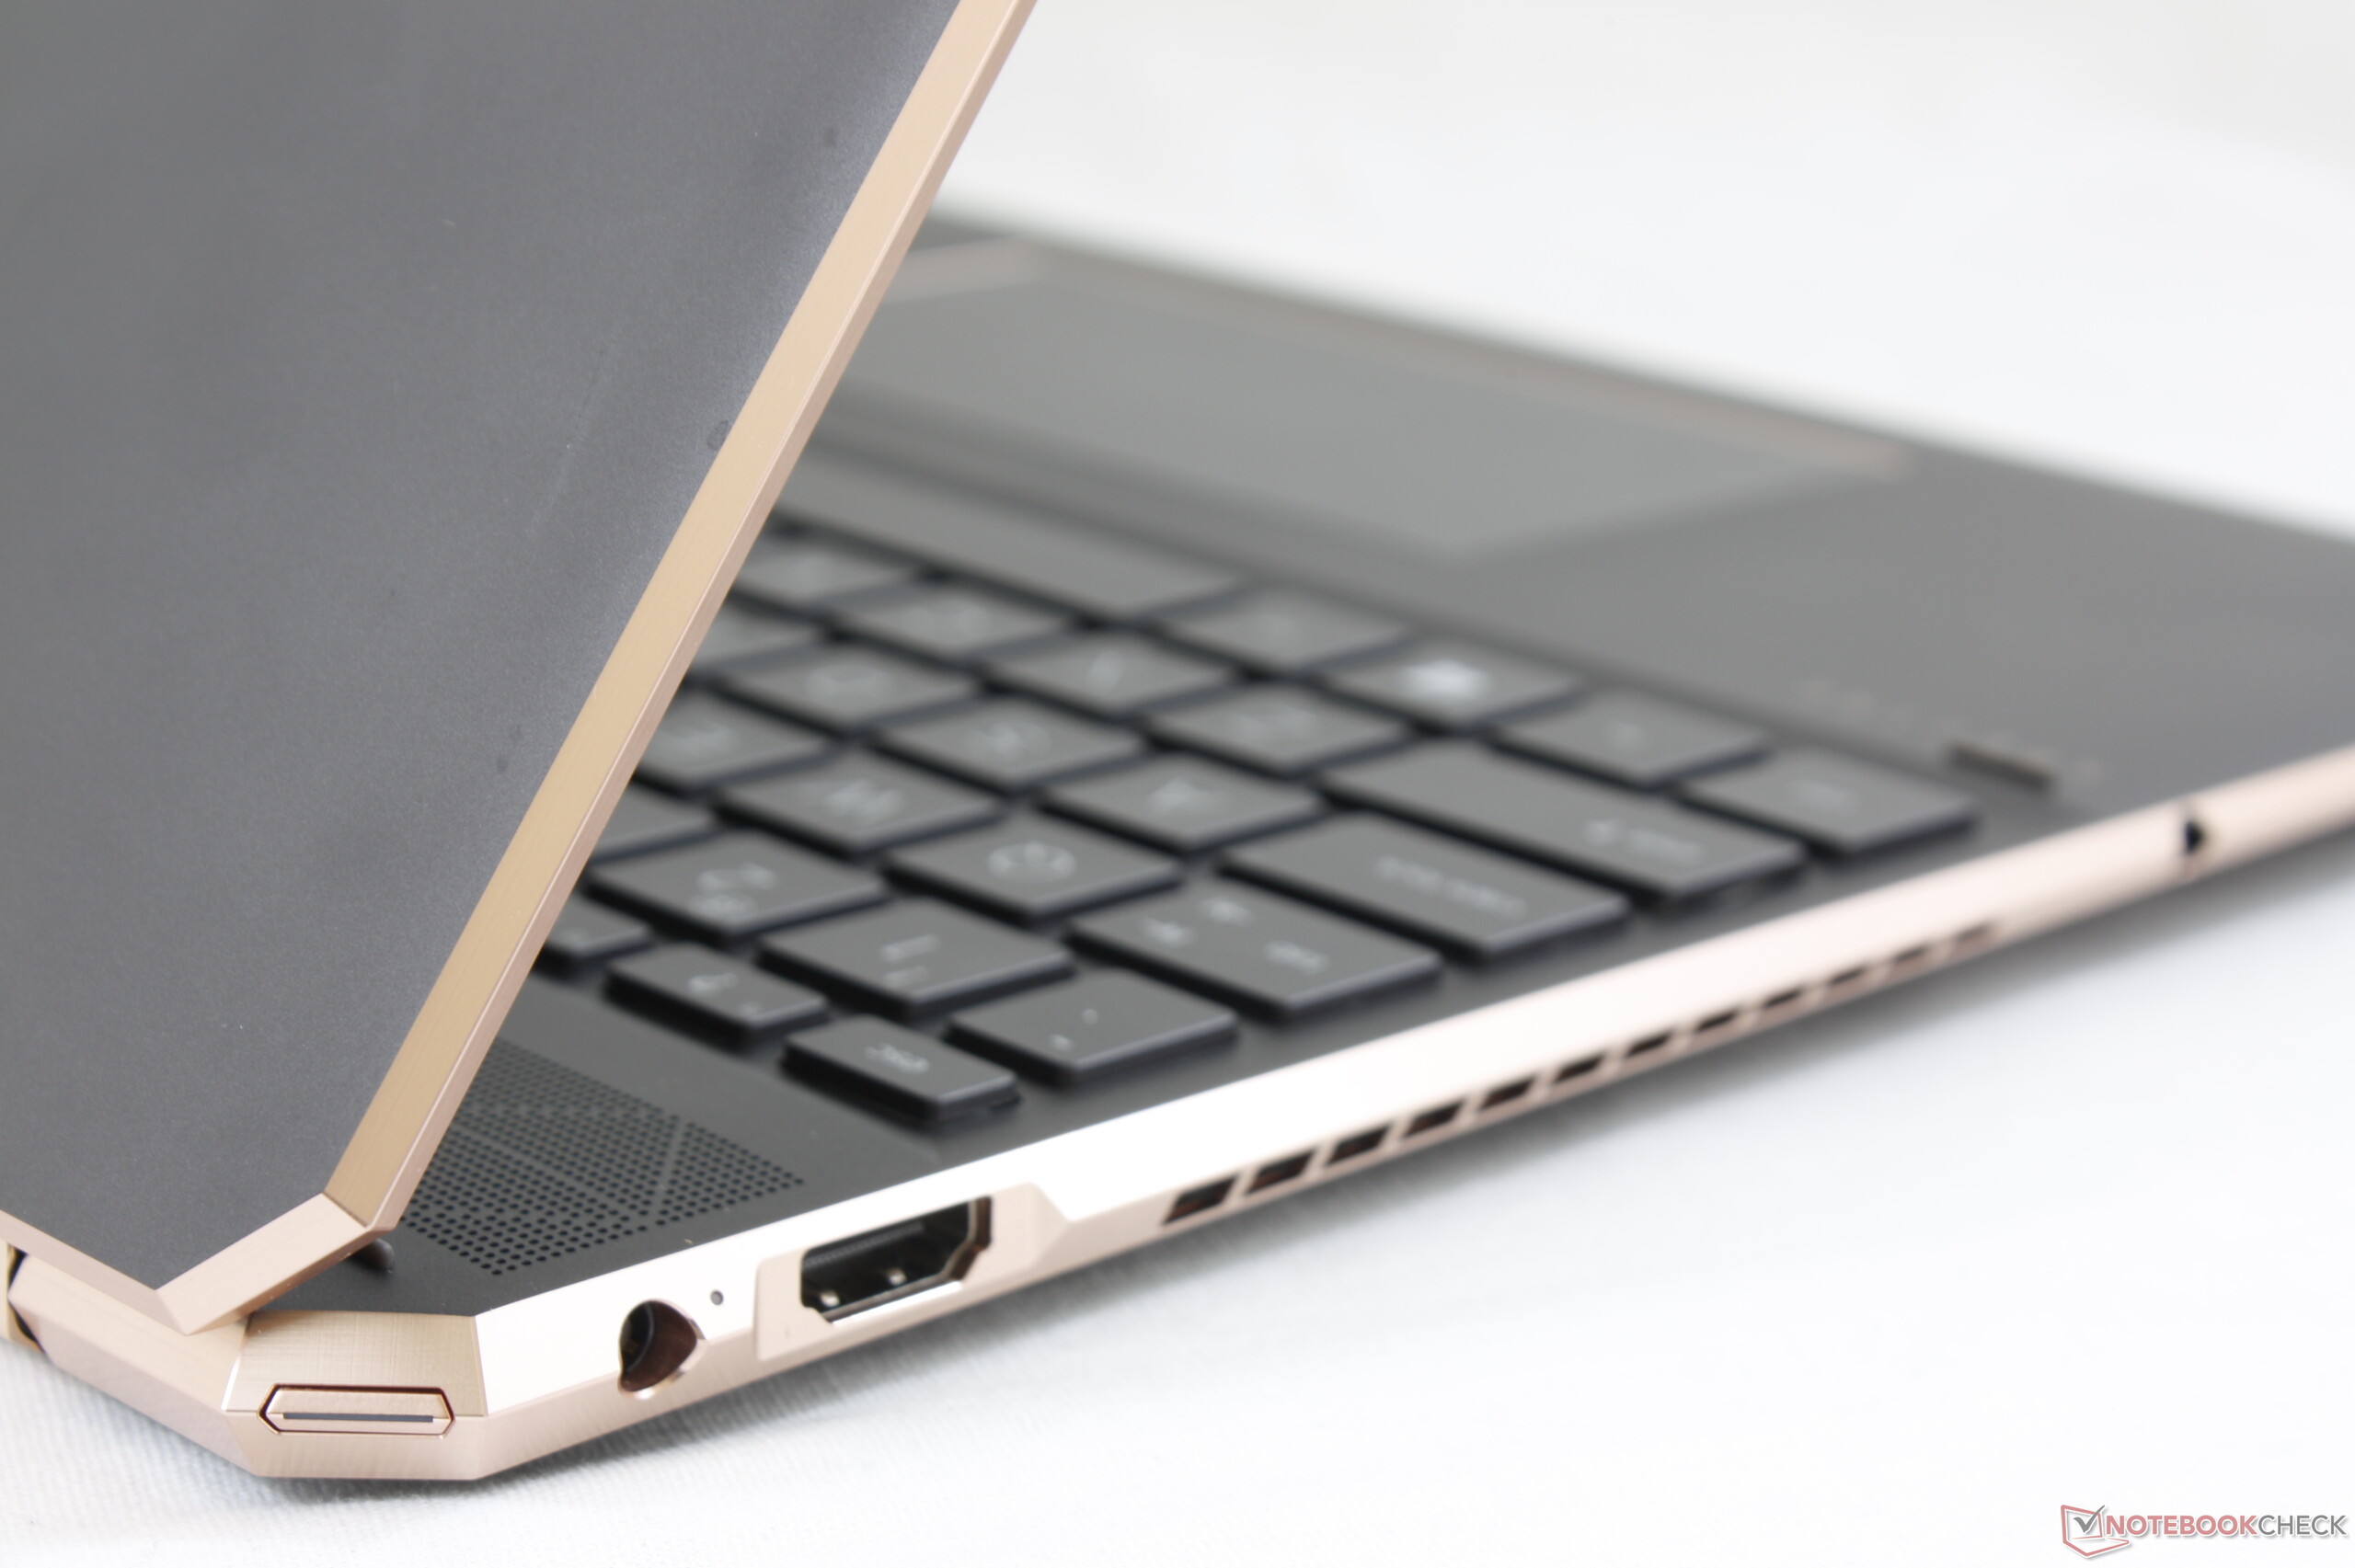
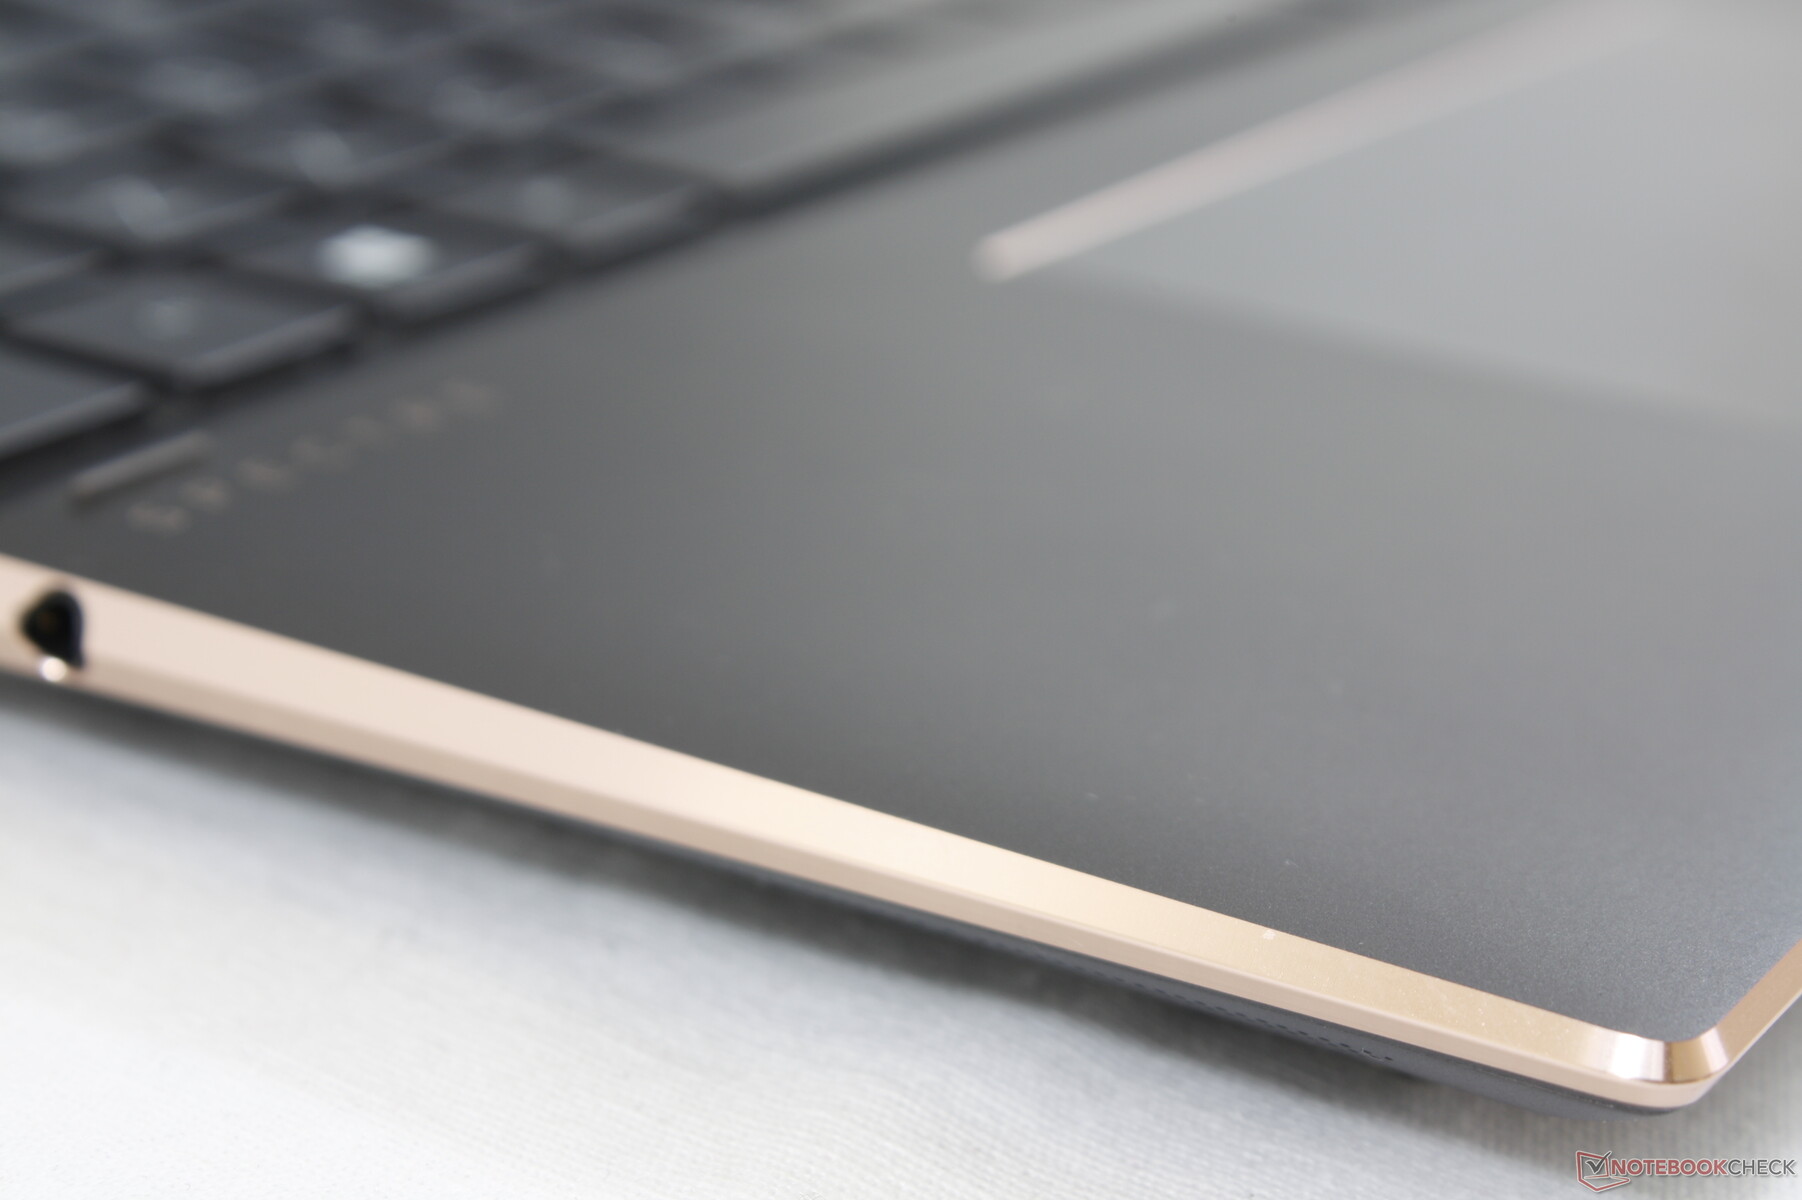
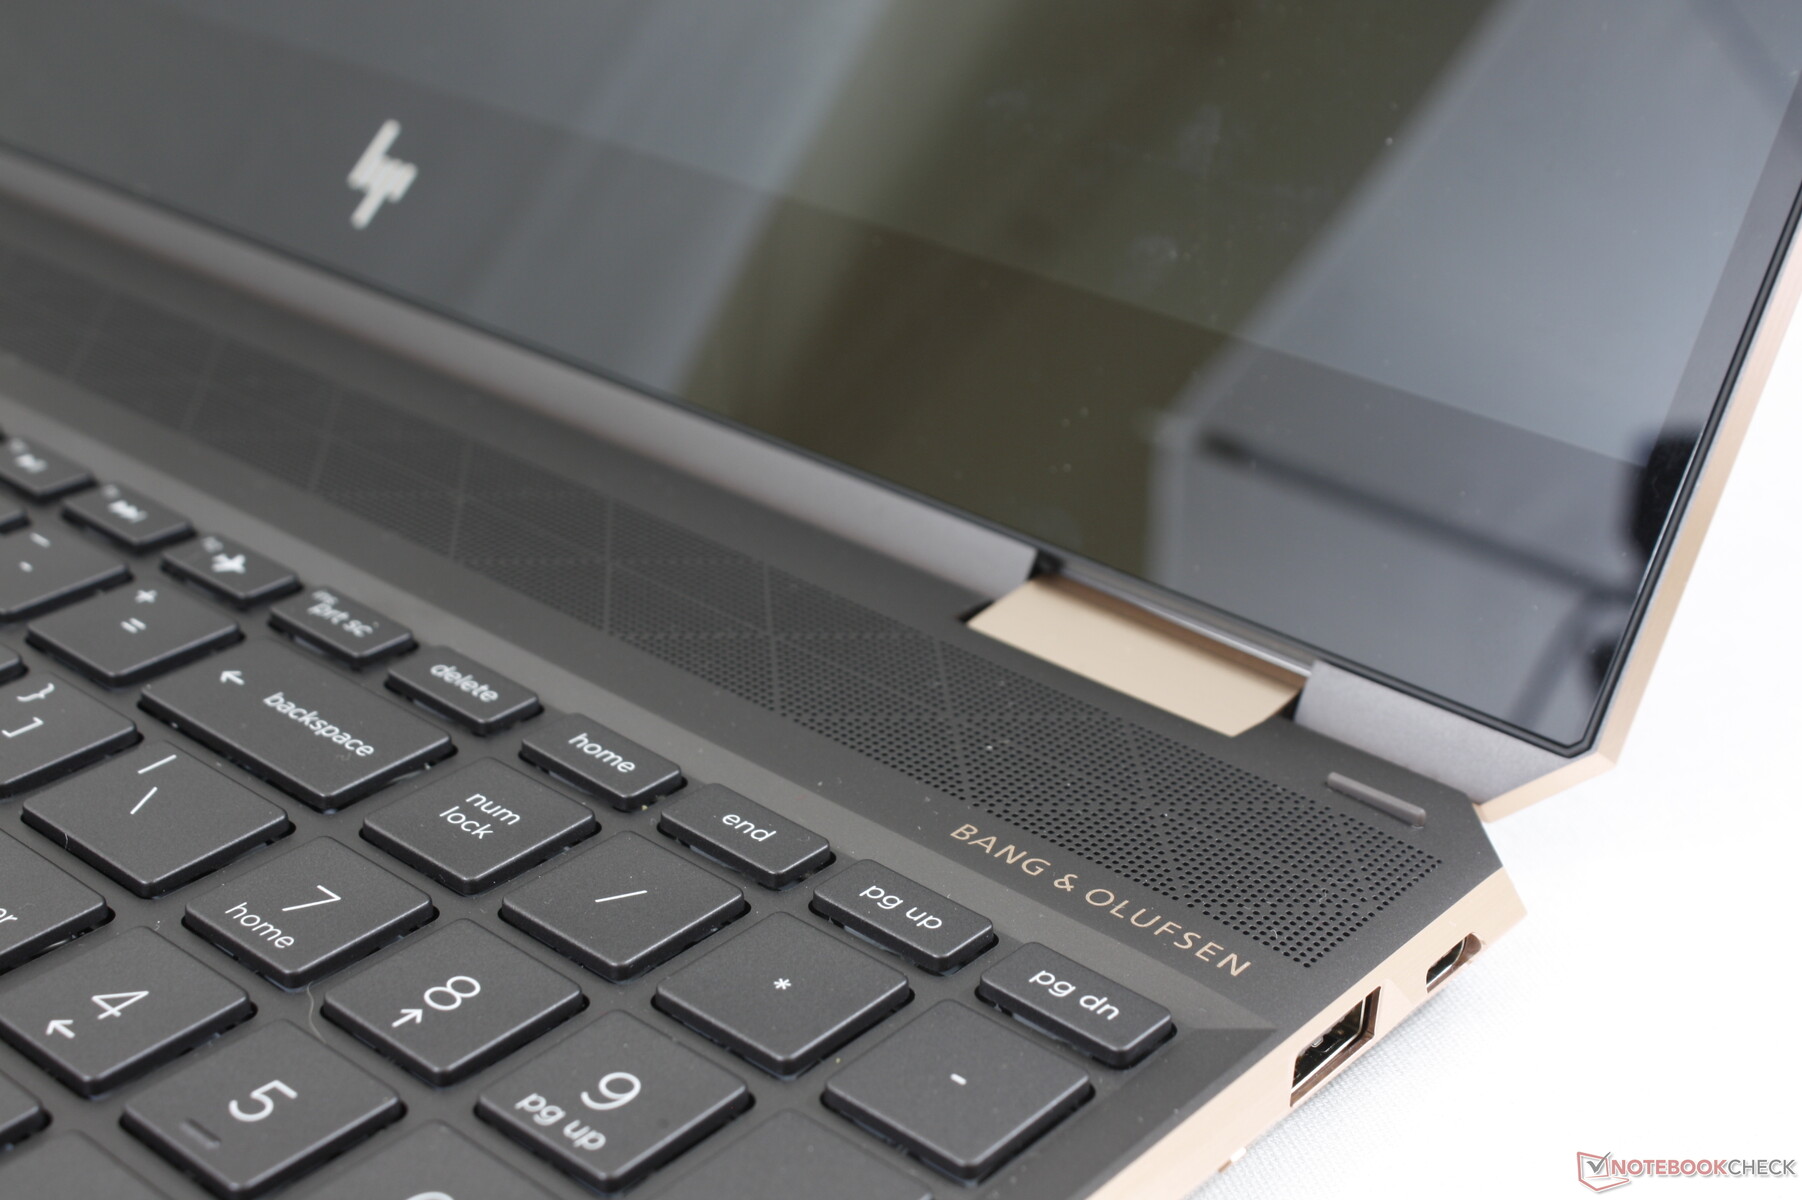
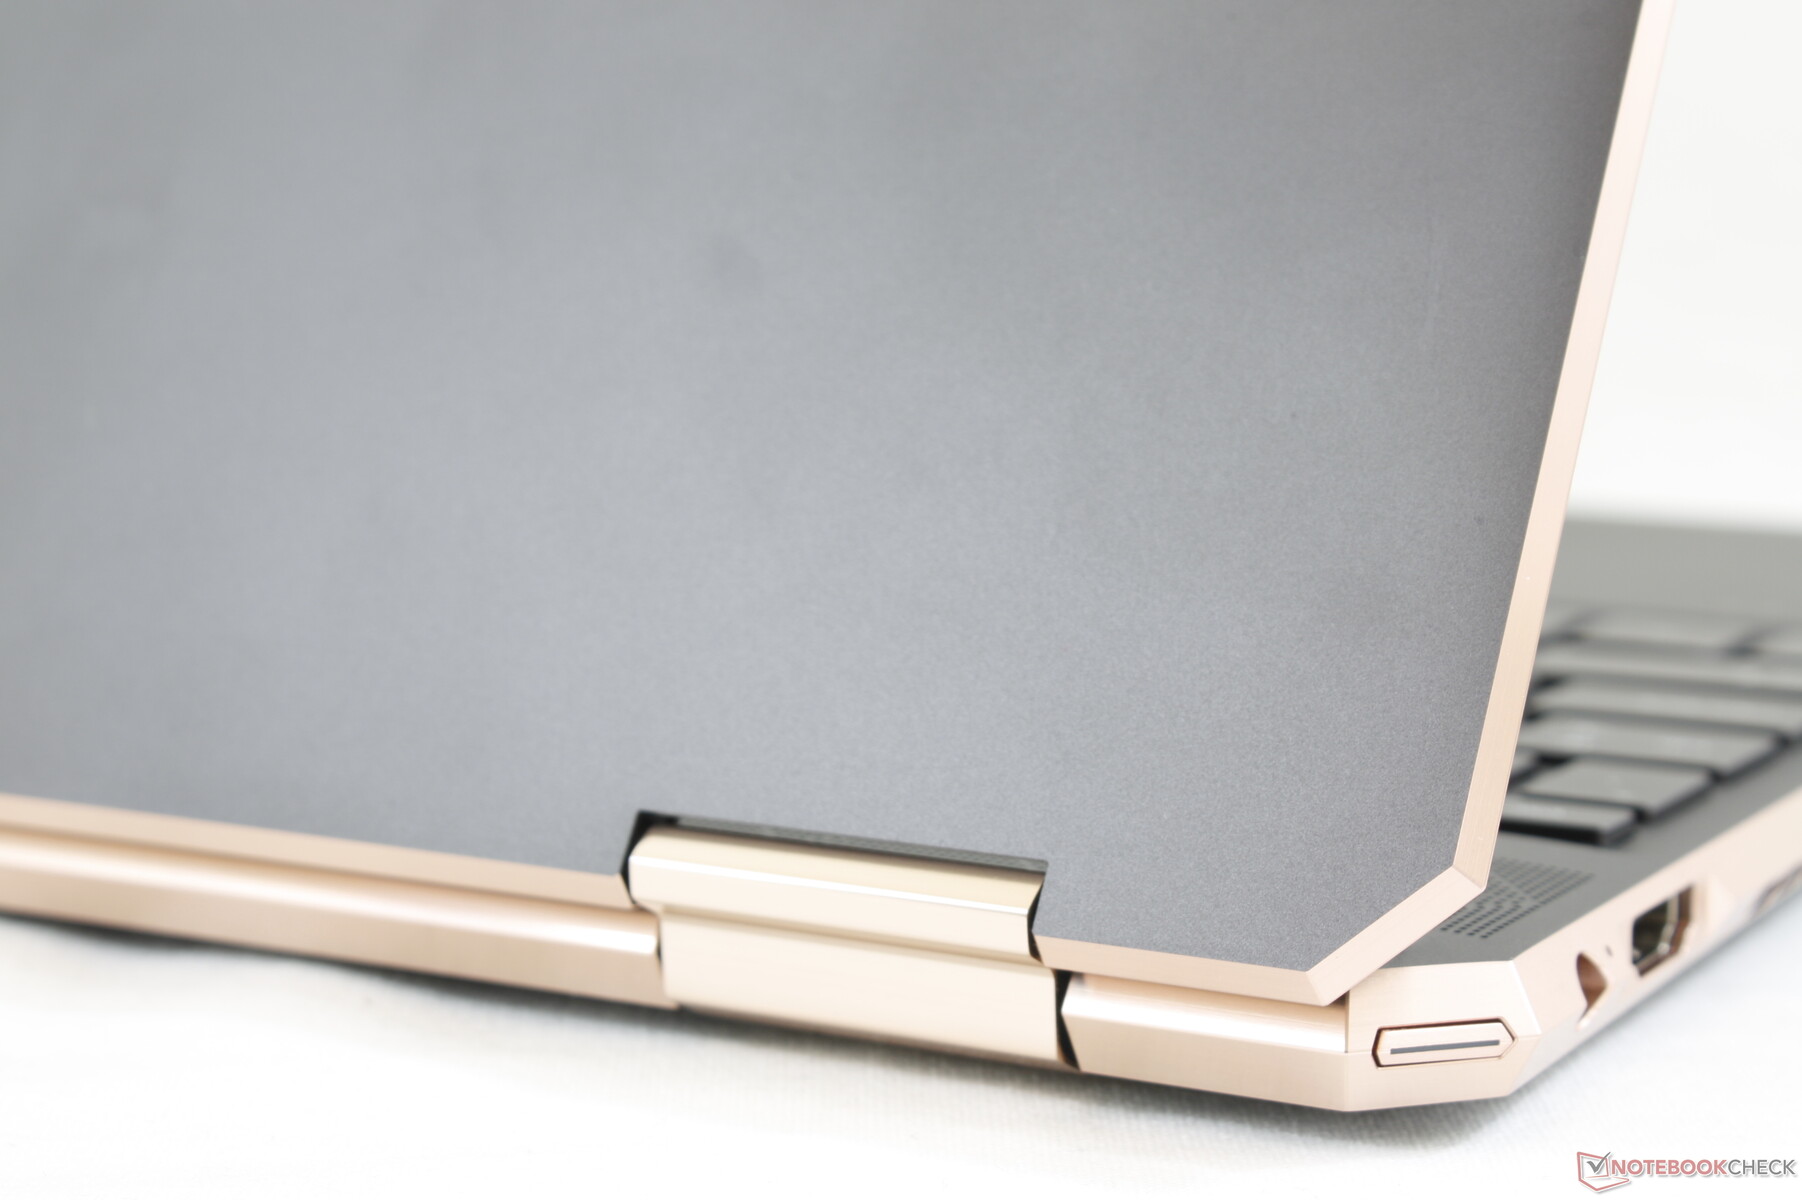
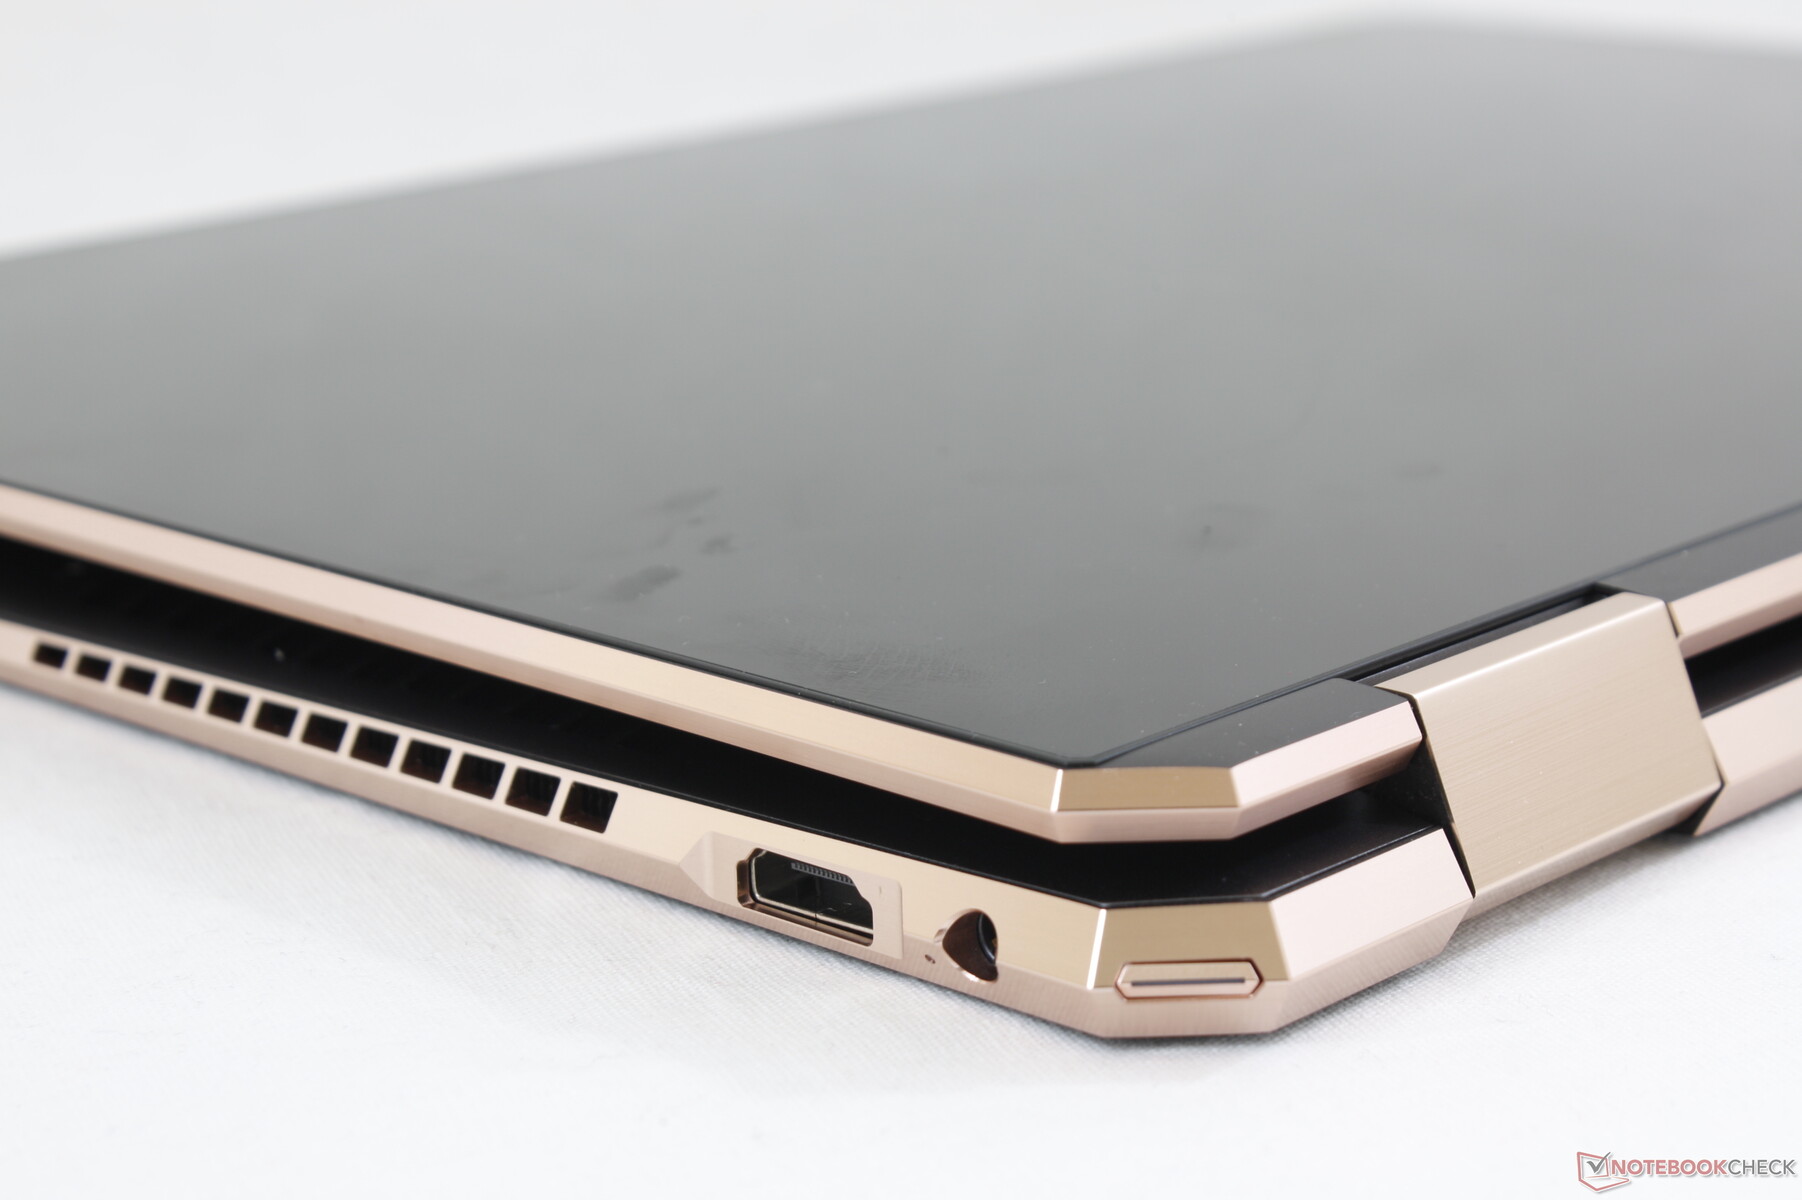
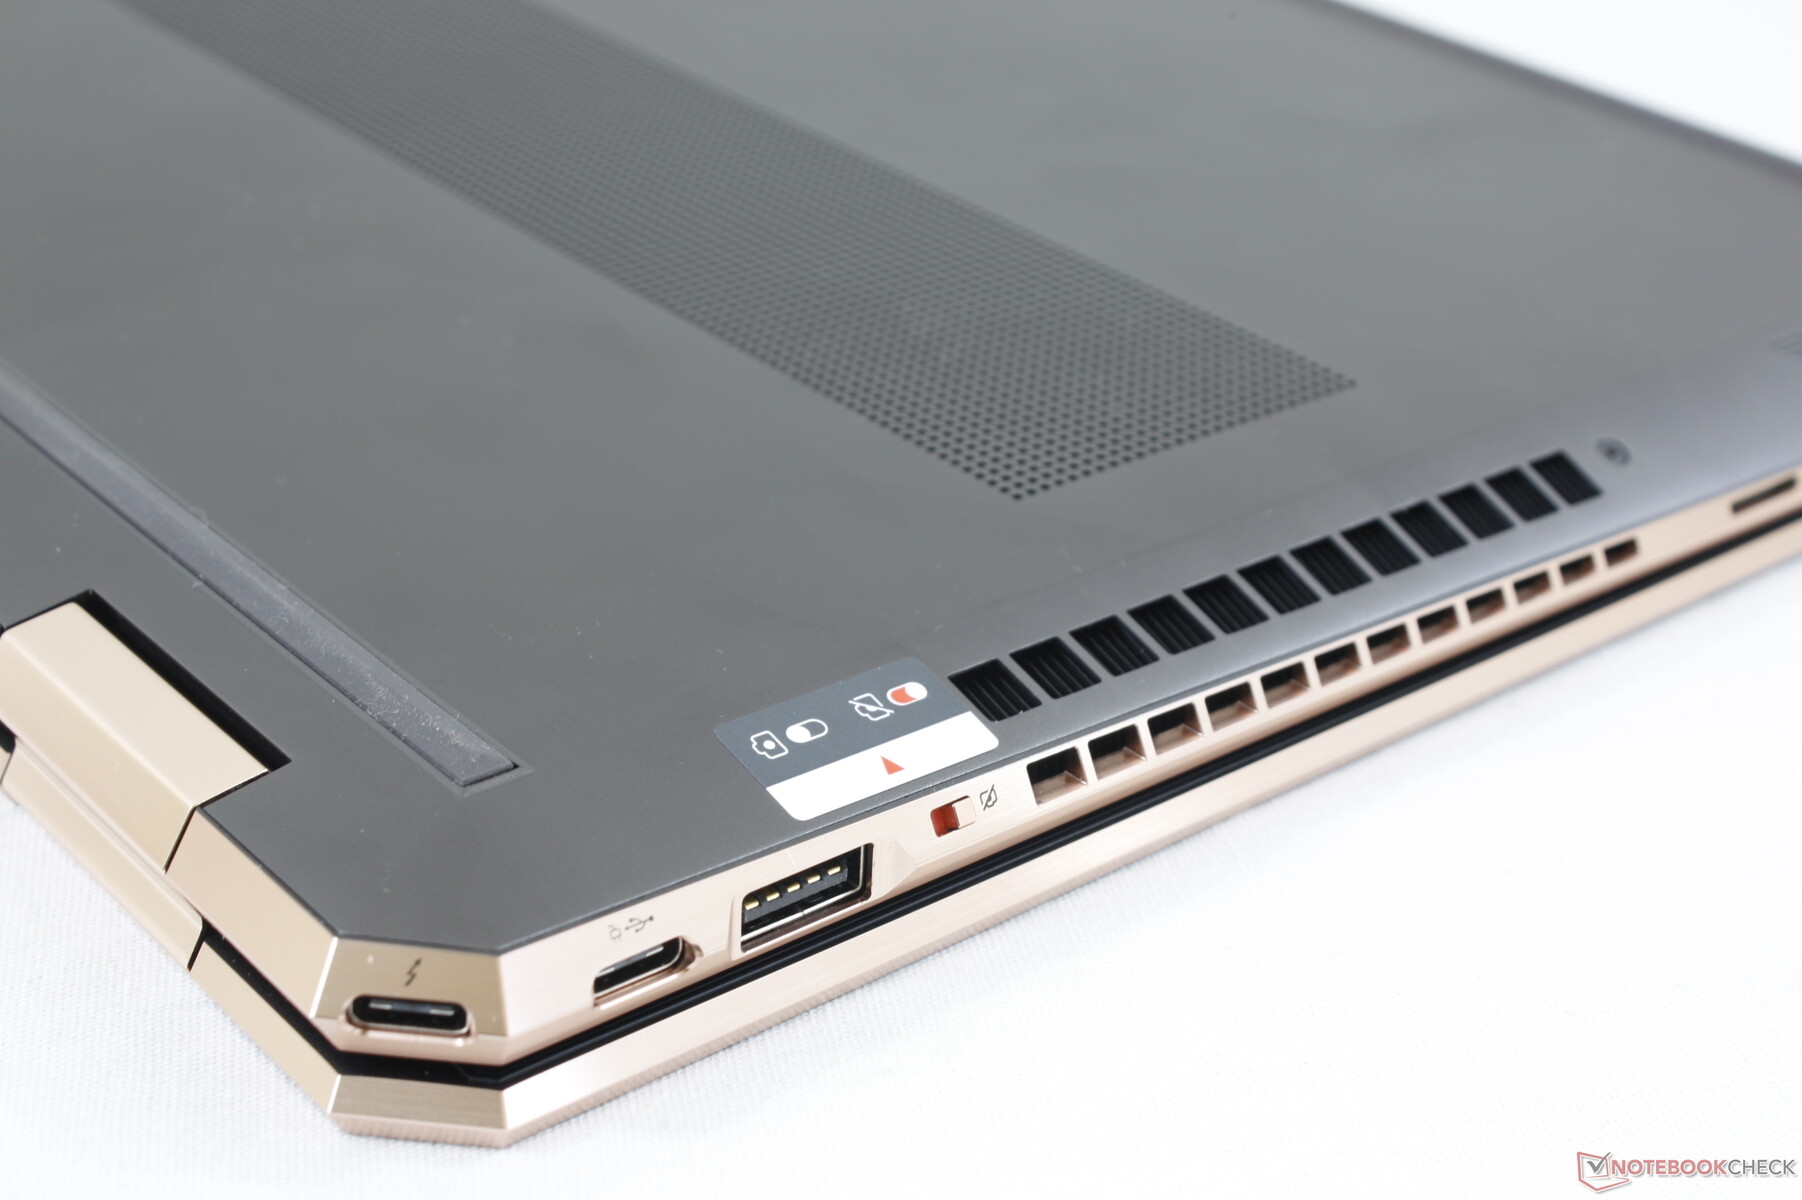
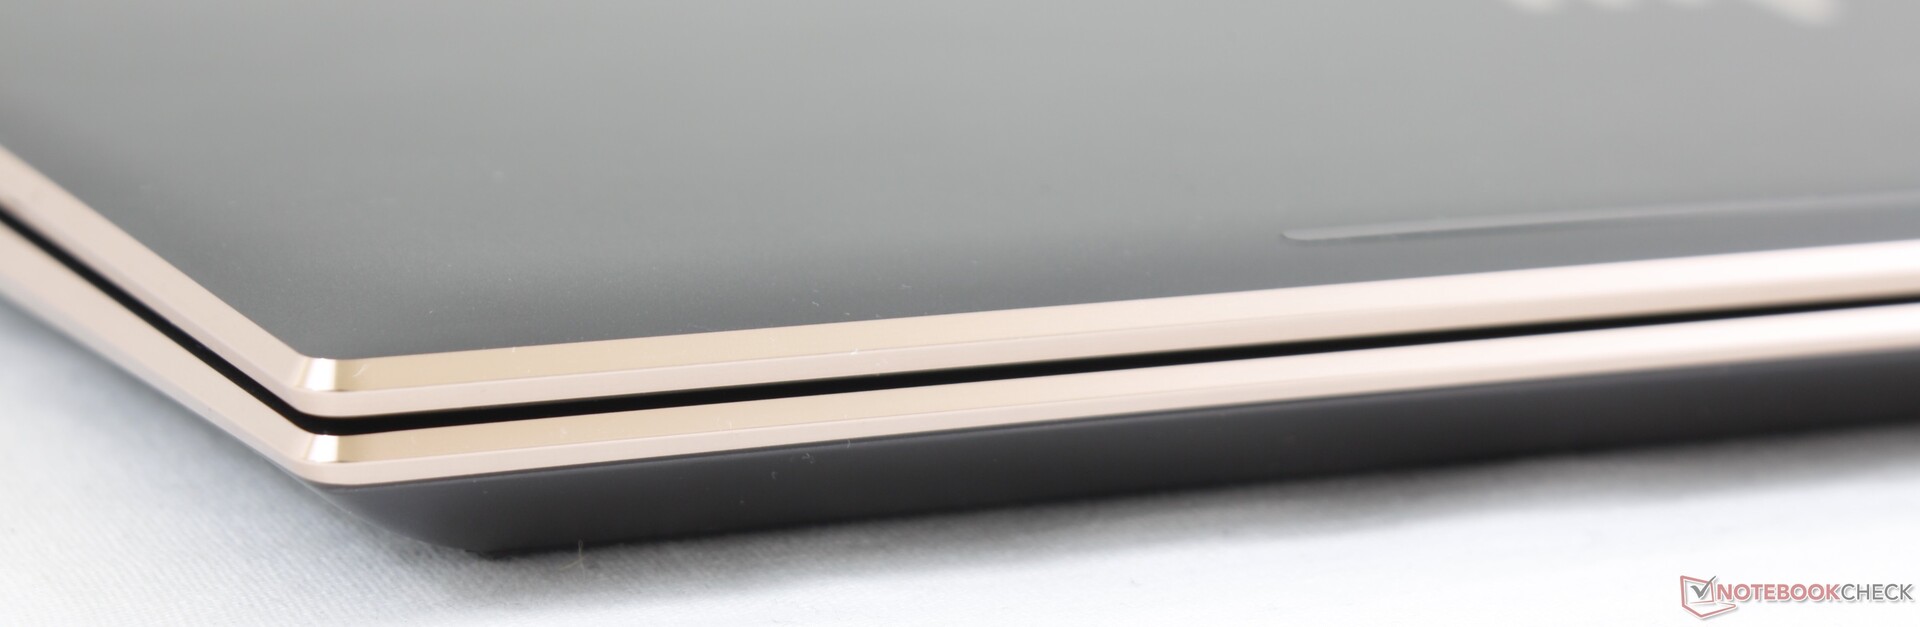
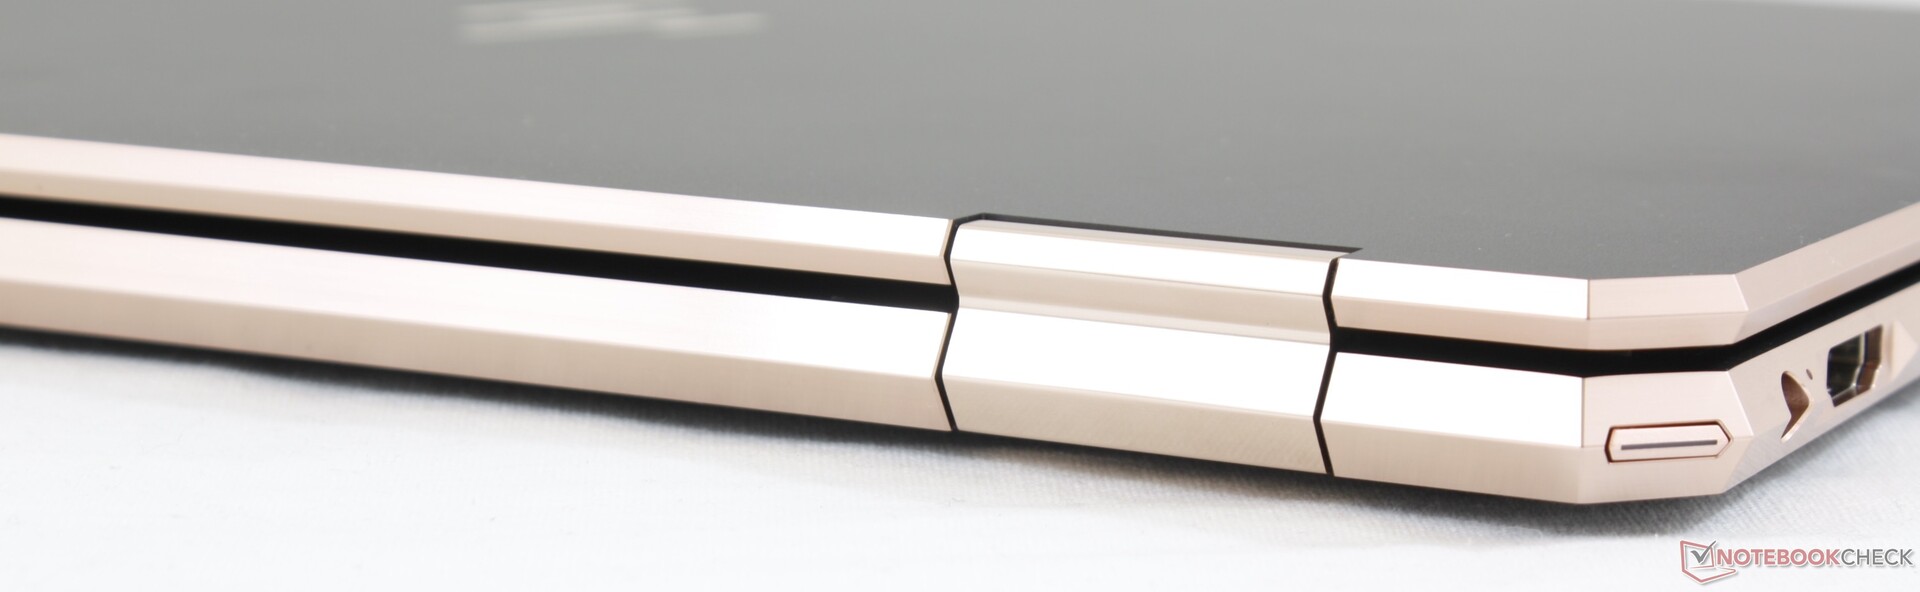
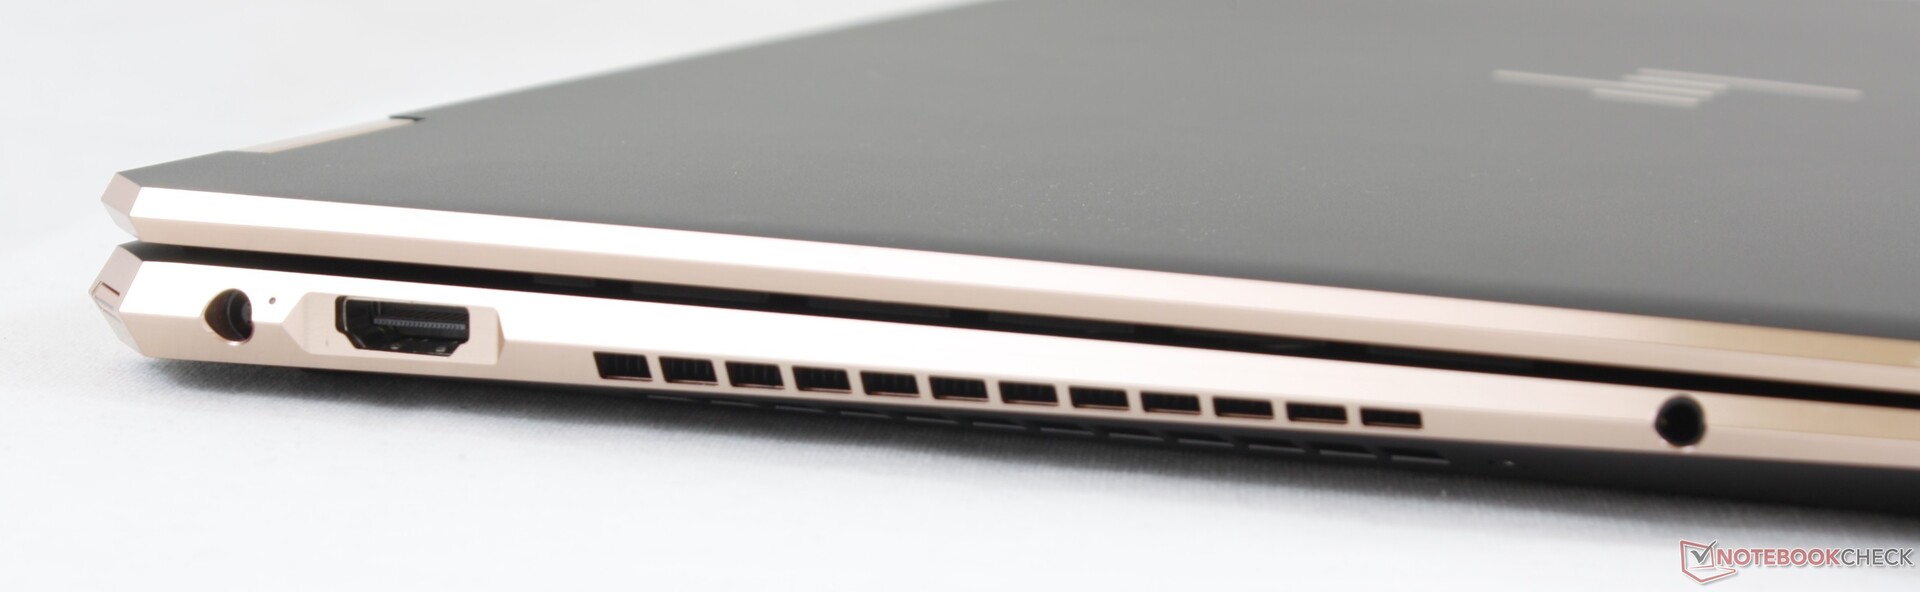
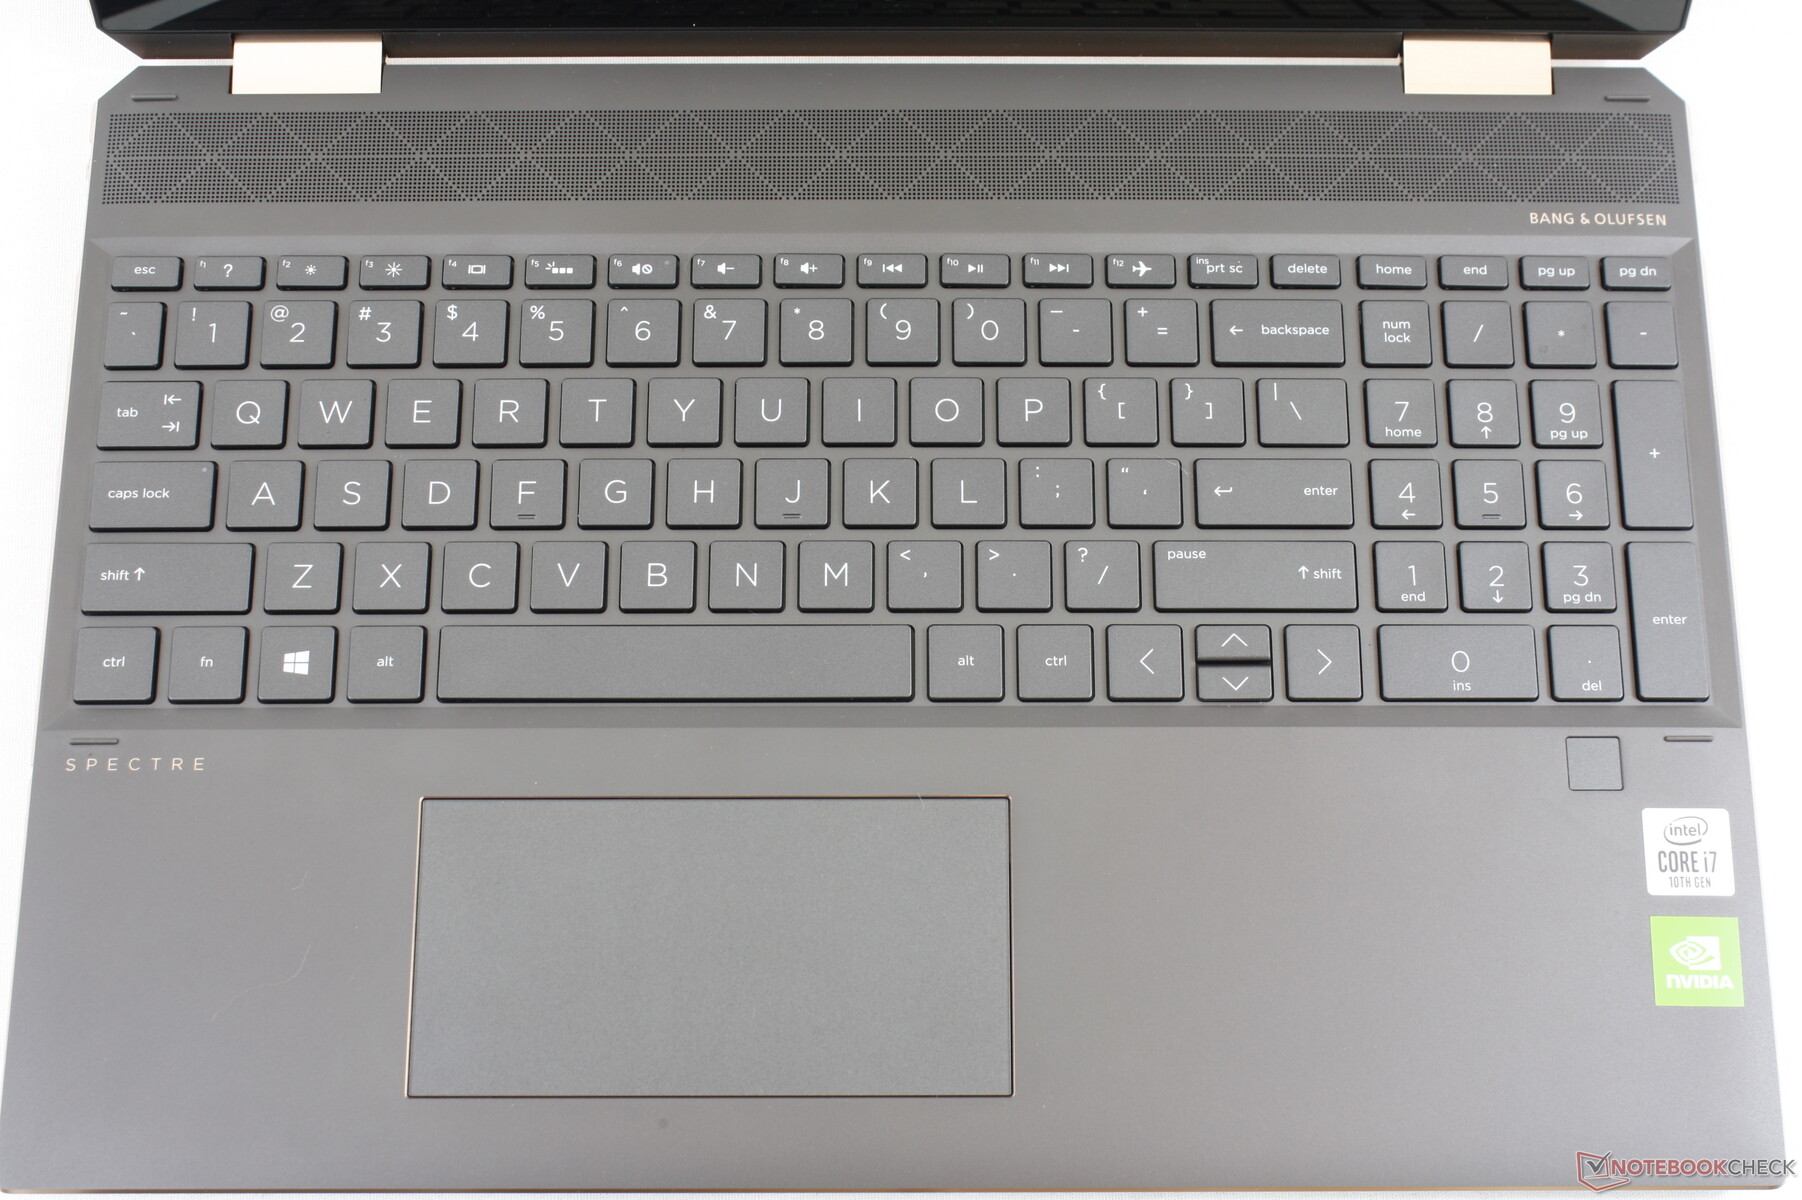
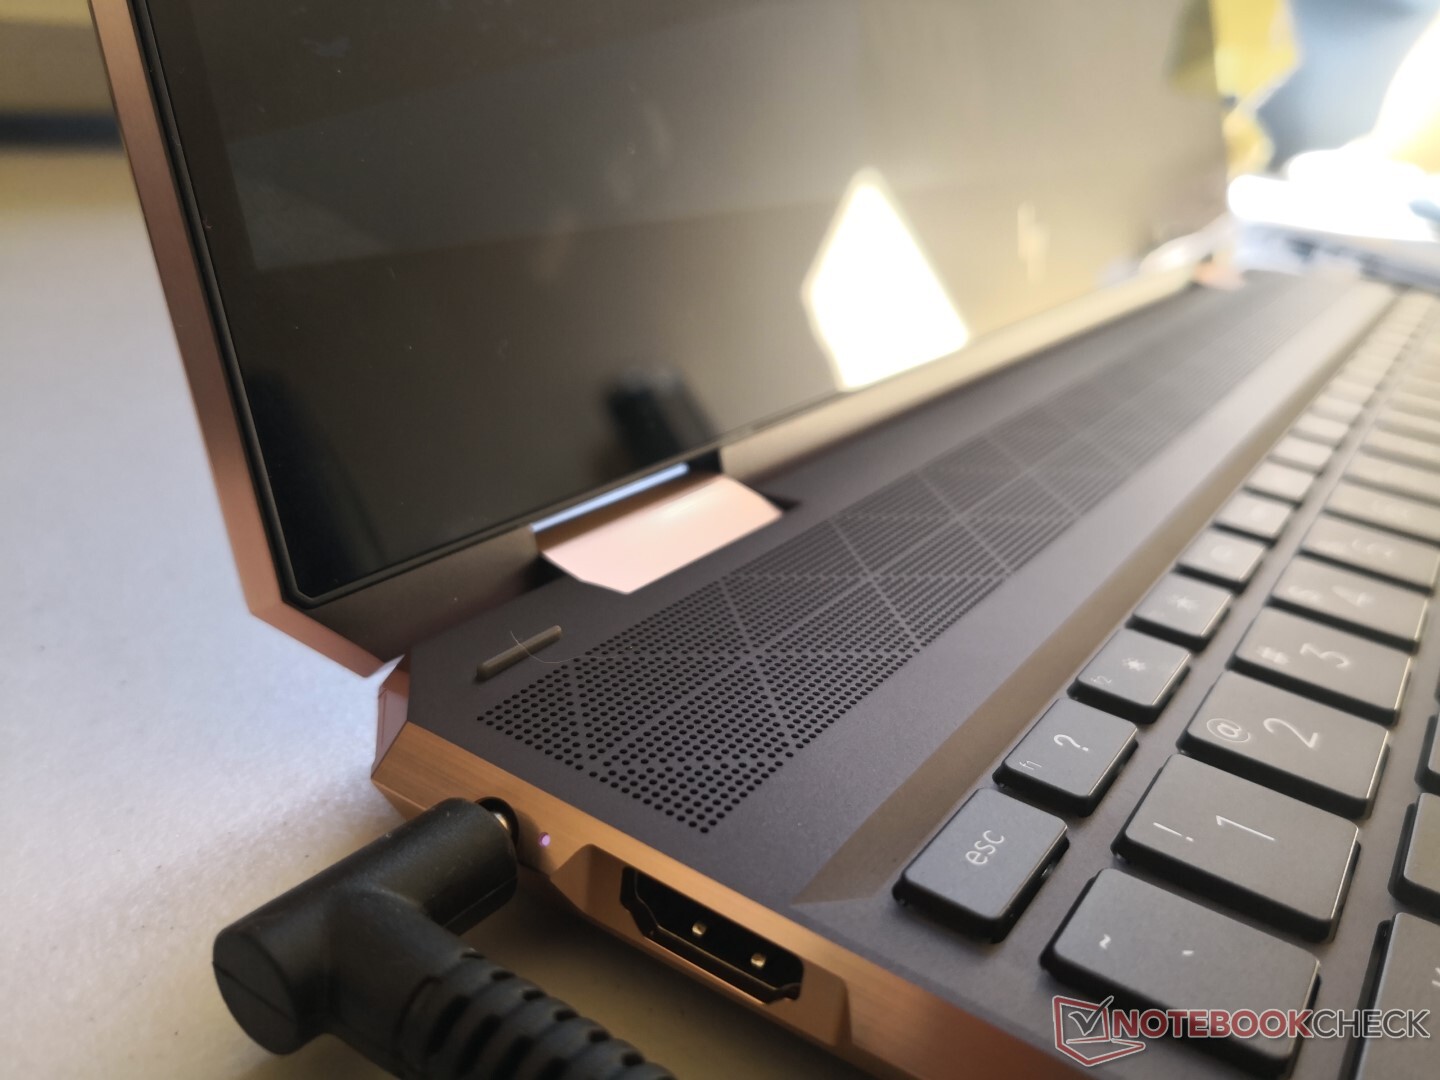
For the 2019 model, HP trimmed the two rear corners for a sharper and more unique visual style. The oddly positioned fingerprint reader on the 2018 model has also been moved back to the right palm rest for easier access. Everything else remains nearly the same meaning that these gen-to-gen changes are mostly superficial. The chassis is still one of the stronger and more rigid designs when compared to the Asus ZenBook 15, Lenovo Yoga C940, or the Dell XPS 15 2-in-1.
Our main complaint relates mostly to the weight of the system rather than the overall look and feel. Tablet mode is unwieldy for even short periods as the system is just over 2 kg.
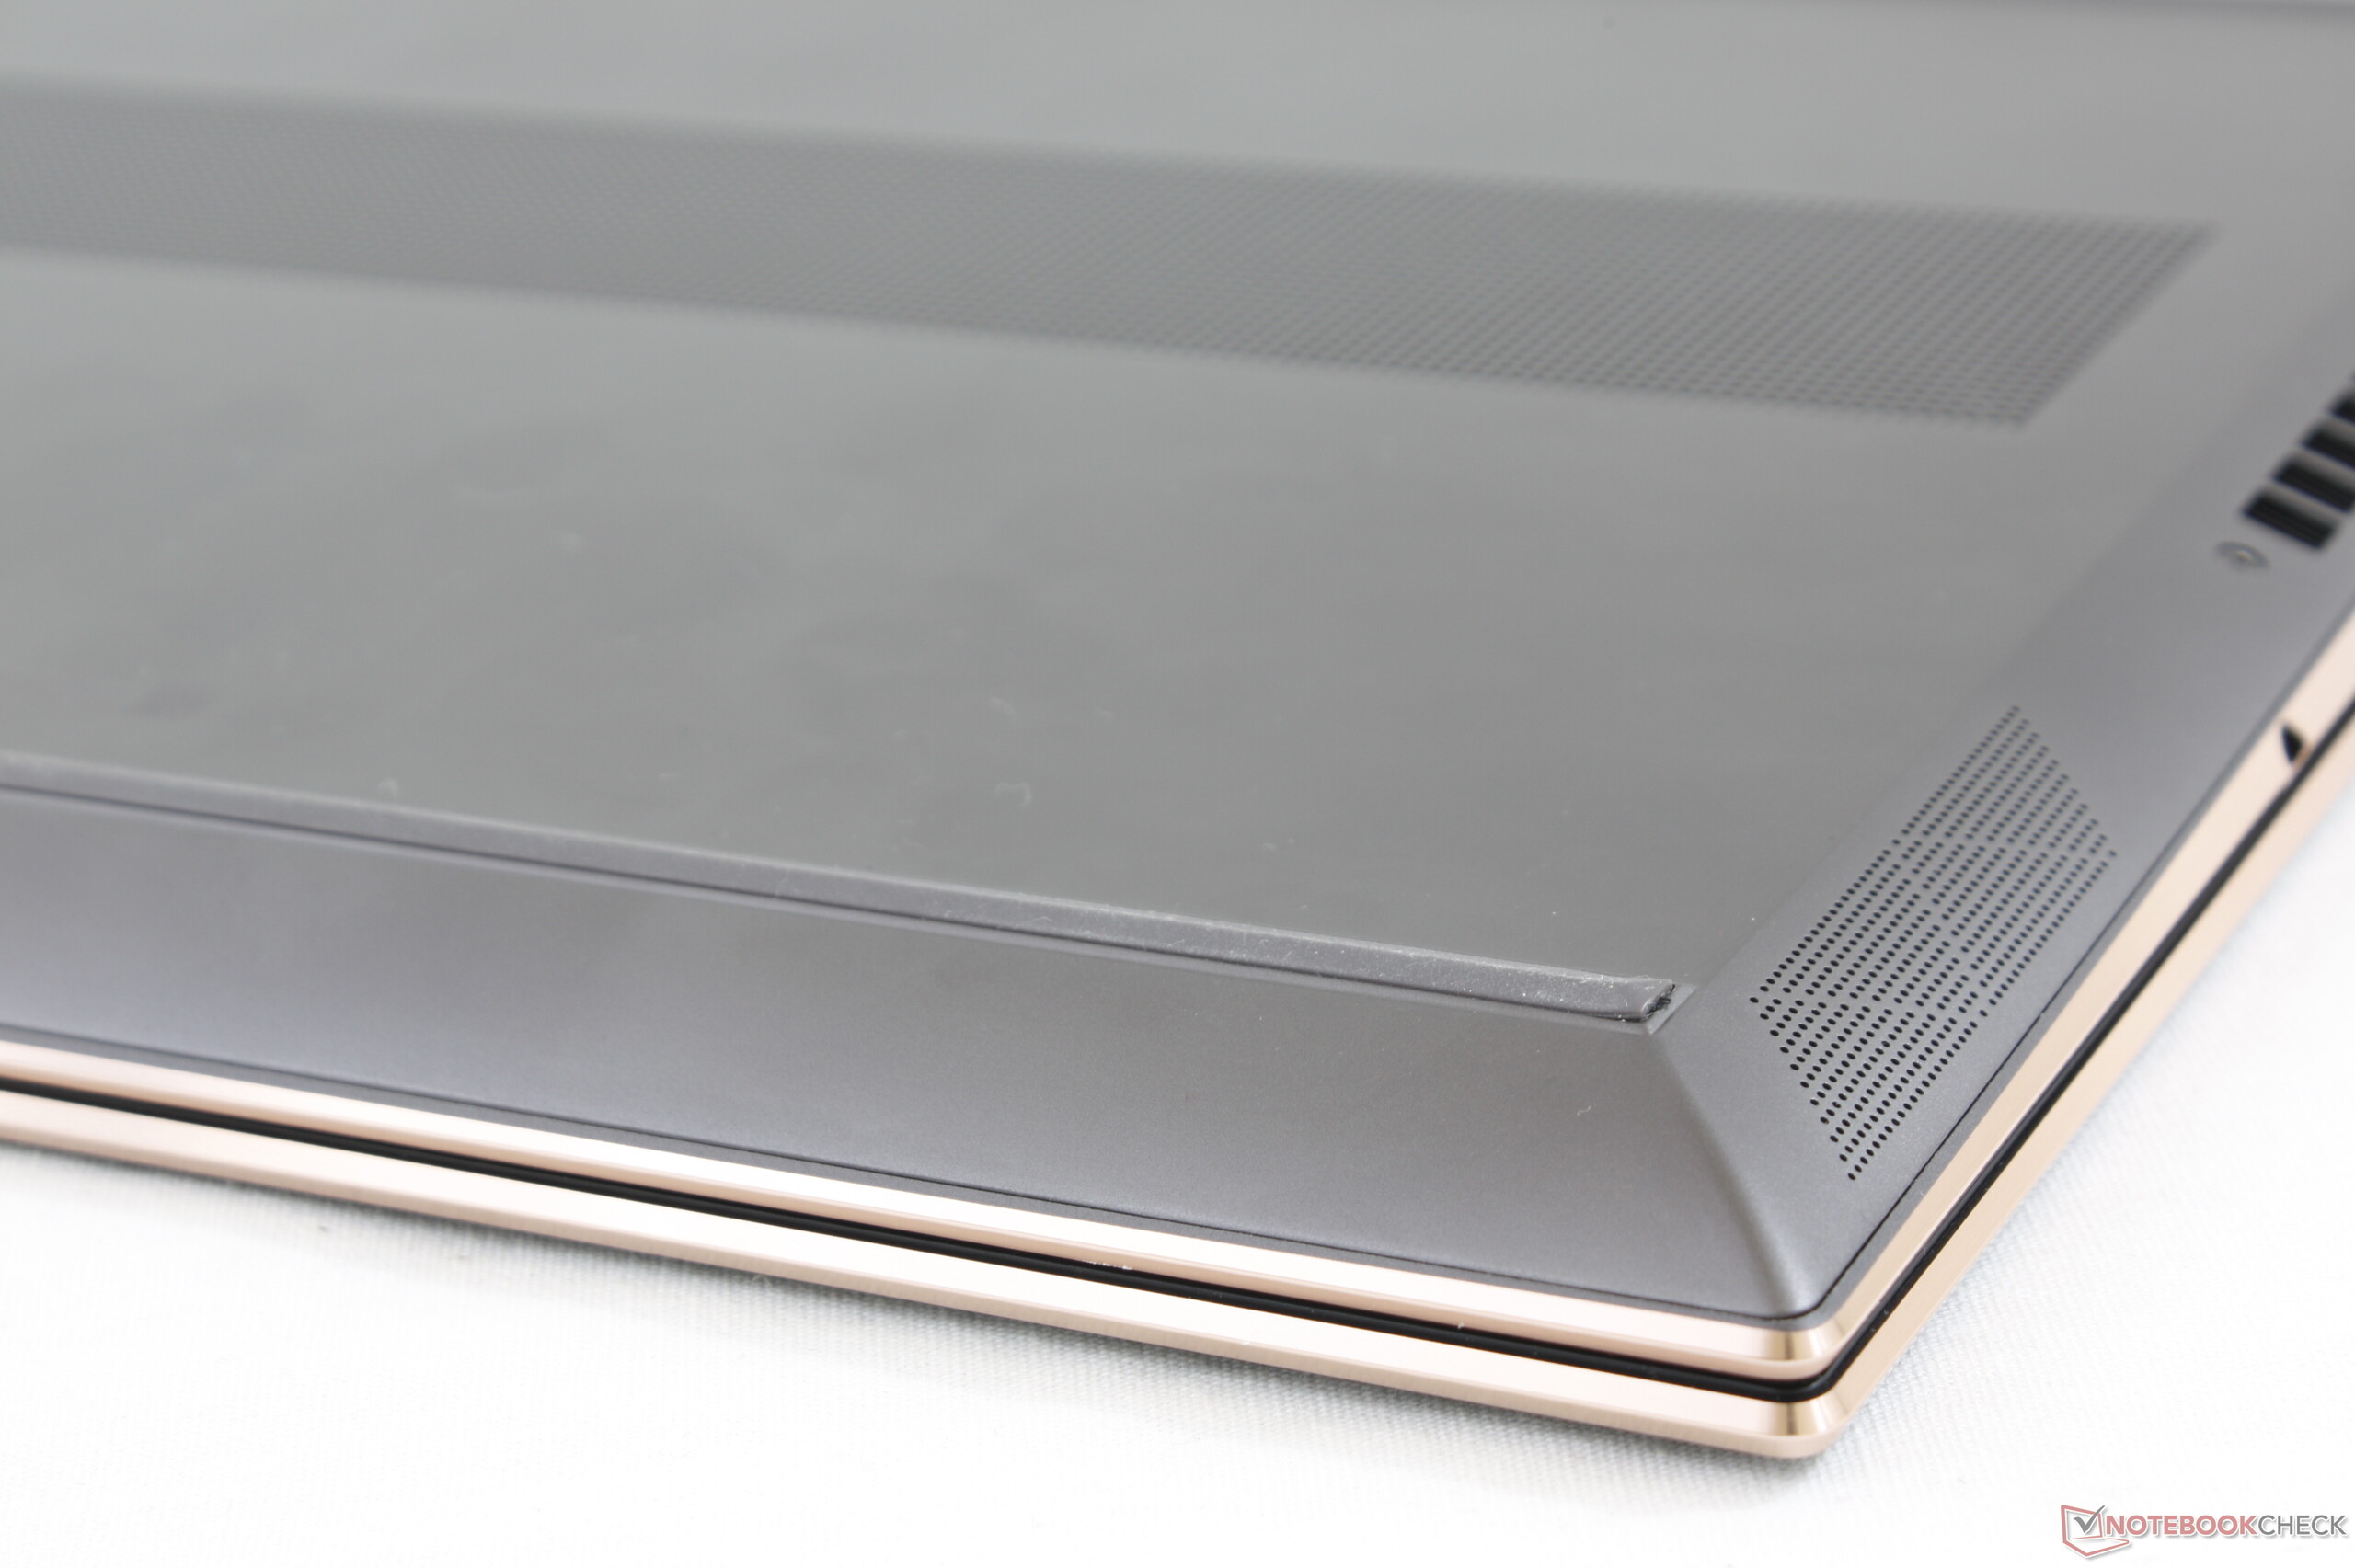

Chassis dimensions and weight are essentially identical to the older 2018 design despite the external and internal differences between them. Users will have to consider the 2020 Spectre x360 15 for a more noticeable reduction in size since the newer model will have much narrower top and bottom bezels.
Connectivity
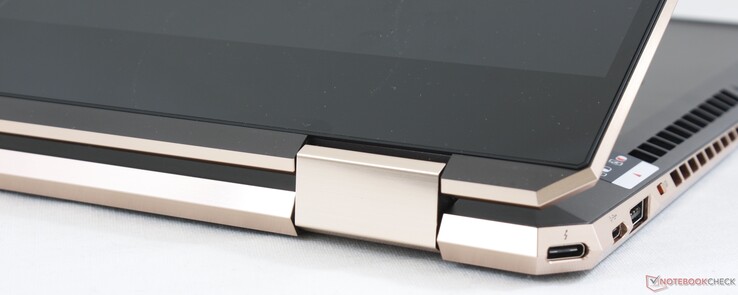
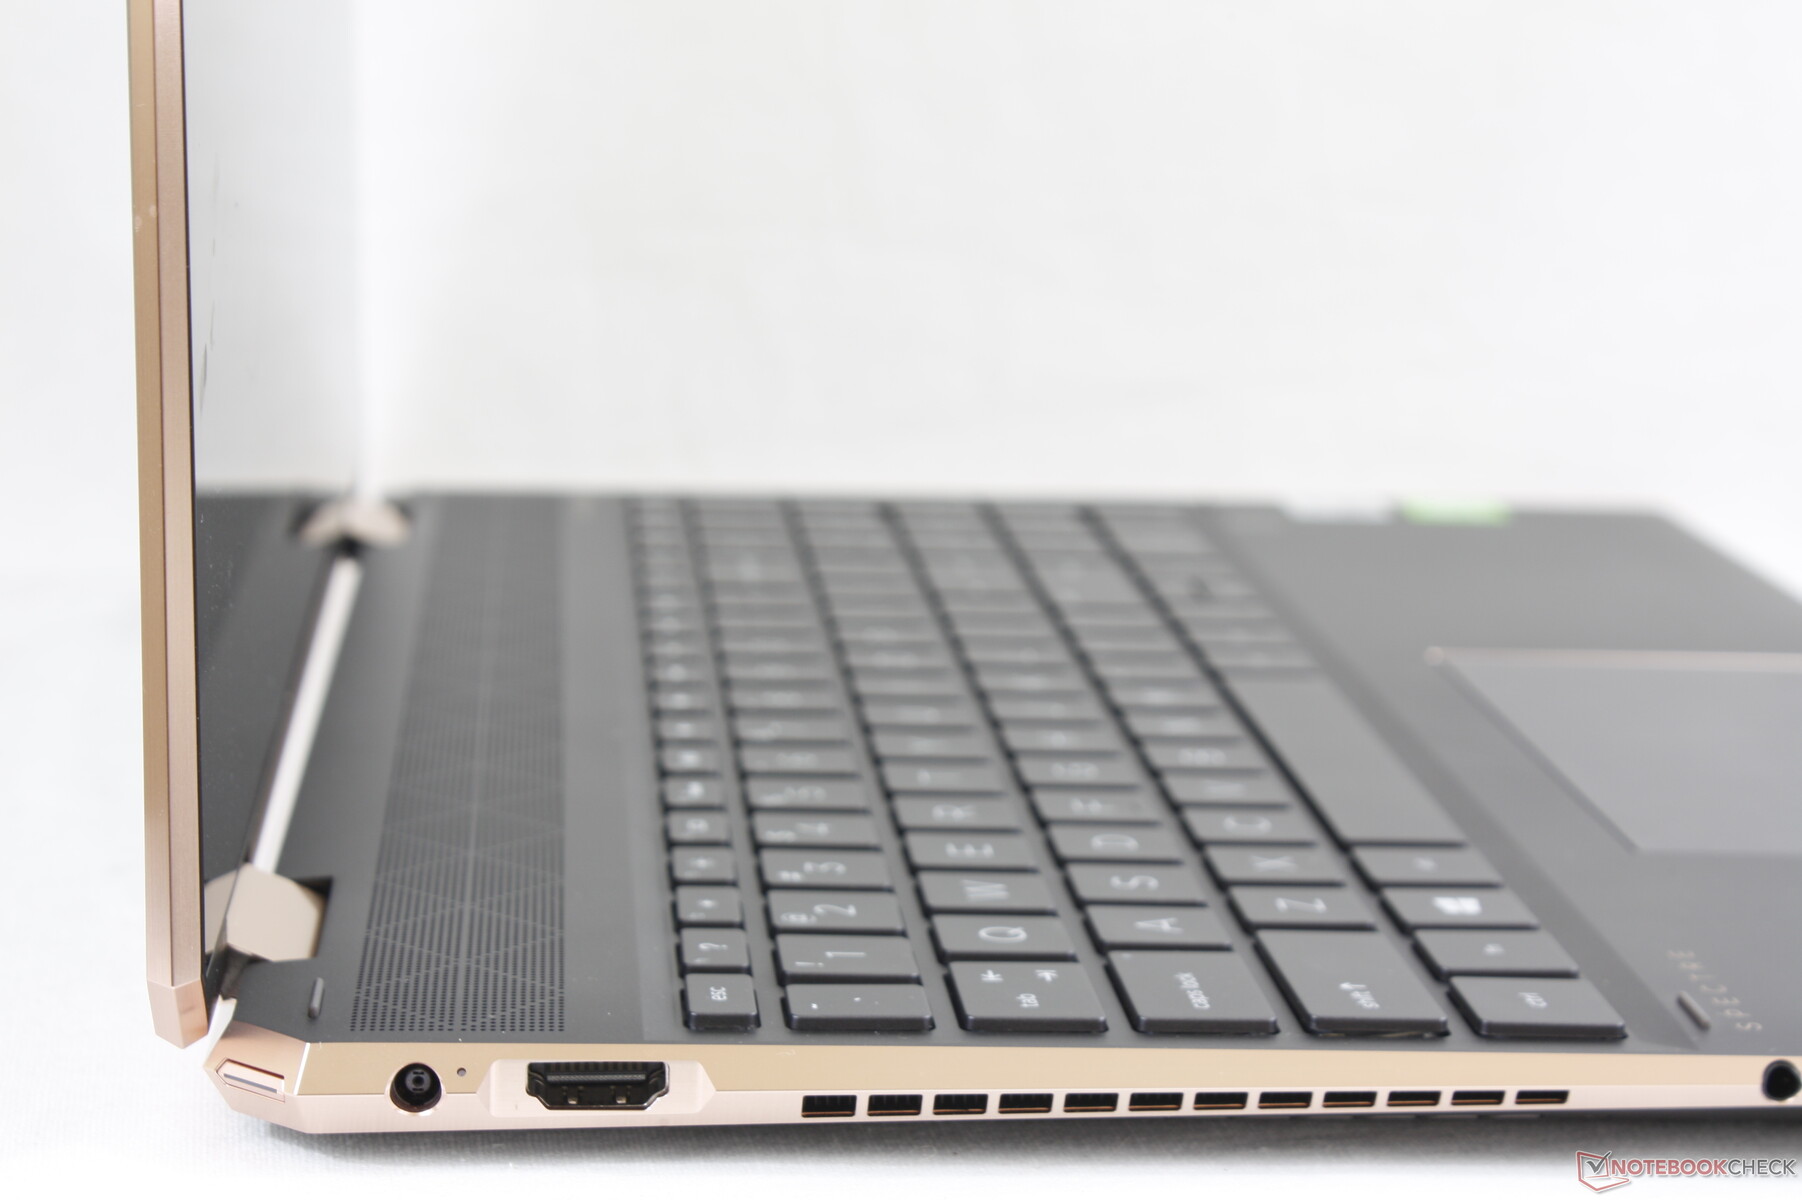
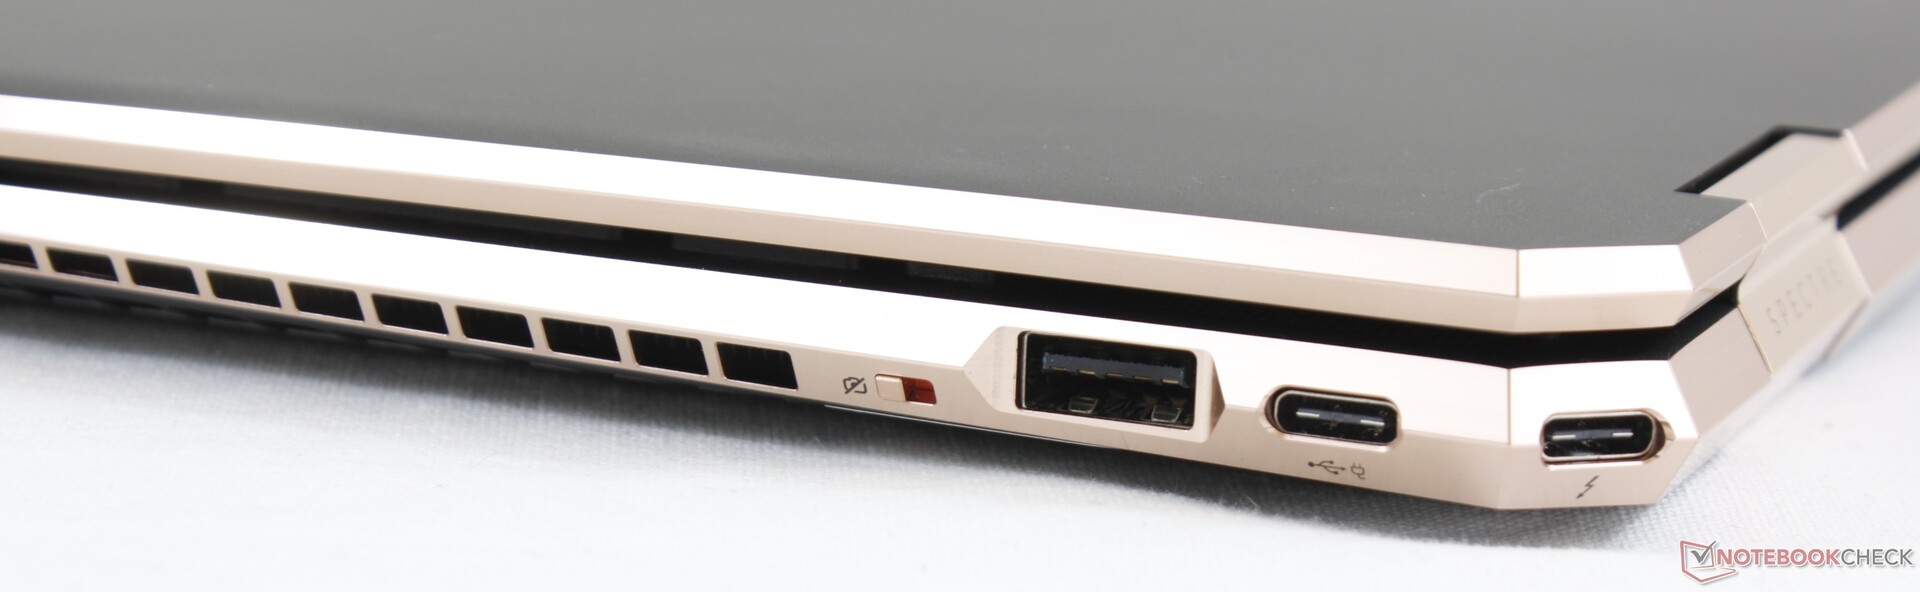
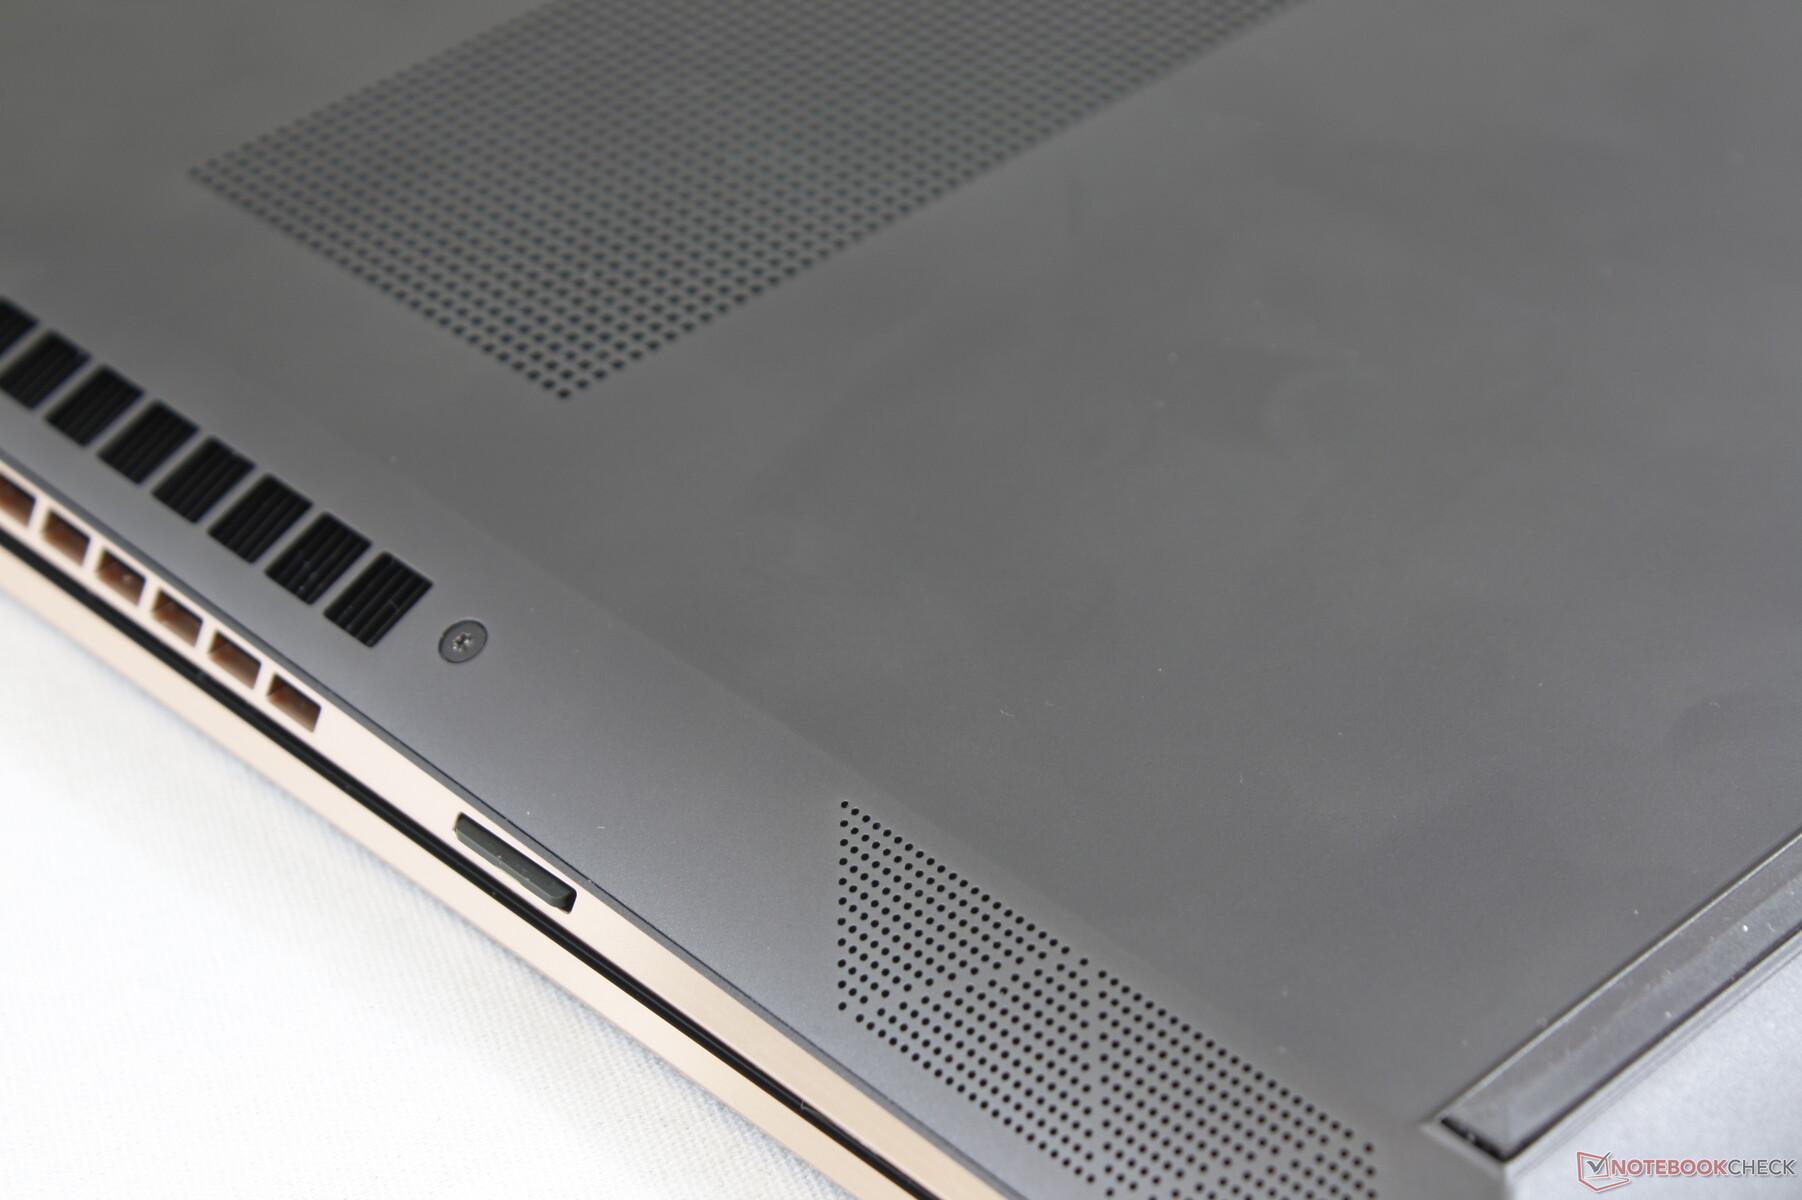
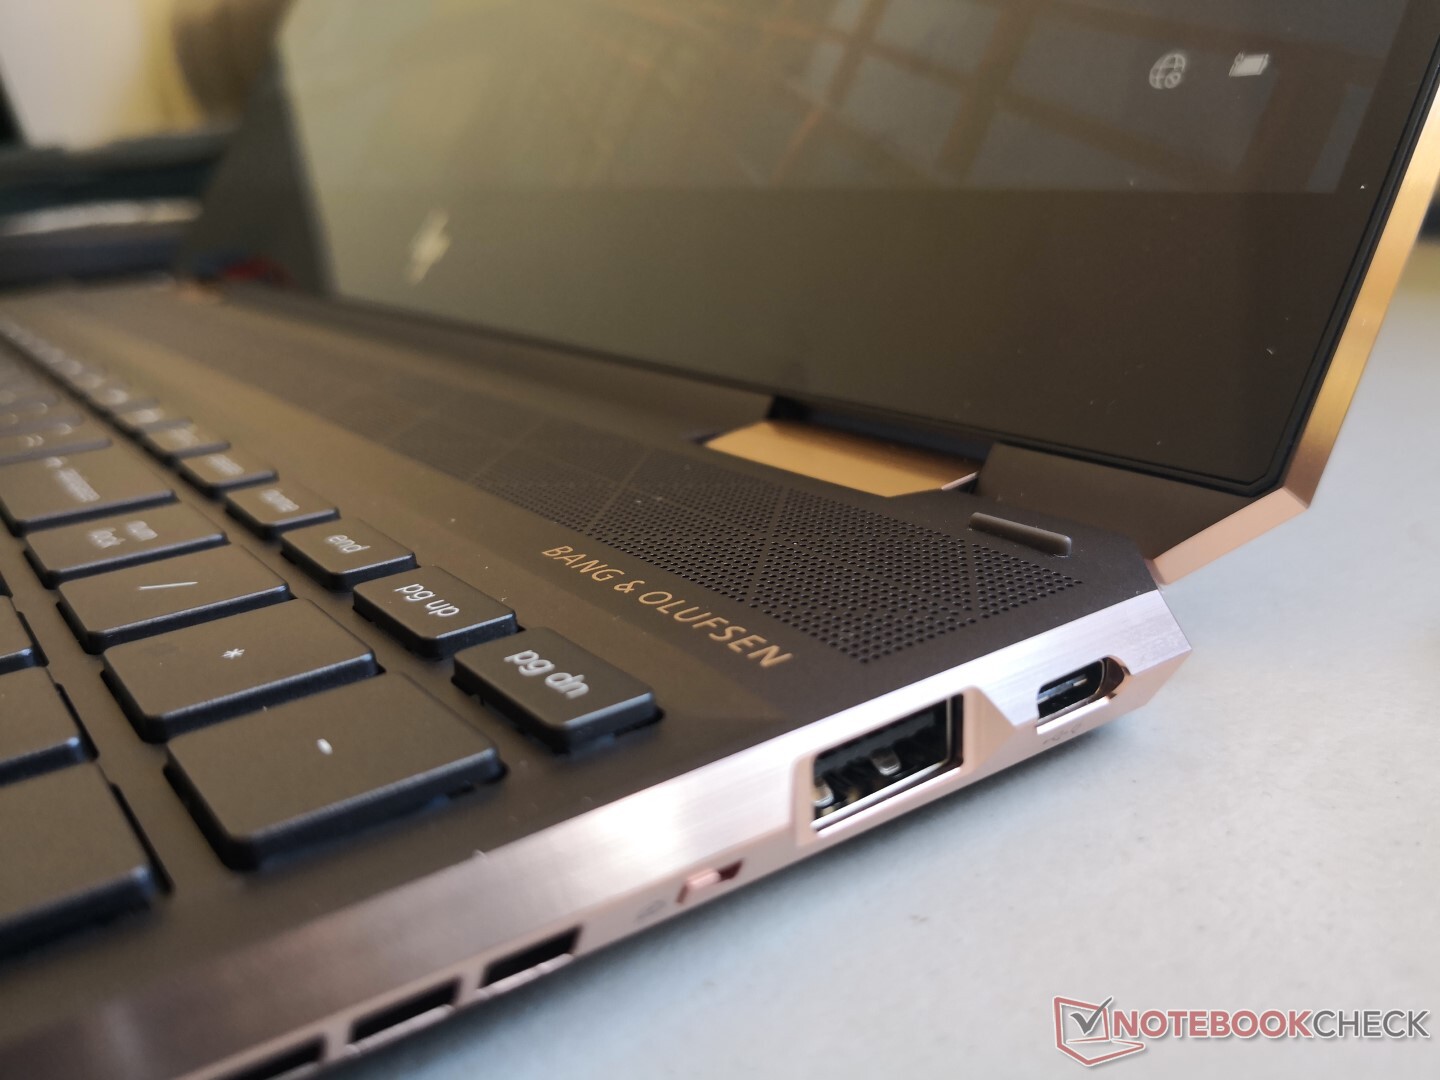
Port options and positioning have changed from the 2018 model. Whereas the older model included a full-size SD reader, the newer model accepts MicroSD only. All other ports are back including the dual Thunderbolt 3 ports. Still, it's disappointing to see just one USB Type-A port for such a large form factor.
SD Card Reader
Thankfully, the spring-loaded MicroSD reader offers the same performance as the full-size SD reader on the 2018 model. Transferring 1 GB of photos from our UHS-II test card to desktop takes about 7 seconds not unlike on the Dell XPS 15.
| SD Card Reader | |
| average JPG Copy Test (av. of 3 runs) | |
| Dell XPS 15 7590 9980HK GTX 1650 (Toshiba Exceria Pro SDXC 64 GB UHS-II) | |
| HP Spectre X360 15-5ZV31AV (Toshiba Exceria Pro M501 UHS-II) | |
| MSI Prestige 15 A10SC (Toshiba Exceria Pro M501 UHS-II) | |
| Asus ZenBook 15 UX534FT-DB77 (Toshiba Exceria Pro SDXC 64 GB UHS-II) | |
| HP Pavilion Gaming 15-ec0017ng (Toshiba Exceria Pro SDXC 64 GB UHS-II) | |
| maximum AS SSD Seq Read Test (1GB) | |
| MSI Prestige 15 A10SC (Toshiba Exceria Pro M501 UHS-II) | |
| Dell XPS 15 7590 9980HK GTX 1650 (Toshiba Exceria Pro SDXC 64 GB UHS-II) | |
| HP Spectre X360 15-5ZV31AV (Toshiba Exceria Pro M501 UHS-II) | |
| Asus ZenBook 15 UX534FT-DB77 (Toshiba Exceria Pro SDXC 64 GB UHS-II) | |
| HP Pavilion Gaming 15-ec0017ng (Toshiba Exceria Pro SDXC 64 GB UHS-II) | |
Communication
The Intel AX201 comes standard for Wi-Fi 6 speeds and integrated Bluetooth 5 in contrast to older Ultrabooks with the slower Intel 9560. We experienced no connectivity issues during our time with the test unit.
| Networking | |
| iperf3 transmit AX12 | |
| MSI Prestige 15 A10SC | |
| HP Pavilion Gaming 15-ec0017ng | |
| iperf3 receive AX12 | |
| MSI Prestige 15 A10SC | |
| HP Pavilion Gaming 15-ec0017ng | |
Maintenance
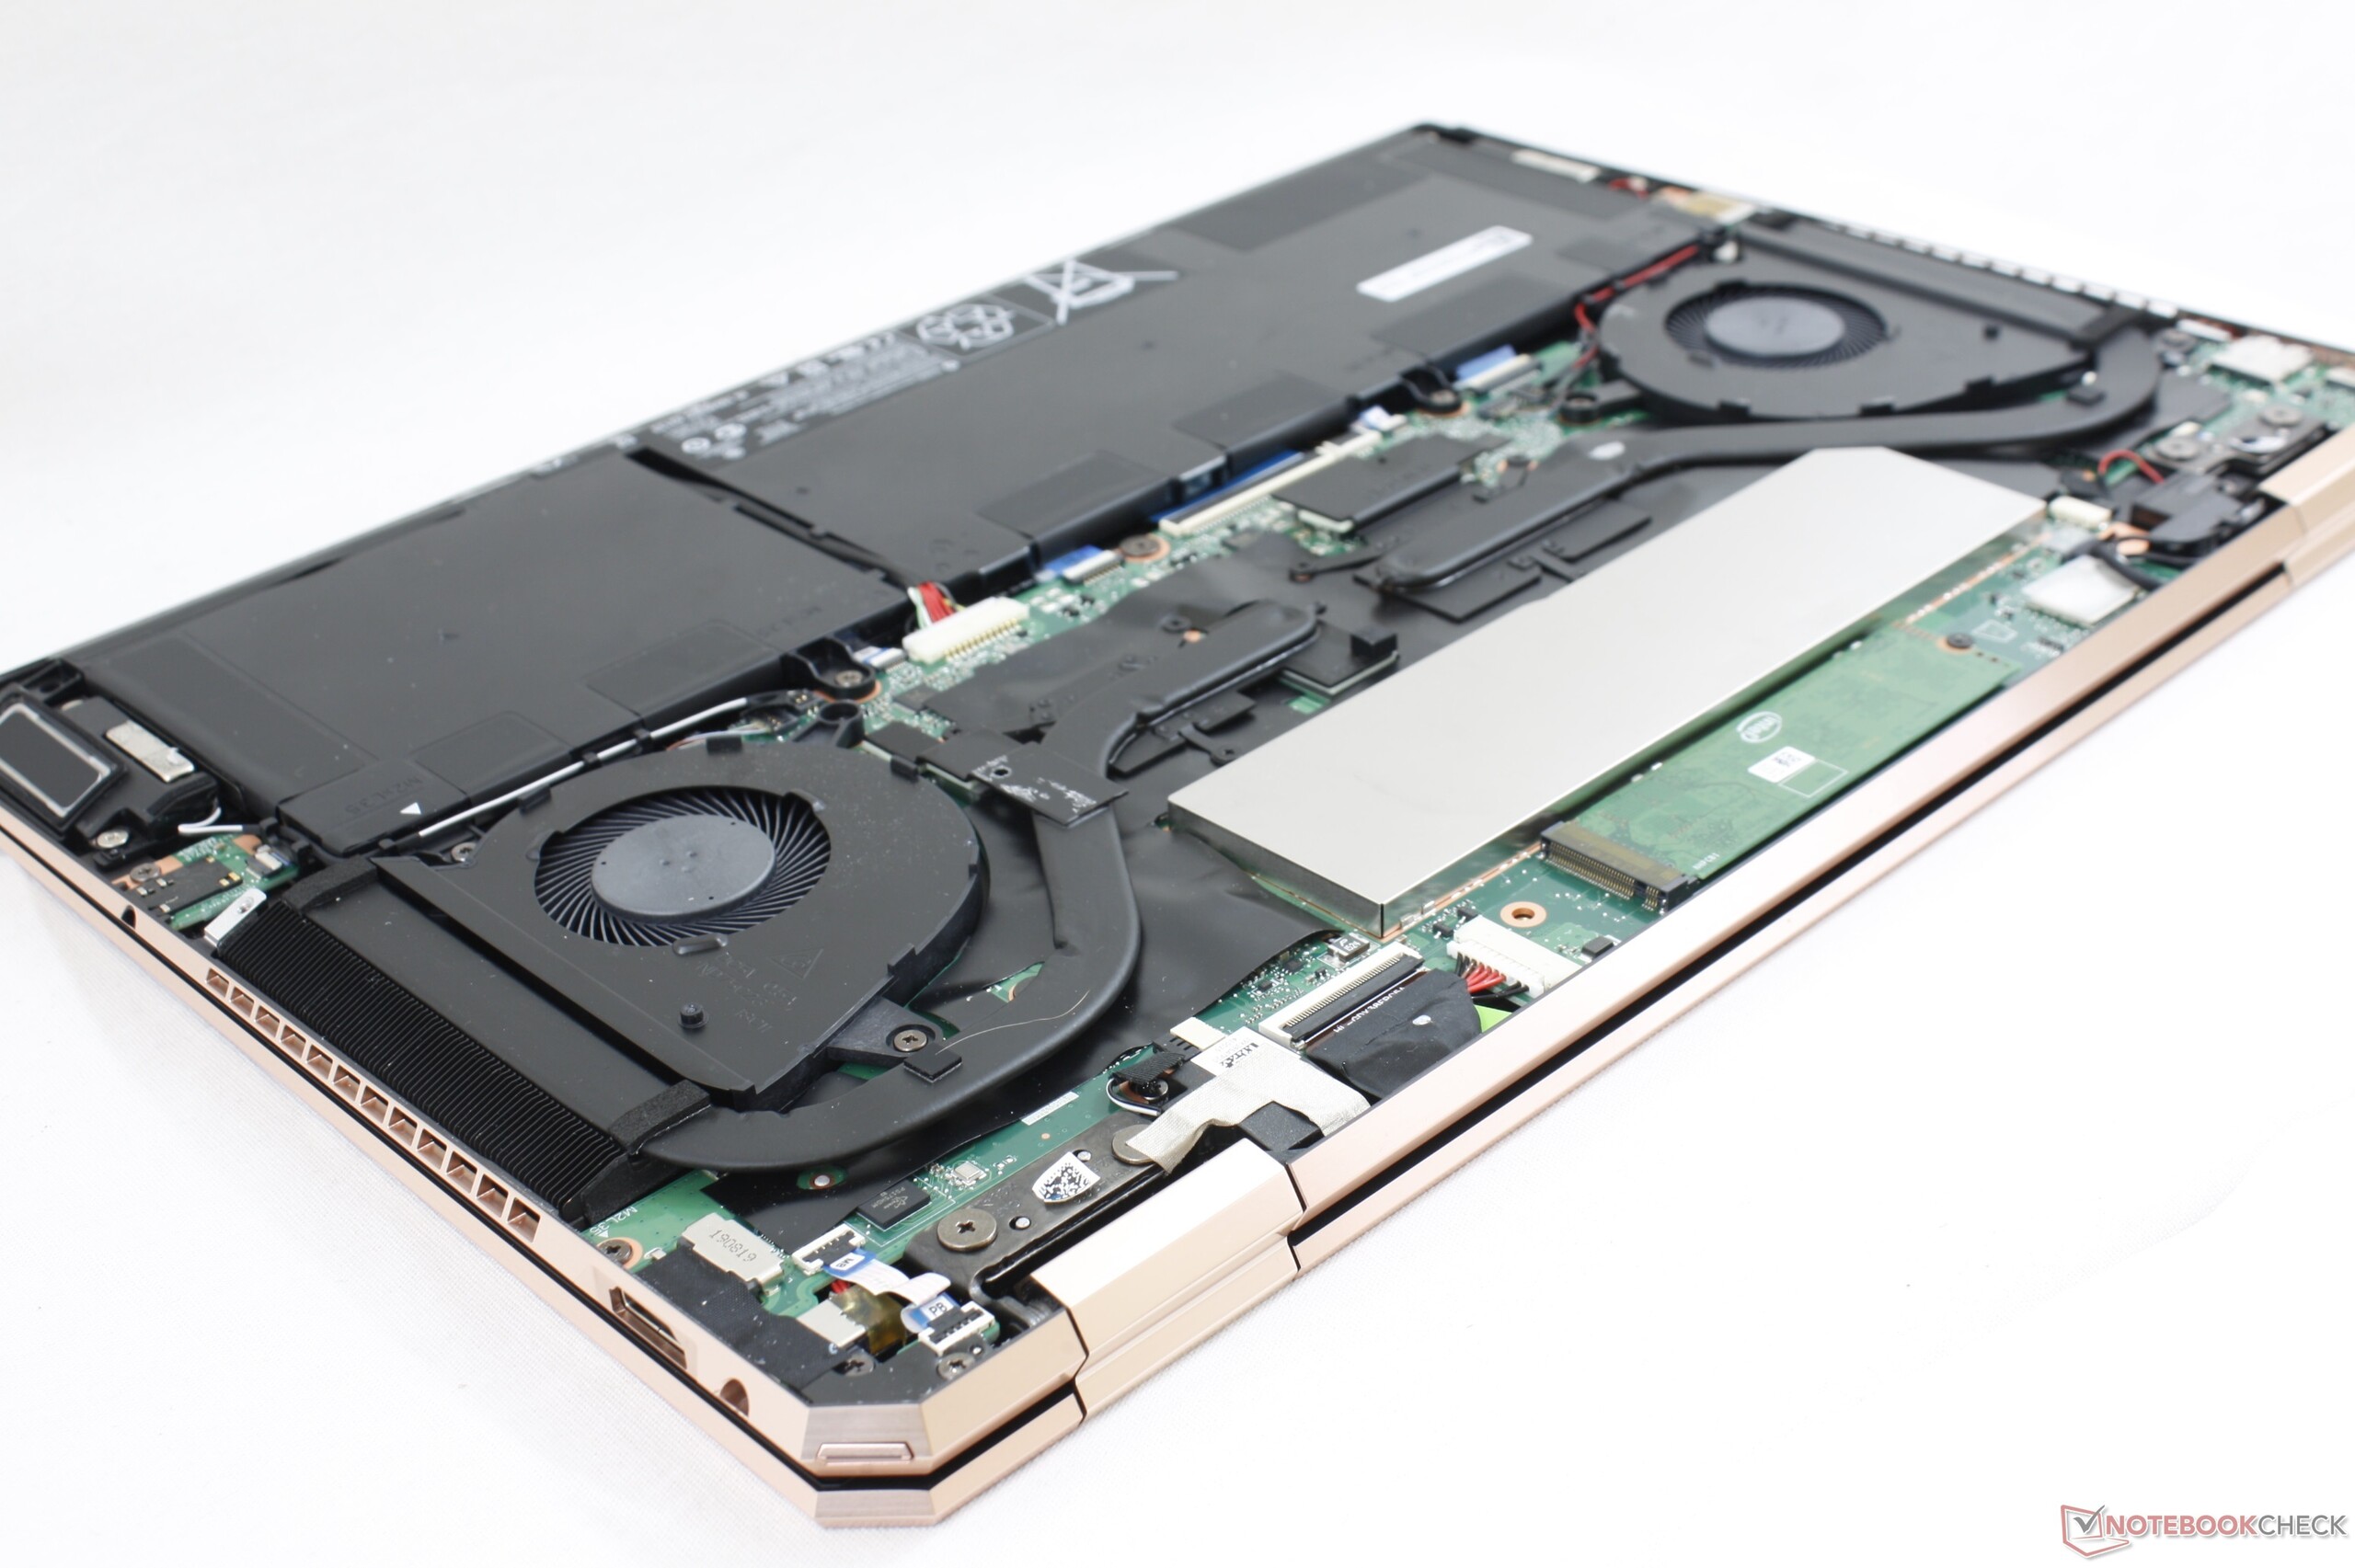
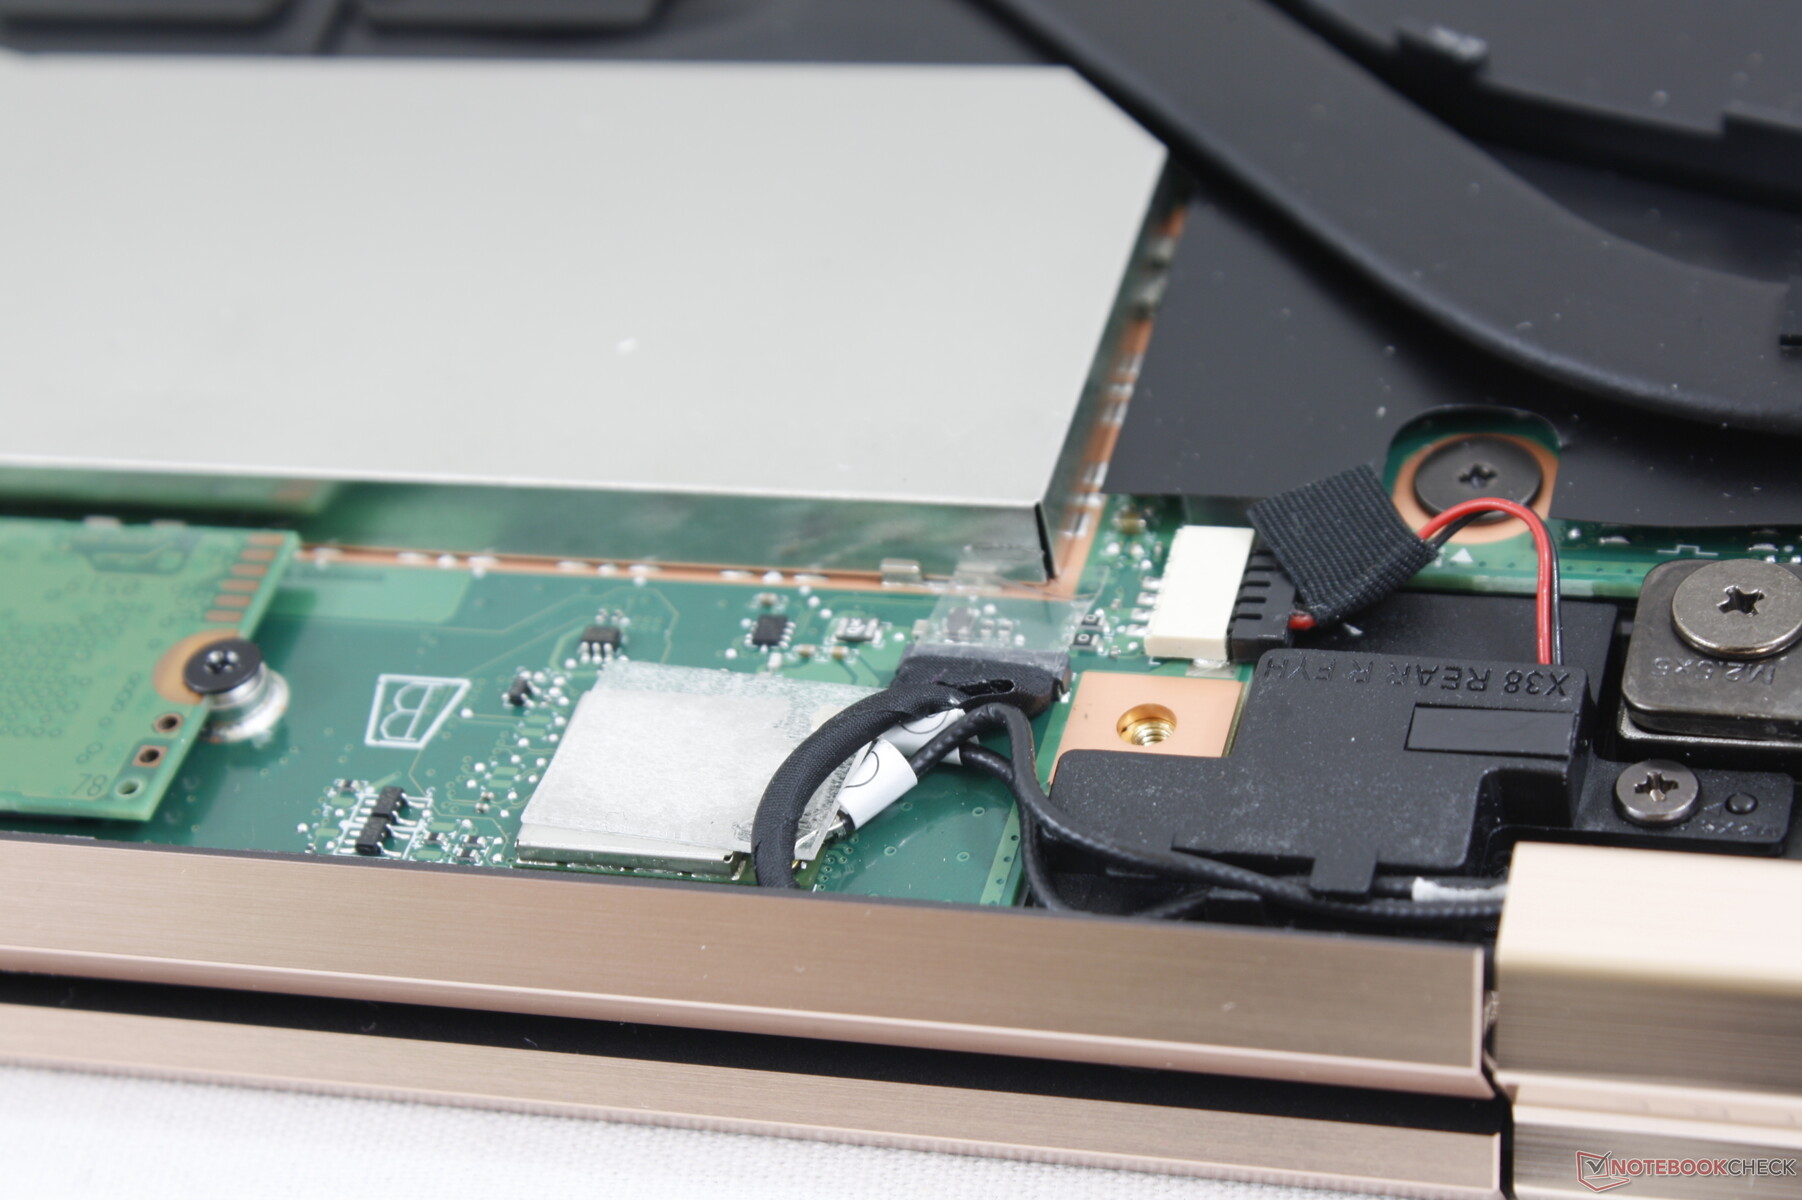
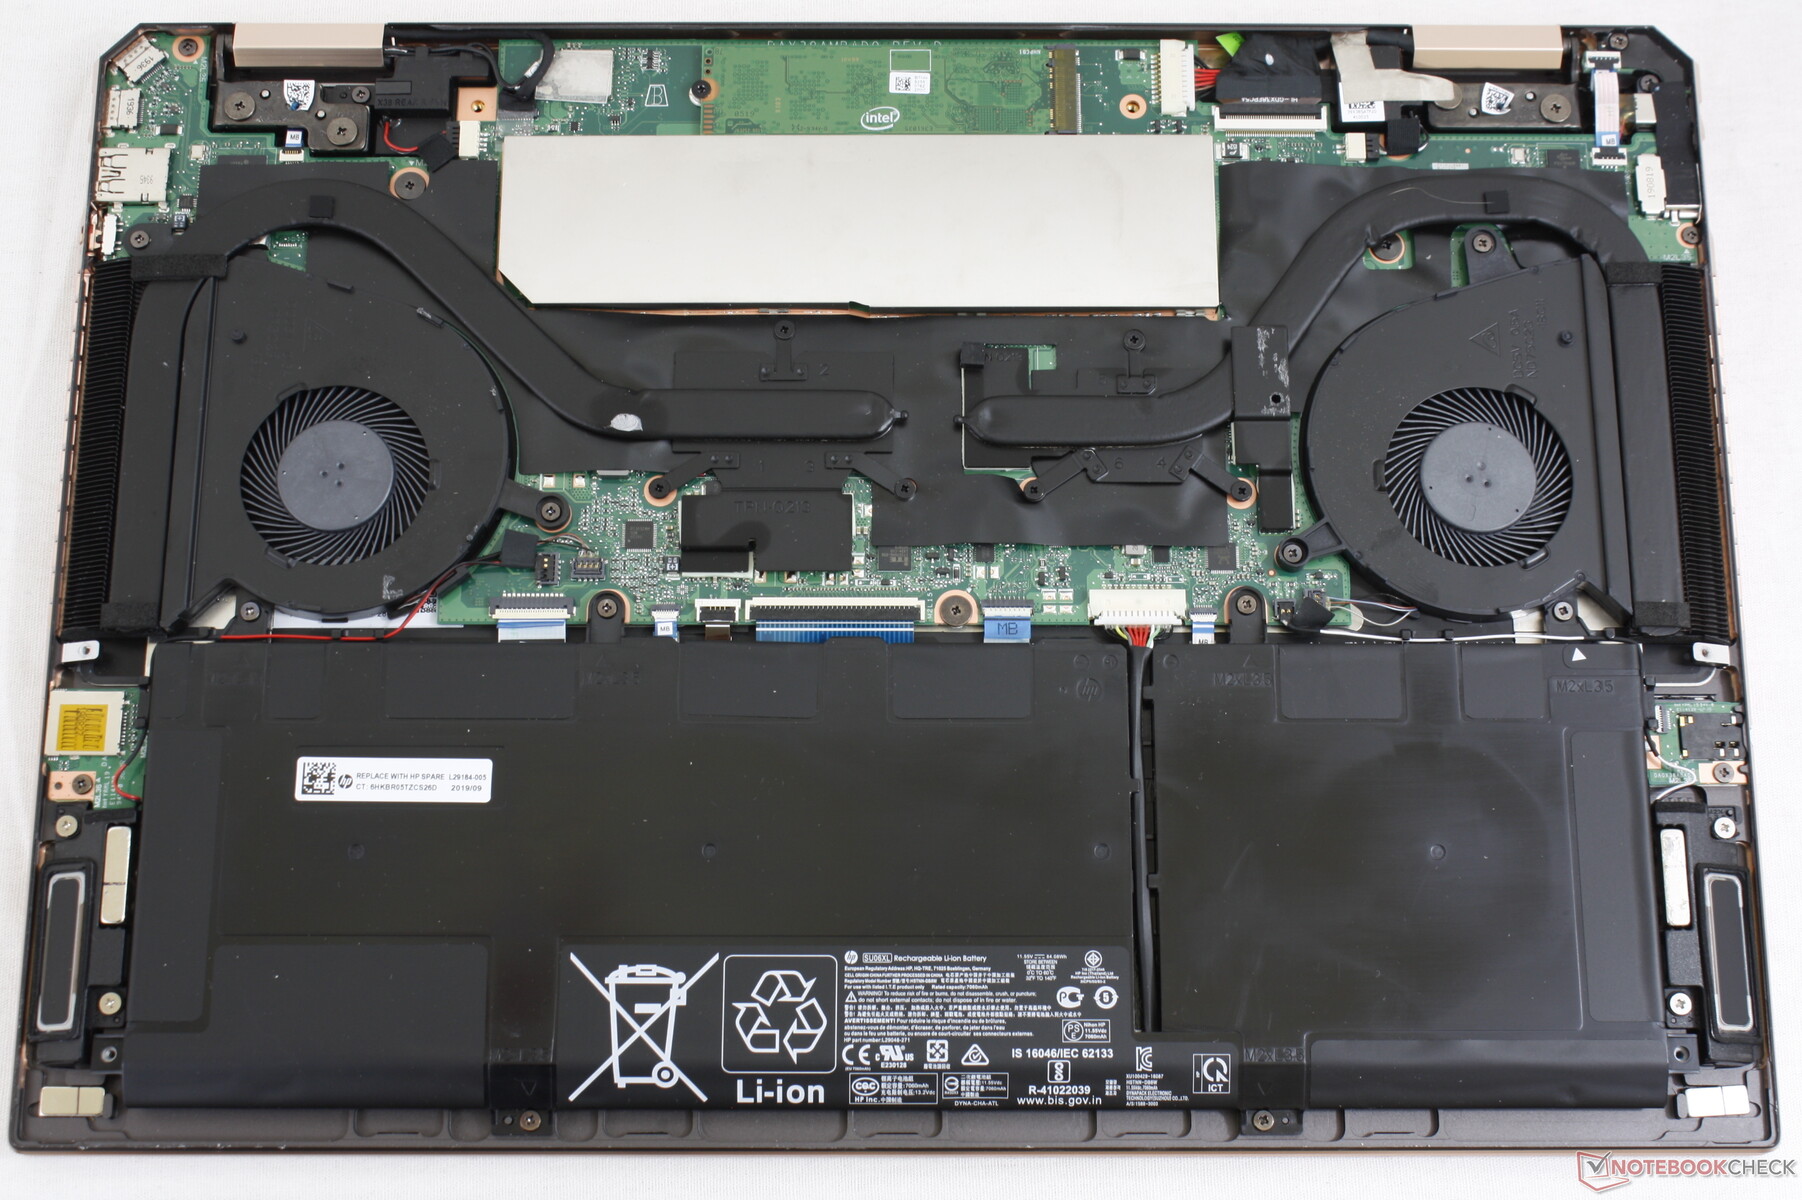
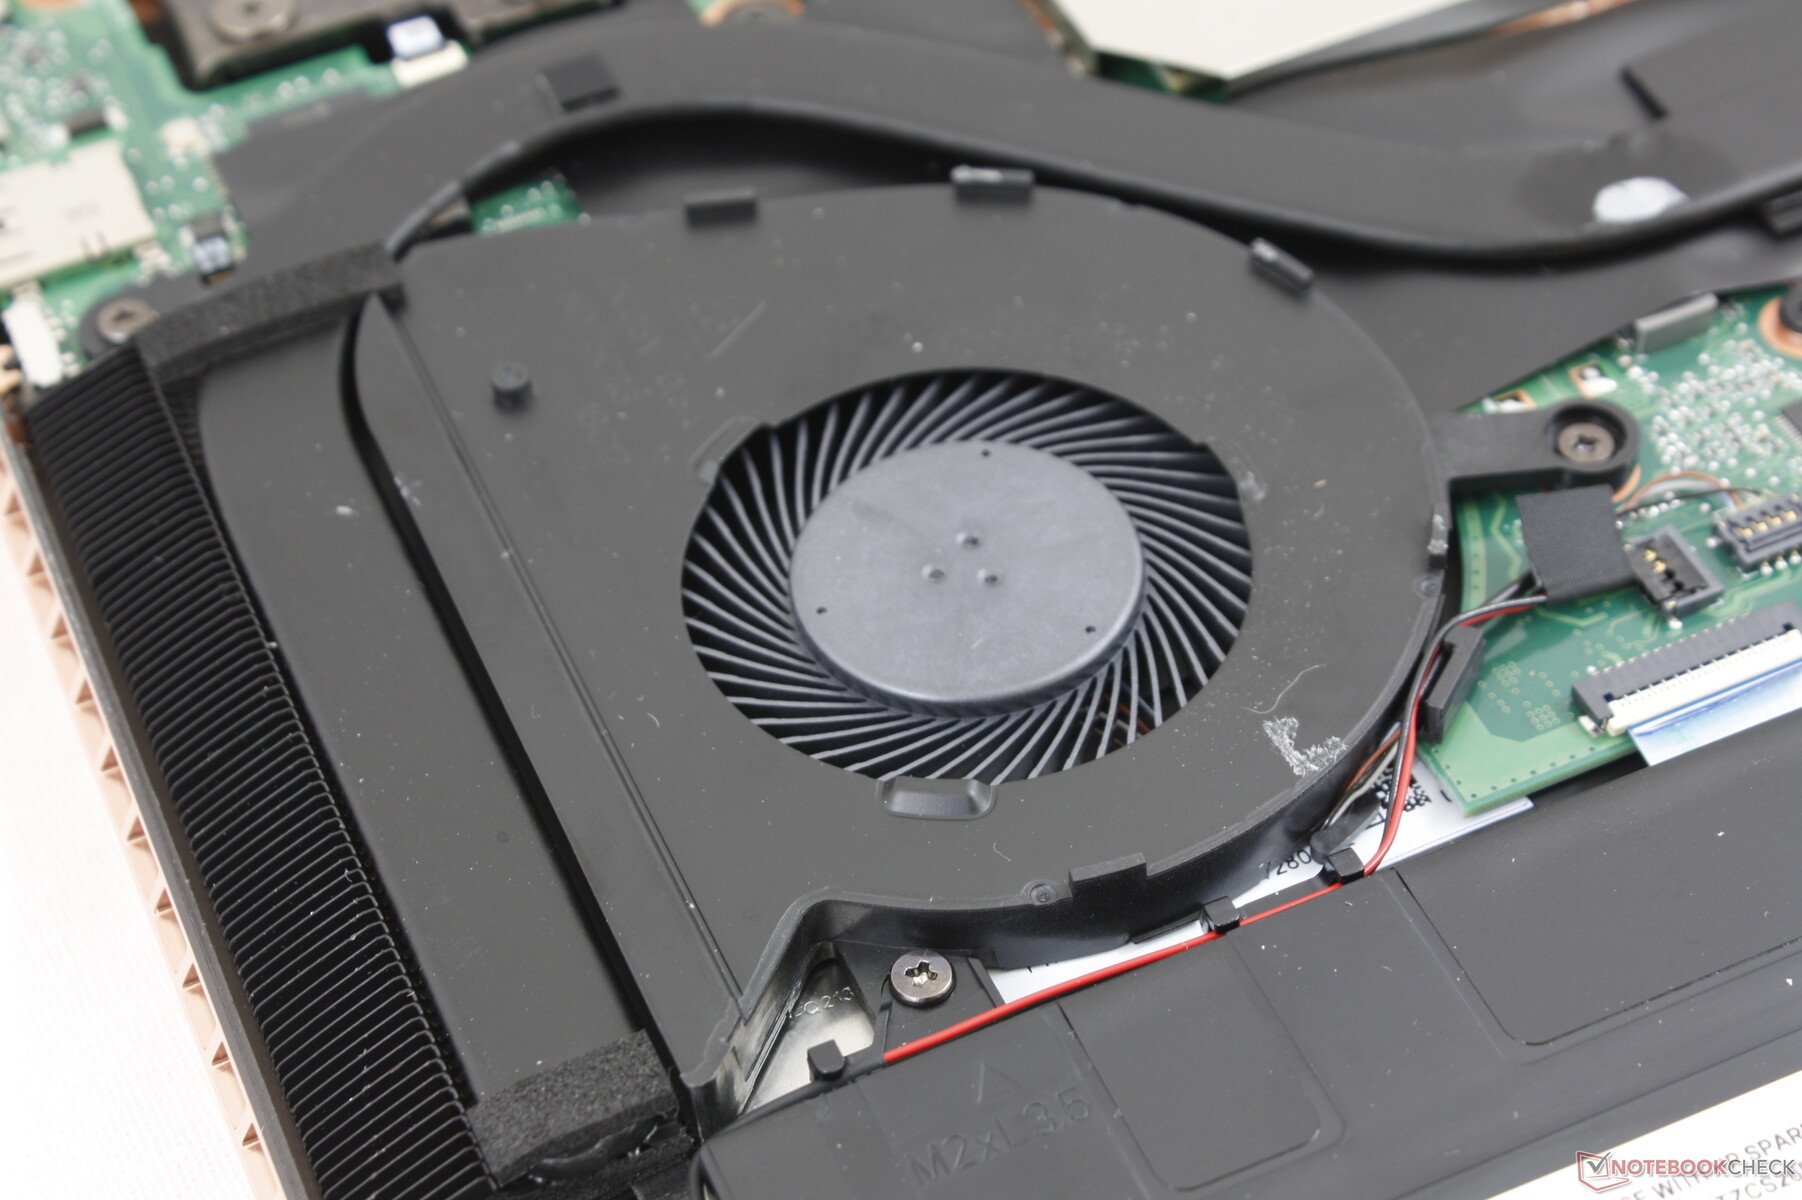
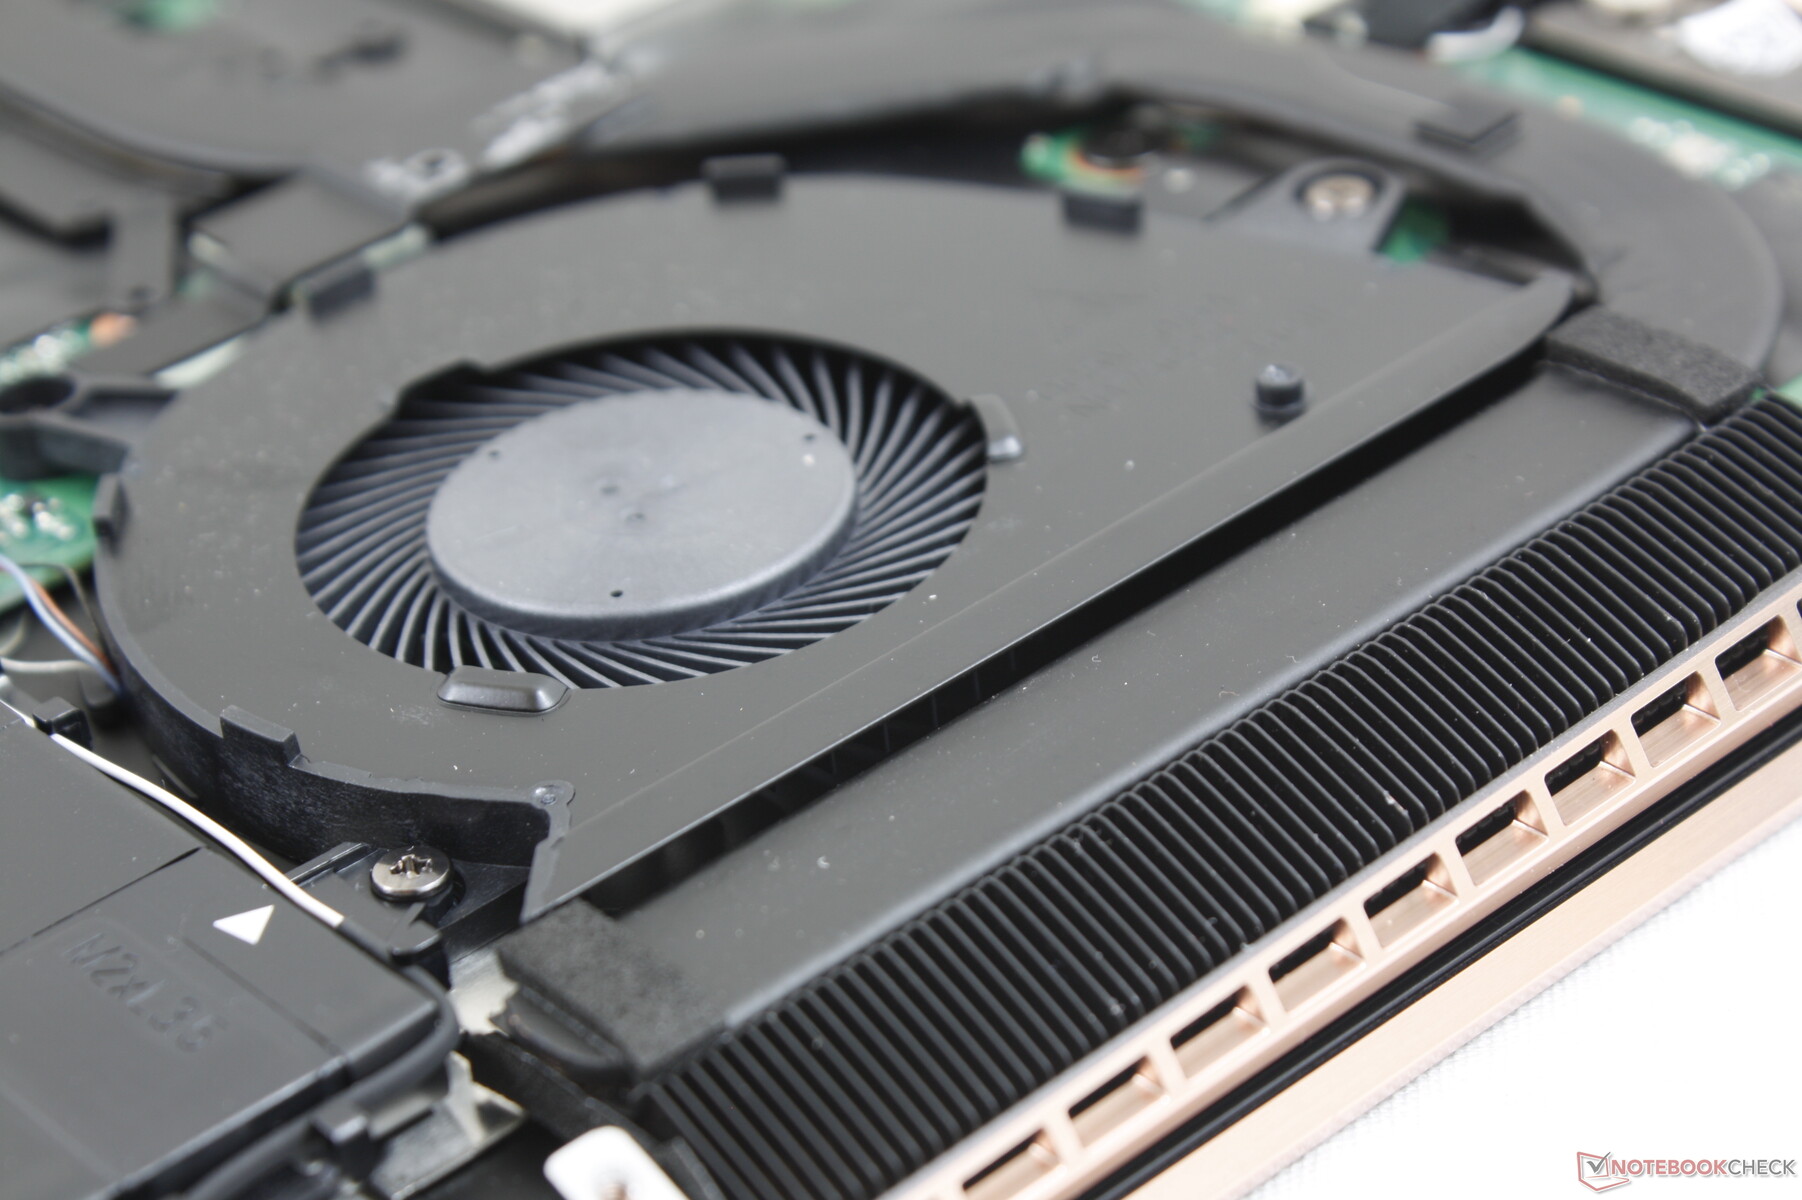
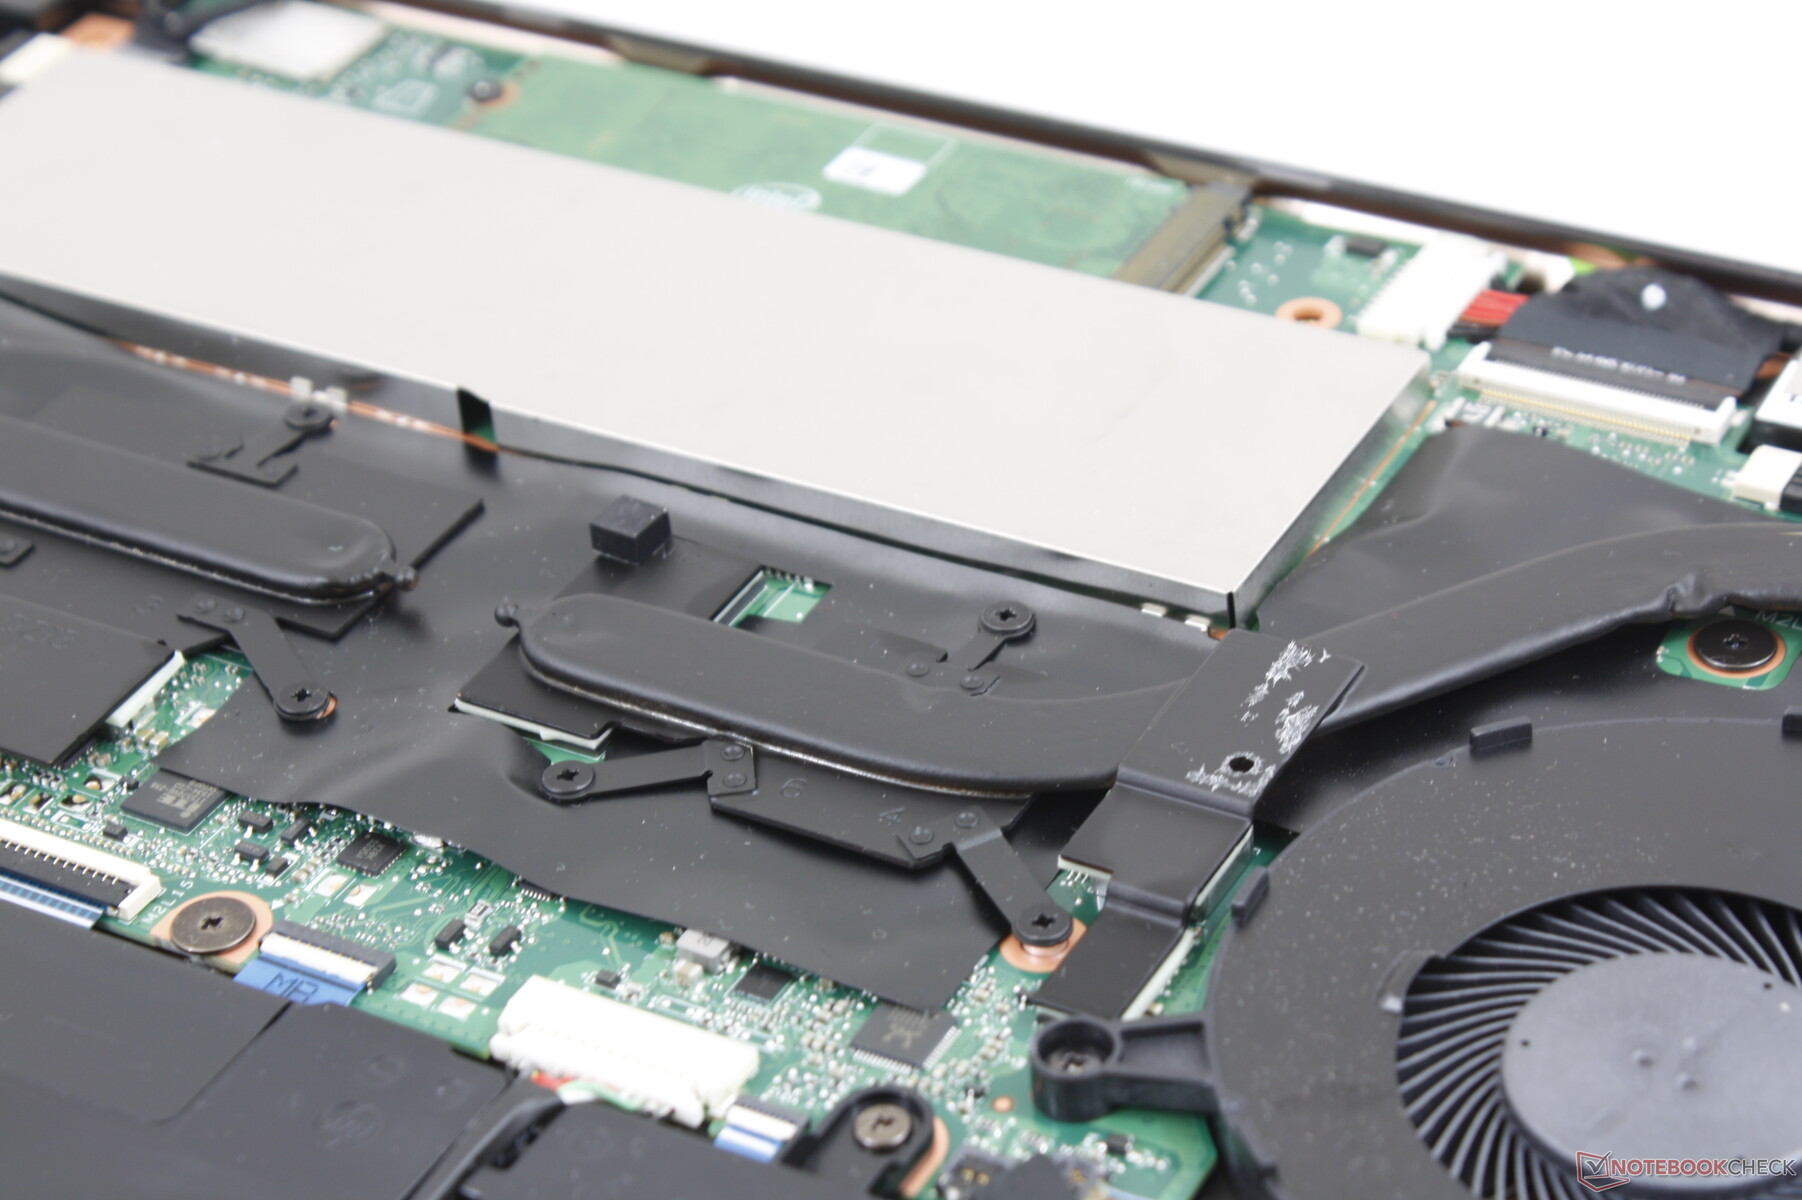
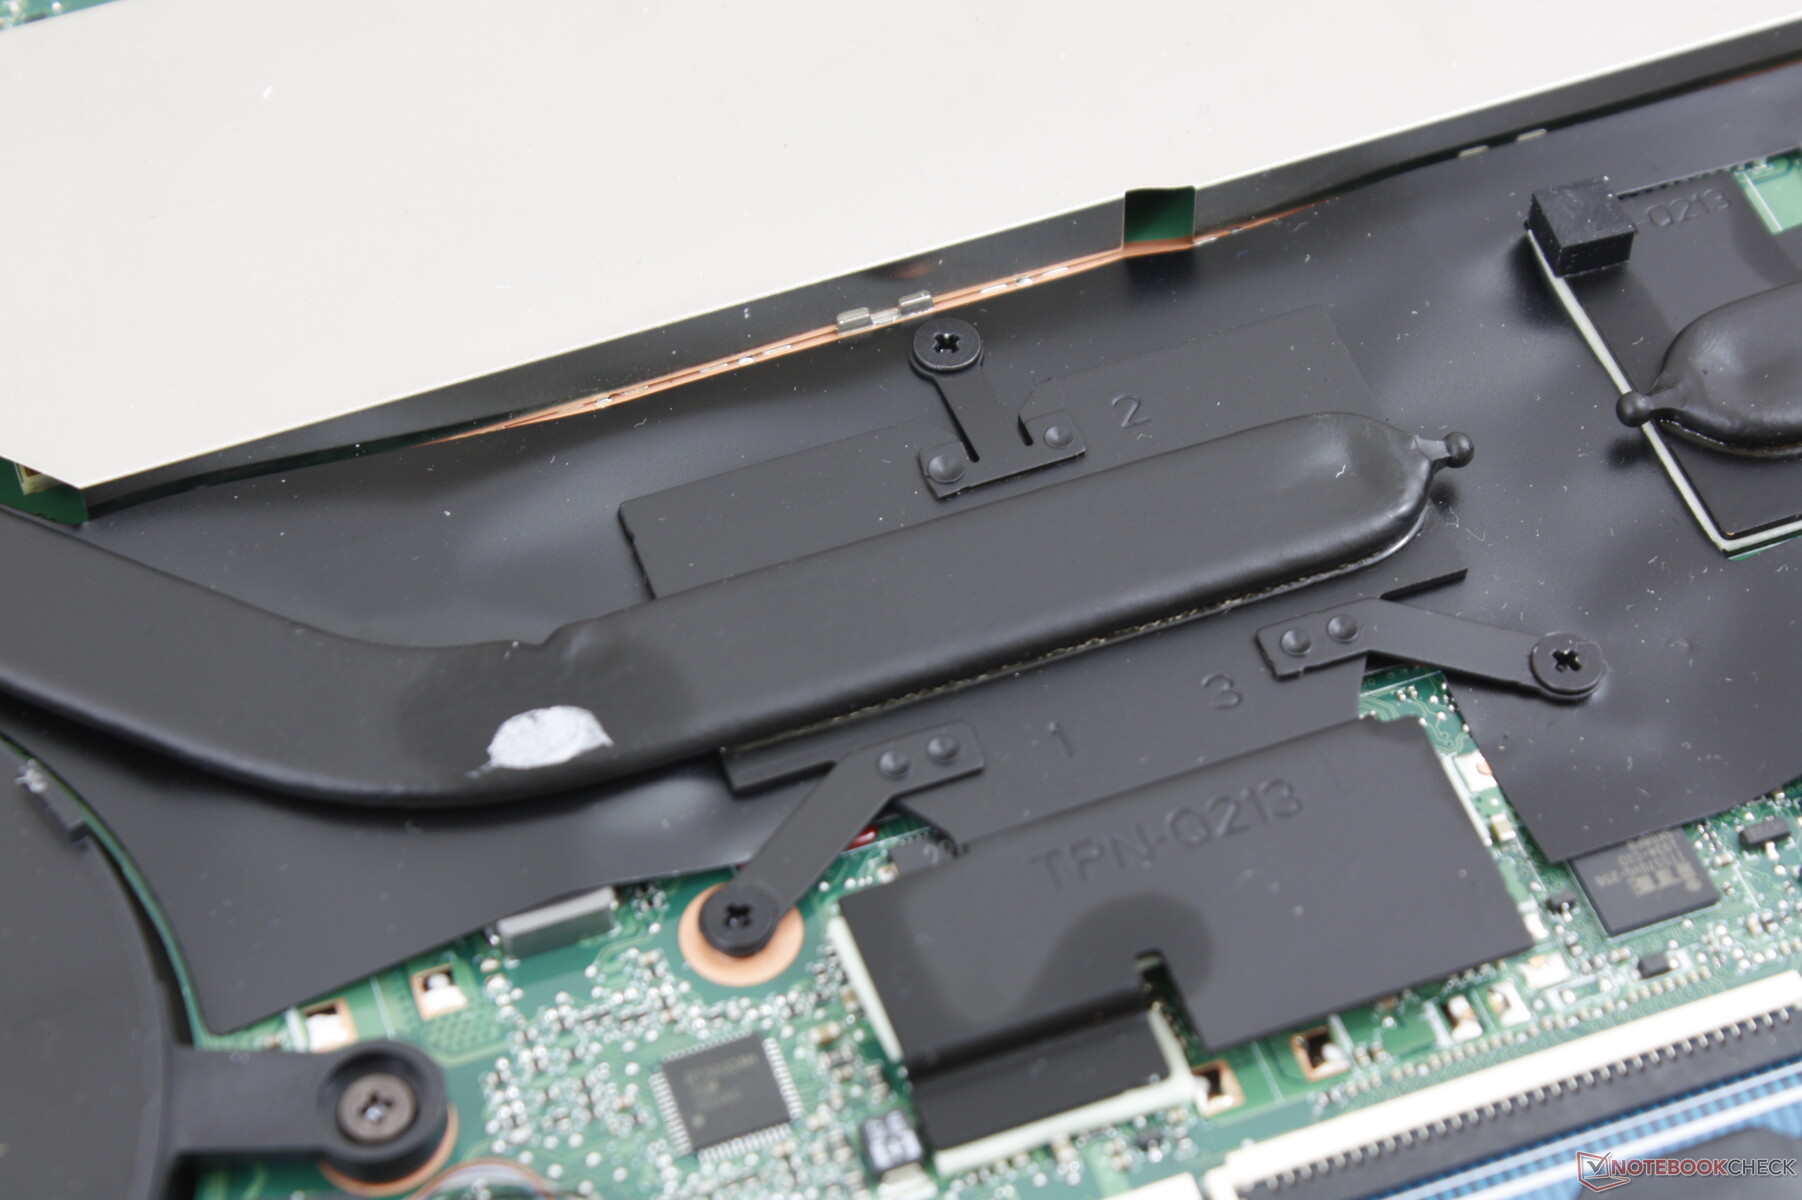
HP discourages end-user tinkering through several means. Firstly, there are two types of screws - Philips and Torx - instead of just one. Secondly, most of the screws are hidden beneath the fragile rubber footing. Thirdly, the edges and corners are sharp meaning gloves and/or sharp tools are recommended. And lastly, once you finally remove the bottom panel, the 2x SODIMM slots are protected by an aluminum housing. It'll take some patience to open up the bottom for any sort of servicing.
Accessories and Warranty
Extras include a faux leather carrying case and an active pen with two extra pen tips and a AAAA battery. A velvet cleaning cloth would have been a nice addition to the already generous set.
The standard one-year limited warranty applies with plenty of externsion options if purchased directly from HP. CUKUSA can cover specific components for three years including RAM and storage.
Input Devices
Keyboard and Trackpad
HP hasn't changed the keyboard or clickpad from the 2018 model and so our existing comments apply here on the 2019 model. The keyboards on Spectre and EliteBook laptops are some of our favorites on an Ultrabook because they tend to feel firmer with stronger feedback than most other Ultrabooks including the ZenBook 15 or XPS 15. On the flip side, key clatter is slightly louder than on a ThinkPad T series.
The 2:1 clickpad is the same size yet again (12 x 6 cm) with smooth cursor control no matter the gliding speed. The integrated mouse keys are moderate in clatter and satisfactory in feedback but could have been firmer overall.


Display
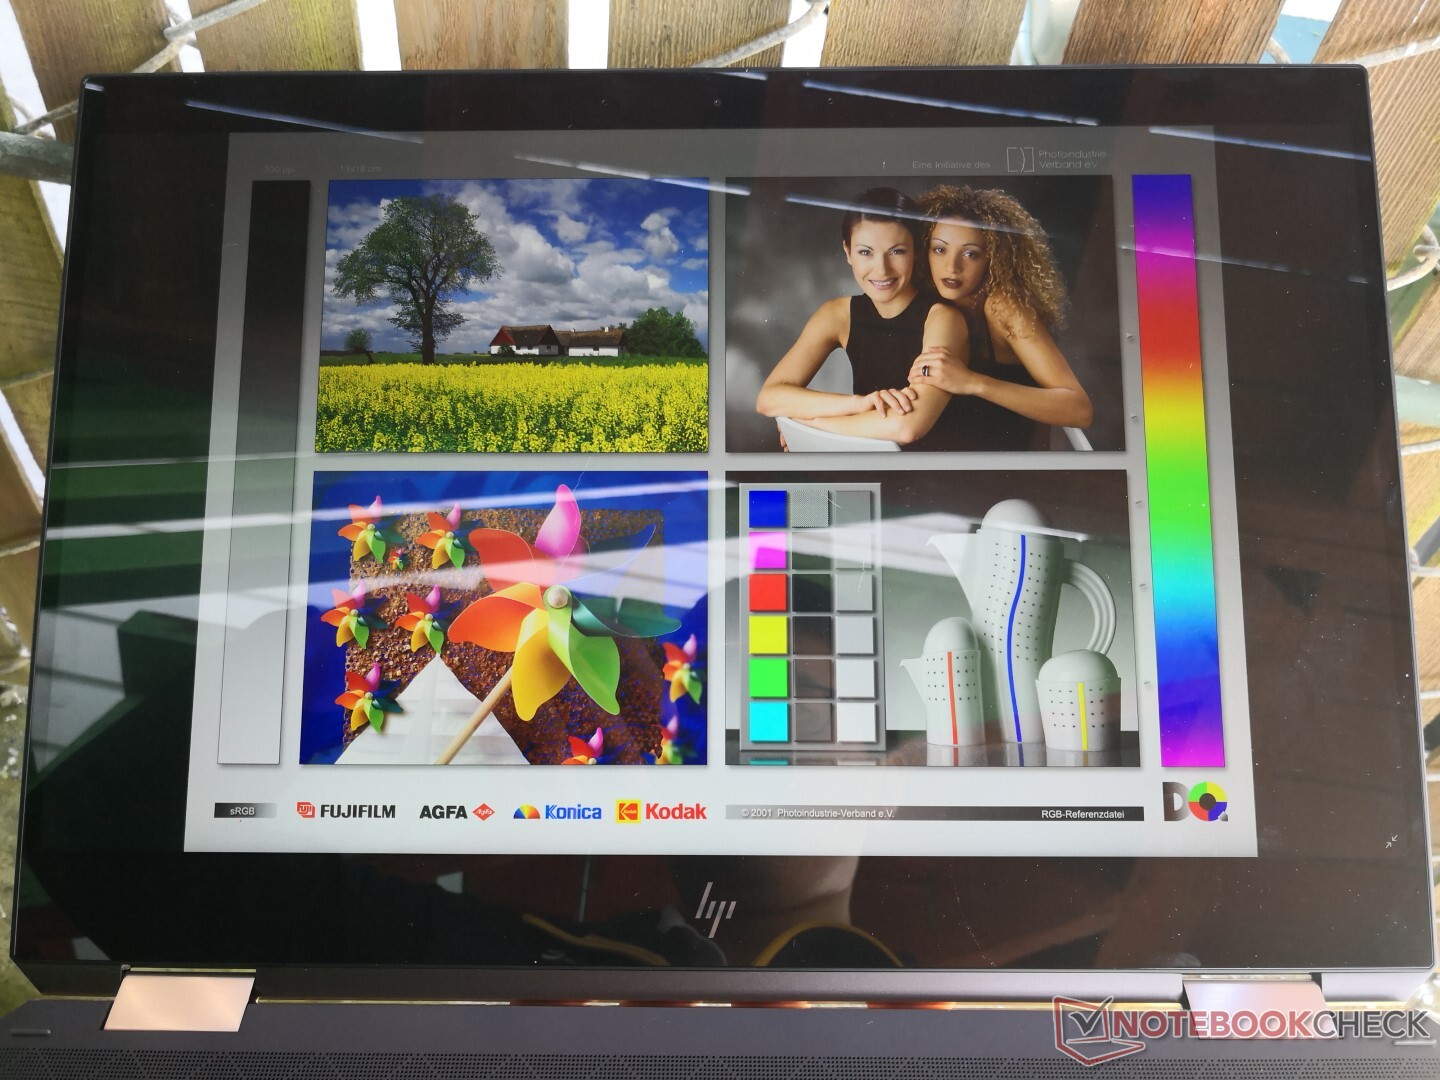
Our late 2019 Spectre x360 15 uses the same AU Optronics AUO30EB controller as found on the Whiskey Lake-U 2019 Spectre x360 15. HWiNFO was unable to pull the panel name from our test unit, but it's safe to say that this is the same 4K panel as found on our earlier 2019 unit since characteristics like color coverage, contrast ratio, and response times are not all that different between them. This unfortunately means that display brightness has not improved and that ghosting remains very noticeable due to the slow black-white and gray-gray response times. The pricier OLED SKU should address both of these drawbacks.
Interestingly, the older 2018 Spectre x360 15 uses a 4K UHD panel from BOE with faster response times for slightly less ghosting than the AU Optronics panel on this 2019 unit.


| |||||||||||||||||||||||||
Brightness Distribution: 85 %
Center on Battery: 284.6 cd/m²
Contrast: 1138:1 (Black: 0.25 cd/m²)
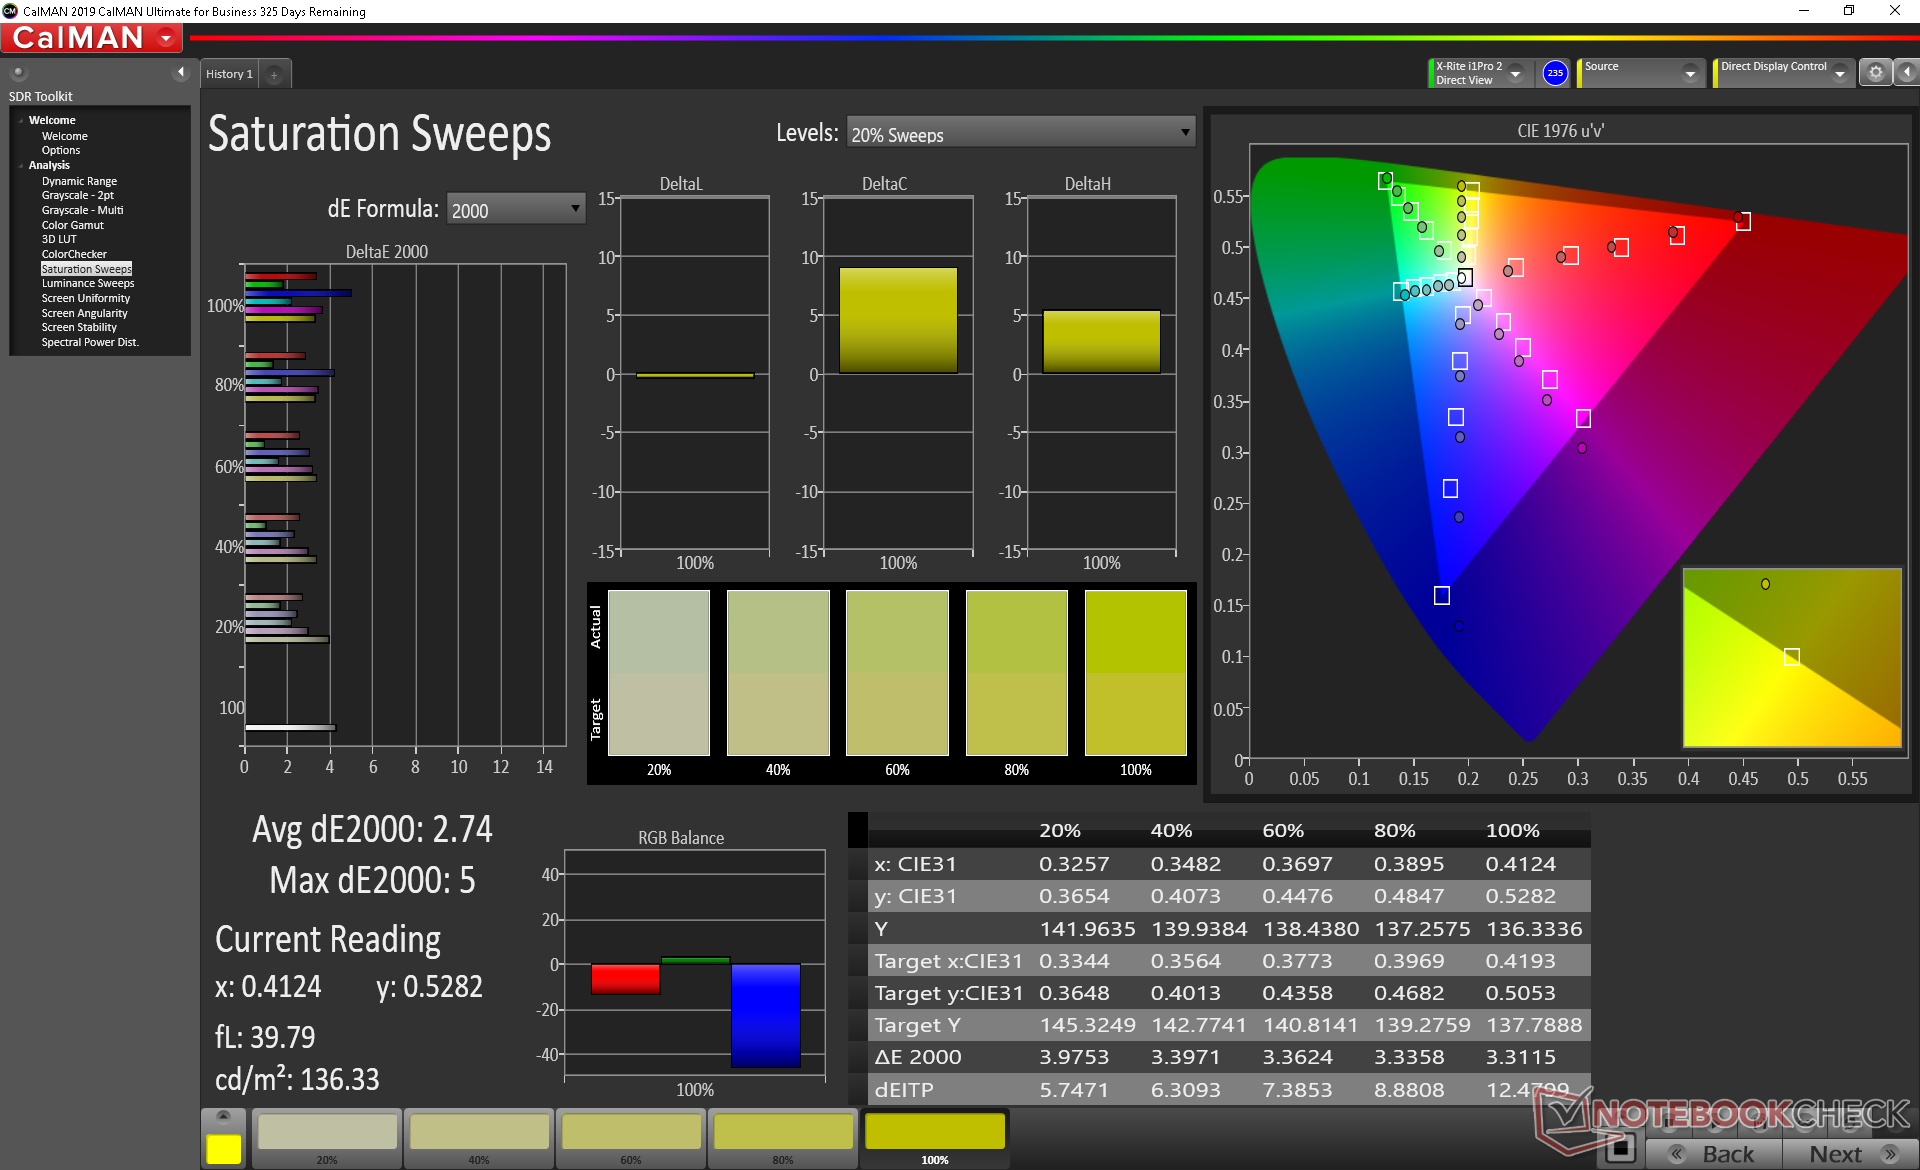
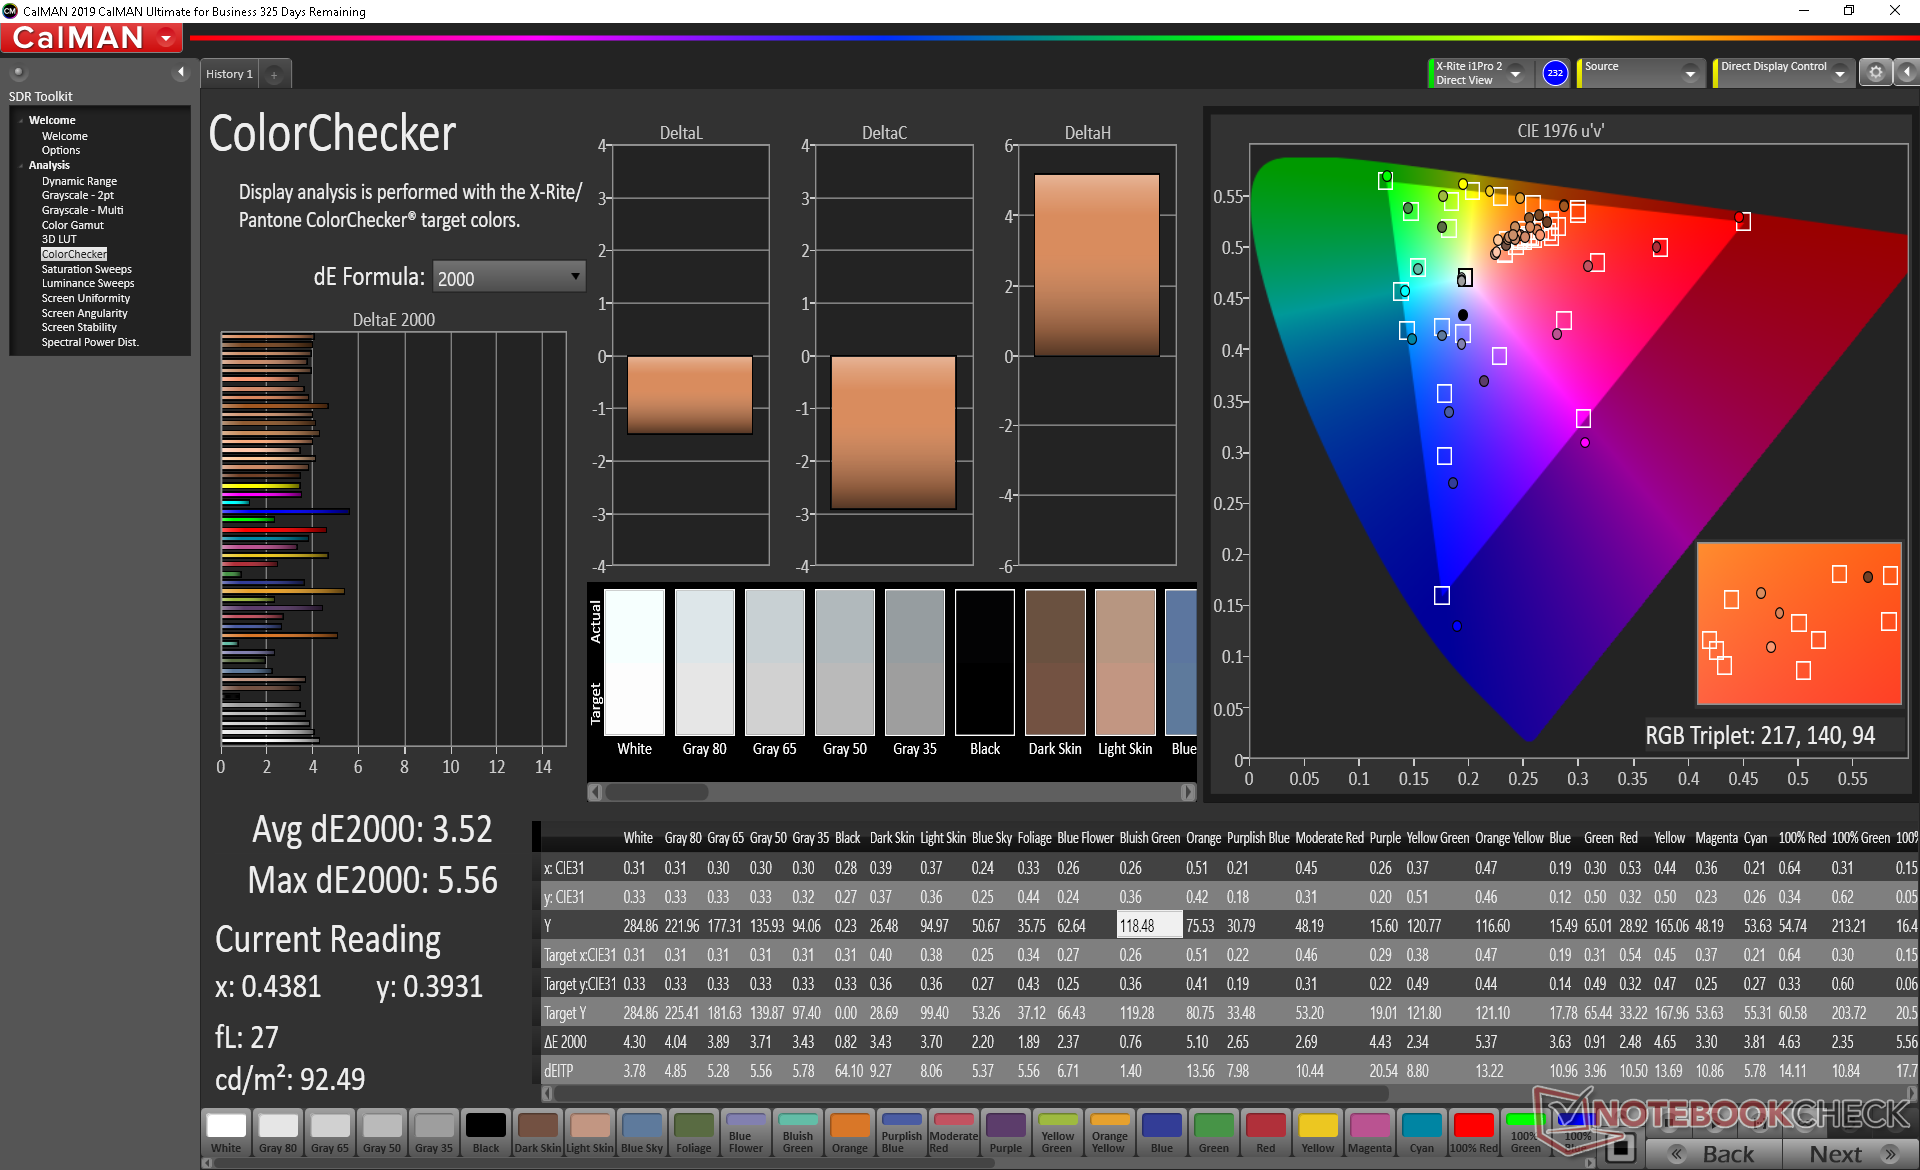
ΔE ColorChecker Calman: 3.52 | ∀{0.5-29.43 Ø4.73}
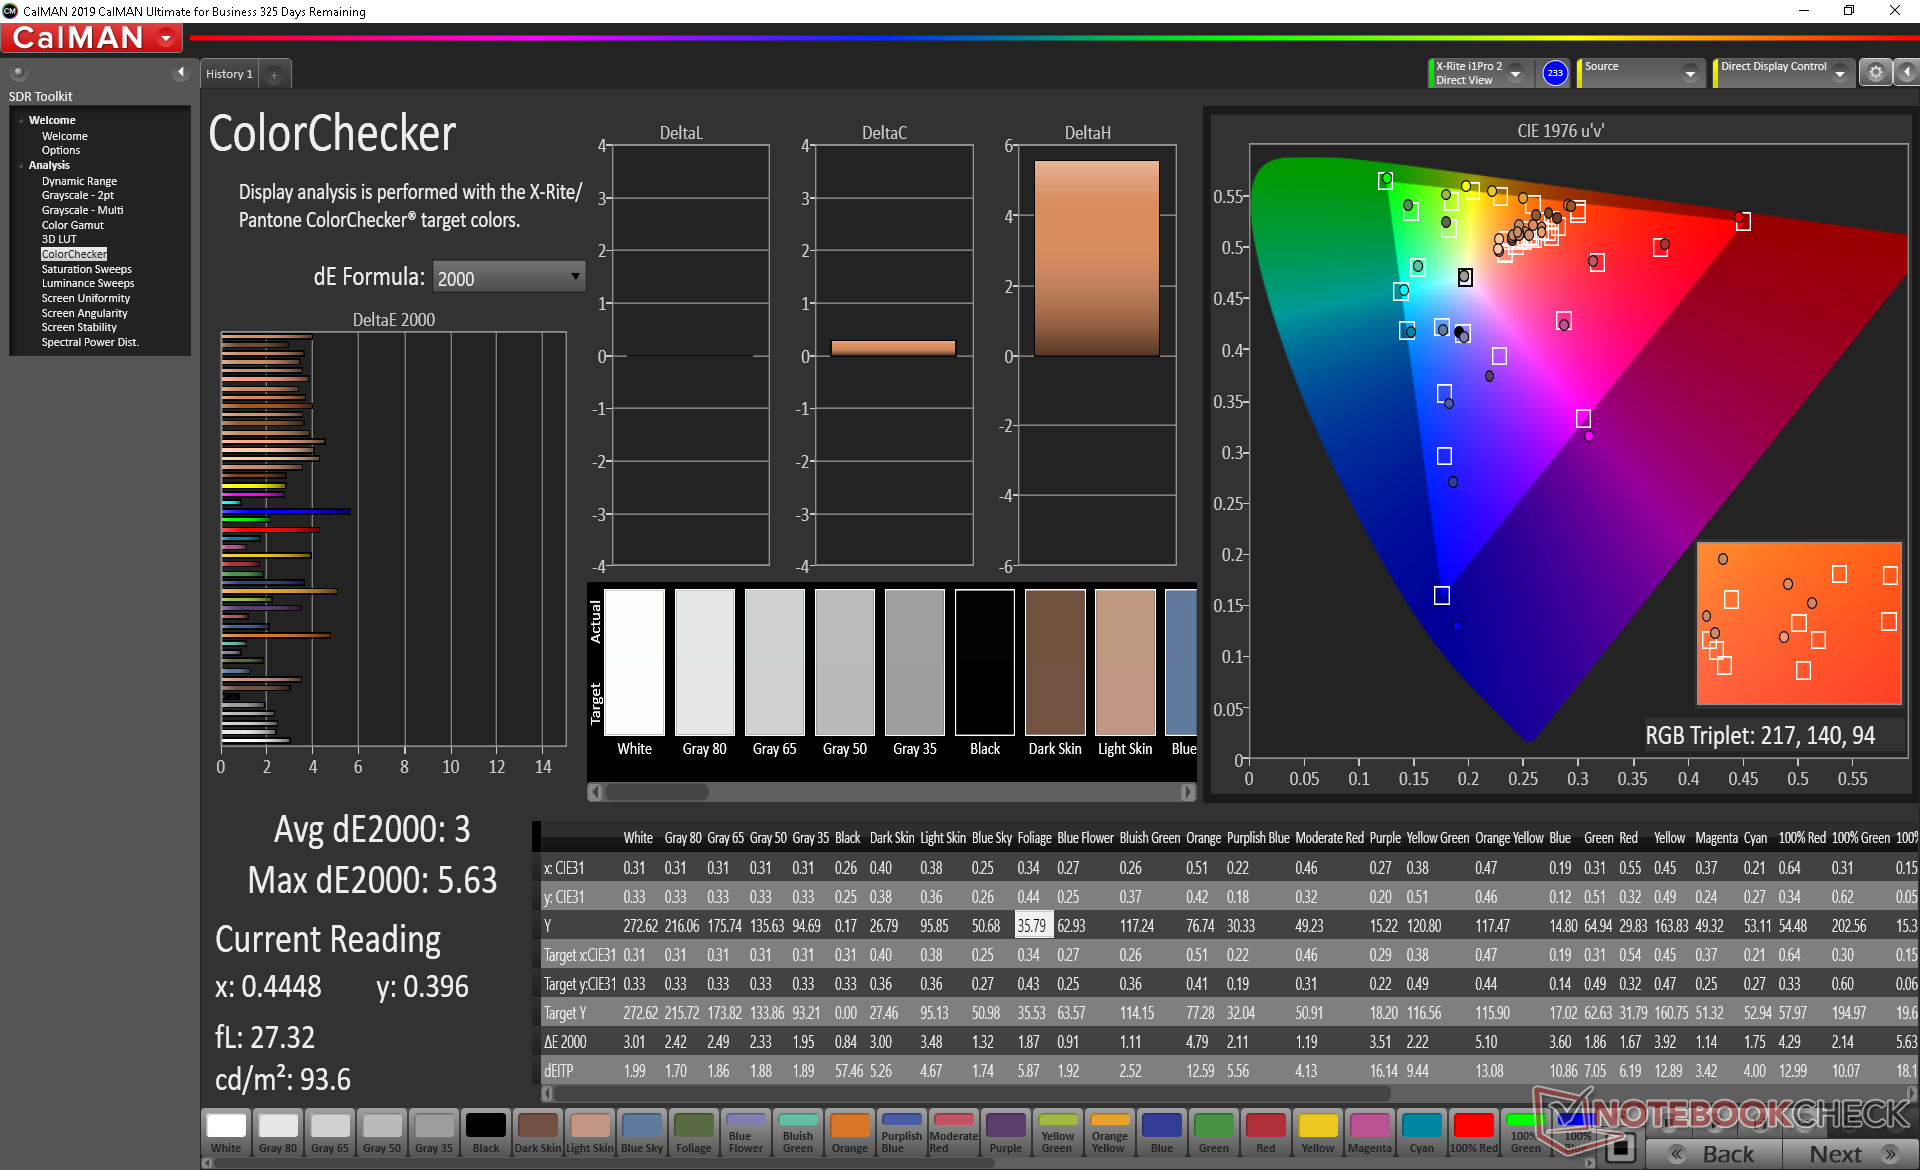
calibrated: 3
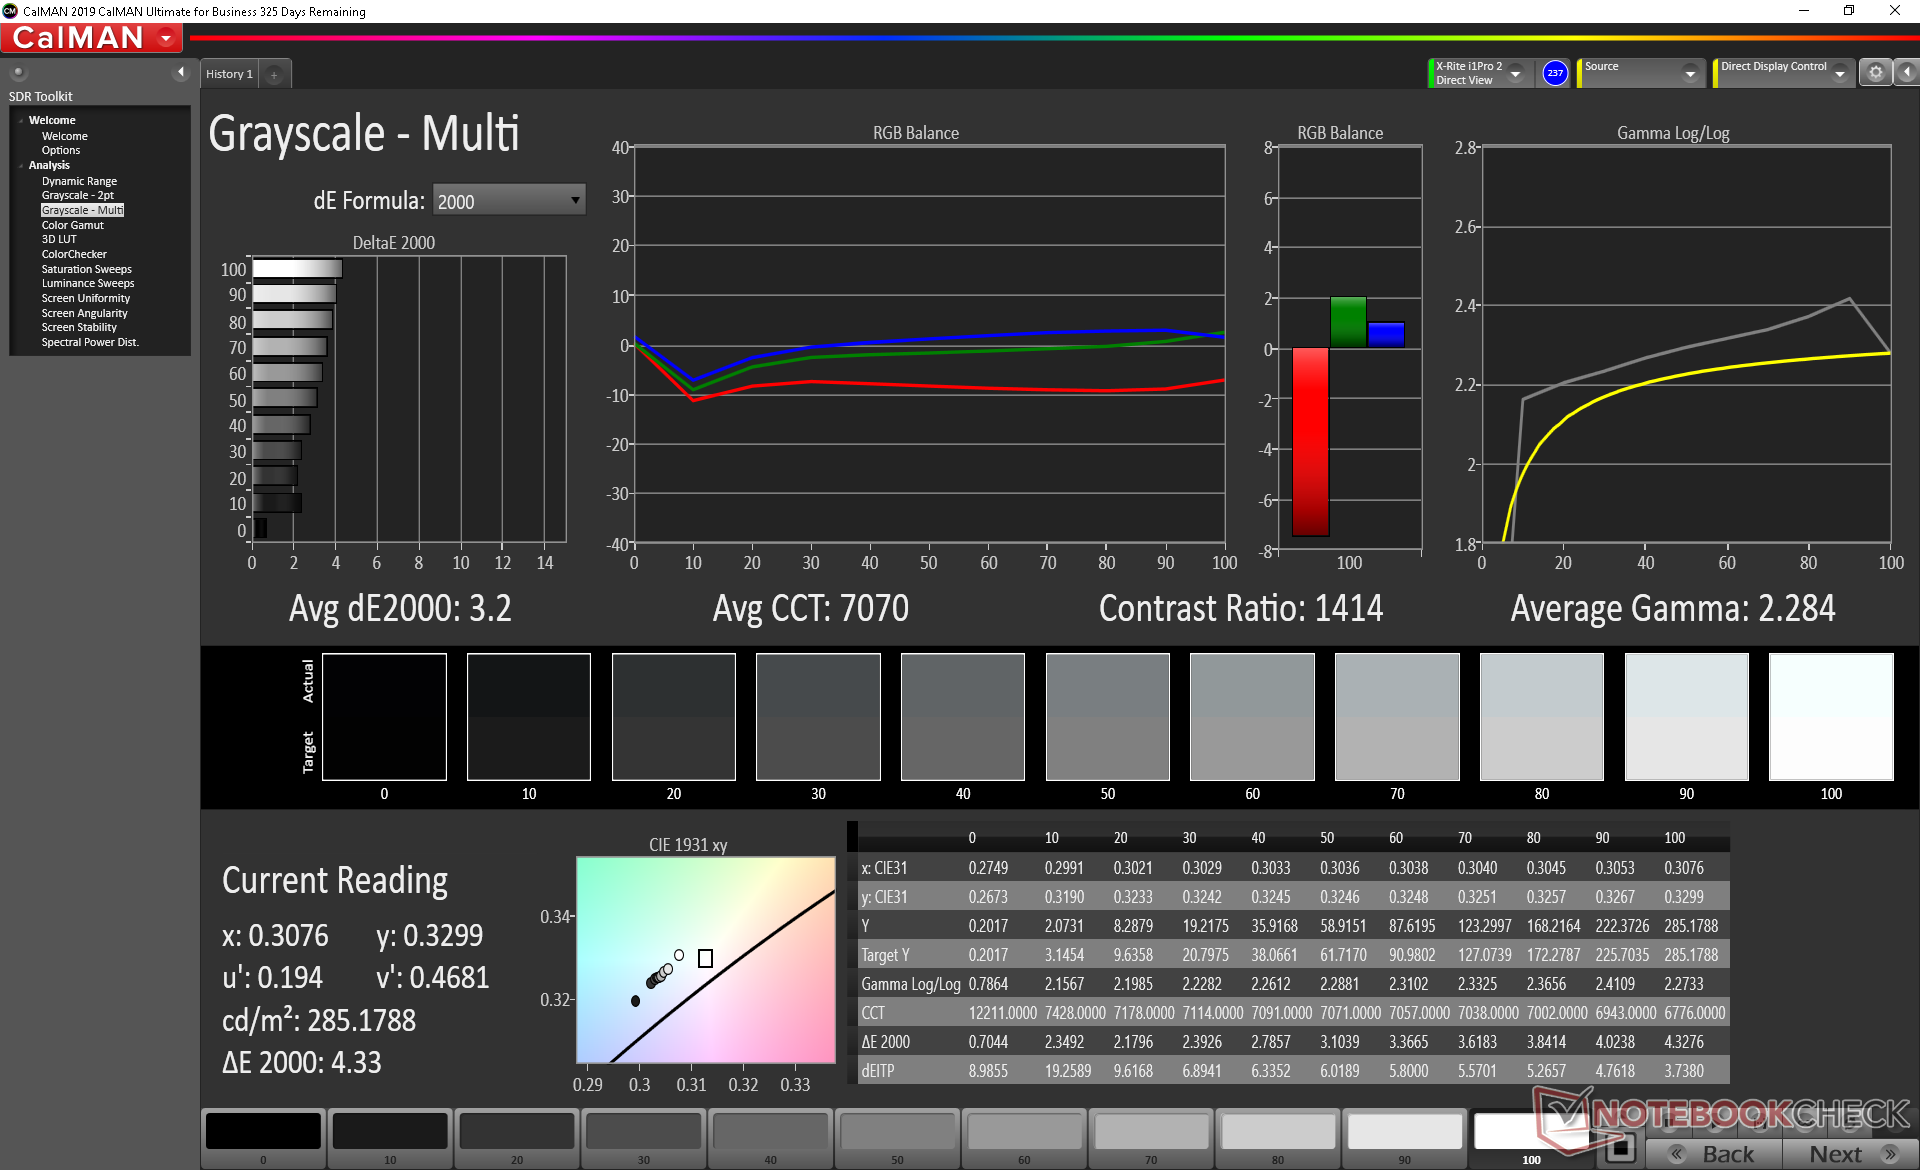
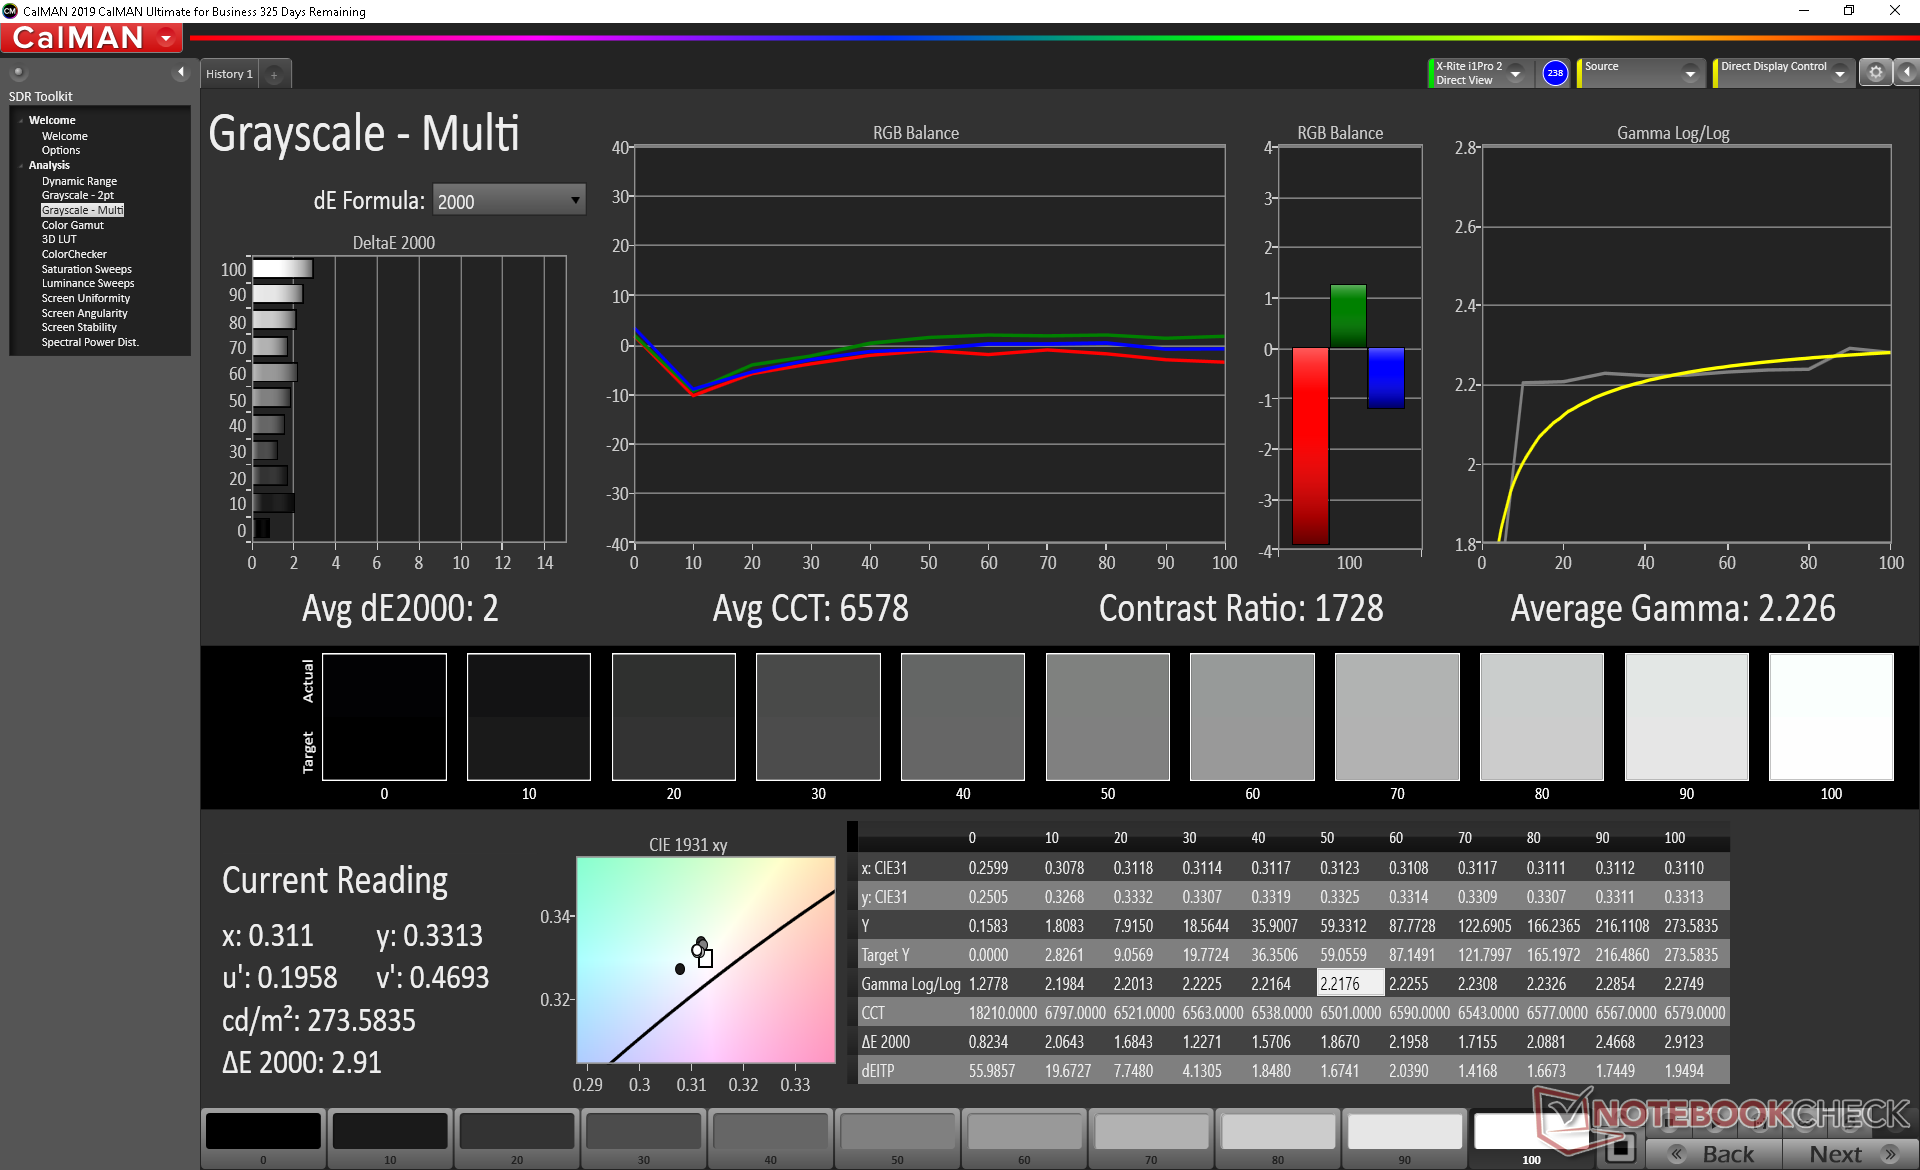
ΔE Greyscale Calman: 3.2 | ∀{0.09-98 Ø4.97}
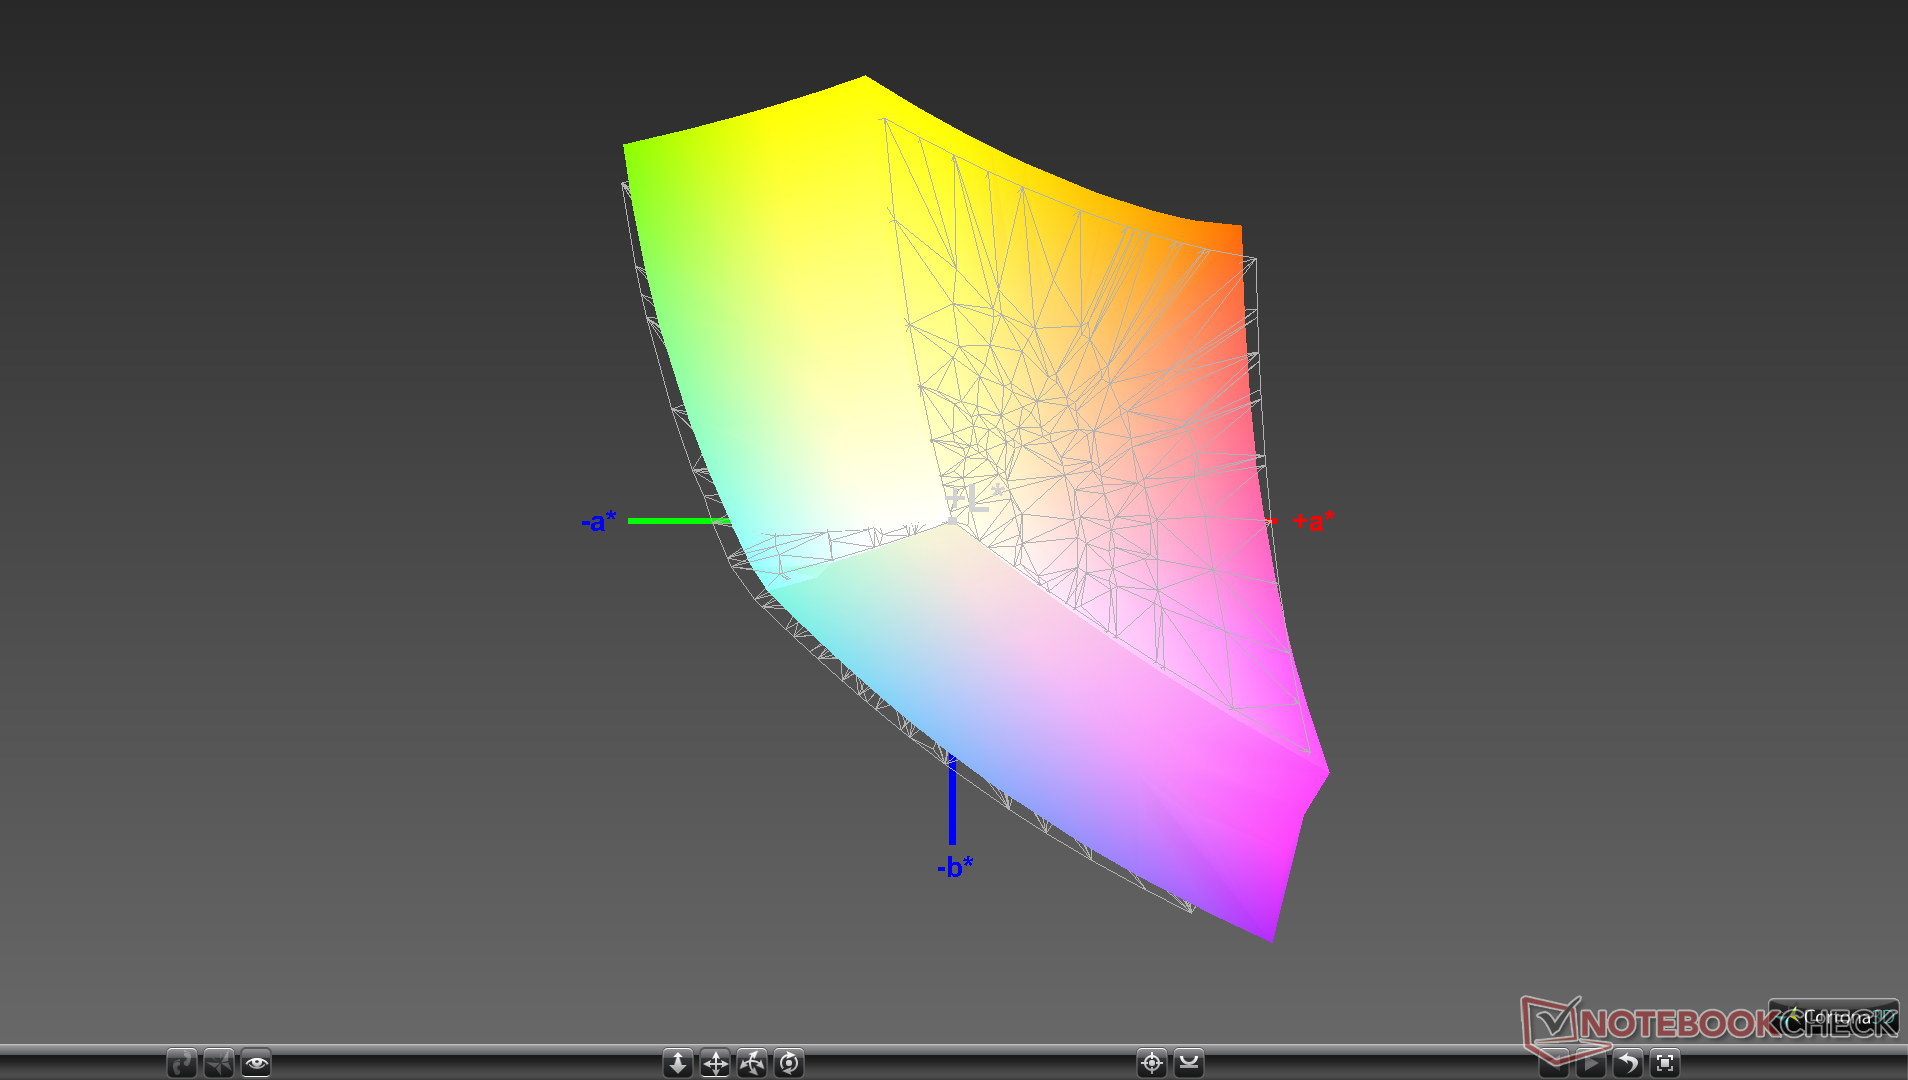
93.8% sRGB (Argyll 1.6.3 3D)
61.1% AdobeRGB 1998 (Argyll 1.6.3 3D)
68.4% AdobeRGB 1998 (Argyll 3D)
94.3% sRGB (Argyll 3D)
68.3% Display P3 (Argyll 3D)
Gamma: 2.28
CCT: 7070 K
| HP Spectre X360 15-5ZV31AV AU Optronics AUO30EB, IPS, 15.6", 3840x2160 | HP Spectre x360 15-ch011nr BOE0730, IPS, 15.6", 3840x2160 | Dell XPS 15 7590 9980HK GTX 1650 Samsung 156WR04, SDCA029, OLED, 15.6", 3840x2160 | Lenovo Yoga C940-15IRH LG Philips LP156WFC-SPU1, IPS, 15.6", 1920x1080 | MSI Prestige 15 A10SC Sharp LQ156D1JW42, IPS, 15.6", 3840x2160 | HP Spectre x360 15-df0126ng AU Optronics AUO30EB, IPS, 15.6", 3840x2160 | |
|---|---|---|---|---|---|---|
| Display | -2% | 23% | -6% | 22% | 0% | |
| Display P3 Coverage (%) | 68.3 | 68.5 0% | 88.1 29% | 61.5 -10% | 82 20% | 68.1 0% |
| sRGB Coverage (%) | 94.3 | 90.7 -4% | 99.6 6% | 92.7 -2% | 98.3 4% | 94.2 0% |
| AdobeRGB 1998 Coverage (%) | 68.4 | 66.3 -3% | 91.8 34% | 63.6 -7% | 96.2 41% | 68.4 0% |
| Response Times | 33% | 95% | 13% | -4% | 12% | |
| Response Time Grey 50% / Grey 80% * (ms) | 56.8 ? | 38 ? 33% | 2.3 ? 96% | 48.4 ? 15% | 60 ? -6% | 57 ? -0% |
| Response Time Black / White * (ms) | 40.8 ? | 27.6 ? 32% | 2.4 ? 94% | 36.4 ? 11% | 41.2 ? -1% | 31 ? 24% |
| PWM Frequency (Hz) | 943 ? | 59.5 ? | 26040 ? | |||
| Screen | -29% | -4% | 9% | 7% | -8% | |
| Brightness middle (cd/m²) | 284.6 | 329.3 16% | 421.2 48% | 484.8 70% | 464.5 63% | 330 16% |
| Brightness (cd/m²) | 285 | 316 11% | 417 46% | 463 62% | 451 58% | 310 9% |
| Brightness Distribution (%) | 85 | 84 -1% | 94 11% | 82 -4% | 92 8% | 87 2% |
| Black Level * (cd/m²) | 0.25 | 0.31 -24% | 0.26 -4% | 0.5 -100% | 0.37 -48% | |
| Contrast (:1) | 1138 | 1062 -7% | 1865 64% | 929 -18% | 892 -22% | |
| Colorchecker dE 2000 * | 3.52 | 4.78 -36% | 6.06 -72% | 4.5 -28% | 3.36 5% | 4.03 -14% |
| Colorchecker dE 2000 max. * | 5.56 | 11.75 -111% | 11.89 -114% | 7.55 -36% | 7.06 -27% | 6.74 -21% |
| Colorchecker dE 2000 calibrated * | 3 | 3.51 -17% | 1.19 60% | 3.42 -14% | 1.96 35% | |
| Greyscale dE 2000 * | 3.2 | 7.9 -147% | 2.8 13% | 5.7 -78% | 1.3 59% | 4.49 -40% |
| Gamma | 2.28 96% | 2.24 98% | 2.15 102% | 2.45 90% | 2.14 103% | 2.57 86% |
| CCT | 7070 92% | 8323 78% | 6235 104% | 6101 107% | 6596 99% | 6744 96% |
| Color Space (Percent of AdobeRGB 1998) (%) | 61.1 | 58.8 -4% | 81 33% | 58.7 -4% | 84.8 39% | 61 0% |
| Color Space (Percent of sRGB) (%) | 93.8 | 90.4 -4% | 99.6 6% | 92.8 -1% | 98.3 5% | 94 0% |
| Total Average (Program / Settings) | 1% /
-17% | 38% /
18% | 5% /
7% | 8% /
9% | 1% /
-4% |
* ... smaller is better
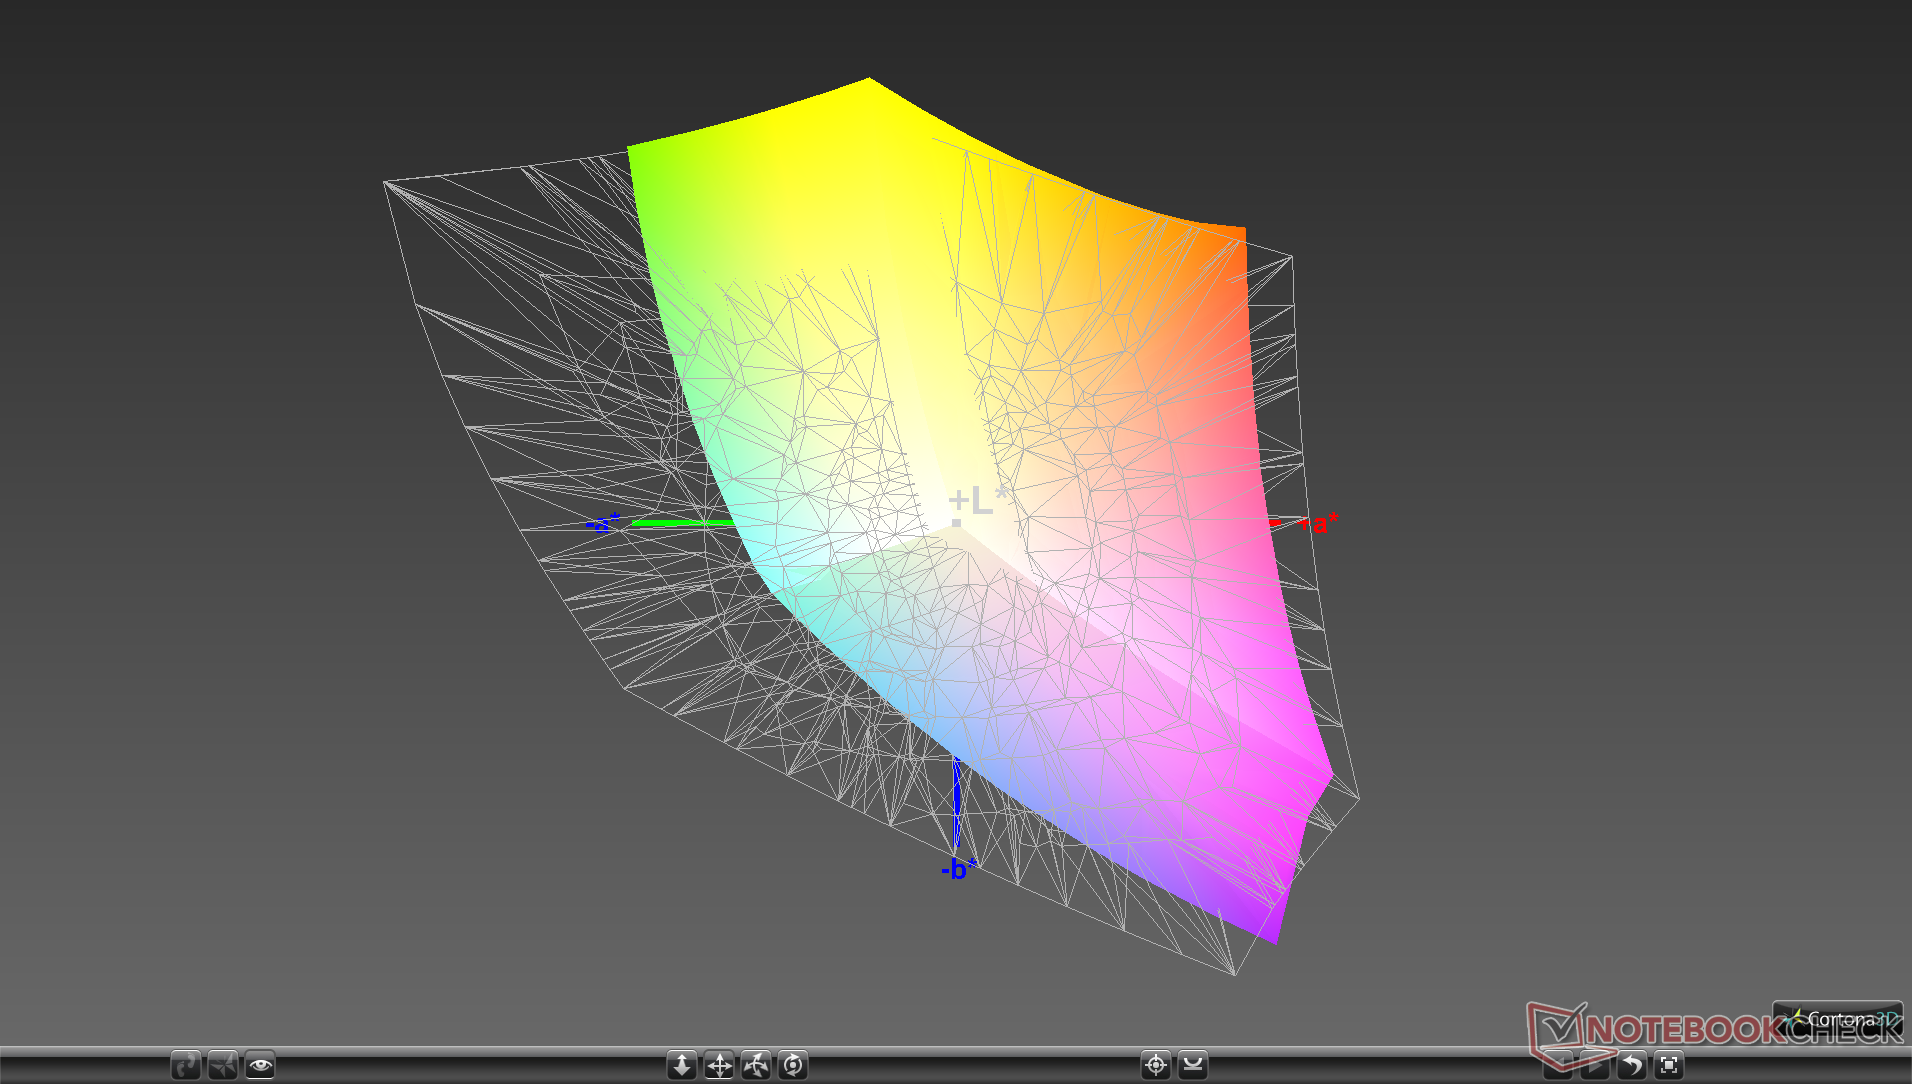
Color space is nearly identical to what we recorded on the 2018 Spectre x360 15 at approximately 61 percent and 94 percent of AdobeRGB and sRGB, respectively. Other 4K panels offer wider gamuts such as the Sharp and Samsung on the MSI Prestige 15 and Dell XPS 15 7390, respectively.
Further measurements with an X-Rite colorimeter show the display to be well-calibrated out of the box. Color temperature, however, is a bit on the cool side at 7070. Calibrating the display ourselves improves both RGB balance and the average grayscale deltaE from 3.2 to 2.
Display Response Times
| ↔ Response Time Black to White | ||
|---|---|---|
| 40.8 ms ... rise ↗ and fall ↘ combined | ↗ 20.4 ms rise | 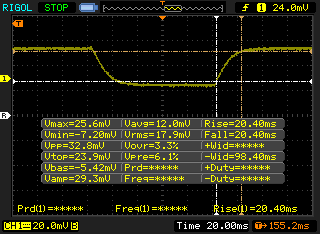 |
| ↘ 20.4 ms fall | ||
| The screen shows slow response rates in our tests and will be unsatisfactory for gamers. In comparison, all tested devices range from 0.1 (minimum) to 240 (maximum) ms. » 98 % of all devices are better. This means that the measured response time is worse than the average of all tested devices (19.9 ms). | ||
| ↔ Response Time 50% Grey to 80% Grey | ||
| 56.8 ms ... rise ↗ and fall ↘ combined | ↗ 26 ms rise | 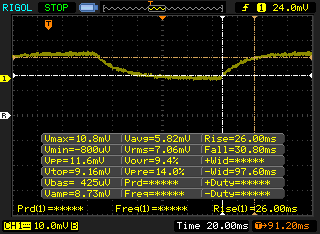 |
| ↘ 30.8 ms fall | ||
| The screen shows slow response rates in our tests and will be unsatisfactory for gamers. In comparison, all tested devices range from 0.165 (minimum) to 636 (maximum) ms. » 94 % of all devices are better. This means that the measured response time is worse than the average of all tested devices (31.1 ms). | ||
Screen Flickering / PWM (Pulse-Width Modulation)
| Screen flickering / PWM not detected | 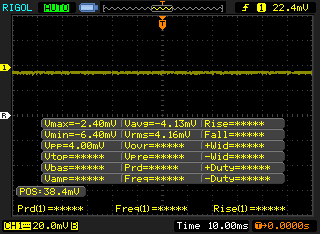 | ||
In comparison: 52 % of all tested devices do not use PWM to dim the display. If PWM was detected, an average of 7798 (minimum: 5 - maximum: 343500) Hz was measured. | |||
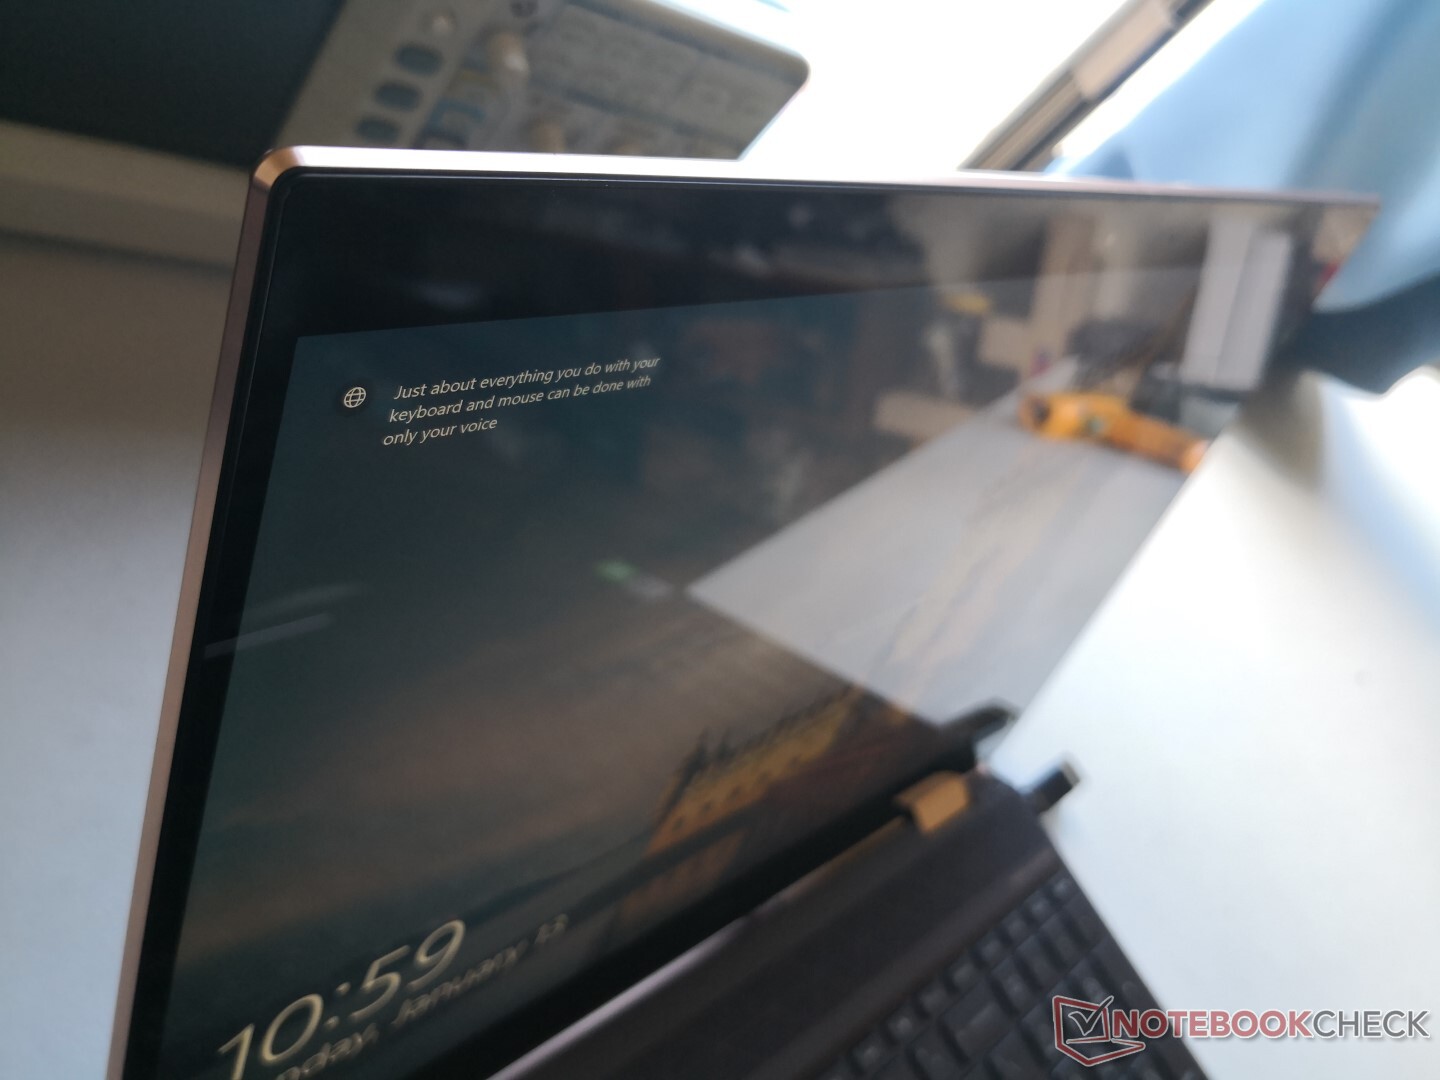
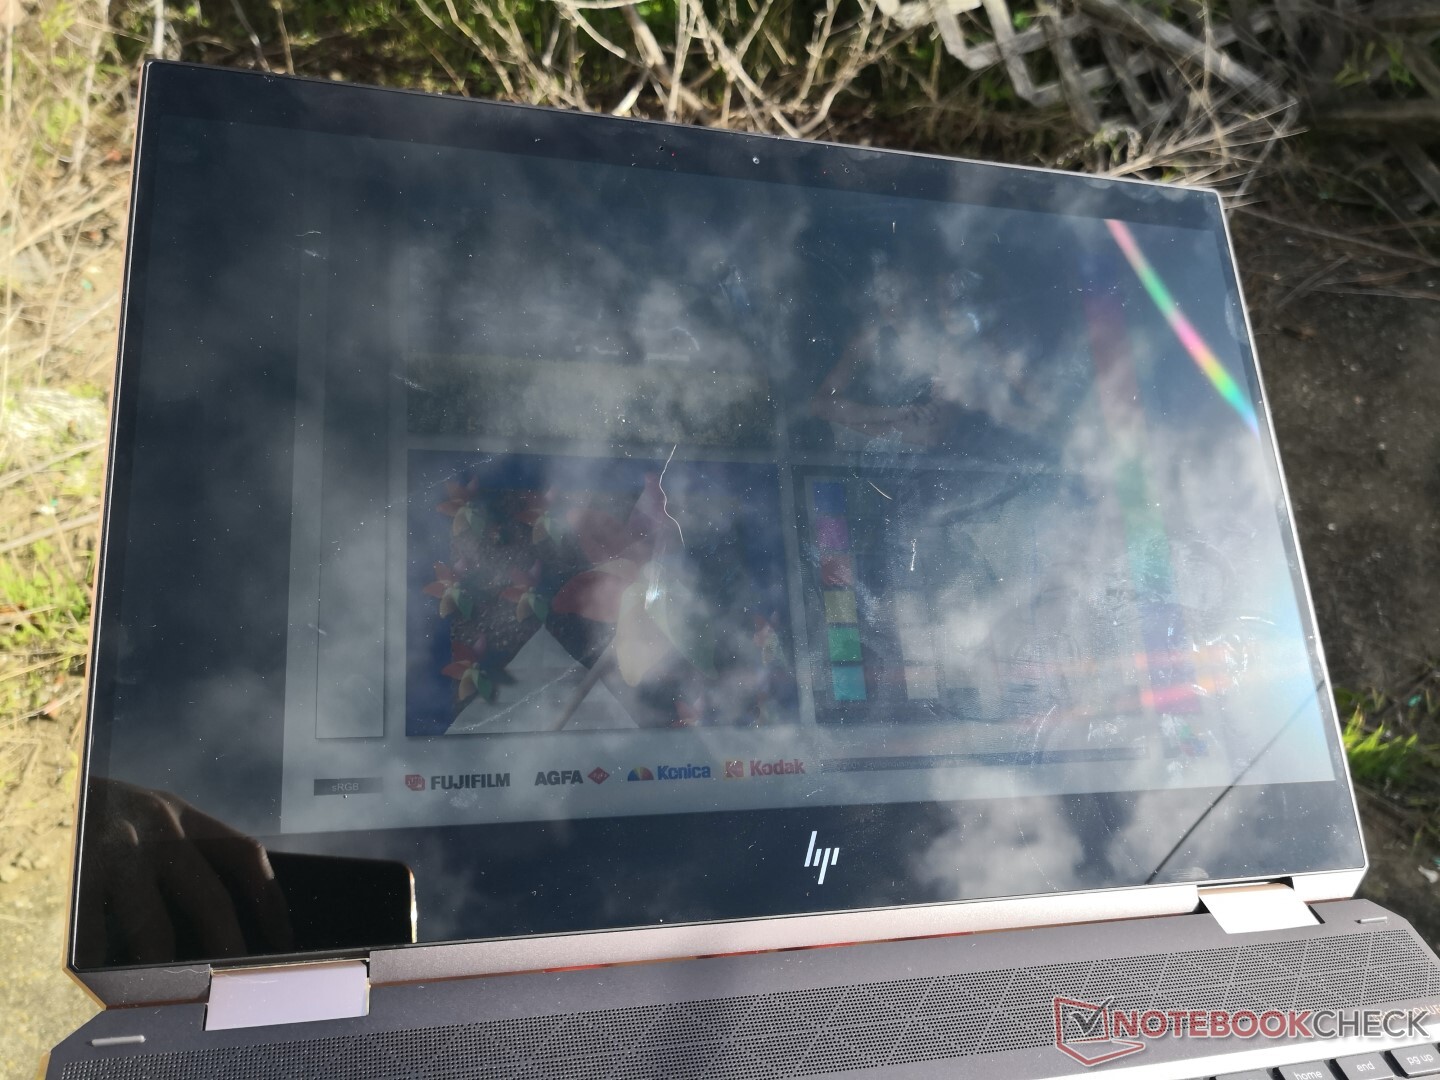
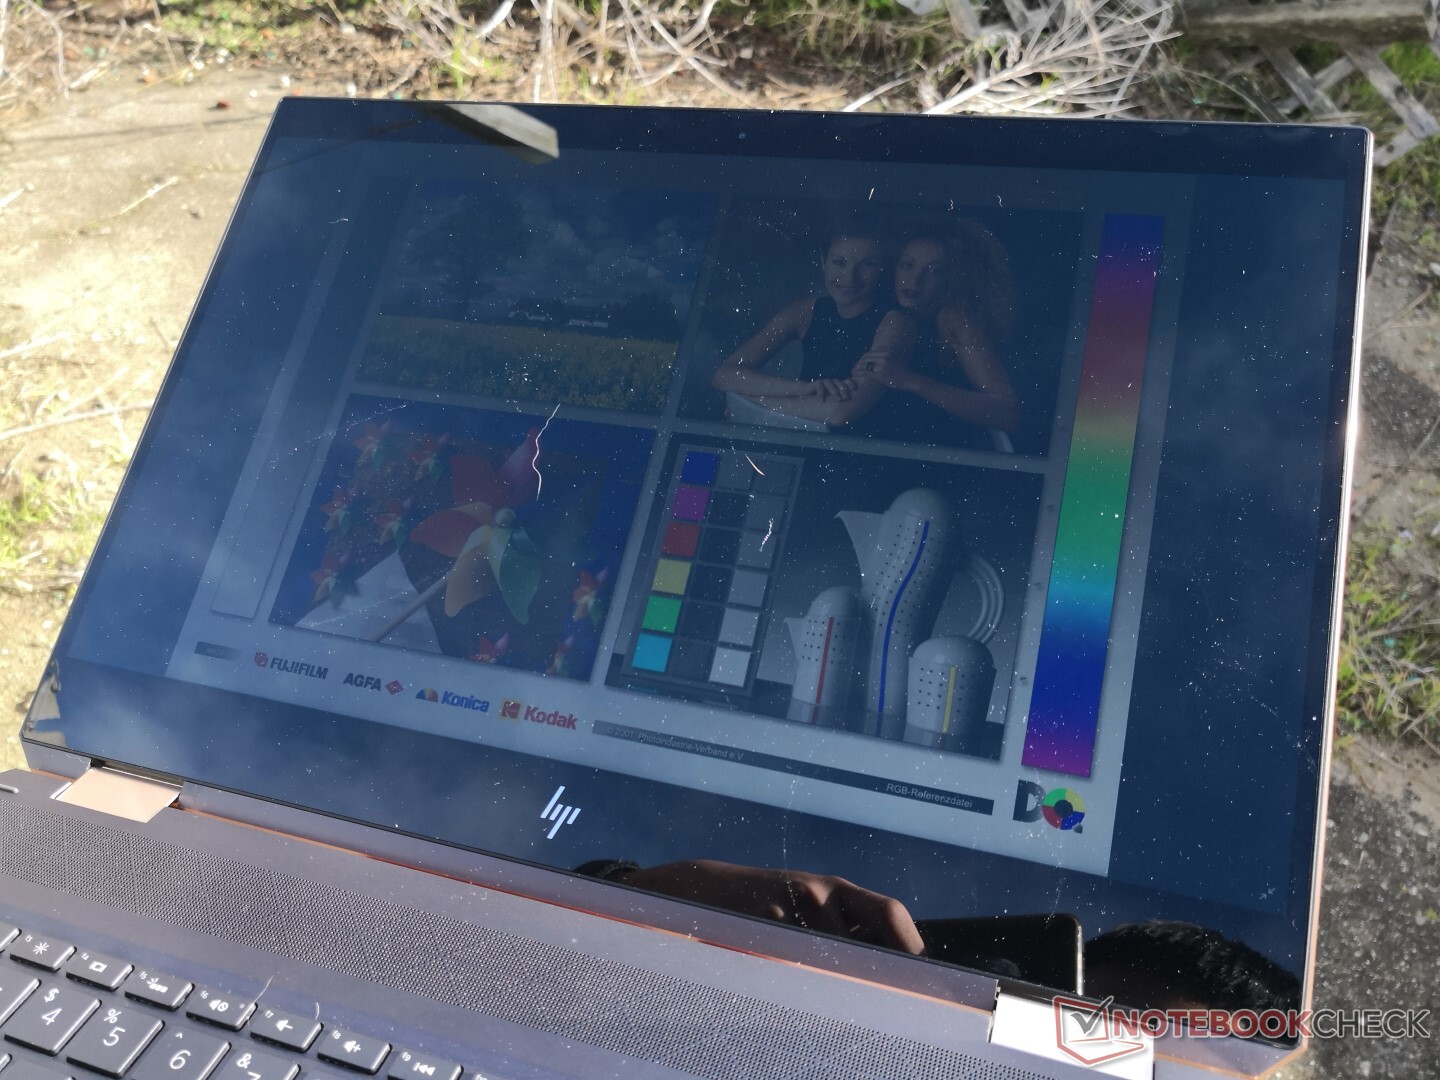
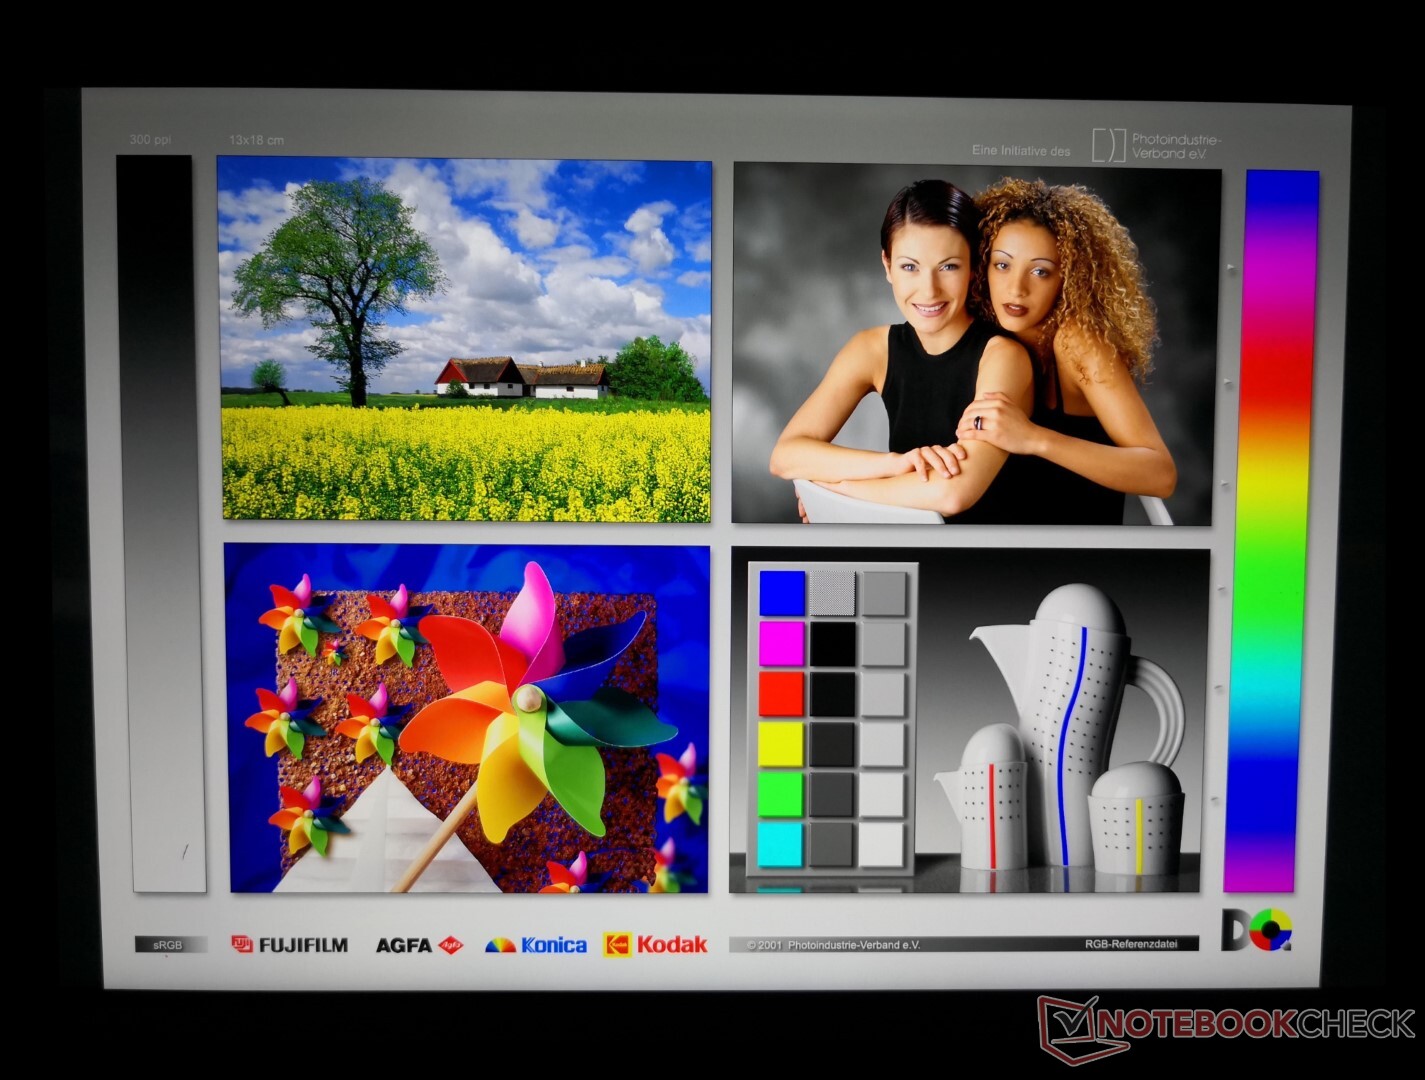
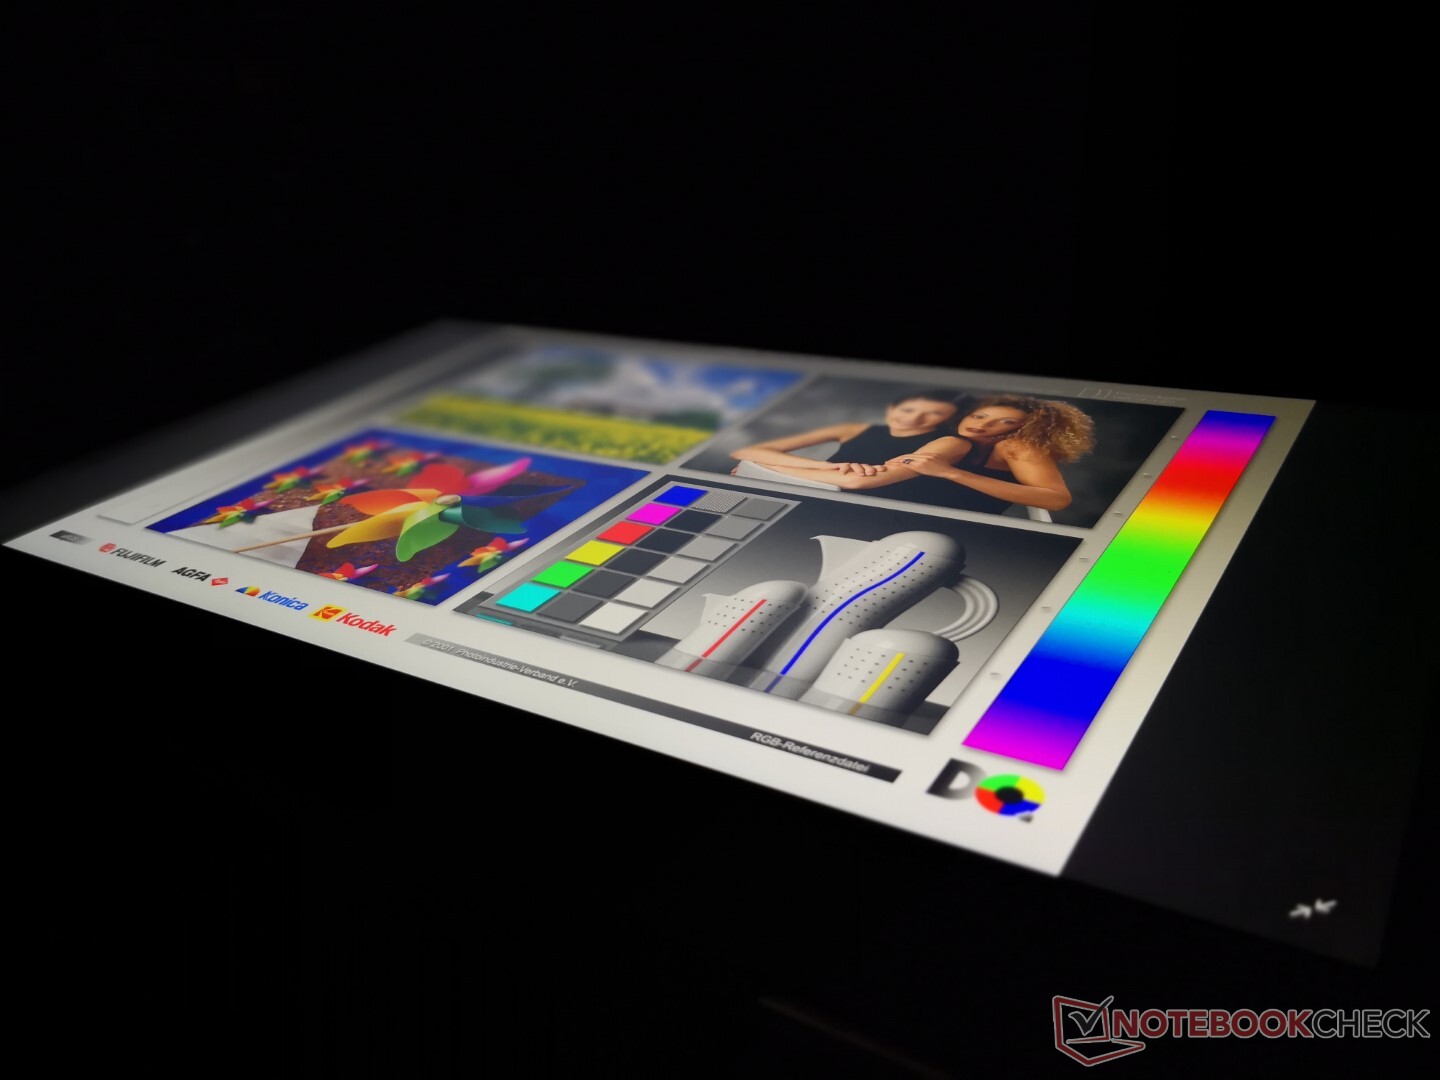
Outdoor visibility has not improved from the 2018 model. Glare from the glossy screen is inevitable and more noticeable than on the competing Lenovo Yoga C940-15IRH since the display is dimmer. Viewing angles are wide for excellent readability in both portrait and landscape modes so long as glare can be kept to a minimum.

Performance
The Spectre x360 15 family is one of the few to offer both 15 W Core-U and 45 W Core-H Intel CPUs and both GeForce MX and GTX GPU SKUs for a very wide range of performance options. The performance difference between a SKU with the Core i7-10510U and GeForce MX250 and one with the Core i7-9750H and GTX 1050 Ti Max-Q, for example, can be well over 2x. HP offers no Core i5 options here unlike on the competing Dell XPS 15.
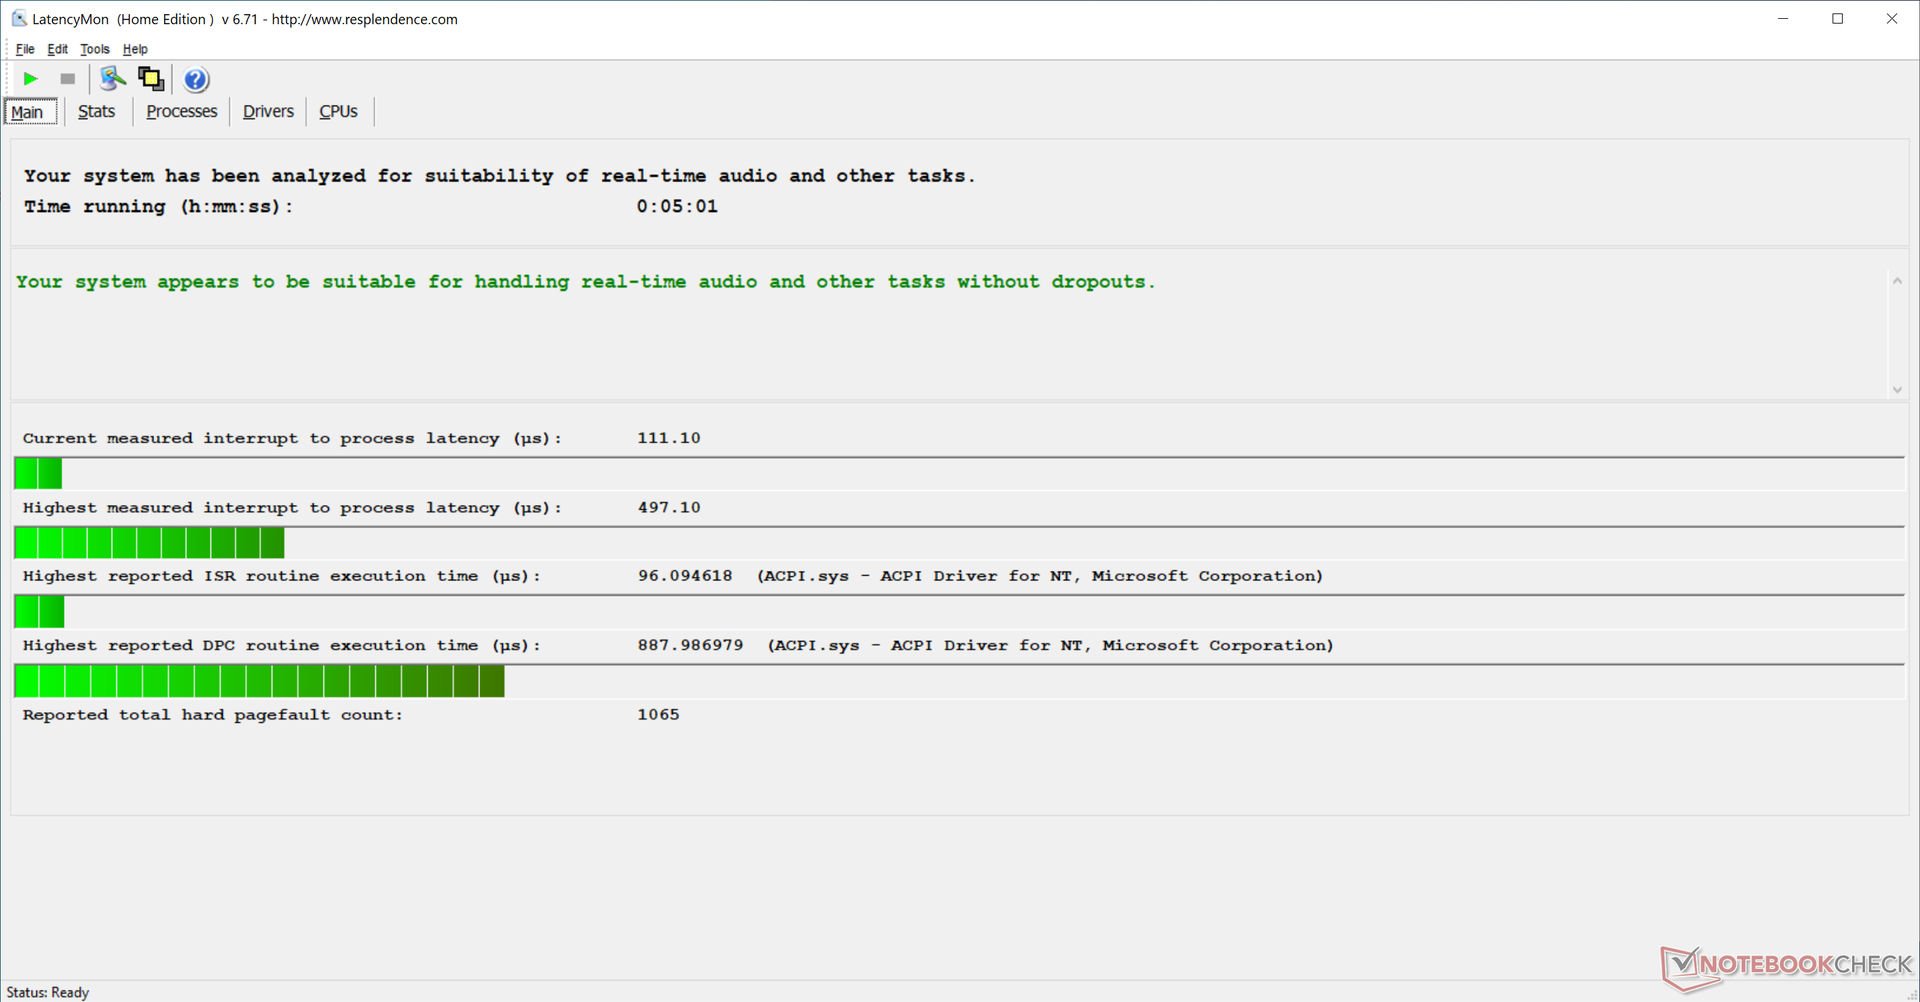
LatencyMon shows no DPC latency issues only when the wireless is disabled.

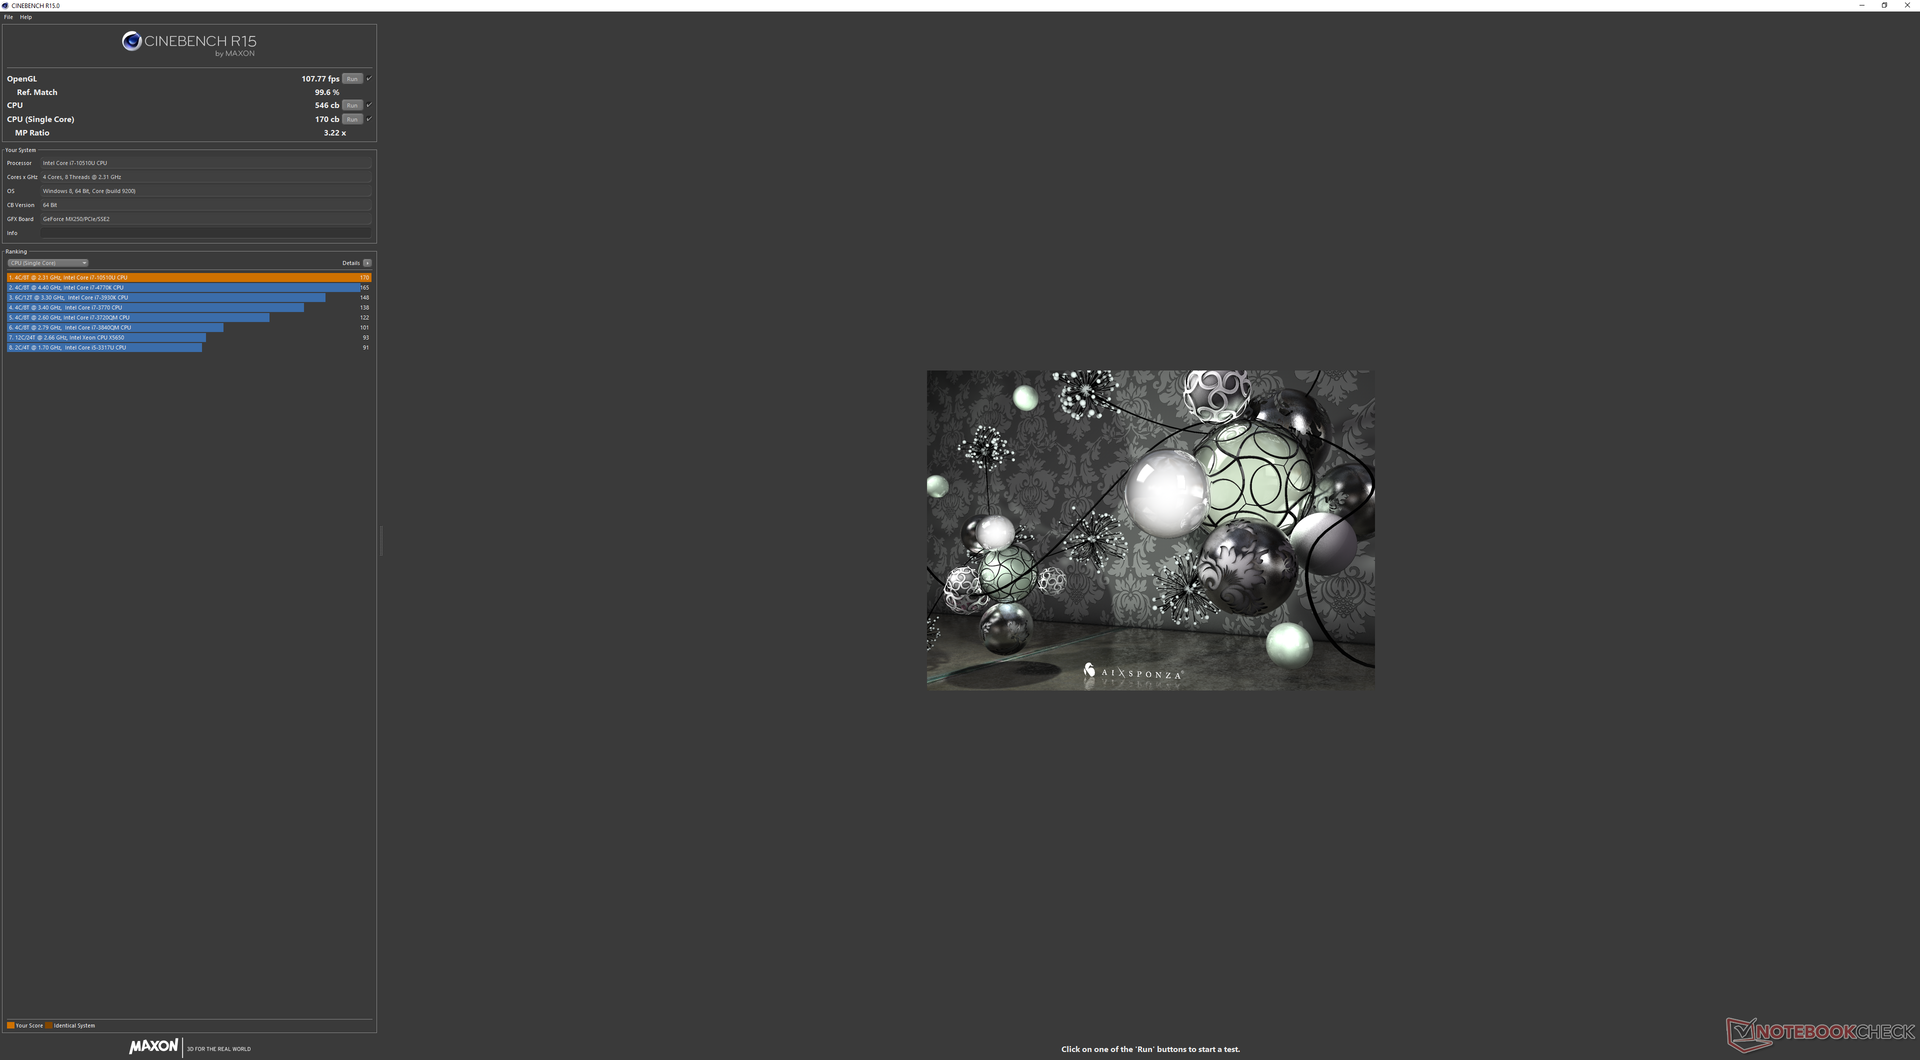
Processor
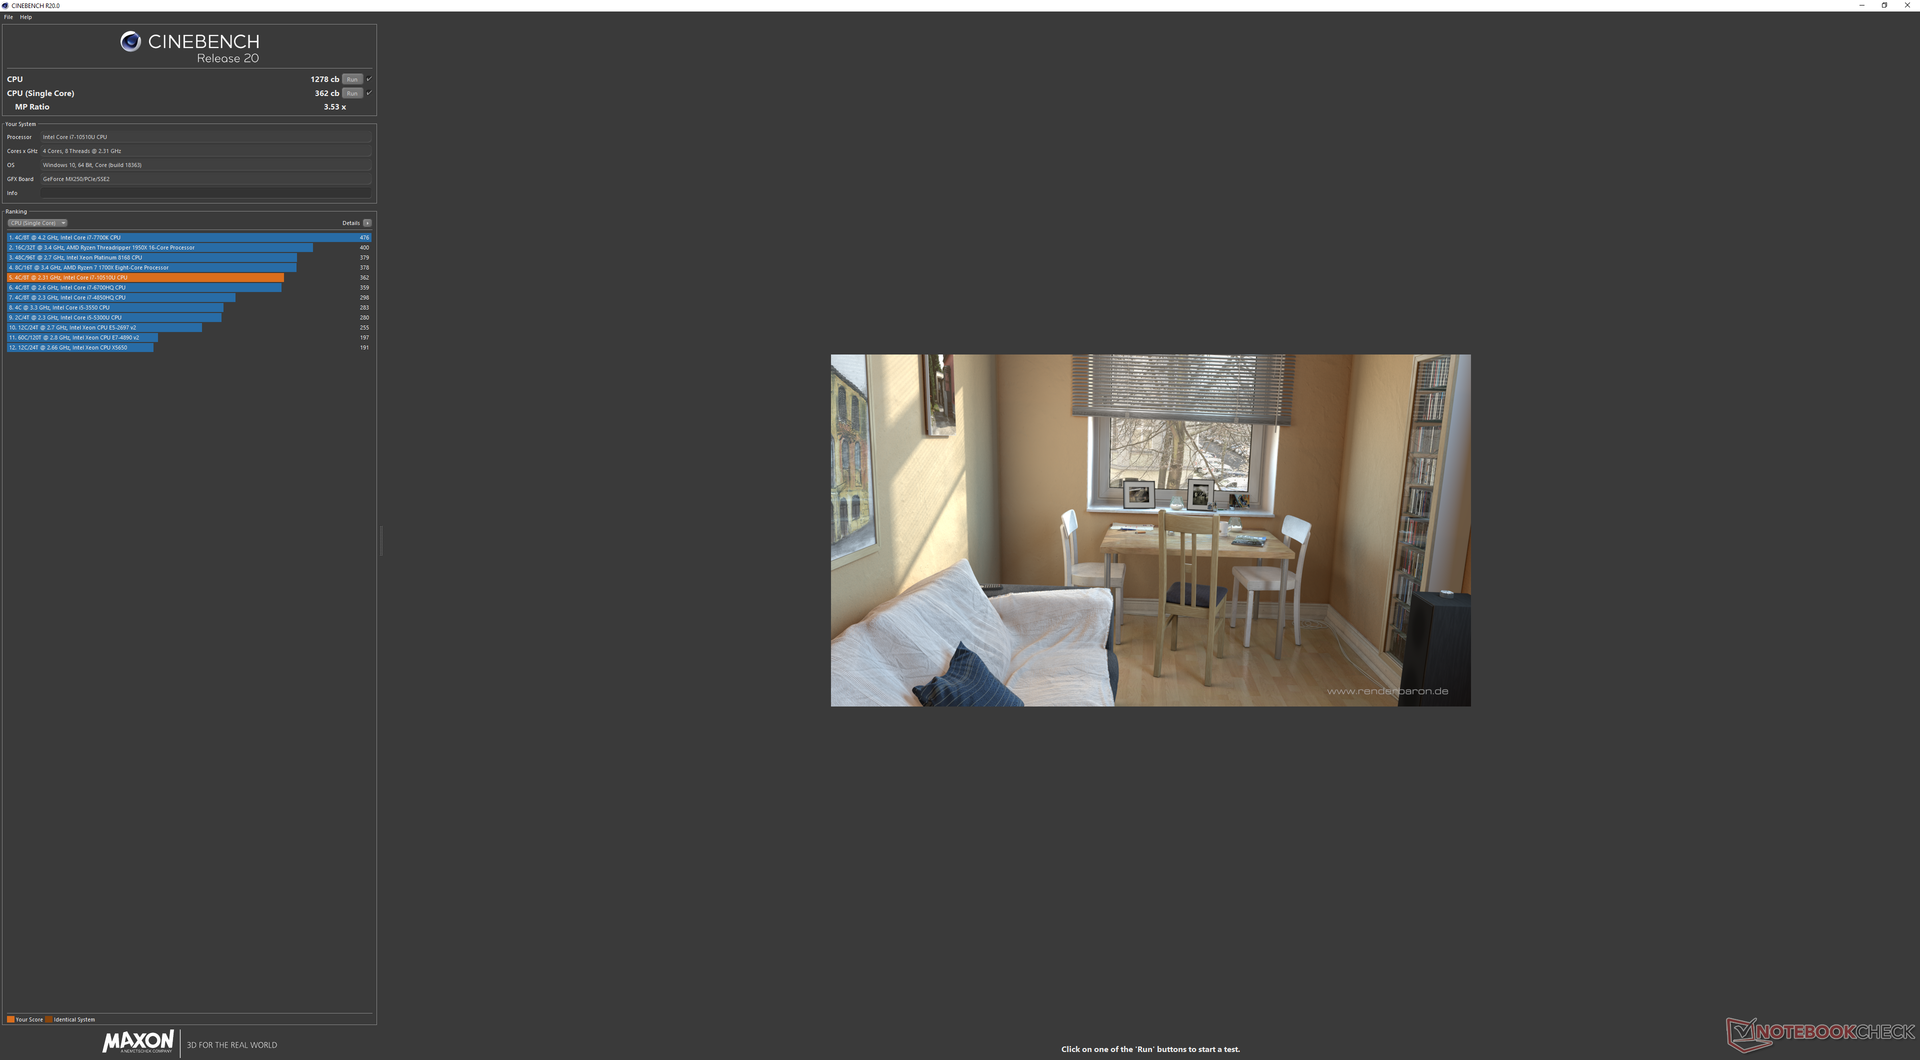
Raw CPU performance is just a hair faster than the Core i7-8565U that the Core i7-10510U replaces. In fact, it's only about 4 to 5 percent faster than the two-generation old Core i7-8550U in the 2018 Spectre x360 15. Users looking for a more significant performance boost should opt for the Core i7-8750H or i7-9750H SKUs or alternatives with the hexa-core Core i7-10710U instead.
Performance sustainability is average. When running CineBench R15 Multi-Thread in a loop, the initial score of 591 points would drop by about 8 percent over time. Scores would then fluctuate between 535 and 555 points as shown by our graph below due to fluctuating clock rates.
See our dedicated page on the Core i7-10510U for more technical information and benchmarks.
System Performance
The HP Envy 17 is one of the very few laptops to offer the same Core i7-10510U CPU and GeForce MX250 GPU as our Spectre. PCMark results are very nearly the same between them and they are almost consistently ahead of the 2018 Spectre x360 15 as well. Only the GPU-bound PCMark Digital Content Creation score is lower than expected.
While Nvidia Optimus is included, we had issues getting it to work manually since the Nvidia Control Panel would not install or launch on our test unit for reasons unknown. Meanwhile, GeForce Experience would work without issues.
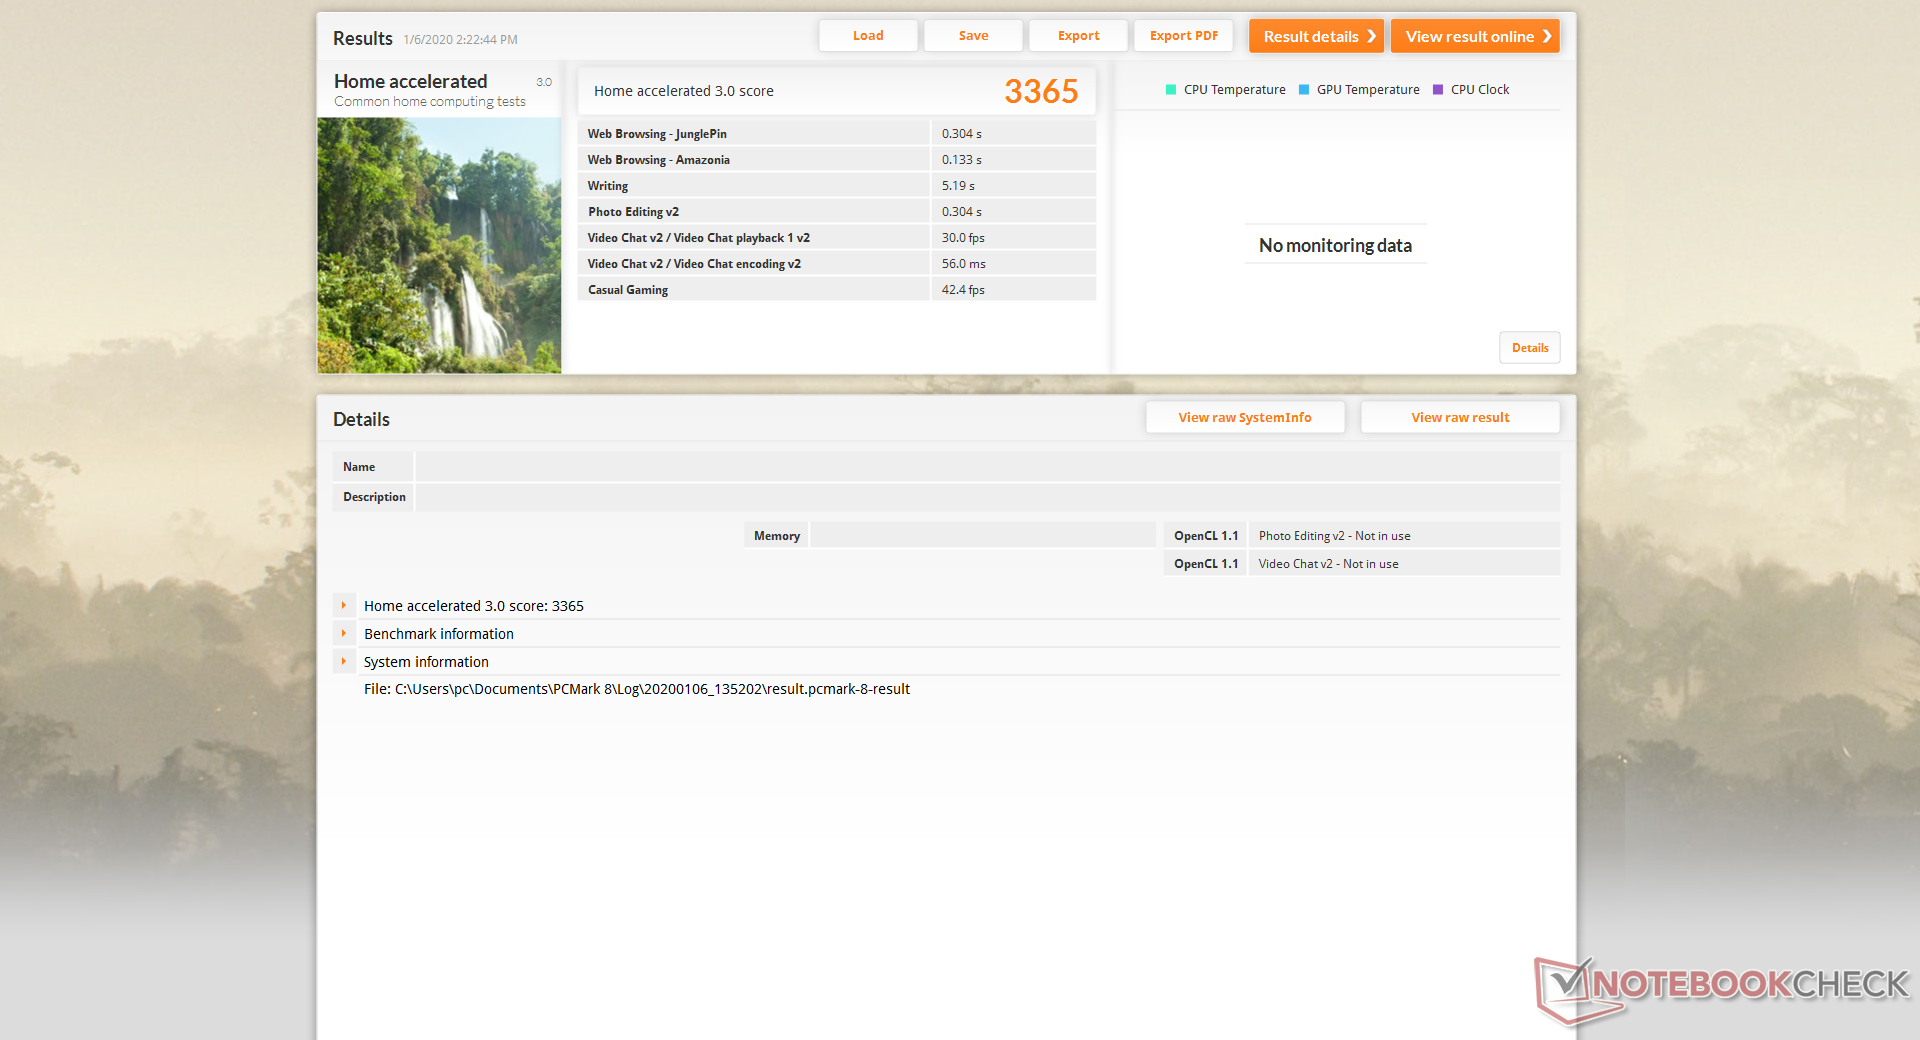
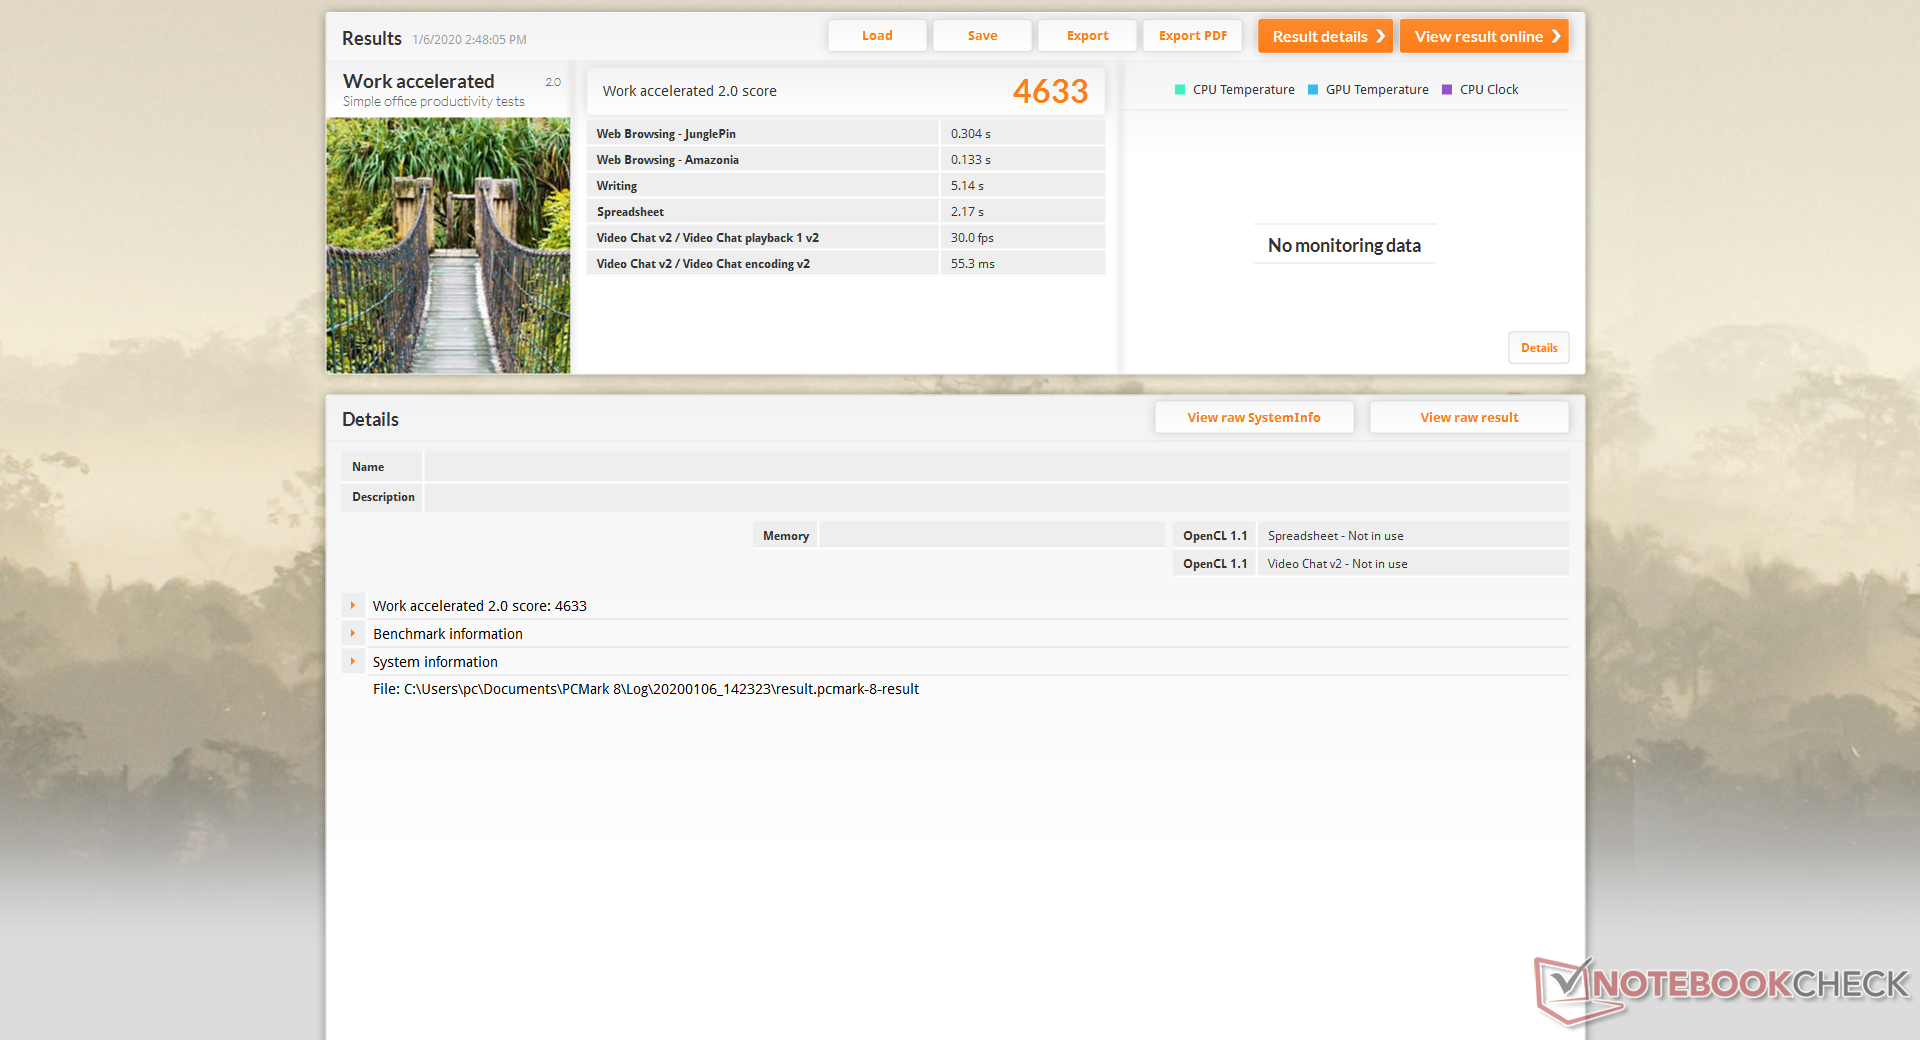
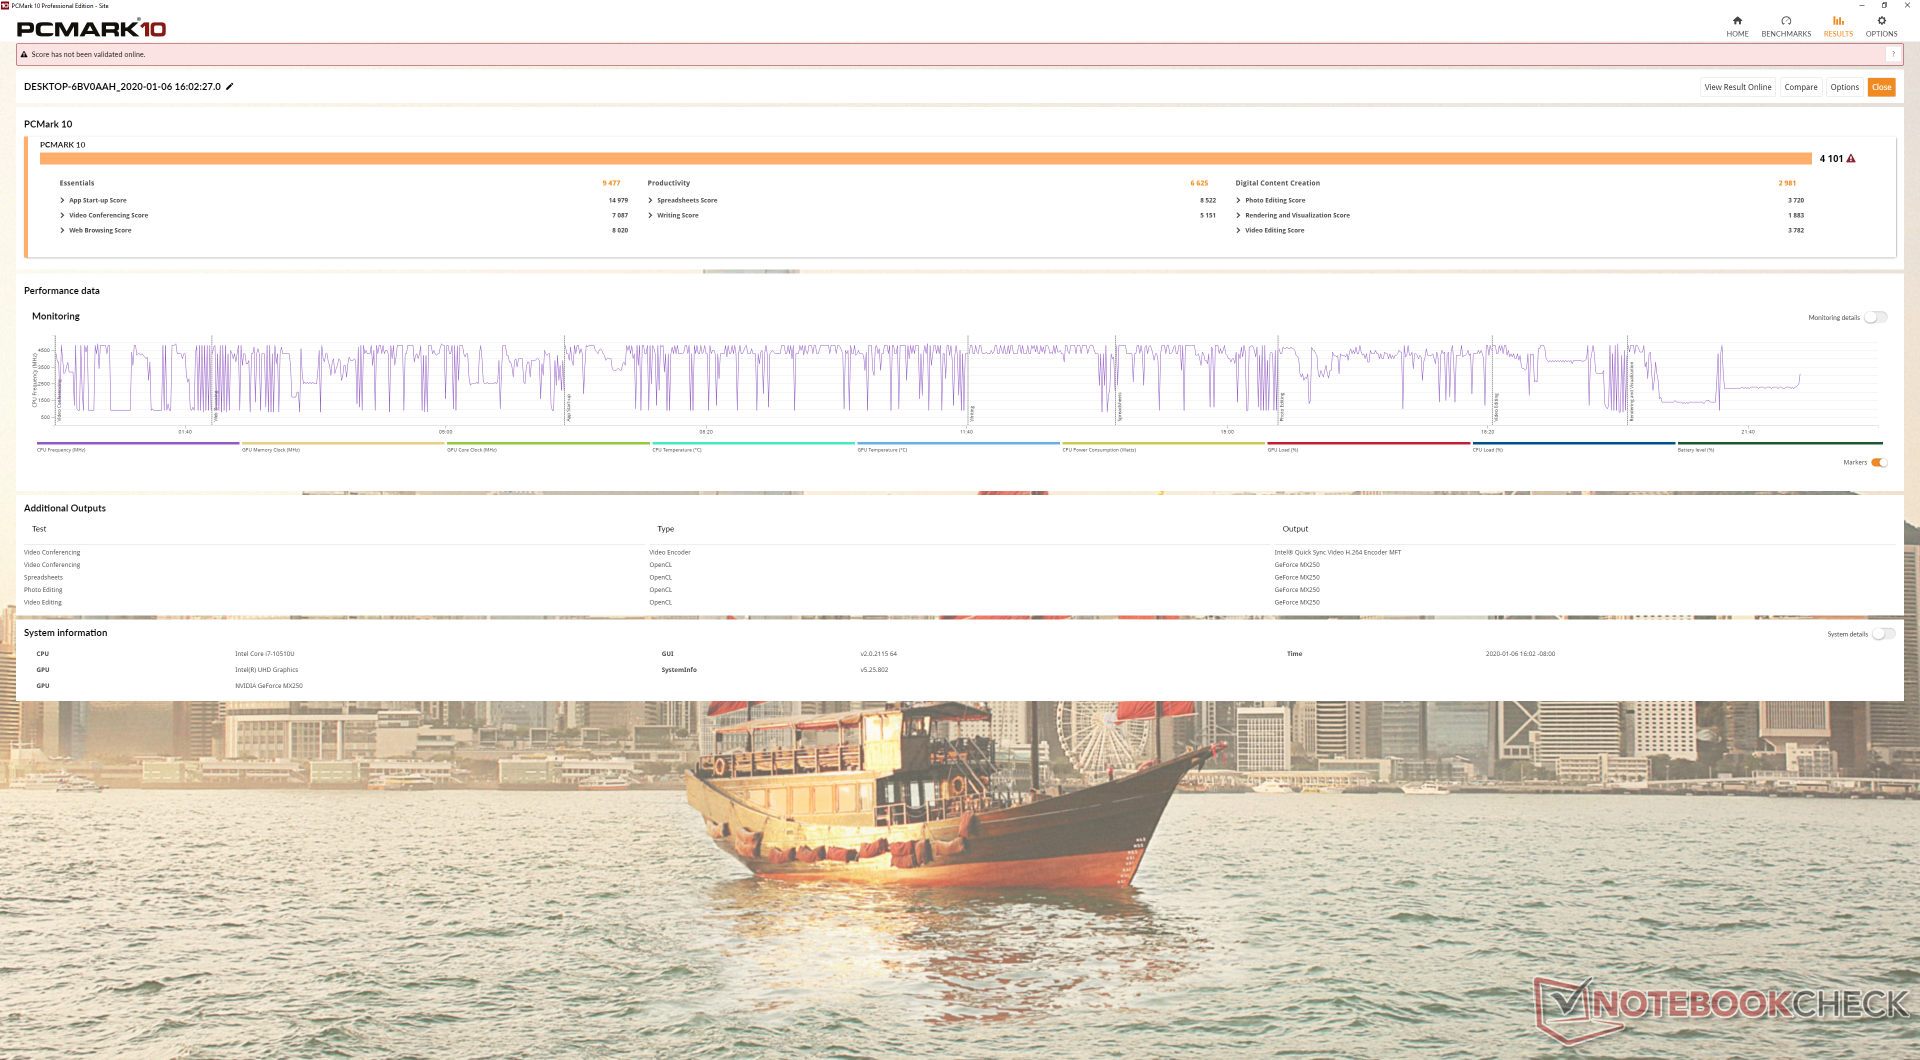
| PCMark 8 Home Score Accelerated v2 | 3365 points | |
| PCMark 8 Work Score Accelerated v2 | 4633 points | |
| PCMark 10 Score | 4101 points | |
Help | ||
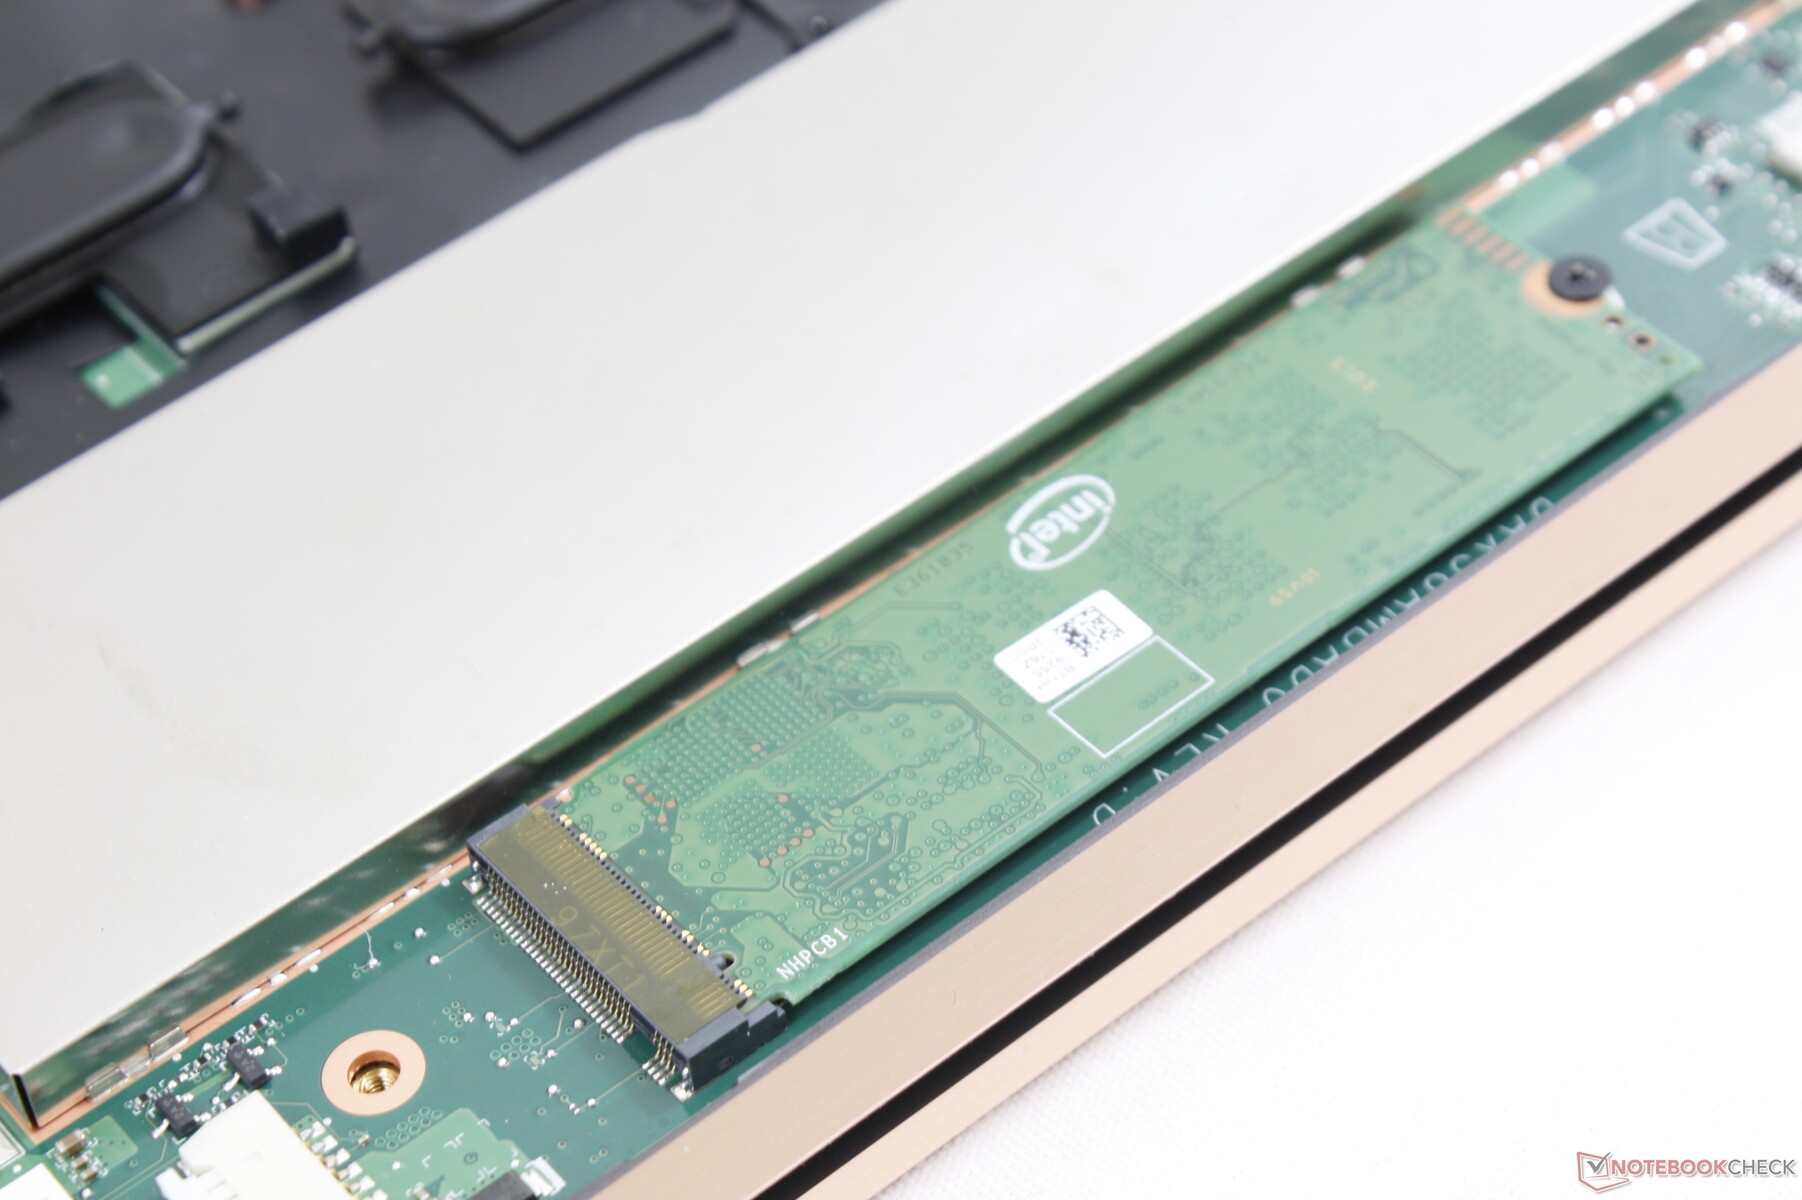
Storage Devices
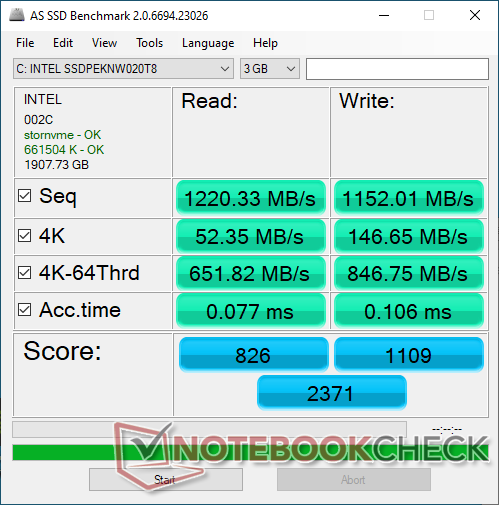
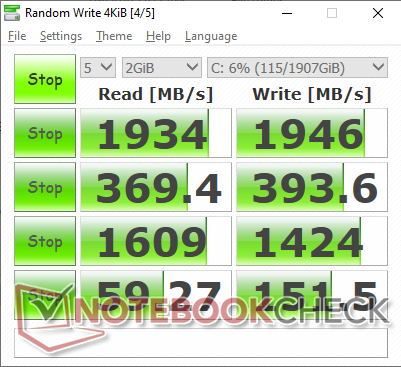
Only one internal storage bay is available. The 2 TB Intel 660p PCIe drive in our test unit offers sequential read and write rates of about 1200 MB/s each to be a mid-range NVMe drive. The pricier Samsung PM981 is able to offer nearly two times the read rate while cheaper NVMe dirves like the SK Hynix BC501 have about half the write rate. Expect SSDs from different manufacturers depending on where you purchase the Spectre x360 15.
| HP Spectre X360 15-5ZV31AV Intel SSD 660p 2TB SSDPEKNW020T8 | Dell XPS 15 7590 9980HK GTX 1650 Toshiba XG6 KXG60ZNV1T02 | Lenovo Yoga C940-15IRH Intel Optane Memory H10 with Solid State Storage 32GB + 512GB HBRPEKNX0202A(L/H) | Asus ZenBook 15 UX534FT-DB77 Samsung SSD PM981 MZVLB1T0HALR | HP Spectre x360 15-ch011nr SK hynix PC401 NVMe 500 GB | |
|---|---|---|---|---|---|
| AS SSD | 42% | -20% | 27% | -4% | |
| Seq Read (MB/s) | 1220 | 1723 41% | 769 -37% | 1887 55% | 1739 43% |
| Seq Write (MB/s) | 1152 | 1386 20% | 351.1 -70% | 1432 24% | 1189 3% |
| 4K Read (MB/s) | 52.3 | 43.25 -17% | 69.1 32% | 52.3 0% | 38.76 -26% |
| 4K Write (MB/s) | 146.6 | 98.3 -33% | 100.9 -31% | 146 0% | 93.2 -36% |
| 4K-64 Read (MB/s) | 652 | 1078 65% | 472 -28% | 969 49% | 646 -1% |
| 4K-64 Write (MB/s) | 847 | 1456 72% | 948 12% | 1375 62% | 545 -36% |
| Access Time Read * (ms) | 0.077 | 0.05 35% | 0.071 8% | 0.034 56% | 0.054 30% |
| Access Time Write * (ms) | 0.106 | 0.039 63% | 0.137 -29% | 0.075 29% | 0.051 52% |
| Score Read (Points) | 826 | 1294 57% | 618 -25% | 1210 46% | 859 4% |
| Score Write (Points) | 1109 | 1693 53% | 1084 -2% | 1664 50% | 757 -32% |
| Score Total (Points) | 2371 | 3638 53% | 2024 -15% | 3483 47% | 2037 -14% |
| Copy ISO MB/s (MB/s) | 2070 | 3182 54% | 839 -59% | 1375 -34% | 1668 -19% |
| Copy Program MB/s (MB/s) | 571 | 984 72% | 455.8 -20% | 468 -18% | 486.8 -15% |
| Copy Game MB/s (MB/s) | 1219 | 1824 50% | 969 -21% | 1287 6% | 1042 -15% |
* ... smaller is better

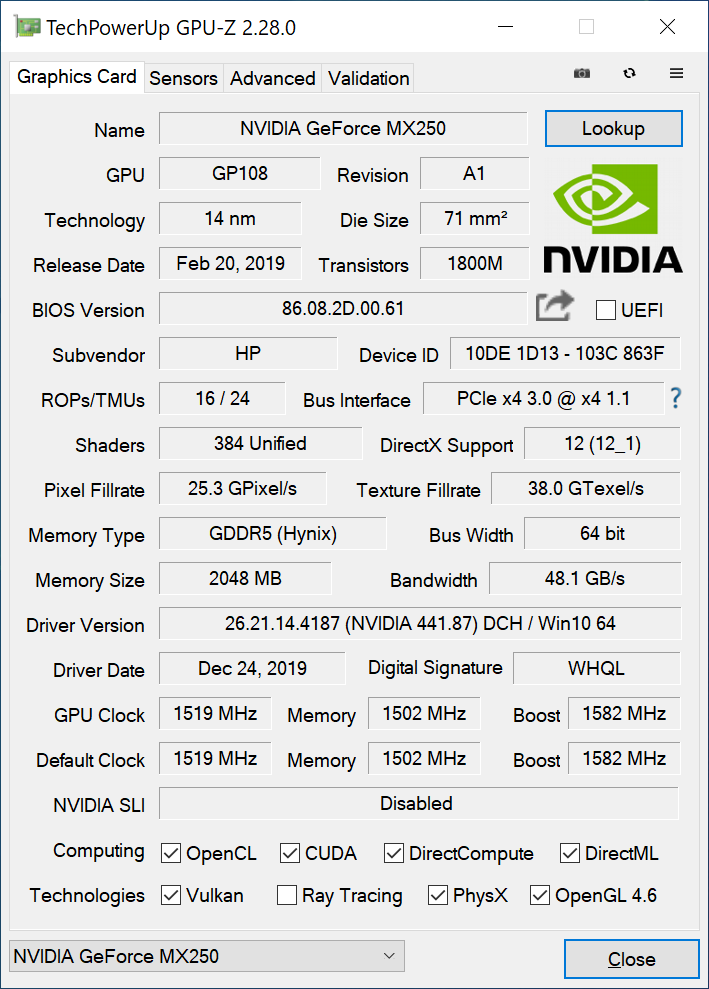
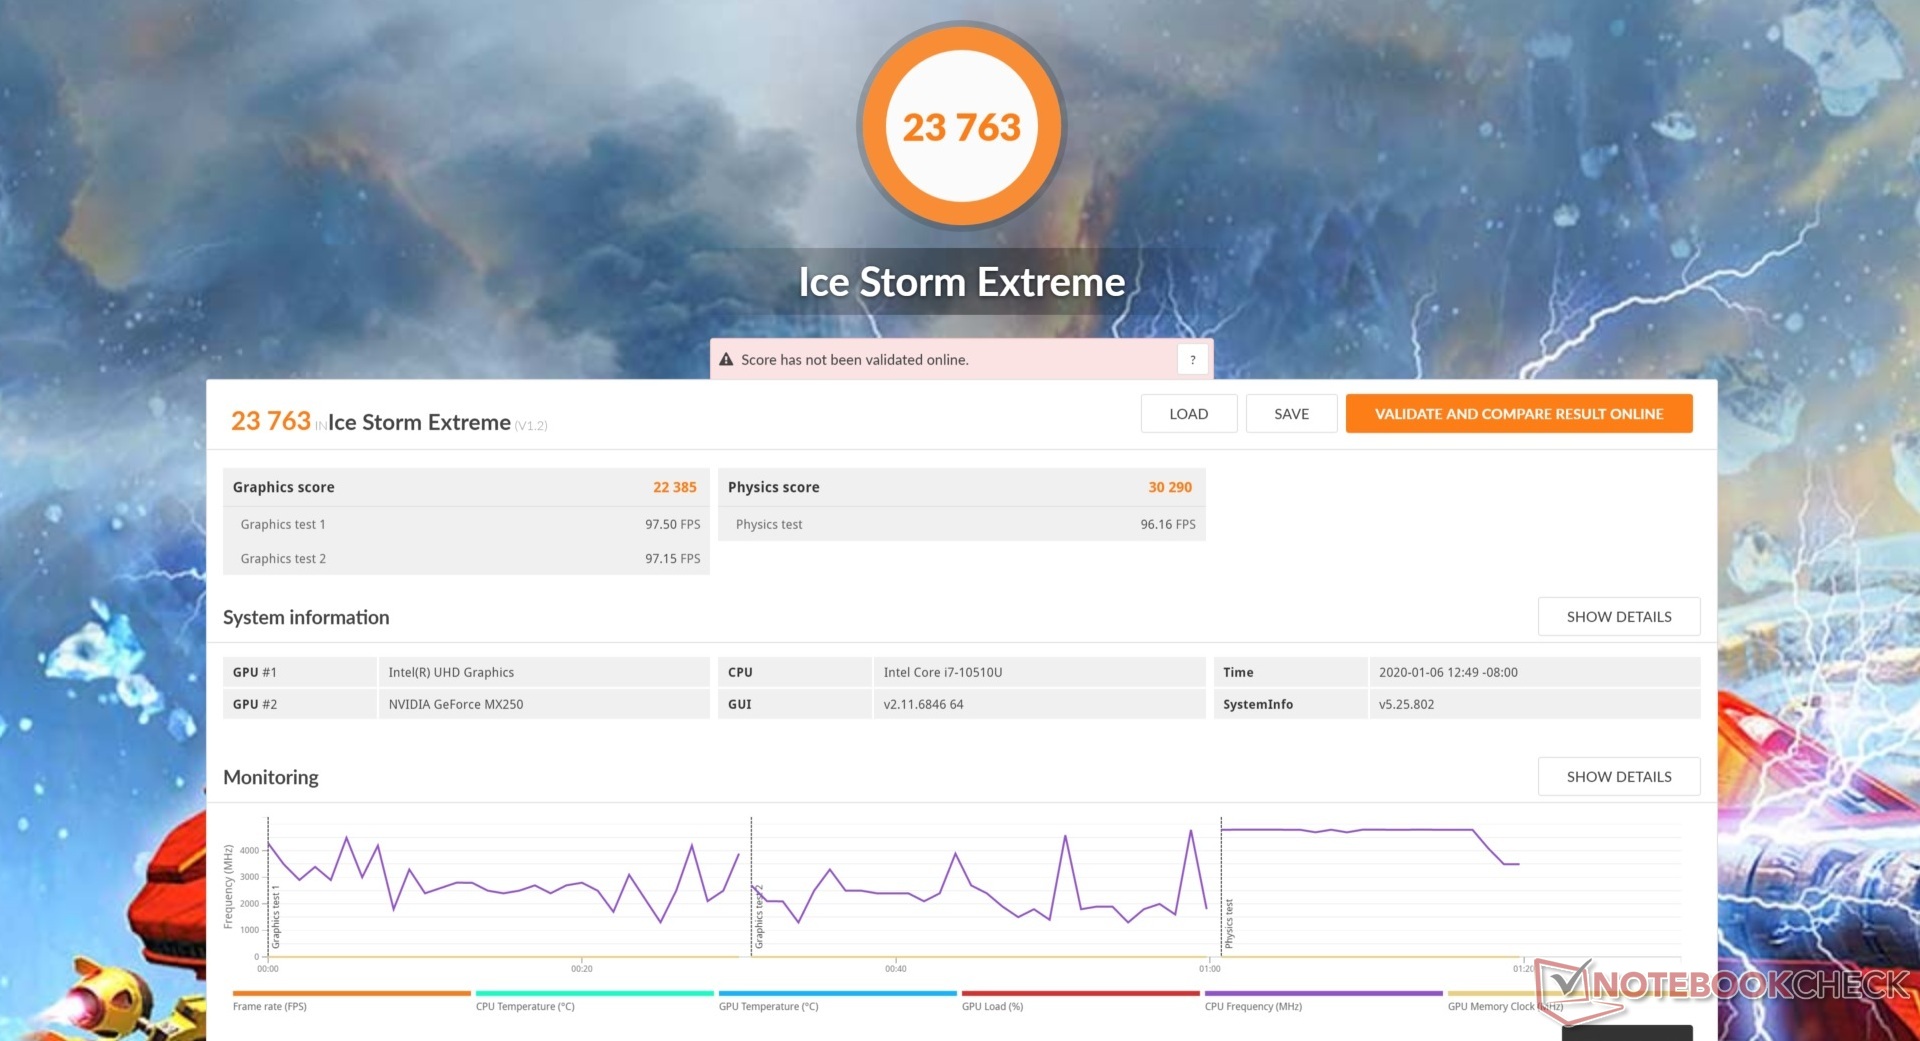
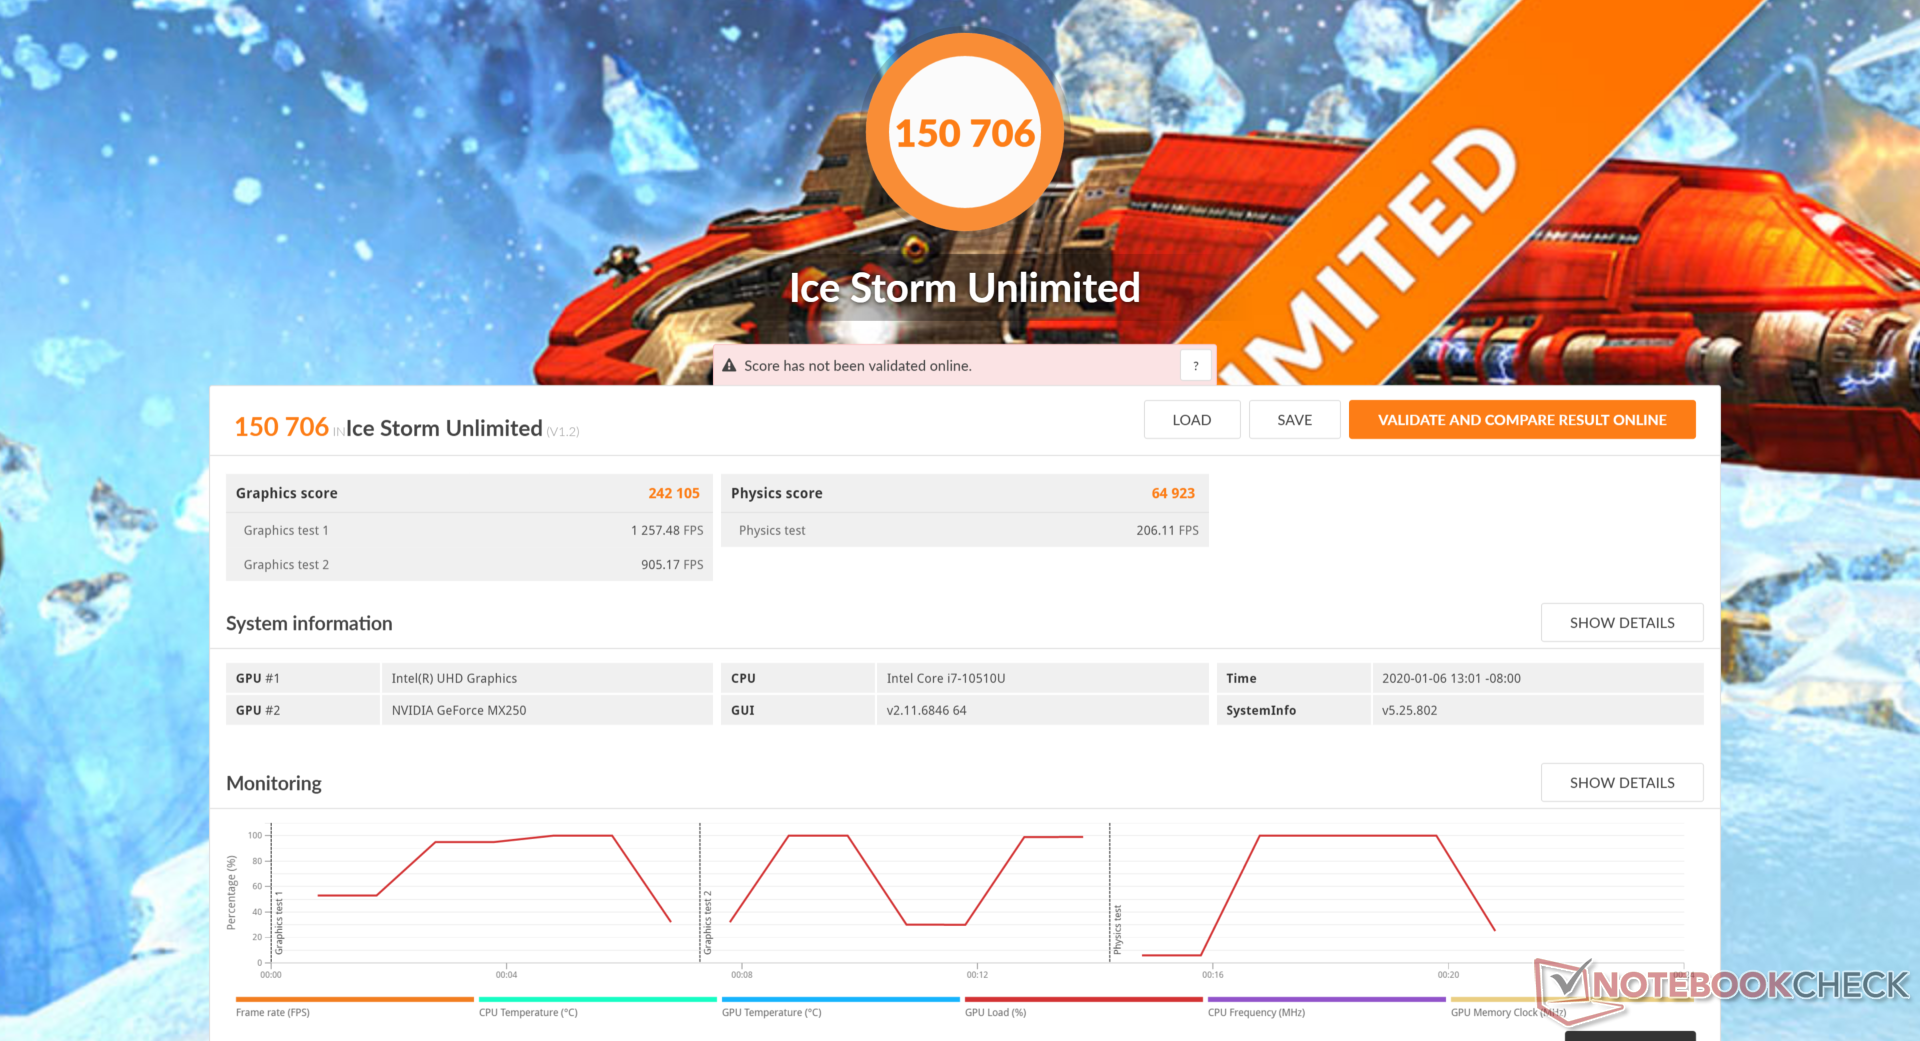
GPU Performance
The GeForce MX250 is essentially a rebadged MX150 and so performance upgrades are minimal. In fact, 3DMark Fire Strike scores between the MX250 and MX150 in the 2018 Spectre x360 15 are only within 3 percent of each other. Users looking for a more significant graphics upgrade should consider the SKU with the GeForce GTX 1050 Ti Max-Q or GTX 1650 Max-Q instead.
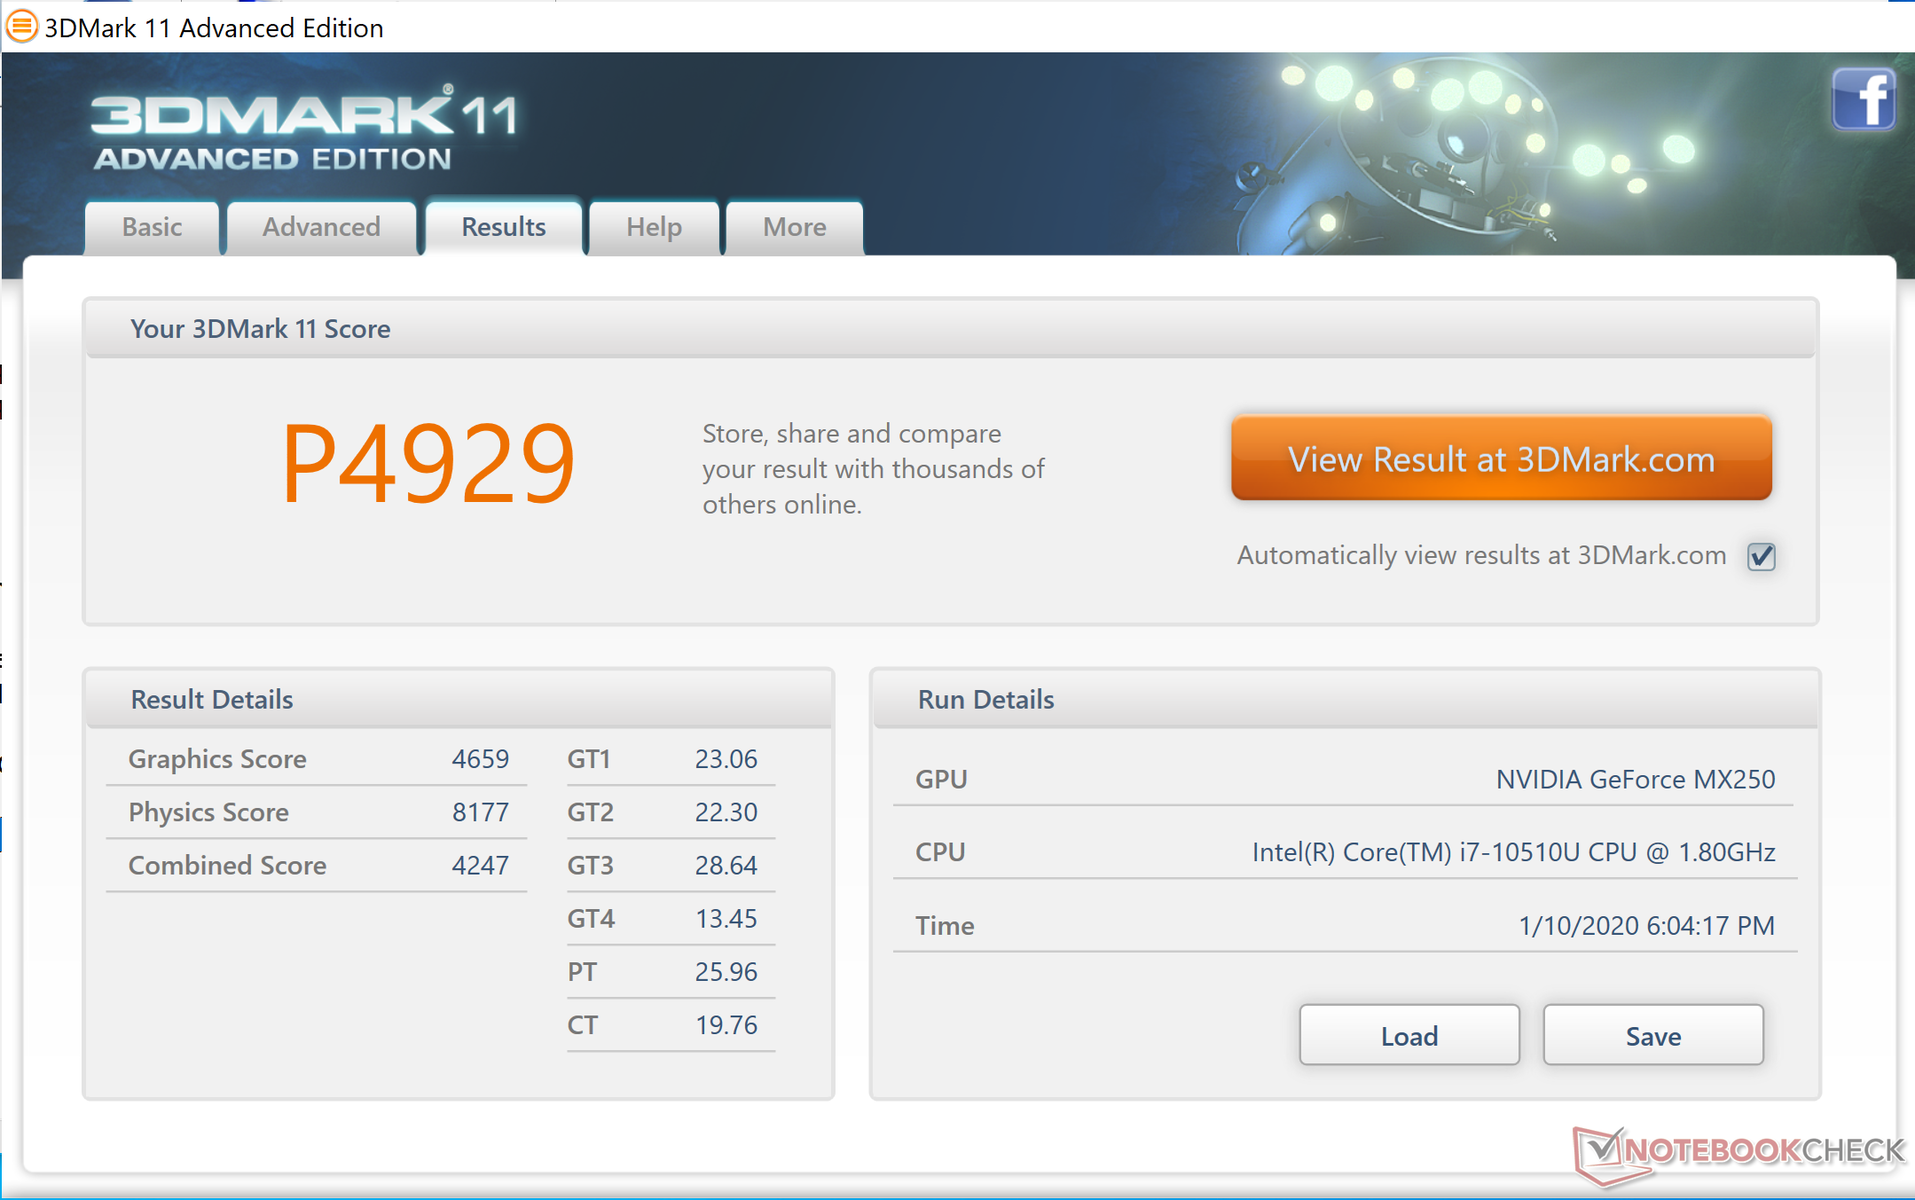
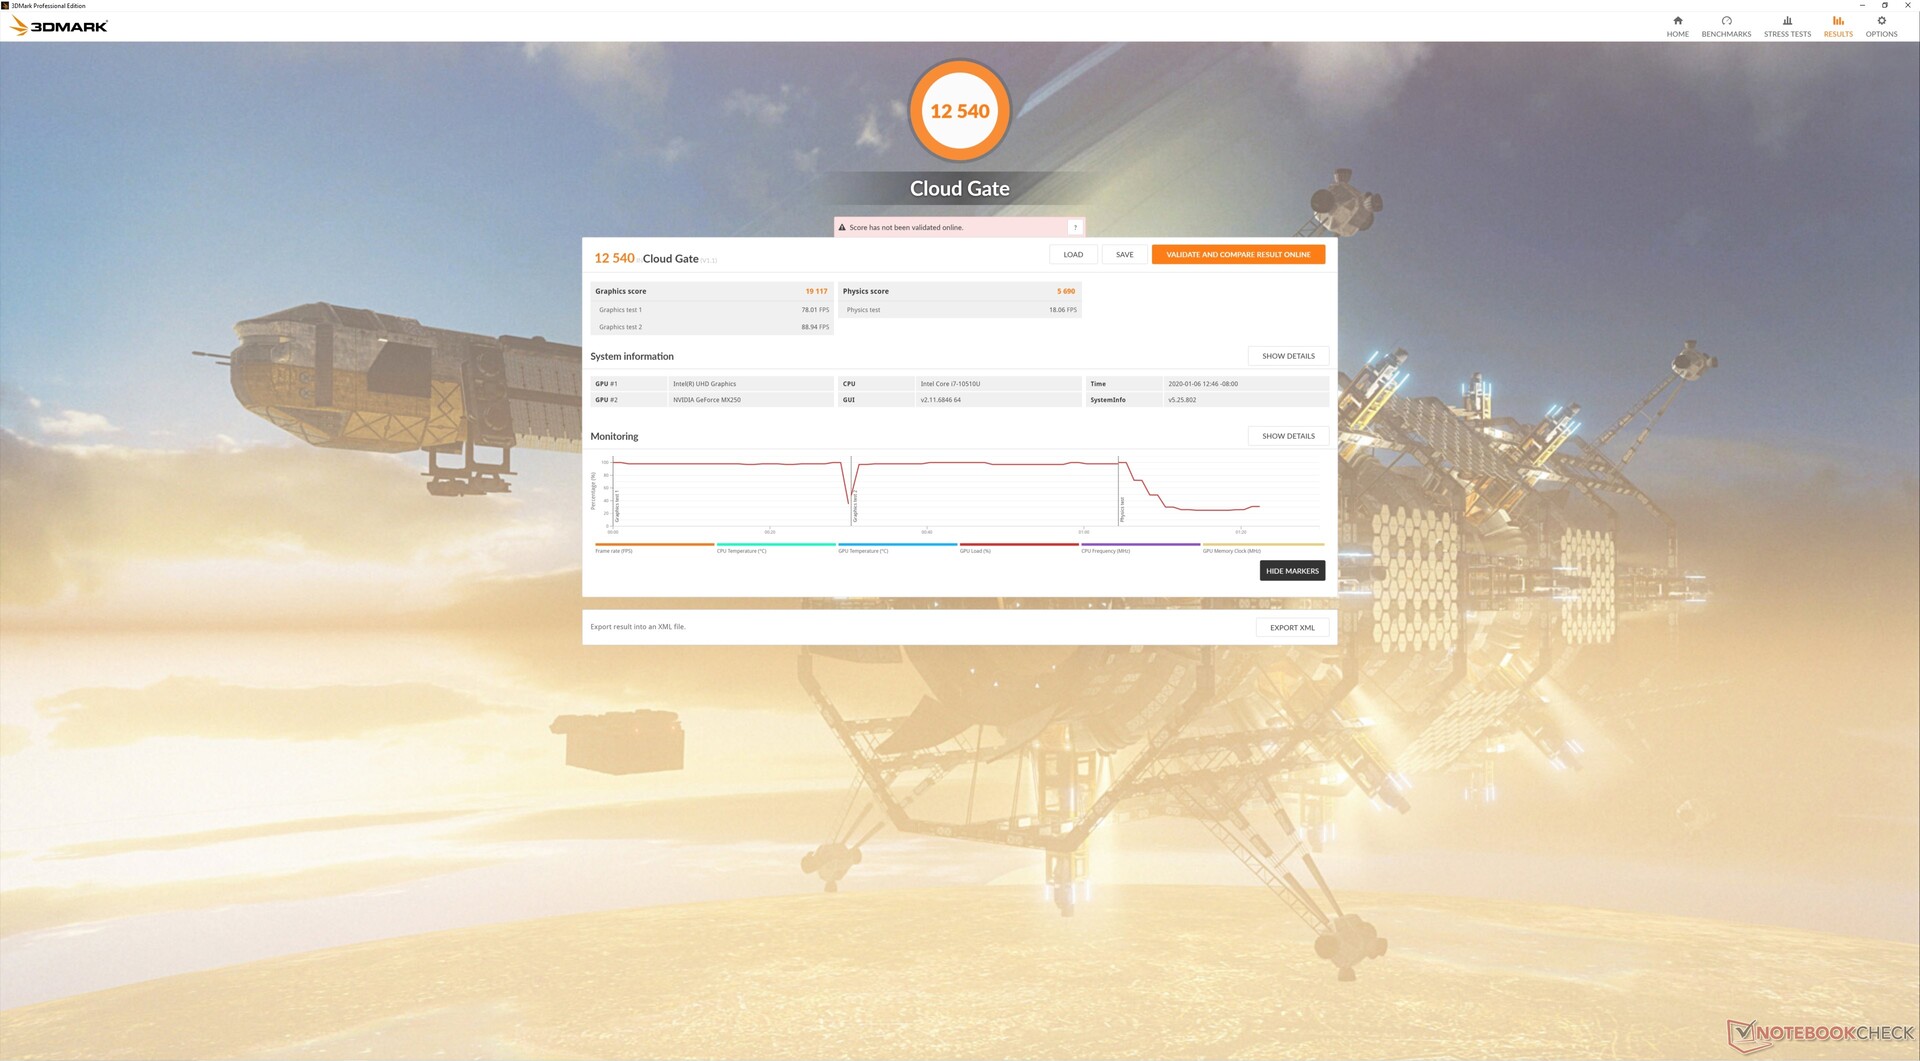
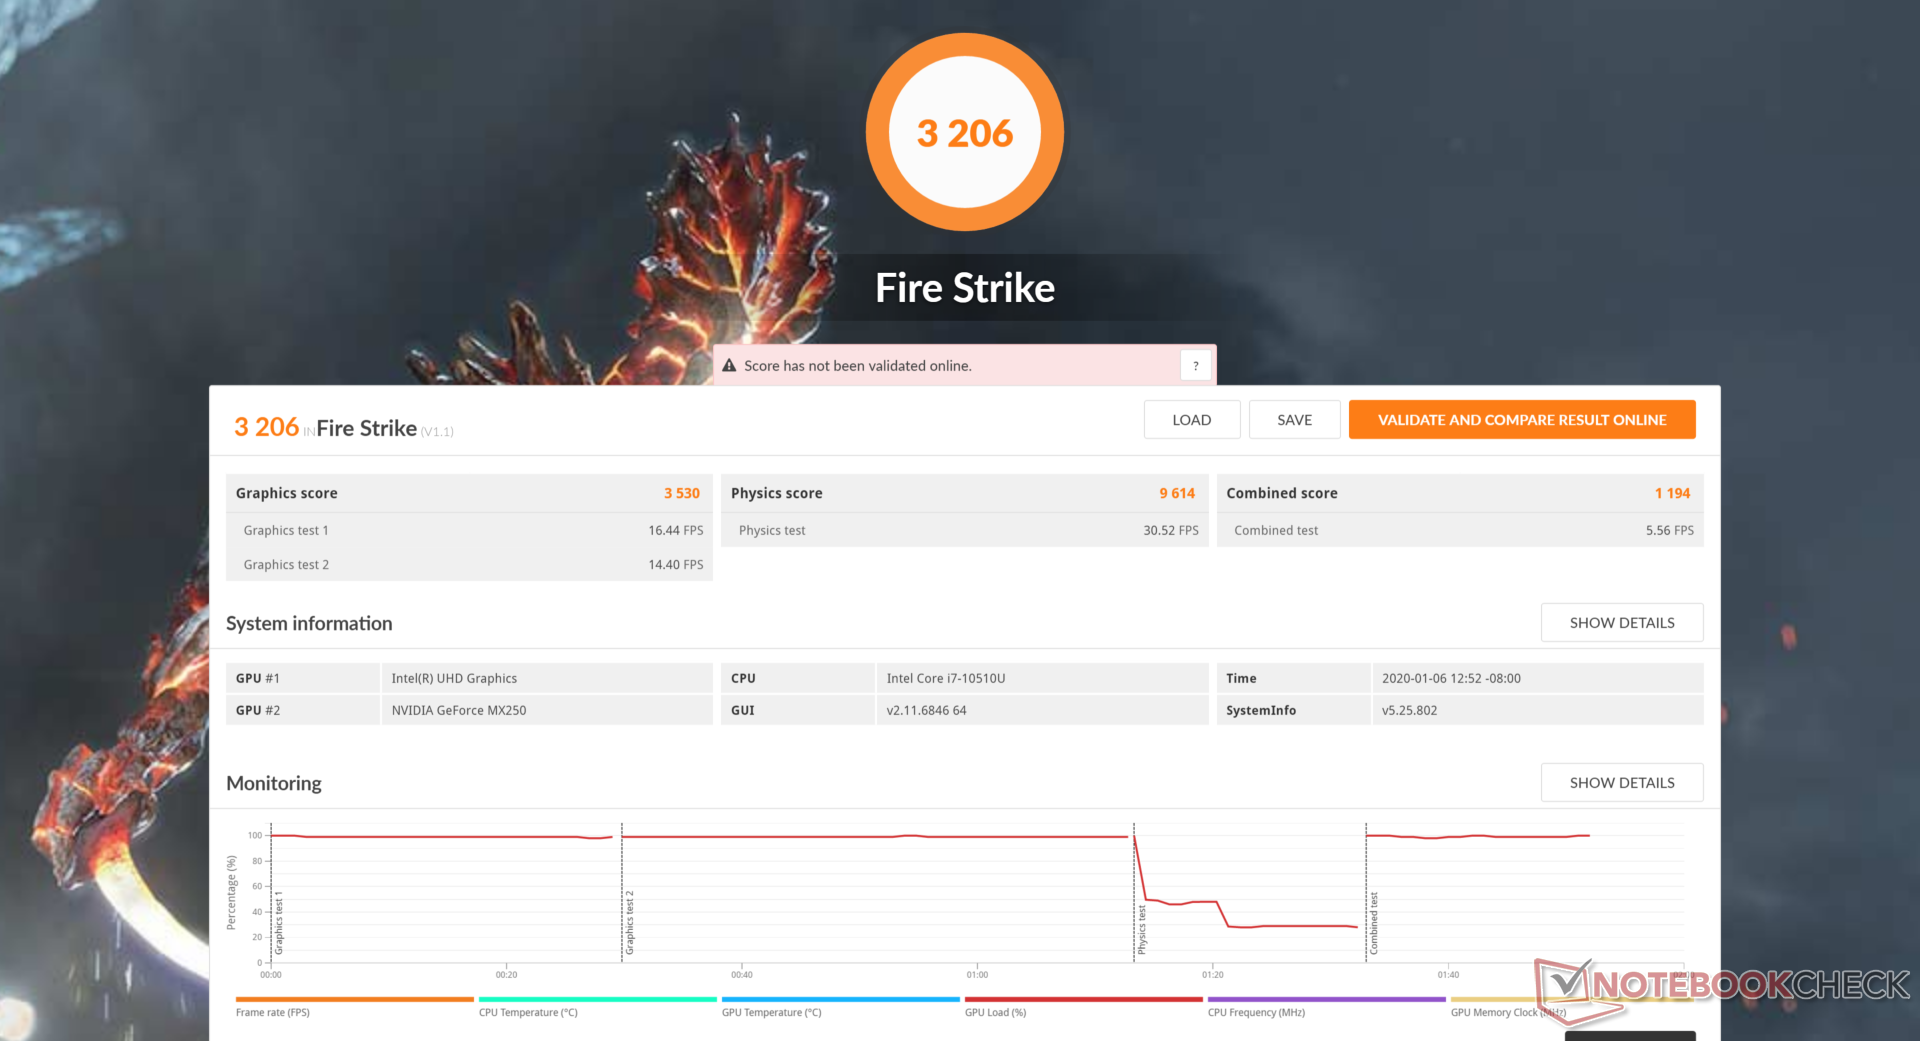
| 3DMark 11 Performance | 4929 points | |
| 3DMark Cloud Gate Standard Score | 12540 points | |
| 3DMark Fire Strike Score | 3206 points | |
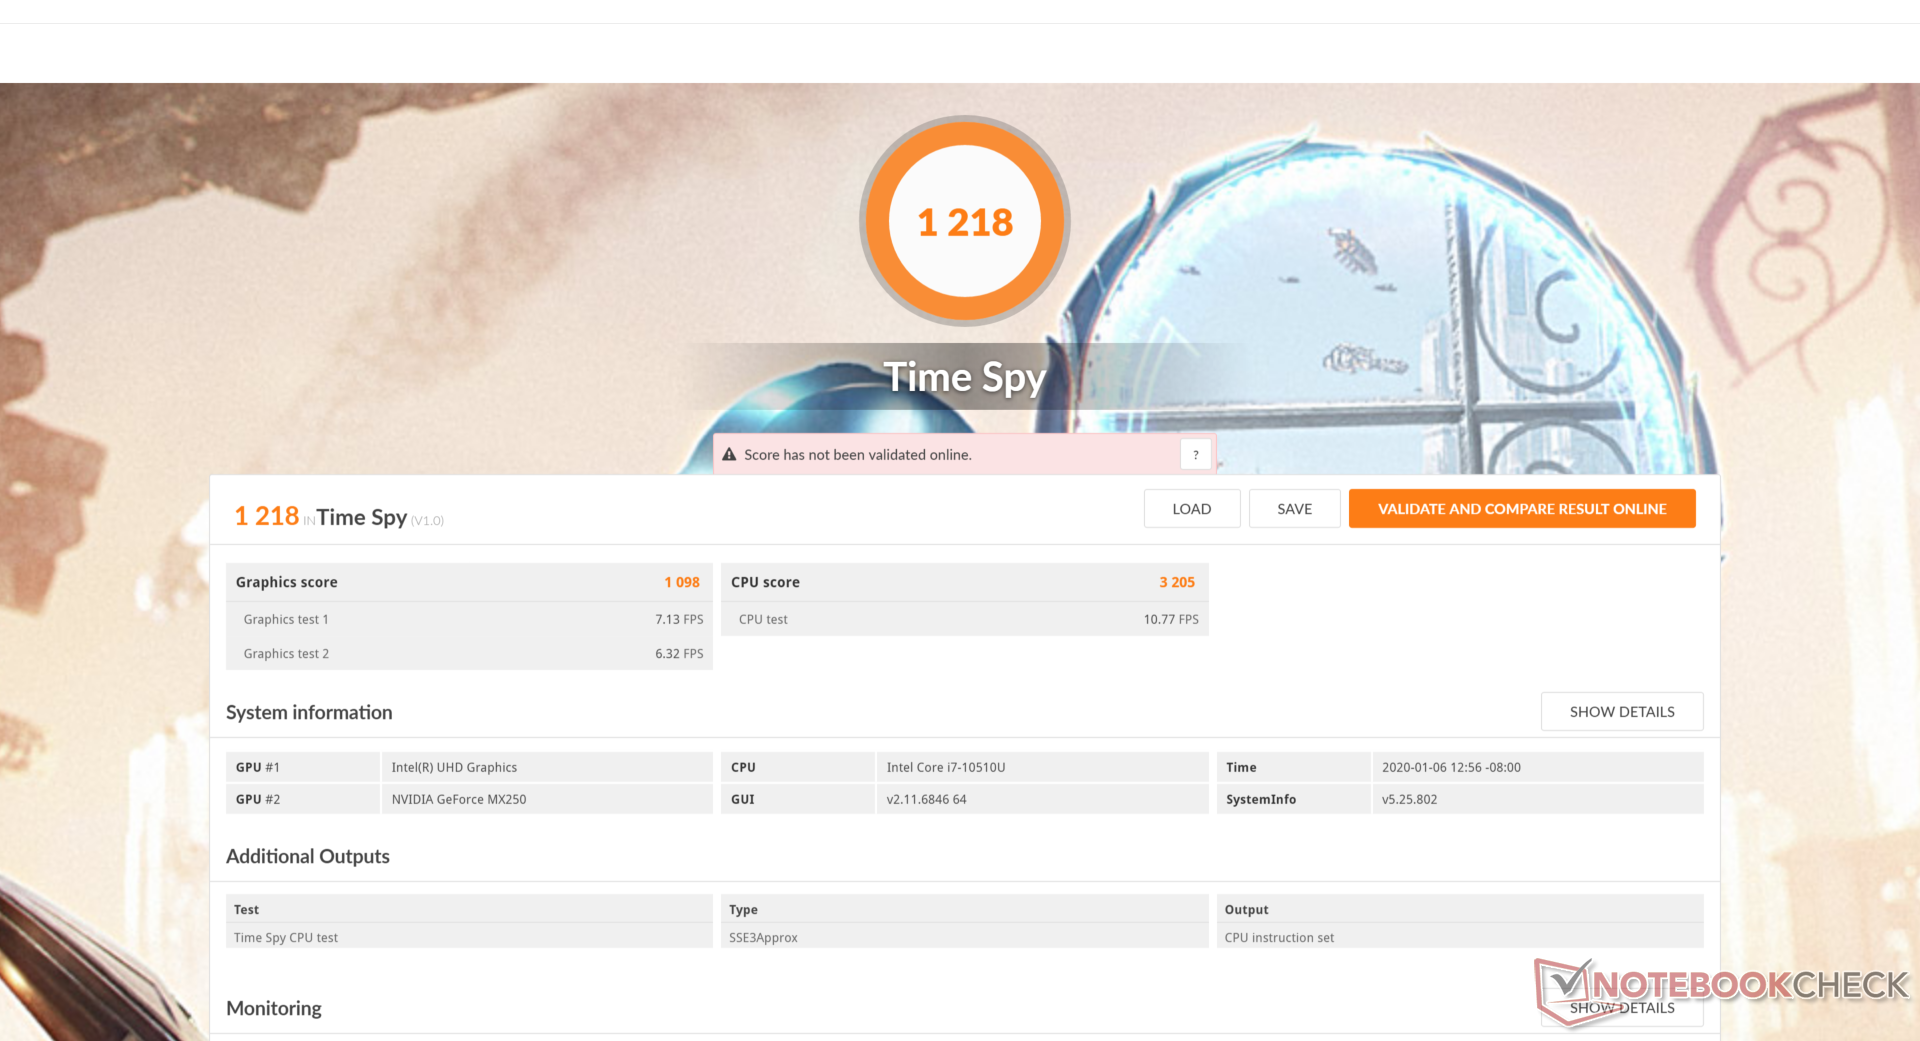
| 3DMark Time Spy Score | 1218 points | |
Help | ||
Gaming Performance
When gaming, expect the Spectre to be just slightly better than an older laptop with GeForce MX150 graphics. Performance over the Xiaomi Mi laptop, for example, can range anywhere between 3 percent to 15 percent on our tested games.
GPU clock rates will cycle when gaming for uneven frame rates as our Stress Test section below will detail. When idling on Witcher 3 for an hour, for example, frame rates will periodically dip just slightly when it should be steady throughout. Most other laptops have steadier GPU clock rates in comparison.
See our dedicated page on the GeForce MX250 for more technical details and benchmark comparisons.
| The Witcher 3 | |
| 1366x768 Medium Graphics & Postprocessing | |
| Lenovo Yoga C940-15IRH | |
| Dell G3 3590 | |
| HP Spectre x360 15-df0126ng | |
| HP Spectre X360 15-5ZV31AV | |
| Xiaomi Mi Notebook Pro i7 | |
| Average NVIDIA GeForce MX250 (30 - 40, n=27) | |
| 1920x1080 High Graphics & Postprocessing (Nvidia HairWorks Off) | |
| Asus TUF FX705GM | |
| Dell G3 3590 | |
| Lenovo Yoga C940-15IRH | |
| HP Spectre x360 15-df0126ng | |
| HP Spectre X360 15-5ZV31AV | |
| Average NVIDIA GeForce MX250 (16.3 - 23.1, n=27) | |
| Xiaomi Mi Notebook Pro i7 | |
| Dell Inspiron 15 5000 5585 | |
| 1920x1080 Ultra Graphics & Postprocessing (HBAO+) | |
| Asus TUF FX705GM | |
| Lenovo Yoga C940-15IRH | |
| Dell G3 3590 | |
| HP Spectre x360 15-df0126ng | |
| HP Spectre X360 15-5ZV31AV | |
| Average NVIDIA GeForce MX250 (9 - 16, n=24) | |
| Xiaomi Mi Notebook Pro i7 | |
| Dell Inspiron 15 5000 5585 | |
| low | med. | high | ultra | |
|---|---|---|---|---|
| BioShock Infinite (2013) | 203 | 112.2 | 94.2 | 35.3 |
| The Witcher 3 (2015) | 38.7 | 21.9 | 12.2 | |
| Shadow of the Tomb Raider (2018) | 53 | 18 | 13 | 9 |
Emissions
System Noise
Fan noise is a mixed bag. On one hand, the system is nearly silent during low to low-medium loads like word processing, video streaming, or browsing. On the other hand, the fans tend to pulse and fluctuate during higher loads like gaming or video encoding. The fans on our test unit would cycle between 33 and 39.7 dB(A) when running Witcher 3 or 35 to 42 dB(A) when under maximum CPU and GPU stress. This behavior matches our cycling core temperatures and GPU clock rates detailed in our Stress Test section below. In contrast, the fans in most other laptops would stabilize at a fixed RPM when gaming to be less noticeable.
We can notice no electronic noise or coil whine on our unit.
| HP Spectre X360 15-5ZV31AV GeForce MX250, i7-10510U, Intel SSD 660p 2TB SSDPEKNW020T8 | Dell XPS 15 7590 9980HK GTX 1650 GeForce GTX 1650 Mobile, i9-9980HK, Toshiba XG6 KXG60ZNV1T02 | Lenovo Yoga C940-15IRH GeForce GTX 1650 Max-Q, i7-9750H, Intel Optane Memory H10 with Solid State Storage 32GB + 512GB HBRPEKNX0202A(L/H) | Asus ZenBook 15 UX534FT-DB77 GeForce GTX 1650 Max-Q, i7-8565U, Samsung SSD PM981 MZVLB1T0HALR | MSI Prestige 15 A10SC GeForce GTX 1650 Max-Q, i7-10710U, Samsung SSD PM981 MZVLB1T0HALR | HP Spectre x360 15-ch011nr GeForce MX150, i5-8550U, SK hynix PC401 NVMe 500 GB | |
|---|---|---|---|---|---|---|
| Noise | -9% | -7% | 2% | -1% | 2% | |
| off / environment * (dB) | 30.1 | 28.2 6% | 28.7 5% | 28.4 6% | 29.3 3% | 28.6 5% |
| Idle Minimum * (dB) | 30.1 | 28.2 6% | 28.7 5% | 28.4 6% | 30.1 -0% | 29.2 3% |
| Idle Average * (dB) | 30.1 | 28.2 6% | 28.8 4% | 28.4 6% | 30.2 -0% | 29.2 3% |
| Idle Maximum * (dB) | 30.1 | 30.4 -1% | 28.8 4% | 28.4 6% | 30.2 -0% | 29.2 3% |
| Load Average * (dB) | 30.1 | 43.8 -46% | 45 -50% | 33.9 -13% | 31.5 -5% | 29.2 3% |
| Witcher 3 ultra * (dB) | 39.7 | 47.2 -19% | 44.7 -13% | 39.8 -0% | 37 7% | 38.4 3% |
| Load Maximum * (dB) | 42 | 47.2 -12% | 44.7 -6% | 40.2 4% | 47 -12% | 45.7 -9% |
* ... smaller is better
Noise level
| Idle |
| 30.1 / 30.1 / 30.1 dB(A) |
| Load |
| 30.1 / 42 dB(A) |
 | ||
30 dB silent 40 dB(A) audible 50 dB(A) loud |
||
min: | ||
Temperature
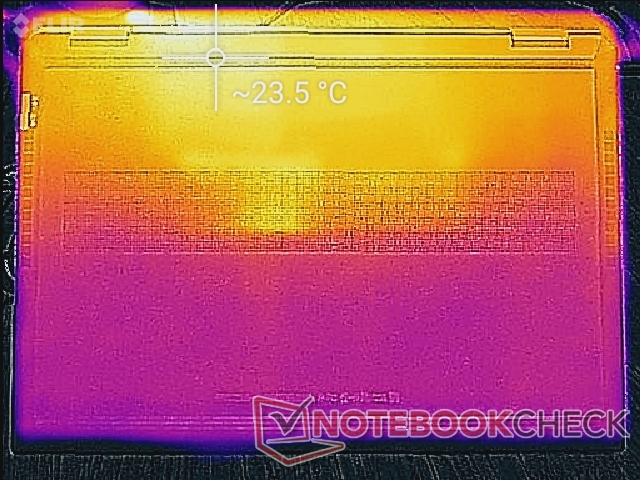
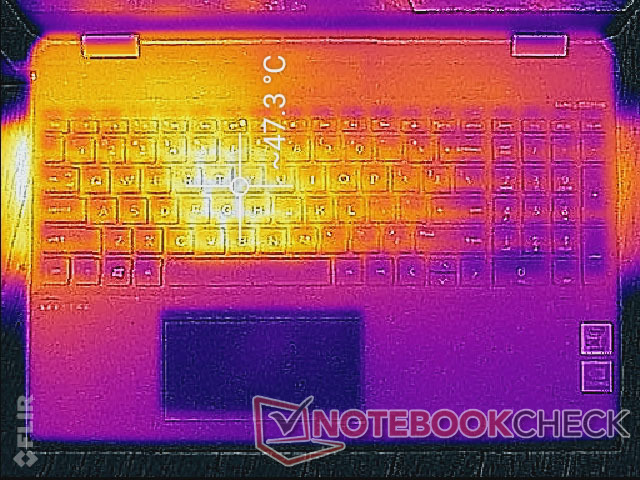
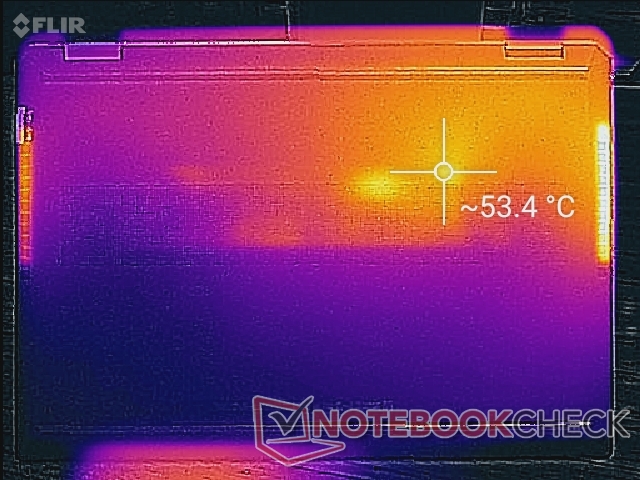
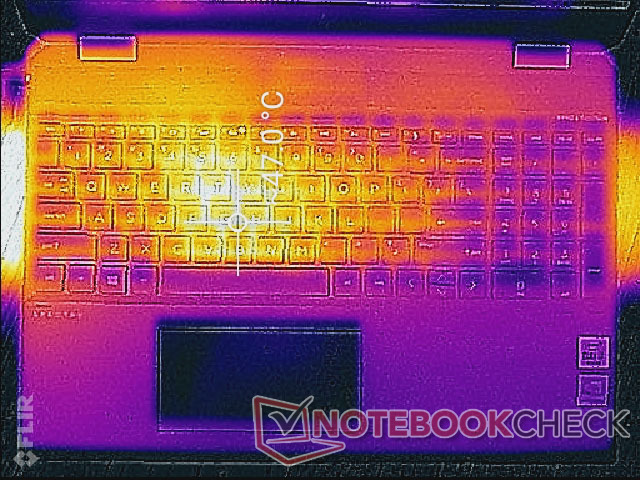
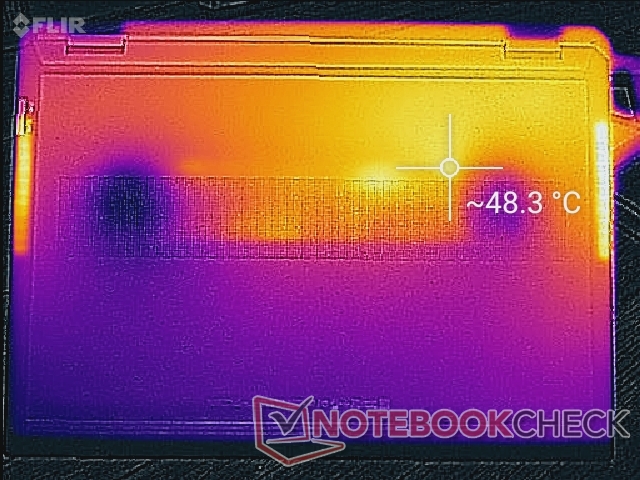
Surface temperature development is interesting on the Spectre because its processors are closer to the center when compared to most other laptops. The processors in the MSI GS65, for example, are located more towards the rear edge. This ultimately means that hot spots on the Spectre are closer to the center of the keyboard where temperatures can reach as high as 47 C since the processors are directly underneath. The surrounding palm rests, clickpad, WASD keys, and NumPad keys all remain cooler. Though certainly warm, temperatures are never irritating.
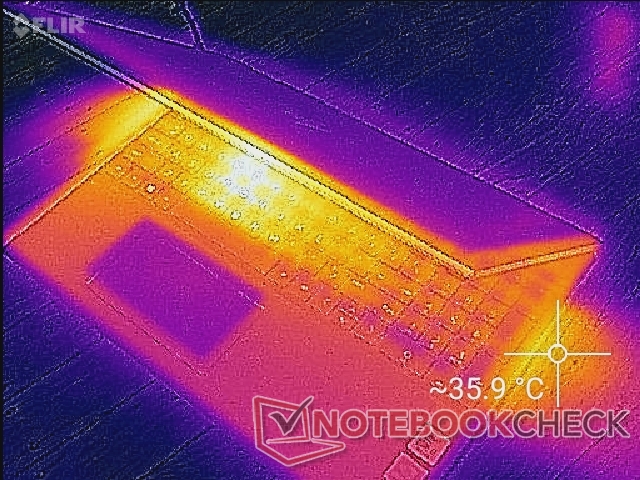
(-) The maximum temperature on the upper side is 47 °C / 117 F, compared to the average of 36.8 °C / 98 F, ranging from 21 to 71 °C for the class Multimedia.
(-) The bottom heats up to a maximum of 47.4 °C / 117 F, compared to the average of 39.1 °C / 102 F
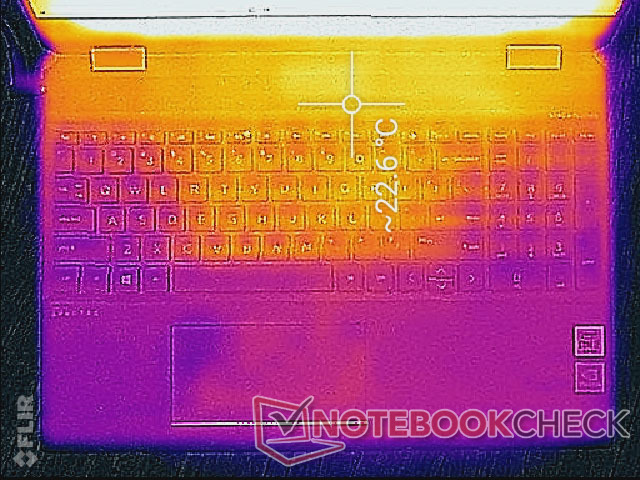
(+) In idle usage, the average temperature for the upper side is 21.4 °C / 71 F, compared to the device average of 31.3 °C / 88 F.
(±) Playing The Witcher 3, the average temperature for the upper side is 33.6 °C / 92 F, compared to the device average of 31.3 °C / 88 F.
(+) The palmrests and touchpad are cooler than skin temperature with a maximum of 29.8 °C / 85.6 F and are therefore cool to the touch.
(±) The average temperature of the palmrest area of similar devices was 28.7 °C / 83.7 F (-1.1 °C / -1.9 F).
Stress Test
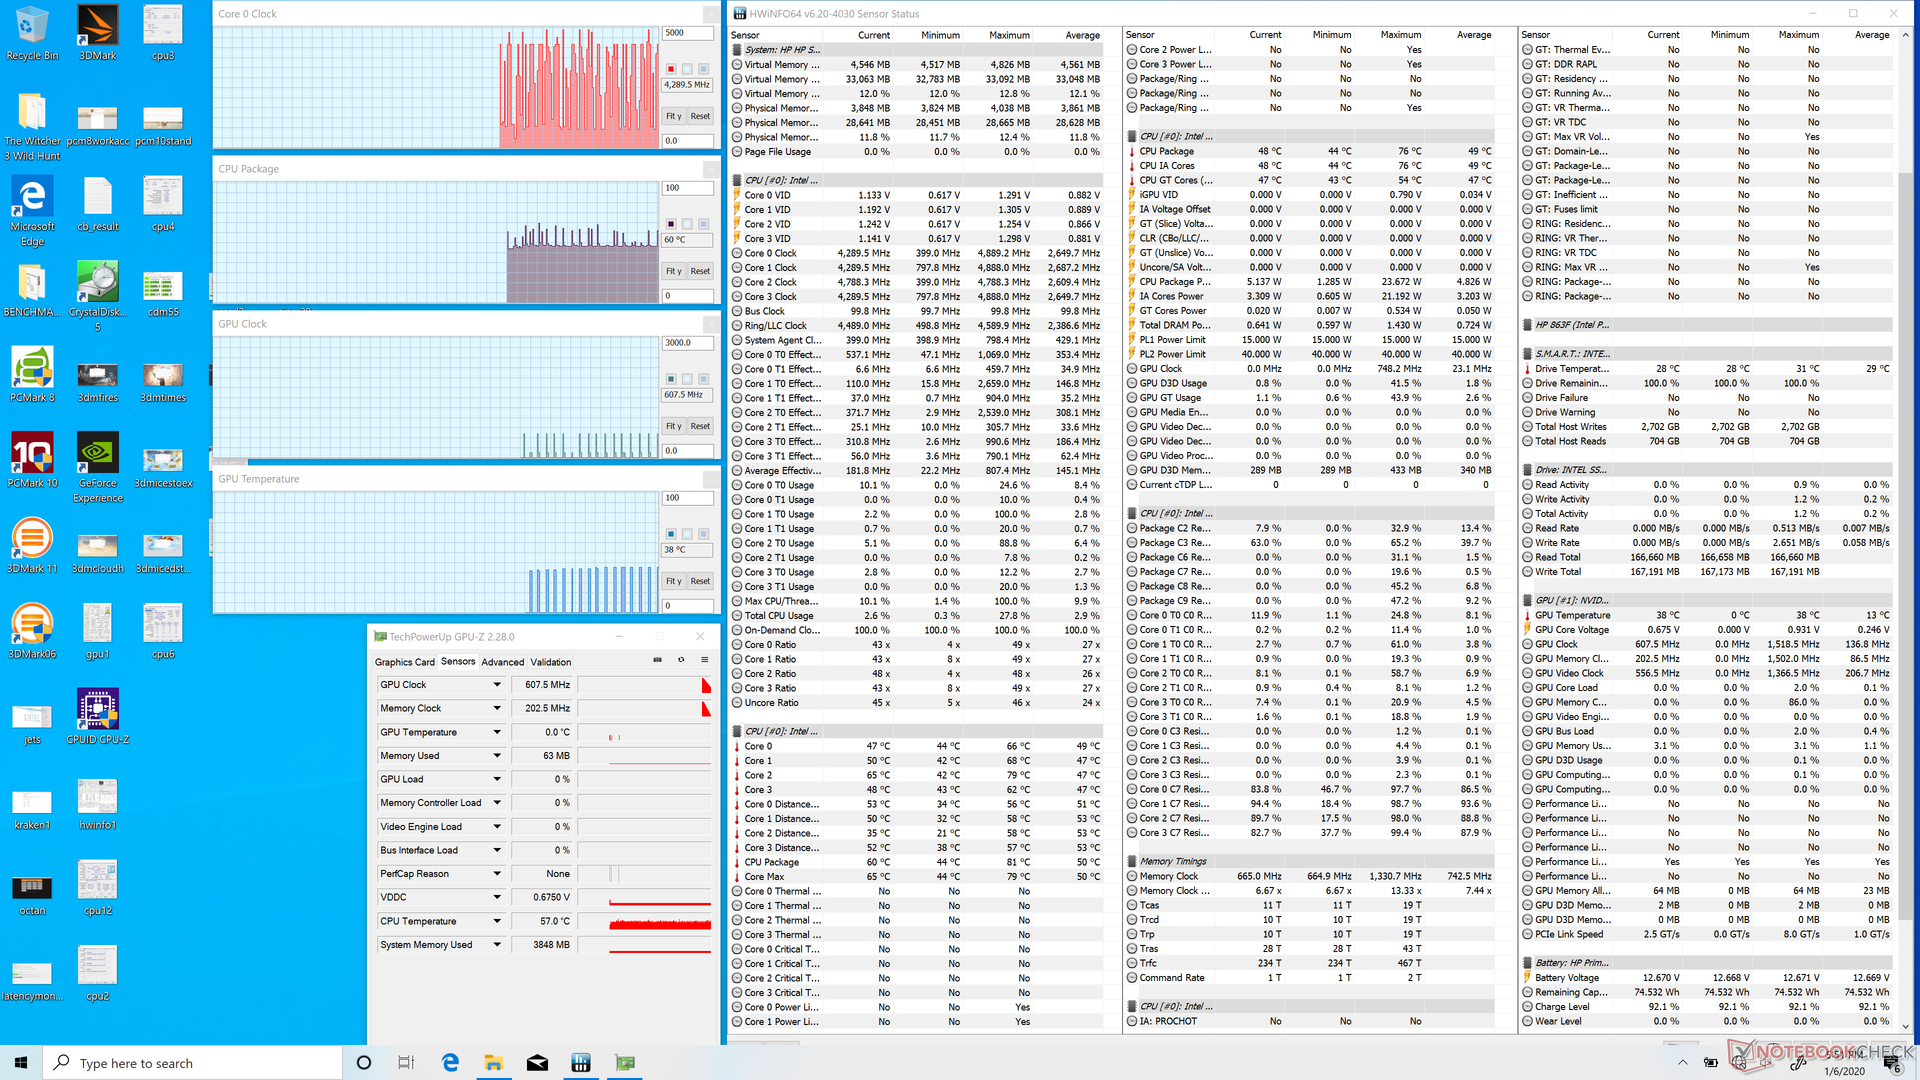
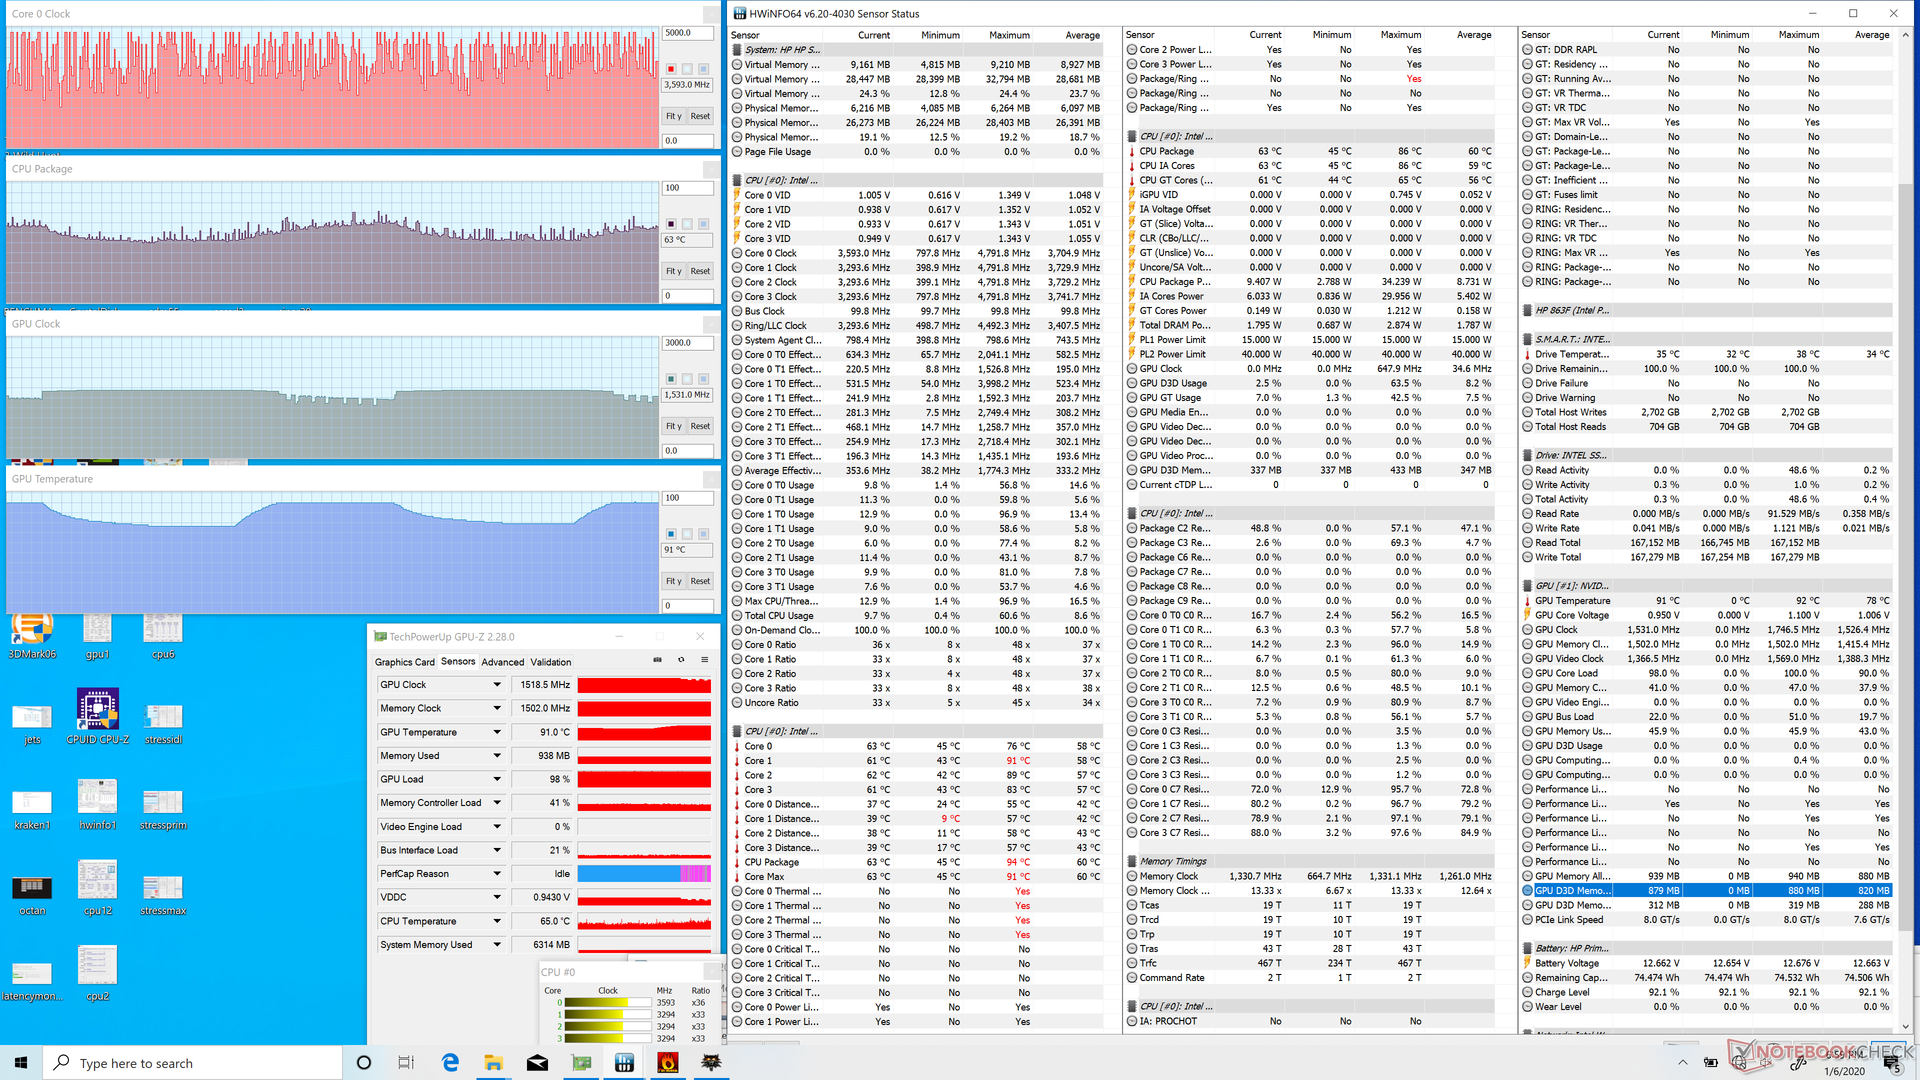
We stress the laptop with synthetic loads to identify for any potential throttling or stability issues. When running Prime95, clock rates would spike to as high as 3.7 GHz for the first 5 seconds until reaching a core temperature of 83 C. Thereafter, clock rates would drop to just 2.1 and 2.2 GHz with a cycling core temperature between 66 C and 84 C due to the cycling RPM of the fans. This same behavior also occurs if running both Prime95 and FurMark simultaneously; CPU and GPU temperatures would cycle between 66 C to 84 C and 74 C to 91 C, respectively.
Running Witcher 3 to represent real-world gaming load shows a cycling GPU clock rate between 1316 MHz to 1683 MHz and a cycling temperature of 52 C to 75 C. Frame rates are therefore unsteady even when idling onscreen; when on Medium 768p settings, for example, frame rates would periodically and consistently fluctuate between 33 FPS and 36 FPS.
Running on battery power will not limit performance. A 3DMark 11 run on batteries returns Physics and Graphics scores of 8221 and 4653 points, respectively, compared to 8177 and 4659 points when on mains.
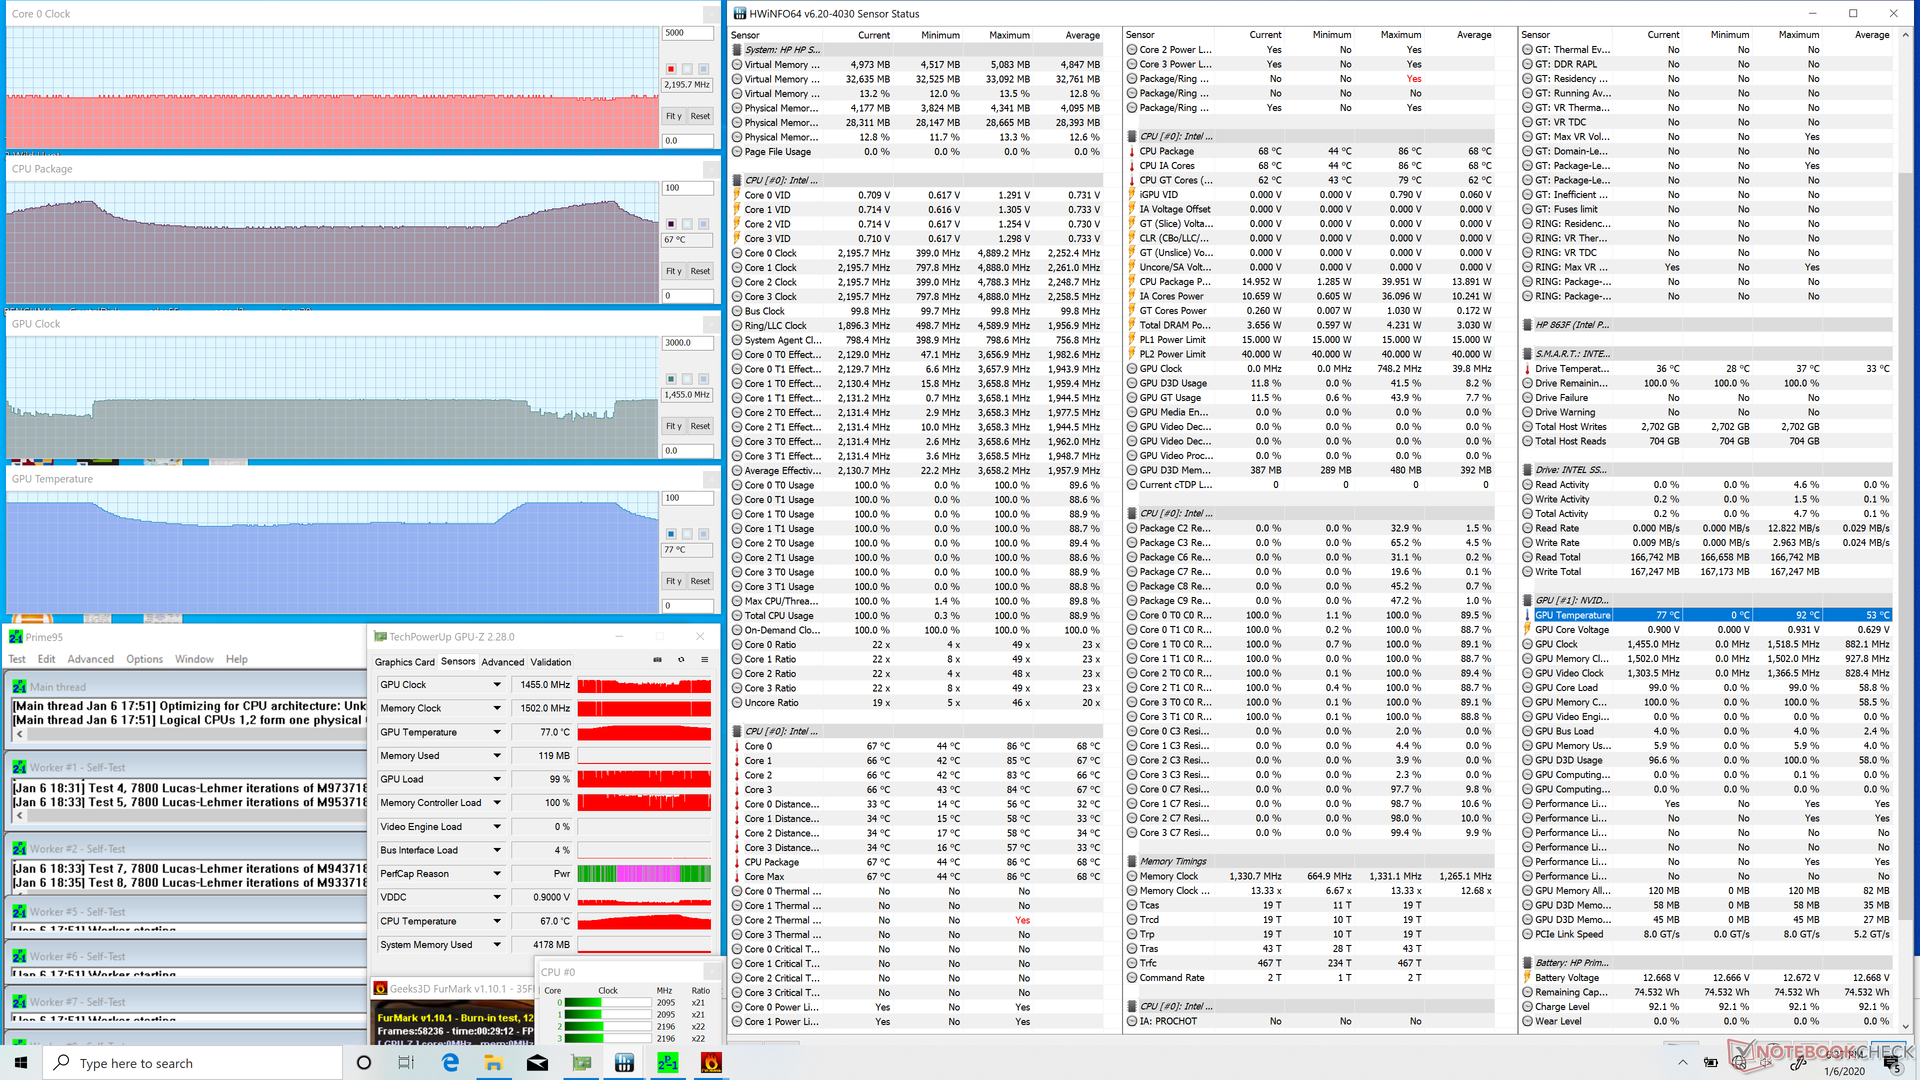
| CPU Clock (GHz) | GPU Clock (MHz) | Average CPU Temperature (°C) | Average GPU Temperature (°C) | |
| System Idle | -- | -- | 60 | 38 |
| Prime95 Stress | 2.2 - 2.3 | -- | 66 - 84 | -- |
| Prime95 + FurMark Stress | 2.1 - 2.2 | 923 - 1455 | 63 - 84 | 74 - 91 |
| Witcher 3 Stress | 2.4 - 4.1 | 1316 - 1683 | 52 - 75 | 74 - 91 |
Speakers
Audio quality is better than most other Ultrabooks and convertibles. The four speakers offer balanced audio and only a shallow frequency dip beginning at around 300 Hz whereas most laptop speakers show sharper declines for poorer bass reproduction.


HP Spectre X360 15-5ZV31AV audio analysis
(+) | speakers can play relatively loud (82.7 dB)
Bass 100 - 315 Hz
(±) | reduced bass - on average 13.6% lower than median
(±) | linearity of bass is average (11.8% delta to prev. frequency)
Mids 400 - 2000 Hz
(+) | balanced mids - only 2.5% away from median
(+) | mids are linear (6.7% delta to prev. frequency)
Highs 2 - 16 kHz
(+) | balanced highs - only 2.5% away from median
(±) | linearity of highs is average (7% delta to prev. frequency)
Overall 100 - 16.000 Hz
(±) | linearity of overall sound is average (15.4% difference to median)
Compared to same class
» 39% of all tested devices in this class were better, 3% similar, 59% worse
» The best had a delta of 5%, average was 17%, worst was 45%
Compared to all devices tested
» 22% of all tested devices were better, 4% similar, 73% worse
» The best had a delta of 4%, average was 24%, worst was 134%
Apple MacBook 12 (Early 2016) 1.1 GHz audio analysis
(+) | speakers can play relatively loud (83.6 dB)
Bass 100 - 315 Hz
(±) | reduced bass - on average 11.3% lower than median
(±) | linearity of bass is average (14.2% delta to prev. frequency)
Mids 400 - 2000 Hz
(+) | balanced mids - only 2.4% away from median
(+) | mids are linear (5.5% delta to prev. frequency)
Highs 2 - 16 kHz
(+) | balanced highs - only 2% away from median
(+) | highs are linear (4.5% delta to prev. frequency)
Overall 100 - 16.000 Hz
(+) | overall sound is linear (10.2% difference to median)
Compared to same class
» 7% of all tested devices in this class were better, 2% similar, 91% worse
» The best had a delta of 5%, average was 18%, worst was 53%
Compared to all devices tested
» 5% of all tested devices were better, 1% similar, 94% worse
» The best had a delta of 4%, average was 24%, worst was 134%
Energy Management
Power Consumption
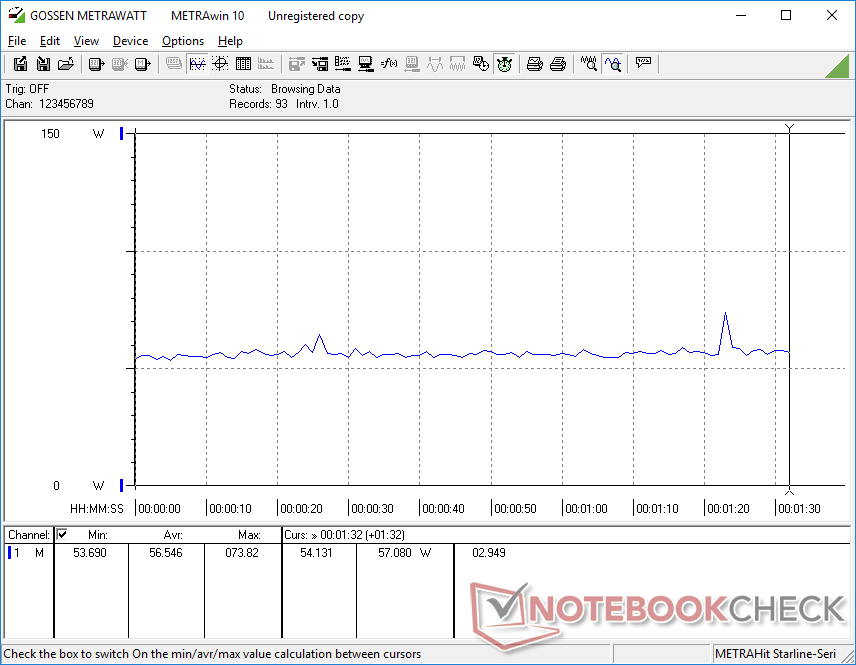
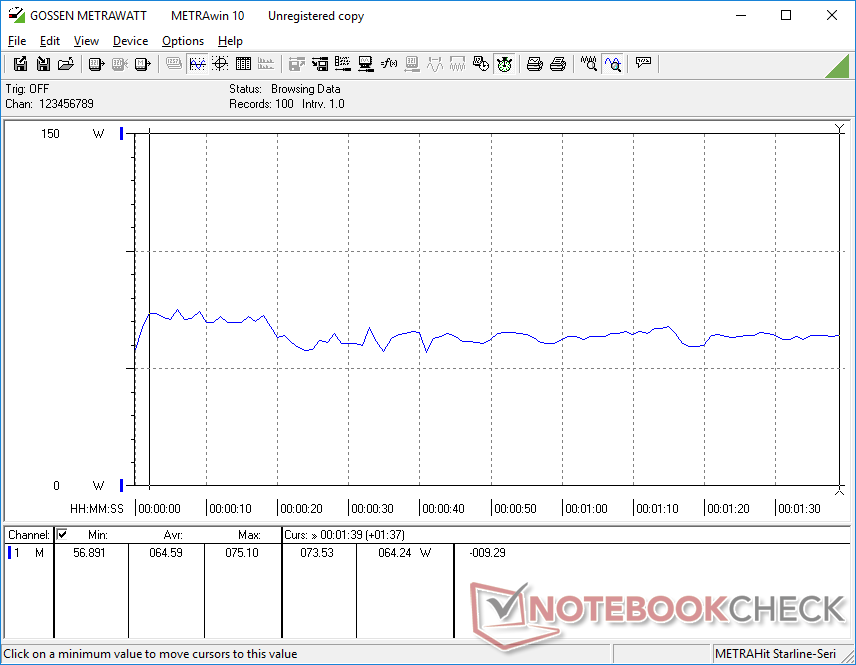
Idling on desktop consumes between 5 W and 9 W depending on the brightness level and power setting. Gaming consumes about 57 W to 66 W to be more efficient than the 2018 model with the older Kaby Lake-R and MX150 GPU as shown by the table below. Note that the Asus ZenBook 15 with GeForce GTX 1650 Max-Q graphics offers 150 to 200 percent faster GPU performance over our Spectre for a mere 11 percent increase in power consumption.
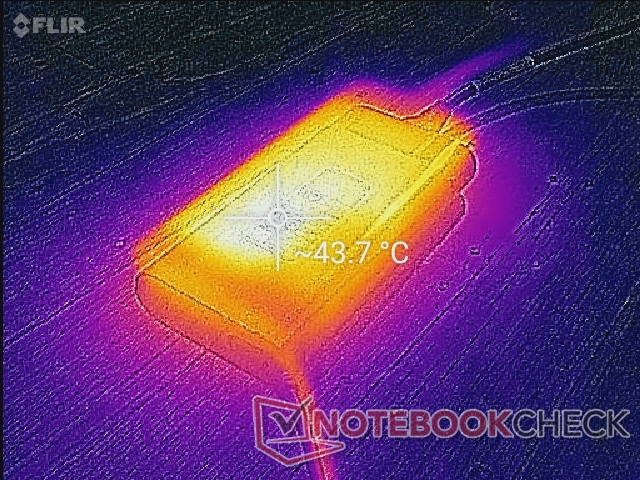
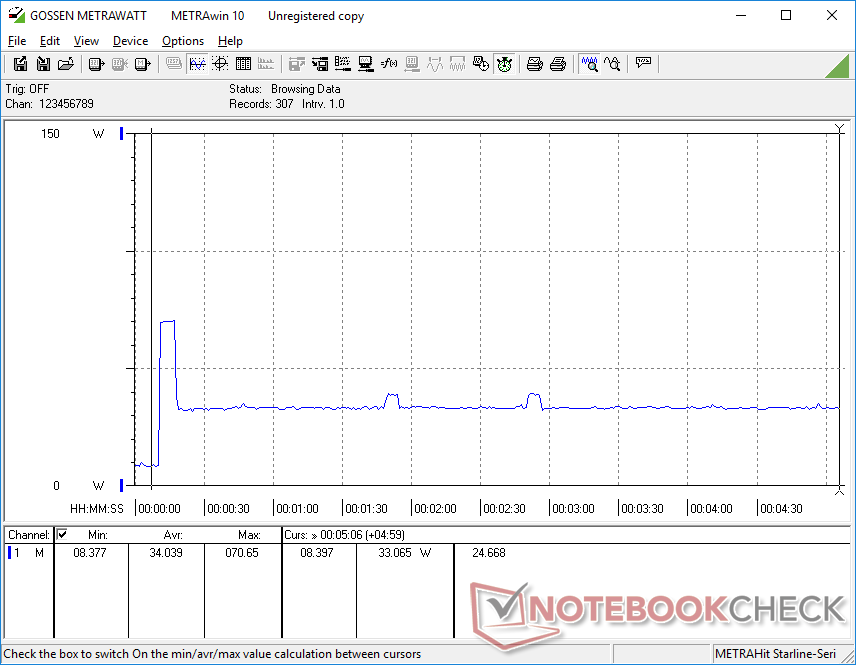
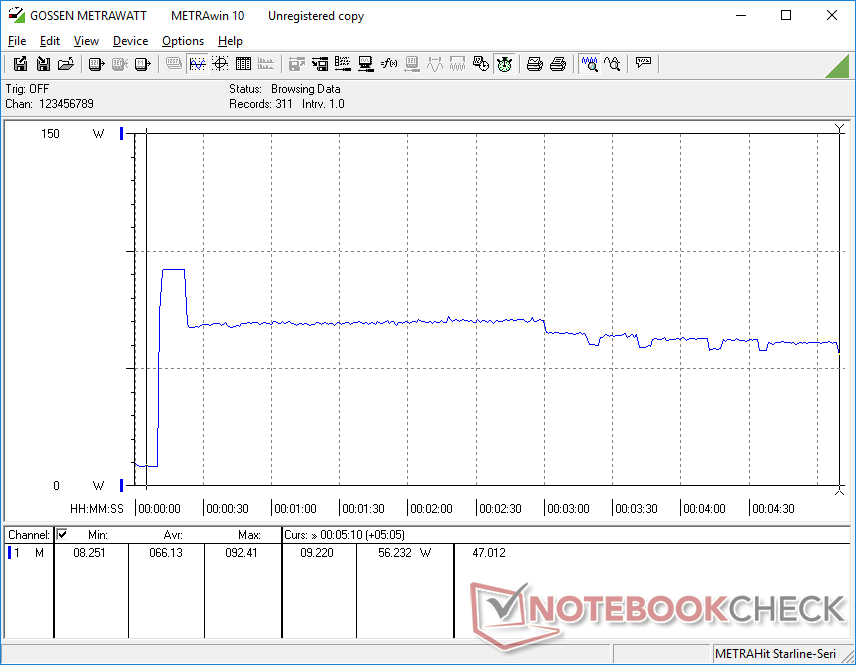
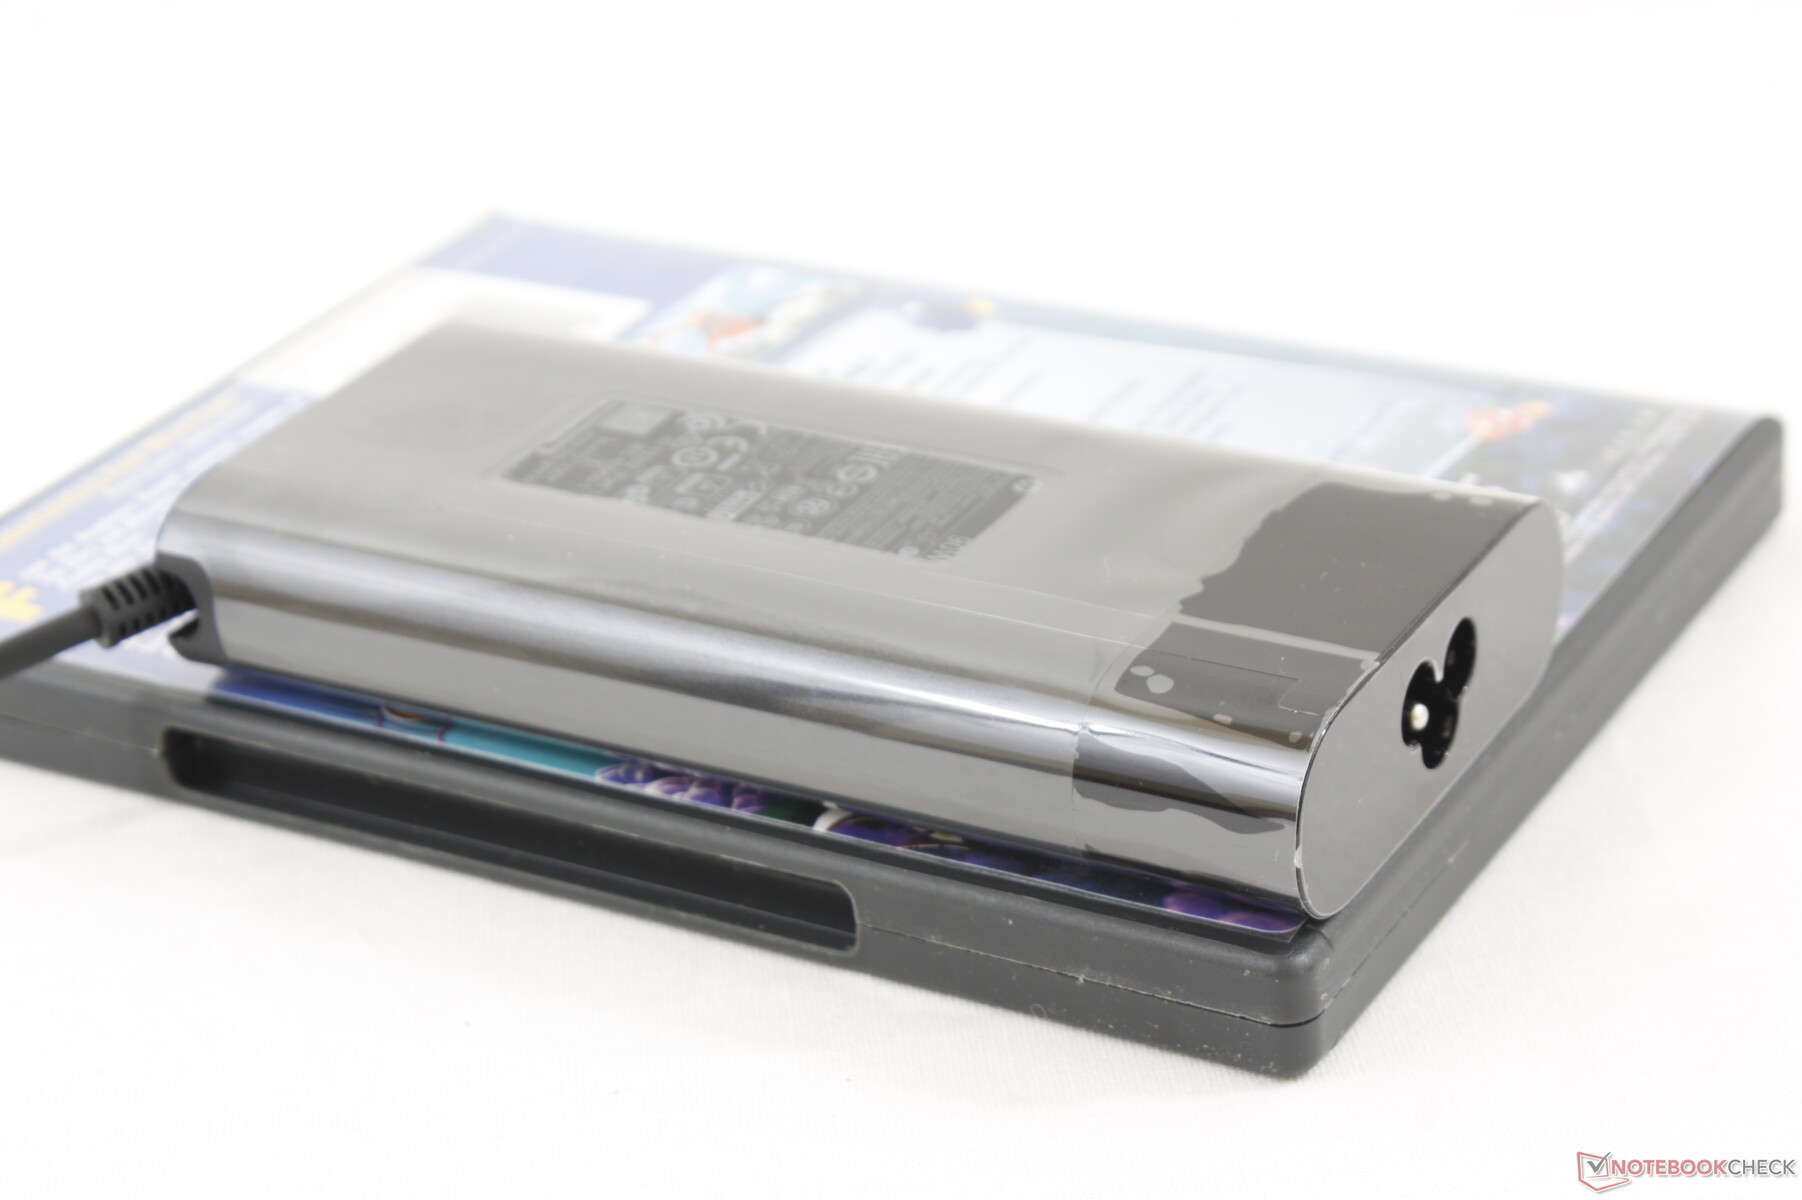
We're able to measure a maximum consumption of 92.4 W from the relatively small (~14 x 6.5 x 2.3 cm) 90 W AC adapter when running both Prime95 and FurMark simultaneously. This high of a consumption is only temporary as shown by our graphs below due to thermal throttling. Interestingly, small but consistent spikes in power consumption occur much like the cycling CineBench loop test results and GPU clock rates mentioned above.
The more powerful and demanding SKU with Core-H and GTX graphics will ship with a more capable 135 W AC adapter.
| Off / Standby | |
| Idle | |
| Load |
|
Key:
min: | |
| HP Spectre X360 15-5ZV31AV i7-10510U, GeForce MX250, Intel SSD 660p 2TB SSDPEKNW020T8, IPS, 3840x2160, 15.6" | HP Spectre x360 15-ch011nr i5-8550U, GeForce MX150, SK hynix PC401 NVMe 500 GB, IPS, 3840x2160, 15.6" | Dell XPS 15 7590 9980HK GTX 1650 i9-9980HK, GeForce GTX 1650 Mobile, Toshiba XG6 KXG60ZNV1T02, OLED, 3840x2160, 15.6" | Lenovo Yoga C940-15IRH i7-9750H, GeForce GTX 1650 Max-Q, Intel Optane Memory H10 with Solid State Storage 32GB + 512GB HBRPEKNX0202A(L/H), IPS, 1920x1080, 15.6" | Asus ZenBook 15 UX534FT-DB77 i7-8565U, GeForce GTX 1650 Max-Q, Samsung SSD PM981 MZVLB1T0HALR, IPS, 1920x1080, 15.6" | MSI Prestige 15 A10SC i7-10710U, GeForce GTX 1650 Max-Q, Samsung SSD PM981 MZVLB1T0HALR, IPS, 3840x2160, 15.6" | |
|---|---|---|---|---|---|---|
| Power Consumption | -13% | -57% | -56% | -45% | -39% | |
| Idle Minimum * (Watt) | 5.2 | 5.3 -2% | 6.2 -19% | 5.2 -0% | 5 4% | 6.1 -17% |
| Idle Average * (Watt) | 8.5 | 9.8 -15% | 9.6 -13% | 10.7 -26% | 13.2 -55% | 13.2 -55% |
| Idle Maximum * (Watt) | 8.7 | 12.6 -45% | 21.2 -144% | 24.3 -179% | 24 -176% | 19.2 -121% |
| Load Average * (Watt) | 65.6 | 73 -11% | 104.3 -59% | 84.4 -29% | 70 -7% | 75 -14% |
| Witcher 3 ultra * (Watt) | 56.5 | 67.6 -20% | 91.7 -62% | 83.9 -48% | 63.3 -12% | 74 -31% |
| Load Maximum * (Watt) | 92.4 | 80 13% | 135.3 -46% | 142.8 -55% | 114 -23% | 89.7 3% |
* ... smaller is better
Battery Life
Battery capacity remains the same as on the last generation model. Runtimes are therefore nearly the same gen-to-gen at roughly 10.5 hours of real-world Wi-Fi use. Charging takes approximately 2 hours with the included proprietary AC adapter. The system supports recharging via third-party USB Type-C adapters as well.
| HP Spectre X360 15-5ZV31AV i7-10510U, GeForce MX250, 84 Wh | Dell XPS 15 7590 9980HK GTX 1650 i9-9980HK, GeForce GTX 1650 Mobile, 97 Wh | Lenovo Yoga C940-15IRH i7-9750H, GeForce GTX 1650 Max-Q, 69 Wh | Asus ZenBook 15 UX534FT-DB77 i7-8565U, GeForce GTX 1650 Max-Q, 71 Wh | MSI Prestige 15 A10SC i7-10710U, GeForce GTX 1650 Max-Q, 82 Wh | HP Spectre x360 15-ch011nr i5-8550U, GeForce MX150, 84 Wh | |
|---|---|---|---|---|---|---|
| Battery runtime | -16% | -32% | -9% | -24% | -19% | |
| Reader / Idle (h) | 22.6 | 15.2 -33% | 18.2 -19% | 21.5 -5% | 19.1 -15% | 15.5 -31% |
| WiFi v1.3 (h) | 10.8 | 7.8 -28% | 9.7 -10% | 8.4 -22% | 7.6 -30% | 10.4 -4% |
| Load (h) | 2.9 | 3.3 14% | 1 -66% | 2.9 0% | 2.1 -28% | 2.3 -21% |
Pros
Cons
Verdict

In our review of the Ice Lake Spectre x360 13 and Kaby Lake-G Spectre x360 15 models, we discovered fluctuating clock rates, frame rates, and fan noise when under high loads for a bumpy gaming experience. This Comet Lake-U Spectre x360 15 exhibits similar characteristics as its clock rates, frame rates, and fan noise would fluctuate as well when gaming. Power users looking for more consistent performance out of their laptops may want to avoid this particular Spectre configuration as a result.
Furthermore, the Comet Lake-U Core i7-10510U and GeForce MX250 are just marginally better than the last generation Whiskey Lake-U Core i7-8565U and GeForce MX150 by the slimmest of margins in terms of raw performance. Combine this with the fact that the Comet Lake-U 2019 model shares the same keyboard, display, battery life, and chassis as the cheaper Whiskey Lake-U model and you have a system that is not worth the upgrade if you already own a Spectre. Outsiders considering the HP convertible would be better off with the Whiskey Lake-U model for its superior performance-per-dollar.
Other than the performance disadvantages noted above, the Spectre x360 15 chassis is otherwise excellent and it remains one of the sturdier 15.6-inch consumer convertibles in the market. Both battery life and fan noise are relatively long and quiet, respectively, for undemanding office tasks.
Users willing to wait a few months ought to consider the 2020 Spectre x360 15 which will bring more significant updates to the series including much narrower bezels and more powerful hexa-core CPUs and GTX 1650 Max-Q Turing GPUs.
HP Spectre X360 15-5ZV31AV
- 01/16/2020 v7 (old)
Allen Ngo
Price comparison
