Surface Laptop 3 15 Ryzen 5 Review: Microsoft Can Do Better
(November 1, 2019 update: Strangely, recharging via USB Type-C would work only after reformatting and updating our unit. We used a 130 W USB Type-C AC adapter for the test. The system also utilizes 8 GB of dual-channel RAM instead of single-channel as initially stated. The page has been corrected to reflect this.)
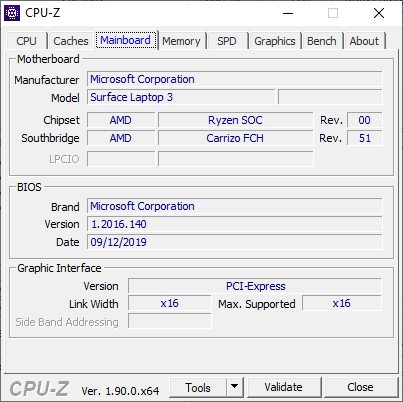
Microsoft unveiled its third generation Surface laptop series earlier this month alongside a handful of other Surface devices ranging from traditional laptops to a foldable Duo smartphone. The model we'll be looking at today is the Surface Laptop 3 15 powered by the semi-custom Ryzen 5 3580U processor. This is the first traditional 3:2 15-inch Surface Laptop and also the first in its family to carry AMD options as an alternative to the usual Intel SKUs. Additionally, this also implies that Microsoft is confident enough that Ryzen can provide the performance they're looking for to be competitive against Intel in the high-end consumer space.
Our 15-inch Ryzen 5 configuration retails for $1500 USD in contrast to the $2100 15-inch Ryzen 7 SKU, $1200 13.5-inch Ryzen 5 SKU, and $1700 13.5-inch Ryzen 7 SKU. The Intel options are even more variable as shown by the official product page. Expect more Surface reviews in the weeks to come so we can paint a bigger picture of the differences between these AMD and Intel configurations. The Surface Laptop 3 15 competes with other flagship ultra-thin laptops including the Dell XPS 15, Apple MacBook Pro 15, Huawei MateBook X Pro, Lenovo Yoga C940, and the Asus ZenBook 15.
More Microsoft Surface reviews:
Rating | Date | Model | Weight | Height | Size | Resolution | Price |
|---|---|---|---|---|---|---|---|
| 82.9 % v7 (old) | 10 / 2019 | Microsoft Surface Laptop 3 15 Ryzen 5 3580U R5 3580U, Vega 9 | 1.5 kg | 14.7 mm | 15.00" | 2496x1664 | |
| 86.3 % v7 (old) | 09 / 2019 | Dell XPS 15 7590 i5 iGPU FHD i5-9300H, UHD Graphics 630 | 1.9 kg | 17 mm | 15.60" | 1920x1080 | |
| 87.9 % v7 (old) | 07 / 2018 | Apple MacBook Pro 15 2018 (2.6 GHz, 560X) i7-8850H, Radeon Pro 560X | 1.8 kg | 15.5 mm | 15.40" | 2880x1800 | |
| 83.9 % v7 (old) | 03 / 2019 | HP Spectre x360 15-df0126ng i7-8750H, GeForce GTX 1050 Ti Max-Q | 2.2 kg | 19.3 mm | 15.60" | 3840x2160 | |
| 90 % v6 (old) | 01 / 2019 | Lenovo ThinkPad X1 Carbon 2018-20KGS5DU00 i5-8550U, UHD Graphics 620 | 1.1 kg | 15.95 mm | 14.00" | 2560x1440 |
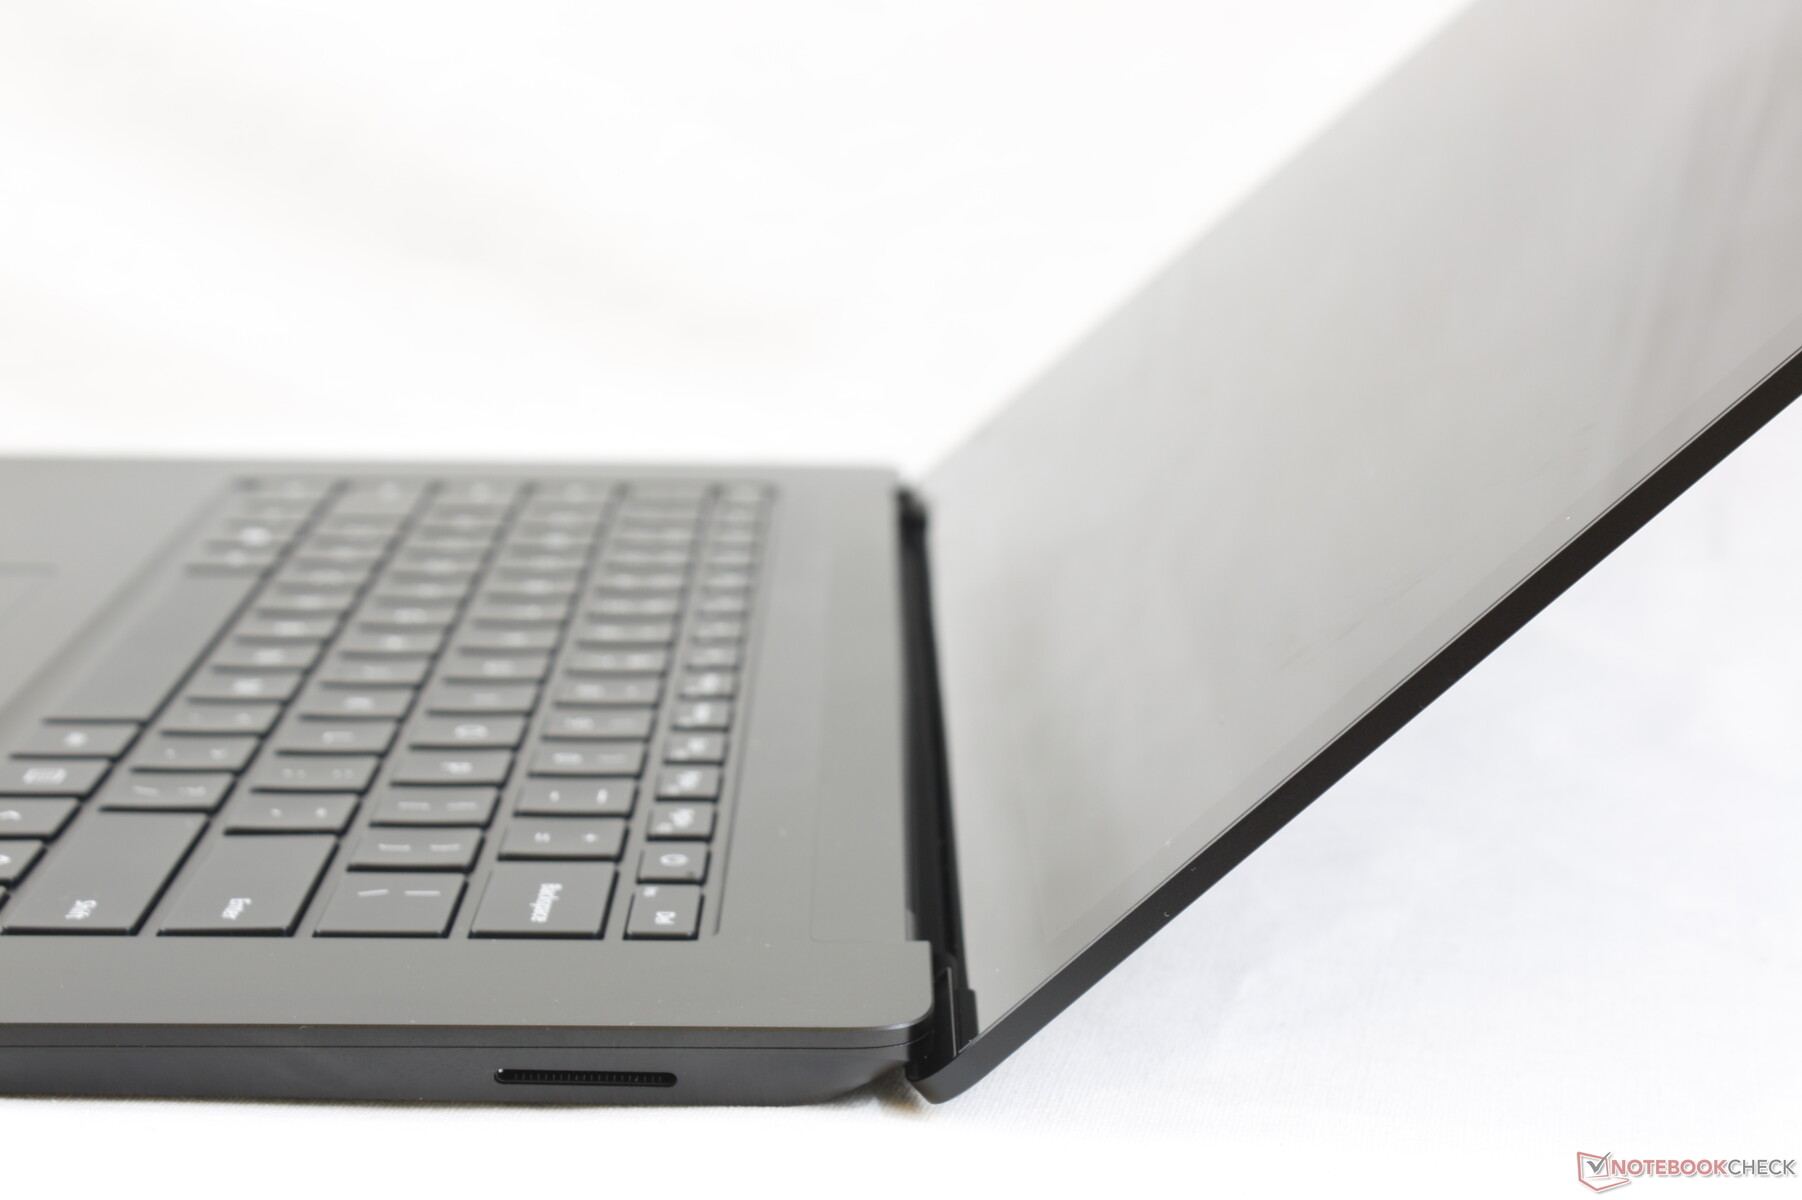
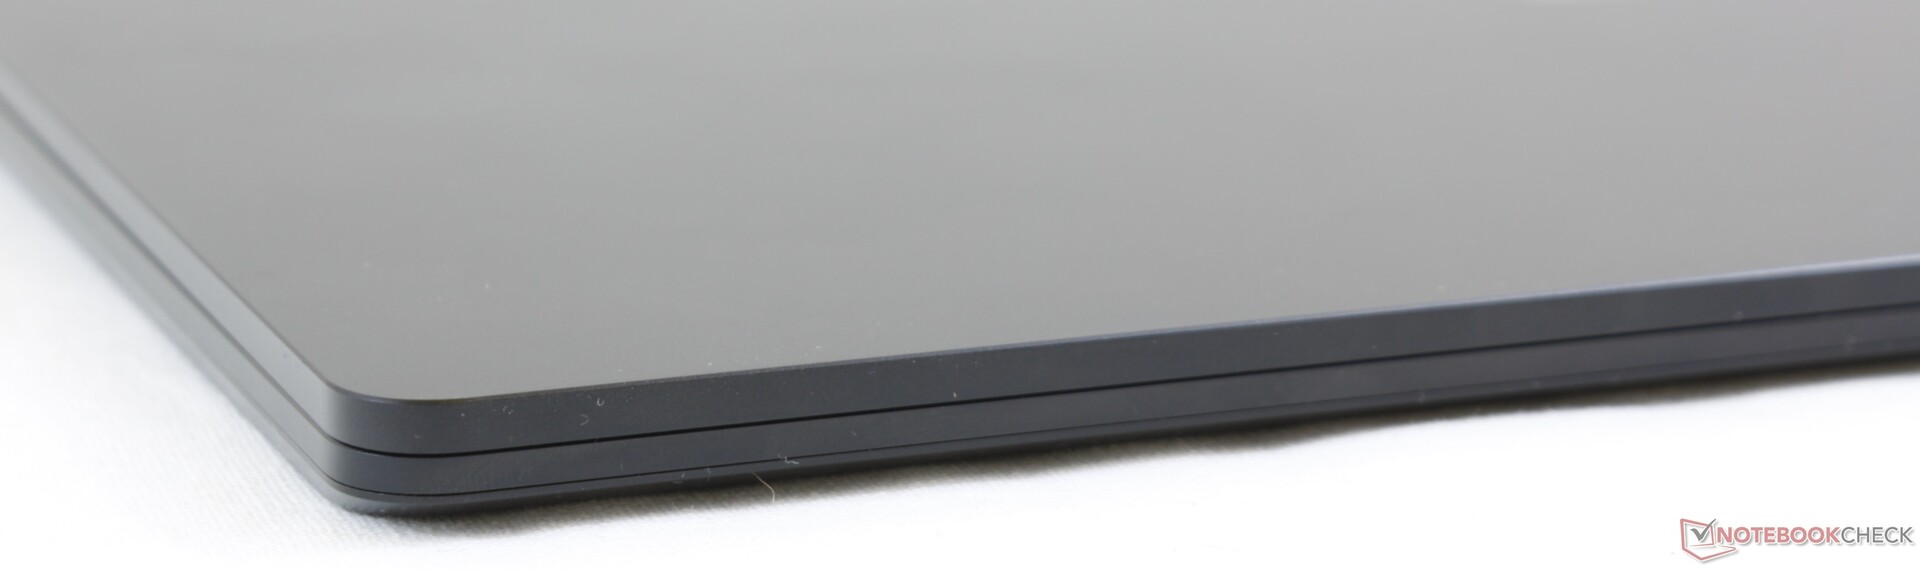
Case - Lightweight and Very Square
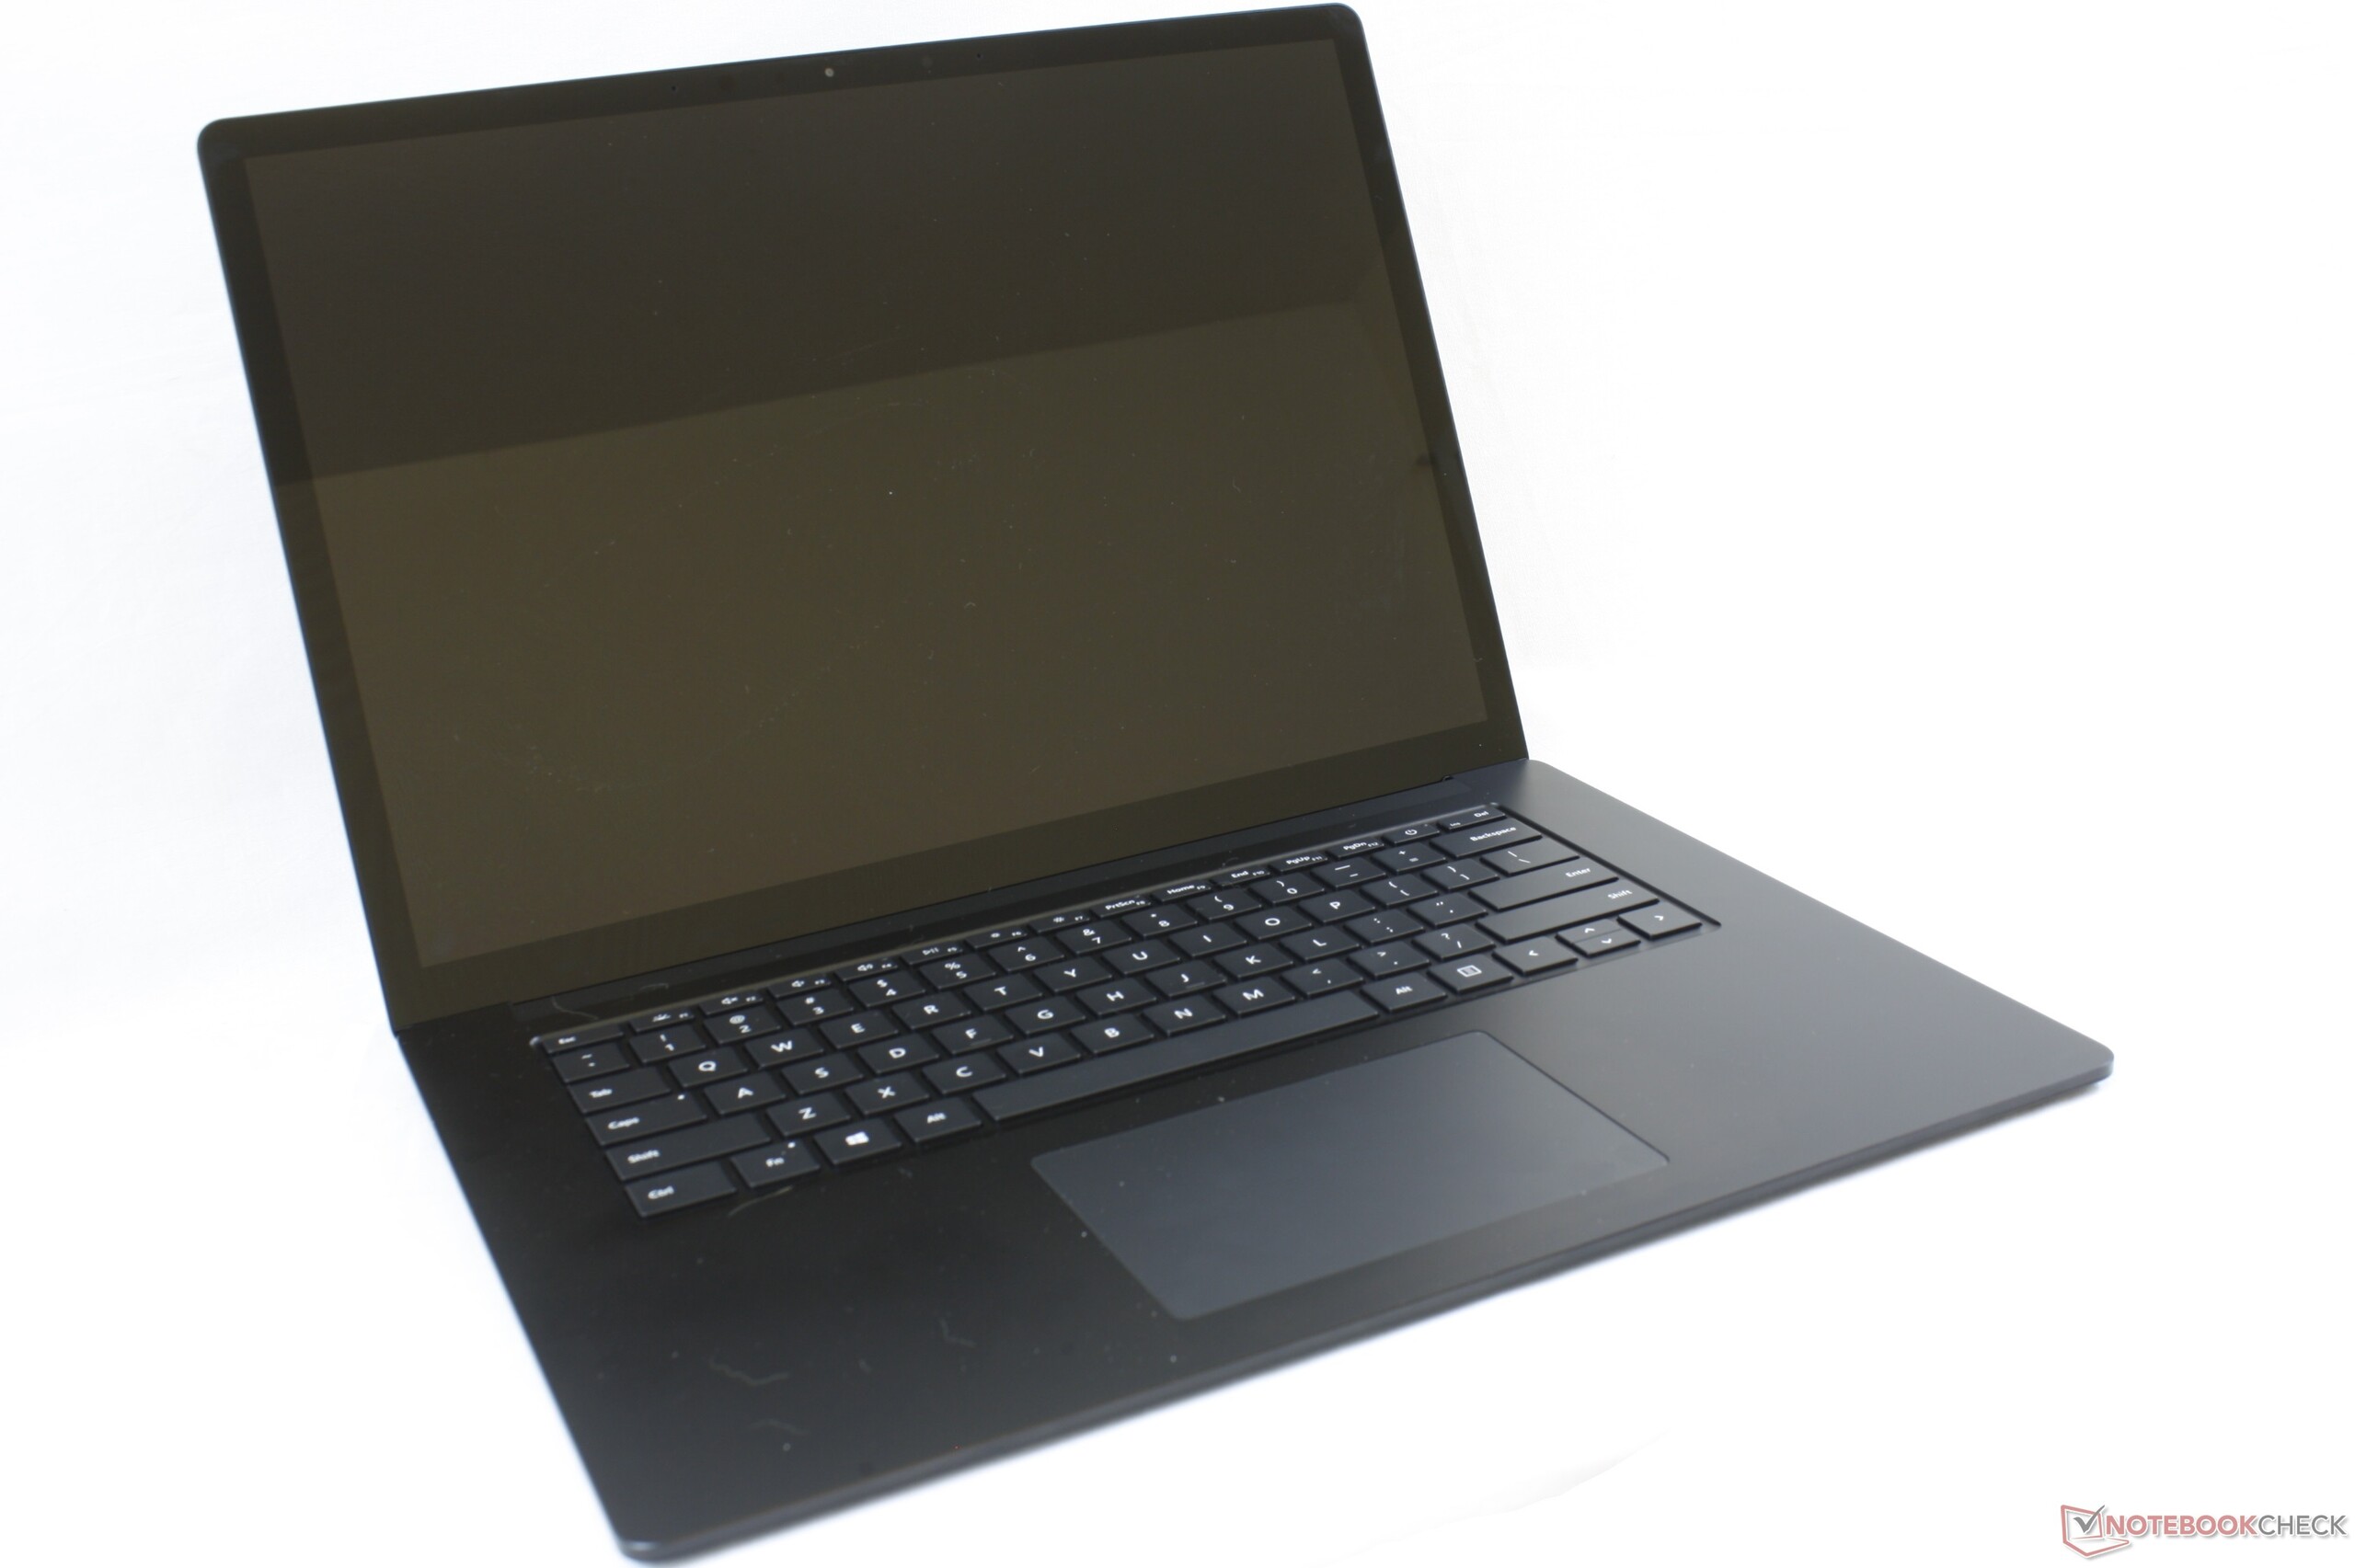
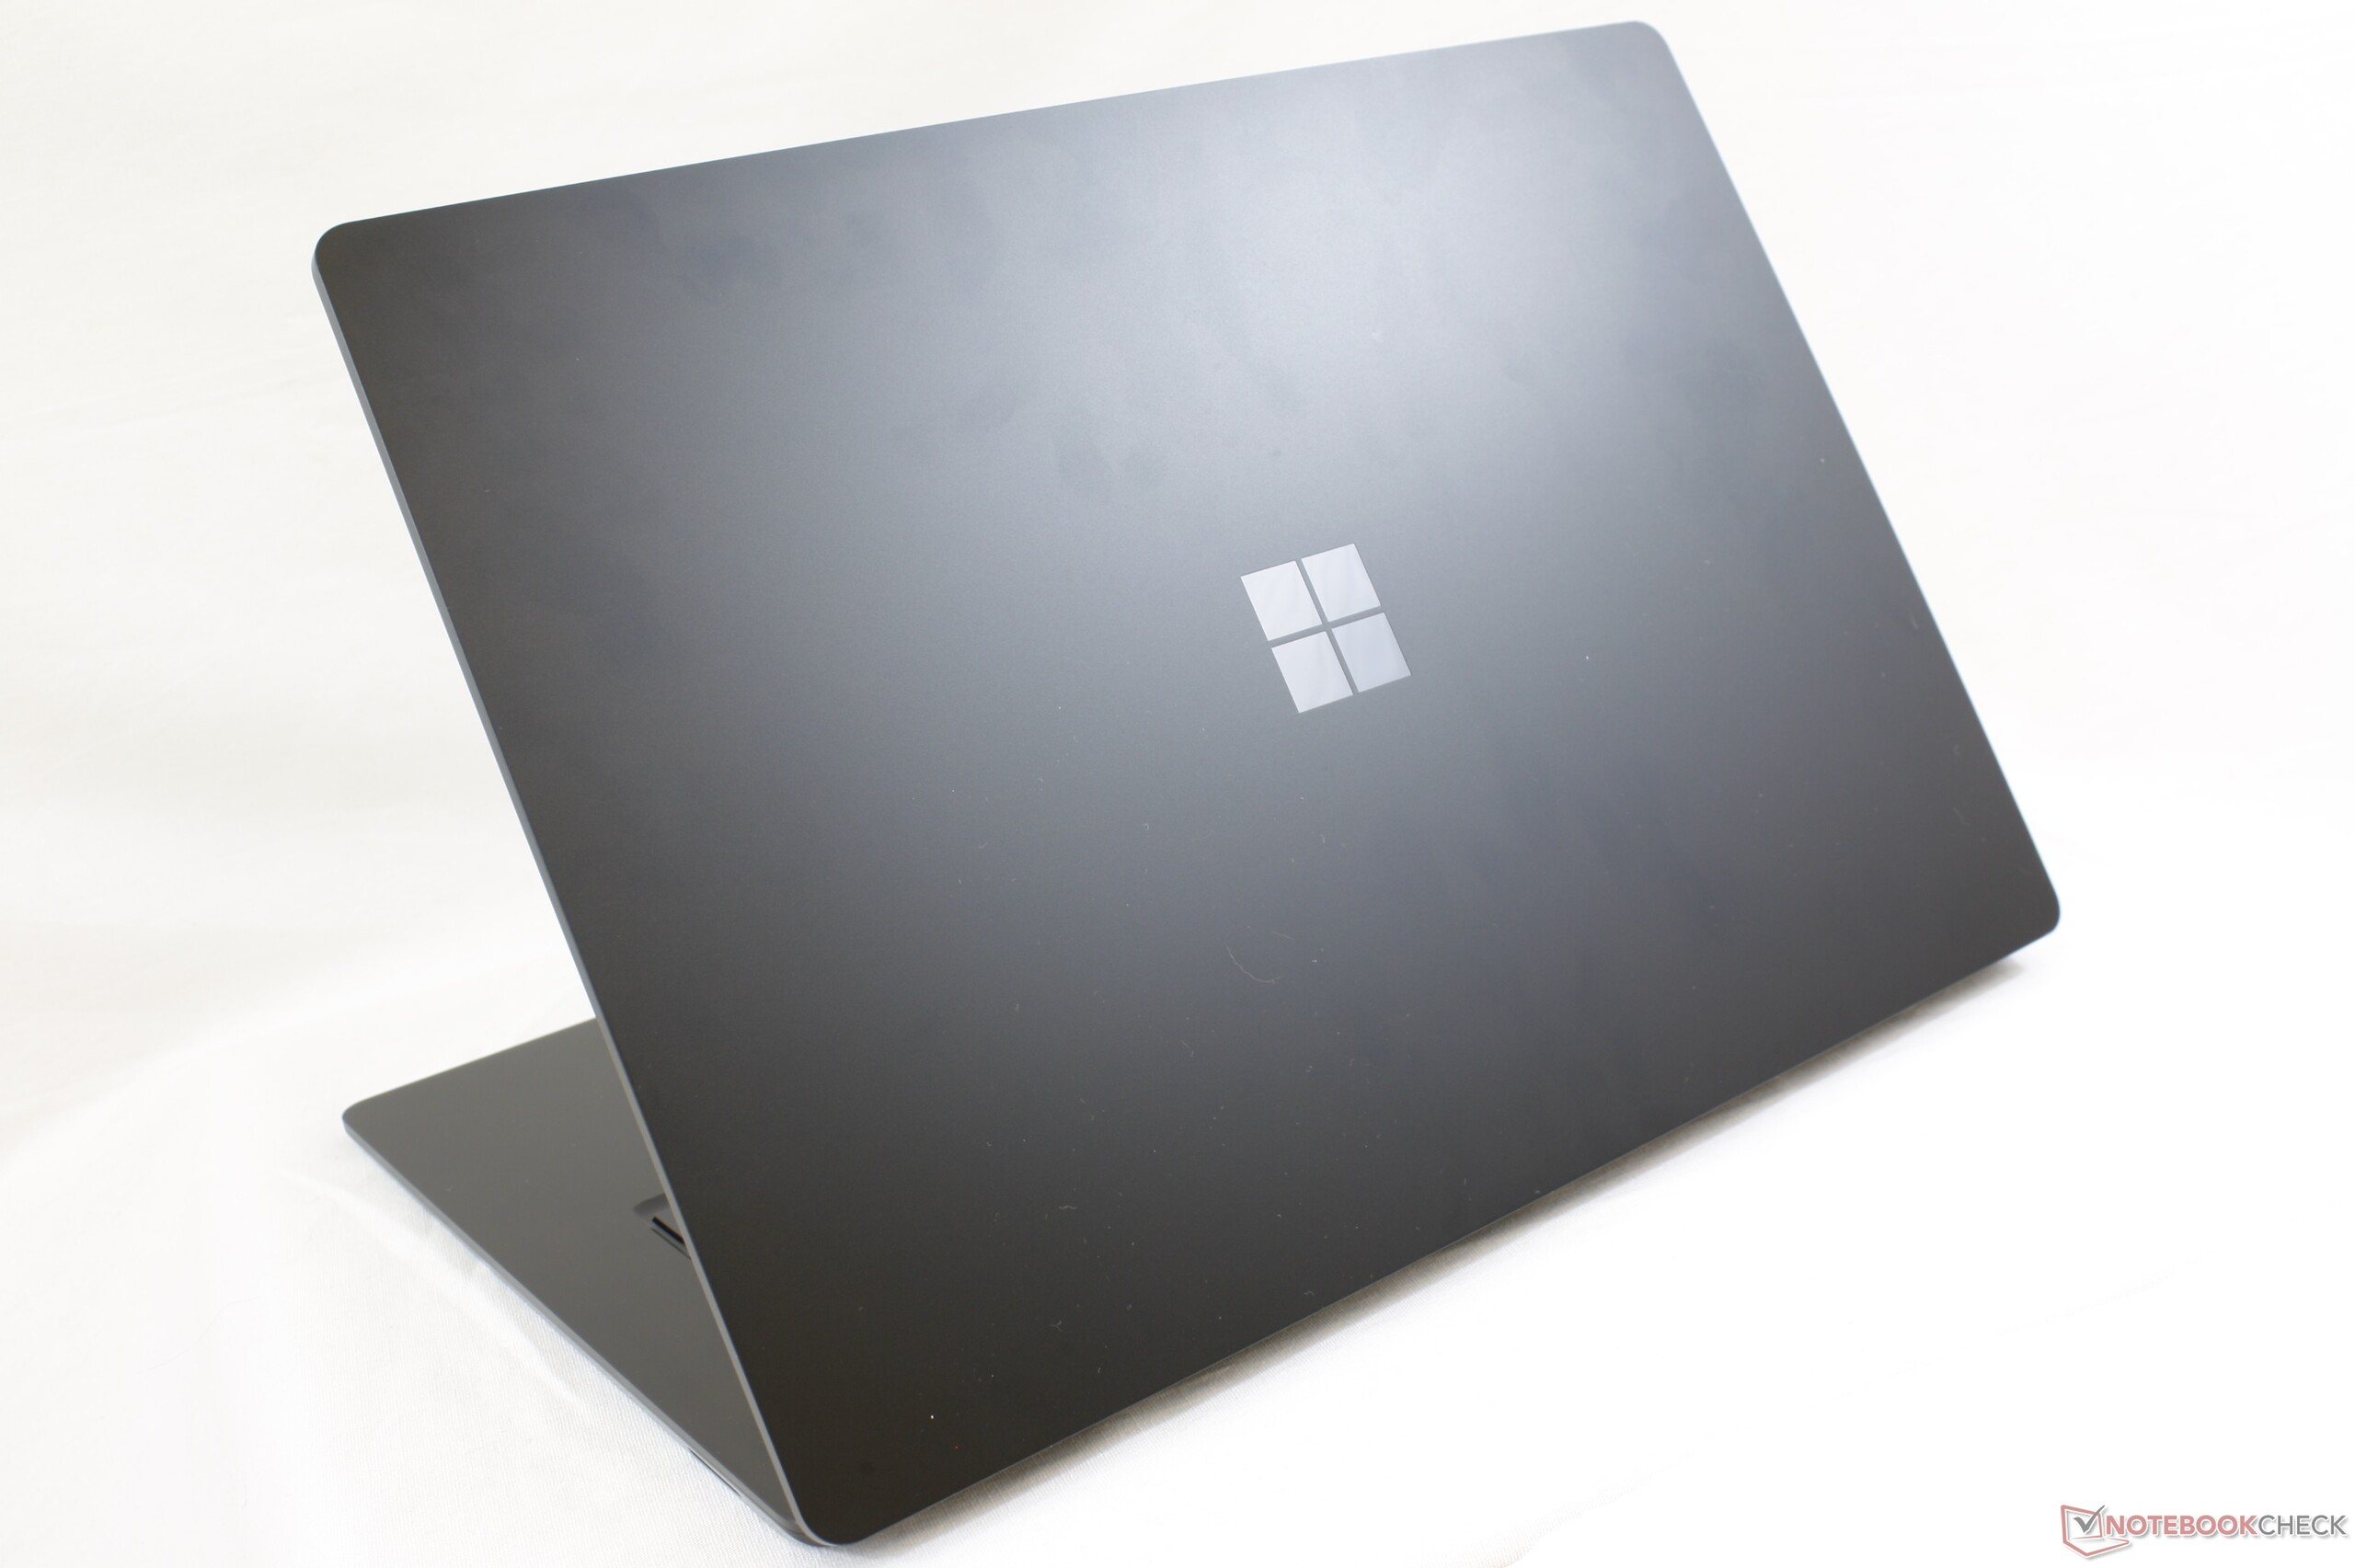
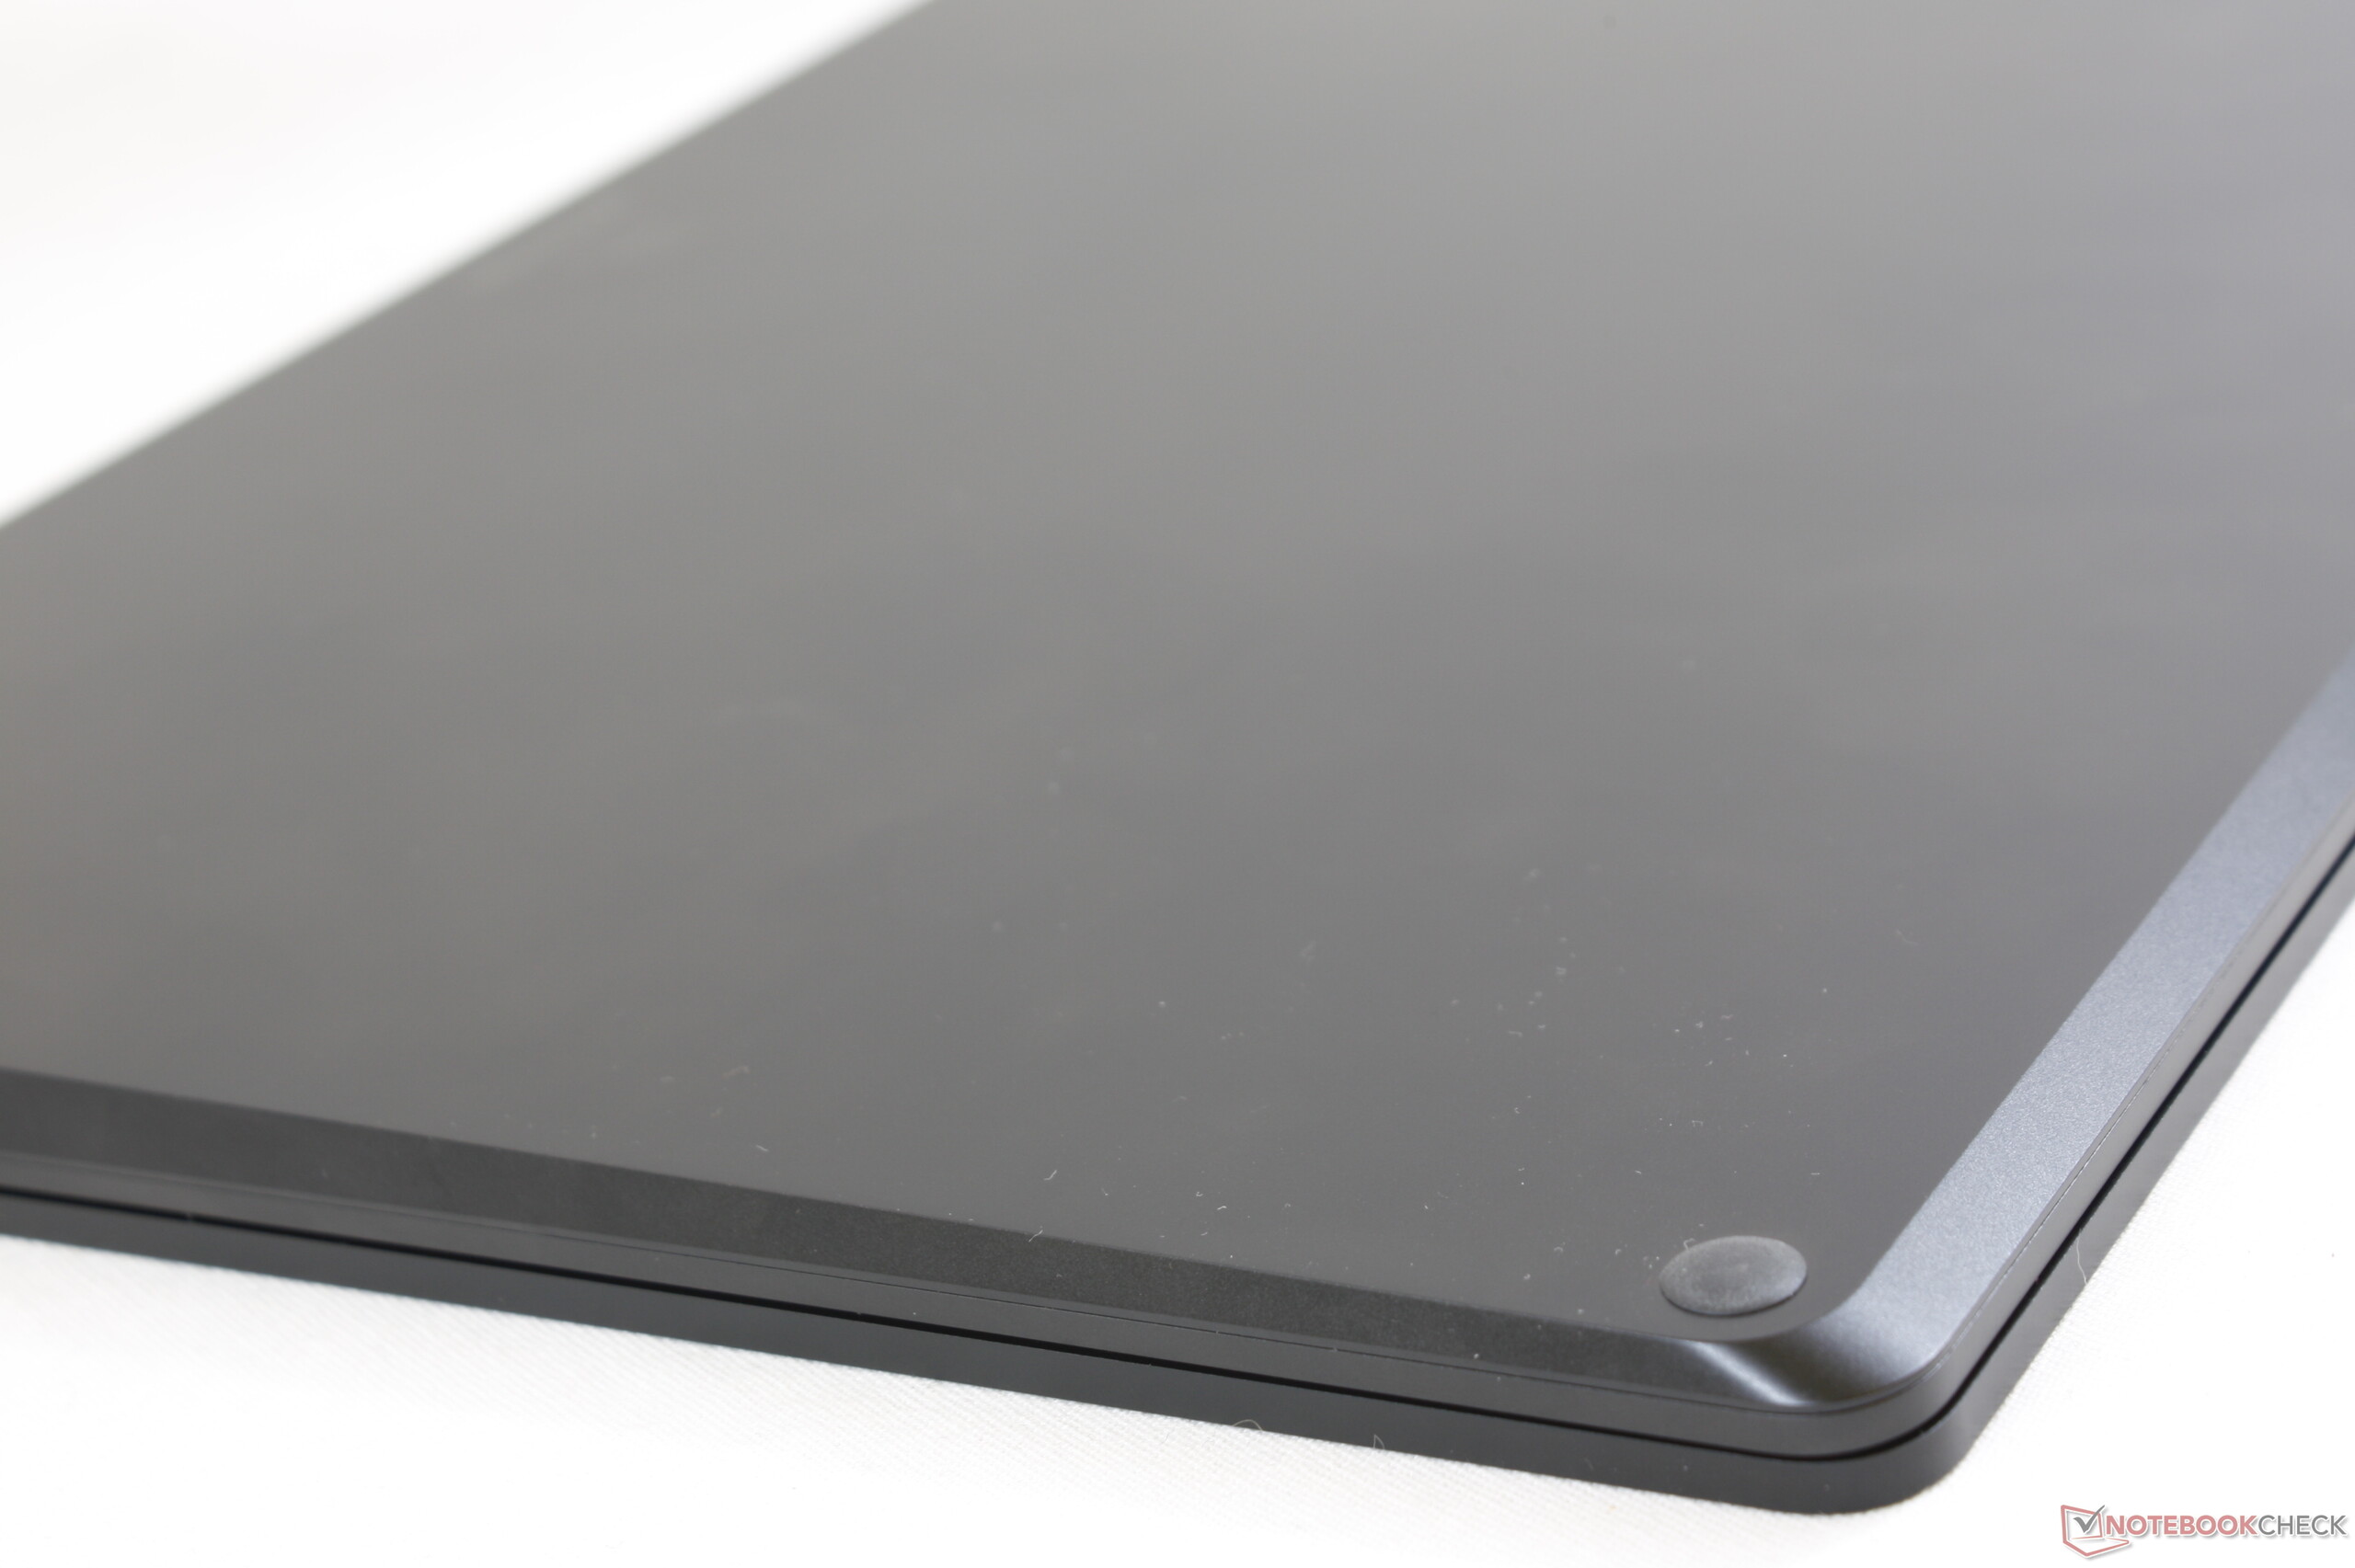
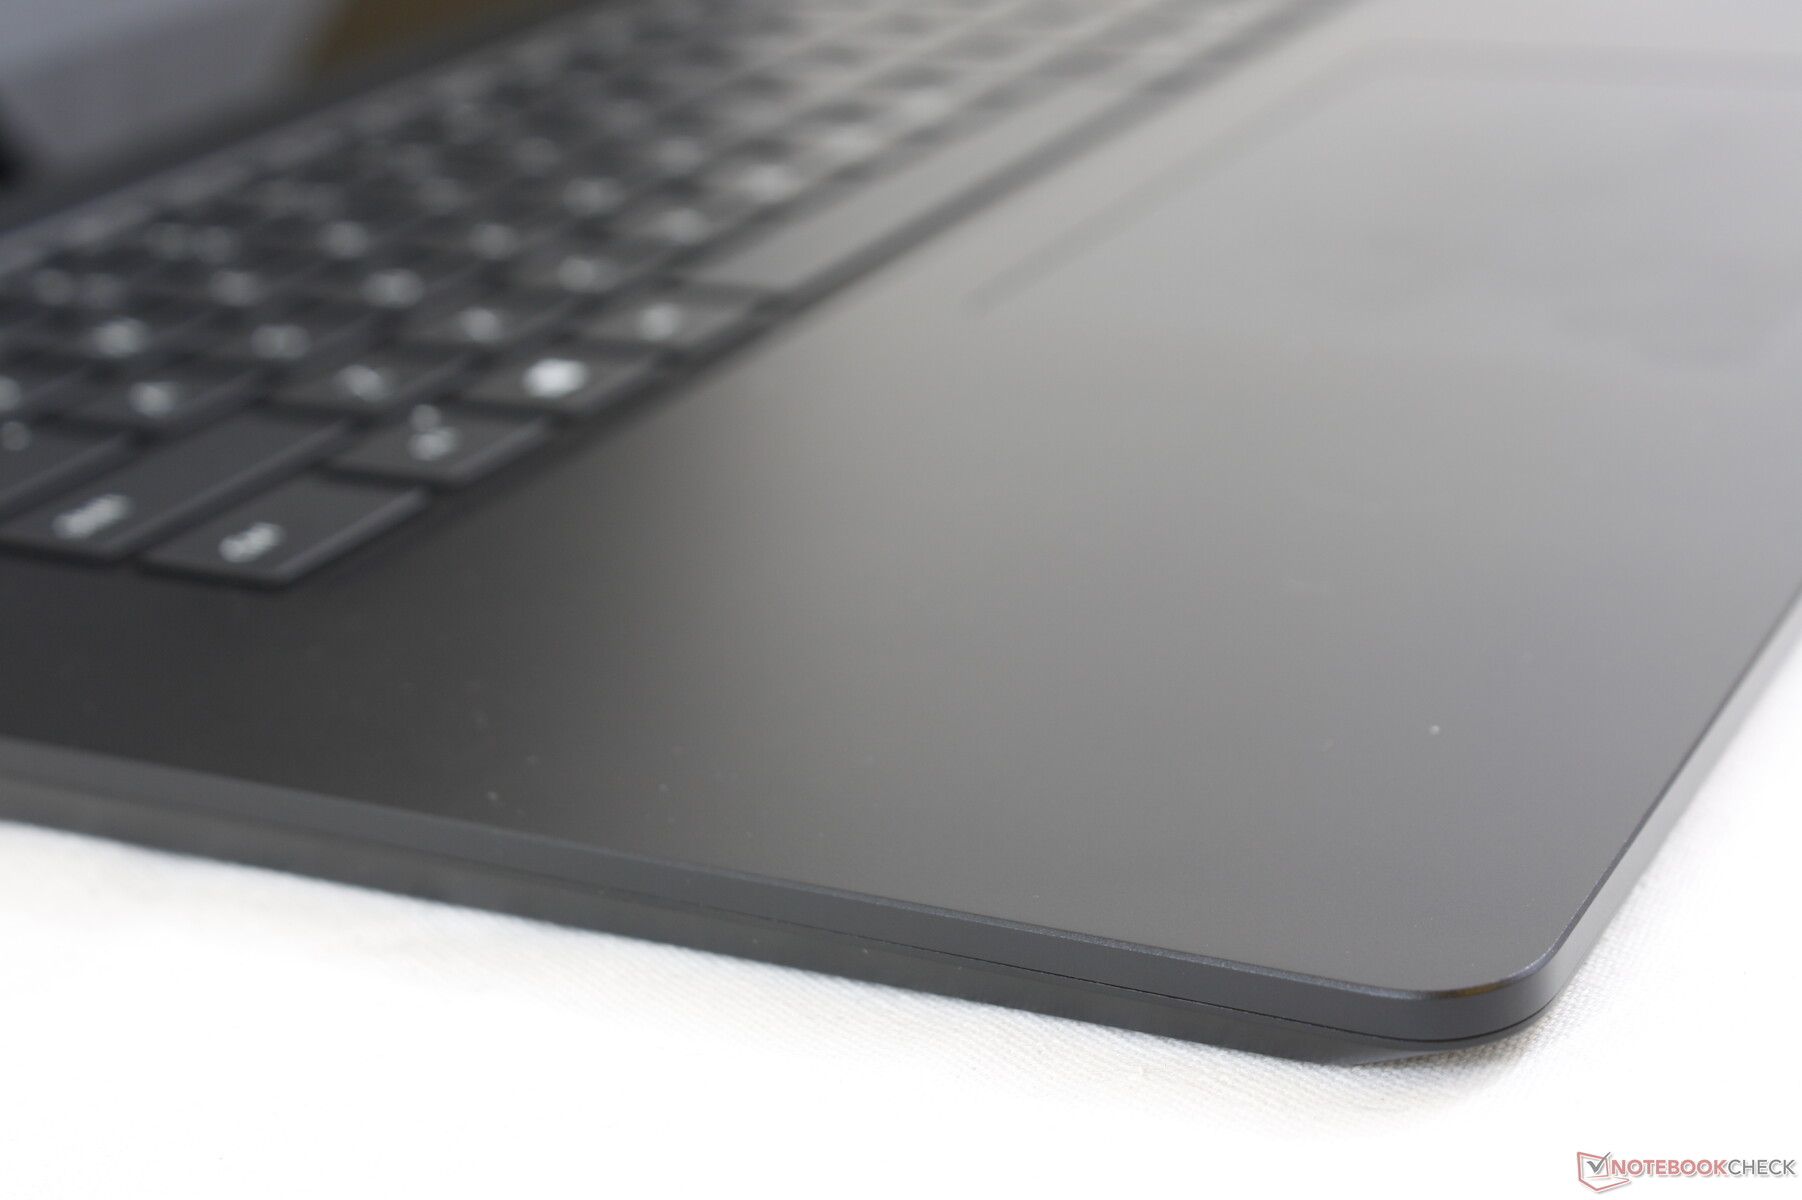
After two generations of complaints, Microsoft is finally offering a metal chassis for its third generation Surface Laptop series in addition to the usual Alcantara that has defined the series. We don't miss Alcantara one bit after having experienced the metal chassis; the smooth surfaces feel more rigid to the touch, look more luxurious than Alcantara, and are easier to clean. In fact, the chassis is one of the best aspects of the new 15-inch Surface Laptop as both flexing and creaking are minimal around the keyboard and outer lid for strong first impressions. We still find the XPS 15, MacBook Pro 15, and Razer Blade 15 to be stronger when it comes to rigidity, but the Microsoft laptop isn't too far behind.
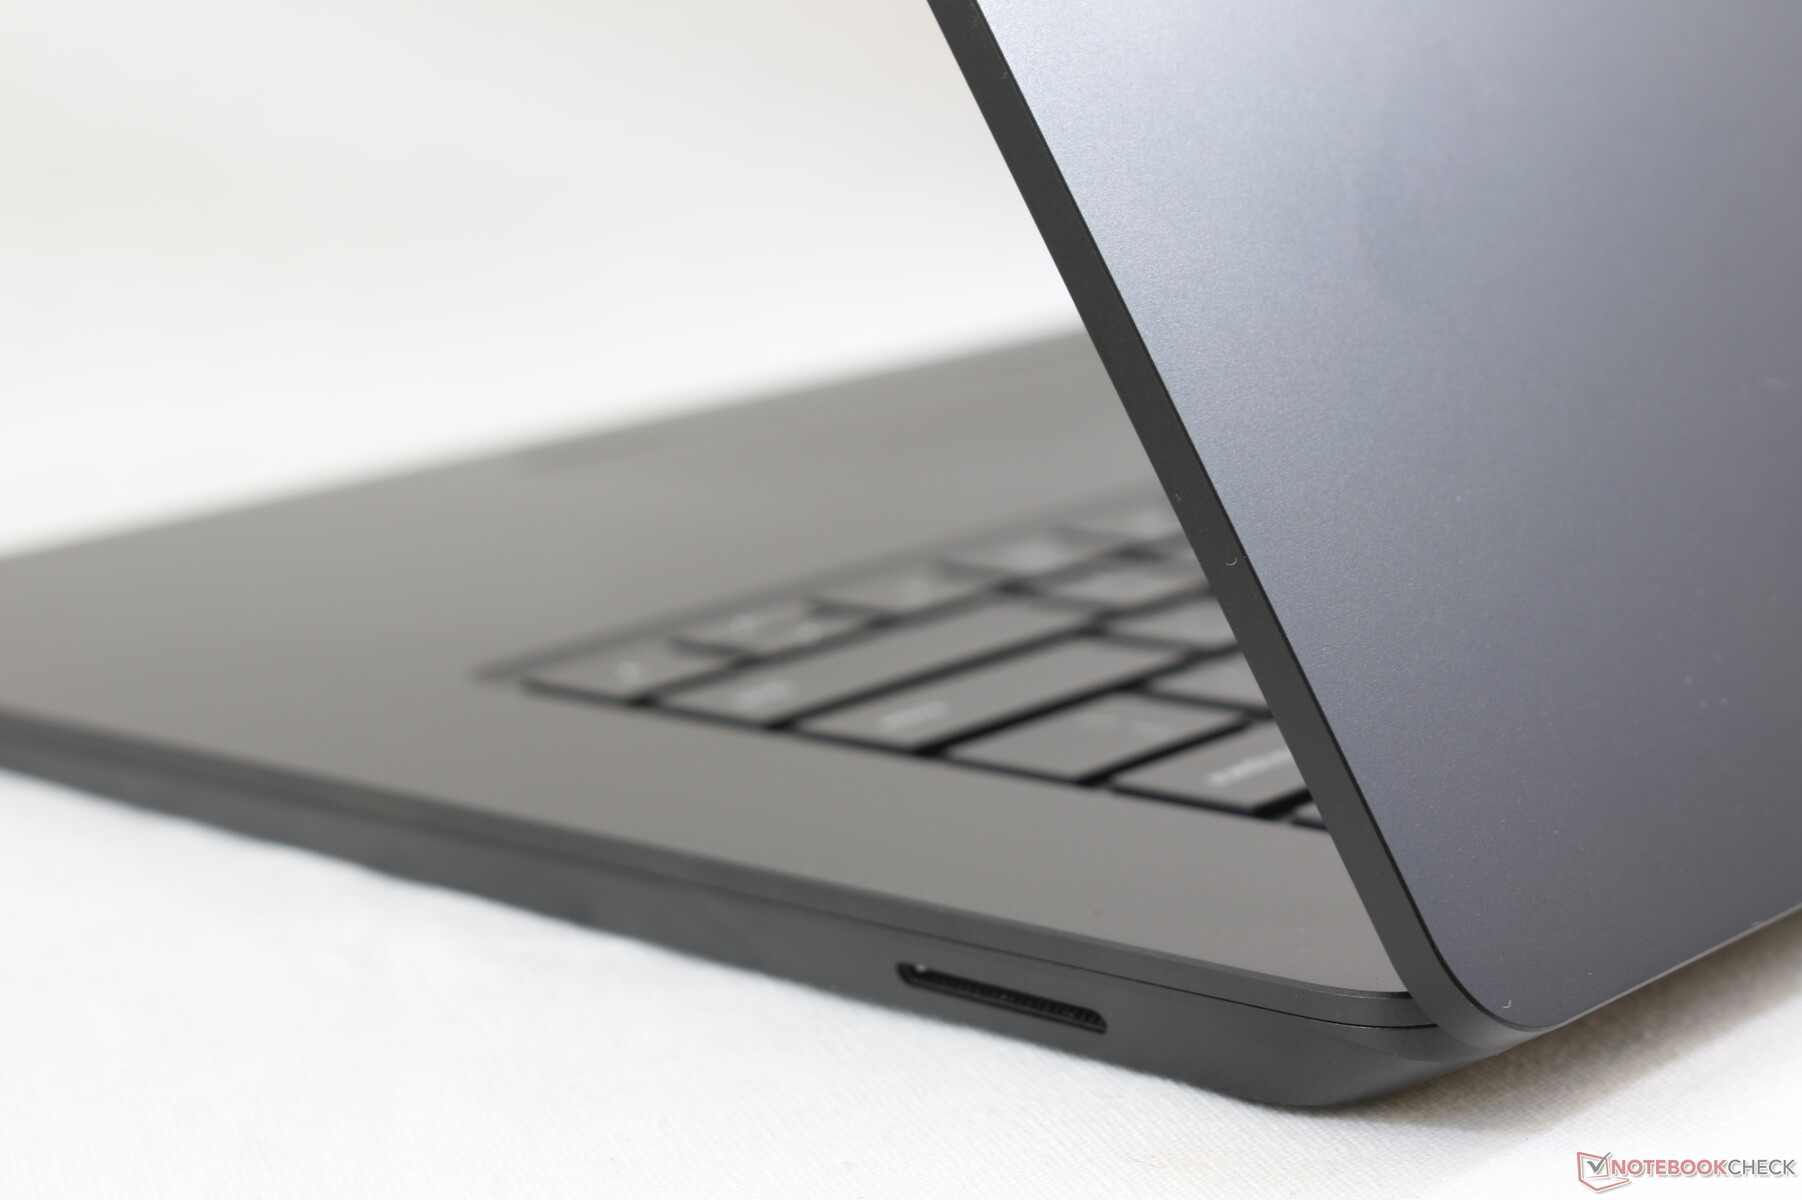
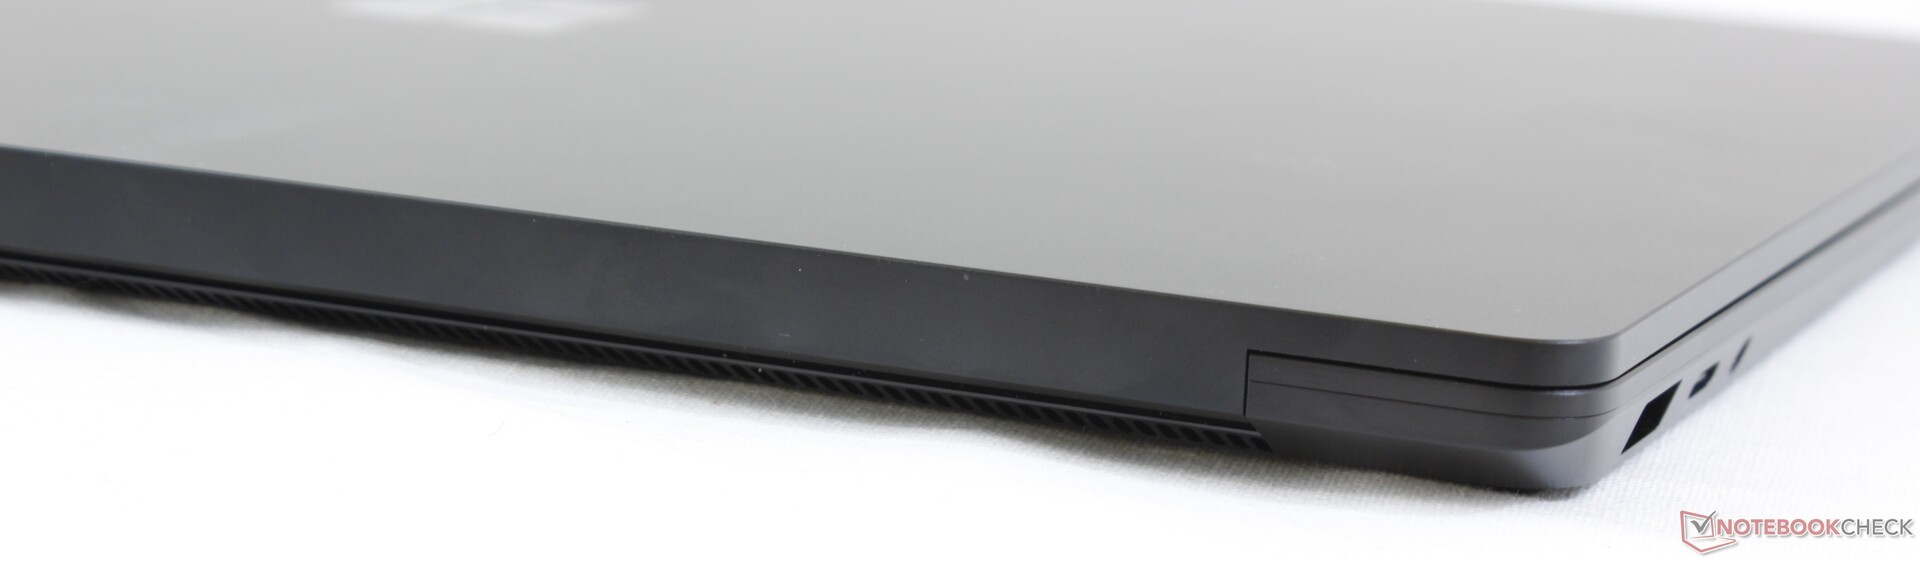
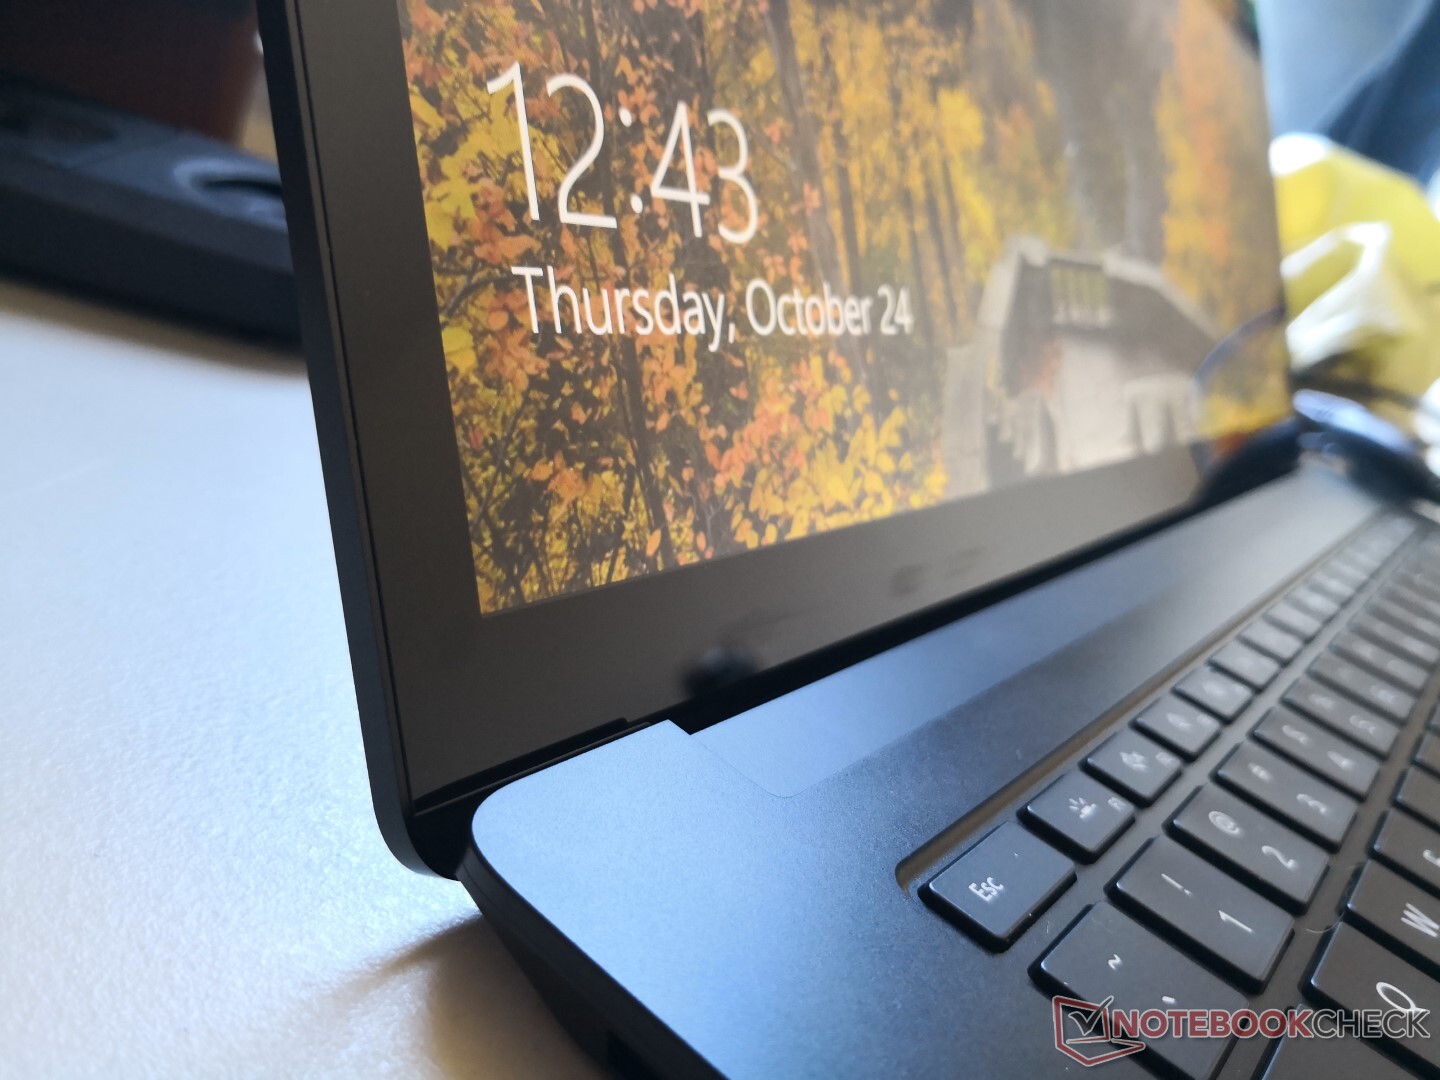
Perhaps the biggest eyesore of the design is its thick display bezels. The Surface Laptop 3 15 looks like an expanded version of the Huawei MateBook X Pro since both are 3:2 Ultrabooks, but the latter benefits from much narrower bezels for a more modern look. We suspect that Microsoft will eventually shrink the bezels for the next generation revision in order to match the current trend of narrow-bezel designs.
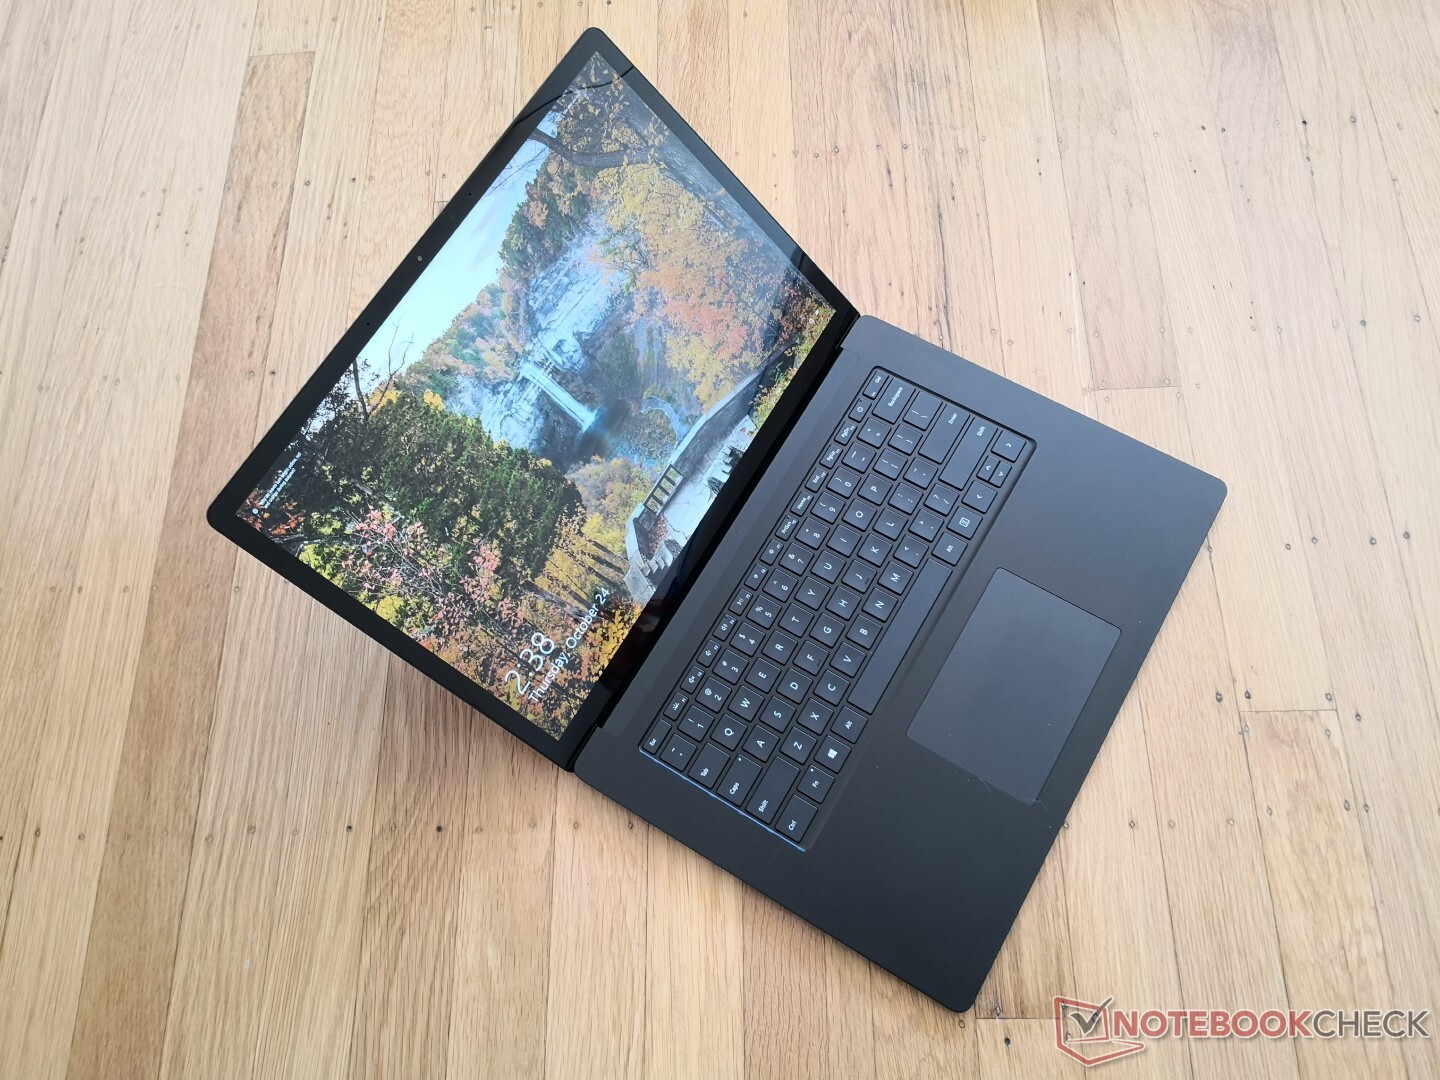

In terms of size and weight, the Microsoft laptop is both thinner and lighter than most traditional 15.6-inch Ultrabooks including the XPS 15, Asus ZenBook 15, HP Spectre x360 15, and the MacBook Pro 15. However, its uncommon 3:2 form factor means the chassis is squarer and longer in length as a result which can potentially make it incompatible with laptop cases designed for 16:9 systems.
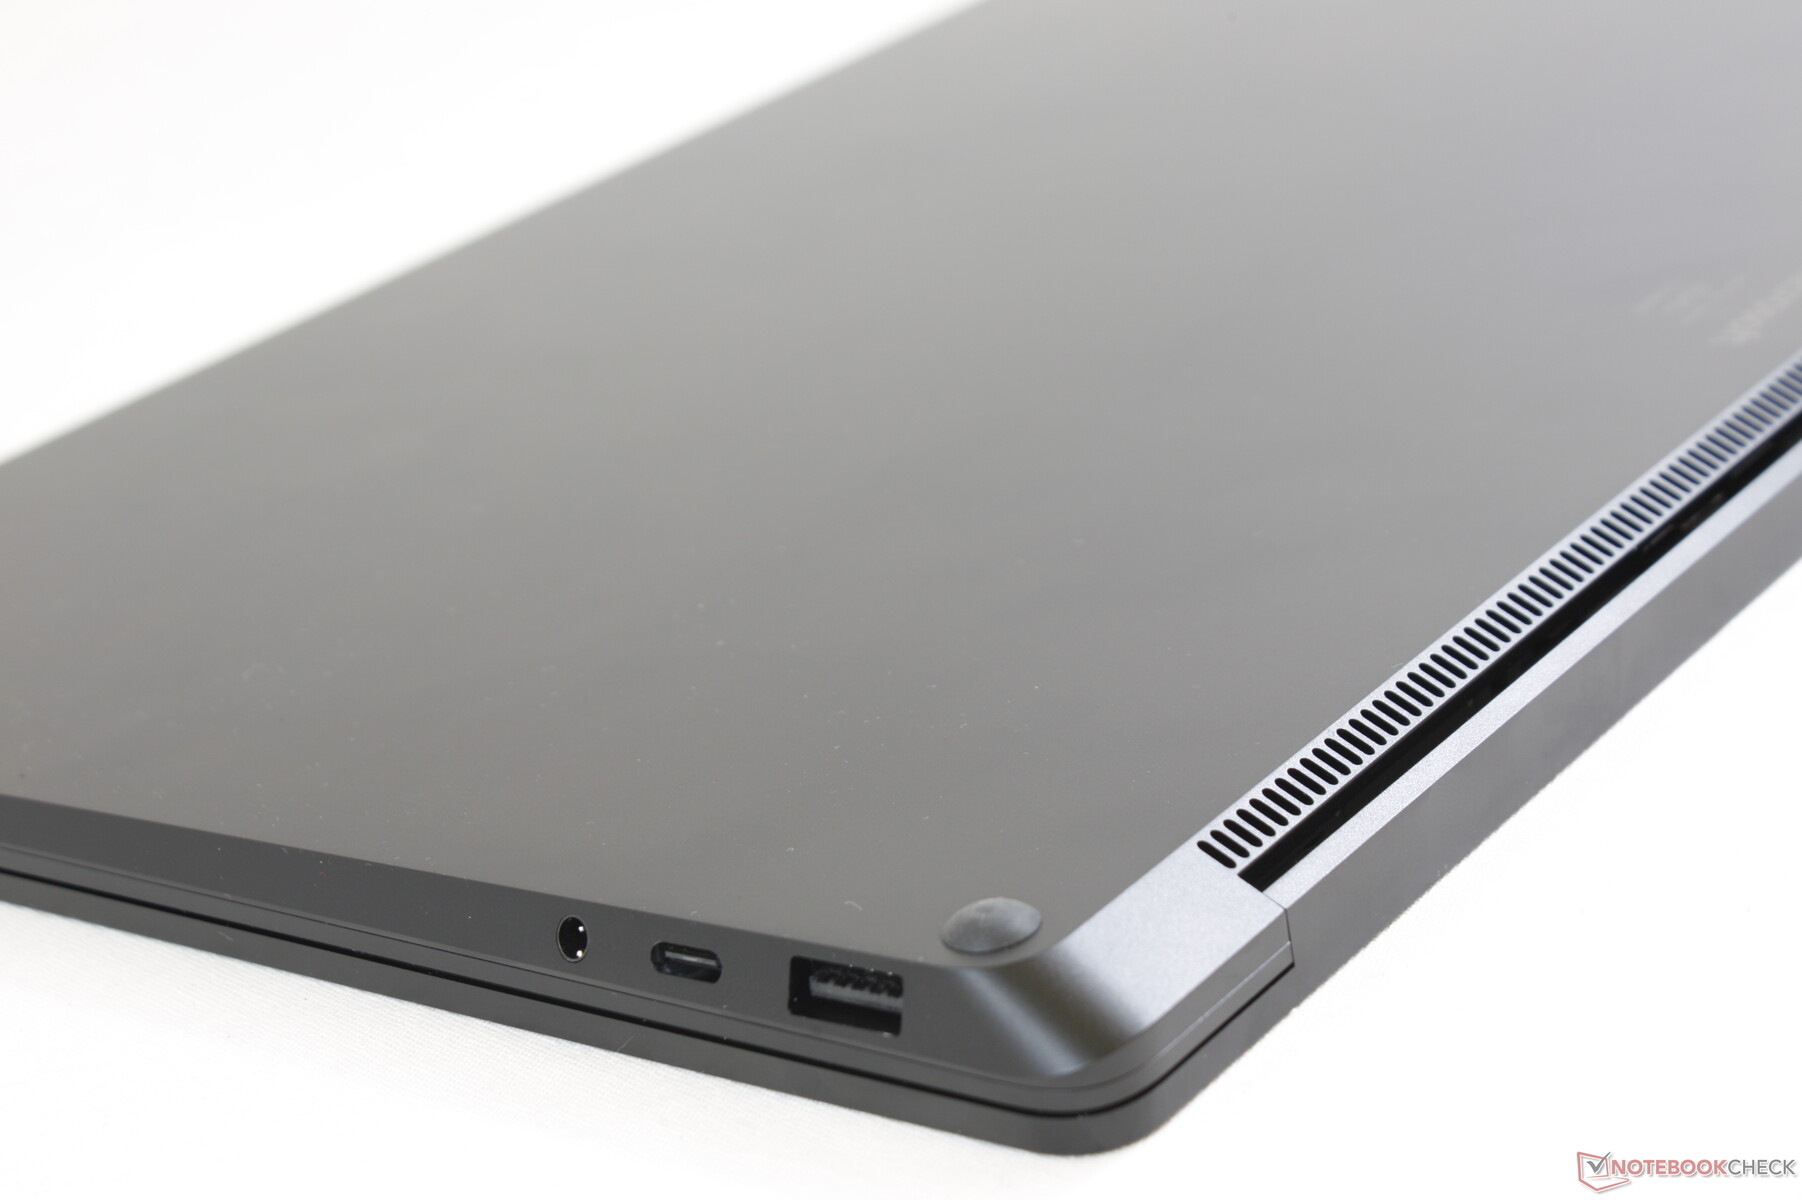
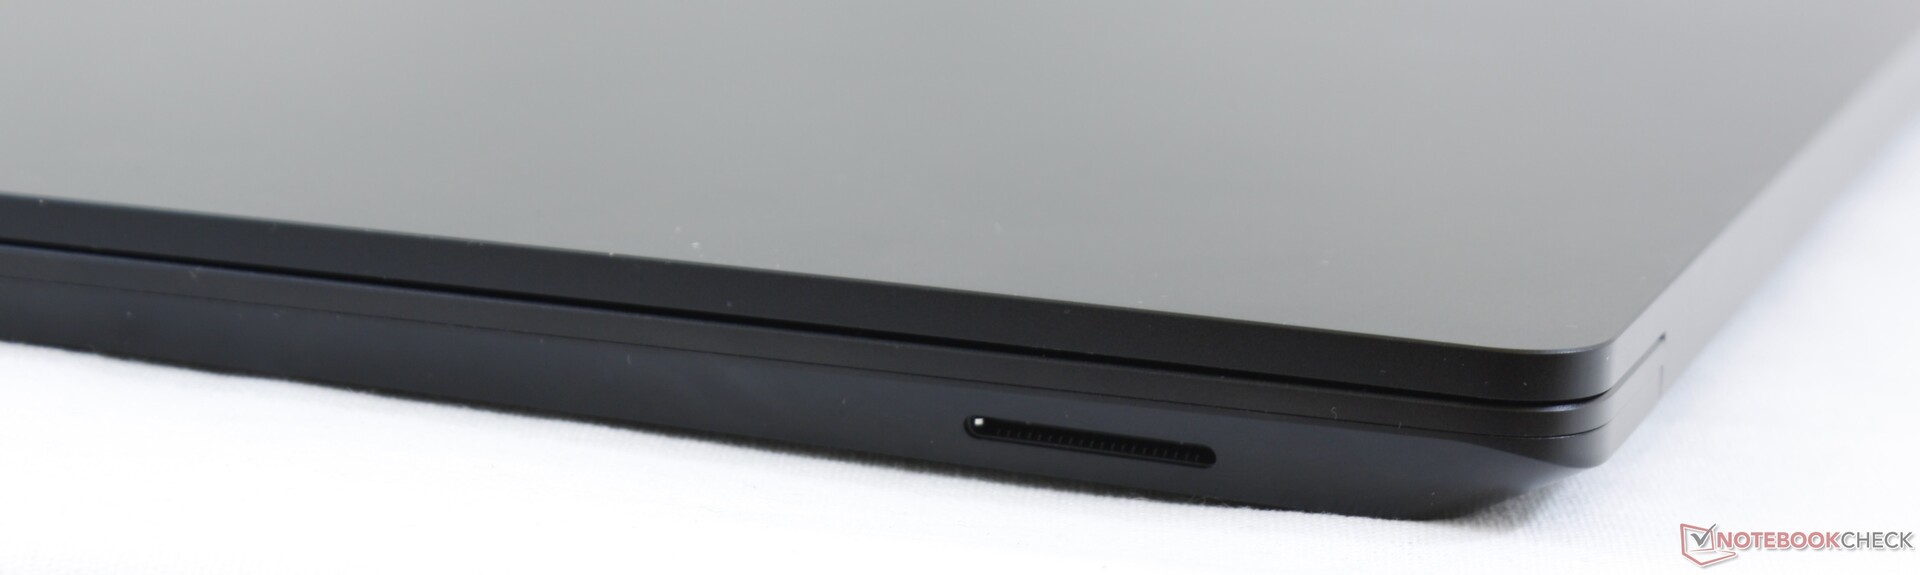
Connectivity - What Connectivity?
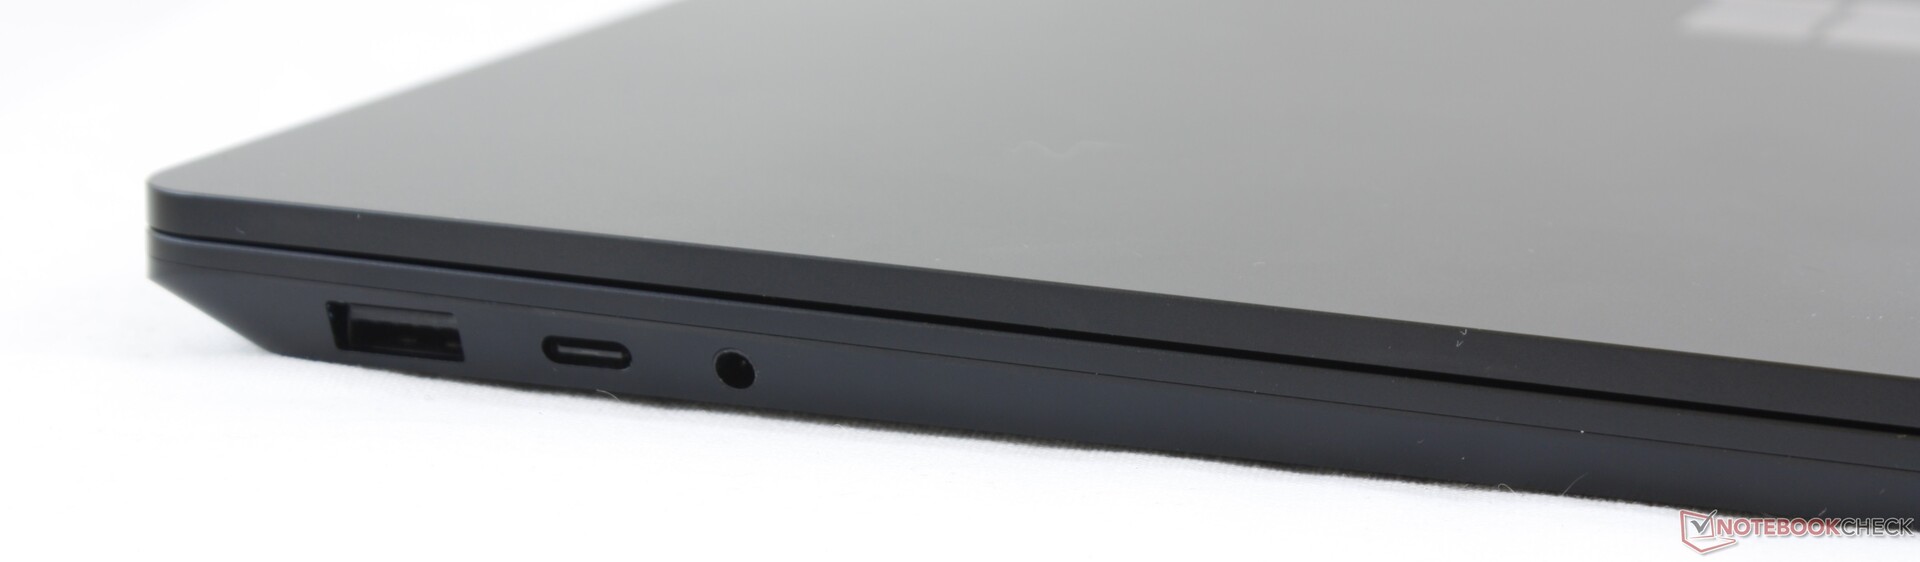
Surface devices have always been stingy when it comes to ports and the Surface Laptop 3 is no different. The dedicated mini DisplayPort is gone and so users will have to rely on DisplayPort over USB Type-C or the $200 Surface Dock for connecting external monitors. Port positioning is otherwise excellent with the few options available.
Interestingly, DisplayPort over USB would only work after updating to the latest drivers at the time of writing.
Communication
The system uses a soldered Qualcomm/Atheros QCA6174 module for 867 Mbps wireless and Bluetooth 5. Wi-Fi 6 options are reserved only for the smaller 13.5-inch Surface Laptop 3. We experienced no wireless issues during our time with the unit.
Maintenance
The bottom panel is secured by four Torx screws hidden underneath the rubber feet to be easier to service than the last generation model. The main problem, however, is that the rubber feet can be difficult to remove without the right tools and one can easily scratch the surrounding surface if not careful. iFixit has a detailed guide on the disassembly of the Surface Laptop 3 15 to reveal that nothing is upgradeable save for the solitary SSD.
Accessories and Warranty
There are no included extras in the box other than the small manual and AC adapter. A cleaning cloth, USB-to-RJ45 adapter, or protective sleeve would have been nice to see. The touchscreen is compatible with the Surface Pen that ships with the Surface Pro tablets.
The standard one-year limited warranty applies.
Input Devices - No Major Changes from the Surface Laptop 2
Keyboard
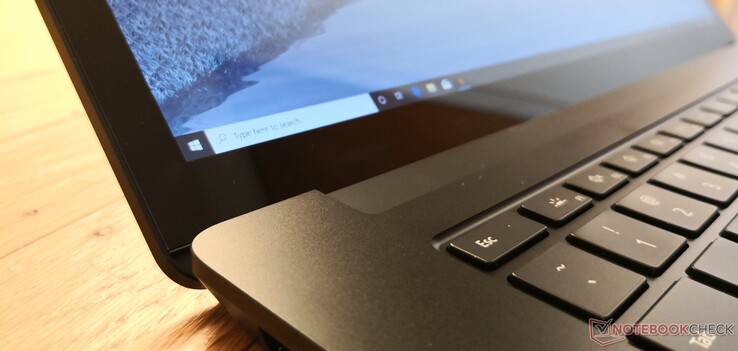
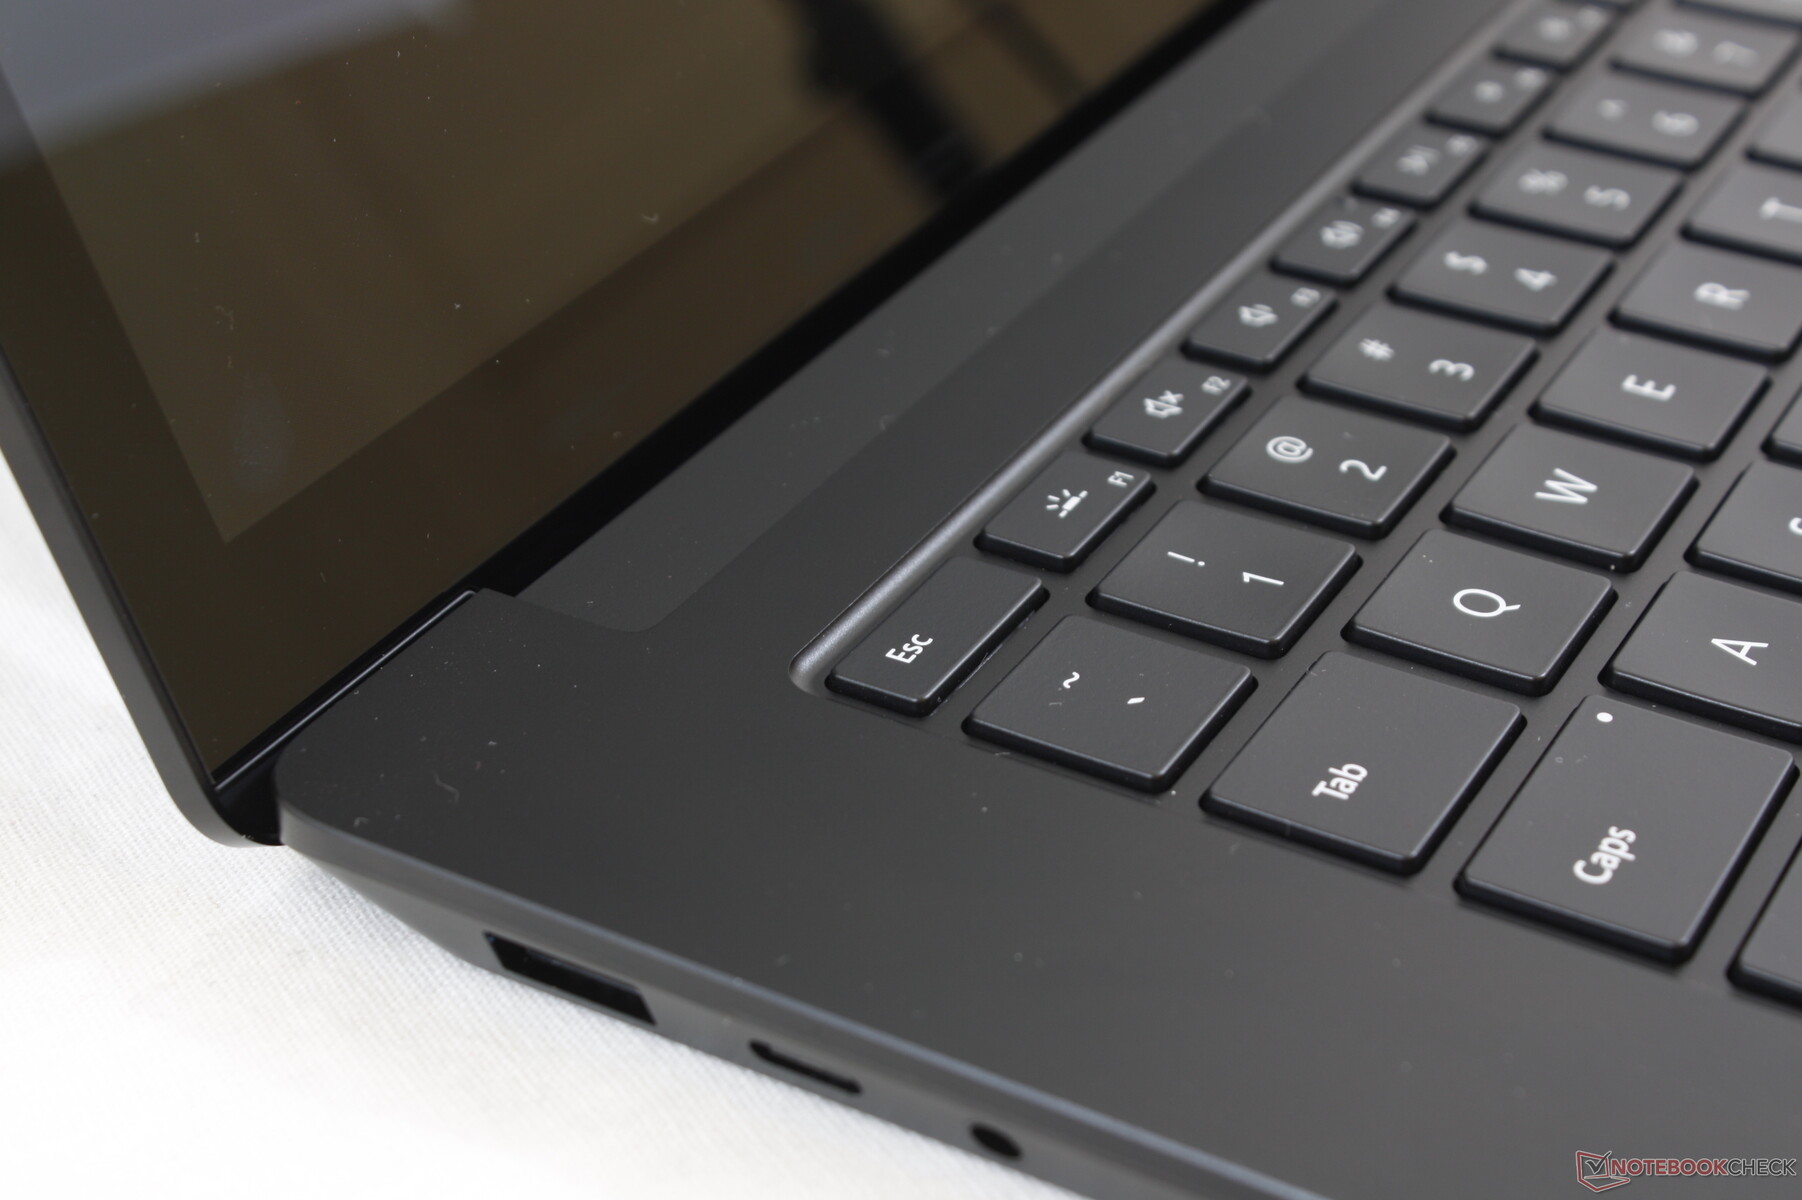
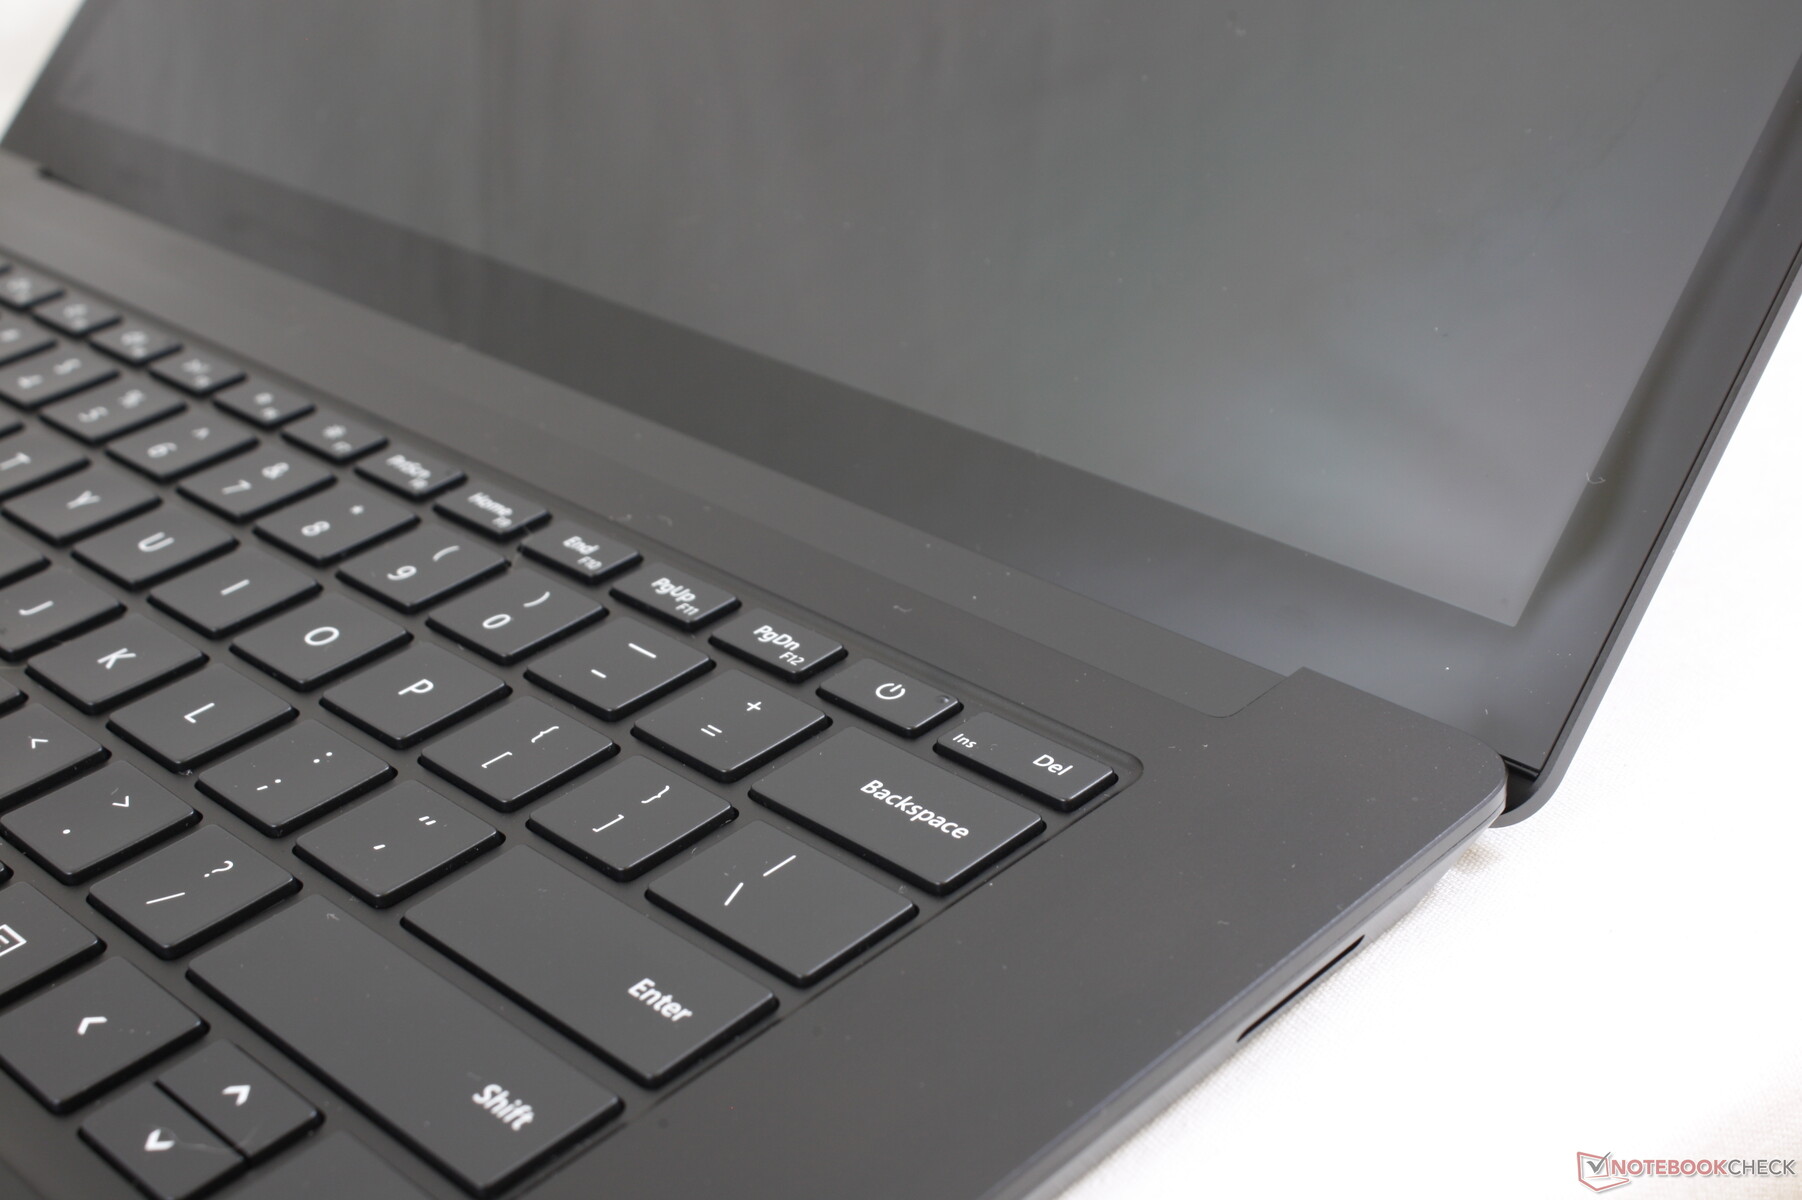
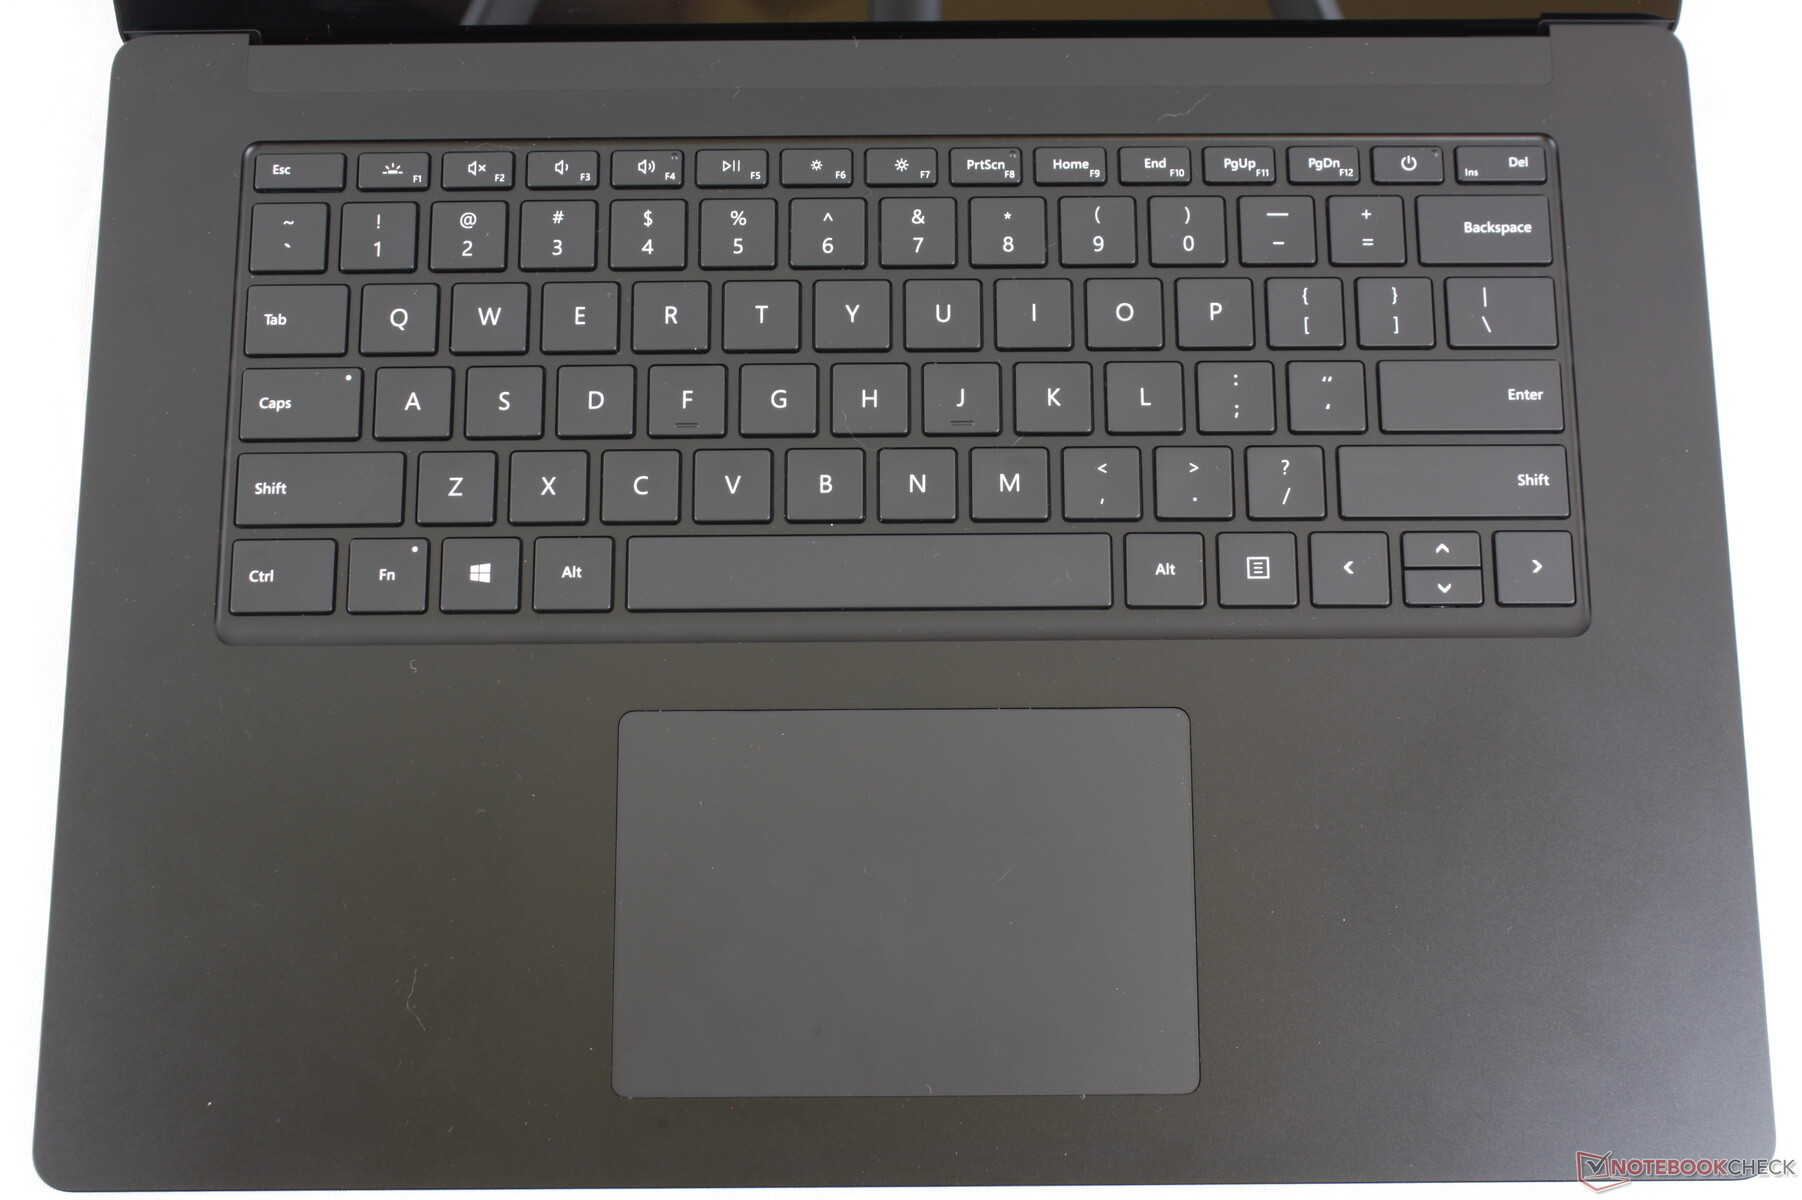
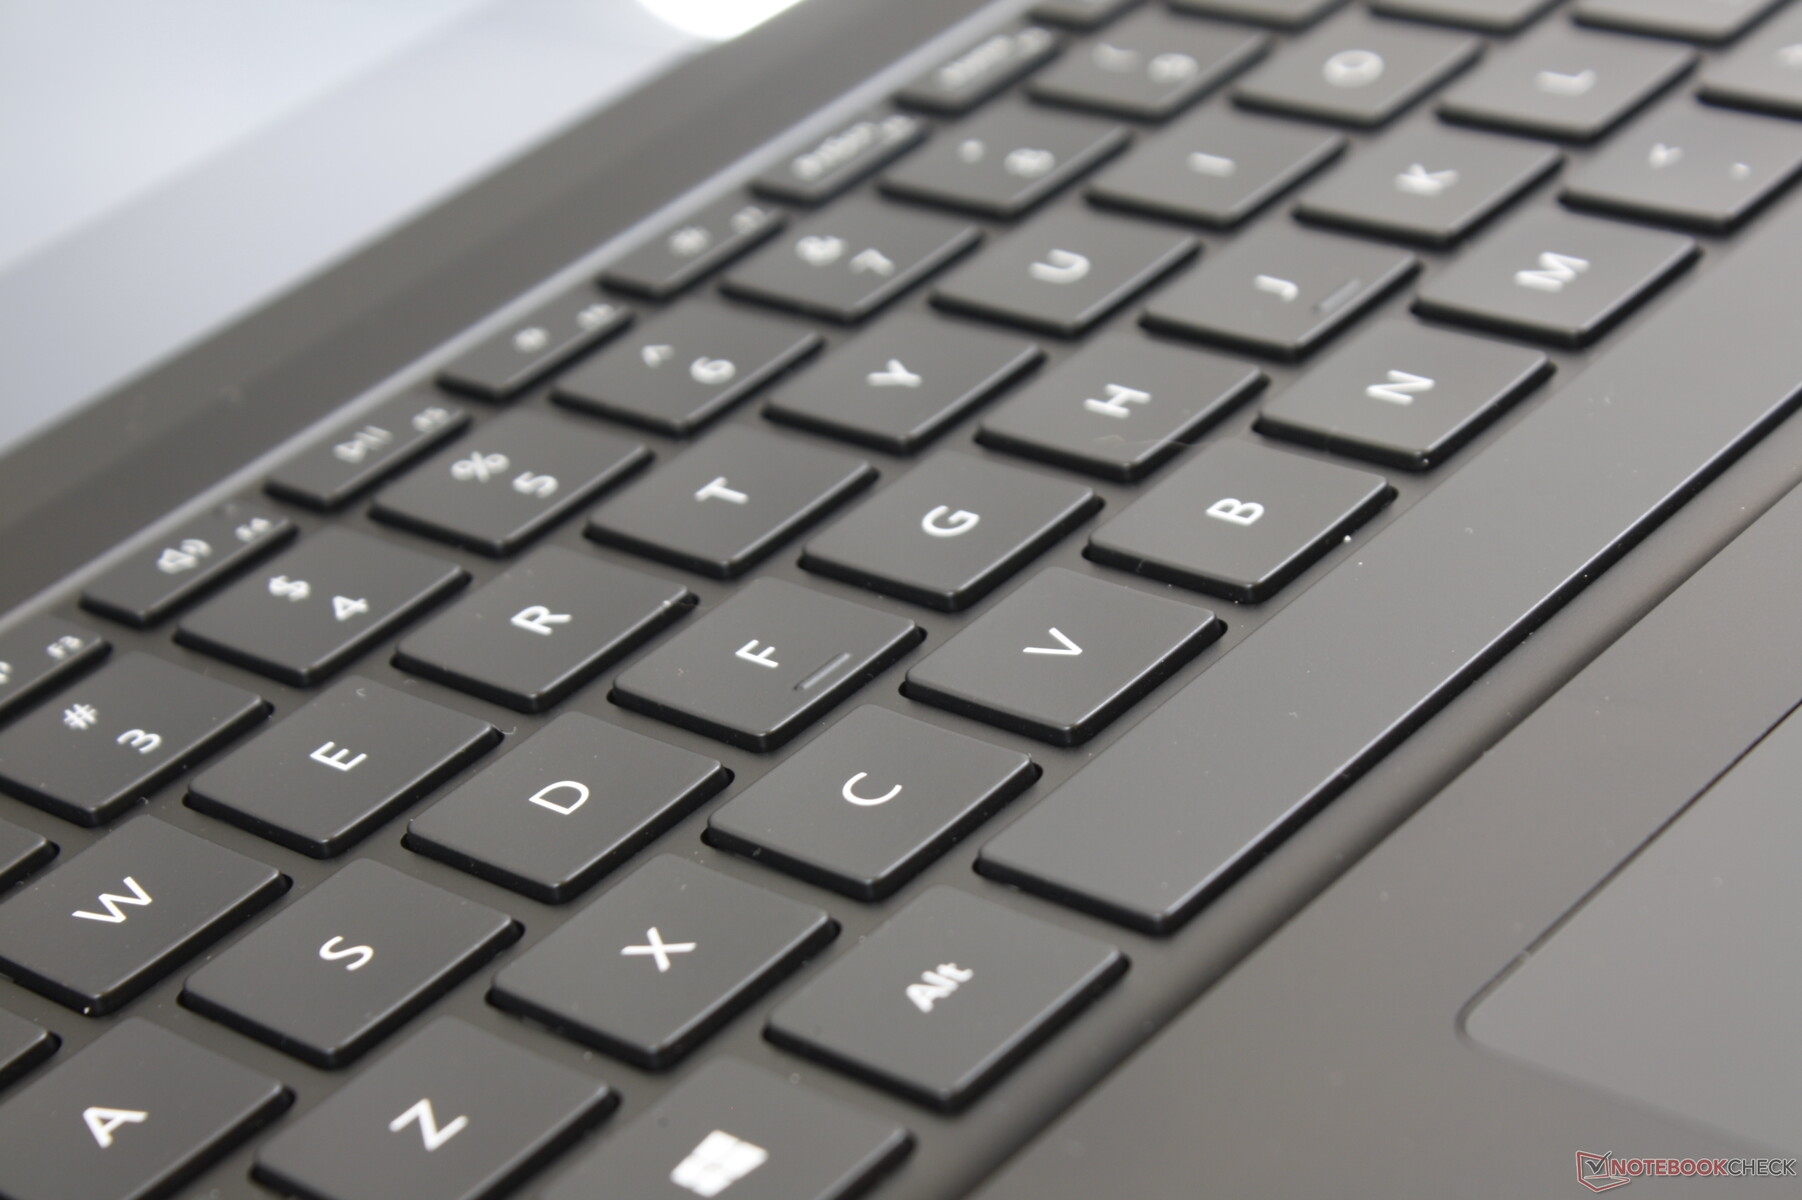
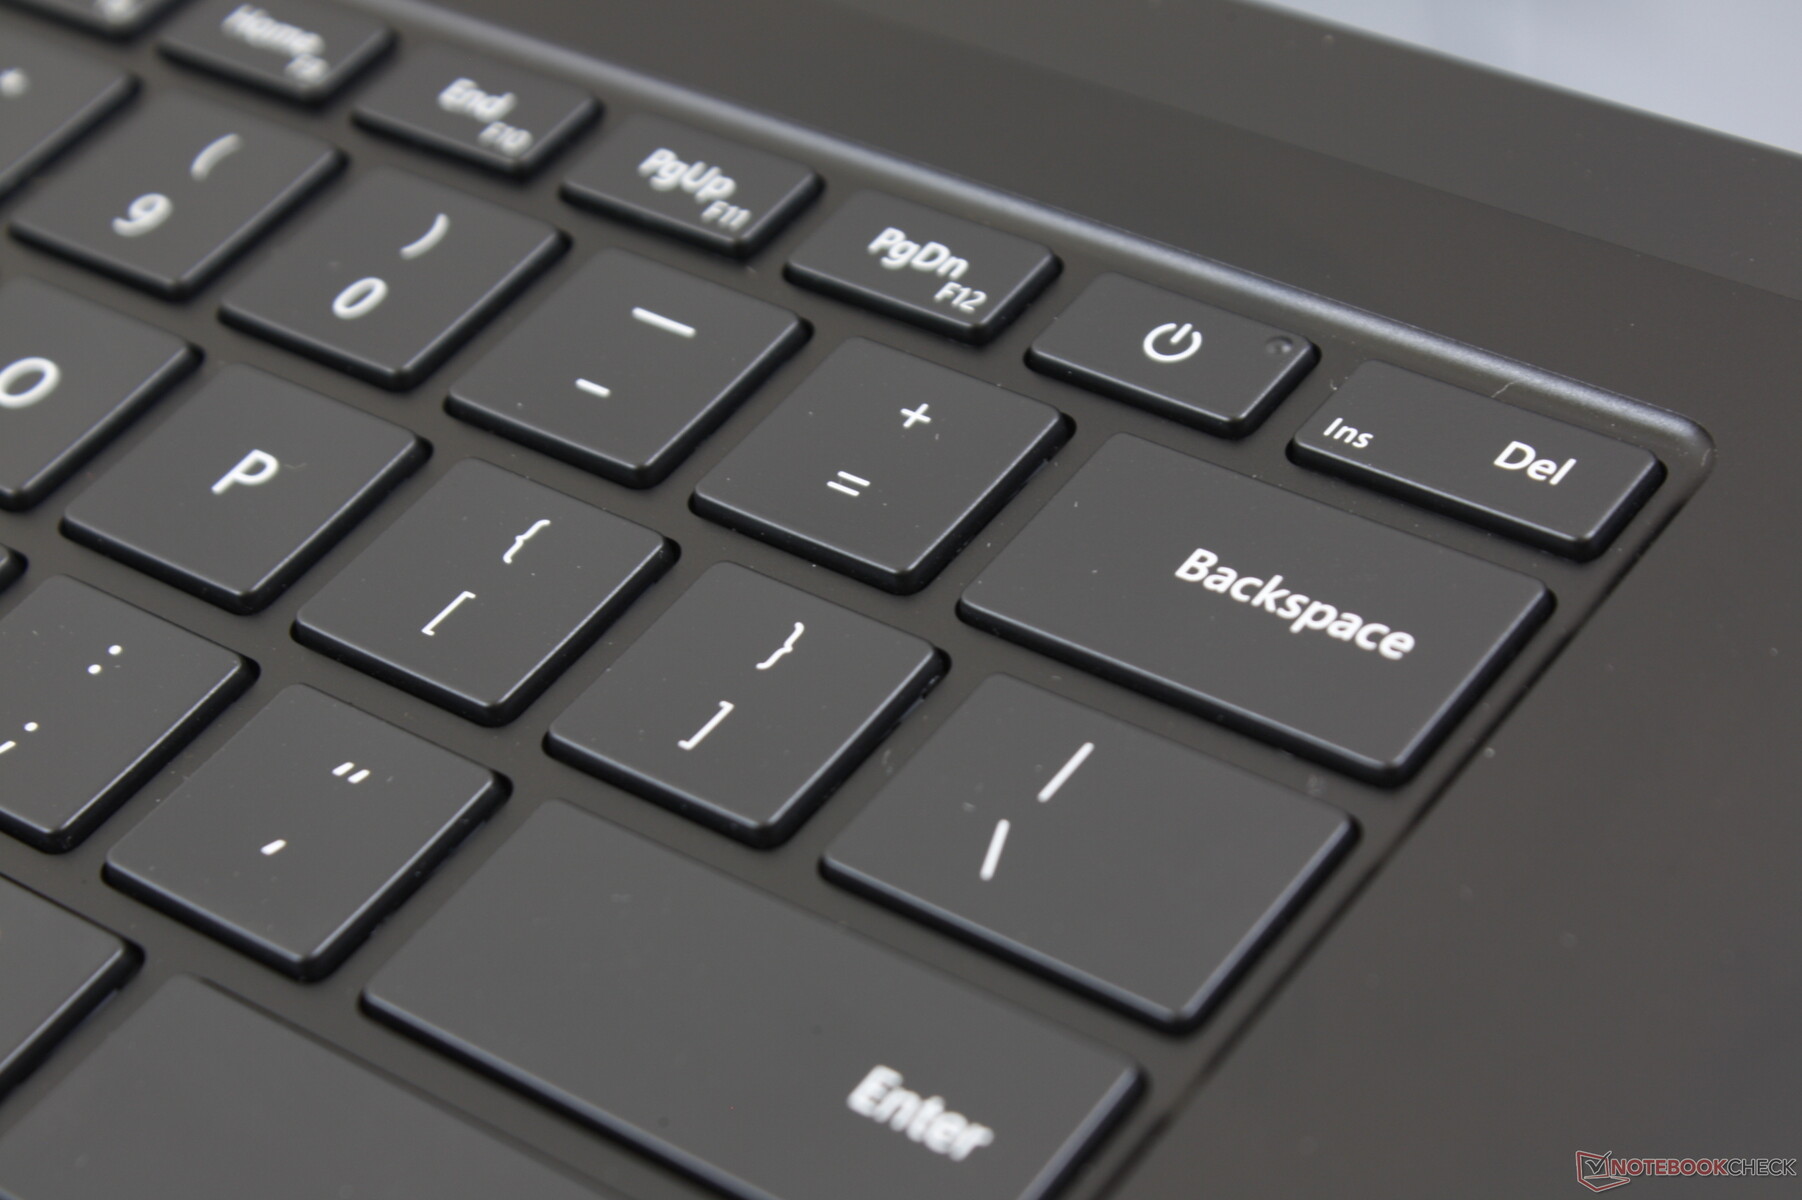
Keyboard size and layout remain identical to last year's 13.5-inch Surface Laptop 2 including the oddly placed Power button. Key feedback is satisfactory with moderate clatter when typing. We find the keys on the HP Spectre x360 15 to be firmer and easier to type on even though they offer the same 1.5 mm key travel. Feedback is not uniform across each and every key as the Enter key and cramped directional keys feel spongier when compared to the main QWERTY keys.
Touchpad
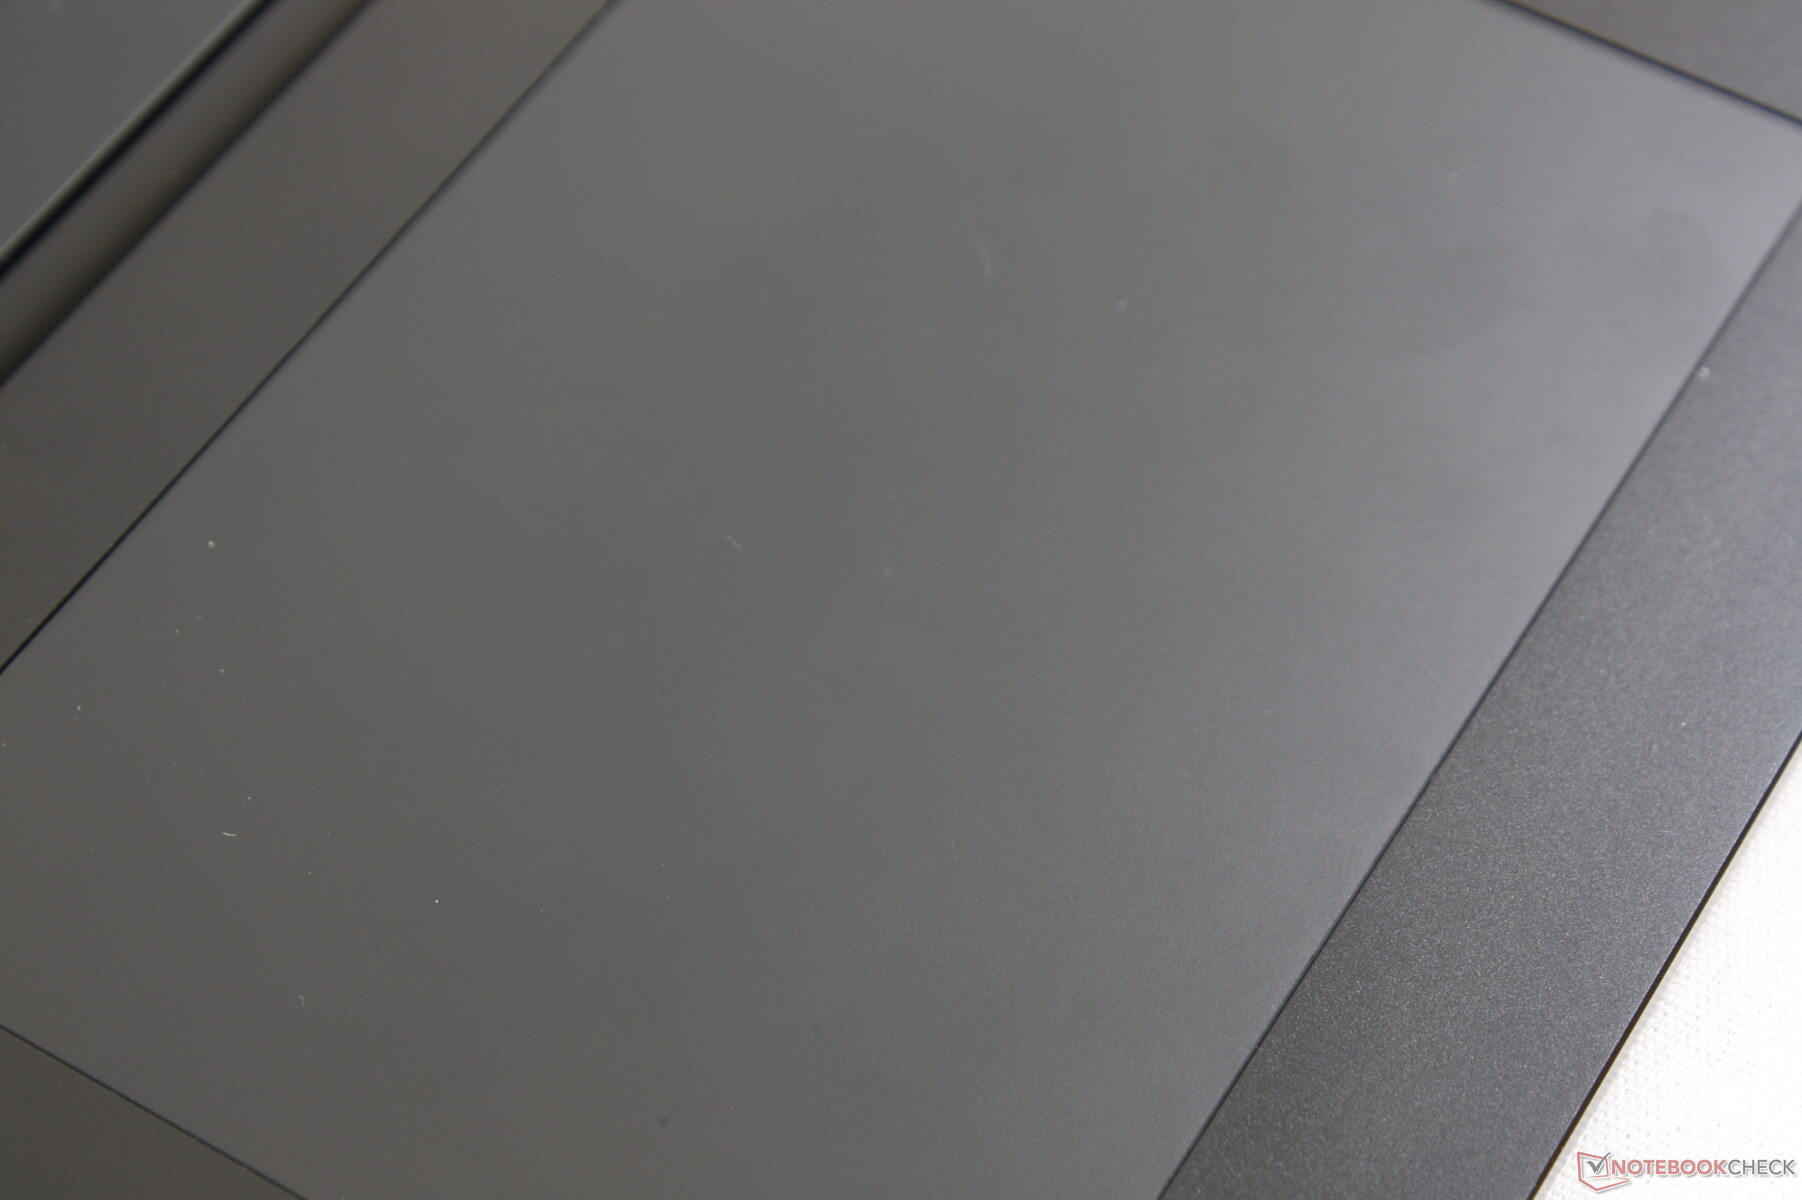
The Precision-enabled clickpad (~11.5 x 7.6 cm) is slightly smaller than the clickpads on the XPS 15 (10.5 x 8.5 cm) and Huawei MateBook X Pro (12.0 x 7.8 cm). Its surface is even smoother than the surrounding metal palm rests with just enough sticking when gliding slowly for accurate clicks. Still, we prefer dedicated mouse keys for improved usability. The integrated keys here are relatively quiet with shallow travel and slightly spongy feedback.
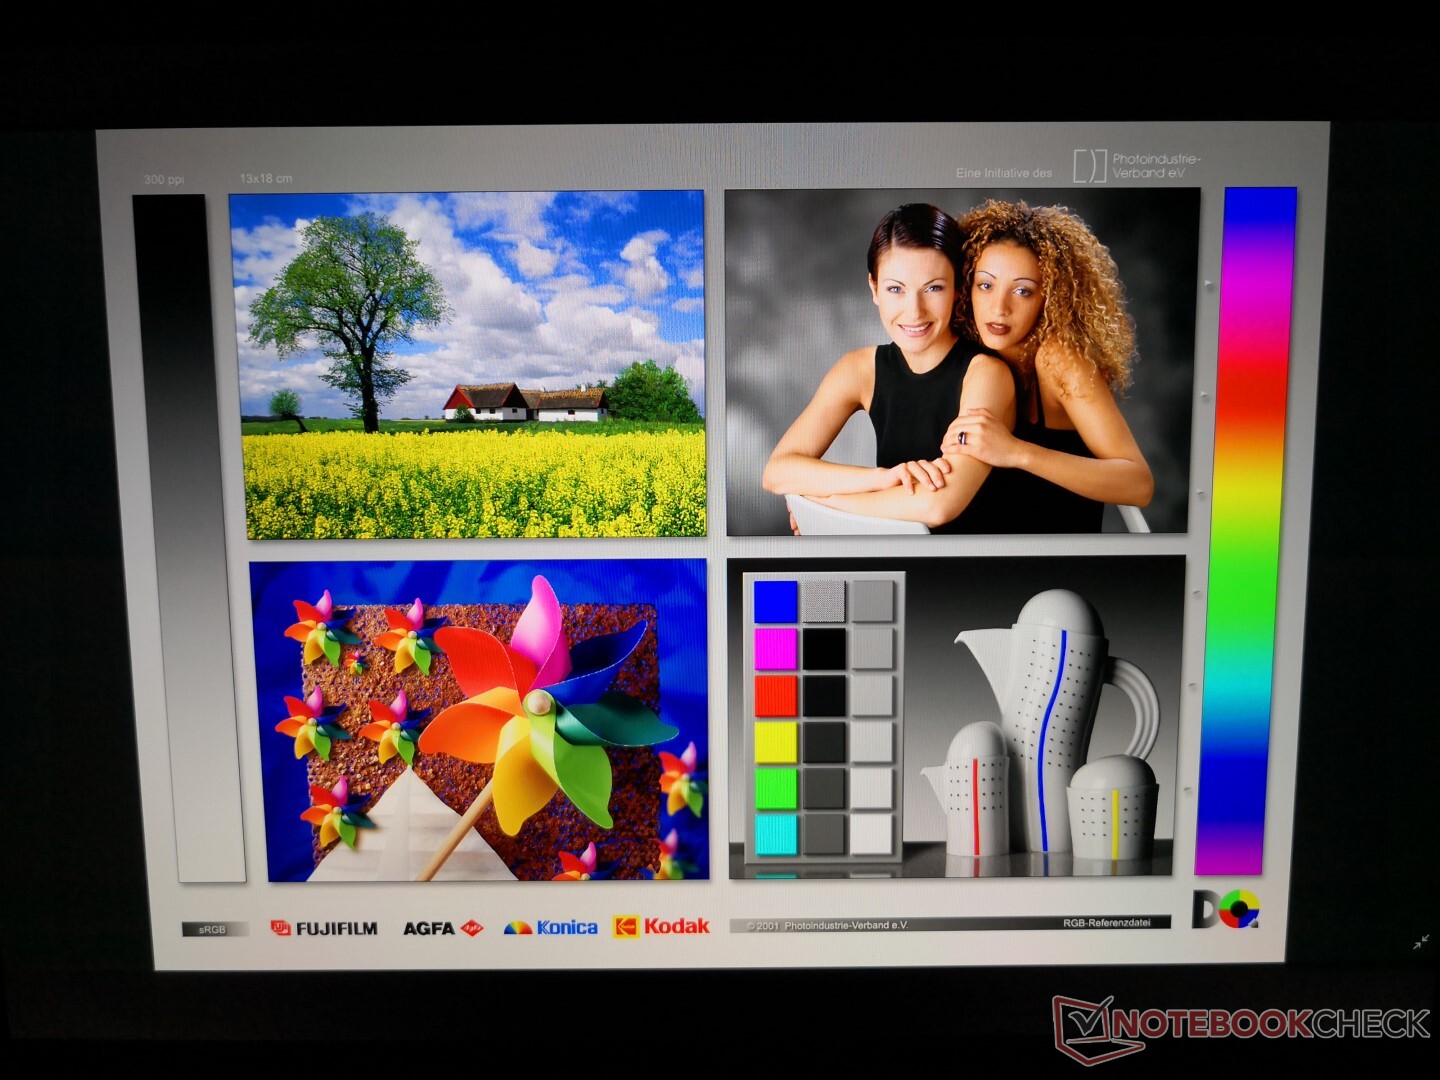
Display - Full sRGB Coverage
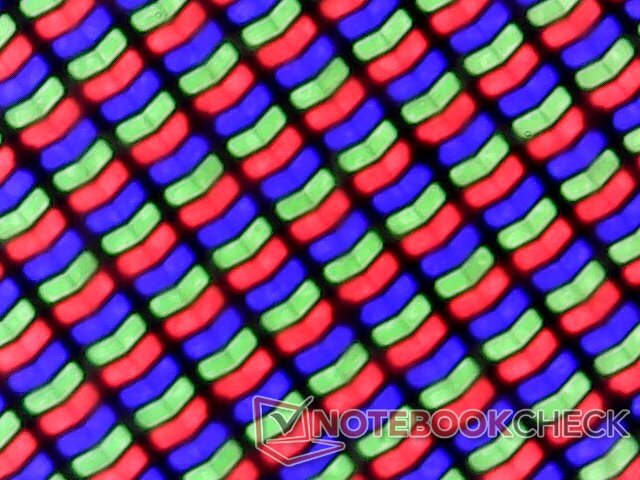
The crisp 15-inch 3:2 touchscreen is what separates the Surface Laptop 3 from the usual Ultrabook. Its Sharp LQ150P1JX51 IPS panel can be found on no other laptop in our database to be a unique offering. Core attributes like brightness and response times have been only marginally improved over last year's 13.5-inch Surface Laptop 2. In short, the already excellent display of the Surface Laptop 2 is back without any obvious improvements aside from the size difference. Ghosting continues to be very noticeable especially when compared to the Razer Blade 15 and its silky smooth 3 ms/144 Hz panel. While this won't negatively impact workloads like word processing, browsing, or video playback, the lack of any high refresh rate options is a bummer considering the price point.
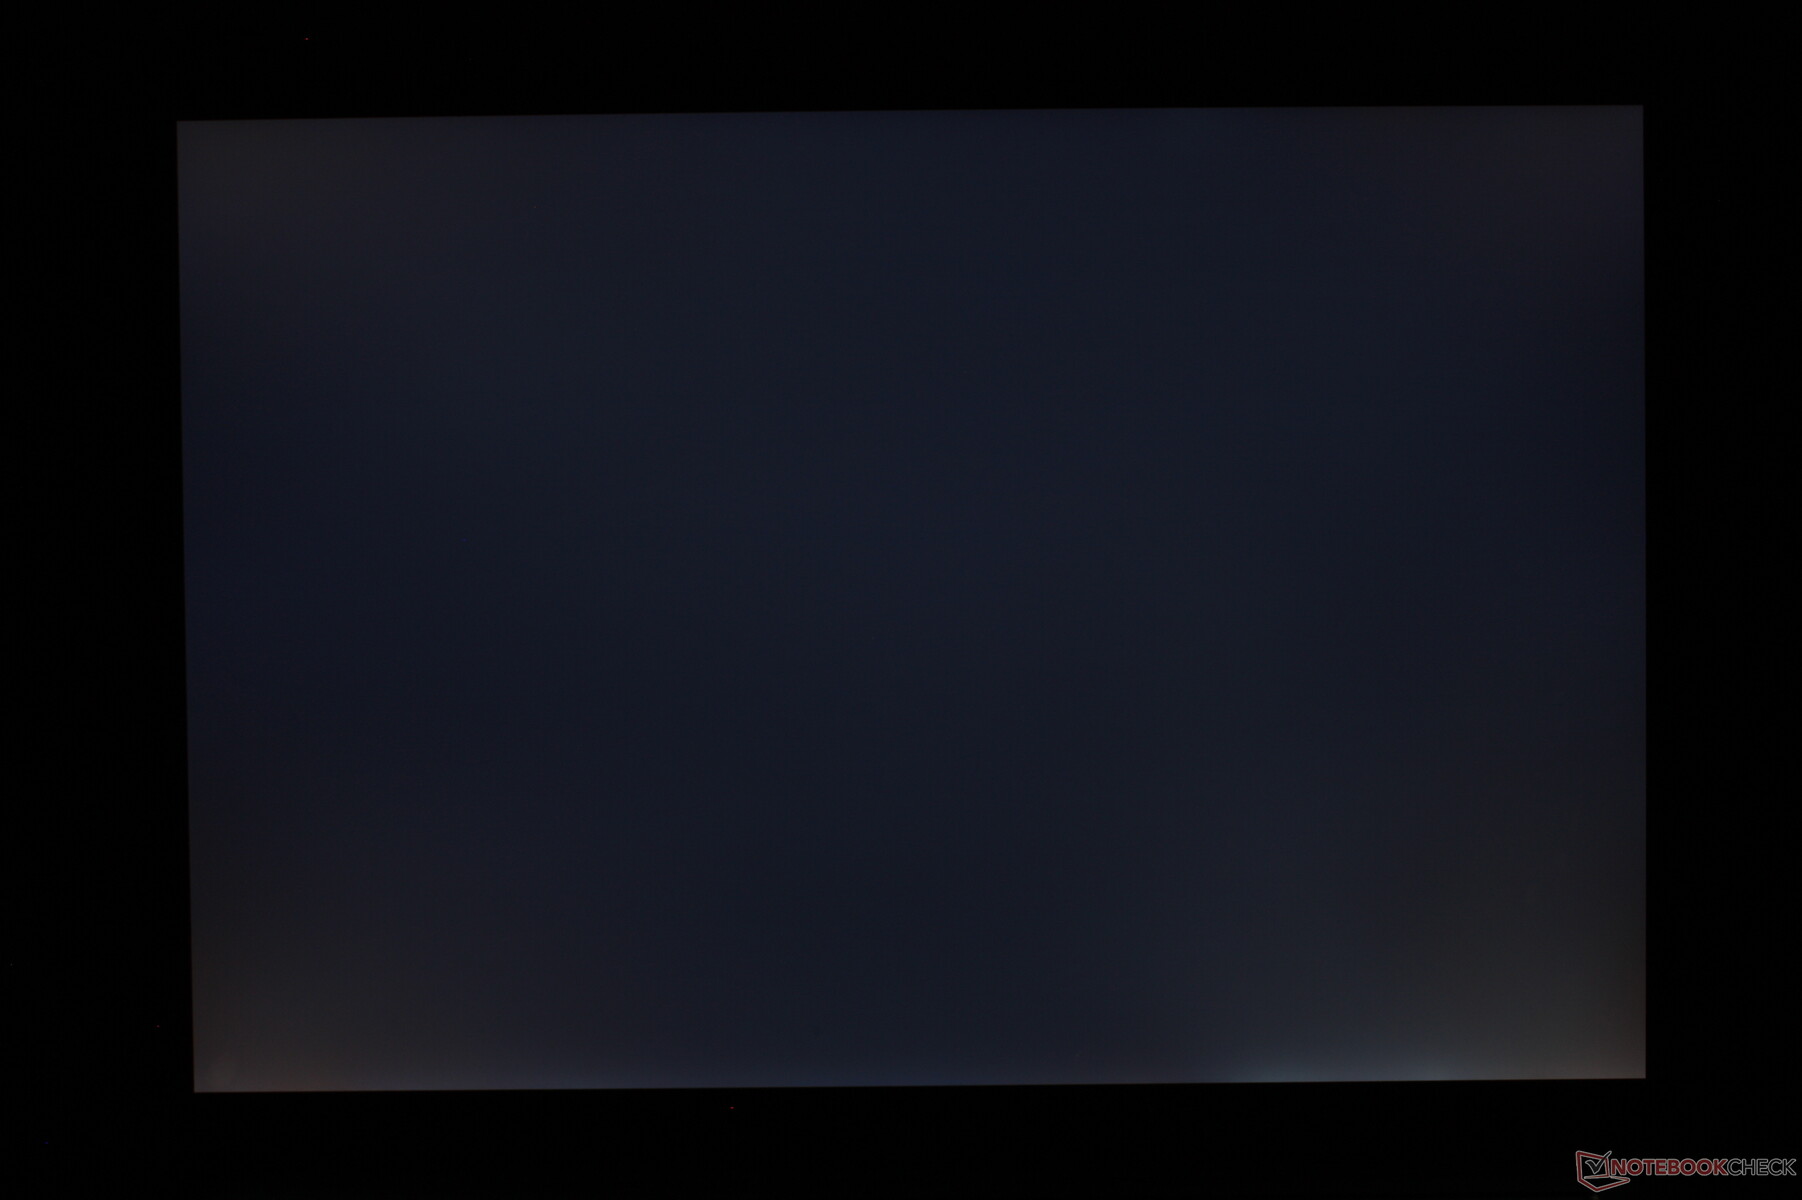
It's worth noting that the display exhibits pulse-width modulation at brightness levels under 52 percent not unlike what we discovered on the Surface Book 2. Uneven backlight bleeding is present on our test unit and it's acute enough to be noticeable during video playback with black borders.

| |||||||||||||||||||||||||
Brightness Distribution: 86 %
Center on Battery: 403.4 cd/m²
Contrast: 1042:1 (Black: 0.4 cd/m²)
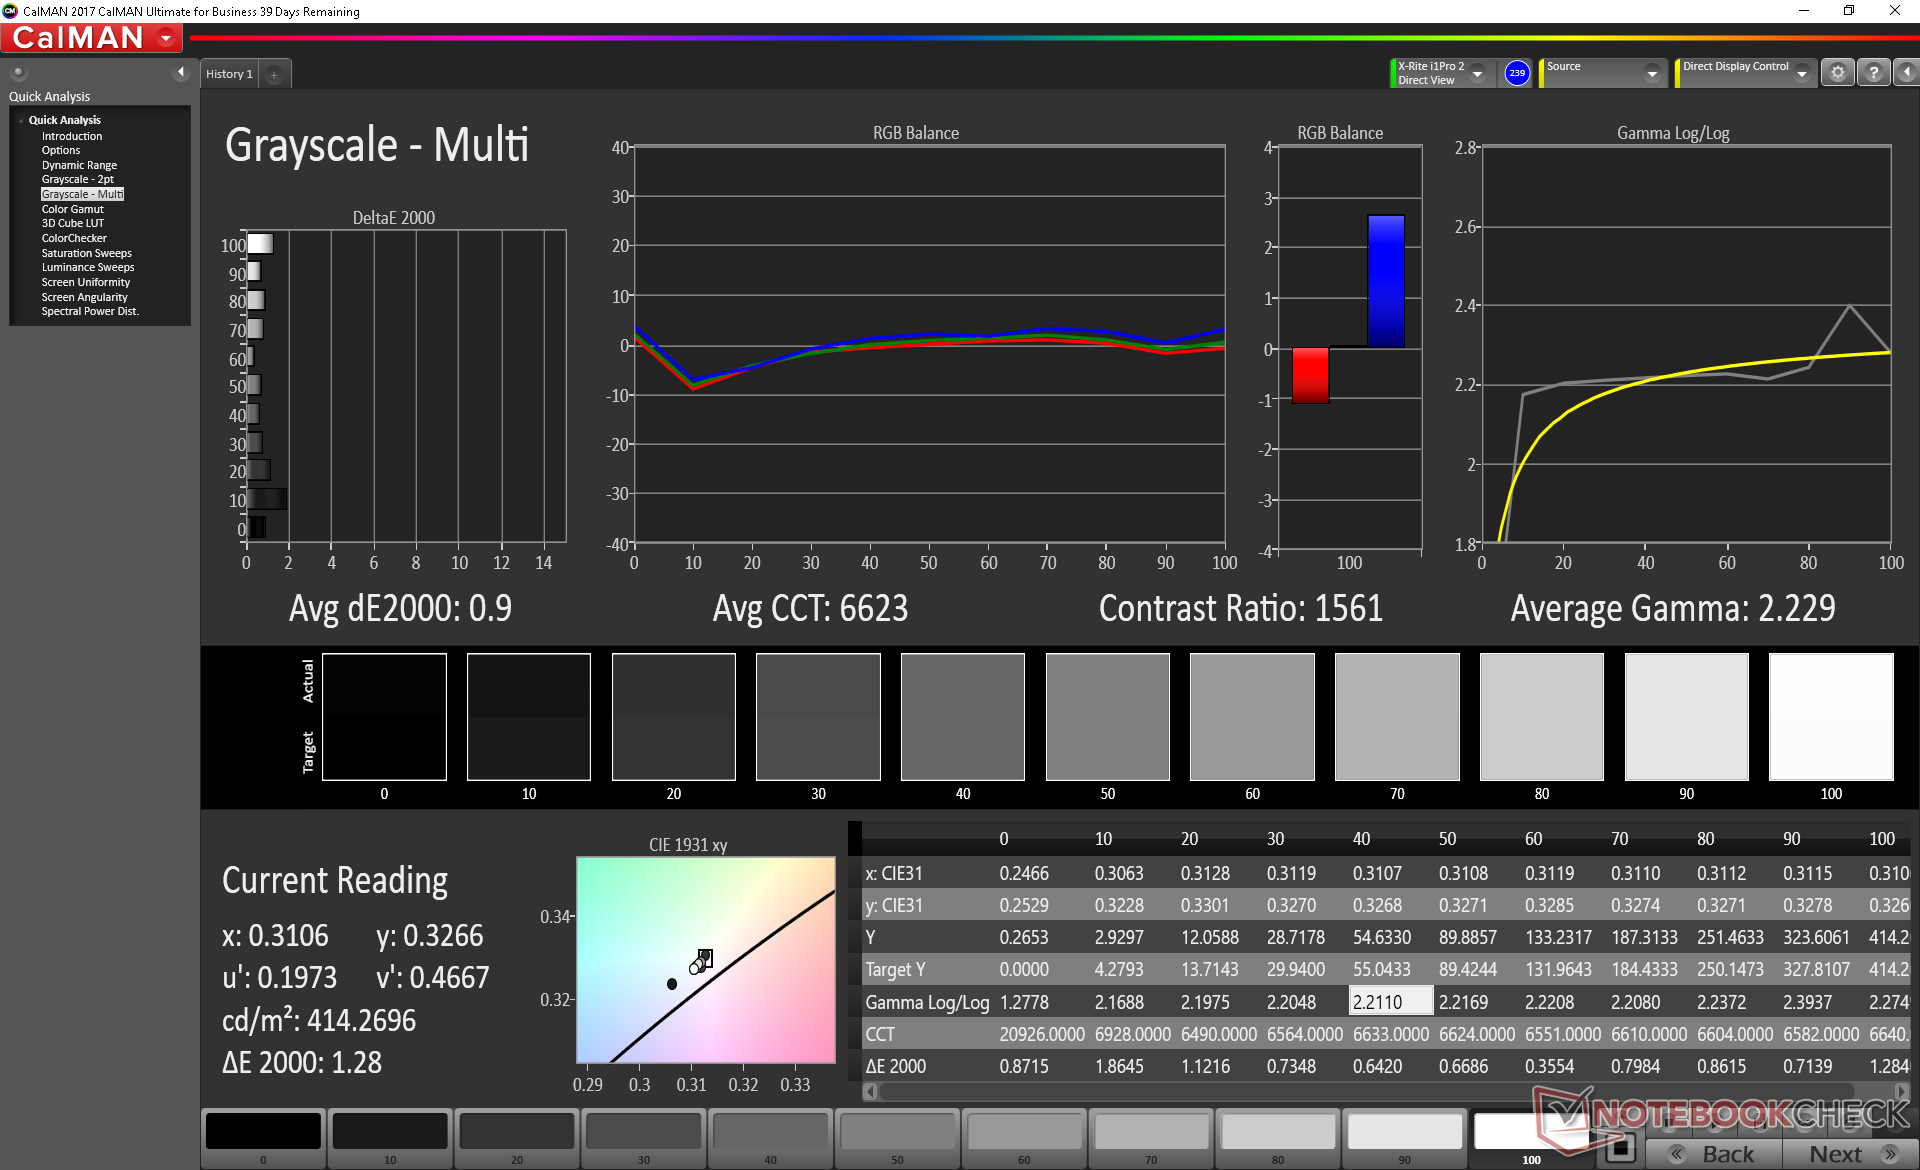
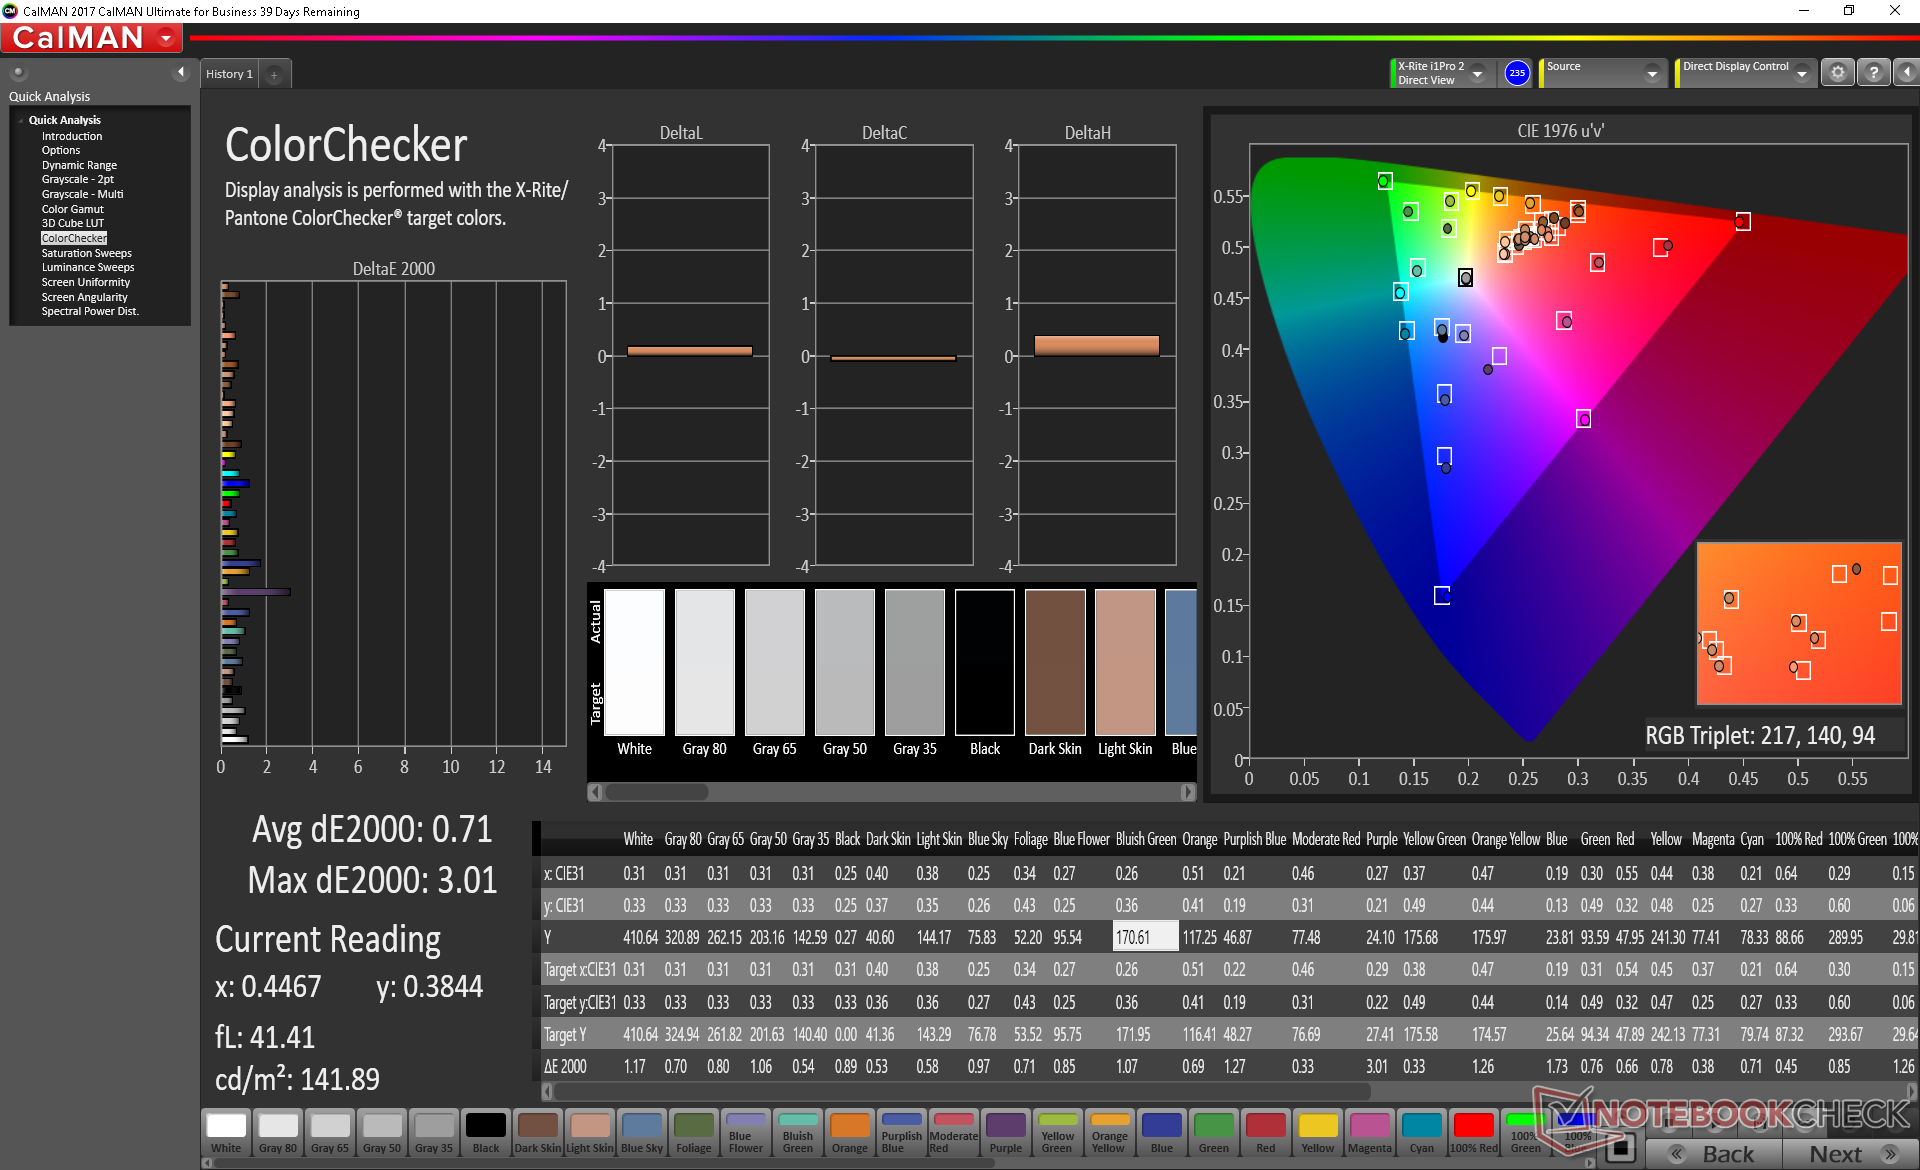
ΔE ColorChecker Calman: 2.75 | ∀{0.5-29.43 Ø4.71}
calibrated: 0.71
ΔE Greyscale Calman: 1.8 | ∀{0.09-98 Ø4.96}
99.4% sRGB (Argyll 1.6.3 3D)
63.4% AdobeRGB 1998 (Argyll 1.6.3 3D)
63.7% AdobeRGB 1998 (Argyll 3D)
99.3% sRGB (Argyll 3D)
66.9% Display P3 (Argyll 3D)
Gamma: 2.09
CCT: 6646 K
| Microsoft Surface Laptop 3 15 Ryzen 5 3580U Sharp LQ150P1JX51, IPS, 15", 2496x1664 | Microsoft Surface Laptop 2-LQN-00004 VVX14T092N00, IPS, 13.5", 2256x1504 | Microsoft Surface Laptop i5 ID: MEI96A2, Name: Panasonic VVX14T092N00, IPS, 13.5", 2256x1504 | Dell XPS 15 7590 i5 iGPU FHD LQ156M1, IPS, 15.6", 1920x1080 | HP Spectre x360 15-df0126ng AU Optronics AUO30EB, IPS, 15.6", 3840x2160 | Apple MacBook Pro 15 2018 (2.6 GHz, 560X) APPA040, IPS, 15.4", 2880x1800 | |
|---|---|---|---|---|---|---|
| Display | 2% | 2% | 2% | 1% | 28% | |
| Display P3 Coverage (%) | 66.9 | 68 2% | 67.8 1% | 66.5 -1% | 68.1 2% | 98.7 48% |
| sRGB Coverage (%) | 99.3 | 94.7 -5% | 94.3 -5% | 98 -1% | 94.2 -5% | 99.9 1% |
| AdobeRGB 1998 Coverage (%) | 63.7 | 69.2 9% | 69.5 9% | 68.4 7% | 68.4 7% | 86.6 36% |
| Response Times | -37% | -5% | 1% | -3% | 12% | |
| Response Time Grey 50% / Grey 80% * (ms) | 47.2 ? | 69.2 ? -47% | 50.8 ? -8% | 52.8 ? -12% | 57 ? -21% | 43.2 ? 8% |
| Response Time Black / White * (ms) | 36.8 ? | 46.4 ? -26% | 37.2 ? -1% | 32 ? 13% | 31 ? 16% | 31.2 ? 15% |
| PWM Frequency (Hz) | 21370 ? | 1020 ? | 117000 ? | |||
| Screen | -15% | 11% | 1% | -39% | 29% | |
| Brightness middle (cd/m²) | 416.9 | 392 -6% | 384.2 -8% | 588 41% | 330 -21% | 520 25% |
| Brightness (cd/m²) | 389 | 390 0% | 378 -3% | 555 43% | 310 -20% | 492 26% |
| Brightness Distribution (%) | 86 | 89 3% | 90 5% | 89 3% | 87 1% | 88 2% |
| Black Level * (cd/m²) | 0.4 | 0.24 40% | 0.36 10% | 0.4 -0% | 0.37 7% | 0.39 2% |
| Contrast (:1) | 1042 | 1633 57% | 1067 2% | 1470 41% | 892 -14% | 1333 28% |
| Colorchecker dE 2000 * | 2.75 | 3.2 -16% | 1.8 35% | 2.5 9% | 4.03 -47% | 1.2 56% |
| Colorchecker dE 2000 max. * | 6.64 | 6.3 5% | 4.2 37% | 6.3 5% | 6.74 -2% | 2.3 65% |
| Colorchecker dE 2000 calibrated * | 0.71 | 1.4 -97% | 0.6 15% | 1.96 -176% | ||
| Greyscale dE 2000 * | 1.8 | 4.5 -150% | 1.2 33% | 4.5 -150% | 4.49 -149% | 1.3 28% |
| Gamma | 2.09 105% | 2.2 100% | 2.21 100% | 2.2 100% | 2.57 86% | 2.18 101% |
| CCT | 6646 98% | 7556 86% | 6708 97% | 6836 95% | 6744 96% | 6738 96% |
| Color Space (Percent of AdobeRGB 1998) (%) | 63.4 | 63.9 1% | 63.7 0% | 63.2 0% | 61 -4% | |
| Color Space (Percent of sRGB) (%) | 99.4 | 95 -4% | 94.2 -5% | 98 -1% | 94 -5% | |
| Total Average (Program / Settings) | -17% /
-15% | 3% /
7% | 1% /
1% | -14% /
-27% | 23% /
26% |
* ... smaller is better
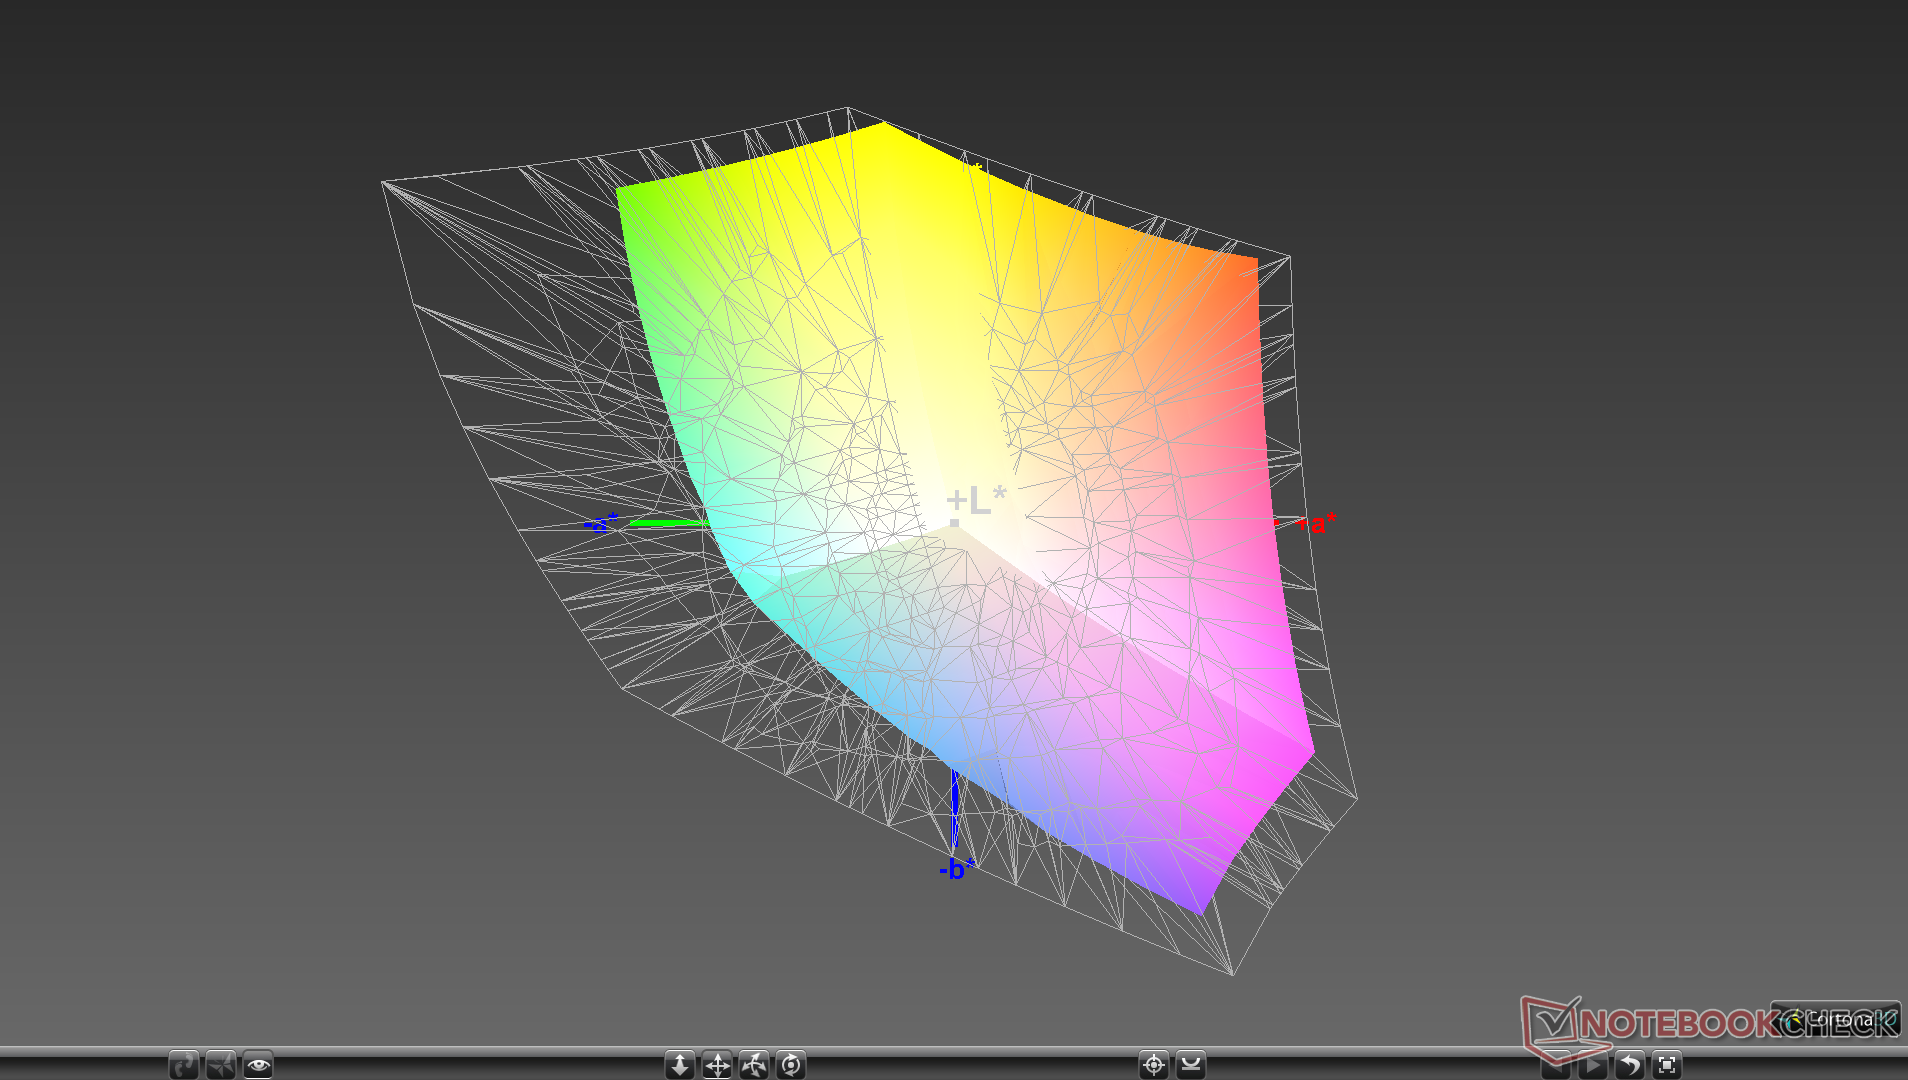
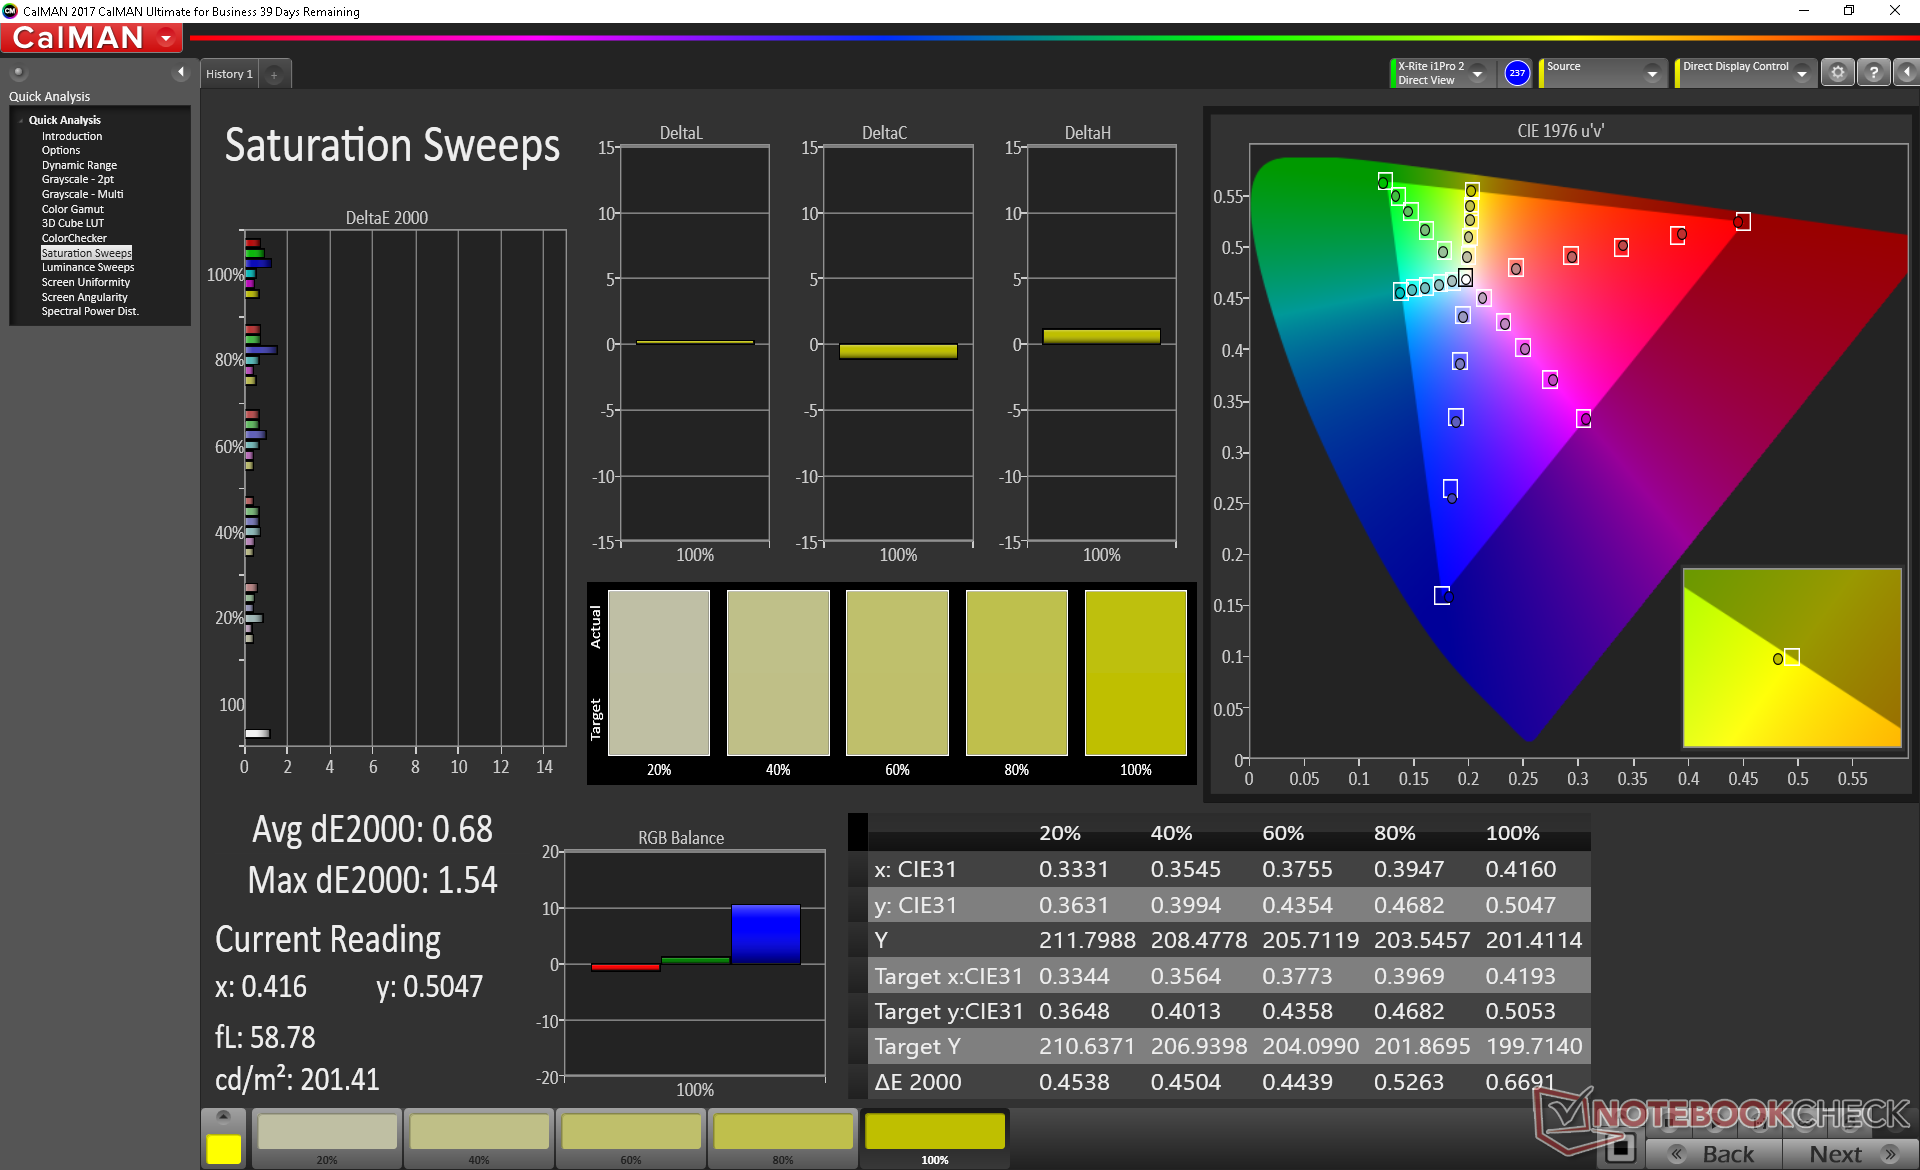
Color space encompasses sRGB in its entirety and approximately 63 percent of AdobeRGB much like on the Dell XPS 15 7590 FHD configuration and last year's Surface Laptop 2. Certain laptops with 4K UHD OLED or Sharp IGZO panels like the Dell XPS 15 or HP Spectre x360 15 offer even wider gamuts.

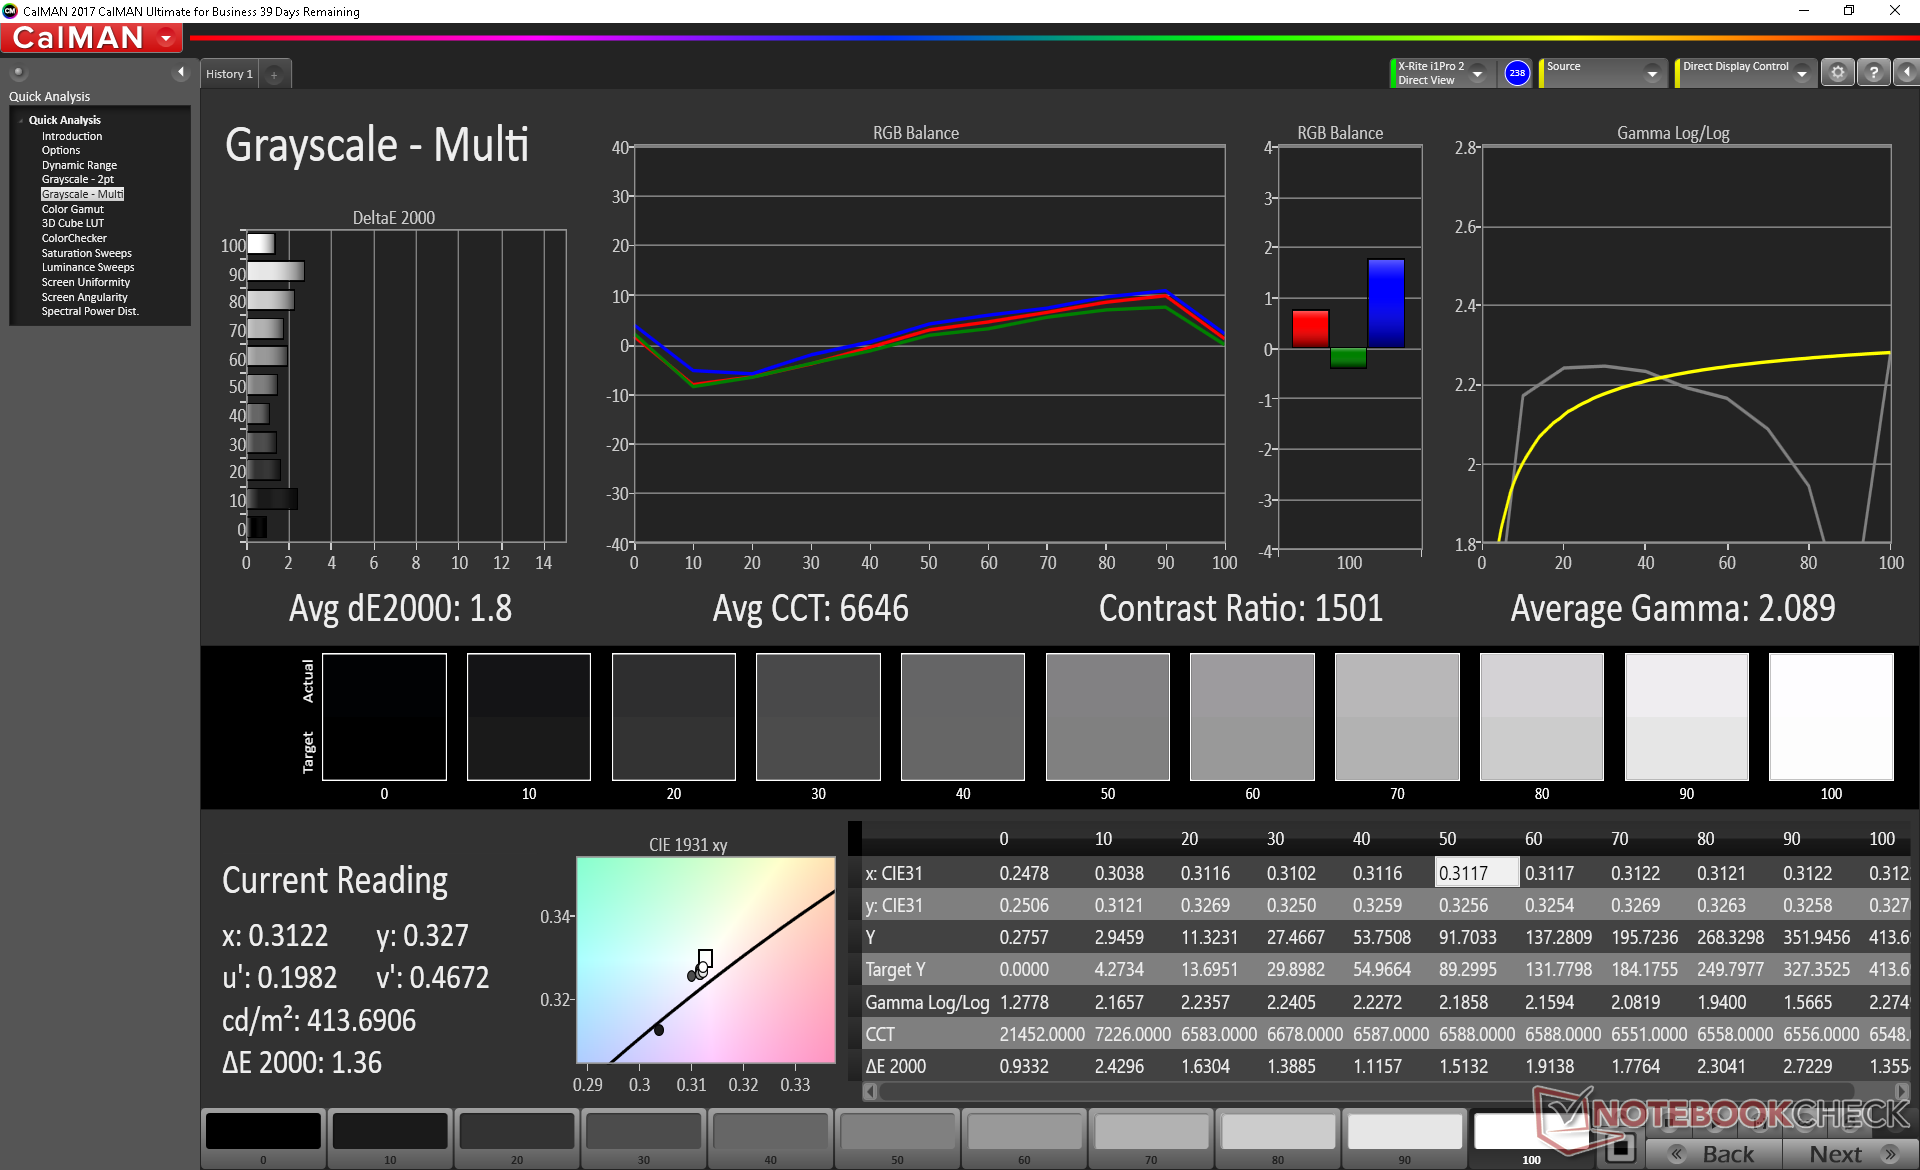
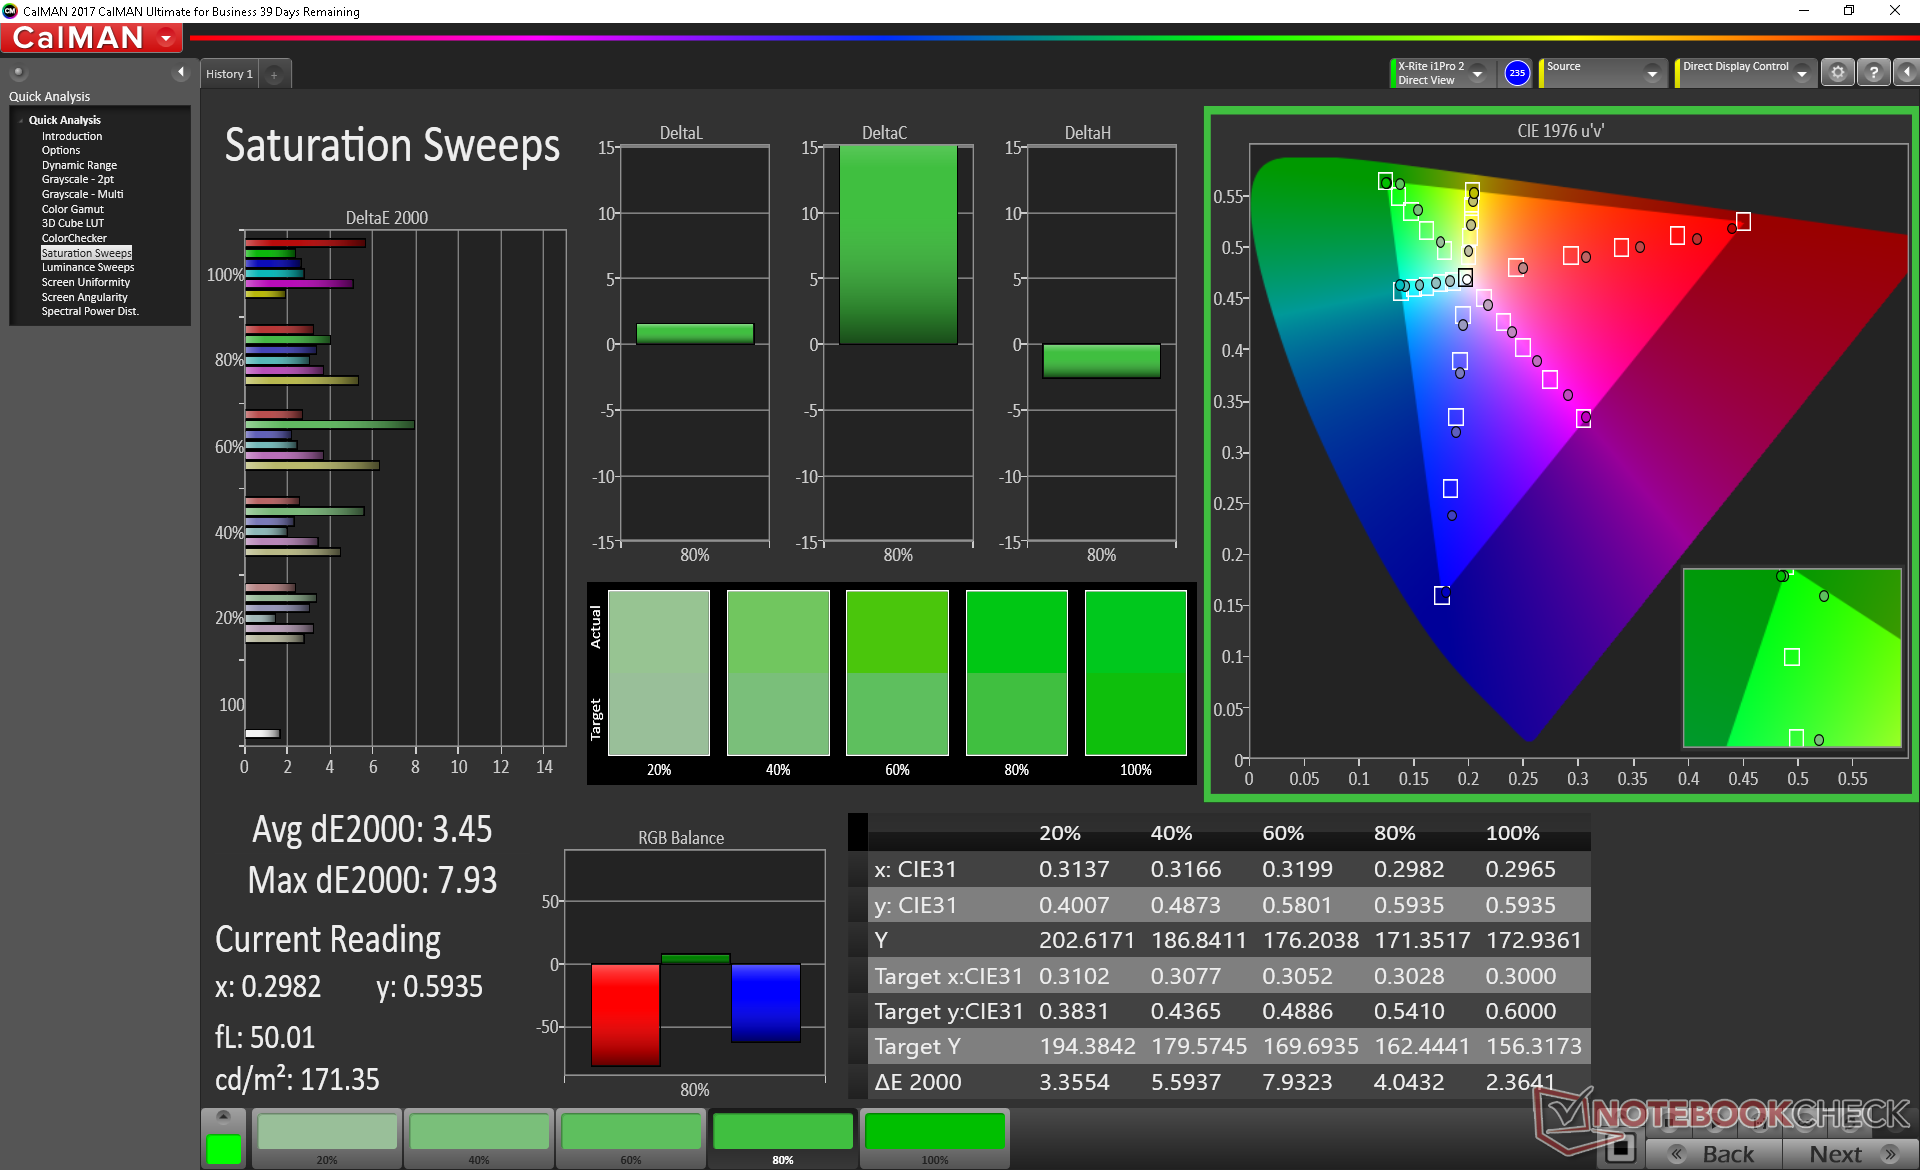
Further measurements with an X-Rite colorimeter reveal an accurate grayscale with only average RGB balance and gamma (2.08). Green in particular is represented more inaccurately than other tested colors. Once we calibrated the panel ourselves, color balance improves for final grayscale and ColorChecker average deltaE values of just 0.8 and 0.71, respectively.

Display Response Times
| ↔ Response Time Black to White | ||
|---|---|---|
| 36.8 ms ... rise ↗ and fall ↘ combined | ↗ 20.4 ms rise | 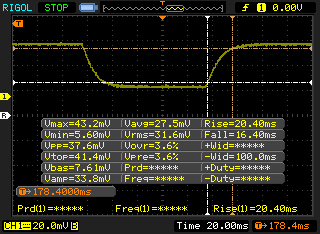 |
| ↘ 16.4 ms fall | ||
| The screen shows slow response rates in our tests and will be unsatisfactory for gamers. In comparison, all tested devices range from 0.1 (minimum) to 240 (maximum) ms. » 95 % of all devices are better. This means that the measured response time is worse than the average of all tested devices (19.8 ms). | ||
| ↔ Response Time 50% Grey to 80% Grey | ||
| 47.2 ms ... rise ↗ and fall ↘ combined | ↗ 23.2 ms rise | 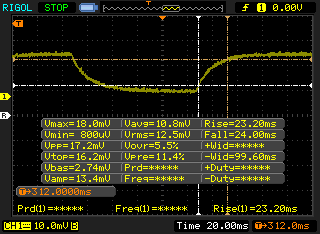 |
| ↘ 24 ms fall | ||
| The screen shows slow response rates in our tests and will be unsatisfactory for gamers. In comparison, all tested devices range from 0.165 (minimum) to 636 (maximum) ms. » 82 % of all devices are better. This means that the measured response time is worse than the average of all tested devices (31 ms). | ||
Screen Flickering / PWM (Pulse-Width Modulation)
| Screen flickering / PWM detected | 21370 Hz | ≤ 51 % brightness setting | 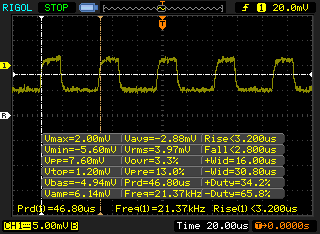 |
The display backlight flickers at 21370 Hz (worst case, e.g., utilizing PWM) Flickering detected at a brightness setting of 51 % and below. There should be no flickering or PWM above this brightness setting. The frequency of 21370 Hz is quite high, so most users sensitive to PWM should not notice any flickering. In comparison: 52 % of all tested devices do not use PWM to dim the display. If PWM was detected, an average of 7757 (minimum: 5 - maximum: 343500) Hz was measured. | |||
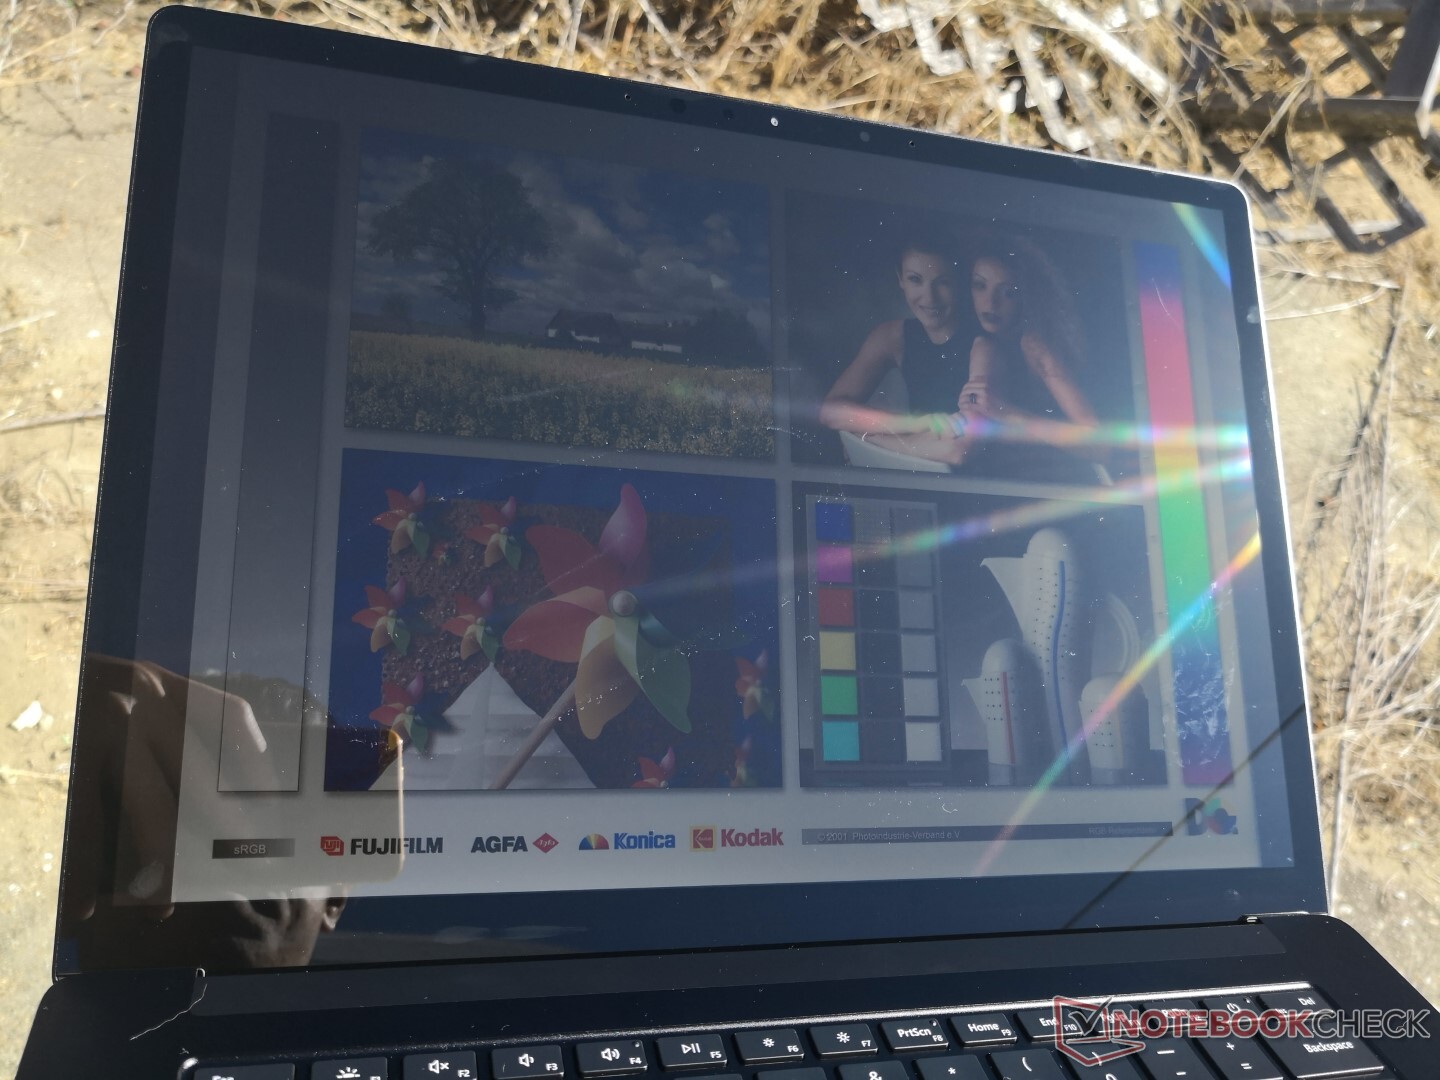
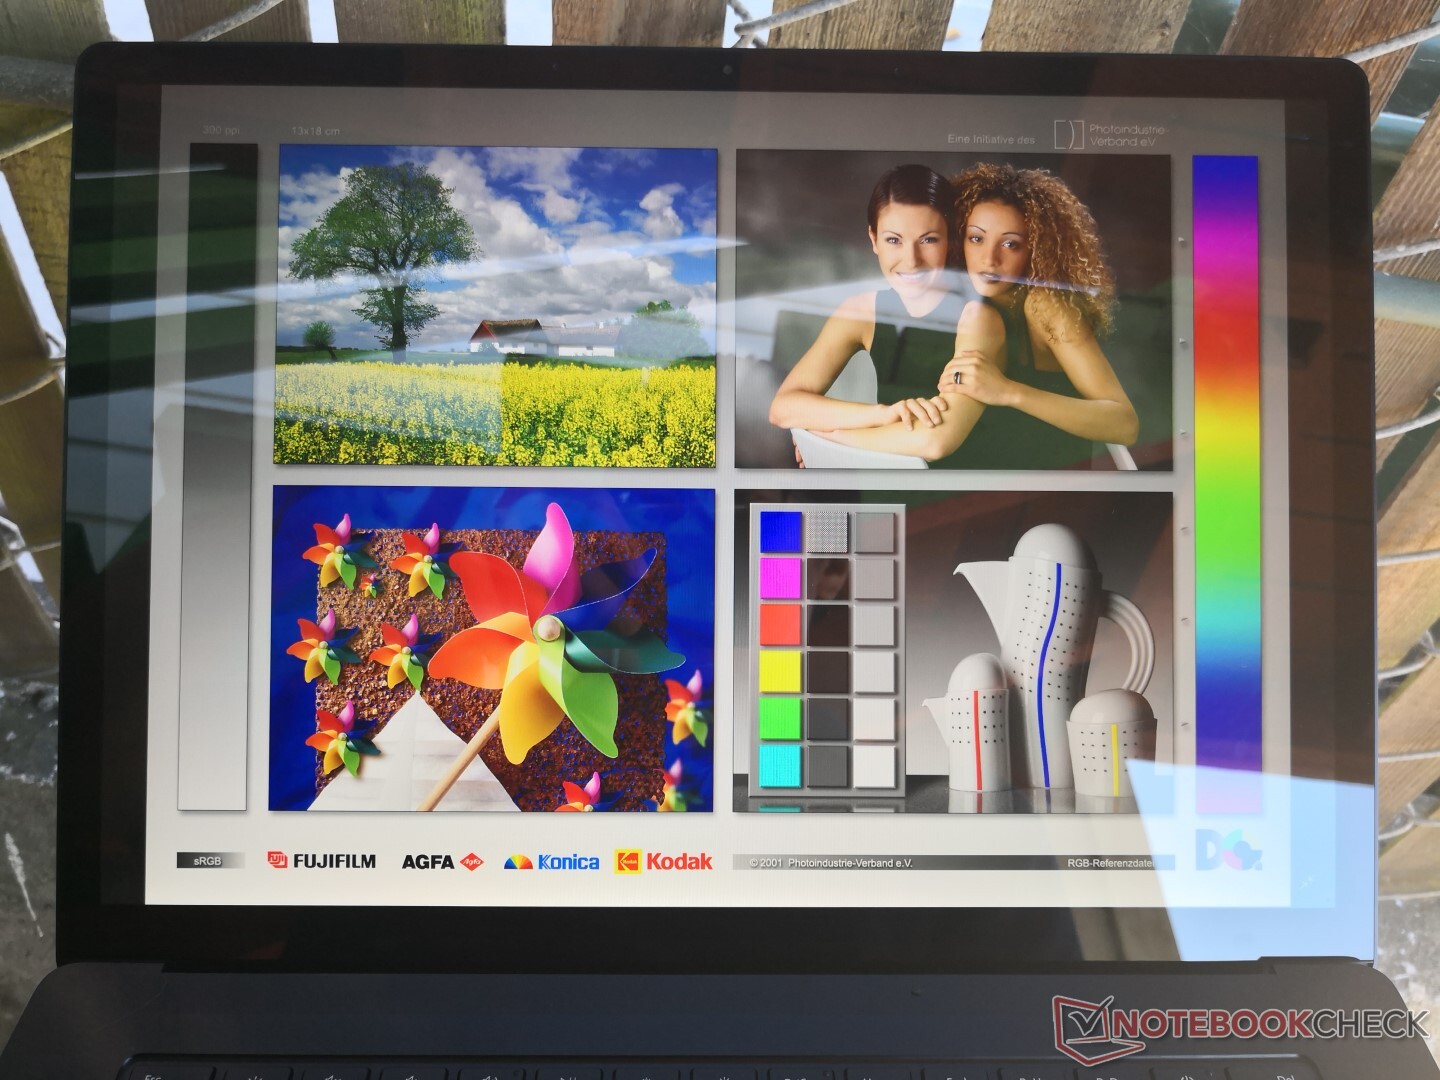
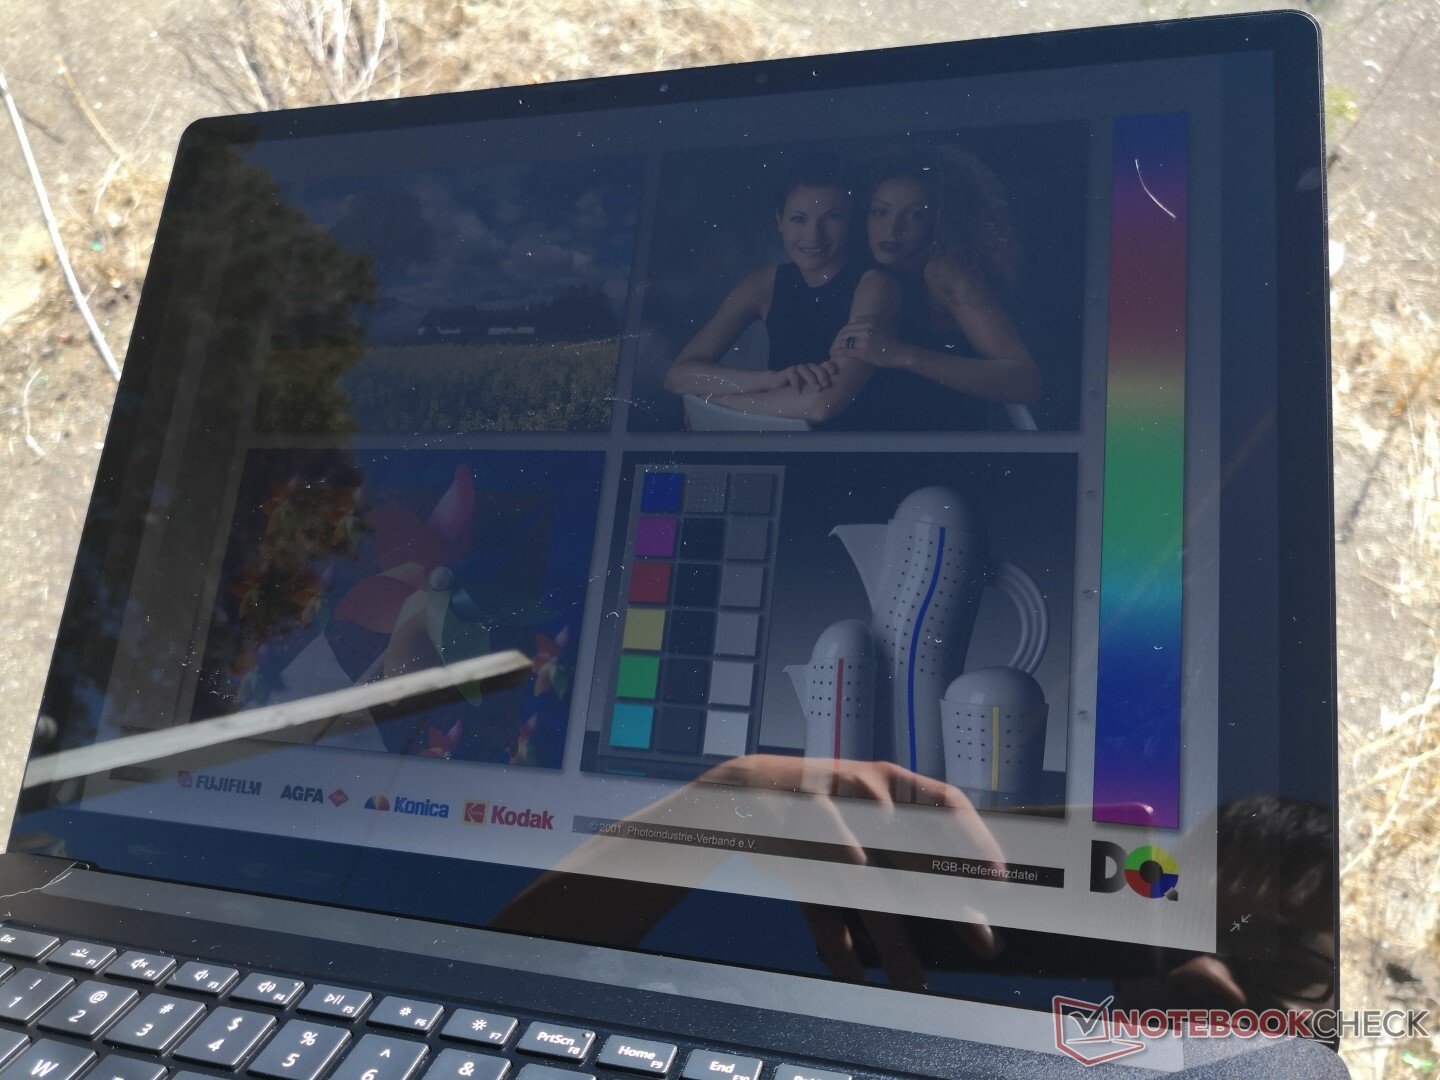
Outdoor visibility is poorer and with more noticeable glare than on both the Dell XPS 15 7590 and Apple MacBook Pro 15 since the Surface Laptop display is dimmer. Running on battery power will lower the maximum brightness ceiling marginally from 417 nits to 403 nits even after disabling the brightness sensor. A few manufacturers like HP and Toshiba offer matte touchscreens for their respective business convertibles in an effort to reduce the heavy glare from traditional glossy panels like on our Surface model.
Performance - One of the Better Ryzen U Laptops
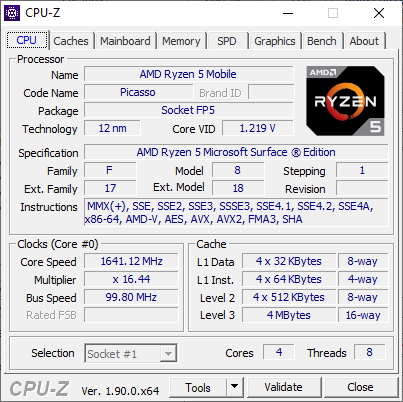
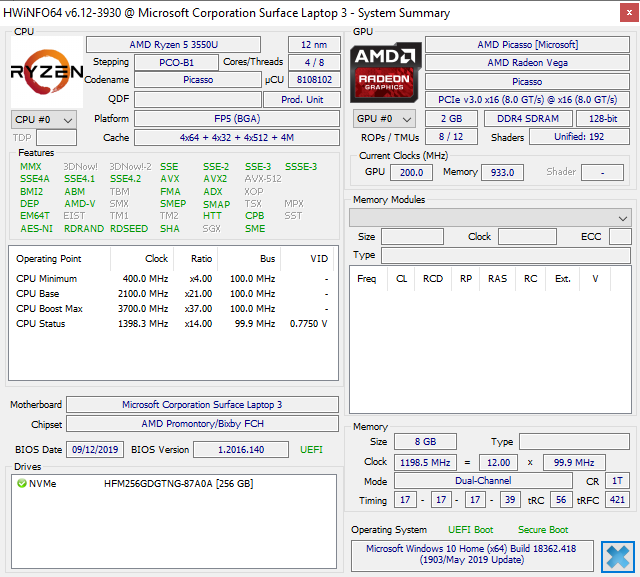
Whereas the Surface Laptop 2 ships with only 8th gen Intel Core i5-8250U and Core i7-8550U Kaby Lake-R options, the Surface Laptop 3 has 10th gen Core i5-1035G7 and Core i7-1065G7 Ice Lake options with 2nd gen AMD Ryzen 5 3580U and Ryzen 7 3780U alternatives. Both Microsoft and AMD have said that these Ryzen CPUs are custom-tailored to the Surface Laptop and so they cannot be found anywhere else at the moment.
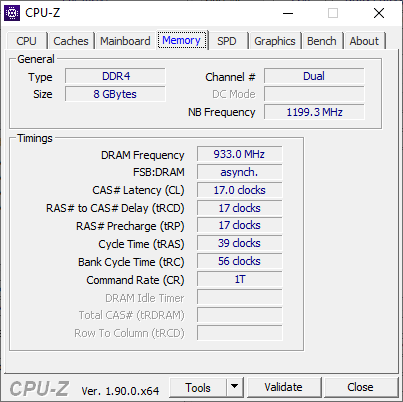
Graphics are limited to integrated Intel Iris Plus or AMD Vega with no GeForce MX options. Microsoft has also raised the minimum RAM from 4 GB to 8 GB running in dual-channel mode.
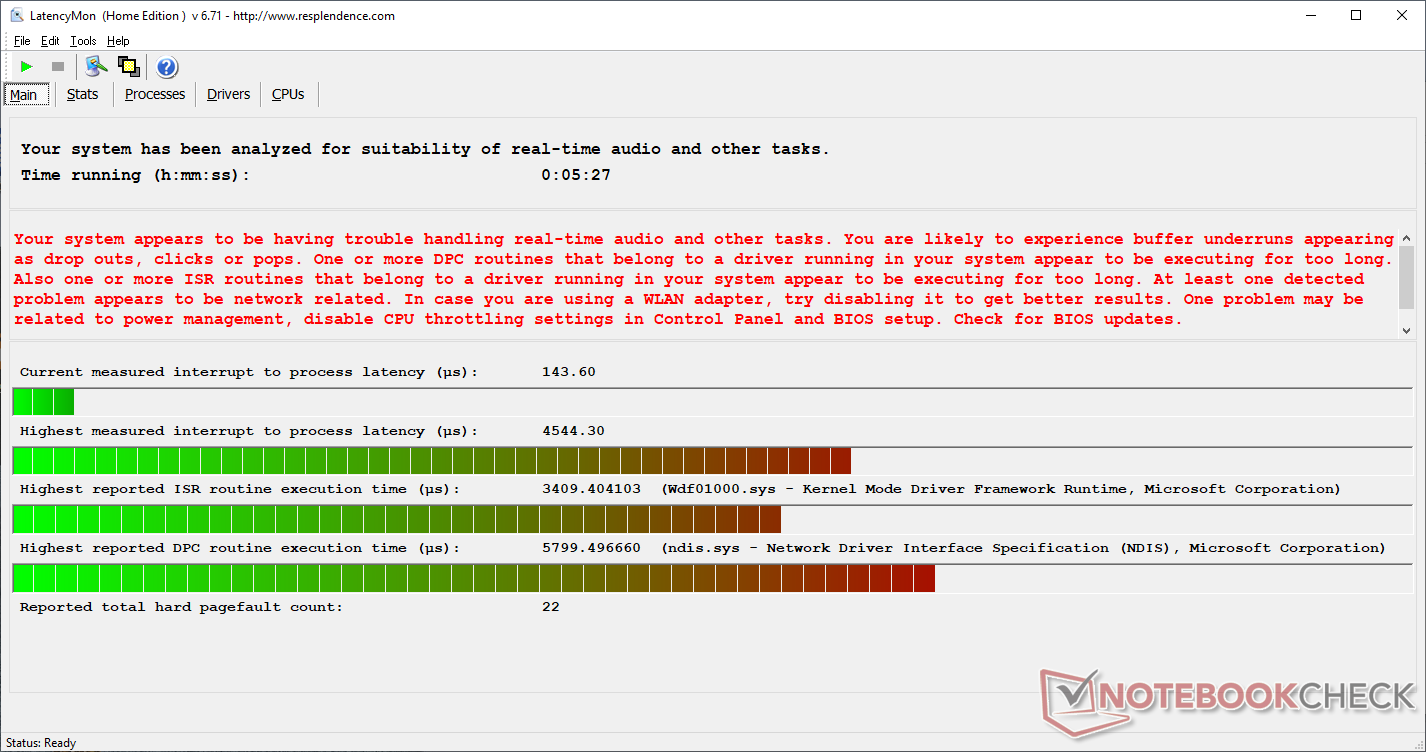
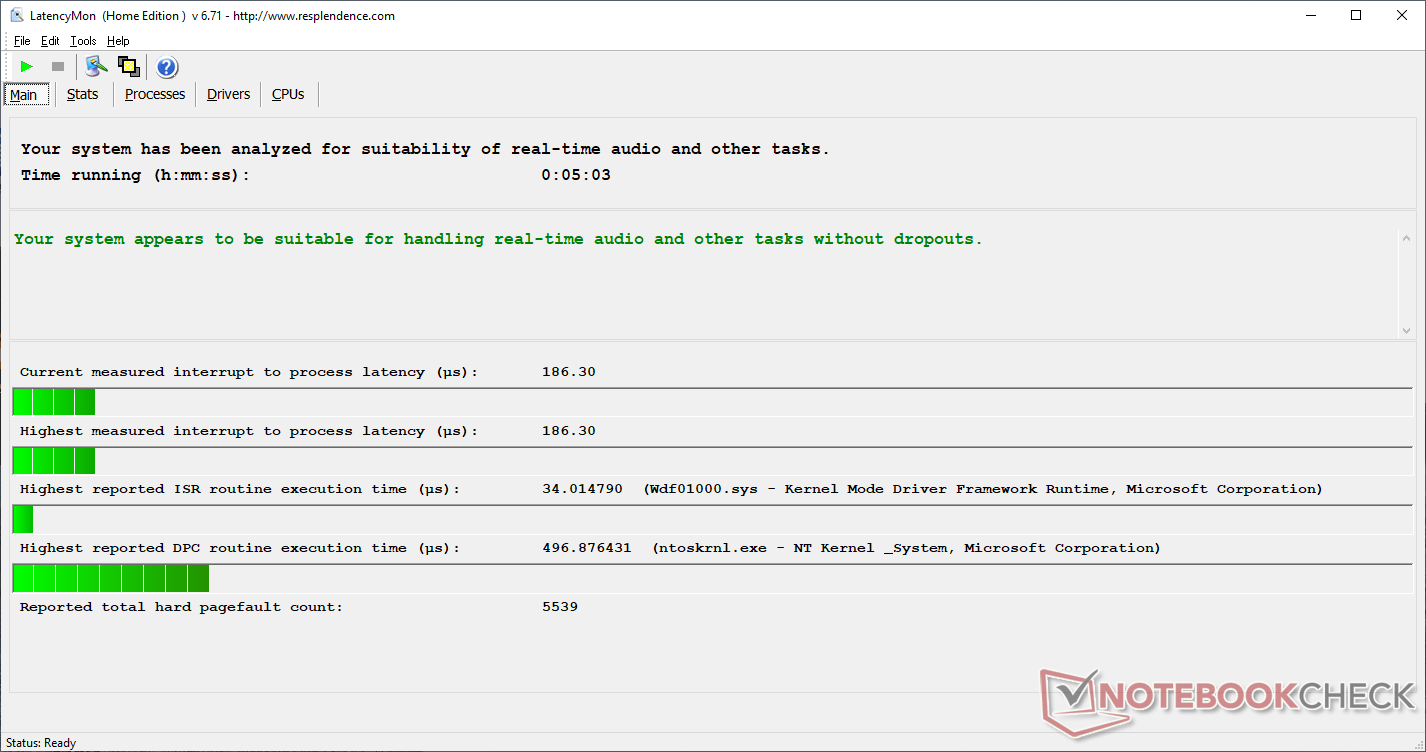
LatencyMon shows DPC latency issues when wireless is enabled which is disappointing considering that the laptop is geared towards office-type work. Disabling the wireless appears to address this issue.
Processor
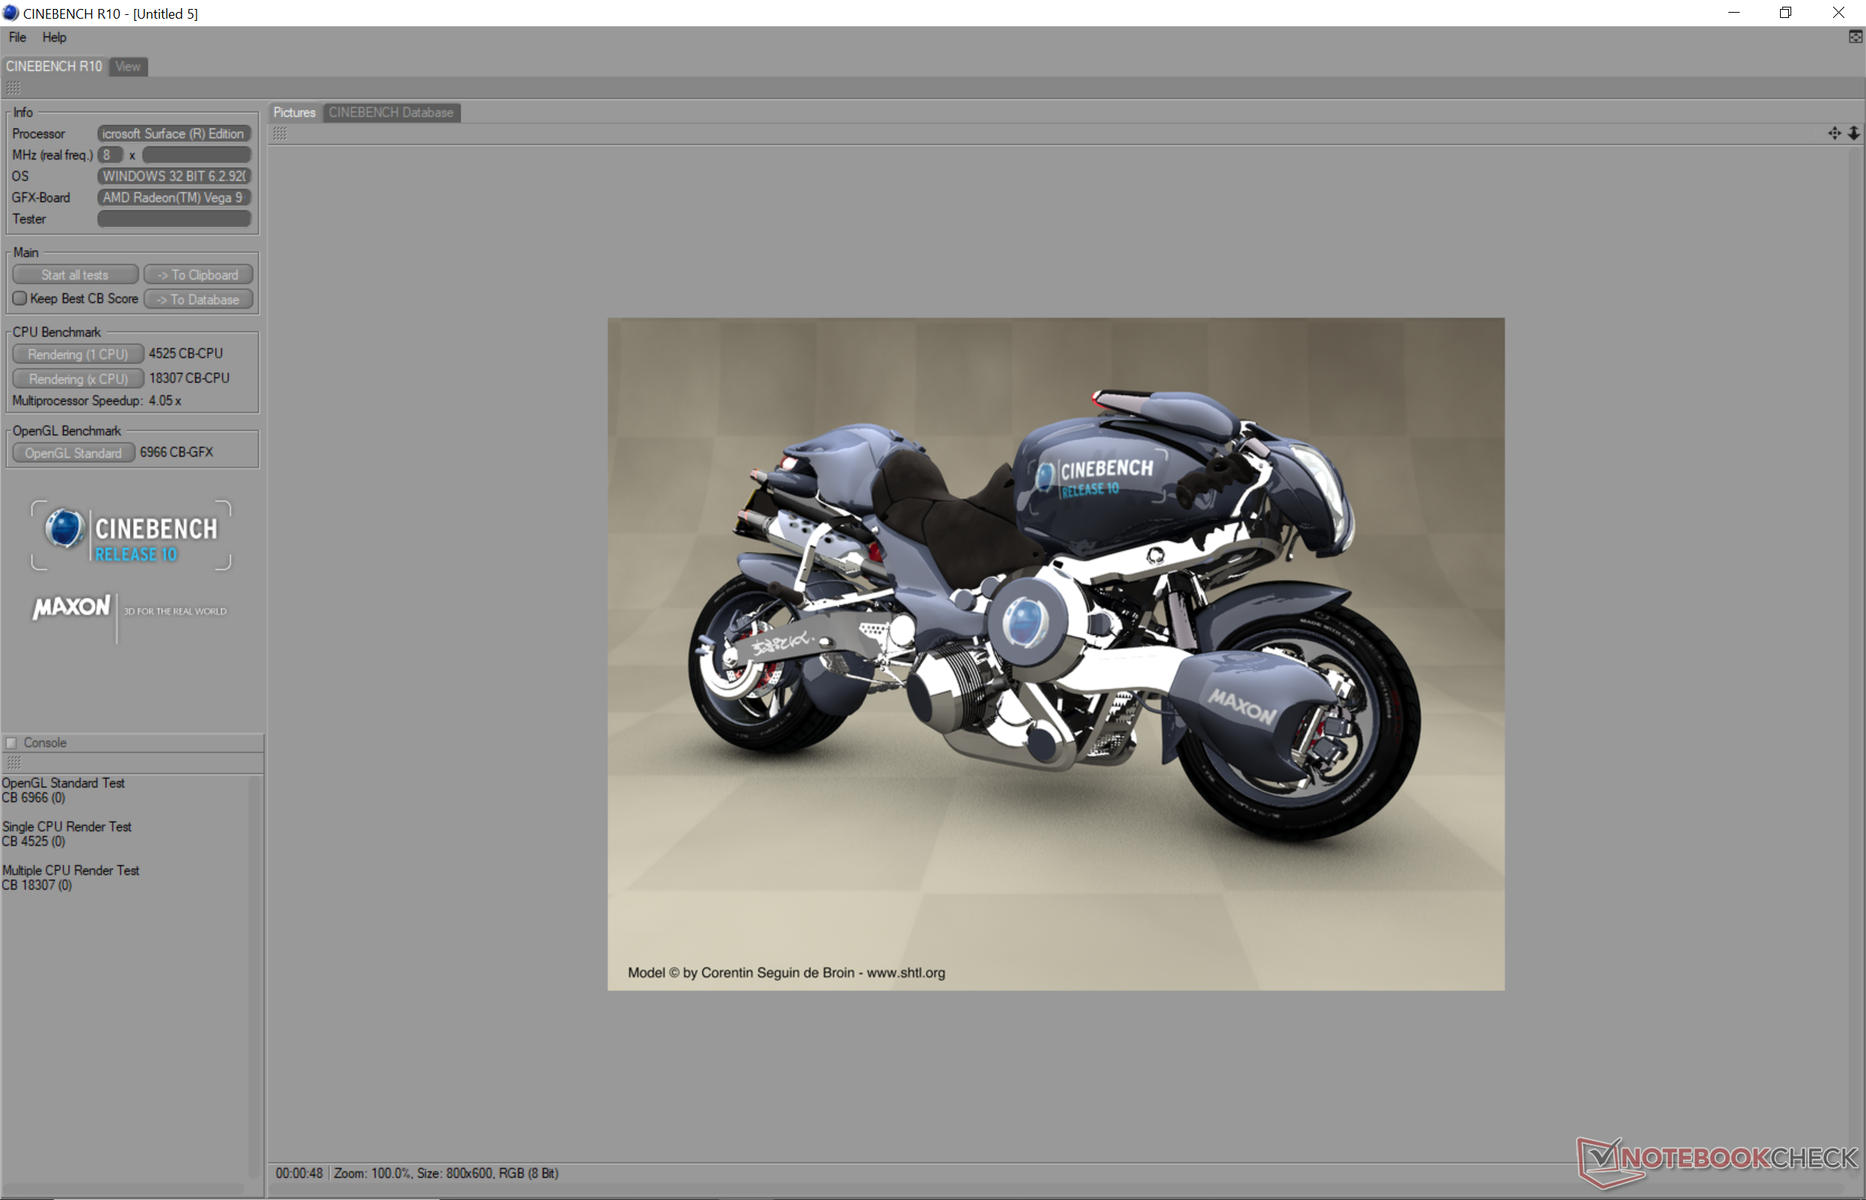
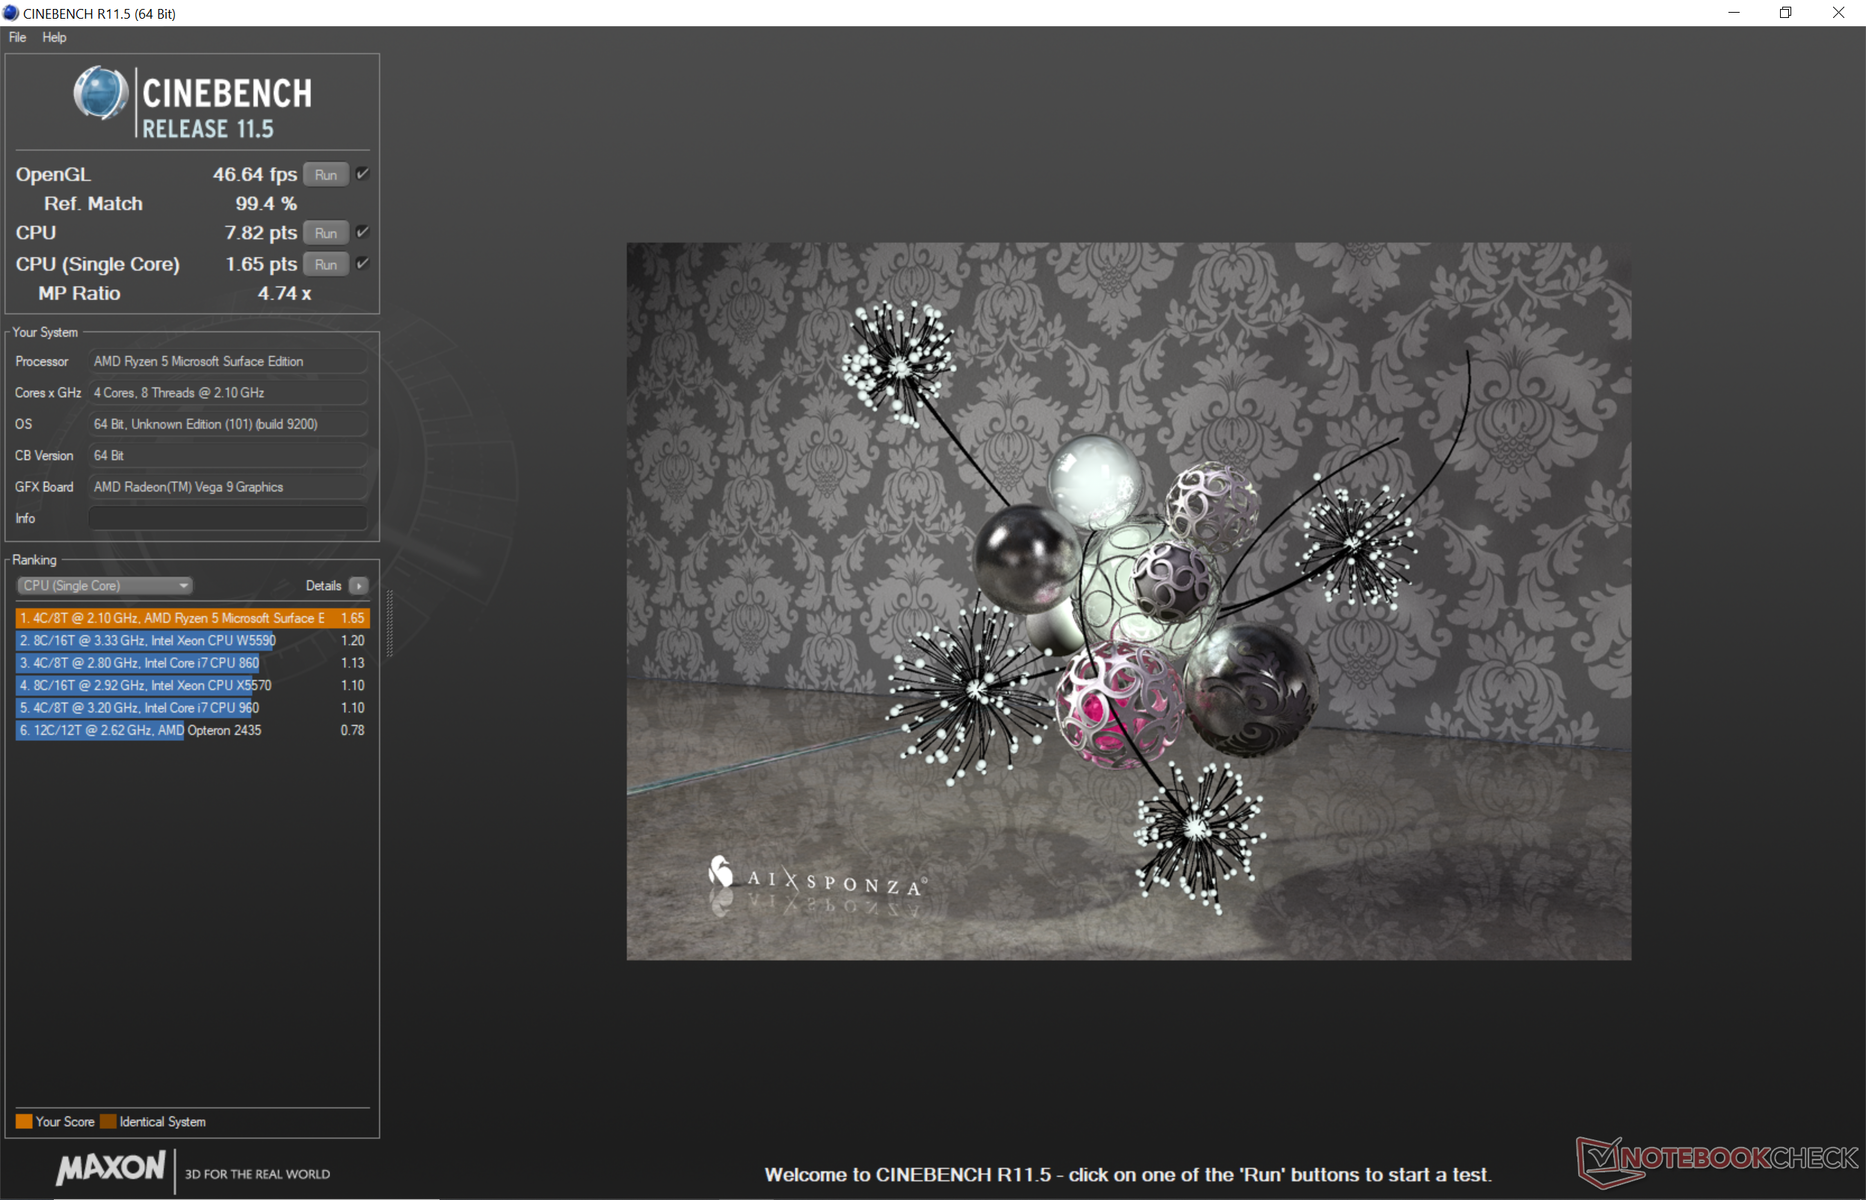
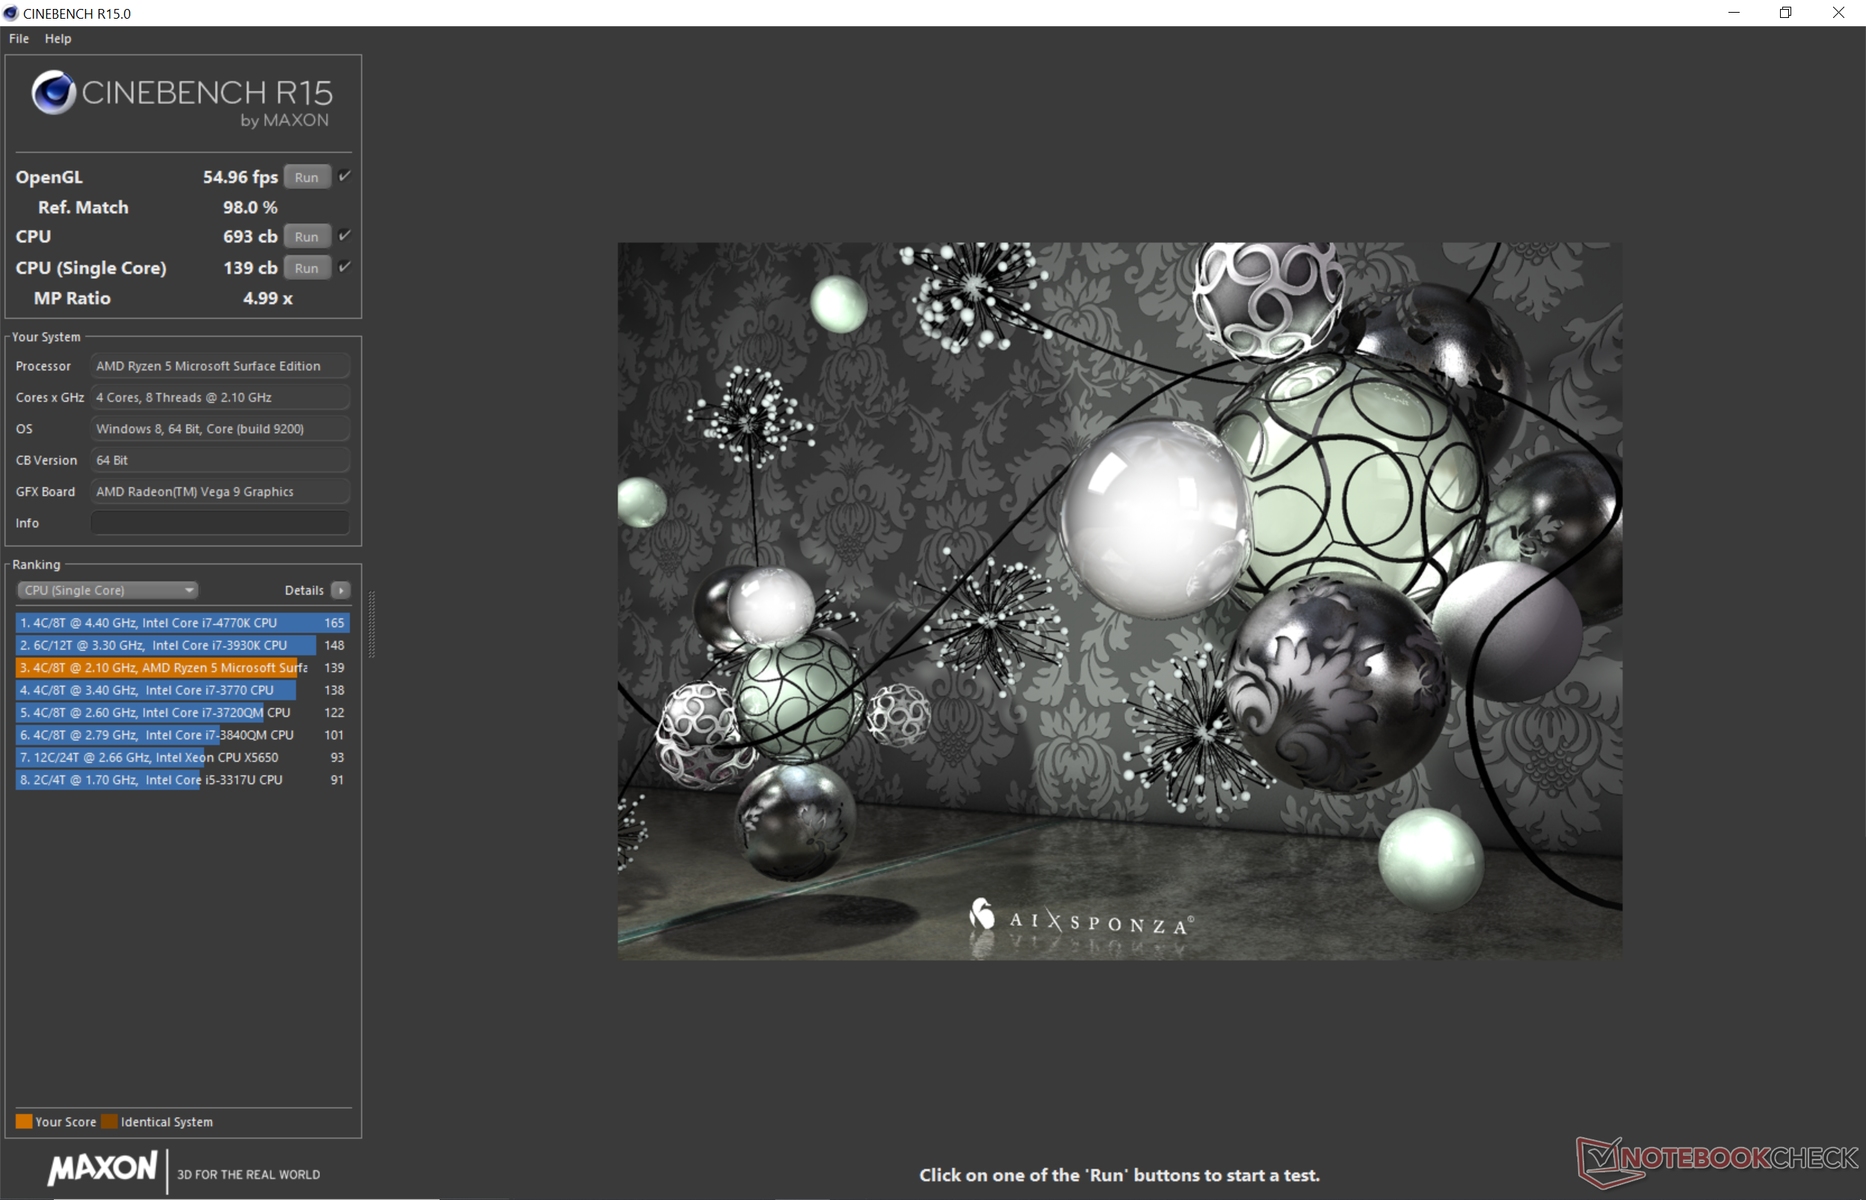
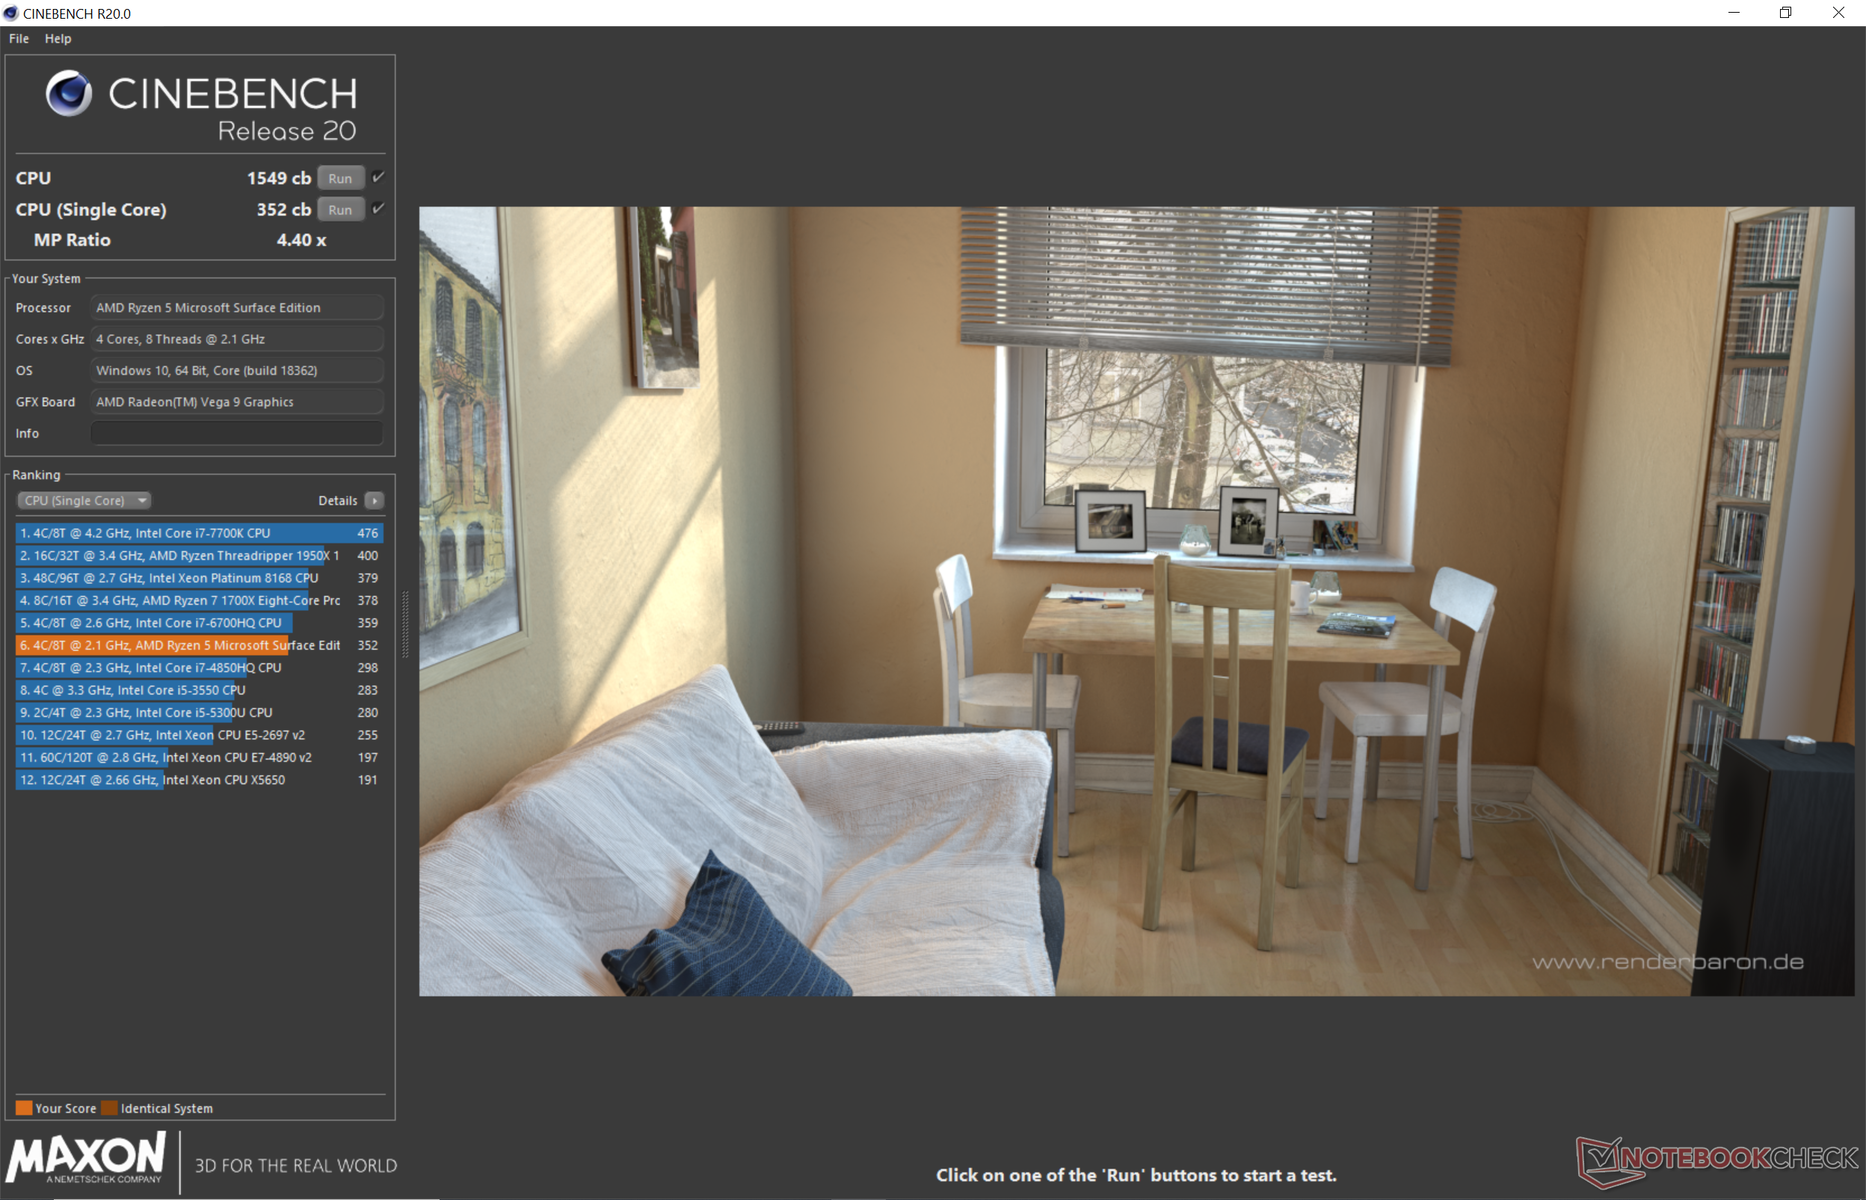
Raw CPU performance is essentially on par with the Ryzen 7 3700U in the Dell Inspiron 15 5585 while edging out Intel's latest Core i7-1065G7 CPU in the Razer Blade Stealth by just the slightest of margins. When running CineBench R15 Multi-Thread in a loop, the Surface Laptop exhibits longer turbo boost sustainability before clock rates inevitably fall. Interestingly, results will fluctuate between 600 and 690 points after a while which, when averaged, almost matches the Ryzen 7 3700U and Core i7-1065G7. Steadier scores are preferable for more predictable performance over time. Overall performance is slower than the 35 W Ryzen 5 3550H by only about 5 to 15 percent on average.
See our dedicated page on the Ryzen 5 3580U for more technical details and benchmark comparisons.
System Performance
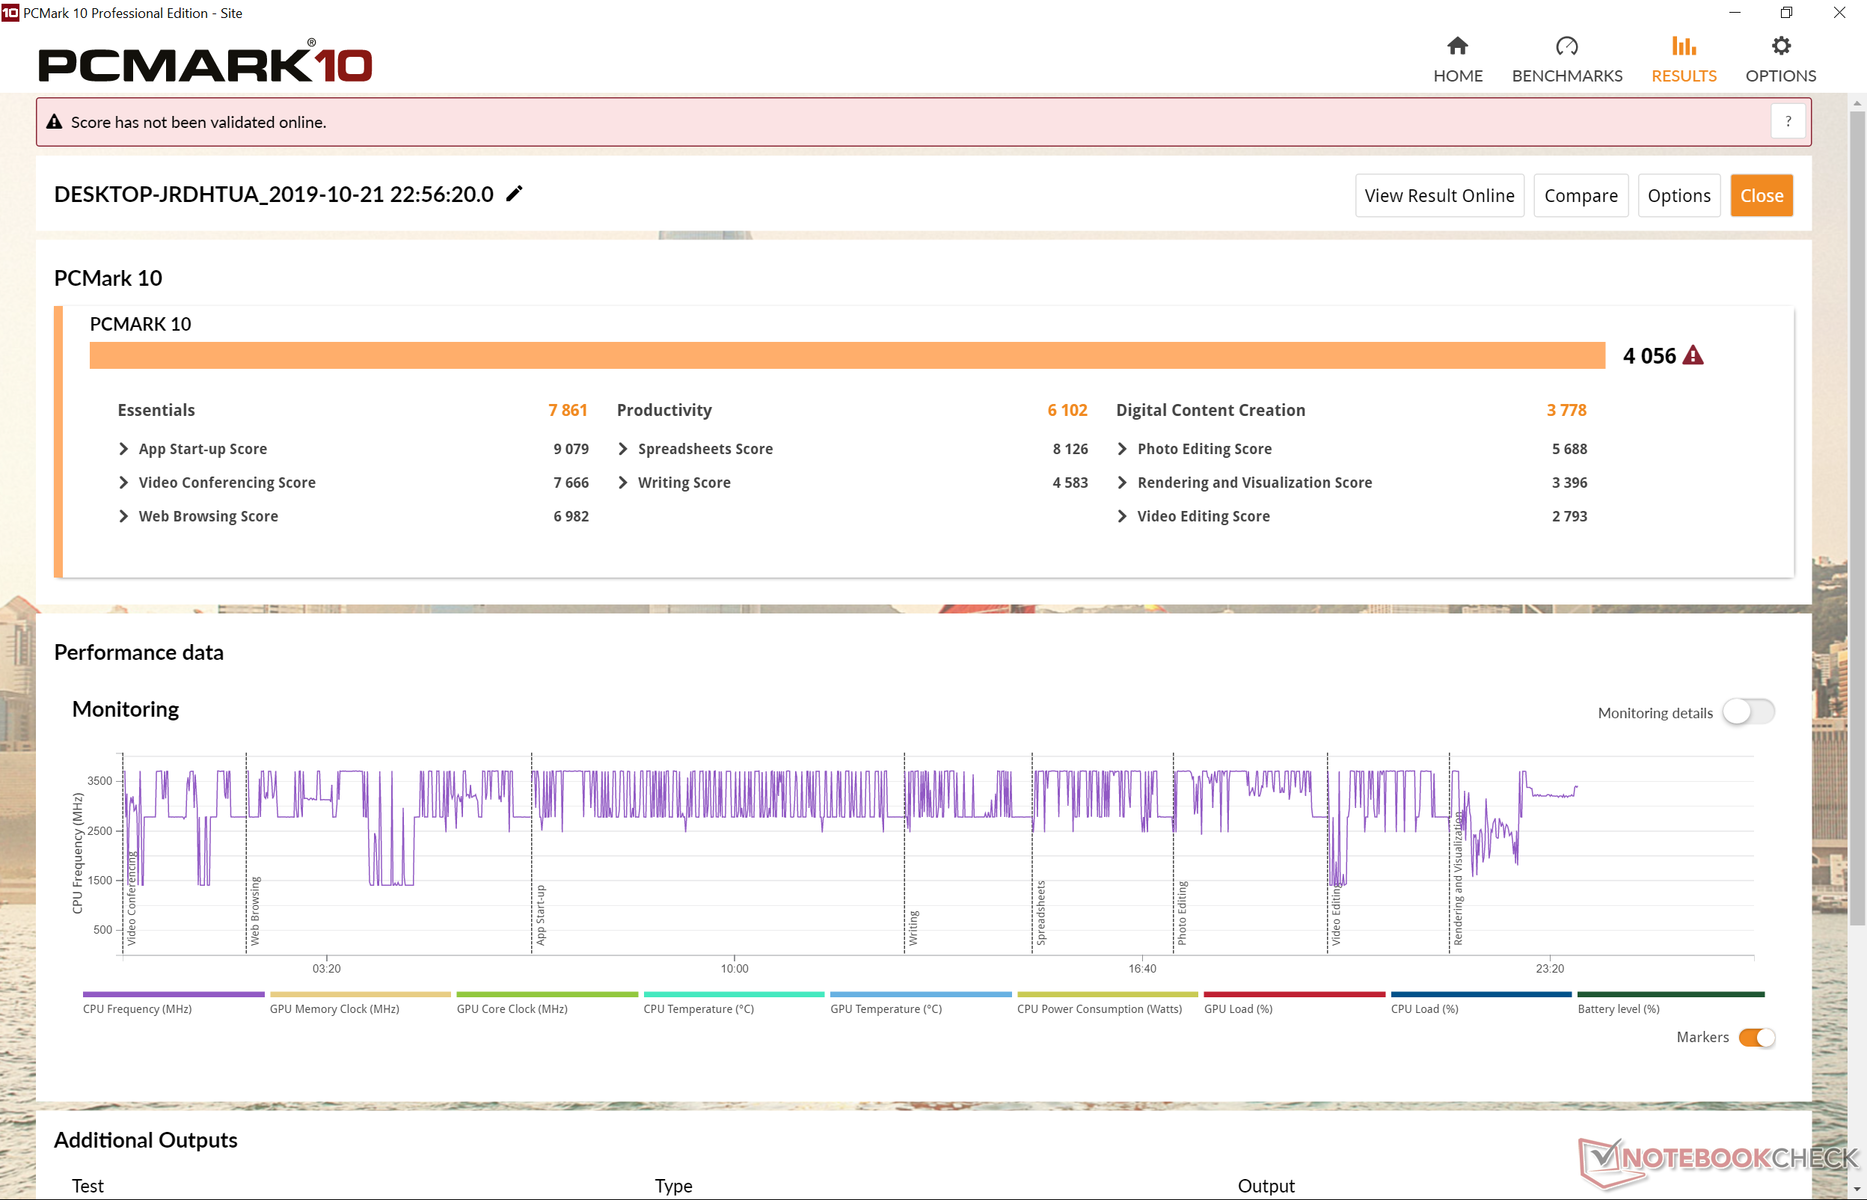
PCMark ranks our Ryzen-powered Surface Laptop higher than any Intel-powered Surface model from previous generations save for the Surface Book series with discrete Nvidia GPUs. The Dell XPS 13 7390 2-in-1 is able to consistently outscore our Surface Laptop to suggest that the pricier Surface Laptop 3 Core i7 SKU should be faster on paper.
We experienced no issues during our time with the unit save for the relatively minor ones as noted here. Nonetheless, we can't ignore the fact that the Surface series has had a rocky history of faulty hardware for long-term owners.
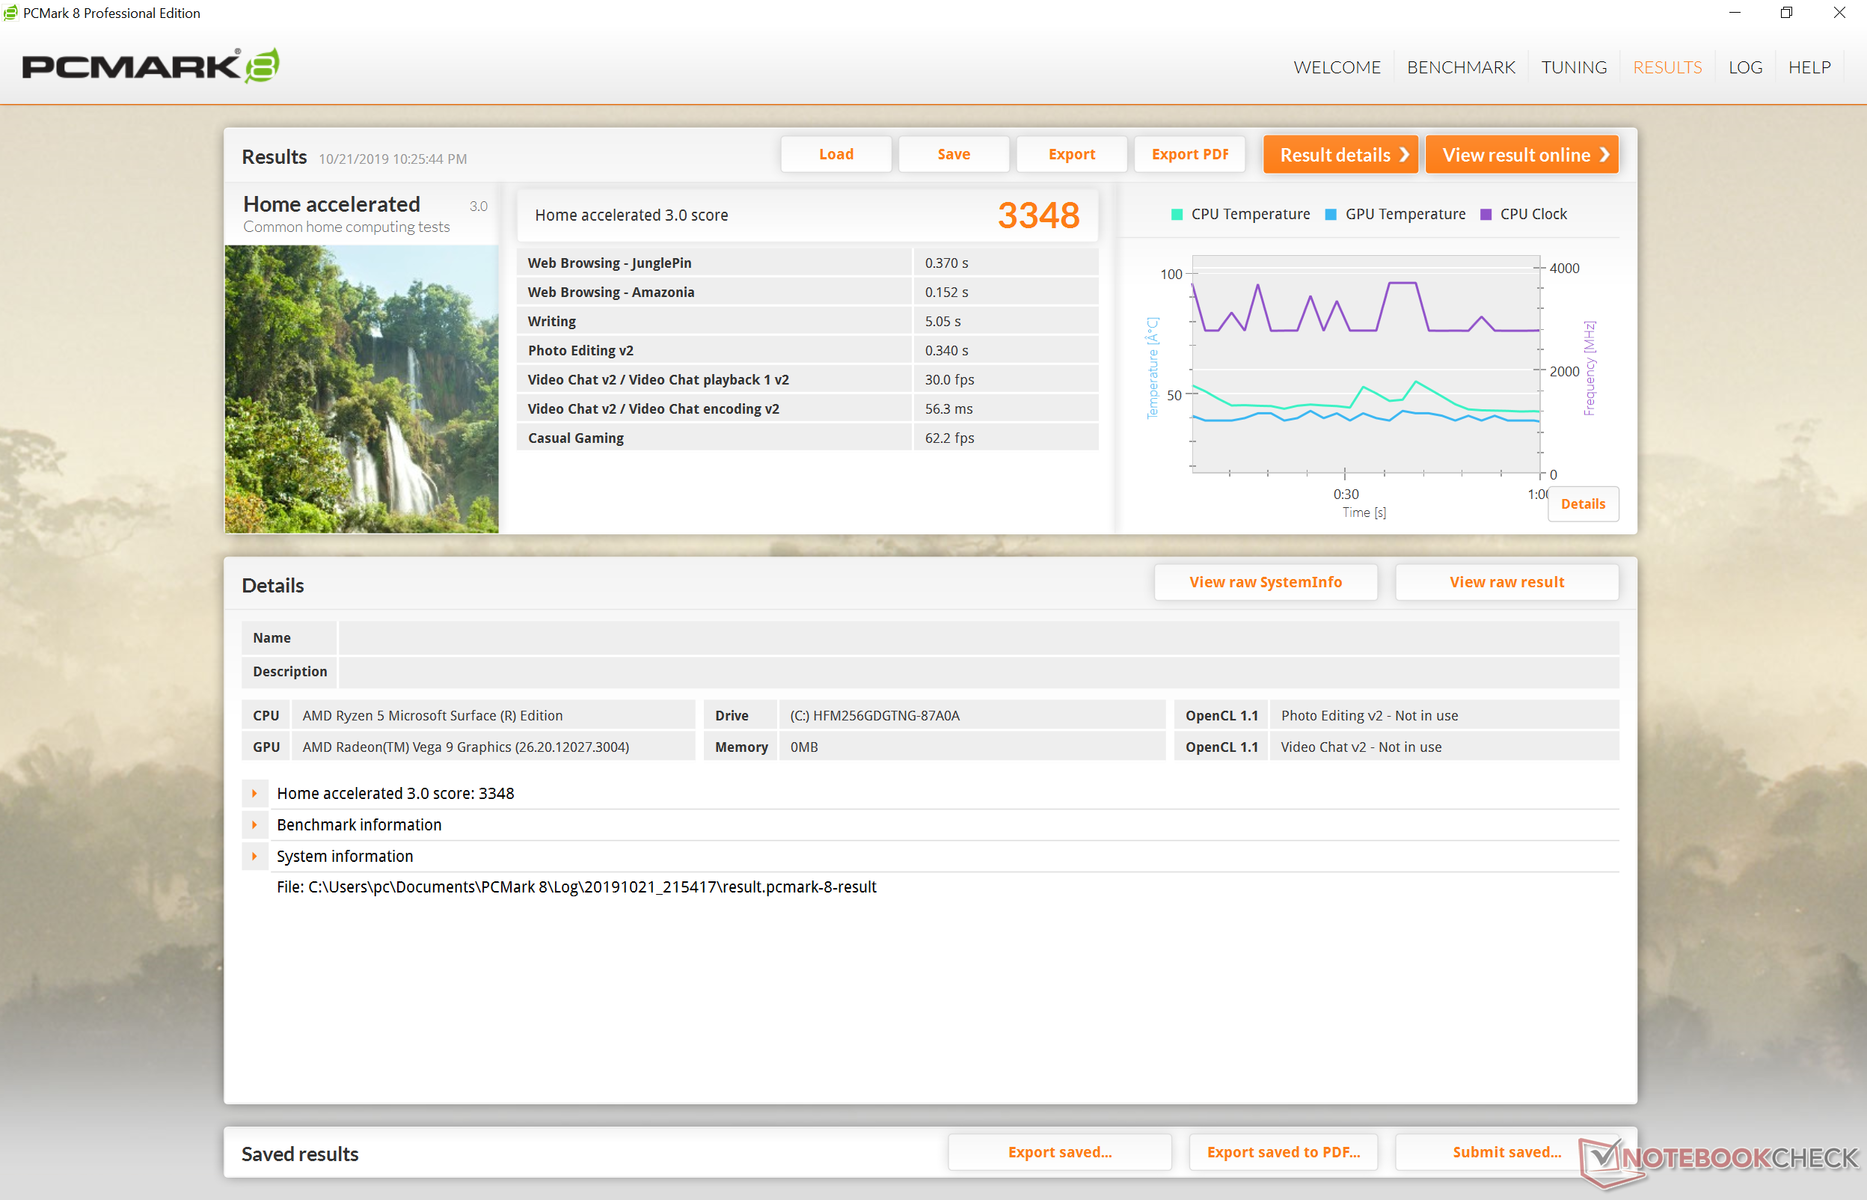
| PCMark 8 Home Score Accelerated v2 | 3348 points | |
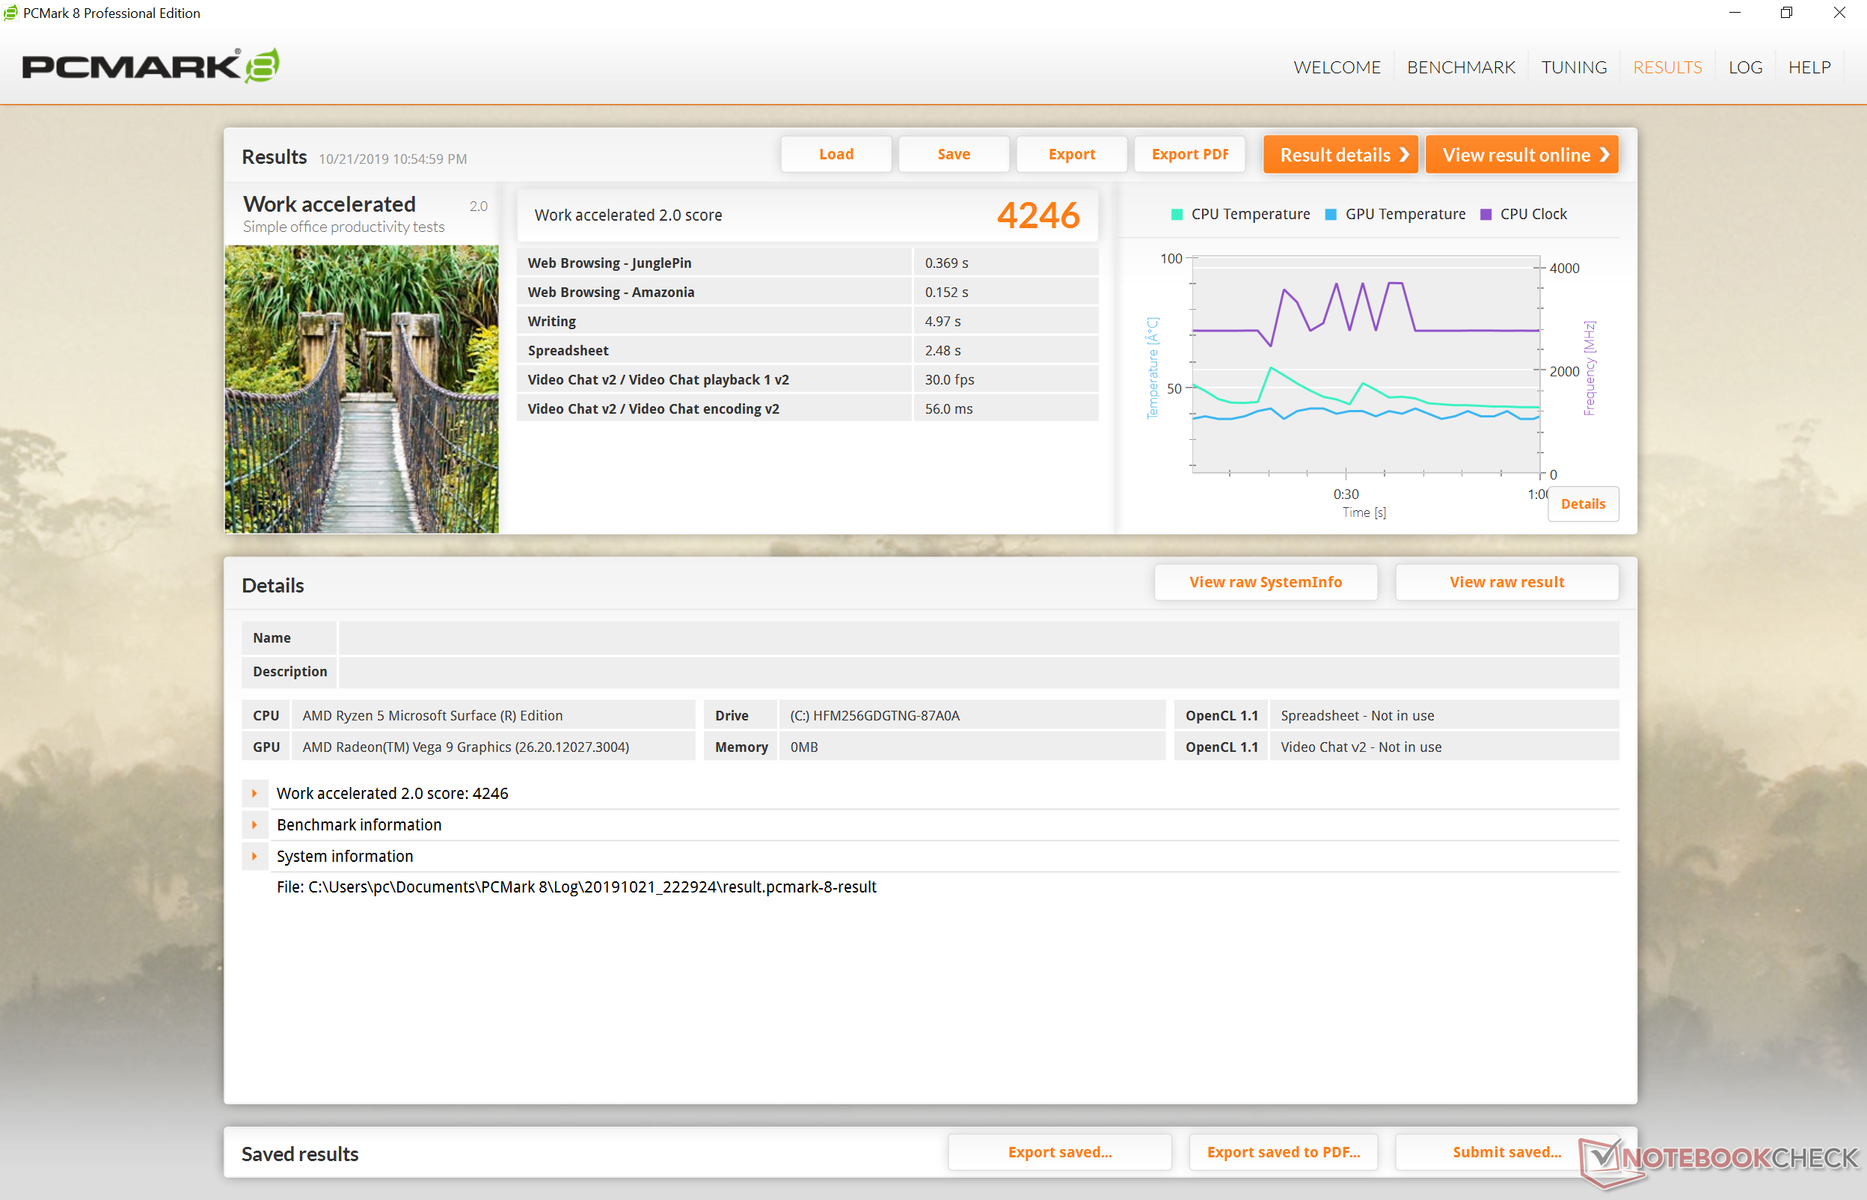
| PCMark 8 Work Score Accelerated v2 | 4246 points | |
| PCMark 10 Score | 4056 points | |
Help | ||
Storage Devices - Slow SK Hynix Again
Microsoft has sourced SK Hynix once again for all its storage needs. The single M.2 2230 slot houses an SK Hynix BC501 HFM256GDGTNG NVMe SSD for slow sequential read and write rates of just 1100 MB/s and 500 MB/s, respectively, to be in line with last year's Surface Laptop 2. Competing flagship Ultrabooks tend to come with much faster drives from Toshiba, Apple, or Samsung.
| Microsoft Surface Laptop 3 15 Ryzen 5 3580U SK hynix BC501 HFM256GDGTNG | Microsoft Surface Laptop 2-LQN-00004 SK Hynix BC501 NVMe 256 GB | Microsoft Surface Laptop i5 Toshiba THNSN0128GTYA | Dell XPS 15 7590 i5 iGPU FHD Toshiba XG6 KXG60ZNV512G | Apple MacBook Pro 15 2018 (2.6 GHz, 560X) Apple SSD AP0512 | HP Spectre x360 15-df0126ng Toshiba XG5-P KXG50PNV2T04 | |
|---|---|---|---|---|---|---|
| AS SSD | 10% | -89% | 133% | 2% | 55% | |
| Seq Read (MB/s) | 1122 | 826 -26% | 561 -50% | 2357 110% | 2239 100% | 2018 80% |
| Seq Write (MB/s) | 514 | 555 8% | 117.2 -77% | 1235 140% | 1644 220% | 773 50% |
| 4K Read (MB/s) | 34.98 | 33.39 -5% | 20.15 -42% | 43.29 24% | 9.46 -73% | 24.62 -30% |
| 4K Write (MB/s) | 96.8 | 95.3 -2% | 39.07 -60% | 99.7 3% | 18.78 -81% | 92.8 -4% |
| 4K-64 Read (MB/s) | 492 | 447 -9% | 80.4 -84% | 1020 107% | 965 96% | 845 72% |
| 4K-64 Write (MB/s) | 339.9 | 370.4 9% | 35.48 -90% | 1502 342% | 163.5 -52% | 957 182% |
| Access Time Read * (ms) | 0.056 | 0.048 14% | 0.128 -129% | 0.07 -25% | 0.225 -302% | 0.147 -163% |
| Access Time Write * (ms) | 0.11 | 0.048 56% | 0.369 -235% | 0.039 65% | 0.057 48% | |
| Score Read (Points) | 639 | 563 -12% | 157 -75% | 1299 103% | 1199 88% | 1071 68% |
| Score Write (Points) | 488 | 521 7% | 86 -82% | 1726 254% | 347 -29% | 1127 131% |
| Score Total (Points) | 1434 | 1369 -5% | 309 -78% | 3640 154% | 2119 48% | 2684 87% |
| Copy ISO MB/s (MB/s) | 828 | 755 -9% | 87.1 -89% | 2145 159% | 1652 100% | |
| Copy Program MB/s (MB/s) | 200.5 | 325.1 62% | 62.7 -69% | 565 182% | 328.5 64% | |
| Copy Game MB/s (MB/s) | 387.4 | 577 49% | 80.5 -79% | 1320 241% | 700 81% |
* ... smaller is better

GPU Performance - Don't Expect Much
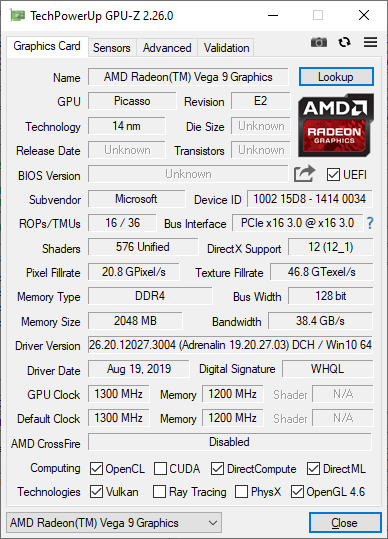
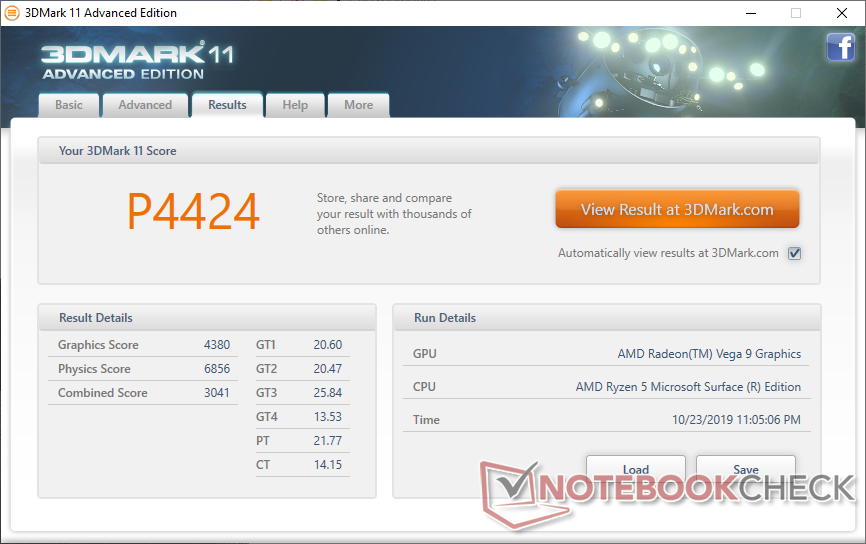
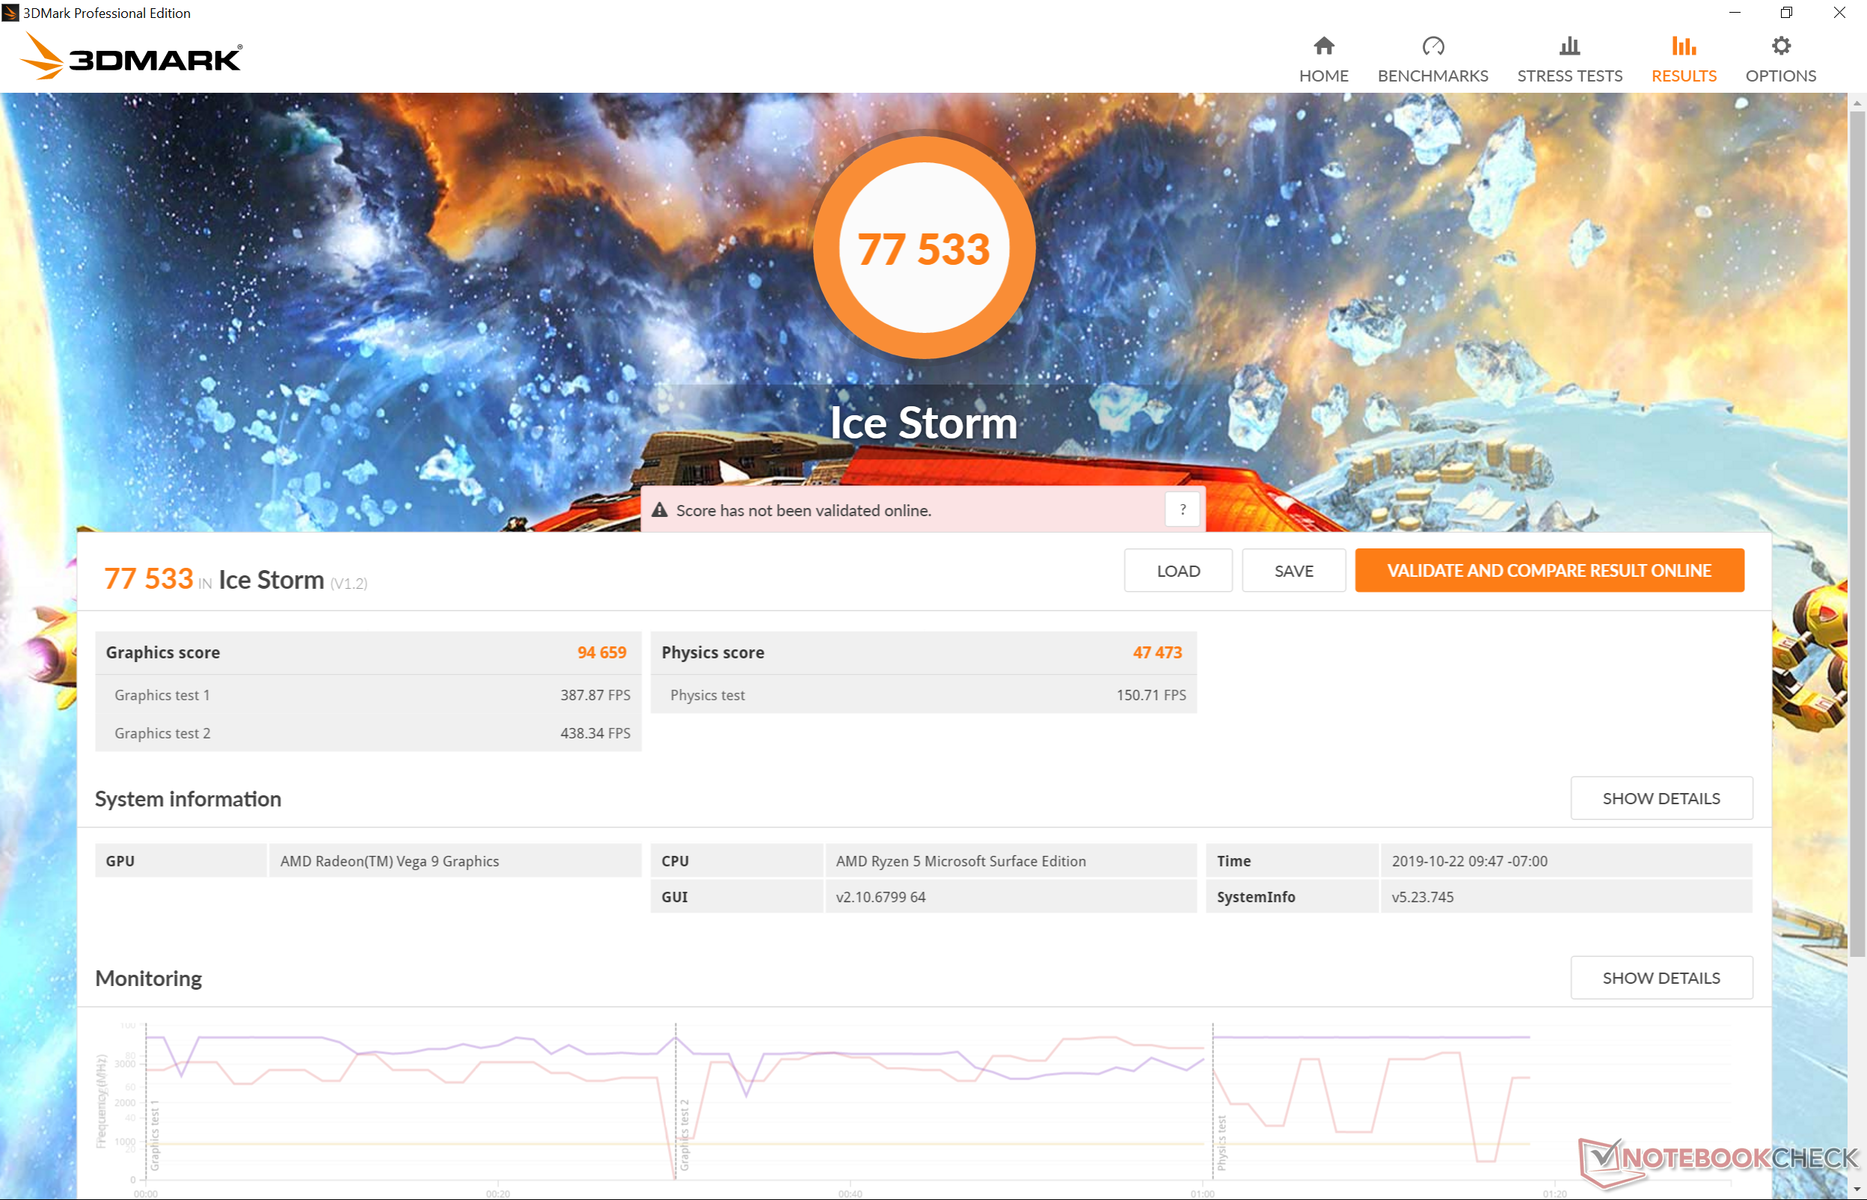
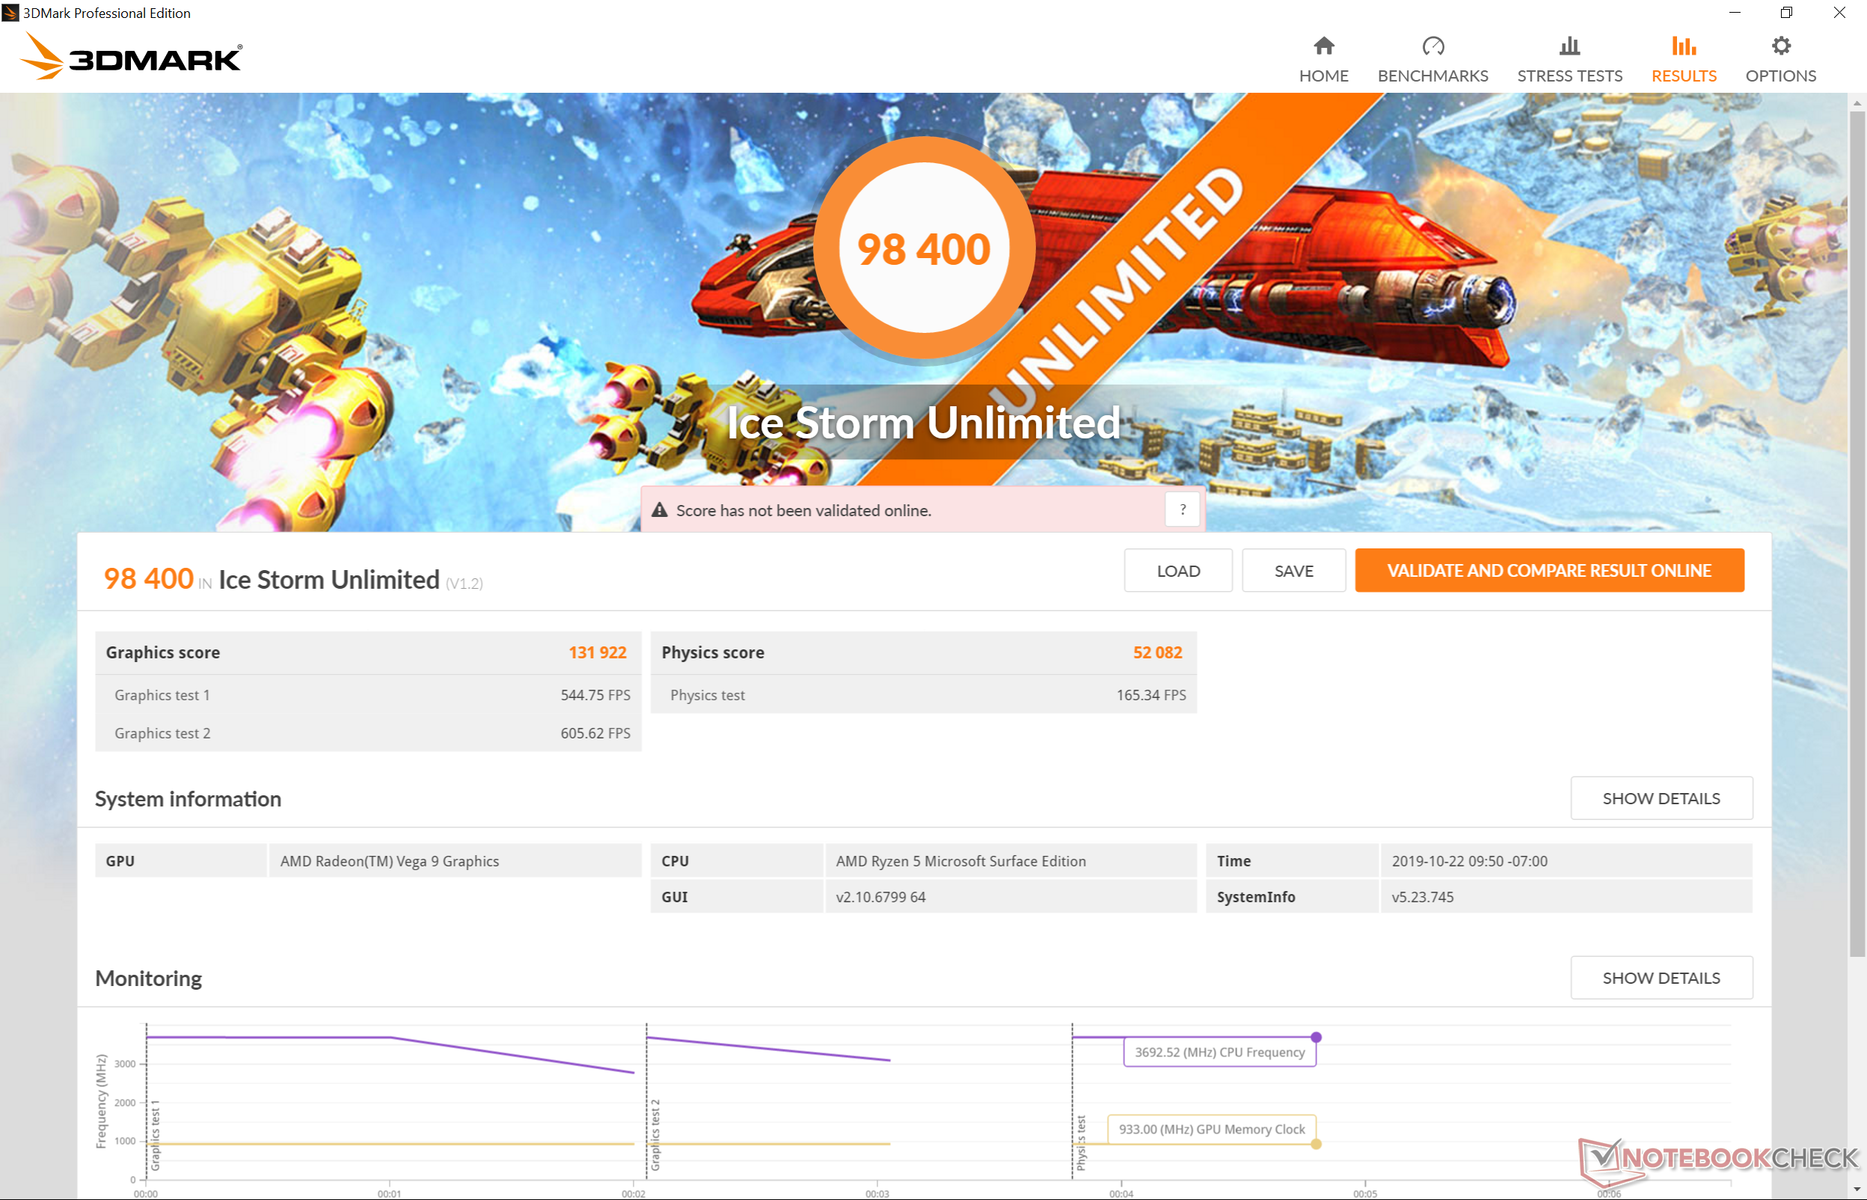
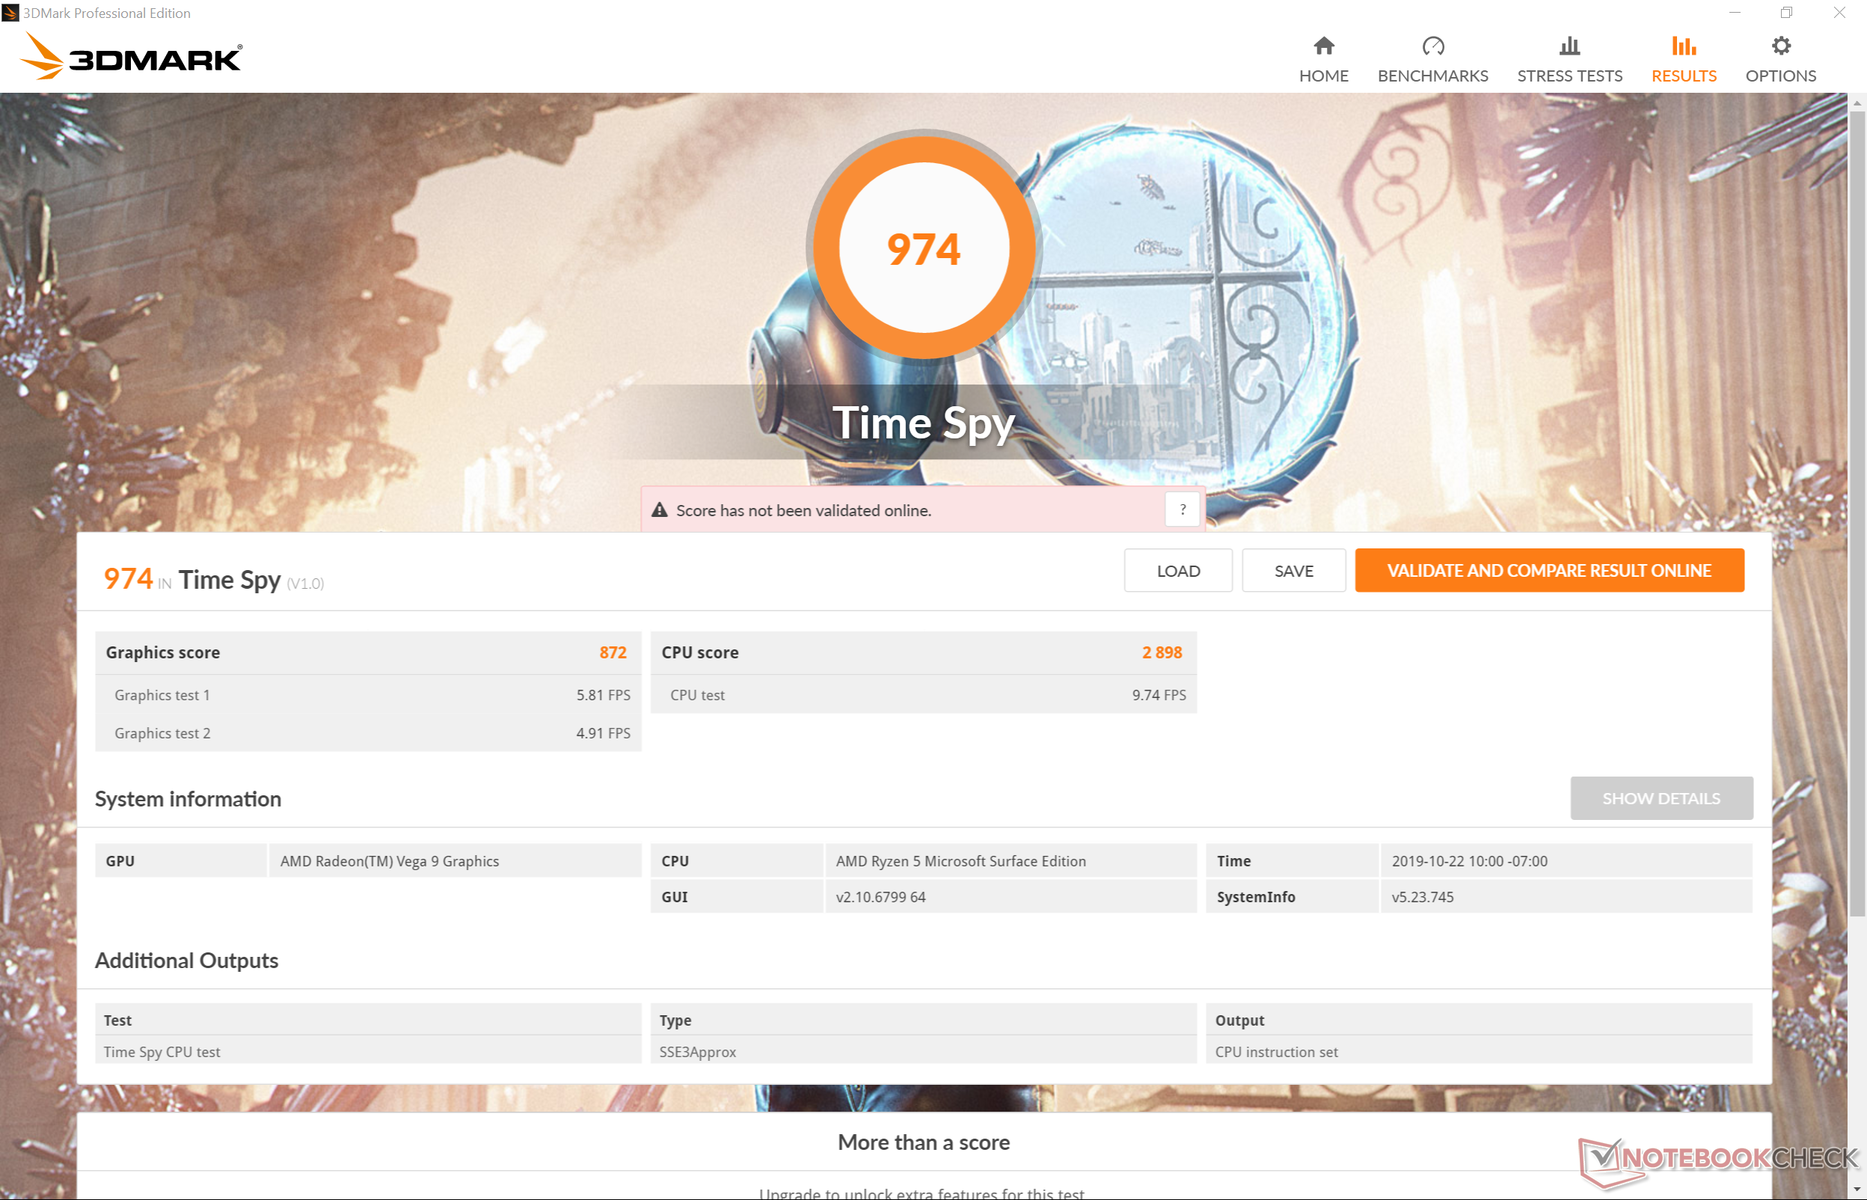
We had anticipated the integrated Radeon RX Vega 9 to perform very similarly to the Vega 10 in the Ryzen 7 3700U and 3DMark benchmarks confirm our predictions. Results are within just a few percentage points of both the Dell Inspiron 15 5585 with the Ryzen 7 3700U and Dell XPS 13 7390 2-in-1 with the Core i7-1065G7 Iris Plus. The gen-to-gen leap is what's more significant here as the UHD Graphics 620 or Iris Plus Graphics 640 on the older Surface Laptop models are each over 2x slower.
| 3DMark 06 Standard Score | 13365 points | |
| 3DMark Vantage P Result | 12628 points | |
| 3DMark 11 Performance | 4424 points | |
| 3DMark Ice Storm Standard Score | 77533 points | |
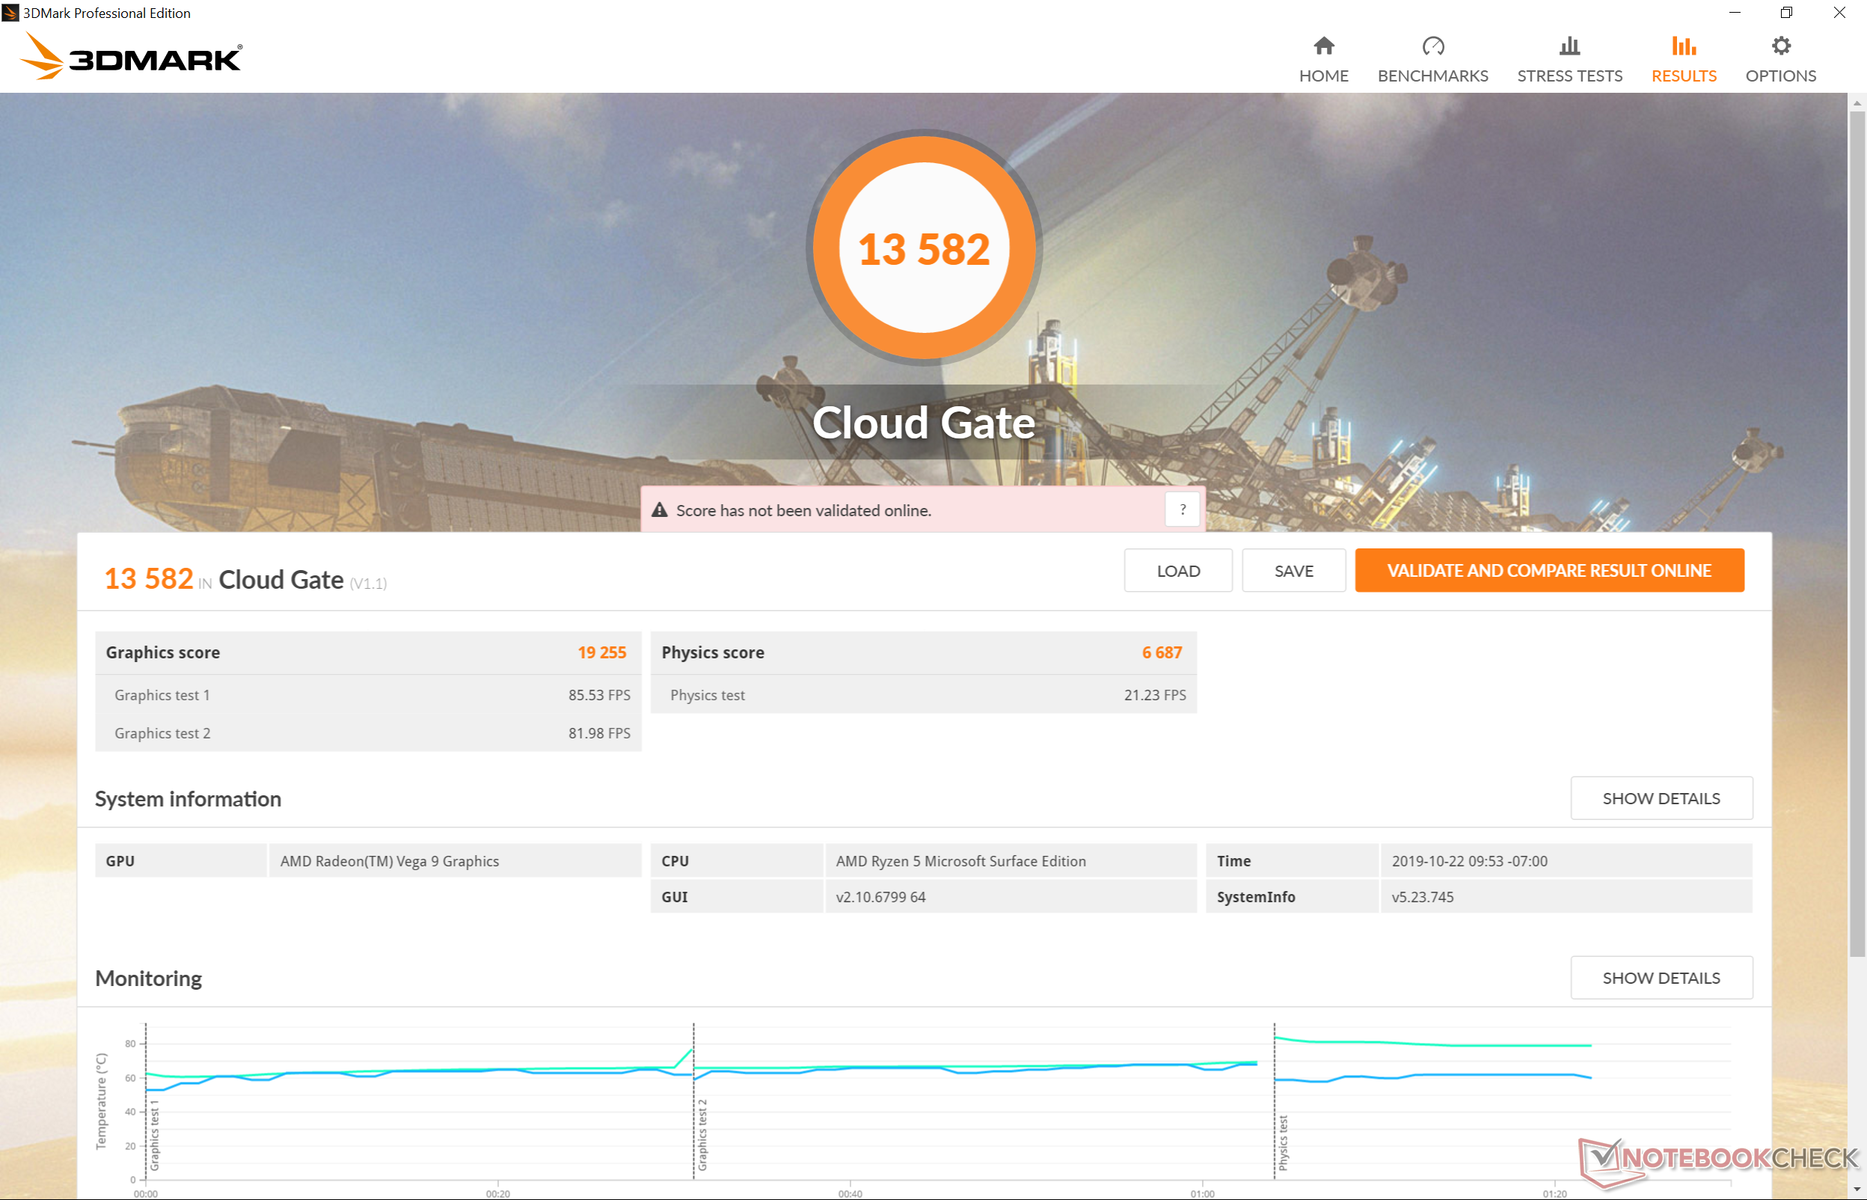
| 3DMark Cloud Gate Standard Score | 13582 points | |
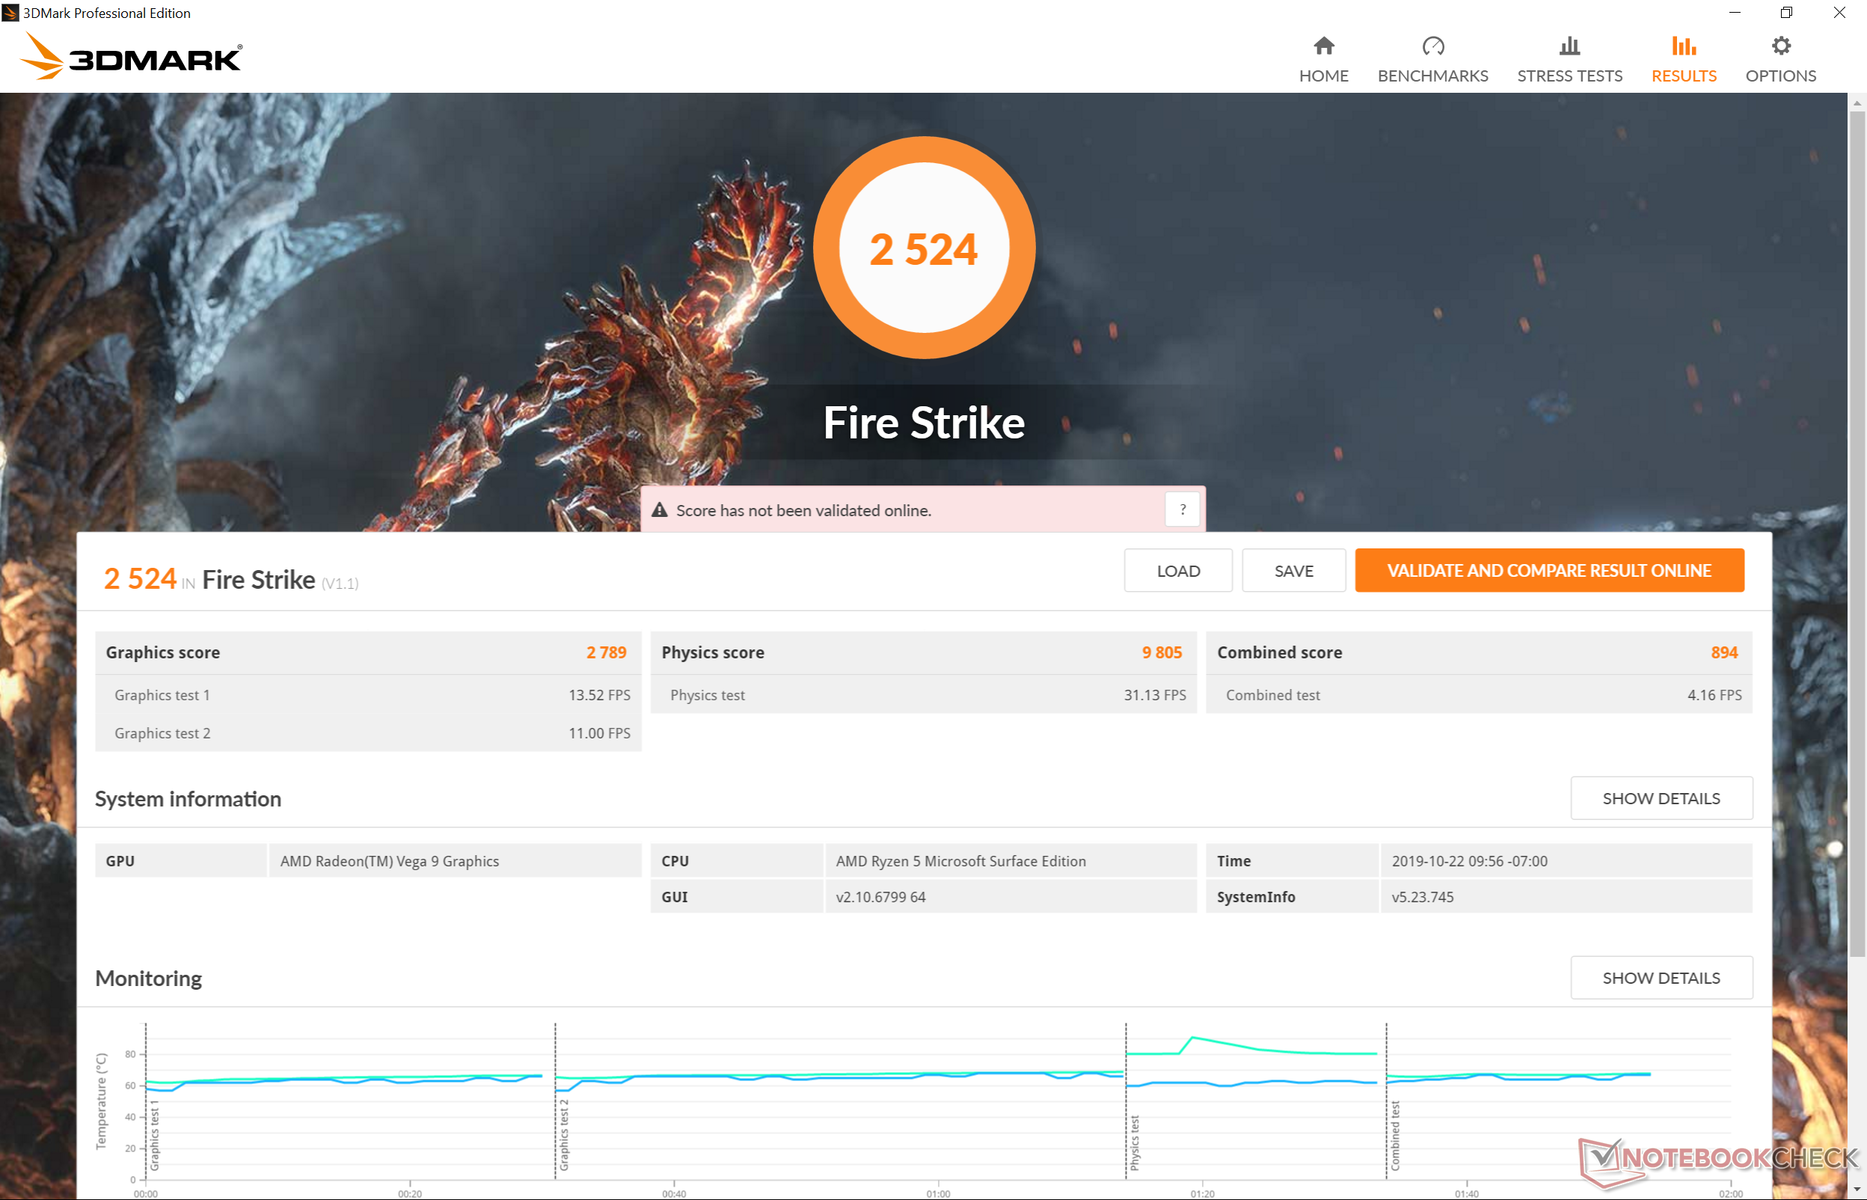
| 3DMark Fire Strike Score | 2524 points | |
| 3DMark Time Spy Score | 974 points | |
Help | ||
Gaming Performance
Real-world performance in games is average at best and disappointing at worst. When running the Shadow of the Tomb Raider benchmark, for example, the 29 FPS average matches what we observed on the XPS 13 7390 2-in-1 and Razer Blade Stealth with the competing Core i7-1065G7 Iris Plus. Meanwhile, other games like Fortnite, Rocket League, and Witcher 3 show the Radeon Vega 9 to be anywhere from 15 to 40 percent slower. In fact, frame rates in Fortnite are 25 percent slower than the Honor Magicbook with the older Ryzen 5 2500U and RX Vega 8. Having dual-channel RAM would have definitely helped here in this regard and so we suspect the higher-end Ryzen 7 3780U Surface Laptop configuration to perform even better. Either way, your safest bet would be to run most games on low settings only.
Idling on Witcher 3 for one hour shows unusual frame rate behavior even after repeat testing. As shown by our graph below, frame rates remain steady at about 47 FPS before dropping sharply to 41 FPS. On most other laptops, frame rates would remain steady throughout with shallower frame rate dips, if any. The Ryzen 5 processor may be reaching its limit when balancing between temperature and TDP for the CPU and integrated GPU.
| Fortnite | |
| 1280x720 Low Preset | |
| Apple MacBook Pro 15 2018 (2.6 GHz, 560X) | |
| Asus ROG Zephyrus G15 GA502DU | |
| Razer Blade Stealth i7-1065G7 Iris Plus | |
| Honor Magicbook | |
| Microsoft Surface Laptop 3 15 Ryzen 5 3580U | |
| 1920x1080 Medium Preset | |
| MSI PS63 Modern 8SC | |
| Asus ROG Zephyrus G15 GA502DU | |
| Apple MacBook Pro 15 2018 (2.6 GHz, 560X) | |
| Razer Blade Stealth i7-1065G7 Iris Plus | |
| Honor Magicbook | |
| Microsoft Surface Laptop 3 15 Ryzen 5 3580U | |
| low | med. | high | ultra | |
|---|---|---|---|---|
| BioShock Infinite (2013) | 117.9 | 20.5 | ||
| The Witcher 3 (2015) | 41.9 | 13.3 | 8.1 | |
| Overwatch (2016) | 92.3 | 36.3 | 19.3 | |
| Rocket League (2017) | 100.7 | 46.2 | 30.4 | |
| Fortnite (2018) | 48 | 22.3 | 15.7 | 9.1 |
| Shadow of the Tomb Raider (2018) | 29 | 8 | ||
| Apex Legends (2019) | 60.7 | 20.9 | 18 | 14.5 |
| F1 2019 (2019) | 51 | 21 | 18 | 12 |
| Borderlands 3 (2019) | 28.3 | 13.5 | 7.8 |
Emissions
System Noise - Quiet Under Most Loads
The cooling solution consists of just two heat pipes and a single fan. We're usually wary of single-fan setups on Ultrabooks as the fan may pulse and become active more frequently than a dual-fan setup. Fortunately, the Surface Laptop 3 is almost always silent or at least very nearly so even after extended browsing or video streaming. We recorded a fan noise of just around 30 dB(A) when running the first benchmark scene of 3DMark 06 to be not unlike what we discovered on the previous generation Surface Laptop models.
Fan noise will ramp up slowly but surely during more demanding loads. When running Witcher 3, the fan steadily increases to 31 .4 dB(A), 34.4 dB(A), 37.2 dB(A), and then finally to a stable 39 dB(A).
We can notice no electronic noise or coil whine on our test unit.
| Microsoft Surface Laptop 3 15 Ryzen 5 3580U Vega 9, R5 3580U, SK hynix BC501 HFM256GDGTNG | Microsoft Surface Laptop 2-LQN-00004 UHD Graphics 620, i5-8250U, SK Hynix BC501 NVMe 256 GB | Microsoft Surface Laptop i5 HD Graphics 620, i5-7200U, Toshiba THNSN0128GTYA | Dell XPS 15 7590 i5 iGPU FHD UHD Graphics 630, i5-9300H, Toshiba XG6 KXG60ZNV512G | Apple MacBook Pro 15 2018 (2.6 GHz, 560X) Radeon Pro 560X, i7-8850H, Apple SSD AP0512 | HP Spectre x360 15-df0126ng GeForce GTX 1050 Ti Max-Q, i7-8750H, Toshiba XG5-P KXG50PNV2T04 | |
|---|---|---|---|---|---|---|
| Noise | 2% | -1% | -4% | -14% | -14% | |
| off / environment * (dB) | 28 | 28.7 -2% | 28.2 -1% | 29.3 -5% | 29.6 -6% | 30.4 -9% |
| Idle Minimum * (dB) | 28 | 28.7 -2% | 28.2 -1% | 29.3 -5% | 30.1 -8% | 30.4 -9% |
| Idle Average * (dB) | 28 | 28.7 -2% | 28.2 -1% | 29.3 -5% | 30.1 -8% | 30.4 -9% |
| Idle Maximum * (dB) | 28 | 28.7 -2% | 29 -4% | 29.8 -6% | 30.1 -8% | 31.6 -13% |
| Load Average * (dB) | 29.2 | 30 -3% | 30.3 -4% | 32.4 -11% | 46.8 -60% | 43.2 -48% |
| Witcher 3 ultra * (dB) | 39 | 36 8% | ||||
| Load Maximum * (dB) | 41.4 | 32.9 21% | 39.3 5% | 37.2 10% | 46.8 -13% | 38.3 7% |
* ... smaller is better
Noise level
| Idle |
| 28 / 28 / 28 dB(A) |
| Load |
| 29.2 / 41.4 dB(A) |
 | ||
30 dB silent 40 dB(A) audible 50 dB(A) loud |
||
min: | ||
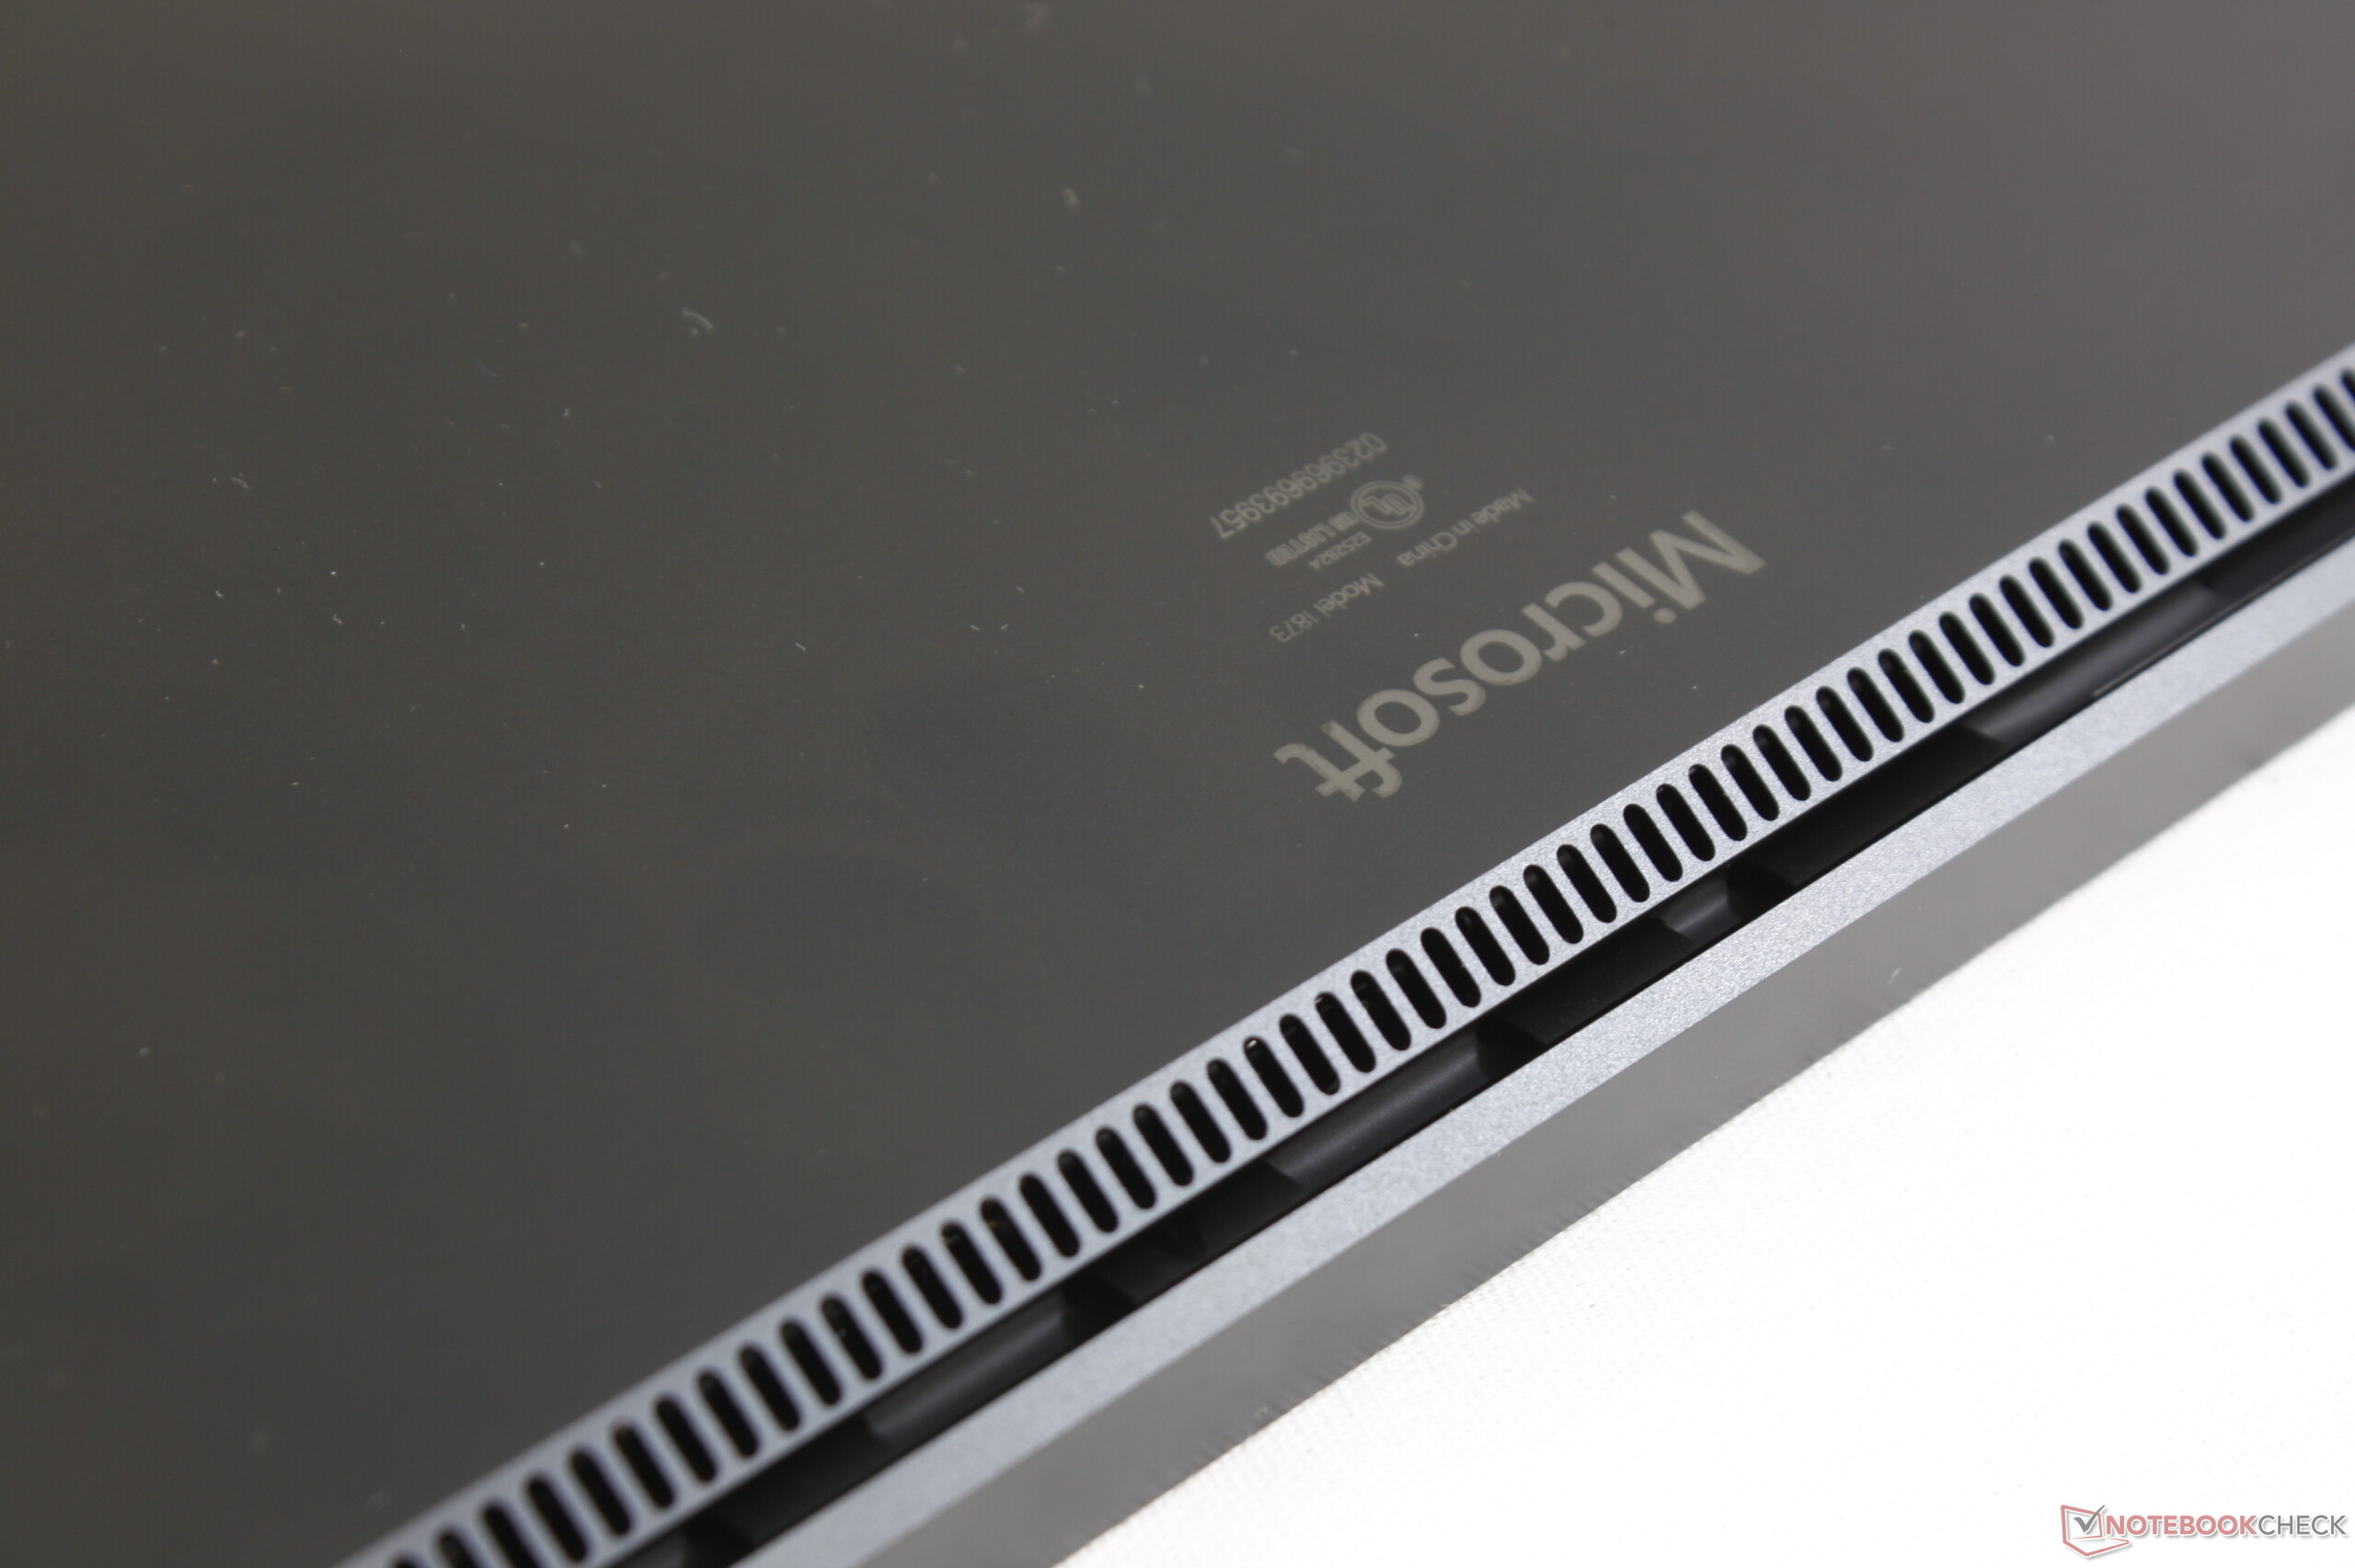
Temperature
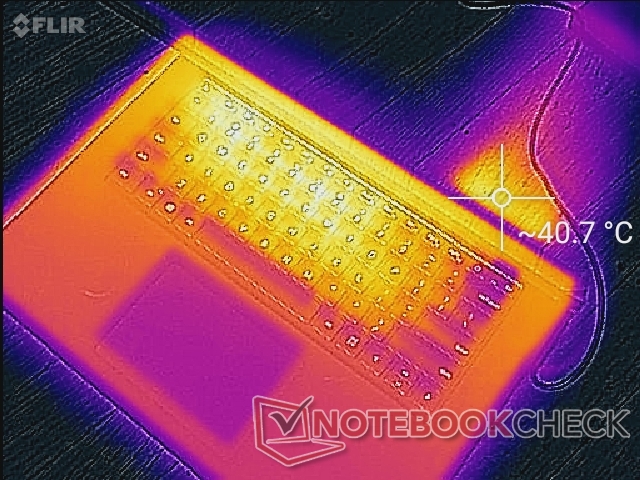
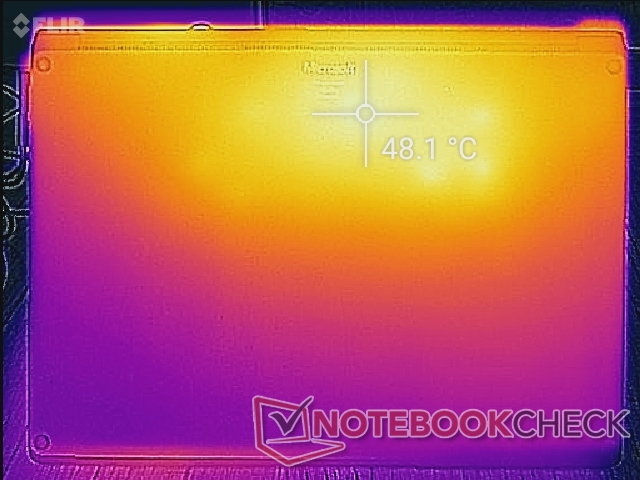
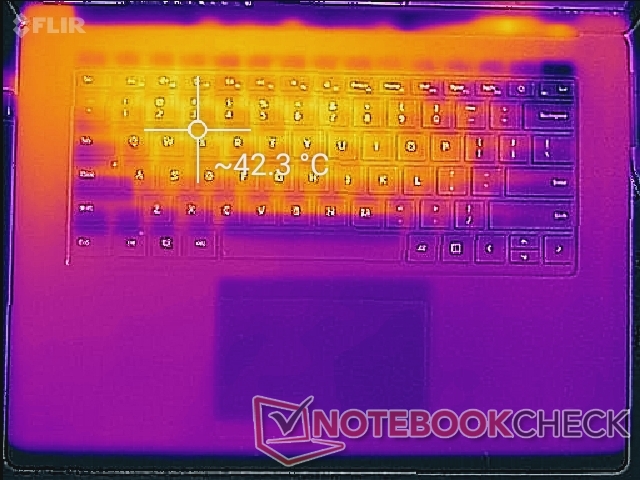
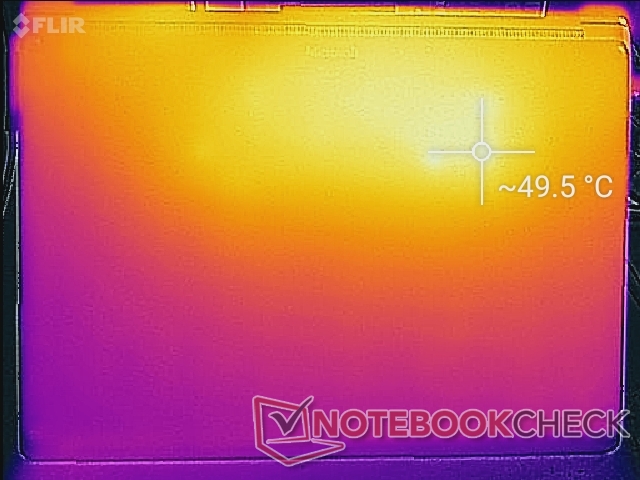
Most laptops have ventilation grilles on the bottom to aid in heat dissipation. The Surface Laptop 3 omits them completely and the consequences are apparent as average surface temperatures are warmer than what we've come to expect from an Ultrabook. Hot spots when gaming or running demanding loads can be as warm as 50 C on the bottom with a shallower temperature gradient than on the HP Spectre or Asus ZenBook. In other words, hot spots are larger and more noticeable when typing or placing the laptop on one's lap. Most of the keyboard keys hover around 40 C when gaming while the palm rests are a balmy 35 C.
(±) The maximum temperature on the upper side is 43.6 °C / 110 F, compared to the average of 34.3 °C / 94 F, ranging from 21.2 to 62.5 °C for the class Office.
(-) The bottom heats up to a maximum of 49.4 °C / 121 F, compared to the average of 36.8 °C / 98 F
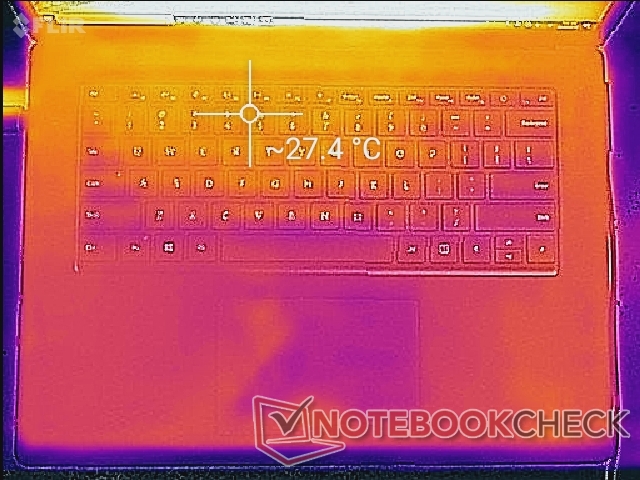
(+) In idle usage, the average temperature for the upper side is 26.6 °C / 80 F, compared to the device average of 29.5 °C / 85 F.
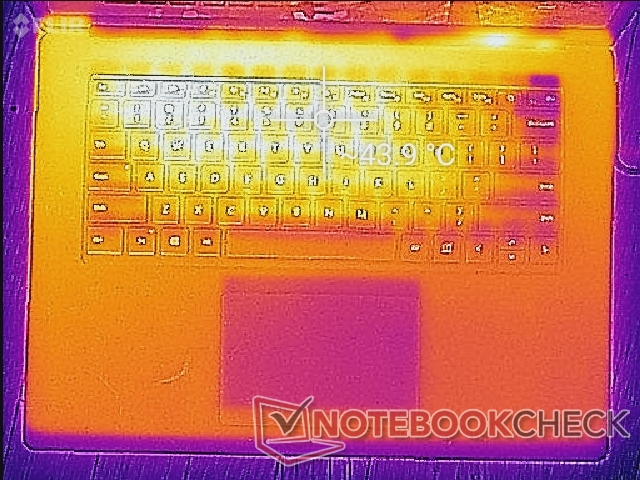
(±) Playing The Witcher 3, the average temperature for the upper side is 37.6 °C / 100 F, compared to the device average of 29.5 °C / 85 F.
(+) The palmrests and touchpad are reaching skin temperature as a maximum (35.8 °C / 96.4 F) and are therefore not hot.
(-) The average temperature of the palmrest area of similar devices was 27.5 °C / 81.5 F (-8.3 °C / -14.9 F).

Stress Test - Decent Core Temperatures
We stress the laptop with synthetic loads in order to identify for any throttling behavior. When running Prime95, clock rates would spike up to 3.75 GHz for the first few seconds before dropping to 3.25 GHz and ~79 C. After a few more minutes, clock rates and temperature drop even further to 2.5 GHz and 66 C, respectively. This two-step drop in performance matches both our power consumption readings below and our CineBench loop test results above. Final stable values are not unlike most Ultrabooks with ULV Intel CPUs including the ZenBook S13 or HP Spectre x360 15. The Dell XPS lineup is a notable exception as these models tend to run even warmer for faster performance.
Running Witcher 3 results in a stable GPU clock rate of 800 MHz and an acceptable core temperature of 62 C. Performance will not drop if running on battery power; a Fire Strike run on batteries returns Physics and Graphics scores of 9636 and 2809 points, respectively, compared to 9805 and 2789 points when on mains.
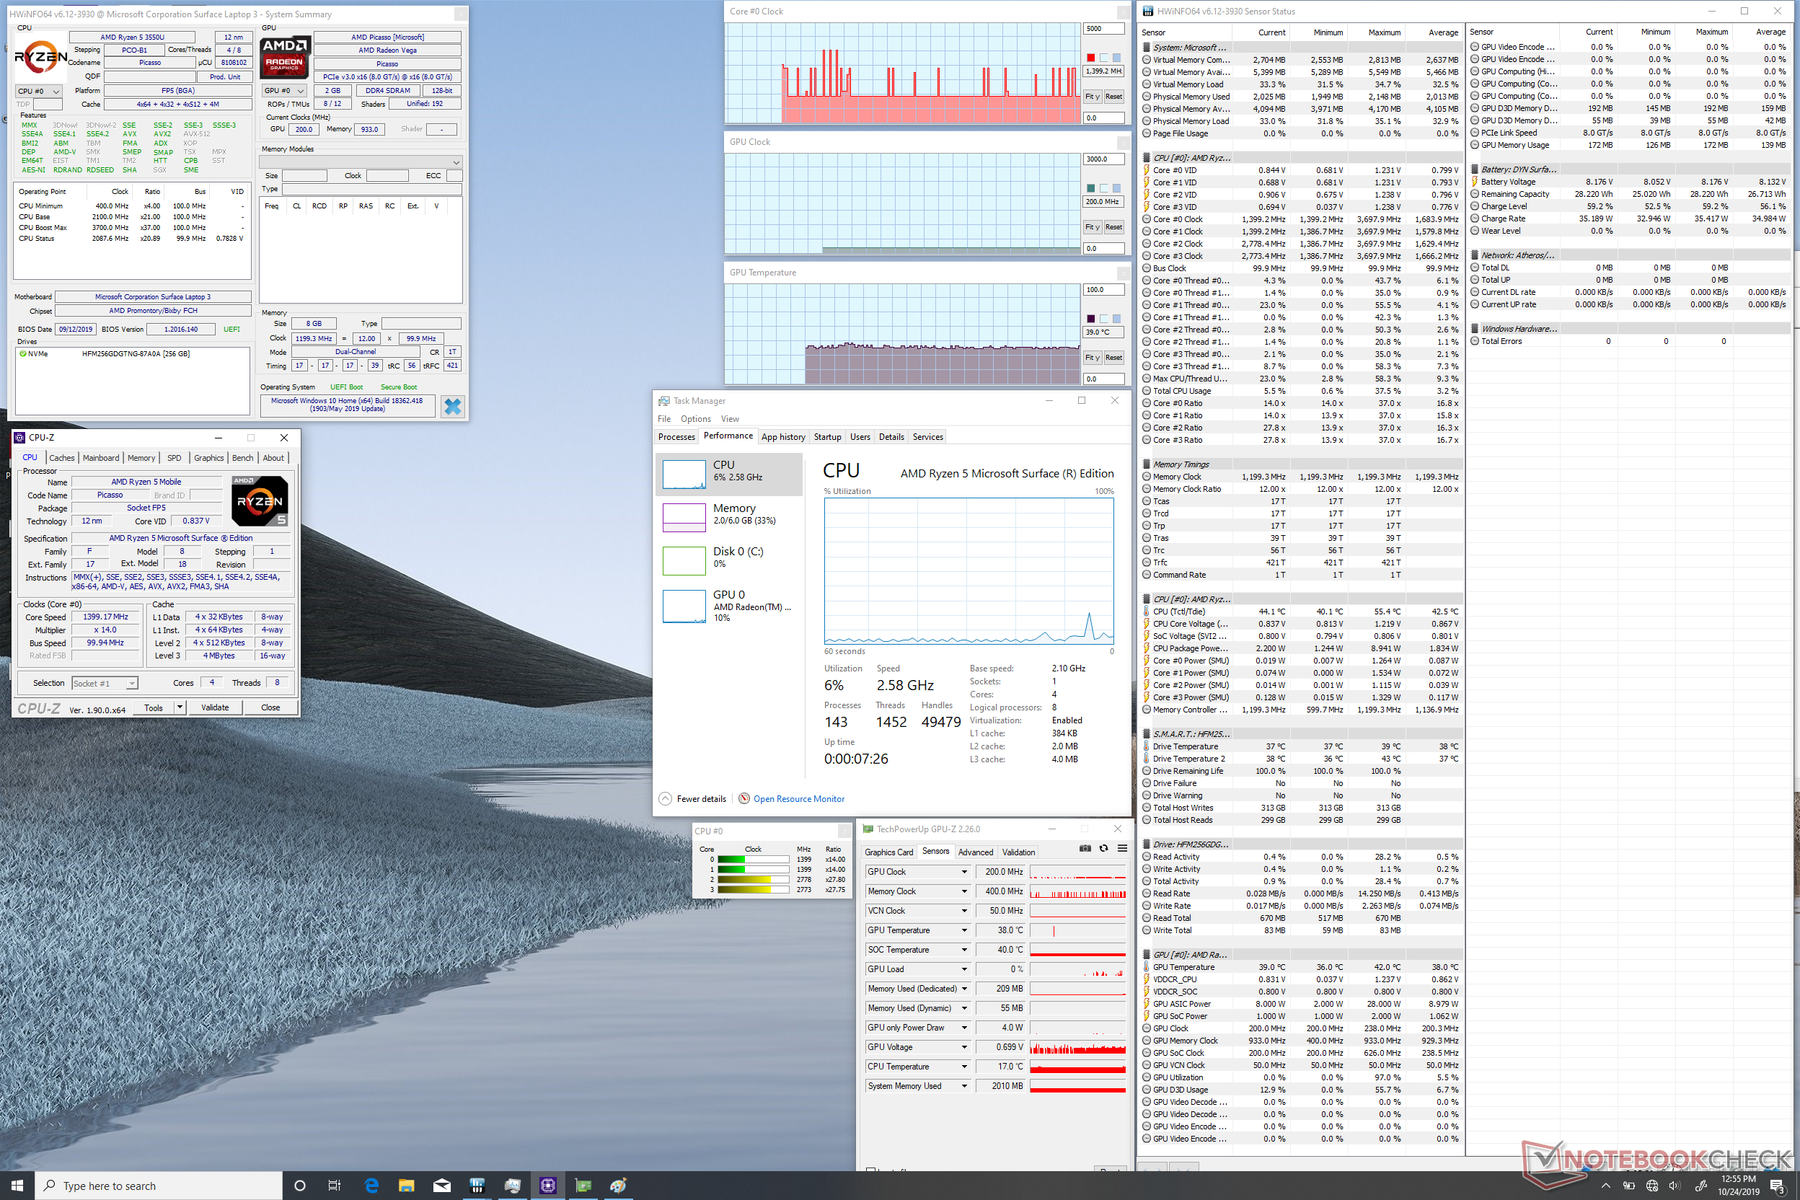
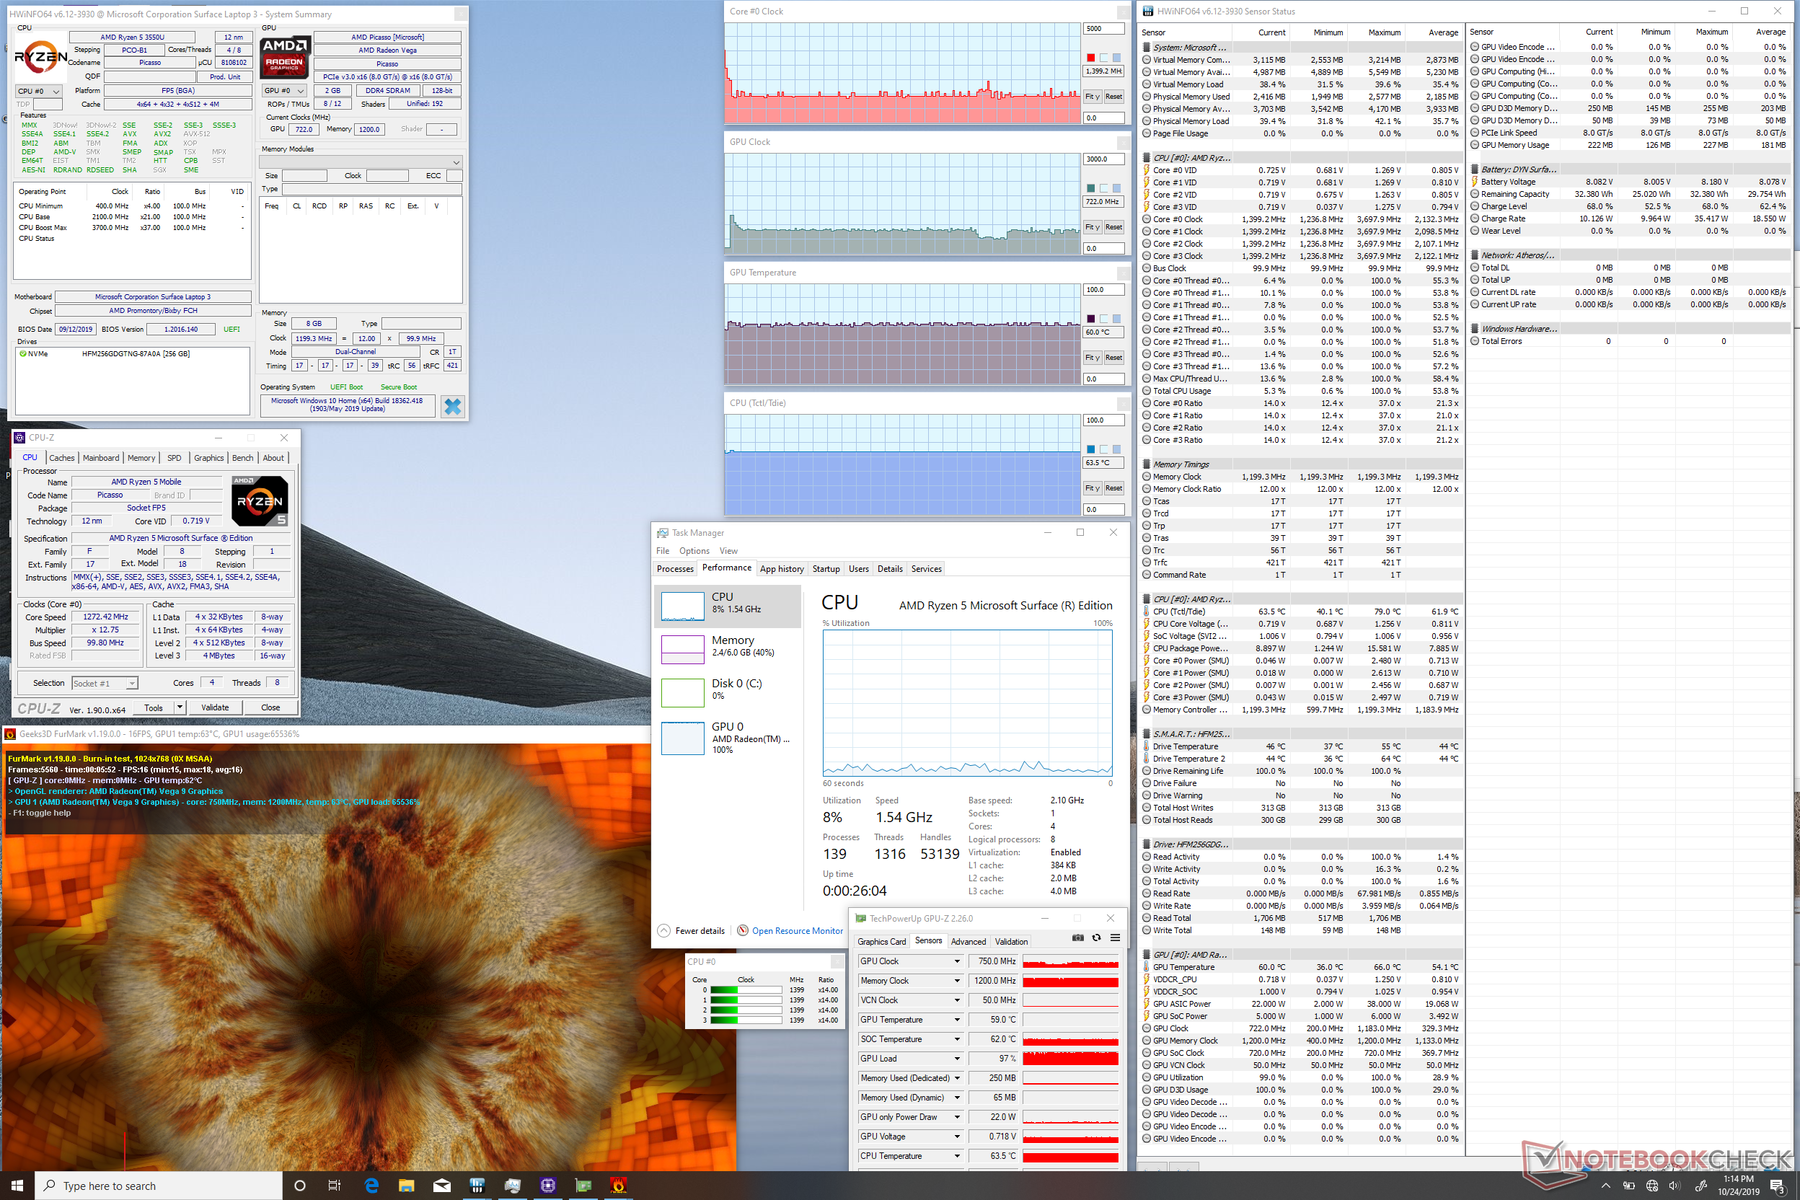
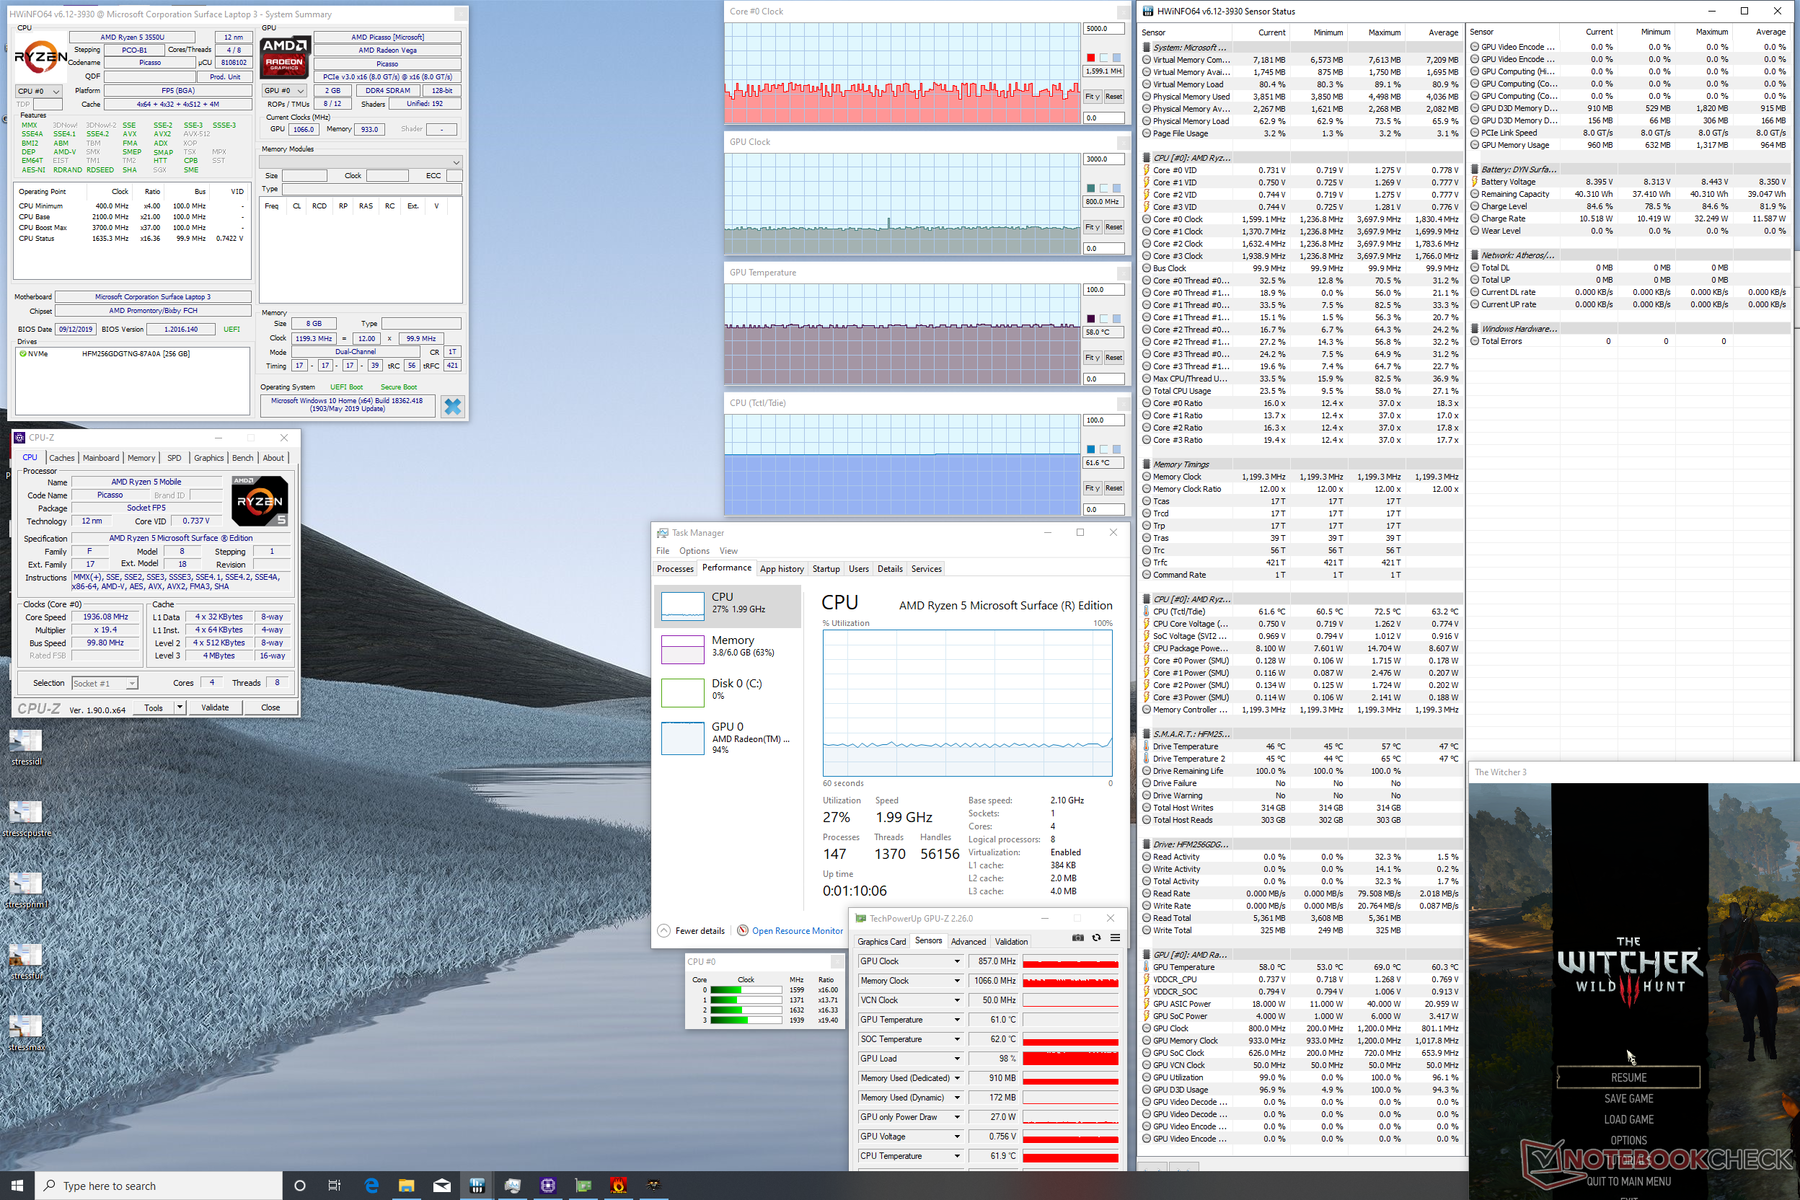
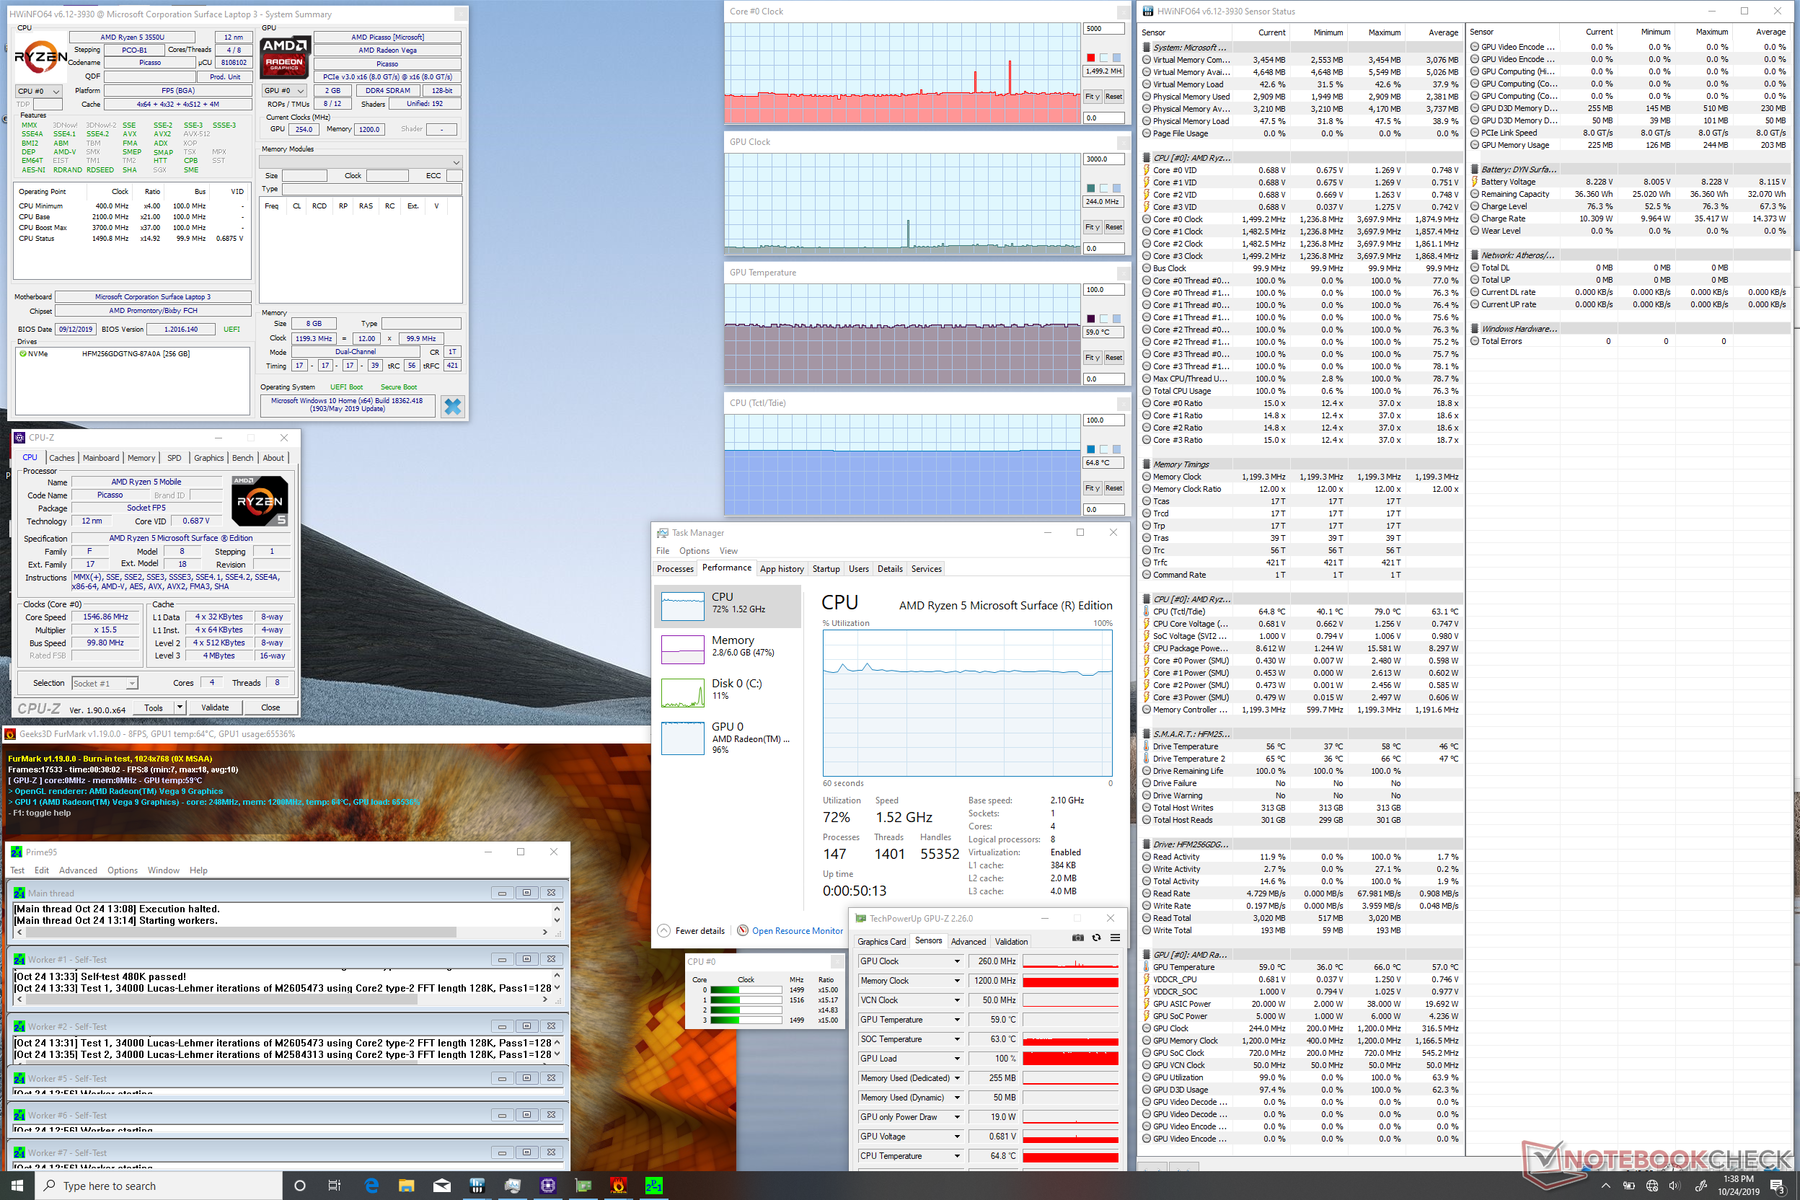
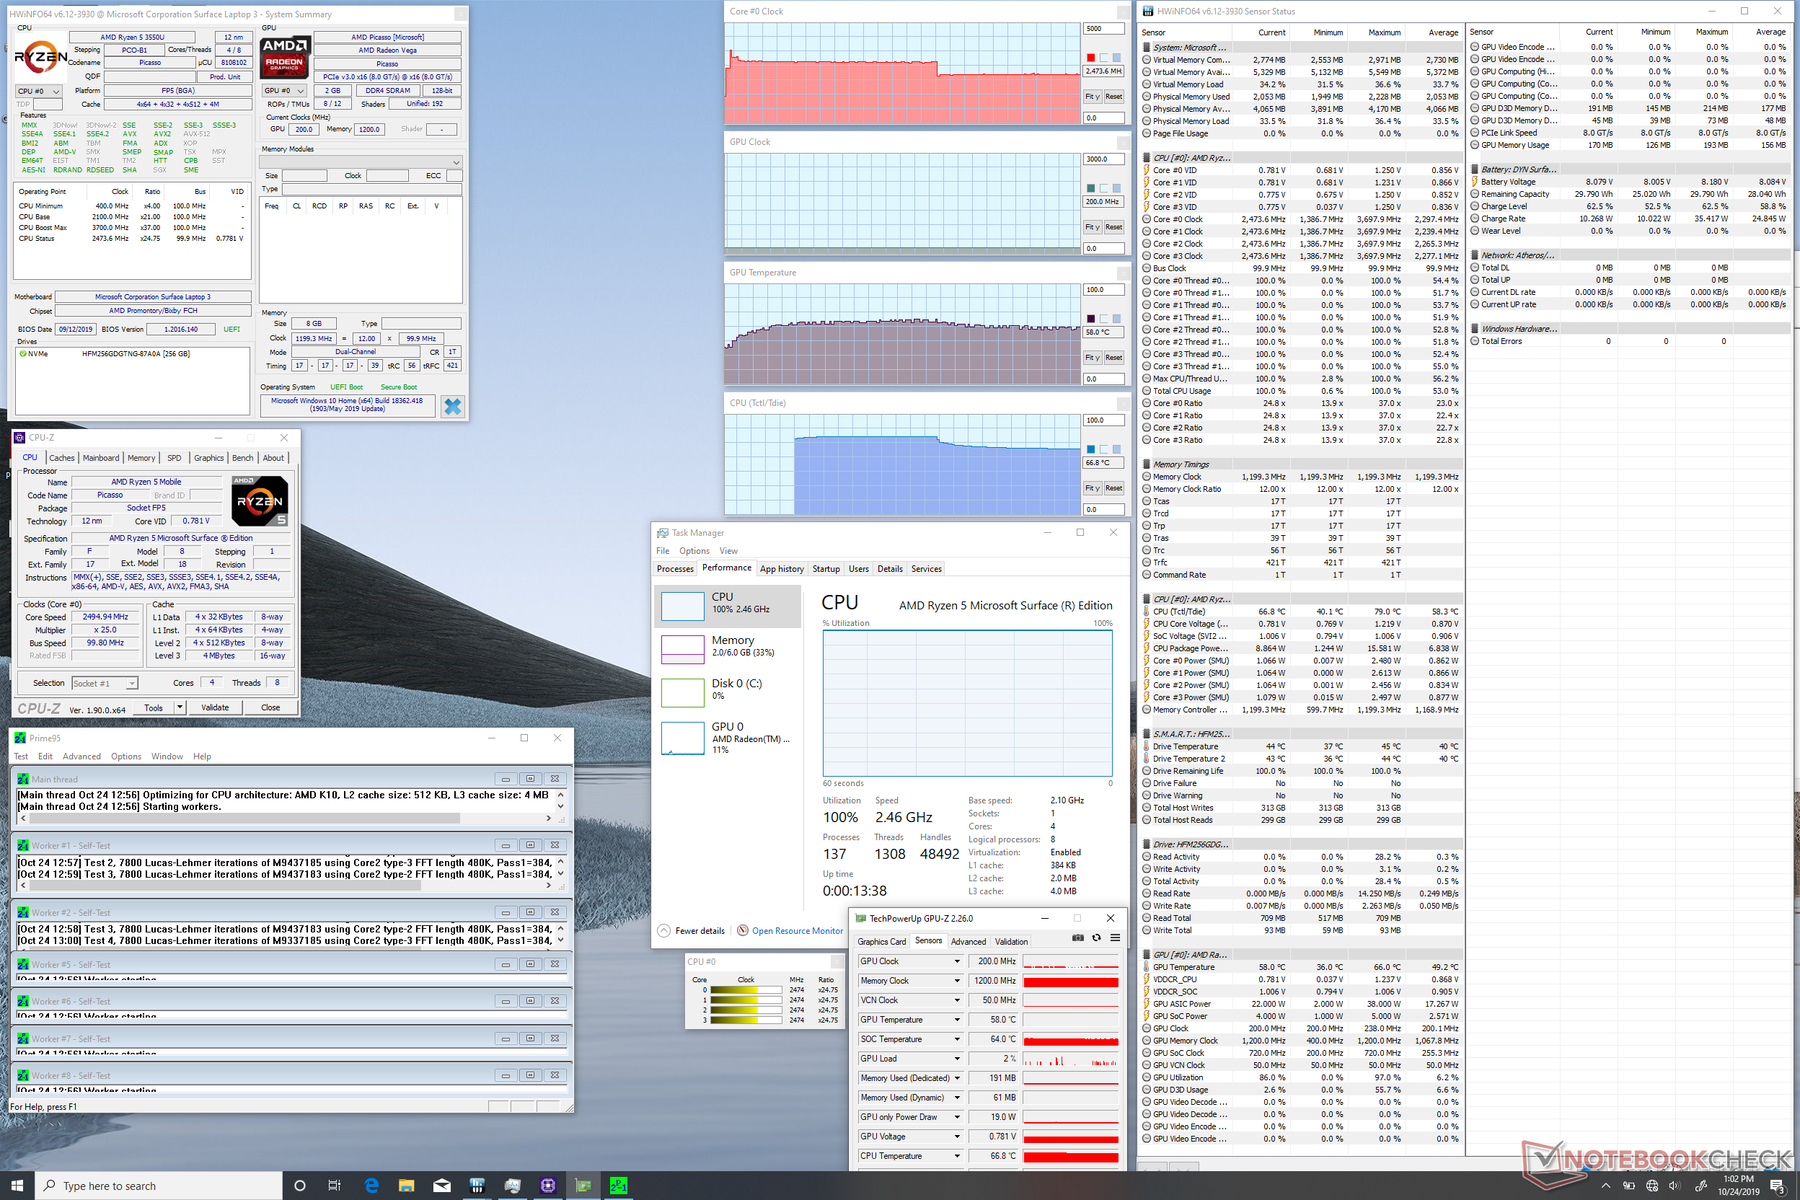
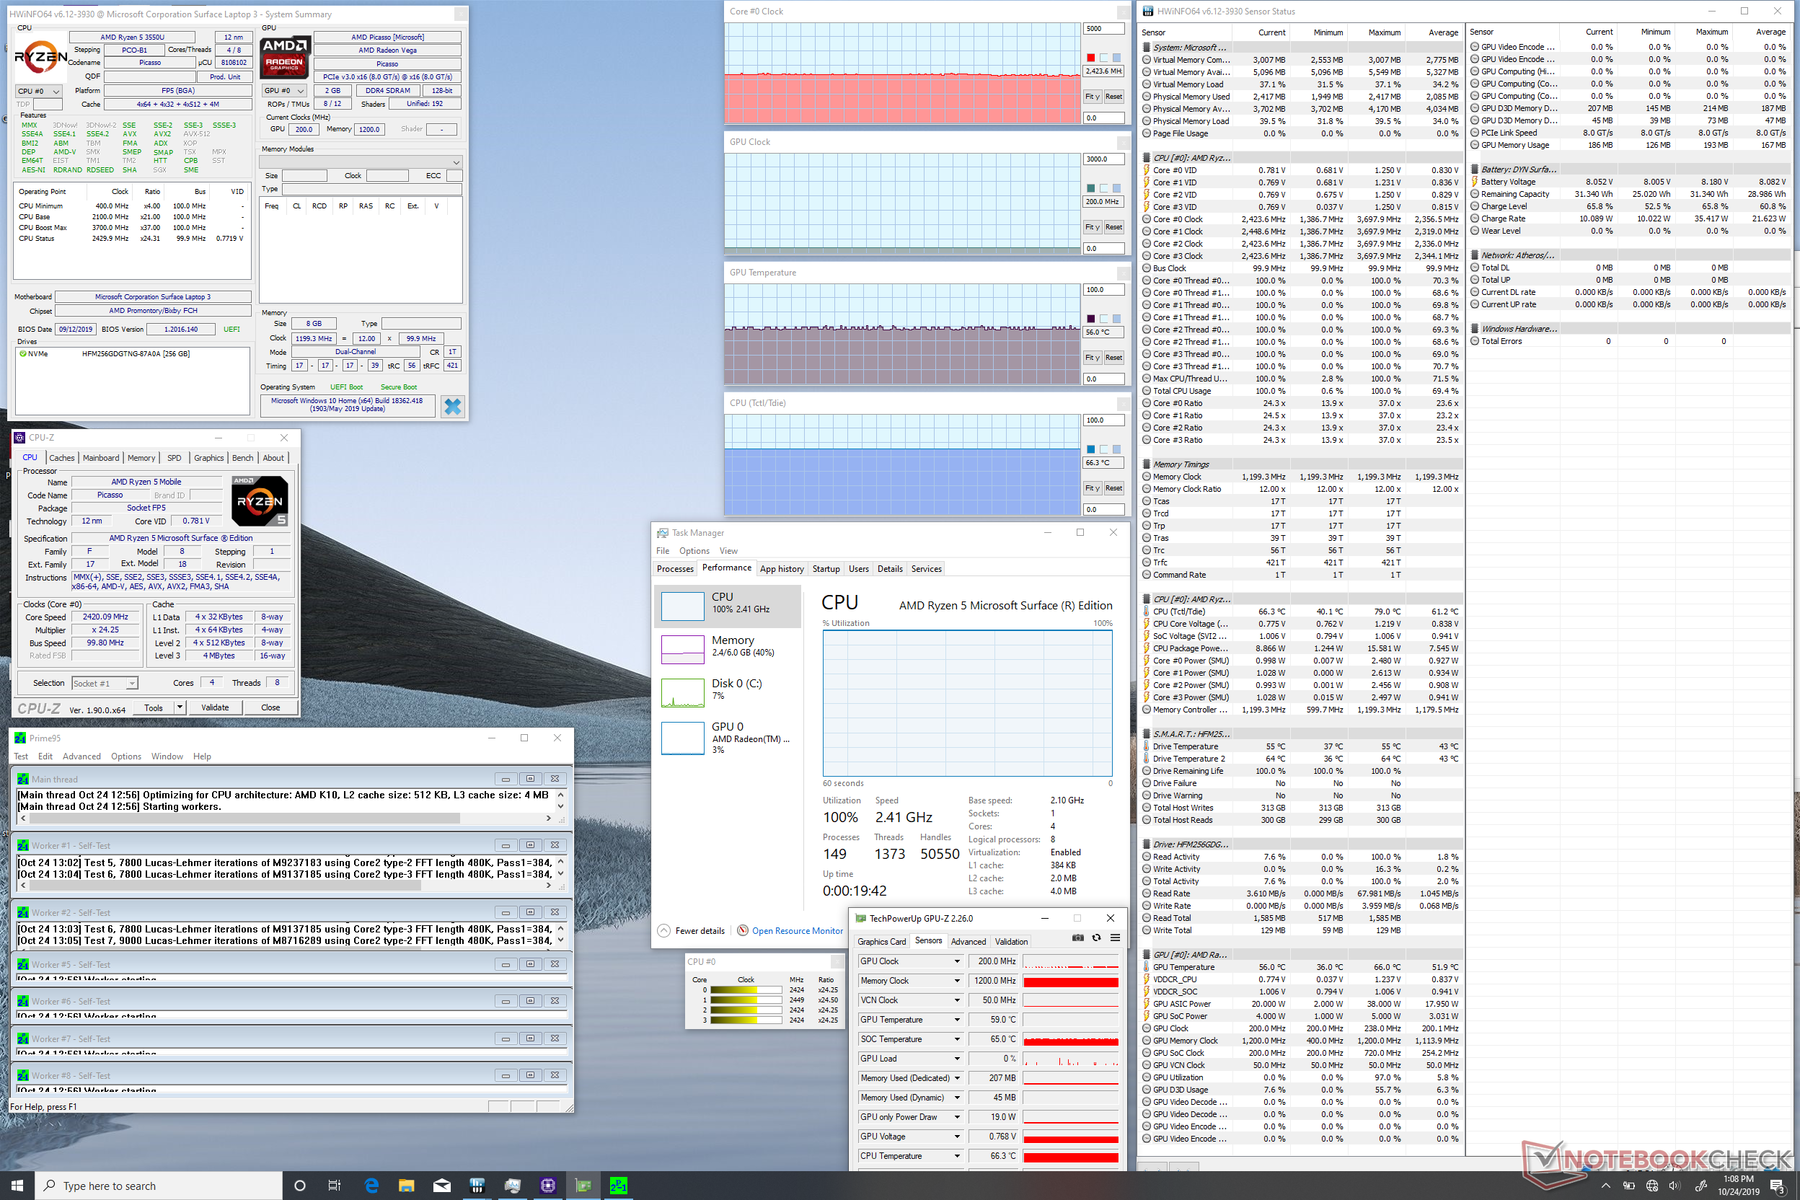
| CPU Clock (GHz) | GPU Clock (MHz) | Average CPU Temperature ( Tctl/Tidle °C) | Average GPU Temperature (°C) | |
| System Idle | -- | -- | 44 | 39 |
| Prime95 Stress | 2.4 | -- | 66 | 56 |
| FurMark Stress | -- | ~730 | 64 | 60 |
| Prime95 + FurMark Stress | 1.5 | 244 | 59 | 65 |
| Witcher 3 Stress | ~1.6 | 800 | 62 | 58 |
Speakers - Could be Louder
There are no dedicated speaker grilles and so audio comes from underneath the keyboard keys. Sound quality is relatively balanced between bass and treble with a shallow roll off at about 500 Hz. HP EliteBook laptops are louder to be the better laptop for conference rooms where speaker volume is more important than bass reproduction. Higher volume settings will not introduce any static or shaking, but the palm rests will vibrate to the touch.

Microsoft Surface Laptop 3 15 Ryzen 5 3580U audio analysis
(±) | speaker loudness is average but good (79.9 dB)
Bass 100 - 315 Hz
(+) | good bass - only 4.8% away from median
(±) | linearity of bass is average (8.2% delta to prev. frequency)
Mids 400 - 2000 Hz
(+) | balanced mids - only 4% away from median
(±) | linearity of mids is average (8.5% delta to prev. frequency)
Highs 2 - 16 kHz
(+) | balanced highs - only 3.5% away from median
(±) | linearity of highs is average (9.1% delta to prev. frequency)
Overall 100 - 16.000 Hz
(+) | overall sound is linear (14.7% difference to median)
Compared to same class
» 13% of all tested devices in this class were better, 4% similar, 83% worse
» The best had a delta of 7%, average was 21%, worst was 53%
Compared to all devices tested
» 19% of all tested devices were better, 4% similar, 77% worse
» The best had a delta of 4%, average was 23%, worst was 134%
Apple MacBook 12 (Early 2016) 1.1 GHz audio analysis
(+) | speakers can play relatively loud (83.6 dB)
Bass 100 - 315 Hz
(±) | reduced bass - on average 11.3% lower than median
(±) | linearity of bass is average (14.2% delta to prev. frequency)
Mids 400 - 2000 Hz
(+) | balanced mids - only 2.4% away from median
(+) | mids are linear (5.5% delta to prev. frequency)
Highs 2 - 16 kHz
(+) | balanced highs - only 2% away from median
(+) | highs are linear (4.5% delta to prev. frequency)
Overall 100 - 16.000 Hz
(+) | overall sound is linear (10.2% difference to median)
Compared to same class
» 7% of all tested devices in this class were better, 2% similar, 90% worse
» The best had a delta of 5%, average was 18%, worst was 53%
Compared to all devices tested
» 5% of all tested devices were better, 1% similar, 94% worse
» The best had a delta of 4%, average was 23%, worst was 134%
Energy Management
Power Consumption - Excellent Power Management During Low Loads
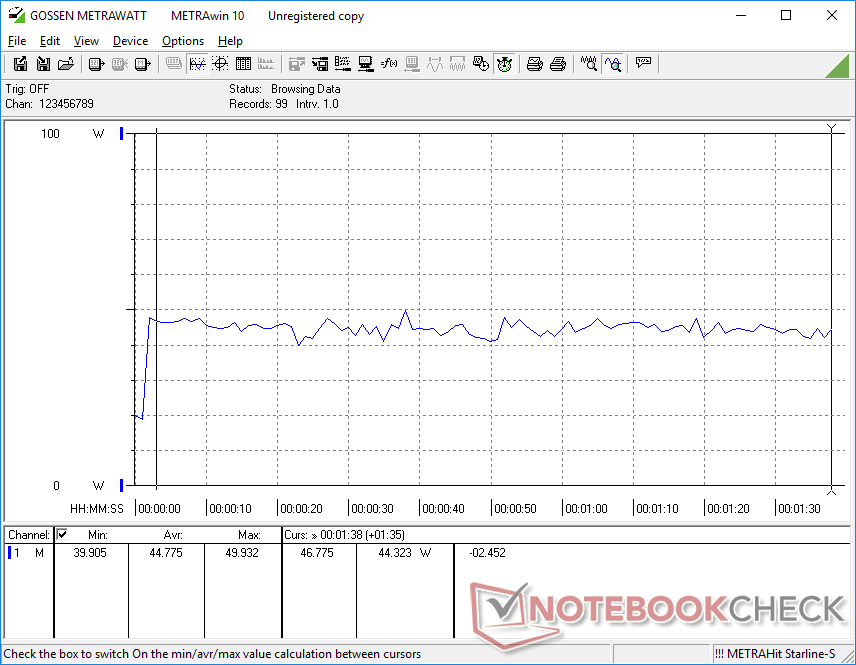
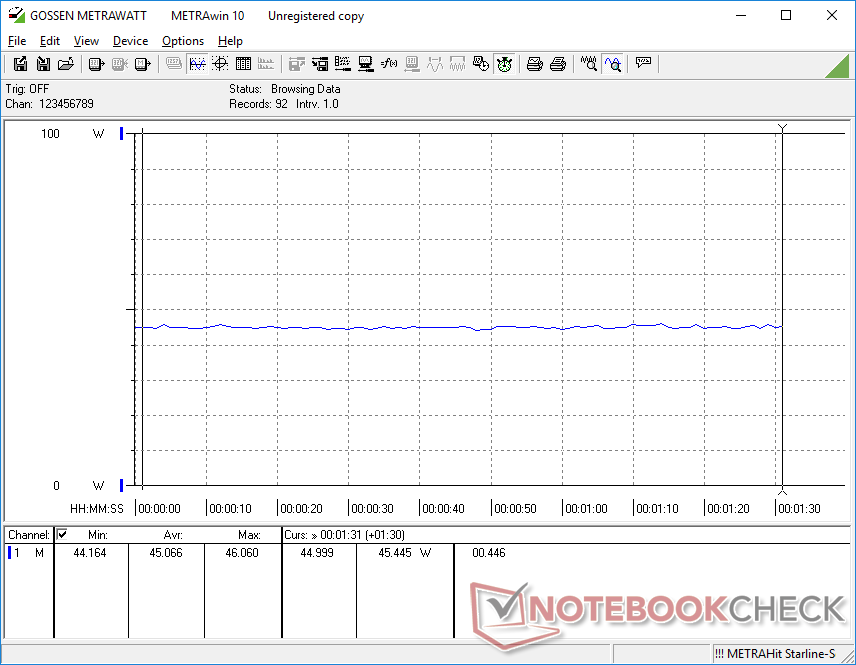
Idling on desktop demands between 3 W and 8 W depending on the system profile and brightness level while medium loads (i.e., 3DMark 06) will demand about 45 W to be more than both the AMD-powered Inspiron 15 5585 and HP EliteBook 755 G5 under similar conditions. Gaming will also demand about 45 W to be not unlike the Asus VivoBook S15 and its 10 W GeForce MX150.
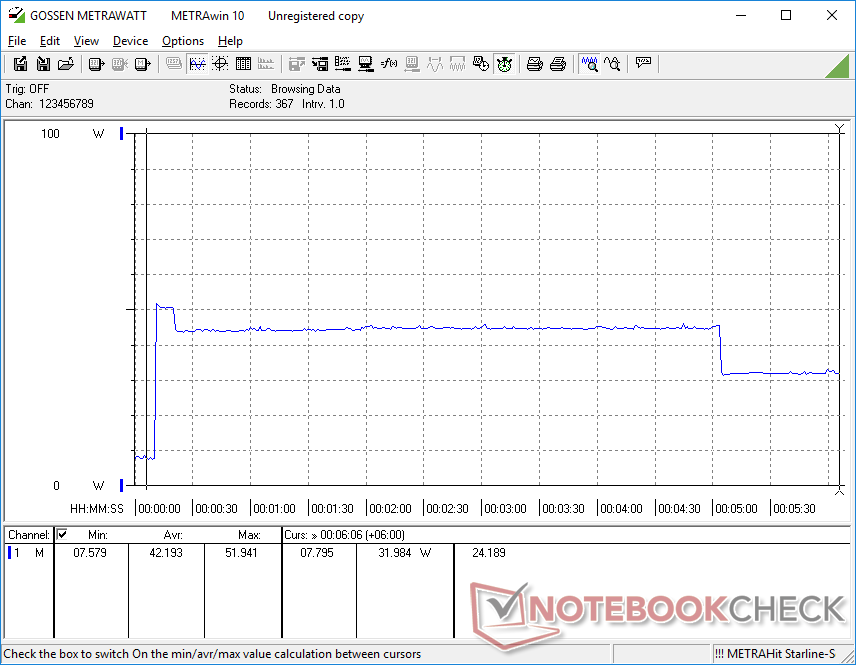
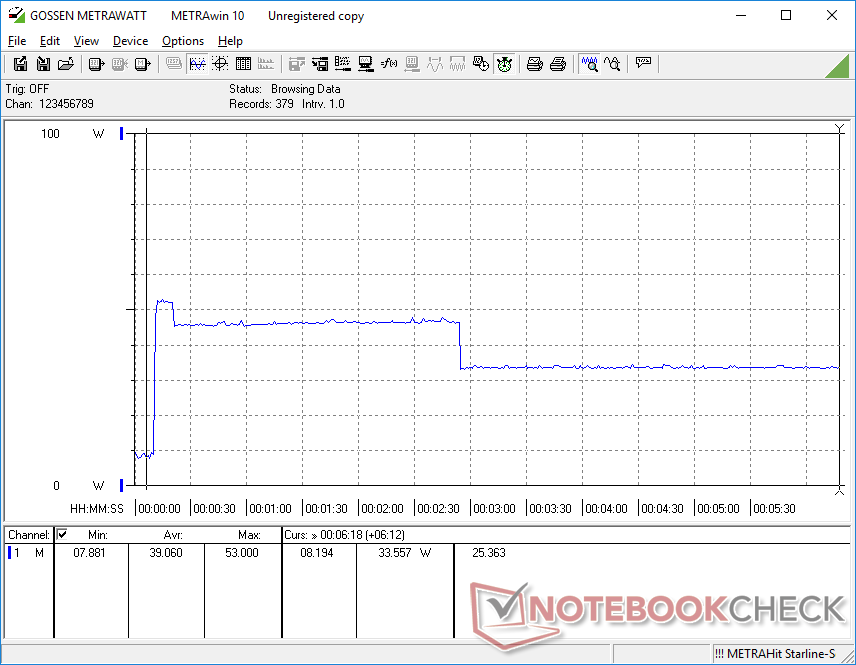
When running Prime95, consumption spikes to 52 W for the first few seconds before dropping to 43 W. After about 4.5 minutes, consumption drops further to just 32 W as shown by our graph below. This behavior mirrors our CineBench R15 Multi-Thread observations above where scores are steady for the initial ten loops before falling and cycling.
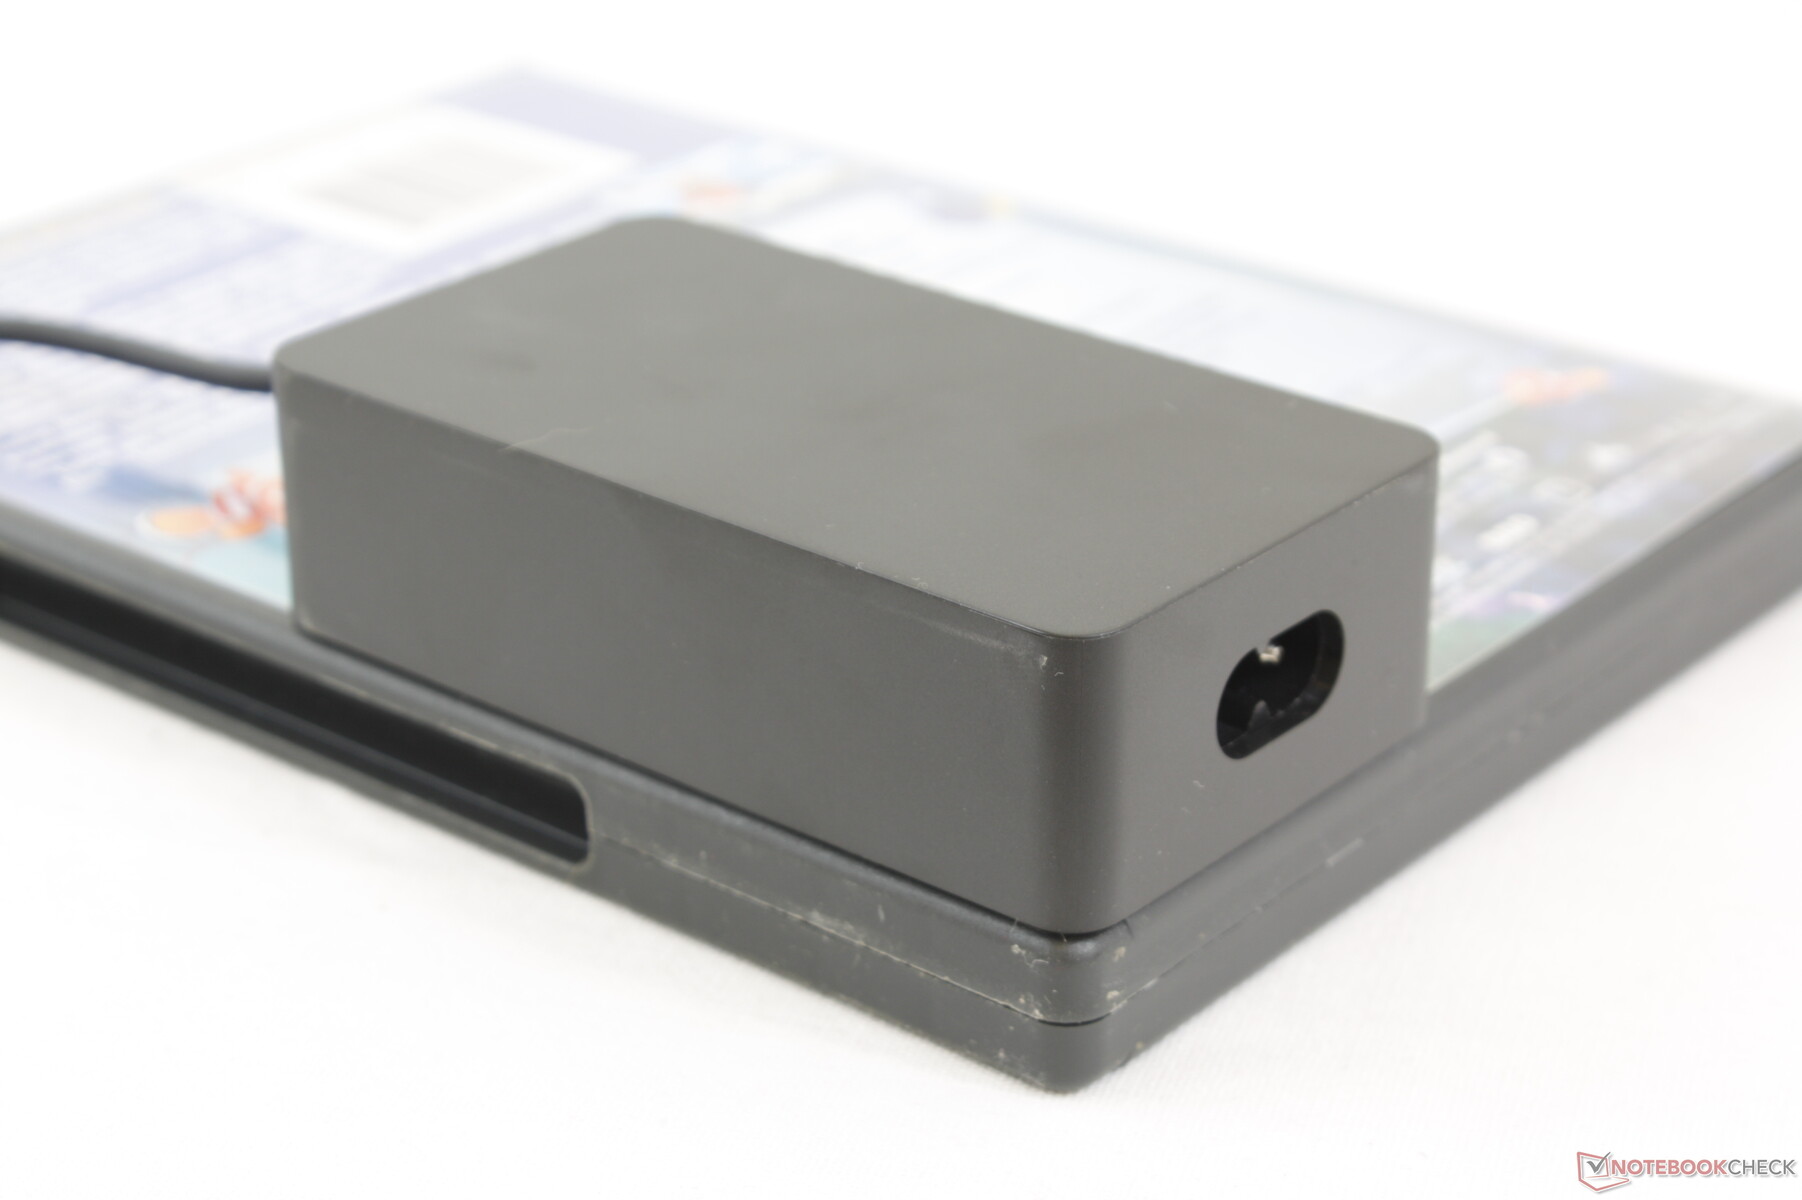
We're able to record a maximum draw of 53 W from the small (~9 x 5 x 2.5 cm) 60 W AC adapter.
| Off / Standby | |
| Idle | |
| Load |
|
Key:
min: | |
| Microsoft Surface Laptop 3 15 Ryzen 5 3580U R5 3580U, Vega 9, SK hynix BC501 HFM256GDGTNG, IPS, 2496x1664, 15" | Microsoft Surface Laptop 2-LQN-00004 i5-8250U, UHD Graphics 620, SK Hynix BC501 NVMe 256 GB, IPS, 2256x1504, 13.5" | Dell XPS 15 7590 i5 iGPU FHD i5-9300H, UHD Graphics 630, Toshiba XG6 KXG60ZNV512G, IPS, 1920x1080, 15.6" | Asus VivoBook S15 S530UN-BQ097T i5-8550U, GeForce MX150, SanDisk SD9SN8W256G1027, IPS LED, 1920x1080, 15.6" | Dell Inspiron 15 5000 5585 R7 3700U, Vega 10, WDC PC SN520 SDAPNUW-512G, IPS, 1920x1080, 15.6" | HP EliteBook 755 G5 3UN79EA R7 2700U, Vega 10, Toshiba XG5 KXG50ZNV512G, IPS, 1920x1080, 15.6" | |
|---|---|---|---|---|---|---|
| Power Consumption | 7% | -36% | -8% | 5% | -32% | |
| Idle Minimum * (Watt) | 3.3 | 3 9% | 3.79 -15% | 3.1 6% | 4.2 -27% | 5 -52% |
| Idle Average * (Watt) | 7.1 | 6.8 4% | 6.9 3% | 6.3 11% | 6.8 4% | 10.6 -49% |
| Idle Maximum * (Watt) | 7.2 | 8.76 -22% | 9.2 -28% | 8.6 -19% | 7 3% | 12.9 -79% |
| Load Average * (Watt) | 44.8 | 35.1 22% | 62 -38% | 56.4 -26% | 36.5 19% | 40.6 9% |
| Witcher 3 ultra * (Watt) | 45.1 | 45 -0% | 37.9 16% | |||
| Load Maximum * (Watt) | 53 | 42.6 20% | 108 -104% | 62.7 -18% | 44 17% | 46.6 12% |
* ... smaller is better
Battery Life
The 45 Wh battery capacity has not changed since the original Surface Laptop. Fortunately, battery life has been relatively consistent gen-over-gen according to our own tests. Users can expect just over 9 hours of real-world WLAN use out of this Ryzen model not unlike on last year's Intel-powered Surface Laptop 2.
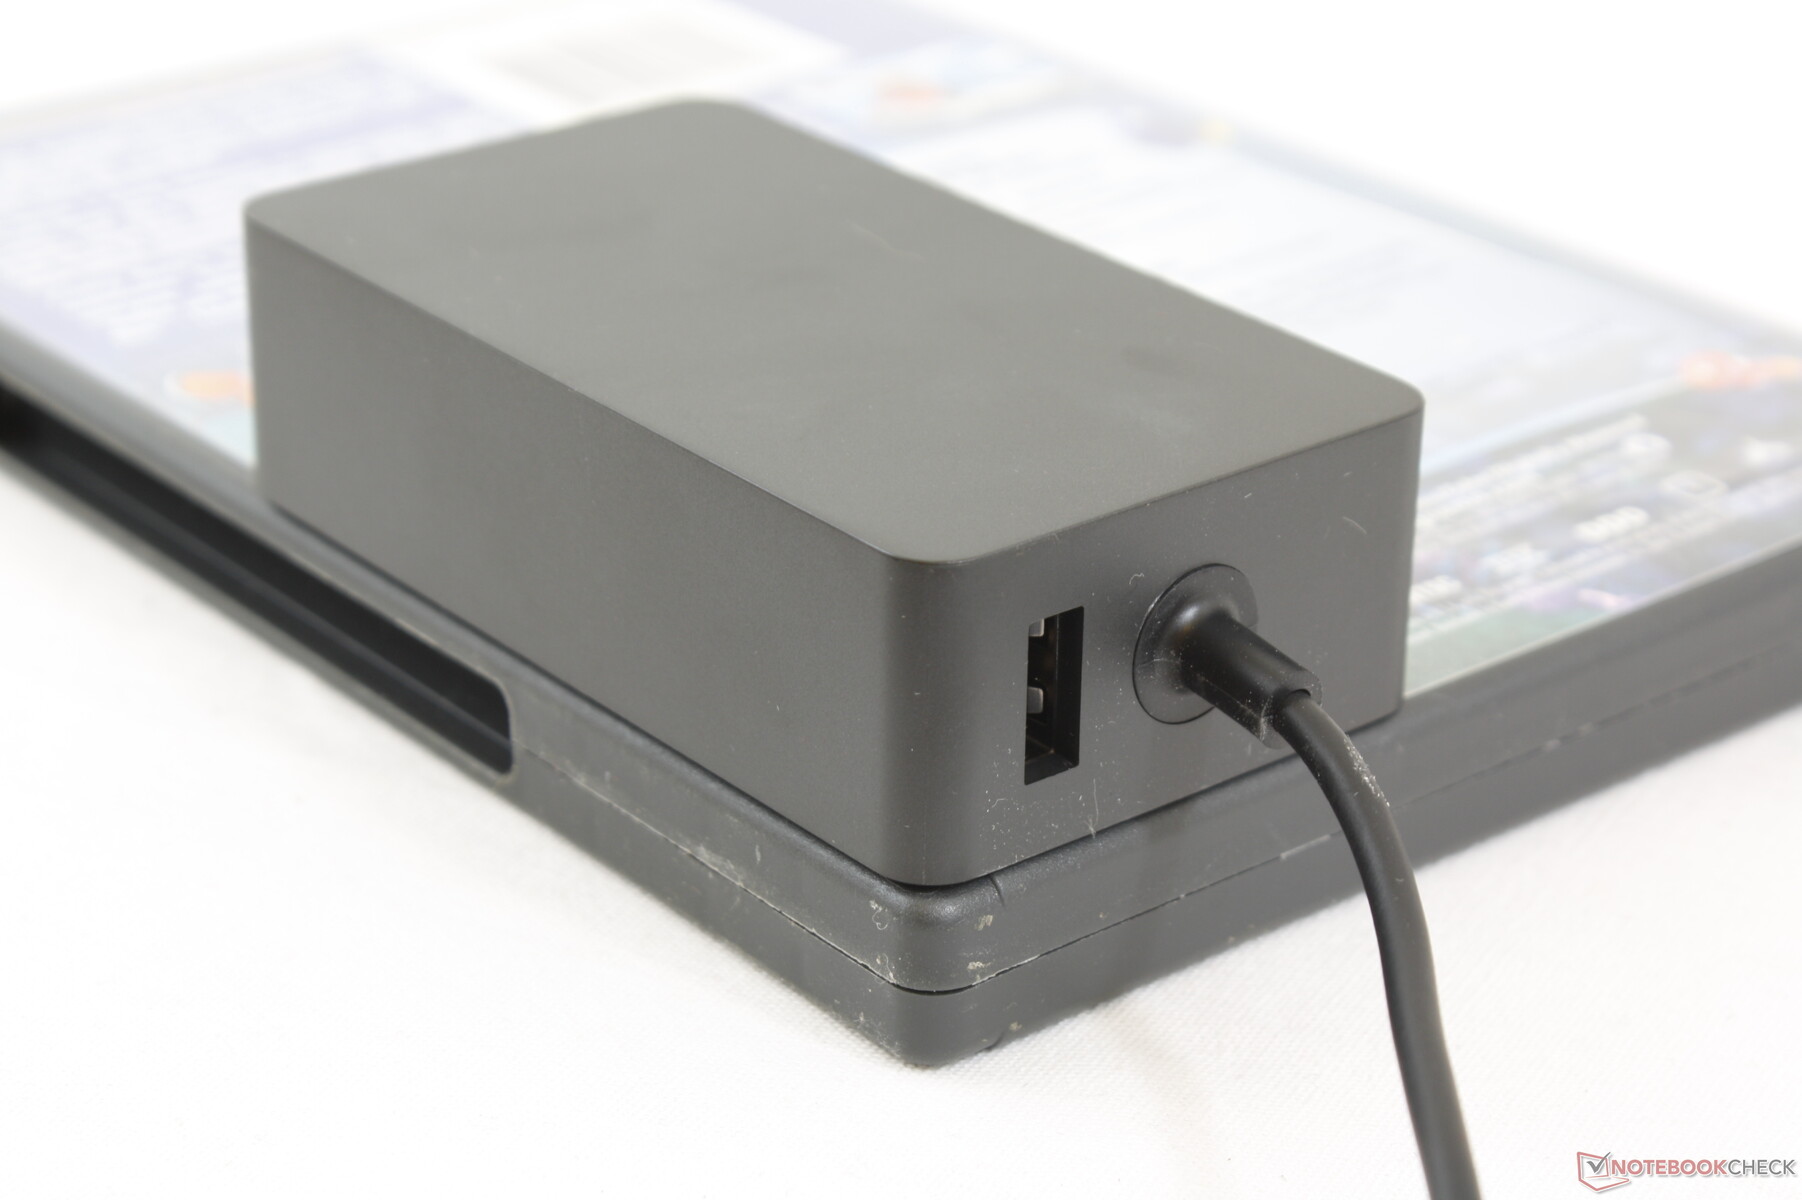
Recharging from empty to full capacity takes about 1.5 hours. The AC adapter integrates a handy USB Type-A port solely for charging additional devices if needed.
| Microsoft Surface Laptop 3 15 Ryzen 5 3580U R5 3580U, Vega 9, 45 Wh | Microsoft Surface Laptop 2-LQN-00004 i5-8250U, UHD Graphics 620, 45 Wh | Microsoft Surface Laptop i5 i5-7200U, HD Graphics 620, 45 Wh | Dell XPS 15 7590 i5 iGPU FHD i5-9300H, UHD Graphics 630, 97 Wh | Apple MacBook Pro 15 2018 (2.6 GHz, 560X) i7-8850H, Radeon Pro 560X, 83 Wh | HP Spectre x360 15-df0126ng i7-8750H, GeForce GTX 1050 Ti Max-Q, 84 Wh | |
|---|---|---|---|---|---|---|
| Battery runtime | 2% | 18% | 28% | 12% | 11% | |
| Reader / Idle (h) | 18.7 | 20.8 11% | 22.5 20% | 18.8 1% | ||
| WiFi v1.3 (h) | 9.1 | 9.1 0% | 10 10% | 14.1 55% | 10.2 12% | 8.8 -3% |
| Load (h) | 1.7 | 1.6 -6% | 2.1 24% | 1.7 0% | 2.3 35% | |
| Witcher 3 ultra (h) | 1.5 |
Pros
Cons
Verdict
The Surface Laptop 3 15 has a few highlights. Firstly, the fact that the cheaper Ryzen 5 3580U can come within just an arm's reach of the more expensive Core i7-1065G7 in CPU horsepower is a notable feat for AMD. Factors like battery life and fan noise have barely changed since the Surface Laptop 2 which means that the AMD-powered Surface Laptop 3 can offer faster performance than the last generation model without the usual repercussions. Keep in mind that while we haven't tested the Core i7 Surface Laptop 3 15 ourselves yet, it's going to have to really impress since it retails for $500 more (!) than the AMD Ryzen 5 version.
The second notable highlight is the uncommon 3:2 touchscreen. The panel is crisp and relatively bright with full sRGB coverage. Unfortunately, Microsoft doesn't offer factory calibration options a la the Gigabyte Aero 15 or Razer Blade and so an end-user calibration is required to get the most out of the display.
Almost everything else about the Surface Laptop 3 is merely average or disappointing considering the high price point. This larger 15-inch Surface Laptop was Microsoft's chance to address the poor connectivity options of the 13.5-inch Surface Laptop, but nothing has really improved. The mini DisplayPort is now gone which pushes users to invest in the separate $200 Surface Dock. The USB Type-C port lacks both Thunderbolt 3 and Power Delivery meaning that you'll have to carry the proprietary AC charger with you everywhere you go. In contrast, users can use a single universal USB Type-C charger between the Dell XPS 13, XPS 15, Huawei MateBook X Pro, HP Spectre x360 13, smartphone, or tablet for superior versatility. (Update: USB Type-C charging now works after updating our Surface Laptop 3 unit.)
The thick bezels, slow NVMe SSD, slow black-white response times, and lack of Wi-Fi 6, LTE, fingerprint reader, and webcam privacy shutter all contribute to a barebones flagship laptop that feels outdated in spite of the great display and processor performance. The Surface Laptop 3 15 may be for you if you value its super-light 3:2 form factor and don't mind the limited connectivity, but you can do a lot better for $1500.
It looks nice and performs very well even for the least expensive AMD SKU, but the lack of features and ports will become apparent very quickly. More traditional flagship Ultrabooks offer so much more in terms of performance and connectivity at this price range.
Microsoft Surface Laptop 3 15 Ryzen 5 3580U
- 10/27/2019 v7 (old)
Allen Ngo
Price comparison
