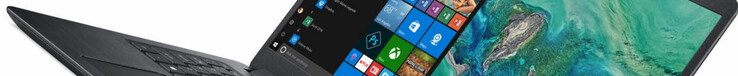
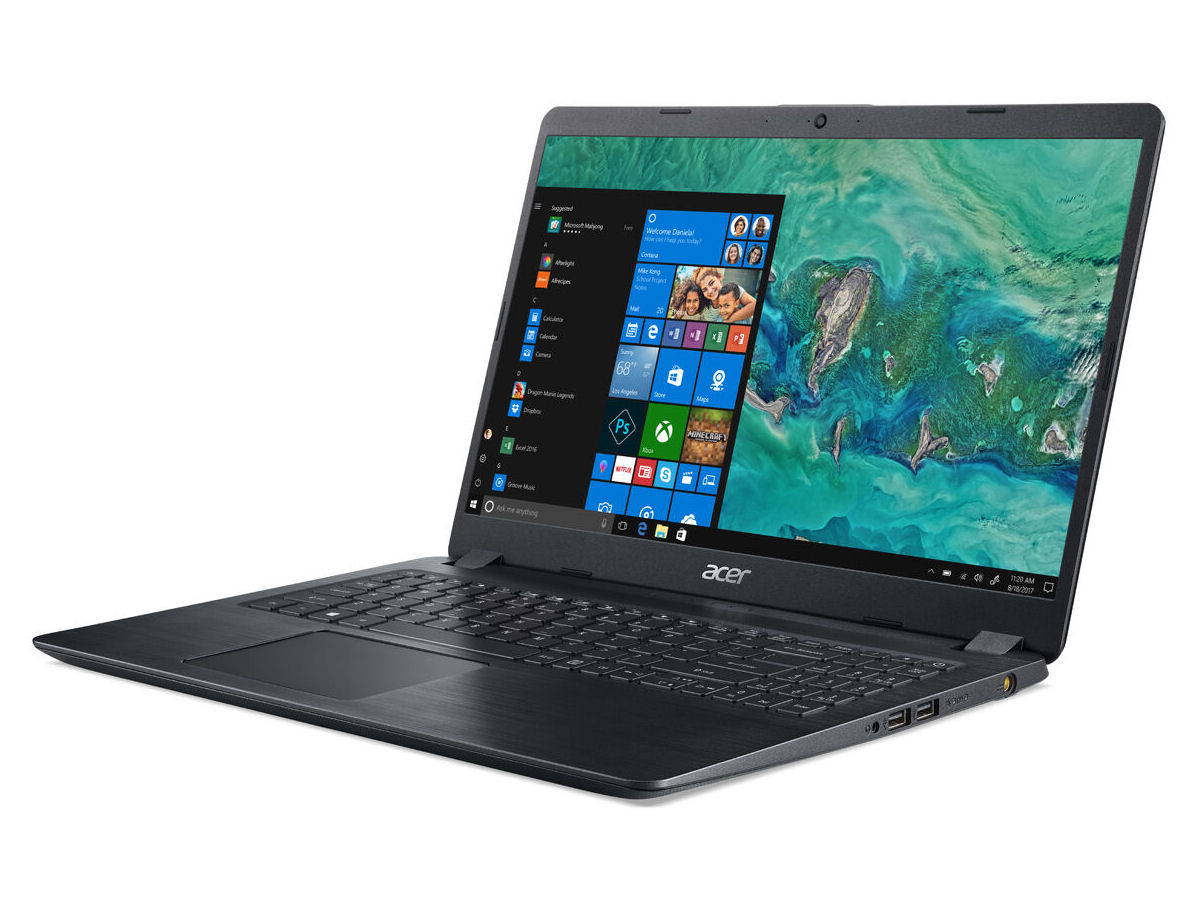
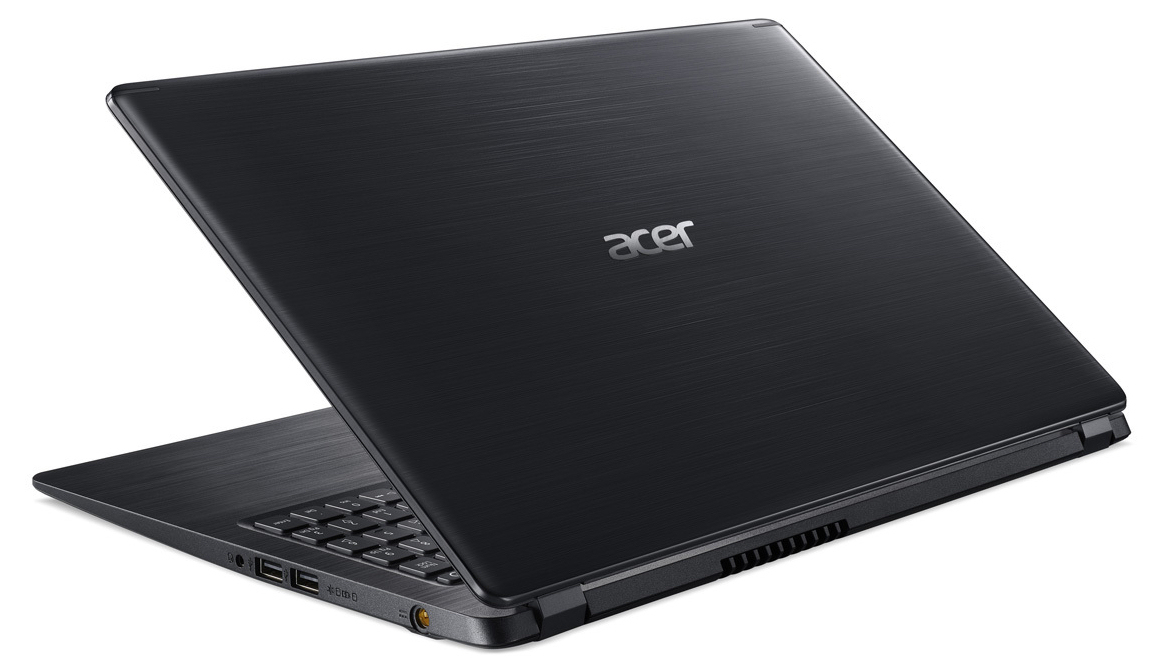
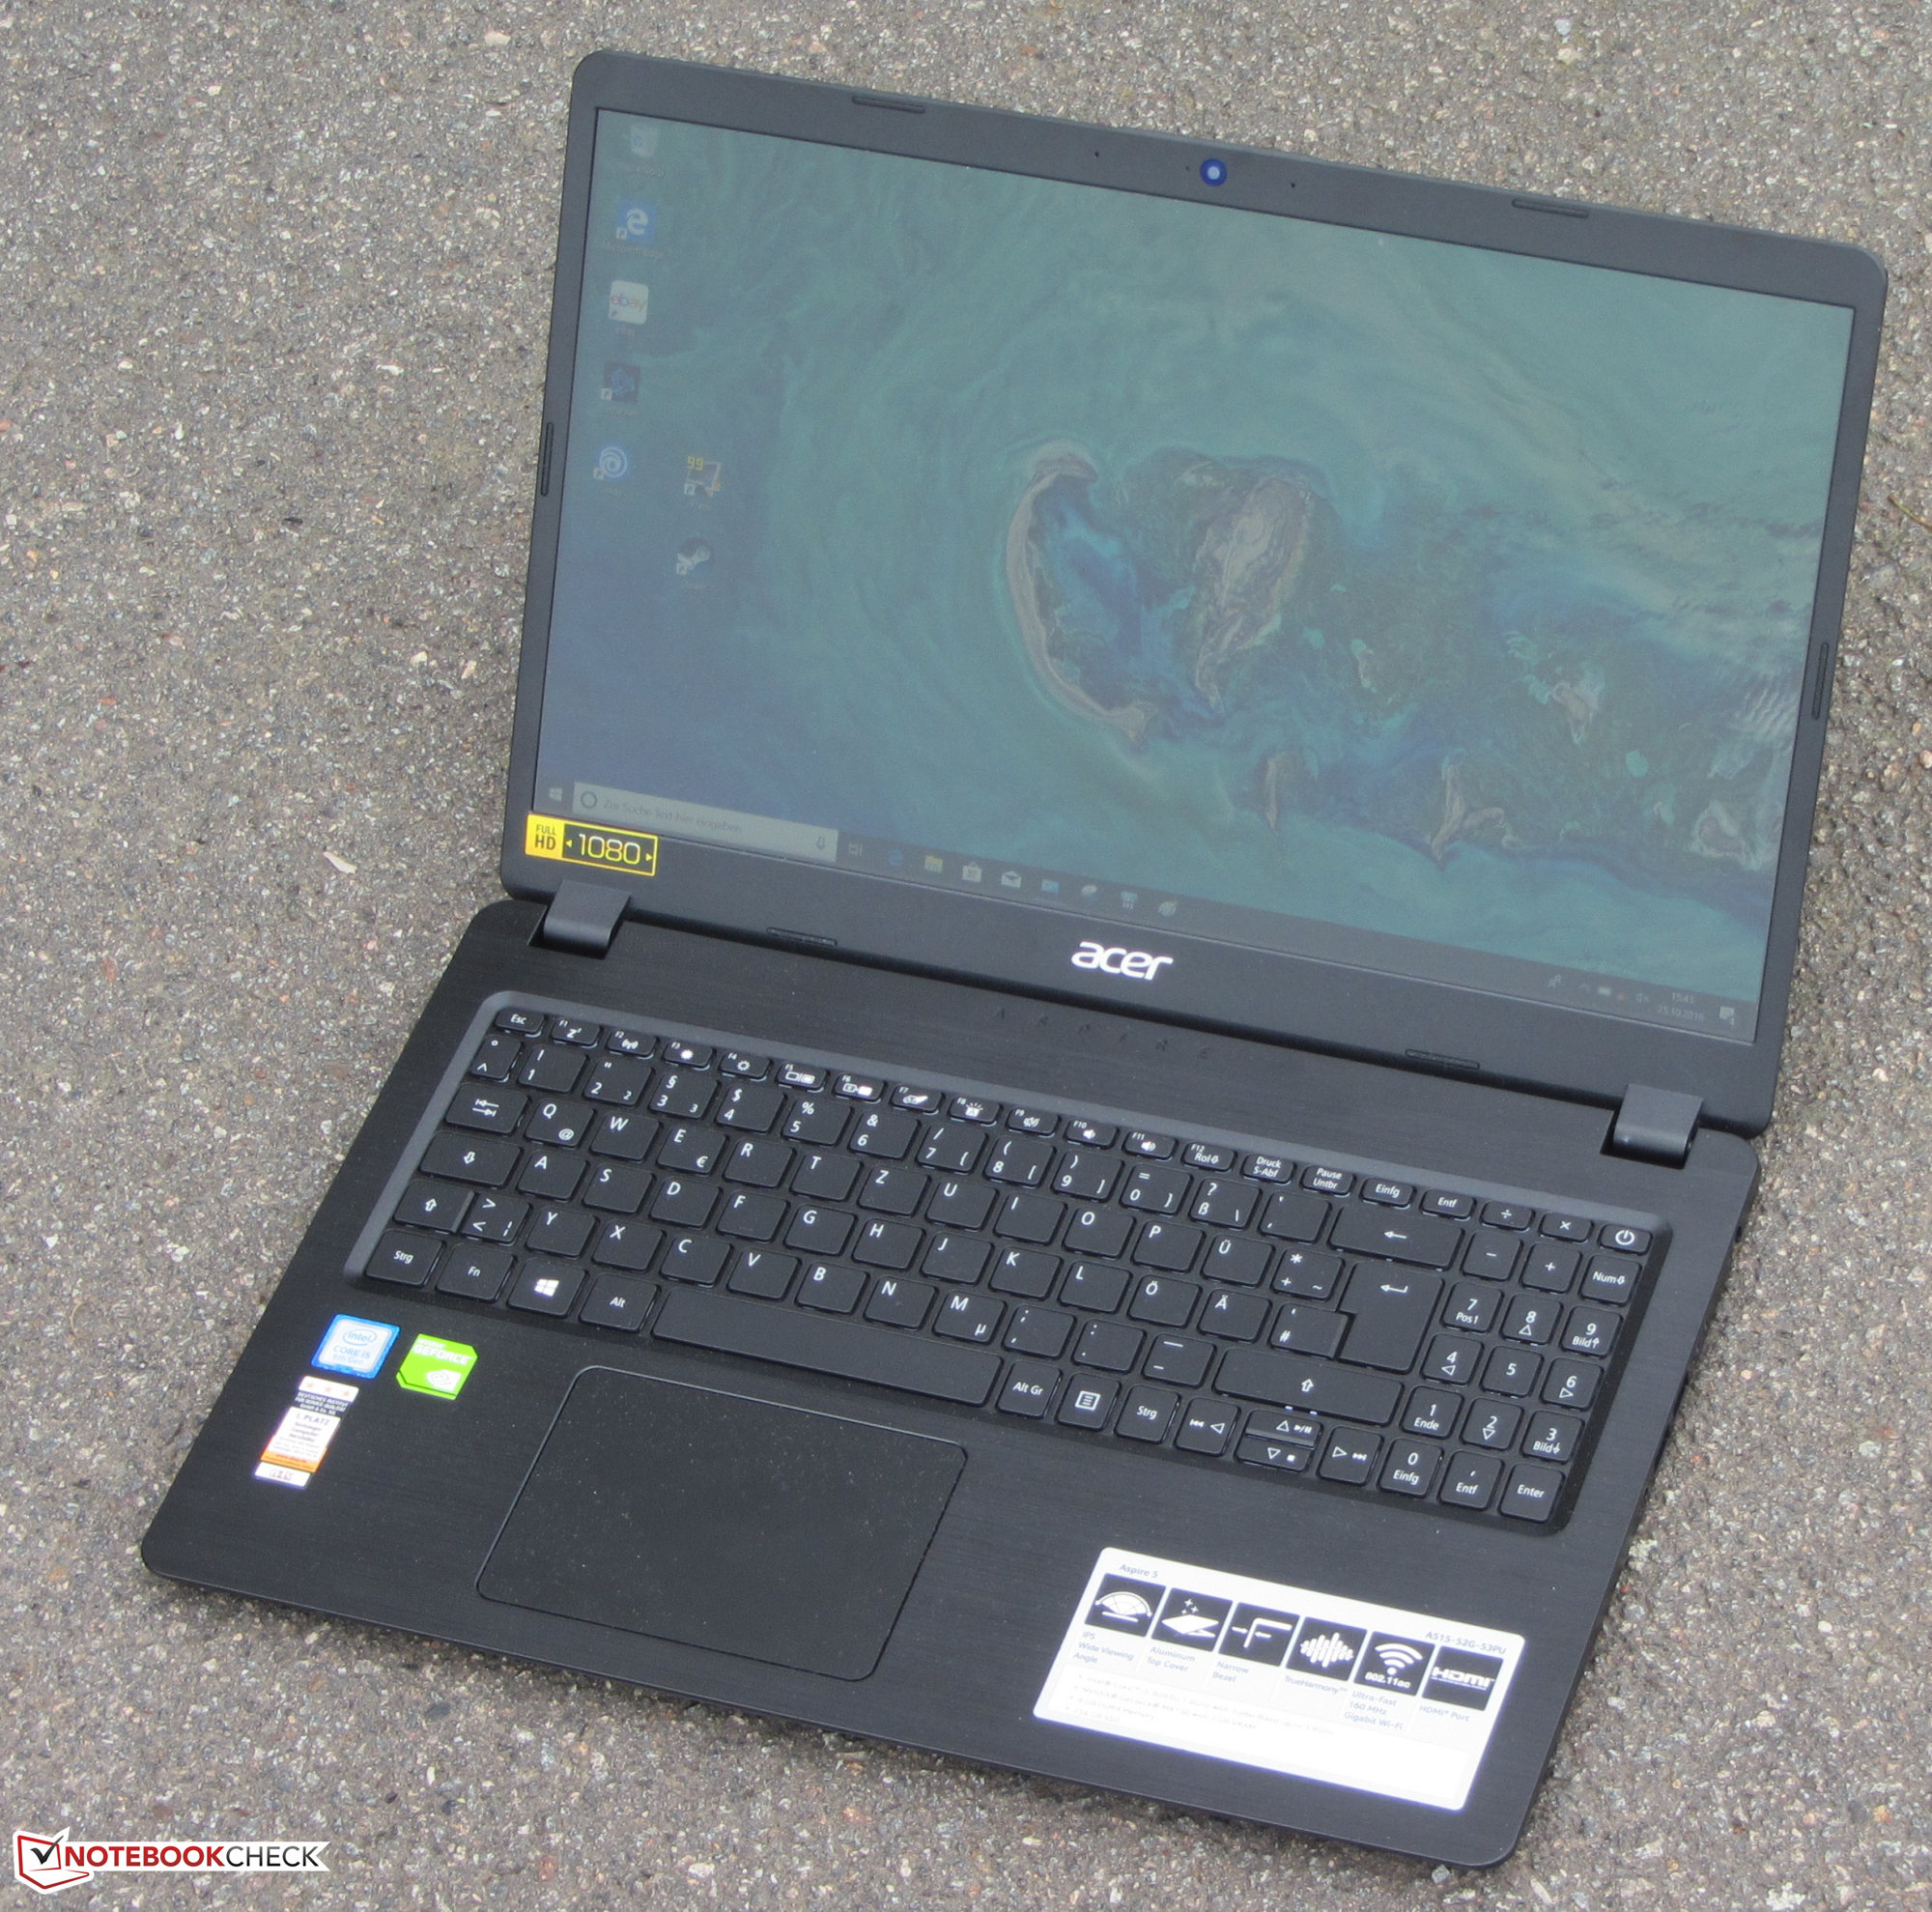
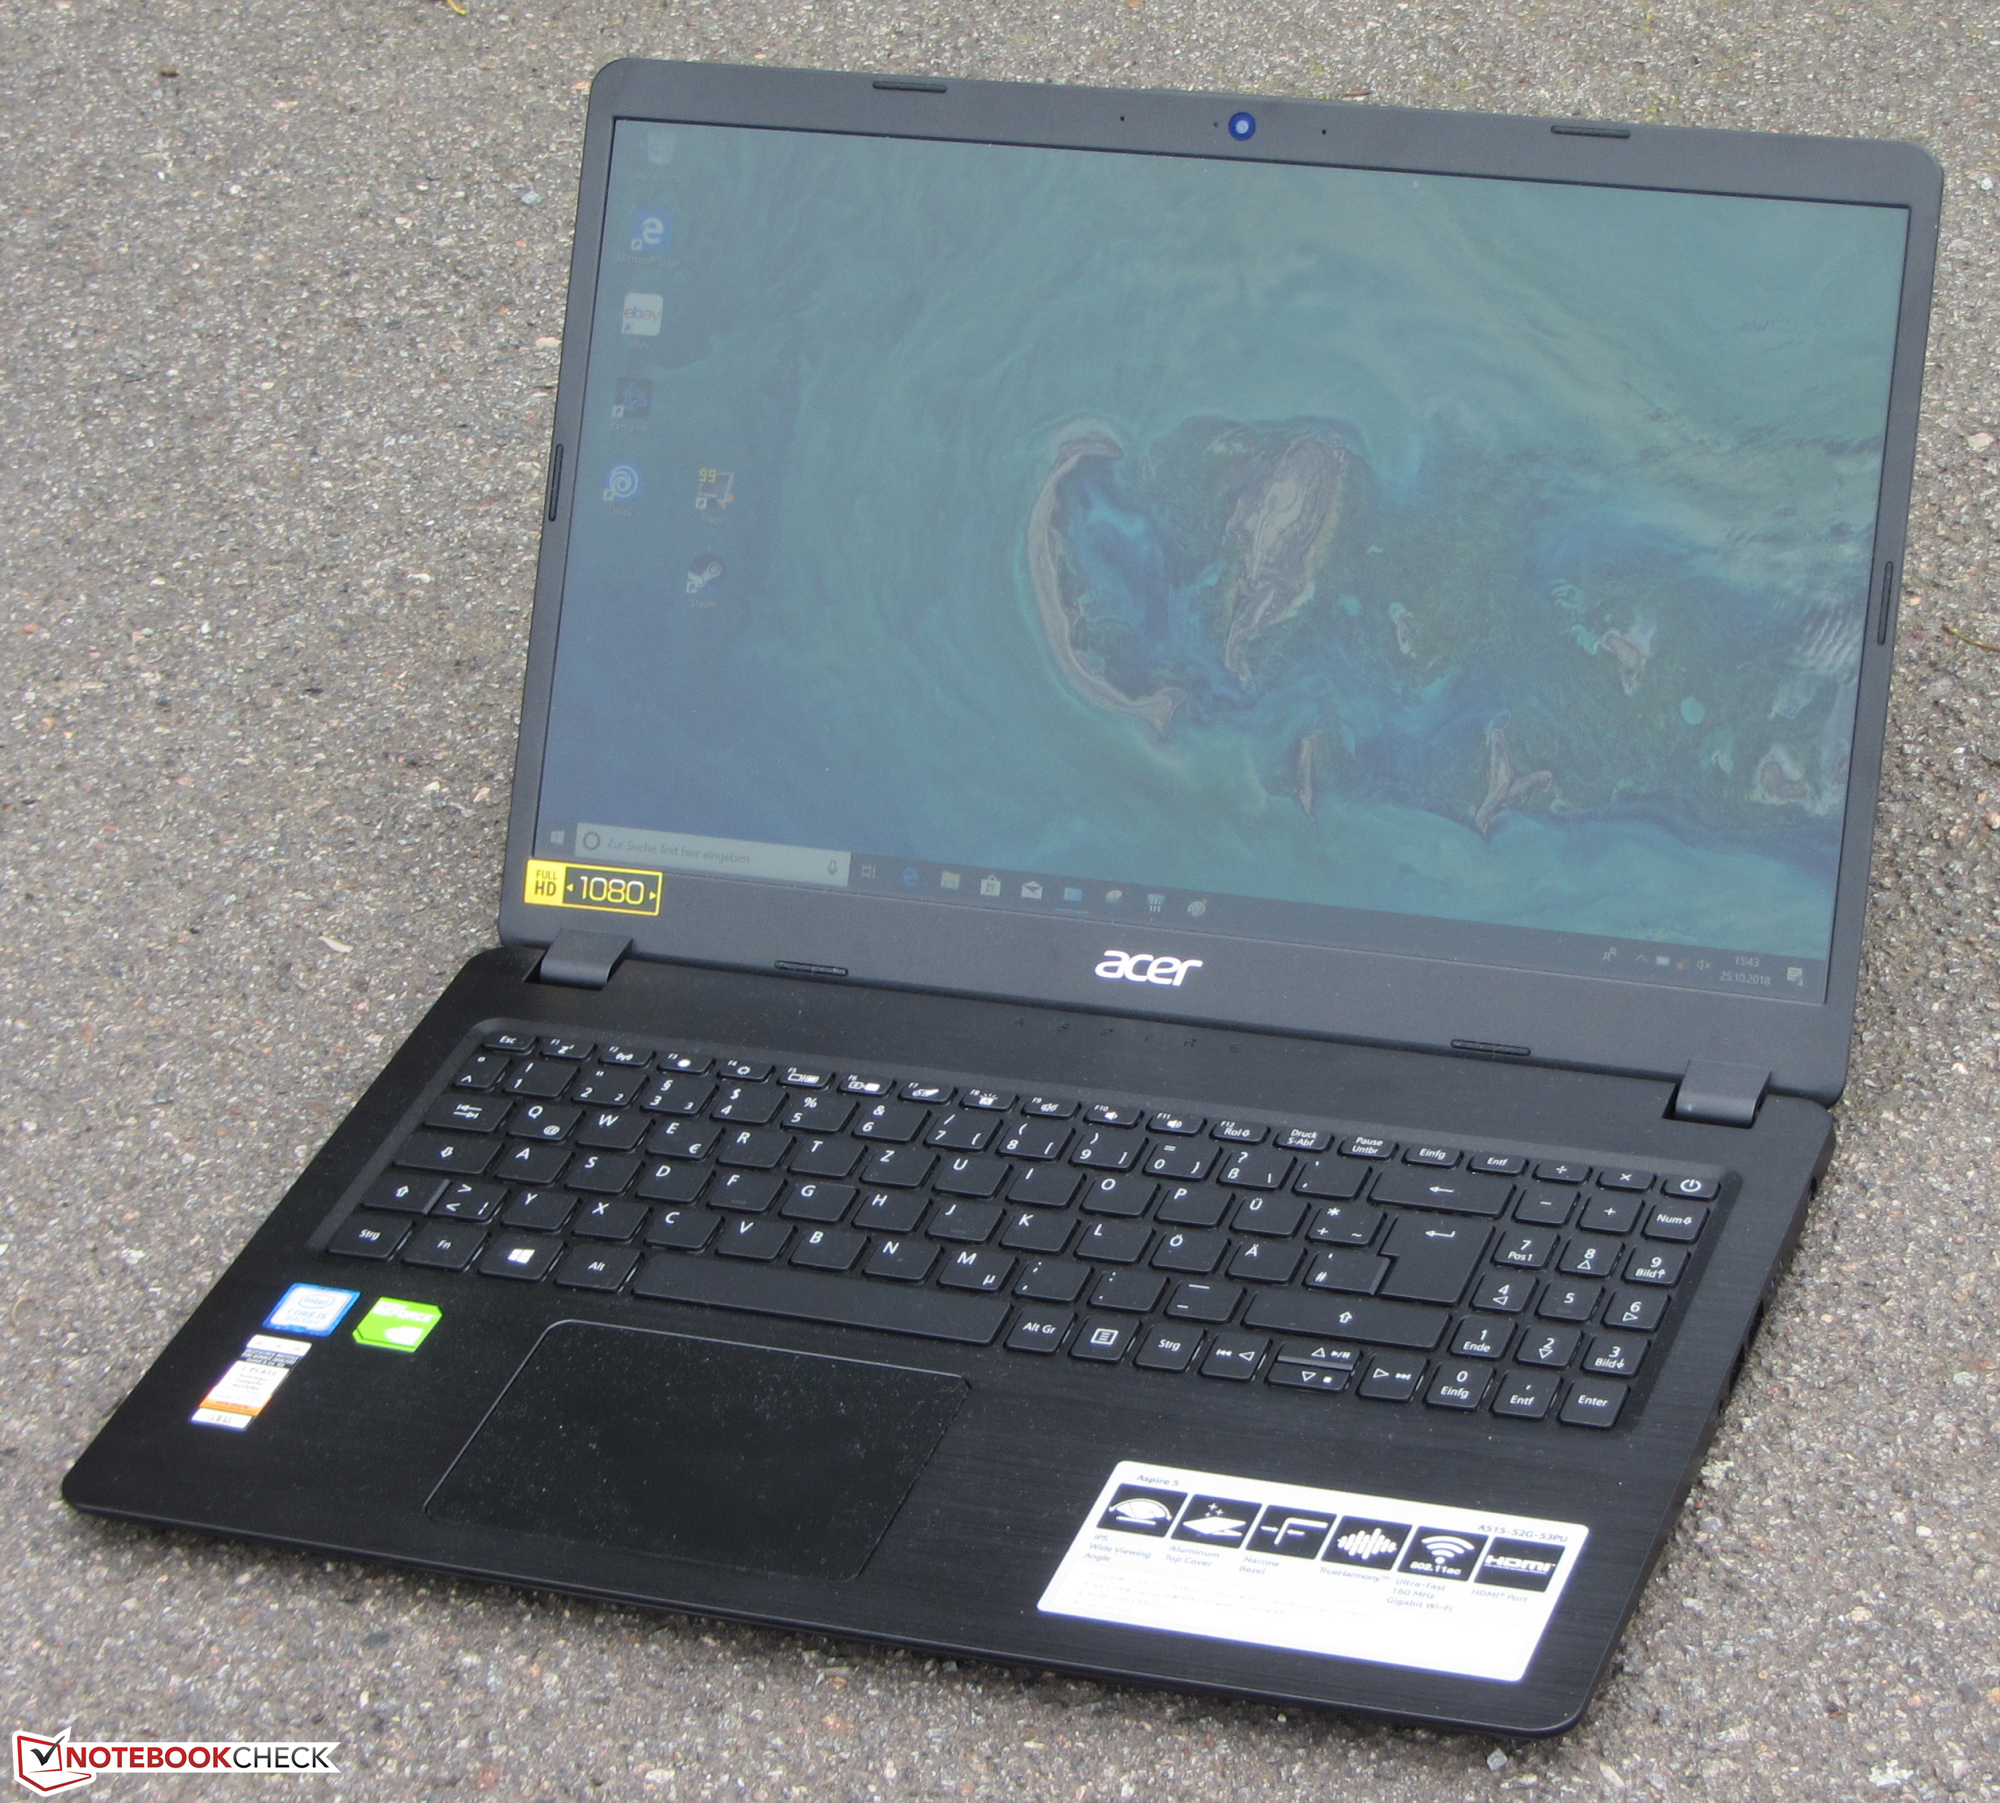
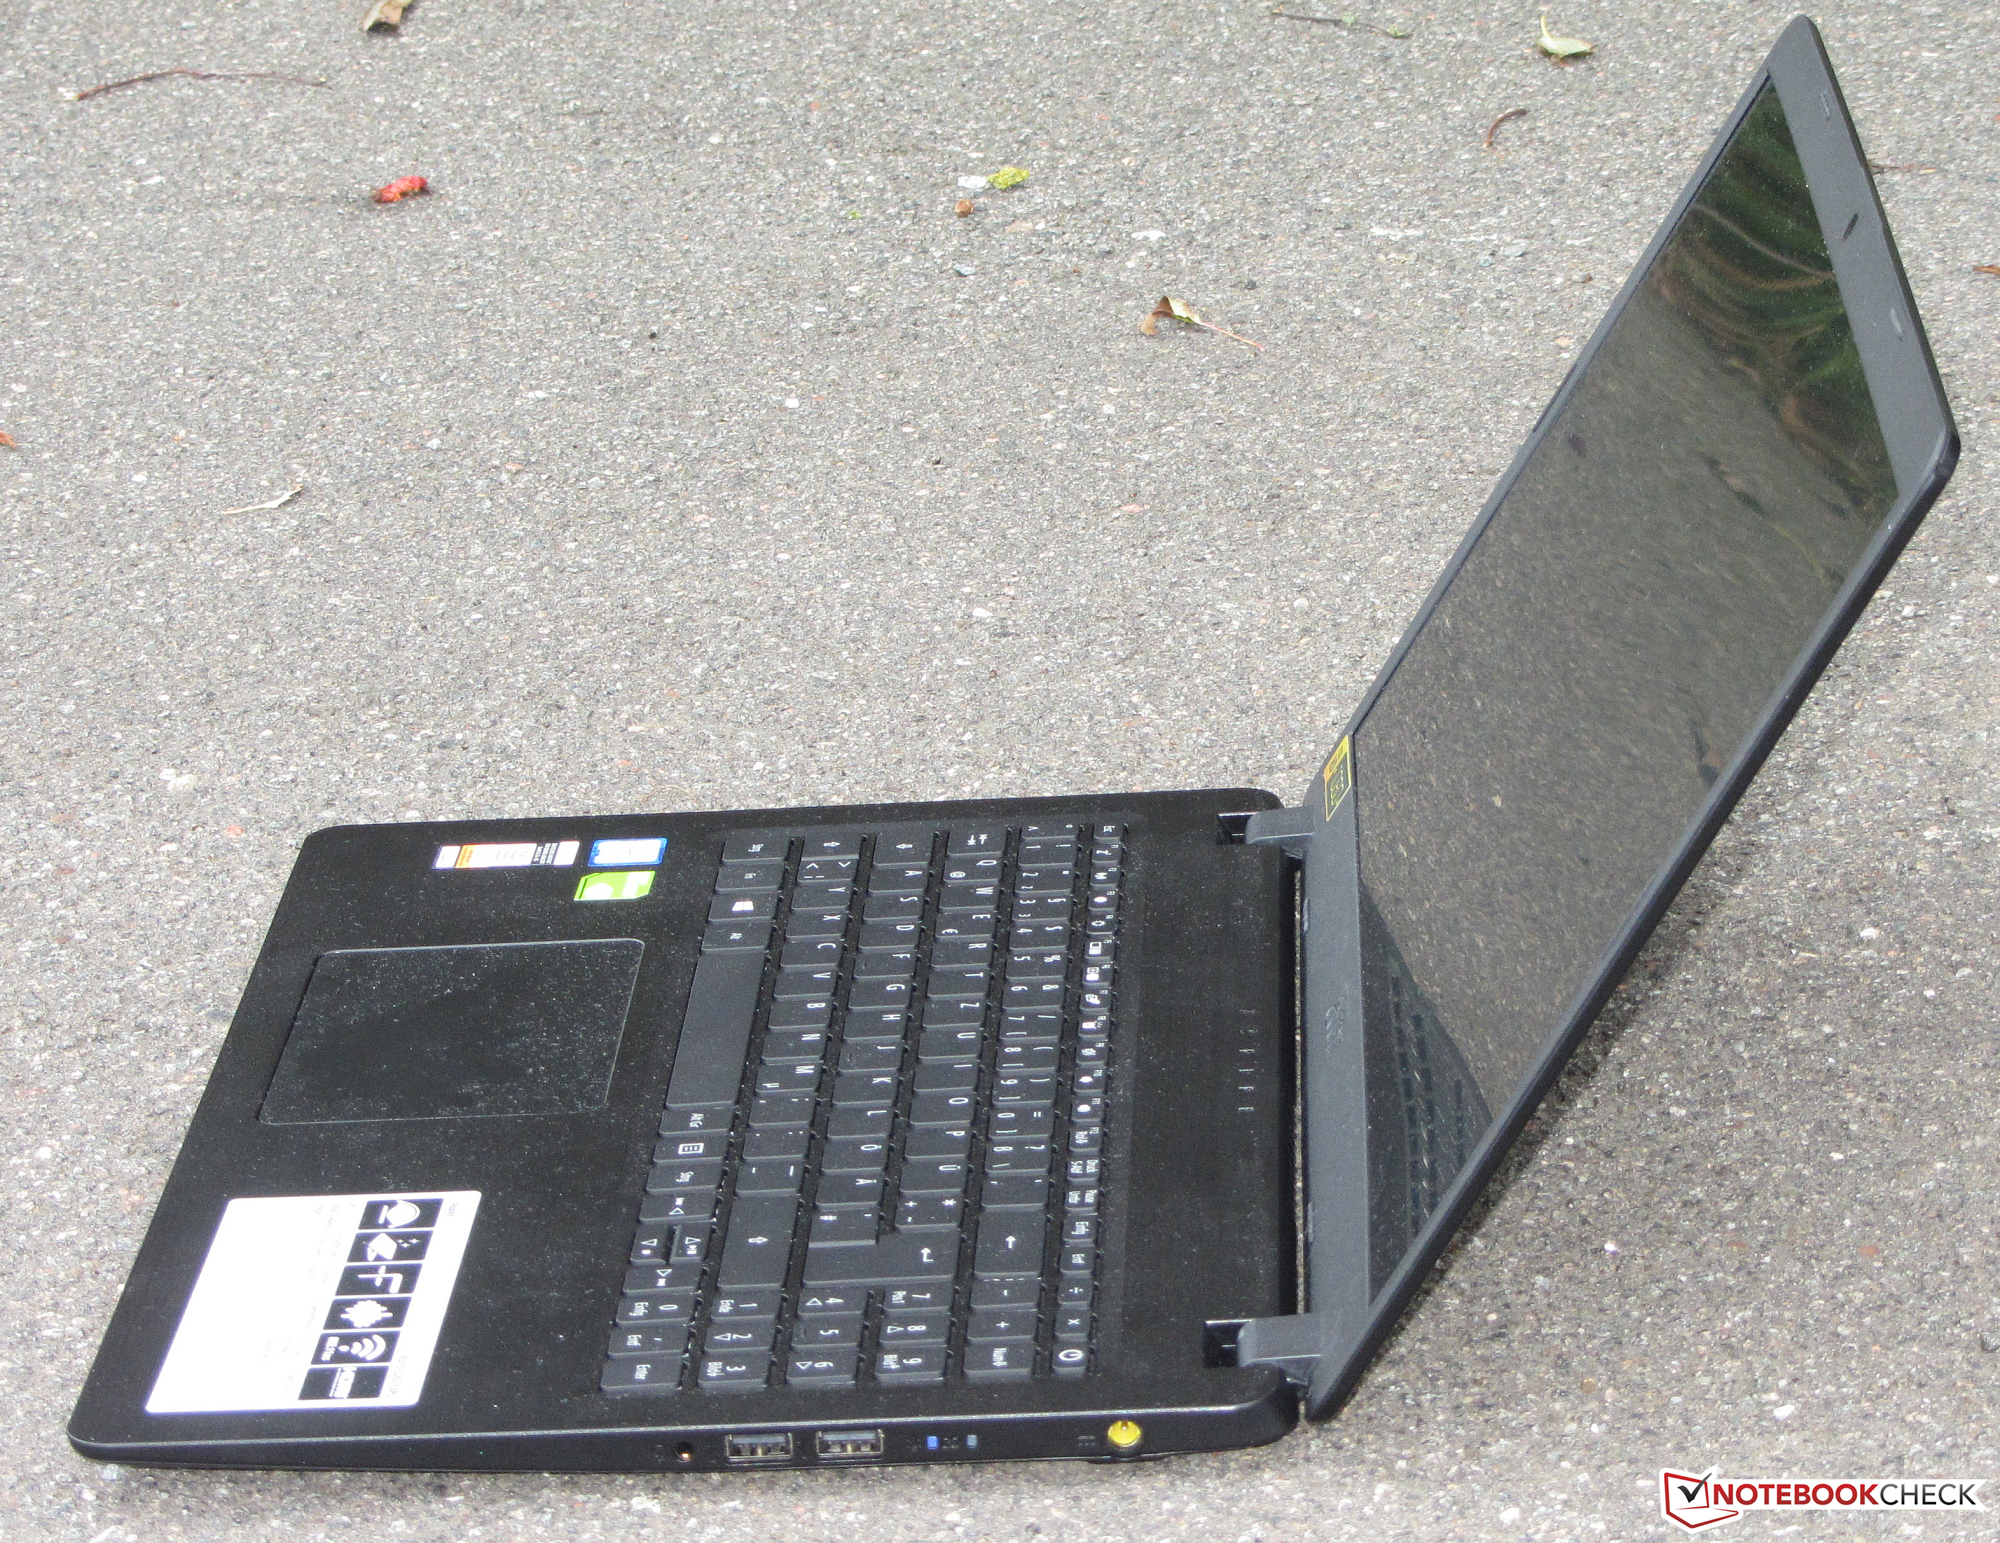
Acer Aspire 5 A515-52G (i7-8565U, GeForce MX250, SSD, FHD) Laptop Review
Acer offers with the Aspire 5 A515-52G series an assortment of 15.6-inch multimedia laptops. With the Acer Aspire 5 A515-52G-53PU, we have already reviewed a representative of this line-up. Our current review device represents the top-of-the-line model of the series. The laptop is equipped with a Core i7 processor and the brand-new GeForce MX250 graphics unit. Competition can be found in laptops such as the Lenovo IdeaPad 720-15IKB, the Asus VivoBook S15 S530UN and the HP Pavilion 15.
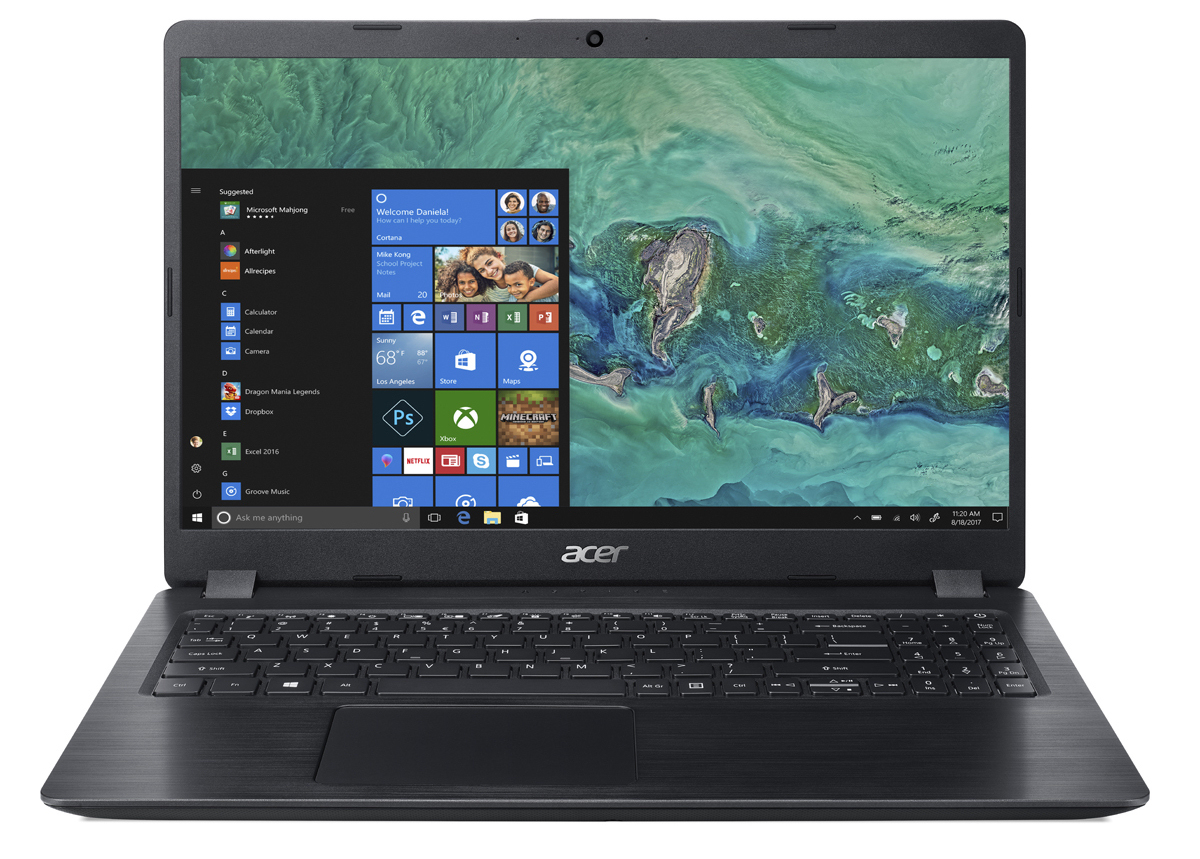
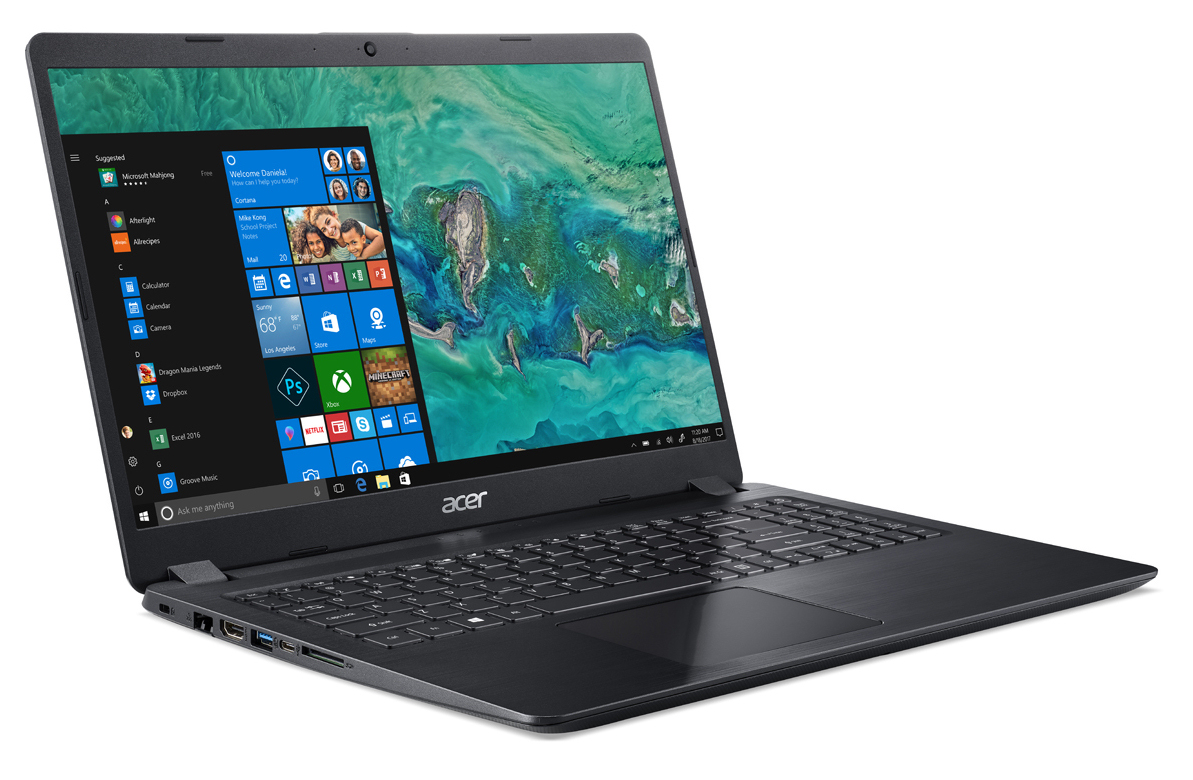
Since both Aspire 5 models are built identically, we will not go over the case, connectivity, input devices, display or speakers. The corresponding information can be found in our Aspire 5 A515-52G-53PU laptop review.
| SD Card Reader | |
| average JPG Copy Test (av. of 3 runs) | |
| Average of class Multimedia (23 - 531, n=43, last 2 years) | |
| Lenovo IdeaPad 720-15IKB (Toshiba Exceria Pro SDXC 64 GB UHS-II) | |
| Acer Aspire 5 A515-52G-53PU (Toshiba Exceria Pro SDXC 64 GB UHS-II) | |
| Acer Nitro 5 AN515-42-R6V0 (Toshiba Exceria Pro SDXC 64 GB UHS-II) | |
| Acer Aspire 5 A515-52G-723L (Toshiba Exceria Pro SDXC 64 GB UHS-II) | |
| HP Pavilion 15-cw0003ng (Toshiba Exceria Pro SDXC 64 GB UHS-II) | |
| HP Pavilion 15-cs0003ng (Toshiba Exceria Pro SDXC 64 GB UHS-II) | |
| Asus VivoBook S15 S530UN-BQ097T (Toshiba Exceria Pro M501 64 GB UHS-II) | |
| Lenovo Ideapad 330-15IKB-81DC00SWGE (Toshiba Exceria Pro SDXC 64 GB UHS-II) | |
| maximum AS SSD Seq Read Test (1GB) | |
| Average of class Multimedia (27.9 - 1455, n=42, last 2 years) | |
| Lenovo IdeaPad 720-15IKB (Toshiba Exceria Pro SDXC 64 GB UHS-II) | |
| Acer Nitro 5 AN515-42-R6V0 (Toshiba Exceria Pro SDXC 64 GB UHS-II) | |
| Acer Aspire 5 A515-52G-53PU (Toshiba Exceria Pro SDXC 64 GB UHS-II) | |
| Acer Aspire 5 A515-52G-723L (Toshiba Exceria Pro SDXC 64 GB UHS-II) | |
| HP Pavilion 15-cw0003ng (Toshiba Exceria Pro SDXC 64 GB UHS-II) | |
| HP Pavilion 15-cs0003ng (Toshiba Exceria Pro SDXC 64 GB UHS-II) | |
| Asus VivoBook S15 S530UN-BQ097T (Toshiba Exceria Pro M501 64 GB UHS-II) | |
| Lenovo Ideapad 330-15IKB-81DC00SWGE (Toshiba Exceria Pro SDXC 64 GB UHS-II) | |
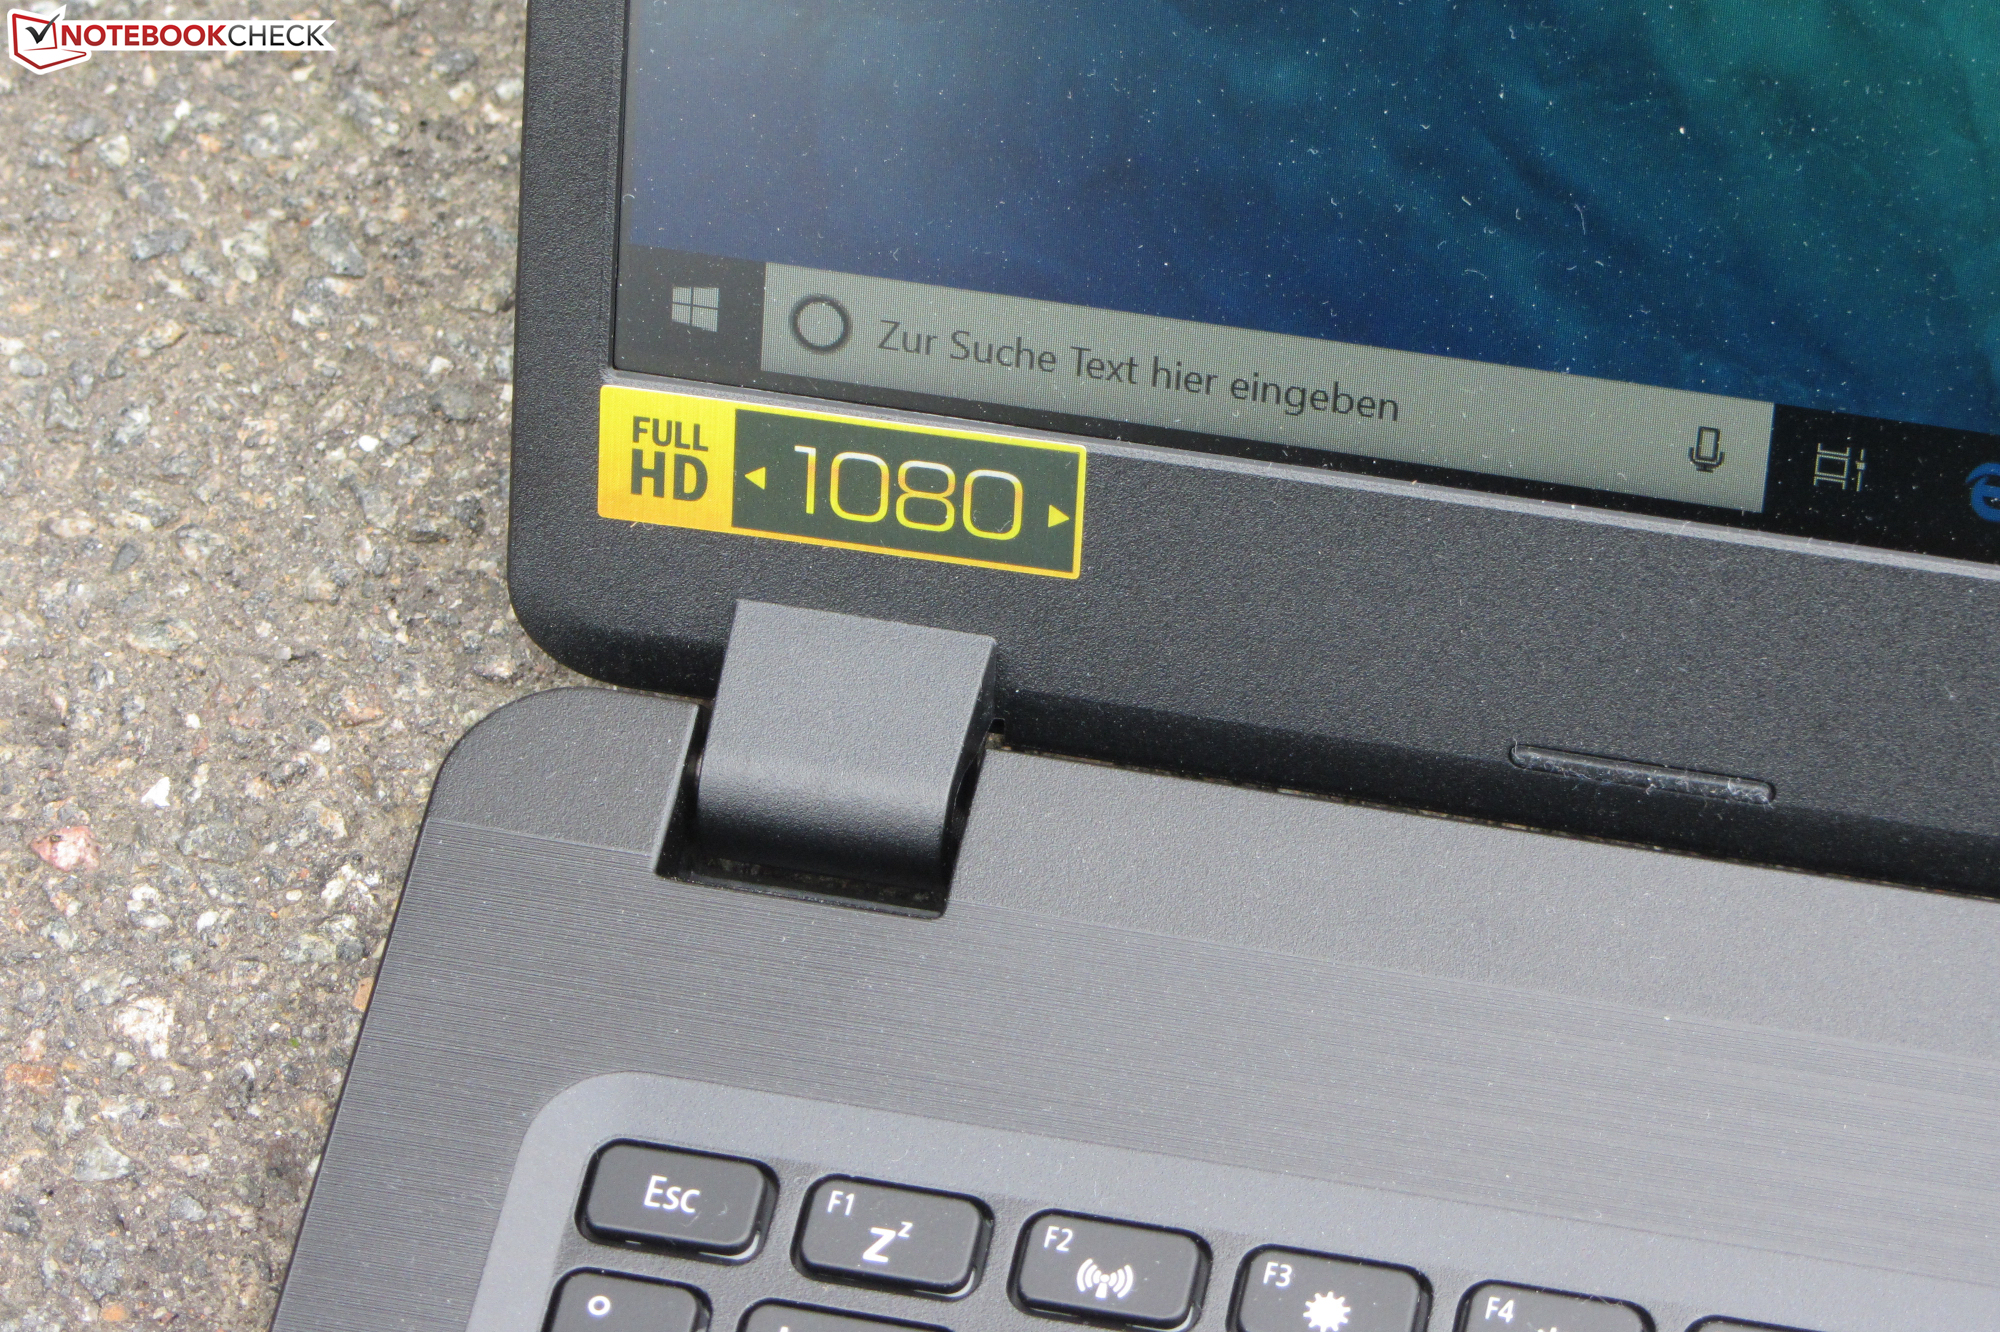
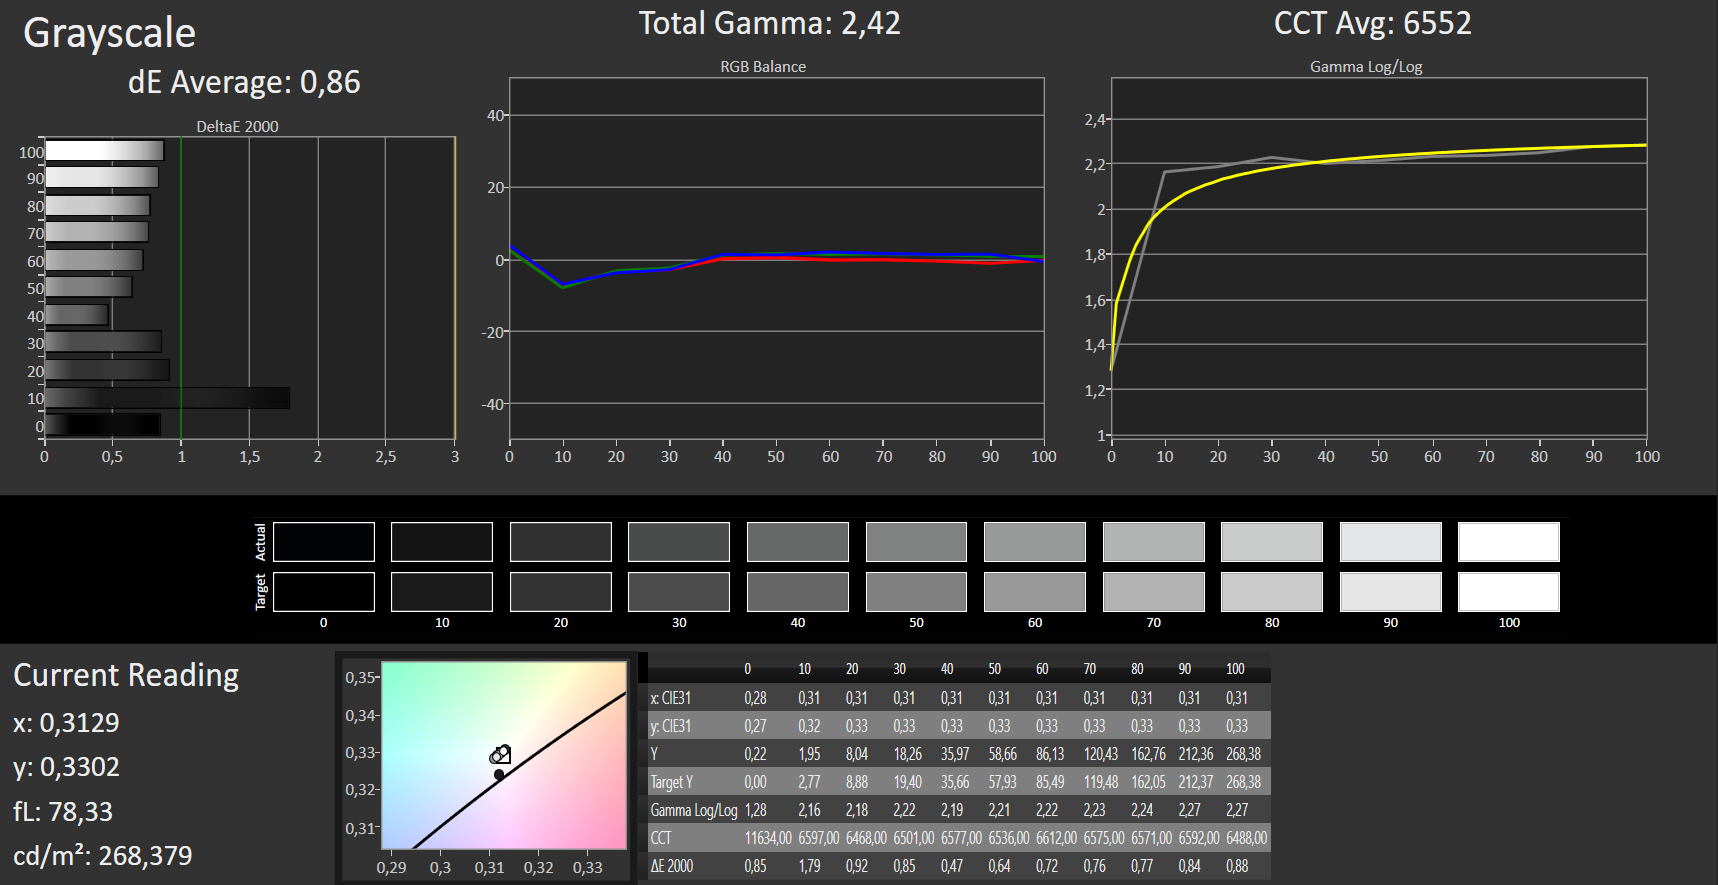
Display - IPS on board

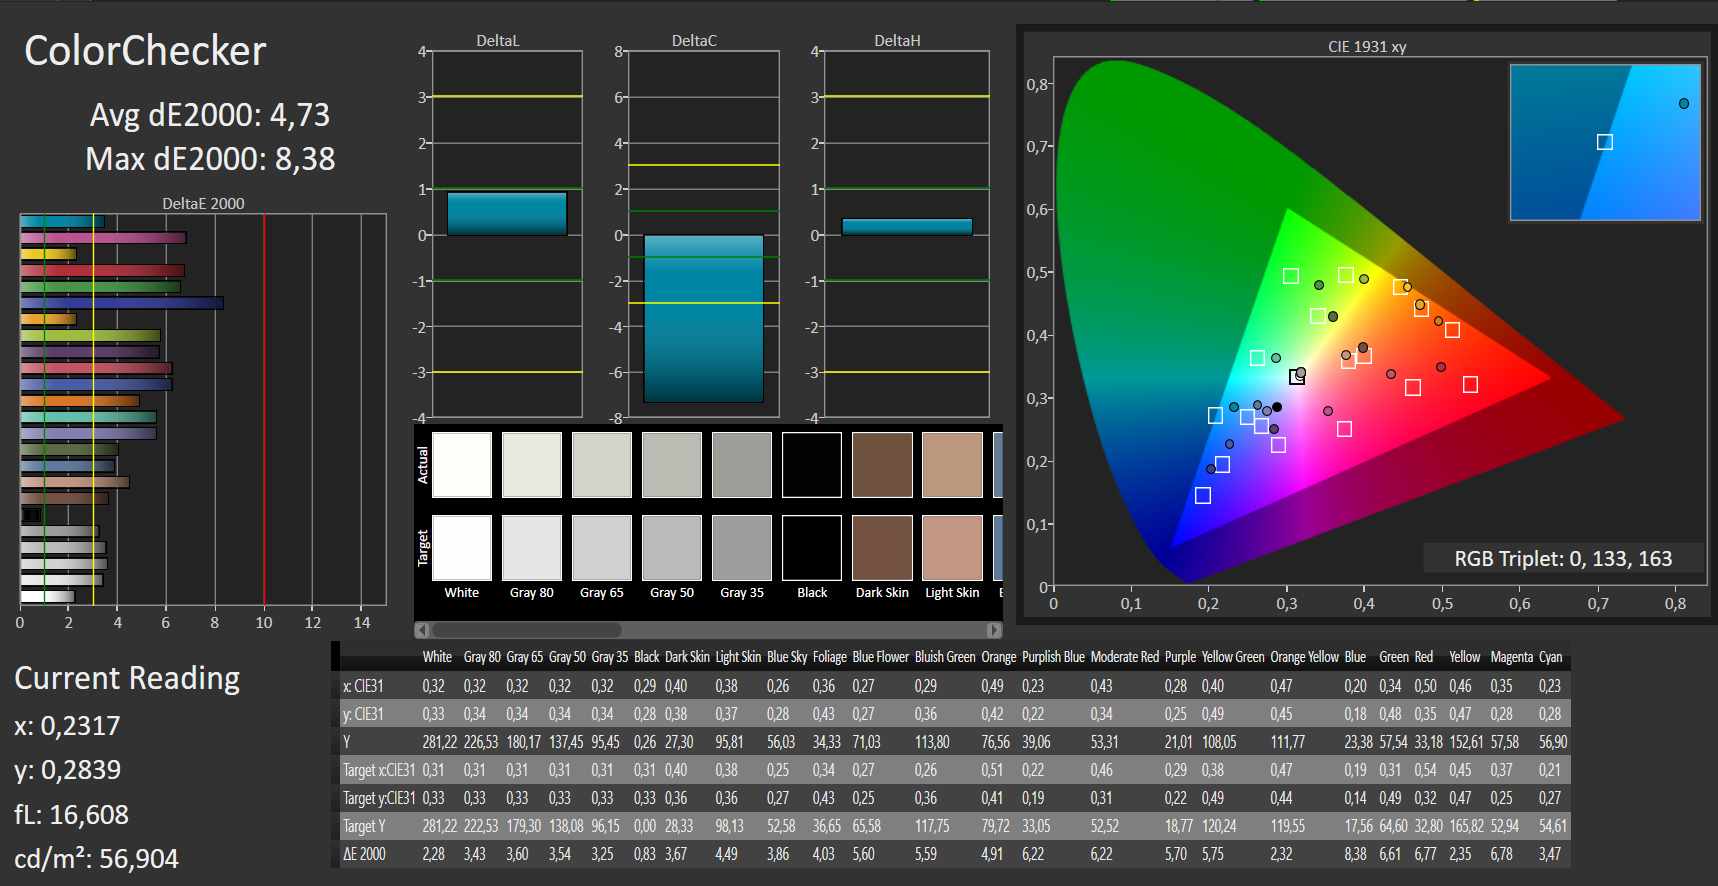
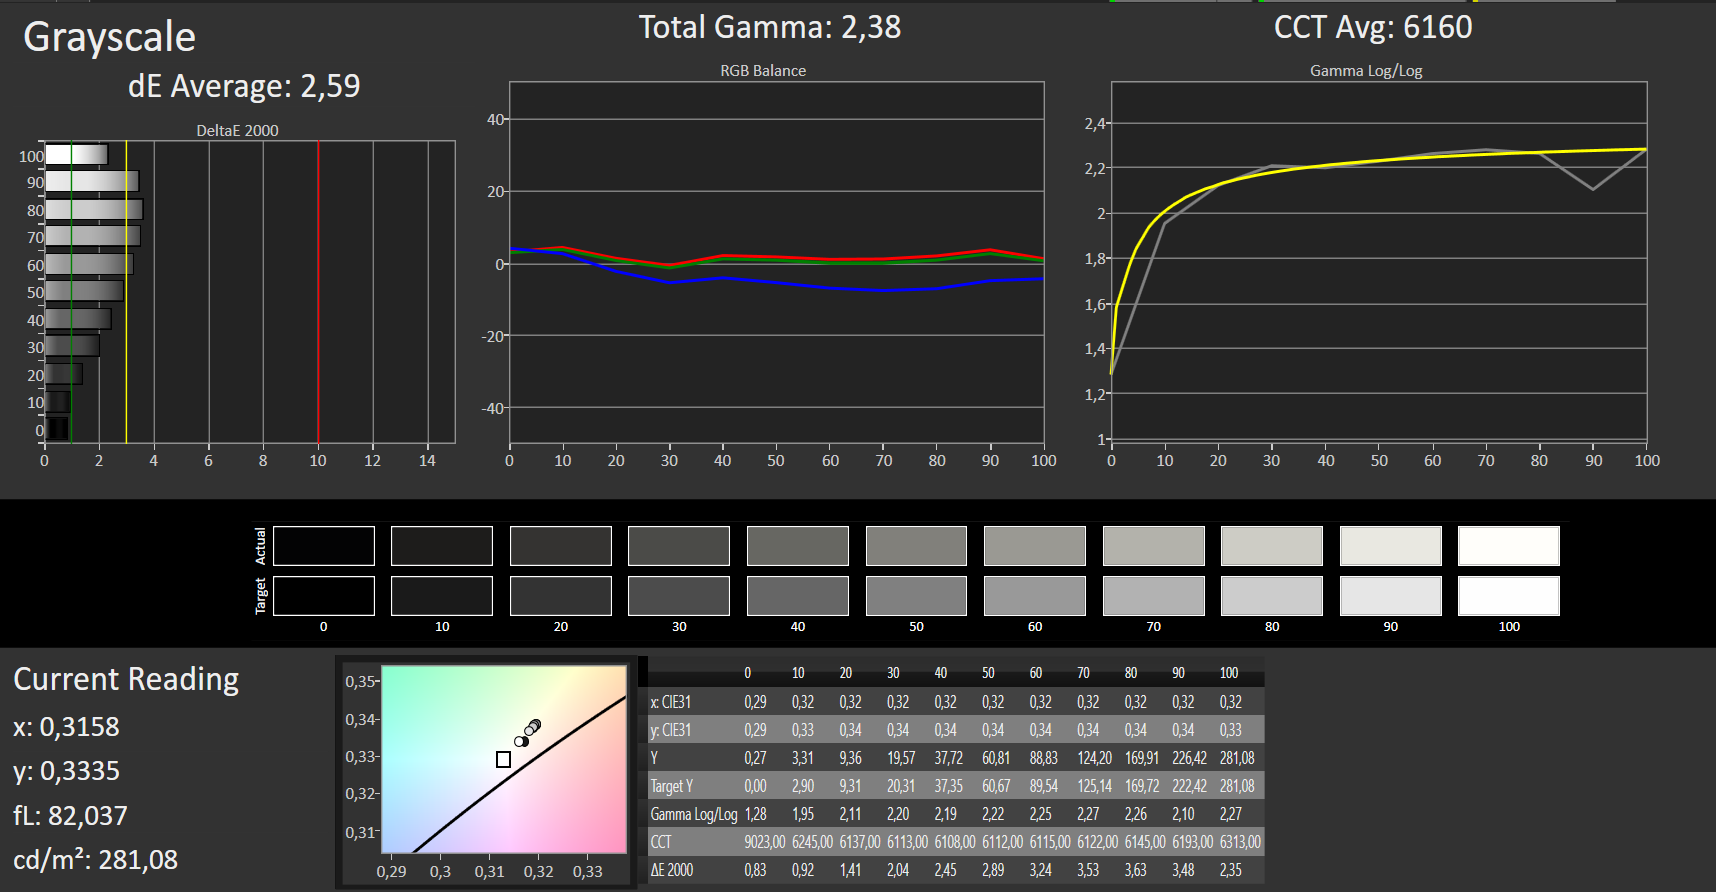
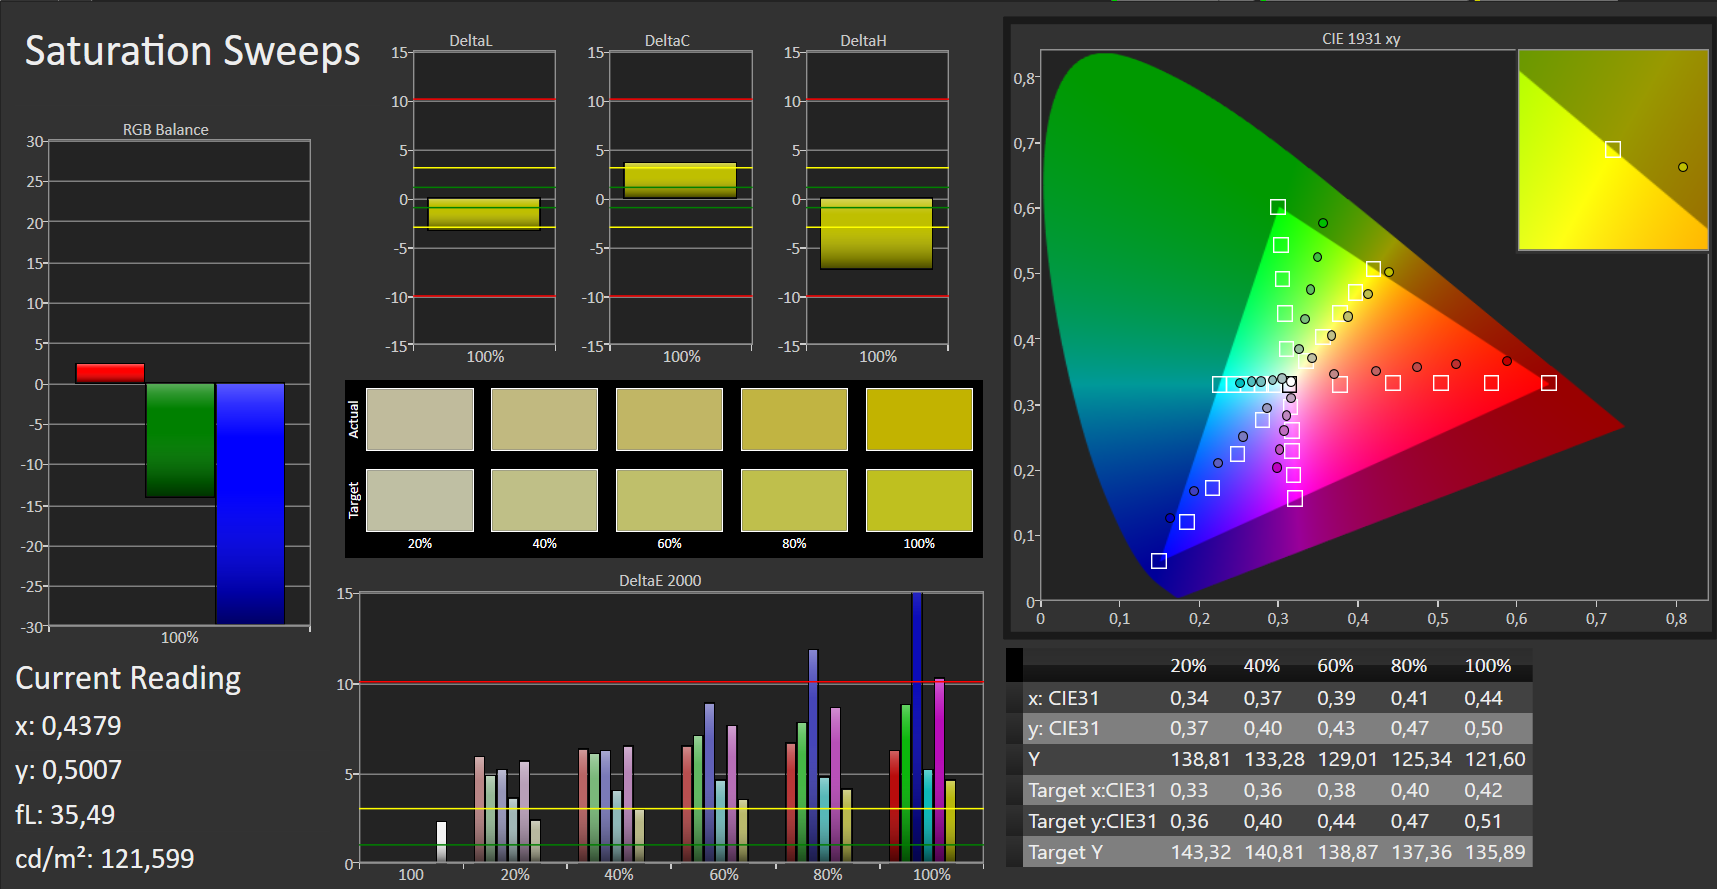
The Aspire's 15.6-inch display comes with a native resolution of 1920x1080 pixels. While contrast (1069:1) is adequate to this price point, brightness (271.2 cd/m²) was too low. We expected a value of around 300 cd/m² here.
The display showed flickering at brightness levels of 90% and below, with a frequency of 250 Hz. The relatively low frequency could lead to headaches and/or eye strain on sensitive users.
The A515-52G is equipped with the same IPS display found on the sibling model we reviewed, which has stable viewing angles. However, measurements differ slightly. In this case, we are dealing with a normal phenomenon. Two identically built displays will never be a hundred percent consistent.
| |||||||||||||||||||||||||
Brightness Distribution: 89 %
Center on Battery: 278 cd/m²
Contrast: 1069:1 (Black: 0.26 cd/m²)
ΔE ColorChecker Calman: 4.73 | ∀{0.5-29.43 Ø4.73}
calibrated: 5.17
ΔE Greyscale Calman: 2.59 | ∀{0.09-98 Ø4.97}
58% sRGB (Argyll 1.6.3 3D)
36% AdobeRGB 1998 (Argyll 1.6.3 3D)
41.34% AdobeRGB 1998 (Argyll 3D)
58.5% sRGB (Argyll 3D)
40.02% Display P3 (Argyll 3D)
Gamma: 2.38
CCT: 6160 K
| Acer Aspire 5 A515-52G-723L IPS, 1920x1080, 15.6" | Acer Aspire 5 A515-52G-53PU IPS, 1920x1080, 15.6" | Asus VivoBook S15 S530UN-BQ097T IPS LED, 1920x1080, 15.6" | Lenovo IdeaPad 720-15IKB IPS, 1920x1080, 15.6" | HP Pavilion 15-cs0003ng IPS, 1920x1080, 15.6" | |
|---|---|---|---|---|---|
| Display | 0% | -3% | -2% | -8% | |
| Display P3 Coverage (%) | 40.02 | 39.85 0% | 38.51 -4% | 38.62 -3% | 36.27 -9% |
| sRGB Coverage (%) | 58.5 | 58.7 0% | 57.9 -1% | 58.1 -1% | 54.6 -7% |
| AdobeRGB 1998 Coverage (%) | 41.34 | 41.17 0% | 39.79 -4% | 39.91 -3% | 37.47 -9% |
| Response Times | -3% | 17% | 14% | 8% | |
| Response Time Grey 50% / Grey 80% * (ms) | 45 ? | 45 ? -0% | 38.8 ? 14% | 42 ? 7% | 45 ? -0% |
| Response Time Black / White * (ms) | 33 ? | 35 ? -6% | 26.8 ? 19% | 26 ? 21% | 28 ? 15% |
| PWM Frequency (Hz) | 250 ? | 20000 ? | |||
| Screen | 7% | -5% | -13% | -39% | |
| Brightness middle (cd/m²) | 278 | 296 6% | 262 -6% | 270 -3% | 240 -14% |
| Brightness (cd/m²) | 271 | 268 -1% | 256 -6% | 250 -8% | 237 -13% |
| Brightness Distribution (%) | 89 | 81 -9% | 90 1% | 87 -2% | 90 1% |
| Black Level * (cd/m²) | 0.26 | 0.3 -15% | 0.21 19% | 0.25 4% | 0.42 -62% |
| Contrast (:1) | 1069 | 987 -8% | 1248 17% | 1080 1% | 571 -47% |
| Colorchecker dE 2000 * | 4.73 | 4.01 15% | 5.8 -23% | 4.79 -1% | 7.43 -57% |
| Colorchecker dE 2000 max. * | 8.38 | 8.7 -4% | 14.3 -71% | 8.83 -5% | 12.42 -48% |
| Colorchecker dE 2000 calibrated * | 5.17 | 4 23% | 4.6 11% | ||
| Greyscale dE 2000 * | 2.59 | 0.98 62% | 2.5 3% | 5.66 -119% | 6.26 -142% |
| Gamma | 2.38 92% | 2.35 94% | 1.99 111% | 2.64 83% | 2.96 74% |
| CCT | 6160 106% | 6408 101% | 6528 100% | 7179 91% | 6661 98% |
| Color Space (Percent of AdobeRGB 1998) (%) | 36 | 38 6% | 36.6 2% | 37 3% | 35 -3% |
| Color Space (Percent of sRGB) (%) | 58 | 58 0% | 57.6 -1% | 59 2% | 54 -7% |
| Total Average (Program / Settings) | 1% /
4% | 3% /
-2% | -0% /
-7% | -13% /
-27% |
* ... smaller is better


Display Response Times
| ↔ Response Time Black to White | ||
|---|---|---|
| 33 ms ... rise ↗ and fall ↘ combined | ↗ 18 ms rise | 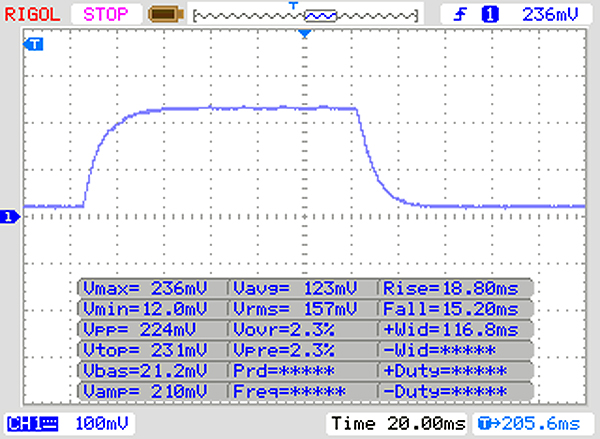 |
| ↘ 15 ms fall | ||
| The screen shows slow response rates in our tests and will be unsatisfactory for gamers. In comparison, all tested devices range from 0.1 (minimum) to 240 (maximum) ms. » 89 % of all devices are better. This means that the measured response time is worse than the average of all tested devices (19.9 ms). | ||
| ↔ Response Time 50% Grey to 80% Grey | ||
| 45 ms ... rise ↗ and fall ↘ combined | ↗ 23 ms rise | 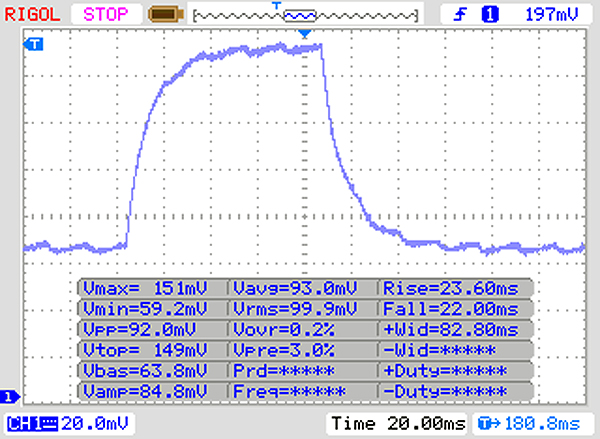 |
| ↘ 22 ms fall | ||
| The screen shows slow response rates in our tests and will be unsatisfactory for gamers. In comparison, all tested devices range from 0.165 (minimum) to 636 (maximum) ms. » 77 % of all devices are better. This means that the measured response time is worse than the average of all tested devices (31.1 ms). | ||
Screen Flickering / PWM (Pulse-Width Modulation)
| Screen flickering / PWM detected | 250 Hz | ≤ 90 % brightness setting | 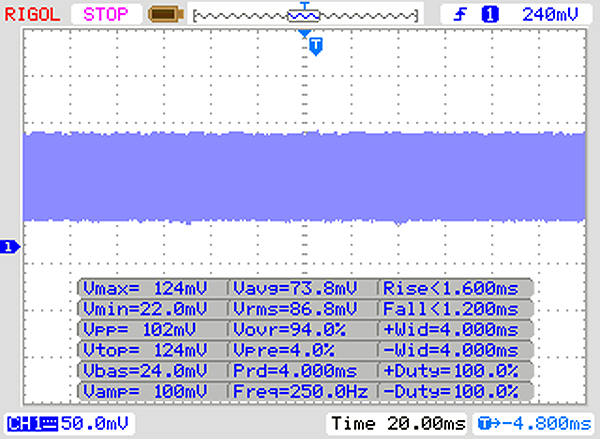 |
The display backlight flickers at 250 Hz (worst case, e.g., utilizing PWM) Flickering detected at a brightness setting of 90 % and below. There should be no flickering or PWM above this brightness setting. The frequency of 250 Hz is relatively low, so sensitive users will likely notice flickering and experience eyestrain at the stated brightness setting and below. In comparison: 52 % of all tested devices do not use PWM to dim the display. If PWM was detected, an average of 7784 (minimum: 5 - maximum: 343500) Hz was measured. | |||
Performance - A new GPU
Acer delivers with the Aspire 5 A515-52G a multimedia all-rounder in 15.6-inch format. The laptop provides enough processing power for common usage scenarios. The dedicated GPU enables the use of computer games. Our review device can be obtained for about 1,100 Euros (~$1,236). Other configurations are also available. Prices begin at 500 Euros (~$562). Note: the budget entry-level models come with GeForce MX130 graphics.
Processor
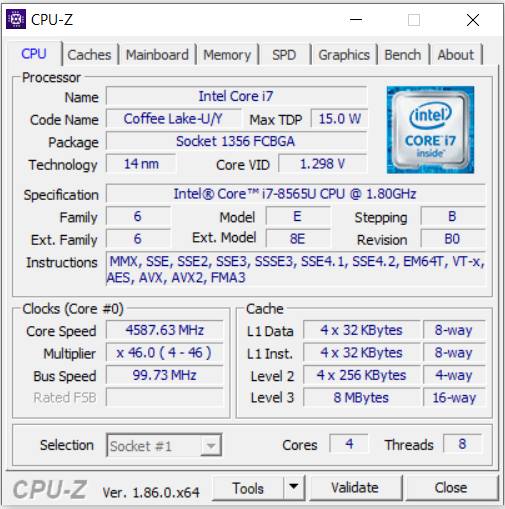
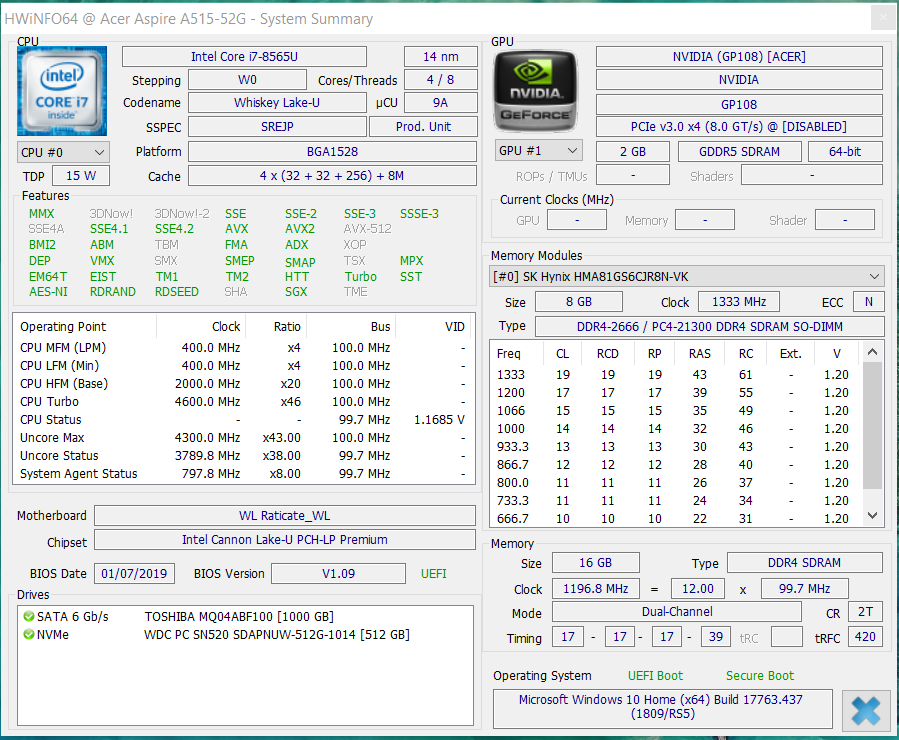
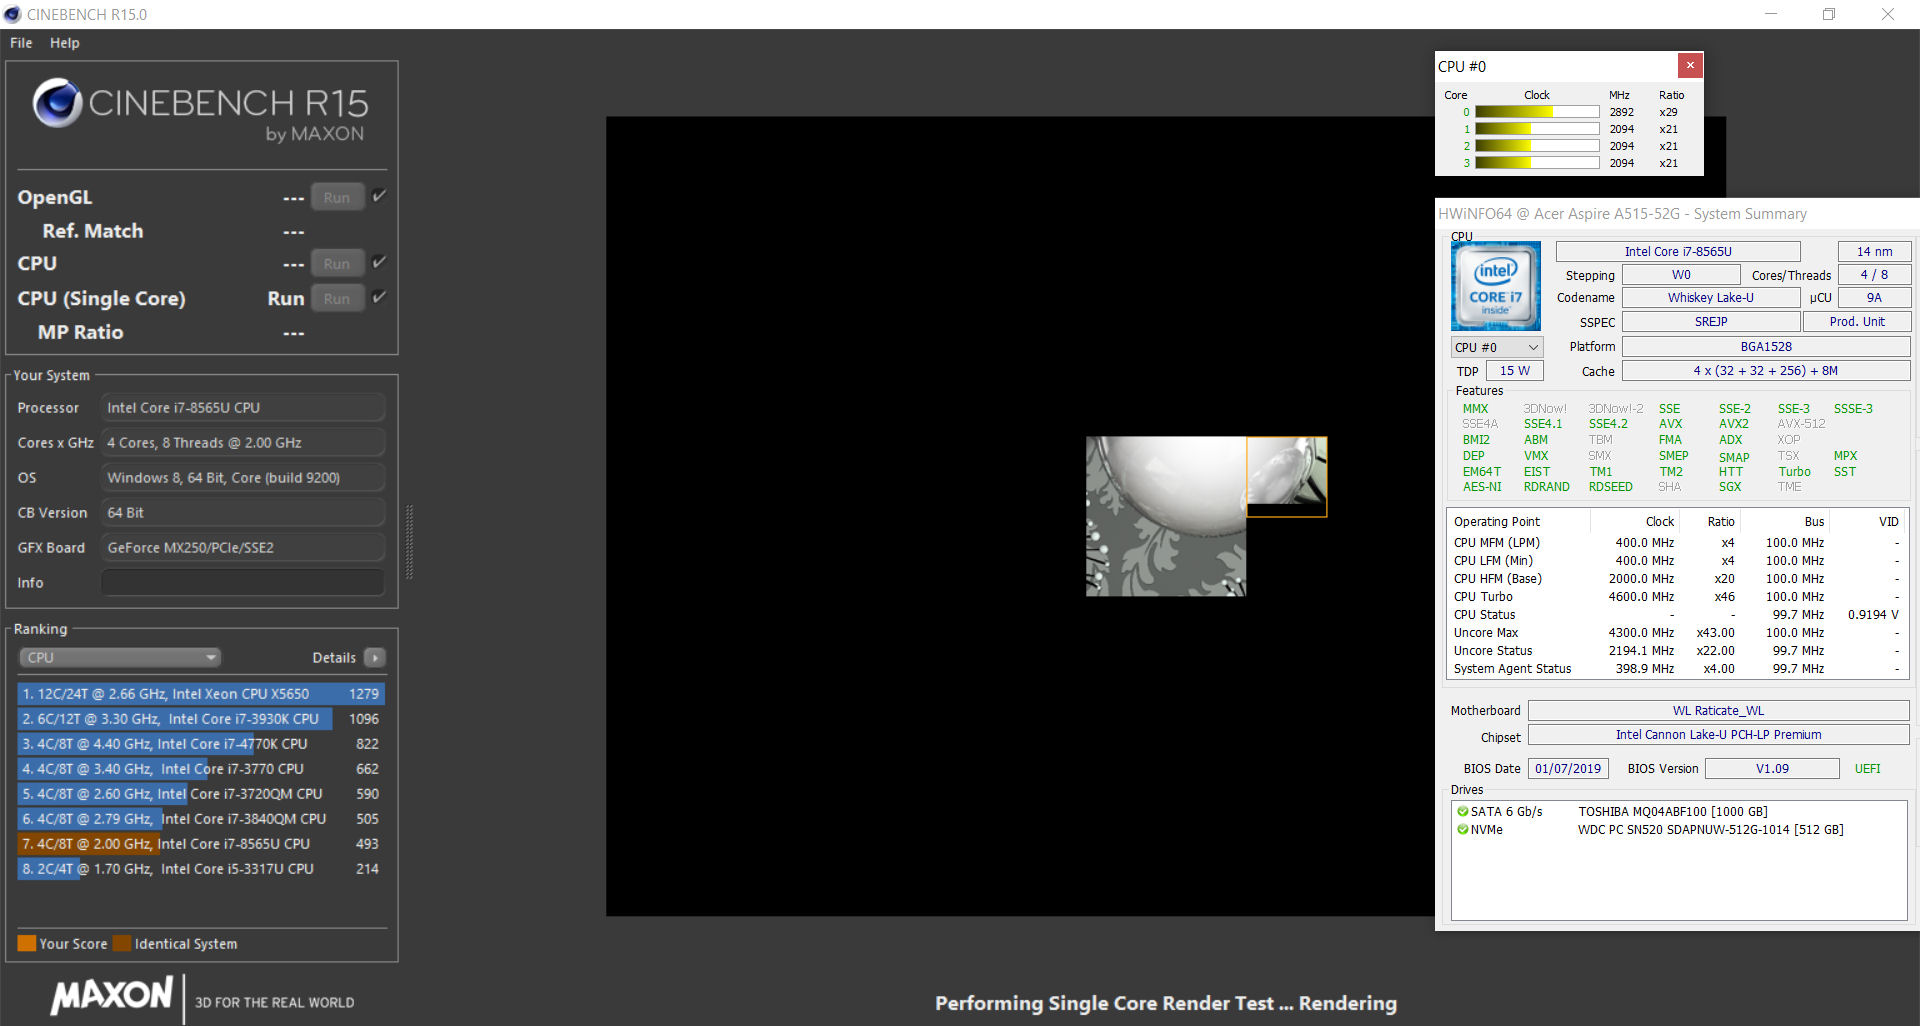
The Aspire is powered by the Core i7-8565U quad-core CPU, which is based on Intel's current Whiskey Lake architecture. This is a ULV model with a TDP of 15 watts. Acer allows a temporary increase to 51 watts. The Core i7 works with a base speed of 1.8 GHz. Through Turbo, the following speeds can be reached: 4.1 GHz (all four cores), 4.5 GHz (two cores) and 4.6 GHz (one core).
The processor works through the Cinebench CPU tests for a few seconds at 2.9 to 3.1 GHz (multi-thread) and 4.1 GHz (single-thread) respectively. The clock speed then drops to 2.1 to 2.3 GHz (multi-thread) and 3.8 to 3.9 GHz (single-thread). This was observed when plugged in. On battery, the tests were carried out at 2.1 to 2.2 GHz (multi-thread) and 2.2 to 4.6 GHz (single-thread) respectively.
Despite the clock speeds being significantly different, the outcome was quite similar. Therefore, results for the CB15 on battery reached 162 points (single-thread) and 470 points (multi-thread).
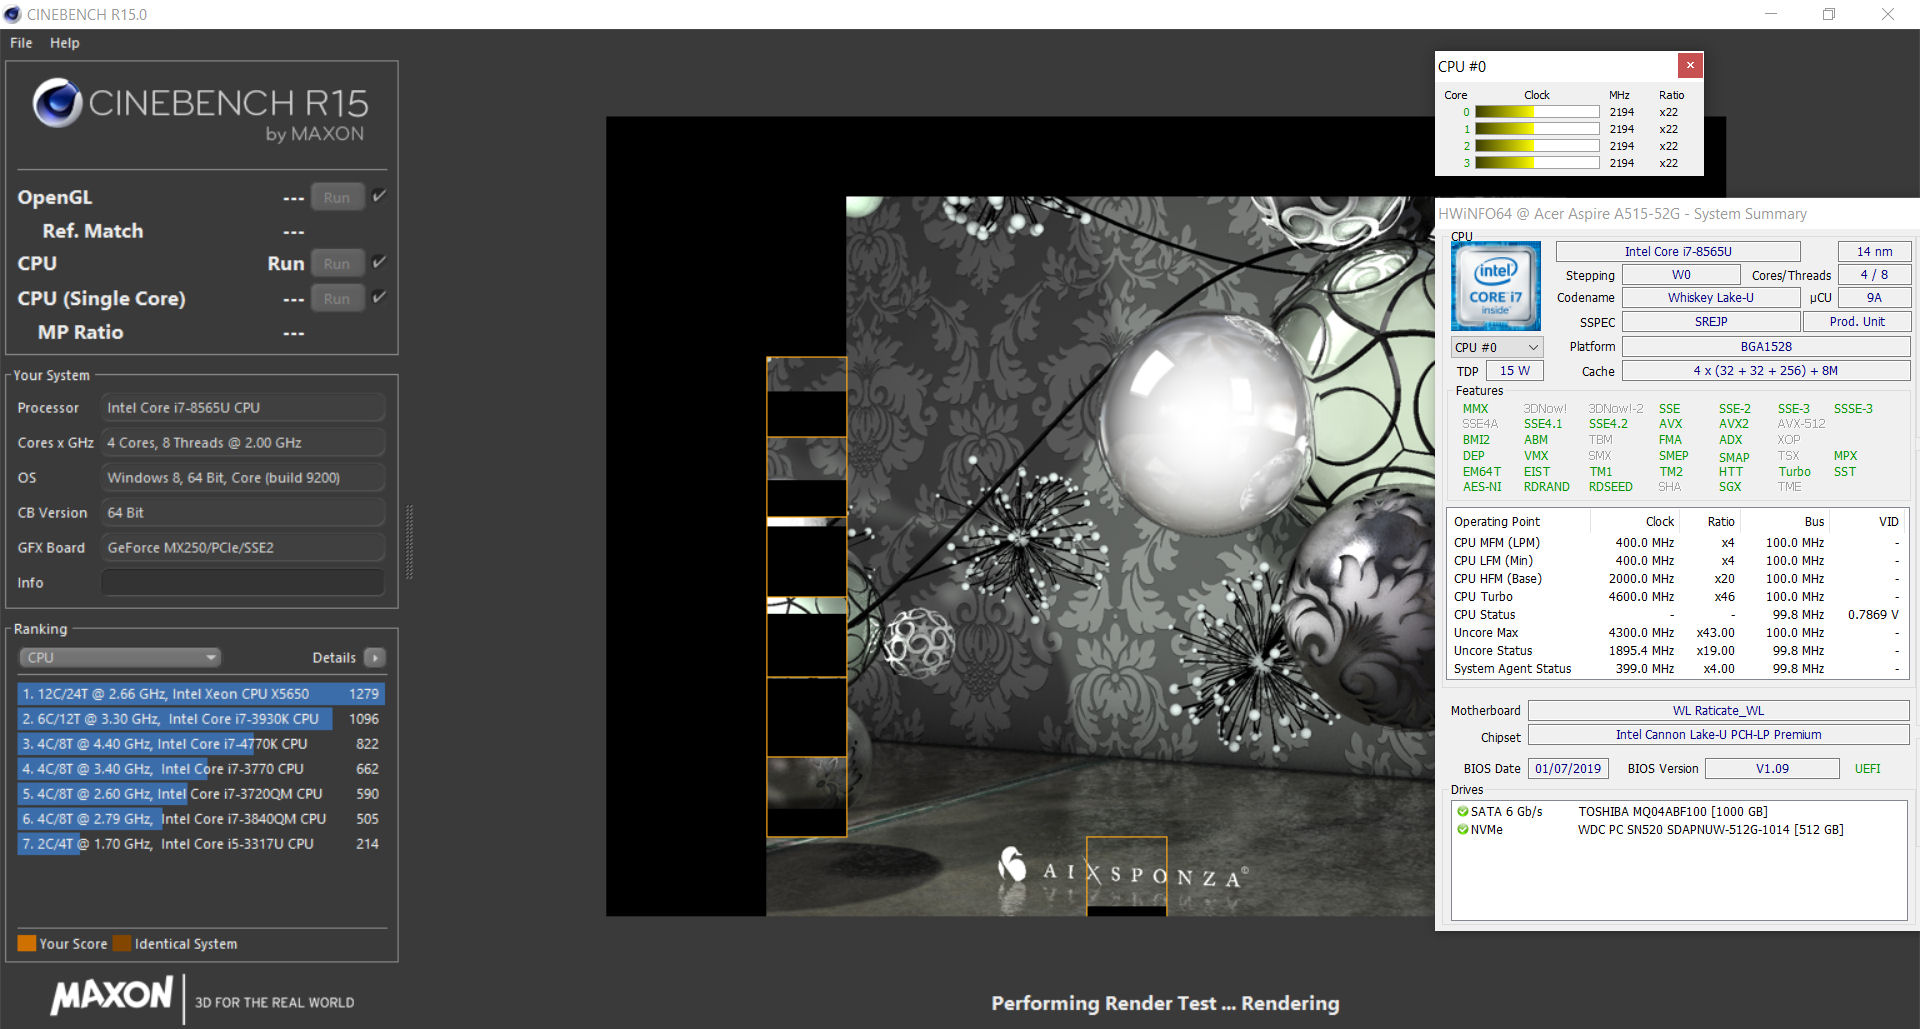
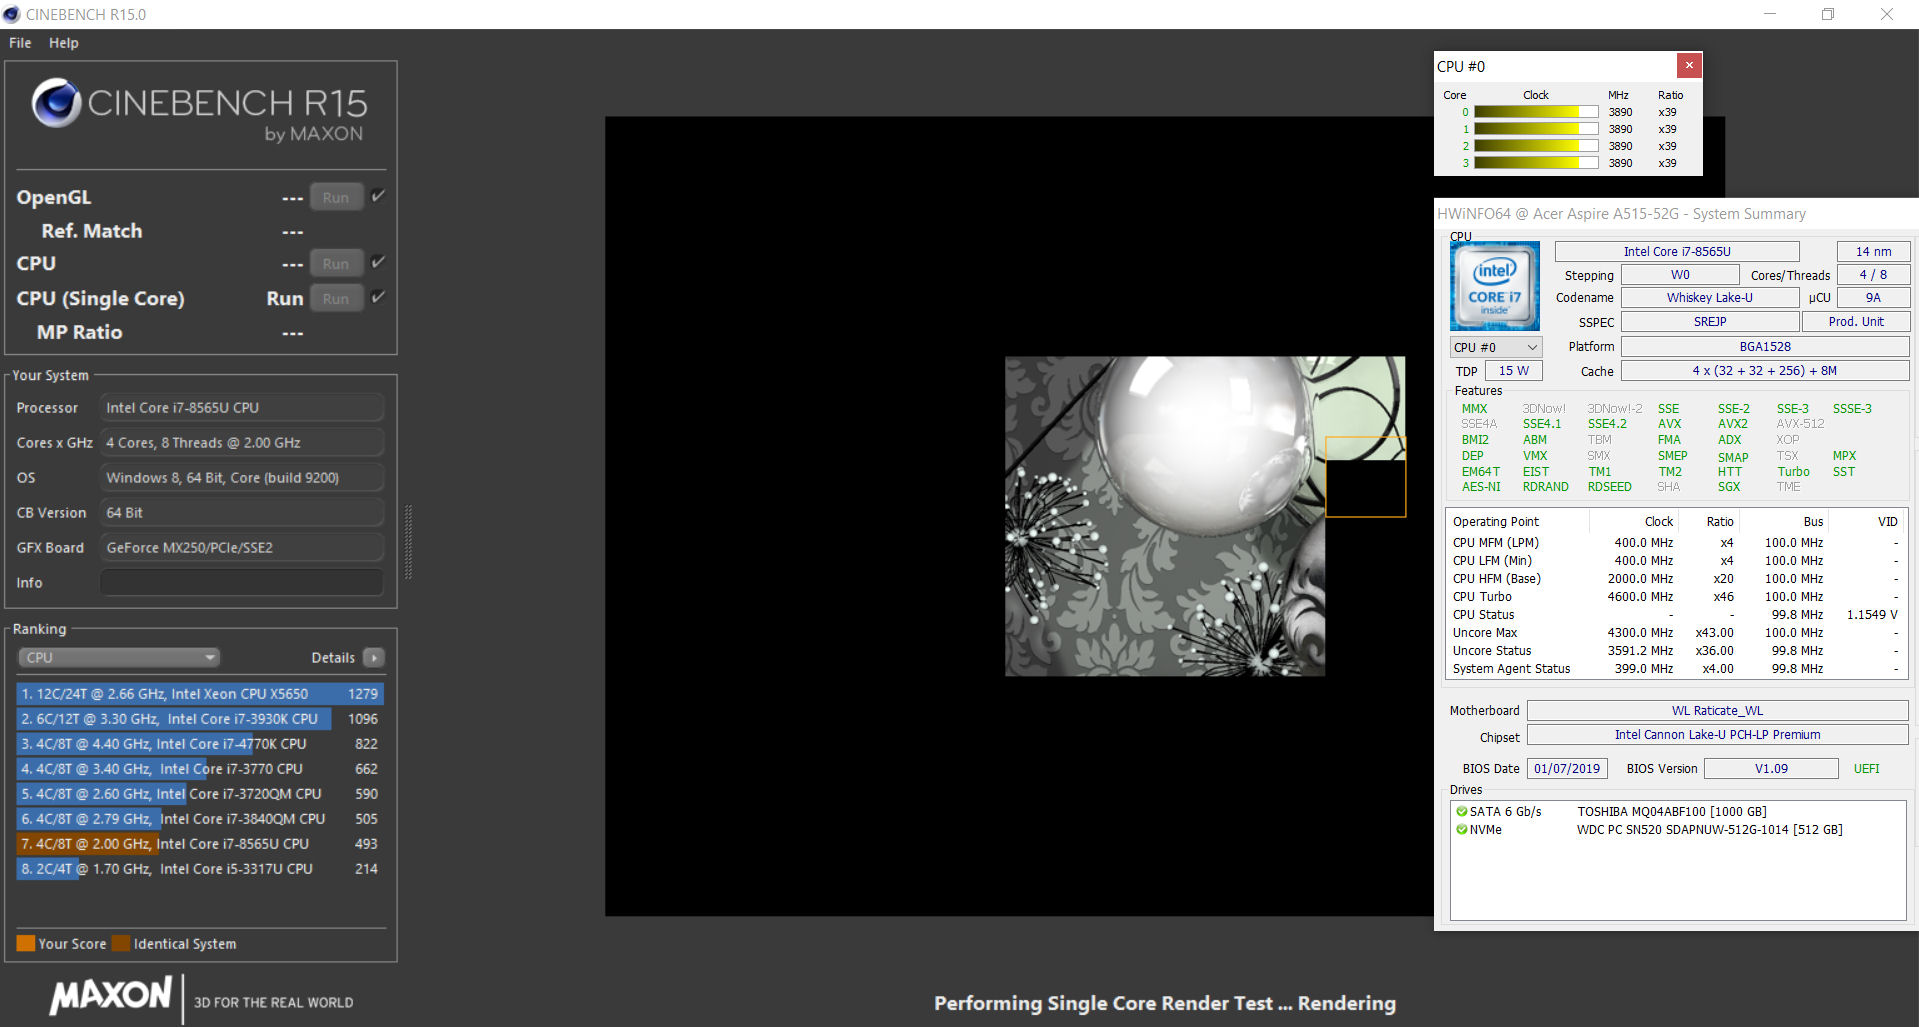
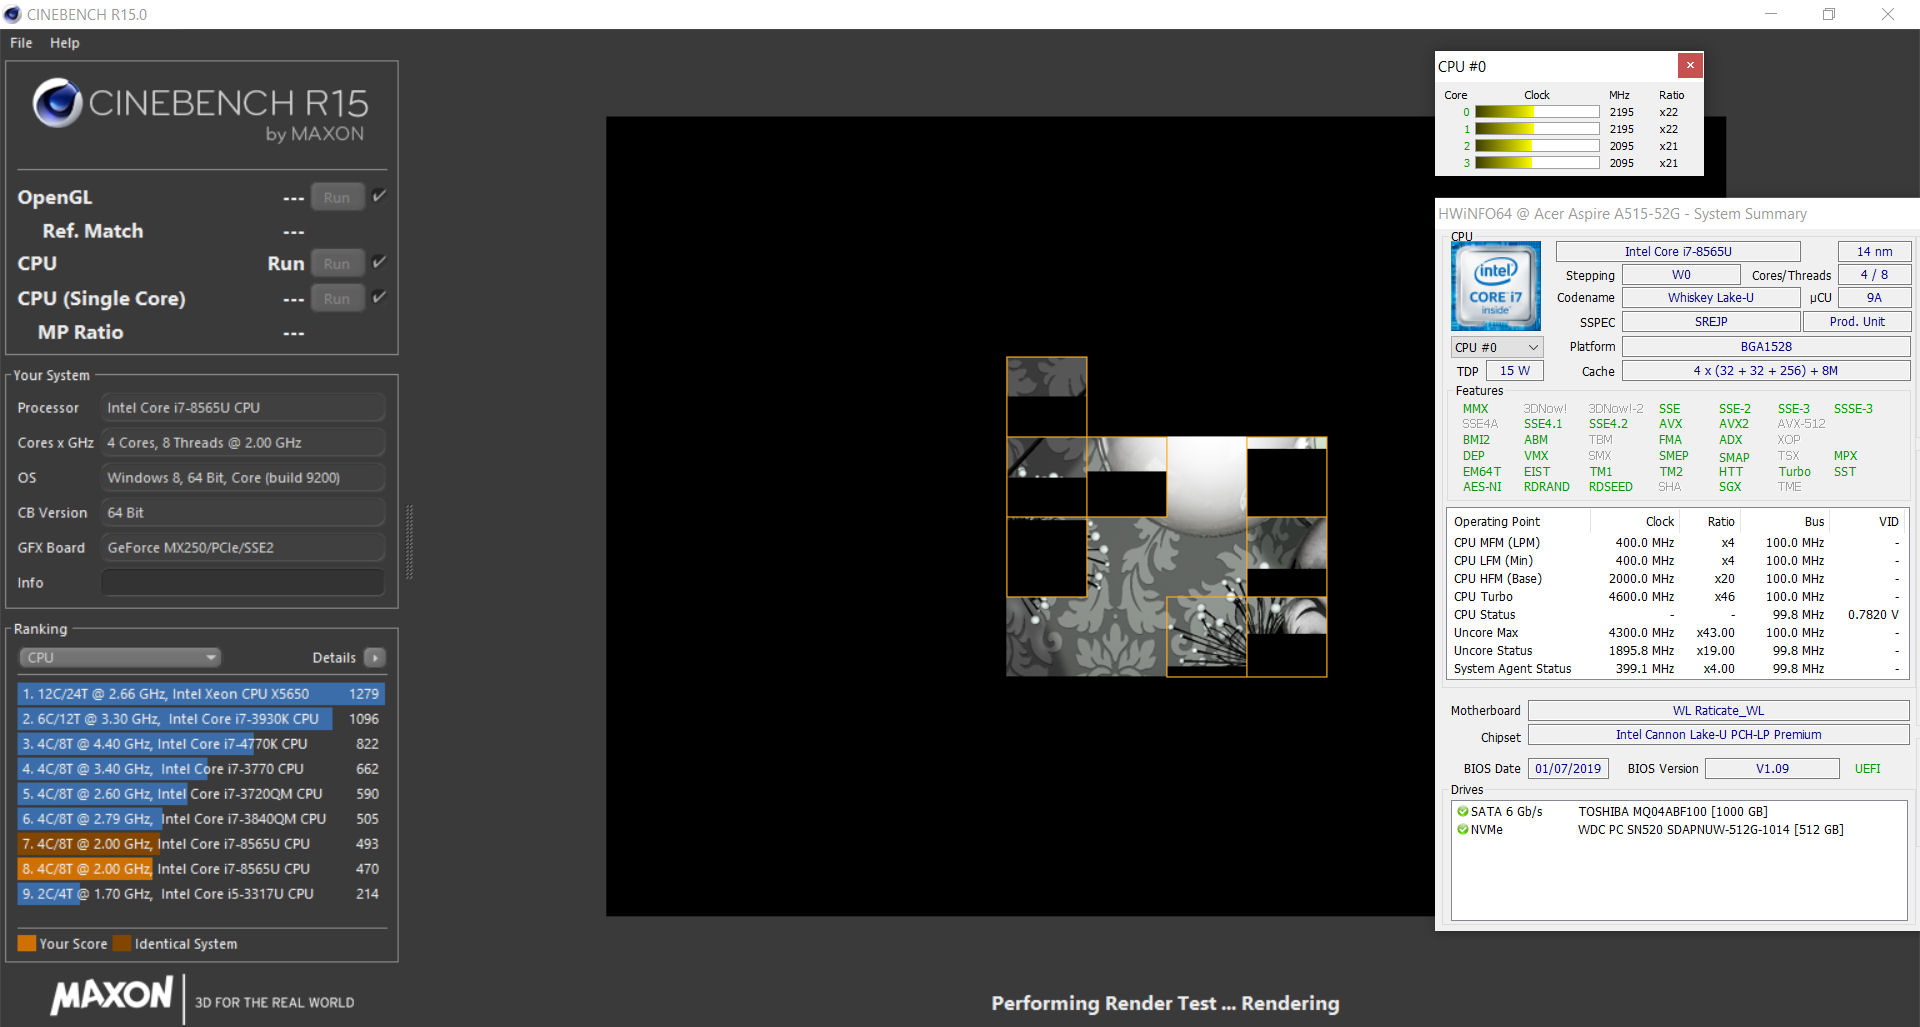
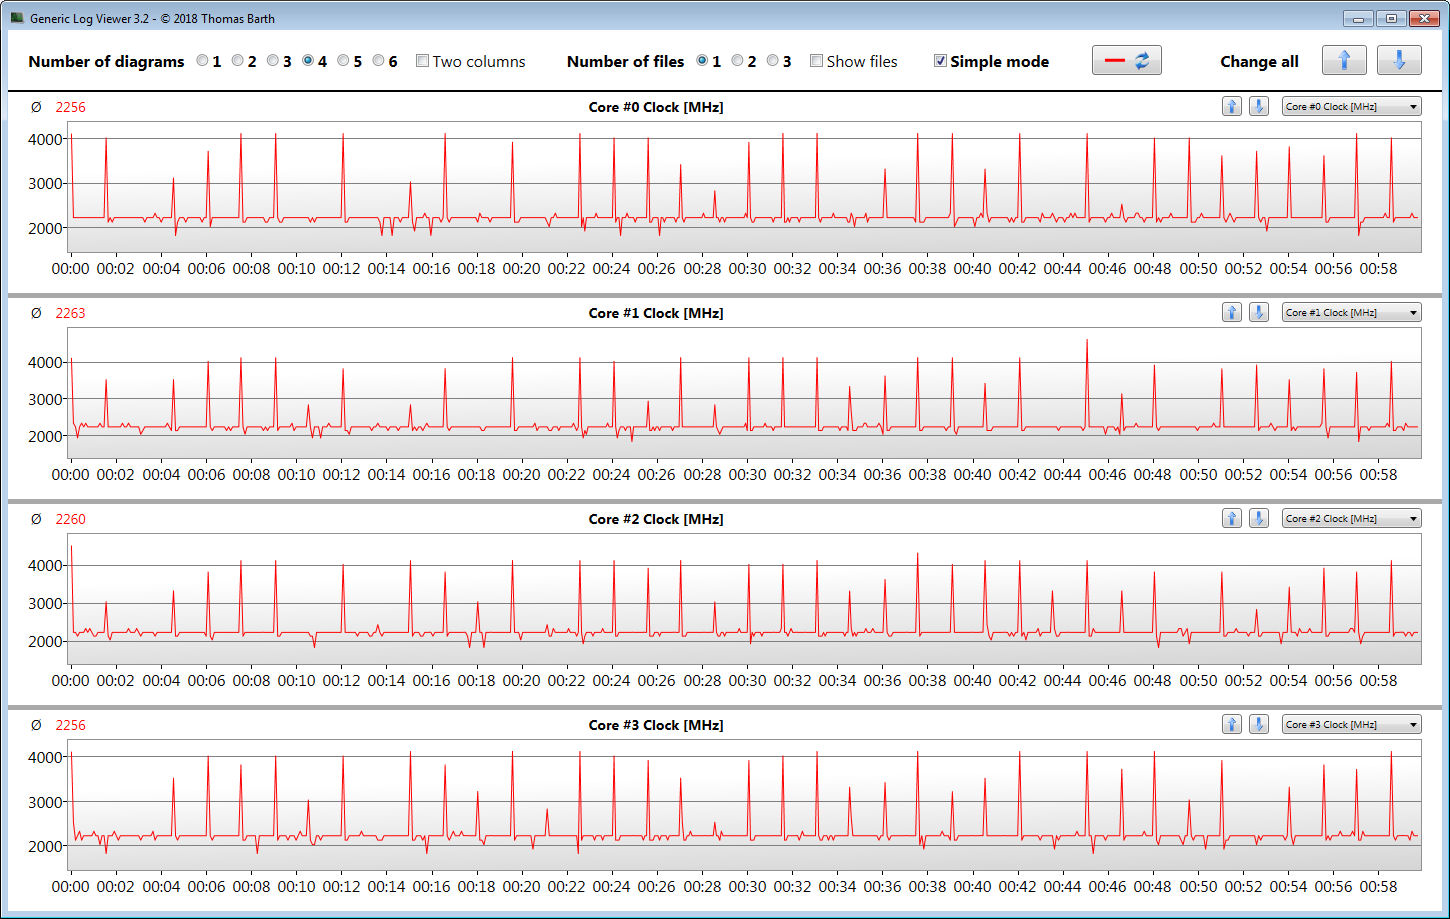
We checked whether Turbo would also be under prolonged load when plugged in by running the multi-thread Cinebench R15 test continuously for at least 30 minutes. Results differ a bit between the first and second run and then remain at a constant level. Turbo is used only to a very small extent. Striking: results fall slightly short of those of the sibling model equipped with a Core i5-8265U processor.
| Mozilla Kraken 1.1 - Total | |
| Lenovo Ideapad 330-15IKB-81DC00SWGE (Edge 44) | |
| Lenovo IdeaPad 720-15IKB | |
| HP Pavilion 15-cw0003ng | |
| Asus TUF FX505DY (Edge 44.17763.1.0) | |
| Acer Aspire 5 A515-52G-53PU (Edge 42) | |
| Asus VivoBook S15 S530UN-BQ097T (Edge) | |
| Acer Aspire 5 A515-52G-723L (Edge 44) | |
| Average Intel Core i7-8565U (730 - 2622, n=43) | |
| HP Pavilion 15-cs0003ng | |
| Average of class Multimedia (228 - 835, n=74, last 2 years) | |
| Octane V2 - Total Score | |
| Average of class Multimedia (64079 - 153175, n=35, last 2 years) | |
| Average Intel Core i7-8565U (13935 - 49795, n=42) | |
| Acer Aspire 5 A515-52G-53PU (Edge 42) | |
| Asus VivoBook S15 S530UN-BQ097T (Edge) | |
| Acer Aspire 5 A515-52G-723L (Edge 44) | |
| HP Pavilion 15-cs0003ng | |
| Asus TUF FX505DY (Edge 44.17763.1.0) | |
| Lenovo IdeaPad 720-15IKB | |
| Lenovo Ideapad 330-15IKB-81DC00SWGE (Edge 44) | |
| Speedometer 2.0 - Result 2.0 | |
| Average of class Multimedia (337 - 946, n=35, last 2 years) | |
| Acer Aspire 5 A515-52G-723L (Edge 44) | |
| Average Intel Core i7-8565U (55.5 - 62.5, n=5) | |
| WebXPRT 3 - Overall | |
| Average of class Multimedia (136.4 - 596, n=70, last 2 years) | |
| Acer Aspire 5 A515-52G-723L (Edge 44) | |
| Average Intel Core i7-8565U (176 - 239, n=5) | |
* ... smaller is better
System Performance
The very good results observed in the PCMark benchmarks confirm that the laptop has enough computing power for all common applications. The dedicated graphics unit enables the use of computer games. The combination of a solid state drive, a quad-core processor and dual-channel RAM results in a fast and smooth system. We did not find any issues.
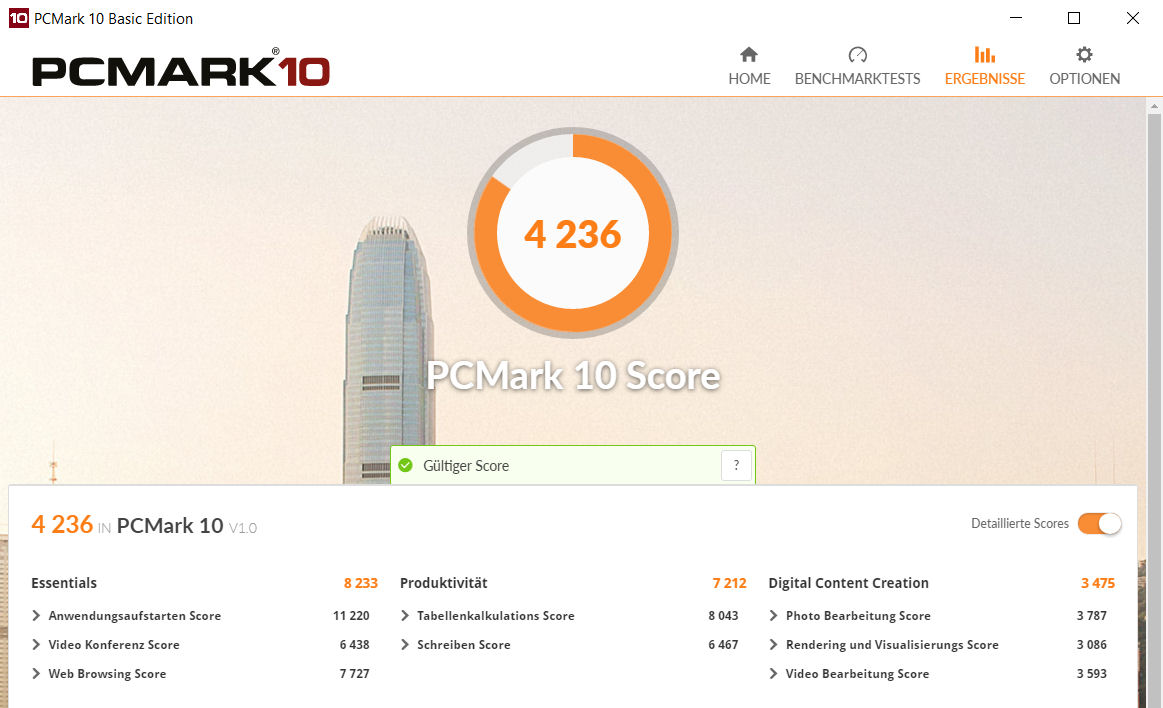
| PCMark 7 Score | 5914 points | |
| PCMark 8 Home Score Accelerated v2 | 4220 points | |
| PCMark 8 Creative Score Accelerated v2 | 5352 points | |
| PCMark 8 Work Score Accelerated v2 | 5272 points | |
| PCMark 10 Score | 4236 points | |
Help | ||
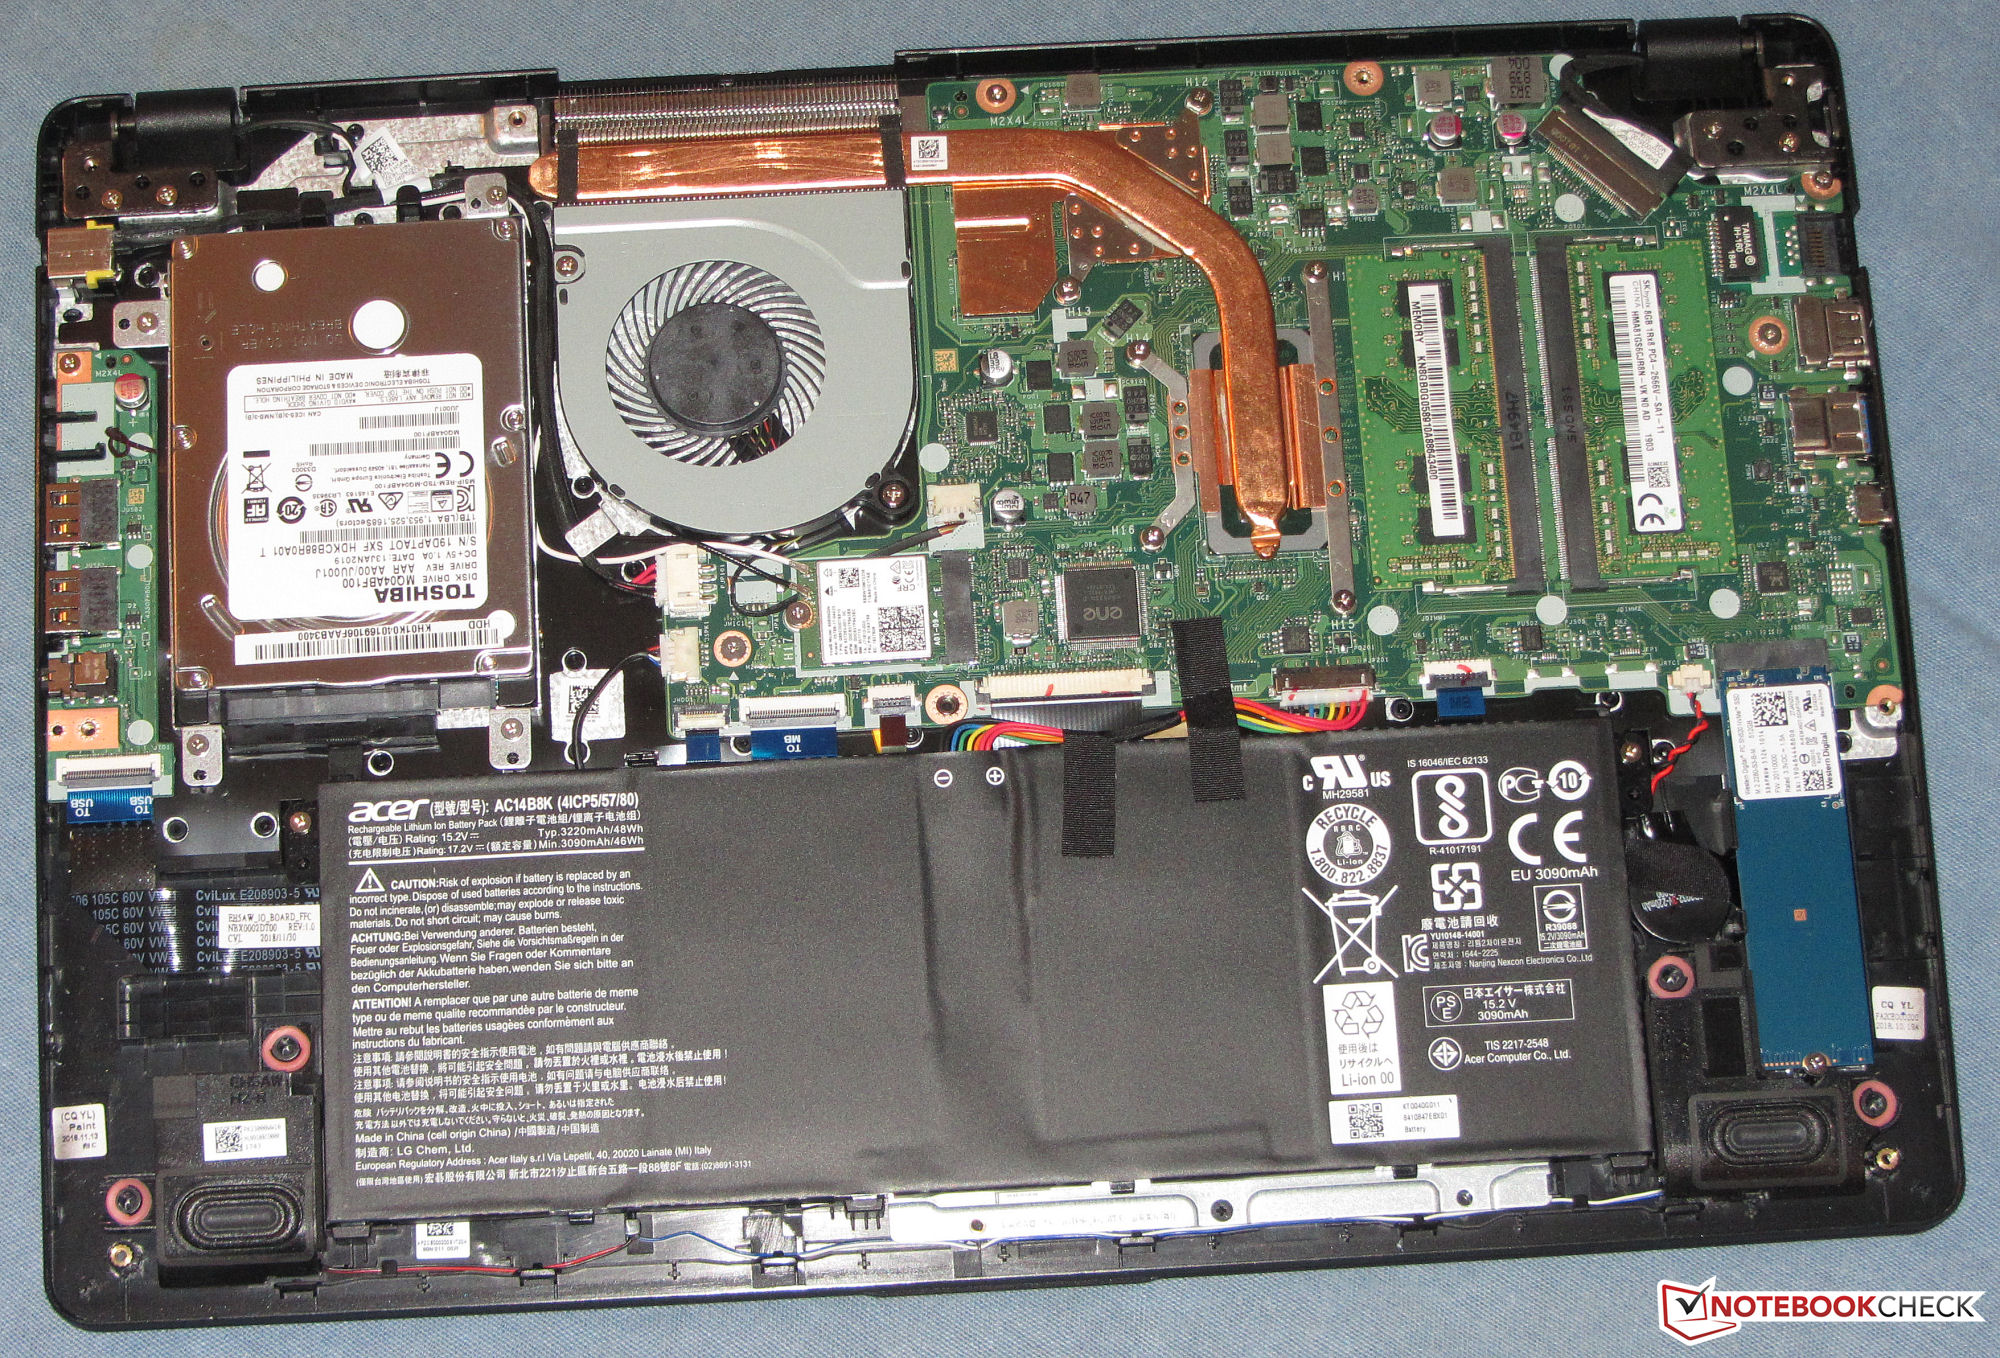
Storage
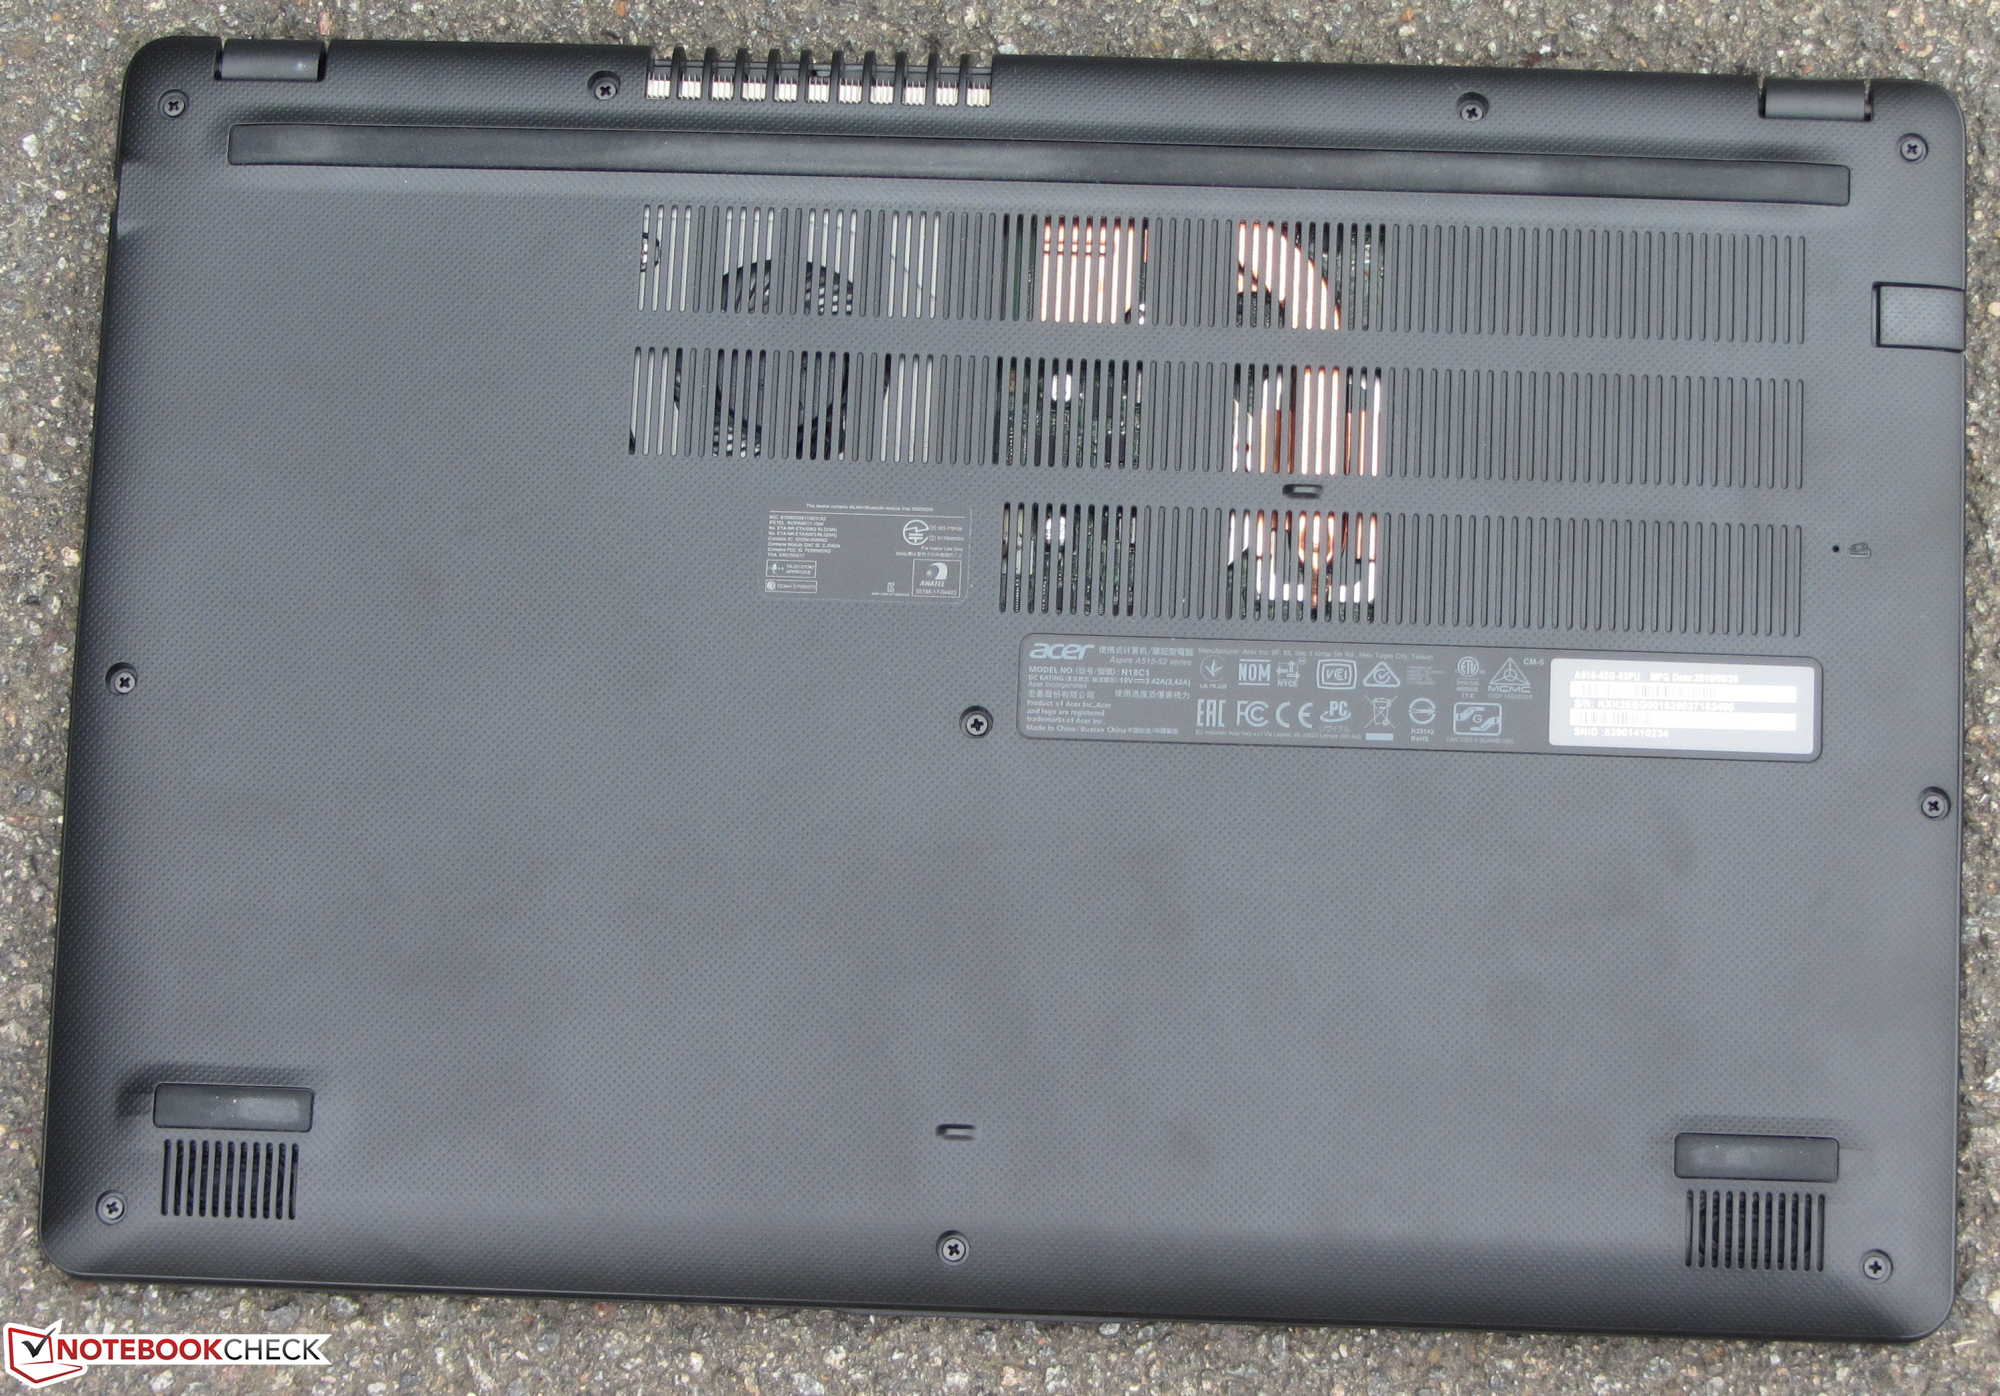
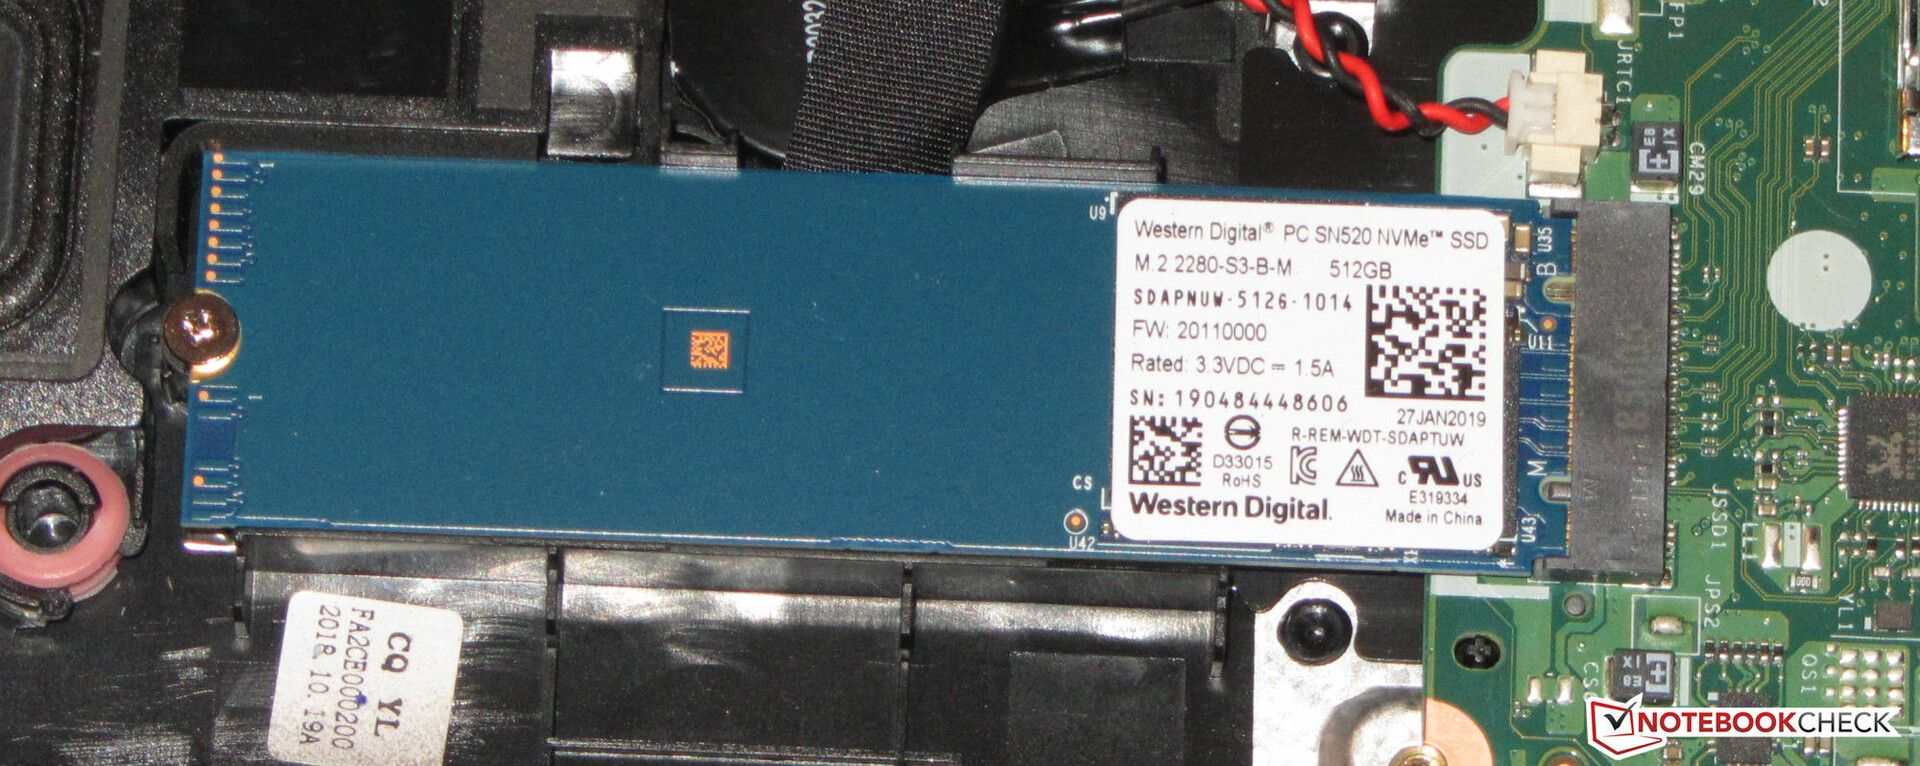
The system drive is an NVMe SSD from Western Digital. This M.2 2280 model has a capacity of 512 GB. Out of the box, around 439 GB is usable. The remaining space is split between the Windows installation and the recovery partition. Transfer speeds are very good, but this particular model is not the best-in-class when it comes to NVMe SSDs however.
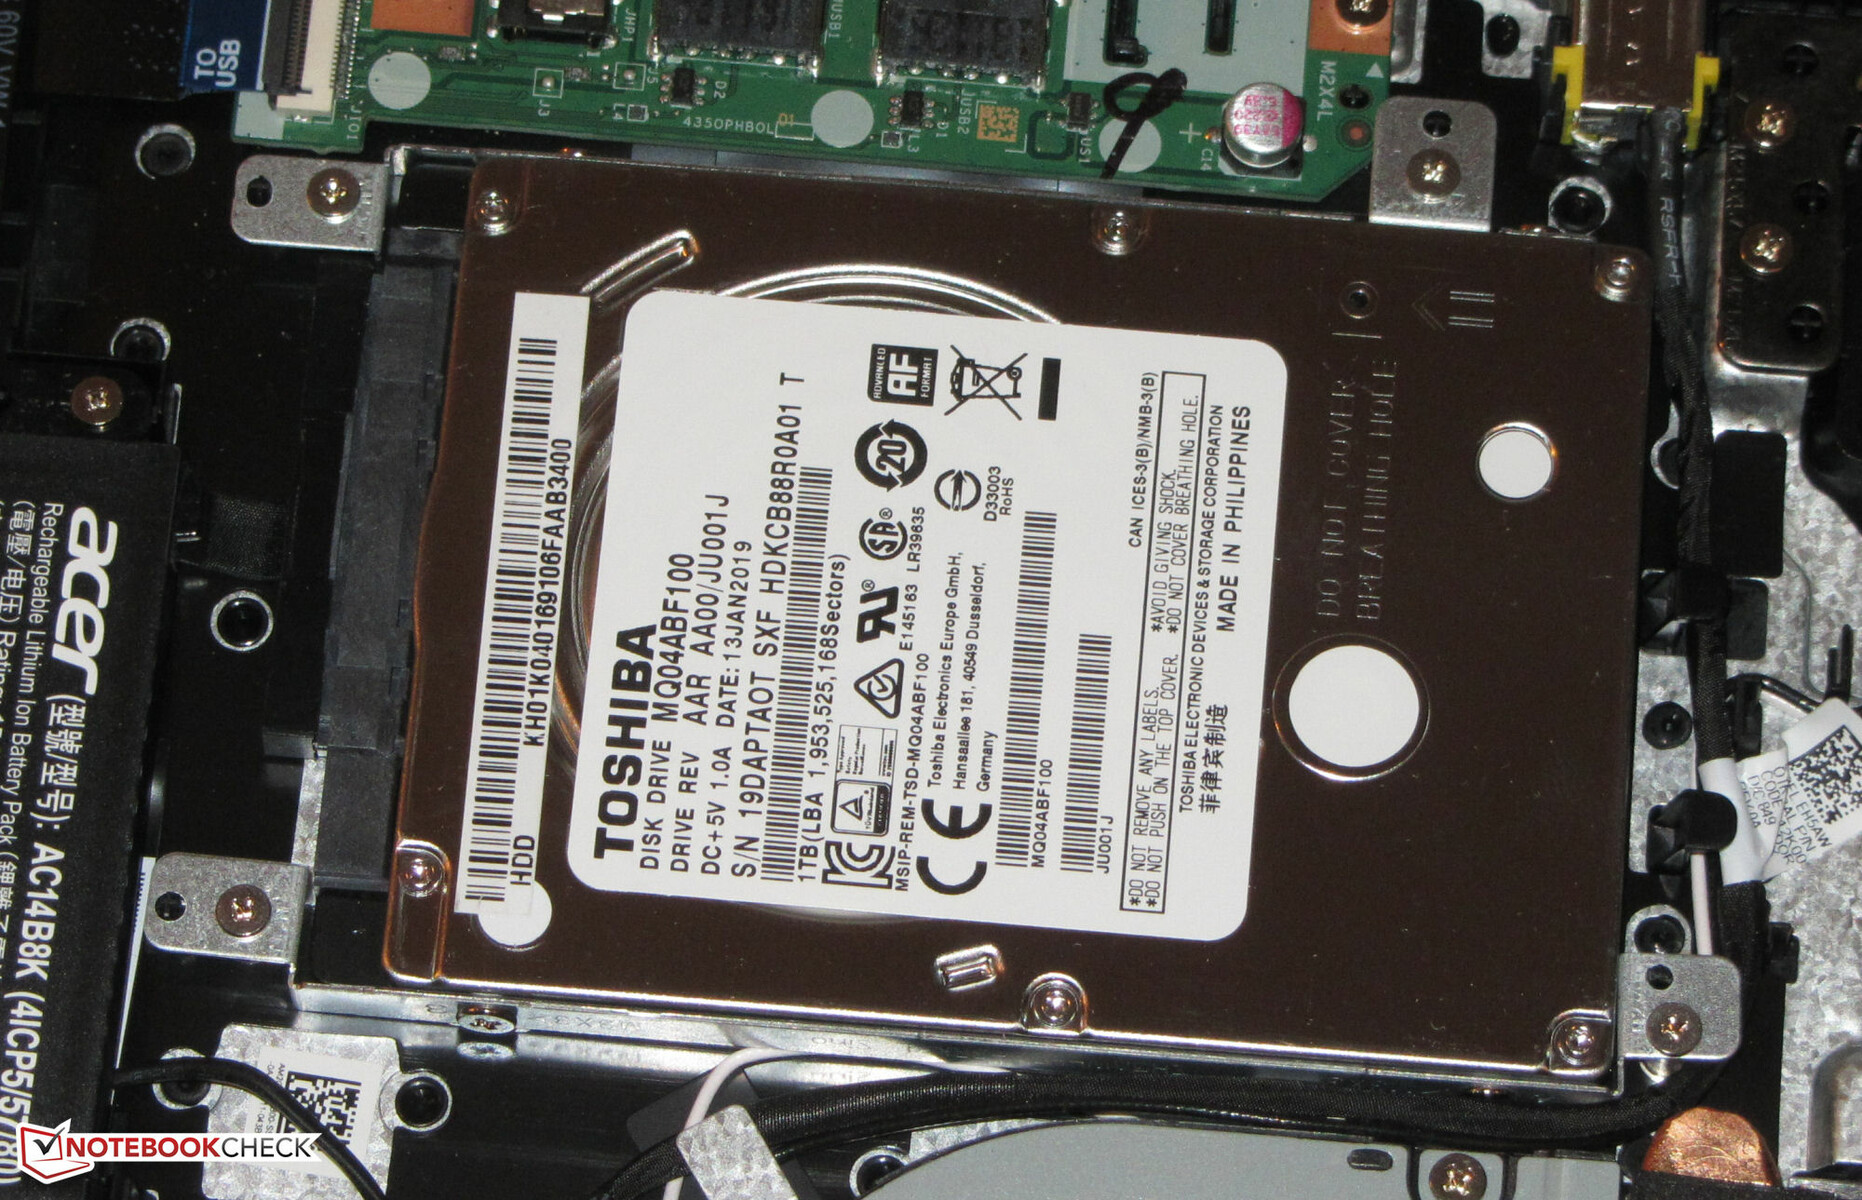
Alongside the SSD, a 2.5-inch hard-disk drive is also to be found inside the device. This one spins at 5400 revolutions per minute and offers 1 TB of storage space.

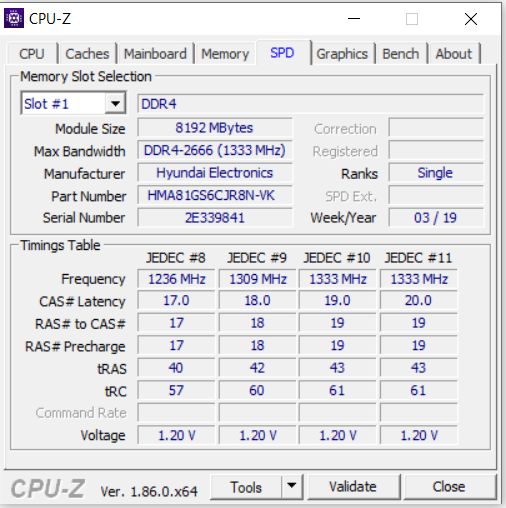
| Acer Aspire 5 A515-52G-723L WDC PC SN520 SDAPNUW-512G | Asus VivoBook S15 S530UN-BQ097T SanDisk SD9SN8W256G1027 | Lenovo IdeaPad 720-15IKB Samsung PM961 MZVLW256HEHP | HP Pavilion 15-cs0003ng SK Hynix SC313 HFS256G39TNF | Acer Aspire 5 A515-52G-53PU Micron 1100 MTFDDAV256TBN | Average WDC PC SN520 SDAPNUW-512G | |
|---|---|---|---|---|---|---|
| AS SSD | -221% | -6% | -67% | -72% | -3% | |
| Seq Read (MB/s) | 1557 | 504 -68% | 1806 16% | 522 -66% | 490.6 -68% | 1363 ? -12% |
| Seq Write (MB/s) | 1237 | 202.7 -84% | 1226 -1% | 476.1 -62% | 390.2 -68% | 1227 ? -1% |
| 4K Read (MB/s) | 42.56 | 27.67 -35% | 51.4 21% | 30.14 -29% | 19.47 -54% | 40.8 ? -4% |
| 4K Write (MB/s) | 127.2 | 51.1 -60% | 113.9 -10% | 64.3 -49% | 72.2 -43% | 127.3 ? 0% |
| 4K-64 Read (MB/s) | 1034 | 373.6 -64% | 485.7 -53% | 319.2 -69% | 236.2 -77% | 957 ? -7% |
| 4K-64 Write (MB/s) | 1186 | 173 -85% | 1652 39% | 239.8 -80% | 276.7 -77% | 1081 ? -9% |
| Access Time Read * (ms) | 0.077 | 0.365 -374% | 0.06 22% | 0.131 -70% | 0.07744 ? -1% | |
| Access Time Write * (ms) | 0.028 | 0.603 -2054% | 0.032 -14% | 0.056 -100% | 0.063 -125% | 0.03671 ? -31% |
| Score Read (Points) | 1233 | 452 -63% | 1881 53% | 402 -67% | 305 -75% | 1134 ? -8% |
| Score Write (Points) | 1437 | 244 -83% | 710 -51% | 352 -76% | 388 -73% | 1331 ? -7% |
| Score Total (Points) | 3291 | 921 -72% | 35 -99% | 967 -71% | 850 -74% | 3046 ? -7% |
| Copy ISO MB/s (MB/s) | 1313 | 810 -38% | 1109 -16% | 321.3 -76% | 1169 ? -11% | |
| Copy Program MB/s (MB/s) | 334.6 | 332.5 -1% | 503 50% | 141.7 -58% | 446 ? 33% | |
| Copy Game MB/s (MB/s) | 684 | 557 -19% | 392.6 -43% | 239.4 -65% | 874 ? 28% |
* ... smaller is better
Graphics card
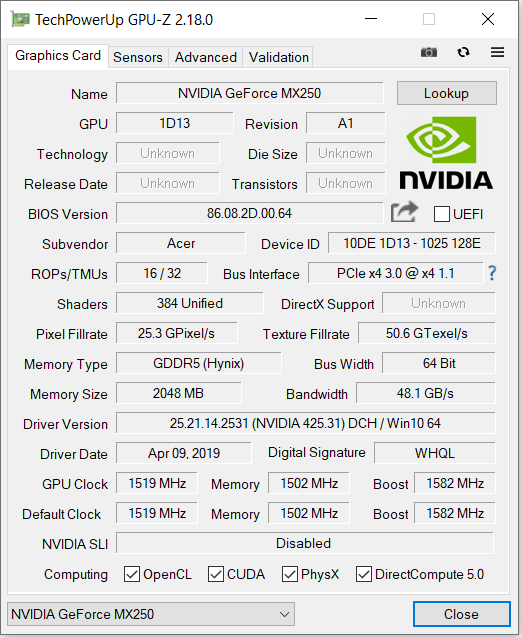
The Aspire has a dedicated GeForce MX250 graphics unit on board. This is Nvidia's current mid-range model, the successor to the GeForce MX150 GPU. The GPU supports DirectX 12 and reaches speeds up to 1582 MHz. The graphics card also features 2048 MB of GDDR5 memory.
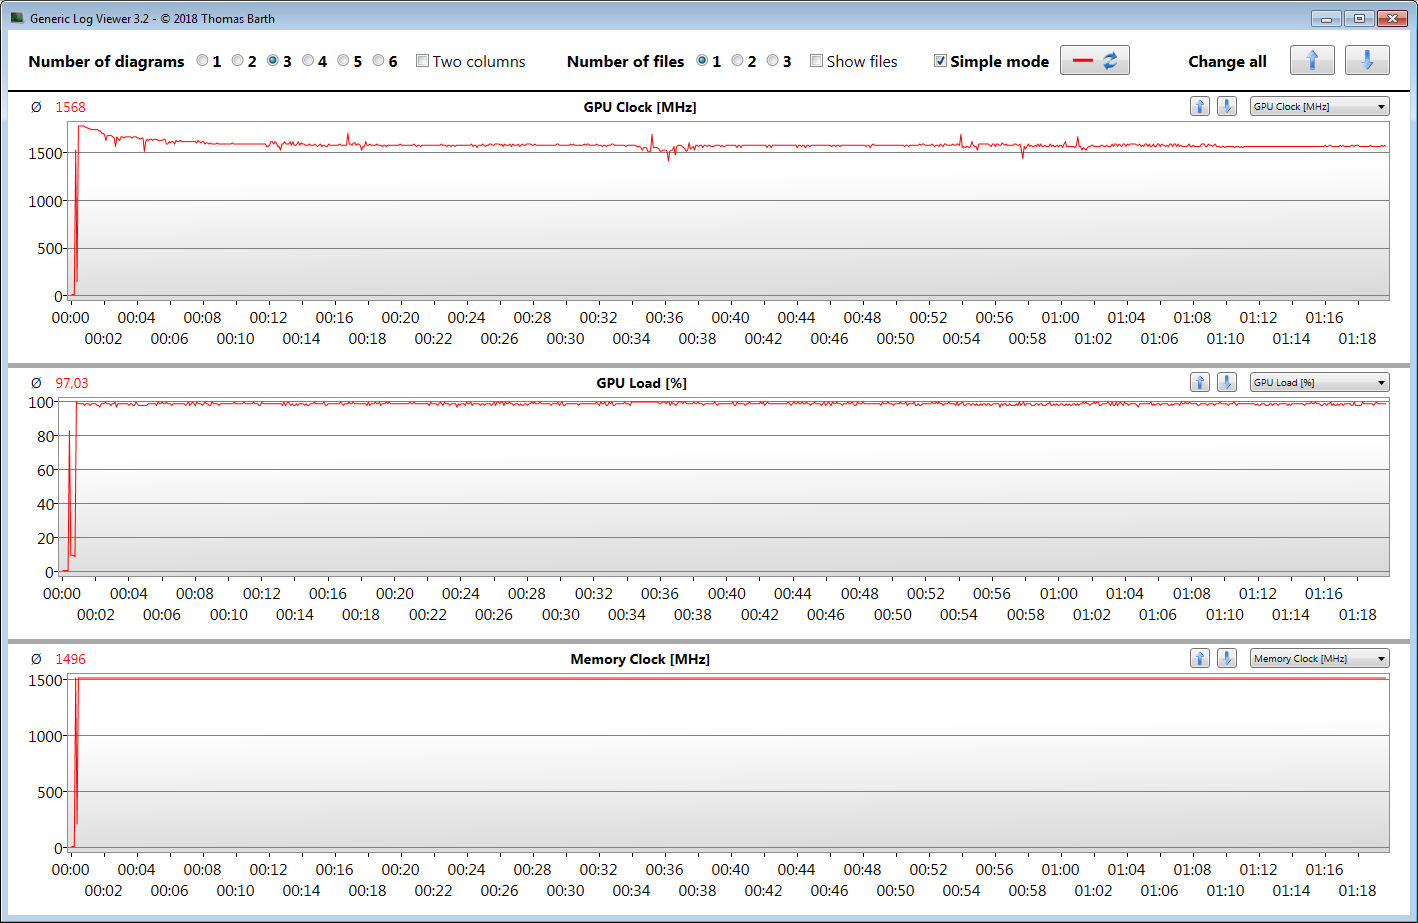
There are not any big differences between the MX150 and the MX250, since they are both based on the same Pascal chip (GP108). However, Nvidia has slightly increased the clock speeds on the MX250. When comparing the 3DMark results obtained by the previously reviewed MX150 Aspire model with the ones from our current review device, it becomes evident that the higher clock speeds lead, at best, to a minimal and irrelevant improvement. A further increase in performance could be achieved by Nvidia's planned ability to increase memory speed to 3.5 GHz. Acer refrains from doing so here. The memory speed remains at 3 GHz.
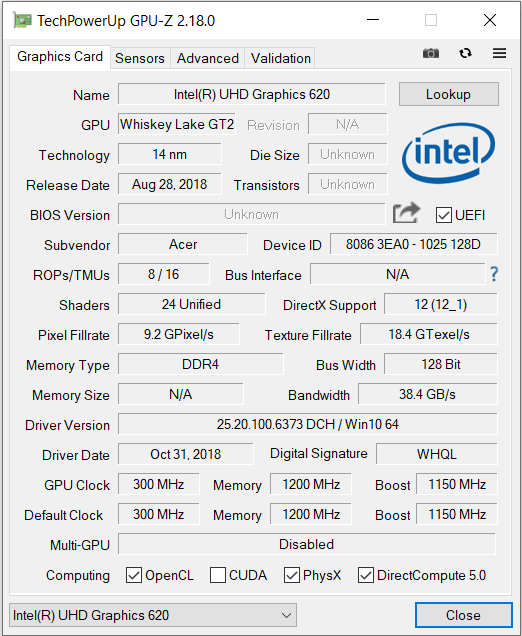
Intel's integrated UHD Graphics 620 GPU is also found in the device, alongside the GeForce graphics unit. The GPUs provide the ability to switch graphics (Optimus). Intel's unit is used for everyday tasks and on battery power, while Nvidia's GPU takes care of tasks that are more graphically demanding. Switching happens automatically so that users do not have to worry about anything in this regard.
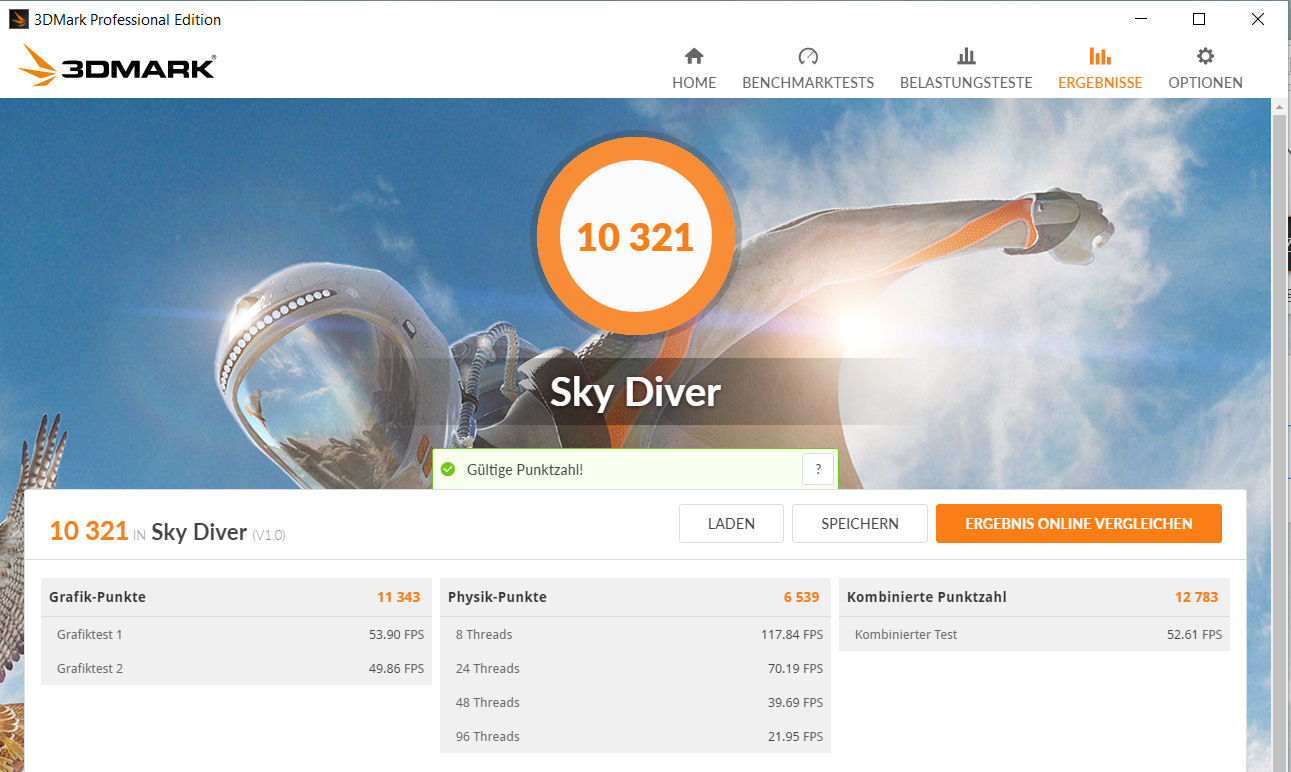
| 3DMark 03 Standard | 56769 points | |
| 3DMark Vantage P Result | 16840 points | |
| 3DMark 11 Performance | 4769 points | |
| 3DMark Ice Storm Standard Score | 73366 points | |
| 3DMark Cloud Gate Standard Score | 12476 points | |
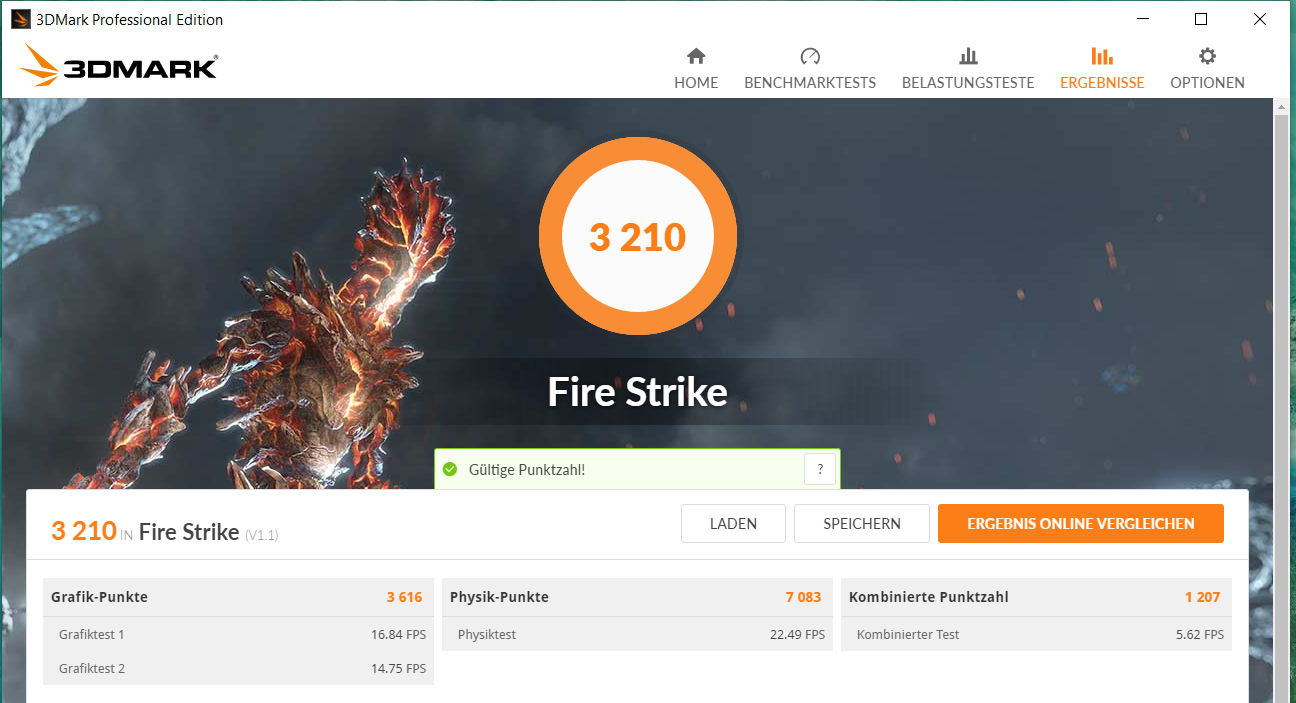
| 3DMark Fire Strike Score | 3210 points | |
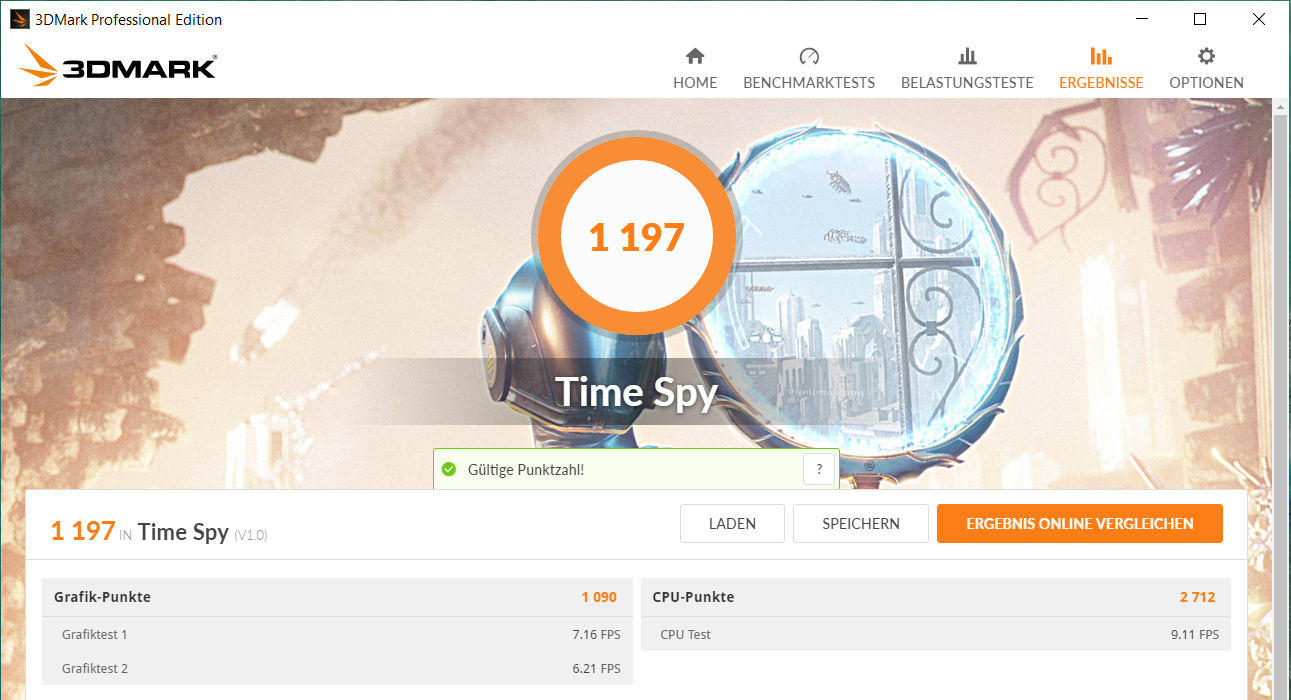
| 3DMark Time Spy Score | 1197 points | |
Help | ||
| GFXBench 3.1 | |
| 1920x1080 Manhattan ES 3.1 Offscreen | |
| Average of class Multimedia (289 - 1647, n=8, last 2 years) | |
| Acer Aspire 5 A515-51G-51RL | |
| Acer Aspire 5 A515-52G-723L | |
| Average NVIDIA GeForce MX250 (101 - 109.6, n=2) | |
| Lenovo Ideapad 330-15IKB-81DC00SWGE | |
| on screen Manhattan ES 3.1 Onscreen | |
| Average of class Multimedia (60 - 151.6, n=8, last 2 years) | |
| Acer Aspire 5 A515-51G-51RL | |
| Acer Aspire 5 A515-52G-723L | |
| Average NVIDIA GeForce MX250 (60 - 82.2, n=2) | |
| Lenovo Ideapad 330-15IKB-81DC00SWGE | |
| Unigine Heaven 2.1 - 1280x1024 high, Tesselation (normal), DirectX11 AA:off AF:1x | |
| Acer Aspire 5 A515-52G-723L | |
| Average NVIDIA GeForce MX250 (n=1) | |
| Acer Aspire 5 A515-51G-51RL | |
| Lenovo Ideapad 330-15IKB-81DC00SWGE | |
Gaming Performance
The hardware in the Aspire A515 runs almost all games found in our data base smoothly. Most titles reach satisfactory frame rates at HD resolution (1366x768 pixels) and medium quality settings. Games that only have moderate hardware requirements run better. A lot of hit games from 2018 and 2019 often allow reducing the resolution and/or quality level in order to get adequate frame rates. However, "Metro Exodus" and "Anthem" are barely playable or not playable at all.
Unsurprisingly, compared to the MX150 Aspire, our current review device does not manage to stand out. Frame rates are normally on par between the two laptops. In some cases, the MX250 Aspire reaches slightly higher frame rates.
| low | med. | high | ultra | |
|---|---|---|---|---|
| BioShock Infinite (2013) | 180.2 | 107 | 94 | 34.8 |
| GTA V (2015) | 110.4 | 100.9 | 41.5 | 7.9 |
| The Witcher 3 (2015) | 63.5 | 37.9 | 20.4 | 11.4 |
| Dota 2 Reborn (2015) | 89.2 | 79.5 | 66.4 | 52.9 |
| World of Warships (2015) | 136.4 | 110.9 | 72.9 | 47.9 |
| Rainbow Six Siege (2015) | 123.1 | 90.3 | 50.2 | 31.9 |
| Ashes of the Singularity (2016) | 34.6 | 16.1 | 5.7 | |
| Overwatch (2016) | 166.4 | 112.2 | 49.5 | 30.4 |
| For Honor (2017) | 82.6 | 28.8 | 26.9 | 21 |
| Ghost Recon Wildlands (2017) | 50.1 | 21.2 | 18.3 | 4.5 |
| Rocket League (2017) | 175.4 | 77 | 52.1 | |
| Destiny 2 (2017) | 62.5 | 32.2 | 30.3 | 25.1 |
| Final Fantasy XV Benchmark (2018) | 36.7 | 16.6 | 9.9 | |
| X-Plane 11.11 (2018) | 56.6 | 48.3 | 43 | |
| Far Cry 5 (2018) | 45 | 20 | 17 | 16 |
| Monster Hunter World (2018) | 51.1 | 17.5 | 17.3 | 13 |
| F1 2018 (2018) | 65 | 33 | 26 | 15 |
| Shadow of the Tomb Raider (2018) | 46 | 18 | 15 | 10 |
| Assassin´s Creed Odyssey (2018) | 41 | 18 | 14 | 7 |
| Call of Duty Black Ops 4 (2018) | 54.6 | 20.9 | 18 | 16.4 |
| Hitman 2 (2018) | 34.7 | 17.3 | 15.8 | 13 |
| Battlefield V (2018) | 59.9 | 27.7 | 22.7 | 18.5 |
| Darksiders III (2018) | 95.7 | 27.9 | 21.7 | 18.6 |
| Just Cause 4 (2018) | 40.7 | 25.3 | 18.4 | 15.9 |
| Apex Legends (2019) | 57 | 24.4 | 19.7 | 17.8 |
| Far Cry New Dawn (2019) | 43 | 21 | 18 | 17 |
| Metro Exodus (2019) | 27.8 | 7.3 | 6.8 | 5.3 |
| Anthem (2019) | 34.5 | 16.9 | 14.7 | 13.1 |
| Dirt Rally 2.0 (2019) | 89.7 | 29.2 | 20.8 | 11.1 |
| The Division 2 (2019) | 46 | 19 | 12 | 9 |
| Assassin´s Creed Odyssey - 1280x720 Low Preset | |
| Acer Aspire 5 A515-52G-53PU | |
| Acer Aspire 5 A515-52G-723L | |
| Average NVIDIA GeForce MX250 (40 - 41, n=2) | |
| Acer Nitro 5 AN515-42-R6V0 | |
| Lenovo Ideapad 330-15IKB-81DC00SWGE | |
In order to verify that frame rates also remained largely constant over longer periods of time, we let the game "The Witcher 3" run for about 60 minutes at HD resolution (1366x768 pixels) and at medium quality settings. The character was not moved during the entire time. There were no frame rate drops to be found.
Emissions - At a normal level
Noise emissions
The A515-52G never gets too loud, even under load. The fan normally remains quiet during idle usage and under light load. Silence reigns - except for when the 2.5-inch hard drive is accessed. The fan turns up under load. Sound pressure levels increased up to 41.7 dB(A) during the stress test. The Aspire does not produce any other noises.
Noise level
| Idle |
| 29.9 / 29.9 / 29.9 dB(A) |
| HDD |
| 31 dB(A) |
| Load |
| 41.7 / 41.7 dB(A) |
 | ||
30 dB silent 40 dB(A) audible 50 dB(A) loud |
||
min: | ||
| Acer Aspire 5 A515-52G-723L i7-8565U, GeForce MX250 | Acer Aspire 5 A515-52G-53PU i5-8265U, GeForce MX150 | Asus VivoBook S15 S530UN-BQ097T i5-8550U, GeForce MX150 | Lenovo IdeaPad 720-15IKB i5-7200U, Radeon RX 560 (Laptop) | HP Pavilion 15-cs0003ng i5-8250U, GeForce MX130 | Lenovo Ideapad 330-15IKB-81DC00SWGE i5-7200U, Radeon 530 | HP Pavilion 15-cw0003ng R5 2500U, Vega 8 | Average NVIDIA GeForce MX250 | Average of class Multimedia | |
|---|---|---|---|---|---|---|---|---|---|
| Noise | -1% | 6% | 1% | -4% | 2% | 3% | 3% | 11% | |
| off / environment * (dB) | 29.9 | 30.5 -2% | 29 3% | 30.3 -1% | 30.6 -2% | 30.5 -2% | 30.5 -2% | 28.7 ? 4% | 24.2 ? 19% |
| Idle Minimum * (dB) | 29.9 | 30.5 -2% | 29 3% | 30.3 -1% | 30.6 -2% | 30.5 -2% | 31.4 -5% | 29 ? 3% | 24.4 ? 18% |
| Idle Average * (dB) | 29.9 | 30.5 -2% | 29 3% | 30.3 -1% | 30.6 -2% | 30.5 -2% | 31.4 -5% | 29.3 ? 2% | 24.8 ? 17% |
| Idle Maximum * (dB) | 29.9 | 30.9 -3% | 30.2 -1% | 30.3 -1% | 32.1 -7% | 31.2 -4% | 31.6 -6% | 30.2 ? -1% | 26.5 ? 11% |
| Load Average * (dB) | 41.7 | 41.2 1% | 36.2 13% | 39.2 6% | 43.2 -4% | 35.4 15% | 33.5 20% | 38.3 ? 8% | 37.6 ? 10% |
| Load Maximum * (dB) | 41.7 | 41.9 -0% | 36.2 13% | 39.2 6% | 43.4 -4% | 38.7 7% | 35.9 14% | 41 ? 2% | 45.9 ? -10% |
| Witcher 3 ultra * (dB) | 36.2 | 41.6 |
* ... smaller is better
Temperature
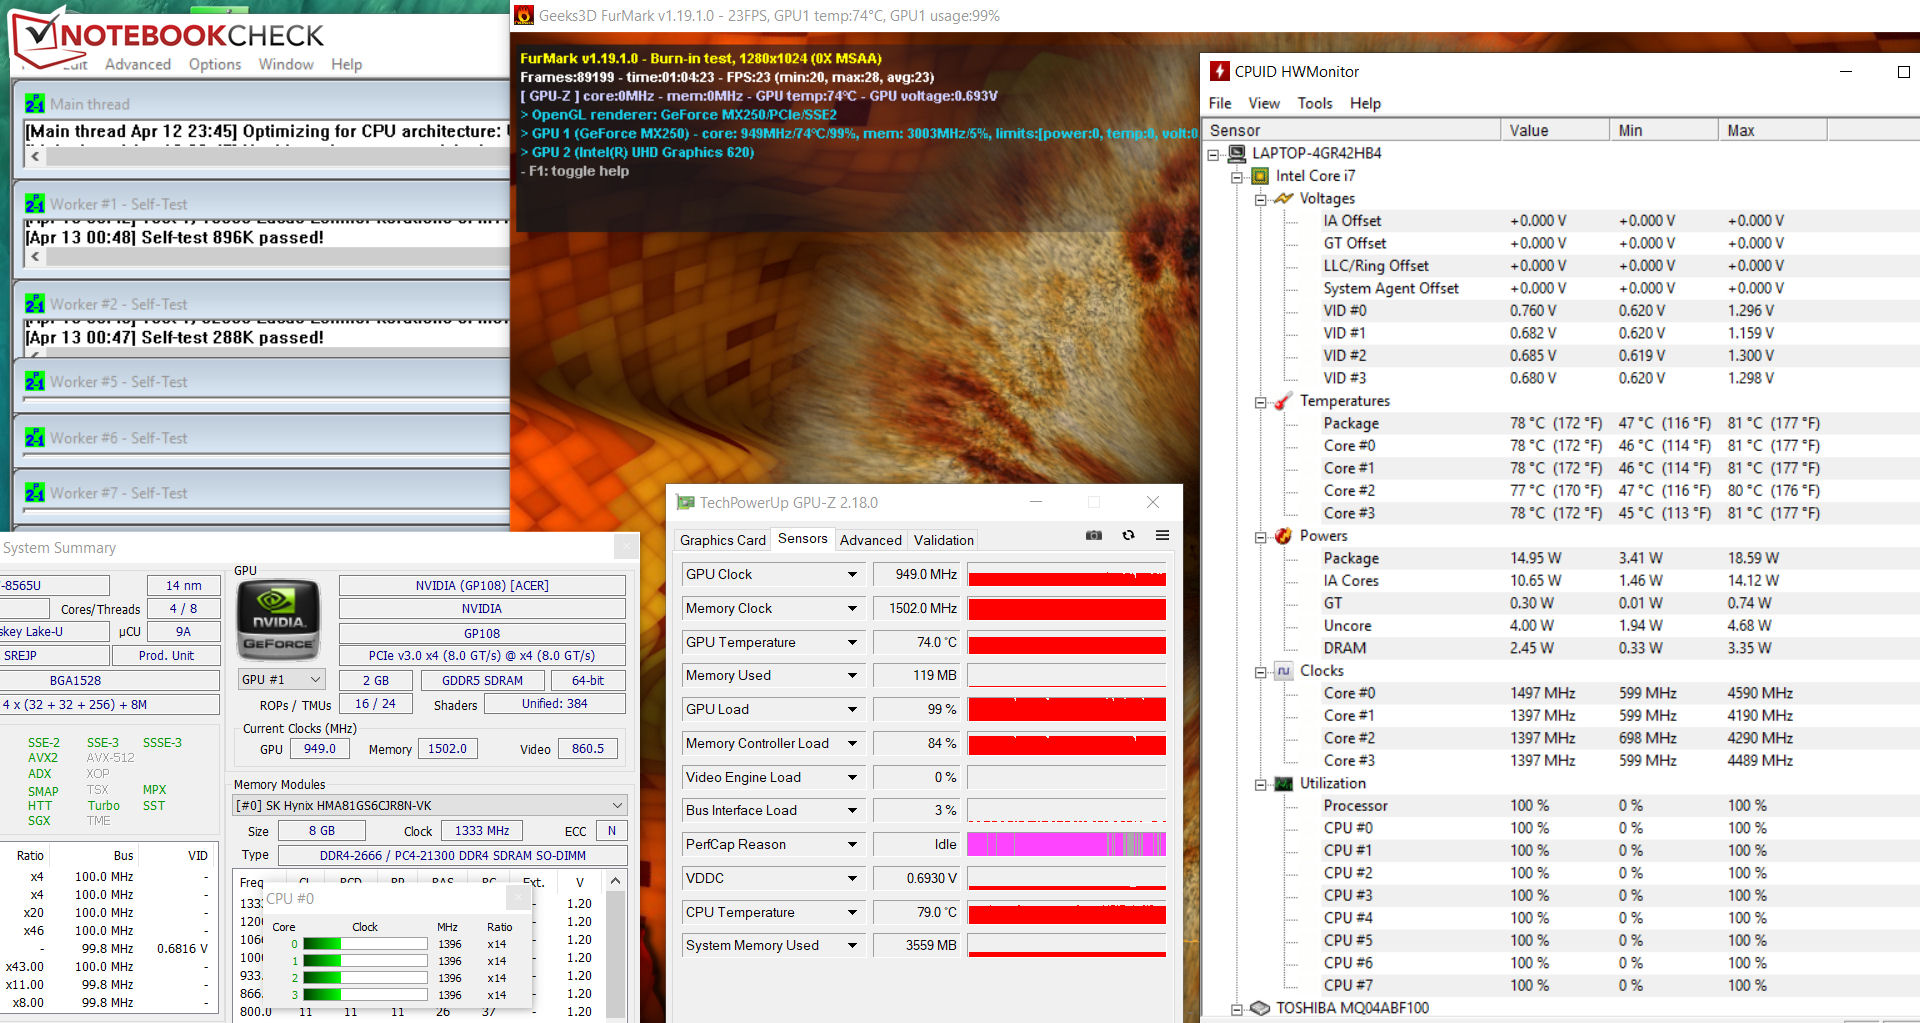
Our stress test (Prime95 and FurMark run for an hour at least) are carried out by the Aspire in the same way on battery power as well as plugged in. The processor runs at 1.8 GHz in the beginning of the test. The clock speed then drops to 1.3 GHz. In the remaining part of the test the CPU speed keeps increasing slightly, up to 1.6 GHz. The graphics unit begins the test with 1230 MHz. Over time, the clock speed drops to 975 MHz.
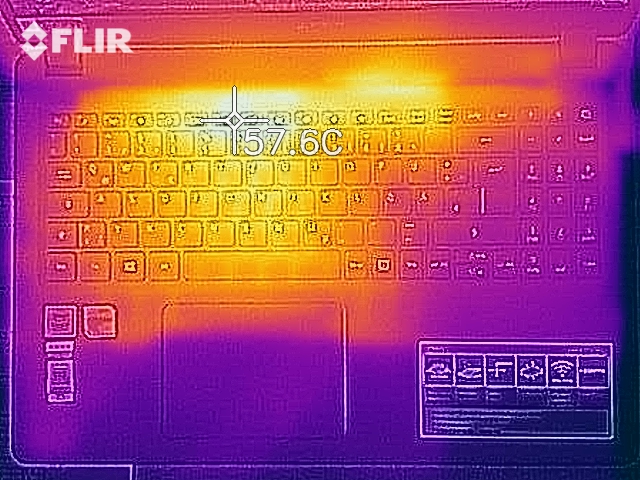
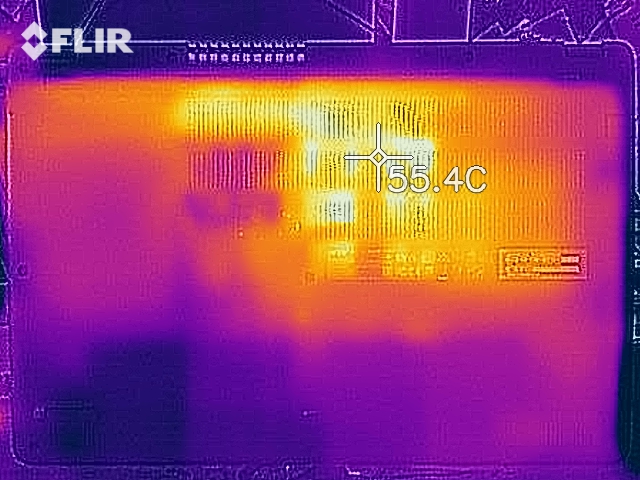
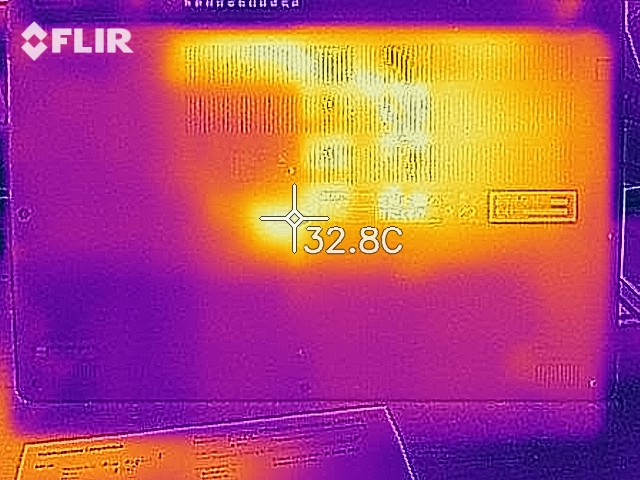
The laptop gets a bit too hot in some areas. Thus we registered temperatures above 50 degrees Celsius (~122 degrees Fahrenheit) around the heat sink area during our stress test. This should not be a cause for concern though. The stress test represents an extreme scenario, which does not occur with everyday use. We use this test to verify that the system also remains stable at full load. The temperatures are fine during everyday use.
(-) The maximum temperature on the upper side is 53.7 °C / 129 F, compared to the average of 36.8 °C / 98 F, ranging from 21 to 71 °C for the class Multimedia.
(-) The bottom heats up to a maximum of 56 °C / 133 F, compared to the average of 39.1 °C / 102 F
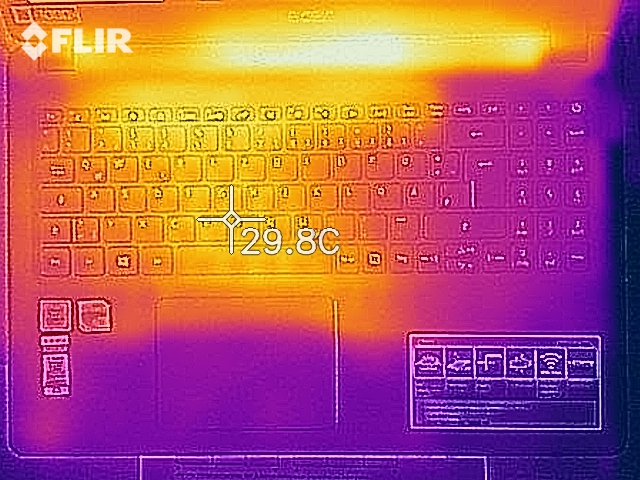
(+) In idle usage, the average temperature for the upper side is 25.9 °C / 79 F, compared to the device average of 31.3 °C / 88 F.
(+) The palmrests and touchpad are cooler than skin temperature with a maximum of 25.4 °C / 77.7 F and are therefore cool to the touch.
(+) The average temperature of the palmrest area of similar devices was 28.7 °C / 83.7 F (+3.3 °C / 6 F).
| Acer Aspire 5 A515-52G-723L i7-8565U, GeForce MX250 | Acer Aspire 5 A515-52G-53PU i5-8265U, GeForce MX150 | Asus VivoBook S15 S530UN-BQ097T i5-8550U, GeForce MX150 | Lenovo IdeaPad 720-15IKB i5-7200U, Radeon RX 560 (Laptop) | HP Pavilion 15-cs0003ng i5-8250U, GeForce MX130 | Lenovo Ideapad 330-15IKB-81DC00SWGE i5-7200U, Radeon 530 | HP Pavilion 15-cw0003ng R5 2500U, Vega 8 | Average NVIDIA GeForce MX250 | Average of class Multimedia | |
|---|---|---|---|---|---|---|---|---|---|
| Heat | 2% | 14% | 25% | 13% | 2% | 25% | 10% | 13% | |
| Maximum Upper Side * (°C) | 53.7 | 52.9 1% | 46.1 14% | 41.2 23% | 48 11% | 46.5 13% | 37.3 31% | 45.3 ? 16% | 41.5 ? 23% |
| Maximum Bottom * (°C) | 56 | 51.5 8% | 50 11% | 36.4 35% | 49 12% | 53.8 4% | 37.3 33% | 48.7 ? 13% | 44.1 ? 21% |
| Idle Upper Side * (°C) | 28.4 | 28.4 -0% | 23.8 16% | 22 23% | 24.4 14% | 30.5 -7% | 23.7 17% | 26.6 ? 6% | 27.1 ? 5% |
| Idle Bottom * (°C) | 28.9 | 29.7 -3% | 24.7 15% | 23.6 18% | 24.6 15% | 30.1 -4% | 23.9 17% | 28.1 ? 3% | 28 ? 3% |
* ... smaller is better
Speakers
Acer Aspire 5 A515-52G-723L audio analysis
(-) | not very loud speakers (65.3 dB)
Bass 100 - 315 Hz
(-) | nearly no bass - on average 25.5% lower than median
(±) | linearity of bass is average (10.3% delta to prev. frequency)
Mids 400 - 2000 Hz
(+) | balanced mids - only 3.4% away from median
(+) | mids are linear (6.9% delta to prev. frequency)
Highs 2 - 16 kHz
(+) | balanced highs - only 2.7% away from median
(+) | highs are linear (3.4% delta to prev. frequency)
Overall 100 - 16.000 Hz
(±) | linearity of overall sound is average (24.2% difference to median)
Compared to same class
» 85% of all tested devices in this class were better, 5% similar, 9% worse
» The best had a delta of 5%, average was 17%, worst was 45%
Compared to all devices tested
» 73% of all tested devices were better, 6% similar, 21% worse
» The best had a delta of 4%, average was 24%, worst was 134%
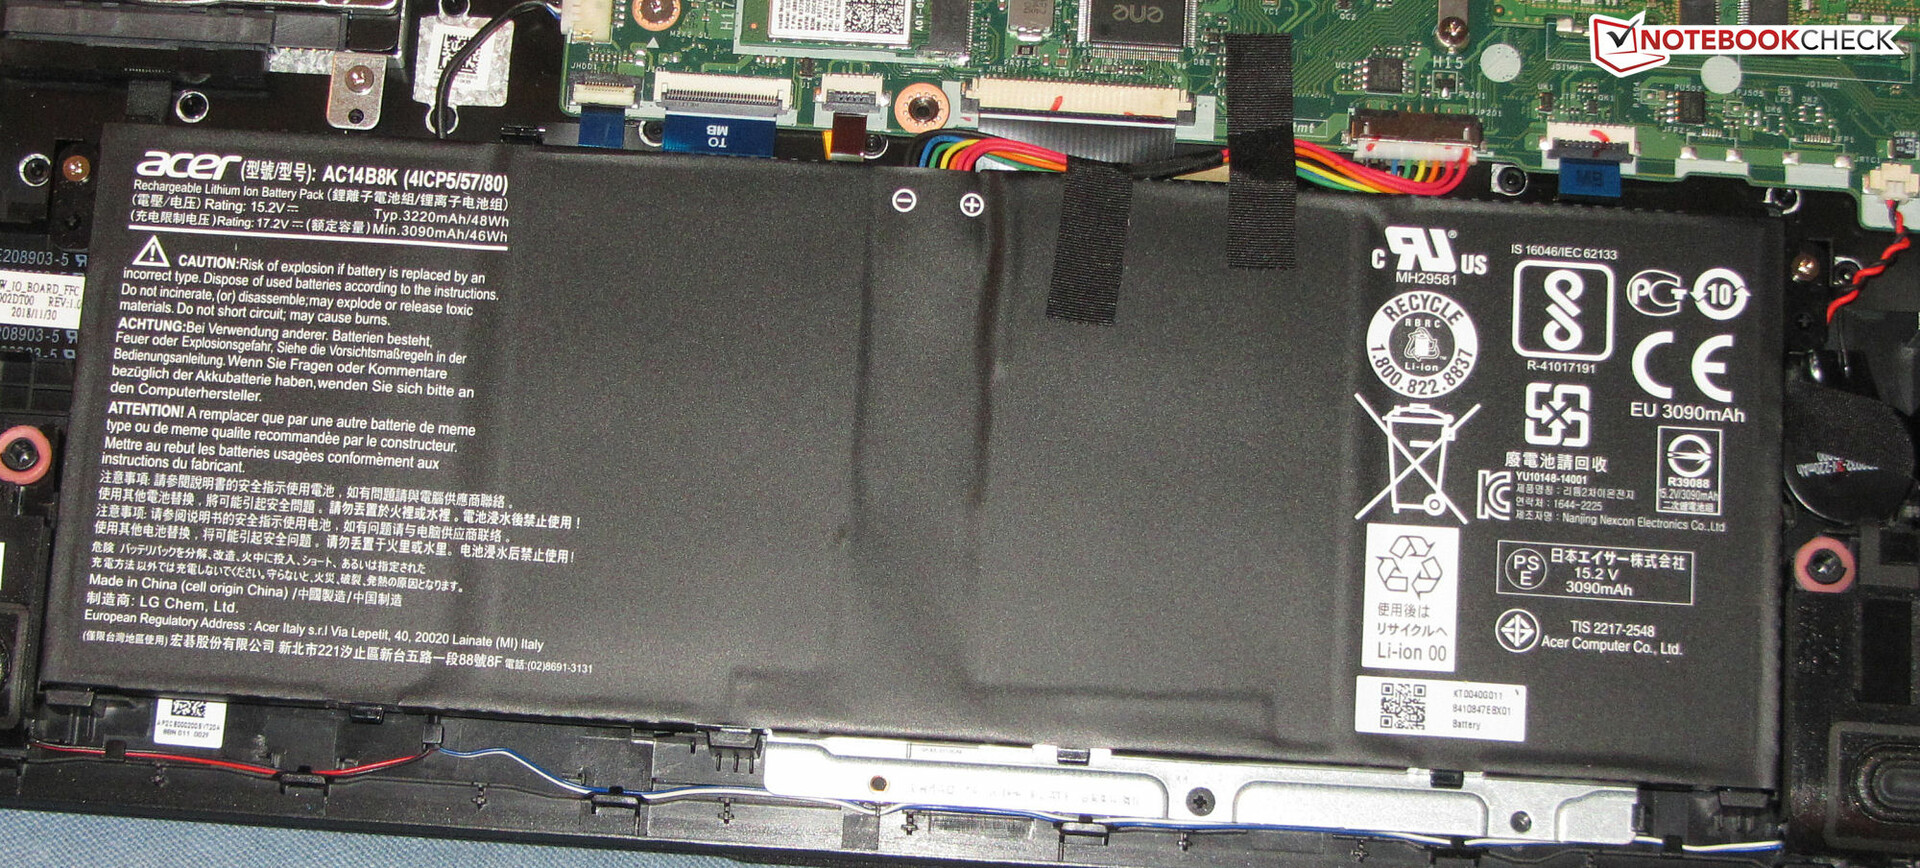
Energy management - Decent battery life
Energy consumption
There are no peculiarities regarding energy requirements. In idle usage we measured a maximum energy consumption of 9.9 watts. This increased up to 63.4 watts during our stress test. This value is normal considering the hardware used. The included power supply has a rated output of 65 watts. Energy consumption is on par with the MX150 sibling model across all different load levels.
| Off / Standby | |
| Idle | |
| Load |
|
Key:
min: | |
| Acer Aspire 5 A515-52G-723L i7-8565U, GeForce MX250 | Acer Aspire 5 A515-52G-53PU i5-8265U, GeForce MX150 | Asus VivoBook S15 S530UN-BQ097T i5-8550U, GeForce MX150 | Lenovo IdeaPad 720-15IKB i5-7200U, Radeon RX 560 (Laptop) | HP Pavilion 15-cs0003ng i5-8250U, GeForce MX130 | Lenovo Ideapad 330-15IKB-81DC00SWGE i5-7200U, Radeon 530 | HP Pavilion 15-cw0003ng R5 2500U, Vega 8 | Average NVIDIA GeForce MX250 | Average of class Multimedia | |
|---|---|---|---|---|---|---|---|---|---|
| Power Consumption | 3% | 10% | -44% | 9% | 19% | 14% | -6% | -39% | |
| Idle Minimum * (Watt) | 4.4 | 3.8 14% | 3.1 30% | 9.9 -125% | 3.3 25% | 3.6 18% | 4.5 -2% | 4.1 ? 7% | 5.71 ? -30% |
| Idle Average * (Watt) | 6.9 | 6.3 9% | 6.3 9% | 9.5 -38% | 6.1 12% | 6.4 7% | 7.3 -6% | 7.91 ? -15% | 10.1 ? -46% |
| Idle Maximum * (Watt) | 9.9 | 9.6 3% | 8.6 13% | 10.7 -8% | 8.3 16% | 7.2 27% | 9.4 5% | 10.4 ? -5% | 12.4 ? -25% |
| Load Average * (Watt) | 55 | 59.5 -8% | 56.4 -3% | 62 -13% | 56 -2% | 39.4 28% | 34 38% | 58.6 ? -7% | 65 ? -18% |
| Load Maximum * (Watt) | 63.4 | 64.4 -2% | 62.7 1% | 86.7 -37% | 67 -6% | 55.3 13% | 41.9 34% | 68.9 ? -9% | 112.2 ? -77% |
| Witcher 3 ultra * (Watt) | 45 | 84 |
* ... smaller is better
Battery life
In our practical Wi-Fi test, Acer's 15.6-incher reached a runtime of 6:54 hours. With this test we simulate the load caused by browsing the web. The "balanced" energy profile is selected and the brightness set to around 150 cd/m². The A515 finishes our video test after 6:28 hours. We test here how long the battery can play videos. To this end we play the short film Big Buck Bunny (H.264-encoded, 1920x1080 pixels) in a loop. The network modules are turned off, energy saving mode is activated and the display brightness is set again to around 150 cd/m². All in all, run times in our review device are a bit behind the ones found on the MX150 Aspire, despite the same battery being used.
| Acer Aspire 5 A515-52G-723L i7-8565U, GeForce MX250, 48 Wh | Acer Aspire 5 A515-52G-53PU i5-8265U, GeForce MX150, 48 Wh | Asus VivoBook S15 S530UN-BQ097T i5-8550U, GeForce MX150, 42 Wh | Lenovo IdeaPad 720-15IKB i5-7200U, Radeon RX 560 (Laptop), 40 Wh | HP Pavilion 15-cs0003ng i5-8250U, GeForce MX130, 41 Wh | Lenovo Ideapad 330-15IKB-81DC00SWGE i5-7200U, Radeon 530, 30 Wh | HP Pavilion 15-cw0003ng R5 2500U, Vega 8, 41 Wh | Average of class Multimedia | |
|---|---|---|---|---|---|---|---|---|
| Battery runtime | 2% | -6% | 3% | -23% | -25% | -25% | 76% | |
| Reader / Idle (h) | 12.9 | 14.1 9% | 16.1 25% | 8.2 -36% | 13.5 5% | 8.4 -35% | 25.2 ? 95% | |
| H.264 (h) | 6.5 | 6.7 3% | 9.2 42% | 5 -23% | 3.8 -42% | 16.4 ? 152% | ||
| WiFi v1.3 (h) | 6.9 | 7.5 9% | 6.5 -6% | 7.1 3% | 4.7 -32% | 4.8 -30% | 5 -28% | 12 ? 74% |
| Load (h) | 2 | 1.7 -15% | 0.8 -60% | 2 0% | 1 -50% | 2.1 5% | 1.675 ? -16% |
Pros
Cons
Verdict
Acer has packed the technology inside the 15.6-inch multimedia all-rounder within a slim, compact, relatively light body, which also offers narrow display bezels.
The laptop is powered by a Core i7 processor based on the Whiskey Lake generation. In addition, it also features the brand-new GeForce MX250 GPU. Together they make for a smooth gaming experience on the majority of computer games included in our data base. Nevertheless, some compromises have to be made regarding resolution and quality - this applies particularly to current titles.
Acer delivers with the Aspire A515-52G a successful all-rounder. The new GeForce MX250 GPU does not bring any real advantages compared to its predecessor.
The laptop does not lack storage space. In this way, a 512 GB SSD and an additional 1 TB hard drive are to be found inside. The NVMe SSD allows for the system to run with ease. It could be possible to swap the storage drives, but the case would need to be opened in order to do this. There is no maintenance hatch available though.
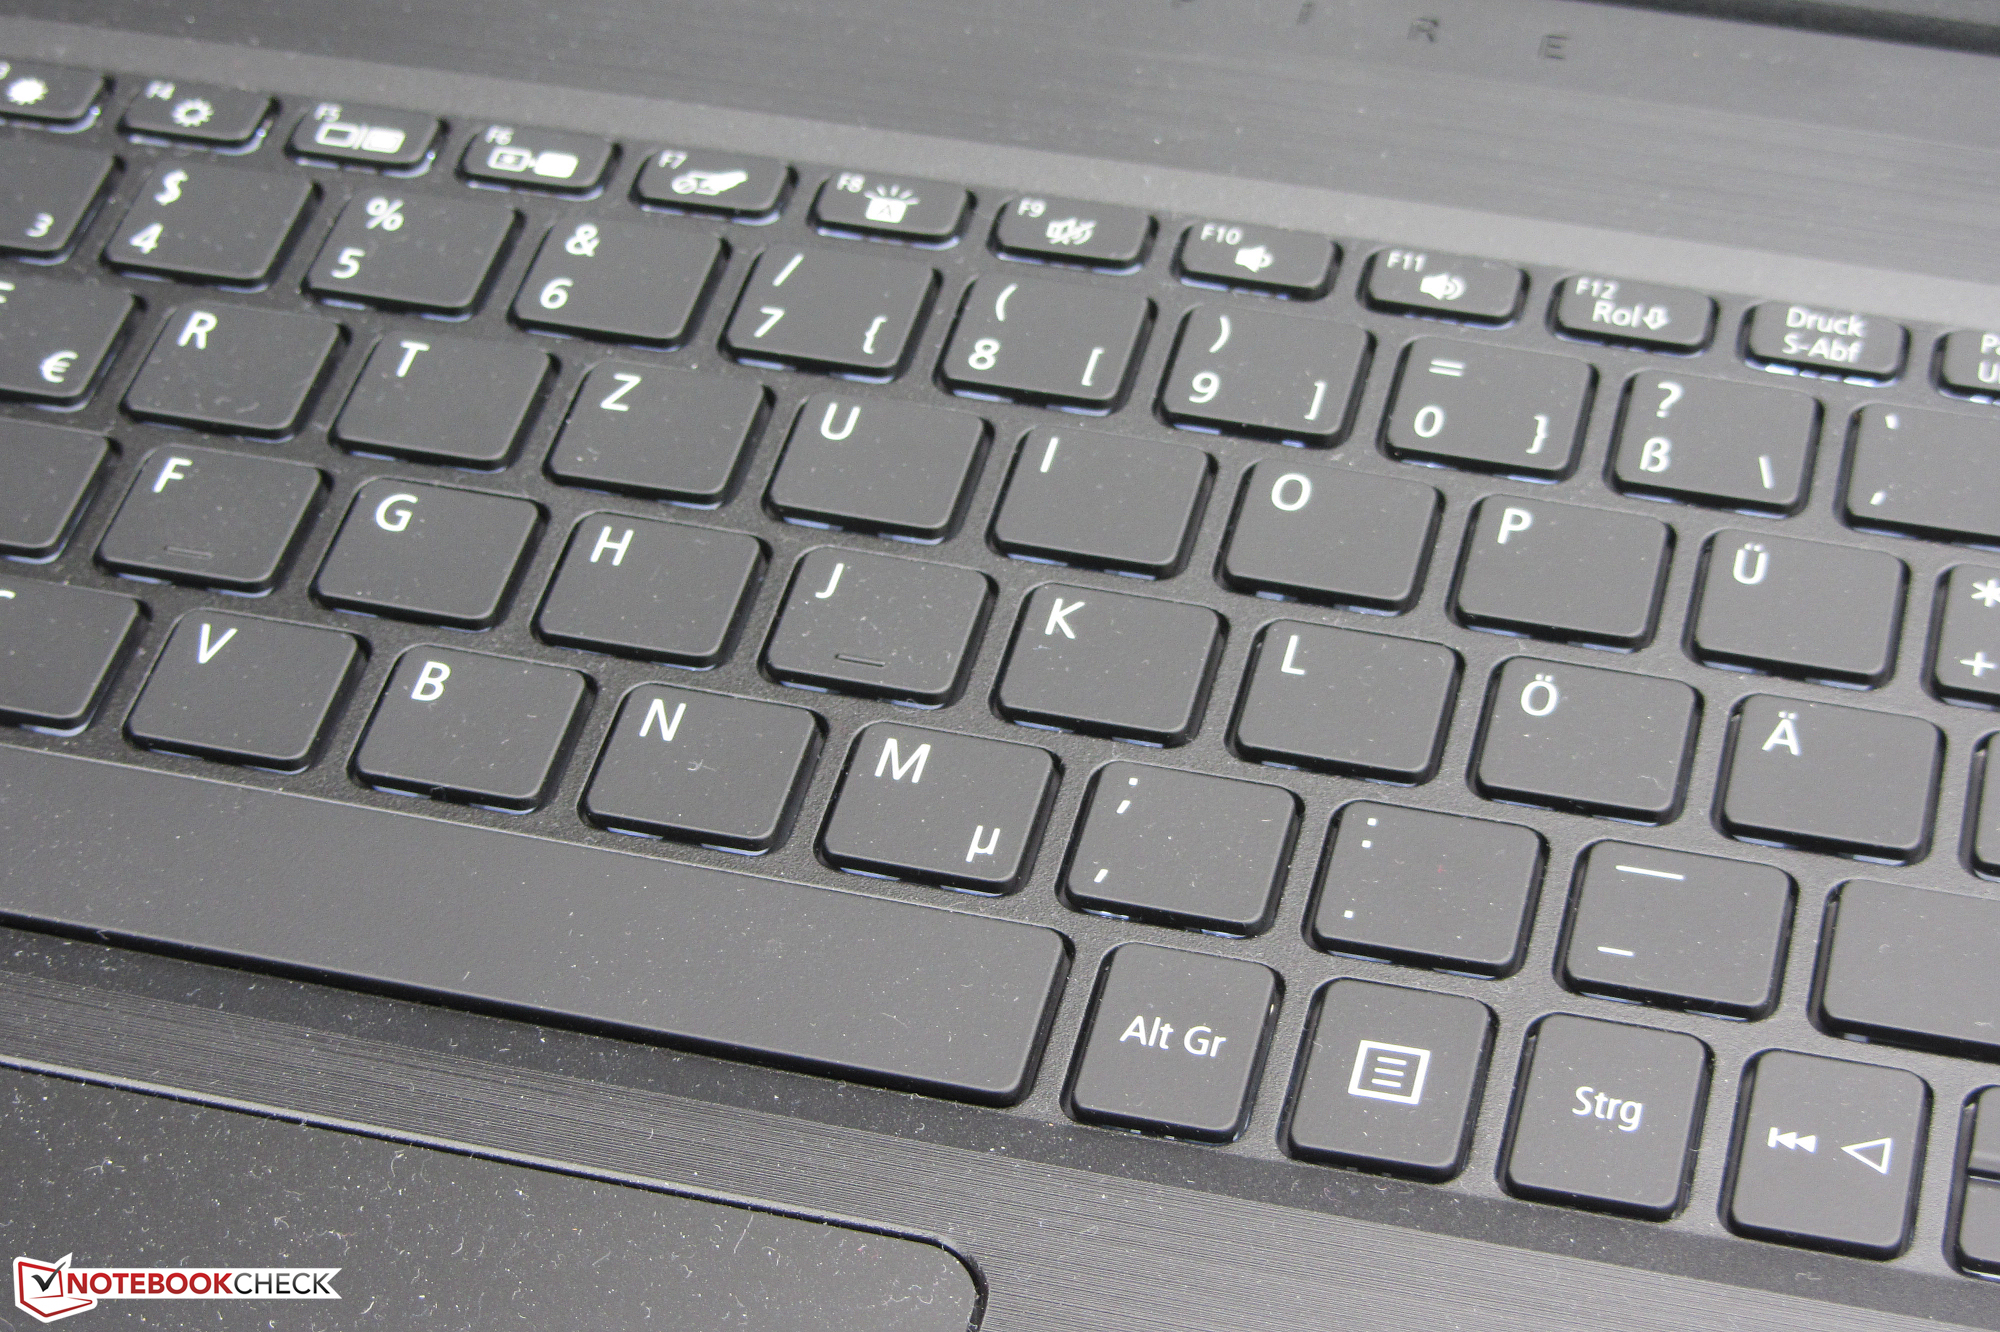
The matte IPS display scores points with stable viewing angles, decent color reproduction and good contrast. However, the brightness is too low. Something better is expected at this laptop's price point. The Aspire comes with a backlit keyboard that is suitable for everyday use. In addition, the laptop offers decent battery life.
The biggest innovation found in our review device compared to its sibling model is the GeForce MX250 graphics processing unit. However, this is not really a new GPU. The MX250 results in a minimally improved version of the MX150 GPU. Subsequently, processing performance and frame rates are at best slightly better than on the MX150 Aspire. There is no real reason to buy an MX250 laptop therefore. In this case, some savings could be eventually made by opting for an MX150 model.
Acer Aspire 5 A515-52G-723L
- 09/26/2019 v7 (old)
Sascha Mölck
Price comparison
