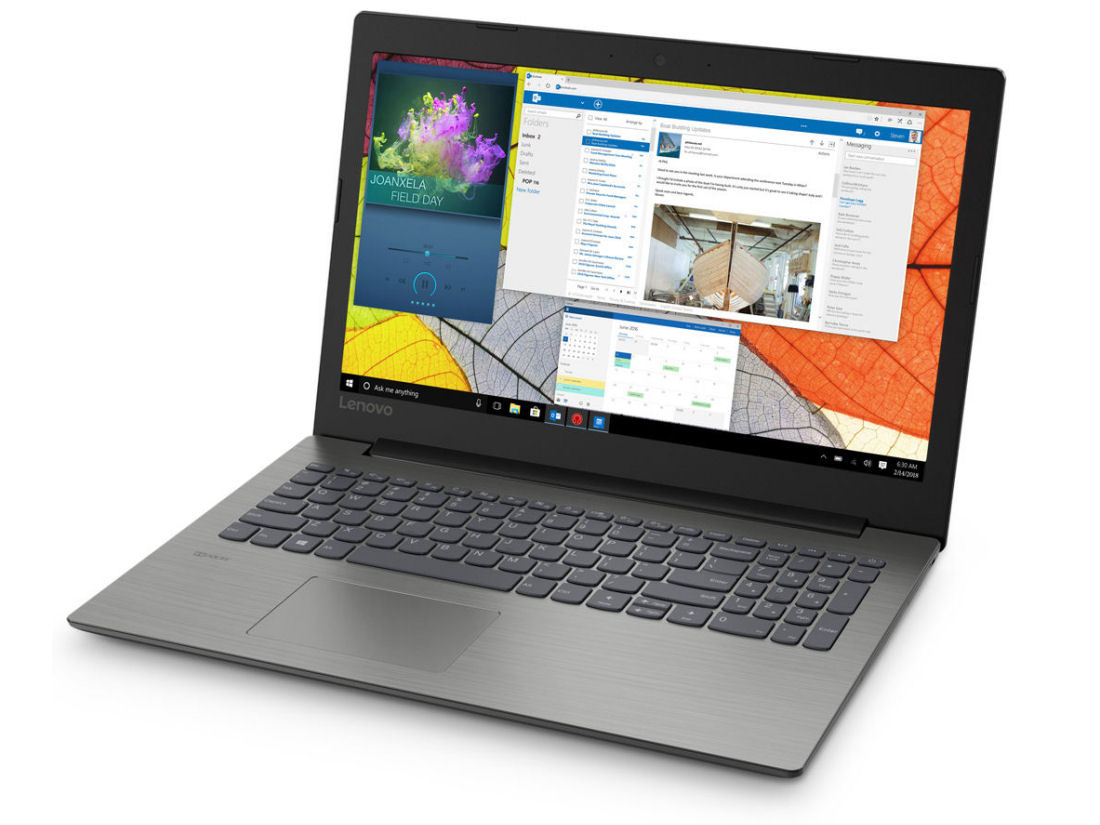
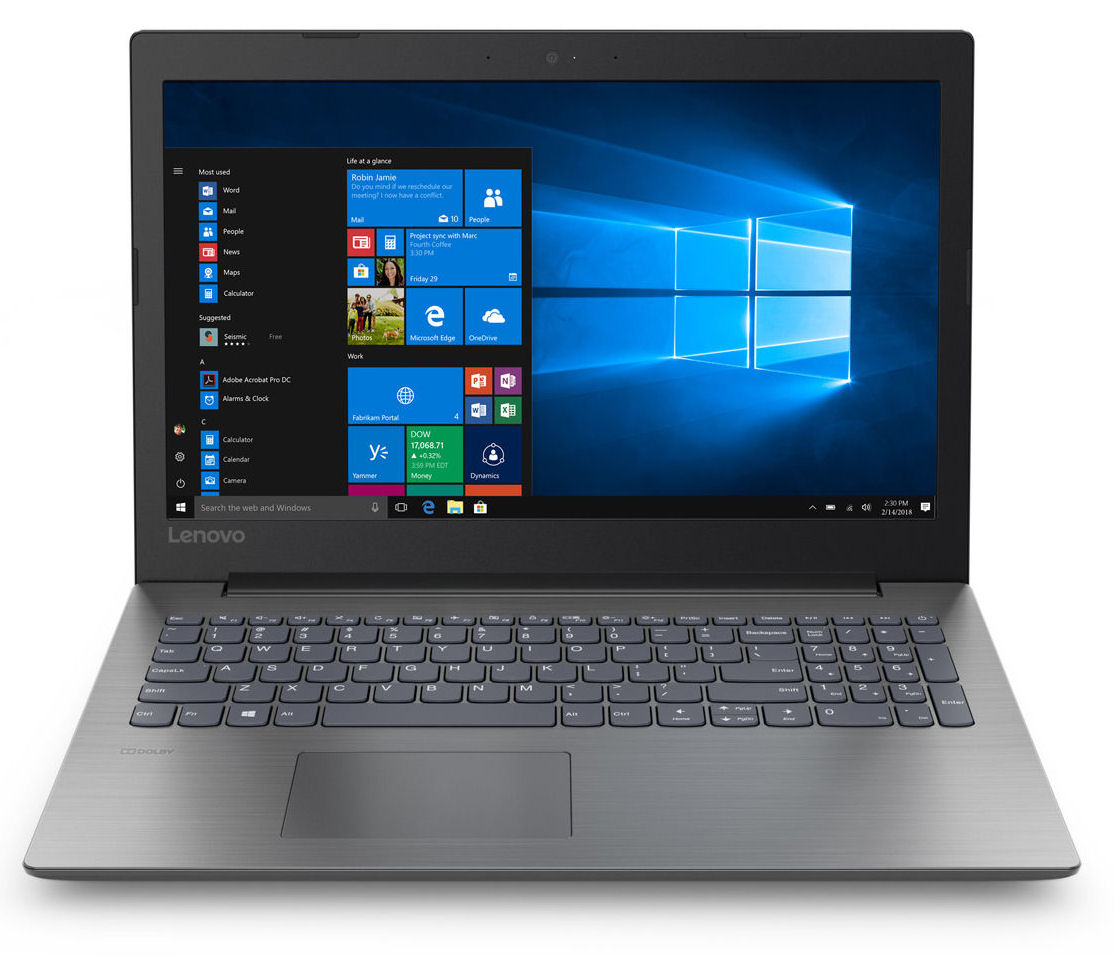
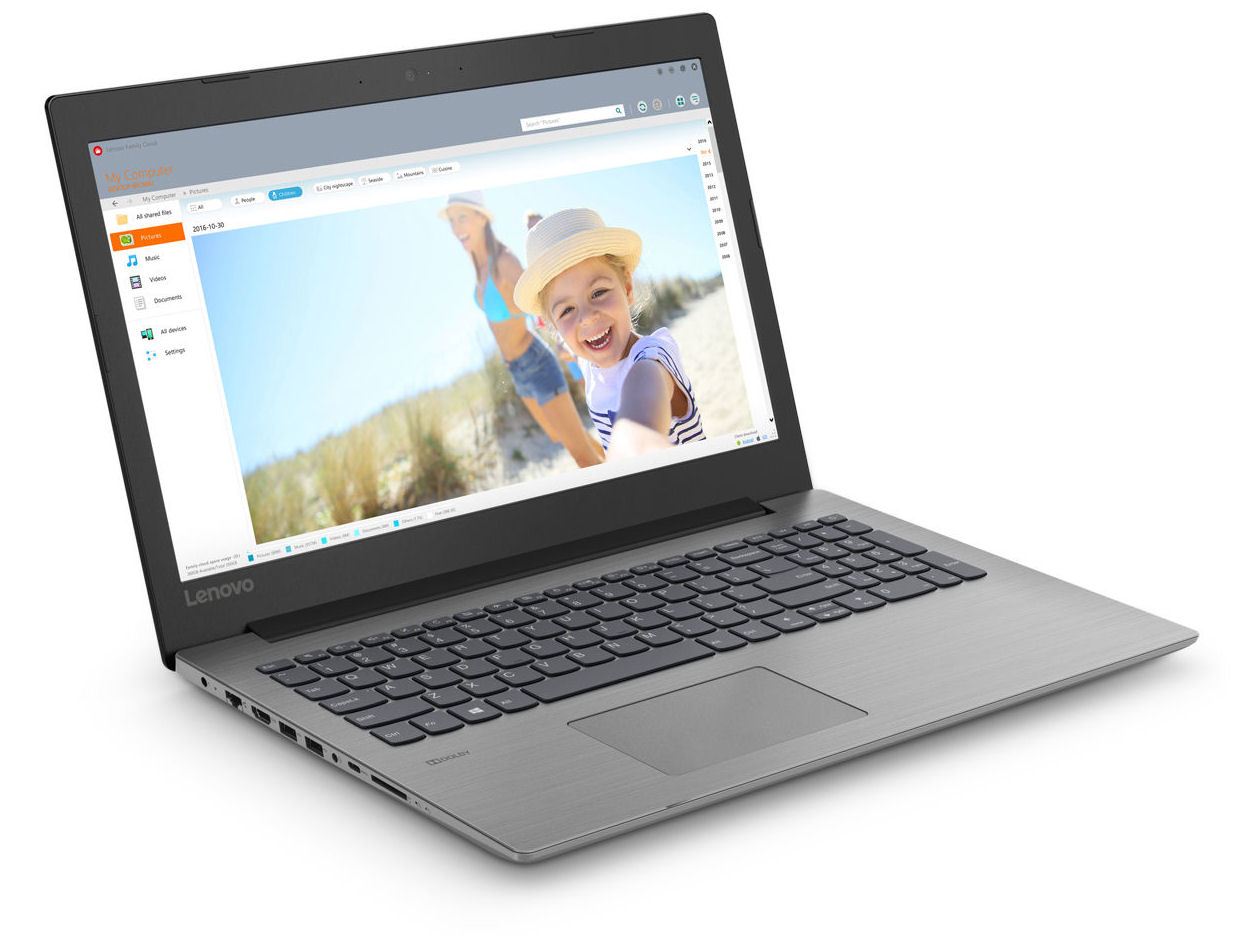
Lenovo IdeaPad 330-15IKB (Core i5-7200U, Radeon 530, 8 GB RAM, 256 GB SSD, FHD) Laptop Review
The IdeaPad 330-15 models are among some of Lenovo's bread-and-butter laptops. Correspondingly, the company offers the device in countless configurations with hardware combinations from AMD, Intel and Nvidia.
Our review unit has an Intel Core i5-7200U processor and an AMD Radeon 530 GPU, which are both now rather outdated. The laptop is known to us too. We have already reviewed several sister models, including the IdeaPad 330-15IGM and the IdeaPad 330-15ARR.
We have chosen to compare the IdeaPad 330-15IKB against other comparably priced 15.6-inch laptops. Our comparison devices include the Acer Swift 3 SF315-41G, Acer TravelMate P2510, ASUS VivoBook 15 X542UF, HP 15-da0405ng, and the HP Pavilion 15-cw0003ng.
Our review unit shares many of its features with its sister models. Hence, we shall not cover the case, connectivity, input devices, display or speakers in depth in this review. Please see our IdeaPad 330-15ARR review for our thoughts on these areas.
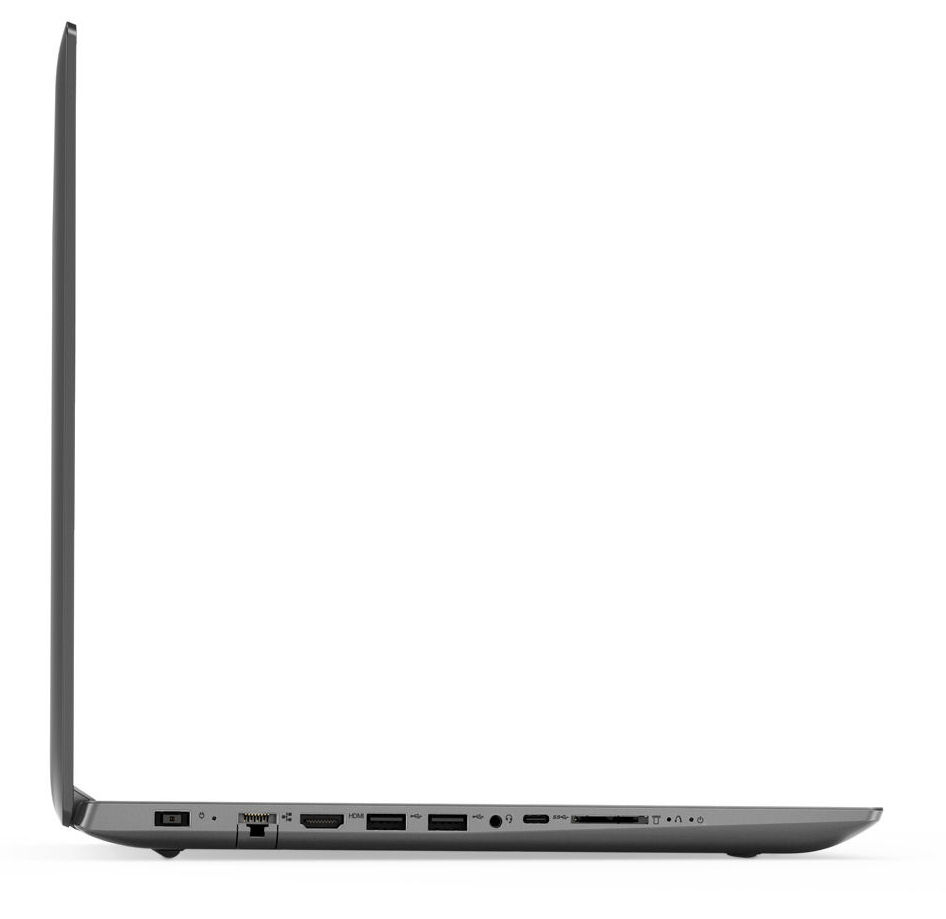
Connectivity
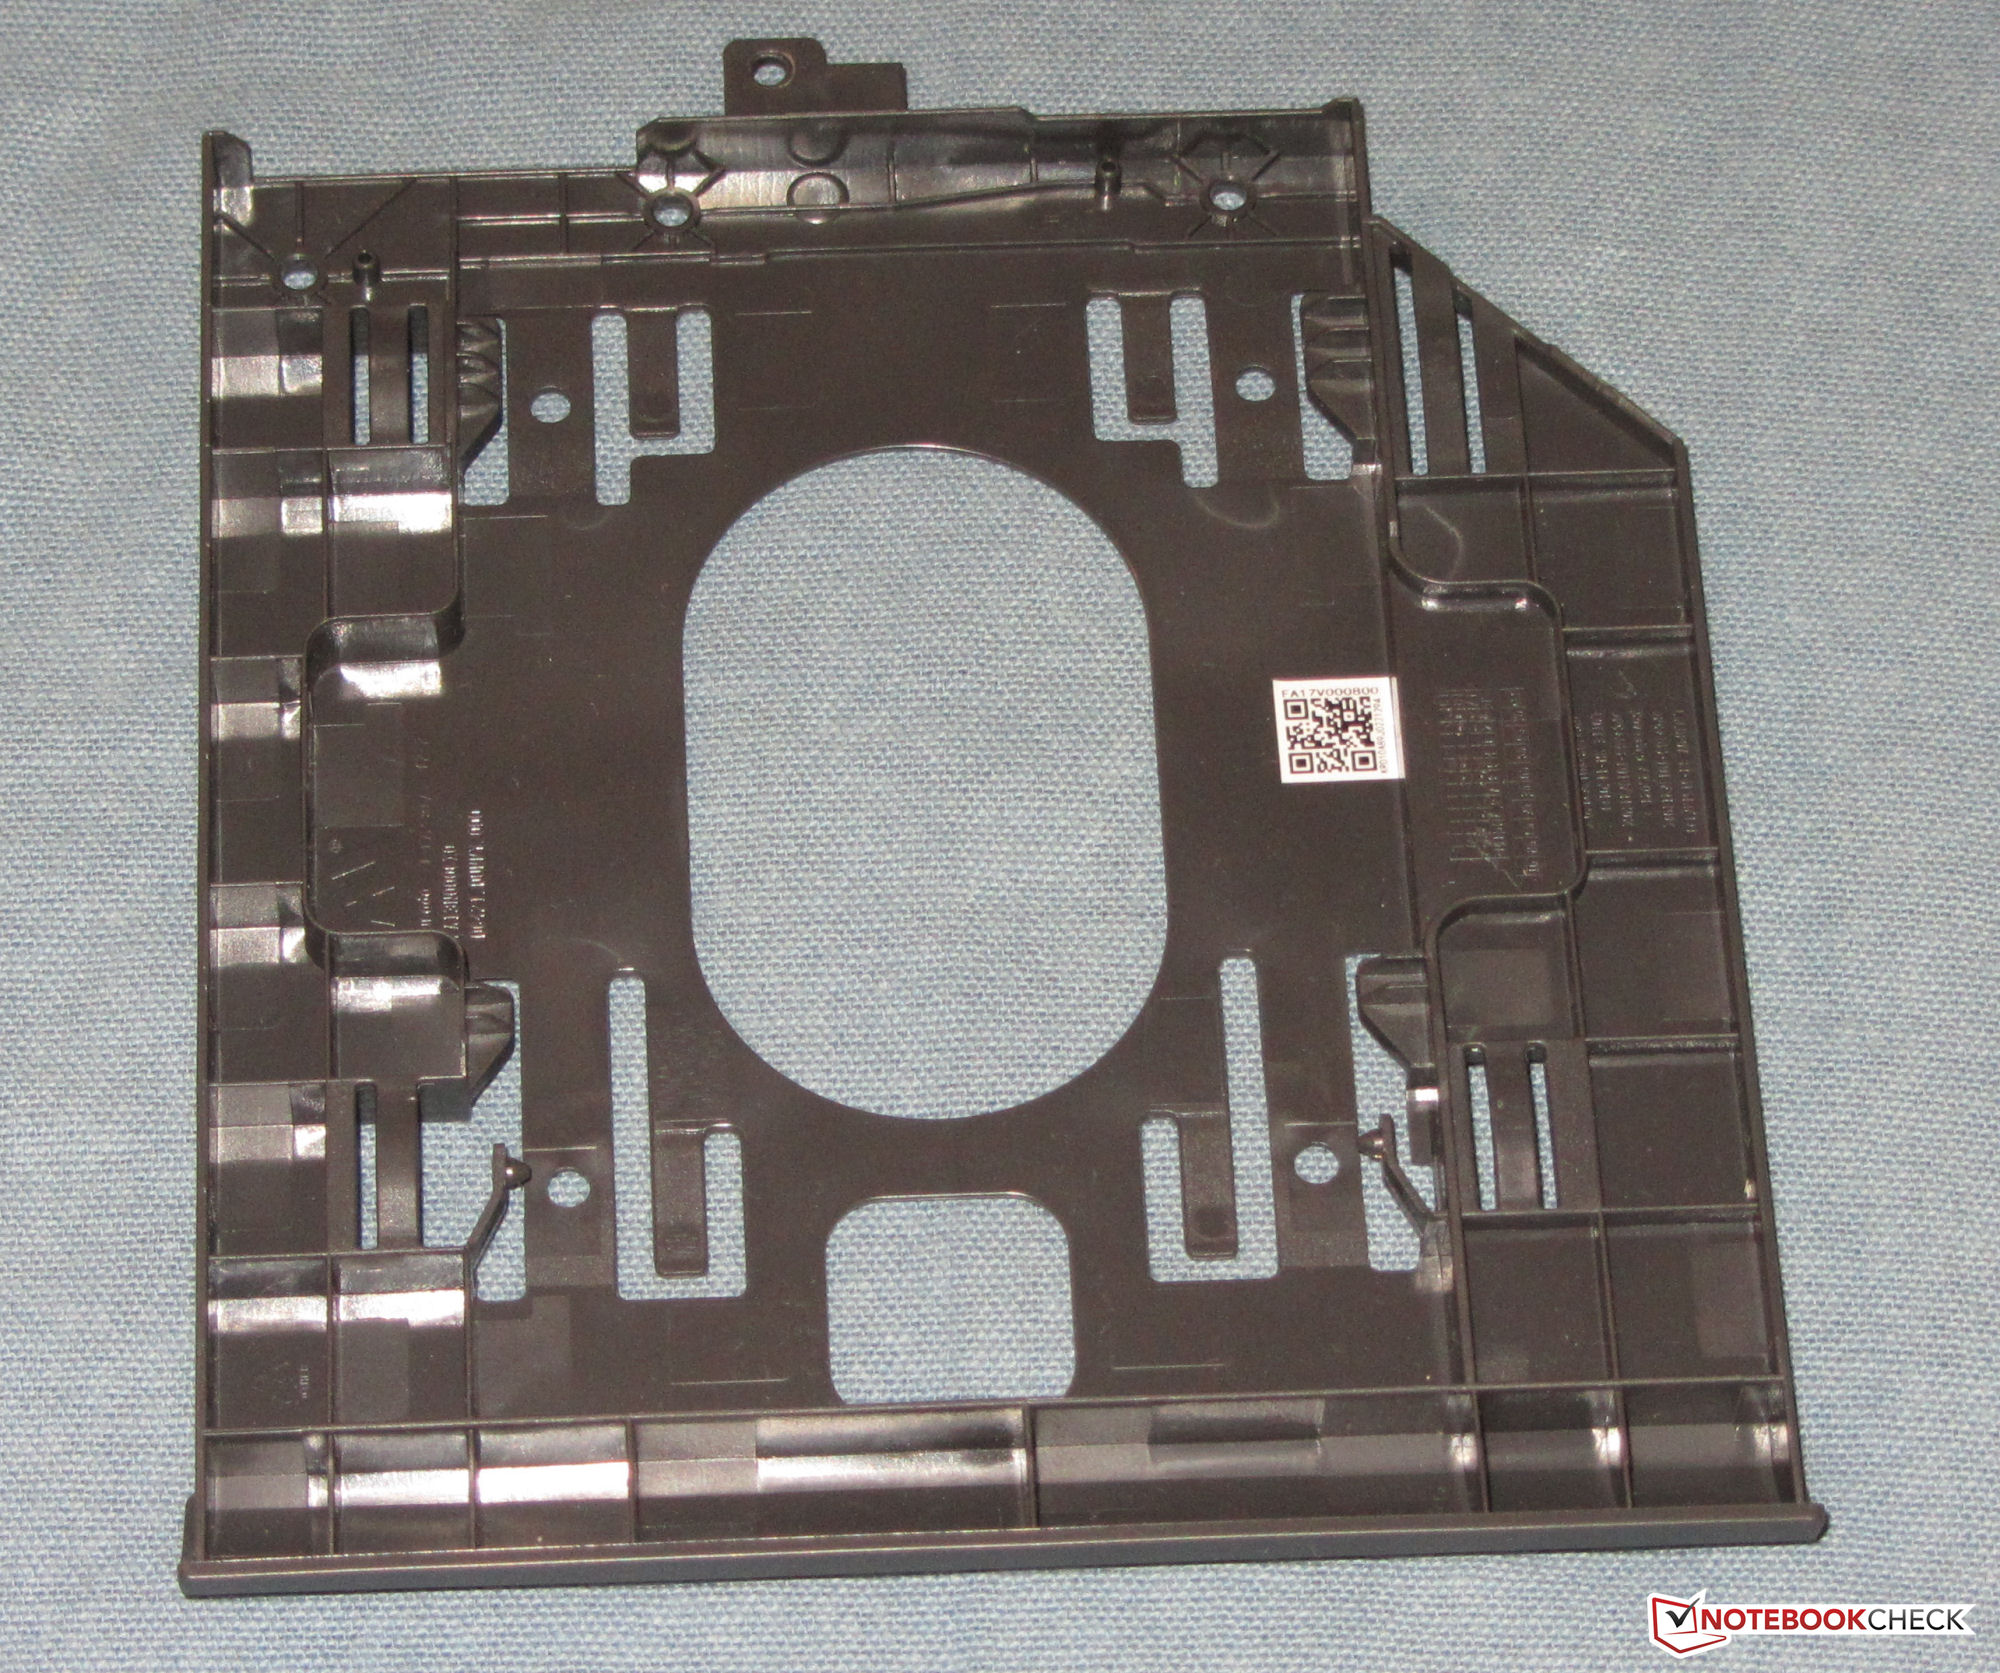
Our review unit has no DVD drive, which in itself is not an unusual thing in 2019. However, there is a dummy in the drive bay, so you could retrofit a DVD drive if necessary. Lenovo also sells a SATA adapter should you wish to add additional storage.
The built-in dummy is even designed in principle for adding an additional 2.5-inch drive. However, Lenovo did not include the necessary adapter and mounting frame with our review unit.
| SD Card Reader | |
| average JPG Copy Test (av. of 3 runs) | |
| Average of class Office (19.8 - 198.5, n=22, last 2 years) | |
| HP Pavilion 15-cw0003ng (Toshiba Exceria Pro SDXC 64 GB UHS-II) | |
| Lenovo IdeaPad 330-15ARR 81D2005CUS (Toshiba Exceria Pro SDXC 64 GB UHS-II) | |
| Acer Swift 3 SF315-41G-R6BR (Toshiba Exceria Pro SDXC 64 GB UHS-II) | |
| Lenovo IdeaPad 330-15ARR-81D2005JGE (Toshiba Exceria Pro SDXC 64 GB UHS-II) | |
| Asus VivoBook 15 X542UF-DM143T (Toshiba Exceria Pro SDXC 64 GB UHS-II) | |
| HP 15-da0405ng (Toshiba Exceria Pro SDXC 64 GB UHS-II) | |
| HP Pavilion 15-cs0003ng (Toshiba Exceria Pro SDXC 64 GB UHS-II) | |
| Acer TravelMate P2510-G2-MG-50WE (Toshiba Exceria Pro SDXC 64 GB UHS-II) | |
| Lenovo Ideapad 330-15IKB-81DC00SWGE (Toshiba Exceria Pro SDXC 64 GB UHS-II) | |
| Medion Akoya S6625 (Toshiba Exceria Pro SDXC 64 GB UHS-II) | |
| maximum AS SSD Seq Read Test (1GB) | |
| Average of class Office (27.4 - 249, n=21, last 2 years) | |
| Lenovo IdeaPad 330-15ARR 81D2005CUS (Toshiba Exceria Pro SDXC 64 GB UHS-II) | |
| Acer Swift 3 SF315-41G-R6BR (Toshiba Exceria Pro SDXC 64 GB UHS-II) | |
| HP Pavilion 15-cw0003ng (Toshiba Exceria Pro SDXC 64 GB UHS-II) | |
| HP Pavilion 15-cs0003ng (Toshiba Exceria Pro SDXC 64 GB UHS-II) | |
| Asus VivoBook 15 X542UF-DM143T (Toshiba Exceria Pro SDXC 64 GB UHS-II) | |
| Lenovo Ideapad 330-15IKB-81DC00SWGE (Toshiba Exceria Pro SDXC 64 GB UHS-II) | |
| Acer TravelMate P2510-G2-MG-50WE (Toshiba Exceria Pro SDXC 64 GB UHS-II) | |
| Medion Akoya S6625 (Toshiba Exceria Pro SDXC 64 GB UHS-II) | |
Display

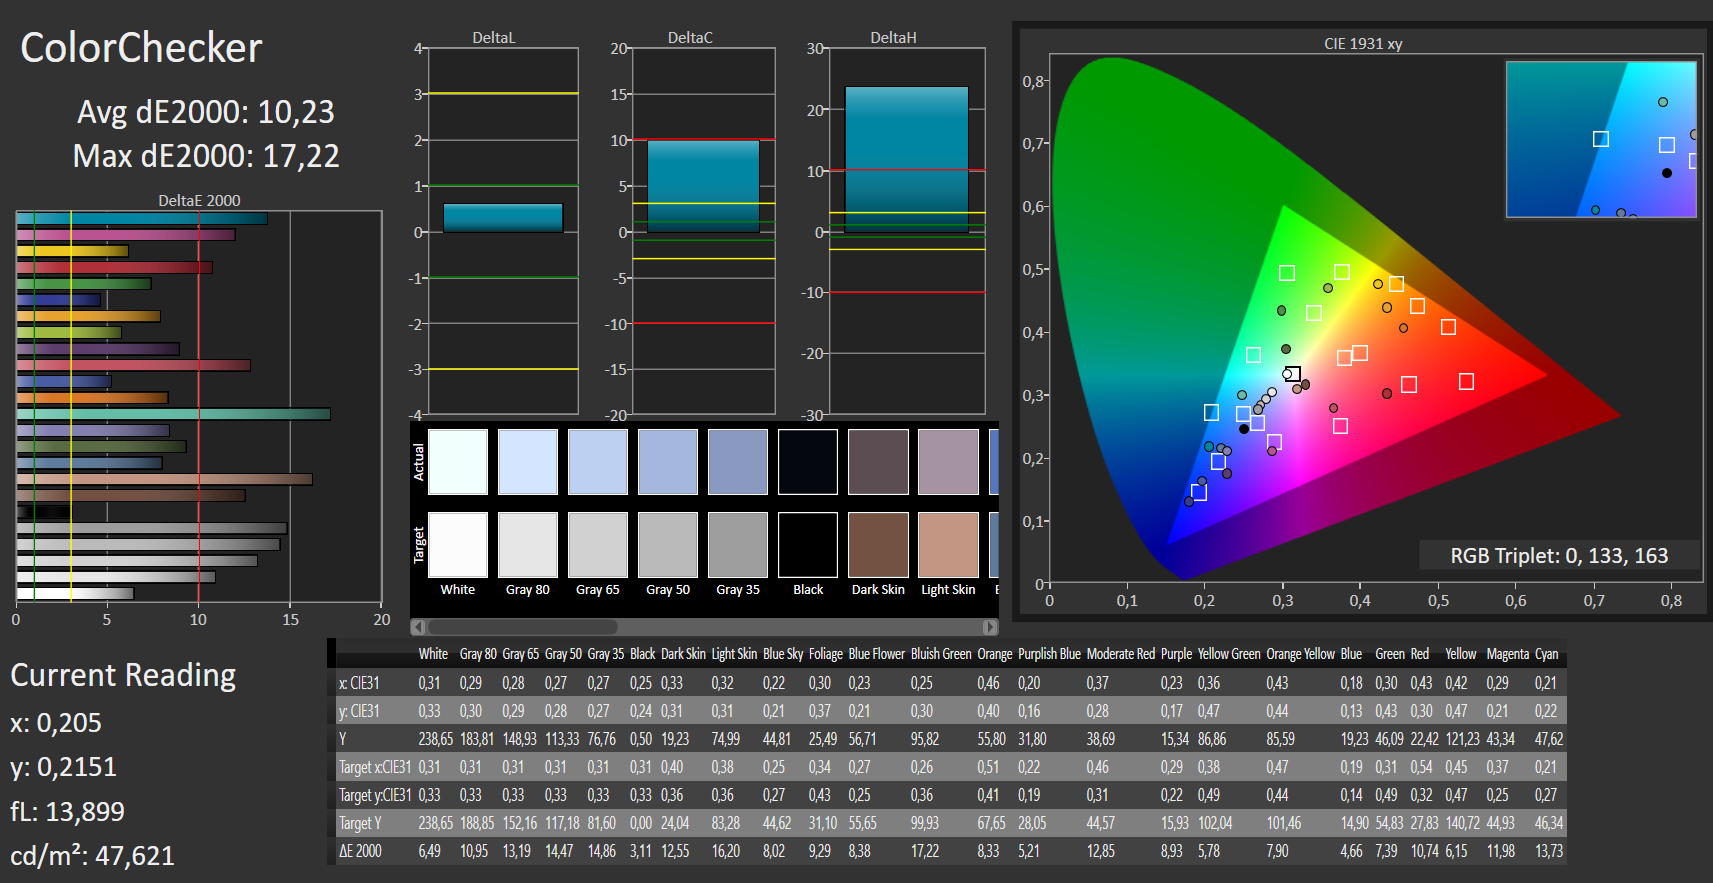
The 330-15IKB has a matte, 15.6-inch display that operates natively at 1920x1080. Our review unit achieved an average maximum brightness of 217.1 cd/m² and 464:1 contrast ratio, which is well below the 300 cd/m² brightness and 1,000:1 contrast ratio that we expect from most modern laptops. The main problem here is that Lenovo has equipped our review unit with a TN panel, which tend to be darker and less vibrant than their IPS or OLED counterparts. TN panels almost always have poor viewing angles too.
Unfortunately, the device also uses pulse-width modulation (PWM) to regulate display brightness, which can cause eye strain and headaches for some people. The screen flickers at 200 Hz at 90% brightness and below, which is low enough to cause issues for those who are PWM sensitive.
Lenovo equips the IdeaPad 330-15IKB with the same display as it did with our IdeaPad 330-15ARR review unit. Please keep in mind that no two panels are the same even if they are the same model. This is a normal phenomenon though, which explains why the two IdeaPad 330 models achieved slightly different results in our tests.
| |||||||||||||||||||||||||
Brightness Distribution: 85 %
Center on Battery: 241 cd/m²
Contrast: 464:1 (Black: 0.5 cd/m²)
ΔE ColorChecker Calman: 10.23 | ∀{0.5-29.43 Ø4.71}
ΔE Greyscale Calman: 11.78 | ∀{0.09-98 Ø4.96}
60% sRGB (Argyll 1.6.3 3D)
38% AdobeRGB 1998 (Argyll 1.6.3 3D)
41.26% AdobeRGB 1998 (Argyll 3D)
60% sRGB (Argyll 3D)
39.93% Display P3 (Argyll 3D)
Gamma: 2.55
CCT: 13383 K
| Lenovo Ideapad 330-15IKB-81DC00SWGE TN LED, 1920x1080, 15.6" | Lenovo IdeaPad 330-15ARR-81D2005JGE IPS, 1920x1080, 15.6" | Lenovo IdeaPad 330-15ARR 81D2005CUS TN LED, 1920x1080, 15.6" | Acer TravelMate P2510-G2-MG-50WE IPS, 1920x1080, 15.6" | HP Pavilion 15-cs0003ng IPS, 1920x1080, 15.6" | Acer Swift 3 SF315-41G-R6BR IPS, 1920x1080, 15.6" | HP Pavilion 15-cw0003ng IPS, 1920x1080, 15.6" | Asus VivoBook 15 X542UF-DM143T TN LED, 1920x1080, 15.6" | HP 15-da0405ng TN LED, 1920x1080, 15.6" | |
|---|---|---|---|---|---|---|---|---|---|
| Display | -2% | -9% | 6% | -9% | -1% | -8% | -6% | -1% | |
| Display P3 Coverage (%) | 39.93 | 39.21 -2% | 36.36 -9% | 42.27 6% | 36.27 -9% | 40.1 0% | 36.7 -8% | 37.47 -6% | 39.52 -1% |
| sRGB Coverage (%) | 60 | 59.1 -1% | 54.7 -9% | 63.5 6% | 54.6 -9% | 59 -2% | 55 -8% | 56.4 -6% | 59.4 -1% |
| AdobeRGB 1998 Coverage (%) | 41.26 | 40.51 -2% | 37.57 -9% | 43.69 6% | 37.47 -9% | 41.43 0% | 37.91 -8% | 38.71 -6% | 40.83 -1% |
| Response Times | 1% | -37% | -95% | -83% | -89% | -67% | -37% | -9% | |
| Response Time Grey 50% / Grey 80% * (ms) | 41 ? | 40 ? 2% | 38.8 ? 5% | 40 ? 2% | 45 ? -10% | 43 ? -5% | 40 ? 2% | 41 ? -0% | 41 ? -0% |
| Response Time Black / White * (ms) | 11 ? | 11 ? -0% | 19.6 ? -78% | 32 ? -191% | 28 ? -155% | 30 ? -173% | 26 ? -136% | 19 ? -73% | 13 ? -18% |
| PWM Frequency (Hz) | 200 ? | 200 ? | 25000 ? | 1471 ? | 7000 ? | 29000 ? | |||
| Screen | -16% | -7% | 49% | 14% | 38% | 33% | 22% | -4% | |
| Brightness middle (cd/m²) | 232 | 222 -4% | 252.2 9% | 259 12% | 240 3% | 284 22% | 186 -20% | 230 -1% | 176 -24% |
| Brightness (cd/m²) | 217 | 200 -8% | 251 16% | 230 6% | 237 9% | 254 17% | 180 -17% | 221 2% | 164 -24% |
| Brightness Distribution (%) | 85 | 87 2% | 84 -1% | 82 -4% | 90 6% | 80 -6% | 88 4% | 91 7% | 69 -19% |
| Black Level * (cd/m²) | 0.5 | 0.57 -14% | 0.54 -8% | 0.19 62% | 0.42 16% | 0.29 42% | 0.15 70% | 0.45 10% | 0.31 38% |
| Contrast (:1) | 464 | 389 -16% | 467 1% | 1363 194% | 571 23% | 979 111% | 1240 167% | 511 10% | 568 22% |
| Colorchecker dE 2000 * | 10.23 | 14.07 -38% | 12.36 -21% | 3.13 69% | 7.43 27% | 4.22 59% | 5.94 42% | 3.6 65% | 11.4 -11% |
| Colorchecker dE 2000 max. * | 17.22 | 23.62 -37% | 24.75 -44% | 7.81 55% | 12.42 28% | 9.29 46% | 10.81 37% | 5.59 68% | 19.76 -15% |
| Greyscale dE 2000 * | 11.78 | 15.89 -35% | 12.2 -4% | 1.42 88% | 6.26 47% | 1.17 90% | 4.44 62% | 3.13 73% | 12.75 -8% |
| Gamma | 2.55 86% | 2.59 85% | 1.83 120% | 2.36 93% | 2.96 74% | 2.39 92% | 2.81 78% | 2.45 90% | 2.59 85% |
| CCT | 13383 49% | 23883 27% | 13028 50% | 6391 102% | 6661 98% | 6360 102% | 6272 104% | 7244 90% | 14899 44% |
| Color Space (Percent of AdobeRGB 1998) (%) | 38 | 37 -3% | 34.6 -9% | 40 5% | 35 -8% | 38 0% | 35 -8% | 36 -5% | 38 0% |
| Color Space (Percent of sRGB) (%) | 60 | 57 -5% | 54.5 -9% | 63 5% | 54 -10% | 59 -2% | 55 -8% | 56 -7% | 59 -2% |
| Colorchecker dE 2000 calibrated * | 2.94 | 4.43 | 3.09 | 6.07 | 2.99 | ||||
| Total Average (Program / Settings) | -6% /
-11% | -18% /
-11% | -13% /
21% | -26% /
-3% | -17% /
13% | -14% /
11% | -7% /
9% | -5% /
-4% |
* ... smaller is better


Display Response Times
| ↔ Response Time Black to White | ||
|---|---|---|
| 11 ms ... rise ↗ and fall ↘ combined | ↗ 7 ms rise | 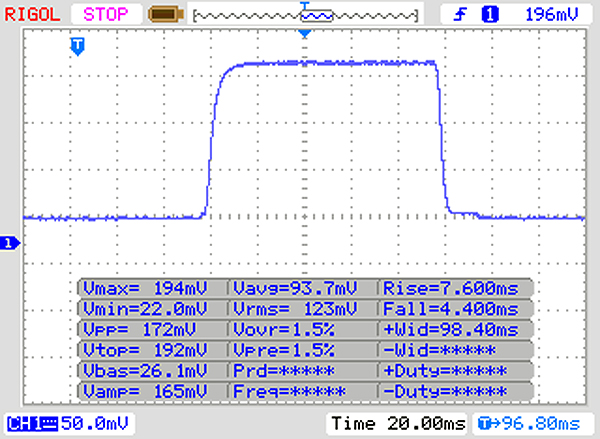 |
| ↘ 6 ms fall | ||
| The screen shows good response rates in our tests, but may be too slow for competitive gamers. In comparison, all tested devices range from 0.1 (minimum) to 240 (maximum) ms. » 30 % of all devices are better. This means that the measured response time is better than the average of all tested devices (19.8 ms). | ||
| ↔ Response Time 50% Grey to 80% Grey | ||
| 41 ms ... rise ↗ and fall ↘ combined | ↗ 22 ms rise | 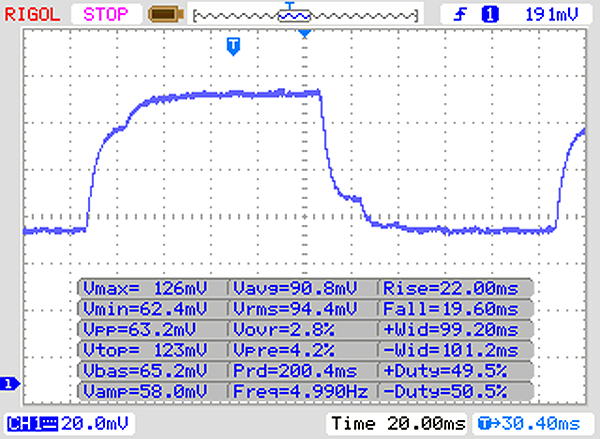 |
| ↘ 19 ms fall | ||
| The screen shows slow response rates in our tests and will be unsatisfactory for gamers. In comparison, all tested devices range from 0.165 (minimum) to 636 (maximum) ms. » 65 % of all devices are better. This means that the measured response time is worse than the average of all tested devices (31 ms). | ||
Screen Flickering / PWM (Pulse-Width Modulation)
| Screen flickering / PWM detected | 200 Hz | ≤ 90 % brightness setting | 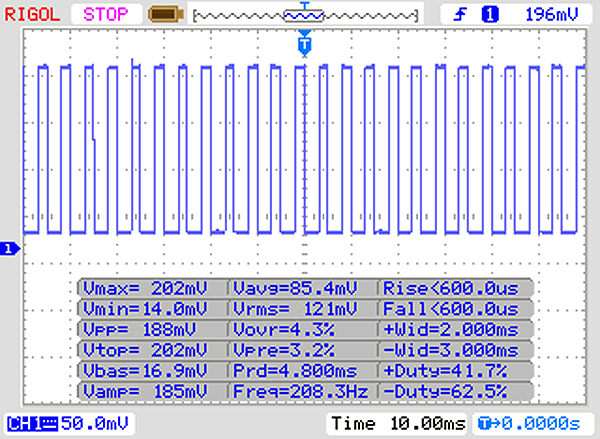 |
The display backlight flickers at 200 Hz (worst case, e.g., utilizing PWM) Flickering detected at a brightness setting of 90 % and below. There should be no flickering or PWM above this brightness setting. The frequency of 200 Hz is relatively low, so sensitive users will likely notice flickering and experience eyestrain at the stated brightness setting and below. In comparison: 52 % of all tested devices do not use PWM to dim the display. If PWM was detected, an average of 7757 (minimum: 5 - maximum: 343500) Hz was measured. | |||
Performance
The IdeaPad 330-15IKB is powerful enough for most office and Internet-based applications. The dedicated GPU is also powerful enough for some light gaming, of which few business laptops are capable. Our review unit currently retails for around 630 Euros (~$714), for reference. There are numerous other configurations available too.


Processor
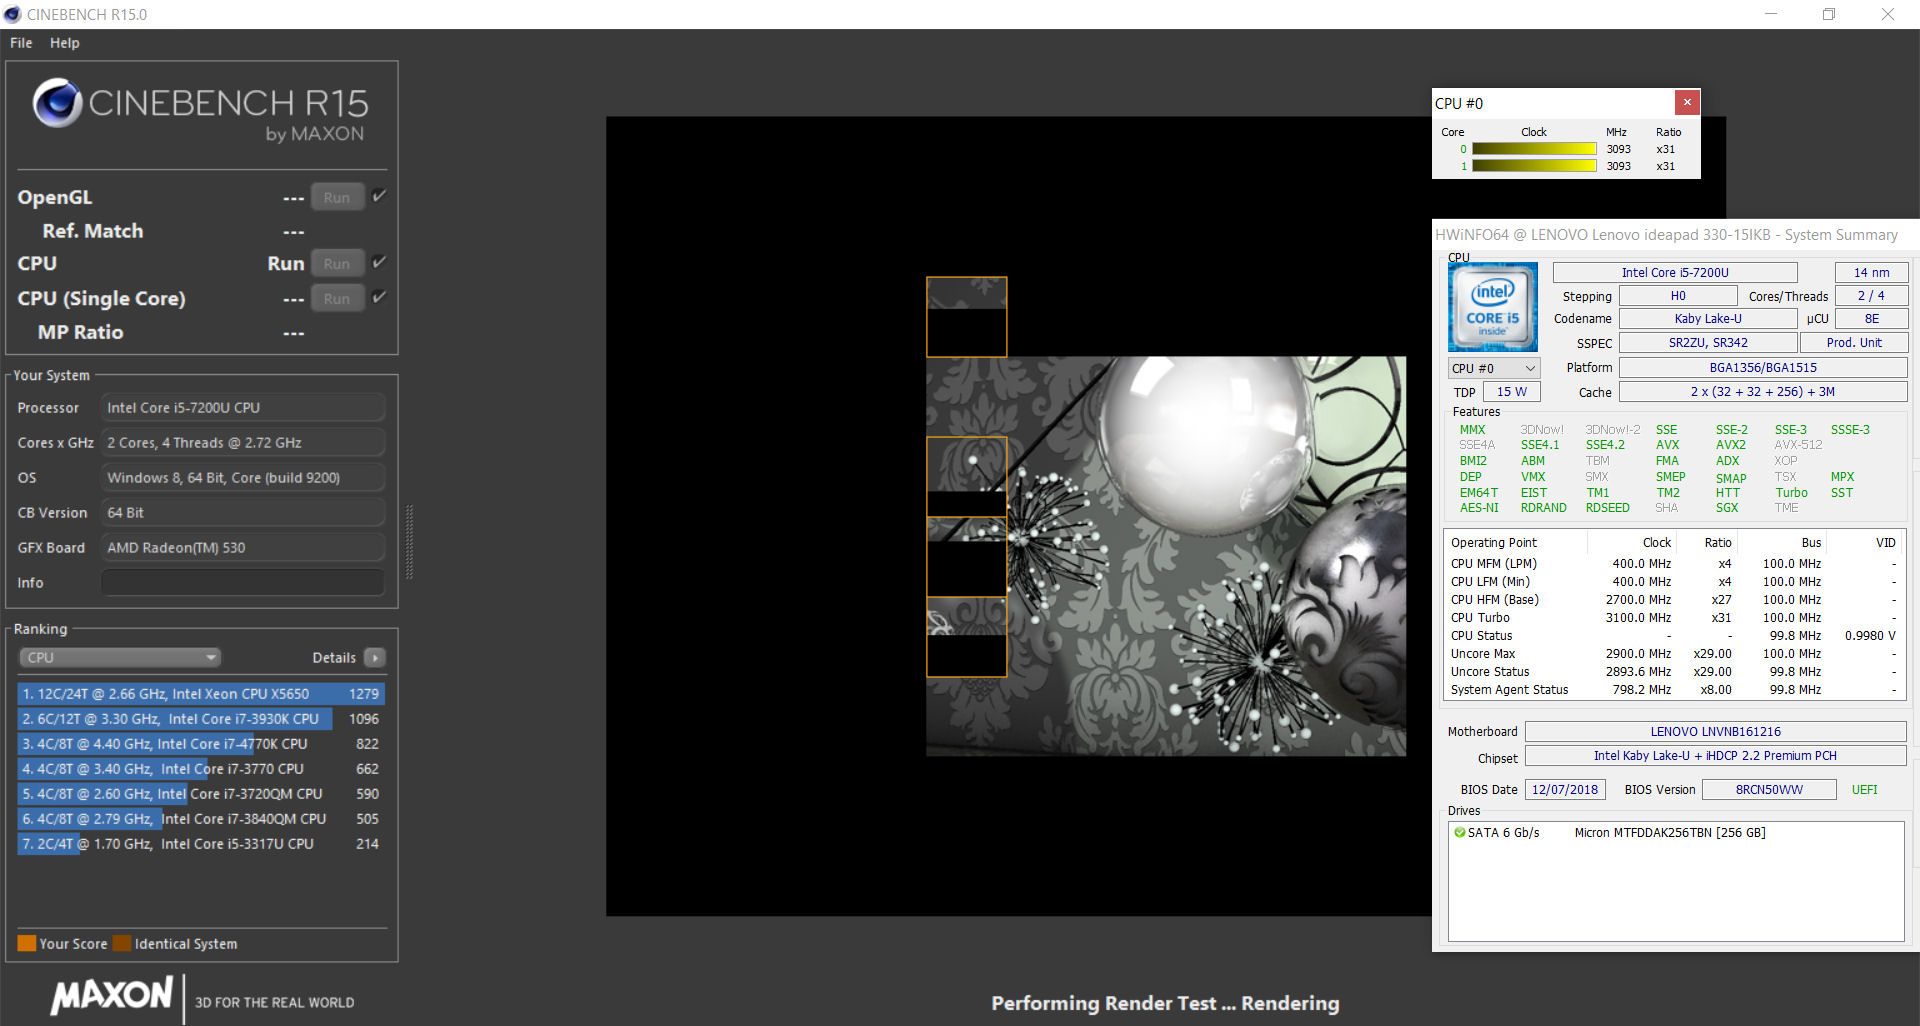
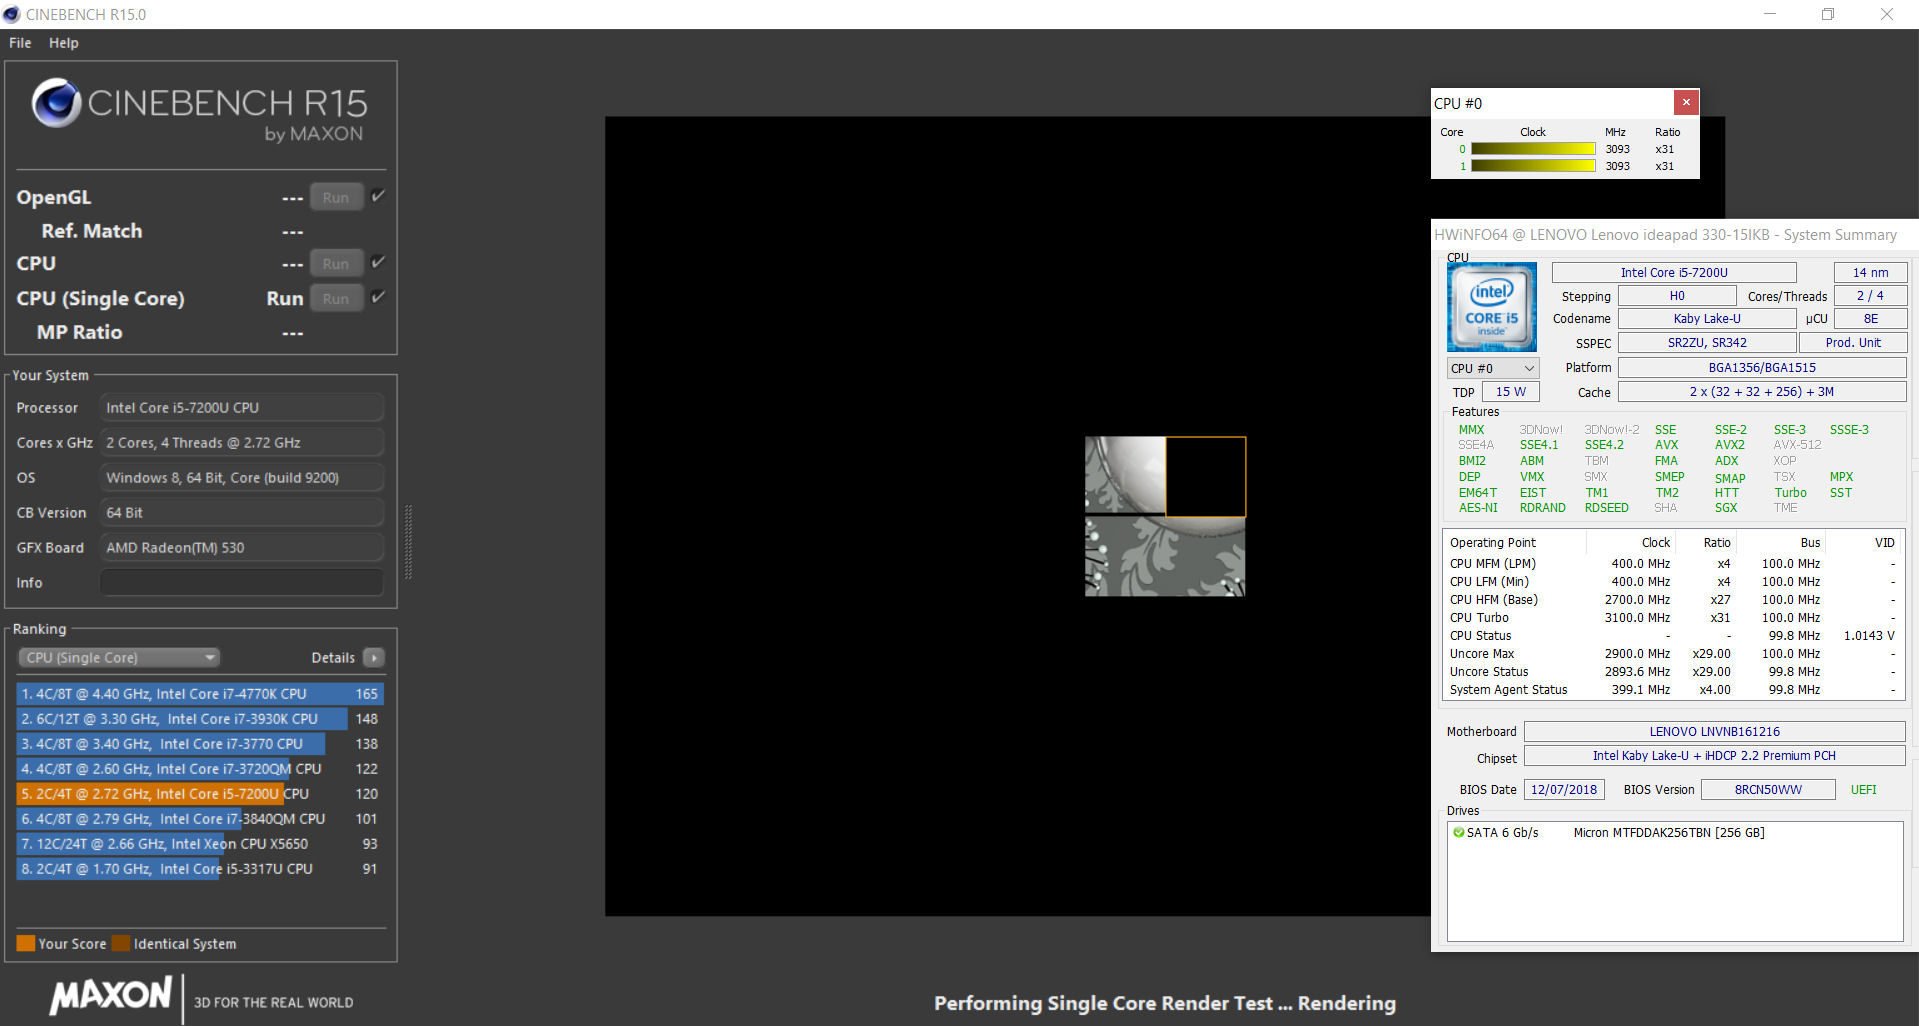
The Core i5-7200U is a dual-core processor from Intel’s Kaby Lake generation. The CPU provides more than enough performance for office and Internet-based applications. The Core i5-7200U is an ultra-low-voltage (ULV) processor with a 15 W thermal design power (TDP) that operates at a 2.5 GHz base clock speed. The CPU can also utilise Intel Turbo Boost to increase its clock speeds to 3.1 GHz across both cores when required.
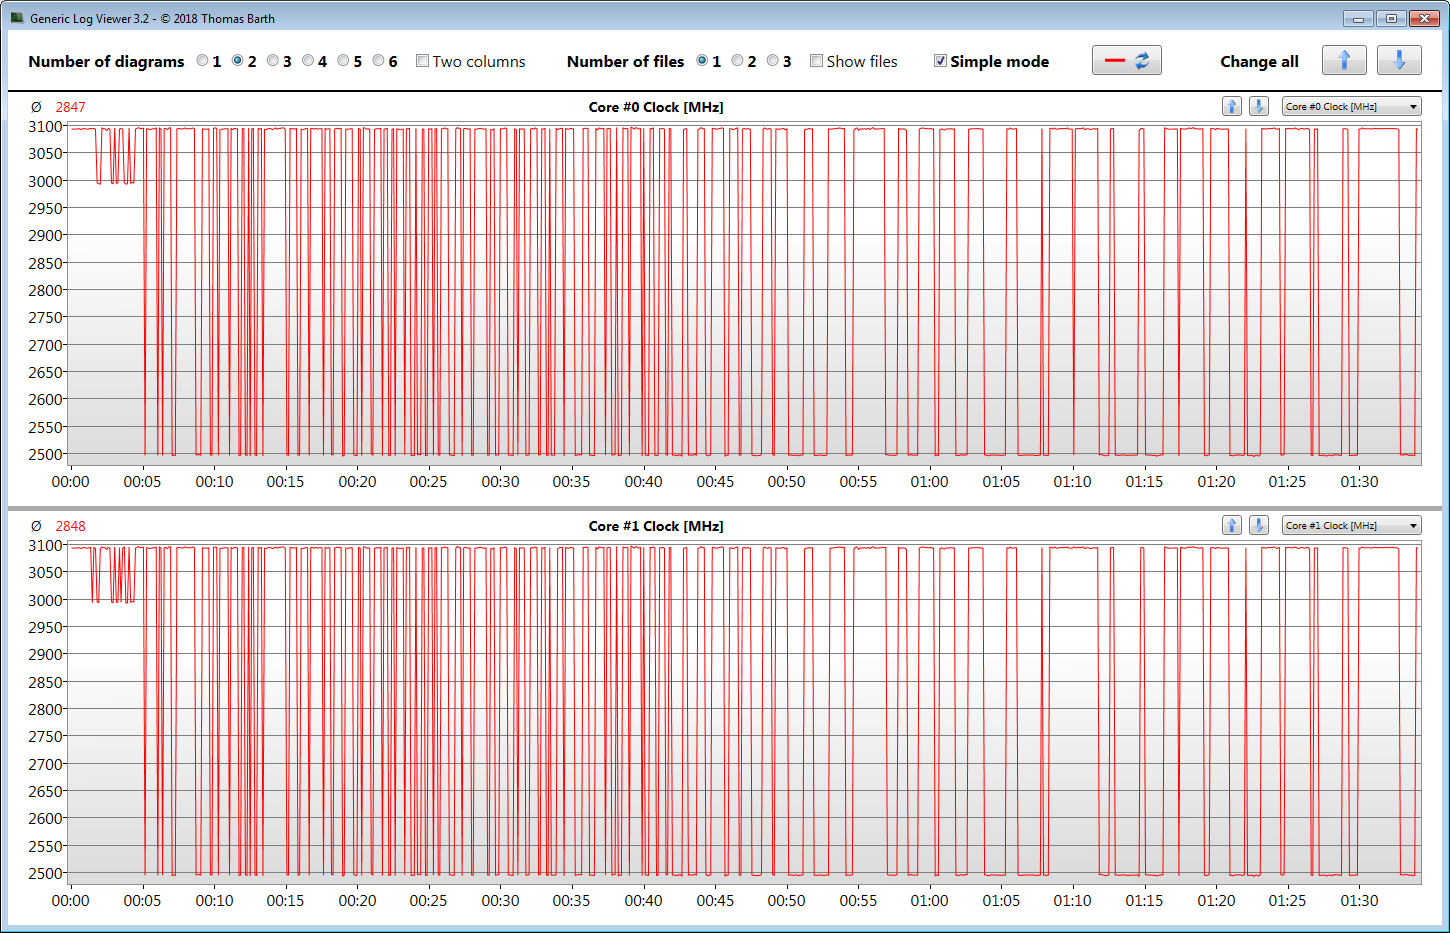
Our review unit initially operated at approximately 3.1 GHz in a Cinebench R15 multithread benchmark before clocking down to 2.9 to 3 GHz. By contrast, the CPU consistently ran at 3.1 GHz during the corresponding single-threaded benchmark. The IdeaPad 330-15IKB performed just as well on battery as it did on mains power.
We also subjected our review unit to a looped CB R15 Multi 64-bit benchmark to determine how well it performs under sustained load. We conducted our test for around 30 minutes on a continuous loop, in which the 330-15IKB initially scored 348 points. This then dropped to 288 points in the second benchmark run through before stabilising by the third benchmark at around 276 points, a score that it consistently achieved for the remainder of our loop. Overall, performance drops by around 20%, but this is only because the CPU has exhausted its Turbo.
The 330-15IKB finished behind all but the AMD Ryzen 3 2200U-powered IdeaPad 330-15ARR of our comparison devices in our looped CB R15 benchmark. All our other comparison devices are powered by quad-core processors including the Ryzen 5 2500U version of the IdeaPad 330-15ARR, which throttled heavily in the same test. The Ryzen 5 2500U is not an underpowered quad-core CPU though, as demonstrated by the Acer Swift 3 SF315 and the HP Pavilion 15-cw0003ng, which achieved consistently higher results than our review unit.
| Cinebench R10 | |
| Rendering Single 32Bit | |
| Average of class Office (4212 - 10817, n=16, last 2 years) | |
| Medion Akoya S6625 | |
| Asus VivoBook 15 X542UF-DM143T | |
| HP 15-da0405ng | |
| Average Intel Core i5-7200U (4787 - 5022, n=47) | |
| Lenovo Ideapad 330-15IKB-81DC00SWGE | |
| Acer Swift 3 SF315-41G-R6BR | |
| Rendering Multiple CPUs 32Bit | |
| Average of class Office (7657 - 60850, n=16, last 2 years) | |
| Asus VivoBook 15 X542UF-DM143T | |
| Medion Akoya S6625 | |
| HP 15-da0405ng | |
| Acer Swift 3 SF315-41G-R6BR | |
| Average Intel Core i5-7200U (9213 - 11955, n=47) | |
| Lenovo Ideapad 330-15IKB-81DC00SWGE | |
| Geekbench 3 | |
| 32 Bit Multi-Core Score | |
| Asus VivoBook 15 X542UF-DM143T | |
| HP 15-da0405ng | |
| Medion Akoya S6625 | |
| Acer Swift 3 SF315-41G-R6BR | |
| Lenovo Ideapad 330-15IKB-81DC00SWGE | |
| Average Intel Core i5-7200U (6297 - 6932, n=30) | |
| 32 Bit Single-Core Score | |
| Medion Akoya S6625 | |
| Acer Swift 3 SF315-41G-R6BR | |
| Asus VivoBook 15 X542UF-DM143T | |
| HP 15-da0405ng | |
| Lenovo Ideapad 330-15IKB-81DC00SWGE | |
| Average Intel Core i5-7200U (2812 - 3209, n=30) | |
| Geekbench 4.4 | |
| 64 Bit Multi-Core Score | |
| Average of class Office (23754 - 44610, n=9, last 2 years) | |
| Medion Akoya S6625 | |
| Asus VivoBook 15 X542UF-DM143T | |
| HP 15-da0405ng | |
| Acer Swift 3 SF315-41G-R6BR | |
| Lenovo Ideapad 330-15IKB-81DC00SWGE | |
| Average Intel Core i5-7200U (7066 - 7767, n=15) | |
| 64 Bit Single-Core Score | |
| Average of class Office (4564 - 8042, n=9, last 2 years) | |
| Medion Akoya S6625 | |
| Asus VivoBook 15 X542UF-DM143T | |
| HP 15-da0405ng | |
| Lenovo Ideapad 330-15IKB-81DC00SWGE | |
| Average Intel Core i5-7200U (3648 - 3958, n=15) | |
| Acer Swift 3 SF315-41G-R6BR | |
| Mozilla Kraken 1.1 - Total | |
| Lenovo Ideapad 330-15IKB-81DC00SWGE (Edge 44) | |
| Lenovo IdeaPad 330-15ARR 81D2005CUS (Edge 41.16299.611.0) | |
| HP Pavilion 15-cw0003ng | |
| Acer Swift 3 SF315-41G-R6BR (Edge 42) | |
| Acer TravelMate P2510-G2-MG-50WE | |
| Average Intel Core i5-7200U (1109 - 1542, n=42) | |
| Medion Akoya S6625 (Edge 42) | |
| HP Pavilion 15-cs0003ng | |
| Average of class Office (391 - 1297, n=78, last 2 years) | |
| Octane V2 - Total Score | |
| Average of class Office (49011 - 126830, n=20, last 2 years) | |
| Medion Akoya S6625 (Edge 42) | |
| HP Pavilion 15-cs0003ng | |
| Average Intel Core i5-7200U (21890 - 32838, n=45) | |
| Acer Swift 3 SF315-41G-R6BR (Edge 42) | |
| Lenovo Ideapad 330-15IKB-81DC00SWGE (Edge 44) | |
| Lenovo IdeaPad 330-15ARR 81D2005CUS (Edge 41.16299.611.0) | |
| JetStream 1.1 - 1.1 Total | |
| Medion Akoya S6625 (Edge 42) | |
| Asus VivoBook 15 X542UF-DM143T (Edge 41) | |
| Acer TravelMate P2510-G2-MG-50WE | |
| HP 15-da0405ng (Edge 42) | |
| Average Intel Core i5-7200U (127.7 - 223, n=69) | |
| Acer Swift 3 SF315-41G-R6BR (Edge 42) | |
| HP Pavilion 15-cw0003ng | |
| Lenovo Ideapad 330-15IKB-81DC00SWGE (Edge 44) | |
| HP Pavilion 15-cs0003ng | |
| Lenovo IdeaPad 330-15ARR 81D2005CUS (Edge 41.16299.611.0) | |
| Lenovo IdeaPad 330-15ARR-81D2005JGE | |
* ... smaller is better
System Performance
Our review unit performed smoothly in our tests, during which we encountered no crashes or micro-stutters. The 330-15IKB achieved decent results for a dual-core-powered laptop in PCMark benchmarks too, even though it generally finished below average for a modern business laptop.
| PCMark 7 Score | 5481 points | |
| PCMark 8 Home Score Accelerated v2 | 3907 points | |
| PCMark 8 Creative Score Accelerated v2 | 4601 points | |
| PCMark 8 Work Score Accelerated v2 | 4631 points | |
| PCMark 10 Score | 3293 points | |
Help | ||
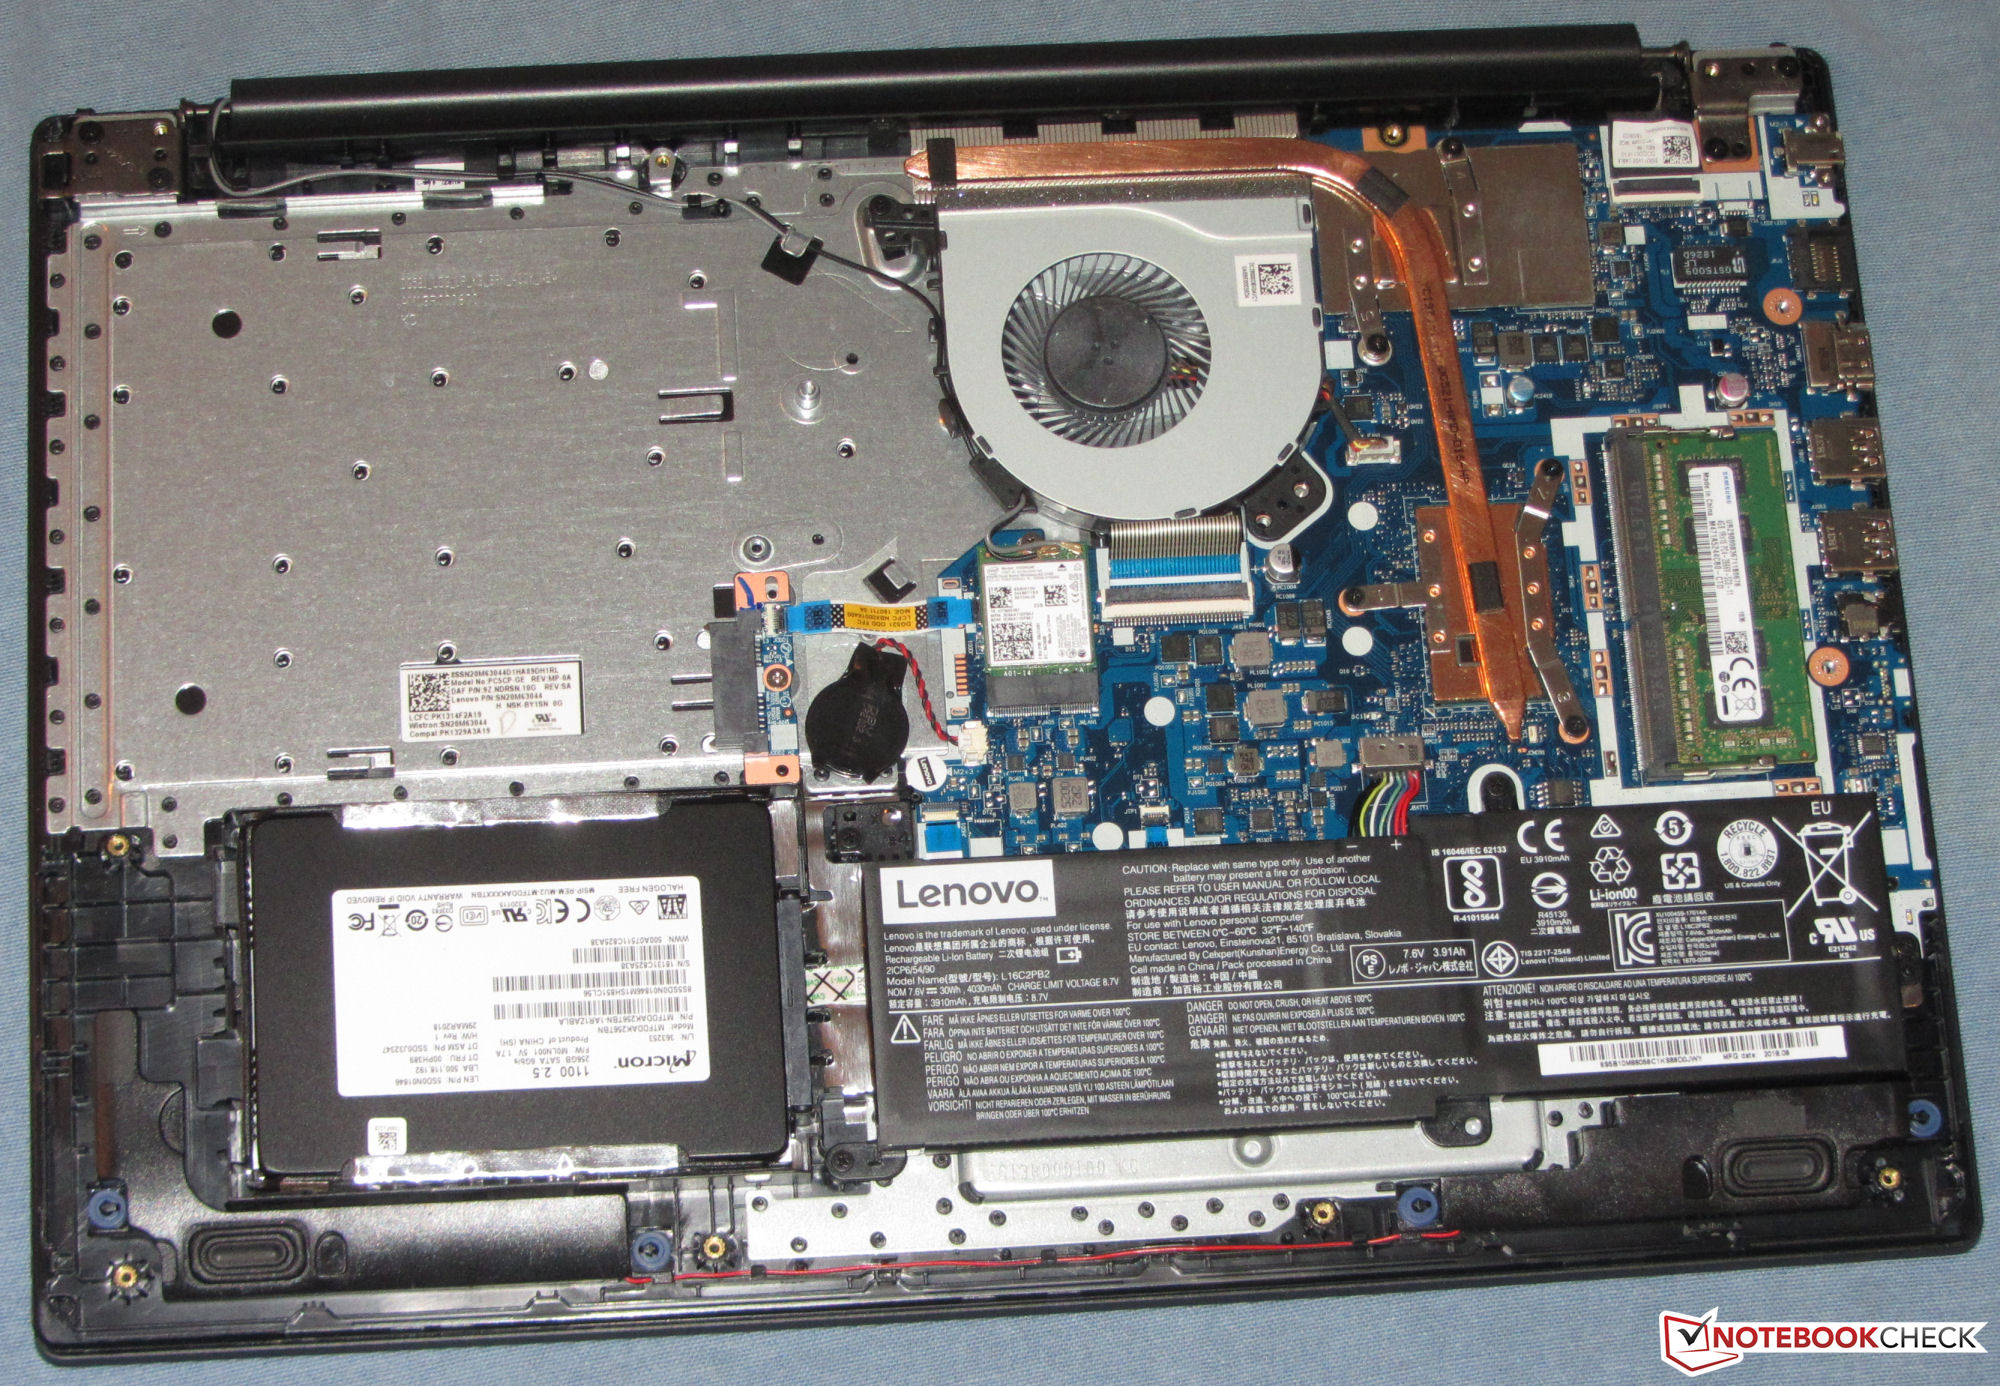
Storage Devices
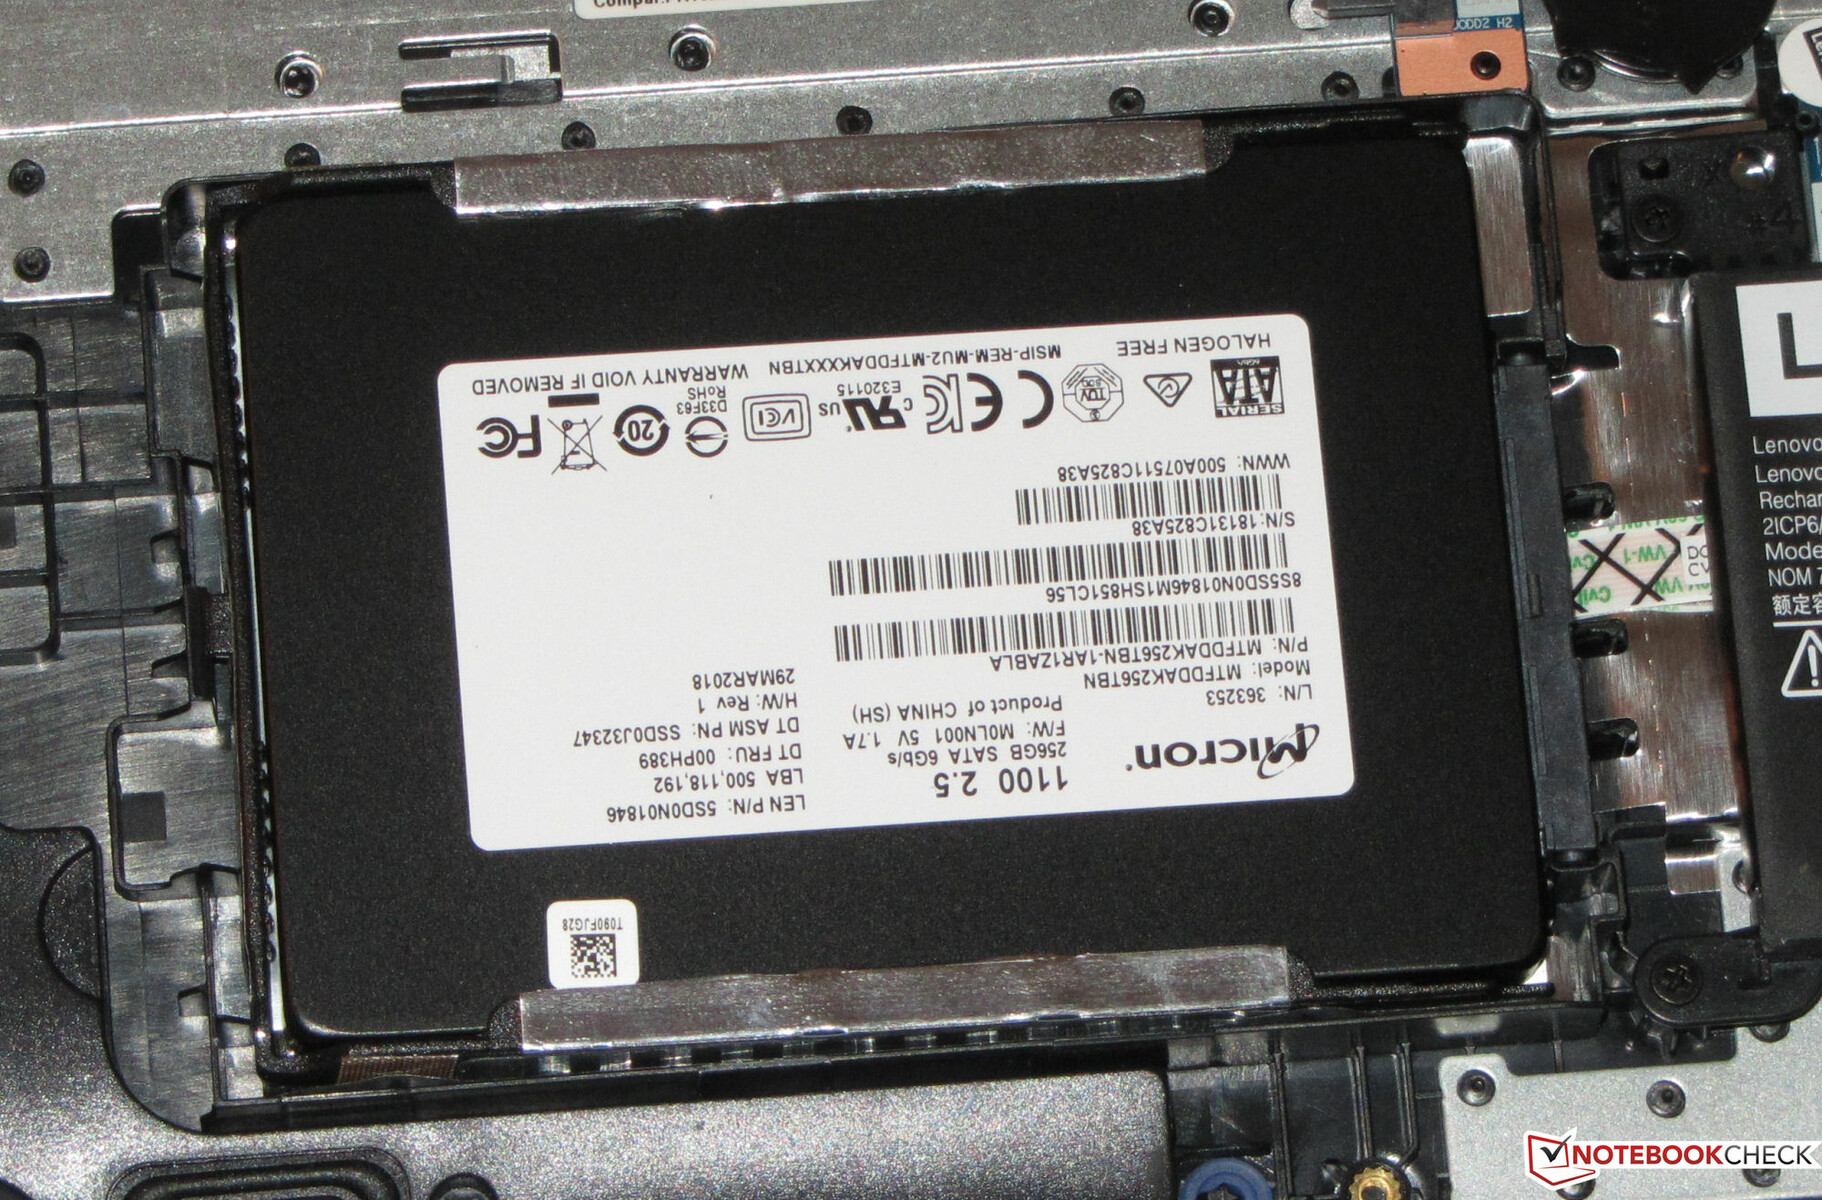
Lenovo has equipped our review unit with a 256 GB Micron 1100 SSD, which is a 2.5-inch SSD that operates on the SATA III protocol. The drive is much slower than modern M.2 2280 SATA III and NVMe drives, but it still delivers acceptable performance. It is worth noting that our review unit had approximately 207 GB free upon delivery, with the remaining space occupied by the recovery partition and Windows 10.

| Lenovo Ideapad 330-15IKB-81DC00SWGE Micron SSD 1100 SED 256GB MTFDDAK256TBN | Acer TravelMate P2510-G2-MG-50WE SK Hynix HFS256G39TND-N210A | HP Pavilion 15-cs0003ng SK Hynix SC313 HFS256G39TNF | HP Pavilion 15-cw0003ng Intel SSD 600p SSDPEKKW512G7 | Asus VivoBook 15 X542UF-DM143T Micron 1100 MTFDDAV256TBN | HP 15-da0405ng SK Hynix BC501 NVMe 256 GB | Acer Swift 3 SF315-41G-R6BR Intel SSD 600p SSDPEKKW256G7 | Lenovo IdeaPad 330-15ARR 81D2005CUS SK Hynix Canvas SC311 256GB HFS256G32TNF | Lenovo IdeaPad 330-15ARR-81D2005JGE Seagate Mobile HDD 1TB ST1000LM035 | Average Micron SSD 1100 SED 256GB MTFDDAK256TBN | |
|---|---|---|---|---|---|---|---|---|---|---|
| CrystalDiskMark 5.2 / 6 | 50% | 73% | 147% | 82% | 168% | 157% | 68% | -88% | 28% | |
| Write 4K (MB/s) | 24.2 | 71.8 197% | 66.9 176% | 105.8 337% | 94.9 292% | 97.6 303% | 112 363% | 66.6 175% | 0.217 -99% | 48.2 ? 99% |
| Read 4K (MB/s) | 7.548 | 21.23 181% | 30.33 302% | 29.22 287% | 27.3 262% | 39.08 418% | 32.44 330% | 29.2 287% | 0.367 -95% | 16.3 ? 116% |
| Write Seq (MB/s) | 395.1 | 257.1 -35% | 447.6 13% | 581 47% | 410.4 4% | 571 45% | 598 51% | 465.6 18% | 98.8 -75% | 404 ? 2% |
| Read Seq (MB/s) | 443.3 | 476.3 7% | 534 20% | 1065 140% | 464 5% | 1110 150% | 1157 161% | 526 19% | 131.1 -70% | 466 ? 5% |
| Write 4K Q32T1 (MB/s) | 160.2 | 202.6 26% | 197.5 23% | 201 25% | 246.5 54% | 235.7 47% | 255.5 59% | 197 23% | 0.222 -100% | 160.9 ? 0% |
| Read 4K Q32T1 (MB/s) | 179 | 282 58% | 234.5 31% | 278.6 56% | 246.4 38% | 297 66% | 287.5 61% | 202.9 13% | 0.781 -100% | 181.9 ? 2% |
| Write Seq Q32T1 (MB/s) | 455.2 | 265.6 -42% | 495.6 9% | 584 28% | 451.4 -1% | 812 78% | 594 30% | 481.4 6% | 97 -79% | 444 ? -2% |
| Read Seq Q32T1 (MB/s) | 517 | 559 8% | 559 8% | 1824 253% | 532 3% | 1742 237% | 1568 203% | 537 4% | 93.3 -82% | 524 ? 1% |
Graphics Card
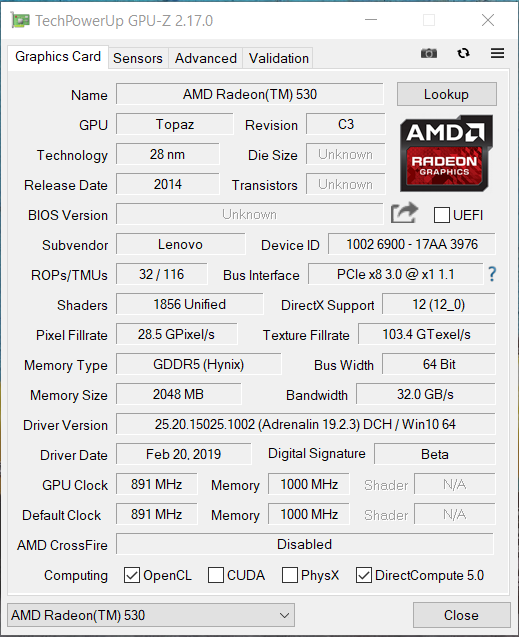
AMD introduced the Radeon 530 GPU in 2017, but its origins are from 2014. The GPU is manufactured on a 28 nm FinFET process and on the company’s GCN 3.0 architecture, which we first saw with the Radeon R9 285. AMD has also released the Radeon 530 under different names over the years, like the Radeon R7 M440.
The Radeon 530 supports DirectX 12 and operates at up to 891 MHz, which is over 100 MHz short of AMD’s stated maximum speed of 1024 MHz. The GPU compensates for the lower clock speed with 2 GB of fast GDDR5 VRAM. The GDDR5 VRAM helps the Radeon 530 to outperform the Radeon 530 with DDR3 VRAM in 3DMark benchmarks and puts it on par with the Nvidia GeForce MX110.
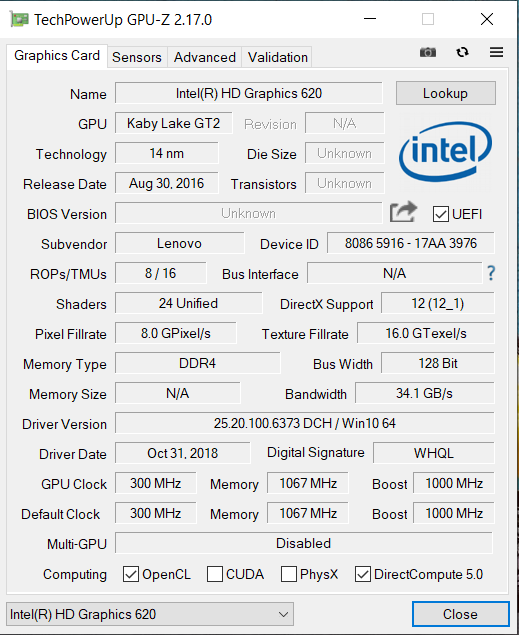
Our review unit also has Intel HD Graphics 620, which is integrated within the Core i5-7200U CPU. The system can switch between the two GPUs when it needs to thanks to AMD Enduro technology, which functions as Nvidia Optimus does. The 330-15IKB uses the Intel GPU when running on battery and in non-graphically intensive tasks, but switches to the AMD GPU when playing games. You can also disable the Radeon 530 in the BIOS should you need to do so.
| 3DMark 03 Standard | 30891 points | |
| 3DMark 05 Standard | 18412 points | |
| 3DMark 06 Standard Score | 11481 points | |
| 3DMark Vantage P Result | 6392 points | |
| 3DMark 11 Performance | 2314 points | |
| 3DMark Ice Storm Standard Score | 48958 points | |
| 3DMark Cloud Gate Standard Score | 6154 points | |
| 3DMark Fire Strike Score | 1386 points | |
| 3DMark Time Spy Score | 497 points | |
Help | ||
Gaming Performance
The Radeon 530 is powerful enough to play older games like BioShock Infinite or Counter-Strike Global Offensive at high graphics in 720p, but modern triple-A titles are out of the question. Dirt Rally 2.0 will play smoothly at minimum graphics in 720p though, but our review unit could not even average 20 FPS in Anthem, Metro Exodus or Hitman 2.
| low | med. | high | ultra | |
|---|---|---|---|---|
| StarCraft 2 (2010) | 247 | 75.8 | 46.6 | 24.8 |
| The Elder Scrolls V: Skyrim (2011) | 58.8 | 42.4 | 31.4 | 17.8 |
| Counter-Strike: GO (2012) | 145.2 | 119.8 | 64.9 | 35.5 |
| Tomb Raider (2013) | 100.1 | 51.7 | 39.9 | 17.8 |
| BioShock Infinite (2013) | 97.5 | 50.5 | 42.9 | 14.8 |
| Middle-earth: Shadow of Mordor (2014) | 46.8 | 29.1 | 15.2 | |
| The Witcher 3 (2015) | 27.1 | 17.3 | 14 | 5.6 |
| Dota 2 Reborn (2015) | 62.1 | 46.9 | 29.3 | 28 |
| World of Warships (2015) | 92.9 | 61.2 | 24.6 | |
| Ashes of the Singularity (2016) | 16.5 | 8.9 | ||
| Overwatch (2016) | 69.9 | 59.3 | 27.8 | |
| Deus Ex Mankind Divided (2016) | 19.7 | 14.2 | ||
| Fortnite (2018) | 62.4 | 18.1 | ||
| Final Fantasy XV Benchmark (2018) | 15.5 | 7.2 | ||
| Kingdom Come: Deliverance (2018) | 25.8 | 10 | ||
| X-Plane 11.11 (2018) | 26.1 | 17.3 | ||
| Far Cry 5 (2018) | 22 | 9 | ||
| Monster Hunter World (2018) | 22.9 | 8.6 | ||
| F1 2018 (2018) | 29 | 18 | ||
| Shadow of the Tomb Raider (2018) | 23 | 8 | ||
| FIFA 19 (2018) | 65.8 | 34.6 | 32 | |
| Forza Horizon 4 (2018) | 31 | 20 | ||
| Assassin´s Creed Odyssey (2018) | 23 | 14 | ||
| Hitman 2 (2018) | 16.5 | 8.2 | ||
| Fallout 76 (2018) | 23.4 | 10.7 | ||
| Battlefield V (2018) | 28.6 | 13.2 | ||
| Farming Simulator 19 (2018) | 53.8 | 21.6 | 10.6 | |
| Darksiders III (2018) | 41.9 | 10.5 | ||
| Just Cause 4 (2018) | 19.6 | 11.8 | ||
| Apex Legends (2019) | 27.8 | 11.9 | ||
| Far Cry New Dawn (2019) | 21 | 9 | ||
| Metro Exodus (2019) | 13.6 | 6.4 | ||
| Anthem (2019) | 18.6 | 11 | ||
| Dirt Rally 2.0 (2019) | 45.6 | 16.1 |
| BioShock Infinite - 1366x768 Medium Preset | |
| HP Pavilion 15-cs0003ng | |
| Acer Swift 3 SF315-41G-R6BR | |
| Asus VivoBook 15 X542UF-DM143T | |
| Medion Akoya S6625 | |
| Dell Latitude 15 3590-K8JP | |
| HP 15-da0405ng | |
| Average AMD Radeon 530 (41.7 - 60.3, n=5) | |
| Lenovo Ideapad 330-15IKB-81DC00SWGE | |
| HP 17-bs103ng | |
| The Witcher 3 - 1024x768 Low Graphics & Postprocessing | |
| Average of class Office (32.2 - 135, n=3, last 2 years) | |
| Acer Swift 3 SF315-41G-R6BR | |
| Asus VivoBook 15 X542UF-DM143T | |
| Medion Akoya S6625 | |
| Dell Latitude 15 3590-K8JP | |
| Average AMD Radeon 530 (24 - 32.8, n=4) | |
| HP 15-da0405ng | |
| Lenovo Ideapad 330-15IKB-81DC00SWGE | |
| Lenovo IdeaPad 330-15ARR 81D2005CUS | |
| Tomb Raider - 1366x768 Normal Preset AA:FX AF:4x | |
| Asus VivoBook 15 X542UF-DM143T | |
| Acer Swift 3 SF315-41G-R6BR | |
| HP 15-da0405ng | |
| Average AMD Radeon 530 (49.7 - 59, n=3) | |
| Lenovo Ideapad 330-15IKB-81DC00SWGE | |
| HP 17-bs103ng | |
| Dota 2 Reborn - 1366x768 med (1/3) | |
| Average of class Office (31.2 - 152, n=77, last 2 years) | |
| Asus VivoBook 15 X542UF-DM143T | |
| HP 15-da0405ng | |
| Acer Swift 3 SF315-41G-R6BR | |
| Average AMD Radeon 530 (46.9 - 66.6, n=4) | |
| HP 17-bs103ng | |
| Lenovo Ideapad 330-15IKB-81DC00SWGE | |
| World of Warships - 1366x768 Medium Preset AF:Trilinear | |
| Asus VivoBook 15 X542UF-DM143T | |
| HP 15-da0405ng | |
| Acer Swift 3 SF315-41G-R6BR | |
| Lenovo Ideapad 330-15IKB-81DC00SWGE | |
| Average AMD Radeon 530 (n=1) | |
| StarCraft 2 - 1360x768 high | |
| Asus VivoBook 15 X542UF-DM143T | |
| HP 15-da0405ng | |
| Lenovo Ideapad 330-15IKB-81DC00SWGE | |
| Average AMD Radeon 530 (n=1) | |
| The Elder Scrolls V: Skyrim - 1366x768 Medium Preset AA:4x | |
| Lenovo Ideapad 330-15IKB-81DC00SWGE | |
| Average AMD Radeon 530 (31 - 42.4, n=2) | |
| HP 17-bs103ng | |
| Counter-Strike: GO - 1366x768 High AA:2x MS AF:4x | |
| Lenovo Ideapad 330-15IKB-81DC00SWGE | |
| Average AMD Radeon 530 (n=1) | |
Emissions
Fan Noise
The 330-15IKB is a comparatively quiet 15.6-inch laptop. The fan is often silent at idle and only reached a maximum of 31.2 dB(A) in these conditions. The fan ramped up to 38.7 dB(A) during our stress tests, but this is not excessively loud. Moreover, we noticed no coil whine or any other electrical-interference related noises during our tests.
Noise level
| Idle |
| 30.5 / 30.5 / 31.2 dB(A) |
| Load |
| 35.4 / 38.7 dB(A) |
 | ||
30 dB silent 40 dB(A) audible 50 dB(A) loud |
||
min: | ||
| Lenovo Ideapad 330-15IKB-81DC00SWGE i5-7200U, Radeon 530 | Lenovo IdeaPad 330-15ARR 81D2005CUS R5 2500U, Vega 8 | Lenovo IdeaPad 330-15ARR-81D2005JGE R3 2200U, Vega 3 | Acer TravelMate P2510-G2-MG-50WE i5-8250U, GeForce MX130 | HP Pavilion 15-cs0003ng i5-8250U, GeForce MX130 | HP Pavilion 15-cw0003ng R5 2500U, Vega 8 | Asus VivoBook 15 X542UF-DM143T i5-8250U, GeForce MX130 | HP 15-da0405ng i5-8250U, GeForce MX110 | Acer Swift 3 SF315-41G-R6BR R5 2500U, Radeon RX 540 | Average AMD Radeon 530 | Average of class Office | |
|---|---|---|---|---|---|---|---|---|---|---|---|
| Noise | 3% | -1% | 1% | -6% | 1% | -1% | -1% | 2% | -5% | 13% | |
| off / environment * (dB) | 30.5 | 28.1 8% | 30.6 -0% | 30.3 1% | 30.6 -0% | 30.5 -0% | 30 2% | 30.6 -0% | 30.3 1% | 29.7 ? 3% | 24.2 ? 21% |
| Idle Minimum * (dB) | 30.5 | 28.1 8% | 31.8 -4% | 30.3 1% | 30.6 -0% | 31.4 -3% | 30.9 -1% | 30.9 -1% | 30.3 1% | 31.6 ? -4% | 24.3 ? 20% |
| Idle Average * (dB) | 30.5 | 31.6 -4% | 31.8 -4% | 30.3 1% | 30.6 -0% | 31.4 -3% | 30.9 -1% | 30.9 -1% | 30.3 1% | 31.6 ? -4% | 24.5 ? 20% |
| Idle Maximum * (dB) | 31.2 | 32.8 -5% | 31.8 -2% | 31 1% | 32.1 -3% | 31.6 -1% | 30.9 1% | 30.9 1% | 32.2 -3% | 31.8 ? -2% | 25.3 ? 19% |
| Load Average * (dB) | 35.4 | 36.5 -3% | 35.2 1% | 35.6 -1% | 43.2 -22% | 33.5 5% | 39 -10% | 36.8 -4% | 34.8 2% | 39.5 ? -12% | 34.3 ? 3% |
| Load Maximum * (dB) | 38.7 | 32.8 15% | 36.4 6% | 38.6 -0% | 43.4 -12% | 35.9 7% | 38 2% | 39 -1% | 35 10% | 42.3 ? -9% | 41.4 ? -7% |
| Witcher 3 ultra * (dB) | 32.8 |
* ... smaller is better
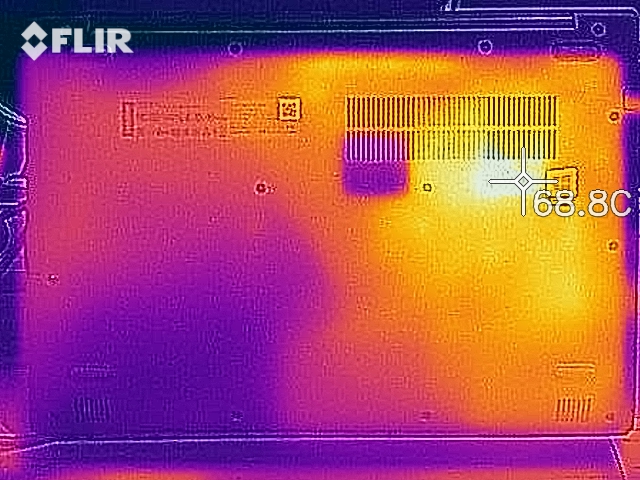
Temperature
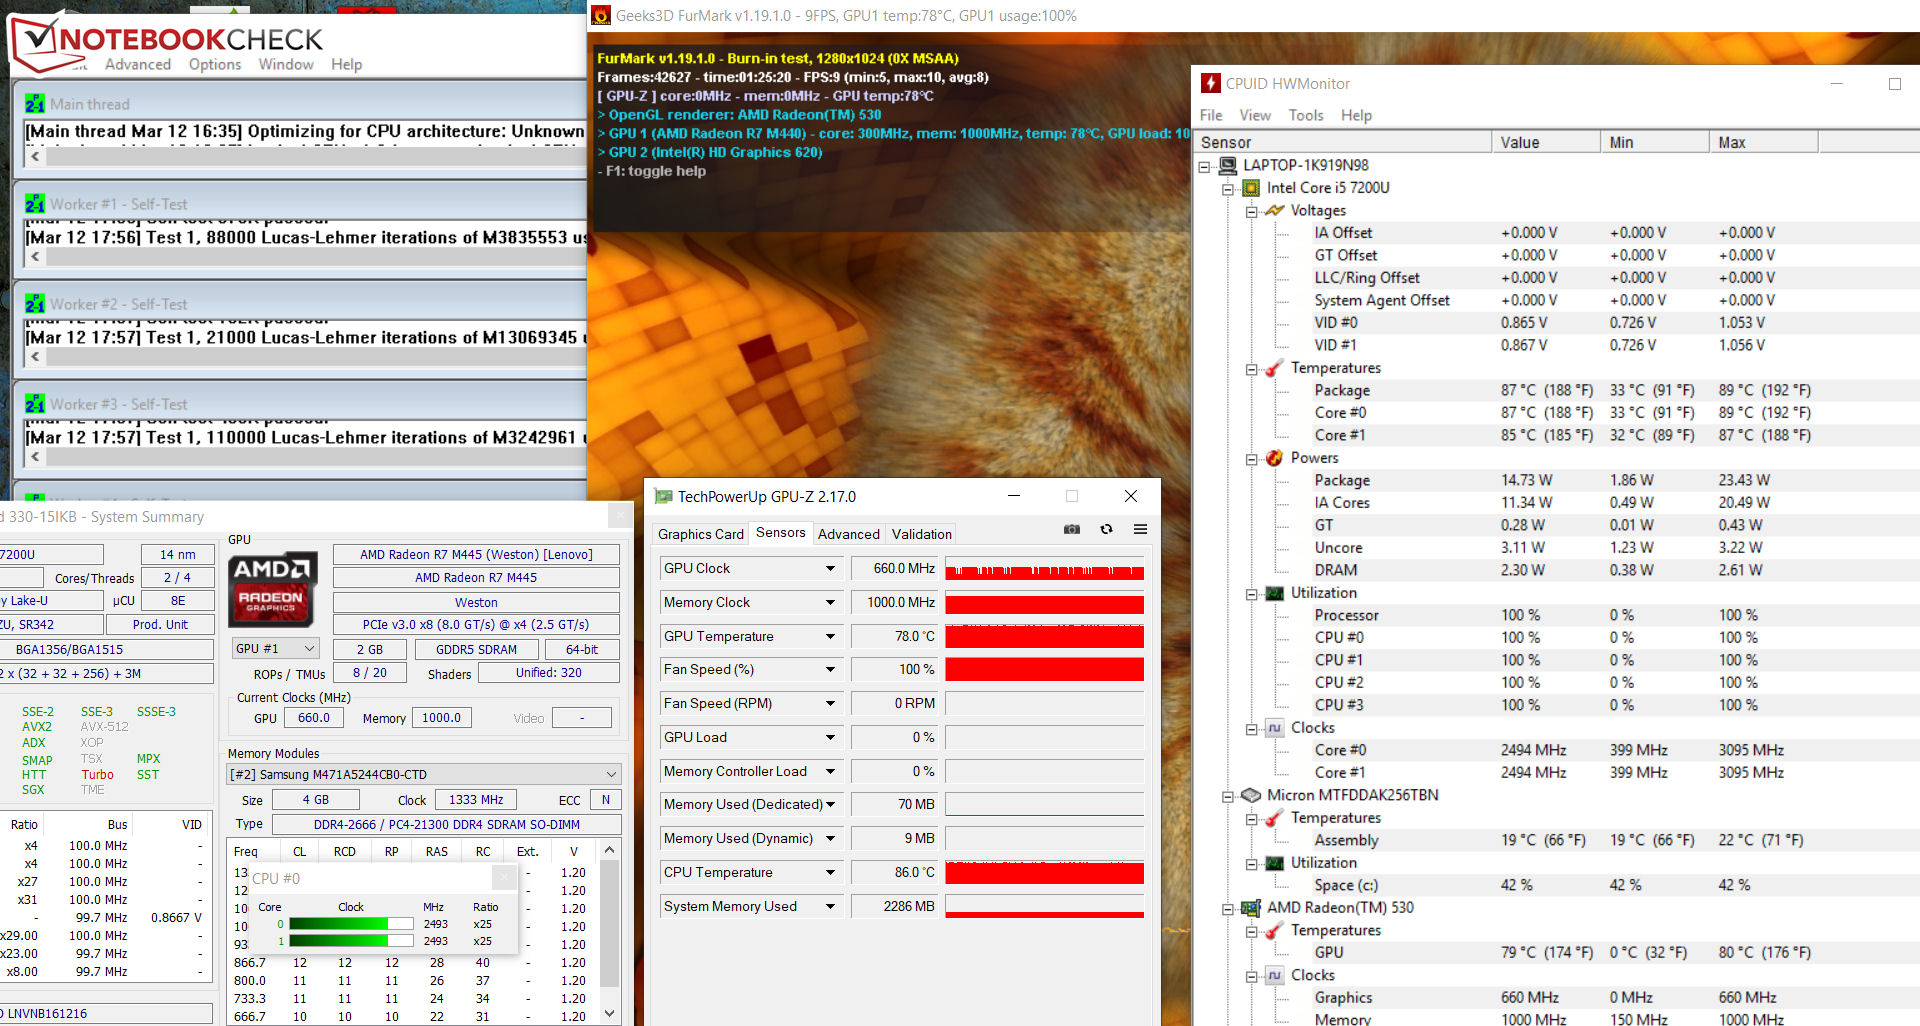
We also subjected our review unit to a combined FurMark and Prime95 stress test that we ran for at least one hour. The 330-15IKB performed equally as well on battery power as it did on mains power with the CPU operating at 2.5 GHz, while the GPU fluctuated between 300 and 660 MHz.
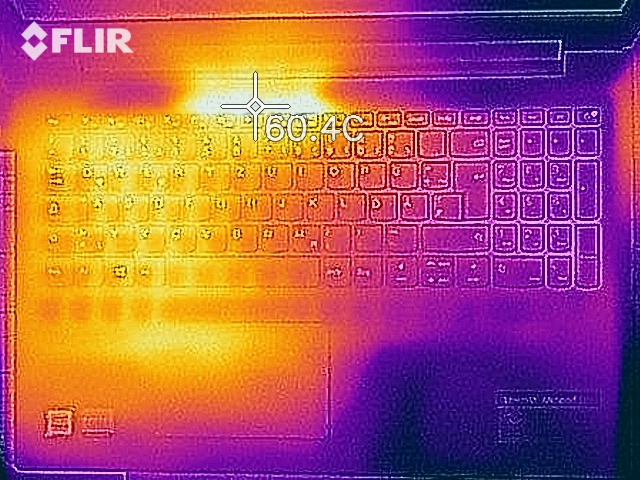
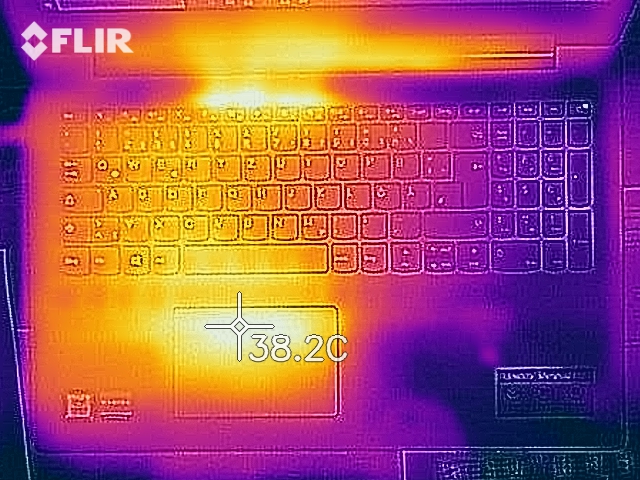
However, our review unit gets too hot for a machine that is equipped with a ULV CPU and an entry-level dedicated GPU. The bottom case reached 53.8 °C under sustained load, which would feel unbearably hot on your lap. Additionally, large parts of the keyboard and palm rest exceeded 40 °C, which will also feel uncomfortable to the touch.
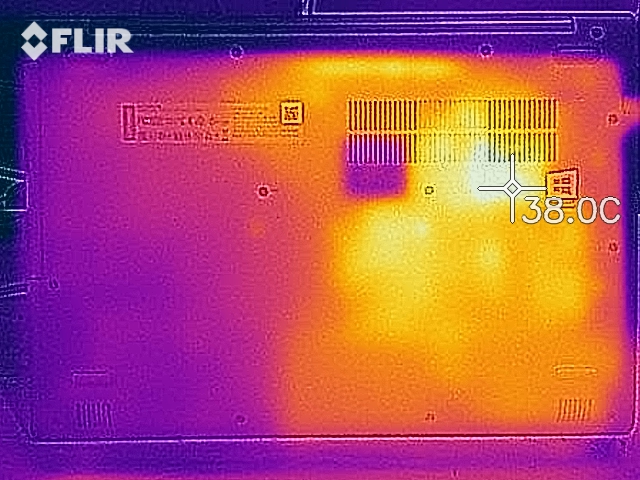
It is worth pointing out that we achieved these surface temperatures during our stress tests, which are an extreme scenario that should not occur in everyday life. Surface temperatures still exceed 30 °C at idle though, which is warmer than we would like to see.
(-) The maximum temperature on the upper side is 46.5 °C / 116 F, compared to the average of 34.3 °C / 94 F, ranging from 21.2 to 62.5 °C for the class Office.
(-) The bottom heats up to a maximum of 53.8 °C / 129 F, compared to the average of 36.8 °C / 98 F
(+) In idle usage, the average temperature for the upper side is 26.9 °C / 80 F, compared to the device average of 29.5 °C / 85 F.
(-) The palmrests and touchpad can get very hot to the touch with a maximum of 42 °C / 107.6 F.
(-) The average temperature of the palmrest area of similar devices was 27.5 °C / 81.5 F (-14.5 °C / -26.1 F).
| Lenovo Ideapad 330-15IKB-81DC00SWGE i5-7200U, Radeon 530 | Lenovo IdeaPad 330-15ARR 81D2005CUS R5 2500U, Vega 8 | Lenovo IdeaPad 330-15ARR-81D2005JGE R3 2200U, Vega 3 | Acer TravelMate P2510-G2-MG-50WE i5-8250U, GeForce MX130 | HP Pavilion 15-cs0003ng i5-8250U, GeForce MX130 | HP Pavilion 15-cw0003ng R5 2500U, Vega 8 | Asus VivoBook 15 X542UF-DM143T i5-8250U, GeForce MX130 | HP 15-da0405ng i5-8250U, GeForce MX110 | Acer Swift 3 SF315-41G-R6BR R5 2500U, Radeon RX 540 | Average AMD Radeon 530 | Average of class Office | |
|---|---|---|---|---|---|---|---|---|---|---|---|
| Heat | 11% | 20% | 8% | 11% | 24% | 15% | 23% | 4% | 10% | 13% | |
| Maximum Upper Side * (°C) | 46.5 | 36.8 21% | 34.5 26% | 49 -5% | 48 -3% | 37.3 20% | 40.2 14% | 37.3 20% | 46.6 -0% | 41.7 ? 10% | 40.4 ? 13% |
| Maximum Bottom * (°C) | 53.8 | 42 22% | 34 37% | 47.4 12% | 49 9% | 37.3 31% | 46.6 13% | 41 24% | 45.5 15% | 42.3 ? 21% | 42.5 ? 21% |
| Idle Upper Side * (°C) | 30.5 | 29.4 4% | 27.5 10% | 26.6 13% | 24.4 20% | 23.7 22% | 25.1 18% | 22.3 27% | 30.2 1% | 28.3 ? 7% | 27.3 ? 10% |
| Idle Bottom * (°C) | 30.1 | 30.6 -2% | 28.2 6% | 26.7 11% | 24.6 18% | 23.9 21% | 25.8 14% | 23.5 22% | 30.7 -2% | 29.3 ? 3% | 28.4 ? 6% |
* ... smaller is better
Speakers
Lenovo Ideapad 330-15IKB-81DC00SWGE audio analysis
(-) | not very loud speakers (63.3 dB)
Bass 100 - 315 Hz
(-) | nearly no bass - on average 23.4% lower than median
(±) | linearity of bass is average (12.7% delta to prev. frequency)
Mids 400 - 2000 Hz
(+) | balanced mids - only 1.9% away from median
(±) | linearity of mids is average (7.6% delta to prev. frequency)
Highs 2 - 16 kHz
(+) | balanced highs - only 1.7% away from median
(+) | highs are linear (5.6% delta to prev. frequency)
Overall 100 - 16.000 Hz
(±) | linearity of overall sound is average (20.7% difference to median)
Compared to same class
» 48% of all tested devices in this class were better, 10% similar, 42% worse
» The best had a delta of 7%, average was 21%, worst was 53%
Compared to all devices tested
» 56% of all tested devices were better, 8% similar, 36% worse
» The best had a delta of 4%, average was 23%, worst was 134%
Asus VivoBook 15 X542UF-DM143T audio analysis
(-) | not very loud speakers (71.1 dB)
Bass 100 - 315 Hz
(-) | nearly no bass - on average 16.9% lower than median
(±) | linearity of bass is average (14.3% delta to prev. frequency)
Mids 400 - 2000 Hz
(+) | balanced mids - only 1.2% away from median
(+) | mids are linear (4.5% delta to prev. frequency)
Highs 2 - 16 kHz
(+) | balanced highs - only 2.9% away from median
(+) | highs are linear (4.2% delta to prev. frequency)
Overall 100 - 16.000 Hz
(±) | linearity of overall sound is average (15.2% difference to median)
Compared to same class
» 37% of all tested devices in this class were better, 4% similar, 59% worse
» The best had a delta of 5%, average was 17%, worst was 45%
Compared to all devices tested
» 22% of all tested devices were better, 4% similar, 74% worse
» The best had a delta of 4%, average was 23%, worst was 134%
HP 15-da0405ng audio analysis
(±) | speaker loudness is average but good (72.1 dB)
Bass 100 - 315 Hz
(-) | nearly no bass - on average 25.4% lower than median
(±) | linearity of bass is average (11.6% delta to prev. frequency)
Mids 400 - 2000 Hz
(+) | balanced mids - only 3% away from median
(±) | linearity of mids is average (7.7% delta to prev. frequency)
Highs 2 - 16 kHz
(+) | balanced highs - only 2.3% away from median
(+) | highs are linear (4% delta to prev. frequency)
Overall 100 - 16.000 Hz
(±) | linearity of overall sound is average (19.9% difference to median)
Compared to same class
» 42% of all tested devices in this class were better, 9% similar, 49% worse
» The best had a delta of 7%, average was 21%, worst was 53%
Compared to all devices tested
» 51% of all tested devices were better, 7% similar, 42% worse
» The best had a delta of 4%, average was 23%, worst was 134%
Acer Swift 3 SF315-41G-R6BR audio analysis
(±) | speaker loudness is average but good (74.2 dB)
Bass 100 - 315 Hz
(-) | nearly no bass - on average 15.1% lower than median
(+) | bass is linear (5% delta to prev. frequency)
Mids 400 - 2000 Hz
(+) | balanced mids - only 3.8% away from median
(+) | mids are linear (5.7% delta to prev. frequency)
Highs 2 - 16 kHz
(±) | higher highs - on average 6.6% higher than median
(+) | highs are linear (5.7% delta to prev. frequency)
Overall 100 - 16.000 Hz
(±) | linearity of overall sound is average (18.2% difference to median)
Compared to same class
» 54% of all tested devices in this class were better, 7% similar, 38% worse
» The best had a delta of 5%, average was 17%, worst was 45%
Compared to all devices tested
» 39% of all tested devices were better, 8% similar, 53% worse
» The best had a delta of 4%, average was 23%, worst was 134%
Power Management
Power Consumption
The 330-15IKB is a comparatively power-efficient device. Our review unit consumes a minimum of 3.6 W at idle, which is on par with our most economic comparison devices. Power consumption rose to a peak of 55.3 W during our stress tests, with the system typically consuming around 40 W under sustained load. This makes the 330-15IKB more efficient than our comparison devices that also have dedicated GPUs, but they also have more powerful components, which is something that is worth bearing in mind.
Lenovo includes a 65 W power supply that is powerful enough to keep the 330-15IKB charged even when the system is being pushed hard.
| Off / Standby | |
| Idle | |
| Load |
|
Key:
min: | |
| Lenovo Ideapad 330-15IKB-81DC00SWGE i5-7200U, Radeon 530 | Lenovo IdeaPad 330-15ARR 81D2005CUS R5 2500U, Vega 8 | Lenovo IdeaPad 330-15ARR-81D2005JGE R3 2200U, Vega 3 | Acer TravelMate P2510-G2-MG-50WE i5-8250U, GeForce MX130 | HP Pavilion 15-cs0003ng i5-8250U, GeForce MX130 | HP Pavilion 15-cw0003ng R5 2500U, Vega 8 | Asus VivoBook 15 X542UF-DM143T i5-8250U, GeForce MX130 | HP 15-da0405ng i5-8250U, GeForce MX110 | Acer Swift 3 SF315-41G-R6BR R5 2500U, Radeon RX 540 | Average AMD Radeon 530 | Average of class Office | |
|---|---|---|---|---|---|---|---|---|---|---|---|
| Power Consumption | -35% | -36% | -8% | -13% | -6% | -18% | -4% | -48% | -30% | -16% | |
| Idle Minimum * (Watt) | 3.6 | 7.6 -111% | 8 -122% | 3.3 8% | 3.3 8% | 4.5 -25% | 4.75 -32% | 3.8 -6% | 6.9 -92% | 5.34 ? -48% | 4.26 ? -18% |
| Idle Average * (Watt) | 6.4 | 10.6 -66% | 9.9 -55% | 5.6 13% | 6.1 5% | 7.3 -14% | 6.9 -8% | 6.2 3% | 9.6 -50% | 8.12 ? -27% | 7.31 ? -14% |
| Idle Maximum * (Watt) | 7.2 | 11.8 -64% | 10.4 -44% | 7.8 -8% | 8.3 -15% | 9.4 -31% | 7 3% | 6.7 7% | 11.8 -64% | 11.3 ? -57% | 8.55 ? -19% |
| Load Average * (Watt) | 39.4 | 24.1 39% | 31 21% | 54 -37% | 56 -42% | 34 14% | 53 -35% | 40.8 -4% | 50 -27% | 46.5 ? -18% | 43.8 ? -11% |
| Load Maximum * (Watt) | 55.3 | 39.4 29% | 43 22% | 63 -14% | 67 -21% | 41.9 24% | 65.3 -18% | 65.2 -18% | 60 -8% | 54.8 ? 1% | 64.5 ? -17% |
| Witcher 3 ultra * (Watt) | 30.3 |
* ... smaller is better
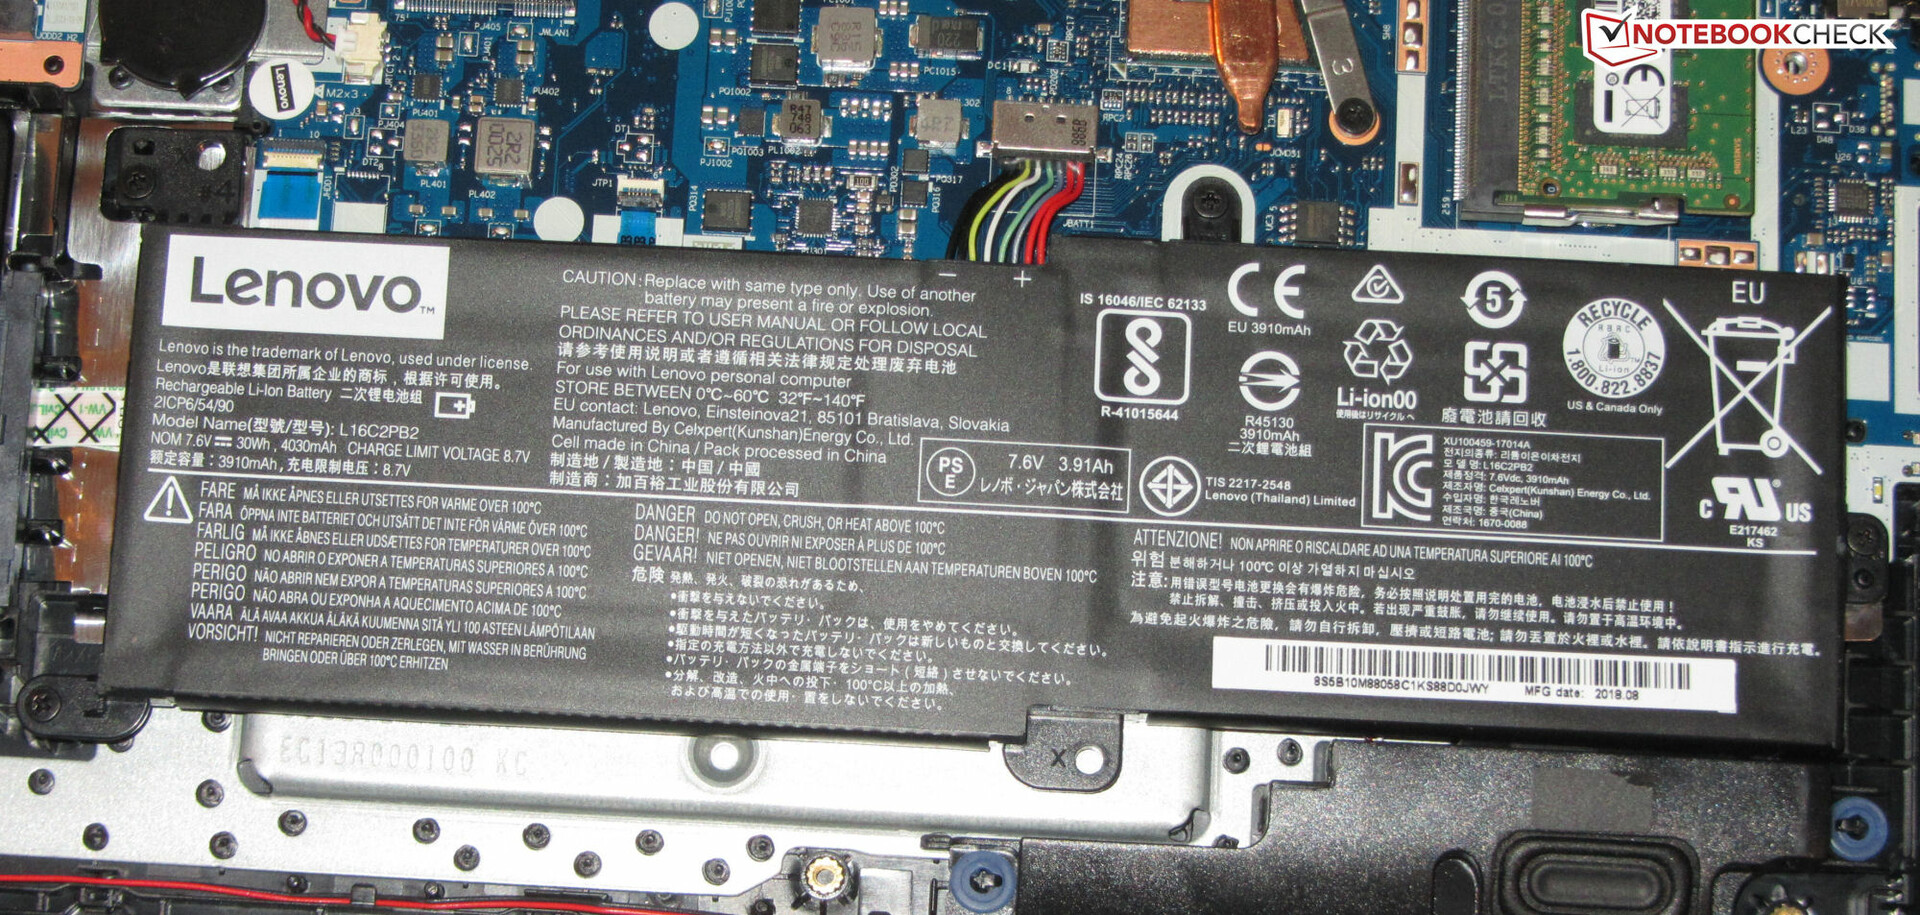
Battery Life
The 330-15IKB has a 30 Wh battery, which is considerably smaller than the batteries in our comparison devices. Correspondingly, our review unit achieved poor runtimes in our battery life tests. The battery needed recharging after just 4:46 hours in our practical Wi-Fi test, during which we run a script that simulates the load required to render websites. We also set the Windows 10 Power mode to balanced, disable all power-saving features and adjust the display to approximately 150 cd/m². Likewise, the device lasted just 5:01 hours in H.264 looped video tests, which is considerably worse than the Acer TravelMate P2510 and its 48 Wh battery.
The 330-15IKB performed better than its Ryzen-powered siblings in these tests though, but that is not saying much. All three laptops have awful battery life, and we hope that Lenovo equips its future 15-inch IdeaPad laptops with larger batteries.
| Lenovo Ideapad 330-15IKB-81DC00SWGE i5-7200U, Radeon 530, 30 Wh | Acer TravelMate P2510-G2-MG-50WE i5-8250U, GeForce MX130, 48 Wh | HP Pavilion 15-cs0003ng i5-8250U, GeForce MX130, 41 Wh | HP Pavilion 15-cw0003ng R5 2500U, Vega 8, 41 Wh | Asus VivoBook 15 X542UF-DM143T i5-8250U, GeForce MX130, 38 Wh | HP 15-da0405ng i5-8250U, GeForce MX110, 41 Wh | Acer Swift 3 SF315-41G-R6BR R5 2500U, Radeon RX 540, 48 Wh | Lenovo IdeaPad 330-15ARR 81D2005CUS R5 2500U, Vega 8, 35 Wh | Lenovo IdeaPad 330-15ARR-81D2005JGE R3 2200U, Vega 3, 35 Wh | Average of class Office | |
|---|---|---|---|---|---|---|---|---|---|---|
| Battery runtime | 82% | 20% | 13% | 42% | 23% | 33% | -17% | -50% | 137% | |
| Reader / Idle (h) | 13.5 | 8.2 -39% | 8.4 -38% | 12.1 -10% | 24.5 ? 81% | |||||
| H.264 (h) | 5 | 8.6 72% | 3.8 -24% | 6.1 22% | 15.5 ? 210% | |||||
| WiFi v1.3 (h) | 4.8 | 8.4 75% | 4.7 -2% | 5 4% | 6.8 42% | 5.9 23% | 6.7 40% | 4 -17% | 2.4 -50% | 13.2 ? 175% |
| Load (h) | 1 | 2 100% | 2 100% | 2.1 110% | 1.8 80% | 1.808 ? 81% |
Pros
Cons
Verdict
The Lenovo IdeaPad 330-15IKB is a bit of an anachronism. Its Core i5-7200U processor and Radeon 530 GPU are both outdated, as is its TN display. Moreover, the battery is simply too small for a 15.6-inch laptop.
Additionally, while the SSD is fast enough to keep the system running smoothly, it is considerably slower than M.2 2280 drives with which most OEMs equip their modern laptops. Furthermore, we cannot understand why Lenovo failed to include a backlit keyboard.
We cannot recommend the Lenovo IdeaPad 330-15IKB. It falls so far short of expectations in so many areas that we would urge you to look elsewhere if you need a budget 15.6-inch business laptop.
If you are interested in the IdeaPad 330-15, then the Ryzen 5-2500U model offers comparable performance with an IPS display but at a much more affordable price. It too has dreadful battery life though, so you may want to skip the series altogether until Lenovo addresses its deficiencies.
Lenovo Ideapad 330-15IKB-81DC00SWGE
- 03/17/2019 v6 (old)
Sascha Mölck
Price comparison

